Influence of feeding thermally peroxidized lipids on growth ...
12
1 Journal of Animal Science, 2020, Vol. 98, No. 12, 1–12 doi:10.1093/jas/skaa392 Advance Access publication December 9, 2020 Received: 20 October 2020 and Accepted: 8 December 2020 Non Ruminant Nutrition Published by Oxford University Press on behalf of the American Society of Animal Science 2020. This work is written by (a) US Government employee(s) and is in the public domain in the US. Non Ruminant Nutrition Influence of feeding thermally peroxidized lipids on growth performance, lipid digestibility, and oxidative status in nursery pigs Brian J. Kerr, †,1,2 Stephanie C. Lindblom, ‡ Junmei Zhao, ‡ and Richard J. Faris ‡ † USDA-ARS National Laboratory for Agriculture and the Environment, Ames, IA 50011, ‡ Cargill Animal Nutrition, Elk River, MN 55330 1 Mention of a trade name, proprietary product, or specific equipment does not constitute a guarantee or warranty by the USDA and does not imply approval to the exclusion of other products that may be suitable. The USDA is an equal opportunity provider and employer. 2 Corresponding author: [email protected] ORCiD number: 0000-0002-3123-8615 (B. J. Kerr). Abstract Three experiments were conducted to evaluate oil source and peroxidation status (experiment 1) or peroxidized soybean oil (SO; experiments 2 and 3) on growth performance, oxidative stress, and digestibility of dietary ether extract (EE). In experiment 1, palm oil (PO), poultry fat (PF), canola oil (CO), and SO were evaluated, while in experiments 2 and 3, only SO was evaluated. Lipids were either an unheated control (CNT) or thermally processed at 90 °C for 72 hr, being added at 10%, 7.5%, or 3% of the diet in experiments 1, 2, and 3, respectively. In experiment 1, 288 pigs (body weight, BW, 6.1 kg) were fed 1 of 8 factorially arranged treatments with the first factor being lipid source (PO, PF, CO, and SO) and the second factor being peroxidation status (CNT or peroxidized). In experiment 2, 216 pigs (BW 5.8 kg) were fed 1 of 6 treatments consisting of 100%, 90%, 80%, 60%, 20%, and 0% CNT SO blended with 0%, 10%, 20%, 40%, 80%, and 100% peroxidized SO, respectively. In experiment 3, 72 pigs (BW 5.8 kg) were fed either CNT or peroxidized SO. Pigs were fed 21 d with feces collected on day 12 or 14 and pigs bled on day 12 blood collection. In experiment 1, an interaction between oil source and peroxidation status was observed for averaged daily gain (ADG) and average daily feed intake (ADFI; P = 0.10) which was due to no impact of feeding pigs peroxidized PO, PF, or SO on ADG or ADFI compared with feeding pigs CNT PO, PF, or SO, respectively; while pigs fed peroxidized CO resulted in reduced ADG and ADFI compared with pigs fed CNT CO. There was no interaction between oil source and peroxidation status, and no lipid source effect on gain to feed ratio (GF; P ≥ 0.84), but pigs fed the peroxidized lipids had a lower GF compared with pigs fed the CNT lipids (P = 0.09). In experiment 2, feeding pigs diets containing increasing levels of peroxidized SO resulted in reduced ADG (quadratic, P = 0.03), ADFI (linear, P = 0.01), and GF (quadratic, P = 0.01). In experiment 3, feeding peroxidized SO at 3% of the diet reduced ADG (P = 0.11) and ADFI (P = 0.13), with no observed change in GF (P = 0.62). Differences in plasma protein carbonyls, glutathione peroxidase, and vitamin E due to feeding peroxidized lipids were inconsistent across the 3 experiments. Digestibility of dietary EE was reduced in pigs fed peroxidized PO or SO (P = 0.01, experiment 1) and peroxidized SO in experiments 2 and 3 (P ≤ 0.02). In conclusion, the peroxidation status of dietary lipids consistently affects growth performance and EE digestibility but has a variable effect on measures of oxidative stress. Key words: fat digestibility, nursery pigs, oxidative status, peroxidized lipids Downloaded from https://academic.oup.com/jas/article/98/12/skaa392/6029086 by guest on 10 March 2022
-
Upload
khangminh22 -
Category
Documents
-
view
1 -
download
0
Transcript of Influence of feeding thermally peroxidized lipids on growth ...

Copyedited by AK
1
Journal of Animal Science 2020 Vol 98 No 12 1ndash12
doi101093jasskaa392Advance Access publication December 9 2020Received 20 October 2020 and Accepted 8 December 2020Non Ruminant Nutrition
Published by Oxford University Press on behalf of the American Society of Animal Science 2020 This work is written by (a) US Government employee(s) and is in the public domain in the US
Non Ruminant Nutrition
Influence of feeding thermally peroxidized lipids on growth performance lipid digestibility and oxidative status in nursery pigsBrian J Kerrdagger12 Stephanie C LindblomDagger Junmei ZhaoDagger and Richard J FarisDagger
daggerUSDA-ARS National Laboratory for Agriculture and the Environment Ames IA 50011 DaggerCargill Animal Nutrition Elk River MN 55330
1Mention of a trade name proprietary product or specific equipment does not constitute a guarantee or warranty by the USDA and does not imply approval to the exclusion of other products that may be suitable The USDA is an equal opportunity provider and employer2Corresponding author briankerrarsusdagov
ORCiD number 0000-0002-3123-8615 (B J Kerr)
AbstractThree experiments were conducted to evaluate oil source and peroxidation status (experiment 1) or peroxidized soybean oil (SO experiments 2 and 3) on growth performance oxidative stress and digestibility of dietary ether extract (EE) In experiment 1 palm oil (PO) poultry fat (PF) canola oil (CO) and SO were evaluated while in experiments 2 and 3 only SO was evaluated Lipids were either an unheated control (CNT) or thermally processed at 90 degC for 72 hr being added at 10 75 or 3 of the diet in experiments 1 2 and 3 respectively In experiment 1 288 pigs (body weight BW 61 kg) were fed 1 of 8 factorially arranged treatments with the first factor being lipid source (PO PF CO and SO) and the second factor being peroxidation status (CNT or peroxidized) In experiment 2 216 pigs (BW 58 kg) were fed 1 of 6 treatments consisting of 100 90 80 60 20 and 0 CNT SO blended with 0 10 20 40 80 and 100 peroxidized SO respectively In experiment 3 72 pigs (BW 58 kg) were fed either CNT or peroxidized SO Pigs were fed 21 d with feces collected on day 12 or 14 and pigs bled on day 12 blood collection In experiment 1 an interaction between oil source and peroxidation status was observed for averaged daily gain (ADG) and average daily feed intake (ADFI P = 010) which was due to no impact of feeding pigs peroxidized PO PF or SO on ADG or ADFI compared with feeding pigs CNT PO PF or SO respectively while pigs fed peroxidized CO resulted in reduced ADG and ADFI compared with pigs fed CNT CO There was no interaction between oil source and peroxidation status and no lipid source effect on gain to feed ratio (GF P ge 084) but pigs fed the peroxidized lipids had a lower GF compared with pigs fed the CNT lipids (P = 009) In experiment 2 feeding pigs diets containing increasing levels of peroxidized SO resulted in reduced ADG (quadratic P = 003) ADFI (linear P = 001) and GF (quadratic P = 001) In experiment 3 feeding peroxidized SO at 3 of the diet reduced ADG (P = 011) and ADFI (P = 013) with no observed change in GF (P = 062) Differences in plasma protein carbonyls glutathione peroxidase and vitamin E due to feeding peroxidized lipids were inconsistent across the 3 experiments Digestibility of dietary EE was reduced in pigs fed peroxidized PO or SO (P = 001 experiment 1) and peroxidized SO in experiments 2 and 3 (P le 002) In conclusion the peroxidation status of dietary lipids consistently affects growth performance and EE digestibility but has a variable effect on measures of oxidative stress
Key words fat digestibility nursery pigs oxidative status peroxidized lipids
FampR All rights reserved For permissions please e-mail (CopyrightLine) ^nAll rights reserved For permissions please e-mail (CopyrightLine)
Dow
nloaded from httpsacadem
icoupcomjasarticle9812skaa3926029086 by guest on 10 M
arch 2022
Copyedited by AK
2 | Journal of Animal Science 2020 Vol 98 No 12
IntroductionLipids provide a concentrated source of energy and are used in varying amounts in swine feeding formulations (Pettigrew and Moser 1991 Azain 2001 Lin et al 2013) However the profile of fatty acids (FA) of a lipid and the time and temperature of a lipid under thermal stress all impact the generation of lipid oxidation products (Holman 1954 Lundberg and Jarvi 1971 Hammond and White 2011) In the animal rendering food industry and restaurant industry lipids can undergo various thermal processing steps which ultimately results in fats and oils used in the livestock industry with variable quality indices (van Kempen and McComas 2002 Shurson et al 2015) While consumption of peroxidized lipids has been shown to reduce growth performance (DeRouchey et al 2004 Rosero et al 2015 Yuan et al 2020) additional information is needed relating specific measures of lipid oxidation products to animal performance (Hung et al 2017) to measures of oxidative stress (Betteridge 2000) and on lipid digestibility (DeRouchey et al 2004 Liu et al 2014c Kerr et al 2020) The objectives of the studies were to evaluate the effect of feeding different lipids that have been thermally processed and the feeding of graded levels of thermally processed soybean oil (SO) on growth performance plasma protein carbonyls (PC) and vitamin E and on ether extract (EE) digestibility in nursery pigs
Materials and MethodsAnimal care and use procedures for all experiments were approved by the Animal Care and Use Committee at Cargill Animal Nutrition Elk River MN
General
All experiments were conducted at the Cargill Animal Nutrition Innovation Campus located in Elk River MN In each experiment pigs (Landrace times Yorkshire Genesus) were weaned and randomly allotted to their experimental diets based on weight and sex into identical rooms with 24 pens each Pigs were housed 3 pigs per pen (074 times 212 m) in environmentally controlled rooms with slatted flooring with each pen containing a self-feeder and a nipple waterer In each experiment diets were formulated to be adequate in energy and nutrients relative to the Cargill Nutrition System Of particular interest the vitaminndashtrace mineral premix was formulated to provide a 60 IU vitamin Ekg diet and no antioxidants added to the oil or the diets prior to diet mixing or feeding Ethoxyquin was however contained in the vitaminndashtrace mineral mix such that the final diet contained 75 microg ethoxyquinkg diet Titanium dioxide was added to all diets at 050 as an indigestible marker for calculation of apparent total tract digestibility (ATTD) of EE All diets were
pelleted (4 mm) at the Elk River facility prior to feeding In each experiment fecal scores were measured on days 4 7 11 and 21 using the following visual scoring system 1 Normal 2 Soft 3 Very Soft 4 Watery
In experiment 1 4 lipids (palm oil PO poultry fat PF canola oil CO and SO Table 1) differing in lipid composition were selected based on their differences in FA profile and potential susceptibility to peroxidation (Holman 1954 Choe and Min 2007 Winkler-Moser et al 2020) as well as their global usage and application in the swine industry (Kerr et al 2015) In experiments 2 and 3 only SO (Table 2) was used due to its susceptibility to peroxidation (Lundberg and Jarvi 1971) use in the swine industry either as a refined product or via yellow grease and the ability to compare the current data to previously conducted experiments (Lindblom et al 2018a b Overholt et al 2018 Kerr et al 2020) Lipids were either unheated or peroxidized by placing each lipid into a 140-L aluminum stock pot measuring 58 cm in diameter and 58 cm high and filling it approximately two-thirds full during the heating process Except for the unheated control (CNT) lipid the heating process was accomplished by using an immersion heater to heat the lipid to 90 degC for 72 hr and each tank was infused with constant airflow (15 Lmin experiment 1 30 Lmin experiments 2 and 3) using an air pump and a calibrated airflow controller with air forced into the tank using a copper pipe with a 95-mm diameter hole (experiment 1) or four 32 mm holes (experiments 2 and 3) Temperatures were taken at regular intervals to ensure the proper heating temperature Diverse analyses of each lipid used were conducted (Tables 1 and 2) to characterize the composition and quality of each lipid treatment using methods shown in Table 3
Experiment 1
To determine the effect of lipid source and peroxidation status on pig performance ATTD of EE and oxidative status 288 mixed-sex pigs (initial body weight BW 61 kg) were weaned at 21 d and allocated to 1 of 8 treatments in a randomized complete block design Treatments were allotted in a 4 times 2 factorial arrangement with the first factor being lipid source (PO PF CO and SO) and the second factor being peroxidation status (CNT or thermally peroxidized at 90 degC) All diets contained 10 added lipid (Table 4) Pigs and feeders were weighed on days 0 and 21 to calculate averaged daily gain (ADG) average daily feed intake (ADFI) and gain to feed ratio (GF) A composite fecal sample was collected from each pen on day 12 resulting in 12 replications per dietary treatment for the ATTD of EE data On day 12 blood was collected in EDTA blood tubes by jugular venipuncture from 1 randomly selected pig in 9 of the 12 pens for subsequent plasma separation
Experiment 2
To determine the effect of graded levels of peroxidation in SO on pig performance ATTD of EE digestibility and oxidative status 216 mixed-sex pigs (initial BW 58 kg) were weaned at 21 d of age and allocated to 1 of 6 treatments in a randomized complete block design Pigs were fed treatment diets containing a total of 75 SO (Table 4) consisting of 100 90 80 60 20 and 0 fresh SO blended with 0 10 20 40 80 and 100 peroxidized SO respectively Pigs and feeders were weighed on days 0 and 21 to calculate growth parameters A composite fecal sample was collected on day 14 from each pen resulting in 12 replications per dietary treatment for the ATTD of EE data On day 12 blood was collected in EDTA blood tubes by jugular venipuncture from 1 randomly selected pig in 9 of the 12 pens for subsequent plasma separation
Abbreviations
AnV anisidine valueATTD apparent total tract digestibilityEE ether extractFA fatty acidsFFA free fatty acidsGPx glutathione peroxidasePC protein carbonylsPF poultry fatPV peroxide valueTBARS thiobarbituric acid reactive
substances
Dow
nloaded from httpsacadem
icoupcomjasarticle9812skaa3926029086 by guest on 10 M
arch 2022
Copyedited by AK
Journal of Animal Science 2020 Vol 98 No 12 | 3
Experiment 3
To determine an industry-relevant effect of SO peroxidation on pig performance ATTD of EE and oxidative status 72 mixed-sex pigs (initial BW 58 kg) weaned at 21 d of age and allocated to 1 of 2 treatments in a randomized complete block design Pigs were fed treatment diets containing either 3 CNT SO or 3 peroxidized SO (Table 4) Pigs and feeders were weighed on days 0 and 21 to calculate growth parameters A composite fecal sample was collected on day 14 from each pen resulting in 12 replications
per dietary treatment for the ATTD of EE data On day 12 blood was collected in EDTA blood tubes by jugular venipuncture from 1 randomly selected pig in 9 of the 12 pens for subsequent plasma separation
Calculations and methodologies
Feces were dried at 60 degC for 48 hr and ground through a 1-mm screen with a subsample taken for subsequent analysis Dried feed and fecal samples were analyzed for
Table 1 Composition and quality indices of lipids used in experiment 11
Lipid Palm oil Poultry fat Canola oil Soybean oil
Temperature degC2 CNT 90 CNT 90 CNT 90 CNT 90
FA of total fat C120 Lauric 031 029 mdash mdash mdash mdash mdash mdashC140 Myristic 105 104 099 080 mdash mdash mdash 009C141 Myristoleic mdash mdash 023 017 mdash mdash mdash mdashC160 Palmitic 4442 4426 2166 2067 396 436 1078 1203C161 Palmitoleic 016 015 526 456 019 021 008 010C170 Margaric mdash 010 031 024 mdash mdash mdash 010C171 Margaroleic mdash mdash 023 016 013 013 mdash mdashC180 Stearic 461 459 705 657 176 195 384 428C181 Oleic 3880 3884 3747 3871 6292 6717 2467 2683C182 Linoleic 981 989 2419 2546 1953 1719 5267 4978C183 Linolenic 021 020 131 168 887 640 671 546C190 Nonadecanoic
mdash mdash mdash mdash 046 032 025 021
C200 Arachidic 036 035 010 017 061 062 032 036C201 Gadoleic 014 013 023 030 113 122 019 021C202 Eicosadienoic mdash mdash 017 014 mdash mdash mdash mdashC204 Arachidonic mdash mdash 044 024 mdash mdash mdash mdashC220 Behenic mdash mdash mdash mdash 031 036 035 039
UFASFA3 097 097 230 250 1307 1213 543 472IV4 51 51 85 87 112 105 130 124FFA3 010 010 62 90 010 040 010 030MIU3 033 043 103 137 109 099 057 081PV3 meqkg 46 42 02 160 60 1559 30 1737AnV5 72 73 82 735 19 139 23 152Oxidized FA 81 23 38 48 25 46 19 56Aldehydes mgkg6
24-Decadienal 02 02 89 4209 02 1389 01 29964-Hydroxynonenal 35 37 00 00 04 1217 02 2352Acrolein 00 00 276 677 00 88 00 762-Decenal 02 02 14 1691 02 469 01 11024-Heptadienal 01 01 08 545 01 859 01 6632-Heptenal 01 01 84 1974 02 483 01 829Hexanal 00 20 1260 11667 00 801 03 11782-Octenal 02 02 15 1226 02 468 01 793Pentanal 01 03 212 980 00 34 01 6724-Undecadienal 00 00 00 53 00 26 00 822-Undecenal 02 01 12 2110 01 470 01 114
Tocopherols mgkg 53 53 68 334 479 lt10 1014 lt10Alpha 53 53 52 53 69 lt10 52 lt10Beta lt10 lt10 lt10 lt10 lt10 lt10 lt10 lt10Delta lt10 lt10 16 281 lt10 lt10 170 lt10Gamma lt10 lt10 lt10 lt10 410 lt10 792 lt10
1Unless otherwise noted analyzed by Barrow-Agee Memphis TN2The control (CNT) oil was not subjected to heat whereas 90 degC oils were heated for 72 hr with constant air flow (15 Lmin)3UFASFA unsaturatedsaturated FA ratio MIU moisture insoluble and unsaponifiable material FFA free fatty acids4Iodine values (IV) were calculated using the FA profile data following the equation proposed by Meadus et al (2010) VI = (161 times 095) + (181 times 086) + (182 times 1732) + (183 times 2615) + (201 times 0785) + (202 times 157) + (203 times 238) + (204 times 319) + (205 times 401) + 224 times 293) + (225 times 368) + (226 times 464)5There are no units for p-anisidine value (AnV)6Analyzed by University of Minnesota St Paul MN
Dow
nloaded from httpsacadem
icoupcomjasarticle9812skaa3926029086 by guest on 10 M
arch 2022
Copyedited by AK
4 | Journal of Animal Science 2020 Vol 98 No 12
titanium (Luthria et al 2004) and acid hydrolyzed EE (Myers et al 2004 University of Missouri Agricultural Experiment Station Chemical Laboratories Columbia MO) with ATTD of EE calculated using the following equation [1-(Tidiet times EEfeces)(Tifeces times EEdiet)] times 100 Plasma samples were analyzed for PC (Biocell Protein Carbonyl Assay Kit Manukau City NZ) glutathione peroxidase (GPx Paglia and Valentine 1967 Koller et al 1984 University of Idaho Moscow ID) and vitamin E (Arnaud et al 1991 Michigan State University Veterinary Diagnostic Laboratory Lansing MI)
Statistical analysis
For all experiments data were analyzed as a randomized complete block design with a room as a block and the pen as
the experimental unit using the Proc MIXED procedure of SAS (version 94 SAS 2009) except fecal scores which were analyzed using R v361 (R Core Team 2019) Means were reported and separated using LSMEANS using initial BW as a covariate Fecal scores were analyzed as a multinomial ordinal response for the probability of a more normal stool including scoring day as a random effect In experiment 1 interactions were constructed to test the potential interactive effect between peroxidation status and oil source on pig performance ATTD of EE and plasma oxidative status In addition correlations between lipid peroxidation measures with growth performance and ATTD of EE were evaluated by simple linear correlation (Pearson correlation coefficients) analysis when P le 005 and r ge 030 In experiment 2 linear or quadratic effects of dietary anisidine value (AnV) were evaluated on growth performance ATTD of EE or plasma PC or vitamin E using regression analysis In experiment 3 differences between treatments were conducted using a simple F-test Differences were considered significant at P le 010
Results and Discussion
Compositional changes of lipids due to thermal processing
Composition and quality changes of lipids used in experiment 1 are shown in Table 1 Thermally processing of PO and PF had little impact on FA composition or on changes in quality indices as represented by free fatty acids (FFA) moisture insoluble and unsaponifiable material peroxide value (PV) AnV and oxidized FA In contrast thermally processing of CO and SO resulted in reductions of linoleic and linolenic acid with a concomitant increase in oleic steric and palmitic acid While the FA changes were small these changes were reflected in a decrease in the unsaturatedsaturated FA ratio and iodine value (Table 1) As expected thermally processing of CO and SO resulted in increased PV and AnV and a small increase in oxidized FA The changes in the FA profile PV and AnV of the thermally processed CO and SO were expected (Yin et al 2011) and are relatively similar to thermally processing of different lipids reported by Winkler-Moser et al (2020) even though the lipids used in the data reported by Winkler-Moser et al (2020) were processed in 5 L round-bottom glass flask vs a 140-L aluminum stock pot in the current experiment and a different level of air infiltration (3 mLmin vs 15 Lmin respectively) The changes in composition and quality indices for SO in experiment 1 are relatively similar to thermally processed SO data reported by
Table 3 Method of lipid analysis
Analyte Method
Aldehydes1 Wang et al (2016)Anisidine value2 AOCS Cd 18-90FA2 AOCS Ce 1a-13FFA2 AOCS Ca 5A-40Insoluble impurities2 AOCS Ca 3-46Moisture2 AOCS Ca 2c-25Oxidized fatty acids2 AOCS G 3-53PV2 AOCS Cd 8b-90Thiobarbituric acid value2 AOCS Cd 19-90Tocopherols2 AOCS Ce 8-89Unsaponifiable matter2 AOCS Ca 6a-40
1Analyzed by University of Minnesota St Paul MN2Analyzed by Barrow-Agee Memphis TN (AOCS 2011)
Table 2 Composition and quality indices of soybean oil (SO) used in experiments 2 and 31
FA of total fat Control6 Peroxidized6
C160 Palmitic 1050 1204C161 Palmitoleic 009 -C170 Margaric 010 012C180 Stearic 443 506C181 Oleic 2347 2609C182 Linoleic 5242 4926C183 Linolenic 766 599C190 Nonadecanoic 033 027C200 Arachidic 032 037C201 Gadoleic 016 019C220 Behenic 035 039
UFASFA2 523 447IV3 131 124FFA2 010 040MIU2 073 111PV2 meqkg 36 1889AnV4 09 167Oxidized FA 30 46Aldehydes mgkg5
24-Decadienal 02 32784-Hydroxynonenal 04 2329Acrolein 00 1362-Decenal 01 16624-Heptadienal 01 8712-Heptenal 013 1005Hexanal 04 11452-Octenal 02 1107Pentanal 03 5424-Undecadienal 00 1282-Undecenal 01 179
Tocopherols mgkg 1389 lt10Alpha 41 lt10Beta lt10 lt10Delta 659 lt10Gamma 689 lt10
1Unless otherwise noted analyzed by Barrow-Agee Memphis TN2UFASFA unsaturatedsaturated FA ratio MIU moisture insoluble and unsaponifiable material3Iodine values (IV) were calculated using the FA profile data following the equation proposed by Meadus et al (2010) VI = (161 times 095) + (181 times 086) + (182 times 1732) + (183 times 2615) + (201 times 0785) + (202 times 157) + (203 times 238) + (204 times 319) + (205 times 401) + 224 times 293) + (225 times 368) + (226 times 464)4There are no units for p-anisidine value (AnV)5Analyzed by University of Minnesota St Paul MN6The control SO was not subjected to heat whereas the peroxidized SO was heated at 90 degC for 72 hr with constant air flow of 15 Lmin
Dow
nloaded from httpsacadem
icoupcomjasarticle9812skaa3926029086 by guest on 10 M
arch 2022
Copyedited by AK
Journal of Animal Science 2020 Vol 98 No 12 | 5
others (Ehr et al 2015 Lindblom et al 2018a Overholt et al 2018 Kerr et al 2020) using similar sized containers and airflow
Even though it is well known that aldehydes are highly damaging to DNA proteins and lipids in vivo (Esterbauer et al 1991 Chang et al 2005) and the measurement of aldehydes is not a new concept in the evaluation of lipid quality (Seppanen and Csallany 2002 Wang et al 2016) the assessment of aldehydes relative to swine and poultry productivity is largely unexplored In experiment 1 thermally processing of PO had little impact on its aldehyde concentrations while aldehydes were moderately increased when CO and SO were thermally processed with the greatest increase in aldehydes when PF was thermally processed (Table 1) The lack of aldehyde change observed in thermally processed PO and the increased aldehydes observed in thermally processed CO and SO were expected (Winkler-Moser et al 2020) In contrast the increase in several aldehydes when PF was thermally processed was unexpected and do not reflect the relatively small change observed in AnV of which no explanation can be ascertained In experiments 2 and 3 thermally processing SO resulted in similar changes in FA PV AnV oxidized FA and aldehydes as in experiment 1 and as reported by others (Ehr et al 2015 Lindblom et al 2018a Overholt et al 2018 Kerr et al 2020) using a similar method to thermally process SO
Total tocopherols were measured because depending upon the degree of processing some vegetable oils contain tocopherols as natural antioxidants that protect the oil from autoxidation (Kamal-Eldin 2006 Seppanen et al 2010) Furthermore tocopherols are often a neglected aspect of lipid quality evaluation due to the effects of thermal processing on tocopherol concentrations and the potential impact of tocopherols on measures of oxidative stress in swine (Sies et al 1992 Silva-Guillen et al 2020ab) In unprocessed PO and PF there were low concentrations of tocopherols as expected (Herting and Drury 1963 OrsquoBrien 2009) whereupon thermally processing had little effect (Table 1) albeit an increase in tocopherols in thermally processed PF was observed but cannot be explained Unprocessed CO contained moderate amounts of tocopherols which are typical of CO (Herting and Drury 1963 OrsquoBrein 2009) whereupon heating of CO resulted in a reduction of tocopherols to lt10 mgkg oil SO is also noted for its high concentration of tocopherols (Herting and Drury 1963 OrsquoBrein 2009) whereupon thermally processing of SO resulted in a reduction in tocopherols from gt1000 mgkg oil in unprocessed SO to lt10 mgkg oil in thermally processed SO (Tables 1 and 2) This is supported by others (Lindblom et al 2018a 2019 Overholt et al 2018 Kerr et al 2020) who have reported either
Table 4 Ingredient and calculated composition of experimental diets experiments 1 2 and 3 as-is basis
Ingredient Experiment 1 Experiment 2 Experiment 3
Corn 4392 3103 3104Soybean meal 46 CP 3000 1380 625Wheat mdash 1483 2480Dried whey powder 1100 1830 1800Soy protein concentrate mdash 731 971Plasma protein mdash 300 300Monocalcium phosphate 132 116 119Calcium carbonate 063 081 084Sodium chloride 046 021 021Vitaminndashmineral premix1 017 017 017Organic acid blend 050 mdash mdashZinc oxide 033 033 033Copper sulfate 005 005 005L-LysinemiddotHCl 048 046 046dl-Methionine 030 028 023l-Threonine 023 020 019l-Tryptophan 001 mdash mdashl-Valine 010 006 003Titanium dioxide 050 050 050Lipid2 1000 750 300Total 10000 10000 10000Calculated composition3 ME kcalkg 3785 3650 3430NE kcalkg 2800 2800 2590CP 196 210 204Lys 148 160 153SID Lys 135 147 140Ca 068 068 068P 063 062 062STTD P 047 045 045
1Provided the following per kilogram of diet vitamin A 10000 IU vitamin D3 1600 IU vitamin E 60 IU vitamin B12 35 microg menadione 35 mg choline 90 mg folic acid 11 mg niacin 50 mg pantothenic acid 60 mg pyridoxine 2 mg riboflavin 8 mg thiamine 15 mg copper 18 mg iron 110 mg iodine 07 mg manganese 50 mg zinc 110 mg selenium 03 mg ethoxyquin 75 microg sources proprietary2Dietary treatments consisted of 10 added lipids that were either unheated or peroxidized by heating at 90 degC for 72 hr with a constant air flow of 15 Lmin (experiment 1) or 75 (experiment 2) and 3 (experiment 3) SO that was either unheated or peroxidized by heating at 90 degC for 72 hr with a constant air flow of 30 Lmin3SID standardized ileal digestible STTD standardized total tract digestible CP crude protein Ca calcium P phosphorus ME metabolizable energy NE net energy
Dow
nloaded from httpsacadem
icoupcomjasarticle9812skaa3926029086 by guest on 10 M
arch 2022
Copyedited by AK
6 | Journal of Animal Science 2020 Vol 98 No 12
complete or nearly complete destruction of tocopherols by thermally processing SO
Vitamin E is important in redox balance in the body (Wanasundara and Shahidi 2005 Finaud et al 2006 Kalyanaraman 2013) it is noteworthy therefore that in the current experiment the vitaminndashtrace mineral premix provided 60 IU of vitamin Ekg diet While this is above the NRC (2012) recommendation of 16 IU vitamin Ekg diet for pigs up to 11 kg and 11 IU vitamin Ekg diet for pigs gt11 kg it is noteworthy that others who have evaluated peroxidized fats or oils in pigs have reported a range of 8 to 77 IU vitamin Ekg diet (DeRouchey et al 2004 Yuan et al 2007 Liu et al 2014a Rosero et al 2015 Hanson et al 2016 Lindblom et al 2018a Overholt et al 2018 Chang et al 2019 Hung et al 2019 Kerr et al 2020 Silva-Guillen et al 2020a b Yuan et al 2020) This complicates comparing the response of pigs to the consumption of peroxidized lipids across studies but delineation of this effect is beyond the scope of this manuscript In addition while no antioxidants were added to the oil or the diets prior to diet mixing or feeding ethoxyquin was contained in the vitaminndashtrace mineral mix such that the final diet contained 75 microg ethoxyquinkg diet While the addition of an antioxidant to the diet post-thermal processing of the oil should prevent further oxidation of the oil (Rosero et al 2015 Hung et al 2019) postaddition of an antioxidant to the diet or vitamin E has been shown to have little effect on pig performance or measures of oxidative stress (Hung et al 2019 Silva-Guillen et al 2020a b) As such the amount of ethoxyquin in the diets of the current study likely had negligible effects on any of the parameters evaluated
Growth performance
In experiment 1 an interaction between oil source and peroxidation status was observed for ADG and ADFI (P = 010)
which was due to no impact of feeding pigs peroxidized PO PF or SO on ADG or ADFI compared with feeding pigs CNT PO PF or SO respectively while pigs fed peroxidized CO resulted in reduced ADG and ADFI compared with pigs fed CNT CO (Table 5) There was no interaction between oil source and peroxidation status and no lipid source effect on GF (P ge 084) but pigs fed the peroxidized lipids had a lower GF compared with pigs fed the CNT lipids (P = 009) There was no interaction between oil source and peroxidation status and no lipid source or peroxidation status effects observed for fecal score (P ge 030 Table 5)
While simple correlations do not represent a cause and effect relationship correlations between pig performance (ADG ADFI and GF) in relation to PV and AnV were conducted because these are two common lipid quality measures used in swine feeding programs (Kerr et al 2015 Hung et al 2017) and also with the sum of 2-decenal and 2-undecenal because these 2 unsaturated alkanals have been correlated with the performance of both broilers and pigs fed peroxidized lipids (Yuan et al 2020) As shown in Table 6 both PV and AnV were correlated to ADG and ADFI with similar correlation values (ndash026 ge r ge ndash029 P = 001) No correlation was observed between GF and PV or AnV and no correlation was observed between unsaturated alkanals and any performance parameter (r lt 020 and P ge 010) While both PV and AnV were highly correlated to pig performance it is important to remember that PV is a measurement of peroxides and hydroperoxides formed during the initiation phase of lipid peroxidation while AnV is a measure of high-molecular-weight saturated and unsaturated aldehydes which are considered compounds associated with the secondary phase of lipid peroxidation (Shahidi and Zhong 2005 Yin et al 2011) To this end the time and temperature of thermal processing of a lipid will have a direct impact on which phase of peroxidation a lipid may be in (Schaich (2005) Liu et al (2014b) Winkler-Moeser et al
Table 5 Effect of oil source and peroxidation status on pig performance experiment 11
Oil Peroxidation2 ADG g ADFI g GF gg SQ3
Palm CNT 303a 356a 085 089Palm 90 degC 289ab 346ab 083 089Poultry CNT 273abc 323abc 084 093Poultry 90 degC 288ab 343ab 084 096Canola CNT 293ab 339ab 087 093Canola 90 degC 250c 297c 084 092Soybean CNT 287ab 336ab 085 095Soybean 90 degC 264bc 318bc 083 092
Main effect
SEM 12 13 002 005
Oil times peroxidation P value 010 010 091 030Oil P-value 019 008 084 099
Peroxidation P-value 006 016 009 099
Palm 296 351a 084 089Poultry 280 333ab 084 095Canola 272 318b 085 092Soybean 276 327ab 084 094 CNT 289 339 085 093 90 degC 273 326 084 093
1Pigs were fed diets containing 10 added lipids for 21 d with an initial and final BW of 61 and 119 kg respectively Data are least square means of 12 replications for each lipid times peroxidation status treatment2The control (CNT) oil was not subjected to heat whereas the 90 degC oils were heated for 72 hr with constant air flow of 15 Lmin3Stool quality is defined as the probability of a more normal (eg firmer) visual fecal scoreSuperscripts reflect peroxidized SO treatment differences (abc P lt 005)
Dow
nloaded from httpsacadem
icoupcomjasarticle9812skaa3926029086 by guest on 10 M
arch 2022
Copyedited by AK
Journal of Animal Science 2020 Vol 98 No 12 | 7
(2020) and thus will affect which specific lipid quality indices may have the greatest correlation to animal performance
Using dietary AnV as the indicator of SO quality feeding pigs diets containing increasing levels of peroxidized SO in experiment 2 resulted in reduced ADG (quadratic P = 003) ADFI (linear P = 001) and GF (quadratic P = 001) Table 7 At the highest level of peroxidized SO intake 1253 AnVkg diet ADG ADFI and GF was reduced to 60 67 and 89 respectively compared with pigs fed the diet containing 007 AnVkg diet In experiment 3 the inclusion level of SO was reduced to 3 of the diet to reflect a more practical level of SO inclusion and as shown in Table 8 ADG was reduced to 88 of the pigs fed the CNT diet (P = 011) and ADFI was reduced to 89 of the pigs fed the CNT diet (P = 013) with no observed change in GF (P = 062) Instead of a correlation analysis ADG data for experiment 2 were regressed using dietary AnV as the independent variable because of the negative correlation observed in experiment 1 and because previous data (Lindblom et al 2018a Overholt et al 2018 Kerr et al 2020) suggest that AnV often has an inverse correlation to ADG In addition Yuan et al (2020) suggested that among common lipid quality indicators AnV had the greatest inverse correlation with the growth performance in both broilers and pigs Using this logic data in experiment 2 were plotted
using the ADG of pigs fed the lowest level of dietary AnV 007kg diet as the base-line level of ADG (100) with all other data points plotted relative to this rate of gain As shown in Figure 1 the relationship between relative growth rate and dietary AnV is represented as ADG = (ndash0237 times AnV2) + (ndash0189 times AnV) + 1003 R2 = 056 Based on this equation pigs fed the 3 peroxidized SO in experiment 3 which contained 501 AnVkg diet would be predicted to have ADG reduced by 7 where in actuality a 12 drop in ADG was observed (Table 8)
Comparing the current data to other studies can be difficult because in some cases AnV is considered the best indicator of lipid quality to animal performance (Lindblom et al 2018a Overholt et al 2018 Kerr et al 2020 Yuan et al 2020) while others have indicated that thiobarbituric acid reactive substances (TBARS) are considered the best indicator of lipid quality to animal performance (Hung et al 2017) It is unfortunate however that both of these measures are not taken in the same study because having both AnV and TBARS being measured in the same experiment would facilitate the generation of a conversion factor between these 2 measures of lipid quality That said both AnV and TBARS are ldquoaldehyde-basedrdquo measures of lipid quality and as such it is not surprising that only one of these measures is commonly taken in an experiment given analyses
Table 6 Pearson correlation coefficients among lipid peroxidation products with performance and total tract digestibility of EE experiment 11
Peroxide value Anisidine value Unsaturated alkanals2
ADG r-value ndash029 ndash028 mdash P-value (001) (001) mdashADFI r-value ndash028 ndash026 mdash P-value (001) (001) mdashGF r-value mdash mdash mdash P-value mdash mdash mdashATTD of EE r-value ndash028 ndash028 mdash P-value (001) (001) mdash
1Correlation (r-value) is top value and correlation significance (P-value) is below in parentheses If no value is given it was not found to be significant at P le 010 and have a correlation of ge0202Consists the sum of 2-decenal and 2-undecenal
Table 7 Pig performance plasma vitamin E and protein carbonyls and apparent total tract digestibility of EE of growing pigs fed diets increments of either 75 SO that was either unheated or peroxidized experiment 21
Inclusion of SO
CNT2 750 675 600 450 225 0
90 degC 0 075 150 300 525 750 SEM M3 LN3 QD3
PV mgkg diet 027 166 305 583 1000 1417 mdash mdash mdash mdashAnV kg diet 007 131 256 505 879 1253 mdash mdash mdash mdashADG g 313a 301ab 320a 278bc 260c 188d 12 001 099 003ADFI g 349a 339ab 347a 308bc 293c 235d 12 001 001 021GF 090a 089a 092a 091a 088a 080b 002 001 030 001Stool quality4 083ab 091a 088a 089a 074b 074b 007 001 001 014ATTD EE 760a 792a 773a 758a 706b 639c 14 001 061 001PC5 nmolmg 68 56 72 63 50 46 12 057 mdash mdashVit E mgmL 089 081 085 086 112 079 013 052 mdash mdash
1Pigs were fed diets containing 75 added SO for 21 d with an initial and final BW of 58 and 116 kg respectively Data are least square means of 12 replications for each dietary treatment for ADG ADFI GF and ATTD of EE 9 replications for each dietary treatment for plasma PC and vitamin E2SO was either an unheated control (CNT) or peroxidized (90 degC) by heating the SO at 90 degC for 72 hr with a constant air flow of 30 Lmin3M model P-value LN linear P-value QD quadratic P-value4Stool quality is defined as the probability of a more normal (eg firmer) visual fecal score5Protein carbonyls are reported per milligram of protein in the plasmaATTD EE apparent total tract digestibility of EE PC plasma protein carbonyls
Dow
nloaded from httpsacadem
icoupcomjasarticle9812skaa3926029086 by guest on 10 M
arch 2022
Copyedited by AK
8 | Journal of Animal Science 2020 Vol 98 No 12
are a cost factor in conducting research and because it would be assumed that only one measure would be needed as conducting both assays would seem to be unnecessary duplication It is important to note however that neither of these analyses are perfect measures of lipid quality (Shurson et al 2015) in that TBARS may be more accurate and sensitive than AnV for some animal fats and animal-vegetable blends (Nuchi et al 2009) even though thiobarbituric acid can also react with other chemicals such alkanals amino acids and ketones to produce
interference color (Guilleacuten-Sans and Guzmaacuten-Chozas 1998 Jardine et al 2002) Likewise AnV may be more sensitive to measuring unsaturated aldehydes compared with saturated aldehydes but AnV may provide misleading indications of the extent of peroxidation if lipids generate more unsaturated than saturated aldehydes during peroxidation (Shahidi and Zhong 2005 Barriuso et al 2013) In an effort to understand how the performance data in the current experiments fit with the review by Hung et al (2017) and realizing that TBARS was not analyzed on the lipids in the current experiments the data reviewed by Hung et al (2017) was re-evaluated on a PV-basis even though Hung et al (2017) reported no correlation between PV and pig performance For this re-evaluation of the data used in the review by Hung et al (2017) the PV of the CNT lipids from each data set (Oldfield et al 1963 DeRouchey et al 2004 Harrell et al 2010 Boler et al 2012 Liu et al 2014a Rosero et al 2015 Hanson et al 2016 van Heugten et al 2016) was incorporated and plotted as a base-line value (ie ADG = 100) from which to compare all other data points with Secondly data points derived from thermally processing lipids at 185 degC used in that review were removed because in the process of lipid peroxidation peroxides are rapidly degraded to other lipid peroxidation products such as acids and aldehydes (Liu et al 2014b Winkler-Moser et al 2020) Thirdly one data point was removed (data from pigs fed a diet containing 61 meqkg diet from Oldfield et al 1963) because it was deemed an outlier While this reduces the amount of data from which to draw conclusions from compared to the review by Hung et al (2017) this re-evaluation suggests there is a quadratic response between ADG and dietary PV ADG = (ndash0043 times PV2) + (0079 times PV) + 985 R2 = 062 Figure 2 This revised prediction equation would suggest that diets containing a PV of 10 meqkg diet would result in gain being reduced by ~5 and diets containing 15 and 20 meq PVkg diet having gains reduced by 10 and 17 respectively compared with pigs fed diets with near-zero meq of PVkg diet While DeRouchey et al (2004) suggested that a lipid would be of inferior quality if its PV exceeded 40 meqkg lipid lipid quality criterion must also take into account the inclusion level of the lipid and not just on the PV of the lipid alone It is
Table 8 Pig performance plasma vitamin E and protein carbonyls and apparent total tract digestibility of EE of growing pigs fed diets increments of either 3 SO that was either unheated or peroxidized experiment 31
Diet inclusion of SO
CNT2 3 0
90 degC 0 3 SEM P-value
PV mgkg diet 011 567 mdash mdashAnV kg diet 003 501 mdash mdashADG g 333 293 17 011ADFI g 376 333 19 013GF 089 088 001 062Stool quality3 095 090 005 009ATTD EE 681 618 13 002PC nmolmg 62 94 09 003Vit E mgmL 090 099 017 073
1Pigs were fed diets containing 3 added SO for 21 d with an initial and final BW of 58 and 125 kg respectively Data are least square means of 12 replications for each dietary treatment for ADG ADFI GF and ATTD of EE 9 replications for each dietary treatment for plasma PC and Vitamin E2SO was either an unheated control (CNT) or peroxidized (90 degC) by heating the SO at 910 degC for 72 hr with a constant air flow of 30 Lmin3Stool quality is defined as the probability of a more normal (eg firmer) visual fecal scoreATTD EE apparent total tract digestibility of EE PC plasma protein carbonyls
Figure 1 Relative growth rate of pigs consuming graded levels of dietary AnV experiment 2 Data were plotted using the ADG of pigs fed the lowest level of dietary
AnV 007kg diet as the base-line level of ADG (100) with all other data points plotted relative to this rate of gain The relationship between relative growth rate and
dietary AnV is represented as ADG = (ndash0237 times AnV2) + (ndash0189 times AnV) + 1003 R2 = 056
Dow
nloaded from httpsacadem
icoupcomjasarticle9812skaa3926029086 by guest on 10 M
arch 2022
Copyedited by AK
Journal of Animal Science 2020 Vol 98 No 12 | 9
also important to note that in the review by Hung et al (2017) there was only one TBARS data point reported to be above 75 mg malondialdehyde equivalencekg diet (data from pigs fed the diet containing 162 mg malondialdehyde equivalencekg diet from Oldfield et al 1963) which has a profound impact on the resultant regression equation and subsequently on performance predictions from such equation This can also be said for interpretation of the data reported by Lindblom et al (2018a) Overholt et al (2018) and Kerr et al (2020) where essentially only one treatment evaluated in their experiments (ie SO thermally processed at 90 degC for 72 hr) resulted in an impact on pig performance Likewise in the re-evaluation of the data reviewed by Hung et al (2017) (Figure 2) the 2 data points with the highest PV per kilogram diet were derived from thermally processing corn and CO at 95 degC for 72 hr (Liu et al 2014ab) which again has a large impact on the subsequently derived regression equation Only recently has a wide range of thermal processing times and temperatures been conducted from which to evaluate the impact of high concentrations of lipid quality indices on animal performance (Yuan et al 2020) data which suggest that AnV is one of the most important lipid quality measures to consider relative to animal production This is not surprising however given that Yuan et al (2020) evaluated SO and many of the thermal processing temperatures used were above 90 degC Although SO was only processed at 90 degC for 72 hr in experiments 2 and 3 similar to data reported by Lindblom et al (2018a) Overholt et al (2018) and Kerr et al (2020) an attempt was made to increase the concentrations of AnV and other lipid quality indices in experiments 2 and 3 by increasing air infiltration flow and using smaller bubbles to increase the air-to-oil interaction This did not however appear to have such an effect on lipid quality measures for the thermally processed SO in experiment 1 and experiments 2 and 3 as shown by the generation of lipid peroxidation products reported in Tables 1 and 2 respectively
Oxidative status
In the current experiments plasma PC were measured because in vivo proteins and amino acids can be damaged by oxidation with PC being an indicator of this damage (Beal 2002 Dalle-Donne et al 2003 Likewise endogenous GPx assists in protecting the body from reactive oxygen species and free radicles (Lykkesfeldt and Svendsen 2007 Kalyanaraman 2013 Royer et al 2016) In experiment 1 there was no interaction observed between lipid source and peroxidation status on plasma vitamin E PC or GPx (P ge 016) and there was no lipid source or peroxidation effect on plasma PC or GPx (P ge 016 Table 9) Plasma vitamin E levels were reduced in pigs fed diets containing SO (P = 001) and in pigs fed peroxidized oils (P = 001) In experiment 2 there was no effect of feeding graded levels of peroxidized SO on plasma vitamin E or PC (P ge 052) In experiment 3 feeding pigs 3 peroxidized SO had no effect on plasma vitamin E (P = 073) but resulted in increased serum PC (P = 003) Because there were not consistent effects of feeding peroxidized SO on plasma PC GPx or vitamin E in experiment 1 we elected not to conduct a correlation analysis between dietary PV AnV and unsaturated alkanals with plasma PC GPx or vitamin E
The impact of feeding peroxidized lipids on plasma or serum PC has been variable Boler et al (2012) Overholt et al (2018) Chang et al (2019) and Kerr et al (2020) observed no impact of feeding 10 peroxidized SO on serum PC while Lindblom et al (2018b) and Silva-Guillen et al (2020ab) reported increases in serum PC due to feeding peroxidized lipid Relative to plasma GPx the lack of a peroxidation effect in experiment 1 is consistent with Overholt et al (2018) who reported no effect of feeding peroxidized SO on serum GPx while Yuan et al (2007) Boler et al (2012) and Lindblom et al (2018b) reported decreases in serum GPx due to feeding pigs peroxidized lipids In contrast to the current experiments the impact on serum vitamin E levels is more consistent with Hanson et al (2016) Chang et al (2019)
Figure 2 Relative growth rate of pigs consuming graded levels of dietary PV Adapted from Hung et al (2017) using data obtained from Oldfield et al (1963) DeRouchey
et al (2004) Harrell et al (2010) Boler et al (2012) Liu et al (2014a) Rosero et al (2015) Hanson et al (2016) and van Heugten et al (2016 The relationship between
relative growth rate and dietary PV is represented as ADG = (ndash0043 times PV2) + (0079 times PV) + 985 R2 = 062
Dow
nloaded from httpsacadem
icoupcomjasarticle9812skaa3926029086 by guest on 10 M
arch 2022
Copyedited by AK
10 | Journal of Animal Science 2020 Vol 98 No 12
and Silva-Guillen et al (2020ab) who have reported decreases in serum vitamin E in pigs consuming peroxidized lipids
ATTD of ether extract
If lipids become highly peroxidized polymers are ultimately formed in the termination phase which have been shown to be poorly digested (Gray 1978 Gonzalez-Munoz et al 1998) In experiment 1 there was an interaction between lipid source and peroxidation status on ATTD of EE where the ATTD of EE was reduced in pigs fed PO or SO when peroxidized but not when pigs were fed peroxidized PF or CO (P = 001 Table 9) There was a negative correlation (r = ndash028) between PV or AnV and ATTD of EE (P = 001 Table 6) In experiment 2 the ATTD of EE was reduced (quadratic P = 001) due to feeding increasing levels of peroxidized SO and in experiment 3 the ATTD of EE was also reduced due to feeding pigs 3 peroxidized SO (P = 002) Tables 7 and 8 respectively
Summarizing the data from pigs only fed SO in the current experiments suggests that for each 1-unit increase in dietary AnV the ATTD of EE in the diet would decrease by an average of 1 percentage unit (06 11 and 13 percentage units for experiments 1 2 and 3 respectively) While the data are in contrast to the study by Liu et al (2014c) and Kerr et al (2020) who reported no change in lipid digestibility in pigs fed peroxidized lipids the current data are supported by others (DeRouchey et al 2004 Yuan et al 2007 Rosero et al 2015 Lindblom et al 2018a Overholt et al 2018) who reported a decrease in lipid digestibility due to feeding pigs peroxidized lipids This suggests that at least part of the negative effect in pigs consuming peroxidized lipids is a decrease in lipid and therefore energy digestibility
ConclusionsWhile thermal processing of PO and PF resulted in little impact on the lipidrsquos FA composition or on their PV or AnV concentrations thermally processing of CO and SO altered their FA profile as shown by a decrease in unsaturated FA and a concomitant increase in saturated FA and resulted in increased PV and AnV The changes in the FA composition and increases in PV and AnV were repeatable in the subsequent experiments which used SO as the test lipid Feeding pigs lipids with increased PV and AnV levels resulted in reduced ADG ADFI and GF which when ADG was regressed using AnV as the independent variable resulted in a quadratic reduction in ADG with increasing levels of dietary AnV Similarly apparent total tract digestibility of EE was also quadratically reduced by feeding increasing levels of peroxidized SO such that at least part of the reduction in ADG might be explained by a reduced energy uptake in addition to a reduction in ADFI that was also noted due to consumption of peroxidized lipids The impact of pigs consuming peroxidized lipids on measures of oxidative stress (ie plasma protein carbonyls and vitamin E) was inconsistent across the trials so that delineating a cause and effect relationship between lipid peroxidation and oxidative stress could not be ascertained
Conflict of interest statement The authors declare no real or perceived conflicts of interest
Table 9 Effect of oil source and peroxidation status on plasma vitamin E protein carbonyls glutathione peroxidase activity and apparent total tract EE digestibility of growing pigs fed diets containing 10 unheated or peroxidized lipids experiment 11
Oil Peroxidation2 Vitamin E microgmL Protein carbonyls nmolmL GPx mUmg Hgb ATTD EE
Palm CNT 13 97 358 766b
Palm 90 degC 10 98 313 726c
Poultry CNT 12 88 306 777b
Poultry 90 degC 08 67 340 762b
Canola CNT 13 74 370 769b
Canola 90 degC 08 67 306 768b
Soybean CNT 11 85 296 821a
Soybean 90 degC 03 73 386 716c
Main effect
SEM 01 11 51 11Oil times peroxidation P-value 016 081 041 001
Oil P-value 001 016 099 010Peroxidation P-value 001 025 091 001
Palm 115a 97 336 746b
Poultry 103a 77 323 769a
Canola 103a 71 338 768a
Soybean 070b 79 341 769a
CNT 122 86 332 783 90 degC 074 76 336 743
1Pigs were fed diets containing 10 added lipids for 21 d with an initial and final BW of 61 and 119 kg respectively Data are least square means of 9 replications for each lipid times peroxidation status treatment for the plasma vitamin E data2The control (CNT) oil was not subjected to heat whereas the 90 degC oils were heated for 72 hr with constant air flow (15 Lmin)Superscripts reflect peroxidized SO treatment differences (abc P lt 005)ATTD EE apparent total tract digestibility of EE GPx glutathione peroxidase activity expressed as milliunits (mU) per mg of hemoglobin where mU is defined as the number of nonomoles of NADPH oxidized per minute as outlined in the assay SEM standard error of the mean
Dow
nloaded from httpsacadem
icoupcomjasarticle9812skaa3926029086 by guest on 10 M
arch 2022
Copyedited by AK
Journal of Animal Science 2020 Vol 98 No 12 | 11
Literature CitedAmerican Oil Chemistsrsquo Society (AOCS) 2011 Official methods
and recommended practices of the AOCS 6th ed (2nd printing) Urbana IL
Arnaud J I Fortis S Blachier D Kia and A Favier 1991 Simultaneous determination of retinol alpha-tocopherol and beta-carotene in serum by isocratic high-performance liquid chromatography J Chromatogr 572103ndash116 doi1010160378-4347(91)80476-s
Azain M J 2001 Fat in swine nutrition In A J Lewis and L L Southern editors Swine nutrition Boca Raton CRC Press p 95ndash106
Barriuso B I Astiasaran and D Ansorena 2013 A review of analytical methods measuring lipid oxidation status in foods a challenging task Eur Food Res Technol 2361ndash15 doiorg101007s00217-012-1866-9
Beal F 2002 Serial review oxidatively modified proteins in aging and disease Free Radic Biol Med 32797ndash803 doiorg101016S0891-5849(02)00780-3
Betteridge D J 2000 What is oxidative stress Metabolism 49(Suppl 1)3ndash8 doi101016S0026-0495(00)80077-3
Boler D D D M Fernaacutendez-Duentildeas L W Kutzler J Zhao R J Harrell D R Campion F K McKeith J Killefer and A C Dilger 2012 Effects of oxidized corn oil and synthetic antioxidant blend on animal performance in finishing barrows J Anim Sci 905159ndash5169 doi102527jas2012ndash5266
Chang P L R D Boyd C Zier-Rush D R Rosero and E Van Heugten 2019 Lipid peroxidation impairs growth and viability of nursery pigs reared under commercial conditions J Anim Sci 973379ndash3389 doi 101093jasskz183
Chang L W W S Lo and P Lin 2005 Trans trans-24-decadienal a product found in cooking oil fumes induces cell proliferation and cytokine production due to reactive oxygen species in human bronchial epithelial cells Toxicol Sci 87337ndash343 doi101093toxscikfi258
Choe E and D B Min 2007 Chemistry of deep-fat frying oils J Food Sci 72R77ndashR86 doi101111j1750-3841200700352x
Dalle-Donne I R Rossi D Giustarini A Milzani and R Colombo 2003 Protein carbonyl groups as biomarkers of oxidative stress Clin Chim Acta 32923ndash38 doi101016s0009-8981(03)00003-2
DeRouchey J M J D Hancock R H Hines C A Maloney D J Lee H Cao D W Dean and J S Park 2004 Effects of rancidity and free fatty acids in choice white grease on growth performance and nutrient digestibility in weanling pigs J Anim Sci 822937ndash2944 doi102527200482102937x
Ehr I J B J Kerr and M E Persia 2015 Effects of peroxidized corn oil on performance AMEn and abdominal fat pad weight in broiler chicks Poult Sci 941629ndash1634 doi103382pspev131
Esterbauer H R J Schaur and H Zollner 1991 Chemistry and biochemistry of 4-hydroxynonenal malonaldehyde and related aldehydes Free Radic Biol Med 1181ndash128 doi1010160891-5849(91)90192-6
Finaud J G Lac and E Filaire 2006 Oxidative stress relationship with exercise and training Sports Med 36327ndash358 doi10216500007256-200636040-00004
Gonzalez-Muntildeoz M J S Bastida and F J Sanchez-Muniz 1998 Short-term in vivo digestibility of triglyceride polymers dimers and monomers of thermoxidized palm olein used in deep-frying J Agric Food Chem 465188ndash5193 doiorg101021jf980598i
Gray J I 1978 Measurement of lipid oxidation a review J AOCS 55539ndash546 doiorg101007BF02668066
Guilleacuten-Sans R and M Guzmaacuten-Chozas 1998 The thiobarbituric acid (TBA) reaction in foods a review Crit Rev Food Sci Nutr 38315ndash350 doi10108010408699891274228
Hammond E G and P J White 2011 A brief history of lipid oxidation J Am Oil Chem Soc 88891ndash897 doiorg101007s11746-011-1761-8
Hanson A R P E Urriola L Wang L J Johnston C Chen and G C Shurson 2016 Dietary peroxidized maize oil affects the growth performance and antioxidant status of nursery pigs Anim Feed Sci Technol 216251ndash261 doiorg101016janifeedsci201603027
Harrell R J J Zhao G Reznik D Macaraeg T Wineman J Richards and G Rexnik 2010 Application of a blend of dietary antioxidants in nursery pigs fed either fresh or oxidized corn oil or DDGS J Anim Sci 88 (E-Suppl 3)60 (Abstr)
Herting D C and E E Drury 1963 Vitamin E content of vegetable oils and fats J Nutr 81335ndash342 doi101093jn814335
van Heugten E D R Rosero P L Y C Chang C Zier-Rush and R D Boyd 2016 Peroxidized lipids in nursery pig diets ndashwhy and when should we be concerned In Midwest Swine Nutrition Conference Indianapolis Indiana p 31ndash39
Holman R 1954 Autoxidation of fats and related substances Prog Chem Fats Other Lipids 251ndash98 doiorg1010160079-6832(54)90004-X
Hung Y T A R Hanson G C Shurson and P E Urriola 2017 Peroxidized lipids reduce growth performance of poultry and swine a meta-analysis Anim Sci Feed Technol 23147ndash58 doiorg101016janifeedsci201706013
Hung Y T A R Hanson P E Urriola L J Johnston B J Kerr and G C Shurson 2019 Addition of tert-butylhydroquinone (TBHQ) to maize oil reduces lipid oxidation but does not prevent reductions in serum vitamin E in nursery pigs J Anim Sci Biotechnol 1051 doi101186s40104-019-0362-5
Jardine D M Antolovich P D Prenzler and K Robards 2002 Liquid chromatography-mass spectrometry (LC-MS) investigation of the thiobarbituric acid reactive substances (TBARS) reaction J Agric Food Chem 501720ndash1724 doi101021jf011336a
Kalyanaraman B 2013 Teaching the basics of redox biology to medical and graduate students oxidants antioxidants and disease mechanisms Redox Biol 1244ndash257 doi101016jredox201301014
Kamal-Eldin A 2006 Effect of fatty acids and tocopherols on the oxidative stability of vegetable oils Eur J Lipid Sci Technol 1081051ndash1061 doiorg101002ejlt200600090|
van Kempen T A and S McComas 2002 Infrared spectroscopy as a tool for assessing fat quality J Appl Poult Res 11191ndash201 doiorg101093japr112191
Kerr B J T A Kellner and G C Shurson 2015 Characteristics of lipids and their feeding value in swine diets J Anim Sci Biotechnol 630 doi101186s40104-015-0028-x
Kerr B J S C Lindblom and M F Overholt 2020 Influence of feeding thermally peroxidized soybean oil on growth performance digestibility gut integrity and oxidative stress in nursery pigs J Anim Sci 981ndash11 doi101093jasskaa016
Koller L D P J South J H Exon G A Whitbeck and J Maas 1984 Comparison of selenium levels and glutathione peroxidase activity in bovine whole blood Can J Comp Med 48431ndash433 PMCID PMC1236100
Lin X M Azain and J Odle 2013 Lipids and lipid utilization in swine In L Chiba editor Sustainable swine nutrition Oxford UK Blackwell Publishing p 59ndash79
Lindblom S C N K Gabler E A Bobeck and B J Kerr 2019 Oil source and peroxidation status interactively affect growth performance and oxidative status in broilers from 4 to 25 d of age Poult Sci 981749ndash1761 doi103382pspey547
Lindblom S C N K Gabler R N Dilger Z F Olson C L Loving and B J Kerr 2018b Influence of feeding thermally peroxidized soybean oil on oxidative status in growing pigs J Anim Sci 96545ndash557 doi101093jassky005
Lindblom S C N K Gabler and B J Kerr 2018a Influence of feeding thermally peroxidized soybean oil on growth performance digestibility and gut integrity in growing pigs J Anim Sci 96558ndash569 doi101093jassky004
Dow
nloaded from httpsacadem
icoupcomjasarticle9812skaa3926029086 by guest on 10 M
arch 2022
Copyedited by AK
12 | Journal of Animal Science 2020 Vol 98 No 12
Liu P C Chen B J Kerr T E Weber L J Johnston and G C Shurson 2014a Influence of thermally oxidized vegetable oils and animal fats on growth performance liver gene expression and liver and serum cholesterol and triglycerides in young pigs J Anim Sci 922960ndash2970 doi102527jas2012ndash5709
Liu P B J Kerr C Chen T E Weber L J Johnston and G C Shurson 2014b Methods to create thermally oxidized lipids and comparison of analytical procedures to characterize peroxidation J Anim Sci 922950ndash2959 doi102527jas2012-5708
Liu P B J Kerr C Chen T E Weber L J Johnston and G C Shurson 2014c Influence of thermally oxidized vegetable oils and animal fats on energy and nutrient digestibility in young pigs J Anim Sci 922980ndash2986 doi102527jas2012-5711
Lundberg W O and P Jarvi 1971 Peroxidation of polyunsaturated fatty compounds Prog Chem Fats Lipids 9377ndash406 doiorg1010160079-6832(71)90032-2
Luthria D D Vinjamoori K Noel and J Ezzell 2004 Accelerated solvent extraction In D L Luthria editors Oil extraction and analysis critical issues and comparative studies Champaign IL AOCS Press p 25ndash38
Lykkesfeldt J and O Svendsen 2007 Oxidants and antioxidants in disease oxidative stress in farm animals Vet J 173502ndash511 doi101016jtvjl200606005
Meadus W J P Duff B Uttaro J L Aalhus D C Rolland L L Gibson and M E Dugan 2010 Production of docosahexaenoic acid (DHA) enriched bacon J Agric Food Chem 58465ndash472 doi101021jf9028078
Myers W D P A Ludden V Nayigihugu and B W Hess 2004 Technical note a procedure for the preparation and quantitative analysis of samples for titanium dioxide J Anim Sci 82179ndash183 doi1025272004821179x
NRC 2012 Nutrient requirements of swine 11th rev ed Washington DC National Academies Press
Nuchi C F Guardiola R Bou P Bondloli L Bella and R Della Codony 2009 Assessment of the levels of degradation in fat co-and byproducts for feed uses and their relationships with some lipid composition parameters J Agric Food Chem 571952ndash1959 doiorg101021jf803369h
OrsquoBrien R D 2009 Fats and oils formulating and processing for application Boca Raton FL CRC Press
Oldfield J E R O Sinnhuber and A A Rasheed 1963 Nutritive value of marine oils II Effects of in vivo antioxidants in feeding menhaden oil to swine J Am Oil Chem Soc 40357ndash360 doiorg101007BF02631558
Overholt M F A C Dilger D D Boler and B J Kerr 2018 Influence of feeding thermally peroxidized soybean oil on growth performance digestibility and gut integrity in finishing pigs J Anim Sci 962789ndash2803 doi101093jassky091
Paglia D E and W N Valentine 1967 Studies on the quantitative and qualitative characterization of erythrocyte glutathione peroxidase J Lab Clin Med 70158ndash169 PMID 6066618
Pettigrew J E and R L Moser 1991 Fat in swine nutrition In Miller E R D E Ullery and A J Lewis editors Swine nutrition Butterworth-Heinemann Stoneham MA p 133ndash145
R Core Team 2019 R a language and environment for statistical computing Vienna Austria R Foundation for Statistical Computing httpswwwR-projectorg
Rosero D S J Odle A J Moeser R D Boyd and E van Heugten 2015 Peroxidised dietary lipids impair intestinal function and morphology of the small intestine villi of nursery pigs
in a dose-dependent manner Br J Nutr 1141985ndash1992 doi101017S000711451500392X
Royer E F Barbeacute D Guillou Y Rousseliegravere and E Chevaux 2016 Development of oxidative stress model in weaned pigs highlighting plasma biomarkersrsquo specificity to stress inducers J Anim Sci 9448ndash53 doi102527jas2015-9857
Schaich K M 2005 Lipid oxidation theoretical aspects In Baileyrsquos industrial oil and fat products Edible oil and fat products chemistry properties and health effects Vol 1 Hoboken NJ John Wiley and Sons p 269ndash355
Seppanen C M and A S Csallany 2002 Formation of 4-hydroxynonenal a toxic aldehyde in soybean oil at frying temperature J Am Oil Chem Soc 791033ndash1038 doiorg101007s11746-002-0598-z|
Seppanen C M Q Song and A S Csallany 2010 The antioxidant functions of tocopherol and tocotrienol homologues in oils fats and food systems J Am Oil Chem Soc 87469ndash481 doi101007s11746-009-1526-9
Shahidi F and Y Zhong 2005 Lipid oxidation measurement methods In F Shahidi and Y Zhong editors Baileyrsquos industrial oil and fat products New Jersey John Wiley amp Sons p 357ndash385
Shurson G C B J Kerr and A R Hanson 2015 Evaluating the quality of feed fats and oils and their effects on pig growth performance J Anim Sci Biotechnol 610 doi101186s40104-015-0005-4
Sies H W Stahl and A R Sundquist 1992 Antioxidant functions of vitamins Ann N Y Acad Sci 6697ndash20 doiorg101111j1749ndash66321992tb17085x
Silva-Guillen Y V C Arellano R D Boyd G Martinez and E van Heugten 2020a Growth performance oxidative stress and immune status of newly weaned pigs fed peroxidized lipids with or without supplemental vitamin E or polyphenols J Anim Sci Biotechnol 1122 doi101186s40104-020-0431-9
Silva-Guillen Y C Arellano G Martinez and E van Heugten 2020b Growth performance oxidative stress and antioxidant capacity of newly weaned piglets fed dietary peroxidized lipids with vitamin E or phytogenic compounds in drinking water App Anim Sci 36341ndash351 doiorg1015232aas2019-01976
Wang L A S Csallany B J Kerr G C Shurson and C Chen 2016 Kinetics of forming aldehydes in frying oils and their distribution in French fries revealed by LC-MS-based chemometrics J Agric Food Chem 643881ndash3889 doi101021acsjafc6b01127
Wanasundara P K J P D and F Shahidi 2005 Antioxidants science technology and applications In F Shahidi editor Baileyrsquos industrial oil and fat products 6th ed Vol 1 Hoboken NJ John Wiley amp Sons p 431ndash489 doiorg101002047167849Xbio002
Winkler-Moser J K H S Hwang and B J Kerr 2020 Changes in markers of lipid oxidation and thermal treatment in feed-grade fats and oils J Sci Food Agric 1003328ndash3340 doi101002jsfa10364
Yin H L Xu and N A Porter 2011 Free radical lipid peroxidation mechanism and analysis Chem Rev 1115944ndash5972 doi101021cr200084z
Yuan S B D W Chen K Y Zhang and B Yu 2007 Effects of oxidative stress on growth performance nutrient digestibilities and activities of antioxidative enzymes of weanling pigs Asian-Aust J Anim Sci 201600ndash1605 doi105713ajas20071600
Yuan J B J Kerr S M Curry and C Chen 2020 Identification of C9-C11 unsaturated aldehydes as prediction markers of growth and feed intake for non-ruminant animals fed oxidized soybean J Anim Sci Biotech 11 (49)1ndash14 doiorg101186s40104-020-00451-4
Dow
nloaded from httpsacadem
icoupcomjasarticle9812skaa3926029086 by guest on 10 M
arch 2022

Copyedited by AK
6 | Journal of Animal Science 2020 Vol 98 No 12
complete or nearly complete destruction of tocopherols by thermally processing SO
Vitamin E is important in redox balance in the body (Wanasundara and Shahidi 2005 Finaud et al 2006 Kalyanaraman 2013) it is noteworthy therefore that in the current experiment the vitaminndashtrace mineral premix provided 60 IU of vitamin Ekg diet While this is above the NRC (2012) recommendation of 16 IU vitamin Ekg diet for pigs up to 11 kg and 11 IU vitamin Ekg diet for pigs gt11 kg it is noteworthy that others who have evaluated peroxidized fats or oils in pigs have reported a range of 8 to 77 IU vitamin Ekg diet (DeRouchey et al 2004 Yuan et al 2007 Liu et al 2014a Rosero et al 2015 Hanson et al 2016 Lindblom et al 2018a Overholt et al 2018 Chang et al 2019 Hung et al 2019 Kerr et al 2020 Silva-Guillen et al 2020a b Yuan et al 2020) This complicates comparing the response of pigs to the consumption of peroxidized lipids across studies but delineation of this effect is beyond the scope of this manuscript In addition while no antioxidants were added to the oil or the diets prior to diet mixing or feeding ethoxyquin was contained in the vitaminndashtrace mineral mix such that the final diet contained 75 microg ethoxyquinkg diet While the addition of an antioxidant to the diet post-thermal processing of the oil should prevent further oxidation of the oil (Rosero et al 2015 Hung et al 2019) postaddition of an antioxidant to the diet or vitamin E has been shown to have little effect on pig performance or measures of oxidative stress (Hung et al 2019 Silva-Guillen et al 2020a b) As such the amount of ethoxyquin in the diets of the current study likely had negligible effects on any of the parameters evaluated
Growth performance
In experiment 1 an interaction between oil source and peroxidation status was observed for ADG and ADFI (P = 010)
which was due to no impact of feeding pigs peroxidized PO PF or SO on ADG or ADFI compared with feeding pigs CNT PO PF or SO respectively while pigs fed peroxidized CO resulted in reduced ADG and ADFI compared with pigs fed CNT CO (Table 5) There was no interaction between oil source and peroxidation status and no lipid source effect on GF (P ge 084) but pigs fed the peroxidized lipids had a lower GF compared with pigs fed the CNT lipids (P = 009) There was no interaction between oil source and peroxidation status and no lipid source or peroxidation status effects observed for fecal score (P ge 030 Table 5)
While simple correlations do not represent a cause and effect relationship correlations between pig performance (ADG ADFI and GF) in relation to PV and AnV were conducted because these are two common lipid quality measures used in swine feeding programs (Kerr et al 2015 Hung et al 2017) and also with the sum of 2-decenal and 2-undecenal because these 2 unsaturated alkanals have been correlated with the performance of both broilers and pigs fed peroxidized lipids (Yuan et al 2020) As shown in Table 6 both PV and AnV were correlated to ADG and ADFI with similar correlation values (ndash026 ge r ge ndash029 P = 001) No correlation was observed between GF and PV or AnV and no correlation was observed between unsaturated alkanals and any performance parameter (r lt 020 and P ge 010) While both PV and AnV were highly correlated to pig performance it is important to remember that PV is a measurement of peroxides and hydroperoxides formed during the initiation phase of lipid peroxidation while AnV is a measure of high-molecular-weight saturated and unsaturated aldehydes which are considered compounds associated with the secondary phase of lipid peroxidation (Shahidi and Zhong 2005 Yin et al 2011) To this end the time and temperature of thermal processing of a lipid will have a direct impact on which phase of peroxidation a lipid may be in (Schaich (2005) Liu et al (2014b) Winkler-Moeser et al
Table 5 Effect of oil source and peroxidation status on pig performance experiment 11
Oil Peroxidation2 ADG g ADFI g GF gg SQ3
Palm CNT 303a 356a 085 089Palm 90 degC 289ab 346ab 083 089Poultry CNT 273abc 323abc 084 093Poultry 90 degC 288ab 343ab 084 096Canola CNT 293ab 339ab 087 093Canola 90 degC 250c 297c 084 092Soybean CNT 287ab 336ab 085 095Soybean 90 degC 264bc 318bc 083 092
Main effect
SEM 12 13 002 005
Oil times peroxidation P value 010 010 091 030Oil P-value 019 008 084 099
Peroxidation P-value 006 016 009 099
Palm 296 351a 084 089Poultry 280 333ab 084 095Canola 272 318b 085 092Soybean 276 327ab 084 094 CNT 289 339 085 093 90 degC 273 326 084 093
1Pigs were fed diets containing 10 added lipids for 21 d with an initial and final BW of 61 and 119 kg respectively Data are least square means of 12 replications for each lipid times peroxidation status treatment2The control (CNT) oil was not subjected to heat whereas the 90 degC oils were heated for 72 hr with constant air flow of 15 Lmin3Stool quality is defined as the probability of a more normal (eg firmer) visual fecal scoreSuperscripts reflect peroxidized SO treatment differences (abc P lt 005)
Dow
nloaded from httpsacadem
icoupcomjasarticle9812skaa3926029086 by guest on 10 M
arch 2022
Copyedited by AK
Journal of Animal Science 2020 Vol 98 No 12 | 7
(2020) and thus will affect which specific lipid quality indices may have the greatest correlation to animal performance
Using dietary AnV as the indicator of SO quality feeding pigs diets containing increasing levels of peroxidized SO in experiment 2 resulted in reduced ADG (quadratic P = 003) ADFI (linear P = 001) and GF (quadratic P = 001) Table 7 At the highest level of peroxidized SO intake 1253 AnVkg diet ADG ADFI and GF was reduced to 60 67 and 89 respectively compared with pigs fed the diet containing 007 AnVkg diet In experiment 3 the inclusion level of SO was reduced to 3 of the diet to reflect a more practical level of SO inclusion and as shown in Table 8 ADG was reduced to 88 of the pigs fed the CNT diet (P = 011) and ADFI was reduced to 89 of the pigs fed the CNT diet (P = 013) with no observed change in GF (P = 062) Instead of a correlation analysis ADG data for experiment 2 were regressed using dietary AnV as the independent variable because of the negative correlation observed in experiment 1 and because previous data (Lindblom et al 2018a Overholt et al 2018 Kerr et al 2020) suggest that AnV often has an inverse correlation to ADG In addition Yuan et al (2020) suggested that among common lipid quality indicators AnV had the greatest inverse correlation with the growth performance in both broilers and pigs Using this logic data in experiment 2 were plotted
using the ADG of pigs fed the lowest level of dietary AnV 007kg diet as the base-line level of ADG (100) with all other data points plotted relative to this rate of gain As shown in Figure 1 the relationship between relative growth rate and dietary AnV is represented as ADG = (ndash0237 times AnV2) + (ndash0189 times AnV) + 1003 R2 = 056 Based on this equation pigs fed the 3 peroxidized SO in experiment 3 which contained 501 AnVkg diet would be predicted to have ADG reduced by 7 where in actuality a 12 drop in ADG was observed (Table 8)
Comparing the current data to other studies can be difficult because in some cases AnV is considered the best indicator of lipid quality to animal performance (Lindblom et al 2018a Overholt et al 2018 Kerr et al 2020 Yuan et al 2020) while others have indicated that thiobarbituric acid reactive substances (TBARS) are considered the best indicator of lipid quality to animal performance (Hung et al 2017) It is unfortunate however that both of these measures are not taken in the same study because having both AnV and TBARS being measured in the same experiment would facilitate the generation of a conversion factor between these 2 measures of lipid quality That said both AnV and TBARS are ldquoaldehyde-basedrdquo measures of lipid quality and as such it is not surprising that only one of these measures is commonly taken in an experiment given analyses
Table 6 Pearson correlation coefficients among lipid peroxidation products with performance and total tract digestibility of EE experiment 11
Peroxide value Anisidine value Unsaturated alkanals2
ADG r-value ndash029 ndash028 mdash P-value (001) (001) mdashADFI r-value ndash028 ndash026 mdash P-value (001) (001) mdashGF r-value mdash mdash mdash P-value mdash mdash mdashATTD of EE r-value ndash028 ndash028 mdash P-value (001) (001) mdash
1Correlation (r-value) is top value and correlation significance (P-value) is below in parentheses If no value is given it was not found to be significant at P le 010 and have a correlation of ge0202Consists the sum of 2-decenal and 2-undecenal
Table 7 Pig performance plasma vitamin E and protein carbonyls and apparent total tract digestibility of EE of growing pigs fed diets increments of either 75 SO that was either unheated or peroxidized experiment 21
Inclusion of SO
CNT2 750 675 600 450 225 0
90 degC 0 075 150 300 525 750 SEM M3 LN3 QD3
PV mgkg diet 027 166 305 583 1000 1417 mdash mdash mdash mdashAnV kg diet 007 131 256 505 879 1253 mdash mdash mdash mdashADG g 313a 301ab 320a 278bc 260c 188d 12 001 099 003ADFI g 349a 339ab 347a 308bc 293c 235d 12 001 001 021GF 090a 089a 092a 091a 088a 080b 002 001 030 001Stool quality4 083ab 091a 088a 089a 074b 074b 007 001 001 014ATTD EE 760a 792a 773a 758a 706b 639c 14 001 061 001PC5 nmolmg 68 56 72 63 50 46 12 057 mdash mdashVit E mgmL 089 081 085 086 112 079 013 052 mdash mdash
1Pigs were fed diets containing 75 added SO for 21 d with an initial and final BW of 58 and 116 kg respectively Data are least square means of 12 replications for each dietary treatment for ADG ADFI GF and ATTD of EE 9 replications for each dietary treatment for plasma PC and vitamin E2SO was either an unheated control (CNT) or peroxidized (90 degC) by heating the SO at 90 degC for 72 hr with a constant air flow of 30 Lmin3M model P-value LN linear P-value QD quadratic P-value4Stool quality is defined as the probability of a more normal (eg firmer) visual fecal score5Protein carbonyls are reported per milligram of protein in the plasmaATTD EE apparent total tract digestibility of EE PC plasma protein carbonyls
Dow
nloaded from httpsacadem
icoupcomjasarticle9812skaa3926029086 by guest on 10 M
arch 2022
Copyedited by AK
8 | Journal of Animal Science 2020 Vol 98 No 12
are a cost factor in conducting research and because it would be assumed that only one measure would be needed as conducting both assays would seem to be unnecessary duplication It is important to note however that neither of these analyses are perfect measures of lipid quality (Shurson et al 2015) in that TBARS may be more accurate and sensitive than AnV for some animal fats and animal-vegetable blends (Nuchi et al 2009) even though thiobarbituric acid can also react with other chemicals such alkanals amino acids and ketones to produce
interference color (Guilleacuten-Sans and Guzmaacuten-Chozas 1998 Jardine et al 2002) Likewise AnV may be more sensitive to measuring unsaturated aldehydes compared with saturated aldehydes but AnV may provide misleading indications of the extent of peroxidation if lipids generate more unsaturated than saturated aldehydes during peroxidation (Shahidi and Zhong 2005 Barriuso et al 2013) In an effort to understand how the performance data in the current experiments fit with the review by Hung et al (2017) and realizing that TBARS was not analyzed on the lipids in the current experiments the data reviewed by Hung et al (2017) was re-evaluated on a PV-basis even though Hung et al (2017) reported no correlation between PV and pig performance For this re-evaluation of the data used in the review by Hung et al (2017) the PV of the CNT lipids from each data set (Oldfield et al 1963 DeRouchey et al 2004 Harrell et al 2010 Boler et al 2012 Liu et al 2014a Rosero et al 2015 Hanson et al 2016 van Heugten et al 2016) was incorporated and plotted as a base-line value (ie ADG = 100) from which to compare all other data points with Secondly data points derived from thermally processing lipids at 185 degC used in that review were removed because in the process of lipid peroxidation peroxides are rapidly degraded to other lipid peroxidation products such as acids and aldehydes (Liu et al 2014b Winkler-Moser et al 2020) Thirdly one data point was removed (data from pigs fed a diet containing 61 meqkg diet from Oldfield et al 1963) because it was deemed an outlier While this reduces the amount of data from which to draw conclusions from compared to the review by Hung et al (2017) this re-evaluation suggests there is a quadratic response between ADG and dietary PV ADG = (ndash0043 times PV2) + (0079 times PV) + 985 R2 = 062 Figure 2 This revised prediction equation would suggest that diets containing a PV of 10 meqkg diet would result in gain being reduced by ~5 and diets containing 15 and 20 meq PVkg diet having gains reduced by 10 and 17 respectively compared with pigs fed diets with near-zero meq of PVkg diet While DeRouchey et al (2004) suggested that a lipid would be of inferior quality if its PV exceeded 40 meqkg lipid lipid quality criterion must also take into account the inclusion level of the lipid and not just on the PV of the lipid alone It is
Table 8 Pig performance plasma vitamin E and protein carbonyls and apparent total tract digestibility of EE of growing pigs fed diets increments of either 3 SO that was either unheated or peroxidized experiment 31
Diet inclusion of SO
CNT2 3 0
90 degC 0 3 SEM P-value
PV mgkg diet 011 567 mdash mdashAnV kg diet 003 501 mdash mdashADG g 333 293 17 011ADFI g 376 333 19 013GF 089 088 001 062Stool quality3 095 090 005 009ATTD EE 681 618 13 002PC nmolmg 62 94 09 003Vit E mgmL 090 099 017 073
1Pigs were fed diets containing 3 added SO for 21 d with an initial and final BW of 58 and 125 kg respectively Data are least square means of 12 replications for each dietary treatment for ADG ADFI GF and ATTD of EE 9 replications for each dietary treatment for plasma PC and Vitamin E2SO was either an unheated control (CNT) or peroxidized (90 degC) by heating the SO at 910 degC for 72 hr with a constant air flow of 30 Lmin3Stool quality is defined as the probability of a more normal (eg firmer) visual fecal scoreATTD EE apparent total tract digestibility of EE PC plasma protein carbonyls
Figure 1 Relative growth rate of pigs consuming graded levels of dietary AnV experiment 2 Data were plotted using the ADG of pigs fed the lowest level of dietary
AnV 007kg diet as the base-line level of ADG (100) with all other data points plotted relative to this rate of gain The relationship between relative growth rate and
dietary AnV is represented as ADG = (ndash0237 times AnV2) + (ndash0189 times AnV) + 1003 R2 = 056
Dow
nloaded from httpsacadem
icoupcomjasarticle9812skaa3926029086 by guest on 10 M
arch 2022
Copyedited by AK
Journal of Animal Science 2020 Vol 98 No 12 | 9
also important to note that in the review by Hung et al (2017) there was only one TBARS data point reported to be above 75 mg malondialdehyde equivalencekg diet (data from pigs fed the diet containing 162 mg malondialdehyde equivalencekg diet from Oldfield et al 1963) which has a profound impact on the resultant regression equation and subsequently on performance predictions from such equation This can also be said for interpretation of the data reported by Lindblom et al (2018a) Overholt et al (2018) and Kerr et al (2020) where essentially only one treatment evaluated in their experiments (ie SO thermally processed at 90 degC for 72 hr) resulted in an impact on pig performance Likewise in the re-evaluation of the data reviewed by Hung et al (2017) (Figure 2) the 2 data points with the highest PV per kilogram diet were derived from thermally processing corn and CO at 95 degC for 72 hr (Liu et al 2014ab) which again has a large impact on the subsequently derived regression equation Only recently has a wide range of thermal processing times and temperatures been conducted from which to evaluate the impact of high concentrations of lipid quality indices on animal performance (Yuan et al 2020) data which suggest that AnV is one of the most important lipid quality measures to consider relative to animal production This is not surprising however given that Yuan et al (2020) evaluated SO and many of the thermal processing temperatures used were above 90 degC Although SO was only processed at 90 degC for 72 hr in experiments 2 and 3 similar to data reported by Lindblom et al (2018a) Overholt et al (2018) and Kerr et al (2020) an attempt was made to increase the concentrations of AnV and other lipid quality indices in experiments 2 and 3 by increasing air infiltration flow and using smaller bubbles to increase the air-to-oil interaction This did not however appear to have such an effect on lipid quality measures for the thermally processed SO in experiment 1 and experiments 2 and 3 as shown by the generation of lipid peroxidation products reported in Tables 1 and 2 respectively
Oxidative status
In the current experiments plasma PC were measured because in vivo proteins and amino acids can be damaged by oxidation with PC being an indicator of this damage (Beal 2002 Dalle-Donne et al 2003 Likewise endogenous GPx assists in protecting the body from reactive oxygen species and free radicles (Lykkesfeldt and Svendsen 2007 Kalyanaraman 2013 Royer et al 2016) In experiment 1 there was no interaction observed between lipid source and peroxidation status on plasma vitamin E PC or GPx (P ge 016) and there was no lipid source or peroxidation effect on plasma PC or GPx (P ge 016 Table 9) Plasma vitamin E levels were reduced in pigs fed diets containing SO (P = 001) and in pigs fed peroxidized oils (P = 001) In experiment 2 there was no effect of feeding graded levels of peroxidized SO on plasma vitamin E or PC (P ge 052) In experiment 3 feeding pigs 3 peroxidized SO had no effect on plasma vitamin E (P = 073) but resulted in increased serum PC (P = 003) Because there were not consistent effects of feeding peroxidized SO on plasma PC GPx or vitamin E in experiment 1 we elected not to conduct a correlation analysis between dietary PV AnV and unsaturated alkanals with plasma PC GPx or vitamin E
The impact of feeding peroxidized lipids on plasma or serum PC has been variable Boler et al (2012) Overholt et al (2018) Chang et al (2019) and Kerr et al (2020) observed no impact of feeding 10 peroxidized SO on serum PC while Lindblom et al (2018b) and Silva-Guillen et al (2020ab) reported increases in serum PC due to feeding peroxidized lipid Relative to plasma GPx the lack of a peroxidation effect in experiment 1 is consistent with Overholt et al (2018) who reported no effect of feeding peroxidized SO on serum GPx while Yuan et al (2007) Boler et al (2012) and Lindblom et al (2018b) reported decreases in serum GPx due to feeding pigs peroxidized lipids In contrast to the current experiments the impact on serum vitamin E levels is more consistent with Hanson et al (2016) Chang et al (2019)
Figure 2 Relative growth rate of pigs consuming graded levels of dietary PV Adapted from Hung et al (2017) using data obtained from Oldfield et al (1963) DeRouchey
et al (2004) Harrell et al (2010) Boler et al (2012) Liu et al (2014a) Rosero et al (2015) Hanson et al (2016) and van Heugten et al (2016 The relationship between
relative growth rate and dietary PV is represented as ADG = (ndash0043 times PV2) + (0079 times PV) + 985 R2 = 062
Dow
nloaded from httpsacadem
icoupcomjasarticle9812skaa3926029086 by guest on 10 M
arch 2022
Copyedited by AK
10 | Journal of Animal Science 2020 Vol 98 No 12
and Silva-Guillen et al (2020ab) who have reported decreases in serum vitamin E in pigs consuming peroxidized lipids
ATTD of ether extract
If lipids become highly peroxidized polymers are ultimately formed in the termination phase which have been shown to be poorly digested (Gray 1978 Gonzalez-Munoz et al 1998) In experiment 1 there was an interaction between lipid source and peroxidation status on ATTD of EE where the ATTD of EE was reduced in pigs fed PO or SO when peroxidized but not when pigs were fed peroxidized PF or CO (P = 001 Table 9) There was a negative correlation (r = ndash028) between PV or AnV and ATTD of EE (P = 001 Table 6) In experiment 2 the ATTD of EE was reduced (quadratic P = 001) due to feeding increasing levels of peroxidized SO and in experiment 3 the ATTD of EE was also reduced due to feeding pigs 3 peroxidized SO (P = 002) Tables 7 and 8 respectively
Summarizing the data from pigs only fed SO in the current experiments suggests that for each 1-unit increase in dietary AnV the ATTD of EE in the diet would decrease by an average of 1 percentage unit (06 11 and 13 percentage units for experiments 1 2 and 3 respectively) While the data are in contrast to the study by Liu et al (2014c) and Kerr et al (2020) who reported no change in lipid digestibility in pigs fed peroxidized lipids the current data are supported by others (DeRouchey et al 2004 Yuan et al 2007 Rosero et al 2015 Lindblom et al 2018a Overholt et al 2018) who reported a decrease in lipid digestibility due to feeding pigs peroxidized lipids This suggests that at least part of the negative effect in pigs consuming peroxidized lipids is a decrease in lipid and therefore energy digestibility
ConclusionsWhile thermal processing of PO and PF resulted in little impact on the lipidrsquos FA composition or on their PV or AnV concentrations thermally processing of CO and SO altered their FA profile as shown by a decrease in unsaturated FA and a concomitant increase in saturated FA and resulted in increased PV and AnV The changes in the FA composition and increases in PV and AnV were repeatable in the subsequent experiments which used SO as the test lipid Feeding pigs lipids with increased PV and AnV levels resulted in reduced ADG ADFI and GF which when ADG was regressed using AnV as the independent variable resulted in a quadratic reduction in ADG with increasing levels of dietary AnV Similarly apparent total tract digestibility of EE was also quadratically reduced by feeding increasing levels of peroxidized SO such that at least part of the reduction in ADG might be explained by a reduced energy uptake in addition to a reduction in ADFI that was also noted due to consumption of peroxidized lipids The impact of pigs consuming peroxidized lipids on measures of oxidative stress (ie plasma protein carbonyls and vitamin E) was inconsistent across the trials so that delineating a cause and effect relationship between lipid peroxidation and oxidative stress could not be ascertained
Conflict of interest statement The authors declare no real or perceived conflicts of interest
Table 9 Effect of oil source and peroxidation status on plasma vitamin E protein carbonyls glutathione peroxidase activity and apparent total tract EE digestibility of growing pigs fed diets containing 10 unheated or peroxidized lipids experiment 11
Oil Peroxidation2 Vitamin E microgmL Protein carbonyls nmolmL GPx mUmg Hgb ATTD EE
Palm CNT 13 97 358 766b
Palm 90 degC 10 98 313 726c
Poultry CNT 12 88 306 777b
Poultry 90 degC 08 67 340 762b
Canola CNT 13 74 370 769b
Canola 90 degC 08 67 306 768b
Soybean CNT 11 85 296 821a
Soybean 90 degC 03 73 386 716c
Main effect
SEM 01 11 51 11Oil times peroxidation P-value 016 081 041 001
Oil P-value 001 016 099 010Peroxidation P-value 001 025 091 001
Palm 115a 97 336 746b
Poultry 103a 77 323 769a
Canola 103a 71 338 768a
Soybean 070b 79 341 769a
CNT 122 86 332 783 90 degC 074 76 336 743
1Pigs were fed diets containing 10 added lipids for 21 d with an initial and final BW of 61 and 119 kg respectively Data are least square means of 9 replications for each lipid times peroxidation status treatment for the plasma vitamin E data2The control (CNT) oil was not subjected to heat whereas the 90 degC oils were heated for 72 hr with constant air flow (15 Lmin)Superscripts reflect peroxidized SO treatment differences (abc P lt 005)ATTD EE apparent total tract digestibility of EE GPx glutathione peroxidase activity expressed as milliunits (mU) per mg of hemoglobin where mU is defined as the number of nonomoles of NADPH oxidized per minute as outlined in the assay SEM standard error of the mean
Dow
nloaded from httpsacadem
icoupcomjasarticle9812skaa3926029086 by guest on 10 M
arch 2022
Copyedited by AK
Journal of Animal Science 2020 Vol 98 No 12 | 11
Literature CitedAmerican Oil Chemistsrsquo Society (AOCS) 2011 Official methods
and recommended practices of the AOCS 6th ed (2nd printing) Urbana IL
Arnaud J I Fortis S Blachier D Kia and A Favier 1991 Simultaneous determination of retinol alpha-tocopherol and beta-carotene in serum by isocratic high-performance liquid chromatography J Chromatogr 572103ndash116 doi1010160378-4347(91)80476-s
Azain M J 2001 Fat in swine nutrition In A J Lewis and L L Southern editors Swine nutrition Boca Raton CRC Press p 95ndash106
Barriuso B I Astiasaran and D Ansorena 2013 A review of analytical methods measuring lipid oxidation status in foods a challenging task Eur Food Res Technol 2361ndash15 doiorg101007s00217-012-1866-9
Beal F 2002 Serial review oxidatively modified proteins in aging and disease Free Radic Biol Med 32797ndash803 doiorg101016S0891-5849(02)00780-3
Betteridge D J 2000 What is oxidative stress Metabolism 49(Suppl 1)3ndash8 doi101016S0026-0495(00)80077-3
Boler D D D M Fernaacutendez-Duentildeas L W Kutzler J Zhao R J Harrell D R Campion F K McKeith J Killefer and A C Dilger 2012 Effects of oxidized corn oil and synthetic antioxidant blend on animal performance in finishing barrows J Anim Sci 905159ndash5169 doi102527jas2012ndash5266
Chang P L R D Boyd C Zier-Rush D R Rosero and E Van Heugten 2019 Lipid peroxidation impairs growth and viability of nursery pigs reared under commercial conditions J Anim Sci 973379ndash3389 doi 101093jasskz183
Chang L W W S Lo and P Lin 2005 Trans trans-24-decadienal a product found in cooking oil fumes induces cell proliferation and cytokine production due to reactive oxygen species in human bronchial epithelial cells Toxicol Sci 87337ndash343 doi101093toxscikfi258
Choe E and D B Min 2007 Chemistry of deep-fat frying oils J Food Sci 72R77ndashR86 doi101111j1750-3841200700352x
Dalle-Donne I R Rossi D Giustarini A Milzani and R Colombo 2003 Protein carbonyl groups as biomarkers of oxidative stress Clin Chim Acta 32923ndash38 doi101016s0009-8981(03)00003-2
DeRouchey J M J D Hancock R H Hines C A Maloney D J Lee H Cao D W Dean and J S Park 2004 Effects of rancidity and free fatty acids in choice white grease on growth performance and nutrient digestibility in weanling pigs J Anim Sci 822937ndash2944 doi102527200482102937x
Ehr I J B J Kerr and M E Persia 2015 Effects of peroxidized corn oil on performance AMEn and abdominal fat pad weight in broiler chicks Poult Sci 941629ndash1634 doi103382pspev131
Esterbauer H R J Schaur and H Zollner 1991 Chemistry and biochemistry of 4-hydroxynonenal malonaldehyde and related aldehydes Free Radic Biol Med 1181ndash128 doi1010160891-5849(91)90192-6
Finaud J G Lac and E Filaire 2006 Oxidative stress relationship with exercise and training Sports Med 36327ndash358 doi10216500007256-200636040-00004
Gonzalez-Muntildeoz M J S Bastida and F J Sanchez-Muniz 1998 Short-term in vivo digestibility of triglyceride polymers dimers and monomers of thermoxidized palm olein used in deep-frying J Agric Food Chem 465188ndash5193 doiorg101021jf980598i
Gray J I 1978 Measurement of lipid oxidation a review J AOCS 55539ndash546 doiorg101007BF02668066
Guilleacuten-Sans R and M Guzmaacuten-Chozas 1998 The thiobarbituric acid (TBA) reaction in foods a review Crit Rev Food Sci Nutr 38315ndash350 doi10108010408699891274228
Hammond E G and P J White 2011 A brief history of lipid oxidation J Am Oil Chem Soc 88891ndash897 doiorg101007s11746-011-1761-8
Hanson A R P E Urriola L Wang L J Johnston C Chen and G C Shurson 2016 Dietary peroxidized maize oil affects the growth performance and antioxidant status of nursery pigs Anim Feed Sci Technol 216251ndash261 doiorg101016janifeedsci201603027
Harrell R J J Zhao G Reznik D Macaraeg T Wineman J Richards and G Rexnik 2010 Application of a blend of dietary antioxidants in nursery pigs fed either fresh or oxidized corn oil or DDGS J Anim Sci 88 (E-Suppl 3)60 (Abstr)
Herting D C and E E Drury 1963 Vitamin E content of vegetable oils and fats J Nutr 81335ndash342 doi101093jn814335
van Heugten E D R Rosero P L Y C Chang C Zier-Rush and R D Boyd 2016 Peroxidized lipids in nursery pig diets ndashwhy and when should we be concerned In Midwest Swine Nutrition Conference Indianapolis Indiana p 31ndash39
Holman R 1954 Autoxidation of fats and related substances Prog Chem Fats Other Lipids 251ndash98 doiorg1010160079-6832(54)90004-X
Hung Y T A R Hanson G C Shurson and P E Urriola 2017 Peroxidized lipids reduce growth performance of poultry and swine a meta-analysis Anim Sci Feed Technol 23147ndash58 doiorg101016janifeedsci201706013
Hung Y T A R Hanson P E Urriola L J Johnston B J Kerr and G C Shurson 2019 Addition of tert-butylhydroquinone (TBHQ) to maize oil reduces lipid oxidation but does not prevent reductions in serum vitamin E in nursery pigs J Anim Sci Biotechnol 1051 doi101186s40104-019-0362-5
Jardine D M Antolovich P D Prenzler and K Robards 2002 Liquid chromatography-mass spectrometry (LC-MS) investigation of the thiobarbituric acid reactive substances (TBARS) reaction J Agric Food Chem 501720ndash1724 doi101021jf011336a
Kalyanaraman B 2013 Teaching the basics of redox biology to medical and graduate students oxidants antioxidants and disease mechanisms Redox Biol 1244ndash257 doi101016jredox201301014
Kamal-Eldin A 2006 Effect of fatty acids and tocopherols on the oxidative stability of vegetable oils Eur J Lipid Sci Technol 1081051ndash1061 doiorg101002ejlt200600090|
van Kempen T A and S McComas 2002 Infrared spectroscopy as a tool for assessing fat quality J Appl Poult Res 11191ndash201 doiorg101093japr112191
Kerr B J T A Kellner and G C Shurson 2015 Characteristics of lipids and their feeding value in swine diets J Anim Sci Biotechnol 630 doi101186s40104-015-0028-x
Kerr B J S C Lindblom and M F Overholt 2020 Influence of feeding thermally peroxidized soybean oil on growth performance digestibility gut integrity and oxidative stress in nursery pigs J Anim Sci 981ndash11 doi101093jasskaa016
Koller L D P J South J H Exon G A Whitbeck and J Maas 1984 Comparison of selenium levels and glutathione peroxidase activity in bovine whole blood Can J Comp Med 48431ndash433 PMCID PMC1236100
Lin X M Azain and J Odle 2013 Lipids and lipid utilization in swine In L Chiba editor Sustainable swine nutrition Oxford UK Blackwell Publishing p 59ndash79
Lindblom S C N K Gabler E A Bobeck and B J Kerr 2019 Oil source and peroxidation status interactively affect growth performance and oxidative status in broilers from 4 to 25 d of age Poult Sci 981749ndash1761 doi103382pspey547
Lindblom S C N K Gabler R N Dilger Z F Olson C L Loving and B J Kerr 2018b Influence of feeding thermally peroxidized soybean oil on oxidative status in growing pigs J Anim Sci 96545ndash557 doi101093jassky005
Lindblom S C N K Gabler and B J Kerr 2018a Influence of feeding thermally peroxidized soybean oil on growth performance digestibility and gut integrity in growing pigs J Anim Sci 96558ndash569 doi101093jassky004
Dow
nloaded from httpsacadem
icoupcomjasarticle9812skaa3926029086 by guest on 10 M
arch 2022
Copyedited by AK
12 | Journal of Animal Science 2020 Vol 98 No 12
Liu P C Chen B J Kerr T E Weber L J Johnston and G C Shurson 2014a Influence of thermally oxidized vegetable oils and animal fats on growth performance liver gene expression and liver and serum cholesterol and triglycerides in young pigs J Anim Sci 922960ndash2970 doi102527jas2012ndash5709
Liu P B J Kerr C Chen T E Weber L J Johnston and G C Shurson 2014b Methods to create thermally oxidized lipids and comparison of analytical procedures to characterize peroxidation J Anim Sci 922950ndash2959 doi102527jas2012-5708
Liu P B J Kerr C Chen T E Weber L J Johnston and G C Shurson 2014c Influence of thermally oxidized vegetable oils and animal fats on energy and nutrient digestibility in young pigs J Anim Sci 922980ndash2986 doi102527jas2012-5711
Lundberg W O and P Jarvi 1971 Peroxidation of polyunsaturated fatty compounds Prog Chem Fats Lipids 9377ndash406 doiorg1010160079-6832(71)90032-2
Luthria D D Vinjamoori K Noel and J Ezzell 2004 Accelerated solvent extraction In D L Luthria editors Oil extraction and analysis critical issues and comparative studies Champaign IL AOCS Press p 25ndash38
Lykkesfeldt J and O Svendsen 2007 Oxidants and antioxidants in disease oxidative stress in farm animals Vet J 173502ndash511 doi101016jtvjl200606005
Meadus W J P Duff B Uttaro J L Aalhus D C Rolland L L Gibson and M E Dugan 2010 Production of docosahexaenoic acid (DHA) enriched bacon J Agric Food Chem 58465ndash472 doi101021jf9028078
Myers W D P A Ludden V Nayigihugu and B W Hess 2004 Technical note a procedure for the preparation and quantitative analysis of samples for titanium dioxide J Anim Sci 82179ndash183 doi1025272004821179x
NRC 2012 Nutrient requirements of swine 11th rev ed Washington DC National Academies Press
Nuchi C F Guardiola R Bou P Bondloli L Bella and R Della Codony 2009 Assessment of the levels of degradation in fat co-and byproducts for feed uses and their relationships with some lipid composition parameters J Agric Food Chem 571952ndash1959 doiorg101021jf803369h
OrsquoBrien R D 2009 Fats and oils formulating and processing for application Boca Raton FL CRC Press
Oldfield J E R O Sinnhuber and A A Rasheed 1963 Nutritive value of marine oils II Effects of in vivo antioxidants in feeding menhaden oil to swine J Am Oil Chem Soc 40357ndash360 doiorg101007BF02631558
Overholt M F A C Dilger D D Boler and B J Kerr 2018 Influence of feeding thermally peroxidized soybean oil on growth performance digestibility and gut integrity in finishing pigs J Anim Sci 962789ndash2803 doi101093jassky091
Paglia D E and W N Valentine 1967 Studies on the quantitative and qualitative characterization of erythrocyte glutathione peroxidase J Lab Clin Med 70158ndash169 PMID 6066618
Pettigrew J E and R L Moser 1991 Fat in swine nutrition In Miller E R D E Ullery and A J Lewis editors Swine nutrition Butterworth-Heinemann Stoneham MA p 133ndash145
R Core Team 2019 R a language and environment for statistical computing Vienna Austria R Foundation for Statistical Computing httpswwwR-projectorg
Rosero D S J Odle A J Moeser R D Boyd and E van Heugten 2015 Peroxidised dietary lipids impair intestinal function and morphology of the small intestine villi of nursery pigs
in a dose-dependent manner Br J Nutr 1141985ndash1992 doi101017S000711451500392X
Royer E F Barbeacute D Guillou Y Rousseliegravere and E Chevaux 2016 Development of oxidative stress model in weaned pigs highlighting plasma biomarkersrsquo specificity to stress inducers J Anim Sci 9448ndash53 doi102527jas2015-9857
Schaich K M 2005 Lipid oxidation theoretical aspects In Baileyrsquos industrial oil and fat products Edible oil and fat products chemistry properties and health effects Vol 1 Hoboken NJ John Wiley and Sons p 269ndash355
Seppanen C M and A S Csallany 2002 Formation of 4-hydroxynonenal a toxic aldehyde in soybean oil at frying temperature J Am Oil Chem Soc 791033ndash1038 doiorg101007s11746-002-0598-z|
Seppanen C M Q Song and A S Csallany 2010 The antioxidant functions of tocopherol and tocotrienol homologues in oils fats and food systems J Am Oil Chem Soc 87469ndash481 doi101007s11746-009-1526-9
Shahidi F and Y Zhong 2005 Lipid oxidation measurement methods In F Shahidi and Y Zhong editors Baileyrsquos industrial oil and fat products New Jersey John Wiley amp Sons p 357ndash385
Shurson G C B J Kerr and A R Hanson 2015 Evaluating the quality of feed fats and oils and their effects on pig growth performance J Anim Sci Biotechnol 610 doi101186s40104-015-0005-4
Sies H W Stahl and A R Sundquist 1992 Antioxidant functions of vitamins Ann N Y Acad Sci 6697ndash20 doiorg101111j1749ndash66321992tb17085x
Silva-Guillen Y V C Arellano R D Boyd G Martinez and E van Heugten 2020a Growth performance oxidative stress and immune status of newly weaned pigs fed peroxidized lipids with or without supplemental vitamin E or polyphenols J Anim Sci Biotechnol 1122 doi101186s40104-020-0431-9
Silva-Guillen Y C Arellano G Martinez and E van Heugten 2020b Growth performance oxidative stress and antioxidant capacity of newly weaned piglets fed dietary peroxidized lipids with vitamin E or phytogenic compounds in drinking water App Anim Sci 36341ndash351 doiorg1015232aas2019-01976
Wang L A S Csallany B J Kerr G C Shurson and C Chen 2016 Kinetics of forming aldehydes in frying oils and their distribution in French fries revealed by LC-MS-based chemometrics J Agric Food Chem 643881ndash3889 doi101021acsjafc6b01127
Wanasundara P K J P D and F Shahidi 2005 Antioxidants science technology and applications In F Shahidi editor Baileyrsquos industrial oil and fat products 6th ed Vol 1 Hoboken NJ John Wiley amp Sons p 431ndash489 doiorg101002047167849Xbio002
Winkler-Moser J K H S Hwang and B J Kerr 2020 Changes in markers of lipid oxidation and thermal treatment in feed-grade fats and oils J Sci Food Agric 1003328ndash3340 doi101002jsfa10364
Yin H L Xu and N A Porter 2011 Free radical lipid peroxidation mechanism and analysis Chem Rev 1115944ndash5972 doi101021cr200084z
Yuan S B D W Chen K Y Zhang and B Yu 2007 Effects of oxidative stress on growth performance nutrient digestibilities and activities of antioxidative enzymes of weanling pigs Asian-Aust J Anim Sci 201600ndash1605 doi105713ajas20071600
Yuan J B J Kerr S M Curry and C Chen 2020 Identification of C9-C11 unsaturated aldehydes as prediction markers of growth and feed intake for non-ruminant animals fed oxidized soybean J Anim Sci Biotech 11 (49)1ndash14 doiorg101186s40104-020-00451-4
Dow
nloaded from httpsacadem
icoupcomjasarticle9812skaa3926029086 by guest on 10 M
arch 2022
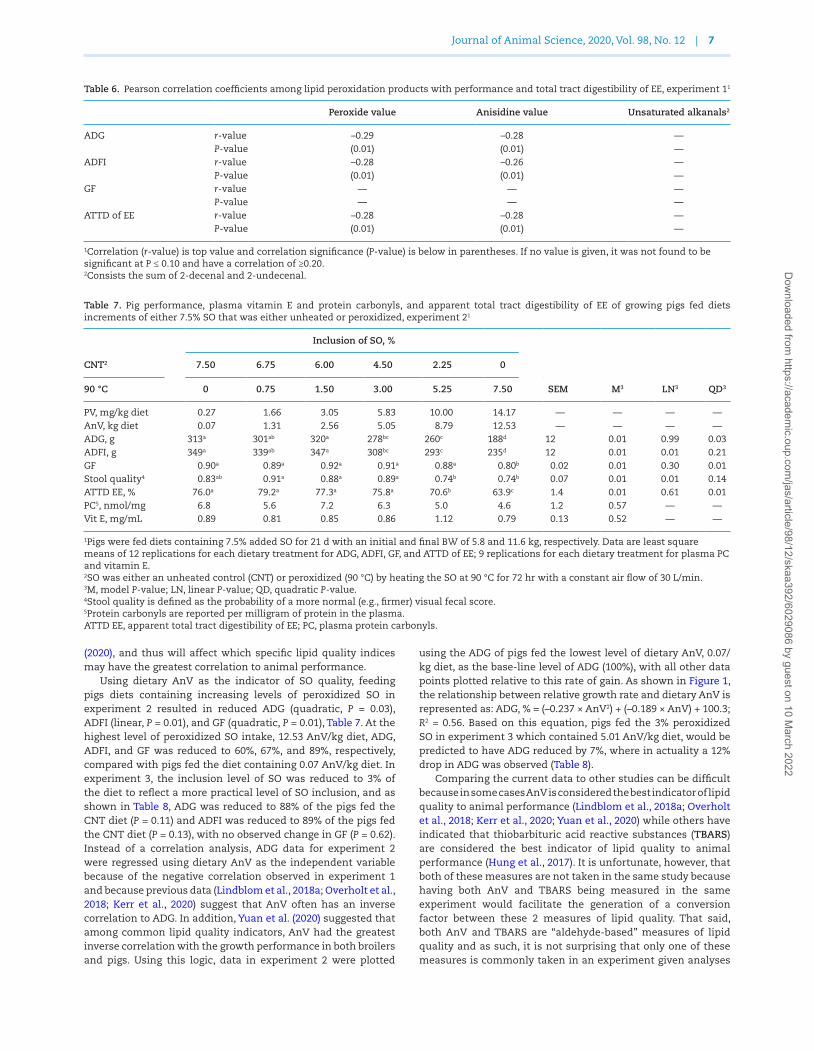
Copyedited by AK
Journal of Animal Science 2020 Vol 98 No 12 | 7
(2020) and thus will affect which specific lipid quality indices may have the greatest correlation to animal performance
Using dietary AnV as the indicator of SO quality feeding pigs diets containing increasing levels of peroxidized SO in experiment 2 resulted in reduced ADG (quadratic P = 003) ADFI (linear P = 001) and GF (quadratic P = 001) Table 7 At the highest level of peroxidized SO intake 1253 AnVkg diet ADG ADFI and GF was reduced to 60 67 and 89 respectively compared with pigs fed the diet containing 007 AnVkg diet In experiment 3 the inclusion level of SO was reduced to 3 of the diet to reflect a more practical level of SO inclusion and as shown in Table 8 ADG was reduced to 88 of the pigs fed the CNT diet (P = 011) and ADFI was reduced to 89 of the pigs fed the CNT diet (P = 013) with no observed change in GF (P = 062) Instead of a correlation analysis ADG data for experiment 2 were regressed using dietary AnV as the independent variable because of the negative correlation observed in experiment 1 and because previous data (Lindblom et al 2018a Overholt et al 2018 Kerr et al 2020) suggest that AnV often has an inverse correlation to ADG In addition Yuan et al (2020) suggested that among common lipid quality indicators AnV had the greatest inverse correlation with the growth performance in both broilers and pigs Using this logic data in experiment 2 were plotted
using the ADG of pigs fed the lowest level of dietary AnV 007kg diet as the base-line level of ADG (100) with all other data points plotted relative to this rate of gain As shown in Figure 1 the relationship between relative growth rate and dietary AnV is represented as ADG = (ndash0237 times AnV2) + (ndash0189 times AnV) + 1003 R2 = 056 Based on this equation pigs fed the 3 peroxidized SO in experiment 3 which contained 501 AnVkg diet would be predicted to have ADG reduced by 7 where in actuality a 12 drop in ADG was observed (Table 8)
Comparing the current data to other studies can be difficult because in some cases AnV is considered the best indicator of lipid quality to animal performance (Lindblom et al 2018a Overholt et al 2018 Kerr et al 2020 Yuan et al 2020) while others have indicated that thiobarbituric acid reactive substances (TBARS) are considered the best indicator of lipid quality to animal performance (Hung et al 2017) It is unfortunate however that both of these measures are not taken in the same study because having both AnV and TBARS being measured in the same experiment would facilitate the generation of a conversion factor between these 2 measures of lipid quality That said both AnV and TBARS are ldquoaldehyde-basedrdquo measures of lipid quality and as such it is not surprising that only one of these measures is commonly taken in an experiment given analyses
Table 6 Pearson correlation coefficients among lipid peroxidation products with performance and total tract digestibility of EE experiment 11
Peroxide value Anisidine value Unsaturated alkanals2
ADG r-value ndash029 ndash028 mdash P-value (001) (001) mdashADFI r-value ndash028 ndash026 mdash P-value (001) (001) mdashGF r-value mdash mdash mdash P-value mdash mdash mdashATTD of EE r-value ndash028 ndash028 mdash P-value (001) (001) mdash
1Correlation (r-value) is top value and correlation significance (P-value) is below in parentheses If no value is given it was not found to be significant at P le 010 and have a correlation of ge0202Consists the sum of 2-decenal and 2-undecenal
Table 7 Pig performance plasma vitamin E and protein carbonyls and apparent total tract digestibility of EE of growing pigs fed diets increments of either 75 SO that was either unheated or peroxidized experiment 21
Inclusion of SO
CNT2 750 675 600 450 225 0
90 degC 0 075 150 300 525 750 SEM M3 LN3 QD3
PV mgkg diet 027 166 305 583 1000 1417 mdash mdash mdash mdashAnV kg diet 007 131 256 505 879 1253 mdash mdash mdash mdashADG g 313a 301ab 320a 278bc 260c 188d 12 001 099 003ADFI g 349a 339ab 347a 308bc 293c 235d 12 001 001 021GF 090a 089a 092a 091a 088a 080b 002 001 030 001Stool quality4 083ab 091a 088a 089a 074b 074b 007 001 001 014ATTD EE 760a 792a 773a 758a 706b 639c 14 001 061 001PC5 nmolmg 68 56 72 63 50 46 12 057 mdash mdashVit E mgmL 089 081 085 086 112 079 013 052 mdash mdash
1Pigs were fed diets containing 75 added SO for 21 d with an initial and final BW of 58 and 116 kg respectively Data are least square means of 12 replications for each dietary treatment for ADG ADFI GF and ATTD of EE 9 replications for each dietary treatment for plasma PC and vitamin E2SO was either an unheated control (CNT) or peroxidized (90 degC) by heating the SO at 90 degC for 72 hr with a constant air flow of 30 Lmin3M model P-value LN linear P-value QD quadratic P-value4Stool quality is defined as the probability of a more normal (eg firmer) visual fecal score5Protein carbonyls are reported per milligram of protein in the plasmaATTD EE apparent total tract digestibility of EE PC plasma protein carbonyls
Dow
nloaded from httpsacadem
icoupcomjasarticle9812skaa3926029086 by guest on 10 M
arch 2022
Copyedited by AK
8 | Journal of Animal Science 2020 Vol 98 No 12
are a cost factor in conducting research and because it would be assumed that only one measure would be needed as conducting both assays would seem to be unnecessary duplication It is important to note however that neither of these analyses are perfect measures of lipid quality (Shurson et al 2015) in that TBARS may be more accurate and sensitive than AnV for some animal fats and animal-vegetable blends (Nuchi et al 2009) even though thiobarbituric acid can also react with other chemicals such alkanals amino acids and ketones to produce
interference color (Guilleacuten-Sans and Guzmaacuten-Chozas 1998 Jardine et al 2002) Likewise AnV may be more sensitive to measuring unsaturated aldehydes compared with saturated aldehydes but AnV may provide misleading indications of the extent of peroxidation if lipids generate more unsaturated than saturated aldehydes during peroxidation (Shahidi and Zhong 2005 Barriuso et al 2013) In an effort to understand how the performance data in the current experiments fit with the review by Hung et al (2017) and realizing that TBARS was not analyzed on the lipids in the current experiments the data reviewed by Hung et al (2017) was re-evaluated on a PV-basis even though Hung et al (2017) reported no correlation between PV and pig performance For this re-evaluation of the data used in the review by Hung et al (2017) the PV of the CNT lipids from each data set (Oldfield et al 1963 DeRouchey et al 2004 Harrell et al 2010 Boler et al 2012 Liu et al 2014a Rosero et al 2015 Hanson et al 2016 van Heugten et al 2016) was incorporated and plotted as a base-line value (ie ADG = 100) from which to compare all other data points with Secondly data points derived from thermally processing lipids at 185 degC used in that review were removed because in the process of lipid peroxidation peroxides are rapidly degraded to other lipid peroxidation products such as acids and aldehydes (Liu et al 2014b Winkler-Moser et al 2020) Thirdly one data point was removed (data from pigs fed a diet containing 61 meqkg diet from Oldfield et al 1963) because it was deemed an outlier While this reduces the amount of data from which to draw conclusions from compared to the review by Hung et al (2017) this re-evaluation suggests there is a quadratic response between ADG and dietary PV ADG = (ndash0043 times PV2) + (0079 times PV) + 985 R2 = 062 Figure 2 This revised prediction equation would suggest that diets containing a PV of 10 meqkg diet would result in gain being reduced by ~5 and diets containing 15 and 20 meq PVkg diet having gains reduced by 10 and 17 respectively compared with pigs fed diets with near-zero meq of PVkg diet While DeRouchey et al (2004) suggested that a lipid would be of inferior quality if its PV exceeded 40 meqkg lipid lipid quality criterion must also take into account the inclusion level of the lipid and not just on the PV of the lipid alone It is
Table 8 Pig performance plasma vitamin E and protein carbonyls and apparent total tract digestibility of EE of growing pigs fed diets increments of either 3 SO that was either unheated or peroxidized experiment 31
Diet inclusion of SO
CNT2 3 0
90 degC 0 3 SEM P-value
PV mgkg diet 011 567 mdash mdashAnV kg diet 003 501 mdash mdashADG g 333 293 17 011ADFI g 376 333 19 013GF 089 088 001 062Stool quality3 095 090 005 009ATTD EE 681 618 13 002PC nmolmg 62 94 09 003Vit E mgmL 090 099 017 073
1Pigs were fed diets containing 3 added SO for 21 d with an initial and final BW of 58 and 125 kg respectively Data are least square means of 12 replications for each dietary treatment for ADG ADFI GF and ATTD of EE 9 replications for each dietary treatment for plasma PC and Vitamin E2SO was either an unheated control (CNT) or peroxidized (90 degC) by heating the SO at 910 degC for 72 hr with a constant air flow of 30 Lmin3Stool quality is defined as the probability of a more normal (eg firmer) visual fecal scoreATTD EE apparent total tract digestibility of EE PC plasma protein carbonyls
Figure 1 Relative growth rate of pigs consuming graded levels of dietary AnV experiment 2 Data were plotted using the ADG of pigs fed the lowest level of dietary
AnV 007kg diet as the base-line level of ADG (100) with all other data points plotted relative to this rate of gain The relationship between relative growth rate and
dietary AnV is represented as ADG = (ndash0237 times AnV2) + (ndash0189 times AnV) + 1003 R2 = 056
Dow
nloaded from httpsacadem
icoupcomjasarticle9812skaa3926029086 by guest on 10 M
arch 2022
Copyedited by AK
Journal of Animal Science 2020 Vol 98 No 12 | 9
also important to note that in the review by Hung et al (2017) there was only one TBARS data point reported to be above 75 mg malondialdehyde equivalencekg diet (data from pigs fed the diet containing 162 mg malondialdehyde equivalencekg diet from Oldfield et al 1963) which has a profound impact on the resultant regression equation and subsequently on performance predictions from such equation This can also be said for interpretation of the data reported by Lindblom et al (2018a) Overholt et al (2018) and Kerr et al (2020) where essentially only one treatment evaluated in their experiments (ie SO thermally processed at 90 degC for 72 hr) resulted in an impact on pig performance Likewise in the re-evaluation of the data reviewed by Hung et al (2017) (Figure 2) the 2 data points with the highest PV per kilogram diet were derived from thermally processing corn and CO at 95 degC for 72 hr (Liu et al 2014ab) which again has a large impact on the subsequently derived regression equation Only recently has a wide range of thermal processing times and temperatures been conducted from which to evaluate the impact of high concentrations of lipid quality indices on animal performance (Yuan et al 2020) data which suggest that AnV is one of the most important lipid quality measures to consider relative to animal production This is not surprising however given that Yuan et al (2020) evaluated SO and many of the thermal processing temperatures used were above 90 degC Although SO was only processed at 90 degC for 72 hr in experiments 2 and 3 similar to data reported by Lindblom et al (2018a) Overholt et al (2018) and Kerr et al (2020) an attempt was made to increase the concentrations of AnV and other lipid quality indices in experiments 2 and 3 by increasing air infiltration flow and using smaller bubbles to increase the air-to-oil interaction This did not however appear to have such an effect on lipid quality measures for the thermally processed SO in experiment 1 and experiments 2 and 3 as shown by the generation of lipid peroxidation products reported in Tables 1 and 2 respectively
Oxidative status
In the current experiments plasma PC were measured because in vivo proteins and amino acids can be damaged by oxidation with PC being an indicator of this damage (Beal 2002 Dalle-Donne et al 2003 Likewise endogenous GPx assists in protecting the body from reactive oxygen species and free radicles (Lykkesfeldt and Svendsen 2007 Kalyanaraman 2013 Royer et al 2016) In experiment 1 there was no interaction observed between lipid source and peroxidation status on plasma vitamin E PC or GPx (P ge 016) and there was no lipid source or peroxidation effect on plasma PC or GPx (P ge 016 Table 9) Plasma vitamin E levels were reduced in pigs fed diets containing SO (P = 001) and in pigs fed peroxidized oils (P = 001) In experiment 2 there was no effect of feeding graded levels of peroxidized SO on plasma vitamin E or PC (P ge 052) In experiment 3 feeding pigs 3 peroxidized SO had no effect on plasma vitamin E (P = 073) but resulted in increased serum PC (P = 003) Because there were not consistent effects of feeding peroxidized SO on plasma PC GPx or vitamin E in experiment 1 we elected not to conduct a correlation analysis between dietary PV AnV and unsaturated alkanals with plasma PC GPx or vitamin E
The impact of feeding peroxidized lipids on plasma or serum PC has been variable Boler et al (2012) Overholt et al (2018) Chang et al (2019) and Kerr et al (2020) observed no impact of feeding 10 peroxidized SO on serum PC while Lindblom et al (2018b) and Silva-Guillen et al (2020ab) reported increases in serum PC due to feeding peroxidized lipid Relative to plasma GPx the lack of a peroxidation effect in experiment 1 is consistent with Overholt et al (2018) who reported no effect of feeding peroxidized SO on serum GPx while Yuan et al (2007) Boler et al (2012) and Lindblom et al (2018b) reported decreases in serum GPx due to feeding pigs peroxidized lipids In contrast to the current experiments the impact on serum vitamin E levels is more consistent with Hanson et al (2016) Chang et al (2019)
Figure 2 Relative growth rate of pigs consuming graded levels of dietary PV Adapted from Hung et al (2017) using data obtained from Oldfield et al (1963) DeRouchey
et al (2004) Harrell et al (2010) Boler et al (2012) Liu et al (2014a) Rosero et al (2015) Hanson et al (2016) and van Heugten et al (2016 The relationship between
relative growth rate and dietary PV is represented as ADG = (ndash0043 times PV2) + (0079 times PV) + 985 R2 = 062
Dow
nloaded from httpsacadem
icoupcomjasarticle9812skaa3926029086 by guest on 10 M
arch 2022
Copyedited by AK
10 | Journal of Animal Science 2020 Vol 98 No 12
and Silva-Guillen et al (2020ab) who have reported decreases in serum vitamin E in pigs consuming peroxidized lipids
ATTD of ether extract
If lipids become highly peroxidized polymers are ultimately formed in the termination phase which have been shown to be poorly digested (Gray 1978 Gonzalez-Munoz et al 1998) In experiment 1 there was an interaction between lipid source and peroxidation status on ATTD of EE where the ATTD of EE was reduced in pigs fed PO or SO when peroxidized but not when pigs were fed peroxidized PF or CO (P = 001 Table 9) There was a negative correlation (r = ndash028) between PV or AnV and ATTD of EE (P = 001 Table 6) In experiment 2 the ATTD of EE was reduced (quadratic P = 001) due to feeding increasing levels of peroxidized SO and in experiment 3 the ATTD of EE was also reduced due to feeding pigs 3 peroxidized SO (P = 002) Tables 7 and 8 respectively
Summarizing the data from pigs only fed SO in the current experiments suggests that for each 1-unit increase in dietary AnV the ATTD of EE in the diet would decrease by an average of 1 percentage unit (06 11 and 13 percentage units for experiments 1 2 and 3 respectively) While the data are in contrast to the study by Liu et al (2014c) and Kerr et al (2020) who reported no change in lipid digestibility in pigs fed peroxidized lipids the current data are supported by others (DeRouchey et al 2004 Yuan et al 2007 Rosero et al 2015 Lindblom et al 2018a Overholt et al 2018) who reported a decrease in lipid digestibility due to feeding pigs peroxidized lipids This suggests that at least part of the negative effect in pigs consuming peroxidized lipids is a decrease in lipid and therefore energy digestibility
ConclusionsWhile thermal processing of PO and PF resulted in little impact on the lipidrsquos FA composition or on their PV or AnV concentrations thermally processing of CO and SO altered their FA profile as shown by a decrease in unsaturated FA and a concomitant increase in saturated FA and resulted in increased PV and AnV The changes in the FA composition and increases in PV and AnV were repeatable in the subsequent experiments which used SO as the test lipid Feeding pigs lipids with increased PV and AnV levels resulted in reduced ADG ADFI and GF which when ADG was regressed using AnV as the independent variable resulted in a quadratic reduction in ADG with increasing levels of dietary AnV Similarly apparent total tract digestibility of EE was also quadratically reduced by feeding increasing levels of peroxidized SO such that at least part of the reduction in ADG might be explained by a reduced energy uptake in addition to a reduction in ADFI that was also noted due to consumption of peroxidized lipids The impact of pigs consuming peroxidized lipids on measures of oxidative stress (ie plasma protein carbonyls and vitamin E) was inconsistent across the trials so that delineating a cause and effect relationship between lipid peroxidation and oxidative stress could not be ascertained
Conflict of interest statement The authors declare no real or perceived conflicts of interest
Table 9 Effect of oil source and peroxidation status on plasma vitamin E protein carbonyls glutathione peroxidase activity and apparent total tract EE digestibility of growing pigs fed diets containing 10 unheated or peroxidized lipids experiment 11
Oil Peroxidation2 Vitamin E microgmL Protein carbonyls nmolmL GPx mUmg Hgb ATTD EE
Palm CNT 13 97 358 766b
Palm 90 degC 10 98 313 726c
Poultry CNT 12 88 306 777b
Poultry 90 degC 08 67 340 762b
Canola CNT 13 74 370 769b
Canola 90 degC 08 67 306 768b
Soybean CNT 11 85 296 821a
Soybean 90 degC 03 73 386 716c
Main effect
SEM 01 11 51 11Oil times peroxidation P-value 016 081 041 001
Oil P-value 001 016 099 010Peroxidation P-value 001 025 091 001
Palm 115a 97 336 746b
Poultry 103a 77 323 769a
Canola 103a 71 338 768a
Soybean 070b 79 341 769a
CNT 122 86 332 783 90 degC 074 76 336 743
1Pigs were fed diets containing 10 added lipids for 21 d with an initial and final BW of 61 and 119 kg respectively Data are least square means of 9 replications for each lipid times peroxidation status treatment for the plasma vitamin E data2The control (CNT) oil was not subjected to heat whereas the 90 degC oils were heated for 72 hr with constant air flow (15 Lmin)Superscripts reflect peroxidized SO treatment differences (abc P lt 005)ATTD EE apparent total tract digestibility of EE GPx glutathione peroxidase activity expressed as milliunits (mU) per mg of hemoglobin where mU is defined as the number of nonomoles of NADPH oxidized per minute as outlined in the assay SEM standard error of the mean
Dow
nloaded from httpsacadem
icoupcomjasarticle9812skaa3926029086 by guest on 10 M
arch 2022
Copyedited by AK
Journal of Animal Science 2020 Vol 98 No 12 | 11
Literature CitedAmerican Oil Chemistsrsquo Society (AOCS) 2011 Official methods
and recommended practices of the AOCS 6th ed (2nd printing) Urbana IL
Arnaud J I Fortis S Blachier D Kia and A Favier 1991 Simultaneous determination of retinol alpha-tocopherol and beta-carotene in serum by isocratic high-performance liquid chromatography J Chromatogr 572103ndash116 doi1010160378-4347(91)80476-s
Azain M J 2001 Fat in swine nutrition In A J Lewis and L L Southern editors Swine nutrition Boca Raton CRC Press p 95ndash106
Barriuso B I Astiasaran and D Ansorena 2013 A review of analytical methods measuring lipid oxidation status in foods a challenging task Eur Food Res Technol 2361ndash15 doiorg101007s00217-012-1866-9
Beal F 2002 Serial review oxidatively modified proteins in aging and disease Free Radic Biol Med 32797ndash803 doiorg101016S0891-5849(02)00780-3
Betteridge D J 2000 What is oxidative stress Metabolism 49(Suppl 1)3ndash8 doi101016S0026-0495(00)80077-3
Boler D D D M Fernaacutendez-Duentildeas L W Kutzler J Zhao R J Harrell D R Campion F K McKeith J Killefer and A C Dilger 2012 Effects of oxidized corn oil and synthetic antioxidant blend on animal performance in finishing barrows J Anim Sci 905159ndash5169 doi102527jas2012ndash5266
Chang P L R D Boyd C Zier-Rush D R Rosero and E Van Heugten 2019 Lipid peroxidation impairs growth and viability of nursery pigs reared under commercial conditions J Anim Sci 973379ndash3389 doi 101093jasskz183
Chang L W W S Lo and P Lin 2005 Trans trans-24-decadienal a product found in cooking oil fumes induces cell proliferation and cytokine production due to reactive oxygen species in human bronchial epithelial cells Toxicol Sci 87337ndash343 doi101093toxscikfi258
Choe E and D B Min 2007 Chemistry of deep-fat frying oils J Food Sci 72R77ndashR86 doi101111j1750-3841200700352x
Dalle-Donne I R Rossi D Giustarini A Milzani and R Colombo 2003 Protein carbonyl groups as biomarkers of oxidative stress Clin Chim Acta 32923ndash38 doi101016s0009-8981(03)00003-2
DeRouchey J M J D Hancock R H Hines C A Maloney D J Lee H Cao D W Dean and J S Park 2004 Effects of rancidity and free fatty acids in choice white grease on growth performance and nutrient digestibility in weanling pigs J Anim Sci 822937ndash2944 doi102527200482102937x
Ehr I J B J Kerr and M E Persia 2015 Effects of peroxidized corn oil on performance AMEn and abdominal fat pad weight in broiler chicks Poult Sci 941629ndash1634 doi103382pspev131
Esterbauer H R J Schaur and H Zollner 1991 Chemistry and biochemistry of 4-hydroxynonenal malonaldehyde and related aldehydes Free Radic Biol Med 1181ndash128 doi1010160891-5849(91)90192-6
Finaud J G Lac and E Filaire 2006 Oxidative stress relationship with exercise and training Sports Med 36327ndash358 doi10216500007256-200636040-00004
Gonzalez-Muntildeoz M J S Bastida and F J Sanchez-Muniz 1998 Short-term in vivo digestibility of triglyceride polymers dimers and monomers of thermoxidized palm olein used in deep-frying J Agric Food Chem 465188ndash5193 doiorg101021jf980598i
Gray J I 1978 Measurement of lipid oxidation a review J AOCS 55539ndash546 doiorg101007BF02668066
Guilleacuten-Sans R and M Guzmaacuten-Chozas 1998 The thiobarbituric acid (TBA) reaction in foods a review Crit Rev Food Sci Nutr 38315ndash350 doi10108010408699891274228
Hammond E G and P J White 2011 A brief history of lipid oxidation J Am Oil Chem Soc 88891ndash897 doiorg101007s11746-011-1761-8
Hanson A R P E Urriola L Wang L J Johnston C Chen and G C Shurson 2016 Dietary peroxidized maize oil affects the growth performance and antioxidant status of nursery pigs Anim Feed Sci Technol 216251ndash261 doiorg101016janifeedsci201603027
Harrell R J J Zhao G Reznik D Macaraeg T Wineman J Richards and G Rexnik 2010 Application of a blend of dietary antioxidants in nursery pigs fed either fresh or oxidized corn oil or DDGS J Anim Sci 88 (E-Suppl 3)60 (Abstr)
Herting D C and E E Drury 1963 Vitamin E content of vegetable oils and fats J Nutr 81335ndash342 doi101093jn814335
van Heugten E D R Rosero P L Y C Chang C Zier-Rush and R D Boyd 2016 Peroxidized lipids in nursery pig diets ndashwhy and when should we be concerned In Midwest Swine Nutrition Conference Indianapolis Indiana p 31ndash39
Holman R 1954 Autoxidation of fats and related substances Prog Chem Fats Other Lipids 251ndash98 doiorg1010160079-6832(54)90004-X
Hung Y T A R Hanson G C Shurson and P E Urriola 2017 Peroxidized lipids reduce growth performance of poultry and swine a meta-analysis Anim Sci Feed Technol 23147ndash58 doiorg101016janifeedsci201706013
Hung Y T A R Hanson P E Urriola L J Johnston B J Kerr and G C Shurson 2019 Addition of tert-butylhydroquinone (TBHQ) to maize oil reduces lipid oxidation but does not prevent reductions in serum vitamin E in nursery pigs J Anim Sci Biotechnol 1051 doi101186s40104-019-0362-5
Jardine D M Antolovich P D Prenzler and K Robards 2002 Liquid chromatography-mass spectrometry (LC-MS) investigation of the thiobarbituric acid reactive substances (TBARS) reaction J Agric Food Chem 501720ndash1724 doi101021jf011336a
Kalyanaraman B 2013 Teaching the basics of redox biology to medical and graduate students oxidants antioxidants and disease mechanisms Redox Biol 1244ndash257 doi101016jredox201301014
Kamal-Eldin A 2006 Effect of fatty acids and tocopherols on the oxidative stability of vegetable oils Eur J Lipid Sci Technol 1081051ndash1061 doiorg101002ejlt200600090|
van Kempen T A and S McComas 2002 Infrared spectroscopy as a tool for assessing fat quality J Appl Poult Res 11191ndash201 doiorg101093japr112191
Kerr B J T A Kellner and G C Shurson 2015 Characteristics of lipids and their feeding value in swine diets J Anim Sci Biotechnol 630 doi101186s40104-015-0028-x
Kerr B J S C Lindblom and M F Overholt 2020 Influence of feeding thermally peroxidized soybean oil on growth performance digestibility gut integrity and oxidative stress in nursery pigs J Anim Sci 981ndash11 doi101093jasskaa016
Koller L D P J South J H Exon G A Whitbeck and J Maas 1984 Comparison of selenium levels and glutathione peroxidase activity in bovine whole blood Can J Comp Med 48431ndash433 PMCID PMC1236100
Lin X M Azain and J Odle 2013 Lipids and lipid utilization in swine In L Chiba editor Sustainable swine nutrition Oxford UK Blackwell Publishing p 59ndash79
Lindblom S C N K Gabler E A Bobeck and B J Kerr 2019 Oil source and peroxidation status interactively affect growth performance and oxidative status in broilers from 4 to 25 d of age Poult Sci 981749ndash1761 doi103382pspey547
Lindblom S C N K Gabler R N Dilger Z F Olson C L Loving and B J Kerr 2018b Influence of feeding thermally peroxidized soybean oil on oxidative status in growing pigs J Anim Sci 96545ndash557 doi101093jassky005
Lindblom S C N K Gabler and B J Kerr 2018a Influence of feeding thermally peroxidized soybean oil on growth performance digestibility and gut integrity in growing pigs J Anim Sci 96558ndash569 doi101093jassky004
Dow
nloaded from httpsacadem
icoupcomjasarticle9812skaa3926029086 by guest on 10 M
arch 2022
Copyedited by AK
12 | Journal of Animal Science 2020 Vol 98 No 12
Liu P C Chen B J Kerr T E Weber L J Johnston and G C Shurson 2014a Influence of thermally oxidized vegetable oils and animal fats on growth performance liver gene expression and liver and serum cholesterol and triglycerides in young pigs J Anim Sci 922960ndash2970 doi102527jas2012ndash5709
Liu P B J Kerr C Chen T E Weber L J Johnston and G C Shurson 2014b Methods to create thermally oxidized lipids and comparison of analytical procedures to characterize peroxidation J Anim Sci 922950ndash2959 doi102527jas2012-5708
Liu P B J Kerr C Chen T E Weber L J Johnston and G C Shurson 2014c Influence of thermally oxidized vegetable oils and animal fats on energy and nutrient digestibility in young pigs J Anim Sci 922980ndash2986 doi102527jas2012-5711
Lundberg W O and P Jarvi 1971 Peroxidation of polyunsaturated fatty compounds Prog Chem Fats Lipids 9377ndash406 doiorg1010160079-6832(71)90032-2
Luthria D D Vinjamoori K Noel and J Ezzell 2004 Accelerated solvent extraction In D L Luthria editors Oil extraction and analysis critical issues and comparative studies Champaign IL AOCS Press p 25ndash38
Lykkesfeldt J and O Svendsen 2007 Oxidants and antioxidants in disease oxidative stress in farm animals Vet J 173502ndash511 doi101016jtvjl200606005
Meadus W J P Duff B Uttaro J L Aalhus D C Rolland L L Gibson and M E Dugan 2010 Production of docosahexaenoic acid (DHA) enriched bacon J Agric Food Chem 58465ndash472 doi101021jf9028078
Myers W D P A Ludden V Nayigihugu and B W Hess 2004 Technical note a procedure for the preparation and quantitative analysis of samples for titanium dioxide J Anim Sci 82179ndash183 doi1025272004821179x
NRC 2012 Nutrient requirements of swine 11th rev ed Washington DC National Academies Press
Nuchi C F Guardiola R Bou P Bondloli L Bella and R Della Codony 2009 Assessment of the levels of degradation in fat co-and byproducts for feed uses and their relationships with some lipid composition parameters J Agric Food Chem 571952ndash1959 doiorg101021jf803369h
OrsquoBrien R D 2009 Fats and oils formulating and processing for application Boca Raton FL CRC Press
Oldfield J E R O Sinnhuber and A A Rasheed 1963 Nutritive value of marine oils II Effects of in vivo antioxidants in feeding menhaden oil to swine J Am Oil Chem Soc 40357ndash360 doiorg101007BF02631558
Overholt M F A C Dilger D D Boler and B J Kerr 2018 Influence of feeding thermally peroxidized soybean oil on growth performance digestibility and gut integrity in finishing pigs J Anim Sci 962789ndash2803 doi101093jassky091
Paglia D E and W N Valentine 1967 Studies on the quantitative and qualitative characterization of erythrocyte glutathione peroxidase J Lab Clin Med 70158ndash169 PMID 6066618
Pettigrew J E and R L Moser 1991 Fat in swine nutrition In Miller E R D E Ullery and A J Lewis editors Swine nutrition Butterworth-Heinemann Stoneham MA p 133ndash145
R Core Team 2019 R a language and environment for statistical computing Vienna Austria R Foundation for Statistical Computing httpswwwR-projectorg
Rosero D S J Odle A J Moeser R D Boyd and E van Heugten 2015 Peroxidised dietary lipids impair intestinal function and morphology of the small intestine villi of nursery pigs
in a dose-dependent manner Br J Nutr 1141985ndash1992 doi101017S000711451500392X
Royer E F Barbeacute D Guillou Y Rousseliegravere and E Chevaux 2016 Development of oxidative stress model in weaned pigs highlighting plasma biomarkersrsquo specificity to stress inducers J Anim Sci 9448ndash53 doi102527jas2015-9857
Schaich K M 2005 Lipid oxidation theoretical aspects In Baileyrsquos industrial oil and fat products Edible oil and fat products chemistry properties and health effects Vol 1 Hoboken NJ John Wiley and Sons p 269ndash355
Seppanen C M and A S Csallany 2002 Formation of 4-hydroxynonenal a toxic aldehyde in soybean oil at frying temperature J Am Oil Chem Soc 791033ndash1038 doiorg101007s11746-002-0598-z|
Seppanen C M Q Song and A S Csallany 2010 The antioxidant functions of tocopherol and tocotrienol homologues in oils fats and food systems J Am Oil Chem Soc 87469ndash481 doi101007s11746-009-1526-9
Shahidi F and Y Zhong 2005 Lipid oxidation measurement methods In F Shahidi and Y Zhong editors Baileyrsquos industrial oil and fat products New Jersey John Wiley amp Sons p 357ndash385
Shurson G C B J Kerr and A R Hanson 2015 Evaluating the quality of feed fats and oils and their effects on pig growth performance J Anim Sci Biotechnol 610 doi101186s40104-015-0005-4
Sies H W Stahl and A R Sundquist 1992 Antioxidant functions of vitamins Ann N Y Acad Sci 6697ndash20 doiorg101111j1749ndash66321992tb17085x
Silva-Guillen Y V C Arellano R D Boyd G Martinez and E van Heugten 2020a Growth performance oxidative stress and immune status of newly weaned pigs fed peroxidized lipids with or without supplemental vitamin E or polyphenols J Anim Sci Biotechnol 1122 doi101186s40104-020-0431-9
Silva-Guillen Y C Arellano G Martinez and E van Heugten 2020b Growth performance oxidative stress and antioxidant capacity of newly weaned piglets fed dietary peroxidized lipids with vitamin E or phytogenic compounds in drinking water App Anim Sci 36341ndash351 doiorg1015232aas2019-01976
Wang L A S Csallany B J Kerr G C Shurson and C Chen 2016 Kinetics of forming aldehydes in frying oils and their distribution in French fries revealed by LC-MS-based chemometrics J Agric Food Chem 643881ndash3889 doi101021acsjafc6b01127
Wanasundara P K J P D and F Shahidi 2005 Antioxidants science technology and applications In F Shahidi editor Baileyrsquos industrial oil and fat products 6th ed Vol 1 Hoboken NJ John Wiley amp Sons p 431ndash489 doiorg101002047167849Xbio002
Winkler-Moser J K H S Hwang and B J Kerr 2020 Changes in markers of lipid oxidation and thermal treatment in feed-grade fats and oils J Sci Food Agric 1003328ndash3340 doi101002jsfa10364
Yin H L Xu and N A Porter 2011 Free radical lipid peroxidation mechanism and analysis Chem Rev 1115944ndash5972 doi101021cr200084z
Yuan S B D W Chen K Y Zhang and B Yu 2007 Effects of oxidative stress on growth performance nutrient digestibilities and activities of antioxidative enzymes of weanling pigs Asian-Aust J Anim Sci 201600ndash1605 doi105713ajas20071600
Yuan J B J Kerr S M Curry and C Chen 2020 Identification of C9-C11 unsaturated aldehydes as prediction markers of growth and feed intake for non-ruminant animals fed oxidized soybean J Anim Sci Biotech 11 (49)1ndash14 doiorg101186s40104-020-00451-4
Dow
nloaded from httpsacadem
icoupcomjasarticle9812skaa3926029086 by guest on 10 M
arch 2022
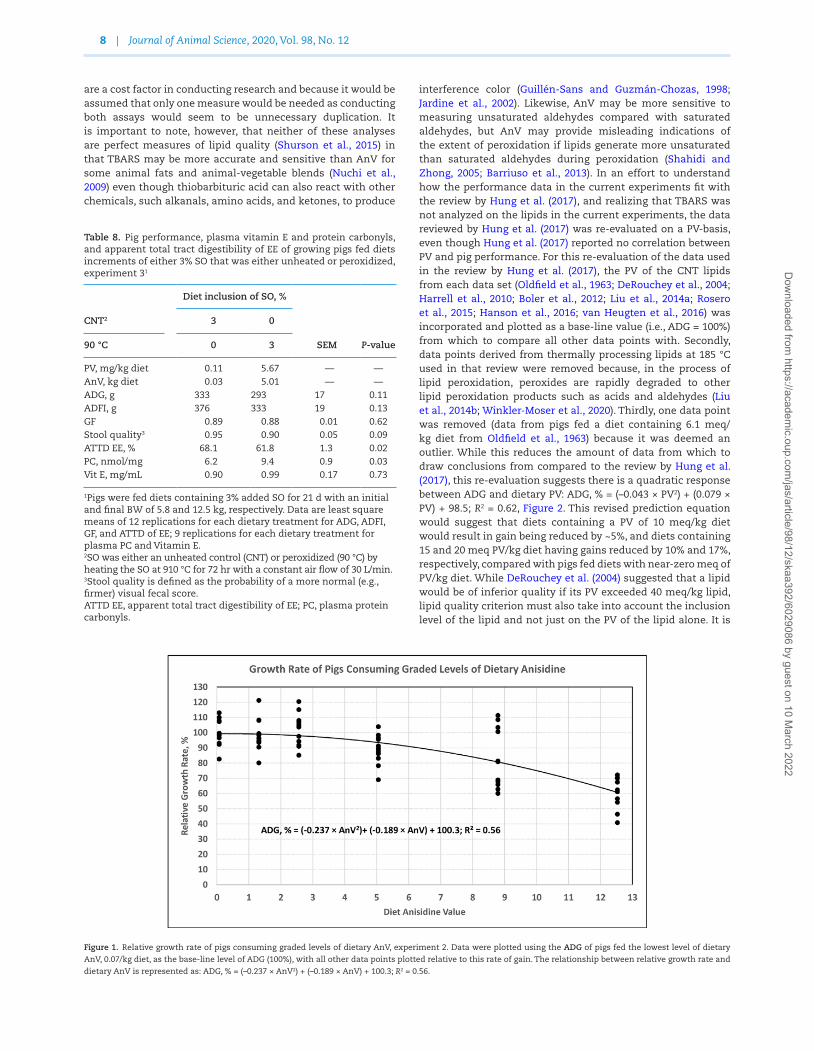
Copyedited by AK
12 | Journal of Animal Science 2020 Vol 98 No 12
Liu P C Chen B J Kerr T E Weber L J Johnston and G C Shurson 2014a Influence of thermally oxidized vegetable oils and animal fats on growth performance liver gene expression and liver and serum cholesterol and triglycerides in young pigs J Anim Sci 922960ndash2970 doi102527jas2012ndash5709
Liu P B J Kerr C Chen T E Weber L J Johnston and G C Shurson 2014b Methods to create thermally oxidized lipids and comparison of analytical procedures to characterize peroxidation J Anim Sci 922950ndash2959 doi102527jas2012-5708
Liu P B J Kerr C Chen T E Weber L J Johnston and G C Shurson 2014c Influence of thermally oxidized vegetable oils and animal fats on energy and nutrient digestibility in young pigs J Anim Sci 922980ndash2986 doi102527jas2012-5711
Lundberg W O and P Jarvi 1971 Peroxidation of polyunsaturated fatty compounds Prog Chem Fats Lipids 9377ndash406 doiorg1010160079-6832(71)90032-2
Luthria D D Vinjamoori K Noel and J Ezzell 2004 Accelerated solvent extraction In D L Luthria editors Oil extraction and analysis critical issues and comparative studies Champaign IL AOCS Press p 25ndash38
Lykkesfeldt J and O Svendsen 2007 Oxidants and antioxidants in disease oxidative stress in farm animals Vet J 173502ndash511 doi101016jtvjl200606005
Meadus W J P Duff B Uttaro J L Aalhus D C Rolland L L Gibson and M E Dugan 2010 Production of docosahexaenoic acid (DHA) enriched bacon J Agric Food Chem 58465ndash472 doi101021jf9028078
Myers W D P A Ludden V Nayigihugu and B W Hess 2004 Technical note a procedure for the preparation and quantitative analysis of samples for titanium dioxide J Anim Sci 82179ndash183 doi1025272004821179x
NRC 2012 Nutrient requirements of swine 11th rev ed Washington DC National Academies Press
Nuchi C F Guardiola R Bou P Bondloli L Bella and R Della Codony 2009 Assessment of the levels of degradation in fat co-and byproducts for feed uses and their relationships with some lipid composition parameters J Agric Food Chem 571952ndash1959 doiorg101021jf803369h
OrsquoBrien R D 2009 Fats and oils formulating and processing for application Boca Raton FL CRC Press
Oldfield J E R O Sinnhuber and A A Rasheed 1963 Nutritive value of marine oils II Effects of in vivo antioxidants in feeding menhaden oil to swine J Am Oil Chem Soc 40357ndash360 doiorg101007BF02631558
Overholt M F A C Dilger D D Boler and B J Kerr 2018 Influence of feeding thermally peroxidized soybean oil on growth performance digestibility and gut integrity in finishing pigs J Anim Sci 962789ndash2803 doi101093jassky091
Paglia D E and W N Valentine 1967 Studies on the quantitative and qualitative characterization of erythrocyte glutathione peroxidase J Lab Clin Med 70158ndash169 PMID 6066618
Pettigrew J E and R L Moser 1991 Fat in swine nutrition In Miller E R D E Ullery and A J Lewis editors Swine nutrition Butterworth-Heinemann Stoneham MA p 133ndash145
R Core Team 2019 R a language and environment for statistical computing Vienna Austria R Foundation for Statistical Computing httpswwwR-projectorg
Rosero D S J Odle A J Moeser R D Boyd and E van Heugten 2015 Peroxidised dietary lipids impair intestinal function and morphology of the small intestine villi of nursery pigs
in a dose-dependent manner Br J Nutr 1141985ndash1992 doi101017S000711451500392X
Royer E F Barbeacute D Guillou Y Rousseliegravere and E Chevaux 2016 Development of oxidative stress model in weaned pigs highlighting plasma biomarkersrsquo specificity to stress inducers J Anim Sci 9448ndash53 doi102527jas2015-9857
Schaich K M 2005 Lipid oxidation theoretical aspects In Baileyrsquos industrial oil and fat products Edible oil and fat products chemistry properties and health effects Vol 1 Hoboken NJ John Wiley and Sons p 269ndash355
Seppanen C M and A S Csallany 2002 Formation of 4-hydroxynonenal a toxic aldehyde in soybean oil at frying temperature J Am Oil Chem Soc 791033ndash1038 doiorg101007s11746-002-0598-z|
Seppanen C M Q Song and A S Csallany 2010 The antioxidant functions of tocopherol and tocotrienol homologues in oils fats and food systems J Am Oil Chem Soc 87469ndash481 doi101007s11746-009-1526-9
Shahidi F and Y Zhong 2005 Lipid oxidation measurement methods In F Shahidi and Y Zhong editors Baileyrsquos industrial oil and fat products New Jersey John Wiley amp Sons p 357ndash385
Shurson G C B J Kerr and A R Hanson 2015 Evaluating the quality of feed fats and oils and their effects on pig growth performance J Anim Sci Biotechnol 610 doi101186s40104-015-0005-4
Sies H W Stahl and A R Sundquist 1992 Antioxidant functions of vitamins Ann N Y Acad Sci 6697ndash20 doiorg101111j1749ndash66321992tb17085x
Silva-Guillen Y V C Arellano R D Boyd G Martinez and E van Heugten 2020a Growth performance oxidative stress and immune status of newly weaned pigs fed peroxidized lipids with or without supplemental vitamin E or polyphenols J Anim Sci Biotechnol 1122 doi101186s40104-020-0431-9
Silva-Guillen Y C Arellano G Martinez and E van Heugten 2020b Growth performance oxidative stress and antioxidant capacity of newly weaned piglets fed dietary peroxidized lipids with vitamin E or phytogenic compounds in drinking water App Anim Sci 36341ndash351 doiorg1015232aas2019-01976
Wang L A S Csallany B J Kerr G C Shurson and C Chen 2016 Kinetics of forming aldehydes in frying oils and their distribution in French fries revealed by LC-MS-based chemometrics J Agric Food Chem 643881ndash3889 doi101021acsjafc6b01127
Wanasundara P K J P D and F Shahidi 2005 Antioxidants science technology and applications In F Shahidi editor Baileyrsquos industrial oil and fat products 6th ed Vol 1 Hoboken NJ John Wiley amp Sons p 431ndash489 doiorg101002047167849Xbio002
Winkler-Moser J K H S Hwang and B J Kerr 2020 Changes in markers of lipid oxidation and thermal treatment in feed-grade fats and oils J Sci Food Agric 1003328ndash3340 doi101002jsfa10364
Yin H L Xu and N A Porter 2011 Free radical lipid peroxidation mechanism and analysis Chem Rev 1115944ndash5972 doi101021cr200084z
Yuan S B D W Chen K Y Zhang and B Yu 2007 Effects of oxidative stress on growth performance nutrient digestibilities and activities of antioxidative enzymes of weanling pigs Asian-Aust J Anim Sci 201600ndash1605 doi105713ajas20071600
Yuan J B J Kerr S M Curry and C Chen 2020 Identification of C9-C11 unsaturated aldehydes as prediction markers of growth and feed intake for non-ruminant animals fed oxidized soybean J Anim Sci Biotech 11 (49)1ndash14 doiorg101186s40104-020-00451-4
Dow
nloaded from httpsacadem
icoupcomjasarticle9812skaa3926029086 by guest on 10 M
arch 2022