Blood lipids in middle-aged British men
9
Br Heart J 1983; 49: 205-13 Blood lipids in middle-aged British men D S THELLE,* A G SHAPER, T P WHITEHEAD, D G BULLOCK, DEBORAH ASHBY, ILA PATEL From the Departments of Clinical Epidemiology and General Practice, Royal Free Hospital School of Medicine, London, and the Department of Clinical Chemistry, Wolfson Research Laboratories, Queen Elizabeth Medical Centre, Birmningham SUMMARY The concentrations of serum total cholesterol, high density lipoprotein-cholesterol, and triglycerides have been measured in 7735 men aged 40 to 59 years who were drawn from general practices in 24 towns in England, Wales, and Scotland. The distribution of these blood lipids, their interrelations and- their association with age, social class, body mass index, cigarette smoking, alcohol intake, and physical activity at work have been examined. Body mass index emerges as the factor most strongly associated with these three blood lipids. Serum total cholesterol increased with increasing body mass index until about 28 kg/M2 but thereafter showed no further rise. The relation between body mass index and high density lipoprotein-cholesterol was negative and linear; that between body mass index and triglycerides was positive and linear. The inverse relation between high density lipoprotein-cholesterol and triglycerides was independent of the fact that both were related to body mass index. Alcohol intake was associated with increased high density lipoprotein- cholesterol concentrations and cigarette smoking with lowered high density lipoprotein concentra- tions; the association with alcohol appeared to be dominant. No significant trends with age were observed for the three blood lipids. In this population, body mass index is closely associated with the concentration of blood lipids but its effects are probably indirect and mediated by a complex of dietary and other factors. The Regional Heart Study seeks to explain the strik- ing geographical variations in cardiovascular mortality in Great Britain and to define risk factors for car- diovascular disease. The study includes a clinical sur- vey of middle-aged men drawn from general practices in 24 towns in Engand, Wales, and Scotland, and this paper describes the distribution, determinants, and interrelations of serum lipids in these men. There is a strong relation between serum lipids and the development of atherosclerosis and coronary heart disease, and both total cholesterol and high density lipoprotein-cholesterol have been firmly established as risk indicators in individuals and in communities.1 2 In the Regional Heart Study, the.contribution made by the various serum lipids to the risk of coronary heart disease will be determined in relation to both the prevalence of coronary heart disease at the initial *Present address: Institute of Communuity Medicine, University of Tromso, N-9010 Asard sykehus, Norway. Accepted for publication 30 November 1982 screening and to the incidence in the following years. In this descriptive study, however, we are primarily concerned with the overall patterns of serum lipids and their interrelations, and with an exanination of the factors affecting these levels in individuals. Subjects and methods The Regional Heart Study includes 7735 men aged 40 to 59 randomly selected from the age-sex registers of representative general practices in 24 towns. The criteria for selecting the towns, the general practices, and the subjects as well as the methods of data collec- tion have been presented in a separate report.3 In brief, the 24 towns were primarily selected from those with populations of 50 000 to 100 000 (1971 census). They were chosen to represent the full range of cardiovascular disease mortality and included towns in all major standard regions. The general prac- tice selected in each town was required to have a social class distribution that reflected the social class dis- tribution of the men of that town. Trained research 205
Transcript of Blood lipids in middle-aged British men

Br Heart J 1983; 49: 205-13
Blood lipids in middle-aged British men
D S THELLE,* A G SHAPER, T P WHITEHEAD, D G BULLOCK, DEBORAH ASHBY,ILA PATEL
From the Departments of Clinical Epidemiology and General Practice, Royal Free Hospital School ofMedicine,London, and the Department ofClinical Chemistry, Wolfson Research Laboratories, Queen Elizabeth MedicalCentre, Birmningham
SUMMARY The concentrations of serum total cholesterol, high density lipoprotein-cholesterol, andtriglycerides have been measured in 7735 men aged 40 to 59 years who were drawn from generalpractices in 24 towns in England, Wales, and Scotland. The distribution of these blood lipids, theirinterrelations and- their association with age, social class, body mass index, cigarette smoking,alcohol intake, and physical activity at work have been examined. Body mass index emerges as thefactor most strongly associated with these three blood lipids. Serum total cholesterol increased withincreasing body mass index until about 28 kg/M2 but thereafter showed no further rise. The relationbetween body mass index and high density lipoprotein-cholesterol was negative and linear; thatbetween body mass index and triglycerides was positive and linear. The inverse relation betweenhigh density lipoprotein-cholesterol and triglycerides was independent of the fact that both were
related to body mass index. Alcohol intake was associated with increased high density lipoprotein-cholesterol concentrations and cigarette smoking with lowered high density lipoprotein concentra-tions; the association with alcohol appeared to be dominant. No significant trends with age were
observed for the three blood lipids. In this population, body mass index is closely associated with theconcentration of blood lipids but its effects are probably indirect and mediated by a complex ofdietary and other factors.
The Regional Heart Study seeks to explain the strik-ing geographical variations in cardiovascular mortalityin Great Britain and to define risk factors for car-diovascular disease. The study includes a clinical sur-vey of middle-aged men drawn from general practicesin 24 towns in Engand, Wales, and Scotland, and thispaper describes the distribution, determinants, andinterrelations of serum lipids in these men.There is a strong relation between serum lipids and
the development of atherosclerosis and coronary heartdisease, and both total cholesterol and high densitylipoprotein-cholesterol have been firmly established asrisk indicators in individuals and in communities.1 2In the Regional Heart Study, the.contribution madeby the various serum lipids to the risk of coronaryheart disease will be determined in relation to both theprevalence of coronary heart disease at the initial
*Present address: Institute of Communuity Medicine, University of Tromso,N-9010 Asard sykehus, Norway.
Accepted for publication 30 November 1982
screening and to the incidence in the following years.In this descriptive study, however, we are primarilyconcerned with the overall patterns of serum lipidsand their interrelations, and with an exanination ofthe factors affecting these levels in individuals.
Subjects and methods
The Regional Heart Study includes 7735 men aged 40to 59 randomly selected from the age-sex registers ofrepresentative general practices in 24 towns. Thecriteria for selecting the towns, the general practices,and the subjects as well as the methods of data collec-tion have been presented in a separate report.3
In brief, the 24 towns were primarily selected fromthose with populations of 50 000 to 100 000 (1971census). They were chosen to represent the full rangeof cardiovascular disease mortality and includedtowns in all major standard regions. The general prac-tice selected in each town was required to have a socialclass distribution that reflected the social class dis-tribution of the men of that town. Trained research
205

206Thelle, Shaper, Whitehead, Bullock, Ashby, Patel
nurses administered'to each man an extensive stan-dard questionnaire which included questions onsmoking habits, alcohol consumption, and occupa-tional history. Body mass index was defined asweight/height2. Smoking habits were recorded as fol-lows: never smoked, ex-cigarette smoker, pipe/cigaronly, pipe/cigar smokers who were ex-cigarette smok-ers, and current cigarette smokers at four levels (I to19, 20, 21 to 39, ¢40/day). Alcohol consumption wasrecorded using questions on frequency, quantity, andtype similar to those used in the General HouseholdSurvey. Eight drinking categories were used: non-drinkers, drinking on special occasions or 1 to 2 permonth, drinking at weekends (1 to 2, 3 to 6, or >6drinks per day), and drinking daily or on most days (1to 2, 3 to 6, or >6 drinks per day). A "drink" wasdefined as half a pint of beer, a glass of wine, or a totof spirits. Those men drinking more than six drinks atweekends or daily will be referred to as weekend ordaily heavy drinkers. To determine social class thelongest held occupation of each man was coded andthe men were then classified within one of the sixsocial classes of the Office of Population Censuses andSurveys.4 Each man's information on occupation wasused to assess his physical activity at work, employinga simple three-category system.5
All the blood samples were obtained in the non-fasting state between 0830 and 1830 hours. Noadjustments have been made for the diurnal variationsin serum triglyceride and high density lipoprotein-cholesterol (HDL-cholesterol) concentrations; theimplications of this will be discussed in the presenta-tion of the findings. The estimations of serum totalcholesterol and high density lipoprotein cholesterolwere carried out in the Wolfson ResearchLaboratories, Birmingham. Serum total cholesterolwas measured by a modified Liebermann-Burchardmethod on a Technicon SMA 12/60 analyser. Highdensity lipoprotein cholesterol was measured by theLiebermann-Burchard or enzymic procedures afterprecipitation with magnesium/phosphotungstate.6The triglyceride estimations were carried out at theRoyal Free Hospital School of Medicine using anenzymic method (Abbott Laboratories A-Gent tri-glycerides test).7 Triglyceride estimations were intro-duced after the survey had been completed in sixtowns and results are therefore available for 5675 menfrom the last 18 towns.
In some groups the totals for the three lipids differbecause of missing data. The correlation coefficientsshown are significant at the 0-1% level, unless someother level is indicated. In the description of the rela-tion between body mass index and each of the lipidvariables, the subjects have been ranked in order ofincreasing body mass index and divided into 20groups of equal size.
1600-
1400.
1200-
1000-
N800600-
400-
200-0-
1800
1600
1400
1200
N1000800
600
400
200
0
2 3 4 5 6 7 8 9 10 11Total cholesterol (mmol/l)
r0 03 0 6 09 12 15 18 21 24 27HDL-C (mmol/l)
800
700
600
500
N 400300-
200
100 A
0-16 -08 0Log triglycerides
08 . 16.. ,24
0.8 1-6 2-4
I .-U I I . .
05 1 2 3 4 56 8 1012Triglycerides ( mmol/l )
Fig. 1 The distribution oftotal cholesterol (7690), high densitylipoprotein-cholesterol (7419), and log triglycerides (5675) in-British men aged 40 to 59years.
206
I

Blood lipids in middle-aged British men
Results
The distributions of the three lipid variables areshown in Fig. 1. Total cholesterol showed a normaldistribution with a mean value of 6-30 mmol/l (242mg/dl). Of the men, 100/o had total cholesterol levelsabove 7*7 mmol/l (296 mg/dl). The distribution ofHDL-cholesterol was slightly skewed to the right andthat of triglycerides was very skewed to the right,which is reflected in the high standard deviation inrelation to the mean (Table 1). In the statisticalanalysis we have therefore used logarithmic transfor-
mations of HDL-cholesterol and triglycerides but inTables 1 and 2 the arithmetic means are presented.The mean HDL-cholesterol level was 1 15 mmol/l (44mg/dl) and 10% of the men had HDL-cholesterollevels below 0-85 mmolfl (33 mg/dl). The medianvalue of the triglycerides was 1*71 mmol/l and 10% ofthe men had triglyceride levels above 3-65 mmol/l.
CORRELATIONTotal cholesterol and log triglycerides were positively
correlated r=+O037.Log HDL-cholesterol was inversely correlated with
Table 1 Mean total cholesterol, high density lipoprotein-cholesterol, and tiglycerides in men aged 40 to 59years accordingto age, body mass index, and other variables
No. Total cholesterol High density Triglycerides(mmol/l) lipoprotein-cholesterol (mmolll)
(mmol/l)
Age (y)40 to 4445 to 4950 to 5555 to 59
Body mass index (kgn'2)<22-522-5-24-526-5-
328.5
Akohol consumptionNoneOccasionallyWeekendI to 2 drinks3 to 6 drinks>6 drinksDailyI to 2 drinks3 to 6 drinks>6 drinks
Cigarette smokingNeverEx-cigPipe/cigEx-cig/pipe/cigarCig: <20
2021-39
340
Phsial activity at workLowMediumHigh
Social class
IIIII non-manualIII manualIVVArmed service
MeanStandard deviation
1-161-141-141-16
2-052-102-052-01
1838 6-261898 6-331974 6-312025 6-30
1255 5-931766 6-222047 6-371421 6-461243 6-48
466 - 6-211845 6-27
725 6-291234 6-301095 6-30
585 6-34947 6-39832 6-27
1-261-181-141-101-06
1-061-08
1-121-131-17
1-191-221-26
162421081956071188835846316
6-256-376-236-276-286-266-296-33
1-181-171-151-131-121-121-141-11
1-471-862-072-332-55
2-052-01
1-932-042-14
1-962-022-21
1-922-062-002-192-112-042-022-18
2-062-042-03
1-912-012-102-111-981-962-12
2-051-34
3899 6-352727 6-26777 6-15
64
7;
33;
312:-
06 6-3735 6-4120 6-3926 6-2484 6-2118 6-1831 6-41
6-301-25
1-141.151-17
1-181-151-131-141-161-161-13
1-150-26
207

8Thelle, Shaper, Whitehead, Bullock, Ashby, Patel
log triglycerides r= -0.48.Log HDL-cholesterol and total cholesterol were not
correlated r= -0-03.
PARTIAL CORRELATIONAll the three lipid variables were related to bodyweight and more specifically to body mass index. Inorder to assess to what extent the relation with bodymass index could account for the interrelation of thethree lipids, the simple correlation coefficients wereagain calculated after the effect of body mass indexhad been removed for each variable. These partialcorrelation coefficients, which were based on theresiduals of the variables after controlling for bodymass index were:Total cholesterol and log triglycerides r= +0 34.Log HDL-cholesterol and log triglycerides r= -0-44.Log HDL-cholesterol and total cholesterolr= +0-002.
All these coefficients are slightly lower than the simplecorrelation coefficients but remain of the same orderof magnitude, indicating that body mass index is onlyto a very small extent a determinant of the interrela-tion between these lipids.
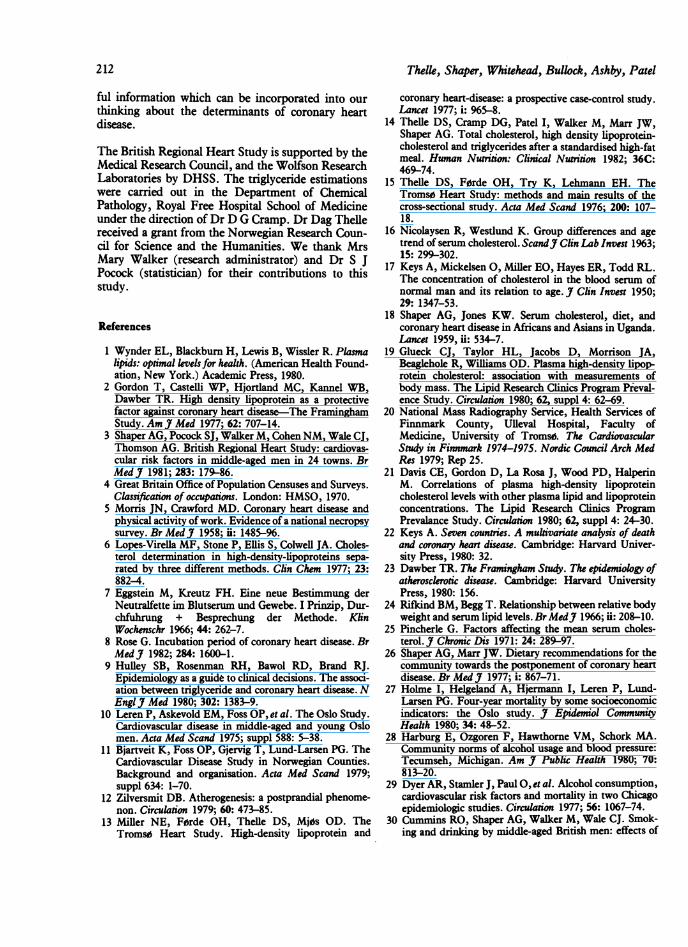
TOTAL CHOLESTEROL (Table 1 and Fig. 2)There was a positive relation between body massindex and total cholesterol concentration (r= +0* 17).While total cholesterol concentration increased mod-erately as body mass index increased, it only did so upto a body mass index of 28 kg/M2. Beyond this there
6.6 -
6.2
5.8
EE
2.61
2.2.
1.8.
1.4
1.0
Total Cholesterol
was no further increase in mean total cholesterol con-centration. About 20% of the men had a body massindex above this level, which corresponds to a man of1.76 m and 87 kg (5' 9' and 13 stone 9 lb).Men in the non-manual social classes (I, II, III nm)
had higher mean total cholesterol levels than men inthe manual classes (III m, IV, and V); the overalldifference was 0-17 mmoVl (p<0.0001). The differ-ence persisted even after adjustment for age, bodymass index, and physical activity at work. This lastvariable was included in the analysis of covariance asthere was a consistent downward trend in mean totalcholesterol with increasing physical activity at work(p<0-0001). Cigarette smoking appeared to have littleeffect on total cholesterol though ex-smokers had thehighest mean level. As this effect could have been aresult of their increased body mass index, an adjust-ment was made for the effect of body mass index, aswell as for social class and physical activity at work.This brought the ex-smokers' mean total cholesteroldown to the same adjusted level as the current smok-ers, and the main contribution to this adjustmentcame from the body mass index. The average increasein total cholesterol which can be ascribed to increasedbody mass index in ex-smokers is only about 0-04mmol/l. Age and alcohol consumption had noinfluence on the total cholesterol level.
HDL-CHOLESTEROL (Table 1 and Fig. 2)There was an inverse relation between HDL-cholesterol and body mass index (r=-0.25), with a16% decrease from the lowest to the highest of the fivebody mass index groups. There was a positive relationbetween alcohol consumption and HDL-cholesterolwhich was dose related in both weekend and dailydrinkers (Fig. 3). The mean levels of all the dailydrinking groups were higher than those of theweekend drinking groups. The greatest increase was
1.322
- 1.24-E
y 1.16.0
1.08.
Triglycerides
HDL-Cholesterol1.00
18 22 26 30 34
Body Mass Index (kglm2)
Fig. 2 The relation between body mass index (weightlheight2)and total cholesterol, high density lipoprotein-choksterol, andtriglycerides (all in mmolll).
0a
a Adjustedo Unadjusted
I'p
I
Ip
None Occ. 1-2 3-6 >6 1-2 3-6 >6Weekend Daily
Alcohol consumption (no. of drinks)
Fig. 3 High density lipoprotein-cholesterol and akoholconsumption adjusted and unadjusted for body mass index,cigarette smoking, and age.
208

Blood lipids in middle-aged British men
seen in the daily heavy drinkers, who were 16%higher (0-19 mmol/1) than occasional drinkers. Withinthe smoking categories, men who had never smokedor who were ex-smokers (that is, men not currentlysmoking at all) had the highest HDL-cholesterollevels. There was no clear relation with HDL-cholesterol within the cigarette smoking categoriesthough the lowest HDL-cholesterol level (1 11 mmolV1) was observed in those smoking more than 40cigarettes a day. There was no social class patternobserved for HDL-cholesterol, no relation with age,and only a very slight trend (p=0.06) towards higherconcentration in men with the higher levels of physi-cal activity at work.
HDL-CHOLESTEROL, SMOKING, AND ALCOHOLIn order to examine further the relation betweenalcohol, smoking, and HDL-cholesterol, the HDL-cholesterol levels in the eight smoking groups weretabulated against the eight drinking groups. Selectedmeans from this cross-tabulation are presented (Table2). The lowest concentrations of HDL-cholesterol areseen in those who drink occasionally or not at all.Within this group, cigarette smoking is associatedwith a lower mean HDL-cholesterol concentrationthan in those who have never smoked. In the neversmoked group, heavy drinking on weekends or on adaily basis is associated with raised concentrations ofHDL-cholesterol. In weekend heavy drinkers, theaddition of cigarette smoking appears to inhibit thisincrease to a significant extent, whereas in daily heavydrinkers, the considerable increase in HDL-cholesterol concentration is not affected by concur-rent cigarette smoking. Thus, alcohol and smokinghave opposing effects on HDL-cholesterol, with theeffect of alcohol apparently being the overridingdeterminant.A further exploration of the relation between
HDL-cholesterol and alcohol intake was made, usinganalysis of covariance to adjust for the effects of smok-ing, body mass index, and age (Fig. 3). This adjust-ment produced a more conspicuous dose-responserelation than initially observed in Table 1, principallybecause heavier drinkers have a higher body massindex. Similar analyses were performed to examine
Table 2 Mean high density lipoprotein-cholesterol (mmolll) byakohol consumption and smoking habits (number ofmenin parentheses)
Akohol None and Weekend >6 Daily >6consumption occasional dnrnks drinks
Smoking habitsNever smoked 1-12 (566) 1-22 (148) 1-25 ( 86)Current cigarette 1-03 (867) 1-14 (561) 1-28 (448)smoker
209
the relation between HDL-cholesterol and body massindex, adjusting for age, smoking, and alcohol intakeand also the relation between HDL-cholesterol andsmoking, adjusting for age, body mass index, andalcohol intake. The effect of these adjustments was tosuggest that the HDL-cholesterol relation with bodymass index is virtually independent of age, smoking,and alcohol intake. After adjusting for age, body massindex, and alcohol consumption, the HDL-cholesterol level in the non-smokers was increased,whereas it decreased in the current smokers, reflect-ing the positive relation between smoking and drink-ing habits.
TRIGLYCERIDESThere was a progressive and considerable increase inthe triglyceride concentration with increasing bodymass index, with a 73% increase from the lowest tothe highest of the five body mass index groups inTable 1. The relation appeared linear (r= +0-25, Fig.2). Triglyceride concentrations were associated withalcohol consumption, but not conspicuously (Table1). Only those taking more than six drinks a day,either at weekends or daily, had higher mean concent-rations than the occasional drinkers (p<0.05). Age,cigarette smoking, social class, and physical activity atwork showed no significant relation with tri-glycerides.
Discussion
The mean levels and distribution of the blood lipidsvary widely between populations and, for some of theblood lipids, these inter-population differences appearto reflect the population differences in coronary heartdisease mortality. 1 8 Strong positive associations havebeen found between total cholesterol concentrationsand the incidence of coronary heart disease, whereasthe association with HDL-cholesterol concentration isstrongly negative.2 These associations appear to beindependent of other risk factors for coronary heartdisease. There is uncertainty regarding the indepen-dence of the association between triglyceride concen-trations and coronary heart disease incidence.9 Mostof this information is derived from studies in theUnited States and there is little epidemiologicalinformation on blood lipids, their interrelations, andtheir associations with other variables for Britishpopulations. In an earlier paper we explored the ques-tion of inter-town comparisons of mean blood lipidconcentrations and standardised mortality ratios.3The Regional Heart Study provides background mat-erial for the overall coronary risk pattern in a randomsample of middle-aged British men. The mean totalcholesterol level in the men in this study is compar-able with that observed in other populations with a

Thelle, Shaper, Whitehead, Bullock, Ashby, Patel
high incidence of coronary heart disease, and is higherthan the mean level currently observed in the UnitedStates.I The mean HDL-cholesterol concentration isabout the same as that observed in United Statespopulations, resulting in a low mean HDL-cholesterol/total cholesterol ratio, also suggesting ahigh risk for coronary heart disease.' 2 These com-parisons between various studies make no allowancefor differences between methods or possible secularchanges and should be regarded with caution.The use of non-fasting blood samples to assess the
lipid concentrations must necessarily introduce anadditional source of variation, that is the influence ofrecent food intake. The decision to use such samplesin population surveys is based on feasibility and hasprecedents in other studies. "I" Serum total choles-terol concentration showed no diurnal variation overthe 10 hour period in which blood samples wereobtained. Both triglyceride and HDL-cholesterolconcentrations showed diurnal variation, but noadjustment has been made for these variations in thispaper. As the presentation is on a group basis and asadjustment is made for other variables wherever thisis indicated, it is extremely unlikely that the diurnalvariations in lipid concentrations introduce any sys-tematic bias. When the data are used for incidencestudies, in which individuals and small groups of sub-jects are involved, adjustments will be necessary andwill be made. The predictive value of non-fasting tri-glycerides remains to be determined, and it has beensuggested that postprandial measurements may bemore relevant to the risk of coronary heart diseasethan the fasting levels. 12The contribution to the risk for coronary heart dis-
ease from each blood lipid variable considered sepa-rately and in combination will be of particular interestin the description of high risk subjects and in theplanning of preventive measures. It is probable thattotal cholesterol and HDL-cholesterol contributeindependently to the coronary heart disease risk,'3whereas the importance of non-fasting triglyceridesmay be overshadowed by their relation with choles-terol and HDL-cholesterol.9 The dynamic interrela-tion which seems to exist between HDL-cholesteroland triglycerides, however (that is the removal of trig-lycerides being dependent on the fasting HDL-cholesterol level'4) may itself be a determinant foratherosclerosis. Incidence data from the regional heartstudy may provide an answer to this possibility.
AGEIn most cross-sectional population studies of bloodlipid concentration, mean total cholesterol increaseswith age, the main increase usually taking place fromthe second to the fifth decades. '5- 7 The rate ofincrease in mean concentration varies considerably
between populations and in some populations noage-related increase is observed.'8 This variation inrelation is probably more the result of environmentalfactors, diet in particular, than of some inherentbiological characteristic. In the present study, noincrease in mean total cholesterol was seen after theage of 45, implying that the main increment in serumcholesterol concentration had already taken place.Consequently, this population can be regarded as hav-ing been exposed to a high concentration of totalcholesterol for a longer period of life than populationsthat continue to rise during the fifth or sixth decade.As this is a cross-sectional survey, the inferences wecan draw about the effects of increasing age are verylimited. The lack of increase in mean total cholesterolconcentration after 45 years, however, is notexplained by changes in body mass index; age andbody mass index show no important relation in thesemen. It is also highly unlikely to be produced byselective elimination from coronary heart disease ofthose with above average concentrations of totalcholesterol, as the numbers involved below the age of60 years are not likely to affect mean levels in groupsof this size.
BODY MASS INDEXThe relation between body mass index and the lipidfractions has been well documented,'9 201 but themechanisms underlying these relations remainunclear. In the present study, analysis of covariancehas been used to adjust for the effects of age, smok-ing, and alcohol intake and it is clear from this thatbody mass index has a strong independent effect onthe HDL-cholesterol concentration. It has been sug-gested that the negative correlation between HDL-cholesterol and triglyceride concentrations observedconsistently in population surveys2' and confirmed inthis study could be explained by both the variablesbeing dependent on body mass index.'9 Our data,however, do not support this suggestion as there wasvirtually no change in the partial correlationcoefficients between triglycerides and HDL-cholesterol after controlling for body mass index.The pattern of the relation observed between body
mass index and total cholesterol is of considerableinterest and unlike that seen for body mass index andtriglycerides or body mass index and HDL-cholesterol. The mean total cholesterol concentrationrises with increasing body mass index until about 28kg/M2, and then there is no further increase despiteincreasing body mass index. Neither social class norphysical activity at work had any influence on thisrelation. Few community studies of serum cholesterolconcentrations have examined the relation with bodymass index in any detailed manner. Most studiesreport correlation coefficients, usually of very low
210

Blood lipids in middle-aged British men
order,22-24 or do not comment on the relation. Thephenomenon we describe in Fig. 2, however, has beenobserved previously in a study of 7133 healthy Lon-don businessmen.25 In men aged 25 to 44 years themean serum cholesterol rose with increasing relativeweight. In men aged 45 to 64 years, serum cholesterolconcentration increased to a relative weight of 110 to1190/o and then showed no further increase in thosewith a relative weight of 120/o or more. The pattern isvery similar to that seen in our data. The cross-sectional view of the relation between body massindex and blood lipids depicted in Fig. 2 should notbe too readily interpreted in dynamic terms. It doesfocus attention, however, on the complexity of theeffects associated with weight gain and weight loss.The data could explain the early and distinct fall in
triglycerides associated with weight loss and thedifficulties encountered in reducing serum totalcholesterol by weight reduction in the very obese sub-ject. If so, weight reduction per se would be too non-specific a recommendation if the main intention is tolower total cholesterol concentration in an individualor in a community, and more specific advice is indi-cated.26
SOCIAL CLASSThere was a small but significant difference betweenthe mean total cholesterol concentration in the manualand non-manual workers. This is somewhat morepronounced if social classes I and II are comparedwith social classes IV and V. This finding of highertotal cholesterol levels in the non-manual workerscontrasts with other European surveys in which totalcholesterol was lower in the higher social classes.27The finding in our study was not explained by physi-cal activity at work or by body mass index. The mostlikely explanation for this observed difference in meantotal cholesterol concentrations is different dietaryhabits, but our data do not allow us to examine this indetail.
CIGARETTE SMOKING AND ALCOHOLBoth cigarette smoking and alcohol have been relatedto the risk of coronary heart disease. The effects ofcigarette smoking are always positive, that is theyincrease the risk of coronary heart disease, while thereported effects of alcohol are conflicting. Light/moderate drinking has been associated with lowerblood pressures and less cardiovascular disease,28 andheavy drinking has been associated with higher bloodpressures and with more ischaemic heart disease.29Smoking and drinking are strongly correlated30 but
appear to have opposing effects on some of the lipidfractions, making it extremely difficult to assess theirindependent contribution to coronary heart diseaserisk. Alcohol has been related to an increased HDL-
cholesterol concentration in both clinical experimentsand cross-sectional surveys.3' 32 The effect is inde-pendent of other factors such as body mass index andcigarette smoking and appears to have a dose-responserelation. The higher levels of HDL-cholesterol inex-smokers compared with the smoking groups is notthe result of the ex-smokers drinking more. Theyhave the same percentage of moderate/heavy drinkingas light smokers and a lower percentage than moder-ate or heavy smokers.30 Even if cigarette smokingdoes decrease the HDL-cholesterol level, our studyindicates that at relatively high levels of alcohol intakethe effect of smoking on HDL-cholesterol is over-whelmed by the HDL-cholesterol-raising effect ofalcohol (Table 2). If HDL-cholesterol is an importantrisk factor for coronary heart disease then the riskcontribution from cigarette smoking, as determinedby its effect on HDL-cholesterol, will be underesti-mated if alcohol consumption is not taken intoaccount. The HDL-decreasing effect of cigarettesmoking was modest but comparable with thatobserved in other studies.33 The actual differenceincreased slightly after adjusting for alcohol and bodymass index but remained so small that it seemsimprobable that the HDL-decreasing effect ofcigarette smoking is an important mechanism in coro-nary heart disease.
Implications
The aim of this presentation has been to describe thepattern of blood lipid concentrations in middle-agedBritish men and to examine a number of factors whichmight affect these patterns. It is evident that bodymass index is closely associated with the concentra-tions of the blood lipids in these men, but the cross-sectional nature of the data does not allow the fullcomplexity of these associations to be explored.Almost certainly, the relations are neither direct norsimple, but are determined by a complex of dietary,physical activity, and constitutional factors. There-fore, one cannot assume from our findings that mak-ing a change in the body mass index will necessarilyresult in a change in the blood lipid concentrations inthe same direction and to the same degree indicatedby the cross-sectional data. The effect of weightreduction on blood lipids is likely to be determined bythe manner in which the weight reduction is achieved,and in particular by the nature of the specific dietaryregime involved. We should be prepared to test therelations we have shown in our attempts to reduce therisk of cardiovascular disease, but we should notexpect the outcome of our endeavours to be readilypredictable. The relations observed in this study willbe explored more thoroughly when the incidence dataare analysed, but in the meantime, they provide use-
211
2Thelle, Shaper, Whitehead, Bullock, Ashby, Patel
ful information which can be incorporated into ourthinking about the determinants of coronary heartdisease.
The British Regional Heart Study is supported by theMedical Research Council, and the Wolfson ResearchLaboratories by DHSS. The triglyceride estimationswere carried out in the Department of ChemicalPathology, Royal Free Hospital School of Medicineunder the direction of Dr D G Cramp. Dr Dag Thellereceived a grant from the Norwegian Research Coun-cil for Science and the Humanities. We thank MrsMary Walker (research administrator) and Dr S JPocock (statistician) for their contributions to thisstudy.
References
1 Wynder EL, Blackburn H, Lewis B, Wissler R. Plasmalipids: optimal levels for health. (American Health Found-ation, New York.) Academic Press, 1980.
2 Gordon T, Castelli WP, Hjortland MC, Kannel WB,Dawber TR. High density lipoprotein as a protectivefactor against coronary heart disease-The FraminghamStudy. Am J Med 1977; 62: 707-14.
3 Shaper AG, Pocock SJ, Walker M, Cohen NM, Wale CJ,Thomson AG. British Regional Heart Study: cardiovas-cular risk factors in middle-aged men in 24 towns. BrMed J 1981; 283: 179-86.
4 Great Britain Office of Population Censuses and Surveys.Classification of occupations. London: HMSO, 1970.
5 Morris JN, Crawford MD. Coronary heart disease andphysical activity of work. Evidence of a national necropsysurvey.BrMedJ 1958; ii: 1485-96.
6 Lopes-Virella MF, Stone P, Ellis S, Colwell JA. Choles-terol determination in high-density-lipoproteins sepa-rated by three different methods. Clin Chem 1977; 23:882-4.
7 Eggstein M, Kreutz FH. Eine neue Bestimmung derNeutralfette im Blutserum und Gewebe. I Prinzip, Dur-chfuhrung + Besprechung der Methode. KlinWochenschr 1966; 44: 262-7.
8 Rose G. Incubation period of coronary heart disease. BrMedI 1982; 284: 1600-1.
9 Hulley SB, Rosenman RH, Bawol RD, Brand RJ.Epidemiology as a guide to clinical decisions. The associ-ation between triglyceride and coronary heart disease. NEngl J Med 1980; 302: 1383-9.
10 Leren P, Askevold EM, Foss OP, et al. The Oslo Study.Cardiovascular disease in middle-aged and young Oslomen. Acta Med Scand 1975; suppl 588: 5-38.
11 Bjartveit K, Foss OP, Gjervig T, Lund-Larsen PG. TheCardiovascular Disease Study in Norwegian Counties.Background and organisation. Acta Med Scand 1979;suppl 634: 1-70.
12 Zilversmit DB. Atherogenesis: a postprandial phenome-non. Circulation 1979; 60: 473-85.
13 Miller NE, F0rde OH, Thelle DS, Mj0s OD. TheTroms0 Heart Study. High-density lipoprotein and
coronary heart-disease: a prospective case-control study.Lancet 1977; i: 965-8.
14 Thelle DS, Cramp DG, Patel I, Walker M, Marr JW,Shaper AG. Total cholesterol, high density lipoprotein-cholesterol and triglycerides after a standardised high-fatmeal. Human Nutrition: Clinical Nutrition 1982; 36C:469-74.
15 Thelle DS, Fdrde OH, Try K, Lehmann EH. TheTroms0 Heart Study: methods and main results of thecross-sectional study. Acta Med Scand 1976; 200: 107-18.
16 Nicolaysen R, Westlund K. Group differences and agetrend of serum cholesterol. ScandJ Clin Lab Invest 1963;15: 299-302.
17 Keys A, Mickelsen 0, Miller EO, Hayes ER, Todd RL.The concentration of cholesterol in the blood serum ofnormal man and its relation to age. J Clin Invest 1950;29: 1347-53.
18 Shaper AG, Jones KW. Serum cholesterol, diet, andcoronary heart disease in Africans and Asians in Uganda.Lancet 1959, ii: 534-7.
19 Glueck CJ, Taylor HL, Jacobs D, Morrison JA,Beaglehole R, Williams OD. Plasma high-density lipop-rotein cholesterol: association with measurements ofbody mass. The Lipid Research Clinics Program Pieval-ence Study. Circulation 1980; 62, suppl 4: 62-69.
20 National Mass Radiography Service, Health Services ofFinnmark County, Ulleval Hospital, Faculty ofMedicine, University of Tromso. The CardiovascularStudy in Finsmark 1974-1975. Nordic Council Arch MedRes 1979; Rep 25.
21 Davis CE, Gordon D, La Rosa J, Wood PD, HalperinM. Correlations of plasma high-density lipoproteincholesterol levels with other plasma lipid and lipoproteinconcentrations. The Lipid Research Clinics ProgramPrevalance Study. Circulation 1980; 62, suppl 4: 24-30.
22 Keys A. Seven countries. A mulivariate analysis of deathand coronary heart disease. Cambridge: Harvard Univer-sity Press, 1980: 32.
23 Dawber TR. The Franingham Study. The epidemiology ofatherosclerotic disease. Cambridge: Harvard UniversityPress, 1980: 156.
24 Rifkind BM, Begg T. Relationship between relative bodyweight and serum lipid levels. Br MedJ3 1966; ii: 208-10.
25 Pincherle G. Factors affecting the mean serum choles-terol. J Chronic Dis 1971: 24: 289-97.
26 Shaper AG, Marr JW. Dietary recommendations for thecommunity towards the postponement of coronary heartdisease. Br Med J 1977; i: 867-71.
27 Holme I, Helgeland A, Hjermann I, Leren P, Lund-Larsen PG. Four-year mortality by some socioeconomicindicators: the Oslo study. J Epidemiol CommunityHealth 1980; 34: 48-52.
28 Harburg E, Ozgoren F, Hawthorne VM, Schork MA.Community norms of alcohol usage and blood pressure:Tecumseh, Michigan. Am J Public Health 1980; 70:813-20.
29 Dyer AR, Stamler J, Paul 0, et al. Alcohol consumption,cardiovascular risk factors and mortality in two Chicagoepidemiologic studies. Circulation 1977; 56: 1067-74.
30 Cummins RO, Shaper AG, Walker M, Wale CJ. Smok-ing and drinking by middle-aged British men: effects of
212

Blood lipids in middle-aged British men
social class and town of residence. Br Med 1981; 283:1497-502.
31 Belfrage P, Berg B, Hagerstrand I, Nilsson-Ehle P,Tornqvist H, Wiebe T. Alterations of lipid metabolismin healthy volunteers during long-term ethanol intake.EurJ Clin Invest 1977; 7: 127-31.
32 Ernst N, Fisher M, Smith W, et al. The association ofplasma high-density lipoprotein cholesterol with dietaryintake and alcohol consumption. The Lipid ResearchClinics Prevalence Study. Circulation 1980; 62, suppl 4:41-52.
33 Criqui MH, Wallace RB, Heiss G, Mishkel M, SchonfeldG, Jones GTL. Cigarette smoking and plasma high-density lipoprotein cholesterol. The Lipid Research Clin-ics Program Prevalence Study. Circulation 1980; 62,suppl 4: 70-6.
Requests for reprints to Professor A G Shaper,Department of Clinical Epidemiology and GeneralPractice, Royal Free Hospital School of Medicine,London NW3 2PF.
213