
Evaluation of sputum smear microscopy in the National Tuberculosis Control Programme in the north of...
159
Downloaded from UvA-DARE, the Institutional Repository of the University of Amsterdam (UvA) http://dare.uva.nl/document/53597 File ID 53597 Filename NTHuong-AMC-2007.pdf SOURCE, OR PART OF THE FOLLOWING SOURCE: Type Dissertation Title Tuberculosis control in Vietnam : does DOTS do it? Author N.T. Huong Faculty Faculty of Medicine Year 2007 Pages 158 FULL BIBLIOGRAPHIC DETAILS: http://dare.uva.nl/record/234634 Copyrights It is not permitted to download or to forward/distribute the text or part of it without the consent of the copyright holder (usually the author), other then for strictly personal, individual use. UvA-DARE is a service provided by the Library of the University of Amsterdam (http://dare.uva.nl)
-
Upload
independent -
Category
Documents
-
view
0 -
download
0
Transcript of Evaluation of sputum smear microscopy in the National Tuberculosis Control Programme in the north of...
Downloaded from UvA-DARE, the Institutional Repository of the University of Amsterdam (UvA)http://dare.uva.nl/document/53597
File ID 53597Filename NTHuong-AMC-2007.pdf
SOURCE, OR PART OF THE FOLLOWING SOURCE:Type DissertationTitle Tuberculosis control in Vietnam : does DOTS do it?Author N.T. HuongFaculty Faculty of MedicineYear 2007Pages 158
FULL BIBLIOGRAPHIC DETAILS: http://dare.uva.nl/record/234634
Copyrights It is not permitted to download or to forward/distribute the text or part of it without the consent of the copyright holder(usually the author), other then for strictly personal, individual use. UvA-DARE is a service provided by the Library of the University of Amsterdam (http://dare.uva.nl)

Tuberculosis control in Vietnam: Does DOTS do it?
Nguyen Thien Huong

Tuberculosis control in Vietnam: Does DOTS do it?
ACADEMISCH PROEFSCHRIFT
ter verkrijging van de graad van doctor aan de Universiteit van Amsterdam op gezag van de Rector Magnificus
prof. dr. J. W. Zwemmer ten overstaan van een door het college voor promoties ingestelde
commissie, in het openbaar te verdedigen in de Aula der Universiteit op donderdag 6 september 2007, te 14:00 uur
Door
Nguyen Thien Huong
geboren te Hai duong, Vietnam
Promotiecommissie Promotor: Prof. dr. M.W. Borgdorff Co-promotors: Prof. dr. N.V. Co
Dr. F.G.J. Cobelens Overige Leden: Prof. dr. P. A. Kager Dr. D. van Soolingen Prof. dr. R.A. Coutinho Prof. dr. E.H.D. Bel Dr. C. Dye Faculteit der Geneeskunde, Universiteit van Amsterdam.
Table of contents
Page Chapter 1 General introduction 7 Chapter 2 Establishment and development of the
National Tuberculosis Control Programme in Vietnam 31 Chapter 3 Delays in the diagnosis and treatment of tuberculosis
patients in Vietnam: a cross-sectional study 41 Chapter 4 Evaluation of sputum smear microscopy in the National
Tuberculosis Control Programme in the north of Vietnam 55 Chapter 5 Variation in case notification of tuberculosis:
Disentangling incidence and access to care 67 Chapter 6 Tuberculosis epidemiology in six provinces of Vietnam
after the introduction of the DOTS Strategy 85 Chapter 7 Survival and relapse rate of tuberculosis patients
who successfully completed treatment in Vietnam 101 Chapter 8 Anti-tuberculosis drug resistance in the south of Vietnam:
Prevalence and trends 111 Chapter 9 General discussion 123 Summary 141 Tãm t¾t 145 Samenvating 149 Acknowledgement 153 Abbreviations 157


Chapter 1
General Introduction
Chapter 1
8
GLOBAL EPIDEMIOLOGY OF TUBERCULOSIS: BURDEN OF DISEASE The World Health Organization (WHO) declared tuberculosis (TB) a global public health emergency in 1993 [1]. About one third of the world’s population is infected with Mycobacterium tuberculosis (M. tuberculosis). It is estimated that, in 2005, there were 8.8 millions new cases of tuberculosis, of which 3.9 million were smear-positive and 11% were in adults infected with the human immunodeficiency virus (HIV) ), as well as 1.6 million TB deaths worldwide. More than 80% of all TB patients in 2005 lived in Asia and Sub-Saharan Africa [2]. In 2005, the TB incidence rate was stable or in decline in all six WHO Regions. However, the total number of new TB cases was still rising slowly [2]. Today, TB is still one of the world’s leading causes of death and of the global burden of disease. It is estimated that between 2002 and 2020, approximately 1,000 million people will be newly infected, over 150 million will become sick and 36 million will die of TB if proper control measures are not instituted [3]. Poverty, HIV and multidrug-resistant tuberculosis (MDR-TB) are key factors driving the TB epidemic. TB is principally a disease of poverty, 95% of TB all cases and 98% of deaths from tuberculosis are in developing countries [4]. Vulnerability to active TB has been strongly correlated with the conditions and consequences of poverty, such as malnutrition, inadequate and overcrowded housing, and unsanitary working conditions [5-12]. As 75% of TB cases in developing countries are people in their most economically productive age groups (15-50 years) [13], a vicious circle ensues in which, TB itself is a cause of poverty. The greatest emerging threat to TB control arises from the HIV pandemic. During 2005 alone, an estimated 2.8 million persons died from AIDS, 4.1 million were newly infected with HIV, and 36.6 million were living with HIV [14]. HIV may alter the epidemiology of tuberculosis in several ways [15]. HIV promotes progression to active TB both in people with recently acquired (16) and with latent [4,17] M.tuberculosis infection. HIV infection is the most powerful risk factor recognized in the progression to active disease from pre-existing infection with M. tuberculosis [18]. HIV increases not only the risk but also the rate of progression of recent or latent M. tuberculosis infection to disease [19-21]. HIV also increases the risk of recurrent TB after successful TB treatment [22]. Persons co-infected with HIV and M. tuberculosis have a five to ten-fold increased risk of developing active TB compared to those infected with M. tuberculosis alone [17]. Increasing tuberculosis incidence in people living with HIV/AIDS (PLHA) poses an increased risk of TB transmission to the general community, whether or not HIV-infected [23]. Over time, the greater risk and propensity to develop active TB among HIV-infected
General Introduction
9
persons, particularly in countries of high TB burden, can lead to rapid increases in TB incidence and prevalence. TB, although preventable and treatable, is one of the most common causes of morbidity and mortality among PLHA worldwide [24-30]. By the end of 2000, of the 11 million people worldwide were co-infected with M. tuberculosis and HIV, with 71% of those co-infected living in sub-Saharan Africa and 22% living in South-East Asia [31]. HIV fuels the TB epidemic where the population infected with M. tuberculosis overlaps with the population infected with HIV. In many countries of Africa and Southeast Asia, infection with HIV resulted in a rapid increase of TB morbidity and mortality [32-34]. HIV prevalence in tuberculosis patients is less than 1% in the Western Pacific region but 38% in Africa [24]. In countries with the highest HIV prevalence, more than 75% of cases of TB are HIV-associated [2]. In addition to HIV-associated TB, multidrug resistant tuberculosis (MDR-TB) is an increasing threat. Data from the global reports on resistance to anti-TB drugs have shown that drug resistance is present worldwide [37-42] with an estimated 424,203 new cases of multidrug resistance TB (MDR-TB) - which are resistant to at least the two most powerful first-line drugs (isoniazid and rifampicin) – in 2004 [40,41]. Most MDR-TB cases are found in three countries – China, India and the Russian Federation – accounting for 62% of the estimated global burden [41]. The prevalence of resistance among previously untreated patients reflects programme performance over a long period of time, and indicates the level of transmission within the community [40]. Outbreaks of multidrug-resistant tuberculosis have been reported from both industrialized and developing countries in patients with HIV infection [37-40]. HIV itself does not cause nor promote the development of multidrug resistance, but it fuels its spread by accelerating the progression from infection to disease [43]. The cost of detecting and treating of MDR-TB was 10- to 100-fold higher than susceptible TB patients. Even when second line drugs are available, the course of treatment takes much longer (18-24 months), its efficacy is lower and adverse reaction rates are higher [44]. In September 2006, the WHO has expressed concern over the emergence of virulent drug-resistant strains of tuberculosis: extensively drug-resistant tuberculosis (XDR-TB) which accounted for on average 10% of the detected MDR-TB case [45]. XDR-TB is TB that is resistant to at least isoniazid and rifampin among the first-line anti-TB drugs (which is the definition of MDR-TB), and in addition to that to any fluoroquinolone and to at least one second-line injectable drug (amikacin, capreomycin or kanamycin) [46]. XDR-TB makes treatment nearly impossible with currently available anti-TB drugs and has extremely high mortality rates. Data from South Africa (2006) showed that out of 1,539 TB cases diagnosed between January 2005 and March 2006, 542 were culture positive, 221 were MDR and 53 XDR cases. Out of 53 “possible” XDR patients, 52 (98%) died with a median survival from sputum collection of 16 days (range 2-210 days) [47-50].
Chapter 1
10
Drug-resistant tuberculosis is a man-made problem. The development of drug resistance is a consequence of inadequate TB control, poor patient or clinician adherence to standard TB treatment regiments, poor quality drugs or inadequate drug supplies [51-56]. NATURAL HISTORY OF TUBERCULOSIS Tuberculosis (TB) is a bacterial disease caused by M. tuberculosis and spread by airborne droplet nuclei, which are particles of 1–5μm in diameter that contain M. tuberculosis, when people with pulmonary TB cough, sneeze, sing or talk [57-59]. TB principally affects the lung. Extrapulmonary TB accounts for about 20% of disease in HIV-seronegative people but is more common in HIV-seropositive individuals [60]. Patients with pulmonary TB whose sputum is smear-positive for M. tuberculosis are the main source of infection [61-65]. The risk of becoming infected with tubercle bacilli depends on the incidence of infectious cases in the community, the duration of their infectiousness, and the number and nature of interactions between a case and a susceptible contact per unit time of infectiousness [66,67]. Data from the pre-chemotherapy era showed that one infectious person infected approximately 20 persons during the average 2-year period that the patient remained infectious [66]. Infected persons can probably develop TB at any time depending on time since infection, age and host immunity. People with latent TB infection have about 10%-20% risk of developing active TB during their lives [67-70]. The risk is highest in the first two years after infection [71]. The risk of developing active TB is greatly increased by HIV co-infection [72,73]. The annual risk of developing TB in PLHA who are co-infected with M. tuberculosis can be exceeded 10%. This risk increases with increasing immunosuppression [74-76]. Without treatment, by the end of 5 years 50% of PTB patients have died, 25% are healthy (self cured) and 25% have chronic infectious TB [77]. In a poorly implemented tuberculosis programme, as many as 30% of patients with smear-positive tuberculosis die [78]. However, under the WHO Stop TB Strategy, the fatality rates throughout the world are less than 5% [2,79]. Adequate chemotherapy not only prevents tuberculosis patients from dying, but also cures them and prevents them from becoming chronic cases [80], as well as reduces the risk of drug resistance [81]. However, much higher death rates were reported for patients treated for HIV associated TB [82-93]. Overall, the case fatality rate of HIV-infected TB cases was 40% across all countries [24]. In sub-Saharan Africa, approximately 30% of HIV-infected, smear-positive tuberculosis patients died within 12 months of starting treatment, and about 25% of those

General Introduction
11
who completed treatment died during the subsequent 12 months in the absence of antiretroviral treatment or prophylactic treatment of opportunistic infections [17]. TUBERCULOSIS CONTROL The ultimate goal of tuberculosis control is the elimination of TB from the population by reducing the transmission of M. tuberculosis infection, resulting in the eventual disappearance of the disease [94]. The key to control TB is rapid detection and cure of infectious cases by TB control programmes. This depends on the timely diagnosis and treatment of the patients with smear-positive pulmonary tuberculosis; the cure of such patients is currently the only form of primary prevention of the disease and therefore diagnosis and treatment at present form the cornerstone of preventive activities for this disease [94]. In addition, vaccination with Bacille Calmette-Guérin (BCG) will supplement tuberculosis control efforts, particularly in high-burden countries, mainly by reducing disability and death in young children [94-97]. However, the protective efficacy of BCG against adult pulmonary TB is limited and its impact on TB transmission is probably minimal [98,99]. The modern strategy of TB treatment is based on standardized short-course chemotherapy (SCC) regimens, applied under proper case management conditions [100]. Standardized treatment is a component of the TB control policy package [101]. The global targets for tuberculosis control are to cure at least 85% of sputum smear-positive patients under treatment and to detect at least 70% of the estimated new sputum smear-positive cases. WHO adopted these targets and began to promote this strategy in 1991 [102-105]. In 1994 WHO produced a Framework for Effective Tuberculosis Control [106] that clearly described the main components of what later became known as the DOTS Strategy. The Framework was revised and expanded in 2002 [107,108], and recently revised as the Stop TB Strategy [109,110]. The Millennium Development Goals include the WHO tuberculosis control targets and aim to decrease the prevalence and death rates of tuberculosis by 50% by 2015 compared with 1990 [111,112]. The DOTS Strategy comprises five elements considered essential for global TB control [106]:
• Political commitment to long-term TB control activities; • Case detection using sputum smear microscopy among persons seeking care for
prolonged cough; • Standardized short-course chemotherapy of 6 to 8 months for at least all sputum
smear-positive cases, with directly observed treatment for at least the initial 2 months;
• Regular, uninterrupted supply of all essential anti-TB drug;

Chapter 1
12
• A standardized recording and reporting system that allows assessment of treatment results for individual patients and of the TB control programme performance overall.
In a number of countries, the DOTS Strategy has been shown to be effective in reducing mortality [113,114] prevalence [115] and incidence [113], at least in the absence of HIV. The World Bank recognizes that the DOTS Strategy is one of the most cost-effective of all health interventions and recommends that effective TB treatment should be a part of the essential clinical services package available in primary health care. DOTS produces significant savings for governments and communities [116-120]. For each dollar invested in DOTS, the expected return in increased economic output is more than $3.50 [116]. A study conducted in Thailand even suggested that for every US$ 1 invested by the government in tuberculosis control, the community gains by US$ 50 over a 20-year period [121]. A total of 187 countries and territories were implementing the DOTS Strategy in 2005. By 2005, 89% of the world’s population lived in areas where DOTS had been implemented by public health services; the global treatment success rate among new smear-positive TB cases had reached 84%; and 60% of new smear-positive cases were estimated to be diagnosed by DOTS programmes and put on short-course chemotherapy [2]. However, current rates of progress are insufficient to achieve the targets of halving TB mortality and prevalence by 2015 [122,123]. Globally, the total number of new TB cases was still rising. In areas like the former Soviet Union and Sub-Saharan Africa, incidence is increasing rather than declining [2,24,25]. Much of the increase in global TB incidence seen since 1980 is attributable to the spread of HIV compounded by an insufficient health infrastructure in Africa despite maintaining reasonable treatment completion rate [24,25,34,122-124] whereas the economic decline, poor tuberculosis control and substandard health services since 1991 in Eastern Europe have contributed to a major increase in the incidence and prevalence of TB including MDR-TB [39]. The current Global Stop TB Strategy has been built on the DOTS Strategy and has an expanded scope to address remaining constraints and challenges to TB control [108,109]. The Stop TB Strategy has 6 principal components:
• Pursue high-quality DOTS expansion and enhancement • Address TB/HIV, MDR-TB and other challenges • Contribute to health system strengthening • Engage all care-providers • Empower people with TB, and communities • Enable and promote research
This strategy is believed to be critical to achievement of the MDG and related Stop TB Partnership targets for TB control [109,110].
General Introduction
13
METHODS FOR MEASURING THE IMPACT OF TUBERCULOSIS CONTROL The impact of TB control efforts on the epidemic can be measured by the trends of morbidity (case notification rate (CNR), incidence, prevalence), mortality, and transmission [67]. Morbidity data is most direct, whereas trend in mortality is more a proxy for trend in morbidity. Trends in incidence are difficult to measure because not all TB patients are diagnosed, and the proportion of incident TB cases that is detected (the case detection rate) is often unknown. Moreover, operational factors affect notification of detected cases. At a constant level of case detection and notification of detected cases, the trend of notification is a valid proxy for the trend in incidence. Trends in prevalence of TB in the community can be detected directly through periodic TB prevalence surveys. However, such surveys are not regularly conducted since they are expensive and complex. Trends in TB mortality can be monitored by death certification trends over several years. However, these data may not always be available, or may often be imprecise so that changes are seen only after several years. The most evident impact on mortality is the trend of deaths in patients under treatment. Trends in TB transmission can be measured by assessing the trend of the annual risk of TB infection (ARTI) [125]. The ARTI is defined as the average risk for a person to be infected or re-infected with M. tuberculosis over the period of one year [66,126]. Trends in ARTI are obtained from surveys of tuberculin skin testing among children that are repeated over the time [127,128]. The prevalence of drug resistance indicates the negative impact of poor quality treatment and is used as a complementary indicator. The prevalence of MDR among new cases reflects the level of sustained transmission of MDR-TB and thereby provides an indicator of quality of treatment that is independent of reported treatment outcomes. A high rate of primary multidrug-resistant tuberculosis interferes with the achievement of high cure rates through an increase of failures (drug resistance) and of case-fatality. STUDY PROJECT There is global consensus that the DOTS Strategy is the key to successful TB control. At the core of this strategy is early detection and effective treatment, by supervised short-course chemotherapy, of sputum-smear positive (i.e. highly infectious) cases of pulmonary TB [129]. The rationale is that it will decrease the pool of infectious TB in the population as a result, fewer people get infected and the epidemic will gradually die out. Epidemiological modeling has demonstrated that achieving the targets of 85% cure rate and 70% case
Chapter 1
14
detection will result in a significant decline in tuberculosis incidence [66,130,131]. Achievement of these targets for case detection and cure is expected to reduce the annual TB incidence rate by 8-12% per year and an even faster reduction in mortality of 9–13% per year, in the absence of HIV co-infection. At 7% annual decline, incidence would be halved in 10 year [130,132]. The question however is whether a DOTS programme that reaches these targets sufficient to control the TB epidemic? (e.g. Does DOTS do it ?) These theoretical figures from modeling are supported by more direct evidence from Europe and developing countries. Tuberculosis declined rapidly in Europe over the last century. The fall in incidence of infection accelerated from 4–5% to 12–13% per year following the introduction of effective treatment [66,67]. Rapid declines in tuberculosis incidence at 7-10% per year have been shown in developing countries applying the DOTS Strategy such as Peru and China. In Peru, where the DOTS Strategy was introduced in 1990, the WHO targets were reached by 1995 and have been maintained since. The estimated case detection rate was more than 90% in 1999 and 90% of TB cases were successfully treated. Notification rates of pulmonary TB decreased by 8% per year, double the rate before DOTS was introduced [113,133,134]. The tuberculosis control programme of Beijing, China has used direct observation of treatment since 1979, and has shown a substantial and progressive decline in tuberculosis cases (87% reduction in prevalence from 1979 to 1990), deaths (80% reduction), and a 9% annual decrease in new smear-positive cases was documented between 1986 and 1996. Drug resistance has remained minimal [135]. Between 1990 and 2000, TB prevalence decreased by 32%-37% in areas where the DOTS Strategy was implemented [115]. Nontheless, more than a decade after the launch of the DOTS Strategy, the number TB cases worldwide continues to rise [2]. In many countries such as Benin, Cambodia, remaining parts of China, Malawi, Nicaragua, and the United Republic of Tanzania, no impact is seen despite remarkable results in terms of high cure rates [114,136-141]. In these countries, case detection rates were estimated to be below 70%, but there is doubt as to whether these CDRs were indeed low. Is then DOTS in many countries inadequate as a TB control strategy, and if so, why? Much effort, political commitment and funding have invested to implement the DOTS Strategy not only at global level but also at national level in many countries over past 10 years. Thus, it is important to establish whether DOTS programmes have impact on the TB epidemic. If not, different or additional control interventions may have to be developed and implemented.
General Introduction
15
Among the 22 countries with the highest burden of TB cases, Vietnam is thus far the only one that has consistently reported case detection rates and cure rates above the WHO targets over the last years [2]. However, TB case notification rates in Vietnam as reported to WHO show no decline. This makes Vietnam an important setting for closely studying the impact of the DOTS Strategy on the TB epidemic. This can be done by analyzing trends in routine TB notification data and comparing these to trends in annual risk of infection, on which data are available from repeated tuberculin surveys among school children in sentinel provinces. Lack of impact despite meeting the WHO targets might be due to erroneous estimate of case detection and cure rates. The CDR is not easily measured since in Vietnam, as in most other high-burden countries, the true incidence of TB is unknown. An estimate of the CDR is therefore derived from the same models on which the WHO targets were based [127]. Direct estimates of the case detection rate can be obtained by population surveys of prevalent pulmonary TB (i.e. prevalence surveys) [142]. Such a survey was planned for Vietnam, but since this was delayed, alternative ways needed to be sought to make an indirect assessment of the quality and completeness of case detection. Relevant indicators for such an assessment are the proportion of the adult population that has sputum smear examination annually at the district TB units (DTU), and the proportion of these patients who have a positive smear [143] By assessing their distribution by age, sex, geography, socio-economic status and traveling distance to the DTU, patterns of high and low case detection can be identified. Another indicator is diagnostic delay, i.e. the period between onset of disease (i.e. of infectiousness), and diagnosis and start of treatment. Early case detection is important in order to reduce the transmission of TB [67]. Both theory [132,144] and practice [145,146] suggest that incidence and death rates could be forced down quickly if diagnostic and treatment delays, and hence the average duration of infectiousness, are shortened. If this delay is long, even high CDRs may not result in sufficient reduction of TB transmission [147]. Thus, short delays point to high CDR, and analysis of risk factors for long delays may help identify segments of the patient population for which case detection should be improved. The cure rates of the NTP are based on routine treatment outcome monitoring. Since inadequate DOTS contributes to increased rates of relapse and drug resistance, independent verification of the cure and failure rates can be sought by follow-up of TB patients after successful treatment for relapse, and by assessing the trend of the prevalence of (multi)drug resistance among TB patients before treatment initiation. These indicators are independent of the quality of the routine surveillance of treatment outcomes [37,43,148]. To answer the question whether a DOTS program in a high-burden country that meets the WHO targets of at least 70% case detection and at least 85% cure has an impact on TB transmission and disease burden or not, this study focused on two aspects: 1/ The quality
Chapter 1
16
and completeness of case detection by the Vietnamese National Tuberculosis Control Program. This was done using the following indicators: diagnostic delays among newly diagnosed smear-positive TB patients; use and yield of sputum smear microscopy by age and sex; geographic patterns of the proportion of the population examined and the proportion of smear-positives; 2/ The impact of control on the TB epidemic was assessed using the following indicators: trends in case notification and annual risk of TB infection (ARTI) in 6 sentinel provinces; extent of relapse among patients successfully treated for new smear-positive pulmonary tuberculosis; and prevalence of drug resistance among TB patients and its trend over time. TUBERCULOSIS AND TUBERCULOSIS CONTROL IN VIETNAM Vietnam is a South East Asian country with an area of 330.000 sq. km that stretches 3,260 km along the eastern coast of the Indochina peninsula. It borders China in the north and Laos and Cambodia in the west. Three great geographical features dominate the country: the Red river in the North, the Mekong river in the South and the central highland in between. Mountains and hills cover four-fifths of the territory. There are two different climatic zones in Vietnam. Northern Vietnam has 4 distinct seasons, spring, summer, autumn and winter. Southern Vietnam has 2 seasons, dry and wet.
The estimated total population of Vietnam in 2005 was 84 million. About 39% of the population was in the age group under 15 years, and 5% in the age group 65 years or more. The average annual population growth over the period 1995-2000 was 2.1%. In 2004, 20% of the Vietnamese population lived below the poverty line [149]. Ethnic minorities account for 13% of the country’s population. Whereas the majority Kinh population inhabit mainly the fertile lowlands in the river deltas and along the coast, these minorities mainly live scattered across the mountain areas that cover two-thirds of the country’s territory, extending from the north to the south. The largest city is Ho Chi Minh City in the South with a population of about 5 million. The capital Hanoi, located in the North, has a population of about 2.5 million [150]. Administratively, there are four levels in the country: central, city/provincial, district and commune. Vietnam has 60 provinces and 4 centrally administered cities, 631 districts (about 130,000 inhabitants each), 10,553 communes (about 7,000-9,000 inhabitants each) and 104,146 villages. Agriculture employs 70% of the labor force and contributes over 50% of the gross domestic product (GDP). The main crop is rice. Over the past ten years Vietnam recorded many achievements in economic reform and a high rate of economic growth in the decade from 1991-2000. The structure of the economic sector is changing in line with market mechanisms. The average annual growth rate of GDP was 7.5%. There is evidence suggesting that income inequity has been rising.
General Introduction
17
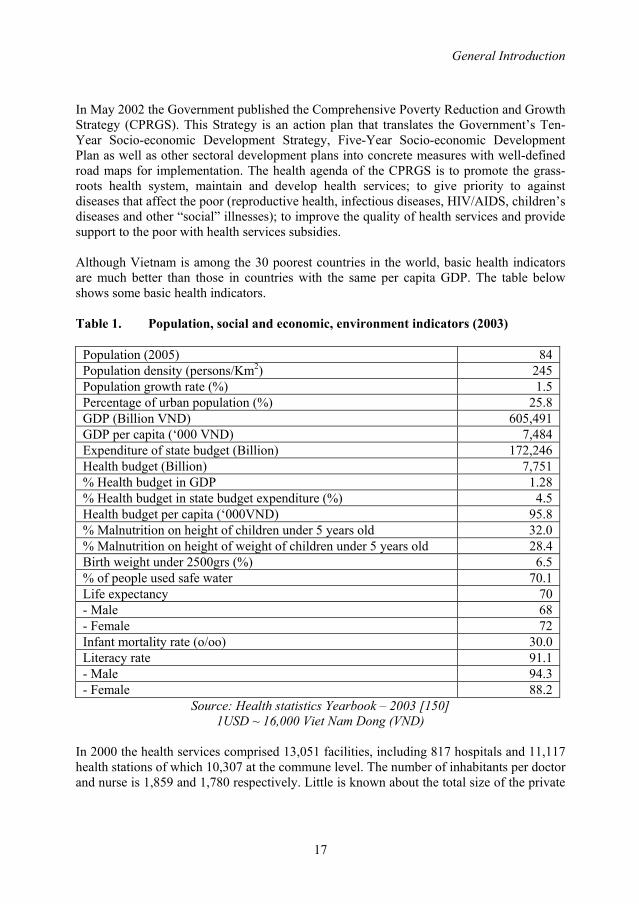
In May 2002 the Government published the Comprehensive Poverty Reduction and Growth Strategy (CPRGS). This Strategy is an action plan that translates the Government’s Ten-Year Socio-economic Development Strategy, Five-Year Socio-economic Development Plan as well as other sectoral development plans into concrete measures with well-defined road maps for implementation. The health agenda of the CPRGS is to promote the grass-roots health system, maintain and develop health services; to give priority to against diseases that affect the poor (reproductive health, infectious diseases, HIV/AIDS, children’s diseases and other “social” illnesses); to improve the quality of health services and provide support to the poor with health services subsidies. Although Vietnam is among the 30 poorest countries in the world, basic health indicators are much better than those in countries with the same per capita GDP. The table below shows some basic health indicators.
Table 1. Population, social and economic, environment indicators (2003)
Population (2005) 84 Population density (persons/Km2) 245 Population growth rate (%) 1.5 Percentage of urban population (%) 25.8 GDP (Billion VND) 605,491 GDP per capita (‘000 VND) 7,484 Expenditure of state budget (Billion) 172,246 Health budget (Billion) 7,751 % Health budget in GDP 1.28 % Health budget in state budget expenditure (%) 4.5 Health budget per capita (‘000VND) 95.8 % Malnutrition on height of children under 5 years old 32.0 % Malnutrition on height of weight of children under 5 years old 28.4 Birth weight under 2500grs (%) 6.5 % of people used safe water 70.1 Life expectancy 70 - Male 68 - Female 72 Infant mortality rate (o/oo) 30.0 Literacy rate 91.1 - Male 94.3 - Female 88.2
Source: Health statistics Yearbook – 2003 [150] 1USD ~ 16,000 Viet Nam Dong (VND)
In 2000 the health services comprised 13,051 facilities, including 817 hospitals and 11,117 health stations of which 10,307 at the commune level. The number of inhabitants per doctor and nurse is 1,859 and 1,780 respectively. Little is known about the total size of the private
Chapter 1
18
sector in the health services market and its growth over the past 10 years. Traditional health services still play an important role in Vietnam. The Ministry of Health divides the country into the 8 health regions: Red River delta, North East Region, North West Region, North Central Coast Region, South Central Coast Region, Central Highlands Region, East South Region, Mekong River Delta Region). The regions have distinct characteristics as regards geographical situation, accessibility, and population density and development indicators. In recent years Vietnam has experienced a rapidly expanding HIV epidemic. As of 31 December 2006, a total of 114,367 cumulative cases of HIV infection, 19,695 cases of AIDS, and 11,468 deaths due to AIDS had been officially reported. It is estimated that more than 280,000 cases of HIV exist in the country. HIV infection has been identified in all 64 provinces of the country (unpublished data, AIDS Division, Ministry of Health, 2006). Of the reported cases in 2003, 85% were male, 51% reported injection drug use (IDU), followed by female sex workers (1.3%) and sexually transmitted disease patients (1.0%). 83% were aged 20 to 39 years at the time of HIV diagnosis. There was an increasing number of young people under 30 years in reported HIV cases over the last years, from 22% in 1995 to 70% in 2002 [151]. HIV/AIDS sentinel data showed that 4.8% of TB patients were HIV positive in 2004. More than 10 provinces had greater than 5% prevalence of HIV among TB patients [unpublished data, AIDS Division, Ministry of Health, 2004]. After independence tuberculosis control started in Vietnam in 1957 with the establishment of the National Institute of Tuberculosis in Hanoi and the National TB Control Program in the South. Since the reunification in 1975 the National Institute in Hanoi is responsible for the National TB Program. During the period 1975-1985 the TB control program missed a clear strategy to address the problem of TB and suffered from lack of funds to purchase drugs. In 1986 the program adopted the TB control strategy of the International Union Against Tuberculosis and Lung Disease (IUATLD) and WHO and started to introduce DOTS. The objective of the NTP in Vietnam is to reduce TB morbidity, mortality and transmission and to prevent emerging of TB drug resistance in the community. Full-scale countrywide coverage of DOTS became only possible when the Government declared TB control a national priority in 1995. The tuberculosis control network covers all four administrative levels and the integration of tuberculosis control activities and other general medical activities at primary level. At the national level the director of the National Hospital for Tuberculosis and Respiratory Disease (NHTRD) in Hanoi is responsible for the NTP. The director is answerable to the Minister of Health. The Pham Ngoc Thach hospital in Ho Chi Minh City has delegated responsibility for TB control in 22 southern provinces. Both hospitals are responsible for the overall implementation of the NTP in the provinces including training, drug distribution
General Introduction
19
and supervision. They also act as reference laboratories and are responsible for the quality control of the laboratories at the peripheral levels At the provincial level exists either a TB center or TB ward as part of the provincial general hospital. Each province has a TB control team headed by the Provincial TB Coordinator (PTC). The provincial TB centres and Tuberculosis Units are responsible for implementation of the tuberculosis program in the provinces and districts respectively. The provincial tuberculosis coordinator gives close guidance to the districts, supervises training activities, data collecting and the distribution and proper use of drugs. The tuberculosis district unit is responsible for confirmation of the diagnosis by microscopy, initiation of the ambulatory treatment at communes near the patient’s home, and supervision of the conduct of the NTP in the communes. At the commune level, a general staff is responsible for communicable diseases including tuberculosis. Health workers are responsible for community health care including TB and in the villages. The commune and village levels identify and refer TB suspects to the districts and provide ambulatory treatment for TB. In 2000, the total staff involved in TB control was 15,772 [153]. Vietnam is one of the seven countries with a high burden of TB in the Western Pacific region. It also ranks 13th on the list of the 22 high TB burden countries in the world [2].
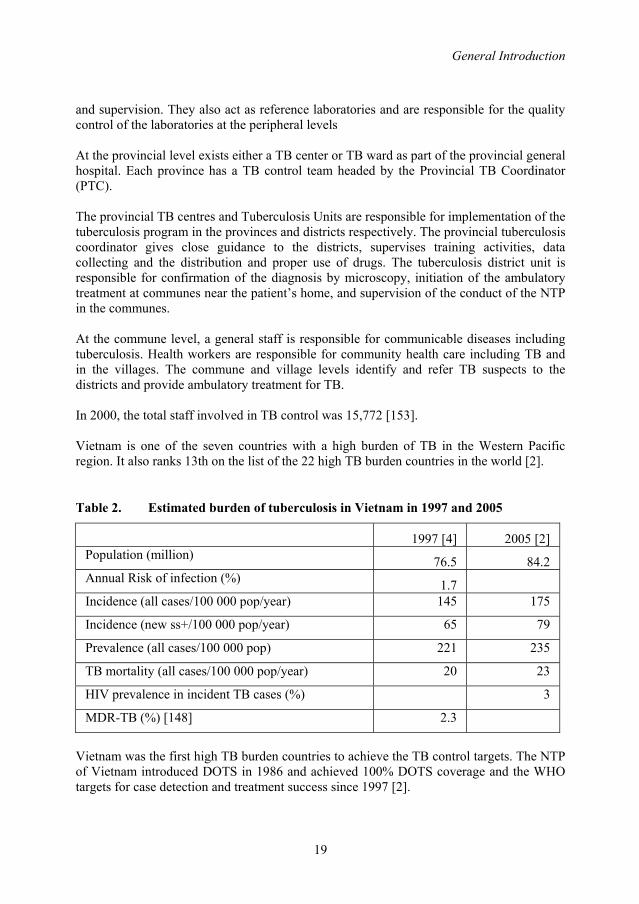
Table 2. Estimated burden of tuberculosis in Vietnam in 1997 and 2005
1997 [4] 2005 [2] Population (million) 76.5 84.2 Annual Risk of infection (%) 1.7 Incidence (all cases/100 000 pop/year) 145 175
Incidence (new ss+/100 000 pop/year) 65 79
Prevalence (all cases/100 000 pop) 221 235
TB mortality (all cases/100 000 pop/year) 20 23
HIV prevalence in incident TB cases (%) 3
MDR-TB (%) [148] 2.3
Vietnam was the first high TB burden countries to achieve the TB control targets. The NTP of Vietnam introduced DOTS in 1986 and achieved 100% DOTS coverage and the WHO targets for case detection and treatment success since 1997 [2].
Chapter 1
20
STRUCTURE OF THIS THESIS Chapter 1 provides an overview of the global TB burden, natural history of tuberculosis, measuring the impact of TB control as well as TB and TB control in Vietnam. The rationales and general objectives of the study are given. Chapter 2 describes trends in case notification and treatment outcomes of tuberculosis patients diagnosed and treated in the NTP since its inception in 1986. Chapter 3 assesses diagnostic delay among TB patients diagnosed within the NTP in a nationwide representative survey. Chapter 4 assesses the use and yield of sputum smear examination by the NTP, and its variation by age and sex with emphasis on gender differences in access to care, in a representative survey in the northern part of Vietnam. In chapter 5 the variation in TB notification by analyzing notification rates of smear-positive TB in Vietnam by individual commune during one quarter in 2003 is presented. Chapter 6 estimates the trends in annual risk of tuberculosis infection, and compares these to trends in case notification rates from repeated tuberculin surveys in 6 sentinel provinces. Chapter 7 assesses the relapse rate after 12-24 months among new smear positive pulmonary TB patients who completed treatment in the northern part of Vietnam. Chapter 8 presents the prevalence of drug resistance among TB cases diagnosed with and without a history of previous TB treatment, and compares this to the results of the previous survey in another nationwide survey. Finally, in chapter 9 contains the main findings of the studies, general discussion and recommendation for TB control and further research. REFERENCES 1. Raviglione MC, Snider DE Jr, Kochi A. Global epidemiology of tuberculosis.
Morbidity and mortality of a worldwide epidemic. JAMA. 1995; 273: 220-6 2. Global Tuberculosis Control: Surveillance, planning, financing. WHO Report
2007. Geneva, World Health Organization (WHO/HTM/TB/2007.376) 3. World Health Organization. Targeted for tuberculosis control: case detection,
treatment success, and the millennium development goals. Geneva: World Health organization 2003a
4. Dye C, Scheele S, Dolin P, Pathania V, Raviglione MC. Consensus statement. Global burden of tuberculosis: estimated incidence, prevalence, and mortality by country. WHO Global Surveillance and Monitoring Project. JAMA 1999;282:677-86.
5. Kochi A. Tuberculosis : distribution, risk factor, mortality. Immunobiol 1994; 191: 325-336
6. Enarson DA,Wang JS, Dirks JM. The incidence of active tuberculosis in a large urban area. Am J Epidemiol 1989;129:1268-76.
7. Cantwell MF, Snider DE, Jr., Cauthen GM, Onorato IM. Epidemiology of tuberculosis in the United States, 1985 through 1992. J Am Med Assoc 1994;272:535-9.
8. Bergner L, Yerby AS. Low income and barriers to use of health services. N Engl J Med 1968;278:541-6.

General Introduction
21
9. Kuemmerer JM, Comstock GW. Sociologic concomitants of tuberculin sensitivity. Am Rev Respir Dis 1967;96:885-92.
10. Cegielski P, McMurray DN. The relationship between malnutrition and tuberculosis: evidence from studies in humans and experimental animals. Int J Tuberc Lung Dis 2004; 8:268-98
11. Cegielski JP, Kohlmeier L, Cornoni-Huntley J. Malnutrition and tuberculosis in a nationally representative cohort of adults in the United States, 1971-1987. Am J Trop Med Hyg 1995; 53(suppl 2): 152
12. Cegielski PJ, Kohlmeier L, Cornoni-Huntley J. Relative and attributable risk of tuberculosis due to undernutrition in population-based sample of adults. TSRU progress report 2007. KNCV Tuberculosis Foundation 2007. The Hague
13. Lonnroth K, Jaramillo E, Williams B, Dye C. Population attributable risk for selected risk factors for tuberculosis. Tuberculosis Surveillance Research Unit. Progress report 2007. KNCV Tuberculosis Foundation. The Hague
14. Joint United National Programe on HIV/AIDS (UNAIDS). 2006 report on the global AIDS epidemic. Geneva, Switzerland: UNAIDS; 2006. Available at http://www.unaids.org/en/hiv_data/2006globalreport/default.asp
15. Sutherland I. The epidemiology of tuberculosis and AIDS. British Communicable Disease Report 1990;90/10:3-4.
16. DiPerri G, Cruciani M, Danzi MH et al. Noocomial epidemic of active tuberculosis in HIV infected patients. Lancet 1989: 2: 1502-1504
17. Raviglione MC, Harries AD, Msiska R, Wikinson D Nunn P. Tuberculosis and HIV: current status in Africa. AIDS, 1997: 11(suppl B) S115-S123.
18. Rieder HL, Cauthen GM, Comstock GW, Snider DE Jr. Epidemiology of tuberculosis in the United States. Epidemiol Rev. 1989;11:79-98
19. Selwyn PA, Hartel D, Lewis VA et al. A prospective study of the risk of tuberculosis among intravenous drug users with human immunodeficiency virus infection. New Engt J Med 1989; 320: 545-550.
20. Narain JP, Raviglione MC, Kochi A. HIV-associated tuberculosis in developing countries: epidemiology and strategies for prevention. Tubercle Lung Dis 1992; 73: 311-321.
21. Braun MM, Badi N, Ryder RW et al. A retrospective cohort study of the risk of tuberculosis among women of childbearing age with HIV infection in Zaire. Am Rev Respir Dis 1991;143: 501-504.
22. Sonnenberg P, Murray J, Glynn JR, Shearer S, Kambashi B, Godfrey-Faussett P. HIV-1 and recurrent, relapse, and reinfection of tuberculosis after cure: a cohort study in South Africa mineworkers. Lancet 2001, 358, 1687-1693
23. Lawn SD, Wood R. National adult antiretroviral therapy guidelines in South Africa: concordance with 2003 WHO guidelines? AIDS 2007; 21(1): 121-122.
24. Corbett EL, Watt CJ, Walker N, et al. The growing burden of tuberculosis: global trends and interactions with the HIV epidemic. Arch Intern Med 2003; 163: 1009–21.
25. Corbett EL, Marston B, Churchvard GJ, De Cock KM. Tuberculosis in sub-Saharan Africa: opportunities, challenges, and change in the era of antiretroviral treatment. Lancet. 2006 Mar 18;367(9514):926-37

Chapter 1
22
26. Styblo K. The impact of HIV infection on the global epidemiology of tuberculosis. Bull Union Tuberc Lung Dis. 1991 Mar; 66(1): 27-32
27. Nunn P, Williams B, Floyd K, Dye C, Elzinga G, Raviglione M. Tuberculosis control in the era of HIV. Nat Rev Immunol. 2005 Oct;5(10):819-26
28. Thongcharoen P, Vitayasai P, vitayasai V, Suparatpinyo K, Tansuphaswadikul S. Opportunistic infection in AIDS/HIV infection patients in Thailand. Tahi AIDS J. 1992;4:117-122
29. Grant AD, Djomand G, De Cock KW. Natural history and spectrum of disease in adults with HIV/AIDS in Africa. AIDS.1997;11(suppl B):S43-S54
30. Yanai H, Uthaivoravit W, Panich V et al. Rapid increase in HIV-related tuberculosis, Chiangrai Rai, Thailand, 1990-1994. AIDS, 1996;10:527-31
31. World Health organization (2002b). World Health report: Reducing risk, promoting health life, WHO, Geneva.
32. Narain JP, Raviglione MC, Kochi A. HIV-associated tuberculosis in developing countries: epidemiology and trategies for prevention. Tuberc Lung Dis 1992; 73:311-21
33. De Cock KM, Soro B, Coulibaly IM, Lucas SB. Tuberculosis and HIV infection in sub-Saharan Africa. JAMA 1992; 268:1581-87
34. Cantwell MF, Binkin NJ. Tuberculosis in sub-Saharan Africa: a regional assessment of the impact of the human immunodeficiency virus and National Tuberculosis Control Program quality. Tubercle and Lung Disease 1996;77:220-225
35. Cantwell MF, Binkin NJ. Impact of HIV on tuberculosis in sub-Saharan Africa: a regional perspective. Int J Tuberc Lung Dis 1997;1:205-14.
36. Harries A, Hargreaves N, Kemp J et al. Death from TB in sub-Saharan Africa countries with a high prevalence of HIV-1. Lancet 2001,357, 1519-1523
37. Pablos- Méndez A, Raviglione MC, Laszlo A, et al. Global surveillance for antituberculosis-drug resistance, 1994–1997. N Engl J Med 1998;338:1641–9.
38. Espinal MA, Laszlo A, Simonsen L, Boulabal F, Kim SJ, Reniero A, et al. Global trends in resistance to antituberculosis drugs. New England Journal of Medicine, 2001, 344:1294-1302
39. Dye C, Espinal M, Watt CJ, Mbiaga C, Williams BG. Worldwide Incidence of Multidrug-Resistant Tuberculosis. The Journal of Infectious Diseases 2002;185:1197–202
40. World Health Organization. Report No. 3. Anti-tuberculosis drug resistance in the world: The WHO/IUATLD Global Project on Anti-tuberculosis Drug Resistance Surveillance 1999-2002. Geneva, 2004 (WHO/HTM/TB/2004-343).
41. Aziz MA, Wright A, Laszlo A, De Muynck A, Portaels F, Van Deun A, Wells C, Nunn P, Blanc L, Raviglione M. Epidemiology of antituberculosis drug resistance (the Global Project on Anti-tuberculosis Drug Resistance Surveillance): an updated analysis. Lancet. 2006 Dec 16;368(9553):2142-54
42. Zignol M, Hosseini MS, Wright A, Weezenbeek CL, Nunn P, Watt CJ, Williams BG, Dye C. Global incidence of multidrug-resistant tuberculosis. J Infect Dis. 2006 Aug 15;194(4):479-85
General Introduction
23
43. Frieden T. Toman’s Tuberculosis Case detection, treatment, and monitoring – questions and answers. Second edition. World Organization. Geneva 2004. WHO/HTM/TB/2004.334
44. World Health Organization. Guidelines for the programmatic management of drug-resistant tuberculosis. World Health Organization 2006. WHO/HTM/TB/2006.361
45. Emergence of Mycobacterium tuberculosis with extensive resistantce to second-line drugs – worldwide. 2000-2004. MMWR Morb Mortal Wkly Rep 2006:55;301-5
46. Raviglione MC, Smith IM. XDR tuberculosis - Implication for global public health. N Engl J Med 2007;356;7:656-659
47. World Healt Organization. XDR-TB – Extensively drug resistant tuberculosis. September 2006. Available at http://www.who.int/tb/xdr/xdrtb_sept06news.pdf
48. XDR-TB – Extensively drug resistant tuberculosis: What, where, how and action steps. Available at http://www.who.int/tb/xdr/xdrmap_feb_en.pdf. Accessed 24 March 2007.
49. Gandhi NR, Moll A, Sturm AW et al. Extensively drug-resistance tuberculosis as a cause of death in patients co-infected with tuberculosis and HIV in rural area of South Africa. Lancet 2006; 368:1575-1580
50. Raviglione M. XDR-TB: entering the post-antibiotic era? Int J Tuberc Lung Dis. 2006 Nov;10(11):1185-7
51. Crofton J, Chaulet P, Mzher D. Possible causes of the failure of the treatment of pulmonary tuberculosis; how to avoid them. Bulletin of the International Union Against Tuberculosis, 1980, 55:93–101.
52. Mahmoudi A, Iseman MD. Pitfalls in the care of patients with tuberculosis. Common errors and their association with the acquisition of drug resistance. Journal of the American Medical Association, 1993, 270:65–68.
53. Barnes PF. The influence of epidemiologic factors on drug resistance rates in tuberculosis. American Review of Respiratory Disease, 1987, 136:325–328.
54. Crofton J et al. Guidelines for the management of drug-resistant tuberculosis. Geneva,World Health Organization, 1997 (document WHO/TB/96.210).
55. Sumartojo E. When tuberculosis treatment fails. A social behavioral account of patient adherence. American Review of Respiratory Disease, 1993, 147:1311–1320.
56. Pablos-Méndez A, Knirsch CA, Barr RG, Lerner BH, Frieden TR.. Nonadherence in tuberculosis treatment: predictors and consequences in New York City. American Journal of Medicine, 1997, 102:164–170.
57. Wells WF. On air-borne infection: Stydy II, droplets and droplet nuclei. Am J Hygiene 1934; 20:611-8
58. Riley RL, Milld CC, Nyka W, et al. Aerial dissemination of pulmonary tuberculosis: a two-year study of contagion in a tuberculosis ward. Am J Hygiene 1959; 70:185-96
59. Louden RG, Roberts RM. Droplet expulsion from the respiratory tract. Am Rev Respir Dis 1966;95:435-42
Chapter 1
24
60. Shafer RW. Edlin BR. Tuberculosis in patients infected with human immunodeficiency virus: perspective on the past decade. Clin Infect Dis 1996; 22:683-704
61. Shaw JB, Wynn-Williams N. Infectivity of pulmonary tuberculosis in relation to sputum status. Am Rev Tuberc 1954; 69:724-32
62. Grzybowski S, Barnett GD, Styblo K. Contacts of cases of active pulmonary tuberculosis. Bull Int Union Tuberc 1975; 50:90-106 (Royal Netherlands Tuberculosis Association, 1975; Selected papers 90-106)
63. van Geuns HA, Meijer J, Styblo K. Results of contact examination in Rotterdam, 1967-1969. Bull Int Union tuberc 1975; 50:107-21
64. Liippo KK, Kulmala K, Tala EOJ. Focusing tuberculosis contact tracing by smear grading of index cases. Am Rev Respir Dis 1993; 148:235-6.
65. Behr MA, Warren SA, Salamon H, Hopewell PC, Ponce de Leon A, Daley CL, Small PM. Transmission of Mycobacterium tuberculosis from patients smear-negative for acid-fast bacilli. Lancet. 1999 Feb 6;353(9151):444-9
66. Styblo K. Epidemiology of tuberculosis. Selected papers. Vol.24, KNCV, 1991 67. Rieder HL. Epidemiologic basis of tuberculosis control. Paris, International Union
Against Tuberculosis and Lung Disease, 1999. 68. Sutherland I. Recent studies in the epidemiology of tuberculosis, based on the risk
of being infected with tubercle bacilli. Adv Tuberc Res. 1976; 19:1-63 69. Vynnycky E, fine PE. The natural history of tuberculosis: the implications of age-
dependent risks of disease and the role of reinfection. Epidemiol Infect. 1997; 119:183-201
70. Vynnycky E, Fine PE. Lifetime risks, incubation period, and serial interval of tuberculosis. Am J Epidemiol. 2000 Aug 1;152(3):247-63
71. D’Arcy Hart P, Sutherland I. BCG and vole bacillus vaccines in the prevention of tuberculosis in adolescence and early adult life. Final report to the Medical Research Coucil. Br Med J 1977;2:293-5
72. Rieder HL Cauthen GM, Bloch AB, Cole CH, Holtzman D, Snider DE, Jr. et al. Tuberculosis and acquired immunodeficiency syndrome – Florida. Arch Inter Med 1989; 149:1268-73
73. Centers for Disease Control. Tuberculosis and acquired immunodeficiency syndrome – New York City. Morb Mort Wkly Rep 1987; 36:785-96
74. Bucher HC, Griffith LE, Guyatt GH, et al. Isoniazid prophylaxis for tuberculosis in HIV infection: a meta-analysis of randomized controlled trials. AIDS. 1999; 13:501-507
75. Selwyn PA, Hartel D, Lewis VA, et al. A prospective study of the risk of tuberculosis among intravenous drug users in human immunodeficiency virus infection. N Engl J Med. 1989; 320:545-550
76. Giradi E, Raviglione MC, Antonucci G, Godfrey Faussett P, Ippolito G. Impact of the HIV epidemic on the spread of other diseases: the case of tuberculosis. AIDS. 2000; 14 (suppl 3): S47-S56.
77. Berg G. The prognosis of open pulmonary tuberculosis – a clinical-statistical analysis. Lund: Hakan. Ohlsson; 1939
General Introduction
25
78. Datta M, Radhamani MP, Selvaraj R, Paramasivan CN, Gopalan BN, Sudeendra CR, Prabhakar R. Critical assessment of smear-positive pulmonary tuberculosis patients after chemotherapy under the district tuberculosis programme. Tubercle and Lung Disease, 1993, 74:180–186.
79. Broekmans J. Control strategies and program management. In: Porter JDH, McAdam KPWJ, editors. Tuberculosis – back to the futher. Chichester John Willey & Sons; 1994.
80. Rouillon A, Perdrizet S, Parrot R. Transmission of tubercle bacilli: the effect of chemotherapy. Tuberc 1976;57:275-99
81. Kim SJ, Bai GH, Hong YP. Drug resistant tuberculosis in Korea, 1994. Int J Tuberc Lung Dis 1997;1:302-8
82. Malkin JE, Prazuck T, Simonnet E, et al. Tuberculosis and human immunodeficiency virus infection in west Burkina Faso: Clinical presentation and clinical evolution. Int J Tuberc Lung Dis 1997;1:68-74
83. Murray J, Sonnenberg P, Shearer SC, Godfrey-Faussett P. Human immunodeficiency virus on presentation and diagnosis of tuberculosis in a cohort study in Zambia. J Trop Med Hyg.1993;96:1-11
84. Palmieri F, Pellicelli AM, Girardi E, et al. Negative predictors of survival in HIV-infected patients with culture-confirmed pulmonary tuberculosis. Infection.1992; 27:331-334
85. Shafer RW, Bloch AB, Larkin C, et al. Predictors of survival in HIV-infected tuberculosis patients. AIDS.1996;10:269-272
86. Ackah AN, Coulibaly D, Digbeu H, et al. Response to treatment, mortality, and CD4 lymphocyte counts in HIV-infected persons with tuberculosis in Abidjan, Côte d’Ivoire. Lancet.1995;345:607-610
87. Greenberg AE, Lucas S, Tossou O, et al. Autopsy-proven causes of death in HIV-infected patients treated for tuberculosis in Abidjan, Côte d’Ivoire. AIDS.1995;9:1251-1254.
88. Nunn P, Brindle R, Carpenter L, et al. Cohort study of Human immunodeficiency virus infection in patients with tuberculosis in Nairobi, Kenya. Am J Respir crit Care Med.1992;146:849
89. Okwera A. Whalen C. Byewaso F, et al. Radomised traial of thiacetazone and refampicin-containing regimens for pulmonary tuberculosis in HIV-infected Ugandans. Lacet.1994;344:1323-1328
90. Elliot AM, Halwiindi B, Hayes RJ, et al. The impact of human immunodeficiency virus on mortality of patients treated for tuberculosis in cohort study in Zambia. Trans R Soc trop Med Hyg.1995;89:78-82
91. Kassim S, Sassan MM, Ackah A, et al. Two-year follow-up of persons with HIV-1 and HIV-2 associated pulmonary tuberculosis treated with short-course chemotherapy in West Africa. AIDS.1995;9:1185-1191
92. Van den Broek J, Mfinanga S, Moshiro C, O’brien R, Mugomela A, Lefi M. Impact of human immunodeficiency virus infection on the outcome of treatment and survival of tuberculosis patients in Mwanza. Tanzania. Int J Tuberc Lung Dis. 1998;2:547-552
Chapter 1
26
93. Wiktor SZ, Sassan MM, Grant AD, et al. Efficacy of trimethoprim-sulphamethoxazole prophylaxis to decrease morbidity and mortality in HIV1-infected patients with tuberculosis in in Abidjan, Côte d’Ivoire: a randomized controlled trial. Lancet. 1999:535:1469-1475
94. Rieder HL. Interventions for tuberculosis control and elimination. International Union Against Tuberculosis and Lung Disease. Paris 2002.
95. Fine PE. Bacille Calmette-Guerien vaccines: a rough guide. Clinical infectious Disease 1995:20:11-4
96. Fine PEM. BCG vaccines and vaccination. In: Reichman LB, Hershfield ES, eds. Tuberculosis: a comprehensive international approach. New York: Marcel Dekker, 2000:503-22
97. Styblo K, Meijer J. Impact of BCG vaccination programmes in children and young adults on the tuberculosis programme. Tubercle 1976;57:17-43
98. Fine PE. Variation in protection by BCG: implications of and for heterologous immunity. Lancet. 1995 Nov 18;346:1339-45
99. Colditz GA,Brewer TF, Berkey CS, Wilson ME, Burdick E, Fineberg HV, Mosteller F. Efficacy of BCG vaccine in the prevention of tuberculosis. Meta-analysis of the published literature. JAMA. 1994 Mar 2;271(9):698-702
100. World Health organization. Treatment of tuberculosis. Guidelines for national programmes. Third edition 2003. World Health Organization – Geneva 2003. WHO/CDS/TB/2003.313
101. World Health Organization. What is DOTS? A guide to understanding the WHO-recommended TB control strategy known as DOTS. World Health Organization 1999 (WHO/CDS/CPC/TB/99.270.
102. Kochi A. The global tuberculosis situation and the new control strategy of the World Health Organization. Tubercle, 1991, 72:1–6.
103. Resolution WHA-44.8. Tuberculosis control programme. In: handbook of resolutions and decisions of the World Health Assembly and the Executive Board. Volum III, 3rd ed. (1985-1992). Geneva, World Health Organization, 1993 (WHA44/1991/REC/1): 116
104. Resolution WHA53.1. Stop Tuberculosis Initiative. In: Fifty-eighth World Health Assembly. Geneva, 16-25 May 2000. Resolutions and decisions. Geneva, World Health Organization, 2000 (WHA53/2000/REC/1), Annex: 1-2
105. Resolution WHA58.14. Sustainable financing for tuberculosis prevention and control. In: Fifty-eighth World Health Assembly. Geneva, 16-25 May 2005. Resolutions and decisions. Geneva, World Health Organization, 2005 (WHA58/2005/REC/1), Annex: 79-81
106. WHO Tuberculosis Programme: Framework for effective tuberculosis control. Geneva. World Health Organization, 1994 (WHO/TB/94.179)
107. World Health Organization. An expanded framework for effective tuberculosis control. Int J Tuberc Lung Dis. 2002;6:378-388
108. World Health Organization. An Expanded DOTS Framework for Effective Tuberculosis Control. Geneva, Switzerland: WHO; 2002. WHO/CDS/TB/2002.297.
General Introduction
27
109. Raviglione MC, Uplekar MW. WHO’s new Stop TB Strategy. Lancet 2006; 367: 952-955
110. World Health Organization. Stop TB Partnership. The stop TB Strategy: Building on and enhancing DOTS to meet the TB-related Millennium Development Goals. World Health Organization 2006. WHO/HTM/TB/2006.368
111. Watts J. G8 countries set priority for infectious diseases but fail to make progress on debt relief. Bulletin of the World Health Organization 2000;78:1168
112. Millennium Development Goal Indicators Database. New York, United Nations Statistics Division. Available at (http://unstas.un.org/unsd/mi/mi_goals.asp)
113. Suárez PG, Watt CJ, Alarcón E, Portocarrero J, Zavala D, Canales R, Luelmo F, Espinal MA, Dye C. The dynamics of tuberculosis in response to 10 years of intensive control effort in Peru. Journal of Infectious Diseases, 2001, 184:473–478.
114. Dye C, Zhao F, Scheele S. Williams BG. Evaluating the impact of tuberculosis control: number of deaths prevented by short-course chemotherapy in China. International Journal of Epidemiology, 2000, 29: 558–564
115. China Tuberculosis Control Collaboration. The effect of tuberculosis control in China. Lancet 2004; 364:417-22
116. The World Bank. Investing in Health: World Development Report 1993. New York, NY: Oxford University Press; 1993.
117. Murray C J L, Styblo K, Rouillon A. Tuberculosis in developing countries: burden, intervention and cost. Bull Int Union Tuberc Lung Dis 1990; 65: 6-24.
118. Borgdorff MW, Floyd K, Broekmans J. Intervention to reduce tuberculosis mortality and transmission in low- and middle-income countries. Bulletin of the World Health Organization 2002, 80(3):217-227.
119. Barnum HN. Cost savings from alternative treatments for tuberculosis. Soc Sci Med. 1986;23:847-850.
120. Jamison DT, Mosley WH, Meashem AR, Bobadilla JL. Disease Control Priorities in Developing Countries. New York, NY: Oxford University Press for the World Bank; 1993.
121. Sawert H, Kongsin S, Payanandana V, Akarasewi P, Nunn PP, Raviglione MC. Costs and benefits of improving tuberculosis control: the case of Thailand. Social Science and Medicine, 1997, 44:1805–1816.
122. Dye C, Watt CJ, Bleed DM, Hosseini SM, Raviglione MC. Evolution of tuberculosis control and prospects for reducing tuberculosis incidence, prevalence, and deaths globally. Journal of the American Medical Association, 2005, 293:2767–2775.
123. Kenyon TA , Mwasekaga MJ, Huebner R, Rumisha D, Binkin N, Maganu E. Low levels of drug resistance amidstrapidly increasing tuberculosis and human immunodeficiency virus co-epidemics in Botswana. Int J Tuberc Lung Dis 1999;3:4-11.
124. Maher D, Harries A, Getahun H. Tuberculosis and HIV interaction in sub-Saharan Africa: impact on patients and programmes; implications for policies. Trop Med Int Health. 2005 Aug;10(8):734-42
125. Ten Dam HG. Surveillance of tuberculosis by means of tuberculin surveys. WHO/TB/85.145. Geneva: World Health Organization; 1985.
Chapter 1
28
126. Cauthen GM, Pio A, ten Dam HG. Annual risk of tuberculosis infection.Geneva,World Health Organization, 1988 (document WHO/TB/88.154).
127. Bleiker MA, Sutherland I, Styblo K, Ten Dam HG, Misljenovic O. Guidelines for estimating the risks of tuberculous infection from tuberculin test results in a representative sample of children. Bull Int Union Tuberc 1989; 64: 7-12.
128. Arnadottir T, Rieder HL, Trebucq A, Waaler HT. Guidelines for conducting tuberculin skin test surveys in high prevalence countries. Tuberc Lung Dis 1996; 77 (Suppl): 1-20.
129. Raviglione MC, Pio A. Evolution of WHO policies for tuberculosis control, 1948-2001. Lancet 2002;359:775-80
130. Dye C, Garnett GP, Sleeman K, William BG. Prospects for worldwide tuberculosis control under the WHO DOTS Strategy. Directly observed short-course therapy. Lancet. 1998 Dec 12; 352 (9144): 1886-91.
131. Styblo K, Bumgarner JR. Tuberculosis can be controlled with existing technologies evidence. Tuberculosis Surveillance Research Unit Progress Report, 1991, 2:60-72
132. Dye C. Tuberculosis 2000-2010: control, but not elimination. Int J Tuberc Lung Dis. 2000 Dec;4(12 Suppl 2):S146-52
133. Global tuberculosis control. WHO Report 2001. Geneva, World Health Organization, 2001. WHO/CDS/TB/2001.287.
134. Global DOTS expansion plan: progress in TB control in high-burden countries, 2001. Geneva, World Health Organization, 2001. WHO/CDS/STB/2001.11.
135. Zhang LX, Tu DH, Enarson DA. The impact of directly-observed treatment on the epidemiology of tuberculosis in Beijing. International Journal of Tuberculosis and Lung Disease, 2000, 4:904–910.
136. Gninafon M. The antituberculosis programme of Benin. Bulletin of the International Union Against Tuberculosis and Lung Disease, 1990, 66:57–58. 4. Perez-Stable EJ, Pedraza RO. Tuberculosis in Cuba. American Review of Respiratory Disease, 1984, 130:520–523.
137. Arguello L. Results of the tuberculosis control programme in Nicaragua in 1984–1989. Bulletin of the International Union Against Tuberculosis and Lung Disease, 1990, 66:51–52. 6. Nyangulu DS, khoma WN, Salaniponi FM. Factors contributing to a successful tuberculosis control programme in Malawi. Bulletin of the International Union Against Tuberculosis and Lung Disease, 1990, 66:45–46.
138. Chum HJ. The Tanzania National Tuberculosis/Leprosy Programme in the face of HIV infection. Bulletin of the International Union Against Tuberculosis and Lung Disease, 1990, 66:53–55.
139. Norval PY, San KK, Bakhim T, Rith DN, Ahn DI, Blanc L. DOTS in Cambodia. Directly observed treatment with short-course chemotherapy. International Journal of Tuberculosis and Lung Disease, 1998, 2:44–51.
140. Global Tuberculosis Control: Surveillance, planning, financing. WHO Report 2006. Geneva, World Health Organization (WHO/HTM/TB/2006.38)
141. Results of directly observed short-course chemotherapy in 112,842 Chinese patients with smear-positive tuberculosis. Lancet, 1996, 347:358–362
General Introduction
29
142. Borgdorff MW. New measurable indicator for tuberculosis case detection. Emerg Infect Dis 2004;10:1523-8.
143. Rieder HL, Arnadottir T, Gutierrez AAT. Evaluation of a standardized recording tool for sputum smear microscopy for AFB under routine conditions in low income countries. Int J Tuberc Lung Dis 1997; 1: 339-345.
144. Dye C, Watt CJ, Bleed DM, Hosseini SM, Raviglione MC. Evolution of tuberculosis control and prospects for reducing tuberculosis incidence, prevalence, and deaths globally. Journal of the America Medical Association. 2005; 293(22): 2767-75.
145. Grzybowski S, Styblo K, Dorken E. Tuberculosis in Eskimos. Tubercle. 1976 Dec;57(4 Suppl):S1-58
146. Grzybowski S. Tuberculosis in Eskimos. Bull Int Union Tuberc. 1976;51(1):181-4 147. Styblo K. The impact of HIV infection on the global epidemiology of tuberculosis.
Bull Int Union Tuberc Lung Dis. 1991 Mar;66(1):27-32 148. World Health Organization. Anti-tuberculosis drug resistance in the world.
WHO/TB/97.229. Geneva: WHO, 1997. 149. Vietnam: Laying the Foundation for Steady Grow. Available at
http://siteresources.worldbank.org/IDA/Resources/IDA-Vietnam.pdf 150. Completed census results. Vietnam population and housing census Vietnam 1999.
Hanoi, Vietnam: general Statistical Office, 2001. 151. Ministry of Health. S.R. Vietnam. Health statistics Yearbook 2003 152. Hien NT, Long NT, Huan TQ. HIV/AIDS Epidemic in Vietnam: Evolution and
Responses. AIDS Education and Prevention 2004, 16 Suppl A, 137-154. 153. Ministry of Health S.R. Vietnam, National Tuberculosis Control Programme. 5-
year review report of the National Tuberculosis Control Programme for the period 1996-2000. Hanoi 2001.

30

31
Chapter 2
Establishment and development of the National Tuberculosis Control Programme in Vietnam
N.T. Huong1,5, B. D. Duong1, N. V. Co1, H. T. Quy2, L. B. Tung2, M.C. Bosman3, A.C. Gebhardt4, J. P. Velema3,
J. F. Broekmans3, M. W. Borgdorff3,5 1. National Hospital of Tuberculosis and Respiratory Diseases, Hanoi, 2. Pham Ngoc Thach Hospital, Ho Chi Minh City, Vietnam; 3. KNCV Tuberculosis Foundation, The Hague, 4. Medical Committee Netherlands-Vietnam, Amsterdam, 5. Academic Medical Center, University of Amsterdam, Amsterdam, The Netherlands
International Journal of Tuberculosis and Lung Disease, 2005 Vol 9 (2), pp:151–156
Chapter 2
32
ABSTRACT Objective: To describe the establishment and development of the National tuberculosis Control Programme (NTP) of Vietnam. Methods: Data were obtained from the surveillance system established by the new NTP in 1986 and based on the principles now described as the WHO DOTS Strategy. Results: The proportion of districts covered by the NTP increased from 40% in 1986 to almost 100% in 2000. The proportion of communes applying NTP guidelines increased from 18% in 1986 to 99.8% in 2000. The total number of tuberculosis cases notified increased from 8737 in 1986 to 89 792 in 2000. Most of these are new smear-positive cases. Based on WHO estimations of the incidence rate, the proportion of new smear-positive cases detected and put on short-course treatment has been over 70% since 1996. Reported cure rates with short-course chemotherapy are consistently over 85%. Conclusions: DOTS is feasible in a low-income, high-burden country. The main reasons for success were political commitment, a well-functioning health network, integration of tuberculosis control into the general health service at district level, a continuous supply of drugs and effective external support. Major challenges are long-term financial support, expansion to remote areas and vulnerable groups, definition of the role of the private sector, and future developments of the HIV epidemic and multidrug resistance.
Establishment and development of the NTP
33
INTRODUCTION Vietnam is among the 22 countries with the highest number of tuberculosis cases in the world [1]. In 2002, 95 577 cases were notified to the World Health Organization (WHO), giving a total case rate of 115 per 100 000 population [2] The prevalence of infectious tuberculosis in Vietnam in 1997 was estimated at 102/100 000, and the incidence at 85/100 000, with 20 000 deaths from tuberculosis (TB) annually [1]. In a survey in 1996, 2.3% of new smear-positive tuberculosis cases had multidrug-resistant strains [3,4]. Until 2000 the prevalence of human immunodeficiency virus (HIV) infection was low, <4% among tuberculosis patients in Ho Chi Minh City in 1995–2000 [5]. Vietnam is the only high-burden country to have reached the WHO targets of 70% case detection rate and 85% cure rate [2]. Tuberculosis control activities in Vietnam started in 1957, with separate systems in the North and the South. After the reunification of Vietnam in 1975, the National Institute for Tuberculosis in Hanoi established national guidelines for tuberculosis control as well as for specialized clinical care. Implementation of these guidelines was decentralized at district level. The cure rate did not exceed 40%. A new national tuberculosis control programme (NTP) was introduced in 1986. Its policies, which were established in 1985, antedated the present WHO DOTS Strategy [6] and followed IUATLD principles: 1) direct smear examination as the main diagnostic method for persons who present to the health service with symptoms suggestive of tuberculosis disease; 2) a uniform treatment regimen throughout the country; 3) continuous monitoring of case finding and treatment results; and 4) integration of tuberculosis control activities into the general health system at primary health care level (district and commune level). In this paper we describe the establishment and development of the Vietnam NTP. Emphasis is given to changes in the case detection and cure rates over time, associated with the introduction of short-course chemotherapy and increasing geographic coverage. METHODS Data on tuberculosis case finding and treatment were obtained from the surveillance system established by the NTP in 1986. Population data were available from 10-yearly population censuses, the last of which was conducted in 1999. Data were processed using Epi Info V 6 (CDC, Atlanta, GA, USA) and maps were made using Epi Map (www.cdc.gov). RESULTS The proportion of districts covered by the NTP increased from 40% in 1986 to 100% in 2000 (Figure 1). Within districts, training of communal health workers and provision of supplies expanded so that the proportion of communes applying NTP guidelines increased
Chapter 2
34
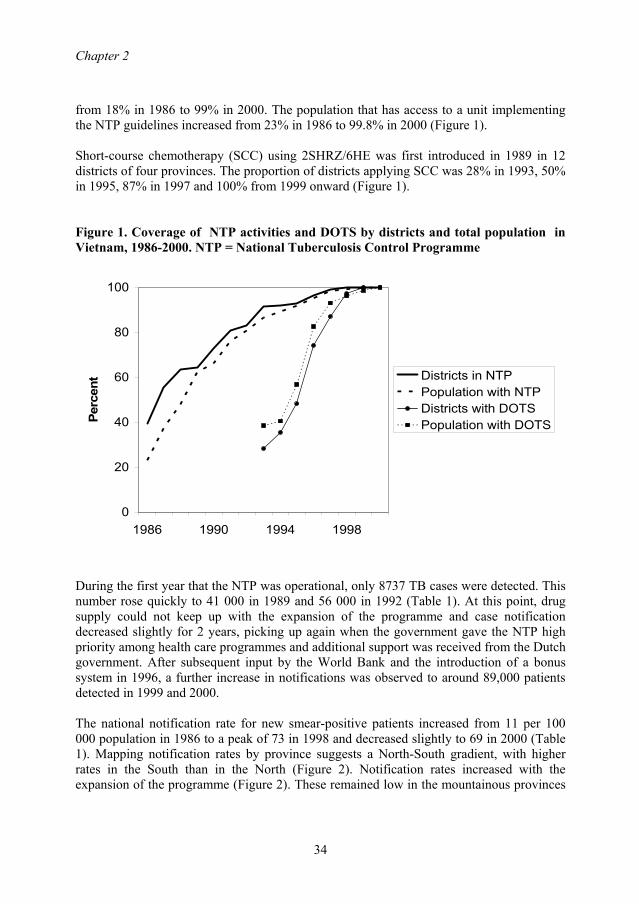
from 18% in 1986 to 99% in 2000. The population that has access to a unit implementing the NTP guidelines increased from 23% in 1986 to 99.8% in 2000 (Figure 1). Short-course chemotherapy (SCC) using 2SHRZ/6HE was first introduced in 1989 in 12 districts of four provinces. The proportion of districts applying SCC was 28% in 1993, 50% in 1995, 87% in 1997 and 100% from 1999 onward (Figure 1). Figure 1. Coverage of NTP activities and DOTS by districts and total population in Vietnam, 1986-2000. NTP = National Tuberculosis Control Programme
0
20
40
60
80
100
1986 1990 1994 1998
Perc
ent Districts in NTP
Population with NTPDistricts with DOTSPopulation with DOTS
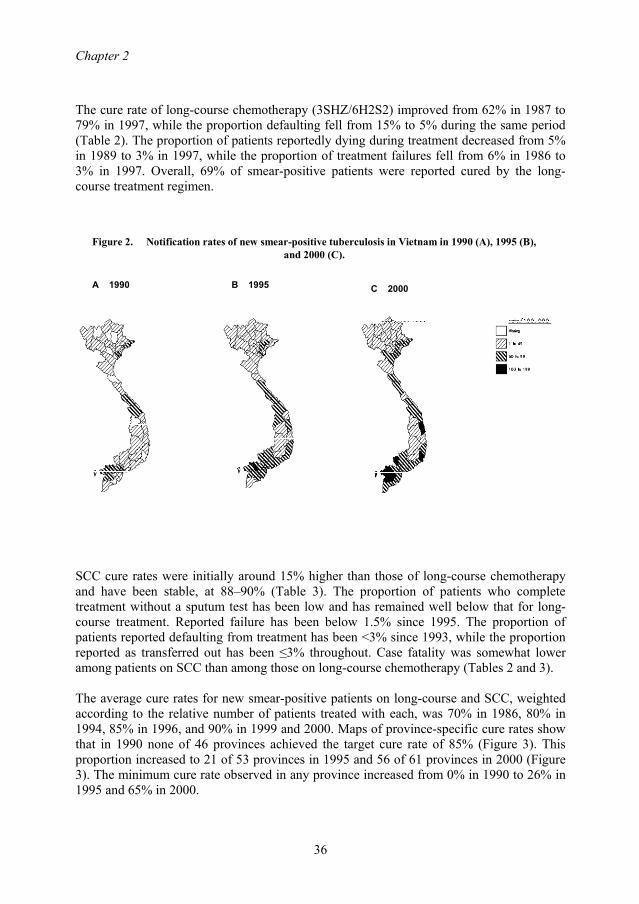
During the first year that the NTP was operational, only 8737 TB cases were detected. This number rose quickly to 41 000 in 1989 and 56 000 in 1992 (Table 1). At this point, drug supply could not keep up with the expansion of the programme and case notification decreased slightly for 2 years, picking up again when the government gave the NTP high priority among health care programmes and additional support was received from the Dutch government. After subsequent input by the World Bank and the introduction of a bonus system in 1996, a further increase in notifications was observed to around 89,000 patients detected in 1999 and 2000. The national notification rate for new smear-positive patients increased from 11 per 100 000 population in 1986 to a peak of 73 in 1998 and decreased slightly to 69 in 2000 (Table 1). Mapping notification rates by province suggests a North-South gradient, with higher rates in the South than in the North (Figure 2). Notification rates increased with the expansion of the programme (Figure 2). These remained low in the mountainous provinces
Establishment and development of the NTP
35
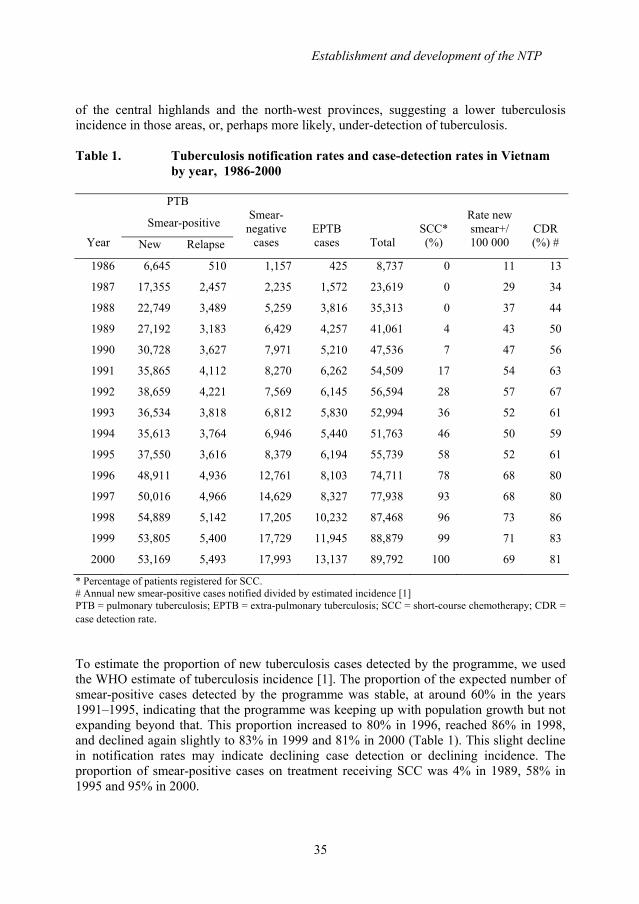
of the central highlands and the north-west provinces, suggesting a lower tuberculosis incidence in those areas, or, perhaps more likely, under-detection of tuberculosis. Table 1. Tuberculosis notification rates and case-detection rates in Vietnam
by year, 1986-2000
PTB
Smear-positive
Year New Relapse
Smear-
negative cases
EPTB cases
Total
SCC* (%)
Rate new smear+/ 100 000
CDR (%) #
1986 6,645 510 1,157 425 8,737 0 11 13
1987 17,355 2,457 2,235 1,572 23,619 0 29 34
1988 22,749 3,489 5,259 3,816 35,313 0 37 44
1989 27,192 3,183 6,429 4,257 41,061 4 43 50
1990 30,728 3,627 7,971 5,210 47,536 7 47 56
1991 35,865 4,112 8,270 6,262 54,509 17 54 63
1992 38,659 4,221 7,569 6,145 56,594 28 57 67
1993 36,534 3,818 6,812 5,830 52,994 36 52 61
1994 35,613 3,764 6,946 5,440 51,763 46 50 59
1995 37,550 3,616 8,379 6,194 55,739 58 52 61
1996 48,911 4,936 12,761 8,103 74,711 78 68 80
1997 50,016 4,966 14,629 8,327 77,938 93 68 80
1998 54,889 5,142 17,205 10,232 87,468 96 73 86
1999 53,805 5,400 17,729 11,945 88,879 99 71 83
2000 53,169 5,493 17,993 13,137 89,792 100 69 81
* Percentage of patients registered for SCC. # Annual new smear-positive cases notified divided by estimated incidence [1] PTB = pulmonary tuberculosis; EPTB = extra-pulmonary tuberculosis; SCC = short-course chemotherapy; CDR = case detection rate. To estimate the proportion of new tuberculosis cases detected by the programme, we used the WHO estimate of tuberculosis incidence [1]. The proportion of the expected number of smear-positive cases detected by the programme was stable, at around 60% in the years 1991–1995, indicating that the programme was keeping up with population growth but not expanding beyond that. This proportion increased to 80% in 1996, reached 86% in 1998, and declined again slightly to 83% in 1999 and 81% in 2000 (Table 1). This slight decline in notification rates may indicate declining case detection or declining incidence. The proportion of smear-positive cases on treatment receiving SCC was 4% in 1989, 58% in 1995 and 95% in 2000.
Chapter 2
36
The cure rate of long-course chemotherapy (3SHZ/6H2S2) improved from 62% in 1987 to 79% in 1997, while the proportion defaulting fell from 15% to 5% during the same period (Table 2). The proportion of patients reportedly dying during treatment decreased from 5% in 1989 to 3% in 1997, while the proportion of treatment failures fell from 6% in 1986 to 3% in 1997. Overall, 69% of smear-positive patients were reported cured by the long-course treatment regimen.
A 1990 B 1995 C 2000
Figure 2. Notification rates of new smear-positive tuberculosis in Vietnam in 1990 (A), 1995 (B), and 2000 (C).
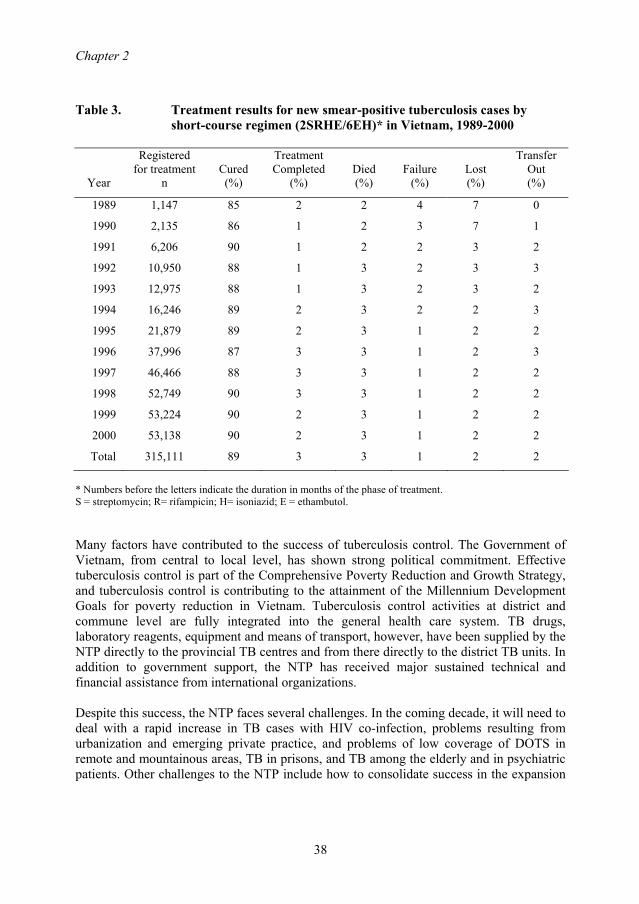
SCC cure rates were initially around 15% higher than those of long-course chemotherapy and have been stable, at 88–90% (Table 3). The proportion of patients who complete treatment without a sputum test has been low and has remained well below that for long-course treatment. Reported failure has been below 1.5% since 1995. The proportion of patients reported defaulting from treatment has been <3% since 1993, while the proportion reported as transferred out has been ≤3% throughout. Case fatality was somewhat lower among patients on SCC than among those on long-course chemotherapy (Tables 2 and 3). The average cure rates for new smear-positive patients on long-course and SCC, weighted according to the relative number of patients treated with each, was 70% in 1986, 80% in 1994, 85% in 1996, and 90% in 1999 and 2000. Maps of province-specific cure rates show that in 1990 none of 46 provinces achieved the target cure rate of 85% (Figure 3). This proportion increased to 21 of 53 provinces in 1995 and 56 of 61 provinces in 2000 (Figure 3). The minimum cure rate observed in any province increased from 0% in 1990 to 26% in 1995 and 65% in 2000.
Establishment and development of the NTP
37
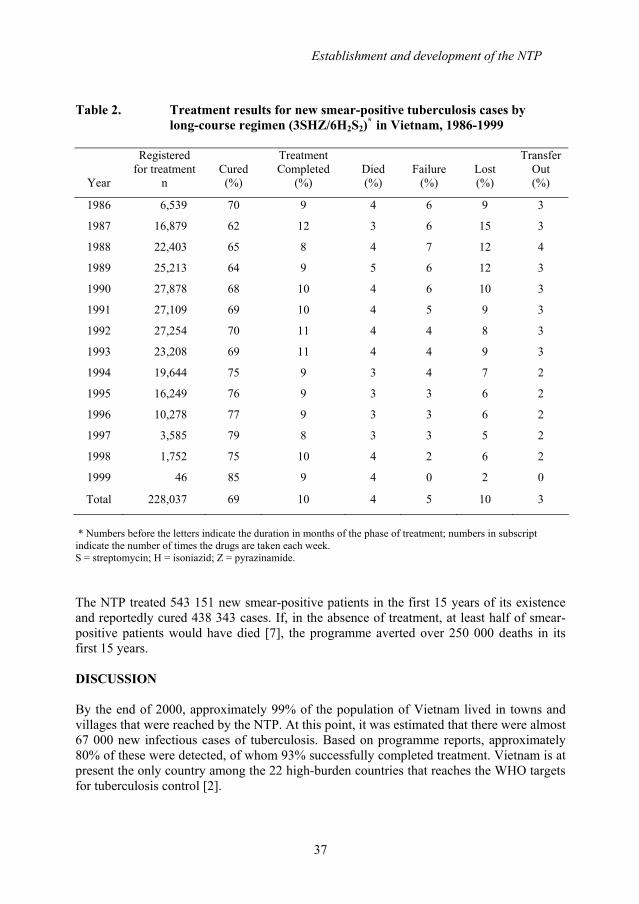
Table 2. Treatment results for new smear-positive tuberculosis cases by long-course regimen (3SHZ/6H2S2)*
in Vietnam, 1986-1999
Year
Registered for treatment
n
Cured (%)
Treatment Completed
(%)
Died (%)
Failure
(%)
Lost (%)
Transfer Out (%)
1986 6,539 70 9 4 6 9 3
1987 16,879 62 12 3 6 15 3
1988 22,403 65 8 4 7 12 4
1989 25,213 64 9 5 6 12 3
1990 27,878 68 10 4 6 10 3
1991 27,109 69 10 4 5 9 3
1992 27,254 70 11 4 4 8 3
1993 23,208 69 11 4 4 9 3
1994 19,644 75 9 3 4 7 2
1995 16,249 76 9 3 3 6 2
1996 10,278 77 9 3 3 6 2
1997 3,585 79 8 3 3 5 2
1998 1,752 75 10 4 2 6 2
1999 46 85 9 4 0 2 0
Total 228,037 69 10 4 5 10 3
* Numbers before the letters indicate the duration in months of the phase of treatment; numbers in subscript indicate the number of times the drugs are taken each week. S = streptomycin; H = isoniazid; Z = pyrazinamide. The NTP treated 543 151 new smear-positive patients in the first 15 years of its existence and reportedly cured 438 343 cases. If, in the absence of treatment, at least half of smear-positive patients would have died [7], the programme averted over 250 000 deaths in its first 15 years. DISCUSSION By the end of 2000, approximately 99% of the population of Vietnam lived in towns and villages that were reached by the NTP. At this point, it was estimated that there were almost 67 000 new infectious cases of tuberculosis. Based on programme reports, approximately 80% of these were detected, of whom 93% successfully completed treatment. Vietnam is at present the only country among the 22 high-burden countries that reaches the WHO targets for tuberculosis control [2].
Chapter 2
38
Table 3. Treatment results for new smear-positive tuberculosis cases by short-course regimen (2SRHE/6EH)* in Vietnam, 1989-2000
Year
Registered for treatment
n
Cured (%)
Treatment Completed
(%)
Died (%)
Failure
(%)
Lost (%)
Transfer Out (%)
1989 1,147 85 2 2 4 7 0
1990 2,135 86 1 2 3 7 1
1991 6,206 90 1 2 2 3 2
1992 10,950 88 1 3 2 3 3
1993 12,975 88 1 3 2 3 2
1994 16,246 89 2 3 2 2 3
1995 21,879 89 2 3 1 2 2
1996 37,996 87 3 3 1 2 3
1997 46,466 88 3 3 1 2 2
1998 52,749 90 3 3 1 2 2
1999 53,224 90 2 3 1 2 2
2000 53,138 90 2 3 1 2 2
Total 315,111 89 3 3 1 2 2
* Numbers before the letters indicate the duration in months of the phase of treatment. S = streptomycin; R= rifampicin; H= isoniazid; E = ethambutol. Many factors have contributed to the success of tuberculosis control. The Government of Vietnam, from central to local level, has shown strong political commitment. Effective tuberculosis control is part of the Comprehensive Poverty Reduction and Growth Strategy, and tuberculosis control is contributing to the attainment of the Millennium Development Goals for poverty reduction in Vietnam. Tuberculosis control activities at district and commune level are fully integrated into the general health care system. TB drugs, laboratory reagents, equipment and means of transport, however, have been supplied by the NTP directly to the provincial TB centres and from there directly to the district TB units. In addition to government support, the NTP has received major sustained technical and financial assistance from international organizations. Despite this success, the NTP faces several challenges. In the coming decade, it will need to deal with a rapid increase in TB cases with HIV co-infection, problems resulting from urbanization and emerging private practice, and problems of low coverage of DOTS in remote and mountainous areas, TB in prisons, and TB among the elderly and in psychiatric patients. Other challenges to the NTP include how to consolidate success in the expansion
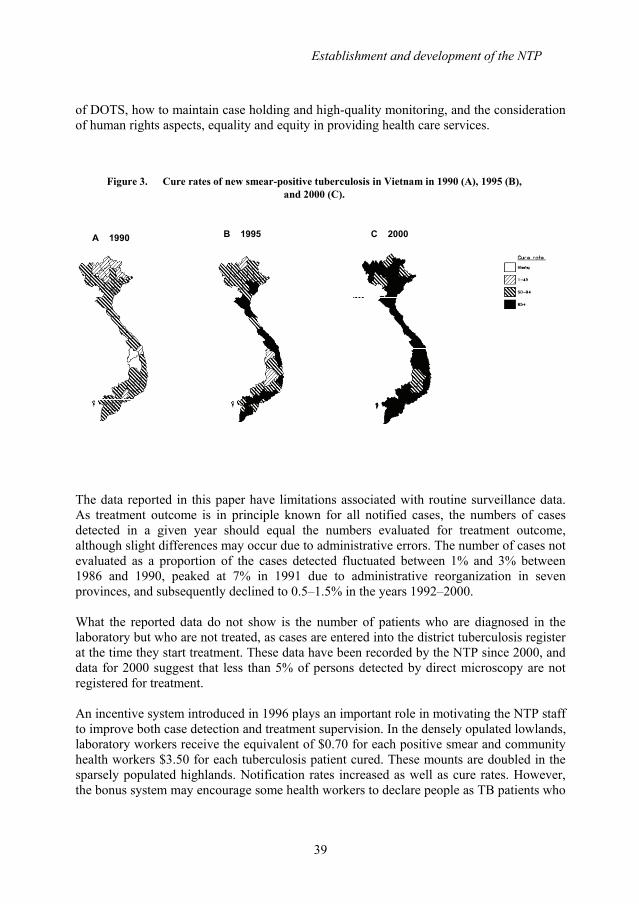
Establishment and development of the NTP
39
of DOTS, how to maintain case holding and high-quality monitoring, and the consideration of human rights aspects, equality and equity in providing health care services.
A 1990 B 1995 C 2000
Figure 3. Cure rates of new smear-positive tuberculosis in Vietnam in 1990 (A), 1995 (B), and 2000 (C).
The data reported in this paper have limitations associated with routine surveillance data. As treatment outcome is in principle known for all notified cases, the numbers of cases detected in a given year should equal the numbers evaluated for treatment outcome, although slight differences may occur due to administrative errors. The number of cases not evaluated as a proportion of the cases detected fluctuated between 1% and 3% between 1986 and 1990, peaked at 7% in 1991 due to administrative reorganization in seven provinces, and subsequently declined to 0.5–1.5% in the years 1992–2000. What the reported data do not show is the number of patients who are diagnosed in the laboratory but who are not treated, as cases are entered into the district tuberculosis register at the time they start treatment. These data have been recorded by the NTP since 2000, and data for 2000 suggest that less than 5% of persons detected by direct microscopy are not registered for treatment. An incentive system introduced in 1996 plays an important role in motivating the NTP staff to improve both case detection and treatment supervision. In the densely opulated lowlands, laboratory workers receive the equivalent of $0.70 for each positive smear and community health workers $3.50 for each tuberculosis patient cured. These mounts are doubled in the sparsely populated highlands. Notification rates increased as well as cure rates. However, the bonus system may encourage some health workers to declare people as TB patients who
Chapter 2
40
never had the disease. Quality control of the laboratories should counteract this danger. Similarly, workers may be tempted to declare a patient as cured, i.e., reading smears too superficially at the end of treatment or not reading them at all. However, the data show that the proportion of patients completing treatment without a smear result is small. Based on the experience reported in this paper and in other countries such as Tanzania [6] China [8] and India [9] we conclude that the DOTS Strategy is feasible in a low-income, high-burden country. REFERENCES 1. Dye C, Scheele S, Dolin P, Pathania V, Raviglione M C, for the WHO Global
Surveillance and Monitoring Group. Global burden of tuberculosis. Estimated incidence, prevalence, and mortality by country. JAMA 1999; 282: 667–686.
2. World Health Organization. Global tuberculosis control: surveillance, planning, financing. WHO Report 2004. Geneva, Switzerland: WHO, 2004.
3. WHO/IUATLD Global Project on Anti-tuberculosis Drug Resistance Surveillance. Anti-tuberculosis drug resistance in the world. Geneva, Switzerland: World Health Organization, 1997.
4. Cohn D L, Bustreo F, Raviglione M C. Drug-resistant tuberculosis: review of the worldwide situation and the WHO/IUATLD Global Surveillance Project. International Union Agaist Tuberculosis and Lung Disease. Clin Infect Dis 1997; 24 (Suppl 1): S121–S130.
5. Quy H T, Nhien D T, Lan N T, Borgdorff M W, Broekmans J F. Steep increase in HIV prevalence among tuberculosis patients in Ho Chi Minh City. AIDS 2002; 16: 931–932.
6. Chum H J. Ten years of the National Tuberculosis/Leprosy Programme in Tanzania. Bull Int Union Tuberc Lung Dis 1989; 64 (3): 34–36.
7. Styblo K. Epidemiology of tuberculosis. Selected Papers, Vol 24. The Hague, The Netherlands: KNCV, 1991.
8. China Tuberculosis Control Collaboration. Results of directly observed short-course chemotherapy in 112,842 Chinese patients with smear-positive tuberculosis. Lancet 1996; 347: 358–362.
9. Khatri G R, Frieden T R. Controlling tuberculosis in India. N Engl J Med 2002; 347: 1420–1425.
41
Chapter 3
Delays in the diagnosis and treatment of tuberculosis patients in Vietnam:
a cross-sectional study
Nguyen T Huong1,3, Marleen Vree2,3, Bui D Duong1, Vu T Khanh1, Vu T Loan1, Nguyen V Co1,
Martien W Borgdorff 2,3, Frank G Cobelens 2,3 1 National Hospital of Tuberculosis and Respiratory Diseases, Hanoi, Vietnam 2 KNCV Tuberculosis Foundation, The Hague, The Netherlands 3 Center for Infection and Immunity Amsterdam, Academic Medical Center, University of Amsterdam, The Netherlands
BMC Public Health, 2007, 7:110

Chapter 3
42
ABSTRACT Background: Treatment delay is an important indicator of access to tuberculosis diagnosis and treatment. Analyses of patient delay (i.e. time interval between onset of symptoms and first consultation of a health care provider) and health care delay (i.e. time interval between first consultation and start of treatment) can inform policies to improve access. This study assesses the patient, health care provider and total delay in diagnosis and treatment of new smear-positive pulmonary tuberculosis patients, and the risk factors for long delay, in Vietnam. Methods: A cross-sectional survey of new patients treated by the National Tuberculosis Control Programme was conducted in 70 randomly selected districts in Vietnam. All consecutively registered patients in one quarter of 2002 were interviewed using a pre-coded structured questionnaire. Results: Median (range) delay was 4 weeks (1-48) for total, 3 (1-48) weeks for patient and 1 (0-25) week for health care delay. Patients with long total delay (≥12 weeks, 15%) accounted for 49% of the cumulative number of delay-weeks. Independent risk factors (p<0.05) for long total delay were female sex, middle age, remote setting, residence in the northern or central area, and initial visit to the private sector. For long patient delay (≥6 weeks) this was female sex, belonging to an ethnic minority, and living at >5 km distance from a health facility or in the northern area. For long health care delay (≥6 weeks) this was urban setting, residence in the central area and initial visit to a communal health post, TB hospital or the private sector. Conclusion: Analyses of patient and treatment delays can indicate target groups and areas for health education and strengthening of the referral system, in particular between the private sector and the NTP.
Delays in diagnosis and treatment of TB patients
43
BACKGROUND Delays in diagnosis and treatment of tuberculosis (TB) are common. They may reflect patient delays in seeking care, health care provider delays in making the diagnosis and starting treatment, or both [1-7]. Diagnostic delay may result in more advanced and severe disease, higher mortality and sustained spread of M. tuberculosis in the community as untreated persons continue to transmit the infection to others [8,9]. Information on diagnostic delay and its trend over time is thus important for evaluation and improvement of TB control programmes. Distributions of diagnostic delays tend to be skewed: they are relatively short for most TB patients, but very long for some [3,4]. Patients with long diagnostic delays may therefore contribute disproportionately to the cumulative delay of all patients and thereby, potentially, to TB transmission. Prevention of these long delays could therefore be more effective in curbing TB transmission than further reduction of the median delay among all patients. Therefore, it is also important to know the risk profile of patients with long diagnostic delays. Vietnam is among the 22 countries with a high TB burden. In 2002, the National Tuberculosis Control Program (NTP) detected 95 044 TB cases (118 per 100 000 population), including 56 811 (71/100 000) new smear-positive cases [10,11]. From 1997 onwards, the estimated case detection rate of the NTP has been above the WHO target of 70%. One would thus expect diagnostic delays to be relatively short, but no nationally representative data are available. A study in 4 provinces in Vietnam in 1996 showed a mean total delay among TB patients of 12 weeks [12]; only small-scale studies of delay have been published since [13,14,15]. In these studies, women had longer delays than men, and more often had visited less qualified health care providers before a diagnosis of TB was made [12-15]. In the NTP, the district is the key level for diagnosis and treatment. Patients with TB symptoms can choose any (private or public) health care provider or go directly to the district TB unit (DTU). Referral to the DTU by private health care providers tends to be limited [16]. The growth of the private health sector may thus affect diagnostic delays [17,18]. We performed a nation-wide study of diagnostic delays in 70 randomly selected district TB units, with the aims of assessing the extent of delay in case-finding and treatment among TB patients diagnosed within the NTP, and identifying risk factors associated with long delay, in particular related to choice of initial health care provider. STUDY POPULATION AND METHODS Eligible were all patients who were registered with newly diagnosed smear-positive pulmonary TB in the third quarter of 2002 in 70 district TB units. These districts had been sampled for a national TB prevalence survey. Sampling was with probability proportional to population size after stratification by area, so that 20 urban, 20 remote and 30 rural
Chapter 3
44
districts were selected. Excluded were patients with permanent or temporary residence outside the district. Patient delay was defined as the period between the onset of cough and the patient’s first attendance of a health care facility because of this cough. Health care provider (HCP) delay was defined as the period between the patient’s first attendance of a health care facility with cough, and the onset of treatment. Treatment delay was defined as the period between diagnosis of smear-positive pulmonary TB and the onset of treatment. Total delay was combined patient and HCP delay. Delay periods were recorded in weeks, rounded to the nearest integer value. Long patient delays and health care provider delays were defined as 6 weeks or more and long total delay as 12 weeks or more. Patients were interviewed using a pre-coded structured questionnaire including demographic variables (age, sex, ethnicity, education and distance from the patient’s house to the first health care provider); time period between onset of cough and first contact with health care provider; time period between onset of cough and start of treatment; date of diagnosis; starting date of treatment. The district TB coordinators were trained to perform interviews and interviewed patients within 2 weeks of treatment registration. The study protocol was approved by the Scientific and Ethical Board of the National Hospital (then: Institute) of Tuberculosis and Respiratory Diseases, Hanoi. Data were double entered using Epi Info v6; inconsistencies were checked against the raw data. Data were analyzed using Stata v8. The chi-square tests were used to compare differences in proportions in total delay between subgroups. Because delays had non-normal distributions, Wilcoxon Rank Sum and Kruskal-Wallis tests were use to test for significance. Mean delays are nonetheless reported for comparison with other studies. Uni- and multivariate logistic regression analysis was used to identify risk factors that were associated with long delay. We tested for significance using the likelihood ratio test for comparing the model likelihood with and without the variable or interaction term of interest. RESULTS During the study period, 2,093 smear positive pulmonary TB patients were registered and interviewed. Among the subjects interviewed, 1898 (92%) patients were interviewed within one week after starting treatment. Of the study subjects, 1491 (71%) were male. The male-to-female ratio (2.5:1) reflected the male-to-female ratio of notified smear positive pulmonary patients in Vietnam in 2002 (2.4:1, NTP unpublished data). Information on total, patient and HCP delay was available for 2069 (99%), 2,075 (99%) and 2034 patients (97%), respectively. Mean total delay was 7.5 weeks with a median of 4 weeks (range: 1-48). Total delay tended to be longer among women and with increasing age, as well as in the northern part of the country, in rural and remote districts settings, among ethnic minority groups and among patients who presented initially to a pharmacy or a communal health post (Table 1).
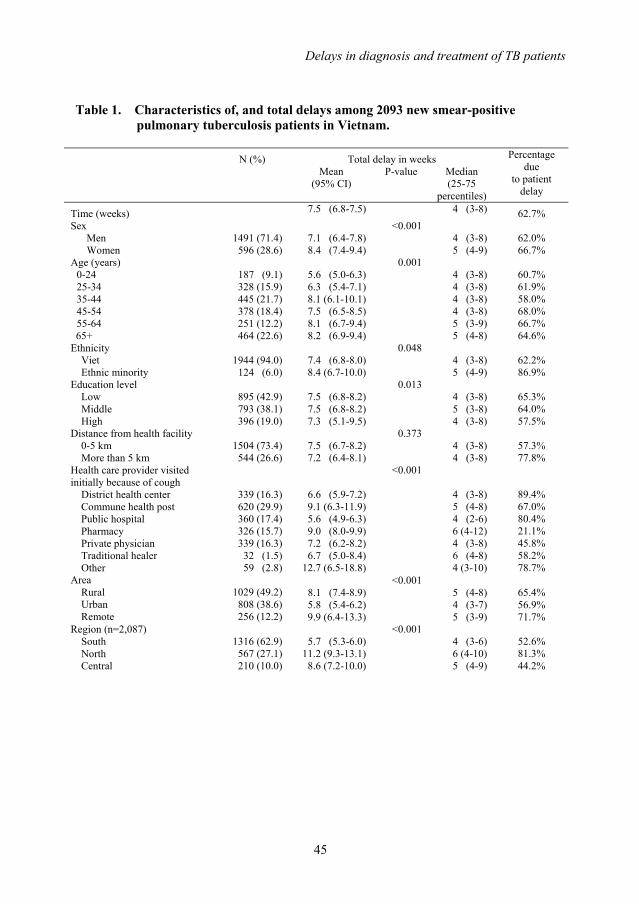
Delays in diagnosis and treatment of TB patients
45
Table 1. Characteristics of, and total delays among 2093 new smear-positive pulmonary tuberculosis patients in Vietnam.
N (%) Total delay in weeks
Mean (95% CI)
P-value Median (25-75
percentiles)
Percentage due
to patient delay
Time (weeks) 7.5 (6.8-7.5) 4 (3-8) 62.7% Sex Men Women
1491 (71.4) 596 (28.6)
7.1 (6.4-7.8) 8.4 (7.4-9.4)
<0.001 4 (3-8) 5 (4-9)
62.0% 66.7%
Age (years) 0-24 25-34 35-44 45-54 55-64
65+
187 (9.1) 328 (15.9) 445 (21.7) 378 (18.4) 251 (12.2) 464 (22.6)
5.6 (5.0-6.3) 6.3 (5.4-7.1) 8.1 (6.1-10.1) 7.5 (6.5-8.5) 8.1 (6.7-9.4) 8.2 (6.9-9.4)
0.001 4 (3-8) 4 (3-8) 4 (3-8) 4 (3-8) 5 (3-9) 5 (4-8)
60.7% 61.9% 58.0% 68.0% 66.7% 64.6%
Ethnicity Viet Ethnic minority
1944 (94.0) 124 (6.0)
7.4 (6.8-8.0) 8.4 (6.7-10.0)
0.048 4 (3-8) 5 (4-9)
62.2% 86.9%
Education level Low Middle High
895 (42.9) 793 (38.1) 396 (19.0)
7.5 (6.8-8.2) 7.5 (6.8-8.2) 7.3 (5.1-9.5)
0.013 4 (3-8) 5 (3-8) 4 (3-8)
65.3% 64.0% 57.5%
Distance from health facility 0-5 km More than 5 km
1504 (73.4) 544 (26.6)
7.5 (6.7-8.2) 7.2 (6.4-8.1)
0.373 4 (3-8) 4 (3-8)
57.3% 77.8%
Health care provider visited initially because of cough District health center Commune health post Public hospital Pharmacy Private physician Traditional healer Other
339 (16.3) 620 (29.9) 360 (17.4) 326 (15.7) 339 (16.3)
32 (1.5) 59 (2.8)
6.6 (5.9-7.2) 9.1 (6.3-11.9) 5.6 (4.9-6.3) 9.0 (8.0-9.9) 7.2 (6.2-8.2) 6.7 (5.0-8.4)
12.7 (6.5-18.8)
<0.001
4 (3-8) 5 (4-8) 4 (2-6) 6 (4-12) 4 (3-8) 6 (4-8) 4 (3-10)
89.4% 67.0% 80.4% 21.1% 45.8% 58.2% 78.7%
Area Rural Urban Remote
1029 (49.2) 808 (38.6) 256 (12.2)
8.1 (7.4-8.9) 5.8 (5.4-6.2) 9.9 (6.4-13.3)
<0.001 5 (4-8) 4 (3-7) 5 (3-9)
65.4% 56.9% 71.7%
Region (n=2,087) South North Central
1316 (62.9) 567 (27.1) 210 (10.0)
5.7 (5.3-6.0)
11.2 (9.3-13.1) 8.6 (7.2-10.0)
<0.001 4 (3-6) 6 (4-10) 5 (4-9)
52.6% 81.3% 44.2%
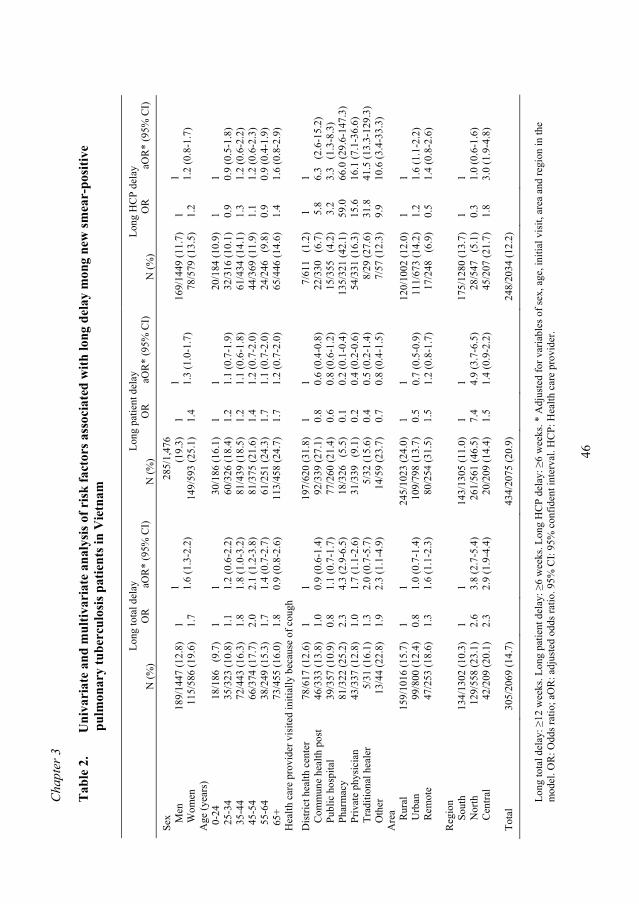
Cha
pter
3
46
Tab
le 2
.
Uni
vari
ate
and
mul
tivar
iate
ana
lysi
s of r
isk
fact
ors a
ssoc
iate
d w
ith lo
ng d
elay
mon
g ne
w sm
ear-
posi
tive
p
ulm
onar
y tu
berc
ulos
is p
atie
nts i
n V
ietn
am
Long
tota
l del
ay
Long
pat
ient
del
ay
Long
HC
P de
lay
N
(%)
OR
aO
R*
(95%
CI)
N
(%)
OR
aO
R*
(95%
CI)
N
(%)
OR
aO
R*
(95%
CI)
Sex
M
en
W
omen
18
9/14
47 (1
2.8)
11
5/58
6 (1
9.6)
1 1.
7
1 1.6
(1.3
-2.2
)
285/
1,47
6 (1
9.3)
14
9/59
3 (2
5.1)
1 1.
4
1 1.3
(1.0
-1.7
) 16
9/14
49 (1
1.7)
78
/579
(13.
5)
1 1.2
1 1.2
(0.8
-1.7
) A
ge (y
ears
) 0-
24
25-3
4 35
-44
45-5
4 55
-64
65+
18/1
86
(9.7
) 35
/323
(10.
8)
72/4
43 (1
6.3)
66
/374
(17.
7)
38/2
49 (1
5.3)
73
/455
(16.
0)
1 1.1
1.8
2.0
1.7
1.8
1 1.2
(0.6
-2.2
) 1.
8 (1
.0-3
.2)
2.1
(1.2
-3.8
) 1.
4 (0
.7-2
.7)
0.9
(0.8
-2.6
)
30/1
86 (1
6.1)
60
/326
(18.
4)
81/4
39 (1
8.5)
81
/375
(21.
6)
61/2
51 (2
4.3)
11
3/45
8 (2
4.7)
1 1.2
1.2
1.4
1.7
1.7
1 1.1
(0.7
-1.9
) 1.
1 (0
.6-1
.8)
1.2
(0.7
-2.0
) 1.
1 (0
.7-2
.0)
1.2
(0.7
-2.0
)
20/1
84 (1
0.9)
32
/316
(10.
1)
61/4
34 (1
4.1)
44
/369
(11.
9)
24/2
46
(9.8
) 65
/446
(14.
6)
1 0.9
1.3
1.1
0.9
1.4
1 0.9
(0.5
-1.8
) 1.
2 (0
.6-2
.2)
1.2
(0.6
-2.3
) 0.
9 (0
.4-1
.9)
1.6
(0.8
-2.9
) H
ealth
car
e pr
ovid
er v
isite
d in
itial
ly b
ecau
se o
f cou
gh
Dis
trict
hea
lth c
ente
r
Com
mun
e he
alth
pos
t
Publ
ic h
ospi
tal
Ph
arm
acy
Pr
ivat
e ph
ysic
ian
Tr
aditi
onal
hea
ler
O
ther
78/6
17 (1
2.6)
46
/333
(13.
8)
39/3
57 (1
0.9)
81
/322
(25.
2)
43/3
37 (1
2.8)
5/
31 (1
6.1)
13
/44
(22.
8)
1 1.0
0.8
2.3
1.0
1.3
1.9
1 0.9
(0.6
-1.4
) 1.
1 (0
.7-1
.7)
4.3
(2.9
-6.5
) 1.
7 (1
.1-2
.6)
2.0
(0.7
-5.7
) 2.
3 (1
.1-4
.9)
197/
620
(31.
8)
92/3
39 (2
7.1)
77
/260
(21.
4)
18/3
26
(5.5
) 31
/339
(9
.1)
5/32
(15.
6)
14/5
9 (2
3.7)
1 0.8
0.6
0.1
0.2
0.4
0.7
1 0.6
(0.4
-0.8
) 0.
8 (0
.6-1
.2)
0.2
(0.1
-0.4
) 0.
4 (0
.2-0
.6)
0.5
(0.2
-1.4
) 0.
8 (0
.4-1
.5)
7/61
1 (
1.2)
22
/330
(6
.7)
15/3
55
(4.2
) 13
5/32
1 (4
2.1)
54
/331
(16.
3)
8/29
(27.
6)
7/57
(12.
3)
1
5.8
3
.2
59.0
15
.6
31.8
9.
9
1 6.3
(2.
6-15
.2)
3.3
(1.
3-8.
3)
66.0
(29.
6-14
7.3)
16
.1 (7
.1-3
6.6)
41
.5 (1
3.3-
129.
3)
10.6
(3.4
-33.
3)
Are
a
Rur
al
U
rban
Rem
ote
15
9/10
16 (1
5.7)
99
/800
(12.
4)
47/2
53 (1
8.6)
1 0.8
1.3
1 1.0
(0.7
-1.4
) 1.
6 (1
.1-2
.3)
24
5/10
23 (2
4.0)
10
9/79
8 (1
3.7)
80
/254
(31.
5)
1 0.5
1.5
1 0.7
(0.5
-0.9
) 1.
2 (0
.8-1
.7)
12
0/10
02 (1
2.0)
11
1/67
3 (1
4.2)
17
/248
(6
.9)
1 1.2
0.5
1 1.6
(1.1
-2.2
) 1.
4 (0
.8-2
.6)
Reg
ion
S
outh
Nor
th
C
entra
l
13
4/13
02 (1
0.3)
12
9/55
8 (2
3.1)
42
/209
(20.
1)
1 2.6
2.3
1 3.8
(2.7
-5.4
) 2.
9 (1
.9-4
.4)
14
3/13
05 (1
1.0)
26
1/56
1 (4
6.5)
20
/209
(14.
4)
1 7.4
1.5
1 4.9
(3.7
-6.5
) 1.
4 (0
.9-2
.2)
17
5/12
80 (1
3.7)
28
/547
(5
.1)
45/2
07 (2
1.7)
1 0.3
1.8
1 1.0
(0.6
-1.6
) 3.
0 (1
.9-4
.8)
Tota
l 30
5/20
69 (1
4.7)
43
4/20
75 (2
0.9)
24
8/20
34 (1
2.2)
Long
tota
l del
ay: ≥
12 w
eeks
. Lon
g pa
tient
del
ay: ≥
6 w
eeks
. Lon
g H
CP
dela
y: ≥
6 w
eeks
. * A
djus
ted
for v
aria
bles
of s
ex, a
ge, i
nitia
l vis
it, a
rea
and
regi
on in
the
mod
el. O
R: O
dds r
atio
; aO
R: a
djus
ted
odds
ratio
. 95%
CI:
95%
con
fiden
t int
erva
l. H
CP:
Hea
lth c
are
prov
ider
.
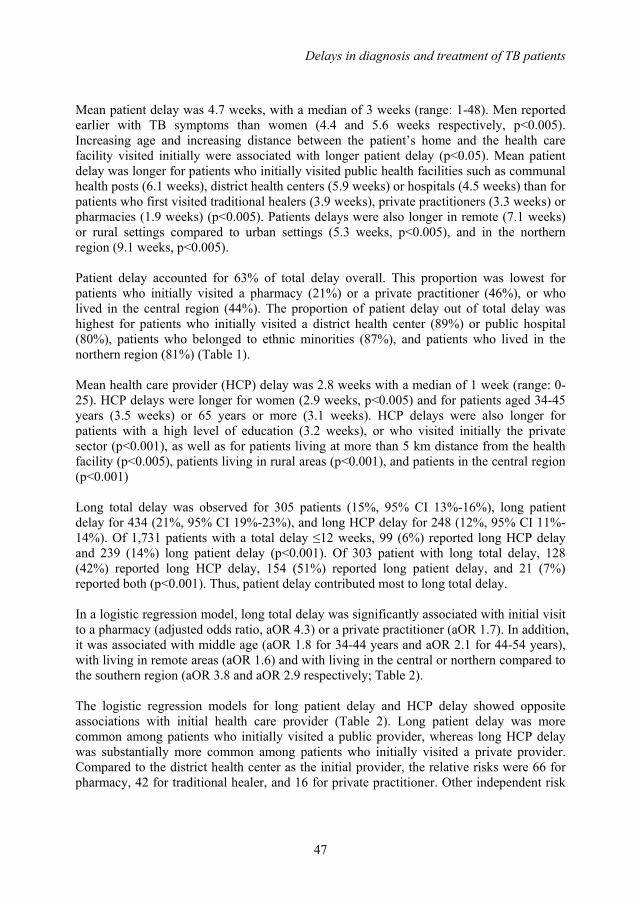
Delays in diagnosis and treatment of TB patients
47
Mean patient delay was 4.7 weeks, with a median of 3 weeks (range: 1-48). Men reported earlier with TB symptoms than women (4.4 and 5.6 weeks respectively, p<0.005). Increasing age and increasing distance between the patient’s home and the health care facility visited initially were associated with longer patient delay (p<0.05). Mean patient delay was longer for patients who initially visited public health facilities such as communal health posts (6.1 weeks), district health centers (5.9 weeks) or hospitals (4.5 weeks) than for patients who first visited traditional healers (3.9 weeks), private practitioners (3.3 weeks) or pharmacies (1.9 weeks) (p<0.005). Patients delays were also longer in remote (7.1 weeks) or rural settings compared to urban settings (5.3 weeks, p<0.005), and in the northern region (9.1 weeks, p<0.005). Patient delay accounted for 63% of total delay overall. This proportion was lowest for patients who initially visited a pharmacy (21%) or a private practitioner (46%), or who lived in the central region (44%). The proportion of patient delay out of total delay was highest for patients who initially visited a district health center (89%) or public hospital (80%), patients who belonged to ethnic minorities (87%), and patients who lived in the northern region (81%) (Table 1). Mean health care provider (HCP) delay was 2.8 weeks with a median of 1 week (range: 0-25). HCP delays were longer for women (2.9 weeks, p<0.005) and for patients aged 34-45 years (3.5 weeks) or 65 years or more (3.1 weeks). HCP delays were also longer for patients with a high level of education (3.2 weeks), or who visited initially the private sector (p<0.001), as well as for patients living at more than 5 km distance from the health facility (p<0.005), patients living in rural areas (p<0.001), and patients in the central region (p<0.001) Long total delay was observed for 305 patients (15%, 95% CI 13%-16%), long patient delay for 434 (21%, 95% CI 19%-23%), and long HCP delay for 248 (12%, 95% CI 11%-14%). Of 1,731 patients with a total delay ≤12 weeks, 99 (6%) reported long HCP delay and 239 (14%) long patient delay (p<0.001). Of 303 patient with long total delay, 128 (42%) reported long HCP delay, 154 (51%) reported long patient delay, and 21 (7%) reported both (p<0.001). Thus, patient delay contributed most to long total delay. In a logistic regression model, long total delay was significantly associated with initial visit to a pharmacy (adjusted odds ratio, aOR 4.3) or a private practitioner (aOR 1.7). In addition, it was associated with middle age (aOR 1.8 for 34-44 years and aOR 2.1 for 44-54 years), with living in remote areas (aOR 1.6) and with living in the central or northern compared to the southern region (aOR 3.8 and aOR 2.9 respectively; Table 2). The logistic regression models for long patient delay and HCP delay showed opposite associations with initial health care provider (Table 2). Long patient delay was more common among patients who initially visited a public provider, whereas long HCP delay was substantially more common among patients who initially visited a private provider. Compared to the district health center as the initial provider, the relative risks were 66 for pharmacy, 42 for traditional healer, and 16 for private practitioner. Other independent risk
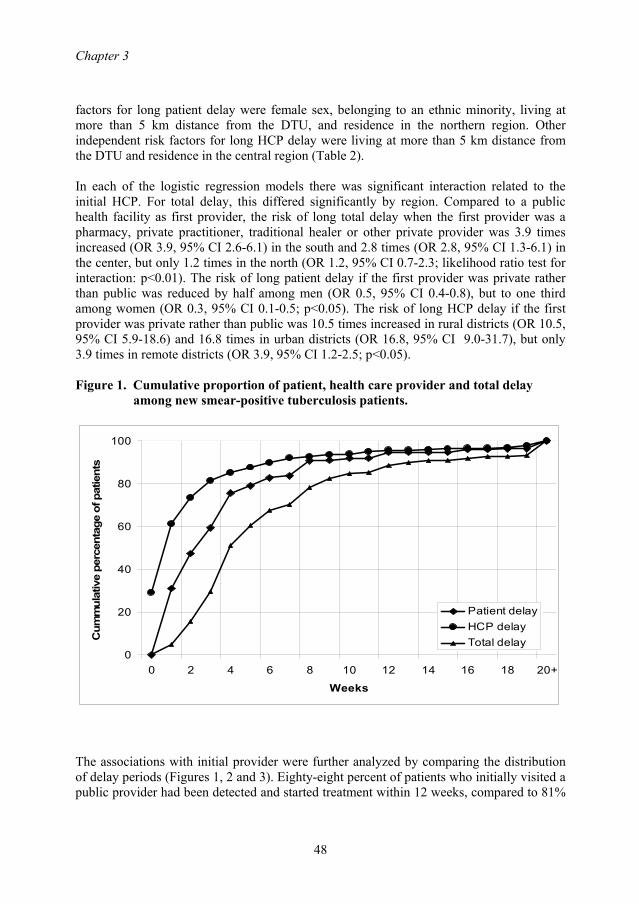
Chapter 3
48
factors for long patient delay were female sex, belonging to an ethnic minority, living at more than 5 km distance from the DTU, and residence in the northern region. Other independent risk factors for long HCP delay were living at more than 5 km distance from the DTU and residence in the central region (Table 2). In each of the logistic regression models there was significant interaction related to the initial HCP. For total delay, this differed significantly by region. Compared to a public health facility as first provider, the risk of long total delay when the first provider was a pharmacy, private practitioner, traditional healer or other private provider was 3.9 times increased (OR 3.9, 95% CI 2.6-6.1) in the south and 2.8 times (OR 2.8, 95% CI 1.3-6.1) in the center, but only 1.2 times in the north (OR 1.2, 95% CI 0.7-2.3; likelihood ratio test for interaction: p<0.01). The risk of long patient delay if the first provider was private rather than public was reduced by half among men (OR 0.5, 95% CI 0.4-0.8), but to one third among women (OR 0.3, 95% CI 0.1-0.5; p<0.05). The risk of long HCP delay if the first provider was private rather than public was 10.5 times increased in rural districts (OR 10.5, 95% CI 5.9-18.6) and 16.8 times in urban districts (OR 16.8, 95% CI 9.0-31.7), but only 3.9 times in remote districts (OR 3.9, 95% CI 1.2-2.5; p<0.05). Figure 1. Cumulative proportion of patient, health care provider and total delay
among new smear-positive tuberculosis patients.
0
20
40
60
80
100
0 2 4 6 8 10 12 14 16 18 20+
Weeks
Cum
mul
ativ
e pe
rcen
tage
of p
atie
nts
Patient delayHCP delayTotal delay
The associations with initial provider were further analyzed by comparing the distribution of delay periods (Figures 1, 2 and 3). Eighty-eight percent of patients who initially visited a public provider had been detected and started treatment within 12 weeks, compared to 81%
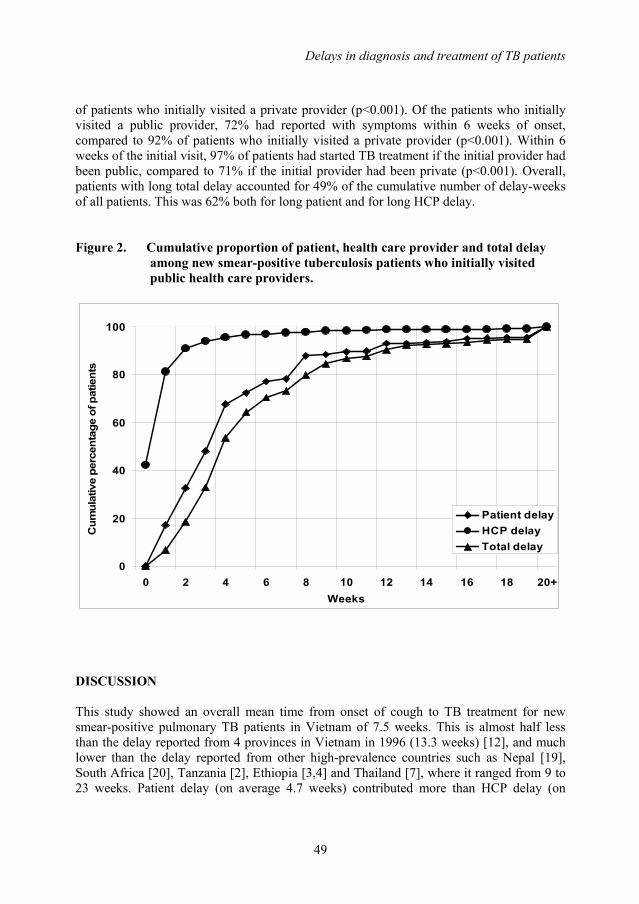
Delays in diagnosis and treatment of TB patients
49
of patients who initially visited a private provider (p<0.001). Of the patients who initially visited a public provider, 72% had reported with symptoms within 6 weeks of onset, compared to 92% of patients who initially visited a private provider (p<0.001). Within 6 weeks of the initial visit, 97% of patients had started TB treatment if the initial provider had been public, compared to 71% if the initial provider had been private (p<0.001). Overall, patients with long total delay accounted for 49% of the cumulative number of delay-weeks of all patients. This was 62% both for long patient and for long HCP delay. Figure 2. Cumulative proportion of patient, health care provider and total delay
among new smear-positive tuberculosis patients who initially visited public health care providers.
0
20
40
60
80
100
0 2 4 6 8 10 12 14 16 18 20+Weeks
Cum
ulat
ive
perc
enta
ge o
f pat
ient
s
Patient delayHCP delayTotal delay
DISCUSSION This study showed an overall mean time from onset of cough to TB treatment for new smear-positive pulmonary TB patients in Vietnam of 7.5 weeks. This is almost half less than the delay reported from 4 provinces in Vietnam in 1996 (13.3 weeks) [12], and much lower than the delay reported from other high-prevalence countries such as Nepal [19], South Africa [20], Tanzania [2], Ethiopia [3,4] and Thailand [7], where it ranged from 9 to 23 weeks. Patient delay (on average 4.7 weeks) contributed more than HCP delay (on
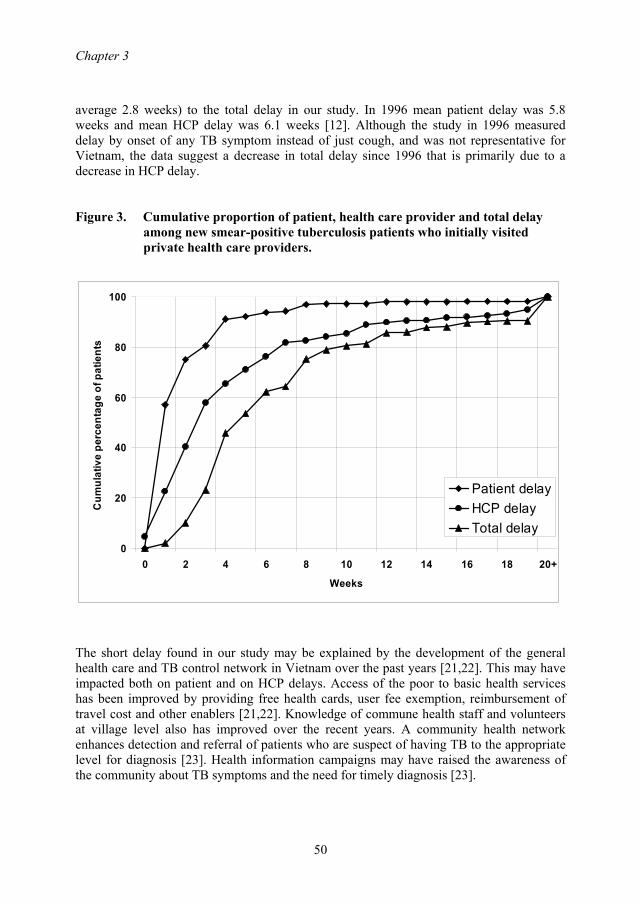
Chapter 3
50
average 2.8 weeks) to the total delay in our study. In 1996 mean patient delay was 5.8 weeks and mean HCP delay was 6.1 weeks [12]. Although the study in 1996 measured delay by onset of any TB symptom instead of just cough, and was not representative for Vietnam, the data suggest a decrease in total delay since 1996 that is primarily due to a decrease in HCP delay. Figure 3. Cumulative proportion of patient, health care provider and total delay
among new smear-positive tuberculosis patients who initially visited private health care providers.
0
20
40
60
80
100
0 2 4 6 8 10 12 14 16 18 20+
Weeks
Cum
ulat
ive
perc
enta
ge o
f pat
ient
s
Patient delayHCP delayTotal delay
The short delay found in our study may be explained by the development of the general health care and TB control network in Vietnam over the past years [21,22]. This may have impacted both on patient and on HCP delays. Access of the poor to basic health services has been improved by providing free health cards, user fee exemption, reimbursement of travel cost and other enablers [21,22]. Knowledge of commune health staff and volunteers at village level also has improved over the recent years. A community health network enhances detection and referral of patients who are suspect of having TB to the appropriate level for diagnosis [23]. Health information campaigns may have raised the awareness of the community about TB symptoms and the need for timely diagnosis [23].
Delays in diagnosis and treatment of TB patients
51
We found clear associations between delay and the type of health care provider first visited by the patient because of cough. Long patient delays were most frequent if this had been the district health centre, and least frequent if this had been a private provider. Long HCP delays were however more frequent among patients who visited a private provider first, as were long total delays. These findings are in accordance with data from Ho Chi Minh City, where, compared to public providers, relative risks for long HCP delay were 5.5 for private pharmacies as the first provider, and 2.1 for private physicians as the first provider [13]. Thus, although initial visits to private health services tended to be earlier after the onset of cough than initial visits to public health services, the time until diagnosis of TB tended to be longer, to the net effect of longer delays if the initial provider had been private. This suggests that referral from the private sector is an important problem. One-third of all patients in our study had initially visited a private provider, although this proportion was higher in the southern (44%) and central (37%) than in the northern region (8%). Also, the observed interaction indicates that referral from private providers is less of a problem in the north and in remote settings. Education on diagnosis of TB of private health care providers and pharmacies may help prevent long health care provider delays, as may implementation of public-private mix DOTS projects in urban and rural areas, in particular in the southern and central regions. The growth of the private sector in Vietnam and its impact on diagnostic delay warrant regular monitoring of these delays. The 21% of patients who had patient delays of more than 6 weeks accounted for 61% of the cumulative patient delay period, and the 13% of patients who had HCP delay of more than 6 weeks accounted for 62% of the cumulative HCP delay. It supports our hypothesis that efforts should not be put in further reduction of total median delay, but in prevention of long delays, since they contribute most to the cumulative delay of all patients and thereby to transmission. The sex difference in delay is small and similar to the difference found by previous studies [12,14,15,24-26]. These longer delays among women, as well as the low proportion of women among patients in this study and among notified TB patients in Vietnam in general, may indicate lower access to diagnosis and treatment of TB for women compared to men [12,25,26]. However, biological differences between men and women with respect to TB incidence and sensitivity of smear examination may play a role as well [24,27]. Analysis of model interactions suggests that, although women tend to report with cough to private providers earlier than men, this does not result in shorter overall delays, supporting earlier findings that health care providers visited by women tend to be less qualified [24,25]. These analyses showed other risk factors for long delay that may help target interventions, such as belonging to an ethnic minority, living in particular geographic areas, middle age and female sex. There were several limitations to our study. First, the reported duration of symptoms is based on the patients’ recall and interpretation. Recall bias is thus a serious threat to the estimates of delay and actions taken. Unfortunately there is no feasible method which can deal with this problem. Second, selection of patients might be biased. Some patients diagnosed within the NTP may have been referred to other facilities or have sought
Chapter 3
52
treatment in the private sector before they were registered. These patients were not included in our study. Third, both health workers and patients can contribute to long HCP delay: patients can delay the start of treatment as well as the health worker, e.g. for fear of stigmatization or reluctance to tell employers [28]. Finally, the observed association of long delay with private health care provider does not necessarily imply causation. Patients may have been more “at risk” of visiting a private practitioner simply because more time elapsed between onset of symptoms and diagnosis at the TB unit. CONCLUSIONS On average, total, patient and health care provider delays were short in this nation-wide study of TB patients in Vietnam. Nonetheless, 15% of patients reported total delays ≥12 weeks, and accounted for half of the cumulative number of delay-weeks. Initial visit to the private sector had a considerable impact on the length of delays but with distinct regional differences across the country. Efforts should be made to further reduce diagnostic delays by improving the referral from the private to the public health sector. ACKNOWLEDGEMENTS We thank the NTP staff at the study sites for their support in this work. This study was supported financially by the Netherlands Government (project number VN002405). Frank Cobelens and Martien Borgdorff receive grants from the Netherlands Ministry of Foreign Affairs (Development Cooperation grants nr. 4917 and 8865). The funding body had no role in study design, data collection, analysis or reporting, not in the decision to submit the manuscript. REFERENCES 1. Sherman LF, Fujiwara PI, Cook SV, Bazerman LB, Frieden TR: Patient and health
care system delays in the diagnosis and treatment of tuberculosis. Int J Tuberc Lung Dis 1999, 3:1088-1095.
2. Wandwalo ER, Morkve O: Delay in tuberculosis case-finding and treatment in Mwanza, Tanzania. Int J Tuberc Lung Dis 2000, 4:133-138.
3. Demissie M, Lindtjorn B, Berhane Y: Patient and health care service delay in the diagnosis of pulmonary tuberculosis in Ethiopia. BMC Public Health 2002, 25:2-23.
4. Yimer S, Bjune G, Alene G: Diagnostic and treatment delay among pulmonary tuberculosis patients in Ethiopia: a cross sectional study. BMC Infectious Diseases 2005, 12:112.
5. Ohmori M, Ozasa K, Mori T, Wada M, Yoshiyama T, Aoki M, Uchimura K, Ishikawa N: Trends of delays in tuberculosis case finding in Japan and associated factors. Int J Tuberc Lung Dis 2005, 9:999-1005.
6. Xu B, Jiang QW, Xiu Y, Diwan VK: Diagnostic delays in access to tuberculosis care in counties with or without the National Tuberculosis Control Programme in rural China. Int J Tuberc Lung Dis 2005, 9:784-790.
Delays in diagnosis and treatment of TB patients
53
7. Rojpibulstit M, Kanjanakiritamrong J, Chongsuvivatwong V. Patient and health system delays in the diagnosis of tuberculosis in Southern Thailand after health care reform. Int J Tuberc Lung Dis 2006, 10: 422-428.
8. Toman K: Tuberculosis case finding and chemotherapy questions and answers. Geneva: WHO; 1979.
9. Styblo K: Epidemiology of tuberculosis. Selected papers, volume 24. The Hague: KNCV; 1991
10. WHO Global Tuberculosis Programme: Global tuberculosis control. Surveillance, planning, financing. Geneva: World Health Organization; 2005.
11. National Tuberculosis Control Program: Annual Data 2002. Socialist Republic of Vietnam. Hanoi: Ministry of Health. National Tuberculosis Control Programme. National Institute of Tuberculosis and Respiratory diseases; 2003.
12. Long NH, Johansson E, Lönnroth K, Eriksson B, Winkvist A, Diwan VK: Longer delays in tuberculosis diagnosis among women in Vietnam. Int J Tuberc Lung Dis 1999, 3 388-393.
13. Lönnroth K, Thuong LM, Linh PD, Diwan VK: Delay and discontinuity- a survey of TB patients’ search of a diagnosis in a diversified health care system. Int J Tuberc Lung Dis 1999; 3: 992-1000.
14. Thorson A, Hoa NP, Long NH: Health-seeking behaviour of individuals with a cough of more than 3 weeks. Lancet 2000, 356:1823-4.
15. Hoa NP, Thorson AEK, Long NH, Diwan VK: Knowledge of tuberculosis and associated health-seeking behavior among rural Vietnamese adults with a cough for at least three weeks. Scand J Public Health 2003; 31 (Suppl. 62):1-7.
16. Lönnroth K, Karlsson M, Lan NT, Buu TN, Dieu TT: Referring TB suspects from private pharmacies to the National Tuberculosis Programme: experiences from two districts in Ho Chi Minh City, Vietnam. Int J Tuberc Lung Dis 2003, 7:1147-1153.
17. Lönnroth K, Thuong LM, Linh PD, Diwan VK: Utilization of private and public health-care providers for tuberculosis symptoms in Ho Chi Minh City, Vietnam. Health Policy Plan 2001, 16: 47-54.
18. Quy HT, Lan NT. Lönnroth K, Buu TN, Dieu TT, Hai LT: Public-private mix for improved TB control in Ho Chi Minh City, Vietnam: an assessment of its impact on case detection. Int J Tuberc Lung Dis 2003, 7:464-71.
19. Yamasaki-Nakagawa M, Ozasa K, Yamada N, Osuga K, Shimouchi A, Ishikawa N, Bam DS, Mori T: Gender difference in delays to diagnosis and health care seeking behaviour in a rural area of Nepal. Int J Tuberc Lung Dis 2001; 5:24-31.
20. Pronyk PM, Makhubele MB, Hargreaves JR, Tollman SM, Hausler HP: Assessing health seeking behaviour among tuberculosis patients in rural South Africa. Int J Tuberc Lung Dis 2001; 5:619-627.
21. Decision 06-CT/TW by the Executive Committee of Central Party on consolidating and strengthening basic health care net work [http//:www.moh.gov.vn/English: health policy (2000-2010)]
22. Decision 35/2001/QD-TTg approving the strategy for protection and care of the people’s health in the 2000-2010 period [http//:www.moh.gov.vn/English: health policy (2000-2010)]
Chapter 3
54
23. National Tuberculosis Control Programme: Middle term review of the National Tuberculosis Control Program for the period 2001-2005. Hanoi: National Hospital of Tuberculosis and Respiratory Diseases; 2004.
24. Long NH, Diwan VK, Winkvist A: Difference in symptoms suggesting pulmonary tuberculosis among men and women. J Clin Epidemiol 2002, 55:115-120.
25. Long NH, Johansson E, Diwan VK, Winkvist A: Fear and social isolation as consequences of tuberculosis in Vietnam: a gender analysis. Health Policy 2001, 58:69-81.
26. Johansson E, Long NH, Diwan VK, Winkvist A: Gender and tuberculosis control. Perspectives on health seeking behavior among men and women in Vietnam. Health Policy 2000, 52:33-51.
27. Huong NT, Duong BD, Linh NN, Van LN, Co NV, Broekmans JF, Cobelens FG, Borgdorff MW: Evaluation of sputum smear microscopy in the National Tuberculosis Control Programme in the north of Vietnam. Int J Tuberc Lung Dis 2006; 10: 277-82.
28. Johansson E, Diwan VK, Huong ND, Ahberg BM: Staff and patient attitudes to tuberculosis and compliance with treatment: an exploratory study in district in Vietnam. Tuber Lung Dis 1996, 77: 178-33.
55
Chapter 4
Evaluation of sputum smear microscopy in the National Tuberculosis Control Programme
in the north of Vietnam
N.T. Huong1,3, B.D. Duong1 , N.N. Linh1, L.N. Van1, N. V. Co1, J.F. Broekmans2, F.G. Cobelens2, 3, M.W. Borgdorff2,3
1. National Hospital of Tuberculosis and Respiratory Diseases, Hanoi, Vietnam 2. KNCV Tuberculosis Foundation, The Hague, The Netherlands 3. Academic Medical Center, University of Amsterdam, The Netherlands
International Journal of Tuberculosis and Lung Disease, 2006 Vol 10(3), pp: 277-282
Chapter 4
56
ABSTRACT Objective: To assess the yield of sputum smear microscopy and sex differences in the National Tuberculosis Control Programme in the north of Vietnam. Methods: Review of registers of 30 randomly selected laboratories (26 districts, 4 provincial level). Results: The average daily workload per technician was 4.4 examinations in district and 5.3 examinations in provincial laboratories. To find one smear-positive case, 9.7 suspects were examined and 29.3 smears done. The smear-positive rate (mean 10.3%) was higher among men (11.6%) than among women (8.4%, p<0.001). There were more men than women among tuberculosis (TB) suspects (male:female ratio 1.36, 95%CI 1.19–1.54), but even more so among smear-positive patients (1.89, 95%CI 1.64–2.14), irrespective of specimen quality and number of smears examined. Three smears were examined for 18 055 suspects (61.7%). The incremental gain was 33.5% and 4.9% for the second and third smear examination, respectively; 186 (95%CI 160–221) smears needed to be examined to find one additional case of TB with a third serial examination. Conclusion: The diagnostic process seemed generally efficient. The male:female ratios suggest higher TB incidence in men rather than lower access to TB facilities for women. The third smear examination could be omitted.
Evaluation of sputum smear microscopy
57
INSTRODUCTION Tuberculosis (TB) remains a major public health problem in Vietnam [1,2]. Sputum smear examination by microscopy for acid-fast bacilli is a key method of TB case finding in developing countries. Since 1986, the National Tuberculosis Control Programme (NTP) has implemented a standard recording and reporting system for smear examination, as recommended by the International Union Against Tuberculosis and Lung Disease (The Union) [3]. This is based on laboratory registers to record the results of every TB examinee at district microscopy centres. Examination of three sputum specimens, of which the first and third are collected on the spot and the second early in the morning (spot-morning-spot), is recommended to exclude smear-positive pulmonary TB. The results are entered in three separate columns on the same line. Sputum smear examination is free of charge. In Vietnam, there are 627 peripheral laboratories capable of performing smear microscopy at district health centres. The population per laboratory varies by region, and is about 125 000 on average. The district laboratories are supported with quality assurance by 61 intermediate-level provincial laboratories. In this study, we assessed the workload of laboratory staff, and the use and yield of sputum smear examination in relation to the demographic characteristics of TB suspects and cases under routine NTP conditions in the north of Vietnam. To assess access to diagnostic services, we were particularly interested in variations by age and sex. In addition, we evaluated the number of slides that needed to be examined to find one additional case of TB with a second and third serial diagnostic sputum smear examination. METHODS Study population and sampling Thirty microscopy centres were selected randomly by cluster sampling with probability proportional to the number of smear-positive TB cases notified in 1997. Eligible for selection were all centres that performed sputum smear examination by the Ziehl-Neelsen method. Laboratory staff were interviewed using a structured questionnaire to obtain data on numbers of TB laboratory technicians, working days, microscopes available, smears done (diagnosis and follow-up smears), suspects examined and smear-positive cases detected in 1998. In addition, laboratory record data were collected of all TB suspects (defined as any person presenting at the laboratory with a history of cough of ≥2 weeks) examined in 1998, including sex, age and reason for examination, sputum appearance and results of smear examination. In accordance with NTP guidelines, a TB case was defined as a suspect with at least two positive sputum smear examinations or one positive sputum smear examination with an abnormal chest x-ray (CXR) or positive culture examination.
Chapter 4
58
Data management and analysis Data were entered in Epi Info v6.4 (Centers for Disease Control and Prevention, Atlanta, GA, USA). A 10% random sample of the laboratory record data was re-entered for data validation and showed only minimal errors. Data were analyzed in STATA v8 (Stata Corp, College Station, TX, USA). Comparison of the proportions of positive smears and of male examinees calculated directly from the total data set with the averages over the laboratory-specific proportions showed no significant differences. We therefore assumed a self-weighted sample and calculated proportions over all laboratories combined [4]. Confidence intervals (CI) and P values were adjusted for the cluster design by first-order Taylor linearization and the second-order correction of Rao and Scott of the Pearson ҳ2 test, respectively, as implemented in the STATA ‘svy’ commands [5,6]. We calculated the number of smears required to identify one additional case of TB with a second or third sequential smear examination, as described by Rieder et al [7]. This number depends on the proportion of cases among suspects and the incremental gain from the first to the second and from the second to the third examination, respectively. The incremental gain is defined as the proportion of all TB cases diagnosed by the second or third smear examination if previous examinations were negative [8]. The product of these two proportions provides the overall fraction of the suspect population that are positive for the first time on the second or third serial examination. The reciprocal value of this proportion provides the number of smears required to identify one additional case; a Bayesian 95%CI is obtained by the Markov Chain Monte Carlo approach [7]. This method underestimates the incremental gain if not all suspects had a complete set of three examinations. We adjusted for this by assuming that the probability of a positive smear did not depend on whether the examination had actually been done. The published algorithm was used to impute the number of missed cases by failing to examine an entire set of three examinations for each suspect [7]. This number was used to estimate the potential incremental gain, i.e., the proportion of all TB cases diagnosed by the second or third smear examination if previous examinations were negative and three smear examinations had been done for all suspects. RESULTS Of the 30 selected laboratories, 26 were district (average population 170 000; range 52200–270 000) and four provincial centres (1 723 000; 881 000–3 580 000). Five were in remote, mountainous areas (68 200; 60 000–80 000) with generally long distances and poor transport services. All used the standard NTP laboratory register. Of 107 860 smears, 49% were performed at district laboratories and 83% were diagnostic (Table 1). The proportion of diagnostic smears was larger in district (86%) than in provincial laboratories (79%). The average number of smears performed by one laboratory was higher in provincial (22.3 smears/laboratory/day) than in district laboratories (5.0
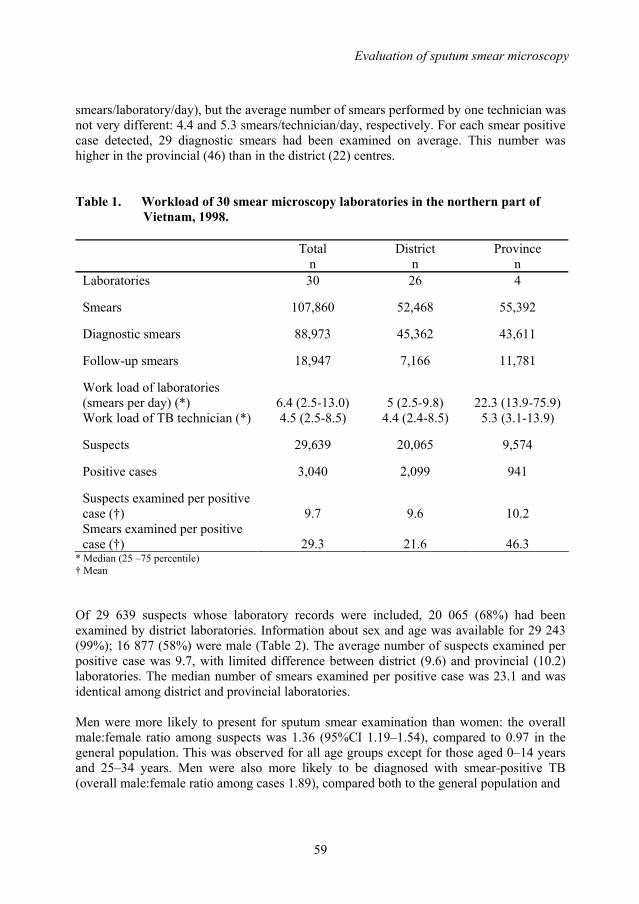
Evaluation of sputum smear microscopy
59
smears/laboratory/day), but the average number of smears performed by one technician was not very different: 4.4 and 5.3 smears/technician/day, respectively. For each smear positive case detected, 29 diagnostic smears had been examined on average. This number was higher in the provincial (46) than in the district (22) centres. Table 1. Workload of 30 smear microscopy laboratories in the northern part of
Vietnam, 1998.
Total n
District n
Province n
Laboratories 30 26 4
Smears 107,860 52,468 55,392
Diagnostic smears 88,973 45,362 43,611
Follow-up smears 18,947 7,166 11,781
Work load of laboratories (smears per day) (*)
6.4 (2.5-13.0)
5 (2.5-9.8)
22.3 (13.9-75.9)
Work load of TB technician (*) 4.5 (2.5-8.5) 4.4 (2.4-8.5) 5.3 (3.1-13.9)
Suspects 29,639 20,065 9,574
Positive cases 3,040 2,099 941
Suspects examined per positive case (†)
9.7
9.6
10.2
Smears examined per positive case (†)
29.3
21.6
46.3
* Median (25 –75 percentile) † Mean
Of 29 639 suspects whose laboratory records were included, 20 065 (68%) had been examined by district laboratories. Information about sex and age was available for 29 243 (99%); 16 877 (58%) were male (Table 2). The average number of suspects examined per positive case was 9.7, with limited difference between district (9.6) and provincial (10.2) laboratories. The median number of smears examined per positive case was 23.1 and was identical among district and provincial laboratories. Men were more likely to present for sputum smear examination than women: the overall male:female ratio among suspects was 1.36 (95%CI 1.19–1.54), compared to 0.97 in the general population. This was observed for all age groups except for those aged 0–14 years and 25–34 years. Men were also more likely to be diagnosed with smear-positive TB (overall male:female ratio among cases 1.89), compared both to the general population and
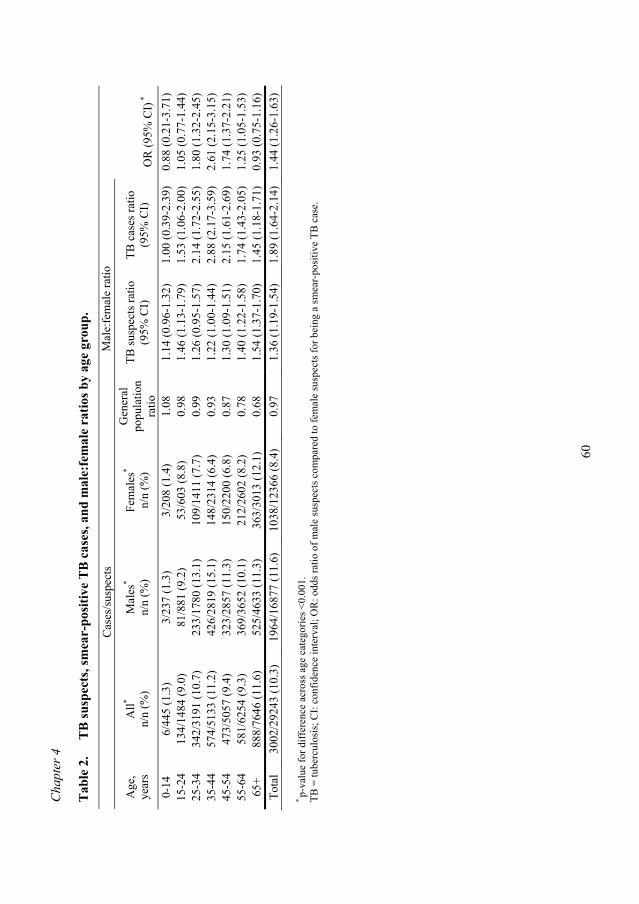
Cha
pter
4
60
Tab
le 2
.
TB
susp
ects
, sm
ear-
posi
tive
TB
cas
es, a
nd m
ale:
fem
ale
ratio
s by
age
grou
p.
C
ases
/sus
pect
s M
ale:
fem
ale
ratio
Age
, ye
ars
All*
n/n
(%)
Mal
es*
n/n
(%)
Fem
ales
*
n/n
(%)
Gen
eral
po
pula
tion
ratio
TB su
spec
ts ra
tio
(95%
CI)
TB
cas
es ra
tio
(95%
CI)
O
R (9
5% C
I) *
0-14
6/
445
(1.3
) 3/
237
(1.3
) 3/
208
(1.4
) 1.
08
1.14
(0.9
6-1.
32)
1.00
(0.3
9-2.
39)
0.88
(0.2
1-3.
71)
15-2
4 13
4/14
84 (9
.0)
81/8
81 (9
.2)
53/6
03 (8
.8)
0.98
1.
46 (1
.13-
1.79
) 1.
53 (1
.06-
2.00
) 1.
05 (0
.77-
1.44
) 25
-34
342/
3191
(10.
7)
233/
1780
(13.
1)
109/
1411
(7.7
) 0.
99
1.26
(0.9
5-1.
57)
2.14
(1.7
2-2.
55)
1.80
(1.3
2-2.
45)
35-4
4 57
4/51
33 (1
1.2)
42
6/28
19 (1
5.1)
14
8/23
14 (6
.4)
0.93
1.
22 (1
.00-
1.44
) 2.
88 (2
.17-
3.59
) 2.
61 (2
.15-
3.15
) 45
-54
473/
5057
(9.4
) 32
3/28
57 (1
1.3)
15
0/22
00 (6
.8)
0.87
1.
30 (1
.09-
1.51
) 2.
15 (1
.61-
2.69
) 1.
74 (1
.37-
2.21
) 55
-64
581/
6254
(9.3
) 36
9/36
52 (1
0.1)
21
2/26
02 (8
.2)
0.78
1.
40 (1
.22-
1.58
) 1.
74 (1
.43-
2.05
) 1.
25 (1
.05-
1.53
) 65
+ 88
8/76
46 (1
1.6)
52
5/46
33 (1
1.3)
36
3/30
13 (1
2.1)
0.
68
1.54
(1.3
7-1.
70)
1.45
(1.1
8-1.
71)
0.93
(0.7
5-1.
16)
Tota
l 30
02/2
9243
(10.
3)
1964
/168
77 (1
1.6)
10
38/1
2366
(8.4
) 0.
97
1.36
(1.1
9-1.
54)
1.89
(1.6
4-2.
14)
1.44
(1.2
6-1.
63)
* p-
valu
e fo
r diff
eren
ce a
cros
s age
cat
egor
ies <
0.00
1.
TB =
tube
rcul
osis
; CI:
conf
iden
ce in
terv
al; O
R: o
dds r
atio
of m
ale
susp
ects
com
pare
d to
fem
ale
susp
ects
for b
eing
a sm
ear-
posi
tive
TB c
ase.
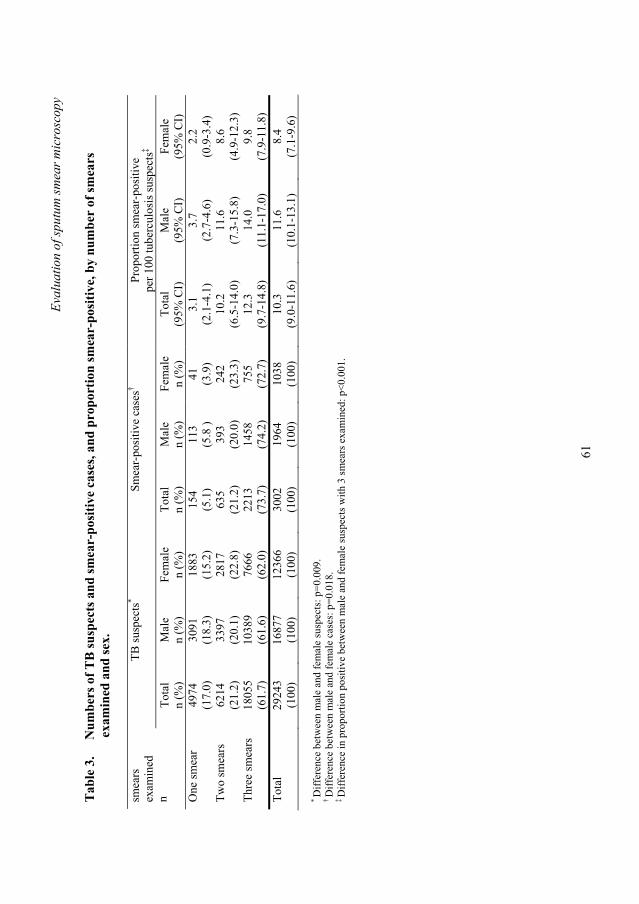
Eval
uatio
n of
sput
um sm
ear m
icro
scop
y
61
Tab
le 3
.
Num
bers
of T
B su
spec
ts a
nd sm
ear-
posi
tive
case
s, an
d pr
opor
tion
smea
r-po
sitiv
e, b
y nu
mbe
r of
smea
rs
e
xam
ined
and
sex.
TB su
spec
ts*
Smea
r-po
sitiv
e ca
ses†
Prop
ortio
n sm
ear-
posi
tive
per 1
00 tu
berc
ulos
is su
spec
ts‡
smea
rs
exam
ined
n
Tota
l n
(%)
Mal
e n
(%)
Fem
ale
n (%
) To
tal
n (%
) M
ale
n (%
) Fe
mal
e n
(%)
Tota
l (9
5% C
I)
Mal
e (9
5% C
I)
Fem
ale
(95%
CI)
O
ne sm
ear
4974
(1
7.0)
30
91
(18.
3)
1883
(1
5.2)
15
4
(5.1
) 11
3
(5.8
) 41
(3
.9)
3.1
(2.1
-4.1
) 3.
7 (2
.7-4
.6)
2.2
(0.9
-3.4
) Tw
o sm
ears
62
14
(21.
2)
3397
(2
0.1)
28
17
(22.
8)
635
(2
1.2)
39
3
(20.
0)
242
(2
3.3)
10
.2
(6.5
-14.
0)
11.6
(7
.3-1
5.8)
8.
6 (4
.9-1
2.3)
Th
ree
smea
rs
1805
5 (6
1.7)
10
389
(61.
6)
7666
(6
2.0)
22
13
(73.
7)
1458
(7
4.2)
75
5
(72.
7)
12.3
(9
.7-1
4.8)
14
.0
(11.
1-17
.0)
9.8
(7.9
-11.
8)
Tota
l 29
243
(100
) 16
877
(100
) 12
366
(100
) 30
02
(100
) 19
64
(100
) 10
38
(100
) 10
.3
(9.0
-11.
6)
11.6
(1
0.1-
13.1
) 8.
4 (7
.1-9
.6)
* D
iffer
ence
bet
wee
n m
ale
and
fem
ale
susp
ects
: p=0
.009
. † D
iffer
ence
bet
wee
n m
ale
and
fem
ale
case
s: p
=0.0
18.
‡ D
iffer
ence
in p
ropo
rtion
pos
itive
bet
wee
n m
ale
and
fem
ale
susp
ects
with
3 sm
ears
exa
min
ed: p
<0.0
01.
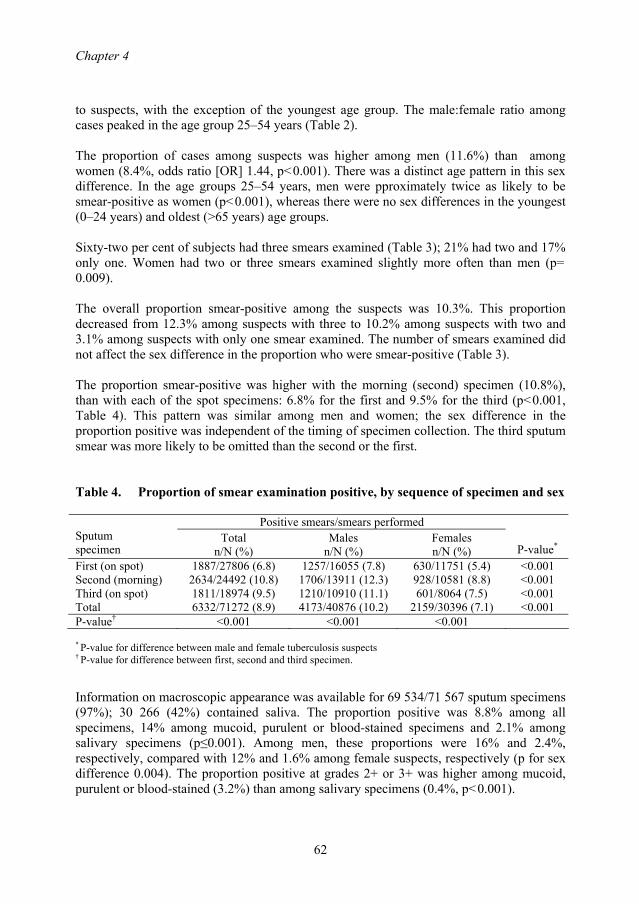
Chapter 4
62
to suspects, with the exception of the youngest age group. The male:female ratio among cases peaked in the age group 25–54 years (Table 2). The proportion of cases among suspects was higher among men (11.6%) than among women (8.4%, odds ratio [OR] 1.44, p<0.001). There was a distinct age pattern in this sex difference. In the age groups 25–54 years, men were pproximately twice as likely to be smear-positive as women (p<0.001), whereas there were no sex differences in the youngest (0–24 years) and oldest (>65 years) age groups. Sixty-two per cent of subjects had three smears examined (Table 3); 21% had two and 17% only one. Women had two or three smears examined slightly more often than men (p= 0.009). The overall proportion smear-positive among the suspects was 10.3%. This proportion decreased from 12.3% among suspects with three to 10.2% among suspects with two and 3.1% among suspects with only one smear examined. The number of smears examined did not affect the sex difference in the proportion who were smear-positive (Table 3). The proportion smear-positive was higher with the morning (second) specimen (10.8%), than with each of the spot specimens: 6.8% for the first and 9.5% for the third (p<0.001, Table 4). This pattern was similar among men and women; the sex difference in the proportion positive was independent of the timing of specimen collection. The third sputum smear was more likely to be omitted than the second or the first. Table 4. Proportion of smear examination positive, by sequence of specimen and sex
Positive smears/smears performed Sputum specimen
Total n/N (%)
Males n/N (%)
Females n/N (%)
P-value* First (on spot) 1887/27806 (6.8) 1257/16055 (7.8) 630/11751 (5.4) <0.001 Second (morning) 2634/24492 (10.8) 1706/13911 (12.3) 928/10581 (8.8) <0.001 Third (on spot) 1811/18974 (9.5) 1210/10910 (11.1) 601/8064 (7.5) <0.001 Total 6332/71272 (8.9) 4173/40876 (10.2) 2159/30396 (7.1) <0.001 P-value† <0.001 <0.001 <0.001
* P-value for difference between male and female tuberculosis suspects † P-value for difference between first, second and third specimen.
Information on macroscopic appearance was available for 69 534/71 567 sputum specimens (97%); 30 266 (42%) contained saliva. The proportion positive was 8.8% among all specimens, 14% among mucoid, purulent or blood-stained specimens and 2.1% among salivary specimens (p≤0.001). Among men, these proportions were 16% and 2.4%, respectively, compared with 12% and 1.6% among female suspects, respectively (p for sex difference 0.004). The proportion positive at grades 2+ or 3+ was higher among mucoid, purulent or blood-stained (3.2%) than among salivary specimens (0.4%, p<0.001).
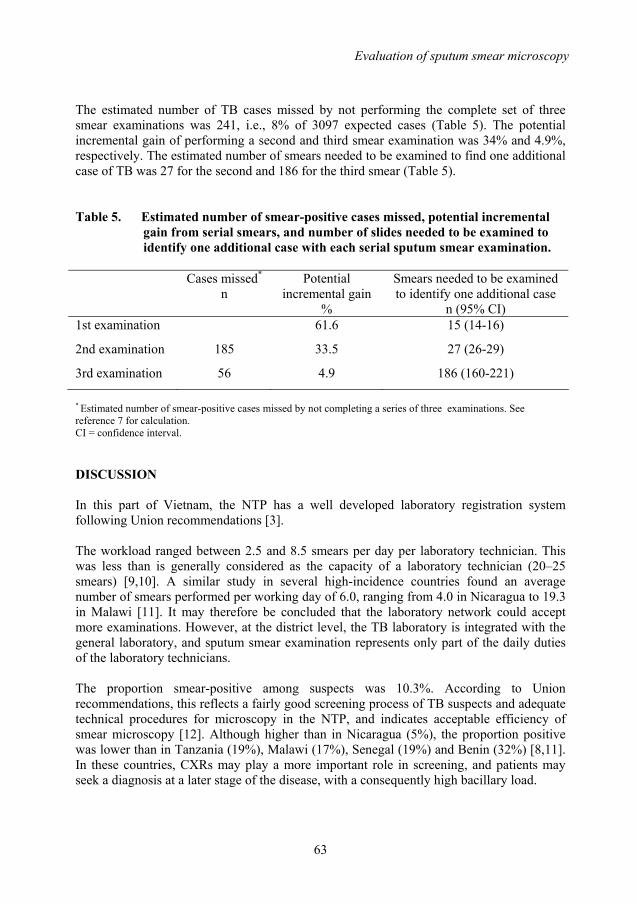
Evaluation of sputum smear microscopy
63
The estimated number of TB cases missed by not performing the complete set of three smear examinations was 241, i.e., 8% of 3097 expected cases (Table 5). The potential incremental gain of performing a second and third smear examination was 34% and 4.9%, respectively. The estimated number of smears needed to be examined to find one additional case of TB was 27 for the second and 186 for the third smear (Table 5). Table 5. Estimated number of smear-positive cases missed, potential incremental
gain from serial smears, and number of slides needed to be examined to identify one additional case with each serial sputum smear examination.
Cases missed*
n Potential
incremental gain %
Smears needed to be examined to identify one additional case
n (95% CI) 1st examination 61.6 15 (14-16)
2nd examination 185 33.5 27 (26-29)
3rd examination 56 4.9 186 (160-221)
* Estimated number of smear-positive cases missed by not completing a series of three examinations. See reference 7 for calculation. CI = confidence interval. DISCUSSION In this part of Vietnam, the NTP has a well developed laboratory registration system following Union recommendations [3]. The workload ranged between 2.5 and 8.5 smears per day per laboratory technician. This was less than is generally considered as the capacity of a laboratory technician (20–25 smears) [9,10]. A similar study in several high-incidence countries found an average number of smears performed per working day of 6.0, ranging from 4.0 in Nicaragua to 19.3 in Malawi [11]. It may therefore be concluded that the laboratory network could accept more examinations. However, at the district level, the TB laboratory is integrated with the general laboratory, and sputum smear examination represents only part of the daily duties of the laboratory technicians. The proportion smear-positive among suspects was 10.3%. According to Union recommendations, this reflects a fairly good screening process of TB suspects and adequate technical procedures for microscopy in the NTP, and indicates acceptable efficiency of smear microscopy [12]. Although higher than in Nicaragua (5%), the proportion positive was lower than in Tanzania (19%), Malawi (17%), Senegal (19%) and Benin (32%) [8,11]. In these countries, CXRs may play a more important role in screening, and patients may seek a diagnosis at a later stage of the disease, with a consequently high bacillary load.
Chapter 4
64
The proportion positive is an important indicator for estimation of supplies. The Union recommendation for the calculation of laboratory supplies has been that 10 suspects need to be examined with three smears each to identify one case of sputum smear-positive TB [12]. We found that 29 smears were indeed examined per case on average, although this was lower at the district centres (22). The higher number of smears at the provincial centres (46) reflects a relatively high case load of referred smear-negative suspects who, as part of the diagnostic work-up, have up to six smears examined. The observed male:female ratio of smear-positive patients (1.9:1) was in accordance with that reported globally (2:1) or among notified TB cases in Vietnam in 1998 (2:1) (NTP, unpublished data) [1]. The causes of this sex difference in case notification are not well understood [13–15]. We found that, compared to women, men were more likely to present for smear examination, but also to be smear-positive upon examination. In the age group 25–54 years, the smear-positive rate was approximately two times higher for men than for women, suggesting that the sex difference reflects biological phenomena rather than lower access to TB diagnosis for women. These may include not only true differences in TB incidence, but also differences in the bacillary load of sputum specimens and thereby in the sensitivity of smear examination [16,17]. Differences in the quality or number of specimens is a less likely explanation, as the sex difference remained after stratification for specimen appearance, timing of collection and number of smears examined. The 1.4:1 male:female ratio for TB suspects may nevertheless reflect gender-related barriers in the access to TB services, as suggested by other research and anecdotal evidence [17–19]. Such barriers may be related to cultural beliefs, traditional customs and practices, labour division within the household and seasonal work preventing women from being diagnosed in time and treated properly [18,19]. Also, the stigma related to TB tends to be greater for women than for men. The Vietnamese NTP has implemented the recommendation to obtain three sputum smears, the first on the spot, the second in the early morning, and the third again on the spot when the second is delivered [3]. Compliance with this policy was low (62%). However, 95% of the smear-positive patients were detected by the first two smears, i.e., the third smear yielded only 5% additional cases. This yield was somewhat higher than in Ethiopia (1%) and Bangladesh (3%), but similar to that in Tanzania (4%) [8,20,21] although in the latter study the potential incremental gain of the second smear was considerably higher. Rieder et al. recently presented a method to objectively assess the appropriateness of current recommendations with regard to the numbers of smears to be examined in different settings [7]. We applied this to the north of Vietnam, and estimated that 186 smears needed to be examined to detect one additional TB case by a third smear examination. This is at the upper end of what experts would consider an efficient use of human and other resources [7]. Omitting the third sputum specimen might thus be an option for the Vietnamese NTP, although further studies need to clarify whether this should apply to the whole country. It has limited impact on case finding, while it saves work for the health services and limits the burden to TB suspects. On the other hand, the TB laboratory workload in the north of
Evaluation of sputum smear microscopy
65
Vietnam is already limited. The advantages should thus be carefully weighed against the disadvantage of detecting fewer cases. The morning specimen had a higher yield than the spot specimens, probably reflecting higher bacillary load. Macroscopic inspection indicated that almost half of the specimens were predominantly salivary. Further studies are needed on how the technique of sputum collection can be improved. This study has limitations. The routine laboratory registers may have contained errors. Furthermore, referral of TB patients between provincial microscopy centres and district TB units was not taken into account and may have introduced bias in the age and sex distribution of suspects and TB cases. Finally, the assumption underlying the estimation of the potential incremental gain of the third sputum smear, i.e., that missed examinations had the same probability of a positive result as performed examinations, may not entirely hold. We observed a significantly higher yield of the third than of the first specimen, although both were collected on the spot. This suggests that suspects who provided a third specimen had a higher than average probability of being smear-positive, e.g., because their symptoms raised higher suspicion of TB than those of suspects who missed the third specimen. If this is true, we have overestimated the potential incremental yield of the third examination and under–estimated the number of smears needed to be examined to detect one additional case. This would reinforce the notion that the third smear examination could be omitted in the diagnostic process. ACKNOWLEDGEMENTS The authors are grateful to Dr H Rieder for his reviews of the manuscript. Special thanks to colleagues at the Provincial TB Centres and District TB Units where the study was conducted for their cooperation in data collection. This study was financed by the KNCV Tuberculosis Foundation. REFERENCES 1. World Health Organization. Global Tuberculosis Control - Surveillance, planning,
finances. WHO Report 2004. Geneva: WHO, 2004. 2. Huong NT, Duong BD, Co NV et al. Establishment and development of the
National Tuberculosis Control Programme in Vietnam. Int J Tuberc Lung Dis 2005; 9: 151-156.
3. Enarson DA, Rieder HL, Arnadottir T, Trebucq A. Management of tuberculosis. A guide for low income countries, 5th edition. Paris: International Union Against Tuberculosis and Lung Disease, 2000.
4. Cochran WG. Sampling techniques. New York: John Wiley & Sons, 1977. 5. Royall RM. Model robust confidence intervals using maximum likelihood
estimators. Int Stat Rev 1986; 54: 221-226. 6. Rao JN, Scott AJ. A simple method for the analysis of clustered binary data.
Biometrics 1992; 48: 577-585.
Chapter 4
66
7. Rieder HL, Chiang CY, Rusen ID. A method to determine the utility of the third diagnostic and the second follow-up sputum smear examinations to diagnose tuberculosis cases and failures. Int J Tuberc Lung Dis 2005; 9: 384-391.
8. Ipuge YA, Rieder HL, Enarson DA. The yield of acid-fast bacilli from serial smears in routine microscopy laboratories in rural Tanzania. Trans R Soc Trop Med Hyg 1996; 90: 258-261.
9. World Health Organization. Laboratory services in tuberculosis control. Part I: organization and management. Geneva: WHO, 1998.
10. World Health Organization. Stop TB Special Project. Quality assurance of sputum microscopy in DOTS programs. Regional guidelines for countries in the Western Pacific. Manila: WHO Western Pacific Regional Office, 2003.
11. Rieder HL, Arnadottir T, Gutierrez AAT. Evaluation of a standardized recording tool for sputum smear microscopy for AFB under routine conditions in low income countries. Int J Tuberc Lung Dis 1997; 1: 339-345.
12. Rieder HL, Enarson DA. A computer-based ordering system for supplies in national tuberculosis programs. Tuber Lung Dis 1995; 76: 450-454.
13. Uplekar MW, Rangan S, Weiss MG, Ogden J, Borgdorff MW, Hudelson P. Attention to gender issues in tuberculosis control: towards a strategy for research and action. Geneva: WHO, 2000.
14. Howson CP, Harrison PF, Hotra D, Law M. In her lifetime: female morbidity and mortality in Sub-Saharan Africa. Washington DC: National Academy Press, 1996
15. Holmes CB, Hausler H, Nunn P. A review of sex differences in the epidemiology of tuberculosis. Int J Tuberc Lung Dis 1998; 2: 96-104.
16. Borgdorff MW, Nagelkerke NJD, Dye C, Nunn P. Gender and tuberculosis: comparison of prevalence survey with notification data to explore sex differences in case detection. Int J Tuberc Lung Dis 2000; 4:123-132.
17. Hudelson P. Gender differentials in tuberculosis: the role of socio-economic and cultural factors. Tubercle Lung Dis 1996; 77: 391-400
18. Hamid Salim MA, Declercq E, Van Deun A, Saki KA. Gender differences in tuberculosis: a prevalence survey done in Bangladesh. Int J Tuberc Lung Dis 2004; 8: 952-957.
19. Thorson A, Hoa NP, Long NH, Allebeck P, Diwan VK. Do women with tuberculosis have a lower likelihood of getting diagnosed? Prevalence and case detection of sputum smear positive pulmonary TB, a population-based study from Vietnam. J Clin Epidemiol 2004; 57: 398-402.
20. Van Deun A, Salim AH, Cooreman E et al. Optimal tuberculosis case detection by direct sputum smear microscopy: how much better is more. Int J Tuberc Lung Disease 2002; 6: 222-230.
21. Yassin MA, Cuevas LE. How many sputum smears are necessary for case finding in pulmonary tuberculosis? Trop Med Int Health 2003; 8: 927-932.
67
Chapter 5
Variation in case notification of tuberculosis: Disentangling incidence and access to care
N.T. Huong1,4, B.D. Duong1, T.N. Buu2,4, N.V.Co1, A.C. Gebhard3, M.W. Borgdorff3,4, F.G. Cobelens3,4
1. National Hospital of Tuberculosis and Respiratory Diseases, Hanoi, Vietnam 2. Pham Ngoc Thach Hospital, Ho Chi Minh City, Vietnam 3. KNCV Tuberculosis Foundation, The Hague, The Netherlands 4. Center for Infection and Immunity Amsterdam, Academic Medical Center,
University of Amsterdam, The Netherlands
Submitted for publication
Chapter 5
68
ABSTRACT Setting: All communes and districts in Vietnam. Objective: To assess to what extent the variation in tuberculosis (TB) notification is explained by variation in TB incidence and by variation in access to diagnosis and treatment. Design: Cross-sectional survey of all districts and communes in the NTP surveillance system. Retrospective reviews of all district TB laboratory registers for the second quarter of 2003. Results: The overall annual notification rate of smear positive TB per 100 000 population was 78 (95% CI 77-79); 9 per 1000 population had sputum smear examination (suspect rate; 95% CI 9-9). Notification and suspect rates were lowest in the communes in the Red River Delta (46.8/100 000 and 4.1/1000 respectively) and highest in those in the North East Highland (117.2/100 000 and 18.2/1000 respectively), both in the northern region of the country. Notification rates and the suspect rates were significantly associated with most of the demographic indicators and TB control indicators analyzed. In the multivariate analyses, both notification and suspect rates were significantly associated with zone, urbanity and indicators of TB control and showed no relevant association with ethnic composition or poverty status of the commune. In addition, case notification rates followed a north-south gradient. The distance to the district health center and availability of health care staff and microscopy centers were strong determinants of the suspect rate. Conclusion: This study suggests that geographic variations in CNRs in Vietnam reflect both differences in access to care and epidemiological differences in TB distribution. The TB suspect rate is probably a useful summary indicator of the diagnostic effort that may be used to disentangle variations in TB incidence from variation in access to diagnosis.
Variation in case notification of tuberculosis
69
INTRODUCTION For tuberculosis (TB) control, the World Health Organization (WHO) recommends the directly observed therapy short-course (DOTS) strategy (currently Stop TB Strategy) [1], and has set global targets for case detection and treatment success [2-5]. This strategy is considered one of the most cost-effective of all health interventions [6]. Successful TB control requires widespread access to diagnosis and care as well as proper case management. National Tuberculosis Control Programmes (NTP) therefore need knowledge of the epidemiology of TB in the country and of determinants of access to diagnosis and treatment. Analyses of TB case notification rates, which are routinely collected by such programmes, may provide useful information and allow monitoring of trends over time. However, TB case notification in high prevalence countries generally reflects not only incidence but also access, or from the perspective of a TB programme, case finding effort [7]. Variations in incidence of TB can thus be obscured by variations in case finding, and vice versa. For example, geographical gradients, urban-rural differences, and variations in socio-economic status may affect both incidence and access. One way of disentangling these two factors may be to use a single indicator that quantifies case finding efforts. A summary indicator that has been proposed is the TB suspect (or examination) rate, i.e. the proportion of the population examined by sputum smear microscopy over a defined period of time [8]. The suspect rate can be obtained relatively easily from TB laboratory registers and population data. Vietnam is one of the seven countries with a high burden of TB in the Western Pacific region. It also ranks 13th on the list of the 22 high TB burden countries in the world [9]. Vietnam started to implement the DOTS strategy in 1989 and has exceeded the targets for case detection and treatment success since 1997 [10]. The TB control network is organized along a four-tiered pyramid: national, province, district and commune/village. The district tuberculosis unit (DTU) is responsible for confirmation of the diagnosis by microscopic sputum examination at the district general laboratory, initiation of ambulatory treatment to be provided near the patient’s home, supervision of the conduct of the NTP in the communes, and integration with other health activities. At the base of the health care system is the commune health post (CHP), serving on average of 7,000-8,000 population. One commune health worker is responsible for communicable diseases including tuberculosis. Their tasks include identification and referral of suspects to the DTU, and application and supervision of ambulatory treatment. Although all districts and communes in Vietnam provide DOTS services, they probably differ in the amount of effort they put into TB case finding and in access to TB diagnosis and treatment. This may be associated with poverty, remoteness and composition of the population. It is unclear to what extent such differences explain the marked variation in tuberculosis case notification rates (CNR) in Vietnam. The CNR are nearly 2 times higher in the south (96 new smear positive cases/100.000) than in the north (51/100.000) of the country [NTP, unpublished data]. By analyzing notification rates of smear-positive TB in Vietnam by individual commune during one quarter in 2003 we aimed to assess to what

Chapter 5
70
extent the variation in TB notification is explained by variation in epidemiology and by variation in access to diagnosis, respectively. METHODS A cross-sectional study was conducted all 639 districts covering 10,659 communes in Vietnam, using data on TB suspects and cases for each commune from retrospective reviews of all district TB laboratory registers in the second quarter (1 April through 30 June) of 2003. Data on demographic indicators (including urban/rural status and ethnic composition) as well as TB control indicators (including number of health care staff and TB staff in the commune, number of microscopy centres in the district, availability of X-ray services and user fees for smear examination) were collected from districts and communes by standard data collection forms. District TB coordinators were trained to collect the data from district TB and laboratory registers and fill in the forms. Communes were defined as poor or non-poor based on government classification [11]. Region was defined as north, centre and south, and zone as the geographical and social-economical areas of the country, based on administrative boundaries. For the purpose of this study, a TB suspect was defined as any person who submitted at least one sputum specimen at the laboratory. A TB case was defined as any TB suspect with at least one positive smear examination as recorded in the district laboratory register. Active case finding means that the health service actively identifies patient suspect of TB in the community, whereas in passive case finding the health service only acts when a patient reports with symptoms suspect of TB. The annual TB suspect and case notification rates were estimated as the numbers of suspects and TB cases, respectively, divided by the commune population and then multiplied by 4 (to obtain suspect-years or patient-years). Data were checked for completeness and quality before entry and corrected when necessary by referring back to the original records. Statistical analysis was performed using Stata SE v8 (Stata Corp., College Station TX, USA). The analyses were based on the following reasoning. The TB case notification rate reflects TB incidence and the proportion of incident cases that are diagnosed by the NTP, and is thus associated with measured and unmeasured determinants of TB incidence as well as with measured and unmeasured determinants of access to diagnosis (figure 1a). For any unit (e.g. district, commune) the proportion of incident cases that are diagnosed is unkown, but can be assumed to correlate with the proportion of the unit population that has sputum smear examination, i.e. with the TB suspect rate. If true, associations between notification rates and variables among units that have equal suspect rates should reflect associations with TB incidence. By extension, determinants of TB incidence can be identified by a

Variation in case notification of tuberculosis
71
multivariable unit-based analysis of case notification rates if it adjusts for differences in suspect rate (figure 1b). Conversely, variations in suspect rate between units can be analyzed to examine variations in case finding efforts. With our data, the extent to which the suspect rate correlates with the proportion of incident cases that is notified cannot be quantified directly. That proportion is likely to be associated with indicators of access to diagnosis, such as distance to the diagnostic unit, number of health care staff and whether examination fees are required. As a consequence, the suspect rate can be considered to be an intermediary factor in the associations between the case notification rate and these indicators, and to have a confounding effect on these associations (figure 1b) [12] An indirect assessment of the correlation between the suspect rate and the proportion of incident cases that are notified can therefore be obtained by comparing, in a multivariable analysis of case notification rates, the relative risks for these indicators before and after adjustment for suspect rate. Figure 1. TB suspect, notification rates and determinants of access to TB diagnosis:
without (1a) and with (1b) adjustment for differences in suspect rate.
Determinants of accessto TB diagnosis
Determinants of TB incidence
Determinants of accessto TB diagnosis
Determinants of TB incidence
TB notificationrate
TB notificationrate
TB suspect rate
Measured deter minants
Unmeasured deter minants
1a 1b
Multivariable analyses of determinants of case notification and suspect rates were done using Poisson regression, taking the commune as the unit of analysis. In the models of case notification rates, suspect rates were checked for linearity by fitting them as deciles, and when linearity was observed, fitted as continuous variables. These models were estimated

Chapter 5
72
with and without suspect rate as an independent variable, and the validity of suspect rate as an indicator of diagnostic effort was assessed by comparing adjusted rate ratios for co-variates that were considered to reflect the health care response to TB. Since the numbers of communes in the analyses were very large, significant interactions were expected between many variables. We therefore only reported interactions with relevant sizes, defined as a more than 2-fold departure from the incidence risk ratio in the basic model. Since suspects include patients finally diagnosed with TB, we repeated all analysis after replacing the suspect rate by the rate of suspects who remained smear-negative. Significance testing was by the likelihood ratio chi-square test for comparing the likelihood of the model with, and without the variable or interaction term of interest. RESULTS Complete data were available for 10,286 (97%) of 10,659 communes. These belonged to 612 (96%) of the 639 districts in Vietnam. Table 1 summarizes the characteristics of these communes. The median commune population was 6,351 (IQR 3,914-9,664). Four-hundred seventy eight (5%) communes did not identify any TB suspect and 4,398 communes (43%) did not detect any TB patient during the study quarter. Figure 2. Map of Vietnam with 8 geographical zones
Variation in case notification of tuberculosis
73
The overall annual notification rate of smear-positive TB was 78 per 100,000 population (95% CI 77-79, Table 1). Notification rates ranged from 70/100,000 (95% CI 68-72) in the north to 78/100,000 (75-82) in the central and 87/100,000 (85-89) in the south of the country (data now shown, Figure 2). The median suspect rate was 2.7 per 1,000 population and ranged across the communes from 0 to 109/1,000. Notification rates increased with increasing suspect rates from 16/100,000 among communes with suspect rates of less than 0.5/1,000, to 204/100,000 among communes with suspect rates of equal or more than 5 per 1,000 population. Notification rates were significantly associated with most of the demographic and TB control indicators analyzed (Table 1). Tuberculosis notification was higher (p<0.001) in communes with ethnic minority groups, in poor communes, in non-urban communes, in communes applying a combination of passive and active case finding and in communes belonging to districts that did not ask fees for smear examination or had X-ray facilities. Notification rates increased with increasing number of microscopy centres in the district, and decreased with increasing numbers of population per commune health care staff and with distance from the commune health post to the district tuberculosis unit. The multivariate analysis of the notification rate (Table 1) was based on 8,570 (83%) of 10,286 communes for which data on all included variables were available. In the multivariate model, there was no association between notification rate and ethnicity or poverty. Notification rates were significantly associated with zone, urban setting and with indicators of TB control (Table 2, model 1). Compared to the communes located less than 5 km from the DTU, the case notification rate was 0.65 times lower in communes located at more than 15 km distance. The CNR was 0.69 times lower when the district had no X-ray facilities. Communes that applied both passive and active case finding had 1.40 times higher CNR compared to those that applied passive case-finding only. Time since implementation of DOTS was significantly associated with the CNR but with no clear pattern (data not shown) When the suspect rate was included in the multivariate Poisson regression model (Table 2, model 2), most of the associations between CNRs and TB control indicators became weaker. There was a strong association between CNR and region (p<0.001) when zone was not in the model. The CNR was 1.3 times (95% CI 1.2-1.4) and 1.6 times (95% CI 1.5-1.7) higher in communes in the central and southern region, respectively, than in those in the northern region. Some significant interactions were observed that showed relevant differences in stratum-specific rate ratios. Compared with those in the Red River Delta, communes with ethnic minorities in the North West Highlands had 2.1 times (95% CI 1.9-2.4) higher CNR. In the Central coast area, communes in districts that did not require user fees for smear examination had 2.0 (1.7-2.4) times higher CNR in comparison with districts that did.
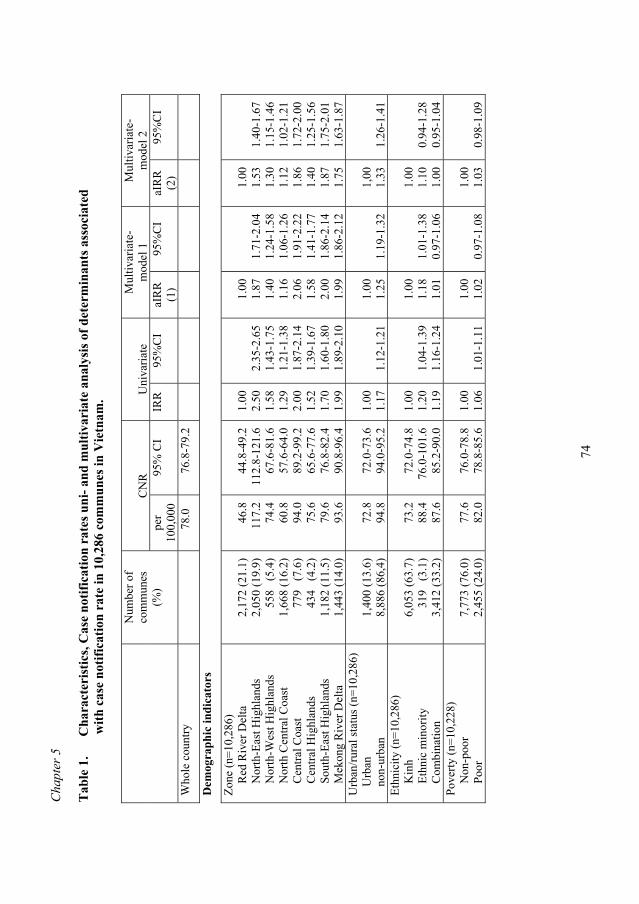
Cha
pter
5
74
Tab
le 1
.
Cha
ract
eris
tics,
Cas
e no
tific
atio
n ra
tes u
ni- a
nd m
ultiv
aria
te a
naly
sis o
f det
erm
inan
ts a
ssoc
iate
d
with
cas
e no
tific
atio
n ra
te in
10,
286
com
mun
es in
Vie
tnam
.
CN
R
Uni
varia
te
Mul
tivar
iate
- m
odel
1
Mul
tivar
iate
- m
odel
2
Num
ber o
f co
mm
unes
(%
) pe
r 10
0,00
0 95
% C
I IR
R
95%
CI
aIR
R
(1)
95%
CI
aIR
R
(2)
95%
CI
Who
le c
ount
ry
78
.0
76.8
-79.
2
D
emog
raph
ic in
dica
tors
Zone
(n=1
0,28
6)
R
ed R
iver
Del
ta
N
orth
-Eas
t Hig
hlan
ds
N
orth
-Wes
t Hig
hlan
ds
N
orth
Cen
tral C
oast
Cen
tral C
oast
Cen
tral H
ighl
ands
Sou
th-E
ast H
ighl
ands
Mek
ong
Riv
er D
elta
2,
172
(21.
1)
2,05
0 (1
9.9)
55
8 (
5.4)
1,
668
(16.
2)
779
(7.
6)
434
(4.
2)
1,18
2 (1
1.5)
1,
443
(14.
0)
46
.8
117.
2 74
.4
60.8
94
.0
75.6
79
.6
93.6
44.8
-49.
2 11
2.8-
121.
6 67
.6-8
1.6
57.6
-64.
0 89
.2-9
9.2
65.6
-77.
6 76
.8-8
2.4
90.8
-96.
4
1.
00
2.50
1.
58
1.29
2.
00
1.52
1.
70
1.99
2.
35-2
.65
1.43
-1.7
5 1.
21-1
.38
1.87
-2.1
4 1.
39-1
.67
1.60
-1.8
0 1.
89-2
.10
1.
00
1.87
1.
40
1.16
2.
06
1.58
2.
00
1.99
1.71
-2.0
4 1.
24-1
.58
1.06
-1.2
6 1.
91-2
.22
1.41
-1.7
7 1.
86-2
.14
1.86
-2.1
2
1.00
1.
53
1.30
1.
12
1.86
1.
40
1.87
1.
75
1.40
-1.6
7 1.
15-1
.46
1.02
-1.2
1 1.
72-2
.00
1.25
-1.5
6 1.
75-2
.01
1.63
-1.8
7 U
rban
/rura
l sta
tus (
n=10
,286
)
Urb
an
no
n-ur
ban
1,
400
(13.
6)
8,88
6 (8
6,4)
72
.8
94.8
72
.0-7
3.6
94.0
-95.
2 1.
00
1.17
1.
12-1
.21
1.00
1.
25
1.19
-1.3
2 1,
00
1.33
1.
26-1
.41
Ethn
icity
(n=1
0,28
6)
K
inh
E
thni
c m
inor
ity
C
ombi
natio
n
6,
053
(63.
7)
319
(3.
1)
3,41
2 (3
3.2)
73.2
88
.4
87.6
72.0
-74.
8 76
.0-1
01.6
85
.2-9
0.0
1.00
1.
20
1.19
1.
04-1
.39
1.16
-1.2
4
1.00
1.
18
1.01
1.
01-1
.38
0.97
-1.0
6
1.00
1.
10
1.00
0.
94-1
.28
0.95
-1.0
4 Po
verty
(n=1
0,22
8)
N
on-p
oor
P
oor
7,
773
(76.
0)
2
,455
(24.
0)
77
.6
82.0
76
.0-7
8.8
78.8
-85.
6
1.
00
1.06
1.
01-1
.11
1.
00
1.02
0.
97-1
.08
1.00
1.
03
0.98
-1.0
9
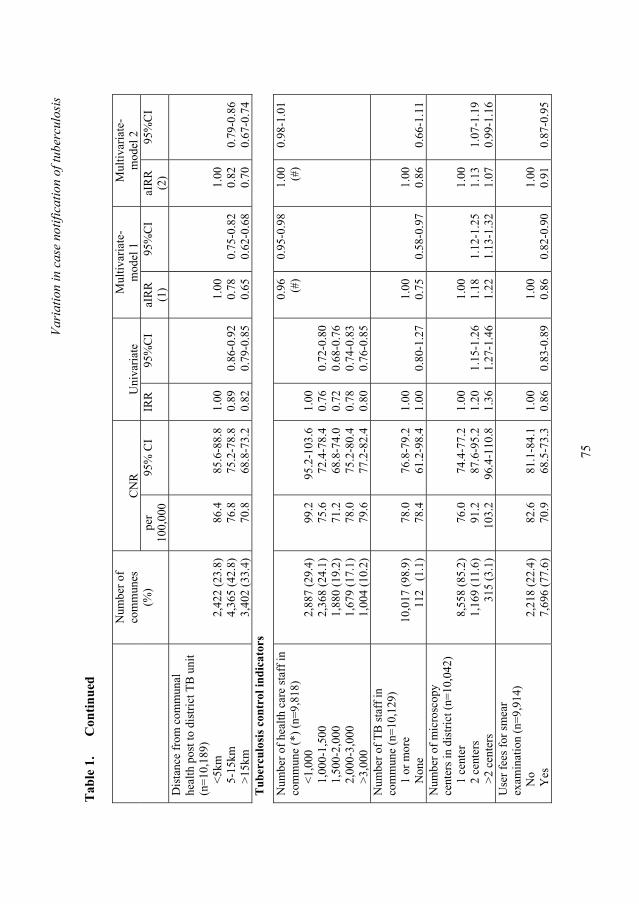
Vari
atio
n in
cas
e no
tific
atio
n of
tube
rcul
osis
75
Tab
le 1
.
Con
tinue
d
CN
R
Uni
varia
te
Mul
tivar
iate
- m
odel
1
Mul
tivar
iate
- m
odel
2
Num
ber o
f co
mm
unes
(%
) pe
r 10
0,00
0 95
% C
I IR
R
95%
CI
aIR
R
(1)
95%
CI
aIR
R
(2)
95%
CI
Dis
tanc
e fr
om c
omm
unal
he
alth
pos
t to
dist
rict T
B u
nit
(n=1
0,18
9)
<
5km
5-1
5km
>15
km
2,
422
(23.
8)
4,36
5 (4
2.8)
3,
402
(33.
4)
86
.4
76.8
70
.8
85
.6-8
8.8
75.2
-78.
8 68
.8-7
3.2
1.
00
0.89
0.
82
0.
86-0
.92
0.79
-0.8
5
1.
00
0.78
0.
65
0.75
-0.8
2 0.
62-0
.68
1.00
0.
82
0.70
0.
79-0
.86
0.67
-0.7
4 T
uber
culo
sis c
ontr
ol in
dica
tors
Num
ber o
f hea
lth c
are
staf
f in
com
mun
e (*
) (n=
9,81
8)
<
1,00
0
1,0
00-1
,500
1,5
00-2
,000
2,0
00-3
,000
>3,
000
2,
887
(29.
4)
2,36
8 (2
4.1)
1,
880
(19.
2)
1,67
9 (1
7.1)
1,
004
(10.
2)
99.2
75
.6
71.2
78
.0
79.6
95.2
-103
.6
72.4
-78.
4 68
.8-7
4.0
75.2
-80.
4 77
.2-8
2.4
1.00
0.
76
0.72
0.
78
0.80
0.72
-0.8
0 0.
68-0
.76
0.74
-0.8
3 0.
76-0
.85
0.96
(#
) 0.
95-0
.98
1.00
(#
) 0.
98-1
.01
Num
ber o
f TB
staf
f in
com
mun
e (n
=10,
129)
1 o
r mor
e
N
one
10
,017
(98.
9)
112
(1.
1)
78.0
78
.4
76.8
-79.
2 61
.2-9
8.4
1.00
1.
00
0.80
-1.2
7 1.
00
0.75
0.
58-0
.97
1.00
0.
86
0.66
-1.1
1 N
umbe
r of m
icro
scop
y ce
nter
s in
dist
rict (
n=10
,042
)
1 c
ente
r
2 c
ente
rs
>
2 ce
nter
s
8,
558
(85.
2)
1,16
9 (1
1.6)
31
5 (3
.1)
76.0
91
.2
103.
2
74.4
-77.
2 87
.6-9
5.2
96.4
-110
.8
1.00
1.
20
1.36
1.
15-1
.26
1.27
-1.4
6
1.00
1.
18
1.22
1.
12-1
.25
1.13
-1.3
2
1.00
1.
13
1.07
1.
07-1
.19
0.99
-1.1
6 U
ser f
ees f
or sm
ear
exam
inat
ion
(n=9
,914
)
No
Y
es
2,
218
(22.
4)
7,69
6 (7
7.6)
82
.6
70.9
81
.1-8
4.1
68.5
-73.
3
1.
00
0.86
0.
83-0
.89
1.
00
0.86
0.
82-0
.90
1.00
0.
91
0.87
-0.9
5
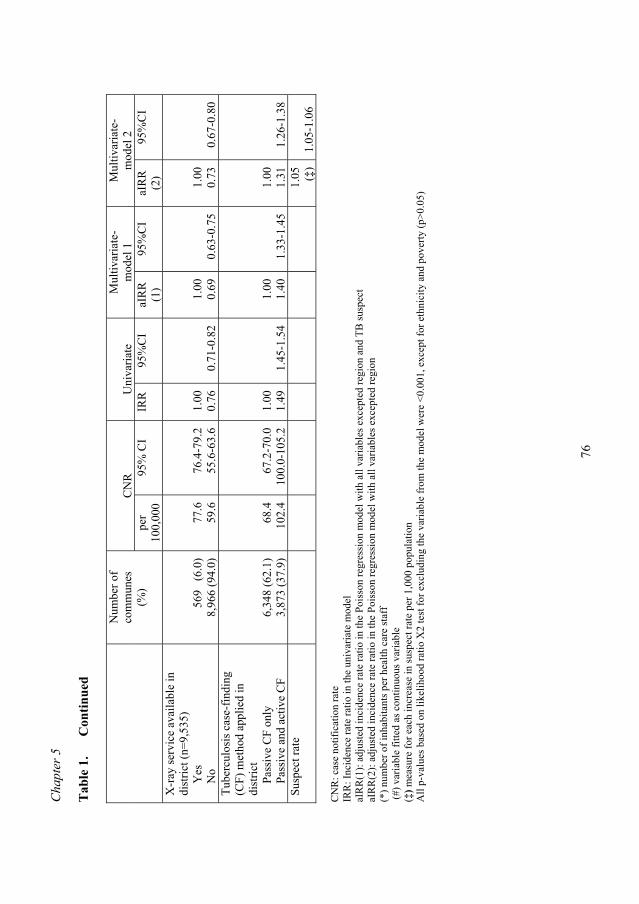
Cha
pter
5
76
Tab
le 1
.
Con
tinue
d
CN
R
Uni
varia
te
Mul
tivar
iate
- m
odel
1
Mul
tivar
iate
- m
odel
2
Num
ber o
f co
mm
unes
(%
) pe
r 10
0,00
0 95
% C
I IR
R
95%
CI
aIR
R
(1)
95%
CI
aIR
R
(2)
95%
CI
X-r
ay se
rvic
e av
aila
ble
in
dist
rict (
n=9,
535)
Yes
No
56
9 (
6.0)
8,
966
(94.
0)
77
.6
59.6
76
.4-7
9.2
55.6
-63.
6
1.
00
0.76
0.
71-0
.82
1.
00
0.69
0.
63-0
.75
1.00
0.
73
0.67
-0.8
0 Tu
berc
ulos
is c
ase-
findi
ng
(CF)
met
hod
appl
ied
in
dist
rict
P
assi
ve C
F on
ly
P
assi
ve a
nd a
ctiv
e C
F
6,
348
(62.
1)
3,87
3 (3
7.9)
68
.4
102.
4 67
.2-7
0.0
100.
0-10
5.2
1.00
1.
49
1.45
-1.5
4 1.
00
1.40
1.
33-1
.45
1.00
1.
31
1.26
-1.3
8 Su
spec
t rat
e
1.05
(‡
) 1.
05-1
.06
CN
R: c
ase
notif
icat
ion
rate
IR
R: I
ncid
ence
rate
ratio
in th
e un
ivar
iate
mod
el
aIR
R(1
): ad
just
ed in
cide
nce
rate
ratio
in th
e Po
isso
n re
gres
sion
mod
el w
ith a
ll va
riabl
es e
xcep
ted
regi
on a
nd T
B su
spec
t aI
RR
(2):
adju
sted
inci
denc
e ra
te ra
tio in
the
Pois
son
regr
essi
on m
odel
with
all
varia
bles
exc
epte
d re
gion
(*
) num
ber o
f inh
abita
nts p
er h
ealth
car
e st
aff
(#) v
aria
ble
fitte
d as
con
tinuo
us v
aria
ble
(‡) m
easu
re fo
r eac
h in
crea
se in
susp
ect r
ate
per 1
,000
pop
ulat
ion
A
ll p-
valu
es b
ased
on
likel
ihoo
d ra
tio X
2 te
st fo
r exc
ludi
ng th
e va
riabl
e fr
om th
e m
odel
wer
e <0
.001
, exc
ept f
or e
thni
city
and
pov
erty
(p>0
.05)

Vari
atio
n in
cas
e no
tific
atio
n of
tube
rcul
osis
77
Tab
le 2
.
Sus
pect
rat
es (/
1,00
0) a
nd u
niva
riat
e-m
ultiv
aria
te o
f ris
k fa
ctor
s ass
ocia
ted
with
susp
ect r
ates
in
6,3
48 c
omm
unes
app
lyin
g pa
ssiv
e ca
se-f
indi
ng m
etho
ds o
nly
in V
ietn
am.
Susp
ect r
ate
U
niva
riate
M
ultiv
aria
te
N
(%)
/1,0
00
95%
CI
IRR
95
%C
I aI
RR
95
%C
I
Who
le c
ount
ry
6.34
8 7.
07
7.02
-7.1
1
Dem
ogra
phic
indi
cato
rs
Zone
Red
Riv
er D
elta
Nor
th-E
ast H
ighl
ands
Nor
th-W
est H
ighl
ands
Nor
th C
entra
l Coa
st
C
entra
l Coa
st
C
entra
l Hig
hlan
ds
S
outh
-Eas
t
Mek
ong
Riv
er D
elta
2,
018
(31.
8)
580
( 9.
1)
213
( 3
.4)
542
( 8
.5)
551
( 8
.7)
186
( 2
.9)
992
(15.
6)
1,26
6 (1
9.9)
4.
09
18.1
9 15
.01
6.63
8.
70
5.62
6.
89
7.93
4.
02-4
.15
17.8
5-18
.53
14.4
9-15
.54
6.46
-6.8
0 8.
53-8
.87
5.40
-5.8
4 6.
80-6
.99
7.84
-8.0
3
1.
00
4.45
3.
67
1.62
2.
13
1.37
1.
69
1.94
4.
34-4
.56
3.53
-3.8
1 1.
57-1
.67
2.08
-2.1
8 1.
32-1
.43
1.65
-1.7
2 1.
90-1
.98
1.00
5.
67
4.42
2.
03
2.60
1.
60
1.88
1.
81
5.48
-5.8
6 4.
22-4
.62
1.95
-2.1
1 2.
53-2
.67
1.52
-1.6
8 1.
84-1
.93
1.77
-1.8
5 U
rban
/rura
l sta
tus
U
rban
non-
urba
n
1,
022
(16.
1)
5,32
6 (8
3.9)
6.
43
7.25
6.
34-6
.52
7.20
-7.3
0
1.
00
1.13
1.
11-1
.15
1.00
1.
41
1.38
-1.4
4 Et
hnic
ity
K
inh
E
M
C
ombi
natio
n
4,
431
(69.
8)
222
( 3
.5)
1,69
5 (2
6.7)
6.
53
16.8
5 8.
05
6.
48-6
.58
16.2
0-17
.53
7.96
-8.1
5
1.
00
2.58
1.
23
2.
48-2
.69
1.22
-1.2
5
1.00
1.
01
1.05
0.
96-1
.06
1.03
-1.0
7 Po
verty
Non
-poo
r
Poo
r
5,
125
(80.
9)
1,20
9 (1
9.1)
6.
82
8.74
6.
78-6
.87
8.60
-8.8
8
1.
00
1.28
1.
26-1
.30
1.
00
1.06
1.
03-1
.08
Dis
tanc
e fr
om c
omm
unal
hea
lth
post
to d
istri
ct tu
berc
ulos
is u
nit
(n=1
0,18
9)
<
5km
5-1
5km
>15
km
1,
644
(26.
0)
2,82
6 (4
4.6)
1,
862
(29.
4)
7.
95
6.73
6.
52
7.
87-8
.04
6.67
-6.8
0 6.
44-6
.61
1.
00
0.85
0.
82
0.
83-0
.86
0.81
-0.8
3
1.
00
0.73
0.
59
0.
72-0
.75
0.58
-0.6
0
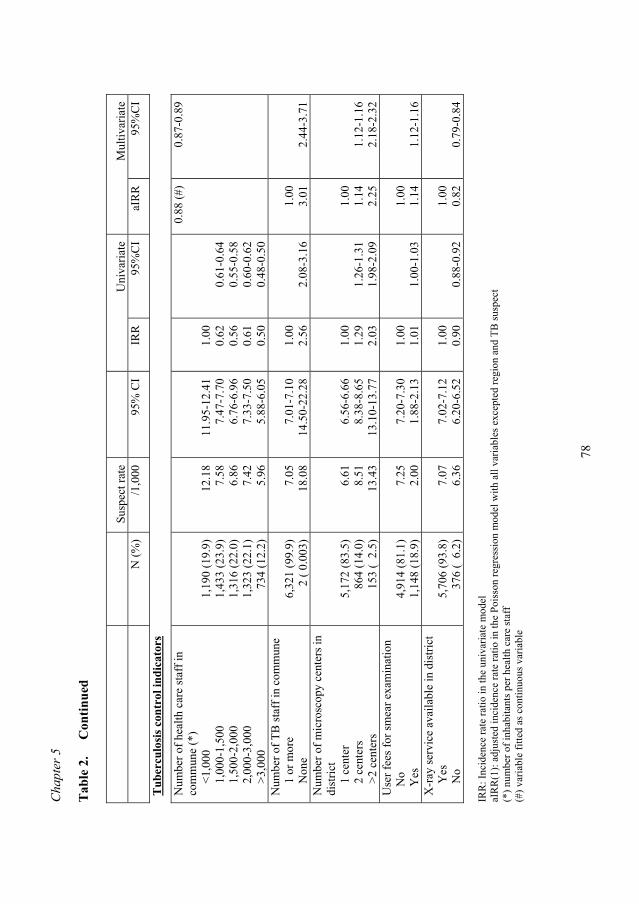
Cha
pter
5
78
Tab
le 2
.
Con
tinue
d
Su
spec
t rat
e
Uni
varia
te
Mul
tivar
iate
N (%
) /1
,000
95
% C
I IR
R
95%
CI
aIR
R
95%
CI
Tub
ercu
losi
s con
trol
indi
cato
rs
Num
ber o
f hea
lth c
are
staf
f in
com
mun
e (*
)
<1,
000
1
,000
-1,5
00
1
,500
-2,0
00
2
,000
-3,0
00
>
3,00
0
1,
190
(19.
9)
1,43
3 (2
3.9)
1,
316
(22.
0)
1,32
3 (2
2.1)
7
34 (1
2.2)
12
.18
7.58
6.
86
7.42
5.
96
11
.95-
12.4
1 7.
47-7
.70
6.76
-6.9
6 7.
33-7
.50
5.88
-6.0
5
1.
00
0.62
0.
56
0.61
0.
50
0.
61-0
.64
0.55
-0.5
8 0.
60-0
.62
0.48
-0.5
0
0.88
(#)
0.87
-0.8
9
Num
ber o
f TB
staf
f in
com
mun
e
1
or m
ore
N
one
6,
321
(99.
9)
2
( 0.
003)
7.
05
18.0
8
7.
01-7
.10
14.5
0-22
.28
1.
00
2.56
2.
08-3
.16
1.00
3.
01
2.44
-3.7
1 N
umbe
r of m
icro
scop
y ce
nter
s in
dist
rict
1
cen
ter
2
cen
ters
>2
cent
ers
5,
172
(83.
5)
864
(14.
0)
153
( 2
.5)
6.
61
8.51
13
.43
6.
56-6
.66
8.38
-8.6
5 13
.10-
13.7
7
1.
00
1.29
2.
03
1.
26-1
.31
1.98
-2.0
9
1.00
1.
14
2.25
1.
12-1
.16
2.18
-2.3
2 U
ser f
ees f
or sm
ear e
xam
inat
ion
N
o
Yes
4,
914
(81.
1)
1,14
8 (1
8.9)
7.
25
2.00
7.
20-7
.30
1.88
-2.1
3
1.
00
1.01
1.
00-1
.03
1.
00
1.14
1.
12-1
.16
X-r
ay se
rvic
e av
aila
ble
in d
istri
ct
Y
es
N
o
5,
706
(93.
8)
376
( 6
.2)
7.
07
6.36
7.
02-7
.12
6.20
-6.5
2
1.
00
0.90
0.
88-0
.92
1.
00
0.82
0.
79-0
.84
IRR
: Inc
iden
ce ra
te ra
tio in
the
univ
aria
te m
odel
aI
RR
(1):
adju
sted
inci
denc
e ra
te ra
tio in
the
Pois
son
regr
essi
on m
odel
with
all
varia
bles
exc
epte
d re
gion
and
TB
susp
ect
(*) n
umbe
r of i
nhab
itant
s per
hea
lth c
are
staf
f (#
) var
iabl
e fit
ted
as c
ontin
uous
var
iabl
e
Variation in case notification of tuberculosis
79
Among communes classified as poor, the CNR in the Central Coast area was 2.1 (1.5-3.0) times higher than in the Red River Delta (Figure 2). Overall 2.2 per 1,000 population had been examined by direct microscopy on suspicion of TB in the study period. The estimated suspect rate for 2003 was 9.0/1,000 (95% CI 9.0-9.0). We limited the analysis of the suspect rate to 6,348 (62%) communes that applied passive case finding of tuberculosis suspects only (Table 2). A Poisson regression model of the suspect rate that also included communes that applied active case finding indeed showed significant and relevant interaction with case finding method for many of the variables (data not shown). The proportion of the population examined was slightly higher in the central (7.8/1,000; 95%CI 6.3-6.5) and southern region (7.5/1,000; 7.4-7.6) compared to the northern region (6.4/1,000; 6.3-6.5). There was substantial variation by zone, with the largest difference within the northern region (4.1/1,000 in the Red River delta and 18.2/1,000 in the North East Highlands, Figure 2). In the multivariate model (Table 3), the suspect rate showed no relevant association with ethnic composition or poverty status of the commune. The suspect rate was strongly associated with zone. Other variables that showed associations of relevant size were urbanity (higher rates in non-urban compared to urban communes); distance from the commune to the DTU (decreasing rate with increasing distance); number of health care and TB staff in the commune (increasing rate with increasing number); and time since full implementation of the DOTS strategy (increasing rate with increasing period). The effect of user fees and availability of x-ray services was limited. Analyses of interactions showed considerable variation in suspect rate between zones within strata of other variables. Taking the Red River Delta as the reference category, suspect rates were higher in the North-East Highlands and the Mekong River Delta among communes classified as poor (adjusted rate ratio (aRR) 3.0, 95% CI 2.9-3.1, and 2.5, 95% CI 2.4-2.6, respectively) as well as among communes with ethnic minorities (aRR 2.7, 95% CI 2.6-2.8, and 2.2, 95% CI 2.2-2.3, respectively). Suspect rates were also higher in the North-East Highlands among communes located at less than 5 km distance from the DTU (aRR 4.9, 95% CI 4.7-5.1), and in the Central Coast and Mekong River Delta zones among communes located at more than 15 km distance from the DTU (aRR 2.2 , 95% CI 2.0-2.3, and aRR 2.5, 95% CI 2.3-2.6, respectively, Figure 2). Because suspects include patients who were diagnosed as smear-positive, we repeated the analyses using the rate of suspects who remained smear-negative instead of the suspect rate. These showed similar results; all incidence rate ratio’s for associations with the case notification rate were within 5% of those estimated from the models based on the suspect rate (data not shown). DISCUSSION We found substantial variation in TB case notification rates across the country. Geographic area, urbanity and distance to the district TB unit were determinants of this variation, also
Chapter 5
80
after controlling for suspect rate, whereas poverty and ethnic composition of the commune were not. This suggests that geographic and urban-rural variations in TB case notification rates in Vietnam reflect, at least in part, differences in TB incidence. Availability of health care and TB staff in the commune and of microscopy centres and X-ray facilities in the district, as well as user fees and case finding methods, all affected case notification rates. Much of these associations disappeared when adjusting for suspect rate, suggesting that the suspect rate is “on the causal pathway” between these indicators and the case notification rate, and that the suspect rate is indeed a useful summary indicator of access to diagnosis and case finding efforts. The suspect rate, limited to districts applying passive case finding only, strongly depended on availability of commune health care and TB staff, on presence of microscopy centres in the district and on distance to the district TB unit, but hardly on user fees and availability of X-ray facilities. Moreover, it was itself associated with geographic area and urbanity. The suspect rate was also not associated with poverty or ethnicity. The remarkable geographic variations partially reflect a north-south gradient in TB incidence. Because of strong overlap between geographic zones and regions we were unable to test both in a single multivariate model, but the model adjusting for suspect rate showed a clear gradient. The causes of this gradient are unknown. It may reflect differences in TB control between the north and the south before unification in 1975, in prevalence of infections with non-tuberculosis mycobacteria or in genotype distribution [13,14]. Apart from this gradient, there are substantial differences between administrative zones that probably reflect at least in part differences in altitude. Lower TB incidence at high altitude has been observed in other countries [15,16]. It is yet unclear to what extent this reflects differences in population density. The suspect rate also showed considerable variation by zone. This appears to reflect relatively low rates in the Red River Delta and relatively high rates in the North-East and North-West Highlands. In these highlands, the high TB suspect rate may reflect high incidence or prevalence of other respiratory diseases due to the cold climate and the tobacco smoking and cooking habits (with much indoor air pollution) of the predominant ethnic minority population We found that both the CNR and suspect rate were lower in urban areas. The likely explanation is that more patients go to the private sector [17] or to provincial health care facilities, but also that more selection takes place before smear examinations are done, e.g by x-ray. It thus cannot be concluded from these data that TB incidence is lower in urban than in non-urban areas. Studies from low TB-prevalence countries have shown strong associations of TB incidence with poverty and ethnicity [18-20]. In addition, poverty may limit access to health services [21,22]. In 2004, 20% of the Vietnamese population lived below the poverty line, and ethnic minorities accounted for 13% of the country’s population [23]. Ethnic minorities in Vietnam are also relatively poor. Whereas the majority Kinh population inhabit mainly the fertile lowlands in the river deltas and along the coast, these minorities live scattered across
Variation in case notification of tuberculosis
81
the mountain areas that cover two-thirds of the country’s territory, extending from the north to the south [24]. An unexpected finding in our study was that, at the commune level, neither poverty nor ethnicity were associated with notification or suspect rate. This could be explained by recent improvements in access of the poor and ethnic minorities to basic health services, but it may also be that poverty and ethnicity at commune level insufficiently reflect the effects of individual (household) poverty and ethnicity in this analysis. Forthcoming results of a tuberculosis prevalence survey in which data on poverty and ethnicity are collected at the household level will shed more light on this. The suspect rate per commune clearly decreased with increasing distance to the district TB unit. Apparently, distance is a key factor determining access to TB services. The diagnosis of TB can in Vietnam only be made at district centres and requires the submission of 3 sputum samples. This makes it difficult for the patients who live far away and do not have their own means of transport. The CNR remained somewhat lower in communes at large distances despite adjustment for suspect rate, suggesting there is also some difference in TB incidence in the peripheries of districts where people live more scattered and their contact rate may be lower compared with those who live in more density populated district centres. Our data and analyses have a number of limitations. When controlling for variation in TB suspect rate, the association between indicators of TB control response and CNR became weaker, but some of these control indicators remained independently associated. This may mean that the suspect rate does not capture all variation in health care response, e.g. because the proportion of examined patients who were truly clinically suspect of having TB may vary between communes and districts. Alternatively, the association between some of the TB control indicators and the CNR may in fact be reverse. For example, active case finding may be practiced because a district has a high TB incidence. Another limitation of the use of the suspect rate in our analysis may be that this is composed of 3 elements: background rate of cough (i.e. due to other causes than TB) and diagnostic effort of NTP facilities, but also TB incidence. By including suspect rate in the model, we may thus have over-adjusted to some extent the variation in CNRs because we partially controlled for variations in incidence. However, we obtained nearly identical results when we replaced in our analyses the suspect rate by the rate of suspects who remained smear-negative, suggesting that this effect is very limited. Finally, data were limited to the district TB units. Patients who went to provincial TB hospitals or private health care providers for diagnosis and treatment of TB were not included in our analyses. This may have resulted in underestimation of suspect rates, in particular in urban areas [17]. CONCLUSIONS This study suggests that geographical variations in TB notification in Vietnam largely reflect true epidemiological differences in TB distribution. Notification rates vary remarkably by latitude, zone and urbanity and are not associated with poverty or ethnicity at commune level. Distance to the district health centre, availability of health care and TB
Chapter 5
82
staff and the number of microscopy centres in the district are key factors determining access to TB services. The TB suspect rate appears to be a useful summary indicator of the diagnostic effort in this setting. ACKNOWLEDGEMENTS The authors thank the NTP staff in all provinces and districts for actively participating in data collection. Special thanks are due to the staff at Pham Ngoc Thach hospital and National Hospital of Tuberculosis and Respiratory Diseases for their contributions to all process of the data collection. The study was funded by the Dutch Government through Project VN002405. REFERENCE 1. World Health Organization. Tuberculosis Programme. Framework for effective
tuberculosis control. WHO/TB/94.179. Geneva: WHO, 1994 2. Raviglione MC, Uplekar MW. WHO’s new Stop TB Strategy. Lancet 2006; 367:
952–955 3. World Health Organization. Stop TB Partnership. The stop TB strategy. Building on
and enhancing DOTS to meet the TB-related Millennium Development Goals. World Health Organization 2006
4. Kochi A. The global tuberculosis situation and the new control strategy of the World Health Organization. Tubercle 1991; 72: 1–6.
5. Anon. Resolution WHA58.14. Sustainable financing for tuberculosis prevention and control. In: Fifty-eighth World Health Assembly. Geneva, 16-25 May 2005. Resolutions and decisions. Geneva, World Health Organization, 2005 (WHA58/2005/REC/1), Annex: 79-81
6. The World Bank. Investing in Health: World Development Report 1993. New York, NY: Oxford University Press; 1993.
7. Borgdorff MW. New measurable indicator for tuberculosis case detection. Emerg Infect Dis 2004; 10: 1523-1528
8. Vree M et al. Tuberculosis trends, Vietnam. Emerg Infect Dis 2007;13:796-7 9. Anon. Global Tuberculosis Control: Surveillance, planning, financing. WHO Report
2007 (WHO/HTM/TB/2007.376). Geneva: World Health Organization, 2007. 10. Huong NT et al. Establishment and development of the National Tuberculosis
Control Programme in Vietnam. Int J Tuberc Lung Dis 2005; 9: 151-156. 11. Anon. Decision 1232/QD-TTg of the Prime Minister on approval of the list of
communes with extreme difficult under the program of socio-economical development for special difficult, mountainous, remote communes (135 Program). Hanoi 24 Septerber 1999.
12. Hennekens CH, Buring JE. Analysis of epidemiologic studies: evaluating the role of confounding. In: Mayrent SL (Ed.). Epidemiology in medicine. Boston: Little Brown, 1987
13. Huong NT et al. Tuberculosis epidemiology in six provinces of Vietnam after the introduction of the DOTS strategy. Int J Tuberc Lung Dis 2006;10:963-9.
Variation in case notification of tuberculosis
83
14. Anh DD et al. M. tuberculosis Beijing genotype emerging in Vietnam. Emerg Infect Dis 2000;6:302-5.
15. Mansoer JR, Kibuga DK, Borgdorff MW. Altitude: a determinant for tuberculosis in Kenya? Int J Tuberc Lung Dis 1999, 2: 156-161.
16. Vargas MH, Furuya MEY, Perez-Guzman C. Effect of altitude on the frequency of pulmonary tuberculosis. Int J Tuberc Lung Dis 2004, 11: 1321-1324.
17. Lonnroth K, et al. Utilization of private and public health care provider for tuberculosis symptoms in Ho Chi Minh City, Vietnam. Health Policy Plan 2001; 16: 47-54
18. Enarson DA, Wang JS, Dirks JM. The incidence of active tuberculosis in a large urban area. Am J Epidemiol 1989; 129: 1268-1276
19. Cantwell MF, et al. Epidemiology of tuberculosis in the United States, 1985 through 1992. J Am Med Assoc 1994; 272: 535-539
20. Rieder HL, et al. Tuberculosis in the United States. J Am Med Assoc 1989; 262: 385-389
21. Bergner L, Yerby AS. Low income and barriers to use of health services. N Engl J Med 1968; 278: 541-546
22. Johansson E, et al. Gender and tuberculosis control. Perspectives on health seeking behavior among men and women in Vietnam. Health Policy 2000; 52: 33-51
23. Anon. Vietnam: Laying the Foundation for Steady Grow. Available at http://siteresources.worldbank.org/IDA/Resources/IDA-Vietnam.pdf. Accessed 20 March 2007.
24. Anon. Completed census results. Vietnam population and housing census Vietnam 1999. Hanoi, Vietnam: General Statistical Office, 2001.

84
85
Chapter 6
Tuberculosis epidemiology in six provinces of Vietnam after
the introduction of the DOTS Strategy
N.T. Huong1,6, B.D. Duong1 , N.V. Co1, H.T.Quy2, L.B.Tung2, J.F. Broekmans3, M.C. Bosman4, C. Verhage5, N. Kalisvaart5,
M.W. Borgdorff5,6, F.G. Cobelens3,6
1. National Hospital of Tuberculosis and Respiratory Diseases, Hanoi, Vietnam 2. Pham Ngoc Thach Hospital, Ho Chi Minh City, Vietnam 3. KNCV Tuberculosis Foundation, The Hague, The Netherlands 4. World Health Organization for Western Pacific Region, Manila, The Philippines 5. International Tuberculosis Surveillance Centre, The Hague, The Netherlands 6. Academic Medical Center, University of Amsterdam, The Netherlands
International Journal of Tuberculosis and Lung Disease, 2006 Vol 10(9), pp: 963-969
Chapter 6
86
ABSTRACT Setting: Six provinces in Vietnam where the DOTS Strategy was introduced in 1989. Objective: To assess the impact of improved tuberculosis (TB) control on TB epidemiology in Vietnam. Methods: Data from the surveillance system in the period 1990–2003 were analysed to assess trends of notification rates and the mean ages of notified cases. Data from repeated tuberculin surveys in the period 1986– 2002 were estimated to assess the prevalence of TB infection, the annual risk of infection and its trend using various cut-off points in those with and without bacilli Calmette-Guérin (BCG) scar. Results: Age-standardised notification rates in the period 1996–2003 declined significantly, by 2.6% to 5.9% per year, in five provinces. However, in four provinces notification rates in the age group 15–24 years increased significantly, by 4.5% to 13.6% per year, during this period. The mean age of newly diagnosed patients with smear-positive TB increased up to 1995 but decreased thereafter. The annual risk of TB infection showed a significant annual decrease (4.9% per year) in one province in surveys performed between 1986 and 1997, and in two provinces (6.6% and 14.7%) in surveys conducted between 1993 and 2002. Conclusion: These data suggest limited impact to date of the DOTS Strategy in Vietnam.
Tuberculosis epidemiology in six provinces
87
INTRODUCTION Tuberculosis (TB) remains a global health problem [1]. Mathematical models predict that if at least 70% of incident cases of smear-positive TB are detected and treated, and at least 85% are cured, TB transmission will decline by 7% to 11% per year [2,3]. The World Health Organization (WHO) has therefore set these thresholds for case detection and cure rates as targets for its global DOTS Strategy [3,4]. The predicted reduction in transmission should result in a decrease in incidence of TB, an increase in the mean age of tuberculosis cases and a decline in the annual risk of tuberculosis infection (ARTI) [5]. Vietnam is among the 22 countries with the highest number of TB cases in the world [6]. The National Tuberculosis Programme (NTP) of Vietnam is the only TB control programme in a high-burden country that has met the WHO targets of a 70% case detection rate and an 85% treatment success rate [6,7]. To assess the impact of Vietnam’s control strategy, we analyzed TB trends between 1986 and 2003 in six provinces using two indicators: the ARTI measured among schoolchildren, and TB case notifications and their age distribution. In these provinces, TB control was introduced in 1989 following the principles of what was later adopted by the WHO as the global DOTS Strategy [8]. Cure rates exceeded 85% from the early 1990s onwards. The gradual introduction of DOTS services in these provinces reached its current coverage in 1996. In the same year, the NTP introduced an incentive system to improve case detection. The estimated case detection rate has been above 70% since 1997 [7,8]. METHODS We obtained from the NTP numbers of notified cases of new smear-positive TB by 10-year age group in six provinces where tuberculin surveys have been conducted periodically (Figure 1). These were available from 1990 onwards. Population denominators were available from two censuses (1989 and 1999) and were inter- and extrapolated for the years 1990–2003 assuming exponential growth [9,10] To assess overall trends of case notification rates (CNRs), age-specific notification rates of each of the six provinces were standardised to the combined population of these provinces in 1999. In addition, we assessed the trends of CNRs separately for the age groups 15–24, 25–64 and ≥65 years by Poisson regression. The study period was split into two periods, with 1995–1996 as the breakpoint, for two reasons. First, the estimated case-detection rate of the NTP was above 70% only after 1996 [7] and second, the expansion of DOTS facilities in the provinces included in this study did not reach its current level of population coverage until that year, and the introduction of an incentive system for detecting and treating TB cases in 1996 clearly increased case detection [8].
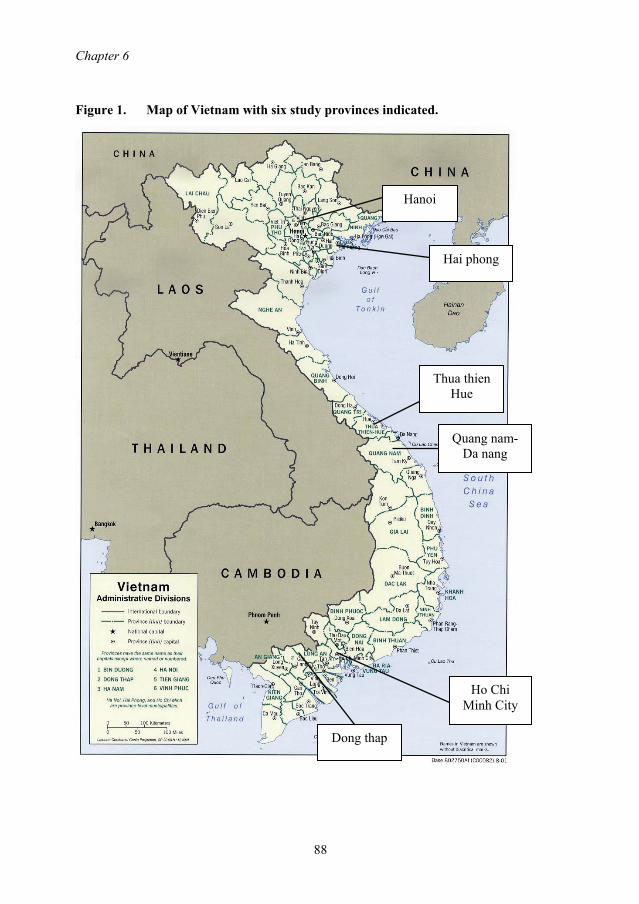
Chapter 6
88
Figure 1. Map of Vietnam with six study provinces indicated.
Quang nam- Da nang
Thua thien Hue
Ho Chi Minh City
Dong thap
Hanoi
Hai phong
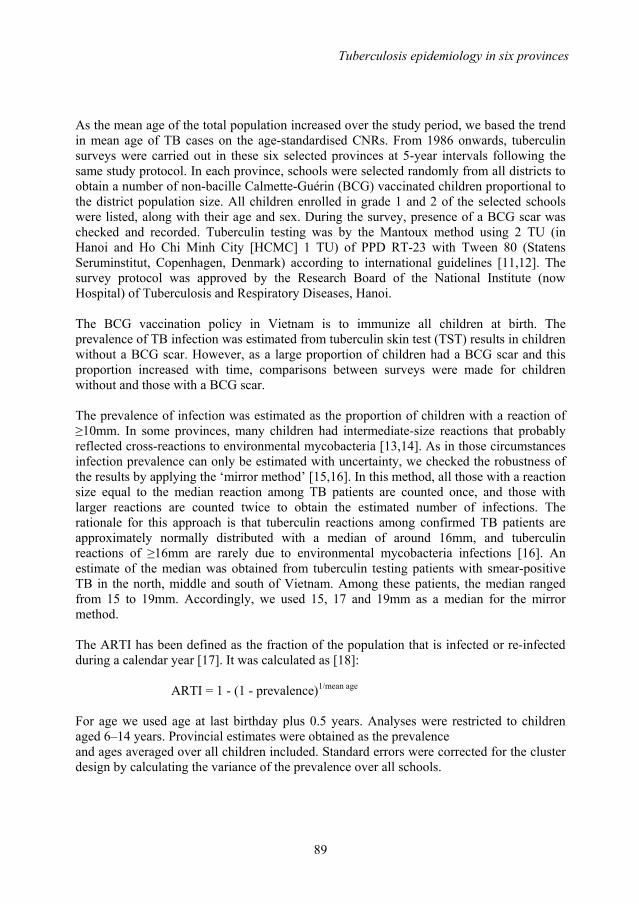
Tuberculosis epidemiology in six provinces
89
As the mean age of the total population increased over the study period, we based the trend in mean age of TB cases on the age-standardised CNRs. From 1986 onwards, tuberculin surveys were carried out in these six selected provinces at 5-year intervals following the same study protocol. In each province, schools were selected randomly from all districts to obtain a number of non-bacille Calmette-Guérin (BCG) vaccinated children proportional to the district population size. All children enrolled in grade 1 and 2 of the selected schools were listed, along with their age and sex. During the survey, presence of a BCG scar was checked and recorded. Tuberculin testing was by the Mantoux method using 2 TU (in Hanoi and Ho Chi Minh City [HCMC] 1 TU) of PPD RT-23 with Tween 80 (Statens Seruminstitut, Copenhagen, Denmark) according to international guidelines [11,12]. The survey protocol was approved by the Research Board of the National Institute (now Hospital) of Tuberculosis and Respiratory Diseases, Hanoi. The BCG vaccination policy in Vietnam is to immunize all children at birth. The prevalence of TB infection was estimated from tuberculin skin test (TST) results in children without a BCG scar. However, as a large proportion of children had a BCG scar and this proportion increased with time, comparisons between surveys were made for children without and those with a BCG scar. The prevalence of infection was estimated as the proportion of children with a reaction of ≥10mm. In some provinces, many children had intermediate-size reactions that probably reflected cross-reactions to environmental mycobacteria [13,14]. As in those circumstances infection prevalence can only be estimated with uncertainty, we checked the robustness of the results by applying the ‘mirror method’ [15,16]. In this method, all those with a reaction size equal to the median reaction among TB patients are counted once, and those with larger reactions are counted twice to obtain the estimated number of infections. The rationale for this approach is that tuberculin reactions among confirmed TB patients are approximately normally distributed with a median of around 16mm, and tuberculin reactions of ≥16mm are rarely due to environmental mycobacteria infections [16]. An estimate of the median was obtained from tuberculin testing patients with smear-positive TB in the north, middle and south of Vietnam. Among these patients, the median ranged from 15 to 19mm. Accordingly, we used 15, 17 and 19mm as a median for the mirror method. The ARTI has been defined as the fraction of the population that is infected or re-infected during a calendar year [17]. It was calculated as [18]:
ARTI = 1 - (1 - prevalence)1/mean age For age we used age at last birthday plus 0.5 years. Analyses were restricted to children aged 6–14 years. Provincial estimates were obtained as the prevalence and ages averaged over all children included. Standard errors were corrected for the cluster design by calculating the variance of the prevalence over all schools.
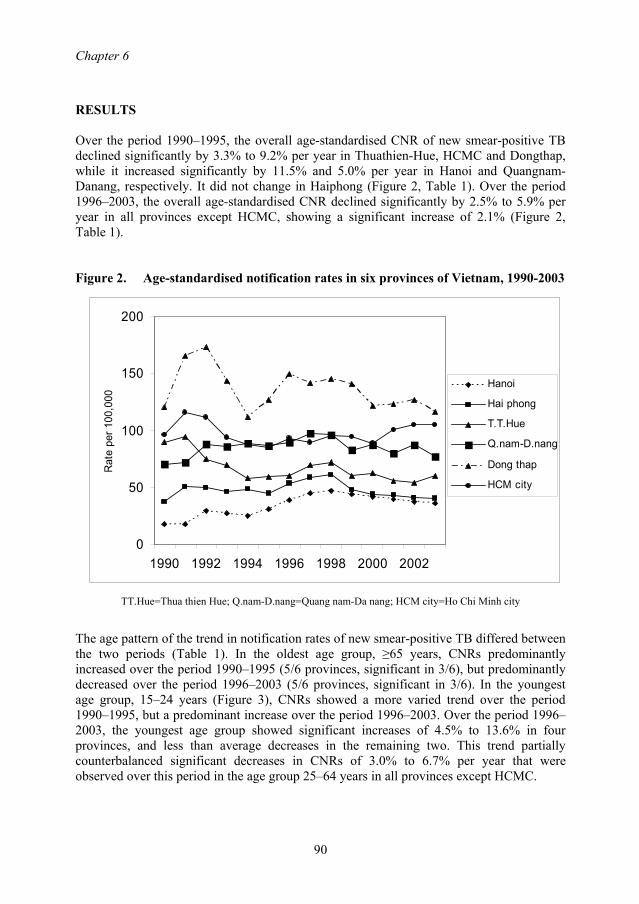
Chapter 6
90
RESULTS Over the period 1990–1995, the overall age-standardised CNR of new smear-positive TB declined significantly by 3.3% to 9.2% per year in Thuathien-Hue, HCMC and Dongthap, while it increased significantly by 11.5% and 5.0% per year in Hanoi and Quangnam-Danang, respectively. It did not change in Haiphong (Figure 2, Table 1). Over the period 1996–2003, the overall age-standardised CNR declined significantly by 2.5% to 5.9% per year in all provinces except HCMC, showing a significant increase of 2.1% (Figure 2, Table 1). Figure 2. Age-standardised notification rates in six provinces of Vietnam, 1990-2003
0
50
100
150
200
1990 1992 1994 1996 1998 2000 2002
Rat
e pe
r 100
,000
Hanoi
Hai phong
T.T.Hue
Q.nam-D.nang
Dong thap
HCM city
TT.Hue=Thua thien Hue; Q.nam-D.nang=Quang nam-Da nang; HCM city=Ho Chi Minh city
The age pattern of the trend in notification rates of new smear-positive TB differed between the two periods (Table 1). In the oldest age group, ≥65 years, CNRs predominantly increased over the period 1990–1995 (5/6 provinces, significant in 3/6), but predominantly decreased over the period 1996–2003 (5/6 provinces, significant in 3/6). In the youngest age group, 15–24 years (Figure 3), CNRs showed a more varied trend over the period 1990–1995, but a predominant increase over the period 1996–2003. Over the period 1996–2003, the youngest age group showed significant increases of 4.5% to 13.6% in four provinces, and less than average decreases in the remaining two. This trend partially counterbalanced significant decreases in CNRs of 3.0% to 6.7% per year that were observed over this period in the age group 25–64 years in all provinces except HCMC.

Tuberculosis epidemiology in six provinces
91
Table 1. Age-adjusted trends in notification rate of new smear-positive tuberculosis in 6 provinces in Vietnam, 1990-2003, by time period and age group.
Province Age, years
1990-1995 % annual change
(95% CI)
1996-2003 % annual change
(95% CI) Hanoi All 11.5 (9.4-13.6) * -2.6 (-3.4, -1.7) * 15-24 6.3 (0.5-12.6) * -0.8 (-3.5, 2.0) 25-64 10.6 (8.2-12.9) * -3.5 (-4.5, -2.5) * 65+ 22.9 (16.4-29.8) * 0.1 (-1.9, 2.2) Haiphong All 1.5 (-0.3-3.4) -5.9 (-6.9, -4.9) * 15-24 8.2 (2.3-14.5) * -1.7 (-3.5, 1.6) 25-64 0.2 (-1.9-2.3) -6.7 (-7.8, -5.5) * 65+ 4.0 (-1.1-9.4) -5.1 (-7.4, -2.8) * Thuathien- All -9.2 (-10.9- -7.4) * -2.5 (-3.7, -1.3) * Hue 15-24 -10.9 (-16.7- -4.7) * 4.5 (0.1, 9.1) * 25-64 -10.9 (-12.9- -8.9) * -3.4 (-4.8, -1.9) * 65+ 0.7 (-4.1-5.7) -2.3 (-4.9, 0.3) Quangnam- All 5.0 (3.6-6.3) * -2.8 (-3.5, -2.1) * Danang 15-24 5.6 (0.5-11.1) * 5.3 (2.6, 8.1) * 25-64 3.4 (1.9-5.0) * -3 (-3.8, -2.1) * 65+ 11.0 (7.8-14.3) * -4.9 (-6.3, -3.4) * HCMC All -4.8 (-5.5- -4.1) * 2.1 (1.6, 2.5) * 15-24 -4.8 (-6.6- -3.0) * 13.6 (12.3, 14.8) * 25-64 -4.7 (-5.5- -3.8) * 0.4 (-0.1, 0.9) 65+ -5.6 (-7.9- -3.2) * -1.6 (-2.9, -0.2) * Dongthap All -3.3 (-4.4- -2.1) * -3.3 (-3.9, -2.6) * 15-24 -2.2 (-7.1-3.0) 6.1 (3.1, 9.1) * 25-64 -5.7 (-6.9- -4.4) * -3.8 (-4.7, -3.0) * 65+ 6.9 (4.0-9.9) * -3.9 (-5.3, -2.5) *
Age adjustment by Poisson regression, based on 10-year age categories. Minus sign (-) denotes decrease. *: significant (p<0.05). TB = tuberculosis; CI = confidence interval; HCM = Ho Chi Minh City

Chapter 6
92
Over the period 1990–1995, the mean age of newly diagnosed patients with smear-positive TB increased significantly in Hanoi (average annual increase 0.58 years; 95% confidence interval [CI] 0.02–0.96), Quangnam-Danang (0.42; 95% CI 0.22–0.61) and Dongthap (0.64; 95% CI 0.39–0.89). In the period 1996–2003, the mean age declined significantly in Quangnam-Danang (average annual decrease 0.35 years; 95% CI 0.59–0.10), Dongthap (0.21; 95% CI 0.34–0.09) and HCMC (0.38; 95% CI 0.59–0.17). Figure 3. Notification rates in age group 15-24 years in six provinces of Vietnam,
1990-2003. Legend as for figure 2.
0
50
100
150
1990 1992 1994 1996 1998 2000 2002
Rat
e pe
r 100
,000
In the tuberculin surveys, a total of 124 915 schoolchildren were listed in six provinces. Of 120 222 (96.2%) children who were eligible, tested and read for analysis, 29 527 (24%) were included in the study in the first period (1986–1991), 40 684 (34%) in the second (1993–1997) and 50 011 (42%) in the third (1998–2002) (Table 2). Of all children included, 52 742 (44%) had no BCG scar. The proportion of children without BCG scar decreased with time from 64% in the first to 57% in the second and 22% in the third survey period (Table 2). The frequency distributions of non-zero tuberculin reactions among children without and those with BCG scar in the three periods showed no clear mode for the distribution among infected children, nor an antimode that separates reactions among infected and non-infected children (data not shown). A higher proportion of reactions in the range 4–20mm were observed among children with BCG scar compared to those without BCG scar in all three periods. However, the shape of the frequency distribution was similar for both in each of the three survey periods.
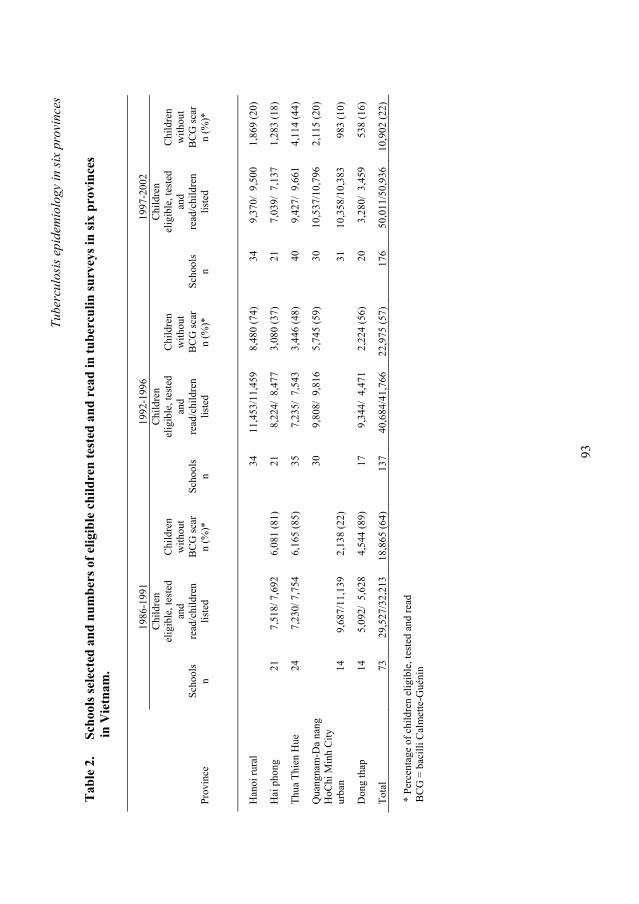
Tube
rcul
osis
epi
dem
iolo
gy in
six
prov
ince
s
93
Tab
le 2
.
Scho
ols s
elec
ted
and
num
bers
of e
ligib
le c
hild
ren
test
ed a
nd r
ead
in tu
berc
ulin
surv
eys i
n si
x pr
ovin
ces
i
n V
ietn
am.
19
86-1
991
1992
-199
6 19
97-2
002
Pr
ovin
ce
Sc
hool
s n
Chi
ldre
n el
igib
le, t
este
d an
d re
ad/c
hild
ren
liste
d
C
hild
ren
with
out
BC
G sc
ar
n (%
)*
Sc
hool
s n
Chi
ldre
n el
igib
le, t
este
d an
d re
ad/c
hild
ren
liste
d
C
hild
ren
with
out
BC
G sc
ar
n (%
)*
Sc
hool
s n
Chi
ldre
n el
igib
le, t
este
d an
d re
ad/c
hild
ren
liste
d
C
hild
ren
with
out
BC
G sc
ar
n (%
)*
Han
oi ru
ral
34
11
,453
/11,
459
8,48
0 (7
4)
34
9,37
0/ 9
,500
1,
869
(20)
Hai
pho
ng
21
7,51
8/ 7
,692
6,
081
(81)
21
8,
224/
8,4
77
3,08
0 (3
7)
21
7,03
9/ 7
,137
1,
283
(18)
Thua
Thi
en H
ue
24
7,23
0/ 7
,754
6,
165
(85)
35
7,
235/
7,5
43
3,44
6 (4
8)
40
9,42
7/ 9
,661
4,
114
(44)
Qua
ngna
m-D
a na
ng
30
9,
808/
9,8
16
5,74
5 (5
9)
30
10,5
37/1
0,79
6 2,
115
(20)
H
oChi
Min
h C
ity
urba
n 14
9,
687/
11,1
39
2,13
8 (2
2)
31
10
,358
/10,
383
983
(10)
Don
g th
ap
14
5,09
2/ 5
,628
4,
544
(89)
17
9,
344/
4,4
71
2,22
4 (5
6)
20
3,28
0/ 3
,459
53
8 (1
6)
Tota
l 73
29
,527
/32,
213
18,8
65 (6
4)
137
40,6
84/4
1,76
6 22
,975
(57)
17
6 50
,011
/50,
936
10,9
02 (2
2)
* Pe
rcen
tage
of c
hild
ren
elig
ible
, tes
ted
and
read
B
CG
= b
acill
i Cal
met
te-G
uéni
n
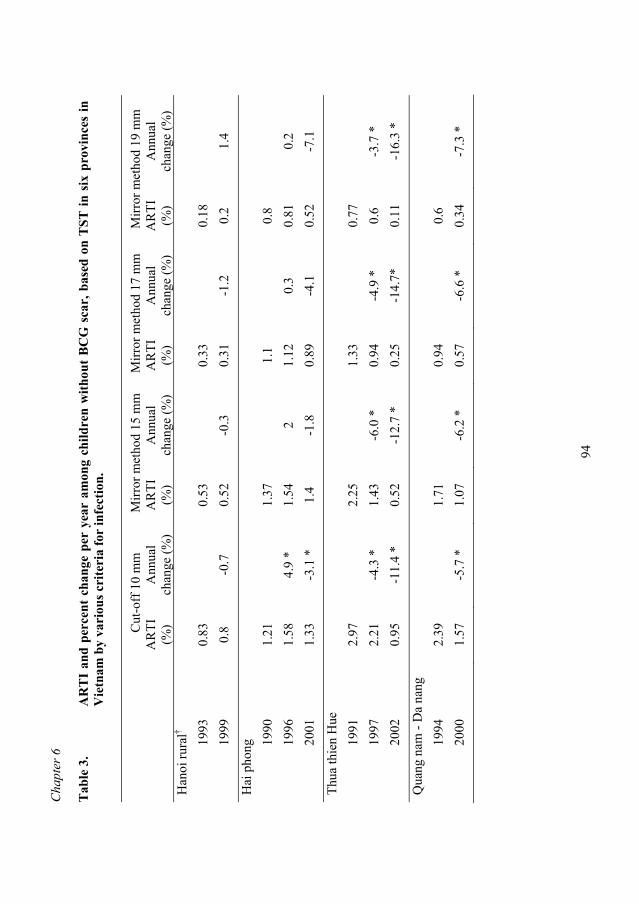
Cha
pter
6
94
Tab
le 3
. A
RT
I an
d pe
rcen
t ch
ange
per
yea
r am
ong
child
ren
with
out
BC
G s
car,
bas
ed o
n T
ST in
six
pro
vinc
es in
V
ietn
am b
y va
riou
s cri
teri
a fo
r in
fect
ion.
C
ut-o
ff 1
0 m
m
Mirr
or m
etho
d 15
mm
M
irror
met
hod
17 m
m
Mirr
or m
etho
d 19
mm
AR
TI
(%)
Ann
ual
chan
ge (%
) A
RTI
(%
) A
nnua
l ch
ange
(%)
AR
TI
(%)
Ann
ual
chan
ge (%
) A
RTI
(%
) A
nnua
l ch
ange
(%)
Han
oi ru
ral†
1993
0.
83
0.
53
0.
33
0.
18
19
99
0.8
-0.7
0.
52
-0.3
0.
31
-1.2
0.
2 1.
4
Hai
pho
ng
1990
1.
21
1.
37
1.
1
0.8
19
96
1.58
4.
9 *
1.54
2
1.12
0.
3 0.
81
0.2
2001
1.
33
-3.1
*
1.4
-1.8
0.
89
-4.1
0.
52
-7.1
Thua
thie
n H
ue
1991
2.
97
2.
25
1.
33
0.
77
19
97
2.21
-4
.3 *
1.
43
-6.0
*
0.94
-4
.9 *
0.
6 -3
.7 *
20
02
0.95
-1
1.4
* 0.
52
-12.
7 *
0.25
-1
4.7*
0.
11
-16.
3 *
Qua
ng n
am -
Da
nang
19
94
2.39
1.71
0.94
0.6
20
00
1.57
-5
.7 *
1.
07
-6.2
*
0.57
-6
.6 *
0.
34
-7.3
*

Tube
rcul
osis
epi
dem
iolo
gy in
six
prov
ince
s
95
Tab
le 3
. C
ontin
ued
Cut
-off
10
mm
M
irror
met
hod
15 m
m
Mirr
or m
etho
d 17
mm
M
irror
met
hod
19 m
m
A
RTI
(%
) A
nnua
l ch
ange
(%)
AR
TI
(%)
Ann
ual
chan
ge (%
) A
RTI
(%
) A
nnua
l ch
ange
(%)
AR
TI
(%)
Ann
ual
chan
ge (%
) H
oChi
Min
h C
ity
(urb
an)
1986
2.
63
2.
13
0.
91
0.
39
19
98
2.52
-0
.4
2.38
1
1.24
3.
1 0.
51
2.8
Don
g th
ap
1990
1.
56
1.
14
0.
63
0.
31
19
95
2.03
6
1.19
0.
9 0.
73
3 0.
41
6.8
2001
2.
05
0.1
1.4
2.9
0.61
-2
.6
0.31
-4
A
nnua
l cha
nge:
ave
rage
ann
ual c
hang
e ex
pres
sed
as p
erce
ntag
e of
the
AR
TI o
bser
ved
in th
e pr
evio
us su
rvey
. M
inus
sign
(-) d
enot
es d
ecre
ase.
† 1
TU P
PD-R
T23
inst
ead
of 2
TU
. *
Sign
ifica
nt (p
<0.0
5).
AR
TI :
ann
ual r
isk
of tu
berc
ulos
is in
fect
ion;
BC
G =
bac
illi C
alm
ette
-Gué
nin;
TST
= tu
berc
ulin
skin
test
.
Chapter 6
96
The prevalence of TB infection varied substantially by definition of a positive test, by province and by period, both among children without (Table 3) and among those with BCG scars (data not shown). Among the provinces where a survey conducted in the period 1993–1997 could be compared with a previous survey, the ARTI showed predominantly non-significant increases in Haiphong and Dongthap, and a 3.7–6.0% annual decrease in Thuathien-Hue that was significant by two of the four definitions used. Among provinces where a survey done in the period 1999–2002 could be compared to a survey done in the mid-1990s, the ARTI showed no significant changes in Hanoi and Dongthap, a predominantly non-significant decrease in Haiphong and decreases of 5.7–7.3% and 11.4–16.3% per year in Thuathien-Hue and Quangnam-Danang, respectively. For both, these trends were significant across all definitions. In HCMC, where surveys were performed in 1986 and 1998, no significant change in ARTI was observed. A similar pattern was observed among children with BCG scar (data not shown). DISCUSSION We observed significant decreases in CNR of new smear-positive TB over the period 1996–2003 of 2.5% to 5.9% per year in all provinces except HCMC. Over the same period, the ARTI decreased significantly in two of six provinces by 6.6% to 14.7% per year. This suggests that control efforts are beginning to have an impact on the TB epidemic in Vietnam. Over this period we also, however, found significant increases in CNR in the youngest age group (15–24 years) in four provinces, and a less than average decrease in the remaining two, which is reflected in a lack of increase in mean age of notified cases in all provinces. This partly offset stronger decreases in CNR in the other age groups. Thus, a new epidemic wave may be underway, in particular in HCMC, where the CNR in the youngest age group increased by 13.6% per year. The decrease in CNR and ARTI was observed mainly from 1996 onwards. When improving case detection, notification rates will increase initially, and thus a decline in incidence can be detected through notification only after the case detection rate has stabilised at this higher level. Second, tuberculin surveys measure impact on transmission with considerable delay, as the risk of infection represents the average risk over the lifetime of the children included, i.e., >6.5 to 8.5 years before the survey. A decline in ARTI would thus not be expected before 1996. The estimates for the period 1996–2003 thus better reflect the impact of TB control than those for the entire period. The increasing CNRs in the oldest age group in four provinces in this period probably reflected improving case finding, i.e., the expanding programme coverage particularly benefited the old. The increase in mean age of TB patients observed in the period 1990–1995 thus does not reflect declining transmission, as was observed in Europe when countries changed from a high-prevalence to a low-prevalence situation [5]. The increase in CNR among the youngest age group over the most recent period (1996–2003) is cause for concern. Apart from Thuathien-Hue, where the ARTI declined between 1991 and 1997, we could not show a clear increase or decrease in ARTI in the period when
Tuberculosis epidemiology in six provinces
97
this age group was eligible for TST. Therefore, the increase in transmission that resulted in increasing notification rates since 1996 probably occurred very recently, and the ARTI may have increased again since the most recent surveys in our study. Nevertheless, even in the older age groups, where CNRs had decreased since 1996, the extent of decline is less than the 7–11% annual decrease in TB incidence that is predicted to occur when the WHO targets of 70% case detection rate and 85% cure rate are met [2,3]. One explanation for this limited impact of TB control is the emerging human immunodeficiency virus (HIV) epidemic [19]. The number of HIV-infected TB cases has increased considerably since 2000 in Haiphong and HCMC [19,20]. The prevalence of HIV infection among patients diagnosed with TB as estimated by sentinel surveillance was 11.8% in Haiphong and 9.3% in HCMC in 2002 (NTP, unpublished). This HIV epidemic is currently concentrated in drug users and commercial sex workers [19]. Studies are underway to assess the impact of HIV on TB CNRs, particularly in the younger age groups. Possible other explanations for the limited impact of TB control include the rapid urbanisation and population movement since the economic liberalization of the late 1980s [9,10] and the spread of new Mycobacterium tuberculosis strains such as the Beijing genotype [21]. Furthermore, case detection and cure rates may have been overestimated. This may be the case in particular in urban areas where the private health sector is growing rapidly, often with poor outcomes of TB treatment [22,23]. However, cure rates may be lower than reported in the NTP, and operational studies are being conducted to evaluate these. The case detection rates reported by the WHO are based on rather uncertain estimates of TB incidence. If TB incidence were underestimated, the case detection rate would be overestimated. A TB prevalence survey would help establish the true burden of TB in the country, as well as provide a baseline against which the impact of the programme on the TB epidemic can be evaluated. This study has limitations. First, there are methodological difficulties in the interpretation of tuberculin survey data [16,24]. These include rounding to multiples of five, problems of interpretation following BCG vaccination, representation of non-vaccinated children, misclassification of vaccination status (not all vaccinated children develop a typical scar), influence of infection with environmental mycobacteria, and the uncertain role of tuberculin reversion [16,24]. However, estimates of trend should be fairly robust and not strongly depend on these factors [24]. With few exceptions, our trend estimates did not depend on the cut-off point used and were similar for those with and without BCG scar. Second, there is a strong urban bias in the provinces included in this analysis. Due to migration from rural areas, districts that were predominantly rural during the first survey may have become predominantly urban by the time of the third, in particular in Hanoi and HCMC [9,10]. TB incidence tends to be higher in urban than in rural settings, and such demographic shifts may have caused a paradoxical increase in incidence.

Chapter 6
98
CONCLUSIONS Our data suggest limited impact to date of the DOTS Strategy in Vietnam despite high case detection and cure rates. However, we did observe the beginning of a decline in transmission and incidence after DOTS coverage and case detection had reached its current levels. ACKNOWLEDGEMENTS The authors thank Dr AC Gebhard for her comments on the manuscript, the national tuberculin team and the staff in the provinces where the study was implemented for their co-operation. This study was supported by the Ministry of Health Vietnam and the Dutch government (Project VN002405). REFERENCES 1. Corbett EL, Watt CJ, Walker N, et al. The growing burden of tuberculosis: global
trends and interactions with the HIV epidemic. Arch Intern Med 2003; 163: 1009-1021.
2. Styblo K, Bumgarner R. Tuberculosis can be controlled with existing technologies: evidence. In: Tuberculosis Surveillance Research Unit; Progress report 1991. The Hague, Netherlands: KNCV, 1991: pp 60-72.
3. Dye C, Garnett GP, Sleeman K, Williams BG. Prospects for worldwide tuberculosis control under the WHO DOTS Strategy. Directly observed short-course therapy. Lancet 1998; 352: 1886-1891.
4. Borgdorff MW, Floyd K, Broekmans JF. Interventions to reduce tuberculosis mortality and transmission in low- and middle-income countries. Bull World Health Organ 2002; 80: 217-227.
5. Rieder HL. Epidemiology of tuberculosis in Europe. Eur Respir J 1995; 20 (Suppl): 620-632.
6. Netto EM, Dye C, Raviglione MC, for the global monitoring and surveillance project. Progress in global tuberculosis control 1995-1996, with emphasis on 22 high-incidence countries. Int J Tuberc Lung Dis 1999; 3: 310-320.
7. World Health Organisation. Global Tuberculosis Control - Surveillance, planning, financing. Geneva, Switzerland: WHO, 2005.
8. Huong NT, Duong BD, Co NV, et al. Establishment and development of the National Tuberculosis Control Programme in Vietnam. Int J Tuberc Lung Dis 2005; 9: 151-156.
9. Completed census results. Vietnam population census, 1989. Volume I. Hanoi, Vietnam: General Statistical Office, 1991.
10. Completed census results. Population and housing census Vietnam 1999. Hanoi, Vietnam: General Statistical Office, 2001.
11. Ten Dam HG. Surveillance of tuberculosis by means of tuberculin surveys. WHO/TB/85.145. Geneva, Switzerland: WHO, 1985.
Tuberculosis epidemiology in six provinces
99
12. Arnadottir T, Rieder HL, Trebucq A, Waaler HT. Guidelines for conducting tuberculin skin test surveys in high prevalence countries. Tuberc Lung Dis 1996; 77 (Suppl): 1-20.
13. Nyboe J. The efficacy of the tuberculin test. An analysis based on results from 33 countries. Bull World Health Org 1960; 22: 35-37.
14. Roelsgaard E, Iversen E, Blocher C. Tuberculosis in tropical Africa. Bull World Health Org 1964; 30: 459-518.
15. Bleiker MA, Sutherland I, Styblo K, Ten Dam HG, Misljenovic O. Guidelines for estimating the risks of tuberculous infection from tuberculin test results in a representative sample of children. Bull Int Union Tuberc 1989; 64: 7-12.
16. Rieder HL. Methodological issues in the estimation of the tuberculosis problem from tuberculin surveys. Tuberc Lung Dis 1995; 76: 114-121.
17. Styblo K. Epidemiology of tuberculosis. Selected papers, volume 24. The Hague, Netherlands: KNCV, 1991.
18. Styblo K, Meijer J, Sutherland I. The transmission of tubercle bacilli. Its trend in a human population. Tuberculosis Surveillance Research Unit, progress report no. 1. Bull Int Union Tuberc 1969; 42: 5-104.
19. UNAIDS/UNICEF/WHO. Epidemiological fact sheet on HIV/AIDS and sexually transmitted infections. Viet Nam. 2004 Update. http://www.unaids.org/en/geographical+area/by+country/viet+nam.asp. Accessed 6 October 2005.
20. Quy HT, Nhien DT, Lan NT, Borgdorff MW, Broekmans JF. Steep increase in HIV prevalence among tuberculosis patients in Ho Chi Minh City. AIDS 2002; 16: 931-932.
21. Anh DD, Borgdorff MW, Van LN, et al. Mycobacterium tuberculosis Beijing genotype emerging in Vietnam. Emerg Infect Dis 2000; 6: 302-305.
22. Lönnroth K, Thuong LM, Linh PD, Diwan VK. Utilization of private and public health-care providers for tuberculosis symptoms in Ho Chi Minh City, Vietnam. Health Policy Plan 2001; 16: 47-54.
23. Lönnroth K, Thuong LM, Lambregts K, Quy HT, Diwan VK. Private tuberculosis care provision associated with poor treatment outcome: comparative study of semi-private lung clinic and the NTP in two urban districts in Ho Chi Minh City, Vietnam. Int J Tuberc Lung Dis 2003; 7: 165-171.
24. Fine PE, Floyd S, Stanford JL, et al. Environmental mycobacteria in northern Malawi: implications for the epidemiology of tuberculosis and leprosy. Epidemiol Infect 2001; 126: 379-387.

100
101
Chapter 7
Survival and relapse rate of tuberculosis patients who successfully
completed treatment in Vietnam
M. Vree1,2, N.T. Huong2,3, B.D. Duong3 , D.N. Sy3, L.N. Van3, N.V. Hung3, N.V. Co3, M.W. Borgdorff1,2, F.G. Cobelens1,2
1. KNCV Tuberculosis Foundation, The Hague, The Netherlands 2. Academic Medical Center, University of Amsterdam, The Netherlands 3. National Hospital of Tuberculosis and Respiratory Diseases, Hanoi, Vietnam
International Journal of Tuberculosis and Lung Disease, 2007 Vol 11(4), pp: 392-397
Chapter 7
102
ABSTRACT Setting: Reported tuberculosis (TB) cure rates are high in Vietnam with the 8-month short-course chemotherapy regimen. However, long-term treatment outcomes are unknown. Objective: To assess survival and relapse rates among patients successfully treated for new smear-positive pulmonary tuberculosis (PTB). Methods: A cohort of patients treated in 32 randomly selected districts in northern Vietnam were followed up 12–24 months after reported cure or treatment success for survival and bacteriologically confirmed relapse. Measurements included sputum smear examination, culture and interview for recent treatment history. Results: Of 304 patients included in the study, no information was available for 31 (10%) and 19 (6%) had died. Bacteriology results were available for 244 (80%). The median interval between treatment completion and follow-up was 19 months. Relapse was recorded in 21/244 (8.6%, 95% CI 5.4–13), including 9 (4%) with positive sputum smears, 3 (1%) with negative smears but positive culture and 9 (4%) who had started TB retreatment. Four of 12 culture-positive relapse cases (33%) had multidrug-resistant strains. If the definition of relapse was extended to include death, reportedly due to TB, the relapse proportion was 26/263 (9.9%, 95% CI 6.6–14). Conclusion: A substantial proportion of patients (15%) had died or relapsed after being successfully treated for TB in northern Vietnam.
Survival and relapse rate of TB patients
103
INTRODUCTION The World Health Oragnization (WHO) global strategy for tuberculosis (TB), the DOTS Strategy, recommends the use of short-course chemotherapy (SCC) for pulmonary tuberculosis (PTB). With SCC, 82% of all new smear-positive cases notified in DOTS programmes worldwide completed treatment successfully, and 1.7% failed [1]. However, patients who are cured with SCC may develop TB disease again with the strain that caused the original disease episode [2]. In the DOTS Strategy a relapse case is defined as a patient previously declared cured, but with a new episode of bacteriologically positive TB [1]. Globally, 265 918 relapse cases were notified in 2004 [1]. Case fatality is higher among relapse cases than among new cases [1]. Therefore, relapse TB is a relevant cause of morbidity and mortality. In addition, relapse cases likely contribute to TB transmission. In an international multi-centre randomised controlled trial, the combined failure and relapse rate was 10% for the 8-month SCC regimen with ethambutol (EMB, E) and isoniazid (INH, H) in the continuation phase and 5% for the 6-month SCC regimen with rifampicin (RMP, R) throughout [3]. In many countries, the 8-month regimen is used because of financial constraints and because it is considered to carry a lower risk of inducing multidrug resistance (MDR) [4]. The relapse rate under routine practice may differ from that in a clinical trial because of differences in TB and human immunodeficiency virus (HIV) epidemiology, different patient populations and possibly less strict supervision of drug intake. More importantly, in many low-income countries, cure is defined routinely by a single negative sputum smear at treatment completion plus a negative smear on at least one previous occasion [5]. In clinical trials, however, cure is based on culture, which is more sensitive than smear microscopy [6]. In routine practice where cure is based on smear microscopy, treatment failures can thus be missed. Such cases will be in addition to true relapses, in which the patient is smear- and culture-negative at the end of treatment but develops TB again with the same infecting strain [2]. Few data are available on relapse rates in DOTS programmes. Numbers of diagnosed relapse cases are routinely collected [1], but time intervals from treatment completion to relapse, and therefore relapse rates, are generally unknown. Furthermore, these cases have been diagnosed because patients report with symptoms. Relapse patients who die, eventually self-heal or are treated outside the National Tuberculosis Programme (NTP) will thus not be included. The relapse rate with culture-based active follow-up under programme conditions is known in only a few settings, such as in India [7]. This study aims to assess survival and the bacteriologically confirmed relapse rate 12–24 months after treatment completion among new smear-positive PTB patients diagnosed and treated by the Vietnam NTP with reported cure or treatment completion. Vietnam is a high-burden country for TB; 58 389 new smear-positive patients were notified in 2004 (70 per 100 000 population) [1]. The DOTS Strategy has been implemented
Chapter 7
104
nationwide since 2000 [8]. The standard NTP treatment regimen for new patients consists of daily streptomycin (SM, S), INH, RMP and pyrazinamide (PZA, Z) for 2 months, followed by daily INH and EMB for 6 months (2SHRZ/6HE). The prevalence of MDR among new smear-positive TB patients was 2.3% in a nationwide survey conducted in 1996–1997 [9]. The estimated prevalence of HIV infection in the adult population was 0.5% in 2005 (range, 0.3–0.9%) [10]. Since 1997, the NTP has reported high treatment success rates of over 90% among new smear-positive TB cases and a 1% failure rate in 2003 [1] STUDY POPULATION AND METHODS The study was restricted to northern Vietnam for logistical reasons. We randomly selected 32 of 298 NTP TB districts. Eligible for inclusion in the cohort in the selected districts were patients diagnosed with previously untreated smear-positive TB who had started treatment between 1 April 2002 and 1 April 2003 and had cure or treatment completion as the reported treatment outcome. Excluded were patients aged ≤15 years and patients living outside the district at the time of treatment. The sample size was based on an estimated relapse rate of 10% and around a desired confidence interval (CI) of 5–15% and calculated at 304 patients, allowing 10% for losses. Patient data were recorded on a pre-coded structured questionnaire. Data on diagnosis, treatment and retreatment were extracted from routine registers. The Institutional Research Board of the National Hospital for Tuberculosis and Respiratory Diseases in Hanoi gave scientific and ethical clearance for the study. Patients identified as smear- or culture-positive at follow-up were offered retreatment. Data were collected by especially trained district TB staff and supervised by provincial staff. In addition, one of the authors (MV) supervised the data collection in 13 districts (41%). In November and December 2004, the selected patients were invited to the district unit. Patients who did not report were visited at their homes. If patients could not be found or had died, a non-response interview was completed with a family member. After written informed consent was obtained, one on-the-spot sputum sample was collected from each patient before and one after the interview. Sputum smear microscopy and mycobacterial culture were performed at two provincial TB laboratories and the National Tuberculosis Reference Laboratory (NTRL) in Hanoi. Sputum specimens were transferred to the laboratory within 2 days after collection and examined using the Ziehl-Neelsen (ZN) method. For each patient, a single mycobacterial culture was performed on Ogawa medium using the simple decontamination method (i.e., without centrifugation) [11]. Mycobacterium tuberculosis was identified using the niacin test. Drug susceptibility testing (DST) was performed at the NTRL by the proportion method [12]. All

Survival and relapse rate of TB patients
105
negative slides of patients with positive cultures and all positive slides of patients with negative cultures were reread by technicians blinded to the original results. Twenty per cent of slides were randomly selected and reread at the NTRL. When false negative results were detected from one laboratory, all slides from that laboratory were reread and the final results were based on the rereading. A case was defined as smear-positive if at least one sputum smear examination was positive. A relapse case was defined as a patient who was smear- or culture positive at the time of follow-up or had been diagnosed with smear-positive TB and started retreatment in the interval between completion of initial treatment and time of follow-up. Analysis Data were double-entered using Epi Info 2002 (Centers for Disease Control and Prevention, Atlanta, GA, USA). Inconsistencies were checked against raw data. Data were analysed using SPSS 11.5 (SPSS Inc, Chicago, IL, USA). Two-sided Fisher’s exact test or ҳ2 test was used to assess differences at the 5% significance level. ҳ2 test was used to test for aggregation of relapse by district. RESULTS Included in the cohort were 304 patients. No information was available for 31 (10%) patients, of whom 17 had moved. Nineteen patients had died (6%). Of 254 patients available for follow-up (84%), interview data could be obtained for 253 and bacteriology results for 244 (Figure). Complete data were available for 243 (80%) patients. The median time interval between end of treatment and follow-up was 19.4 months (interquartile range [IQR], 17–22 months). Baseline characteristics of patients are described in Table 1. Eleven patients (4%) had a negative HIV status as reported in the treatment register; HIV status was unknown for the remaining patients. At the time of follow-up, 14 patients were smear or culture-positive (5.7%, 95% CI 3.2–9.5). Of these, 12 were not on retreatment, including 2 who were smear-positive, 3 who were culture-positive, and 7 who were both (Figure). Nine patients had started retreatment for smear-positive TB between the end of initial treatment and follow-up, of whom 2 were smear- and culture-positive and 7 smear- and culturenegative at the time of follow-up. The median interval between end of treatment and start of retreatment was 8 months (IQR 4–9 months). Of 12 strains isolated, 7 were resistant to any drug (58%, 95% CI 28–85), 6 to SM (50%, 95% CI 21–79) and 4 to both INH and RMP (MDR) (33%, 95% CI 10–65) (Table 2). A total of 21/244 (8.6%, 95% CI 5.4–13) patients with bacteriology results had relapsed (sputum smear or culture-positive or started on retreatment). Relapse showed no significant aggregation by district (p=0.22). The proportion of relapses did not differ between patients with an interval from end of treatment to relapse or follow-up of 12–18 months and those
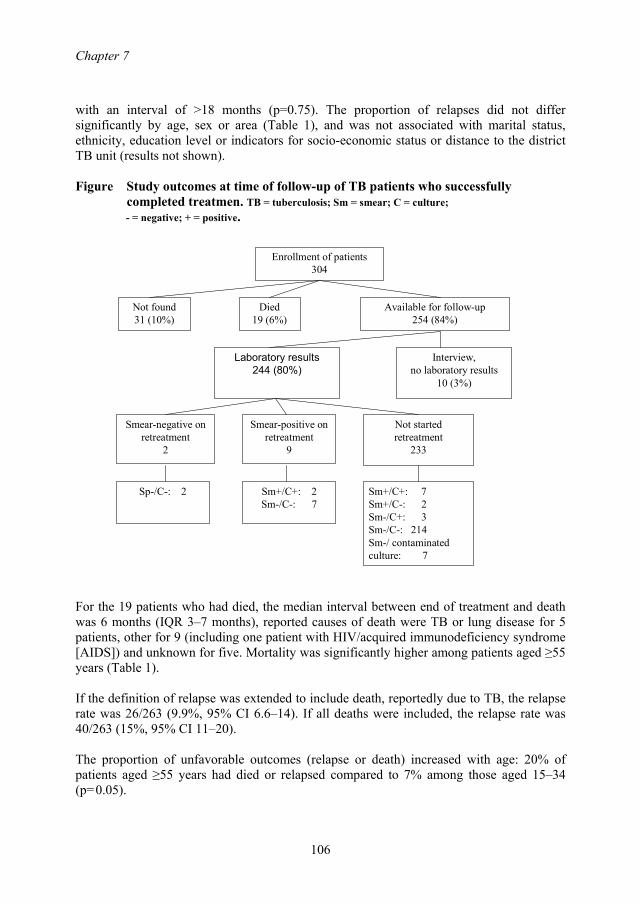
Chapter 7
106
with an interval of >18 months (p=0.75). The proportion of relapses did not differ significantly by age, sex or area (Table 1), and was not associated with marital status, ethnicity, education level or indicators for socio-economic status or distance to the district TB unit (results not shown). Figure Study outcomes at time of follow-up of TB patients who successfully
completed treatmen. TB = tuberculosis; Sm = smear; C = culture; - = negative; + = positive.
Enrollment of patients304
Not found31 (10%)
Died19 (6%)
Available for follow-up254 (84%)
Interview,no laboratory results
10 (3%)
Laboratory results244 (80%)
Smear-negative on retreatment
2
Smear-positive on retreatment
9
Not started retreatment
233
Sp-/C-: 2 Sm+/C+: 2Sm-/C-: 7
Sm+/C+: 7Sm+/C-: 2Sm-/C+: 3Sm-/C-: 214Sm-/ contaminated culture: 7
For the 19 patients who had died, the median interval between end of treatment and death was 6 months (IQR 3–7 months), reported causes of death were TB or lung disease for 5 patients, other for 9 (including one patient with HIV/acquired immunodeficiency syndrome [AIDS]) and unknown for five. Mortality was significantly higher among patients aged ≥55 years (Table 1). If the definition of relapse was extended to include death, reportedly due to TB, the relapse rate was 26/263 (9.9%, 95% CI 6.6–14). If all deaths were included, the relapse rate was 40/263 (15%, 95% CI 11–20). The proportion of unfavorable outcomes (relapse or death) increased with age: 20% of patients aged ≥55 years had died or relapsed compared to 7% among those aged 15–34 (p=0.05).
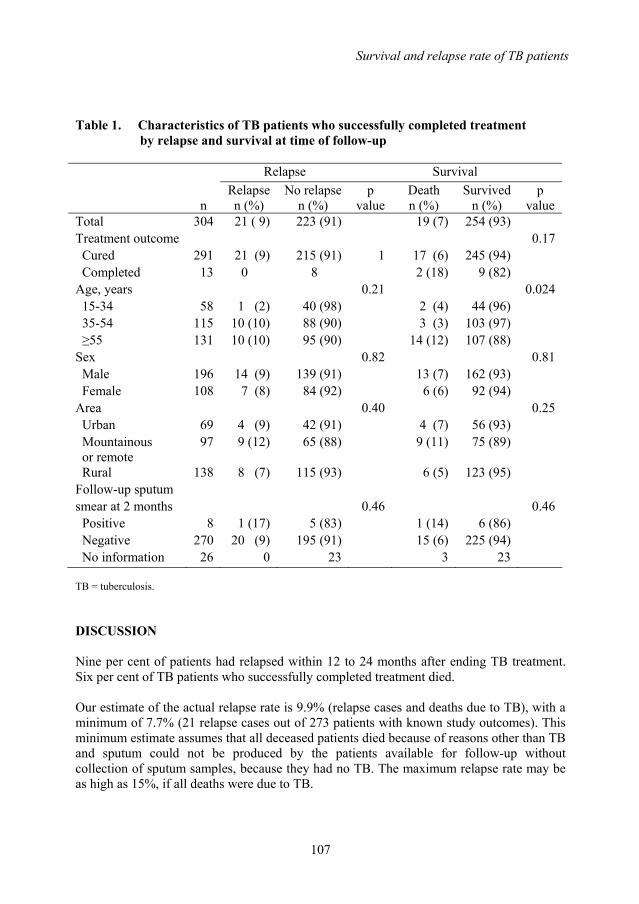
Survival and relapse rate of TB patients
107
Table 1. Characteristics of TB patients who successfully completed treatment
by relapse and survival at time of follow-up
Relapse Survival
n Relapse n (%)
No relapse n (%)
p value
Death n (%)
Survived n (%)
p value
Total 304 21 ( 9) 223 (91) 19 (7) 254 (93) Treatment outcome 0.17 Cured 291 21 (9) 215 (91) 1 17 (6) 245 (94) Completed 13 0 8 2 (18) 9 (82) Age, years 0.21 0.024 15-34 58 1 (2) 40 (98) 2 (4) 44 (96) 35-54 115 10 (10) 88 (90) 3 (3) 103 (97) ≥55 131 10 (10) 95 (90) 14 (12) 107 (88) Sex 0.82 0.81 Male 196 14 (9) 139 (91) 13 (7) 162 (93) Female 108 7 (8) 84 (92) 6 (6) 92 (94) Area 0.40 0.25 Urban 69 4 (9) 42 (91) 4 (7) 56 (93) Mountainous or remote
97 9 (12) 65 (88) 9 (11) 75 (89)
Rural 138 8 (7) 115 (93) 6 (5) 123 (95) Follow-up sputum smear at 2 months 0.46 0.46 Positive 8 1 (17) 5 (83) 1 (14) 6 (86) Negative 270 20 (9) 195 (91) 15 (6) 225 (94) No information 26 0 23 3 23 TB = tuberculosis. DISCUSSION Nine per cent of patients had relapsed within 12 to 24 months after ending TB treatment. Six per cent of TB patients who successfully completed treatment died. Our estimate of the actual relapse rate is 9.9% (relapse cases and deaths due to TB), with a minimum of 7.7% (21 relapse cases out of 273 patients with known study outcomes). This minimum estimate assumes that all deceased patients died because of reasons other than TB and sputum could not be produced by the patients available for follow-up without collection of sputum samples, because they had no TB. The maximum relapse rate may be as high as 15%, if all deaths were due to TB.
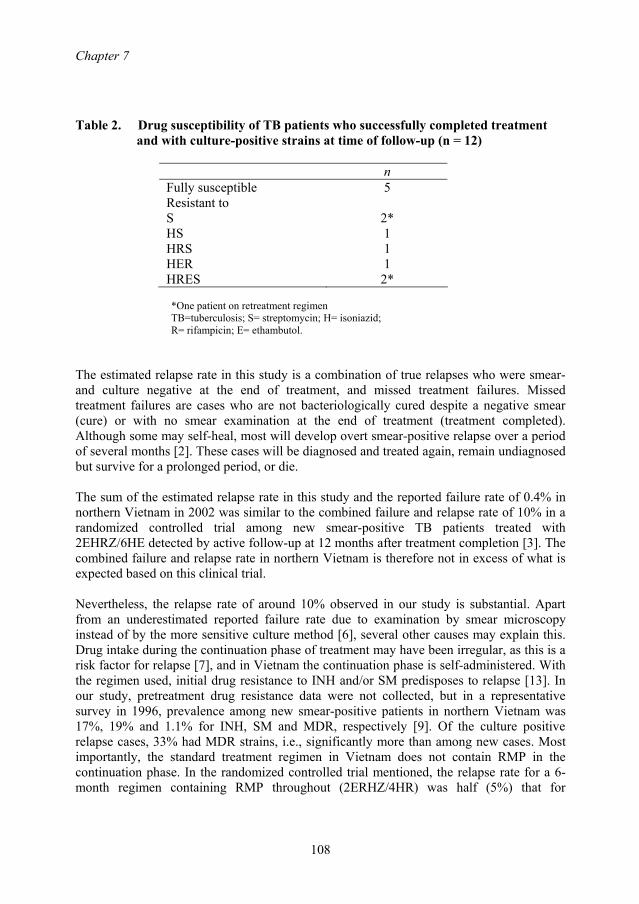
Chapter 7
108
Table 2. Drug susceptibility of TB patients who successfully completed treatment
and with culture-positive strains at time of follow-up (n = 12)
n Fully susceptible 5 Resistant to S 2*
HS 1 HRS 1 HER 1 HRES 2*
*One patient on retreatment regimen TB=tuberculosis; S= streptomycin; H= isoniazid; R= rifampicin; E= ethambutol.
The estimated relapse rate in this study is a combination of true relapses who were smear- and culture negative at the end of treatment, and missed treatment failures. Missed treatment failures are cases who are not bacteriologically cured despite a negative smear (cure) or with no smear examination at the end of treatment (treatment completed). Although some may self-heal, most will develop overt smear-positive relapse over a period of several months [2]. These cases will be diagnosed and treated again, remain undiagnosed but survive for a prolonged period, or die. The sum of the estimated relapse rate in this study and the reported failure rate of 0.4% in northern Vietnam in 2002 was similar to the combined failure and relapse rate of 10% in a randomized controlled trial among new smear-positive TB patients treated with 2EHRZ/6HE detected by active follow-up at 12 months after treatment completion [3]. The combined failure and relapse rate in northern Vietnam is therefore not in excess of what is expected based on this clinical trial. Nevertheless, the relapse rate of around 10% observed in our study is substantial. Apart from an underestimated reported failure rate due to examination by smear microscopy instead of by the more sensitive culture method [6], several other causes may explain this. Drug intake during the continuation phase of treatment may have been irregular, as this is a risk factor for relapse [7], and in Vietnam the continuation phase is self-administered. With the regimen used, initial drug resistance to INH and/or SM predisposes to relapse [13]. In our study, pretreatment drug resistance data were not collected, but in a representative survey in 1996, prevalence among new smear-positive patients in northern Vietnam was 17%, 19% and 1.1% for INH, SM and MDR, respectively [9]. Of the culture positive relapse cases, 33% had MDR strains, i.e., significantly more than among new cases. Most importantly, the standard treatment regimen in Vietnam does not contain RMP in the continuation phase. In the randomized controlled trial mentioned, the relapse rate for a 6-month regimen containing RMP throughout (2ERHZ/4HR) was half (5%) that for
Survival and relapse rate of TB patients
109
2ERHZ/6HE [3]. Therefore, changing from the current standard regimen to one with RMP in the continuation phase could reduce the relapse rate. However, there may be disadvantages to such a change. A treatment regimen containing RMP in the continuation phase, especially if the drug intake is unsupervised, may result in more MDR relapse cases than the 8-month regimen. Moreover, data from Ho Chi Minh City [14] suggest that a 6-month regimen that contains SM instead of EMB in the intensive phase has higher failure rates, probably related to the high initial resistance to SM and INH [15]. Of new patients in northern Vietnam in 1996, 7.7% had strains resistant to both INH and SM [9], and three of four relapse patients with MDR in this study also had SM resistance. The mortality rate was high for patients who successfully completed TB treatment. This is likely due to the relatively old age of the patients in the cohort, as mortality was 12% among patients aged ≥55 years compared to 3% among those aged <55 years. This high mortality rate may be caused in part by TB. The cause of death was TB or lung disease for 5 (of 19) patients. However, the cause of death as reported by family members is probably not accurate, and the mortality rate attributed to TB can be under- or overestimated. The relapse rate may have been overestimated. Since no DNA fingerprinting was performed of M. tuberculosis strains before treatment and at relapse, we could not distinguish between relapse and re-infection [2]. At the time of follow-up, nine patients had started retreatment and nine were smear-positive and had not yet started retreatment. One consequence of this high relapse rate is therefore that early case finding of relapsed patients should be considered. Another consequence is that this high relapse rate may contribute substantially to continued transmission, in particular of multidrug-resistant TB. Interventions to lower the relapse rate and deaths due to TB should be investigated for cost-effectiveness, such as confirmation of cure by culture, supervision of drug intake during the continuation phase or a change in the treatment regimen. CONCLUSION A substantial proportion of patients (15%) had died or relapsed after being successfully treated with the 8-month TB treatment regimen in northern Vietnam. ACKNOWLEDGEMENTS We thank Dr. T.T. Huyen and Dr. H.T. Thuy for logistical and secretarial support. We thank staff from the National Reference Laboratory, provincial laboratories of Thanh Hoa and Hai Phong, and staff from the provincial and district units who participated in the study for their cooperation. This study was supported by the Ministry of Health Vietnam and The Netherlands government (Project VN002405).
Chapter 7
110
REFERENCES 1. World Health Organization. Global tuberculosis control: surveillance, planning,
financing. WHO report 2006. WHO/HTM/TB/2006.362. Geneva, Switzerland: WHO, 2006.
2. Lambert M L, Hasker E, Van Deun A, Roberfroid D, Boelaert M, Van der Stuyft P. Recurrence in tuberculosis: relapse or reinfection? Lancet Infect Dis 2003; 3: 282-287.
3. Jindani A, Nunn AJ, Enarson D A. Two 8-month regimens of chemotherapy for treatment of newly diagnosed pulmonary tuberculosis: international multicentre randomized trial. Lancet 2004; 364: 1244-1251.
4. Rieder H L. Interventions for tuberculosis control and elimination. Paris, France: International Union Against Tuberculosis and Lung Disease: 2002.
5. World Health Organization, International Union Against Tuberculosis and Lung Disease; Royal Netherlands Tuberculosis Association. Revised international definitions in tuberculosis control. Int J Tuberc Lung Dis 2001; 5: 213-215.
6. Toman K. 5. How reliable is smear microscopy? In: Frieden T, eds, Toman’s tuberculosis case detection, treatment, and monitoring: questions and answers. 2nd ed. Geneva, Switzerland: WHO, 2004: pp 14-22.
7. Thomas A, Gopi P G, Santha T, et al. Predictors of relapse among pulmonary tuberculosis patients treated in a DOTS programme in South India. Int J Tuberc Lung Dis 2005; 9: 556-561.
8. Huong N T. Duong B D, Co N V, et al. Establishment and development of the National Tuberculosis Control Programme in Vietnam. Int J Tuberc Lung Dis 2005; 9: 151-156.
9. World Health Organization, International Union Against Tuberculosis and Lung Disease. Anti-tuberculosis drug resistance in the world. Geneva, Switzerland: WHO, 1997.
10. Joint United Nations Programme on HIV/AIDS, United Nations Children’s Fund, World Health Organization. Epidemiological fact sheet on HIV/AIDS and sexually transmitted infections. Viet Nam. Geneva, Switzerland: UNAIDS, 2006. http://www.who.int/globatlas/predefinedreports/EFS2006/EFS_PDFs/EFS2006_VN.pdf. Accessed September 2006.
11. World Health Organization. Laboratory services in tuberculosis control. Part III: culture. Geneva, Switzerland: WHO, 1998.
12. World Health Organization. Guidelines for surveillance of drug resistance in tuberculosis. 2nd ed. Geneva, Switzerland: WHO, 2003.
13. Quy H T W, Lan N T N, Borgdorff M W, et al. Drug resistance among failure and relapse cases of tuberculosis: is the standard re-treatment regimen adequate? Int J Tuberc Lung Dis 2003; 7: 631-636.
14. Quy H T, Cobelens F G J, Lan N T N, Buu T N, Lambregts C S B, Borgdorff M W. Treatment outcomes by drug resistance and HIV status among tuberculosis patients in Ho Chi Minh City, Vietnam. Int J Tuberc Lung Dis 2006; 10: 45-51.
15. Quy H T, Buu T N, Cobelens F G J, Lan N T N, Lambregts C S B, Borgdorff M W. Drug resistance among smear-positive tuberculosis patients in Ho Chi Minh City, Vietnam. Int J Tuberc Lung Dis 2006; 10: 160-166.
111
Chapter 8
Anti-tuberculosis drug resistance in the south of Vietnam: Prevalence and trends
Nguyen T. Huong1,7, Nguyen T.N. Lan2, Frank G.J. Cobelens3,7, Bui D. Duong1, Nguyen V. Co1, Maarten C. Bosman4, Sang-Jae Kim5,
Dick van Soolingen6, Martien W. Borgdorff3,7
1. National Hospital of Tuberculosis and Respiratory Diseases, Hanoi, Vietnam 2. Pham Ngoc Thach Hospital, Ho Chi Minh City, Vietnam 3. KNCV Tuberculosis Foundation, the Hague, the Netherlands 4. World Health Organization for the Western Pacific Region, Manila, the Philippines 5. International Union Against Tuberculosis and Lung Disease, Paris, France 6. National Institute of Public Health and the Environment, Bilthoven, the Netherlands 7. Academic Medical Center, University of Amsterdam, the Netherlands
Journal of Infectious Diseases, 2006 Vol 194, pp: 1226-32
Chapter 8
112
ABSTRACT Background: There is limited evidence that the DOTS (directly observed therapy, short course) Strategy for tuberculosis (TB) control can contain the emergence and spread of drug resistance in the absence of second-line treatment. We compared drug-resistance levels between 1996 and 2001 in the south of Vietnam, an area with a well-functioning DOTS program. Methods: Sputum specimens were collected from consecutively diagnosed patients with smear-positive TB at 40 randomly selected public TB clinics. Mycobacterium tuberculosis isolates were tested for susceptibility to first line drugs. Results: Among 888 new patients in 2001, resistance to any drug was observed in 238 (26.3%), resistance to isoniazid was observed in 154 (16.6%), resistance to rifampin was observed in 22 (2.0%), resistance to ethambutol was observed in 12 (1.1%), resistance to streptomycin was observed in 173 (19.4%), and resistance to both isoniazid and rifampicin (multidrug resistance [MDR]) was observed in 20 (1.8% [95% confidence interval, 1.0%–3.3%]). Among 136 previously treated patients in 2001, any resistance was observed in 89 (62.9%), and MDR was observed in 35 (23.2%). The prevalence of any drug resistance and of streptomycin resistance among new patients had decreased significantly (p<0.01) since 1996; there was no increase in the prevalence of MDR. Conclusion: The prevalence of drug resistance decreased despite high initial levels of resistance to isoniazid and streptomycin and despite the absence of second-line treatment. Therefore, a DOTS program can contain drug resistant TB in this setting.

Anti-tuberculosis drug resistance
113
INTRODUCTION With >8 million cases and 2 million deaths annually, tuberculosis (TB) is a major cause of morbidity and mortality worldwide [1]. The approach to TB control advocated by the World Health Organization (WHO) is DOTS (directly observed therapy, short course), which focuses on the treatment of sputum smear–positive pulmonary TB with standardized short-course chemotherapy under proper case-management conditions [2]. Among the objectives of the DOTS Strategy is the prevention of the emergence and spread of resistance to anti-TB drugs, in particular of resistance to both isoniazid and rifampin (multidrug resistance [MDR]). MDR-TB carries a highly increased risk of treatment failure or death with short-course chemotherapy and is an important challenge for TB control [3–5]. An increasing number of TB control programs are adding second-line treatment of patients with MDR-TB to their DOTS services (previously called “DOTS-Plus”) [6]. Although it is clear that the individual patient with MDR-TB benefits from second-line treatment [7], it is still a matter of debate whether and under what conditions the DOTS Strategy as such is effective in containing the spread of drug resistance [8]. Recently, a prospective population-based study in Mexico showed that the introduction of DOTS rapidly reduced the transmission and incidence of drug-resistant TB [9]. In Botswana, however, repeated nationwide surveys showed a significant increase in the prevalence of drug resistance among new patients with TB, despite the presence of a long-standing DOTS program [10]. Vietnam is among the countries with a high burden of TB [6]. The National Tuberculosis Control Program of Vietnam (NTPV) implemented the DOTS Strategy in 1989, and the estimated case-detection rate has been 70% since 1997 [6,11]. The NTPV’s standard treatment regimen for new (i.e., previously untreated) patients consists of 2 months of streptomycin, isoniazid, rifampin, and pyrazinamide, followed by 6 months of isoniazid and ethambutol (the 2SHRZ/6HE regimen). It has been used widely since 1990, with cure rates well over 85% and failure rates <3% [11]. Despite high performance by these indicators, there are concerns about the ability of the NTPV to control the spread of drug resistance in the absence of second-line treatment [12]. This applies in particular to the southern part of the country, which in 2002 was home to 38% of the country’s population of 80 million but carried 54% of the burden of smear-positive TB [11]. In the first nationwide drug-resistance survey conducted among new patients with smear-positive TB in 1996, this region had the highest level of drug resistance (36.1%) [13]. In particular, the levels of resistance against isoniazid (21.6%) and streptomycin (29.4%) were high, as was the level of MDR (3.5%). Subsequent studies of new patients with smear-positive TB in Ho Chi Minh City showed that 15 (65.2%) of 23 patients who experienced treatment failure during the 2SHRZ/6HE regimen developed MDR-TB and that the risk of treatment failure for those infected with strains resistant to both streptomycin and isoniazid was increased 13-fold, compared with that for those infected with pansusceptible strains [14,15]. Moreover, the south of Vietnam has a rapidly expanding private health sector, in particular in the large urban area of Ho Chi Minh City. It
Chapter 8
114
has been estimated that 30%–40% of all TB cases in Ho Chi Minh City are treated in the private sector [16], with low cure rates [17,18]. As part of the WHO/International Union against Tuberculosis and Lung Disease (IUATLD) Global Project on Drug-Resistance Surveillance, the NTPV conducted a second nationwide survey of anti-TB drug resistance among new patients with smear-positive TB in 2001. This survey also included previously treated patients. Here, we report the results for the south of Vietnam and compare them with the results from the previous survey, to assess trends over time. METHODS The survey was conducted between 1 August and 31 October 2001 in 40 clusters (i.e., district TB units, general hospitals, and designated TB hospitals). These included the 22 clusters studied in the 1996 survey, which had been randomly selected in 1995 with sampling probabilities proportional to the number of notified new patients with smear-positive TB in 1994. The 18 clusters added to these were randomly selected in 2001 with sampling probabilities proportional to the number of notified new patients in 2000. In each cluster, 23 consecutively registered new patients with smear-positive TB were enrolled. To obtain information on the level of acquired drug resistance, each cluster was requested to also submit sputum specimens from each consecutive patient with smear-positive TB who had a history of TB treatment for 1 month or more and had received their diagnosis during the period in which the new patients were included. This was expected to be 4 patients/cluster, on average. Among the clusters selected for the first survey were 3 that had each been administratively split into 2 clusters since the first survey was conducted but were inadvertently treated as multiple clusters in the data-collection process. In the analysis, these were treated as single clusters, with consequently larger numbers of patients. Two sputum specimens were collected from each patient and sent, without the addition of decontaminant, to the Regional Mycobacterial Reference Laboratory (RMRL) in HoChiMinh City within 4 days. Treatment history and symptoms were ascertained by clinic staff from treatment registers and by interviewing the patient by means of a standard questionnaire. At the RMRL, specimens were decontaminated and homogenized with 4% NaOH, inoculated onto modified Ogawa medium by the Petroff method, and incubated at 35oC–37oC for up to 4–8 weeks [19]. Cultures were examined for growth at the end of weeks 1, 2, 4, 6, and 8 after inoculation; cultures with no growth after 8 weeks were reported as negative. Mycobacterium tuberculosis was identified by the niacin test. Drug susceptibility testing (DST) was done by the proportion method, in accordance with WHO/IUATLD guidelines [19]. Criteria for drug resistance were ≥1% colony growth at 28 or 40 days relative to the drug-free control medium at the following drug concentrations: for isoniazid, 0.2 mg/mL; for rifampin, 40 mg/mL; for streptomycin, 4 mg/mL; and for ethambutol, 2 mg/mL [19]. External DST quality control was done by annual proficiency testing
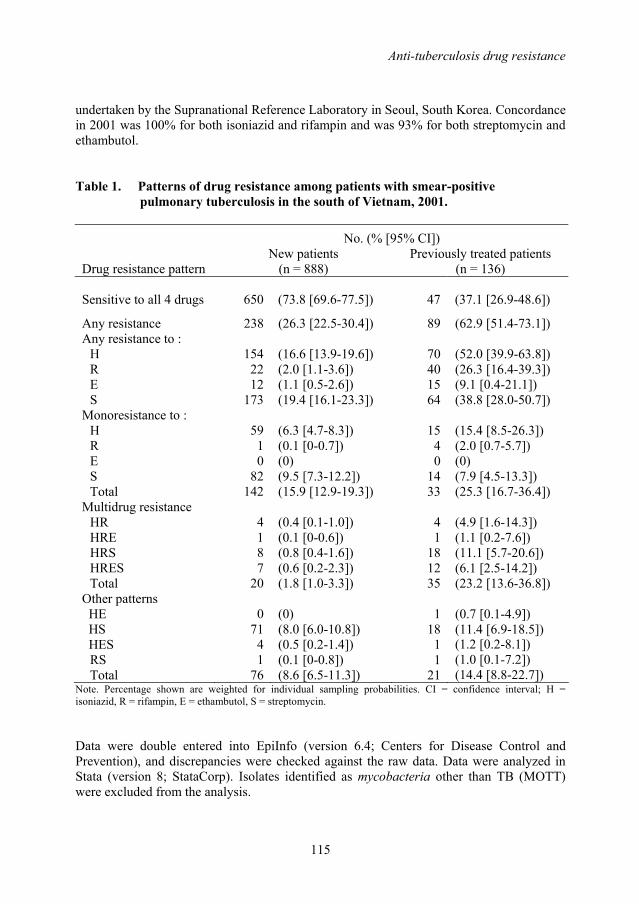
Anti-tuberculosis drug resistance
115
undertaken by the Supranational Reference Laboratory in Seoul, South Korea. Concordance in 2001 was 100% for both isoniazid and rifampin and was 93% for both streptomycin and ethambutol. Table 1. Patterns of drug resistance among patients with smear-positive
pulmonary tuberculosis in the south of Vietnam, 2001. No. (% [95% CI])
Drug resistance pattern New patients
(n = 888) Previously treated patients
(n = 136)
Sensitive to all 4 drugs 650 (73.8 [69.6-77.5]) 47 (37.1 [26.9-48.6])
Any resistance 238 (26.3 [22.5-30.4]) 89 (62.9 [51.4-73.1]) Any resistance to :
H R E S
154 22 12
173
(16.6 [13.9-19.6]) (2.0 [1.1-3.6]) (1.1 [0.5-2.6]) (19.4 [16.1-23.3])
70 40 15 64
(52.0 [39.9-63.8]) (26.3 [16.4-39.3]) (9.1 [0.4-21.1]) (38.8 [28.0-50.7])
Monoresistance to : H R E S Total
59 1 0
82 142
(6.3 [4.7-8.3]) (0.1 [0-0.7]) (0) (9.5 [7.3-12.2]) (15.9 [12.9-19.3])
15 4 0
14 33
(15.4 [8.5-26.3]) (2.0 [0.7-5.7]) (0) (7.9 [4.5-13.3]) (25.3 [16.7-36.4])
Multidrug resistance HR HRE HRS HRES Total
4 1 8 7
20
(0.4 [0.1-1.0]) (0.1 [0-0.6]) (0.8 [0.4-1.6]) (0.6 [0.2-2.3]) (1.8 [1.0-3.3])
4 1
18 12 35
(4.9 [1.6-14.3]) (1.1 [0.2-7.6]) (11.1 [5.7-20.6]) (6.1 [2.5-14.2]) (23.2 [13.6-36.8])
Other patterns HE HS HES
RS Total
0 71
4 1
76
(0) (8.0 [6.0-10.8]) (0.5 [0.2-1.4]) (0.1 [0-0.8]) (8.6 [6.5-11.3])
1 18
1 1
21
(0.7 [0.1-4.9]) (11.4 [6.9-18.5]) (1.2 [0.2-8.1]) (1.0 [0.1-7.2]) (14.4 [8.8-22.7])
Note. Percentage shown are weighted for individual sampling probabilities. CI = confidence interval; H = isoniazid, R = rifampin, E = ethambutol, S = streptomycin. Data were double entered into EpiInfo (version 6.4; Centers for Disease Control and Prevention), and discrepancies were checked against the raw data. Data were analyzed in Stata (version 8; StataCorp). Isolates identified as mycobacteria other than TB (MOTT) were excluded from the analysis.
Chapter 8
116
Drug resistance among new patients was defined as the presence of resistant M. tuberculosis isolates in newly diagnosed patients who either had never been treated with anti-TB drugs or had been treated for <1 month. Drug resistance among previously treated patients was defined as that found in patients with a history of a least 1 month of anti-TB therapy. Multidrug resistance was defined as resistance to at least isoniazid and rifampin [19]. The prevalence of drug resistance was calculated as the proportion across all clusters after weighting for the exact sampling probabilities for each individual patient for whom DST results were available. Although the sampling scheme was intended to be self-weighting, this weighed analysis was preferred for 2 reasons. First, the sampling probabilities of the clusters selected in 1994 differed from the probabilities by which these clusters would have been sampled in 2000. Second, there was large variation in the numbers of patients for whom DST results were available. The exact sampling probabilities were calculated as the cluster sampling probability times the individual sampling probability within the cluster. The cluster sampling probabilities were calculated as the cluster patient load times the number of selected clusters divided by the total patient population, using data for the year 1994 for clusters that had been selected for the first survey and data for the year 2000 for clusters that were selected for the second survey only. Individual sampling probabilities were calculated as the number of patients for whom DST results were obtained divided by the cluster patient load in 2000. In all these analyses, confidence intervals (CIs) and p values were adjusted for the cluster design by first order Taylor linearization and by the second-order correction of Rao and Scott of the Pearson x2 test, respectively, as implemented by the Stata svy commands [20, 21]. Multivariate analysis was done by logistic regression. Because population weights were applied, p values were based on the Wald statistic [22]. For age group, the p values presented are for ordinal linear fitting. For comparison with the previous survey, design effects were calculated separately for the 2 surveys. Aggregation of MDR-TB cases within clusters was analyzed by assessing the intraclass coefficient r by 1-way analysis of variance [23]. RESULTS During the study period, 2 360 sputum specimens were collected from 1 180 patients with smear-positive pulmonary TB. On the basis of an expected number of 23 new patients for each cluster, the proportion of specimens received at the RMRL was 106%. Specimens from <23 patients were received from 19 clusters (47.5%), including 4 (10.0%) with 15 or less, primarily because of insufficient numbers of patients registered during the inclusion period. Excluded were 118 patients (10%) because of either culture contamination (9 patients [1%]), negative culture result (98 patients [9%]), or growth of MOTT (11 patients
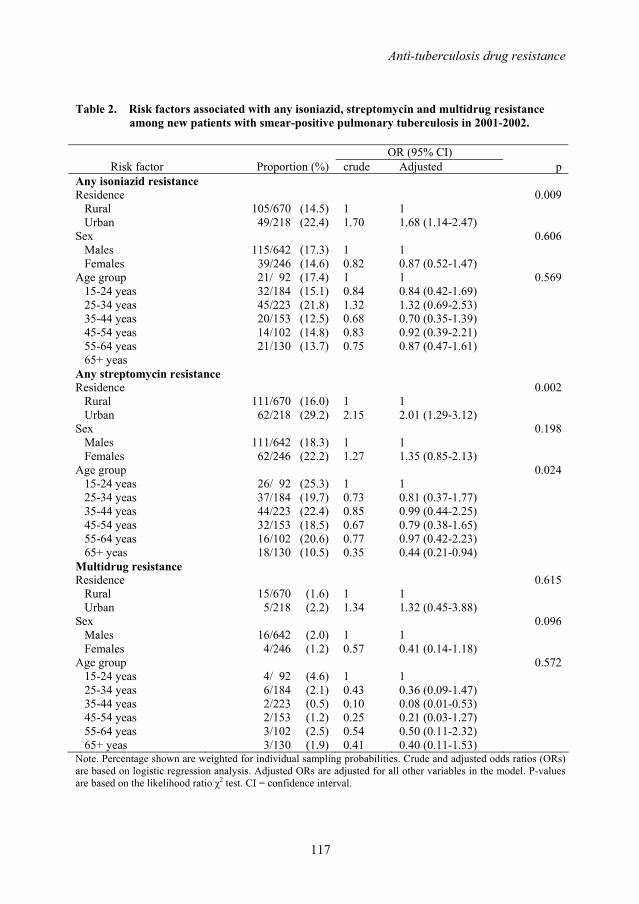
Anti-tuberculosis drug resistance
117
Table 2. Risk factors associated with any isoniazid, streptomycin and multidrug resistance among new patients with smear-positive pulmonary tuberculosis in 2001-2002.
OR (95% CI)
Risk factor Proportion (%) crude Adjusted p Any isoniazid resistance Residence Rural Urban
105/670 (14.5) 49/218 (22.4)
1 1.70
1 1.68 (1.14-2.47)
0.009
Sex Males Females
115/642 (17.3) 39/246 (14.6)
1 0.82
1 0.87 (0.52-1.47)
0.606
Age group 15-24 yeas 25-34 yeas 35-44 yeas 45-54 yeas 55-64 yeas 65+ yeas
21/ 92 (17.4) 32/184 (15.1) 45/223 (21.8) 20/153 (12.5) 14/102 (14.8) 21/130 (13.7)
1 0.84 1.32 0.68 0.83 0.75
1 0.84 (0.42-1.69) 1.32 (0.69-2.53) 0.70 (0.35-1.39) 0.92 (0.39-2.21) 0.87 (0.47-1.61)
0.569
Any streptomycin resistance Residence Rural Urban
111/670 (16.0) 62/218 (29.2)
1 2.15
1 2.01 (1.29-3.12)
0.002
Sex Males Females
111/642 (18.3) 62/246 (22.2)
1 1.27
1 1.35 (0.85-2.13)
0.198
Age group 15-24 yeas 25-34 yeas 35-44 yeas 45-54 yeas 55-64 yeas 65+ yeas
26/ 92 (25.3) 37/184 (19.7) 44/223 (22.4) 32/153 (18.5) 16/102 (20.6) 18/130 (10.5)
1 0.73 0.85 0.67 0.77 0.35
1 0.81 (0.37-1.77) 0.99 (0.44-2.25) 0.79 (0.38-1.65) 0.97 (0.42-2.23) 0.44 (0.21-0.94)
0.024
Multidrug resistance Residence Rural Urban
15/670 (1.6) 5/218 (2.2)
1 1.34
1 1.32 (0.45-3.88)
0.615
Sex Males Females
16/642 (2.0) 4/246 (1.2)
1 0.57
1 0.41 (0.14-1.18)
0.096
Age group 15-24 yeas 25-34 yeas 35-44 yeas 45-54 yeas 55-64 yeas 65+ yeas
4/ 92 (4.6) 6/184 (2.1) 2/223 (0.5) 2/153 (1.2) 3/102 (2.5) 3/130 (1.9)
1 0.43 0.10 0.25 0.54 0.41
1 0.36 (0.09-1.47) 0.08 (0.01-0.53) 0.21 (0.03-1.27) 0.50 (0.11-2.32) 0.40 (0.11-1.53)
0.572
Note. Percentage shown are weighted for individual sampling probabilities. Crude and adjusted odds ratios (ORs) are based on logistic regression analysis. Adjusted ORs are adjusted for all other variables in the model. P-values are based on the likelihood ratio χ2 test. CI = confidence interval.
Chapter 8
118
[1%]). Previous treatment status was missing for 38 patients (3%). The remaining isolates from 1024 patients (87%) underwent DST. Of 1024 strains, 888 (87%) were isolated from new patients, and 136 (13%) were isolated from previously treated patients. The mean number of new patients per cluster was 22 (range, 5–40). Of the 888 isolates from new patients, 238 (26.3%) were resistant to at least 1 drug, 154 (16.6%) were resistant to isoniazid, 22 (2.0%) were resistant to rifampin, 12 (1.1%) were resistant to ethambutol, 173 (19.4%) were resistant to streptomycin, and 20 (1.8%) were MDR (resistant to both isoniazid and rifampin) (Table 1). There were 9 clusters with 1 MDR case, 2 clusters with 2 MDR cases, 1 cluster with 3 MDR cases, and 1 cluster with 4 MDR cases. The distribution of MDR isolates among clusters showed no significant aggregation (ρ=0.03 [95% CI, 0–0.06]). Of the 20 MDR isolates, 7 (35.0%) were resistant to isoniazid, rifampin, streptomycin, and ethambutol, and 8 (40.0%) were resistant to isoniazid, rifampin, and streptomycin. Of the 136 isolates from previously treated patients, 89 (62.9%) were resistant to at least 1 drug, 70 (52.0%) were resistant to isoniazid, 40 (26.3%) were resistant to rifampin, 15 (9.1%) were resistant to ethambutol, and 64 (38.8%) were resistant to streptomycin (table 1). MDR was observed in 35 isolates (23.2%) and aggregated significantly within clusters ([95% CI, 0.12–0.51]). There were 10 clusters ρ=0.32 with 1 MDR case, 1 cluster with 2 MDR cases, 3 clusters with 3 MDR cases, 2 clusters with 4 MDR cases, and 1 cluster with 6 MDR cases. Both isoniazid and streptomycin resistance in new patients was significantly more common in urban areas than in rural areas (adjusted odds ratio [aOR] for isoniazid resistance, 1.68 [95% CI, 1.14–2.47]; aOR for streptomycin resistance, 2.01 [95% CI, 1.29–3.12]) (Table 2). Resistance to streptomycin was significantly associated with age, whereas resistance to isoniazid was not. The prevalence of resistance to streptomycin was significantly lower among patients ≥65 years old than among younger patients (p=0.024). MDR was not associated with age, sex, or urban/rural residence (Table 2). Comparison of the results of the second survey (2001) with those of the first (1996) showed a significant decrease in the prevalence of resistance to any drug (from 36.1% to 26.3%; p<0.01) and of resistance to streptomycin (from 29.4% to 19.4%; p<0.01) among new patients. The prevalence of MDR also decreased (from 3.5% to 1.8%) during this period, but the difference was not significant (Table 3). Repetition of the analysis without weighting for individual sampling probabilities for new patients in the 2001 survey changed the prevalence estimates for any resistance (26.8%), for streptomycin resistance (19.5%), and for MDR (2.3%) by 0.5% or less. It did not affect the results of the comparison with the 1996 survey.
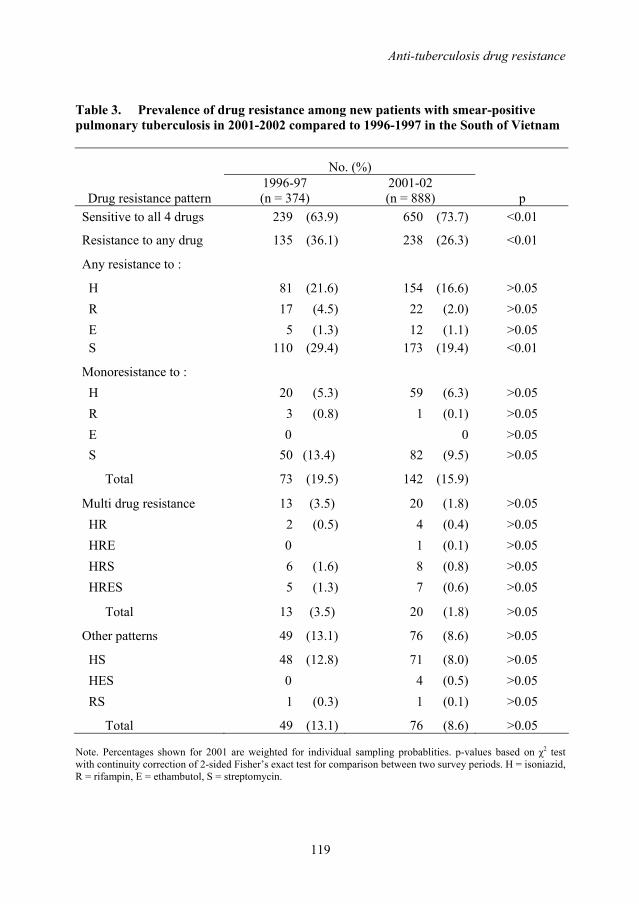
Anti-tuberculosis drug resistance
119
Table 3. Prevalence of drug resistance among new patients with smear-positive pulmonary tuberculosis in 2001-2002 compared to 1996-1997 in the South of Vietnam
No. (%)
Drug resistance pattern 1996-97 (n = 374)
2001-02 (n = 888) p
Sensitive to all 4 drugs 239 (63.9) 650 (73.7) <0.01
Resistance to any drug 135 (36.1) 238 (26.3) <0.01
Any resistance to :
H 81 (21.6) 154 (16.6) >0.05 R 17 (4.5) 22 (2.0) >0.05 E 5 (1.3) 12 (1.1) >0.05 S 110 (29.4) 173 (19.4) <0.01
Monoresistance to : H 20 (5.3) 59 (6.3) >0.05 R 3 (0.8) 1 (0.1) >0.05 E 0 0 >0.05 S 50 (13.4) 82 (9.5) >0.05
Total 73 (19.5) 142 (15.9)
Multi drug resistance 13 (3.5) 20 (1.8) >0.05 HR 2 (0.5) 4 (0.4) >0.05 HRE 0 1 (0.1) >0.05 HRS 6 (1.6) 8 (0.8) >0.05 HRES 5 (1.3) 7 (0.6) >0.05
Total 13 (3.5) 20 (1.8) >0.05
Other patterns 49 (13.1) 76 (8.6) >0.05
HS 48 (12.8) 71 (8.0) >0.05 HES 0 4 (0.5) >0.05 RS 1 (0.3) 1 (0.1) >0.05
Total 49 (13.1) 76 (8.6) >0.05 Note. Percentages shown for 2001 are weighted for individual sampling probablities. p-values based on χ2 test with continuity correction of 2-sided Fisher’s exact test for comparison between two survey periods. H = isoniazid, R = rifampin, E = ethambutol, S = streptomycin.
Chapter 8
120
DISCUSSION In the south of Vietnam, the prevalence of drug resistance among new patients with smear-positive TB decreased during the period 1996–2001. The prevalence of MDR-TB also declined, but the decrease was not significant. These findings indicate that the NTPV has managed to contain the emergence and spread of drug resistance, including MDR, and are consistent with the high cure rates (88.0% in 1996 and 91.8% in 2001) and low failure rates (1.7% in 1996 and 1.3% in 2001) reported for this part of the country (NTPV, unpublished data). This containment has been achieved by a DOTS program that does not include second-line treatment of patients with MDRTB and in spite of several challenges to effective TB control: high levels of initial drug resistance to isoniazid and streptomycin [13], an increasing contribution to TB treatment from the private sector [16–18], and the spread of new M. tuberculosis strains, such as the Beijing genotype [24]. The decrease in the prevalence of drug resistance since 1996 predominantly reflected a decrease in resistance to streptomycin. This could be due to a natural decrease in the number of patients with reactivation TB who had been infected a long time ago when the uncontrolled use of streptomycin and isoniazid was widespread. However, initial resistance to streptomycin was least frequent in the oldest age group and most frequent in the youngest, suggesting a different explanation. One may be the role played by strain genotype. In a study of M. tuberculosis isolates mainly from the south of Vietnam, the Beijing genotype was associated both with drug resistance (notably to streptomycin) and with younger age, suggesting recent transmission [24]. Thus, recent selection and spread of Beijing strains could have resulted in a relative increase in the prevalence of streptomycin resistance that partly compensated for the decreasing prevalence due to the ageing of the patient population infected with streptomycin-resistant strains before 1975. Studies are under way to further explore the association between age, drug resistance, and genotype in Vietnam. Initial resistance to isoniazid and streptomycin was also more common in urban areas. This may reflect differences in the availability of these drugs on the free market and in the contribution of private health providers to TB treatment. In the 1996 survey, resistance among previously treated patients was not assessed. In the 2001 survey, nearly two-thirds of the previously treated patients were infected with strains that were resistant to at least 1 drug, and nearly one-quarter were infected with MDR strains. Similar resistance levels were observed in recent studies in HoChiMinh City [14,15]. The levels are consistent with high treatment adherence (i.e., a large proportion of patients who experienced treatment failure did so because of initial drug resistance) but also with the amplification of drug resistance via use of the 2SHRZ/6HE regimen in the presence of high initial levels of isoniazid and streptomycin resistance [12,15]. There are limitations to the present study. First, previous treatment of TB may have been missed—that is, previously treated patients may have been misclassified as new patients. (The opposite, new patients being misclassified as previously treated patients, may also have occurred but is less probable). The effect would be overestimation of drug resistance among new patients. However, a substantial effect on the trend estimates would be unlikely,
Anti-tuberculosis drug resistance
121
because the proportion of previously treated patients reported by the NTPV has remained constant since 1995 [11]. Second, the inclusion of part of the same clusters surveyed in 1996 and the variation in the numbers of specimens that were available for DST were reason for use of a weighed analysis based on individual sampling weights. Although in our view this analysis provides the best estimate from the available data, it is influenced by clusters from which only a few specimens were tested. Although this had only a minimal effect on the estimates of the prevalence of drug resistance, it may have affected the representativeness of our survey sample. We conclude that, in the south of Vietnam, the prevalence of drug resistance has significantly decreased and that levels of drug resistance, including MDR, among new patients with smear-positive TB have not increased during the past 6 years. This occurred despite high initial levels of resistance to isoniazid and streptomycin and despite the absence of second-line treatment. Although the availability of second-line treatment in a DOTS-Plus program is important from the perspective of an individual patient, a well-functioning DOTS program with high cure rates among new patients is apparently sufficient for containing MDR-TB in this setting. ACKNOWLEDGEMENTS We are grateful to our colleagues at the provincial tuberculosis (TB) centers and district TB units and especially to the staff at the Regional Mycobacterial Reference Laboratory in Ho Chi Minh City. REFERENCES 1. Corbett EL, Watt CJ, Walker N, et al. The growing burden of tuberculosis: global
trends and interactions with the HIV epidemic. Arch Intern Med 2003; 163:1009-21. 2. WHO Global Tuberculosis Programme. An expanded DOTS framework for
effective tuberculosis control. WHO/CDS/TB/2002.297. Geneva: World Health Organization, 2002.
3. Dye C, Espinal MA, Watt CJ, Mbiaga C, Williams BG. Worldwide incidence of multidrug-resistant tuberculosis. J Infect Dis 2002; 185:1197-202.
4. The WHO/IUATLD Global Project on Anti-Tuberculosis Drug Resistance Surveillance. Anti-tuberculosis drug resistance in the world. Third Global Report. Geneva: World Health Organization, 2004.
5. Espinal MA, The global situation of MDR-TB, Tuberculosis (Edinb) 2003; 83 (1-3): 44-51.
6. WHO Global Tuberculosis Programme. Global tuberculosis control. Surveillance, planning, financing. Geneva: World Health Organization, 2005.
7. Mukherjee JS, Rich ML, Socci AR et al. Programmes and principles in treatment of multidrug-resistant tuberculosis. Lancet 2004; 363:474-81.
Chapter 8
122
8. Espinal MA, Dye C. Can DOTS control multidrug-resistant tuberculosis? Lancet 2005; 365:1206-9.
9. DeRiemer K, Garcia-Garcia L, Bobadilla-del-Valle M, et al. Does DOTS work in populations with drug-resistant tuberculosis? Lancet 2005; 365:1239-45.
10. Nelson LJ, Talbot EA, Mwasekaga MJ, et al. Antituberculosis drug resistance and anonymous HIV surveillance in tuberculosis patients in Botswana, 2002. Lancet 2005; 366:438-9.
11. Huong NT, Duong BD, Co NV, et al. Establishment and development of the National Tuberculosis Control Programme in Vietnam. Int J Tuberc Lung Dis 2005; 9:151-156.
12. Espinal MA. Time to abandon the standard retreatment regimen with first-line drugs for failures of standard treatment. Int J Tuberc Lung Dis 2003; 7:607-8
13. The WHO/IUATLD Global Project on Anti-Tuberculosis Drug Resistance Surveillance. Anti-tuberculosis drug resistance in the world. First Global Report. Geneva: World Health Organization, 1997.
14. Quy HT, Lan NT, Borgdorff MW, et al. Drug resistance among failure and relapse cases of tuberculosis: is the standard re-treatment regimen adequate? Int J Tuberc Lung Dis 2003; 7:631-6.
15. Quy HT, Cobelens FGJ, Lan NTN, Buu NT, Lambregts CSB, Borgdorff MW. . Treatment outcomes by drug resistance, HIV-status and treatment regimen among smear-positive tuberculosis patients in Ho Chi Minh City, Vietnam. Int J Tuberc Lung Dis 2006, 10:45-51.
16. Lönnroth K. Public health in private hands – Studies on private and public tuberculosis care in Ho Chi Minh City, Vietnam. Academic thesis. Göteborg: Göteborg University, 2000.
17. Lönnroth K, Thuong LM, Lambregts K, Quy HT, Diwan VK. Private tuberculosis care provision associated with poor treatment outcome: comparative study of semi-private lung clinic and the NTP in two urban districts in Ho Chi Minh City, Vietnam. Int J Tuberc Lung Dis 2003; 7: 165-71.
18. Quy HT, Lonnroth K, Lan NT, Buu TN. Treatment results among tuberculosis patients treated by private lung specialists involved in a public-private mix project in Vietnam. Int J Tuberc Lung Dis 2003; 7: 1139-46.
19. WHO. Guidelines for surveillance of drug resistance in tuberculosis. 2nd Ed. Geneva: World Health Organization, 2003.
20. Royall RM. Model robust confidence intervals using maximum likelihood estimators. Int Stat Rev 1986; 54:221-6.
21. Rao JN, Scott AJ. A simple method for the analysis of clustered binary data. Biometrics 1992; 48:577-85.
22. Hosmer D.W, Lemeshow S. Applied logistic regression. New York, N.Y: John Wiley & Sons, 1989.
23. Shrout PE, Fleiss JL. Intraclass Correlations: Uses in Assessing Rater Reliability. Psychol Bull 1979; 2,420-8.
24. Anh DD, Borgdorff MW, Van LN, et al. Mycobacterium tuberculosis Beijing genotype emerging in Vietnam. Emerg Infect Dis 2000; 6: 302-5.

123
Chapter 9
General Discussion

Chapter 9
124
The studies presented in this thesis focused on determining why a DOTS program in a high-burden country that meets the WHO targets of at least 70% case detection and at least 85% cure apparently failed to have an impact on TB transmission and disease burden. MAIN FINDINGS Vietnam is among 22 highest TB burden countries in the world. The NTP of Vietnam introduced DOTS Strategy in 1989 and achieved 100% DOTS coverage in 2000. The proportion of smear-positive cases detected and put on short-course treatment was over 70% since 1996. Reported cure rates with short-course chemotherapy are consistently over 85%. However, TB case notification rates in Vietnam show no decline (Chapter 2). Total, patient and health care provider delays in TB diagnosis and treatment were short in Vietnam. Median delay was 4 weeks for total, 3 weeks for patient and 1 week for health care delay. Nonetheless, 15% of patients reported total delay ≥12 weeks, and accounted for 49% of the cumulative number of delay-weeks. Initial visit to the private sector had a considerable impact on the length of delays but with distinct regional differences across the country (Chapter 3). In the north of Vietnam, 9.7 suspects were examined and 29.3 smears done to find one smear-positive case. The smear-positive rate was 10.3%. The male:female ratios were 1.36 among TB suspects and 1.89 among smear-positive patients, suggesting higher TB incidence among men rather than lower access to TB facilities for women (Chapter 4). The overall annual notification rate of smear positive TB per 100,000 population was 78; 9 per 1,000 population had sputum smear examination. The case notification rates (CNR) were higher in the south and centre than in the north. Geographical variations in CNRs largely reflected true epidemiological differences in TB distribution in Vietnam. CNRs varied remarkably by latitude, zone and urbanity and were not associated with poverty or ethnicity at commune level. The distance to the district health center was a key factor determining access to TB services, suggesting under-diagnosis in areas further away from health facilities (Chapter 5). In 6 sentinel provinces where the DOTS Strategy had been introduced in the 1980s, the CNRs of new smear-positive tuberculosis over the period 1996-2003 decreased by 2.5 to 5.9% per year in all provinces except HCMC. Over the same period, the ARTI decreased in 2 of 6 provinces by 6.6 to 14.7% per year. This suggests that control efforts are beginning to have impact on the tuberculosis epidemic in Vietnam. Over this period, however, the CNR in the youngest age group (15-24 years) in 4 provinces were found to increase by 4.5% to 13.6% per year, and to decrease less than average in the remaining two. As a result, the expected increase in the mean age of notified cases is not observed in the provinces studied. The increase in the younger age groups partly offsets stronger decreases in CNR in the other age groups. Thus, a new epidemic wave may be underway, in particular in HCMC where the CNR in the youngest age group increased by 13.6% per year (Chapter 6).
General Discussion
125
Among 304 patients included in the study in the northern part of the country, the bacteriology relapse rate was 5%. An additional 4% started TB retreatment. Four of 12 culture-positive relapse cases (33%) had multidrug-resistant strains. In total, the relapse proportion was 9.9% (Chapter 7). In the south of Vietnam, among new patients, the prevalence of resistance to any drug was 26% and the prevalence of MDR 1.8%. Among previously treated patients, prevalence of any resistance and MDR was 63% and 23% respectively. The prevalence of resistance to any drug has significantly declined and the level of multidrug resistance among new smear-positive patients has not increased over the past six years in the absence of second-line treatment (Chapter 8). In conclusion, national level data suggest that in Vietnam the DOTS Strategy is insufficient to reduce TB incidence, but detailed analysis of data from sentinel provinces indicate that there is in fact impact but the impact has been modest. The impact is less than predicted by models. The main explanation is an increase in CNR among young adults. The short average delay and the relatively low average smear-positive rate suggest that the case detection rate is at least not low. The findings suggest substantial variation in case detection rate between parts of the country and between subpopulations, as well as substantial variation in TB incidence. The relapse rate was not above that expected with the 8-month regimen used for the treatment of new TB patients. This and the stable or even partially declining drug resistance levels suggest that reported cure rates are not grossly overestimating true cure rates, and that the reported treatment efficacy is as expected with the standard first-line regimens used. MAJOR LIMITATIONS AND EXPLANATIONS In this chapter possible explanations for the shortfall in decrease in TB notification rates in Vietnam are discussed, as well as a number of limitations to the data. It may be that the TB notification data in Vietnam are unreliable, i.e. do not reflect the true numbers of patients diagnosed; that despite our findings the true case detection rate in Vietnam is below the 70% target; and that the true cure rate is lower that reported. Additional explanations for the shortfall in decline in TB incidence may be grouped as reflecting increased rates of progression of M. tuberculosis infection to disease, or as increased rates of M. tuberculosis transmission (both compared to the rates assumed in prediction models). Reliability of routine surveillance data The Vietnam National Tuberculosis Control Programme (NTP) has a very well developed registration, recording and reporting system as recommended by IUATLD and WHO [1]. All AFB microscopy centers keep laboratory registers to record suspects examined by direct microscopy. All district TB centers keep district TB registers in which patients are registered when started on treatment. The district reports of the results of case finding and treatment are submitted to the provincial/national level on a quarterly basis.
Chapter 9
126
The reliability of the routine NTP data can be questioned for a number of possible reasons, including non-registration of diagnosed patients (“initial defaulting”), diagnostic misclassification, and the use of incentives and targets for reporting. The NTP has collected routine data on initial defaulting – the situation in which patients diagnosed by the NTP with (smear-positive) TB are not registered for treatment and thus not notified - since 2001. The proportion of initial defaulters among new smear-positive patients in the period 2001-2005 was 2-6% [2]. A study in HCMC in 2000 showed that the proportion initial defaulting was 8.3% [3]. This may contribute to an underestimate of case notifications. Diagnostic misclassification may occur due to false-negative or false-positive diagnostic smears, and to misclassification of treatment history. The NTP operates a well-developed external quality assurance system for smear examination [1] based on blinded rereading of all positive slides and 10% negative slides monthly at provincial laboratories [4]. The system found more than 99% concordance, 0.3% false negatives and 0.4% false positives among 151 719 positive and 186 435 negative slides reported for 2005 [2]. Misclassification of previously treated patients as new and vice versa may occur for various reasons including recall errors and insufficient history taking. Misclassification of retreatment cases as new is probably more common than vice versa. The proportion of smear-positive cases registered for retreatment remained stable after 1995 at around 10% (Chapter 1) [2]. These observations suggest that diagnostic misclassification may occur but is unlikely to have a major effect on the routine NTP reporting data. Since 1996 the NTP has applied an incentive system for case detection and completion of TB treatment (Chapters 1, 2). For each patient detected with sputum smear-positive TB the health worker receives US$0.70, and for each completed course of TB treatment US$3.5 in lowland areas and US$7.5 in mountainous areas [5]. This may affect case notifications of new smear-positive TB. The NTP sets annual targets for case detection and cure. These targets are using for planning, financing and ordering of drugs [2]. At provincial level, based on the national and provincial target, provinces set the target for districts for number of TB suspect, case detection and cure. This target system may work two ways: additional (active) case finding may be started when targets appear not to be met, and case finding efforts may become less if targets have been met before the end of the period. As for incentives, a tendency for meeting case finding and treatment outcome targets may affect reporting, but it is unlikely that such effect would be different for different age groups. Although they may have a “damping” effect on decreases in case notification in general, it is unlikely that incentives and targets are responsible for the observed rise in CNR among young adults. Accuracy of the case detection rate The data presented in this thesis on diagnostic delay, proportion of the population examined and smear-positive rate do not suggest that the CDR in Vietnam is low. However, these
General Discussion
127
data have limitations since they are indirect. In fact, how the average delay, suspect rate or smear-positive rate relates to the actual CDR is uncertain. In addition, there may be reasons to question the accuracy of the CDR as estimated for Vietnam. The numerator for the case detection target is the number of new cases of sputum smear-positive tuberculosis registered in one year, and the denominator is the number of new sputum smear-positive cases estimated to have arisen in the same population over the same period [6]. As the case detection target relies on an estimate for the incidence of tuberculosis, it is difficult to measure it accurately in most settings. In Vietnam, the estimated annual incidence of new smear positive TB was estimated based on a countrywide ARTI of 1.7% [7], with an estimate of approximately 50 incident sputum smear-positive cases for each 1% of annual risk of infection [8,9]. There are two problems which are the interpretation of tuberculin data and the correlation between TB incidence and ARTI. Tuberculin surveys have various methodological problems including selection of standardized tuberculin, the technique of administration, and reading of the test results. Even if all of these barriers are overcome, it is in many circumstances difficult to arrive at an estimate of the prevalence of infection. Sensitization to environmental mycobacteria and M.bovis BCG results in cross-reactions with the standard tuberculin. The higher this sensitization is and the lower the prevalence of true infection with tubercle bacilli, the more difficult it becomes to disentangle the true prevalence from confounding factors [10]. Assuming that the prevalence of infection with M. tuberculosis has been satisfactorily estimated, the essence of the analysis of a tuberculin skin test survey is the estimation of the average annual risk of infection. The annual risk of infection refers to a risk at a specified calendar year. Estimates of the risk of infection were usually derived from surveys in a single age group, and have thus assumed a constant risk of infection across age groups. If the risk of infection varies considerably by age, extrapolations from a single age group might thus be erroneous [10,11]. In Vietnam, a countrywide ARTI of 1.7% was the average of the ARTI estimated from the sentinel tuberculin surveys done in different regions of the country in the period 1986-1994. It was estimated among children with no BCG and based on a definition of TB infection of any reaction size of 10mm or more. The results from the sentinel tuberculin surveys were not representative for the country as a whole. Estimates of the ARTI are obtained from tuberculin reaction size distributions among children without BCG scar. The proportion of children vaccinated with BCG has however increased over time. The children who had no BCG scar in the last round may thereby not be representative with respect to their risk of TB or the size of the tuberculin skin test response if infected. A substantial proportion of children, both with and without BCG scar, have intermediate size reactions that are probably due to cross-reaction to environmental mycobacteria. A cut-off of 10mm as criterion for TB infection may then overestimate the infection prevalence. There may be a north-south gradient in the mode of the distribution of reaction sizes among TB patients
Chapter 9
128
from 19mm in the north to 15mm in the south. The result would be that the sensitivity of the 10 mm criterion also differs between provinces (Chapter 6). One per cent risk of infection has been proposed to correspond to approximately 50 incident infectious cases per 100 000 population [8]. This correlation between TB incidence and ARTI has been questioned since this was established in the pre-chemotherapy era. The duration of infectiousness, coupled with the incidence of new infectious cases, is reflected in the prevalence of such cases (i.e., prevalence is a function of incidence and duration). As soon as an effective intervention is introduced, the duration of infectiousness is reduced, transmission is decreased and the relation between prevalence and incidence is disturbed [10,11]. This was shown for the United States before HIV had a noticeable impact on tuberculosis. Here, extrapolation required over 400 incident cases per 100 000 population to result in a 1 per cent risk of infection [12]. It could thus be that the true incidence of TB in Vietnam is higher and thereby the case detection rate of the NTP is lower than has been estimated by WHO [6,7]. Besides the problem with interpretation of results of tuberculin survey and estimation of TB incidence from ARTI, the single countrywide estimate of TB incidence does not take into account the substantial geographic variation in TB epidemiology across the country (Chapter 5), notably a north-south gradient in ARTI and notification rates (Chapters 2,5,6). Lower CDRs than estimated by the WHO have been suggested by two local surveys of TB prevalence. A population based study done in 2000 in Bavi, a rural district in the northern part of the country, found a prevalence of smear-positive TB of 60/100 000 among men and 79/100 000 among women [13]. The estimated CDR in Bavi district (45%) was far from the reported national CDR (80% in 2000) [6]. Recently a TB prevalence survey in Hanoi (2003-2004), the capital in the north of the country, showed that the sputum smear-positive prevalence rate was 146/100 000 in persons aged 15 years old or more while the notification rate was reported to be much lower (40/100 000 in 2004) [14]. From these data, the CDR can be estimated as 35% [15]. Although 100% of districts had DOTS services by 1997 (Chapter 2), there has been further expansion of DOTS services within districts since then. The grass-root laboratory network for AFB smear microscopy has been well established and is easily accessible to the population (Chapter 4) [1]. The proportions of the population examined vary by region reflecting both the size of the TB problem and the utilization of health services (Chapter 5). For the period of 2001-2005, the proportions of the population who had a sputum smear examined ranged from 0.74% in 2001 to 0.79% in 2005 and the positive rates were around 10.5% [2]. This expansion of DOTS services resulted in an overall increased case detection. A smear-positive rate of around 10% is often regarded to reflect adequate case finding in practice. However, the proportion of the population of Vietnam that was examined by direct microscopy on suspicion of TB (0.74% in 2001) was much lower compared with that in Peru (approximately 5% every year, by 1999) [16] where an impact of the DOTS programme on TB incidence was observed. Thus, the proportion of the population examined in Vietnam could, in fact, represent a CDR that is below 70%.

General Discussion
129
The findings in chapters 3 and 4 suggest gender-related barriers to access to NTP services. More men than women were examined by microscopy, but also the proportion of men with positive smears was higher than the proportion of women (Chapter 3). The sex difference in smear positive rate, as well as in notification rate, suggests either biological differences, e.g. men may have higher TB incidence than women or higher the bacillary load of sputum specimens, or lower access to TB diagnosis for women [17-19]. However, in Hanoi (2003-2004), by active case finding, the male:female ratio of TB patients detected was 0.7 [14]. In addition, we found longer delay for women (chapter 3). These data, and data from other studies [13,20-23], suggest that reported incidence/notification rates for TB may under-represent women. Chapter 3 and 5 indicated that distance to the district health center was a key factor determining access to TB services, suggesting under-diagnosis in areas further away from health facilities. In addition, our findings showed that CNR and suspect rate varied by zones and urbanity setting (Chapter 5). Thus under-diagnosis may happen in certain zones as well as in urban or rural settings. However, poverty status or ethnic composition apparently plays no major role in differences in CDR (Chapter 5). In some settings, an important source of unnotified tuberculosis cases is the private sector. Despite the presence of an effective low-cost or free NTP, a significant number of TB patients may opt for diagnosis and treatment by private practitioners [24-26]. Part of the reason for failing to bring about a more rapid reduction in tuberculosis incidence worldwide is the lack of effective involvement of all practitioners-public and private-in the provision of high quality tuberculosis care [27]. What proportion of sputum smear-positive cases of tuberculosis are managed in the private sector remains unclear. In India between 60 and 88% of suspect tuberculosis cases first approached the private sector for their diagnosis and treatment [28-30]. In Vietnam, no data are available on overall magnitude of private health sector involvement in TB care. Studies on the private sector in HCMC showed that about 50% of all TB patients in the NTP have been in contact with the private sector prior to attending the NTP, and that about 40% of all prevalent TB cases received treatment with anti-TB drugs in the private sector [31-33]. In our study on diagnostic delay (chapter 3), we found that 36% of patients had first consulted the facilities out-side the NTP. The NTP case detection in HCMC increased by 18% as a result of referral of TB suspects from private providers to NTP services [34-35]. These data suggest that there is a large contribution of the private sector in diagnosis and treatment of new smear-positive TB cases which leads to an underestimate of TB incidence by the TB case notification because the private sector does not report. Accuracy of reported cure rates Effective diagnosis and treatment of tuberculosis can rapidly reduce the risk of infection [36]. With short course chemotherapy, the overall cure rate of new smear positive TB

Chapter 9
130
patients who were treated in NTP facilities was more than 90% (Chapter 1), surpassing the WHO target of 85%. However, cure rates of smear-positive patients may be overestimated due to the following problems. Cure is defined as a negative sputum smear at months 5 and 8 of treatment. Because at both occasions only a single smear is examined, false-negative reading of these follow-up smears is possible [37]. Moreover, the laboratory quality control system used in Vietnam has limited power for detecting false-negative follow-up smears [38], and the incentive system may affect reporting of failure cases. However, we showed that, at least in the north of the country, the relapse rate (9.9%) was not in excess of that expected with the regimen used, suggesting that few treatment failures are missed (Chapter 7). The non-increasing levels of drug resistance, in particular the stable level of MDR, among new smear-positive patients (Chapter 7) suggest that treatment does not result in increasing transmission of MDR-TB in the southern part of the country, and are thus compatible with high cure rates and low failure rates of new smear-positive patients. The high prevalence of MDR among retreatment patients is in accordance with the high failure rates among patients who failed on retreatment. A limitation of these findings may be that the drug resistance surveys conducted in the south of Vietnam (Chapter 7) included only patients presenting to NTP facility but not those diagnosed in the private sector. Prevalence of multidrug resistance in these patients may be higher since overall treatment outcome was very poor in the private sector [31-33], while high cure rate were only confirmed within the NTP. Private sector treatment may thereby create chronic cases and contribute to sustained transmission of (drug resistant) TB. We nonetheless believe that exclusion from our surveys of patients treated in private sector has not affected our prevalence estimates of MDR among new patients. It would only do so if patients who failed or relapsed after treatment in the private sector preferentially transmitted to people who, when having TB, also turn to the private sector for treatment, and it shows unlikely that such aggregation of transmission occurs at a relevant scale. Progression rates of infection to disease TB incidence may not decline despite high case detection and cure rates if the risk of progression from TB infection to TB disease is higher than assumed by the model. The most important cause of such increased progression rates would be HIV infection, but other factors may also play a role. In Vietnam, the prevalence of HIV is still low. The epidemic is in the concentrated stage and mainly occurring among young adults (20-39 years old). The HIV-epidemic is predominant among males and this has not changed in the last 10 years [39]. The age-sex groups with highest HIV prevalence were the same as those in which the rise in tuberculosis CNR is most pronounced in our findings (Chapter 6). In our study, we found the steepest increase in CNR among young adults (Chapter 6). Data from HCM City showed that the HIV prevalence among TB patients increased from 1.5% in 1997-1998 to
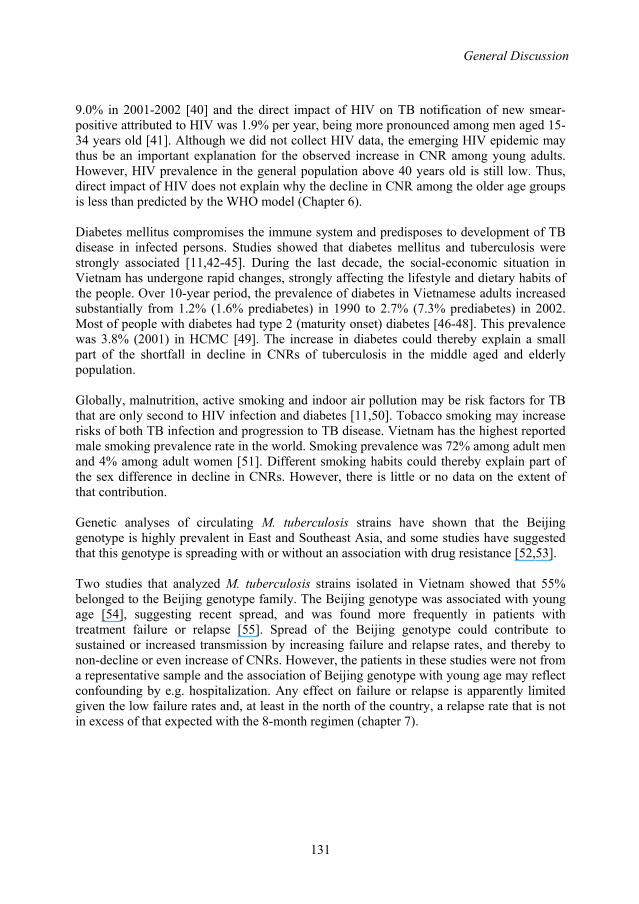
General Discussion
131
9.0% in 2001-2002 [40] and the direct impact of HIV on TB notification of new smear-positive attributed to HIV was 1.9% per year, being more pronounced among men aged 15-34 years old [41]. Although we did not collect HIV data, the emerging HIV epidemic may thus be an important explanation for the observed increase in CNR among young adults. However, HIV prevalence in the general population above 40 years old is still low. Thus, direct impact of HIV does not explain why the decline in CNR among the older age groups is less than predicted by the WHO model (Chapter 6). Diabetes mellitus compromises the immune system and predisposes to development of TB disease in infected persons. Studies showed that diabetes mellitus and tuberculosis were strongly associated [11,42-45]. During the last decade, the social-economic situation in Vietnam has undergone rapid changes, strongly affecting the lifestyle and dietary habits of the people. Over 10-year period, the prevalence of diabetes in Vietnamese adults increased substantially from 1.2% (1.6% prediabetes) in 1990 to 2.7% (7.3% prediabetes) in 2002. Most of people with diabetes had type 2 (maturity onset) diabetes [46-48]. This prevalence was 3.8% (2001) in HCMC [49]. The increase in diabetes could thereby explain a small part of the shortfall in decline in CNRs of tuberculosis in the middle aged and elderly population. Globally, malnutrition, active smoking and indoor air pollution may be risk factors for TB that are only second to HIV infection and diabetes [11,50]. Tobacco smoking may increase risks of both TB infection and progression to TB disease. Vietnam has the highest reported male smoking prevalence rate in the world. Smoking prevalence was 72% among adult men and 4% among adult women [51]. Different smoking habits could thereby explain part of the sex difference in decline in CNRs. However, there is little or no data on the extent of that contribution. Genetic analyses of circulating M. tuberculosis strains have shown that the Beijing genotype is highly prevalent in East and Southeast Asia, and some studies have suggested that this genotype is spreading with or without an association with drug resistance [52,53]. Two studies that analyzed M. tuberculosis strains isolated in Vietnam showed that 55% belonged to the Beijing genotype family. The Beijing genotype was associated with young age [54], suggesting recent spread, and was found more frequently in patients with treatment failure or relapse [55]. Spread of the Beijing genotype could contribute to sustained or increased transmission by increasing failure and relapse rates, and thereby to non-decline or even increase of CNRs. However, the patients in these studies were not from a representative sample and the association of Beijing genotype with young age may reflect confounding by e.g. hospitalization. Any effect on failure or relapse is apparently limited given the low failure rates and, at least in the north of the country, a relapse rate that is not in excess of that expected with the 8-month regimen (chapter 7).
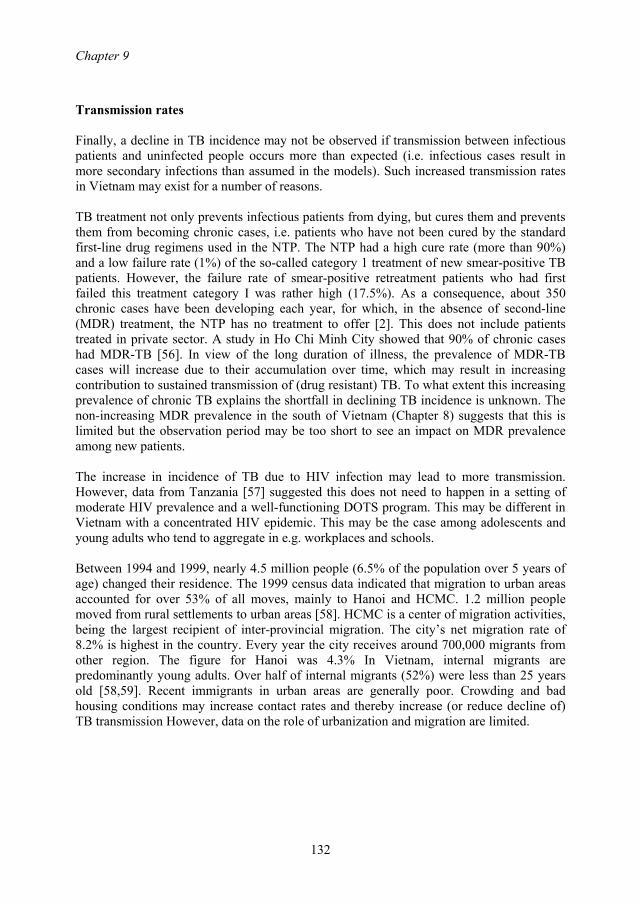
Chapter 9
132
Transmission rates Finally, a decline in TB incidence may not be observed if transmission between infectious patients and uninfected people occurs more than expected (i.e. infectious cases result in more secondary infections than assumed in the models). Such increased transmission rates in Vietnam may exist for a number of reasons. TB treatment not only prevents infectious patients from dying, but cures them and prevents them from becoming chronic cases, i.e. patients who have not been cured by the standard first-line drug regimens used in the NTP. The NTP had a high cure rate (more than 90%) and a low failure rate (1%) of the so-called category 1 treatment of new smear-positive TB patients. However, the failure rate of smear-positive retreatment patients who had first failed this treatment category I was rather high (17.5%). As a consequence, about 350 chronic cases have been developing each year, for which, in the absence of second-line (MDR) treatment, the NTP has no treatment to offer [2]. This does not include patients treated in private sector. A study in Ho Chi Minh City showed that 90% of chronic cases had MDR-TB [56]. In view of the long duration of illness, the prevalence of MDR-TB cases will increase due to their accumulation over time, which may result in increasing contribution to sustained transmission of (drug resistant) TB. To what extent this increasing prevalence of chronic TB explains the shortfall in declining TB incidence is unknown. The non-increasing MDR prevalence in the south of Vietnam (Chapter 8) suggests that this is limited but the observation period may be too short to see an impact on MDR prevalence among new patients. The increase in incidence of TB due to HIV infection may lead to more transmission. However, data from Tanzania [57] suggested this does not need to happen in a setting of moderate HIV prevalence and a well-functioning DOTS program. This may be different in Vietnam with a concentrated HIV epidemic. This may be the case among adolescents and young adults who tend to aggregate in e.g. workplaces and schools. Between 1994 and 1999, nearly 4.5 million people (6.5% of the population over 5 years of age) changed their residence. The 1999 census data indicated that migration to urban areas accounted for over 53% of all moves, mainly to Hanoi and HCMC. 1.2 million people moved from rural settlements to urban areas [58]. HCMC is a center of migration activities, being the largest recipient of inter-provincial migration. The city’s net migration rate of 8.2% is highest in the country. Every year the city receives around 700,000 migrants from other region. The figure for Hanoi was 4.3% In Vietnam, internal migrants are predominantly young adults. Over half of internal migrants (52%) were less than 25 years old [58,59]. Recent immigrants in urban areas are generally poor. Crowding and bad housing conditions may increase contact rates and thereby increase (or reduce decline of) TB transmission However, data on the role of urbanization and migration are limited.
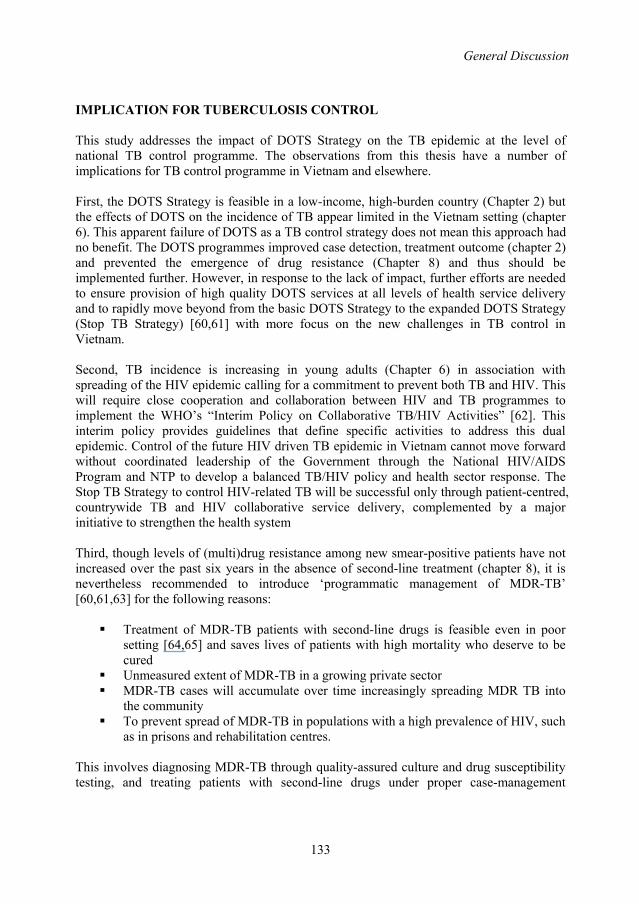
General Discussion
133
IMPLICATION FOR TUBERCULOSIS CONTROL This study addresses the impact of DOTS Strategy on the TB epidemic at the level of national TB control programme. The observations from this thesis have a number of implications for TB control programme in Vietnam and elsewhere. First, the DOTS Strategy is feasible in a low-income, high-burden country (Chapter 2) but the effects of DOTS on the incidence of TB appear limited in the Vietnam setting (chapter 6). This apparent failure of DOTS as a TB control strategy does not mean this approach had no benefit. The DOTS programmes improved case detection, treatment outcome (chapter 2) and prevented the emergence of drug resistance (Chapter 8) and thus should be implemented further. However, in response to the lack of impact, further efforts are needed to ensure provision of high quality DOTS services at all levels of health service delivery and to rapidly move beyond from the basic DOTS Strategy to the expanded DOTS Strategy (Stop TB Strategy) [60,61] with more focus on the new challenges in TB control in Vietnam. Second, TB incidence is increasing in young adults (Chapter 6) in association with spreading of the HIV epidemic calling for a commitment to prevent both TB and HIV. This will require close cooperation and collaboration between HIV and TB programmes to implement the WHO’s “Interim Policy on Collaborative TB/HIV Activities” [62]. This interim policy provides guidelines that define specific activities to address this dual epidemic. Control of the future HIV driven TB epidemic in Vietnam cannot move forward without coordinated leadership of the Government through the National HIV/AIDS Program and NTP to develop a balanced TB/HIV policy and health sector response. The Stop TB Strategy to control HIV-related TB will be successful only through patient-centred, countrywide TB and HIV collaborative service delivery, complemented by a major initiative to strengthen the health system Third, though levels of (multi)drug resistance among new smear-positive patients have not increased over the past six years in the absence of second-line treatment (chapter 8), it is nevertheless recommended to introduce ‘programmatic management of MDR-TB’ [60,61,63] for the following reasons:
Treatment of MDR-TB patients with second-line drugs is feasible even in poor setting [64,65] and saves lives of patients with high mortality who deserve to be cured
Unmeasured extent of MDR-TB in a growing private sector MDR-TB cases will accumulate over time increasingly spreading MDR TB into
the community To prevent spread of MDR-TB in populations with a high prevalence of HIV, such
as in prisons and rehabilitation centres. This involves diagnosing MDR-TB through quality-assured culture and drug susceptibility testing, and treating patients with second-line drugs under proper case-management

Chapter 9
134
conditions [63]. Second-line TB treatment must be mainstreamed into a countrywide TB control plan. Fourth, our findings indicate that initial visit to the private sector had a considerable impact on the length of delays in TB patients diagnosed in the NTP (Chapter 3). It is critical to develop public-private mix approaches as a means to expand and strengthen DOTS, with an emphasis on establishing a referral system and improving case detection and treatment success [66]. In addition, it is important to ensure all care providers are involved and deliver to all patients the DOTS international standard of care and support [27]. Fifth, the efficiency of sputum smear examination can be improved. The incremental return on specimens subsequent to the second sputum specimen was small (chapter 3). Omitting the third sample has limited impact on the diagnostic sensitivity while it saves a lot of work and burden to the patient (Chapter 3). The examination of 2 consecutive sputum smears is almost as efficient as culture for detecting cases [67]. These results led to a recommendation of only two consecutive sputum specimens for tuberculosis diagnosis that should be considered by the NTP. Sixth, though this thesis was inconclusive about gender differences in TB access and case notification (Chapters 3, 4). However, several studies in Vietnam showed gender-related differences in health seeking and barriers to access [20-23]. More information on gender-related barriers to access to NTP services at the local and national levels should be collected and analyzed. Prevention and control strategies should be adapted accordingly. New community–based and public-private service approaches that aim to increase access and effective treatment, especially for those most vulnerable, should seek to address known gender-related barriers to care. Seventh, the distance to the district health center was a key factor determining access to TB services (Chapter 5), suggesting under-diagnosis in areas further away from health facilities. Measures should be explored to provide adequate laboratory services for those areas by transporting either specimens or fixed smear slides prepared by a local health worker after training to district laboratories or establishment of more than 1 microscopy centers in districts with a large population or a large area, in order to bring the TB diagnostic service close to the community. However, the number of microscopy centres, the quality of performance and the cost-effectiveness of the extra microscopy centers in the district should be considered by each provincial TB center. Finally, the variation in TB epidemiology according to zones and urban-rural settings (Chapter 5) required further analysis to develop specific TB control strategies for each geographical area and setting with the appropriate investment. Though in this study, both case notification and suspect rates clearly showed no relevant association with ethnic composition and poverty status, poverty status and ethnicity at level of individual patients should be further explored.

General Discussion
135
RECOMMENDATIONS FOR FURTHER RESEARCH In order to have base-line data as well as to assess trend of TB burden and TB control effect over time in the country, periodical nationwide TB prevalence and tuberculin surveys should be conducted. The trends of TB drug resistance including MDR and XDR in the country need to be monitored routinely. Operational research is required to identify potential flaws in case detection and treatment in order to improve them, and to investigate the causes of increase in TB incidence among young adult patients. Important issues to explore would be the direct and indirect impacts of HIV on TB epidemic to improve the care of people who are infected with both TB and HIV, gender-related issues and links between TB and poverty at individual level for equal access to TB care. In addition, studies are needed to estimate the extent of private sector involvement, and of the impact of private-public mix DOTS on case detection and treatment, as well as to identify key issues for private-public mix DOTS in order to develop new approaches to involve the private sector in DOTS implementation. Other potential determinants and risk factors such as diabetes, smoking, malnutrition, indoor air pollution, urbanization, immigration, and genotype are needed to be investigated as well. REFERENCES
1. Ministry of Health, S.R.Vietnam. Report of the end term evaluation of the
tuberculosis component of the National health sector project of the World Bank in Vietnam, 11-22 August 2003. Ministry of Health 2004.
2. Ministry of Health S.R. Vietnam, National Tuberculosis Control Programme. 5-year review report of the National Tuberculosis Control Programme for the period 2001-2005. Hanoi 2006
3. Buu TN, Lonnroth K, Quy HT. Initial defaulting in the National Tuberculosis Programme in Ho Chi Minh City, Vietnam: a survey of extent, reasons and alternative actions taken following default. Int J Tuberc Lung Dis 2003;7:735-41.
4. Ministry of Health – SR. Vietnam. National Tuberculosis control Program. Guidelines for Tuberculosis control activities. Hanoi, 1999
5. Degree No. 51/2002/TT-LT/BTC-BYT, 3 June 2002. Degree on the guidelines for performances and cost-norms for the National Target Programs to prevent and combat some social diseases, dangerous epidemics and HIV/AIDS in the 2001-2005
6. Global Tuberculosis Control: Surveillance, planning, financing. WHO Report 2007. Geneva, World Health Organization (WHO/HTM/TB/2007.376)
7. Dye C, Scheele S, Dolin P, Pathania V, Raviglione MC. Consensus statement. Global burden of tuberculosis: estimated incidence, prevalence, and mortality by country. WHO Global Surveillance and Monitoring Project. JAMA 1999; 282: 677-686
Chapter 9
136
8. Styblo K. The relationship between the risk of tuberculous infection and the risk of developing infectious tuberculosis. Bull Int Union Tuberc 1985;60(3-4):117-9.
9. Murray CJL, Styblo K, Rouillon A. Tuberculosis in developing countries: burden, intervention and cost. Bull Int Union Tuberc Lung Dis 1990; 65:6-24
10. Rieder H L. Methodological issues in the estimation of the tuberculosis problem from tuberculin surveys. Tuber Lung Dis 1995;76:114-21.
11. Rieder HL. Epidemiologic basis of tuberculosis control. Paris, International Union Against Tuberculosis and Lung Disease, 1999.
12. Cauthen GM, Rieder HL, Geiter LJ. A model of the relation between age-specific prevalence of tuberculous infection and incidence of infectious tuberculosis: implications for screening policies. Tuberculosis Surveillance Research Unit Progress Report 1991;1:1-20.
13. Thorson A, Hoa NP, Long NH, Allebeck P. Diwan VK. Do women with tuberculosis have a lower likelihood of getting diagnosed? Prevalence and case detection of sputum smear positive pulmonary TB, a population based study from Vietnam. Journal of Clinical Epidemiology 2004;57(4):398-402
14. Horie T, Lien LT, Tuan LA, Tuan PL, Sakurada S, Yanai H, Keicho N, Nakata K. A survey of tuberculosis prevalence in Hanoi, Vietnam. Int J Tuberc Lung Dis 2007;11(5):562-566
15. Borgdorff MW. New measurable indicator for tuberculosis case detection. Emerg Infect Dis 2004;10:1523-8.
16. Tuberculosis en el Peru 1999. [Peru National TB control programme 1999]. Lima, Ministry of Health, 2000.
17. Uplekar MW, Rangan S, Weiss MG, Ogden J, Borgdorff MW, Hudelson P. Attention to gender issues in tuberculosis control: towards a strategy for research and action. Geneva: WHO, 2000.
18. Howson CP, Harrison PF, Hotra D, Law M. In her lifetime: female morbidity and mortality in Sub-Saharan Africa. Washington DC: National Academy Press, 1996
19. Holmes CB, Hausler H, Nunn P. A review of sex differences in the epidemiology of tuberculosis. Int J Tuberc Lung Dis 1998; 2: 96-104.
20. Long NH, Johansson E, Lönnroth K, Eriksson B, Winkvist A, Diwan VK. Longer delays in tuberculosis diagnosis among women in Vietnam. Int J Tuberc Lung Dis 1999, 3(5): 388-393
21. Thorson A, Hoa NP, Long NH. Health-seeking behaviour of individuals with a cough of more than 3 weeks. The Lancet 2000, 356(25):1823-1824
22. Thorson A, Johansson E. Equality or equity in health care access: a qualitative study of doctors' explanations to a longer doctor's delay among female TB patients in Vietnam. Health Policy. 2004 Apr;68(1):37-46
23. Johansson E, Long NH, Diwan VK, Winkvist K. Gender and tuberculosis control Perspectives on health seeking behaviour among men and women in Vietnam. Health Policy 52 (2000) 33–51
24. Roth Gabriel. The private provision of public service in developing countries. Oxford: Oxford University Press, 1987
25. Bath R. The private/public mix in health care in India. Health Policy and Planning 1993;8:43-56
General Discussion
137
26. Bennet S, McPake B, Mills A (eds). Private health providers in developing countries. London: Zed Books. 1997
27. Tuberculosis Coalition for Technical Assistance. International Standards for Tuberculosis Care (ISTC). The Hague: Tuberculosis Coalition for Technical Assistance, 2006.
28. Pathania V, Almeida J, Kochi A. TB patients and private for-profit health care providers in India. Geneva. World Health Organization, 1997.
29. Ramana GNV, Naidu BMCS, Murthy KJR. Mapping of TB treatment providers at selected sites in Andhra Pradesj Wstate, India. Geneva: World Health Organization, 1997.
30. Nair DM, Geogre A, Chacke KT. Tuberculosis in Bombay: New insights from poor urban patients. Health Policy and Planning 1997;12:77-85.
31. Lönnroth K, Tran TU, Thuong LM, Quy HT, Diwan V. Can I afford free treatment? Perceived consequences of health care provider choices among people with tuberculosis in Ho Chi Minh City, Vietnam. Soc Sci Med 2001;52:935-48.
32. Lönnroth K, Karlsson M, Lan NT, Buu TN, Dieu TT. Referring TB suspects from private pharmacies to the National Tuberculosis Programme: experiences from two districts in Ho Chi Minh City, Vietnam. Int J Tuberc Lung Dis 2003;7:1147-53
33. Quy HT, Lönnroth K, Lan NT, Buu TN. Treatment results among tuberculosis patients treated by private lung specialists involved in a public-private mix project in Vietnam. Int J Tuberc Lung Dis 2003;7:1139-46.
34. Quy HT, Lan NT, Lönnroth K, Buu TN, Dieu TT, Hai LT. Public-private mix for improved TB control in Ho Chi Minh City, Vietnam: an assessment of its impact on case detection. Int J Tuberc Lung Dis 2003;7:464-71.
35. Lönnroth K, Uplekar M, Arora VK, Juveka S, Lan NTN, Mwaniki D, Pathania V. Public-private mix for DOTS implementation: what makes it work? Buletin of World Health organization, 2004, 82(8):580-586
36. Styblo K, Bumgarner JR. Tuberculosis can be controlled with existing technologies: evidence. In: Progress report 1991. The Hague, Tuberculosis Surveillance Research Unit:60–72.
37. Enarson DA, Rieder HL, Arnadottir T, Trébucq A. Management of tuberculosis. A guide for low income countries (Fifth edition). International Union Against Tuberculosis and Lung Disease, Paris: 2000.
38. Nguyen TN, Wells CD, Binkin NJ, Pham DL, Nguyen VC. The importance of quality control of sputum smear microscopy: the effect of reading errors on treatment decisions and outcomes. Int J Tuberc Lung Dis. 1999 Jun;3(6):483-7
39. Hien NT, Long NT, Huan TQ. HIV/AIDS Epidemic in Vietnam: Evolution and Responses. AIDS Education and Prevention 2004, 16 Suppl A, 137-154.
40. Quy HT, Nhien DT, Lan NT, Borgdorff MW, Broekmans JF. Steep increase in HIV prevalence among tuberculosis patients in Ho Chi Minh City. AIDS 2002;16:931-932
41. Buu TN, Houben RMGJ, Lan NTN, Cobelens FGJ, Borgdorff MW, Quy HT. The arrival of a combined epidemic; HIV and TB in HoChiMinh city, Vietnam, 1997

Chapter 9
138
through 2002. TSRU Progress report 2006. KNCV Tuberculosis foundation, the Hague 2006:5-16.
42. Perret L. Pulmonary tuberculosis and diabetes mellitus. Scand J Respir Dis Suppl. 1970;72:68-71
43. Jabbar A, Hussain SF, Khan AA. Clinical characteristics of pulmonary tuberculosis in adult Pakistani patients with co-existing diabetes mellitus. East Mediterr Health J. 2006 Sep;12(5):522-7
44. Perez-Guzman C, Vargas MH, Torres-Cruz A, Perez-Padilla JR, Furuya ME, Villarreal-Velarde H. Diabetes modifies the male:female ratio in pulmonary tuberculosis. Int J Tuberc Lung Dis. 2003 Apr;7(4):354-8
45. Feleke Y, Abdulkadir J, Aderaye G. Prevalence and clinical features of tuberculosis in Ethiopian diabetic patients. East Afr Med J. 1999 Jul;76(7):361-4
46. Quoc PS, Charles MA, Cuong NH, Lieu LH, Tan NA, Thomas M et al. Blood glucose distribution and prevalence of diabetes in Hanoi (Vietnam). Am J Epidemol. 1994;139:713-722.
47. Davidson MB. Metabolic syndrome/insulin resistance syndrome/pre-diabetes. Diabetes Care. 2003;26:3179.
48. Baumann LC, Blobner D, Binh TV, Lan PT. A training program for diabetes care in Vietnam. The Diabetes Educator, 2006, 32:189-194.
49. Duc Son LENT, Kusama K, Hung NTK, Loan TTH, Van Chuyen N, KuniiD, Sakai T, Yamamoto S. Prevalance and risk factors for diabetes in Ho Chi Minh City, Vietnam. Diabetic Medicine, 2004, 21,371-376
50. Lönnroth K, Jaramillo E, Williams B, Dye C. Population attributable risk for selected risk factors for tuberculosis. TSRU Progress Report 2005. KNCV Tuberculosis Foundation, the Hague 2007:19-20
51. Jenkins CN, Dai PX, Ngoc DH et al. Tobacco use in Vietnam. Prevalence, predictors, and the role of the transnational tobacco corporations. JAMA 1997;277:1726-31.
52. Glynn JR, Whiteley J, Bifani PJ, Kremer K, van Soolingen D. Worldwide occurrence of Beijing/W strains of Mycobacterium tuberculosis: a systematic review. Emerg Infect Dis. 2002 Aug;8(8):843-9
53. Glynn JR, Crampin AC, Traore H, Yates MD, Mwaungulu FD, Ngwira BM, Chaguluka SD, Mwafulirwa DT, Floyd S, Murphy C, Drobniewski FA, Fine PE. Mycobacterium tuberculosis Beijing genotype, northern Malawi. Emerg Infect Dis. 2005 Jan;11(1):150-3
54. Anh DD, Borgdorff MW, Van LN, Lan NT, van Gorkom T, Kremer K, van Soolingen D. Mycobacterium tuberculosis Beijing genotype emerging in Vietnam. Emerg Infect Dis 2000;6:302-5.
55. Lan NT, Lien HT, Tung le B, Borgdorff MW, Kremer K, van Soolingen D. Mycobacterium tuberculosis Beijing genotype and risk for treatment failure and relapse, Vietnam. Emerg Infect Dis 2003;9:1633-5.
56. Quy HT, Giang DC, Lan NTN, Borgdorff MW, Quy NC, Hai LT, Eilers P, Cobelens FGJ. Follow-up of chronic tuberculosis patients in Ho Chi Minh City, Vietnam. TSRU Progress Report 2004. The Hague: KNCV Tuberculosis Foundation; 2004
General Discussion
139
57. Egwaga SM, Cobelens FG, Muwinge H, Verhage C, Kalisvaart N, Borgdorff MW. The impact of the HIV epidemic on tuberculosis transmission in Tanzania. AIDS. 2006 Apr 4;20(6):915-21
58. Completed census results. Vietnam population and housing census Vietnam 1999. Hanoi, Vietnam: general Statistical Office, 2001.
59. Migration, Development And Poverty Reduction in Asia By International Organization for Migration - 2005
60. Raviglione MC, Uplekar MW. WHO’s new Stop TB Strategy. Lancet 2006; 367: 952-955
61. World Health Organization. Stop TB Partnership. The stop TB Strategy: Building on and enhancing DOTS to meet the TB-related Millennium Development Goals. World Health Organization 2006. WHO/HTM/TB/2006.368
62. Interim policy on collaborative TB/HIV activities. WHO/HTM/TB/2004.330 63. World Health Organization. Guidelines for the programmatic management of
drug-resistant tuberculosis. World Health Organization 2006. WHO/HTM/TB/2006.361
64. Leimane V, Riekstina V, Holtz TH, Zarovska E, Skripconoka V, Thorpe LE, Laserson KF, Wells CD. Clinical outcome of individualised treatment of multidrug-resistant tuberculosis in Latvia: a retrospective cohort study. Lancet. 2005 Jan 22-28;365(9456):318-26
65. Resch SC, Salomon JA, Murray M, Weinstein MC. Cost-effectiveness of treating multidrug-resistant tuberculosis. PLoS Med. 2006 Jul;3(7):e241
66. World Health Organization, Stop TB Partneship. Public-Private Mix for DOTS: Practical tools to help implementation. TB Strategy and Operations Stop TB Department. World Health Organization 2003. WHO/CDS/TB/2003.325
67. Frieden T. Toman’s Tuberculosis Case detection, treatment, and monitoring – questions and answers. Second edition. World Organization. Geneva 2004. WHO/HTM/TB/2004.334

140
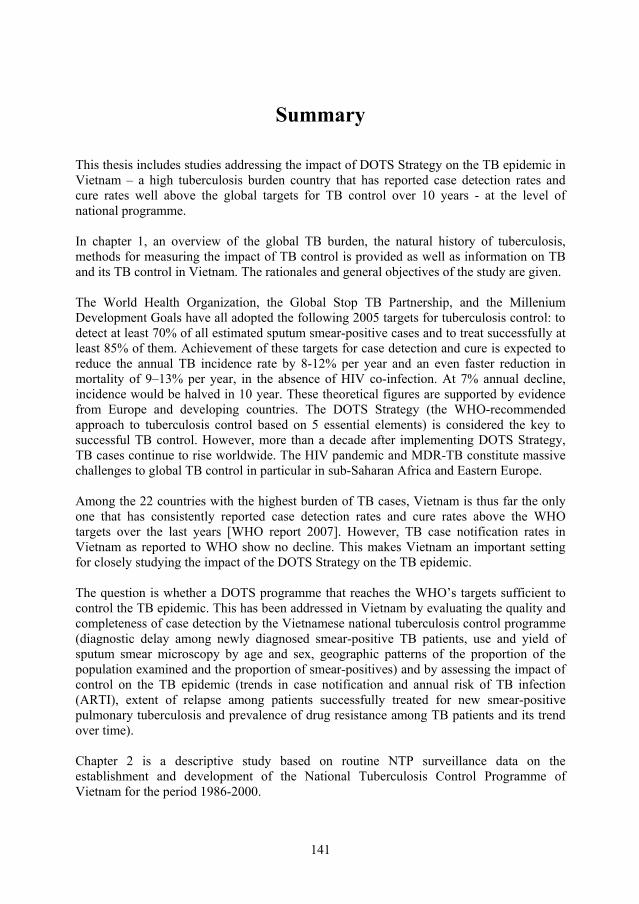
141
Summary This thesis includes studies addressing the impact of DOTS Strategy on the TB epidemic in Vietnam – a high tuberculosis burden country that has reported case detection rates and cure rates well above the global targets for TB control over 10 years - at the level of national programme. In chapter 1, an overview of the global TB burden, the natural history of tuberculosis, methods for measuring the impact of TB control is provided as well as information on TB and its TB control in Vietnam. The rationales and general objectives of the study are given. The World Health Organization, the Global Stop TB Partnership, and the Millenium Development Goals have all adopted the following 2005 targets for tuberculosis control: to detect at least 70% of all estimated sputum smear-positive cases and to treat successfully at least 85% of them. Achievement of these targets for case detection and cure is expected to reduce the annual TB incidence rate by 8-12% per year and an even faster reduction in mortality of 9–13% per year, in the absence of HIV co-infection. At 7% annual decline, incidence would be halved in 10 year. These theoretical figures are supported by evidence from Europe and developing countries. The DOTS Strategy (the WHO-recommended approach to tuberculosis control based on 5 essential elements) is considered the key to successful TB control. However, more than a decade after implementing DOTS Strategy, TB cases continue to rise worldwide. The HIV pandemic and MDR-TB constitute massive challenges to global TB control in particular in sub-Saharan Africa and Eastern Europe. Among the 22 countries with the highest burden of TB cases, Vietnam is thus far the only one that has consistently reported case detection rates and cure rates above the WHO targets over the last years [WHO report 2007]. However, TB case notification rates in Vietnam as reported to WHO show no decline. This makes Vietnam an important setting for closely studying the impact of the DOTS Strategy on the TB epidemic. The question is whether a DOTS programme that reaches the WHO’s targets sufficient to control the TB epidemic. This has been addressed in Vietnam by evaluating the quality and completeness of case detection by the Vietnamese national tuberculosis control programme (diagnostic delay among newly diagnosed smear-positive TB patients, use and yield of sputum smear microscopy by age and sex, geographic patterns of the proportion of the population examined and the proportion of smear-positives) and by assessing the impact of control on the TB epidemic (trends in case notification and annual risk of TB infection (ARTI), extent of relapse among patients successfully treated for new smear-positive pulmonary tuberculosis and prevalence of drug resistance among TB patients and its trend over time). Chapter 2 is a descriptive study based on routine NTP surveillance data on the establishment and development of the National Tuberculosis Control Programme of Vietnam for the period 1986-2000.
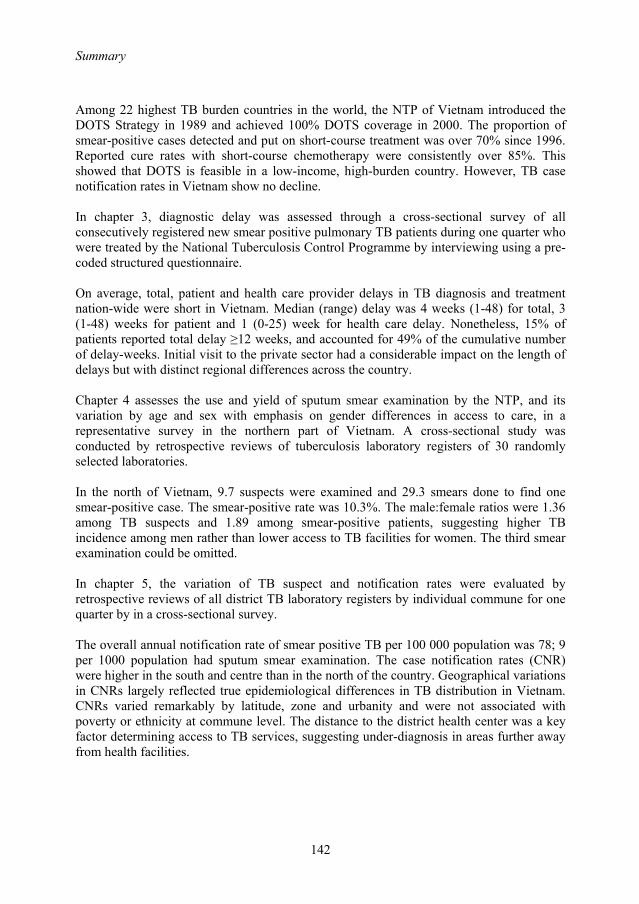
Summary
142
Among 22 highest TB burden countries in the world, the NTP of Vietnam introduced the DOTS Strategy in 1989 and achieved 100% DOTS coverage in 2000. The proportion of smear-positive cases detected and put on short-course treatment was over 70% since 1996. Reported cure rates with short-course chemotherapy were consistently over 85%. This showed that DOTS is feasible in a low-income, high-burden country. However, TB case notification rates in Vietnam show no decline. In chapter 3, diagnostic delay was assessed through a cross-sectional survey of all consecutively registered new smear positive pulmonary TB patients during one quarter who were treated by the National Tuberculosis Control Programme by interviewing using a pre-coded structured questionnaire. On average, total, patient and health care provider delays in TB diagnosis and treatment nation-wide were short in Vietnam. Median (range) delay was 4 weeks (1-48) for total, 3 (1-48) weeks for patient and 1 (0-25) week for health care delay. Nonetheless, 15% of patients reported total delay ≥12 weeks, and accounted for 49% of the cumulative number of delay-weeks. Initial visit to the private sector had a considerable impact on the length of delays but with distinct regional differences across the country. Chapter 4 assesses the use and yield of sputum smear examination by the NTP, and its variation by age and sex with emphasis on gender differences in access to care, in a representative survey in the northern part of Vietnam. A cross-sectional study was conducted by retrospective reviews of tuberculosis laboratory registers of 30 randomly selected laboratories. In the north of Vietnam, 9.7 suspects were examined and 29.3 smears done to find one smear-positive case. The smear-positive rate was 10.3%. The male:female ratios were 1.36 among TB suspects and 1.89 among smear-positive patients, suggesting higher TB incidence among men rather than lower access to TB facilities for women. The third smear examination could be omitted. In chapter 5, the variation of TB suspect and notification rates were evaluated by retrospective reviews of all district TB laboratory registers by individual commune for one quarter by in a cross-sectional survey. The overall annual notification rate of smear positive TB per 100 000 population was 78; 9 per 1000 population had sputum smear examination. The case notification rates (CNR) were higher in the south and centre than in the north of the country. Geographical variations in CNRs largely reflected true epidemiological differences in TB distribution in Vietnam. CNRs varied remarkably by latitude, zone and urbanity and were not associated with poverty or ethnicity at commune level. The distance to the district health center was a key factor determining access to TB services, suggesting under-diagnosis in areas further away from health facilities.
Summary
143
In chapter 6, the trends in annual risk of tuberculosis infection were estimated from repeated tuberculin surveys and compared with trends in case notification rates in six sentinel provinces where the DOTS Strategy had been introduced in the 1980s. The age-standardised notification rates in the period 1996-2003 declined significantly by 2.6 to 5.9% per year in five provinces. However, notification rates in the age group 15-24 years increased significantly by 4.5 to 13.6% per year during this period in four. The mean age of newly diagnosed patients with smear-positive tuberculosis increased up to 1995 but decreased afterwards. The annual risk of tuberculosis infection showed significant annual decrease (4.9% per year) in one province in surveys done between 1986 and 1997, in two (6.6 and 14.7%) and no decline in other 3 provinces in surveys done between 1993 and 2002. Chapter 7 assesses survival and bacteriologically confirmed relapse rate after 12-24 months among new smear-positive pulmonary TB patients who completed treatment. Data were colleted from a cohort of patients treated in 32 randomly selected districts in the northern part of Vietnam Among 304 patients included in the study, the bacteriology relapse rate was 5%. An additional 4% started TB retreatment. Four of 12 culture-positive relapse cases (33%) had multidrug-resistant strains. In total, the relapse proportion was 9.9%. The relapse rate was not in excess of that expected from a randomized controlled trial with the 8-month regimen. Chapter 8 presents the results of a drug resistance survey. This survey was conducted by collecting sputum specimens from consecutively diagnosed patients with smear-positive TB at 40 randomly selected public TB clinics in the south of Vietnam. M. tuberculosis isolates were tested for susceptibility to first-line drugs. Among new patients, the prevalence of resistance to any drug was 26% and the prevalence of MDR 1.8%. Among previously treated patients, prevalence of any resistance and MDR was 63% and 23% respectively. The prevalence of resistance to any drug has significantly declined and levels of (multi)drug resistance among new smear-positive patients have not increased over the past six years in the absence of second-line treatment. Therefore, a DOTS program can contain drug resistant TB in this setting. In chapter 9, the main findings and major limitations are discussed as well as the implications of these studies for TB control programme and recommendations for further research. In conclusion, TB control in Vietnam failed to have the expected impact. Initial indirect assessments of case detection and cure rates did not identify major problems. Better, more direct evaluation of case detection and treatment outcome are indicated. The increase among adolescents recognized a specific explanation.

144
145
Tãm t¾t B¶n luËn v¨n nµy bao gåm nh÷ng nghiªn cøu vÒ t¸c ®éng cña chiÕn l−îc DOTS tíi t×nh h×nh bÖnh lao t¹i ViÖt nam – quèc gia cã t×nh h×nh dÞch tÔ bÖnh lao cao ®· ®¹t ®−îc tû lÖ ph¸t hiÖn vµ tû lÖ khái cao h¬n môc tiªu phßng chèng lao toµn cÇu tõ h¬n 10 n¨m qua. Ch−¬ng 1 tr×nh bµy tæng quan dÞch tÔ bÖnh lao toµn cÇu, xu h−íng ph¸t triÓn tù nhiªn cña bÖnh lao, c¸c ph−¬ng ph¸p ®¸nh gi¸ t¸c ®éng cña c«ng t¸c phßng chèng lao lªn t×nh h×nh dÞch bÖnh, còng nh− c¸c th«ng tin c¬ b¶n vÒ ViÖt nam vµ c«ng t¸c phßng chèng lao t¹i ViÖt nam. C¬ së khoa häc vµ môc tiªu nghiªn cøu còng ®−îc ®−a ra trong ch−¬ng nµy. Tæ chøc Y tÕ thÕ giíi (TCYTTG), Tæ chøc §èi t¸c Ng¨n chÆn bÖnh lao toµn cÇu (Stop TB Partnership) ®· th«ng qua môc tiªu phßng chèng lao ®Õn n¨m 2005 lµ ph¸t hiÖn tèi thiÓu 70% sè bÖnh nh©n lao phæi míi vµ ®iÒu trÞ khái tèi thiÓu 85% cho sè bÖnh nh©n ®ã. Khi ®¹t ®−îc môc tiªu vÒ ph¸t hiÖn vµ ®iÒu trÞ khái, −íc tÝnh tû lÖ bÖnh lao míi hµng n¨m sÏ gi¶m tõ 8-12% mçi n¨m vµ tû lÖ tö vong thËm chÝ sÏ gi¶m nhanh h¬n tõ 9-13% mçi n¨m trong bèi c¶nh kh«ng cã ®ång nhiÔm HIV. Vµ nh− vËy, víi 7% gi¶m bÖnh lao hµng n¨m, tû lÖ bÖnh lao míi sÏ gi¶m cßn mét nöa trong vßng 10 n¨m tíi. C¸c con sè lý thuyÕt nµy ®· ®−îc minh chøng t¹i ch©u ¢u vµ c¸c n−íc ®ang ph¸t triÓn. ChiÕn l−îc DOTS (do TCYTTG khuyÕn c¸o dùa trªn 5 thµnh tè thiÕt yÕu) ®−îc xem lµ ®iÓm then chèt ®Ó phßng chèng bÖnh lao mét c¸ch hiÖu qu¶. Tuy nhiªn, trªn mét thËp kû kÓ tõ sau khi b¾t ®Çu triÓn khai chiÕn l−îc DOTS, sè bÖnh nh©n lao vÉn tiÕp tôc gia t¨ng trªn ph¹m vi toµn cÇu. §¹i dÞch HIV phèi hîp víi bÖnh lao kh¸ng ®a thuèc lµ th¸ch thøc lín cho c«ng t¸c phßng chèng lao toµn cÇu, ®Æc biÖt t¹i khu vùc CËn Sahara ch©u Phi vµ §«ng ¢u. Trong 22 quèc gia cã t×nh h×nh dÞch tÔ bÖnh lao cao, ViÖt nam lµ quèc gia duy nhÊt ®¹t tû lÖ ph¸t hiÖn vµ kÕt qu¶ ®iÒu trÞ khái cao h¬n c¸c môc tiªu cña TCYTTG trong nhiÒu n¨m [B¸o c¸o cña TCYTTG n¨m 2007] . Tuy nhiªn, tû lÖ thu dung bÖnh lao t¹i ViÖt nam theo b¸o c¸o cho TCYTTG lµ ch−a thuyªn gi¶m. ChÝnh ®iÒu nµy lµm cho ViÖt nam trë thµnh ®Þa bµn lý t−ëng ®Ó nghiªn cøu s©u vÒ t¸c ®éng cña chiÕn l−îc DOTS lªn t×nh h×nh dÞch bÖnh lao. VÊn ®Ò ®Æt ra lµ khi mét ch−¬ng tr×nh chèng lao ¸p dông ChiÕn l−îc DOTS ®¹t ®−îc môc tiªu cña TCYTTG vÒ phßng chèng bÖnh lao cã ®ñ ®iÒu kiÖn ®Ó khèng chÕ dÞch bÖnh lao. VÊn ®Ò nµy ®−îc nghiªn cøu t¹i ViÖt nam b»ng c¸ch ®¸nh gi¸ chÊt l−îng, ®é tin cËy vµ tÝnh ®Çy ®ñ cña biÖn ph¸p ph¸t hiÖn chÈn ®o¸n trong Ch−¬ng tr×nh Chèng lao quèc gia (CTCLQG) (thêi gian chÈn ®o¸n chËm trÔ bÖnh nh©n lao phæi AFB(+) míi, sö dông vµ hiÖu qu¶ cña xÐt nghiÖm soi ®êm trùc tiÕp theo giíi vµ tuæi, tû lÖ d©n sè ®−îc xÐt nghiÖm ®êm soi trùc tiÕp vµ tû lÖ xÐt nghiÖm d−¬ng tÝnh theo khu vùc ®Þa lý) vµ b»ng c¸ch ®¸nh gi¸ t¸c ®éng cña c«ng t¸c phßng chèng lao lªn t×nh h×nh dÞch bÖnh lao (xu h−íng thu dung vµ nguy c¬ nhiÔm lao hµng n¨m, t×nh h×nh t¸i ph¸t sau ®iÒu trÞ cña bÖnh nh©n lao phæi AFB(+) míi ®· hoµn thµnh ®iÒu trÞ vµ tû lÖ kh¸ng thuèc trong bÖnh nh©n còng nh− xu h−íng kh¸ng thuèc theo thêi gian).
Tóm tắt
146
Ch−¬ng 2 tr×nh bµy nghiªn cøu dÞch tÔ häc m« t¶ dùa trªn sè liÖu cña hÖ thèng gi¸m s¸t th−êng kú cña CTCLQG vÒ sù h×nh thµnh vµ ph¸t triÓn cña CTCLQG trong giai ®o¹n 1986-2000. CTCLQG ViÖt nam ®· triÓn khai chiÕn l−îc DOTS tõ n¨m 1989 vµ ®¹t ®é bao phñ 100% d©n sè trong c¶ n−íc vµo n¨m 2000. Tû lÖ bÖnh nh©n AFB(+) míi thu dung vµo ho¸ trÞ liÖu ng¾n ngµy (HTLNN) chiÕm trªn 70% sè bÖnh nh©n −íc tÝnh tõ 1996. Tû lÖ ®iÒu trÞ khái víi HTLNN ®¹t trªn 85%. §iÒu nµy cho thÊy chiÕn l−îc DOTS lµ kh¶ thi t¹i mét quèc gia cã thu nhËp thÊp vµ cã t×nh h×nh dÞch bÖnh lao cao. Tuy nhiªn, tû lÖ thu dung bÖnh nh©n lao vÉn ch−a thuyªn gi¶m t¹i ViÖt nam. Trong ch−¬ng 3, thêi gian chËm trÔ trong chÈn ®o¸n ®−îc ®¸nh gi¸ qua ®iÒu tra c¾t ngang toµn bé bÖnh nh©n lao phæi AFB(+) míi ®−îc ®¨ng ký ®iÒu trÞ trong 1 quý trong CTCLQG b»ng c¸ch pháng vÊn qua phiÕu pháng vÊn ®−îc thiÕt kÕ tr−íc. ë ViÖt nam, tæng thêi gian chËm trÔ, chËm trÔ do ng−êi bÖnh vµ chËm trÔ do thÇy thuèc trong chÈn ®o¸n vµ ®iÒu trÞ bÖnh nh©n lao lµ ng¾n. 4 tuÇn (kho¶ng 1-48 tuÇn) lµ trung vÞ ®èi víi tæng thêi gian chËm trÔ, 3 (1-48) tuÇn ®èi víi thêi gian chËm trÔ do ng−êi bÖnh vµ 1 (0-25) tuÇn lµ thêi gian chËm trÔ do thÇy thuèc. Tuy nhiªn, 15% sè bÖnh nh©n cã tæng thêi gian chËm trÔ trªn 12 tuÇn vµ chiÕm tíi 49% tæng sè thêi gian chËm trÔ céng dån. ViÖc tiÕp cËn víi y tÕ t− trong lÇn kh¸m ®Çu tiªn cã t¸c ®éng ®Õn thêi gian chËm trÔ nh−ng cã sù kh¸c biÖt gi÷a c¸c vïng trong toµn quèc. Ch−¬ng 4 ®¸nh gi¸ viÖc sö dông vµ kÕt qu¶ xÐt nghiÖm ®êm soi trùc tiÕp trong CTCLQG, vµ sù thay ®æi cña kÕt qu¶ nµy theo tuæi, giíi víi nhÊn m¹nh vÒ sù kh¸c biÖt vÒ giíi trong tiÕp cËn vµ ch¨m sãc y tÕ ®¹i diÖn cho khu vùc miÒn B¾c ViÖt nam. Nghiªn cøu c¾t ngang ®· ®−îc tiÕn hµnh b»ng c¸ch håi cøu l¹i c¸c sæ xÐt nghiÖm cña 30 huyÖn ®−îc lùa chän ngÉu nhiªn. T¹i miÒn B¾c, ®Ó ph¸t hiÖn ®−îc 1 bÖnh nh©n lao phæi AFB(+) cÇn kh¸m vµ cho xÐt nghiÖm ®êm 9.7 ng−êi nghi lao vµ lµm xÐt nghiÖm 29.3 tiªu b¶n ®êm. Tû suÊt nam:n÷ lµ 1.36 trong sè ng−êi nghi lao ®Õn kh¸m vµ 1.89 trong sè bÖnh nh©n d−¬ng tÝnh, ®iÒu nµy cho thÊy tû lÖ m¾c lao trong nam giíi cao h¬n chø kh«ng ph¶i do sù tiÕp cËn víi c¬ së kh¸m ch÷a lao thÊp h¬n ë n÷ giíi. Nghiªn cøu còng ®−a ra khuyÕn c¸o kh«ng nªn xÐt nghiÖm mÉu ®êm thø 3. Trong ch−¬ng 5, sù thay ®æi cña tû lÖ ng−êi nghi lao ®−îc xÐt nghiÖm ®êm vµ tû lÖ thu dung bÖnh lao theo tõng x· trong 1 quý ®−îc ®¸nh gi¸ qua håi cøu sæ xÐt nghiÖm cña toµn bé c¸c huyÖn trong c¶ n−íc th«ng qua nghiªn cøu c¾t ngang. Tû lÖ thu dung bÖnh nh©n lao phæi AFB(+) hµng n¨m lµ 78/100.000 d©n vµ 9/1000 ng−êi d©n ®−îc xÐt nghiÖm ®êm soi trùc tiÕp ®Ó t×m vi khuÈn lao. Tû lÖ thu dung t¹i c¸c x· thu«c khu vùc miÒn Trung vµ miÒn Nam cao h¬n so víi c¸c x· thuéc khu vùc miÒn B¾c. Sù thay ®æi cña tû lÖ thu dung mang tÝnh chÊt ®Þa lý ph¶n ¸nh sù kh¸c nhau thùc sù vÒ t×nh h×nh dÞch tÔ trong ph©n bè dÞch tÔ bÖnh lao t¹i ViÖt nam. Tû lÖ thu dung kh¸c nhau râ rÖt theo vÜ ®é, khu vùc vµ t×nh tr¹ng thµnh thÞ n«ng th«n vµ tû lÖ thu dung kh«ng liªn quan ®Õn t×nh tr¹ng nghÌo ®ãi vµ d©n téc thiÓu sè t¹i cÊp x·. Kho¶ng c¸ch tõ tr¹m y tÕ x· ®Õn trung t©m y tÕ
Tóm tắt
147
huyÖn lµ yÕu tè quan träng ®Ó ®¸nh gi¸ t×nh h×nh tiÕp cËn víi dÞch vô kh¸m ch÷a bÖnh lao, ®iÒu nµy cho thÊy c¸c khu vùc n»m c¸ch xa c¸c c¬ së y tÕ cho tû lÖ chÈn ®o¸n thÊp. Trong ch−¬ng 6, xu h−íng nguy c¬ nhiÔm lao ®−îc −íc tÝnh th«ng qua c¸c ®iÒu tra nguy c¬ nhiÔm lao lÆp l¹i vµ so s¸nh víi tû lÖ thu dung t¹i 6 tØnh gi¸m s¸t träng ®iÓm ®· triÓn khai chiÕn l−îc DOTS tõ nh÷ng n¨m 1980. Tû lÖ thu dung hiÖu chØnh theo tuæi trong giai ®o¹n 1996-2003 gi¶m cã y nghÜa tõ 2.6%-5.9% mçi n¨m t¹i 5 tØnh. Tuy nhiªn, trong giai ®o¹n nµy, tû lÖ thu dung trong nhãm 15-24 tuæi t¨ng cã ý nghÜa tõ 4.5% lªn 13.6% mçi n¨m t¹i 4 tØnh. Tuæi trung b×nh cña bÖnh nh©n lao phæi AFB(+) míi t¨ng trong giai ®o¹n tr−íc n¨m 1995 vµ gi¶m sau ®ã. Nguy c¬ nhiÔm lao hµng n¨m gi¶m (4.9% mçi n¨m) t¹i 1 tØnh trong giai ®o¹n 1986-1997 vµ t¹i 2 tØnh (6.6% vµ 14.7% mçi n¨m) vµ kh«ng gi¶m t¹i 3 tØnh kh¸c trong giai ®o¹n 1993-2002. Ch−¬ng 7 x¸c ®Þnh tû lÖ t¸i ph¸t b»ng xÐt nghiÖm vi trïng häc sau 12-24 th¸ng cña l« bÖnh nh©n lao phæi AFB(+) míi ®· hoµn thµnh ®iÒu trÞ. Sè liÖu ®−îc thu thËp th«ng qua nghiªn cøu thuÇn tËp nh÷ng bÖnh nh©n ®· hoµn thµnh ®iÒu trÞ t¹i 32 huyÖn chän ngÉu nhiªn t¹i c¸c tØnh khu vùc miÒn B¾c. Víi 304 bÖnh nh©n tham gia nghiªn cøu, tû lÖ t¸i ph¸t dùa theo xÐt nghiÖm vi trïng häc lµ 5%. Bæ sung 4% ®· ®iÒu trÞ t¸i trÞ bÖnh lao. 4/12 (33%) bÖnh nhËn t¸i ph¸t dùa theo kÕt qu¶ nu«i cÊy vµ kh¸ng sinh ®å lµ chñng vi khuÈn kh¸ng ®a thuèc. Tæng céng, tû lÖ t¸i ph¸t lµ 9.9%. Nh− vËy, tû lÖ t¸i ph¸t kh«ng cao h¬n so víi kÕt qu¶ t¸i ph¸t theo nghiªn cøu thö nghiÖm l©m sµng c«ng thøc 8 th¸ng. Ch−¬ng 8 tr×nh bµy kÕt qu¶ ®iÒu tra kh¸ng thuèc. §iÒu tra nµy ®−¬c tiÕn hµnh b»ng c¸ch thu thËp mÉu ®êm cña bÖnh nh©n lao phæi AFB(+) ®−îc chÈn ®o¸n liªn tôc t¹i 40 quËn/huyÖn ®−îc chän ngÉu nhiªn t¹i khu vùc miÒn Nam. Vi trïng lao ph©n lËp ®−îc xÐt nghiÖm kh¸ng sinh ®å víi c¸c thuèc chèng lao hµng I. §èi víi bÖnh nh©n lao míi, tû lÖ kh¸ng thuèc lao lµ 26% vµ tû lÖ kh¸ng ®a thuèc lµ 1.8%. §èi víi bÖnh nh©n ®· ®iÒu trÞ thuèc lao, tû lÖ kh¸ng thuèc vµ kh¸ng ®a thuèc t−¬ng øng lµ 63% vµ 23%. Tû lÖ kh¸ng thuèc lao gi¶m cã ý nghÜa thèng kª vµ tû lÖ kh¸ng ®a thuèc kh«ng t¨ng trong vßng 6 n¨m trong bèi c¶nh CTCLQG ch−a ¸p dông qu¶n lý ®iÒu trÞ bÖnh lao kh¸ng thuèc b»ng thuèc chèng lao hµng 2. Do vËy, ChiÕn l−îc DOTS cã kh¶ n¨ng ng¨n c¶n kh¸ng thuèc trong bèi c¶nh nµy. Trong ch−¬ng 9, c¸c kÕt qu¶ vµ c¸c h¹n chÕ chÝnh cña nghiªn cøu ®−îc th¶o luËn còng nh− c¸c khuyÕn c¸o rót ra tõ nghiªn cøu nµy cho CTCL vµ c¸c nghiªn cøu cÇn triÓn khai trong t−¬ng lai. Tãm l¹i, c«ng t¸c phßng chèng bÖnh lao t¹i ViÖt nam cã t¸c ®éng rÊt h¹n chÕ trong viÖc lµm gi¶m t×nh h×nh m¾c lao nh− mong muèn. C¸c ®¸nh gi¸ gi¸n tiÕp vÒ ph¸t hiÖn vµ ®iÒu trÞ kh«ng x¸c ®Þnh ®−îc vÊn ®Ò g× lín. C¸c ®¸nh gi¸ trùc tiÕp bæ sung vÒ ph¸t hiÖn vµ kÕt qu¶ ®iÒu trÞ ®· ®−îc chØ ra. BÖnh lao gia t¨ng ë nhãm ng−êi trÎ tuæi ®−îc coi lµ mét sù gi¶i thÝch râ rµng cho t¸c ®éng h¹n chÕ nµy.

148
149
Samenvatting Dit proefschrift beschrijft onderzoeken naar het effect van de DOTS strategie op de tuberculose epidemie in Vietnam. Vietnam is een land met een hoge tuberculose-ziektelast. De laatste 10 jaar overtreffen, op het niveau van het nationale tuberculose bestrijdingsprogramma (NTP), de gerapporteerde tuberculose-opsporingspercentages en genezingspercentages de wereldwijde doelstellingen voor tuberculosebestrijding. In hoofdstuk 1 wordt een overzicht gegeven van de wereldwijde tuberculose-ziektelast, van het natuurlijk beloop van tuberculose, en van methoden voor het meten van het effect van tuberculosebestrijding. Ook wordt informatie over tuberculose en de tuberculosebestrijding in Vietnam samengevat, en worden de rationale en de algemene doelstellingen van het onderzoek gegeven. De Wereldgezondheidsorganisatie (WHO), de Global Stop TB Partnership en de Millenium Development Goals hebben voor het jaar 2005 de volgende doelen voor tuberculosebestrijding gesteld: opsporing van ten minste 70% van alle geschatte sputum-positieve gevallen, en succesvolle behandeling van ten minste 85% van deze gevallen. Indien deze doelstellingen voor gevalsopsporing en genezing worden bereikt, wordt een daling van de tuberculose-incidentie verwacht met 8-12% per jaar, evenals een zelfs snellere daling van de sterfte aan tuberculose met 9-13% per jaar, dit in de afwezigheid van HIV co-infectie. Bij een daling van 7% per jaar zou dan de incidentie van tuberculose in 10 jaar tijd worden gehalveerd. Deze theoretische getallen worden ondersteund door gegevens uit Europa en ontwikkelingslanden. De DOTS strategie (de door de WHO aanbevolen aanpak van tuberculosebestrijding, gebaseerd op 5 essentiële elementen) wordt beschouwd als de sleutel voor succesvolle tuberculosebestrijding. Echter, meer dan 10 jaar na het implementeren van de DOTS strategie blijven wereldwijd het aantal tuberculosegevallen toenemen. De HIV pandemie en multiresistente tuberculose vormen enorme uitdagingen voor wereldwijde tuberculosebestrijding, met name in Afrika bezuiden de Sahara en Oost Europa. Van de 22 landen met de hoogste ziektelast van tuberculosegevallen is Vietnam tot nu toe het enige land dat gedurende de laatste jaren consistent tuberculose-opsporingspercentages en genezingspercentages rapporteert, welke boven de doelstellingen van de WHO liggen [WHO report 2007]. Echter, tuberculose-aangiftecijfers in Vietnam, zoals gerapporteerd aan de WHO, laten geen afname zien. Daarom is Vietnam een belangrijk gebied om het effect van de DOTS strategie op de tuberculose-epidemie in detail te onderzoeken. De vraag is daarbij of een DOTS programma, dat de WHO-doelstellingen heeft bereikt, voldoende is voor bestrijding van de tuberculose-epidemie. Dit wordt onderzocht door evaluatie van de kwaliteit en de volledigheid van opsporing door het Vietnamese NTP (diagnostisch uitstel onder nieuw gediagnosticeerde sputum-positieve tuberculosepatiënten, toepassing en opbrengst van microscopisch sputumonderzoek naar leeftijd en geslacht,
Samenvatting
150
geografische patronen van de onderzochte proportie van de bevolking welke is onderzocht, respectievelijk welke sputum-positief is), en door beoordeling van het effect van bestrijding op de tuberculose-epidemie (trends in aangifte en jaarlijkse risico op tuberculose-infectie, recidiefpercentage onder succesvol behandelde patiënten met nieuwe sputum-positieve longtuberculose, en prevalentie en trends over tijd van geneesmiddelenresistentie onder tuberculosepatiënten). Hoofdstuk 2 is een beschrijvend onderzoek, gebaseerd op routinegegevens, over de totstandkoming en ontwikkeling van het NTP in Vietnam gedurende de periode 1986-2000. Vietnam is één van de 22 landen met de hoogste tuberculoseziektelast wereldwijd. Het NTP Vietnam introduceerde de DOTS aanpak in 1989 en bereikte 100% dekking in het jaar 2000. Sinds 1996 bedraagt de proportie sputum-positieve gevallen welke worden gedetecteerd en behandeld met “short course” chemotherapie meer dan 70%, en zijn de gerapporteerde genezings-percentages met het 8-maands behandelregime consistent hoger dan 85%. Dit toont aan dat de DOTS aanpak haalbaar is in een laag-inkomen land met een hoge ziektelast. Echter, de tuberculose-aangiftecijfers in Vietnam nemen niet af. In hoofdstuk 3 is het diagnostisch uitstel onderzocht in een dwarsdoorsnede-onderzoek van alle gedurende één kwartaal opeenvolgend geregistreerde patiënten met nieuwe sputum-positieve longtuberculose die werden behandelend door het NTP. Patiënten werden aan de hand van een voorgecodeerde gestructureerde vragenlijst geïnterviewd. Gemiddeld was, op nationaal niveau in Vietnam, het diagnostisch uitstel kort. Dit betrof het totale uitstel in diagnose en behandeling, het door de patiënt veroorzaakte uitstel (patiënt-uitstel) en het uitstel veroorzaakt door de gezondheidszorgaanbieder (aanbieder-uitstel). Het mediane (spreiding) totale uitstel bedroeg 4 weken (1-48), het mediane patiënt-uitstel 3 (1-48) weken, en het mediane aanbieder-uitstel 1 (0-25) week. Desondanks rapporteerde 15% van de patiënten een totaal uitstel van ≥12 weken en dit vertegenwoordigde 49% van het cumulatieve aantal uitstelweken. Initiële consultatie van een private zorgaanbieder had aanzienlijk effect op de lengte van uitstel, maar met duidelijke regionale verschillen binnen het land. In hoofdstuk 4 worden toepassing en opbrengst bepaald van microscopisch sputumonderzoek door het NTP, evenals de variatie hierin naargelang leeftijd en geslacht met nadruk op sexeverschillen in toegang tot gezondheidszorg. Hiertoe werd een dwarsdoorsnede-onderzoek uitgevoerd op basis van registers van tuberculoselaboratoria in een aselecte steekproef van 30 districten in het noordelijke deel van Vietnam. In dit onderzoek bedroegen het aantal van tuberculose verdachte patiënten, en het aantal microscopische sputumpreparaten, welke moesten worden onderzocht teneinde één sputum-positief geval te vinden, 9.7 respectievelijk 29.3. Het percentage van tuberculose verdachte gevallen dat sputum-positief was bedroeg 10.3%. De man-vrouw verhouding was 1,36:1 onder van tuberculose verdachte patiënten, en 1,89:1 onder sputum-positieve tuberculose patiënten. Dit doet eerder vermoeden dat de tuberculose-incidentie hoger is onder mannen,
Samenvatting
151
dan dat vrouwen een slechtere toegang hebben tot tuberculosediagnostiek. Het onderzoek van een derde microscopisch preparaat zou kunnen worden weggelaten. In hoofdstuk 5 wordt de variatie geëvalueerd in aantallen van tuberculose verdachte gevallen en aangegeven tuberculosepatiënten. In een dwarsdoorsnede-onderzoek werden retrospectief gegevens verzameld uit de registers van alle districtstuberculoselaboratoria in Vietnam over een periode van één kwartaal. Hierbij werd van alle patiënten bij wie onderzoek was verricht het dorp of stadsdeel van herkomst bepaald. Het totale jaarlijkse aangiftecijfer van sputum-positieve tuberculose bedroeg 78 per 100.000 bevolking; 9 per 1000 had een microscopisch sputum onderzoek. De aangiftecijfers per 100,000 bevolking waren hoger in het zuiden en het midden dan in het noorden van het land. Geografische verschillen in aangiftecijfers weerspiegelden grotendeels werkelijke epidemiologische verschillen in het voorkomen van tuberculose in Vietnam. Aangiftecijfers varieerden aanzienlijk naar geografische breedtegraad, regio en mate van verstedelijking en waren op dorps of stadsdeelniveau niet geassocieerd met armoede of etniciteit. De afstand tot het district gezondheidscentrum was een belangrijke determinant van de toegang tot tuberculosediagnostiek, hetgeen onderdiagnose doet vermoeden in gebieden die verder van gezondheidscentra verwijderd liggen. In hoofdstuk 6 worden de trends geschat in het jaarlijkse risico op tuberculose- infectie (ARTI) met herhaalde tuberculine-onderzoeken, en worden deze vergeleken met trends in tuberculose-aangiftecijfers, beide in 6 sentinelprovincies waar de DOTS strategie in de jaren ’80 van de vorige eeuw werd geïntroduceerd. Over de periode 1996-2003 daalden de voor leeftijd en geslacht gestandaardiseerde aangiftecijfers met 2.5 tot 5.9% per jaar in 5 provincies. Aangiftecijfers in de leeftijdsgroep 15-24 jaar namen over deze periode echter significant toe met 4.5 tot 13.6% per jaar in 4 provincies. De gemiddelde leeftijd van nieuw gediagnosticeerde sputum-positieve patiënten nam toe tot 1995, maar daalde daarna weer. De ARTI vertoonde een significante jaarlijkse afname in 3 provincies: één(met 4.9% per jaar) in surveys gehouden tussen 1986 en 1997, en 2 (met 6.6.% en 14.7% per jaar) in surveys gehouden tussen 1993 en 2002. De ARTI vertoonde geen significante afname in de overige 3 provincies. In hoofdstuk 7 worden de overleving en bacteriologisch bewezen recidiefpercentages bepaald onder patiënten met nieuwe sputum-positieve longtuberculose, 12-24 maanden na voltooide behandeling. Gegevens werden verzameld van een patiëntencohort in een aselecte steekproef van 32 districten in het noordelijke deel van Vietnam. Onder 304 geïncludeerde patiënten bedroeg het bacteriologische bewezen recidiefpercentage 5%, en was 4% gestart met herbehandeling. Vier van de 12 kweek-positieve recidiefgevallen (33%) had multiresistente tuberculose. In totaal bedroeg het recidiefpercentage 9.9%. Dit was niet hoger dan verwacht op basis van resultaten van een klinisch trial met de behandeling met het 8-maandsregime.
Samenvatting
152
In hoofdstuk 8 worden de resultaten gepresenteerd van onderzoek naar resistentie. Dit onderzoek werd uitgevoerd door verzameling van sputummonsters van opeenvolgend gediagnosticeerde patiënten met sputum-positieve tuberculose in een aselecte steekproef van 40 openbare tuberculoseklinieken in het zuiden van Vietnam. M. tuberculosis isolaten werden getest op gevoeligheid voor eerstelijns chemotherapeutica. Onder nieuwe patiënten bedroeg de prevalentie van resistentie tegen tenminste één middel 26%, en de prevalentie van meervoudige (multidrug) resistentie 1.8%. Onder eerder behandelde patiënten was dit 63%, respectievelijk 23%. Over de voorgaande 6 jaar was de prevalentie van resistentie tegen tenminste één middel significant afgenomen, en was de prevalentie van meervoudige resistentie onder nieuwe sputum-positieve patiënten niet toegenomen, dit in afwezigheid van tweedelijns behandeling. De conclusie is dat, onder deze omstandigheden, een DOTS programma in staat is de ontwikkeling van resistentie tegen antituberculosemiddelen beperkt te houden. In hoofdstuk 9 worden de belangrijkste bevindingen en beperkingen bediscussieerd, en worden de implicaties van deze studies voor tuberculose bestrijdingsprogramma’s en aanbevelingen voor verder onderzoek besproken. De conclusie luidt dat de tuberculosebestrijding in Vietnam niet het verwachte effect op de tuberculose-epidemie heeft gehad. In deze initiële, indirecte onderzoeken werden geen belangrijke problemen gevonden met betrekking tot de gerapporteerde opsporings- and genezingspercentages. Echter, meer directe evaluaties van de gevalsopsporing en behandelingsuitkomsten zijn nodig. De toename onder adolescenten vraagt om een specifieke verklaring.

153
Acknowledgements The studies presented in this thesis were conducted during my work as an Executive Secretary of the National Tuberculosis Control Programme, Vietnam (NTP). These studies are the result of the collaboration on epidemiological and operational research between the NTP, and KNCV Tuberculosis Foundation. This collaboration follows the research agenda set by the NTP based on its needs for improvement of TB control in Vietnam. Many organizations and individuals contributed to the success of the studies in this thesis. First of all, I would like to express my gratitude to all TB patients for their participation in the studies. This research would not have been possible without them. I would like to sincerely thank: - The Management Board of the NTP in Vietnam and the Directory Board of the
National Hospital of Tuberculosis and Respiratory Disease (NHTRD), in particular Professor Nguyen Viet Co (former Director), Associate Professor Dinh Ngoc Sy (Director) and Dr. Bui Duc Duong (Deputy Director) for allowing me to carry out the studies in Vietnam and supporting my training in Vietnam and in the Netherlands as well.
- The colleagues and friends at the NTP Central Unit for their collaboration and support,
and for taking over the heavy burden of my work when I was in the Netherlands for my training.
- The leaders, colleagues and friends at the Pham Ngoc Thach hospital (Ho Chi Minh
City), Da nang hospital of TB and lung Disease, provincial TB and lung disease hospitals/centers, provincial centers for social disease control and prevention and district TB units for their collaboration and great contribution to the study implementation phase.
- The leaders, colleagues and friends at the national, regional, and provincial
tuberculosis laboratories and district microscopy centers for their hard work in collection and examination of sputum specimens.
I would like to express my sincere thanks to: - The Directors of KNCV Tuberculosis Foundation (KNVC) and the head and staff of
the Research Unit for the technical and financial support for my training. Your support made my training in the University of Amsterdam possible.

Acknonledgement
154
- Professor Martien Borgdorff (Executive Director, KNCV) and Dr. Frank Cobelens for introducing me to epidemiological research, for valuable epidemiological and statistical advice, for guidance through the research and administrative processes, for always having time to listen, assist and comment. This thesis could not have been completed without your contribution.
- Dr. Jaap Broekmans (former Director, KNCV) for your valuable advice,
criticalcomments and great encouragement before and during my training. - Dr. Nico Nagelkerke for valuable statistical advice. - Mrs. Elly van Leeuwen, Mrs. Marian Haasnoot and Mr. Nico Kalisvaart for their warm
hospitality and effective administrative assistance. Your help made my study in the Netherlands fruitful and enjoyable.
- All other staff of the KNCV family for your help and encouragement all the time. I wish to express my gratitude to the International Tuberculosis Surveillance Center (ITSC), in particular Mrs. Ozrenka Misljenovic and Corry Verhage for their technical assistant in implementing the tuberculin surveys. I would like to express my thanks to: - The members of the promotion committee of the University of Amsterdam: Prof. dr. P.
A. Kager, Dr. D. van Soolingen, Prof. dr. R.A. Coutinho, Prof. dr. E.H.D. Bel, Dr. C. Dye.
- Mrs. Eva Hartkamp at the University of Amsterdam for your very kind and effective
assistance in all administrative matters and in the promotion process. I would like to warmly thank - My co-authors for your close and effective collaboration and support in our studies and
publications. - Dr. Kim Sang Jea, Dr. Dick van Soolingen, Dr. Hans Rieder, Dr. Pieter van Maaren,
Dr. Dong Il Ahn, Dr. Marteen Bosman, Dr. Agnes Gebhard, Dr. Michael Iademarco, Dr. Kayla Laserson for your technical and research assistance and sharing knowledge on TB and TB control in Vietnam.
- Ms. Marleen Vree and Dr. Tran Ngoc Buu, my PhD-companions in TB research, for
fruitful collaboration and friendship.

Acknonledgement
155
- The Brethren of the Stadsklooster FIC in Den Haag for giving me a warm home at Westeinde 101, 2512 GW Den Haag, and for your kind hospitality and good care during my stays in the Netherlands.
I would like to thank my parents, sister and brother for the life, their love, good care and great encouragement in my life, my work and my study

156
157
ABBREVIATIONS AFB acid fast bacilli AIDS acquired Immune-deficiency syndrome aOR adjusted odds ratio ARTI annual risk of tuberculoous infection ART anti-retroviral therapy ARV anti-retroviral BCG bacilli Calmette-Guéri CDR case detection rate CHC commune Health Centers CHP commune Health Posts CI confidence interval CNR case notification rate CPRGS Comprehensive Poverty Reduction and Growth Strategy CXR chest x-ray DHC District Health Centers DOT direct observed treatment DOTS Direct Observed Treatment Short course DST drug susceptibility testing DTU District tuberculosis unit EM ethnic minority EQA external quality assessment GDP gross domestic product HCMC Ho Chi Minh City HCP health care provider HIV human Immunodeficiency Virus IUATLD/UNION International Union Against Tuberculosis and Lung Disease IVDU intravenous drug user MDG Millennium Development Goals MDR multidrug resistance resistant MDR-TB multidrug resistance resistant tuberculosis MOH Ministry of Health MOTT mycobactera other than Tuberculosis MTB mycobacterium tuberculosis (M. tuberculosis) NTP/NTPV National TB Control Programme (of Vietnam) NTRL National TB Reference Laboratory OR odds ratio PLHA people living with HIV/AIDS PNT Pham Ngoc Thach Hospital PPM DOTS public–private mix for DOTS PTB pulmonary tuberculosis PTC provincial Tuberculosis coordinator RMRL Regional Mycobacterial Reference Laboratory SCC short-course chemotherapy
158
SS/ss sputum smear STI sexually transmitted infections TB tuberculosis TST tuberculin skin test UNAIDS United Nations AIDS program VND Viet Nam Dong WHO World Health Organization XDR-TB extensively drug-resistant tuberculosis ZN Ziehl-Neelsen - negative + positive ABBREVIATION OF TUBERCULOSIS DRUGS E, EMB ethambutol H, INH isoniazid S, SM streptomycin R, RIF rifampycin Z, PZA pyrazinamid TUBERCULOSIS TREATMENT REGIMENS Long-course 3SHZ/6S2H2 3HRE/6H2R2E2 Short-course 2SHRS/6HE 2SHRZE/1HRZE/5H3R3E3 Numbers before the letters indicate the duration in months of the treatment phase; numbers in subscript indicate the number of times the drugs are taken each week.