Evaluating the role of high quality 3D-visualisations in establishing economic valuations for urban...
20
Mell, IC. & Allin, S. (2014) Evaluating the role of high quality 3D-visualisations in establishing economic valuations for urban green infrastructure investments. envecon 2014: Applied Environmental Economics Conference, 14 th March 2014, The Royal Society London. 1 Paper title: Evaluating the role of high quality 3D-visualisations in establishing economic valuations for urban green infrastructure investments Theme: Theme A - Economic evaluation Dr Ian Mell, University of Liverpool Ian Mell is a Lecturer in Planning & Civic Design at The University of Liverpool. He teaches and researches a variety of green infrastructure and planning issues evaluating the opportunities and disconnects between planning strategy, policy and practice. His research assesses the utility of green infrastructure in a number of geographical locations (UK, EU, USA and India) to better understand how innovative/integrated landscape management can address social, economic and ecological issues simultaneously. Outside of academia he has experience of working with advocacy agents with the Community Forests in North-East England and in local government in Cambridgeshire. Dr Simone Allin, Nottingham Trent University Simone Allin is a Senior Lecturer at Nottingham Trent University. Her research interests broadly cover property and planning; governance capacity of planning policies/instruments at various scales; efficiency and material consistency of planning systems, models and contents; and the (re-) emergence of strategic and integrated approached to spatial planning and governance of spatial development across Europe. Her most recent research work has focused on the review of strategic spatial planning practices and responses to diverse territorial development challenges across Europe as part of a comparative case study analysis. Simone previously studied and worked at the Universities of Sheffield and Kaiserslautern. Abstract The economic value of green infrastructure in urban areas has a complex history of partial evaluations and assessments. As a consequence the process of valuation has, in many locations, been relegated within decision-making. Attempts to valorise intangible or intrinsic values economically led the environmental sector to limit its attempts to establish monetary values on environmental resources. However, as the financial implications of investment have become increasingly central in decision-making advocates have started to engage more directly with economic valuation tools. Utilising cost-benefit analysis, hedonic pricing, and contingent valuation methods Green Infrastructure researchers and practitioners have started to actively valorise environmental resources. The success of this process though has historically been undermined due to a lack of robustness in the values generated. Such limitations influenced the development, and subsequent use, of visualisations to support valuation. 2D and 3D images/photomontages are now being used to provide a platform to generate more robust valuations based on ‘realistic’ depictions of investments. The Interreg IVB project Valuing Attractive Landscapes in the Urban Economy (VALUE) made use of advanced visualisation methodologies. VALUE investigated the economic value of investment in Green Infrastructure in Belgium, Germany, The Netherlands and the UK using benefit transfer, social CBA, hedonic
-
Upload
manchester -
Category
Documents
-
view
0 -
download
0
Transcript of Evaluating the role of high quality 3D-visualisations in establishing economic valuations for urban...

Mell, IC. & Allin, S. (2014) Evaluating the role of high quality 3D-visualisations in establishing economic valuations for urban green infrastructure investments.
envecon 2014: Applied Environmental Economics Conference, 14th
March 2014, The Royal Society London.
1
Paper title:
Evaluating the role of high quality 3D-visualisations in establishing economic valuations for urban green infrastructure investments Theme: Theme A - Economic evaluation
Dr Ian Mell, University of Liverpool Ian Mell is a Lecturer in Planning & Civic Design at The University of Liverpool. He teaches and researches a variety of green infrastructure and planning issues evaluating the opportunities and disconnects between planning strategy, policy and practice. His research assesses the utility of green infrastructure in a number of geographical locations (UK, EU, USA and India) to better understand how innovative/integrated landscape management can address social, economic and ecological issues simultaneously. Outside of academia he has experience of working with advocacy agents with the Community Forests in North-East England and in local government in Cambridgeshire. Dr Simone Allin, Nottingham Trent University Simone Allin is a Senior Lecturer at Nottingham Trent University. Her research interests broadly cover property and planning; governance capacity of planning policies/instruments at various scales; efficiency and material consistency of planning systems, models and contents; and the (re-) emergence of strategic and integrated approached to spatial planning and governance of spatial development across Europe. Her most recent research work has focused on the review of strategic spatial planning practices and responses to diverse territorial development challenges across Europe as part of a comparative case study analysis. Simone previously studied and worked at the Universities of Sheffield and Kaiserslautern. Abstract The economic value of green infrastructure in urban areas has a complex history of partial evaluations and assessments. As a consequence the process of valuation has, in many locations, been relegated within decision-making. Attempts to valorise intangible or intrinsic values economically led the environmental sector to limit its attempts to establish monetary values on environmental resources. However, as the financial implications of investment have become increasingly central in decision-making advocates have started to engage more directly with economic valuation tools. Utilising cost-benefit analysis, hedonic pricing, and contingent valuation methods Green Infrastructure researchers and practitioners have started to actively valorise environmental resources. The success of this process though has historically been undermined due to a lack of robustness in the values generated. Such limitations influenced the development, and subsequent use, of visualisations to support valuation. 2D and 3D images/photomontages are now being used to provide a platform to generate more robust valuations based on ‘realistic’ depictions of investments. The Interreg IVB project Valuing Attractive Landscapes in the Urban Economy (VALUE) made use of advanced visualisation methodologies. VALUE investigated the economic value of investment in Green Infrastructure in Belgium, Germany, The Netherlands and the UK using benefit transfer, social CBA, hedonic
Mell, IC. & Allin, S. (2014) Evaluating the role of high quality 3D-visualisations in establishing economic valuations for urban green infrastructure investments.
envecon 2014: Applied Environmental Economics Conference, 14th
March 2014, The Royal Society London.
2
pricing, and contingent valuation. The VALUE project also integrated 2D (photo-visualisation montage) and 3D visualisations. The VALUE research in Manchester used visualisations depicting street tree investments scenarios1, whilst in Sheffield 3D visualisations evaluated two alternative sets of investments2 concentrated on an urban river corridor (Blonk Street) and a wider neighbourhood plan (Nursery Street). Visualisations were used in conjunction with willingness to pay (WTP) surveys to explore the willingness of people to pay for various forms of urban greening. The outcomes highlighted WTP values of £1.46-£2.33 for five scenarios in Manchester, and £4.28-£10.56 for Blonk Street (three scenarios) and £3.87-£29.28 for Nursery Street (four scenarios) in Sheffield. In each case visibly greener options returned higher WTP values. Assessments of each location were based on complex socio-economic-environmental perceptions where multi-functionality, accessibility and aesthetics quality have significant impacts on WTP; each of which is easier to define when high quality visualisations are used. 2D and 3D visualisations provided increased scope to the valuation process in Manchester and Sheffield respectively. As a result the focus and details of each investment could be controlled, enabling expectations to be more effectively managed through accurate representations and sufficient background information (realistic-hypothetical development scenarios). Respondents reported that visualisations acted as a central element in facilitating WTP valuation, with positive responses to each set of scenarios being reported (90%+). The policy implications of this research focus on the economic returns that Green Infrastructure provides for Local Authorities. Although it is difficult to extrapolate trans-locational added value, the valuations highlighted continuity between WTP, urban greening and visualisations. Furthermore, due to the complex socio-economic and physical interactions the valuations provide an insight into the potential transferable value between areas of limited economic viability and those with higher existing residual values.
1 Sample size: 512
2 Sample size: 510 for both sets of scenarios

Mell, IC. & Allin, S. (2014) Evaluating the role of high quality 3D-visualisations in establishing economic valuations for urban green infrastructure investments.
envecon 2014: Applied Environmental Economics Conference, 14th
March 2014, The Royal Society London.
3
1. Introduction The process of establishing economic evaluations for green infrastructure3 has a complex history. Periodic attempts have been made to determine the value of urban green spaces, however, an inability on the behalf of researchers and practitioners to rationalise the different implicit-explicit/tangible-intangible4 benefits of environmental resources has led to an underuse of valuation mechanisms in decision-making (Mell, 2012; Sutherland, 2012). In practice this has limited the capacity of Local Planning Authorities (LPAs) to develop sufficiently detailed business cases to support investment in green infrastructure. This has impacted upon their decision-making ability to support investment in urban greening. As a consequence, investment in urban greening has, as stated by Walmsley (2006), been something nice to have once the main process of development has occurred. In response green infrastructure practitioners (Greed, 2011; Natural England, 2009) have called for a more focussed engagement with economic valuation techniques to promote investment in urban greening. Such a shift towards a more detailed understanding of the economic value of green infrastructure has been undertaken to establish greater influence within decision-making structures (Mell et al., 2013). By generating economic valuations of comparable robustness to grey5 infrastructure investments, academics and researchers in the UK, Europe and North America are trying to rebalance the framing of development towards a ‘greener’ perspective (South Yorkshire Forest Partnership & Sheffield City Council, 2012). The rationale for this process draws on Walmsley’s assessment of green space planning proposing, that there is a contested understanding of the ‘value’ of green infrastructure, which limits investment. The notion of ‘value’ raises a number of questions over how we as planners, developers and citizens, rationalise tangible-intangible benefits. Historically, the outcome of this process has been the limited discussion of landscape value compared to the more refined socio-economic discussions of grey infrastructure. More recently though practitioners and academics have explored how the integration use visualisations can address the difficulties people have conceptualising the investment proposals used in valuation studies (Atkinson et al., 2008; Bateman et al., 2002). Addressing these barriers, therefore, requires a more direct engagement with the practices of economic valuation (and advanced visualisations techniques) if a comparable investment framework for green infrastructure is to be generated. 2. Establishing economic valuations for green infrastructure The process of value attribution for green infrastructure resources is subject to a complex interplay of socio-ecological, economic and political influences. These factors are complicated further by the difficulties identified by government, developers and people in defining the value of tangible and intangible benefits within the urban landscape (Kaplan & Kaplan, 1989; Nassauer, 1995; Tuan, 1990). Valuation can thus be considered as an examination of how people form and debate place attachment (identity and place), which explores the interaction between the physical context of a landscape and personal interpretations of it (Proshansky, 1978). Subsequently, our use and interpretation of green infrastructure supports the proposal
3 Green infrastructure is widely considered to be an interconnected network of green spaces that conserves natural ecosystems
values and functions and provides associated benefits to human populations. Green Infrastructure is the ecological framework needed for environmental, social and economic sustainability (Benedict and McMahon, 2002:12). 4 Implicit values are those which are socially, ecological or economically implied of a resource, i.e. access to a park has an impact of
mental/physical well-being, whereas explicit benefits include the economic uplift associated with the development of new road infrastructure. Intangible benefits are those which cannot be touched or easily quantifiable, i.e. ethereal or aesthetic values, whilst tangible benefits can be touched or quantified using a economic or ecological metric. 5 Grey infrastructure are those elements of the built environment that do not serve a green/sustainable function and which are
manufactured from resources such as concrete or steel. Examples of grey infrastructure are highways and buildings not developed with green technology.

Mell, IC. & Allin, S. (2014) Evaluating the role of high quality 3D-visualisations in establishing economic valuations for urban green infrastructure investments.
envecon 2014: Applied Environmental Economics Conference, 14th
March 2014, The Royal Society London.
4
that through interaction spaces become imbued with meanings, and can subsequently be considered as places (Tuan, 1990), as values are endowed and place dependency can develop. The relationship people have with urban landscapes though are also influenced by its physical composition, utility and psychological meaning. Consequently, the economic value of a place is constructed through a combination of social and ecological understandings, as well as its context within its surrounding environment (Winter & Lockwood, 2004). Investments in urban greening therefore modify the physical, ecological and social structure of a place and may reshape the relationships between landscape preferences, willingness to pay and green infrastructure (Mell et al., 2013). The development and utilisation of economic valuation studies for green infrastructure are though often undermined by a constantly shifting understanding of what, and how, value is attributed. A number of these key issues have been raised within the research and practitioner research (CABE Space, 2004; Mell et al., 2013; South Yorkshire Forest Partnership & Sheffield City Council, 2012) illustrating the factors that hinder the development/application of economic valuation techniques for green infrastructure development discussions. The most frequently discussed influences are:
• Contested understanding of how we establish economic valuations for green infrastructure; • Variation in discussions of the utility of economic valuations in green infrastructure development; • The growing complexity of interacting issues visible in environmental evaluation debates; • Lack of a grounded methodology to establish economic value for green infrastructure; • Growing reflection in green infrastructure literature calling for a greater engagement with valuation
practices – especially at a national or international level. Although each of these issues can be viewed as impacting on the development of economic values for green infrastructure, they can rarely be viewed in isolation. Alternatively, they should be considered to hold an interacting influence between each other, which comes to the fore when valuation techniques are utilised. It is therefore important for practitioners and academics addressing these issues to both understand and reflect on such interactions and make adjustments to their assumptions accordingly. The green infrastructure literature debates this process and supports the view that competing investment objectives may lead to uneven development (Sutherland, 2012). Gehl (2011) stated that to develop more liveable places that there must be a balance to what infrastructure is built, why it is built and identify what the long-term goals of investment are. However, authors including Lennon (2014) and Wright (2011) argue that green infrastructure planning is inherently versatile in its focus providing a more holistic approach to investment which integrates socio-economic needs with ecological resource management. As such a singular approach to valuation may not be appropriate as the context of a location may be undermined. Research focussing on the benefits delivered by green infrastructure offer an insight into how this process can be achieved (Benedict & McMahon, 2006; Mell, 2013). To highlight the complexity of establishing the parameters of an economic valuation process for green infrastructure it is possible to break investment down into its component parts. The equation below presents a simplified assessment of the green infrastructure elements or urban characteristics which are debated in the literature as influencing valuation. It identifies positive influences along with those deemed to limit the allocation of higher economic values for investments in urban greening.
The equation below proposes that willingness to pay (WTP) is generated by the Location (L) of an investment, the GI treatment under investigation (T), the perceived greenness of an investment (PG), and the socio-economic variables of the participant/local community (SE) divided by the existing

Mell, IC. & Allin, S. (2014) Evaluating the role of high quality 3D-visualisations in establishing economic valuations for urban green infrastructure investments.
envecon 2014: Applied Environmental Economics Conference, 14th
March 2014, The Royal Society London.
5
rent/mortgages/taxes and the existing built environment (BI). This equation locates the contextual information about the focus and perceived greenness of a treatment, and its value to an individual/community as positive factors influencing WTP. Whilst current expenditure on rent/mortgages/taxes and the existing built infrastructure are presented as factors which may lead to lower values being placed on a green infrastructure development. This combination of factors illustrates that valuations are drawn from a range of socio-economic and environmental factors.
As stated above, this is a very simplified form of evaluation outlining a basic assessment of the factors which influence valuation6. Several authors including Davies, Laing, & Scott (2002) and Todorova, Asakawa, and Aikoh (2004) have explored this process using a more in-depth analysis to highlight the factors that they consider central to this process. Each of these authors though acknowledge, as Nassauer (1995) and Tuan (1990) do, that value attribution is subject to a range of tangible (i.e. current housing costs) and intangible (perceived greenness of an area/treatment) influences.
Figure 1. VALUE economic valuation toolkit (South Yorkshire Forest Partnership & Sheffield City Council, 2012)
One aspect of the valuation process where such complexity is visible is the balancing of interacting investment issues (Garrod, Pickering, & Willis, 1993; Willis & Garrod, 1992). Both strategic and localised planning aims to create a balance between social, economic and ecological needs to promote more sustainable forms of development. However, this process is subject to a number of constraints linked to the
6 The field of ecological economics has extended this simplification of value to a far greater extent highlighting the complexity of
factors (internalities and externalities) which influence the attribution of economic valuations. However, in this instance the simplified nature of the equation is used to illustrate how a range of factors can be focussed to facilitate a simpler discussion.

Mell, IC. & Allin, S. (2014) Evaluating the role of high quality 3D-visualisations in establishing economic valuations for urban green infrastructure investments.
envecon 2014: Applied Environmental Economics Conference, 14th
March 2014, The Royal Society London.
6
objectives of a given investment, as well as, the broader spatial development goals of a location (Austin, 2014). Complexity of this type can therefore potentially limit the focus on ecological objectives in favour of more easily identified social or economic returns. As a consequence, and perhaps sensibly, most developments aim to meet a number of priorities simultaneously. Moreover, although there may be a visible hierarchy to the objectives discussed in green infrastructure planning attempts are being made to understand the complex interactions witnessed in urban development (Benedict & McMahon, 2006). Figure 1, drawn from the VALUE project, highlights the variation of approaches that can be used to generate economic valuations for green infrastructure. The utilisation of valuations in developing a rationale for investment is not, however, a straight forward process. Whilst, establishing economic values for green infrastructure mirrors the process undertaken for grey infrastructure it has not, to date, led to the same level of immediate use of these processes. Therefore, although a greater awareness of the interactivity of green infrastructure with economic and social benefits can be identified, Beatley (2000) and Mell (2010) both argue that the added complexity that these techniques add to these debates does not necessarily lead to more effective delivery. To address the challenge of establishing robust economic valuations for green infrastructure the environment sector and academia has started to shift its focus to include visualisations techniques to help establish willingness to pay for urban greening. The following sections will discuss the development of a contingent valuation and willingness to pay project undertaken within the Valuing Attractive Landscapes in the Urban Economy (VALUE) project. This project examined the use of a range of valuation techniques to establish values for green infrastructure investments in North-West Europe. The project also made extensive use of advanced photomontages, 2D and 3D visualisations to aid the development of economic values.
Figure 2. VALUE strategic objectives
3. Interreg IVB Valuing Attractive Landscapes in the Urban Economy (VALUE) The Valuing Attractive Landscapes in the Urban Economy (VALUE) project brought together partners from Belgium, Germany, The Netherlands and the UK to investigate whether a trans-locational approach to

Mell, IC. & Allin, S. (2014) Evaluating the role of high quality 3D-visualisations in establishing economic valuations for urban green infrastructure investments.
envecon 2014: Applied Environmental Economics Conference, 14th
March 2014, The Royal Society London.
7
valuing green infrastructure could be developed (see Fig. 2)7. VALUE attempted to establish transnational actions to enhance the economic and social performance of cities, towns and rural areas, by promoting the economic potential of green infrastructure to increase the value of local and regional assets (Mell et al., 2013; Vandermeulen et al., 2011; Wilker & Rusche, 2013). The project investigated whether continuity in approach and evaluation techniques could be established for a suite of urban green infrastructure investments. Investigations were undertaken in ten locations8 enabling VALUE to generate a robust dataset illustrating whether comparable economic data could facilitate evaluation between different urban environments. The project utilised a number of economic valuation techniques along with visualisations to highlight whether a continuity of approach can potentially lead to transferable investment mechanisms (South Yorkshire Forest Partnership & Sheffield City Council, 2012). 4. Advanced visualisations In the context of developing valuations for the VALUE green infrastructure assessments advanced visualisations were used and can be considered to be 2D and 3D images, which depict current and/or proposed investment proposals for a given area. They differ from historical visualisations as they are predominately generated using computer software and/or photo montaging, compared to the sketch/line drawings or collages of images previously used (Lange & Hehl-Lange, 2010). Advanced visualisations employ more sophisticated software to manipulate images in order to illustrate a range of development options. When coupled with a well-constructed willingness to pay (WTP) survey the utility of advanced visualisations increases. This reflects the ability of such tools to show greater definition to development options compared to standard drawings or photographs. Furthermore, despite the time implications associated with the use of advanced visualisations they also offer flexibility to the detail and focus of what can be presented (Hehl-Lange et al., 2012). Additionally, any technique which facilitates a more engaged and data/resource driven valuation process can potentially increases the validity of the data generated (and its subsequent use in decision-making). In terms of exploring the value of green infrastructure investments this is a crucial aspect of the valuation process (South Yorkshire Forest Partnership & Sheffield City Council, 2012). To achieve this process, visualisations (photomontages, 2D and 3D models) have been integrated with contingent valuation WTP scenarios for each location, as a mechanism to define the financial worth for a range of tangible and intangible benefits (Atkinson et al., 2008; Bateman et al., 2002). The ability of visualisations to represent spatial information in a recognisable format provides it with the following benefits:
- Provide options for LPAs, developers and academics to present more realistic depictions (and alternative scenarios) of a development - this includes providing LPAs with a greater range of techniques/visuals to choose from (i.e. 2D, 3D and photomontages);
- Illustrate discreet changes which provide an increased clarity for discussions of payments and valuation using visuals;
- Provide researchers with options to help construct contingent valuation investigations including an ease of manipulation for scenario building;
- Versatility of the material that can be modified and controlled by the researcher; Each of these factors have been reported in the research literature as being important aspects of establishing greater validity for contingent valuation and WTP studies (Beattie et al., 1998; Mell et al., 2013;
7 See VALUE website: www.value-landscapes.eu for further details.
8 These locations were: UK - The Wicker (Sheffield), Centenary Riverside (Rotherham), PArkwood Springs/A61 Corridor (Sheffield),
Oxford Road Corridor (Manchester); Belgium – Green Cycle Belt (Bruges), Vesdre River Greenway (Verviers); Germany – Stuttgart Greenway Enhancement (Stuttgart); The Netherlands - Euterpeplein (Amersfoort), Randenbroek Park (Amersfoort).
Mell, IC. & Allin, S. (2014) Evaluating the role of high quality 3D-visualisations in establishing economic valuations for urban green infrastructure investments.
envecon 2014: Applied Environmental Economics Conference, 14th
March 2014, The Royal Society London.
8
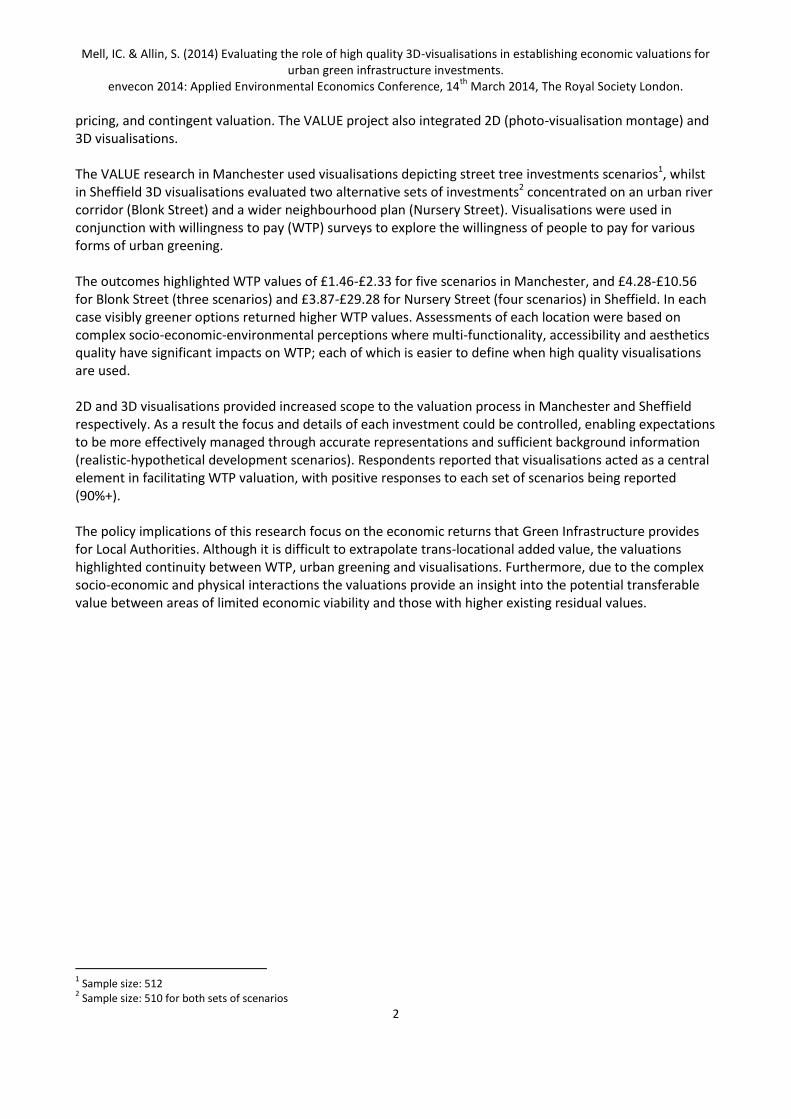
Soares et al., 2011; Willis & Garrod, 1992) . Thus, in studies where developing robust valuations of green infrastructure investments is central to the research process visualisations provide a useful technique to shape valuations. The development of high quality 2D and 3D-visualisations used in Manchester and Sheffield for the VALUE project attempted to investigate the utility of visualisations in two dynamic urban environments (South Yorkshire Forest Partnership & Sheffield City Council, 2012). 5. Case Studies: Whitworth Street West, Manchester and The Wicker, Sheffield Both of the UK based VALUE case studies: Whitworth Street West in Manchester and The Wicker in Sheffield, utilised advanced visualisations. In each location visualisations were used in conjunction with a contingent valuation survey to assess whether respondents would be WTP more to live in areas that invested in urban greening projects. Both case study areas were located in central urban locations and were considered to have a low percentage of existing green infrastructure (Mell et al., 2012a, 2012b). 5a. Whitworth Street West, Manchester The Manchester research was conducted in conjunction with Community Forest North West/Red Rose Forest (CFNW-RRF). The research in Manchester focussed on street tree investments, which tested (Lorenzo et al's (2000:319) assumption that: ‘urban and community forests have become widely recognized as an important component of the infrastructure of urban communities’, thus people become attached to places and are subsequently WTP more to support current/future green investments. The street tree investments were located on Whitworth Street West, which was identified as an area of green infrastructure deficiency (see Fig 3). The installation of street trees tested CABE Space's (2004) assumption that residents and users prefer to live and use streetscapes with a higher proportion of trees. Comparable research undertaken by Soares et al. (2011) in Lisbon and Tyrväinen (2001) in Finland, also highlighted the social, as well as the economic value of urban street trees.
Figure 3. Whitworth Street West, Manchester
5b. The Wicker, Sheffield The Wicker has been subject to a series of development master plans. Its proximity to the centre of Sheffield and its strategic role as a gateway to the city has established it as a key development site. However, due to its industrial heritage and more recent social problems the area has been viewed as a transitional zone (Mell et al., 2012b), which can be considered to be physically and psychologically isolated from the city centre. The VALUE investment aimed to improve access to the area, raise the perceptions of
Mell, IC. & Allin, S. (2014) Evaluating the role of high quality 3D-visualisations in establishing economic valuations for urban green infrastructure investments.
envecon 2014: Applied Environmental Economics Conference, 14th
March 2014, The Royal Society London.
9
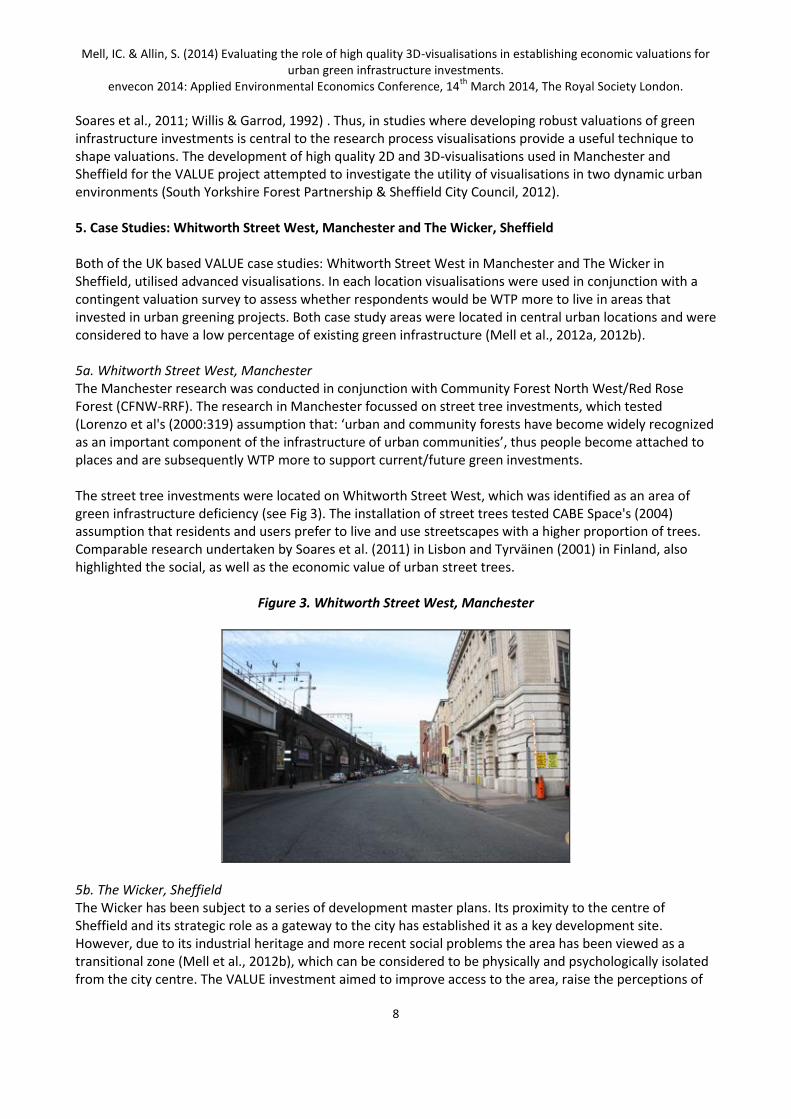
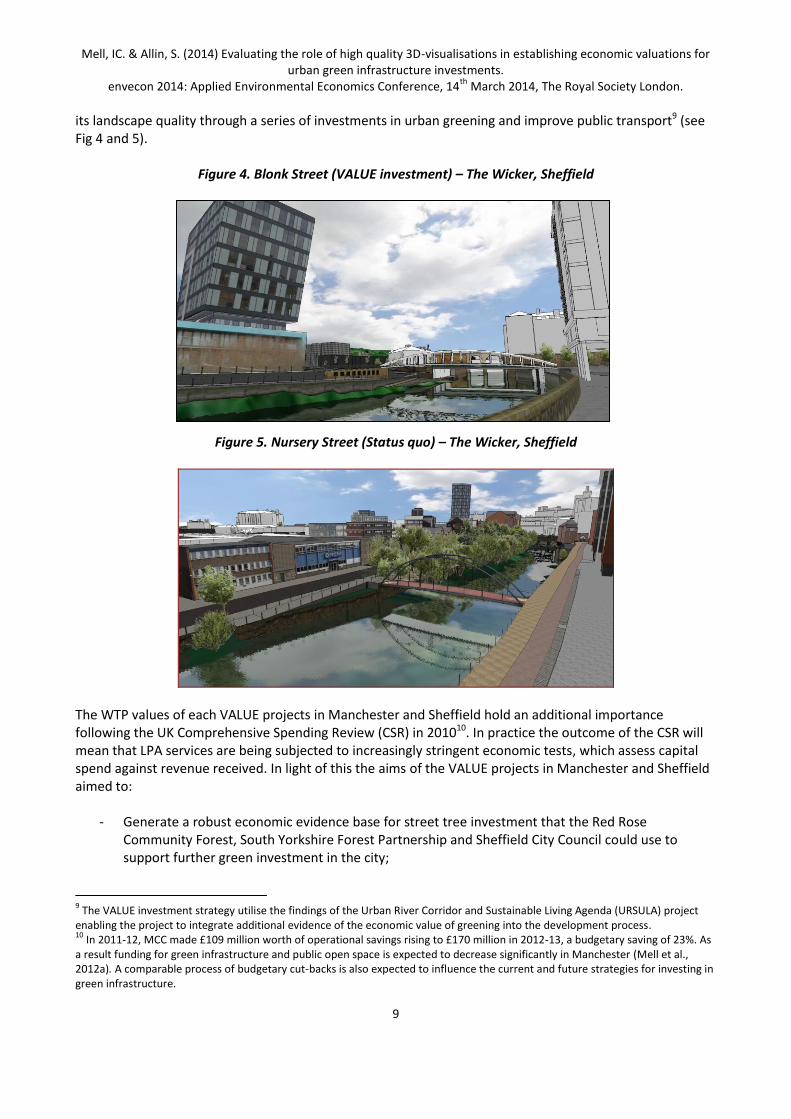
its landscape quality through a series of investments in urban greening and improve public transport9 (see Fig 4 and 5).
Figure 4. Blonk Street (VALUE investment) – The Wicker, Sheffield
Figure 5. Nursery Street (Status quo) – The Wicker, Sheffield
The WTP values of each VALUE projects in Manchester and Sheffield hold an additional importance following the UK Comprehensive Spending Review (CSR) in 201010. In practice the outcome of the CSR will mean that LPA services are being subjected to increasingly stringent economic tests, which assess capital spend against revenue received. In light of this the aims of the VALUE projects in Manchester and Sheffield aimed to:
- Generate a robust economic evidence base for street tree investment that the Red Rose
Community Forest, South Yorkshire Forest Partnership and Sheffield City Council could use to support further green investment in the city;
9 The VALUE investment strategy utilise the findings of the Urban River Corridor and Sustainable Living Agenda (URSULA) project
enabling the project to integrate additional evidence of the economic value of greening into the development process. 10
In 2011-12, MCC made £109 million worth of operational savings rising to £170 million in 2012-13, a budgetary saving of 23%. As a result funding for green infrastructure and public open space is expected to decrease significantly in Manchester (Mell et al., 2012a). A comparable process of budgetary cut-backs is also expected to influence the current and future strategies for investing in green infrastructure.

Mell, IC. & Allin, S. (2014) Evaluating the role of high quality 3D-visualisations in establishing economic valuations for urban green infrastructure investments.
envecon 2014: Applied Environmental Economics Conference, 14th
March 2014, The Royal Society London.
10
- To examine how green infrastructure can promote a better sense of place and increased well-being through an assessment of different qualitative characteristics.
6. Methodology – Contingent valuation, WTP and large-scale surveys A contingent valuation study utilising a willingness to pay (WTP) question for a series of development scenarios was developed for the Manchester and Sheffield investigations. The WTP question was framed as an increase in monthly council tax payment to live in a ‘greener’ Whitworth Street West (Manchester) and an increase in rental/mortgage payments above a defined baseline price for a 2-bedroom apartment in The Wicker (Sheffield)11. The survey focussed on four main areas of investigation:
- general attitudes to green space; - preferences to tree and landscaping options based the three sets of visualisations; - WTP; - and attitudes towards the LA services and green spaces provided in Manchester and Sheffield
Mell et al. (2013, 2012b) The survey guided respondents through a series of questions focussing on increasingly discreet aspects of urban greening (personal-communal value; ecological-social-economic benefits), before assessing their WTP for each development scenarios. Visualisations were used to present alternative development scenarios, plus in the case of Manchester the current status quo. The use of visualisation in conjunction with WTP has been considered one of the most appropriate methods in effectively gauging respondent valuations (Davies et al., 2002). Data collection was undertaken through face-to-face interviews generating a sample of 512 respondents (N:512) for Manchester and 510 (N:510) for Sheffield. Interviews were conducted on Whitworth Street West and in The Wicker by a professional survey team. Cue cards were used to aid responses to attitudinal scales and the investment options. The economic value (WTP scale) was established using a constructed market for street trees in Manchester and a hypothetical market for the various green infrastructure options in Sheffield, and were developed in line with the research literature and correspondence with WTP researchers12 (Bateman et al., 2002; Mell et al., 2013). The WTP elicitation question was complemented by further contextual questions enabling the survey to establish a deeper understanding of preferences as ‘…cost is not ‘just money’: it is an expression of resources that could be used for all kinds of other, perhaps equally deserving, purposes’ (Bateman et al., 2002:19). 7. Methodology – 2D and 3D visualisations Complexity is embedded within the process of economic evaluation due to the fluidity of understanding of its meanings, functions and value of green infrastructure. When asked whether or not they value a green space, i.e. a park, they invariably say yes, however, when asked to place an economic value on the same resource they often struggle. Establishing a rational process of decision-making that enables people to think more critically about the value they place on a resource to therefore central to valuation.
11
A expanded discussion of study’s methodology is outlined in (Mell et al., 2012a, 2012b)report to the VALUE project regarding the green investments in Manchester. 12
The WTP scale was based on extensive review of existing WTP research studies and used the work of Bateman, et al. (1993) and Atkinson et al, (2008) as specific reference points in its development. Personal communications with Professor Guy Garrod, Newcastle University and Professor Liisa Tyrväinen, Finnish Forest Research Institute were also sought to provide additional information to construct the WTP scale.
Mell, IC. & Allin, S. (2014) Evaluating the role of high quality 3D-visualisations in establishing economic valuations for urban green infrastructure investments.
envecon 2014: Applied Environmental Economics Conference, 14th
March 2014, The Royal Society London.
11
One aspect of this process is the inability people have to visualise a green infrastructure resource without the assistance of aide-memoirs (i.e. 2D/3D visualisations or videos). Asking a person to value a park, even if the place already exists, places a level of abstraction onto the evaluation. Without a physical, and therefore by association visual, representation of the resource under investigation the process of valuation can become increasingly hypothetical to the respondent. To address this issue valuation studies have employed 2D, and more recently, 3D visualisations to minimise the effects of such abstraction. For Manchester four development scenarios images (plus a status quo image) were developed for Whitworth Street (West) the status quo and four greening options (see appendix 1). The options related to the planting of large or small trees, with or without associated grass landscaping. Further landscaping was considered for inclusion but was dismissed, as CFNW-RRF considered that they would not provide realistic delivery options (Mell et al., 2012a). Additional options may also have distracted respondents from making judgements on the actual greening options under investigation. Visualisations of alternatives or future scenarios are helpful, because they provide scope for people to explore the image further (Lange & Hehl-Lange, 2010). If the future design – in this case of new small or large trees - is only described in words, then each individual will generate his/her own picture of how it might look. This will affect their evaluation of the design and their WTP for it. The five images used in this survey were developed by CFNW-RRF in conjunction with the VALUE research team. CFNW-RRF produced the visualisations using visualize2d software (Mell et al., 2012a). For Sheffield a constructed WTP market and associated questions were used in conjunction with a set of 3D visualisations for the proposed investments on Blonk Street and Nursery Street – see appendix 2 (Mell et al., 2012b). Unlike the Manchester case study (Mell et al., 2011), where a photograph was combined in Photoshop with 2D visualisations, in Sheffield the images used were detailed virtual landscape models developed by URSULA. Site plans of alternative scenarios were developed by URSULA and digitised into 2D models before being developed into 3D visualisations. Simmetry3d and LENNÉ3D were used to model the vegetation in each image. The virtual model of The Wicker Riverside consists of a digital terrain model (DTM) provided by Ordnance Survey Land-form profile DTM with a resolution of 10 m onto which an aerial photo of 0.2 m resolution from Cities Revealed was draped within Simmetry3d. All built form - building footprint, roads, paths and river channels and land usage data - was imported as GIS vector data from Ordnance Survey MasterMap (Mell et al., 2012b). Virtual landscape models have several advantages for WTP studies, including the ability to build scenarios of future landscape investments or model proposed impacts in the existing landscape. A range of applications using GIS data can be incorporated within digital terrain modelling in a virtual environment (Hehl-Lange, 2001; Hehl-Lange et al., 2012). 8. Results The responses generated from the Manchester and Sheffield surveys provided a range of interesting interpretations of the value of green infrastructure. Both surveys reported that WTP increased for investment options which were deemed to illustrate higher proportions of green infrastructure. Respondents were also asked a series of additional contextual questions regarding their perceptions of green space in Manchester and Sheffield which focussed on the functionality and value of these spaces. These questions were asked to allow respondents to draw parallels between the VALUE investments shown in the visualisations and other green infrastructure resources in Manchester and Sheffield, thus providing them with comparable sites from which to make value judgements.
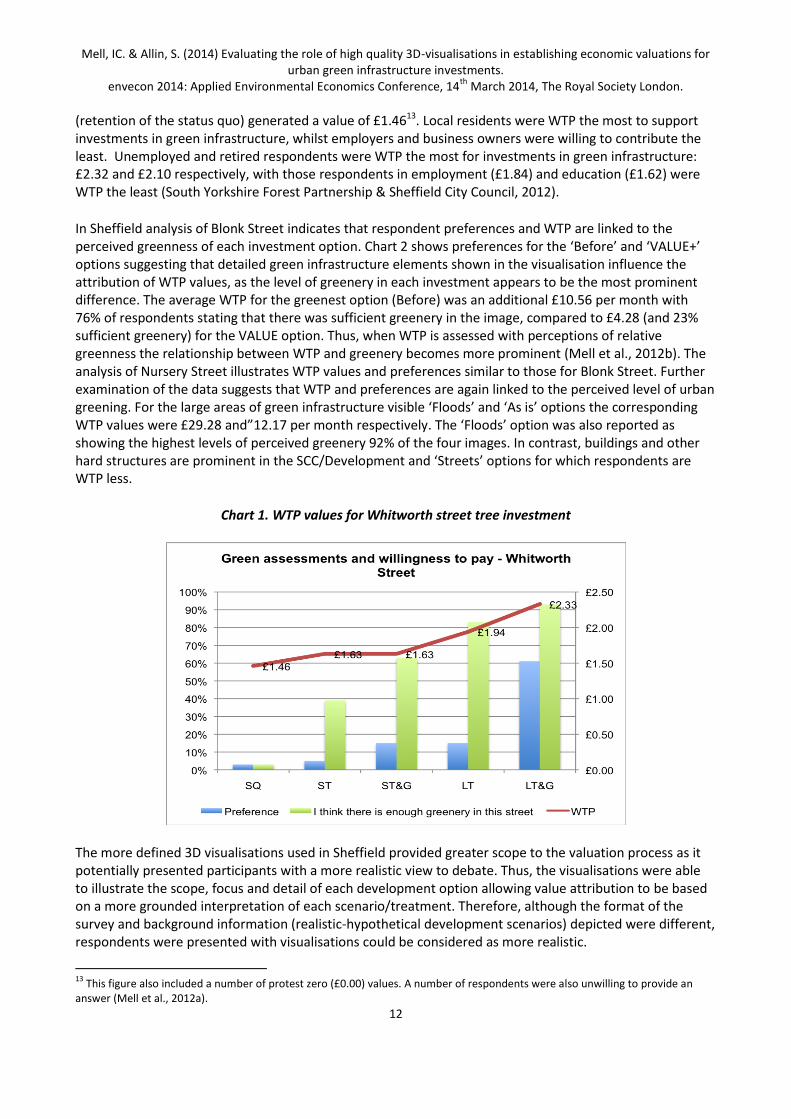
For the Manchester survey respondents were, on average, WTP an additional £1.80 per month for investments in green infrastructure, with a range of payments of £1.46-£2.33 (Chart 1). The highest WTP, £2.33 was established for the greenest option (large trees and grass/landscaping), whilst the lowest value
Mell, IC. & Allin, S. (2014) Evaluating the role of high quality 3D-visualisations in establishing economic valuations for urban green infrastructure investments.
envecon 2014: Applied Environmental Economics Conference, 14th
March 2014, The Royal Society London.
12
(retention of the status quo) generated a value of £1.4613. Local residents were WTP the most to support investments in green infrastructure, whilst employers and business owners were willing to contribute the least. Unemployed and retired respondents were WTP the most for investments in green infrastructure: £2.32 and £2.10 respectively, with those respondents in employment (£1.84) and education (£1.62) were WTP the least (South Yorkshire Forest Partnership & Sheffield City Council, 2012).
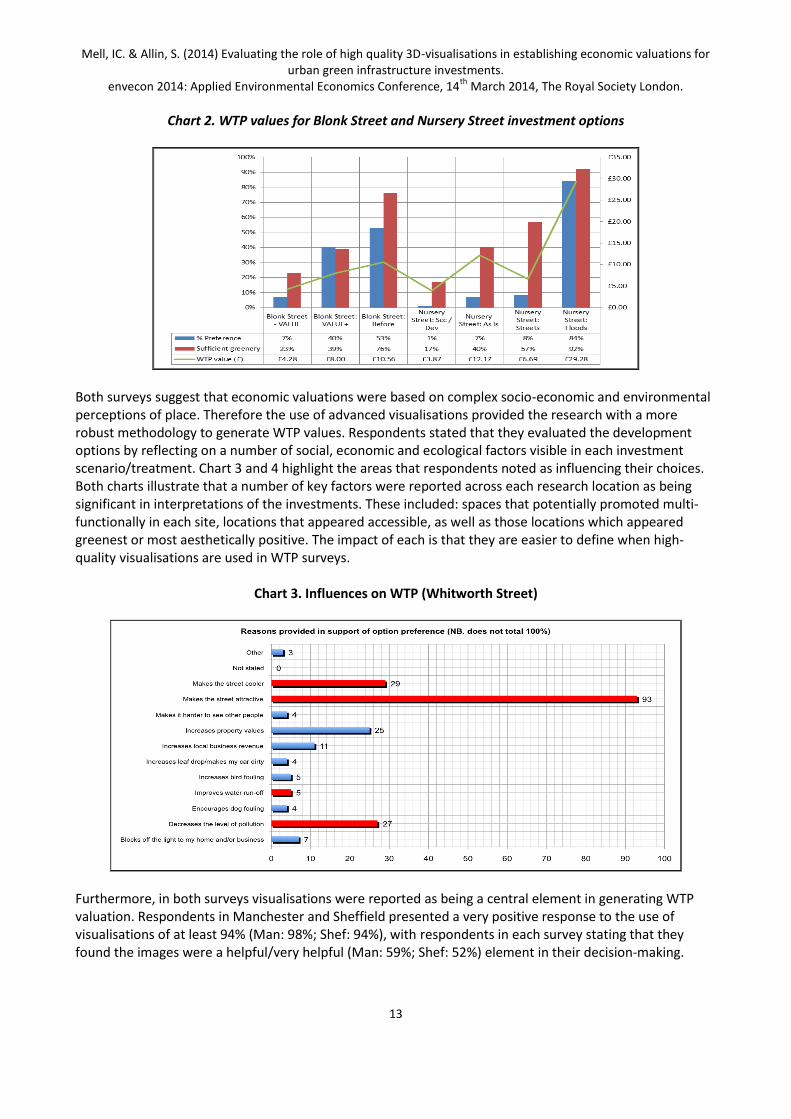
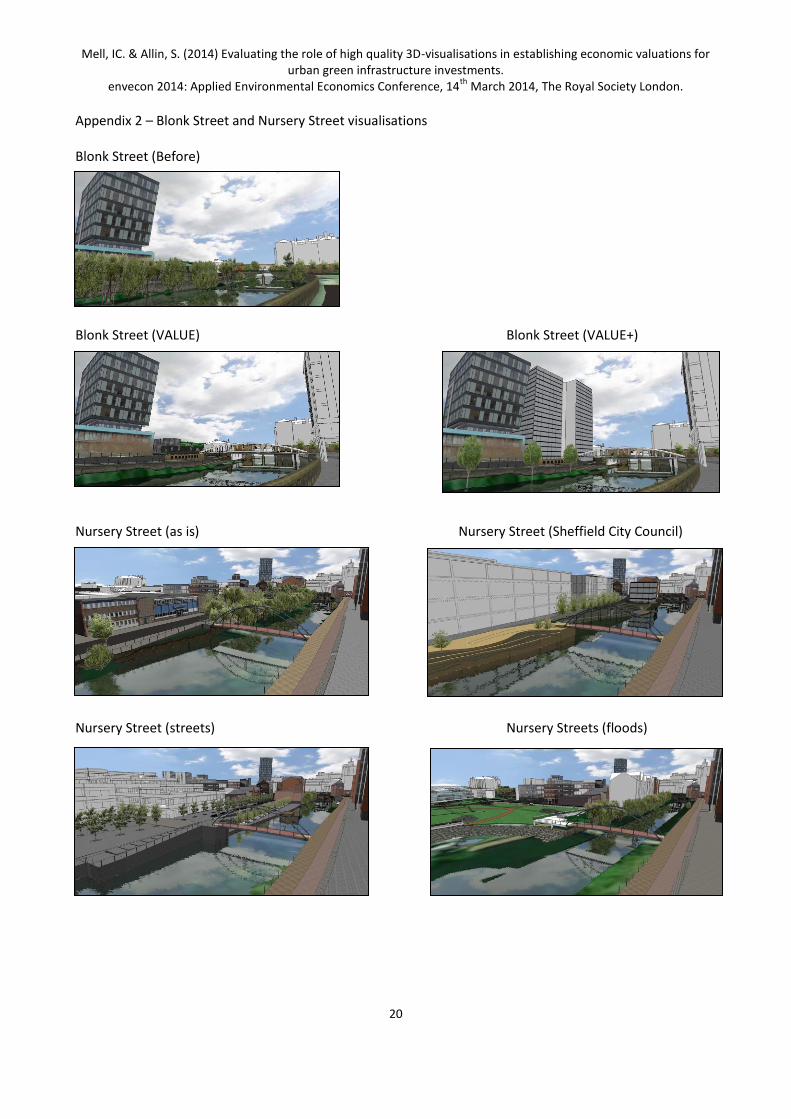
In Sheffield analysis of Blonk Street indicates that respondent preferences and WTP are linked to the perceived greenness of each investment option. Chart 2 shows preferences for the ‘Before’ and ‘VALUE+’ options suggesting that detailed green infrastructure elements shown in the visualisation influence the attribution of WTP values, as the level of greenery in each investment appears to be the most prominent difference. The average WTP for the greenest option (Before) was an additional £10.56 per month with 76% of respondents stating that there was sufficient greenery in the image, compared to £4.28 (and 23% sufficient greenery) for the VALUE option. Thus, when WTP is assessed with perceptions of relative greenness the relationship between WTP and greenery becomes more prominent (Mell et al., 2012b). The analysis of Nursery Street illustrates WTP values and preferences similar to those for Blonk Street. Further examination of the data suggests that WTP and preferences are again linked to the perceived level of urban greening. For the large areas of green infrastructure visible ‘Floods’ and ‘As is’ options the corresponding WTP values were £29.28 and”12.17 per month respectively. The ‘Floods’ option was also reported as showing the highest levels of perceived greenery 92% of the four images. In contrast, buildings and other hard structures are prominent in the SCC/Development and ‘Streets’ options for which respondents are WTP less.
Chart 1. WTP values for Whitworth street tree investment
The more defined 3D visualisations used in Sheffield provided greater scope to the valuation process as it potentially presented participants with a more realistic view to debate. Thus, the visualisations were able to illustrate the scope, focus and detail of each development option allowing value attribution to be based on a more grounded interpretation of each scenario/treatment. Therefore, although the format of the survey and background information (realistic-hypothetical development scenarios) depicted were different, respondents were presented with visualisations could be considered as more realistic.
13
This figure also included a number of protest zero (£0.00) values. A number of respondents were also unwilling to provide an answer (Mell et al., 2012a).
Mell, IC. & Allin, S. (2014) Evaluating the role of high quality 3D-visualisations in establishing economic valuations for urban green infrastructure investments.
envecon 2014: Applied Environmental Economics Conference, 14th
March 2014, The Royal Society London.
13
Chart 2. WTP values for Blonk Street and Nursery Street investment options
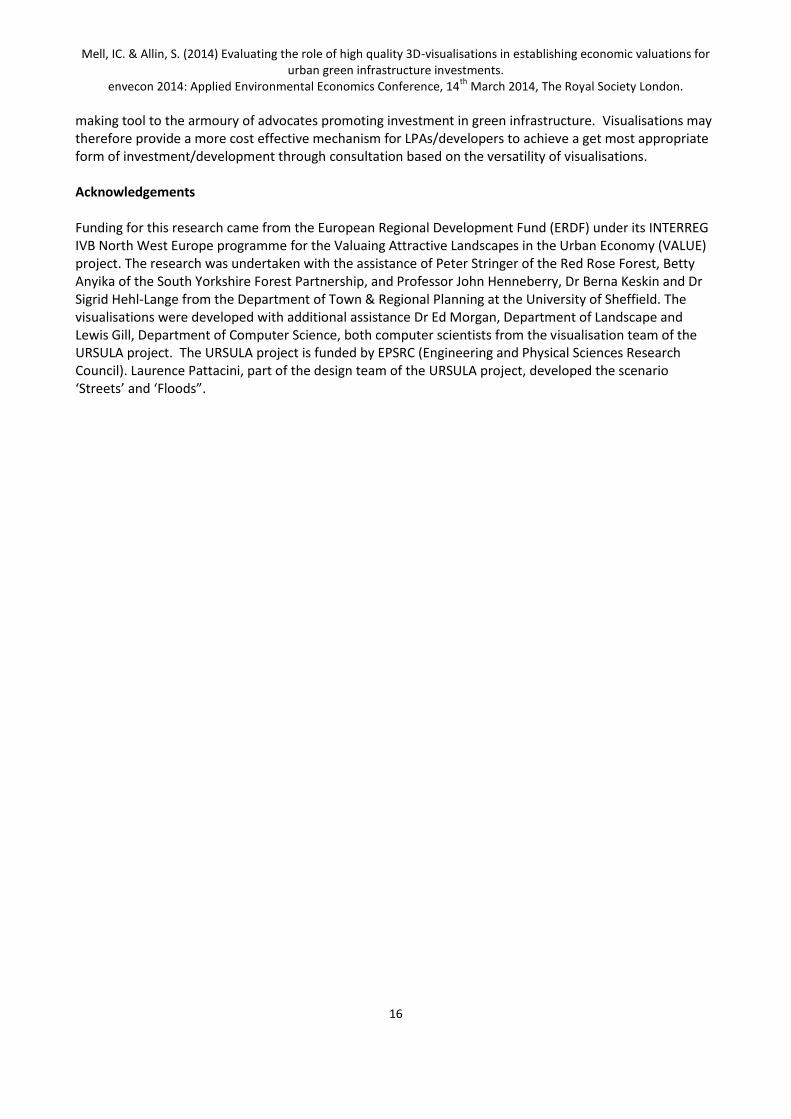
Both surveys suggest that economic valuations were based on complex socio-economic and environmental perceptions of place. Therefore the use of advanced visualisations provided the research with a more robust methodology to generate WTP values. Respondents stated that they evaluated the development options by reflecting on a number of social, economic and ecological factors visible in each investment scenario/treatment. Chart 3 and 4 highlight the areas that respondents noted as influencing their choices. Both charts illustrate that a number of key factors were reported across each research location as being significant in interpretations of the investments. These included: spaces that potentially promoted multi-functionally in each site, locations that appeared accessible, as well as those locations which appeared greenest or most aesthetically positive. The impact of each is that they are easier to define when high-quality visualisations are used in WTP surveys.
Chart 3. Influences on WTP (Whitworth Street)
Furthermore, in both surveys visualisations were reported as being a central element in generating WTP valuation. Respondents in Manchester and Sheffield presented a very positive response to the use of visualisations of at least 94% (Man: 98%; Shef: 94%), with respondents in each survey stating that they found the images were a helpful/very helpful (Man: 59%; Shef: 52%) element in their decision-making.

Mell, IC. & Allin, S. (2014) Evaluating the role of high quality 3D-visualisations in establishing economic valuations for urban green infrastructure investments.
envecon 2014: Applied Environmental Economics Conference, 14th
March 2014, The Royal Society London.
14
Chart 4. Positive influences on WTP (Blonk Street and Nursery Street)
9. Application in Local Planning Authority decision-making The value of using 2D and 3D visualisations in the Manchester and Sheffield studies was illustrated through the WTP figures calculated for each study. By embedded visualisations within the survey participants were provided with clear written descriptions and corresponding visual depictions of the proposed development, from which they make informed WTP valuations for each development scenario. Although the development of such economic data is the most frequently noted advantages of the use of visualisations in WTP studies, there are also additional supplementary benefits. Central to this discussion is the view that visualisations provide LPAs with greater flexibility to generate a range of consultation material including visual development scenarios. This reflects the criticism mad within the academic literature there has been criticism of the difficulties respondents find in understanding the nature of written descriptions of development scenarios (Bateman et al., 2002). Visualisations therefore provide an alternative approach for LPA, where the use photomontages, 2D and 3D images, can be seen as a starting point for debate. Visual aids have, as a consequence, been integrated into planning activities in the form of maps (i.e. for Area Action Plans or development proposals). The advance in 2D and 3D visualisations has extended this process by providing LPAs and developers with the scope to develop a range of investment options for discussion. Visualisations therefore offer a level of versatility of material to allow a range of green infrastructure investment options to be discussed. In both VALUE surveys the role of visualisations was reported as being positive with over 94% of respondents highlighting the positive role of the visual material in their decision-making (Mell et al., 2012a, 2012b). However, a number of limitations have also been raised regarding the use of visualisation in generating WTP values for green infrastructure. First, the level of expertise and data needed to create realistic models/development scenarios can be greater than the value of the results. Depending on the depth of information required and the focus of the investment, the development of visualisations can take a disproportionately long time to achieve (Hehl-Lange et al., 2012). Is it therefore vital that the focus of each the scenario is agreed prior to commencement to avoid time delays and conflicts. Secondly, the time needed to initially develop high quality visualisations can be constraining. However, if the objectives scope, scale and focus of a visualisation can be agreed then development can be relatively speedy. Furthermore,

Mell, IC. & Allin, S. (2014) Evaluating the role of high quality 3D-visualisations in establishing economic valuations for urban green infrastructure investments.
envecon 2014: Applied Environmental Economics Conference, 14th
March 2014, The Royal Society London.
15
changes can be made if, and when, the expertise is available (Lange & Hehl-Lange, 2010). Finally, the costs of such expertise, and associated software, can be expensive. Therefore is recommended that the value of using high quality visualisations is discussed prior to commencement. The benefits associated with their use though can counter balance each of these potential issues (Mell et al., 2012a, 2012b) The robust nature of the WTP values enabled a tentative process of grossing up to be undertaken indicating the potential value of green infrastructure investments to Manchester and Sheffield City Councils (Mell et al., 2013; Mell et al., 2012a; Mell et al., 2012b). Although this process only provides indicative economic returns, the figures can be used to illustrate the value of urban greening at the local level. Moreover, as further economic constraints are placed on development decision-making, LPAs within the UK need to highlight the (social, ecological and economic) value of investments in environmental improvements. The WTP (and grossing up) values generated by these two large-scale surveys provide evidence that LPAs can use to support this process. Thus, LPA can effectively build business cases for investment that integrate robust-economic valuations (using valuations) and expected returns on investments14. 10. Conclusions The use of photomontages, 2D and 3D visualisations has been debated in the research literature as holding a value, although heavily caveated, in establishing the economic value of ecological resources. Whilst such approaches can provide a more controlled and defined method of generating economic valuations, the time and costs associated with the generation of images/visualisations can undermine the use of such techniques. However, the photomontage and 3D visualisations utilised in the two large-scale surveys in Manchester and Sheffield illustrated the added value of visualisations in both the positive responses (Man: 98%; Shef: 94%) to their use, and through the development of a robust set of data from which WTP could be generated. Given the current nature of LPA decision-making the value of such WTP data based on visualisations is heightened because it illustrates the potential economic returns that LPAs can expect from investments in urban greening. Developed with the right expertise visualisations offer a valuable insight into how various landscape elements can be valued. Visualisations could therefore be considered as potentially offering a valuable technique which, if used effectively, could be placed at the centre of the valuation processes. Furthermore, visualisations provide a far more recognisable format to surveying that provides visual (as well as written or verbal) stimuli to discussions of value. Visualisations can also offer a more discreet environment for valuation compared to other forms i.e. hedonic pricing, as it takes into account specific investment elements compared to a broader discussion of the area. However, there is a danger that the manipulation or inappropriate use of ‘images’ can hinder the process of valuation, the production and focus of visualisations therefore needs to be taken into account. Finally, there are time, cost and data constraints based on need to ‘evolve’ the images as development occurs and urban areas change (updating scenarios), which raises the question of whether it is worth the cost (time and money) to do it. In conclusion, we can ask whether the use of visualisations justify the means of development and application. The data developed for the VALUE surveys in Manchester and Sheffield, supported by complimentary research in Esslingen (Germany) and Verviers (Belgium) suggests that a more robust form of data collection and analysis can be generated through the use of visualisations (South Yorkshire Forest Partnership & Sheffield City Council, 2012). A note of caution though should be made, as without sufficient expertise of visualisation technology, the use of 2D and 3D visualisations can potentially lower the validity of WTP/contingent valuations for green infrastructure development. Used well, they add a strong decision-
14
Although the timeframe for economic returns may be longer than with other forms of infrastructure development/investment.
Mell, IC. & Allin, S. (2014) Evaluating the role of high quality 3D-visualisations in establishing economic valuations for urban green infrastructure investments.
envecon 2014: Applied Environmental Economics Conference, 14th
March 2014, The Royal Society London.
16
making tool to the armoury of advocates promoting investment in green infrastructure. Visualisations may therefore provide a more cost effective mechanism for LPAs/developers to achieve a get most appropriate form of investment/development through consultation based on the versatility of visualisations. Acknowledgements Funding for this research came from the European Regional Development Fund (ERDF) under its INTERREG IVB North West Europe programme for the Valuaing Attractive Landscapes in the Urban Economy (VALUE) project. The research was undertaken with the assistance of Peter Stringer of the Red Rose Forest, Betty Anyika of the South Yorkshire Forest Partnership, and Professor John Henneberry, Dr Berna Keskin and Dr Sigrid Hehl-Lange from the Department of Town & Regional Planning at the University of Sheffield. The visualisations were developed with additional assistance Dr Ed Morgan, Department of Landscape and Lewis Gill, Department of Computer Science, both computer scientists from the visualisation team of the URSULA project. The URSULA project is funded by EPSRC (Engineering and Physical Sciences Research Council). Laurence Pattacini, part of the design team of the URSULA project, developed the scenario ‘Streets’ and ‘Floods”.

Mell, IC. & Allin, S. (2014) Evaluating the role of high quality 3D-visualisations in establishing economic valuations for urban green infrastructure investments.
envecon 2014: Applied Environmental Economics Conference, 14th
March 2014, The Royal Society London.
17
Bibliography Atkinson, G., Mourato, S., Szymanski, S., & Ozdemiroglu, E. (2008). Are We Willing to Pay Enough to `Back
the Bid’?: Valuing the Intangible Impacts of London's Bid to Host the 2012 Summer Olympic Games. Urban Studies, 45(2), 419–444.
Austin, G. (2014). Green Infrastructure for Landscape Planning: Integrating Human and Natural Systems [Hardcover]. New York: Routledge.
Bateman, I. J., Carson, R. T., Day, B., Hanemann, M., Hanley, N., Hett, T., … Loomes, G., et al. (2002). Economic valuation with stated preference techniques: a manual. London: Edward Elgar Publishing.
Beatley, T. (2000). Green Urbanism: Learning from European Cities (p. 308). Island Press. Beattie, J., Covery, J., Dolan, P., Hopkins, L., Jones-Lee, M., Loomes, G., … Spencer, A. (1998). On the
Contingent Valuation of Safety and the Safety of Contingent Valuation: Part 1-Caveat Investigator. Journal of Risk and Uncertainty, 17(1), 5–26.
Benedict, M. A., & McMahon, E. T. (2006). Green Infrastructure: Linking Landscapes and Communities. Urban Land (Vol. June, p. 299). Island Press.
CABE Space. (2004). Green Space Strategies: A Good Practice Guide. London. Davies, A.-M., Laing, R., & Scott, S. (2002). Combining visualisation and choice experiments in built
environment research. In Proceedings Sixth International Conference on Information Visualisation (pp. 785–790). IEEE Comput. Soc. doi:10.1109/IV.2002.1028870
Garrod, G., Pickering, A., & Willis, K. (1993). The economic value of botanic gardens: a recreational perspective. Geoforum, 24(2), 215–224.
Gehl, J. (2011). Life Between Buildings: Using Public Space (p. 216). Island Press. Greed, C. (2011). Planning for sustainable urban areas or everyday life and inclusion. Proceedings of the ICE
- Urban Design and Planning, 164(2), 107–119. doi:10.1680/udap.2011.164.2.107 Hehl-Lange, S. (2001). Structural elements of the visual landscape and their ecological functions. Landscape
and Urban Planning, 54(1-4), 107–115. Hehl-Lange, S., Gill, S. L., Henneberry, J., Keskin, B., Lange, E., Mell, I. C., & Morgan, E. (2012). Using 3D
Virtual GeoDesigns for exploring the economic value of alternative green infrastructure options. In E. Buhmann, S. Irvin, & M. Pietsch (Eds.), GeoDesign, 3D-Modelling and Visualization (pp. 273–280). Heidelberg: Wichmann.
Kaplan, R., & Kaplan, S. (1989). The Experience of Nature: A Psychological Perspective (p. 340). New York: Cambridge University Press.
Lange, E., & Hehl-Lange, S. (2010). Making visions visible for long-term landscape management. Futures, 42(7), 693–699. doi:10.1016/j.futures.2010.04.006
Lennon, M. (2014). Green infrastructure and planning policy: a critical assessment. Local Environment, 1–24. doi:10.1080/13549839.2014.880411
Lorenzo, A. B., Blanche, C. A., Qi, Y., & Guldry, M. M. (2000). Assessing resident’s willingness to pay to preserve the community urban forest: A small-city case study. Journal of Aboriculture, 26(6), 319–325.
Mell, I. C. (2010). Green infrastructure : concepts , perceptions and its use in spatial planning. University of Newcastle.
Mell, I. C. (2012). Green Infrastructure: Concepts, Perceptions and its use it Planning: Developing Green Infrastructure Planning in the UK, Europe and North America. Saarbrucken, Germany: Lambert Academic Publishing.
Mell, I. C. (2013). Can you tell a green field from a cold steel rail ? Examining the “ green ” of Green Infrastructure development. Local Environment : The International Journal of Justice and Sustainability, 18(2), 37–41.
Mell, I. C., Henneberry, J., Hehl-Lange, S., & Keskin, B. (2013). Promoting urban greening: Valuing the development of green infrastructure investments in the urban core of Manchester, UK. Urban Forestry & Urban Greening, 12(3), 296–306.
Mell, I. C., Keskin, B., Hehl-Lange, S., & Henneberry, J. (2012a). Action 4.2 Case study report – Street tree investments on Whitworth Street West, Manchester. Sheffield.
Mell, IC. & Allin, S. (2014) Evaluating the role of high quality 3D-visualisations in establishing economic valuations for urban green infrastructure investments.
envecon 2014: Applied Environmental Economics Conference, 14th
March 2014, The Royal Society London.
18
Mell, I. C., Keskin, B., Hehl-Lange, S., & Henneberry, J. (2012b). Action 4.2 Level II Report - A Contingent Valuation of Green Investments in The Wicker Riverside, Sheffield. Sheffield.
Nassauer, J. (1995). Culture and changing landscape structure. Landscape Ecology, 10(4), 229–237. doi:10.1007/BF00129257
Natural England. (2009). Green Infrastructure Guidance. Peterborough. Proshansky, H. M. (1978). The City and Self-Identity. Environment and Behavior, 10(2), 147–169. Soares, A. L., Rego, F. C., McPherson, E. G., Simpson, J. R., Peper, P. J., & Xiao, Q. (2011). Benefits and costs
of street trees in Lisbon, Portugal. Urban Forestry & Urban Greening, 10(2), 69–78. South Yorkshire Forest Partnership & Sheffield City Council. (2012). The VALUE Project: The Final Report.
Sheffield. Sutherland, T. (2012). Microeconomic Evidence for the Benefits of Investment in the Environment – review.
Natural England Research Reports, Number 033. Peterborough. Todorova, A., Asakawa, S., & Aikoh, T. (2004). Preferences for and attitudes towards street flowers and
trees in Sapporo, Japan. Landscape and Urban Planning, 69(4), 403–416. doi:10.1016/j.landurbplan.2003.11.001
Tuan, Y. (1990). Topophilia: A Study of Environmental Perceptions, Attitudes, and Values (p. 260). Columbia University Press; New Ed edition.
Tyrväinen, L. (2001). Economic valuation of urban forest benefits in Finland. Journal of Environmental Management, 62(1), 75–92.
Vandermeulen, V., Verspecht, A., Vermeire, B., Van Huylenbroeck, G., & Gellynck, X. (2011). The use of economic valuation to create public support for green infrastructure investments in urban areas. Landscape and Urban Planning, 103(2), 198–206.
Walmsley, A. (2006). Greenways: multiplying and diversifying in the 21st century. Landscape and Urban Planning, 76(1-4), 252–290.
Wilker, J., & Rusche, K. (2013). Economic valuation as a tool to support decision-making in strategic green infrastructure planning. Local Environment, 1–12.
Willis, K. ., & Garrod, G. . (1992). Assessing the value of future landscapes. Landscape and Urban Planning, 23(1), 17–32.
Winter, C., & Lockwood, M. (2004). The Natural Area Value Scale: A New Instrument for Measuring Natural Area Values. Australasian Journal of Environmental Management, 11(1), 11–20.
Wright, H. (2011). Understanding green infrastructure : the development of a contested concept in England. Local Environment : The International Journal of Justice and Sustainability, 16(10), 37–41.

Mell, IC. & Allin, S. (2014) Evaluating the role of high quality 3D-visualisations in establishing economic valuations for urban green infrastructure investments.
envecon 2014: Applied Environmental Economics Conference, 14th
March 2014, The Royal Society London.
19
Appendix 1 – Whitworth Street West visualisations Whitworth Street West (status quo)
Whitworth Street West (small trees) Whitworth Street West (Small trees and grass)
Whitworth Street West (large trees) Whitworth Street West (large trees and grass)
Mell, IC. & Allin, S. (2014) Evaluating the role of high quality 3D-visualisations in establishing economic valuations for urban green infrastructure investments.
envecon 2014: Applied Environmental Economics Conference, 14th
March 2014, The Royal Society London.
20
Appendix 2 – Blonk Street and Nursery Street visualisations Blonk Street (Before)
Blonk Street (VALUE) Blonk Street (VALUE+)
Nursery Street (as is) Nursery Street (Sheffield City Council)
Nursery Street (streets) Nursery Streets (floods)