November 12, 2020* 3. Public Comment 4. Actuarial Valuations
410
*Board Action required KENTUCKY RETIREMENT SYSTEMS BOARD OF TRUSTEES REGULAR QUARTERLY MEETING DECEMBER 3, 2020 AT 10:00 A.M., ET 1270 LOUISVILLE ROAD,FRANKFORT,KENTUCKY 40601 VIA LIVE TELECONFERENCE/FACEBOOK LIVE 1. Roll Call 2. Approval of Minutes – November 12, 2020* 3. Public Comment 4. Actuarial Valuations – David Eager / GRS ∑ Approval of GRS Actuarial Valuations for Year Ending June 30, 2020* ∑ Approval of Contribution Rates for FY 2022* 5. Audit Committee Report – John Chilton / Kristen Coffey ∑ Financial Report ∑ GASB 67 and 74* ∑ Results of Independent Actuarial Audit of the June 30, 2019 Actuarial Valuations and the 2014-2018 Experience Study* - Segal 6. Approval Financial Statement Audit FY June 30, 2020* – Dean Dorton Allen Ford 7. Review and Approval of the Comprehensive Annual Report (CAFR) for Year Ending June 30, 2020* - Rebecca Adkins 8. CERS Health Insurance Trust Document* - Kathy Rupinen 9. KRS Update – David Eager 10.Closed Session [Pending Litigation KRS 61.810(1)(c)]; Personnel KRS61.810(1)(f)] * 11. Adjourn Board Meeting - December 3, 2020 - Agenda 1
-
Upload
khangminh22 -
Category
Documents
-
view
0 -
download
0
Transcript of November 12, 2020* 3. Public Comment 4. Actuarial Valuations

*Board Action required
KENTUCKY RETIREMENT SYSTEMSBOARD OF TRUSTEES
REGULAR QUARTERLY MEETING
DECEMBER 3, 2020 AT 10:00 A.M., ET1270 LOUISVILLE ROAD, FRANKFORT, KENTUCKY 40601
VIA LIVE TELECONFERENCE/FACEBOOK LIVE
1. Roll Call
2. Approval of Minutes – November 12, 2020*
3. Public Comment
4. Actuarial Valuations – David Eager / GRS
∑ Approval of GRS Actuarial Valuations for Year Ending June 30, 2020*
∑ Approval of Contribution Rates for FY 2022*
5. Audit Committee Report – John Chilton / Kristen Coffey
∑ Financial Report∑ GASB 67 and 74*∑ Results of Independent Actuarial Audit of the June 30, 2019 Actuarial Valuations and
the 2014-2018 Experience Study* - Segal
6. Approval Financial Statement Audit FY June 30, 2020* – Dean Dorton Allen Ford
7. Review and Approval of the Comprehensive Annual Report (CAFR) for Year Ending June 30, 2020* - Rebecca Adkins
8. CERS Health Insurance Trust Document* - Kathy Rupinen
9. KRS Update – David Eager
10.Closed Session [Pending Litigation KRS 61.810(1)(c)]; Personnel KRS61.810(1)(f)] *
11. Adjourn
Board Meeting - December 3, 2020 - Agenda
1

MINUTES OF MEETING #431 BOARD OF TRUSTEES KENTUCKY RETIREMENT SYSTEMS
QUARTERLY MEETING NOVEMBER 12, 2020 AT 10:00A.M. VIA LIVE VIDEO TELECONFERENCE DUE TO SB 150,
SIGNED INTO LAW BY THE GOVERNOR ON MARCH 30, 2020, AND EXECUTIVE ORDER 2020-215 DECLARING A STATE OF EMERGENCY
EFFECTIVE MARCH 6, 2020 DUE TO COVID-19
At the meeting of the Board of Trustees held on November 12, 2020 the following members were
present: David Harris (Chair), Joe Brothers, John Chilton, John Cheshire, Raymond Connell, Kelly
Downard, JT Fulkerson, Joseph Grossman, Sherry Kremer, Prewitt Lane, Matthew Monteiro,
Keith Peercy, Betty Pendergrass, Jerry Powell, David Rich and Sec. Gerina Whethers. Staff
members present were David Eager, Rebecca Adkins, Erin Surratt, Kathy Rupinen, Connie Davis,
D’Juan Surratt, Kristen Coffey, Connie Pettyjohn, Ann Case, Elizabeth Smith, Victoria Hale,
Carrie Bass, Shaun Case, Phillip Cook, Steve Willer, Lisa Perry and Alane Foley. Also in
attendance were Tracey Garrison, Larry Loew and Carla Whaley from Humana as well as Danny
White and Janie Shaw from GRS.
Mr. Harris called the meeting to order.
Ms. Alane Foley called roll.
Mr. Harris opened the meeting by stating the order of some agenda items would be changing. Item
#6 Approval of the CERS Health Insurance Trust Documents will be moved to Item #4.
We received a written statement from Mr. Jim Carroll for Public Comment. Ms. Alane Foley read
the following statement from Mr. Carroll:
As president of Kentucky Government Retirees, I commend the Kentucky Retirement Systems
staff for its outstanding work during difficult conditions arising from the pandemic. We appreciate
that live streaming is the only alternative currently available for conducting public meetings.
However, we point out that it is impossible for members of the public to meaningfully follow board
deliberations that rely on board materials that are impossible to read on the computer screen. We
point out that in the past, KRS board materials were posted online in advance of meetings. We
Board Meeting - December 3, 2020 - Approval of Minutes November 12, 2020
2

2
request that the board consider resuming that practice so that KRS stakeholders can fully
participate in public meetings as envisioned by the Open Meetings law. Thank you, Jim Carroll,
President, Kentucky Government Retirees.
Mr. David Eager and Mr. Harris both thanked Mr. Carroll for his support and feedback. KRS will
now begin posting meeting material to the website prior to meetings for the public. In addition, in
the future, meeting minutes will provide greater detail to improve transparency.
Mr. Harris introduced agenda item Approval of Minutes- September 10 and 16, 2020. A motion
was made by Mr. Fulkerson and was seconded by Mr. Chilton to approve the minutes as presented.
The motion passed unanimously.
Mr. Harris introduced agenda item Approval of the CERS Health Insurance Trust Document. Mr.
Harris introduced Mr. Christopher Sears from ICE Miller. Mr. Sears and Ms. Kathy Rupinen
provided details and answered questions from the Trustees regarding the Private Letter Ruling
from the IRS, which would establish the qualified tax status of the insurance trust fund. Ms.
Pendergrass suggested that the three current CERS Trustees work alongside the KRS Legal
Division to prepare the document for submission to the IRS. Mr. Harris, Ms. Pendergrass and Mr.
Powell suggests an ad hoc committee for the CERS Health Insurance Trust Document preparation.
Mr. Harris introduced agenda item Draft 2020 Actuarial Valuations. Mr. Harris introduced Mr.
Danny White and Ms. Janie Shaw from GRS. They provided the valuation results as of June 30,
2020 for KERS-NH, KERS-H, CERS-NH, CERS-H and SPRS. This was provided for information
purposes only at this time.
Mr. Harris introduced agenda item Retiree Health Plan Committee Update. Mr. Rich and Ms.
Connie Pettyjohn provided an update to the Trustees from their November 10, 2020 meeting and
reviewed an informational presentation from Humana regarding the KRS Medicare Eligible
Pharmacy Review for 2021, Cohere Health, 2022 STAR Ratings, 2020 Dental Utilization and 2021
COVID Support. This was provided for informational purposes only.
Board Meeting - December 3, 2020 - Approval of Minutes November 12, 2020
3

3
Mr. Harris introduced agenda item Investment Committee Report and Recommendations. Mr. Lane
addressed the Trustees and explained that the Investment Committee will be updating the way they
report to the Board, this should make investment performance easier to review. Mr. Lane then
provided a performance update and provided details on the Investment Policy Statement, which
was approved at the Investment Committee Meeting on November 4, 2020. Mr. Cheshire moved
and was seconded by Mr. Fulkerson to ratify the Investment Policy Statement as adopted by the
Investment Committee. The motion passed with the majority vote, 15(Y) and 1(N).
Mr. Harris introduced agenda item Audit Committee Report. Mr. Chilton advised that the Audit
Committee met on November 5, 2020. The following agencies are requesting hazardous duty
coverage:
Agency Position Effective Date
Hardin County Fiscal Court Emergency Medical Services 06/01/2020
Director
Hardin County Fiscal Court Emergency Medical Services 07/01/2020
Deputy Director
Shelby County Fiscal Court Captain/Emergency Medical 12/01/2020
Technician (EMT)
Shelby County Fiscal Court Chief of Operations/EMT 12/01/2020
Shelby County Fiscal Court Deputy Chief of Operations/ 12/01/2020
EMT
Shelby County Fiscal Court Sergeant/Emergency Medical 12/01/2020
Technician (EMT)
Anchorage Middletown Fire and EMS Fire Recruit – Career 09/01/2020
Office of the Attorney General Forensic Computer Examiner I 12/01/2020
Office of the Attorney General Forensic Computer Examiner II 12/01/2020
Office of the Attorney General Forensic Computer Examiner III 12/01/2020
Ms. Pendergrass made a motion and was seconded by Mr. Fulkerson to ratify the approval of the
hazardous duty position requests listed above. The motion passed unanimously.
Board Meeting - December 3, 2020 - Approval of Minutes November 12, 2020
4

4
Ms. Adkins will present the Financial Reports, GASB 67 and GASB 74 at the December meeting.
Mr. Harris introduced agenda item Legislative Update and KRS Update. Mr. Eager discussed fixed
allocation BR 424, HB 484, retirement trends and a KRS staffing update. KRS Executive Staff
met with Governor Andy Beshear on October 30, 2020. Ms. Erin Surratt provided details of that
meeting including updating the Governor on how KRS staff is working from home, training new
employees and providing customer service to the Retirees.
A motion was made by Ms. Pendergrass and seconded by Mr. Fulkerson to go in to closed session.
The motion passed unanimously.
Mr. Harris read the following statement and the meeting moved into closed session: A motion
having been made in open session to move into closed session for a specific purpose, and such
motion having carried by majority vote in open, public session, the Board shall now enter closed
session to consider litigation, pursuant to KRS 61.810(1)(c), because of the necessity of protecting
the confidentiality of the Systems’ litigation strategy and preserving any available attorney-client
privilege and to discuss the potential appointment of an employee, pursuant to KRS 61.810(1)(f).
It is necessary to enter closed session because of the sensitive nature of the material to be
considered regarding this employee. All public attendees exited the meeting.
Mr. Harris had to leave the meeting during Closed Session. Mr. Peercy served as Chair for the
remainder of the meeting.
Mr. Peercy called the meeting back in to Open Session.
Mr. Brothers had concerns regarding public communication regarding significant internal
personnel activity at KRS. With the recent resignations of the CIO and Deputy CIO, he wanted to
know the reason behind that resignation. Mr. David Eager and Mr. Lane addressed the concern
stating that the change was based on career opportunities. KRS Investment staff is working with
Mr. Lane (Investment Committee Chair) while a replacement CIO search in underway.
Board Meeting - December 3, 2020 - Approval of Minutes November 12, 2020
5

5
Mr. Rich made a motion and was seconded by Mr. Lane to adjourn the meeting, to meet again on
December 3, 2020 or upon the call of the Executive Director or the Chair of the Board of Trustees.
The motion passed unanimously.
Copies of all documents presented are incorporated as part of the Minutes of the Board of Trustees
held November 12, 2020 except documents provided during a closed session conducted pursuant
to the open meetings act and exempt under the open records act.
Board Meeting - December 3, 2020 - Approval of Minutes November 12, 2020
6

6
CERTIFICATION
I do certify that I was present at this meeting, and I have recorded the above actions of the Directors
on the various items considered by it at this meeting. Further, I certify that all requirements of
KRS 61.805-61.850 were met in conjunction with this meeting.
________________________________ Recording Secretary
We, the Chair of the Board of Directors of the Kentucky Retirement Systems and Executive
Director of the Kentucky Retirement Systems, do certify that the Minutes of Meeting Number 431,
held on November 12, 2020 were approved on December 3, 2020.
________________________________ Chair of the Board of Directors
________________________________ Executive Director
I have reviewed the Minutes of the November 12, 2020 Board of Trustees Meeting for content,
form, and legality.
________________________________ Executive Director
Office of Legal Services
Board Meeting - December 3, 2020 - Approval of Minutes November 12, 2020
7

Copyright © 2020 GRS – All rights reserved.
Kentucky Retirement Systems
2020 Actuarial Valuation Results
November 12, 2020
Janie Shaw, ASA, MAAA
Danny White, FSA, EA, MAAA
Board Meeting - December 3, 2020 - Actuarial Valuations
8

Comments on KERS Non-Haz Retirement
Fund
• Imperative to maintain or increase contribution effort for the KERS Non-Hazardous Retirement Fund – June 30, 2020 plan assets were $2,308 million – Fund distributed $1,023 million in benefit payments and
administrative expenses in FYE 2020 – Actuarially determined employer contribution for FYE 2022
is $1,045 million (75.32% of covered payroll)
• Covered payroll decreased by 3.5% since the prior valuation – We recommend KRS work with the legislators to change
the method for collecting the amortization cost of the unfunded liability such that it is no longer dependent on covered payroll (similar to HB 171 from the 2020 session).
2
Board Meeting - December 3, 2020 - Actuarial Valuations
9

Comments on Valuation Results
• Overview of legislation passed in 2020 – SB 249: Changed the amortization period to 30 years
(from 24 years) at June 30, 2019 Gains and losses incurring in future years are amortized as
separate closed 20-year amortization bases
– SB 249: CERS rates remained unchanged from FYE 2020 to FYE 2021 Expected FYE 2021 contributions $74 million less for the non-
hazardous fund and $27 million less for the hazardous fund
– HB 352: KERS Non-Hazardous Quasi contribution rate of 49.47% of pay extended for an additional year Expected FYE 2021 contributions $102 million less due to
legislation
3
Board Meeting - December 3, 2020 - Actuarial Valuations
10

Comments on Valuation Results
• Change in active membership and covered payroll – Active membership declined in all funds except KERS Haz – Covered payroll decreased in KERS Non-Haz and SPRS – Covered payroll increased by 13.5% in KERS Haz – Covered payroll increased by 1.7% and 1.6% in CERS Non-
Haz and CERS Haz, respectively (payroll growth assumption is 2%)
• FYE 2020 Investment Experience – 0.1% to 2.3% return on market value (varies by fund)
Assumed rate of return is 5.25% for KERS Non-Haz and SPRS retirement funds and 6.25% for all other funds)
– Fund assets $957M less than expected ($629M pension and $328M insurance)
4
Board Meeting - December 3, 2020 - Actuarial Valuations
11

Comments on Valuation Results
• Retirement Fund Liability Experience
– $136 million gain for all retirement funds combined
• Insurance Fund Liability Experience
– $662 million gain for all insurance funds combined
– Both the 2021 non-Medicare and Medicare premiums were lower than expected based on the prior year’s actuarial assumptions
5
Board Meeting - December 3, 2020 - Actuarial Valuations
12

Employer Contribution Rates
6
Actuarially Determined Rates 2019 Valuation (prior to SB 249)
Actuarially Determined Rates 2019 Valuation (after SB 249)
FYE 2021 Certified
Rates Fund Pension Insurance Combined Pension Insurance Combined
(1) (2) (3) (4) (5) (6) (7) (8)
KERS Non-Hazardous 80.98% 12.03% 93.01% 73.28% 11.15% 84.43% 84.43%
KERS Hazardous 38.71% 0.00% 38.71% 36.00% 0.00% 36.00% 36.00%
CERS Non-Hazardous 26.21% 5.78% 31.99% 23.81% 5.43% 29.24% 24.06%
CERS Hazardous 46.31% 10.47% 56.78% 42.02% 9.86% 51.88% 39.58%
SPRS 136.12% 20.85% 156.97% 123.79% 19.69% 143.48% 143.48%
Board Meeting - December 3, 2020 - Actuarial Valuations
13

Employer Contribution Rates
7
Actuarially Determined Rates 2019 Valuation (after to SB 249)
Actuarially Determined Rates 2020 Valuation
FYE 2021 Certified
Rates
FYE 2022 Certified
Rates Fund Pension Insurance Combined Pension Insurance Combined
(1) (2) (3) (4) (5) (6) (7) (8) (9)
KERS Non-Hazardous 73.28% 11.15% 84.43% 75.32% 9.71% 85.03% 84.43% 85.03%
KERS Hazardous 36.00% 0.00% 36.00% 33.43% 0.00% 33.43% 36.00% 33.43%
CERS Non-Hazardous 23.81% 5.43% 29.24% 23.88% 4.17% 28.05% 24.06% 26.95%
CERS Hazardous 42.02% 9.86% 51.88% 43.23% 8.73% 51.96% 39.58% 44.33%
SPRS 123.79% 19.69% 143.48% 127.99% 18.07% 146.06% 143.48% 146.06%
Board Meeting - December 3, 2020 - Actuarial Valuations
14

Actuarially Determined Employer
Contributions ($ in Millions)
8
2019 Valuation (after SB 249) 2020 Valuation Change In ADEC Pension Insurance Combined Pension Insurance Combined
(1) (2) (3) (4) (5) (6) (7) (8)
KERS Non-Hazardous $1,053 $160 $1,213 $1,045 $134 $1,179 $(34)
KERS Hazardous 54 0 54 57 0 57 3
CERS Non-Hazardous 612 138 750 625 108 733 (17)
CERS Hazardous 240 56 296 251 50 301 5
SPRS 59 9 68 59 8 67 (1)
Amounts above reflect the full actuarially determined employer contributions. The KERS non-hazardous fund amounts do not reflect any reduction in the rates for Quasi agencies and the CERS amounts do not reflect any contribution rate phase-in provisions.
Board Meeting - December 3, 2020 - Actuarial Valuations
15

Unfunded Actuarial Accrued Liability –
Actuarial Value of Asset Basis ($ in Billions)
9
2019 Valuation 2020 Valuation Change In UAAL Pension Insurance Combined Pension Insurance Combined
(1) (2) (3) (4) (5) (6) (7) (8)
KERS Non-Hazardous $14.26 $1.74 $16.00 $14.03 $1.47 $15.50 $(0.50)
KERS Hazardous 0.55 (0.10) 0.45 0.57 (0.11) 0.46 0.01
CERS Non-Hazardous 7.31 1.04 8.35 7.39 0.73 8.12 (0.23)
CERS Hazardous 2.87 0.42 3.29 2.98 0.38 3.36 0.07
SPRS 0.76 0.08 0.84 0.76 0.07 0.83 (0.01)
Total $25.75 $3.18 $28.93 $25.73 $2.54 $28.27 $(0.66)
Board Meeting - December 3, 2020 - Actuarial Valuations
16

Active Membership Count
10
81,506
81,250
33,696
31,703
0
10,000
20,000
30,000
40,000
50,000
60,000
70,000
80,000
90,000
2010 2011 2012 2013 2014 2015 2016 2017 2018 2019 2020
Me
mb
ers
hip
Co
un
t
June 30,
CERS Non-Hazardous KERS Non-Hazardous
CERS NH: 0.3% Decrease (0.4% Average Decrease Over Last 10 Years)
KERS NH: 5.9% Decrease (3.9% Average Decrease Over Last 10 Years)
9,474
9,419
3,705
4,094
883 798
0
1,000
2,000
3,000
4,000
5,000
6,000
7,000
8,000
9,000
10,000
11,000
2010 2011 2012 2013 2014 2015 2016 2017 2018 2019 2020
Me
mb
ers
hip
Co
un
t
June 30,
CERS Hazardous KERS Hazardous SPRS
CERS HZ: 0.6% Decrease (0.2% Average Decrease Over Last 10 Years)
KERS HZ: 10.5% Increase (0.5% Average Decrease Over Last 10 Years)
SPRS: 9.6% Decrease (1.8% Average Decrease Over Last 10 Years)
Board Meeting - December 3, 2020 - Actuarial Valuations
17

Covered Payroll ($ in Millions)
11
$559
$569
$150 $171
$48 $46
$0
$50
$100
$150
$200
$250
$300
$350
$400
$450
$500
$550
$600
2010 2011 2012 2013 2014 2015 2016 2017 2018 2019 2020
Co
vere
d P
ayro
ll
Valuation Year
CERS Hazardous KERS Hazardous SPRS
$2,522
$2,565
$1,438
$1,388
$0
$250
$500
$750
$1,000
$1,250
$1,500
$1,750
$2,000
$2,250
$2,500
$2,750
2010 2011 2012 2013 2014 2015 2016 2017 2018 2019 2020
Co
vere
d P
ayro
ll
Valuation Year
CERS Non-Hazardous KERS Non-Hazardous
KERS NH: 3.5% Decrease (2.6% Average Decrease Over Last 10 Years)
CERS NH: 1.7% Increase (1.4% Average Increase Over Last 10 Years)
CERS HZ: 1.6% Increase (2.0% Average Increase Over Last 10 Years)
KERS HZ: 13.5% Increase (1.7% Average Increase Over Last 10 Years)
SPRS: 3.4% Decrease
(1.2% Average Decrease Over Last 10 Years)
Board Meeting - December 3, 2020 - Actuarial Valuations
18

Retired Membership Count
12
64,539 65,414
47,410
47,333
0
10,000
20,000
30,000
40,000
50,000
60,000
70,000
2011 2012 2013 2014 2015 2016 2017 2018 2019 2020
Me
mb
ers
hip
Co
un
t
June 30,
CERS Non-Hazardous KERS Non-Hazardous
10,023 10,452
4,537 4,628
1,647 1,669
0
1,000
2,000
3,000
4,000
5,000
6,000
7,000
8,000
9,000
10,000
11,000
12,000
2011 2012 2013 2014 2015 2016 2017 2018 2019 2020
Me
mb
ers
hip
Co
un
t
June 30,
CERS Hazardous KERS Hazardous SPRS
Board Meeting - December 3, 2020 - Actuarial Valuations
19

Pension Benefit Distributions ($ in Millions)
13
$1,001
$1,011
$781
$811
$0
$100
$200
$300
$400
$500
$600
$700
$800
$900
$1,000
$1,100
$1,200
2011 2012 2013 2014 2015 2016 2017 2018 2019 2020
FYE
Be
ne
fit
Dis
trib
uti
on
Fiscal Year End
KERS Non-Hazardous CERS Non-Hazardous
$262
$280
$72 $75
$61 $63
$0
$25
$50
$75
$100
$125
$150
$175
$200
$225
$250
$275
$300
2011 2012 2013 2014 2015 2016 2017 2018 2019 2020
FYE
Be
ne
fit
Dis
trib
uti
on
Fisal Year End
CERS Hazardous KERS Hazardous SPRS
Board Meeting - December 3, 2020 - Actuarial Valuations
20

Funding Results – KERS ($ in millions)
14
Non-Hazardous System Hazardous System
Pension Insurance Pension Insurance
Item 2019* 2020 2019* 2020 2019* 2020 2019* 2020
(1) (2) (3) (4) (5) (6) (7) (8) (9)
Total Normal Cost Rate 12.18% 12.04% 2.71% 2.58% 16.48% 16.15% 4.92% 4.63%
Member Rate (5.00%) (5.00%) (0.41%) (0.44%) (8.00%) (8.00%) (0.60%) (0.64%)
Employer Normal Cost Rate 7.18% 7.04% 2.30% 2.14% 8.48% 8.15% 4.32% 3.99%
Administrative Expenses 0.81% 0.86% 0.06% 0.06% 0.73% 0.69% 0.08% 0.07%
Amortization Cost 65.29% 67.42% 8.79% 7.51% 26.79% 24.59% (4.97%) (4.94%)
Total Actuarially Determined Rate
73.28% 75.32% 11.15% 9.71% 36.00% 33.43% 0.00% 0.00%
Actuarial Accrued Liability (AAL) $16,466 $16,349 $2,733 $2,565 $1,226 $1,284 $427 $428
Actuarial Value of Assets 2,206 2,323 991 1,096 672 710 525 539
Unfunded AAL $14,260 $14,026 $1,742 $1,469 $555 $574 ($99) ($111)
Funded Ratio 13.4% 14.2% 36.3% 42.7% 54.8% 55.3% 123.1% 126.0%
* after reflection of SB 249
Board Meeting - December 3, 2020 - Actuarial Valuations
21

Funding Results – SPRS ($ in millions)
15
Pension Insurance
Item 2019* 2020 2019* 2020
(1) (2) (3) (4) (5)
Total Normal Cost Rate 26.92% 26.46% 8.41% 7.69%
Member Rate (8.00%) (8.00%) (0.40%) (0.44%)
Employer Normal Cost Rate 18.92% 18.46% 8.01% 7.25%
Administrative Expenses 0.47% 0.58% 0.14% 0.15%
Amortization Cost 104.40% 108.95% 11.54% 10.67%
Total Actuarially Determined Rate
123.79% 127.99% 19.69% 18.07%
Actuarial Accrued Liability (AAL) $1,045 $1,053 $277 $276
Actuarial Value of Assets 282 296 197 207
Unfunded AAL $763 $757 $79 $69
Funded Ratio 27.0% 28.1% 71.3% 75.0%
* after reflection of SB 249
Board Meeting - December 3, 2020 - Actuarial Valuations
22

Funding Results – CERS ($ in millions)
16
Non-Hazardous System Hazardous System
Pension Insurance Pension Insurance
Item 2019* 2020 2019* 2020 2019* 2020 2019* 2020
(1) (2) (3) (4) (5) (6) (7) (8) (9)
Total Normal Cost Rate 10.77% 10.59% 3.40% 3.17% 19.05% 18.65% 5.84% 5.33%
Member Rate (5.00%) (5.00%) (0.49%) (0.52%) (8.00%) (8.00%) (0.46%) (0.51%)
Employer Normal Cost Rate 5.77% 5.59% 2.91% 2.65% 11.05% 10.65% 5.38% 4.82%
Administrative Expenses 0.86% 0.87% 0.04% 0.04% 0.31% 0.35% 0.08% 0.08%
Amortization Cost 17.18% 17.42% 2.48% 1.48% 30.66% 32.23% 4.40% 3.83%
Total Actuarially Determined Rate
23.81% 23.88% 5.43% 4.17% 42.02% 43.23% 9.86% 8.73%
Actuarial Accrued Liability (AAL) $14,356 $14,611 $3,568 $3,392 $5,245 $5,431 $1,733 $1,741
Actuarial Value of Assets 7,050 7,221 2,523 2,661 2,375 2,448 1,314 1,362
Unfunded AAL $7,307 $7,390 $1,045 $731 $2,870 $2,983 $419 $379
Funded Ratio 49.1% 49.4% 70.7% 78.5% 45.3% 45.1% 75.8% 78.2%
* after reflection of SB 249
Board Meeting - December 3, 2020 - Actuarial Valuations
23

PROJECTION INFORMATION
PENSION AND INSURANCE
17
Board Meeting - December 3, 2020 - Actuarial Valuations
24

KERS Non-Hazardous Projection
18
Pension Insurance
Board Meeting - December 3, 2020 - Actuarial Valuations
25

KERS Hazardous Projection
19
Pension Insurance
Board Meeting - December 3, 2020 - Actuarial Valuations
26

SPRS Projection
20
Pension Insurance
Board Meeting - December 3, 2020 - Actuarial Valuations
27

CERS Non-Hazardous Projection
21
Pension Insurance
Board Meeting - December 3, 2020 - Actuarial Valuations
28

CERS Hazardous Projection
22
Pension Insurance
Board Meeting - December 3, 2020 - Actuarial Valuations
29

Closing Comments on 2020 Valuation
Results
• It is imperative the State and participating employers in the Systems contribute the actuarially determined contributions in each future year to improve the System’s financial security.
• We recommend KRS work with the legislators to find an alternative method for collecting the amortization cost from participating employers that is not payroll based. – Needed most for the KERS Non-Hazardous System – Legislative action will be required (similar to HB 171
from the 2020 legislative session)
23
Board Meeting - December 3, 2020 - Actuarial Valuations
30

Disclaimers
• This presentation is intended to be used in conjunction with the actuarial valuation as of June 30, 2020. This presentation should not be relied on for any purpose other than the purpose described in the valuation report.
• This presentation shall not be construed to provide tax advice, legal advice or investment advice.
• Readers are cautioned to examine original source materials and to consult with subject matter experts before making decisions related to the subject matter of this presentation.
24
Board Meeting - December 3, 2020 - Actuarial Valuations
31

To: Board of Trustees
From: Rebecca H Adkins, Executive Director, Office of Operations
Date: December 3, 2020
Subject: Employer Contribution Rates FY 2022
The employer contribution rates for all plans administered by the Kentucky Retirement Systems are based on an annual actuarial valuation as required by Kentucky Revised Statute 61.565 and 61.702. The CERS plans are set every year by vote of the Board. The KERS and SPRS plans are recommended by the Board to the General Assembly for inclusion in the budget of the Commonwealth. Generally, this is performed in odd years for the following biennial budget. However, due to the financial uncertainties accompanying COVID19, the General Assembly elected to adopt a one-year budget for FY2021, so they are required to adopt another one-yearbudget in the 2021 session for FY2022.
KRS actuaries, Gabriel Roeder Smith, Consultants & Actuaries (GRS), have finalized the actuarial valuation by plan for the year ending June 30, 2020. Included in the valuation are the recommendations for FY2022 employer contribution rates in the blue table on the following page. Current rates for FY2021 are included for your information (green table). The Board is asked to vote on the approval of the FY2022 rates in the yellow.
Action Requested: Board approval of the Employer Contribution Rates for FY
2022 as follows:
26.95% CERS Non-Haz, 44.33% CERS Hazardous
85.03% KERS Non-Haz, 33.43% KERS Hazardous, and 146.06% SPRS
Board Meeting - December 3, 2020 - Actuarial Valuations
32

Proposed Employer Contribution Rates FY 2022
Plan Pension Insurance2020
Valuation Rates
Contribution Rate for
Fiscal Year 2022*
CERS Non-Hazardous 23.88% 4.17% 28.05% 26.95%CERS Hazardous 43.23% 8.73% 51.96% 44.33%
KERS Non-Hazardous 75.32% 9.71% 85.03% 85.03%KERS Hazardous 33.43% 0.00% 33.43% 33.43%
SPRS 127.99% 18.07% 146.06% 146.06%
* Contribution rates for the CERS plans are limited to a 12% increase in the contribution rates from the prior fiscal year in accordance with KRS 61.565.
Employer Contribution Rates FY 2021
Plan
2019 Valuation
Rates(prior to SB249*)
Board ApprovedFY 2021**
(prior to SB249*)
Contribution Rate Effective for FY 2021 ***
CERS Non-Hazardous 31.99% 26.95% 24.06%CERS Hazardous 56.78% 44.33% 39.58%KERS Non-Hazardous 93.01% 93.01% 84.43% (49.47%)KERS Hazardous 38.71% 38.71% 36.00%
SPRS 156.97% 156.97% 143.48%
* SB249 passed during the 2020 regular legislative reset the amortization period to 30 years.
** Contribution rates for the CERS plans are limited to a 12% increase in the contribution rates from the prior fiscal year in accordance with KRS 61.565.
*** HB352 and SB249 of the 2020 regular session set the FY2021 employer contribution rates as indicated including the 49.47% rate for KERS Non-Hazardous quasi-governmental agencies.
Board Meeting - December 3, 2020 - Actuarial Valuations
33

CERS CHAZ KERS KHAZ SPRS 2020 2019ASSETSCash and Short-term Investments Cash Deposits 1,274,220 374,801 1,249,868 146,565 108,712 3,154,166 5,186,701 -39% 1 Short-term Investments 375,561,007 128,015,912 208,415,492 39,017,357 28,113,404 779,123,172 631,550,178 23% 2Total Cash and Short-term Investments $ 376,835,227 $ 128,390,712 $ 209,665,360 $ 39,163,922 $ 28,222,116 $ 782,277,338 $ 636,736,879
RECEIVABLES Accounts Receivable 51,969,580 25,198,825 48,710,436 4,233,211 9,250,261 139,362,312 130,236,128 7% Accounts Receivable - Investments 207,046,739 71,078,040 81,166,976 20,929,599 9,080,794 389,302,148 152,157,456 156% 3Total Receivables $ 259,016,319 $ 96,276,865 $ 129,877,412 $ 25,162,810 $ 18,331,055 $ 528,664,460 $ 282,393,584
INVESTMENTS, AT FAIR VALUE Fixed Income 1,262,453,319 433,699,909 565,225,831 131,624,225 72,465,835 2,465,469,119 2,381,748,632 4% Public Equities 2,926,239,470 987,030,122 767,414,556 288,713,489 99,067,619 5,068,465,257 4,796,570,508 6% Specialty Credit 1,221,937,886 418,395,609 435,873,924 127,191,538 47,688,903 2,251,087,860 2,006,735,121 12% 4 Private Equities 638,299,411 214,654,670 190,326,404 58,910,626 18,118,290 1,120,309,401 1,153,844,068 -3% Absolute Return 87,110,175 27,593,370 27,992,958 7,303,527 3,030,316 153,030,346 200,213,255 -24% 5 Real Estate 326,730,259 104,547,046 100,452,325 30,743,115 12,846,717 575,319,462 546,773,760 5% Real Return 437,731,208 148,270,356 138,273,523 42,209,701 17,061,496 783,546,284 1,095,092,347 -28% 6 Opportunistic 184,935,817 61,136,916 54,077,852 16,765,704 6,679,668 323,595,957 139,104,289 133% 7 Derivatives 1,093,540 374,403 359,390 107,341 41,715 1,976,388 1,424,775 39% 8Total Investments, at Fair Value $ 7,086,531,084 $ 2,395,702,400 $ 2,279,996,763 $ 703,569,266 $ 277,000,560 $ 12,742,800,073 $ 12,321,506,754
CAPITAL/INTANGIBLE ASSETS Capital Assets 1,700,704 153,235 929,074 91,375 11,003 2,885,391 2,885,391 Intangible Assets 9,960,922 826,734 5,919,584 493,581 100,005 17,300,826 17,300,826 Accumulated Depreciation (1,677,870) (150,944) (915,962) (89,877) (11,536) (2,846,189) (2,765,954) Accumulated Amortization (9,212,814) (784,060) (5,395,718) (459,603) (109,789) (15,961,984) (15,008,062)Total Capital Assets $ 770,943 $ 44,966 $ 536,978 $ 35,475 $ (10,317) $ 1,378,044 $ 2,412,201 -43% 9
Total Assets $ 7,723,153,573 $ 2,620,414,943 $ 2,620,076,512 $ 767,931,473 $ 323,543,414 $ 14,055,119,915 $ 13,243,049,417
LIABILITIES Accounts Payable 4,096,037 700,547 2,110,897 160,010 211,228 7,278,719 10,562,227 -31% 10 Investment Accounts Payable 332,630,998 115,937,428 140,957,655 34,870,098 14,984,801 639,380,980 203,131,940 215% 11Total Liabilities $ 336,727,035 $ 116,637,975 $ 143,068,552 $ 35,030,108 $ 15,196,029 $ 646,659,699 $ 213,694,167
Total Fiduciary Net Position Restricted for Pensions $ 7,386,426,538 $ 2,503,776,968 $ 2,477,007,960 $ 732,901,364 $ 308,347,385 $ 13,408,460,215 $ 13,029,355,251
12
3456789
1011
The decrease in Accounts Payable is due to a decrease in outstanding credit invoices in KERS, KERH, CERH and SPRS.Variance is a result of transaction activity which is based on each individual manager.
The increase in Opportunistic is due to additional funds invested in current manager.
The decrease in total Fixed Assets is due to the increase in the amortization of the fixed assets.Variance is a result of hedging and arbitration of risk within the portfolios
Variance is a result of continuous fluctuation of deposits and transactions that flow through the cash account.
KENTUCKY RETIREMENT SYSTEMSCOMBINING STATEMENTS OF FIDUCIARY NET POSITION
PENSION FUNDSAs of September 30, 2020
(Unaudited)(In Whole Dollars)
NOTE - Variance Explanation
Short Term Investments is primarily comprised of the cash on hand with the custodial bank along with any small amounts of cash managers and brokers may have; therefore, the variance is driven by cash flow. Variance is a result of transaction activity which is based on each individual manager.The increase in Specialty Credit is due to additional funds invested in current managers and funding of five (5) new managers.
The assets declined in Real Return is a result of redemption of PIMCO, Nuveen and the Internal TIPS account.The decline in Absolute Return is due to the continued redemption of the entire portfolio.
Board Meeting - December 3, 2020 - Audit Committee Report
34

CERS CHAZ KERS KHAZ SPRS 2021 2020ADDITIONS Member Contributions 37,769,371 17,333,136 22,111,692 5,140,074 1,206,138 83,560,412 84,154,936 -1% Employer Contributions 106,074,431 47,871,235 240,111,374 15,858,812 15,238,060.55 425,153,913 415,883,985 2% General Fund Appropriations - - - - - - 1,086,200 -100% 1 Pension Spiking Contributions 19,128 19,479 34,388 140 1,009 74,143 86,367 -14% 2 Health Insurance Contributions (HB1) (273) 273 (629) 629 - - 12,121 -100% 3 Total Contributions $ 143,862,658 $ 65,224,122 $ 262,256,824 $ 20,999,656 $ 16,445,208 $ 508,788,468 $ 501,223,610
INVESTMENT INCOME From Investing Activities Net Appreciation in FV of Investments 314,525,282 105,993,547 99,702,111 30,926,591 11,419,761 562,567,291 94,405,591 496% 4 Interest/Dividends 43,061,809 14,479,157 13,415,727 4,208,920 1,718,730 76,884,342 92,887,409 -17% 5 Total Investing Activities Income $ 357,587,091 $ 120,472,704 $ 113,117,838 $ 35,135,511 $ 13,138,490 $ 639,451,633 $ 187,293,000
Investment Expense 9,497,593 3,126,609 2,745,179 895,495 325,590 16,590,467 15,487,161 7% Performance Fee/Carried Interest 3,555,427 1,348,946 917,782 312,237 39,634 6,174,027 12,968,911 -52% 6Net Income from Investing Activities $ 344,534,071 $ 115,997,148 $ 109,454,876 $ 33,927,779 $ 12,773,266 $ 616,687,140 $ 158,836,928
From Securities Lending Activities Securities Lending Income 119,916 40,888 39,321 12,073 5,048 217,245 2,487,277 Securities Lending Expense Securities Lending Borrower Rebates (100,259) (34,072) (29,077) (9,944) (3,683) (177,035) 1,665,650 Securities Lending Agent Fee 32,999 11,235 10,251 3,299 1,309 59,094 94,354 Net Income from Securities Lending $ 187,176 $ 63,726 $ 58,146 $ 18,717 $ 7,421 $ 335,186 $ 727,272 -54% 7
Total Investment Income $ 344,721,247 $ 116,060,874 $ 109,513,022 $ 33,946,496 $ 12,780,687 $ 617,022,326 $ 159,564,201
Total Additions $ 488,583,905 $ 181,284,996 $ 371,769,846 $ 54,946,152 $ 29,225,895 $ 1,125,810,794 $ 660,787,810
DEDUCTIONS Benefit Payments 203,786,196 71,269,622 252,049,767 18,251,675 15,773,769 561,131,029 546,687,715 3% Refunds 3,837,061 1,448,304 2,132,251 843,893 88,380 8,349,889 10,425,937 -20% 8 Administrative Expenses 5,423,250 478,491 2,810,453 314,818 60,261 9,087,273 8,651,168 5%Total Deductions $ 213,046,508 $ 73,196,417 $ 256,992,471 $ 19,410,386 $ 15,922,410 $ 578,568,191 $ 565,764,820
Net Increase (Decrease) in Fiduciary Net Position $ 275,537,397 $ 108,088,579 $ 114,777,375 $ 35,535,767 $ 13,303,485 $ 547,242,603 $ 95,022,990
FIDUCIARY NET POSITION HELD IN TRUST FOR PENSION BENEFITSBeginning of Period $ 7,110,889,139 $ 2,395,688,389 $ 2,362,230,585 $ 697,365,599 $ 295,043,909 $ 12,861,217,621 $ 12,934,332,269 End of Period $ 7,386,426,536 $ 2,503,776,968 $ 2,477,007,960 $ 732,901,366 $ 308,347,395 $ 13,408,460,225 $ 13,029,355,260
123456
78
The decline in Interest/Dividends is due to a decrease in income from Private Equity due to the payout of the funds.
Refunds taken by members who terminated employment and were not eligible for a retirement benefit decreased in CERS, KERS, KHAZ and SPRS.
The decline in Performance fees is a result of the redemption of the Absolute Return managers and the payout of Private Equity funds. A decline in assets of $81.1 M for these two portfolios since this time last year.Variance is a result of the demand of the Securities Lending Program.
KENTUCKY RETIREMENT SYSTEMSCOMBINING STATEMENTS OF CHANGES IN FIDUCIARY NET POSITION
PENSION FUNDSFor the Year Ended September 30, 2020
(Unaudited)(In Whole Dollars)
The increase in Net Appreciation in Fair Value of Investments is a result of favorable market conditions, particularly in the public equity portfolio.
Pension Spiking contributions decreased due to a change in statute. Pension spiking is now the member's responsibility.
NOTE - Variance Explanation
General Fund Appropriations have significantly decreased in FY 2021. We expect to receive $384,000 for SPRS from the General Fund.
Health Insurance Contributions will continue to decrease in the Pension Funds, as they are now qualified in the Insurance Fund.
Board Meeting - December 3, 2020 - Audit Committee Report
35

CERS CHAZ KERS KHAZ SPRS 2020 2019ASSETSCash and Short-Term Investments Cash Deposits 531,882 8,144 210,800 22,291 8,202 781,318 453,528 72% 1 Short-term Investments 132,004,490 69,725,820 52,537,531 26,819,566 9,073,241 290,160,648 157,547,690 84% 2Total Cash and Short-term Investments $ 132,536,372 $ 69,733,964 $ 52,748,331 $ 26,841,858 $ 9,081,442 $ 290,941,967 $ 158,001,218
RECEIVABLES Accounts Receivable 14,148,797 7,076,921 15,512,560 442,318 1,000,198 38,180,794 36,863,322 4% Investment Accounts Receivable 73,997,365 38,261,250 32,190,862 15,012,371 5,843,665 165,305,513 53,803,454 207% 3Total Receivables $ 88,146,163 $ 45,338,172 $ 47,703,421 $ 15,454,689 $ 6,843,862 $ 203,486,307 $ 90,666,776
INVESTMENTS, AT FAIR VALUE Fixed Income 437,935,642 232,682,885 181,246,307 89,335,771 36,041,783 977,242,387 1,010,757,222 -3% Public Equities 1,009,224,175 517,346,846 459,738,450 203,635,258 81,584,107 2,271,528,836 2,138,766,637 6% Specialty Credit 455,942,573 224,821,572 188,533,012 96,976,186 31,870,808 998,144,153 827,397,591 21% 4 Private Equities 249,892,538 140,455,145 57,685,407 47,571,616 21,739,456 517,344,161 554,094,931 -7% Absolute Return 27,979,328 15,675,895 9,856,241 6,544,749 2,454,317 62,510,530 82,085,422 -24% 5 Real Estate 111,421,643 61,065,190 34,928,502 25,685,831 9,812,848 242,914,014 227,114,222 7% Real Return 154,561,325 80,738,873 62,359,407 31,842,849 12,363,512 341,865,965 466,050,924 -27% 6 Opportunistic 74,673,142 40,681,053 26,697,663 16,596,604 6,128,592 164,777,054 70,832,760 133% 7 Derivatives 310,329 161,459 135,363 63,903 24,615 695,670 653,904 -6%Total Investments, at Fair Value $ 2,521,940,696 $ 1,313,628,918 $ 1,021,180,351 $ 518,252,769 $ 202,020,038 $ 5,577,022,770 $ 5,377,753,614
Total Assets $ 2,742,623,230 $ 1,428,701,054 $ 1,121,632,103 $ 560,549,315 $ 217,945,342 $ 6,071,451,044 $ 5,626,421,608
LIABILITIES Accounts Payable 281,802 53,824 157,089 6,906 9,069 508,691 501,960 1% Investment Accounts Payable 129,653,421 64,319,650 55,040,998 25,454,148 9,252,996 283,721,212 78,795,754 260% 8Total Liabilities $ 129,935,223 $ 64,373,474 $ 55,198,087 $ 25,461,054 $ 9,262,065 $ 284,229,904 $ 79,297,713
Total Fiduciary Net Position Restricted for Insurance $ 2,612,688,007 $ 1,364,327,580 $ 1,066,434,016 $ 535,088,261 $ 208,683,277 $ 5,787,221,141 $ 5,547,123,895
12
345678 Variance is a result of transaction activity which is based on each individual manager.
Variance is a result of continuous fluctuation of deposits and transactions that flow through the cash account. Short Term Investments is primarily comprised of the cash on hand with the custodial bank along with any small amounts of cash managers and brokers may have; therefore, the variance is driven by cash flow.
The increase in Opportunistic is due to additional funds invested in current manager.
Variance is a result of transaction activity which is based on each individual manager.The increase in Specialty Credit is due to additional funds invested in current managers and funding of five (5) new managers.The decline in Absolute Return is due to the continued redemption of the entire portfolio.The assets declined in Real Return is a result of redemption of PIMCO, Nuveen and the Internal TIPS account.
NOTE - Variance Explanation
KENTUCKY RETIREMENT SYSTEMSCOMBINING STATEMENTS OF FIDUCIARY NET POSITION
INSURANCE FUNDSAs of September 30, 2020
(Unaudited)(In Whole Dollars)
Board Meeting - December 3, 2020 - Audit Committee Report
36

CERS CHAZ KERS KHAZ SPRS 2020 2019ADDITIONS Employer Contributions 28,207,412 16,801,215 38,797,442 52,210 2,444,062 86,302,340 89,748,173 -4% Medicare Drug Reimbursement 529 - 2 - - 531 2,605 -80% 1 Insurance Premiums 142,530 (14,004) 43,480 3,144 (1,501) 173,649 208,795 -17% 2 Retired Reemployed Healthcare 1,753,906 310,790 1,077,865 330,143 - 3,472,704 3,369,760 3% Health Insurance Contributions (HB1) 2,829,020 751,549 1,563,720 291,381 52,291 5,487,960 5,250,160 5%Total Contributions $ 32,933,397 $ 17,849,550 $ 41,482,510 $ 676,878 $ 2,494,851 $ 95,437,185 $ 98,579,494
INVESTMENT INCOMEFrom Investing Activities Net Appreciation in FV of Investments 108,015,341 56,688,242 46,514,872 22,736,998 8,851,686 242,807,139 36,871,686 559% 3 Interest/Dividends 15,115,215 7,899,028 5,968,897 3,018,168 1,180,380 33,181,688 37,476,760 -11% 4Total From Investing Activities $ 123,130,556 $ 64,587,269 $ 52,483,769 $ 25,755,167 $ 10,032,066 $ 275,988,827 $ 74,348,446
Investment Expense $2,559,803 $1,368,418 $932,871 $506,916 $208,973 $5,576,981 6,728,053 -17% 5 Performance Fee $1,944,218 $1,179,689 $840,213 $500,158 $186,412 $4,650,689 6,516,267 -29% 6Net Income from Investing Activities $ 118,626,535 $ 62,039,162 $ 50,710,686 $ 24,748,093 $ 9,636,681 $ 265,761,157 $ 61,104,126
From Securities Lending Securities Lending Income 43,222 22,368 18,351 8,350 3,239 95,531 1,086,833 Securities Lending Expense Security Lending Borrower Rebates ($32,951) ($17,128) ($14,736) ($6,598) ($2,593) ($74,006) 795,474 Security Lending Agent Fees $11,410 $5,917 $4,955 $2,239 $873 $25,394 43,655 Net Income from Securities Lending $ 64,764 $ 33,579 $ 28,132 $ 12,708 $ 4,959 $ 144,143 $ 247,703 -42% 7
Total Net Income from Investments $ 118,691,299 $ 62,072,741 $ 50,738,818 $ 24,760,801 $ 9,641,640 $ 265,905,300 $ 61,351,830
Total Additions $ 151,624,695 $ 79,922,291 $ 92,221,328 $ 25,437,680 $ 12,136,491 $ 361,342,485 $ 159,931,323
DEDUCTIONS Healthcare Premiums Subsidies $35,937,279 $20,544,942 $31,789,878 $5,050,925 $3,678,904 $97,001,929 91,207,083 6% Administrative Expense $221,359 $109,664 $202,101 $29,265 $17,575 $579,963 591,672 -2% Self Funded Healthcare Costs $829,039 $72,388 $293,319 $8,455 $2,286 $1,205,486 1,647,662 -27% 8Total Deductions $ 36,987,677 $ 20,726,994 $ 32,285,298 $ 5,088,645 $ 3,698,765 $ 98,787,378 $ 93,446,418
Net Increase (Decrease) in Fiduciary Net Position $ 114,637,018 $ 59,195,297 $ 59,936,030 $ 20,349,035 $ 8,437,726 $ 262,555,107 $ 66,484,906
FIDUCIARY NET POSITION HELD INTRUST FOR INSURANCE BENEFITSBeginning of Period $ 2,498,050,987 $ 1,305,132,283 $ 1,006,497,976 $ 514,739,226 $ 200,245,552 $ 5,524,666,024 $ 5,480,638,979 End of Period $ 2,612,688,006 $ 1,364,327,580 $ 1,066,434,006 $ 535,088,261 $ 208,683,278 $ 5,787,221,131 $ 5,547,123,885
12
3 The increase in Net Appreciation in Fair Value of Investments is a result of favorable market conditions, particularly in the public equity portfolio.4
5 & 6
78 The decrease in Self Funded Healthcare Claims is due to a decrease in claims billed from the self funded insurance plan.
The decrease in Insurance Premiums received is due to refunds processed to hazardous retirees for premiums paid for dependents that should have been covered by KRS.
Variance is a result of the demand of the program.
The decline in Management Fees and Performance fees are a result of the redemption of the Absolute Return managers and the payout of Private Equity funds. A decline in assets of $56.5 M for these two portfolios since this time last year.
KENTUCKY RETIREMENT SYSTEMSCOMBINING STATEMENTS OF CHANGES IN FIDUCIARY NET POSITION
INSURANCE FUNDSFor the Year Ended September 30, 2020
(Unaudited)(In Whole Dollars)
The decline in Interest/Dividends is due to a decrease in income from Private Equity due to the payout of the funds.
NOTE - Variance Explanation
Medicare drug reimbursement payments fluctuate year to year based on claims reviewed.
Board Meeting - December 3, 2020 - Audit Committee Report
37

Acc't # Account Name Budgeted Actual Expenditures Remaining % Remaining
PERSONNEL111 Salaries $15,500,000 $4,231,883 $11,268,117 72.70%
115 Wages (Overtime) $265,000 $9,321 $255,679 96.48%
119 Wages (Block 50) $28,500 $0 $28,500 100.00%
121 Emp Paid FICA $1,135,000 $302,360 $832,640 73.36%
122 Emp Paid Retirement $13,086,645 $3,406,894 $9,679,751 73.97%
123 Emp Paid Health Ins $2,550,000 $730,662 $1,819,338 71.35%
124 Emp Paid Life Ins $3,500 $1,002 $2,498 71.37%
128 Emp Paid Sick Leave $75,000 $0 $75,000 100.00%
131 Workers Compensation $13,200 $75,163 ($61,963) -469.42%
132 Unemployment $10,000 $0 $10,000 100.00%
133 Tuition Assistance $13,100 $2,421 $10,679 81.52%
133I Investment Tuition Assistance $5,000 $0 $5,000 100.00%
133T Audit Tuition Assistance $2,500 $0 $2,500 100.00%
141 LEGAL & AUDITING SERVICES141A Legal Hearing Officers $91,200 $12,595 $78,605 86.19%
141B Legal (Stoll, Keenon) $340,500 $20,537 $319,964 93.97%
141D Frost Brown $114,300 $1,146 $113,155 99.00%
141E Reinhart $444,000 $0 $444,000 100.00%
141F Ice Miller $187,200 $25,559 $161,641 86.35%
141L Legal Expense $125,500 $0 $125,500 100.00%
142 Auditing $176,500 $8,401 $168,099 95.24%
146 CONSULTING SERVICES146A Medical Reviewers $273,865 $0 $273,865 100.00%
146E Escrow for Actuary Fees $12,000 $0 $12,000 100.00%
150 CONTRACTUAL SERVICES150C Miscellaneous Contracts $22,750 ($3,600) $26,350 115.82%
150G Human Resources Consulting $7,500 $5,794 $1,706 22.75%
159 Actuarial Services $612,000 $43,072 $568,928 92.96%
162 Facility Security Charges $80,500 $17,679 $62,821 78.04%
PERSONNEL SUBTOTAL $35,175,260 $8,890,888 $26,284,372 74.72%
KRS ADMINISTRATIVE BUDGET 2020-21FIRST QUARTER BUDGET-TO-ACTUAL ANALYSIS
Fiscal 21
Board Meeting - December 3, 2020 - Audit Committee Report
38

Acc't # Account Name Budgeted Actual Expenditures Remaining % Remaining
OPERATIONAL211 Natural Gas $22,500 $2,109 $20,391 90.63%
212 Electric $176,500 $30,980 $145,520 82.45%
221 Rent-NonState Building $71,600 $28,921 $42,679 59.61%
222 Building Rental - PPW $1,100,000 $266,742 $833,258 75.75%
223 Equipment Rental $0 $7,163 ($7,163)
224 Copier Rental $73,000 $9,438 $63,562 87.07%
226 Rental Carpool $9,100 $970 $8,130 89.34%
232 Vehicle/Equip. Mainten. $1,350 $0 $1,350 100.00%
241 Postage $455,000 $28,484 $426,516 93.74%
242 Freight $46 $0 $46 100.00%
251 Printing (State) $11,700 $2,425 $9,276 79.28%
252 Printing (non-state) $102,700 $0 $102,700 100.00%
254 Insurance $11,650 $3,591 $8,059 69.18%
256 Garbage Collection $5,500 $1,324 $4,176 75.94%
259 Conference Expense $18,250 $2,897 $15,353 84.13%
259I Conference Exp. Investment $6,000 $0 $6,000 100.00%
259T Conference Exp. Audit $1,500 $0 $1,500 100.00%
300 MARS Usage $51,300 $11,912 $39,388 76.78%
302 COVID-19 Expenses $146,800 89,100.35$ $57,700 39.30%
321 Office Supplies $89,125 $3,197 $85,928 96.41%
346 Furniture & Office Equipment $25,075 $0 $25,075 100.00%
361 Travel (In-State) $30,000 $61 $29,939 99.80%
361I Travel (In-State) Investment $300 $0 $300 100.00%
361T Travel (In-State) Audit $500 $0 $500 100.00%
362 Travel (Out of State) $20,150 $0 $20,150 100.00%
362I Travel (Out of State) Invest $38,700 ($169) $38,869 100.44%
362T Travel (Out of State) Audit $450 $0 $450 100.00%
381 Dues & Subscriptions $60,250 $9,816 $50,434 83.71%
381I Dues & Subscriptions Invest $1,375 $0 $1,375 100.00%
381T Dues & Subscriptions Audit $5,000 $0 $5,000 100.00%
399 Miscellaneous $2,700 $0 $2,700 100.00%
399I Miscellaneous Investment $200 $0 $200 100.00%
399T Miscellaneous Audit $200 $0 $200 100.00%
802 COT Charges $22,225 $2,540 $19,685 88.57%
814 Telephone - Wireless $5,100 $1,184 $3,916 76.79%
815 Telephone - Other $119,000 $22,195 $96,805 81.35%
847 Computer Equip./Software $3,325,500 $722,402 $2,603,098 78.28%
Contingent $7,702,594
OPERATIONAL SUBTOTAL $13,712,940 $1,247,280 $4,763,066 34.73%
TOTALS $48,888,200 $10,138,167 $31,047,439 63.51%
KRS ADMINISTRATIVE BUDGET 2020-21FIRST QUARTER BUDGET-TO-ACTUAL ANALYSIS
Board Meeting - December 3, 2020 - Audit Committee Report
39

1
Kentucky Retirement Systems
Audit Committee
November 5, 2020
Board Meeting - December 3, 2020 - Audit Committee Report
40

Pension Fund Contribution Report(CERS-Non Hazardous and CERS-Hazardous)
September 30, 2020 (compared to September 30, 2019)($ in millions)
Contributions FY20 FY21 FY20 FY21
Member Contributions $37.6 $37.8 $15.5 $17.3
Employer Contributions 104.8 106.1 42.4 47.9
Contribution Inflows 142.4 143.9 57.9 65.2
Benefit Payments/Refunds 201.9 207.6 68.1 72.7
Administrative Expenses 5.1 5.5 0.5 0.5
Contribution Outflows 207.0 213.1 68.6 73.2
NET Contributions (64.6) (69.2) (10.7) (8.0)
Net Investment Income 36.4 30.2 12.4 10.1
Realized Gain/(Loss) 74.6 34.5 25.1 11.9
Unrealized Gain/(Loss) (23.8) 280.0 (8.5) 94.1
NET Investment Activity 87.2 344.7 29.0 116.1
Change in Net Position 22.6 275.5 18.3 108.1
Beginning of Period 7,243.0 7,110.9 2,429.6 2,395.7
End of Period $7,265.6 $7,386.4 $2,447.9 $2,503.8
2
Board Meeting - December 3, 2020 - Audit Committee Report
41

Pension Fund Contribution Report(KERS Non Hazardous, KERS Hazardous & SPRS)
September 30, 2020 (compared to September 30, 2019)($ in millions)
Contributions FY20 FY21 FY20 FY21 FY20 FY21
Member Contributions $25.6 $22.1 $4.2 $5.1 $1.3 $1.2
Employer Contributions 240.2 240.2 13.9 15.9 14.7 15.2
Contribution Inflows 265.8 262.3 18.1 21.0 16.0 16.4
Benefit Payments/Refunds 253.0 254.2 18.7 19.1 15.5 15.9
Administrative Expenses 2.7 2.8 0.3 0.3 0.0 0.0
Contribution Outflows 255.7 257.0 19.0 19.4 15.5 15.9
NET Contributions 10.1 5.3 (0.9) 1.6 0.5 0.5
Net Investment Income 11.4 9.8 3.6 3.0 1.4 1.4
Realized Gain/(Loss) 20.2 11.2 6.9 3.4 2.7 1.3
Unrealized Gain/(Loss) (0.8) 88.5 (1.7) 27.5 (0.3) 10.1
NET Investment Activity 30.8 109.5 8.8 33.9 3.8 12.8
Change in Net Position 40.9 114.8 7.9 35.5 4.3 13.3
Beginning of Period 2,286.6 2,362.2 687.9 697.4 287.2 295.0
End of Period $2,327.4 $2,477.0 $695.8 $732.9 $291.5 $308.33
Board Meeting - December 3, 2020 - Audit Committee Report
42

Insurance Fund Contribution Report(CERS Non Hazardous and CERS Hazardous)
September 30, 2020 (compared to September 30, 2019)(in $millions)
Contributions FY20 FY21 FY20 FY21
Employer Contributions $27.5 $28.2 $15.4 $16.8
Insurance Premiums 0.2 0.1 0.0 0.0
Retired Reemployed Healthcare 1.7 1.8 0.3 0.3
Health Insurance Contributions (HB1) 2.7 2.8 0.7 0.7
Contribution Inflows 32.1 32.9 16.4 17.8
Healthcare Premiums 33.8 36.8 19.7 20.6
Administrative Expenses 0.2 0.2 0.1 0.1
Contribution Outflows 34.0 37.0 19.8 20.7
NET Contributions (1.9) (4.1) (3.4) (2.9)
Net Investment Income 10.6 10.7 5.6 5.4
Realized Gain/(Loss) 26.5 10.2 14.4 5.4
Unrealized Gain/(Loss) (7.8) 97.8 (5.5) 51.3
NET Investment Activity 29.3 118.7 14.5 62.1
Change in Net Position 27.4 114.6 11.1 59.2
Beginning of Period 2,486.5 2,498.1 1,324.8 1,305.1
End of Period $2,513.9 $2,612.7 $1,335.9 $1,364.3
4
Board Meeting - December 3, 2020 - Audit Committee Report
43

CASH FLOW – Insurance Fund (KERS Non-Haz, KERS Haz & SPRS)
September 30, 2020 (compared to September 30, 2019)($ in millions)
Contributions FY20 FY21 FY20 FY21 FY20 FY21
Employer Contributions $43.4 $38.8 $1.0 $0.1 $2.3 $2.4
Insurance Premiums 0.0 0.0 0.0 0.0 0.0 0.0
Retired Reemployed Healthcare 1.1 1.1 0.3 0.3 0.0 0.0
Health Insurance Contributions (HB1) 1.5 1.6 0.3 0.3 0.1 0.1
Contribution Inflow 46.0 41.5 1.6 0.7 2.4 2.5
Healthcare Premiums 31.0 32.1 4.9 5.1 3.5 3.7
Administrative Expenses 0.2 0.2 0.0 0.0 0.0 0.0
Contribution Outflow 31.2 32.3 4.9 5.1 3.5 3.7
NET Contributions 14.8 9.2 (3.3) (4.4) (1.1) (1.2)
Net Investment Income 5.1 4.2 2.4 2.0 0.8 0.8
Realized Gain/(Loss) 6.6 3.6 5.3 2.0 2.1 0.8
Unrealized Gain/(Loss) (1.7) 42.9 (2.4) 20.8 (0.6) 8.0
NET Investment Activity 10.0 50.7 5.3 24.8 2.3 9.6
Change in Net Position 24.8 59.9 2.0 20.4 1.2 8.4
Beginning of Period 942.1 1,006.5 527.1 514.7 200.1 200.3
Ending of Period $966.9 $1,066.4 $529.1 $535.1 $201.3 $208.7
5
Board Meeting - December 3, 2020 - Audit Committee Report
44

Invoice Type 9/30/2020 6/30/2020Change
H/(L)
Averaging Refund to Employer (371,437)$ (57,909)$ 541%Employer Free Military and Decompression Service 471,374$ 390,962$ 21%Member Pension Spiking Refund (22,674)$ (22,950)$ -1%Monthly Reporting Invoice (208,280)$ (258,589)$ -19%Penalty – Monthly Reporting 306,492$ 275,446$ 11%Reinstatement 327,867$ 231,935$ 41%
Total 547,445$ 602,908$ -9%
Health Insurance Reimbursement 2,226,910$ 1,652,346$ 35%Omitted Employer 1,322,862$ 1,017,840$ 30%Pension Spiking* 1,875,039$ 1,825,433$ 3%Standard Sick Leave 9,555,688$ 8,835,323$ 8%
Total 14,980,500$ 13,330,942$ 12%
Grand Total 15,527,945$ 13,933,850$ 11%
Employer Name (Top Ten) 9/30/2020 6/30/2020
Kentucky State Police 8,976,851$ 8,557,656$ 5%Department of Highways 500,457$ 338,054$ 48%City of Covington 366,646$ 363,402$ 1%Kenton County Airport Board 306,648$ 301,163$ 2%Department for Community Based Services 235,148$ 134,983$ 74%Kentucky River Regional Jail 230,955$ 230,955$ 0%Judicial Department Admin Office of the Courts 215,873$ 2,902$ 7339%City of Villa Hills 212,533$ 212,533$ 0%City of Fort Thomas 208,336$ 204,499$ 2%Henry County Fiscal Court 205,135$ 205,201$ 0%
KENTUCKY RETIREMENT SYSTEMSOutstanding Invoices by Type and Employer
*By statute Pension Spiking invoices are due 12 months from invoice date. Of the 324 outstanding invoices, 300 of them (totaling $1,819,758) are greater than 12 months old.
Board Meeting - December 3, 2020 - Audit Committee Report
45

KYRET\cdavis
10/21/2020
12:13:14 PM
Invoice
Amount
Invoice
Remaining
Balance
Delinquent
Interest
Invoice
Status
Date
Invoice
Due Date
Invoice
Status Employer Classification Plan Comments
$1,000.00 $0.00 $0.00 8/12/2020 4/4/2020 CANC Riverport Authorities CERS New employer reporting official
$1,000.00 $0.00 $0.00 8/10/2020 4/25/2020 CANC County Attorneys CERS Circumstances outside of agency control
$1,000.00 $0.00 $0.00 8/6/2020 7/3/2020 CANC Master Commissioner KERS New employer reporting official
$1,000.00 $0.00 $0.00 8/28/2020 8/5/2020 CANC Utility Boards CERS Agency in good standing with KRS
$1,000.00 $0.00 $0.00 8/5/2020 8/22/2020 CANC Cities CERS Agency in good standing with KRS
$1,000.00 $0.00 $0.00 8/6/2020 9/2/2020 CANC Master Commissioner KERS KRS at fault
$1,000.00 $0.00 $0.00 8/6/2020 9/2/2020 CANC Master Commissioner KERS KRS at fault
$1,000.00 $0.00 $0.00 9/4/2020 9/26/2020 CANC Utility Boards CERS Agency in good standing with KRS
$1,000.00 $0.00 $0.00 8/28/2020 9/26/2020 CANC Non-P1 State Agencies KERS Agency in good standing with KRS
$1,000.00 $0.00 $0.00 9/3/2020 9/28/2020 CANC County Attorneys CERS KRS at fault
$1,000.00 $0.00 $0.00 9/3/2020 9/28/2020 CANC County Attorneys CERS KRS at fault
$1,000.00 $0.00 $0.00 9/23/2020 10/22/2020 CANC Utility Boards CERS Agency in good standing with KRS
TOTAL $12,000.00
$1,081.90 $1,081.90 $0.00 7/2/2020 8/1/2020 CRTD Cities CERS
$1,000.00 $1,000.00 $0.00 7/7/2020 8/6/2020 CRTD Cities CERS
$1,000.00 $1,000.00 $0.00 7/10/2020 8/9/2020 CRTD Cities CERS
$1,000.00 $1,000.00 $0.00 7/10/2020 8/9/2020 CRTD Cities CERS
$1,000.00 $1,000.00 $0.00 7/10/2020 8/9/2020 CRTD Cities CERS
$1,000.00 $1,000.00 $0.00 7/10/2020 8/9/2020 CRTD Fiscal Courts CERS
$1,000.00 $1,000.00 $0.00 7/10/2020 8/9/2020 CRTD Cities CERS
$1,000.00 $1,000.00 $0.00 7/21/2020 8/20/2020 CRTD Cities CERS
$1,000.00 $1,000.00 $0.00 7/23/2020 8/22/2020 CRTD Cities CERS
$1,000.00 $1,000.00 $0.00 7/23/2020 8/22/2020 CRTD Cities CERS
$1,000.00 $1,000.00 $0.00 7/24/2020 8/23/2020 CRTD County Attorneys CERS
$1,000.00 $1,000.00 $0.00 7/24/2020 8/23/2020 CRTD Libraries CERS
$1,000.00 $1,000.00 $0.00 8/18/2020 9/17/2020 CRTD County Attorneys CERS
$1,000.00 $1,000.00 $0.00 8/18/2020 9/17/2020 CRTD Non-P1 State Agencies KERS
$1,000.00 $1,000.00 $0.00 8/19/2020 9/18/2020 CRTD Planning Commissions CERS
$1,000.00 $1,000.00 $0.00 8/20/2020 9/19/2020 CRTD Cities CERS
$1,000.00 $1,000.00 $0.00 8/21/2020 9/20/2020 CRTD Cities CERS
Kentucky Retirement Systems
Penalty/Open Invoices Report
From: 7/1/2020 To: 9/30/2020
Note: Delinquent Interest amounts are included in the totals for the invoice
Board Meeting - December 3, 2020 - Audit Committee Report
46

KYRET\cdavis
10/21/2020
12:13:14 PM
Invoice
Amount
Invoice
Remaining
Balance
Delinquent
Interest
Invoice
Status
Date
Invoice
Due Date
Invoice
Status Employer Classification Plan Comments
Kentucky Retirement Systems
Penalty/Open Invoices Report
From: 7/1/2020 To: 9/30/2020
Note: Delinquent Interest amounts are included in the totals for the invoice
$1,000.00 $1,000.00 $0.00 8/24/2020 9/23/2020 CRTD Cities CERS
$3,262.32 $3,262.32 $0.00 8/27/2020 9/26/2020 CRTD Community Action Agencies CERS
$1,000.00 $1,000.00 $0.00 8/29/2020 9/28/2020 CRTD Cities CERS
$1,000.00 $1,000.00 $0.00 9/1/2020 10/1/2020 CRTD Riverport Authorities CERS
$1,000.00 $1,000.00 $0.00 9/10/2020 10/10/2020 CRTD Cities CERS
$1,000.00 $1,000.00 $0.00 9/15/2020 10/15/2020 CRTD Ambulance Services CERS
$1,000.00 $1,000.00 $0.00 9/15/2020 10/15/2020 CRTD Ambulance Services CERS
$1,000.00 $1,000.00 $0.00 9/17/2020 10/17/2020 CRTD Cities CERS
$1,000.00 $1,000.00 $0.00 9/21/2020 10/21/2020 CRTD Cities CERS
$1,410.96 $1,410.96 $0.00 9/21/2020 10/21/2020 CRTD Fire Departments CERS
$1,000.00 $1,000.00 $0.00 9/21/2020 10/21/2020 CRTD Cities CERS
$2,290.20 $2,290.20 $0.00 9/22/2020 10/22/2020 CRTD Community Action Agencies CERSTOTAL $33,045.38
$1,000.00 $0.00 $0.00 8/10/2020 3/29/2017 PAID Cities CERS
$1,000.00 $0.00 $0.00 8/4/2020 8/14/2020 PAID Libraries CERS
$1,000.00 $0.00 $0.00 8/4/2020 8/14/2020 PAID Libraries CERS
$1,000.00 $0.00 $0.00 8/4/2020 8/14/2020 PAID Libraries CERS
$1,000.00 $0.00 $0.00 8/4/2020 8/14/2020 PAID Libraries CERS
$1,000.00 $0.00 $0.00 8/4/2020 8/14/2020 PAID Libraries CERS
$1,000.00 $0.00 $0.00 8/4/2020 8/14/2020 PAID Libraries CERS
$1,000.00 $0.00 $0.00 8/4/2020 8/14/2020 PAID Libraries CERS
$1,000.00 $0.00 $0.00 8/4/2020 8/14/2020 PAID Libraries CERS
$1,000.00 $0.00 $0.00 9/28/2020 10/8/2020 PAID Non-P1 State Agencies KERS
$1,000.00 $0.00 $0.00 7/14/2020 5/3/2020 PAID Libraries CERS
$1,000.00 $0.00 $0.00 7/14/2020 5/14/2020 PAID Ambulance Services CERS
$1,273.92 $0.00 $0.00 7/1/2020 6/17/2020 PAID Fire Departments CERS
$1,000.00 $0.00 $0.00 7/7/2020 7/17/2020 PAID Libraries CERS
$1,075.92 $0.00 $0.00 8/3/2020 7/17/2020 PAID Fire Departments CERS
$1,000.00 $0.00 $0.00 7/10/2020 7/17/2020 PAID Libraries CERS
$1,000.00 $0.00 $0.00 8/31/2020 7/18/2020 PAID Cities CERS
Board Meeting - December 3, 2020 - Audit Committee Report
47

KYRET\cdavis
10/21/2020
12:13:14 PM
Invoice
Amount
Invoice
Remaining
Balance
Delinquent
Interest
Invoice
Status
Date
Invoice
Due Date
Invoice
Status Employer Classification Plan Comments
Kentucky Retirement Systems
Penalty/Open Invoices Report
From: 7/1/2020 To: 9/30/2020
Note: Delinquent Interest amounts are included in the totals for the invoice
$1,000.00 $0.00 $0.00 7/15/2020 7/30/2020 PAID Community Action Agencies CERS
$1,000.00 $0.00 $0.00 9/15/2020 8/13/2020 PAID Ambulance Services CERS
$1,000.00 $0.00 $0.00 8/4/2020 8/13/2020 PAID Libraries CERS
$1,000.00 $0.00 $0.00 9/15/2020 8/13/2020 PAID Ambulance Services CERS
$1,000.00 $0.00 $0.00 7/23/2020 8/14/2020 PAID Community Action Agencies CERS
$1,129.25 $0.00 $0.00 9/1/2020 8/19/2020 PAID Fire Departments CERS
$1,000.00 $0.00 $0.00 9/10/2020 9/20/2020 PAID Housing Authorities CERS
$1,013.19 $0.00 $0.00 8/3/2020 8/22/2020 PAID Community Action Agencies CERS
$1,000.00 $0.00 $0.00 8/6/2020 8/27/2020 PAID Fiscal Courts CERS
$1,000.00 $0.00 $0.00 8/10/2020 8/30/2020 PAID Health Departments KERS
$1,000.00 $0.00 $0.00 8/7/2020 9/2/2020 PAID Community Action Agencies CERS
$1,707.56 $0.00 $0.00 9/30/2020 9/18/2020 PAID Fire Departments CERS
$1,000.00 $0.00 $0.00 9/25/2020 10/5/2020 PAID Utility Boards CERS
$1,000.00 $0.00 $0.00 9/10/2020 9/20/2020 PAID Housing Authorities CERS
$1,000.00 $0.00 $0.00 9/9/2020 9/30/2020 PAID Utility Boards CERS
$1,000.00 $0.00 $0.00 9/10/2020 9/30/2020 PAID Cities CERSTOTAL $34,199.84
Notes:
Invoice Status: CANC - Cancelled
CRTD - Created
PAID - Paid
Board Meeting - December 3, 2020 - Audit Committee Report
48

KYRET\cdavis
10/21/2020
12:13:14 PM
Invoice
Amount
Invoice
Remaining
Balance
Delinquent
Interest
Invoice
Status
Date
Invoice
Due Date
Invoice
Status Employer Classification Plan Comments
Kentucky Retirement Systems
Penalty/Open Invoices Report
From: 7/1/2020 To: 9/30/2020
Note: Delinquent Interest amounts are included in the totals for the invoice
Board Meeting - December 3, 2020 - Audit Committee Report
49

September 4, 2020 Board of Trustees Kentucky Retirement Systems Perimeter Park West 1260 Louisville Road Frankfort, KY 40601
Re: GASB 67 Reporting – Actuarial Information Dear Members of the Board: The reports provided herein contain certain information for the Kentucky Employees Retirement System (KERS), the County Employees Retirement System (CERS), and the State Police Retirement System (SPRS) in connection with the Governmental Accounting Standards Board (GASB) Statement No. 67, “Financial Reporting for Pension Plans” for the fiscal year ending June 30, 2020. Separate reports will be provided at a later date with additional accounting information determined in accordance with GASB Statement No. 68, “Accounting and Financial Reporting for Pensions”. Basis of Calculations The liability calculations presented in the reports were performed for the purpose of satisfying the requirements of GASB No. 67 and are not applicable for other purposes, such as determining the plans’ funding requirements. The plan’s liability for other purposes may produce significantly different results. The total pension liability, net pension liability, and sensitivity information are based on an actuarial valuation date of June 30, 2019. The total pension liability was rolled-forward from the valuation date to the plan’s fiscal year ending June 30, 2020 using generally accepted actuarial principles. Assumptions There have been no changes in actuarial assumptions since June 30, 2019. Plan Provisions House Bill 1 passed during the 2019 Special Legislative Session and allowed certain agencies in the KERS Non-Hazardous plan to elect to cease participating in the System as of June 30, 2020 under different provisions than were previously established. Senate Bill 249 passed during the 2020 Legislative Session delayed the effective date of cessation for these provisions to June 30, 2021. Since each employer’s election is unknown at this time, we did not make any adjustment to the Total Pension Liability to reflect this legislation.
Board Meeting - December 3, 2020 - Audit Committee Report
50

Board of Trustees September 4, 2020 Page 2
Senate Bill 249 also changed the funding period for the amortization of the unfunded liability to 30 years as of June 30, 2019. Gains and losses incurring in future years will be amortized over separate, 20-year amortization bases. This change does not impact the calculation of Total Pension Liability and only impacts the calculation of the contribution rates that would be payable starting July 1, 2020. Additionally, House Bill 271 passed during the 2020 Legislative Session and removed provisions that reduce the monthly payment to a surviving spouse of a member whose death was due to a duty-related injury upon remarriage of the spouse. It also increased benefits for a very small number of beneficiaries. This did not have a material (or measurable) impact on the liability of the plans and therefore, we did not make any adjustment to the Total Pension Liability to reflect this legislation. There were no other material plan provision changes and it is our opinion that these procedures are reasonable and appropriate, and comply with applicable requirements under GASB No. 67. Discount Rates A single discount rate of 5.25% was used for the KERS Non-Hazardous Fund and SPRS and a single discount rate of 6.25% was used for the KERS Hazardous Fund, the CERS Non-Hazardous Fund and the CERS Hazardous Fund to measure the total pension liability for the fiscal year ending June 30, 2020. These single discount rates were based on the expected rate of return on pension plan investments for each system. Based on the stated assumptions and the projection of cash flows as of each fiscal year ending, the pension plan’s fiduciary net position and future contributions were projected to be sufficient to finance all the future benefit payments of the current plan members. Therefore, the long-term expected rate of return on pension plan investments was applied to all periods of the projected benefit payments to determine the total pension liability for each system. The projection of cash flows used to determine the single discount rate must include an assumption regarding actual employer contributions made each future year. Except where noted below, the future contributions are projected assuming that each participating employer in the System contribute the actuarially determined employer contribution rate each future year calculated in accordance with the current funding policy, as most recently revised by Senate Bill 249, passed during the 2020 Legislative Session. This includes the phase-in provisions from House Bill 362 (passed in 2018) that applies to the CERS Funds as well as the provisions from Senate Bill 249 (passed in 2020) which kept CERS contributions level for fiscal year ending 2021. If there is a pattern of legislation that has a resulting effect of employers making contributions less than the actuarially determined rate, we may be required to project contributions that are reflective of recent actual contribution efforts regardless of the stated funding policy (as required by paragraph 42 of GASB Statement No. 67). Legislation has been enacted three times (for FY 18/19, FY 19/20, and FY 20/21) that allowed certain employers (referred to as “Quasi” agencies) in the KERS Non-Hazardous Fund to contribute 41.06% of pay into the retirement fund, which is significantly less than the actuarially determined contribution rate. We believe this constitutes a pattern and as such, the projection for the KERS Non-Hazardous Fund assumes these Quasi agencies contribute no more than 41.06% of pay throughout the entire projection.
Board Meeting - December 3, 2020 - Audit Committee Report
51

Board of Trustees September 4, 2020 Page 2
401(h) Subaccount Based on guidance issued by GASB in connection with GASB Statement No. 74, the 1% of pay member contributions for Tier 2 and Tier 3 members to a 401(h) subaccount is considered as an OPEB asset. As a result, the reported fiduciary net positions as of June 30, 2017 and later are net of the 401(h) asset balance. Additional Disclosures The reports are based upon information, furnished to us by the Retirement System, which includes benefit provisions, membership information, and financial data. We did not audit this data and information, but we did apply a number of tests and concluded that it was reasonable and consistent. GRS is not responsible for the accuracy or completeness of the information provided by the Retirement System. Please see the “Actuarial Valuation Report as of June 30, 2019” for additional discussion of the nature of the actuarial calculations and more information related to participant data, economic and demographic assumptions, and benefit provisions. These reports should be considered together as a complete report for KRS’s fiscal year ending June 30, 2020. To the best of our knowledge, the reports are complete and accurate and are in accordance with generally recognized actuarial practices and methods. Mr. Newton and Mr. White are Enrolled Actuaries. All three of the undersigned are independent actuaries and consultants and members of the American Academy of Actuaries and meet the Qualification Standards of the American Academy of Actuaries to render the actuarial opinion herein. They are also experienced in performing valuations for large public retirement system. This communication shall not be construed to provide tax advice, legal advice or investment advice. Sincerely, Gabriel, Roeder, Smith & Co. Joseph P. Newton, FSA, EA, MAAA Daniel J. White, FSA, EA, MAAA Pension Market Leader and Actuary Senior Consultant and Actuary Janie Shaw, ASA, MAAA Consultant and Actuary
Board Meeting - December 3, 2020 - Audit Committee Report
52

Kentucky County Employees Retirement System GASB No. 67 Accounting Valuation Report As of June 30, 2020
Board Meeting - December 3, 2020 - Audit Committee Report
53

September 15, 2020 Board of Trustees Kentucky Retirement Systems Perimeter Park West 1260 Louisville Road Frankfort, KY 40601
Re: GASB 67 Reporting – Actuarial Information – County Employees Retirement System Dear Members of the Board: This report provided herein contains certain information for the County Employees Retirement System (CERS) in connection with the Governmental Accounting Standards Board (GASB) Statement No. 67, “Financial Reporting for Pension Plans” for the fiscal year ending June 30, 2020. A separate report will be provided at a later date with additional accounting information determined in accordance with GASB Statement No. 68, “Accounting and Financial Reporting for Pensions”. The liability calculations presented in this report were performed for the purpose of satisfying the requirements of GASB No. 67 and are not applicable for other purposes, such as determining the plans’ funding requirements. The plan’s liability for other purposes may produce significantly different results. This report may be provided to parties other than the Board of Trustees of the Kentucky Retirement Systems only in its entirety and only with the permission of the Board. The total pension liability, net pension liability, and sensitivity information shown in this report are based on an actuarial valuation date of June 30, 2019. The total pension liability was rolled-forward from the valuation date to the plan’s fiscal year ending June 30, 2020 using generally accepted actuarial principles. GASB 67 requires Kentucky Retirement Systems to disclose a 10-year history of certain information in the Required Supplementary Information within their comprehensive annual financial report. The exhibits provided in this report include the applicable information for historical years that were calculated in accordance with this accounting standard. Information disclosed for years prior to June 30, 2017 were prepared by KRS’s prior actuary. There have been no plan provision or actuarial assumption changes since June 30, 2019. Senate Bill 249 passed during the 2020 Legislative Session and changed the funding period for the amortization of the unfunded liability to 30 years as of June 30, 2019. Gains and losses incurring in future years will be amortized over separate 20-year amortization bases. This change does not impact the calculation of Total Pension Liability and only impacts the calculation of the contribution rates that would be payable starting July 1, 2020.
Board Meeting - December 3, 2020 - Audit Committee Report
54

Board of Trustees September 15, 2020 Page 2
Additionally, House Bill 271 passed during the 2020 Legislative Session and removed provisions that reduce the monthly payment to a surviving spouse of a member whose death was due to a duty-related injury upon remarriage of the spouse. It also increased benefits for a very small number of beneficiaries. This did not have a material (or measurable) impact on the liability of the plans and therefore, we did not make any adjustment to the Total Pension Liability to reflect this legislation. There were no other material plan provision changes and it is our opinion that these procedures are reasonable and appropriate, and comply with applicable requirements under GASB No. 67. This report is based upon information, furnished to us by the Retirement System, which includes benefit provisions, membership information, and financial data. We did not audit this data and information, but we did apply a number of tests and concluded that it was reasonable and consistent. GRS is not responsible for the accuracy or completeness of the information provided by the Retirement System. Please see the “Actuarial Valuation Report as of June 30, 2019” for additional discussion of the nature of the actuarial calculations and more information related to participant data, economic and demographic assumptions, and benefit provisions. These reports should be considered together as a complete report for KRS’s fiscal year ending June 30, 2020. A single discount rate of 6.25% was used for both the non-hazardous and hazardous system to measure the total pension liability for the fiscal year ending June 30, 2020. This single discount rate was based on the expected rate of return on pension plan investments for each system. Based on the stated assumptions and the projection of cash flows as of each fiscal year ending, the pension plan’s fiduciary net position and future contributions were projected to be sufficient to finance all the future benefit payments of the current plan members. Therefore, the long-term expected rate of return on pension plan investments was applied to all periods of the projected benefit payments to determine the total pension liability for each system. The projection of cash flows used to determine the single discount rate must include an assumption regarding actual employer contributions made each future year. Except where noted below, the future contributions are projected assuming that each participating employer in the System contribute the actuarially determined employer contribution rate each future year calculated in accordance with the current funding policy, as most recently revised by Senate Bill 249, passed during the 2020 Legislative Session. This includes the phase-in provisions from House Bill 362 (passed in 2018) that applies to the CERS Funds as well as the provisions from Senate Bill 249 (passed in 2020) which kept CERS contributions level for fiscal year ending 2021. If there is a future pattern of legislation that has a resulting effect of employers making contributions less than the actuarially determined rate, we may be required to project contributions that are reflective of recent actual contribution efforts regardless of the stated funding policy (as required by paragraph 42 of GASB Statement No. 67). Based on guidance issued by GASB in connection with GASB Statement No. 74, the 1% of pay member contributions for Tier 2 and Tier 3 members to a 401(h) subaccount is considered as an OPEB asset. As a result, the reported fiduciary net positions as of June 30, 2017 and later are net of the 401(h) asset balance.
Board Meeting - December 3, 2020 - Audit Committee Report
55

Board of Trustees September 15, 2020 Page 2
To the best of our knowledge, this report is complete and accurate and is in accordance with generally recognized actuarial practices and methods. Mr. Newton and Mr. White are Enrolled Actuaries. All three of the undersigned are independent actuaries and consultants and members of the American Academy of Actuaries and meet the Qualification Standards of the American Academy of Actuaries to render the actuarial opinion herein. They are also experienced in performing valuations for large public retirement system. This communication shall not be construed to provide tax advice, legal advice or investment advice. Sincerely, Joseph P. Newton, FSA, EA, MAAA Daniel J. White, FSA, EA, MAAA Pension Market Leader and Actuary Senior Consultant and Actuary Janie Shaw, ASA, MAAA Consultant and Actuary
Board Meeting - December 3, 2020 - Audit Committee Report
56

Table of Contents
Kentucky County Employees Retirement System
Page
COVER LETTER
SECTION 1 SUPPORTING EXHIBITS
EXHIBIT 1 — SCHEDULE OF EMPLOYERS’ NET PENSION LIABILITY
EXHIBIT 2 — SCHEDULE OF CHANGES IN EMPLOYERS’ NET PENSION LIABILITY
EXHIBIT 3 — SCHEDULE OF EMPLOYERS’ CONTRIBUTIONS
EXHIBIT 4 — SENSITIVITY OF THE NET PENSION LIABILITY TO CHANGES IN THE DISCOUNT RATE
2
4
6
9
Board Meeting - December 3, 2020 - Audit Committee Report
57

SECTION 1
Board Meeting - December 3, 2020 - Audit Committee Report
58

Kentucky County Employees Retirement System 2
EXHIBIT 1a
Schedule of the Employers’ Net Pension Liability – CERS Non-Hazardous Plan ($ thousands)
Fiscal Year Ending
June 30,
Total Pension Liability
Plan Fiduciary Net Position
Employers' Net Pension
Liability (Asset)
Plan Fiduciary Net Position
as a Percentage of the Total
Pension Liability
Covered Employee
Payroll1
Net Pension Liability
as a Percentage of Covered
Employee Payroll(1) (2) (3) = (1) - (2) (4) = (2) / (1) (5) (6) = (3) / (5)
2020 14,697,244$ 7,027,327$ 7,669,917$ 47.81% 2,462,752$ 311.44%
2019 14,192,966 7,159,921 7,033,045 50.45% 2,424,796 290.05%
2018 13,109,268 7,018,963 6,090,305 53.54% 2,454,927 248.08%
2017 12,540,545 6,687,237 5,853,308 53.32% 2,376,290 246.32%
2016 11,065,013 6,141,395 4,923,618 55.50% 2,417,187 203.69%
2015 10,740,325 6,440,800 4,299,525 59.97% 2,296,716 187.20%
2014 9,772,522 6,528,146 3,244,376 66.80% 2,272,270 142.78%
Note:1 Based on derived compensation using the provided employer contribution information for fiscal years 2017 and later.
Board Meeting - December 3, 2020 - Audit Committee Report
59

Kentucky County Employees Retirement System 3
EXHIBIT 1b
Schedule of the Employers’ Net Pension Liability – CERS Hazardous Plan ($ thousands)
Fiscal Year Ending
June 30,
Total Pension Liability
Plan Fiduciary Net Position
Employers' Net Pension
Liability (Asset)
Plan Fiduciary Net Position
as a Percentage of the Total
Pension Liability
Covered Employee
Payroll1
Net Pension Liability
as a Percentage of Covered
Employee Payroll(1) (2) (3) = (1) - (2) (4) = (2) / (1) (5) (6) = (3) / (5)
2020 5,394,732$ 2,379,704$ 3,015,028$ 44.11% 559,551$ 538.83%
2019 5,176,003 2,413,708 2,762,295 46.63% 553,541 499.02%
2018 4,766,794 2,348,337 2,418,457 49.26% 562,853 429.68%
2017 4,455,275 2,217,996 2,237,279 49.78% 526,559 424.89%
2016 3,726,115 2,010,174 1,715,941 53.95% 526,334 326.02%
2015 3,613,308 2,078,202 1,535,106 57.52% 483,641 317.41%
2014 3,288,826 2,087,002 1,201,824 63.46% 479,164 250.82%
Note:1 Based on derived compensation using the provided employer contribution information for fiscal years 2017 and later.
Board Meeting - December 3, 2020 - Audit Committee Report
60

Kentucky County Employees Retirement System 4
EXHIBIT 2a
Schedule of the Employers’ Net Pension Liability – CERS Non-Hazardous Plan ($ thousands)
Change in the Net Pension Liability 2020 2019 2018 2017 2016 2015 2014
Total pension liabilityService Cost 280,092$ 254,643$ 254,169$ 193,082$ 209,101$ 207,400$ 192,482$ Interest 861,720 794,935 760,622 803,555 780,587 733,002 710,526 Benefit Changes 0 0 15,708 0 0 0 0 Difference between actual and expected experience 173,345 87,377 279,401 (208,015) 0 49,966 0 Assumption Changes 0 727,351 0 1,388,800 0 606,293 0 Benefit Payments (810,879) (780,608) (741,177) (701,891) (665,000) (628,858) (597,136) Net Change in Total Pension Liability 504,278$ 1,083,698$ 568,723$ 1,475,532$ 324,687$ 967,803$ 305,872$
Total Pension Liability - Beginning 14,192,966$ 13,109,268$ 12,540,545$ 11,065,013$ 10,740,325$ 9,772,522$ 9,466,650$ Total Pension Liability - Ending (a) 14,697,244$ 14,192,966$ 13,109,268$ 12,540,545$ 11,065,013$ 10,740,325$ 9,772,522$
Plan Fiduciary Net Position1
Contributions - Employer 475,416$ 393,453$ 358,017$ 333,554$ 284,105$ 298,565$ 324,231$ Contributions - Member2 168,994 159,064 160,370 150,715 141,674 140,311 128,568 Refunds of contributions to members (14,919) (14,387) (14,608) (14,430) (13,753) (13,523) (14,286) Retirement benefits (795,960) (766,221) (726,569) (687,461) (651,246) (615,335) (582,850) Net Investment Income2 56,180 390,664 573,829 825,900 (40,800) 110,568 895,530 Administrative Expense (22,305) (21,659) (19,592) (19,609) (19,385) (18,212) (18,615)
Other 0 44 5 361 5 (42,827) 4 0 10,280 0 Net Change in Plan Fiduciary Net Position (132,594)$ 140,958$ 331,808$ 545,843$ (299,405)$ (87,346)$ 732,578$
Plan Fiduciary Net Position - Beginning 7,159,921$ 7,018,963$ 6,687,237$ 6,141,395$ 6,440,800$ 6,528,146$ 5,795,568$ Prior Year Adjustment - - (82) - - - - Plan Fiduciary Net Position - Ending (b) 7,027,327$ 7,159,921$ 7,018,963$ 6,687,237$ 6,141,395$ 6,440,800$ 6,528,146$
Net Pension Liability - Ending (a) - (b) 7,669,917$ 7,033,045$ 6,090,305$ 5,853,308$ 4,923,618$ 4,299,525$ 3,244,376$ Plan Fiduciary Net Position as a Percentage 47.81% 50.45% 53.54% 53.32% 55.50% 59.97% 66.80%Covered Employee Payroll3 2,462,752$ 2,424,796$ 2,454,927$ 2,376,290$ 2,417,187$ 2,296,716$ 2,272,270$ Net Pension Liability as a Percentage of Covered Employee Payroll 311.44% 290.05% 248.08% 246.32% 203.69% 187.20% 142.78%
Notes:1 Does not include 401(h) assets for fiscal years 2017 and later2 Does not include 401(h) contributions and investment income on 401(h) contributions for fiscal years 2017 and later3 Based on derived compensation using the provided employer contribution information for fiscal years 2017 and later4 Adjustment due to 401(h) plan asset balance that is considered an OPEB asset under GASB 74 for fiscal years 2017 and later5 Northern Trust Settlement
Board Meeting - December 3, 2020 - Audit Committee Report
61

Kentucky County Employees Retirement System 5
EXHIBIT 2b
Schedule of the Employers’ Net Pension Liability – CERS Hazardous Plan ($ thousands)
Change in the Net Pension Liability 2020 2019 2018 2017 2016 2015 2014
Total pension liabilityService Cost 109,887$ 77,426$ 81,103$ 58,343$ 66,249$ 71,934$ 66,761$ Interest 314,762 289,741 270,694 270,860 262,886 247,008 238,665 Benefit Changes 0 0 2,172 0 0 0 0 Difference between actual and expected experience 73,696 27,364 205,882 92,588 0 41,935 0 Assumption Changes 0 276,541 0 536,667 0 166,849 0 Benefit Payments (279,616) (261,863) (248,332) (229,299) (216,327) (203,244) (192,299) Net Change in Total Pension Liability 218,729$ 409,209$ 311,519$ 729,159$ 112,807$ 324,482$ 113,127$
Total Pension Liability - Beginning 5,176,003$ 4,766,794$ 4,455,275$ 3,726,115$ 3,613,308$ 3,288,826$ 3,175,699$ Total Pension Liability - Ending (a) 5,394,732$ 5,176,003$ 4,766,794$ 4,455,275$ 3,726,115$ 3,613,308$ 3,288,826$
Plan Fiduciary Net Position1
Contributions - Employer 168,443$ 138,053$ 127,660$ 115,947$ 105,713$ 108,071$ 115,240$ Contributions - Member2 63,236 58,661 61,089 60,101 52,972 47,692 43,722 Refunds of contributions to members (3,814) (2,854) (4,214) (2,315) (2,879) (3,111) (2,664) Retirement benefits (275,802) (259,009) (244,118) (226,984) (213,448) (200,134) (189,635) Net Investment Income2 15,914 132,232 191,324 270,473 (9,020) 37,104 288,490 Administrative Expense (1,981) (1,726) (1,504) (1,421) (1,366) (1,288) (1,721)
Other 0 14 5 111 5 (7,979) 4 0 2,865 0 Net Change in Plan Fiduciary Net Position (34,004)$ 65,371$ 130,348$ 207,822$ (68,028)$ (8,801)$ 253,432$
Plan Fiduciary Net Position - Beginning 2,413,708$ 2,348,337$ 2,217,996$ 2,010,174$ 2,078,202$ 2,087,002$ 1,833,570$ Prior Year Adjustment - - (7) - - - - Plan Fiduciary Net Position - Ending (b) 2,379,704$ 2,413,708$ 2,348,337$ 2,217,996$ 2,010,174$ 2,078,202$ 2,087,002$
Net Pension Liability - Ending (a) - (b) 3,015,028$ 2,762,295$ 2,418,457$ 2,237,279$ 1,715,941$ 1,535,106$ 1,201,824$ Plan Fiduciary Net Position as a Percentage 44.11% 46.63% 49.26% 49.78% 53.95% 57.52% 63.46%Covered Employee Payroll3 559,551$ 553,541$ 562,853$ 526,559$ 526,334$ 483,641$ 479,164$ Net Pension Liability as a Percentage of Covered Employee Payroll 538.83% 499.02% 429.68% 424.89% 326.02% 317.41% 250.82%
Notes:1 Does not include 401(h) assets for fiscal years 2017 and later2 Does not include 401(h) contributions and investment income on 401(h) contributions for fiscal years 2017 and later3 Based on derived compensation using the provided employer contribution information for fiscal years 2017 and later4 Adjustment due to 401(h) plan asset balance that is considered an OPEB asset under GASB 74 for fiscal years 2017 and later5 Northern Trust Settlement
Board Meeting - December 3, 2020 - Audit Committee Report
62

Kentucky County Employees Retirement System 6
EXHIBIT 3a
Schedule of Employers’ Contributions – CERS Non-Hazardous Plan ($ thousands)
Fiscal Year
Ending
Actuarially Determined
Contribution1
Total Employer
Contributions
Contribution Deficiency
(Excess)
Covered Employee
Payroll2
Actual Contributions
as a Percentage of Covered
Payroll
2020 554,612$ 475,416$ 79,196$ 2,462,752$ 19.30%
2019 529,575 393,453 136,122 2,424,796 16.23%
2018 355,473 358,017 (2,544) 2,454,927 14.58%
2017 331,492 333,554 (2,062) 2,376,290 14.04%
2016 282,767 284,106 (1,339) 2,417,187 11.75%
2015 297,715 298,566 (851) 2,296,716 13.00%
2014 324,231 324,231 - 2,272,270 14.27%
2013 294,914 294,914 - 2,236,277 13.19%
2012 261,764 275,736 (13,972) 2,236,546 12.33%
2011 218,985 248,519 (29,534) 2,276,596 10.92%
Notes:1 Actuarially determined contribution rate for fiscal year ending 2020 is based on the contribution rate calculated with the June 30, 2018 actuarial valuation.2 Based on derived compensation using the provided employer contribution information for fiscal years 2017 and later
Board Meeting - December 3, 2020 - Audit Committee Report
63

Kentucky County Employees Retirement System 7
EXHIBIT 3b
Schedule of Employers’ Contributions – CERS Hazardous Plan ($ thousands)
Fiscal Year
Ending
Actuarially Determined
Contribution1
Total Employer
Contributions
Contribution Deficiency
(Excess)
Covered Employee
Payroll2
Actual Contributions
as a Percentage of Covered
Payroll
2020 206,922$ 168,443$ 38,479$ 559,551$ 30.10%
2019 197,559 138,053 59,506 553,541 24.94%
2018 124,953 127,660 (2,707) 562,853 22.68%
2017 114,316 115,947 (1,631) 526,559 22.02%
2016 104,952 105,713 (761) 526,334 20.08%
2015 107,514 108,071 (557) 483,641 22.35%
2014 115,240 115,240 - 479,164 24.05%
2013 120,140 120,140 - 461,673 26.02%
2012 83,589 89,329 (5,740) 464,229 19.24%
2011 78,796 85,078 (6,282) 466,964 18.22%
Notes:1 Actuarially determined contribution rate for fiscal year ending 2020 is based on the contribution rate calculated with the June 30, 2018 actuarial valuation.2 Based on derived compensation using the provided employer contribution information for fiscal years 2017 and later
Board Meeting - December 3, 2020 - Audit Committee Report
64

Kentucky County Employees Retirement System 8
Notes to Schedule of Employers’ Contributions for FYE 2020
The actuarially determined contribution rates effective for fiscal year ending 2020 that are documented in the schedule on the previous pages were calculated as of June 30, 2018. Based on the June 30, 2018 actuarial valuation report, the actuarial methods and assumptions used to calculate these contribution rates are below:
Item CERS
Non-Hazardous CERS
Hazardous
Determined by the Actuarial Valuation as of:
June 30, 2018
June 30, 2018
Actuarial Cost Method: Entry Age Normal Entry Age Normal
Asset Valuation Method: 20% of the difference between the market value of assets and the expected actuarial value of assets is recognized
20% of the difference between the market value of assets and the expected actuarial value of assets is recognized
Amortization Method: Level Percent of Pay Level Percent of Pay
Amortization Period: 25 Years, Closed 25 Years, Closed
Payroll Growth Rate 2.00% 2.00%
Investment Return: 6.25% 6.25%
Inflation: 2.30% 2.30%
Salary Increases: 3.30% to 11.55%, varies by service 3.05% to 18.55%, varies by service
Mortality: RP-2000 Combined Mortality Table, projected to 2013 with Scale BB (set back 1 year for females)
RP-2000 Combined Mortality Table, projected to 2013 with Scale BB (set back 1 year for females)
Phase-In provision Board certified rate is phased into the actuarially determined rate in accordance with HB 362 enacted in 2018.
Board certified rate is phased into the actuarially determined rate in accordance with HB 362 enacted in 2018.
Board Meeting - December 3, 2020 - Audit Committee Report
65

Kentucky County Employees Retirement System 9
EXHIBIT 4
Sensitivity of the Net Pension Liability to Changes in the Discount Rate ($ thousands)
Table 1. Sensitivity of the Net Pension Liability to Changes in the Discount Rate for CERS (Non-Hazardous)
1.00% Decrease (5.25%)
Current Discount Rate
(6.25%)
1.00% Increase (7.25%)
9,458,677$ 7,669,917$ 6,188,756$
Table 2. Sensitivity of the Net Pension Liability to Changes in the Discount Rate for CERS (Hazardous)
1.00% Decrease (5.25%)
Current Discount Rate
(6.25%)
1.00% Increase (7.25%)
3,726,146$ 3,015,028$ 2,434,569$
Board Meeting - December 3, 2020 - Audit Committee Report
66

Kentucky Employees Retirement System GASB No. 67 Accounting Valuation Report As of June 30, 2020
Board Meeting - December 3, 2020 - Audit Committee Report
67

September 4, 2020 Board of Trustees Kentucky Retirement Systems Perimeter Park West 1260 Louisville Road Frankfort, KY 40601
Re: GASB 67 Reporting – Actuarial Information – Kentucky Employees Retirement System Dear Members of the Board: This report provided herein contains certain information for the Kentucky Employees Retirement System (KERS) in connection with the Governmental Accounting Standards Board (GASB) Statement No. 67, “Financial Reporting for Pension Plans” for the fiscal year ending June 30, 2020. A separate report will provided at a later date with additional accounting information determined in accordance with GASB Statement No. 68, “Accounting and Financial Reporting for Pensions”. The liability calculations presented in this report were performed for the purpose of satisfying the requirements of GASB No. 67 and are not applicable for other purposes, such as determining the plans’ funding requirements. The plan’s liability for other purposes may produce significantly different results. This report may be provided to parties other than the Board of Trustees of the Kentucky Retirement Systems only in its entirety and only with the permission of the Board. The total pension liability, net pension liability, and sensitivity information shown in this report are based on an actuarial valuation date of June 30, 2019. The total pension liability was rolled-forward from the valuation date to the plan’s fiscal year ending June 30, 2020 using generally accepted actuarial principles. GASB 67 requires Kentucky Retirement Systems to disclose a 10-year history of certain information in the Required Supplementary Information within their comprehensive annual financial report. The exhibits provided in this report include the applicable information for historical years that were calculated in accordance with this accounting standard. Information disclosed for years prior to June 30, 2017 were prepared by KRS’s prior actuary. There have been no assumption changes since June 30, 2019. House Bill 1 passed during the 2019 Special Legislative Session and allowed certain agencies in the Non-Hazardous plan to elect to cease participating in the System as of June 30, 2020 under different provisions than were previously established. Senate Bill 249 passed during the 2020 Legislative Session and delayed the effective date of cessation for these provisions to June 30, 2021. Since each employer’s election is unknown at this time, we did not make any adjustment to the Total Pension Liability to reflect this legislation.
Board Meeting - December 3, 2020 - Audit Committee Report
68

Board of Trustees September 4, 2020 Page 2
Senate Bill 249 also changed the funding period for the amortization of the unfunded liability to 30 years as of June 30, 2019. Gains and losses incurring in future years will be amortized over separate 20-year amortization bases. This change does not impact the calculation of Total Pension Liability and only impacts the calculation of the contribution rates that would be payable starting July 1, 2020. Additionally, House Bill 271 passed during the 2020 Legislative Session and removed provisions that reduce the monthly payment to a surviving spouse of a member whose death was due to a duty-related injury upon remarriage of the spouse. It also increased benefits for a very small number of beneficiaries. This did not have a material (or measurable) impact on the liability of the plans and therefore, we did not make any adjustment to the Total Pension Liability to reflect this legislation. There were no other material plan provision changes and it is our opinion that these procedures are reasonable and appropriate, and comply with applicable requirements under GASB No. 67. This report is based upon information, furnished to us by the Retirement System, which includes benefit provisions, membership information, and financial data. We did not audit this data and information, but we did apply a number of tests and concluded that it was reasonable and consistent. GRS is not responsible for the accuracy or completeness of the information provided by the Retirement System. Please see the “Actuarial Valuation Report as of June 30, 2019” for additional discussion of the nature of the actuarial calculations and more information related to participant data, economic and demographic assumptions, and benefit provisions. These reports should be considered together as a complete report for KRS’s fiscal year ending June 30, 2020. Single discount rates of 5.25% for the non-hazardous system and 6.25% for the hazardous system were used to measure the total pension liability for the fiscal year ending June 30, 2020. This single discount rate was based on the expected rate of return on pension plan investments for each system. Based on the stated assumptions and the projection of cash flows as of each fiscal year ending, the pension plan’s fiduciary net position and future contributions were projected to be sufficient to finance all the future benefit payments of the current plan members. Therefore, the long-term expected rate of return on pension plan investments was applied to all periods of the projected benefit payments to determine the total pension liability for each system. The projection of cash flows used to determine the single discount rate must include an assumption regarding actual employer contributions made each future year. Except where noted below, the future contributions are projected assuming that each participating employer in the System contribute the actuarially determined employer contribution rate each future year calculated in accordance with the current funding policy, as most recently revised by Senate Bill 249, passed during the 2020 Legislative Session. If there is a pattern of legislation that has a resulting effect of employers making contributions less than the actuarially determined rate, we may be required to project contributions that are reflective of recent actual contribution efforts regardless of the stated funding policy (as required by paragraph 42 of GASB Statement No. 67). Legislation has been enacted three times (for FY 18/19, FY 19/20, and FY 20/21) that allowed certain employers (referred to as “Quasi” agencies) in the KERS Non-Hazardous Fund to contribute 41.06% of pay into the retirement fund, which is significantly less than the actuarially determined contribution rate. We believe this constitutes a pattern and as such, the projection for the KERS Non-Hazardous Fund assumes these Quasi agencies contribute no more than 41.06% of pay throughout the entire projection.
Board Meeting - December 3, 2020 - Audit Committee Report
69

Board of Trustees September 4, 2020 Page 2
Based on guidance issued by GASB in connection with GASB Statement No. 74, the 1% of pay member contributions for Tier 2 and Tier 3 members to a 401(h) subaccount is considered as an OPEB asset. As a result, the reported fiduciary net positions as of June 30, 2017 and later are net of the 401(h) asset balance. To the best of our knowledge, this report is complete and accurate and is in accordance with generally recognized actuarial practices and methods. Mr. Newton and Mr. White are Enrolled Actuaries. All three of the undersigned are independent actuaries and consultants and members of the American Academy of Actuaries and meet the Qualification Standards of the American Academy of Actuaries to render the actuarial opinion herein. They are also experienced in performing valuations for large public retirement system. This communication shall not be construed to provide tax advice, legal advice or investment advice. Sincerely, Gabriel Roeder Smith & Co. Joseph P. Newton, FSA, EA, MAAA Daniel J. White, FSA, EA, MAAA Pension Market Leader and Actuary Senior Consultant and Actuary Janie Shaw, ASA, MAAA Consultant and Actuary
Board Meeting - December 3, 2020 - Audit Committee Report
70

Table of Contents
Kentucky Employees Retirement System
Page
COVER LETTER
SECTION 1 SUPPORTING EXHIBITS
EXHIBIT 1 — SCHEDULE OF EMPLOYERS’ NET PENSION LIABILITY
EXHIBIT 2 — SCHEDULE OF CHANGES IN EMPLOYERS’ NET PENSION LIABILITY
EXHIBIT 3 — SCHEDULE OF EMPLOYERS’ CONTRIBUTIONS
EXHIBIT 4 — SENSITIVITY OF THE NET PENSION LIABILITY TO CHANGES IN THE DISCOUNT RATE
2
4
6
9
Board Meeting - December 3, 2020 - Audit Committee Report
71

SECTION 1
Board Meeting - December 3, 2020 - Audit Committee Report
72

Kentucky Employees Retirement System 2
EXHIBIT 1a
Schedule of the Employers’ Net Pension Liability – KERS Non-Hazardous Plan ($ in thousands)
Fiscal Year
Ending
June 30,
Total
Pension
Liability
Plan Fiduciary
Net Position
Employers'
Net Pension
Liability (Asset)
Plan Fiduciary
Net Position
as a Percentage
of the Total
Pension Liability
Covered
Employee
Payroll1
Net Pension
Liability
as a Percentage
of Covered
Employee Payroll
(1) (2) (3) = (1) - (2) (4) = (2) / (1) (5) (6) = (3) / (5)
2020 16,472,733$ 2,308,080$ 14,164,653$ 14.01% 1,476,156$ 959.56%
2019 16,356,674 2,233,672 14,123,002 13.66% 1,485,854 950.50%
2018 15,608,221 2,004,446 13,603,775 12.84% 1,509,955 900.94%
2017 15,445,206 2,056,870 13,388,336 13.32% 1,602,396 835.52%
2016 13,379,781 1,980,292 11,399,489 14.80% 1,631,025 698.92%
2015 12,359,673 2,327,783 10,031,890 18.83% 1,544,234 649.64%
2014 11,550,110 2,578,291 8,971,819 22.32% 1,577,496 568.74%
Note:1 Based on derived compensation using the provided employer contribution information for fiscal years 2017 and later.
Board Meeting - December 3, 2020 - Audit Committee Report
73

Kentucky Employees Retirement System 3
EXHIBIT 1b
Schedule of the Employers’ Net Pension Liability – KERS Hazardous Plan ($ in thousands)
Fiscal Year
Ending
June 30,
Total
Pension
Liability
Plan Fiduciary
Net Position
Employers'
Net Pension
Liability (Asset)
Plan Fiduciary
Net Position
as a Percentage
of the Total
Pension Liability
Covered
Employee
Payroll1
Net Pension
Liability
as a Percentage
of Covered
Employee Payroll
(1) (2) (3) = (1) - (2) (4) = (2) / (1) (5) (6) = (3) / (5)
2020 1,251,027$ 690,350$ 560,677$ 55.18% 171,840$ 326.28%
2019 1,227,226 680,932 546,294 55.49% 160,600 340.16%
2018 1,150,610 645,485 505,125 56.10% 152,936 330.29%
2017 1,098,630 601,529 497,101 54.75% 178,511 278.47%
2016 919,517 527,879 391,638 57.41% 158,828 246.58%
2015 895,433 552,468 342,965 61.70% 128,680 266.53%
2014 816,850 561,484 255,366 68.74% 129,076 197.84%
Note:1 Based on derived compensation using the provided employer contribution information for fiscal years 2017 and later.
Board Meeting - December 3, 2020 - Audit Committee Report
74

Kentucky Employees Retirement System 4
EXHIBIT 2a
Schedule of the Employers’ Net Pension Liability – KERS Non-Hazardous Plan ($ in thousands)
Change in the Net Pension Liability 2020 2019 2018 2017 2016 2015 2014
Total pension liabilityService Cost 179,702$ 184,988$ 195,681$ 143,858$ 139,631$ 143,847$ 133,361$
Interest 832,178 793,163 785,123 870,725 891,897 859,509 853,653
Benefit Changes 0 0 9,624 0 0 0 0
Difference between actual and expected experience 115,515 70,529 153,565 (134,379) 0 30,958 0
Assumption Changes 0 700,464 0 2,145,530 923,999 694,592 0
Benefit Payments (1,011,336) (1,000,691) (980,978) (960,309) (935,419) (919,343) (903,564)
Net Change in Total Pension Liability 116,059$ 748,453$ 163,015$ 2,065,425$ 1,020,108$ 809,563$ 83,450$
Total Pension Liability - Beginning 16,356,674$ 15,608,221$ 15,445,206$ 13,379,781$ 12,359,673$ 11,550,110$ 11,466,660$
Total Pension Liability - Ending (a) 16,472,733$ 16,356,674$ 15,608,221$ 15,445,206$ 13,379,781$ 12,359,673$ 11,550,110$
Plan Fiduciary Net Position1
Contributions - Employer 948,592$ 1,035,462$ 689,143$ 757,121$ 513,084$ 521,691$ 296,836$
Contributions - Member296,594 93,759 104,972 100,543 106,495 104,606 97,487
Refunds of contributions to members (11,523) (12,342) (13,603) (11,819) (12,130) (13,552) (13,627)
Retirement benefits (999,813) (988,349) (967,375) (948,490) (923,288) (905,791) (889,937)
Net Investment Income252,499 112,371 144,881 220,985 (20,663) 44,570 337,923
Administrative Expense (11,941) (11,712) (10,692) (10,957) (10,989) (10,474) (11,145)
Other 0 37 5 301 5 (30,805) 4 0 8,442 0
Net Change in Plan Fiduciary Net Position 74,408$ 229,226$ (52,373)$ 76,578$ (347,491)$ (250,508)$ (182,463)$
Plan Fiduciary Net Position - Beginning 2,233,672$ 2,004,446$ 2,056,870$ 1,980,292$ 2,327,783$ 2,578,291$ 2,760,754$
Prior Year Adjustment - - (51) - - - -
Plan Fiduciary Net Position - Ending (b) 2,308,080$ 2,233,672$ 2,004,446$ 2,056,870$ 1,980,292$ 2,327,783$ 2,578,291$
Net Pension Liability - Ending (a) - (b) 14,164,653$ 14,123,002$ 13,603,775$ 13,388,336$ 11,399,489$ 10,031,890$ 8,971,819$ Plan Fiduciary Net Position as a Percentage 14.01% 13.66% 12.84% 13.32% 14.80% 18.83% 22.32%
Covered Employee Payroll3 1,476,156$ 1,485,854$ 1,509,955$ 1,602,396$ 1,631,025$ 1,544,234$ 1,577,496$
Net Pension Liability as a Percentage of
Covered Employee Payroll 959.56% 950.50% 900.94% 835.52% 698.92% 649.64% 568.74%
Notes:1 Does not include 401(h) assets for fiscal years 2017 and later2 Does not include 401(h) contributions and investment income on 401(h) contributions for fiscal years 2017 and later3 Based on derived compensation using the provided employer contribution information for fiscal years 2017 and later4 Adjustment due to 401(h) plan asset balance that is considered an OPEB asset under GASB 74 for fiscal years 2017 and later5 Northern Trust Settlement
Board Meeting - December 3, 2020 - Audit Committee Report
75

Kentucky Employees Retirement System 5
EXHIBIT 2b
Schedule of the Employers’ Net Pension Liability – KERS Hazardous Plan ($ in thousands)
Change in the Net Pension Liability 2020 2019 2018 2017 2016 2015 2014
Total pension liability
Service Cost 25,568$ 27,117$ 28,641$ 21,081$ 20,751$ 18,729$ 16,880$
Interest 74,357 69,657 66,536 66,589 64,851 61,005 59,594
Benefit Changes 0 0 705 0 0 0 0
Difference between actual and expected experience (1,095) 1,395 24,215 26,902 0 6,067 0
Assumption Changes 0 50,658 0 127,878 0 52,165 0
Benefit Payments (75,029) (72,211) (68,117) (63,338) (61,518) (59,383) (57,151)
Net Change in Total Pension Liability 23,801$ 76,616$ 51,980$ 179,112$ 24,084$ 78,583$ 19,323$
Total Pension Liability - Beginning 1,227,226$ 1,150,610$ 1,098,630$ 919,517$ 895,433$ 816,850$ 797,527$
Total Pension Liability - Ending (a) 1,251,027$ 1,227,226$ 1,150,610$ 1,098,630$ 919,517$ 895,433$ 816,850$
Plan Fiduciary Net Position1
Contributions - Employer 59,115$ 55,259$ 43,661$ 52,974$ 23,759$ 28,536$ 11,670$
Contributions - Member219,769 17,118 17,891 17,524 15,739 13,207 12,546
Refunds of contributions to members (3,168) (2,684) (2,501) (2,106) (2,211) (2,610) (2,830)
Retirement benefits (71,861) (69,527) (65,616) (61,231) (59,306) (56,773) (54,320)
Net Investment Income26,739 36,380 51,467 70,994 (1,653) 8,701 80,724
Administrative Expense (1,176) (1,103) (975) (919) (916) (844) (897)
Other 0 4 5 33 5 (3,586) 4 0 767 0
Net Change in Plan Fiduciary Net Position 9,418$ 35,447$ 43,960$ 73,650$ (24,588)$ (9,016)$ 46,893$
Plan Fiduciary Net Position - Beginning 680,932$ 645,485$ 601,529$ 527,879$ 552,468$ 561,484$ 514,591$
Prior Year Adjustment - - (4) - - - -
Plan Fiduciary Net Position - Ending (b) 690,350$ 680,932$ 645,485$ 601,529$ 527,879$ 552,468$ 561,484$
Net Pension Liability - Ending (a) - (b) 560,677$ 546,294$ 505,125$ 497,101$ 391,638$ 342,965$ 255,366$ Plan Fiduciary Net Position as a Percentage 55.18% 55.49% 56.10% 54.75% 57.41% 61.70% 68.74%
Covered Employee Payroll3 171,840$ 160,600$ 152,936$ 178,511$ 158,828$ 128,680$ 129,076$
Net Pension Liability as a Percentage of
Covered Employee Payroll 326.28% 340.16% 330.29% 278.47% 246.58% 266.53% 197.84%
Notes:1 Does not include 401(h) assets for fiscal years 2017 and later2 Does not include 401(h) contributions and investment income on 401(h) contributions for fiscal years 2017 and later3 Based on derived compensation using the provided employer contribution information for fiscal years 2017 and later4 Adjustment due to 401(h) plan asset balance that is considered an OPEB asset under GASB 74 for fiscal years 2017 and later5 Northern Trust Settlement
Board Meeting - December 3, 2020 - Audit Committee Report
76

Kentucky Employees Retirement System 6
EXHIBIT 3a
Schedule of Employers’ Contributions – KERS Non-Hazardous Plan ($ in thousands)
Fiscal
Year
Ending
Actuarially
Determined
Contribution1
Total
Employer
Contributions
Contribution
Deficiency
(Excess)
Covered
Employee
Payroll2
Actual
Contributions
as a Percentage
of Covered
Payroll
2020 1,048,513$ 948,592$ 99,921$ 1,476,156$ 64.26%
2019 1,055,402 1,035,462 19,940 1,485,854 69.69%
2018 633,879 689,143 (55,264) 1,509,955 45.64%
2017 623,813 757,121 (133,308) 1,602,396 47.25%
2016 512,670 513,084 (414) 1,631,025 31.46%
2015 520,948 521,691 (743) 1,544,234 33.78%
2014 520,765 296,836 223,929 1,577,496 18.82%
2013 485,396 280,874 204,522 1,644,409 17.08%
2012 441,094 214,786 226,308 1,644,897 13.06%
2011 381,915 193,754 188,161 1,731,633 11.19%
Notes:1 Actuarially determined contribution rate for fiscal year ending 2020 is based on the
contribution rate calculated with the June 30, 2017 actuarial valuation.
2 Based on derived compensation using the provided employer contribution information for
fiscal years 2017 and later
Board Meeting - December 3, 2020 - Audit Committee Report
77

Kentucky Employees Retirement System 7
EXHIBIT 3b
Schedule of Employers’ Contributions – KERS Hazardous Plan ($ in thousands)
Fiscal
Year
Ending
Actuarially
Determined
Contribution1
Total
Employer
Contributions
Contribution
Deficiency
(Excess)
Covered
Employee
Payroll2
Actual
Contributions
as a Percentage
of Covered
Payroll
2020 59,096$ 59,115$ (19)$ 171,840$ 34.40%
2019 55,230 55,259 (29) 160,600 34.41%
2018 31,321 43,661 (12,340) 152,936 28.55%
2017 37,630 52,974 (15,344) 178,511 29.68%
2016 23,690 23,759 (69) 158,828 14.96%
2015 28,374 28,536 (162) 128,680 22.18%
2014 13,570 11,670 1,900 129,076 9.04%
2013 21,502 27,334 (5,832) 131,015 20.86%
2012 20,265 20,809 (544) 131,977 15.77%
2011 20,605 19,141 1,464 133,054 14.39%
Notes:1 Actuarially determined contribution rate for fiscal year ending 2020 is based on the
contribution rate calculated with the June 30, 2017 actuarial valuation.
2 Based on derived compensation using the provided employer contribution information for
fiscal years 2017 and later
Board Meeting - December 3, 2020 - Audit Committee Report
78

Kentucky Employees Retirement System 8
Notes to Schedule of Employers’ Contributions for FYE 2020
The actuarially determined contribution rates effective for fiscal year ending 2020 that are documented in the schedule on the previous pages were calculated as of June 30, 2017. Based on the June 30, 2017 actuarial valuation report, the actuarial methods and assumptions used to calculate these contribution rates are below:
Item
KERS Non-Hazardous
KERS Hazardous
Determined by the Actuarial Valuation as of:
June 30, 2017
June 30, 2017
Actuarial Cost Method: Entry Age Normal Entry Age Normal
Asset Valuation Method: 20% of the difference between the market value of assets and the expected actuarial value of assets is recognized
20% of the difference between the market value of assets and the expected actuarial value of assets is recognized
Amortization Method: Level Percent of Pay Level Percent of Pay
Amortization Period: 26 Years, Closed 26 Years, Closed
Payroll Growth Rate 0.00% 0.00%
Investment Return: 5.25% 6.25%
Inflation: 2.30% 2.30%
Salary Increases: 3.55% to 15.55%, varies by service 3.55% to 19.55%, varies by service
Mortality: RP-2000 Combined Mortality Table, projected to 2013 with Scale BB (set back 1 year for females)
RP-2000 Combined Mortality Table, projected to 2013 with Scale BB (set back 1 year for females)
Board Meeting - December 3, 2020 - Audit Committee Report
79

Kentucky Employees Retirement System 9
EXHIBIT 4
Sensitivity of the Net Pension Liability to Changes in the Discount Rate ($ in thousands)
Table 1. Sensitivity of the Net Pension Liability to Changes in the Discount Rate for KERS (Non-Hazardous)
1.00%
Decrease
(4.25%)
Current
Discount Rate
(5.25%)
1.00%
Increase
(6.25%)
16,223,729$ 14,164,653$ 12,472,483$
Table 2. Sensitivity of the Net Pension Liability to Changes in the Discount Rate for KERS (Hazardous)
1.00%
Decrease
(5.25%)
Current
Discount Rate
(6.25%)
1.00%
Increase
(7.25%)
717,449$ 560,677$ 433,056$
Board Meeting - December 3, 2020 - Audit Committee Report
80

Kentucky State Police Retirement System GASB No. 67 Accounting Valuation Report As of June 30, 2020
Board Meeting - December 3, 2020 - Audit Committee Report
81

September 15, 2020 Board of Trustees Kentucky Retirement Systems Perimeter Park West 1260 Louisville Road Frankfort, KY 40601
Re: GASB 67 Reporting – Actuarial Information – State Police Retirement System Dear Members of the Board: This report provided herein contains certain information for the State Police Retirement System (SPRS) in connection with the Governmental Accounting Standards Board (GASB) Statement No. 67, “Financial Reporting for Pension Plans” for the fiscal year ending June 30, 2020. A separate report will be provided at a later date with additional accounting information determined in accordance with GASB Statement No. 68, “Accounting and Financial Reporting for Pensions”. The liability calculations presented in this report were performed for the purpose of satisfying the requirements of GASB No. 67 and are not applicable for other purposes, such as determining the plans’ funding requirements. The plan’s liability for other purposes may produce significantly different results. This report may be provided to parties other than the Board of Trustees of the Kentucky Retirement Systems only in its entirety and only with the permission of the Board. The total pension liability, net pension liability, and sensitivity information shown in this report are based on an actuarial valuation date of June 30, 2019. The total pension liability was rolled-forward from the valuation date to the plan’s fiscal year ending June 30, 2020 using generally accepted actuarial principles. GASB 67 requires Kentucky Retirement Systems to disclose a 10-year history of certain information in the Required Supplementary Information within their comprehensive annual financial report. The exhibits provided in this report include the applicable information for historical years that were calculated in accordance with this accounting standard. Information disclosed for years prior to June 30, 2017 were prepared by KRS’s prior actuary. There have been no plan provision or actuarial assumption changes since June 30, 2019. Senate Bill 249 passed during the 2020 Legislative Session and changed the funding period for the amortization of the unfunded liability to 30 years as of June 30, 2019. Gains and losses incurring in future years will be amortized over a separate 20-year amortization bases. This change does not impact the calculation of Total Pension Liability and only impacts the calculation of the contribution rates that would be payable starting July 1, 2020.
Board Meeting - December 3, 2020 - Audit Committee Report
82

Board of Trustees September 15, 2020 Page 2
Additionally, House Bill 271 passed during the 2020 Legislative Session and removed provisions that reduce the monthly payment to a surviving spouse of a member whose death was due to a duty-related injury upon remarriage of the spouse. It also increased benefits for a very small number of beneficiaries. This did not have a material (or measurable) impact on the liability of the plans and therefore, we did not make any adjustment to the Total Pension Liability to reflect this legislation. There were no other material plan provision changes and it is our opinion that these procedures are reasonable and appropriate, and comply with applicable requirements under GASB No. 67. This report is based upon information, furnished to us by the Retirement System, which includes benefit provisions, membership information, and financial data. We did not audit this data and information, but we did apply a number of tests and concluded that it was reasonable and consistent. GRS is not responsible for the accuracy or completeness of the information provided by the Retirement System. Please see the “Actuarial Valuation Report as of June 30, 2019” for additional discussion of the nature of the actuarial calculations and more information related to participant data, economic and demographic assumptions, and benefit provisions. These reports should be considered together as a complete report for KRS’s fiscal year ending June 30, 2020. A single discount rate of 5.25% was used to measure the total pension liability for the fiscal year ending June 30, 2020. This single discount rate was based on the expected rate of return on pension plan investments for the system. Based on the stated assumptions and the projection of cash flows as of each fiscal year ending, the pension plan’s fiduciary net position and future contributions were projected to be sufficient to finance all the future benefit payments of the current plan members. Therefore, the long-term expected rate of return on pension plan investments was applied to all periods of the projected benefit payments to determine the total pension liability for each system. The projection of cash flows used to determine the single discount rate must include an assumption regarding actual employer contributions made each future year. The future contributions are projected assuming that each participating employer in the System contribute the actuarially determined employer contribution rate each future year calculated in accordance with the current funding policy, as most recently revised by Senate Bill 249, passed during the 2020 Legislative Session. Based on guidance issued by GASB in connection with GASB Statement No. 74, the 1% of pay member contributions for Tier 2 and Tier 3 members to a 401(h) subaccount is considered as an OPEB asset. As a result, the reported fiduciary net positions as of June 30, 2017 and later are net of the 401(h) asset balance.
Board Meeting - December 3, 2020 - Audit Committee Report
83

Board of Trustees September 15, 2020 Page 2
To the best of our knowledge, this report is complete and accurate and is in accordance with generally recognized actuarial practices and methods. Mr. Newton and Mr. White are Enrolled Actuaries. All three of the undersigned are independent actuaries and consultants and members of the American Academy of Actuaries and meet the Qualification Standards of the American Academy of Actuaries to render the actuarial opinion herein. They are also experienced in performing valuations for large public retirement system. This communication shall not be construed to provide tax advice, legal advice or investment advice. Sincerely, Joseph P. Newton, FSA, EA, MAAA Daniel J. White, FSA, EA, MAAA Pension Market Leader and Actuary Senior Consultant and Actuary Janie Shaw, ASA, MAAA Consultant and Actuary
Board Meeting - December 3, 2020 - Audit Committee Report
84

Table of Contents
Kentucky State Police Retirement System
Page
COVER LETTER
SECTION 1 SUPPORTING EXHIBITS
EXHIBIT 1 — SCHEDULE OF EMPLOYERS’ NET PENSION LIABILITY
EXHIBIT 2 — SCHEDULE OF CHANGES IN EMPLOYERS’ NET PENSION LIABILITY
EXHIBIT 3 — SCHEDULE OF EMPLOYERS’ CONTRIBUTIONS
EXHIBIT 4 — SENSITIVITY OF THE NET PENSION LIABILITY TO CHANGES IN THE DISCOUNT RATE
2
3
4
6
Board Meeting - December 3, 2020 - Audit Committee Report
85

SECTION 1
Board Meeting - December 3, 2020 - Audit Committee Report
86

Kentucky State Police Retirement System 2
EXHIBIT 1
Schedule of the Employers’ Net Pension Liability – SPRS ($ thousands)
Fiscal Year Ending
June 30,
Total Pension Liability
Plan Fiduciary Net Position
Employers' Net Pension
Liability (Asset)
Plan Fiduciary Net Position
as a Percentage of the Total
Pension Liability
Covered Employee
Payroll1
Net Pension Liability
as a Percentage of Covered
Employee Payroll(1) (2) (3) = (1) - (2) (4) = (2) / (1) (5) (6) = (3) / (5)
2020 1,049,237$ 293,949$ 755,288$ 28.02% 49,019$ 1,540.81%
2019 1,035,000 286,165 748,835 27.65% 49,515 1,512.34%
2018 969,622 267,572 702,050 27.60% 50,346 1,394.45%
2017 943,271 255,737 687,534 27.11% 54,065 1,271.68%
2016 795,421 218,012 577,409 27.41% 46,685 1,236.82%
2015 734,156 247,228 486,928 33.68% 45,765 1,063.97%
2014 681,118 260,974 420,144 38.32% 44,616 941.69%
Note:1 Based on derived compensation using the provided employer contribution information for fiscal years 2017 and later.
Board Meeting - December 3, 2020 - Audit Committee Report
87

Kentucky State Police Retirement System 3
EXHIBIT 2
Schedule of the Employers’ Net Pension Liability – SPRS ($ thousands)
Change in the Net Pension Liability 2020 2019 2018 2017 2016 2015 2014
Total pension liabilityService Cost 13,192$ 11,726$ 11,890$ 8,297$ 8,402$ 7,695$ 7,142$ Interest 52,697 49,301 47,978 51,769 52,951 50,661 50,391 Benefit Changes 0 0 184 0 0 0 0 Difference between actual and expected experience 10,859 20,952 25,126 8,143 0 9,331 0 Assumption Changes 0 44,510 0 136,602 56,191 40,201 0 Benefit Payments (62,511) (61,111) (58,827) (56,960) (56,279) (54,850) (53,239) Net Change in Total Pension Liability 14,237$ 65,378$ 26,351$ 147,850$ 61,265$ 53,038$ 4,294$
Total Pension Liability - Beginning 1,035,000$ 969,622$ 943,271$ 795,421$ 734,156$ 681,118$ 676,824$ Total Pension Liability - Ending (a) 1,049,237$ 1,035,000$ 969,622$ 943,271$ 795,421$ 734,156$ 681,118$
Plan Fiduciary Net Position1
Contributions - Employer 59,453$ 60,048$ 46,877$ 63,239$ 25,822$ 31,990$ 20,279$ Contributions - Member2 4,767 5,062 5,522 5,348 5,263 5,244 5,075 Refunds of contributions to members (88) (162) (22) (26) (11) (85) (213) Retirement benefits (62,423) (60,949) (58,805) (56,934) (56,268) (54,765) (53,026) Net Investment Income2 6,341 14,816 18,437 26,795 (3,843) 3,426 40,374 Administrative Expense (266) (225) (194) (181) (178) (201) (215)
Other 0 3 5 21 5 (517) 4 0 645 0 Net Change in Plan Fiduciary Net Position 7,784$ 18,593$ 11,836$ 37,724$ (29,215)$ (13,746)$ 12,274$
Plan Fiduciary Net Position - Beginning 286,165$ 267,572$ 255,737$ 218,012$ 247,228$ 260,974$ 248,700$ Prior Year Adjustment - - (1) - - - - Plan Fiduciary Net Position - Ending (b) 293,949$ 286,165$ 267,572$ 255,737$ 218,012$ 247,228$ 260,974$
Net Pension Liability - Ending (a) - (b) 755,288$ 748,835$ 702,050$ 687,534$ 577,409$ 486,928$ 420,144$ Plan Fiduciary Net Position as a Percentage 28.02% 27.65% 27.60% 27.11% 27.41% 33.68% 38.32%Covered Employee Payroll3 49,019$ 49,515$ 50,346$ 54,065$ 46,685$ 45,765$ 44,616$ Net Pension Liability as a Percentage of Covered Employee Payroll 1540.81% 1512.34% 1394.45% 1271.68% 1236.82% 1063.97% 941.69%
Notes:1 Does not include 401(h) assets for fiscal years 2017 and later2 Does not include 401(h) contributions and investment income on 401(h) contributions for fiscal years 2017 and later3 Based on derived compensation using the provided employer contribution information for fiscal years 2017 and later4 Adjustment due to 401(h) plan asset balance that is considered an OPEB asset under GASB 74 for fiscal years 2017 and later5 Northern Trust Settlement
Board Meeting - December 3, 2020 - Audit Committee Report
88

Kentucky State Police Retirement System 4
EXHIBIT 3
Schedule of Employers’ Contributions – SPRS ($ thousands)
Fiscal Year
Ending
Actuarially Determined
Contribution1
Total Employer
Contributions
Contribution Deficiency
(Excess)
Covered Employee
Payroll2
Actual Contributions
as a Percentage of Covered
Payroll
2020 58,358$ 59,453$ (1,095)$ 49,019$ 121.29%
2019 58,948 60,048 (1,100) 49,515 121.27%
2018 36,033 46,877 (10,844) 50,346 93.11%
2017 35,937 63,240 (27,303) 54,065 116.97%
2016 25,723 25,822 (99) 46,685 55.31%
2015 31,444 31,990 (546) 45,765 69.90%
2014 25,808 20,279 5,529 44,616 45.45%
2013 23,117 18,501 4,616 45,256 40.88%
2012 20,498 15,362 5,136 48,373 31.76%
2011 18,463 12,657 5,806 48,693 25.99%
Notes:1 Actuarially determined contribution rate for fiscal year ending 2020 is based on the contribution rate calculated with the June 30, 2017 actuarial valuation.2 Based on derived compensation using the provided employer contribution information for fiscal years 2017 and later
Board Meeting - December 3, 2020 - Audit Committee Report
89

Kentucky State Police Retirement System 5
Notes to Schedule of Employers’ Contributions for FYE 2020
The actuarially determined contribution rate effective for fiscal year ending 2020 that is documented in the schedule on the previous pages was calculated as of June 30, 2017. Based on the June 30, 2017 actuarial valuation report, the actuarial methods and assumptions used to calculate these contribution rates are below:
Item
SPRS
Determined by the Actuarial Valuation as of:
June 30, 2017
Actuarial Cost Method: Entry Age Normal
Asset Valuation Method: 20% of the difference between the market value of assets and the expected actuarial value of assets is recognized
Amortization Method: Level Percent of Pay
Amortization Period: 26 Years, Closed
Payroll Growth Rate 0.00%
Investment Return: 5.25%
Inflation: 2.30%
Salary Increases: 3.05% to 15.55%, varies by service
Mortality: RP-2000 Combined Mortality Table, projected to 2013 with Scale BB (set back 1 year for females)
Board Meeting - December 3, 2020 - Audit Committee Report
90

Kentucky State Police Retirement System 6
EXHIBIT 4
Sensitivity of the Net Pension Liability to Changes in the Discount Rate ($ thousands)
1.00% Decrease (4.25%)
Current Discount Rate
(5.25%)
1.00% Increase (6.25%)
891,868$ 755,288$ 644,122$
Board Meeting - December 3, 2020 - Audit Committee Report
91

September 8, 2020 Board of Trustees Kentucky Retirement Systems Perimeter Park West 1260 Louisville Road Frankfort, KY 40601
Re: GASB No. 74 Reporting – Actuarial Information Dear Members of the Board: The reports provided herein contain certain information for the Kentucky Employees Retirement System (KERS), the County Employees Retirement System (CERS), and the State Police Retirement System (SPRS) in connection with the Governmental Accounting Standards Board (GASB) Statement No. 74, “Financial Reporting for Postemployment Benefit Plans Other than Pension Plans” for the fiscal year ending June 30, 2020. Separate reports will be provided at a later date with additional accounting information determined in accordance with GASB Statement No. 75, “Accounting and Financial Reporting for Postemployment Benefits Other Than Pensions”. Basis of Calculations The liability calculations presented in the reports were performed for the purpose of satisfying the requirements of GASB No. 74 and are not applicable for other purposes, such as determining the plans’ funding requirements. The plan’s liability for other purposes may produce significantly different results. The total OPEB liability, net OPEB liability, and sensitivity information are based on an actuarial valuation date of June 30, 2019. The total OPEB liability was rolled-forward from the valuation date to the plan’s fiscal year ending June 30, 2020 using generally accepted actuarial principles. Assumptions The discount rates used to calculate the total OPEB liability decreased for all Funds (see further discussion on the calculation of the single discount rate later in this letter). The assumed increase in future health care costs, or trend assumption, was reviewed during the June 30, 2019 valuation process and was updated to better reflect more current expectations relating to anticipated future increases in the medical costs. Also, the June 30, 2020 GASB No. 74 actuarial information reflects the anticipated savings from the repeal of the “Cadillac Tax” and “Health Insurer Fee”, which occurred in December of 2019. The assumed load on pre-Medicare premiums to reflect the cost of the Cadillac Tax was removed and the Medicare premiums were reduced by 11% to reflect the repeal of the Health Insurer Fee. There were no other material assumption changes and it is our opinion that these procedures are reasonable and appropriate, and comply with applicable requirements under GASB No. 74.
Board Meeting - December 3, 2020 - Audit Committee Report
92

Board of Trustees September 8, 2020 Page 2
Plan Provisions House Bill 1 passed during the 2019 Special Legislative Session and allowed certain agencies in the KERS Non-Hazardous plan to elect to cease participating in the System as of June 30, 2020 under different provisions than were previously established. Senate Bill 249 passed during the 2020 Legislative Session and delayed the effective date of cessation for these provisions to June 30, 2021. Since each employer’s election is unknown at this time, we did not make any adjustment to the Total OPEB Liability to reflect this legislation. Senate Bill 249 also changed the funding period for the amortization of the unfunded liability to 30 years as of June 30, 2019. Gains and losses incurring in future years will be amortized over separate 20-year amortization bases. This change does not impact the calculation of the Total OPEB Liability and only impacts the calculation of the contribution rates that would be payable starting July 1, 2020. There were no other material plan provision changes and it is our opinion that these procedures are reasonable and appropriate, and comply with applicable requirements under GASB No. 74. Implicit Employer Subsidy for non-Medicare retirees The fully-insured premiums KRS pays for the Kentucky Employees’ Health Plan are blended rates based on the combined experience of active and retired members. Because the average cost of providing health care benefits to retirees under age 65 is higher than the average cost of providing health care benefits to active employees, there is an implicit employer subsidy for the non-Medicare eligible retirees. GASB No. 74 requires that the liability associated with this implicit subsidy be included in the calculation of the Total OPEB Liability. Discount Rates The following single discount rates were used to measure the total OPEB liability for the fiscal year ending June 30, 2020.
KERS Non-Hazardous 5.43% KERS Hazardous 5.28% CERS Non-Hazardous 5.34% CERS Hazardous 5.30% SPRS 5.40%
The single discount rates are based on the expected rate of return on OPEB plan investments of 6.25% and a municipal bond rate of 2.45%, as reported in Fidelity Index’s “20-Year Municipal GO AA Index” as of June 30, 2020. Based on the stated assumptions and the projection of cash flows as of each fiscal year ending, the plan’s fiduciary net position and future contributions were projected to be sufficient to finance the future benefit payments of the current plan members. Therefore, the long-term expected rate of return on insurance plan investments was applied to all periods of the projected benefit payments paid from the retirement system. However, the cost associated with the implicit employer subsidy is not currently being included in the calculation of the System’s actuarial determined contributions, and it is our understanding that any cost associated with the implicit subsidy will not be paid out of the System’s trust. Therefore, the municipal bond rate was applied to future expected benefit payments associated with the implicit subsidy.
Board Meeting - December 3, 2020 - Audit Committee Report
93

Board of Trustees September 8, 2020 Page 2
The projection of cash flows used to determine the single discount rate must include an assumption regarding actual employer contributions made each future year. Except where noted below, the future contributions are projected assuming that each participating employer in the System contribute the actuarially determined employer contribution rate each future year calculated in accordance with the current funding policy, as most recently revised by Senate Bill 249, passed during the 2020 Legislative Session. This includes the phase-in provisions from House Bill 362 (passed in 2018) that applies to the CERS Funds as well as the provisions from Senate Bill 249 (passed in 2020) which kept CERS contributions level for fiscal year ending 2021. If there is a pattern of legislation that has a resulting effect of employers making contributions less than the actuarially determined rate, we may be required to project contributions that are reflective of recent actual contribution efforts regardless of the stated funding policy (as required by paragraph 50 of GASB Statement No. 74). Legislation has been enacted three times (for FY 18/19, FY 19/20, and FY 20/21) that allowed certain employers (referred to as “Quasi” agencies) in the KERS Non-Hazardous Fund to contribute 8.41% of pay into the insurance fund, which is less than the actuarially determined contribution rate. We believe this constitutes a pattern and as such, the projection for the KERS Non-Hazardous Fund assumes these Quasi agencies contribute no more than 8.41% of pay throughout the entire projection. 401(h) Subaccount Based on guidance issued by GASB in connection with GASB Statement No. 74, the 1% of pay member contributions for Tier 2 and Tier 3 members to a 401(h) subaccount is considered as an OPEB asset. As a result, the reported fiduciary net position includes these 401(h) assets. Additionally, these member contributions and associated investment income are included in the reconciliation of the fiduciary net position. Additional Disclosures The reports are based upon information, furnished to us by the Retirement System, which includes benefit provisions, membership information, and financial data. We did not audit this data and information, but we did apply a number of tests and concluded that it was reasonable and consistent. GRS is not responsible for the accuracy or completeness of the information provided by the Retirement System. Please see the “Actuarial Valuation Report as of June 30, 2019” for additional discussion of the nature of the actuarial calculations and more information related to participant data, economic and demographic assumptions, and benefit provisions. These reports should be considered together as a complete report for KRS’s fiscal year ending June 30, 2020.
Board Meeting - December 3, 2020 - Audit Committee Report
94

Board of Trustees September 8, 2020 Page 2
To the best of our knowledge, the reports are complete and accurate and are in accordance with generally recognized actuarial practices and methods. Mr. Newton, Mr. Riazi, and Mr. White are Enrolled Actuaries. All of the undersigned are independent actuaries and consultants and members of the American Academy of Actuaries and meet the Qualification Standards of the American Academy of Actuaries to render the actuarial opinion herein. They are also experienced in performing valuations for large public retirement system. This communication shall not be construed to provide tax advice, legal advice or investment advice. Sincerely, Joseph P. Newton, FSA, EA, MAAA Daniel J. White, FSA, EA, MAAA Pension Market Leader and Actuary Senior Consultant and Actuary Janie Shaw, ASA, MAAA Mehdi Riazi, FSA, EA, MAAA Consultant and Actuary Consultant and Actuary
Board Meeting - December 3, 2020 - Audit Committee Report
95

Kentucky County Employees Retirement System GASB No. 74 Accounting Valuation Report As of June 30, 2020
Board Meeting - December 3, 2020 - Audit Committee Report
96

September 8, 2020 Board of Trustees Kentucky Retirement Systems Perimeter Park West 1260 Louisville Road Frankfort, KY 40601
Re: GASB No. 74 Reporting – Actuarial Information – County Employees’ Retirement System Dear Members of the Board: This report provided herein contains certain information for the Kentucky County Employees’ Retirement System (CERS) in connection with the Governmental Accounting Standards Board (GASB) Statement No. 74, “Financial Reporting for Postemployment Benefit Plans Other than Pension Plans” for the fiscal year ending June 30, 2020. A separate report will be provided at a later date with additional accounting information determined in accordance with GASB Statement No. 75, “Accounting and Financial Reporting for Postemployment Benefits Other Than Pensions”. The liability calculations presented in this report were performed for the purpose of satisfying the requirements of GASB No. 74 and are not applicable for other purposes, such as determining the plans’ funding requirements. The plan’s liability for other purposes may produce significantly different results. This report may be provided to parties other than the Board of Trustees of the Kentucky Retirement Systems only in its entirety and only with the permission of the Board. GRS is not responsible for unauthorized use of this report. The total OPEB liability, net OPEB liability, and sensitivity information shown in this report are based on an actuarial valuation date of June 30, 2019. The total OPEB liability was rolled-forward from the valuation date to the plan’s fiscal year ending June 30, 2020, using generally accepted actuarial principles. GASB No. 74 requires Kentucky Retirement Systems to disclose a 10-year history of certain information in the Required Supplementary Information within their comprehensive annual financial report. The exhibits provided in this report include the applicable information for historical years that were calculated in accordance with this accounting standard. Information disclosed for years prior to June 30, 2017 were prepared by KRS’s prior actuary. The discount rate used to calculate the total OPEB liability decreased from 5.68% to 5.34% for the Non-Hazardous Fund and from 5.69% to 5.30% for the Hazardous Fund (see further discussion on the calculation of the single discount rate later in this letter). The assumed increase in future health care costs, or trend assumption, was reviewed during the June 30, 2019 valuation process and was updated to better reflect more current expectations relating to anticipated future increases in the medical costs. Also, the June 30, 2020 GASB No. 74 actuarial information reflects the anticipated savings from the repeal of the “Cadillac Tax” and “Health Insurer Fee”, which occurred in December of 2019. The assumed load on pre-Medicare premiums to reflect the cost of the Cadillac Tax was removed and the Medicare premiums were reduced by 11% to reflect the repeal of the Health Insurer Fee. There were no other material assumption changes and it is our opinion that these procedures are reasonable and appropriate, and comply with applicable requirements under GASB No. 74.
Board Meeting - December 3, 2020 - Audit Committee Report
97

Board of Trustees September 8, 2020 Page 2
Senate Bill 249 changed the funding period for the amortization of the unfunded liability to 30 years as of June 30, 2019. Gains and losses incurring in future years will be amortized over separate 20-year amortization bases. This change does not impact the calculation of the Total OPEB Liability and only impacts the calculation of the contribution rates that would be payable starting July 1, 2020. There were no other material plan provision changes and it is our opinion that these procedures are reasonable and appropriate, and comply with applicable requirements under GASB No. 74. The fully-insured premiums KRS pays for the Kentucky Employees’ Health Plan are blended rates based on the combined experience of active and retired members. Because the average cost of providing health care benefits to retirees under age 65 is higher than the average cost of providing health care benefits to active employees, there is an implicit employer subsidy for the non-Medicare eligible retirees. GASB No. 74 requires that the liability associated with this implicit subsidy be included in the calculation of the Total OPEB Liability. This report is based upon information, furnished to us by the Retirement System, which includes benefit provisions, membership information, and financial data. We did not audit this data and information, but we did apply a number of tests and concluded that it was reasonable and consistent. GRS is not responsible for the accuracy or completeness of the information provided by the Retirement System. Please see the “Actuarial Valuation Report as of June 30, 2019” for additional discussion of the nature of the actuarial calculations and more information related to participant data, economic and demographic assumptions, and benefit provisions. These reports should be considered together as a complete report for KRS’s fiscal year ending June 30, 2020. Single discount rates of 5.34% for the non-hazardous system and 5.30% for hazardous system were used to measure the total OPEB liability as of June 30, 2020. The single discount rates are based on the expected rate of return on OPEB plan investments of 6.25% and a municipal bond rate of 2.45%, as reported in Fidelity Index’s “20-Year Municipal GO AA Index” as of June 30, 2020. Based on the stated assumptions and the projection of cash flows as of each fiscal year ending, the plan’s fiduciary net position and future contributions were projected to be sufficient to finance the future benefit payments of the current plan members. Therefore, the long-term expected rate of return on insurance plan investments was applied to all periods of the projected benefit payments paid from the retirement system. However, the cost associated with the implicit employer subsidy is not currently being included in the calculation of the System’s actuarial determined contributions, and it is our understanding that any cost associated with the implicit subsidy will not be paid out of the System’s trust. Therefore, the municipal bond rate was applied to future expected benefit payments associated with the implicit subsidy. The projection of cash flows used to determine the single discount rate must include an assumption regarding actual employer contributions made each future year. Except where noted below, the future contributions are projected assuming that each participating employer in the System contribute the actuarially determined employer contribution rate each future year calculated in accordance with the current funding policy, as most recently revised by Senate Bill 249, passed during the 2020 Legislative Session. This includes the phase-in provisions from House Bill 362 (passed in 2018) that applies to the CERS Funds as well as the provisions from Senate Bill 249 (passed in 2020) which kept CERS contributions level for fiscal year ending 2021. If there is future legislation that has a resulting effect of employers making contributions less than the actuarially determined rate, we may be required to project contributions that are reflective of recent actual contribution efforts regardless of the stated funding policy (as required by paragraph 50 of GASB Statement No. 74).
Board Meeting - December 3, 2020 - Audit Committee Report
98

Board of Trustees September 8, 2020 Page 3
Based on guidance issued by GASB in connection with GASB Statement No. 74, the 1% of pay member contributions for Tier 2 and Tier 3 members to a 401(h) subaccount is considered as an OPEB asset. As a result, the reported fiduciary net position includes these 401(h) assets. Additionally, these member contributions and associated investment income are included in the reconciliation of the fiduciary net position. Future actuarial measurements may differ significantly from the current measurements presented in this report due to such factors as the following: plan experience differing from that anticipated by the economic or demographic assumptions; changes in economic or demographic assumptions; increases or decreases expected as part of the natural operation of the methodology used for these measurements; and changes in plan provisions or applicable law. To the best of our knowledge, this report is complete and accurate and is in accordance with generally recognized actuarial practices and methods. Mr. Newton, Mr. White, and Mr. Riazi are Enrolled Actuaries. All of the undersigned are independent actuaries and consultants and members of the American Academy of Actuaries and meet the Qualification Standards of the American Academy of Actuaries to render the actuarial opinion herein. They are also experienced in performing valuations for large public retirement systems. This communication shall not be construed to provide tax advice, legal advice or investment advice. Sincerely, Gabriel Roeder Smith & Co. Joseph P. Newton, FSA, EA, MAAA Daniel J. White, FSA, EA, MAAA Pension Market Leader and Actuary Senior Consultant and Actuary Janie Shaw, ASA, MAAA Mehdi Riazi, FSA, EA, MAAA Consultant and Actuary Consultant and Actuary
Board Meeting - December 3, 2020 - Audit Committee Report
99
Table of Contents
County Employees Retirement System
Page
COVER LETTER
SECTION 1 SUPPORTING EXHIBITS
EXHIBIT 1 — SCHEDULE OF EMPLOYERS’ NET OPEB LIABILITY
EXHIBIT 2 — DEVELOPMENT OF THE SINGLE DISCOUNT RATE
EXHIBIT 3 — SCHEDULE OF CHANGES IN EMPLOYERS’ NET OPEB LIABILITY
EXHIBIT 4 — SCHEDULE OF EMPLOYERS’ CONTRIBUTIONS
EXHIBIT 5 — SENSITIVITY OF THE NET OPEB LIABILITY TO CHANGES IN THE DISCOUNT RATE AND HEALTHCARE TREND RATE
2
4
5
7
10
APPENDIX 1 DEVELOPMENT OF BASELINE CLAIMS COST
Board Meeting - December 3, 2020 - Audit Committee Report
100

SECTION 1
Board Meeting - December 3, 2020 - Audit Committee Report
101

County Employees Retirement System 2
EXHIBIT 1a
Schedule of the Employers’ Net OPEB Liability – CERS Non-Hazardous Plan ($ in thousands)
Year
Total
OPEB
Liability
Plan Fiduciary
Net Position
Net OPEB
Liability/(Asset)
Plan Fiduciary
Net Position
as a Percentage
of the Total
OPEB Liability
Covered
Employee
Payroll1
Net OPEB Liability
as a Percentage
of Covered
Employee Payroll
(1) (2) (3) = (1) - (2) (4) = (2) / (1) (5) (6) = (3) / (5)
2020 4,996,309$ 2,581,613$ 2,414,696$ 51.67% 2,620,585$ 92.14%
2019 4,251,466 2,569,511 1,681,955 60.44% 2,577,378 65.26%
2018 4,189,606 2,414,126 1,775,480 57.62% 2,570,156 69.08%
2017 4,222,878 2,212,536 2,010,342 52.39% 2,480,130 81.06%
Note:1 Based on derived compensation using the provided employer contribution information.
Board Meeting - December 3, 2020 - Audit Committee Report
102

County Employees Retirement System 3
EXHIBIT 1b
Schedule of the Employers’ Net OPEB Liability – CERS Hazardous Plan ($ in thousands)
Year
Total
OPEB
Liability
Plan Fiduciary
Net Position
Net OPEB
Liability/(Asset)
Plan Fiduciary
Net Position
as a Percentage
of the Total
OPEB Liability
Covered
Employee
Payroll1
Net OPEB Liability
as a Percentage
of Covered
Employee Payroll
(1) (2) (3) = (1) - (2) (4) = (2) / (1) (5) (6) = (3) / (5)
2020 2,245,222$ 1,321,117$ 924,105$ 58.84% 596,001$ 155.05%
2019 2,080,574 1,340,714 739,860 64.44% 583,632 126.77%
2018 1,993,941 1,280,982 712,959 64.24% 588,526 121.14%
2017 2,015,673 1,189,001 826,672 58.99% 542,710 152.32%
Note:1 Based on derived compensation using the provided employer contribution information.
Board Meeting - December 3, 2020 - Audit Committee Report
103

County Employees Retirement System 4
EXHIBIT 2
Development of Single Discount Rate
CERS
Non-Hazardous
CERS
Hazardous
Single Discount Rate 5.34% 5.30%
Long-Term Expected Rate of Return 6.25% 6.25%
Long-Term Municipal Bond Rate1 2.45% 2.45%
Notes:1 Fixed-income municipal bonds with 20 years to maturity that include only federally tax-exempt municipal bonds as
reported in Fidelity Index’s “20-Year Municipal GO AA Index” as of June 30, 2020.
Board Meeting - December 3, 2020 - Audit Committee Report
104

County Employees Retirement System 5
EXHIBIT 3a Schedule of the Employers’ Net OPEB Liability – CERS Non-Hazardous Plan
($ in thousands)
Change in the Net OPEB Liability 2020 2019 2018 2017
Total OPEB liability
Service Cost 131,289$ 119,011$ 122,244$ 85,468$
Interest on the total OPEB liability 236,126 240,352 242,048 240,854
Benefit Changes 0 0 4,306 0
Difference between actual and expected experience 505,843 (404,301) (240,568) (6,641)
Assumption Changes 60,225 268,842 (4,876) 520,286
Benefit Payments1 (188,640) (162,044) (156,426) (140,120)
Net Change in Total OPEB Liability 744,843 61,860 (33,272) 699,847
Total OPEB Liability - Beginning 4,251,466$ 4,189,606$ 4,222,878$ 3,523,031$ Total OPEB Liability - Ending (a) 4,996,309$ 4,251,466$ 4,189,606$ 4,222,878$
Plan Fiduciary Net Position
Contributions - Employer2 179,521$ 168,905$ 145,809$ 133,326$
Contributions - Member 12,964 11,801 10,825 9,158
Benefit Payments1 (188,640) (162,044) (156,426) (140,120)
OPEB Plan Net Investment Income 9,160 137,591 202,068 264,782
OPEB Plan Administrative Expense (903) (877) (761) (789)
Other 0 9 4 75 4 0
Net Change in Plan Fiduciary Net Position 12,102 155,385 201,590 266,357
Plan Fiduciary Net Position - Beginning 2,569,511$ 2,414,126$ 2,212,536$ 1,946,179$
Plan Fiduciary Net Position - Ending (b) 2,581,613$ 2,569,511$ 2,414,126$ 2,212,536$
Net OPEB Liability - Ending (a) - (b) 2,414,696 1,681,955 1,775,480 2,010,342
Plan Fiduciary Net Position as a Percentage
of the Total OPEB Liability 51.67% 60.44% 57.62% 52.39%
Covered Employee Payroll3 2,620,585$ 2,577,378$ 2,570,156$ 2,480,130$
Net OPEB Liability as a Percentage of
Covered Employee Payroll 92.14% 65.26% 69.08% 81.06%
Notes:
from retirees, Medicare Drug Reimbursements, and Humana Gain Share Payments (in applicable years).2 Employer contributions include expected benefits due to the implicit subsidy for members under age 65.3 Based on derived compensation using the provided employer contribution information.
1 Benefit payments include expected benefits due to the implicit subsidy for members under age 65. They are also offset by insurance premiums received
4 Northern Trust Settlement
Board Meeting - December 3, 2020 - Audit Committee Report
105

County Employees Retirement System 6
EXHIBIT 3b Schedule of the Employers’ Net OPEB Liability – CERS Hazardous Plan
($ in thousands) Change in the Net OPEB Liability 2020 2019 2018 2017
Total OPEB liability
Service Cost 47,443$ 32,623$ 33,948$ 20,493$
Interest on the total OPEB liability 115,998 116,768 118,009 113,166
Benefit Changes 0 0 484 0
Difference between actual and expected experience 38,156 (103,317) (100,348) (2,470)
Assumption Changes 46,925 116,618 (2,500) 391,061
Benefit Payments1 (83,874) (76,059) (71,325) (63,656)
Net Change in Total OPEB Liability 164,648 86,633 (21,732) 458,594
Total OPEB Liability - Beginning 2,080,574$ 1,993,941$ 2,015,673$ 1,557,079$ Total OPEB Liability - Ending (a) 2,245,222$ 2,080,574$ 1,993,941$ 2,015,673$
Plan Fiduciary Net Position
Contributions - Employer2 59,662$ 60,445$ 51,615$ 44,325$
Contributions - Member 2,762 2,458 2,173 1,708
Benefit Payments1 (83,874) (76,059) (71,325) (63,656)
OPEB Plan Net Investment Income 2,315 73,317 109,854 143,892
OPEB Plan Administrative Expense (462) (434) (376) (381)
Other 0 5 4 40 4 0
Net Change in Plan Fiduciary Net Position (19,597) 59,732 91,981 125,888
Plan Fiduciary Net Position - Beginning 1,340,714$ 1,280,982$ 1,189,001$ 1,063,113$
Plan Fiduciary Net Position - Ending (b) 1,321,117$ 1,340,714$ 1,280,982$ 1,189,001$
Net OPEB Liability - Ending (a) - (b) 924,105 739,860 712,959 826,672
Plan Fiduciary Net Position as a Percentage
of the Total OPEB Liability 58.84% 64.44% 64.24% 58.99%
Covered Employee Payroll3 596,001$ 583,632$ 588,526$ 542,710$
Net OPEB Liability as a Percentage of
Covered Employee Payroll 155.05% 126.77% 121.14% 152.32%
Notes:
4 Northern Trust Settlement
from retirees, Medicare Drug Reimbursements, and Humana Gain Share Payments (in applicable years).
2 Employer contributions include expected benefits due to the implicit subsidy for members under age 65.3 Based on derived compensation using the provided employer contribution information.
1 Benefit payments include expected benefits due to the implicit subsidy for members under age 65. They are also offset by insurance premiums received
Board Meeting - December 3, 2020 - Audit Committee Report
106

County Employees Retirement System 7
EXHIBIT 4a
Schedule of Employers’ Contributions – CERS Non-Hazardous Plan ($ in thousands)
Fiscal
Year
Ending1
Actuarially
Determined
Contribution2
Total Employer
Contributions3
Contribution
Deficiency
(Excess)
Covered
Employee
Payroll4
Actual
Contributions
as a Percentage
of Covered
Payroll
2020 124,740$ 129,267$ (4,527)$ 2,620,585$ 4.93%
2019 160,055 139,655 20,400 2,577,378 5.42%
2018 120,797 124,619 (3,822) 2,570,156 4.85%
2017 122,270 120,712 1,558 2,480,130 4.87%
2016 110,987 111,836 (849) 2,352,762 4.75%
2015 119,511 119,444 67 2,296,716 5.20%
2014 130,652 123,278 7,374 2,272,270 5.43%
2013 195,561 159,993 35,568 2,236,277 7.15%
2012 214,421 171,925 42,496 2,236,546 7.69%
2011 213,429 186,886 26,543 2,276,596 8.21%
Notes:
4 Based on derived compensation using the provided employer contribution information.
1 Data for years prior to 2018 is based on contribution data provided in the 2017 CAFR, based
on calculations provided by the prior actuary.2 Actuarially determined contribution for fiscal year ending 2020 is based on the contribution
rate calculated with the June 30, 2018 actuarial valuation.3 Employer contributions do not include the expected implicit subsidy included in exhibit 3.
Board Meeting - December 3, 2020 - Audit Committee Report
107

County Employees Retirement System 8
EXHIBIT 4b
Schedule of Employers’ Contributions – CERS Hazardous Plan ($ in thousands)
Fiscal
Year
Ending1
Actuarially
Determined
Contribution2
Total Employer
Contributions3
Contribution
Deficiency
(Excess)
Covered
Employee
Payroll4
Actual
Contributions
as a Percentage
of Covered
Payroll
2020 56,739$ 57,897$ (1,158)$ 596,001$ 9.71%
2019 71,028 62,272 8,756 583,632 10.67%
2018 55,027 56,002 (975) 588,526 9.52%
2017 53,131 51,537 1,594 542,710 9.50%
2016 64,253 67,619 (3,366) 492,851 13.72%
2015 69,103 71,778 (2,675) 483,641 14.84%
2014 74,360 74,792 (432) 479,164 15.61%
2013 102,011 85,319 16,692 461,673 18.48%
2012 110,763 92,564 18,199 464,229 19.94%
2011 109,227 98,592 10,635 466,964 21.11%
Notes:1 Data for years prior to 2018 is based on contribution data provided in the 2017 CAFR, based
on calculations provided by the prior actuary.2 Actuarially determined contribution for fiscal year ending 2020 is based on the contribution
rate calculated with the June 30, 2018 actuarial valuation.3 Employer contributions do not include the expected implicit subsidy included in exhibit 3.
4 Based on derived compensation using the provided employer contribution information.
Board Meeting - December 3, 2020 - Audit Committee Report
108

County Employees Retirement System 9
Notes to Schedule of Employers’ Contributions for FYE 2020 The actuarially determined contribution rates effective for fiscal year ending 2020 that are documented in the schedule on the previous pages were calculated as of June 30, 2018. Based on the June 30, 2018 actuarial valuation report, the actuarial methods and assumptions used to calculate these contribution rates are below:
Item CERS Non-Hazardous CERS Hazardous
Determine by the Actuarial Valuation as of:
June 30, 2018
June 30, 2018
Actuarial Cost Method: Entry Age Normal Entry Age Normal
Asset Valuation Method: 20% of the difference between the market value of assets and the expected actuarial value of assets is recognized
20% of the difference between the market value of assets and the expected actuarial value of assets is recognized
Amortization Method: Level Percent of Pay Level Percent of Pay
Amortization Period: 25 Years, Closed 25 Years, Closed
Payroll Growth Rate: 2.00% 2.00%
Investment Return: 6.25% 6.25%
Inflation: 2.30% 2.30%
Salary Increases: 3.30% to 11.55%, varies by service 3.05% to 18.55%, varies by service
Mortality:
RP-2000 Combined Mortality Table, projected to 2013 with Scale BB (set back 1 year for females)
RP-2000 Combined Mortality Table, projected to 2013 with Scale BB (set back 1 year for females)
Healthcare Trend Rates: Pre-65
Initial trend starting at 7.00% at January 1, 2020 and gradually decreasing to an ultimate trend rate of 4.05% over a period of 12 years. The 2019 premiums were known at the time of the valuation and were incorporated into the liability measurement.
Initial trend starting at 7.00% at January 1, 2020 and gradually decreasing to an ultimate trend rate of 4.05% over a period of 12 years. The 2019 premiums were known at the time of the valuation and were incorporated into the liability measurement.
Post-65 Initial trend starting at 5.00% at January 1, 2020 and gradually decreasing to an ultimate trend rate of 4.05% over a period of 10 years. The 2019 premiums were known at the time of the valuation and were incorporated into the liability measurement.
Initial trend starting at 5.00% at January 1, 2020 and gradually decreasing to an ultimate trend rate of 4.05% over a period of 10 years. The 2019 premiums were known at the time of the valuation and were incorporated into the liability measurement.
Phase-In provision Board certified rate is phased into the actuarially determined rate in accordance with HB 362 enacted in 2018.
Board certified rate is phased into the actuarially determined rate in accordance with HB 362 enacted in 2018.
Board Meeting - December 3, 2020 - Audit Committee Report
109

County Employees Retirement System 10
EXHIBIT 5a
Sensitivity of the Net OPEB Liability to Changes in the Discount Rate and Healthcare Trend Rate CERS Non-Hazardous Plan
($ in thousands)
Table 1. Sensitivity of the Net OPEB Liability to Changes in the Discount Rate
1.00%
Decrease,
Current
Discount Rate,
1.00%
Increase,
4.34% 5.34% 6.34%
3,102,175$ 2,414,696$ 1,850,046$
Table 2. Sensitivity of the Net OPEB Liability to Changes in the Healthcare Cost Trend Rate
1.00%
Decrease
Current Healthcare
Cost Trend Rate
1.00%
Increase
1,869,578$ 2,414,696$ 3,076,209$
Board Meeting - December 3, 2020 - Audit Committee Report
110

County Employees Retirement System 11
EXHIBIT 5b
Sensitivity of the Net OPEB Liability to Changes in the Discount Rate and Healthcare Trend Rate CERS Hazardous Plan
($ in thousands)
Table 1. Sensitivity of the Net OPEB Liability to Changes in the Discount Rate
1.00%
Decrease,
Current
Discount Rate,
1.00%
Increase,
4.30% 5.30% 6.30%
1,254,449$ 924,105$ 657,916$
Table 2. Sensitivity of the Net OPEB Liability to Changes in the Healthcare Cost Trend Rate
1.00%
Decrease
Current Healthcare
Cost Trend Rate
1.00%
Increase
660,393$ 924,105$ 1,248,318$
Board Meeting - December 3, 2020 - Audit Committee Report
111

APPENDIX 1
Board Meeting - December 3, 2020 - Audit Committee Report
112

Appendix 1
County Employees Retirement System 13
Development of Baseline Claims Cost
For non-Medicare retirees, the initial per capita costs were developed using retiree claims experience
for calendar year 2019. The claims were projected on an incurred claim basis, adjusted for prescription
drug rebates, and loaded for administrative expense. The per capita costs shown in the table below also
include HRA contributions for retirees on the CDHP plans. An inherent assumption in this methodology
is that the projected future retirees will have a similar distribution by plan type as the current retirees.
The fully-insured premiums KRS pays the Kentucky Employees’ Health Plan are blended rates based on
the combined experience of active and retired members. Because the average cost of providing health
care benefits to retirees under age 65 is higher than the average cost of providing health care benefits
to active employees, there is an implicit employer subsidy for the non-Medicare eligible retirees.
For Medicare retirees, the initial per capita costs were estimated based on the plan premiums effective
January 1, 2020, and are used for both current and future retirees. An inherent assumption in this
methodology is that the projected future retirees will have a similar distribution by plan type as the
current retirees.
Age graded and sex distinct premiums are utilized by this valuation. These costs are appropriate for the
unique age and sex distribution currently existing. Over the future years covered by this valuation, the
age and sex distribution will most likely change. Therefore, our process “distributes” the average
premium over all age/sex combinations and assigns a unique premium for each combination. The
age/sex specific costs more accurately reflect the health care utilization and cost at that age.
Mehdi Riazi is a Member of the American Academy of Actuaries (MAAA) and meets the Qualification Standards of the American Academy of Actuaries to render the actuarial opinions contained herein.
Mehdi Riazi, FSA, EA, MAAA
FOR THOSE NOT ELIGIBLE FOR MEDICARE
AGE MALE FEMALE
40 50 60 64
$337.39 546.91 929.50
1,130.30
$548.24 673.74 915.24
1,066.69
FOR THOSE ELIGIBLE FOR MEDICARE
AGE MALE FEMALE
65 75 85
$186.68 218.42 230.96
$176.08 213.13 233.68
Board Meeting - December 3, 2020 - Audit Committee Report
113

Kentucky Employees Retirement System GASB No. 74 Accounting Valuation Report As of June 30, 2020
Board Meeting - December 3, 2020 - Audit Committee Report
114

September 8, 2020 Board of Trustees Kentucky Retirement Systems Perimeter Park West 1260 Louisville Road Frankfort, KY 40601
Re: GASB No. 74 Reporting – Actuarial Information – Kentucky Employees’ Retirement System Dear Members of the Board: This report provided herein contains certain information for the Kentucky Employees’ Retirement System (KERS) in connection with the Governmental Accounting Standards Board (GASB) Statement No. 74, “Financial Reporting for Postemployment Benefit Plans Other than Pension Plans” for the fiscal year ending June 30, 2020. A separate report will be provided at a later date with additional accounting information determined in accordance with GASB Statement No. 75, “Accounting and Financial Reporting for Postemployment Benefits Other Than Pensions”. The liability calculations presented in this report were performed for the purpose of satisfying the requirements of GASB No. 74 and are not applicable for other purposes, such as determining the plans’ funding requirements. The plan’s liability for other purposes may produce significantly different results. This report may be provided to parties other than the Board of Trustees of the Kentucky Retirement Systems only in its entirety and only with the permission of the Board. GRS is not responsible for unauthorized use of this report. The total OPEB liability, net OPEB liability, and sensitivity information shown in this report are based on an actuarial valuation date of June 30, 2019. The total OPEB liability was rolled-forward from the valuation date to the plan’s fiscal year ending June 30, 2020, using generally accepted actuarial principles. GASB No. 74 requires Kentucky Retirement Systems to disclose a 10-year history of certain information in the Required Supplementary Information within their comprehensive annual financial report. The exhibits provided in this report include the applicable information for historical years that were calculated in accordance with this accounting standard. Information disclosed for years prior to June 30, 2017 were prepared by KRS’s prior actuary. The discount rate used to calculate the total OPEB liability decreased from 5.73% to 5.43% for the Non-Hazardous Fund and from 5.66% to 5.28% for the Hazardous Fund (see further discussion on the calculation of the single discount rate later in this letter). The assumed increase in future health care costs, or trend assumption, was reviewed during the June 30, 2019 valuation process and was updated to better reflect more current expectations relating to anticipated future increases in the medical costs. Also, the June 30, 2020 GASB No. 74 actuarial information reflects the anticipated savings from the repeal of the “Cadillac Tax” and “Health Insurer Fee”, which occurred in December of 2019. The assumed load on pre-Medicare premiums to reflect the cost of the Cadillac Tax was removed and the Medicare premiums were reduced by 11% to reflect the repeal of the Health Insurer Fee. There were no other material assumption changes and it is our opinion that these procedures are reasonable and appropriate, and comply with applicable requirements under GASB No. 74.
Board Meeting - December 3, 2020 - Audit Committee Report
115

Board of Trustees September 8, 2020 Page 2
House Bill 1 passed during the 2019 Special Legislative Session and allowed certain agencies in the Non-Hazardous plan to elect to cease participating in the System as of June 30, 2020 under different provisions than were previously established. Senate Bill 249 passed during the 2020 Legislative Session and delayed the effective date of cessation for these provisions to June 30, 2021. Since each employer’s election is unknown at this time, we did not make any adjustment to the Total OPEB Liability to reflect this legislation. Senate Bill 249 also changed the funding period for the amortization of the unfunded liability to 30 years as of June 30, 2019. Gains and losses incurring in future years will be amortized over separate 20-year amortization bases. This change does not impact the calculation of the Total OPEB Liability and only impacts the calculation of the contribution rates that would be payable starting July 1, 2020. There were no other material plan provision changes and it is our opinion that these procedures are reasonable and appropriate, and comply with applicable requirements under GASB No. 74. The fully-insured premiums KRS pays for the Kentucky Employees’ Health Plan are blended rates based on the combined experience of active and retired members. Because the average cost of providing health care benefits to retirees under age 65 is higher than the average cost of providing health care benefits to active employees, there is an implicit employer subsidy for the non-Medicare eligible retirees. GASB No. 74 requires that the liability associated with this implicit subsidy be included in the calculation of the Total OPEB Liability. This report is based upon information, furnished to us by the Retirement System, which includes benefit provisions, membership information, and financial data. We did not audit this data and information, but we did apply a number of tests and concluded that it was reasonable and consistent. GRS is not responsible for the accuracy or completeness of the information provided by the Retirement System. Please see the “Actuarial Valuation Report as of June 30, 2019” for additional discussion of the nature of the actuarial calculations and more information related to participant data, economic and demographic assumptions, and benefit provisions. These reports should be considered together as a complete report for KRS’s fiscal year ending June 30, 2020. Single discount rates of 5.43% for the non-hazardous system and 5.28% for hazardous system were used to measure the total OPEB liability as of June 30, 2020. The single discount rates are based on the expected rate of return on OPEB plan investments of 6.25% and a municipal bond rate of 2.45%, as reported in Fidelity Index’s “20-Year Municipal GO AA Index” as of June 30, 2020. Based on the stated assumptions and the projection of cash flows as of each fiscal year ending, the plan’s fiduciary net position and future contributions were projected to be sufficient to finance the future benefit payments of the current plan members. Therefore, the long-term expected rate of return on insurance plan investments was applied to all periods of the projected benefit payments paid from the retirement system. However, the cost associated with the implicit employer subsidy is not currently being included in the calculation of the System’s actuarial determined contributions, and it is our understanding that any cost associated with the implicit subsidy will not be paid out of the System’s trust. Therefore, the municipal bond rate was applied to future expected benefit payments associated with the implicit subsidy. The projection of cash flows used to determine the single discount rate must include an assumption regarding actual employer contributions made each future year. Except where noted below, the future contributions are projected assuming that each participating employer in the System contribute the actuarially determined employer contribution rate each future year calculated in accordance with the current funding policy, as most recently revised by Senate Bill 249, passed during the 2020 Legislative Session.
Board Meeting - December 3, 2020 - Audit Committee Report
116

Board of Trustees September 8, 2020 Page 3
If there is a pattern of legislation that has a resulting effect of employers making contributions less than the actuarially determined rate, we may be required to project contributions that are reflective of recent actual contribution efforts regardless of the stated funding policy (as required by paragraph 50 of GASB Statement No. 74). Legislation has been enacted three times (for FY 18/19, FY 19/20, and FY 20/21) that allowed certain employers (referred to as “Quasi” agencies) in the KERS Non-Hazardous Fund to contribute 8.41% of pay into the insurance fund, which is less than the actuarially determined contribution rate. We believe this constitutes a pattern and as such, the projection for the KERS Non-Hazardous Fund assumes these Quasi agencies contribute no more than 8.41% of pay throughout the entire projection. Based on guidance issued by GASB in connection with GASB Statement No. 74, the 1% of pay member contributions for Tier 2 and Tier 3 members to a 401(h) subaccount is considered as an OPEB asset. As a result, the reported fiduciary net position includes these 401(h) assets. Additionally, these member contributions and associated investment income are included in the reconciliation of the fiduciary net position. Future actuarial measurements may differ significantly from the current measurements presented in this report due to such factors as the following: plan experience differing from that anticipated by the economic or demographic assumptions; changes in economic or demographic assumptions; increases or decreases expected as part of the natural operation of the methodology used for these measurements; and changes in plan provisions or applicable law. To the best of our knowledge, this report is complete and accurate and is in accordance with generally recognized actuarial practices and methods. Mr. Newton, Mr. White, and Mr. Riazi are Enrolled Actuaries. All of the undersigned are independent actuaries and consultants and members of the American Academy of Actuaries and meet the Qualification Standards of the American Academy of Actuaries to render the actuarial opinion herein. They are also experienced in performing valuations for large public retirement systems. This communication shall not be construed to provide tax advice, legal advice or investment advice. Sincerely, Gabriel Roeder Smith & Co. Joseph P. Newton, FSA, EA, MAAA Daniel J. White, FSA, EA, MAAA Pension Market Leader and Actuary Senior Consultant and Actuary Janie Shaw, ASA, MAAA Mehdi Riazi, FSA, EA, MAAA Consultant and Actuary Consultant and Actuary
Board Meeting - December 3, 2020 - Audit Committee Report
117

Table of Contents
Kentucky Employees Retirement System
Page
COVER LETTER
SECTION 1 SUPPORTING EXHIBITS
EXHIBIT 1 — SCHEDULE OF EMPLOYERS’ NET OPEB LIABILITY
EXHIBIT 2 — DEVELOPMENT OF THE SINGLE DISCOUNT RATE
EXHIBIT 3 — SCHEDULE OF CHANGES IN EMPLOYERS’ NET OPEB LIABILITY
EXHIBIT 4 — SCHEDULE OF EMPLOYERS’ CONTRIBUTIONS
EXHIBIT 5 — SENSITIVITY OF THE NET OPEB LIABILITY TO CHANGES IN THE DISCOUNT RATE AND HEALTHCARE TREND RATE
2
4
5
7
10
APPENDIX 1 DEVELOPMENT OF BASELINE CLAIMS COST
Board Meeting - December 3, 2020 - Audit Committee Report
118

SECTION 1
Board Meeting - December 3, 2020 - Audit Committee Report
119

Kentucky Employees Retirement System 2
EXHIBIT 1a
Schedule of the Employers’ Net OPEB Liability – KERS Non-Hazardous Plan ($ in thousands)
Year
Total
OPEB
Liability
Plan Fiduciary
Net Position
Net OPEB
Liability/(Asset)
Plan Fiduciary
Net Position
as a Percentage
of the Total
OPEB Liability
Covered
Employee
Payroll1
Net OPEB Liability
as a Percentage
of Covered
Employee Payroll
(1) (2) (3) = (1) - (2) (4) = (2) / (1) (5) (6) = (3) / (5)
2020 3,599,557$ 1,060,649$ 2,538,908$ 29.47% 1,482,431$ 171.27%
2019 3,217,985 995,089 2,222,896 30.92% 1,515,953 146.63%
2018 3,262,117 891,205 2,370,912 27.32% 1,573,898 150.64%
2017 3,353,332 817,370 2,535,962 24.37% 1,593,097 159.18%
Note:1 Based on derived compensation using the provided employer contribution information.
Board Meeting - December 3, 2020 - Audit Committee Report
120
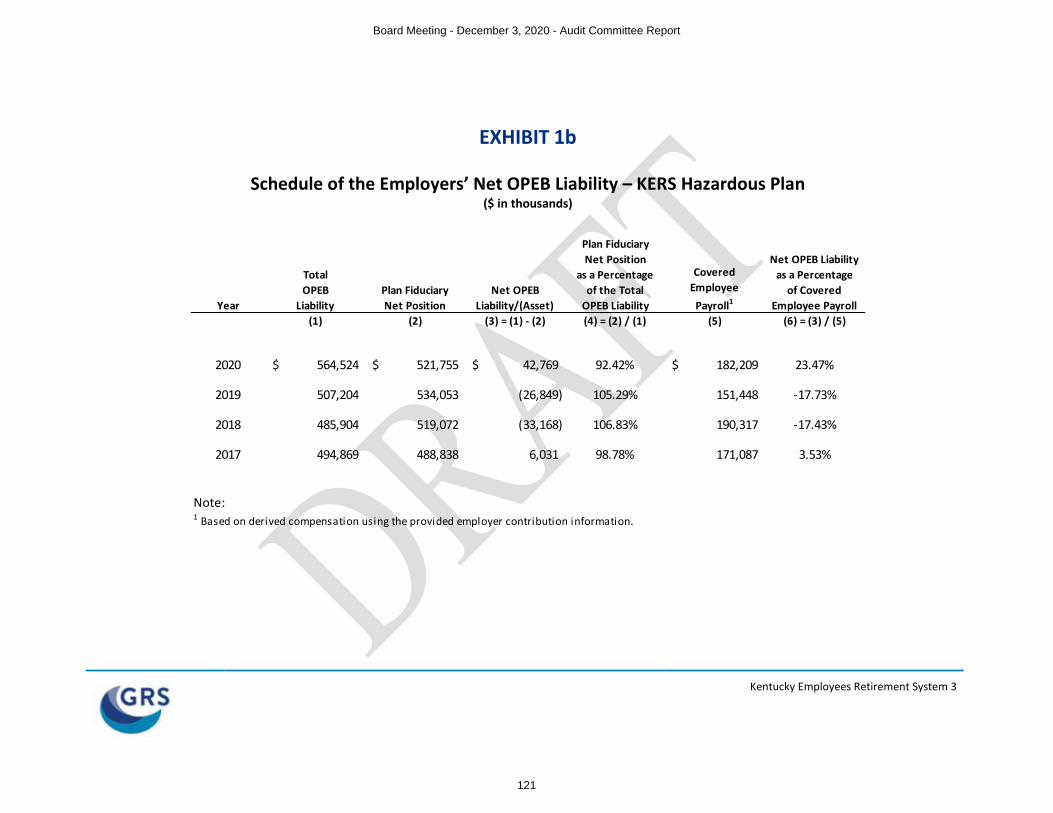
Kentucky Employees Retirement System 3
EXHIBIT 1b
Schedule of the Employers’ Net OPEB Liability – KERS Hazardous Plan ($ in thousands)
Year
Total
OPEB
Liability
Plan Fiduciary
Net Position
Net OPEB
Liability/(Asset)
Plan Fiduciary
Net Position
as a Percentage
of the Total
OPEB Liability
Covered
Employee
Payroll1
Net OPEB Liability
as a Percentage
of Covered
Employee Payroll
(1) (2) (3) = (1) - (2) (4) = (2) / (1) (5) (6) = (3) / (5)
2020 564,524$ 521,755$ 42,769$ 92.42% 182,209$ 23.47%
2019 507,204 534,053 (26,849) 105.29% 151,448 -17.73%
2018 485,904 519,072 (33,168) 106.83% 190,317 -17.43%
2017 494,869 488,838 6,031 98.78% 171,087 3.53%
Note:1 Based on derived compensation using the provided employer contribution information.
Board Meeting - December 3, 2020 - Audit Committee Report
121

Kentucky Employees Retirement System 4
EXHIBIT 2
Development of Single Discount Rate
KERS
Non-Hazardous
KERS
Hazardous
Single Discount Rate 5.43% 5.28%
Long-Term Expected Rate of Return 6.25% 6.25%
Long-Term Municipal Bond Rate1 2.45% 2.45%
Notes:1 Fixed-income municipal bonds with 20 years to maturity that include only federally tax-exempt municipal bonds as
reported in Fidelity Index’s “20-Year Municipal GO AA Index” as of June 30, 2020.
Board Meeting - December 3, 2020 - Audit Committee Report
122

Kentucky Employees Retirement System 5
EXHIBIT 3a Schedule of the Employers’ Net OPEB Liability – KERS Non-Hazardous Plan
($ in thousands)
Change in the Net OPEB Liability 2020 2019 2018 2017
Total OPEB liability
Service Cost 59,600$ 61,345$ 66,360$ 46,992$
Interest on the total OPEB liability 179,811 186,820 191,178 192,911
Benefit Changes 0 0 1,865 0
Difference between actual and expected experience 288,235 (302,189) (191,147) (3,921)
Assumption Changes 13,767 158,004 (11,235) 414,835
Benefit Payments1 (159,841) (148,112) (148,236) (139,601)
Net Change in Total OPEB Liability 381,572 (44,132) (91,215) 511,216
Total OPEB Liability - Beginning 3,217,985$ 3,262,117$ 3,353,332$ 2,842,116$ Total OPEB Liability - Ending (a) 3,599,557$ 3,217,985$ 3,262,117$ 3,353,332$
Plan Fiduciary Net Position
Contributions - Employer2 208,300$ 201,155$ 152,985$ 162,636$
Contributions - Member 6,128 5,963 5,786 5,156
Benefit Payments1 (159,841) (148,112) (148,236) (139,601)
OPEB Plan Net Investment Income 11,820 45,749 64,028 94,239
OPEB Plan Administrative Expense (847) (875) (760) (861)
Other 0 4 4 32 4 0
Net Change in Plan Fiduciary Net Position 65,560 103,884 73,835 121,569
Plan Fiduciary Net Position - Beginning 995,089$ 891,205$ 817,370$ 695,801$
Plan Fiduciary Net Position - Ending (b) 1,060,649$ 995,089$ 891,205$ 817,370$
Net OPEB Liability - Ending (a) - (b) 2,538,908 2,222,896 2,370,912 2,535,962
Plan Fiduciary Net Position as a Percentage
of the Total OPEB Liability 29.47% 30.92% 27.32% 24.37%
Covered Employee Payroll3 1,482,431$ 1,515,953$ 1,573,898$ 1,593,097$
Net OPEB Liability as a Percentage of
Covered Employee Payroll 171.27% 146.63% 150.64% 159.18%
Notes:1 Benefit payments include expected benefits due to the implicit subsidy for members under age 65. They are also offset by insurance premiums received
2 Employer contributions include expected benefits due to the implicit subsidy for members under age 65.
from retirees, Medicare Drug Reimbursements, and Humana Gain Share Payments (in applicable years).
3 Based on derived compensation using the provided employer contribution information.4 Northern Trust Settlement
Board Meeting - December 3, 2020 - Audit Committee Report
123

Kentucky Employees Retirement System 6
EXHIBIT 3b Schedule of the Employers’ Net OPEB Liability – KERS Hazardous Plan
($ in thousands) Change in the Net OPEB Liability 2020 2019 2018 2017
Total OPEB liability
Service Cost 11,548$ 12,337$ 12,893$ 8,002$
Interest on the total OPEB liability 28,101 27,990 28,500 27,591
Benefit Changes 0 0 167 0
Difference between actual and expected experience 27,668 (30,947) (31,240) (1,029)
Assumption Changes 11,428 31,687 (581) 89,401
Benefit Payments1 (21,425) (19,767) (18,704) (16,618)
Net Change in Total OPEB Liability 57,320 21,300 (8,965) 107,347
Total OPEB Liability - Beginning 507,204$ 485,904$ 494,869$ 387,522$ Total OPEB Liability - Ending (a) 564,524$ 507,204$ 485,904$ 494,869$
Plan Fiduciary Net Position
Contributions - Employer2 7,441$ 5,556$ 5,165$ 4,579$
Contributions - Member 1,105 934 909 811
Benefit Payments1 (21,425) (19,767) (18,704) (16,618)
OPEB Plan Net Investment Income 704 28,373 42,950 59,614
OPEB Plan Administrative Expense (123) (117) (104) (105)
Other 0 2 4 18 4 0
Net Change in Plan Fiduciary Net Position (12,298) 14,981 30,234 48,281
Plan Fiduciary Net Position - Beginning 534,053$ 519,072$ 488,838$ 440,557$
Plan Fiduciary Net Position - Ending (b) 521,755$ 534,053$ 519,072$ 488,838$
Net OPEB Liability - Ending (a) - (b) 42,769 (26,849) (33,168) 6,031
Plan Fiduciary Net Position as a Percentage
of the Total OPEB Liability 92.42% 105.29% 106.83% 98.78%
Covered Employee Payroll3 182,209$ 151,448$ 190,317$ 171,087$
Net OPEB Liability as a Percentage of
Covered Employee Payroll 23.47% -17.73% -17.43% 3.53%
Notes:
from retirees, Medicare Drug Reimbursements, and Humana Gain Share Payments (in applicable years).2 Employer contributions include expected benefits due to the implicit subsidy for members under age 65.3 Based on derived compensation using the provided employer contribution information.
1 Benefit payments include expected benefits due to the implicit subsidy for members under age 65. They are also offset by insurance premiums received
4 Northern Trust Settlement
Board Meeting - December 3, 2020 - Audit Committee Report
124

Kentucky Employees Retirement System 7
EXHIBIT 4a
Schedule of Employers’ Contributions – KERS Non-Hazardous Plan ($ in thousands)
Fiscal
Year
Ending1
Actuarially
Determined
Contribution2
Total Employer
Contributions3
Contribution
Deficiency
(Excess)
Covered
Employee
Payroll4
Actual
Contributions
as a Percentage
of Covered
Payroll
2020 183,821$ 175,007$ 8,814$ 1,482,431$ 11.81%
2019 187,978 178,964 9,014 1,515,953 11.81%
2018 132,365 136,419 (4,054) 1,573,898 8.67%
2017 133,024 152,356 (19,332) 1,593,097 9.56%
2016 121,899 135,816 (13,917) 1,529,249 8.88%
2015 130,455 135,940 (5,485) 1,544,234 8.80%
2014 208,881 166,610 42,271 1,577,496 10.56%
2013 286,143 165,331 120,812 1,644,409 10.05%
2012 297,904 156,057 141,847 1,644,897 9.49%
2011 294,898 129,336 165,562 1,731,633 7.47%
Notes:1 Data for years prior to 2018 is based on contribution data provided in the 2017 CAFR, based
on calculations provided by the prior actuary.2 Actuarially determined contribution for fiscal year ending 2020 is based on the contribution
rate calculated with the June 30, 2017 actuarial valuation.3 Employer contributions do not include the expected implicit subsidy included in exhibit 3.
4 Based on derived compensation using the provided employer contribution information.
Board Meeting - December 3, 2020 - Audit Committee Report
125

Kentucky Employees Retirement System 8
EXHIBIT 4b
Schedule of Employers’ Contributions – KERS Hazardous Plan ($ in thousands)
Fiscal
Year
Ending1
Actuarially
Determined
Contribution2
Total Employer
Contributions3
Contribution
Deficiency
(Excess)
Covered
Employee
Payroll4
Actual
Contributions
as a Percentage
of Covered
Payroll
2020 4,482$ 5,776$ (1,294)$ 182,209$ 3.17%
2019 3,726 4,970 (1,244) 151,448 3.28%
2018 2,550 5,288 (2,738) 190,317 2.78%
2017 4,688 5,620 (932) 171,087 3.28%
2016 9,186 16,766 (7,580) 147,563 11.36%
2015 13,152 14,882 (1,730) 128,680 11.57%
2014 15,627 23,874 (8,247) 129,076 18.50%
2013 26,253 25,682 571 132,015 19.45%
2012 28,326 24,538 3,788 131,977 18.59%
2011 29,585 19,953 9,632 133,054 15.00%
Notes:1 Data for years prior to 2018 is based on contribution data provided in the 2017 CAFR, based
on calculations provided by the prior actuary.2 Actuarially determined contribution for fiscal year ending 2020 is based on the contribution
rate calculated with the June 30, 2017 actuarial valuation.3 Employer contributions do not include the expected implicit subsidy included in exhibit 3.
4 Based on derived compensation using the provided employer contribution information.
Board Meeting - December 3, 2020 - Audit Committee Report
126

Kentucky Employees Retirement System 9
Notes to Schedule of Employers’ Contributions for FYE 2020
The actuarially determined contribution rates effective for fiscal year ending 2020 that are documented in the schedule on the previous pages were calculated as of June 30, 2017. Based on the June 30, 2017 actuarial valuation report, the actuarial methods and assumptions used to calculate these contribution rates are below:
Item KERS Non-Hazardous KERS Hazardous
Determine by the Actuarial Valuation as of:
June 30, 2017
June 30, 2017
Actuarial Cost Method: Entry Age Normal Entry Age Normal
Asset Valuation Method: 20% of the difference between the market value of assets and the expected actuarial value of assets is recognized
20% of the difference between the market value of assets and the expected actuarial value of assets is recognized
Amortization Method: Level Percent of Pay Level Percent of Pay
Amortization Period: 26 Years, Closed 26 Years, Closed
Payroll Growth Rate: 0.00% 0.00%
Investment Return: 6.25% 6.25%
Inflation: 2.30% 2.30%
Salary Increases: 3.55% to 15.55%, varies by service 3.55% to 19.55%, varies by service
Mortality:
RP-2000 Combined Mortality Table, projected to 2013 with Scale BB (set back 1 year for females)
RP-2000 Combined Mortality Table, projected to 2013 with Scale BB (set back 1 year for females)
Healthcare Trend Rates: Pre-65
Initial trend starting at 7.25% at January 1, 2019 and gradually decreasing to an ultimate trend rate of 4.05% over a period of 13 years. The 2018 premiums were known at the time of the valuation and were incorporated into the liability measurement.
Initial trend starting at 7.25% at January 1, 2019 and gradually decreasing to an ultimate trend rate of 4.05% over a period of 13 years. The 2018 premiums were known at the time of the valuation and were incorporated into the liability measurement.
Post-65 Initial trend starting at 5.10% at January 1, 2019 and gradually decreasing to an ultimate trend rate of 4.05% over a period of 11 years. The 2018 premiums were known at the time of the valuation and were incorporated into the liability measurement.
Initial trend starting at 5.10% at January 1, 2019 and gradually decreasing to an ultimate trend rate of 4.05% over a period of 11 years. The 2018 premiums were known at the time of the valuation and were incorporated into the liability measurement.
Board Meeting - December 3, 2020 - Audit Committee Report
127

Kentucky Employees Retirement System 10
EXHIBIT 5a
Sensitivity of the Net OPEB Liability to Changes in the Discount Rate and Healthcare Trend Rate KERS Non-Hazardous Plan
($ in thousands)
Table 1. Sensitivity of the Net OPEB Liability to Changes in the Discount Rate
1.00%
Decrease,
Current
Discount Rate,
1.00%
Increase,
4.43% 5.43% 6.43%
3,026,103$ 2,538,908$ 2,139,021$
Table 2. Sensitivity of the Net OPEB Liability to Changes in the Healthcare Cost Trend Rate
1.00%
Decrease
Current Healthcare
Cost Trend Rate
1.00%
Increase
2,136,914$ 2,538,908$ 3,025,819$
Board Meeting - December 3, 2020 - Audit Committee Report
128

Kentucky Employees Retirement System 11
EXHIBIT 5b
Sensitivity of the Net OPEB Liability to Changes in the Discount Rate and Healthcare Trend Rate KERS Hazardous Plan
($ in thousands)
Table 1. Sensitivity of the Net OPEB Liability to Changes in the Discount Rate
1.00%
Decrease,
Current
Discount Rate,
1.00%
Increase,
4.28% 5.28% 6.28%
126,165$ 42,769$ (24,330)$
Table 2. Sensitivity of the Net OPEB Liability to Changes in the Healthcare Cost Trend Rate
1.00%
Decrease
Current Healthcare
Cost Trend Rate
1.00%
Increase
(20,042)$ 42,769$ 119,675$
Board Meeting - December 3, 2020 - Audit Committee Report
129

APPENDIX 1
Board Meeting - December 3, 2020 - Audit Committee Report
130

Appendix 1
Kentucky Employees Retirement System 13
Development of Baseline Claims Cost
For non-Medicare retirees, the initial per capita costs were developed using retiree claims experience
for calendar year 2019. The claims were projected on an incurred claim basis, adjusted for prescription
drug rebates, and loaded for administrative expense. The per capita costs shown in the table below also
include HRA contributions for retirees on the CDHP plans. An inherent assumption in this methodology
is that the projected future retirees will have a similar distribution by plan type as the current retirees.
The fully-insured premiums KRS pays the Kentucky Employees’ Health Plan are blended rates based on
the combined experience of active and retired members. Because the average cost of providing health
care benefits to retirees under age 65 is higher than the average cost of providing health care benefits
to active employees, there is an implicit employer subsidy for the non-Medicare eligible retirees.
For Medicare retirees, the initial per capita costs were estimated based on the plan premiums effective
January 1, 2020, and are used for both current and future retirees. An inherent assumption in this
methodology is that the projected future retirees will have a similar distribution by plan type as the
current retirees.
Age graded and sex distinct premiums are utilized by this valuation. These costs are appropriate for the
unique age and sex distribution currently existing. Over the future years covered by this valuation, the
age and sex distribution will most likely change. Therefore, our process “distributes” the average
premium over all age/sex combinations and assigns a unique premium for each combination. The
age/sex specific costs more accurately reflect the health care utilization and cost at that age.
Mehdi Riazi is a Member of the American Academy of Actuaries (MAAA) and meets the Qualification Standards of the American Academy of Actuaries to render the actuarial opinions contained herein.
Mehdi Riazi, FSA, EA, MAAA
FOR THOSE NOT ELIGIBLE FOR MEDICARE
AGE MALE FEMALE
40 50 60 64
$337.39 546.91 929.50
1,130.30
$548.24 673.74 915.24
1,066.69
FOR THOSE ELIGIBLE FOR MEDICARE
AGE MALE FEMALE
65 75 85
$186.68 218.42 230.96
$176.08 213.13 233.68
Board Meeting - December 3, 2020 - Audit Committee Report
131

Kentucky State Police Retirement System GASB No. 74 Accounting Valuation Report As of June 30, 2020
Board Meeting - December 3, 2020 - Audit Committee Report
132

September 8, 2020 Board of Trustees Kentucky Retirement Systems Perimeter Park West 1260 Louisville Road Frankfort, KY 40601
Re: GASB No. 74 Reporting – Actuarial Information – State Police Retirement System Dear Members of the Board: This report provided herein contains certain information for the Kentucky State Police Retirement System (SPRS) in connection with the Governmental Accounting Standards Board (GASB) Statement No. 74, “Financial Reporting for Postemployment Benefit Plans Other than Pension Plans” for the fiscal year ending June 30, 2020. A separate report will be provided at a later date with additional accounting information determined in accordance with GASB Statement No. 75, “Accounting and Financial Reporting for Postemployment Benefits Other Than Pensions”. The liability calculations presented in this report were performed for the purpose of satisfying the requirements of GASB No. 74 and are not applicable for other purposes, such as determining the plans’ funding requirements. The plan’s liability for other purposes may produce significantly different results. This report may be provided to parties other than the Board of Trustees of the Kentucky Retirement Systems only in its entirety and only with the permission of the Board. GRS is not responsible for unauthorized use of this report. The total OPEB liability, net OPEB liability, and sensitivity information shown in this report are based on an actuarial valuation date of June 30, 2019. The total OPEB liability was rolled-forward from the valuation date to the plan’s fiscal year ending June 30, 2020, using generally accepted actuarial principles. GASB No. 74 requires Kentucky Retirement Systems to disclose a 10-year history of certain information in the Required Supplementary Information within their comprehensive annual financial report. The exhibits provided in this report include the applicable information for historical years that were calculated in accordance with this accounting standard. Information disclosed for years prior to June 30, 2017 were prepared by KRS’s prior actuary. The discount rate used to calculate the total OPEB liability decreased from 5.76% to 5.40% (see further discussion on the calculation of the single discount rate later in this letter). The assumed increase in future health care costs, or trend assumption, was reviewed during the June 30, 2019 valuation process and was updated to better reflect more current expectations relating to anticipated future increases in the medical costs. Also, the June 30, 2020 GASB No. 74 actuarial information reflects the anticipated savings from the repeal of the “Cadillac Tax” and “Health Insurer Fee”, which occurred in December of 2019. The assumed load on pre-Medicare premiums to reflect the cost of the Cadillac Tax was removed and the Medicare premiums were reduced by 11% to reflect the repeal of the Health Insurer Fee. There were no other material assumption changes and it is our opinion that these procedures are reasonable and appropriate, and comply with applicable requirements under GASB No. 74
Board Meeting - December 3, 2020 - Audit Committee Report
133

Board of Trustees September 8, 2020 Page 2
Senate Bill 249 changed the funding period for the amortization of the unfunded liability to 30 years as of June 30, 2019. Gains and losses incurring in future years will be amortized over separate 20-year amortization bases. This change does not impact the calculation of the Total OPEB Liability and only impacts the calculation of the contribution rates that would be payable starting July 1, 2020. There were no other material plan provision changes and it is our opinion that these procedures are reasonable and appropriate, and comply with applicable requirements under GASB No. 74. The fully-insured premiums KRS pays for the Kentucky Employees’ Health Plan are blended rates based on the combined experience of active and retired members. Because the average cost of providing health care benefits to retirees under age 65 is higher than the average cost of providing health care benefits to active employees, there is an implicit employer subsidy for the non-Medicare eligible retirees. GASB No. 74 requires that the liability associated with this implicit subsidy be included in the calculation of the Total OPEB Liability. This report is based upon information, furnished to us by the Retirement System, which includes benefit provisions, membership information, and financial data. We did not audit this data and information, but we did apply a number of tests and concluded that it was reasonable and consistent. GRS is not responsible for the accuracy or completeness of the information provided by the Retirement System. Please see the “Actuarial Valuation Report as of June 30, 2019” for additional discussion of the nature of the actuarial calculations and more information related to participant data, economic and demographic assumptions, and benefit provisions. These reports should be considered together as a complete report for KRS’s fiscal year ending June 30, 2020. A Single discount rate of 5.40% was used to measure the total OPEB liability as of June 30, 2020. The single discount rate is based on the expected rate of return on OPEB plan investments of 6.25% and a municipal bond rate of 2.45%, as reported in Fidelity Index’s “20-Year Municipal GO AA Index” as of June 30, 2020. Based on the stated assumptions and the projection of cash flows as of each fiscal year ending, the plan’s fiduciary net position and future contributions were projected to be sufficient to finance the future benefit payments of the current plan members. Therefore, the long-term expected rate of return on insurance plan investments was applied to all periods of the projected benefit payments paid from the retirement system. However, the cost associated with the implicit employer subsidy is not currently being included in the calculation of the System’s actuarial determined contributions, and it is our understanding that any cost associated with the implicit subsidy will not be paid out of the System’s trust. Therefore, the municipal bond rate was applied to future expected benefit payments associated with the implicit subsidy. The projection of cash flows used to determine the single discount rate must include an assumption regarding actual employer contributions made each future year. The future contributions are projected assuming that each participating employer in the System contribute the actuarially determined employer contribution rate each future year calculated in accordance with the current funding policy, as most recently revised by Senate Bill 249, passed during the 2020 Legislative Session. Based on guidance issued by GASB in connection with GASB Statement No. 74, the 1% of pay member contributions for Tier 2 and Tier 3 members to a 401(h) subaccount is considered as an OPEB asset. As a result, the reported fiduciary net position includes these 401(h) assets. Additionally, these member contributions and associated investment income are included in the reconciliation of the fiduciary net position.
Board Meeting - December 3, 2020 - Audit Committee Report
134

Board of Trustees September 8, 2020 Page 3
Future actuarial measurements may differ significantly from the current measurements presented in this report due to such factors as the following: plan experience differing from that anticipated by the economic or demographic assumptions; changes in economic or demographic assumptions; increases or decreases expected as part of the natural operation of the methodology used for these measurements; and changes in plan provisions or applicable law. To the best of our knowledge, this report is complete and accurate and is in accordance with generally recognized actuarial practices and methods. Mr. Newton, Mr. White, and Mr. Riazi are Enrolled Actuaries. All of the undersigned are independent actuaries and consultants and members of the American Academy of Actuaries and meet the Qualification Standards of the American Academy of Actuaries to render the actuarial opinion herein. They are also experienced in performing valuations for large public retirement systems. This communication shall not be construed to provide tax advice, legal advice or investment advice. Sincerely, Gabriel Roeder Smith & Co. Joseph P. Newton, FSA, EA, MAAA Daniel J. White, FSA, EA, MAAA Pension Market Leader and Actuary Senior Consultant and Actuary Janie Shaw, ASA, MAAA Mehdi Riazi, FSA, EA, MAAA Consultant and Actuary Consultant and Actuary
Board Meeting - December 3, 2020 - Audit Committee Report
135

Table of Contents
State Police Retirement System
Page
COVER LETTER
SECTION 1 SUPPORTING EXHIBITS
EXHIBIT 1 — SCHEDULE OF EMPLOYERS’ NET OPEB LIABILITY
EXHIBIT 2 — DEVELOPMENT OF THE SINGLE DISCOUNT RATE
EXHIBIT 3 — SCHEDULE OF CHANGES IN EMPLOYERS’ NET OPEB LIABILITY
EXHIBIT 4 — SCHEDULE OF EMPLOYERS’ CONTRIBUTIONS
EXHIBIT 5 — SENSITIVITY OF THE NET OPEB LIABILITY TO CHANGES IN THE DISCOUNT RATE AND HEALTHCARE TREND RATE
2
3
4
5
7
APPENDIX 1 DEVELOPMENT OF BASELINE CLAIMS COST
Board Meeting - December 3, 2020 - Audit Committee Report
136

SECTION 1
Board Meeting - December 3, 2020 - Audit Committee Report
137

State Police Retirement System 2
EXHIBIT 1
Schedule of the Employers’ Net OPEB Liability ($ in thousands)
Year
Total
OPEB
Liability
Plan Fiduciary
Net Position
Net OPEB
Liability/(Asset)
Plan Fiduciary
Net Position
as a Percentage
of the Total
OPEB Liability
Covered
Employee
Payroll1
Net OPEB Liability
as a Percentage
of Covered
Employee Payroll
(1) (2) (3) = (1) - (2) (4) = (2) / (1) (5) (6) = (3) / (5)
2020 339,942$ 201,340$ 138,602$ 59.23% 48,231$ 287.37%
2019 312,553 201,206 111,347 64.38% 48,780 228.26%
2018 301,012 190,847 110,165 63.40% 50,064 220.05%
2017 313,234 178,838 134,396 57.09% 48,873 274.99%
Note:1 Based on derived compensation using the provided employer contribution information.
Board Meeting - December 3, 2020 - Audit Committee Report
138

State Police Retirement System 3
EXHIBIT 2
Development of Single Discount Rate
SPRS
Single Discount Rate 5.40%
Long-Term Expected Rate of Return 6.25%
Long-Term Municipal Bond Rate1 2.45%
Notes:1 Fixed-income municipal bonds with 20 years to maturity that include only federally tax-exempt municipal bonds as
reported in Fidelity Index’s “20-Year Municipal GO AA Index” as of June 30, 2020.
Board Meeting - December 3, 2020 - Audit Committee Report
139

State Police Retirement System 4
EXHIBIT 3 Schedule of the Employers’ Net OPEB Liability
($ in thousands)
Change in the Net OPEB Liability 2020 2019 2018 2017
Total OPEB liability
Service Cost 5,389$ 4,816$ 6,087$ 4,147$
Interest on the total OPEB liability 17,600 17,724 18,432 17,993
Benefit Changes 0 0 34 0
Difference between actual and expected experience 13,810 (14,295) (23,320) (573)
Assumption Changes 4,578 16,483 (358) 57,312
Benefit Payments1 (13,988) (13,187) (13,097) (12,123)
Net Change in Total OPEB Liability 27,389 11,541 (12,222) 66,756
Total OPEB Liability - Beginning 312,553$ 301,012$ 313,234$ 246,478$ Total OPEB Liability - Ending (a) 339,942$ 312,553$ 301,012$ 313,234$
Plan Fiduciary Net Position
Contributions - Employer2 12,873$ 12,623$ 8,535$ 7,862$
Contributions - Member 196 176 155 131
Benefit Payments1 (13,988) (13,187) (13,097) (12,123)
OPEB Plan Net Investment Income 1,124 10,815 16,470 21,627
OPEB Plan Administrative Expense (71) (69) (62) (66)
Other 0 1 4 8 4 0
Net Change in Plan Fiduciary Net Position 134 10,359 12,009 17,431
Plan Fiduciary Net Position - Beginning 201,206$ 190,847$ 178,838$ 161,407$
Plan Fiduciary Net Position - Ending (b) 201,340$ 201,206$ 190,847$ 178,838$
Net OPEB Liability - Ending (a) - (b) 138,602 111,347 110,165 134,396
Plan Fiduciary Net Position as a Percentage
of the Total OPEB Liability 59.23% 64.38% 63.40% 57.09%
Covered Employee Payroll3 48,231$ 48,780$ 50,064$ 48,873$
Net OPEB Liability as a Percentage of
Covered Employee Payroll 287.37% 228.26% 220.05% 274.99%
Notes:
4 Northern Trust Settlement
3 Based on derived compensation using the provided employer contribution information.
from retirees, Medicare Drug Reimbursements, and Humana Gain Share Payments (in applicable years).2 Employer contributions include expected benefits due to the implicit subsidy for members under age 65.
1 Benefit payments include expected benefits due to the implicit subsidy for members under age 65. They are also offset by insurance premiums received
Board Meeting - December 3, 2020 - Audit Committee Report
140

State Police Retirement System 5
EXHIBIT 4 Schedule of Employers’ Contributions
($ in thousands)
Fiscal
Year
Ending1
Actuarially
Determined
Contribution2
Total Employer
Contributions3
Contribution
Deficiency
(Excess)
Covered
Employee
Payroll4
Actual
Contributions
as a Percentage
of Covered
Payroll
2020 13,133$ 13,133$ 0$ 48,231$ 27.23%
2019 13,283 13,288 (5) 48,780 27.24%
2018 9,062 9,397 (335) 50,064 18.77%
2017 9,222 9,222 0 48,873 18.87%
2016 8,553 10,237 (1,684) 45,551 22.47%
2015 9,890 10,382 (492) 45,765 22.69%
2014 20,879 14,493 6,386 44,616 32.48%
2013 27,234 16,829 10,405 45,256 37.19%
2012 28,247 11,960 16,287 48,373 24.72%
2011 25,773 11,051 14,722 48,693 22.70%
Notes:
3 Employer contributions do not include the expected implicit subsidy included in exhibit 3.
4 Based on derived compensation using the provided employer contribution information.
1 Data for years prior to 2018 is based on contribution data provided in the 2017 CAFR, based
on calculations provided by the prior actuary.2 Actuarially determined contribution for fiscal year ending 2020 is based on the contribution
rate calculated with the June 30, 2017 actuarial valuation.
Board Meeting - December 3, 2020 - Audit Committee Report
141

State Police Retirement System 6
Notes to Schedule of Employers’ Contributions for FYE 2020
The actuarially determined contribution rate effective for fiscal year ending 2020 that is documented in the schedule on the previous pages was calculated as of June 30, 2017. Based on the June 30, 2017 actuarial valuation report, the actuarial methods and assumptions used to calculate these contribution rates are below:
Item SPRS
Determine by the Actuarial Valuation as of:
June 30, 2017
Actuarial Cost Method: Entry Age Normal
Asset Valuation Method: 20% of the difference between the market value of assets and the expected actuarial value of assets is recognized
Amortization Method: Level Percent of Pay
Amortization Period: 26 Years, Closed
Payroll Growth Rate: 0.00%
Investment Return: 6.25%
Inflation: 2.30%
Salary Increases: 3.05% to 15.55%, varies by service
Mortality:
RP-2000 Combined Mortality Table, projected to 2013 with Scale BB (set back 1 year for females)
Healthcare Trend Rates: Pre-65
Initial trend starting at 7.25% at January 1, 2019 and gradually decreasing to an ultimate trend rate of 4.05% over a period of 13 years. The 2018 premiums were known at the time of the valuation and were incorporated into the liability measurement.
Post-65 Initial trend starting at 5.10% at January 1, 2019 and gradually decreasing to an ultimate trend rate of 4.05% over a period of 11 years. The 2018 premiums were known at the time of the valuation and were incorporated into the liability measurement.
Board Meeting - December 3, 2020 - Audit Committee Report
142

State Police Retirement System 7
EXHIBIT 5
Sensitivity of the Net OPEB Liability to Changes in the Discount Rate and Healthcare Trend Rate ($ in thousands)
Table 1. Sensitivity of the Net OPEB Liability to Changes in the Discount Rate
1.00%
Decrease,
Current
Discount Rate,
1.00%
Increase,
4.40% 5.40% 6.40%
187,528$ 138,602$ 99,093$
Table 2. Sensitivity of the Net OPEB Liability to Changes in the Healthcare Cost Trend Rate
1.00%
Decrease
Current Healthcare
Cost Trend Rate
1.00%
Increase
98,159$ 138,602$ 188,131$
Board Meeting - December 3, 2020 - Audit Committee Report
143

APPENDIX 1
Board Meeting - December 3, 2020 - Audit Committee Report
144

Appendix 1
State Police Retirement System 9
Development of Baseline Claims Cost
For non-Medicare retirees, the initial per capita costs were developed using retiree claims experience
for calendar year 2019. The claims were projected on an incurred claim basis, adjusted for prescription
drug rebates, and loaded for administrative expense. The per capita costs shown in the table below also
include HRA contributions for retirees on the CDHP plans. An inherent assumption in this methodology
is that the projected future retirees will have a similar distribution by plan type as the current retirees.
The fully-insured premiums KRS pays the Kentucky Employees’ Health Plan are blended rates based on
the combined experience of active and retired members. Because the average cost of providing health
care benefits to retirees under age 65 is higher than the average cost of providing health care benefits
to active employees, there is an implicit employer subsidy for the non-Medicare eligible retirees.
For Medicare retirees, the initial per capita costs were estimated based on the plan premiums effective
January 1, 2020, and are used for both current and future retirees. An inherent assumption in this
methodology is that the projected future retirees will have a similar distribution by plan type as the
current retirees.
Age graded and sex distinct premiums are utilized by this valuation. These costs are appropriate for the
unique age and sex distribution currently existing. Over the future years covered by this valuation, the
age and sex distribution will most likely change. Therefore, our process “distributes” the average
premium over all age/sex combinations and assigns a unique premium for each combination. The
age/sex specific costs more accurately reflect the health care utilization and cost at that age.
Mehdi Riazi is a Member of the American Academy of Actuaries (MAAA) and meets the Qualification Standards of the American Academy of Actuaries to render the actuarial opinions contained herein.
Mehdi Riazi, FSA, EA, MAAA
FOR THOSE NOT ELIGIBLE FOR MEDICARE
AGE MALE FEMALE
40 50 60 64
$337.39 546.91 929.50
1,130.30
$548.24 673.74 915.24
1,066.69
FOR THOSE ELIGIBLE FOR MEDICARE
AGE MALE FEMALE
65 75 85
$186.68 218.42 230.96
$176.08 213.13 233.68
Board Meeting - December 3, 2020 - Audit Committee Report
145

MEMORANDUM
Date: December 2, 2020
To: Members of the Audit Committee of the KRS Board of Trustees
From: Rebecca H Adkins, Executive Director Office of Operations
Re: Actuarial Audit of the June 30, 2019 Actuarial Valuations and the 2014 – 2018 Experience Study
The Government Finance Officers Association (GFOA), a well-respected authority on governmental finance, reviews the KRS Comprehensive Annual Financial Report (CAFR) annually. For twenty-one years, GFOA has issued to KRS the prestigious Certificate of Achievement in Excellence in Financial Reporting national awardrecognizing excellence in state and local financial reports. One of the requirements of GFOA is that the systems conduct an audit of the actuary at least every five years.
At the February Audit Committee meeting, the members agreed that an audit of the actuarial methods and assumptions is a critical component of transparency in financial reporting. Through the RFP process, KRS selected Segal to conduct an actuarial audit of the June 30, 2019 actuarial valuations and review the 2014-2018 experience study conducted by the system actuary, GRS Consulting. The result is the attached report. We are pleased to communicate to you that this is a clean audit with only minor recommendations.
RECOMMENDATION: Management requests approval of the actuarial audit as presented.
Board Meeting - December 3, 2020 - Audit Committee Report
146

© 2020 by The Segal Group, Inc. All rights reserved.
Kentucky Retirement Systems
Independent Actuarial Audit of the June 30, 2019 Actuarial Valuations and the 2014-2018 Experience Study
D R
A F
T
Board Meeting - December 3, 2020 - Audit Committee Report
147

101 North Wacker Drive Suite 500
Chicago, IL 60606-1724 segalco.com
October 29, 2020
Board of Trustees
Kentucky Retirement Systems
Perimeter Park West
1260 Louisville Road
Frankfort, KY 40601
Re: Independent Actuarial Audit of the June 30, 2019 Actuarial Valuations and the
2004 -2018 Experience Study
Ladies and Gentlemen:
We are pleased to present the results of Segal’s actuarial audit of the June 30, 2019, actuarial
valuations and review of the 2014-2018 experience study. The purpose of this audit is to conduct a
review of the actuarial methods, assumptions, and procedures employed by the Kentucky Retirement
Systems (KRS) and the Systems’ actuary Gabriel, Roeder, Smith & Company (GRS). This audit
includes the following:
1. Report review – a review of the valuation results and reports for the Kentucky Employees
Retirement System (KERS), the County Employees Retirement System (CERS), and the State
Police Retirement System (SPRS). The results were reviewed to determine if they comply with
actuarial standards and whether such valuation reports reflect appropriate disclosure
information under any required reporting.
2. Validation of benefits valued through test lives and data review – discussion of the
procedures used to validate the participant data and the test lives selected, with a detailed
review of the findings.
3. Methods and assumptions review – an analysis and benchmarking of the actuarial
assumptions and a review of the actuarial methods utilized in determining the funded status and
accrued liability as of June 30, 2019, for compliance with generally accepted actuarial principles,
as well as a review of the experience study report for the five-year period ending June 30, 2018.
This review was conducted under the supervision of Kim Nicholl, a Fellow of the Society of Actuaries, a
member of the American Academy of Actuaries, and an Enrolled Actuary under ERISA, and Matthew
Strom, a Fellow of the Society of Actuaries, a member of the American Academy of Actuaries, and an
Enrolled Actuary under ERISA. This review was conducted in accordance with the standards of practice
prescribed by the Actuarial Standards Board.
The assistance of the KRS staff and GRS is gratefully acknowledged.
D R
A F
T
Board Meeting - December 3, 2020 - Audit Committee Report
148

We appreciate the opportunity to serve as an independent actuarial advisor for KRS and we are
available to answer any questions you may have on this report.
Sincerely,
Kim Nicholl, FSA, MAAA, EA Matthew A. Strom, FSA, MAAA, EA Senior Vice President & Actuary Senior Vice President & Actuary
D R
A F
T
Board Meeting - December 3, 2020 - Audit Committee Report
149

Table of Contents
Kentucky Retirement Systems
Page
Executive Summary .......................................................................................... 1
Section I: Purpose, Scope and Methodology of the Audit ............................. 3
Section II: Review of Reports and Validation of Benefits Valued .................. 6
Section III: Analysis of Actuarial Assumptions Employed ........................... 18
Section IV: Conclusions and Recommendations.......................................... 26
D R
A F
T
Board Meeting - December 3, 2020 - Audit Committee Report
150

Kentucky Retirement Systems 1
Executive Summary
The Board of Trustees of the Kentucky Retirement Systems (KRS) retained Segal to conduct an independent actuarial audit of the Systems’ June 30, 2019, actuarial valuations and the 2014-2018 experience study, as performed by the KRS Consulting Actuary, Gabriel, Roeder, Smith & Company (GRS). The Board requested an opinion on the reasonableness, consistency, and accuracy of the following:
• Demographic and financial data used in the actuarial valuations;
• Methods, procedures, and assumptions used in the actuarial valuations;
• Format of the actuarial valuation reports;
• Adequacy and reasonableness of the actuarial valuations; and
• Results and the actuarial assumptions generated from the experience study.
The objective of a limited scope audit (actuarial review) of any system is to provide validation that the liabilities and costs of the system are reasonable and being calculated as intended. This audit is not a full replication of the actuarial valuation results, but rather is a review of the key components in the valuation process that encompass the derivation of the liabilities and costs for the Systems. These key components are the data, the benefits valued, the actuarial assumptions and funding method used, and the asset valuation method employed. The valuation reports and the valuation output for a select group of test lives provide the detail necessary to validate each of these key components.
We reviewed all information supplied to us. We also requested and reviewed additional information provided by GRS. Finally, we considered the reasonableness of the actuarial assumptions and methods in the context of our own experience, and those of other state and local pension systems.
In summary, we found the following:
1. More detail on the calculation of the Recommended Employer Contribution Rates should be included in the report;
2. The economic assumptions are within norms for the peer group, with the aggregate investment return assumption below the peer group range;
3. The demographic actuarial assumptions recommended in the 2014-2018 experience study are for the most part sound and appropriate;
4. The valuation reports for KERS, CERS and SPRS provide sufficient detail upon which to render opinions; and
5. The review of selected test lives identified a modification to the valuation programming that could be made.
These items and recommendations are described in more detail throughout this report.
D R
A F
T
Board Meeting - December 3, 2020 - Audit Committee Report
151

Executive Summary
Kentucky Retirement Systems 2
Conclusions
This audit reviewed the findings of the June 30, 2019, actuarial valuations and 2014-2018 experience
study. We have made a few recommendations for the valuation report and test lives that may improve
the usefulness and accuracy, which are described in detail in Section II of this report. We generally
agree with the results of the experience study, with a few recommendations for improvement, as
described in Section III. We found the actuarial cost method and asset valuation method conform with
the Actuarial Standards of Practice.
The data appears complete and with a cursory analysis of the information supplied by KRS staff, we
were able to closely match the participant counts reported by GRS.
Finally, we offer ideas to improve the quality and understanding of the valuation reports and experience
review process. Several suggestions and recommendations are made throughout this document. We
would classify them as either: a) “presentation” suggestions to enhance the valuation process or report;
b) something to be examined during the next experience review; and c) something that may affect the
cost of the Systems. Where we make a comment in this regard in this report, we have identified the
location in the margin with the following icons:
Enhancement to valuation process or report
Examine during next experience review
May affect the cost of the Systems
D R
A F
T
Board Meeting - December 3, 2020 - Audit Committee Report
152

Kentucky Retirement Systems 3
Section I: Purpose, Scope and Methodology of the Audit Purpose of the Audit
The KRS Board retained Segal to conduct an independent review of the Systems’ current actuarial
calculations, assumptions and methods. The Board requested an assessment of the validity of the data
used in the valuations, a review of the appropriateness of the current funding method and procedures,
an evaluation of both economic and non-economic assumptions, a test of the valuation results, and a
review of the actuarial reports to determine if there is consistency in the presentation of the actuarial
results and whether they are consistent with professional standards.
Scope of the Audit
This actuarial audit has a specified, limited scope in its review. A full scope audit would include
performing the 2019 actuarial valuations from start to finish, in essence, a parallel valuation for each of
the three Systems. This limited scope audit reviews the valuations already performed, through
reviewing the benefits, assumptions, and methods, without a full replication of the actuarial valuation
results. This review is conducted by analyzing detailed output of certain selected test lives from each
membership group.
By not performing a full parallel valuation for each System, the following assumptions are made:
1. The current actuary’s valuation system is accurately applying each assumption consistent with
the test life review; and
2. The valuation system is adding together liabilities appropriately for each decrement (retirement,
turnover, disability, and death), for each member, and over the entire population (meaning no
participant group is being “dropped off” and no particular liabilities are being omitted).
What a limited scope audit can provide is:
1. Assurance that appropriate benefits are being valued;
2. Confirmation that the valuation system is accurately applying decrements to the test lives;
3. Confirmation that the program is valuing benefits as described in the valuation reports and
consistent with applicable statutes;
4. A measurement of economic actuarial assumptions against a peer group and hence an
assessment of their reasonableness;
D R
A F
T
Board Meeting - December 3, 2020 - Audit Committee Report
153

Section I: Purpose, Scope and Methodology of the Audit
Kentucky Retirement Systems 4
5. A review of the reasonableness of actuarial funding and asset valuation methods;
6. An indication as to whether the liabilities and contribution rates shown are not reasonable or are
incorrectly calculated; and
7. An assessment of whether the valuation appropriately reflects information required to be
disclosed under required reporting standards (GASB, etc.).
Methodology of the Audit for the 2019 Actuarial Valuation
The purpose of this audit is to express an opinion regarding the reasonableness and accuracy of the
actuarial assumptions, methods, valuation results, and contribution rates. The limited scope review is
not the same as an actuarial valuation, but represents a “second opinion” of the findings and processes
included in the valuation.
The measurement of the reasonableness of the funding levels encompasses three key analyses:
1. A verification of the benefits being projected for future payment;
2. A verification of the appropriateness of the actuarial assumptions that are used in calculating the
liability; and
3. A verification of the appropriateness of the funding and asset valuation methods.
Benefits Analysis
Critical to projecting future benefits is receiving complete and accurate data. We reviewed the process
by which data is prepared for the actuarial valuation, including:
1. An assessment of the completeness of the data;
2. A review of the data screening process employed; and
3. An examination of individual test life calculations.
We developed computer models that generated test life output, which enabled us to compare our test
life results with GRS’s results. These models also allowed us to confirm that the GRS valuations project
benefits in a manner consistent with the Summary of Plan Provisions in the valuation reports. For
purposes of this study, we regard differences of less than 3% to be acceptable for the Total Present
Value of Benefits (PVB) and for the review of census data.
D R
A F
T
Board Meeting - December 3, 2020 - Audit Committee Report
154

Section I: Purpose, Scope and Methodology of the Audit
Kentucky Retirement Systems 5
Assumptions Analysis
The second critical component in assessing the reasonableness of the funding levels is in the selection
and the application of the actuarial assumptions. With respect to the assumptions, we:
1. Reviewed the 2014-2018 experience study report;
2. Independently determined the reasonability of the investment return assumption by using Segal
Marco Advisors’ capital market assumptions; and
3. Benchmarked the economic assumptions against a survey of state and local employee
retirement systems.
Methods Analysis
The third component in assessing funding levels is the selection and application of the actuarial cost
method (including the method for amortizing the unfunded actuarial accrued liability) and the asset
valuation method (including smoothing techniques).
D R
A F
T
Board Meeting - December 3, 2020 - Audit Committee Report
155

Kentucky Retirement Systems 6
Section II: Review of Reports and Validation of Benefits Valued Data Used in the Valuation
We independently obtained data files directly from KRS and GRS. With minimal data scrubbing, we
found that the counts for the active and retired files were relatively close, and well within the 3%
threshold we established for determining materiality of differences.
All data for actives, inactives, annuitants and beneficiaries was provided as of the valuation date (June
30, 2019). In situations where there is missing or invalid data, we assume the GRS valuation software
applies adjustments to the data records for completeness. Given the large size of the data, this
shortens the amount of staff time spent on data reconciliation (for both GRS and KRS) without
sacrificing any material accuracy in the valuation results.
The tables that follow summarize our determination of key data elements as compared to those shown
in the valuation report.
D R
A F
T
Board Meeting - December 3, 2020 - Audit Committee Report
156

Section II: Review of Reports and Validation of Benefits Valued
Kentucky Retirement Systems 7
June 30, 2019
Analysis of Participant Data – KERS
Non-Hazardous Hazardous
GRS Segal
Ratio of
Segal/GRS GRS Segal
Ratio of
Segal/GRS
Active Members:
Number 33,696 33,697 1.00 3,705 3,705 1.00
Total payroll (in thousands) 1,437,647 1,437,647 1.00 150,446 150,446 1.00
Average Salary 42,665 42,664 1.00 40,606 40,606 1.00
Average Age 45.4 45.4 1.00 39.8 39.8 1.00
Average Service 11.0 11.0 1.00 7.3 7.3 1.00
Vested Inactive Members:
Number 31,544 31,545 1.00 2,178 2,178 1.00
Annual Benefits (in thousands) 82,692 82,695 1.00 4,407 4,407 1.00
Average Benefit 2,621 2,622 1.00 2,023 2,023 1.00
Average Age 51.3 51.3 1.00 46.5 46.5 1.00
Nonvested Inactive Members:
Number 20,370 20,353 1.00 4,070 4,065 1.00
Average Contributions with Interest 1,722 1,723 1.00 1,752 1,754 1.00
Retirees:
Number 40,519 40,519 1.00 3,913 3,915 1.00
Annual Benefits (in thousands) 870,243 870,243 1.00 61,454 61,473 1.00
Average Benefit 21,477 21,477 1.00 15,705 15,702 1.00
Average Age 69.4 69.4 1.00 64.8 64.8 1.00
Disability Retirees:
Number 1,949 1,949 1.00 162 162 1.00
Annual Benefits (in thousands) 25,745 25,745 1.00 1,541 1,541 1.00
Average Benefit 13,209 13,209 1.00 9,510 9,510 1.00
Average Age 65.8 65.8 1.00 60.3 60.4 1.00
Beneficiaries:
Number 4,942 4,941 1.00 462 462 1.00
Annual Benefits (in thousands) 72,718 72,683 1.00 4,528 4,528 1.00
Average Benefit 14,714 14,710 1.00 9,801 9,801 1.00
Average Age 70.6 70.6 1.00 66.0 66.0 1.00
D R
A F
T
Board Meeting - December 3, 2020 - Audit Committee Report
157

Section II: Review of Reports and Validation of Benefits Valued
Kentucky Retirement Systems 8
June 30, 2019
Analysis of Participant Data – CERS
Non-Hazardous Hazardous
GRS Segal
Ratio of
Segal/GRS GRS Segal
Ratio of
Segal/GRS
Active Members:
Number 81,506 81,535 1.00 9,474 9,474 1.00
Total payroll (in thousands) 2,521,860 2,521,860 1.00 559,353 559,353 1.00
Average Salary 30,941 30,930 1.00 59,041 59,041 1.00
Average Age 47.7 47.7 1.00 38.6 38.6 1.00
Average Service 9.1 9.1 1.00 10.1 10.1 1.00
Vested Inactive Members:
Number 50,768 50,771 1.00 1,782 1,784 1.00
Annual Benefits (in thousands) 77,396 77,395 1.00 7,387 7,421 1.00
Average Benefit 1,525 1,524 1.00 4,145 4,160 1.00
Average Age 52.3 52.3 1.00 45.3 45.4 1.00
Nonvested Inactive Members:
Number 40,775 40,746 1.00 1,640 1,638 1.00
Average Contributions with Interest 1,179 1,180 1.00 3,344 3,347 1.00
Retirees:
Number 54,493 54,494 1.00 8,275 8,277 1.00
Annual Benefits (in thousands) 644,546 644,546 1.00 231,301 231,318 1.00
Average Benefit 11,828 11,828 1.00 27,952 27,947 1.00
Average Age 70.6 70.6 1.00 62.0 62.0 1.00
Disability Retirees:
Number 4,198 4,198 1.00 576 576 1.00
Annual Benefits (in thousands) 48,289 48,289 1.00 9,697 9,697 1.00
Average Benefit 11,503 11,503 1.00 16,835 16,835 1.00
Average Age 65.5 65.5 1.00 57.1 57.1 1.00
Beneficiaries:
Number 5,848 5,849 1.00 1,172 1,173 1.00
Annual Benefits (in thousands) 54,282 54,312 1.00 17,815 17,822 1.00
Average Benefit 9,282 9,286 1.00 15,200 15,194 1.00
Average Age 68.2 68.2 1.00 58.6 58.6 1.00
D R
A F
T
Board Meeting - December 3, 2020 - Audit Committee Report
158

Section II: Review of Reports and Validation of Benefits Valued
Kentucky Retirement Systems 9
June 30, 2019
Analysis of Participant Data – SPRS
Hazardous
GRS Segal
Ratio of
Segal/GRS
Active Members:
Number 883 883 1.00
Total payroll (in thousands) 47,752 47,752 1.00
Average Salary 54,079 54,079 1.00
Average Age 36.7 36.7 1.00
Average Service 10.0 10.0 1.00
Vested Inactive Members:
Number 289 289 1.00
Annual Benefits (in thousands) 811 811 1.00
Average Benefit 2,806 2,806 1.00
Average Age 43.5 43.5 1.00
Nonvested Inactive Members:
Number 268 268 1.00
Average Contributions with Interest 1,264 1,264 1.00
Retirees:
Number 1,363 1,363 1.00
Annual Benefits (in thousands) 54,142 54,142 1.00
Average Benefit 39,723 39,723 1.00
Average Age 63.0 63.0 1.00
Disability Retirees:
Number 54 54 1.00
Annual Benefits (in thousands) 959 959 1.00
Average Benefit 17,757 17,757 1.00
Average Age 58.0 58.0 1.00
Beneficiaries:
Number 230 231 1.00
Annual Benefits (in thousands) 6,303 6,307 1.00
Average Benefit 27,404 27,301 1.00
Average Age 67.1 66.9 1.00
As previously mentioned, we were able to match most information reported by GRS to within 1% with
minimal data scrubbing.
D R
A F
T
Board Meeting - December 3, 2020 - Audit Committee Report
159

Section II: Review of Reports and Validation of Benefits Valued
Kentucky Retirement Systems 10
Valuation Results
We have reviewed the Recommended Employer Contribution Rate for each System and have the
following observation:
1. The required employer contributions are equal to the sum of the employer’s share of normal
cost (i.e., total normal cost, less expected member contributions), plus administrative expenses,
plus an unfunded accrued liability amortization payment. We were unable to exactly replicate
the Recommended Employer Contribution Rates shown in the valuation report, although our
independent calculations are reasonably close. Providing additional detail with respect to how
the unfunded liability amortization payment is calculated would be beneficial and would provide
a degree of transparency as to the mechanics of that calculation.
Valuation Report
While the accuracy of the actuarial valuation is the primary focus of an actuarial review, the content and
presentation of the actuarial valuation results to a layperson and professional are also important. Our
report recommendations are to provide clarity to the existing report. Based on our review of the
actuarial valuation report, we offer the following comments:
1. The July 1, 2019 valuation reports included the recommended assumptions in the experience
study for the period ending June 30, 2018. All of the assumptions that were updated were
identified in the beginning of the valuation reports and the reports included the effect of the
assumption changes in all the calculations. The reports disclosed the effect of the assumption
changes on the actuarial accrued liabilities. However, the effect of the assumption changes on
other funding metrics, such as the funded percentage and the Actuarially Determined
Contribution Rate, were not disclosed. Since these changes could provide useful insight to
users of the reports, we recommend showing the impact of assumption changes on these
funding metrics.
2. In the tables labeled as “Experience Gain or (Loss),” plan changes and assumption changes are
identified as actuarial gains and losses. In addition, the footnotes to the tables also describe
these changes in liabilities as actuarial losses. As these changes in liabilities are not actuarial
losses, we recommend that the descriptions in the tables and the footnotes be modified.
3. Also related to the liability gain or (loss), it would be informative to show the gain or loss
attributable to each source as well as to actual contributions that are more or less than
expected.
4. Section 5 of the Annual Actuarial Valuation Report contains information related to discussion of
risks, which is required information for funding valuations and pricing valuations pursuant to
Actuarial Standards of Practice Statement No. 51 (ASOP 51). The discussion of risk includes
two and a half pages of relatively generic language that outlines the general risks that affect a
pension system. This section also includes two tables with ratios and other calculations specific
to KRS. In general, we believe this section complies with the spirit of ASOP 51 and the risk
discussion. However, these disclosures may not help the intended users of the actuarial
D R
A F
T
Board Meeting - December 3, 2020 - Audit Committee Report
160

Section II: Review of Reports and Validation of Benefits Valued
Kentucky Retirement Systems 11
valuation reports gain a better understanding of risks inherent in the measurements of liabilities
and actuarially determined contributions.
Some observations and suggestions for improvement in the June 30, 2019 Actuarial Valuation
Reports are as follows:
a. Section 3.6 of ASOP 51 states, “If, in the actuary’s professional judgment, a more detailed assessment would be significantly beneficial for the intended user to understand the risks identified by the actuary, the actuary should recommend to the intended user that such an assessment be performed.” Section 5 does not contain such a
recommendation. This implies that the actuary does not believe a more detailed risk
assessment is necessary or that one would not be useful to the intended user.
However, we believe there is enough risk inherent in KRS that a more detailed risk
assessment would be useful.
b. One suggestion to improve the usefulness of this section would be to keep (and expand)
the existing language and add commentary specific to KRS when discussing each risk
element. For example, the information in this section could be reformatted to explain
each risk, show the particular KRS metric related to that risk, and provide commentary.
The current format makes it challenging for the intended user to grasp the concepts and
understand the risks inherent in KRS.
5. The reports do not include any projections of future funded percentages or contribution
requirements. Adding a projection of liabilities, assets, and required contribution rates
throughout the remaining amortization period (24 years for the 2019 valuation reports) could be
helpful for the long-term planning for the future funding requirements of the System.
Projected Benefits in the Valuation
We requested test lives in order to compare the benefit amounts projected in the valuations against our
understanding of the CERS, KERS and SPRS benefits summarized in the valuation report. We did not
run “parallel” valuations of each System, which is beyond the scope of this audit. We reproduced the
present value of future salary, present value of future benefits, actuarial accrued liability, and normal
cost for the test lives received to determine whether GRS correctly projected plan benefits and whether
the costs and liabilities were determined in accordance with the actuary’s stated methods and
assumptions.
Based on our review of the individual test life calculations, we have the following observations and/or
recommendations:
1. There is an inconsistency between how service to determine benefit eligibility and service to
determine benefit amounts are calculated. Service for eligibility purposes is calculated as a
rounded amount and service for benefit amount purposes is calculated as an exact amount. We
would expect both to be calculated with the same methodology. Furthermore, using rounded
service for benefit eligibility may not be appropriate, as it would allow some participants to retire
within the valuation program at an age when they are not actually eligible. For example, if a
participant needs 10 credits to retire at a certain age, they would not be able to retire at that age
D R
A F
T
Board Meeting - December 3, 2020 - Audit Committee Report
161

Section II: Review of Reports and Validation of Benefits Valued
Kentucky Retirement Systems 12
if they only had 9.9 credits. Rounding the 9.9 credits to 10 allows the valuation program to treat
them as retiring earlier than actually allowable. We recommend using exact service for eligibility
purposes.
The individual test life comparison exhibits on the following pages summarize the calculations
performed by Segal and GRS and show the differences by each liability category, as well as the ratio of
Segal’s results to GRS’s results.
As shown in the following tables, we have generally matched the GRS calculations to within our 3%
threshold. In the handful of instances where the ratio of Segal to GRS is outside of that tolerance, we
have reviewed these test lives in further detail. Primarily, these discrepancies are due to different
rounding of ages during interim step in the valuation process that, in aggregate across all members,
should net out to an immaterial amount.
D R
A F
T
Board Meeting - December 3, 2020 - Audit Committee Report
162

Section II: Review of Reports and Validation of Benefits Valued
Kentucky Retirement Systems 13
June 30, 2019 Valuation of the
Kentucky Employees Retirement System – Non-Hazardous
Test Life Comparison
Test Life Description
Present Value of Future Salary Present Value of Benefits Accrued Liability Normal Cost Rate
GRS Segal
Ratio of
Segal/
GRS GRS Segal
Ratio of
Segal/
GRS GRS Segal
Ratio of
Segal/
GRS GRS Segal
Ratio of
Segal/
GRS
Pension Retiree 1 164,202 164,645 1.00
Pension Disabled Retiree 285,110 285,649 1.00
Pension Surviving Spouse 114,508 117,025 1.02
Pension Vested Terminated 38,064 38,643 1.02
Pension Due Refund 298 298 1.00
Pension Active Tier 1 254,261 260,645 1.03 222,698 223,160 1.00 186,901 185,082 0.99 14.08% 14.61% 1.04
Pension Active Tier 2 193,779 198,595 1.02 50,304 50,078 1.00 27,783 27,493 0.99 11.62% 11.37% 0.98
Insurance Retiree 1 67,531 66,212 0.98
Insurance Retiree 2 15,691 15,987 1.02
Insurance Vested Terminated 27,694 27,838 1.01
Insurance Active 1 244,108 251,393 1.03 130,166 127,385 0.98 110,944 106,987 0.96 7.87% 8.38% 1.06
Insurance Active 2 186,762 193,970 1.04 4,038 3,960 0.98 2,236 2,169 0.97 0.97% 0.97% 1.00
* Items above that are blank are not applicable to that test life.
D R
A F
T
Board Meeting - December 3, 2020 - Audit Committee Report
163

Section II: Review of Reports and Validation of Benefits Valued
Kentucky Retirement Systems 14
June 30, 2019 Valuation of the
Kentucky Employees Retirement System – Hazardous
Test Life Comparison
Test Life Description
Present Value of Future Salary Present Value of Benefits Accrued Liability Normal Cost
GRS Segal
Ratio of
Segal/
GRS GRS Segal
Ratio of
Segal/
GRS GRS Segal
Ratio of
Segal/
GRS GRS Segal
Ratio of
Segal/
GRS
Pension Retiree 1 133,573 134,522 1.01
Pension Surviving Spouse 113,256 114,193 1.01
Pension Active Tier 1 228,380 235,143 1.03 191,905 191,865 1.00 145,768 143,059 0.98 20.20% 20.76% 1.03
Pension Active Tier 3 394,293 398,700 1.01 78,828 77,028 0.98 27,748 28,367 1.02 12.95% 12.20% 0.94
Insurance Retiree 1 45,733 46,513 1.02
Insurance Surviving Spouse 26,920 26,991 1.00
Insurance Active 1 228,380 235,143 1.03 60,241 60,206 1.00 47,309 46,905 0.99 5.66% 5.86% 1.03
Insurance Active 2 394,293 403,875 1.02 25,345 25,625 1.01 11,225 11,164 0.99 3.58% 3.76% 1.05
* Items above that are blank are not applicable to that test life.
D R
A F
T
Board Meeting - December 3, 2020 - Audit Committee Report
164

Section II: Review of Reports and Validation of Benefits Valued
Kentucky Retirement Systems 15
June 30, 2019 Valuation of the
County Employees Retirement System – Non-Hazardous
Test Life Comparison
Test Life Description
Present Value of Future Salary Present Value of Benefits Accrued Liability Normal Cost
GRS Segal
Ratio of
Segal/
GRS GRS Segal
Ratio of
Segal/
GRS GRS Segal
Ratio of
Segal/
GRS GRS Segal
Ratio of
Segal/
GRS
Pension Retiree 1 40,980 41,143 1.00
Pension Surviving Spouse 1 12,379 12,593 1.02
Pension Surviving Spouse 2 18,432 18,227 0.99
Pension Vested Terminated 47,246 48,926 1.04
Pension Due Refund 3,146 3,146 1.00
Pension Active Tier 1 162,134 167,000 1.03 41,933 41,996 1.00 20,324 20,125 0.99 13.32% 13.10% 0.98
Pension Active Tier 3 445,156 454,901 1.02 58,672 59,139 1.01 23,047 20,535 0.89 8.00% 8.49% 1.06
Insurance Retiree 1 30,187 30,250 1.00
Insurance Vested Terminated 25,230 25,612 1.02
Insurance Active 1 445,156 458,265 1.03 12,003 11,924 0.99 4,856 4,768 0.98 1.61% 1.63% 1.01
Insurance Active 2 162,134 168,233 1.04 17,694 17,297 0.98 9,159 8797 0.96 5.26% 5.25% 1.00
* Items above that are blank are not applicable to that test life.
D
R A
F T
Board Meeting - December 3, 2020 - Audit Committee Report
165

Section II: Review of Reports and Validation of Benefits Valued
Kentucky Retirement Systems 16
June 30, 2019 Valuation of the
County Employees Retirement System – Hazardous
Test Life Comparison
Test Life Description
Present Value of Future Salary Present Value of Benefits Accrued Liability Normal Cost
GRS Segal
Ratio of
Segal/
GRS GRS Segal
Ratio of
Segal/
GRS GRS Segal
Ratio of
Segal/
GRS GRS Segal
Ratio of
Segal/
GRS
Pension Retiree 1 541,594 544,587 1.01
Pension Surviving Spouse 360,419 360,628 1.00
Pension Active Tier 1 333,511 343,288 1.03 486,338 487,050 1.00 409,471 408,280 1.00 23.05% 22.95% 1.00
Pension Active Tier 2 648,791 668,327 1.03 270,809 272,323 1.01 155,823 154,801 0.99 17.72% 17.58% 0.99
Insurance Retiree 1 287,718 287,352 1.00
Insurance Surviving Spouse 124,737 121,106 0.97
Insurance Active 1 333,511 344,128 1.03 314,592 303,321 0.96 264,958 256,489 0.97 14.88% 14.09% 0.95
Insurance Active 2 648,791 668,327 1.03 46,161 44,917 0.97 27,532 26,810 0.97 2.87% 2.81% 0.98
* Items above that are blank are not applicable to that test life.
D R
A F
T
Board Meeting - December 3, 2020 - Audit Committee Report
166

Section II: Review of Reports and Validation of Benefits Valued
Kentucky Retirement Systems 17
June 30, 2019 Valuation of the
State Police Retirement System
Test Life Comparison
Test Life Description
Present Value of Future Salary Present Value of Benefits Accrued Liability Normal Cost
GRS Segal
Ratio of
Segal/
GRS GRS Segal
Ratio of
Segal/
GRS GRS Segal
Ratio of
Segal/
GRS GRS Segal
Ratio of
Segal/
GRS
Pension Retiree 1 900,573 902,217 1.00
Pension Surviving Spouse 714,979 719,225 1.01
Pension Vested Terminated 288,226 291,466 1.01
Pension Due Refund 661 661 1.00
Pension Active Tier 1 327,240 335,327 1.02 485,133 484,668 1.00 383,022 370,904 0.97 31.20% 33.93% 1.09
Pension Active Tier 1 427,582 432,552 1.01 391,589 390,132 1.00 268,685 266,182 0.99 28.75% 28.66% 1.00
Pension Active Tier 2 731,157 749,876 1.03 268,940 268,805 1.00 58,329 56,774 0.97 28.80% 28.28% 0.98
Pension Active Tier 3 222,465 231,013 1.04 38,386 38,607 1.01 396 0 N/A 17.07% 16.71% 0.98
Insurance Retiree 1 93,366 93,898 1.01
Insurance Surviving Spouse 52,997 53,253 1.00
Insurance Vested Termination 219,665 217,741 0.99
Insurance Active 1 412,213 419,126 1.02 62,640 62,257 0.99 44,329 44,020 0.99 4.44% 4.51% 1.01
Insurance Active 2 209,926 206,098 0.98 2,614 2,657 1.02 0 0 1.00 1.25% 1.29% 1.03
Insurance Active 3 317,264 326,582 1.03 319,612 314,773 0.98 259,330 262,112 1.01 19.00% 18.16% 0.96
Insurance Active 4 669,526 674,778 1.01 47,462 48,151 1.01 19,842 21,194 1.07 4.13% 4.00% 0.97
* Items above that are blank are not applicable to that test life.
D R
A F
T
Board Meeting - December 3, 2020 - Audit Committee Report
167

Kentucky Retirement Systems 18
Section III: Analysis of Actuarial Assumptions Employed Economic Assumptions
Actuarial Standard of Practice No. 27, Selection of Economic Assumptions for Measuring Pension Obligations (ASOP No. 27), provides guidance for setting economic assumptions used in actuarial
valuations. GRS references ASOP No. 27 in its Experience Study report, and appears to have taken the
guidance into account when making its recommendations for the economic assumptions.
As part of our review, we also compared the recommended set of economic assumptions to those used by
a peer group of 200 pension plans covering state and local employees, the Public Plans Data (PPD). The
PPD is maintained by the Center for Retirement Research at Boston College in partnership with the Center
for State and Local Government Excellence and the National Association of State Retirement
Administrators (NASRA). The current database is populated with information from Comprehensive Annual
Financial Reports through the 2019 fiscal year.
Economic assumptions have a significant effect on the development of KRS liabilities. Changes to these
assumptions can substantially alter the results determined by the actuary. The goal is to have a consistent
set of economic assumptions that appropriately reflect expected future economic trends. However,
economic assumptions are uncertain, and, as a result, there may be a reasonable range of potential
recommendations. Different actuaries will apply different professional judgment and may choose different
reasonable assumptions.
Inflation
The underlying inflation assumption of 2.30% is at the low end of the range of 2.25% to 3.28% (based
on the 5th to 95th percentile range from valuations primarily covering fiscal years ending in 2019). The
Experience Study report cited several sources of data that supports the reasonableness of the 2.3%
inflation assumption.
Investment Return
KRS maintains five retirement and five health insurance plans. Due to differences in external liquidity
requirements of the systems, there are differences in how plan assets are invested. The investment
return assumption is 6.25% for the CERS retirement system (non-hazardous and hazardous), KERS
hazardous retirement system, and all five health insurance plans. The return assumption for the KERS
non-hazardous retirement system and SPRS is 5.25%. These assumptions, when compared to the
peer group, are below the low end of the range of 6.67% to 7.66% (based on the 5th to 95th percentile
range). 5.25% and 6.25% represent two of the lowest investment return assumptions in use for public
sector systems. The asset allocation policy for the severely underfunded systems (i.e., KERS non-
hazardous and SPRS) is an allocation that has approximately a 60% likelihood of achieving an
assumed rate of return of 5.25%, while decreasing short-term volatility by 10% and lowering the
D R
A F
T
Board Meeting - December 3, 2020 - Audit Committee Report
168

Section III: Analysis of Actuarial Assumptions Employed
Kentucky Retirement Systems 19
portfolio’s sensitivity to the economic growth cycle by 14%. The asset allocation policy for the other
systems has approximately a 50% likelihood of achieving a 6.25% rate of return, while increasing
projected liquidity and maintaining a similar investment risk profile as the prior allocation. Given the
analysis presented by GRS and the characteristics of KRS, the 5.25% and 6.25% investment return
assumptions recommended by GRS appear to be reasonable.
The data presented in the Experience Study Report relies on capital market assumptions covering 7 to
10 year expectations for most of the investment consultants considered. These relatively short-term
expectations were used to model distributions of 20-year geometric nominal returns. Applying the 7 to
10 year assumptions to a 20-year period typically would understate the expected geometric returns
(assuming an environment where longer time horizons have higher expected returns).
Payroll Growth
In 2017, the KRS Board decreased the payroll growth assumption from 4.0% to 0.0% for both KERS
systems (non-hazardous and hazardous) and the SPRS. The Board also decreased the payroll growth
assumption from 4.0% to 2.0% for both CERS systems (non-hazardous and hazardous). GRS
recommended that these assumptions be maintained. GRS also recommended that KRS work with the
General assembly to enact legislation modifying the method by which employers collect employer
contributions toward the unfunded actuarial accrued liability such that the System invoices the employer
the required amortization payment and the employer contributes only the normal cost as a percentage
of payroll. Given the funded status of KRS, we believe the payroll growth assumptions are reasonable
and the recommendation is appropriate.
Salary Scale
For all members, the salary scale assumption is comprised of inflation, productivity, and step
rate/promotional. Inflation is 2.3% for all systems. Productivity is 1% for non-hazardous members and
1.25% for hazardous members. The report does not include an analysis of the method for determining
the proposed productivity increase.
The step rate/promotional increase analysis was performed by reviewing year-over-year increases, net
of the actual inflation experienced in each year of the study period. The proposed assumptions look
reasonable.
Demographic Assumptions
The demographic assumptions used to value KRS reflect the expected occurrence of various events
among participants. The assumptions should reflect specific characteristics of the System and produce
reasonable results. A reasonable assumption is one that is expected to model the contingency being
measured and not expected to produce significant gains and losses. The types of demographic
assumptions used to measure pension obligations include, but are not limited to the following:
• Mortality;
• Termination of employment;
• Retirement;
D R
A F
T
Board Meeting - December 3, 2020 - Audit Committee Report
169

Section III: Analysis of Actuarial Assumptions Employed
Kentucky Retirement Systems 20
• Disability;
• Retiree medical participation; and
• Others, including refunds, marriage assumptions, and health care trend.
Actuarial Standard of Practice No. 35, Selection of Demographic and Other Noneconomic Assumptions for Measuring Pension Obligations provides guidance for setting noneconomic assumptions used in
actuarial valuations. The standard recommends that the actuary follow a general process for selecting
demographic assumptions.
The first step of this general process is to identify the types of assumptions to use. The actuary should
consider relevant system provisions that will affect timing and value of any potential benefit payments, all
contingencies that give rise to benefits or loss of benefits, and the characteristics of the covered group.
The next step in the process is to identify the relevant assumption universe. The assumption universe
may include prior experience studies or general studies of trends relevant to the specific type of
demographic assumption and system experience to the extent that it is credible.
The third step in the process is to consider the assumption format. The format may include different tables
for different segments of the covered population (such as different turnover rates for general employees
versus public safety).
The final step in the process is to select the assumptions and evaluate the reasonableness of each assumption. The specific experience of KRS should be incorporated but not given undue weight if recent experience is attributable to a phenomenon that is unlikely to continue. For example, if recent rates of termination were due to a one-time reduction in workforce it may be unreasonable to assume that such rates will continue.
Overall, the methodology that GRS used to review experience and set proposed assumptions is similar to the approach that Segal would take for an experience review.
Mortality
The base mortality rates for retirees age 58 to 94 are based on the System’s experience, using a
benefits weighted approach and a polynomial model to provide a smooth fit to the midpoint of the
experience. Mortality rates for ages under 58 and over 98 are equal to the most recently published Pub-
2010 mortality assumptions for general employees. The preliminary mortality table was projected from
the center point of the analysis period (2015) to 2019 using the MP-Ultimate mortality improvement
assumption. Future mortality improvements are projected using the MP-Ultimate scale. The base
mortality rates for disabled retirees is the Pub-2010 Disabled mortality table, with a four-year set
forward for both male and female rates. The Pub-2010 mortality table is used for active employees. The
General Employees table is used for non-hazardous systems and the Public Safety table if used for the
hazardous and State Police Systems. Future improvements in mortality are based on the MP-Ultimate
mortality improvement assumption.
GRS assumes that the number of total death by gender indicates that System experience is fully
credible. Segal believes that if the base mortality table is based on System experience, every age
would need to have some threshold of deaths. In addition, with roughly the same number of deaths for
males and females over the experience period (5,078 and 5,060, respectively), it is unclear why the
D R
A F
T
Board Meeting - December 3, 2020 - Audit Committee Report
170

Section III: Analysis of Actuarial Assumptions Employed
Kentucky Retirement Systems 21
female data is considered more credible than the male data (99% confidence that experience is within
5% for males, but within 3% for females).
Although the employee groups are allocated between “hazardous and non-hazardous” categories, the
mortality data is not studied separately for retirees in former hazardous occupations. While it is
conceivable that upon achieving retirement age, all retirees would exhibit the same mortality
experience, it would be worth studying the information separately and have the conclusion drawn from
the data. We note that there is no mention of this distinction in the report.
Generational mortality improvement is reflected by using only the flat 1% improvement rate per year
beyond the first 15 years from the Society of Actuaries’ Retirement Plans Experience Committee
mortality improvement tables (MP series). We believe this is a non-standard approach and should be
supported with analysis as to why 1% mortality improvement across the board is appropriate for the
System.
Retirement Rates
Retirement liability is the most significant portion of the liability for active employees, and therefore the
assumed rates of retirement are important. The valuation employs retirement rates for some groups that
are based on age (KERS and CERS non-hazardous) and other groups that are based on years of service
(KERS and CERS hazardous and SPRS members).
The retirement experience was analyzed on a benefits-weighted basis and modifications were proposed
to better reflect experience. In general, we believe the retirement rates proposed by GRS are reasonable.
However, it would be useful to provide some analysis or graphs in this section to better understand the
rationale for the recommended retirement rates.
Termination Rates
Separate unisex, service-based tables for separation from active service apply to the various
membership groups. Termination experience was analyzed on a salary-weighted basis and
modifications were proposed to better reflect experience. It is unclear whether termination rates were
studied net of rehires; that distinction should be outlined in the report. In general, we believe the
termination rates proposed by GRS are reasonable.
Disability Rates
Age-based, unisex disability rates are applied only to eligible members. Based on the analysis in the
Experience Study Report, we believe the current and proposed disability rates are reasonable.
Other Comments
To improve the usefulness of the analysis and communicate how the rates were developed, it would be
beneficial to include additional analysis and/or graphs to understand why there were recommended
changes to rates.
D R
A F
T
Board Meeting - December 3, 2020 - Audit Committee Report
171

Section III: Analysis of Actuarial Assumptions Employed
Kentucky Retirement Systems 22
Overall, the economic and demographic actuarial assumptions adopted by the KRS Board are
reasonable and consistent with generally accepted actuarial standards and practices contained in
Actuarial Standard of Practice No. 27 covering economic assumptions and Actuarial Standard of
Practice No. 35 covering demographic and non-economic assumptions.
Funding Method for Liabilities
The funding method employed is the entry age normal (EAN) actuarial cost method and is the same
method used by the majority of plans in the Public Plans Database. We find the current method to be
reasonable.
Asset Valuation Method
The June 30, 2019 actuarial valuation uses an “actuarial” value of assets for purposes of establishing
the required employer contributions. The current method smooths investment gains and losses for each
fiscal year by recognizing these gains and losses evenly over a five-year period. This method does not
impose a corridor, which would place a limit on the spread between actuarial value of assets (AVA) and
market value of assets (MVA).
An essential part of the public sector budgeting process is that material budget items, including pension
contributions, should have a level cost pattern from year to year to the extent possible. Segal
recognizes the importance of this requirement and assists clients in establishing reasonable
methodologies for recognizing investment gains and losses and limiting the potential volatility that may
result in increased contributions due to investment results.
The actuary’s guide for determining the reasonableness of an asset smoothing method is ASOP No.
44. The following is an excerpt from this ASOP that establishes the qualities a reasonable asset
smoothing method must exhibit.
From the Actuarial Standard of Practice No. 44:
3.3 Selecting Methods Other Than Market Value -- If the considerations in section 3.2 have led the actuary to conclude that an asset valuation method other than market value may be appropriate, the actuary should select an asset valuation method that is designed to produce actuarial values of assets that bear a reasonable relationship to the corresponding market values. The qualities of such an asset valuation method include the following:
a. The asset valuation method is likely to produce actuarial values of assets that are sometimes greater than and sometimes less than the corresponding market values.
b. The asset valuation method is likely to produce actuarial values of assets that, in the actuary’s professional judgment, satisfy both of the following:
1. The asset values fall within a reasonable range around the corresponding market values. For example, there might be a corridor centered at market value, outside
D R
A F
T
Board Meeting - December 3, 2020 - Audit Committee Report
172

Section III: Analysis of Actuarial Assumptions Employed
Kentucky Retirement Systems 23
of which the actuarial value of assets may not fall, in order to assure that the difference from market value is not greater than the actuary deems reasonable.
2. Any differences between the actuarial value of assets and the market value are recognized within a reasonable period of time. For example, the actuary might use a method where the actuarial value of assets converges toward market value at a pace that the actuary deems reasonable, if the investment return assumption is realized in future periods.
In lieu of satisfying both (1) and (2) above, an asset valuation method could satisfy section 3.3(b) if, in the actuary’s professional judgment, the asset valuation method either (i) produces values within a sufficiently narrow range around market value or (ii) recognizes differences from market value in a sufficiently short period.
Two key principles arise from ASOP 44. These are that acceptable asset smoothing must create asset
values that fall within a reasonable range around market value and are recognized in a reasonable
period of time. In lieu of satisfying both of these principles, a smoothing method could satisfy the
requirements if, in the actuary’s professional judgment, the range around market value is sufficiently
narrow or the differences are recognized in a sufficiently short period.
Segal has established an internal policy, which is consistent with others in the actuarial community, that
five years is a sufficiently short period to constitute a reasonable asset smoothing method even if no
corridor is used. Therefore, it is our opinion that the method utilized by KRS is reasonable.
Funding Policy Contribution
By statute, the KRS Board of Trustees must approve the employer contribution rates for the two
upcoming fiscal years for KERS and SPRS and for the upcoming fiscal year for CERS, based upon the
results of the most recent actuarial valuation The funding policy set by the Board of Trustees provides
that the contribution rate consists of the normal cost and an amortization payment (level percentage of
payroll) on the unfunded accrued liability (UAL). The amortization period was reestablished as a closed
30 year period beginning with the June 30, 2013, actuarial valuation. The amortization period will
decrease by one each year in the future. This type of closed period amortization provides a contribution
schedule that, if actual experience is reasonably close to expected, will amortize the existing unfunded
liability over time.
However, House Bill 362 passed during the 2018 legislative session provides for a phase-in of
contributions to the CERS systems. In addition, the funded ratio for KERS Non-Hazardous was 13.4%
as of June 30, 2019. For the remaining systems, we believe this funding policy is sufficient and
provides a reasonable contribution rate schedule for adequately funding the Systems. For CERS, we
recommend that the employers pay the actuarially determined contribution rates. For KERS Non-
Hazardous, we recommend that contributions continue to exceed benefit payments and that the
actuarially determined contributions be contributed in order to avoid the risk of insolvency.
D R
A F
T
Board Meeting - December 3, 2020 - Audit Committee Report
173

Section III: Analysis of Actuarial Assumptions Employed
Kentucky Retirement Systems 24
Insurance Assumptions
Health Care Trend Rate
Trend is a measure of the rate of change, over time, of the per capita health care rates. It includes
factors such as medical inflation, utilization, plan design, and technology improvements. GRS currently
bases their assumption on the model issued by the Society of Actuaries “Getzen model of Long-Run
Medical Costs Trends for the SOA;” Thomas E. Getzen, iHEA and Temple University 2014 © Society of
Actuaries. GRS has developed separate assumptions for Medicare and non-Medicare plans. We agree
with their approach. Additionally, the trend rates developed are reasonable and produce results
consistent with trend rates used for other similar plans.
Age-Related Morbidity
Morbidity or aging factors are used to estimate variation in per capita health care rates by age for the
benefits being modeled. To model the impact of aging on the underlying health care costs for Medicare
retirees, GRS relied on the Society of Actuaries’ 2013 Study “Health Care Costs – From Birth to Death”
Table 4 (Development of Plan Specific Medicare Age Curve) to model the impact of aging for ages 65
and over. For Medicare retirees, this approach and the aging factors used by GRS are reasonable and
appropriate for the valuation.
As GRS correctly noted, Actuarial Standards of Practice No. 6 requires aging subsidies to be
recognized and GASB Statements No. 74 and No. 75 require adhering to ASOP No. 6. However, no
aging factors are applied to non-Medicare retirees. Since the health insurance trusts are designed to
reimburse the employer’s portion of the non-Medicare premium, this approach is reasonable solely for
the purposes of a funding valuation.
Plan Election
GRS assumes that the proportion of current retirees electing each coverage option will remain
unchanged. There are separate assumptions for Medicare and non-Medicare retirees. This approach is
supported by the data, reasonable and appropriate for the valuation.
Participation
The participation assumption is used to project what percentage of members elect retiree health care
coverage upon retirement.
For members retiring from active status who were hired before July 1, 2003, GRS has continued their
approach to base participation on retiree contribution percentage, which is based on service at
retirement. This approach is reasonable and appropriate for the valuation.
D R
A F
T
Board Meeting - December 3, 2020 - Audit Committee Report
174

Section III: Analysis of Actuarial Assumptions Employed
Kentucky Retirement Systems 25
For members retiring from active or inactive vested status who were hired after July 1, 2003, GRS
recommends continuing to use the current assumptions of 100% participation. We believe this
assumption may be conservative, especially for non-hazardous non-Medicare retirees. We would
suggest that when the experience is next reviewed, in addition to considering service-based
participation rates, rates of participation may also vary by Medicare status at retirement.
Members who become disabled in the line of duty, and surviving spouses and dependents of members
who die in the line of duty, receive 100% of their health care paid by KRS. Continuing to assume that
100% will participate is reasonable and appropriate for the valuation.
D R
A F
T
Board Meeting - December 3, 2020 - Audit Committee Report
175

Kentucky Retirement Systems 26
Section IV: Conclusions and Recommendations This limited scope audit reviewed the data used, the benefits valued, the valuation results, and the actuarial
methods and assumptions employed in the June 30, 2019, actuarial valuations. We provided a few
recommendations for the valuation report and test lives, and we generally agree with the results of the
experience study, with a few recommendations for improvement. We found the actuarial cost method and
asset valuation method conform with the Actuarial Standards of Practice. The data appears complete and with
a cursory analysis of the information supplied by KRS staff, we were able to closely match the participant
counts reported by GRS.
Below we summarize our comments and recommendations for your consideration:
A. Valuation Results
1. Additional detail relative to the calculation of Recommended Employer Contribution Rates would be
beneficial to the user and improve transparency.
B. Valuation Report
1. The report disclosed the effect of the assumption changes on the actuarial accrued liabilities. However,
the effect of the assumption changes on other funding metrics, such as the funded percentage and the
Actuarially Determined Contribution Rate, were not disclosed. Since these changes could provide
useful insight to users of the reports, we recommend showing the impact of assumption changes on
these funding metrics.
2. In the tables labeled as “Experience Gain or (Loss),” we believe it is clearer and more appropriate that
plan changes and assumption changes not be classified as actuarial gains and losses.
3. Also related to the liability gain or (loss), it would be informative to show the gain or loss attributable to
each source as well as to actual contributions that are more or less than expected.
4. Section 5 of the Annual Actuarial Valuation Report contains information related to discussion of risks,
which is required information for funding valuations and pricing valuations pursuant to Actuarial
Standards of Practice Statement No. 51 (ASOP 51). We recommend this section be expanded to add
commentary specific to KRS when discussing each risk element. In addition, we believe this section
should contain a recommendation for a more detailed risk assessment since there is, in our opinion,
enough risk inherent in KRS that a more detailed risk assessment would be useful.
D R
A F
T
Board Meeting - December 3, 2020 - Audit Committee Report
176
Kentucky Retirement Systems 27
5. The reports do not include any projections of future funded percentages or contribution requirements.
Adding a projection of liabilities, assets, and required contribution rates throughout the remaining
amortization period (24 years for the 2019 valuation reports) could be helpful for the long-term planning
for the future funding requirements of the System.
C. Projected Benefits
1. There is an inconsistency between how service to determine benefit eligibility and service to determine
benefit amounts are calculated. Service for eligibility purposes is calculated as a rounded amount and
service for benefit amount purposes is calculated as an exact amount. We would expect both to be
calculated with the same methodology. Furthermore, using rounded service for benefit eligibility may
not be appropriate, as it would allow some participants to retire within the valuation program at an age
when they are not actually eligible. For example, if a participant needs 10 credits to retire at a certain
age, they would not be able to retire at that age if they only had 9.9 credits. Rounding the 9.9 credits to
10 allows the valuation program to treat them as retiring earlier than actually allowable. We recommend
using exact service for eligibility purposes.
2. The trend rates for insurance test lives appears to include the adjustment for known 2020 Medicare
premiums for current retirees but not for future retirees.
D. Assumptions and Methods
1. We believe that the investment return assumption recommendations are reasonable.
2. The experience study report does not include an analysis of the method for determining the proposed
productivity increase.
3. GRS should expand their analysis of post-retirement mortality to verify mortality experience after
retirement is similar for both hazardous and non-hazardous employees.
4. There is no documented support that 1% mortality improvement across the board is appropriate for the
System.
5. It is unclear whether termination rates were studied net of rehires; that distinction should be outlined in
the report.
6. To improve the usefulness of the analysis and communicate how the rates were developed, it would be
beneficial to include additional analysis and/or graphs to understand why there were recommended
changes to rates.
In this report, we have noted areas that we believe will improve the usefulness and clarity of the KRS annual
actuarial valuations and experience study, and improve the valuation results. We are available to discuss any
aspect of our review with KRS staff or the Systems’ actuary.
5962355v4/05392.013
D R
A F
T
Board Meeting - December 3, 2020 - Audit Committee Report
177

November 23, 2020
Mr. David Eager Executive Director Kentucky Retirement Systems 1260 Louisville Road Frankfort, KY 40601
Re: Response to Segal’s Actuarial Audit of Kentucky Retirement Systems (KRS) Dear Mr. Eager: Gabriel, Roeder, Smith & Company (“GRS”) offers our comments below on the draft provided of the Independent Actuarial Audit of the June 30, 2019 Actuarial Valuations and the 2014-2018 Experience Study prepared by Segal and dated October 29, 2020. General Comments We are pleased with the results of the actuarial audit of KRS. We believe Segal’s findings should provide both KRS Staff and the Board with the confidence that the actuarial results they are receiving are both accurate and in compliance with the actuarial standards of practice. In the remainder of our letter, we will respond to specific recommendations made by Segal in the Conclusions and Recommendations section of the report. Response to Recommendations regarding Valuation Results A1 – Valuation Results – Conclusion/Recommendation: Additional detail relative to the calculation of Recommended Employer Contribution Rates would be beneficial to the user and improve transparency.
GRS Response: Due to a change in amortization methodology enacted during the 2020 legislative session, additional information regarding the amortization of the unfunded liability was added to the 2020 Valuation Report.
Board Meeting - December 3, 2020 - Audit Committee Report
178

Mr. David Eager November 23, 2020 Page 2
B1 – Valuation Report – Conclusion/Recommendation: The report disclosed the effect of the assumption changes on the actuarial accrued liabilities. However, the effect of the assumption changes on other funding metrics, such as the funded percentage and the Actuarially Determined Contribution Rate, were not disclosed. Since these changes could provide useful insights to users of the reports, we recommend showing the impact of assumption changes on these funding metrics.
GRS Response: The impact on the employer contribution rates, actuarial accrued liability, and funded status of all funds of the assumption changes made as a result of the 2004-2018 Experience Study was fully disclosed in the experience study report, which was at the time when the Board was required to evaluate and make decisions regarding those recommended assumptions.
B2 – Valuation Report – Conclusion/Recommendation: In the tables labeled as “Experience Gain or (Loss), we believe it is clearer and more appropriate that plan changes and assumption changes not be classified as actuarial gains and losses.
GRS Response: GRS will consider updating the labels of this table in the next valuation report. B3 – Valuation Report – Conclusion/Recommendation: It would be informative to show the gain or loss attributable to each source as well as to actual contributions that are more or less than expected.
GRS Response: The major sources of change in employer contribution rates and unfunded liability are discussed in the certification letter and executive summary of each report. Since these Systems receive contributions as a percentage of covered payroll, the causal effect of differences in expected and actual contributions is the difference in expected and actual covered payroll which we generally include in our discussion. As a result, we believe the analysis of the source of the difference is more relevant. GRS will consider if more detail is appropriate.
B4 – Valuation Report – Conclusion/Recommendation: Section 5 of the Annual Actuarial Valuation Report contains information related to discussion of risks, which is required information for funding valuations and pricing valuations pursuant to Actuarial Standards of Practice Statement No. 51 (ASOP 51). We recommend this section be expanded to add commentary specific to KRS when discussing each risk element. In addition, we believe this section should contain a recommendation for a more detailed risk assessment since there is, in our opinion, enough risk inherent in KRS that a more detailed risk assessment would be useful.
GRS Response: This additional risk assessment analysis is performed and is provided outside of the annual Valuation Report. GRS will consider updating our reference to the additional risk assessment analysis in the next valuation report.
Board Meeting - December 3, 2020 - Audit Committee Report
179

Mr. David Eager November 23, 2020 Page 3
B5 – Valuation Report – Conclusion/Recommendation: The reports do not include any projections of future funded percentages or contribution requirements.
GRS Response: This information is provided separately from the annual Valuation Report. For example, this information is provided when GRS presents the valuation results to the Board.
C1 – Projected Benefits – Conclusion/Recommendation: We recommend using exact service for eligibility purposes.
GRS Response: We find that using exact service for this purpose understates the number of members eligible to retire during any given year and thus understates the liability and costs. GRS’ current methodology for determining retirement eligibility is most appropriate for determining whether a member is eligible to retire at any point during the fiscal year. Unrounded service is used for the calculation of a member’s projected benefit amount, which estimates a more accurate projected benefit than using a rounded service amount for this purpose. We believe our current methodology is reasonable and the most appropriate in the calculation of the liabilities of each System.
C2 – Projected Benefits – Conclusion/Recommendation: The trend rates for insurance test lives appears to include the adjustment for known 2020 Medicare premiums for current retirees but not for future retirees.
GRS Response: The adjustment for known 2020 Medicare premiums was applied consistently to both current retirees and future retirees.
D1 – Assumptions and Methods – Conclusion/Recommendation: We believe that the investment return assumption recommendations are reasonable.
GRS Response: N/A D2 – Assumptions and Methods – Conclusion/Recommendation: The experience study report does not include an analysis of the method for determining the proposed productivity increase.
GRS Response: This is implicitly analyzed in other segments of the analysis, but GRS will consider including additional discussion in the next experience study report.
D3 – Assumptions and Methods – Conclusion/Recommendation: GRS should expand their analysis for post-retirement mortality to verify mortality experience after retirement is similar for both hazardous and non-hazardous employees.
GRS Response: GRS will consider including additional discussion in the next experience study
report. All recent national data, including the recently published Pub-2010 tables for public
Board Meeting - December 3, 2020 - Audit Committee Report
180

Mr. David Eager November 23, 2020 Page 4
sector retirees, have found very little difference between hazardous and non-hazardous
retirees, once they have retired and are classified as non-disabled.
D4 – Assumptions and Methods – Conclusion/Recommendation: There is no documented support that 1% mortality improvement across the board is appropriate for the System.
GRS Response: Discussion related to the mortality improvement assumption was provided on page 24 of the experience study report and in our professional opinion provides the rationale required to support of our recommendation.
D5 – Assumptions and Methods – Conclusion/Recommendation: It is unclear whether termination rates were studied net of rehires; that distinction should be outlined in the report.
GRS Response: GRS will consider this recommendation when preparing the next experience study.
D6 – Assumptions and Methods – Conclusion/Recommendation: To improve the usefulness of the analysis and communicate how the rates were developed, it would be beneficial to include additional analysis and/or graphs to understand why there were recommended changes to rates.
GRS Response: Supporting data for rate development was provided in Section 8 of the experience study report. Due the size of KRS and number of assumption tables reviewed for the System, we do not believe providing graphs for all assumptions would be useful for Stakeholders. Instead, graphs/tables are provided in Section 3 of the report where we believe is useful.
If you have any questions or need any additional clarifying information with regard to our comments, please do not hesitate to contact either one of us. Sincerely,
Daniel J. White, FSA, MAAA, EA Janie Shaw, ASA, MAAA, EA
Joseph P. Newton, FSA, MAAA, EA Pension Market Leader and Actuary
Board Meeting - December 3, 2020 - Audit Committee Report
181

DRAFT
REPORT OF INDEPENDENT AUDITORS
Board of DirectorsKentucky Retirement SystemsFrankfort, Kentucky
Report on the Combining Financial Statements
We have audited the accompanying combining financial statements of the Pension Funds and Insurance Fund of Kentucky Retirement Systems, a component unit of the Commonwealth of Kentucky, as of and for the fiscal year ended June 30, 2020, and the related notes to the combining financial statements, which comprise the Kentucky Retirement Systems’ basic combining financial statements as listed in the table of contents (collectively, the financial statements).
Management’s Responsibility for the Financial Statements
Management is responsible for the preparation and fair presentation of these financial statements in accordance with accounting principles generally accepted in the United States of America; this includes the design, implementation, and maintenance of internal control relevant to the preparation and fair presentation of financial statements that are free from material misstatement, whether due to fraud or error.
Auditor’s Responsibility
Our responsibility is to express an opinion on these financial statements based on our audit. We conducted our audit in accordance with auditing standards generally accepted in the United States of America and the standards applicable to financial audits contained in Government Auditing Standards, issued by the Comptroller General of the United States. Those standards require that we plan and perform the audit to obtain reasonable assurance about whether the financial statements are free from material misstatement.
An audit involves performing procedures to obtain audit evidence about the amounts and disclosures in the financial statements. The procedures selected depend on the auditor’s judgment, including the assessment of the risks of material misstatement of the financial statements, whether due to fraud or error. In making those risk assessments, the auditor considers internal control relevant to the entity’s preparation and fair presentation of the financial statements in order to design audit procedures that are appropriate in the circumstances, but not for the purpose of expressing an opinion on the effectiveness of the entity’s internal control. Accordingly, we express no such opinion. An audit also includes evaluating the appropriateness of accounting policies used and the reasonableness of significant accounting estimates made by management, as well as evaluating the overall presentation of the financial statements.
We believe that the audit evidence we have obtained is sufficient and appropriate to provide a basis for our audit opinion.
Opinion
In our opinion, the financial statements referred to above present fairly, in all material respects, the respective combining fiduciary net position of the Pension Funds and Insurance Fund of Kentucky Retirement Systems, a component unit of the Commonwealth of Kentucky, as of June 30, 2020, and the respective combining changes in fiduciary net position for the year then ended, in accordance with accounting principles generally accepted in the United States of America.
Report on Summarized Comparative Information
We have previously audited the Kentucky Retirement Systems 2019 financial statements of the Pension Funds and Insurance Fund, and we expressed an unmodified audit opinion on those audited financial statements in our report dated December 5, 2019. In our opinion, the summarized comparative information presented herein as of and for the year endedJune 30, 2019, is consistent, in all material respects, with the audited financial statements from which it has been derived.
Board Meeting - December 3, 2020 - Approval of Financial Statement Audit FY June 30, 2020
182

DRAFT
Board of TrusteesKentucky Retirement SystemsReport of Independent Auditors, continued
Other Matters
Required Supplementary Information
Accounting principles generally accepted in the United States of America require that the Management’s Discussion and Analysis (on pages __ to __) and the Schedules of Employer Net Pension Liability, Changes in Employers’ Total Pension Liability, Employer Contributions Pension, Employers’ Net OPEB Liability, Changes in Employers’ Net OPEB Liability, Employers’ OPEB Contributions, and the Money Weighted Rates of Return (on pages __ to __) be presented to supplement the basic financial statements. Such information, although not a part of the basic financial statements, is required by the Governmental Accounting Standards Board who considers it to be an essential part of financial reporting for placing the basic financial statements in an appropriate operational, economical, or historical context. We have applied certain limited procedures to the required supplementary information in accordance with auditing standards generally accepted in the United States of America, which consisted of inquiries of management about the methods of preparing the information and comparing the information for consistency with management’s responses to our inquiries, the basic financial statements, and other knowledge we obtained during our audit of the basic financial statements. We do not express an opinion or provide any assurance on the information because the limited procedures do not provide us with sufficient evidence to express an opinion or provide any assurance.
Other Information
Our audit was conducted for the purpose of forming an opinion on the financial statements that collectively comprise the Pension Funds and Insurance Fund of Kentucky Retirement Systems’ basic financial statements. The Additional Supporting Schedules (on pages __ to __), Introduction, Investments, Actuarial and Statistical Sections are presented for purposes of additional analysis and are not a required part of the basic financial statements.
The Additional Supporting Schedules are the responsibility of management and were derived from and relate directly to the underlying accounting and other records used to prepare the basic financial statements. Such information has been subjected to the auditing procedures applied in the audit of the basic financial statements and certain additional procedures, including comparing and reconciling such information directly to the underlying accounting and other records used to prepare the basic financial statements, or to the basic financial statements themselves, and other additional procedures in accordance with auditing standards generally accepted in the United States of America. In our opinion, theAdditional Supporting Schedules are fairly stated, in all material respects, in relation to the basic financial statements as a whole.
The Introduction, Investments, Actuarial and Statistical Sections have not been subjected to the auditing procedures applied in the audit of the basic financial statements, and accordingly, we do not express an opinion or provide any assurance on it.
Other Reporting Required by Government Auditing Standards
In accordance with Government Auditing Standards, we have also issued our report dated December 3, 2020 on ourconsideration of the Kentucky Retirement Systems’ internal control over financial reporting and on our tests of its compliance with certain provisions of laws, regulations, contracts, and grant agreements and other matters. The purpose of that report is to describe the scope of our testing of internal control over financial reporting and compliance and the results of that testing, and not to provide an opinion on the internal control over financial reporting or on compliance. That report is an integral part of an audit performed in accordance with Government Auditing Standards in considering the Kentucky Retirement Systems’ internal control over financial reporting and compliance.
Lexington, KentuckyDecember 3, 2020
Board Meeting - December 3, 2020 - Approval of Financial Statement Audit FY June 30, 2020
183

DRAFT
REPORT ON INTERNAL CONTROL OVER FINANCIAL REPORTING AND ON COMPLIANCE AND OTHER MATTERS BASED ON AN AUDIT OF FINANCIAL STATEMENTS PERFORMED IN
ACCORDANCE WITH GOVERNMENT AUDITING STANDARDS
REPORT OF INDEPENDENT AUDITORS
Board of TrusteesKentucky Retirement SystemsFrankfort, Kentucky
We have audited, in accordance with auditing standards generally accepted in the United States of America and the standards applicable to financial audits contained in Government Auditing Standards issued by the Comptroller General of the United States, the combining financial statements of the Pension Funds and Insurance Fund of Kentucky Retirement Systems (KRS)as of and for the fiscal year ended June 30, 2020, and the related notes to the combining financial statements, which comprise KRS’ basic combining financial statements (collectively, the financial statements), and have issued our report thereon dated December 3, 2020.
Internal Control over Financial Reporting
In planning and performing our audit of the financial statements, we considered KRS’ internal control over financial reporting (internal control) to determine the audit procedures that are appropriate in the circumstances for the purpose of expressing our opinion on the financial statements, but not for the purpose of expressing an opinion on the effectiveness of KRS’ internal control. Accordingly, we do not express an opinion on the effectiveness of KRS’ internal control.
A deficiency in internal control exists when the design or operation of a control does not allow management or employees, in the normal course of performing their assigned functions, to prevent, or detect and correct misstatements on a timely basis. A material weakness is a deficiency, or a combination of deficiencies, in internal control, such that there is a reasonable possibility that a material misstatement of the entity’s financial statements will not be prevented, or detected and corrected, on a timely basis. A significant deficiency is a deficiency, or a combination of deficiencies, in internal control that is less severe than a material weakness yet important enough to merit attention by those charged with governance.
Our consideration of internal control was for the limited purpose described in the first paragraph of this section and was not designed to identify all deficiencies in internal control that might be material weaknesses or significant deficiencies. Given these limitations, during our audit we did not identify any deficiencies in internal control over financial reporting that we consider to be material weaknesses. However, material weaknesses may exist that have not been identified.
Compliance and Other Matters
As part of obtaining reasonable assurance about whether KRS’ financial statements are free from material misstatement, we performed tests of its compliance with certain provisions of laws, regulations, contracts, and grant agreements, noncompliance with which could have a direct and material effect on the determination of financial statement amounts. However, providing an opinion on compliance with those provisions was not an objective of our audit, and accordingly, we do not express such an opinion. The results of our tests disclosed no instances of noncompliance or other matters that are required to be reported under Government Auditing Standards.
Purpose of this Report
The purpose of this report is solely to describe the scope of our testing of internal control and compliance and the results of that testing, and not to provide an opinion on the effectiveness of the entity’s internal control or on compliance. This report is an integral part of an audit performed in accordance with Government Auditing Standards in considering the entity’s internal control and compliance. Accordingly, this communication is not suitable for any other purpose.
Lexington, KentuckyDecember 3, 2020
Board Meeting - December 3, 2020 - Approval of Financial Statement Audit FY June 30, 2020
184

KENTUCKY RETIREMENT SYSTEMS
County Employees Retirement System (CERS)Kentucky Employees Retirement System (KERS)
State Police Retirement System (SPRS)
2020For the Fiscal Year Ended June 30, 2020
Prepared by the Accounting, Investment and Communications Divisions
COMPREHENSIVE ANNUALFINANCIAL REPORT
A component unit of the Commonwealth of Kentucky
Board Meeting - December 3, 2020 - Review and Approval of CAFR
185

FINANCIAL
TAB
LE OF C
ON
TENTS
INTRODUCTION
20202020 Comprehensive Annual Financial Report
For The Fiscal Year Ended June 30, 2020
5 Management’s Responsibility For Financial Reporting
6 Letter of Transmittal8 Governance9 Agency Structure10 GFOA Certificate11 Pension Benefits by County12 Active Refunds14 Fiduciary Net Position HighlightsLine
Line spaceing
Line Spacing
Line Spacing
Line Spacing
Line Spacing
Line Spacing
Line Spacing
Line
Line
Line
Line
Line
Line
Line
Line
Line
Line
16 Report of Independent Auditors18 Management’s Discussion & Analysis21 Fund Activities24 Historical Trends25 Combining Statements of Fiduciary Net
Position - Pension Funds26 Combining Statements of Changes In
Fiduciary Net Position - Pension Funds27 Combining Statements of Fiduciary Net
Position - Insurance Fund28 Combining Statements of Changes in
Fiduciary Net Position - Insurance Fund29 Note A. Summary of Significant
Accounting Policies32 Note B. Plan Descriptions & Contribution
Information39 Note C. Cash, Short-Term Investments &
Securities Lending Collateral40 Note D. Investments58 Note E. Securities Lending Transactions58 Note F. Risk of Loss59 Note G. Contingencies59 Note H. Defined Benefit Pension Plan59 Note I. Income Tax Status59 Note J. Equipment59 Note K. Intangible Assets61 Note L. Actuarial Valuation63 Note M. GASB 67 and GASB 74
Valuations71 Note N. Pension Legislation75 Note P. Reciprocity Agreement75 Note Q. Reimbursement Of Retired–
Reemployed and Active Member Health Insurance
76 Note R. Related Party76 Note S. Reduction of Receivables77 Note T. Prisma Daniel Boone Fund
Adjustment77 Note U. Subsequent Events77 Note V. Coronavirus203 Glossary
Board Meeting - December 3, 2020 - Review and Approval of CAFR
186

REQUIRED SUPPLEMENTARY
INFORMATIONINVESTMENTS ACTUARIAL
STATISTICAL
82 CERS Non-Hazardous82 CERS Hazardous83 Schedule of Employer NPL83 KERS Non-Hazardous83 KERS Hazardous83 SPRS84 CERS Non-Hazardous85 CERS Hazardous86 Schedule of Changes in
Employers’ TPL86 KERS Non-Hazardous87 KERS Hazardous88 SPRS89 Notes to Schedule of
Employers’ Contributions90 CERS Non-Hazardous90 CERS Hazardous91 Schedule of Employers’
Contributions Pension91 KERS Non-Hazardous91 KERS Hazardous92 SPRS92 CERS Non-Hazardous92 CERS Hazardous93 Schedule of Employers’
NOL93 KERS Non-Hazardous93 KERS Hazardous93 SPRS94 CERS Non-Hazardous95 CERS Hazardous96 Schedule of Changes in
Employers’ Net OPEB Liability
96 KERS Non-Hazardous97 KERS Hazardous98 SPRS99 Notes to Schedule
of Employers’ OPEB Contribution
101 CERS Non-Hazardous101 CERS Hazardous102 Schedule of Employers’
OPEB Contributions102 KERS Non-Hazardous102 KERS Hazardous103 SPRS104 Money Weighted Rates of
Return106 Schedule of Administrative
Expenses107 Schedule of Direct
Investment Expenses108 Schedule of Professional
Consultant Fees109 Report On Internal Control
111 Investment Activities114 Investment Committee
Initiatives116 Investment Summary117 Investment Strategies118 Investment Objectives119 Investment Results120 Benchmarks121 Long-Term Results122 U.S. Equity123 Non-U.S. Equity124 Core Fixed Income125 Specialty Credit126 Opportunistic126 Private Equity127 Real Estate127 Real Return128 Absolute Return129 Cash130 Additional Schedules &
Required Supplemental Information
130 Investment Advisors138 External Investment
Expense139 Commissions140 Fair Values By Plan
143 Certification of Actuarial Results
147 Summary of Actuarial Assumptions
156 Summary of Actuarial Valuation Results
158 Recommended Employer Contribution Rates
161 Summary of Actuarial Unfunded Liabilities
165 Solvency Test168 Active Member Valuation172 Summary of Benefit
Provisions KERS & CERS Non-Hazardous Plans
176 Summary of Benefit Provisions KERS Hazardous, CERS Hazardous, & SPRS Plans
178 Summary of Benefit Provisions KERS Hazardous, CERS Hazardous & SPRS Plans - Tier 3
181 Fund Statistics184 Participating Employers186 Member Monthly Benefit187 Fiduciary Net Position190 Changes in Fiduciary Net
Position195 Schedule of Benefit
Expenses198 Analysis of Initial Retirees199 Payment Options200 Employer Contribution
Rates201 Insurance Contracts
Board Meeting - December 3, 2020 - Review and Approval of CAFR
187

INTRODUCTION TABLE OF CONTENTS
4
5 MANAGEMENT’S RESPONSIBILITY FOR FINANCIAL REPORTING
6 LETTER OF TRANSMITTAL8 GOVERNANCE9 AGENCY STRUCTURE10 GFOA CERTIFICATE11 PENSION BENEFITS BY COUNTY12 ACTIVE REFUNDS14 FIDUCIARY NET POSITION HIGHLIGHTS
Board Meeting - December 3, 2020 - Review and Approval of CAFR
188

5 INT
Management’s Responsibility for Financial Reporting Management has prepared the combining financial statements of Kentucky Retirement Systems (KRS) and is responsible for the integrity and fairness of the information presented.
December 3, 2020: Management has prepared the combining financial statements of KRS and is responsible for the integrity and fairness of the information presented. Some amounts included in the combining financial statements may be based upon estimates and judgements. These estimates and judgements were made utilizing the best business practices available. The accounting policies followed in the preparation of these combining financial statements conform to U.S. Generally Accepted Accounting Principles (GAAP). Financial information presented throughout the annual report is consistent with the combining financial statements.
Responsibility: Ultimate responsibility for the combining financial statements and annual report rests with the Board of Trustees (Board). The Executive Director and KRS staff assist the Board in its responsibilities.
Systems of internal control and supporting procedures are maintained to provide assurance that transactions are authorized, assets safeguarded, and proper records maintained. These controls include standards in hiring and training employees, the establishment of an organizational structure, and the communications of policies and guidelines throughout the organization. The cost of a control should not exceed the benefits to be derived; the objective is to provide reasonable, rather than absolute, assurance that the combining financial statements are free of any material misstatements. These internal controls are reviewed by internal audit programs. All internal audit reports are submitted to the Audit Committee and Board.
KRS’ external auditors, Dean Dorton, CPA, have conducted an independent audit of the combining financial statements in accordance with U.S. Generally Accepted Government Auditing Standards. This audit is described in their Independent Auditors’ Report on pages 16 through 17 in the Financial Section. Management has provided the external auditors with full and unrestricted access to KRS’ staff to discuss their audit and related findings as to the integrity of the plan’s financial reporting and the adequacy of internal controls for the preparation of combining financial statements.
David L. Eager Executive Director
Rebecca H. Adkins Executive Director, Office of Operations
Connie Davis, CIA, CGAP, CRMA Director of Accounting
Board Meeting - December 3, 2020 - Review and Approval of CAFR
189

6INT
December 1, 2020On behalf of the Board, management, and staff of KRS, it is my honor to present the Comprehensive Annual Financial Report (CAFR) for the Fiscal Year Ended June 30, 2020. This report is provided as a resource for understanding the structure and financial status of KRS.
Here are a few highlights:
COVID-19 PandemicSince early April, 2020 KRS has had more than 85% of its staff working from home. We made the swift transition almost seamlessly with members experiencing minimal disruption to services, and our various productivity metrics have remained strong throughout the period.
Effective and Transparent ManagementThe Board and staff are committed to managing all aspects of KRS effectively and with complete transparency. We continuously examine every aspect of our procedures and policies striving for enhancements. All records and information not protected by statutes or confidentiality agreements are available on our website, in our CAFR, or by request. All Board meetings and Committee meetings are live streamed and archived on the official KRS Facebook page.
We publish various newsletters targeted to our members and governmental officials including all legislators, employees of the Legislative Research Commission and most members of the Executive Branch senior staff. We have frequent meetings with members, government officials, member groups and other stakeholders who are interested in getting information about KRS or giving us input. Continuous ImprovementAgain this year our most financially troubled plan, KERS Non-Hazardous, had positive cash flow during Fiscal Year 2020. We received more in contributions than we paid in benefits and expenses. CERS plans will likely move into that position shortly as the phase-in of higher contributions moves into its third year.
Over the past year, several service enhancements were implemented with an emphasis on Self Service. In February
2020, members were provided the ability to securely apply for their retirements and upload documents online. This allows members the ease of initiating the retirement process and submitting forms from their mobile devices or personal computer.
We prepared for the first Trustee election with an online ballot option for the 2021 CERS election. We anticipate significant savings for board elections prospectively due to recent legislation which reduced the number of CERS Trustee elections from two every four years to one every four years and providing for online voting.
LegislationThe 2019 Special Session of the General Assembly produced House Bill (HB) 1. That bill provided four new options for the 115 Quasi State Agencies to exit the KERS Non-Hazardous plan, should they choose to do so at discount rates ranging from 4.5% to 3.0% through lump sum or installment payments. Two of the four options include continuing active KERS membership for Tier 1 and Tier 2 employees.
The 2020 Regular Session of the General Assembly produced significant KRS-related legislation. Senate Bill (SB) 249 extended the exit date for universities and all Quasi-governmental agencies to June 30, 2021. SB 249 also reset the amortization period for paying off the unfunded liabilities for all pension and insurance plans. Based on previous assumptions, all pension plans were to be fully funded by Fiscal Year 2043. However, SB 249 extends that period to Fiscal Year 2049 by resetting the amortization period from 24 years to 30 years which reduces the required employer contributions for Fiscal Year 2021 by an estimated $120 million.
In addition, the General Assembly also passed HB 484 which changes our current administrative structure by creating a new CERS Board with oversight and governance responsibility for the CERS plans. The KERS and SPRS plans will remain under the authority of the KRS Board. The Kentucky Public Pension Authority (KPPA) is a new board, which will be responsible for the day to day administrative, legal, operational, and investment aspects of all five plans. All employees of the current KRS will now work for the KPPA. To date, we have determined more than 100 action items,
Board Meeting - December 3, 2020 - Review and Approval of CAFR
190

7 INT
or steps, required to make the transition, and expect to identify more as our work progresses.
From a budget standpoint, the economic uncertainty surrounding COVID-19 prompted the General Assembly to approve a one-year Executive Branch budget bill rather than the usual two-year budget. As a result, the employer contribution rates for Fiscal Year 2022 will be set in the 2021 Regular Session.
KRS continues to work on implementing previous legislative changes. During the 2017 Regular Session of the General Assembly, SB 104 was enacted which allows Tier 2 members to opt into Tier 3. This provision required a favorable Private Letter Ruling from the Internal Revenue Service, which was received this year. Staff is currently working on system changes to support this law change.
InvestmentsFor Fiscal Year 2020, the investment markets had low returns and limited the ability for our funds to earn their actuarial assumed rates of return of 5.25% and 6.25%. KERS Non-Hazardous and SPRS pension plans earned 2.37% and 2.22%, respectively, and fell short of their assumed rate of return of 5.25%. All of the other pension and insurance plans earned between .19 % and .94%. As such, all eight of those plans failed to earn their assumed rate of return of 6.25%.
ActuarialFollowing approval of the Actuarial Valuation for Fiscal Year 2020 at the Board of Trustees meeting on December 3, 2020, this section will be updated.
Cyber SecurityKRS’ goal is to be on the forefront of cyber security for similar-sized public funds because our members and employers have entrusted us with sensitive data that must be protected. Two of the most significant cyber threats in 2020 are social engineering and ransomware. To address these and other threats, KRS is continuing its rigorous staff security training, software patching and system upgrades, which are key to a quality cyber security program. Additionally, KRS is expanding its business continuity, disaster recovery and incident response plans. COVID-19 ushered in a new work-at-home environment for our employees, which increased the cyber risks to our infrastructure. Our technology team acted swiftly to add measures to counteract that risk.
Looking ForwardBy far our most important mandate is to work with the Legislature and the Governor’s Office to assure that KRS gets the required funding. Our actuaries, GRS Consulting, project that all of our pension and insurance plans will become fully funded in Fiscal Year 2049, provided KRS receives the full Actuarially Determined Contribution (ADC) each year. Those same projections indicate that all benefits will be secure going forward, supported by the positive fiscal impact of the Tier 3 Hybrid Cash Balance Plan. Receiving the full ADC ensures that KRS continues to provide a stabilizing element for all local economies in the Commonwealth, paying at least $1 million in ongoing pension benefits to each county annually.
There continues to be consideration of legislation that would change the funding method for employers from a uniform percent of pay method to a method that allocates a dollar value based upon each employer’s unfunded liability and requires them to pay it off over a period not to exceed 30 years in most cases. Without this change, employers will likely continue to reduce their employee head count through outsourcing and layoffs and thereby reduce their payrolls and, subsequently, their contributions. This results in their liability being absorbed by other employers and forces contribution rates even higher.
AcknowledgmentsThe preparation of this report has been a collaborative effort of Executive Management and the Accounting, Investments and Communications Divisions. The contents have been reviewed by the Internal Audit Division. KRS takes responsibility for all of the information contained in the report and confidently presents it as a basis for making management decisions that promote the responsible stewardship of the assets of KRS.
David L. EagerExecutive Director
Board Meeting - December 3, 2020 - Review and Approval of CAFR
191

8INT
GOVERNANCE
ELECTED
JOHN CHESHIRE III Term ends 6/17/23
GERINA WHETHERS Personnel Secretary
Ex Officio
KELLY DOWNARDTerm ends 6/17/23
JOSEPH GROSSMANTerm ends 6/17/22
C. PREWITT LANETerm ends 6/17/23
MATTHEW MONTEIROTerm ends 6/17/23
DAVID RICHElected by CERSTerm ends 10/31/21
BETTY PENDERGRASSElected by CERSTerm ends 3/31/21
JERRY W. POWELL Elected by CERSTerm ends 3/31/21
CAMPBELL CONNELL Elected by KERS
Term ends 3/31/22
SHERRY LYNN KREMER Elected by KERS
Term ends 3/31/22
KEITH PEERCY VICE CHAIR
Elected by SPRSTerm ends 3/31/23
W. JOE BROTHERS Nominated by KSBA
Term ends 7/1/21
JOHN E. CHILTONTerm ends 6/17/22
J.T. FULKERSON Nominated by KLC
Term ends 7/1/21
Our Six Mandates 1. Strive for appropriate funding for all
plans.2. Provide members with efficient access
to information and helpful counseling to meet their individual needs.
3. Manage the assets in accordance with each plan’s needs while adding value to a passive portfolio.
4. Communicate effectively with all constituents, while ensuring appropriate transparency.
5. Maintain a work environment that promotes employee inclusion and diversity, effectiveness, morale, safety, and retention.
6. Insist on a culture of continuous enhancement to everything we do.
KENTUCKY PUBLIC PENSION AUTHORITYDuring the 2020 Legislative Session, House Bill 484 was passed establishing a new governance structure for KRS. Effective April 1, 2021 KRS as an “office” will be known as the Kentucky Public Pension Authority (KPPA). Current KRS employees will become KPPA employees and continue to provide administrative support, investment management and conduct daily activities for the new CERS, KRS and KPPA boards. KPPA will be led by an Executive Director who will work with the Chief Executive Officers of the CERS and KRS boards to carry out the statutory provisions of the systems.
COUNTY EMPLOYEES RETIREMENT SYSTEM
• 3 trustees elected by members
• 6 trustees appointed by the Governor selected from lists of candidates provided by KACo, KLC and KSBA
CERS BOARDKENTUCKY EMPLOYEES RETIREMENT SYSTEM
&STATE POLICE
RETIREMENT SYSTEM
• 3 trustees elected by members
• 6 trustees appointed by the Governor
KRS BOARD• CERS Board Chair• KRS Board Chair• CERS Investment Committee Chair• CERS Trustee, Elected by Members*• CERS Trustee, Governor Appointee*• KRS Investment Committee Chair• KRS Trustee, Elected by Members**• KRS Trustee, Governor Appointee**
*Selected by the CERS Board Chair**Selected by the KRS Board Chair
KPPA BOARD
Our Board of Trustees serves as the KRS governing body. Six trustees are elected by members, ten are appointed by the Governor and the Secretary of the Personnel Cabinet serves ex officio. Three of the ten appointees are selected from lists of candidates provided by the Kentucky Association of Counties (KACo), the Kentucky League of Cities (KLC), and the Kentucky School Boards Association (KSBA).
DAVID L. HARRIS CHAIR
Term ends 6/17/22
KYRET.KY.GOVVisit our website for meeting schedules. Watch meetings live
on Facebook.
@KYretirement
VACANT Nominated by KACo
Term ends 7/1/21
APPOINTED
Board Meeting - December 3, 2020 - Review and Approval of CAFR
192

9 INT
KENTUCKY RETIREMENT SYSTEMS AGENCY STRUCTURE
as of November 1, 2020
Executive Director Office of Benefits
ERIN SURRATT
Division Director Disability & Survivor Benefits
LIZA WELCH
Division Director Member Services SHAUNA MILLER
Division Director Membership Support
KEVIN GAINES
Assistant Director Retiree Services
STEPHANIE ALDRIDGE
Division Director Retiree Health Care
CONNIE PETTYJOHN
Division Director Quality Assurance
WES CROSTHWAITE
General Counsel Advocacy
KATHY RUPINEN
General Counsel Non-Advocacy
VACANT
Interim Executive Director Office of Legal Services
KATHY RUPINEN
Division Director Human Resources
MARLANE ROBINSON
Division Director Communications
SHAWN SPARKS
Retiree Health Care Committee Chair
DAVID RICH
Audit Committee Chair
JOHN CHILTON
Investment Committee Chair
PREWITT LANE
Division Director Enterprise and Technology
ServicesDOMINIQUE MCKINLEY
Division Director
Employer Reporting, Compliance & Education
D’JUAN SURRATT
Division Director Accounting
CONNIE DAVIS
Interim Assistant Director Procurement & Office Services
ANNE BAKER
Procurement Staff AdvisorCASSANDRA WEISS
Executive Director Office of Investments
VACANT
Disability Appeals andAdministrative Appeals
Committees Chairs
KEITH PEERCY and BETTY PENDERGRASS
Deputy Executive DirectorOffice of Investments
VACANTInvestment Division Directors
Division of Public Equity - JOE GILBERTDivision of Private Equity - ANTHONY CHIU
Division of Fixed Income - STEVE WILLER
Executive DirectorDAVID EAGER
KRS
- 3 elected by CERS - 2 elected by KERS - 1 elected by SPRS
- Personnel Secretary- 10 Trustees appointed
by the Governor
17 Member Board of Trustees Chair
DAVID HARRIS
CONSULTANTSActuarial ServicesGabriel, Roeder, Smith & Co.
Legal ServicesStoll Keenon Ogden, PLLCReinhart Boerner Van Deuren, SCFrost Brown Todd, LLCFaegre Drinker Biddle & Reath, LLPManatt, Phelps & Phillips, LLPHirschler Fleischer, P.C.Ice Miller, LLP
Auditing ServicesDean Dorton Allen Ford, PLLC
Fiduciary Review CounselIce Miller, LLP
Investment ConsultantWilshire
Master CustodianBNY Mellon
Refer to the Investments Section for additional information regarding Investment Advisors and Schedules of Fees and Expenses.
Division Director Internal Audit
KRISTEN COFFEY
Executive Director Office of Operations
REBECCA ADKINS
Board Meeting - December 3, 2020 - Review and Approval of CAFR
193

10INT
The Government Finance Officers Association (GFOA) awarded a Certificate of Achievement for Excellence in Financial Reporting to the Kentucky Retirement Systems (KRS) for its Comprehensive Annual Financial Report (CAFR) for the fiscal year ended June 30, 2019. The Certificate of Achievement is a prestigious national award recognizing excellence in the preparation of state and local government financial reports and is valid for a period of one year. This was the 21st award earned by KRS. In order to be awarded a Certificate of Achievement, a government unit must publish an easily readable and efficiently organized document. The report must satisfy both generally accepted accounting principles and applicable legal requirements. We believe our 2020 CAFR will continue to meet the Certificate of Achievement Program’s requirements, and we will be submitting it to the GFOA for their consideration.
Certificate of Achievement
Board Meeting - December 3, 2020 - Review and Approval of CAFR
194

11 INT
2020 Total Fiscal Year KRS Pension Benefits Paid by County County Payees* Total County Payees* Total County Payees* Total Adair 489 $8,189,678 Grant 603 $11,473,025 McLean 310 $4,533,338 Allen 403 5,464,411 Graves 892 13,851,245 Meade 455 6,523,980 Anderson 1,401 34,951,581 Grayson 763 11,744,174 Menifee 206 2,951,915 Ballard 239 3,357,055 Green 304 4,356,302 Mercer 772 14,048,532 Barren 1,068 16,558,475 Greenup 661 9,039,603 Metcalfe 303 3,879,555 Bath 393 5,896,769 Hancock 220 2,873,426 Monroe 261 2,941,638 Bell 661 10,687,746 Hardin 2,215 36,505,157 Montgomery 656 10,686,697 Boone 1,832 37,692,644 Harlan 638 9,628,785 Morgan 621 10,742,983 Bourbon 551 9,198,963 Harrison 453 6,979,484 Muhlenberg 800 10,279,648 Boyd 1,063 17,356,820 Hart 336 5,062,458 Nelson 1,058 18,466,011 Boyle 893 15,359,711 Henderson 1,064 17,830,095 Nicholas 207 2,856,758 Bracken 229 3,012,682 Henry 911 20,235,961 Ohio 636 6,807,191 Breathitt 510 7,872,081 Hickman 92 1,654,089 Oldham 1,347 28,364,338 Breckinridge 478 6,822,737 Hopkins 1,269 19,356,950 Owen 530 12,179,872 Bullitt 1,535 28,492,707 Jackson 338 4,510,629 Owsley 214 3,199,640 Butler 319 4,365,675 Jefferson 16,438 358,247,177 Pendleton 354 5,866,231 Caldwell 529 7,870,900 Jessamine 1,104 18,911,290 Perry 778 11,242,764 Calloway 1,077 15,319,568 Johnson 620 9,462,589 Pike 1,267 18,705,012 Campbell 1,530 28,834,286 Kenton 2,319 48,177,371 Powell 343 4,649,527 Carlisle 122 1,712,343 Knott 451 7,048,344 Pulaski 2,237 37,922,837 Carroll 318 5,125,189 Knox 608 9,501,098 Robertson 65 1,078,616 Carter 781 10,408,718 LaRue 360 5,551,977 Rockcastle 400 5,487,107 Casey 359 4,607,025 Laurel 1,254 20,793,279 Rowan 862 14,857,931 Christian 1,551 27,145,965 Lawrence 334 4,053,937 Russell 558 8,275,937 Clark 838 14,347,648 Lee 232 3,306,520 Scott 1,263 26,768,422 Clay 583 8,620,846 Leslie 268 4,067,092 Shelby 1,655 41,483,106 Clinton 254 3,439,091 Letcher 608 8,342,719 Simpson 284 3,491,665 Crittenden 218 2,849,836 Lewis 327 4,267,942 Spencer 498 11,032,296 Cumberland 184 2,834,103 Lincoln 679 8,635,787 Taylor 645 9,382,740 Daviess 2,645 47,318,563 Livingston 264 4,437,679 Todd 254 3,479,777 Edmonson 233 3,342,669 Logan 617 8,790,307 Trigg 516 8,343,995 Elliott 179 2,656,436 Lyon 352 6,955,321 Trimble 274 4,294,204 Estill 408 5,743,254 Madison 2,385 40,256,296 Union 364 4,177,682 Fayette 5,475 119,368,493 Magoffin 360 5,024,880 Warren 2,823 49,670,729 Fleming 466 7,956,960 Marion 548 7,628,231 Washington 334 5,256,408 Floyd 892 13,616,713 Marshall 924 13,632,181 Wayne 548 7,573,357 Franklin 6,370 197,068,347 Martin 280 3,108,248 Webster 357 4,714,436 Fulton 180 2,266,700 Mason 414 6,691,167 Whitley 1,086 15,493,629 Gallatin 122 2,022,389 McCracken 1,599 29,204,659 Wolfe 335 5,452,682 Garrard 419 $6,196,393 McCreary 402 $4,137,326 Woodford 1,041 $26,037,584
Pension Benefits paid to retirees and beneficiaries of Kentucky Retirement Systems have a wide ranging impact on the state’s economic health. In fiscal year 2020, KRS paid over $2 billion to its recipients. The majority, 93.40%, of these payments are issued to Kentucky residents. Each county in the Commonwealth receives at least $1 million annually from KRS, providing a stabilizing element for all local economies.
Total Retirement Payments As of June 30, 2020
(In Whole $)
Payees* % Payments
Retirement Eligible/Actuarial Refund 307 $2,407,311
Kentucky 109,820 93.40% 2,044,487,743
Out of State 8,593 6.60% 144,399,747
Grand Total 118,720 100.00% $2,190,721,477
*This table represents all payees receiving a monthly payment, retirement eligible refund, or actuarial refund during the fiscal year.
Board Meeting - December 3, 2020 - Review and Approval of CAFR
195

12INT
Active Refunds Report as of June 30, 2020
Active Termination Refunds Active Death Refunds Totals
Number of Refunds
Amount of Refunds
Number of Refunds
Amount of Refunds
Number of Refunds
Amount of Refunds
System Tier
CERS Non-Hazardous
1 370 $4,780,510 150 $239,192 520 $5,019,7022 619 4,562,618 36 79,267 655 4,641,8853 1,228 3,710,211 52 118,577 1,280 3,828,788
Total 2,217 13,053,339 238 437,036 2,455 13,490,375
CERS Hazardous
1 32 1,191,313 1 322 33 1,191,6352 54 1,249,638 1 22,219 55 1,271,8573 96 883,376 1 15,045 97 898,421
Total 182 3,324,327 3 37,586 185 3,361,913
KERS Non-Hazardous
1 272 4,640,758 68 121,862 340 4,762,6192 305 3,091,895 13 64,131 318 3,156,0263 616 2,549,638 12 39,361 628 2,589,000
Total 1,193 10,282,291 93 225,354 1,286 10,507,645
KERS Hazardous
1 24 476,247 3 17,612 27 493,8592 67 1,081,174 3 3,916 70 1,085,0903 183 1,043,242 3 6,537 186 1,049,779
Total 274 2,600,663 9 28,065 283 2,628,728
SPRS
1 2 21,611 - - 2 21,6112 3 48,323 - - 3 48,3233 1 17,634 - - 1 17,634
Total 6 87,568 - - 6 87,568TOTALS 3,872 $29,348,188 343 $728,041 4,215 $30,076,229
Board Meeting - December 3, 2020 - Review and Approval of CAFR
196
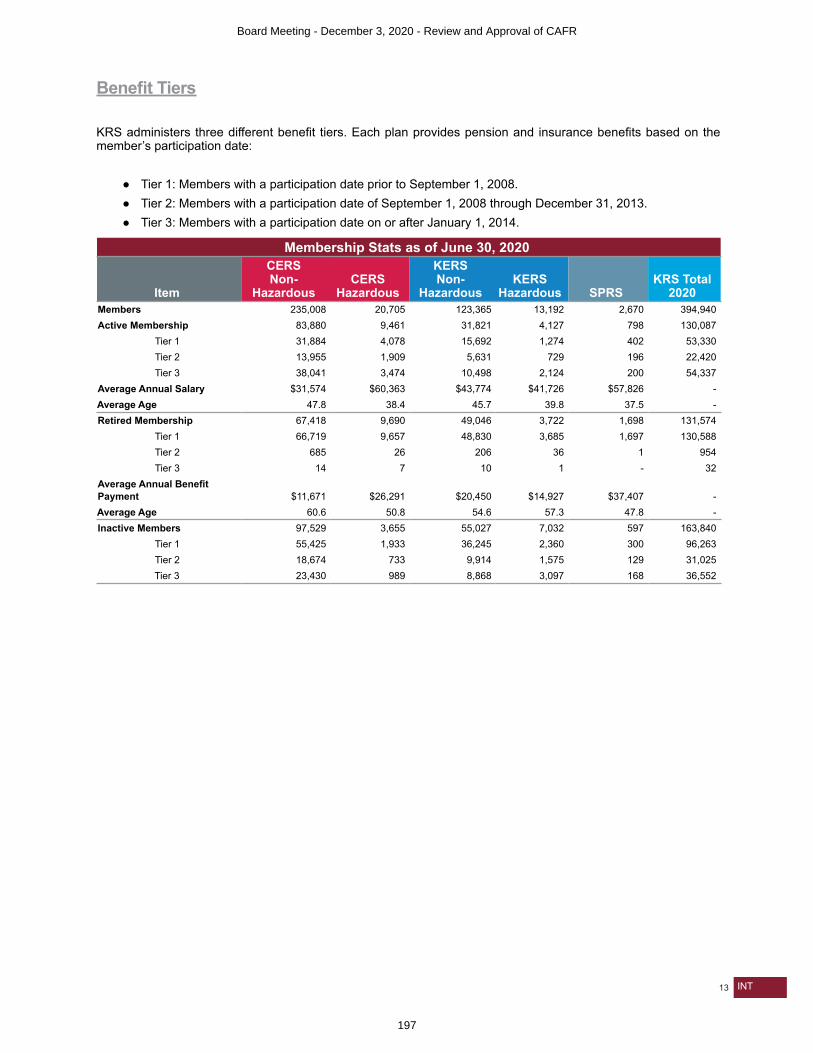
13 INT
Benefit Tiers KRS administers three different benefit tiers. Each plan provides pension and insurance benefits based on the member’s participation date:
● Tier 1: Members with a participation date prior to September 1, 2008. ● Tier 2: Members with a participation date of September 1, 2008 through December 31, 2013. ● Tier 3: Members with a participation date on or after January 1, 2014.
Membership Stats as of June 30, 2020
Item
CERS Non-
HazardousCERS
Hazardous
KERS Non-
HazardousKERS
Hazardous SPRSKRS Total
2020Members 235,008 20,705 123,365 13,192 2,670 394,940Active Membership 83,880 9,461 31,821 4,127 798 130,087
Tier 1 31,884 4,078 15,692 1,274 402 53,330Tier 2 13,955 1,909 5,631 729 196 22,420Tier 3 38,041 3,474 10,498 2,124 200 54,337
Average Annual Salary $31,574 $60,363 $43,774 $41,726 $57,826 -Average Age 47.8 38.4 45.7 39.8 37.5 -Retired Membership 67,418 9,690 49,046 3,722 1,698 131,574
Tier 1 66,719 9,657 48,830 3,685 1,697 130,588Tier 2 685 26 206 36 1 954Tier 3 14 7 10 1 - 32
Average Annual Benefit Payment $11,671 $26,291 $20,450 $14,927 $37,407 -Average Age 60.6 50.8 54.6 57.3 47.8 -Inactive Members 97,529 3,655 55,027 7,032 597 163,840
Tier 1 55,425 1,933 36,245 2,360 300 96,263Tier 2 18,674 733 9,914 1,575 129 31,025Tier 3 23,430 989 8,868 3,097 168 36,552
Board Meeting - December 3, 2020 - Review and Approval of CAFR
197

1414INT
CERS was established on July 1, 1958 by the State Legislature.
CERS Non-Hazardous - Fiduciary Net Position* ($ in Thousands)
Fund 2013 2014 2015 2016 2017 2018 2019 2020 Pension $5,795,568 $6,528,146 $6,440,800 $6,141,396 $6,739,142 $7,086,322 $7,242,975 $7,110,889 Insurance 1,618,960 1,878,711 1,920,946 1,908,550 2,160,553 2,346,767 2,486,458 2,498,051 Total $7,414,528 $8,406,857 $8,361,746 $8,049,946 $8,899,695 $9,433,089 $9,729,433 $9,608,940
CERS Hazardous - Fiduciary Net Position* ($ in Thousands) Fund 2013 2014 2015 2016 2017 2018 2019 2020 Pension $1,833,571 $2,087,002 $2,078,202 $2,010,177 $2,227,679 $2,361,047 $2,429,613 $2,395,688 Insurance 891,320 1,030,303 1,056,480 1,056,097 1,179,313 1,268,272 1,324,809 1,305,132 Total $2,724,891 $3,117,305 $3,134,682 $3,066,274 $3,406,992 $3,629,319 $3,754,422 $3,700,820
KERS was established on July 1, 1956 by the State Legislature.
KERS Non-Hazardous - Fiduciary Net Position* ($ in Thousands)
Fund 2013 2014 2015 2016 2017 2018 2019 2020 Pension $2,760,753 $2,578,290 $2,327,782 $1,980,292 $2,092,781 $2,048,890 $2,286,625 $2,362,231 Insurance 496,040 646,905 665,639 668,318 781,406 846,762 942,136 1,006,498 Total $3,256,793 $3,225,195 $2,993,421 $2,648,610 $2,874,187 $2,895,652 $3,228,761 $3,368,729
KERS Hazardous - Fiduciary Net Position* ($ in Thousands) Fund 2013 2014 2015 2016 2017 2018 2019 2020 Pension $514,592 $561,484 $552,468 $527,880 $605,921 $651,173 $687,877 $697,366 Insurance 372,883 433,525 439,113 437,397 484,442 513,384 527,108 514,740 Total $887,475 $995,009 $991,581 $965,277 $1,090,363 $1,164,557 $1,214,985 $1,212,106
SPRS was established on July 1, 1958 by the State Legislature.
SPRS - Fiduciary Net Position* ($ in Thousands)
Fund 2013 2014 2015 2016 2017 2018 2019 2020 Pension $248,698 $260,974 $247,229 $218,013 $256,383 $268,425 $287,242 $295,044 Insurance 142,691 164,958 164,714 160,949 178,191 189,994 200,128 200,245 Total $391,389 $425,932 $411,943 $378,962 $434,574 $458,419 $487,370 $495,289
KRS Total Fiduciary Net Position
Fiduciary Net Position ($ in Thousands)
Fund 2013 2014 2015 2016 2017 2018 2019 2020Pension $11,153,182 $12,015,897 $11,646,481 $10,877,758 $11,921,906 $12,415,856 $12,934,332 $12,861,218Insurance 3,521,894 4,154,401 4,246,892 4,231,311 4,783,905 5,165,179 5,480,639 5,524,666Total $14,675,076 $16,170,298 $15,893,373 $15,109,069 $16,705,811 $17,581,035 $18,414,971 $18,385,884* The Fiduciary Net Positions are the resources accumulated and held in trust to pay benefits.
Board Meeting - December 3, 2020 - Review and Approval of CAFR
198

14
FINANCIAL TABLE OF CONTENTS
1515
16 REPORT OF INDEPENDENT AUDITORS18 MANAGEMENT’S DISCUSSION & ANALYSIS21 FUND ACTIVITIES24 HISTORICAL TRENDS25 COMBINING STATEMENT OF FIDUCIARY NET POSITION - PENSION FUNDS
26 COMBINING STATEMENT OF CHANGES IN FIDUCIARY NET POSITION - PENSION FUNDS
27 COMBINING STATEMENT OF FIDUCIARY NET POSITION - INSURANCE FUND
28 COMBINING STATEMENT OF CHANGES IN FIDUCIARY NET POSITION - INSURANCE FUND
29 NOTE A. SUMMARY OF SIGNIFICANT ACCOUNTING POLICIES
32 NOTE B. PLAN DESCRIPTIONS & CONTRIBUTION INFORMATION
39 NOTE C. CASH, SHORT-TERM INVESTMENTS & SECURITIES LENDING COLLATERAL
40 NOTE D. INVESTMENTS
58 NOTE E. SECURITIES LENDING TRANSACTIONS
58 NOTE F. RISK OF LOSS
59 NOTE G. CONTINGENCIES
59 NOTE H. DEFINED BENEFIT PENSION PLAN
59 NOTE I. INCOME TAX STATUS
59 NOTE J. EQUIPMENT
59 NOTE K. INTANGIBLE ASSETS
61 NOTE L. ACTUARIAL VALUATION
63 NOTE M. GASB 67 AND GASB 74 VALUATIONS
71 NOTE N. PENSION LEGISLATION
75 NOTE P. RECIPROCITY AGREEMENT
75 NOTE Q. REIMBURSEMENT OF RETIRED-REEMPLOYED AND ACTIVE MEMBER HEALTH INSURANCE
76 NOTE R. RELATED PARTY
76 NOTE S. REDUCTION OF RECEIVABLES
77 NOTE T. PRISMA DANIEL BOONE FUND ADJUSTMENT
77 NOTE U. SUBSEQUENT EVENTS
77 NOTE V. CORONAVIRUS
Board Meeting - December 3, 2020 - Review and Approval of CAFR
199

16FIN
DRAFT
REPORT OF INDEPENDENT AUDITORS
Board of DirectorsKentucky Retirement SystemsFrankfort, Kentucky
Report on the Combining Financial Statements
We have audited the accompanying combining financial statements of the Pension Funds and Insurance Fund of Kentucky Retirement Systems, a component unit of the Commonwealth of Kentucky, as of and for the fiscal year ended June 30, 2020, and the related notes to the combining financial statements, which comprise the Kentucky Retirement Systems’ basic combining financial statements as listed in the table of contents (collectively, the financial statements).
Management’s Responsibility for the Financial Statements
Management is responsible for the preparation and fair presentation of these financial statements in accordance with accounting principles generally accepted in the United States of America; this includes the design, implementation, and maintenance of internal control relevant to the preparation and fair presentation of financial statements that are free from material misstatement, whether due to fraud or error.
Auditor’s Responsibility
Our responsibility is to express an opinion on these financial statements based on our audit. We conducted our audit in accordance with auditing standards generally accepted in the United States of America and the standards applicable to financial audits contained in Government Auditing Standards, issued by the Comptroller General of the United States. Those standards require that we plan and perform the audit to obtain reasonable assurance about whether the financial statements are free from material misstatement.
An audit involves performing procedures to obtain audit evidence about the amounts and disclosures in the financial statements. The procedures selected depend on the auditor’s judgment, including the assessment of the risks of material misstatement of the financial statements, whether due to fraud or error. In making those risk assessments, the auditor considers internal control relevant to the entity’s preparation and fair presentation of the financial statements in order to design audit procedures that are appropriate in the circumstances, but not for the purpose of expressing an opinion on the effectiveness of the entity’s internal control. Accordingly, we express no such opinion. An audit also includes evaluating the appropriateness of accounting policies used and the reasonableness of significant accounting estimates made by management, as well as evaluating the overall presentation of the financial statements.
We believe that the audit evidence we have obtained is sufficient and appropriate to provide a basis for our audit opinion.
Opinion
In our opinion, the financial statements referred to above present fairly, in all material respects, the respective combining fiduciary net position of the Pension Funds and Insurance Fund of Kentucky Retirement Systems, a component unit of the Commonwealth of Kentucky, as of June 30, 2020, and the respective combining changes in fiduciary net position for the year then ended, in accordance with accounting principles generally accepted in the United States of America.
Report on Summarized Comparative Information
We have previously audited the Kentucky Retirement Systems 2019 financial statements of the Pension Funds and Insurance Fund, and we expressed an unmodified audit opinion on those audited financial statements in our report dated December 5, 2019. In our opinion, the summarized comparative information presented herein as of and for the year endedJune 30, 2019, is consistent, in all material respects, with the audited financial statements from which it has been derived.
Board Meeting - December 3, 2020 - Review and Approval of CAFR
200

17 FIN
DRAFT
Board of TrusteesKentucky Retirement SystemsReport of Independent Auditors, continued
Other Matters
Required Supplementary Information
Accounting principles generally accepted in the United States of America require that the Management’s Discussion and Analysis (on pages __ to __) and the Schedules of Employer Net Pension Liability, Changes in Employers’ Total Pension Liability, Employer Contributions Pension, Employers’ Net OPEB Liability, Changes in Employers’ Net OPEB Liability, Employers’ OPEB Contributions, and the Money Weighted Rates of Return (on pages __ to __) be presented to supplement the basic financial statements. Such information, although not a part of the basic financial statements, is required by the Governmental Accounting Standards Board who considers it to be an essential part of financial reporting for placing the basic financial statements in an appropriate operational, economical, or historical context. We have applied certain limited procedures to the required supplementary information in accordance with auditing standards generally accepted in the United States of America, which consisted of inquiries of management about the methods of preparing the information and comparing the information for consistency with management’s responses to our inquiries, the basic financial statements, and other knowledge we obtained during our audit of the basic financial statements. We do not express an opinion or provide any assurance on the information because the limited procedures do not provide us with sufficient evidence to express an opinion or provide any assurance.
Other Information
Our audit was conducted for the purpose of forming an opinion on the financial statements that collectively comprise the Pension Funds and Insurance Fund of Kentucky Retirement Systems’ basic financial statements. The Additional Supporting Schedules (on pages __ to __), Introduction, Investments, Actuarial and Statistical Sections are presented for purposes of additional analysis and are not a required part of the basic financial statements.
The Additional Supporting Schedules are the responsibility of management and were derived from and relate directly to the underlying accounting and other records used to prepare the basic financial statements. Such information has been subjected to the auditing procedures applied in the audit of the basic financial statements and certain additional procedures, including comparing and reconciling such information directly to the underlying accounting and other records used to prepare the basic financial statements, or to the basic financial statements themselves, and other additional procedures in accordance with auditing standards generally accepted in the United States of America. In our opinion, theAdditional Supporting Schedules are fairly stated, in all material respects, in relation to the basic financial statements as a whole.
The Introduction, Investments, Actuarial and Statistical Sections have not been subjected to the auditing procedures applied in the audit of the basic financial statements, and accordingly, we do not express an opinion or provide any assurance on it.
Other Reporting Required by Government Auditing Standards
In accordance with Government Auditing Standards, we have also issued our report dated December 3, 2020 on ourconsideration of the Kentucky Retirement Systems’ internal control over financial reporting and on our tests of its compliance with certain provisions of laws, regulations, contracts, and grant agreements and other matters. The purpose of that report is to describe the scope of our testing of internal control over financial reporting and compliance and the results of that testing, and not to provide an opinion on the internal control over financial reporting or on compliance. That report is an integral part of an audit performed in accordance with Government Auditing Standards in considering the Kentucky Retirement Systems’ internal control over financial reporting and compliance.
Lexington, KentuckyDecember 3, 2020
Board Meeting - December 3, 2020 - Review and Approval of CAFR
201

18FIN
Management'sDISCUSSION & ANALYSIS
(Unaudited)Pension Funds The following highlights are explained in more detail later in this report.
The Management Discussion and Analysis is the KRS leadership summary of the management of the CERS, KERS, and SPRS Fiduciary Pension Funds and Insurance Fund. KRS is a component unit of the Commonwealth of Kentucky, (the Commonwealth) for financial and reporting purposes. Total Pension Fiduciary Net Position was $12.9 billion at the beginning of the fiscal year and decreased by 0.57% to $12.8 billion as of June 30, 2020. The $0.1 billion decrease is primarily attributable to unrealized losses creating a decline in the market value of investments. The Pension Funds received $1.1 million in General Fund appropriations in fiscal year 2020 compared to $76.9 million in fiscal year 2019. In addition, the KERS Pension Fund was notified by the Commonwealth of a budget surplus of which $60.1 million would be distributed to KRS in fiscal year 2020, but the funds were accrued in fiscal year 2019. There were no budget surplus distributions for FY 2021, thus the reduction in accounts receivable for FY 2020.
CONTRIBUTIONS ● Total contributions reported for fiscal year 2020 were $2,064.4 million compared to $2,037.4 million in fiscal
year 2019. The major contributor to the increase resulted from increases in Employer Contributions for CERS Non-Hazardous, CERS Hazardous, and KERS Hazardous and General Fund appropriations of $1.1 million for the SPRS plan.
● The member health insurance, 401(h) contributions, totaled $0.0 for fiscal year 2020 compared to $21.3 million in the prior fiscal year. The decrease was due to Health Insurance Contributions being deposited to the Insurance Fund for 2020, in accordance with HB 80 passed by the legislature in the 2019 regular session.
INVESTMENTS ● The investment portfolio for the Pension Funds reported a net return of 1.15% for fiscal year 2020 compared
to 5.83% return for fiscal year 2019. The performance of the portfolio was adversely impacted by the COVID-19 pandemic for fiscal year 2020.
● The net depreciation in the fair value of investments for fiscal year 2020 was $98.1 million compared to net appreciation of $484.7 million for the previous fiscal year.
● Interest, dividends, and net securities lending income for fiscal year 2020 was $290.7 million compared to $288.4 million in fiscal year 2019. All investment returns are reported net of fees, including carried interest. Investment expenses totaled $53.1 million for fiscal year 2020 compared to $79.1 million in the prior fiscal year. The decline in fees is a combination of less than favorable market conditions and a decline in assets in certain portfolios due to redemptions. KRS also had several redemptions/distributions in the private equity and absolute return portfolio resulting in $169.0 million fewer assets in those portfolios.
DEDUCTIONS ● Pension benefits paid to retirees and beneficiaries for fiscal year 2020 totaled $2,205.9 million compared
to $2,144.1 million in fiscal year 2019, a 2.88% increase. The increase was due to a 2.42% increase in the number of retirees to 131,574. Refunded contributions paid to former members upon termination of employment for fiscal year 2020 totaled $33.5 million compared to $32.4 million in fiscal year 2019, a 3.34% increase, as more members elected a refund at employment termination.
● KRS’ fiscal year 2020 Pension administrative expense totaled $37.7 million compared to $36.4 million in the prior year. The increase was mainly due to salary and fringe benefit increases for KERS employees.
Board Meeting - December 3, 2020 - Review and Approval of CAFR
202

19 FIN
Management'sDISCUSSION & ANALYSIS
(Unaudited)
Insurance Fund The following highlights are explained in more detail later in this report.
The combined fiduciary net position of the Insurance Fund increased by $44.0 million during fiscal year 2020. Total combined net position for the fiscal year was $5,524.7 million. Total contributions and net investment income of $428.2 million offset deductions of $384.2 million which resulted in the net position increase.
CONTRIBUTIONS ● Employer contributions of $369.6 million were received in fiscal year 2020 compared to $387.3 million in
fiscal year 2019. Total contributions decreased 4.57% primarily due to the decrease in covered payroll for KERS Non-Hazardous, and SPRS as well as the decrease in the insurance contribution rate for CERS Non-Hazardous and CERS Hazardous.
● The reimbursement of retired/re-employed health insurance for fiscal year 2020 totaled $11.5 million compared to $10.5 million in the prior fiscal year. The increase is due to an increase in retired/re-employed members for whom employers are paying health insurance reimbursements.
INVESTMENTS ● Interest, dividends, and net securities lending income for fiscal year 2020 was $126.5 million compared
to $129.8 million in fiscal year 2019. The primary driver of this decrease was due to unfavorable market conditions which resulted in a decrease in income and dividends.
● The investment portfolio reported a net return of 0.48% for the fiscal year, which was lower than fiscal year 2019 net return of 5.67%. The investment return was below the 6.25% assumed rate of return. The performance of the portfolio was adversely impacted by the COVID-19 pandemic for fiscal year 2020.
● The net depreciation in the fair value of investments for fiscal year 2020 was $81.9 million compared to net appreciation of $196.0 million for the previous fiscal year. This $277.9 million decrease in fiscal year 2020 was due to lower market returns compared to fiscal year 2019.
● Investment expenses totaled $21.3 million for fiscal year 2020 compared to $37.5 million in the prior fiscal year. The decline in fees is a combination of less than favorable market conditions and a decline in certain portfolios due to redemptions. KRS also had several redemptions/distributions in the private equity and absolute return portfolio resulting in $86.9 million fewer assets in those portfolios.
DEDUCTIONS ● Total insurance premiums, plus self-funded reimbursements were $381.8 million for fiscal year 2020.
Although fiscal year 2020 insurance premiums were comparable to fiscal year 2019 rates, the number of covered lives increased by approximately 5% year-over-year.
● Insurance administrative expenses for retirees under age 65, increased from $2.37 million in fiscal year 2019 to $2.41 million in fiscal year 2020.
Using This Financial Report Because of the long-term nature of a defined benefit pension plan and post-employment healthcare benefit plan, the combining financial statements alone cannot provide sufficient information to properly reflect the Plans’ ongoing plan perspective. This financial report consists of two combining financial statements and two required schedules of
Board Meeting - December 3, 2020 - Review and Approval of CAFR
203

20FIN
Management'sDISCUSSION & ANALYSIS
(Unaudited)historical trend information. All plans within KRS are included in the aforementioned combining financial statements. The Combining Statement of Fiduciary Net Position for the Pension Funds on page 25 and the Combining Statement of Fiduciary Net Position for the Insurance Fund on page 27 provide a snapshot of the financial position of each of the three systems as of fiscal year 2020. The Combining Statement of Changes in Fiduciary Net Position for the Pension Funds on page 26, and the Combining Statement of Changes in Fiduciary Net Position for the Insurance Fund on page 27, summarize the additions and deductions that occurred for each of the three systems during fiscal year 2020. The economic assumptions for the Pension and Insurance Funds for fiscal year 2020 are on page ##, the Schedules of Changes in Employers’ Total Pension Liability on pages 86-88, the Schedules of the Employer Net Pension Liability on pages ##; the Schedule of Changes in Employers’ Total Other Post-Employment Benefits (OPEB) Liability are on pages 96-98; and, the Schedule of the Employers’ Net OPEB Liabilities are on page 70-70. These schedules include current and historical trend information about the actuarially funded status of each plan from a long-term, ongoing plan perspective and the progress made in accumulating sufficient assets to pay benefits and insurance premiums when due. The Schedules of the Employers’ Contributions – Pensions are on pages 91-92, and the Schedules of the Employers’ Contributions – OPEB are on pages 102-103These schedules present current and historical trend information about the annual required contributions and the contributions made in relation to the requirement. These schedules provide information that contributes to understanding the changes over time in the funded status of the plans.
Kentucky Retirement Systems CombinedKRS’ combined fiduciary net position decreased $29.1 million in fiscal year 2020, compared to the fiduciary net position for the previous fiscal year. The decrease in fiduciary net position for the fiscal year 2020 is primarily attributable to lower contributions, health insurance contributions, employer cessation contributions, and negative investment performance. The analysis focuses on the net position table and changes in fiduciary net position table for KRS’ Pension and Insurance Funds.
Board Meeting - December 3, 2020 - Review and Approval of CAFR
204

21 FIN
Management'sDISCUSSION & ANALYSIS
(Unaudited)Fund Activities
The net position of the Pension Funds decreased by $73.1 million to $12,861.2 million in fiscal year 2020 compared to $12,934.3 million in fiscal year 2019. All of these assets are restricted in use to provide monthly retirement allowances to members who contributed to the Pension Funds as employees and on behalf of their beneficiaries. The net position of the Insurance Fund increased by $44.0 million to $5,524.7 million in fiscal year 2020 compared to $5,480.6 million in fiscal year 2019. All of these assets are restricted in use to provide hospital and medical insurance benefits to members of the Pension Funds who receive a monthly retirement allowance.
Financial data presented in this report is
abbreviated “in thousands” or “in millions.”
Fiduciary Net PositionAs of June 30 ($ in Thousands)
Pension Funds Insurance Fund Total 2020 2019 2018 2020 2019 2018 2020 2019 2018Cash & Invest. $13,150,428 $13,133,900 $12,859,431 $5,687,583 $5,622,703 $5,367,071 $18,838,011 $18,756,603 $18,226,502Receivables 295,988 468,221 349,172 87,102 142,538 148,883 383,090 610,759 498,055Equip/Int Assets, net of dep/amort. 1,619 2,677 4,437 - - - 1,619 2,677 4,437Total Assets 13,448,035 13,604,798 13,213,040 5,774,685 5,765,241 5,515,954 19,222,720 19,370,039 18,728,994Total Liabilities (586,817) (670,466) (797,184) (250,019) (284,602) (350,775) (836,836) (955,068) (1,147,959)Fiduciary Net Position $12,861,218 $12,934,332 $12,415,856 $5,524,666 $5,480,639 $5,165,179 $18,385,884 $18,414,971 $17,581,035
Pension Fund ActivitiesMember contributions increased by $19.7 million. This is primarily due to an increase in covered payroll in KERS Hazardous, CERS Non-Hazardous and CERS Hazardous. Retirement contributions are calculated by applying a percentage factor to salary and are remitted by each employer on behalf of the member. Non-Hazardous Tier 1 members pay pension contributions of 5.00% of creditable compensation and Hazardous Tier 1 members contribute 8.00% of creditable compensation. Whereas Non-Hazardous Tier 2 and 3 members pay pension contributions of 6.00% of creditable compensation and Hazardous Tier 2 and 3 members contribute 9% of creditable compensation. Employer contributions increased by $115.5 million as a result of the increase in the contribution rates for CERS Non-Hazardous, CERS Hazardous as well as the increase in covered payroll for KERS Hazardous, CERS Non-Hazardous and CERS Hazardous. Total Pension Funds deductions increased by $64.1 million. The 2.90% increase was primarily driven by the normal increase in retirements across all plans. Net investment income decreased by $554.5 million. This is illustrated in the Investment Income Pension table on the next page. The Pension Funds experienced a decrease in income when compared to fiscal year 2019, due to less favorable market conditions. KRS overall returned 1.15% for the fiscal year. This outperformed the benchmark of 0.50% and under performed the actuarial assumed rate of return of 6.25% used by CERS and KERS Hazardous, and 5.25% used by KERS Non-Hazardous and SPRS.
Board Meeting - December 3, 2020 - Review and Approval of CAFR
205

22FIN
Management'sDISCUSSION & ANALYSIS
(Unaudited)Changes in Fiduciary Net PositionFor the fiscal year ending June 30, ($ in Thousands) Pension Funds Insurance Fund Total 2020 2019 2018 2020 2019 2018 2020 2019 2018Additions:Member Cont. $353,360 $333,664 $349,844 $- $- $- $353,360 $333,664 $349,844Employer Cont. 1,709,544 1,594,008 1,169,690 369,573 387,259 321,888 2,079,117 1,981,267 1,491,578Heath Ins. Cont. 11 21,332 19,849 23,142 - - 23,153 21,332 19,849Humana Gain Share - - - - 7,516 - - 7,516 7,516Pension Spiking Cont. 369 677 8,078 - - - 369 677 8,078Northern Trust Settlement - 102 827 - 21 173 - 123 1,000General Fund Appro. 1,086 76,944 87,574 - - - 1,086 76,944 87,574Employer Cessation Cont. 20 10,643 17 25 1,391 - 45 12,034 17Premiums Rec’d - - - 730 715 497 730 715 497Retired Re-emp Ins. - - - 11,482 10,498 9,837 11,482 10,498 9,837Medicare Subsidy - - - 7 9 16 7 9 16Invest. Inc. (net) 139,534 694,013 988,463 23,263 288,294 426,842 162,797 982,307 1,415,305Total Additions 2,203,924 2,731,383 2,624,342 428,222 695,703 759,253 2,632,146 3,427,086 3,383,595Deductions:Benefit payments 2,205,859 2,144,053 2,062,482 - - - 2,205,859 2,144,053 2,062,482Refunds 33,511 32,429 34,948 - - - 33,511 32,429 34,948Admin. Exp. 37,668 36,425 32,957 2,406 2,372 2,063 40,074 38,797 35,020Healthcare Costs - - - 381,789 377,871 375,918 381,789 377,871 375,918Total Deductions 2,277,038 2,212,907 2,130,387 384,195 380,243 377,981 2,661,233 2,593,150 2,508,368Increase (Decrease) in Fiduciary Net Position (73,114) 518,476 493,955 44,027 315,460 381,272 (29,087) 833,936 875,227Beginning of Period 12,934,332 12,415,856 11,921,901 5,480,639 5,165,179 4,783,907 18,414,971 17,581,035 16,705,808End of Period $12,861,218 $12,934,332 $12,415,856 $5,524,666 $5,480,639 $5,165,179 $18,385,884 $18,414,971 $17,581,035
Board Meeting - December 3, 2020 - Review and Approval of CAFR
206
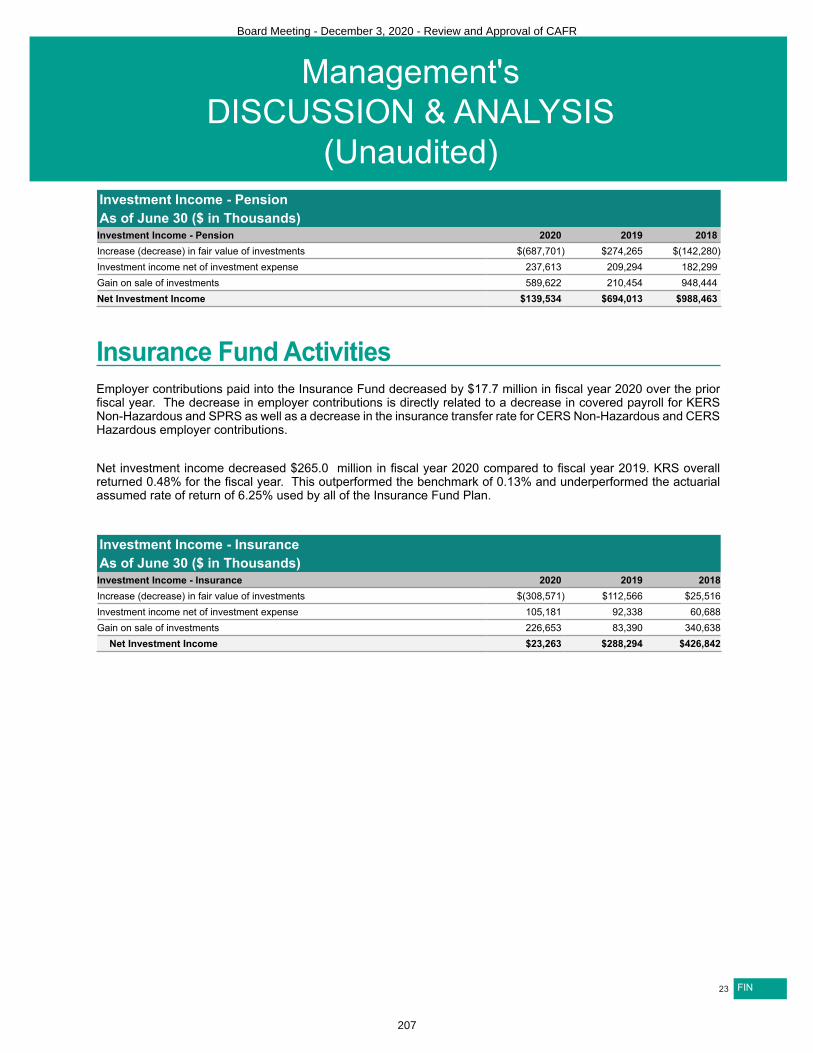
23 FIN
Management'sDISCUSSION & ANALYSIS
(Unaudited)Investment Income - PensionAs of June 30 ($ in Thousands)Investment Income - Pension 2020 2019 2018Increase (decrease) in fair value of investments $(687,701) $274,265 $(142,280)Investment income net of investment expense 237,613 209,294 182,299Gain on sale of investments 589,622 210,454 948,444Net Investment Income $139,534 $694,013 $988,463
Insurance Fund Activities Employer contributions paid into the Insurance Fund decreased by $17.7 million in fiscal year 2020 over the prior fiscal year. The decrease in employer contributions is directly related to a decrease in covered payroll for KERS Non-Hazardous and SPRS as well as a decrease in the insurance transfer rate for CERS Non-Hazardous and CERS Hazardous employer contributions. Net investment income decreased $265.0 million in fiscal year 2020 compared to fiscal year 2019. KRS overall returned 0.48% for the fiscal year. This outperformed the benchmark of 0.13% and underperformed the actuarial assumed rate of return of 6.25% used by all of the Insurance Fund Plan.
Investment Income - InsuranceAs of June 30 ($ in Thousands) Investment Income - Insurance 2020 2019 2018Increase (decrease) in fair value of investments $(308,571) $112,566 $25,516Investment income net of investment expense 105,181 92,338 60,688Gain on sale of investments 226,653 83,390 340,638
Net Investment Income $23,263 $288,294 $426,842
Board Meeting - December 3, 2020 - Review and Approval of CAFR
207

24FIN
Management'sDISCUSSION & ANALYSIS
(Unaudited)Historical TrendsAccounting standards require that the Combining Statement of Fiduciary Net Position state asset value at fair value and include only benefits and refunds due plan members and beneficiaries; accrued investment income (loss); and administrative expenses as of the reporting date. Information regarding the actuarial funding status of the Pension and Insurance Funds is provided in the Schedules of Net Pension Liability (NPL) on page ## and Net OPEB Liability on pages 93-70. The asset values stated in the Schedules of Changes in Employers’ TPL on pages 86-88 and Total OPEB Liability on pages 96-98 are the actuarial value of assets. The actuarial value of assets recognizes a portion of the difference between the fair value of assets and the expected fair value of assets based on the investment return assumption. The amount recognized each year is 20% of the difference between fair value and expected fair value. The actuarial accrued liability is calculated using the entry age normal cost funding method. This actuarial accrued liability is the measure of the cost of benefits that have been earned to date by KRS’ members, but not yet paid. The difference in value between the actuarial accrued liability and the actuarial value of assets is defined as the unfunded actuarial accrued liability. The unfunded actuarial accrued liability from the June 30, 2020, actuarial valuation in the Pension Plans increased by $2,153 million for a total unfunded amount of $25,754.7 million in fiscal year 2020, compared to an unfunded amount of $25,754.4 million in fiscal year 2019. In recent years, funding levels for the Pension Funds have decreased significantly due to a number of factors including: the change in assumptions for the 2017 valuations; investment returns that were less than the actuarially assumed rates; lower payroll growth; higher than anticipated retirement rates; and changes in the mortality assumptions for the 2019 actuarial valuation. In addition, KERS Non-Hazardous, KERS Hazardous, and SPRS were funded less than the actuarially determined rate until fiscal year 2015. The Insurance Plan’s unfunded actuarial accrued liability from the June 30, 2020, actuarial valuation for fiscal year 2020, was $3,186.4 million compared to $3,186.9 million for fiscal year 2019. This is an increase in the unfunded actuarial accrued liability of $532.5 million. The increase is primarily due to the change in the mortality assumptions. Annual required actuarially determined contributions of the employers and actual contributions made by employers and other contributing entities in relation to the required contributions, are provided in the Schedules of Employer Contributions - Pension on pages 91-92, and in the Schedules of Contributions - OPEB on pages 102-103. The difference in the annual required contributions and actual contributions made by employers and other contributing entities in the KERS and SPRS funds is attributable to the fact that the employer contribution rate set by the Kentucky General Assembly was less than the rate recommended by the KRS actuary in prior years and adopted by the Board.
Board Meeting - December 3, 2020 - Review and Approval of CAFR
208

25 FIN
Combining Statement of Fiduciary Net Position - Pension FundsAs of June 30, 2020 with Comparative Totals as of June 30, 2019 ($ in Thousands)
ASSETS
CERS CERS KERS KERS SPRS KRS Total KRS TotalNon-
Hazardous HazardousNon-
Hazardous Hazardous 2020 2019CASH AND SHORT-TERM INVESTMENTS
Cash Deposits $231 $59 $211 $52 $55 $608 $1,740Short-term Investments 468,218 166,539 226,555 50,865 23,090 935,267 623,854
Total Cash and Short-term Investments 468,449 166,598 226,766 50,917 23,145 935,875 625,594RECEIVABLES
Accounts Receivable 68,395 19,199 47,510 3,666 8,567 147,337 197,424Accounts Receivable - Investments 81,310 26,740 28,854 8,036 3,711 148,651 270,797
Total Receivables 149,705 45,939 76,364 11,702 12,278 295,988 468,221INVESTMENTS, AT FAIR VALUE
Core Fixed Income 1,222,626 420,018 547,394 127,472 70,180 2,387,690 2,315,962Public Equities 2,722,500 918,210 771,379 268,568 99,431 4,780,088 4,817,428Private Equities 597,906 201,345 180,312 54,981 17,340 1,051,884 1,180,776Specialty Credit 1,124,021 373,349 347,365 109,739 43,749 1,998,223 1,968,701Derivatives 4,270 1,449 1,180 409 158 7,466 (912)Absolute Return 99,838 31,625 32,083 8,371 3,473 175,390 218,571Real Return 405,486 137,258 95,793 36,579 14,653 689,769 1,078,889Opportunistic 179,781 59,433 52,570 16,298 6,493 314,575 117,663Real Estate 325,908 104,278 99,664 30,659 12,804 573,313 471,449
Total Investments, at Fair Value 6,682,336 2,246,965 2,127,740 653,076 268,281 11,978,398 12,168,527Securities Lending Collateral Invested 130,998 44,231 42,773 12,851 5,302 236,155 339,779CAPITAL/INTANGIBLE ASSETS
Capital Assets 1,701 153 929 91 11 2,885 2,885Intangible Assets 9,961 827 5,920 494 100 17,302 17,302Accumulated Depreciation (1,666) (150) (910) (89) (11) (2,826) (2,747)Accumulated Amortization (9,082) (772) (5,327) (452) (109) (15,742) (14,763)
Total Capital Assets 914 58 612 44 (9) 1,619 2,677Total Assets 7,432,402 2,503,791 2,474,255 728,590 308,997 13,448,035 13,604,798LIABILITIES
Accounts Payable 7,334 1,042 3,632 340 254 12,602 13,243Investment Accounts Payable 183,181 62,830 65,619 18,033 8,397 338,060 317,444Securities Lending Collateral 130,998 44,231 42,773 12,851 5,302 236,155 339,779
Total Liabilities 321,513 108,103 112,024 31,224 13,953 586,817 670,466Total Fiduciary Net Position Restricted for Pension Benefits $7,110,889 $2,395,688 $2,362,231 $697,366 $295,044 $12,861,218 $12,934,332See accompanying notes which are an integral part of these combining financial statements.Note: The displayed fair values include investable assets held by each System and its associated contributions, payables, equipment and intangible assets; unlike those found in the Investment Section, which include only those investable assets held by each System.
Board Meeting - December 3, 2020 - Review and Approval of CAFR
209

26FIN
Combining Statement of Changes In Fiduciary Net Position - Pension FundsFor the fiscal year ending June 30, 2020, with Comparative Totals as of June 30, 2019 ($ in Thousands)
CERS CERS KERS KERS SPRS KRS Total KRS TotalNon-
Hazardous HazardousNon-
Hazardous Hazardous 2020 2019
ADDITIONS Member Contributions $168,994 $63,236 $96,594 $19,769 $4,767 $353,360 $333,664Employer Contributions 475,311 168,201 948,578 59,096 58,358 1,709,544 1,594,008General Fund Appropriations - - - - 1,086 1,086 76,944Pension Spiking Contributions 105 242 (6) 19 9 369 677Northern Trust Settlement - - - - - - 102Health Insurance Contributions (HB1) 5 1 1 4 - 11 21,332Employer Cessation Contributions - - 20 - - 20 10,643
Total Contributions 644,415 231,680 1,045,187 78,888 64,220 2,064,390 2,037,370
INVESTMENT INCOME From Investing Activities Net Appreciation (Depreciation) in FV of Investments (77,193) (30,359) 14,969 (6,541) 1,045 (98,079) 484,717
Interest/Dividends 162,986 55,097 47,805 16,062 6,571 288,521 286,295Total Investing Activities Income 85,793 24,738 62,774 9,521 7,616 190,442 771,012Less: Investment Expense 29,426 9,258 8,184 2,728 1,144 50,740 52,506Less: Performance Fees 943 (89) 1,244 108 160 2,366 26,563
Net Income from Investing Activities 55,424 15,569 53,346 6,685 6,312 137,336 691,943From Securities Lending Activities
Securities Lending Income 3,185 1,071 891 304 126 5,577 10,190Less: Securities Lending Borrower Rebates 1,741 585 488 166 72 3,052 7,756Less: Securities Lending Agent Fees 186 63 53 18 7 327 364
Net Income from Securities Lending 1,258 423 350 120 47 2,198 2,070Net Investment Income 56,682 15,992 53,696 6,805 6,359 139,534 694,013Total Additions 701,097 247,672 1,098,883 85,693 70,579 2,203,924 2,731,383
DEDUCTIONS Benefit Payments 795,960 275,802 999,813 71,861 62,423 2,205,859 2,144,053Refunds 14,918 3,814 11,523 3,168 88 33,511 32,429Administrative Expenses 22,304 1,981 11,941 1,176 266 37,668 36,425
Total Deductions 833,182 281,597 1,023,277 76,205 62,777 2,277,038 2,212,907Net Increase (Decrease) in Fiduciary Net Position Restricted for Pension Benefits (132,085) (33,925) 75,606 9,488 7,802 (73,114) 518,476Total Fiduciary Net Position Restricted for Pension Benefits Beginning of Period 7,242,974 2,429,613 2,286,625 687,878 287,242 12,934,332 12,415,856End of Period $7,110,889 $2,395,688 $2,362,231 $697,366 $295,044 $12,861,218 $12,934,332See accompanying notes, which are an integral part of these combining financial statements.
Board Meeting - December 3, 2020 - Review and Approval of CAFR
210

27 FIN
Combining Statement of Fiduciary Net Position - Insurance FundAs of June 30, 2020, with Comparative Totals as of June 30, 2019 ($ In Thousands)
ASSETS
CERS CERS KERS KERS SPRS KRS Total KRS TotalNon-
Hazardous HazardousNon-
Hazardous Hazardous 2020 2019CASH AND SHORT-TERM INVESTMENTS
Cash Deposits $79 $18 $81 $19 $9 $206 $348Short-term Investments 147,287 72,138 62,643 27,241 11,135 320,444 293,315
Total Cash and Short-term Investments 147,366 72,156 62,724 27,260 11,144 320,650 293,663
RECEIVABLES Accounts Receivable 16,383 4,988 16,364 843 1,208 39,786 37,620Investment Accounts Receivable 21,221 11,149 8,904 4,366 1,676 47,316 104,918
Total Receivables 37,604 16,137 25,268 5,209 2,884 87,102 142,538
INVESTMENTS, AT FAIR VALUE Core Fixed Income 440,742 234,174 182,408 89,908 36,273 983,505 853,577Public Equities 937,802 480,717 430,591 198,753 75,830 2,123,693 2,135,606Specialty Credit 397,175 205,865 159,324 81,695 29,026 873,085 808,132Private Equities 243,617 136,615 50,110 46,030 20,863 497,235 567,531Derivatives 992 513 370 207 70 2,152 (368)Absolute Return 32,189 18,034 11,339 7,529 2,824 71,915 89,591Real Return 137,421 71,895 47,557 28,781 10,115 295,769 457,897Opportunistic 72,592 39,547 25,954 16,134 5,958 160,185 59,915Real Estate 110,334 60,466 34,586 25,435 9,716 240,537 197,044
Total Investments, at Fair Value 2,372,864 1,247,826 942,239 494,472 190,675 5,248,076 5,168,925Securities Lending Collateral Invested 53,822 28,290 21,249 11,170 4,326 118,857 160,115Total Assets 2,611,656 1,364,409 1,051,480 538,111 209,029 5,774,685 5,765,241
LIABILITIES Accounts Payable 204 62 96 7 9 378 831Investment Accounts Payable 59,579 30,925 23,637 12,194 4,449 130,784 123,656Securities Lending Collateral 53,822 28,290 21,249 11,170 4,326 118,857 160,115
Total Liabilities 113,605 59,277 44,982 23,371 8,784 250,019 284,602Total Fiduciary Net Position Restricted for OPEB $2,498,051 $1,305,132 $1,006,498 $514,740 $200,245 $5,524,666 $5,480,639See accompanying notes, which are an integral part of these combining financial statements.
Board Meeting - December 3, 2020 - Review and Approval of CAFR
211

28FIN
Combining Statement of Changes In Fiduciary Net Position - Insurance FundFor the fiscal year ending June 30, 2020, with Comparative Totals as of June 30, 2019 ($ In Thousands)
CERS CERS KERS KERS SPRS KRS Total KRS TotalNon-
Hazardous HazardousNon-
Hazardous Hazardous 2020 2019ADDITIONS
Employer Contributions $124,740 $56,739 $170,479 $4,482 $13,133 $369,573 $387,259Medicare Drug Reimbursement 4 - 2 1 - 7 9Insurance Premiums 596 (32) 183 (5) (12) 730 715Humana Gain Share Payment - - - - - - 7,516Retired Re-employed Healthcare 4,528 1,158 4,502 1,294 - 11,482 10,498Health Insurance Contributions (HB1) 12,959 2,760 6,127 1,100 196 23,142 -Northern Trust Settlement - - - - - - 21Employer Cessation Contributions - - 25 - - 25 1,391
Total Contributions 142,827 60,625 181,318 6,872 13,317 404,959 407,409INVESTMENT INCOME From Investing Activities
Net Appreciation (Depreciation) in FV of Investments (39,027) (22,761) (8,322) (9,246) (2,562) (81,918) 195,957Interest/Dividends 56,865 29,621 22,803 11,843 4,435 125,567 128,954Total Investing Activities Income 17,838 6,860 14,481 2,597 1,873 43,649 324,910Less: Investment Expense 8,717 4,531 3,871 1,940 732 19,791 24,340Less: Performance Fees 863 301 152 104 64 1,484 13,171
Net Income from Investing Activities 8,258 2,028 10,458 553 1,077 22,374 287,400From Securities Lending Activities
Securities Lending Income 1,055 554 438 225 84 2,356 3,913Less: Securities Lending Borrower Rebates 594 312 246 127 48 1,327 2,862Less: Securities Lending Agent Fees 63 33 26 13 5 140 157
Net Income from Securities Lending 398 209 166 85 31 889 894Net Investment Income 8,656 2,237 10,624 638 1,108 23,263 288,294Total Additions 151,483 62,862 191,942 7,510 14,425 428,222 695,703DEDUCTIONS
Healthcare Premiums Subsidies 135,094 81,849 125,006 19,630 14,215 375,794 371,638Administrative Expenses 903 462 847 123 71 2,406 2,372Self-Funded Healthcare Costs 3,887 228 1,724 125 22 5,986 6,224Excise Tax Insurance 6 - 3 - - 9 9
Total Deductions 139,890 82,539 127,580 19,878 14,308 384,195 380,243Net Increase (Decrease) in Fiduciary Net Position Restricted for OPEB 11,593 (19,677) 64,362 (12,368) 117 44,027 315,460Total Fiduciary Net Position Restricted for OPEB Beginning of Period 2,486,458 1,324,809 942,136 527,108 200,128 5,480,639 5,165,179End of Period $2,498,051 $1,305,132 $1,006,498 $514,740 $200,245 $5,524,666 $5,480,639See accompanying notes which are an integral part of these combining financial statements.
Board Meeting - December 3, 2020 - Review and Approval of CAFR
212

29 FIN
NOTE A. Summary of Significant Accounting PoliciesThis summary of KRS’ significant accounting policies is presented to assist in understanding KRS’ combining financial statements. The combining financial statements and notes are representations of KRS’ management, which is responsible for their integrity and objectivity. These accounting policies conform to Generally Accepted Accounting Principles (GAAP) and have been consistently applied in the preparation of the combining financial statements.
OrganizationUnder the provisions of Kentucky Revised Statute Section 61.645, the KRS Board administers KERS, CERS, and SPRS in accordance with the provisions of Kentucky Revised Statute Sections 16.555, 61.570, and 78.630. KRS’ assets are segregated by plan, where each system’s assets are used only for the payment of benefits to the members of that plan and a pro rata share of administrative costs. Under the provisions of Kentucky Revised Statute Section 61.701, the KRS Board administers the KRS Insurance Fund. The statutes provide for a single insurance fund to provide group hospital and medical benefits to retirees drawing a benefit from the three pension funds administered by KRS: (1) KERS; (2) CERS; and, (3) SPRS. The assets of the Insurance Fund are also segregated by plan. The following notes apply to the various funds administered by KRS.
Basis of AccountingKRS’ combining financial statements are prepared using the accrual basis of accounting. Plan member contributions are recognized in the period in which contributions are due. Employer contributions to the plan are recognized when due and the employer has made a formal commitment to provide the contributions. Benefits and refunds are recognized when due and payable in accordance with the terms of the plan. Premium payments are recognized when due and payable in accordance with the terms of the plan. Administrative and investment expenses are recognized when incurred. The net position represents the funds KRS has accumulated thus far to pay pension benefits for retirees, active and inactive members, and health care premiums for current and future employees.
Method Used to Value InvestmentsInvestments are reported at fair value. Fair value is the price that would be received upon selling an asset or the amount paid to transfer a liability in an orderly transaction between market participants at the measurement date. Short-term investments are reported at cost, which approximates fair value. See Investments Note D for further discussion of fair value measurements. Purchases and sales of securities are recorded on a trade-date basis. Interest income is recorded on the accrual basis. Dividends are recorded on the dividend date. Gain (loss) on investments includes KRS’ gains and losses on investments bought and sold as well as held during the fiscal year. Investment returns are recorded in all plans net of investment fees.
EstimatesThe preparation of financial statements in accordance with GAAP requires management to make estimates and assumptions that affect certain reported amounts and disclosures. Accordingly, actual results could differ from those estimates.
EquipmentEquipment is valued at historical cost and depreciation is computed utilizing the straight-line method over the estimated useful lives of the assets ranging from three to ten years. Improvements, which increase the useful life of the equipment, are capitalized. Maintenance and repairs are charged as an expense when incurred. The capitalization threshold used in fiscal years 2020 and 2019 was $3,000 (see Equipment Note J for further information).
Intangible AssetsIntangible assets, currently computer software, are valued at historical cost and amortization is computed utilizing the straight-line method over the estimated useful lives of the assets which is ten years. The capitalization threshold used in fiscal years 2020 and 2019 was $3,000 (see Intangible Assets Note K for further information).
Board Meeting - December 3, 2020 - Review and Approval of CAFR
213

30FIN
Contributions ReceivableContributions receivable consist of amounts due from employers. KRS management considers contributions receivable to be fully collectible; accordingly, no allowance for doubtful accounts is considered necessary. If amounts become uncollectible, they will be charged to operations when that determination is made. If amounts previously written off are collected, they will be credited to income when received. The Investment Accounts Receivable and Investment Accounts Payable consist of investment management earning and fee accruals, as well as all buys and sells of securities which have not closed as of the reporting date.
Payment of BenefitsBenefits are recorded when paid.
Expense AllocationKRS administrative expenses are allocated in proportion to the number of total members participating in each plan and direct investment manager expenses are allocated in proportion to the percentage of investment assets held by each plan.
Component UnitKRS is a component unit of the Commonwealth of Kentucky (the Commonwealth) for financial reporting purposes. KERS was created by the Kentucky General Assembly pursuant to the provisions of Kentucky Revised Statute 61.515. CERS was created by the Kentucky General Assembly pursuant to the provisions of Kentucky Revised Statute 78.520. SPRS was created by the Kentucky General Assembly pursuant to the provisions of Kentucky Revised Statute 16.510. The KRS Insurance Fund was created by the Kentucky General Assembly pursuant to the provisions of Kentucky Revised Statute 61.701. KRS’ administrative budget is subject to approval by the Kentucky General Assembly. Employer contribution rates for KERS and SPRS are also subject to legislative approval. Employer contribution rates for CERS are determined by the Board of KRS without further legislative review. The methods used to determine the employer rates for KRS are specified in Kentucky Revised Statute 61.565. Employee contribution rates are set by statute and may be changed only by the Kentucky General Assembly.
Recent Accounting PronouncementsIn June 2017, the Governmental Accounting Standards Board (GASB) issued Statement Number 87 Leases. The objective of this Statement is to address government lessee’s recognition of lease liabilities, intangible assets, and report amortization expense for using the leased asset, interest expense on the lease liability, and note disclosures about the lease. Another objective of this Statement is to address government lessor’s recognition of a lease receivable, deferred inflow, and report lease revenue, interest income, and note disclosures about the lease. Due to COVID-19, Statement Number 87 Leases was updated to extend the requirement of this standard to take effect for financial statements starting with the fiscal year that ends June 30, 2022. KRS is evaluating the impact of this Statement to the financial report. GASB Statement Number 84 Fiduciary Activities established the criteria for identifying fiduciary activities of all state and local governments. The Statement also clarified whether and how business type activities should report their fiduciary activities. This Statement became effective for the fiscal year beginning July 1, 2019. KRS meets the criteria as a fiduciary activity. KRS reports the plan’s assets, deferred outflows of resources, liabilities, deferred inflows of resources, and fiduciary net position in accordance with Statement Number 67 and Statement Number 74, as applicable.
Prior Year AdjustmentDuring fiscal year 2020, it was discovered that KRS’ custodian bank had misreported fees for one of the real estate managers. The misreporting was as result of a change in reporting by the manager. Until fiscal year 19, the manager reported a quarterly incentive fee that only included the incentive fee for the quarter. In fiscal year 19, the manager changed their report and began reporting the cumulative total of incentive fees. The bank nor KRS caught the change and ultimately the overstatement until late FY20. There were also a few manager fees and miscellaneous fees that had not been captured. The overstatement was corrected for the current year and as well as FY19 through a restatement. The restatement resulted in an increase of $375 thousand for the pension fund and $149 thousand
Board Meeting - December 3, 2020 - Review and Approval of CAFR
214

31 FIN
dollars for the insurance fund in manager fees. Offset with, a reduction of $7.6 million dollars for the pension fund and $3.0 million dollars for the insurance fund in incentive fees.
Board Meeting - December 3, 2020 - Review and Approval of CAFR
215

32FIN
Note B. Plan Descriptions & Contribution Information
CERS Membership CombinedAs of June 30 2020 2019Members Non-Haz Hazardous Total Non-Haz Hazardous TotalRetirees and Beneficiaries Receiving Benefits 60,877 8,431 69,308 58,933 8,000 66,933Inactive Memberships 90,673 2,924 93,597 85,300 2,702 88,002Active Plan Members 83,458 9,350 92,808 84,632 9,402 94,034
Total 235,008 20,705 255,713 228,865 20,104 248,969Number of Participating Employers 1,132 1,140
KERS Membership CombinedAs of June 30 2020 2019Members Non-Haz Hazardous Total Non-Haz Hazardous TotalRetirees and Beneficiaries Receiving Benefits 43,592 3,242 46,834 42,874 3,146 46,020Inactive Memberships 48,583 5,838 54,421 46,721 5,094 51,815Active Plan Members 31,190 4,112 35,302 33,432 3,779 37,211
Total 123,365 13,192 136,557 123,027 12,019 135,046Number of Participating Employers 335 343
SPRS MembershipAs of June 30 Members 2020 2019
Retirees and Beneficiaries Receiving Benefits 1,523 1,484Inactive Memberships 349 313Active Plan Members 798 899
Total 2,670 2,696Number of Participating Employers 1 1
Note: Each person is only counted once in the Membership by System report. A member who has both a membership account and a retired account is included in retired count. Members who have multiple membership accounts are included under the system where they most recently contributed. Members who have more than one retirement account are included in the system with the greatest service credit. If the retired accounts have equal service credit, they are counted first in SPRS, CERS Hazardous, KERS Hazardous, CERS Non- Hazardous, then KERS Non-Hazardous.
Board Meeting - December 3, 2020 - Review and Approval of CAFR
216

33 FIN
Retiree Medical Insurance CoverageAs of June 30, 2020
System SingleCouple/ Family Parent
Medicare Without
Prescription
Medicare With
PrescriptionCERS Non-Hazardous 8,751 519 210 2,183 27,786CERS Hazardous 1,731 2,816 425 116 3,911KERS Non-Hazardous 7,942 666 433 1,089 22,271KERS Hazardous 677 491 112 82 1,662SPRS 226 459 85 16 998
Totals 19,327 4,951 1,265 3,486 56,628
Retiree Medical Insurance CoverageAs of June 30, 2019
System SingleCouple/ Family Parent
Medicare Without
Prescription
Medicare With
PrescriptionCERS Non-Hazardous 8,912 530 214 2,278 26,848
CERS Hazardous 1,746 2,648 430 121 3,658
KERS Non-Hazardous 8,304 700 441 1,141 21,713
KERS Hazardous 699 493 103 83 1,584
SPRS 224 454 77 16 975
Totals 19,885 4,825 1,265 3,639 54,778Note: Medical Insurance coverage is provided based on the member’s initial participation date and length of service. Members receive either a percentage or dollar amount for insurance coverage.The counts are the number of medical plans contracted with the Department of Employee Insurance or medicare vendor and not representative of the number of persons.
Board Meeting - December 3, 2020 - Review and Approval of CAFR
217

34FIN
Pension Plan DescriptionsKRS provides retirement, disability, and death benefits to system members. Retirement benefits may be extended to beneficiaries of members under certain circumstances.
CERS - County Employees Retirement SystemThis system consists of two plans: Non-Hazardous and Hazardous. Each plan is a cost-sharing, multiple-employer defined benefit pension plan that covers all regular full-time members employed in positions of each participating county, city, and school board, and any additional eligible local agencies electing to participate in CERS.
KERS - Kentucky Employees Retirement SystemThis system consists of two plans-Non-Hazardous and Hazardous. Each plan is a cost-sharing, multiple-employer defined benefit pension plan that covers all regular full-time members employed in positions of any state department, board, or agency directed by Executive Order to participate in KERS.
SPRS - State Police Retirement SystemThis system is a single-employer defined benefit pension plan that covers all full-time state troopers employed in positions by the Kentucky State Police.
Cost of Living Adjustment (COLA) Prior to July 1, 2009, COLAs were provided annually equal to the percentage increase in the annual average of the consumer price index (CPI) for all urban consumers for the most recent calendar year, not to exceed 5% in any plan year. After July 1, 2009, the COLAs were limited to 1.50%. No COLA has been granted since July 1, 2011.
Contributions The Commonwealth is required to contribute at an actuarially determined rate for KERS and SPRS pensions. Participating employers are required to contribute at an actuarially determined rate for CERS pensions. Per Kentucky Revised Statute Sections KERS 61.565(3), CERS 78.545(33), and SPRS 16.645(18), normal contribution and past service contribution rates shall be determined by the Board on the basis of the last annual valuation preceding July 1 of a new biennium. The Board may amend contribution rates as of the first day of July of the second year of a biennium, if it is determined on the basis of a subsequent actuarial valuation that amended contribution rates are necessary to satisfy requirements determined in accordance with actuarial bases adopted by the Board. However, formal commitment to provide the contributions by the employer is made through the biennial budget for KERS and SPRS. For the fiscal years ended June 30, 2020 and 2019, participating employers contributed a percentage of each employee’s creditable compensation. The actuarially determined rates set by the Board for the fiscal year is a percentage of each employee’s creditable compensation. Administrative costs of KRS are financed through employer contributions and investment earnings. See the chart on the following page for the fiscal year employer contribution rates, including the actuarially recommended rates.
Board Meeting - December 3, 2020 - Review and Approval of CAFR
218

35 FIN
TIER 1: Tier 1 plan members who began participating prior to September 1, 2008, are required to contribute 5% (Non-Hazardous) or 8% (Hazardous) of their annual creditable compensation. These members are classified in the Tier 1 structure of benefits. Interest is paid each June 30 on members’ accounts at a rate of 2.5%. If a member terminates employment and applies to take a refund, the member is entitled to a full refund of contributions and interest.
TIER 2: Tier 2 plan members, who began participating on, or after, September 1, 2008, and before January 1, 2014, are required to contribute 6% (Non-Hazardous) or 9% (Hazardous) of their annual creditable compensation. Further, 1% of these contributions are deposited to an account created for the payment of health insurance benefits under 26 USC Section 401(h) in the Insurance Fund (see Kentucky Administrative Regulation (KAR) 105 KAR 1:420). These members are classified in the Tier 2 structure of benefits. Interest is paid each June 30 on members’ accounts at a rate of 2.5%. If a member terminates employment and applies to take a refund, the member is entitled to a full refund of contributions and interest; however, the 1% contribution to the 401(h) account is non-refundable and is forfeited.
TIER 3: Tier 3 plan members, who began participating on, or after, January 1, 2014, are required to contribute to the Cash Balance Plan. The Cash Balance Plan is known as a hybrid plan because it has characteristics of both a defined benefit plan and a defined contribution plan. Members contribute 5% (Non-Hazardous) or 8% (Hazardous) of their monthly creditable compensation which is deposited into their account, and an additional 1% which is deposited to an account created for payment of health insurance benefits under 26 USC Section 401(h) in the Insurance Fund (see 105 KAR1:420), which is not refundable. Tier 3 member accounts are also credited with an employer pay credit in the amount of 4%(Non-Hazardous or 7.5% (Hazardous) of the member’s monthly creditable compensation. The employer pay credit amount is deducted from the total employer contribution rate paid on the member’s monthly creditable compensation.
Contribution Rate Breakdown by SystemAs of June 30 Pension Insurance Combined Total
Employer Contribution
Rates
Actuarially Recommended
Rates
Employer Contribution
Rates
Actuarially Recommended
Rates
Employer Contribution
Rates
Actuarially Recommended
RatesSystem 2020 2019 2020 2019 2020 2019 2020 2019 2020 2019 2020 2019
CERS Non-Hazardous** 19.30% 16.22% 22.52% 21.84% 4.76% 5.26% 4.76% 6.21% 24.06% 21.48% 27.28% 28.05%CERS Hazardous** 30.06% 24.87% 36.98% 35.69% 9.52% 10.47% 9.52% 12.17% 39.58% 35.34% 46.50% 47.86%KERS Non-Hazardous * 41.06% 41.06% 71.03% 71.03% 8.41% 8.41% 12.40% 12.40% 49.47% 49.47% 83.43% 83.43%KERS Non-Hazardous 71.03% 71.03% 71.03% 71.03% 12.40% 12.40% 12.40% 12.40% 83.43% 83.43% 83.43% 83.43%KERS Hazardous 34.39% 34.39% 34.39% 34.39% 2.46% 2.46% 2.46% 2.46% 36.85% 36.85% 36.85% 36.85%SPRS 119.05% 119.05% 119.05% 119.05% 27.23% 27.23% 27.23% 27.23% 146.28% 146.28% 146.28% 146.28%* House Bill 265 passed during the 2018 legislative session reduced the employer contribution rate for fiscal year 2019 (same as fiscal year 2018 rate) for Regional Mental Health/Mental Retardation Boards, Local and District Health Departments, State Universities, Community Colleges and any agency eligible to voluntarily cease participating in the KERS. The July 2019 Special Session HB 1 continued the reduced KERS Non-Hazardous employer contribution rate for fiscal year 2020 (same as fiscal year 2019) for the agencies listed. The legislated reduced rates have been continued for fiscal year 2021 by the passage of House Bill 352 in the 2020 regular session. **House Bill 362 passed during the 2018 legislative session caps CERS employer contribution rate increases up to 12% per year over the prior fiscal year for the period of July 1, 2018 to June 30, 2028.
Board Meeting - December 3, 2020 - Review and Approval of CAFR
219

36FIN
Tier 3 PlanInterest is paid into the Tier 3 member’s account. The account currently earns 4% interest credit on the member’s accumulated account balance as of June 30 of the previous year. The member’s account may be credited with additional interest if the system’s five-year Geometric Average Net Investment Return (GANIR) exceeded 4%. If the member was actively employed and participating in the fiscal year, and if KRS’ GANIR for the previous five years exceeds 4%, then the member’s account will be credited with 75% of the amount of the returns over 4% on the account balance as of June 30 of the previous year (Upside Sharing Interest). It is possible that one system in KRS may get an Upside Sharing Interest, while another may not.
Upside Sharing Interest Upside Sharing Interest is credited to both the member contribution balance and Employer Pay Credit balance. Upside Sharing Interest is an additional interest credit. Member accounts automatically earn 4% interest annually. The GANIR is calculated on an individual system basis. The chart below shows the interest calculated on the members’ balances as of June 30, 2019, and credited to each member’s account on June 30, 2020.
(A-B) = C x 75% = D then B + D = Interest ($ in Thousands) A B C D
System
5-Year Geometric Average Return
Less Guarantee Rate of 4%
Upside Sharing Interest
Upside Sharing
Interest X 75% = Upside Gain
Interest Rate Earned (4% +
Upside)
Total Interest Credited
to Member Accounts
CERS Non-Hazardous 5.29% 4.00% 1.29% 0.97% 4.97% $9,203CERS Hazardous 5.53% 4.00% 1.53% 1.15% 5.15% $2,791KERS Non-Hazardous 4.76% 4.00% 0.76% 0.57% 4.57% $4,213KERS Hazardous 5.42% 4.00% 1.42% 1.07% 5.07% $1,323SPRS 5.13% 4.00% 1.13% 0.85% 4.85% $175
Board Meeting - December 3, 2020 - Review and Approval of CAFR
220

37 FIN
Insurance Plan Description KRS Insurance Fund was established to provide hospital and medical insurance for eligible members receiving benefits from CERS, KERS, and SPRS. The eligible non-Medicare retirees are covered by the Department of Employee Insurance (DEI) plans. KRS submits the premium payments to DEI. The Board contracts with Humana to provide health care benefits to the eligible Medicare retirees through a Medicare Advantage Plan. KRS submits the premium payments to DEI and Humana. The Insurance Fund pays a prescribed contribution for whole or partial payment of required premiums to purchase hospital and medical insurance. For the fiscal year ended June 30, 2020, insurance premiums withheld from benefit payments for KRS’ members were $24.5 million and $3.0 million for CERS Non-Hazardous and Hazardous, respectively; $20.9 million and $1.3 million for KERS Non-Hazardous and Hazardous, respectively; and, $292,556 for SPRS. For fiscal year 2019, insurance premiums withheld from benefit payments for KRS’ members were $24.3 million and $2.8 million for CERS Non-Hazardous and Hazardous, respectively; $21.1 million and $1.3 million for KERS Non-Hazardous and Hazardous, respectively; and, $286,479 for SPRS. The Insurance Fund pays the same proportion of hospital and medical insurance premiums for the spouse and dependents of retired hazardous members killed in the line of duty. The amount of benefit paid by the Insurance Fund is based on years of service. For members who began participating prior to July 1, 2003, a percentage of the contribution rate is paid based on years of service with a 100% of the contribution rate being paid with 20 years of service. Since the passage of House Bill 290 (2004 Kentucky General Assembly), medical insurance benefits have been calculated differently for members who began participating on, or after, July 1, 2003. Once members reach a minimum vesting period of 10 years, Non-Hazardous employees whose participation began on, or after, July 1, 2003, earn $10 per month for insurance benefits at retirement for every year of earned service without regard to a maximum dollar amount. Hazardous employees whose participation began on, or after, July 1, 2003 earn $15 per month for insurance benefits at retirement for every year of earned service without regard to a maximum dollar amount. Upon death of a Hazardous employee, the employee’s spouse receives $10 per month for insurance benefits for each year of the deceased employee’s earned Hazardous service. This dollar amount is subject to adjustment annually, which is currently 1.5%, based upon Kentucky Revised Statutes. House Bill 1 (2008 Kentucky General Assembly) changed the minimum vesting requirement for participation in the health insurance plan to 15 years for members whose participation began on or after September 1, 2008. This benefit is not protected under the inviolable contract provisions of Kentucky Revised Statutes 16.652, 61.692 and 78.852. The Kentucky General Assembly reserves the right to suspend or reduce this benefit if, in its judgment, the welfare of the Commonwealth so demands. The Insurance Fund pays 100% of the contribution rate for hospital and medical insurance premiums for the spouse and dependents of members who die as a direct result of an act in the line of duty or from a duty-related injury.
For members participating prior to July 1, 2003, years of service and respective percentages of the maximum benefit are as follows:
Portion Paid by Insurance FundAs of June 30, 2020
Years of Service Paid by Insurance
Fund (%)20+ years 100.00%15-19 years 75.00%10-14 years 50.00%4-9 years 25.00%Less than 4 years 0.00%
The amount of benefit paid by the Insurance Fund is based on years of service. For members participating on or after July 1, 2003, the dollar amounts of the benefit per year of service are as follows:
Dollar Contribution for Fiscal Year 2020 For Member participation date on or after July 1, 2003System (in Whole $)CERS Non-Hazardous $13.58CERS Hazardous $20.37KERS Non-Hazardous $13.58
Board Meeting - December 3, 2020 - Review and Approval of CAFR
221

38FIN
KERS Hazardous $20.37SPRS $20.37
Board Meeting - December 3, 2020 - Review and Approval of CAFR
222

39 FIN
Note C. Cash, Short-Term Investments & Securities Lending CollateralThe provisions of GASB Statement No. 28 Accounting and Financial Reporting for Securities Lending Transactions require that cash received as collateral on securities lending transactions and investments made with that cash be reported as assets on the financial statements. In accordance with GASB No. 28, KRS classifies certain other investments, not related to the securities lending program as short-term. Cash and short-term investments consist of the following:
Cash, Short-Term Investments, & Securities Lending CollateralAs of June 30 ($ in Thousands) CERS - Pension 2020 2019Cash $290 $873Short-Term Investments 634,757 355,251Securities Lending Collateral Invested 175,229 256,006
Total $810,276 $612,130 KERS - Pension 2020 2019Cash $263 $724Short-Term Investments 277,420 246,534Securities Lending Collateral Invested 55,624 76,308
Total $333,307 $323,566 SPRS - Pension 2020 2019Cash $55 $143Short-Term Investments 23,090 22,069Securities Lending Collateral Invested 5,302 7,465
Total $28,447 $29,677 KRS - Insurance Fund 2020 2019Cash $206 $348Short-Term Investments 320,444 293,315Securities Lending Collateral Invested 118,857 160,115
Total $439,507 $453,778
Board Meeting - December 3, 2020 - Review and Approval of CAFR
223

40FIN
Note D. InvestmentsKentucky Revised Statute 61.650 grants the responsibility for the investment of plan assets to the KRS Board. In addition, KRS 61.645 requires six (6) members of the board shall have at least ten (10) years of investment experience. The Board established Investment Committee is specifically charged with the oversight and investment of plan assets. The Investment Committee recognizes their duty to invest the funds in accordance with the “Prudent Person Rule” set forth in Kentucky Revised Statute 61.650 and manage those funds consistent with the long-term nature of KRS. The Investment Committee has adopted an Investment Policy Statement (IPS) that contains guidelines and restrictions for deposits and investments. A copy of the IPS can be found on the KRS website. By statute, all investments are to be registered and held in the name of KRS. The IPS contains the specific guidelines for the investment of Pension and Insurance assets. Additionally, the Investment Committee establishes specific investment guidelines that are summarized below and are included in the Investment Management Agreement (IMA) for each investment management firm.
Growth
Equity Investments Investments may be made in common stock; securities convertible into common stock; preferred stock of publicly traded companies on stock markets; asset class relevant Exchange Traded Funds (ETFs); or any other type of security contained in a manager’s benchmark. Each individual equity account has a comprehensive set of investment guidelines prepared, which contains a listing of permissible investments, portfolio restrictions, and standards of performance.
Specialty Credit InvestmentsThe Specialty Credit accounts may include, but are not limited to, the following types of securities and investments: non-investment grade U.S. corporate credit including both bonds and bank loans; non-investment grade non-U.S. corporate credit including bonds and bank loans; private debt; municipal bonds; non-U.S. sovereign debt; mortgages, including residential mortgage-backed securities; commercial mortgage backed securities and whole loans; asset-backed securities and emerging market debt (EMD), including both sovereign EMD and corporate EMD; and asset class relevant ETFs.
Private EquitySubject to the specific approval of the Investment Committee, Private Equity investments may be made to diversify the Private Equity portfolio. The Board may invest in, but not limited to and without limitation: venture capital and Private Equity investments. The Investment Committee believes Private Equity investments have the potential to generate substantial income, but may have a higher degree of risk. It is important to note that KERS and SPRS have not made any new investments in Private Equity since 2010 and 2016, respectively, due to the lack of resources available to invest in long-term investments as a result of the underfunding of the plans. Investments may be made in real estate mortgages on a direct basis or in the form of mortgage pool instruments.
Liquidity
Core Fixed IncomeThe Core Fixed Income accounts may include, but are not limited to, the following securities: U.S. government and agency bonds; investment grade U.S. corporate credit; investment grade non-U.S. corporate credit; mortgages, including residential mortgage-backed securities; commercial mortgage-backed securities and whole loans; asset-backed securities; and, asset class relevant ETFs.
Cash Equivalent Securities
Board Meeting - December 3, 2020 - Review and Approval of CAFR
224

41 FIN
The following Short-Term investment vehicles are considered acceptable: publicly traded investment grade corporate bonds; variable rate demand notes; government and agency bonds; mortgages; municipal bonds; Short Term Investment Funds (STIFs); money market funds or instruments (including, but not limited to, certificates of deposit, bank notes, deposit notes, bankers’ acceptances and commercial paper); and repurchase agreements relating to the above instruments. Instruments may be selected from among those having an investment grade rating at the time of purchase by at least one recognized bond rating service. In cases where the instrument has a split rating, the lower of the two ratings is used.Repurchase agreements shall be deemed to have a maturity equal to the period remaining until the date on which the repurchase of the underlying securities is scheduled to occur. Variable rate securities shall be deemed to have a maturity equal to the time left until the next interest rate reset occurs, but in no case will any security have a stated final maturity of more than three years. KRS’ fixed income managers, who utilize cash equivalent securities as an integral part of their investment strategy, are exempt from the permissible investments contained in the preceding paragraph. Permissible short-term investments for Fixed Income managers shall be included in the investment manager’s investment guidelines.
Diversifying
Real Estate/Real Return/Absolute Return/Opportunistic Investments Subject to the specific approval of the Investment Committee, investments may be made to create a diversified portfolio of alternative investments. The Board may invest in real estate or alternative investments including, but not limited to and without limitation: real return and absolute return investments. The Investment Committee believes alternative investments have the potential to generate substantial income, but may have a higher degree of risk. Investments may be made in real estate mortgages on a direct basis or in the form of mortgage pool instruments.
Investment Expenses In accordance with GASB Statement No. 67 and No. 74, Financial Reporting for Pension Plans and Other Postemployment Benefit Plans other than Pension Plans, KRS has exercised professional judgment to report investment expenses. It is not cost-beneficial to separate certain investment expenses from either the related investment income or the general administrative expenses. In fiscal year 2015, KRS changed Private Equity investment fees from a gross basis to a net basis. KRS made this decision to enhance transparency reporting. Prior to 2015, the majority of KRS’ Private Equity investment fees were netted against investment activity which is the standard used within the Private Equity sector. KRS’ net investment income has always included these fees regardless of the reporting method used. During the 2017 Regular Session of the Kentucky General Assembly, legislators passed SB 2 which requires the reporting of all investment fees and expenses. KRS staff continues to work with managers to enhance fee and expense reporting.
DerivativesDerivative instruments are financial contracts that have various effective dates and maturity dates and whose values depend on the values of one or more underlying assets, reference rates, or financial indices. Investments may be made in derivative securities or strategies which make use of derivative instruments, only if such investments do not cause the portfolio to be in any way leveraged beyond a 100% invested position. Examples of such derivatives include, but are not limited to the following securities: foreign currency forward contracts; collateralized mortgage obligations; treasury inflation protected securities (TIPS); futures; options; and swaps. Investments in derivative securities are subject to large or unanticipated changes in duration or cash flows and can be interest only, principal only, inverse floater or structured note securities. These are permitted only to the extent that they are authorized in a contract or an alternative investment offering memorandum of agreement. Investments in securities such as collateralized mortgage obligations and planned amortization class issues are allowed if, in the judgment of the investment manager, they are not expected to be subject to large or unanticipated changes in duration or cash flows. Investment managers may make use of derivative securities for defensive or hedging purposes. Any derivative security shall be sufficiently liquid so that it can be expected to be sold at, or near, its most recently quoted market price.
Board Meeting - December 3, 2020 - Review and Approval of CAFR
225

42FIN
For accounting and financial reporting purposes, all derivative instruments are considered investment derivative instruments. The derivatives have been segregated on the Combining Statement of Fiduciary Net Position for both the Pension and Insurance Funds. In accordance with GASB Statement No. 53, Accounting and Financial Reporting for Derivative Instruments, KRS provides additional disclosure regarding its derivatives. The charts included represent the derivatives by types as of June 30, 2020. The chart shows the change in fair value of each of the derivatives types as well as the current fair value and notional value. The notional value is the reference amount of the underlying asset times its current spot price. KRS holds investments in options, commitments, futures, and forward foreign exchange contracts. KRS is exposed to counterparty risk with the foreign exchange contracts that are held.
Derivative InstrumentsAs of June 30, 2020 ($ in Thousands)Pension
Derivatives (by Type) Net Appreciation (Depreciation) in Fair Value for the
Fiscal year Ended June 30, 2020 Classification Fair Value Notional
ValueFX Spots and Forwards $486 Investment $6,433 $-Futures 484 Investment 484 304,676Commits and Options (47) Investment 387 -Swaps 3 Investment 162 -Insurance
Derivatives (by Type) Net Appreciation (Depreciation) in Fair Value for the
Fiscal year Ended June 30, 2020 Classification Fair Value Notional
ValueFX Spots and Forwards $208 Investment $1,799 $-Futures 171 Investment 172 96,491Commits and Options (12) Investment 150 -Swaps 9 Investment 31 -
Derivative Instruments Subject to Counterparty Credit RiskAs of June 30, 2020
PensionCounterparty Percentage of Net Exposure S & P Ratings
Derivative Instruments - Pension FundAustralia & New Zealand Banking Group Ltd 0.69% AA-BNP Paribas SA 0.29% A+Bank of America Corp 2.77% A-The Bank of New York Mellon Corp 1.89% ABrown Brothers Harriman & Co 0.25% Canadian Imperial bank of Commerce 13.29% A+Citigroup Inc 12.51% BBB+Credit Suisse Group AG 1.16% BBB+The Goldman Sachs Group Inc 4.60% BBB+HSBS Holding PLC 6.28% A-JPMorgan Chase & Co 20.77% A-Morgan Stanley 8.84% BBB+Royal Bank of Canada 8.25% AA-Standard Chartered PLC 0.88% BBB+State Street Corp 9.73% AThe Toronto-Dominion Bank 3.15% AA-UBS Group AG 4.60% A-Westpac Banking Corp 0.05% AA-
TOTAL 100.00% Derivative Instruments Subject to Counterparty Credit RiskAs of June 30, 2020
Board Meeting - December 3, 2020 - Review and Approval of CAFR
226

43 FIN
InsuranceCounterparty Percentage of Net Exposure S & P Ratings
Derivative Instruments - Insurance FundAustralia & New Zealand Banking Group Ltd 0.77% AA-BNP Paribas SA 1.10% A+Bank of America Corp 2.95% A-The Bank of New York Mellon Corp 1.97% ABrown Brothers Harriman & Co 0.36% Canadian Imperial bank of Commerce 13.31% A+Citigroup Inc 12.60% BBB+Credit Suisse Group AG 1.23% BBB+The Goldman Sachs Group Inc 4.53% BBB+HSBS Holding PLC 4.61% A-JPMorgan Chase & Co 20.81% A-Morgan Stanley 8.71% BBB+Royal Bank of Canada 8.17% AA-Standard Chartered PLC 0.88% BBB+State Street Corp 9.66% AThe Toronto-Dominion Bank 3.35% AA-UBS Group AG 4.94% A-Westpac Banking Corp 0.05% AA-
TOTAL 100.00%
Board Meeting - December 3, 2020 - Review and Approval of CAFR
227

44FIN
Custodial Credit Risk for DepositsCustodial credit risk for deposits is the risk that may occur as a result of a financial institution’s failure, whereby KRS’ deposits may not be returned. All non-investment related bank balances are held by JP Morgan Chase and each individual account is insured by the Federal Deposit Insurance Corporation (FDIC). None of these balances were exposed to custodial credit risk as they were either insured or collateralized at required levels. Custodial Credit Risk for Deposits
As of June 30 ($ in Thousands)
2020 2019 Pension Funds at JPM Chase $2,055 $3,620 Insurance Fund at JPM Chase 210 351 Clearing Account at JPM Chase 4,121 1,420
Excess Benefit Account at JPM Chase - 11
Custodial Credit Risk for InvestmentsCustodial credit risk for investments is the risk that, in the event of the failure of the counterparty to a transaction, a government will not be able to recover the value of an investment or collateral securities that are in the possession of an outside party. As of June 30, 2020, the currencies in the chart below were uninsured and unregistered, with securities held by the counterparty or by its trust department or agent but not in KRS’ name. These funds are cash held by KRS’ Global Managers and consist of various currencies.
Custodial Credit Risk for Investments
As of June 30 ($ in Thousands) 2020 2019 Pension Funds Foreign Currency $1,545,920 $1,430,724 Insurance Fund Foreign Currency 678,433 615,931
Pension Fund Securities
Pension Funds Investment Summary
As of June 30 ($ in Thousands) Type 2020 2019Core Fixed Income $2,387,690 $2,315,962Public Equities 4,780,088 4,817,428Private Equities 1,051,884 1,180,776Specialty Credit 1,998,223 1,968,701Derivatives 7,466 (912)Absolute Return 175,390 218,571Real Return 689,769 1,078,889Opportunistic 314,575 117,663Real Estate 573,313 471,449Short-Term Investments 935,267 623,854Accounts Receivable (Payable), Net (189,409) (46,647)Total $12,724,256 $12,745,734Note: Differences due to rounding.
Board Meeting - December 3, 2020 - Review and Approval of CAFR
228

45 FIN
Insurance Fund Securities
Insurance Fund Investment SummaryAs of June 30 ($ in Thousands)Type 2020 2019Core Fixed Income $983,505 $853,577Public Equities 2,123,693 2,135,606Private Equities 497,235 567,531Specialty Credit 873,085 808,132Derivatives 2,152 (368)Absolute Return 71,915 89,591Real Return 295,769 457,897Opportunistic 160,185 59,915Real Estate 240,537 197,044Short-Term Investments 320,444 293,315Accounts Receivable (Payable), Net (83,467) (18,738)Total $5,485,053 $5,443,502Note: Differences due to rounding.
Credit Risk Debt Securities Credit risk is the risk that an issuer or other counterparty to an investment will not fulfill its obligations. The debt security portfolios are managed by the Office of Investments staff and by external investment management firms. All portfolio managers are required by the IPS to maintain diversified portfolios. Each portfolio is also required to be in compliance with risk management guidelines that are assigned to them based upon the portfolio’s specific mandate. In total, the Pension and Insurance Funds’ debt securities portfolios are managed using the following guidelines adopted by the Board:
● Bonds, notes, or other obligations issued or guaranteed by the U.S. Government, its agencies or instrumentalities are permissible investments and may be held without restrictions.
● Fixed Income investments, which include both Core Fixed Income and Specialty Credit, will be similar in type to those securities found in the KRS Fixed Income and Specialty Credit benchmarks and the characteristics of the KRS Fixed Income and Specialty Credit portfolios will be similar to the KRS Fixed Income and Specialty Credit benchmarks. The duration of the total Fixed Income and Specialty Credit portfolio shall not deviate from the KRS Fixed Income and Specialty Credit by more than 25%.
● The duration of TIPS portfolio shall not deviate from the KRS Fixed Income Index by more than 10%. ● The amount invested in the debt of a single corporation shall not exceed 5% of the total market value of
KRS’ assets. ● No public Fixed Income manager shall invest more than 5% of the market value of assets held in any
single issue Short-Term instrument with the exception of U.S. Government issued, guaranteed or agency obligations.
Board Meeting - December 3, 2020 - Review and Approval of CAFR
229

46FIN
As of June 30, 2020, the KRS Pension portfolio had $936.5 million compared to $784.5 million in the prior year in debt securities rated below BBB- and does not include unrated (NR) securities. The government agencies in which KRS invested have credit ratings of AA+ or above.
Pension Funds Debt SecuritiesAs of June 30 ($ in Thousands)Rating 2020 2019AAA $357,788 $446,486AA+ 8,434 38,581AA 40,657 44,001AA- 14,746 66,260A+ 44,240 106,908A 41,874 95,168A- 139,867 184,721BBB+ 261,626 221,198BBB 288,167 278,917BBB- 336,979 270,311BB+ 173,241 95,863BB 174,628 137,041BB- 152,747 149,966B+ 114,527 114,175B 146,837 151,094B- 93,963 89,460CCC+ 60,605 33,269CCC 13,199 10,642CCC- 1,333 247CC 2,622 1,834C 213 858D 2,624 63NR 1,000,895 889,886Total Credit Risk Debt Securities 3,471,812 3,426,949Government Agencies 45,623 5,404Government Mortgage-Backed Securities 242,167 347,456Government Issued Commercial Mortgage Backed 417,533 20,607Government Collateralized Mortgage Obligations 22,056 6,507Government Bonds 186,722 477,740Total $4,385,913 $4,284,663Note: These ratings are based on Standard & Poor’s (S&P) Global Ratings. Where S&P ratings are unavailable, equivalent Fitch and Moody’s Ratings are used as proxies.Note: Differences due to rounding.Note: Government Agencies, Government Mortgage-Backed Securities, Government Issued Commercial Mortgage Backed and Government Bonds are highly rated securities since they are backed by the US Government.Note: The NR reported above consist of pooled investment funds, cash, and derivatives, which do not carry a rating.
Board Meeting - December 3, 2020 - Review and Approval of CAFR
230

47 FIN
As of June 30, 2020, the KRS Insurance portfolio had $389.9 million compared to $256.2 million in the prior year in debt securities rated below BBB- and does not include NR securities. The government agencies in which KRS invested have credit ratings of AA+ or above.
Insurance Fund Debt SecuritiesAs of June 30 ($ in Thousands)Rating 2020 2019AAA $130,546 $32,110AA+ 5,442 6,637AA 16,106 8,965AA- 5,880 18,548A+ 17,892 34,863A 18,116 30,251A- 48,271 62,597BBB+ 107,705 75,670BBB 117,578 94,683BBB- 136,714 91,633BB+ 71,578 32,884BB 69,327 36,169BB- 61,378 48,903B+ 47,947 40,393B 65,547 54,768B- 41,749 29,395CCC+ 24,749 10,441CCC 5,005 2,565CCC- 501 18CC 511 592C - 28D 1,622 -NR 455,627 620,888Total Credit Risk Debt 1,449,791 1,333,001Government Agencies 18,074 2,054Government Mortgage-Backed Securities 93,882 7,916Government Issued Commercial Mortgage Backed 175,153 131,698Governement Collateralized Mortgage Obligations 12,509 2,517Government Bonds 107,181 184,523Total $1,856,590 $1,661,709Note: These ratings are based on Standard & Poor’s (S&P) Global Ratings. Where S&P ratings are unavailable, equivalent Fitch and Moody’s Ratings are used as proxies.Note: Differences due to rounding.Note: Government Agencies, Government Mortgage-Backed Securities, Government Issued Commercial Mortgage Backed and Government Bonds are highly rated securities since they are backed by the US Government.Note: The NR reported above consist of pooled investment funds, cash, and derivatives, which do not carry a rating.
Board Meeting - December 3, 2020 - Review and Approval of CAFR
231

48FIN
Concentration of Credit Risk Debt Securities Concentration of credit risk is the risk of loss attributed to the magnitude of an entity’s exposure in a single issuer. The total debt securities portfolio is managed using the following general guidelines adopted by the KRS Board: bonds, notes, or other obligations issued or guaranteed by the U.S. Government, its agencies, or instrumentalities are permissible investments and may be held without restrictions. Debt obligations of any single U.S. corporation is limited to a maximum of 5% of the total portfolio at market value.
Interest Rate RiskInterest rate risk is the risk that changes in interest rates will adversely affect the fair value of an investment. Duration measures the sensitivity of the market prices of fixed income securities to changes in the yield curve and can be measured using two methodologies: effective or modified duration. Effective duration uses the present value of cash flows, weighted for those cash flows as a percentage of the investment’s full price, and makes adjustments for any bond features that would retire the bonds prior to maturity. The modified duration, similar to effective duration, measures the sensitivity of the market prices to changes in the yield curve, but does not assume the securities will be called prior to maturity.
Board Meeting - December 3, 2020 - Review and Approval of CAFR
232

49 FIN
Below are the Pension Fund market values and modified durations for the combined debt securities. The modified duration in fiscal year 2020 was 2.76 compared to 3.40 in fiscal year 2019.
GASB 40 - Interest Rate Risk - Modified Duration for the Pension FundsAs of June 30 ($ in Thousands)
TYPE 2020Weighted Avg
Modified Duration 2019Weighted Avg
Modified DurationAsset Backed Securities $453,003 1.87 $284,401 1.93Financial Institutions 522,920 3.62 490,325 3.24Collateralized Mortgage Obligations 22,056 3.21 19,358 2.47Commercial Mortgage Backed Securities 417,533 4.04 296,000 4.40Corporate Bonds - Industrial 1,408,111 3.77 1,204,917 4.19Corporate Bonds - Utilities 112,013 4.28 116,072 4.28Agencies 45,623 4.05 80,187 3.89Government Bonds - Sovereign Debt 19,189 6.98 35,785 5.57Mortgage Back Securities Pass-through - Not CMO’s 242,167 3.13 349,584 4.10Local Authorities - Municipal Bonds 11,127 6.01 23,829 4.46Supranational - Multi-National Bonds 5,452 1.14 52,361 2.99Treasuries 186,722 5.08 551,059 5.60Unclassifed 10,650 6.41 Other 929,347 0.10 780,785 0.22Total $4,385,913 2.76 $4,284,663 3.40NOTE: For fiscal year 2019 Unclassified and Other were combined.
Below are the Insurance Fund market values and modified durations for the combined debt securities. The modified duration in fiscal year 2020 was 2.83 compared to 3.25 in fiscal year 2019.
GASB 40 - Interest Rate Risk - Modified Duration for the Insurance FundAs of June 30 ($ in Thousands)
TYPE 2020Weighted Avg
Modified Duration 2019Weighted Avg
Modified DurationAsset Backed Securities $180,777 1.86 $111,108 1.83Financial Institutions 218,033 3.65 178,014 3.24Collateralized Mortgage Obligations 12,509 2.88 8,670 2.62Commercial Mortgage Backed Securities 175,153 4.06 129,999 4.42Corporate Bonds - Industrial 574,169 3.72 434,898 3.98Corporate Bonds - Utilities 46,910 4.16 42,339 4.18Agencies 18,074 4.38 28,962 3.94Government Bonds - Sovereign Debt 9,581 6.43 13,342 5.73Mortgage Back Securities Pass-through - Not CMO’s 93,882 3.12 132,526 4.11Local Authorities - Municipal Bonds 4,552 6.15 9,033 4.49Supranational - Multi-National Bonds 2,318 1.15 18,500 2.98Treasuries 107,181 5.58 213,739 5.65Unclassified 4,506 6.17 Other 408,945 0.07 340,576 5.63Total $1,856,590 2.83 $1,661,706 3.25NOTE: For fiscal year 2019 Unclassified and Other were combined.
Board Meeting - December 3, 2020 - Review and Approval of CAFR
233

50FIN
Foreign Currency Risk Foreign currency risk is the risk that occurs if exchange rates adversely affect the value of a non-U.S. dollar based investment or deposit within the KRS portfolio. KRS’ currency risk exposure, or exchange rate risk, primarily resides with KRS’ Non-U.S. equity holdings, but also affects other asset classes. KRS does not have a formal policy to limit foreign currency risk; however, some individual managers are given the latitude to hedge some currency exposures. All foreign currency transactions are classified as Short-Term Investments. All gains and losses associated with these transactions are recorded in the Net Appreciation (Depreciation) in Fair Value of Investments on the combining financial statements.
GASB 40: Foreign Currency Risk for the Pension FundsAs of June 30 ($ in Thousands)
2020 2019Australian Dollar $36,170 $50,615Brazilian Real 28,474 36,207Canadian Dollar 26,478 71,115Chilean Peso - 798Columbian Peso - 5,860Czech Koruna 2,857 1Danish Krone 52,282 24,456Egyptian Pound 1,082 1,174Euro 574,694 468,834Hong Kong Dollar 138,988 85,806Hungarian Forint 6,252 -Indian Rupee 40,705 13,751Indonesian Rupiah 19,558 28,497Israeli Shekel 4,399 9,610Japanese Yen 165,382 185,616Kenyan Shilling 1,419 -Malaysian Ringgit 6,391 6,592Mexican Peso 2,343 (2,901)New Taiwan Dollar 38,537 16,070New Zealand Dollar 2,963 3,749Norwegian Krone 10,525 6,418Philippine Peso 862 9,830Polish Zloty 1,940 -Pound Sterling 162,880 207,901Romanian Leu 1,152 -Russian Ruble 19 5Singapore Dollar 5,777 19,177South African Rand 6,416 3,363South Korean Won 55,698 33,190Swedish Krona 37,414 55,282Swiss Franc 88,918 72,773Thai Bhat 11,123 11,570Turkish Lira 11,510 5,365UAE Dirham 2,712 -Total Foreign Investment Securities 1,545,920 1,430,724U.S. Dollar 11,178,336 11,315,010Total Investment Securities $12,724,256 $12,745,734Note: Differences due to rounding.
Board Meeting - December 3, 2020 - Review and Approval of CAFR
234

51 FIN
GASB 40: Foreign Currency Risk for the Insurance FundAs of June 30 ($ in Thousands) 2020 2019Australian Dollar $15,280 $21,721Brazilian Real 12,760 15,323Canadian Dollar 11,291 30,999Chilean Peso - 319Columbian Peso - 2,511Czech Koruna 1,345 -Danish Krone 23,192 10,784Egyptian Pound 375 407Euro 253,147 201,301Hong Kong Dollar 61,962 37,232Hungarian Forint 3,052 -Indian Rupee 17,657 5,826Indonesian Rupiah 8,305 12,021Israeli Shekel 1,922 4,007Japanese Yen 74,009 81,435Kenyan Shilling 643 -Malaysian Ringgit 2,862 2,689Mexican Peso 1,057 (1,207)New Taiwan Dollar 13,231 6,548New Zealand Dollar 1,330 1,522Norwegian Krone 4,526 2,863Philippine Peso 370 4,096Polish Zloty 876 -Pound Sterling 71,797 89,626Romanian Leu 520 -Russian Ruble 8 3Singapore Dollar 2,982 8,172South African Rand 2,890 1,482South Korean Won 24,909 13,794Swedish Krona 16,814 24,169Swiss Franc 39,095 31,751Thai Bhat 4,875 4,704Turkish Lira 5,361 1,833Total Foreign Investment Securities 678,443 615,931U.S. Dollar 4,806,610 4,827,571Total Investment Securities $5,485,053 $5,443,502Note: Differences due to rounding
Board Meeting - December 3, 2020 - Review and Approval of CAFR
235

52FIN
GASB 72 In accordance with GASB Statement No. 72, Fair Value Measurement and Application, KRS provides this additional disclosure regarding the fair value of its Pension and Insurance investments. KRS categorizes its fair value measurements within the fair value hierarchy established by GAAP.
KRS defined the Fair Value Hierarchy and Levels as follows:
Level 1 Quoted prices (unadjusted) in an active market for identical assets or liabilities that KRS has the ability to access at the measurement date (e.g., prices derived from NYSE, NASDAQ, Chicago Board of Trade, and Pink Sheets). Debt and equity securities classified in Level 1 of the fair value hierarchy are valued using quoted prices (unadjusted) in an active market for identical assets or liabilities that KRS has the ability to access at the measurement date.
Level 2 Inputs (other than quoted prices included within Level 1) that are observable for an asset or liability, either directly or indirectly. These inputs can include matrix pricing, market corroborated pricing and inputs such as yield curves and indices.
Level 3 Unobservable inputs for an asset or liability, which generally results in a government using the best information available.
Net Asset Value (NAV) The remaining investments not categorized under the fair value hierarchy are shown at net asset value (NAV). These are investments in non-governmental entities for which a readily determinable fair value is not available, such as member units or an ownership interest in partners’ capital to which a proportionate share of net assets is attributed.
Board Meeting - December 3, 2020 - Review and Approval of CAFR
236

53 FIN
GASB 72 Pension FundsAs of June 30, 2020 ($ in Thousands)
Asset Type Fair ValueLevel
1 2 3Public Equity Emerging Markets $265,805 $263,287 $- $2,518US Equity 2,426,639 2,412,440 - 14,199Non-US Equity 2,124,988 1,317,906 - 807,082Total Public Equity 4,817,432 3,993,633 - 823,799Core Fixed Income Agencies 7,385 - 7,385 -Asset-Backed 318,689 - 318,689 -Bank & Finance 604,118 975 353,886 249,257Cash & Cash Equivalent 609,380 - 34,644 574,736Collateralized Mortgage 883 - 883 -Commercial Mortgage 99,961 - 99,961 -Healthcare 92,225 - 92,225 -Insurance 17,967 - 17,967 -Municipals 5,227 - 5,227 -Sovereign Debt 59,427 - 59,427 -US Corporate 1,852,344 9,594 1,841,065 1,685US Government 507,603 252,350 255,253 -Total Fixed Income 4,175,209 262,919 3,086,612 825,678Derivatives Futures 484 484 - -Options 387 - 387 -Swaps 162 - 162 -Total Derivatives 1,033 484 549 -Other Real Estate 158,010 - - 158,010Real Return 529,422 373,128 156,016 278Total Other 687,432 373,128 156,016 158,288Total Investments at Fair Value 9,681,106 4,630,163 3,243,177 1,807,765Investments Measured at NAV Absolute Return 175,389 - - 175,389Specialty Credit 777,177 - - 777,177Opportunistic 314,576 - - 314,576Private Equity 1,035,383 211 - 1,035,172Real Estate 566,014 - - 566,014Real Return 195,748 - - 195,748Total Investments Measured at NAV 3,064,287 211 - 3,064,076Cash and Accruals (21,137) Total Investments $12,724,256 $4,630,374 $3,243,177 $4,871,840Note: The fair value hierarchies do not reflect cash and accruals thus totals differ from the Investment Summaries.Note: Cash Equivalents include publicly traded investment grade corporate bonds; variable rate demand notes; government and agency bonds; mortgages; municipal bonds; Short Term Investment Funds (STIF); money market funds or instruments (including, but not limited to, certificates of deposit, bank notes, deposit notes, bankers’ acceptances and commercial paper); and repurchase agreements.
Board Meeting - December 3, 2020 - Review and Approval of CAFR
237

54FIN
The investments measured at net asset value (NAV) are presented in the chart below: GASB 72 Pension Funds - Investments at Net Asset Value (NAV) As of June 30, 2020 ($ in Thousands)
Asset Type Fair ValueUnfunded
CommitmentsRedemption
FrequencyRedemption
Notice Period Absolute Return (1) $175,389 $- Daily - Quarterly 2 days - 60 Days Specialty Credit (2) 777,177 588,058 Daily - Quarterly 90 Days Opportunistic (3) 314,576 - Annually Real Estate (4) 566,014 259,775 Real Return (5) 195,748 32,422 Daily 30 - 60 Days Private Equity (6) 1,035,383 184,147 Total Investments Measured at NAV $3,064,287 $1,064,402 (1) This type includes 11 hedge fund managers that invest in multiple strategies to diversify risks and reduce volatility. These managers are intended to provide both favorable risk-adjusted returns and provide moderate liquidity for the plans. (2) This type includes 13 high yield specialty credit managers with multiple strategies. These managers may invest in U.S. or non-U.S. investment grade corporate credit, U.S. or non U.S. non-investment grade corporate credit, including both bonds and bank loans, municipal bonds, non-U.S. sovereign debt, mortgages including residential mortgage backed securities, commercial mortgage backed securities and whole loans, asset-backed securities and emerging market debt. (3) This type includes one opportunistic manager. This strategy is to provide correlation with inflation over time and may include liquid strategies such as inflation swaps, diversified inflation hedging mutual funds, or nominal bonds backed by inflation sensitive assets. This strategy may also include other illiquid strategies such as private equity inflation sensitive companies, hard asset-backed private credit, and structured inflation-linked products.
Ask for clarification
(4) This type includes 12 real estate funds that invest primarily in U.S. commercial real estate; however, there is one manager who invests solely in non-U.S. commercial real estate. The fair value of the investments have been determined using the NAV per share of the Plan’s ownership interest and in the partners’ capital. Distributions from each fund will be received as the underlying investments of the funds are liquidated. It is expected that the funds will be liquidated over the next 7 to 10 years. Because it is not probable that any individual investment will be sold, the fair value of each individual investment has been determined using the NAV per share of the Plan’s ownership interest in the partners’ capital. Due to restrictions in the contract, redemptions are not likely until the assets of the fund are liquidated. (5) This type includes 11 real return managers that investment in multiple strategies such as infrastructure, real estate, commodities, and natural resources. These managers should provide both favorable risk adjustment returns and help with the hedging of inflation for the broader plan.
Ask for clarification
(6) This type includes 37 managers with multiple strategies. These investments cannot be redeemed with the funds. Instead, the nature of the investments in this type is that distributions are received through the liquidation of the underlying assets of the fund. It is expected that each fund will remain invested for a period of 5 to 10 years. It is probable that the all of the investments in this type will be sold at an amount different from the NAV per share of the Plan’s ownership interest in partners’ capital. Therefore, the fair values of the investment in this asset class have been determined using recent observable transaction information.
Board Meeting - December 3, 2020 - Review and Approval of CAFR
238

55 FIN
GASB 72 Insurance FundAs of June 30, 2020 ($ in Thousands)
Asset Type Fair ValueLevel
1 2 3Public Equity Emerging Markets $118,091 $116,691 $- $1,400US Equity 1,079,569 1,073,266 - 6,303Non-US Equity 943,906 580,011 - 363,895Total Public Equity 2,141,566 1,769,968 - 371,598Core Fixed Income Agencies 3,094 - 3,094 -
Asset-Backed 128,539 - 128,539 -Bank & Finance 265,114 408 137,029 127,677Cash & Cash Equivalent 206,639 - 11,523 195,116Collateralized Mortgage 301 - 301 -
Commercial Mortgage 34,959 - 34,959 -Healthcare 37,809 - 37,809 -Insurance 8,194 - 8,194 -Municipals 2,138 - 2,138 -Sovereign Debt 26,213 - 26,213 -US Corporate 753,620 4,121 748,740 759US Government 195,319 96,936 98,383 -Total Fixed Income 1,661,939 101,465 1,236,922 323,552Derivatives Futures 171 171 - -Options 150 - 150 -Swaps 31 - 31 -Total Derivatives 352 171 181 -Other Real Estate 75,177 - - 75,177Real Return 224,620 156,539 67,992 89Total Other 299,797 156,539 67,992 75,266Total investments by fair value level 4,103,654 2,028,143 1,305,095 770,416Investments Measured at NAV Absolute Return 71,915 - - 71,915Specialty Credit 334,424 - - 334,424Opportunistic 160,184 - - 160,184Private Equity 488,985 184 - 488,801Real Estate 240,536 - - 240,536Real Return 87,507 - - 87,507Total Investments Measured at NAV 1,383,551 184 - 1,383,367Cash & Accruals (2,152) Total Investments $5,485,053 $2,028,327 $1,305,095 $2,153,783Note: The fair value hierarchies do not reflect cash and accruals thus totals differ from the Investment Summaries.Note: Cash Equivalents include publicly traded investment grade corporate bonds; variable rate demand notes; government and agency bonds; mortgages; municipal bonds; STIFs; money market funds or instruments (including, but not limited to, certificates of deposit, bank notes, deposit notes, bankers’ acceptances and commercial paper); and repurchase agreements.
Board Meeting - December 3, 2020 - Review and Approval of CAFR
239

56FIN
The investments measured at net asset value (NAV) are presented in the chart below: GASB 72 Insurance Fund - Investments at Net Asset Value (NAV)As of June 30, 2020 ($ in Thousands)
Asset Type Fair ValueUnfunded
CommitmentsRedemption
FrequencyRedemption Notice
PeriodAbsolute Return (1) $71,915 $- Daily - Quarterly 2 days - 60 DaysSpecialty Credit (2) 334,424 258,510 Daily - Quarterly 90 Days
Opportunistic (3) 160,184 - Annually Real Estate (4) 240,536 109,821 Real Return (5) 87,507 12,969 Daily 30 - 60 DaysPrivate Equity (6) 488,985 89,198 Total Investments Measured at NAV $1,383,551 $470,498 (1) This type includes 11 hedge fund managers that invest in multiple strategies to diversify risks and reduce volatility. These managers provide both favorable risk-adjusted returns and provide moderate liquidity for the plans.(2) This type includes 13 high yield specialty credit managers with multiple strategies. These managers may invest in U.S. or non-U.S. investment grade corporate credit, U.S. or non U.S. non-investment grade corporate credit, including both bonds and bank loans, municipal bonds, non-U.S. sovereign debt, mortgages including residential mortgage backed securities, commercial mortgage backed securities and whole loans, asset-backed securities and emerging market debt.(3) This type includes one opportunistic manager. This strategy is to provide correlation with inflation over time and may include liquid strategies such as inflation swaps, diversified inflation hedging mutual funds, or nominal bonds backed by inflation sensitive assets. This strategy may also include other illiquid strategies such as private equity inflation sensitive companies, hard asset-backed private credit, and structured inflation-linked products.(4) This type includes 12 real estate funds that invest primarily in U.S. commercial real estate; however, there is one manager who invests solely in non-U.S. commercial real estate. The fair value of the investments have been determined using the NAV per share of the Plan’s ownership interest and in the partners’ capital. Distributions from each fund will be received as the underlying investments of the funds are liquidated. It is expected that the funds will be liquidated over the next 7 to 10 years. Because it is not probable that any individual investment will be sold, the fair value of each individual investment has been determined using the NAV per share of the Plan’s ownership interest in the partners’ capital. Due to restrictions in the contract, redemptions are not likely until the assets of the fund are liquidated.(5) This type includes 11 real return managers that investment in multiple strategies such as infrastructure, real estate, commodities, and natural resources. These managers should provide both favorable risk adjustment returns and help with the hedging of inflation for the broader plan.(6) This type includes 41 managers with multiple strategies. These investments cannot be redeemed with the funds. Instead, the nature of the investments in this type is that distributions are received through the liquidation of the underlying assets of the fund. It is expected that each fund will remain invested for a period of 5 to 10 years. It is probable that the all of the investments in this type will be sold at an amount different from the NAV per share of the Plan’s ownership interest in partners’ capital. Therefore, the fair values of the investment in this asset class have been determined using recent observable transaction information.
Board Meeting - December 3, 2020 - Review and Approval of CAFR
240

57 FIN
Money-Weighted Rates of ReturnIn accordance with GASB Statement No. 67, Financial Reporting for Pension Plans, and GASB Statement No. 74, Financial Reporting for Post-Employment Benefit Plans Other than Pension Plans, KRS provides this additional disclosure regarding its money-weighted rate of return for the Pension and Insurance Funds for the periods of June 30, 2019 through June 30, 2020. The money-weighted rate of return is a method of calculating period-by-period returns on the Pension and Insurance Funds’ investments that adjusts for the changing amounts actually invested. For the purposes of this Statement, money-weighted rate of return is calculated as the internal rate of return on the Pension and Insurance Funds’ investments, net of the Pension and Insurance Funds’ investment expenses, then adjusted for the changing amounts actually invested.
Money-Weighted Rates of Return As of June 30
CERS CERS KERS KERS SPRS
Non-Hazardous Hazardous Non-Hazardous Hazardous Pension Funds
2020 0.84% 0.71% 2.35% 0.96% 2.21%2019 5.78% 5.80% 5.73% 5.68% 5.71%
CERS CERS KERS KERS SPRS
Non-Hazardous Hazardous Non-Hazardous Hazardous Insurance Fund
2020 0.36% 0.27% 0.98% 0.21% 0.64%2019 5.73% 5.81% 4.95% 5.61% 5.74%
Board Meeting - December 3, 2020 - Review and Approval of CAFR
241

58FIN
Note E. Securities Lending TransactionsKentucky Revised Statutes Sections 61.650 and 386.020(2) permit the Pension and Insurance Funds to lend their securities to broker-dealers and other entities. The borrowers of the securities agree to transfer to the Funds’ custodial banks either cash collateral or other securities with an initial fair value of 102% or 105% of the value of the borrowed securities. The borrowers of the securities simultaneously agree to return the borrowed securities in exchange for the collateral at a later date. The types of securities lent include U.S. Treasuries, U.S. Agencies, U.S. Corporate Bonds, U.S. Equities, Global Fixed Income Securities, and Global Equities Securities. The IPS does not address any restrictions on the amount of loans that can be made. As of June 30, 2020, KRS had no credit risk exposure to borrowers because the collateral amounts received exceeded the amounts out on loan. The contracts with the custodial banks require them to indemnify KRS if the borrowers fail to return the securities and one or both of the custodial banks have failed to live up to their contractual responsibilities relating to the lending of securities. All securities loans can be terminated on demand by either party to the transaction. BNY Mellon invests cash collateral as permitted by state statute and Board policy. The agent of the Funds cannot pledge or sell collateral securities received unless the borrower defaults. KRS maintains a conservative approach to investing the cash collateral with BNY Mellon, emphasizing capital preservation, liquidity, and credit quality. As of June 30, 2020, the cash collateral received for the securities on loan for the Pension and Insurance Funds was $236.2 million and $118.9 million, respectively. The total collateral received included both cash and non-cash totaling $367.3 million and $183.7 million, respectively. The fair value of the underlying securities on loan was $356.9 million and $178.5 million, respectively.
Note F. Risk of LossKRS is exposed to various risks of loss related to torts; thefts of, damage to, and destruction of assets; errors and omissions; injuries to employees; and natural disasters. Under the provisions of the Kentucky Revised Statutes, the Kentucky Claims Commission is vested with full power and authority to investigate, hear proof, and compensate persons for damages sustained to either person or property as a result of negligence of the agency or any of its employees. Awards are limited to $250,000 for a single claim and $400,000 in aggregate per occurrence. Awards and a pro rata share of the operating cost of the Kentucky Claims Commission are paid from the fund of the agency having a claim or claims before the Kentucky Claims Commission. During the period of July 1, 2018 to May 26, 2019, claims against the KRS Board, or any of its staff as a result of an actual or alleged breach of fiduciary duty, were insured with two commercial insurance policies. Hallmark Specialty provides coverage of up to $2.5 million and ANV Global Services provides coverage up to $2.5 million for a total coverage of $5 million, with a deductible/retention of $250,000 for each claim (the retention increases to $500,000 from $250,000 for any claims arising out of the (1) KERS plans and (2) any investment in any alternative investment - including any private equity funds or hedge funds for all plans). Defense costs incurred in defending such claims will be paid by the insurance company. However, the total defense cost and claims paid shall not exceed the total aggregate coverage of the policies. The aggregate limit for all loss is $5 million. The Voluntary Compliance Program (cyber privacy violations) sub-limit is $200,000, and the Health Insurance Portability and Accountability Act (HIPAA) and Patient Protection and Affordable Care Act (PPACA) fines and penalties sub-limit is $1.5 million. Claims against the KRS Board, or any of its staff as a result of an actual or alleged breach of fiduciary duty, are self-insured effective May 26, 2019. Claims for job-related illnesses or injuries to employees are insured by the state’s self-insured workers’ compensation program. Payments approved by the program are not subject to maximum limitations. All medical expenses related to a work injury or illness are paid based upon appropriate statutory and regulatory reductions, and up to 66.67% of wages for temporary disability. Each agency pays premiums based on fund reserves and payroll. Settlements did not exceed insurance coverage in any of the past three fiscal years. Thus, no secondary insurance had to be utilized. There were no claims which were appealed to the Kentucky Workers’ Compensation Board.
Board Meeting - December 3, 2020 - Review and Approval of CAFR
242

59 FIN
Note G. ContingenciesIn the normal course of business, KRS is involved in litigation concerning the right of participants, or their beneficiaries, to receive benefits. KRS does not anticipate any material losses as a result of the contingent liabilities.
Note H. Defined Benefit Pension PlanKRS is an agency within the Executive branch of the Commonwealth of Kentucky. All regular full-time employees in non-hazardous positions of any Kentucky State Department, Board, or Agency are directed by Executive Order (EO) to participate in KRS. These employees participate in KERS Non-Hazardous, a cost-sharing, multiple-employer defined pension plan that provides retirement, disability, and death benefits to plan members. Plan benefits are extended to beneficiaries of plan members under certain circumstances. Tier 1 Plan members contributed 5% of creditable compensation for the fiscal years ended June 30, 2020, 2019, and 2018. Tier 2 and Tier 3 Plan members contributed 6% of creditable compensation for the fiscal years ended June 30, 2020, 2019, and 2018. The chart below includes the covered payroll and contribution amounts for the employees of KRS:
Payroll and Contributions as of June 30 ($ in Thousands) 2020 2019 2018 Covered Payroll $13,837 $13,311 $13,287 Required Employer Contributions 11,545 11,097 6,570 Employer Percentage Contributed 100% 100% 100%
Note I. Income Tax StatusThe Internal Revenue Service (IRS) has ruled that KRS qualifies under Section 401(a) of the Internal Revenue Code so is, generally, not subject to tax. KRS is subject to income tax on any unrelated business income (UBI).
Note J. Equipment
Equipment as of June 30 ($ in Thousands) 2020 2019 Equipment, cost $2,885 $2,885 Less Accumulated Depreciation (2,826) (2,747) Equipment, net $59 $138 Accumulated depreciation rose to $2.8 million in fiscal year 2020, an increase of $79 thousand over fiscal year 2019
Note K. Intangible AssetsThe provisions of GASB Statement No. 51, Accounting and Financial Reporting for Intangible Assets, requires that intangible assets be recognized in the Combining Statement of Plan Net Position only if they are considered identifiable. In accordance with the Statement, KRS has capitalized software costs as indicated below for the Strategic Technology Advancements for the Retirement of Tomorrow (START) project.
Software Expenses as of June 30 ($ in Thousands)
Board Meeting - December 3, 2020 - Review and Approval of CAFR
243

60FIN
2020 2019 Software, Cost $17,302 $17,302 Less Accumulated Amortization (15,742) (14,763) Intangible Assets, Net $1,560 $2,539
Accumulated amortization rose to $15.7 million in fiscal year 2020, an increase of $978 thousand over fiscal year 2019.
Board Meeting - December 3, 2020 - Review and Approval of CAFR
244

61 FIN
Note L. Actuarial ValuationKRS’ actuary, Gabriel, Roeder, Smith & Co. (GRS), completed the actuarial valuation of the Pension and Insurance plans for the period ended June 30, 2020. The last experience study for the five-year period ended June 30, 2018 was completed prior to the June 2019 valuation. At that time, the actuary made changes to the actuarial assumptions used in the annual valuation. For example, one of the more significant changes was to the mortality assumption rate, which presumes improvement in life expectancy. The 2020 valuation utilized the same assumptions. The following two charts show the economic assumptions and target asset allocations for the Pension Funds and Insurance Fund.
Economic Assumptions - Pension as of June 30
CERS CERS KERS KERS SPRSNon-
Hazardous HazardousNon-
Hazardous Hazardous 2020 2019 2020 2019 2020 2019 2020 2019 2020 2019Assumed Investment Return 6.25% 6.25% 6.25% 6.25% 5.25% 5.25% 6.25% 6.25% 5.25% 5.25%Inflation Factor 2.30% 2.30% 2.30% 2.30% 2.30% 2.30% 2.30% 2.30% 2.30% 2.30%Payroll Growth 2.00% 2.00% 2.00% 2.00% 0.00% 0.00% 0.00% 0.00% 0.00% 0.00%
Economic Assumptions - Insurance as of June 30
CERS CERS KERS KERS SPRSNon-
Hazardous HazardousNon-
Hazardous Hazardous 2020 2019 2020 2019 2020 2019 2020 2019 2020 2019Assumed Investment Return 6.25% 6.25% 6.25% 6.25% 6.25% 6.25% 6.25% 6.25% 6.25% 6.25%Inflation Factor 2.30% 2.30% 2.30% 2.30% 2.30% 2.30% 2.30% 2.30% 2.30% 2.30%Payroll Growth 2.00% 2.00% 2.00% 2.00% 0.00% 0.00% 0.00% 0.00% 0.00% 0.00%
Board Meeting - December 3, 2020 - Review and Approval of CAFR
245

62FIN
Target Asset AllocationThe long-term expected rates of return were determined by using a building block method in which best estimated ranges of expected future real rates of return were developed for each asset class. The ranges were combined by weighting the expected future real rate of return by the target asset allocation percentage. The target allocation and best estimates of arithmetic real rate of return for each major asset class are summarized in the tables below.
Target Asset Allocation - PensionAs of June 30, 2020Allocations Apply Only to KERS and SPRS in Pension Funds
Asset ClassTarget
Allocation
Long-Term Expected Real Rate of Return
Growth 53.50% US Equity 15.75% 4.50%Non-US Equity 15.75% 5.25%Private Equity 7.00% 5.15%Specialty Credit/High Yield 15.00% 3.90%
Liquidity 23.50% Core Bonds 20.50% (0.25)%Cash 3.00% (0.75)%
Diversifying Strategies 23.00% Real Estate 5.00% 5.30%Opportunistic/Absolute Return 3.00% 2.25%Real Return 15.00% 3.95%
Total 100.00% 3.33%
Target Asset Allocation - Pension and InsuranceAs of June 30, 2020Allocations Apply to CERS, CERS-Haz, and KERS-Haz in Pension Funds and All Plans are included in the Insurance Fund
Asset ClassTarget
Allocation
Long-Term Expected Real Rate of Return
Growth 62.50% US Equity 18.75% 4.50%Non-US Equity 18.75% 5.25%Private Equity 10.00% 6.65%Specialty Credit/High Yield 15.00% 3.90%
Liquidity 14.50% Core Bonds 13.50% (0.25)%Cash 1.00% (0.75)%
Diversifying Strategies 23.00% Real Estate 5.00% 5.30%Opportunistic 3.00% 2.25%Real Return 15.00% 3.95%
Total 100.00% 3.96%Long Term Inflation Expectation is 2.30%
NOTE: Minor deviations are expected between the actuarial assumed rate of return and the expected rate of return reported in the above charts. The actuarial assumed rates of return are based on a review of economic assumptions completed periodically as warranted but not longer than every 5 years; whereas, the expected rate of return is calculated annually for GASB purposes by taking KRS’ current asset allocation and applying the most recent long term market expectations for each asset class as of June 30.
Board Meeting - December 3, 2020 - Review and Approval of CAFR
246

63 FIN
Note M. GASB 67 and GASB 74 ValuationsThe following details actuarial information and assumptions utilized in determining the unfunded (overfunded) actuarial accrued liabilities for both Pension and Insurance Funds. Please note that calculations for TPL, net fiduciary position, NPL, total OPEB liability, net OPEB fiduciary position, and net OPEB liability reported in the Plans’ Required Supplementary Information (RSI) on pages ##-104 are based on June 30, 2019, actuarial valuations, rolled forward to June 30, 2020. The prior year valuations are used as the basis for the roll forward method and are applied to complete the current year pension and OPEB valuations as of the measurement date, June 30, 2020, in accordance with GASB Statement No.67, paragraph 37, and GASB Statement No. 74, paragraph 41.
GASB 67Basis of CalculationsGRS completed reports by plan in compliance with GASB Statement No. 67 Financial Reporting for Pension Plans. The TPL, NPL, and sensitivity information are based on an actuarial valuation date of June 30, 2019. The TPL was rolled forward from the valuation date to the Plans’ fiscal year ended June 30, 2020, using generally accepted actuarial principles. Information disclosed for years prior to June 30, 2017, were prepared by KRS’ prior actuary. Separate reports will be provided at a later date with additional accounting information determined in accordance with GASB Statement No. 68, Accounting and Financial Reporting for Pensions.
AssumptionsThere have been no changes in actuarial assumptions since June 30, 2019. The actuarially determined contribution rates effective for the fiscal year ended June 30, 2020, that are documented in the schedules were calculated as of June 30, 2017, for KERS and SPRS plans and June 30, 2018, for CERS plans. Based on the June 30, 2019, actuarial valuation report, the actuarial methods and assumptions used to calculate these contributions rates are:
● Investment Return - 6.25% for KERS Hazardous, CERS Non-Hazardous, and CERS Hazardous, 5.25% for KERS Non-Hazardous and SPRS.
● Inflation - 2.30% for all plans. ● Salary Increases - 3.30% to 11.55% for CERS Non-Hazardous, 3.05% to 18.55% for CERS Hazardous,
3.55% to 15.55% for KERS Non-Hazardous, 3.55% to 19.55% for KERS Hazardous, and 3.05% to 15.55% for SPRS, varies by service.
● Payroll Growth - 2% for CERS Non-Hazardous and Hazardous, 0% for KERS Non-Hazardous, Hazardous, and SPRS.
● Mortality - RP-2000 Combined Mortality Table projected to 2013 with Scale BB (set-back 1 year for females)
Plan ProvisionsHouse Bill 1 passed during the Special Legislative Session allowed certain agencies in the KERS Non-Hazardous plan to elect to cease participating in KRS as of June 30, 2020 under different provisions than were previously established. Senate Bill 249 passed during the 2020 Legislative Session delayed the effective date of cessation for these provisions to June 30, 2021. Since each employer’s election is unknown at this time, GRS did not make any adjustment to the TPL to reflect this legislation.Senate Bill 249 also changed the funding period for the amortization of the unfunded liability to 30 years as of June 30, 2021. Gains and losses incurring in future years will be amortized over separate, 20-year amortization bases. This change does not impact the calculation of TPL and only impacts the calculation of the contribution rates that would be payable starting July 1, 2020.Additionally, House Bill 271 passed during the 2020 Legislative Session removed provisions that reduce the monthly payment to a surviving spouse of a member whose death was due to a duty-related injury upon remarriage of the spouse. It also increased benefits for a very small number of beneficiaries. This did not have a material (or measurable) impact on the liability of the plans and therefore, we did not make any adjustment to the TPL to reflect this legislation. There were no other material plan provision changes and it is our opinion that these procedures are reasonable and appropriate, and comply with applicable requirements under GASB Statement No. 67.
Board Meeting - December 3, 2020 - Review and Approval of CAFR
247

64FIN
Discount Rate The following single discount rates were used to measure the TPL as of June 30, 2019. CERS Non-Hazardous 6.25% CERS Hazardous 6.25% KERS Non-Hazardous 5.25% KERS Hazardous 6.25% SPRS 5.25%
These single discount rates were based on the expected rate of return on pension investments for each plan. Based on the stated assumptions and the projection of cash flows as of each fiscal year ending, the Pension Plans’ fiduciary net position and future contributions were projected to be sufficient to finance all the future benefit payments of the current plan members. Therefore, the long-term expected rates of return on Pension Plans’ investments were applied to all periods of projected benefit payments to determine the TPL for each plan. The projections of cash flows used to determine the single discount rate must include an assumption regarding actual employer contributions made each future year. Except where noted, the future contributions are projected assuming that each participating employer in KRS contributes the actuarially determined employer contribution rate each future year calculated in accordance with the current funding policy, as most recently revised by Senate Bill 249, passed during the 2020 Legislative Session. This includes the phase-in provisions from House Bill 362 (passed in 2020) which kept CERS contributions level for fiscal year ending 2021.If there is a pattern of legislation that has a resulting effect of employers making contributions less than the actuarially determined rate, it may be required to project contributions that are reflective of recent actual contribution efforts regardless of the stated funding policy (as required by paragraph 42 of GASB Statement No. 67). Legislation has been enacted three times (for FY18/19, FY 19/20, and FY 20/21) that allowed certain employers (referred to as “Quasi” agencies) in the KERS Non-Hazardous fund to contribute 41.06% of pay into the retirement fund, which is significantly less than the actuarially determined contribution rate. We believe this constitutes a pattern and as such, the projection for the KERS Non-Hazardous Fund assumes these Quasi agencies contribute no more than 41.06% of pay throughout the entire projection.
401(h) SubaccountBased on guidance issued by GASB in connection with GASB Statement No. 74, the 1% member contributions for Tier 2 and Tier 3 members to a 401(h) subaccount is considered as an Other Post Employment Benefit (OPEB) asset. As a result, the reported pension fiduciary net positions as of June 30, 2017 and later are net of the 401(h) asset balance. Beginning in FY2020 the 401(h) contributions are being deposited directly into the insurance funds. Any 401(h) contributions received prior to FY2020 and deposited into the pension fund will be used to pay Tier 3 retiree insurance premiums until those funds have been exhausted.
Additional DisclosuresThe reports are based upon information furnished to GRS by the KRS, which includes benefit provisions, membership information, and financial data. GRS did not audit this data and information, but did apply a number of tests and concluded that it was reasonable and consistent. GRS is not responsible for the accuracy or completeness of the information provided by KRS. Please see the “Actuarial Valuation Report as of June 30, 2019”, for additional discussion of the nature of the actuarial calculations and more information related to participant data, economic and demographic assumptions, and benefit provisions. These reports should be considered together as a complete report for KRS’ fiscal year ending June 30, 2020.
GASB 74GRS completed reports by plan in compliance with GASB Statement No. 74, Financial Reporting for Postemployment Benefit Plans Other than Pension Plans for the fiscal year ended June 30, 2020. Separate reports will be provided at a later date with additional accounting information determined in accordance with GASB Statement No. 75, Accounting and Financial Reporting for Postemployment Benefits Other Than Pensions.
Board Meeting - December 3, 2020 - Review and Approval of CAFR
248

65 FIN
Basis of CalculationsThe total OPEB liability, net OPEB liability (NOL), and sensitivity information are based on an actuarial valuation date of June 30, 2019. The total OPEB liability was rolled forward from the valuation date to the plan’s fiscal year ended June 30, 2020, using generally accepted actuarial principles.
AssumptionsThe discount rates used to calculate the total OPEB liability decreased (0.25%-0.41%) for all Funds. The assumed increase in future healthcare costs, or trend assumption, was reviewed during the June 30, 2019, valuation process and was updated to better reflect more current expectations relating to anticipated future increases in the medical costs. Also, the June 30, 2020, GASB Statement No. 74 actuarial information reflects the anticipated savings from the repeal of “Cadillac Tax” and “Health Insurer Fee”, which occurred in December of 2019. The assumed load on pre-Medicare premiums to reflect the cost of the Cadillac Tax was removed and the Medicare premiums were reduced by 11% to reflect the repeal of the Health Insurer Fee. There were no other material assumption changes and it is GRS’ opinion that these procedures are reasonable and appropriate, and comply with applicable requirements under GASB Statement No. 74.The actuarially determined contribution rates effective for fiscal year ended 2019 that are documented in the schedules were calculated as of June 30, 2017, for KERS and SPRS plans and June 30, 2018, for CERS plans. Based on the June 30, 2018, actuarial valuation reports, the actuarial methods and assumptions used to calculate these contribution rates are:
● Investment Return - 6.25% for all Investment Fund Plans. ● Inflation - 2.30% for all Investment Fund Plans. ● Salary Increases - 3.30% to 11.55% for CERS Non-Hazardous, 3.05% to 18.55% for CERS Hazardous,
3.55% to 15.55% for KERS Non-Hazardous, 3.55% to 19.55% for KERS Hazardous, 3.05% to 15.55% for SPRS, varies by service.
● Payroll Growth - 2.00% for CERS Non-Hazardous and CERS Hazardous, 0.00% for KERS Non-Hazardous, KERS Hazardous, and SPRS.
● Mortality - RP-2000 Combined Mortality Table, projected to 2013 with Scale BB (set-back 1 year for females). ● Health Care Trend Rates:
■ Pre-65 - Initial trend starting at 7.00% on January 1, 2020, and gradually decreasing to an ultimate trend rate of 4.05% over a period of 12 years for CERS Non-Hazardous, CERS Hazardous.
■ Post-65 - Initial trend starting at 5.00% on January 1, 2020, and gradually decreasing to an ultimate trend rate of 4.05% over a period of 10 years for CERS Non-Hazardous, CERS Hazardous.
■ Pre-65 - Initial trend starting at 7.25% on January 1, 2019, and gradually decreasing to an ultimate trend rate of 4.05% over a period of 13 years for KERS Non-Hazardous, KERS Hazardous and SPRS.
■ Post-65 - Initial trend starting at 5.10% on January 1, 2019, and gradually decreasing to an ultimate trend rate of 4.05% over a period of 11 years for KERS Non-Hazardous, KERS Hazardous and SPRS.
Plan ProvisionsHouse Bill 1 passed during the 2019 Special Legislative Session allowed certain agencies in the KERS Non-Hazardous plan to elect to cease participating in KRS as of June 30, 2020, under different provisions than were previously established. Senate 249 passed during the 2020 Legislative Session delayed that effective date of cessation for these provisions to June 30, 2021. Since each employer’s election is unknown at this time, GRS did not make any adjustment to the total OPEB liability to reflect this legislation. Senate Bill 249 also changed the funding period for the amortization of the unfunded liability to 30 years as of June 30, 2019. Gains and losses incurring in future years will be amortized over separate 20-year amortization bases. This change does not impact the calculation of the Total OPEB Liability and only impacts the calculation of the contribution rates that would be payable starting July 1, 2020. There were no other material plan provision changes and it is GRS’ opinion that these procedures are reasonable and appropriate, and comply with applicable requirements under GASB Statement No. 74.
Implicit Employer Subsidy for non-Medicare retireesThe fully-insured premiums KRS pays for the Kentucky Employees’ Health Plan are blended rates based on the combined experience of active and retired members. Because the average cost of providing health care benefits to retirees under age 65 is higher than the average cost of providing health care benefits to active employees, there is an implicit employer subsidy for the non-Medicare eligible retirees. GASB Statement No. 74 required that the liability associated with this implicit subsidy be included in the calculation of the Total OPEB Liability.
Discount RatesThe following single discount rates were used to measure the total OPEB liability as of June 30, 2020.
Board Meeting - December 3, 2020 - Review and Approval of CAFR
249

66FIN
CERS Non-Hazardous 5.34% CERS Hazardous 5.30% KERS Non-Hazardous 5.43% KERS Hazardous 5.28% SPRS 5.40%
The single discount rates are based on the expected rate of return on OPEB plan investments of 6.25% and a municipal bond rate of 2.45%, as reported in Fidelity Index’s 20-Year Municipal GO AA Index as of June 28, 2020. Based on the stated assumptions and the projection of cash flows as of each fiscal year ending, the plan’s fiduciary net position and future contributions were projected to be sufficient to finance the future benefit payments of the current plan members. Therefore, the long-term expected rate of return on insurance plan investments was applied to all periods of the projected benefit payments paid from the retirement plan. However, the cost associated with the implicit subsidy is not currently being included in the calculation of the System’s actuarial determined contributions, and it is understood that any cost associated with the implicit subsidy will not be paid out of the Plan’s trust. Therefore, the municipal bond rate was applied to future expected benefit payments associated with the implicit subsidy. The projection of cash flows used to determine the single discount rate must include an assumption regarding actual employer contributions made each future year. Except where noted below, the future contributions are projected assuming that each participating employer in KRS contributes the actuarially determined employer contribution rate each future year calculated in accordance with the current funding policy, as most recently revised by Senate Bill 249, passed during the 2020 Legislative Session. This includes the phase-in provisions from House Bill 362 (passed in 2018) that applies to the CERS Funds as well as the provisions from Senate Bill 249 (passed in 2020) which kept CERS contributions level from fiscal year ending 2021.If there is a pattern of legislation that has a resulting effect of employers making contributions less than the actuarially determined rate, GRS may be required to project contributions that are reflective of recent actual contribution efforts regardless of the stated funding policy (as required by paragraph 50 of GASB No. 74). Legislation has been enacted three times (for FY18/19, FY 19/20, and FY 20/21) that allowed certain employer (referred to as “Quasi” agencies) in the KERS Non-Hazardous Fund to contribute 8.41% of pay into the insurance fund, which is less than the actuarially determined contribution rate. GRS believes this constitutes a pattern and as such, the projection for the KERS Non-Hazardous Fund assumes these Quasi agencies contribute no more than 8.41% of pay throughout the entire projection.
401(h) SubaccountBased on guidance issued by GASB in connection with the GASB Statement No. 74, the 1% member contributions for Tier 2 and Tier 3 members to a 401(h) subaccount is considered as an OPEB asset. As a result, the reported insurance fiduciary net position includes these 401(h) assets. Additionally, these member contributions and associated investment income are included in the reconciliation of the fiduciary net position. Beginning in FY2020 the 401(h) contributions are being deposited directly into the insurance funds. Any 401(h) contributions received prior to FY2020 and deposited into the pension fund will be used to pay Tier 3 retiree insurance premiums until those funds have been exhausted.
Additional Disclosures1
The reports are based upon information furnished to GRS by the KRS, which includes benefit provisions, membership information, and financial data. GRS did not audit this data and information, but GRS did apply a number of tests and concluded that it was reasonable and consistent. GRS is not responsible for the accuracy or completeness of the information provided by the KRS. Please see the “Actuarial Valuation Report as of June 30, 2019”, for additional discussion of the nature of the actuarial calculations and more information related to participant data, economic and demographic assumptions, and benefit provisions. These reports should be considered together as a complete report for KRS’ fiscal year ending June 30, 2020.
1 Note: Data and information regarding GASB 67 and GASB 74 reporting was provided by GRS Retirement Consulting.
Board Meeting - December 3, 2020 - Review and Approval of CAFR
250

67 FIN
Sensitivity to the NPL to Changes in the Discount Rate Fiscal Year 2020As of June 30, 2020 ($ in Thousands)
CERS CERS KERS KERS SPRSNon-
Hazardous HazardousNon-
Hazardous Hazardous Current 6.25% Current 6.25% Current 5.25% Current 6.25% Current 5.25%
1% Decrease $9,458,677 $3,726,146 $16,223,729 $717,449 $891,868Current Discount Rate 7,669,917 3,015,028 14,164,653 560,677 755,2881% Increase $6,188,756 $2,434,569 $12,472,483 $433,056 $644,122
Sensitivity of the Net OPEB Liability to Changes in the Discount Rate and Healthcare Trend RateAs of June 30, 2020 ($ in Thousands)
CERS CERS KERS KERS SPRSNon-
Hazardous HazardousNon-
Hazardous Single 5.34% Single 5.30% Single 5.43% Single 5.28% Single 5.40%Sensitivity of the Net OPEB Liability to Changes in the Discount Rate1% Decrease $3,102,175 $1,254,449 $3,026,103 $126,165 $187,528Single Discount Rate 2,414,696 924,105 2,538,908 42,769 138,6021% Increase $1,850,046 $657,916 $2,139,021 $(24,330) $99,093Sensitivity of the Net OPEB Liability to Changes in the Current Healthcare Cost Trend Rate1% Decrease $1,869,578 $660,393 $2,136,914 $(20,042) $98,159Current Healthcare Cost Trend Rate 2,414,696 924,105 2,538,908 42,769 138,6021% Increase $3,076,209 $1,248,318 $3,025,819 $119,675 $188,131
Board Meeting - December 3, 2020 - Review and Approval of CAFR
251

68FIN
Schedule of Employers’ NPL - CERS Non-HazardousAs of June 30 ($ in Thousands) 2020 2019Total Pension Liability (TPL) $14,697,244 $14,192,966Plan Fiduciary Net Position 7,027,327 7,159,921Net Pension Liability $7,669,917 $7,033,045Ratio of Plan Fiduciary Net Position to TPL 47.81% 50.45%Covered Payroll (1) $2,462,752 $2,424,796Net Pension Liability as a Percentage of Covered Employee Payroll 311.44% 290.05%
Schedule of Employers’ NPL - CERS HazardousAs of June 30 ($ in Thousands) 2020 2019Total Pension Liability (TPL) $5,394,732 $5,176,003Plan Fiduciary Net Position 2,379,704 2,413,708Net Pension Liability $3,015,028 $2,762,295Ratio of Plan Fiduciary Net Position to TPL 44.11% 46.63%Covered Employee Payroll (1) $559,551 $553,541Net Pension Liability as a Percentage of Covered Employee Payroll 538.83% 499.02%
Schedule of Employers’ NPL - KERS Non-HazardousAs of June 30 ($ in Thousands) 2020 2019Total Pension Liability (TPL) $16,472,733 $16,356,674Plan Fiduciary Net Position 2,308,080 2,233,672Net Pension Liability $14,164,653 $14,123,002Ratio of Plan Fiduciary Net Position to TPL 14.01% 13.66%Covered Payroll (1) $1,476,156 $1,485,854Net Pension Liability as a Percentage of Covered Employee Payroll 959.56% 950.50%
Schedule of Employers’ NPL - KERS HazardousAs of June 30 ($ in Thousands) 2020 2019Total Pension Liability (TPL) $1,251,027 $1,227,226Plan Fiduciary Net Position 690,350 680,932Net Pension Liability $560,677 $546,294Ratio of Plan Fiduciary Net Position to TPL 55.18% 55.49%Covered Payroll (1) $171,840 $160,600Net Pension Liability as a Percentage of Covered Employee Payroll 326.28% 340.16%
Schedule of Employer’s NPL - SPRSAs of June 30 ($ in Thousands) 2020 2019Total Pension Liability (TPL) $1,049,237 $1,035,000Plan Fiduciary Net Position 293,949 286,165Net Pension Liability $755,288 $748,835Ratio of Plan Fiduciary Net Position to TPL 28.02% 27.65%Covered Payroll (1) $49,019 $49,515Net Pension Liability as a Percentage of Covered Employee Payroll 1,540.81% 1,512.34%1 Based on derived compensation using the provided employer contribution information.
Board Meeting - December 3, 2020 - Review and Approval of CAFR
252

69 FIN
Development of Single Discount Rate for OPEBAs of June 30
CERS CERS KERS KERS SPRSNon-
Hazardous HazardousNon-
Hazardous 2020
Single Discount Rate 5.34% 5.30% 5.43% 5.28% 5.40%Long-Term Expected Rate of Return 6.25% 6.25% 6.25% 6.25% 6.25%Long-Term Municipal Bond Rate 2.45% 2.45% 2.45% 2.45% 2.45%
2019 Single Discount Rate 5.68% 5.69% 5.73% 5.66% 5.76%Long-Term Expected Rate of Return 6.25% 6.25% 6.25% 6.25% 6.25%Long-Term Municipal Bond Rate 3.13% 3.13% 3.13% 3.13% 3.13%Note: Fixed-income municipal bonds with 20 years to maturity that include only federally tax-exempt municipal bonds as reported in fidelity index’s “20-Year municipal GO AA index” as of June 30, 2020 and June 30, 2019.
Schedule of the Employers’ Net OPEB Liability - CERS Non-Hazardous PlanAs of June 30 ($ in Thousands)
YearTotal OPEB
LiabilityPlan Fiduciary Net Position
Net OPEB Liability/(Asset)
Plan Fiduciary Net Position as a Percentage of the Total OPEB
Liability
Covered Employee Payroll (1)
Net OPEB Liability as a Percentage of Covered Employee
Payroll2020 $4,996,309 $2,581,613 $2,414,696 51.67% $2,620,585 92.14%2019 $4,251,466 $2,569,511 $1,681,955 60.44% $2,577,378 65.26%1 Based on derived compensation using the provided employer contribution information.
Schedule of the Employers’ Net OPEB Liability - CERS Hazardous PlanAs of June 30 ($ in Thousands)
YearTotal OPEB
LiabilityPlan Fiduciary Net Position
Net OPEB Liability/(Asset)
Plan Fiduciary Net Position as a Percentage of the Total OPEB
Liability
Covered Employee Payroll (1)
Net OPEB Liability as a Percentage of Covered Employee
Payroll2020 $2,245,222 $1,321,117 $924,105 58.84% $596,001 155.05%2019 $2,080,574 $1,340,714 $739,860 64.44% $583,632 126.77%1Based on derived compensation using the provided employer contribution information.
Board Meeting - December 3, 2020 - Review and Approval of CAFR
253

70FIN
Schedule of the Employers’ Net OPEB Liability - KERS Non-Hazardous PlanAs of June 30 ($ in Thousands)
YearTotal OPEB
LiabilityPlan Fiduciary
Net PositionNet OPEB
Liability/(Asset)
Plan Fiduciary Net Position as a Percentage of the Total OPEB
Liability
Covered Employee Payroll
(1)
Net OPEB Liability as a
Percentage of Covered Employee
Payroll2020 $3,599,557 $1,060,649 $2,538,908 29.47% $1,482,431 171.27%2019 $3,217,985 $995,089 $2,222,896 30.92% $1,515,953 146.63%(1) Based on derived compensation using the provided employer contribution information.
Schedule of the Employers’ Net OPEB Liability - KERS Hazardous PlanAs of June 30 ($ in Thousands)
YearTotal OPEB
LiabilityPlan Fiduciary Net Position
Net OPEB Liability/(Asset)
Plan Fiduciary Net Position as a Percentage of the Total OPEB
Liability
Covered Employee Payroll (1)
Net OPEB Liability as a Percentage of Covered Employee
Payroll2020 $564,524 $521,755 $42,769 92.42% $182,209 23.47%2019 $507,204 $534,053 $(26,849) 105.29% $151,448 -17.73%(1) Based on derived compensation using the provided employer contribution information.
Schedule of the Employer’s Net OPEB Liability-SPRS PlanAs of June 30 ($ in Thousands)
YearTotal OPEB
LiabilityPlan Fiduciary Net Position
Net OPEB Liability/(Asset)
Plan Fiduciary Net Position as a Percentage of the Total OPEB
Liability
Covered Employee Payroll (1)
Net OPEB Liability as a Percentage of Covered
Employee Payroll2020 $339,942 $201,340 $138,602 59.23% $48,231 287.37%2019 $312,553 $201,206 $111,347 64.38% $48,780 228.26%(1) Based on derived compensation using the provided employer contribution information.
Board Meeting - December 3, 2020 - Review and Approval of CAFR
254

71 FIN
Note N. Pension Legislation
2020 Regular SessionThe 2020 Regular Session of the Kentucky General Assembly adjourned on Wednesday, April 15, 2020. Six bills and five resolutions passed this Session that will have an impact on KERS. 1. Senate Bill 249 (C. McDaniel) resets the amortization period for financing the unfunded liability of all KRS plans from 24-years to 30-years; extends by one year the date for most Quasi-governmental agencies to decide if they want to voluntarily cease participation in KERS; and pauses the CERS employer rate phase-in for one year. 2. House Bill 352 (S. Rudy), the State Executive Branch budget bill, sets the employer contribution rates for KERS and SPRS for July 1, 2020 through June 30, 2021. The General Assembly would typically approve a budget for the two-year period beginning on July 1, 2020 and extending through June 30, 2022 (FY Ended 2021 and FY Ended 2022). However, due to the COVID-19 crisis, the legislature only passed a one-year budget, and a budget for FY Ending 2022 will have to be introduced in a future Session.The bill also froze the contribution rate for Quasi-governmental agencies from July 1, 2020 - June 30, 2021 at 49.47% (41.06% pension and 8.41% insurance) for all Non-Hazardous duty employees employed by Mental Health/Mental Retardation Boards, Local and District Health Departments, State-supported universities and community colleges, domestic violence centers, rape crisis centers, child advocacy centers, and any other agency eligible to voluntarily cease participation in KERS pursuant to KRS 61.522. 3. House Bill 484 (R. Webber, et al) separates the governance of CERS from KRS. The bill establishes one 9-member board for KERS and SPRS, and a second 9-member board for CERS. Further, the bill establishes a third 8-member board, the Kentucky Public Pensions Authority Board (KPPA), which will be responsible for the day-to-day operations of all three systems including having all current staff members be under its authority. The employees will still be subject to the provisions of Kentucky Revised Statute Chapter 18A and the State Personnel Cabinet. 4. House Bill 271 (J. Blanton) concerns in-line-of-duty death benefits. Previously, surviving spouses of members who died due to a duty-related injury would have their monthly benefit payments reduced if they remarried. House Bill 271 removes those provisions and the monthly benefit amount will no longer be reduced.The bill also restores the original benefit amount for surviving spouses of members who have already remarried and increases the benefits for beneficiaries who chose to receive lifetime monthly benefits in lieu of the line-of-duty survivor benefits to the amount calculated under the line-of-duty survivor provisions.Finally, the bill provides a window for a surviving spouse of a member who died prior to April 13, 2018 to make a claim for line-of-duty survivor benefits on or before January 1, 2021. 5. Senate Bill 177 (A. Kerr) mandates that local boards of education shall allow emergency leave to any full-time or part-time classified employee if it is in relation to the COVID-19 public health emergency. This will count toward the number of days worked during the school year for determining service credit. 6. Senate Bill 239 (M. Wilson) includes provisions for Mayors and other members of a city legislative body who are age 62 and above to retire and begin drawing a benefit, but they do not have to resign office to do so. They would not build any further retirement service credit for this extended time in office.The bill also makes one more important change. Under Kentucky Revised Statute 95.022 cities may re-employ as many retired police officers as they deem necessary, but the city is only excused from paying employer contributions and insurance premiums for a certain, limited number of these re-employed retirees. If they exceed this number, the city is responsible for paying contributions on the rest of the retired officers they employ. Senate Bill 239 removes School Resource Officers (SROs) from this limit, so SROs will no longer be included in the count. Removing SROs from the count means a city can hire other types of officers in those places, which allows a city to have more officers on the job without paying additional contributions for retirement and insurance.
Board Meeting - December 3, 2020 - Review and Approval of CAFR
255

72FIN
7. Finally, five Senate Resolutions were adopted during the 2020 Regular Session that confirmed recent gubernatorial appointments (or reappointments) to the KRS Board of Trustees.
A. Senate Resolution 93 (J. Adams) confirmed the reappointment of Patrick Kelly Downard to the Board for a term expiring June 17, 2023.B. Senate Resolution 234 (J. Adams) confirmed the appointment of Joseph L. Grossman to the Board for a term expiring June 17, 2022.C. Senate Resolution 236 (J. Adams) confirmed the appointment of Caswell Prewitt Lane to the Board for a term expiring June 17, 2023.D. Senate Resolution 237 (J. Adams) confirmed the appointment of John Carroll Cheshire III to the Board for a term expiring June 17, 2023; and,E. Senate Resolution 270 (J. Adams) confirmed the reappointment of Matthew Louis Monteiro to the Board for a term expiring June 17, 2023.
Board Meeting - December 3, 2020 - Review and Approval of CAFR
256

73 FIN
Note O. Litigation
City of Fort WrightIn June 2014, the City of Fort Wright and several other participating employers in CERS filed a lawsuit against KRS, alleging that the Board invested CERS funds in investments that were prohibited by both statutory and common law. In addition, the plaintiffs alleged that the Board paid substantial asset management fees, which the suit alleges were improper. On September 20, 2018, Franklin Circuit Court issued an Opinion and Order denying the City of Fort Wright’s Motion for Declaratory Judgment and granting KRS’ Cross-Motion for Declaratory Judgment. The Court stated in relevant part, “There is nothing in the record or in the City’s pleadings to this Court that persuades this Court that the Board did not follow the law or did not appropriately apply the facts to the law.” The City of Fort Wright filed an appeal with the Kentucky Court of Appeals. In a January 10, 2020, Opinion, the Court of Appeals affirmed the decision of Franklin Circuit Court. The City of Fort Wright filed a Motion for Discretionary Review with the Supreme Court of Kentucky. On September 16, 2020, the Supreme Court of Kentucky granted this Motion. On September 28, 2020, KRS filed a Cross Motion for Discretionary Review. The case is currently being litigated. On September 2, 2015, a CERS member filed a complaint that is substantially similar in terms of allegations and ambiguous requests for relief to that of the City of Fort Wright. The exact nature and scope of the relief sought is unclear; therefore, no provision has been made in the combining financial statements. The member’s complaint is currently being held in abeyance pending the outcome of the City of Fort Wright’s appeal. No new action has been taken in this matter to date.
Seven CountiesSeven Counties Services, Inc. (Seven Counties) filed for Chapter 11 bankruptcy in the United States Bankruptcy Court for the Western District of Kentucky (the Bankruptcy Court) in April 2013. Seven Counties provides mental health services for the Cabinet for Health and Family Services for the greater Louisville, Kentucky area and surrounding counties. Seven Counties participated in KERS for approximately twenty-five years. Seven Counties identified KERS as a creditor with a primary objective of discharging its continuing obligation to remit retirement contributions for approximately 1,300 employees and to terminate its participation in KERS. If Seven Counties is successful in discharging its obligations to KERS, the estimated member pension and insurance actuarial accrued liability is in the range of $145 to $150 million. KERS opposed Seven Counties’ attempt to discharge its obligations and terminate its participation. KERS asserted that Seven Counties is a Governmental Unit properly participating in KERS by Executive Order issued in 1978 and thus ineligible for Chapter 11 relief. Consequently, Seven Counties would remain statutorily obligated to continue participation and remit contributions. On May 30, 2014, the Bankruptcy Court held that Seven Counties was not a Governmental Unit and could move forward with its Chapter 11 bankruptcy case. The Bankruptcy Court further held that Seven Counties’ statutory obligation to continue to participate in and remit contributions to KERS was a “contract” eligible for rejection. KRS appealed this decision. On August 24, 2018, the U.S. Court of Appeals for the Sixth Circuit (the Sixth Circuit) issued a two to one Opinion affirming the decision that Seven Counties is eligible to file for bankruptcy under Chapter 11. However, the Sixth Circuit went on to state, “lacking state court precedent characterizing the nature of the relationship between Seven Counties and KERS, we CERTIFY that question to the Kentucky Supreme Court.” KERS filed a petition to have the Opinion Reheard En Banc by the entire Sixth Circuit. On October 5, 2018, the Sixth Circuit issued an order holding the petition in abeyance pending a response from the Kentucky Supreme Court on the certified question of law. On November 1, 2018, the Supreme Court of Kentucky issued an Order granting certification of the question. The certified question of law was briefed by the parties and oral arguments were held before the Supreme Court of Kentucky on March 6, 2019. On August 29, 2019, the Supreme Court of Kentucky ruled that Seven Counties’ participation in and its contributions to KERS are based on a statutory obligation. The Supreme Court of Kentucky’s ruling was forwarded to the Sixth Circuit for further consideration. On July 20, 2020, the Sixth Circuit Court of Appeals issued an Opinion stating that they affirmed their previous determination that Seven Counties was eligible to file a Chapter 11 bankruptcy case. The Sixth Circuit also reversed the conclusion that Seven Counties can reject its obligation to participate as an executory contract and that Seven Counties need not maintain its statutory contribution obligation during the pendency of the bankruptcy. The Sixth Circuit dismissed Seven Counties’ cross appeal and remanded the case for further proceedings consistent with
Board Meeting - December 3, 2020 - Review and Approval of CAFR
257

74FIN
the opinion. KERS again filed a petition to have the Opinion regarding Seven Counties’ ability to file a Chapter 11 bankruptcy Reheard En Banc by the entire Sixth Circuit. This petition was denied in an Order dated September 11, 2020. The case was remanded back to the Bankruptcy Court. The case is currently being litigated.
MayberryIn December 2017, members and beneficiaries of KERS filed a derivative action suit in Franklin Circuit Court naming KRS as a nominal defendant. The suit alleges that investment managers actively pursued KRS while it was under the control of Trustees who were acting adversely to its interests, and that the investment managers recommended risky investments in alternative investment strategies which resulted in billions of dollars in losses to KRS. The Amended Complaint alleges numerous claims against KRS Trustees and Officers, hedge fund sellers, actuarial, fiduciary, and investment advisors, and an annual report certifier. Plaintiffs alleged that the defendants breached statutory, fiduciary, and other duties and engaged in civil conspiracy. The Complaint further alleged claims against Officers and hedge fund sellers, actuarial, fiduciary, and investment advisors, and an annual report certifier for aiding and abetting breaches of statutory, fiduciary, and other duties. Plaintiffs sought compensatory and punitive damages, as well as equitable relief. More specifically, plaintiffs sought compensatory damages against defendants for the violations of statutory, fiduciary, and other duties; while also seeking punitive damages against hedge fund sellers, investment, actuarial, and fiduciary advisors and each of their principals/officers named as defendants. Further, plaintiffs requested several forms of equitable relief, which included directing a complete accounting of fees associated with fund of hedge funds and other absolute return strategies. On April 19, 2018, KRS and plaintiffs filed a Joint Notice to the Court and Parties notifying the parties that (1) KRS will not pursue the claims asserted by plaintiffs; and (2) KRS would not have been in a position to pursue those claims had they been brought prior to the filing of the Complaint. Since then, the Franklin Circuit Court has ruled on various defendants’ motions to dismiss, denying nearly all of them. On January 10, 2019, Kohlberg, Kravis, Roberts (KKR), Henry Kravis and George Roberts (collectively, “KKR Parties”) amended their Answer to assert cross-claims against KRS. Certain Officer and Trustee defendants appealed the denial of their Motion to Dismiss on immunity grounds to the Court of Appeals and that appeal was transferred to the Supreme Court of Kentucky. The hedge fund defendants filed a Petition for Writ of Prohibition in the Court of Appeals arguing that the Circuit Judge acted outside his jurisdiction. The Writ was issued on April 23, 2019, and the judgment granting standing was vacated. Plaintiffs promptly appealed the Court of Appeals’ decision to the Supreme Court of Kentucky. On July 9, 2020, the Supreme Court of Kentucky issued an Opinion stating that the plaintiffs, as beneficiaries of a defined-benefit plan who have received all of their vested benefits so far and are legally entitled to receive their benefits for the rest of their lives, do not have a concrete stake in this case and therefore lack standing to bring this claim. The case was remanded to the circuit court with directions to dismiss the complaint. Thereafter, plaintiffs filed a motion seeking to amend their complaint to add parties and claims that would purportedly correct the standing defect identified by the Supreme Court of Kentucky. Furthermore, the Attorney General of the Commonwealth sought leave to intervene in this action through a motion filed July 20, 2020, and an Intervening Complaint on July 22, 2020. The matter is pending with Franklin Circuit Court. A number of related cases have also developed based on issues raised in the above referenced Mayberry action. There has been an action filed by certain Mayberry Trustees and Officers seeking reimbursement by KRS of legal fees. KRS has also filed an action against Hallmark Specialty Insurance seeking a declaratory judgment that Hallmark has a duty to defend and indemnify KRS in the Mayberry action. Two of the hedge fund defendants in the Mayberry action have also filed an action in the United States District Court for the Eastern District of Kentucky naming individual members of the current KRS Board as defendants. This action is seeking a judgment declaring that the Trustees violated plaintiffs’ right to due process as well as an award of costs and attorneys’ fees. Three actions have been filed in Delaware Chancery Court regarding the Mayberry action. One filed by Prisma Capital Partners and one filed by Blackstone Alternative Asset Management allege breaches of warranties, representations and more relating to the Subscription Agreements signed by KRS. The Blackstone action was voluntarily dismissed without prejudice on July 8, 2019. The third was filed by Prisma Capital Partners against the Daniel Boone Fund, LLC. Finally, an action was filed by PAAMCO against KRS in California alleging breach of warranties, representations and more relating to the Subscription Agreements. Litigation of those cases is currently ongoing.
Western Kentucky UniversityOn November 17, 2016, Western Kentucky University (WKU), a participating employer, filed a petition for declaration of rights in the Franklin Circuit Court in Frankfort, KY. The petition involved a dispute as to whether WKU can terminate a group of its employees, which participated in KERS, and reutilize those same employees through a privatization
Board Meeting - December 3, 2020 - Review and Approval of CAFR
258

75 FIN
process, in order to excuse WKU from its obligations to pay contributions to the KERS Fund. On March 10, 2020, Franklin Circuit Court issued an Opinion and Order declaring that:
1. As of August 1, 2016, former WKU employees are Sodexo employees, not WKU employees;2. As of August 1, 2016, WKU is no longer required to provide employer or employee contributions to KERS on behalf of the former employees;3. WKU and its former employees are not responsible for any penalties or interest since August 1, 2016, insofar as they are related to contributions to KERS on behalf of the former employees at issue; and,4. The former WKU employees had a break in service from WKU as of July 31, 2016, and may have full access to their retirement benefits being held by KERS and administered by KRS for all benefits earned prior to August 1, 2016.
KRS filed an appeal of this Opinion and Order with the Court of Appeals on June 17, 2020. Litigation is ongoing.
Note P. Reciprocity AgreementKRS has a reciprocity agreement with Kentucky Teachers’ Retirement System (TRS) for the payment of insurance benefits for those members who have creditable service in both systems.
Note Q. Reimbursement of Retired Re-Employed Health Insurance, Active Member Health Insurance Contributions, and Retired Re-Employed Employer ContributionsAs a result of the passage of House Bill 1 on September 1, 2008, if a retiree is re-employed in a regular full time position and has chosen health insurance coverage through KRS, the employer is required to reimburse KRS for the health insurance premium paid on the retiree’s behalf, not to exceed the cost of the single premium rate. For the fiscal years ended June 30, 2020 and 2019, the reimbursement totaled $11.5 million and $10.5 million, respectively. Also, for new plan participants after August 31, 2008, House Bill 1 required an active member contribution of 1% in addition to the member pension contribution. This 1% is applicable to all Non-hazardous and Hazardous plans. Due to a change in accounting for the 1% contribution, the contribution was placed in the Insurance Fund starting fiscal year 2020. For the fiscal year ended June 30, 2020, members paid into the Insurance Fund $23.1 million. For the fiscal year ended June 30, 2019, members paid into the Pension Fund $21.3 million. In addition, employers are required to report employer contributions on retired re-employed members. These are reported within the employer contributions on the financial statements. Please see the chart below for the breakdown.
Retired Re-employed Employer Contributions As of June 30 ($ in Thousands)
CERS CERS KERS KERS SPRS KRS Total
Non-Hazardous Hazardous Non-Hazardous Hazardous FY 2020 $12,116 $4,339 $32,438 $2,772 $0 $51,665FY 2019 9,953 $3,691 $28,138 $2,540 $64 $44,386
Board Meeting - December 3, 2020 - Review and Approval of CAFR
259

76FIN
Note R. Related PartyPerimeter Park West, Inc. (PPW) was established in 1998 as a 501(c) (25) corporation located at 1260 and 1270 Louisville Road, Frankfort, Kentucky. As such, PPW can only acquire and hold title to real property. The only source of revenue for the Corporation is rent paid from KRS. When excess cash is on hand at PPW, the money is paid back to the PPW shareholders in the form of dividends. PPW’s expenses are for the maintenance of the property. Title to the property is held in the name of PPW and there is no mortgage on the property. KRS does not have title to the property, however, KRS maintains PPW as an investment on its books and the Pension plans are the sole shareholders. PPW’s market value was $7.3 million as of June 30, 2020. PPW is audited annually and submits IRS Form 990 as required for this entity. The sole purpose of PPW is to protect the Pension and Insurance Trusts of KRS should someone become injured on the property. If this occurred and a lawsuit was filed against the property, the suit would be filed against PPW instead of the Pension and Insurance Trusts. The current lease between PPW and KRS was entered into on December 1, 2019, and continuing thereafter until altered by a new agreement or termination of the lease. The premises, consisting of 85,357 square feet, are rented for the fiscal year period of July 1 to June 30. The contractual lease payments through June 30, 2024, are: FY 2020 - $934,188FY 2021 - $1,066,968FY 2022 - $1,066,968FY 2023 - $1,066,968FY 2024 - $1,066,968
Note S. Reduction of ReceivablesEmployers reported June 2019 wages earned in the following month of July 2019 (next fiscal year) and the new Annual Required Contribution (ARC) rate was applied. The Commonwealth’s approved budget guidelines paid contributions at the fiscal year 2019 ARC rate in effect when the wages were earned. It is unlikely that KRS will receive payments at the new ARC rate for that period; therefore, contribution receivables have been reduced as of June 30, 2020 as noted in the chart. For fiscal year 2020, no reduction was necessary since the contribution rate did not change.
Reduction of Receivables
As of June 30 ($ in Thousands) 2020 2019
KERS Non-Hazardous $0 $15,947 KERS Hazardous 0 921 SPRS 0 1,134
TOTAL $0 $18,002
Board Meeting - December 3, 2020 - Review and Approval of CAFR
260

77 FIN
Note T. Prisma Daniel Boone Fund The funds invested with Prisma Daniel Boone Fund continue to be held in a contingency reserve to cover potential obligations arising from the Mayberry Action (see Note O for details of Mayberry Case). The total reported in reserve as of June 30, 2020, is $98.1 million for the pension fund and $40.8 million for the insurance fund. This is based on the May 31, 2020, report because Absolute Return managers are reported on a one month lag.
Note U. Subsequent EventsManagement has evaluated the period June 30, 2020, to December 3, 2020, (the date the combining financial statements were available to be issued) for items requiring recognition or disclosure in the combining financial statements.
Note V. Coronavirus Before the onset of the coronavirus, or COVID-19, in Kentucky in March 2020, KRS staff was assessing the risks and potential action necessary to address these risks. On March 6, 2020, the Governor of Kentucky declared a state of emergency with the first confirmed case of COVID-19. KRS staff acted quickly with these goals in mind:
■ To preserve the health and safety of staff, members and other stakeholders, ■ To protect the assets of every plan, ■ To maintain vigilance in cyber security, and ■ To ensure all required services were available to our members
With change as significant as has been experienced since the beginning of this state of emergency, there has been an increase in risk. These risks and the KRS responses to these risks are discussed in the following table.
Board Meeting - December 3, 2020 - Review and Approval of CAFR
261

78FIN
Risk to Employee Health RISK RESPONSEEmployees contract the COVID-19 virus. KRS adheres to state and CDC guidelines for employee health. By
mid-March, 60% of KRS staff were “Healthy at Home” by working remotely. Since mid-April, at least 85% of staff have been working from home (WFH). For those still working in the office, social distancing of desks, use of masks, gloves and hand sanitizer, and deep cleaning services helped make the office work-ready.
Large numbers of employees are out of the office simultaneously.
KRS utilizes cross training of employees and has an up-to-date Business Continuity Plan (COOP). For tasks that require a physical presence in the office, the teams have been divided to limit exposure and the risk that the entire team will be out simultaneously.
Employees need to work from home instead of the office.
Information Technology (IT) has aggressively developed solutions that allow all employees who have internet access at home to WFH as securely as they would from the office. HR encouraged employees to keep safety in mind in their new home-based workspaces. Leadership developed WFH Guidelines and a WFH tips on the internal website.
Health requirements change frequently, and employees find it difficult to keep up.
Executive leadership created a daily email update on COVID-19 with the latest news for employees and their supervisors. As of October 2020, this communication email is a weekly update developed by the Communications division in coordination with executive leadership.
Supplies important to keeping employees healthy have limited availability.
Staff placed orders as early as possible. Efforts were coordinated with state purchasing agents including getting masks and hand sanitizer from another state agency.
Risk to Funds RISK RESPONSEBudgetary stress at the state/county level resulting in reduction of or deferment of plan contributions so that the actuarially determined contribution (ADC) is not met.
KRS leadership meets regularly with legislative leadership, including the Public Pension Oversight Board (PPOB), to ensure there is adequate awareness on this risk. The KRS actuary supports the effort of education and awareness on this risk in the valuation, sensitivity studies and in presentations. Staff continues to manage funds to achieve the assumed rate of return with a long-term focus. Liquidity is managed to ensure adequate funds are available to pay benefits in the case of decreased contributions.
Reduction in participating agency staffing and/or overall compensation (layoffs, furloughs, attrition, etc.) causes payroll decline resulting in missed payroll assumptions.
KRS leadership meets regularly with legislative leadership, including the Public Pension Oversight Board (PPOB), to ensure there is adequate awareness on this risk. The KRS actuary supports the effort of education and awareness on this risk in the valuation, sensitivity studies and in presentations. Staff continues to manage funds to achieve the assumed rate of return with a long-term focus. Liquidity is managed to ensure adequate funds are available to pay benefits in the case of decreased contributions.
Persisting low rates will hamper the income generation of the safety/liquidation focused funds of the allocation. In addition, a historically low risk-free rate has depressed the return expectation of other asset classes, despite increasing risk premiums.
An updated asset-liability study was conducted by the KRS consultant, Wilshire, and resulted in new asset allocation guidelines that take into account these headwinds. The result was a modest increase in exposure to risk assets to maintain expected returns and a similar level of liquidity. The KRS Investment Committee continues to monitor these risks and is well-positioned to take action when necessary.
Market volatility has been elevated in 2020 reaching unprecedented levels during the equity selloff in March. Subsequent waves of coronavirus infections/hospitalizations could lead to shutdowns and economic shocks causing market volatility spikes.
KRS manages plan assets to achieve long-term objectives, and must accept short-term downside risks. During the first half of 2020 equity market declines presented opportunities to rebalance into risk assets at more attractive valuations.
Board Meeting - December 3, 2020 - Review and Approval of CAFR
262

79 FIN
Rising coronavirus infection rates lead to KRS investment service providers to work remotely.
Operational disaster recovery responses are tested regularly and significantly mitigate any threat to the ability of KRS to operate smoothly.
Board Meeting - December 3, 2020 - Review and Approval of CAFR
263

80FIN
Risk to Cyber Security RISK RESPONSECrises like the COVID-19 pandemic increase the risk of security attacks/breeches/threats.
KRS has had an excellent cyber security program in place since 2006. It has already taken steps to mitigate the ever-growing number of cyber threats including garnering support from Trustees and executive leadership, budgetary resources and trained staff.
Work from home increases security risks. Security and IT staff created minimum requirements for internet speed and virus protection for staff who WFH. IT utilized laptop/desktop encryption and various other measures to increase security for those staff who WFH.
Significant changes to infrastructure without corresponding assessment.
IT immediately attained an informal third-party evaluation of the state of the network as it relates to moving a large percentage of staff to WFH. A formal assessment is planned in the next fiscal year.
Risk to Services RISK RESPONSEOffices close to public and end in-person services.
KRS closed its offices to the public on March 17, 2020, and remains closed as of the writing of this note. This eliminated one-on-one counseling, in-person member and employer training and health insurance open enrollment fairs. KRS successfully replaced these with video conferencing tools. Business teams increased the number and frequency of recorded and live webinars and trainings. All of these were conducted virtually via web-based tools.
The public cannot attend Board of Trustee and Committee meetings.
It is critical that stakeholders across Kentucky have access to view Board meetings. With this in mind, KRS has been live streaming its Board meetings since April 2018. Since April 2020, the members and support staff of the Board and its committees now utilize video conferring tools to meet virtually. These virtual meetings are live streamed to FaceBook @kyretirement.
Sudden increase in requests for service. KRS cross trains employees and has the flexibility to rearrange resources to address spikes in service requests. More importantly, KRS insists on a culture of continuous enhancements often looking to technology to improve the efficiency of operations. KRS provides a web-based self-service, https://kyret.ky.gov/Pages/Login.aspx to all its members. Here members have access to a plethora of account-specific information and services.
Supply chain issues. Staff closely monitor supplies and utilize resources available to all state agencies via the 45A Model Procurement avenues.
Postal Service Delays. Member self-service has a document upload capability that allows members to upload documents from their home computer or phone. We also accept emailed and faxed documents. KRS installed a mail drop box for members who wish to drop off forms and documents at the KRS offices.
Decrease in Productivity. KRS has long-established methods of monitoring productivity. WFH options will allow staff to remain “Healthy at Home”. Intentional communications keep staff knowledgeable and well connected with management and co-workers.
WFH makes training new employees more difficult.
Video and audio conferencing solutions are utilized to replace in-person training. IT secured video cameras for staff to make this more effective. Staff continue to attend conferences, webinars and other third-party trainings virtually.
WFH makes maintaining a specific business culture more difficult.
Leadership has intentionally increased communications efforts across every level at KRS. Video and audio conferencing solutions are utilized to mirror “water cooler” interactions. Every level of management has creatively approached the issue of maintaining a family-like atmosphere at KRS where every person contributes and feels valued.
Board Meeting - December 3, 2020 - Review and Approval of CAFR
264

REQUIRED SUPPLEMENTARY INFORMATION
INCLUDING GASB 67 AND 74
81 FIN
CERS Non-HazardousCERS HazardousSchedule of Employer NPLKERS Non-HazardousKERS HazardousSPRSCERS Non-HazardousCERS HazardousSchedule of Changes in Employers’ TPLKERS Non-HazardousKERS HazardousSPRSNotes to Schedule of Employers’ ContributionsCERS Non-HazardousCERS HazardousSchedule of Employers’ Contributions PensionKERS Non-HazardousKERS HazardousSPRSCERS Non-HazardousCERS HazardousSchedule of Employers’ NOLKERS Non-HazardousKERS HazardousSPRSCERS Non-HazardousCERS HazardousSchedule of Changes in Employers’ Net OPEB LiabilityKERS Non-HazardousKERS HazardousSPRSNotes to Schedule of Employers’ OPEB ContributionCERS Non-HazardousCERS HazardousSchedule of Employers’ OPEB ContributionsKERS Non-HazardousKERS HazardousSPRSMoney Weighted Rates of ReturnReport On Internal Control
Board Meeting - December 3, 2020 - Review and Approval of CAFR
265

82FIN
Schedule of Employers’ NPL - CERS Non-Hazardous Pension FundsAs of June 30 ($ in Thousands) Net Pension Liability as a Ratio of Plan Percentage of Total Pension Plan Fiduciary Net Pension Fiduciary Net Covered Covered
Year Liability (TPL) Net Position Liability Position to TPL Payroll(1) Payroll 2020 $14,697,244 $7,027,327 $7,669,917 47.81% $2,462,752 311.44% 2019 14,192,966 7,159,921 7,033,045 50.45% 2,424,796 290.05% 2018 13,109,268 7,018,963 6,090,305 53.54% 2,454,927 248.08% 2017 12,540,545 6,687,237 5,853,308 53.32% 2,376,290 246.32% 2016 11,065,013 6,141,395 4,923,618 55.50% 2,417,187 203.69% 2015 10,740,325 6,440,800 4,299,525 59.97% 2,296,716 187.20% 2014 $9,772,522 $6,528,146 $3,244,376 66.80% $2,272,270 142.78%(1) Based on derived compensation using the provided employer contribution information for fiscal years 2017 and later.These tables are intended to show information for ten years; additional year’s information will be displayed as it becomes available.
Schedule of Employers’ NPL - CERS Hazardous Pension FundsAs of June 30 ($ in Thousands) Net Pension Liability as a Ratio of Plan Percentage of Total Pension Plan Fiduciary Net Pension Fiduciary Net Covered Covered
Year Liability (TPL) Net Position Liability Position to TPL Payroll(1) Payroll2020 $5,394,732 $2,379,704 $3,015,028 44.11% $559,551 538.83%2019 5,176,003 2,413,708 2,762,295 46.63% 553,541 499.02%2018 4,766,794 2,348,337 2,418,457 49.26% 562,853 429.68%2017 4,455,275 2,217,996 2,237,279 49.78% 526,559 424.89%2016 3,726,115 2,010,174 1,715,941 53.95% 526,334 326.02%2015 3,613,308 2,078,202 1,535,106 57.52% 483,641 317.41%2014 $3,288,826 $2,087,002 $1,201,824 63.46% $479,164 250.82%
(1) Based on derived compensation using the provided employer contribution information for fiscal years 2017 and later.These tables are intended to show information for ten years; additional year’s information will be displayed as it becomes available.
Board Meeting - December 3, 2020 - Review and Approval of CAFR
266

83 FIN
Schedule of Employers’ NPL - KERS Non-Hazardous Pension FundsAs of June 30 ($ in Thousands) Net Pension Liability as a Ratio of Plan Percentage of Total Pension Plan Fiduciary Net Pension Fiduciary Net Covered Covered
Year Liability (TPL) Net Position Liability Position to TPL Payroll(1) Payroll 2020 $16,472,733 $2,308,080 $14,164,653 14.01% $1,476,156 959.56% 2019 16,356,674 2,233,672 14,123,002 13.66% 1,485,854 950.50% 2018 15,608,221 2,004,446 13,603,775 12.84% 1,509,955 900.94% 2017 15,445,206 2,056,870 13,388,336 13.32% 1,602,396 835.52% 2016 13,379,781 1,980,292 11,399,489 14.80% 1,631,025 698.92% 2015 12,359,673 2,327,783 10,031,890 18.83% 1,544,234 649.64% 2014 $11,550,110 $2,578,291 $8,971,819 22.32% $1,577,496 568.74%(1) Based on derived compensation using the provided employer contribution information for fiscal years 2017 and later.These tables are intended to show information for ten years; additional year’s information will be displayed as it becomes available.
Schedule of Employers’ NPL - KERS Hazardous Pension FundsAs of June 30 ($ in Thousands) Net Pension Liability as a Ratio of Plan Percentage of Total Pension Plan Fiduciary Net Pension Fiduciary Net Covered Covered
Year Liability (TPL) Net Position Liability Position to TPL Payroll(1) Payroll 2020 $1,251,027 $690,350 $560,677 55.18% $171,840 326.28% 2019 1,227,226 680,932 546,294 55.49% 160,600 340.16% 2018 1,150,610 645,485 505,125 56.10% 152,936 330.29% 2017 1,098,630 601,529 497,101 54.75% 178,511 278.47% 2016 919,517 527,879 391,638 57.41% 158,828 246.58% 2015 895,433 552,468 342,965 61.70% 128,680 266.53% 2014 $816,850 $561,484 $255,366 68.74% $129,076 197.84%(1) Based on derived compensation using the provided employer contribution information for fiscal years 2017 and later.These tables are intended to show information for ten years; additional year’s information will be displayed as it becomes available.
Schedule of Employers’ NPL - SPRS Pension FundsAs of June 30 ($ in Thousands) Net Pension Liability as a Ratio of Plan Percentage of Total Pension Plan Fiduciary Net Pension Fiduciary Net Covered Covered
Year Liability (TPL) Net Position Liability Position to TPL Payroll(1) Payroll 2020 $1,049,237 $293,949 $755,288 28.02% $49,019 1,540.81% 2019 1,035,000 286,165 748,835 27.65% 49,515 1,512.34% 2018 969,622 267,572 702,050 27.60% 50,346 1,394.45% 2017 943,271 255,737 687,534 27.11% 54,065 1,271.68% 2016 795,421 218,012 577,409 27.41% 46,685 1,236.82% 2015 734,156 247,228 486,928 33.68% 45,765 1,063.97% 2014 $681,118 $260,974 $420,144 38.32% $44,616 941.69%(1) Based on derived compensation using the provided employer contribution information for fiscal years 2017 and later.These tables are intended to show information for ten years; additional year’s information will be displayed as it becomes available.
Board Meeting - December 3, 2020 - Review and Approval of CAFR
267

84FIN
Schedule of Changes in Employers’ TPL - CERS Non-HazardousAs of June 30 ($ in Thousands)Total Pension Liability (TPL) 2020 2019 2018 2017 2016 2015 2014Service Cost $280,092 $254,643 $254,169 $193,082 $209,101 $207,400 $192,482Interest 861,720 794,935 760,622 803,555 780,587 733,002 710,526Benefit Changes - - 15,708 - - - -Difference between Expected and Actual Experience 173,345 87,377 279,401 (208,015) - 49,966 -Changes of Assumptions - 727,351 - 1,388,800 - 606,293 -Benefit Payments (810,879) (780,608) (741,177) (701,891) (665,000) (628,858) (597,136)Net Change in TPL 504,278 1,083,698 568,723 1,475,532 324,687 967,803 305,872TPL – Beginning 14,192,966 13,109,268 12,540,545 11,065,013 10,740,325 9,772,522 9,466,650TPL – Ending (a) $14,697,244 $14,192,966 $13,109,268 $12,540,545 $11,065,013 $10,740,325 $9,772,522Plan Fiduciary Net Position (1) Contributions – Employer $475,416 $393,453 $358,017 $333,554 $284,105 $298,565 $324,231Contributions – Member (2) 168,994 159,064 160,370 150,715 141,674 140,311 128,568Net Investment Income (2) 56,180 390,664 573,829 825,900 (40,800) 110,568 895,530Retirement Benefit (795,960) (766,221) (726,569) (687,461) (651,246) (615,335) (582,850)Administrative Expense (22,304) (21,659) (19,592) (19,609) (19,385) (18,212) (18,615)Refunds of Contributions (14,918) (14,387) (14,608) (14,430) (13,753) (13,523) (14,286)Other - 44 (5) 361 (5) (42,827) (4) - 10,280 -Net Change in Plan Fiduciary Net Position (132,592) 140,958 331,808 545,843 (299,405) (87,346) 732,578Plan Fiduciary Net Position - Beginning 7,159,921 7,018,963 6,687,237 6,141,395 6,440,800 6,528,146 5,795,568Prior Year Adjustment 0 - (82) - - - -Plan Fiduciary Net Position – Ending (b) 7,027,329 7,159,921 7,018,963 6,687,237 6,141,395 6,440,800 6,528,146Net Pension Liability – Ending (a) – (b) $7,669,915 $7,033,045 $6,090,305 $5,853,308 $4,923,618 $4,299,525 $3,244,376Plan Fiduciary Net Position as a Percentage 47.81% 50.45% 53.54% 53.32% 55.50% 59.97% 66.80%Covered Payroll (3) $2,462,752 $2,424,796 $2,454,927 $2,376,290 $2,417,187 $2,296,716 $2,272,270Net Pension Liability as a Percentage of Covered Payroll 311.44% 290.05% 248.08% 246.32% 203.69% 187.20% 142.78%(1) Does not include 401(h) assets for fiscal years 2017 and later.(2) Does not include 401(h) contributions and investment income on 401(h) contributions for fiscal years 2017 and later.(3) Based on derived compensation using the provided employer contribution information for fiscal years 2017 and later.(4) Adjustment due to 401(h) plan asset balance that is considered an OPEB asset under GASB 74 for fiscal years 2017 and later.(5) Northern Trust Settlement.This table is intended to show information for ten years; additional year’s information will be displayed as it becomes available.
Board Meeting - December 3, 2020 - Review and Approval of CAFR
268

85 FIN
Schedule of Changes in Employers’ TPL - CERS HazardousAs of June 30 ($ in Thousands)Total Pension Liability (TPL) 2020 2019 2018 2017 2016 2015 2014Service Cost $109,887 $77,426 $81,103 $58,343 $66,249 $71,934 $66,761Interest 314,762 289,741 270,694 270,860 262,886 247,008 238,665Benefit Changes - - 2,172 - - - -Difference between Expected and Actual Experience 73,696 27,364 205,882 92,588 - 41,935 -Changes of Assumptions - 276,541 - 536,667 - 166,849 -Benefit Payments (279,616) (261,863) (248,332) (229,299) (216,327) (203,244) (192,299)Net Change in TPL 218,729 409,209 311,519 729,159 112,807 324,482 113,127TPL – Beginning 5,176,003 4,766,794 4,455,275 3,726,115 3,613,308 3,288,826 3,175,699TPL – Ending (a) $5,394,732 $5,176,003 $4,766,794 $4,455,275 $3,726,115 $3,613,308 $3,288,826Plan Fiduciary Net Position (1)
Contributions – Employer $168,443 $138,053 $127,660 $115,947 $105,713 $108,071 $115,240Contributions – Member (2) 63,236 58,661 61,089 60,101 52,972 47,692 43,722Net Investment Income (2) 15,914 132,232 191,324 270,473 (9,020) 37,104 288,490Retirement Benefit (275,802) (259,009) (244,118) (226,984) (213,448) (200,134) (189,635)Administrative Expense (1,981) (1,726) (1,504) (1,421) (1,366) (1,288) (1,721)Refunds of Contributions (3,814) (2,854) (4,214) (2,315) (2,879) (3,111) (2,664)Other - 14 (5) 111(5) (7,979) (4) - 2,865 -Net Change in Plan Fiduciary Net Position (34,004) 65,371 130,348 207,822 (68,028) (8,801) 253,432Plan Fiduciary Net Position – Beginning 2,413,708 2,348,337 2,217,996 2,010,174 2,078,202 2,087,002 1,833,570Prior Year Adjustment - - (7) - - - -Plan Fiduciary Net Position – Ending (b) 2,379,704 2,413,708 2,348,337 2,217,996 2,010,174 2,078,202 2,087,002Net Pension Liability – Ending (a) – (b) $3,015,028 $2,762,295 $2,418,457 $2,237,279 $1,715,941 $1,535,106 $1,201,824Plan Fiduciary Net Position as a Percentage 44.11% 46.63% 49.26% 49.78% 53.95% 57.52% 63.46%Covered Payroll (3) $559,551 $553,541 $562,853 $526,559 $526,334 $483,641 $479,164Net Pension Liability as a Percentage of Covered Payroll 538.83% 499.02% 429.68% 424.89% 326.02% 317.41% 250.82%(1) Does not include 401(h) assets for fiscal years 2017 and later.(2) Does not include 401(h) contributions and investment income on 401(h) contributions for fiscal years 2017 and later.(3) Based on derived compensation using the provided employer contribution information for fiscal years 2017 and later.(4) Adjustment due to 401(h) plan asset balance that is considered an OPEB asset under GASB 74 for fiscal years 2017 and later.(5) Northern Trust Settlement.This table is intended to show information for ten years; additional year’s information will be displayed as it becomes available.
Board Meeting - December 3, 2020 - Review and Approval of CAFR
269

86FIN
Schedule of Changes in Employers’ TPL - KERS Non-Hazardous As of June 30 ($ in Thousands) Total Pension Liability (TPL) 2020 2019 2018 2017 2016 2015 2014Service Cost $179,702 $184,988 $195,681 $143,858 $139,631 $143,847 $133,361Interest 832,178 793,163 785,123 870,725 891,897 859,509 853,653Benefit Changes - - 9,624 - - - -Difference between Expected and Actual Experience 115,515 70,529 153,565 (134,379) - 30,958 -Changes of Assumptions - 700,464 - 2,145,530 923,999 694,592 -Benefit Payments (1,011,336) (1,000,691) (980,978) (960,309) (935,419) (919,343) (903,564)Net Change in TPL 116,059 748,453 163,015 2,065,425 1,020,108 809,563 83,450TPL – Beginning 16,356,674 15,608,221 15,445,206 13,379,781 12,359,673 11,550,110 $11,466,660TPL – Ending (a) $16,472,733 $16,356,674 $15,608,221 $15,445,206 $13,379,781 $12,359,673 $11,550,110Plan Fiduciary Net Position (1)
Contributions – Employer $948,592 $1,035,462 $689,143 $757,121 $513,084 $521,691 $296,836Contributions – Member (2) 96,594 93,759 104,972 100,543 106,494 104,606 97,487Net Investment Income (2) 52,499 112,371 144,881 220,985 (20,663) 44,570 337,922Retirement Benefit (999,813) (988,349) (967,375) (948,490) (923,288) (905,791) (889,937)Administrative Expense (11,941) (11,712) (10,692) (10,957) (10,989) (10,474) (11,145)Refunds of Contributions (11,523) (12,342) (13,603) (11,819) (12,130) (13,552) (13,627)Other - 37 (5) 301 (5) (30,805) (4) - 8,442 -Net Change in Fiduciary Net Position 74,408 229,226 (52,373) 76,578 (347,491) (250,508) (182,463)Plan Fiduciary Net Position – Beginning 2,233,672 2,004,446 2,056,870 1,980,292 2,327,783 2,578,291 2,760,754Prior Year Adjustment - - (51) - - - -Plan Fiduciary Net Position – Ending (b) 2,308,080 2,233,672 2,004,446 2,056,870 1,980,292 2,327,783 2,578,291Net Pension Liability – Ending (a) – (b) $14,164,653 $14,123,002 $13,603,775 $13,388,336 $11,399,489 $10,031,890 $8,971,819Plan Fiduciary Net Position as a Percentage 14.01% 13.66% 12.84% 13.32% 14.80% 18.83% 22.32%Covered Payroll (3) $1,476,156 $1,485,854 $1,509,955 $1,602,396 $1,631,025 $1,544,234 $1,577,496Net Pension Liability as a Percentage of Covered Payroll 959.56% 950.50% 900.94% 835.52% 698.92% 649.64% 568.74%(1) Does not include 401(h) assets for fiscal years 2017 and later.(2) Does not include 401(h) contributions and investment income on 401(h) contributions for fiscal years 2017 and later.(3) Based on derived compensation using the provided employer contribution information for fiscal years 2017 and later.(4) Adjustment due to 401(h) plan asset balance that is considered an OPEB asset under GASB 74 for fiscal years 2017 and later.(5) Northern Trust Settlement.This table is intended to show information for ten years; additional year’s information will be displayed as it becomes available.
Board Meeting - December 3, 2020 - Review and Approval of CAFR
270

87 FIN
Schedule of Changes in Employers’ TPL - KERS HazardousAs of June 30 ($ in Thousands)Total Pension Liability (TPL) 2020 2019 2018 2017 2016 2015 2014Service Cost $25,568 $27,117 $28,641 $21,081 $20,751 $18,729 $16,880Interest 74,357 69,657 66,536 66,589 64,851 61,005 59,594Benefit Changes - - 705 - - - -Difference between Expected and Actual Experience (1,095) 1,395 24,215 26,902 - 6,067 -Changes of Assumptions - 50,658 - 127,878 - 52,165 -Benefit Payments (75,029) (72,211) (68,117) (63,338) (61,518) (59,383) (57,151)Net Change in TPL 23,801 76,616 51,980 179,112 24,084 78,583 19,323TPL – Beginning 1,227,226 1,150,610 1,098,630 919,517 895,433 816,850 797,527TPL – Ending (a) $1,251,027 $1,227,226 $1,150,610 $1,098,630 $919,517 $895,433 $816,850Plan Fiduciary Net Position (1)
Contributions – Employer $59,115 $55,259 $43,661 $52,974 $23,759 $28,536 $11,670Contributions - Member (2) 19,769 17,118 17,891 17,524 15,739 13,207 12,546Net Investment Income 6,739 36,380 51,467 70,994 (1,653) 8,701 80,724Retirement Benefit (71,861) (69,527) (65,616) (61,231) (59,306) (56,773) (54,320)Administrative Expense (1,176) (1,103) (975) (919) (916) (844) (897)Refunds of Contributions (3,168) (2,684) (2,501) (2,106) (2,211) (2,610) (2,830)Other - 4 (5) 33 (5) (3,586) (4) - 767 -Net Change in Plan Fiduciary Net Position 9,418 35,447 43,960 73,650 (24,588) (9,016) 46,893Plan Fiduciary Net Position – Beginning 680,932 645,485 601,529 527,879 552,468 561,484 514,591Prior Year Adjustment 0 0 (4) 0 0 0 0Fiduciary Net Position – Ending (b) 690,350 680,932 645,485 601,529 527,879 552,468 561,484Net Pension Liability – Ending (a) – (b) $560,677 $546,294 $505,125 $497,101 $391,638 $342,965 $255,366Plan Fiduciary Net Position as a Percentage 55.18% 55.49% 56.10% 54.75% 57.41% 61.70% 68.74%Covered Payroll (3) $171,840 $160,600 $152,936 $178,511 $158,828 $128,680 $129,076Net Pension Liability as a Percentage of Covered Payroll 326.28% 340.16% 330.29% 278.47% 246.58% 266.53% 197.84%(1) Does not include 401(h) assets for fiscal years 2017 and later.(2) Does not include 401(h) contributions and investment income on 401(h) contributions for fiscal years 2017 and later.(3) Based on derived compensation using the provided employer contribution information for fiscal years 2017 and later.(4) Adjustment due to 401(h) plan asset balance that is considered an OPEB asset under GASB 74 for fiscal years 2017 and later.(5) Northern Trust Settlement.This table is intended to show information for ten years; additional year’s information will be displayed as it becomes available.
Board Meeting - December 3, 2020 - Review and Approval of CAFR
271

88FIN
Schedule of Changes in Employer’s TPL - SPRSAs of June 30 ($ in Thousands)Total Pension Liability (TPL) 2020 2019 2018 2017 2016 2015 2014Service Cost $13,192 $11,726 $11,890 $8,297 $8,402 $7,695 $7,142Interest 52,697 49,301 47,978 51,769 52,951 50,661 50,391Benefit Changes - - 184 - - - -Difference between Expected and Actual Experience 10,859 20,952 25,126 8,143 - 9,331 -Changes of Assumptions - 44,510 - 136,602 56,191 40,201 -Benefit Payments (62,511) (61,111) (58,827) (56,960) (56,279) (54,850) (53,239)Net Change in TPL 14,237 65,378 26,351 147,850 61,265 53,038 4,294TPL - Beginning 1,035,000 969,622 943,271 795,421 734,156 681,118 676,824TPL – Ending (a) $1,049,237 $1,035,000 $969,622 $943,271 $795,421 $734,156 $681,118Plan Fiduciary Net Position (1)
Contributions – Employer $59,453 $60,048 $46,877 $63,239 $25,822 $31,990 $20,279Contributions - Member (2) 4,767 5,062 5,522 5,348 5,263 5,244 5,075Net Investment Income (2) 6,341 14,816 18,437 26,795 (3,843) 3,426 40,374Retirement Benefit (62,423) (60,949) (58,805) (56,934) (56,268) (54,765) (53,026)Administrative Expense (266) (225) (194) (181) (178) (201) (215)Refunds of Contributions (88) (162) (22) (26) (11) (85) (213)Other - 3 (5) 21 (5) (517) (4) - 645 -Net Change in Plan Fiduciary Net Position 7,784 18,593 11,836 37,724 (29,215) (13,746) 12,274Plan Fiduciary Net Position – Beginning 286,165 267,572 255,737 218,012 247,228 260,974 248,700Prior Year Adjustment 0 0 (1) 0 0 0 0Plan Fiduciary Net Position – Ending (b) 293,949 286,165 267,572 255,737 218,012 247,228 260,974Net Pension Liability – Ending (a) – (b) $755,288 $748,835 $702,050 $687,534 $577,409 $486,928 $420,144Plan Fiduciary Net Position as a Percentage 28.02% 27.65% 27.60% 27.11% 27.41% 33.68% 38.32%Covered Payroll (3) $49,019 $49,515 $50,346 $54,065 $46,685 $45,765 $44,616Net Pension Liability as a Percentage of Covered Payroll 1,540.81% 1,512.34% 1,394.45% 1,271.68% 1,236.82% 1,063.97% 941.69%(1) Does not include 401(h) assets for fiscal years 2017 and later.(2) Does not include 401(h) contributions and investment income on 401(h) contributions for fiscal years 2017 and later.(3) Based on derived compensation using the provided employer contribution information for fiscal years 2017 and later.(4) Adjustment due to 401(h) plan asset balance that is considered an OPEB asset under GASB 74 for fiscal years 2017 and later.(5) Northern Trust Settlement.This table is intended to show information for ten years; additional year’s information will be displayed as it becomes available.
Board Meeting - December 3, 2020 - Review and Approval of CAFR
272

89 FIN
The actuarially determined contribution rates effective for fiscal year ended 2020 that are documented in the schedule on the following pages, were calculated as of June 30, 2018, for CERS plans and as of June 30, 2017, for KERS and SPRS plans. Based on the June 30, 2018, and the June 30, 2017, actuarial valuation report, the actuarial methods and assumptions used to calculate these contribution rates are below:
Notes to Schedule of Employers’ Contribution CERS CERS KERS KERS SPRS
ItemNon-
Hazardous HazardousNon-
Hazardous Hazardous Determined by the Actuarial Valuation as of: June 30, 2018 June 30, 2018 June 30, 2017 June 30, 2017 June 30, 2017Actuarial Cost Method: Entry Age Normal Entry Age Normal Entry Age Normal Entry Age Normal Entry Age Normal
Asset Valuation Method:
20 % of the difference between the market value of assets and the expected actuarial value of assets is recognized
20 % of the difference between the market value of assets and the expected actuarial value of assets is recognized
20 % of the difference between the market value of assets and the expected actuarial value of assets is recognized
20 % of the difference between the market value of assets and the expected actuarial value of assets is recognized
20 % of the difference between the market value of assets and the expected actuarial value of assets is recognized
Amortization Method:Level Percent of Pay
Level Percent of Pay
Level Percent of Pay
Level Percent of Pay
Level Percent of Pay
Amortization Period: 25 Years, Closed 25 Years, Closed 26 Years, Closed 26 Years, Closed 26 Years, ClosedPayroll Growth 2.00% 2.00% 0.00% 0.00% 0.00%Investment Return: 6.25% 6.25% 5.25% 6.25% 5.25%Inflation: 2.30% 2.30% 2.30% 2.30% 2.30%
Salary Increase:3.30% to 11.55%, varies by service
3.05% to 18.55%, varies by service
3.55% to 15.55%, varies by service
3.55% to 19.55%, varies by service
3.05% to 15.55%, varies by service
Mortality:
RP-2000 Combined Mortality Table, projected to 2013 with Scale BB (set back 1 year for females)
RP-2000 Combined Mortality Table, projected to 2013 with Scale BB (set back 1 year for females)
RP-2000 Combined Mortality Table, projected to 2013 with Scale BB (set back 1 year for females)
RP-2000 Combined Mortality Table, projected to 2013 with Scale BB (set back 1 year for females)
RP-2000 Combined Mortality Table, projected to 2013 with Scale BB (set back 1 year for females)
Phase-In provision
Board certified rate is phased into the actuarially determined rate in accordance with HB 362 enacted in 2018.
Board certified rate is phased into the actuarially determined rate in accordance with HB 362 enacted in 2018. N/A N/A N/A
Board Meeting - December 3, 2020 - Review and Approval of CAFR
273
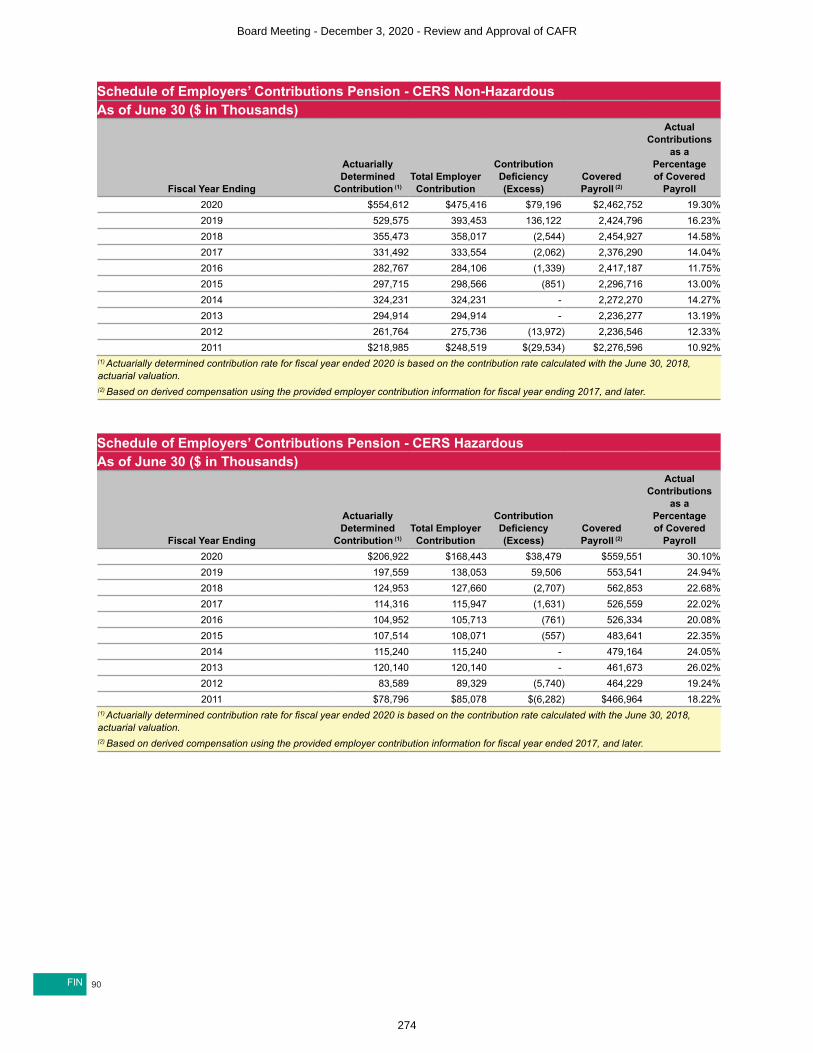
90FIN
Schedule of Employers’ Contributions Pension - CERS Non-HazardousAs of June 30 ($ in Thousands)
Fiscal Year Ending
Actuarially Determined
Contribution (1)Total Employer
Contribution
Contribution Deficiency (Excess)
Covered Payroll (2)
Actual Contributions
as a Percentage of Covered
Payroll2020 $554,612 $475,416 $79,196 $2,462,752 19.30%2019 529,575 393,453 136,122 2,424,796 16.23%2018 355,473 358,017 (2,544) 2,454,927 14.58%2017 331,492 333,554 (2,062) 2,376,290 14.04%2016 282,767 284,106 (1,339) 2,417,187 11.75%2015 297,715 298,566 (851) 2,296,716 13.00%2014 324,231 324,231 - 2,272,270 14.27%2013 294,914 294,914 - 2,236,277 13.19%2012 261,764 275,736 (13,972) 2,236,546 12.33%2011 $218,985 $248,519 $(29,534) $2,276,596 10.92%
(1) Actuarially determined contribution rate for fiscal year ended 2020 is based on the contribution rate calculated with the June 30, 2018, actuarial valuation.(2) Based on derived compensation using the provided employer contribution information for fiscal year ending 2017, and later.
Schedule of Employers’ Contributions Pension - CERS HazardousAs of June 30 ($ in Thousands)
Fiscal Year Ending
Actuarially Determined
Contribution (1)Total Employer
Contribution
Contribution Deficiency (Excess)
Covered Payroll (2)
Actual Contributions
as a Percentage of Covered
Payroll2020 $206,922 $168,443 $38,479 $559,551 30.10%2019 197,559 138,053 59,506 553,541 24.94%2018 124,953 127,660 (2,707) 562,853 22.68%2017 114,316 115,947 (1,631) 526,559 22.02%2016 104,952 105,713 (761) 526,334 20.08%2015 107,514 108,071 (557) 483,641 22.35%2014 115,240 115,240 - 479,164 24.05%2013 120,140 120,140 - 461,673 26.02%2012 83,589 89,329 (5,740) 464,229 19.24%2011 $78,796 $85,078 $(6,282) $466,964 18.22%
(1) Actuarially determined contribution rate for fiscal year ended 2020 is based on the contribution rate calculated with the June 30, 2018, actuarial valuation.(2) Based on derived compensation using the provided employer contribution information for fiscal year ended 2017, and later.
Board Meeting - December 3, 2020 - Review and Approval of CAFR
274

91 FIN
Schedule of Employers’ Contributions Pension - KERS Non-HazardousAs of June 30 ($ in Thousands)
Fiscal Year Ending
Actuarially Determined
Contribution (1)Total Employer
Contribution
Contribution Deficiency (Excess)
Covered Payroll (2)
Actual Contributions
as a Percentage of Covered
Payroll2020 $1,048,513 $948,592 $99,921 $1,476,156 64.26%2019 1,055,402 1,035,462 19,940 1,485,854 69.69%2018 633,879 689,143 (55,264) 1,509,955 45.64%2017 623,813 757,121 (133,308) 1,602,396 47.25%2016 512,670 513,084 (414) 1,631,025 31.46%2015 520,948 521,691 (743) 1,544,234 33.78%2014 520,765 296,836 223,929 1,577,496 18.82%2013 485,396 280,874 204,522 1,644,409 17.08%2012 441,094 214,786 226,308 1,644,897 13.06%2011 $381,915 $193,754 $188,161 $1,731,633 11.19%
(1) Actuarially determined contribution rate for fiscal year ended 2020 is based on the contribution rate calculated with the June 30, 2017, actuarial valuation.(2) Based on derived compensation using the provided employer contribution information for fiscal year ended 2017 and later.
Schedule of Employers’ Contributions Pension - KERS HazardousAs of June 30 ($ in Thousands)
Fiscal Year Ending
Actuarially Determined
Contribution (1)Total Employer
Contribution
Contribution Deficiency (Excess)
Covered Payroll (2)
Actual Contributions
as a Percentage of Covered
Payroll2020 $59,096 $59,115 $(19) $171,840 34.40%2019 55,230 55,259 (29) 160,600 34.41%2018 31,321 43,661 (12,340) 152,936 28.55%2017 37,630 52,974 (15,344) 178,511 29.68%2016 23,690 23,759 (69) 158,828 14.96%2015 28,374 28,536 (162) 128,680 22.18%2014 13,570 11,670 1,900 129,076 9.04%2013 21,502 27,334 (5,832) 131,015 20.86%2012 20,265 20,809 (544) 131,977 15.77%2011 $20,605 $19,141 $1,464 $133,054 14.39%
(1) Actuarially determined contribution rate for fiscal year ended 2020 is based on the contribution rate calculated with the June 30, 2017, actuarial valuation.(2) Based on derived compensation using the provided employer contribution information for fiscal year ended 2017, and later.
Board Meeting - December 3, 2020 - Review and Approval of CAFR
275

92FIN
Schedule of Employer’s Contributions Pension - SPRSAs of June 30 ($ in Thousands)
Fiscal Year Ending
Actuarially Determined
Contribution (1)Total Employer
Contribution
Contribution Deficiency (Excess)
Covered Payroll (2)
Actual Contributions
as a Percentage of Covered
Payroll2020 $58,358 $59,453 $(1,095) $49,019 121.29%2019 58,948 60,048 (1,100) 49,515 121.27%2018 36,033 46,877 (10,844) 50,346 93.11%2017 35,937 63,240 (27,303) 54,065 116.97%2016 25,723 25,822 (99) 46,685 55.31%2015 31,444 31,990 (546) 45,765 69.90%2014 25,808 20,279 5,529 44,616 45.45%2013 23,117 18,501 4,616 45,256 40.88%2012 20,498 15,362 5,136 48,373 31.76%2011 $18,463 $12,657 $5,806 $48,693 25.99%
(1) Actuarially determined contribution rate for fiscal year ended 2020 is based on the contribution rate calculated with the June 30, 2017, actuarial valuation.(2) Based on derived compensation using the provided employer contribution information for fiscal year ended 2017, and later.
Schedule of the Employers’ Net OPEB Liability - CERS Non-Hazardous PlanAs of June 30 ($ in Thousands)
YearTotal OPEB
LiabilityPlan Fiduciary Net Position
Net OPEB Liability/(Asset)
Plan Fiduciary Net Position as a Percentage of the Total OPEB
LiabilityCovered Payroll (1)
Net OPEB Liability as a Percentage of Covered
Payroll2020 $4,996,309 $2,581,613 $2,414,696 51.67% $2,620,585 92.14%2019 4,251,466 2,569,511 1,681,955 60.44% 2,577,378 65.26%2018 4,189,606 2,414,126 1,775,480 57.62% 2,570,156 69.08%2017 $4,222,878 $2,212,536 $2,010,342 52.39% $2,480,130 81.06%(1) Based on derived compensation using the provided employer contribution information.This table is intended to show information for ten years; additional year’s information will be displayed as it becomes available.
Schedule of the Employers’ Net OPEB Liability - CERS Hazardous PlanAs of June 30 ($ in Thousands)
YearTotal OPEB
LiabilityPlan Fiduciary Net Position
Net OPEB Liability/(Asset)
Plan Fiduciary Net Position as a Percentage of the Total OPEB
LiabilityCovered Payroll (1)
Net OPEB Liability as a Percentage of Covered
Payroll2020 $2,245,222 $1,321,117 $924,105 58.84% $596,001 155.05%2019 2,080,574 1,340,714 739,860 64.44% 583,632 126.77%2018 1,993,941 1,280,982 712,959 64.24% 588,526 121.14%2017 $2,015,673 $1,189,001 $826,672 58.99% $542,710 152.32%(1) Based on derived compensation using the provided employer contribution information.This table is intended to show information for ten years; additional year’s information will be displayed as it becomes available.
Board Meeting - December 3, 2020 - Review and Approval of CAFR
276

93 FIN
Schedule of the Employers’ Net OPEB Liability - KERS Non-Hazardous PlanAs of June 30 ($ in Thousands)
YearTotal OPEB
LiabilityPlan Fiduciary Net Position
Net OPEB Liability/(Asset)
Plan Fiduciary Net Position as a Percentage of the Total OPEB
LiabilityCovered Payroll (1)
Net OPEB Liability as a
Percentage of Covered Payroll
2020 $3,599,557 $1,060,649 $2,538,908 29.47% $1,482,431 171.27%2019 3,217,985 995,089 2,222,896 30.92% 1,515,953 146.63%2018 3,262,117 891,205 2,370,912 27.32% 1,573,898 150.64%2017 $3,353,332 $817,370 $2,535,962 24.37% $1,593,097 159.18%(1) Based on derived compensation using the provided employer contribution information.This table is intended to show information for ten years; additional year’s information will be displayed as it becomes available.
Schedule of the Employers’ Net OPEB Liability - KERS Hazardous PlanAs of June 30 ($ in Thousands)
YearTotal OPEB
LiabilityPlan Fiduciary Net Position
Net OPEB Liability/(Asset)
Plan Fiduciary Net Position as a Percentage of the Total OPEB
LiabilityCovered Payroll (1)
Net OPEB Liability as a Percentage of Covered
Payroll2020 $564,524 $521,755 $42,769 92.42% $182,209 23.47%2019 507,204 534,053 (26,849) 105.29% 151,448 (17.73)%2018 485,904 519,072 (33,168) 106.83% 190,317 (17.43)%2017 $494,869 $488,838 $6,031 98.78% $171,087 3.53%(1) Based on derived compensation using the provided employer contribution information.This table is intended to show information for ten years; additional year’s information will be displayed as it becomes available.
Schedule of the Employer’s Net OPEB Liability - SPRS PlanAs of June 30 ($ in Thousands)
YearTotal OPEB
LiabilityPlan Fiduciary Net Position
Net OPEB Liability/(Asset)
Plan Fiduciary Net Position as a Percentage of the Total OPEB
Liability Covered Payroll (1)
Net OPEB Liability as a
Percentage of Covered Payroll
2020 $339,942 $201,340 $138,602 59.23% $48,231 287.37%2019 312,553 201,206 111,347 64.38% 48,780 228.26%2018 301,012 190,847 110,165 63.40% 50,064 220.05%2017 $313,234 $178,838 $134,396 57.09% $48,873 274.99%(1) Based on derived compensation using the provided employer contribution information.This table is intended to show information for ten years; additional year’s information will be displayed as it becomes available.
Board Meeting - December 3, 2020 - Review and Approval of CAFR
277

94FIN
Schedule of Changes in Employers’ Net OPEB Liability - CERS Non-Hazardous PlanAs of June 30 ($ in Thousands) 2020 2019 2018 2017Total OPEB LiabilityService Cost $131,289 $119,011 $122,244 $85,468Interest on Total OPEB liability 236,126 240,352 242,048 240,854Benefit Changes - - 4,306 -Difference between Expected and Actual Experience 505,843 (404,301) (240,568) (6,641)Assumption Changes 60,225 268,842 (4,876) 520,286Benefit Payments (1) (188,640) (162,044) (156,426) (140,120)Net Change in Total OPEB Liability 744,843 61,860 (33,272) 699,847Total OPEB Liability - Beginning 4,251,466 4,189,606 4,222,878 3,523,031Total OPEB Liability - Ending (a) $4,996,309 $4,251,466 $4,189,606 $4,222,878Plan Fiduciary Net PositionContributions – Employer (2) $179,521 $168,905 $145,809 $133,326Contributions – Member 12,964 11,801 10,825 9,158Benefit Payments (1) (188,640) (162,044) (156,426) (140,120)OPEB Plan Net Investment Income 9,160 137,591 202,068 264,782OPEB Plan Administrative Expense (903) (877) (761) (789)Other (4) - 9 75 -Net Change in Plan Fiduciary Net Position 12,102 155,385 201,590 266,357Plan Fiduciary Net Position – Beginning 2,569,511 2,414,126 2,212,536 1,946,179Plan Fiduciary Net Position – Ending (b) 2,581,613 2,569,511 2,414,126 2,212,536Net OPEB Liability – Ending (a) – (b) $2,414,696 $1,681,955 $1,775,480 $2,010,342Plan Fiduciary Net Position as a Percentage of the Total OPEB Liability 51.67% 60.44% 57.62% 52.39%Covered Payroll (3) $2,620,585 $2,577,378 $2,570,156 $2,480,130Net OPEB Liability as a Percentage of Covered Employee Payroll 92.14% 65.26% 69.08% 81.06%(1) Benefit payments include expected benefits due to the implicit subsidy for members under age 65. They are also offset by insurance premiums received from retirees, Medicare Drug Reimbursements, and Humana Gain Share Payments (in applicable years).(2) Employer contributions include expected benefits due to the implicit subsidy for members under age 65.(3) Based on derived compensation using the provided employer contribution information.(4) Northern Trust Settlement.This table is intended to show information for ten years; additional year’s information will be displayed as it becomes available.
Board Meeting - December 3, 2020 - Review and Approval of CAFR
278

95 FIN
Schedule of Changes in Employers’ Net OPEB Liability - CERS Hazardous PlanAs of June 30 ($ in Thousands) 2020 2019 2018 2017Total OPEB LiabilityService Cost $47,443 $32,623 $33,948 $20,493Interest on Total OPEB liability 115,998 116,768 118,009 113,166Benefit Changes - - 484 -Difference between Expected and Actual Experience 38,156 (103,317) (100,348) (2,470)Assumption Changes 46,925 116,618 (2,500) 391,061Benefit Payments (1) (83,874) (76,059) (71,325) (63,656)Net Change in Total OPEB Liability 164,648 86,633 (21,732) 458,594Total OPEB Liability - Beginning 2,080,574 1,993,941 2,015,673 1,557,079Total OPEB Liability - Ending (a) $2,245,222 $2,080,574 $1,993,941 $2,015,673Plan Fiduciary Net PositionContributions – Employer (2) $59,662 $60,445 $51,615 $44,325Contributions – Member 2,762 2,458 2,173 1,708Benefit Payments (1) (83,874) (76,059) (71,325) (63,656)OPEB Plan Net Investment Income 2,315 73,317 109,854 143,892OPEB Plan Administrative Expense (462) (434) (376) (381)Other (4) - 5 40 -Net Change in Plan Fiduciary Net Position (19,597) 59,732 91,981 125,888Plan Fiduciary Net Position – Beginning 1,340,714 1,280,982 1,189,001 1,063,113Plan Fiduciary Net Position – Ending (b) 1,321,117 1,340,714 1,280,982 1,189,001Net OPEB Liability – Ending (a) – (b) $924,105 $739,860 $712,959 $826,672Plan Fiduciary Net Position as a Percentage of the Total OPEB Liability 58.84% 64.44% 64.24% 58.99%Covered Payroll (3) $596,001 $583,632 $588,526 $542,710Net OPEB Liability as a Percentage of Covered Employee Payroll 155.05% 126.77% 121.14% 152.32%(1) Benefit payments include expected benefits due to the implicit subsidy for members under age 65. They are also offset by insurance premiums received from retirees, Medicare Drug Reimbursements, and Humana Gain Share Payments (in applicable years).(2) Includes expected benefits due to the implicit subsidy for members under age 65.(3) Based on derived compensation using the provided employer contribution information.(4) Northern Trust Settlement.This table is intended to show information for ten years; additional year’s information will be displayed as it becomes available.
Board Meeting - December 3, 2020 - Review and Approval of CAFR
279

96FIN
Schedule of Changes in Employers’ Net OPEB Liability - KERS Non-Hazardous PlanAs of June 30 ($ in Thousands) 2020 2019 2018 2017Total OPEB Liability Service Cost $59,600 $61,345 $66,360 $46,992Interest 179,811 186,820 191,178 192,911Benefit Changes - - 1,865 -Difference between Expected and Actual Experience 288,235 (302,189) (191,147) (3,921)Changes of Assumptions 13,767 158,004 (11,235) 414,835Benefit Payments (1) (159,841) (148,112) (148,236) (139,601)Net Change in Total OPEB Liability 381,572 (44,132) (91,215) 511,216Total OPEB Liability - Beginning 3,217,985 3,262,117 3,353,332 2,842,116Total OPEB Liability - Ending (a) $3,599,557 $3,217,985 $3,262,117 $3,353,332Plan Fiduciary Net Position Contributions – Employer (2) $208,300 $201,155 $152,985 $162,636Contributions – Member 6,128 5,963 5,786 5,156Benefit Payments (1) (159,841) (148,112) (148,236) (139,601)OPEB Plan Net Investment Income 11,820 45,749 64,028 94,239OPEB Plan Administrative Expense (847) (875) (760) (861)Other (4) - 4 32 -Net Change in Plan Fiduciary Net Position 65,560 103,884 73,835 121,569Plan Fiduciary Net Position – Beginning 995,089 891,205 817,370 695,801Plan Fiduciary Net Position – Ending (b) 1,060,649 995,089 891,205 817,370Net OPEB Liability – Ending (a) – (b) $2,538,908 $2,222,896 $2,370,912 $2,535,962Plan Fiduciary Net Position as a Percentage of the Total OPEB Liability 29.47% 30.92% 27.32% 24.37%Covered Payroll (3) $1,482,431 $1,515,953 $1,573,898 $1,593,097Net OPEB Liability as a Percentage of Covered Employee Payroll 171.27% 146.63% 150.64% 159.18%(1) Benefit payments include expected benefits due to the implicit subsidy for members under age 65. They are also offset by insurance premiums received from retirees, Medicare Drug Reimbursements, and Humana Gain Share Payments (in applicable years).(2) Employer contributions includes expected benefits due to the implicit subsidy for members under age 65.(3) Based on derived compensation using the provided employer contribution information.(4) Northern Trust Settlement.This table is intended to show information for ten years; additional year’s information will be displayed as it becomes available.
Board Meeting - December 3, 2020 - Review and Approval of CAFR
280

97 FIN
Schedule of Changes in Employers’ Net OPEB Liability - KERS Hazardous PlanAs of June 30 ($ in Thousands) 2020 2019 2018 2017Total OPEB Liability Service Cost $11,548 $12,337 $12,893 $8,002Interest on Total OPEB liability 28,101 27,990 28,500 27,591Benefit Changes - - 167 -Difference between Expected and Actual Experience 27,668 (30,947) (31,240) (1,029)Assumption Changes 11,428 31,687 (581) 89,401Benefit Payments (1) (21,425) (19,767) (18,704) (16,618)Net Change in Total OPEB Liability 57,320 21,300 (8,965) 107,347Total OPEB Liability - Beginning 507,204 485,904 494,869 387,522Total OPEB Liability - Ending (a) $564,524 $507,204 $485,904 $494,869Plan Fiduciary Net PositionContributions – Employer (2) $7,441 $5,556 $5,165 $4,579Contributions – Member 1,105 934 909 811Benefit Payments (1) (21,425) (19,767) (18,704) (16,618)OPEB Plan Net Investment Income 704 28,373 42,950 59,614OPEB Plan Administrative Expense (123) (117) (104) (105)Other (4) 0 2 18 -Net Change in Plan Fiduciary Net Position (12,298) 14,981 30,234 48,281Plan Fiduciary Net Position – Beginning 534,053 519,072 488,838 440,557Plan Fiduciary Net Position – Ending (b) 521,755 534,053 519,072 488,838Net OPEB Liability – Ending (a) – (b) $42,769 $(26,849) $(33,168) $6,031Plan Fiduciary Net Position as a Percentage of the Total OPEB Liability 92.42% 105.29% 106.83% 98.78%Covered Payroll (3) $182,209 $151,448 $190,317 $171,087Net OPEB Liability as a Percentage of Covered Employee Payroll 23.47% (17.73)% (17.43)% 3.53%(1) Benefit payments include expected benefits due to the implicit subsidy for members under age 65. They are also offset by insurance premiums received from retirees, Medicare Drug Reimbursements, and Humana Gain Share Payments (in applicable years).(2) Employer contributions includes expected benefits due to the implicit subsidy for members under age 65.(3) Based on derived compensation using the provided employer contribution information.(4) Northern Trust Settlement.This table is intended to show information for ten years; additional year’s information will be displayed as it becomes available.
Board Meeting - December 3, 2020 - Review and Approval of CAFR
281

98FIN
Schedule of Changes in Employer’s Net OPEB Liability - SPRS Plan As of June 30 ($ in Thousands) 2020 2019 2018 2017Total OBEP LiabilityService Cost $5,389 $4,816 $6,087 $4,147Interest on Total OPEB liability 17,600 17,724 18,432 17,993Benefit Changes - - 34 -Difference between Expected and Actual Experience 13,810 (14,295) (23,320) (573)Assumption Changes 4,578 16,483 (358) 57,312Benefit Payments (1) (13,988) (13,187) (13,097) (12,123)Net Change in Total OPEB Liability 27,389 11,541 (12,222) 66,756Total OPEB Liability - Beginning 312,553 301,012 313,234 246,478Total OPEB Liability - Ending (a) $339,942 $312,553 $301,012 $313,234Plan Fiduciary Net PositionContributions – Employer (2) $12,873 $12,623 $8,535 $7,862Contributions – Member 196 176 155 131Benefit Payments (1) (13,988) (13,187) (13,097) (12,123)OPEB Plan Net Investment Income 1,124 10,815 16,470 21,627OPEB Plan Administrative Expense (71) (69) (62) (66)Other (4) - 1 8 -Net Change in Plan Fiduciary Net Position 134 10,359 12,009 17,431Plan Fiduciary Net Position – Beginning 201,206 190,847 178,838 161,407Plan Fiduciary Net Position – Ending (b) 201,340 201,206 190,847 178,838Net OPEB Liability – Ending (a) – (b) $138,602 $111,347 $110,165 $134,396Plan Fiduciary Net Position as a Percentage of the Total OPEB Liability 59.23% 64.38% 63.40% 57.09%Covered Payroll (3) $48,231 $48,780 $50,064 $48,873Net OPEB Liability as a Percentage of Covered Employee Payroll 287.37% 228.26% 220.05% 274.99%(1) Benefit payments include expected benefits due to the implicit subsidy for members under age 65. They are also offset by insurance premiums received from retirees, Medicare Drug Reimbursements, and Humana Gain Share Payments (in applicable years).(2) Employer contributions includes expected benefits due to the implicit subsidy for members under age 65.(3) Based on derived compensation using the provided employer contribution information.(4) Northern Trust Settlement.This table is intended to show information for ten years; additional year’s information will be displayed as it becomes available.
Board Meeting - December 3, 2020 - Review and Approval of CAFR
282

99 FIN
The actuarially determined contribution rates effective for fiscal year ending 2020 that are documented in the schedules on the previous pages are calculated as of June 30, 2017, for KERS and SPRS plans and June 30, 2018, for the CERS plans. Based on the June 30, 2017, and June 30, 2018, actuarial valuation report, the actuarial methods and assumptions used to calculate these contribution rates are below.
Notes to Schedule of Employers’ OPEB Contributions
Item
CERS CERS KERS KERS SPRSNon-
Hazardous HazardousNon-
Hazardous Hazardous Determined by the Actuarial Valuation as of: June 30, 2018 June 30, 2018 June 30, 2017 June 30, 2017 June 30, 2017Actuarial Cost Method: Entry Age Normal Entry Age Normal Entry Age Normal Entry Age Normal Entry Age Normal
Asset Valuation Method:
20 % of the difference between the market value of assets and the expected actuarial value of assets is recognized
20 % of the difference between the market value of assets and the expected actuarial value of assets is recognized
20 % of the difference between the market value of assets and the expected actuarial value of assets is recognized
20 % of the difference between the market value of assets and the expected actuarial value of assets is recognized
20 % of the difference between the market value of assets and the expected actuarial value of assets is recognized
Amortization Method: Level Percent of Pay Level Percent of PayLevel Percent of Pay
Level Percent of Pay
Level Percent of Pay
Amortization Period: 25 Years, Closed 25 Years, Closed 26 Years, Closed 26 Years, Closed 26 Years, ClosedPayroll Growth Rate: 2.00% 2.00% 0.00% 0.00% 0.00%Investment Return: 6.25% 6.25% 6.25% 6.25% 6.25%Inflation: 2.30% 2.30% 2.30% 2.30% 2.30%
Salary Increase:3.30% to 11.55%, varies by service
3.05% to 18.55%, varies by service
3.55% to 15.55%, varies by service
3.55% to 19.55%, varies by service
3.05% to 15.55%, varies by service
Mortality:
RP-2000 Combined Mortality Table, projected to 2013 with Scale BB (set back 1 year for females)
RP-2000 Combined Mortality Table, projected to 2013 with Scale BB (set back 1 year for females)
RP-2000 Combined Mortality Table, projected to 2013 with Scale BB (set back 1 year for females)
RP-2000 Combined Mortality Table, projected to 2013 with Scale BB (set back 1 year for females)
RP-2000 Combined Mortality Table, projected to 2013 with Scale BB (set back 1 year for females)
Healthcare Trend Rates:
Pre-65
Initial trend starting at 7.00% at January 1, 2020 and gradually decreasing to an ultimate trend rate of 4.05% over a period of 12 years. The 2019 premiums were known at the time of the valuation and were incorporated into the liability measurement.
Initial trend starting at 7.00% at January 1, 2020 and gradually decreasing to an ultimate trend rate of 4.05% over a period of 12 years. The 2019 premiums were known at the time of the valuation and were incorporated into the liability measurement.
Initial trend starting at 7.25% at January 1, 2019 and gradually decreasing to an ultimate trend rate of 4.05% over a period of 13 years. The 2018 premiums were known at the time of the valuation and were incorporated into the liability measurement.
Initial trend starting at 7.25% at January 1, 2019 and gradually decreasing to an ultimate trend rate of 4.05% over a period of 13 years. The 2018 premiums were known at the time of the valuation and were incorporated into the liability measurement.
Initial trend starting at 7.25% at January 1, 2019 and gradually decreasing to an ultimate trend rate of 4.05% over a period of 13 years. The 2018 premiums were known at the time of the valuation and were incorporated into the liability measurement.
Post-65
Initial trend starting at 5.00% at January 1, 2020 and gradually decreasing to an ultimate trend rate of 4.05% over a period of 10 years. The 2019 premiums were known at the time of the valuation and were incorporated into the liability measurement.
Initial trend starting at 5.00% at January 1, 2020 and gradually decreasing to an ultimate trend rate of 4.05% over a period of 10 years. The 2019 premiums were known at the time of the valuation and were incorporated into the liability measurement.
Initial trend starting at 5.10% at January 1, 2019 and gradually decreasing to an ultimate trend rate of 4.05% over a period of 11 years. The 2018 premiums were known at the time of the valuation and were incorporated into the liability measurement.
Initial trend starting at 5.10% at January 1, 2019 and gradually decreasing to an ultimate trend rate of 4.05% over a period of 11 years. The 2018 premiums were known at the time of the valuation and were incorporated into the liability measurement.
Initial trend starting at 5.10% at January 1, 2019 and gradually decreasing to an ultimate trend rate of 4.05% over a period of 11 years. The 2018 premiums were known at the time of the valuation and were incorporated into the liability measurement.
Board Meeting - December 3, 2020 - Review and Approval of CAFR
283

100FIN
Phase-In provision
Board certified rate is phased into the actuarially determined rate in accordance with HB 362 enacted in 2018.
Board certified rate is phased into the actuarially determined rate in accordance with HB 362 enacted in 2018. N/A N/A N/A
Board Meeting - December 3, 2020 - Review and Approval of CAFR
284

101 FIN
Schedule of Employers’ OPEB Contributions - CERS Non-HazardousAs of June 30 ($ in Thousands)
1 2 3 4
Fiscal Year Ending
Actuarially Determined
ContributionTotal Employer
Contribution
Contribution Deficiency
(Excess)Covered
Payroll
Actual Contributions
as a Percentage of Covered
Payroll2020 $124,740 $129,267 $(4,527) $2,620,585 4.93%2019 160,055 139,655 20,400 2,577,378 5.42%2018 120,797 124,619 (3,822) 2,570,156 4.85%2017 122,270 120,712 1,558 2,480,130 4.87%2016 110,987 111,836 (849) 2,352,762 4.75%2015 119,511 119,444 67 2,296,716 5.20%2014 130,652 123,278 7,374 2,272,270 5.43%2013 195,561 159,993 35,568 2,236,277 7.15%2012 214,421 171,925 42,496 2,236,546 7.69%2011 $213,429 $186,886 $26,543 $2,276,596 8.21%
(1) Data for years prior to 2018 is based on contribution data provided in the 2017 CAFR, based on calculations provided by the prior actuary.(2) Actuarially determined contribution for fiscal year ended 2020 are based on the contribution rate calculated with the June 30, 2018, actuarial valuation.(3) Employer contributions do not include the expected implicit subsidy included in exhibit 3.(4) Based on derived compensation using the provided employer contribution information.
Schedule of Employers’ OPEB Contributions - CERS HazardousAs of June 30 ($ in Thousands)
1 2 3 4
Fiscal Year Ending
Actuarially Determined
ContributionTotal Employer
Contribution
Contribution Deficiency
(Excess)Covered
Payroll
Actual Contributions
as a Percentage of Covered
Payroll2020 $56,739 $57,897 $(1,158) $596,001 9.71%2019 71,028 62,272 8,756 583,632 10.67%2018 55,027 56,002 (975) 588,526 9.52%2017 53,131 51,537 1,594 542,710 9.50%2016 64,253 67,619 (3,366) 492,851 13.72%2015 69,103 71,778 (2,675) 483,641 14.84%2014 74,360 74,792 (432) 479,164 15.61%2013 102,011 85,319 16,692 461,673 18.48%2012 110,763 92,564 18,199 464,229 19.94%2011 $109,227 $98,592 $10,635 $466,964 21.11%
(1) Data for years prior to 2018 is based on contribution data provided in the 2017 CAFR, based on calculations provided by the prior actuary.(2) Actuarially determined contribution for fiscal year ended 2020 are based on the contribution rate calculated with the June 30, 2018, actuarial valuation.(3) Employer contributions do not include the expected implicit subsidy included in exhibit 3.(4) Based on derived compensation using the provided employer contribution information.
Board Meeting - December 3, 2020 - Review and Approval of CAFR
285

102FIN
Schedule of Employers’ OPEB Contributions - KERS Non-HazardousAs of June 30 ($ in Thousands)
1 2 3 4
Fiscal Year Ending
Actuarially Determined
ContributionTotal Employer
Contribution
Contribution Deficiency
(Excess)Covered
Payroll
Actual Contributions
as a Percentage of Covered
Payroll2020 $183,821 $175,007 $8,814 $1,482,431 11.81%2019 187,978 178,964 9,014 1,515,953 11.81%2018 132,365 136,419 (4,054) 1,573,898 8.67%2017 133,024 152,356 (19,332) 1,593,097 9.56%2016 121,899 135,816 (13,917) 1,529,249 8.88%2015 130,455 135,940 (5,485) 1,544,234 8.80%2014 208,881 166,610 42,271 1,577,496 10.56%2013 286,143 165,331 120,812 1,644,409 10.05%2012 297,904 156,057 141,847 1,644,897 9.49%2011 $294,898 $129,336 $165,562 $1,731,633 7.47%
(1) Data for years prior to 2018 is based on contribution data provided in the 2017 CAFR, based on calculations provided by the prior actuary.(2) Actuarially determined contribution for fiscal year ended 2020 are based on the contribution rate calculated with the June 30, 2017, actuarial valuation.(3) Employer contributions do not include the expected implicit subsidy included in exhibit 3.(4) Based on derived compensation using the provided employer contribution information.
Schedule of Employers’ OPEB Contributions - KERS HazardousAs of June 30 ($ in Thousands)
1 2 3 4
Fiscal Year Ending
Actuarially Determined
ContributionTotal Employer
Contribution
Contribution Deficiency
(Excess)Covered
Payroll
Actual Contributions
as a Percentage of Covered
Payroll2020 $4,482 $5,776 $(1,294) $182,209 3.17%2019 3,726 4,970 (1,244) 151,448 3.28%2018 2,550 5,288 (2,738) 190,317 2.78%2017 4,688 5,620 (932) 171,087 3.28%2016 9,186 16,766 (7,580) 147,563 11.36%2015 13,152 14,882 (1,730) 128,680 11.57%2014 15,627 23,874 (8,247) 129,076 18.50%2013 26,253 25,682 571 132,015 19.45%2012 28,326 24,538 3,788 131,977 18.59%2011 $29,585 $19,953 $9,632 $133,054 15.00%
(1) Data for years prior to 2018 is based on contribution data provided in the 2017 CAFR, based on calculations provided by the prior actuary.(2) Actuarially determined contribution for fiscal year ended 2020 are based on the contribution rate calculated with the June 30, 2017, actuarial valuation.(3) Employer contributions do not include the expected implicit subsidy included in exhibit 3.(4) Based on derived compensation using the provided employer contribution information.
Board Meeting - December 3, 2020 - Review and Approval of CAFR
286

103 FIN
Schedule of Employer’s OPEB Contributions - SPRSAs of June 30 ($ in Thousands)
1 2 3 4
Fiscal Year Ending
Actuarially Determined
ContributionTotal Employer
Contribution
Contribution Deficiency
(Excess)Covered
Payroll
Actual Contributions
as a Percentage of Covered
Payroll2020 $13,133 $13,133 $- $48,231 27.23%2019 13,283 13,288 (5) 48,780 27.24%2018 9,062 9,397 (335) 50,064 18.77%2017 9,222 9,222 - 48,873 18.87%2016 8,553 10,237 (1,684) 45,551 22.47%2015 9,890 10,382 (492) 45,765 22.69%2014 20,879 14,493 6,386 44,616 32.48%2013 27,234 16,829 10,405 45,256 37.19%2012 28,247 11,960 16,287 48,373 24.72%2011 $25,773 $11,051 $14,722 $48,693 22.70%
(1) Data for years prior to 2018 is based on contribution data provided in the 2017 CAFR, based on calculations provided by the prior actuary.(2) Actuarially determined contribution for fiscal year ended 2020 are based on the contribution rate calculated with the June 30, 2017, actuarial valuation.(3) Employer contributions do not include the expected implicit subsidy included in exhibit 3.(4) Based on derived compensation using the provided employer contribution information
Board Meeting - December 3, 2020 - Review and Approval of CAFR
287

104FIN
Money-Weighted Rates of ReturnIn accordance with GASB, KRS provides this additional disclosure regarding its money-weighted rate of return for the Pension Funds and Insurance Fund. The money-weighted rate of return is a method of calculating period-by-period returns on Pension Funds’ and Insurance Fund’s investments that adjusts for the changing amounts actually invested. For purposes of this statement, money-weighted rate of return is calculated as the internal rate of return on Pension Funds’ and Insurance Fund’s investments, net of Pension Funds’ and Insurance Fund’s investment expense, adjusted for the changing amounts actually invested. See below for the money-weighted rates of return for multiple periods including fiscal year June 30, 2020, as calculated by the custodian bank, BNY Mellon:
Money - Weighted Rates of Return As of June 30
CERS CERS KERS KERS SPRSNon-
Hazardous HazardousNon-
Hazardous Hazardous Pension Funds
2020 0.84% 0.71% 2.35% 0.96% 2.21%2019 5.78% 5.80% 5.73% 5.68% 5.71%2018 8.82% 8.82% 7.63% 8.69% 7.68%2017 13.80% 13.72% 12.08% 13.45% 12.50%2016 -0.62% -0.46% -0.97% -0.33% -1.76%2015 1.65% 1.88% 1.89% 1.69% 1.71%2014 15.56% 15.50% 15.50% 15.65% 15.66%
Insurance Fund
CERS CERS KERS KERS SPRSNon-
Hazardous HazardousNon-
Hazardous Hazardous 2020 0.36% 0.27% 0.98% 0.21% 0.64%2019 5.73% 5.81% 4.95% 5.61% 5.74%2018 9.22% 9.35% 7.95% 8.93% 9.39%2017 13.67% 13.69% 13.77% 13.75% 13.69%
Note: This table is intended to show information for ten years; additional year’s information will be displayed as it becomes available.
Board Meeting - December 3, 2020 - Review and Approval of CAFR
288

105 FIN
Additional Supporting SchedulesSchedule of Administrative ExpensesSchedule of Direct Investment ExpensesSchedule of Professional Consultant FeesReport on Internal Control
Board Meeting - December 3, 2020 - Review and Approval of CAFR
289

106FIN
Schedule of Administrative ExpensesAs of June 30 ($ in Thousands) 2020 2019Personnel Salaries and Per Diem $14,725 $14,098Pension, Insurance Related Benefits 14,616 13,789Unemployment Compensation 6 8Tuition Assistance 12 17
Total Personnel 29,359 27,912Contractual Actuarial Services 512 642Audit Services 160 259Healthcare 7 (390)Legal Counsel 811 1,306Medical Review Services 249 247Miscellaneous 93 92
Total Contractual 1,832 2,156Communication Printing 104 99Telephone 113 127Postage 412 321Travel 62 78
Total Communication 691 625Internal Audit Travel/Conferences 1 -
Total Internal Audit 1 -Investments-Pension Funds Travel/Conferences 35 20Dues/Subscriptions 1 3Legal 32 195
Total Investments $68 $218
Board Meeting - December 3, 2020 - Review and Approval of CAFR
290

107 FIN
Schedule of Administrative Expenses (cont...) 2020 2019Rentals Office Space $999 $788Equipment 74 90
Total Rentals 1,073 878Information Technology Software 3,224 2,476
Total Information Technology 3,224 2,476Miscellaneous Utilities 186 207Supplies 107 108Insurance 10 -Dues & Subscriptions 56 49Maintenance 1 16Other 2 22
Total Miscellaneous 362 402Depreciation/Amortization 1,058 1,759
Total Pension Fund Administrative Expense 37,668 36,425Healthcare Fees 2,406 2,372
Total Insurance Fund Administrative Expense 2,406 2,372Total Administrative Expenses $40,074 $38,797
Schedule of Direct Investment ExpensesAs of June 30 ($ in Thousands) 2020 2019PENSION FUNDS Security Lending Fees
Borrower (Income) Rebates $3,052 $7,756Lending Agent Fees 327 364
Total Security Lending 3,379 8,120Contractual Services
Investment Management 48,816 50,694Security Custody 1,252 1,229Investment Consultant 672 583Performance Fees 2,366 26,563
Total Contractual Services 53,106 79,069INSURANCE FUND Security Lending Fees
Borrower (Income) Rebates 1,327 2,862Lending Agent Fees 140 157
Total Security Lending 1,467 3,019Contractual Services
Investment Management 18,738 23,263Security Custody 765 832Investment Consultant 288 245Performance Fees 1,484 13,171
Total Contractual Services 21,275 37,511Total Investment Expenses $79,227 $127,719
Board Meeting - December 3, 2020 - Review and Approval of CAFR
291

108FIN
Schedule of Professional Consultant FeesAs of June 30 ($ in Thousands) 2020 2019Actuarial Services $512 $642Medical Review Services 249 247Audit Services 160 259Legal Counsel 842 1,501Healthcare 7 (390)Miscellaneous 93 92
Total $1,863 $2,351
Board Meeting - December 3, 2020 - Review and Approval of CAFR
292

109 FIN
DRAFT
REPORT ON INTERNAL CONTROL OVER FINANCIAL REPORTING AND ON COMPLIANCE AND OTHER MATTERS BASED ON AN AUDIT OF FINANCIAL STATEMENTS PERFORMED IN
ACCORDANCE WITH GOVERNMENT AUDITING STANDARDS
REPORT OF INDEPENDENT AUDITORS
Board of TrusteesKentucky Retirement SystemsFrankfort, Kentucky
We have audited, in accordance with auditing standards generally accepted in the United States of America and the standards applicable to financial audits contained in Government Auditing Standards issued by the Comptroller General of the United States, the combining financial statements of the Pension Funds and Insurance Fund of Kentucky Retirement Systems (KRS)as of and for the fiscal year ended June 30, 2020, and the related notes to the combining financial statements, which comprise KRS’ basic combining financial statements (collectively, the financial statements), and have issued our report thereon dated December 3, 2020.
Internal Control over Financial Reporting
In planning and performing our audit of the financial statements, we considered KRS’ internal control over financial reporting (internal control) to determine the audit procedures that are appropriate in the circumstances for the purpose of expressing our opinion on the financial statements, but not for the purpose of expressing an opinion on the effectiveness of KRS’ internal control. Accordingly, we do not express an opinion on the effectiveness of KRS’ internal control.
A deficiency in internal control exists when the design or operation of a control does not allow management or employees, in the normal course of performing their assigned functions, to prevent, or detect and correct misstatements on a timely basis. A material weakness is a deficiency, or a combination of deficiencies, in internal control, such that there is a reasonable possibility that a material misstatement of the entity’s financial statements will not be prevented, or detected and corrected, on a timely basis. A significant deficiency is a deficiency, or a combination of deficiencies, in internal control that is less severe than a material weakness yet important enough to merit attention by those charged with governance.
Our consideration of internal control was for the limited purpose described in the first paragraph of this section and was not designed to identify all deficiencies in internal control that might be material weaknesses or significant deficiencies. Given these limitations, during our audit we did not identify any deficiencies in internal control over financial reporting that we consider to be material weaknesses. However, material weaknesses may exist that have not been identified.
Compliance and Other Matters
As part of obtaining reasonable assurance about whether KRS’ financial statements are free from material misstatement, we performed tests of its compliance with certain provisions of laws, regulations, contracts, and grant agreements, noncompliance with which could have a direct and material effect on the determination of financial statement amounts. However, providing an opinion on compliance with those provisions was not an objective of our audit, and accordingly, we do not express such an opinion. The results of our tests disclosed no instances of noncompliance or other matters that are required to be reported under Government Auditing Standards.
Purpose of this Report
The purpose of this report is solely to describe the scope of our testing of internal control and compliance and the results of that testing, and not to provide an opinion on the effectiveness of the entity’s internal control or on compliance. This report is an integral part of an audit performed in accordance with Government Auditing Standards in considering the entity’s internal control and compliance. Accordingly, this communication is not suitable for any other purpose.
Lexington, KentuckyDecember 3, 2020
Board Meeting - December 3, 2020 - Review and Approval of CAFR
293

INVESTMENTS TABLE OF CONTENTS
110110
111 INVESTMENT ACTIVITIES114 INVESTMENT COMMITTEE INITIATIVES116 INVESTMENT SUMMARY117 INVESTMENT STRATEGIES118 INVESTMENT OBJECTIVES119 INVESTMENT RESULTS120 BENCHMARKS121 LONG-TERM RESULTS122 U.S. EQUITY123 NON-U.S. EQUITY124 CORE FIXED INCOME125 SPECIALTY CREDIT126 OPPORTUNISTIC126 PRIVATE EQUITY127 REAL ESTATE127 REAL RETURN128 ABSOLUTE RETURN129 CASH130 ADDITIONAL SCHEDULES & REQUIRED SUPPLEMENTAL
INFORMATION130 INVESTMENT ADVISORS AND ASSETS UNDER
MANAGEMENT138 EXTERNAL INVESTMENT EXPENSE139 COMMISSIONS140 FAIR VALUES BY PLAN
Board Meeting - December 3, 2020 - Review and Approval of CAFR
294

111 INV
Wilshire Associates 210 Sixth Avenue Suite 3720 Pittsburgh, PA 15222 TEL 412.434.1580 FAX 412.434.1584 www.wilshire.com
MEMORANDUM
To: Kentucky Retirement Systems From: Wilshire Associates Subject: 2019-20 Fiscal Year Investment Portfolio CAFR Letter Date: November 5, 2020 Economic Review The fiscal year ended June 30, 2020 will be remembered for the COVID-19 pandemic, the severe economic slowdown, and wildly turbulent financial markets left in its wake. In spite of this, a global 60/40 portfolio produced a 5.3% return for the year thanks to a rapid recovery of risk asset in Q2 2020. The world of investing was introduced to an unprecedented set of conditions in Q1 2020. As the COVID-19 virus spread globally, the response was to separate people and close nonessential businesses, with others working remotely. The U.S. unemployment rate jumped to 14.7% in April as payrolls were slashed by over 20 million jobs, and U.S. GDP fell by 31.7% (annualized) in Q2. The fight against the Coronavirus made positive strides as the second quarter advanced, with parts of the country beginning to loosen Coronavirus-related restrictions. However, more than a dozen states were forced to pause or reverse their reopening plans. Government response was swift and decisive, with the Federal Reserve cutting short-term rates to near zero and the Congress passing a $2 trillion stimulus bill. A surprising employment report in May pointed towards an eventual recovery, while unemployment claims began to point towards a bottom and perhaps the beginning of a recovery, albeit off extremely weak levels. Capital Markets Review U.S. Equity The U.S. stock market, as measured by the Wilshire 5000 Index, was up over 10% in the second half of 2019, capping off the strongest year for stocks since 2013. Trade talks with China improved in the latter half of the year, and the expectation of continued monetary easing by the Federal Reserve bolstered markets. Investors were encouraged by 2.6% and 2.4% GDP growth (respectively) in Q3 and Q4, which compared favorably to global economic conditions. The tide changed quickly in 2020, with U.S. stocks down -20.70% in Q1, the worst quarter since the Global Financial Crisis. Uncertainty and a declining outlook were the driving forces behind the sell-off, as the COVID-19 pandemic worsened and significantly limited global commerce. Energy was by far the worst performing sector, down over 50% for the quarter as oil markets were rocked by a downward shock to demand. Despite the slow pace of economic recovery, U.S. equities experienced a V-shaped recovery in Q2, recovering most of the losses from Q1 with a 21.94% return for the quarter resulting in a 6.78% return for
Board Meeting - December 3, 2020 - Review and Approval of CAFR
295

112INV
Wilshire Associates 210 Sixth Avenue Suite 3720 Pittsburgh, PA 15222 TEL 412.434.1580 FAX 412.434.1584 www.wilshire.com
the trailing one-year period. Small- and micro-cap stocks outperformed large-cap companies, having underperformed during the Q1 selloff, while the outperformance of growth compared to value accelerated. For the year ended June 30, 2020 the Wilshire Large-Cap Growth Index outperformed its Value counterpart by nearly 20%, with returns of 18.31% and -1.46% respectively. Non-U.S. Equity Equity markets outside of the U.S. also ended 2019 with strong advances, although they generally underperformed the U.S. equity market. Conditions in the UK and Germany showed signs of economic weakness but improving sentiment. Japan experienced economic expansion throughout 2019, due mostly to capital expenditures and private consumption. China benefitted from good news on the trade front although the country’s economic growth cooled to near 30-year lows. Non-U.S. equity sold off during Q1 as the COVID-19 virus was officially categorized as a global pandemic, with the MSCI ACWI ex USA Index falling -23.36%. Across continental Europe, quarantine efforts were implemented and began to bear fruit by quarter end as cases in Italy, one of the worst afflicted countries, and Spain appeared to be approaching a peak. China began relaxing severe travel restrictions and the lockdown of Wuhan. The official Purchasing Manager’s Index for China indicated that manufacturing in the country was expanding after a dramatic slowdown. Despite lagging U.S. stocks, equity markets abroad also enjoyed a strong rebound during Q2, with the MSCI ACWI ex USA Index returning 16.12% and cutting one-year losses to -4.80%. Although the 19-nation euro region is expected to shrink more than -8% in 2020, survey data shows that economic sentiment is improving. China’s economic recovery continued during the second quarter due, in part, to government support policies and the reopening of some overseas markets. Fixed Income The U.S. Treasury yield curve fell across all maturities during the second half of 2019, with the biggest declines occurring in the short end of the curve. The 10-year Treasury yield ended the year at 1.92%, down 8 basis points from June. The Federal Open Market Committee decreased its overnight rate by 0.25% at the July, September, and October meetings. As the coronavirus became a global pandemic in Q1 2020, the U.S. Treasury yield curve fell dramatically across the maturity spectrum. While the largest decreases occurred in the short end, yields across the curve all fell in excess of 100 basis points. The 10-year Treasury yield ended the quarter at 0.70%, down 122 basis points from December. The Federal Open Market Committee decreased its overnight rate by 1.50% during two unscheduled meetings in March. The Fed also announced quantitative easing measures, committing to Treasury purchases of at least $500 billion and mortgage-backed securities of at least $200 billion over the coming months. Credit spreads were up big during the quarter within both the investment grade and high yield markets. After a dramatic drop in Q1, the yield curve was little changed during the second quarter. Although the entire curve ended below 1.50% it also was steeper than it had been in two years. The 10-year Treasury yield ended the quarter at 0.66%, down just 4 basis points from March. The Federal Open Market Committee met twice during the quarter, as scheduled, with no change to their overnight rate, which they expect will be near zero until at least 2022. Chair Jerome Powell attempted to temper expectations by
Board Meeting - December 3, 2020 - Review and Approval of CAFR
296

113 INV
Wilshire Associates 210 Sixth Avenue Suite 3720 Pittsburgh, PA 15222 TEL 412.434.1580 FAX 412.434.1584 www.wilshire.com
stating that, “The path forward for the economy is extraordinarily uncertain.” Credit spreads tightened significantly during the quarter, as evidenced by the double-digit return within the high yield market. Real Assets Real estate struggled during the fiscal year ended June 30, 2020, with the Wilshire Global RESI falling -5.15%. Real estate securities produced positive returns in three of the four quarters in this timeframe, but fell by -7.21% during Q1 2020 as the pandemic caused particular trouble for office and retail related properties. Commodity results were also negative for the year, with the Bloomberg Commodity Index posting a -19.40% return for the one-year period ending June 30, 2020. As countries closed down to slow the spread of the coronavirus, demand for crude oil cratered and prices fell -66.5% to $20.48 per barrel, the lowest level since the end of the 2001 recession. Crude oil jumped 91.7% in Q2 to $39.27 per barrel, but remained well below the levels of 2019. MLPs were already suffering losses in the second half of 2019, before being among the worst performing market segments in Q1, down -57.2% for the quarter. Off these lows, midstream Energy was among the best performing market segments in Q2 2020, up 32.6% for the quarter, but much like crude oil remained significantly depressed compared to 2019 levels. Asset Allocation Review The Board maintained the previously approved asset allocation changes from the June 7th, 2018 meeting, which maintained the probability of achieving the assumed rates of return while improving the liquidity profile of the portfolios. The asset allocation policy for the significantly underfunded KERS Non-Hazardous and SPRS plans decreases expected volatility and sensitivity to economic growth cycles. The asset allocation targets align with the actuarial assumed rate of returns previously approved by the Board: 6.25% for the pension plans (CERS Non Hazardous, CERS Hazardous, and KERS Hazardous) and all of the insurance plans, and 5.25% for the KERS Non Hazardous and the State Police pension. Pension Review The KRS Pension Plan Composite (“Pension Plan”) ended the fiscal year with assets of $12.7 billion as of June 30, 2020, unchanged from June 30, 2019. The Pension Plan returned 1.15% net of fees for the year, outperforming the KRS Allocation Index (0.51%) and KRS IPS Benchmark (0.72%) in that time. The plan ranked in the 85th percentile of the Investment Metrics All Public Plan Total Fund Universe, net of fees, for the fiscal year. The KERS and SPRS plans underperformed their 5.25% assumed rate of return for the year ended 6/30/2020, while the other three pension plans fell short of the 6.25% target. Insurance Review The KRS Insurance Plan Composite (“Insurance Plan”) ended the fiscal year with assets of $5.5 billion as of June 30, 2020, up from $5.4 billion on June 30, 2019. The Insurance Plan returned 0.48% net of fees for the year, outperforming the KRS Allocation Index (0.24%) and KRS IPS Benchmark (0.13%) in that time. The plan ranked in the 90th percentile of the Investment Metrics All Public Plan Total Fund Universe, net of fees, for the fiscal year. In addition, all of the plans underperformed their 6.25% assumed rate of return for the year ended 6/30/2020.
Board Meeting - December 3, 2020 - Review and Approval of CAFR
297

114INV
Investment Committee Initiatives
Investment PolicyAt the February 4, 2020 Investment Committee meeting, the committee approved an updated Investment Policy Statement (IPS). The update centered on clarifying some governance issues and language cleanup.
Actuarial AssumptionsThe committee ratified existing actuarial assumptions relating to the inflation rate (2.3%), payroll growth rate (0% and 2% depending on plan), and assumed rates of return (5.25% and 6.25% depending on plan) at the May 21, 2020, Investment Committee meeting. These data points are used to project cash flows needed in studies to determine the health of the plans and in making decisions in asset liability studies and allocation decisions.
House Bill 484HB 484 was signed into law in April 2020 transferring the administration of CERS from the KRS Board to a newly established CERS Board effective April 1, 2021. The KRS Board will remain tasked with the administration of KERS and SPRS. A new entity, KPPA, established by the legislation, will be responsible for daily operational duties as required by the KRS and CERS Boards.
Emerging Market and Non-U.S. Small Cap Search ProcessStaff and consultant continued to work to create greater efficiencies in the public equity allocation as tasked by the Investment Committee. In response, staff and consultant have determined what methods of market access are most efficient within the KRS portfolios, both in terms of opportunity for outperformance and wise fee dollar usage.KRS portfolios will be more active in nature within Non-U.S. markets as they are perceived to be less efficient than their domestic counterparts, especially so when referring to the international small cap and emerging market segments. To that end, staff and consultant have begun a search process to identify alternative means of exposure to those parts of the market and hope to have those investments funded by January 2021.
Investment Activity The 2020 fiscal year was busy in terms of both funding new investments and rebalancing amongst existing investment strategies. The Investment Committee approved several investments in the areas of active public equities, core fixed income, specialty finance / credit opportunities, private equity, and real estate.
New Activity ● Approved an allocation to JPMorgan (Emerging Market Equity – Growth) for 5-7% of the Non-U.S Equity
allocation, which amounted to roughly $180 million across the Pension and Insurance funds at time of initial funding.
● Approved an allocation to Pzena (Emerging Market Equity – Value) for 5-7% of the Non-U.S Equity allocation, which amounted to roughly $180 million across the pension and insurance funds at time of initial funding.
● Approved an allocation to Next Century (U.S. Micro-cap Equity – Growth) for 2.5-3.5% of the domestic equity allocation, which amounted to roughly $80 million across the Pension and Insurance funds at time of initial funding.
● Approved a $200 million allocation to Capital Spring (Specialty Finance), focusing in the quick service and fast casual restaurant market.
● Approved a $300 million allocation to Arrowmark Partners (Opportunistic) which brings the total amount committed to the strategy to $625 million. The strategy focuses on providing funding to address regulatory capital relief.
● Approved a $75 million allocation to Middleground Partners (Private Equity), a leveraged buyout fund focused on U.S. industrial and distribution markets.
● Approved a $250 million allocation to Adams Street Partner (Private Equity), to serve as senior debt used to finance private equity transactions. Further, the committee approved an additional $250 million allocation in a sidecar co-investment to the strategy.
Board Meeting - December 3, 2020 - Review and Approval of CAFR
298

115 INV
● Approved a $212.5 million allocation to Barings Real Estate European Value Add Fund II. ● Approved an allocation to Putnam (Real Return), a multi-asset portfolio funded in the last month of the fiscal
year from the exit from the PIMCO All Asset and Nuveen Real Return portfolio strategies, which amounted to roughly $650 million.
● Approved a $200 million allocation to Blue Torch, focusing in distressed and special situations, with the initial funding occurring in the early months of the 2021 fiscal year.
Other Activity ● Transitioning the remaining balance (post carve-out to fund the above-mentioned active emerging market
investments) of the BlackRock MSCI ACWI Ex-US portfolio to the BlackRock MSCI World Ex-US strategy. ● Rebalancing activity was significant as volatility spiked during the second half of the fiscal year. Most notably
during late March and April, a shift to risk assets was conducted in order to take advantage of a rebound from the late February to late March selloff that occurred in response to COVID-19 concerns. In general, the Core Fixed Income segment of the portfolio was reduced by approximately $840 million (along with additional cash) and redeployed to the public equity markets (roughly $560 million) and Specialty Credit / Opportunistic strategies (approximately $340 million).
Board Meeting - December 3, 2020 - Review and Approval of CAFR
299

116INV
Investment SummaryThe KRS Board is charged with the responsibility of investing KRS’ assets to provide benefits to KRS members. To achieve this goal, the Board follows the IPS that thoughtfully grows the asset base while at the same time protects against undue risks and losses in all investment areas. The Board recognizes its fiduciary duty not only to invest the funds in compliance with the “Prudent Person Rule”, but to also manage the funds while recognizing the long-term nature of KRS’ investments. In order to carry out their fiduciary duties the Board has created clearly defined investment policies, objectives, and strategies for both the Pension and Insurance portfolios.
Investment PolicyThe IPS was issued by KRS’ Board in connection with investing the Pension and Insurance Funds of KERS, CERS, and SPRS, supersedes all prior documents entitled IPS. The policy is located on the KRS website at kyret.ky.gov and outlines staff responsibilities, use of service providers, investment philosophy, investment objectives, asset allocations, and investment guidelines. The following charts represent the composites for the total Pension and Insurance Funds (dollar-weighted by plan).
Pension Board Policy vs. Actual Asset AllocationAs of June 30, 2020 GROWTH LIQUIDITY DIVERSIFYING STRATEGIES
Total Plan
U.S. Equity
Non U.S. Equity
Private Equity
Specialty Credit
Core Fixed
Income CashReal
EstateAbsolute Return/
Real Return
KERS and SPRS Policy’s Pension Asset Allocation 100.00% 15.75% 15.75% 7.00% 15.00% 20.50% 3.00% 5.00% 3.00% 15.00%Actual Pension Asset Allocation 100.00% 17.42% 16.43% 7.59% 15.35% 25.32% 5.20% 4.32% 3.76% 4.61% CERS, CERS Hazardous, and KERS Hazardous Policy’s Pension Asset Allocation 100.00% 18.75% 18.75% 10.00% 15.00% 13.50% 1.00% 5.00% 3.00% 15.00%Actual Pension Asset Allocation 100.00% 19.53% 19.59% 8.44% 16.27% 18.68% 2.75% 4.29% 4.04% 6.41%
Insurance Board Policy vs. Actual Asset AllocationAs of June 30, 2020 GROWTH LIQUIDITY DIVERSIFYING STRATEGIES
Total Plan
U.S. Equity
Non U.S. Equity
Private Equity
Specialty Credit
Core Fixed
Income CashReal
Estate
Absolute Return/
OpportunisticReal
ReturnPolicy’s Insurance Asset Allocation 100.00% 18.75% 18.75% 10.00% 15.00% 13.50% 1.00% 5.00% 3.00% 15.00%Actual Insurance Asset Allocation 100.00% 19.71% 19.48% 9.07% 16.35% 18.28% 2.54% 4.39% 4.38% 5.80%
Board Meeting - December 3, 2020 - Review and Approval of CAFR
300

117 INV
Investment Strategies
DiversificationKRS portfolios are diversified on several levels, primarily through the use of the aforementioned multiple asset classes. Asset allocations are evaluated on a periodic basis and represent an efficient allocation to maximize returns and minimize risks at a level appropriate for each system. The individual asset classes are diversified through the use of multiple portfolios that are managed by both the Office of Investments Staff and external Investment Advisors. Finally, portfolios within each of the asset classes are diversified through both investment styles and the selection of individual securities. Each portfolio advisor is afforded discretion to diversify its portfolio(s) within the parameters established by the KRS Board.
RebalancingProper implementation of the investment policy requires that a periodic adjustment, or rebalancing, of assets be made to ensure conformance with KRS’ IPS target levels. Such rebalancing is necessary to reflect sizable cash flows and performance imbalances among asset classes and investment advisors. KRS’ rebalancing policies call for a rebalancing to within its allocation ranges if an asset class exceeds or falls outside its allowable range as defined in the IPS.
Investments Performance Review ProceduresAt least once each quarter, the Investment Committee, on behalf of the KRS Board, reviews the performance of the portfolio to determine compliance with the IPS. The Investment Committee also reviews a report created and presented by the KRS Compliance Officer who is part of the independent Internal Audit Division. The Compliance Officer performs tests daily, monthly, and quarterly to assure compliance with the restrictions imposed by the IPS.
Investment ConsultingThe Board employs industry leading external consultants to assist in determining and reviewing the asset allocation guidelines. Consultants also provide performance reports covering both the internally managed and externally managed assets. A letter from our consulting firm, Wilshire Associates, precedes this section and provides a discussion of current allocations, performance, and significant changes during the fiscal year.
Board Meeting - December 3, 2020 - Review and Approval of CAFR
301

118INV
Investment ObjectivesThe investment objectives of the portfolios are to produce results that exceed the stated goals over both short-term and long-term periods.
● Shorter-Term (5 years and less): The returns of the particular asset classes of the managed funds, measured on an annual basis, should exceed the returns achieved by a policy benchmark portfolio of comparable unmanaged market indices.
● Medium-Term (5 to 20 years): The returns of the particular asset classes of the managed funds of KRS,
measured on a rolling 5 to 20 year basis, should exceed the returns achieved by a policy benchmark portfolio composed of comparable unmanaged market indices and perform above the median of an appropriate peer universe, if there is one.
● Longer-Term: The total assets of KRS should achieve a return of 5.25% for KERS Non-Hazardous and SPRS
pensions and 6.25% for all other Pension and Insurance plans. This is measured for 20 years and beyond and should exceed the actuarially required rate of return as well as the return achieved by its total fund benchmark.
In keeping with KRS Board’s fiduciary responsibility, when all else is equal, the Board encourages the investment of KRS’ assets in securities of corporations that provide a positive contribution to the economy of the Commonwealth. The following section was prepared by the Investment Operations staff members with support from the KRS Investment Committee. Information reported in the respective schedules and supplemental information was provided by our investment consultant and custodial bank.
Board Meeting - December 3, 2020 - Review and Approval of CAFR
302

119 INV
Investment Results For the purposes of this report, total fund return information has been reported net of investment manager fees with audited data since July 2011. At the manager or individual account level, returns have been reported net of fees since July 2011 and gross of fees are used for prior historical data. All rates of return are calculated using time-weighted rates of return.
Fiscal Year 2020 ResultsFor the fiscal year ended June 30, 2020, KRS Pension Funds in total earned a net return of 1.15%, outperforming its benchmark return of 0.50%. KRS Insurance Fund in total for that period earned a return net of fees of 0.48% compared to the benchmark return of 0.13%.
Net Returns By Plan: Pension Fund As of June 30, 2020 ($ in Thousands)
PlanMarket Value
% of Total 1 Year 3 Years 5 Years 10 Years Inception
KRS Index KRS Index KRS Index GANIR KRS Index KRS Index
CERS $
7,048,683 55.40% 0.84% 0.51% 5.07% 4.85% 5.60% 5.41% 5.29% 7.37% 7.53% 8.82% 8.90%CERS HAZ 2,377,414 18.68% 0.71% 0.51% 5.04% 4.85% 5.60% 5.41% 5.53% 7.36% 7.53% 8.82% 8.90%KERS 2,317,530 18.21% 2.36% 1.07% 5.17% 4.76% 5.31% 5.33% 4.76% 7.26% 7.47% 8.79% 8.88%KERS HAZ 693,944 5.45% 0.95% 0.51% 5.06% 4.85% 5.58% 5.41% 5.42% 7.36% 7.53% 8.82% 8.90%SPRS 286,685 2.25% 2.21% 1.07% 5.17% 4.83% 5.21% 5.28% 5.13% 7.17% 7.46% 8.76% 8.88%Total $12,724,256 100.00% 1.15% 0.50% 5.14% 4.75% 5.58% 5.38% 7.37% 7.55% 8.82% 8.90%
Net Returns By Plan: Insurance Fund As of June 30, 2020 ($ in Thousands)
PlanMarket Value % of Total 1 Year 3 Years 5 Years 10 Years Inception
KRS Index KRS Index KRS Index KRS Index KRS IndexCERS $2,481,793 45.25% 0.36% 0.24% 5.04% 4.85% 5.66% 5.50% 7.50% 8.13% 7.21% 7.51%CERS HAZ 1,300,188 23.70% 0.26% 0.24% 5.06% 4.85% 5.70% 5.50% 7.52% 8.14% 7.21% 7.51%KERS 990,149 18.05% 0.97% 0.24% 4.59% 4.80% 5.31% 5.45% 7.20% 8.09% 7.12% 7.50%KERS HAZ 513,885 9.37% 0.20% 0.24% 4.84% 4.86% 5.51% 5.49% 7.42% 8.12% 7.18% 7.51%SPRS 199,038 3.63% 0.65% 0.24% 5.18% 4.85% 5.76% 5.50% 7.55% 8.14% 7.22% 7.51%Total $5,485,053 100.00% 0.48% 0.13% 5.01% 4.77% 5.64% 5.49% 7.47% 8.19% 7.20% 7.53%
Board Meeting - December 3, 2020 - Review and Approval of CAFR
303

120INV
Benchmarks
The KRS Pension and Insurance Funds’ benchmarks are weighted averages that are composites of the various asset class indices that exist within each of KRS’ investment portfolios. KRS uses the Modified Dietz Method as its basis for calculations, and is used to determine the performance of an investment portfolio based on a time weighted cash flow. The various asset class benchmarks are shown below:
BenchmarksAs of June 30, 2020 Asset Allocation by Fund
Index Asset Class KERS/SPRSKERS-H/CERS/
CER-H InsuranceRussell 3000 U.S. Equity 15.75% 18.75% 18.75%MSCI ACWI Ex-US IMI Non U.S. Equity 15.75% 18.75% 18.75%50% Bloomberg Barclays US High Yield, 50% S&P LSTA Leveraged Loan
High Yield/Specialty Credit 15.00% 15.00% 15.00%
Bloomberg Barclay’s US Aggregate Core Fixed Income 20.50% 13.50% 13.50%NCREIF ODCE Real Estate 5.00% 5.00% 5.00%
Highest Assumed Rate of Participating PlansOpportunistic/Absolute Return 3.00% 3.00% 3.00%
US CPI + 3% Real Return 15.00% 15.00% 15.00%Actual Performance Private Equity < 5 years
7.00% 10.00% 10.00%Russell 3000 Quarter Lagged + 300 bps Private Equity > 5 yearsCiti Group 3-mos Treasury Bill Cash 3.00% 1.00% 1.00%Note: These benchmarks are intended to be objective, measurable, investable/replicable, and representative of the investment mandates. The benchmarks are developed from publicly available information and accepted by the investment advisor and KRS as the neutral position consistent with the investment mandate and status. KRS’ Investment Staff and our Consultant recommends the indices and benchmarks, which are reviewed and approved by the Investment Committee and ratified by the KRS Board. It is anticipated that as KRS continues to diversify through other markets and asset classes, both the Pension Funds and Insurance Funds’ Total benchmarks will evolve to reflect these exposures.
Board Meeting - December 3, 2020 - Review and Approval of CAFR
304

121 INV
Long-Term ResultsThe chart below displays the growth of $1,000 over the course of 10 years given the performance of KRS’ portfolios compared to the benchmark and the actuarial assumed rate of return. Beginning with the fiscal year 2018 valuation, the Board lowered the actuarial rates of return to 5.25% for KERS Non-Hazardous and SPRS pension plans and 6.25% for all other plans. Since June 30, 2011, returns ranged from a minimum of (0.52)% in 2016 to a maximum of 18.96% in 2011. For fiscal year 2020, the annualized total net return fell short of the actuarially assumed rates of return. Translating this into dollars, an ending balance of $1,000 in fiscal year 2010 would have a balance of $2,041 in fiscal year 2020 compared to $1,943 and $2,013. The annualized benchmark would have returned $2,080.
Pension Fund GrowthAs of June 30 (in Whole $) 2011 2012 2013 2014 2015 2016 2017 2018 2019 2020Total Fund Return 18.96% 0.14% 10.82% 15.55% 2.01% -0.52% 13.47% 8.57% 5.83% 1.15%Performance BM 20.34% 0.90% 11.21% 14.91% 3.13% -0.19% 13.28% 7.91% 6.00% 0.50%Actuarial Assumed ROR CERS, CERS-H, and KERS-H 7.75% 7.75% 7.75% 7.75% 7.75% 7.50% 7.50% 6.25% 6.25% 6.25%Actuarial Assumed ROR KERS and SPRS 7.75% 7.75% 7.75% 7.75% 7.75% 7.50% 6.75% 5.25% 5.25% 5.25% KRS Pension Fund $1,000 $1,190 $1,191 $1,320 $1,525 $1,556 $1,548 $1,757 $1,907 $2,018 $2,041Performance Benchmark 1,000 1,203 1,214 1,350 1,552 1,600 1,597 1,809 1,952 2,070 2,080Actuarial Assumed ROR CERS, CERS-H, and KERS-H 1,000 1,078 1,161 1,251 1,348 1,452 1,561 1,678 1,783 1,895 2,013Actuarial Assumed ROR KERS and SPRS $1,000 $1,078 $1,161 $1,251 $1,348 $1,452 $1,561 $1,667 $1,754 $1,846 $1,943
The chart below shows theoretical annual returns for the Insurance Fund since June 30, 2011, where returns range from a minimum of -1.71% in 2012 to a maximum of 23.47% in 2011. As of June 30, 2020, the Insurance Fund portfolios earned 0.48% versus the annualized benchmark return of 0.13%. The chart below indicates that with a ending balance of $1,000 in fiscal year 2010, the Insurance Fund would have earned $2,057 compared to the actuarially assumed rate of return of $2,013 and the annualized benchmark return of $2,211 over the 10-year period. Insurance FundAs of June 30 (in Whole $) 2011 2012 2013 2014 2015 2016 2017 2018 2019 2020Total Fund Return 23.47% (1.71)% 10.11% 14.89% 1.86% -0.09% 13.72% 9.05% 5.67% 0.48%Performance BM 26.93% 0.58% 11.05% 15.03% 3.79% 0.03% 13.55% 8.48% 5.89% 0.13%Actuarial Assumed ROR 7.75% 7.75% 7.75% 7.75% 7.75% 7.50% 7.50% 6.25% 6.25% 6.25% KRS Insurance Fund $1,000 $1,235 $1,214 $1,336 $1,535 $1,564 $1,562 $1,777 $1,938 $2,047 $2,057Performance Benchmark 1,000 1,269 1,277 1,418 1,631 1,693 1,693 1,923 2,086 2,208 2,211Actuarial Assumed ROR $1,000 $1,078 $1,161 $1,251 $1,348 $1,452 $1,561 $1,678 $1,783 $1,895 $2,013
Board Meeting - December 3, 2020 - Review and Approval of CAFR
305

122INV
U.S. EquityFor the fiscal year ended June 30, 2020, the KRS Pension Funds’ U.S. Equity portfolio posted a return of 4.86% versus the benchmark return of 6.53%. The KRS Insurance U.S. Equity portfolio posted a return of 4.76% compared to the benchmark return of 6.53%. Relative underperformance was a product of allocation as the portfolio tilts slightly smaller in terms of market cap versus the Russell 3000 index; large caps outperformed small caps by over 14% during the fiscal year. The portfolio also employs a value tilt which was detrimental to relative performance as growth outpaced value by over 30% during the period (21.9% vs -9.4%). Since inception, performance has remained sound. The Pension Fund’s Public Equity portfolio has generated an annualized return of 11.08% throughout its duration against the benchmark’s annualized return of 11.18%. The Insurance Fund has returned 9.49% since inception, while the benchmark returned 9.48%.
Return on U.S. EquityAs of June 30, 2020 Inception Date Fiscal Year 3-Year 5-Year 10-Year InceptionKRS Pension 4/1/1984 4.86% 8.96% 9.14% 12.95% 11.08%Performance Benchmark 6.53% 10.04% 10.03% 13.71% 11.18%KRS Insurance 7/1/1992 4.76% 8.90% 9.31% 12.95% 9.49%Performance Benchmark 6.53% 10.04% 10.03% 13.66% 9.48%Note: Pension and Insurance benchmark is the KY Domestic Equity Blend
2020 Top 10 U.S. Equity Holdings 2020 Top 10 U.S. Equity HoldingsPension Funds Insurance FundAs of June 30, 2020 ($ in Thousands) As of June 30, 2020 ($ in Thousands)Company Shares Market Value Company Shares Market ValueMICROSOFT CORP 479,647 97,613 MICROSOFT CORP 212,782 43,303APPLE INC 263,371 96,078 APPLE INC 116,898 42,644AMAZON.COM INC 29,284 80,789 AMAZON.COM INC 13,023 35,928FACEBOOK INC 176,973 40,185 FACEBOOK INC 78,776 17,888ALPHABET INC-CL A 24,273 34,420 ALPHABET INC-CL A 10,838 15,369BERKSHIRE HATHAWAY INC 182,139 32,514 BERKSHIRE HATHAWAY INC 81,624 14,571ALPHABET INC-CL C 20,052 28,346 ALPHABET INC-CL C 8,922 12,612VISA INC 128,816 24,883 VISA INC 57,451 11,098JOHNSON & JOHNSON 152,346 21,424 JOHNSON & JOHNSON 67,293 9,463HOME DEPOT INC 83,763 20,983 HOME DEPOT INC 37,375 9,363Total 1,540,664 $477,235 Total 684,982 $212,239A complete list of holdings is located at https://kyret.ky.gov/Investments/Investments-Library/Pages/Investments-Holdings.aspx.
Board Meeting - December 3, 2020 - Review and Approval of CAFR
306

123 INV
Non-U.S. EquityFor the fiscal year ended June 30, 2020, the KRS Pension Funds’ Non-U.S. Equity portfolio returned (2.03)%, compared to its benchmark of (4.74)%. The KRS Insurance Non-U.S. Equity portfolio returned (2.10)% versus its benchmark of (4.74)% during the same period. Virus fears and continued geo-political issues weighed on international markets. The relative outperformance of the KRS portfolios can be attributed to strong stock selection within the active mandates, particularly within the growth mandates, both outperforming the MSCI ACWI Ex-U.S. Index by 15%. Since inception, the Insurance Non-U.S. Equity portfolios have outperformed the benchmark by 0.67%; while the Pension portfolio has slightly underperformed the benchmark.
Return on Non-U.S. EquityAs of June 30, 2020 Inception Date Fiscal Year 3-Year 5-Year 10-Year InceptionKRS Pension 7/1/2000 -2.03% 3.17% 3.86% 5.35% 2.88%Performance Benchmark -4.74% 0.99% 2.38% 5.32% 2.94%KRS Insurance 4/1/2000 -2.10% 3.02% 3.76% 5.03% 2.86%Performance Benchmark -4.74% 0.99% 2.38% 5.30% 2.19%Note: Pension and Insurance benchmark is the KY Ret Int’l Equity Blended Index.
2020 Top 10 Non-U.S. Equity Holdings
2020 Top 10 Non-U.S. Equity Holdings
Pension Funds Insurance FundAs of June 30, 2020 ($ in Thousands) As of June 30, 2020 ($ in Thousands)Company Shares Market Value Company Shares Market Value
SANOFI 185,685 $18,905 TAIWAN SEMICONDUCTOR MANUFACTU 474,966 $10,530
HDFC BANK LTD 553,794 18,429 SANOFI 83,705 8,522TAIWAN SEMICONDUCTOR MANUFACTU 942,939 16,925 HDFC BANK LTD 239,557 7,841CSL LTD 84,350 16,688 SAMSUNG ELECTRONICS CO LTD 148,560 7,603CELLNEX TELECOM SA 270,553 16,482 DSV PANALPINA A/S 60,140 7,339PARTNERS GROUP HOLDING AG 17,790 16,135 CSL LTD 35,730 7,060DSV PANALPINA A/S 129,720 15,830 CELLNEX TELECOM SA 115,610 7,043TENCENT HOLDINGS LTD 243,600 15,671 TENCENT HOLDINGS LTD 109,400 7,038NOVARTIS AG 179,468 15,611 NOVARTIS AG 80,316 6,986SAMSUNG ELECTRONICS CO LTD 296,081 15,392 PARTNERS GROUP HOLDING AG 7,440 6,748Total 2,903,980 $166,068 Total 1,355,424 $76,710A complete list of holdings is located at https://kyret.ky.gov/Investments/Investments-Library/Pages/Investments-Holdings.aspx.
Board Meeting - December 3, 2020 - Review and Approval of CAFR
307

124INV
Core Fixed IncomeFor the fiscal year ended June 30, 2020, the KRS Pension Funds’ Fixed Income portfolio returned 5.33% versus the Bloomberg Barclays U.S. Aggregate Bond Index return of 8.74%. The KRS Insurance Fixed Income portfolio posted a 4.93% rate of return, which underperformed the Bloomberg Barclays U.S. Aggregate Bond Index by 3.81%. Relative underperformance is primarily due to the overweight portfolio positioning in the front end of the curve as short-term yields failed to keep pace with the rally in longer rates as reflected in the index.
Return on Core Fixed IncomeAs of June 30, 2020 Portfolio Inception Date Fiscal Year 3-Year 5-Year 10-Year InceptionKRS Pension 7/1/2013 5.33% 4.23% 3.80% N/A 3.59%Performance Benchmark 7/1/2013 8.74% 5.32% 4.30% N/A 3.96%KRS Insurance 7/1/2013 4.93% 4.13% 3.72% N/A 3.24%Performance Benchmark 7/1/2013 8.74% 5.32% 4.30% N/A 3.96%Note: Pension and Insurance benchmark is KY Ret Core Fixed Income Blended Index.
2020 Top 10 Core Fixed Income Holdings
Top 10 Core Fixed Income Holdings
Pension Funds Insurance FundAs of June 30, 2020 ($ in Thousands) As of June 30, 2020 ($ in Thousands)
Issuer Shares
Base Market Value Issuer Shares
Base Market Value
U S TREASURY NOTE 147,876,000 $ 151,232 U S TREASURY NOTE 83,391,000 $86,050U S TREASURY BILL 91,351,000 $ 91,301 CITIGROUP INC 9,331,000 9,827CITIGROUP INC 24,298,000 $ 25,626 BOEING CO/THE 9,861,000 10,465BOEING CO/THE 22,595,000 $ 24,055 GOLDMAN SACHS GROUP INC/THE 9,309,000 9,552GOLDMAN SACHS GROUP INC/THE 21,043,000 $ 21,631 JPMORGAN CHASE & CO 5,430,000 5,803JPMORGAN CHASE & CO 20,155,000 $ 21,103 WELLS FARGO & CO 5,482,000 5,636WELLS FARGO & CO 17,223,000 $ 17,701 ABBVIE INC 144A 6,340,000 6,721ABBVIE INC 144A 16,220,000 $ 17,016 BANK OF AMERICA CORP 5,340,000 5,873BANK OF AMERICA CORP 14,197,000 $ 15,606 MPLX LP 4,662,000 4,717MPLX LP 15,333,000 $ 15,417 AT&T 6,246,000 6,381Total 390,291,000 $400,688 Total 145,392,000 $ 151,025Note: A complete list of holdings is located at https://kyret.ky.gov/Investments/Investments-Library/Pages/Investments-Holdings.aspx.
Board Meeting - December 3, 2020 - Review and Approval of CAFR
308

125 INV
Specialty CreditFor the fiscal year ended June 30, 2020, the KRS Pension Funds’ Specialty Credit portfolio returned (1.38)% versus the benchmark return of (0.98)%. The KRS Insurance Specialty Credit portfolio posted a (1.64)% rate of return, versus the benchmark return of (0.98)%.
Return on Specialty CreditAs of June 30, 2020 Portfolio Inception Date Fiscal Year 3-Year 5-Year 10-Year InceptionKRS Pension 7/1/2017 (1.38)% 3.71% N/A N/A 3.71%Performance Benchmark 7/1/2017 (0.98)% 2.71% N/A N/A 2.71%KRS Insurance 7/1/2017 (1.64)% 3.40% N/A N/A 3.40%Performance Benchmark 7/1/2017 (0.98)% 2.71% N/A N/A 2.71%Note: Pension and Insurance benchmark is High Yield Custom Benchmark.
2020 Top 10 Specailty Credit Holdings
Top 10 Specailty Credit Holdings
Pension Funds Insurance FundsAs of June 30, 2020 ($ in Thousands) As of June 30, 2020 ($ in Thousands)
Issuer SharesBase Market
Value Issuer SharesBase Market
ValueCS ADJ INVEST PTNS PARALLEL LP 47,582,524 $47,582
CS ADJ INVEST PTNS PARALLEL LP 20,392,081 $20,392
CSC HOLDINGS LLC 144A 19,088,000 20,252 CSC HOLDINGS LLC 144A 7,560,000 8,021CCO HOLDINGS LLC / CCO HO 144A 17,049,000 17,533
CCO HOLDINGS LLC / CCO HO 144A 6,599,000 6,791
POWERSCOURT 12,060,246 12,199 POWERSCOURT 5,947,304 6,016FORD MOTOR CREDIT CO LLC 12,533,000 12,065
FORD MOTOR CREDIT CO LLC 5,073,000 4,884
BAUSCH HEALTH COS INC 144A 12,242,000 12,013
BAUSCH HEALTH COS INC 144A 4,868,000 4,783
OCCIDENTAL PETROLEUM CORP 14,363,000 11,839
OCCIDENTAL PETROLEUM CORP 5,489,000 4,498
1011778 BC ULC / NEW RED 144A 11,115,000 10,911
1011778 BC ULC / NEW RED 144A 4,669,000 4,597
VISTRA OPERATIONS CO LLC 144A 10,628,000 10,802
VISTRA OPERATIONS CO LLC 144A 4,341,000 4,409
T-MOBILE USA INC 10,347,000 10,643 T-MOBILE USA INC 3,875,000 3,979Total 167,007,770 $165,839 Total 68,813,385 $68,370Note: A complete list of holdings is located at https://kyret.ky.gov/Investments/Investments-Library/Pages/Investments-Holdings.aspx.
Board Meeting - December 3, 2020 - Review and Approval of CAFR
309

126INV
OpportunisticFor the fiscal year ended June 30, 2020, the KRS Pension and Insurance Funds’ Opportunistic portfolio both returned (2.76)% versus the S&P LSTA Leveraged Loan Index return of (1.99)%.
Return on OpportunisticAs of June 30, 2020 Portfolio Inception Date Fiscal Year 3-Year 5-Year 10-Year InceptionKRS Pension 7/1/2018 -2.76% N/A N/A N/A 3.72%Performance Benchmark 6/1/2018 -1.99% N/A N/A N/A 0.96%KRS Insurance 7/1/2018 -2.76% N/A N/A N/A 3.72%Performance Benchmark 6/1/2018 -1.99% N/A N/A N/A 0.96%Note: Pension and Insurance benchmark is S&P LSTA Leveraged Loan Index.
Private EquityFor the fiscal year ended June 30, 2020, the KRS Pension Funds’ Private Equity portfolio posted a return of 0.29%, while the Insurance Private Equity portfolio returned (5.83)%. The Investment Committee determined that the short-term benchmark (1, 3, and 5 year) should match actual performance because of the difficulty in assessing short-term returns. Fund performance is typically based on quarterly estimates of each underlying business’s value, and managers are often slow to mark valuations up or down. This can distort relative performance against a public market benchmark during periods when that index moves dramatically. A better indication of program performance would be the mid- to longer-term time periods because more underlying company holdings have likely transacted at a specific (rather than estimated) valuation. For the five years ended June 30, 2020, the Pension and Insurance Funds’ Private Equity portfolios returned 8.77% and 9.03%, respectively. Over the past 10 years, the Pension Fund trailed its benchmark by 2.72% but still produced a 11.27% return. The Insurance Fund’s 12.30% return was below its benchmark of 14.28%. Since inception in 2002, the Pension portfolio’s 10.56% return is above its benchmark by 0.28%, while the Insurance portfolio’s 9.33% return has slightly lagged its benchmark return of 9.78%.
Return on Private EquityAs of June 30, 2020Portfolio Inception Date Fiscal Year 3-Year 5-Year 10-Year InceptionKRS Pension 7/1/2002 0.29% 8.59% 8.77% 11.27% 10.56%Performance Benchmark 0.29% 8.59% 8.77% 13.99% 10.28%KRS Insurance 7/1/2002 -5.83% 7.31% 9.03% 12.30% 9.33%Performance Benchmark -5.83% 7.31% 9.03% 14.28% 9.78%Note: Pension and Insurance Benchmark 5 years and beyond is the Russell 3000 Lagged + 300bps. For shorter term periods, the benchmark matches actual performance experienced.
Board Meeting - December 3, 2020 - Review and Approval of CAFR
310

127 INV
Real EstateFor the fiscal year ended June 30, 2020, the KRS Pension Funds’ Real Estate portfolio saw returns of 9.77%. exceeding its benchmark return of 3.93%. The KRS Insurance Real Estate portfolio also surpassed the benchmark, returning 10.00% compared to 3.93%. For the five years ending June 30, 2020, both the Pension and Insurance Fund portfolios outperformed the benchmarks return by 2.29% and 2.58% respectively.
Return on Real EstateAs of June 30, 2020Portfolio Inception Date Fiscal Year 3-Year 5-Year 10-Year InceptionKRS Pension Jul-84 9.77% 9.93% 9.77% 10.59% 6.28%Performance Benchmark 3.93% 5.85% 7.48% 10.42% 6.39%KRS Insurance May-09 10.00% 10.03% 10.06% 10.90% 9.27%Performance Benchmark 3.93% 5.85% 7.48% 10.42% 5.84%Note: Pension and Insurance benchmark is NCREIF ODCE
Real ReturnFor the fiscal year ended June 30, 2020, the KRS Pension Funds’ Real Return portfolio returned (9.24)% equaling its benchmark return of (9.24)%. The KRS Insurance Real Return portfolio posted a return of (7.13)%, also in line with the benchmark return of (7.13)% for the period. Since inception, the Pension and Insurance Real Return portfolios have outperformed their respective benchmarks by 0.91% and 0.63% respectively.
Return on Real ReturnAs of June 30, 2020Portfolio Inception Date Fiscal Year 3-Year 5-Year 10-Year InceptionKRS Pension 7/1/2011 -9.24% -0.95% 1.11% N/A 2.32%Performance Benchmark -9.24% -0.95% 1.11% N/A 1.41%KRS Insurance 7/1/2011 -7.13% -0.25% 1.44% N/A 2.35%Performance Benchmark -7.13% -0.25% 1.44% N/A 1.72%Note: Pension and Insurance benchmark is Custom - Allocation Specific.
Board Meeting - December 3, 2020 - Review and Approval of CAFR
311

128INV
Absolute Return For the fiscal year ended June 30, 2020, the KRS Pension and Insurance Funds’ Absolute Return portfolios returned (4.19)% and (4.11)%, respectively, versus a benchmark return of 0.87%. The majority of these assets have been in redemption over the past year or longer, making comparison to active investments difficult.Since inception in 2010, the Pension and Insurance portfolios have both outperformed their benchmark by 0.11% and 0.07% respectively. The portfolios originally consisted of three fund-of-funds, with several underlying funds eventually becoming direct investments by KRS.
Return on Absolute ReturnAs of June 30, 2020 ($ in Thousands)Portfolio Inception Date Fiscal Year 3-Year 5-Year 10-Year InceptionKRS Pension 4/1/2010 -4.19% 0.18% -0.13% 3.18% 2.84%Performance Benchmark 0.87% 2.63% 1.46% 2.79% 2.73%KRS Insurance 4/1/2010 -4.11% 0.24% -0.09% 3.19% 2.80%Performance Benchmark 0.87% 2.63% 1.46% 2.79% 2.73%Note: Pension and Insurance benchmark is the Absolute Return Index.
2020 Top 10 Alternative Asset Holdings
2020 Top 10 Alternative Asset Holdings
Pension Funds Insurance FundAs of June 30, 2020 ($ in Thousands) As of June 30, 2020 ($ in Thousands)
IssuerSub Asset Class
Market Value Issuer
Sub Asset Class
Market Value
ARROWMARK FUND I OPP $314,576 ARROWMARK FUND I OPP $160,184
PROLOGIS REAL EST 149,814 BAY HILLS EMERGING PARTNERS II-B PVT EQ 58,192
BAY HILLS EMERGING PARTNERS PVT EQ 138,352 PROLOGIS REAL EST 57,991DANIEL BOONE LLC ABS RET 98,127 SECONDARY OPP FUND III LP PVT EQ 51,779STOCKBRIDGE FUND LP REAL EST 87,818 STOCKBRIDGE FUND LP REAL EST 41,522HARRISON STREET CORE PROPERTY REAL EST 83,941 DANIEL BOONE LLC ABS RET 40,765HORSLEY BRIDGE V PVT EQ 80,974 HARRISON STREE CORE PROPERTY REAL EST 39,734BAY HILLS EMERGING PARTNERS II-B PVT EQ 64,596 VISTA EQUITY PARTNERS PVT EQ 28,986FUNDAMENTAL PARTNERS III REAL EST 59,365 GREEN EQUITY INVESTORS VI LP PVT EQ 28,124AMERRA-KRS AGRI HOLDING CORP REAL RTN 49,211 AMERRA-KRS AGRI HOLDING CORP REAL RTN 26,498Total $1,126,774 Total $533,775A complete list of holdings is located at https://kyret.ky.gov/Investments/Investments-Library/Pages/Investments-Holdings.aspx.
Board Meeting - December 3, 2020 - Review and Approval of CAFR
312

129 INV
CashFor the fiscal year ended June 30, 2020, the KRS Pension Funds’ Cash portfolio returned 1.89%, outpacing its benchmark, the FTSE Treasury Bill - 3 Month by 0.33%. The KRS Insurance Cash portfolio underperformed the index, posting a return of 1.44% during the same 12-month period.As the accompanying table indicates, longer-term Cash portfolios have performed well compared to their benchmark. For the five years ending June 30, 2020, the Pension Fund portfolio has outperformed its custom benchmark by 0.37% on an annualized basis. Since its inception, the portfolio has exceeded its benchmark by 0.43% per year. The Insurance portfolio has also done very well, exceeding its benchmark return over the five-year and since inception periods by 0.10% and 0.13%, respectively.
Return on CashAs of June 30, 2020Portfolio Inception Date Fiscal Year 3-Year 5-Year 10-Year InceptionKRS Pension Jan-88 1.89% 2.05% 1.52% 0.93% 3.50%Performance Benchmark 1.56% 1.72% 1.15% 0.61% 3.07%KRS Insurance Jul-92 1.44% 1.77% 1.25% 0.76% 2.59%Performance Benchmark 1.56% 1.72% 1.15% 0.61% 2.46%Note: Pension and Insurance benchmark is the Citi Group 3-month Treasury.
Board Meeting - December 3, 2020 - Review and Approval of CAFR
313

130INV
Additional SchedulesIn the following pages are additional schedules which include the assets under management for each firm KRS employs, external investment-related expenses, commissions paid, and portfolio summaries for each of the five Pension and Insurance plans for the fiscal year ended June 30, 2020.
Investment Advisors & Assets Under Management (Actively Managed)As of June 30, 2020 ($ in Thousands)Advisor Assets Under ManagementAdams Street $34,782American Century Investments 498,109Arrowmark 494,895Baring Real Estate 68,972Black Diamond Capital Management 62,256BlackRock ACWI Ex-US 1,066,260BNY Mellon Accruals (1,053)BSP Private Credit 126,263BTG Pactual 33,277Cash Accounts 555,215Capital Springs 67,974Cerberus 174,435Columbia Capital 546,046DivcoWest 4,052Franklin Templeton 387,472Greenfield Acquisition Partners 27,998H/2 Credit Partners 95,531Harrison Street 123,675IFM Infrastructure Debt Fund 64,417Internally Managed Accounts 576,426JP Morgan Emerging Markets 199,472Lazard Asset Management 567,686Loomis, Sayles & Company 723,562Lord Abbett 2,506,656LSV Asset Management 497,991Lubert-Adler 84,165Magnetar Capital 29,042Manulife Financial 473,746Marathon Bluegrass 484,493Mesa West 130,356Middle Ground 24,750
Board Meeting - December 3, 2020 - Review and Approval of CAFR
314

131 INV
Investment Advisors & Assets Under Management (Actively Managed)As of June 30, 2020 ($ in Thousands)Advisor Assets Under ManagementNext Century 100,936NISA Investment Advisors 321,947Northern Trust Global Investments 330,502Nuveen Real Asset (355)Oberland Capital 11,046Patron Capital 25,818Perimeter Park 7,300Prologis 207,805Putnam 655,349Pzena Emergings Markets 184,868River Road Asset Management 251,951Rubenstein Capital 24,536S&P 500 2,059,136Shenkman Capital 295,840Stockbridge 129,340Strategic Value Special Fund 36,616Taurus Mine Finance 34,007Tenaska Power 861Tortoise Capital 121,735Transition Accounts 1,799Walton Street 25,381Waterfall Investment 315,125Westfield Capital 267,105White Oak 198,902Assets Under Management $16,336,471
Investment Advisors & Assets Under Management (Manager with terminated or runoff status)As of June 30, ($ in Thousands)Advisor Assets Under ManagementAMERRA Capital Management $110,206Arbor Investments 78Arcano Capital 25,904ARES Capital 33,280Bay Hills Emerging Partners 278,232Blackstone Capital Partners 54,627CM Growth Capital Partners 9,050Columbia Asset Management 3,693Crestview Partners 57,199CVC Capital Partners 41,799DAG Ventures 70,451DB Secondary Opportunities 69,038DCM 12,131Essex Woodland 11,619Fundamental Partners 84,808
Board Meeting - December 3, 2020 - Review and Approval of CAFR
315

132INV
Investment Advisors & Assets Under Management (Manager with terminated or runoff status)As of June 30, 2020 ($ in Thousands)Advisor Assets Under ManagementMerit Capital Partners 218MHR Insitituional Advisors 953Mill Road Capital 7,332Myriad Opportunities 55,444New Mountain Partners 65,013Oak Hill Partners 8,331Oaktree Capital Management 17Pacific Alternative Asset Management Company 9Pine River Capital 173Prisma Capital 138,892Riverside Capital 26,884SRS Partners 12,416Sun Capital Partners IV 222Systematic 3Technology Crossover Ventures 339Tricadia Select 4,970Triton Fund 19,321VantagePoint Capital Partners 9,179Vista Equity Partners 90,870Warburg Pincus 8,490Wayzata Investment Partners 9,180Assets Under Management 1,872,838Total $18,209,309Note: Totals reflect external manager assets under management, therefore totals will differ from Total Fair Values.
Board Meeting - December 3, 2020 - Review and Approval of CAFR
316

133 INV
Investment Advisors & Assets Under Management by SystemAs of June 30, 2020 ($ in Thousands) CERS CERS KERS KERS SPRS Haz Total
Advisor/Asset ClassNon-
Hazardous HazardousNon-
HazardousNon-
Hazardous Absolute Return $101,867 $32,268 $32,734 $8,541 $3,544 $178,954Blackstone Strategic Opportunistic 1,136 359 365 95 40 1,995Gotham Neutral Strategies 6,865 2,175 2,206 575 239 12,060Governor’s Lane 144 46 46 12 5 253Liquidalts H20 Force 7,544 2,390 2,424 633 262 13,253Luxor Capital 572 181 184 48 20 1,005Myriad Opportunities 22,572 7,150 7,253 1,893 785 39,653Pacific Alternative Asset Management Company 4 1 1 1 - 7Pine River Capital 74 23 24 6 3 130Prisma Capital 55,857 17,694 17,950 4,683 1,943 98,127SRS Partners 5,070 1,606 1,629 425 176 8,906Tricadia Select 2,029 643 652 170 71 3,565Accruals $(366) $(123) $(119) $(36) $(15) $(659)BNYM Fee Accruals (366) (123) (119) (36) (15) (659)Cash $187,008 $69,501 $125,602 $23,151 $9,965 $415,227Cash 187,008 69,501 125,602 23,151 9,965 415,227Core Fixed Income $1,305,553 $448,507 $584,523 $136,118 $74,940 $2,549,641Lord Abbett 933,715 320,766 418,043 97,350 53,596 1,823,470Loomis, Sayles & Company Core 273,428 93,934 122,420 28,508 15,695 533,985NISA Investment Advisors 98,410 33,807 44,060 10,260 5,649 192,186Opportunistic $187,406 $61,954 $54,800 $16,990 $6,769 $327,919Arrowmark 187,406 61,954 54,800 16,990 6,769 327,919Private Equity $597,907 $201,345 $180,315 $54,980 $17,339 $1,051,886Arbor Investments II 30 10 25 3 2 70Arcano Capital 10,095 3,142 8,452 1,069 556 23,314ARES Capital IV 14,905 5,087 - 1,348 425 21,765Bay Hills Captial Partners 106,224 34,250 55,951 10,640 4,807 211,872Black Diamond Capital Management 25,281 8,629 - 2,287 721 36,918Blackstone Capital Partners 19,708 9,368 784 1,719 52 31,631CM Growth I 3,527 1,098 2,953 373 194 8,145Columbia Asset Management IV 1,439 448 1,205 152 79 3,323Crestview Partners 24,053 7,913 8,282 2,328 949 43,525CVC Capital Partners 18,728 6,392 - 1,695 534 27,349DAG Ventures 26,890 9,032 19,295 2,772 1,270 59,259DB Private Equity 13,401 3,858 - - - 17,259DCM VI 4,727 1,472 3,958 501 260 10,918Essex Woodland VIII 4,116 1,281 3,446 436 227 9,506Green Equity Investors 50,526 19,257 10,900 4,597 718 85,998Harvest Partners 21,223 6,338 48 1,745 99 29,453Hellman & Friedman 2,894 901 2,423 307 159 6,684H.I.G. Capital 21,346 8,642 2,062 1,928 387 34,365Horsley Bridge International V 35,061 10,914 29,355 3,712 1,932 80,974Institutional Venture Partners XII 2,398 746 2,007 254 132 5,537JW Childs III 9 3 8 1 - 21Kayne Anderson 10,318 3,214 - 879 - 14,411Keyhaven Capital Partners 15,013 4,887 6,618 1,480 638 28,636Levine Leichtman 36,488 12,185 - 3,254 783 52,710Matlin Patterson 3,127 974 2,618 331 172 7,222Merit Capital Partners 85 26 71 9 5 196Middle Ground 11,839 3,696 - 965 - 16,500
Board Meeting - December 3, 2020 - Review and Approval of CAFR
317

134INV
Mill Road Capital 2,857 889 2,392 303 158 6,599New Mountain Partners 26,648 8,809 7,999 2,558 1,014 47,028Oak Hill Partners 2,702 841 2,263 286 149 6,241Riverside Capital VI 12,874 3,584 - 997 150 17,605Strategic Value Special Fund 17,501 5,464 - 1,427 - 24,392Triton Fund 8,664 2,957 - 784 247 12,652VantagePoint Capital Partners 3,577 1,113 2,995 379 197 8,261Vista Equity Partners 32,252 11,756 1,299 2,791 86 48,184Warburg Pincus 3,075 957 2,575 326 170 7,103Wayzata Investment Partners 4,306 1,212 331 344 67 6,260Public Equity $2,603,269 $878,935 $739,053 $257,145 $95,252 $4,573,654American Century Investments 198,147 65,490 54,071 19,062 6,980 343,750BlackRock 410,452 136,115 111,636 39,404 14,646 712,253Franklin Templeton 158,387 52,349 43,220 15,237 5,580 274,773Internally Managed 224,535 77,175 66,035 22,713 8,460 398,918Invesco 27 9 8 2 1 47Lazard Asset Management 227,895 75,323 62,188 21,924 8,028 395,358LSV Asset Management 196,875 65,070 53,723 18,940 6,936 341,544Next Century 39,118 13,422 11,462 3,933 1,458 69,393Northern Trust 143,117 48,561 41,065 14,200 5,247 252,190River Road Asset Management 97,375 33,410 28,531 9,788 3,630 172,734S & P 500 803,333 276,334 236,654 81,489 30,410 1,428,220Transition Accounts 741 245 203 72 26 1,287Westfield Capital 103,267 35,432 30,257 10,381 3,850 183,187Emerging Markets $153,394 $50,699 $41,858 $14,756 $5,405 $266,112JP Morgan Emerging Markets 79,894 26,406 21,802 7,686 2,815 138,603Pzena Emerging Markets 73,500 24,293 20,056 7,070 2,590 127,509Real Estate $325,906 $104,278 $99,665 $30,661 $12,803 $573,313Baring Real Estate 27,162 8,589 9,019 2,467 1,043 48,280DivcoWest IV 1,968 613 - 168 60 2,809Fundamental Partners 33,399 10,561 11,090 3,034 1,282 59,366Greenfield Acquisition Partners 13,629 4,247 - 1,164 419 19,459Harrison Street 46,573 14,567 16,691 4,136 1,973 83,940Lubert-Adler 36,750 11,535 5,936 3,235 1,266 58,722Patron Capital 10,458 3,307 3,472 950 401 18,588Perimeter Park West 1,682 1,832 1,880 1,541 365 7,300Prologis 84,285 26,652 27,985 7,656 3,236 149,814Rubenstein Capital II 11,915 3,713 - 1,018 366 17,012Stockbridge 46,490 14,825 20,457 4,073 1,973 87,818Walton Street 11,595 3,837 3,135 1,219 419 20,205Real Return $434,909 $147,390 $104,454 $39,247 $15,687 $741,687AMERRA Capital Management 50,867 16,060 - 4,560 2,307 73,794BTG Pactual 15,871 5,086 - 1,370 634 22,961IFM Infrastructure Debt Fund 25,554 8,800 7,523 2,317 898 45,092Internal TIPS 72 25 21 6 2 126Magnetar MTP EOF II 11,185 3,537 5,573 994 493 21,782Nuveen Real Asset (133) (46) (39) (12) (5) (235)Oberland Capital 5,469 1,707 - 446 - 7,622Putnam 257,107 88,541 75,693 23,313 9,037 453,691Taurus Mining Finance 16,158 5,515 - 1,462 461 23,596Tenaska Power II 348 116 253 39 18 774Tortoise Capital 52,411 18,049 15,430 4,752 1,842 92,484Specialty Credit $1,151,830 $382,660 $354,645 $112,391 $44,996 $2,046,522Adam Street 13,513 4,556 4,417 1,314 548 24,348BSP Private Credit 49,509 16,397 12,459 4,475 1,157 83,997Capital Springs 28,045 9,289 7,058 2,535 655 47,582
Board Meeting - December 3, 2020 - Review and Approval of CAFR
318

135 INV
Cerberus 71,969 23,836 18,112 6,506 1,681 122,104Columbia Asset Management 213,162 71,890 83,994 21,137 9,797 399,980H/2 Credit Partners 34,984 10,991 18,175 3,100 1,531 68,781Manulife Financial 203,865 67,957 36,589 17,925 7,507 333,843Loomis, Sayles & Company Core 23 7 4 2 1 37Marathon Bluegrass 174,317 57,275 91,963 15,537 8,303 347,395Mesa West 50,255 15,853 9,834 4,509 1,477 81,928Shenkman Capital 111,089 37,629 18,114 17,632 4,652 189,116Waterfall Investment 121,382 40,577 33,864 10,513 5,825 212,161White Oak 79,717 26,403 20,062 7,206 1,862 135,250Total Assets Under Management $7,048,683 $2,377,414 $2,317,530 $693,944 $286,685 $12,724,256
Investment Advisors & Assets Under Management by SystemAs of June 30, 2020 ($ in Thousands) CERS CERS KERS KERS SPRS Haz Total
Advisor/Asset ClassNon-
Hazardous HazardousNon-
HazardousNon-
Hazardous Absolute Return $32,817 $18,387 $11,560 $7,676 $2,880 $73,320Blackstone Strategic Opportunistic 352 197 124 82 31 786Gotham Neutral Strategies 2,242 1,256 789 525 197 5,009Governor’s Lane 47 27 17 11 4 106Liquidalts H20 Force 2,492 1,396 878 583 219 5,568Luxor Capital 150 84 53 35 13 335Myriad Opportunities 7,068 3,960 2,490 1,653 620 15,791Pacific Alternative Asset Management Company 1 1 - - - 2Pine River Capital 19 11 7 4 2 43Prisma Capital 18,246 10,223 6,427 4,268 1,601 40,765SRS Partners 1,571 880 553 368 138 3,510Tricadia Select 629 352 222 147 55 1,405Accruals $(179) $(94) $(70) $(37) $(14) $(394)BNYM Fee Accruals (179) (94) (70) (37) (14) (394)Cash $65,386 $29,695 $29,678 $10,211 $5,018 $139,988Cash 65,386 29,695 29,678 10,211 5,018 139,988Core Fixed Income $449,233 $238,685 $185,922 $91,639 $36,971 $1,002,450IG Credit - - - - - -Lord Abbett 306,159 162,668 126,709 62,454 25,196 683,186Loomis, Sayles & Company Core 84,923 45,121 35,147 17,323 6,990 189,504NISA Investment Advisors 58,151 30,896 24,066 11,862 4,785 129,760Opportunistic $75,670 $41,224 $27,054 $16,818 $6,210 $166,976Arrowmark 75,670 41,224 27,054 16,818 6,210 166,976Private Equity $243,615 $136,615 $50,111 $46,029 $20,866 $497,236Arbor Investments II 3 2 2 1 - 8Arcano Capital 1,043 559 585 279 124 2,590ARES Capital IV 6,561 3,549 - 866 539 11,515Bay Hills Captial Partners 34,950 18,865 3,875 5,546 3,124 66,360Black Diamond Capital Management 14,438 7,809 - 1,905 1,186 25,338Blackstone Capital Partners 10,995 6,567 129 1,711 813 20,215CM Growth I 365 195 205 97 43 905Columbia Asset Management IV 149 80 83 40 18 370Crestview Partners 7,367 3,979 574 1,111 643 13,674CVC Capital Partners 8,234 4,454 - 1,086 676 14,450DAG Ventures 5,275 3,007 1,336 1,080 494 11,192DB Private Equity 24,084 13,013 7,282 6,046 1,354 51,779DCM VI 489 262 274 130 58 1,213Essex Woodland VIII 851 456 478 227 101 2,113
Board Meeting - December 3, 2020 - Review and Approval of CAFR
319
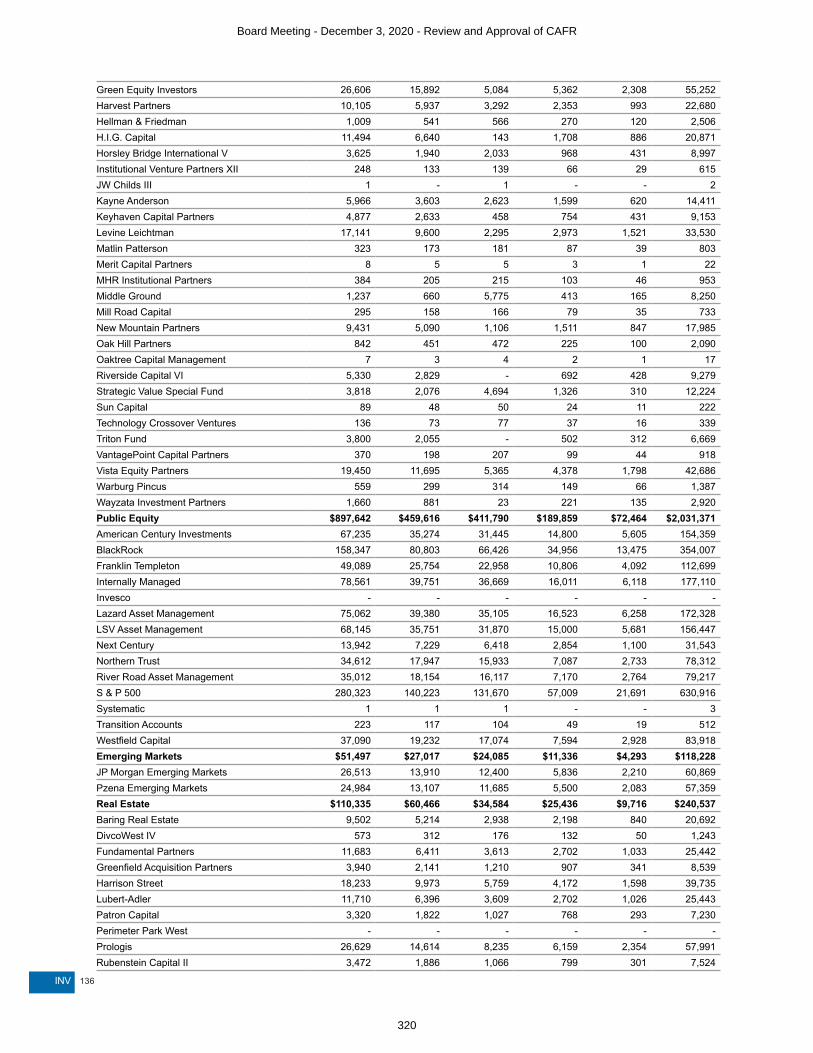
136INV
Green Equity Investors 26,606 15,892 5,084 5,362 2,308 55,252Harvest Partners 10,105 5,937 3,292 2,353 993 22,680Hellman & Friedman 1,009 541 566 270 120 2,506H.I.G. Capital 11,494 6,640 143 1,708 886 20,871Horsley Bridge International V 3,625 1,940 2,033 968 431 8,997Institutional Venture Partners XII 248 133 139 66 29 615JW Childs III 1 - 1 - - 2Kayne Anderson 5,966 3,603 2,623 1,599 620 14,411Keyhaven Capital Partners 4,877 2,633 458 754 431 9,153Levine Leichtman 17,141 9,600 2,295 2,973 1,521 33,530Matlin Patterson 323 173 181 87 39 803Merit Capital Partners 8 5 5 3 1 22MHR Institutional Partners 384 205 215 103 46 953Middle Ground 1,237 660 5,775 413 165 8,250Mill Road Capital 295 158 166 79 35 733New Mountain Partners 9,431 5,090 1,106 1,511 847 17,985Oak Hill Partners 842 451 472 225 100 2,090Oaktree Capital Management 7 3 4 2 1 17Riverside Capital VI 5,330 2,829 - 692 428 9,279Strategic Value Special Fund 3,818 2,076 4,694 1,326 310 12,224Sun Capital 89 48 50 24 11 222Technology Crossover Ventures 136 73 77 37 16 339Triton Fund 3,800 2,055 - 502 312 6,669VantagePoint Capital Partners 370 198 207 99 44 918Vista Equity Partners 19,450 11,695 5,365 4,378 1,798 42,686Warburg Pincus 559 299 314 149 66 1,387Wayzata Investment Partners 1,660 881 23 221 135 2,920Public Equity $897,642 $459,616 $411,790 $189,859 $72,464 $2,031,371American Century Investments 67,235 35,274 31,445 14,800 5,605 154,359BlackRock 158,347 80,803 66,426 34,956 13,475 354,007Franklin Templeton 49,089 25,754 22,958 10,806 4,092 112,699Internally Managed 78,561 39,751 36,669 16,011 6,118 177,110Invesco - - - - - -Lazard Asset Management 75,062 39,380 35,105 16,523 6,258 172,328LSV Asset Management 68,145 35,751 31,870 15,000 5,681 156,447Next Century 13,942 7,229 6,418 2,854 1,100 31,543Northern Trust 34,612 17,947 15,933 7,087 2,733 78,312River Road Asset Management 35,012 18,154 16,117 7,170 2,764 79,217S & P 500 280,323 140,223 131,670 57,009 21,691 630,916Systematic 1 1 1 - - 3Transition Accounts 223 117 104 49 19 512Westfield Capital 37,090 19,232 17,074 7,594 2,928 83,918Emerging Markets $51,497 $27,017 $24,085 $11,336 $4,293 $118,228JP Morgan Emerging Markets 26,513 13,910 12,400 5,836 2,210 60,869Pzena Emerging Markets 24,984 13,107 11,685 5,500 2,083 57,359Real Estate $110,335 $60,466 $34,584 $25,436 $9,716 $240,537Baring Real Estate 9,502 5,214 2,938 2,198 840 20,692DivcoWest IV 573 312 176 132 50 1,243Fundamental Partners 11,683 6,411 3,613 2,702 1,033 25,442Greenfield Acquisition Partners 3,940 2,141 1,210 907 341 8,539Harrison Street 18,233 9,973 5,759 4,172 1,598 39,735Lubert-Adler 11,710 6,396 3,609 2,702 1,026 25,443Patron Capital 3,320 1,822 1,027 768 293 7,230Perimeter Park West - - - - - -Prologis 26,629 14,614 8,235 6,159 2,354 57,991Rubenstein Capital II 3,472 1,886 1,066 799 301 7,524
Board Meeting - December 3, 2020 - Review and Approval of CAFR
320

137 INV
Stockbridge 18,927 10,426 6,159 4,345 1,665 41,522Walton Street 2,346 1,271 792 552 215 5,176Real Return $147,852 $77,269 $51,394 $30,940 $10,841 $318,296AMERRA Capital Management 16,863 9,309 4,840 3,925 1,475 36,412BTG Pactual 4,670 2,566 1,592 1,079 409 10,316IFM Infrastructure Debt Fund 8,948 4,610 3,291 1,852 624 19,325Internally Managed 126 65 46 26 9 272Magnetar MTP EOF II 3,348 1,852 987 777 296 7,260Nuveen Real Asset (56) (29) (20) (11) (4) (120)Oberland Capital 1,069 581 1,315 372 87 3,424Putnam 93,371 48,108 34,344 19,325 6,510 201,658Taurus Mining Finance 5,932 3,209 - 783 487 10,411Tenaska Power II 37 20 17 9 4 87Tortoise Capital 13,544 6,978 4,982 2,803 944 29,251Specialty Credit $407,925 $211,308 $164,041 $83,978 $29,793 $897,045Adam Street 4,731 2,500 1,835 987 381 10,434BSP Private Credit 18,888 10,301 7,180 4,336 1,561 42,266Capital Springs 9,113 4,970 3,464 2,092 753 20,392Cerberus 23,386 12,754 8,890 5,368 1,933 52,331Columbia Asset Management 74,695 38,591 20,653 8,914 3,213 146,066H/2 Credit Partners 12,357 6,808 3,668 2,829 1,088 26,750Loomis, Sayles & Company 17 9 6 4 1 37Manulife Financial 63,290 34,500 22,773 14,178 5,162 139,903Marathon Bluegrass 60,401 33,016 24,201 14,480 5,000 137,098Mesa West 22,505 12,419 6,280 5,250 1,974 48,428Shenkman Capital 44,255 15,857 35,256 8,408 2,948 106,724Waterfall Investment 45,842 24,069 19,022 10,603 3,428 102,964White Oak 28,445 15,514 10,813 6,529 2,351 63,652Total Assets Under Management $2,481,793 $1,300,188 $990,149 $513,885 $199,038 $5,485,053
Board Meeting - December 3, 2020 - Review and Approval of CAFR
321

138INV
External Investment Expense - Pension Funds Asset Class/Type BreakdownFor the fiscal year ending June 30, 2020 ($ in Thousands)
US
PublicNon US Equity
Core Fixed
IncomeReal
ReturnPrivate Equity
Real Estate
Absolute Return Opportunistic
Specialty Credit Cash Total
Fee for Long Balance $- $6 $- $0 $1 $2 $- $- $2 $- $11Securities Lending Fee Rebate 1,007 (40) 834 223 - - - - 1,028 - 3,052Investment Advisory Fees 1,801 7,292 2,585 4,128 8,430 5,777 806 13,892 - 44,711Performance/Incentive Fees - - - (1,406) (2,462) 5,270 171 2,469 (1,676) - 2,366Securities Lending Fees 131 60 47 42 - - - - 47 - 327Taxes and Insurance - - - - 116 - - - - - 116Administration 251 - - - - - - - - 1,465 1,716Miscellaneous - 26 - 1,365 (1,129) 1,270 - - 670 6 2,208Commission on Future Contracts 2 - 40 3 - - - - 9 - 54Consultant Fees - - - - - - - - - 672 672Custodial Fees - - - - - - - - - 1,252 1,252 $3,192 $7,344 $3,506 $4,355 $4,956 $12,319 $977 $2,469 $13,972 $3,395 $56,485
External Investment Expense - Insurance Fund Asset Class/Type BreakdownFor the fiscal year ending June 30, 2020 ($ in Thousands)
US
PublicNon US Equity
Core Fixed
IncomeReal
ReturnPrivate Equity
Real Estate
Absolute Return Opportunistic
Specialty Credit Cash Total
Fee for Long Balance $- $2 $- $0 $0 $1 $- $- $1 $- $4Securities Lending Fee Rebate 458 2 419 90 - - - - 357 - 1,326Investment Advisory Fees 849 3,185 1,053 1,794 5,994 2,442 321 - 6,088 - 21,726Performance/Incentive Fees - - - 298 (1,961) 2,240 68 1,258 (419) - 1,484Securities Lending Fees 55 27 21 19 - - - - 19 - 141Administration 111 - - - - - - - - 631 742Miscellaneous - 12 - (237) (4,469) 602 - - 293 2 (3,797)Taxes and Insurance - - - - 42 - - - - - 42Commission on Future Contracts 1 - 15 1 - - - - 4 - 21Consultant Fees - - - - - - - - - 288 288Custodial Fees - - - - - - - - - 765 765 $1,474 $3,228 $1,508 $1,965 $(394) $5,285 $389 $1,258 $6,343 $1,686 $22,742The Governmental Accounting Standards Board recognizes that it may not be possible or cost-beneficial to separate certain investment expenses from either the related investment income or the general administrative expenses of the plan. KRS has displayed all investment related fees and expenses identifiable and captured by our custodial bank, BNY Mellon and KRS staff.
Board Meeting - December 3, 2020 - Review and Approval of CAFR
322

External Investment ExpensesFor the fiscal year ending June 30, 2020 ($ in Thousands)
Expense Fees PaidShare of Assets
Portfolio Management Pension Funds $51,182 64.60%Insurance Fund 20,222 25.52%Securities Lending Pension Funds 3,379 4.26%Insurance Fund 1,467 1.85%Custody Pension Funds 1,252 1.58%Insurance Fund 765 0.97%Consultant Pension Funds 672 0.85%Insurance Fund 288 0.36% Total Pension Funds 56,485 71.30%Total Insurance Fund 22,742 28.70%Total Expenses $79,227 100.00%
Schedule of Commissions Paid (Whole $)For the fiscal year ending June 30, 2020
Assets Total SharesCommissions
PaidPrice per
ShareU.S. Equities 49,967,404 $694,973 0.01Non U.S. Equities 217,808,417 $1,203,092 0.01Total 267,775,821 $1,898,065 0.01
Board Meeting - December 3, 2020 - Review and Approval of CAFR
323

140INV
Fair Values By Plan - PensionAs of June 30, 2020 ($ in Thousands)
CERS Non-Hazardous CERS-Hazardous
KERS Non-Hazardous KERS-Hazardous
Fair Value
(FV)% of Total
FVFair Value
(FV)% of Total
FVFair Value
(FV)% of Total
FVFair Value
(FV)% of Total
FVAssets Liquidity Cash $186,642 2.65% $69,378 2.92% $125,483 5.42% $23,115 3.33%Core Fixed Income 1,305,553 18.52% 448,507 18.86% 584,523 25.22% 136,118 19.61%Growth Public Equity 2,756,663 39.11% 929,634 39.10% 780,911 33.70% 271,903 39.18%
US Equity 1,367,655 19.40% 470,093 19.77% 402,247 17.36% 138,360 19.94%Non-US Equity 1,235,614 17.53% 408,842 17.20% 336,806 14.53% 118,785 17.12%Emerging Markets 153,394 2.18% 50,699 2.13% 41,858 1.81% 14,756 2.12%
Specialty Credit 1,151,830 16.34% 382,660 16.10% 354,645 15.30% 112,391 16.20%Private Equity 597,907 8.48% 201,345 8.47% 180,315 7.78% 54,980 7.92%Diversifying Strategies Opportunistic 187,406 2.66% 61,954 2.60% 54,800 2.36% 16,990 2.45%Real Return 434,907 6.17% 147,390 6.20% 104,454 4.51% 39,247 5.66%Real Estate 325,908 4.62% 104,278 4.39% 99,665 4.30% 30,661 4.42%Absolute Return 101,867 1.45% 32,268 1.36% 32,734 1.41% 8,541 1.23%TOTAL PORTFOLIO $7,048,683 $2,377,414 $2,317,530 $693,944
Insurance
CERS Non-Hazardous CERS-Hazardous
KERS Non-Hazardous KERS-Hazardous
Fair Value
(FV)% of Total
FVFair Value
(FV)% of Total
FVFair Value
(FV)% of Total
FVFair Value
(FV)% of Total
FVAssets Liquidity Cash $65,207 2.63% $29,601 2.28% $29,608 2.99% $10,174 1.98%Core Fixed Income 449,232 18.10% 238,685 18.36% 185,921 18.78% 91,640 17.83%Growth Public Equity 949,140 38.24% 486,634 37.43% 435,875 44.02% 201,193 39.15%
US Equity 479,541 19.32% 242,539 18.65% 223,881 22.61% 97,724 19.02%Non-US Equity 418,102 16.85% 217,078 16.70% 187,909 18.98% 92,133 17.93%Emerging Markets 51,497 2.07% 27,017 2.08% 24,085 2.43% 11,336 2.21%
Specialty Credit 407,924 16.44% 211,308 16.25% 164,041 16.57% 83,979 16.34%Private Equity 243,617 9.82% 136,615 10.51% 50,110 5.06% 46,030 8.96%Diversifying Strategies Opportunistic 75,671 3.05% 41,224 3.17% 27,054 2.73% 16,818 3.27%Real Return 147,851 5.96% 77,269 5.94% 51,394 5.19% 30,940 6.02%Real Estate 110,334 4.44% 60,466 4.65% 34,585 3.49% 25,435 4.95%Absolute Return 32,817 1.32% 18,386 1.41% 11,561 1.17% 7,676 1.49%TOTAL PORTFOLIO $2,481,793 $1,300,188 $990,149 $513,885
Board Meeting - December 3, 2020 - Review and Approval of CAFR
324

141 INV
Fair Values By Plan - PensionAs of June 30, 2020 ($ in Thousands)
SPRS Total Fair Value (FV) % of Total FV Fair Value (FV) % of Total FV
Assets Liquidity Cash $9,950 3.47% $414,568 3.26%Core Fixed Income 74,940 26.14% 2,549,641 20.04%Growth Public Equity 100,655 35.11% 4,839,766 38.04%
US Equity 51,536 17.98% 2,429,891 19.10%Non-US Equity 43,716 15.25% 2,143,763 16.85%Emerging Markets 5,405 1.88% 266,112 2.09%
Specialty Credit 44,996 15.69% 2,046,522 16.08%Private Equity 17,339 6.05% 1,051,886 8.27%Diversifying Strategies Opportunistic 6,769 2.36% 327,919 2.58%Real Return 15,687 5.47% 741,685 5.83%Real Estate 12,803 4.47% 573,315 4.50%Absolute Return 3,544 1.24% 178,954 1.40%TOTAL PORTFOLIO $286,685 $12,724,256
Insurance SPRS INS Total Fair Value (FV) % of Total FV Fair Value (FV) % of Total FV
Assets Liquidity Cash $5,004 2.51% $139,594 2.54%Core Fixed Income 36,972 18.58% 1,002,450 18.28%Growth Public Equity 76,758 38.56% 2,149,600 39.19%
US Equity 37,335 18.76% 1,081,020 19.71%Non-US Equity 35,130 17.65% 950,352 17.33%Emerging Markets 4,293 2.16% 118,228 2.15%
Specialty Credit 29,793 14.97% 897,045 16.35%Private Equity 20,863 10.48% 497,235 9.07%Diversifying Strategies Opportunistic 6,211 3.12% 166,978 3.04%Real Return 10,842 5.45% 318,296 5.80%Real Estate 9,716 4.88% 240,536 4.39%Absolute Return 2,879 1.45% 73,319 1.34%TOTAL PORTFOLIO $199,038 $5,485,053
Board Meeting - December 3, 2020 - Review and Approval of CAFR
325

ACTUARIAL TABLE OF CONTENTS
142142
143 CERTIFICATION OF ACTUARIAL RESULTS147 SUMMARY OF ACTUARIAL ASSUMPTIONS156 SUMMARY OF ACTUARIAL VALUATION RESULTS158 RECOMMENDED EMPLOYER CONTRIBUTION RATES161 SUMMARY OF ACTUARIAL UNFUNDED LIABILITIES165 SOLVENCY TEST168 ACTIVE MEMBER VALUATION172 SUMMARY OF BENEFIT PROVISIONS KERS & CERS NON-
HAZARDOUS PLANS176 SUMMARY OF BENEFIT PROVISIONS KERS HAZARDOUS,
CERS HAZARDOUS, & SPRS PLANS178 SUMMARY OF BENEFIT PROVISIONS KERS HAZARDOUS,
CERS HAZARDOUS & SPRS PLANS - TIER 3
Board Meeting - December 3, 2020 - Review and Approval of CAFR
326

143 ACT
Certification of Actuarial ResultsRe: Certification for the Actuarial Results as of June 30, 2020. Dear Board of Trustees:Actuarial valuations are prepared annually as of June 30, for the Kentucky Employees Retirement System (KERS), the County Employees Retirement System (CERS), and the State Police Retirement System (SPRS). These reports describe the current actuarial condition of the Kentucky Retirement Systems (KRS) and document the calculated employer contribution rates as well as the changes in the financial condition since the prior actuarial valuation.Under state statute, the Board of Trustees must approve the employer contribution rates determined by each actuarial valuation. The contribution rates are determined actuarially based upon the membership, plan assets, assumptions, and funding policies adopted by the KRS Board. This actuarial valuation (as of June 30, 2020) was used by the Board of Trustees to certify the KERS, CERS, and SPRS employer contribution rates for the period beginning July 1, 2021 and ending June 30, 2022. FINANCING OBJECTIVES AND FUNDING POLICYKRS administers pension and health insurance funds to provide for monthly retirement income and retiree health insurance benefits. The total employer contribution rate is comprised of a contribution to each respective fund. The employer contribution rate is determined in accordance with Section 61.565 of Kentucky Statute, which was last amended by SB249 (passed during the 2020 legislative session). As specified by the Statute, the employer contribution rate is comprised of a normal cost contribution and an actuarial accrued liability contribution. The actuarial accrued liability contribution is calculated by amortizing the unfunded accrued liability as of June 30, 2019 over a closed 30-year amortization period. Gains and losses incurring in future years (including those incurred in this June 30, 2020 valuation) are amortized as separate closed 20-year amortization bases. Absent changes in benefits, assumptions, or material liability or investment gains or losses, the total contribution rate for each fund is expected to remain stable, as a percentage of payroll, in future years. If new legislation is enacted between the valuation date and the date the contribution rates become effective, the Board may recertify the calculated rates in order to reflect the impact of new legislation. Such adjustments are based on information supplied by the actuary.
PROGRESS TOWARD REALIZATION OF FINANCING OBJECTIVESThe funded ratio (the ratio of the actuarial value of assets to the actuarial accrued liability) is a standard measure of a plan’s funded status. In the absence of benefit improvements, assumption changes, or actuarial losses, it should increase over time, until it reaches at least 100%. As of June 30, 2020, the funded ratios for the pension and health insurance funds are as follows:
Board Meeting - December 3, 2020 - Review and Approval of CAFR
327

Funding LevelAs of June 30 2020 2019 2018 2017
SystemPension
FundInsurance
FundPension
FundInsurance
FundPension
FundInsurance
FundPension
FundInsurance
FundCERS Non-Hazardous 49.4% 78.5% 49.1% 70.7% 52.7% 76.7% 52.8% 66.4%
CERS Hazardous 45.1% 78.2% 45.3% 75.8% 48.4% 74.6% 48.1% 66.9%
KERS Non-Hazardous 14.2% 42.7% 13.4% 36.3% 12.9% 36.4% 13.6% 30.7%
KERS Hazardous 55.3% 126.0% 54.8% 123.1% 55.5% 130.0% 54.1% 117.6%
SPRS 28.1% 75.0% 27.0% 71.3% 27.1% 71.6% 27.0% 65.2%
Board Meeting - December 3, 2020 - Review and Approval of CAFR
328

ASSUMPTIONS AND METHODSThe Board of Trustees, in consultation with the actuary, sets the actuarial assumptions and methods used in the actuarial valuation. An experience study was conducted after the June 30, 2018 actuarial valuation and the Board adopted updated assumptions for first use in the June 30, 2019 actuarial valuation.The assumed increase in future healthcare costs, or trend assumption, is reviewed on an annual basis and was updated since the June 30, 2019 valuation to better reflect the plan’s anticipated long-term healthcare cost increases. There were no other changes in actuarial assumptions since the prior valuation.In our opinion, all the assumptions and methods adopted by the Board Trustees satisfy the requirements in the Actuarial Standards of Practice that are applicable for actuarial valuations of public retirement systems. It is our opinion that the actuarial assumptions used to perform this valuation are internally consistent and reasonably reflect the anticipated future experience of the System. The results of the actuarial valuation are dependent on the actuarial assumptions used. Actual results can, and almost certainly will, differ as actual experience deviates from the assumptions. Even seemingly minor changes in the assumptions can materially change the liabilities, calculated contribution rate, and funding periods. The actuarial calculations are intended to provide information for rational decision making.
ADDITIONAL DISCLOSURESThe benefit structure is outlined in this section of the annual report. GRS prepared the following schedules in the actuarial section: Summary of Actuarial Valuation Results, Recommended Employer Contribution Rates, Summary of Actuarial Unfunded Liabilities, the Solvency Test, the Summary of Active Member Valuation Data, the Summary of Retired Member Valuation Data, Summary of the Assumptions and Methods, and the Summary of the Benefit Provisions.In addition, GRS prepared the following schedules in the financial section in accordance with GASB Statement No. 67: Net Pension Liability Schedule, Discount Rate Sensitivity Analysis, Schedule of Changes in the Employers’ Net Pension Liability, Schedule of Employers’ Net Pension Liability, and the Schedule of Employers’ Contributions.
DATAMember data for retired, active and inactive members was supplied as of June 30, 2020, by the KRS staff. The staff also supplied asset information as of June 30, 2020. We did not audit this data, but we did apply a number of tests to the data, and we concluded that it was reasonable and consistent with the prior year’s data. GRS is not responsible for the accuracy or completeness of the information provided to us by KRS.
IMPACT DUE TO COVID-19The actuarial valuations were performed as of June 30, 2020, which is approximately three months after the start of the COVID-19 pandemic in the United States. It is uncertain how the mortality and other demographic behavior (e.g. retirement and turnover) may change during the next couple years. However, if government budgets are constrained then we would expect lower than expected salary increases for individual members and a possible reduction in active membership until the Commonwealth’s economy recovers. There may also be increased volatility and uncertainty in future investment returns.
CERTIFICATIONWe certify that the information presented herein is accurate and fairly portrays the actuarial position of the Retirement Systems as of June 30, 2020. All of our work conforms with generally accepted actuarial principles and practices, and in conformity with the Actuarial Standards of Practice issued by the Actuarial Standards Board. In our opinion, our calculations also comply with the requirements of Kentucky Code of Laws and, where applicable, the Internal Revenue Code, ERISA, and the Statements of the Governmental Accounting Standards Board.The undersigned are independent actuaries and consultants. Mr. Newton and Mr. White are Enrolled Actuaries. All three of the undersigned are Members of the American Academy of Actuaries and meet the Qualification Standards of the American Academy of Actuaries. All are experienced in performing valuations for large public retirement systems.Sincerely,
Board Meeting - December 3, 2020 - Review and Approval of CAFR
329

Gabriel, Roeder, Smith & Co.
Joseph P. Newton, FSA, MAAA, EASenior Consultant
Daniel J. White, FSA, MAAA, EASenior Consultant
Janie Shaw, ASA, MAAAConsultant
Board Meeting - December 3, 2020 - Review and Approval of CAFR
330

147 ACT
Summary of Actuarial AssumptionsThe results of the actuarial valuation are based upon the assumptions and funding policies adopted by the Board and statutory funding requirements. Assumptions and funding policies are reviewed against actual plan experience at least once every five years through the completion of the Actuarial Experience Study. In general, the assumptions and methods used in the June 30, 2020 valuation are based on the most recent actuarial experience study for the five-year period ending June 30, 2018, submitted, and adopted by the Board in April 2019. 1. Actuarial Cost Method: The actuarial valuation was prepared using the entry age normal cost (EANC) method as required by state statute. Under this method, the present value of future benefits is determined for each member and allocated equitably as a level percentage of payroll from the member’s entry age into the plan to the assumed age of exit from the plan. The portion of the present value of future benefits allocated to the current valuation year is called the normal cost. The portion of the present value of future benefits allocated to prior years of service is called the actuarial accrued liability. The unfunded actuarial accrued liability represents the difference between the actuarial accrued liability and the actuarial value of assets as of the valuation date. Relative to the pension fund and the insurance fund, an employer contribution rate has been established to be equal to the sum of the normal cost and the amount needed to amortize the unfunded actuarial accrued liability (UAAL). 2. UAAL Amortization Method: Effective for the June 30, 2019 valuation, the actuarial accrued liability contribution is calculated by amortizing the unfunded accrued liability as of June 30, 2019 over a closed 30-year amortization period. Gains and losses incurring in future years are amortized as separated closed 20-year amortization bases. This amortization cost is calculated using a 0.00% payroll growth assumption for the KERS and SPRS Funds and a 2.00% payroll growth assumption for the CERS Funds. 3. Asset Valuation Method: The actuarial value of assets recognizes a portion of the difference between the market value of assets and the expected market value of assets, based on the investment return assumption. The amount recognized each year is 20% of the difference between market value and expected market value. 4. Retiree Insurance Funding Policy: Effective for the June 30, 2019, valuation, the actuarial accrued liability is calculated by amortizing the unfunded accrued liability as of June 30, 2019 over a closed 30-year amortization period. Gains/losses incurring in future years are amortized as separated closed 20-year amortization bases. This amortization cost is calculated using a 0.00% payroll growth assumption for the KERS and SPRS Funds and a 2.00% payroll growth assumption for the CERS Funds. 5. Investment Return Assumption: The future investment earnings of plan assets are assumed to accumulate at a rate of 6.25% per annum for the CERS Non-Hazardous Retirement System, the CERS Hazardous Retirement System, the KERS Hazardous Retirement System, and all Insurance Systems. This rate consists of a 2.30% price inflation component and a 3.95% real rate of return component. The assumed rate of return for the KERS Non-Hazardous Retirement System and the State Police Retirement System is 5.25% and consists of a 2.30% inflationary component and a 2.95% real rate of return component. This assumption was adopted in 2017. 6. Salary Increase Assumptions: Active member salaries are assumed to increase at the rates provided in Table 1. The rates include a price inflation and productivity component, and an additional increase due to promotion based upon plan experience. The price inflation component is 2.30% for all plans and the productivity component is 1.00% for the non-hazardous systems and 1.25% for the hazardous systems. This assumption was adopted in 2019.
Board Meeting - December 3, 2020 - Review and Approval of CAFR
331

148ACT
Table 1. Salary Increase Assumptions
Service CERS Non-Hazardous
CERS Hazardous
KERS Non-Hazardous
KERS Hazardous SPRS
0 10.30% 19.05% 15.30% 20.05% 16.05%1 7.30% 7.55% 6.80% 7.55% 8.55%2 6.30% 5.55% 6.05% 6.55% 7.55%3 4.80% 4.80% 5.80% 6.55% 5.55%4 4.55% 4.55% 5.30% 5.55% 5.55%5 4.55% 4.55% 4.80% 5.05% 5.55%6 4.30% 4.55% 4.55% 4.55% 5.55%7 4.30% 4.05% 4.30% 4.05% 4.55%8 4.05% 4.05% 4.05% 4.05% 4.55%9 4.05% 3.55% 3.80% 3.55% 3.55%10 3.80% 3.55% 3.80% 3.55% 3.55%11 3.80% 3.55% 3.30% 3.55% 3.55%12 3.55% 3.55% 3.30% 3.55% 3.55%13 3.55% 3.55% 3.30% 3.55% 3.55%14 3.55% 3.55% 3.30% 3.55% 3.55%15 & Over 3.30% 3.55% 3.30% 3.55% 3.55% .
7. Health Care Cost Trend Rate:The costs for retiree medical premiums are assumed to increase according to the assumptions provided in Table 2.
Table 2: Health Care Cost Trend Rate (See footnotes 1-3)January (1) Non-Medicare Plans Medicare Plans Dollar Contribution (2)
2022 6.40% 2.90% (3) 1.50%2023 6.30% 6.30% 1.50%2024 6.20% 6.20% 1.50%2025 6.10% 6.10% 1.50%2026 6.00% 6.00% 1.50%2027 5.80% 5.80% 1.50%2028 5.60% 5.60% 1.50%2029 5.40% 5.40% 1.50%2030 5.20% 5.20% 1.50%2031 5.00% 5.00% 1.50%2032 4.80% 4.80% 1.50%2033 4.60% 4.60% 1.50%2034 4.40% 4.40% 1.50%2035 4.20% 4.20% 1.50%
2036+ 4.05% 4.05% 1.50%(1) All increases are assumed to occur on January 1. The 2021 premiums were known at the time of the June 30, 2020 valuation and were incorporated into the liability measurement.(2) Applies to members participating on or after July 1, 2003. All increases are assumed to occur on July 1.(3) Humana provided “Not to Exceed” 2022 Medicare premiums, which were incorporated into the liability measurement and resulted in an assumed 2.90% increase Medicare premiums at January 1, 2022.
8. Payroll Growth Assumption: For purposes of determining the amortization rate to finance the unfunded actuarial accrued liability, the active member payroll in CERS (Non-hazardous and Hazardous) is assumed to increase at a rate of 2.00% per year and the active member payroll in KERS (Non-hazardous and Hazardous) and SPRS is assumed to increase at the rate of 0.00% per annum. This assumption was adopted in 2017. 9. Retiree Cost of Living Adjustments (COLA): SB2 only allows the Cost of Living Adjustments (COLAs) to be awarded on a biennial basis if the State Legislature so authorizes and either (i) the system is over 100% funded or (ii) the Legislature appropriates sufficient funds to pay the increased liability for the COLA.
Board Meeting - December 3, 2020 - Review and Approval of CAFR
332

149 ACT
10. Retirement Rate Assumptions: The probability, or the likelihood, that a member will retire at a specified age or level of service is provided in Table 3. These assumptions were adopted in 2019.
Board Meeting - December 3, 2020 - Review and Approval of CAFR
333

150ACT
Table 3a: Retirement Rate Assumptions CERS (See footnotes 1 - 3) Non-Hazardous Hazardous
Age
CERS Normal Retirement CERS Early Retirement(1)
Service
CERS Members
Participating before
9/1/2008(2)
CERS Members
Participating between
9/1/208 and 1/1/2014(3)
CERS Members
Participating after
1/1/2014(3)Male Female Male FemaleUnder 45 35.00% 27.00% 5 17.00%
45 35.00% 27.00% 6 17.00% 46 35.00% 27.00% 7 17.00% 47 35.00% 27.00% 8 17.00% 48 35.00% 27.00% 9 17.00% 49 35.00% 27.00% 10 17.00% 50 30.00% 27.00% 11 17.00% 51 30.00% 27.00% 12 17.00% 52 30.00% 27.00% 13 17.00% 53 30.00% 27.00% 14 17.00% 54 30.00% 27.00% 15 17.00% 55 30.00% 27.00% 4.00% 5.00% 16 17.00% 56 30.00% 27.00% 4.00% 5.00% 17 17.00% 57 30.00% 27.00% 4.00% 5.00% 18 17.00% 58 30.00% 27.00% 4.00% 5.00% 19 17.00% 59 30.00% 27.00% 4.00% 5.00% 20 30.00% 60 30.00% 27.00% 4.00% 8.00% 21 22.50% 61 30.00% 27.00% 4.00% 9.00% 22 18.00% 62 30.00% 40.00% 15.00% 20.00% 23 21.00% 63 30.00% 35.00% 15.00% 18.00% 24 24.00% 64 30.00% 30.00% 15.00% 16.00% 25 27.00% 21.60% 16.00%65 30.00% 30.00% 26 30.00% 24.00% 16.00%66 30.00% 27.00% 27 33.00% 26.40% 16.00%67 30.00% 27.00% 28 36.00% 28.80% 16.00%68 30.00% 27.00% 29 39.00% 31.20% 16.00%69 30.00% 27.00% 30+ 39.00% 31.20% 100.00%70 30.00% 27.00% 71 30.00% 27.00% 72 30.00% 27.00% 73 30.00% 27.00% 74 30.00% 27.00% 75 100.00% 100.00%
(1) The annual rate of retirement is 11% for male members and 12% for female members with 25-26 years of service.
(2) The annual rate of retirement is 100% at age 62.
(3) The annual rate of retirement is 100% at age 60.
Non-Hazardous System: For members hired after 7/1/2003, the rates shown above are multiplied by 80% if the member is under age 65 to reflect the different retiree health insurance benefit.
Hazardous Sytem: For memebers hired after 7/1/2003 and prior to 9/1/2008, the rates shown above are multiplied by 80% if the member is under age 62 to reflect the different retiree health insurance benefit.
Board Meeting - December 3, 2020 - Review and Approval of CAFR
334

151 ACT
Table 3b: Retirement Rate Assumptions KERS (See footnotes 1 - 3)Non-Hazardous Hazardous
Age
KERS Normal RetirementKERS Early Retirement(1)
Service
KERS Members participating before
9/1/2008(2)
KERS Members participating
between 9/1/2008 and
1/1/2014(3)
KERS Members
participating after
1/1/2014(3)Male Female Male Female Age 55-61 Age 62+Under 45 20.00% 33.00% 5 10.00% 35.00%
45 21.00% 33.00% 6 10.00% 35.00% 46 22.00% 33.00% 7 10.00% 35.00% 47 23.00% 33.00% 8 10.00% 35.00% 48 24.00% 33.00% 9 10.00% 35.00% 49 25.00% 33.00% 10 10.00% 35.00% 50 26.00% 33.00% 11 10.00% 35.00% 51 27.00% 33.00% 12 10.00% 35.00% 52 28.00% 33.00% 13 10.00% 35.00% 53 29.00% 33.00% 14 10.00% 35.00% 54 30.00% 33.00% 15 10.00% 35.00% 55 30.00% 33.00% 5.00% 5.00% 16 10.00% 35.00% 56 30.00% 33.00% 5.00% 5.00% 17 10.00% 35.00% 57 30.00% 33.00% 5.00% 5.00% 18 10.00% 35.00% 58 30.00% 33.00% 5.00% 5.00% 19 10.00% 35.00% 59 30.00% 33.00% 5.00% 5.00% 20 50.00% 50.00% 60 30.00% 33.00% 5.00% 8.00% 21 32.00% 32.00% 61 30.00% 33.00% 8.00% 9.00% 22 32.00% 32.00% 62 35.00% 35.00% 15.00% 20.00% 23 32.00% 32.00% 63 30.00% 33.00% 15.00% 18.00% 24 32.00% 32.00% 64 30.00% 33.00% 15.00% 16.00% 25 32.00% 32.00% 25.60% 16.00%65 30.00% 33.00% 26 32.00% 32.00% 25.60% 16.00%66 30.00% 33.00% 27 32.00% 32.00% 25.60% 16.00%67 30.00% 33.00% 28 32.00% 32.00% 25.60% 16.00%68 30.00% 33.00% 29 32.00% 32.00% 25.60% 16.00%69 30.00% 33.00% 30+ 32.00% 32.00% 25.60% 100.00%70 30.00% 33.00% 71 30.00% 33.00% 72 30.00% 33.00% 73 30.00% 33.00% 74 30.00% 33.00% 75 100.00% 100.00%
(1) The annual rate of retirement is 12% for male members and 14% for female members with 25-26 years of service.
(2) The annual rate of retirement is 100% at age 65.
(3) The annual rate of retirement is 100% at age 60.
Hazardous Sytem: For memebers hired after 7/1/2003, the rates shown above are multiplied by 80% if the member is under age 65 to reflect the different retiree health insurance benefit.
Non-Hazardous System: For members hired after 7/1/2003 and prior to 9/1/2008, the rates shown above are multiplied by 80% if the member is under age 65 to reflect the different retiree health insurance benefit.
Board Meeting - December 3, 2020 - Review and Approval of CAFR
335

152ACT
Table 3c: Retirement Rate Assumptions SPRS (See footnotes 1 - 2)
Service
Hazardous
SPRS Members Participating
before 9/1/2008(1)
SPRS Members Participating
between 9/1/2008 and 1/1/2014(2)
SPRS Members participating after
1/1/2014(3)
20 22.00% 21 22.00% 22 22.00% 23 28.00% 24 28.00% 25 28.00% 17.60% 16.00% 26 28.00% 17.60% 16.00% 27 28.00% 17.60% 16.00% 28 44.00% 22.40% 16.00% 29 44.00% 22.40% 16.00% 30 44.00% 22.40% 100.00% 31 58.00% 22.40% 32 58.00% 22.40% 33 58.00% 35.20% 34 58.00% 35.20% 35 58.00% 35.20% 36 58.00% 46.40% 37 58.00% 46.40% 38 58.00% 46.40% 39 58.00% 46.40%
40+ 58.00% 46.40% (1) The annual rate of service retirement is100% at age 55. (2) The annual rate of service retirement is 100% at age 60. For members hired after 7/1/2003 and prior to 9/1/2008, the rates shown above are multiplied by 80% if the member is under age 55 to reflect the different retiree health insurance benefit.
Board Meeting - December 3, 2020 - Review and Approval of CAFR
336

153 ACT
11. Mortality Assumptions: Pre-retirement mortality: PUB-2010 General Mortality table, for the Non-Hazardous Systems, and the PUB-2010 Public Safety Mortality table for the Hazardous Systems, projected with the ultimate rates from the MP-2014 mortality improvement scale using a base year of 2010.Post-retirement mortality (non-disabled): System-specific mortality table based on mortality experience from 2013-2018, projected with the ultimate rates from MP-2014 mortality improvement scale using a base year of 2019.The following table provides the life expectancy for a non-disabled retiree in future years based on the assumption with full generational projection:Post-retirement mortality (disabled): PUB-2010 Disabled Mortality table, with a 4-year set-forward for both male and female rates, projected with the ultimate rates from the MP-2014 mortality improvement scale using a base year of 2010.These mortality assumptions were adopted in 2019. The following table provides sample annual rates of mortality in the base year of each table (2019 for the retired member mortality rates and 2010 for the active member and disabled member mortality rates).
Table 4: Sample Annual Rate of Mortality
Active Member Mortality -
Non HazardousActive Member Mortality -
Hazardous Retired Member Mortality Disabled Member MortalityAge Males Females Males Females Males Females Males Females20 0.04% 0.01% 0.04% 0.02% 0.03% 0.01% 0.29% 0.16%22 0.03% 0.01% 0.04% 0.02% 0.03% 0.01% 0.29% 0.18%32 0.04% 0.02% 0.04% 0.03% 0.04% 0.02% 0.49% 0.44%42 0.08% 0.04% 0.07% 0.06% 0.07% 0.04% 1.11% 1.07%52 0.18% 0.10% 0.14% 0.10% 0.31% 0.22% 2.20% 1.79%62 0.37% 0.22% 0.32% 0.19% 1.04% 0.72% 3.19% 2.35%72 0.84% 0.60% 0.98% 0.60% 1.79% 1.18% 5.54% 4.32%
Table 4a: Life Expectancy for an Age 65 Retiree in Years Year of Retirement
Gender 2020 2025 2030 2035 2040Male 21.0 21.4 21.8 22.2 22.6Female 24.0 24.4 24.8 25.2 25.6
Board Meeting - December 3, 2020 - Review and Approval of CAFR
337

154ACT
12. Withdrawal Rates: The probability, or likelihood, of active members terminating employment prior toretirement is provided in Table 5. The rates below include the pre-retirement mortality rates described in item #11. These assumptions were adopted in 2019.
Table 5: Selected Rates of Termination Prior to Retirement
CERS Non-Hazardous
CERS Hazardous
KERS Non-Hazardous KERS SPRS
Years of Service Years of Service
Years of Service
1 20.00% 20.00% 1 20.00% 25.00% 1 15.00%2 15.58% 9.11% 2 16.45% 19.68% 2 4.82%3 12.48% 7.24% 3 13.39% 15.12% 3 3.76%4 10.66% 6.14% 4 11.61% 12.45% 4 3.15%5 9.37% 5.37% 5 10.34% 10.56% 5 2.71%6 8.37% 4.76% 6 9.35% 9.09% 6 2.37%7 7.56% 4.27% 7 8.55% 7.89% 7 2.09%8 6.87% 3.85% 8 7.87% 6.87% 8 1.86%9 6.27% 3.49% 9 7.28% 5.99% 9 1.66%
10 5.74% 3.18% 10 6.76% 5.22% 10 1.48%11 5.27% 2.89% 11 6.30% 4.53% 11 1.32%12 4.84% 2.63% 12 5.88% 3.90% 12 1.17%13 4.45% 2.40% 13 5.49% 3.33% 13 1.04%14 4.09% 2.18% 14 5.14% 2.80% 14 0.92%15 3.76% 1.98% 15 4.81% 2.31% 15 0.80%16 3.45% 1.80% 16 4.51% 1.86% 16 0.70%17 3.16% 1.62% 17 4.22% 1.43% 17 0.60%18 2.89% 1.46% 18 3.96% 1.03% 18 0.51%19 2.64% 1.30% 19 3.70% 0.66% 19 0.42%20 2.39% 1.16% 20 3.47% 0.30% 20 0.34%21 2.16% 0.00% 21 3.24% 0.00% 21 0.00%22 1.94% 0.00% 22 3.02% 0.00% 22 0.00%23 1.74% 0.00% 23 2.82% 0.00% 23 0.00%24 1.54% 0.00% 24 2.62% 0.00% 24 0.00%25 1.35% 0.00% 25 2.43% 0.00% 25 0.00%
26+ 0.00% 0.00% 26+ 0.00% 0.00% 26+ 0.00%
13. Rates of Disablement: KRS provides disability benefits for those individuals meeting specific qualifications established by state law. This assumption provides the probability, or likelihood, that a member will become disabled during the course of employment for various age levels. These assumptions were adopted in 2019. 14. Assumption Changes Since Prior Valuation: The assumed increase in future health care costs, or trend assumption, is reviewed on an annual basis and was updated to better reflect more current expectations relating to anticipated future increases in the medical costs. The assumed impact of the Cadillac Tax (previously a 0.9% load on employer paid non-Medicare premiums for those who became participants prior to July 1, 2003) was removed to reflect its repeal since the prior valuation.
Table 6: Sample Rates of Disablement
CERS Non-Hazardous
CERS Hazardous
KERS Non-Hazardous
KERS Hazardous SPRS
Nearest Age Probability Probability Probability Probability Probability20 0.04% 0.07% 0.03% 0.05% 0.05%30 0.06% 0.12% 0.06% 0.08% 0.09%40 0.14% 0.26% 0.12% 0.18% 0.20%50 0.39% 0.73% 0.34% 0.50% 0.56%60 1.02% 1.90% 0.88% 1.32% 1.46%
Board Meeting - December 3, 2020 - Review and Approval of CAFR
338

155 ACT
Board Meeting - December 3, 2020 - Review and Approval of CAFR
339

156ACT
Summary of Actuarial Valuation Results
CERS Non-Hazardous
CERS Hazardous
KERS Non-Hazardous
KERS Hazardous SPRS
Recommended Contribution Rate (Fiscal Year 2022)(1)
Pension Fund Contribution 23.88% 43.23% 75.32% 33.43% 127.99%Insurance Fund Contribution 4.17% 8.73% 9.71% 0.00% 18.07%Recommended Employer Contribution 28.05% 51.96% 85.03% 33.43% 146.06%
Funded Status as of Valuation Date As of June 30, 2020 (in Whole $)Pension FundActuarial Liability $14,610,867,358 $5,431,298,482 $16,348,961,571 $1,283,769,521 $1,053,157,155Actuarial Value of Assets 7,220,607,024 2,447,885,345 2,323,298,166 709,586,801 296,126,111Unfunded Liability on Actuarial Value of Assets 7,390,260,334 2,983,413,137 14,025,663,405 574,182,720 757,031,044Funding Ratio on Actuarial Value of Assets 49.42% 45.07% 14.21% 55.27% 28.12%Market Value of Assets 7,027,327,214 2,379,703,906 2,308,080,030 690,349,952 293,949,424Unfunded Liability on Market Value of Assets $7,583,540,144 $3,051,594,576 $14,040,881,541 $593,419,569 $759,207,731Funding Ratio on Market Value of Assets 48.10% 43.81% 14.12% 53.78% 27.91%Insurance FundActuarial Liability $3,392,085,755 $1,740,970,549 $2,564,787,757 $427,976,729 $276,143,386Actuarial Value of Assets 2,661,350,936 1,362,027,828 1,095,958,769 539,251,445 207,017,723Unfunded Liability on Actuarial Value of Assets 730,734,819 378,942,721 1,468,828,988 (111,274,716) 69,125,663Funding Ratio on Actuarial Value of Assets 78.46% 78.23% 42.73% 126.00% 74.97%Market Value of Assets 2,581,612,912 1,321,116,766 1,060,648,531 521,754,873 201,340,037Unfunded Liability on Market Value of Assets $810,472,843 $419,853,783 $1,504,139,226 $(93,778,144) $74,803,349Funding Ratio on Market Value of Assets 76.11% 75.88% 41.35% 121.91% 72.91%Member Data (See Footnotes)Number of Active Members 81,250 9,419 31,703 4,094 798Total Annual Payroll (Active Members)(2) $2,565,390,935 $568,557,746 $1,387,760,907 $170,825,646 $46,144,943Average Annual Pay (Active Members) $31,574 $60,363 $43,774 $41,726 $57,826Number of Retired Members & Beneficiaries 65,414 10,452 47,333 4,628 1,669Average Annual Retirement Allowance $11,671 $26,291 $20,450 $14,927 $37,407Number of Vested Inactive Members 50,599 1,767 31,829 2,201 300Number of Inactive Members Due a Refund 45,093 1,823 21,670 4,740 289(1) Rates do not reflect the CERS phase-in provisions, which limit the certified contribution rates to a 12% increase from the prior year. The recommended certified contribution rates for CERS for FYE 2022 are 26.95% of pay for the non-hazardous fund and 44.33% of pay for the hazardous fund.(2) Annual payroll included in the Summary of Actuarial Valuation Results is based upon the annualized monthly payroll for active members as of the valuation date. The annual payroll recorded in the financial section is based upon the sum of the monthly payroll for active members recorded for each month of fiscal year ending June 30, 2020.
Board Meeting - December 3, 2020 - Review and Approval of CAFR
340

157 ACT
CERS FundsThe Insurance Fund contribution rates and the employer contribution rates for CERS Non-Hazardous and CERS Hazardous shown in the tables below are the full funding rates presented by the actuary in the 2011 through 2020 annual valuations. House Bill 362 was enacted during the 2018 legislative session that limits the annual increase in the CERS employer contribution over the prior fiscal year to 12% per year for the period of July 1, 2018 to June 30, 2028, or until the full actuarial required contribution is met.
Recommended Employer Contribution RatesAs of June 30County Employees Retirement SystemCERS (Non-Hazardous Employers)
Valuation Date
Applicable Fiscal Year
Pension Fund Normal Cost
Pension Fund: Payment on Unfunded Liability
Pension Fund Contribution
Insurance Fund Contribution
Recommended Employer
Contribution6/30/2011 2012-2013 4.68% 7.94% 12.62% 8.59% 21.21%6/30/2012 2013-2014 4.68% 9.06% 13.74% 5.84% 19.58%6/30/2013 2014-2015 4.35% 8.40% 12.75% 5.35% 18.10%6/30/2014 2015-2016 4.23% 8.19% 12.42% 4.88% 17.30%6/30/2015 2016-2017 3.80% 10.15% 13.95% 4.93% 18.88%6/30/2016 2017-2018 3.70% 10.78% 14.48% 4.70% 19.18%6/30/2017 2018-2019 5.85% 15.99% 21.84% 6.21% 28.05%6/30/2018 2019-2020 5.80% 16.72% 22.52% 4.76% 27.28%6/30/2019 2020-2021 6.63% 17.18% 23.81% 5.43% 29.24%6/30/2020 2021-2022 6.46% 17.42% 23.88% 4.17% 28.05%
CERS (Hazardous Employers)
Valuation Date
Applicable Fiscal Year
Pension Fund Normal Cost
Pension Fund: Payment on Unfunded Liability
Pension Fund Contribution
Insurance Fund Contribution
Recommended Employer
Contribution6/30/2011 2012-2013 7.40% 12.70% 20.10% 21.84% 41.94%6/30/2012 2013-2014 6.44% 15.33% 21.77% 16.02% 37.79%6/30/2013 2014-2015 6.35% 14.38% 20.73% 14.97% 35.70%6/30/2014 2015-2016 6.21% 14.05% 20.26% 13.42% 33.68%6/30/2015 2016-2017 4.52% 17.19% 21.71% 9.79% 31.50%6/30/2016 2017-2018 4.40% 17.80% 22.20% 9.35% 31.55%6/30/2017 2018-2019 6.78% 28.91% 35.69% 12.17% 47.86%6/30/2018 2019-2020 6.35% 30.63% 36.98% 9.52% 46.50%6/30/2019 2020-2021 11.36% 30.66% 42.02% 9.86% 51.88%6/30/2020 2021-2022 11.00% 32.23% 43.23% 8.73% 51.96%
The insurance fund contribution rates and the employer contribution rates for CERS Non-Hazardous and CERS Hazardous shown in the above tables are the full funding rates presented by the actuary in the 2011 through 2020 annual valuations. However, in the case of CERS Non-Hazardous and CERS Hazardous, in 2006 the actuary recommended a five-year phase-in of the rate which requires the payment of the insurance benefit normal cost with a five-year phase-in of the unfunded accrued liability (UAL) associated with the insurance funds. In 2008 this recommendation was changed to a ten-year phase-in from the initial starting date. This phase-in was complete and the full actuarial rates were paid in FYE 2018. HB 362 (passed during the 2018 legislative session) limited the employer contribution rate increases to 12% per year over the prior fiscal year for the period of July 1, 2018 to June 30, 2028. SB 249 (passed during the 2020 legislative session) froze the contribution rates for one year so that the rates for FYE 2021 were equal to FYE 2020.
Board Meeting - December 3, 2020 - Review and Approval of CAFR
341

158ACT
KERS FundsThe contribution rates for KERS Non-Hazardous and KERS Hazardous shown in the tables below are the full funding rates presented by the actuary for 2011 through 2020 annual valuations. However, actual employer contributions were less than the recommended rates for years 2009 through 2014. SB 2 required full funding starting in fiscal year 2015. HB 265 from the 2018 legislative session reduced the employer contribution rate for KERS quasi-governmental agencies to the fiscal year 2018 rate for fiscal year 2019, which was 49.47%. The 2019 Special Legislative Session HB 1 sets the employer contribution rate at 49.47%, retroactive to July 1, 2019, for fiscal year 2020 for KERS quasi-governmental agencies.
Recommended Employer Contribution RatesAs of June 30KERS (Non-Hazardous Employers)
Valuation Date
Applicable Fiscal Year
Pension Fund: Normal Cost
Pension Fund: Payment on Unfunded Liability
Pension Fund Contribution
Insurance Fund Contribution
Recommended Employer
Contribution6/30/2011 2012-2013 4.38% 23.65% 28.03% 16.52% 44.55%6/30/2012 2013-2014 4.26% 28.31% 32.57% 12.71% 45.28%6/30/2013 2014-2015 4.13% 26.71% 30.84% 7.93% 38.77%6/30/2014 2015-2016 4.10% 29.47% 33.57% 7.74% 41.31%6/30/2015 2016-2017 3.60% 35.33% 38.93% 8.35% 47.28%6/30/2016 2017-2018 4.93% 37.05% 41.98% 8.41% 50.39%6/30/2017 2018-2019 8.17% 62.86% 71.03% 12.40% 83.43%6/30/2018 2019-2020 7.98% 66.56% 74.54% 10.65% 85.19%6/30/2019 2020-2021 7.99% 65.29% 73.28% 11.15% 84.43%6/30/2020 2021-2022 7.90% 67.42% 75.32% 9.71% 85.03%
KERS (Hazardous Employers)
Valuation Date
Applicable Fiscal Year
Pension Fund Normal Cost
Pension Fund: Payment on Unfunded Liability
Pension Fund Contribution
Insurance Fund Contribution
Recommended Employer
Contribution6/30/2011 2012-2013 7.47% 8.69% 16.16% 19.73% 35.89%6/30/2012 2013-2014 6.09% 10.91% 17.00% 11.84% 28.84%6/30/2013 2014-2015 5.79% 10.58% 16.37% 9.97% 26.34%6/30/2014 2015-2016 5.69% 11.40% 17.09% 7.12% 24.21%6/30/2015 2016-2017 6.93% 14.15% 21.08% 2.74% 23.82%6/30/2016 2017-2018 6.44% 14.04% 20.48% 1.34% 21.82%6/30/2017 2018-2019 9.67% 24.72% 34.39% 2.46% 36.85%6/30/2018 2019-2020 9.24% 25.18% 34.42% 0.00% 34.42%6/30/2019 2020-2021 9.21% 26.79% 36.00% 0.00% 36.00%6/30/2020 2021-2022 8.84% 24.59% 33.43% 0.00% 33.43%
The contribution rates for KERS Non-Hazardous and KERS Hazardous shown in the above tables are the full funding rates presented by the actuary in the 2011 through 2020 annual valuations. However, the actual employer contribution rates have been less than those shown above. As a result of HB 1 passed in 2008 the statue called for an employer contribution rate at an increasing percentage of the full funding rates until 100% was achieved in 2025 for KERS Non-Hazardous and 2019 for KERS Hazardous. SB2 eliminated this phase-in beginning with the June 30, 2013 actuarial valuation. Additionally, HB 265 (passed during the 2018 legislative session), HB 1 (passed during the 2019 special legislative session), and HB 352 (passed during the 2020 legislative session) reduced the FYE 2019-2021 employer contribution rate to 49.47% for Regional Mental Health/Mental Retardation Boards, Local and District Health Departments, State Universities, Community Colleges and any other agencies eligible to voluntarily cease participating in the KERS non-hazardous fund.
Board Meeting - December 3, 2020 - Review and Approval of CAFR
342

159 ACT
SPRS FundsThe contribution rates for SPRS shown in the below tables are the full funding rates presented by the actuary in the 2011 through 2020 annual valuations. However, the actual employer contribution rates have been less than those shown below. As a result of HB1 passed in 2008 the statute called for an employer contribution rate at an increasing percentage of the full funding rates. SB2 eliminated this phase-in beginning with the June 30, 2013, actuarial valuation.
Recommended Employer Contribution RatesAs of June 30SPRS Employers
Valuation Date
Applicable Fiscal Year
Pension Fund Normal Cost
Pension Fund: Payment on Unfunded Liability
Pension Fund Contribution
Insurance Fund Contribution
Recommended Employer
Contribution6/30/2011 2012-2013 8.12% 39.36% 47.48% 55.93% 103.41%6/30/2012 2013-2014 8.14% 45.21% 53.35% 43.17% 96.52%6/30/2013 2014-2015 8.46% 45.44% 53.90% 21.86% 75.76%6/30/2014 2015-2016 8.39% 50.05% 58.44% 19.17% 77.61%6/30/2015 2016-2017 8.77% 57.70% 66.47% 18.87% 85.34%6/30/2016 2017-2018 11.16% 60.41% 71.57% 18.10% 89.67%6/30/2017 2018-2019 16.21% 102.84% 119.05% 27.23% 146.28%6/30/2018 2019-2020 15.81% 104.73% 120.54% 19.50% 140.04%6/30/2019 2020-2021 19.39% 104.40% 123.79% 19.69% 143.48%6/30/2020 2021-2022 19.04% 108.95% 127.99% 18.07% 146.06%
The contribution rates for SPRS shown in the above tables are the full funding rates presented by the actuary in the 2011 through 2020 annual valuations. However, the actual employer contribution rates have been less than those shown above. As a result of HB 1 passed in 2008 the statue called for an employer contribution rate at an increasing percentage of the full funding rates. SB2 eliminated this phase-in beginning with the June 30, 2013 actuarial valuation.
Board Meeting - December 3, 2020 - Review and Approval of CAFR
343

160ACT
Summary of Actuarial Unfunded LiabilitiesAs of June 30 ($ in Thousands)CERS (Non-Hazardous Pension Fund)
Valuation Date
Actuarial Liability Value of Assets Unfunded Actuarial Liability Funding Level
Actuarial Market Actuarial Market Actuarial Market6/30/2011 $8,918,085 $5,629,611 $5,577,252 $3,288,474 $3,340,833 63.13% 62.54%6/30/2012 9,139,568 5,547,236 5,372,770 3,592,332 3,766,798 60.69% 58.79%6/30/2013 9,378,876 5,637,094 5,780,830 3,741,782 3,598,046 60.10% 61.64%6/30/2014 9,772,523 6,117,134 6,507,300 3,655,389 3,265,222 62.60% 66.59%6/30/2015 10,740,325 6,474,849 6,416,854 4,265,477 4,323,472 60.29% 59.75%6/30/2016 11,076,457 6,535,372 6,106,187 4,541,084 4,970,270 59.00% 55.13%6/30/2017 12,803,509 6,764,873 6,687,237 6,038,636 6,116,272 52.84% 52.23%6/30/2018 13,191,505 6,950,225 7,018,963 6,241,280 6,172,542 52.69% 53.21%6/30/2019 14,356,114 7,049,527 7,159,921 7,306,587 7,196,192 49.10% 49.87%6/30/2020 $14,610,867 $7,220,607 $7,027,327 $7,390,260 $7,583,540 49.42% 48.10%
CERS (Non-Hazardous Insurance Fund)Valuation
DateActuarial Liability Value of Assets Unfunded Actuarial Liability Funding Level
Actuarial Market Actuarial Market Actuarial Market6/30/2011 $3,073,973 $1,433,451 $1,451,984 $1,640,522 $1,621,989 46.63% 47.23%6/30/2012 2,370,771 1,512,854 1,439,226 857,917 931,545 63.81% 60.71%6/30/2013 2,443,894 1,628,244 1,633,697 815,650 810,197 66.62% 66.85%6/30/2014 2,616,915 1,831,199 1,899,557 785,715 717,357 69.98% 72.59%6/30/2015 2,907,827 1,997,456 1,948,454 910,371 959,373 68.69% 67.01%6/30/2016 2,988,121 2,079,811 1,943,757 908,310 1,044,364 69.60% 65.05%6/30/2017 3,355,151 2,227,401 2,212,536 1,127,750 1,142,616 66.39% 65.94%6/30/2018 3,092,623 2,371,430 2,414,126 721,193 678,497 76.68% 78.06%6/30/2019 3,567,947 2,523,249 2,569,511 1,044,698 998,435 70.72% 72.02%6/30/2020 $3,392,086 $2,661,351 $2,581,613 $730,735 $810,473 78.46% 76.11%
CERS (Hazardous Pension Fund)Valuation
DateActuarial Liability Value of Assets Unfunded Actuarial Liability Funding Level
Actuarial Market Actuarial Market Actuarial Market6/30/2011 $2,859,041 $1,779,545 $1,760,603 $1,079,496 $1,098,438 62.24% 61.58%6/30/2012 3,009,992 1,747,379 1,677,940 1,262,613 1,332,052 58.05% 55.75%6/30/2013 3,124,206 1,801,691 1,830,658 1,322,514 1,293,548 57.67% 58.60%6/30/2014 3,288,826 1,967,640 2,082,998 1,321,186 1,205,827 59.83% 63.34%6/30/2015 3,613,308 2,096,783 2,073,397 1,516,525 1,539,911 58.03% 57.38%6/30/2016 3,704,456 2,139,119 2,003,669 1,565,337 1,700,787 57.74% 54.09%6/30/2017 4,649,047 2,238,320 2,217,996 2,410,726 2,431,051 48.15% 47.71%6/30/2018 4,792,548 2,321,721 2,348,337 2,470,827 2,444,211 48.44% 49.00%6/30/2019 5,245,365 2,375,106 2,413,708 2,870,258 2,831,657 45.28% 46.02%6/30/2020 $5,431,298 $2,447,885 $2,379,704 $2,983,413 $3,051,595 45.07% 43.81%
Board Meeting - December 3, 2020 - Review and Approval of CAFR
344

161 ACT
CERS (Hazardous Insurance Fund)Valuation
DateActuarial Liability Value of Assets Unfunded Actuarial Liability Funding Level
Actuarial Market Actuarial Market Actuarial Market6/30/2011 $1,647,703 $770,790 $774,509 $876,912 $873,194 46.78% 47.01%6/30/2012 1,364,843 829,041 788,071 535,802 576,772 60.74% 57.74%6/30/2013 1,437,333 892,774 894,232 544,558 543,101 62.11% 62.21%6/30/2014 1,493,864 997,733 1,034,308 496,131 459,557 66.79% 69.24%6/30/2015 1,504,015 1,087,707 1,061,561 416,308 442,454 72.32% 70.58%6/30/2016 1,558,818 1,135,784 1,062,602 423,034 496,216 72.86% 68.17%6/30/2017 1,788,433 1,196,780 1,189,001 591,653 599,431 66.92% 66.48%6/30/2018 1,684,028 1,256,306 1,280,982 427,722 403,046 74.60% 76.07%6/30/2019 1,732,879 1,313,659 1,340,714 419,221 392,165 75.81% 77.37%6/30/2020 $1,740,971 $1,362,028 $1,321,117 $378,943 $419,854 78.23% 75.88%
Summary of Actuarial Unfunded LiabilitiesAs of June 30 ($ in Thousands)KERS (Non-Hazardous Pension Fund)
Valuation DateActuarial Liability Value of Assets Unfunded Actuarial Liabilities Funding Level
Actuarial Market Actuarial Market Actuarial Market6/30/2011 $11,182,142 $3,726,986 $3,538,878 $7,455,156 $7,643,264 33.33% 31.65%6/30/2012 11,361,048 3,101,317 2,980,402 8,259,731 8,380,647 27.30% 26.23%6/30/2013 11,386,602 2,636,123 2,747,428 8,750,479 8,639,174 23.15% 24.13%6/30/2014 11,550,110 2,423,957 2,560,420 9,126,154 8,989,691 20.99% 22.17%6/30/2015 12,359,673 2,350,990 2,307,858 10,008,683 10,051,815 19.02% 18.67%6/30/2016 13,224,698 2,112,287 1,953,422 11,112,412 11,271,276 15.97% 14.77%6/30/2017 15,591,641 2,123,623 2,056,870 13,468,018 13,534,771 13.62% 13.19%6/30/2018 15,675,232 2,019,278 2,004,446 13,655,954 13,670,786 12.88% 12.79%6/30/2019 16,466,427 2,206,280 2,233,672 14,260,147 14,232,755 13.40% 13.57%6/30/2020 $16,348,962 $2,323,298 $2,308,080 $14,025,663 $14,040,882 14.21% 14.12%
KERS (Non-Hazardous Insurance Fund)
Valuation DateActuarial Liability Value of Assets Unfunded Actuarial Liabilities Funding Level
Actuarial Market Actuarial Market Actuarial Market6/30/2011 $4,280,090 $451,620 $433,305 $3,828,469 $3,846,784 10.55% 10.12%6/30/2012 3,125,330 446,081 430,806 2,679,250 2,694,524 14.27% 13.78%6/30/2013 2,128,754 497,584 509,364 1,631,170 1,619,390 23.37% 23.93%6/30/2014 2,226,760 621,237 664,776 1,605,523 1,561,984 27.90% 29.85%6/30/2015 2,413,705 695,018 687,684 1,718,687 1,726,021 28.79% 28.49%6/30/2016 2,456,678 743,270 695,189 1,713,408 1,761,489 30.26% 28.30%6/30/2017 2,683,496 823,918 817,370 1,859,579 1,866,126 30.70% 30.46%6/30/2018 2,435,506 887,121 891,205 1,548,385 1,544,301 36.42% 36.59%6/30/2019 2,733,065 991,427 995,089 1,741,639 1,737,977 36.28% 36.41%6/30/2020 $2,564,788 $1,095,959 $1,060,649 $1,468,829 $1,504,139 42.73% 41.35%
Board Meeting - December 3, 2020 - Review and Approval of CAFR
345

162ACT
KERS (Hazardous Pension Fund)
Valuation DateActuarial Liability Value of Assets Unfunded Actuarial Liabilities Funding Level
Actuarial Market Actuarial Market Actuarial Market6/30/2011 $721,293 $510,749 $510,628 $210,545 $210,665 70.81% 70.79%6/30/2012 752,699 497,226 478,104 255,473 274,596 66.06% 63.52%6/30/2013 783,981 505,657 513,162 278,324 270,818 64.50% 65.46%6/30/2014 816,850 527,897 559,504 288,953 257,346 64.63% 68.50%6/30/2015 895,433 556,688 550,120 338,746 345,313 62.17% 61.44%6/30/2016 936,706 559,487 524,679 377,219 412,027 59.73% 56.01%6/30/2017 1,121,420 607,159 601,529 514,261 519,891 54.14% 53.64%6/30/2018 1,151,923 639,262 645,485 512,661 506,438 55.50% 56.04%6/30/2019 1,226,195 671,647 680,932 554,548 545,262 54.77% 55.53%6/30/2020 $1,283,770 $709,587 $690,350 $574,183 $593,420 55.27% 53.78%
KERS (Hazardous Insurance Fund)
Valuation DateActuarial Liability Value of Assets Unfunded Actuarial Liabilities Funding Level
Actuarial Market Actuarial Market Actuarial Market6/30/2011 $507,059 $329,962 $321,072 $177,097 $185,987 65.07% 63.32%6/30/2012 384,592 345,574 333,298 39,018 51,294 89.85% 86.66%6/30/2013 385,518 370,774 374,310 14,743 11,208 96.18% 97.09%6/30/2014 396,987 419,396 435,504 (22,409) (38,517) 105.64% 109.70%6/30/2015 374,904 451,514 441,626 (76,610) (66,722) 120.43% 117.80%6/30/2016 377,745 473,160 440,596 (95,415) (62,851) 125.26% 116.64%6/30/2017 419,440 493,458 488,838 (74,019) (69,399) 117.65% 116.55%6/30/2018 393,481 511,441 519,072 (117,961) (125,592) 129.98% 131.92%6/30/2019 426,705 525,315 534,053 (98,610) (107,348) 123.11% 125.16%6/30/2020 $427,977 $539,251 $521,755 $(111,275) $(93,778) 126.00% 121.91%
Board Meeting - December 3, 2020 - Review and Approval of CAFR
346

163 ACT
Summary of Actuarial Unfunded LiabilitiesAs of June 30 ($ in Thousands)SPRS (Pension)
Valuation Date
Actuarial Liability Value of Assets Unfunded Actuarial Liability Funding Level
Actuarial Market Actuarial Market Actuarial Market6/30/2011 $634,379 $285,581 $279,934 $348,799 $354,445 45.02% 44.13%6/30/2012 647,689 259,792 252,897 387,897 394,792 40.11% 39.05%6/30/2013 651,581 241,800 248,559 409,780 403,022 37.11% 38.15%6/30/2014 681,118 242,742 260,763 438,377 420,355 35.64% 38.28%6/30/2015 734,156 248,388 246,968 485,769 487,188 33.83% 33.64%6/30/2016 775,160 234,568 217,594 540,593 557,566 30.26% 28.07%6/30/2017 967,145 261,320 255,737 705,824 711,408 27.02% 26.44%6/30/2018 989,528 268,259 267,572 721,269 721,956 27.11% 27.04%6/30/2019 1,045,318 282,162 286,165 763,156 759,153 26.99% 27.38%6/30/2020 $1,053,157 $296,126 $293,949 $757,031 $759,208 28.12% 27.91%
SPRS (Insurance)Valuation
DateActuarial Liability Value of Assets Unfunded Actuarial Liability Funding Level
Actuarial Market Actuarial Market Actuarial Market6/30/2011 $438,428 $123,687 $127,368 $314,740 $311,060 28.21% 29.05%6/30/2012 333,904 124,372 125,568 209,532 208,336 37.25% 37.61%6/30/2013 222,327 136,321 142,831 86,006 79,496 61.32% 64.24%6/30/2014 234,271 155,595 165,168 78,676 69,103 66.42% 70.50%6/30/2015 254,839 167,775 165,018 87,064 89,821 65.84% 64.75%6/30/2016 257,197 172,704 161,366 84,494 95,831 67.15% 62.74%6/30/2017 276,641 180,464 178,838 96,178 97,803 65.23% 64.65%6/30/2018 262,088 187,535 190,847 74,553 71,242 71.55% 72.82%6/30/2019 276,809 197,395 201,206 79,415 75,604 71.31% 72.69%6/30/2020 $276,143 $207,018 $201,340 $69,126 $74,803 74.97% 72.91%
Board Meeting - December 3, 2020 - Review and Approval of CAFR
347

164ACT
Solvency TestAs of June 30 ($ in Thousands)CERS (Non-Hazardous Pension Fund) Actuarial Liabilities
Valuation Date
(1) Active Member Contributions
(2) Retired Members & Beneficiaries
(3) Active Members
(Employer Portion)Actuarial Value of
Assets% of Actuarial Liabilities Covered
by Actuarial Assets (1) (2) (3)
6/30/2011 $1,110,967 $5,209,784 $2,597,334 $5,629,611 100.00% 86.70% 0.00%6/30/2012 1,117,549 5,416,933 2,605,085 5,547,236 100.00% 81.80% 0.00%6/30/2013 1,149,611 5,638,371 2,590,894 5,637,094 100.00% 79.60% 0.00%6/30/2014 1,204,383 5,873,279 2,694,860 6,117,134 100.00% 83.60% 0.00%6/30/2015 1,216,585 6,489,863 3,033,878 6,474,849 100.00% 81.00% 0.00%6/30/2016 1,231,027 6,785,530 3,059,900 6,535,372 100.00% 78.20% 0.00%6/30/2017 1,277,432 7,731,682 3,794,396 6,764,873 100.00% 71.00% 0.00%6/30/2018 1,269,287 8,196,719 3,725,500 6,950,225 100.00% 69.30% 0.00%6/30/2019 1,280,679 8,905,545 4,169,890 7,049,527 100.00% 64.80% 0.00%6/30/2020 $1,312,554 $9,088,237 $4,210,077 $7,220,607 100.00% 65.00% 0.00%
CERS (Non-Hazardous Insurance Fund) Actuarial Liabilities
Valuation Date
(1) Active Member Contributions
(2) Retired Members & Beneficiaries
(3) Active Members
(Employer Portion)Actuarial Value of
Assets% of Actuarial Liabilities Covered
by Actuarial Assets (1) (2) (3)
6/30/2011 $- $1,460,808 $1,613,165 $1,433,451 100.00% 98.10% 0.00%6/30/2012 - 1,146,908 1,223,864 1,512,854 100.00% 100.00% 29.90%6/30/2013 - 1,205,599 1,238,295 1,628,244 100.00% 100.00% 34.10%6/30/2014 - 1,318,183 1,298,732 1,831,199 100.00% 100.00% 39.50%6/30/2015 - 1,372,597 1,535,231 1,997,456 100.00% 100.00% 40.70%6/30/2016 - 1,484,937 1,503,184 2,079,811 100.00% 100.00% 39.60%6/30/2017 - 1,603,438 1,751,713 2,227,401 100.00% 100.00% 35.60%6/30/2018 - 1,525,322 1,567,301 2,371,430 100.00% 100.00% 54.00%6/30/2019 - 1,830,692 1,737,255 2,523,249 100.00% 100.00% 39.90%6/30/2020 $- $1,746,160 $1,645,926 $2,661,351 100.00% 100.00% 55.60%
CERS (Hazardous Pension Fund) Actuarial Liabilities
Valuation Date
(1) Active Member Contributions
(2) Retired Members & Beneficiaries
(3) Active Members
(Employer Portion)Actuarial Value of
Assets% of Actuarial Liabilities Covered
by Actuarial Assets (1) (2) (3)
6/30/2011 $382,072 $1,768,512 $708,457 $1,779,545 100.00% 79.00% 0.00%6/30/2012 381,672 1,889,884 738,435 1,747,379 100.00% 72.30% 0.00%6/30/2013 390,471 1,988,030 745,705 1,801,691 100.00% 71.00% 0.00%6/30/2014 415,070 2,077,517 796,239 1,967,640 100.00% 74.70% 0.00%6/30/2015 422,359 2,297,703 893,246 2,096,783 100.00% 72.90% 0.00%6/30/2016 428,713 2,388,712 887,031 2,139,119 100.00% 71.60% 0.00%6/30/2017 458,808 2,910,601 1,279,638 2,238,320 100.00% 61.10% 0.00%6/30/2018 442,637 3,151,057 1,198,853 2,321,721 100.00% 59.60% 0.00%6/30/2019 458,559 3,399,954 1,386,852 2,375,106 100.00% 56.40% 0.00%6/30/2020 $454,801 $3,606,091 $1,370,407 $2,447,885 100.00% 55.30% 0.00%
Board Meeting - December 3, 2020 - Review and Approval of CAFR
348

165 ACT
CERS (Hazardous Insurance Fund) Actuarial Liabilities
Valuation Date
(1) Active Member Contributions
(2) Retired Members & Beneficiaries
(3) Active Members
(Employer Portion)Actuarial Value of
Assets% of Actuarial Liabilities Covered
by Actuarial Assets (1) (2) (3)
6/30/2011 $- $771,631 $876,071 $770,790 100.00% 99.90% 0.00%6/30/2012 - 575,099 789,744 829,041 100.00% 100.00% 32.20%6/30/2013 - 660,955 776,377 892,774 100.00% 100.00% 29.90%6/30/2014 - 700,312 793,553 997,733 100.00% 100.00% 37.50%6/30/2015 - 790,714 713,301 1,087,707 100.00% 100.00% 41.60%6/30/2016 - 879,360 679,458 1,135,784 100.00% 100.00% 37.70%6/30/2017 - 994,764 793,669 1,196,780 100.00% 100.00% 25.50%6/30/2018 - 1,001,717 682,311 1,256,306 100.00% 100.00% 37.30%6/30/2019 - 1,072,861 660,018 1,313,659 100.00% 100.00% 36.50%6/30/2020 $- $1,154,389 $586,582 $1,362,028 100.00% 100.00% 35.40%
Solvency TestAs of June 30 ($ in Thousands)KERS (Non-Hazardous Pension Fund) Actuarial Liabilities
Valuation Date
(1) Active Member Contributions
(2) Retired Members & Beneficiaries
(3) Active Members
(Employer Portion)Actuarial Value of
Assets% of Actuarial Liabilities Covered
by Actuarial Assets (1) (2) (3)
6/30/2011 $916,569 $8,482,714 $1,782,859 $3,726,986 100.00% 33.10% 0.00%6/30/2012 885,137 8,708,536 1,767,375 3,101,317 100.00% 25.40% 0.00%6/30/2013 922,928 8,709,324 1,754,351 2,636,123 100.00% 19.70% 0.00%6/30/2014 928,558 8,870,693 1,750,860 2,423,957 100.00% 16.90% 0.00%6/30/2015 925,934 9,437,468 1,996,271 2,350,990 100.00% 15.10% 0.00%6/30/2016 920,120 10,010,168 2,294,410 2,112,286 100.00% 11.90% 0.00%6/30/2017 934,559 11,608,346 3,048,736 2,123,623 100.00% 10.20% 0.00%6/30/2018 892,033 11,929,018 2,854,180 2,019,278 100.00% 9.40% 0.00%6/30/2019 881,020 12,513,230 3,072,176 2,206,280 100.00% 10.60% 0.00%6/30/2020 $869,196 $12,467,523 $3,012,243 $2,323,298 100.00% 11.70% 0.00%
KERS (Non-Hazardous Insurance Fund) Actuarial Liabilities
Valuation Date
(1) Active Member Contributions
(2) Retired Members & Beneficiaries
(3) Active Members
(Employer Portion)Actuarial Value of
Assets% of Actuarial Liabilities Covered
by Actuarial Assets (1) (2) (3)
6/30/2011 $- $2,568,003 $1,712,087 $451,620 100.00% 17.60% 0.00%6/30/2012 - 1,924,069 1,201,262 446,081 100.00% 23.20% 0.00%6/30/2013 - 1,338,773 789,981 497,584 100.00% 37.20% 0.00%6/30/2014 - 1,425,605 801,155 621,237 100.00% 43.60% 0.00%6/30/2015 - 1,428,350 985,355 695,018 100.00% 48.70% 0.00%6/30/2016 - 1,483,636 973,042 743,270 100.00% 50.10% 0.00%6/30/2017 - 1,575,294 1,108,202 823,918 100.00% 52.30% 0.00%6/30/2018 - 1,475,954 959,552 887,121 100.00% 60.10% 0.00%6/30/2019 - 1,686,605 1,046,461 991,427 100.00% 58.80% 0.00%6/30/2020 $- $1,589,742 $975,045 $1,095,959 100.00% 68.90% 0.00%
Board Meeting - December 3, 2020 - Review and Approval of CAFR
349

166ACT
KERS (Hazardous Pension Fund) Actuarial Liabilities
Valuation Date
(1) Active Member Contributions
(2) Retired Members & Beneficiaries
(3) Active Members
(Employer Portion)Actuarial Value of
Assets% of Actuarial Liabilities Covered
by Actuarial Assets (1) (2) (3)
6/30/2011 $86,614 $490,395 $144,284 $510,749 100.00% 86.50% 0.00%6/30/2012 82,101 521,689 148,910 497,226 100.00% 79.60% 0.00%6/30/2013 82,146 545,597 156,238 505,657 100.00% 77.60% 0.00%6/30/2014 83,664 581,231 151,955 527,897 100.00% 76.40% 0.00%6/30/2015 83,606 633,189 178,638 556,688 100.00% 74.70% 0.00%6/30/2016 86,705 648,482 201,519 559,487 100.00% 72.90% 0.00%6/30/2017 93,350 746,350 281,720 607,159 100.00% 68.80% 0.00%6/30/2018 89,106 810,311 252,506 639,262 100.00% 67.90% 0.00%6/30/2019 86,663 879,818 259,713 671,647 100.00% 66.50% 0.00%6/30/2020 $95,528 $898,128 $290,114 $709,587 100.00% 68.40% 0.00%
KERS (Hazardous Insurance Fund) Actuarial Liabilities
Valuation Date
(1) Active Member Contributions
(2) Retired Members & Beneficiaries
(3) Active Members
(Employer Portion)Actuarial Value of
Assets% of Actuarial Liabilities Covered
by Actuarial Assets (1) (2) (3)
6/30/2011 $- $285,540 $221,519 $329,962 100.00% 100.00% 20.10%6/30/2012 - 196,579 188,013 345,574 100.00% 100.00% 79.20%6/30/2013 - 202,032 183,486 370,774 100.00% 100.00% 92.00%6/30/2014 - 206,477 190,509 419,396 100.00% 100.00% 100.00%6/30/2015 - 221,115 153,789 451,514 100.00% 100.00% 100.00%6/30/2016 - 228,361 149,384 473,160 100.00% 100.00% 100.00%6/30/2017 - 243,816 175,623 493,458 100.00% 100.00% 100.00%6/30/2018 - 248,775 144,706 511,441 100.00% 100.00% 100.00%6/30/2019 - 282,070 144,635 525,315 100.00% 100.00% 100.00%6/30/2020 $- $281,924 $146,053 $539,251 100.00% 100.00% 100.00%
Board Meeting - December 3, 2020 - Review and Approval of CAFR
350

167 ACT
Solvency TestAs of June 30 ($ in Thousands)SPRS (Pension Fund) Actuarial Liabilities
Valuation Date
(1) Active Member Contributions
(2) Retired Members &
Beneficiaries
(3) Active Members
(Employer Portion)Actuarial Value of
Assets% of Actuarial Liabilities Covered
by Actuarial Assets (1) (2) (3)
6/30/2011 $43,574 $499,194 $91,611 $285,581 100.00% 48.50% 0.00%6/30/2012 41,139 523,017 83,533 259,792 100.00% 41.80% 0.00%6/30/2013 39,788 535,720 76,072 241,800 100.00% 37.70% 0.00%6/30/2014 41,831 563,011 76,276 242,742 100.00% 35.70% 0.00%6/30/2015 41,567 605,855 86,734 248,388 100.00% 34.10% 0.00%6/30/2016 41,871 636,499 96,791 234,568 100.00% 30.30% 0.00%6/30/2017 44,798 773,982 148,365 261,320 100.00% 28.00% 0.00%6/30/2018 43,835 800,788 144,905 268,259 100.00% 28.00% 0.00%6/30/2019 41,948 848,396 154,974 282,162 100.00% 28.30% 0.00%6/30/2020 $40,831 $863,579 $148,747 $296,126 100.00% 29.60% 0.00%
SPRS (Insurance Fund) Actuarial Liabilities
Valuation Date
(1) Active Member Contributions
(2) Retired Members &
Beneficiaries
(3) Active Members
(Employer Portion)Actuarial Value of
Assets% of Actuarial Liabilities Covered
by Actuarial Assets (1) (2) (3)
6/30/2011 $- $252,440 $185,988 $123,687 100.00% 49.00% 0.00%6/30/2012 - 190,259 143,645 124,372 100.00% 65.40% 0.00%6/30/2013 - 139,509 82,818 136,321 100.00% 97.70% 0.00%6/30/2014 - 143,402 90,869 155,595 100.00% 100.00% 13.40%6/30/2015 - 170,447 84,392 167,775 100.00% 98.40% 0.00%6/30/2016 - 177,094 80,103 172,704 100.00% 97.50% 0.00%6/30/2017 - 186,390 90,251 180,464 100.00% 96.80% 0.00%6/30/2018 - 183,151 78,937 187,535 100.00% 100.00% 5.60%6/30/2019 - 199,959 76,850 197,395 100.00% 98.70% 0.00%6/30/2020 $- $207,638 $68,506 $207,018 100.00% 99.70% 0.00%
Board Meeting - December 3, 2020 - Review and Approval of CAFR
351

168ACT
Active Member ValuationMethodology The actuarial value of assets recognizes a portion of the difference between the market value of assets and the expected market value of assets, based on the investment return assumption. The amount recognized each year is 20% of the difference between market value and expected market value. The Asset Valuation Method was adopted in 2006.
Summary of Active Member Valuation DataAs of June 30 ($ in Thousands)CERS Non-Hazardous Schedule of Active Member Valuation Data
Valuation DateNumber of Employers
Total Active Members
Annual Covered Payroll (1)
Annual Average Pay
% Increase In Average Pay
Average Age
Average Years of Service
Credit6/30/2011 1,102 85,285 $2,276,596 $27 1.10% 46.8 9.06/30/2012 1,080 83,052 2,236,546 27 0.90% 47.5 9.16/30/2013 1,081 81,815 2,236,277 27 1.50% 47.8 9.36/30/2014 1,101 81,115 2,272,270 28 2.50% 48.1 9.66/30/2015 1,092 80,852 2,296,716 28 1.40% 48.0 9.56/30/2016 1,095 80,664 2,352,762 29 2.70% 47.9 9.46/30/2017 1,096 82,198 2,452,407 30 2.29% 47.9 9.46/30/2018 1,092 81,818 2,466,801 30 1.06% 47.7 9.26/30/2019 1,094 81,506 2,521,860 31 2.62% 47.7 9.16/30/2020 1,087 81,250 $2,565,391 $32 2.05% 47.8 9.1
CERS Hazardous Schedule of Active Member Valuation Data
Valuation DateNumber of Employers
Total Active Members
Annual Covered Payroll (1)
Annual Average Pay
% Increase In Average Pay
Average Age
Average Years of Service
Credit6/30/2011 281 9,407 $466,964 $50 1.70% 39.1 9.56/30/2012 254 9,130 464,229 51 2.40% 39.3 10.36/30/2013 248 9,123 461,673 51 (0.50)% 39.1 10.36/30/2014 254 9,194 479,164 52 3.00% 39.2 10.66/30/2015 246 9,172 483,641 53 1.20% 39.1 10.66/30/2016 246 9,084 492,851 54 2.90% 39.1 10.66/30/2017 250 9,495 541,633 57 5.14% 39.2 10.56/30/2018 247 9,263 533,618 58 0.99% 38.5 10.26/30/2019 243 9,474 559,353 59 2.49% 38.6 10.16/30/2020 243 9,419 $568,558 $60 2.24% 38.4 10.0
(1) Annual payroll included in the Schedule of Active Member Valuation Data is based upon the annualized monthly payroll for active members as of the valuation date. The annual payroll recorded in the financial section is based upon the sum of the monthly payroll for active members recorded for each month of fiscal year ending June 30, 2020.Member data in actuarial section will differ from reported data in other CAFR sections. For this section, the data is reported by account instead of by person (ex: a member could have vested service in KERS, but is currently active in a CERS and is reported in two membership categories).
Board Meeting - December 3, 2020 - Review and Approval of CAFR
352

169 ACT
KERS Non-Hazardous Schedule of Active Member Valuation Data
Valuation DateNumber of Employers
Total Active Members
Annual Covered Payroll (1)
Annual Average Pay
% Increase In Average Pay
Average Age
Average Years of Service
Credit6/30/2011 427 46,617 $1,731,633 $37 (3.60)% 43.8 9.46/30/2012 286 42,196 1,644,897 39 4.90% 44.3 9.86/30/2013 285 42,226 1,644,409 39 (0.10)% 44.5 10.16/30/2014 353 40,365 1,577,496 39 0.40% 44.8 10.56/30/2015 348 39,056 1,544,234 40 1.20% 45.0 10.66/30/2016 349 37,779 1,529,249 40 2.40% 45.1 10.76/30/2017 342 37,234 1,531,535 41 1.62% 45.4 10.96/30/2018 338 35,139 1,471,477 42 1.81% 45.2 10.86/30/2019 331 33,696 1,437,647 43 1.88% 45.4 11.06/30/2020 313 31,703 $1,387,761 $44 2.60% 45.7 11.2
KERS Hazardous Schedule of Active Member Valuation Data
Valuation DateNumber of Employers
Total Active Members
Annual Covered Payroll (1)
Annual Average Pay
% Increase In Average Pay
Average Age
Average Years of Service
Credit6/30/2011 16 4,291 $133,054 $31 (7.30)% 41.3 6.96/30/2012 14 4,086 131,977 32 4.20% 41.1 7.36/30/2013 14 4,127 132,015 32 (1.00)% 40.6 7.26/30/2014 18 4,024 129,076 32 0.30% 40.6 7.46/30/2015 17 3,886 128,680 33 3.20% 40.7 7.56/30/2016 17 3,959 147,563 37 12.60% 40.4 7.56/30/2017 18 4,047 162,418 40 7.67% 40.3 7.66/30/2018 18 3,929 158,213 40 0.34% 39.8 7.36/30/2019 18 3,705 150,446 41 0.84% 39.8 7.36/30/2020 19 4,094 $170,826 $42 2.76% 39.8 7.3
SPRS Schedule of Active Member Valuation Data
Valuation DateNumber of Employers
Total Active Members
Annual Covered Payroll (1)
Annual Average Pay
% Increase In Average Pay
Average Age
Average Years of Service
Credit6/30/2011 1 965 $48,693 $50 (5.90)% 37.7 10.66/30/2012 1 907 48,373 53 5.70% 37.3 10.46/30/2013 1 902 45,256 50 (5.90)% 37.0 10.06/30/2014 1 855 44,616 52 4.00% 37.8 10.96/30/2015 1 937 45,765 49 (6.40)% 36.8 9.86/30/2016 1 908 45,551 50 2.71% 37.0 10.06/30/2017 1 903 48,598 54 7.28% 37.5 10.66/30/2018 1 886 48,808 55 2.36% 37.3 10.56/30/2019 1 883 47,752 54 (1.83)% 36.7 10.06/30/2020 1 798 $46,145 $58 6.93% 37.5 10.7
(1) Annual payroll included in the Schedule of Active Member Valuation Data is based upon the annualized monthly payroll for active members as of the valuation date. The annual payroll recorded in the financial section is based upon the sum of the monthly payroll for active members recorded for each month of fiscal year ending June 30, 2020.Member data in actuarial section will differ from reported data in other CAFR sections. For this section, the data is reported by account instead of by person (ex: a member could have vested service in KERS, but is currently active in a CERS and is reported in two membership categories).
Board Meeting - December 3, 2020 - Review and Approval of CAFR
353

170ACT
Summary of Retired Member Valuation DataAs of June 30 ($ in Thousands)CERS (Non-Hazardous)
Valuation Date
Number Added
Number Removed
Total Retirees &
Beneficiaries
Annualized Retirement Allowances
Added
Annualized Retirement Allowances Removed
Annualized Retirement
Allowances 1
% Increase In Allowances
Average Annual
Allowance6/30/2011 3,250 1,077 43,211 $38,861 $7,881 $483,594 6.84% $116/30/2012 3,300 1,207 45,304 41,161 9,746 515,008 6.50% 116/30/2013 3,570 1,198 47,676 56,721 13,750 557,979 8.34% 126/30/2014 3,480 1,221 49,935 33,975 8,996 582,958 4.48% 126/30/2015 4,020 1,304 52,651 44,962 10,369 617,551 5.93% 126/30/2016 4,409 721 56,339 49,487 5,822 661,217 7.07% 126/30/2017 4,141 1,467 59,013 47,074 40,823 667,468 0.95% 116/30/2018 4,650 1,725 61,938 57,343 14,436 710,374 6.43% 116/30/2019 4,472 1,871 64,539 53,392 16,649 747,117 5.17% 126/30/2020 3,550 2,675 65,414 $40,409 $24,066 $763,459 2.19% $12
CERS (Hazardous)
Valuation Date
Number Added
Number Removed
Total Retirees &
Beneficiaries
Annualized Retirement Allowances
Added
Annualized Retirement Allowances Removed
Annualized Retirement
Allowances 1
% Increase In Allowances
Average Annual
Allowance6/30/2011 502 102 6,468 $14,641 $1,298 $160,259 9.08% $256/30/2012 483 73 6,878 14,149 1,187 173,221 8.09% 256/30/2013 519 104 7,293 10,924 1,510 182,635 5.43% 256/30/2014 469 116 7,646 9,940 1,567 191,008 4.58% 256/30/2015 526 138 8,034 13,430 2,284 202,153 5.84% 256/30/2016 604 75 8,563 14,642 1,494 215,302 6.50% 256/30/2017 576 141 8,998 15,102 3,724 226,680 5.28% 256/30/2018 779 190 9,587 22,292 3,297 245,675 8.38% 266/30/2019 608 172 10,023 16,096 2,957 258,813 5.35% 266/30/2020 621 192 10,452 $19,621 $3,643 $274,791 6.17% $26
(1) The Annualized Retirement Allowance is the annualized value of the monthly retirement allowance for retired members and beneficiaries as of the valuation date. Consequently, the values will not match the fiscal year total benefit payments recorded in the financial section.(2) Member data in actuarial section will differ from reported data in other CAFR sections. For this section, the data is reported by account instead of by person (ex: a member could have vested service in KERS, but is currently active in CERS and is reported in two membership categories).
Board Meeting - December 3, 2020 - Review and Approval of CAFR
354

171 ACT
KERS (Non-Hazardous)
Valuation Date
Number Added
Number Removed
Total Retirees &
Beneficiaries
Annualized Retirement Allowances
Added
Annualized Retirement Allowances Removed
Annualized Retirement
Allowances 1
% Increase In Allowances
Average Annual
Allowance6/30/2011 1,592 940 38,597 $31,931 $12,615 $821,197 2.41% $216/30/2012 1,707 1,078 39,226 37,458 13,774 844,881 2.88% 226/30/2013 1,982 1,014 40,194 41,468 14,209 872,140 3.23% 226/30/2014 2,067 1,038 41,223 31,433 15,143 866,047 (0.70)% 216/30/2015 2,140 1,094 42,269 32,433 14,902 883,578 2.02% 216/30/2016 2,441 706 44,004 61,294 9,942 934,930 5.81% 216/30/2017 2,181 1,269 44,916 35,150 48,778 921,302 (1.46)% 216/30/2018 2,853 1,243 46,526 50,360 18,711 952,951 3.44% 206/30/2019 2,226 1,342 47,410 36,115 20,359 968,706 1.65% 206/30/2020 1,806 1,883 47,333 $29,576 $30,319 $967,963 (0.08)% $20
KERS (Hazardous)
Valuation Date
Number Added
Number Removed
Total Retirees &
Beneficiaries
Annualized Retirement Allowances
Added
Annualized Retirement Allowances Removed
Annualized Retirement
Allowances 1
% Increase In Allowances
Average Annual
Allowance6/30/2011 288 59 3,064 $5,013 $519 $45,609 10.93% $156/30/2012 243 54 3,253 4,213 591 49,231 7.94% 156/30/2013 229 52 3,430 2,391 500 51,122 3.84% 156/30/2014 256 66 3,620 3,762 612 54,272 6.16% 156/30/2015 203 65 3,758 3,144 985 56,431 3.98% 156/30/2016 237 29 3,966 3,028 458 59,001 4.55% 156/30/2017 206 79 4,093 2,771 2,609 59,162 0.27% 146/30/2018 321 44 4,370 5,394 507 64,050 8.26% 156/30/2019 227 60 4,537 4,242 769 67,523 5.42% 156/30/2020 214 123 4,628 $3,102 $1,543 $69,081 2.31% $15
SPRS State Police Retirement System
Valuation Date
Number Added
Number Removed
Total Retirees &
Beneficiaries
Annualized Retirement Allowances
Added
Annualized Retirement Allowances Removed
Annualized Retirement
Allowances 1
% Increase In Allowances
Average Annual
Allowance6/30/2011 52 12 1,263 $2,342 $390 $47,467 4.29% $386/30/2012 52 16 1,299 3,027 607 49,887 5.10% 386/30/2013 63 16 1,346 1,471 453 50,906 2.04% 386/30/2014 95 28 1,413 3,360 833 53,432 4.96% 386/30/2015 62 15 1,460 1,947 449 54,930 2.80% 386/30/2016 65 10 1,515 2,004 285 56,650 3.13% 376/30/2017 30 9 1,536 1,046 443 57,253 1.06% 376/30/2018 81 17 1,600 2,837 464 59,626 4.14% 376/30/2019 74 27 1,647 2,735 957 61,404 2.98% 376/30/2020 61 39 1,669 $2,411 $1,382 $62,432 1.68% $37
(1) The Annualized Retirement Allowance is the annualized value of the monthly retirement allowance for retired members and beneficiaries as of the valuation date. Consequently, the values will not match the fiscal year total benefit payments recorded in the financial section.(2) Member data in actuarial section will differ from reported data in other CAFR sections. For this section, the data is reported by account instead of by person (ex: a member could have vested service in KERS, but is currently active in CERS and is reported in two membership categories).
Board Meeting - December 3, 2020 - Review and Approval of CAFR
355

172ACT
Summary of Benefit Provisions KERS & CERS Non-Hazardous Plans
Plan FundingState statute requires active members to contribute 5% of creditable compensation. For members participating on or after September 1, 2008 an additional 1% of creditable compensation is required. This amount is credited to the Insurance Fund and is non-refundable to the member. Employers contribute at the rate determined by the Board to be necessary for the actuarial soundness of the systems, as required by KRS 61.565 and KRS 61.752. KERS rates are subject to state budget approval.
Membership EligibilityFor non-school board employers, all regular full-time positions that average 100 or more hours of work per month over a fiscal or calendar year. For school board employers, all regular full-time positions that average 80 hours of work per month over the actual days worked during the school year.
Retirement Eligibility for Non-Hazardous EmployeesAge Years of Service Allowance Reduction
Tier 1 Members Whose Participation Began Before 9/1/200865 1 month None
Any 27 None55 5 6.5% per year for first five years, and 4.5% for next five years before age 65 or 27 years of service.
Any 25 6.5% per year for first five years, and 4.5% for next five years before age 65 or 27 years of service.
Tier 2 Members Whose Participation Began On or After 9/1/2008 but before 1/1/201465 5 None57 Rule of 87 None60 10 6.5% per year for first five years, and 4.5% for next five years before age 65 or Rule of 87 (age
plus years of service)
Tier 3 Members Whose Participation Began On or After 1/1/201465 5 None57 Rule of 87 None
Board Meeting - December 3, 2020 - Review and Approval of CAFR
356

173 ACT
Benefit FormulaTier 1: Members whose participation began before 9/1/2008Final Compensation Benefit Factor Years of Service KERS 1.97% if: Member does not have 13 months of service credit for 1/1/1998-1/1/1999. KERS 2.00% if: Member has 13 months of service credit from 1/1/1998-1/1/1999. Includes earned service,Average of the KERS 2.20% if: Member has 20 or more years purchased service, prior service,five highest years of of service, including 13 months and sick leave service (if thecompensation. from 1/1/1998-1/1/1999 and member’s employer participates retires by 1/1/2009. in an approved sick leave CERS 2.20% if: Member begins participating program).
prior to 8/1/2004. CERS 2.00% if: Member begins participating on or after 8/1/2004 but before 9/1/2008. If a member retires with less than four years of service credit, the member’s benefit is equal to the actuarially equivalent of two times their member contribution balance with interest.
Benefit FormulaTier 2: Members whose participation began on or after 9/1/2008 but before 1/1/2014Final Compensation Benefit Factor Years of Service KERS & CERS increasing percent based on service at retirement up to 30 years* Includes earned service,Average of the last plus 2.00% for each year of Member begins participating purchased service, prior service,five years of service over 30 years on or after 9/1/2008 but before and sick leave service (if thecompensation *Service Multiplier 1/1/2014. member’s employer participates in 10 years or less 1.10% an approved sick leave program) 10-20 years 1.30% 20-26 years 1.50% 26-30 years 1.75%
Tier 3: Members whose participation began on or after 1/1/2014(A - B) = C X 75% = D then B + D = Interest ($ in Thousands)
A B C D 5-Year Less Upside Upside Sharing Interest Total Interest Geometric Guarantee Sharing Interest X 75% = Rate Earned Credited Average Rate of 4% Interest Upside Gain (4% + Upside) to Member
System Return AccountsCERS Non-Hazardous 5.29% 4.00% 1.29% 0.97% 4.97% $9,203CERS Hazardous 5.53% 4.00% 1.53% 1.15% 5.15% 2,791KERS Non-Hazardous 4.76% 4.00% 0.76% 0.57% 4.57% 4,213KERS Hazardous 5.42% 4.00% 1.42% 1.07% 5.07% 1,323SPRS 5.13% 4.00% 1.13% 0.85% 4.85% $175Note: Please see Plan Provisions for additional details on Tier 3.
Board Meeting - December 3, 2020 - Review and Approval of CAFR
357

174ACT
Summary of Benefit Provisions KERS & CERS Non-Hazardous Plan
Post-Retirement Death BenefitsIf the member is receiving a monthly benefit based on at least four (4) years of creditable service, the retirement system will pay a $5,000 death benefit payment to the beneficiary named by the member specifically for this benefit.
Disability BenefitsMembers participating before 8/1/2004 may retire on account of disability provided the member has at least 60 months of service credit and is not eligible for an unreduced benefit. Additional service credit may be added for computation of benefits under the benefit formula. Members participating on or after 8/1/2004 but before 1/1/2014 may retire on account of disability provided the member has at least 60 months of service credit. Benefits are computed as the greater of 20% of member’s monthly final rate of pay or the amount calculated under the Benefit Formula based upon actual service.Members participating on or after 1/1/2014 may retire on account of disability provided the member has at least 60 months of service credit. The hypothetical account which includes member contributions, employer contributions and interest credits can be withdrawn from the System as a lump sum or an annuity equal to the greater of 20% of the member’s monthly final rate of pay or the annuitized hypothetical account into a single life annuity option.Members disabled as a result of a single duty-related injury or act of violence related to their job may be eligible for special benefits.
Pre-Retirement Death BenefitsThe beneficiary of a deceased active member is eligible for a monthly benefit if the member died while in the line of duty. The beneficiary of a deceased active member who did not die in the line of duty is eligible for a monthly benefit if the member was: (1) eligible for retirement at the time of death or, (2) under the age of 55 with at least 60 months of service credit and currently working for a participating agency at the time of death or (3) no longer working for a participating agency but at the time of death had at least 144 months of service credit. If the beneficiary of a deceased active member is not eligible for a monthly benefit, the beneficiary will receive a lump-sum payment of the member’s contributions and any accumulated interest.
Cost of Living AdjustmentSB 2 of 2013 eliminated all future COLAs unless the State Legislature so authorizes on a biennial basis and either (i) the system is over 100% funded or (ii) the Legislature appropriates sufficient funds to pay the increased liability for the COLA.
Insurance BenefitsFor members participating prior to July 1, 2003, KRS pays a percentage of the monthly premium for single coverage based upon the service credit accrued at retirement. Members participating on or after July 1, 2003 and before September 1, 2008 are required to earn at least 10 years of service credit in order to be eligible for insurance benefits at retirement. Members participating on or after September 1, 2008 are required to earn at least 15 years of service credit in order to be eligible for insurance benefits at retirement. The monthly health insurance contribution will be $10 for each year of earned service increased by the CPI prior to July 1, 2009, and by 1.5% annually from July 1, 2009.
RefundsUpon termination of employment, a refund of member contributions and accumulated interest is available to the member.
Board Meeting - December 3, 2020 - Review and Approval of CAFR
358

175 ACT
Interest on AccountsFor employees participating prior to September 1, 2008, the interest paid is set by the Board of Trustees and will not be less than 2.0%, for employees participating on or after September 1, 2008 but before January 1, 2014, interest will be credited at a rate of 2.5%. For employees participating on or after January 1, 2014, interest will be credited at a minimum rate of 4.0%.
Benefit Changes since the Prior ValuationHouse Bill 1 passed during the 2019 special legislative session and allowed certain agencies in the KERS Non-Hazardous fund to elect to cease participating in the System as of June 30, 2020 under different provisions than were previously established. Senate Bill 249 passed during the 2020 legislative session and delayed the effective date of cessation for these provisions to June 30, 2021. House Bill 271 passed during the 2020 legislative session and removed provisions that reduce the monthly payment to a surviving spouse of a member whose death was due to a duty-related injury upon remarriage of the spouse. It also increased benefits for a very small number of beneficiaries. There were no other material benefit provision changes since the prior valuation.
Board Meeting - December 3, 2020 - Review and Approval of CAFR
359

176ACT
Summary of Benefit Provisions KERS Hazardous, CERS Hazardous & SPRS Plans
Plan FundingState statute requires active members to contribute 8% of creditable compensation. For members participating on or after September 1, 2008 an additional 1% of creditable compensation is required. This amount is credited to the Insurance Fund and is non-refundable to the member. Employers contribute at the rate determined by the Board to be necessary for the actuarial soundness of the systems, as required by KRS 61.565 and KRS 61.752. KERS and SPRS rates are subject to state budget approval.
Membership EligibilityAll regular full-time hazardous duty positions approved by the Board that average 100 or more hours of work per month over a fiscal or calendar year.
Retirement Eligibility for HazardousAge Years of Service Allowance Reduction
Tier 1 Members Whose Participation Began Before 9/1/200855 1 month None
Any 20 None50 15 6.5% per year for first five years, and 4.5% for next five years before age 55 or 20 years of service.
Tier 2 Members Whose Participation Began On or After 9/1/2008 but before 1/1/201460 5 None
Any 25 None50 15 6.5% per year for first five years, and 4.5% for next five years before age 60 or 25 years of service.
Tier 3 Members Whose Participation Began On or After 1/1/201460 5 None
Any 25 None
Board Meeting - December 3, 2020 - Review and Approval of CAFR
360

Benefit Formula for Hazardous for Tier 1: Members whose participation began before 9/1/2008Final Compensation Benefit Factor Years of Service
Average of the three highest years of compensation.
CERS 2.50% if:
Member begins participating before 9/1/2008.
Includes earned service, purchased service, prior service, and sick leave service (if the member’s employer participates in an approved sick leave program.
KERS 2.49% if:
SPRS 2.50% if:If a member retires with less than four years of service, the member’s benefit is equal to the actuarially equivalent of two times their member contribution balance with interest.Benefit Formula for Hazardous for Tier 2: Members whose participation began on or after 9/1/2008 but before 1/1/2014Final Compensation Benefit Factor Years of Service
Average of the three highest complete years of compensation.
CERS, KERS, & SPRS increasing percent based on service at retirement*
Member begins participating on or after 9/1/2008 but before 1/1/2014.
Includes earned service, purchased service, prior service, and sick leave service (if the member’s employer participates in an approved sick leave program).
*Service Multiplier10 years or less 1.30%10-20 years 1.50%20-25 years 2.25%25+ years 2.50%
Benefit Formula for Hazardous for Tier 3: Members whose participation began on or after 1/1/2014Each year that the member is active, a 7.50% employer pay credit and the employee’s 8.00% contribution will be credited to each member’s hypothetical cash balance account. The hypothetical account will earn interest at a minimum rate of 4%, annually. If KRS’ geometric average net investment return for the previous five years exceeds 4%, then the hypothetical account will be credited with an additional amount of interest in that year equal to 75% of the amount of the return which exceeds 4%. All interest credits will be applied to the hypothetical account balance on June 30 based on the account balance as of June 30 of the previous year. At retirement, the member’s hypothetical account balance may be converted into an annuity based on an actuarial factor.
Board Meeting - December 3, 2020 - Review and Approval of CAFR
361

178ACT
Summary of Benefit Provisions KERS Hazardous, CERS Hazardous & SPRS Plans - Tier 3
Post-Retirement Death BenefitsIf the member is receiving a monthly benefit based on at least four (4) years of creditable service, the retirement system will pay a $5,000 death benefit payment to the beneficiary named by the member specifically for this benefit.
Disability BenefitsMembers participating before 8/1/2004 may retire on account of disability provided the member has at least 60 months of service credit and is not eligible for an unreduced benefit. Additional service credit may be added for computation of benefits under the benefit formula. Members participating on or after 8/1/2004 but before 1/1/2014 may retire on account of disability provided the member has at least 60 months of service credit. Benefits are computed as the greater of 25% of the member’s monthly final rate of pay or the amount calculated under the Benefit Formula based upon actual service.Members participating on or after 1/1/2014 may retire on account of disability provided the member has at least 60 months of service credit. The hypothetical account which includes member contributions, employer contributions and interest credits can be withdrawn from the System as a lump sum or an annuity equal to the greater of 25% of the member’s monthly final rate of pay or the annuitized hypothetical account into a single life annuity option.Members disabled as a result of a single duty-related injury or act of violence related to their job may be eligible for special benefits.
Pre-Retirement Death BenefitsThe beneficiary of a deceased active member is eligible for a monthly benefit if the member died while in the line of duty. The beneficiary of a deceased active member who did not die in the line of duty is eligible for a monthly benefit if the member was: (1) eligible for retirement at the time of death or, (2) under the age of 55 with at least 60 months of service credit and currently working for a participating agency at the time of death or (3) no longer working for a participating agency but at the time of death had at least 144 months of service credit. If the beneficiary of a deceased active member is not eligible for a monthly benefit, the beneficiary will receive a lump sum payment of the member’s contributions and any accumulated interest.
Cost of Living AdjustmentSB 2 of 2013 eliminated all future COLAs unless the State Legislature so authorizes on a biennial basis and either (i) the system is over 100% funded or (ii) the Legislature appropriates sufficient funds to pay the increased liability for the COLA.
Insurance BenefitsFor members participating prior to July 1, 2003, KRS pays a percentage of the monthly premium for single coverage based upon the service credit accrued at retirement. Members participating on or after July 1, 2003 and before September 1, 2008 are required to earn at least 10 years of service credit in order to be eligible for insurance benefits at retirement. Members participating on or after September 1, 2008 are required to earn at least 15 years of service credit in order to be eligible for insurance benefits at retirement. The monthly health insurance contribution will be $15 for each year of earned service increased by the CPI prior to July 1, 2009, and by 1.5% annually from July 1, 2009.
Board Meeting - December 3, 2020 - Review and Approval of CAFR
362

179 ACT
RefundsUpon termination of employment, a refund of member contributions and accumulated interest is available to the member.
Interest on AccountsFor employees participating prior to September 1, 2008, the interest paid is set by the Board of Trustees and will not be less than 2.0%, for employees participating on or after September 1, 2008 but before January 1, 2014, interest will be credited at a rate of 2.5%. For employees participating on or after January 1, 2014, interest will be credited at a minimum rate of 4.0%.
Benefit Changes since the Prior ValuationHouse Bill 271 passed during the 2020 legislative session and removed provisions that reduce the monthly payment to a surviving spouse of a member whose death was due to a duty-related injury upon remarriage of the spouse. It also increased benefits for a very small number of beneficiaries. There were no other material benefit provision changes since the prior valuation.
Board Meeting - December 3, 2020 - Review and Approval of CAFR
363

STATISTICAL TABLE OF CONTENTS
180180
181 FUND STATISTICS184 PARTICIPATING EMPLOYERS186 MEMBER MONTHLY BENEFIT187 FIDUCIARY NET POSITION190 CHANGES IN FIDUCIARY NET POSITION195 SCHEDULE OF BENEFIT EXPENSES198 ANALYSIS OF INITIAL RETIREES199 PAYMENT OPTIONS200 EMPLOYER CONTRIBUTION RATES201 INSURANCE CONTRACTS203 GLOSSARY
Board Meeting - December 3, 2020 - Review and Approval of CAFR
364

181 STAT
Fund StatisticsDefinitionsActive members are those members who are currently employed by a participating agency and contributing to KRS as a condition of employment. Inactive members are those members who are no longer employed with a participating agency but have not yet retired or taken a refund of contributions. Retired members include both members and beneficiaries who are receiving a monthly benefit from KRS. A single member may have multiple accounts, which contribute to one pension. Each person is only counted once in the Membership by System report. A member who has both a membership account and a retired account is included in the retired count. Members who have multiple membership accounts are included under the system where they most recently contributed. Members who have more than one retirement account are included in the system with the greatest service credit. If the retired accounts have equal service credit, they are counted first in SPRS, CERS Hazardous, KERS Hazardous, CERS Non-Hazardous, then KERS Non-Hazardous. These tables do not include individuals receiving payments under dependent child accounts, Qualified Domestic Relations Orders, or multiple beneficiary accounts.
Board Meeting - December 3, 2020 - Review and Approval of CAFR
365

182STAT
CERS Non-Hazardous Membership As of June 30, 2020Fiscal Year Active Inactive Retired Total2013 82,631 67,013 44,164 193,8082014 82,494 70,231 46,112 198,8372015 82,969 72,965 48,515 204,4492016 83,346 75,904 51,673 210,9232017 84,401 78,940 54,018 217,3592018 84,435 81,608 56,629 222,6722019 84,632 85,300 58,933 228,8652020 83,458 90,673 60,877 235,008
CERS Hazardous Membership As of June 30, 2020Fiscal Year Active Inactive Retired Total2013 9,069 1,956 5,840 16,8652014 9,189 2,038 6,066 17,2932015 9,188 2,142 6,389 17,7192016 9,139 2,309 6,834 18,2822017 9,321 2,442 7,186 18,9492018 9,285 2,581 7,647 19,5132019 9,402 2,702 8,000 20,1042020 9,350 2,924 8,431 20,705
KERS Non-Hazardous Membership As of June 30, 2020Fiscal Year Active Inactive Retired Total2013 40,710 40,375 37,240 118,3252014 40,500 41,213 38,022 119,7352015 39,289 42,479 38,827 120,5952016 38,121 43,926 40,099 122,1462017 36,725 44,848 40,813 122,3862018 34,845 45,768 42,175 122,7882019 33,432 46,721 42,874 123,0272020 31,190 48,583 43,592 123,365
KERS Hazardous Membership As of June 30, 2020Fiscal Year Active Inactive Retired Total2013 4,057 2,882 2,312 9,2512014 4,094 3,318 2,467 9,8792015 3,932 3,761 2,575 10,2682016 3,987 4,067 2,739 10,7932017 4,061 4,363 2,823 11,2472018 3,963 4,716 3,010 11,6892019 3,779 5,094 3,146 12,0192020 4,112 5,838 3,242 13,192
Board Meeting - December 3, 2020 - Review and Approval of CAFR
366

183 STAT
SPRS Membership As of June 30, 2020Fiscal Year Active Inactive Retired Total2013 901 236 1,240 2,3772014 861 239 1,279 2,3792015 940 257 1,324 2,5212016 924 262 1,379 2,5652017 910 278 1,393 2,5812018 891 290 1,445 2,6262019 899 313 1,484 2,6962020 798 349 1,523 2,670
Kentucky Retirement Systems Membership Totals As of June 30, 2020Fiscal Year Active Inactive Retired Total2013 137,368 112,462 90,796 340,6262014 137,138 117,039 93,946 348,1232015 136,318 121,604 97,630 355,5522016 135,517 126,468 102,725 364,7102017 135,418 130,871 106,234 372,5232018 133,419 134,963 110,906 379,2882019 132,144 140,130 114,437 386,7112020 128,908 148,367 117,665 394,940
Principal Participating Employers in CERS As of June 30, 2020
Participating Employer RankCovered
Employees% of Total
SystemJefferson County Board of Education 1 5,982 6.41%Louisville Jefferson County Metro Government 2 4,805 5.15%Fayette County Board of Education 3 1,982 2.12%Lexington Fayette Urban County Government 4 1,716 1.84%Judicial Department Administrative Office of the Courts 5 1,585 1.70%Boone County Board of Education 6 1,196 1.28%Bullitt County Board of Education 7 1,128 1.21%Hardin County Board of Education 8 1,032 1.11%Warren County Board of Education 9 961 1.03%Pike County Board of Education 10 930 1.00%All Others 72,024 77.15%
Total 93,341 100.00%
Board Meeting - December 3, 2020 - Review and Approval of CAFR
367

184STAT
Schedule of Participating Employers in CERS As of June 30, 2020
Agency ClassificationNumber of Agencies
Number of Employees
Airport Boards 5 531Ambulance Services 19 416Area Development Districts 14 645Boards of Education 172 48,154Cities 221 10,275Community Action Agencies 21 2,861Conservation Districts 49 58County Attorneys 79 567County Clerks 16 588Development Authorities 6 10Fire Departments 32 1,001Fiscal Courts 118 10,982Hospitals & Clinics (incl. Dental) 1 342Housing Authorities 41 419Jailers 2 68Libraries 85 1,259Other Retirement Systems 2 3P1 State Agencies 4 1,585Parks and Recreation 7 55Planning Commissions 16 204Police Departments 2 15Riverport Authorities 5 69Sanitation Districts 9 352Sheriff Departments 12 737Special Districts & Boards 49 1,370Tourist Commissions 23 178Urban Government Agencies 2 6,521Utility Boards 120 4,076Total 1,132 93,341Total Employees By Tier LevelsTier 1 35,962Tier 2 15,864Tier 3 41,515
Principal Participating Employers in KERS As of June 30, 2020
Participating Employer RankCovered
Employees
% of Total
SystemDepartment for Community Based Services 1 4,344 12.08%Department of Highways 2 3,608 10.04%Department of Corrections 3 3,553 9.88%Judicial Department Administrative Office of the Courts 4 1,401 3.90%Department of Juvenile Justice 5 1,041 2.90%Unified Prosecutorial System 6 957 2.66%Kentucky State Police 7 891 2.48%Department of Revenue 8 782 2.18%Northern Kentucky University 9 747 2.08%New Vista of the Bluegrass, Inc 10 745 2.07%All Others 17,880 49.73%Total 35,949 100.00%
Board Meeting - December 3, 2020 - Review and Approval of CAFR
368

185 STAT
Schedule of Participating Employers in KERS As of June 30, 2020
Agency ClassificationNumber of Agencies
Number of Employees
County Attorneys 59 172Health Departments 60 1,956Master Commissioner 34 65Non-P1 State Agencies 34 791Other Retirement Systems 1 22P1 State Agencies 128 28,835Regional Mental Health Units 12 1,809Universities 7 2,298Total 335 35,948Total Employees By Tier LevelsTier 1 16,966Tier 2 6,360Tier 3 12,622
Schedule of Participating Employers in SPRS As of June 30, 2020Kentucky State Police - Uniformed Police Officers 1 798Total Employees By Tier LevelsTier 1 402Tier 2 196Tier 3 200
Board Meeting - December 3, 2020 - Review and Approval of CAFR
369

186STAT
Average Monthly Benefit by Length of Service in CERS As of June 30, 2020 (in Whole $)
Service Credit Range
CERS Non-Hazardous CERS Hazardous
Number of Accounts
Average Monthly Benefit
Number of Accounts
Average Monthly Benefit
Under 5 years 9,681 $164 1,192 $4035 or more but less than 10 11,420 342 1,123 70810 or more but less than 15 11,520 541 1,068 1,26815 or more but less than 20 9,539 810 1,077 1,82520 or more but less than 25 11,283 1,011 4,113 2,59625 or more but less than 30 12,823 1,920 1,531 3,59230 or more but less than 35 3,046 2,689 426 4,33535 or more 814 3,723 88 5,421
Total 70,126 $951 10,618 $2,175
Average Monthly Benefit by Length of Service in KERS As of June 30, 2020 (in Whole $)
Service Credit Range
KERS Non-Hazardous KERS Hazardous
Number of Accounts
Average Monthly Benefit
Number of Accounts
Average Monthly Benefit
Under 5 years 6,390 $174 875 $2045 or more but less than 10 6,093 435 870 57510 or more but less than 15 5,652 724 792 1,02915 or more but less than 20 4,839 1,064 719 1,53920 or more but less than 25 5,189 1,412 1,169 2,02525 or more but less than 30 13,091 2,295 206 2,87230 or more but less than 35 6,737 3,235 59 3,73235 or more 2,527 4,586 6 4,231
Total 50,518 $1,658 4,696 $1,236
Average Monthly Benefit by Length of Service in SPRS As of June 30, 2020 (in Whole $)
Service Credit RangeNumber of Accounts
Average Monthly Benefit
Under 5 years 140 $5505 or more but less than 10 56 96910 or more but less than 15 65 1,42015 or more but less than 20 122 2,11620 or more but less than 25 523 2,72325 or more but less than 30 501 3,72830 or more but less than 35 231 4,80335 or more 60 6,203Total 1,698 $3,095Note: These tables reflect the Average Monthly Pension Benefit. A single member may have multiple accounts, which contribute to one pension. These tables do not reflect dependent child accounts, Qualified Domestic Relations Order (QDRO) accounts or multiple beneficiary accounts.
Board Meeting - December 3, 2020 - Review and Approval of CAFR
370

187 STAT
Fiduciary Net Position - CERSAs of June 30 ($ in Thousands) Non-Hazardous HazardousFiscal Year Pension Insurance Total Pension Insurance Total2012 5,381,602 1,428,821 6,810,423 1,672,970 785,874 2,458,8442013 5,795,568 1,618,960 7,414,528 1,833,571 891,320 2,724,8912014 6,528,147 1,878,711 8,406,858 2,087,002 1,030,303 3,117,3052015 6,440,800 1,920,946 8,361,746 2,078,202 1,056,480 3,134,6822016 6,141,396 1,908,550 8,049,946 2,010,177 1,056,097 3,066,2742017 6,739,142 2,160,553 8,899,695 2,227,679 1,179,313 3,406,9922018 7,086,322 2,346,767 9,433,089 2,361,047 1,268,272 3,629,3192019 7,242,975 2,486,458 9,729,433 2,429,613 1,324,809 3,754,4222020 $7,110,889 $2,498,051 $9,608,940 $2,395,688 $1,305,132 $3,700,820
Fiduciary Net Position - KERSAs of June 30 ($ in Thousands) Non-Hazardous HazardousFiscal Year Pension Insurance Total Pension Insurance Total2012 2,977,935 418,490 3,396,425 476,589 330,730 807,3192013 2,760,753 496,040 3,256,793 514,592 372,883 887,4752014 2,578,290 646,905 3,225,195 561,484 433,525 995,0092015 2,327,782 665,639 2,993,421 552,468 439,113 991,5812016 1,980,292 668,318 2,648,610 527,880 437,397 965,2772017 2,092,781 781,406 2,874,187 605,921 484,442 1,090,3632018 2,048,890 846,762 2,895,652 651,173 513,384 1,164,5572019 2,286,625 942,136 3,228,761 687,877 527,108 1,214,9852020 $2,362,231 $1,006,498 $3,368,729 $697,366 $514,740 $1,212,106
Fiduciary Net Position - SPRSAs of June 30 ($ in Thousands)Fiscal Year Pension Insurance Total2012 250,476 125,398 375,8742013 248,698 142,691 391,3892014 260,974 164,958 425,9322015 247,229 164,714 411,9432016 218,013 160,949 378,9622017 256,383 178,191 434,5742018 268,425 189,994 458,4192019 287,242 200,128 487,3702020 $295,044 $200,245 $495,289
Fiduciary Net Position - KRSAs of June 30 ($ in Thousands)Fiscal Year Pension Insurance Total2012 $10,758,706 $3,089,313 $13,848,0192013 11,153,182 3,521,894 14,675,0762014 12,015,897 4,154,402 16,170,2992015 11,646,481 4,246,892 15,893,3732016 10,877,757 4,231,311 15,109,0682017 11,921,906 4,783,905 16,705,8112018 12,415,856 5,165,179 17,581,0352019 12,934,332 5,480,639 18,414,9712020 $12,861,218 $5,524,666 $18,385,884Note: For additional historical data for all charts presented, please visit our website for previous annual reports at https://kyret.ky.gov/Publications/ Pages/Comprehensive-Annual-Financial- Reports.aspx
Board Meeting - December 3, 2020 - Review and Approval of CAFR
371

188STAT
Changes in Fiduciary Net Position - CERS Non-Hazardous Pension FundAs of June 30 ($ in Thousands)Additions 2012 2013 2014 2015 2016 2017 2018 2019 2020Members’ Contributions $119,123 $120,777 $122,459 $133,637 $133,987 $150,714 $160,370 $159,064 $168,994Employers’ Contributions 270,664 294,914 324,231 297,714 282,767 331,493 355,473 393,302 475,311Health Insurance Contributions (HB1) 5,101 4,659 6,109 6,674 7,687 9,158 10,826 11,801 5Net Investment Income (Loss) (3,349) 579,161 895,531 110,569 (40,799) 825,901 578,377 394,558 56,682Bank of America Settlement - - - 10,280 - - - - -Northern Trust Settlement - - - - - - 361 44 -Pension Spiking - - - 850 1,339 2,061 2,544 151 105Total Additions 391,539 999,511 1,348,330 559,724 384,981 1,319,327 1,107,951 958,920 701,097Deductions Benefit Payments 524,385 553,204 582,850 615,335 651,247 687,460 726,568 766,221 795,960Refunds 12,765 13,306 14,286 13,524 13,754 14,430 14,608 14,387 14,918Administrative Expenses 16,740 17,743 18,615 18,212 19,078 19,614 19,592 21,659 22,304Capital Project Expenses 9 - - - 307 77 - - -Total Deductions 553,899 584,253 615,751 647,071 684,385 721,581 760,768 802,267 833,182Net Increase (Decrease) in Fiduciary Net Position $(162,360) $415,258 $732,579 $(87,347) $(299,404) $597,746 $347,183 $156,653 $ (132,085)
CERS Non-Hazardous Insurance FundAdditions 2012 2013 2014 2015 2016 2017 2018 2019 2020Employers’ Contributions $164,297 $158,212 $121,161 $115,836 $108,269 $117,310 $120,798 $135,570 $124,740Net Investment Income (Loss) (32,992) 147,194 232,330 36,731 (1,422) 259,586 197,520 133,697 8,656Retired Re-employed (HB1) - - 2,117 3,608 3,567 3,402 3,821 4,085 4,528Member Drug Reimbursement 8,443 5,360 6 - - 1 11 6 4Premiums Received from Retirees 17,493 16,293 1,450 582 629 707 637 616 596Humana Gain Share - - - - - - - 3,574 -Northern Trust Settlement - - - - - - 75 9 -Health Insurance Contributions (HB1) - - - - - - - - 12,959Total Additions 157,241 327,059 357,064 156,757 111,043 381,006 322,862 277,557 151,483Deductions Health Insurance Premiums 141,694 132,489 96,804 113,734 122,713 124,573 131,631 133,005 135,094Administrative Expenses 5,545 4,431 508 782 726 789 761 877 903Self-Funded Healthcare Costs - - - - - 3,635 4,248 3,979 3,887Excise Tax Insurance - - - 6 - 6 6 6 6Total Deductions 147,239 136,920 97,312 114,522 123,439 129,003 136,646 137,867 139,890Net Increase (Decrease) in Fiduciary Net Position $10,002 $190,139 $259,751 $42,235 $(12,396) $252,003 $186,216 $139,690 $11,593
Board Meeting - December 3, 2020 - Review and Approval of CAFR
372

189 STAT
Changes in Fiduciary Net Position - CERS Hazardous Pension FundAs of June 30 ($ in Thousands)Additions 2012 2013 2014 2015 2016 2017 2018 2019 2020Members’ Contributions $41,797 $42,863 $42,631 $46,609 $51,554 $60,102 $61,089 $58,661 $63,236Employers’ Contributions 77,311 120,140 115,240 107,515 104,952 114,315 124,953 137,664 168,201Health Insurance Contributions (HB1) 811 734 1,091 1,084 1,418 1,708 2,173 2,458 1Net Investment Income (Loss) (24,724) 181,171 288,490 37,104 (9,021) 270,473 192,174 132,970 15,992Bank of America Settlement - - - 2,865 - - - - -Northern Trust Settlement - - - - - - 111 14 -Pension Spiking - - - 557 762 1,632 2,707 387 242Total Additions 95,195 344,908 447,452 195,734 149,665 448,230 383,207 332,154 247,672Deductions Benefit Payments 169,352 179,696 189,635 200,134 213,448 226,985 244,119 259,008 275,802Refunds 3,516 3,158 2,664 3,111 2,879 2,315 4,214 2,854 3,814Administrative Expenses 1,319 1,202 1,721 1,289 1,337 1,421 1,504 1,726 1,981Capital Project Expenses - - - - 26 7 - - -Total Deductions 174,187 184,056 194,020 204,534 217,690 230,728 249,837 263,588 281,597Net Increase (Decrease) in Fiduciary Net Position $(79,992) $160,852 $253,431 $(8,800) $(68,025) $217,502 $133,370 $68,566 $(33,925)
CERS Hazardous Insurance FundAdditions 2012 2013 2014 2015 2016 2017 2018 2019 2020Employers’ Contributions $90,204 $84,962 $74,265 $71,008 $66,757 $50,743 $55,027 $61,106 $56,739Net Investment Income (Loss) (16,127) 79,885 125,278 20,283 1,102 142,929 109,004 72,580 2,237Retired Re-employed (HB1) - - 526 770 862 794 975 1,166 1,158Member Drug Reimbursement 871 562 - - - - - - -Premiums Received from Retirees 695 657 32 10 (106) (301) (265) (53) (32)Humana Gain Share - - - - - - - 506 -Northern Trust Settlement - - - - - - 40 5 -Health Insurance Contributions (HB1) - - - - - - - - 2,760Total Additions 75,643 166,066 200,101 92,071 68,615 194,165 164,781 135,310 62,862Deductions Health Insurance Premiums 50,155 59,941 60,843 65,553 68,518 70,407 74,844 78,190 81,849Administrative Expenses 688 679 275 339 480 381 376 434 462Self-Funded Healthcare Costs - - - - - 160 603 149 228Total Deductions 50,843 60,620 61,117 65,894 68,998 70,948 75,823 78,773 82,539Net Increase (Decrease) in Fiduciary Net Position $24,800 $105,446 $138,983 $26,177 $(383) $123,216 $88,958 $56,537 $(19,677)
Board Meeting - December 3, 2020 - Review and Approval of CAFR
373

190STAT
Changes in Fiduciary Net Position - KERS Non-Hazardous Pension FundAs of June 30 ($ in Thousands)Additions 2012 2013 2014 2015 2016 2017 2018 2019 2020Members’ Contributions $96,418 $96,744 $92,941 $100,424 $101,677 $100,544 $104,972 $93,759 $96,594Employers’ Contributions 211,071 280,874 296,836 520,948 512,670 644,803 619,988 948,866 948,578General Fund Appropriations - - - - - 58,193 67,574 75,858 -Health Insurance Contributions (HB1) 5,337 3,344 4,546 4,181 4,817 5,156 5,786 5,963 1Employer Cessation - - - - - 53,215 17 10,643 20Net Investment Income (Loss) 9,789 303,011 337,923 44,570 (20,662) 220,985 147,577 114,918 53,696Bank of America Settlement - - - 8,442 - - - - -Northern Trust Settlement - - - - - - 301 37 -Pension Spiking - - - 743 414 909 1,564 95 (6)Total Additions 322,615 683,973 732,246 679,308 598,916 1,083,805 947,779 1,250,139 1,098,883Deductions Benefit Payments 858,151 873,906 889,937 905,790 923,288 948,489 967,374 988,349 999,813Refunds 12,004 12,907 13,627 13,552 12,130 11,819 13,603 12,342 11,523Administrative Expenses 8,776 10,719 11,145 10,474 10,807 10,974 10,692 11,712 11,941Capital Project Expenses 8 - - - 181 34 - - -Total Deductions 878,939 897,532 914,709 929,816 946,406 971,316 991,669 1,012,403 1,023,277Net Increase (Decrease) in Fiduciary Net Position $(556,324) $(213,559) $(182,463) $(250,508) $(347,490) $112,489 $(43,890) $237,736 $75,606
KERS Non-Hazardous Insurance FundAdditions 2012 2013 2014 2015 2016 2017 2018 2019 2020Employers’ Contributions $146,844 $162,191 $164,176 $132,208 $131,935 $133,024 $132,364 $173,576 $170,479Net Investment Income (Loss) (4,803) 40,661 96,738 8,690 (3,904) 90,915 61,331 43,202 10,624Retired Re-employed (HB1) - - 2,433 3,732 3,880 3,765 4,055 3,996 4,502Member Drug Reimbursement 7,865 4,846 8 - - 1 5 3 2Premiums Received from Retirees 15,666 14,294 918 272 240 248 216 184 183Humana Gain Share Payment - - - - - - - 3,079 -Employer Cessations - - - - - 15,567 - 1,391 25Northern Trust Settlement - - - - - - 32 4 -Health Insurance Contribution (HB1) - - - - - - - - 6,127Total Additions 165,563 221,992 264,273 144,902 132,151 243,520 198,003 225,435 191,942Deductions Health Insurance Premiums 163,841 140,157 112,671 123,127 126,550 127,648 130,069 127,221 125,006Administrative Expenses 5,203 4,285 736 893 818 861 760 875 847Self-Funded Healthcare Costs - - - 2,145 2,095 1,920 1,819 1,962 1,724Excise Tax Insurance - - - 3 6 3 3 3 3Total Deductions 169,044 144,442 113,407 126,168 129,469 130,432 132,651 130,061 127,580Net Increase (Decrease) in Fiduciary Net Position $(3,481) $77,550 $150,866 $18,734 $2,679 $113,088 $65,352 $95,374 $64,362
Board Meeting - December 3, 2020 - Review and Approval of CAFR
374

191 STAT
Changes in Fiduciary Net Position - KERS Hazardous Pension FundAs of June 30 ($ in Thousands)Additions 2012 2013 2014 2015 2016 2017 2018 2019 2020Members’ Contributions $11,602 $11,467 $11,995 $12,670 $15,055 $17,523 $17,891 $17,118 $19,769Employers’ Contributions 17,367 27,334 11,670 28,374 23,690 37,630 32,790 55,229 59,096General Fund Appropriations - - - - - 15,000 10,000 - -Health Insurance Contributions (HB1) 629 402 551 537 684 811 909 934 4Net Investment Income (Loss) (10,286) 51,497 80,724 8,701 (1,652) 70,993 51,848 36,704 6,805Bank of America Settlement - - - 767 - - - - -Northern Trust Settlement - - - - - - 33 4 -Pension Spiking - - - 162 70 344 871 29 19Total Additions 19,312 90,700 104,941 51,211 37,847 142,301 114,342 110,018 85,693Deductions Benefit Payments 48,424 48,855 54,320 56,774 59,306 61,231 65,616 69,527 71,861Refunds 2,543 2,762 2,830 2,609 2,211 2,106 2,501 2,684 3,168Administrative Expenses 877 733 897 844 903 919 975 1,103 1,176Capital Project Expenses - - - - 15 4 - - -Total Deductions 51,844 52,350 58,048 60,227 62,435 64,260 69,092 73,314 76,205Net Increase (Decrease) in Fiduciary Net Position $(32,532) $38,350 $46,892 $(9,016) $(24,588) $78,041 $45,250 $36,704 $9,488
KERS Hazardous Insurance FundAdditions 2012 2013 2014 2015 2016 2017 2018 2019 2020Employers’ Contributions $23,984 $25,144 $23,336 $14,173 $15,929 $4,688 $4,302 $3,725 $4,482Net Investment Income (Loss) 60 32,887 52,214 7,793 (882) 59,188 42,567 28,049 638Retired Re-employed (HB1) - - 538 709 837 932 986 1,245 1,294Member Drug Reimbursement 351 243 - - - - - - 1Premiums Received from Retirees 876 895 37 14 (13) (51) (50) (19) (5)Humana Gain Share - - - - - - - 213 -Northern Trust Settlement - - - - - - 18 2 -Health Insurance Contributions (HB1) - - - - - - - - 1,100Total Additions 25,271 59,169 76,126 22,689 15,871 64,757 47,823 33,215 7,510Deductions Health Insurance Premiums 13,941 16,837 15,405 17,000 17,490 17,562 18,697 19,280 19,630Administrative Expenses 335 179 78 101 97 105 104 117 123Self-Funded Healthcare Costs - - - - - 45 79 94 125Excise Tax Insurance - - - - - - - - -Total Deductions 14,276 17,016 15,482 17,101 17,587 17,712 18,880 19,491 19,878Net Increase (Decrease) in Fiduciary Net Position $10,995 $42,153 $60,642 $5,588 $(1,716) $47,045 $28,943 $13,724 $(12,368)
Board Meeting - December 3, 2020 - Review and Approval of CAFR
375

192STAT
Changes in Fiduciary Net Position - SPRS Pension FundAs of June 30 ($ in Thousands)Additions 2012 2013 2014 2015 2016 2017 2018 2019 2020Members’ Contributions $5,154 $4,495 $5,005 $5,150 $5,149 $5,349 $5,522 $5,062 $4,767Employers’ Contributions 15,040 18,501 20,279 31,444 25,723 38,028 36,486 58,947 58,358General Fund Appropriations - - - - - 25,000 10,000 1,086 1,086Health Insurance Contributions (HB1) 46 48 70 94 113 131 155 176 -Net Investment Income (Loss) 43 25,954 40,374 3,427 (3,841) 26,795 18,487 14,863 6,359Bank of America Settlement - - - 646 - - - - -Northern Trust Settlement - - - - - - 21 3 -Pension Spiking - - - 546 99 210 392 15 9Total Additions 20,283 48,998 65,729 41,307 27,243 95,513 71,063 80,152 70,579Deductions Benefit Payments 48,867 50,559 53,026 54,766 56,268 56,935 58,805 60,948 62,423Refunds 149 31 214 85 11 26 22 162 88Administrative Expenses 73 184 215 201 176 181 194 225 266Capital Project Expenses - - - - 4 1 - - -Total Deductions 49,089 50,774 53,454 55,052 56,459 57,143 59,021 61,335 62,777Net Increase (Decrease) in Fiduciary Net Position $(28,806) $(1,776) $12,276 $(13,745) $(29,216) $38,370 $12,042 $18,817 $7,802
SPRS Insurance FundAdditions 2012 2013 2014 2015 2016 2017 2018 2019 2020Employers’ Contributions $10,810 $16,829 $14,498 $10,379 $10,228 $9,222 $9,397 $13,282 $13,133Net Investment Income (Loss) (1,458) 12,993 20,508 2,921 (48) 21,570 16,420 10,766 1,108Retired Re-employed (HB1) - - (5) 3 9 - - 6 -Member Drug Reimbursement 279 178 - - - - - - -Premiums Received from Retirees 20 23 11 1 (29) (55) (41) (13) (12)Humana Gain Share - - - - - - - 144 -Northern Trust Settlement - - - - - - 8 1 -Health Insurance contributions (HB1) - - - - - - - - 196Total Additions 9,651 30,023 35,012 13,304 10,160 30,737 25,784 24,186 14,425Deductions Health Insurance Premiums 10,791 12,546 12,688 13,483 13,836 13,405 13,881 13,942 14,215Administrative Expenses 201 184 58 65 89 66 62 69 71Self-Funded Healthcare Costs - - - - - 24 38 40 22Excise Tax Insurance - - - - - - - - -Total Deductions 10,992 12,730 12,745 13,548 13,925 13,495 13,981 14,051 14,308Net Increase (Decrease) in Fiduciary Net Position $(1,341) $17,293 $22,267 $(244) $(3,765) $17,242 $11,803 $10,135 $117
Board Meeting - December 3, 2020 - Review and Approval of CAFR
376

193 STAT
Schedule of Benefit Expenses CERS Non-HazardousAs of June 30 (in Whole $)
Normal
RetirementEarly
RetirementDisability
RetirementBeneficiary Payments
Fiscal Year 2013 Average Benefit 591 1,042 878 625Number of Accounts 11,266 33,393 4,537 1,075Total Monthly Benefits $6,661,524 $34,797,169 $3,982,213 $672,310% of Total Monthly Benefits 14.45% 75.46% 8.64% 1.45%Fiscal Year 2014 Average Benefit $596 $1,042 $856 $613Number of Accounts 11,885 34,911 4,729 1,110Total Monthly Benefits $7,081,048 $36,375,607 $4,047,035 $680,784% of Total Monthly Benefits 14.70% 75.49% 8.40% 1.41%Fiscal Year 2015 Average Benefit $612 $1,044 $862 $616Number of Accounts 12,749 36,746 4,854 1,161Total Monthly Benefits $7,801,662 $38,375,001 $4,186,130 $715,032% of Total Monthly Benefits 15.27% 75.13% 8.20% 1.40%Fiscal Year 2016 Average Benefit $623 $1,045 $874 $626Number of Accounts 14,014 39,066 5,118 1,268Total Monthly Benefits $8,724,563 $40,823,334 $4,472,723 $793,726% of Total Monthly Benefits 15.92% 74.48% 8.16% 1.45%Fiscal Year 2017 Average Benefit $634 $1,050 $883 $616Number of Accounts 14,792 40,873 5,280 1,318Total Monthly Benefits $9,374,583 $42,912,604 $4,661,375 $811,542% of Total Monthly Benefits 16.23% 74.29% 8.07% 1.41%Fiscal Year 2018 Average Benefit $647 $1,062 $892 $645Number of Accounts 15,713 42,918 5,425 1,359Total Monthly Benefits $10,169,605 $45,560,863 $4,838,284 $875,980% of Total Monthly Benefits 16.55% 74.15% 7.87% 1.43%Fiscal Year 2019 Average Benefit $668 $1,067 $901 $657Number of Accounts 16,710 44,594 5,479 1,363Total Monthly Benefits $11,167,300 $47,580,052 $4,934,518 $895,303% of Total Monthly Benefits 17.29% 73.68% 7.64% 1.39%Fiscal Year 2020 Average Benefit $673 $1,070 $904 $667Number of Accounts 17,378 45,973 5,405 1,370Total Monthly Benefits $11,693,581 $49,186,433 $4,888,554 $913,574% of Total Monthly Benefits 17.54% 73.76% 7.33% 1.37%Note: This table includes individuals receiving a monthly benefit as of June 30 in the indicated fiscal year. A single member may have multiple accounts which contribute to one pension. This table represents all individuals receiving a benefit including dependent children, Qualified Domestic Relations Order(QDRO) accounts and multiple beneficiary accounts. If a member has died or a disability decision is pending, the monthly benefit amount is reflected as zero until the account status changes.
Board Meeting - December 3, 2020 - Review and Approval of CAFR
377

194STAT
Schedule of Benefit Expenses - CERS HazardousAs of June 30 (in Whole $)
Normal
RetirementEarly
RetirementDisability
RetirementBeneficiary Payments
Fiscal Year 2013 Average Benefit 1,433 2,429 1,121 1,073Number of Accounts 1,883 4,683 681 119Total Monthly Benefits $2,699,176 $11,374,811 $763,700 $127,689% of Total Monthly Benefits 18.04% 76.01% 5.10% 0.85%Fiscal Year 2014 Average Benefit $1,467 $2,437 $1,125 $1,008Number of Accounts 1,974 4,873 695 119Total Monthly Benefits $2,895,353 $11,876,578 $781,685 $119,935% of Total Monthly Benefits 18.47% 75.77% 4.99% 0.77%Fiscal Year 2015 Average Benefit $1,480 $2,448 $1,145 $954Number of Accounts 2,097 5,139 688 127Total Monthly Benefits $3,103,613 $12,581,191 $787,549 $121,103% of Total Monthly Benefits 18.70% 75.82% 4.75% 0.73%Fiscal Year 2016 Average Benefit $1,494 $2,453 $1,137 $975Number of Accounts 2,269 5,485 742 143Total Monthly Benefits $3,388,890 $13,452,235 $843,463 $139,353% of Total Monthly Benefits 19.01% 75.47% 4.73% 0.78%Fiscal Year 2017 Average Benefit $1,509 $2,473 $1,138 $997Number of Accounts 2,394 5,764 794 149Total Monthly Benefits $3,612,099 $14,255,349 $903,238 $148,515% of Total Monthly Benefits 19.09% 75.35% 4.77% 0.78%Fiscal Year 2018 Average Benefit $1,542 $2,505 $1,141 $1,110Number of Accounts 2,540 6,189 811 158Total Monthly Benefits $3,917,668 $15,503,185 $925,221 $175,316% of Total Monthly Benefits 19.09% 75.55% 4.51% 0.85%Fiscal Year 2019 Average Benefit $1,546 $2,522 $1,163 $1,166Number of Accounts 2,655 6,488 822 168Total Monthly Benefits $4,104,061 $16,365,945 $956,017 $195,932% of Total Monthly Benefits 18.98% 75.69% 4.42% 0.91%Fiscal Year 2020 Average Benefit $1,590 $2,554 $1,174 $1,205Number of Accounts 2,771 6,864 814 169Total Monthly Benefits $4,406,958 $17,527,561 $955,266 $203,646% of Total Monthly Benefits 19.08% 75.90% 4.14% 0.88%Note: This table includes individuals receiving a monthly benefit as of June 30 in the indicated fiscal year. A single member may have multiple accounts which contribute to one pension. This table represents all individuals receiving a benefit including dependent children, Qualified Domestic Relations Order (QDRO) accounts and multiple beneficiary accounts. If a member has died or a disability decision is pending, the monthly benefit amount is reflected as zero until the account status changes.
Board Meeting - December 3, 2020 - Review and Approval of CAFR
378

195 STAT
Schedule of Benefit Expenses - KERS Non-HazardousAs of June 30 (in Whole $)
Normal
RetirementEarly
RetirementDisability
RetirementBeneficiary Payments
Fiscal Year 2013Average Benefit 1,003 1,915 1,020 $889Number of Accounts 6,441 32,310 2,687 962Total Monthly Benefits $6,459,840 $61,882,399 $2,740,491 $855,033% of Total Monthly Benefits 8.98% 86.02% 3.81% 1.19%Fiscal Year 2014Average Benefit $992 $1,911 $987 $886Number of Accounts 6,678 33,106 2,706 954Total Monthly Benefits $6,624,472 $63,255,779 $2,671,749 $845,468% of Total Monthly Benefits 9.03% 86.18% 3.64% 1.15%Fiscal Year 2015 Average Benefit $992 $1,901 $996 $909Number of Accounts 6,896 33,940 2,696 983Total Monthly Benefits $6,843,193 $64,503,048 $2,684,720 $893,407% of Total Monthly Benefits 9.13% 86.09% 3.58% 1.19%Fiscal Year 2016 Average Benefit $989 $1,886 $1,005 $902Number of Accounts 7,390 35,192 2,770 1,014Total Monthly Benefits $7,312,293 $66,383,638 $2,784,928 $914,804% of Total Monthly Benefits 9.45% 85.77% 3.60% 1.18%Fiscal Year 2017 Average Benefit $992 $1,883 $1,013 $924Number of Accounts 7,628 35,890 2,772 1,028Total Monthly Benefits $7,565,780 $67,591,003 $2,807,938 $950,318% of Total Monthly Benefits 9.59% 85.65% 3.56% 1.20%Fiscal Year 2018 Average Benefit $998 $1,879 $1,019 $940Number of Accounts 8,070 37,141 2,767 1,007Total Monthly Benefits $8,049,794 $69,780,011 $2,818,593 $946,466% of Total Monthly Benefits 9.87% 85.52% 3.45% 1.16%Fiscal Year 2019 Average Benefit $993 $1,876 $1,029 $933Number of Accounts 8,387 37,751 2,751 997Total Monthly Benefits $8,328,706 $70,826,696 $2,831,527 $930,110% of Total Monthly Benefits 10.04% 85.42% 3.41% 1.12%Fiscal Year 2020 Average Benefit $984 $1,872 $1,031 $937Number of Accounts 8,622 38,233 2,676 987Total Monthly Benefits $8,483,484 $71,585,386 $2,759,983 $924,459% of Total Monthly Benefits 10.13% 85.47% 3.30% 1.10%Note: This table includes individuals receiving a monthly benefit as of June 30 in the indicated fiscal year. A single member may have multiple accounts which contribute to one pension. This table represents all individuals receiving a benefit including dependent children, Qualified Domestic Relations Order (QDRO) accounts and multiple beneficiary accounts. If a member has died or a disability decision is pending, the monthly benefit amount is reflected as zero until the account status changes.
Board Meeting - December 3, 2020 - Review and Approval of CAFR
379

196STAT
Schedule of Benefit Expenses - KERS HazardousAs of June 30 (in Whole $)
Normal
RetirementEarly
RetirementDisability
RetirementBeneficiary Payments
Fiscal Year 2013 Average Benefit $961 $1,543 $662 $725Number of Accounts 1,751 1,417 190 93Total Monthly Benefits $1,682,541 $2,186,334 $125,704 $67,440% of Total Monthly Benefits 41.42% 53.82% 3.10% 1.66%Fiscal Year 2014 Average Benefit $971 $1,560 $649 $749Number of Accounts 1,851 1,497 191 89Total Monthly Benefits $1,797,900 $2,335,190 $123,867 $66,679% of Total Monthly Benefits 41.58% 54.01% 2.86% 1.54%Fiscal Year 2015 Average Benefit $986 $1,556 $661 $714Number of Accounts 1,912 1,566 193 90Total Monthly Benefits $1,884,477 $2,436,923 $127,477 $64,250% of Total Monthly Benefits 41.76% 54.00% 2.82% 1.42%Fiscal Year 2016 Average Benefit $984 $1,542 $663 $730Number of Accounts 2,046 1,658 194 94Total Monthly Benefits $2,011,530 $2,557,114 $128,663 $68,605% of Total Monthly Benefits 42.21% 53.65% 2.70% 1.44%Fiscal Year 2017 Average Benefit $993 $1,541 $662 $721Number of Accounts 2,101 1,719 205 96Total Monthly Benefits $2,086,732 $2,648,685 $135,625 $69,255% of Total Monthly Benefits 42.24% 53.61% 2.75% 1.40%Fiscal Year 2018 Average Benefit $1,002 $1,551 $684 $737Number of Accounts 2,215 1,877 205 100Total Monthly Benefits $2,218,520 $2,911,409 $140,174 $73,704% of Total Monthly Benefits 41.52% 54.48% 2.62% 1.38%Fiscal Year 2019 Average Benefit $1,020 $1,561 $708 $744Number of Accounts 2,269 1,987 208 99Total Monthly Benefits $2,315,435 $3,101,783 $147,342 $73,702% of Total Monthly Benefits 41.07% 55.01% 2.61% 1.31%Fiscal Year 2020 Average Benefit $1,017 $1,561 $701 $739Number of Accounts 2,334 2,061 207 94Total Monthly Benefits $2,374,412 $3,216,376 $145,112 $69,433% of Total Monthly Benefits 40.90% 55.40% 2.50% 1.20%This table includes individuals receiving a monthly benefit as of June 30 in the indicated fiscal year. A single member may have multiple accounts which contribute to one pension. This table represents all individuals receiving a benefit including dependent children, Qualified Domestic Relations Order (QDRO) accounts and multiple beneficiary accounts. If a member has died or a disability decision is pending, the monthly benefit amount is reflected as zero until the account status changes.
Board Meeting - December 3, 2020 - Review and Approval of CAFR
380

197 STAT
Schedule of Benefit Expenses - SPRSAs of June 30 (in Whole $)
Normal
RetirementEarly
RetirementDisability
RetirementBeneficiary Payments
Fiscal Year 2013 Average Benefit $3,601 $3,130 $1,320 $2,198Number of Accounts 149 1,126 74 23Total Monthly Benefits $536,481 $3,524,248 $97,681 $50,563% of Total Monthly Benefits 12.75% 83.73% 2.32% 1.20%Fiscal Year 2014 Average Benefit $3,621 $3,197 $1,346 $2,196Number of Accounts 146 1,172 75 23Total Monthly Benefits $528,611 $3,747,012 $100,974 $49,197% of Total Monthly Benefits 11.94% 84.66% 2.28% 1.11%Fiscal Year 2015 Average Benefit $3,578 $3,189 $1,347 $2,153Number of Accounts 150 1,213 75 23Total Monthly Benefits $536,649 $3,867,971 $101,018 $49,524% of Total Monthly Benefits 11.78% 84.91% 2.22% 1.09%Fiscal Year 2016 Average Benefit $3,579 $3,135 $1,269 $2,008Number of Accounts 155 1,277 82 25Total Monthly Benefits $554,743 $4,002,993 $104,056 $50,196% of Total Monthly Benefits 11.77% 84.95% 2.21% 1.07%Fiscal Year 2017 Average Benefit $3,611 $3,135 $1,278 $2,008Number of Accounts 149 1,303 82 25Total Monthly Benefits $538,032 $4,084,771 $104,788 $50,196% of Total Monthly Benefits 11.26% 85.50% 2.19% 1.05%Fiscal Year 2018 Average Benefit $3,642 $3,128 $1,289 $2,082Number of Accounts 153 1,361 83 26Total Monthly Benefits $557,249 $4,257,579 $107,019 $54,127% of Total Monthly Benefits 11.20% 85.56% 2.15% 1.09%Fiscal Year 2019 Average Benefit $3,607 $3,138 $1,298 $2,082Number of Accounts 156 1,401 83 26Total Monthly Benefits $562,630 $4,395,857 $107,737 $54,127% of Total Monthly Benefits 10.99% 85.85% 2.10% 1.06%Fiscal Year 2020 Average Benefit $3,628 $3,154 $1,339 $2,137Number of Accounts 152 1,440 80 26Total Monthly Benefits $551,470 $4,541,490 $107,148 $55,558% of Total Monthly Benefits 10.49% 86.41% 2.04% 1.06%Note: This table includes individuals receiving a monthly benefit as of June 30 in the indicated fiscal year. A single member may have multiple accounts which contribute to one pension. This table represents all individuals receiving a benefit including dependent children, Qualified Domestic Relations Order (QDRO) accounts and multiple beneficiary accounts. If a member has died or a disability decision is pending, the monthly benefit amount is reflected as zero until the account status changes.
Board Meeting - December 3, 2020 - Review and Approval of CAFR
381

198STAT
Analysis of Initial Retirees As of June 30 (in Whole $)
CERS Non-
HazardousCERS
Hazardous
KERS Non-
HazardousKERS
Hazardous SPRSFiscal Year 2013 Number of Accounts 3,303 443 1,810 205 59Average Service Credit (months) 189 202 199 157 234Average Final Compensation $34,292 $58,516 $47,168 $46,456 $69,325Average Monthly Benefit $938 $2,196 $1,275 $1,250 $2,893Average System Payment for Health Insurance $259 $853 $303 $433 $994Fiscal Year 2014 Number of Accounts 3,529 430 2,037 245 77Average Service Credit (months) 182 194 202 165 260Average Final Compensation $33,816 $57,718 $46,480 $46,595 $70,009Average Monthly Benefit $879 $2,021 $1,278 $1,296 $3,322Average System Payment for Health Insurance $486 $1,279 $534 $937 $1,378Fiscal Year 2015 Number of Accounts 4,084 496 2,078 191 55Average Service Credit (months) 188 204 204 164 251Average Final Compensation $34,561 $59,589 $47,187 $47,148 $67,862Average Monthly Benefit $913 $2,178 $1,308 $1,280 $3,009Average System Payment for Health Insurance $489 $1,254 $549 $906 $1,376Fiscal Year 2016 Number of Accounts 4,151 522 2,043 205 57Average Service Credit (months) 190 212 207 160 234Average Final Compensation $34,632 $58,977 $47,429 $44,494 $65,535Average Monthly Benefit $932 $2,303 $1,351 $1,225 $2,953Average System Payment for Health Insurance $501 $1,277 $558 $870 $1,425Fiscal Year 2017 Number of Accounts 4,151 544 2,094 191 30Average Service Credit (months) 191 203 208 146 241Average Final Compensation $34,779 $58,384 $46,753 $47,604 $68,401Average Monthly Benefit $940 $2,236 $1,339 $1,150 $2,935Average System Payment for Health Insurance $510 $1,247 $558 $872 $1,192Fiscal Year 2018 Number of Accounts 4,570 696 2,682 328 68Average Service Credit (months) 195 211 223 167 241Average Final Compensation $37,683 $65,407 $48,552 $51,219 $71,132Average Monthly Benefit $1,027 $2,528 $1,481 $1,392 $3,035Average System Payment for Health Insurance $531 $1,300 $578 $1,033 $1,365Fiscal Year 2019 Number of Accounts 4,283 541 1,993 234 63Average Service Credit (months) 193 198 204 174 254Average Final Compensation $37,412 $64,646 $47,824 $51,901 $73,795Average Monthly Benefit $997 $2,366 $1,355 $1,532 $3,341Average System Payment for Health Insurance $513 $1,231 $569 $1,015 $1,391Fiscal Year 2020 Number of Accounts 3,584 580 1,755 195 54Average Service Credit (months) 189 221 211 150 245Average Final Compensation $36,968 $67,994 $47,069 $51,021 $78,468Average Monthly Benefit $935 $2,715 $1,352 $1,242 $3,313Average System Payment for Health Insurance $539 $1,361 $579 $1,013 $1,404Note: This table represents all individuals who had an initial retirement date within the fiscal year.
Board Meeting - December 3, 2020 - Review and Approval of CAFR
382

199 STAT
Payment Options Selected by Retired Members As of June 30, 2020 (in Whole $)
Basic OtherPeriod Certain Pop Up
Social Security
Adjustment Survivorship Annuity
CERS Non-HazardousNumber of Accounts 30,470 20 9,829 11,343 2,147 16,311 6Monthly Benefits $24,817,503 $27,457 $8,623,035 $13,966,756 $2,760,044 $16,486,466 $880
CERS HazardousNumber of Accounts 1,828 33 951 4,278 551 2,977 -Monthly Benefits $3,498,464 $46,872 $1,755,191 $10,808,925 $862,878 $6,121,102 $-
KERS Non-HazardousNumber of Accounts 18,762 18 6,275 9,878 3,307 12,273 5Monthly Benefits $27,936,229 $36,156 $9,762,283 $20,075,396 $5,684,801 $20,257,504 $943
KERS HazardousNumber of Accounts 1,355 3 499 1,328 290 1,220 1Monthly Benefits $1,482,753 $4,763 $594,052 $1,961,265 $318,851 $1,443,407 $243
SPRSNumber of Accounts 186 1 132 727 196 456 -Monthly Benefits $531,935 $3,084 $379,848 $2,498,843 $395,393 $1,446,563 $-
KRS TotalNumber of Accounts 52,601 75 17,686 27,554 6,491 33,237 12Monthly Benefits $58,266,884 $118,332 $21,114,409 $49,311,185 $10,021,967 $45,755,042 $2,066The information in this table represents accounts administered by KRS. A single member may have multiple accounts, which contribute to one pension.
Board Meeting - December 3, 2020 - Review and Approval of CAFR
383

200STAT
Employer Contribution RatesIn CERS, KERS, and SPRS, both the employee and the employer contribute a percentage of creditable compensation to KRS. The employee contribution rate is set by state statute. Non-Hazardous employees contribute 5% while Hazardous duty members contribute 8%. Employees hired on or after September 1, 2008, contribute an additional 1% to health insurance. CERS employer contribution rates are set by the KRS Board under Kentucky Revised Statute 61.565 based on an annual actuarial valuation, unless altered by legislation enacted by the Kentucky General Assembly. The CERS employer contribution rates for fiscal year 2008 through 2009 were reduced from the actuarially recommended rate as a result of the passage of House Bill (HB) 1 during the 2008 Extraordinary Session of the Kentucky General Assembly. Also, during its 2009 Regular Session, the Kentucky General Assembly enacted HB 117, which mandated an extension of the phase-in of insurance contribution rates that had been previously approved by the KRS Board in 2006 from five years to 10 years to further mitigate the impact of the application of GASB Statements 43 and 45 on CERS employer contribution rates for health insurance. During the 2018 Regular Session of the Kentucky General Assembly, HB 362 capped CERS employer contribution rate increases up to 12% per year over the prior fiscal year for the period of July 1, 2018 to June 30, 2028. The actual pension and insurance employer contribution rates that were paid are shown below. Under Kentucky Revised Statute 61.565, KERS and SPRS employer contribution rates are set by the KRS Board of Trustees based on an annual actuarial valuation. However, KERS and SPRS employer rates are subject to approval by the Kentucky General Assembly through the adoption of the biennial Executive Branch Budget. For fiscal years 2003 through 2014, the Kentucky General Assembly suspended Kentucky Revised Statute 61.565 in the budget in order to provide an employer contribution rate that is less than the amount recommended by the Board’s consulting actuary. For fiscal years 2018, 2019, and 2020, the legislature amended the KERS Non Hazardous rate for quasi-government agencies to 49.47%. The table in the Actuarial Section shows the KERS and SPRS employer contribution rates that were actuarial recommended rates in the annual valuation without any adjustments.
Employer Contribution Rates (%) As of June 30 2013 2014 2015 2016 2017 2018 2019 2020
CERS Non-Hazardous Actual Rate 19.55% 18.89% 17.67% 17.06% 18.68% 19.18% 21.48% 24.06%
CERS Hazardous Actual Rate 37.60% 35.70% 34.31% 32.95% 31.06% 31.55% 35.34% 39.58%
KERS Non-HazardousActual Rate 23.61% 26.79% 38.77% 38.77% 48.59% 49.47% 83.43% 83.43%
KERS Hazardous Actual Rate 29.79% 32.21% 26.34% 26.34% 23.82% 23.70% 36.85% 36.85%
SPRS Actual Rate 63.67% 71.15% 75.76% 75.76% 89.21% 91.24% 146.28% 146.28%Note: House Bill 1 passed during the 2019 special legislative session reduced the employer contribution rate for KERS quasi-governmental agencies, keeping the rate at 49.47% effective July 1, 2019. All other KERS Nonhazardous agencies paid the shown contribution rate for fiscal year 2019.
Board Meeting - December 3, 2020 - Review and Approval of CAFR
384

201 STAT
Insurance Contracts KRS provides medical insurance and other managed care coverage for eligible retired members. Participation in the insurance program is optional and requires the completion of the proper forms at the time of retirement in order to obtain the insurance coverage. KRS provides access to health insurance coverage through the Kentucky Employees’ Health Plan (KEHP) for recipients until they reach age 65 and/or become Medicare eligible. After a retired member becomes eligible for Medicare, coverage is available through a Medicare eligible plan offered by KRS. A retired member’s spouse and/or dependents may also be covered on health insurance through KRS.
Insurance Benefits Paid to Retirees & BeneficiariesParticipating in a KRS Health Insurance Plan As of June 30, 2020 (in Whole $)
CERS Non -
HazardousCERS
Hazardous
KERS Non -
HazardousKERS
Hazardous SPRSNumber 39,450 8,999 32,401 3,024 1,784Average Service Credit (Months) 264 278 311 264 321Average Monthly System Payment for Health Insurance $323 $956 $360 $680 $891Average Monthly Member Payment for Health Insurance $59 $35 $58 $45 $19Total Monthly Payment for Health Insurance $14,170,086 $7,300,217 $12,661,846 $1,802,607 $1,253,060
Board Meeting - December 3, 2020 - Review and Approval of CAFR
385

202STAT
Insurance Contracts by Type As of June 30 (in Whole $)CERS Non-Hazardous 2013 2014 2015 2016 2017 2018 2019 2020KEHP Parent Plus 340 278 242 235 222 231 214 210KEHP Couple/Family 857 546 473 465 462 510 530 519KEHP Single 7,652 7,843 8,098 8,164 8,313 8,802 8,912 8,751Medicare without Prescription 2,707 2,583 2,531 2,499 2,462 2,389 2,278 2,183Medicare with Prescription 18,824 20,200 21,520 23,007 24,247 25,476 26,848 27,786
CERS Hazardous 2013 2014 2015 2016 2017 2018 2019 2020KEHP Parent Plus 400 432 456 378 395 422 430 425KEHP Couple/Family 2,155 2,184 2,255 2,321 2,387 2,571 2,648 2,816KEHP Single 1,425 1,447 1,500 1,595 1,645 1,712 1,746 1,731Medicare without Prescription 79 89 107 114 125 119 121 116Medicare with Prescription 2,324 2,510 2,697 2,969 3,205 3,388 3,658 3,911
KERS Non-Hazardous 2013 2014 2015 2016 2017 2018 2019 2020KEHP Parent Plus 618 506 452 441 411 460 441 433KEHP Couple/Family 1,276 797 714 656 663 696 700 666KEHP Single 9,364 9,491 9,251 8,876 8,627 8,638 8,304 7,942Medicare without Prescription 1,474 1,370 1,303 1,286 1,229 1,179 1,141 1,089Medicare with Prescription 16,834 17,738 18,577 19,447 20,215 21,117 21,713 22,271
KERS Hazardous 2013 2014 2015 2016 2017 2018 2019 2020KEHP Parent Plus 106 110 110 97 88 96 103 112KEHP Couple/Family 451 448 448 439 432 478 493 491KEHP Single 625 647 656 663 667 686 699 677Medicare without Prescription 60 56 62 66 72 73 83 82Medicare with Prescription 985 1,104 1,177 1,302 1,401 1,495 1,584 1,662
SPRS 2013 2014 2015 2016 2017 2018 2019 2020KEHP Parent Plus 76 78 81 77 79 74 77 85KEHP Couple/Family 421 444 441 355 420 426 454 459KEHP Single 283 263 265 246 251 253 224 226Medicare without Prescription 20 20 16 18 17 21 16 16Medicare with Prescription 682 712 777 850 897 941 975 998
KRS Total 2013 2014 2015 2016 2017 2018 2019 2020KEHP Parent Plus 1,540 1,404 1,341 1,228 1,195 1,283 1,265 1,265KEHP Couple/Family 5,160 4,419 4,331 4,328 4,364 4,681 4,825 4,951KEHP Single 19,349 19,691 19,770 19,544 19,503 20,091 19,885 19,327Medicare without Prescription 4,340 4,118 4,019 3,983 3,905 3,781 3,639 3,486Medicare with Prescription 39,649 42,264 44,748 47,575 49,965 52,417 54,778 56,628
Board Meeting - December 3, 2020 - Review and Approval of CAFR
386

203 INT
Acronym Glossary for Kentucky Retirement SystemsAs of December 3, 2020
Phrase AcronymKentucky Retirement Systems KRSGenerally Accepted Accounting Principles GAAPBoard of Trustees BoardComprehensive Annual Financial Report CAFRHouse Bill HBSenate Bill SBPublic Pension Oversight Board PPOBFiscal Year FYTotal Pension Liability TPLOther post-employment benefits OPEBNet Pension Liability NPLUnfunded Actuarial Accrued Liability UAALCommonwealth of Kentucky CommonwealthGovernmental Accounting Standards Board GASBKentucky Administrative Regulations KARDepartment of Employee Insurance DEIInvestment Policy Statement IPSInvestment Management Agreement IMAExchange Traded Funds ETFsShort Term Investment Funds STIFsEmerging Market Debt EMDTreasury Inflation Protected Securities TIPSNot Rated NRNet Asset Value NAVExecutive Order EOInternal Revenue Service IRSUnrelated Business Income UBIStrategic Technology Advancements for the Retirement of Tomorrow STARTGabriel, Roeder, Smith & Co. GRSRequired Supplementary Information RSINet OPEB Liability NOLSenate Resolution SRKohlberg, Kravis, Roberts KKRPacific Alternative Asset Management Company PAAMCOWestern Kentucky University WKUTeachers Retirement System TRSPerimeter Park West PPWAnnual Required Contribution ARCUnfunded Accrued Liability UALConsumer Price Index CPIQualified Domestic Relations Order QDROKentucky Employees’ Health Plan KEHP
Board Meeting - December 3, 2020 - Review and Approval of CAFR
387

Kentucky Retirement Systems1260 Louisville Road Frankfort, KY 40601
Hours of Operation8:00 AM - 4:30 PM (EST) Monday-Friday
(502) 696-8800 or (800) 928-4646
KYRET.KY.GOV @KYretire @KYretirement
Board Meeting - December 3, 2020 - Review and Approval of CAFR
388

COUNTY EMPLOYEES RETIREMENT SYSTEM
INSURANCE FUND TRUST AGREEMENT
Effective: [DATE]
Board Meeting - December 3, 2020 - CERS Health Insurance Trust Document
389

- i -
TABLE OF CONTENTS
Page
Article I DEFINITIONS AND RULES OF CONSTRUCTION .................................................2
Section 1.01 Definitions ..................................................................................................2
Section 1.02 Rules of Construction .................................................................................4
Article II TRUST AND TRUST ADMINISTRATION ................................................................4
Section 2.01 Trust Fund...................................................................................................4
Article III DEPOSITS AND DISBURSEMENTS FROM THE TRUST FUND ...........................5
Section 3.01 Trust Deposits .............................................................................................5
Section 3.02 Sub-Trusts ...................................................................................................5
Section 3.03 Trust Payments ...........................................................................................5
Article IV ACCOUNTS AND INVESTMENTS............................................................................5
Section 4.01 Accounts .....................................................................................................5
Section 4.02 Investment of Trust Fund ...........................................................................6
Article V POWERS AND DUTIES OF THE TRUSTEES ...........................................................6
Section 5.01 Appointment of Trustees ............................................................................6
Section 5.02 Powers and Duties ......................................................................................6
Section 5.03 Fiduciary Liability Insurance ......................................................................7
Section 5.04 Delegation by Trustees ...............................................................................8
Article VI LIMITATIONS OF RESPONSIBILITY AND INDEMNIFICATION ........................8
Section 6.01 Limitations of Responsibility .....................................................................8
Section 6.02 Indemnification ...........................................................................................8
Article VII ACCOUNTS AND RECORDKEEPING ......................................................................9
Section 7.01 Maintenance of Records .............................................................................9
Section 7.02 Independent Audit ......................................................................................9
Section 7.03 Annual Report.............................................................................................9
Article VIII RELIANCE ON COMMUNICATIONS ..........................................................9
Section 8.01 Certification of Trust Administrator ...........................................................9
Section 8.02 Certification of Other Providers .................................................................9
Article IX AMENDMENT AND TERMINATION .....................................................................10
Board Meeting - December 3, 2020 - CERS Health Insurance Trust Document
390

TABLE OF CONTENTS
(continued)
Page
- ii -
Section 9.01 Amendment ..............................................................................................10
Section 9.02 Irrevocability ............................................................................................10
Section 9.03 Termination ..............................................................................................10
Article X MISCELLANEOUS ....................................................................................................10
Section 10.01 Construction and Governing Law .............................................................10
Section 10.02 Parties Bound ............................................................................................11
Section 10.03 Necessary Parties to Disputes ...................................................................11
Section 10.04 Severability ...............................................................................................11
Section 10.05 Supersession .............................................................................................11
Section 10.06 Nonassignment .........................................................................................11
Section 10.07 Erroneous Payments .................................................................................11
Section 10.08 Release ......................................................................................................11
Board Meeting - December 3, 2020 - CERS Health Insurance Trust Document
391

COUNTY EMPLOYEES RETIREMENT SYSTEM
INSURANCE FUND TRUST AGREEMENT
THIS TRUST AGREEMENT is executed as of this [DAY] day of [MONTH] 2020, by
the Board of Trustees of the Kentucky Retirement Systems ("KRS") on behalf of the Board of
Trustees of the County Employees Retirement System.
W I T N E S S E T H:
WHEREAS, the County Employees Retirement System Insurance Fund Trust ("Trust")
was created and established pursuant to Kentucky Revised Statutes 61.701 for the purpose of
providing medical benefits under Kentucky Revised Statutes 61.702 to retired recipients and
employees of employers participating in the County Employees Retirement System and to
certain of their dependents or beneficiaries;
WHEREAS, pursuant to Governmental Accounting Standards Board Statements No. 74
("GASB 74") and No. 75 ("GASB 75"), a non-federal governmental plan and employer must
take steps to define and disclose the post-employment benefits, other than pension benefits,
provided for former employees and retirees and to actuarially determine its liability for such
benefits;
WHEREAS, a governmental plan or employer may reduce or eliminate its net OPEB
Liability (as defined in GASB 74 or GASB 75) by making contributions to an irrevocable trust in
relation to such anticipated benefits;
WHEREAS, the Trust is intended to be established as an irrevocable trust that receives
contributions for the purpose of providing certain post-employment benefits other than pension
benefits and to make distributions from the Trust for certain post-employment benefits other than
pension benefits;
WHEREAS, Kentucky Revised Statutes 78.782 established the Board of Trustees of the
County Employees Retirement System ("Trustees");
WHEREAS, pursuant to Kentucky Revised Statutes 78.790, the Trustees are authorized
and directed to administer and manage the assets of the Trust, and are given full and exclusive
power to invest and reinvest such funds in accordance with federal law;
WHEREAS, the Trustees may establish separate sub-trusts and accounts within the Trust
to accept contributions and make distributions for the medical benefits described in Kentucky
Revised Statutes 61.702;
WHEREAS, participation in and any coverage under the Trust shall not constitute nor be
construed to constitute a specific, accrued or vested benefit for any specific employee or retiree
unless otherwise specifically provided herein;
Board Meeting - December 3, 2020 - CERS Health Insurance Trust Document
392

- 2 -
WHEREAS, the Trustees are authorized to receive, hold and manage the funds in the
Trust, and such funds, when received by the Trustees (or its delegate), will constitute the trust
fund (the "Trust Fund" or "Fund");
WHEREAS, the Trustees agree to accept this Trust and to perform the duties of the
Trustees hereunder;
WHEREAS, the Commonwealth intends that the income accruing to the Trust shall be
excluded from income for tax purposes, as such trust income accrues to the Commonwealth or an
entity the income of which is excluded from taxation under Section 115 of the Code, and as such
trust income is derived from the exercise of an essential governmental function as provided for
under section 115(1) of the Code, Revenue Rulings 77-261 and 90-74, and other relevant
guidance;
WHEREAS, pursuant to Section 45 of House Bill 484 (2020), the Board of Trustees of
the Kentucky Retirement Systems ("KRS Board") is authorized and directed to act on behalf of
the Trustees prior to April 1, 2021; and
WHEREAS, pursuant to Section 45 of House Bill 484 (2020), all administrative
decisions made by the KRS Board prior to April 1, 2021, on behalf of the County Employees
Retirement System shall be implemented on April 1, 2021, and all administrative regulations
promulgated by the KRS Board prior to April 1, 2021, on behalf of the County Employees
Retirement System shall continue to apply to the County Employees Retirement System on or
after April 1, 2021;
NOW, THEREFORE, the Board of Trustees of the Kentucky Retirement Systems,
on behalf of the Board of Trustees of the County Employees Retirement System, hereby
adopts a Trust to provide as follows:
ARTICLE I
DEFINITIONS AND RULES OF CONSTRUCTION
Section 1.01 Definitions. When the initial letter of a word or phrase is capitalized, it
shall have the following meaning:
(a) "CERS" means the County Employees Retirement System or any successor
thereto.
(b) "Code" means the Internal Revenue Code of 1986, as amended.
(c) "Custodian" means a bank, mutual fund, savings and loan association, insurance
company or other qualified entity selected by the Trustees, to hold and administer the assets of
the Trust Fund.
(d) "Dependent" means a dependent, as defined in Section 152 of the Code,
determined without regard to subsections (b)(1), (b)(2) and (d)(1)(B) thereof, of a Retiree.
Board Meeting - December 3, 2020 - CERS Health Insurance Trust Document
393

- 3 -
(e) "Health and Welfare Benefit" means a medical or prescription drug benefit
considered a post-retirement benefit other than pension under GASB 74 or GASB 75. Such a
benefit is limited to medical care expenses as defined by Code Section 213(d).
(f) "Investment Fund" means an investment fund that forms part of the Trust Fund as
established by the Trustees.
(g) "Investment Manager" means an investment manager selected by the Trustees.
(h) "KRS" means Kentucky Retirement Systems.
(i) "OPEB Liability" means the net liability for post-employment benefits other than
pension benefits under GASB 74 or GASB 75.
(j) "Property" refers to any property, real or personal, or partial interests therein,
wherever situated, including, but without being limited to, preferred and common stocks, shares
of investment companies, bonds, notes, debentures and mortgages, equipment trust certificates,
investment trust certificates, interests in limited liability companies, in partnerships whether
limited or general or in any insurance contract, policy, annuity, or other investment media
offered by an insurance company, in which trust assets may be invested pursuant to Kentucky
law.
(k) "Regulation" means a policy, procedure, rule or regulation adopted by the
Trustees, establishing administrative procedures or interpretations affecting the Trust.
(l) "Retiree" means a former employee of an employer participating in CERS who
receives a monthly retirement allowance from CERS.
(m) "Spouse" means the spouse of a Retiree in a marriage of two individuals if such
marriage would be recognized by any state, possession, or territory of the United States.
(n) "Trust" means the trust created and established hereunder.
(o) "Trust Administrator" means CERS, except that prior to April 1, 2021, "Trust
Administrator" means KRS acting on CERS' behalf.
(p) "Trust Fund" means all such money, Property, and all investments made therewith
and proceeds thereof and all earnings and profits thereon, less payments made by the Trustees as
authorized herein.
(q) "Trust Year" means the twelve (12) month period beginning each July 1 and
ending the following June 30 on which the books and records of the Trust are maintained.
(r) "Trustees" means the Board of Trustees of the County Employees Retirement
Systems, except that prior to April 1, 2021, "Trustees" means the Board of Trustees of the
Kentucky Retirement System acting on CERS' behalf.
Board Meeting - December 3, 2020 - CERS Health Insurance Trust Document
394

- 4 -
Section 1.02 Rules of Construction. Words used herein in the masculine gender
shall be construed to include the feminine gender where appropriate, and words used herein in
the singular or plural shall be construed as being in the plural or singular where appropriate.
Accounting terms and principles used herein or applicable hereto shall be as defined and
described from time to time by pronouncements and other guidance of the Governmental
Accounting Standards Board, or any successor organization.
ARTICLE II
TRUST AND TRUST ADMINISTRATION
Section 2.01 Trust Fund.
(a) Each employer participating in the CERS as provided in Kentucky Revised
Statutes 78.510 to 78.852 shall contribute to the Trust the amount necessary to provide Health
and Welfare Benefits as provided for under this Trust Agreement. Separate sub-trusts may be
established for appropriate categories of Retirees or of employers and any income or earnings of
the Trust Fund shall be allocable to each sub-trust.
(b) The Trustees shall receive and accept for the purposes hereof all contributions
described herein and shall hold, invest, reinvest, manage, administer, and distribute Property and
the increments, proceeds, earnings, and income solely to meet OPEB Liabilities and provide
Health and Welfare Benefits as described herein, and in accordance with Code Sections 105 and
106.
(c) All assets held by the Trustees in the Trust are referred to herein as the "Trust
Fund." The Trustees have the authority to invest and manage the assets of the Trust Fund.
(d) This Trust is created for the sole purpose of providing Health and Welfare
Benefits as described herein. During the life of the Trust, no portion of the principal or income
of this Trust shall revert to the Commonwealth or an employer or shall be used for or diverted to
any purpose other than to provide Health and Welfare Benefits for Retirees, Spouses and the
Dependents of Retirees as provided by Kentucky law and to pay the reasonable expenses of the
Trust. Trust assets shall not be used to satisfy the claims of any creditor of any employer, the
Commonwealth, or the Trustees.
(e) The contributions made by each employer and all investments, receipts,
disbursements, and other transactions thereunder may be maintained in a common account,
which contributions shall be used solely for the payment of benefits, expenses and other charges
properly allocable to the Trust.
(f) The Trust Fund shall continue to be held by the Trustees in trust and dealt with in
accordance with the provisions of the Trust. At no time shall any part of the Trust Fund be used
for, or diverted to, purposes other than for the exclusive benefit of Retirees and their eligible
Spouses and Dependents, as applicable, as provided herein and for defraying the reasonable
expenses of administering the Trust.
Board Meeting - December 3, 2020 - CERS Health Insurance Trust Document
395

- 5 -
ARTICLE III
DEPOSITS AND DISBURSEMENTS FROM THE TRUST FUND
Section 3.01 Trust Deposits.
(a) The Trustees hereby delegate to the Trust Administrator the responsibility for
accepting contributions to the Trust and remitting said contributions to the Custodian. The Trust
Administrator is also responsible for crediting the deposits to the appropriate sub-trust, if sub-
trusts have been established. In all cases, deposits of contributions shall be treated as actually
made only as of the date the funds are accepted as in good order by the Trust Administrator.
(b) The Trustees shall: (i) invest and reinvest the Trust Fund, and (ii) pay benefits as
described herein from the Trust Fund on the order of the Trust Administrator or its duly
authorized representative. The Trustees shall account for contributions, income, and payments
made to or from the Trust. The Trustees, Custodian and Trust Administrator shall not be
responsible for the adequacy of the Trust Fund to meet and discharge any liabilities of the
Commonwealth or any employer.
(c) Contributions to fund the benefits under the Trust shall consist of annual amounts
determined under Kentucky law pursuant to Kentucky Revised Statutes 78.635.
Section 3.02 Sub-Trusts. Separate sub-trusts in the Trust Fund may be maintained by
the Trust Administrator for appropriate categories of Retirees or employers. The Trustees shall
not be required to maintain separate investments for any sub-trust. Interest may be credited to
each sub-trust by the Trustees from time to time.
Section 3.03 Trust Payments.
(a) The Trustees shall disburse amounts from the Trust Fund for the sole purpose of
assisting in the payment of Health and Welfare Benefits for Retirees and their eligible Spouse
and Dependents and for reasonable expenses, fees and allocated administrative fees and
expenses.
(b) Any amounts remaining in the Trust Fund after all Health and Welfare Benefits,
fees and expenses have been paid shall be retained for payment of future Health and Welfare
Benefits until all Commonwealth and employer liabilities for such benefits have been satisfied.
(c) Trust Expenses. The Trustees may incur reasonable administrative expenses,
which shall be payable from the assets of the Trust Fund.
ARTICLE IV
ACCOUNTS AND INVESTMENTS
Section 4.01 Accounts. Trust assets shall be held in a common account. The
Trustees and Custodian shall be under no duty to determine the amount of contributions paid to
Board Meeting - December 3, 2020 - CERS Health Insurance Trust Document
396

- 6 -
the Trust, whether such contributions are adequate to meet the Commonwealth’s and all
employers’ obligations for Health and Welfare Benefits, or to collect or enforce payment of any
contribution.
Section 4.02 Investment of Trust Fund.
(a) Except as otherwise provided by Regulation or as delegated to the Custodian or
an Investment Manager, the Trustees shall have complete control of the management and
investment of the Trust Fund and shall have all powers necessary or convenient to enable it to
exercise such control.
(b) The Trustees may invest and reinvest funds held by the Fund in any investments
which are legal investments under Kentucky law, and shall have the discretion to decide the
allocation of funds among such investments. The Trustees may purchase, acquire, hold, lease,
sell, and convey real and personal Property, and place funds held herein with banks or trust
companies which have corporate trust powers, with insurance companies authorized to do
business within the Commonwealth, and do all such other acts as are permitted by law.
ARTICLE V
POWERS AND DUTIES OF THE TRUSTEES
Section 5.01 Appointment of Trustees. Prior to April 1, 2021, the Board of Trustees
of KRS shall serve as the Board of Trustees of this Trust. Therefore, the appointment and term
of members of the Board of Trustees of this Trust shall be made pursuant to Kentucky Revised
Statues 61.645. On and after April 1, 2021, the Board of Trustees of CERS shall serve as the
Board of Trustees of this Trust. Therefore, the appointment and term of members of the Board of
Trustees of this Trust shall be made pursuant to Kentucky Revised Statutes 78.782.
Section 5.02 Powers and Duties. The Trustees, in administering the Trust, shall have
such power and authority (including discretion with respect to the exercise of that power and
authority) as may be necessary, advisable, desirable, or convenient to the Trustees, in their sole
discretion as Trustees and investment fiduciaries subject to the provisions of this Trust
Agreement, and consistent with Kentucky Revised Statutes 61.645 and 78.782, including the
power and authority:
(a) To make Regulations with respect to the Trust not inconsistent with the Trust,
GASB 74 or 75, Code Section 115 or applicable law, and to amend or rescind such Regulations;
(b) To determine, consistent with the applicable laws, rules or regulations, all
questions of law or fact that may arise as to any person or entity claiming rights under the Trust;
(c) Subject to and consistent with GASB 74 and 75, Code Section 115 and applicable
law, to construe and interpret the Trust and to correct any defect, supply any omission, or
reconcile any inconsistency in the Trust;
(d) To adopt and amend bylaws governing its operations and procedures;
Board Meeting - December 3, 2020 - CERS Health Insurance Trust Document
397

- 7 -
(e) To make and enter into contracts with any agency of the Commonwealth or any
outside agency or company for the purpose of assisting in the general administration of the Trust
or the investing or advising as to the investment of the Trust Fund;
(f) To provide for termination of trusteeship and transfer of assets to successor
trustees as permitted by law;
(g) To employ legal counsel;
(h) To employ and contract with actuaries, auditors, accountants, investment advisers,
investment brokers, consultants, medical personnel, and other agents and employees;
(i) Subject to Section 4.01, to collect and disburse all funds due and payable under
the Trust;
(j) To provide for and promulgate all the rules, regulations, and forms that are
deemed as necessary or desirable in fulfilling its purposes of assisting in providing Health and
Welfare Benefits and in maintaining proper records and accountings consistent with GASB
Statement 74 and 75 and Internal Revenue Service standards;
(k) To adopt an Investment Policy Statement and asset allocation;
(l) To bring and defend actions, sue and be sued, and plead and be impleaded;
(m) To expend funds for the purchase of fidelity and surety bonds and liability
insurance for the protection and indemnification of Trustees in the performance of their duties;
(n) To expend funds for the reasonable expenses of the Trustees while engaged in the
performance of their duties;
(o) To employ insurance companies, banks, trust companies, and investment brokers
as agents for the keeping of records and the receipt and disbursement of funds held by or due the
Trustees;
(p) To exercise generally any of the powers of an owner with respect to all or any part
of the Trust Fund; and
(q) To take all actions consistent with this Trust Agreement necessary or appropriate
to administer or carry out the purposes of the Trust; provided, however, the Trustees need not
take any action unless, in their opinion, there are sufficient Trust assets available for the expense
thereof.
Section 5.03 Fiduciary Liability Insurance. The Trustees may buy fiduciary
liability insurance or errors and omissions insurance, as described above. However, all such
insurance shall provide that proceeds shall be payable to the Trust and shall contain express
provisions reserving to the insurer executing the same the full right of recourse against all parties
or other individuals whose errors, acts, omissions, or breaches may obligate such insurer to make
Board Meeting - December 3, 2020 - CERS Health Insurance Trust Document
398

- 8 -
payments to the Trust. CERS may buy fiduciary liability insurance covering any fiduciary of the
Trust, including any member of the Trustees, and CERS shall pay the premiums therefore from
the Trust.
Section 5.04 Delegation by Trustees. In addition to the powers stated in
Section 5.02, the Trustees may from time to time delegate to an individual, committee, or
organization certain of its fiduciary responsibilities under the Trust. Any such individual,
committee, or organization shall remain a fiduciary until such delegation is revoked by the
Trustees, which revocation may be without cause and without advance notice. Such individual,
committee, or organization shall have such power and authority with respect to such delegated
fiduciary responsibilities as the Trustees have under the Trust.
ARTICLE VI
LIMITATIONS OF RESPONSIBILITY AND INDEMNIFICATION
Section 6.01 Limitations of Responsibility. The Trustees' responsibilities and
liabilities shall be subject to the following limitations:
(a) The Trustees shall have no duties other than those expressly set forth in this Trust
Agreement and those imposed on the Trustees by applicable laws.
(b) The Trustees and the Trust Administrator shall not be responsible for any
particular federal, state or local income, payroll or other tax consequence to the Commonwealth
or a Retiree, Spouse, or Dependent.
(c) The Trustees shall be responsible only for money and Property actually received
by the Trust, and then to the extent described in this Trust Agreement.
(d) The Trustees shall not be responsible for the correctness of any determination of
payments or disbursements from the Trust Fund.
(e) No Trustee shall have any liability for the acts or omissions of any predecessor or
successor in office.
(f) The Trustees shall have no liability for (i) the acts or omissions of any Investment
Manager or Managers; (ii) the acts or omissions of any insurance company; (iii) the acts or
omissions of any Investment Fund; (iv) the acts or omissions of any Custodian; (v) the acts or
omissions of the Trust Administrator; or (vi) the acts or omissions of any contractor.
Section 6.02 Indemnification. The Trust shall, and hereby does, to the extent
permitted by law, indemnify the Trustees, including persons who have served as such in the past
or who are heirs, executors, or administrators thereof, against expenses (including attorney's
fees), judgments, fines, settlements, and other amounts actually and reasonably incurred in
connection with any actual or threatened proceeding of any kind, arising by reason of the fact that
any such person is or was a Trustee, and shall advance to such person expenses reasonably
incurred in defending any such proceedings as permitted by law. Such indemnity shall apply,
Board Meeting - December 3, 2020 - CERS Health Insurance Trust Document
399

- 9 -
however, only if, in connection with the matter at issue, the person claiming indemnity hereunder
acted in good faith and in a manner he or she reasonably believed was in the best interests of the
Trust. This indemnity does not extend to any acts of the person seeking indemnity which involve
gross negligence or willful misconduct, or are materially in breach of this Agreement, or any
bylaw. The Trustees may obtain and may rely on a written opinion of independent legal counsel
on any issues of good faith, reasonable belief, or breach, or on any and all other issues that may
bear on the application of this indemnity.
ARTICLE VII
ACCOUNTS AND RECORDKEEPING
Section 7.01 Maintenance of Records. The Trustees shall maintain or cause to be
maintained suitable records, data, and information relating to its responsibilities hereunder. The
Trust's books and records relating thereto shall be open to inspection and audit at reasonable
times, subject to applicable law.
Section 7.02 Independent Audit. The Trustees shall cause an independent audit of
the Trust Fund to be performed annually, with results reported to the Trust Administrator.
Section 7.03 Annual Report. Each year, the Trustees shall publish an annual
consolidated report that includes:
(a) The fiscal transactions of the Trust Fund for the preceding Trust Year; and
(b) The amount of the accumulated cash, securities, and other assets of the Trust
Fund.
ARTICLE VIII
RELIANCE ON COMMUNICATIONS
Section 8.01 Certification of Trust Administrator. The Trustees may rely upon a
certification of the Trust Administrator with respect to any instruction, direction, or approval of
such Trust Administrator and may continue to rely upon such certification until a subsequent
certification is filed with the Trustees. The Trustees shall have no duty to make any investigation
or inquiry as to any statement contained in any such writing but may accept the same as fully
authorized by the Trust Administrator.
Section 8.02 Certification of Other Providers. The Trustees shall be protected
further in relying upon a written certification that purports to be from any Custodian, Investment
Manager, insurance company, or mutual fund as to the person or persons authorized to give
instructions or directions on behalf of such Custodian, Investment Manager or insurance
company and continue to rely upon such certification until a subsequent written certification is
filed with the Trustees.
Board Meeting - December 3, 2020 - CERS Health Insurance Trust Document
400

- 10 -
ARTICLE IX
AMENDMENT AND TERMINATION
Section 9.01 Amendment. This Trust Agreement may be amended by the Trustees at
any time and in any manner permitted by applicable Commonwealth law and not inconsistent
with GASB 74 and 75 or Code Section 115. Notice of such Amendment shall be promptly
provided to the Trust Administrator and Custodian.
Section 9.02 Irrevocability. This Trust Agreement and the Trust created hereby is
irrevocable.
Section 9.03 Termination. The Trust shall have perpetual existence, except if
dissolved by the Trustees. Following any such dissolution, the Trustees shall proceed to wind up
the affairs of the Trust in an orderly manner and within a reasonable period of time considering
relevant circumstances. After paying or making reasonable provision for the payment of all
liabilities of the Trust, and upon receipt of such releases, indemnities or like documentation as the
Trustees may reasonably deem necessary for the protection of the Trustees, the Trustees shall
distribute the remaining Property of the Trust, in cash or in kind or partly each, for the sole
purpose of assisting in the payment of Health and Welfare Benefits for Retirees and their eligible
Spouses and Dependents, and for related reasonable expenses, fees and allocated administrative
fees and expenses. If all such obligations are extinguished, the assets of the Trust may revert to
the employers that participate in CERS as determined by the Trustees; provided, however, that
any employer receiving such a reversion must be a state, a political subdivision of a state, or an
entity whose income is excluded from gross income under Code Section 115.
ARTICLE X
MISCELLANEOUS
Section 10.01 Construction and Governing Law.
(a) This Trust Agreement shall be construed, enforced and administered and the
validity thereof determined in accordance with the Code and the laws of the Commonwealth of
Kentucky. If any provision of the Trust Agreement is held to violate the Code or Kentucky law,
or to be illegal or invalid for any other reason, that provision shall be deemed to be null and void,
but the invalidation of that provision shall not otherwise affect the Trust.
(b) The headings and subheadings in this Trust Agreement are inserted for
convenience of reference only and are not to be considered in the construction of any provision
of the Trust Agreement.
(c) In resolving any conflict among provisions of this Trust Agreement and in
resolving any other uncertainty as to the meaning or intention of any provision of this Trust
Agreement, the interpretation that (i) causes the Trust to be exempt from tax as a governmental
instrumentality under Code Section 115, and (ii) causes the Trust to comply with all applicable
Board Meeting - December 3, 2020 - CERS Health Insurance Trust Document
401

- 11 -
requirements of the Code and the laws of the Commonwealth of Kentucky, shall prevail over any
different interpretation.
Section 10.02 Parties Bound. This Trust Agreement shall be binding upon the
Trustees, the Commonwealth, the former employers of Retirees, and, as the case may be, the
delegates, successors, and assigns of each of them.
Section 10.03 Necessary Parties to Disputes. Necessary parties to any accounting,
litigation, or other proceedings relating to the Trust Agreement shall include only the Trustees.
The settlement or judgment in any such case in which the Trustees are duly served or cited shall
be binding upon all persons claiming by, through, or under this Trust.
Section 10.04 Severability. If any provisions of the Trust Agreement shall be held by
a court of competent jurisdiction to be invalid or unenforceable, the remaining provisions of the
Trust Agreement shall continue to be fully effective.
Section 10.05 Supersession. The terms of the Trust Agreement shall supersede any
previous oral or written agreement between the parties to this Trust pertaining to matters that are
the subject of the Trust.
Section 10.06 Nonassignment. The Commonwealth may not commute, sell, assign,
transfer, or otherwise convey any right it may have under the Trust. The assets held under this
Trust shall not be subject to the rights of the creditors of the Commonwealth, any employer, the
Trustees or the Trust Administrator, and shall be exempt from execution, attachment, prior
assignment or any other judicial relief or order for the benefit of creditors or other third person.
Section 10.07 Erroneous Payments. If the Trustees or the Trust Administrator make
any payment that according to the terms of the Trust and the benefits provided hereunder should
not have been made, the Trustees or Trust Administrator may recover that incorrect payment, by
whatever means necessary, whether or not it was made due to the error of the Trustees or Trust
Administrator, from the person to whom it was made or from any other appropriate party. For
example, the Trustees or Trust Administrator may deduct the amount of the incorrect payment
when making any future payments to the recipient of the incorrect payment.
Section 10.08 Release. Any payment to any Commonwealth agency or insurance
company, or its designee, shall, to the extent thereof, be in full satisfaction of the claim of such
entity being paid thereby and the Trustees or Trust Administrator may condition payment thereof
on the delivery by the Commonwealth agency or insurance company, or its designee, of the duly
executed receipt and release in such form as may be determined by the Trustees or Trust
Administrator.
IN WITNESS WHEREOF, this Trust has been executed by the undersigned on the date
indicated.
Board Meeting - December 3, 2020 - CERS Health Insurance Trust Document
402

- 12 -
On behalf of the Board of Trustees of the County
Employees Retirement System
BOARD OF TRUSTEES OF THE KENTUCKY
RETIREMENT SYSTEMS
Name
Title
Date
The Trust provides no guaranty that payments or reimbursements to employees, former
employees, retirees, spouses or beneficiaries will be tax-free. The Trust will obtain a ruling
from the Internal Revenue Service concerning only the federal tax treatment of the Trust's
income. That ruling may not be cited or relied upon by the County Employees Retirement
Systems whatsoever as precedent concerning any matter relating to the Kentucky
Retirement Systems' health plan(s) (including post-retirement health plans). In particular,
that ruling has no effect on whether contributions to the County Employees Retirement
Systems' health plan(s) or payments from the County Employees Retirement Systems'
health plans (including reimbursements of medical expenses) are excludable from the gross
income of employees, former employees or retirees, under the Internal Revenue Code. The
federal income tax consequences to employees, former employees and retirees depend on
the terms and operation of the County Employees Retirement Systems' health plan(s).
C\1498724.4
Board Meeting - December 3, 2020 - CERS Health Insurance Trust Document
403

Kentucky Retirement SystemsStress Test Report - Purpose
• Quantify risks to help determine if funding methods or policies need to be changed to substantially improve the sustainability of the System
• Primarily focuses on investment return risk but can also review:– Contribution risk (i.e. System not receiving full actuarially
determined contribution, which includes payroll growth)– Future changes to funding policy (i.e. resetting
amortization period)
1
Board Meeting - December 3, 2020 - KRS Update
404

Kentucky Retirement SystemsStress Test Report - Process• Deterministic Projections
– One scenario with one set of results– Identifies the magnitude of the impact of a certain event
happeningm Specific investment experience scenariosm Funding policy changesm Payroll growth experience
• Stochastic Projections– 5,000 investment return scenarios generated based on KRS
return and volatility expectations – Identifies the probability of certain events in the next 5, 10,
15, 20, or 30 yearsm Probability of reaching 60%/80%/100% fundedm Probability of contribution rates exceeding X%
2
Board Meeting - December 3, 2020 - KRS Update
405

Kentucky Retirement SystemsStress Test Report – Scope and Status
• GRS working with KRS staff to finalize scenarios to be included in reports
• Reports will focus on the five pension funds – i.e. will not include the insurance funds
3
Board Meeting - December 3, 2020 - KRS Update
406

KERS – Non-Hazardous Pension FundStress Test Report – Example – 2019 Valuation
4
Contributions are Dependent on Future Investment ExperienceProjected Employer Contributions by Percentile
($ in Millions)
Fiscal Year
Investment Return Percentile
25% 50% 75%
2022 $1,054 $1,054 $1,054
2023 1,051 1,049 1,046 2024 1,048 1,045 1,043 2025 1,052 1,042 1,031
2030 1,058 1,027 992 2035 1,075 1,016 952 2040 1,096 1,018 926 2045 1,100 998 864
Board Meeting - December 3, 2020 - KRS Update
407

KERS – Non-Hazardous Pension FundStress Test Report – Example – 2019 Valuation
5
Within X Years 80% Funded Ratio 100% Funded Ratio
15 Years 0% 0%
20 Years 2% 0%
25 Years 35% 8%
30 Years 91% 55%
Probability of Attaining an 80% and 100% Funded Ratio
Board Meeting - December 3, 2020 - KRS Update
408

KERS – Non-Hazardous Pension FundStress Test Report – Example – 2019 Valuation
6
Funded Ratio
Distribution of Projected Funded Ratio
Board Meeting - December 3, 2020 - KRS Update
409

Disclaimers
• This presentation should not be relied on for any purpose other than the purpose described herein.
• This presentation shall not be construed to provide tax advice, legal advice or investment advice.
• Readers are cautioned to examine original source materials and to consult with subject matter experts before making decisions related to the subject matter of this presentation.
• This presentation expresses the views of the author and does not necessarily express the views of Gabriel, Roeder, Smith & Company.
7
Board Meeting - December 3, 2020 - KRS Update
410