Valuations using royalty data in the life sciences area ...
26
Lee, Jeong Hee; In, Youngyong; Lee, Il-hyung; Lee, Joon Woo Article Valuations using royalty data in the life sciences area—focused on anticancer and cardiovascular therapies Journal of Open Innovation: Technology, Market, and Complexity Provided in Cooperation with: Society of Open Innovation: Technology, Market, and Complexity (SOItmC) Suggested Citation: Lee, Jeong Hee; In, Youngyong; Lee, Il-hyung; Lee, Joon Woo (2016) : Valuations using royalty data in the life sciences area—focused on anticancer and cardiovascular therapies, Journal of Open Innovation: Technology, Market, and Complexity, ISSN 2199-8531, Springer, Heidelberg, Vol. 2, Iss. 1, pp. 1-25, https://doi.org/10.1186/s40852-015-0025-5 This Version is available at: http://hdl.handle.net/10419/176512 Standard-Nutzungsbedingungen: Die Dokumente auf EconStor dürfen zu eigenen wissenschaftlichen Zwecken und zum Privatgebrauch gespeichert und kopiert werden. Sie dürfen die Dokumente nicht für öffentliche oder kommerzielle Zwecke vervielfältigen, öffentlich ausstellen, öffentlich zugänglich machen, vertreiben oder anderweitig nutzen. Sofern die Verfasser die Dokumente unter Open-Content-Lizenzen (insbesondere CC-Lizenzen) zur Verfügung gestellt haben sollten, gelten abweichend von diesen Nutzungsbedingungen die in der dort genannten Lizenz gewährten Nutzungsrechte. Terms of use: Documents in EconStor may be saved and copied for your personal and scholarly purposes. You are not to copy documents for public or commercial purposes, to exhibit the documents publicly, to make them publicly available on the internet, or to distribute or otherwise use the documents in public. If the documents have been made available under an Open Content Licence (especially Creative Commons Licences), you may exercise further usage rights as specified in the indicated licence. https://creativecommons.org/licenses/by/4.0/
-
Upload
khangminh22 -
Category
Documents
-
view
5 -
download
0
Transcript of Valuations using royalty data in the life sciences area ...

Lee, Jeong Hee; In, Youngyong; Lee, Il-hyung; Lee, Joon Woo
Article
Valuations using royalty data in the life sciencesarea—focused on anticancer and cardiovasculartherapies
Journal of Open Innovation: Technology, Market, and Complexity
Provided in Cooperation with:Society of Open Innovation: Technology, Market, and Complexity (SOItmC)
Suggested Citation: Lee, Jeong Hee; In, Youngyong; Lee, Il-hyung; Lee, Joon Woo(2016) : Valuations using royalty data in the life sciences area—focused on anticancer andcardiovascular therapies, Journal of Open Innovation: Technology, Market, and Complexity,ISSN 2199-8531, Springer, Heidelberg, Vol. 2, Iss. 1, pp. 1-25,https://doi.org/10.1186/s40852-015-0025-5
This Version is available at:http://hdl.handle.net/10419/176512
Standard-Nutzungsbedingungen:
Die Dokumente auf EconStor dürfen zu eigenen wissenschaftlichenZwecken und zum Privatgebrauch gespeichert und kopiert werden.
Sie dürfen die Dokumente nicht für öffentliche oder kommerzielleZwecke vervielfältigen, öffentlich ausstellen, öffentlich zugänglichmachen, vertreiben oder anderweitig nutzen.
Sofern die Verfasser die Dokumente unter Open-Content-Lizenzen(insbesondere CC-Lizenzen) zur Verfügung gestellt haben sollten,gelten abweichend von diesen Nutzungsbedingungen die in der dortgenannten Lizenz gewährten Nutzungsrechte.
Terms of use:
Documents in EconStor may be saved and copied for yourpersonal and scholarly purposes.
You are not to copy documents for public or commercialpurposes, to exhibit the documents publicly, to make thempublicly available on the internet, or to distribute or otherwiseuse the documents in public.
If the documents have been made available under an OpenContent Licence (especially Creative Commons Licences), youmay exercise further usage rights as specified in the indicatedlicence.
https://creativecommons.org/licenses/by/4.0/

Lee et al. Journal of Open Innovation: Technology, Market,and Complexity (2016) 2:1 DOI 10.1186/s40852-015-0025-5
RESEARCH Open Access
Valuations using royalty data in the lifesciences area—focused on anticancerand cardiovascular therapies
Jeong Hee Lee1, Youngyong In1, Il-Hyung Lee2 and Joon Woo Lee2** Correspondence: [email protected] Institute of Science andTechnology Information (KISTI),Hoegi-ro, 66 Dongdemun-gu, Seoul130-741, South KoreaFull list of author information isavailable at the end of the article
©Lpi
Abstract
Purpose: This research seeks to answer the basic question, “How can we buildup the formula to estimate the proper royalty rate and up-front payment usingthe data I can get simply as input?” This paper suggests a way to estimate theproper royalty rate and up-front payment using a formula derived from theregression of historical royalty dataset.
Design/methodology/approach: This research analyzes the dataset, includingthe royalty-related data like running royalty rate (back-end payments) and up-frontpayment (up-front fee +milestones), regarding drug candidates for specific drug classes,like anticancer or cardiovascular, by regression analysis. Then, the formula to predictroyalty-related data is derived using the attrition rate for the corresponding developmentphase of the drug candidate for the license deal and the revenue data of the licensebuyer (licensee). Lastly, the relationship between the formula to predict royalty-relateddata and the expected net present value is investigated.(Continued on next page)
2016 Lee et al. Open Access This article is distributed under the terms of the Creative Commons Attribution 4.0 Internationalicense (http://creativecommons.org/licenses/by/4.0/), which permits unrestricted use, distribution, and reproduction in any medium,rovided you give appropriate credit to the original author(s) and the source, provide a link to the Creative Commons license, andndicate if changes were made.

Lee et al. Journal of Open Innovation: Technology, Market, and Complexity (2016) 2:1 Page 2 of 25
(Continued from previous page)
Findings: For the anticancer (antineoplastics) and cardiovascular drug classes, the formulato predict the royalty rate and up-front payment is as follows.
X ¼ Attrition Rate � Licensee Revenueð Þ=100
< Drug Class : Anticancer activity candidates >
Royalty Rate ¼ 1þ a � Xð Þ= bþ c �Xð Þ¼ 1þ –5:14147E‐09�Xð Þ= 0:128436559þ –6:37E–10 � Xð Þ
ð1Þ
Upfront payment Up‐frontþMilestonesð Þ ¼ aþXð Þ= bþ c � Xð Þ¼ –133620928:7þXð Þ= –3:990489631þ 2:04191E–08 �Xð Þ
ð2Þ
X ¼ Attrition Rate � Licensee Revenueð Þ=100
< Drug Class : Cardiovascular activity drug candidates >
Royalty Rate ¼ y0þ a=Xþ b=X2
¼ 9:26eþ 0þ −8:528þ 5ð Þ=Xþ 1:744eþ 10=X2ð3Þ
Upfront payment Up‐frontþMilestoneð Þ ¼ y0þ axþ bx2
¼ 7:103eþ 6þ –3:990489631ð Þ �Xþ –1:536e–12ð Þ � X2
ð4Þ
In the case of Equations Equation 2 and Equation 4, it is statistically meaningful(R2: 039–0.41); however, in the case of Equations Equation 1 and Equation 3, it has aweak relationship (R2: 022–0.28), thus requiring further study.
Research limitations/implications (if applicable): This research is limited to therelationship between two drug classes—anticancer (antineoplastics) andcardiovascular—and royalty-related data.
Practical implications (if applicable): Valuation for the drug candidate within aspecific drug class can be possible, and the royalty rate can be a variable accordingto drug class and licensee revenue.
Keywords: Valuation, Licensing deal, Drug, Royalty data, Royalty rate, Up-front fee,Milestones, Regression, Drug class, Anticancer, Antineoplastics, Attrition rate,Development phase, Licensee, Life sciences, rNPV, eNPV (expected NPV), DCF, QSAR,Computational chemistry
IntroductionThe existing valuation methodologies used in the life sciences area and their strengths
and weaknesses
As shown in Fig. 1, the R & D process of medicine requires a lengthy long-term develop-
ment period between 12 to 15 years and a development cost that can reach about USD 13
billion. However, among the number of drug candidates that ranges from 5000 to 10,000,
only 1 can be finalized as the approved drug. Because of this, the attrition rate of medicine
is extremely small. With this, the drug development process is categorized by the following
development stages: drug discovery; preclinical testing; phase I, II, and III clinical trials;
submission for approval; and phase IV. To sum up, drug development is expensive, time-
consuming, complex, and risky.
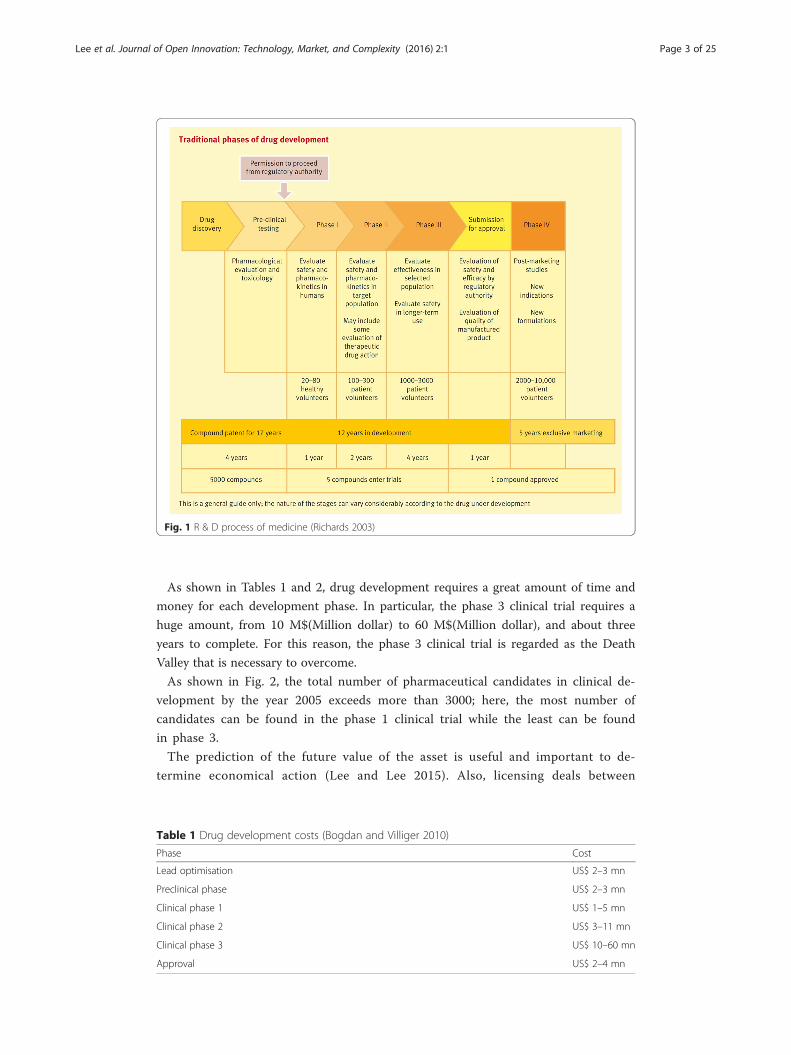
Fig. 1 R & D process of medicine (Richards 2003)
Lee et al. Journal of Open Innovation: Technology, Market, and Complexity (2016) 2:1 Page 3 of 25
As shown in Tables 1 and 2, drug development requires a great amount of time and
money for each development phase. In particular, the phase 3 clinical trial requires a
huge amount, from 10 M$(Million dollar) to 60 M$(Million dollar), and about three
years to complete. For this reason, the phase 3 clinical trial is regarded as the Death
Valley that is necessary to overcome.
As shown in Fig. 2, the total number of pharmaceutical candidates in clinical de-
velopment by the year 2005 exceeds more than 3000; here, the most number of
candidates can be found in the phase 1 clinical trial while the least can be found
in phase 3.
The prediction of the future value of the asset is useful and important to de-
termine economical action (Lee and Lee 2015). Also, licensing deals between
Table 1 Drug development costs (Bogdan and Villiger 2010)
Phase Cost
Lead optimisation US$ 2–3 mn
Preclinical phase US$ 2–3 mn
Clinical phase 1 US$ 1–5 mn
Clinical phase 2 US$ 3–11 mn
Clinical phase 3 US$ 10–60 mn
Approval US$ 2–4 mn

Table 2 Drug development duration (Bogdan and Villiger 2010)
Phase Length
Lead optimisation 20–40 months
Preclinical 10–12 months
Clinical phase 1 18–22 months
Clinical phase 2 24–28 months
Clinical phase 3 28–32 months
Approval 16–20 months
Lee et al. Journal of Open Innovation: Technology, Market, and Complexity (2016) 2:1 Page 4 of 25
pharmaceutical companies and biotech/academia are popular in the life sciences
area because drug development is expensive, time-consuming, complex, and
risky.
As shown in Fig. 3, the total number of licensing deals for 1 year by the year
2006 reached almost 700 cases, and the total value of deals in the same year is
lively enough to reach 77 B$(Billion dollar). Licensing deals, as you can see from
the other paper, were increased from about 50 cases in 1993 to more than 400
cases in 2001—about an 8-fold increase as shown in Fig. 4.
In Fig. 5, the number of back-end payments (running royalties) is higher than that of
up-front payments (up-front fee +milestones) in a normal license deal condition in all
development stages.
Determining a reasonable royalty rate for a licensing deal is highly difficult, and
proper valuation is essential to make a reasonable determination. There are two
major valuation approaches used in the life sciences area: discounted cash flow
(DCF) and real options. According to a preceding paper (Puran 2005), the risk-
adjusted net present value (rNPV), DCF, scenario analysis, and decision-tree
method achieved the highest scores as the valuation methods used by biotech and
pharma companies, analysts, and venture capital (VC) firms on value part-
developed projects, as shown in Fig. 6. The DCF method is based on the know-
ledge that a dollar today will be worth less in the future; here, the most common
DCF metric used in biotechnology is the net present value (NPV). The NPV
Fig. 2 Clinical stage development candidates (Kessel and Frank 2007)
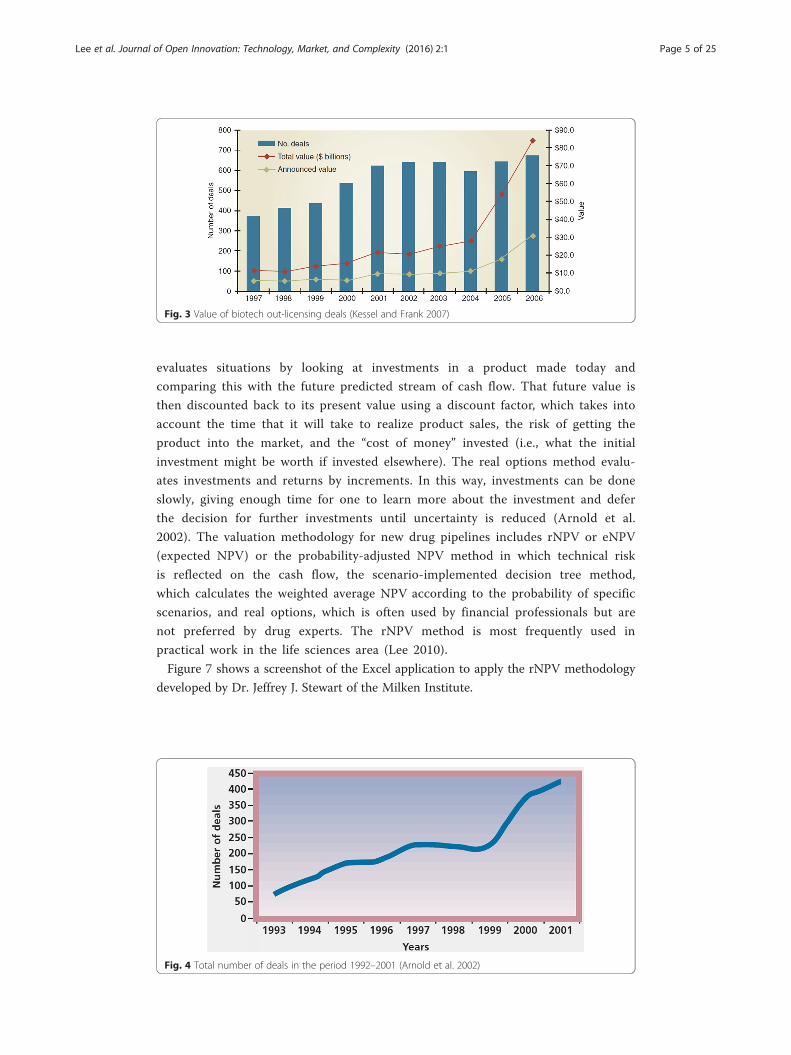
Fig. 3 Value of biotech out-licensing deals (Kessel and Frank 2007)
Lee et al. Journal of Open Innovation: Technology, Market, and Complexity (2016) 2:1 Page 5 of 25
evaluates situations by looking at investments in a product made today and
comparing this with the future predicted stream of cash flow. That future value is
then discounted back to its present value using a discount factor, which takes into
account the time that it will take to realize product sales, the risk of getting the
product into the market, and the “cost of money” invested (i.e., what the initial
investment might be worth if invested elsewhere). The real options method evalu-
ates investments and returns by increments. In this way, investments can be done
slowly, giving enough time for one to learn more about the investment and defer
the decision for further investments until uncertainty is reduced (Arnold et al.
2002). The valuation methodology for new drug pipelines includes rNPV or eNPV
(expected NPV) or the probability-adjusted NPV method in which technical risk
is reflected on the cash flow, the scenario-implemented decision tree method,
which calculates the weighted average NPV according to the probability of specific
scenarios, and real options, which is often used by financial professionals but are
not preferred by drug experts. The rNPV method is most frequently used in
practical work in the life sciences area (Lee 2010).
Figure 7 shows a screenshot of the Excel application to apply the rNPV methodology
developed by Dr. Jeffrey J. Stewart of the Milken Institute.
Fig. 4 Total number of deals in the period 1992–2001 (Arnold et al. 2002)

Lee et al. Journal of Open Innovation: Technology, Market, and Complexity (2016) 2:1 Page 6 of 25
Figure 8 shows an example of the application of the decision alternative and tree
methodology on the valuation for a licensing deal by Merck & Co.
Table 3 shows the pros and cons of the two main valuation methodologies: DCF
and real options. While DCF has been the gold standard for years, real options
valuation is gaining grounds and is regarded as a possible alternative in life
sciences. Both methods have their advantages and drawbacks. DCF, when applied
to early stage projects, generally yields negative values; nevertheless, the industry
remains profitable. Consequently, managers do not trust their valuations and disregard
the recommendation retrieved from the valuations. Projects in early development are con-
tinued despite their negative DCF values. This often translates into a general refusal of
quantitative methods. As soon as it comes to licensing and M&A, companies are in
urgent need of a valuation method that displays the correct value of early stage projects.
Real options valuation, on the other hand, has been developed to overcome the shortfalls
Fig. 5 Common deal terms by development stage (Source: Adapted Recombinant Capital) (Kessel andFrank 2007)

Fig. 6 Valuation methods used by biotech, pharma companies, analysts, and VC firms (Puran 2005)
Lee et al. Journal of Open Innovation: Technology, Market, and Complexity (2016) 2:1 Page 7 of 25
of DCF; however, it is still regarded as too complex and highly theoretic, compared to the
easy-to-use DCF method. Today, there is no standard on how to apply the method to life
sciences valuation.
Table 4 shows the main pros and cons of the four methods of the real options
valuation methodology. All four methods of the real options methodology yield
the same result, but the ways to achieve it are different. In case of the formula
and finite difference methods, the calculation process is similar to a black box,
Fig. 7 Excel application to apply the rNPV methodology developed by Dr. Jeffrey J. Stewart of the MilkenInstitute (Stewart et al. 2001)

Fig. 8 An example of the application of the decision alternative and tree methodology (Cho 2004)
Lee et al. Journal of Open Innovation: Technology, Market, and Complexity (2016) 2:1 Page 8 of 25
as it is not visible, and here, it is not helpful to use a formula. In case of the
simulations method, it gives a good impression about the uncertainty of the
value and is, therefore, an excellent risk measurement too1. However, the
process of the simulations method is time-consuming and carries a path-
dependency problem. In case of the trees method, it is easy to understand and
visualize what can happen to the market, but the link to the value drivers con-
tinues to be missing.
Review of preceding research
The prevailing wisdom in the biotech industry is that the main factor driving the
size of a deal is the development phase—whether preclinical, clinical, or approval.
Because of this, the attrition rate of each development phase is used in the eNPV
valuation in the life sciences area. Table 5 shows an example of the process to derive the
risk-adjusted added-value pharmaceutical NPV from the attrition rate (Blair 2008). The
eNPV (rNPV) value can be derived by multiplying the attrition rate of each development
phase of the drug to the NPV in the table.
Table 3 Main pros and cons of the two main valuation methodologies (Bogdan and Villiger 2010)
Advantages Disadvantages
DCF Easy to implement and to understand Misses the value of flexibility and marketuncertainty
Standard in all sectors of the economy Not suitable for risk management
Real Options Captures market uncertainty and the management’sability to react
Relies on more hypothesis and requiresmore data
Suitable for risk management Technical
Improves strategic thinking if properly understood

Table 4 Main pros and cons of the four methods of real options valuation methodologies(Bogdan and Villiger 2010)
Method Advantages Disadvantages
Formula Easy to use Calculation process not visible
Fast Only for simple option structures
Sensitivities Simple assumptions
Trees Easy to understand Rigid
Visualisation
can deal with more complicated options
Simulations Easy to understand Time consuming
Visualisation Problems with path dependency
Can deal with more complicated assumptions
Finite differences Can deal with more complicated assumptions Calculation process not visible,hard to understand
Can deal with more complicated options Technically demanding
Lee et al. Journal of Open Innovation: Technology, Market, and Complexity (2016) 2:1 Page 9 of 25
eNPV ¼ Risk�NPV ¼ Attrition Rate=100ð Þ �NPV
The valuation is required to proceed the licensing agreement, and the latest attrition
rate mainly used for the valuation in the life sciences area is that of Dr. Joseph A.
DiMasi, as shown in Table 6 (DiMasi et al. 2010).
There is a preceding research work on the main factor driving the size of the
licensing deal in the life sciences area that fully evaluated 105 biotechnology drug
deals signed over the past 10 years, identifying the factors that influenced the size
of the deal in a statistically significant manner and then comparing these results
with the opinions of a panel of industry leaders actively involved in the out-
licensing of products and technologies (Arnold et al. 2002). According to the
paper, there are 6 factors that influence the value of a licensing deal, and the
ranking of factors from the manager panel of 16 biotechnology leaders is avail-
able, as shown in Table 7. Here, the ranking of the factors for influencing the
deal size follows this order: development phase, drug class, contract type, con-
tract scope, licensee, and molecular structure. These factors can be the candidates for
the input to estimate the size of a licensing deal in the life sciences area. In the same
paper, other value drivers, like the market, strategies, competition, intellectual property
(IP), novelty, and so on, can also be found, as shown in Table 8. This study considers the
Table 5 Risk-adjusted added-value pharmaceutical net present value (NPV) (Blair 2008)
Trial phase Cumulative risk NPV ($US million) Risk adjusted eNPV($US million)II III Pre-registration Registration Base-case CDx enhanced
Baseline attrition ratesa
0.52 0.76 0.89 0.94 0.331 892 295
CDx adjusted attrition ratesb
0.57 0.81 0.4 0.99 0.429 2694 1157a Data on file at PJB PharmaPredict (http://www.pjbpubs.com/pharmaprojects_plus/predict.htm) and EvaluatePharma®(http://www.evaluatepharma.com/)b Primary research with industry expertsCDx = companion diagnostic test; eNVP = expected NPV

Table 6 Attrition rate (DiMasi et al. 2010)
♦ Preclinical to IND: 70 % Start End Probability
♦ Phase I to Phase 2: 71 % PC Approval 13.3 %
♦ Phase 2 to Phase 3: 45 % P1 Approval 19.0 %
♦ Phase 3 to NDA/BLA: 64 % P2 Approval 26.8 %
♦ NDA/BLA to approval: 93 % P3 Approval 59.5 %
NDA/BLA Approval 93.0 %
Lee et al. Journal of Open Innovation: Technology, Market, and Complexity (2016) 2:1 Page 10 of 25
likely candidates for the input to estimate the size of a licensing deal in the life sciences
area as the development phase, drug class, market size, IP, and molecular structure, taking
data availability and the ease of quantification into consideration.
As a likely candidate for the input to estimate the size of a licensing deal in
the life sciences area, there is a drug classification of over 300 kinds according to
Drugs.com, which is the largest, most widely visited, independent medicine information
Web site available on the Internet (Drugs.com 2015). However, such a detailed drug
classification is not available in the licensing deal data; thus, a simpler drug classification
like that in Table 9 is needed for this study. Table 9 shows the main drug classification by
Drugs.com, and there are 21 main drug classes.
There is only one case to perform the regression analysis on the work on evalu-
ating pharmaceutical licensing agreements (Arnold et al. 2002; Rogers and Maranas
2005), but the analysis for historical licensing data was for identifying the factors
that most affect a deal’s financial terms (Arnold et al. 2002; Rogers and Maranas
2005). In reviewing the preceding research, there have been no cases where a
regression analysis could be performed to estimate the proper royalty rate and up-
front payment using the formula derived from the regression of the dataset of
historical licensing data.
This study is believed to be the first case to estimate the royalty rate and up-
front payment using the formula derived from the regression of the dataset of
historical licensing data, and can therefore be used as a simple tool to answer the
basic question, “How can we find the formula to estimate the proper royalty rate
and up-front payment using the data I can get simply as input?” It can also be a good
starting point to be referred to by a manager in case of negotiations in pharmaceutical
licensing deals for a specific drug class.
Table 7 Manager panel’s ranking of factors that influence the value of a licensing deal(Arnold et al. 2002)
Rank Driver Scorea
1 Phase of molecule 1.13
2 Therapeutic area 1.56
3 Type of agreement 1.94
4 Scope of agreement 1.94
5 Type and reputation of buyer 1.94
6 Type of molecule 2.19aScores are ranked from 1 (most important) to 3 (least important)

Table 8 Manager panel’s perceptions about the importance of value drivers (Arnold et al. 2002)
Value driver Percentage of respondentsmentioning it as important
Market, including market size for the licensing agreement, market potential,or patient population
88 %
Stage-phase or stage in the development of the product 69 %
Strategy, including issues of “fit” of the product in the company’s pipeline andfranchises, impact on the current business, and synergies
44 %
Competition-competitive markets, competition from other partners for theproduct, and competitive products
38 %
Reputation of the licensee or licensor, including inventor and management talent 31 %
Investment-financial needs to develop the product 25 %
Intellectual property-gaining key patents or trade secrets 25 %
Novelty-innovative merit of the product (revolutionary or evolutionary) 19 %
Control of the development and commercialization of a product 6 %
Comparable deal valuations for similar products/technologies 6 %
Reimbursement–ability or willingness of customers (payers or patients) to payfor the product
6 %
Lee et al. Journal of Open Innovation: Technology, Market, and Complexity (2016) 2:1 Page 11 of 25
Research design and scope and limitationResearch design
The purpose of this research is to derive the formula to predict royalty-related
data, such as running royalty rate (back-end payments) and up-front payment (up-
front fee + milestones), using the attrition rate for the corresponding development
Table 9 Main drug classification (Drugs.com 2015)
Drug class- Tre view
1 Allergenics
2 Alternative medicines
3 Anti-infectives
4 Antineoplastics
5 Biologicals
6 Cardiovascular agents
7 Central nervous system agents
8 Coagulation modifiers
9 Gastrointestinal agents
10 Genitourinary tract agents
11 Hormones
12 Immunologic agents
13 Medical gas
14 Metabolic agents
15 Miscellaneous agents
16 Nutritional products
17 Plasma expanders
18 Psychotherapeutic agents
19 Radiologic agents
20 Respiratory agents
21 Topical agents

Lee et al. Journal of Open Innovation: Technology, Market, and Complexity (2016) 2:1 Page 12 of 25
phase of the drug candidate within a specific drug class, such as anticancer (anti-
neoplastics) or cardiovascular, and the revenue data of the license buyer (licensee)
using regression analysis. Another purpose is to find the relationship between the
formula to predict royalty-related data and eNPV.
According to the preceding research, the main factors to drive the size of licens-
ing deals in the life sciences area are development phase, drug class, contract type,
contract scope, licensee, molecular structure, market, strategies, competition, IP,
and novelty (Arnold et al. 2002). Market size, licensee revenue, molecular structure,
and IP can be converted to numerical value and can be used for the input for
prediction for royalty-related data such as running royalty rate (back-end pay-
ments) and up-front payment (up-front fee + milestones). In the case of market
size, it requires a great amount of time to estimate the proper market size for the
subclass of a drug class (e.g., epidermal growth factor, anticancer immunity, ovarian
cancer, alpha interferon as a subclass of the anticancer drug class). In the case of
molecular structure, it requires professional chemical software to convert chemical
structure into numeric code and requires the collection of molecular structure
information for the drug candidate. In the case of IP, identifying what could be the
unique descriptor for the drug-related patents for input for the X-axis of
regression requires more thought (e.g., the technology cycle time median value for
the International Patent Classification (IPC) code can be the descriptor candidate).
This study selected drug class, licensee revenue, and attrition rate for the
development phase as descriptors for the input for the X-axis of regression.
The main research procedure is divided into three steps as shown in Fig. 9: data
collection, data normalization, and regression analysis.
Step 1. Collection of data such as the running royalty rate, up-front fee, milestones,
licensor, licensee, the revenue of licensee, the corresponding drug class, and
the development phase in drug licensing deals
This study collected the data for two drug classes in the format of Table 10: anticancer
and cardiovascular. Data collection is based on the following resources: ① Book:
Royalty Rates for Pharmaceuticals and Biotechnology, 8th Edition Published by IPRA
Inc (2012);
② Book: Intellectual Property: Valuation, Exploitation, and Infringement Damages,
written by Russell L. Parr and Smith (2005); ③ Site for checking the deal condition:
http://www.sec.gov/ (U.S. Securities and Exchange Commission);
④ Site for checking the development phase: https://clinicaltrials.gov; ⑤ Site for
Fig. 9 Procedure and steps to carry out research

Ta
#
1
2
3
4
5
6
7
8
Lee et al. Journal of Open Innovation: Technology, Market, and Complexity (2016) 2:1 Page 13 of 25
checking the revenue of Licensee: http://www.google.com/finance and http://
finance.yahoo.com/; ⑥ Site to retrieve the needed data: http://www.google.com.
Step 2. Preparation of dataset ready for regression analysis via data normalization
like in Figs. 10 and 11
Step 3. Regression analysis to investigate the relationship between (attrition rate *
licensee revenue) and up-front payment (up-front fee +milestones) and the
relationship between attrition rate * licensee revenue and back-end payment
(running royalty rate)
Used software: ① Preliminary analysis for checking rough type: Microsoft Office
Excel 2007
② Main analysis: open-source statistical software
Regression 1: X-axis = (attrition rate * licensee revenue)/100
Y-axis = up-front payment (up-front fee +milestones) [Unit: USD]
Regression 2: X-axis = (attrition rate * licensee revenue)/100
Y-axis = back-end payment (running royalty rate) [Unit: USD]
Scope and limitation of research
The scope of this research is to derive the formula to predict royalty-related data,
such as running royalty rate (back-end payments) and up-front payment (up-front
fee + milestones), using the attrition rate for the corresponding development
phase of the drug candidate for the anticancer (antineoplastics) or cardiovascular
drug class and the revenue data of the license buyer (licensee), and to investigate
the relationship between the formula to predict royalty-related data and eNPV.
Statistically speaking, this research derives the formula to predict royalty-related
data using a single independent variable like royalty rate and up-front payment,
(attrition rate * licensee revenue)/100]. Also, this research selected drug class,
licensee revenue, and attrition rate for the development phase as descriptors for
the input for the X-axis of regression. This study is limited to the relationship
between the two drug classes of anticancer (antineoplastics) and cardiovascular
and royalty-related data. For further studies, it is advised that the relationship be
analyzed in more detail to involve more drug classes and royalty-related data
using several independent variables through software like SPSS or SAS.
ble 10 Example of data collection (IPRA Inc 2012)
Development stage Upfront fee Milestones Royalty rate Contract year SubClass
Pre-Clinical or Phase I $500,000 4 % of sales 2006 Lyophilized docetaxel
Phase I/II 35 M$ 372 M$ Low double digit 2009 MEK inhibitors
Pre-Clinical $30,000 $155,000 1 %~2 % of sales 2005 Immunotherapy
Pre-Clinical $100,000 8.5 % of sales 2001 Platinum complex
Pre-Clinical 3.5 % of sales 2006 Pseudomonas exotoxin
Pre-Clinical 1.5 % of sales 2002 Lm-LLO cancer
Phase II $3,000,000 10 M$ 0 1997 Immune systemcancer product
Phase II 25 M$ 400 M$ 35 % of sales 2005 VEGF Trap

Fig. 11 Normalization example of back-end payment (running royalty rate)
Fig. 10 Normalization example of up-front payment (up-front fee +milestones)
Lee et al. Journal of Open Innovation: Technology, Market, and Complexity (2016) 2:1 Page 14 of 25
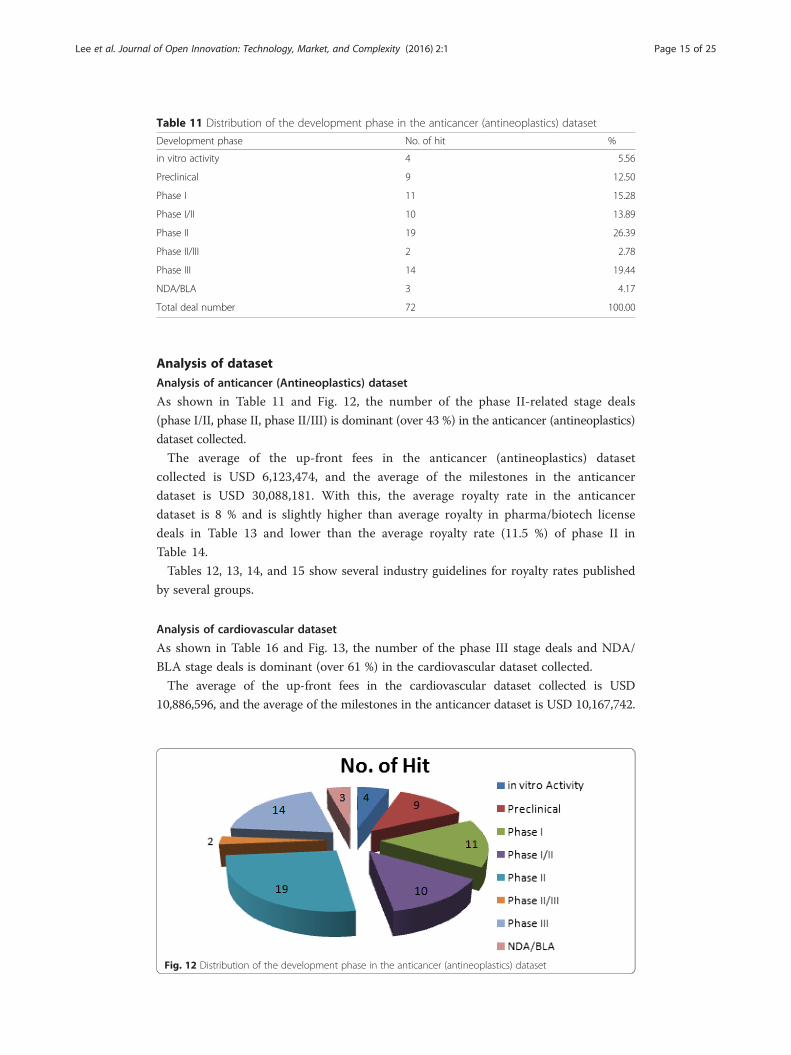
Table 11 Distribution of the development phase in the anticancer (antineoplastics) dataset
Development phase No. of hit %
in vitro activity 4 5.56
Preclinical 9 12.50
Phase I 11 15.28
Phase I/II 10 13.89
Phase II 19 26.39
Phase II/III 2 2.78
Phase III 14 19.44
NDA/BLA 3 4.17
Total deal number 72 100.00
Lee et al. Journal of Open Innovation: Technology, Market, and Complexity (2016) 2:1 Page 15 of 25
Analysis of datasetAnalysis of anticancer (Antineoplastics) dataset
As shown in Table 11 and Fig. 12, the number of the phase II-related stage deals
(phase I/II, phase II, phase II/III) is dominant (over 43 %) in the anticancer (antineoplastics)
dataset collected.
The average of the up-front fees in the anticancer (antineoplastics) dataset
collected is USD 6,123,474, and the average of the milestones in the anticancer
dataset is USD 30,088,181. With this, the average royalty rate in the anticancer
dataset is 8 % and is slightly higher than average royalty in pharma/biotech license
deals in Table 13 and lower than the average royalty rate (11.5 %) of phase II in
Table 14.
Tables 12, 13, 14, and 15 show several industry guidelines for royalty rates published
by several groups.
Analysis of cardiovascular dataset
As shown in Table 16 and Fig. 13, the number of the phase III stage deals and NDA/
BLA stage deals is dominant (over 61 %) in the cardiovascular dataset collected.
The average of the up-front fees in the cardiovascular dataset collected is USD
10,886,596, and the average of the milestones in the anticancer dataset is USD 10,167,742.
Fig. 12 Distribution of the development phase in the anticancer (antineoplastics) dataset

Table 12 Industry guideline for royalty rates (Source: 1998, Dr. Michael, CASRIP Newsletter)(IPRA Inc 2012)
Industry Royalty rate
Electronics 0.5–5 %
Machinery 0.33–10 %
Chemical 2–5 %
Pharmaceutical 2–10 %
Lee et al. Journal of Open Innovation: Technology, Market, and Complexity (2016) 2:1 Page 16 of 25
The average royalty rate in the anticancer dataset is 10 % and is slightly higher than the
average royalty in pharma/biotech license deals in Table 13 and slightly lower than the
average royalty rate (15 %) of Phase III; it is much lower than the average royalty rate
(20 %+) of launched products in Table 16.
Regression analysisPreliminary regression analysis of anticancer (Antineoplastics) dataset
To detect and exclude outliers (an observation point that is distant from other observations
in statistics) and to find proper regression models for a specific dataset, a preliminary re-
gression analysis using Microsoft Excel is needed. Figures 18 and 19 show some outliers,
and a linear regression model does not fit the anticancer dataset.
The following items are the X-axis and Y-axis input information in the regression
analysis in Figs. 14 and 15.
Figure 14: X-axis = (attrition rate * licensee revenue)/100
Y-axis = up-front payment (up-front fee + milestones) [Unit: USD]
Figure 15: X-axis = (attrition rate * licensee revenue)/100
Y-axis = back-end payment (running royalty rate) [Unit: USD]
The deal data from the preliminary regression was excluded if the normalization of
the “royalty rate” data is not possible (a total six sets of deal data).
This study selected outliers in the following cases according to the result from the
preliminary regression analysis of the anticancer (antineoplastics) dataset; such outliers
from the main regression analysis in section Main regression analysis of anticancer
dataset by open-source statistical software were excluded.
① If “up-front payment” has a value of 0 (zero), it is selected as an outlier
(a total of 15 outliers).
Table 13 David Weiler’s royalty rate based on 458 deals in the pharma/biotech license agreement(Source: www.royaltysource.com) (IPRA Inc 2012)
485 deals Rate
Average royalty 7 %
Median royalty 5 %
Maximum royalty 50 %
Minimum royalty 0 %

Table 14 Medius Associates’ royalty rate by development stage (Source: www.medius-associate.com)(IPRA Inc 2012)
Development stage Royalty rate
Pre-clinical 0–5 %
Phase I 5–10 %
Phase II 8–15 %
Phase III 10–20 %
Launched product 20 % +
Lee et al. Journal of Open Innovation: Technology, Market, and Complexity (2016) 2:1 Page 17 of 25
② If “(attrition rate * licensee revenue)/100” has a value of more than 5,000,000,000,
it is selected as an outlier (a total of 3 outliers),
Thus, the number of deal data used for the main regression analysis to develop the
model for prediction is 48.
The deal data from the preliminary regression was excluded if the normalization of
the “royalty rate” data is not possible (a total of seven sets of deal data).
Outliers were selected in the following cases according to the result from the preliminary
regression analysis of the anticancer (antineoplastics) dataset, and such outliers from the
main regression analysis in section Main regression analysis of anticancer dataset
by open-source statistical software were excluded.
① If “(attrition rate * licensee revenue)/100” has a value of more than 1,000,000,000, it
is selected as an outlier (a total of eight outliers).
Thus, the number of deal data used for the main regression analysis to develop the
model for prediction is 57.
Main regression analysis of anticancer dataset by open-source statistical software
The used regression model for investigating the relationship between (attrition
rate * licensee revenue)/100 and up-front payment (up-front fee + milestones) is
“Rational Model, 3 Parameter Type 4 Regression”, having the following formula
type and curve type in a statistical software; its graph is as shown in Fig. 16, and
its prediction formula follows Equation 1.
Formula type½ � y ¼ aþ xbþ cx
[Curve type]
Table 15 Mark G. Edw
Average royalty by R&D s
R&D Stage
Discovery
Lead Molecule
Pre-Clinical
ards’ royalty rate guideline (So
tage
urce: www.recap.com) (IPRA Inc 2012)
Rate
6.4 %
8.1 %
11.3 %

Table 16 Distribution of the development phase in the cardiovascular dataset
Development No. of hit %
in vitro activity 3 9.68
Preclinical 3 9.68
Phase I 4 12.90
Phase II 2 6.45
Phase III 7 22.58
NDA/BLA 12 38.71
Total deal number 31 100.00
Lee et al. Journal of Open Innovation: Technology, Market, and Complexity (2016) 2:1 Page 18 of 25
Equation 1
Y ¼ aþ Xð Þ= bþ c � Xð Þ ¼ −133620928:7 þ Xð Þ= −3:990489631þ 2:04191E−08 � Xð Þ
R2 = 0.384618
X = (attrition rate * licensee revenue)/100
Y = up-front payment (up-front fee +milestones) [Unit: USD]
The used regression model for investigating the relationship between (attrition rate *
licensee revenue)/100 and royalty rates is “Rational Model, 3 Parameter Type 2
Regression” having the following formula type and curve type in a statistical software;
its graph is as shown in Fig. 17, and its prediction formula follows Equation 2.
Formula type½ � y ¼ 1þ axbþ cx
[Curve type]
Fig. 13 Distribution of the development phase
Equation 2Y ¼ 1þ a � Xð Þ= bþ c � Xð Þ ¼ 1þ −5:14147E−09ð Þ � Xð Þ= 0:128436559þ −6:37E−10 � Xð Þ
R2 = 0.223928
X = (attrition rate * licensee revenue)/100
Y = royalty rates [Unit: %]
in the cardiovascular dataset
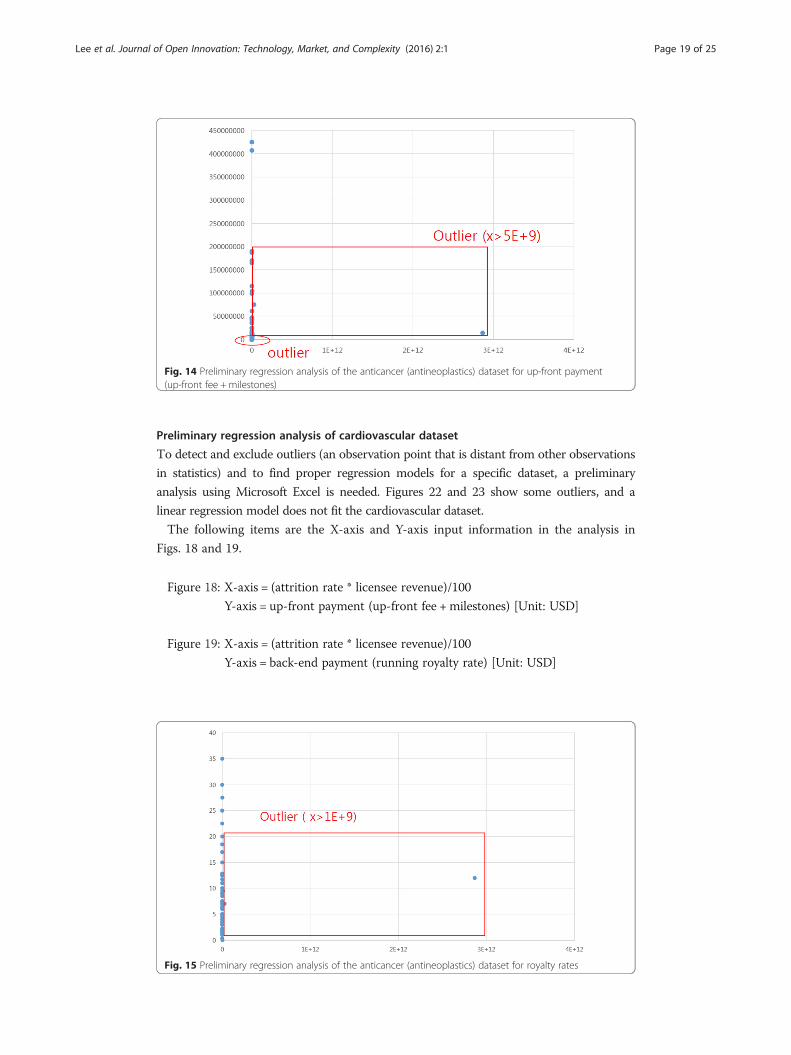
Fig. 14 Preliminary regression analysis of the anticancer (antineoplastics) dataset for up-front payment(up-front fee + milestones)
Lee et al. Journal of Open Innovation: Technology, Market, and Complexity (2016) 2:1 Page 19 of 25
Preliminary regression analysis of cardiovascular dataset
To detect and exclude outliers (an observation point that is distant from other observations
in statistics) and to find proper regression models for a specific dataset, a preliminary
analysis using Microsoft Excel is needed. Figures 22 and 23 show some outliers, and a
linear regression model does not fit the cardiovascular dataset.
The following items are the X-axis and Y-axis input information in the analysis in
Figs. 18 and 19.
Figure 18: X-axis = (attrition rate * licensee revenue)/100
Y-axis = up-front payment (up-front fee +milestones) [Unit: USD]
Figure 19: X-axis = (attrition rate * licensee revenue)/100
Y-axis = back-end payment (running royalty rate) [Unit: USD]
Fig. 15 Preliminary regression analysis of the anticancer (antineoplastics) dataset for royalty rates

Fig. 16 Main regression analysis of the anticancer dataset by statistical software for up-front payment(up-front fee + milestones): X-axis (real up-front payment) vs. Y-axis (predicted up-front payment)
Fig. 17 Main regression analysis of the anticancer dataset by statistical software for royalty rates: X-axis(real royalty rate) vs. Y-axis (predicted royalty rate)
Lee et al. Journal of Open Innovation: Technology, Market, and Complexity (2016) 2:1 Page 20 of 25

Fig. 18 Preliminary regression analysis of the cardiovascular dataset for up-front payment (up-front fee +milestones)
Lee et al. Journal of Open Innovation: Technology, Market, and Complexity (2016) 2:1 Page 21 of 25
The deal data from the preliminary regression was excluded if the normalization
of the “royalty rate” data is not possible (a total of one set of deal data).
Outliers were selected in the following cases according to the result from the
preliminary regression analysis of the cardiovascular dataset, and such outliers from
the main regression analysis in section Main regression analysis of cardiovascular
dataset by open-source statistical software were excluded.
① If the “up-front payment” has a value under 50,000, it is selected as an outlier
(a total of 12 outliers).
② If the “up-front payment” has a value of more than 190,000,000, it is selected as an
outlier (a total of 2 outliers).
Fig. 19 Preliminary regression analysis of the cardiovascular dataset for royalty rates

Lee et al. Journal of Open Innovation: Technology, Market, and Complexity (2016) 2:1 Page 22 of 25
Thus, the number of deal data used for the main regression analysis to develop the
model for prediction is 16.
The deal data from the preliminary regression was excluded if the normalization of
the “royalty rate” data is not possible (a total of one set of deal data).
Outliers were selected in the following cases according to the result from the
preliminary regression analysis of the cardiovascular dataset, and such outliers from
the main regression analysis in section Main regression analysis of cardiovascular
dataset by open-source statistical software were excluded.
① If the “royalty rate” has a value of more than 25, it is selected as an outlier (a total
of 3 outliers).
Thus, the number of deal data used for the main regression analysis to develop the
model for prediction is 27.
Main regression analysis of cardiovascular dataset by open-source statistical software
The used regression model for investigating the relationship between (attrition rate *
licensee revenue)/100 and up-front payment (up-front fee + milestones) is the
“Polynomial Model, Quadratic-type Regression” having the following formula type
and curve type in a statistical software; its graph is as shown in Fig. 20, and its
prediction formula follows Equation 3.
Formula type½ � Y ¼ y0þ axþ bx2
[Curve type]
Fig. 20 Main regression analysis of the card(up-front fee + milestones): X-axis (real up-fro
Equation 3
Y ¼ y0þ axþ bx2 ¼ 7 :103eþ 6 þ −3:990489631ð Þ � X þ −1:536e−12ð Þ � X2
iovascular dataset by statistical software for up-front paymentnt payment) vs. Y-axis (predicted up-front payment)

Lee et al. Journal of Open Innovation: Technology, Market, and Complexity (2016) 2:1 Page 23 of 25
R2 = 0.413879
X = (attrition rate * licensee revenue)/100
Y = up-front payment (up-front fee +milestones) [Unit: USD]
The used regression model for investigating the relationship between (attrition
rate * licensee revenue)/100 and royalty rates is “Polynomial Model, Inverse Second
Order-type Regression” having the following formula type and curve type in a
statistical software; its graph is as shown in Fig. 21, and its prediction formula
follows Equation 4.
Formula type½ � y ¼ y0þ a=xþ b=x2
[Curve type]
Fig. 21 Main regression analysis of the cardiova(real royalty rate) vs. Y-axis (predicted royalty rat
Equation 4
Y ¼ y0þ a=X þ b=X2 ¼ 9:262eþ 0 þ −8:528þ 5ð Þ=X þ 1:744eþ 10=X2
R2 = 0.287886
X = (attrition rate * licensee revenue)/100
Y = royalty rates [Unit: %]
DiscussionA regression analysis was carried out to estimate up-front payments and royalty rates
for two datasets of anticancer (antineoplastics) and cardiovascular drug classes. In the
case of the prediction of up-front payments, the models for predicting having an R2
value of 0.384618 for the anticancer (antineoplastics) dataset and an R2 value of
0.413879 for the cardiovascular dataset were obtained through statistical analyses. In
case of the prediction of royalty rates, the models for predicting having an R2 value of
0.223928 for the anticancer (antineoplastics) dataset and an R2 value of 0.287886 for
scular dataset by statistical software for royalty rates: X-axise)

Fig. 22 Overview of the study’s process
Lee et al. Journal of Open Innovation: Technology, Market, and Complexity (2016) 2:1 Page 24 of 25
the cardiovascular dataset were obtained through statistical analyses. Figure 22 shows
the overview of the process of this study.
This study was presented with many limitations to reasonably determine the variables for
prediction because up-front payments and royalty rates are determined by various
environmental variables in the field. However, this study developed a prediction model
having an R2 value of about 0.4 if the variables of “attrition rate * licensee revenue” are used.
This is a “statistically significant” finding, and it shows the importance of the variables of
“attrition rate * licensee revenue” for determining up-front payments. Thus, the said
variables can be used as the solid basis for evaluating up-front payments in the future.
In the case of the prediction of royalty rates, this study achieved a low R2 value of
about 0.25 in the statistical analysis using the variables of “attrition rate * licensee
revenue”. This means that it is not possible to perform the analysis reasonably using
the said variables only. Because of this, the introduction of other variables is necessary
for the analysis of royalty rates.
It is possible to identify the relationship between the eNPV and input for the regression
formula as shown in Fig. 23. This can be used for predicting rough eNPV using the
licensee’s revenue and the licensee’s maximum reserve for the project according to the
development phase and drug class.
ConclusionSummary
This study yielded meaningful results as it aimed to create a tool to predict royalty
rate and up-front payment (up-front fee + milestones) only using knowledge on the
development phase and its attrition rate, drug class, and licensee’s revenue, which can
easily be known.
It is possible to predict rough eNPV using the licensee’s revenue and the licensee’s
maximum reserve for the project according to the development phase instead of the
attrition rate for the development phase.
Fig. 23 The relationship between the eNPV and input for the regression formula

Lee et al. Journal of Open Innovation: Technology, Market, and Complexity (2016) 2:1 Page 25 of 25
Implications
This study allowed valuation of a drug specific to a drug class and proved that the royalty
rate can be a variable according to drug class and licensee.
Topics for further research
Further in-depth research is necessary for the following topics in the future.
① The relationship to involve more drug classes and royalty-related data.
② Regression analysis using several independent variables through software such as
SPSS or SAS.
③ Regression analysis to investigate the relationship between royalty-related data and more
input descriptors such as market size, molecular structure (numerical code for sub-
structure/fragment), and IP (technology cycle time median value for the IPC code).
AcknowledgmentsWe would like to show our gratitude to Dr. Kee Heon Cho of Korea Valuation Association and Dr. Sung-Joo Lee ofSanofi-aventis Korea for their guidance, and to KISTI for the data source provided.
Author details1Digital Science Co., Ltd. (DS), # 304, 3F, Kumkang B/D, 71 Garak-ro, Songpa-gu, Seoul 138-846, South Korea. 2KoreaInstitute of Science and Technology Information (KISTI), Hoegi-ro, 66 Dongdemun-gu, Seoul 130-741, South Korea.
Received: 23 July 2015 Accepted: 8 December 2015
References
Arnold K, Coia A, Saywell S, Smith T, Minick S, Löffler A. Value drivers in licensing deals. Nat Biotechnol. 2002;20:1085–9.Blair ED. Assessing the value-adding impact of diagnostic-type tests on drug development and marketing. Mol DiagnTher. 2008;12(5):331–7.Bogdan B, Villiger R. Valuation in life sciences—a practical guide. 3rd ed. New York: Springer; 2010.Cho BS. Biotech business case study—Merck & Co.: evaluating a drug licensing opportunity. BioWave. 2004 6(21):1–12.DiMasi JA, Feldman L, Seckler A, Wilson A. Trends in risks associated with new drug development: success rates for
investigational drugs. Clin Pharmacol Ther. 2010;87(3):272–7.Drugs.com. Drug classes. 2015. http://www.drugs.com/drug-classes.html.IPRA Inc. Royalty rates for pharmaceuticals & biotechnology, 8th Edition. 2012.Kessel M, Frank F. A better prescription for drug-development financing. Nat Biotechnol. 2007a;25(8):859–66.Lee SJ. Valuation in life sciences and portfolio management. 2008 Korean Crystal Ball User Conference. 2010.Lee S, Lee K. Heterogeneous expectations leading to bubbles and crashes in asset markets: Tipping point, herding
behavior and group effect in an agent-based model. J Open Innov. 2015;2015:1–12.Parr RL, Smith GV. Valuation, Exploitation, and Infringement Damages. 2005.Puran S. The valuation of part-developed projects in the pharmaceutical sector. Masters of BioScience Enterprise,
Fitzwilliam College, sponsored by Cambridge Healthcare and Biotech. 2005.Richards D. Drug development and regulation. Medicine. 2003;31(8):25–31.Rogers MJ, Maranas CD. Valuation and design of pharmaceutical R&D licensing deals. AIChE J. 2005;51(1):198–209.Stewart JJ, Allison PN, Johnson RS. Putting a price on biotechnology. Nat Biotechnol. 2001;19(9):813–7.
Submit your manuscript to a journal and benefi t from:
7 Convenient online submission
7 Rigorous peer review
7 Immediate publication on acceptance
7 Open access: articles freely available online
7 High visibility within the fi eld
7 Retaining the copyright to your article
Submit your next manuscript at 7 springeropen.com