an actuarial approach to assessing personal injury ...
28
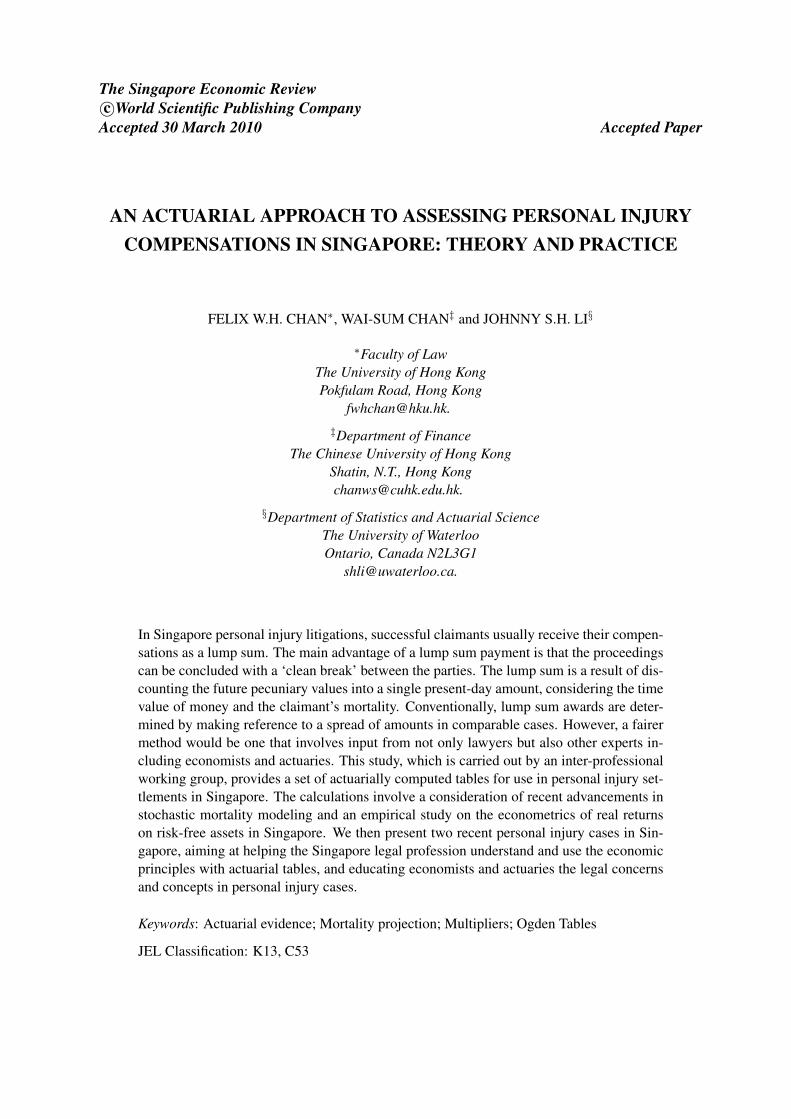
The Singapore Economic Review c World Scientific Publishing Company Accepted 30 March 2010 Accepted Paper AN ACTUARIAL APPROACH TO ASSESSING PERSONAL INJURY COMPENSATIONS IN SINGAPORE: THEORY AND PRACTICE FELIX W.H. CHAN * , WAI-SUM CHAN ‡ and JOHNNY S.H. LI § * Faculty of Law The University of Hong Kong Pokfulam Road, Hong Kong [email protected]. ‡ Department of Finance The Chinese University of Hong Kong Shatin, N.T., Hong Kong [email protected]. § Department of Statistics and Actuarial Science The University of Waterloo Ontario, Canada N2L3G1 [email protected]. In Singapore personal injury litigations, successful claimants usually receive their compen- sations as a lump sum. The main advantage of a lump sum payment is that the proceedings can be concluded with a ‘clean break’ between the parties. The lump sum is a result of dis- counting the future pecuniary values into a single present-day amount, considering the time value of money and the claimant’s mortality. Conventionally, lump sum awards are deter- mined by making reference to a spread of amounts in comparable cases. However, a fairer method would be one that involves input from not only lawyers but also other experts in- cluding economists and actuaries. This study, which is carried out by an inter-professional working group, provides a set of actuarially computed tables for use in personal injury set- tlements in Singapore. The calculations involve a consideration of recent advancements in stochastic mortality modeling and an empirical study on the econometrics of real returns on risk-free assets in Singapore. We then present two recent personal injury cases in Sin- gapore, aiming at helping the Singapore legal profession understand and use the economic principles with actuarial tables, and educating economists and actuaries the legal concerns and concepts in personal injury cases. Keywords: Actuarial evidence; Mortality projection; Multipliers; Ogden Tables JEL Classification: K13, C53
-
Upload
khangminh22 -
Category
Documents
-
view
1 -
download
0
Transcript of an actuarial approach to assessing personal injury ...
The Singapore Economic Reviewc©World Scientific Publishing Company
Accepted 30 March 2010 Accepted Paper
AN ACTUARIAL APPROACH TO ASSESSING PERSONAL INJURYCOMPENSATIONS IN SINGAPORE: THEORY AND PRACTICE
FELIX W.H. CHAN∗, WAI-SUM CHAN‡ and JOHNNY S.H. LI§
∗Faculty of LawThe University of Hong KongPokfulam Road, Hong Kong
‡Department of FinanceThe Chinese University of Hong Kong
Shatin, N.T., Hong [email protected].
§Department of Statistics and Actuarial ScienceThe University of WaterlooOntario, Canada N2L3G1
In Singapore personal injury litigations, successful claimants usually receive their compen-sations as a lump sum. The main advantage of a lump sum payment is that the proceedingscan be concluded with a ‘clean break’ between the parties. The lump sum is a result of dis-counting the future pecuniary values into a single present-day amount, considering the timevalue of money and the claimant’s mortality. Conventionally, lump sum awards are deter-mined by making reference to a spread of amounts in comparable cases. However, a fairermethod would be one that involves input from not only lawyers but also other experts in-cluding economists and actuaries. This study, which is carried out by an inter-professionalworking group, provides a set of actuarially computed tables for use in personal injury set-tlements in Singapore. The calculations involve a consideration of recent advancements instochastic mortality modeling and an empirical study on the econometrics of real returnson risk-free assets in Singapore. We then present two recent personal injury cases in Sin-gapore, aiming at helping the Singapore legal profession understand and use the economicprinciples with actuarial tables, and educating economists and actuaries the legal concernsand concepts in personal injury cases.
Keywords: Actuarial evidence; Mortality projection; Multipliers; Ogden Tables
JEL Classification: K13, C53

The Singapore Economic Reviewc©World Scientific Publishing Company
Accepted 30 March 2010 Accepted Paper
1. Introduction
When an innocent party is injured in a tort-based system of law as the result of the wrong ofanother party, the innocent party should be awarded adequate and proper compensation. Thebasic principle underlying the assessment of the quantum of damages is restitutio in integrum,which implies that the amount of compensation awarded should put the successful plaintiff inthe position he or she would have been had the tortious action not been committed.
When assessing future pecuniary loss in personal injury litigations, courts often use themultiplicand/multiplier approach. The objective is to calculate a lump sum to compensate theplaintiff for future loss of earnings and to cover a stream of future expenses. This lump sumis simply considered as the product of a multiplicand and a multiplier. The multiplicand (thefuture annual loss of income and the annual consequential expense, such as the cost of care) isestablished by evidence put before the judge, who then has to decide an appropriate multiplier.The multiplier is used to discount the future pecuniary values into a present lump sum, consid-ering the time value of money, the plaintiff’s mortality and contingencies other than mortality.
The conventional approach to selecting multipliers is based on the applied wisdom of thecourts over many years. In choosing a particular multiplier, the court will make comparisonswith multipliers used in similar cases. However, when the conventional approach is used, themultipliers would not be linked to the mortality experience or the local economic environment.Furthermore, it is practically impossible to find any truly comparable cases that have similarfactors in respect of age and sex of the victims, mortality experience of the general population,inflation, taxation, and investment return rates. The fairness of conventional multipliers, whichare based on analogy is, therefore, questionable.
Alternatively, an actuarial approach may be used in deciding a multiplier. In England, theOgden Tables1 – tables of actuarially computed multipliers – assist in the calculation of dam-ages for personal injury. They are computed on the basis of the actuarial equivalence principle,by which we mean the compensating amount is the expected present value of all future lossesand expenses. Initially, the Ogden Tables had no legal authority. However, the working partyresponsible for their production strongly encouraged the legal profession and the judiciary touse them. Although they have been widely used by judges since 1984, they have only recentlyreceived formal recognition. Under the Civil Evidence Act 1995, the Ogden Tables are admis-sible in evidence for the purpose of assessing, in an action for personal injury, the sum to beawarded as general damages for future pecuniary loss. In July 1998 the House of Lords ap-proved actuarial evidence as the primary method of assessing future pecuniary loss, rather thanviewing it as a mere check.
At present, courts in Singapore use the conventional approach to choosing multipliers, with-out admitting any actuarial evidence. However, given that the judicial system in Singapore isbased on the English common law, the current practice in Singapore may need to be reformed.Although judicial decisions in the United Kingdom are not binding in the Singapore Courts,these decisions are, even following the introduction of the Application of English Law Act
1Their first edition, officially named ‘Actuarial Tables with Explanatory Notes for Use in Personal Injury andFatal Accident Cases,’ prepared by the British Government Actuary’s Department, was published in 1984. Theyare generally known as the ‘Ogden Tables,’ after Sir Michael Ogden, QC, who was responsible for their publica-tion, and who was also the chairperson of the joint working party of actuaries and lawyers responsible for victimcompensations.

The Singapore Economic Reviewc©World Scientific Publishing Company
Accepted 30 March 2010 Accepted Paper
in 1993,2 still persuasive. The implications of the House of Lords’ (July 1998) decision inSingapore cannot yet be seen, but it is anticipated that the conventional approach to choosingmultipliers in Singapore will be hotly contested and challenged.
There are several possible ways of implementing the actuarial approach in Singapore. Oneoption is simply to adopt the Ogden Tables in Singapore. However, it would not be practical asthe Ogden Tables were constructed in the light of circumstances in England,3 but not Singapore.In Figure 1 we compare the 5-year (2001–2005) average values of death probabilities (qx) forthese two regions.4 We observe that Singaporeans in general have a lighter mortality pattern(except at a few ages). As a result, the appropriate multipliers for Singaporeans should be largerthan those given in the Ogden Tables.
0 10 20 30 40 50 60 70 80
0.8
1
1.2
1.4
1.6
1.8
2
2.2
Age
Rat
io
MalesFemales
Figure 1. Ratios of death probabilities: England and Wales to Singapore
Another option is to, as recommended by Chan and Chan (2000) in a case commentary,construct modified forms of the Ogden Tables by a working party, which would ideally consistof lawyers, actuaries and econometricians. In the wake of this recommendation, this inter-disciplinary study sets out to derive a set of multiplier tables that would be appropriate for
2Cap 7A, 1994 (Rev Ed). The Act has created a climate in which the Singapore courts have been encouragedto look beyond English decisions when deciding on applicable law. This contrasts strongly with the previousposition, under which decisions of the House of Lords relating to very similar areas of law were followed almostautomatically by the Singapore courts.
3The Ogden Tables are now in their sixth edition. They are calculated using the projected mortality rates forEngland and Wales assumed in the latest 2002-based population projections.
4Sources of data: (i) Human Mortality Database (for England and Wales) and (ii) Singapore Department ofStatistics (for Singapore).

The Singapore Economic Reviewc©World Scientific Publishing Company
Accepted 30 March 2010 Accepted Paper
use in personal injury cases in Singapore. The derivation requires a reasonable estimate of thefuture mortality likely to be experienced by the population of Singapore. We obtain such anestimate by considering the stochastic mortality models proposed by Lee and Carter (1992) andRenshaw and Haberman (2006). Further, we examine on the basis of these models the potentialimpact of cohort effects on the multipliers. The resulting multiplier tables are applied to tworecent personal injury cases in Singapore. We intent to, through the study of these cases, helpthe Singapore legal profession understand and use the actuarial tables and educate actuaries thelegal concerns and concepts in personal injury cases.
The remainder of this paper is organized as follows: Section 2 provides an overview ofthe multiplier tables and explains the underlying actuarial principles; Section 3 details the pro-jection of Singaporeans’ mortality and examines the potential impact of cohort effects on themultipliers; Section 4 discusses how an appropriate discount rate may be chosen; Section 5applies the multiplier tables to some recent personal injury cases in Singapore and comparesthe actuarial approach (implemented with the multipliers we derived) with the conventionalapproach; finally, Section 6 concludes.
2. The Multiplier Tables
The multipliers in the Ogden Tables allow users to assess the present capital value of futureannual loss or expense calculated on the basis of various assumptions. In the current (sixth)edition, there are 28 tables of multipliers, which may be divided into the following categories:
1. Multipliers for pecuniary loss for life (Multiplier Tables 1 and 2)Multiplier Tables 1 and 2 assume that the loss or expense begins immediately and con-tinues for the whole of the rest of the claimant’s life, allowing for different potentiallifespans, including the possibility of early death or prolonged life.
2. Multipliers for loss of earnings to pension age (Multiplier Tables 3 to 14)Multipliers Tables 3 to 14 assume that the loss or expense begins without delay but con-tinues only until the claimant’s retirement or earlier death. Retirement ages 50, 55, ...,75 are assumed. If the claimant’s retiring age is different from that assumed in any ofthe tables, a linear interpolation may be used.5 For instance, if a claimant of age 42(x = 42) is retiring at age 58 (R = 58), then the correct multiplier can be computed bythe interpolating between the multipliers for (x = 39, R = 55) and (x = 44, R = 60).
3. Multipliers for loss of pension commencing from the retirement age (Multiplier Tables 15to 26)Multipliers Tables 15 to 26 assume that the annual loss or annual expense will not beginuntil the claimant reaches his/her retirement but will then continue for the whole of therest of his/her life. Due allowance is made for the chance that the claimant may not liveto the age of retirement. Retirement ages 50, 55, ..., 75 are assumed. An approximation isalso required when the claimant’s retiring age is different from that assumed in the tables.
5Within a reasonable number of tables, it is impossible to cover all possible situations. Therefore, approxima-tion techniques may be used even if a more accurate formulation may be available.

The Singapore Economic Reviewc©World Scientific Publishing Company
Accepted 30 March 2010 Accepted Paper
4. Discount factors for term certain (Multiplier Table 27)Multiplier Table 27 contains discount factors computed on the basis of a fixed interestrate and a fixed term.
5. Multipliers for pecuniary loss for term certain (Multiplier Table 28)Multiplier Table 28 contains annuity factors that relate purely to the effect of compoundinterest and ignore mortality. These factors are used when there is clear evidence to sup-port the view that the claimant is atypical and will enjoy a longer or shorter expectation oflife. In this situation, we may approximate the multiplier by an annuity factor (from Mul-tiplier Table 28) whose term equals the claimant’s expected future lifetime, determinedby the court or agreed by both parties.6
In each table, the multipliers/factors are shown for a range of possible annual rates of returnranging from 0% to 5%. A summary of the Ogden Tables is provided in Table 1.6
Table 1. A Summary of the Ogden Tables
Table number Multipliers Formula1, 2 Multipliers for pecuniary loss for life ax
3, 4 Multipliers for loss of earnings to pension age 50 ax:50−xe5, 6 Multipliers for loss of earnings to pension age 55 ax:55−xe7, 8 Multipliers for loss of earnings to pension age 60 ax:60−xe
9, 10 Multipliers for loss of earnings to pension age 65 ax:65−xe11, 12 Multipliers for loss of earnings to pension age 70 ax:70−xe13, 14 Multipliers for loss of earnings to pension age 75 ax:75−xe15, 16 Multipliers for loss of pension commercing age 50 (50−x)|ax
17, 18 Multipliers for loss of pension commercing age 55 (55−x)|ax
19, 20 Multipliers for loss of pension commercing age 60 (60−x)|ax
21, 22 Multipliers for loss of pension commercing age 65 (65−x)|ax
23, 24 Multipliers for loss of pension commercing age 70 (70−x)|ax
25, 26 Multipliers for loss of pension commercing age 75 (75−x)|ax
27 Discounting factors for term certain vn
28 Multipliers for pecuniary loss for term certain ane
The actuarial approach to assessing personal injury compensations involves the followingsteps:
1. Choose the appropriate tablesChoose the table that relates to the sex of the plaintiff and the appropriate period of lossesand expenses.
6Note: (i) Multiplier Tables 1, 3, ..., 25 are for males while Multiplier Tables 2, 4, ..., 26 are for females; (ii) xdenotes the age at date of trial.
The Singapore Economic Reviewc©World Scientific Publishing Company
Accepted 30 March 2010 Accepted Paper
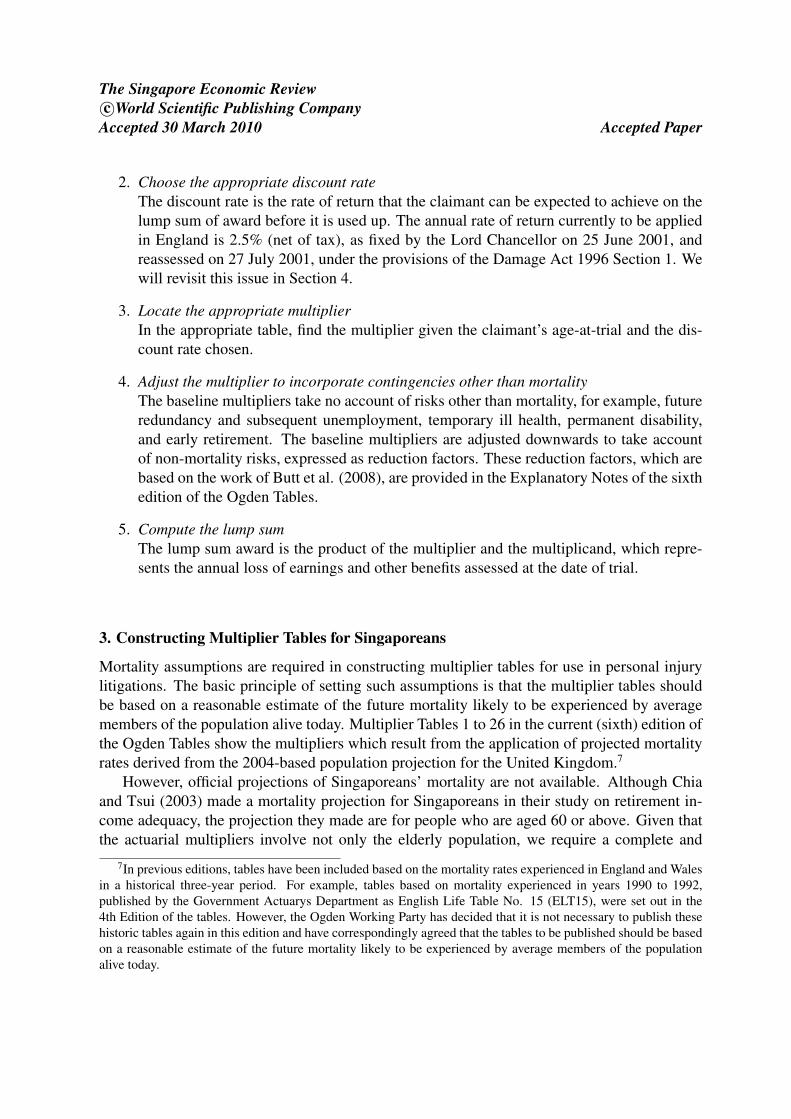
2. Choose the appropriate discount rateThe discount rate is the rate of return that the claimant can be expected to achieve on thelump sum of award before it is used up. The annual rate of return currently to be appliedin England is 2.5% (net of tax), as fixed by the Lord Chancellor on 25 June 2001, andreassessed on 27 July 2001, under the provisions of the Damage Act 1996 Section 1. Wewill revisit this issue in Section 4.
3. Locate the appropriate multiplierIn the appropriate table, find the multiplier given the claimant’s age-at-trial and the dis-count rate chosen.
4. Adjust the multiplier to incorporate contingencies other than mortalityThe baseline multipliers take no account of risks other than mortality, for example, futureredundancy and subsequent unemployment, temporary ill health, permanent disability,and early retirement. The baseline multipliers are adjusted downwards to take accountof non-mortality risks, expressed as reduction factors. These reduction factors, which arebased on the work of Butt et al. (2008), are provided in the Explanatory Notes of the sixthedition of the Ogden Tables.
5. Compute the lump sumThe lump sum award is the product of the multiplier and the multiplicand, which repre-sents the annual loss of earnings and other benefits assessed at the date of trial.
3. Constructing Multiplier Tables for Singaporeans
Mortality assumptions are required in constructing multiplier tables for use in personal injurylitigations. The basic principle of setting such assumptions is that the multiplier tables shouldbe based on a reasonable estimate of the future mortality likely to be experienced by averagemembers of the population alive today. Multiplier Tables 1 to 26 in the current (sixth) edition ofthe Ogden Tables show the multipliers which result from the application of projected mortalityrates derived from the 2004-based population projection for the United Kingdom.7
However, official projections of Singaporeans’ mortality are not available. Although Chiaand Tsui (2003) made a mortality projection for Singaporeans in their study on retirement in-come adequacy, the projection they made are for people who are aged 60 or above. Given thatthe actuarial multipliers involve not only the elderly population, we require a complete and
7In previous editions, tables have been included based on the mortality rates experienced in England and Walesin a historical three-year period. For example, tables based on mortality experienced in years 1990 to 1992,published by the Government Actuarys Department as English Life Table No. 15 (ELT15), were set out in the4th Edition of the tables. However, the Ogden Working Party has decided that it is not necessary to publish thesehistoric tables again in this edition and have correspondingly agreed that the tables to be published should be basedon a reasonable estimate of the future mortality likely to be experienced by average members of the populationalive today.
The Singapore Economic Reviewc©World Scientific Publishing Company
Accepted 30 March 2010 Accepted Paper
up-to-date mortality projection to construct the multiplier tables for Singaporeans.
3.1 The Data
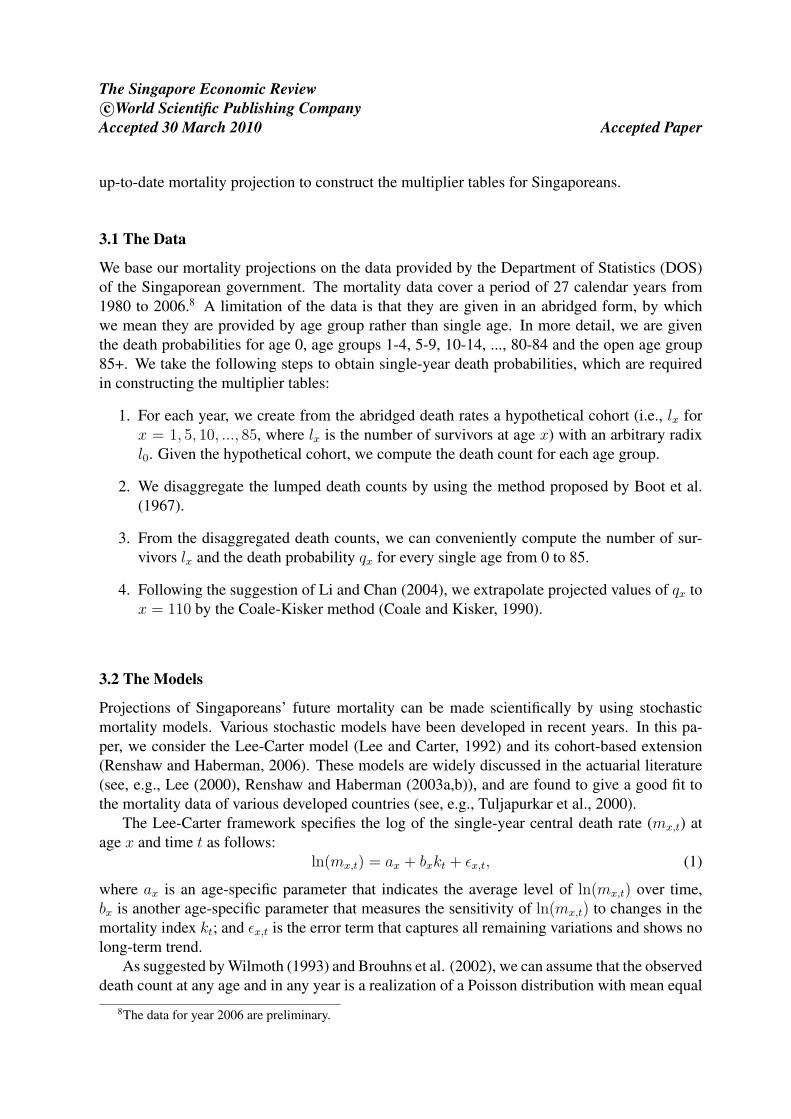
We base our mortality projections on the data provided by the Department of Statistics (DOS)of the Singaporean government. The mortality data cover a period of 27 calendar years from1980 to 2006.8 A limitation of the data is that they are given in an abridged form, by whichwe mean they are provided by age group rather than single age. In more detail, we are giventhe death probabilities for age 0, age groups 1-4, 5-9, 10-14, ..., 80-84 and the open age group85+. We take the following steps to obtain single-year death probabilities, which are requiredin constructing the multiplier tables:
1. For each year, we create from the abridged death rates a hypothetical cohort (i.e., lx forx = 1, 5, 10, ..., 85, where lx is the number of survivors at age x) with an arbitrary radixl0. Given the hypothetical cohort, we compute the death count for each age group.
2. We disaggregate the lumped death counts by using the method proposed by Boot et al.(1967).
3. From the disaggregated death counts, we can conveniently compute the number of sur-vivors lx and the death probability qx for every single age from 0 to 85.
4. Following the suggestion of Li and Chan (2004), we extrapolate projected values of qx tox = 110 by the Coale-Kisker method (Coale and Kisker, 1990).
3.2 The Models
Projections of Singaporeans’ future mortality can be made scientifically by using stochasticmortality models. Various stochastic models have been developed in recent years. In this pa-per, we consider the Lee-Carter model (Lee and Carter, 1992) and its cohort-based extension(Renshaw and Haberman, 2006). These models are widely discussed in the actuarial literature(see, e.g., Lee (2000), Renshaw and Haberman (2003a,b)), and are found to give a good fit tothe mortality data of various developed countries (see, e.g., Tuljapurkar et al., 2000).
The Lee-Carter framework specifies the log of the single-year central death rate (mx,t) atage x and time t as follows:
ln(mx,t) = ax + bxkt + εx,t, (1)
where ax is an age-specific parameter that indicates the average level of ln(mx,t) over time,bx is another age-specific parameter that measures the sensitivity of ln(mx,t) to changes in themortality index kt; and εx,t is the error term that captures all remaining variations and shows nolong-term trend.
As suggested by Wilmoth (1993) and Brouhns et al. (2002), we can assume that the observeddeath count at any age and in any year is a realization of a Poisson distribution with mean equal
8The data for year 2006 are preliminary.
The Singapore Economic Reviewc©World Scientific Publishing Company
Accepted 30 March 2010 Accepted Paper
to the expected number of deaths under the Lee-Carter model. Given this assumption, the log-likelihood is as follows:∑
x,t
(Dx,t(ax + bxkt)− Ex,t(exp(ax + bxkt)) + c, (2)
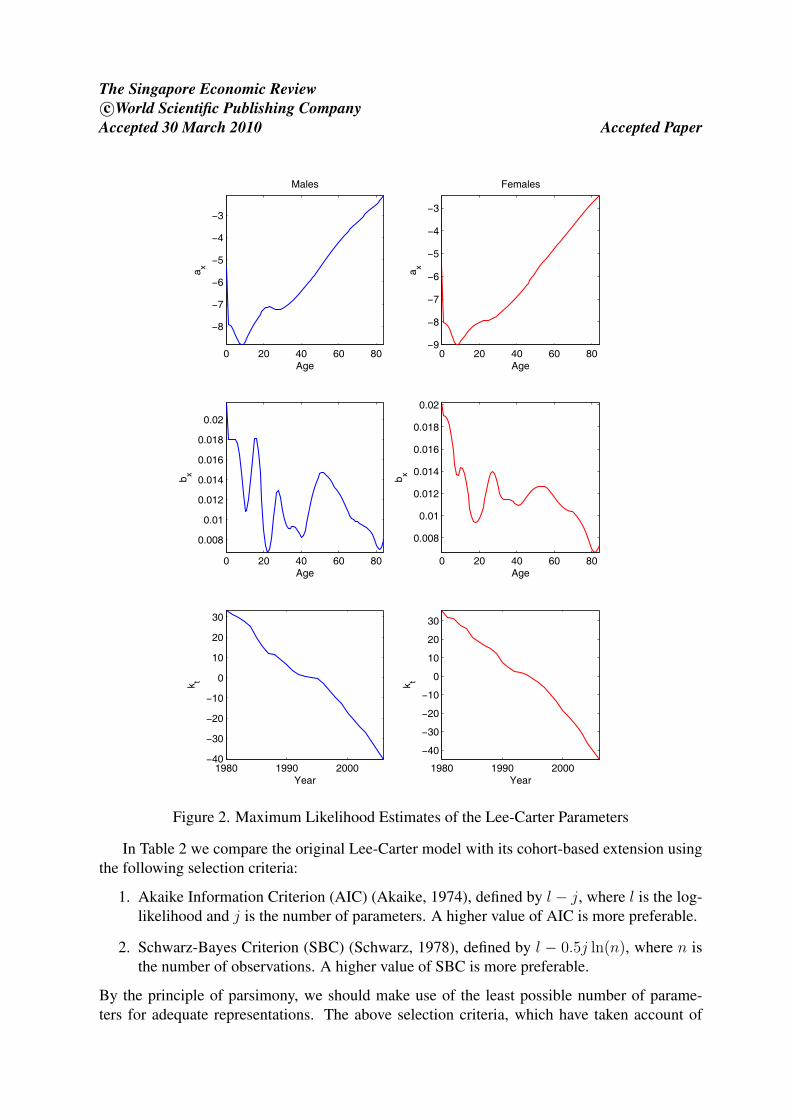
whereDx,t andEx,t are the number of deaths and exposures at age x and time t, respectively, andc is a constant that is free of the model parameters. We obtain the number of exposures by settingEx,t to (lx,t + lx,t+1)/2, where lx,t is the number of survivors at age x and time t, assumingthat deaths are uniformly distributed over each year.9 By maximizing the log-likelihood usingstandard Newton’s method, we obtain estimates of {ax}, {bx}, and {kt}, which are shown inFigure 2.
The prediction of future death rates is often complicated by cohort effects, which refers tothe situation when the mortality improvement for a group of birth years is systematically higheror lower than that of the neighboring cohorts. The implications of cohort effects are twofolds:
1. multipliers for birth cohorts with a systematically higher (lower) rate of mortality im-provement are higher (lower), assuming all other factors are equal;
2. the original Lee-Carter model, which specifies no relationship between death rates andyears of birth, may not give an adequate fit.
To have a better understanding on cohort effects in Singaporeans’ mortality, we considerRenshaw and Haberman’s (2006) extension to the original Lee-Carter model. This extension,which relates future death rates (mx,t) to years of birth (t− x), can be expressed as follows:
ln(mx,t) = ax + bxkt + cxιt−x + εx,t, (3)
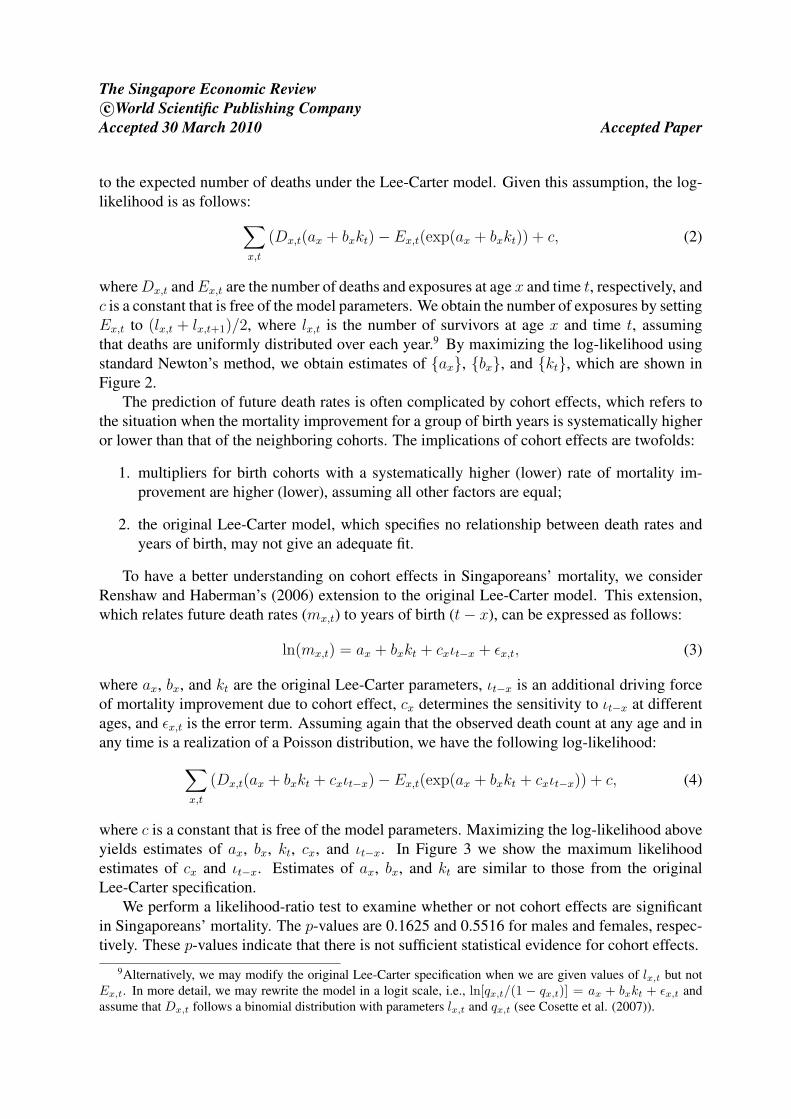
where ax, bx, and kt are the original Lee-Carter parameters, ιt−x is an additional driving forceof mortality improvement due to cohort effect, cx determines the sensitivity to ιt−x at differentages, and εx,t is the error term. Assuming again that the observed death count at any age and inany time is a realization of a Poisson distribution, we have the following log-likelihood:∑
x,t
(Dx,t(ax + bxkt + cxιt−x)− Ex,t(exp(ax + bxkt + cxιt−x)) + c, (4)
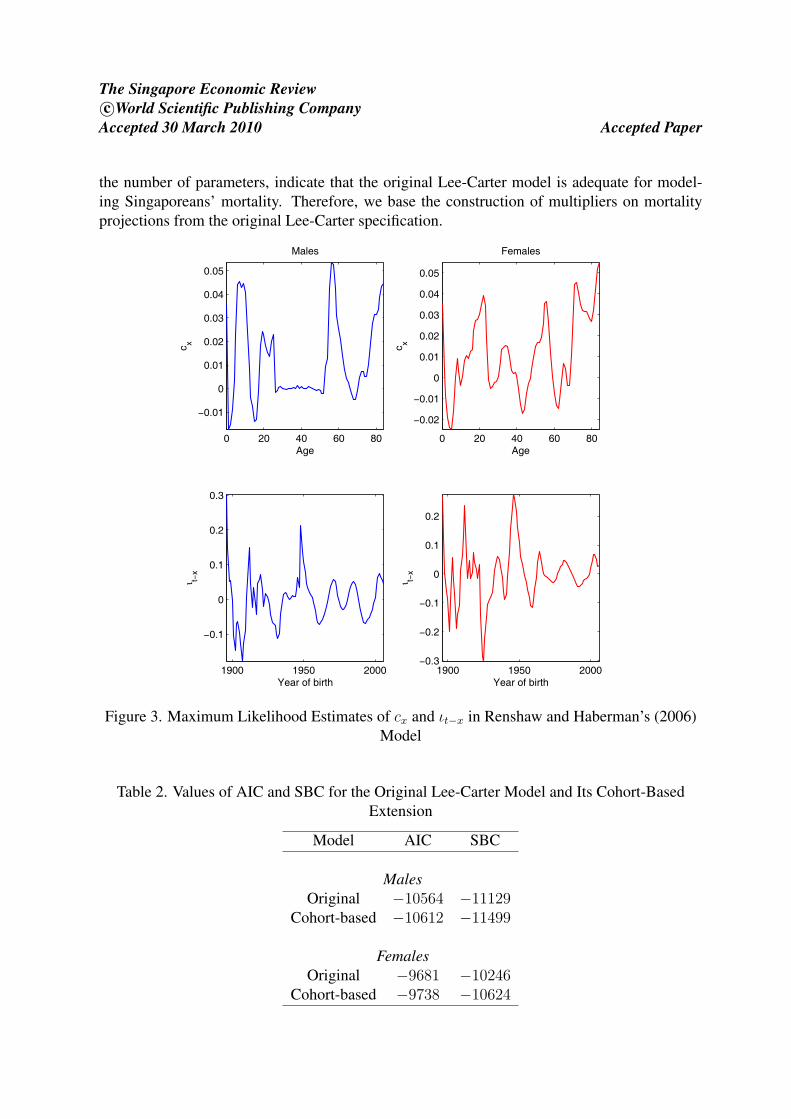
where c is a constant that is free of the model parameters. Maximizing the log-likelihood aboveyields estimates of ax, bx, kt, cx, and ιt−x. In Figure 3 we show the maximum likelihoodestimates of cx and ιt−x. Estimates of ax, bx, and kt are similar to those from the originalLee-Carter specification.
We perform a likelihood-ratio test to examine whether or not cohort effects are significantin Singaporeans’ mortality. The p-values are 0.1625 and 0.5516 for males and females, respec-tively. These p-values indicate that there is not sufficient statistical evidence for cohort effects.
9Alternatively, we may modify the original Lee-Carter specification when we are given values of lx,t but notEx,t. In more detail, we may rewrite the model in a logit scale, i.e., ln[qx,t/(1 − qx,t)] = ax + bxkt + εx,t andassume that Dx,t follows a binomial distribution with parameters lx,t and qx,t (see Cosette et al. (2007)).
The Singapore Economic Reviewc©World Scientific Publishing Company
Accepted 30 March 2010 Accepted Paper
0 20 40 60 80
−8
−7
−6
−5
−4
−3
Age
a x
Males
0 20 40 60 80
0.008
0.01
0.012
0.014
0.016
0.018
0.02
Age
b x
1980 1990 2000−40
−30
−20
−10
0
10
20
30
Year
k t
0 20 40 60 80−9
−8
−7
−6
−5
−4
−3
Age
a x
Females
0 20 40 60 80
0.008
0.01
0.012
0.014
0.016
0.018
0.02
Age
b x
1980 1990 2000
−40
−30
−20
−10
0
10
20
30
Year
k t
Figure 2. Maximum Likelihood Estimates of the Lee-Carter Parameters
In Table 2 we compare the original Lee-Carter model with its cohort-based extension usingthe following selection criteria:
1. Akaike Information Criterion (AIC) (Akaike, 1974), defined by l − j, where l is the log-likelihood and j is the number of parameters. A higher value of AIC is more preferable.
2. Schwarz-Bayes Criterion (SBC) (Schwarz, 1978), defined by l − 0.5j ln(n), where n isthe number of observations. A higher value of SBC is more preferable.
By the principle of parsimony, we should make use of the least possible number of parame-ters for adequate representations. The above selection criteria, which have taken account of
The Singapore Economic Reviewc©World Scientific Publishing Company
Accepted 30 March 2010 Accepted Paper
the number of parameters, indicate that the original Lee-Carter model is adequate for model-ing Singaporeans’ mortality. Therefore, we base the construction of multipliers on mortalityprojections from the original Lee-Carter specification.
0 20 40 60 80
−0.01
0
0.01
0.02
0.03
0.04
0.05
Age
c x
Males
1900 1950 2000
−0.1
0
0.1
0.2
0.3
Year of birth
ι t−x
0 20 40 60 80
−0.02
−0.01
0
0.01
0.02
0.03
0.04
0.05
Age
c x
Females
1900 1950 2000−0.3
−0.2
−0.1
0
0.1
0.2
Year of birth
ι t−x
Figure 3. Maximum Likelihood Estimates of cx and ιt−x in Renshaw and Haberman’s (2006)Model
Table 2. Values of AIC and SBC for the Original Lee-Carter Model and Its Cohort-BasedExtension
Model AIC SBC
MalesOriginal −10564 −11129
Cohort-based −10612 −11499
FemalesOriginal −9681 −10246
Cohort-based −9738 −10624
The Singapore Economic Reviewc©World Scientific Publishing Company
Accepted 30 March 2010 Accepted Paper
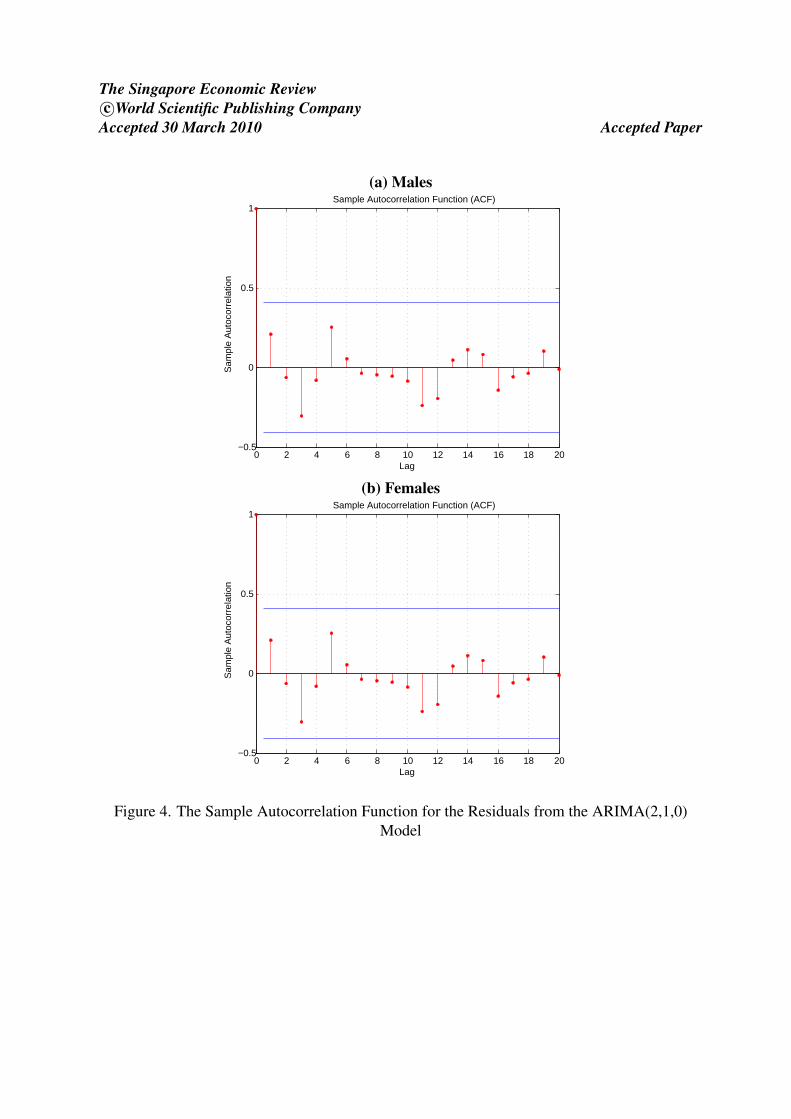
To obtain a projection of future death rates, we model and extrapolate {kt} using an autore-gressive integrated moving average (ARIMA) model10. On the basis of the Box and Jenkins’approach (Box and Jenkins, 1976), we find that the specification of ARIMA(2,1,0) fits wellfor both genders. In Figure 4 we show, separately for each gender, the sample autocorrelationfunction (ACF) for the residuals. The sample ACFs cut off at lag 0, indicating that the ARIMAmodels have adequately captured the serial correlations in {kt}.
From the ARIMA(2,1,0) models we obtain a central projection of future mortality (see Fig-ure 5). For readers’ information, we also include in Figure 5 probabilistic confidence intervalsthat are generated by parametric bootstrapping (Brouhns et al., 2005). Other methods of attach-ing confidence intervals to the central projection include residual bootstrapping (Koissi et al.,2006), Markov Chain Monte Carlo (Czedo et al., 2005) and the generation of random deviationsfrom the central estimates of model parameters (Renshaw and Haberman, 2008).
Given the mortality projection, we can readily compute the actuarial multipliers using theformulas shown in Table 1. Note that tpx in the formulas is a continuous function of time. Weapply the procedure described in English Life Tables No. 15 (Office for National Statistics,1997, p.17) to postulate tpx from discrete death probabilities. Examples of the multiplier tables(Multiplier Tables 7, 8, 27, and 28) are provided in the Appendix.
10We have examined whether the mortality indexes kt for men and women in Singapore are best describedby stochastic trends (difference stationary models) or deterministic trends (trend stationary models). Such a dis-tinction is important because mortality forecasts generated from these two classes of time-series models couldbe highly different. In particular, we applied the conventional Augmented Dickey-Fuller (ADF) test to examinethe stationarity of the mortality indexes. The lag order of the model is selected based on the recursive t-statisticprocedure suggested by Ng and Perron (1995). The finite sample critical values of the ADF test are simulated bya non-parametric bootstrap. The resulting test statistics are −1.60 and −1.80 for Singapore male and female kt
indexes, respectively. We conclude that difference stationary models, such as the class of ARIMA processes, aremore appropriate for modelling the kt data.
The Singapore Economic Reviewc©World Scientific Publishing Company
Accepted 30 March 2010 Accepted Paper
(a) Males
0 2 4 6 8 10 12 14 16 18 20−0.5
0
0.5
1
Lag
Sam
ple
Aut
ocor
rela
tion
Sample Autocorrelation Function (ACF)
(b) Females
0 2 4 6 8 10 12 14 16 18 20−0.5
0
0.5
1
Lag
Sam
ple
Aut
ocor
rela
tion
Sample Autocorrelation Function (ACF)
Figure 4. The Sample Autocorrelation Function for the Residuals from the ARIMA(2,1,0)Model

The Singapore Economic Reviewc©World Scientific Publishing Company
Accepted 30 March 2010 Accepted Paper
2010 2020 2030
−8.6
−8.4
−8.2
−8
−7.8
−7.6
Age 20, Males
2010 2020 2030
−9.5
−9
−8.5
Age 20, Females
2010 2020 2030
−7.6
−7.4
−7.2
−7
−6.8
Age 40, Males
2010 2020 2030
−8.5
−8
−7.5
Age 40, Females
2010 2020 2030
−6
−5.5
−5
Age 60, Males
2010 2020 2030
−6.5
−6
−5.5
Age 60, Females
2010 2020 2030
−3.4
−3.2
−3
−2.8
Year
log(
q x)
Age 80, Males
2010 2020 2030
−3.8
−3.6
−3.4
−3.2
Age 80, Females
Central95% CI
Figure 5. Projected Death Probabilities at Representative Ages
4. The Discount Rate
The discount rate, which may be considered the rate of return that a claimant can achieve onthe lump sum of award before it is used up, is crucial in determining an appropriate multiplier.In England, judges used discount rates of about 4 to 5% (net of tax) in personal injury casesbefore 1998, assuming that plaintiffs would invest in a spread of investments ranging from gilts
The Singapore Economic Reviewc©World Scientific Publishing Company
Accepted 30 March 2010 Accepted Paper
to equity. However, the position was changed in deciding Wells v. Wells ([1999] 1 AC 345)in July 1998. In Wells v. Wells, the Lord Chancellor acknowledged that plaintiffs are differentthan ordinary investors in that they have a need for a dependable source of income to meet thecosts of future care. Therefore, plaintiffs should not be required to take even moderate riskwhen they invest their damages awards.
“... I think the reality is that the plaintiffs in the present cases are not in the sameposition as other persons who have to rely on capital for future support. Unlikethe great majority of persons who invest their capital, it is vital for the plaintiffsthat they receive constant and costly nursing care for the remainder of their livesand that they should be able to pay for it, and any fall in income or depreciation incapital value of their investments will affect them much more severely than personsin better health who depend on their investment for support...” – Lord Hutton inWells v Wells.
In England, the only investment that is free of even moderate risk is Index-Linked Gov-ernment Stocks (ILGS) – the government guarantees the capital and income, and there is aprotection from the erosion of purchasing power due to inflation. In deciding Wells v. Wells,the House of Lords ruled that the discount rate (net of tax) should be 3% per annum, which wasthe prevailing rate of return on ILGS when the decision was made. The House of Lords alsowent on to lay down an authoritative guideline discount rate of 3% to be applied in other cases,until a rate was prescribed under Section 1 of the Damages Act 1996 by the Lord Chancellor.
On 25 June 2001, the Lord Chancellor made the Damages (Personal Injury) Order 2001pursuant to Section 1 of the Damages Act 1996. On the basis of the arithmetic average of thegross redemption yields on ILGS (at an assumed rate of inflation of 3%), for 3 years leadingup to 8 June 2001, the Lord Chancellor decided a discount rate of 2.5%, which would cover allpersonal injury cases in England in the foreseeable future. There are two advantages of using afixed discount rate:
1. A fixed discount rate avoids deliberate delays in settlement resulting from one side’sdetermination to gamble on the movement of the yield on ILGS.
2. A fixed discount rate eliminates the disparity of outcome between similar cases resolvedor decided at different times.
Initially, the order was criticized by some personal injury practitioners (see, e.g., Hogg(2002)), but later the Lord Chancellor re-confirmed the authority of his decision with additionalsupporting reasons.
Following the current practice in England, the discount rate for personal injury cases inSingapore would be chosen by making reference to the yields on inflation-protected securi-ties issued by the Government of Singapore. Such securities, however, are not available. Todetermine a real and risk-free rate of return that is applicable for personal injury settlementsin Singapore, we consider the Fisher hypothesis (Fisher, 1930), which states that the nominalinterest rate is the sum of the expected inflation rate and the ex ante real interest rate. That is,
r = i− πe, (5)
The Singapore Economic Reviewc©World Scientific Publishing Company
Accepted 30 March 2010 Accepted Paper
where r, i and πe are the ex ante real interest rate, the nominal interest rate and the expectedinflation rate, respectively.
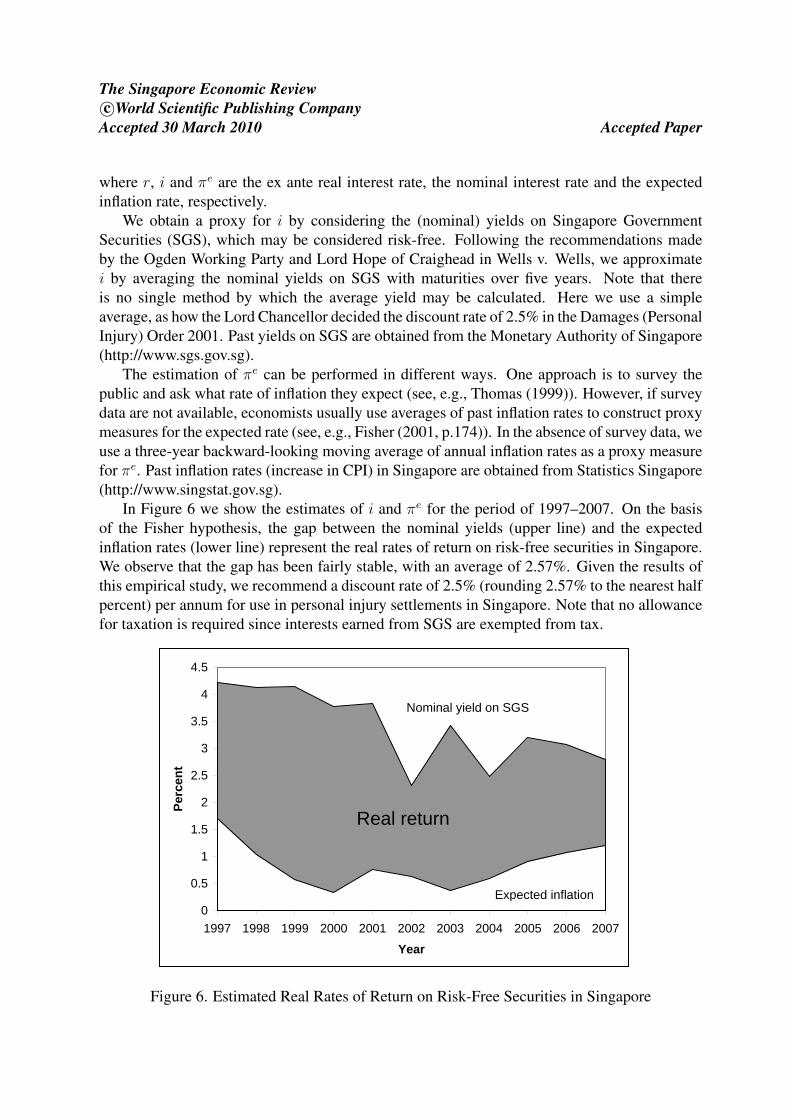
We obtain a proxy for i by considering the (nominal) yields on Singapore GovernmentSecurities (SGS), which may be considered risk-free. Following the recommendations madeby the Ogden Working Party and Lord Hope of Craighead in Wells v. Wells, we approximatei by averaging the nominal yields on SGS with maturities over five years. Note that thereis no single method by which the average yield may be calculated. Here we use a simpleaverage, as how the Lord Chancellor decided the discount rate of 2.5% in the Damages (PersonalInjury) Order 2001. Past yields on SGS are obtained from the Monetary Authority of Singapore(http://www.sgs.gov.sg).
The estimation of πe can be performed in different ways. One approach is to survey thepublic and ask what rate of inflation they expect (see, e.g., Thomas (1999)). However, if surveydata are not available, economists usually use averages of past inflation rates to construct proxymeasures for the expected rate (see, e.g., Fisher (2001, p.174)). In the absence of survey data, weuse a three-year backward-looking moving average of annual inflation rates as a proxy measurefor πe. Past inflation rates (increase in CPI) in Singapore are obtained from Statistics Singapore(http://www.singstat.gov.sg).
In Figure 6 we show the estimates of i and πe for the period of 1997–2007. On the basisof the Fisher hypothesis, the gap between the nominal yields (upper line) and the expectedinflation rates (lower line) represent the real rates of return on risk-free securities in Singapore.We observe that the gap has been fairly stable, with an average of 2.57%. Given the results ofthis empirical study, we recommend a discount rate of 2.5% (rounding 2.57% to the nearest halfpercent) per annum for use in personal injury settlements in Singapore. Note that no allowancefor taxation is required since interests earned from SGS are exempted from tax.
0
0.5
1
1.5
2
2.5
3
3.5
4
4.5
1997 1998 1999 2000 2001 2002 2003 2004 2005 2006 2007
Year
Perc
ent
Nominal yield on SGS
Real return
Expected inflation
Figure 6. Estimated Real Rates of Return on Risk-Free Securities in Singapore

The Singapore Economic Reviewc©World Scientific Publishing Company
Accepted 30 March 2010 Accepted Paper
5. Two Examples
In this section we illustrate the use of actuarial multipliers with two recent personal injury casesin Singapore. All multiplier tables involved in the illustrations are provided in the Appendix.
5.1 Coh Eng Hong v. Management Corporation of Textile Centre and another ([2003] 1SLR 209)
The plaintiff was injured on May 1997 when the lift she was using fell 19 floors to the bottomof the lift shaft. At the time of the accident, she was 51 years old and was working as a host‘mamasan’ at a nightclub in Singapore. She could not resume work after the accident becauseof injuries to her left lower limb, post-traumatic stress disorders and problems she had with hereyes.
In the interlocutory judgment, the assistant registrar (AR) used a multiplier (for loss ofearnings) of 5 years, considering that the plaintiff was 54 years old at the time of the trial andthat host ‘mamasans’ can work till 60 as long as they have their customers and ‘daughters’.Based on a multiplier of 5 years and a multiplicand of SG$32,400 per year, the plaintiff wasawarded an amount of SG$120,000 for post-trial loss of earnings.
Subsequently, the defendants appealed against the damages awarded. The judge in the HighCourt criticized the AR for overlooking the following matters:
1. ‘Mamasans’ are prone to come and go, as are the lounges and nightclubs they operatein. Therefore, there is a high chance of future redundancy (which may be considered acontingency other than mortality). Given this piece of uncertainty, the judge lowered theoriginal multiplier by 40% to 3 years.
2. The plaintiff’s eye problems were unrelated to the accident, although they were devel-oped after the accident. Having considered this issue, the multiplicand was reduced toSG$26,400 per annum.
Accordingly, the final amount awarded to the plaintiff for post-trial loss of earnings wasSG$79,200.
When we use the actuarial tables to make a decision on the multiplier, the post-trial loss ofearnings would be computed as follows:
1. Look up Multiplier Table 8 for multipliers for loss of earnings to pension age 60 forfemales.
2. Given the information from Section 4, we choose a discount rate of 2.5%.
3. Multiplier Table 8 shows that, on the basis of a 2.5% discount rate, the multiplier for a54-year-old female is 5.53 years.
4. It is necessary to take account of contingencies other than mortality. Following the deci-sion made by the judge in the High Court, we reduce the baseline multiplier by 40% to
The Singapore Economic Reviewc©World Scientific Publishing Company
Accepted 30 March 2010 Accepted Paper
3.32 years11.
5. Using the multiplicand decided by the judge in the High Court, the lump sum award forloss of future earnings is SG$87,648 (3.32×26,400).
5.2 Tan Woei Jinn v. Thapjang Amorthap and another ([2005] 2 SLR 553)
The plaintiff, a Malaysian, had been working in Singapore as a carpenter for SG$1,500 permonth at the time of the accident. After the accident in which he was seriously injured, theplaintiff returned to Malaysia and found employment repairing telephones for SG$220 a month.
Having considered the plaintiff’s age (20-year-old), the AR adopted a multiplier of 15 yearswhen calculating the plaintiff’s loss of future earnings. She applied the multiplier to two multi-plicands:
1. SG$1,280 per month ($1, 500− $220) for the first ten years;
2. SG$2,780 per month ($3, 000− $220) for the next five years.
As a result, the plaintiff was awarded an amount of SG$320,400 for the loss of future earn-ings in the interlocutory judgment.
The defendants then appealed against the amount awarded. In the High Court, the judgepointed out the following two errors made in the interlocutory judgment:
1. The AR was wrong on the plaintiff’s age. The plaintiff was 22, but not 20, years old whenthe awards were made.
2. The AR did not consider the possibility that the plaintiff would return home before theend of his working life, and that the plaintiff would earn a different wage on returninghome.
The judge believed that the error in the plaintiff’s age was immaterial and therefore did notchange the multiplier. However, the judge thought that it would be more reasonable to assumethat the plaintiff would return to Malaysia after 10 years even if the accident had not occurred.Provided that the plaintiff would work until age 60, he would work for 28 years on returning toMalaysia.
Given the above considerations, the judge split the multiplier of 15 years into two portions:the first portion (4 years) was applied to the anticipated loss of earnings (SG$1,280 per month)in Singapore, while the remaining portion (11 years) was applied to the anticipated loss of
11The court should consider the impact of contingencies (such as sickness, unemployment and stoppages) otherthan mortality on working life. Tables of reduction factors to be applied to the multipliers were first introduced inthe Second Edition of the Ogden Tables, and they were significantly expanded in the Sixth Edition of the Tables(Section B). These factors were based on studies by a number of researchers in the United Kingdom. It would notbe practical for the Singapore courts to simply adopt the exact Tables of reduction factors in the Ogden Tables,as they were constructed in the light of labour force circumstances in the United Kingdom, not of Singapore.However, these factors can serve as a benchmark for Singapore judges.
The Singapore Economic Reviewc©World Scientific Publishing Company
Accepted 30 March 2010 Accepted Paper
earnings (SG$530 per month) in Malaysia. As a result, the amount awarded to the plaintiff wasSG$131,400 (4×1,280×12+11×530×12).
Alternatively, we can use the actuarial tables to compute the lump sum award for loss of fu-ture earnings. Assuming a discount rate of 2.5% as in the previous case, we have the followingprocedure to compute the post-trial loss of earnings:
The loss of future earnings in Singapore:
1. Look up Multiplier Table 28 for multipliers for pecuniary loss for term certain.
2. Multiplier Table 28 shows that, on the basis of a 2.5% discount rate, the multiplier for acertain term of 10 years is 8.86 years.
3. Given a multiplicand of SG$1,280×12 per year, the estimated loss of future earnings inSingapore is SG$136,090 (8.86×1,280×12).
The loss of future earnings in Malaysia12:
1. Look up Multiplier Table 7 for multipliers for loss of earnings to pension age 60 for males.
2. The judge assumed that the plaintiff would return to Malaysia at age 32 (10 years fromnow). Multiplier Table 7 shows that, on the basis of 2.5% discount rate, the multiplier fora 32-year-old male is 19.99 years.
3. The multiplier must be discounted to the time when the award was made. Multiplier Table27 shows that, on the basis of 2.5% discount rate, the discounting factor for a certain termof 10 years is 0.7812. The correct multiplier is therefore 15.62 years (0.7812×19.99).
4. Given a multiplicand of SG$530×12 per year, the estimated loss of future earnings inMalaysia is SG$99,343 (15.62×530×12).
Using an actuarial approach, the lump sum award for future earnings is SG$235,433 (136,090+ 99,343). Note that we made no allowance for the plaintiff’s mortality from age 22 to 32. How-ever, since mortality rates for this age range are very low, this assumption has only a minimaleffect on the resulting multipliers13.
6. Conclusion and Future Research
In personal injury and fatal accident cases, assessing the entitlement of a claimant is a compli-cated process. The actuarial multiplier tables, which involve input from lawyers, actuaries and
12The traditional English approach had treated matters of quantification of damages in personal injury litigationas matters of procedure rather than substance. The paragraph 7-004 of Collins et al. (2008) states: The primaryobjective of this Rule is to obviate the inconvenience of conducting the trial of a case containing foreign elements ina manner with which the court is unfamiliar. The plaintiff is a Malaysian but the trial was conducted in Singapore.We assume that the court follows the traditional English approach and applies the Singapore Multiplier Tables nomatter the person is living in Malaysia or Singapore.
13If the age range under consideration is high, then the court should ask an actuarial expert to compute anactuarial discount factor.

The Singapore Economic Reviewc©World Scientific Publishing Company
Accepted 30 March 2010 Accepted Paper
other experts, can ensure that the principle of restitutio in integrum is properly applied. Thelump sum award computed from an appropriate actuarial multiplier is fair from the followingviewpoints:
1. The award, if invested in risk-free securities, would generate a stream of income that is,on an inflation-adjusted basis, equal to the annual loss of earnings and/or other benefitsassessed in the law court.
2. Although the claimant may die immediately after the trial or survive to extreme ages, theactuarially calculated award would, on average, exhaust on the claimant’s date of death,considering a large number of claimants.
The conventional approach to choosing multipliers tends to result in under-compensation.In both cases we discussed in Section 5, the amount awarded to the plaintiff is significantlylower than that we computed from the actuarial multipliers (see Table 3). Luckett and Craner(1994) also found in an empirical study that multipliers that are determined by the conventionalboard-brush approach are consistently lower than the corresponding actuarial multipliers. Al-though courts in Singapore are still relying on the conventional approach, the need for reformis obvious. The multipliers tables we construct in this study will provide an important tool forcourts in Singapore to use to ensure that an accurate and fair level of compensation is calculatedfor each case.
Table 3. Awards Based on the Conventional Approach (the Actual Amount Awarded) and theActuarial Approach
Conventional approach Actuarial approachThe case in Section 5.1 SG$79,200 SG$87,648The case in Section 5.2 SG$131,400 SG$235,433
Readers are reminded that the baseline multipliers take no account of risks other than mor-tality. The Explanatory Notes of the Ogden Tables provide tables of reduction factors, whichserve as a ‘ready reckenor’ for adjusting the baseline multipliers according to the employmentstatus, disability status and education attainment of the claimant. These reduction factors wereinitially based on the work of Haberman and Bloomfield (1990). They were then revised in theFifth Edition of the Ogden Tables on the basis of the study carried out by Butt et al. (2008)in which reduction factors are modeled by a multiple-state Markov process that is fitted to thedata from UK Labour Force Surveys for 1973, 1977, 1981 and 1985. Tables of reduction fac-tors for use in Singapore can be produced in future research when sufficient information on themorbidity and labor force participation of Singaporeans is available.
Mortality data reported by the Singapore Department of Statistics (SDS) are given by ageintervals and various assumptions are needed to extract individual age mortality rates. Thisintroduces a source of error in those rates, although this is unlikely to be serious. In any case,it is necessary to verify that the approach of estimating individual age mortality rates producesreasonable results. Furthermore, the mortality rates produced by SDS relate to the generalpopulation. A plaintiff may be subject to lighter or heavier mortality than the general population

The Singapore Economic Reviewc©World Scientific Publishing Company
Accepted 30 March 2010 Accepted Paper
depending on his/her health conditions, occupational hazards, etc. Adjustment factors need tobe produced to account of these deviations from the ‘average’ population mortality. To producemultipliers that address these two points requires a great deal of data. At this stage, with thepaucity of data, it is probably not feasible to embark on such a large scale exercise. Nevertheless,it may be a worthwhile project to undertake in the future.
We conclude from the patterns of inflation rates and nominal yields on SGS for the past 10years that a discount rate of 2.5% is appropriate for use in personal injury cases in Singapore.This figure is less precise than could be achieved, but it is important to keep calculations simpleand accurate in legal applications. Further, the use of a fixed discount rate eliminates potentialarguments about the applicable rate, and avoids the complexity and extra costs that a mathe-matical formula would entail. However, when the anticipated award is large, a small differencein the discount rate can be material and therefore a more exact calculation may be necessary.In this case, a consideration of stochastic investment models, for example, the Wilkie Model(Wilkie, 1995), is warranted.
The most serious criticism of lump sum awards for personal injury is that there is a needto forecast the real rate of return and how long the payments will be required. The need forforecasting may be avoided by making lifetime periodic payments to the claimant. Recently,judges in Britain have been given the power to make a periodical payment order (PPO), even ifit is against the wishes of both parties.14 Rather than having a clean break, a PPO will producean uncertain continuing relationship that may vary over time, because the payments must beindexed against inflation and they can be set to continue for the claimant’s lifetime. In addition,judges can arrange for the awards to be varied, if necessary, long after trial.
However, the court’s power to make a PPO is limited in the following three aspects: (1)the power cannot be exercised in respect of damages for past pecuniary loss unless the partiesagree; (2) a PPO can only be made if the continuity of payment is ‘reasonably secure, by whichit means the payments are to be made by a government of health service body, or they areprotected by a compensation scheme which guarantees payment in the event of an insurer’sinsolvency; (3) the power to impose periodic payments can only be exercised if the case comesto the court for the judge to make the order.15 As the scope to make a PPO is rather limited, inBritain, the practice of making lump sum payments is still pervasive, and the importance of theactuarial multiplier tables remains.
As described in Lewis (1993, 2006) and Langstaff (2003), from the claimants’ viewpoint,this newer form of payment is attractive for several reasons. First, it offers claimants greatercertainty and security. Second, it is not reliant on uncertain forecasts of inflation and life ex-pectancy. Third, it can relieve a claimant from the stress of having to invest and avoid the costsof obtaining financial advice. However, when periodic payments are made, the defendant hasto absorb all risks (investment and mortality) involved. Insurers in Britain are not in favor ofthe new legislation, due partly to the challenge of setting reserves when future liability is highlyuncertain, and partly to the difficulty in deciding the threshold above which the liability is rein-sured. In fact, according to Lewis (2006), only a bare majority (57%) of respondents to the LordChancellor’s consultation paper gave an unqualified welcome to the imposition of PPOs.
14Such power follows from the amendment of the Damages Act 1996. The changes were made by s100 ands101 of the Courts Act 2003, but these sections did not come into force until April 2005.
15Lewis (2006) provides a further discussion on the scope to make a PPO.

The Singapore Economic Reviewc©World Scientific Publishing Company
Accepted 30 March 2010 Accepted Paper
Since the issue of the power to make a PPO is such controversial, we anticipate a lengthyconsultation before there is any change to the personal injury legislation in Singapore. Signif-icant further research, for example, on the impact of PPOs on the insurance industry in Singa-pore, is demanded. For the time being, the lump sum approach is dominant in Singapore, andthe multiplier tables we provide in this article would serve as a useful tool for personal injurypractitioners in Singapore.
Acknowledgments
The first two authors wish to acknowledge and express their appreciation for the support of aresearch grant from the Research Grants Council of the Hong Kong Special Administrative Re-gion (General Research Fund Project No. HKU 741408H). Johnny S.H. Li’s work was partiallysupported by a grant from the Natural Science and Engineering Research Council of Canada.

The Singapore Economic Reviewc©World Scientific Publishing Company
Accepted 30 March 2010 Accepted Paper
Appendix: Multiplier tables involved in Section 5
Multiplier Table 7Multipliers for Loss of Earnings to Pension Age 60 (Males)
Multiplier calculated at a rate of return of
Age at date of trial 0.0% 0.5% 1.0% 1.5% 2.0% 2.5% 3.0% 3.5% 4.0% 4.5% 5.0%
16 43.57 39.14 35.32 32.01 29.13 26.63 24.44 22.51 20.82 19.32 17.99
17 42.57 38.33 34.66 31.48 28.71 26.28 24.15 22.28 20.63 19.17 17.87
18 41.57 37.52 34.00 30.94 28.27 25.93 23.87 22.05 20.44 19.01 17.74
19 40.57 36.71 33.34 30.40 27.83 25.56 23.57 21.80 20.24 18.85 17.60
20 39.57 35.89 32.67 29.85 27.38 25.19 23.26 21.55 20.03 18.67 17.46
21 38.58 35.07 32.00 29.30 26.92 24.82 22.95 21.30 19.82 18.50 17.31
22 37.59 34.26 31.32 28.74 26.46 24.43 22.63 21.03 19.60 18.31 17.16
23 36.60 33.43 30.64 28.17 25.99 24.04 22.31 20.76 19.37 18.12 17.00
24 35.61 32.61 29.95 27.60 25.50 23.64 21.97 20.47 19.13 17.92 16.83
25 34.62 31.78 29.25 27.01 25.01 23.22 21.62 20.18 18.88 17.71 16.66
26 33.62 30.94 28.55 26.41 24.51 22.79 21.26 19.87 18.62 17.49 16.47
27 32.62 30.09 27.83 25.81 23.99 22.36 20.88 19.55 18.35 17.26 16.27
28 31.63 29.24 27.11 25.19 23.46 21.90 20.50 19.22 18.07 17.02 16.06
29 30.63 28.39 26.37 24.56 22.92 21.44 20.10 18.88 17.77 16.77 15.84
30 29.63 27.53 25.64 23.92 22.37 20.97 19.69 18.53 17.47 16.50 15.61
31 28.63 26.67 24.89 23.28 21.81 20.48 19.27 18.16 17.15 16.22 15.37
32 27.64 25.80 24.14 22.62 21.25 19.99 18.84 17.79 16.82 15.94 15.12
33 26.64 24.93 23.38 21.96 20.66 19.48 18.39 17.39 16.48 15.63 14.86
34 25.65 24.06 22.61 21.29 20.07 18.96 17.93 16.99 16.12 15.32 14.58
35 24.65 23.18 21.84 20.60 19.47 18.43 17.46 16.57 15.75 14.99 14.29
36 23.66 22.30 21.06 19.91 18.86 17.88 16.98 16.14 15.37 14.65 13.98
37 22.66 21.42 20.27 19.21 18.23 17.32 16.48 15.70 14.97 14.29 13.66
38 21.67 20.53 19.48 18.50 17.59 16.75 15.96 15.23 14.55 13.92 13.33
39 20.68 19.64 18.67 17.78 16.94 16.16 15.44 14.76 14.12 13.53 12.98
40 19.69 18.75 17.87 17.04 16.28 15.56 14.89 14.27 13.68 13.13 12.61
41 18.70 17.85 17.05 16.30 15.60 14.95 14.33 13.76 13.21 12.71 12.23
42 17.71 16.95 16.23 15.55 14.92 14.32 13.76 13.23 12.73 12.26 11.82
43 16.73 16.04 15.40 14.79 14.22 13.68 13.17 12.69 12.23 11.81 11.40
44 15.74 15.13 14.56 14.02 13.51 13.02 12.56 12.13 11.72 11.33 10.95
45 14.76 14.22 13.72 13.23 12.78 12.35 11.94 11.55 11.18 10.82 10.49
46 13.77 13.30 12.86 12.44 12.04 11.66 11.29 10.95 10.62 10.30 10.00
47 12.79 12.38 12.00 11.63 11.28 10.95 10.63 10.32 10.03 9.75 9.49
48 11.80 11.46 11.13 10.81 10.51 10.22 9.95 9.68 9.43 9.18 8.95
49 10.82 10.53 10.25 9.98 9.73 9.48 9.25 9.02 8.80 8.59 8.39
50 9.84 9.60 9.37 9.14 8.93 8.72 8.52 8.33 8.15 7.97 7.80
51 8.85 8.66 8.47 8.29 8.12 7.95 7.78 7.62 7.47 7.32 7.18
52 7.87 7.72 7.57 7.43 7.29 7.15 7.02 6.89 6.76 6.64 6.53
53 6.89 6.78 6.66 6.55 6.44 6.33 6.23 6.13 6.03 5.94 5.85
54 5.91 5.83 5.74 5.66 5.58 5.50 5.42 5.35 5.27 5.20 5.13
55 4.93 4.87 4.81 4.76 4.70 4.64 4.59 4.54 4.48 4.43 4.38
56 3.95 3.92 3.88 3.84 3.80 3.77 3.73 3.70 3.66 3.63 3.59
57 2.97 2.95 2.93 2.91 2.89 2.86 2.84 2.82 2.80 2.78 2.77
58 1.99 1.98 1.97 1.96 1.95 1.94 1.93 1.92 1.91 1.90 1.89
59 1.00 0.99 0.99 0.99 0.99 0.98 0.98 0.98 0.98 0.97 0.97

The Singapore Economic Reviewc©World Scientific Publishing Company
Accepted 30 March 2010 Accepted Paper
Multiplier Table 8Multipliers for Loss of Earnings to Pension Age 60 (Females)
Multiplier calculated at a rate of return of
Age at date of trial 0.0% 0.5% 1.0% 1.5% 2.0% 2.5% 3.0% 3.5% 4.0% 4.5% 5.0%
16 43.80 39.33 35.48 32.15 29.26 26.74 24.53 22.60 20.89 19.39 18.05
17 42.80 38.53 34.83 31.63 28.83 26.39 24.25 22.37 20.71 19.24 17.93
18 41.80 37.72 34.18 31.10 28.40 26.04 23.97 22.14 20.52 19.08 17.80
19 40.80 36.91 33.52 30.56 27.96 25.68 23.67 21.90 20.32 18.92 17.67
20 39.80 36.09 32.85 30.01 27.51 25.31 23.37 21.65 20.12 18.75 17.53
21 38.80 35.27 32.17 29.45 27.05 24.94 23.06 21.39 19.90 18.57 17.38
22 37.80 34.44 31.49 28.89 26.59 24.55 22.74 21.12 19.68 18.39 17.23
23 36.80 33.61 30.80 28.31 26.11 24.15 22.41 20.85 19.45 18.20 17.07
24 35.80 32.78 30.10 27.73 25.62 23.74 22.06 20.56 19.21 17.99 16.90
25 34.80 31.94 29.40 27.14 25.13 23.33 21.71 20.26 18.96 17.78 16.72
26 33.80 31.10 28.69 26.54 24.62 22.90 21.35 19.96 18.70 17.56 16.53
27 32.80 30.25 27.97 25.93 24.10 22.46 20.97 19.64 18.43 17.33 16.33
28 31.80 29.40 27.25 25.31 23.57 22.01 20.59 19.31 18.14 17.09 16.13
29 30.80 28.54 26.51 24.69 23.04 21.54 20.19 18.97 17.85 16.83 15.91
30 29.80 27.68 25.77 24.05 22.49 21.07 19.78 18.61 17.55 16.57 15.68
31 28.80 26.82 25.03 23.40 21.93 20.59 19.36 18.25 17.23 16.30 15.44
32 27.80 25.95 24.27 22.75 21.36 20.09 18.93 17.87 16.90 16.01 15.19
33 26.80 25.08 23.51 22.08 20.78 19.58 18.49 17.48 16.56 15.71 14.92
34 25.80 24.20 22.74 21.41 20.18 19.06 18.03 17.08 16.20 15.39 14.65
35 24.80 23.33 21.97 20.72 19.58 18.53 17.56 16.66 15.83 15.07 14.36
36 23.81 22.44 21.19 20.03 18.96 17.98 17.07 16.23 15.45 14.73 14.05
37 22.81 21.55 20.40 19.33 18.34 17.42 16.57 15.78 15.05 14.37 13.73
38 21.81 20.66 19.60 18.61 17.70 16.85 16.06 15.32 14.63 14.00 13.40
39 20.82 19.77 18.79 17.89 17.04 16.26 15.53 14.84 14.20 13.61 13.05
40 19.82 18.87 17.98 17.15 16.38 15.66 14.98 14.35 13.76 13.20 12.68
41 18.83 17.96 17.16 16.41 15.70 15.04 14.42 13.84 13.29 12.78 12.29
42 17.83 17.06 16.33 15.65 15.01 14.41 13.84 13.31 12.81 12.33 11.89
43 16.84 16.15 15.50 14.88 14.31 13.76 13.25 12.76 12.30 11.87 11.46
44 15.85 15.23 14.65 14.11 13.59 13.10 12.64 12.20 11.78 11.39 11.02
45 14.85 14.31 13.80 13.32 12.86 12.42 12.01 11.61 11.24 10.89 10.55
46 13.86 13.39 12.94 12.52 12.11 11.73 11.36 11.01 10.68 10.36 10.06
47 12.87 12.46 12.08 11.71 11.35 11.02 10.69 10.39 10.09 9.81 9.54
48 11.88 11.53 11.20 10.88 10.58 10.29 10.01 9.74 9.48 9.24 9.00
49 10.89 10.60 10.32 10.05 9.79 9.54 9.30 9.07 8.85 8.64 8.44
50 9.90 9.66 9.43 9.20 8.99 8.78 8.58 8.38 8.20 8.02 7.84
51 8.91 8.72 8.53 8.34 8.17 8.00 7.83 7.67 7.52 7.37 7.22
52 7.93 7.77 7.62 7.47 7.33 7.20 7.06 6.93 6.81 6.69 6.57
53 6.94 6.82 6.70 6.59 6.48 6.37 6.27 6.17 6.07 5.97 5.88
54 5.95 5.86 5.78 5.69 5.61 5.53 5.46 5.38 5.31 5.23 5.16
55 4.96 4.90 4.84 4.78 4.73 4.67 4.62 4.56 4.51 4.46 4.41
56 3.97 3.94 3.90 3.86 3.82 3.79 3.75 3.71 3.68 3.65 3.61
57 2.98 2.96 2.94 2.92 2.90 2.88 2.86 2.84 2.82 2.80 2.78
58 1.99 1.98 1.97 1.96 1.95 1.94 1.93 1.93 1.92 1.91 1.90
59 1.00 1.00 0.99 0.99 0.99 0.99 0.98 0.98 0.98 0.98 0.97

The Singapore Economic Reviewc©World Scientific Publishing Company
Accepted 30 March 2010 Accepted Paper
Multiplier Table 27Discounting Factors for Term Certain
Factor to discount value of multiplier for a period of deferment
Term 0.5% 1.0% 1.5% 2.0% 2.5% 3.0% 3.5% 4.0% 4.5% 5.0%
1 0.9950 0.9901 0.9852 0.9804 0.9756 0.9709 0.9662 0.9615 0.9569 0.9524
2 0.9901 0.9803 0.9707 0.9612 0.9518 0.9426 0.9335 0.9246 0.9157 0.9070
3 0.9851 0.9706 0.9563 0.9423 0.9286 0.9151 0.9019 0.8890 0.8763 0.8638
4 0.9802 0.9610 0.9422 0.9238 0.9060 0.8885 0.8714 0.8548 0.8386 0.8227
5 0.9754 0.9515 0.9283 0.9057 0.8839 0.8626 0.8420 0.8219 0.8025 0.7835
6 0.9705 0.9420 0.9145 0.8880 0.8623 0.8375 0.8135 0.7903 0.7679 0.7462
7 0.9657 0.9327 0.9010 0.8706 0.8413 0.8131 0.7860 0.7599 0.7348 0.7107
8 0.9609 0.9235 0.8877 0.8535 0.8207 0.7894 0.7594 0.7307 0.7032 0.6768
9 0.9561 0.9143 0.8746 0.8368 0.8007 0.7664 0.7337 0.7026 0.6729 0.6446
10 0.9513 0.9053 0.8617 0.8203 0.7812 0.7441 0.7089 0.6756 0.6439 0.6139
11 0.9466 0.8963 0.8489 0.8043 0.7621 0.7224 0.6849 0.6496 0.6162 0.5847
12 0.9419 0.8874 0.8364 0.7885 0.7436 0.7014 0.6618 0.6246 0.5897 0.5568
13 0.9372 0.8787 0.8240 0.7730 0.7254 0.6810 0.6394 0.6006 0.5643 0.5303
14 0.9326 0.8700 0.8118 0.7579 0.7077 0.6611 0.6178 0.5775 0.5400 0.5051
15 0.9279 0.8613 0.7999 0.7430 0.6905 0.6419 0.5969 0.5553 0.5167 0.4810
16 0.9233 0.8528 0.7880 0.7284 0.6736 0.6232 0.5767 0.5339 0.4945 0.4581
17 0.9187 0.8444 0.7764 0.7142 0.6572 0.6050 0.5572 0.5134 0.4732 0.4363
18 0.9141 0.8360 0.7649 0.7002 0.6412 0.5874 0.5384 0.4936 0.4528 0.4155
19 0.9096 0.8277 0.7536 0.6864 0.6255 0.5703 0.5202 0.4746 0.4333 0.3957
20 0.9051 0.8195 0.7425 0.6730 0.6103 0.5537 0.5026 0.4564 0.4146 0.3769
21 0.9006 0.8114 0.7315 0.6598 0.5954 0.5375 0.4856 0.4388 0.3968 0.3589
22 0.8961 0.8034 0.7207 0.6468 0.5809 0.5219 0.4692 0.4220 0.3797 0.3418
23 0.8916 0.7954 0.7100 0.6342 0.5667 0.5067 0.4533 0.4057 0.3634 0.3256
24 0.8872 0.7876 0.6995 0.6217 0.5529 0.4919 0.4380 0.3901 0.3477 0.3101
25 0.8828 0.7798 0.6892 0.6095 0.5394 0.4776 0.4231 0.3751 0.3327 0.2953
26 0.8784 0.7720 0.6790 0.5976 0.5262 0.4637 0.4088 0.3607 0.3184 0.2812
27 0.8740 0.7644 0.6690 0.5859 0.5134 0.4502 0.3950 0.3468 0.3047 0.2678
28 0.8697 0.7568 0.6591 0.5744 0.5009 0.4371 0.3817 0.3335 0.2916 0.2551
29 0.8653 0.7493 0.6494 0.5631 0.4887 0.4243 0.3687 0.3207 0.2790 0.2429
30 0.8610 0.7419 0.6398 0.5521 0.4767 0.4120 0.3563 0.3083 0.2670 0.2314
31 0.8567 0.7346 0.6303 0.5412 0.4651 0.4000 0.3442 0.2965 0.2555 0.2204
32 0.8525 0.7273 0.6210 0.5306 0.4538 0.3883 0.3326 0.2851 0.2445 0.2099
33 0.8482 0.7201 0.6118 0.5202 0.4427 0.3770 0.3213 0.2741 0.2340 0.1999
34 0.8440 0.7130 0.6028 0.5100 0.4319 0.3660 0.3105 0.2636 0.2239 0.1904
35 0.8398 0.7059 0.5939 0.5000 0.4214 0.3554 0.3000 0.2534 0.2143 0.1813
36 0.8356 0.6989 0.5851 0.4902 0.4111 0.3450 0.2898 0.2437 0.2050 0.1727
37 0.8315 0.6920 0.5764 0.4806 0.4011 0.3350 0.2800 0.2343 0.1962 0.1644
38 0.8274 0.6852 0.5679 0.4712 0.3913 0.3252 0.2706 0.2253 0.1878 0.1566
39 0.8232 0.6784 0.5595 0.4619 0.3817 0.3158 0.2614 0.2166 0.1797 0.1491
40 0.8191 0.6717 0.5513 0.4529 0.3724 0.3066 0.2526 0.2083 0.1719 0.1420
41 0.8151 0.6650 0.5431 0.4440 0.3633 0.2976 0.2440 0.2003 0.1645 0.1353
42 0.8110 0.6584 0.5351 0.4353 0.3545 0.2890 0.2358 0.1926 0.1574 0.1288
43 0.8070 0.6519 0.5272 0.4268 0.3458 0.2805 0.2278 0.1852 0.1507 0.1227
44 0.8030 0.6454 0.5194 0.4184 0.3374 0.2724 0.2201 0.1780 0.1442 0.1169
45 0.7990 0.6391 0.5117 0.4102 0.3292 0.2644 0.2127 0.1712 0.1380 0.1113
46 0.7950 0.6327 0.5042 0.4022 0.3211 0.2567 0.2055 0.1646 0.1320 0.1060
47 0.7910 0.6265 0.4967 0.3943 0.3133 0.2493 0.1985 0.1583 0.1263 0.1009
48 0.7871 0.6203 0.4894 0.3865 0.3057 0.2420 0.1918 0.1522 0.1209 0.0961
49 0.7832 0.6141 0.4821 0.3790 0.2982 0.2350 0.1853 0.1463 0.1157 0.0916
50 0.7793 0.6080 0.4750 0.3715 0.2909 0.2281 0.1791 0.1407 0.1107 0.0872

The Singapore Economic Reviewc©World Scientific Publishing Company
Accepted 30 March 2010 Accepted Paper
Multiplier Table 28Multipliers for Pecuniary Loss for Term Certain
Multiplier for regular frequent payments for a term certain at rate of return of
Term 0.5% 1.0% 1.5% 2.0% 2.5% 3.0% 3.5% 4.0% 4.5% 5.0%
1 1.00 1.00 0.99 0.99 0.99 0.99 0.98 0.98 0.98 0.98
2 1.99 1.98 1.97 1.96 1.95 1.94 1.93 1.92 1.91 1.91
3 2.98 2.96 2.93 2.91 2.89 2.87 2.85 2.83 2.81 2.79
4 3.96 3.92 3.88 3.85 3.81 3.77 3.74 3.70 3.67 3.63
5 4.94 4.88 4.82 4.76 4.70 4.65 4.59 4.54 4.49 4.44
6 5.91 5.82 5.74 5.66 5.58 5.50 5.42 5.35 5.27 5.20
7 6.88 6.76 6.65 6.54 6.43 6.32 6.22 6.12 6.02 5.93
8 7.84 7.69 7.54 7.40 7.26 7.12 6.99 6.87 6.74 6.62
9 8.80 8.61 8.42 8.24 8.07 7.90 7.74 7.58 7.43 7.28
10 9.75 9.52 9.29 9.07 8.86 8.66 8.46 8.27 8.09 7.91
11 10.70 10.42 10.15 9.88 9.63 9.39 9.16 8.93 8.72 8.51
12 11.65 11.31 10.99 10.68 10.39 10.10 9.83 9.57 9.32 9.08
13 12.59 12.19 11.82 11.46 11.12 10.79 10.48 10.18 9.90 9.63
14 13.52 13.07 12.64 12.23 11.84 11.46 11.11 10.77 10.45 10.14
15 14.45 13.93 13.44 12.98 12.54 12.12 11.72 11.34 10.98 10.64
16 15.38 14.79 14.24 13.71 13.22 12.75 12.30 11.88 11.48 11.11
17 16.30 15.64 15.02 14.43 13.88 13.36 12.87 12.41 11.97 11.55
18 17.22 16.48 15.79 15.14 14.53 13.96 13.42 12.91 12.43 11.98
19 18.13 17.31 16.55 15.83 15.17 14.54 13.95 13.39 12.87 12.38
20 19.03 18.14 17.30 16.51 15.78 15.10 14.46 13.86 13.30 12.77
21 19.94 18.95 18.03 17.18 16.39 15.65 14.95 14.31 13.70 13.14
22 20.84 19.76 18.76 17.83 16.97 16.17 15.43 14.74 14.09 13.49
23 21.73 20.56 19.48 18.47 17.55 16.69 15.89 15.15 14.46 13.82
24 22.62 21.35 20.18 19.10 18.11 17.19 16.34 15.55 14.82 14.14
25 23.50 22.13 20.87 19.72 18.65 17.67 16.77 15.93 15.16 14.44
26 24.38 22.91 21.56 20.32 19.19 18.14 17.18 16.30 15.48 14.73
27 25.26 23.68 22.23 20.91 19.71 18.60 17.59 16.65 15.80 15.01
28 26.13 24.44 22.90 21.49 20.21 19.04 17.97 16.99 16.09 15.27
29 27.00 25.19 23.55 22.06 20.71 19.47 18.35 17.32 16.38 15.52
30 27.86 25.94 24.20 22.62 21.19 19.89 18.71 17.64 16.65 15.75
31 28.72 26.67 24.83 23.17 21.66 20.30 19.06 17.94 16.91 15.98
32 29.58 27.41 25.46 23.70 22.12 20.69 19.40 18.23 17.16 16.19
33 30.43 28.13 26.07 24.23 22.57 21.08 19.73 18.51 17.40 16.40
34 31.27 28.85 26.68 24.74 23.01 21.45 20.04 18.78 17.63 16.59
35 32.12 29.56 27.28 25.25 23.43 21.81 20.35 19.04 17.85 16.78
36 32.95 30.26 27.87 25.74 23.85 22.16 20.64 19.28 18.06 16.96
37 33.79 30.95 28.45 26.23 24.26 22.50 20.93 19.52 18.26 17.13
38 34.62 31.64 29.02 26.70 24.65 22.83 21.20 19.75 18.45 17.29
39 35.44 32.32 29.58 27.17 25.04 23.15 21.47 19.97 18.64 17.44
40 36.26 33.00 30.14 27.63 25.42 23.46 21.73 20.19 18.81 17.58
41 37.08 33.67 30.69 28.08 25.78 23.76 21.97 20.39 18.98 17.72
42 37.89 34.33 31.23 28.52 26.14 24.06 22.21 20.59 19.14 17.86
43 38.70 34.98 31.76 28.95 26.49 24.34 22.45 20.78 19.30 17.98
44 39.51 35.63 32.28 29.37 26.83 24.62 22.67 20.96 19.44 18.10
45 40.31 36.27 32.80 29.78 27.17 24.88 22.89 21.13 19.58 18.21
46 41.10 36.91 33.30 30.19 27.49 25.15 23.10 21.30 19.72 18.32
47 41.90 37.54 33.80 30.59 27.81 25.40 23.30 21.46 19.85 18.43
48 42.69 38.16 34.30 30.98 28.12 25.64 23.49 21.62 19.97 18.53
49 43.47 38.78 34.78 31.36 28.42 25.88 23.68 21.77 20.09 18.62
50 44.25 39.39 35.26 31.74 28.72 26.11 23.86 21.91 20.20 18.71
The Singapore Economic Reviewc©World Scientific Publishing Company
Accepted 30 March 2010 Accepted Paper
References
Akaike, H. (1974). A New Look at the Statistical Model Identification. IEEE Transactionson Automatic Control, AC-19 : 716-723.
Boot, J.C.G. and J.H.C. Lisman (1967). Further Methods of Derivation of Quarterly Figuresfrom Annual Data. Applied Statistics, 16, 65-75.
Box, G.E.P. and G.M. Jenkins (1976). Time Series Analysis Forecasting and Control. 2nd ed.,San Francisco: Holden-Day.
Collins, L., C. G. J. Morse, D. McClean, A. Briggs, J. Harris and C. McLachlan (2008).Dicey, Morris & Collins on the Conflict of Laws: Mainwork & Supplement. 14th Edition,London: Sweet & Maxwell.
Brouhns, N., M. Denuit and J.K. Vermunt (2002). A Poisson Log-bilinear Regression Ap-proach to the Construction of Projected Lifetables. Insurance: Mathematics and Eco-nomics, 31, 373-393.
Brouhns, N., M. Denuit and I.V. Keilegom (2005). Bootstrapping the Poisson Log-bilinearModel for Mortality Forecasting. Scandinavian Actuarial Journal, 3, 212-224.
Butt, Z., S. Haberman, R. Verrall and V. Wass (2008). Calculating Compensation for Lossof Future Earnings: Estimating and Using Work Life Expectancy. Journal of the RoyalStatistical Society Series A, 171, 763-805.
Chan, W.S. and F.W.H. Chan (2000). Lai Wee Lian Revisited – Should Actuarial Tables beUsed for the Assessment of Damages in Personal Injury Litigation in Singapore? Singa-pore Journal of Legal Studies, 5, 364-378.
Chia, N.C. and A.K.C. Tsui (2003). Life Annuities of Compulsory Savings and Income Ade-quacy of the Elderly in Singapore. Journal of Pension Economics and Finance, 2, 41-65.
Coale, A. and E. Kisker (1990). Defects in Data on Old-age Mortality in the United States:New Procedures for Calculating Mortality Schedules and Life Tables at the Highest Ages.Asian and Pacific Population Forum, 4, 1-31.
Cossette, H., A. Delwarde, M. Denuit, F. Guillot and E. Marceau (2007). Pension Plan Val-uation and Mortality Projection: A Case Study with Mortality Data. North AmericanActuarial Journal 11, 1-34.
Czado, C., A. Delwarde, and M. Denuit (2005). Bayesian Poisson Log-bilinear MortalityProjections. Insurance: Mathematics and Economics, 36, 260-284.
Fisher, D. (2001). Intermediate Macroeconomics: A Statistical Approach. Singapore: WorldScientific.
Fisher, I. (1930). The Theory of Interest. New York: Macmillan.
Haberman, S. and D.S.F. Bloomfield (1990). Work Time Loss to Sickness, Unemploymentand Stoppages: Measurement and Application. Journal of the Institute of Actuaries,117, 533-595.
The Singapore Economic Reviewc©World Scientific Publishing Company
Accepted 30 March 2010 Accepted Paper
Hermer, R. and J. Pickering (2002). Future Loss Multipliers: The Quantification of Damagesfor Catastrophic Injuries. Journal of Personal Injury Law, 4, 377-383.
Hogg, R. (2002). Multipliers – The Discount Rate. Journal of Personal Injury Law, 1, 46-48.
Hogg, R. and D. Kemp (1999). Assessing Future Pecuniary Loss Using the ‘Ogden Tables’.Journal of Personal Injury Litigation, 9, 42-48.
Human Mortality Database. University of California, Berkeley (USA), and Max Planck Insti-tute of Demographic Research (Germany). Available at www.mortality.org or www.humanmortality.de(data downloaded on 15 March 2008).
Kemp, D. and R. Hogg (2000). How to Determine Multipliers in Assessing Damages underthe Fatal Accident Acts, Using Revised ‘Ogden Tables’. Journal of Personal Injury Law,2/3, 142-155.
Koissi, M.C., A.F. Shapiro and G. Hognas (2006). Evaluating and Extending the Lee-CarterModel for Mortality Forecasting: Bootstrap Confidence Interval. Insurance: Mathemat-ics and Economics, 38, 1-20.
Langstaff, B. (2003). Structured Settlements: Past, Present and Future. Journal of PersonalInjury Law, 217/282, 237-255.
Lee, R.D. (2000). The Lee-Carter Method for Forecasting Mortality, with Various Extensionsand Applications. North American Actuarial Journal, 4, 80-91.
Lee, R.D. and L. Carter (1992). Modeling and Forecasting U.S. Mortality. Journal of theAmerican Statistical Association, 87, 659-671.
Lewis, R. (1993). The Merits of a Structured Settlement: The Plaintif’s Perspective OxfordJournal of Legal Studies, 13, 530-547.
Lewis, R. (2006). The Politics and Economics of Tort Law: Judicially Imposed PeriodicalPayments of Damages. Modern Law Review, 69, 418-442.
Li, S.H. and W.S. Chan (2004). Estimation of Complete Period Life Tables for Singaporeans.Journal of Actuarial Practice, 11, 129-146.
Luckett, N. and J. Craner (1994). Multiplers: Are the Courts Being Fair to Plaintiffs? Journalof Personal Injury Litigation, 4, 139-146.
Lyons, M. (2002) Personal Injuries – Brain Damage – Care Expenses. Journal of PersonalInjury Law, 3, 332-333.
Ng, S. and P. Perron (1995). Unit Root Test in ARMA Models with Data Dependent Methodsfor the Selection of the Truncation Lag, Journal of the American Statistical Association,90, 268-281.
Office for National Statistics (1997). English Life Tables No. 15. London: The StationeryOffice.
Renshaw, A.E. and S. Haberman (2003a). LeeCarter Mortality Forecasting with Age-SpecificEnhancement. Insurance: Mathematics and Economics, 33, 255-272.
The Singapore Economic Reviewc©World Scientific Publishing Company
Accepted 30 March 2010 Accepted Paper
Renshaw, A.E. and S. Haberman (2003b). On the Forecasting of Mortality Reduction Factors.Insurance: Mathematics and Economics, 32, 379-401.
Renshaw, A.E. and S. Haberman (2006). A Cohort-based Extension to the Lee-Carter Modelfor Mortality Reduction Factors. Insurance: Mathematics and Economics, 38, 556-570.
Renshaw, A.E. and S. Haberman (2008). On Simulation-Based Approaches to Risk Measure-ment in Mortality with Specific Reference to Poisson LeeCarter Modelling. Insurance:Mathematics and Economics, 42, 797-816.
Schwarz, G. (1978). Estimating the Dimension of a Model. Annals of Statistics, 6, 461-464.
Thomas, L.B. (1999). Survey Measures of Expected U.S. Inflation. Journal of EconomicPerspectives, 13, 125-144.
Tuljapurkar, S., N. Li and C. Boe (2000). A Universal Pattern of Mortality Decline in the G7Countries. Nature, 405, 789-792.
Wilkie, A.D. (1995). More on a Stochastic Asset Model for Actuarial Use. British ActuarialJournal, 1, 777-964.
Wilmoth, J.R. (1993). Computational Methods for Fitting and Extrapolating the Lee-CarterModel of Mortality Change. Technical report. Department of Demography. Universityof California, Berkeley.