Exam 9, Spring 2017 - Casualty Actuarial Society
96
-
Upload
khangminh22 -
Category
Documents
-
view
0 -
download
0
Transcript of Exam 9, Spring 2017 - Casualty Actuarial Society


Exam 9, Spring 2017
- 1 - CONTINUED ON NEXT PAGE
1. (7.5 points)
The actuarial department of a property and casualty insurer is reviewing a potential growth opportunity. Given the following information about this opportunity:
• All policies are effective on the same day and are in force for one year. • Premium is collected at the beginning of the policy period and is expected to be $4
million per year. • Premium is immediately earned, so there is no unearned premium reserve. • Loss reserves are established at the beginning of the policy period, on an
undiscounted basis. • Variable expenses equal to 25% of the premium are paid at policy inception. • Losses (including Loss Adjustment Expenses (LAE)) as a percentage of Written
Premium are expected to be 45% paid out at the end of the first year and 30% paid out at the end of the second year, with no other loss payments.
• The expected client retention rate is 80%. • The undiscounted reserve-to-surplus ratio is 2.5:1. • The risk-free interest rate is 3%. • The expected return on the market portfolio is 7%. • The cost of capital is 8% per year. • The insurer has an expected investment yield of 10%. • Investment income is earned at the end of each year. • There are no taxes.
a. (3 points)
Calculate the internal rate of return (IRR) and net present value (NPV) for one year of policies for the growth opportunity.
b. (1.75 points) Assume the risk-adjusted allocated capital is $2.5 million. Calculate the projected risk-adjusted return on capital (RAROC) of the opportunity.
c. (1.25 points) Calculate the projected increase in franchise value resulting from the growth opportunity.
d. (0.5 point) Give support for why the company should pursue this project.
e. (1 point) The company plans a public announcement of the project in one week and it is expected that the stock price will increase as a result of the project. Briefly describe what will happen to the stock price both before and after the announcement under both the strong-form and the semistrong-form of the efficient market hypothesis.

Exam 9, Spring 2017
- 2 - CONTINUED ON NEXT PAGE
2. (1 point)
a. (0.5 point) Describe what a passive investment strategy is.
b. (0.5 point)
Briefly describe two advantages of selecting a passive investment strategy over an active strategy.

Exam 9, Spring 2017
- 3 - CONTINUED ON NEXT PAGE
3. (1.25 points)
Given the following statistics for three stocks, A, B, and C:
Expected Return and Standard Deviations of Returns
Stock A B C Expected Return 𝑟𝑟 𝑟𝑟 𝑟𝑟 Standard Deviation 𝜎𝜎1 𝜎𝜎1 𝜎𝜎2
Note that 𝜎𝜎1 > 𝜎𝜎2 > 0.
Correlations of Returns
Stock A B C A
𝜌𝜌 𝜌𝜌
B
0.1 × 𝜌𝜌 C
Note that 𝜌𝜌 > 0.
Assume an investor wants to select a two-stock portfolio and will invest equally in the two. Rank the three possible stock portfolios in order based on risk-return trade-off and explain the rationale for the ranking.

Exam 9, Spring 2017
- 4 - CONTINUED ON NEXT PAGE
4. (2 points)
Given the following:
• The assets are perfectly negatively correlated. • The risk-free rate is 2%.
a. (0.5 point)
Describe the arbitrage opportunity that exists without using any calculations.
b. (1.5 points)
Calculate the expected return of this arbitrage opportunity.
Asset Expected Return Standard Deviation A 4% 25% B 7% 35%

Exam 9, Spring 2017
- 5 - CONTINUED ON NEXT PAGE
5. (1.5 points)
Given the following:
Portfolio
Expected Annual Rate of Return
Beta
A 7.8% 0.4 B 8.3% 0.9
• The market portfolio has an expected annual rate of return of 10%. • The risk-free rate is 5%.
a. (0.5 point)
Calculate the alpha for each of portfolio A and B using the capital asset pricing model (CAPM).
b. (1 point)
Graph the security market line (SML). Plot the positions of portfolio A, portfolio B, the market portfolio and the risk-free portfolio. Clearly label the axes and the alpha for each of portfolio A and B.

Exam 9, Spring 2017
- 6 - CONTINUED ON NEXT PAGE
6. (2.5 points)
Given the following:
Stock
Current Price
(time=0)
Investors’ Forecast Price
(time=1) Beta Covariance with Market Portfolio
A 80 85 0.2 Not given B 60 63 Not given 0.03
• The market risk premium is 6%. • The market variance is 5%. • The risk-free rate is 4%.
a. (1.5 points)
Explain which stock is the superior investment strategy according to the capital asset pricing model (CAPM).
b. (1 point)
Compare and contrast CAPM and the single-index model with respect to the optimal risky portfolio.

Exam 9, Spring 2017
- 7 - CONTINUED ON NEXT PAGE
7. (2 points)
An insurance company with $100 billion in assets is seeking advice for its investment strategy. Assume that only the weak form of the efficient market hypothesis (EMH) holds. Recommend and support a strategy for portfolio management and investment analysis by discussing:
• weak versus semi-strong form of the EMH • research costs • transaction costs • portfolio size

Exam 9, Spring 2017
- 8 - CONTINUED ON NEXT PAGE
8. (2.75 points)
Given the following:
Week Company Stock
Price Index Value
1 $101.88 $263.26 2 $101.75 $263.27 3 $102.22 $277.50 4 $109.68 $305.46 5 $117.86 $334.75
An investor wants to buy the company’s stock because the investor expects the stock price to continue to increase at the rate that it has been increasing over the past two weeks. a. (0.75 point)
Identify and describe an information processing bias that may be present in the investor’s expectation, and relate it to the information given above.
b. (1 point)
Recommend and justify an action for the investor to take using the relative strength technical analysis technique.
c. (0.5 point)
Describe the purpose of technical analysis in relation to behavioral finance.
d. (0.5 point)
Explain one reason why the technical analysis recommendation in part b. above may not be valid.

Exam 9, Spring 2017
- 9 - CONTINUED ON NEXT PAGE
9. (1.5 points)
Given the following:
Bond Par Value Time to Maturity (years)
Annual Coupon Rate
Current Bond Price
1 $1000 1 0% $956.94 2 $1000 2 4% $981.41
• Coupons are paid annually. • Assume annual compounding. • Liquidity premium = 1.5%.
a. (0.75 point)
Calculate the forward rate in year two.
b. (0.75 point)
For bond 2 at time t=1, calculate the expected prices under both the expectations hypothesis and the liquidity preference theory.

Exam 9, Spring 2017
- 10 - CONTINUED ON NEXT PAGE
10. (2 points)
Given the following:
Bond Par Value Time To Maturity (years) Current Bond Price 1 $100 1 $96.15 2 $100 2 $91.40 3 $100 3 $85.40
• Assume annual compounding. • All bonds are zero-coupon bonds.
a. (0.75 point) Calculate the forward rate in year three.
b. (0.5 point) An investor wants to borrow $100 two years from now for one year. Outline a strategy the investor could take to construct a synthetic forward loan and identify all of the investor’s cash flows.
c. (0.75 point) Using a theory of term structure, explain why an investor would want to construct a synthetic forward loan.

Exam 9, Spring 2017
- 11 - CONTINUED ON NEXT PAGE
11. (1.5 points)
An insurance company must make the following payments:
Payment Amount Payment Timing $1 million t=1 $2 million t=3 $3 million t=5
• The company wants to fully fund and immunize its obligation by issuing a zero-
coupon bond at t=0. • The yield curve is flat at 8%.
a. (1 point)
Calculate the maturity of the zero-coupon bond.
b. (0.5 point)
Immediately after issuing the bond, the entire yield curve shifts to 10%. Calculate the revised value of the zero-coupon bond.

Exam 9, Spring 2017
- 12 - CONTINUED ON NEXT PAGE
12. (3 points)
a. (1.25 point) An insurance company writes 100 identical policies for a particular line of business. Given the following information for each policy:
Premium $1,500 Expenses $250 Losses $1,100
• The risk-free rate is 5%. • Premium is collected and expenses are paid at the beginning of each policy year. • Losses are paid at the end of each policy year. • The client retention percentage is 90% in the first policy year and 80% in each
subsequent policy year. Calculate the insurer’s franchise value.
b. (1 point)
Describe two aspects of the practical dilemma associated with managing franchise value.
c. (0.75 point)
Outline a proposed solution to the practical dilemma of managing franchise value and discuss how it addresses each aspect of the practical dilemma in part b. above.

Exam 9, Spring 2017
- 13 - CONTINUED ON NEXT PAGE
13. (2.25 points)
Given the following newly issued 3-year inflation-indexed bond with $1,000 par value:
• The bond pays annual coupons at a coupon rate of 5%. • The inflation rate is 1% throughout the first year and is expected to increase 100
basis points each year for the following two years. • The principal is fully repaid at the end of year 3. • Tax rate is 0%.
a. (1.25 points)
Calculate the nominal return of the bond in the third year.
b. (0.5 point) Demonstrate that the inflation-indexed bond reduces return volatility.
c. (0.5 point) The asset manager of the portfolio is concerned about the risk associated with receiving the principal at the end of the bond’s life. Describe a mechanism available to the bond issuer to reduce this risk.

Exam 9, Spring 2017
- 14 - CONTINUED ON NEXT PAGE
14. (1.25 points) An asset manager has a fund composed entirely of A-rated catastrophe (CAT) bonds. They have an equal amount invested in bonds that are hurricane-exposed and earthquake-exposed. The manager then creates two pools of bonds in order to manufacture collateralized debt obligations (CDOs): one from the hurricane bonds, and another from the earthquake bonds. Both CDOs are structured to maximize the amount of notional value in the AAA-rated tranches.
a. (0.75 point)
Explain how the manager could have designed the CDOs differently so that an even larger proportion of the tranches are AAA-rated and why this is an effective mechanism.
b. (0.5 point) Explain a technique the manager can use to potentially issue even more AAA-rated securities.

Exam 9, Spring 2017
- 15 - CONTINUED ON NEXT PAGE
15. (2 points)
Consider the following information about reinsurance pricing and catastrophe (CAT) bond pricing:
• Industry average CAT bond spreads from secondary market transactions:
2005 2006 Expected Loss as a Percent of Principal 2% 3%
Ratio of Bond Premium to Expected Loss (Spread) 2.7 3.3
• CAT reinsurance rate on line (ROL) and loss on line (LOL) from industry data:
Loss on Line (LOL) 2005 ROL / LOL 2006 ROL / LOL
1% 5.9 12.9 2% 3.6 7.1 3% 2.9 5.2
20% 1.7 1.8
o where ROL is defined as reinsurance premium divided by the policy limit, and o LOL is defined as expected loss on the contract divided by the policy limit.
a. (1 point)
Evaluate the cost of purchasing protection through a CAT bond market compared to purchasing through the traditional reinsurance market.
b. (0.5 point) Using the above information, explain why a company may choose not to purchase high excess layers of reinsurance.
c. (0.5 point) Discuss why CAT bonds may be preferable to traditional reinsurance for protecting higher layers of loss.

Exam 9, Spring 2017
- 16 - CONTINUED ON NEXT PAGE
16. (1.5 points)
A company is expected to experience a loss in one year according to the following table:
Loss Amount Probability $5 million 90% Catastrophic 10%
• The company currently (t=0) holds $10 million in assets. • The company expects its assets to increase in value by 5% by the end of this year
(t=1).
a. (1 point) Based on the table above, calculate the catastrophic loss amount that would give an expected policyholder deficit (EPD) ratio of 5% at t=1.
b. (0.5 point) Assuming no changes to the company’s loss distribution, calculate the amount of capital that would have to be added at t=1 to decrease the EPD ratio to 1%.

Exam 9, Spring 2017
- 17 - CONTINUED ON NEXT PAGE
17. (3.25 points)
An insurer faces the incurred loss scenarios in the table below. Only one scenario can occur in the coming year. The insurer uses VaR (99%) as the capital requirement.
Scenario Probability Water Loss Wind Loss Total Loss 1 0.50 0 M 0 M 0 M 2 0.25 20 M 5 M 25 M 3 0.15 30 M 20 M 50 M 4 0.09 30 M 45 M 75 M 5 0.01 25 M 75 M 100 M
a. (2.75 points)
Allocate the capital to each peril using capital allocation by percentile layer.
b. (0.5 point) Without performing any calculations, explain how switching to coTVaR(99%) would impact the capital allocated to each peril.
Exam 9, Spring 2017
- 18 - CONTINUED ON NEXT PAGE
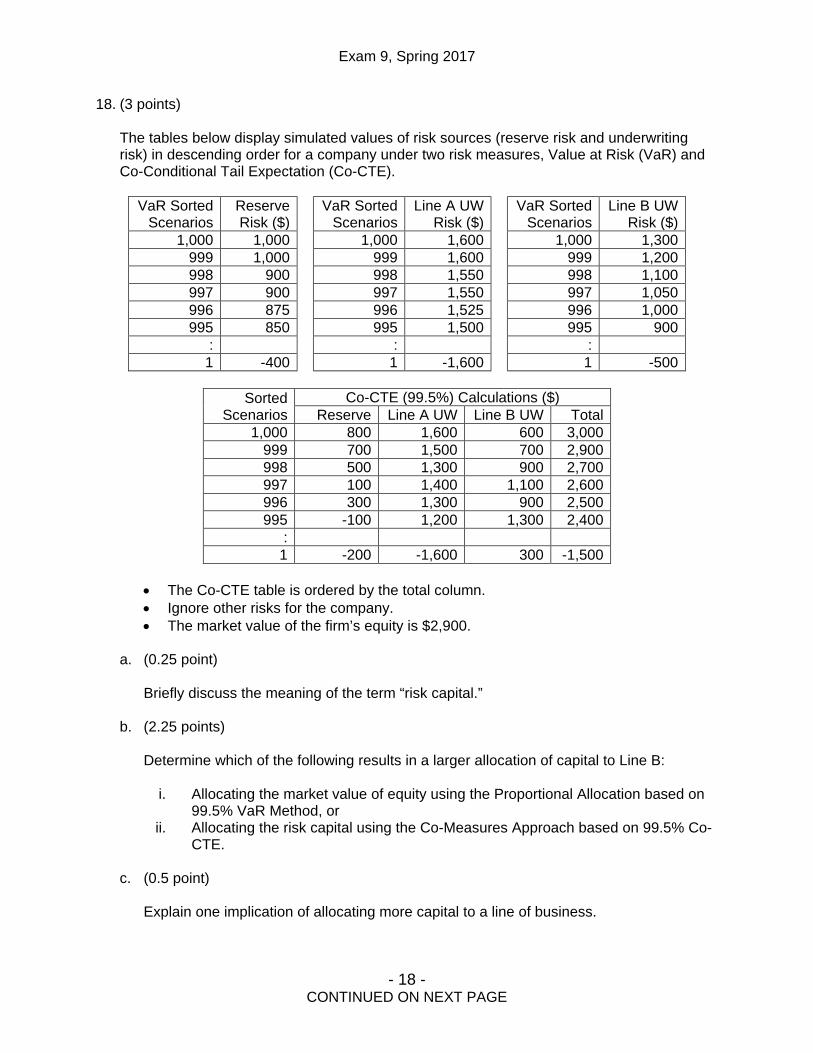
18. (3 points)
The tables below display simulated values of risk sources (reserve risk and underwriting risk) in descending order for a company under two risk measures, Value at Risk (VaR) and Co-Conditional Tail Expectation (Co-CTE).
VaR Sorted
Scenarios Reserve Risk ($)
VaR Sorted Scenarios
Line A UW Risk ($)
VaR Sorted Scenarios
Line B UW Risk ($)
1,000 1,000 1,000 1,600 1,000 1,300 999 1,000 999 1,600 999 1,200 998 900 998 1,550 998 1,100 997 900 997 1,550 997 1,050 996 875 996 1,525 996 1,000 995 850 995 1,500 995 900
: : : 1 -400 1 -1,600 1 -500
Sorted
Scenarios Co-CTE (99.5%) Calculations ($)
Reserve Line A UW Line B UW Total 1,000 800 1,600 600 3,000
999 700 1,500 700 2,900 998 500 1,300 900 2,700 997 100 1,400 1,100 2,600 996 300 1,300 900 2,500 995 -100 1,200 1,300 2,400
: 1 -200 -1,600 300 -1,500
• The Co-CTE table is ordered by the total column. • Ignore other risks for the company. • The market value of the firm’s equity is $2,900.
a. (0.25 point)
Briefly discuss the meaning of the term “risk capital.”
b. (2.25 points)
Determine which of the following results in a larger allocation of capital to Line B:
i. Allocating the market value of equity using the Proportional Allocation based on 99.5% VaR Method, or
ii. Allocating the risk capital using the Co-Measures Approach based on 99.5% Co-CTE.
c. (0.5 point)
Explain one implication of allocating more capital to a line of business.

Exam 9, Spring 2017
- 19 - CONTINUED ON NEXT PAGE
19. (2.5 points)
An insurer is exploring purchasing an excess of loss reinsurance policy that attaches at $100,000. The insurer has simulated 1,000 different scenarios with the following results:
Expected Retained Loss Gross of Reinsurance Net of Reinsurance
$29,000 $27,000 The largest scenarios for the insurer’s retained losses are shown in the table below:
Scenario Rank Gross of Reinsurance ($) Net of Reinsurance ($) 1,000 127,000 100,000 999 120,000 100,000 998 118,000 100,000 997 117,000 100,000 996 115,000 100,000 995 115,000 100,000
Given the following:
• Direct premium is $50,000. • Reinsurance premium is $2,500. • Expense ratio (other than ceding commission) is 20%. • Ceding commission is 20%. • Investment yield is 5%. • Cost of capital is 12.5%. • Capital is set at the 99.5% conditional tail expectation (CTE). • All losses are paid at the end of the year. All other amounts are paid or received at
the beginning of the year.
a. (2 points)
Using a risk-adjusted return approach, determine whether the insurer should purchase the reinsurance policy.
b. (0.5 point) Calculate the additional risk margin that would need to be charged by the direct writer on the ground-up policy to make the risk-adjusted returns on capital equal on a gross and net basis.

Exam 9, Spring 2017
- 20 - CONTINUED ON NEXT PAGE
20. (2.5 points)
A put option pricing function was used to construct the VaR Exceedence Probability Curves below. Use the curves to answer the following questions.
• The firm’s cost of capital is 9%. • The firm chooses an exceedence probability of 5% to allocate capital.
a. (0.5 point)
Discuss how value maximization is affected by capital allocation.
b. (1.5 points) For each line, using the exceedence probability curves, demonstrate how this insurer can increase its shareholder value.
c. (0.5 point) Describe an issue with allocating capital based on exceedence probabilities.
0%
5%
10%
15%
20%
25%
30%
35%
40%
45%
50%
0.50 1.00 1.50 2.00 2.50 3.00 3.50 4.00 4.50 5.00 5.50 6.00 6.50 7.00
Prob
abili
ty
(Losses + Capital) / (Losses)
VaR Exceedence Probability Curves
Line 1 Line 2 Line 3
Exam 9, Spring 2017
- 21 - CONTINUED ON NEXT PAGE
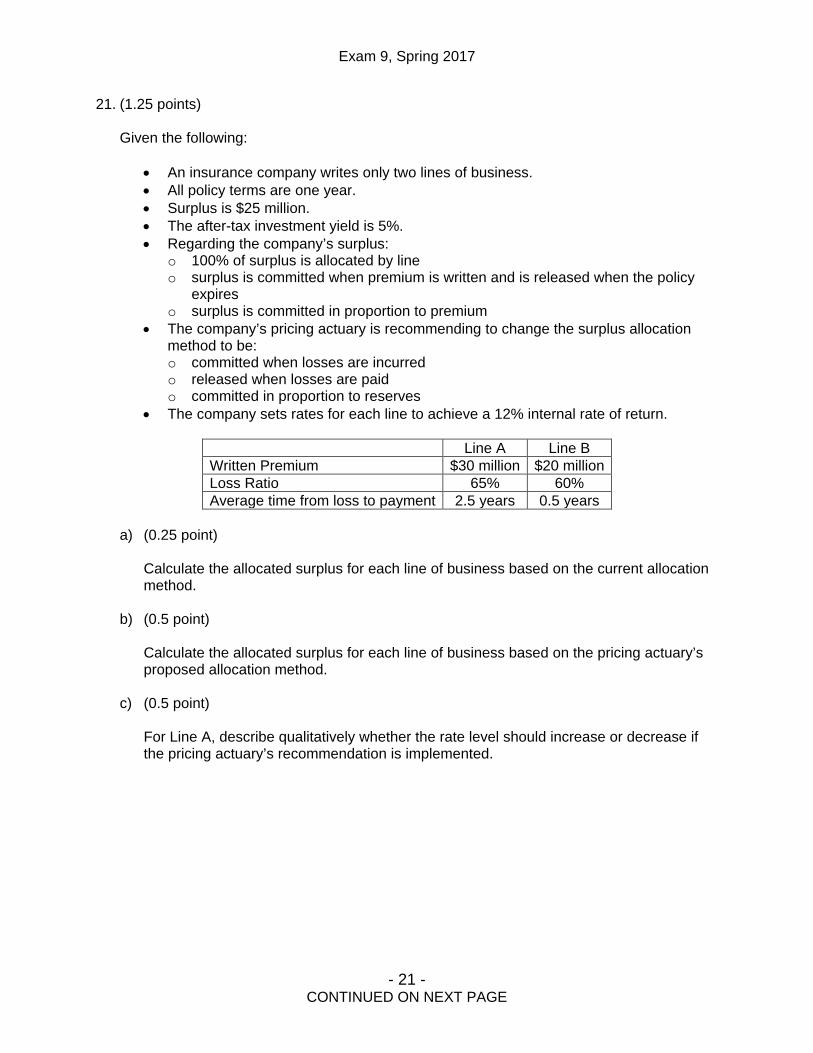
21. (1.25 points)
Given the following:
• An insurance company writes only two lines of business. • All policy terms are one year. • Surplus is $25 million. • The after-tax investment yield is 5%. • Regarding the company’s surplus:
o 100% of surplus is allocated by line o surplus is committed when premium is written and is released when the policy
expires o surplus is committed in proportion to premium
• The company’s pricing actuary is recommending to change the surplus allocation method to be: o committed when losses are incurred o released when losses are paid o committed in proportion to reserves
• The company sets rates for each line to achieve a 12% internal rate of return.
Line A Line B Written Premium $30 million $20 million Loss Ratio 65% 60% Average time from loss to payment 2.5 years 0.5 years
a) (0.25 point)
Calculate the allocated surplus for each line of business based on the current allocation method.
b) (0.5 point) Calculate the allocated surplus for each line of business based on the pricing actuary’s proposed allocation method.
c) (0.5 point) For Line A, describe qualitatively whether the rate level should increase or decrease if the pricing actuary’s recommendation is implemented.

Exam 9, Spring 2017
- 22 - CONTINUED ON NEXT PAGE
22. (1.75 points)
An investor allocates a portfolio between an insurance company and risk-free assets. Given the following information:
Expected
Value Standard Deviation
U / R 2% 10% I / A 4% 4%
• Reserves are 150. • Surplus is 100. • Surplus is equal to Shareholders’ Equity. • The risk-free rate is 3%. • I / A is independent from U / R. • I, A, U and R are defined as in Ferrari’s “The Relationship of Underwriting
Investment, Leverage, and Exposure to Total Return on Owner’s Equity.” • The investor assigns utility to the portfolio by the function 𝑈𝑈𝑈𝑈𝑈𝑈𝑈𝑈𝑈𝑈𝑈𝑈𝑈𝑈 = 𝐸𝐸(𝑟𝑟) – 3𝜎𝜎2.
Determine the weight this investor would assign to the insurance company in the optimal complete portfolio.

Exam 9, Spring 2017
- 23 - CONTINUED ON NEXT PAGE
23. (1 point)
Fully discuss the problems that arise when insurance price levels are regulated using rate of return on equity and how using rate of return on sales addresses those problems.

Exam 9, Spring 2017
- 24 - CONTINUED ON NEXT PAGE
24. (2 points)
For a line of business, the Underwriting Profit Provision is determined using a Risk-Adjusted Discounted Cash Flow (RA DCF) method.
Long-term growth and profitability targets are:
• Financial statement ROE: 15% • Yearly growth target: 10%
a. (1 point) Briefly discuss two advantages of the RA DCF method, and identify whether each advantage helps to achieve the above targets.
b. (1 point) Recommend an alternate Underwriting Profit Provision approach that addresses both targets. Describe how the recommended approach addresses the targets.
Exam 9, Spring 2017
- 25 - CONTINUED ON NEXT PAGE
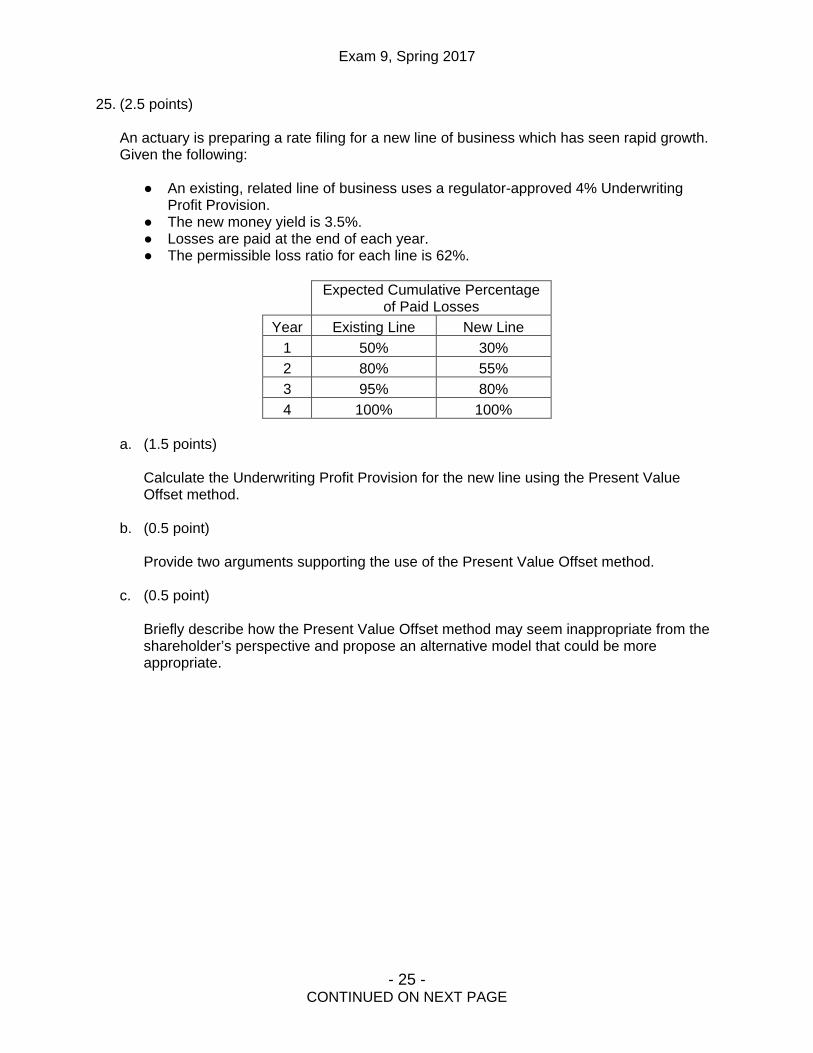
25. (2.5 points)
An actuary is preparing a rate filing for a new line of business which has seen rapid growth. Given the following:
● An existing, related line of business uses a regulator-approved 4% Underwriting Profit Provision.
● The new money yield is 3.5%. ● Losses are paid at the end of each year. ● The permissible loss ratio for each line is 62%.
Expected Cumulative Percentage
of Paid Losses Year Existing Line New Line
1 50% 30% 2 80% 55% 3 95% 80% 4 100% 100%
a. (1.5 points)
Calculate the Underwriting Profit Provision for the new line using the Present Value Offset method.
b. (0.5 point) Provide two arguments supporting the use of the Present Value Offset method.
c. (0.5 point) Briefly describe how the Present Value Offset method may seem inappropriate from the shareholder’s perspective and propose an alternative model that could be more appropriate.
Exam 9, Spring 2017
- 26 - CONTINUED ON NEXT PAGE
26. (2.25 points)
a. (0.75 point) Identify three desirable properties of a riskiness leverage measure from the perspective of company management.
b. (1.5 points) For each of the three risks below, identify a riskiness leverage measure that can be used to manage that risk and justify use of the identified measure. Use a different measure for each risk. • Rating agency downgrade • Failing to meet investor expectations • Reserve adequacy on run-off business with one open claim reserved at $1,000

Exam 9, Spring 2017
- 27 - END OF EXAMINATION
27. (2.5 points)
Two independent, privately held businesses are currently self-insured. The two companies want to pool their risk, which will lower their combined required regulatory capital.
Given the following modeled events:
Scenario Probability Loss for Company A
1 0.1% 120,000 2 0.5% 60,000 3 1.0% 35,000 4 2.0% 10,000 5 96.4% 0
Scenario Probability Loss for Company B 1 0.1% 100,000 2 0.5% 25,000 3 1.0% 10,000 4 2.0% 2,000 5 96.4% 0
For each company:
• Target Return on Equity: 15% • Probability of Ruin: 2.5%
Standard deviations of losses:
• Company A: 6,811 • Company B: 3,764 • Combined Losses (A & B): 10,351
Both companies will use the marginal surplus method to allocate risk load.
Calculate and explain the range of capital that Company B can offer for its share of the risk load that will make pooling risk with Company A individually and collectively rational.


SPRING 2017 EXAM 9 SAMPLE ANSWERS AND EXAMINER’S REPORT
GENERAL COMMENTS: • Candidates should note that the instructions to the exam explicitly say to show all work; graders
expect to see enough support on the candidate’s answer sheet to follow the calculations performed. While the graders made every attempt to follow calculations that were not well-documented, lack of documentation may result in the deduction of points where the calculations cannot be followed or are not sufficiently supported.
• Candidates should justify all selections when prompted to do so. For example, if the candidate selects an all year average and the question prompts a justification of all selections, a brief explanation should be provided for the reasoning behind this selection. Candidates should note that a restatement of a numerical selection in words is not a justification.
• Incorrect responses in one part of a question did not preclude candidates from receiving credit for correct work on subsequent parts of the question that depended upon that response.
• Candidates should try to be cognizant of the way an exam question is worded. They must look for key words such as “briefly” or “fully” within the problem. We refer candidates to the Future Fellows article from December 2009 entitled “The Importance of Adverbs” for additional information on this topic.
• Some candidates provided lengthy responses to a “briefly describe” question, which does not provide extra credit and only takes up additional time during the exam.
• Candidates should note that the sample answers provided in the examiner’s report are not an exhaustive representation of all responses given credit during grading, but rather the most common correct responses.
• In cases where a given number of items were requested (e.g., “three reasons” or “two scenarios”), the examiner’s report often provides more sample answers than the requested number. The additional responses are provided for educational value, and would not have resulted in any additional credit for candidates who provided more than the requested number of responses. Candidates are reminded that, per the instructions to the exam, when a specific number of items is requested, only the items adding up to that number will be graded (i.e., if two items are requested and three are provided, only the first two are graded).
• It should be noted that all exam questions have been written and graded based on information included in materials that have been directly referenced in the official syllabus, which is located on the CAS website. The CAS takes no responsibility for the content of supplementary study materials and/or manuals produced by outside corporations and/or individuals which are not directly referenced in the official syllabus.
EXAM STATISTICS:
• Number of Candidates: 514 • Available Points: 60 • Passing Score: 43.75 • Number of Passing Candidates: 290 • Raw Pass Ratio: 56.42% • Effective Pass Ratio: 57.65%

SPRING 2017 EXAM 9 SAMPLE ANSWERS AND EXAMINER’S REPORT
SPRING 2017 EXAM 9, QUESTION 1 TOTAL POINT VALUE: 7.5 LEARNING OBJECTIVE(S):
Part a: D1 Part b: C6, C8 Part c: B4 Part d: C9 Part e: A9
SAMPLE ANSWERS Part a: 3 points Sample solution
𝑁𝑁𝑁𝑁𝑁𝑁 = −1.2𝑀𝑀 + 1.14𝑀𝑀1.08 +
0.648𝑀𝑀1.082 = 411,111
0 = −1.2𝑀𝑀 +1.14𝑀𝑀
1 + 𝐼𝐼𝐼𝐼𝐼𝐼 +0.648𝑀𝑀
(1 + 𝐼𝐼𝐼𝐼𝐼𝐼)2 → 𝐼𝐼𝐼𝐼𝐼𝐼 = 35.0%
Year 0 1 2 Premium 4,000,000 Expenses -1,000,000
= 4M * 25%
Paid losses 0 -1,800,000 = 4M * 45%
-1,200,000
Reserve 3,000,000 = 1.8M + 1.2M
1,200,000 0
Required surplus 1,200,000 = Reserve/2.5
480,000 0
Required assets 4,200,000 = Reserve + Surplus
1,680,000 0
Investment income 0 420,000 = Prior Ending Assets * 10%
168,000
Beginning assets 3,000,000 = Premium - Expenses
4,620,000 = Prior Ending Assets + Investment Income
1,848,000
Loss payments 0 -1,800,000 -1,200,000 Equity flow from investors
1,200,000 =Required assets – Beginning assets – Loss payments
-1,140,000 -648,000
Ending assets 4,200,000 =Beginning assets – Loss payments + Equity flow from investors
1,680,000 0

SPRING 2017 EXAM 9 SAMPLE ANSWERS AND EXAMINER’S REPORT
Part b: 1.75 points Sample solution 1
Discounted Loss Ratio = 0.45 + 0.3/1.10 = 0.7227. (Disc. Loss = 2,890,909) Investment Income (on reserves only) = 0.1 * 3M = 300,000 Economic Profit = 4M - 1M – 0.7227 * 4M + 300,000 = 409,091 RAROC = 409,091 / 2,500,000 = 16.4% The following variations of this approach were also acceptable:
1. Using risk-free rate to discount losses. 2. Discounting losses and investment income to t=0 or to t=2. 3. Including investment income earned in year 2. 4. Including investment income earned on risk capital. 5. Including investment income earned on required surplus (as determined in part a.). 6. Modifying Risk Capital to reflect a multi-period capital commitment.
Part c: 1.25 points Sample solution
𝑑𝑑 =𝑐𝑐𝑐𝑐
1 + 𝑐𝑐𝑓𝑓=
0.81.03 = 0.7767
𝑀𝑀𝑀𝑀𝑐𝑐𝑀𝑀𝑀𝑀𝑀𝑀𝑀𝑀𝑀𝑀 𝐹𝐹𝑐𝑐𝑀𝑀𝑀𝑀𝑐𝑐ℎ𝑀𝑀𝑖𝑖𝑖𝑖 𝑁𝑁𝑀𝑀𝑀𝑀𝑉𝑉𝑖𝑖 = �𝑁𝑁 − 𝐸𝐸 − 𝑁𝑁𝑁𝑁�𝑀𝑀𝑙𝑙𝑖𝑖𝑖𝑖𝑖𝑖𝑖𝑖 @𝑡𝑡 = 0 @ 𝑐𝑐𝑓𝑓�� ×𝑑𝑑
1 − 𝑑𝑑
= �4,000,000 − 1,000,000 − �1.8𝑀𝑀1.03 +
1.2𝑀𝑀1.032�� ×
0.77671 − 0.7767
= 121,312 × 3.47828 = 421,567
Part d: 0.5 point Sample solution 1 IRR > cost of capital (0.35>0.08) Sample solution 2 NPV > 0 Sample solution 3 RAROC > cost of capital Sample solution 4 It increases franchise value
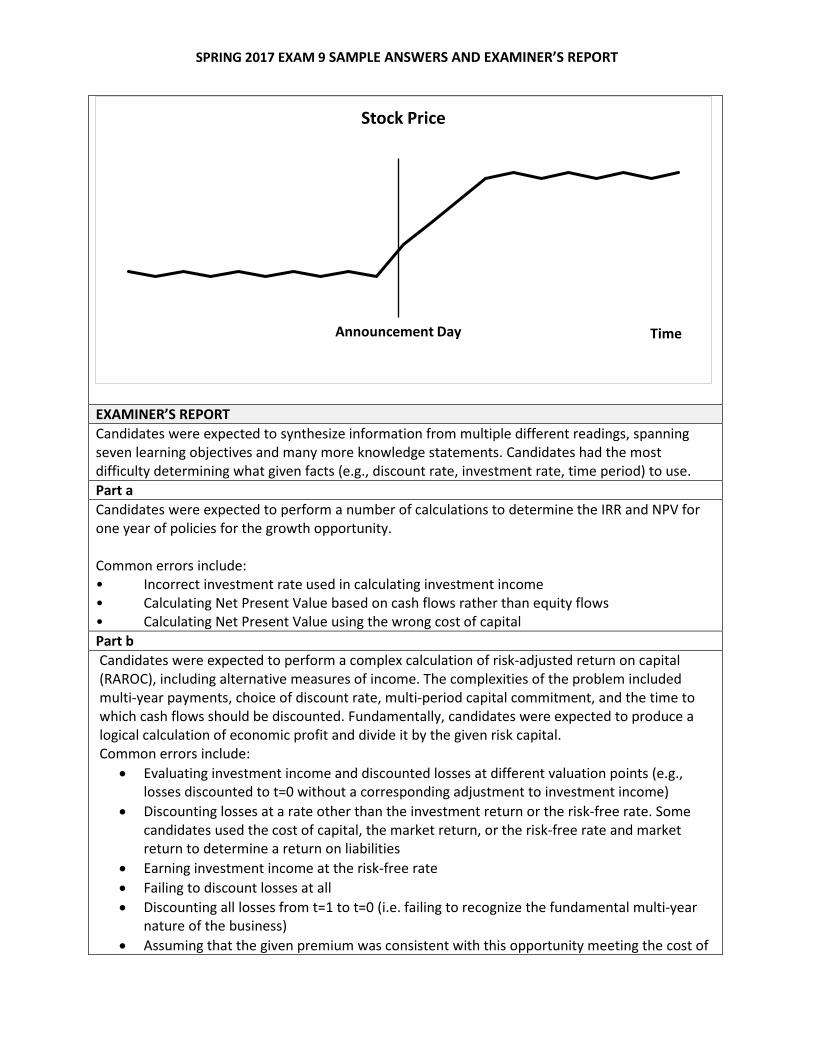
Part e: 1 point Sample solution 1 Strong form:
Before: Price goes up prior to announcement due to insider information being known and immediately reflected in stock price After: Inside information already reflected so no change in price

SPRING 2017 EXAM 9 SAMPLE ANSWERS AND EXAMINER’S REPORT
Semi-strong form: Before: No change in stock price as announcement is not public yet and it is not reflected in any of the company’s proposed information. After: Price goes up after announcement and then immediately levels off (flat curve)
Sample solution 2 Strong form: Under strong form, stock prices have reflected all available info including insider information. The stock price will already be increased to the new equilibrium level before the announcement because everyone knows about the project already even before the official announcement. There is no change to stock price after the announcement. Semi-strong form: Under semi-strong form, stock prices here reflected all publicly available info. The stock price may be increased a bit before the announcement, due to leakage of information. After the announcement, the project becomes public news and thus, the stock price will move further upward to the new equilibrium immediately. Sample solution 3 Strong form:
Before: Stock price reflects this insider information and goes up After: Nothing, as stock price already reflects change
Semi-strong form: Before: Nothing, since information is not public After: Price immediately jumps to reflect this information
Sample solution 4 Under Strong form, stock price moves like below due to insider trading:
Under semi-strong form, stock price moves like below due to no insider trading:
Stock Price
Announcement Day Time
SPRING 2017 EXAM 9 SAMPLE ANSWERS AND EXAMINER’S REPORT
EXAMINER’S REPORT Candidates were expected to synthesize information from multiple different readings, spanning seven learning objectives and many more knowledge statements. Candidates had the most difficulty determining what given facts (e.g., discount rate, investment rate, time period) to use. Part a Candidates were expected to perform a number of calculations to determine the IRR and NPV for one year of policies for the growth opportunity. Common errors include: • Incorrect investment rate used in calculating investment income • Calculating Net Present Value based on cash flows rather than equity flows • Calculating Net Present Value using the wrong cost of capital Part b Candidates were expected to perform a complex calculation of risk-adjusted return on capital (RAROC), including alternative measures of income. The complexities of the problem included multi-year payments, choice of discount rate, multi-period capital commitment, and the time to which cash flows should be discounted. Fundamentally, candidates were expected to produce a logical calculation of economic profit and divide it by the given risk capital. Common errors include:
• Evaluating investment income and discounted losses at different valuation points (e.g., losses discounted to t=0 without a corresponding adjustment to investment income)
• Discounting losses at a rate other than the investment return or the risk-free rate. Some candidates used the cost of capital, the market return, or the risk-free rate and market return to determine a return on liabilities
• Earning investment income at the risk-free rate • Failing to discount losses at all • Discounting all losses from t=1 to t=0 (i.e. failing to recognize the fundamental multi-year
nature of the business) • Assuming that the given premium was consistent with this opportunity meeting the cost of
Stock Price
Announcement Day Time

SPRING 2017 EXAM 9 SAMPLE ANSWERS AND EXAMINER’S REPORT
capital. The fundamental task requested in connection with part d. was to evaluate whether this was indeed the case.
Part c Candidates were expected to perform basic calculations to quantify franchise value. The solution to this problem required a very minor modification to the fundamental formula in Panning to calculate present value of loss at time 0. Common errors include:
• Discounting all losses from t=1 to t=0 (i.e. failing to recognize the fundamental multi-year nature of the business)
• Discounting losses at a rate other than the investment return or the risk-free rate. (Though Panning specifically used the risk-free rate, the investment return was acceptable as well)
Part d Candidates were expected to use any of the metrics calculated in part a. – part c. and compare to the appropriate measure that would support pursuit of this project (e.g., compare IRR or RAROC to the cost of capital). Candidates performed well on this part relative to other parts of this question.
Part e Candidates were expected to state what would happen to the stock price before and after the announcement under the strong and semi-strong form of the efficient market hypothesis. A common error was not identifying what would happen at a certain point in time when there would be no stock price changes (i.e. no increase after the announcement under strong form and no increase prior to the announcement under semi-strong form).

SPRING 2017 EXAM 9 SAMPLE ANSWERS AND EXAMINER’S REPORT
SPRING 2017 EXAM 9, QUESTION 2 TOTAL POINT VALUE: 1 LEARNING OBJECTIVE(S): A1 SAMPLE ANSWERS Part a: 0.5 point Sample solution 1 Passive investment strategy is to use the market portfolio as risky portfolio and allocate between market and risk-free asset depending on the investor’s risk aversion. Sample solution 2 Passive investment strategy relies on investing in a well-diversified portfolio often mimicking a market index without actively researching/security analysis to find mispriced assets. Part b: 0.5 point Sample solution 1
1. Transaction costs – Passive strategy is cheaper than active strategy – don’t need to spend money researching stocks and constantly buying and selling.
2. Free-rider benefit – Passive strategy benefits from work of active portfolio managers who do security analysis and make stock prices more accurate by identifying mispricing and trading based on them.
Sample solution 2
1. Reduce cost: reduce time and resources to find mispricing and avoid transaction costs 2. Historical data show that passive investment outperforms active, so likely to increase
return vs active EXAMINER’S REPORT Candidates were expected to understand the differences between passive and active investment strategies. Part a Candidates were expected to understand and describe a passive investment strategy. A common error was failing to mention that passive investors do not conduct stock analyses. Part b Candidates were expected to acknowledge the cost and benefits of a passive strategy (both transactional and/or the lack of research costs) and the free-rider benefit. A common error was to state that there are no transaction costs associated with the passive strategy

SPRING 2017 EXAM 9 SAMPLE ANSWERS AND EXAMINER’S REPORT
SPRING 2017 EXAM 9, QUESTION 3 TOTAL POINT VALUE: 1.25 LEARNING OBJECTIVE(S): A2 SAMPLE ANSWERS Sample solution 1 3 scenarios:
1. ½ A ½ B 2. ½ A ½ C 3. ½ B ½ C
All have same return -> compare 𝜎𝜎𝑝𝑝2 𝜎𝜎𝑝𝑝2 = 𝑤𝑤12𝜎𝜎12 + 𝑤𝑤2
2𝜎𝜎22 + 2𝑤𝑤1𝑤𝑤2𝜎𝜎12 𝜎𝜎12 = . 52𝜎𝜎12 +. 52𝜎𝜎12 + 2(. 52)𝜌𝜌𝜎𝜎12 𝜎𝜎32 = . 52𝜎𝜎12 +. 52𝜎𝜎22 + 2(. 52)𝜌𝜌𝜎𝜎1𝜎𝜎2 𝜎𝜎32 = . 52𝜎𝜎12 +. 52𝜎𝜎22 + 2(. 52)(0.1)𝜌𝜌𝜎𝜎1𝜎𝜎2 𝜎𝜎2 for 3 < 𝜎𝜎2 for 2 < 𝜎𝜎2 for 1 Lowest is best -> Rank: Best = ½ B ½ C 2nd Best = ½ A ½ C 3rd Best = ½ A ½ B Sample solution 2 B & C is the best option since all stocks have the same expected return, the difference will be in riskiness. Want to minimize variation, and so C should be one of the stocks as 𝜎𝜎2 < 𝜎𝜎1. B would be the second stock as you also want to diversify and since 𝜌𝜌𝐵𝐵𝐵𝐵 = 0.1𝜌𝜌 where 𝜌𝜌 > 0 then B and C are less correlated than A and C. Second best is A & C. Again, having C will reduce variation and risk for same reason above, so an option with C is better than an option without. A is picked because B was selected above and it’s the only other option. Least preferable is A & B as it gives no benefit to expected return, is riskier due to higher variance than the two above, and A & B are more correlated than B & C. EXAMINER’S REPORT Candidates were expected to rank the three possible two-stock portfolios in terms of risk-return tradeoff using the given return, variance and correlation information. The correct ranking is BC is a better choice than AC and AC is a better choice than AB. There were two main acceptable approaches to this question. Candidates can comment fully on the comparison between each pair of the stock portfolios’ returns, variances and covariance terms using the given information to arrive at the correct ranking. Alternatively, candidates can calculate the correct return and variance for each portfolio and use the given information to compare these formulae to arrive at the correct ranking. Both return and risk should be

SPRING 2017 EXAM 9 SAMPLE ANSWERS AND EXAMINER’S REPORT
discussed. Common errors include:
• Ranking individual stocks rather than the portfolios • Picking only the best portfolio without fully ranking all three • Switching 𝜎𝜎1 and 𝜎𝜎2 • Partial discussion of correlation/covariance term only • Not discussing the relationship between the returns • Using the incorrect portfolio variance formula

SPRING 2017 EXAM 9 SAMPLE ANSWERS AND EXAMINER’S REPORT
SPRING 2017 EXAM 9, QUESTION 4 TOTAL POINT VALUE: 2 LEARNING OBJECTIVE(S): A2, A8 SAMPLE ANSWERS Part a: 0.5 point Sample solution 1 Because assets A&B are perfectly negatively correlated it is possible to create a portfolio between A&B that has no variance and is thus risk free. Since both the returns for A&B are above the risk free rate, this return would be larger than the risk free rate with no risk. You can borrow at the risk free rate and purchase this portfolio. Sample solution 2 Since assets are perfectly negatively correlated can find minimum variance = 0 with weights of A & B and borrow @ rf to fund investment= riskless profit w/ no net investment. Part b: 1.5 points Sample solution 1 (Standard Deviation Shortcut)
𝑊𝑊𝐴𝐴 =𝜎𝜎𝐵𝐵
𝜎𝜎𝐴𝐴 + 𝜎𝜎𝐵𝐵=
. 35. 25 + .35 = .5833
𝑊𝑊𝐵𝐵 = 1 − .5833 = .4167
𝐸𝐸(𝑐𝑐𝑃𝑃) = .5833(. 04) + .4167(. 07) = .0525
𝜎𝜎𝑃𝑃 = 0 Since greater than risk free rate, we borrow 1 unit of r.f. then buy 1 unit of the riskless portfolio, P. This gives us a riskless return of .0525 − .02 = .0325. Sample solution 2 (Risk Premium)
𝑊𝑊𝐴𝐴 = 𝐸𝐸(𝐼𝐼𝐴𝐴)𝜎𝜎𝐵𝐵2 − 𝐸𝐸(𝐼𝐼𝐵𝐵)𝑐𝑐𝑙𝑙𝑐𝑐(𝐴𝐴,𝐵𝐵)
𝐸𝐸(𝐼𝐼𝐴𝐴)𝜎𝜎𝐵𝐵2 + 𝐸𝐸(𝐼𝐼𝐵𝐵)𝜎𝜎𝐴𝐴2 − �𝐸𝐸(𝐼𝐼𝐴𝐴) + 𝐸𝐸(𝐼𝐼𝐵𝐵)�𝑐𝑐𝑙𝑙𝑐𝑐(𝐴𝐴,𝐵𝐵)
=2%(35%)2 − 5%(−25% ∙ 35%)
2%(35%)2 + 5%(25%)2 − (2% + 5%)(−25% ∙ 35%)
= 0.5833
𝐸𝐸(𝐼𝐼𝑃𝑃) = 𝑊𝑊𝐴𝐴 ∙ 𝐸𝐸(𝐼𝐼𝐴𝐴) + (1 −𝑊𝑊𝐴𝐴) ∙ 𝐸𝐸(𝐼𝐼𝐵𝐵)
= 0.5833 ∙ 2% + (1 − 0.5833) ∙ 5% = 3.25% Sample solution 3 (Weight formula)
𝑊𝑊𝐴𝐴 =(0.35)2 − (−1)(0.35)(0.25)
(0.35)2 + (0.25)2 − 2(−1)(0.35)(0.25) = 0.583
𝐶𝐶ℎ𝑖𝑖𝑐𝑐𝑒𝑒 = (0.583)2(0.25)2 + (1 − 0.583)2(0.35)2 + 2(−1)(0.25)(0.35)(0.583)(0.417) = 0
𝐸𝐸(𝑐𝑐𝑃𝑃) = 0.583(0.04) + (1 − 0.583)(0.07) = 5.25%
SPRING 2017 EXAM 9 SAMPLE ANSWERS AND EXAMINER’S REPORT
Borrow full amount invested here at rf. So E(rc) = 1(5.25%) − (2%) = 3.25%
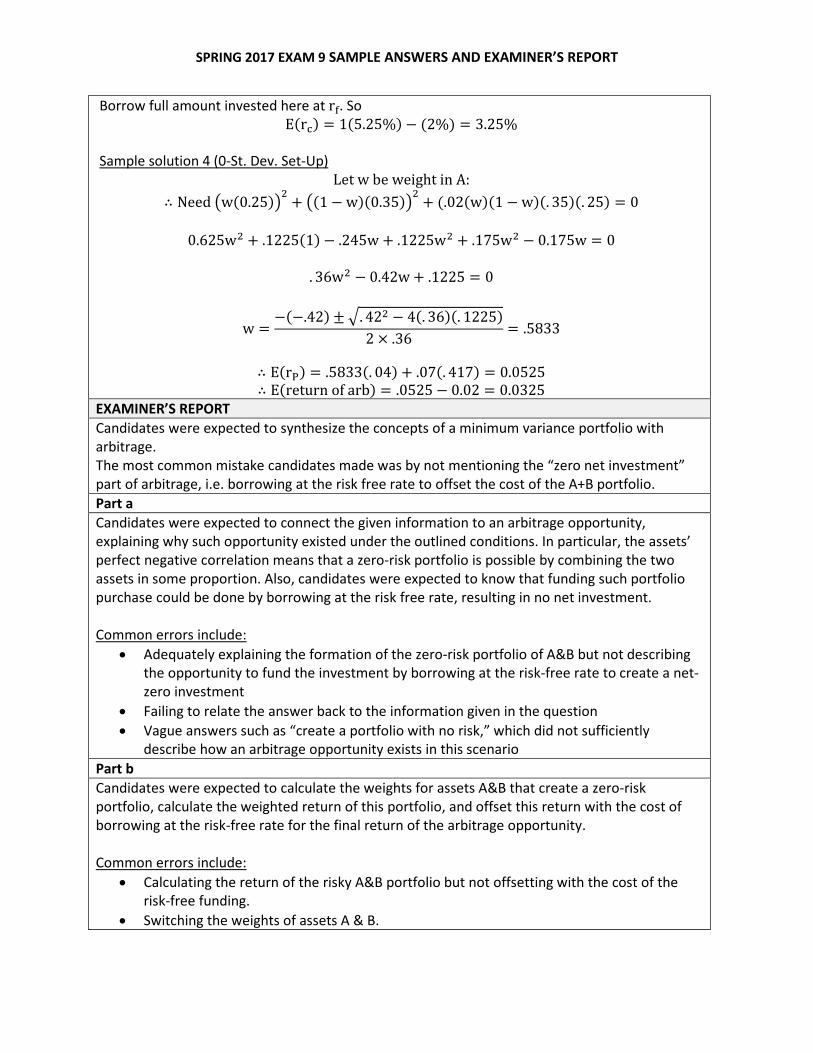
Sample solution 4 (0-St. Dev. Set-Up)
Let w be weight in A: ∴ Need �w(0.25)�2 + �(1 − w)(0.35)�2 + (.02(w)(1 − w)(. 35)(. 25) = 0
0.625w2 + .1225(1)− .245w + .1225w2 + .175w2 − 0.175w = 0
. 36w2 − 0.42w + .1225 = 0
w =−(−.42) ± �. 422 − 4(. 36)(. 1225)
2 × .36 = .5833
∴ E(rP) = .5833(. 04) + .07(. 417) = 0.0525 ∴ E(return of arb) = .0525 − 0.02 = 0.0325
EXAMINER’S REPORT Candidates were expected to synthesize the concepts of a minimum variance portfolio with arbitrage. The most common mistake candidates made was by not mentioning the “zero net investment” part of arbitrage, i.e. borrowing at the risk free rate to offset the cost of the A+B portfolio. Part a Candidates were expected to connect the given information to an arbitrage opportunity, explaining why such opportunity existed under the outlined conditions. In particular, the assets’ perfect negative correlation means that a zero-risk portfolio is possible by combining the two assets in some proportion. Also, candidates were expected to know that funding such portfolio purchase could be done by borrowing at the risk free rate, resulting in no net investment. Common errors include:
• Adequately explaining the formation of the zero-risk portfolio of A&B but not describing the opportunity to fund the investment by borrowing at the risk-free rate to create a net-zero investment
• Failing to relate the answer back to the information given in the question • Vague answers such as “create a portfolio with no risk,” which did not sufficiently
describe how an arbitrage opportunity exists in this scenario Part b Candidates were expected to calculate the weights for assets A&B that create a zero-risk portfolio, calculate the weighted return of this portfolio, and offset this return with the cost of borrowing at the risk-free rate for the final return of the arbitrage opportunity. Common errors include:
• Calculating the return of the risky A&B portfolio but not offsetting with the cost of the risk-free funding.
• Switching the weights of assets A & B.

SPRING 2017 EXAM 9 SAMPLE ANSWERS AND EXAMINER’S REPORT
SPRING 2017 EXAM 9, QUESTION 5 TOTAL POINT VALUE: 1.5 LEARNING OBJECTIVE(S): A6 SAMPLE ANSWERS Part a: 0.5 point Sample solution 1 𝛼𝛼𝐴𝐴 = .078 − �𝑐𝑐𝑓𝑓 + 𝛽𝛽𝐴𝐴(𝐸𝐸(𝑐𝑐𝑀𝑀)− 𝑐𝑐𝑓𝑓)� = . 078 − [. 05 + 0.4(. 10 − .05)] = 0.008 𝛼𝛼𝐵𝐵 = . 083 − [. 05 + 0.9(. 10 − .05)] = -0.012 Sample solution 2 α = Expected rate of return – Rate predicted by CAPM CAPM E(ra) = �𝑐𝑐𝑓𝑓 + 𝛽𝛽𝐴𝐴(𝐸𝐸(𝑐𝑐𝑀𝑀) − 𝑐𝑐𝑓𝑓)� = [. 05 + 0.4(. 10 − .05)] = .07 CAPM E(ra) = �𝑐𝑐𝑓𝑓 + 𝛽𝛽𝐴𝐴(𝐸𝐸(𝑐𝑐𝑀𝑀) − 𝑐𝑐𝑓𝑓)� = [. 05 + 0.4(. 10 − .05)] = .095 𝛼𝛼𝐴𝐴 = . 078 -.070 = .8% 𝛼𝛼𝐵𝐵 = . 083 -.095 = -1.2% Part b: 1 point
EXAMINER’S REPORT Candidates were expected to understand the relationship between beta and the expected return of a portfolio using the CAPM. They were also expected to understand where each of the 4 portfolios plotted in relation to the SML. Candidates had to know that alpha was the difference between the SML’s fair price given Beta and the published return. Candidates were then required to represent this difference graphically. Part a
(1, 0.1)
(0, 0.05)
(0.9, 0.083)
(0.4, 0.078)
0
0.02
0.04
0.06
0.08
0.1
0.12
0 0.2 0.4 0.6 0.8 1 1.2
E(R)
β
M
rf
A
B
αb
αa

SPRING 2017 EXAM 9 SAMPLE ANSWERS AND EXAMINER’S REPORT
Candidates were expected to calculate the alpha for each of the 2 portfolios given by subtracting the expected return from the CAPM model from the published returns. Common errors include:
• Simple calculation errors while calculating α • Calculating the CAPM E(r) instead of alpha
Part b Candidates were expected to:
• Plot the portfolios using the appropriate Beta-Return coordinates • Label the axes as Beta and Expected Return • Plot the SML with the 2 key portfolios (risk free and Market) on it • Clearly label the alphas as distances from the SML to the given portfolios A and B
Common errors include:
• Plotting A and B directly on the SML • Plotting the risk free rate at a value other than 5% • Mixing up Beta with Sigma • Not plotting the alphas as distances between points

SPRING 2017 EXAM 9 SAMPLE ANSWERS AND EXAMINER’S REPORT
SPRING 2017 EXAM 9, QUESTION 6 TOTAL POINT VALUE: 2.5 LEARNING OBJECTIVE(S): A6, A7 SAMPLE ANSWERS Part a: 1.5 points Sample solution 1
E(A) = rf+β*(RM) = 0.04+0.2*(0.06) = 0.052 E(B) = rf +β*(RM) = rf + (Covariance/Market variance)*(RM) = 0.04 + (0.03/0.05)*0.06 = 0.076 α(Α) = (85/80-1)-0.052 = 0.0105 α(Β) = (63/60-1)-0.076=-.026 A is the better buy if short sales are not allowed, but B is the better strategy if short sales are allowed, as the absolute value of its alpha is greater than that of A
Sample solution 2
E(A) = rf+β*(RM) = 0.04+0.2*(0.06) = 0.052 E(B) = rf +β*(RM) = rf + (Covariance/Market variance)*(RM) = 0.04 + (0.03/0.05)*0.06 = 0.076 According to CAPM, price of A at time 1 = 80*(1+0.052)=84.16 <85 According to CAPM, price of B at time 1 = 60*(1+0.076)=64.56>63 A is underpriced, it is the better buy if short sales are not allowed, but portfolio B is the better strategy if short sales are allowed, as the absolute value difference of its forecast price and expected is greater than that of A
Sample solution 3
E (A) = rf+β*(RM) = 0.04+0.2*(0.06) = 0.052 E (B) = rf +β*(RM) = rf + (Covariance/Market variance)*(RM) = 0.04 + (0.03/0.05)*0.06 = 0.076 According to CAPM, price of A at time 0 = 85/(1+0.052)=80.80 >80 According to CAPM, price of B at time 0 = 63/(1+0.076)=58.55<60 A is underpriced, it is the better buy if short sales are not allowed, but portfolio B is the better strategy if short sales are allowed, as the absolute value difference of its forecast price and expected is greater than that of A.
Part b: 1 point Sample solution 1 Under CAPM, all investors apply the Markowitz optimization process to a common set of investable assets and input list (expected returns and covariance matrix). The optimal risky portfolio that all investors hold would, by definition, will be the market portfolio. According to the single-index model, when forming a portfolio, investors will relentlessly pursue positive alpha stocks, or taking short positions in negative alpha stocks to increase the risk premium. Consequently, prices of positive alpha stocks will rise and prices of negative alpha will fall. This will continue until all alpha values are driven to zero. At this point, investors will be content to minimize risk by completely eliminating unique risk, that is, by holding the broadest possible, market portfolio. When all stocks have zero alphas, the market portfolio will be the optimal risk portfolio.

SPRING 2017 EXAM 9 SAMPLE ANSWERS AND EXAMINER’S REPORT
So both CAPM and the single-index model suggest that the market portfolio is the optimal risky portfolio, but do so from different starting assumptions. Sample solution 2 Under CAPM, the optimal risky portfolio is the market portfolio. Under the single-index model, investors search for stocks with non-zero alphas and create a portfolio of passive (market) and active (non-zero-alphas) investing. In this process, the investors will bring the alphas to zero and the optimal portfolio will also be the market portfolio. EXAMINER’S REPORT Candidates were expected to know the CAPM and single-index model calculations and the optimal portfolio strategies underlying each. Candidates had more difficulty with contrasting CAPM with the single index model (part b.) compared to explaining the superior investment strategy according to CAPM (part a.). Part a Candidates were expected to understand the CAPM expected return calculation and evaluate the superior investment strategy according to CAPM. A common error was using the market return risk premium as the market return Part b Candidates were expected to understand the differences between CAPM and the single-index model and how they would result in differences in the optimal risky portfolios. Common errors include:
• Incorrectly stating that CAPM optimal risk portfolio leads to Market index (incorrect, leads to Market Portfolio)
• Incorrectly stating that the single index model optimal risk portfolio is an index • Not explaining how both models will lead to the market portfolio as the optimal risky
portfolio • Including true statements that do not directly tie to the question, such as:
o CAPM investors all are mean-variance investors with the same input list (failing to specify that this results in the Market portfolio being the optimal portfolio)
o CAPM has more variables, leading to more parameter estimation risk o CAPM looks at expected return, but single-index model looks at actual return o CAPM assumes an unobservable market

SPRING 2017 EXAM 9 SAMPLE ANSWERS AND EXAMINER’S REPORT
SPRING 2017 EXAM 9, QUESTION 7 TOTAL POINT VALUE: 2 LEARNING OBJECTIVE(S): A9 SAMPLE ANSWERS Part a: 2 points Sample solution 1 Weak form EMH – Stock price reflects all information from historical prices and trading volumes. Technical analysis will not beat the market. Semi-strong form EMH – stock prices reflect all public information. Fundamental analysis will not beat the market. If only Weak form EMH holds, a fundamental analysis can still give a return above the market return. This does involve research costs for gathering information on stock fundamentals and transaction costs to rebalance portfolio for an active strategy that can reduce total returns. Fundamental analysis is only valuable if excess return exceeds these costs. The larger the portfolio, the greater gains from excess returns, so a small improvement can mean a lot for a $100 billion portfolio. With these considerations I suggest a fundamental analysis and active management strategy. Sample solution 2 Suggest passive investment strategy, but still manage portfolio.
• Weak – technical analysis does not bring extra profit to the company. Passive investment strategy is efficient as stock prices reflect all info from studying market trading data. Technical analysis tries to profit by finding recurrent and predictable patterns from stock prices. Semi-strong – Fundamental analysis doesn’t bring extra profit to the company. Stock prices already reflect all publicly available info about firm’s prospects. Fundamental analysis attempts to calculate the fair price of a stock by calculating present value of all payments investor will receive from holding one share of stock.
• There is no research cost if choose to invest passively in market portfolio and T-Bill. • Transaction cost only occurs when managing portfolio or adjust the weights between
market portfolio and risk free investment. • Portfolio size is large, hence will benefit from economies of scale. Manage portfolio to
make sure the systematic risk is what’s preferred by the firm, also reflect the tax preference of the firm, and the diversification preference of the firm.
EXAMINER’S REPORT Candidates were expected to have a strong understanding of the different forms of the Efficient Market Hypothesis and how they relate to portfolio management strategies. Part a Candidates were expected to demonstrate an understanding of the different forms of the Efficient Markets Hypothesis, investment analysis and investment strategy. They were also expected to synthesize these ideas with the information provided in the question and provide a recommendation discussing the form of the efficient market hypothesis, research costs, transaction costs and the portfolio size. Common errors include:

SPRING 2017 EXAM 9 SAMPLE ANSWERS AND EXAMINER’S REPORT
• Not fully supporting the choice of investments analysis and strategy • Discussing the information without making a recommendation • Failing to compare the magnitude of returns on a large portfolio to the costs of
investment
SPRING 2017 EXAM 9 SAMPLE ANSWERS AND EXAMINER’S REPORT
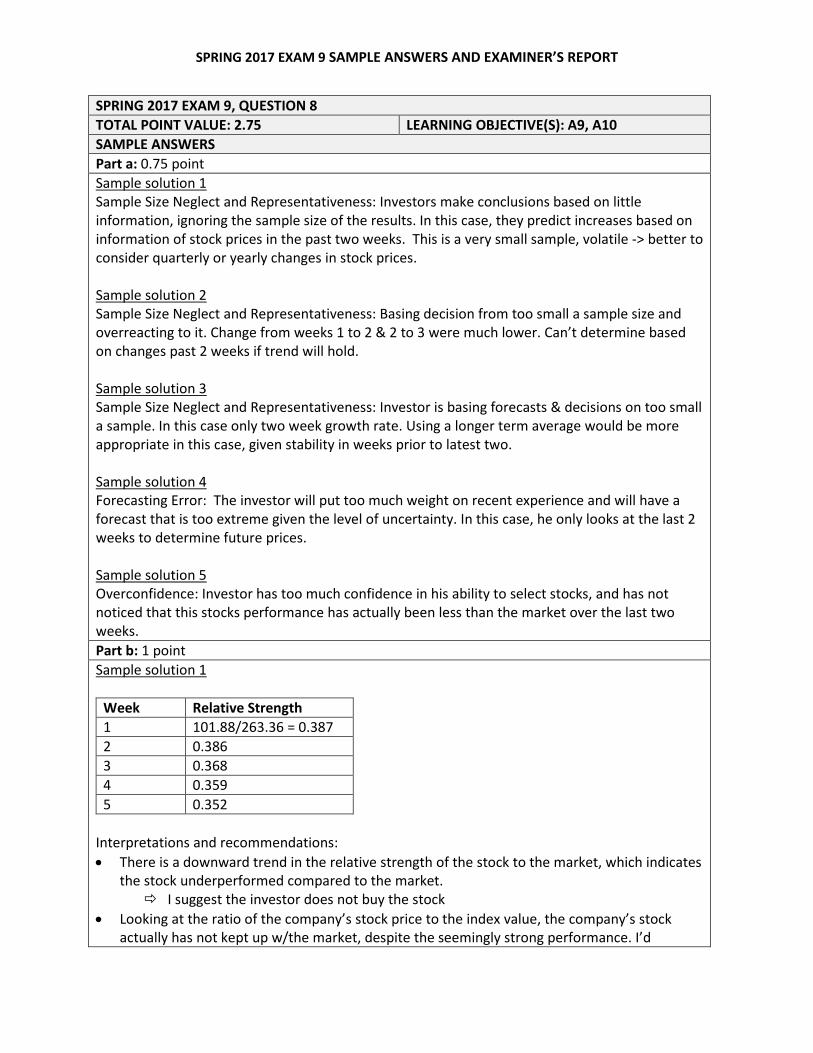
SPRING 2017 EXAM 9, QUESTION 8 TOTAL POINT VALUE: 2.75 LEARNING OBJECTIVE(S): A9, A10 SAMPLE ANSWERS Part a: 0.75 point Sample solution 1 Sample Size Neglect and Representativeness: Investors make conclusions based on little information, ignoring the sample size of the results. In this case, they predict increases based on information of stock prices in the past two weeks. This is a very small sample, volatile -> better to consider quarterly or yearly changes in stock prices. Sample solution 2 Sample Size Neglect and Representativeness: Basing decision from too small a sample size and overreacting to it. Change from weeks 1 to 2 & 2 to 3 were much lower. Can’t determine based on changes past 2 weeks if trend will hold. Sample solution 3 Sample Size Neglect and Representativeness: Investor is basing forecasts & decisions on too small a sample. In this case only two week growth rate. Using a longer term average would be more appropriate in this case, given stability in weeks prior to latest two. Sample solution 4 Forecasting Error: The investor will put too much weight on recent experience and will have a forecast that is too extreme given the level of uncertainty. In this case, he only looks at the last 2 weeks to determine future prices. Sample solution 5 Overconfidence: Investor has too much confidence in his ability to select stocks, and has not noticed that this stocks performance has actually been less than the market over the last two weeks. Part b: 1 point Sample solution 1
Week Relative Strength 1 101.88/263.36 = 0.387 2 0.386 3 0.368 4 0.359 5 0.352
Interpretations and recommendations: • There is a downward trend in the relative strength of the stock to the market, which indicates
the stock underperformed compared to the market. I suggest the investor does not buy the stock
• Looking at the ratio of the company’s stock price to the index value, the company’s stock actually has not kept up w/the market, despite the seemingly strong performance. I’d

SPRING 2017 EXAM 9 SAMPLE ANSWERS AND EXAMINER’S REPORT
recommend investing in the index instead sine it has outperformed the company + has the added benefit of being well-diversified.
• The firm is consistently losing value relative to the entire market. This trend can be exploited by shorting the stock and purchasing the market index. This will allow the investor to gain from depreciation of the stock relative to the market.
Sample solution 2
% Change (stock) % Change (index) Strength = % s / % index 0.9987 1 .9987 1.005 1.054 .9531 1.073 1.1008 .9748 1.075 1.096 .9806
• Price increase less than comparable index increase
I would recommend investing in the index instead of the stock Sample solution 3
Week Stock Market RSI 1 2 .999 1 .999/1=.999 3 1.0033 1.054 .954 4 1.0766 1.160 .928 5 1.157 1.128 .9096
• Relative strength -> measure performance of a stock against the industry or market index. If >1, then -> outperform & strong momentum, else if <1 then underperform. Use price at week 1 as base. It seems that the RSI is <1 and is going down Investor should stay out of the stock, since it is weak in trend compared to index.
Sample solution 4
Week Company % change Index % change Relative change 1 2 -0.13% 263.27/263.26-1 = 0% -0.0012/~0 = 0 3 0.46% 5.41% 0.0046/0.0541 = 0.085 4 7.3% 10.01% 0.073/0.1001 = 0.729 5 7.5% 9.51% 0.075/0.959 = 0.782
• Comparing the index to the company’s stock price movement, we actually see that on a relative basis the index outperforms the stock, as the measure is always below 1. Thus the investor should just invest in the index rather than the stock of the company.

SPRING 2017 EXAM 9 SAMPLE ANSWERS AND EXAMINER’S REPORT
Sample solution 5 Week Company/stock 1 253.36/101.88 = 2.58 2 2.58 3 2.71 4 2.79 5 2.84
Getting higher thus index value increasing faster than stock. Market index is outperforming the stock so investor should short stock and buy market assuming this trend continues, making profit. Part c: 0.5 point Sample solution 1 To study recurring patterns in historical trading data and exploit opportunities where prices are different from intrinsic value. Irrational behavior causes prices to diverge from intrinsic value, but they slowly converge back, so TA exploits that adjustment period. Sample solution 2 Technical analysis looks for patterns in stock prices over time. Some technical strategies rely on “momentum,” or the tendency for a stock price to move in the same direction for a period of time. Momentum can be partially explained by behavioral finance -> it arises from investors who buy stocks, who have been going up, sell stocks that have been going down, because they assign too much weight on recent results. Sample solution 3 One can use technical analysis to exploit mispricing caused by behavioral biases. Investors may be slow to adapt to new market information (i.e. conservatism) causing mispricing. Investors may have forecasting errors by overpricing stocks. Technical analysis can identify these mispricings. Sample solution 4 Technical analysis aims to identify trends in market trading data to profit. Trends may indeed exist due to the market anomalies caused by certain behavioral finance, such as overconfidence or conservatism. Sample solution 5 Due to behavioral biases/information processing errors, mispricings in the market and various return relationships are likely to persist. Technical analysis seeks to capitalize on these errors. Sample solution 6 To search for recurrent, predictable patterns in stock prices based on past data. Assume that historical stock prices are related to invertor’s behavior (i.e. momentum), sluggish response to new info. Assume that will happen and can benefit from it (e.g., buy after good announcement) -> will continue to increase. Sample solution 7 Technical analysis is the study of past stock prices and volume to ascertain trends in stock price
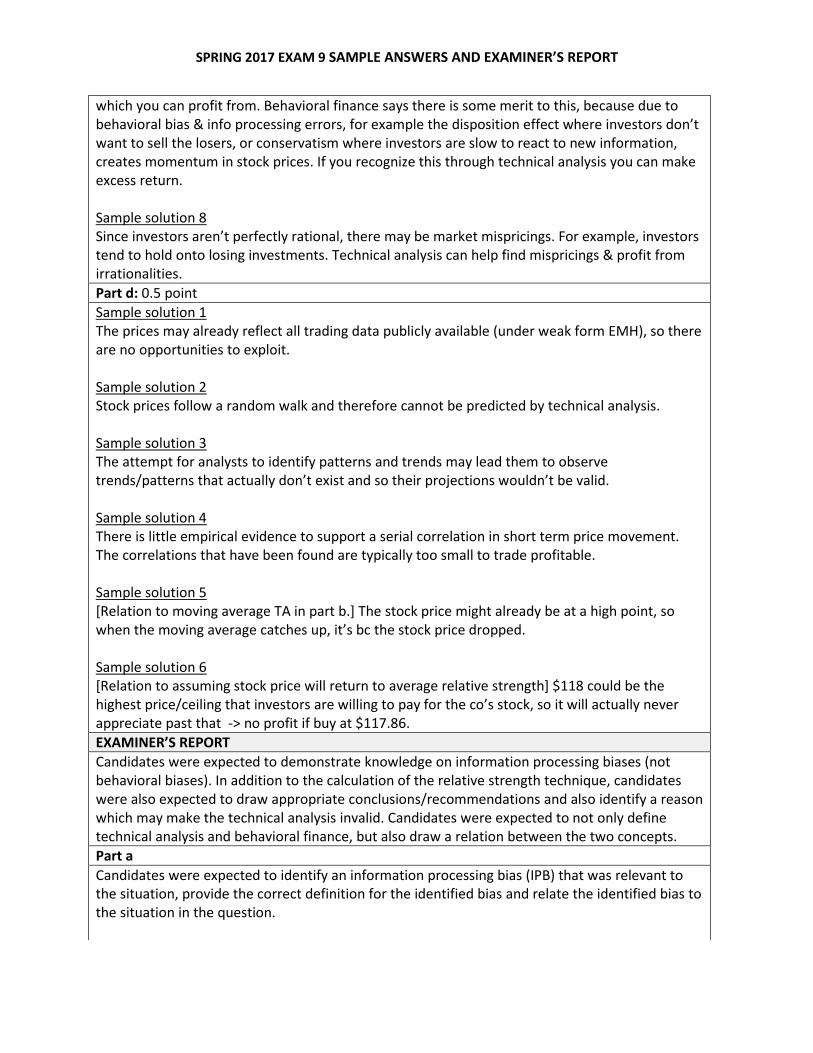
SPRING 2017 EXAM 9 SAMPLE ANSWERS AND EXAMINER’S REPORT
which you can profit from. Behavioral finance says there is some merit to this, because due to behavioral bias & info processing errors, for example the disposition effect where investors don’t want to sell the losers, or conservatism where investors are slow to react to new information, creates momentum in stock prices. If you recognize this through technical analysis you can make excess return. Sample solution 8 Since investors aren’t perfectly rational, there may be market mispricings. For example, investors tend to hold onto losing investments. Technical analysis can help find mispricings & profit from irrationalities. Part d: 0.5 point Sample solution 1 The prices may already reflect all trading data publicly available (under weak form EMH), so there are no opportunities to exploit. Sample solution 2 Stock prices follow a random walk and therefore cannot be predicted by technical analysis. Sample solution 3 The attempt for analysts to identify patterns and trends may lead them to observe trends/patterns that actually don’t exist and so their projections wouldn’t be valid. Sample solution 4 There is little empirical evidence to support a serial correlation in short term price movement. The correlations that have been found are typically too small to trade profitable. Sample solution 5 [Relation to moving average TA in part b.] The stock price might already be at a high point, so when the moving average catches up, it’s bc the stock price dropped. Sample solution 6 [Relation to assuming stock price will return to average relative strength] $118 could be the highest price/ceiling that investors are willing to pay for the co’s stock, so it will actually never appreciate past that -> no profit if buy at $117.86. EXAMINER’S REPORT Candidates were expected to demonstrate knowledge on information processing biases (not behavioral biases). In addition to the calculation of the relative strength technique, candidates were also expected to draw appropriate conclusions/recommendations and also identify a reason which may make the technical analysis invalid. Candidates were expected to not only define technical analysis and behavioral finance, but also draw a relation between the two concepts. Part a Candidates were expected to identify an information processing bias (IPB) that was relevant to the situation, provide the correct definition for the identified bias and relate the identified bias to the situation in the question.
SPRING 2017 EXAM 9 SAMPLE ANSWERS AND EXAMINER’S REPORT
Common errors include: • The most common errors were where a candidate identified one IPB but provided the
definition of another. • Neglecting to relate the IPB back to the question. Part b Candidates were expected to correctly calculate relative strength (stock price/market index or vice versa) and show at least 3 points to determine a trend in the results. Candidates were also expected to interpret their calculations correctly and provide a recommendation about whether or not to buy the stock. Common errors include: • The most common error was calculating the change or growth rate week over week. • Another common error was recommending the short sale of the stock. This is invalid as there
is no indication that the stock price would decrease in the future. While short sale of the stock by itself would not be an acceptable strategy, short selling the stock and buying the index would still generate a profit under the conclusion of the relative strength, as we expect the index to perform better than the stock.
Part c Candidates were expected to answer this question in a way that related the two concepts of technical analysis and behavioral finance. Common errors include: • Failing to relate technical analysis and behavioral finance. • Stating that technical analysis helps avoid behavioral mistakes. This is incorrect; it helps take
advantage of instances where investors make behavioral mistakes. Part d Candidates were expected to provide a reason why technical analysis may not be valid and elaborate on this reason. Common errors include: • Giving a reason the technical analysis may not be profitable, rather than a reason technical
analysis is invalid. These responses include referencing limits to arbitrage, referencing another IPB, or providing a reason without explanation.

SPRING 2017 EXAM 9 SAMPLE ANSWERS AND EXAMINER’S REPORT
SPRING 2017 EXAM 9, QUESTION 9 TOTAL POINT VALUE: 1.5 LEARNING OBJECTIVE(S): B1, B2 SAMPLE ANSWERS Part a: 0.75 point Sample solution 1 Bond 1: 956.94 = 1000 / (1 + Y1) Rate 1 = 4.50%. Bond 2: 981.41 = 40 / 1.045 + 1040 / (1 + Y2)^2. (1 + Y2)^2 = 1.1027 Forward Rate: 1 + F = (1 + Y2)^2 / (1 + Y1). F = 5.5% Sample solution 2 Bond 1: 956.94 = 1000 / (1 + Y1) Rate 1 = 4.50%. Bond 2: 981.41 = 40 / 1.045 + 1040 / (1.045)*(1 + F). F = 5.5% Sample solution 3 Bond 1: 956.94 = 1000 / (1 + Y1) Rate 1 = 4.50%. Bond 2: 981.41 = 40/(1 + R2) + 1040/(1 + R2)^2. Solve quadratic equation R2 = 1.05 Forward Rate: 1 + F = (1 + R2)^2 / (1 + Y1). F = 5.5% Part b: 0.75 point Sample solution Under EH, expected future short rate = year two forward rate, therefore, Price = 1040 / 1.055 = 985.78
Under LP, expected future short rate + liquidity premium = year two forward rate, therefore, Price = 1040 / (1.055 – 0.015) = 1000
EXAMINER’S REPORT Candidates were expected to:
• Calculate forward rates from spot rates • Apply appropriate rates under Expectations Hypothesis and Liquidity Preference Theories
to derive bond prices
Common errors include applying the liquidity premium incorrectly. Part a Candidates were expected to derive the year 1 spot rate implied in the price of bond 1, and use that rate along with bond 2 information to derive the forward rate. Common errors include:
• Mistaking the bond 2 spot rate for the forward rate • Subtracting or adding the liquidity premium from the derived 5.5%
Part b Candidates were expected to price the bond using the appropriate interest rate under both the Expectations Hypothesis and the Liquidity Preference theories. Common errors include:
• Switching the rates for the two different theories • Using the same rate for the two different theories

SPRING 2017 EXAM 9 SAMPLE ANSWERS AND EXAMINER’S REPORT
• Using a higher interest rate for Liquidity Preference as compared to the Expectations Hypothesis
• Stating that under Expectations Hypothesis the bond price at T = 1 equals price of the one year zero coupon bond given in the problem
• Pricing the bond other than at T = 1 • Excluding or including the incorrect coupon amount
SPRING 2017 EXAM 9 SAMPLE ANSWERS AND EXAMINER’S REPORT
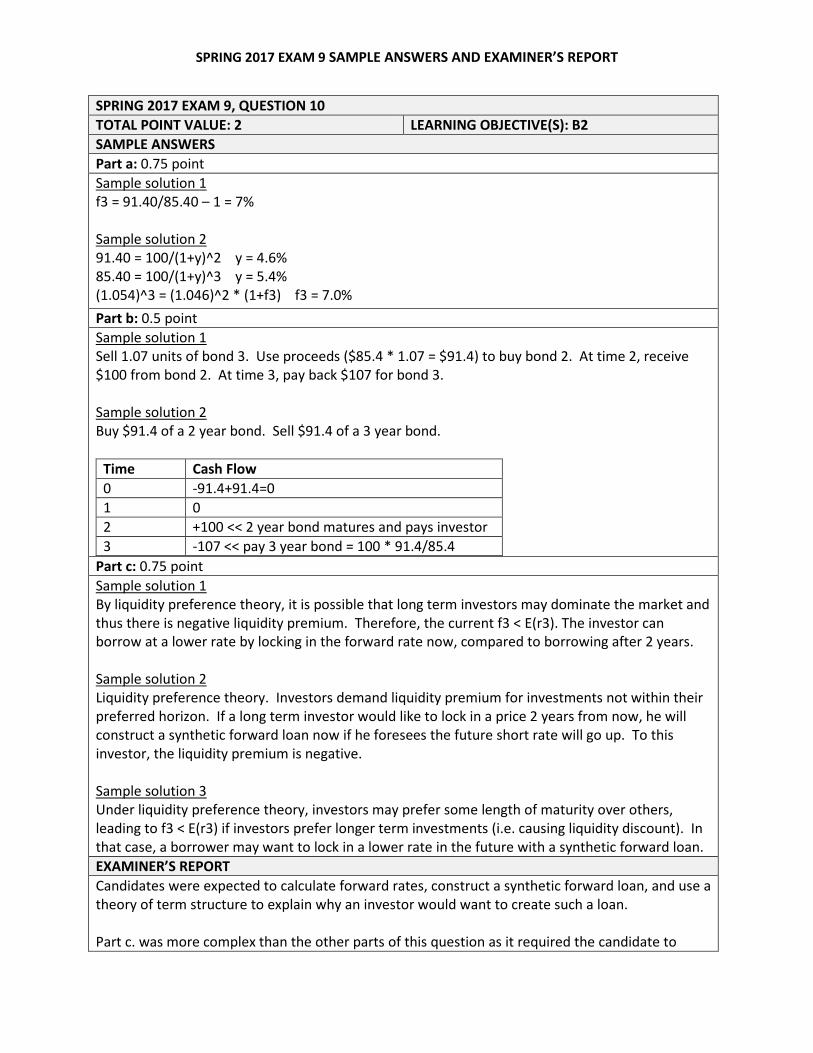
SPRING 2017 EXAM 9, QUESTION 10 TOTAL POINT VALUE: 2 LEARNING OBJECTIVE(S): B2 SAMPLE ANSWERS Part a: 0.75 point Sample solution 1 f3 = 91.40/85.40 – 1 = 7% Sample solution 2 91.40 = 100/(1+y)^2 y = 4.6% 85.40 = 100/(1+y)^3 y = 5.4% (1.054)^3 = (1.046)^2 * (1+f3) f3 = 7.0% Part b: 0.5 point Sample solution 1 Sell 1.07 units of bond 3. Use proceeds ($85.4 * 1.07 = $91.4) to buy bond 2. At time 2, receive $100 from bond 2. At time 3, pay back $107 for bond 3. Sample solution 2 Buy $91.4 of a 2 year bond. Sell $91.4 of a 3 year bond.
Time Cash Flow 0 -91.4+91.4=0 1 0 2 +100 << 2 year bond matures and pays investor 3 -107 << pay 3 year bond = 100 * 91.4/85.4
Part c: 0.75 point Sample solution 1 By liquidity preference theory, it is possible that long term investors may dominate the market and thus there is negative liquidity premium. Therefore, the current f3 < E(r3). The investor can borrow at a lower rate by locking in the forward rate now, compared to borrowing after 2 years. Sample solution 2 Liquidity preference theory. Investors demand liquidity premium for investments not within their preferred horizon. If a long term investor would like to lock in a price 2 years from now, he will construct a synthetic forward loan now if he foresees the future short rate will go up. To this investor, the liquidity premium is negative. Sample solution 3 Under liquidity preference theory, investors may prefer some length of maturity over others, leading to f3 < E(r3) if investors prefer longer term investments (i.e. causing liquidity discount). In that case, a borrower may want to lock in a lower rate in the future with a synthetic forward loan. EXAMINER’S REPORT Candidates were expected to calculate forward rates, construct a synthetic forward loan, and use a theory of term structure to explain why an investor would want to create such a loan. Part c. was more complex than the other parts of this question as it required the candidate to

SPRING 2017 EXAM 9 SAMPLE ANSWERS AND EXAMINER’S REPORT
apply liquidity preference theory to a synthetic forward loan. Candidates performed much better on parts a. and b. than on part c. Part a Candidates were expected to use 2 and 3 year yields to maturity to calculate a 3 year forward rate. There were no common errors on this part. Part b Candidates were expected to recommend buying bond 2 and selling bond 3 to create a $100 loan at time 2, showing the correct cash flows. A common error was recommending to sell bond 2 and buy bond 3, instead of the reverse. Part c Candidates were expected to identify the proper theory of term structure and apply it to create a synthetic forward loan. Common errors include:
• Selecting Expectation Hypothesis instead of Liquidity Preference Theory • Failing to recognize that long-term investors would dominate the market according to the
given information due to the upward-sloping yield curve

SPRING 2017 EXAM 9 SAMPLE ANSWERS AND EXAMINER’S REPORT
SPRING 2017 EXAM 9, QUESTION 11 TOTAL POINT VALUE: 1.5 LEARNING OBJECTIVE(S): B3 SAMPLE ANSWERS Part a: 1 point Sample solution 1
(1) (2) (3) (4) (5)
Time until payments (years) Cash Flow PV of Cash Flow @ 8% Weight (1) X (4)
1 $1,000,000 $925,926 0.2033 0.20326
2 $0 $0
0.00000
3 $2,000,000 $1,587,664 0.3485 1.04558
4 $0 $0
0.00000
5 $3,000,000 $2,041,750 0.4482 2.24105
$4,555,340 1.0000 3.4899
Duration = 3.4899 years Part b: 0.5 point Sample solution 1 $4,555,340 * 1.083.4899 / 1.10 3.4899 = $4,272,775
Sample solution 2 Assuming convexity can be ignored: D* = (3.4899/1.08) = 3.2314 ΔP/P = -3.232*(.10-.08) = -.0646 ΔP = ($4,555,340) * (1-.0646) = $4,260,938
EXAMINER’S REPORT Candidates were expected to calculate the duration of a zero-coupon bond that would immunize an obligation. They were then expected to calculate a revised value for that issued bond when interest rates change by 200 basis points. Part a The candidates needed to correctly calculate the duration of the future payment obligation by taking a weighted average of the timing of each payment with the present value of each payment. Common errors include:
• Calculating the duration using timing of payments and weights of 1,2,3 rather than 1,3,5 • Calculating the present value of the cash flows at 1,2,3 and calculating the weighted
average using 1,3,5

SPRING 2017 EXAM 9 SAMPLE ANSWERS AND EXAMINER’S REPORT
Part b Candidates were expected to calculate the revised value of the issued bond when the interest rates change from 8% to 10%. Common errors include:
• Using the modified duration formula without stating an assumption about convexity • Discounting the cash flows at 10%

SPRING 2017 EXAM 9 SAMPLE ANSWERS AND EXAMINER’S REPORT
SPRING 2017 EXAM 9, QUESTION 12 TOTAL POINT VALUE: 3 LEARNING OBJECTIVE(S): B4 SAMPLE ANSWERS Part a: 1.25 points Sample solution 1 FV = economic value of future renewals FV = [ P - E - L /(1+y) ] * cr/(1+y) / [ 1 - cr/(1+y) ] usually, must account for different retentions 100 * [1500 - 250 - 1100/1.05] = 20,238.1 20,238.1 * 0.9/1.05 = 17,346.94 for first year 20,238.1 * 0.9/1.05 * [0.8/1.05 / ( 1 - 0.8/1.05) ] = 55,510.20 for second year and beyond Total FV = 17,346.94 + 55,510.20 = 72,857.14 Sample solution 2 F = [P - E - L / (1+y)]* [ d / (1-d) ] d = cr / (1+y) = 0.8 / 1.05 = 0.762 1st year: 100 [ 1500 - 250 - 1100/1.05] * 0.9/1.05 = 17,347 After: 17,347 * d / (1-d) = 55,539 F = 17,347 + 55,539 = 72,886 Part b: 1 point Sample solution 1 The larger the franchise value, the harder it is to manage the interest rate risk. This is because F.V. has a high duration so is highly sensitive to interest rates. Sample solution 2 Regulators and rating agencies see the action of reducing asset duration as increasing risk since they only look at accounting numbers. Sample solution 3 Since franchise value is usually a large portion of total economic value, lowering the duration of invested assets is usually not enough to lower the duration of total economic value by a substantial amount. Sample solution 4 If the duration of the franchise value is too large, we may not be able to reduce the duration of our invested assets enough to get the total duration to appropriate level. It may require using assets with negative durations, which are difficult to find. Part c: 0.75 point Sample solution 1 Make the target ROS a function of the interest rate (e.g. k= a + by w/ b > 0) • Reduces duration of franchise value and therefore keeping duration of TEV under control. • Manages interest rate risk via pricing policy, not by shortening duration of inv. assets, so
regulators/rating agencies shouldn’t object. Sample solution 2 Using a pricing strategy would avoid the dilemma in (b). Let the target return on surplus k = a + by.

SPRING 2017 EXAM 9 SAMPLE ANSWERS AND EXAMINER’S REPORT
y is risk free rate. Using the combination of a and b can reduce the duration of franchise value significantly and can still achieve the required return. The method does not need to bring down the duration of current assets to zero or negative, which won’t cause any concern to regulators.
EXAMINER’S REPORT Candidates were expected to calculate Franchise Value and recognize benefits of managing duration through a pricing strategy instead of modifying invested assets. Part a Candidates were expected to know the formula for franchise value and how to apply it when the client retention rates vary from one year to the next. Common errors include: • Calculating the franchise value for a single policy rather than for 100 policies • Using the wrong client retention rate (cr) in the multiplier d = cr / (1+y) • Not multiplying the client retention rate for year 2 to the franchise value from years 3 and
beyond • Omitting the franchise value from year 2 • Only calculating the franchise value from years 2 and 3 • Not discounting the franchise value back to the present Part b Candidates were expected to know that franchise value is subject to interest rate risk and can contribute greatly to increasing the duration of total economic value. Candidates needed to explain two aspects of the dilemma in reducing total duration by reducing the invested asset duration. Common errors include: • Not stating that adjusting the invested asset duration could reduce total duration. Instead,
candidates would simply write “actions can be taken to reduce duration”. • Omitting that franchise value is subject to interest rate risk or can have a high duration. • Simply stating franchise value is subject to interest rate risk, but not elaborating on its impact
to the duration of total economic value. • Stating that reducing the invested asset duration would reduce the franchise value duration. • Stating that management and/or investors are not aware of franchise value or that franchise
value goes unmanaged since it's not on the financial statements. Part c Candidates were expected to identify how a pricing strategy can be used to manage franchise value, instead of reducing asset duration. Candidates were also expected to discuss how the pricing strategy solves the two dilemmas identified in part b. Common errors include: • Identifying the pricing strategy, but not discussing how it addresses one or both dilemmas in
part b. • Not specifying that the target return was tied to interest rates.

SPRING 2017 EXAM 9 SAMPLE ANSWERS AND EXAMINER’S REPORT
SPRING 2017 EXAM 9, QUESTION 13 TOTAL POINT VALUE: 2.25 LEARNING OBJECTIVE(S): B3, C1 SAMPLE ANSWERS Part a: 1.25 points Sample solution 1
Time Inflation in
Year Par Value Coupon Nominal Return 0 N/A 1,000 =Par Value x 5% N/A 1 1% 1,000*(1.01) = 1,010.0 50.50 6.05% 2 2% 1,010.0*(1.02) = 1,030.2 51.51 7.10% 3 3% 1,030.2*(1.03) = 1,061.1 53.06 8.15%
Nominal Return = (Interest + Price Appreciation) / Par Valuet-1 Nominal return at the end of year 3 = (53.06 + (1,061.1 -1,030.2)) / 1,030.2 = 8.15% Sample solution 2 (1+Nominal Return) = (1+Real Return) * (1+Inflation) Coupon Rate = Real Return = 5% Inflation in Year 3 = 3% (1.05) * (1.03) - 1 = 8.15% Part b: 0.5 point Sample solution Return volatility is reduced to zero if the real return is constant year over year: Year 1: Real return = (1 + 6.05%) / (1 + 1%) - 1 = 5% Year 2: Real return = (1 + 7.10%) / (1 + 2%) - 1 = 5% Year 3: Real return = (1 + 8.15%) / (1 + 3%) - 1 = 5%
Part c: 0.5 point Sample solution 1 The buyer can require the bond issuer to establish a sinking fund in order to spread the payment over a number of years. The issuer can repurchase a fraction of the outstanding bond in the open market each year or repurchase a fraction of the outstanding bond at a special call price associated with the sinking fund. Sample solution 2 The issuer can include a provision for collateral in the bond indenture should the issuer default. This collateral could be specific to assets and machinery that the firm owns. Sample solution 3 The issuer can include a provision for subordination of further debt in the bond indenture. This restricts the amount of additional borrowing the firm can do during the lifetime of the bond. In the event of default, subordinated debt holders will not be paid unless prior senior debt is fully
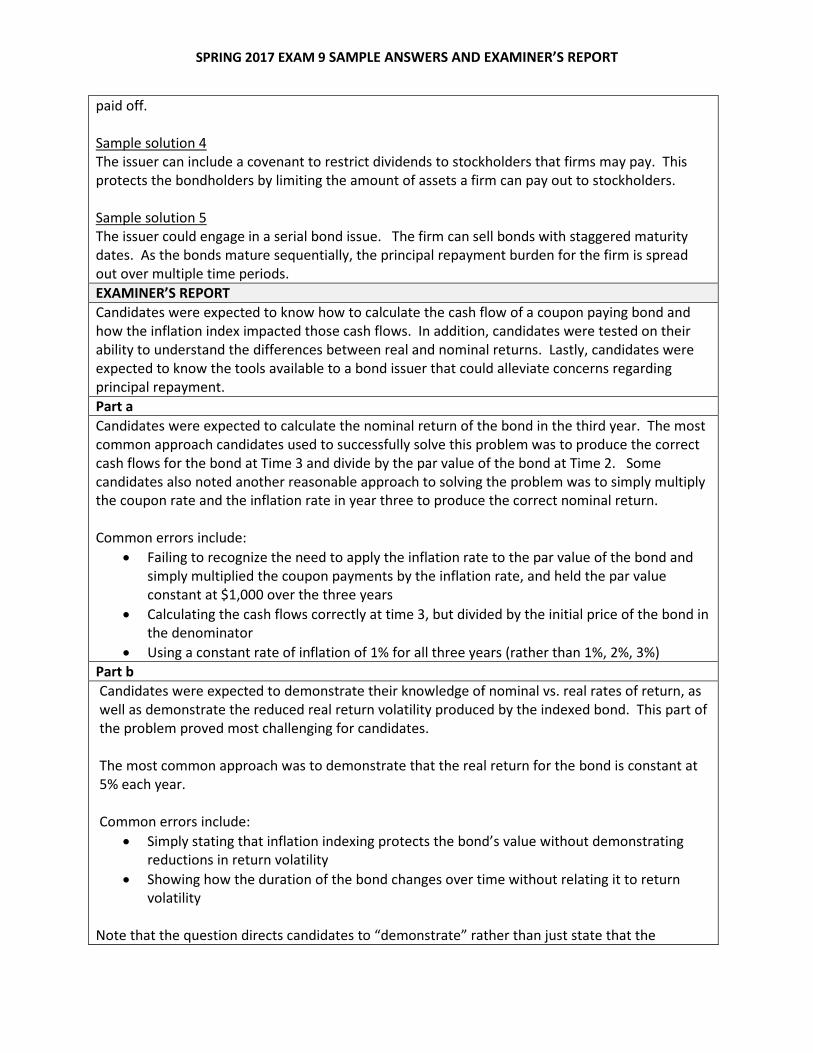
SPRING 2017 EXAM 9 SAMPLE ANSWERS AND EXAMINER’S REPORT
paid off. Sample solution 4 The issuer can include a covenant to restrict dividends to stockholders that firms may pay. This protects the bondholders by limiting the amount of assets a firm can pay out to stockholders. Sample solution 5 The issuer could engage in a serial bond issue. The firm can sell bonds with staggered maturity dates. As the bonds mature sequentially, the principal repayment burden for the firm is spread out over multiple time periods. EXAMINER’S REPORT Candidates were expected to know how to calculate the cash flow of a coupon paying bond and how the inflation index impacted those cash flows. In addition, candidates were tested on their ability to understand the differences between real and nominal returns. Lastly, candidates were expected to know the tools available to a bond issuer that could alleviate concerns regarding principal repayment. Part a Candidates were expected to calculate the nominal return of the bond in the third year. The most common approach candidates used to successfully solve this problem was to produce the correct cash flows for the bond at Time 3 and divide by the par value of the bond at Time 2. Some candidates also noted another reasonable approach to solving the problem was to simply multiply the coupon rate and the inflation rate in year three to produce the correct nominal return. Common errors include:
• Failing to recognize the need to apply the inflation rate to the par value of the bond and simply multiplied the coupon payments by the inflation rate, and held the par value constant at $1,000 over the three years
• Calculating the cash flows correctly at time 3, but divided by the initial price of the bond in the denominator
• Using a constant rate of inflation of 1% for all three years (rather than 1%, 2%, 3%) Part b Candidates were expected to demonstrate their knowledge of nominal vs. real rates of return, as well as demonstrate the reduced real return volatility produced by the indexed bond. This part of the problem proved most challenging for candidates. The most common approach was to demonstrate that the real return for the bond is constant at 5% each year. Common errors include:
• Simply stating that inflation indexing protects the bond’s value without demonstrating reductions in return volatility
• Showing how the duration of the bond changes over time without relating it to return volatility
Note that the question directs candidates to “demonstrate” rather than just state that the

SPRING 2017 EXAM 9 SAMPLE ANSWERS AND EXAMINER’S REPORT
inflation-indexed bond reduces return volatility. Part c Candidates were expected to demonstrate their knowledge of bond indentures and the tools available to the bond issuer to reduce the risk of insufficient capital to repay the bond principal upon expiration. The most common answer to this question discussed a sinking fund provision.
Common errors include:
• Entering into a Credit Default Swap with a third party. This would be an appropriate mechanism for the bond purchaser if they are concerned with purchasing insurance for default from a third party, but the question asked specifically for a mechanism available to the bond issuer.
• Issuing callable bonds as an available tool for the bond issuer. Callable bonds by themselves do not alleviate the concern of having assets available to repay the bond principal.
• Offering a put bond. A put bond gives the bondholder the option to terminate or extend the life of the bond. This does not address the concerns that the issuer would have in repaying the principal upon termination of the bond.
• Failing to accurately describe sinking funds. An example of this incorrectly stated that a sinking fund would be set up when the bond was sold and it would hold the principal value until the bond expires – functioning similarly to a savings account. Candidates were expected to state that sinking funds allow the issuer to repurchase fractions of the outstanding bond at market price each year or at a special call price associated with the sinking fund.

SPRING 2017 EXAM 9 SAMPLE ANSWERS AND EXAMINER’S REPORT
SPRING 2017 EXAM 9, QUESTION 14 TOTAL POINT VALUE: 1.25 LEARNING OBJECTIVE(S): C3 SAMPLE ANSWERS Part a: 0.75 point Sample solution 1 The manager could have structured the CDOs by using a 50/50 mix of hurricane and earthquake bonds instead of separating the pools by peril. Because these perils are uncorrelated, this would have reduced the default risk of the CDO tranches and allowed more of the tranches to achieve a AAA rating. Sample solution 2 The manager could have created a single CDO by pooling together all of the bonds. Increasing the number of securities in the CDO pool will reduce the default risk of the tranches and allowed more of them to achieve a AAA rating. Part b: 0.5 point The manager could create a CDO2 by pooling together any of the non-AAA rated (junior or mezzanine) tranches of the CDOs. The senior tranches from this pool could achieve a AAA rating.
EXAMINER’S REPORT Candidates were expected to explain how the properties of the underlying asset pool of a CDO impact the creditworthiness of the CDO tranches. Part a Candidates were expected to explain knowledge of CDOs (and CDO2s) and the mechanics of pooling and tranching risks. They should have been comfortable identifying how the default probabilities of the tranches are impacted by the correlation of the underlying asset pools. Candidates needed to explain that dividing the asset pools by peril was not optimal, and that the CDOs could be improved by either mixing the assets across perils or bringing all the assets together into a single pool. They further needed to explain that the gain would come from reducing the correlation of the underlying assets which would lower the default probabilities of the CDO tranches. Common errors include:
• Buying additional assets to be included in the pools or buying protection on the assets. This was not a complete response as it involves a cost to the portfolio manager while a cost-free solution was available.
• Creating additional tranches of the CDO. The question stated that the manager had already maximized the amount of value in the AAA tranches given the current pools.
Part b Candidates were expected to explain that a CDO2 could be created from the tranches of the CDOs. They also were expected to explain that the non-AAA rated (or junior / mezzanine) tranches would be pooled together and tranched into the new CDO in order to create new AAA securities. Common errors include:
• Proposing that the senior tranches of the CDOs be pooled into the new CDO2, or otherwise failing to identify which of the CDO tranches should be used
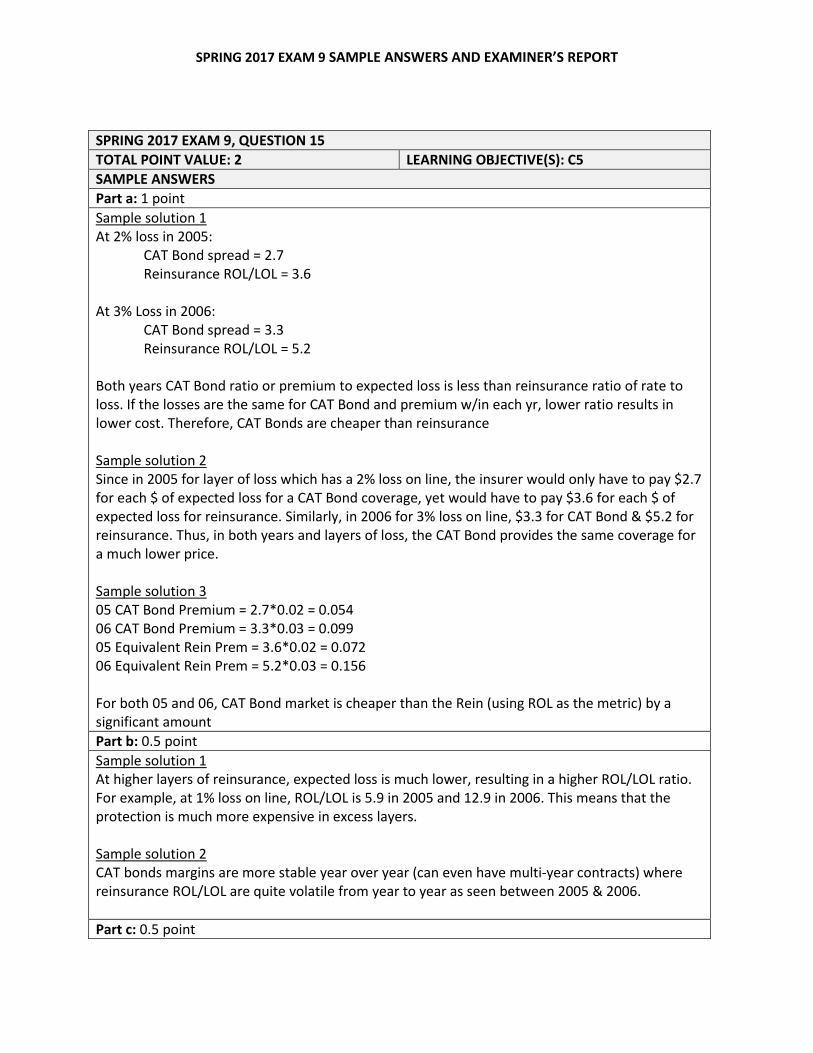
SPRING 2017 EXAM 9 SAMPLE ANSWERS AND EXAMINER’S REPORT
SPRING 2017 EXAM 9, QUESTION 15 TOTAL POINT VALUE: 2 LEARNING OBJECTIVE(S): C5 SAMPLE ANSWERS Part a: 1 point Sample solution 1 At 2% loss in 2005:
CAT Bond spread = 2.7 Reinsurance ROL/LOL = 3.6
At 3% Loss in 2006:
CAT Bond spread = 3.3 Reinsurance ROL/LOL = 5.2
Both years CAT Bond ratio or premium to expected loss is less than reinsurance ratio of rate to loss. If the losses are the same for CAT Bond and premium w/in each yr, lower ratio results in lower cost. Therefore, CAT Bonds are cheaper than reinsurance Sample solution 2 Since in 2005 for layer of loss which has a 2% loss on line, the insurer would only have to pay $2.7 for each $ of expected loss for a CAT Bond coverage, yet would have to pay $3.6 for each $ of expected loss for reinsurance. Similarly, in 2006 for 3% loss on line, $3.3 for CAT Bond & $5.2 for reinsurance. Thus, in both years and layers of loss, the CAT Bond provides the same coverage for a much lower price. Sample solution 3 05 CAT Bond Premium = 2.7*0.02 = 0.054 06 CAT Bond Premium = 3.3*0.03 = 0.099 05 Equivalent Rein Prem = 3.6*0.02 = 0.072 06 Equivalent Rein Prem = 5.2*0.03 = 0.156 For both 05 and 06, CAT Bond market is cheaper than the Rein (using ROL as the metric) by a significant amount Part b: 0.5 point Sample solution 1 At higher layers of reinsurance, expected loss is much lower, resulting in a higher ROL/LOL ratio. For example, at 1% loss on line, ROL/LOL is 5.9 in 2005 and 12.9 in 2006. This means that the protection is much more expensive in excess layers. Sample solution 2 CAT bonds margins are more stable year over year (can even have multi-year contracts) where reinsurance ROL/LOL are quite volatile from year to year as seen between 2005 & 2006. Part c: 0.5 point

SPRING 2017 EXAM 9 SAMPLE ANSWERS AND EXAMINER’S REPORT
Sample solution 1 CAT bonds are preferred because of the spread price is lower compared to reinsurance, because the CAT event has low correlation with the investment market. The investor would like to take the CAT bond at lower price due to the low correlations and diversification. Sample solution 2 Margins are much lower on CAT bonds and they lock in multi-year pricing which means more price stability and lower transaction costs. Sample solution 3 CAT bonds have lower profit margin. There is lots of credit risk for high layers of reinsurance. CAT bonds are fully collateralized, so they have no credit risk. EXAMINER’S REPORT Candidates were expected to demonstrate their knowledge of the current state of the CAT Bond market and differentiate features of the CAT Bond compared to the traditional CAT Reinsurance. For this question, candidates were expected to explain conceptually why CAT Bonds are more attractive at the excess loss layer as well as demonstrate understanding of the concept numerically. Candidates generally performed well on part c., but had some difficulty answering part a. and part b. completely. These parts required an evaluation and application based on the information provided, and many candidates provided generic responses that were not based on the information provided. Part a Candidates were expected to compare CAT Bond Spreads (Premium to Expected Loss) against the Reinsurance ROL/LOL ratio for similar points on the expected loss distribution. They were then expected to apply that comparison criteria to the numbers given in the problem and draw the conclusion that CAT Bonds are priced either comparably or favorably to reinsurance pricing. Common errors include:
• Providing reasons as to why CAT Bond may be preferable to the traditional CAT Reinsurance market without providing numerical justification as directed by the question (“Evaluate the cost…”).
• Failure to draw a conclusion that CAT Bond pricing is comparable or priced lower than Reinsurance.
• Failure to identify the correct Reinsurance Loss on Line (LOL) layer to compare against the CAT Bond Expected Loss as a Percent of Principal (i.e. 2% in 2005 and 3% in 2006). Some candidates calculated an expected value on the Reinsurance pricing using the ROL/LOL at all 4 of the given LOL layers. Other candidates compared the CAT Bond spread at 2% (in 2005) and 3% (in 2006) against all 4 of the given LOL layers for Reinsurance individually and drew the incorrect conclusion that CAT Bond is cheaper than Reinsurance at LOL less than or equal to 3%, but CAT Bond is more expensive compared to the 20% LOL Reinsurance layer.
Part b Candidates were expected to use actual information provided in the question to explain why a company may not purchase excess layers of reinsurance.

SPRING 2017 EXAM 9 SAMPLE ANSWERS AND EXAMINER’S REPORT
Common errors include:
• Failing to provide numerical justification using the information provided in the question. For example, explaining why primary insurers do not purchase high excess layers of reinsurance without referring to information provided in the question to support their explanations.
o For example, correctly explaining that at high excess layers, insurance companies may be concerned with the credit risk of traditional CAT reinsurers and purchase CAT Bonds, which are fully collateralized, without providing numerical justification using the information given in the part.
• Using the 20% LOL layer of reinsurance to explain why a company may not purchase high excess layers of reinsurance. However, the question asked specifically about the excess layers.
Part c Part c. expected candidates to explain why CAT bonds may be preferable to traditional reinsurance. A common error was listing a simple reason without including a “discussion.”

SPRING 2017 EXAM 9 SAMPLE ANSWERS AND EXAMINER’S REPORT
SPRING 2017 EXAM 9, QUESTION 16 TOTAL POINT VALUE: 1.5 LEARNING OBJECTIVE(S): C6 SAMPLE ANSWERS Part a: 1 point Sample solution 1 EPD Ratio = 5% Expected Deficit = [L–10*1.05]*0.1 = 0.1L – 1.05 E(L) = 0.1L+0.9*5 = 0.1L+4.5 EPD Ratio = 0.05 = 0.1𝐿𝐿−1.05
0.1𝐿𝐿+4.5
0.005L+0.225 = 0.1L-1.05 L = 13.421053 Sample solution 2 0.05 = 0.1(𝑋𝑋−1.05∗10)
0.9∗5+.1𝑋𝑋
0.225+0.005X = 0.1X-1.05 X=13.42M Part b: 0.5 point Sample solution 1 0.01 = 0.1(13.421053−𝑋𝑋)
5.842105
X = 12.836843 Capital Added = X – 10.5 = 2.336843 Sample solution 2 0.01 = 0.1(13.421053−10.5−𝐵𝐵)
0.9∗5+0.1(13.421053)
C = 2.336842 EXAMINER’S REPORT Candidates were expected to know the Expected Policyholder Deficit risk measure, how it is calculated, and how it can be used as a measure of capital allocation. Part a Candidates were expected to calculate the catastrophic loss amount using the formula for Expected Policyholder Deficit. A common error was not applying the probability of 0.1 to the policyholder deficit. Part b Candidates were expected to demonstrate their ability to apply the Expected Policyholder Deficit formula to a target EPD ratio. A common error was incorrectly applying the time value of money.

SPRING 2017 EXAM 9 SAMPLE ANSWERS AND EXAMINER’S REPORT
SPRING 2017 EXAM 9, QUESTION 17 TOTAL POINT VALUE: 3.25 LEARNING OBJECTIVE(S): C6, C7 SAMPLE ANSWERS Part a: 2.75 points Sample solution 1
Scenario 25x0 25x25 25x50 Total 1 0 0 0 0 2 (.25/.5)(25)=12.5 0 0 12.5 3 (.15/.5)(25)=7.5 (.15/.25)(25)=15 0 22.5 4 (.09/.5)(25)=4.5 9 22.5 36 5 0.5 1 2.5 4 Total 75
Water = (20/25)(12.5) + (30/50)(22.5) + (30/75)(36) + (25/100)(4) = 38.9M Wind = (5/25)(12.5) + (20/50)(22.5) + (45/75)(36) + (75/100)(4) = 36.1M Sample solution 2 VaR 99% = 75M, capital held is 75M
Scenario 0-25M Layer Water Wind 1 0 2 (.25/.5)(25)=12.5M (20/25)(12.5)=10 (5/25)(12.5)=2.5 3 (.15/.5)(25)=7.5M 4.5 3 4 (.09/.5)(25)=4.5M 1.8 2.7 5 (.01/.5)(25)=.5 .125 .375
Scenario 25-50M Layer Water Wind 1 0 2 0 3 (.15/.25)(25)=15M 9 6 4 (.09/.25)(25)=9M 3.6 5.4 5 (.01/.25)(25)=1 .25 .75
Scenario 50-75M Layer Water Wind 1 0 2 0 3 0 4 (.09/.10)(25)=22.5M 9 13.5 5 (.01/.10)(25)=2.5 .625 1.875
Total Allocation Water = 16.425 + 12.85 + 9.625 = $38.9M Wind = 8.575 + 12.15 + 15.375 = $36.1M

SPRING 2017 EXAM 9 SAMPLE ANSWERS AND EXAMINER’S REPORT
Sample solution 3 Capital = VaR.99 = 75M Water Allocation 25xs0: 25 ��.25
.5� �20
25�+ �.15
.5� �30
50�+ �.09
.5� �30
75� + �.01
.5� � 25
100�� = 16.425𝑀𝑀
25xs25: 25 ��.15.5� �30
50� + �.09
.5� �30
75� + �.01
.5� � 25
100�� = 12.85𝑀𝑀
25xs50: 25 ��.09.5� �30
75� + �.01
.5� � 25
100�� = 9.625𝑀𝑀
Total = 38.9M Wind Allocation Same work as water but with wind proportions Total = 36.1M Part b: 0.5 point Sample solution 1 Allocation using coTVaR will focus on tail events which are dominated by the wind peril. More capital will be allocated to wind and less capital will be allocated to water. Sample solution 2 TVaR means that total capital will increase. Wind makes up a greater proportion of worst-case scenarios, so wind would get a larger proportion allocated to it. EXAMINER’S REPORT Candidates were expected to allocate the capital to each layer using a percentile method. They were also expected to calculate the VaR of a discrete distribution. This question was computationally heavy and candidates made a number of calculation errors on this question. Part a Candidates were expected to calculate the VaR and then use the capital allocation by percentile layer approach to allocate the required capital (VaR) to water and wind perils. Candidates were expected to recognize the three different layers to be allocated, apply the correct weights to allocate the losses within the layers to the 5 scenarios to assign the appropriate amount of capital to each scenario. Finally, candidates were expected to allocate the capital for each scenario to peril and then sum across scenarios to get the total capital allocated to each peril. Common errors include:
• Incorrectly using $100M as the VaR • Excluding scenario 5 from contributing to any loss layer • Misunderstanding what the layers represented • Including an extra layer above the 99% VaR
Part b Candidates were expected to directionally explain how switching the capital allocation methodology from percentile layer approach to co-TVaR approach would impact the allocation to peril.

SPRING 2017 EXAM 9 SAMPLE ANSWERS AND EXAMINER’S REPORT
Despite the fact that this wasn’t mentioned in the question, candidates that explicitly assumed that the total capital requirements would increase were not penalized for making this assumption. Common errors include:
• Failing to recognize that coTVaR ONLY considers losses that contribute to the tail (TVaR) of the aggregate distribution.
• Calculate the coTVaR percentages incorrectly by considering only scenario 5 as opposed to scenarios 4 and 5.

SPRING 2017 EXAM 9 SAMPLE ANSWERS AND EXAMINER’S REPORT
QUESTION 18 TOTAL POINT VALUE: 3 LEARNING OBJECTIVE(S): C7, C8 SAMPLE ANSWERS Part a: 0.25 point Sample solution Risk capital is the capital provided by equity holder to the company to cover the risk that liability may exceed the funds provided by policyholder in forms of loss reserves and UPR. Part b: 2.25 points Sample solution 1 99.5% VaR -> 6th worst observation of 1000 Reserve VaR 99.5% = 850 Line A VaR 99.5% = 1500 Line B VaR 99.5% = 900 Line B allocation = [(900) / (850+1500+900) ] x 2900 = 803.077 99.5% Co-CTE -> average 5 worst observations where worst based on overall distribution: Reserve Co-CTE = (800+500+500+100+300)/5=480 Line A Co-CTE = (1600+1500+1300+1400+1300)/5=1420 Line B Co-CTE = (600+700+900+1100+900)/5=840 Line B allocation = 840 <- since using 99.5% CTE as risk capital (instead of allocation market value of equity) Line B allocation higher under Co-CTE in ii Sample solution 2 i.) capital for B = (900)/(900+1500+850) = 27.7% ii.) capital for B = [(600+700+900+1100+900)/(5)] / [(3000+2900+…+2500)/(5)] = 30% Co-Measures approach allocates more to B Sample solution 3 Var(99.5) is the 995 scenario Var(99.5) = 850 reserve, 1500 A, 900 B = 3250 total i) Line B = (900/3250)x(2900) = $803.077 Co-CTE (99.5) = (800+500+500+100+300)/5 = 480 reserve = (1600+1500+1300+1400+1300)/5=1420 A = (600+700+900+1100+900)/5 = 840 B 2740 ii) Line B = (840/2740)x(2900)=$889.051 So ii) allocates more to B Part c: 0.5 point Sample solution 1 When measuring profitability with measures like RAROC, the line with more capital must generate
SPRING 2017 EXAM 9 SAMPLE ANSWERS AND EXAMINER’S REPORT
more income to meet the target return. Sample solution 2 You will depress its RAROC which could influence decision-making (downsize, exit LOB), if it is below the cost of capital. Sample solution 3 If allocate more capital -> reduce the return on capital (RAROC) -> required to generate more income to be equally attractive as another line with the same cost of capital, but for which we allocate less capital. Sample solution 4 Allocating more capital means it is riskier and needs to produce higher returns in order to have a RAROC over the hurdle rate and justify its business. EXAMINER’S REPORT Candidates were expected to understand risk capital, allocation methodologies, and implications of capital allocation. Part a Candidates were expected to know the definition of risk capital. A common error was giving the definition of other types of capital, such as economic capital Part b Candidates were expected to know how to use the VaR and Co-CTE methods to find the correct allocated capital. Common errors include:
• Using the wrong capital bases • Selecting the wrong observations used for the methods
Part c Candidates were expected to know implications of allocating more capital to a given line. There were no common errors to this part as the question was straight from the text and several approaches were accepted.
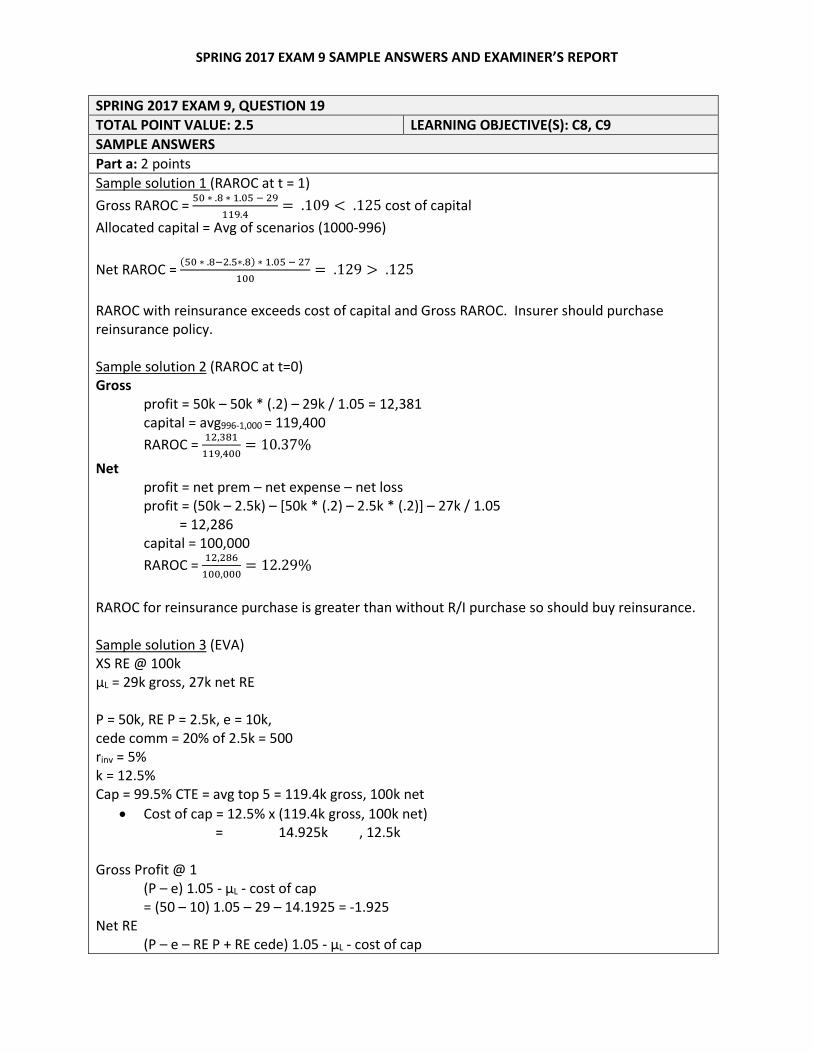
SPRING 2017 EXAM 9 SAMPLE ANSWERS AND EXAMINER’S REPORT
SPRING 2017 EXAM 9, QUESTION 19 TOTAL POINT VALUE: 2.5 LEARNING OBJECTIVE(S): C8, C9 SAMPLE ANSWERS Part a: 2 points Sample solution 1 (RAROC at t = 1) Gross RAROC = 50 ∗ .8 ∗ 1.05 − 29
119.4= .109 < .125 cost of capital
Allocated capital = Avg of scenarios (1000-996) Net RAROC = (50 ∗ .8−2.5∗.8) ∗ 1.05 − 27
100= .129 > .125
RAROC with reinsurance exceeds cost of capital and Gross RAROC. Insurer should purchase reinsurance policy. Sample solution 2 (RAROC at t=0) Gross
profit = 50k – 50k * (.2) – 29k / 1.05 = 12,381 capital = avg996-1,000 = 119,400 RAROC = 12,381
119,400= 10.37%
Net profit = net prem – net expense – net loss profit = (50k – 2.5k) – [50k * (.2) – 2.5k * (.2)] – 27k / 1.05
= 12,286 capital = 100,000 RAROC = 12,286
100,000= 12.29%
RAROC for reinsurance purchase is greater than without R/I purchase so should buy reinsurance. Sample solution 3 (EVA) XS RE @ 100k μL = 29k gross, 27k net RE P = 50k, RE P = 2.5k, e = 10k, cede comm = 20% of 2.5k = 500 rinv = 5% k = 12.5% Cap = 99.5% CTE = avg top 5 = 119.4k gross, 100k net
• Cost of cap = 12.5% x (119.4k gross, 100k net) = 14.925k , 12.5k
Gross Profit @ 1
(P – e) 1.05 - μL - cost of cap = (50 – 10) 1.05 – 29 – 14.1925 = -1.925
Net RE (P – e – RE P + RE cede) 1.05 - μL - cost of cap

SPRING 2017 EXAM 9 SAMPLE ANSWERS AND EXAMINER’S REPORT
= (50 – 10 - 2.5 + .5) * 1.05 – 27 – 12.5 = 0.4 > -1.925 • YES buy it!
Part b: 0.5 point Sample solution 1 (Risk margin does not include expenses) Additional Risk Margin = 119.4 ∗ .129 −(50∗.8∗1.05 − 29)
1.05= $2.288Thousand
Sample solution 2 (Risk margin does not include expenses) .129 x 119.4k = 15,402.6 profit needed We only have 13k profit w/o add’l numerator So we need 15,402.6−13𝑘𝑘
1.05= 2288.19 to get there.
Sample solution 3 (Risk margin does include expenses)
(50,000 + 𝑥𝑥) ∗ .8 ∗ 1.05 − 29,000119,400 = .129
• 𝑋𝑋 = 2,860.24 EXAMINER’S REPORT Candidates were expected to evaluate the performance of the firm both with and without reinsurance based on risk based measures, leveraging information from both a simulation and a reinsurance policy. While ceding commissions on excess of loss reinsurance policies are rare, they do occur. Part a Candidates were expected to calculate CTE correctly and evaluate either RAROC or EVA for both the gross and net scenarios. Candidates were also expected to compare the resulting calculations to each other and come to a reasonable conclusion on whether or not the insurance company should purchase the reinsurance. There were a number of acceptable approaches for this part (e.g., RAROC at t=0, RAROC at t=1, EVA). These approaches were acceptable if consistent timing was used for premiums, expenses, and losses. Common errors included:
• Having a mismatch in the timing of the valuations. If investment income is included, then the losses should not have been discounted to time 0.
• Misapplication of the ceding commission • Using VaR as the capital rather than CTE • Not calculating RAROC or EVA for both the gross and net scenarios. • Including capital in the base for investment income
Part b Candidates were expected to calculate the additional risk margin that would have to be charged on the ground-up policy in order for its RAROC or EVA to equal what was calculated for the net scenario in part a.
Common errors include:
• Using the incorrect target RAROC to solve for the risk margin (e.g., setting the target at the

SPRING 2017 EXAM 9 SAMPLE ANSWERS AND EXAMINER’S REPORT
cost of capital) • Calculating the value of the risk margin at time 1 instead of time 0 • Calculating an additional risk margin for both the net and gross scenarios simultaneously

SPRING 2017 EXAM 9 SAMPLE ANSWERS AND EXAMINER’S REPORT
Spring 2017 EXAM 9, QUESTION 20 TOTAL POINT VALUE: 2.5 LEARNING OBJECTIVE(S): C7, C8, C9 SAMPLE ANSWERS Part a: 0.5 point Sample solution 1 Allocating capital to line can help determine which lines are profitable or unprofitable based on RAROC or EVA. You can decide which lines to exit or which lines to manage more closely by comparing RAROC to the cost of capital. Grow lines that show RAROC greater than the cost of capital and shrink lines that show RAROC less than the cost of capital. Sample solution 2 By allocating capital to line of business you can review the economic value being added by each line of business by calculating RAROC and comparing it to the cost of capital. From there, you can make decisions on pricing and where to grow or shrink lines based on how much or how little value is being added. Part b: 1.5 points Sample solution 1 Solving for RAROC:
(1) (2) (3) (4)
(5) = Solve for "C" in (4) (6) = (3) / (5)
Line Premium Losses Net
Income (E(L) + C) /
E(L) Capital Return 1 40 25 8 3.5 62.5 12.8% 2 65 35 11 4.5 122.5 9.0% 3 85 50 15 5.5 225 6.7%
Total 190 110 34 410.0 8.3%
• Grow Line 1 since the return is higher than the firm’s cost of capital. • Maintain Line 2 since the return meets the firm’s cost of capital. • Shrink Line 3 since the return is lower than the firm’s cost of capital.
Sample solution 2 Solving for Economic Value Add:
(1) (2) (3) (4)
(5) = Solve for "C" in (4)
(6) = (3) - (5) * 9%
Line Premium Losses Net
Income (E(L) + C) /
E(L) Capital EVA 1 40 25 8 3.5 62.5 2.375 2 65 35 11 4.5 122.5 -0.025 3 85 50 15 5.5 225 -5.25
• Grow Line 1 since the return is higher than the firm’s cost of capital. • Increase charged premium for Line 2 since the return doesn’t meets the firm’s cost of

SPRING 2017 EXAM 9 SAMPLE ANSWERS AND EXAMINER’S REPORT
capital. • Purchase reinsurance for Line 3 since the return is lower than the firm’s cost of capital.
Part c: 0.5 point Sample solution 1 The firm may not have enough capital to attain a given exceedance probability. Therefore, the firm can raise its exceedance probability or raise more capital.
Sample solution 2 The exceedance probability framework does not allow for diversification. Thus capital is likely to be overstated.
Sample solution 3 The exceedance probability does not tell mangers anything about the amount by which losses are likely to exceed available resources.
EXAMINER’S REPORT Candidates were expected to understand, apply, and synthesize the concepts of RAROC, EVA, exceedance probabilities, capital allocation, and value maximization. Part a Candidates were expected to discuss allocation of capital to line or sub-business unit. Doing so allows calculation of RAROC or EVA. Calculated RAROC or EVA should be compared to the cost of capital (RAROC) or greater than 0 (EVA) to determine which lines to grow or shrink. Common errors include:
• Not relating RAROC to cost of capital and then discussing how to maximize firm value by growing lines generating returns higher than the cost of capital.
• Mentioning that capital allocation would allow for better pricing and underwriting decisions. This was an incomplete response.
• Providing statements such as “firm value is maximized by allocating capital efficiently” without including a sufficient discussion.
Part b Candidates were expected to evaluate the exceedance probability curves and assess the profitability of each line using RAROC or EVA. The candidates were then expected to demonstrate a strategy for the insurer based on the resulting profitability. Common errors include:
• Failure to comment on a strategy for each line • Suggesting that only shifting capital between lines would increase shareholder’s value
Part c Candidates were expected to demonstrate an issue with using exceedance probabilities when allocating capital. There were no common errors to this part, as it required candidates to recall basic information from the syllabus material.

SPRING 2017 EXAM 9 SAMPLE ANSWERS AND EXAMINER’S REPORT
SPRING 2017 EXAM 9, QUESTION 21 TOTAL POINT VALUE: 1.25 LEARNING OBJECTIVE: D1 SAMPLE ANSWERS Part a: 0.25 point Sample solution
Line A allocation= 25M * [30M/(30M+20M)] = 15M Line B allocation = 25M * [20M/(30M+20M)] = 10M Part b: 0.5 point Sample solution Reserve A = 30M*0.65 = 19.5M Reserve B = 20M*0.60 = 12M Line A allocation = (19.5M*2.5)/(19.5M*2.5+12M*0.5) = 22.26M Line B allocation = (12M*0.5)/(19.5M*2.5+12M*0.5) = 2.74M Part c: 0.5 point Sample solution 1 Given that the investor yield if 5% and IRR is 12%, the management will require the difference be made up by earning underwriting income or investment income from policyholder supplied funds. Given that the surplus allocation increased for Line A, additional underwriting profit will be required to meet the 12% target return on equity. The rate for line A needs to be increased. Sample solution 2 The surplus used in the calculation was 15M which is much smaller than the proposed allocation of 22.26M. Thus there is a need to earn more premium for line A to still be able to support the 12% IRR. Increase rate level. Sample solution 3 Based on the proposed surplus allocation, line A is almost 10 times the surplus as line B, but premium is only 50% higher. Since there is a mismatch in the amount of risk reflected in the premium (as it was probably based on initial allocation), we should increase the rate level for line A. Sample solution 4 Rate level should increase because the company needs more profit to support the higher capital allocation in order to achieve the same RAROC.
EXAMINER’S REPORT Candidates were expected to understand the methods of allocating surplus and impact on IRR. Part a Candidates were expected to allocate capital based on premium. There were no common errors to this part as it required a calculation straight from the text. Part b Candidates were expected to allocate capital based on reserves. Common errors include:

SPRING 2017 EXAM 9 SAMPLE ANSWERS AND EXAMINER’S REPORT
• Attempting to discount the surplus allocation using the after-tax investment yield • Not correctly adjusting the allocation for the average time from loss to payment for each
line. Part c Candidates were expected to understand of how capital allocation strategies would impact rate levels and describe why the rate level would decrease if the pricing strategy is implemented. Common errors include:
• Support the decision quantitatively rather than qualitatively • Falsely concluding that the allocation should decrease simply because the average time
from loss to payment was longer for line A so there is more investment income to be earned
• Concluding that the rate level should increase without explaining why

SPRING 2017 EXAM 9 SAMPLE ANSWERS AND EXAMINER’S REPORT
SPRING 2017 EXAM 9, QUESTION 22 TOTAL POINT VALUE: 1.75 LEARNING OBJECTIVE(S): A2, D2 SAMPLE ANSWERS Sample solution 1 E(T/S) = I/A + (R/S)*(I/A + U/R) = 0.04 + (150/100)*(0.04+0.02) = 13% Var(T/S) = Var[I/A + (R/S)*(I/A + U/R)] = Var[(1+R/S)*(I/A) + (R/S)*(U/R)] =(1+R/S)2*Var(I/A) + (R/S)2*Var(U/R) = (2.5) 2*(.04) 2 + (1.5) 2*(.10) 2 = .0325 Utility = E(r) – ½Aσ2 = E(r) – 3σ2 so A=6 y* = (E(rp) – rf) / (Aσ2
p) = (13% - 3%) / (6*.0325) = 51.28% should invested in the insurance company Sample solution 2 E(T/S) = I/A + (R/S)*(I/A + U/R) = 0.04 + (150/100)*(0.04+0.02) = 13% Var(T/S) = Var[I/A + (R/S)*(I/A + U/R)] = Var[(1+R/S)*(I/A) + (R/S)*(U/R)] =(1+R/S)2*Var(I/A) + (R/S)2*Var(U/R) = (2.5) 2*(.04) 2 + (1.5) 2*(.10) 2 = .0325 U = rf + y*[E(rp) – rf] – 3*(y2 * σ2
p) U1 = 0 = [E(rp) – rf] – 3*2*(y * σ2
p) = (13% - 3%) – y*6*.0325 → y = 51.28% EXAMINER’S REPORT Candidates were expected to recognize the concepts of return on equity from Ferrari as an investor’s viewpoint, and connect this with the concepts of investment returns, utility and the optimal complete portfolio. Specifically, candidates were expected to:
• Calculate the expected ROE of the insurance company using Ferrari’s methodology • Calculate the Variance of the return of the insurance company by applying knowledge of
variance formulas to Ferrari’s methodology • Subsequently calculate the optimal weight in the optimal risky portfolio
Common errors include:
• Calculating the variance of the return on equity incorrectly • Using the wrong “A” value when determining the allocation to the insurance company in
the optimal complete portfolio

SPRING 2017 EXAM 9 SAMPLE ANSWERS AND EXAMINER’S REPORT
SPRING 2017 EXAM 9, QUESTION 23 TOTAL POINT VALUE: 1 LEARNING OBJECTIVE(S): D3 SAMPLE ANSWERS Sample solution 1
• Regulator focuses more on rate of return on equity instead of rate equity • We have to allocate capital to line of business, which is artificial allocation • Return on sales has the same concept as markup • ROS can be easily understood by consumers
Sample solution 2 • Does not focus on true rate equity, but rather focus on rate of return equity. This results in
companies that have the same premiums and losses not having the same outcome (rates approved) depending on their surplus level.
• ROE requires allocating equity by line of business, which is somewhat artificial • Also, all surplus is available to pay for all claims • Using ROS results in true rate equity; doesn’t require allocating capital, and it’s similar to a
“mark-up” so it’s more understandable. EXAMINER’S REPORT Candidates were expected to discuss the advantages and disadvantages of ROE and ROS rate regulation. There were a number of acceptable responses, but candidates only needed to discuss four.
Common errors include:
• Providing one problem as opposed to a sufficient number of problems. A discussion of at least four problems was required for a complete discussion.
• Substituting “rate equity” for “rate adequacy.”

SPRING 2017 EXAM 9 SAMPLE ANSWERS AND EXAMINER’S REPORT
SPRING 2017 EXAM 9, QUESTION 24 TOTAL POINT VALUE: 2 LEARNING OBJECTIVE(S): D5 SAMPLE ANSWERS Part a: 1 point Any two of the following:
• RA DCF method is interesting from a regulator’s perspective as it is mostly concerned with what a fair premium should be (i.e. it is intuitive). It should thus help in achieving the 15% ROE target.
• RA DCF does not need to select a target return – the fair premium is obtained directly. Does not yield help in achieving the growth and profitability targets
• Not sensitive to allocation of surplus. Does not help achieving the growth or profitability targets.
• Grounded in modern financial theory – underwriting cash flows are risk-adjusted (w/ CAPM concepts). Does not help achieve growth or profitability targets.
Part b: 1 point Any 1 of the following approaches:
• Book of Business Growth ROE Model • PV Cash Flows Method • Projecting the income and equity of the company, and the equity flows between the
company and its investors so that the target ROE and growth rate are achieved.
Any one of the following defenses: • Sensitivity to leverage effect of surplus • Considers the impact of portfolio growth on calendar year profitability (incorporates a
growth assumption) • Relates indicated pricing and/or underwriting profit provision with CY ROE, growth rate,
and leverage ratios. (Metrics of interest to company executives) • Reflects conservative treatment of expenses under statutory accounting. • Produces a CY premium-to-surplus ratio leverage ratio for the book of business in
equilibrium that can be compared to industry benchmarks. EXAMINER’S REPORT Candidates were expected to understand the methods of calculating the Underwriting Profit Provision, and in particular, the risk-adjusted discounted cash flow method. Part a Candidates were expected to describe 2 advantages of the risk-adjusted discounted cash flow method, as well as state whether they helped achieve the growth and return targets of the company. Common errors include:
• Listing only one advantage or not actually stating whether the advantage favors the targets
• Simply stating that the method calculates a “fair premium” and not explaining how the concept of fair premium is a strength of the model (intuitive, accepted by regulators, etc.)
• Stating that the method does NOT follow generally accepted or statutory accounting principles. This could arguably be a disadvantage of the method
SPRING 2017 EXAM 9 SAMPLE ANSWERS AND EXAMINER’S REPORT
Part b Candidates were expected to propose an alternate underwriting profit provision approach that would be better at achieving the ROE and growth targets than the RA DCF method. They were also expected to describe in sufficient detail why their approach is effective.
Common errors include:
• Insufficient detail or arguments describing the alternate approach • Only stating that the method includes assumptions for growth and ROE and not
explaining how the premium or UW PP could be adjusted to achieve the targets • Using the CY Investment Income Offset procedure or the PV Offset procedure • Proposing the CY ROE Method without the growth element • Recommending the IRR or PVI/PVE methods. These methods were unacceptable because
the UPP resulting from the exercise will only be consistent with the growth target if discount rate = target ROE = PVI/PVE = growth rate. Thus, using an IRR or PVI/PVE equal to the target ROE will not yield a valid result.

SPRING 2017 EXAM 9 SAMPLE ANSWERS AND EXAMINER’S REPORT
SPRING 2017 EXAM 9, QUESTION 25 TOTAL POINT VALUE: 2.5 LEARNING OBJECTIVE(S): D4, D5 SAMPLE ANSWERS Part a: 1.5 points
Incremental percentage paid PV of payment
Payment at t = Existing Line New Line PV factor Existing Line New Line
[1] [2] [3] [4] [5] [6]
1 50% 30% 0.96618 0.48309 0.28986
2 30% 25% 0.93351 0.28005 0.23338
3 15% 25% 0.90194 0.13529 0.22549
4 5% 20% 0.87144 0.04357 0.17429
0.94201 0.92301
[4] = 1.035 ^-[1]
[5] = [2] x [4] [6] = [3] X [4]
[7] Difference between present values: 0.01900 = Tot[5] - Tot[6]
[8] Offset to apply to New Line: 1.18% = [7] x 0.62
[9] Reference line profit provision: 0.04
[10] Indicated Profit Prov for New Line: 2.82% = [9] - [8]
Sample solution Existing Line: PV(L0) = 50%/1.035 + (80%-50%)/1.0352 + (95%-80%)/1.0353 + (100%-95%)/1.0354 = 0.942
New Line: PV(L) = 30%/1.035 + (25%)/1.0352 + (25%)/1.0353 + (20%)/1.0354 = 0.923
UN = u0 – PLR x (PV(L0) - PV(L)) = 4% - 62% x (0.942 – 0.923) = 0.282

SPRING 2017 EXAM 9 SAMPLE ANSWERS AND EXAMINER’S REPORT
Part b: 0.5 point Any two of the following were the most commonly provided solutions:
• The method easily accounts for the investment income • The method will provide a profit provision that is not heavily distorted by the rapid growth
of the new line • There is no need to select a target return • There is no need to allocate surplus • Easily approved/ already approved by a regulator (used in Florida) • This method is convenient for a new line of business with little data • The method is unaffected by a change in reserve adequacy • Based on a line already approved, therefore likely based on a UW profit provision with
adequate rates • The policyholder is given some credit for a longer tailed LOB as more investment income is
generated • The PLR is used in the model and is prospective looking, which is what ratemaking should be
Sample solution 1 1- PV Offset method is not distorted by rapid growth of a line of business. 2- It also does not require an assumption about a target rate of return. Sample solution 2 1- Does not require allocation of surplus 2- Prospective, not distorted by rapid growth Part c: 0.5 point Sample solution 1 It does not at all consider the return demanded by the shareholders for their investment. An internal rate of return approach that targets an IRR of at least the cost of capital will ensure that the expected return to shareholders is appropriate. Sample solution 2 Since Present Value Offset method does not take into account cash flows to shareholders it may seem inappropriate from a shareholder’s perspective. Calendar year ROE method or IRR method could be more appropriate. Other acceptable responses The following ROE-based models were also accepted alternatives: PVI/PVE, Growth ROE, Present value of cash flow. Complete responses typically included an alternative model along with a discussion on one of the following:
• The fact that the PV Offset method does not explicitly target a ROE, which is what the shareholders are interested in.
• The fact that cash flows between the shareholders and the company are not considered at all in the PV Offset method.
SPRING 2017 EXAM 9 SAMPLE ANSWERS AND EXAMINER’S REPORT
• The fact that the cost of capital (provided by shareholders) is not taken into account in the PV Offset method.
• The fact that the PV Offset model does not ensure that the shareholders will have a sufficient return on their investment (as it does not use a target ROE).
EXAMINER’S REPORT Candidates were expected to demonstrate knowledge on calculating an underwriting profit provision by using the Present Value Offset method. Additionally, the candidates were expected to identify the benefits of the Present Value Offset method compared to other similar methods. The candidates were also tested on their ability to recognize the differences in perspective between the shareholders vs. the regulators/insurers in terms of what is an appropriate measure of profit. Candidates did best on the quantitative part of this question, and were able to identify correctly arguments supporting the use of the method. Some candidates had more difficulty to explain how the shareholders’ perspective differed from those of the regulators and the insurers. Part a The candidates were expected to calculate the underwriting profit provision using the Present Value Offset method with the information provided. Common errors include:
• Setting up the formula incorrectly • Inverting the present value of payment of the existing and new line in the formula • Adjusting the underwriting profit provision of the existing line by a ratio of the durations of
the payments of the two lines Part b Candidates were expected to provide arguments supporting the use of the Present Value Offset method. Many candidates were able to identify at least one argument. Many answers provided came directly from Robbin’s closing paragraph on the method. Common errors include:
• Being too vague in the answer provided (e.g., simply stating that the calculations were easy without specifying how it differentiated from other methods)
• Mentioning that the use of the new money yield was appropriate given the prospective nature of ratemaking. While true, the use of the new money yield is not directly tied to the method as the method only mandates the use of a discount rate (one of which can optionally be the new money yield)
Part c Candidates were expected to demonstrate knowledge of the differences in perspective between the shareholders and the regulators and the insurers. Candidates had trouble with this part in comparison to the other parts.
Common errors include:
• Disregarding totally the shareholders interest in having a return based on the equity they provided (a return on equity)
• Giving general potential disadvantages of the method (including the way the numbers were obtained, the lack of accuracy of the resulting underwriting profit provision) that were not

SPRING 2017 EXAM 9 SAMPLE ANSWERS AND EXAMINER’S REPORT
related specifically to the shareholder’s perspective • Simply mentioning that the shareholders could have difficulties understanding the method. • Stating that the shareholders may find 4% to be too low (with no mention of the effect on
the ROE) • Stating that the shareholders received 4% (the underwriting profit provision) as a return.
The underwriting profit provision is a percentage of the premium paid by the policyholder whereas the shareholders receive a return on the capital provided
• Making an argument about the split of the investment income (between the policyholder supplied funds and the shareholders supplied funds). This is irrelevant from the shareholder’s perspective to the extent that they receive an appropriate return

SPRING 2017 EXAM 9 SAMPLE ANSWERS AND EXAMINER’S REPORT
SPRING 2017 EXAM 9, QUESTION 26 TOTAL POINT VALUE: 2.25 LEARNING OBJECTIVE(S): D6 SAMPLE ANSWERS Part a: 0.75 point Sample solution Any three of the following:
• Be a downside measure (the accountant’s point of view) • Be more or less constant for excess that is small compared to capital (risk of not making
plan, but also not a disaster) • Become much larger for excess significantly impacting capital • Go to zero (or at least not increase) for excess significantly exceeding capital–once you
are buried, it doesn’t matter how much dirt is on top. • It should be allocated to any desired level of definition • The risk load allocated for any sum of random variables should be sum of the risk load
amounts allocated individually • The same additive formula is used to calculate the risk load for any subgroup or group of
groups
Part b: 1.5 points Rating agency downgrade Sample solution 1 TVaR: This measure only attributes risk to the portion of the distribution which exceeds the defined threshold, which in this case coincides with the rating agency downgrade Sample solution 2 Use VaR--The riskiness leverage measure is 0 except at one point (the selected percentile). Since we are only concerned about one point that would cause a rating agency downgrade, VaR is appropriate if the percentile selected corresponds to the level at which downgrade would occur. Failing to meet investor expectations Sample solution 1 Semi-Variance: Assigns capital to all events causing results worse than the mean, increasing as results get more adverse. Sample solution 2 Mean downside deviation: Allocates riskiness based on how bad the outcome is. Sample solution 3 TVaR: Use TVaR, because the impact of how much the expectation was not met also matters. TVaR starts at the loss that would fail to meet expectation and then gets larger as the loss increases.
Reserve adequacy on run-off business with one open claim reserved at $1,000 Sample solution 1

SPRING 2017 EXAM 9 SAMPLE ANSWERS AND EXAMINER’S REPORT
Risk-neutral. L(x) is constant. Excess is small relative to capital. Sample solution 2 TVaR: use the TVaR measure to ensure the capital is enough to cover the events in the tail in the case of adverse development Sample solution 3 SVar: Only concerned w/ adverse development from a reserve adequacy standpoint, so we don’t care about favorable deviations – semi-variance only considers deviations above the mean. Sample solution 4 Proportional Excess: Risk load is proportional to the amount the claim exceeds the reserve Sample solution 5 Mean downside deviation: Interested in bad deviation from the mean (reserve) EXAMINER’S REPORT Candidates were expected to know the desirable qualities of riskiness leverage measures as well as select appropriate riskiness leverage measures for different situations. Part a Candidates were expected to identify three desirable properties of a riskiness leverage measure from the perspective of management. Common errors include:
1. Listing out facts about riskiness leverage measures rather than desirable properties 2. Indicating that the risk load should decrease immediately once capital is exceeded rather
than significantly exceeded Part b Candidates were expected to select an appropriate riskiness leverage measure for each risk and justify its use.
Rating agency downgrade Candidates were expected to realize that a rating agency downgrade would be triggered at a certain point in the tail and select a riskiness leverage measure which would be 0 before that point in the distribution. Common errors include:
• Selecting risk measures such as semi-variance and mean downside deviation which do not satisfy the condition above
• Selecting surplus allocation methods that were not risk measures Failure to meet investor expectations Candidates were expected to realize that the failure to meet investor expectations would not only be influenced by whether the company missed the expectations but also by how much. Common errors include:

SPRING 2017 EXAM 9 SAMPLE ANSWERS AND EXAMINER’S REPORT
• Using riskiness leverage measures such as VaR which only look at one point in the distribution
• Selecting a surplus allocation method that was not a risk measure Reserve adequacy on run-off business with one open claim reserved at $1,000 Candidates were expected to realize that the claim was either insignificant or make an assumption about the possibility of adverse development on the claim. Common errors include:
• Using riskiness leverage methods such as variance which assign a risk load based on the possibility of both favorable and adverse development
• Selecting a riskiness leverage measure without opining on the materiality of the reserve in comparison to capital or potential adverse development

SPRING 2017 EXAM 9 SAMPLE ANSWERS AND EXAMINER’S REPORT
SPRING 2017 EXAM 9, QUESTION 27 TOTAL POINT VALUE: 2.5 LEARNING OBJECTIVE(S): D7 SAMPLE ANSWERS Sample solution 1 Multiplier: z=1.96 y*z/(1+y) = 1.96*.15/1.15 = .2557 Build up risk load for A = 6811*.2557 = 1741 Build up risk load for B = 3754*.2557 = 962 Renewal risk load for A = (10351 – 3764)*.2557 = 1684 Renewal risk load for B = (10351 - 6811)*.2557 = 905 By itself, B would have a risk load of 962. But when joined with A, benefits from lower risk load. A can argue B’s risk load can come down below 962 by any amount when joining and it still benefits. B can argue A benefits by B joining, bringing its risk load down from 1741 to 1684 (57). So B should be able to get a risk load of only 905. Therefore, range is between 905 and 962, but will likely end up somewhere in the middle after rational negotiating. Sample solution 2 ʎ=y*z/(1+y) = 1.96*.15/1.15 = .2557 Standalone risk loads: R(A) = 6811*.2557 = 1741 R(B) = 3754*.2557 = 962 Combined = 1741+962=2703 Combined Risk Load: R(A+B) = 10351*.2557 = 2647 Risk Load Reduction: 2703 – 2647 = 56 2647 – 1741 = 906 Company B can offer between 906 and 962. Any less than 906 and A will be allocated more than on a standalone basis, which would be irrational for A. Any more than 962 and B will be allocated more than on a standalone basis, which would be irrational for B. Therefore, B can offer between 906 and 962 for its share of the risk. Sample solution 3 The risk load for company B should be between its independent amount and its marginal impact to the total. Independent R:

SPRING 2017 EXAM 9 SAMPLE ANSWERS AND EXAMINER’S REPORT
Multiplier: y*z/(1+y) = 1.96*.15/1.15 = .2557 R = 3764*.2557 = 962.45 Marginal Impact: R = (10351 – 6811)*.2557 = 905.178 R should be between 905.178 and 962.45. Independent Capital = z*sd(loss) – R Capital = 1.96(3764) – 962.45 = 6414.99 Marginal Impact = z(S1 – S0) – R = 1.96(10351 – 6811) – 905.178 = 6033.22 The capital for company B should be between 6033.22 and 6414.99. Sample solution 4 y = 15% z = 1.96 E[La] = 970 E[Lb] = 365 Individual R(A) = .15*1.96/1.15*(6811 – 0) = 1741.25 R(B) = .15*1.96/1.15*(3764 – 0) = 962.27 Collect – build up (A 1st) R(A) = .15*1.96/1.15*(6811 – 0) = 1741.25 R(B) = .15*1.96/1.15*(10351 – 6811) = 905
- Renewal R(A) = .15*1.96/1.15*(10351 – 3764) = 1683.98 R(B) – same as build up
Collect – build up (B 1st) R(A) = .15*1.96/1.15*(10351 – 3764) = 1683.98 R(B) = .15*1.96/1.15*(3764 – 0) = 962.27 Range for R(B) = 905 to 962.27 Capital = E[L] + R = 365 + 905 = 1270 = 365 + 962.27 = 1327.27 A is no worse if gets same allocation as individual (1741.25), so together they need yz/(1+y)(σa+b) = 2646.26 so B must give at least 2646.26 – 1741.25 = 905. B is no worse with same as now
SPRING 2017 EXAM 9 SAMPLE ANSWERS AND EXAMINER’S REPORT
(962.27). Range of capital = 1270 – 1327.27. EXAMINER’S REPORT Candidates were expected to understand how to use the marginal surplus method to calculate risk loads and demonstrate a basic understanding of the application of game theory to this topic. Candidates were specifically expected to:
• Calculate the risk load for B on a standalone basis • Calculate the marginal impact of adding B to A using the marginal surplus method • State the range of outcomes and why values in this range are rational for both companies
Responses that stated B’s risk load only, the capital required to transfer B’s liabilities to A, or each company’s allocated surplus in a pooling scenario were acceptable. Common errors include:
• Not stating the range or giving a point estimate • Insufficient explanation of the rationality of the agreement, particularly from the
perspective of Company A • Using the covariance share or Shapley method to restrict the range beyond the rational
outer boundaries