Evaluating tagging behavior in social bookmarking systems: metrics and design heuristics
10
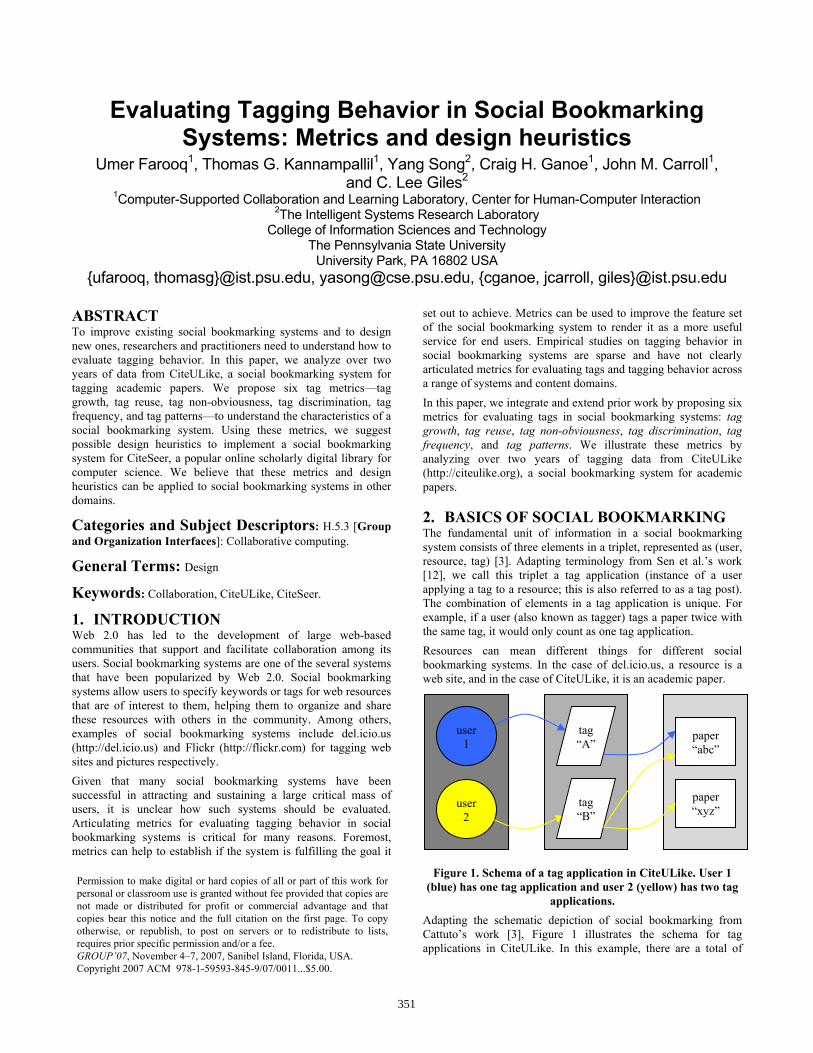
Evaluating Tagging Behavior in Social Bookmarking Systems: Metrics and design heuristics Umer Farooq 1 , Thomas G. Kannampallil 1 , Yang Song 2 , Craig H. Ganoe 1 , John M. Carroll 1 , and C. Lee Giles 2 1 Computer-Supported Collaboration and Learning Laboratory, Center for Human-Computer Interaction 2 The Intelligent Systems Research Laboratory College of Information Sciences and Technology The Pennsylvania State University University Park, PA 16802 USA {ufarooq, thomasg}@ist.psu.edu, [email protected], {cganoe, jcarroll, giles}@ist.psu.edu ABSTRACT To improve existing social bookmarking systems and to design new ones, researchers and practitioners need to understand how to evaluate tagging behavior. In this paper, we analyze over two years of data from CiteULike, a social bookmarking system for tagging academic papers. We propose six tag metrics—tag growth, tag reuse, tag non-obviousness, tag discrimination, tag frequency, and tag patterns—to understand the characteristics of a social bookmarking system. Using these metrics, we suggest possible design heuristics to implement a social bookmarking system for CiteSeer, a popular online scholarly digital library for computer science. We believe that these metrics and design heuristics can be applied to social bookmarking systems in other domains. Categories and Subject Descriptors: H.5.3 [Group and Organization Interfaces]: Collaborative computing. General Terms: Design Keywords: Collaboration, CiteULike, CiteSeer. 1. INTRODUCTION Web 2.0 has led to the development of large web-based communities that support and facilitate collaboration among its users. Social bookmarking systems are one of the several systems that have been popularized by Web 2.0. Social bookmarking systems allow users to specify keywords or tags for web resources that are of interest to them, helping them to organize and share these resources with others in the community. Among others, examples of social bookmarking systems include del.icio.us (http://del.icio.us) and Flickr (http://flickr.com) for tagging web sites and pictures respectively. Given that many social bookmarking systems have been successful in attracting and sustaining a large critical mass of users, it is unclear how such systems should be evaluated. Articulating metrics for evaluating tagging behavior in social bookmarking systems is critical for many reasons. Foremost, metrics can help to establish if the system is fulfilling the goal it set out to achieve. Metrics can be used to improve the feature set of the social bookmarking system to render it as a more useful service for end users. Empirical studies on tagging behavior in social bookmarking systems are sparse and have not clearly articulated metrics for evaluating tags and tagging behavior across a range of systems and content domains. In this paper, we integrate and extend prior work by proposing six metrics for evaluating tags in social bookmarking systems: tag growth, tag reuse, tag non-obviousness, tag discrimination, tag frequency, and tag patterns. We illustrate these metrics by analyzing over two years of tagging data from CiteULike (http://citeulike.org), a social bookmarking system for academic papers. 2. BASICS OF SOCIAL BOOKMARKING The fundamental unit of information in a social bookmarking system consists of three elements in a triplet, represented as (user, resource, tag) [3]. Adapting terminology from Sen et al.’s work [12], we call this triplet a tag application (instance of a user applying a tag to a resource; this is also referred to as a tag post). The combination of elements in a tag application is unique. For example, if a user (also known as tagger) tags a paper twice with the same tag, it would only count as one tag application. Resources can mean different things for different social bookmarking systems. In the case of del.icio.us, a resource is a web site, and in the case of CiteULike, it is an academic paper. Figure 1. Schema of a tag application in CiteULike. User 1 (blue) has one tag application and user 2 (yellow) has two tag applications. Adapting the schematic depiction of social bookmarking from Cattuto’s work [3], Figure 1 illustrates the schema for tag applications in CiteULike. In this example, there are a total of Permission to make digital or hard copies of all or part of this work for personal or classroom use is granted without fee provided that copies are not made or distributed for profit or commercial advantage and that copies bear this notice and the full citation on the first page. To copy otherwise, or republish, to post on servers or to redistribute to lists, requires prior specific permission and/or a fee. GROUP’07, November 4–7, 2007, Sanibel Island, Florida, USA. Copyright 2007 ACM 978-1-59593-845-9/07/0011...$5.00. user 1 user 2 paper “abc” paper “xyz” tag “A” tag “B” 351
-
Upload
independent -
Category
Documents
-
view
0 -
download
0
Transcript of Evaluating tagging behavior in social bookmarking systems: metrics and design heuristics
Evaluating Tagging Behavior in Social Bookmarking Systems: Metrics and design heuristics
Umer Farooq1, Thomas G. Kannampallil1, Yang Song2, Craig H. Ganoe1, John M. Carroll1, and C. Lee Giles2
1Computer-Supported Collaboration and Learning Laboratory, Center for Human-Computer Interaction 2The Intelligent Systems Research Laboratory
College of Information Sciences and Technology The Pennsylvania State University
University Park, PA 16802 USA {ufarooq, thomasg}@ist.psu.edu, [email protected], {cganoe, jcarroll, giles}@ist.psu.edu
ABSTRACT To improve existing social bookmarking systems and to design new ones, researchers and practitioners need to understand how to evaluate tagging behavior. In this paper, we analyze over two years of data from CiteULike, a social bookmarking system for tagging academic papers. We propose six tag metrics—tag growth, tag reuse, tag non-obviousness, tag discrimination, tag frequency, and tag patterns—to understand the characteristics of a social bookmarking system. Using these metrics, we suggest possible design heuristics to implement a social bookmarking system for CiteSeer, a popular online scholarly digital library for computer science. We believe that these metrics and design heuristics can be applied to social bookmarking systems in other domains.
Categories and Subject Descriptors: H.5.3 [Group and Organization Interfaces]: Collaborative computing.
General Terms: Design
Keywords: Collaboration, CiteULike, CiteSeer.
1. INTRODUCTION Web 2.0 has led to the development of large web-based communities that support and facilitate collaboration among its users. Social bookmarking systems are one of the several systems that have been popularized by Web 2.0. Social bookmarking systems allow users to specify keywords or tags for web resources that are of interest to them, helping them to organize and share these resources with others in the community. Among others, examples of social bookmarking systems include del.icio.us (http://del.icio.us) and Flickr (http://flickr.com) for tagging web sites and pictures respectively. Given that many social bookmarking systems have been successful in attracting and sustaining a large critical mass of users, it is unclear how such systems should be evaluated. Articulating metrics for evaluating tagging behavior in social bookmarking systems is critical for many reasons. Foremost, metrics can help to establish if the system is fulfilling the goal it
set out to achieve. Metrics can be used to improve the feature set of the social bookmarking system to render it as a more useful service for end users. Empirical studies on tagging behavior in social bookmarking systems are sparse and have not clearly articulated metrics for evaluating tags and tagging behavior across a range of systems and content domains. In this paper, we integrate and extend prior work by proposing six metrics for evaluating tags in social bookmarking systems: tag growth, tag reuse, tag non-obviousness, tag discrimination, tag frequency, and tag patterns. We illustrate these metrics by analyzing over two years of tagging data from CiteULike (http://citeulike.org), a social bookmarking system for academic papers.
2. BASICS OF SOCIAL BOOKMARKING The fundamental unit of information in a social bookmarking system consists of three elements in a triplet, represented as (user, resource, tag) [3]. Adapting terminology from Sen et al.’s work [12], we call this triplet a tag application (instance of a user applying a tag to a resource; this is also referred to as a tag post). The combination of elements in a tag application is unique. For example, if a user (also known as tagger) tags a paper twice with the same tag, it would only count as one tag application. Resources can mean different things for different social bookmarking systems. In the case of del.icio.us, a resource is a web site, and in the case of CiteULike, it is an academic paper.
Figure 1. Schema of a tag application in CiteULike. User 1 (blue) has one tag application and user 2 (yellow) has two tag
applications. Adapting the schematic depiction of social bookmarking from Cattuto’s work [3], Figure 1 illustrates the schema for tag applications in CiteULike. In this example, there are a total of
Permission to make digital or hard copies of all or part of this work for personal or classroom use is granted without fee provided that copies are not made or distributed for profit or commercial advantage and that copies bear this notice and the full citation on the first page. To copy otherwise, or republish, to post on servers or to redistribute to lists, requires prior specific permission and/or a fee. GROUP’07, November 4–7, 2007, Sanibel Island, Florida, USA. Copyright 2007 ACM 978-1-59593-845-9/07/0011...$5.00.
user 1
user 2
paper “abc”
paper “xyz”
tag “A”
tag “B”
351
three tag applications: (user 1, paper “abc”, tag “A”), (user 2, paper “abc”, tag “B”), and (user 2, paper “xyz”, tag “B”).
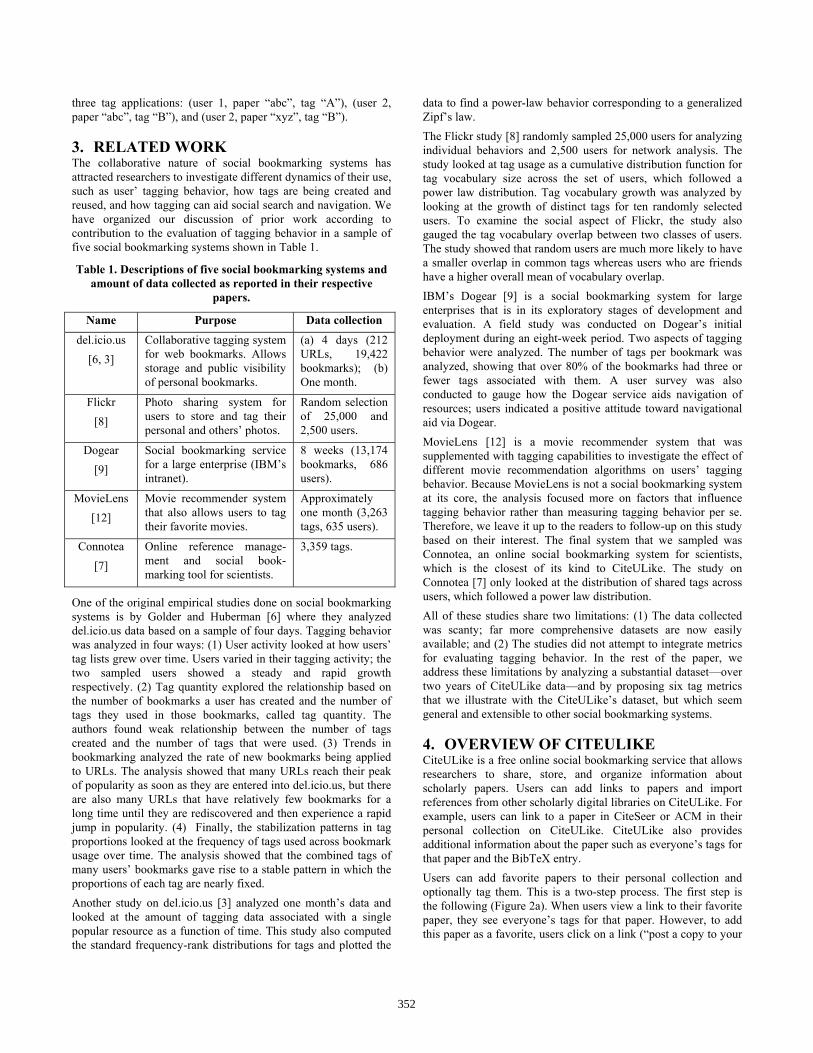
3. RELATED WORK The collaborative nature of social bookmarking systems has attracted researchers to investigate different dynamics of their use, such as user’ tagging behavior, how tags are being created and reused, and how tagging can aid social search and navigation. We have organized our discussion of prior work according to contribution to the evaluation of tagging behavior in a sample of five social bookmarking systems shown in Table 1.
Table 1. Descriptions of five social bookmarking systems and amount of data collected as reported in their respective
papers.
Name Purpose Data collection
del.icio.us [6, 3]
Collaborative tagging system for web bookmarks. Allows storage and public visibility of personal bookmarks.
(a) 4 days (212 URLs, 19,422 bookmarks); (b) One month.
Flickr [8]
Photo sharing system for users to store and tag their personal and others’ photos.
Random selection of 25,000 and 2,500 users.
Dogear [9]
Social bookmarking service for a large enterprise (IBM’s intranet).
8 weeks (13,174 bookmarks, 686 users).
MovieLens [12]
Movie recommender system that also allows users to tag their favorite movies.
Approximately one month (3,263 tags, 635 users).
Connotea [7]
Online reference manage-ment and social book-marking tool for scientists.
3,359 tags.
One of the original empirical studies done on social bookmarking systems is by Golder and Huberman [6] where they analyzed del.icio.us data based on a sample of four days. Tagging behavior was analyzed in four ways: (1) User activity looked at how users’ tag lists grew over time. Users varied in their tagging activity; the two sampled users showed a steady and rapid growth respectively. (2) Tag quantity explored the relationship based on the number of bookmarks a user has created and the number of tags they used in those bookmarks, called tag quantity. The authors found weak relationship between the number of tags created and the number of tags that were used. (3) Trends in bookmarking analyzed the rate of new bookmarks being applied to URLs. The analysis showed that many URLs reach their peak of popularity as soon as they are entered into del.icio.us, but there are also many URLs that have relatively few bookmarks for a long time until they are rediscovered and then experience a rapid jump in popularity. (4) Finally, the stabilization patterns in tag proportions looked at the frequency of tags used across bookmark usage over time. The analysis showed that the combined tags of many users’ bookmarks gave rise to a stable pattern in which the proportions of each tag are nearly fixed. Another study on del.icio.us [3] analyzed one month’s data and looked at the amount of tagging data associated with a single popular resource as a function of time. This study also computed the standard frequency-rank distributions for tags and plotted the
data to find a power-law behavior corresponding to a generalized Zipf’s law. The Flickr study [8] randomly sampled 25,000 users for analyzing individual behaviors and 2,500 users for network analysis. The study looked at tag usage as a cumulative distribution function for tag vocabulary size across the set of users, which followed a power law distribution. Tag vocabulary growth was analyzed by looking at the growth of distinct tags for ten randomly selected users. To examine the social aspect of Flickr, the study also gauged the tag vocabulary overlap between two classes of users. The study showed that random users are much more likely to have a smaller overlap in common tags whereas users who are friends have a higher overall mean of vocabulary overlap. IBM’s Dogear [9] is a social bookmarking system for large enterprises that is in its exploratory stages of development and evaluation. A field study was conducted on Dogear’s initial deployment during an eight-week period. Two aspects of tagging behavior were analyzed. The number of tags per bookmark was analyzed, showing that over 80% of the bookmarks had three or fewer tags associated with them. A user survey was also conducted to gauge how the Dogear service aids navigation of resources; users indicated a positive attitude toward navigational aid via Dogear. MovieLens [12] is a movie recommender system that was supplemented with tagging capabilities to investigate the effect of different movie recommendation algorithms on users’ tagging behavior. Because MovieLens is not a social bookmarking system at its core, the analysis focused more on factors that influence tagging behavior rather than measuring tagging behavior per se. Therefore, we leave it up to the readers to follow-up on this study based on their interest. The final system that we sampled was Connotea, an online social bookmarking system for scientists, which is the closest of its kind to CiteULike. The study on Connotea [7] only looked at the distribution of shared tags across users, which followed a power law distribution. All of these studies share two limitations: (1) The data collected was scanty; far more comprehensive datasets are now easily available; and (2) The studies did not attempt to integrate metrics for evaluating tagging behavior. In the rest of the paper, we address these limitations by analyzing a substantial dataset—over two years of CiteULike data—and by proposing six tag metrics that we illustrate with the CiteULike’s dataset, but which seem general and extensible to other social bookmarking systems.
4. OVERVIEW OF CITEULIKE CiteULike is a free online social bookmarking service that allows researchers to share, store, and organize information about scholarly papers. Users can add links to papers and import references from other scholarly digital libraries on CiteULike. For example, users can link to a paper in CiteSeer or ACM in their personal collection on CiteULike. CiteULike also provides additional information about the paper such as everyone’s tags for that paper and the BibTeX entry. Users can add favorite papers to their personal collection and optionally tag them. This is a two-step process. The first step is the following (Figure 2a). When users view a link to their favorite paper, they see everyone’s tags for that paper. However, to add this paper as a favorite, users click on a link (“post a copy to your
352
library”) that takes them to another “tagging” page, which is the second step.
In the second step (Figure 2b), users can optionally tag the paper. Users can create new tags (by typing them in a textbox), which may or may not overlap with existing tags other users have used before, or users can select existing tags (by clicking on each tag that automatically adds it to the textbox) but only from their personal collection. In this case, the user’s personal collection contains three tags: “ibm”, “ibm-research”, and “yahoo-research”. Note that users are not given the option to select a tag from everyone’s tag collection. If users want to tag a paper with another user’s tag, they have to manually type it in (note that in such a design, a user may not intend to tag a paper with another user’s tag but the applied tag may coincidentally overlap with a previously applied tag).
Figure 2a. User viewing a potentially favorite paper in
CiteULike with everyone’s tags visible.
Figure 2b. User tagging a favorite paper in CiteULike.
5. EVALUATION METRICS Our analysis is based on over two years of CiteULike’s data from November 15, 2004 to February 13, 2007. Because the authors of this paper are part of the CiteSeer research group, the underlying CiteULike dataset that we had access to comprised tag applications for papers in CiteSeer that CiteULike indexes.
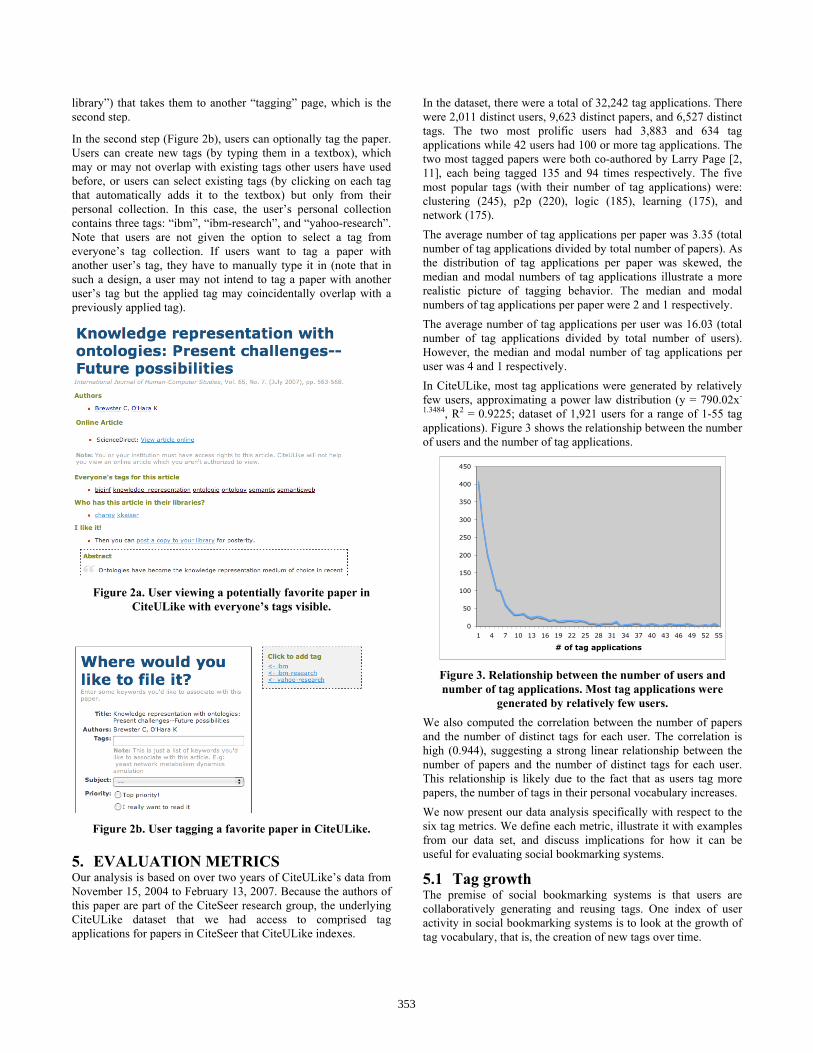
In the dataset, there were a total of 32,242 tag applications. There were 2,011 distinct users, 9,623 distinct papers, and 6,527 distinct tags. The two most prolific users had 3,883 and 634 tag applications while 42 users had 100 or more tag applications. The two most tagged papers were both co-authored by Larry Page [2, 11], each being tagged 135 and 94 times respectively. The five most popular tags (with their number of tag applications) were: clustering (245), p2p (220), logic (185), learning (175), and network (175). The average number of tag applications per paper was 3.35 (total number of tag applications divided by total number of papers). As the distribution of tag applications per paper was skewed, the median and modal numbers of tag applications illustrate a more realistic picture of tagging behavior. The median and modal numbers of tag applications per paper were 2 and 1 respectively. The average number of tag applications per user was 16.03 (total number of tag applications divided by total number of users). However, the median and modal number of tag applications per user was 4 and 1 respectively. In CiteULike, most tag applications were generated by relatively few users, approximating a power law distribution (y = 790.02x-
1.3484, R2 = 0.9225; dataset of 1,921 users for a range of 1-55 tag applications). Figure 3 shows the relationship between the number of users and the number of tag applications.
0
50
100
150
200
250
300
350
400
450
1 4 7 10 13 16 19 22 25 28 31 34 37 40 43 46 49 52 55
# of tag applications
Figure 3. Relationship between the number of users and number of tag applications. Most tag applications were
generated by relatively few users. We also computed the correlation between the number of papers and the number of distinct tags for each user. The correlation is high (0.944), suggesting a strong linear relationship between the number of papers and the number of distinct tags for each user. This relationship is likely due to the fact that as users tag more papers, the number of tags in their personal vocabulary increases. We now present our data analysis specifically with respect to the six tag metrics. We define each metric, illustrate it with examples from our data set, and discuss implications for how it can be useful for evaluating social bookmarking systems.
5.1 Tag growth The premise of social bookmarking systems is that users are collaboratively generating and reusing tags. One index of user activity in social bookmarking systems is to look at the growth of tag vocabulary, that is, the creation of new tags over time.
353
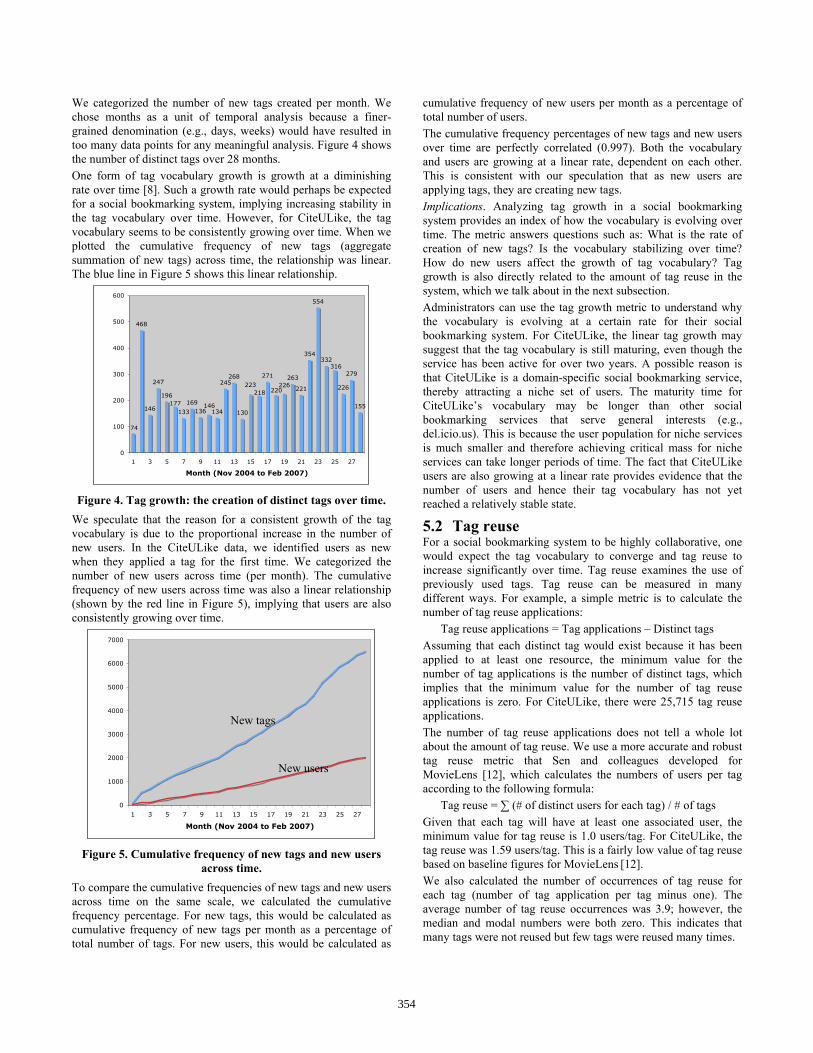
We categorized the number of new tags created per month. We chose months as a unit of temporal analysis because a finer-grained denomination (e.g., days, weeks) would have resulted in too many data points for any meaningful analysis. Figure 4 shows the number of distinct tags over 28 months. One form of tag vocabulary growth is growth at a diminishing rate over time [8]. Such a growth rate would perhaps be expected for a social bookmarking system, implying increasing stability in the tag vocabulary over time. However, for CiteULike, the tag vocabulary seems to be consistently growing over time. When we plotted the cumulative frequency of new tags (aggregate summation of new tags) across time, the relationship was linear. The blue line in Figure 5 shows this linear relationship.
468
146
247
196
133
169136 134
245268
130
271 263
221
354
554
332
226
279
155
74
177
316
220226223
218
146
0
100
200
300
400
500
600
1 3 5 7 9 11 13 15 17 19 21 23 25 27
Month (Nov 2004 to Feb 2007)
Figure 4. Tag growth: the creation of distinct tags over time.
We speculate that the reason for a consistent growth of the tag vocabulary is due to the proportional increase in the number of new users. In the CiteULike data, we identified users as new when they applied a tag for the first time. We categorized the number of new users across time (per month). The cumulative frequency of new users across time was also a linear relationship (shown by the red line in Figure 5), implying that users are also consistently growing over time.
0
1000
2000
3000
4000
5000
6000
7000
1 3 5 7 9 11 13 15 17 19 21 23 25 27
Month (Nov 2004 to Feb 2007)
Figure 5. Cumulative frequency of new tags and new users
across time. To compare the cumulative frequencies of new tags and new users across time on the same scale, we calculated the cumulative frequency percentage. For new tags, this would be calculated as cumulative frequency of new tags per month as a percentage of total number of tags. For new users, this would be calculated as
cumulative frequency of new users per month as a percentage of total number of users. The cumulative frequency percentages of new tags and new users over time are perfectly correlated (0.997). Both the vocabulary and users are growing at a linear rate, dependent on each other. This is consistent with our speculation that as new users are applying tags, they are creating new tags. Implications. Analyzing tag growth in a social bookmarking system provides an index of how the vocabulary is evolving over time. The metric answers questions such as: What is the rate of creation of new tags? Is the vocabulary stabilizing over time? How do new users affect the growth of tag vocabulary? Tag growth is also directly related to the amount of tag reuse in the system, which we talk about in the next subsection. Administrators can use the tag growth metric to understand why the vocabulary is evolving at a certain rate for their social bookmarking system. For CiteULike, the linear tag growth may suggest that the tag vocabulary is still maturing, even though the service has been active for over two years. A possible reason is that CiteULike is a domain-specific social bookmarking service, thereby attracting a niche set of users. The maturity time for CiteULike’s vocabulary may be longer than other social bookmarking services that serve general interests (e.g., del.icio.us). This is because the user population for niche services is much smaller and therefore achieving critical mass for niche services can take longer periods of time. The fact that CiteULike users are also growing at a linear rate provides evidence that the number of users and hence their tag vocabulary has not yet reached a relatively stable state.
5.2 Tag reuse For a social bookmarking system to be highly collaborative, one would expect the tag vocabulary to converge and tag reuse to increase significantly over time. Tag reuse examines the use of previously used tags. Tag reuse can be measured in many different ways. For example, a simple metric is to calculate the number of tag reuse applications:
Tag reuse applications = Tag applications – Distinct tags Assuming that each distinct tag would exist because it has been applied to at least one resource, the minimum value for the number of tag applications is the number of distinct tags, which implies that the minimum value for the number of tag reuse applications is zero. For CiteULike, there were 25,715 tag reuse applications. The number of tag reuse applications does not tell a whole lot about the amount of tag reuse. We use a more accurate and robust tag reuse metric that Sen and colleagues developed for MovieLens [12], which calculates the numbers of users per tag according to the following formula:
Tag reuse = ∑ (# of distinct users for each tag) / # of tags Given that each tag will have at least one associated user, the minimum value for tag reuse is 1.0 users/tag. For CiteULike, the tag reuse was 1.59 users/tag. This is a fairly low value of tag reuse based on baseline figures for MovieLens [12]. We also calculated the number of occurrences of tag reuse for each tag (number of tag application per tag minus one). The average number of tag reuse occurrences was 3.9; however, the median and modal numbers were both zero. This indicates that many tags were not reused but few tags were reused many times.
New tags
New users
354

Figure 6 illustrates the number of tags that have been reused. The x-axis indicates the number of tag reuse occurrences while the y-axis indicates the number of tags. The data has been sorted in ascending order of tag reuse occurrences. For example, data point “A” indicates that 1014 tags were reused once; data point “B” indicates that 514 tags were reused twice, and so on. The distribution resembled a power law (y = 2043.6x-1.6727, R2 = 0.9469; dataset of 3,058 tags for a range of 1-48 tag reuse occurrences).
0
200
400
600
800
1000
1200
1 3 5 7 9 11 13 15 17 19 21 23 25 27 29 31 33 35 37 39 41 43 45 47
# of reuse occurrences
Figure 6. Shows the number of tags and their frequency of
reuse occurrences. “A” indicates that 1014 tags were reused once; “B” indicates that 514 tags were reused twice.
We also wanted to understand how many tags users were reusing from their personal collection (i.e., how much does a user reuse tags he/she has applied before). The average number of tag reuse occurrences for each user was 8.5; the median and modal numbers were 5 and 1 respectively. This indicates that users were moderately reusing tags from their personal collection when tagging new papers. Figure 7 illustrates the number of users reusing tags from their personal collection. Data point “C” indicates that 167 users reused one tag from their personal collection; data point “D” indicates that 136 users reused two tags from their personal collection, and so on. The distribution resembled a power law (y = 370.7x-1.3172, R2 = 0.8862; dataset of 879 users for a range of 1-49 tags reused).
0
20
40
60
80
100
120
140
160
180
1 4 7 10 13 16 19 22 25 28 31 34 37 40 43 46 49
# of tags reused
Figure 7. Shows the number of users and the frequency of
reuse occurrences from their personal collection. “A” indicates that 167 users reused one tag; “B” indicates that 136
users reused two tags.
Implications. Related to the tag growth metric, tag reuse provides a direct interpretation of how often tags in a social bookmarking system are being recycled among the users. Note that both tag growth and tag reuse are important metrics to understand how the tagging vocabulary is evolving. A social bookmarking system could have a high tag growth but low tag reuse (as in the case of CiteULike), low tag growth and low tag reuse (perhaps implying that the system is not being used at all for tagging), low tag growth and high tag reuse (users are recycling previous tags and not creating new ones), and so on. Such an assessment is important for administrators to gauge how their service is being used and for designers to consider how they intend to support tag reuse in their social bookmarking systems. From our analysis of tag reuse for CiteULlike, we found that most users did not reuse tags from others’ tag collection. However, users were indeed reusing tags from their personal collection. In trying to understand the reason for this discrepancy, we noticed that the CiteULike user interface provided to users for tagging might explain this phenomenon. When users tag papers (refer to Figures 2a and 2b), they are given a choice of selecting and reusing tags from only their personal collection, but if they want to reuse tags from outside their personal collection, such tags are not visible during the time of tagging. The only mechanism for tags to be reused from others’ collection is by remembering them when they were first seen by users before they actually tag the paper or through mere coincidence. We reflect more on this issue in the next section when we discuss our design heuristics.
5.3 Tag non-obviousness One way to assess the usefulness of a tag is to establish how obvious the tag is with respect to its resource—if the tag is less obvious, the more useful it is in describing the paper. In the case of CiteULike, tag non-obviousness answers the following question: how obvious is a tag with respect to its associated paper? In other words, tag non-obviousness measures how often the tag itself occurs in the text of the paper associated with it. A tag that does not occur in the paper can be claimed to be a very useful tag. The premise is that a non-obvious tag adds more intellectual value to the paper than an obvious tag. We can operationalize tag non-obviousness in a simple way by calculating the frequency percentage of all tags applied to a paper. For the purposes of providing an example, we took the top five tagged papers from the CiteULike data. We converted each paper, originally in PDF format, to text. For each paper, we checked off the tags applied to that paper that appeared in the text of the paper, counted the tags that were not checked off, divided this by the number of total tags for that paper, and multiplied this by 100 to get a percentage measure of tags that are non-obvious. Table 2 shows these tag non-obviousness values (“N.O.” stands for tag “non-obviousness”). The paper entitled “ReferralWeb” has the most non-obvious tags associated with it among these five papers. There are obvious limitations to this simple way of calculating tag non-obviousness. We did an exact character-by-character match between the tag and its occurrence in the paper. This ignored cases where the tags contained hyphens (e.g., “citation-analysis”) or were concatenated words (e.g., “randomwalks”). The biggest disadvantage of simply counting the binary occurrence for a tag in the paper (whether the tag occurs or not) is that it fails to take into account the tags that occur more than once in the paper. For example, one of the tags for the top tagged paper was “pagerank”,
“A”
“B”
“C”
“D”
355
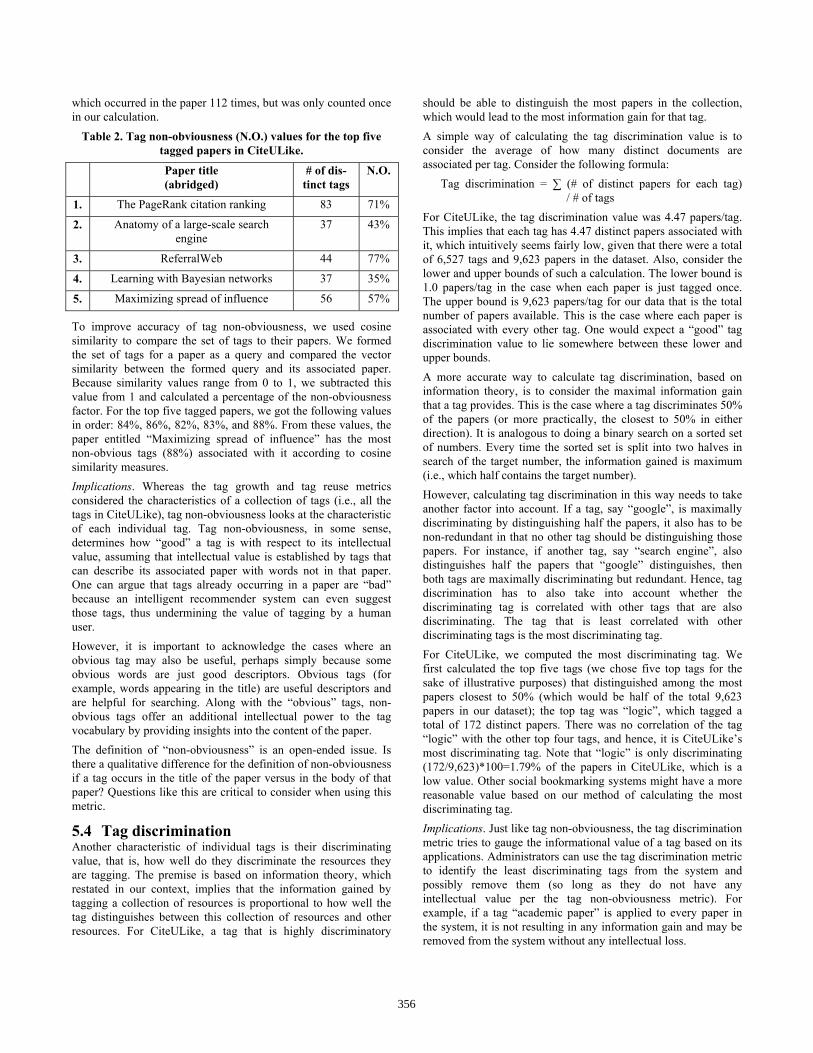
which occurred in the paper 112 times, but was only counted once in our calculation.
Table 2. Tag non-obviousness (N.O.) values for the top five tagged papers in CiteULike.
Paper title (abridged)
# of dis-tinct tags
N.O.
1. The PageRank citation ranking 83 71%
2. Anatomy of a large-scale search engine
37 43%
3. ReferralWeb 44 77%
4. Learning with Bayesian networks 37 35%
5. Maximizing spread of influence 56 57%
To improve accuracy of tag non-obviousness, we used cosine similarity to compare the set of tags to their papers. We formed the set of tags for a paper as a query and compared the vector similarity between the formed query and its associated paper. Because similarity values range from 0 to 1, we subtracted this value from 1 and calculated a percentage of the non-obviousness factor. For the top five tagged papers, we got the following values in order: 84%, 86%, 82%, 83%, and 88%. From these values, the paper entitled “Maximizing spread of influence” has the most non-obvious tags (88%) associated with it according to cosine similarity measures. Implications. Whereas the tag growth and tag reuse metrics considered the characteristics of a collection of tags (i.e., all the tags in CiteULike), tag non-obviousness looks at the characteristic of each individual tag. Tag non-obviousness, in some sense, determines how “good” a tag is with respect to its intellectual value, assuming that intellectual value is established by tags that can describe its associated paper with words not in that paper. One can argue that tags already occurring in a paper are “bad” because an intelligent recommender system can even suggest those tags, thus undermining the value of tagging by a human user. However, it is important to acknowledge the cases where an obvious tag may also be useful, perhaps simply because some obvious words are just good descriptors. Obvious tags (for example, words appearing in the title) are useful descriptors and are helpful for searching. Along with the “obvious” tags, non-obvious tags offer an additional intellectual power to the tag vocabulary by providing insights into the content of the paper. The definition of “non-obviousness” is an open-ended issue. Is there a qualitative difference for the definition of non-obviousness if a tag occurs in the title of the paper versus in the body of that paper? Questions like this are critical to consider when using this metric.
5.4 Tag discrimination Another characteristic of individual tags is their discriminating value, that is, how well do they discriminate the resources they are tagging. The premise is based on information theory, which restated in our context, implies that the information gained by tagging a collection of resources is proportional to how well the tag distinguishes between this collection of resources and other resources. For CiteULike, a tag that is highly discriminatory
should be able to distinguish the most papers in the collection, which would lead to the most information gain for that tag. A simple way of calculating the tag discrimination value is to consider the average of how many distinct documents are associated per tag. Consider the following formula:
Tag discrimination = ∑ (# of distinct papers for each tag) / # of tags For CiteULike, the tag discrimination value was 4.47 papers/tag. This implies that each tag has 4.47 distinct papers associated with it, which intuitively seems fairly low, given that there were a total of 6,527 tags and 9,623 papers in the dataset. Also, consider the lower and upper bounds of such a calculation. The lower bound is 1.0 papers/tag in the case when each paper is just tagged once. The upper bound is 9,623 papers/tag for our data that is the total number of papers available. This is the case where each paper is associated with every other tag. One would expect a “good” tag discrimination value to lie somewhere between these lower and upper bounds. A more accurate way to calculate tag discrimination, based on information theory, is to consider the maximal information gain that a tag provides. This is the case where a tag discriminates 50% of the papers (or more practically, the closest to 50% in either direction). It is analogous to doing a binary search on a sorted set of numbers. Every time the sorted set is split into two halves in search of the target number, the information gained is maximum (i.e., which half contains the target number). However, calculating tag discrimination in this way needs to take another factor into account. If a tag, say “google”, is maximally discriminating by distinguishing half the papers, it also has to be non-redundant in that no other tag should be distinguishing those papers. For instance, if another tag, say “search engine”, also distinguishes half the papers that “google” distinguishes, then both tags are maximally discriminating but redundant. Hence, tag discrimination has to also take into account whether the discriminating tag is correlated with other tags that are also discriminating. The tag that is least correlated with other discriminating tags is the most discriminating tag. For CiteULike, we computed the most discriminating tag. We first calculated the top five tags (we chose five top tags for the sake of illustrative purposes) that distinguished among the most papers closest to 50% (which would be half of the total 9,623 papers in our dataset); the top tag was “logic”, which tagged a total of 172 distinct papers. There was no correlation of the tag “logic” with the other top four tags, and hence, it is CiteULike’s most discriminating tag. Note that “logic” is only discriminating (172/9,623)*100=1.79% of the papers in CiteULike, which is a low value. Other social bookmarking systems might have a more reasonable value based on our method of calculating the most discriminating tag. Implications. Just like tag non-obviousness, the tag discrimination metric tries to gauge the informational value of a tag based on its applications. Administrators can use the tag discrimination metric to identify the least discriminating tags from the system and possibly remove them (so long as they do not have any intellectual value per the tag non-obviousness metric). For example, if a tag “academic paper” is applied to every paper in the system, it is not resulting in any information gain and may be removed from the system without any intellectual loss.
356
The tag discrimination metric, which we calculated earlier (4.47 papers/tag), can be traced across time for a social bookmarking system. Such a temporal analysis can be helpful for administrators to evaluate the usefulness of tags over time in their ability to discriminate among papers. It is important to note that a tag can change in its discriminating value as more papers are added and tagged in the system.
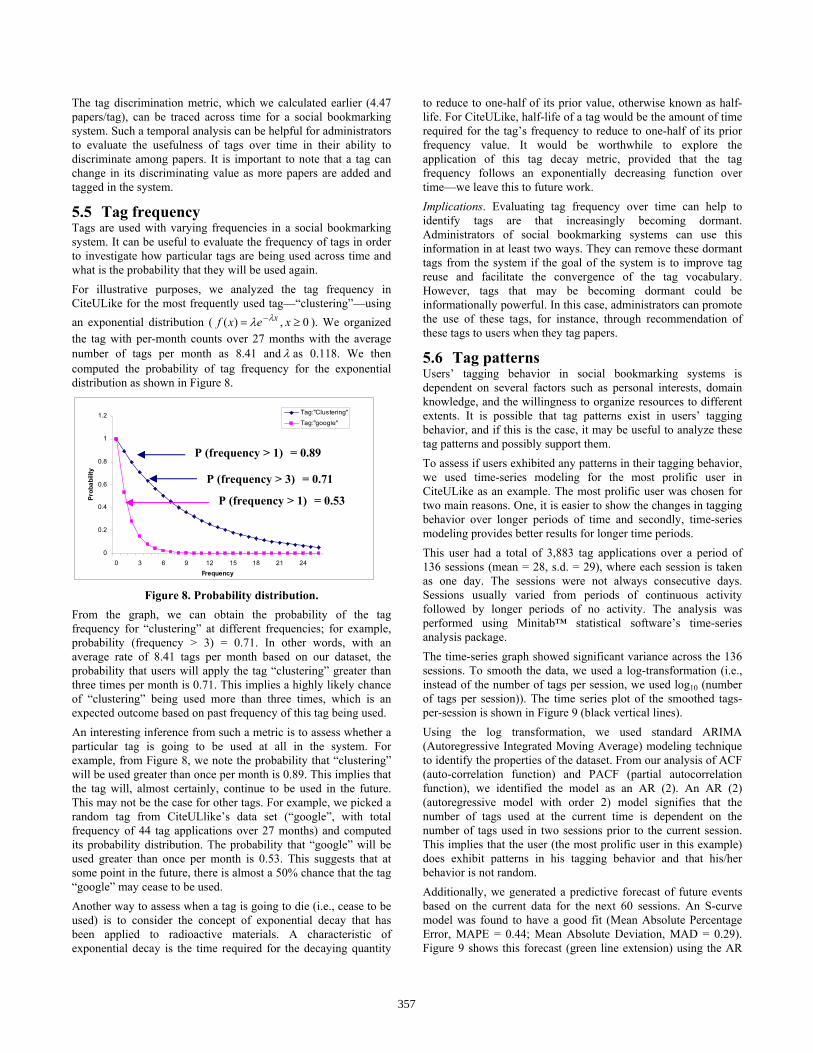
5.5 Tag frequency Tags are used with varying frequencies in a social bookmarking system. It can be useful to evaluate the frequency of tags in order to investigate how particular tags are being used across time and what is the probability that they will be used again. For illustrative purposes, we analyzed the tag frequency in CiteULike for the most frequently used tag—“clustering”—using an exponential distribution ( 0,)( ≥= − xexf xλλ ). We organized the tag with per-month counts over 27 months with the average number of tags per month as 8.41 and λ as 0.118. We then computed the probability of tag frequency for the exponential distribution as shown in Figure 8.
0
0.2
0.4
0.6
0.8
1
1.2
0 3 6 9 12 15 18 21 24Frequency
Prob
abili
ty
Tag:"Clustering"
Tag:"google"
Figure 8. Probability distribution.
From the graph, we can obtain the probability of the tag frequency for “clustering” at different frequencies; for example, probability (frequency > 3) = 0.71. In other words, with an average rate of 8.41 tags per month based on our dataset, the probability that users will apply the tag “clustering” greater than three times per month is 0.71. This implies a highly likely chance of “clustering” being used more than three times, which is an expected outcome based on past frequency of this tag being used. An interesting inference from such a metric is to assess whether a particular tag is going to be used at all in the system. For example, from Figure 8, we note the probability that “clustering” will be used greater than once per month is 0.89. This implies that the tag will, almost certainly, continue to be used in the future. This may not be the case for other tags. For example, we picked a random tag from CiteULlike’s data set (“google”, with total frequency of 44 tag applications over 27 months) and computed its probability distribution. The probability that “google” will be used greater than once per month is 0.53. This suggests that at some point in the future, there is almost a 50% chance that the tag “google” may cease to be used. Another way to assess when a tag is going to die (i.e., cease to be used) is to consider the concept of exponential decay that has been applied to radioactive materials. A characteristic of exponential decay is the time required for the decaying quantity
to reduce to one-half of its prior value, otherwise known as half-life. For CiteULike, half-life of a tag would be the amount of time required for the tag’s frequency to reduce to one-half of its prior frequency value. It would be worthwhile to explore the application of this tag decay metric, provided that the tag frequency follows an exponentially decreasing function over time—we leave this to future work. Implications. Evaluating tag frequency over time can help to identify tags are that increasingly becoming dormant. Administrators of social bookmarking systems can use this information in at least two ways. They can remove these dormant tags from the system if the goal of the system is to improve tag reuse and facilitate the convergence of the tag vocabulary. However, tags that may be becoming dormant could be informationally powerful. In this case, administrators can promote the use of these tags, for instance, through recommendation of these tags to users when they tag papers.
5.6 Tag patterns Users’ tagging behavior in social bookmarking systems is dependent on several factors such as personal interests, domain knowledge, and the willingness to organize resources to different extents. It is possible that tag patterns exist in users’ tagging behavior, and if this is the case, it may be useful to analyze these tag patterns and possibly support them. To assess if users exhibited any patterns in their tagging behavior, we used time-series modeling for the most prolific user in CiteULike as an example. The most prolific user was chosen for two main reasons. One, it is easier to show the changes in tagging behavior over longer periods of time and secondly, time-series modeling provides better results for longer time periods. This user had a total of 3,883 tag applications over a period of 136 sessions (mean = 28, s.d. = 29), where each session is taken as one day. The sessions were not always consecutive days. Sessions usually varied from periods of continuous activity followed by longer periods of no activity. The analysis was performed using Minitab™ statistical software’s time-series analysis package. The time-series graph showed significant variance across the 136 sessions. To smooth the data, we used a log-transformation (i.e., instead of the number of tags per session, we used log10 (number of tags per session)). The time series plot of the smoothed tags-per-session is shown in Figure 9 (black vertical lines). Using the log transformation, we used standard ARIMA (Autoregressive Integrated Moving Average) modeling technique to identify the properties of the dataset. From our analysis of ACF (auto-correlation function) and PACF (partial autocorrelation function), we identified the model as an AR (2). An AR (2) (autoregressive model with order 2) model signifies that the number of tags used at the current time is dependent on the number of tags used in two sessions prior to the current session. This implies that the user (the most prolific user in this example) does exhibit patterns in his tagging behavior and that his/her behavior is not random. Additionally, we generated a predictive forecast of future events based on the current data for the next 60 sessions. An S-curve model was found to have a good fit (Mean Absolute Percentage Error, MAPE = 0.44; Mean Absolute Deviation, MAD = 0.29). Figure 9 shows this forecast (green line extension) using the AR
P (frequency > 3) = 0.71
P (frequency > 1) = 0.89
P (frequency > 1) = 0.53
357
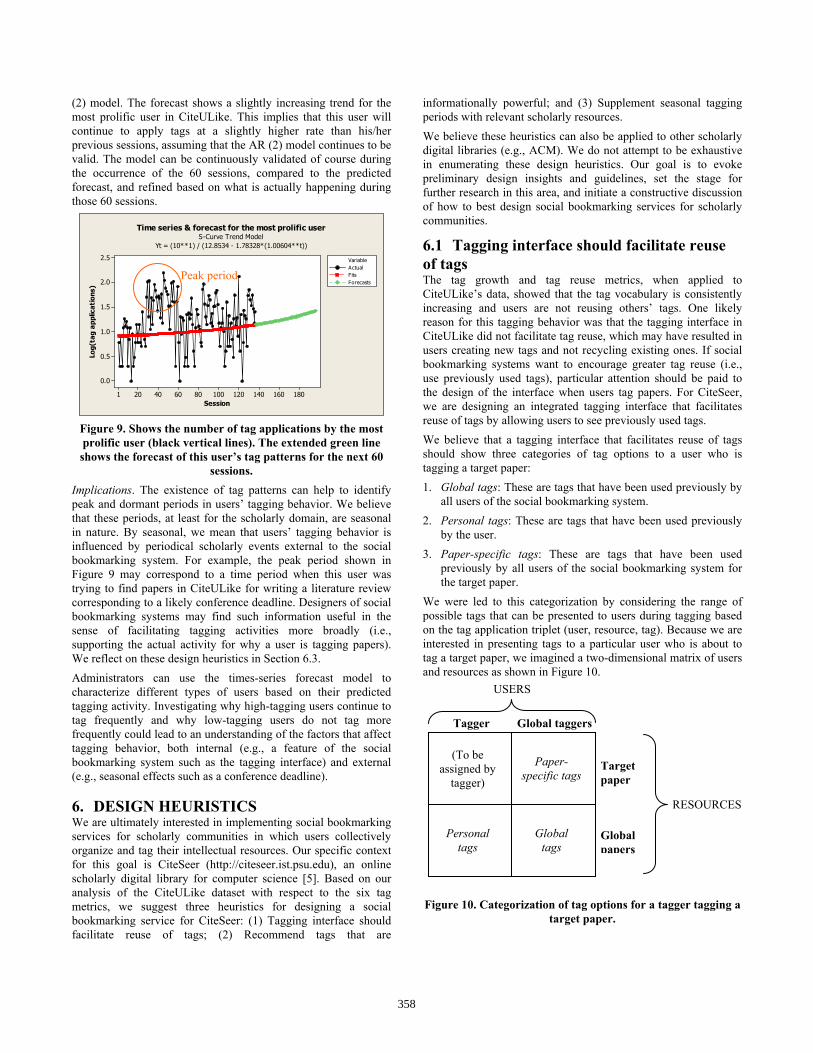
(2) model. The forecast shows a slightly increasing trend for the most prolific user in CiteULike. This implies that this user will continue to apply tags at a slightly higher rate than his/her previous sessions, assuming that the AR (2) model continues to be valid. The model can be continuously validated of course during the occurrence of the 60 sessions, compared to the predicted forecast, and refined based on what is actually happening during those 60 sessions.
180160140120100806040201
2.5
2.0
1.5
1.0
0.5
0.0
Session
Log(
tag
appl
icat
ions
)
ActualFitsForecasts
Variable
Time series & forecast for the most prolific userS-Curve Trend Model
Yt = (10**1) / (12.8534 - 1.78328*(1.00604**t))
Figure 9. Shows the number of tag applications by the most prolific user (black vertical lines). The extended green line shows the forecast of this user’s tag patterns for the next 60
sessions. Implications. The existence of tag patterns can help to identify peak and dormant periods in users’ tagging behavior. We believe that these periods, at least for the scholarly domain, are seasonal in nature. By seasonal, we mean that users’ tagging behavior is influenced by periodical scholarly events external to the social bookmarking system. For example, the peak period shown in Figure 9 may correspond to a time period when this user was trying to find papers in CiteULike for writing a literature review corresponding to a likely conference deadline. Designers of social bookmarking systems may find such information useful in the sense of facilitating tagging activities more broadly (i.e., supporting the actual activity for why a user is tagging papers). We reflect on these design heuristics in Section 6.3. Administrators can use the times-series forecast model to characterize different types of users based on their predicted tagging activity. Investigating why high-tagging users continue to tag frequently and why low-tagging users do not tag more frequently could lead to an understanding of the factors that affect tagging behavior, both internal (e.g., a feature of the social bookmarking system such as the tagging interface) and external (e.g., seasonal effects such as a conference deadline).
6. DESIGN HEURISTICS We are ultimately interested in implementing social bookmarking services for scholarly communities in which users collectively organize and tag their intellectual resources. Our specific context for this goal is CiteSeer (http://citeseer.ist.psu.edu), an online scholarly digital library for computer science [5]. Based on our analysis of the CiteULike dataset with respect to the six tag metrics, we suggest three heuristics for designing a social bookmarking service for CiteSeer: (1) Tagging interface should facilitate reuse of tags; (2) Recommend tags that are
informationally powerful; and (3) Supplement seasonal tagging periods with relevant scholarly resources. We believe these heuristics can also be applied to other scholarly digital libraries (e.g., ACM). We do not attempt to be exhaustive in enumerating these design heuristics. Our goal is to evoke preliminary design insights and guidelines, set the stage for further research in this area, and initiate a constructive discussion of how to best design social bookmarking services for scholarly communities.
6.1 Tagging interface should facilitate reuse of tags The tag growth and tag reuse metrics, when applied to CiteULike’s data, showed that the tag vocabulary is consistently increasing and users are not reusing others’ tags. One likely reason for this tagging behavior was that the tagging interface in CiteULike did not facilitate tag reuse, which may have resulted in users creating new tags and not recycling existing ones. If social bookmarking systems want to encourage greater tag reuse (i.e., use previously used tags), particular attention should be paid to the design of the interface when users tag papers. For CiteSeer, we are designing an integrated tagging interface that facilitates reuse of tags by allowing users to see previously used tags. We believe that a tagging interface that facilitates reuse of tags should show three categories of tag options to a user who is tagging a target paper: 1. Global tags: These are tags that have been used previously by
all users of the social bookmarking system. 2. Personal tags: These are tags that have been used previously
by the user. 3. Paper-specific tags: These are tags that have been used
previously by all users of the social bookmarking system for the target paper.
We were led to this categorization by considering the range of possible tags that can be presented to users during tagging based on the tag application triplet (user, resource, tag). Because we are interested in presenting tags to a particular user who is about to tag a target paper, we imagined a two-dimensional matrix of users and resources as shown in Figure 10. Figure 10. Categorization of tag options for a tagger tagging a
target paper.
Tagger Global taggers
Target paper
Global papers
RESOURCES
Global tags
Personal tags
Paper-specific tags
(To be assigned by
tagger)
USERS
Peak period
358
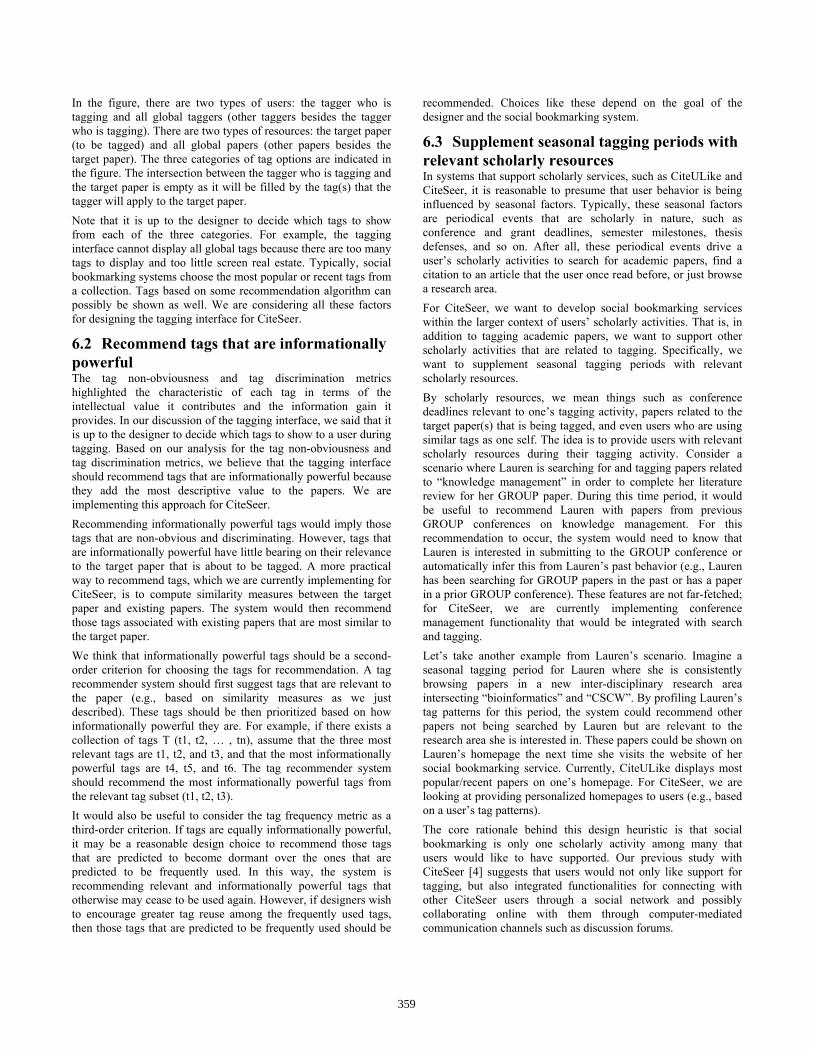
In the figure, there are two types of users: the tagger who is tagging and all global taggers (other taggers besides the tagger who is tagging). There are two types of resources: the target paper (to be tagged) and all global papers (other papers besides the target paper). The three categories of tag options are indicated in the figure. The intersection between the tagger who is tagging and the target paper is empty as it will be filled by the tag(s) that the tagger will apply to the target paper. Note that it is up to the designer to decide which tags to show from each of the three categories. For example, the tagging interface cannot display all global tags because there are too many tags to display and too little screen real estate. Typically, social bookmarking systems choose the most popular or recent tags from a collection. Tags based on some recommendation algorithm can possibly be shown as well. We are considering all these factors for designing the tagging interface for CiteSeer.
6.2 Recommend tags that are informationally powerful The tag non-obviousness and tag discrimination metrics highlighted the characteristic of each tag in terms of the intellectual value it contributes and the information gain it provides. In our discussion of the tagging interface, we said that it is up to the designer to decide which tags to show to a user during tagging. Based on our analysis for the tag non-obviousness and tag discrimination metrics, we believe that the tagging interface should recommend tags that are informationally powerful because they add the most descriptive value to the papers. We are implementing this approach for CiteSeer. Recommending informationally powerful tags would imply those tags that are non-obvious and discriminating. However, tags that are informationally powerful have little bearing on their relevance to the target paper that is about to be tagged. A more practical way to recommend tags, which we are currently implementing for CiteSeer, is to compute similarity measures between the target paper and existing papers. The system would then recommend those tags associated with existing papers that are most similar to the target paper. We think that informationally powerful tags should be a second-order criterion for choosing the tags for recommendation. A tag recommender system should first suggest tags that are relevant to the paper (e.g., based on similarity measures as we just described). These tags should be then prioritized based on how informationally powerful they are. For example, if there exists a collection of tags T (t1, t2, … , tn), assume that the three most relevant tags are t1, t2, and t3, and that the most informationally powerful tags are t4, t5, and t6. The tag recommender system should recommend the most informationally powerful tags from the relevant tag subset (t1, t2, t3). It would also be useful to consider the tag frequency metric as a third-order criterion. If tags are equally informationally powerful, it may be a reasonable design choice to recommend those tags that are predicted to become dormant over the ones that are predicted to be frequently used. In this way, the system is recommending relevant and informationally powerful tags that otherwise may cease to be used again. However, if designers wish to encourage greater tag reuse among the frequently used tags, then those tags that are predicted to be frequently used should be
recommended. Choices like these depend on the goal of the designer and the social bookmarking system.
6.3 Supplement seasonal tagging periods with relevant scholarly resources In systems that support scholarly services, such as CiteULike and CiteSeer, it is reasonable to presume that user behavior is being influenced by seasonal factors. Typically, these seasonal factors are periodical events that are scholarly in nature, such as conference and grant deadlines, semester milestones, thesis defenses, and so on. After all, these periodical events drive a user’s scholarly activities to search for academic papers, find a citation to an article that the user once read before, or just browse a research area. For CiteSeer, we want to develop social bookmarking services within the larger context of users’ scholarly activities. That is, in addition to tagging academic papers, we want to support other scholarly activities that are related to tagging. Specifically, we want to supplement seasonal tagging periods with relevant scholarly resources. By scholarly resources, we mean things such as conference deadlines relevant to one’s tagging activity, papers related to the target paper(s) that is being tagged, and even users who are using similar tags as one self. The idea is to provide users with relevant scholarly resources during their tagging activity. Consider a scenario where Lauren is searching for and tagging papers related to “knowledge management” in order to complete her literature review for her GROUP paper. During this time period, it would be useful to recommend Lauren with papers from previous GROUP conferences on knowledge management. For this recommendation to occur, the system would need to know that Lauren is interested in submitting to the GROUP conference or automatically infer this from Lauren’s past behavior (e.g., Lauren has been searching for GROUP papers in the past or has a paper in a prior GROUP conference). These features are not far-fetched; for CiteSeer, we are currently implementing conference management functionality that would be integrated with search and tagging. Let’s take another example from Lauren’s scenario. Imagine a seasonal tagging period for Lauren where she is consistently browsing papers in a new inter-disciplinary research area intersecting “bioinformatics” and “CSCW”. By profiling Lauren’s tag patterns for this period, the system could recommend other papers not being searched by Lauren but are relevant to the research area she is interested in. These papers could be shown on Lauren’s homepage the next time she visits the website of her social bookmarking service. Currently, CiteULike displays most popular/recent papers on one’s homepage. For CiteSeer, we are looking at providing personalized homepages to users (e.g., based on a user’s tag patterns). The core rationale behind this design heuristic is that social bookmarking is only one scholarly activity among many that users would like to have supported. Our previous study with CiteSeer [4] suggests that users would not only like support for tagging, but also integrated functionalities for connecting with other CiteSeer users through a social network and possibly collaborating online with them through computer-mediated communication channels such as discussion forums.
359
7. DISCUSSION In this paper, we proposed and illustrated an integrated set of metrics for evaluating tagging behavior in social bookmarking systems. We focused on an analysis of a CiteULike dataset, but the metrics seem general and extensible to the analysis of other social bookmarking systems. The metrics serve as first-order approximations [1] for evaluating social bookmarking systems. We regard this set of metrics as a concrete starting point for developing more exhaustive measurement schemes for tags and tagging behavior. Indeed, some of our metrics were extensions of metrics in prior literature. Other metrics mentioned in literature, those that were not considered by us for the sake of scope and length of this paper, will unquestionably supplement the set described here. We hope researchers and designers of social bookmarking systems will apply, tweak, and add to our metrics within their specific study context. We see no reason to think that the set of metrics we developed would not be useful for social bookmarking services in domains other than the scholarly field. The real challenge in applying these metrics to other domains involves, at the least, answering the following two questions: (1) How do we interpret these metrics in a particular domain? (2) Which metrics are important in a particular domain? To reflect on question (1), one way to interpret the metrics in a particular domain is to characterize that domain. After all, users of CiteULike and Flickr have different goals, they are social and collaborative to different extents within their respective community, the importance they assign to resources varies, and so on. The standards or benchmarks for metrics in each of these services will be different. A tag reuse value of 1.59 users/tag for CiteULike may be considered low but for Flickr, it may represent a reasonable amount of reuse. Most importantly, the characteristics of users are different for different types of social bookmarking services. Users of CiteULike are most likely research scholars interested in reading academic papers, whereas users of Flickr are avid photographers interested in sharing pictures. Individual differences of users are likely to affect tagging behavior. We expect that tagging behavior, and thus the interpretation of tagging behavior per the metrics, in social bookmarking services will vary across domains. To reflect on question (2), one way to think about and apply our set of metrics is to adopt an activity-centric perspective [10]. In this case, the metrics can be prioritized depending on the user activities that the particular social bookmarking system is trying to support. For example, if the primary user activity that the social bookmarking system is trying to support is social search and navigation of resources through tags, then it probably makes sense to pay careful attention to the tag discrimination metric. This is because the tag discrimination metric can help assess how useful the tags are in facilitating users to quickly narrow their search and find their target resource. In this case, tags should be able to provide the most information gain to users. However, if the goal of the social bookmarking system is to support resource browsing based on growing interests of users over time, the tag growth metric can be relevant for ensuring that enough new tags are being regularly added to the system to maintain a critical mass of users based on their changing interests.
In our own research investigation to develop a social bookmarking service for CiteSeer, we have started to adopt such an activity-centric perspective. Based on an initial requirements survey of CiteSeer users [4], one of the primary user activities that we want to support is the formation of social networks based on common tag usage. In this case, tag reuse is possibly the most important metric. This is because we want to facilitate maximum sharing of common tags among users so that tag-based social networks are tightly knit and meaningful. We are continuing to explore the feasibility of applying an activity-centric perspective to our metrics for social bookmarking systems in other domains.
8. ACKNOWLEDGMENTS This work is supported by NSF grant CRI-0454052.
9. REFERENCES [1] Ackerman, M. The Intellectual Challenge of CSCW: The Gap
Between Social Requirements and Technical Feasibility. Human-Computer Interaction, 15, 2-3 (2000), 181-205.
[2] Brin, S. and Page, L. The anatomy of a large-scale hypertextual web search engine. In Proceedings of the Conference on World Wide Web (Brisbane, Australia, Apr 14-18, 1998), 107-117.
[3] Catutto, C. Semiotic dynamics in online social communities. Eur. Phys. J. C., 46 (2006), 33-37.
[4] Farooq, U., Ganoe, C.H., Carroll, J.M., and Giles, C.L. Supporting distributed scientific collaboration: Implications for designing the CiteSeer collaboratory. In Proceedings of the Hawaii Int’l Conference on System Sciences (Waikoloa, Hawaii, Jan 3-6, 2007), IEEE Compute Society, 26c.
[5] Giles, C.L., Bollacker, K., and Lawrence, S. CiteSeer: An Automatic Citation Indexing System. In Proceedings of the Conference on Digital Libraries (Pittsburg, Pennsylvania, June 23-26, 1998), ACM Press, New York, 89-98.
[6] Golder, S.A. and Huberman, B.A. Usage patterns of collaborative tagging systems. Journal of Information Science, 32, 2 (2006), 198-208.
[7] Lund, B., Hammond, T., Flack, M., and Hannay, T. Social Bookmarking Tools (II). D-Lib Magazine, 11, 4 (April 2005). Available at http://www.dlib.org//dlib/april05/ lund/04lund.html (last accessed May 28, 2007).
[8] Marlow, C., Naaman, M., boyd, d., and Davis, M. HT06, Tagging Paper, Taxonomy, Flickr, Academic Article, To Read. In Proceedings of the Conference on Hypertext and Hypermedia (Odense, Denmark, Aug 22-25, 2006), ACM Press, New York, 2006, 31-40.
[9] Millen, D.R., Feinberg, J., and Kerr, B. Dogear: Social bookmarking in the enterprise. In Proceedings of the Conference on Computer Human Interaction (Montreal, Canada, Apr 22-27, 2006), ACM Press, New York, 2006, 111-120.
[10] Norman, D.A. Human-centered design considered harmful. ACM Interactions, 12, 4 (July and August, 2005), 14-19.
[11] Page, L., Brin, S., Motwani, R., and Winograd, T. The PageRank Citation Ranking: Bring Order to the Web. Technical Report, Stanford University, 1998. Available at http://dbpubs.stanford.edu:8090/pub/1999-66 (last accessed May 28, 2007).
[12] Sen, S., Lam, S.K., Rashid, A.M., Cosley, D., Frankowski, D., Osterhouse, J., Harper, F.M., and Riedl, J. tagging communities, vocabulary, evolution. In Proceedings of the Conference on Computer Supported Cooperative Work (Banff, Canada, Nov 4-8, 2006), ACM Press, New York, 181-190.
360