
Sequence based heuristics for two-dimensional bin packing problems
56
For Peer Review Only Sequence based heuristics for two-dimensional bin packing problems Journal: Engineering Optimization Manuscript ID: GENO-2008-0224.R3 Manuscript Type: Original Article Date Submitted by the Author: 12-Feb-2009 Complete List of Authors: Alvelos, Filipe; Universidade do Minho, Production and Systems; University of Minho, Algoritmi Research Center Chan, T. M.; University of Minho, Algoritmi Research Center Vilaça, Paulo; University of Minho, Algoritmi Research Center Gomes, Tiago; University of Minho, Algoritmi Research Center Silva, Elsa; University of Minho, Algoritmi Research Center Valério de Carvalho, José Manuel; Universidade do Minho, Production and Systems; University of Minho, Algoritmi Research Center Keywords: Cutting and packing, 2D rectangular SBSBPP with guillotine constraints, local search, greedy heuristics, VND URL: http:/mc.manuscriptcentral.com/geno Email: [email protected] Engineering Optimization
-
Upload
independent -
Category
Documents
-
view
1 -
download
0
Transcript of Sequence based heuristics for two-dimensional bin packing problems
For Peer Review O
nly
Sequence based heuristics for two-dimensional bin packing
problems
Journal: Engineering Optimization
Manuscript ID: GENO-2008-0224.R3
Manuscript Type: Original Article
Date Submitted by the Author:
12-Feb-2009
Complete List of Authors: Alvelos, Filipe; Universidade do Minho, Production and Systems; University of Minho, Algoritmi Research Center Chan, T. M.; University of Minho, Algoritmi Research Center Vilaça, Paulo; University of Minho, Algoritmi Research Center Gomes, Tiago; University of Minho, Algoritmi Research Center Silva, Elsa; University of Minho, Algoritmi Research Center Valério de Carvalho, José Manuel; Universidade do Minho, Production and Systems; University of Minho, Algoritmi Research Center
Keywords: Cutting and packing, 2D rectangular SBSBPP with guillotine constraints, local search, greedy heuristics, VND
URL: http:/mc.manuscriptcentral.com/geno Email: [email protected]
Engineering Optimization

For Peer Review O
nly
1
Sequence based heuristics for two-dimensional bin packing problems Filipe Alvelos
ab*, T. M. Chan
b, Paulo Vilaça
b, Tiago Gomes
b, Elsa Silva
b and J.
M. Valério de Carvalhoab
a Department of Production and Systems, University of Minho, Braga, Portugal
b Algoritmi Research Center, University of Minho, Braga, Portugal
This article addresses several variants of the two-dimensional bin packing problem. In the most
basic version of the problem it is intended to pack a given number of rectangular items with given
sizes in rectangular bins in such a way that the number of bins used is minimized.
Different heuristic approaches (greedy, local search, and variable neighborhood descent) are
proposed for solving four guillotine two-dimensional bin packing problems. The heuristics are
based on the definition of a packing sequence for items and in a set of criteria for packing one item
in a current partial solution. Several extensions are introduced to deal with issues pointed out by
two furniture companies.
Extensive computational results on instances from the literature and from the two furniture
companies are reported and compared with optimal solutions, solutions from other five
(meta)heuristics and, for a small set of instances, with the ones used in the companies.
Keywords: Cutting and packing; guillotine constraints; greedy heuristics; local search; variable
neighbourhood descent
_____________________
*Corresponding author. Email: [email protected]. Department of Production and
Systems, University of Minho, 4710-057 Braga, Portugal. Tel. +351253604751. Fax:
+351253604741.
Deleted: Sequence based heuristics for two-dimensional bin packing
problems ¶This paper addresses several variants of
the two-dimensional bin packing problem. In the most
basic version of the problem it is intended
to pack a given number of rectangular
items with given sizes in rectangular bins
in such a way that the number of bins
used is minimized.¶Different heuristic approaches (greedy,
local search, and variable neighborhood
descent) are proposed for solving four
guillotine two-dimensional bin packing
problems. The heuristics are based on the
definition of a packing sequence for items and in a set of criteria for packing one
item in a current partial solution. Several
extensions are introduced to deal with
issues pointed out by two furniture
companies. 
Extensive computational results on
instances from the literature and from the
two furniture companies are reported and
compared with optimal solutions, solutions from other five (meta)heuristics
and, for a small set of instances, with the
ones used in the companies.
Keywords: Cutting and packing; 2D
rectangular SBSBPP with guillotine constraints; greedy heuristics; local
search; VND
Page Break
Deleted: paper
Deleted: 2D rectangular SBSBPP with
Deleted: VND
Page 1 of 55
URL: http:/mc.manuscriptcentral.com/geno Email: [email protected]
Engineering Optimization
123456789101112131415161718192021222324252627282930313233343536373839404142434445464748495051525354555657585960

For Peer Review O
nly
2
1. Introduction
In this article, two-dimensional bin packing problems, where an unlimited number of
rectangular bins (all of the same size) are available to pack a given number of rectangular
small items, are addressed. The objective is to pack all the items in such a way that the number
of bins used is as small as possible. The practical application that has motivated this work is
wood cutting in small- and medium-sized furniture companies. In this application, the large
wood plates and the wood pieces resulting from the cutting operations correspond to the bins
and to the items, respectively. The objective of minimizing the number of bins used is
equivalent to the minimization of the wood waste produced in the cutting process. Note that,
conceptually, cutting and packing are equivalent. However, it is usual (Wäscher et al. 2007) to
distinguish between bin packing problems and cutting stock problems, depending on whether
there are few equal items (bin packing problems) or many equal items (cutting stock
problems).
According to the typology of Wäscher et al. (2007), the problem addressed is a two-
dimensional rectangular Single Bin Size Bin Packing Problem (SBSBPP) with additional
constraints which are described next. In the specific problems addressed in this article, it is
imposed by the wood cutting process itself that only orthogonal (parallel to one edge of the
plate) and guillotine (from one edge of the plate to the opposite one) cuts are allowed.
Furthermore, the number of stages is limited to two or three. A stage is a set of cuts with the
same orientation that, conceptually, can be executed at the same time. In a staged problem, the
orientation of the cuts in consecutive stages alternates between horizontal and vertical.
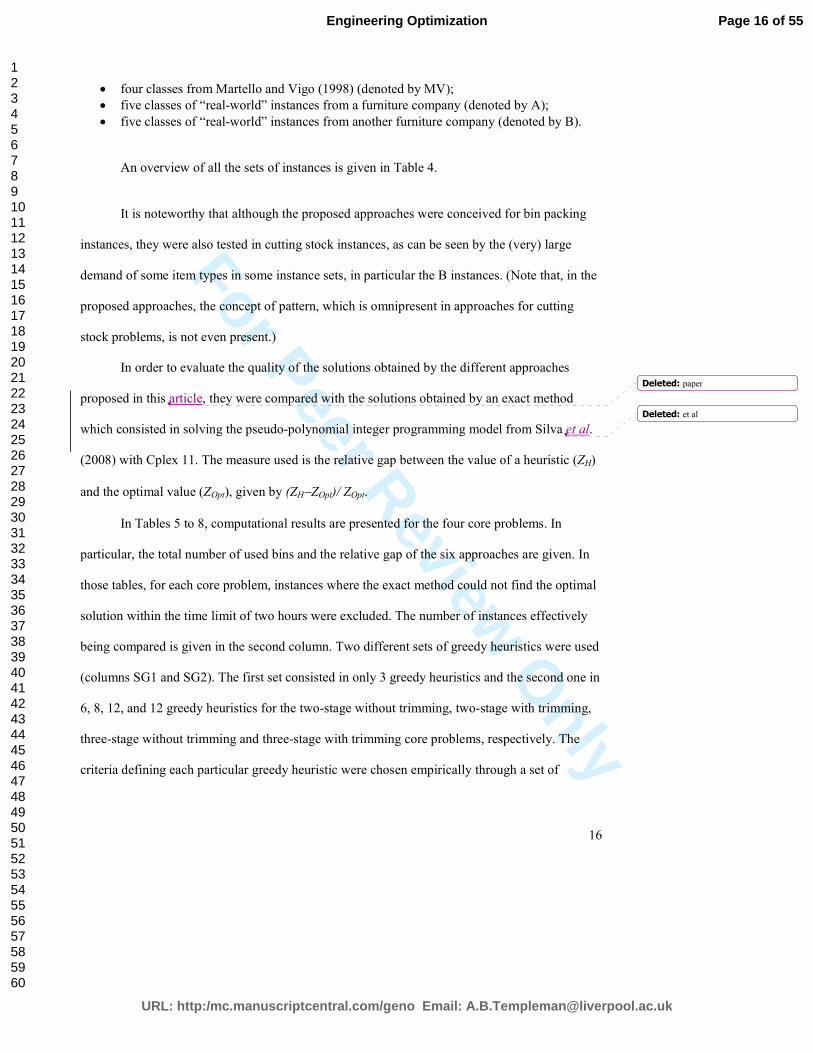
Assuming the first set of cuts is horizontal, feasible two-stage and three-stage packings for a
single bin are depicted in Figure 1 and Figure 2, respectively. In both cases two horizontal cuts
Deleted: paper
Deleted: with
Deleted: s
Deleted: used
Deleted: et al
Deleted: et al
Deleted: paper
Page 2 of 55
URL: http:/mc.manuscriptcentral.com/geno Email: [email protected]
Engineering Optimization
123456789101112131415161718192021222324252627282930313233343536373839404142434445464748495051525354555657585960

For Peer Review O
nly
3
are executed in the first stage, dividing the bin in three shelves: the bottom one with items 1, 2,
and 3; the middle one with items 4 and 5; and the top one with waste. In the second stage,
vertical cuts are executed in each shelf. For the two-stage problem, three vertical cuts are
executed to obtain items 1, 2, and 3 (bottom shelf) and two vertical cuts are needed to obtain
items 4 and 5 (middle shelf). For the three-stage problem, the bottom shelf is made of two
stacks (set of items packed on the top of each other): one stack with item 1 and one stack with
items 2 and 3. In this case, the two stacks are separated by vertical cuts in stage two, and items
2 and 3 are obtained by using two horizontal cuts in stage three.
In the examples, for the two-stage problem, items in the same shelf have the same
height and, for the three-stage problem, items in the same stack have the same width. When
this happens, the problem is without trimming. If those conditions are not fulfilled, additional
cuts (with the opposite orientation relative to the last stage, i.e., horizontal for two-stage
problems and vertical for three-stage problems) may be required to separate items from waste.
If this additional set of cuts is allowed, the problem is said to have trimming. Examples of
feasible packings are given in Figure 3 and Figure 4 for two and three-stage problems with
trimming, respectively.
Figure 1 here
Figure 2 here
Figure 3 here
Figure 4 here
Deleted: i.e.
Page 3 of 55
URL: http:/mc.manuscriptcentral.com/geno Email: [email protected]
Engineering Optimization
123456789101112131415161718192021222324252627282930313233343536373839404142434445464748495051525354555657585960

For Peer Review O
nly
4
In summary, four versions of the problem are considered: two-stage without trimming,
two-stage with trimming, three-stage without trimming, and three-stage with trimming. In the
remaining of the article these four versions are denoted as the core problems. In order to
accommodate different settings (imposed by technological constraints and/or defined by the final
user who may have requirements based on other issues other than cutting such as the production
flow or stock management) in which the proposed heuristics may be used, several extensions to
the core problems are also considered. Before introducing those extensions, note that items with
the same sizes can be considered as belonging to the same type. The number of items of a given
type is the demand of the item type. The following extensions to the core problems are
considered:
• allowing rotation (by 90 degrees) of the items;
• allowing to cut more items (of a required type) than the demand (overproduction);
• executing a single cut (head-cut) with the opposite orientation relative to the one of the
first stage before the first stage;
• limiting the maximum number of item types per bin;
• performing vertical cuts in the first stage;
• incorporating the side objective of reducing the number of cuts.
The proposed heuristics are based on packing the items sequentially, keeping record of
the spaces which are free to receive items that come later in the sequence. The location in which
an item is packed is chosen according to some criteria. Several greedy heuristics, which differ in
the definition of the sequence of items and in the criteria used to pack the items in the available
free spaces, are proposed. Using the sequence of items as the representation of a solution
(obtainable by applying one of the above mentioned greedy procedures) three local search
heuristics are proposed. The corresponding three neighbourhood structures are based on
modifications of the current sequence. The last proposed approach is a variable neighbourhood
Deleted: paper
Page 4 of 55
URL: http:/mc.manuscriptcentral.com/geno Email: [email protected]
Engineering Optimization
123456789101112131415161718192021222324252627282930313233343536373839404142434445464748495051525354555657585960

For Peer Review O
nly
5
descent (VND) metaheuristic which allows exploring the three neighbourhood structures of the
local search heuristics systematically.
This article is organized as follows. In Section 2, a literature review on related cutting
and packing problems and solution approaches is presented. In sections 3, 4, and 5, the proposed
approaches for solving the core problems are described. In section 3, the greedy heuristics are
presented; in section 4, the three local search approaches, which differ in the neighbourhood
structures employed, are presented; and in section 5, the VND metaheuristic, which combines the
neighbourhood structures previously introduced, is presented. In section 6, it is detailed how the
proposed approaches can be extended to deal with variants of the core problems. In section 7,
computational tests performed in order to evaluate the proposed approaches are reported. In
particular, comparisons of the quality of the solutions with the optimal ones, with the ones
obtained with five (meta)heuristics from the literature, and with solutions made available by two
furniture companies are shown. In section 8, the main conclusions of this work are drawn.
2. Literature review
Local search heuristics have been widely applied in combinatorial optimization and may be seen
as the base of several metaheuristics as tabu search or simulated annealing. For a survey on local
search the interested reader is referred to Yagiura and Ibaraki (2002). For a recent survey on
VND and variable neighbourhood search the interested reader is referred to Hansen et al. (2008).
Cutting and packing problems have been extensively studied in the last decades. The
interested reader is referred to Dyckhoff et al. (1997) and Wäscher et al. (2007) for a more
general overview of these problems, and to the categorized database of articles on cutting and
packing available in the “EURO Special Interest Group on Cutting and Packing” site
(http://paginas.fe.up.pt/~esicup/).
Deleted: paper
Deleted: et al
Deleted: et al
Deleted: et al
Deleted: paper
Page 5 of 55
URL: http:/mc.manuscriptcentral.com/geno Email: [email protected]
Engineering Optimization
123456789101112131415161718192021222324252627282930313233343536373839404142434445464748495051525354555657585960

For Peer Review O
nly
6
Several heuristics were previously proposed for the two-stage with trimming core
problem. A two-step approach was first proposed by Chung et al. (1982). In the first step, the
items are sorted by decreasing height and then packed in shelves sequentially following a first fit
policy (an item is packed in the first shelf that can accommodate it). In the second step, the
shelves obtained in the first step are packed in the bins following again a first fit policy.
Extensions and modifications of this approach were proposed by Berkey and Wang (1987), as
the finite best strip (FBS) heuristic in which the items (first step) and the shelves (second step)
are packed using a best fit policy. A heuristic (finite first fit) which packs the items directly in
the bins was also proposed by Berkey and Wang. Again, the items are sorted by decreasing
height, and then packed sequentially. One item is placed in the first shelf where it fits. If the item
does not fit in any shelf, a new bin is created and the item is packed in it. In the greedy heuristics
proposed in this article, the items are also packed sequentially in the bins. However, other types
of sequences are also considered and the location in which an item is packed is not the first one
where it fits, but the best one according to a criterion which can vary for locations in existing
shelves, in existing bins (top of the upper shelf), or in a new bin. These ideas are also adapted to
three-stage problems and the extensions aforementioned are taken into account.
Lodi et al. (1999) presented several heuristics for different variants of the two-
dimensional bin packing problem. For the two-stage with trimming problem, a two-step
approach (knapsack packing) was proposed. In the first step, a set of shelves is obtained and
then, in the second step, a one-dimensional bin packing problem is solved to pack them in the
bins. In this heuristic, a shelf is constructed by selecting the tallest unpacked item and solving a
knapsack problem to decide which of the unpacked items should be packed in the shelf. In the
knapsack problem, the profits are the areas of the items, the weights are the widths of the items
Deleted: et al
Deleted: paper
Deleted: et al
Page 6 of 55
URL: http:/mc.manuscriptcentral.com/geno Email: [email protected]
Engineering Optimization
123456789101112131415161718192021222324252627282930313233343536373839404142434445464748495051525354555657585960
For Peer Review O
nly
7
and the capacity is given by the available width. The extension of this approach for three-stage
problems is not straightforward. In the same reference, besides heuristics for non-guillotine
cutting problems, other heuristics were presented for guillotine cutting (as the floor ceiling
heuristic) which may not produce solutions for two or three-stage problems. Extensions for
allowing rotation are also proposed. Still in the same reference, a tabu search metaheuristic was
proposed with the important feature of having two conceptual levels. In a higher level, a target
bin is selected to be emptied. Then, it is attempted to pack the items in the target bin together
with the items of some subsets of bins. This last procedure relies on a lower level in which
subsets of items are packed in bins. The lower level defines the type of problem addressed (the
ones mentioned in the article are the problems with or without rotation and with guillotine cuts or
free). In order to deal with all the core problems and extensions already mentioned, the same idea
of having two levels in used in the local search based heuristics proposed in this article. In the
higher level sequences of items are considered and modified without taking into account which
core problem with which combination of extensions is being solved. In the lower level, the items
are packed taking into account the specific problem and the obtained solution is evaluated.
Exact approaches have also been proposed for the two-stage problem as the ones by Lodi
et al. (2004), where a compact integer programming model was presented. It is noteworthy that
models conceived for cutting stock problems may also be applied in bin packing problems, as it
is the case of the classic column generation models of Gilmore and Gomory (1965). In (Fekete
and Schepers 2007), a related problem is addressed with a different type of exact approach,
which is based on the characterization of two-dimensional orthogonal packings through interval
graphs and on an enumerative search scheme.
Deleted: paper
Deleted: paper
Deleted: et al
Page 7 of 55
URL: http:/mc.manuscriptcentral.com/geno Email: [email protected]
Engineering Optimization
123456789101112131415161718192021222324252627282930313233343536373839404142434445464748495051525354555657585960
For Peer Review O
nly
8
Specific approaches for three-stage problems are not as frequent as the ones for two-stage
problems. Exceptions are the compact and branch and price exact models of Puchinger and Raidl
(2007) and the nested column generation approach of Vanderbeck (2001) for cutting stock
problems. The authors are aware of only one publication dealing with head-cuts and a limit on
the maximum number of item types per bin, where approaches for a particular problem in a
wood cutting company were devised by Morabito and Belluzzo (2007). The followed approach is
based on the column generation model of Gilmore and Gomory where each column is associated
with a cutting pattern and the subproblem is solved by dynamic programming.
The more general problem in which there are no guillotine cutting constraints was
recently addressed by Parreño et al. (2008) by combining a GRASP and a VND metaheuristic.
The neighbourhood structures defined in the VND are based on removing a set of items (from
different bins) from the current solution and packing them again with a constructive algorithm.
In the work of Boschetti and Mingozzi (2003), empty bins are considered in turn and filled by
items in a sequence defined by prices attributed to the items and updated in each iteration.
Monaci and Toth (2006) used greedy heuristics to generate the columns of an integer
programming (set covering) model which is then solved by a Lagrangean heuristic. Pisinger and
Sigurd (2007) developed a column generation based approach with the subproblem solved by
constraint programming. In (Faroe et al. 2003), a solution is represented by the coordinates of the
items (boxes in the case of the three dimensional problem also considered in the article) and the
neighbourhood of a solution is defined by movements (within the same bin or from one bin to
another bin) of items. A packing with no overlapping in the current number of bins minus one is
persecuted until a time limit or a lower bound on the number of bin is achieved. For a survey in
two-dimensional packing problems, the interested reader is referred to (Lodi et al. 2002).
Deleted: We
Deleted: et al
Deleted: et al
Deleted: paper
Deleted: et al
Page 8 of 55
URL: http:/mc.manuscriptcentral.com/geno Email: [email protected]
Engineering Optimization
123456789101112131415161718192021222324252627282930313233343536373839404142434445464748495051525354555657585960

For Peer Review O
nly
9
3. Greedy heuristics
In this section, the greedy heuristics for solving the core problems (two-stage and three-stage,
with and without trimming) two-dimensional bin packing problems are presented. The
adaptations to deal with the core problems extensions will be discussed in section 6.
The heuristics are based on a packing sequence for items. In order to define the sequence,
three possible criteria to sort (in decreasing order) the item types are considered: by width, by
height, and by area. After a sequence is defined based on one of those criteria, each item is
packed in turn. As illustrated in Figure 5, in general, an item can be packed in an existing stack
(in Figure 5, rectangle A) (only for three-stage problems), in the rightmost part of an existing
shelf (B and C), in the top of the shelves of a bin which is already being used (D), or in an empty
bin.
Figure 5 here.
A greedy heuristic starts with a list of items sequenced according to a given criterion.
While the list is not empty, the first item is packed and removed from the list. Firstly, the
packing in the best fit location in a stack (according to a given criterion) is attempted. If there are
no feasible locations for placing the item in the stacks, the packing in the best fit location in a
shelf (according to a given criterion) is attempted. If there are no feasible locations for placing
the item in the shelves, the packing in the best fit location in a bin (according to a given criterion)
is attempted. If there are no feasible locations for placing the item in bins, the item is packed in a
new bin. The defined criteria for packing items in different locations are the smaller residual
width, height, or area.
Page 9 of 55
URL: http:/mc.manuscriptcentral.com/geno Email: [email protected]
Engineering Optimization
123456789101112131415161718192021222324252627282930313233343536373839404142434445464748495051525354555657585960

For Peer Review O
nly
10
In Figure 6, it is illustrated how an item is packed. Consider that the current (partial)
solution is made by items 1, 2, and 3, and the next item to be packed is item 4. Since item 4 does
not fit in rectangle A, the other rectangles, B and C, on existing shelves are considered. If the
criterion defined in the particular heuristic being used for packing in existing shelves is the
width, the item 4 is packed in B because of the smaller remaining width after being packed. If the
criterion is given by the area, item 4 is packed in C since, proportionally, more area is occupied
in that case when comparing with B.
Figure 6 here.
A greedy heuristic has two phases: the sorting phase and the packing one. The packing
phase has an outer cycle in which all items are considered in turn and an inner cycle in which all
locations are considered in turn. The number of locations is bounded by n, since in each iteration
of the outer cycle one location is deleted (the one in which the item is packed) and at most 2 new
locations are created (one on the right of the item just packed and another on the top). Being so,
the worst-case time complexity of each greedy heuristic is O(n2).
4. Local search heuristics
The three local search heuristics are based on the same representation of a solution as a sequence
of items and in a greedy heuristic which constructs a solution from a sequence. They also share
the way an initial solution is obtained and how a solution is evaluated. This section starts with
the presentation of the common aspects of the local search heuristics and follows with the details
of the differences between them which lie in their neighbourhood structures.
The initial sequence and the set of criteria for packing the items (when constructing a
solution from a sequence) are obtained by running a subset of the greedy heuristics previously
Page 10 of 55
URL: http:/mc.manuscriptcentral.com/geno Email: [email protected]
Engineering Optimization
123456789101112131415161718192021222324252627282930313233343536373839404142434445464748495051525354555657585960
For Peer Review O
nly
11
presented and selecting the one that provides the best solution according to the evaluation
function shown next. The value of a solution s is given by the following function
V(s) = bs a + as − ns, where bs is the number of bins used in the solution s, a is the area of a bin, as is the
occupied area of the bin in solution s with the smallest occupied area, and ns is the number of
items packed in that same bin. The rationale behind this function is that a solution with fewer
used bins is always better than another solution that uses more bins and that if two solutions have
the same number of bins, the solution where it is easier to empty one used bin is better than the
other one. In the three local search heuristics, a first descent strategy is used.
4.1. Swap adjacent item types
The first neighbourhood structure consists in swapping adjacent item types (SAIT). A sequence
of types can be defined by replacing consecutive items of the same type by their type. Two types
are adjacent if, in the sequence of types, they appear one after the other. A sequence is in the
neighbourhood of the current sequence if the position of two adjacent types in the sequence of
types is swapped. After a swap of adjacent types, all the items of what was the first type come
after all the items of what was the second type.
An illustration of this neighbourhood structure is given in Table 1, where all the
neighbour sequences of a given current solution are presented. The sequence of types of the
current sequence is 12312.
4.2. Swap adjacent sub-sequences
The second neighbourhood consists in swapping adjacent sub-sequences (SAS). In fact, a set of
neighbour sequences is considered since a parameter (size) controls the size of the sub-sequences
being swapped. A neighbour sequence is obtained by considering a set of (2*size) consecutive
Formatted: No underline
Formatted: No underline
Deleted: subsequences
Deleted: subsequences
Page 11 of 55
URL: http:/mc.manuscriptcentral.com/geno Email: [email protected]
Engineering Optimization
123456789101112131415161718192021222324252627282930313233343536373839404142434445464748495051525354555657585960

For Peer Review O
nly
12
items of the current sequence, and by defining two sub-sequences with the same number of
items. After swapping the sub-sequences, the first size items (first sub-sequence) come after the
second size items (second sub-sequence). The order of the items within each sub-sequence is not
changed.
An example of the neighbourhood for the size parameter equal to two is given in Table 2.
As shown in the example, if the size parameter is greater than one, the neighbourhood is not fully
explored: the sequence is first divided in adjacent (not overlapping) sub-sequences and only
those are considered in the swapping operations. The search is initialized with the neighbourhood
of size one and when no improvement is obtained for a given size, the size parameter is
incremented by one.
4.3. Reverse sub-sequences
The third neighbourhood consists in reversing sub-sequences (RS). A size parameter is used in
the same way as in the SAS local search heuristic. A neighbour sequence is obtained by
considering a set of size consecutive items of the sequence and reversing their order.
In Table 3, an example is given for the size parameter equal to two. Note that, in some
easily identifiable cases, the same sequence is obtained and thus the corresponding solution is the
same as the current one and it is not evaluated.
5. VND metaheuristic
The VND metaheuristic proposed is based on the three neighbourhood structures which are
sequentially explored by the same order they were previously introduced (SAIT – SAS − RS). In
the sequential VND variant used, a neighbourhood is explored, even if there was an
improvement in the previous one.
Deleted: subsequences
Deleted: subsequences
Deleted: subsequence
Deleted: subsequence
Deleted: subsequence
Deleted: subsequences
Deleted: subsequences
Deleted: subsequences
Page 12 of 55
URL: http:/mc.manuscriptcentral.com/geno Email: [email protected]
Engineering Optimization
123456789101112131415161718192021222324252627282930313233343536373839404142434445464748495051525354555657585960

For Peer Review O
nly
13
The algorithm is given in Figure 7. There are two stopping criteria: one is achieved when
a time limit is reached (TimeLimit parameter) and the other is achieved when the three
neighbourhood structures are explored without any improvement.
Figure 7 here.
6. Extensions
In this section, variants of the approaches proposed for dealing with extensions of the core
problems are considered. Note that the first three variants only imply modifications on the
greedy heuristics, i.e., exactly the same neighbourhood structures can be used. The last three can
be seen as pre-processing or post-processing steps.
First, the extension where it is possible to rotate the items by 90 degrees is considered. In
this case, when evaluating the different locations for placing an item, the two possible
orientations are considered.When rotation is allowed, the worst-case time complexity of the
greedy heuristics remains O(n2).
The second extension is related with having a constraint on the maximum number of item
types per bin. This constraint was pointed out by the furniture companies as relevant for two
reasons: it may lead to more simple cutting patterns (thus requiring less cutting time) and it may
have an impact on the production process in which the cutting operations are embedded (since
items of the same type can be grouped more easily). In fact, the proposed approaches were
integrated in a software prototype where the problem of minimizing the maximum number of
open stacks (MOSP) is also addressed taking the solution of the bin packing problem as input
(De Giovanni et al. 2008). Constraining the maximum number of types per bin can provide bin
packing solutions with more waste but may lead to better MOSP solutions. For a description of
Deleted: i.e.
Deleted: et al
Page 13 of 55
URL: http:/mc.manuscriptcentral.com/geno Email: [email protected]
Engineering Optimization
123456789101112131415161718192021222324252627282930313233343536373839404142434445464748495051525354555657585960

For Peer Review O
nly
14
the MOSP problem, see, for example, Yanasse (1997).The proposed greedy heuristics deal with
the limit on the maximum number of item types per bin by keeping record of the types present in
each bin in the solution being constructed. When packing a new item, the only locations allowed
are those in bins where the type is already present or where the limit on the maximum number of
item types was not reached.
The third extension is related with the use of a head-cut. A head-cut is a single cut
applied in the vertical direction (assuming the first stage is made of horizontal cuts) before the
first stage. An example of a packing with a head-cut is given in Figure 8. When a head-cut is
performed, the bin is divided into two parts, where, in each of the parts, two or three-stage
patterns, with or without trimming, are constructed according to the core problem. The proposed
greedy heuristics deal with the head-cut by setting its coordinate to the width of the first item that
is packed in a new bin. After the head-cut is done, a location to place a new item is characterized
not only by a bin, but also by the part, left or right of the head cut.
Figure 8 here,
Three more aspects were taken into account in the proposed methods in order to make
their use more flexible to possible different practical settings. The first one is the possibility of
deciding the orientation of the cuts in the first stage. If vertical cuts are desired in the first stage,
before using the heuristics, the widths and the heights of the bins and those of all items are
swapped. The second one is the possibility of overproduction. In this case, after the final solution
with no overproduction is obtained, an attempt is made to pack items (in decreasing order of
areas) in the available locations. Finally, the third aspect is related with the side objective of
reducing the number of cutting operations when using head-cuts. If the solution remains feasible
for the core problem in the left part of the bin when the coordinate of the head-cut is moved to
Page 14 of 55
URL: http:/mc.manuscriptcentral.com/geno Email: [email protected]
Engineering Optimization
123456789101112131415161718192021222324252627282930313233343536373839404142434445464748495051525354555657585960

For Peer Review O
nly
15
the right, then the coordinate is changed, because the number of cutting operations may be
reduced. One of these situations is illustrated in Figure 9, where 16 cuts are needed in the left
solution, while the right solution only has 13 cuts.
Figure 9 here.
7. Computational results
The proposed approaches were coded in C++ in the Microsoft Visual Studio IDE 2008.
The computational tests were divided into three groups. In the first group of tests, each of six
heuristics (two sets of greedy heuristics, the three local search and VND) was tested for each of
the four core problems in 528 instances from the literature and 128 “real-world” instances. The
values obtained by the different solution approaches were compared with known optimal values,
and with the values from five (meta)heuristics from the literature. The aim of the second group
of tests was to measure (empirically) the impact of the extensions on the quality of the solutions
obtained. A subset of 27 real-world instances from one company and 42 from the other were
used. The aim of the third group of tests was to compare the quality of the solutions from the
proposed approach with those given by the software applications in use at the two companies.
Those tests were conducted in the same sets of instances used in the second group of tests.
7.1. Core problems
The computational tests of the approaches for the core problems were conducted in a desktop
computer equipped with an Intel Core 2, 2.13 GHz processor, 2 GB RAM, and running Windows
XP Professional Edition. For the core problems, the proposed approaches were tested in the
following sets of instances:
• cgcut, gcut, and ngcut introduced by Christofides and Whitlock (1977), Beasley (1985a), and Beasley (1985b);
• six classes of instances from Berkey and Wang (1987) (denoted by BW);
Page 15 of 55
URL: http:/mc.manuscriptcentral.com/geno Email: [email protected]
Engineering Optimization
123456789101112131415161718192021222324252627282930313233343536373839404142434445464748495051525354555657585960
For Peer Review O
nly
16
• four classes from Martello and Vigo (1998) (denoted by MV);
• five classes of “real-world” instances from a furniture company (denoted by A);
• five classes of “real-world” instances from another furniture company (denoted by B).
An overview of all the sets of instances is given in Table 4.
It is noteworthy that although the proposed approaches were conceived for bin packing
instances, they were also tested in cutting stock instances, as can be seen by the (very) large
demand of some item types in some instance sets, in particular the B instances. (Note that, in the
proposed approaches, the concept of pattern, which is omnipresent in approaches for cutting
stock problems, is not even present.)
In order to evaluate the quality of the solutions obtained by the different approaches
proposed in this article, they were compared with the solutions obtained by an exact method
which consisted in solving the pseudo-polynomial integer programming model from Silva et al.
(2008) with Cplex 11. The measure used is the relative gap between the value of a heuristic (ZH)
and the optimal value (ZOpt), given by (ZH−ZOpt)/ ZOpt.
In Tables 5 to 8, computational results are presented for the four core problems. In
particular, the total number of used bins and the relative gap of the six approaches are given. In
those tables, for each core problem, instances where the exact method could not find the optimal
solution within the time limit of two hours were excluded. The number of instances effectively
being compared is given in the second column. Two different sets of greedy heuristics were used
(columns SG1 and SG2). The first set consisted in only 3 greedy heuristics and the second one in
6, 8, 12, and 12 greedy heuristics for the two-stage without trimming, two-stage with trimming,
three-stage without trimming and three-stage with trimming core problems, respectively. The
criteria defining each particular greedy heuristic were chosen empirically through a set of
Deleted: paper
Deleted: et al
Page 16 of 55
URL: http:/mc.manuscriptcentral.com/geno Email: [email protected]
Engineering Optimization
123456789101112131415161718192021222324252627282930313233343536373839404142434445464748495051525354555657585960

For Peer Review O
nly
17
preliminary computational tests. The next four columns are for the number of used bins of the
three local search heuristics and VND. The optimal number of used bins is given in the column
Optimal. The last column is the relative gap, (ZVND−ZOpt)/ ZOpt, between the number of used bins
of VND and optimal the number of used bins. In the last line of each table, the relative gap of
each approach is given.
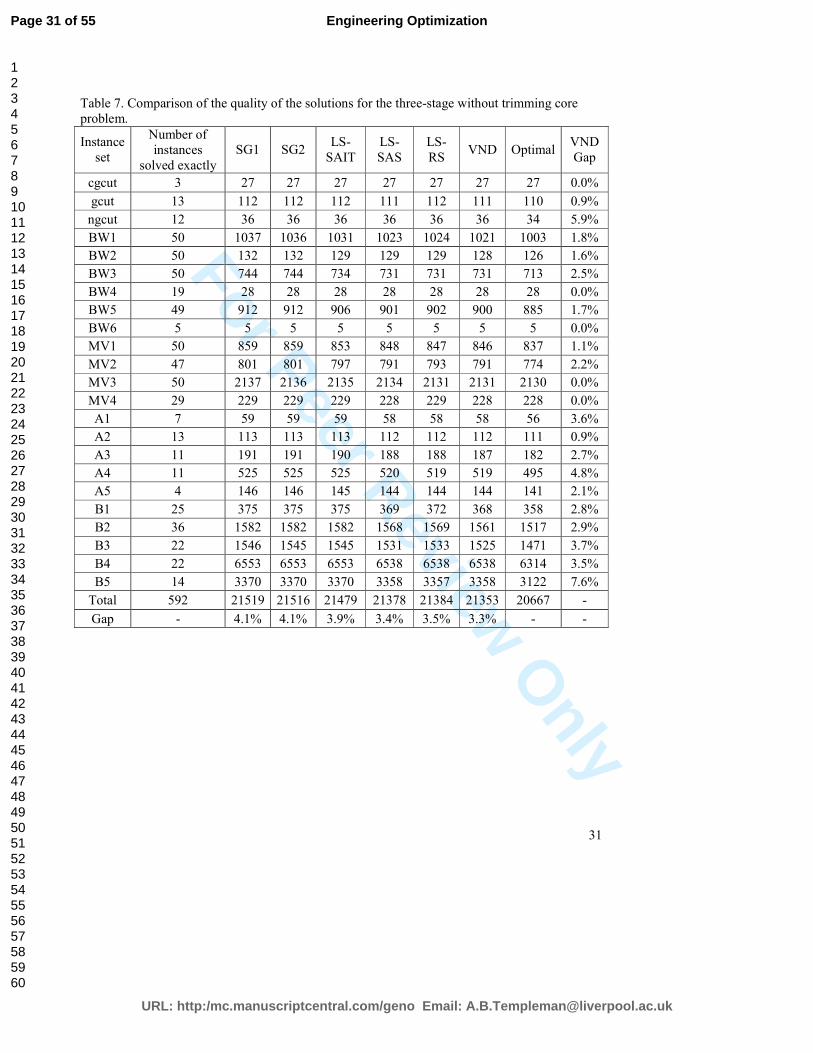
The quality of the solutions decreases when the number of feasible cutting operations
increases (from two-stage without trimming to three-stage with trimming) as can be seen by the
gaps for VND which are 2.3%, 3.0%, 3.3%, and 3.5% for the four problems in the same order as
they are displayed in the tables. As the combinatorial structure of the problem becomes more
relevant (since the items can be packed in more different ways), it is expected that the quality of
the heuristic solutions decreases. In terms of quality, the solutions of the first set of heuristics
(SG1) are almost as good as the ones obtained by the second set of heuristics (SG2). The only
core problem where the difference between the relative gaps of the heuristics is greater than
0.1% is the two-stage problem without trimming. When comparing the three different local
search heuristics, in general, SAS provides slightly better solutions than SR. The SAIT heuristic
provides significantly worse solutions than the other two. As shown below, the computational
times of the different approaches vary significantly, and clearly there is a trade-off between the
quality of the solutions obtained and the time spent in obtaining them.In general, VND improves
the results from the best local search heuristic. There are some exceptions for the sets B4 and B5,
which have instances with a very large number of items (more than four thousands on average).
A possible reason lies in having a time limit which is reached for some of those very large
instances. In that case, the amount of time spent in a single neighbourhood is more effective than
the same amount of time spent in other neighbourhoods that may not be as effective.
Page 17 of 55
URL: http:/mc.manuscriptcentral.com/geno Email: [email protected]
Engineering Optimization
123456789101112131415161718192021222324252627282930313233343536373839404142434445464748495051525354555657585960

For Peer Review O
nly
18
For several sets of instances the relative gap is 0.0% indicating that the optimal solutions
were obtained in all of the instances of the set. In general, better results are obtained in the
instances from the literature than in the “real-world” instances. Also, in general, better results are
obtained in the instances from company A than in the ones from company B. The latter instances
are clearly cutting stock instances (the average demand of the item types ranges from 31 to 695).
If the B instances are excluded from the gap calculations, i.e., if only instances closer to the bin
packing “extreme” are considered, the relative gaps given by VND are 0.3%, 1.2%, 1.5%, and
1.9% for the four core problems in the same order they appear in the tables. If only the bin
packing instances from the literature are considered the relative gaps are even smaller: 0.2%,
0.9%, 1.2%, and 1.6%, for the four core problems in the same order they appear in the tables.
The average computational time for each set of instances was, in most cases 0.0 or 0.1
seconds for each approach. Only for sets with very large instances, the LS-SAS, LS-RS and
VND approaches took seconds or tens of seconds (sets of “real-world” instances A4, A5, B2, and
B3), or was even close to the time limit imposed of 600 seconds (sets of “real-world” instances
B4 and B5).In Table 9, the average percentage of waste (total area of the items divided by the
number of used bins times the area of a single bin) for the four core problems is given. As
expected, in general, the percentage of waste decreases from the core problems on the left to the
ones of the right. A significant decrease is obtained from the two-stage problems without
trimming to the two-stage problems with trimming. The difference between the waste for the
other problems (in particular, for three-stage without and with trimming) is not so significant.
In Table 10 and Table 11 the results of the VND metaheuristic and of other three
heuristics and two metaheuristics for the two-stage with trimming problem are presented. The
Deleted: i.e.
Deleted: In Table 9, the average time
spent by each approach in each set of
instances is given for the three-stage with
trimming problem. The results on the
other three core problems are not shown since they are similar. As mentioned
before, a time limit of 600 seconds was
imposed on running all the approaches.It should be noted that only for large
instances (roughly speaking, more than
150 items) is the computational time
longer than one second. As expected,
greedy heuristics are able to provide
solutions very quickly, even for very
large instances.
Deleted: 
Deleted: Table 10
Deleted: Table 11 and Table 12
Page 18 of 55
URL: http:/mc.manuscriptcentral.com/geno Email: [email protected]
Engineering Optimization
123456789101112131415161718192021222324252627282930313233343536373839404142434445464748495051525354555657585960

For Peer Review O
nly
19
first three heuristics are the finite first fit (FFF) and the finite best strip (FBS) heuristics proposed
in (Berkey and Wang 1987) and the knapsack packing (KP) proposed in (Lodi et al. 1999). The
two metaheuristics are the tabu search approaches from (Lodi et al. 1999) using FBS and KP as
inner algorithms. All values but the ones in the last two columns are taken from (Lodi et al.
1999). The values presented are the average of the ten instances with the same number of items
of each class and, for each class, their average. As in (Lodi et al. 1999), the column z/LB gives
the value of the heuristic solution divided by the lower bound presented in (Martello and Vigo
1998). The last column gives the computational time of the proposed VND approach. In (Lodi et
al. 1999) the computational times for the FFF, FBS and KP heuristics are not reported, but the
authors mention that it is always less than 0.5 seconds. For the tabu search heuristics, the average
time for the ten classes is 33 seconds, with a minimum of 4 seconds and a maximum of 55
seconds. Since the computers are different (and they are not included in SPEC2000 or in
SPEC2006) it is difficult to make a direct comparison between the computational times.
The solutions given by the proposed VND approach are clearly better than the ones of the
FFF, FBS, and KP heuristics. For eight of the ten classes, VND has a better average than KP (the
best of the three mentioned very fast heuristics). Analysing with more detail, for the 50 groups of
instances, VND produces better solutions in 27 and worst solutions only in 6 (the values are the
same in 17 groups).The results of VND are very similar to those of TS – KP. For half of the ten
classes VND has a better average than TS – KP. Analysing with more detail, for the 50 groups of
instances, VND produces better solutions in 14 and worst solutions in 19 (the values are the
same in 17 groups).The results of VND are slightly worse than those of TS – FBS. For four of
the ten classes VND has a better average than TS – FBS. Analysing with more detail, for the 50
Deleted: et al
Deleted: et al
Deleted: et al
Deleted: et al
Deleted: et al
Page 19 of 55
URL: http:/mc.manuscriptcentral.com/geno Email: [email protected]
Engineering Optimization
123456789101112131415161718192021222324252627282930313233343536373839404142434445464748495051525354555657585960

For Peer Review O
nly
20
groups of instances, VND produces better solutions in 15 and worst solutions in 21 (the values
are the same in 14 groups).
7.2. Extensions
For measuring the impact of the extensions in the quality of the solutions obtained, a
subset of 27 real-world instances from company A and 42 from company B were used. The
selection of these instances was based on the availability of the solutions obtained with the
software at use in the companies. The core problem was the three-stage without trimming. The
computational tests of the VND approach for the extensions were conducted in a laptop equipped
with an Intel Core 2, 1.83 GHz processor, 2 GB RAM, and running Windows Vista Home
Premium.
The impact of allowing rotation is significant in terms of the quality of the solutions
without compromising the computational times. For company A, the total number of used bins
was reduced from 671 to 650 corresponding to a waste reduction from 18.4% to 16.0%. For
company B, the total number of used bins was reduced from 4094 to 3956 corresponding to a
waste reduction from 14.2% to 10.0%. Allowing overproduction further decreases the waste
percentage to 9.1% and 8.5% for companies A and B, respectively. The waste percentage is 8.6%
and 8.3% for companies A and B, respectively, when the head-cut is allowed.
In Table 12, the percentage waste for the two companies for different values of the
maximum number of item types per bin is given. Rotation, overproduction, and the head-cut,
were considered. Since the instances from company B have larger demands, they are not so
sensitive to the constraint that was introduced. In fact, for the company B instances, the average
Deleted: es
Deleted: In Table 13 and Table 14, results on allowing rotation or not for the
three-stage problem without trimming are
given for the instances of companies A
and B, respectively. Three approaches (a
greedy one, a local search one and VND)
were tested.For both companies, the
impact of allowing rotation is significant
in terms of the quality of the solutions
without compromising the computational
times. The decrease in the percentage
waste ranges from 2.1 to 2.4 for company
A and from 3.8 to 4.2 for company B,
depending on the approach.
In Table 15, the percentages of waste
obtained by VND, with and without overproduction, are compared for the two
companies when rotation is allowed. The
percentage waste decreases significantly in particular for the instances of the A
company. Since, in general, the bin
packing instances have more waste than
the cutting stock instances, it is natural
that they can accommodate more “extra”
items.
Deleted: In Table 16, the quality of the solutions in terms of number of used bins
and waste is given for the cases where a
head-cut is done or not. Rotation and
overproduction were considered. For
company A, the number of used bins is
only slightly improved but, for company
B, it is significantly reduced. The waste
percentage has a reduction of 0.5% and
0.2% for companies A and B,
respectively.
Deleted: Table 17
Page 20 of 55
URL: http:/mc.manuscriptcentral.com/geno Email: [email protected]
Engineering Optimization
123456789101112131415161718192021222324252627282930313233343536373839404142434445464748495051525354555657585960

For Peer Review O
nly
21
waste is not affected by the constraint with the limit of 5 item types per bin while, for the A
instances, that only happens for a limit of 10 item types per bin.
7.3. Comparison with “real-world” solutions
In Table 13, the type of cutting problems faced by the companies is detailed Company A can use
two different types of patterns in the same instance as denoted by A1 and A2.The proposed
approach was run for exactly the same three specific problems and the results obtained were
compared with the ones the companies made available to us obtained using two different
commercial softwares (one in each company). The comparison is summarized in Table 14.
For company A, for the small set of instances tested, the improvement is impressive: in
70% of the instances, the number of used bins was reduced by the proposed approach. Both the
two types of problems of company A (A1 and A2 as detailed in Table 13) were solved and the
best solution was chosen. For problem A1, the number of used bins was 650 and for problem A2,
the number of used bins was 652. Even when using a single type of pattern, the results of the
proposed approach are impressive.For company B, for the small set of instances tested, the
proposed approach also gave better results, but, in this case, only slightly better. In 43% of the
instances, the number of used bins was reduced, in 36% it was increased and it was equal in the
remaining 21% instances.
8. Conclusions
In this article, a set of different approaches for solving several variants of two-dimensional bin
packing problems was proposed. The approaches are based on packing the items into their best
fit locations according to some criteria and on a given sequence. Three local search heuristics
and a VND metaheuristic based on associating changes in the sequence of items to moves in the
search space were conceived.
Formatted: First paragraph style
Deleted: Table 18
Deleted: according to the extensions of the core problems.
Deleted: 
Deleted: Table 19
Deleted: Table 18
Deleted: In Table 20 and Table 21, the
detailed results for the instances of
company A and B, respectively, are
provided. NUB stands for “number of
used bins”.
Deleted: paper
Page 21 of 55
URL: http:/mc.manuscriptcentral.com/geno Email: [email protected]
Engineering Optimization
123456789101112131415161718192021222324252627282930313233343536373839404142434445464748495051525354555657585960

For Peer Review O
nly
22
The extensive computational tests revealed that the proposed approaches are able to find
good-quality solutions within reasonable amounts of time for instances from the literature and
for “real-world” instances. This conclusion is supported by the gaps of the proposed VND
metaheuristic to the optimal values (the average gap is less than 2% for bin packing instances of
the four problem variants considered) and by the comparison with five (meta)heuristics from the
literature.
The motivation for this work was the wood cutting in small and medium-sized furniture
companies. For the small set of instances tested, the proposed VND metaheuristic reduced
significantly (from 738 to 648) the number of used bins for instances of one of the companies
and slightly (from 3943 to 3926) the number of used bins for instances of another company.
These reductions in the number of used bins translate in the reduction of waste of 8% and 1%,
respectively.
Three of the proposed approaches (one based on selecting the best solution from a set of
solutions given by greedy heuristics, a local search one, and a sequential VND) are now
integrated in a software prototype for small- and medium-sized furniture companies, along with a
visual interface, a database, and algorithms for related problems, as the minimization of the
maximum number of open stacks.
Acknowledgements
This work was supported by project SCOOP - Sheet cutting and process optimization for furniture enterprises
(Contract NoCOOP-CT-2006-032998), financed by the European Commission, 6th Framework Programme on
Research, Technological Development and Dissemination, specific actions for SMEs, Cooperative Research
Projects. The fifth author was also supported by Grant SFRH/BD/42259/2007 from Fundação para a Ciência e
Tecnologia, Portugal.
Page 22 of 55
URL: http:/mc.manuscriptcentral.com/geno Email: [email protected]
Engineering Optimization
123456789101112131415161718192021222324252627282930313233343536373839404142434445464748495051525354555657585960

For Peer Review O
nly
23
References
Beasley, J. E., 1985a. Algorithms for unconstrained two-dimensional guillotine cutting. Journal of the
Operational Research Society, 36, 297-306.
Beasley, J. E., 1985b. An exact two-dimensional non-guillotine cutting tree search procedure. Operations
Research, 33 (1), 49-64.
Berkey, J. O. and Wang, P. Y., 1987. Two-dimensional finite bin-packing algorithms. Journal of the
Operational Research Society, 38 (5), 423-429.
Boschetti, M. A. and Mingozzi, A., 2003. The two-dimensional finite bin packing problem. Part II: New
lower and upper bounds. 4OR, 2, 135–147.
Christofides, N. and Whitlock, C., 1977. An algorithm for two-dimensional cutting problems. Operations
Research, 25 (1), 30-44.
Chung, F. K., Garey, M. R. and Johnson, D. S., 1982. On packing two-dimensional bins. SIAM Journal of
Algebraic and Discrete Methods, 3, 66-76.
De Giovanni, L., Pezzella, F., Massi, G., “An adaptive genetic algorithm for the pattern sequencing
problem”, article presented at 5th ESICUP Meeting, L'Aquila, Italy, April 20 - 22, 2008.
Dyckhoff, H., Scheithauer, G. and Terno, J., 1997. Cutting and packing. IN Dell'Amico, M., Maffioli, F.
and Martello, S. (Eds.) Annotated Bibliographies in Combinatorial Optimization. John Wiley and
Sons.
Gilmore, P. C. and Gomory, R. E., 1965. Multistage cutting stock problems of two and more dimensions.
Operations Research, 13, 94-120.
Faroe, O., Pisinger, D. and Zachariasen, M., 2003. Guided local search for the three-dimensional bin-
packing problem. INFORMS Journal on Computing, 15, 267-283.
Fekete, S. P., Schepers, J. and Veen, J. C. V. D., 2007. An exact algorithm for higher-dimensional
orthogonal packing. Operations Research, 55, 569-587.
Hansen, P., Mladenovic, N. and Pérez, J. A. M. (2008) Variable neighborhood search: methods and
applications. Montreal, HEC Montreal and GERAD
Lodi, A., Martello, S. and Monaci, M., 2002. Two dimensional packing problems: A survey. European
Journal of Operational Research, 141, 241-252.
Lodi, A., Martello, S. and Vigo, D., 1999. Heuristic and metaheuristic approaches for a class of two-
dimensional bin packing problems. INFORMS Journal on Computing, 11 (4), 345-357.
Lodi, A., Martello, S. and Vigo, D., 2004. Models and bounds for two-dimensional level packing
problems. Journal of Combinatorial Optimization, 8, 363-379.
Martello, S. and Vigo, D., 1998. Exact solution of the two-dimensional finite bin packing problem.
Management Science, 44 (3), 388-399.
Monaci, M. and Toth, P., 2006. A set-covering-based heuristic approach for bin-packing problems.
INFORMS Journal on Computing, 18 (1), 71-85.
Morabito, R. and Belluzzo, L., 2007. Optimising the cutting of wood fibre plates in the hardboard
industry. European Journal of Operational Research, 183 (3), 1405-1420.
Parreño, F., Alvarez-Valdes, R., Oliveira, J. F. and Tamarit, J. M., 2008. A hybrid GRASP/VND
algorithm for two- and three-dimensional bin packing. To be published in Annals of Operations
Research.
Pisinger, D. and Sigurd, M., 2007. Using decomposition techiniques and constraint programming for
solving the two-dimensional bin-packing problem. INFORMS Journal on Computing, 19 (1), 36-
51.
Puchinger, J. and Raidl, G. R., 2007. Models and algorithms for three-stage two-dimensional bin packing.
European Journal of Operational Research, 183 (3), 1304-1327.
Silva, E., Alvelos, F. and Carvalho, J. M. V. D., 2008. An integer programming model for two-staged and
three-staged two dimensional cutting stock problems. Submitted.
Deleted: paper
Page 23 of 55
URL: http:/mc.manuscriptcentral.com/geno Email: [email protected]
Engineering Optimization
123456789101112131415161718192021222324252627282930313233343536373839404142434445464748495051525354555657585960

For Peer Review O
nly
24
Vanderbeck, F., 2001. A nested decomposition approach to a three-strage, two-dimensional cutting-stock
problem. Management Science, 47 (6), 864-879.
Wäscher, G., Haussner, H. and Schumann, H., 2007. An improved typology of cutting and packing
problems. European Journal of Operational Research, 183 (3), 1109-1130.
Yagiura, M. and Ibaraki, T., 2002. Local Search. IN Pardalos, P. M. and Resende, M. G. C. (Eds.)
Handbook of Applied Optimization. Oxford University Press.
Yanasse, H. H., 1997. On a pattern sequencing problem to minimize the maximum number of open
stacks. European Journal of Operational Research, 100 (3), 454-463
Page 24 of 55
URL: http:/mc.manuscriptcentral.com/geno Email: [email protected]
Engineering Optimization
123456789101112131415161718192021222324252627282930313233343536373839404142434445464748495051525354555657585960

For Peer Review O
nly
25
Table 1. Illustration of the “swapping adjacent item types” neighbourhood.
Current sequence 1 2 2 2 3 3 1 2
first and second item types 2 2 2 1 3 3 1 2
second and third item types 1 3 3 2 2 2 1 2
third and fourth item types 1 2 2 2 1 3 3 2
Neighbour sequence
obtained by swapping the
fourth and fifth item types 1 2 2 2 3 3 2 1
Page 25 of 55
URL: http:/mc.manuscriptcentral.com/geno Email: [email protected]
Engineering Optimization
123456789101112131415161718192021222324252627282930313233343536373839404142434445464748495051525354555657585960

For Peer Review O
nly
26
Table 2. Illustration of the “swapping adjacent sub-sequences” neighbourhood for size two.
Current sequence 1 2 2 2 3 3 1 2
first and second item
sub-sequences of size two 2 2 1 2 3 3 1 2
second and third item
sub-sequences of size two 1 2 3 3 2 2 1 2
Neighbour sequence
obtained by swapping the
third and fourth item
sub-sequences of size two 1 2 2 2 1 2 3 3
Deleted: subsequences
Deleted: subsequences
Deleted: subsequences
Deleted: subsequences
Page 26 of 55
URL: http:/mc.manuscriptcentral.com/geno Email: [email protected]
Engineering Optimization
123456789101112131415161718192021222324252627282930313233343536373839404142434445464748495051525354555657585960

For Peer Review O
nly
27
Table 3. Illustration of the “reversing sub-sequences” neighbourhood.
Current sequence 1 2 2 2 3 3 1 2
first sub-sequence of size two 2 1 2 2 3 3 1 2
second sub-sequence of size two −
third sub-sequence of size two −
Neighbour sequence
obtained by reversing the
fourth sub-sequence of size two 1 2 2 2 3 3 2 1
Deleted: subsequences
Deleted: subsequence
Deleted: subsequence
Deleted: subsequence
Deleted: subsequence
Page 27 of 55
URL: http:/mc.manuscriptcentral.com/geno Email: [email protected]
Engineering Optimization
123456789101112131415161718192021222324252627282930313233343536373839404142434445464748495051525354555657585960

For Peer Review O
nly
28
Table 4. Sets of instances tested.
Number of types Number of items Instance set
Total number
of instances Min Avg Max Min Avg Max
Avg
demand
cgcut 3 7 12.3 20 16 33.7 62 2.7
gcut 13 10 27.8 50 10 27.8 50 1
ngcut 12 5 7.3 10 7 13.5 22 1.8
BW1-BW6a 300 20 60 100 20 60 100 1
MV1-MV4a 200 20 60 100 20 60 100 1
A1 7 8 18.3 32 13 37.9 71 2.2
A2 13 1 3.4 8 16 49.9 138 17.3
A3 12 34 57.5 98 61 130.3 184 1.9
A4 11 8 19.5 31 215 515.4 809 26.1
A5 4 82 108.3 134 217 250.3 309 2.3
B1 25 1 4.9 9 32 151.8 394 31.1
B2 36 1 4.6 9 156 619.1 1575 134.3
B3 23 10 14.3 24 169 948.4 1456 66.5
B4 22 1 6.3 9 1734 4360.4 10710 695.1
B5 15 10 24.5 60 2013 4286.4 9090 175.2 a Each instance set has 50 instances.
Page 28 of 55
URL: http:/mc.manuscriptcentral.com/geno Email: [email protected]
Engineering Optimization
123456789101112131415161718192021222324252627282930313233343536373839404142434445464748495051525354555657585960

For Peer Review O
nly
29
Table 5. Comparison of the quality of the solutions for the two-stage without trimming core
problem.
Instance
set
Number of
instances
solved exactly
SG1 SG2 LS-
SAIT
LS-
SAS
LS-
RS VND Optimal
VND
Gap
cgcut 3 31 30 30 30 30 30 30 0.0%
gcut 13 189 186 186 186 186 185 185 0.0%
ngcut 12 44 44 44 44 44 44 44 0.0%
BW1 50 1141 1137 1135 1134 1134 1134 1134 0.0%
BW2 50 167 167 167 167 167 167 167 0.0%
BW3 50 1021 1003 1001 999 999 999 998 0.1%
BW4 49 265 264 264 263 263 263 263 0.0%
BW5 50 1413 1386 1386 1386 1386 1386 1385 0.1%
BW6 48 364 363 362 362 362 362 362 0.0%
MV1 50 1082 1061 1061 1061 1061 1061 1057 0.4%
MV2 50 1566 1557 1557 1556 1556 1556 1556 0.0%
MV3 50 2324 2320 2320 2320 2320 2320 2320 0.0%
MV4 50 918 892 892 892 892 892 889 0.3%
A1 7 68 66 65 65 65 65 65 0.0%
A2 13 120 120 120 118 118 118 118 0.0%
A3 12 258 257 257 256 256 256 249 2.8%
A4 11 574 571 571 563 563 562 550 2.2%
A5 4 175 175 175 173 174 173 172 0.6%
B1 25 398 396 396 393 394 392 386 1.6%
B2 36 1640 1638 1638 1626 1628 1619 1575 2.8%
B3 20 1523 1520 1520 1512 1512 1511 1465 3.1%
B4 22 6621 6620 6620 6594 6638 6623 6400 3.5%
B5 12 3119 3117 3117 3101 3098 3101 2888 7.4%
Total 687 25021 24890 24884 24801 24846 24819 24258 -
Gap - 3.2% 2.6% 2.6% 2.2% 2.4% 2.3% - -
Page 29 of 55
URL: http:/mc.manuscriptcentral.com/geno Email: [email protected]
Engineering Optimization
123456789101112131415161718192021222324252627282930313233343536373839404142434445464748495051525354555657585960

For Peer Review O
nly
30
Table 6. Comparison of the quality of the solutions for the two-stage with trimming core
problem.
Instance
set
Number of
instances
solved exactly
SG1 SG2 LS-
SAIT
LS-
SAS
LS-
RS VND Optimal
VND
Gap
cgcut 3 28 28 28 28 28 28 28 0.0%
gcut 12 109 109 109 109 109 109 106 2.8%
ngcut 12 37 37 37 37 37 37 37 0.0%
BW1 50 1042 1041 1034 1030 1032 1029 1015 1.4%
BW2 48 124 124 124 124 124 124 124 0.0%
BW3 50 744 744 735 732 733 731 717 2.0%
BW4 19 29 29 29 29 29 29 29 0.0%
BW5 50 938 938 932 926 927 925 911 1.5%
BW6 11 12 12 12 12 12 12 12 0.0%
MV1 50 859 859 854 852 849 848 842 0.7%
MV2 50 878 878 873 868 869 867 857 1.2%
MV3 50 2137 2136 2135 2134 2131 2131 2130 0.0%
MV4 42 420 419 413 413 413 412 410 0.5%
A1 7 59 59 59 58 58 57 57 0.0%
A2 13 116 116 116 114 114 114 112 1.8%
A3 12 215 215 213 210 211 210 204 2.9%
A4 11 531 531 531 525 525 525 502 4.6%
A5 4 147 147 146 145 144 144 144 0.0%
B1 25 376 376 376 371 373 370 361 2.5%
B2 36 1583 1583 1583 1570 1570 1564 1521 2.8%
B3 22 1548 1548 1548 1533 1536 1525 1478 3.2%
B4 22 6553 6553 6553 6529 6535 6524 6314 3.3%
B5 14 3371 3371 3371 3348 3347 3348 3126 7.1%
Total 613 21856 21853 21811 21697 21706 21663 21037 -
Gap - 3.9% 3.9% 3.7% 3.1% 3.2% 3.0% - -
Page 30 of 55
URL: http:/mc.manuscriptcentral.com/geno Email: [email protected]
Engineering Optimization
123456789101112131415161718192021222324252627282930313233343536373839404142434445464748495051525354555657585960
For Peer Review O
nly
31
Table 7. Comparison of the quality of the solutions for the three-stage without trimming core
problem.
Instance
set
Number of
instances
solved exactly
SG1 SG2 LS-
SAIT
LS-
SAS
LS-
RS VND Optimal
VND
Gap
cgcut 3 27 27 27 27 27 27 27 0.0%
gcut 13 112 112 112 111 112 111 110 0.9%
ngcut 12 36 36 36 36 36 36 34 5.9%
BW1 50 1037 1036 1031 1023 1024 1021 1003 1.8%
BW2 50 132 132 129 129 129 128 126 1.6%
BW3 50 744 744 734 731 731 731 713 2.5%
BW4 19 28 28 28 28 28 28 28 0.0%
BW5 49 912 912 906 901 902 900 885 1.7%
BW6 5 5 5 5 5 5 5 5 0.0%
MV1 50 859 859 853 848 847 846 837 1.1%
MV2 47 801 801 797 791 793 791 774 2.2%
MV3 50 2137 2136 2135 2134 2131 2131 2130 0.0%
MV4 29 229 229 229 228 229 228 228 0.0%
A1 7 59 59 59 58 58 58 56 3.6%
A2 13 113 113 113 112 112 112 111 0.9%
A3 11 191 191 190 188 188 187 182 2.7%
A4 11 525 525 525 520 519 519 495 4.8%
A5 4 146 146 145 144 144 144 141 2.1%
B1 25 375 375 375 369 372 368 358 2.8%
B2 36 1582 1582 1582 1568 1569 1561 1517 2.9%
B3 22 1546 1545 1545 1531 1533 1525 1471 3.7%
B4 22 6553 6553 6553 6538 6538 6538 6314 3.5%
B5 14 3370 3370 3370 3358 3357 3358 3122 7.6%
Total 592 21519 21516 21479 21378 21384 21353 20667 -
Gap - 4.1% 4.1% 3.9% 3.4% 3.5% 3.3% - -
Page 31 of 55
URL: http:/mc.manuscriptcentral.com/geno Email: [email protected]
Engineering Optimization
123456789101112131415161718192021222324252627282930313233343536373839404142434445464748495051525354555657585960

For Peer Review O
nly
32
Table 8. Comparison of the quality of the solutions for the three-stage with trimming core
problem.
Instance
set
Number of
instances
solved exactly
SG1 SG2 LS-
SAIT
LS-
SAS
LS-
RS VND Optimal
VND
Gap
cgcut 3 27 27 27 27 27 27 27 0.0%
gcut 13 111 111 111 110 110 109 109 0.0%
ngcut 12 36 36 35 35 36 35 33 6.1%
BW1 50 1036 1034 1027 1021 1024 1019 1001 1.8%
BW2 50 131 131 129 129 129 128 126 1.6%
BW3 50 746 744 734 731 732 731 710 3.0%
BW4 13 16 16 16 16 16 16 16 0.0%
BW5 48 886 884 877 872 875 872 849 2.7%
BW6 6 6 6 6 6 6 6 6 0.0%
MV1 50 856 856 850 845 845 844 830 1.7%
MV2 44 709 708 700 698 698 698 675 3.4%
MV3 50 2136 2135 2131 2131 2130 2130 2130 0.0%
MV4 24 170 170 170 169 170 169 166 1.8%
A1 7 58 58 58 58 58 58 56 3.6%
A2 13 113 113 113 112 112 112 111 0.9%
A3 11 193 192 191 190 190 189 182 3.8%
A4 11 524 524 524 519 519 519 495 4.8%
A5 3 109 109 109 108 108 108 106 1.9%
B1 25 375 375 375 369 372 368 358 2.8%
B2 36 1582 1582 1582 1567 1568 1560 1516 2.9%
B3 23 1733 1733 1733 1716 1718 1710 1649 3.7%
B4 22 6553 6553 6553 6537 6535 6537 6314 3.5%
B5 14 3372 3370 3370 3356 3358 3356 3122 7.5%
Total 578 21478 21467 21421 21322 21336 21301 20587 -
Gap - 4.3% 4.3% 4.1% 3.6% 3.6% 3.5% - -
Page 32 of 55
URL: http:/mc.manuscriptcentral.com/geno Email: [email protected]
Engineering Optimization
123456789101112131415161718192021222324252627282930313233343536373839404142434445464748495051525354555657585960

For Peer Review O
nly
33
Table 9. Average percentage of waste for the VND solutions for the four core problems (all
instances).
Instance
set
Two-stage without
trimming
Two-stage with
trimming
Three-stage without
trimming
Three-stage with
trimming
cgcut 44.02% 34.44% 26.11% 26.11%
gcut 58.89% 31.36% 30.52% 29.02%
ngcut 45.92% 37.89% 35.61% 33.97%
BW1 23.69% 14.13% 13.33% 13.13%
BW2 43.71% 27.13% 24.53% 24.53%
BW3 42.75% 19.75% 19.76% 19.76%
BW4 66.95% 39.53% 37.84% 38.74%
BW5 47.06% 19.97% 20.20% 20.05%
BW6 79.28% 45.37% 49.63% 51.41%
MV1 36.09% 19.42% 19.27% 18.91%
MV2 57.73% 21.20% 21.56% 21.38%
MV3 42.44% 36.77% 36.77% 36.75%
MV4 50.90% 17.89% 19.98% 20.51%
A1 37.90% 29.11% 30.14% 30.14%
A2 35.68% 33.63% 30.80% 30.80%
A3 30.54% 15.20% 14.39% 14.29%
A4 19.98% 13.92% 13.00% 13.00%
A5 27.26% 12.75% 12.75% 13.89%
B1 23.97% 21.14% 20.88% 20.88%
B2 17.77% 15.07% 15.01% 14.86%
B3 18.10% 12.69% 12.67% 12.15%
B4 18.20% 17.49% 17.73% 17.67%
B5 16.56% 12.09% 12.30% 12.25%
Average 38.50% 23.82% 23.25% 23.23%
Deleted: 
Deleted: Table 9. Average
computational times (in seconds) for the three-stage with trimming core problem
(all instances).
Deleted: Page Break
Deleted: Table 10
... [1]
Page 33 of 55
URL: http:/mc.manuscriptcentral.com/geno Email: [email protected]
Engineering Optimization
123456789101112131415161718192021222324252627282930313233343536373839404142434445464748495051525354555657585960

For Peer Review O
nly
34
Table 10. Comparison of VND with other heuristics for the Berkey and Wang
instances.
FFF FBS KP TS -
FBS
TS -
KP
VND
Class of
instances
Number
of items
z/LB z/LB z/LB z/LB z/LB z/LB time
20 1.17 1.14 1.13 1.09 1.11 1.10 0.01
40 1.12 1.09 1.10 1.08 1.08 1.10 0.06
60 1.10 1.07 1.07 1.05 1.05 1.07 0.16
80 1.08 1.06 1.06 1.04 1.04 1.04 0.31
100 1.07 1.06 1.05 1.04 1.05 1.05 0.57
BW1
Average 1.108 1.084 1.082 1.060 1.066 1.072 0.223
20 1.10 1.10 1.00 1.10 1.00 1.00 0.01
40 1.10 1.10 1.10 1.10 1.10 1.05 0.05
60 1.15 1.15 1.15 1.15 1.15 1.12 0.13
80 1.07 1.07 1.07 1.07 1.07 1.06 0.27
100 1.06 1.06 1.03 1.06 1.03 1.03 0.46
BW2
Average 1.096 1.096 1.070 1.096 1.070 1.053 0.18
20 1.20 1.18 1.18 1.18 1.18 1.20 0.01
40 1.18 1.14 1.15 1.12 1.12 1.13 0.05
60 1.14 1.11 1.12 1.08 1.07 1.10 0.15
80 1.13 1.10 1.10 1.07 1.08 1.09 0.37
100 1.12 1.09 1.09 1.09 1.09 1.08 0.74
BW3
Average 1.154 1.124 1.128 1.108 1.108 1.118 0.27
20 1.0 1.0 1.0 1.0 1.0 1.0 0.01
40 1.1 1.1 1.1 1.1 1.1 1.1 0.04
60 1.2 1.2 1.2 1.2 1.2 1.2 0.13
80 1.1 1.1 1.1 1.1 1.1 1.1 0.28
100 1.1 1.1 1.1 1.1 1.1 1.1 0.57
BW4
Average 1.100 1.100 1.106 1.100 1.100 1.082 0.20
20 1.14 1.14 1.13 1.13 1.13 1.15 0.01
40 1.11 1.11 1.09 1.09 1.09 1.12 0.06
60 1.11 1.10 1.10 1.06 1.07 1.09 0.15
80 1.12 1.09 1.09 1.06 1.08 1.09 0.33
100 1.12 1.09 1.09 1.08 1.09 1.09 0.66
BW5
Average 1.120 1.106 1.100 1.084 1.092 1.108 0.24
20 1.0 1.0 1.0 1.0 1.0 1.0 0.01
40 1.4 1.4 1.5 1.4 1.5 1.3 0.04
60 1.1 1.1 1.1 1.1 1.1 1.1 0.14
80 1.0 1.0 1.0 1.0 1.0 1.0 0.29
BW6
100 1.1 1.1 1.1 1.1 1.1 1.1 0.52
Deleted: Table 11
Page 34 of 55
URL: http:/mc.manuscriptcentral.com/geno Email: [email protected]
Engineering Optimization
123456789101112131415161718192021222324252627282930313233343536373839404142434445464748495051525354555657585960

For Peer Review O
nly
35
Average 1.126 1.120 1.140 1.120 1.140 1.091 0.20
Page 35 of 55
URL: http:/mc.manuscriptcentral.com/geno Email: [email protected]
Engineering Optimization
123456789101112131415161718192021222324252627282930313233343536373839404142434445464748495051525354555657585960

For Peer Review O
nly
36
Table 11. Comparison of VND with other heuristics for the Martello and Vigo
instances.
FFF FBS KP TS -
FBS
TS -
KP
VND
Class of
instances
Number
of items
z/LB z/LB z/LB z/LB z/LB z/LB time
20 1.10 1.10 1.10 1.08 1.08 1.08 0.01
40 1.11 1.11 1.07 1.07 1.07 1.06 0.07
60 1.08 1.08 1.06 1.05 1.05 1.06 0.20
80 1.07 1.06 1.06 1.05 1.05 1.05 0.47
100 1.04 1.04 1.04 1.03 1.04 1.03 1.08
MV1
Average 1.080 1.078 1.066 1.056 1.058 1.057 0.37
20 1.17 1.16 1.12 1.12 1.12 1.13 0.01
40 1.09 1.08 1.07 1.04 1.04 1.07 0.05
60 1.06 1.06 1.06 1.03 1.03 1.05 0.20
80 1.07 1.06 1.05 1.03 1.03 1.05 0.37
100 1.06 1.06 1.04 1.04 1.04 1.05 0.60
MV2
Average 1.090 1.084 1.068 1.052 1.052 1.069 0.24
20 1.01 1.01 1.01 1.00 1.00 1.00 0.01
40 1.02 1.02 1.02 1.01 1.01 1.03 0.06
60 1.02 1.02 1.01 1.01 1.01 1.01 0.17
80 1.02 1.02 1.02 1.02 1.01 1.02 0.32
100 1.02 1.01 1.01 1.01 1.01 1.01 0.65
MV3
Average 1.018 1.016 1.014 1.010 1.008 1.012 0.24
20 1.14 1.14 1.16 1.14 1.14 1.13 0.01
40 1.14 1.09 1.10 1.09 1.09 1.08 0.06
60 1.15 1.12 1.10 1.08 1.08 1.08 0.20
80 1.15 1.13 1.12 1.10 1.10 1.11 0.45
100 1.14 1.10 1.08 1.08 1.07 1.07 0.77
MV4
Average 1.144 1.116 1.112 1.098 1.096 1.094 0.30
Deleted: Table 12
Page 36 of 55
URL: http:/mc.manuscriptcentral.com/geno Email: [email protected]
Engineering Optimization
123456789101112131415161718192021222324252627282930313233343536373839404142434445464748495051525354555657585960

For Peer Review O
nly
37
Deleted: Table 13. Impact of allowing
rotation in the quality of the solutions and
in the computational times – company A.... [2]
Page 37 of 55
URL: http:/mc.manuscriptcentral.com/geno Email: [email protected]
Engineering Optimization
123456789101112131415161718192021222324252627282930313233343536373839404142434445464748495051525354555657585960

For Peer Review O
nly
38
Table 12. Impact of the maximum number of item types per bin on the waste percentage. Maximum number
of item types
per bin
1 2 3 4 5 6 7 8 9 10 999
Company A 25.8% 16.3% 12.4% 11.1% 9.7% 9.1% 8.9% 8.8% 8.7% 8.6% 8.6%
Company B 19.0% 10.1% 8.7% 8.4% 8.3% 8.3% 8.3% 8.3% 8.3% 8.3% 8.3%
Deleted: Table 17
Page 38 of 55
URL: http:/mc.manuscriptcentral.com/geno Email: [email protected]
Engineering Optimization
123456789101112131415161718192021222324252627282930313233343536373839404142434445464748495051525354555657585960

For Peer Review O
nly
39
Table 13. Problems considered by the two companies.
Core
problem
Rotation
of items
First cut
Direction
Limit on the
number of item
types per plate
Over-
production Head-cut
A1 3 stages
without trimming Allowed Horizontal No limit Not allowed No
A2 2 stages
with trimming Allowed Horizontal No limit Not allowed Yes
B 2 stages
without trimming Allowed Horizontal No limit Allowed Yes
Deleted: Table 18
Page 39 of 55
URL: http:/mc.manuscriptcentral.com/geno Email: [email protected]
Engineering Optimization
123456789101112131415161718192021222324252627282930313233343536373839404142434445464748495051525354555657585960

For Peer Review O
nly
40
Table 14. Comparison between VND and the solutions obtained by the companies.
Solutions from the
Company VND Improvement
Number of used bins 736 648 88 (12.0%)
Average waste 24.2% 16.0% 8.2 Company A
Number of better solutions
(27 instances) 0 19 -
Number of used bins 3943 3926 17 (0.4%)
Average waste 11.9% 10.7% 1.2 Company B
Number of better solutions
(42 instances) 15 18 -
Deleted: Table 19
Page 40 of 55
URL: http:/mc.manuscriptcentral.com/geno Email: [email protected]
Engineering Optimization
123456789101112131415161718192021222324252627282930313233343536373839404142434445464748495051525354555657585960

For Peer Review O
nly
41
Deleted: ¶Table 20. Detailed results for the
instances of company A. ... [3]
Page 41 of 55
URL: http:/mc.manuscriptcentral.com/geno Email: [email protected]
Engineering Optimization
123456789101112131415161718192021222324252627282930313233343536373839404142434445464748495051525354555657585960

For Peer Review O
nly
42
Figure 1. A two-stage without trimming packing in a single bin.
Figure 2. A three-stage without trimming packing in a single bin.
Figure 3. A two-stage with trimming packing in a single bin.
Figure 4. A three-stage with trimming packing in a single bin.
Figure 5. Example of locations where an item can be packed.
Figure 6. Example of two possible locations in a shelf where one item can be packed.
Figure 7. Algorithm of the proposed sequential VND approach.
Figure 8. Illustration of a head-cut (represented by the bold vertical line).
Figure 9. Illustration of the reduction on the number of cuts by changing the coordinate of the
head-cut.
Page 42 of 55
URL: http:/mc.manuscriptcentral.com/geno Email: [email protected]
Engineering Optimization
123456789101112131415161718192021222324252627282930313233343536373839404142434445464748495051525354555657585960

For Peer Review O
nly
Page 33: [1] Deleted Templeman 2/16/2009 10:25:00 PM
Table 9. Average computational times (in seconds) for the three-stage
with trimming core problem (all instances).
Instance set SG1 SG2 LS-SAIT LS-SAS LS-RS VND
cgcut 0.0 0.0 0.0 0.0 0.0 0.1
gcut 0.0 0.0 0.0 0.0 0.0 0.1
ngcut 0.0 0.0 0.0 0.0 0.0 0.0
BW1 0.0 0.0 0.0 0.1 0.1 0.3
BW2 0.0 0.0 0.0 0.1 0.1 0.2
BW3 0.0 0.0 0.0 0.1 0.1 0.3
BW4 0.0 0.0 0.0 0.0 0.0 0.0
BW5 0.0 0.0 0.0 0.1 0.1 0.3
BW6 0.0 0.0 0.0 0.0 0.0 0.0
MV1 0.0 0.0 0.1 0.1 0.1 0.5
MV2 0.0 0.0 0.0 0.1 0.1 0.3
MV3 0.0 0.0 0.0 0.1 0.1 0.3
MV4 0.0 0.0 0.0 0.1 0.0 0.1
A1 0.0 0.0 0.0 0.0 0.0 0.1
A2 0.0 0.0 0.0 0.0 0.0 0.1
A3 0.0 0.0 0.1 0.4 0.4 2.1
A4 0.0 0.0 0.2 13.6 14.2 84.4
A5 0.0 0.0 0.3 3.2 2.8 14.3
B1 0.0 0.0 0.0 0.4 0.5 3.1
B2 0.0 0.1 0.1 12.3 14.0 71.0
B3 0.0 0.1 0.3 50.6 54.2 284.1
B4 0.7 2.0 4.6 491.5 498.8 573.2
B5 0.5 1.5 6.8 566.3 570.7 603.2
Page 37: [2] Deleted Filipe Pereira e Alvelos 2/12/2009 11:40:00 AM
Table 13. Impact of allowing rotation in the quality of the solutions and in the computational
times – company A.
No rotation Rotation
SG2 LS-SAS VND SG2 LS-SAS VND
Number of used bins 679 673 671 658 654 650
Waste 19.0% 18.5% 18.4% 16.7% 16.4% 16.0%
Total 1 59 294 1 64 350
Min 0 0 0 0 0 0
Median 0 0 1 0 0 1
Avg 0 2 11 0 2 13
Time (secs)
Max 0 15 109 0 16 95
Page 43 of 55
URL: http:/mc.manuscriptcentral.com/geno Email: [email protected]
Engineering Optimization
123456789101112131415161718192021222324252627282930313233343536373839404142434445464748495051525354555657585960

For Peer Review O
nly
Page Break
Table 14. Impact of allowing rotation in the quality of the solutions and in the computational
times – company B.
No rotation Rotation
SG2 LS-SAS VND SG2 LS-SAS VND
Number of used bins 4142 4106 4094 3981 3965 3956
Waste 14.8% 14.4% 14.2% 11.0% 10.6% 10.0%
Total 5 2284 8410 10 2156 8458
Min 0 0 0 0 0 0
Median 0 19 85 0 16 61
Avg 0 54 200 0 51 206
Time (secs)
Max 1 600 600 2 600 600
Page Break
Table 15. Impact of allowing overproduction on the average waste.
No overproduction Overproduction
Company A 16.0% 9.1%
Company B 10.0% 8.5%
Page Break
Table 16. Impact on the quality of the solutions of the head-cut.
No head-cut Head- cut
Number of used bins 650 648
Company A
Waste 9.1% 8.6%
Number of used bins 3956 3899
Company B
Waste 8.5% 8.3%
Page 41: [3] Deleted Filipe Pereira e Alvelos 2/12/2009 11:42:00 AM
Table 20. Detailed results for the instances of company A.
Page 44 of 55
URL: http:/mc.manuscriptcentral.com/geno Email: [email protected]
Engineering Optimization
123456789101112131415161718192021222324252627282930313233343536373839404142434445464748495051525354555657585960

For Peer Review O
nly
VND Company
A1 A2 Improvement
Instance
NUB Waste NUB Waste NUB Waste NUB Waste
a01 66 17.1% 61 10.3% 61 10.3% 5 6.8
a02 73 19.1% 67 11.9% 67 11.9% 6 7.2
a03 71 28.3% 55 7.4% 55 7.4% 16 20.9
a04 29 22.7% 25 10.3% 25 10.3% 4 12.4
a05 36 29.6% 28 9.5% 28 9.5% 8 20.1
a06 16 26.2% 14 15.7% 14 15.7% 2 10.5
a07 3 38.5% 2 7.8% 2 7.8% 1 30.7
a08 54 19.8% 48 9.7% 49 11.6% 6 10.0
a09 14 22.4% 14 22.4% 14 22.4% 0 0.0
a10 16 25.9% 14 15.3% 14 15.3% 2 10.6
a11 80 21.2% 68 7.2% 69 8.6% 12 13.9
a12 42 16.5% 38 7.7% 39 10.1% 4 8.8
a13 96 18.8% 84 7.2% 85 8.3% 12 11.6
a14 6 25.7% 5 10.8% 5 10.8% 1 14.9
a15 8 15.0% 8 15.0% 8 15.0% 0 0.0
a16 6 23.4% 6 23.4% 6 23.4% 0 0.0
a17 8 20.1% 8 20.1% 8 20.1% 0 0.0
a18 12 17.4% 12 17.4% 12 17.4% 0 0.0
a19 4 17.8% 4 17.8% 4 17.8% 0 0.0
a20 10 35.1% 8 18.9% 8 18.9% 2 16.2
a21 5 17.2% 5 17.2% 5 17.2% 0 0.0
a22 24 16.0% 23 12.3% 23 12.3% 1 3.7
a23 4 31.7% 4 31.7% 4 31.7% 0 0.0
a24 18 20.4% 16 10.4% 16 10.4% 2 9.9
a25 20 29.5% 19 25.7% 18 21.6% 2 7.8
a26 8 44.8% 7 37.0% 7 37.0% 1 7.9
a27 7 32.3% 7 32.3% 6 21.0% 1 11.3
Page Break
Table 21. Detailed results for the instances of company B.
Company VND Improvement Instance
NUB Waste NUB Waste NUB Waste
b01 73 6.6% 73 6.6% 0 0.0
b02 10 11.1% 9 1.2% 1 9.9
b03 91 10.3% 88 7.2% 3 3.1
b04 85 13.7% 80 8.4% 5 5.4
b05 177 4.6% 180 6.2% -3 -1.6
b06 189 6.3% 184 3.8% 5 2.5
b07 124 6.1% 131 11.1% -7 -5.0
b08 221 10.3% 215 7.8% 6 2.5
b09 33 18.5% 35 23.2% -2 -4.7
Page 45 of 55
URL: http:/mc.manuscriptcentral.com/geno Email: [email protected]
Engineering Optimization
123456789101112131415161718192021222324252627282930313233343536373839404142434445464748495051525354555657585960

For Peer Review O
nly
b10 17 14.7% 16 9.4% 1 5.3
b11 23 30.6% 19 16.0% 4 14.6
b12 3 21.7% 3 21.7% 0 0.0
b13 12 9.0% 13 16.0% -1 -7.0
b14 225 9.5% 226 9.9% -1 -0.4
b15 11 17.1% 11 17.1% 0 0.0
b16 6 21.9% 6 21.9% 0 0.0
b17 19 14.2% 19 14.2% 0 0.0
b18 22 17.0% 20 8.7% 2 8.3
b19 109 6.7% 106 4.1% 3 2.6
b20 127 9.8% 129 11.2% -2 -1.4
b21 221 10.3% 215 7.8% 6 2.5
b22 74 10.5% 76 12.8% -2 -2.4
b23 415 10.4% 418 11.1% -3 -0.6
b24 104 12.1% 107 14.6% -3 -2.5
b25 98 8.8% 98 8.8% 0 0.0
b26 102 7.4% 105 10.0% -3 -2.6
b27 108 5.9% 106 4.1% 2 1.8
b28 107 5.0% 106 4.1% 1 0.9
b29 123 5.3% 132 11.8% -9 -6.5
b30 221 7.3% 222 7.7% -1 -0.4
b31 172 3.5% 174 4.6% -2 -1.1
b32 60 12.8% 57 8.2% 3 4.6
b33 61 10.3% 63 13.1% -2 -2.8
b34 62 7.5% 65 11.8% -3 -4.3
b35 60 13.5% 55 5.6% 5 7.9
b36 49 12.0% 46 6.3% 3 5.7
b37 34 12.0% 34 12.0% 0 0.0
b38 75 13.8% 70 7.6% 5 6.2
b39 185 8.5% 183 7.5% 2 1.0
b40 28 24.7% 24 12.1% 4 12.6
b41 5 16.6% 5 16.6% 0 0.0
b42 2 23.5% 2 23.5% 0 0.0
Page 46 of 55
URL: http:/mc.manuscriptcentral.com/geno Email: [email protected]
Engineering Optimization
123456789101112131415161718192021222324252627282930313233343536373839404142434445464748495051525354555657585960
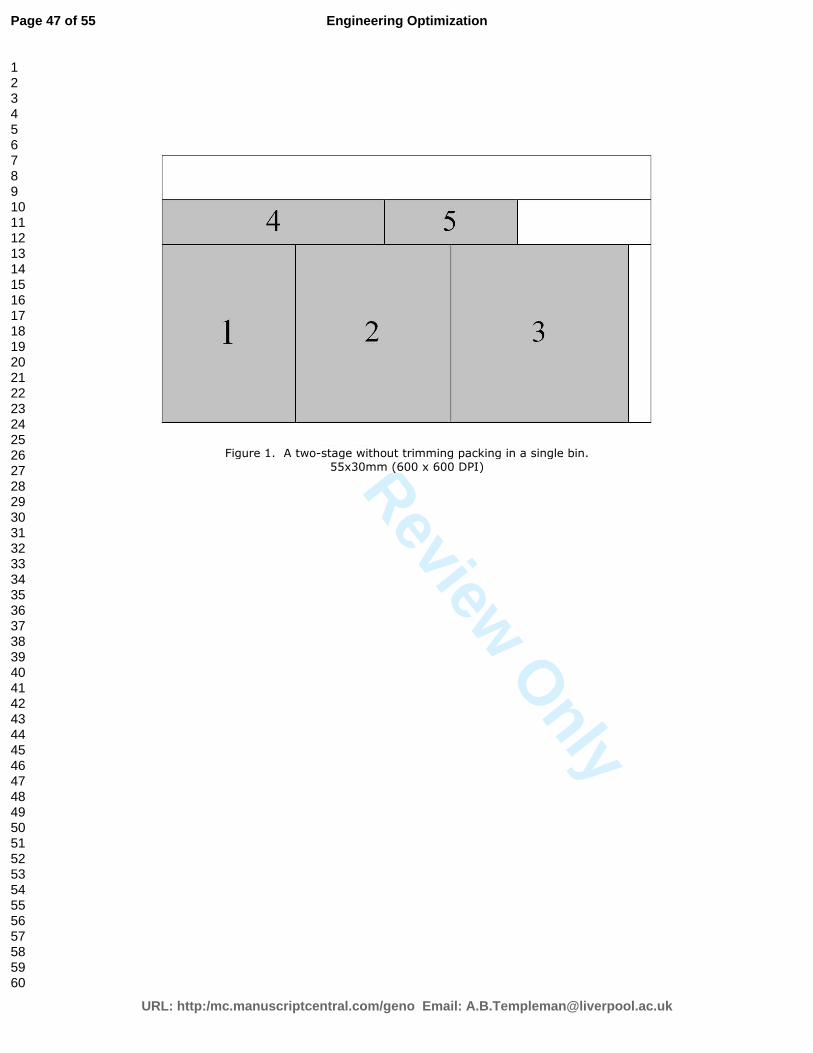
For Peer Review O
nly
Figure 1. A two-stage without trimming packing in a single bin. 55x30mm (600 x 600 DPI)
Page 47 of 55
URL: http:/mc.manuscriptcentral.com/geno Email: [email protected]
Engineering Optimization
123456789101112131415161718192021222324252627282930313233343536373839404142434445464748495051525354555657585960

For Peer Review O
nly
Figure 2. A three-stage without trimming packing in a single bin. 55x30mm (600 x 600 DPI)
Page 48 of 55
URL: http:/mc.manuscriptcentral.com/geno Email: [email protected]
Engineering Optimization
123456789101112131415161718192021222324252627282930313233343536373839404142434445464748495051525354555657585960

For Peer Review O
nly
Figure 3. A two-stage with trimming packing in a single bin. 55x30mm (600 x 600 DPI)
Page 49 of 55
URL: http:/mc.manuscriptcentral.com/geno Email: [email protected]
Engineering Optimization
123456789101112131415161718192021222324252627282930313233343536373839404142434445464748495051525354555657585960

For Peer Review O
nly
Figure 4. A three-stage with trimming packing in a single bin. 55x30mm (600 x 600 DPI)
Page 50 of 55
URL: http:/mc.manuscriptcentral.com/geno Email: [email protected]
Engineering Optimization
123456789101112131415161718192021222324252627282930313233343536373839404142434445464748495051525354555657585960

For Peer Review O
nly
Figure 5. Example of locations where an item can be packed. 55x30mm (600 x 600 DPI)
Page 51 of 55
URL: http:/mc.manuscriptcentral.com/geno Email: [email protected]
Engineering Optimization
123456789101112131415161718192021222324252627282930313233343536373839404142434445464748495051525354555657585960
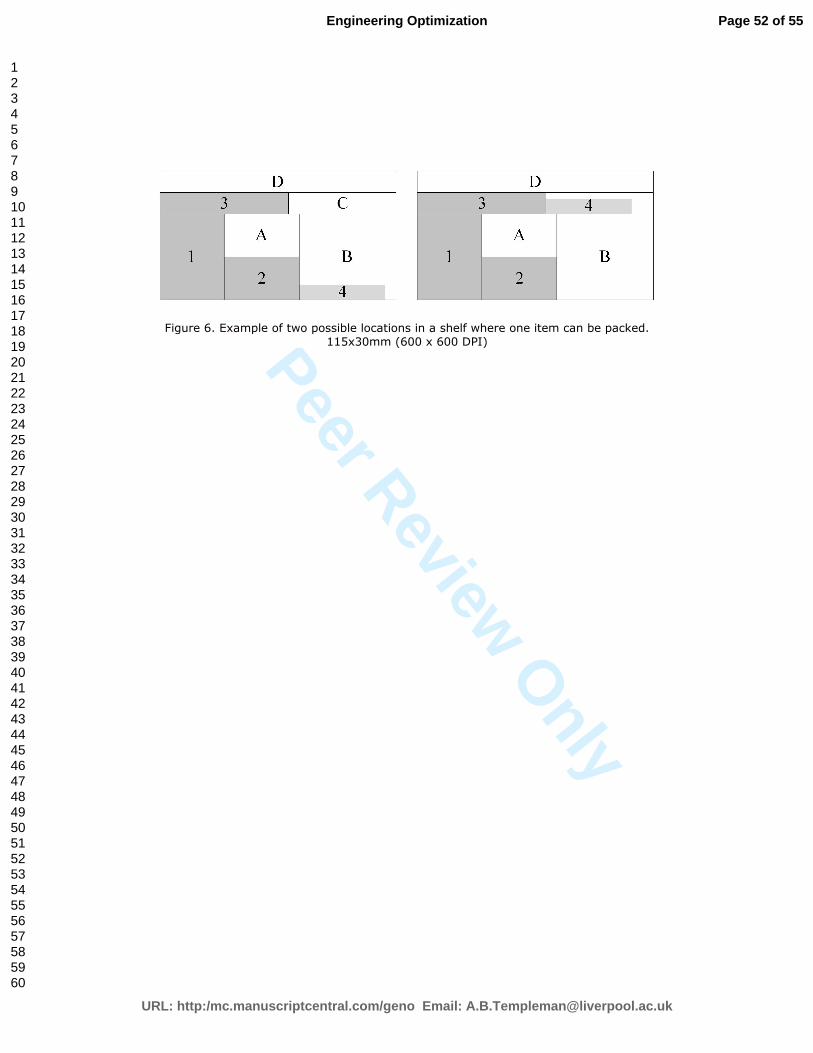
For Peer Review O
nly
Figure 6. Example of two possible locations in a shelf where one item can be packed. 115x30mm (600 x 600 DPI)
Page 52 of 55
URL: http:/mc.manuscriptcentral.com/geno Email: [email protected]
Engineering Optimization
123456789101112131415161718192021222324252627282930313233343536373839404142434445464748495051525354555657585960

For Peer Review O
nly
Figure 7. Algorithm of the proposed sequential VND approach. 130x132mm (600 x 600 DPI)
Page 53 of 55
URL: http:/mc.manuscriptcentral.com/geno Email: [email protected]
Engineering Optimization
123456789101112131415161718192021222324252627282930313233343536373839404142434445464748495051525354555657585960

For Peer Review O
nly
Figure 8. Illustration of a head-cut (represented by the bold vertical line). 55x36mm (600 x 600 DPI)
Page 54 of 55
URL: http:/mc.manuscriptcentral.com/geno Email: [email protected]
Engineering Optimization
123456789101112131415161718192021222324252627282930313233343536373839404142434445464748495051525354555657585960

For Peer Review O
nly
Figure 9. Illustration of the reduction on the number of cuts by changing the coordinate of the head-cut.
118x36mm (600 x 600 DPI)
Page 55 of 55
URL: http:/mc.manuscriptcentral.com/geno Email: [email protected]
Engineering Optimization
123456789101112131415161718192021222324252627282930313233343536373839404142434445464748495051525354555657585960