Estimation of Tag Shedding and Reporting Rates for Lake Erie Jaw-Tagged Walleyes
14
This article was downloaded by: [Michigan State University] On: 06 April 2012, At: 05:29 Publisher: Taylor & Francis Informa Ltd Registered in England and Wales Registered Number: 1072954 Registered office: Mortimer House, 37-41 Mortimer Street, London W1T 3JH, UK North American Journal of Fisheries Management Publication details, including instructions for authors and subscription information: http://www.tandfonline.com/loi/ujfm20 Estimation of Tag Shedding and Reporting Rates for Lake Erie Jaw-Tagged Walleyes Christopher S. Vandergoot a b , Travis O. Brenden b , Michael V. Thomas c , Donald W. Einhouse d , H. Andrew Cook e & Mark W. Turner a a Ohio Department of Natural Resources, Division of Wildlife, Sandusky Fisheries Research Station, 305 East Shoreline Drive, Sandusky, Ohio, 44870, USA b Quantitative Fisheries Center, Department of Fisheries and Wildlife, Michigan State University, 153 Giltner Hall, East Lansing, Michigan, 48824, USA c Michigan Department of Natural Resources, Lake St. Clair Fisheries Research Station, 33135 South River Road, Mt. Clemens, Michigan, 48045, USA d New York State Department of Environmental Conservation, Lake Erie Fisheries Research Unit, 178 Point Drive North, Dunkirk, New York, 14048, USA e Ontario Ministry of Natural Resources, Lake Erie Management Unit, 320 Milo Road, Wheatley, Ontario, N0P 2P0, Canada Available online: 29 Mar 2012 To cite this article: Christopher S. Vandergoot, Travis O. Brenden, Michael V. Thomas, Donald W. Einhouse, H. Andrew Cook & Mark W. Turner (2012): Estimation of Tag Shedding and Reporting Rates for Lake Erie Jaw-Tagged Walleyes, North American Journal of Fisheries Management, 32:2, 211-223 To link to this article: http://dx.doi.org/10.1080/02755947.2012.672365 PLEASE SCROLL DOWN FOR ARTICLE Full terms and conditions of use: http://www.tandfonline.com/page/terms-and-conditions This article may be used for research, teaching, and private study purposes. Any substantial or systematic reproduction, redistribution, reselling, loan, sub-licensing, systematic supply, or distribution in any form to anyone is expressly forbidden. The publisher does not give any warranty express or implied or make any representation that the contents will be complete or accurate or up to date. The accuracy of any instructions, formulae, and drug doses should be independently verified with primary sources. The publisher shall not be liable for any loss, actions, claims, proceedings, demand, or costs or damages whatsoever or howsoever caused arising directly or indirectly in connection with or arising out of the use of this material.
-
Upload
independent -
Category
Documents
-
view
0 -
download
0
Transcript of Estimation of Tag Shedding and Reporting Rates for Lake Erie Jaw-Tagged Walleyes

This article was downloaded by: [Michigan State University]On: 06 April 2012, At: 05:29Publisher: Taylor & FrancisInforma Ltd Registered in England and Wales Registered Number: 1072954 Registered office: Mortimer House,37-41 Mortimer Street, London W1T 3JH, UK
North American Journal of Fisheries ManagementPublication details, including instructions for authors and subscription information:http://www.tandfonline.com/loi/ujfm20
Estimation of Tag Shedding and Reporting Rates forLake Erie Jaw-Tagged WalleyesChristopher S. Vandergoot a b , Travis O. Brenden b , Michael V. Thomas c , Donald W.Einhouse d , H. Andrew Cook e & Mark W. Turner aa Ohio Department of Natural Resources, Division of Wildlife, Sandusky Fisheries ResearchStation, 305 East Shoreline Drive, Sandusky, Ohio, 44870, USAb Quantitative Fisheries Center, Department of Fisheries and Wildlife, Michigan StateUniversity, 153 Giltner Hall, East Lansing, Michigan, 48824, USAc Michigan Department of Natural Resources, Lake St. Clair Fisheries Research Station, 33135South River Road, Mt. Clemens, Michigan, 48045, USAd New York State Department of Environmental Conservation, Lake Erie Fisheries ResearchUnit, 178 Point Drive North, Dunkirk, New York, 14048, USAe Ontario Ministry of Natural Resources, Lake Erie Management Unit, 320 Milo Road,Wheatley, Ontario, N0P 2P0, Canada
Available online: 29 Mar 2012
To cite this article: Christopher S. Vandergoot, Travis O. Brenden, Michael V. Thomas, Donald W. Einhouse, H. Andrew Cook& Mark W. Turner (2012): Estimation of Tag Shedding and Reporting Rates for Lake Erie Jaw-Tagged Walleyes, North AmericanJournal of Fisheries Management, 32:2, 211-223
To link to this article: http://dx.doi.org/10.1080/02755947.2012.672365
PLEASE SCROLL DOWN FOR ARTICLE
Full terms and conditions of use: http://www.tandfonline.com/page/terms-and-conditions
This article may be used for research, teaching, and private study purposes. Any substantial or systematicreproduction, redistribution, reselling, loan, sub-licensing, systematic supply, or distribution in any form toanyone is expressly forbidden.
The publisher does not give any warranty express or implied or make any representation that the contentswill be complete or accurate or up to date. The accuracy of any instructions, formulae, and drug doses shouldbe independently verified with primary sources. The publisher shall not be liable for any loss, actions, claims,proceedings, demand, or costs or damages whatsoever or howsoever caused arising directly or indirectly inconnection with or arising out of the use of this material.

North American Journal of Fisheries Management 32:211–223, 2012American Fisheries Society 2012ISSN: 0275-5947 print / 1548-8675 onlineDOI: 10.1080/02755947.2012.672365
ARTICLE
Estimation of Tag Shedding and Reporting Rates for LakeErie Jaw-Tagged Walleyes
Christopher S. Vandergoot*Ohio Department of Natural Resources, Division of Wildlife, Sandusky Fisheries Research Station,305 East Shoreline Drive, Sandusky, Ohio 44870, USA; and Quantitative Fisheries Center, Department ofFisheries and Wildlife, Michigan State University, 153 Giltner Hall, East Lansing, Michigan 48824, USA
Travis O. BrendenQuantitative Fisheries Center, Department of Fisheries and Wildlife, Michigan State University,153 Giltner Hall, East Lansing, Michigan 48824, USA
Michael V. ThomasMichigan Department of Natural Resources, Lake St. Clair Fisheries Research Station,33135 South River Road, Mt. Clemens, Michigan 48045, USA
Donald W. EinhouseNew York State Department of Environmental Conservation, Lake Erie Fisheries Research Unit,178 Point Drive North, Dunkirk, New York 14048, USA
H. Andrew CookOntario Ministry of Natural Resources, Lake Erie Management Unit, 320 Milo Road, Wheatley, OntarioN0P 2P0, Canada
Mark W. TurnerOhio Department of Natural Resources, Division of Wildlife, Sandusky Fisheries Research Station,305 East Shoreline Drive, Sandusky, Ohio 44870, USA
AbstractSince 1990, walleyes Sander vitreus in Lake Erie have been tagged annually with jaw tags to better understand the
population dynamics and ecological characteristics of individual spawning populations. Although the data collectedfrom this tagging program have been used for a variety of management purposes (e.g., estimating migration patterns,stock intermixing, and mortality rates), there has been only cursory examination of the shedding and reporting ratesassociated with the program. We used double tagging and high-reward tagging experiments to estimate tag sheddingand reporting rates for jaw-tagged walleyes in Lake Erie. Double tagging of walleyes with jaw and passive integratedtransponder (PIT) tags suggested that the tagging method and tagging agency contributed to the observed variability inboth immediate (within 21 d of tagging) retention and chronic jaw tag shedding rates. Agency-specific model-averagedestimates of immediate tag retention ranged from 95% to 99%. For chronic shedding, model-averaged instantaneousrates (annual) ranged from 0.07 to 0.28. Jaw tag reporting rates, estimated via releases of high-reward tags in 1990and 2000, varied among tagging years, tagging basins, and commercial and recreational fisheries. In general, tagreporting rates were higher for the recreational fishery (range, 33–55%) than for the commercial fishery (10–17%),
*Corresponding author: [email protected] September 13, 2011; accepted November 30, 2011
211
Dow
nloa
ded
by [
Mic
higa
n St
ate
Uni
vers
ity]
at 0
5:29
06
Apr
il 20
12
212 VANDERGOOT ET AL.
and the reporting rates for both fisheries and tagging basins were found to have declined between 1990 and 2000.Uncertainty in the tag reporting rates was greater for the recreational fishery than for the commercial fishery. Ourfindings will benefit management of the economically important Lake Erie walleye fisheries by providing managerswith robust tag shedding and reporting rate estimates, providing more reliable estimates of important dynamic rates(e.g., fishing and natural mortality) by correcting the long-term jaw tagging data set for these previously unaccountedfor biases.
Walleyes Sander vitreus in Lake Erie support a large com-mercial fishery in Canadian waters and an equally large recre-ational component in U.S. waters (Walleye Task Group 2011).Between 1990 and 2008, average annual walleye harvest was2.7 million fish in the commercial fishery and 1.9 million in therecreational fishery (Walleye Task Group 2011). The fishery ismanaged cooperatively by a binational committee (Lake ErieCommittee) composed of resource managers from the OntarioMinistry of Natural Resources (OMNR), Michigan Departmentof Natural Resources (MDNR), Ohio Department of NaturalResources (ODNR), Pennsylvania Fish and Boat Commission,and New York State Department of Environmental Conserva-tion (NYSDEC). As part of their management of the walleyefishery, the Lake Erie Committee agencies have cooperatedin an interagency tagging study commonly referred to as theLake Erie walleye (LEW) tagging program. This program, ini-tiated in 1990, has involved annual tagging of walleyes throughthe maxillary or mandible (Scott and Crossman 1998); size-10 or size-12 Monel butt-end bands (jaw tags) have been used(Einhouse and Haas 1995). The recovery and reporting of jawtags by commercial and recreational fishers, as well as by scien-tific personnel, has facilitated a variety of conclusions, such aswalleye movements and stock dynamics in Lake Erie (Isermannand Knight 2005; Wang et al. 2007; Zhao et al. 2011).
Multiyear tagging studies, such as the LEW tagging program,are commonly used by fisheries biologists to estimate migrationpatterns, stock intermixing, and mortality rates of fish stocks(Nielsen 1992). Brownie models (Brownie et al. 1985) havebecome the standard analytic approach for estimating mortal-ity rates from tagging studies due in part to their flexibility(Pollock et al. 1991; Hearn et al. 1998; Hoenig et al. 1998;Pollock et al. 2001; Jiang et al. 2007). Although estimation ofmortality rates through Brownie models is facilitated through theavailability of data analysis programs such as SURVIV (White1983) and MARK (White and Burnham 1999), it is importantto recognize that there are a variety of assumptions associatedwith these models (Pollock et al. 2001) and that violations ofthese assumptions can lead to biased estimates, if not properlyaccounted for in the estimation process (Miranda et al. 2002;Brenden et al. 2010).
One of the most widely recognized assumptions of mark–recapture studies is no tag loss. We characterize this assumptionas widely recognized because of the large number of studiesthat have evaluated tag shedding (Fabrizio et al. 1996; Latouret al. 2001; Miranda et al. 2002; Isermann and Knight 2005).
Tag shedding can occur soon after tags are first applied (type-Itag loss) or chronically through time (type-II tag loss; Bevertonand Holt 1957; Pollock et al. 2001). Several studies have eval-uated jaw tag shedding in Lake Erie walleyes, but the resultsof these studies have been inconsistent. As part of a short-termexperiment conducted in the early 1990s, no (0%) shedding wasobserved over a 5-month period for adult walleyes tagged withsize-10 and size-12 jaw tags and held in hatchery ponds (R. Haas,MDNR, unpublished data). Einhouse and Haas (1995) reported0% tag shedding over a 1-year period for walleyes tagged withsize-12 jaw tags and released in New York jurisdictional watersof Lake Erie; however, they also reported a 41% tag sheddingover a 1-year period for walleyes tagged with size-10 tags. Morerecently, Isermann and Knight (2005) reported a 60% sheddingrate for size-10 jaw tags on walleyes tagged and released in Ohiowaters of Lake Erie and a 30% rate for size-12 tags. The dispar-ities in the results of these studies are probably due to a varietyof factors, such as study environment, duration of study, sizeof fish tagged, and variations in tagging methods. Regardless,the inconsistency in the results suggested substantial uncertaintyover actual tag shedding rates for the LEW tagging program andfactors that may contribute to shedding.
Incomplete reporting of tags recovered by fishers is anothersource of bias that can affect conclusions drawn from multiple-year tagging studies (Pollock et al. 1991). Although tag reportingrates can be estimated as part of the process of fitting Browniemodels (Hearn et al. 1998; Pollock et al. 2001, 2002), it is notuncommon for tag reporting rates to be estimated separatelyand later incorporated into Brownie model recovery probabili-ties (Latour et al. 2001; Taylor et al. 2006; Cadigan and Brattey2008; Ebener et al. 2010). Reporting rates can be estimated bycovertly planting tags in harvested fish (Matlock 1981; Greenet al. 1983), distributing surrogate postcards to simulate fisherencounters with tagged fish (Zale and Bain 1994), using creel orport observers to monitor the harvest of tagged fish (Pollock et al.1991; Polacheck and Hearn 2003), and releasing high-rewardtags along with standard-reward tags (Pollock et al. 2001). Forthe LEW tagging program, periodic (once in 1990 and 2000)releases of high-reward jaw tags have been used to estimatereporting rates. The amount offered for the return of a high-reward tag has been US$100, which was based in part on thefindings of Nichols et al. (1991) that this amount was sufficientto elicit nearly 100% return of tags for recaptures of mallardsAnas platyrhynchos. Similar reward amounts have been usedin high-reward tagging of fishes as well (Denson et al. 2002;
Dow
nloa
ded
by [
Mic
higa
n St
ate
Uni
vers
ity]
at 0
5:29
06
Apr
il 20
12

TAG SHEDDING AND REPORTING RATES FOR WALLEYES 213
Taylor et al. 2006; Cadigan and Brattey 2006). Althoughthis high-reward tagging has been conducted on Lake Eriewalleyes, the results have only been cursorily examined.When using jaw-tag return data to estimate mortality ratesfor Lake Erie walleyes, a constant reporting rate that is as-sumed to apply to both commercial and recreational fish-eries, and all agencies and years have been incorporated inthe Brownie model structure (Walleye Task Group 1991).However, there are a number of factors that can influencefishers’ motivations to return tags, which is why both spa-tially and temporally varying rates are frequently reportedin studies characterizing tag reporting (Jenkins et al. 2000;Pollock et al. 2002; Polacheck et al. 2006; Taylor et al. 2006).It is conceivable, if not likely, that such motivations could differwith fishery (commercial or recreational) and jurisdiction (areasor management), which could lead to biased mortality estimatesif unaccounted for in Brownie model recovery probabilities.
The purpose of our study was to conduct an in-depth exam-ination of Lake Erie walleye tag shedding and tag reporting inthe hopes that this would (1) answer some lingering questionsregarding the accuracy of values currently used to estimate mor-tality rates as part of the LEW tagging program, (2) improveestimates of tag shedding and provide managers with the nec-essary information to correct the tag-return data collected fromthe program, and (3) improve estimates of important dynamicrates (e.g., fishing and natural mortality), which is imperative forensuring sustainable management of Lake Erie walleye stocks(Locke et al. 2005).
METHODSTag shedding.—To assess jaw tag shedding, walleyes from
eight Lake Erie spawning populations were double tagged withjaw and passive integrated transponder (PIT) tags by agency per-sonnel from MDNR, ODNR and NYSDEC during 2005, 2006,and 2007 and the OMNR in 2005. Passive integrated transpondertags were selected as the second tagging method because thesetags generally have high (>95%) retention (Prentice et al. 1990;Gries and Letcher 2002; Rude et al. 2011), although variable(56–100%) retention rates have also been observed (Dietermanand Hoxmeier 2009). Each management agency collected andtagged fish using collection and tagging protocols they used inprevious tagging efforts. Tagging occurred annually from lateMarch to early May when walleyes were congregated in tribu-taries or on open-water reefs to spawn.
Jaw tags used in the LEW tagging program were constructedof a stainless metal alloy (Monel), and two sizes were used:size 10 (inside diameter 7.95 mm) and size 12 (inside diam-eter 9.53 mm). We included both tag sizes in our sheddingevaluation to determine if shedding rates differed between tagsizes as indicated by Einhouse and Haas (1995) and Isermannand Knight (2005) suggested. Walleyes less than 500 mm weretagged by ODNR with size-10 jaw tags, and those greater than500 mm were tagged with size-12 tags; all fish were tagged on
FIGURE 1. Photographs of (A) jaw tag secured to the mandible of a walleye(not shown: some jaw tags were applied to the maxillary), and (B) a taggingneedle injecting a passive integrated transponder (PIT) tag subcutaneously intothe isthmus.
the mandible. Walleyes less than 450 mm were tagged by NYS-DEC with a size-10 jaw tag on the mandible, those 450–650 mmreceived a size-10 tag on the maxillary, and those greater than650 mm received a size-12 tag on the maxillary. Size-12 jawtags were used exclusively by MDNR; however, jaw tags wereaffixed to the mandible or maxillary without an a priori, size-based criterion. Size-10 and size-12 jaw tags were randomlyassigned by OMNR among walleye of all sizes and each jawtag was affixed to the maxillary or mandible (Figure 1A) oftagged fish using one of two methods. For method 1, used byMDNR and NYSDEC, the end of a jaw tag was inserted throughthe flesh around the maxillary or mandible and the ends of thetag were overlapped firmly with a pair of pliers. For method2, which is used by ODNR and OMNR personnel, the jaw tagwas crimped onto the mandible with a specialized pair of plierswith the overlapping ends of the tag facing the interior of themouth cavity. Each jaw tag was inscribed with agency-specificfish identification numbers and tag reporting information.
Passive integrated transponder tags (length 12 mm, 134.2-kHz ISO, Destron-Fearing, St. Paul, Minnesota) were insertedinto the subcutaneous musculature of the isthmus by usinga modified, 12-gauge syringe-style hypodermic needle (Fig-ure 1B). After PIT tags were implanted, fish were scannedwith a radio-frequency identification (RFID) tag reader (PocketReader, Pocket Reader EX, or FS2001F-ISO, Destron-Fearing,St. Paul, Minnesota) to ensure the tag was functioning properly.
Dow
nloa
ded
by [
Mic
higa
n St
ate
Uni
vers
ity]
at 0
5:29
06
Apr
il 20
12

214 VANDERGOOT ET AL.
Before release, corresponding jaw and PIT tag identificationnumbers were recorded, as was fish total length (TL; mm) andsex. All walleyes captured during tagging operations and routinepopulation assessment surveys from 2005 to 2009 were visiblyexamined for jaw tags and scanned with an RFID reader to de-termine whether tags of either type had been shed during thetime at liberty.
Tag shedding rates were estimated using methodology de-scribed in Barrowman and Myers (1996). The probability that ajaw tag was shed at year t after release was modeled as
QA(t) = ρA exp(−φAt),
where QA(t) was the shedding rate in year t, ρA was the prob-ability that a jaw tag was retained immediately (≤21 d) afterrelease, and φA was the instantaneous (annual) rate of chronicshedding. Shedding rate of PIT tags, QB(t), was similarly mod-eled, ρB and φB distinguishing the immediate retention and in-stantaneous shedding rate parameters for PIT tags. From theseshedding rates we calculated, for a fish initially double-tagged,the probability of observing both PIT and jaw tags at time t afterrelease, ρAB(t); a jaw tag only, or ρA (t); or a PIT tag only, ρB(t):
ρAB(t) = QA(t)QB(t),
ρA(t) = QA(t)[1 − QB(t)], and
ρB(t) = QB(t)[1 − QA(t)].
Reporting rates did not factor into the above equations be-cause only recaptures examined by tagging agency personnelwere used to estimate shedding rates; thus, reporting rates wereassumed to be 1.0. The parameters of the shedding-rate equa-tions were estimated via maximum likelihood, as described inBarrowman and Myers (1996). Because all tagging was con-ducted within a 21-d period, annual releases of double-taggedindividuals were considered to be simultaneous. For each taggedcohort, the log likelihood (�) of observed recaptures of double-tagged and single-tagged fish conditional on observed recapturetimes was
� =nAB∑j=1
loge
ρAB(tj )
ρAB(tj ) + ρA(tj ) + ρB(tj )
+nA∑
j=1
loge
ρA(tj )
ρAB(tj ) + ρA(tj ) + ρB(tj )
+nB∑
j=1
loge
ρB(tj )
ρAB(tj ) + ρA(tj ) + ρB(tj ),
where nAB is the number of recaptures with both jaw and PITtags, nA is the number with a jaw tag only, nB is the numberwith a PIT tag only, and tj is the time after release (0 = within21 d, 1 = 1 year at liberty, 2 = 2 years at liberty, and 3 = 3years at liberty) that a recapture of a particular tag combination
occurred. Model estimation was conducted in SAS using thenonlinear programming procedure (SAS Institute 2010a).
We fit a series of models to the tag shedding data using aset of explanatory variables that were hypothesized a priori toinfluence tag loss. The explanatory variables used to evaluatetag shedding included tagging agency, tagging method (for jawtags), tag size (for jaw tags), and different combinations of thesevariables. The simplest (null) model estimated model parame-ters as constant across the explanatory variables, whereas themost complex model estimated model parameters separatelyfor each tagging agency and tag size. Because there were onlya few recaptures of jaw-tag-only fish, we were unable to in-clude explanatory variables for the PIT tag shedding models;thus, PIT tag shedding was assumed to be the same for all tag-ging agencies and years. Akaike information criterion (AIC)was used to evaluate the performance of the different candidatemodels (Burnham and Anderson 2002). Empirical support (i.e.,plausibility) for a particular candidate model was evaluated viaAIC differences. Models with �i values less than 3.0 were con-sidered to have strong plausibility as being the “best” model. Ifmore than one model had an AIC difference of less than 3.0,we used model-averaging of tag shedding parameters, based onAkaike weights for the models, to incorporate the results of allstrongly plausible models (Burnham and Anderson 2002).
Tag reporting rates.—We estimated jaw tag reporting ratesfrom tag-return data collected via the high-reward tagging con-ducted in 1990 and 2000 (LEW tagging program). Walleyeswere tagged by the OMNR, MDNR, ODNR, and NYSDECfrom western (1990 and 2000) and eastern (2000) basin spawn-ing stocks (Figure 2). The high-reward tags were identical tothe jaw tags used to estimate tag loss, except that the high-reward tags included the inscription “REWARD $100.” Tagreturns were solicited via posters, news releases, and informa-tional meetings from the recreational and commercial fisheriesthroughout Lake Erie, and fishers were encouraged to reporttags, regardless of tag type, from harvested fish.
Reporting rates were estimated by comparing the number ofstandard (RS) to reward (RR) tags reported by fishers relative tothe number of standard (NS) and reward (NR) tags released, basedon the assumption that 100% of high-reward tags are returnedby fishers (Pollock et al. 1991). For simplicity, the number ofrecaptures observed between 1990 and 1999 from the 1990release of high-reward tags were used for the analysis, as werethe 2000–2009 observations from the 2000 release. There wereonly four high reward tags returned after more than 10 years atliberty, so this data censoring had little effect on estimated rates.
As described in Cadigan and Brattey (2008), the statisticaldistribution of the return of standard jaw tags conditional on thesum of standard and high-reward jaw tag returns is binomialwith probability p(t), with
p(t) = λ(t)NS
λ(t)NS + NR
,
Dow
nloa
ded
by [
Mic
higa
n St
ate
Uni
vers
ity]
at 0
5:29
06
Apr
il 20
12

TAG SHEDDING AND REPORTING RATES FOR WALLEYES 215
FIGURE 2. Spawning populations of walleyes in Lake Erie used in double-tagging experiments to estimate jaw tag shedding (†) and high-reward tagging toestimate reporting rates (∗). Walleyes were tagged in the western basin of Lake Erie by the Ontario Ministry of Natural Resources (1 = Hen/Chick Islands†∗
),Michigan Department of Natural Resources (2 = Huron River†, 3 = Rasin River∗, and 4 = Monroe†), and Ohio Department of Natural Resources (5 = MaumeeRiver†, 6 = Sandusky River†, 7 = Sandusky Bay†∗
, and 8 = Sugar Rock∗) and in the eastern basin by the New York State Department of EnvironmentalConservation (9 = Van Buren Bay†∗
, 10 = Cattaraugus Creek∗, and 11 = Lackawanna Shoreline∗).
where p(t) is the conditional probability of the return of standardjaw tag in year t, and λ(t) is the reporting rate for year t. Cadiganand Brattey (2006, 2008) noted that with a logit link function,this conditional probability can be expressed as
loge
{p(t)
1 − p(t)
}= loge{λ(t)} + loge
(NS
NR
),
where loge( NS
NR) is an offset constant that adjusts for the number
of standard and high-reward tags released for the experiment. Asnoted by Cadigan and Brattey (2008), reporting rates using theabove formulation can be estimated through either fixed-effectsor mixed-effects logistic regression (MELR). We used MELRbecause of the benefits identified in Cadigan and Brattey (2008),including the ability to estimate yearly reporting rates even withsparse data. As was done with tag shedding, we evaluated sev-eral factors that were identified as possibly influencing reportingrates. These factors were tagging year (1990 and 2000), basin(eastern and western basin), agency (OMNR, MDNR, ODNRand NYSDEC), and recapture fishery (commercial and recre-ational). We did not include tag size in the evaluations because
we had little reason to suspect that reporting rates differed bytag size and because our tag shedding evaluations provided littlesupport for tag loss differing by tag size. The factors mentionedabove and various combinations of these factors were incorpo-rated in the MELR as fixed effects. The random effect includedin each of the MELR models was the interaction between yearof recapture and all the fixed effects included in a particularmodel (Cadigan and Brattey 2008). The MELR models werefit by the Laplace approximation of the marginal likelihoodfunction in SAS using the GLIMMIX procedure (SAS Institute2010b). Performances of the fitted models were compared viaAIC. As was done with tag shedding, plausibility of modelswas evaluated based on AIC differences, model averaging be-ing conducted if more than one model had AIC differences lessthan 3.0.
RESULTS
Tag SheddingBetween 2005 and 2007, 15,695 walleyes (x = 509 mm
TL, SE = 0.6, range = 317 to 817 mm) were double-tagged
Dow
nloa
ded
by [
Mic
higa
n St
ate
Uni
vers
ity]
at 0
5:29
06
Apr
il 20
12
216 VANDERGOOT ET AL.
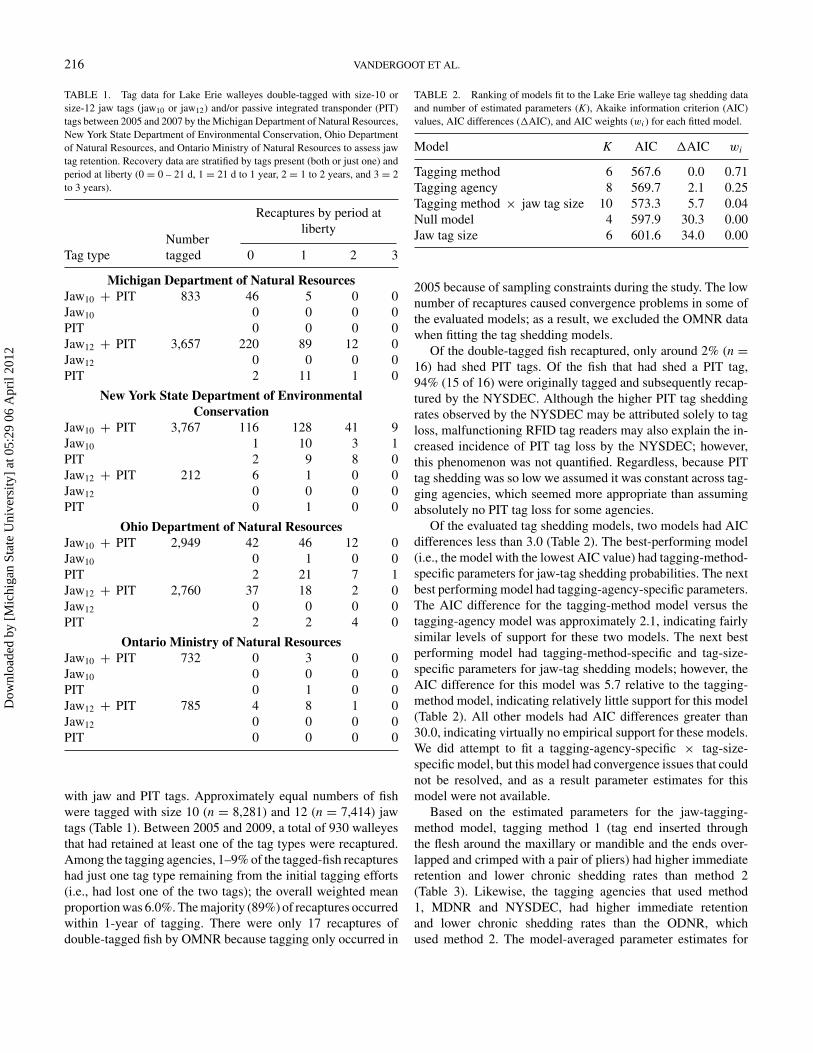
TABLE 1. Tag data for Lake Erie walleyes double-tagged with size-10 orsize-12 jaw tags (jaw10 or jaw12) and/or passive integrated transponder (PIT)tags between 2005 and 2007 by the Michigan Department of Natural Resources,New York State Department of Environmental Conservation, Ohio Departmentof Natural Resources, and Ontario Ministry of Natural Resources to assess jawtag retention. Recovery data are stratified by tags present (both or just one) andperiod at liberty (0 = 0 – 21 d, 1 = 21 d to 1 year, 2 = 1 to 2 years, and 3 = 2to 3 years).
Recaptures by period atliberty
NumberTag type tagged 0 1 2 3
Michigan Department of Natural ResourcesJaw10 + PIT 833 46 5 0 0Jaw10 0 0 0 0PIT 0 0 0 0Jaw12 + PIT 3,657 220 89 12 0Jaw12 0 0 0 0PIT 2 11 1 0
New York State Department of EnvironmentalConservation
Jaw10 + PIT 3,767 116 128 41 9Jaw10 1 10 3 1PIT 2 9 8 0Jaw12 + PIT 212 6 1 0 0Jaw12 0 0 0 0PIT 0 1 0 0
Ohio Department of Natural ResourcesJaw10 + PIT 2,949 42 46 12 0Jaw10 0 1 0 0PIT 2 21 7 1Jaw12 + PIT 2,760 37 18 2 0Jaw12 0 0 0 0PIT 2 2 4 0
Ontario Ministry of Natural ResourcesJaw10 + PIT 732 0 3 0 0Jaw10 0 0 0 0PIT 0 1 0 0Jaw12 + PIT 785 4 8 1 0Jaw12 0 0 0 0PIT 0 0 0 0
with jaw and PIT tags. Approximately equal numbers of fishwere tagged with size 10 (n = 8,281) and 12 (n = 7,414) jawtags (Table 1). Between 2005 and 2009, a total of 930 walleyesthat had retained at least one of the tag types were recaptured.Among the tagging agencies, 1–9% of the tagged-fish recaptureshad just one tag type remaining from the initial tagging efforts(i.e., had lost one of the two tags); the overall weighted meanproportion was 6.0%. The majority (89%) of recaptures occurredwithin 1-year of tagging. There were only 17 recaptures ofdouble-tagged fish by OMNR because tagging only occurred in
TABLE 2. Ranking of models fit to the Lake Erie walleye tag shedding dataand number of estimated parameters (K), Akaike information criterion (AIC)values, AIC differences (�AIC), and AIC weights (wi ) for each fitted model.
Model K AIC �AIC wi
Tagging method 6 567.6 0.0 0.71Tagging agency 8 569.7 2.1 0.25Tagging method × jaw tag size 10 573.3 5.7 0.04Null model 4 597.9 30.3 0.00Jaw tag size 6 601.6 34.0 0.00
2005 because of sampling constraints during the study. The lownumber of recaptures caused convergence problems in some ofthe evaluated models; as a result, we excluded the OMNR datawhen fitting the tag shedding models.
Of the double-tagged fish recaptured, only around 2% (n =16) had shed PIT tags. Of the fish that had shed a PIT tag,94% (15 of 16) were originally tagged and subsequently recap-tured by the NYSDEC. Although the higher PIT tag sheddingrates observed by the NYSDEC may be attributed solely to tagloss, malfunctioning RFID tag readers may also explain the in-creased incidence of PIT tag loss by the NYSDEC; however,this phenomenon was not quantified. Regardless, because PITtag shedding was so low we assumed it was constant across tag-ging agencies, which seemed more appropriate than assumingabsolutely no PIT tag loss for some agencies.
Of the evaluated tag shedding models, two models had AICdifferences less than 3.0 (Table 2). The best-performing model(i.e., the model with the lowest AIC value) had tagging-method-specific parameters for jaw-tag shedding probabilities. The nextbest performing model had tagging-agency-specific parameters.The AIC difference for the tagging-method model versus thetagging-agency model was approximately 2.1, indicating fairlysimilar levels of support for these two models. The next bestperforming model had tagging-method-specific and tag-size-specific parameters for jaw-tag shedding models; however, theAIC difference for this model was 5.7 relative to the tagging-method model, indicating relatively little support for this model(Table 2). All other models had AIC differences greater than30.0, indicating virtually no empirical support for these models.We did attempt to fit a tagging-agency-specific × tag-size-specific model, but this model had convergence issues that couldnot be resolved, and as a result parameter estimates for thismodel were not available.
Based on the estimated parameters for the jaw-tagging-method model, tagging method 1 (tag end inserted throughthe flesh around the maxillary or mandible and the ends over-lapped and crimped with a pair of pliers) had higher immediateretention and lower chronic shedding rates than method 2(Table 3). Likewise, the tagging agencies that used method1, MDNR and NYSDEC, had higher immediate retentionand lower chronic shedding rates than the ODNR, whichused method 2. The model-averaged parameter estimates for
Dow
nloa
ded
by [
Mic
higa
n St
ate
Uni
vers
ity]
at 0
5:29
06
Apr
il 20
12

TAG SHEDDING AND REPORTING RATES FOR WALLEYES 217
TABLE 3. Immediate retention (ρA ≤ 21 d postrelease) and chronic instan-taneous (annual) shedding rate (φA) estimates for double-tagged Lake Eriewalleyes between 2005 and 2009 by tagging agency: the Michigan Departmentof Natural Resources (MDNR), New York State Department of EnvironmentalConservation (NYSDEC), or Ohio Department of Natural Resources (ODNR).The parameter estimates were calculated by model-averaging the parameterestimates from the tagging method and tagging agency shedding models. Themodel-averaged 95% confidence interval for each parameter estimate is shownin parentheses.
Agency
Parameter MDNR NYSDEC ODNR
Tagging methodρA 0.99
(0.98–1.00)0.99
(0.98–1.00)0.95
(0.89–0.99)φA 0.07
(0.04–0.10)0.07
(0.04–0.10)0.28
(0.17–0.40)
Tagging agencyρA 0.98
(0.95–1.00)0.99
(0.98–1.00)0.95
(0.89–0.99)φA 0.10
(0.05–0.21)0.05
(0.02–0.09)0.28
(0.17–0.40)
Model averageρA 0.99
(0.97–1.00)0.99
(0.97–1.00)0.95
(0.89–0.99)φA 0.08
(0.04–0.12)0.07
(0.04–0.10)0.28
(0.17–0.40)
immediate jaw-tag retention were similar (range 95–99%)among the tagging agencies; however, there was considerablevariation among the tagging agencies with respect to chronictag loss. Instantaneous jaw-tag shedding rates were highest forODNR (0.28), followed by MDNR (0.08) and NYSDEC (0.07;Table 3). Using these model-averaged parameter estimates ofimmediate tag retention and chronic tag shedding, the proba-bility of an MDNR-applied jaw tag being retained was 92%for 1 year after tagging, 85% for 2 years, and 79% for 3 years(Figure 3). The probability of a NYSDEC-applied jaw tag beingretained was 93% for 1 year, 87% for 2 years, and 81% for 3years, and the probability of an ODNR-applied jaw tag being re-tained was 72% for 1 year, 55% for 2 years, and 42% for 3 years.For the most part, the model-averaged tag shedding models fitthe observed tag-loss rates well. The only obvious disparity be-tween the observed and predicted probabilities of retention wasobserved for fish at liberty for 3 years for the NYSDEC model.However, this disparity may have been caused by a low numberof recaptures (n = 10) observed 3 years after release. As forPIT-tag shedding, immediate PIT tag retention was estimatedto be 99% (95% confidence interval [CI], 99–100%), and theinstantaneous shedding rate was 0.03 (95% CI, 0.02–0.05).
Tag Reporting RatesDuring 1990 and 2000, there were 1,551 high-reward and
11,748 standard jaw tags released at various spawning sites in
FIGURE 3. Observed (symbols) versus model-predicted (lines with 95% con-fidence intervals) probabilities of jaw tag retention for walleyes at liberty for0, 1, 2, and 3 years after application by the Michigan Department of NaturalResources (MDNR: open triangles, short dashed line), New York State Depart-ment of Environmental Conservation (NYSDEC: open squares, solid line), andOhio Department of Natural Resources (ODNR: open circles, long dashed line).
the western and eastern basins of Lake Erie (Table 4). The ratioof standard : reward tags released in the western basin of LakeErie was 7:1 in 1990 and 9:1 in 2000, and in the eastern basinthe ratio was 8:1 in 2000. The majority of tags released (92%)and harvested (92%) during the reporting rate studies originatedfrom western basin tagging sites. Overall, the reporting rate ratiofor tags released in the western basin in 1990 and subsequentlyreported by the recreational fishery (1.7:1) was 1.4 times thatof the commercial fishery (1.2:1). In 2000, the reporting rateratio for the recreational fishery (3.3:1) was 5.5 times that of the
TABLE 4. Number of Lake Erie walleyes tagged and released with either ahigh-reward or standard jaw tag in the western and eastern basins during 1990and 2000 and number of tags subsequently recovered between 1990 and 2009from the commercial (RC) and recreational fisheries (RR).
Number tagged and recovered(RC, RR)
Tagging site Reward Standard
Western basin, tagged in 1990Hen/Chick Islands 400 (57, 44) 1,971 (71, 86)Sandusky Bay 149 (2, 14) 1,344 (7, 81)Sugar Rock 178 (13, 39) 1,333 (17, 133)Raisin River 218 (23, 58) 1,675 (23, 58)
Western basin, tagged in 2000Hen/Chick Islands 115 (31, 5) 1,091 (23, 33)Sandusky Bay 162 (5, 15) 1,460 (6, 37)Raisin River 208 (33, 45) 1,874 (14, 143)
Eastern basin, tagged in 2000Lackawanna shoreline 29 (1, 7) 239 (0, 23)Van Buren Bay 92 (2, 18) 761 (2, 57)
Dow
nloa
ded
by [
Mic
higa
n St
ate
Uni
vers
ity]
at 0
5:29
06
Apr
il 20
12

218 VANDERGOOT ET AL.
TABLE 5. Ranking of models fit to the Lake Erie walleye tag reporting dataand number of estimated parameters (K), Akaike information criterion (AIC)values, AIC differences (�AIC), and AIC weights (wi ) for each fitted model.
Model K AIC �AIC wi
Tagging year × fishery 4 369.0 0.0 0.47Tagging year × tagging
basin × fishery5 369.5 0.5 0.37
Fishery 3 372.7 3.7 0.07Tagging basin × fishery 4 373.1 4.1 0.06Tagging year × tagging
agency × fishery7 374.8 5.8 0.03
Tagging agency × fishery 6 380.2 11.2 0.00Tagging year × tagging
basin3 427.8 60.9 0.00
Tagging year 2 434.1 65.2 0.00Tagging basin 3 435.7 66.7 0.00Null model 2 439.8 70.8 0.00Tagging agency 5 440.8 71.8 0.00
commercial fishery (0.6:1). For tags released in the eastern basinin 2000 the reporting rate ratio was 3.2:1 for the recreationalfishery. There were only three high-reward and two standardjaw tags returned by the commercial fishery for fish taggedin the eastern basin of Lake Erie; thus we did not attempt toestimate reporting for this fishery component from fish taggedin this basin.
Of the evaluated tag reporting models, two models hadAIC differences less than 3.0 (Table 5). The model with thelowest AIC value had a tagging-year × fishery fixed effectand a tagging-year × fishery × recapture year random ef-fect. The next best-performing model had a tagging-year ×tagging-basin × fishery fixed effect and a tagging-year ×tagging-basin × fishery random effect. The AIC differencefor the best-performing model compared with the next best-performing model was approximately 0.5, suggesting both mod-els had nearly equal probability of being the best model. Thenext best-performing models had fishery, tagging-basin × fish-ery, or tagging-year × tagging-agency × fishery fixed effects;the AIC differences for these models ranged from 3.7 to 5.8.The worst-performing models had tagging-agency × fishery,tagging-basin, or tagging-agency as fixed effects, which had AICdifferences in excess of 30 (Table 5). Models with tagging-yearor tagging-year × tagging-basin fixed effects did not convergeduring the fitting process.
Because there was more than one model with AIC differ-ences less than 3.0, model averaging was used to estimate re-porting rates based on the results of the tagging-year × fisheryand tagging-year × tagging-basin × fishery models. Basedon these model-averaged estimates, the average reporting rateof jaw tags was (without added random effects) lower in the2000s than in the 1990s for both basins and fishery components
FIGURE 4. Model-averaged annual jaw tag reporting rates and associated 95%confidence intervals for the commercial and recreational walleye fisheries in thewestern (WB) and eastern (EB) basins of Lake Erie for the 1990 (diamonds)and 2000 (circles) high-reward tagging studies. Darkened symbols represent theactual reporting rates, as described by Pollock et al. (1991). Reporting rates forthe recreational fishery that exceeded 1.0 are represented by an “X.” Dashedlines show the mean reporting rate and associated 95% confidence intervals(shaded area) for each tagging year, absent the model random effects.
(Figure 4). For the western basin, average reporting rates forthe commercial fishery were (without added random effects)lower than for the recreational fishery in the 1990s (17% versus55%) and 2000s (10% versus 33%). Average recreational fish-ery reporting rates in the 2000s (without annual random effects)were slightly higher (39% versus 33%) in the eastern basinthan in the western basin. Uncertainty in the tag reporting rateswas greater for the recreational fishery than for the commer-cial fishery, based on the widths of confidence intervals aroundthe annual reporting rate estimates. Uncertainty in the tag re-porting rates for the recreational fishery in the western basinwas similar to the uncertainty for the recreational fishery in theeastern basin.
Dow
nloa
ded
by [
Mic
higa
n St
ate
Uni
vers
ity]
at 0
5:29
06
Apr
il 20
12
TAG SHEDDING AND REPORTING RATES FOR WALLEYES 219
DISCUSSIONIsermann and Knight (2005) noted that there are a variety
of factors that can influence tag shedding, including attachmenttechnique, tag construction, fish behavior, recapture method,and tag size. We were able to evaluate the influence of some,but not all, of the factors Isermann and Knight (2005) identified.Based on our results, tag size did not appear to have a largeeffect on tag shedding; however, tag attachment method did.Both NYSDEC and MDNR use the method-1 approach (tagend inserted through the flesh around the maxillary or mandibleand the ends overlapped firmly with a pair of pliers) for attachingtags, whereas ODNR and OMNR used method 2 (tags crimpedonto the mandible with a specialized pair of pliers). Based onpredicted retention probabilities, retention of tags applied byNYSDEC and MDNR after 3 years at liberty was approximatelytwice that of tags applied by ODNR. Newman and Hoff (1998)theorized that jaw tag shedding could be minimized if the endsof the tags were slightly overlapped before crimping. The resultsof our research lends strong support to this suggestion, and toreduce tag loss, we recommend that future jaw tag studies usethe method 1 approach for applying tags.
While the influence of attachment method on tag sheddingwas clearly evident, the fact that the tagging-agency model hadmoderate support (based on AIC values) suggests that perhapssubtle variations in how tags are applied can also influence tagshedding. Even though NYSDEC and MDNR used the samegeneral method for attaching tags, the results of the tagging-agency model suggested that NYSDEC-applied tags had lower(0.05 versus 0.10) chronic shedding rates than MDNR-appliedtags. At this point, it is unclear what might lead NYSDEC tags tohave lower chronic shedding rates. One major difference in howNYSDEC and MDNR applied tags was that NYSDEC person-nel applied jaw tags exclusively to the mandible of fishes, exceptthose greater than 650 mm, whereas MDNR personnel appliedtags to both the maxillary and mandible. This suggests that tagshedding could perhaps be minimized by applying tags exclu-sively to the mandible. However, other subtle variations in howNYSDEC and MDNR applied tags could also explain the dif-ference, such as how firmly the ends were overlapped or wherethe tags were inserted through the jaw. Our study was not de-signed to evaluate such subtle differences in tagging methods ordifferences in shedding between maxillary and mandible appli-cations. To further improve understanding of jaw tag shedding,it may be worthwhile for future studies to attempt to addresshow subtle variations in tagging and maxillary versus mandibletagging can affect jaw tag loss.
Our finding that tag shedding was not greatly affected bytag size differed from the results of other jaw tag studies con-ducted on walleyes. Einhouse and Haas (1995) and Isermannand Knight (2005) each found retention to be higher for size-12than size-10 jaw tags. However, Newman and Hoff (1998) foundsize-8 (inside diameter: 6.75 mm) jaw tags to have better reten-tion than size-10 (inside diameter 8.33 mm) tags for walleyesin Lake Escanaba, Wisconsin. Newman and Hoff (1998) noted
that perhaps the size-10 tags they used in their research were notlarge enough for some of the larger fish they tagged. Althoughwe did not find tag size to have a large influence on tag shed-ding, we do not necessarily discount the findings of these otherstudies because there are probably strong interactions betweentag size, fish size, growth rates, and application methods thatcould influence tag loss.
As previously indicated, there has been wide discrepancyin the results of studies that have attempted to quantify jaw tagshedding in Lake Erie walleyes. Our findings may provide someexplanation as to why these discrepancies have been occurred.From our study, one would expect that tag shedding wouldhave been greater in the Isermann and Knight (2005) study(tagged by ODNR personnel) than in the Einhouse and Haas(1995) study (tagged by NYSDEC personnel), which indeedwas the case. Overall, Einhouse and Haas (1995) observed anapproximately 28% shedding rate 1year after tagging, whileIsermann and Knight (2005) observed approximately a 43%shedding rate. The shedding rates observed by both studies after1 year at liberty were higher than would be predicted from ourstudy, although this could be a result of their using fin-clippingand fin-punching to secondarily mark their fish (as opposedto PIT tags in our study). Fin-clipping for assessing chronicshedding can be problematic because complete fin regenerationcan occur relatively quickly after clipping (Eipper and Forney1965; Deroba et al. 2005). Additionally, natural abrasions onfins can be easily confused for partial fin clips (Guy et al. 1996),which could lead to an overestimation of tag shedding (i.e.,lead to concluding more tag loss than actually occurred). Theinjection of PIT tags subcutaneously in the isthmus served asan excellent secondary tagging method for evaluating jaw tagloss and we highly recommend this tag type and approach forevaluating tag shedding. As has been found in other studies(Prentice et al. 1990; Gries and Letcher 2002; Rude et al. 2011),retention of PIT tags was excellent, and after 3 years at liberty,retention was still predicted to be in excess of 90%.
We do not know why PIT tag loss in our study was higherfor NYSDEC than for the other agencies because the sametagging method was used by all agencies. However, Buzby andDeegan (1999) noted that PIT tag retention rates can vary amongtagging crews, and Fuller et al. (2008) reported differences inPIT tag reader efficiencies. Interestingly, NYSDEC personneloccasionally experienced difficulties with the PIT tag reader (D.Einhouse, personal observation), so PIT tag reader differencesmight explain their higher shedding rates.
A common belief with tagging programs is that at some pointshedding rates stabilize; for example, if a tag is retained after thefirst year, that tag will be retained indefinitely. Perhaps this is onereason why jaw tag shedding studies have generally only lasted 1year. From our research, however, we saw little indication of tagshedding stabilizing even after 3 years of tagging. This may haveimportant bearing on the LEW tagging program, particularly forODNR-tagged fish. That is, based on our estimates, in as littleas 5 years more than 75% of jaw-tagged fish will have lost
Dow
nloa
ded
by [
Mic
higa
n St
ate
Uni
vers
ity]
at 0
5:29
06
Apr
il 20
12

220 VANDERGOOT ET AL.
their tags, which if unaccounted for could have large impacts onestimated mortality rates. Considering that it is not uncommonfor Lake Erie walleyes to live 15–20 years (C. S. Vandergoot,unpublished data), conducting even longer tag shedding studiesthan we conducted here is needed to determine if shedding ratesstabilize or even accelerate with increasing posttagging liberty.
Our finding that tag reporting rates of Lake Erie jaw-taggedwalleyes varied both spatially and temporally matches findingsfrom studies conducted on species such as red drum Sciaenopsocellatus (Denson et al. 2002) and Atlantic cod Gadus morhua(Cadigan and Brattey 2006). In general, variable tag report-ing rates are common in exploited fish populations (Pollocket al. 2001; Polacheck et al. 2006; Taylor et al. 2006; Cadiganand Brattey 2006), even though they are frequently assumedto be spatially and temporally constant in tagging models. Thehigh-reward tagging studies conducted with Lake Erie walleyesprovided a unique opportunity to compare recreational and com-mercial fishery reporting rates, which to our knowledge is notroutinely done (see Brattey et al. 2010 for an exception). Forboth tagging periods, tag reporting rates for the recreationalfishery were higher than the commercial fishery, albeit Bratteyet al. (2010) found that reporting rates for the inshore cod fish-ery in Newfoundland were higher for commercial fishers thanrecreational fishers. Several studies have theorized as to whyrecreational fishers may be more apt to report tags than oth-ers (Denson et al. 2002; Polacheck and Hearn 2003; Schmalzet al. 2004; Cadigan and Brattey 2006; Taylor et al. 2006). Ingeneral, recreational fishers are supportive of tagging studiesbecause they derive personal satisfaction from the experienceof catching a tagged fish and have a concern for the manage-ment of the fishery, both serving as sufficient incentives forreporting tags (Schmalz et al. 2004; Taylor et al. 2006). How-ever, angler ambivalence leading to reduced cooperation maycause recreational fishers to neglect reporting tagged fish whencaught (Denson et al. 2002). For commercial fishers, the per-ception that reporting tags may adversely impact their financialinterests (Polacheck and Hearn 2003) or the lack of a financialincentive (Taylor et al. 2006) may deter them from reportingharvested tagged fish. Regardless of the motives, the disparityin reporting rates between commercial and recreational fishersunderscores the need for fishery-specific reporting rates whenestimating mortality parameters via tag returns for the Lake Eriewalleyes, as well as other exploited fish populations.
Similar to the variable reporting rates observed between fish-eries, the degree of precision in the estimates also varied betweenfisheries in our study. Denson et al. (2002) suggested that, be-cause of a lack of novelty, individuals who caught fewer fishwere more likely to report tags than those who caught themfrequently. Although this phenomenon may explain why the re-porting rates were higher for the recreational fishery than com-mercial fishery, it also may provide some insight into the pre-cision of these estimates. Unlike the recreational fishery whereaccess is open, the harvest of walleyes in the commercial fish-ery is restricted to license holders, who retain a portion of the
commercial quota (Cowan and Paine 1997; Vandergoot et al.2010). Because there are fewer commercial than recreationalfishers, individual commercial fishers had a higher probabilityof harvesting a tagged fish during the course of the study. Thus,for the commercial fishery, the probability that an individual tagis reported may be contingent upon previous recaptures (i.e.,lower variability in reporting rates), whereas in the recreationalfishery tag returns may be independent of each other becauseof individual reporting tendencies (i.e., higher variability in re-porting rates). Therefore, it appears that individuals from thecommercial fishery report tags in a consistent manner; however,Denson et al. (2002) and Brenden et al. (2010) recommendedadditional research to further understand individual reportingtendencies for Lake Erie fishers.
The decline in high-reward tag-reporting rates from bothfisheries between the 1990 and 2000 experiments is possiblyrelated to fisher apathy of the LEW tagging program (Hoeniget al. 1998; Denson et al. 2002). The tagging program has beenin effect for more than 20 years, and it is possible that anglersmay be unaware of the valuable information that has been gath-ered from this program or how management of the Lake Eriewalleye fishery has benefitted from the program. As noted byPollock et al. (2001), there are steps that can be taken to combatangler apathy and stimulate their desire to return tags. Giventhe length of time this tagging has been conducted on Lake Erie(i.e., since 1990), it may be worthwhile to implement some ofthe recommendations proposed by Pollock et al. (2001) if thisprogram continues into the future. This may include adjustmentsto the amount of reward offered for tags, alternative methods ofadvertising the tagging program, and better dissemination ofhow the results from the program are aiding management of thefishery.
The Lake Erie walleye population is generally consideredto be composed of eastern and western basin spawning stocks(Einhouse and MacDougall 2010; Vandergoot et al. 2010). Al-though Stepien et al. (2010) showed that there can be substantialgenetic variation among walleye spawning aggregations withinthe western basin, fish originating from the western basin exhibitsimilar interbasin and intrabasin movement patterns (Wang et al.2007). Consequently, for population modeling purposes, mor-tality parameters for the western basin spawning aggregationsare estimated separately from eastern basin spawning aggrega-tions because fish from the eastern basin exhibit little interbasinmovement (Einhouse and MacDougall 2010). Currently for thewestern basin stock, mortality parameter estimates are based onpooled tag recoveries across basins (Walleye Task Group 2011).However, based on the findings of our research, it may proveuseful to separate out western and eastern basin fishery compo-nents to account for differences in tag reporting rates betweenthe basins.
One issue concerning reporting that this study did not addresswas tag detection (i.e., the probability of detecting a taggedfish) in either fishery component. Jaw tag detection rates forboth commercial and recreational fisheries in Lake Erie are
Dow
nloa
ded
by [
Mic
higa
n St
ate
Uni
vers
ity]
at 0
5:29
06
Apr
il 20
12

TAG SHEDDING AND REPORTING RATES FOR WALLEYES 221
unknown. However, tags are sometimes reported to agency per-sonnel by fish processors, implying that the fisher who caughtthe fish either failed to recognize the tag or recognized the tagbut did not remove it. Such tag recoveries would otherwisehave gone unreported. A similar phenomenon has been ob-served in the coastal cod commercial fishery in Iceland, whereBjornsson et al. (2011) reported 20% of the tag returns were fromfish processors and improved detection and reporting rates fordouble-tagged than for single-tagged fish; they recommendedthat future tagging studies adopt a strategy of double-taggingall fish to increase tag detection. Although double tagging mayseem a logical strategy to incorporate into the LEW taggingprogram, several studies have demonstrated reduced growth andsurvival rates in fish tagged with single jaw tags (DeRoche andBond 1955; MacCrimmon and Robbins 1979; Zerrenner et al.1997); so while double jaw tagging may improve detection rates,tagging mortality could also increase.
In conclusion, the most recent natural mortality rate for LakeErie walleyes was estimated assuming 100% retention of jawtags and a constant nonreporting rate between the fisheries andamong years. Because inaccurate estimates of tag shedding andtag reporting can lead to significant errors in mortality and ex-ploitation estimates (Pollock et al. 2001; Miranda et al. 2002;Isermann and Knight 2005; Brenden et al. 2010), the accuracy ofthe current natural mortality rate estimates should be consideredsuspect, and we highly recommend that tag recovery data fromthe LEW tagging program be reanalyzed taking advantage of thetag shedding and tag reporting rate estimates that have resultedfrom this research. This also draws into the question the accu-racy of current estimates of fishing mortality rates for the LakeErie walleye stocks. Inaccurate estimates could lead to greaterharvests on the stocks than they can sustain and ultimately leadto stock collapse (Myers et al. 1996, 1997). The importance ofreanalyzing the data from the LEW tagging program cannot beoveremphasized given the ecological and economic importanceof the Lake Erie walleye fishery.
ACKNOWLEDGMENTSThis publication is manuscript 2012-02 of the Quantitative
Fisheries Center at Michigan State University. Funding for thetagging studies was provided by the Michigan Department ofNatural Resources, New York State Department of Environ-mental Conservation, Ohio Department of Natural Resources,and the Ontario Ministry of Natural Resources. Partial fundingfor the tag shedding study was provided by the Great LakesFish and Wildlife Restoration Act. Monetary rewards for thehigh-reward tagging studies conducted in 1990 and 2000 weredistributed by the Great Lakes Fishery Commission, Ann Arbor,Michigan. Special thanks are extended to P. Kocovsky, M. Bur,M. Porta, B. Edwards, J. Baughman, T. Hartman, J. Tyson, E.Weimer, K. Knight, J. Deller, A. Gorman, T. Bader, R. Zimmer,D. Zeller, B. Beckwith, and D. Fielder for field assistance. Wealso thank N. Cadigan for his willingness to share SAS code
and provide insight for the estimation of tag reporting rates. Theauthors would like to express our deep gratitude to Robert Haasof the Michigan Department of Natural Resources (retired) forhis long-time commitment to understanding the biology of LakeErie walleyes. Under his direction, walleye tagging studies inthe Michigan waters of Lake Erie were initiated in the early1970s. These early tagging efforts clearly illustrated the migra-tory nature of Lake Erie walleyes and the need for interagencymanagement strategies and tagging studies. The tagging studywas adopted by the Lake Erie Committee walleye task groupas a critical component of the walleye management process andbecame an interagency cooperative effort in the mid-1980s. Hesuccessfully lobbied for conducting the high-reward tag studies(1990 and 2000), which further enhanced the value of the tag-ging data set for estimating exploitation, survival, and naturalmortality of walleyes in Lake Erie.
REFERENCESBarrowman, N., and R. Myers. 1996. Estimating tag shedding rates for experi-
ments with multiple tag types. Biometrics 52:1410–1416.Beverton, R., and S. Holt. 1957. On the dynamics of exploited fish populations.
Fishery Investigations, Series II, Marine Fisheries, Great Britain Ministry ofAgriculture, Fisheries and Food 19:533.
Bjornsson, B., H. Karlsson, V. Thorsteinsson, and J. Solmundsson. 2011. Shouldall fish in mark-recapture experiments be double-tagged? lessons learnedfrom tagging coastal cod (Gadus morhua). ICES Journal of Marine Science68:603–610.
Brattey, J., N. G. Cadigan, K. Dwyer, B. P. Healey, M. J. Morgan, E. F.Murphy, D. Maddock Parsons, and D. Power. 2010. Assessment of the cod(Gadus morhua) stock in NAFO divisions 2J+3KL in 2010. Department ofFisheries and Oceans, Science Advisory Secretariat Research Document2010/103, St. John’s, Newfoundland, Canada. Available: www.dfo-mpo.gc.ca/csas-sccs/publications/resdocs-docrech/2010/2010 103-eng.html. (September 2011).
Brenden, T. O., M. L. Jones, and M. P. Ebener. 2010. Sensitivity of tag-recoverymortality estimates to inaccuracies in tag shedding, handling mortality, andtag reporting. Journal of Great Lakes Research 36(Supplement 1):100–109.
Brownie, C., D. R. Anderson, K. P. Burnham, and D. S. Robson. 1985. Statis-tical inference from band recovery data: a handbook. U.S. Fish and WildlifeService Resource Publication 156.
Burnham, K. P., and D. R. Anderson. 2002. Model selection and multimodelinference, 2nd edition. Springer-Verlag, New York.
Buzby, K., and L. Deegan. 1999. Retention of anchor and passive integratedtransponder tags by arctic grayling. North American Journal of FisheriesManagement 19:1147–1150.
Cadigan, N. G., and J. Brattey. 2006. Reporting and shedding rate estimatesfrom tag-recovery experiments on Atlantic cod (Gadus morhua) in coastalNewfoundland. Canadian Journal of Fisheries and Aquatic Sciences 63:1944–1958.
Cadigan, N. G., and J. Brattey. 2008. Reporting rates from cod tagging studiesin NAFO divisions 2J3Kl and subdivision 3Ps. Department of Fisheriesand Oceans, Science Advisory Secretariat Research Document 2008/031,St. John’s, Newfoundland, Canada. Available: www.dfo-mpo.gc.ca/csas-sccs/publications/resdocs-docrech/2008/2008 031-eng.htm. (September2011).
Cowan, E. R., and J. Paine. 1997. The introduction of individual transferablequotas to the Lake Erie fishery. Canadian Technical Report of Fisheries andAquatic Sciences 2133.
Denson, M. R., W. E. Jenkins, A. G. Woodward, and T. I. J. Smith. 2002.Tag-reporting levels for red drum (Sciaenops ocellatus) caught by anglers in
Dow
nloa
ded
by [
Mic
higa
n St
ate
Uni
vers
ity]
at 0
5:29
06
Apr
il 20
12
222 VANDERGOOT ET AL.
South Carolina and Georgia estuaries. U.S. National Marine Fisheries ServiceFishery Bulletin 100:35–41.
Deroba, J. J., M. J. Hansen, N. A. Nate, and J. M. Hennessy. 2005. Evaluatingassumptions of mark–recapture studies for estimating angling exploitation ofwalleyes in northern Wisconsin lakes. North American Journal of FisheriesManagement 25:890–896.
DeRoche, S. E., and L. H. Bond. 1955. The lake trout of Cold Stream Pond,Enfield, Maine. Transactions of the American Fisheries Society 85:257–270.
Dieterman, D. J., and R. J. H. Hoxmeier. 2009. Instream evaluation of passiveintegrated transponder retention in brook trout: effect of season, anatomicalplacement and fish length. North American Journal of Fisheries Management29:109–115.
Ebener, M. P., T. O. Brenden, G. M. Wright, M. L. Jones, and M. Faisal.2010. Spatial and temporal distributions of lake whitefish spawning stocksin northern lakes Michigan and Huron, 2003–2008. Journal of Great LakesResearch 36(Supplement 1):38–51.
Einhouse, D. W., and R. Haas. 1995. A preliminary examination of walleye dis-tribution and exploitation in the eastern basin of Lake Erie using tag-recoverydata. New York Department of Environmental Conservation, Division of Fishand Wildlife, Dunkirk.
Einhouse, D. W., and T. M. MacDougall. 2010. An emerging view of the mixed-stock structure of Lake Erie’s eastern-basin walleye population. Great LakesFishery Commission Technical Report 69:151–164.
Eipper, A. W., and J. L. Forney. 1965. Evaluation of partial fin clips for markinglargemouth bass, walleyes, and rainbow trout. New York Fish and GameJournal 12:233–240.
Fabrizio, M. C., B. L. Swanson, S. T. Schram, and M. H. Hoff. 1996. Comparisonof three nonlinear models to describe long-term tag shedding by lake trout.Transactions of the American Fisheries Society 125:261–273.
Fuller, S. A., J. P. Henne, J. Seals, and V. A. Mudrak. 2008. Performance ofcommercially available passive integrated transponder (PIT) tag systems usedfor fish identification and interjurisdictional fisheries management. NorthAmerican Journal of Fisheries Management 28:386–393.
Green, A. W., G. C. Matlock, and J. E. Weaver. 1983. A method for directlyestimating the tag reporting rate of anglers. Transactions of the AmericanFisheries Society 112:412–415.
Gries, G., and B. H. Letcher. 2002. Tag retention and survival of age-0 Atlanticsalmon following surgical implantation with passive integrated transpondertags. North American Journal of Fisheries Management 22:219–222.
Guy, C. S., H. L. Blankenship, and L. A. Nielsen. 1996. Tagging and mark-ing. Pages 353–383 in B. R. Murphy and D. W. Willis, editors. Fisheriestechniques, 2nd edition. American Fisheries Society, Bethesda, Maryland.
Hearn, W. S., K. H. Pollock, and E. N. Brooks. 1998. Pre- and postseasontagging models: estimation or reporting rate and fishing and mortality rates.Canadian Journal of Fisheries and Aquatic Sciences 55:199–205.
Hoenig, J. M., N. J. Barrowman, W. S. Hearn, and K. H. Pollock. 1998. Mul-tiyear tagging studies incorporating fishing effort data. Canadian Journal ofFisheries and Aquatic Sciences 55:1466–1476.
Isermann, D. A., and C. T. Knight. 2005. Potential effects of jaw tag loss onexploitation estimates for Lake Erie walleyes. North American Journal ofFisheries Management 25:557–562.
Jenkins, W. E., M. R. Denson, and T. I. J. Smith. 2000. Determination of anglerreporting level for red drum (Sciaenops ocellatus) in a South Carolina estuary.Fisheries Research 44:273–277.
Jiang, H., K. H. Pollock, C. Brownie, J. E. Hightower, J. M. Hoenig, and W. S.Hearn. 2007. Age-dependent tag return models for estimating fishing mortal-ity, natural mortality, and selectivity. Journal of Agricultural, Biological, andEnvironmental Statistics 12:177–194.
Latour, R. J., K. H. Pollock, C. A. Wenner, and J. M. Hoenig. 2001. Estimatesof fishing and natural mortality for red drum in South Carolina waters. NorthAmerican Journal of Fisheries Management 21:733–744.
Locke, B. L., M. Belore, A. Cook, D. Einhouse, R. Kenyon, R. Knight, K.Newman, P. Ryan, and E. Wright. 2005. Lake Erie management plan.Lake Erie Committee of the Great Lakes Fishery Commission, Ann Arbor,Michigan.
MacCrimmon, H. R., and W. H. Robbins. 1979. Suitability of jaw and Atkinsstreamer tags for marking smallmouth bass Micropterus dolomieu. Transac-tions of the American Fisheries Society 108:499–501.
Matlock, G. C. 1981. Nonreporting of recaptured tagged fish by saltwater recre-ational boat anglers in Texas. Transactions of the American Fisheries Society110:90–92.
Miranda, L. E., R. E. Brock, and B. S. Dorr. 2002. Uncertainty of exploita-tion estimates made from tag returns. North American Journal of FisheriesManagement 22:1358–1363.
Myers, R. A., N. J. Barrowman, J. M. Hoenig, and Z. Qu. 1996. The collapse ofcod in eastern Canada: the evidence of tagging data. ICES Journal of MarineScience 53:629–640.
Myers, R. A., N. J. Barrowman, and J. A. Hutchings. 1997. Inshore exploitationof Newfoundland Atlantic cod (Gadus morhua) since 1948 as estimated frommark–recapture data. Canadian Journal of Fisheries and Aquatic Sciences54(Supplement 1):224–235.
Newman, S. P., and M. H. Hoff. 1998. Estimates of loss rates of jaw tags onwalleyes. North American Journal of Fisheries Management 18:202–205.
Nichols, J. D., R. J. Blohm, R. E. Reynolds, R. E. Trost, J. E. Hines, andJ. P. Bladen. 1991. Band reporting rates for mallards with reward bands ofdifferent dollar values. Journal of Wildlife Management 55:119–126.
Nielsen, L. A. 1992. Methods of marking fish and shellfish. American FisheriesSociety, Special Publication 23, Bethesda, Maryland.
Polacheck, T., J. P. Eveson, G. M. Laslett, K. H. Pollock, and W. S. Hearn. 2006.Integrating catch-at-age and multiyear tagging data: a combined Brownieand Petersen estimation approach in a fishery context. Canadian Journal ofFisheries and Aquatic Sciences 63:534–548.
Polacheck, T., and W. Hearn. 2003. Designing tagging programs for pelagiclongline fisheries: trade-offs between the number of releases and ob-server coverage. North American Journal of Fisheries Management 23:810–821.
Pollock, K. H., J. M. Hoenig, W. S. Hearn, and B. Calingaert. 2001. Tag reportingrate estimation: 1. An evaluation of the high-reward tagging method. NorthAmerican Journal of Fisheries Management 21:521–532.
Pollock, K. H., J. M. Hoenig, W. S. Hearn, and B. Calingaert. 2002. Tagreporting rate estimation: 2. Use of high-reward tagging and observers inmultiple-component fisheries. North American Journal of Fisheries Manage-ment 22:727–736.
Pollock, K. H., J. M. Hoenig, and C. M. Jones. 1991. Estimation of fishingand natural mortality when a tagging study is combined with a creel surveyor port sampling. Pages 423–434 in D. Guthrie, J. M. Hoenig, M. Holliday,C. M. Jones, M. J. Mills, S. A. Moberly, K. H. Pollock, and D. R. Talhelm,editors. Creel and angler surveys in fisheries management. American FisheriesSociety, Symposium 12, Bethesda, Maryland.
Prentice, E. F., T. A. Flagg, and C. S. McCutcheon. 1990. Feasibility of usingimplantable passive integrated transponder (PIT) tags in salmonids. Pages317–322 in N. C. Parker, A. E. Giorgi, R. C. Heidinger, D. B. Jester Jr.,E. D. Prince, and G. A. Winans, editors. Fish-marking techniques. AmericanFisheries Society, Symposium 7, Bethesda, Maryland.
Rude, N. P., G. W. Whitledge, Q. E. Phelps, and S. Hirst. 2011. Long-termPIT and t-bar anchor retention rates in adult muskellunge. North AmericanJournal of Fisheries Management 31:515–519.
SAS Institute. 2010a. SAS/OR R© 9.22 user’s guide: mathematical programming.SAS Institute, Cary, North Carolina.
SAS Institute. 2010b. SAS/STAT R© 9.22 user’s guide. SAS Institute, Cary, NorthCarolina.
Schmalz, P. J., M. J. Hansen, M. E. Holey, P. C. McKee, and M. L. Toneys. 2004.Effect of rewards on lake trout tag returns in northwestern Lake Michigan.North American Journal of Fisheries Management 24:1–6.
Scott, W. B., and E. J. Crossman. 1998. Freshwater fishes of Canada. Galt HousePublications, Oakville, Ontario.
Stepien, C. A., D. J. Murphy, R. N. Lohner, A. E. Haponski, and O. J. Sepulveda-Villet. 2010. Status and delineation of walleye (Sander vitreus) genetic stockstructure across the Great Lakes. Great Lakes Fishery Commission TechnicalReport 69:189–223.
Dow
nloa
ded
by [
Mic
higa
n St
ate
Uni
vers
ity]
at 0
5:29
06
Apr
il 20
12

TAG SHEDDING AND REPORTING RATES FOR WALLEYES 223
Taylor, R. G., J. A. Whittington, W. E. Pine, and K. H. Pollock. 2006. Effect ofdifferent reward levels on tag reporting rates and behavior of common snookangler in southeast Florida. North American Journal of Fisheries Management26:645–651.
Vandergoot, C. S., H. A. Cook, M. V. Thomas, D. W. Einhouse, and C. Murray.2010. Status of walleye in western Lake Erie, 1985–2006. Great Lakes FisheryCommission Technical Report 69:123–150.
Walleye Task Group. 1991. Report for 1990 of the Lake Erie walleye task group.Great Lakes Fishery Commission, Ann Arbor, Michigan.
Walleye Task Group. 2011. Report for 2010 of the Lake Erie walleye task group.Great Lakes Fishery Commission, Ann Arbor, Michigan.
Wang, H., E. Rutherford, A. Cook, D. W. Einhouse, R. C. Haas, T. B. Johnson,R. Kenyon, B. Locke, and M. W. Turner. 2007. Movement of walleye in lakesErie and St. Clair inferred from tag recapture and fisheries data. Transactionsof the American Fisheries Society 136:539–551.
White, G. C. 1983. Numerical estimation of survival rates from band-recoveryand biotelemetry data. Journal of Wildlife Management 47:716–728.
White, G. C., and K. P. Burnham. 1999. Program MARK: survival estimationfrom populations of marked animals. Bird Study 46(Supplement 1):S120–S139.
Zale, A. V., and M. B. Bain. 1994. Estimating tag reporting rates with postcardsas tag surrogates. North American Journal of Fisheries Management 14:208–211.
Zerrenner, A., D. C. Josephson, and C. C. Krueger. 1997. Growth, mortality,and mark retention of hatchery brook trout marked with visible implant tags,jaw tags, and adipose fin clips. Progressive Fish-Culturist 59:241–254.
Zhao, Y., D. W. Einhouse, and T. M. MacDougall. 2011. Resolving some of thecomplexity of a mixed-origin walleye population in the east basin of LakeErie using a mark–recapture study. North American Journal of FisheriesManagement 31:379–389.
Dow
nloa
ded
by [
Mic
higa
n St
ate
Uni
vers
ity]
at 0
5:29
06
Apr
il 20
12