.. ;'.' ~.._....\.,.'.'..~-:"'.".,-.'.'."..,.,...,' .'.'.' ..'..•.;."' - Agricultural Marketing ...
Upload
khangminh22Category
view
3download
0
�����������������
Citation: Vaish, S.; Kaur, G.; Sharma,
N.K.; Gakkhar, N. Estimation for
Potential of Agricultural Biomass
Sources as Projections of
Bio-Briquettes in Indian Context.
Sustainability 2022, 14, 5077. https://
doi.org/10.3390/su14095077
Academic Editors: Elena Rada,
Marco Ragazzi, Ioannis Katsoyiannis,
Elena Magaril, Paolo Viotti, Hussain
H. Al-Kayiem, Marco Schiavon,
Gabriela Ionescu and
Natalia Sliusar
Received: 24 February 2022
Accepted: 18 March 2022
Published: 23 April 2022
Publisher’s Note: MDPI stays neutral
with regard to jurisdictional claims in
published maps and institutional affil-
iations.
Copyright: © 2022 by the authors.
Licensee MDPI, Basel, Switzerland.
This article is an open access article
distributed under the terms and
conditions of the Creative Commons
Attribution (CC BY) license (https://
creativecommons.org/licenses/by/
4.0/).
sustainability
Article
Estimation for Potential of Agricultural Biomass Sources asProjections of Bio-Briquettes in Indian ContextSunny Vaish 1,*, Gagandeep Kaur 2, Naveen Kumar Sharma 2 and Nikhil Gakkhar 3
1 Research Scholar, I.K. Gujral Punjab Technical University Jalandhar, Kapurthala 144603, India2 Faculty of Engineering, I.K. Gujral Punjab Technical University Jalandhar, Kapurthala 144603, India;
[email protected] (G.K.); [email protected] (N.K.S.)3 Sardar Swaran Singh National Institute of Bioenergy, Kapurthala 144602, India; [email protected]* Correspondence: [email protected]; Tel.: +91-7986406065
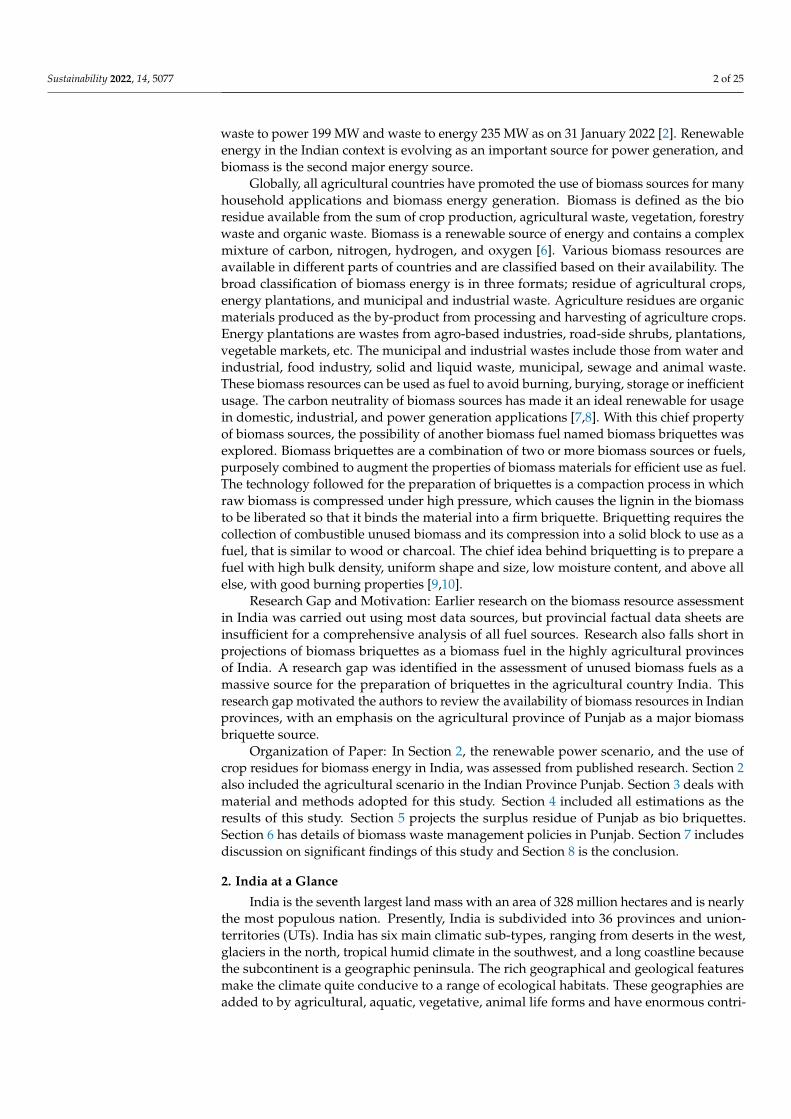
Abstract: Energy is an indicator of the socio-economic development of any country and has becomean indispensable part of modern society. Despite several renewable sources of energy generation,biomass sources are still under-utilized due to the absence of standard policies of estimation ofresources at the country level. This paper attempts to estimate the gross crop residue and surplusresidue potential for all provinces of the agricultural country, India. In India, the total area undercrop production is 94,305 thousand hectares and the yield from all significant crops is 309,133 kgper hectare. It is estimated that total gross crop residue generation in the country is 480 milliontonnes. Subsequently, after consumption of crop residues for numerous applications, the surpluscrop residues are 121 million tonnes. The bioenergy potential from the surplus residues is estimatedas 1988 PJ, which offers a huge potential energy source, from materials otherwise treated as waste.The Indian province Punjab, rich in agricultural sources and covering only 7% of the total croppingarea of the country, generates 11% of the total surplus crop which could be used for further efficientuse as bio briquettes.
Keywords: biomass; crop residue; surplus residue; bioenergy potential; briquettes
1. Introduction
Globally, mostly government agencies have introduced subsidies, incentives, feedin tariff schemes, or many others, as a part of an effective policy to enhance investmentsin the renewable energy sector. India, being a fast developed country with increasingeconomy and industrial growth, requires additional energy sources. The present nationalenergy scenario has according to the Ministry of Power, a total installed capacity for Indiaof near 395,075 MW, out of which the contribution by central, state, and private sectorsare approximately 98,327 MW (24.9%), 105,314 MW (26.7%) and 191,434 MW (48.5%)respectively, up to 31 January 2022 [1]. The electricity generation from these installedcapacities thermal 11,385.33 BU, nuclear 43.880 BU, hydro 140.357 BU, RES 105.01 BU, andBhutan import 7.230 BU (2020–2021) [2]. The all-of-India total generation for 2019–2020was 1623 TWh, generated as follows: hydro 156 TWh, Thermal 1043 TWh, Nuclear 46 TWhand RES 138 TWh, with the non-utilities contributions in generation 240 TWh. The Indiangovernment’s13th five-year plan shows a commitment for an addition of 100 GW fromconventional sources, and the targets set for grid connected renewable electrical energyare 175 GW, out of which the highest is 100 GW solar, followed by 60 GW wind, 10 GWbiomass, 5 GW small hydro by 2022 [3–5]. The total estimated potential of renewable powerin the country is 1,097,465 MW, distributed as solar 68.2%, wind 27.5%, small hydro 1.9%,biomass 1.6%, cogeneration and bagasse 0.5%, and waste to energy 0.2%, as of 31 January2022 [1]. The total installed capacity of renewable power plants in country is 105,854 MW,and contributions as cumulative achievements from renewable energy sources are solarpower 50,304 MW, wind power 40,101 MW, biopower 10,176 MW, small hydro 4840 MW,
Sustainability 2022, 14, 5077. https://doi.org/10.3390/su14095077 https://www.mdpi.com/journal/sustainability
Sustainability 2022, 14, 5077 2 of 25
waste to power 199 MW and waste to energy 235 MW as on 31 January 2022 [2]. Renewableenergy in the Indian context is evolving as an important source for power generation, andbiomass is the second major energy source.
Globally, all agricultural countries have promoted the use of biomass sources for manyhousehold applications and biomass energy generation. Biomass is defined as the bioresidue available from the sum of crop production, agricultural waste, vegetation, forestrywaste and organic waste. Biomass is a renewable source of energy and contains a complexmixture of carbon, nitrogen, hydrogen, and oxygen [6]. Various biomass resources areavailable in different parts of countries and are classified based on their availability. Thebroad classification of biomass energy is in three formats; residue of agricultural crops,energy plantations, and municipal and industrial waste. Agriculture residues are organicmaterials produced as the by-product from processing and harvesting of agriculture crops.Energy plantations are wastes from agro-based industries, road-side shrubs, plantations,vegetable markets, etc. The municipal and industrial wastes include those from water andindustrial, food industry, solid and liquid waste, municipal, sewage and animal waste.These biomass resources can be used as fuel to avoid burning, burying, storage or inefficientusage. The carbon neutrality of biomass sources has made it an ideal renewable for usagein domestic, industrial, and power generation applications [7,8]. With this chief propertyof biomass sources, the possibility of another biomass fuel named biomass briquettes wasexplored. Biomass briquettes are a combination of two or more biomass sources or fuels,purposely combined to augment the properties of biomass materials for efficient use as fuel.The technology followed for the preparation of briquettes is a compaction process in whichraw biomass is compressed under high pressure, which causes the lignin in the biomassto be liberated so that it binds the material into a firm briquette. Briquetting requires thecollection of combustible unused biomass and its compression into a solid block to use as afuel, that is similar to wood or charcoal. The chief idea behind briquetting is to prepare afuel with high bulk density, uniform shape and size, low moisture content, and above allelse, with good burning properties [9,10].
Research Gap and Motivation: Earlier research on the biomass resource assessmentin India was carried out using most data sources, but provincial factual data sheets areinsufficient for a comprehensive analysis of all fuel sources. Research also falls short inprojections of biomass briquettes as a biomass fuel in the highly agricultural provincesof India. A research gap was identified in the assessment of unused biomass fuels as amassive source for the preparation of briquettes in the agricultural country India. Thisresearch gap motivated the authors to review the availability of biomass resources in Indianprovinces, with an emphasis on the agricultural province of Punjab as a major biomassbriquette source.
Organization of Paper: In Section 2, the renewable power scenario, and the use ofcrop residues for biomass energy in India, was assessed from published research. Section 2also included the agricultural scenario in the Indian Province Punjab. Section 3 deals withmaterial and methods adopted for this study. Section 4 included all estimations as theresults of this study. Section 5 projects the surplus residue of Punjab as bio briquettes.Section 6 has details of biomass waste management policies in Punjab. Section 7 includesdiscussion on significant findings of this study and Section 8 is the conclusion.
2. India at a Glance
India is the seventh largest land mass with an area of 328 million hectares and is nearlythe most populous nation. Presently, India is subdivided into 36 provinces and union-territories (UTs). India has six main climatic sub-types, ranging from deserts in the west,glaciers in the north, tropical humid climate in the southwest, and a long coastline becausethe subcontinent is a geographic peninsula. The rich geographical and geological featuresmake the climate quite conducive to a range of ecological habitats. These geographies areadded to by agricultural, aquatic, vegetative, animal life forms and have enormous contri-
Sustainability 2022, 14, 5077 3 of 25
butions to generating huge biomass sources and can be taken out as potential renewableenergy sources.
2.1. Renewable Energy Scenario
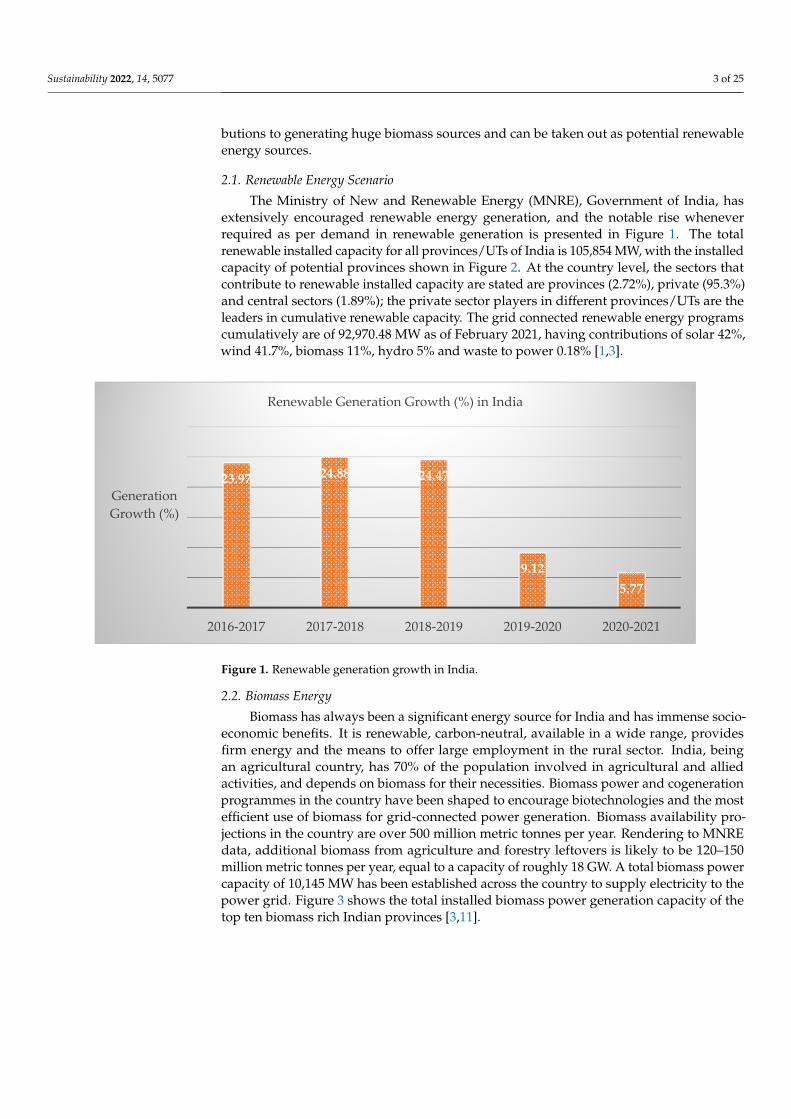
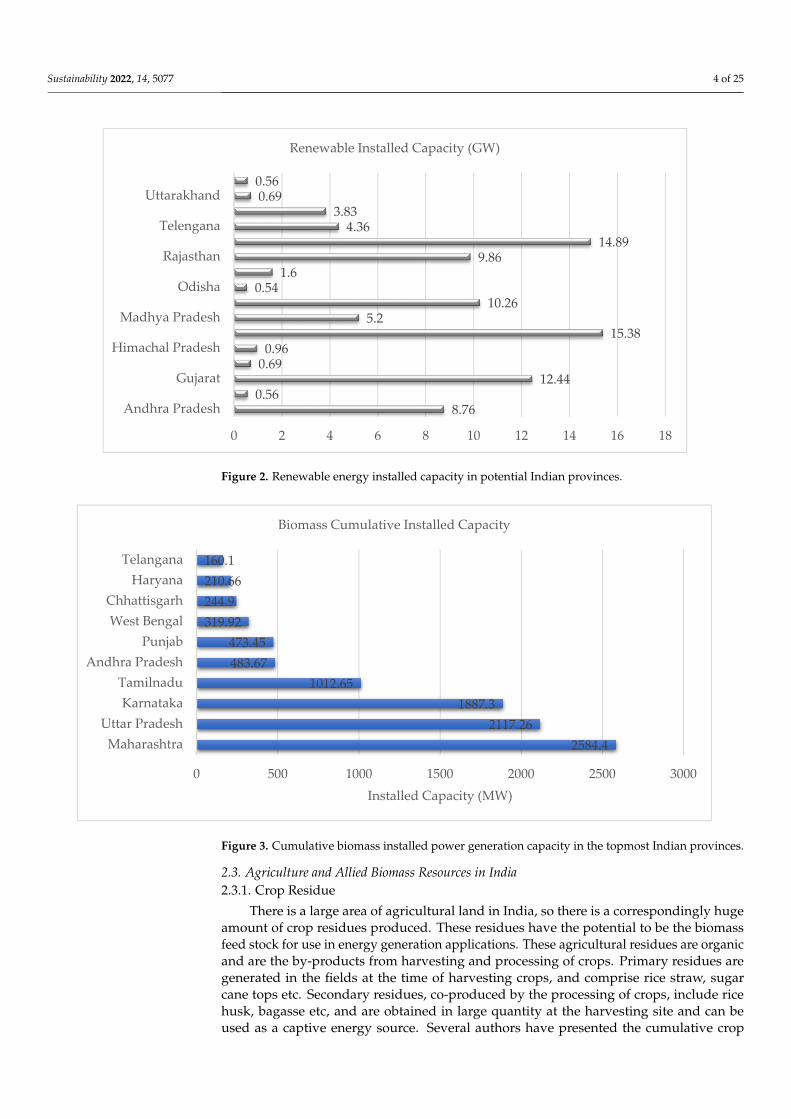
The Ministry of New and Renewable Energy (MNRE), Government of India, hasextensively encouraged renewable energy generation, and the notable rise wheneverrequired as per demand in renewable generation is presented in Figure 1. The totalrenewable installed capacity for all provinces/UTs of India is 105,854 MW, with the installedcapacity of potential provinces shown in Figure 2. At the country level, the sectors thatcontribute to renewable installed capacity are stated are provinces (2.72%), private (95.3%)and central sectors (1.89%); the private sector players in different provinces/UTs are theleaders in cumulative renewable capacity. The grid connected renewable energy programscumulatively are of 92,970.48 MW as of February 2021, having contributions of solar 42%,wind 41.7%, biomass 11%, hydro 5% and waste to power 0.18% [1,3].
Sustainability 2022, 14, x FOR PEER REVIEW 3 of 27
phies are added to by agricultural, aquatic, vegetative, animal life forms and have enor-mous contributions to generating huge biomass sources and can be taken out as potential renewable energy sources.
2.1. Renewable Energy Scenario The Ministry of New and Renewable Energy (MNRE), Government of India, has ex-
tensively encouraged renewable energy generation, and the notable rise whenever re-quired as per demand in renewable generation is presented in Figure 1. The total renew-able installed capacity for all provinces/UTs of India is 105,854 MW, with the installed capacity of potential provinces shown in Figure 2. At the country level, the sectors that contribute to renewable installed capacity are stated are provinces (2.72%), private (95.3%) and central sectors (1.89%); the private sector players in different provinces/UTs are the leaders in cumulative renewable capacity. The grid connected renewable energy pro-grams cumulatively are of 92,970.48 MW as of February 2021, having contributions of so-lar 42%, wind 41.7%, biomass 11%, hydro 5% and waste to power 0.18% [1,3].
Figure 1. Renewable generation growth in India.
23.97 24.88 24.47
9.125.77
2016-2017 2017-2018 2018-2019 2019-2020 2020-2021
Generation Growth (%)
Renewable Generation Growth (%) in India
8.760.56
12.440.690.96
15.385.2
10.260.54
1.69.86
14.894.36
3.830.690.56
0 2 4 6 8 10 12 14 16 18
Andhra Pradesh
Gujarat
Himachal Pradesh
Madhya Pradesh
Odisha
Rajasthan
Telengana
Uttarakhand
Renewable Installed Capacity (GW)
Figure 1. Renewable generation growth in India.
2.2. Biomass Energy
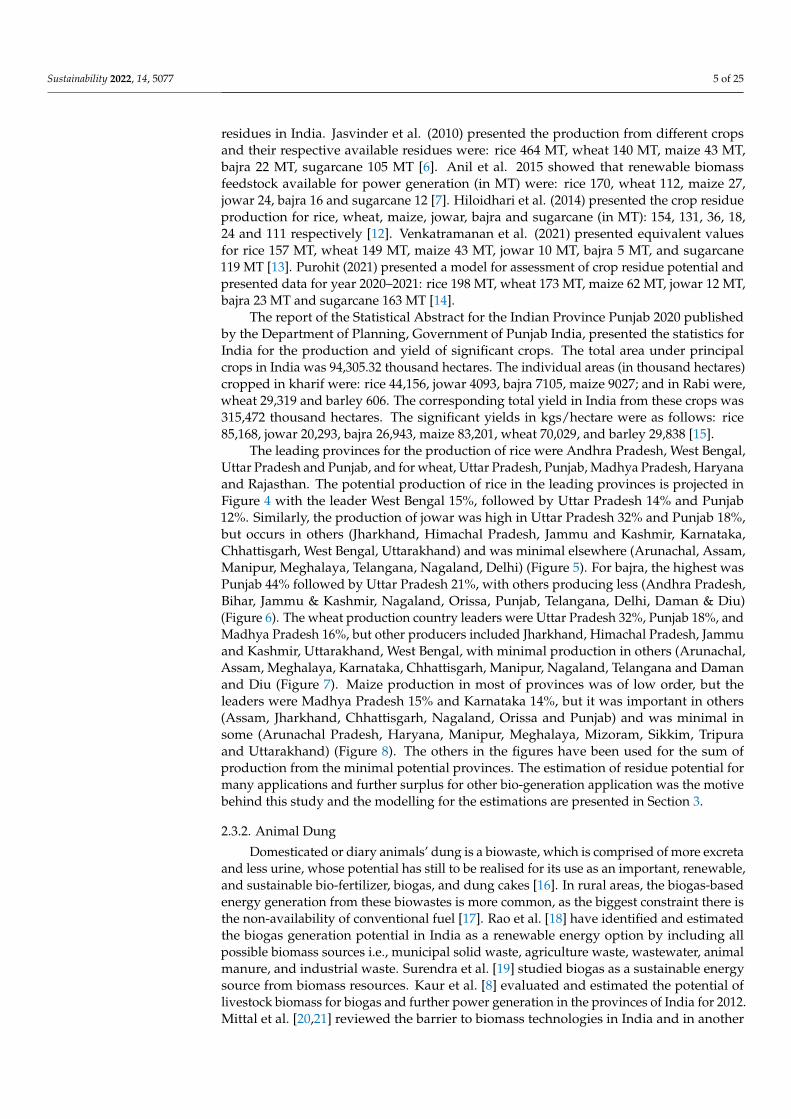
Biomass has always been a significant energy source for India and has immense socio-economic benefits. It is renewable, carbon-neutral, available in a wide range, providesfirm energy and the means to offer large employment in the rural sector. India, beingan agricultural country, has 70% of the population involved in agricultural and alliedactivities, and depends on biomass for their necessities. Biomass power and cogenerationprogrammes in the country have been shaped to encourage biotechnologies and the mostefficient use of biomass for grid-connected power generation. Biomass availability pro-jections in the country are over 500 million metric tonnes per year. Rendering to MNREdata, additional biomass from agriculture and forestry leftovers is likely to be 120–150million metric tonnes per year, equal to a capacity of roughly 18 GW. A total biomass powercapacity of 10,145 MW has been established across the country to supply electricity to thepower grid. Figure 3 shows the total installed biomass power generation capacity of thetop ten biomass rich Indian provinces [3,11].
Sustainability 2022, 14, 5077 4 of 25
Sustainability 2022, 14, x FOR PEER REVIEW 3 of 27
phies are added to by agricultural, aquatic, vegetative, animal life forms and have enor-mous contributions to generating huge biomass sources and can be taken out as potential renewable energy sources.
2.1. Renewable Energy Scenario The Ministry of New and Renewable Energy (MNRE), Government of India, has ex-
tensively encouraged renewable energy generation, and the notable rise whenever re-quired as per demand in renewable generation is presented in Figure 1. The total renew-able installed capacity for all provinces/UTs of India is 105,854 MW, with the installed capacity of potential provinces shown in Figure 2. At the country level, the sectors that contribute to renewable installed capacity are stated are provinces (2.72%), private (95.3%) and central sectors (1.89%); the private sector players in different provinces/UTs are the leaders in cumulative renewable capacity. The grid connected renewable energy pro-grams cumulatively are of 92,970.48 MW as of February 2021, having contributions of so-lar 42%, wind 41.7%, biomass 11%, hydro 5% and waste to power 0.18% [1,3].
Figure 1. Renewable generation growth in India.
23.97 24.88 24.47
9.125.77
2016-2017 2017-2018 2018-2019 2019-2020 2020-2021
Generation Growth (%)
Renewable Generation Growth (%) in India
8.760.56
12.440.690.96
15.385.2
10.260.54
1.69.86
14.894.36
3.830.690.56
0 2 4 6 8 10 12 14 16 18
Andhra Pradesh
Gujarat
Himachal Pradesh
Madhya Pradesh
Odisha
Rajasthan
Telengana
Uttarakhand
Renewable Installed Capacity (GW)
Figure 2. Renewable energy installed capacity in potential Indian provinces.
Sustainability 2022, 14, x FOR PEER REVIEW 4 of 27
Figure 2. Renewable energy installed capacity in potential Indian provinces.
2.2. Biomass Energy Biomass has always been a significant energy source for India and has immense so-
cio-economic benefits. It is renewable, carbon-neutral, available in a wide range, provides firm energy and the means to offer large employment in the rural sector. India, being an agricultural country, has 70% of the population involved in agricultural and allied activi-ties, and depends on biomass for their necessities. Biomass power and cogeneration pro-grammes in the country have been shaped to encourage biotechnologies and the most efficient use of biomass for grid-connected power generation. Biomass availability projec-tions in the country are over 500 million metric tonnes per year. Rendering to MNRE data, additional biomass from agriculture and forestry leftovers is likely to be 120–150 million metric tonnes per year, equal to a capacity of roughly 18 GW. A total biomass power ca-pacity of 10,145 MW has been established across the country to supply electricity to the power grid. Figure 3 shows the total installed biomass power generation capacity of the top ten biomass rich Indian provinces [3,11].
Figure 3. Cumulative biomass installed power generation capacity in the topmost Indian prov-inces.
2.3. Agriculture and Allied Biomass Resources in India 2.3.1. Crop Residue
There is a large area of agricultural land in India, so there is a correspondingly huge amount of crop residues produced. These residues have the potential to be the biomass feed stock for use in energy generation applications. These agricultural residues are or-ganic and are the by-products from harvesting and processing of crops. Primary residues are generated in the fields at the time of harvesting crops, and comprise rice straw, sugar cane tops etc. Secondary residues, co-produced by the processing of crops, include rice husk, bagasse etc, and are obtained in large quantity at the harvesting site and can be used as a captive energy source. Several authors have presented the cumulative crop residues in India. Jasvinder et al. (2010) presented the production from different crops and their respective available residues were: rice 464 MT, wheat 140 MT, maize 43 MT, bajra 22 MT, sugarcane 105 MT [6]. Anil et al. 2015 showed that renewable biomass feedstock available for power generation (in MT) were: rice 170, wheat 112, maize 27, jowar 24, bajra 16 and
2584.42117.26
1887.31012.65
483.67473.45
319.92244.9210.66160.1
0 500 1000 1500 2000 2500 3000
MaharashtraUttar Pradesh
KarnatakaTamilnadu
Andhra PradeshPunjab
West BengalChhattisgarh
HaryanaTelangana
Installed Capacity (MW)
Biomass Cumulative Installed Capacity
Figure 3. Cumulative biomass installed power generation capacity in the topmost Indian provinces.
2.3. Agriculture and Allied Biomass Resources in India2.3.1. Crop Residue
There is a large area of agricultural land in India, so there is a correspondingly hugeamount of crop residues produced. These residues have the potential to be the biomassfeed stock for use in energy generation applications. These agricultural residues are organicand are the by-products from harvesting and processing of crops. Primary residues aregenerated in the fields at the time of harvesting crops, and comprise rice straw, sugarcane tops etc. Secondary residues, co-produced by the processing of crops, include ricehusk, bagasse etc, and are obtained in large quantity at the harvesting site and can beused as a captive energy source. Several authors have presented the cumulative crop
Sustainability 2022, 14, 5077 5 of 25
residues in India. Jasvinder et al. (2010) presented the production from different cropsand their respective available residues were: rice 464 MT, wheat 140 MT, maize 43 MT,bajra 22 MT, sugarcane 105 MT [6]. Anil et al. 2015 showed that renewable biomassfeedstock available for power generation (in MT) were: rice 170, wheat 112, maize 27,jowar 24, bajra 16 and sugarcane 12 [7]. Hiloidhari et al. (2014) presented the crop residueproduction for rice, wheat, maize, jowar, bajra and sugarcane (in MT): 154, 131, 36, 18,24 and 111 respectively [12]. Venkatramanan et al. (2021) presented equivalent valuesfor rice 157 MT, wheat 149 MT, maize 43 MT, jowar 10 MT, bajra 5 MT, and sugarcane119 MT [13]. Purohit (2021) presented a model for assessment of crop residue potential andpresented data for year 2020–2021: rice 198 MT, wheat 173 MT, maize 62 MT, jowar 12 MT,bajra 23 MT and sugarcane 163 MT [14].
The report of the Statistical Abstract for the Indian Province Punjab 2020 publishedby the Department of Planning, Government of Punjab India, presented the statistics forIndia for the production and yield of significant crops. The total area under principalcrops in India was 94,305.32 thousand hectares. The individual areas (in thousand hectares)cropped in kharif were: rice 44,156, jowar 4093, bajra 7105, maize 9027; and in Rabi were,wheat 29,319 and barley 606. The corresponding total yield in India from these crops was315,472 thousand hectares. The significant yields in kgs/hectare were as follows: rice85,168, jowar 20,293, bajra 26,943, maize 83,201, wheat 70,029, and barley 29,838 [15].
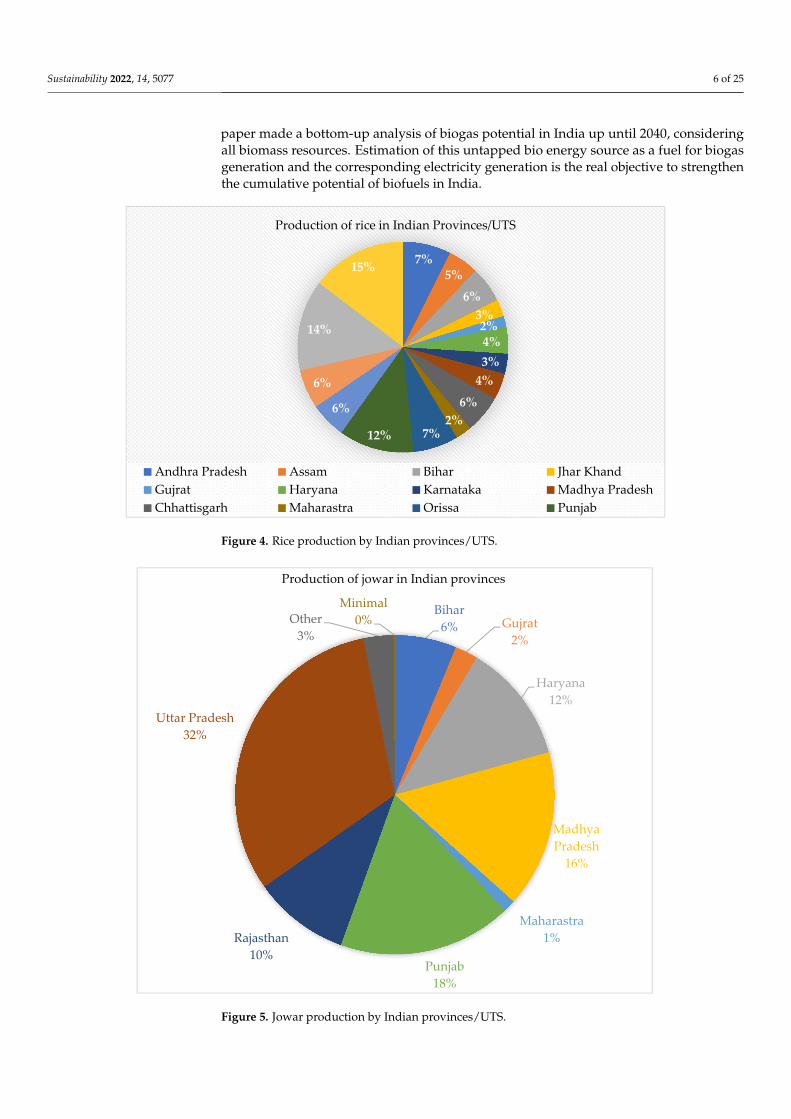
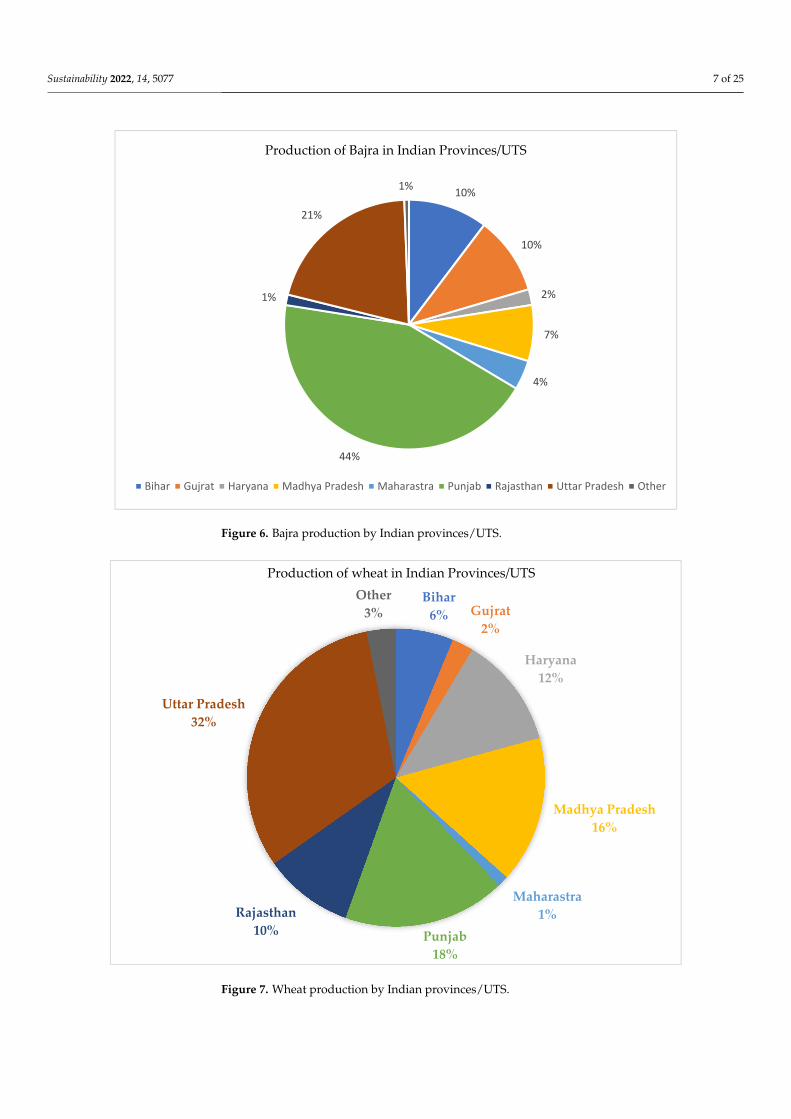
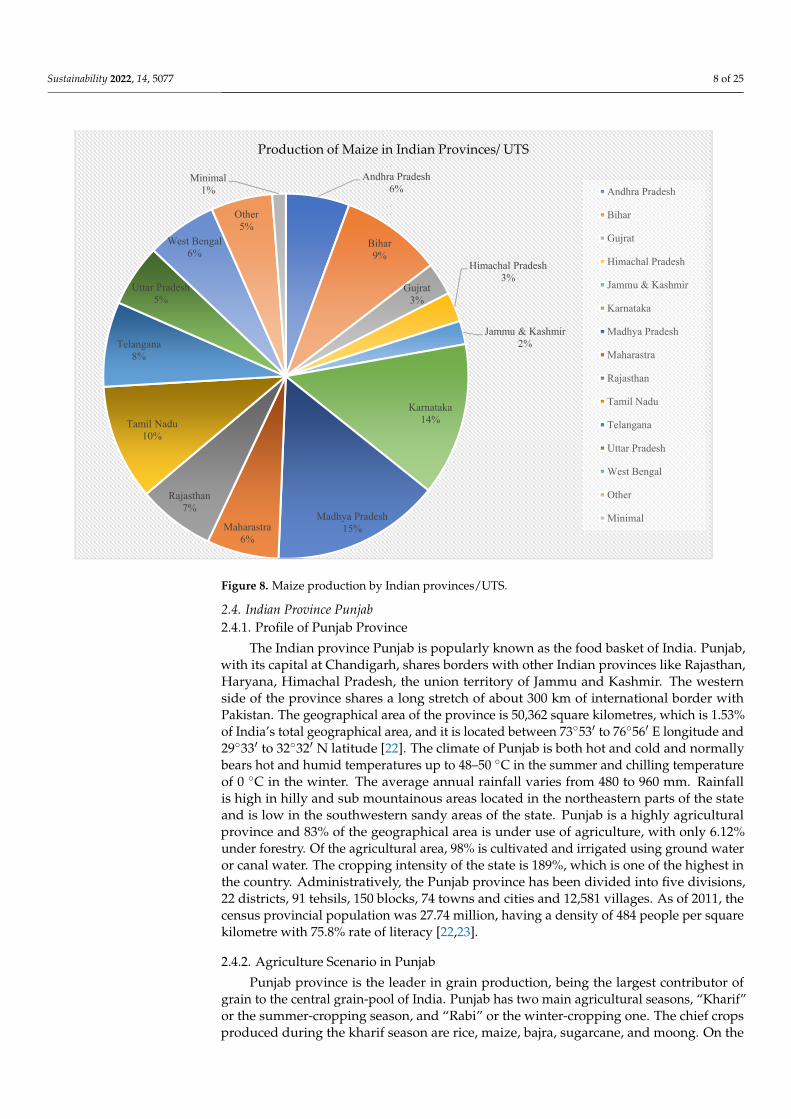
The leading provinces for the production of rice were Andhra Pradesh, West Bengal,Uttar Pradesh and Punjab, and for wheat, Uttar Pradesh, Punjab, Madhya Pradesh, Haryanaand Rajasthan. The potential production of rice in the leading provinces is projected inFigure 4 with the leader West Bengal 15%, followed by Uttar Pradesh 14% and Punjab12%. Similarly, the production of jowar was high in Uttar Pradesh 32% and Punjab 18%,but occurs in others (Jharkhand, Himachal Pradesh, Jammu and Kashmir, Karnataka,Chhattisgarh, West Bengal, Uttarakhand) and was minimal elsewhere (Arunachal, Assam,Manipur, Meghalaya, Telangana, Nagaland, Delhi) (Figure 5). For bajra, the highest wasPunjab 44% followed by Uttar Pradesh 21%, with others producing less (Andhra Pradesh,Bihar, Jammu & Kashmir, Nagaland, Orissa, Punjab, Telangana, Delhi, Daman & Diu)(Figure 6). The wheat production country leaders were Uttar Pradesh 32%, Punjab 18%, andMadhya Pradesh 16%, but other producers included Jharkhand, Himachal Pradesh, Jammuand Kashmir, Uttarakhand, West Bengal, with minimal production in others (Arunachal,Assam, Meghalaya, Karnataka, Chhattisgarh, Manipur, Nagaland, Telangana and Damanand Diu (Figure 7). Maize production in most of provinces was of low order, but theleaders were Madhya Pradesh 15% and Karnataka 14%, but it was important in others(Assam, Jharkhand, Chhattisgarh, Nagaland, Orissa and Punjab) and was minimal insome (Arunachal Pradesh, Haryana, Manipur, Meghalaya, Mizoram, Sikkim, Tripuraand Uttarakhand) (Figure 8). The others in the figures have been used for the sum ofproduction from the minimal potential provinces. The estimation of residue potential formany applications and further surplus for other bio-generation application was the motivebehind this study and the modelling for the estimations are presented in Section 3.
2.3.2. Animal Dung
Domesticated or diary animals’ dung is a biowaste, which is comprised of more excretaand less urine, whose potential has still to be realised for its use as an important, renewable,and sustainable bio-fertilizer, biogas, and dung cakes [16]. In rural areas, the biogas-basedenergy generation from these biowastes is more common, as the biggest constraint there isthe non-availability of conventional fuel [17]. Rao et al. [18] have identified and estimatedthe biogas generation potential in India as a renewable energy option by including allpossible biomass sources i.e., municipal solid waste, agriculture waste, wastewater, animalmanure, and industrial waste. Surendra et al. [19] studied biogas as a sustainable energysource from biomass resources. Kaur et al. [8] evaluated and estimated the potential oflivestock biomass for biogas and further power generation in the provinces of India for 2012.Mittal et al. [20,21] reviewed the barrier to biomass technologies in India and in another
Sustainability 2022, 14, 5077 6 of 25
paper made a bottom-up analysis of biogas potential in India up until 2040, consideringall biomass resources. Estimation of this untapped bio energy source as a fuel for biogasgeneration and the corresponding electricity generation is the real objective to strengthenthe cumulative potential of biofuels in India.
Sustainability 2022, 14, x FOR PEER REVIEW 6 of 27
Figure 4. Rice production by Indian provinces/UTS.
Figure 5. Jowar production by Indian provinces/UTS.
7%5%
6%3%2%4%3%
4%
6%2%
7%12%
6%
6%
14%
15%
Production of rice in Indian Provinces/UTS
Andhra Pradesh Assam Bihar Jhar KhandGujrat Haryana Karnataka Madhya PradeshChhattisgarh Maharastra Orissa Punjab
Bihar6% Gujrat
2%
Haryana12%
Madhya Pradesh
16%
Maharastra1%
Punjab18%
Rajasthan10%
Uttar Pradesh32%
Other 3%
Minimal0%
Production of jowar in Indian provinces
Figure 4. Rice production by Indian provinces/UTS.
Sustainability 2022, 14, x FOR PEER REVIEW 6 of 27
Figure 4. Rice production by Indian provinces/UTS.
Figure 5. Jowar production by Indian provinces/UTS.
7%5%
6%3%2%4%3%
4%
6%2%
7%12%
6%
6%
14%
15%
Production of rice in Indian Provinces/UTS
Andhra Pradesh Assam Bihar Jhar KhandGujrat Haryana Karnataka Madhya PradeshChhattisgarh Maharastra Orissa Punjab
Bihar6% Gujrat
2%
Haryana12%
Madhya Pradesh
16%
Maharastra1%
Punjab18%
Rajasthan10%
Uttar Pradesh32%
Other 3%
Minimal0%
Production of jowar in Indian provinces
Figure 5. Jowar production by Indian provinces/UTS.
Sustainability 2022, 14, 5077 7 of 25Sustainability 2022, 14, x FOR PEER REVIEW 7 of 27
Figure 6. Bajra production by Indian provinces/UTS.
Figure 7. Wheat production by Indian provinces/UTS.
10%
10%
2%
7%
4%
44%
1%
21%
1%
Production of Bajra in Indian Provinces/UTS
Bihar Gujrat Haryana Madhya Pradesh Maharastra Punjab Rajasthan Uttar Pradesh Other
Bihar6% Gujrat
2%
Haryana12%
Madhya Pradesh16%
Maharastra1%
Punjab18%
Rajasthan10%
Uttar Pradesh32%
Other 3%
Production of wheat in Indian Provinces/UTS
Figure 6. Bajra production by Indian provinces/UTS.
Sustainability 2022, 14, x FOR PEER REVIEW 7 of 27
Figure 6. Bajra production by Indian provinces/UTS.
Figure 7. Wheat production by Indian provinces/UTS.
10%
10%
2%
7%
4%
44%
1%
21%
1%
Production of Bajra in Indian Provinces/UTS
Bihar Gujrat Haryana Madhya Pradesh Maharastra Punjab Rajasthan Uttar Pradesh Other
Bihar6% Gujrat
2%
Haryana12%
Madhya Pradesh16%
Maharastra1%
Punjab18%
Rajasthan10%
Uttar Pradesh32%
Other 3%
Production of wheat in Indian Provinces/UTS
Figure 7. Wheat production by Indian provinces/UTS.
Sustainability 2022, 14, 5077 8 of 25Sustainability 2022, 14, x FOR PEER REVIEW 8 of 27
Figure 8. Maize production by Indian provinces/UTS.
2.3.2. Animal Dung Domesticated or diary animals’ dung is a biowaste, which is comprised of more ex-
creta and less urine, whose potential has still to be realised for its use as an important, renewable, and sustainable bio-fertilizer, biogas, and dung cakes [16]. In rural areas, the biogas-based energy generation from these biowastes is more common, as the biggest con-straint there is the non-availability of conventional fuel [17]. Rao et al. [18] have identified and estimated the biogas generation potential in India as a renewable energy option by including all possible biomass sources i.e., municipal solid waste, agriculture waste, wastewater, animal manure, and industrial waste. Surendra et al. [19] studied biogas as a sustainable energy source from biomass resources. Kaur et al. [8] evaluated and estimated the potential of livestock biomass for biogas and further power generation in the prov-inces of India for 2012. Mittal et al. [20,21] reviewed the barrier to biomass technologies in India and in another paper made a bottom-up analysis of biogas potential in India up until 2040, considering all biomass resources. Estimation of this untapped bio energy source as a fuel for biogas generation and the corresponding electricity generation is the real objec-tive to strengthen the cumulative potential of biofuels in India.
2.4. Indian Province Punjab 2.4.1. Profile of Punjab Province
The Indian province Punjab is popularly known as the food basket of India. Punjab, with its capital at Chandigarh, shares borders with other Indian provinces like Rajasthan, Haryana, Himachal Pradesh, the union territory of Jammu and Kashmir. The western side of the province shares a long stretch of about 300 km of international border with Paki-stan. The geographical area of the province is 50,362 square kilometres, which is 1.53% of India’s total geographical area, and it is located between 73° 53′ to 76° 56′ E longitude and 29°33′ to 32°32′ N latitude [22]. The climate of Punjab is both hot and cold and normally
Andhra Pradesh6%
Bihar9%
Gujrat3%
Himachal Pradesh3%
Jammu & Kashmir2%
Karnataka14%
Madhya Pradesh15%Maharastra
6%
Rajasthan7%
Tamil Nadu10%
Telangana8%
Uttar Pradesh5%
West Bengal6%
Other5%
Minimal1%
Production of Maize in Indian Provinces/ UTS
Andhra Pradesh
Bihar
Gujrat
Himachal Pradesh
Jammu & Kashmir
Karnataka
Madhya Pradesh
Maharastra
Rajasthan
Tamil Nadu
Telangana
Uttar Pradesh
West Bengal
Other
Minimal
Figure 8. Maize production by Indian provinces/UTS.
2.4. Indian Province Punjab2.4.1. Profile of Punjab Province
The Indian province Punjab is popularly known as the food basket of India. Punjab,with its capital at Chandigarh, shares borders with other Indian provinces like Rajasthan,Haryana, Himachal Pradesh, the union territory of Jammu and Kashmir. The westernside of the province shares a long stretch of about 300 km of international border withPakistan. The geographical area of the province is 50,362 square kilometres, which is 1.53%of India’s total geographical area, and it is located between 73◦53′ to 76◦56′ E longitude and29◦33′ to 32◦32′ N latitude [22]. The climate of Punjab is both hot and cold and normallybears hot and humid temperatures up to 48–50 ◦C in the summer and chilling temperatureof 0 ◦C in the winter. The average annual rainfall varies from 480 to 960 mm. Rainfallis high in hilly and sub mountainous areas located in the northeastern parts of the stateand is low in the southwestern sandy areas of the state. Punjab is a highly agriculturalprovince and 83% of the geographical area is under use of agriculture, with only 6.12%under forestry. Of the agricultural area, 98% is cultivated and irrigated using ground wateror canal water. The cropping intensity of the state is 189%, which is one of the highest inthe country. Administratively, the Punjab province has been divided into five divisions,22 districts, 91 tehsils, 150 blocks, 74 towns and cities and 12,581 villages. As of 2011, thecensus provincial population was 27.74 million, having a density of 484 people per squarekilometre with 75.8% rate of literacy [22,23].
2.4.2. Agriculture Scenario in Punjab
Punjab province is the leader in grain production, being the largest contributor ofgrain to the central grain-pool of India. Punjab has two main agricultural seasons, “Kharif”or the summer-cropping season, and “Rabi” or the winter-cropping one. The chief cropsproduced during the kharif season are rice, maize, bajra, sugarcane, and moong. On the
Sustainability 2022, 14, 5077 9 of 25
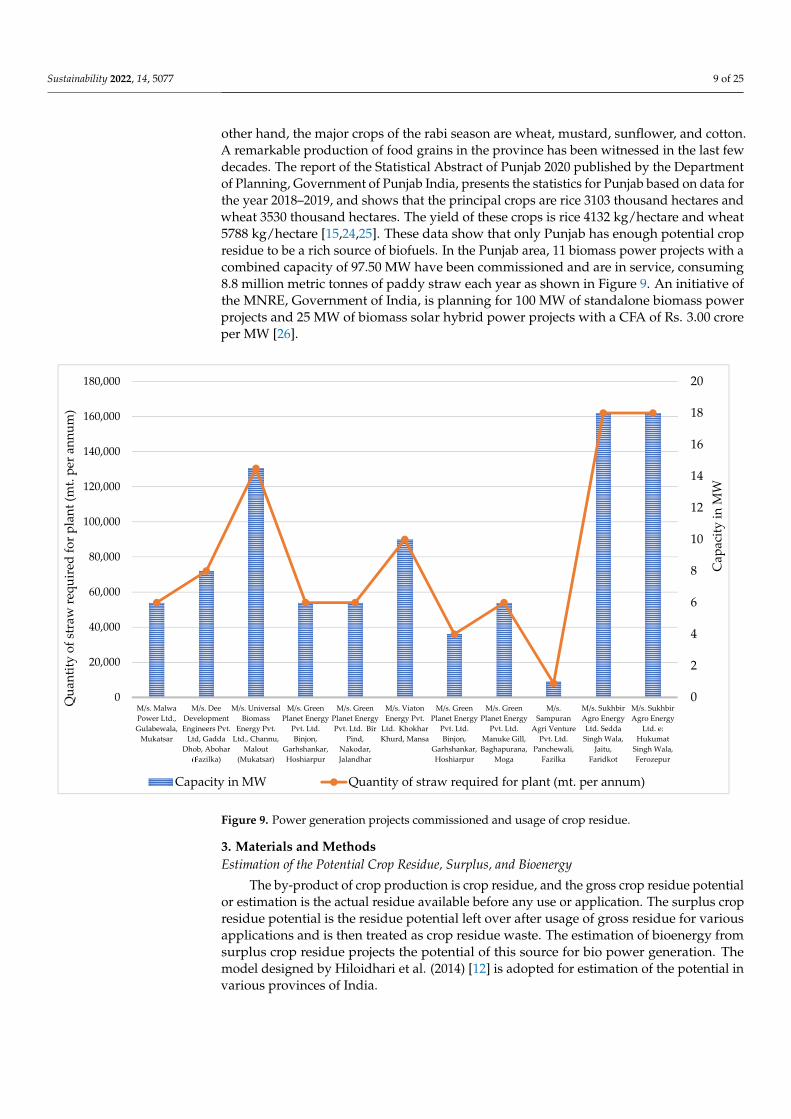
other hand, the major crops of the rabi season are wheat, mustard, sunflower, and cotton.A remarkable production of food grains in the province has been witnessed in the last fewdecades. The report of the Statistical Abstract of Punjab 2020 published by the Departmentof Planning, Government of Punjab India, presents the statistics for Punjab based on data forthe year 2018–2019, and shows that the principal crops are rice 3103 thousand hectares andwheat 3530 thousand hectares. The yield of these crops is rice 4132 kg/hectare and wheat5788 kg/hectare [15,24,25]. These data show that only Punjab has enough potential cropresidue to be a rich source of biofuels. In the Punjab area, 11 biomass power projects with acombined capacity of 97.50 MW have been commissioned and are in service, consuming8.8 million metric tonnes of paddy straw each year as shown in Figure 9. An initiative ofthe MNRE, Government of India, is planning for 100 MW of standalone biomass powerprojects and 25 MW of biomass solar hybrid power projects with a CFA of Rs. 3.00 croreper MW [26].
Sustainability 2022, 14, x FOR PEER REVIEW 10 of 27
Figure 9. Power generation projects commissioned and usage of crop residue.
3. Materials and Methods Estimation of the Potential Crop Residue, Surplus, and Bioenergy
The by-product of crop production is crop residue, and the gross crop residue poten-tial or estimation is the actual residue available before any use or application. The surplus crop residue potential is the residue potential left over after usage of gross residue for various applications and is then treated as crop residue waste. The estimation of bioen-ergy from surplus crop residue projects the potential of this source for bio power genera-tion. The model designed by Hiloidhari et al. (2014) [12] is adopted for estimation of the potential in various provinces of India.
Gross crop residue potential of a selected crop depends on area under crop, crop yield and RPR of crop, and the further estimation of gross residue potential is presented in Equation (1)
𝐶𝑅𝑔 𝑗 = 𝐴 𝑖, 𝑗 × 𝑌 𝑖, 𝑗 × 𝑅𝑃𝑅 𝑖. 𝑗 (1)
where, 𝐶𝑅𝑔 𝑗 denotes Gross Crop Biomass Residue Potential at jth State from 𝑛, Number of Crops, tonne; 𝐴 𝑖, 𝑗 denotes Area under ith Crop at jth State, ha; 𝑌 𝑖, 𝑗 Yield of ith Crop at jth State, tonne ha−1 and 𝑅𝑃𝑅 𝑖, 𝑗 denotes Biomass Residue Production ratio of ith Crop at jth State.
The surplus crop residue potential depends on the gross residue potential and the surplus residue fraction, which vary from crop to crop and are presented in Equation (2).
0
2
4
6
8
10
12
14
16
18
20
0
20,000
40,000
60,000
80,000
100,000
120,000
140,000
160,000
180,000
M/s. MalwaPower Ltd.,Gulabewala,
Mukatsar
M/s. DeeDevelopmentEngineers Pvt.
Ltd, GaddaDhob, Abohar
(Fazilka)
M/s. UniversalBiomass
Energy Pvt.Ltd., Channu,
Malout(Mukatsar)
M/s. GreenPlanet Energy
Pvt. Ltd.Binjon,
Garhshankar,Hoshiarpur
M/s. GreenPlanet EnergyPvt. Ltd. Bir
Pind,Nakodar,Jalandhar
M/s. ViatonEnergy Pvt.
Ltd. KhokharKhurd, Mansa
M/s. GreenPlanet Energy
Pvt. Ltd.Binjon,
Garhshankar,Hoshiarpur
M/s. GreenPlanet Energy
Pvt. Ltd.Manuke Gill,Baghapurana,
Moga
M/s.Sampuran
Agri VenturePvt. Ltd.
Panchewali,Fazilka
M/s. SukhbirAgro EnergyLtd. Sedda
Singh Wala,Jaitu,
Faridkot
M/s. SukhbirAgro Energy
Ltd. e:Hukumat
Singh Wala,Ferozepur
Cap
acity
in M
W
Qua
ntity
of s
traw
requ
ired
for p
lant
(mt.
per a
nnum
)
Capacity in MW Quantity of straw required for plant (mt. per annum)
Figure 9. Power generation projects commissioned and usage of crop residue.
3. Materials and MethodsEstimation of the Potential Crop Residue, Surplus, and Bioenergy
The by-product of crop production is crop residue, and the gross crop residue potentialor estimation is the actual residue available before any use or application. The surplus cropresidue potential is the residue potential left over after usage of gross residue for variousapplications and is then treated as crop residue waste. The estimation of bioenergy fromsurplus crop residue projects the potential of this source for bio power generation. Themodel designed by Hiloidhari et al. (2014) [12] is adopted for estimation of the potential invarious provinces of India.
Sustainability 2022, 14, 5077 10 of 25
Gross crop residue potential of a selected crop depends on area under crop, cropyield and RPR of crop, and the further estimation of gross residue potential is presented inEquation (1)
CRg(j) =n
∑i=1
A(i, j)×Y(i, j)× RPR(i.j) (1)
where, CRg(j) denotes Gross Crop Biomass Residue Potential at jth State from n, Numberof Crops, tonne; A(i, j) denotes Area under ith Crop at jth State, ha; Y(i, j) Yield of ithCrop at jth State, tonne ha−1 and RPR(i, j) denotes Biomass Residue Production ratio ofith Crop at jth State.
The surplus crop residue potential depends on the gross residue potential and thesurplus residue fraction, which vary from crop to crop and are presented in Equation (2).
CRs(j) =n
∑i=1
CRg(i, j)× SF(i.j) (2)
where, CRs(j) denotes the Surplus Biomass Residue Potential at jth State from n, Numberof Crops, tonne; CRg(i, j) denotes Gross Crop Biomass Residue Potential at jth State, tonneand SF(i.j) is Surplus Biomass Residue Fraction of ith Crop at jth State. The bioenergypotential from the surplus crop residue is presented in Equation (3)
E(j) =n
∑i=1
CRs(i.j)× HHV(i.j) (3)
where, E(j) denotes the Biomass Bioenergy Potential of n Crops at jth State, MJ; CRs(i.j)denotes the Surplus Biomass Residue Potential of ith Crop at jth State, tonne and HHV(i.j)denotes the High Heating Value of ith Crop at jth State, MJ tonne−1.
For this study, the values of the residue to product ratio (RPR) are taken as follows:rice 1.7, wheat 1.8, maize 2.3, bajra 2.6, barley 1.3, jowar 2.4, sugarcane 0.38, and cotton 6.The values for the surplus residue fraction for crops are taken as per reference [12]. TheHHV for this study as per crop in MJ/kg are as follows: rice 15.54, wheat 17.27, maize 17.03,bajra 17.67, barley 18.16, jowar 17.67, sugarcane 20, and cotton 17.47.
4. Results4.1. Gross and Surplus Residue Potential for Crop Based Bioenergy Potential
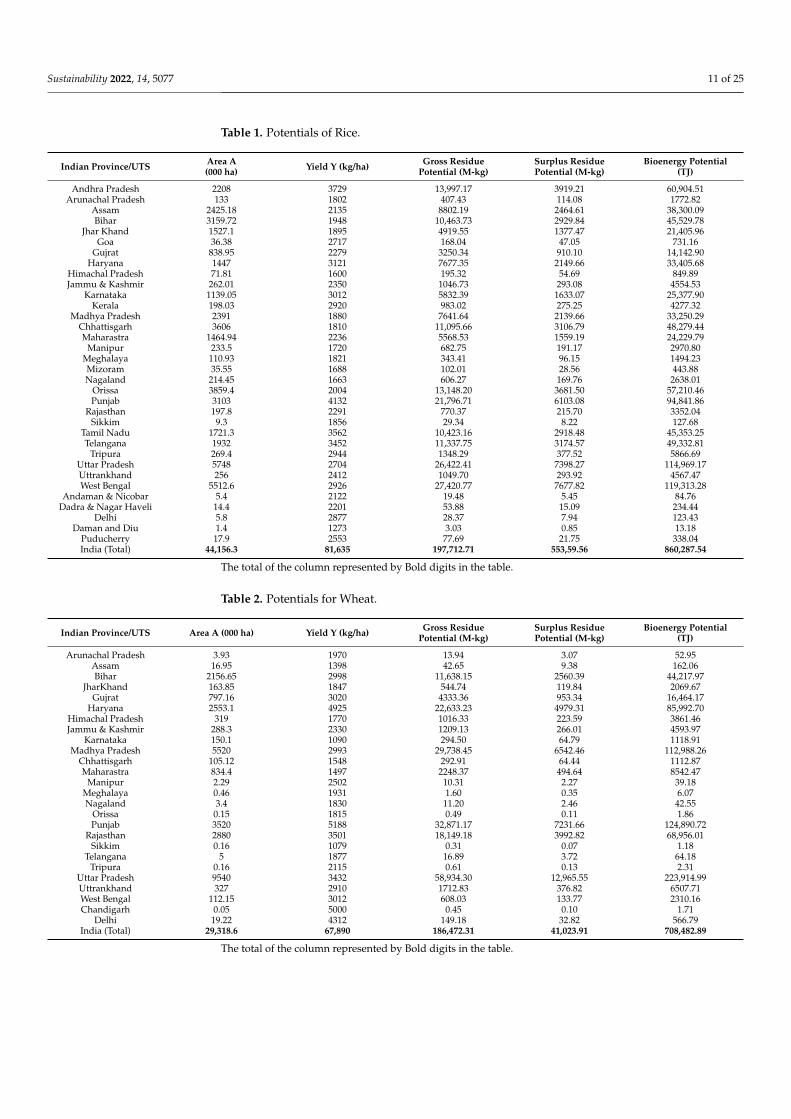
Table 1 presents for the three leading rice production provinces the values for gross residuepotential (M-kg), surplus residue potential (M-kg) and bioenergy potential (TJ), respectively:West Bengal (27,420.77, 7677.82, 119,313.28), Uttar Pradesh (26,422.41, 7398.27, 114,969.17) andPunjab (21,796.71, 6103.08, 94,841.86). Table 2 presents for the three leading wheat producingprovinces the values of gross residue potential (M-kg), surplus residue potential (M-kg) andbioenergy potential (TJ), respectively: Uttar Pradesh (58,934.30, 12,965.55, 223,914.99), Punjab(32,871.17, 7231.66, 124,890.71) and Madhya Pradesh (29,738.45, 6542.46, 112,988.26).
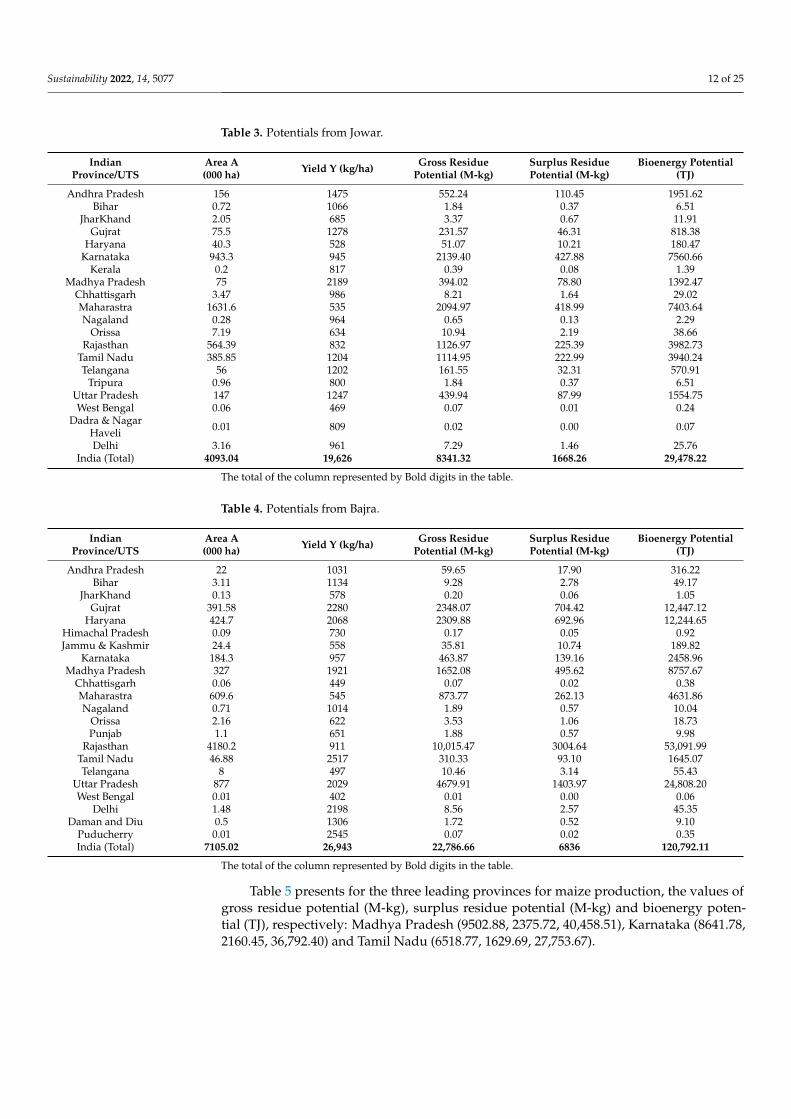
Table 3 presents for the three leading provinces for jowar production the values of grossresidue potential (M-kg), surplus residue potential (M-kg) and bioenergy potential (TJ),respectively: Karnataka (2139.40, 427.88, 7560.66), Maharashtra (2094.97, 418.99, 7403.64)and Rajasthan (1126.97, 225.39, 3982.73). Table 4 presents for the three leading provinces forbajra production, the values of gross residue potential (M-kg), surplus residue potential(M-kg) and bioenergy potential (TJ), respectively: Rajasthan (10,015.47, 3004.64, 53,091.99),Uttar Pradesh (4679.91, 1403.97, 24,808.20) and Gujarat (2348.07, 704.42, 12,447.12).
Sustainability 2022, 14, 5077 11 of 25
Table 1. Potentials of Rice.
Indian Province/UTS Area A(000 ha) Yield Y (kg/ha) Gross Residue
Potential (M-kg)Surplus ResiduePotential (M-kg)
Bioenergy Potential(TJ)
Andhra Pradesh 2208 3729 13,997.17 3919.21 60,904.51Arunachal Pradesh 133 1802 407.43 114.08 1772.82
Assam 2425.18 2135 8802.19 2464.61 38,300.09Bihar 3159.72 1948 10,463.73 2929.84 45,529.78
Jhar Khand 1527.1 1895 4919.55 1377.47 21,405.96Goa 36.38 2717 168.04 47.05 731.16
Gujrat 838.95 2279 3250.34 910.10 14,142.90Haryana 1447 3121 7677.35 2149.66 33,405.68
Himachal Pradesh 71.81 1600 195.32 54.69 849.89Jammu & Kashmir 262.01 2350 1046.73 293.08 4554.53
Karnataka 1139.05 3012 5832.39 1633.07 25,377.90Kerala 198.03 2920 983.02 275.25 4277.32
Madhya Pradesh 2391 1880 7641.64 2139.66 33,250.29Chhattisgarh 3606 1810 11,095.66 3106.79 48,279.44Maharastra 1464.94 2236 5568.53 1559.19 24,229.79
Manipur 233.5 1720 682.75 191.17 2970.80Meghalaya 110.93 1821 343.41 96.15 1494.23Mizoram 35.55 1688 102.01 28.56 443.88Nagaland 214.45 1663 606.27 169.76 2638.01
Orissa 3859.4 2004 13,148.20 3681.50 57,210.46Punjab 3103 4132 21,796.71 6103.08 94,841.86
Rajasthan 197.8 2291 770.37 215.70 3352.04Sikkim 9.3 1856 29.34 8.22 127.68
Tamil Nadu 1721.3 3562 10,423.16 2918.48 45,353.25Telangana 1932 3452 11,337.75 3174.57 49,332.81
Tripura 269.4 2944 1348.29 377.52 5866.69Uttar Pradesh 5748 2704 26,422.41 7398.27 114,969.17Uttrankhand 256 2412 1049.70 293.92 4567.47West Bengal 5512.6 2926 27,420.77 7677.82 119,313.28
Andaman & Nicobar 5.4 2122 19.48 5.45 84.76Dadra & Nagar Haveli 14.4 2201 53.88 15.09 234.44
Delhi 5.8 2877 28.37 7.94 123.43Daman and Diu 1.4 1273 3.03 0.85 13.18
Puducherry 17.9 2553 77.69 21.75 338.04India (Total) 44,156.3 81,635 197,712.71 553,59.56 860,287.54
The total of the column represented by Bold digits in the table.
Table 2. Potentials for Wheat.
Indian Province/UTS Area A (000 ha) Yield Y (kg/ha) Gross ResiduePotential (M-kg)
Surplus ResiduePotential (M-kg)
Bioenergy Potential(TJ)
Arunachal Pradesh 3.93 1970 13.94 3.07 52.95Assam 16.95 1398 42.65 9.38 162.06Bihar 2156.65 2998 11,638.15 2560.39 44,217.97
JharKhand 163.85 1847 544.74 119.84 2069.67Gujrat 797.16 3020 4333.36 953.34 16,464.17
Haryana 2553.1 4925 22,633.23 4979.31 85,992.70Himachal Pradesh 319 1770 1016.33 223.59 3861.46Jammu & Kashmir 288.3 2330 1209.13 266.01 4593.97
Karnataka 150.1 1090 294.50 64.79 1118.91Madhya Pradesh 5520 2993 29,738.45 6542.46 112,988.26
Chhattisgarh 105.12 1548 292.91 64.44 1112.87Maharastra 834.4 1497 2248.37 494.64 8542.47
Manipur 2.29 2502 10.31 2.27 39.18Meghalaya 0.46 1931 1.60 0.35 6.07Nagaland 3.4 1830 11.20 2.46 42.55
Orissa 0.15 1815 0.49 0.11 1.86Punjab 3520 5188 32,871.17 7231.66 124,890.72
Rajasthan 2880 3501 18,149.18 3992.82 68,956.01Sikkim 0.16 1079 0.31 0.07 1.18
Telangana 5 1877 16.89 3.72 64.18Tripura 0.16 2115 0.61 0.13 2.31
Uttar Pradesh 9540 3432 58,934.30 12,965.55 223,914.99Uttrankhand 327 2910 1712.83 376.82 6507.71West Bengal 112.15 3012 608.03 133.77 2310.16Chandigarh 0.05 5000 0.45 0.10 1.71
Delhi 19.22 4312 149.18 32.82 566.79India (Total) 29,318.6 67,890 186,472.31 41,023.91 708,482.89
The total of the column represented by Bold digits in the table.
Sustainability 2022, 14, 5077 12 of 25
Table 3. Potentials from Jowar.
IndianProvince/UTS
Area A(000 ha) Yield Y (kg/ha) Gross Residue
Potential (M-kg)Surplus ResiduePotential (M-kg)
Bioenergy Potential(TJ)
Andhra Pradesh 156 1475 552.24 110.45 1951.62Bihar 0.72 1066 1.84 0.37 6.51
JharKhand 2.05 685 3.37 0.67 11.91Gujrat 75.5 1278 231.57 46.31 818.38
Haryana 40.3 528 51.07 10.21 180.47Karnataka 943.3 945 2139.40 427.88 7560.66
Kerala 0.2 817 0.39 0.08 1.39Madhya Pradesh 75 2189 394.02 78.80 1392.47
Chhattisgarh 3.47 986 8.21 1.64 29.02Maharastra 1631.6 535 2094.97 418.99 7403.64Nagaland 0.28 964 0.65 0.13 2.29
Orissa 7.19 634 10.94 2.19 38.66Rajasthan 564.39 832 1126.97 225.39 3982.73
Tamil Nadu 385.85 1204 1114.95 222.99 3940.24Telangana 56 1202 161.55 32.31 570.91
Tripura 0.96 800 1.84 0.37 6.51Uttar Pradesh 147 1247 439.94 87.99 1554.75West Bengal 0.06 469 0.07 0.01 0.24
Dadra & NagarHaveli 0.01 809 0.02 0.00 0.07
Delhi 3.16 961 7.29 1.46 25.76India (Total) 4093.04 19,626 8341.32 1668.26 29,478.22
The total of the column represented by Bold digits in the table.
Table 4. Potentials from Bajra.
IndianProvince/UTS
Area A(000 ha) Yield Y (kg/ha) Gross Residue
Potential (M-kg)Surplus ResiduePotential (M-kg)
Bioenergy Potential(TJ)
Andhra Pradesh 22 1031 59.65 17.90 316.22Bihar 3.11 1134 9.28 2.78 49.17
JharKhand 0.13 578 0.20 0.06 1.05Gujrat 391.58 2280 2348.07 704.42 12,447.12
Haryana 424.7 2068 2309.88 692.96 12,244.65Himachal Pradesh 0.09 730 0.17 0.05 0.92Jammu & Kashmir 24.4 558 35.81 10.74 189.82
Karnataka 184.3 957 463.87 139.16 2458.96Madhya Pradesh 327 1921 1652.08 495.62 8757.67
Chhattisgarh 0.06 449 0.07 0.02 0.38Maharastra 609.6 545 873.77 262.13 4631.86Nagaland 0.71 1014 1.89 0.57 10.04
Orissa 2.16 622 3.53 1.06 18.73Punjab 1.1 651 1.88 0.57 9.98
Rajasthan 4180.2 911 10,015.47 3004.64 53,091.99Tamil Nadu 46.88 2517 310.33 93.10 1645.07Telangana 8 497 10.46 3.14 55.43
Uttar Pradesh 877 2029 4679.91 1403.97 24,808.20West Bengal 0.01 402 0.01 0.00 0.06
Delhi 1.48 2198 8.56 2.57 45.35Daman and Diu 0.5 1306 1.72 0.52 9.10
Puducherry 0.01 2545 0.07 0.02 0.35India (Total) 7105.02 26,943 22,786.66 6836 120,792.11
The total of the column represented by Bold digits in the table.
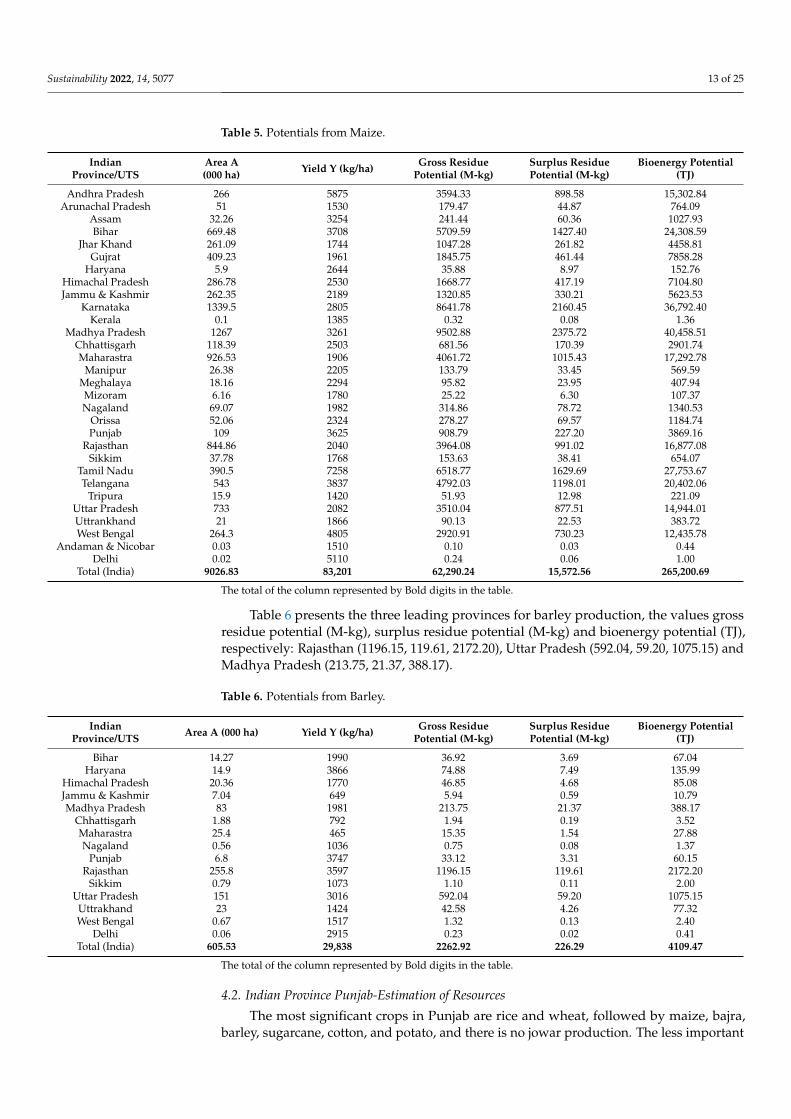
Table 5 presents for the three leading provinces for maize production, the values ofgross residue potential (M-kg), surplus residue potential (M-kg) and bioenergy poten-tial (TJ), respectively: Madhya Pradesh (9502.88, 2375.72, 40,458.51), Karnataka (8641.78,2160.45, 36,792.40) and Tamil Nadu (6518.77, 1629.69, 27,753.67).
Sustainability 2022, 14, 5077 13 of 25
Table 5. Potentials from Maize.
IndianProvince/UTS
Area A(000 ha) Yield Y (kg/ha) Gross Residue
Potential (M-kg)Surplus ResiduePotential (M-kg)
Bioenergy Potential(TJ)
Andhra Pradesh 266 5875 3594.33 898.58 15,302.84Arunachal Pradesh 51 1530 179.47 44.87 764.09
Assam 32.26 3254 241.44 60.36 1027.93Bihar 669.48 3708 5709.59 1427.40 24,308.59
Jhar Khand 261.09 1744 1047.28 261.82 4458.81Gujrat 409.23 1961 1845.75 461.44 7858.28
Haryana 5.9 2644 35.88 8.97 152.76Himachal Pradesh 286.78 2530 1668.77 417.19 7104.80Jammu & Kashmir 262.35 2189 1320.85 330.21 5623.53
Karnataka 1339.5 2805 8641.78 2160.45 36,792.40Kerala 0.1 1385 0.32 0.08 1.36
Madhya Pradesh 1267 3261 9502.88 2375.72 40,458.51Chhattisgarh 118.39 2503 681.56 170.39 2901.74Maharastra 926.53 1906 4061.72 1015.43 17,292.78
Manipur 26.38 2205 133.79 33.45 569.59Meghalaya 18.16 2294 95.82 23.95 407.94Mizoram 6.16 1780 25.22 6.30 107.37Nagaland 69.07 1982 314.86 78.72 1340.53
Orissa 52.06 2324 278.27 69.57 1184.74Punjab 109 3625 908.79 227.20 3869.16
Rajasthan 844.86 2040 3964.08 991.02 16,877.08Sikkim 37.78 1768 153.63 38.41 654.07
Tamil Nadu 390.5 7258 6518.77 1629.69 27,753.67Telangana 543 3837 4792.03 1198.01 20,402.06
Tripura 15.9 1420 51.93 12.98 221.09Uttar Pradesh 733 2082 3510.04 877.51 14,944.01Uttrankhand 21 1866 90.13 22.53 383.72West Bengal 264.3 4805 2920.91 730.23 12,435.78
Andaman & Nicobar 0.03 1510 0.10 0.03 0.44Delhi 0.02 5110 0.24 0.06 1.00
Total (India) 9026.83 83,201 62,290.24 15,572.56 265,200.69
The total of the column represented by Bold digits in the table.
Table 6 presents the three leading provinces for barley production, the values grossresidue potential (M-kg), surplus residue potential (M-kg) and bioenergy potential (TJ),respectively: Rajasthan (1196.15, 119.61, 2172.20), Uttar Pradesh (592.04, 59.20, 1075.15) andMadhya Pradesh (213.75, 21.37, 388.17).
Table 6. Potentials from Barley.
IndianProvince/UTS Area A (000 ha) Yield Y (kg/ha) Gross Residue
Potential (M-kg)Surplus ResiduePotential (M-kg)
Bioenergy Potential(TJ)
Bihar 14.27 1990 36.92 3.69 67.04Haryana 14.9 3866 74.88 7.49 135.99
Himachal Pradesh 20.36 1770 46.85 4.68 85.08Jammu & Kashmir 7.04 649 5.94 0.59 10.79Madhya Pradesh 83 1981 213.75 21.37 388.17
Chhattisgarh 1.88 792 1.94 0.19 3.52Maharastra 25.4 465 15.35 1.54 27.88Nagaland 0.56 1036 0.75 0.08 1.37
Punjab 6.8 3747 33.12 3.31 60.15Rajasthan 255.8 3597 1196.15 119.61 2172.20
Sikkim 0.79 1073 1.10 0.11 2.00Uttar Pradesh 151 3016 592.04 59.20 1075.15
Uttrakhand 23 1424 42.58 4.26 77.32West Bengal 0.67 1517 1.32 0.13 2.40
Delhi 0.06 2915 0.23 0.02 0.41Total (India) 605.53 29,838 2262.92 226.29 4109.47
The total of the column represented by Bold digits in the table.
4.2. Indian Province Punjab-Estimation of Resources
The most significant crops in Punjab are rice and wheat, followed by maize, bajra,barley, sugarcane, cotton, and potato, and there is no jowar production. The less important
Sustainability 2022, 14, 5077 14 of 25
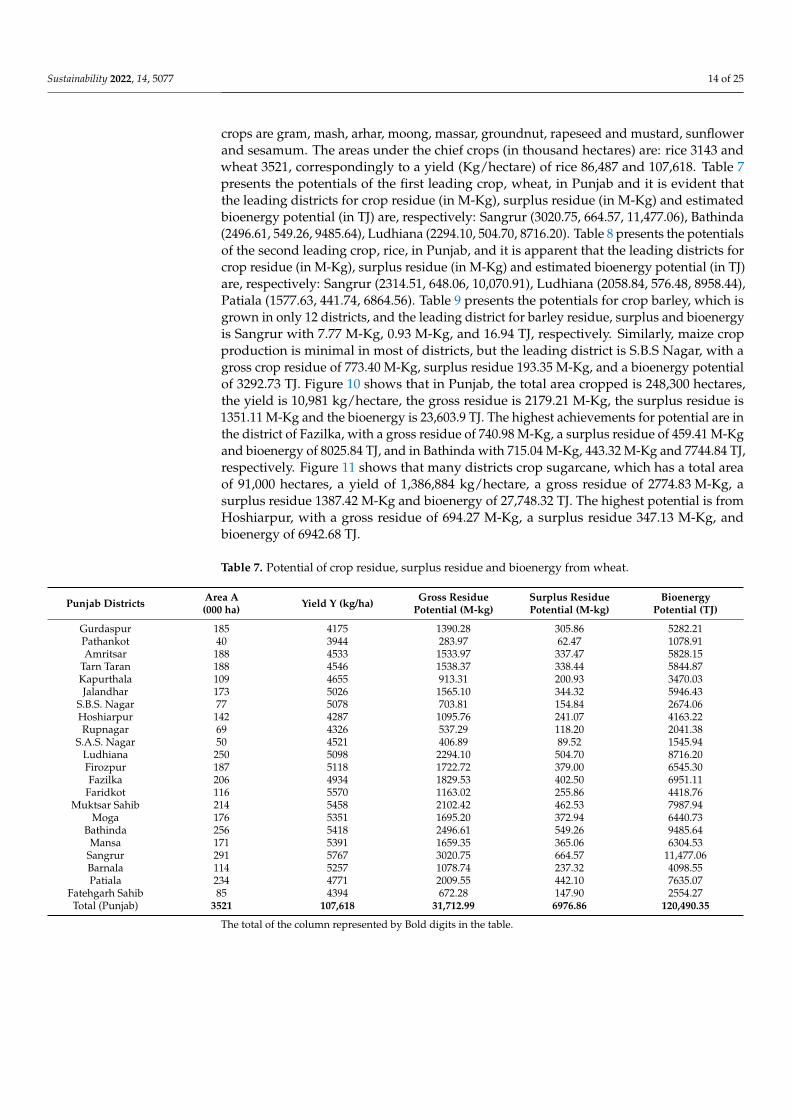
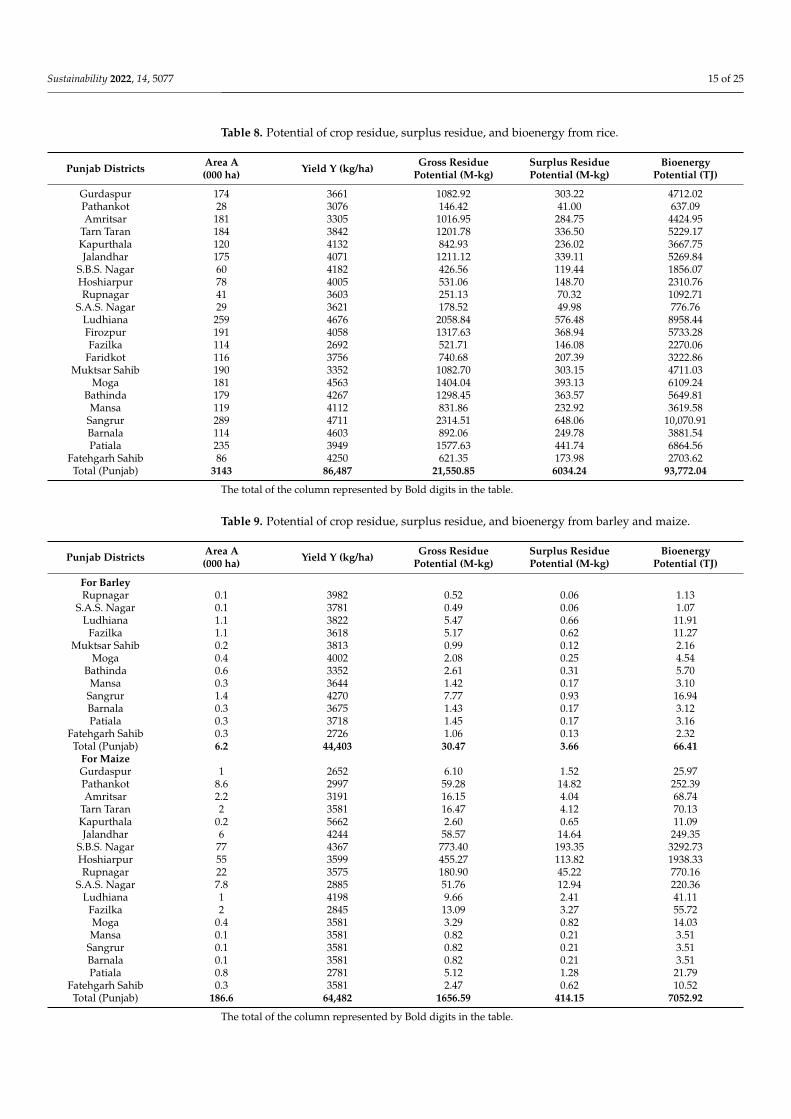
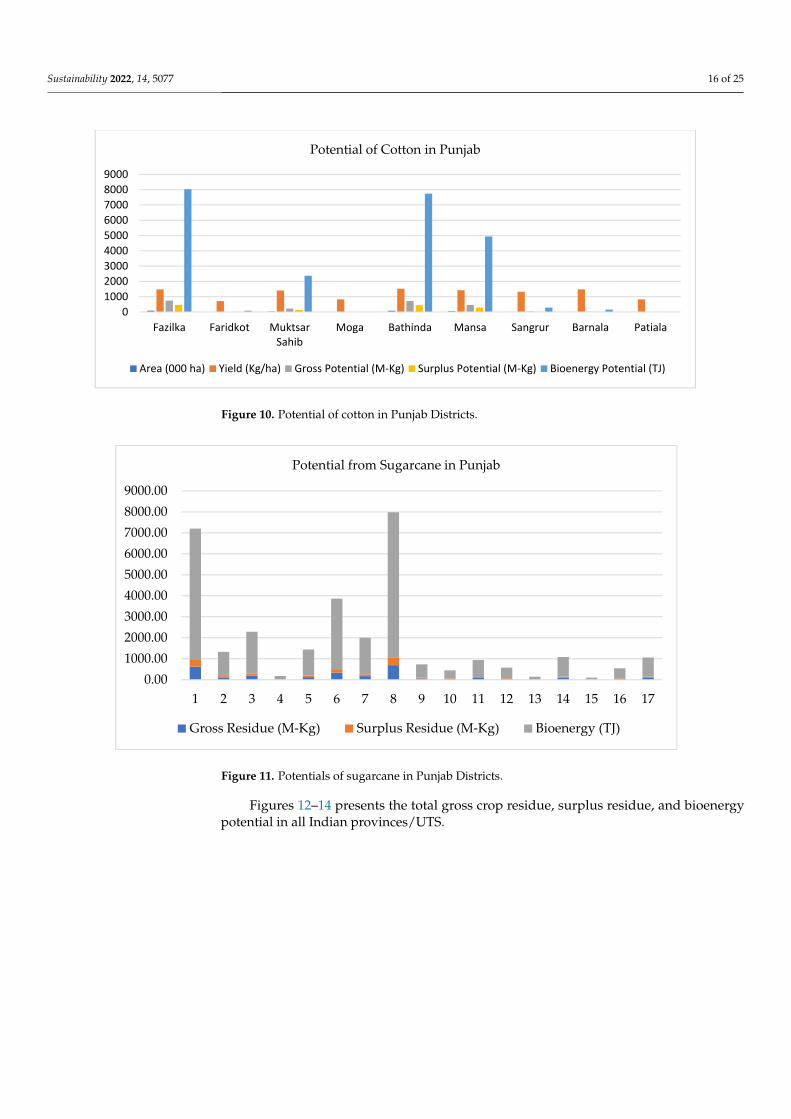
crops are gram, mash, arhar, moong, massar, groundnut, rapeseed and mustard, sunflowerand sesamum. The areas under the chief crops (in thousand hectares) are: rice 3143 andwheat 3521, correspondingly to a yield (Kg/hectare) of rice 86,487 and 107,618. Table 7presents the potentials of the first leading crop, wheat, in Punjab and it is evident thatthe leading districts for crop residue (in M-Kg), surplus residue (in M-Kg) and estimatedbioenergy potential (in TJ) are, respectively: Sangrur (3020.75, 664.57, 11,477.06), Bathinda(2496.61, 549.26, 9485.64), Ludhiana (2294.10, 504.70, 8716.20). Table 8 presents the potentialsof the second leading crop, rice, in Punjab, and it is apparent that the leading districts forcrop residue (in M-Kg), surplus residue (in M-Kg) and estimated bioenergy potential (in TJ)are, respectively: Sangrur (2314.51, 648.06, 10,070.91), Ludhiana (2058.84, 576.48, 8958.44),Patiala (1577.63, 441.74, 6864.56). Table 9 presents the potentials for crop barley, which isgrown in only 12 districts, and the leading district for barley residue, surplus and bioenergyis Sangrur with 7.77 M-Kg, 0.93 M-Kg, and 16.94 TJ, respectively. Similarly, maize cropproduction is minimal in most of districts, but the leading district is S.B.S Nagar, with agross crop residue of 773.40 M-Kg, surplus residue 193.35 M-Kg, and a bioenergy potentialof 3292.73 TJ. Figure 10 shows that in Punjab, the total area cropped is 248,300 hectares,the yield is 10,981 kg/hectare, the gross residue is 2179.21 M-Kg, the surplus residue is1351.11 M-Kg and the bioenergy is 23,603.9 TJ. The highest achievements for potential are inthe district of Fazilka, with a gross residue of 740.98 M-Kg, a surplus residue of 459.41 M-Kgand bioenergy of 8025.84 TJ, and in Bathinda with 715.04 M-Kg, 443.32 M-Kg and 7744.84 TJ,respectively. Figure 11 shows that many districts crop sugarcane, which has a total areaof 91,000 hectares, a yield of 1,386,884 kg/hectare, a gross residue of 2774.83 M-Kg, asurplus residue 1387.42 M-Kg and bioenergy of 27,748.32 TJ. The highest potential is fromHoshiarpur, with a gross residue of 694.27 M-Kg, a surplus residue 347.13 M-Kg, andbioenergy of 6942.68 TJ.
Table 7. Potential of crop residue, surplus residue and bioenergy from wheat.
Punjab Districts Area A(000 ha) Yield Y (kg/ha) Gross Residue
Potential (M-kg)Surplus ResiduePotential (M-kg)
BioenergyPotential (TJ)
Gurdaspur 185 4175 1390.28 305.86 5282.21Pathankot 40 3944 283.97 62.47 1078.91Amritsar 188 4533 1533.97 337.47 5828.15
Tarn Taran 188 4546 1538.37 338.44 5844.87Kapurthala 109 4655 913.31 200.93 3470.03Jalandhar 173 5026 1565.10 344.32 5946.43
S.B.S. Nagar 77 5078 703.81 154.84 2674.06Hoshiarpur 142 4287 1095.76 241.07 4163.22Rupnagar 69 4326 537.29 118.20 2041.38
S.A.S. Nagar 50 4521 406.89 89.52 1545.94Ludhiana 250 5098 2294.10 504.70 8716.20Firozpur 187 5118 1722.72 379.00 6545.30Fazilka 206 4934 1829.53 402.50 6951.11
Faridkot 116 5570 1163.02 255.86 4418.76Muktsar Sahib 214 5458 2102.42 462.53 7987.94
Moga 176 5351 1695.20 372.94 6440.73Bathinda 256 5418 2496.61 549.26 9485.64
Mansa 171 5391 1659.35 365.06 6304.53Sangrur 291 5767 3020.75 664.57 11,477.06Barnala 114 5257 1078.74 237.32 4098.55Patiala 234 4771 2009.55 442.10 7635.07
Fatehgarh Sahib 85 4394 672.28 147.90 2554.27Total (Punjab) 3521 107,618 31,712.99 6976.86 120,490.35
The total of the column represented by Bold digits in the table.
Sustainability 2022, 14, 5077 15 of 25
Table 8. Potential of crop residue, surplus residue, and bioenergy from rice.
Punjab Districts Area A(000 ha) Yield Y (kg/ha) Gross Residue
Potential (M-kg)Surplus ResiduePotential (M-kg)
BioenergyPotential (TJ)
Gurdaspur 174 3661 1082.92 303.22 4712.02Pathankot 28 3076 146.42 41.00 637.09Amritsar 181 3305 1016.95 284.75 4424.95
Tarn Taran 184 3842 1201.78 336.50 5229.17Kapurthala 120 4132 842.93 236.02 3667.75Jalandhar 175 4071 1211.12 339.11 5269.84
S.B.S. Nagar 60 4182 426.56 119.44 1856.07Hoshiarpur 78 4005 531.06 148.70 2310.76Rupnagar 41 3603 251.13 70.32 1092.71
S.A.S. Nagar 29 3621 178.52 49.98 776.76Ludhiana 259 4676 2058.84 576.48 8958.44Firozpur 191 4058 1317.63 368.94 5733.28Fazilka 114 2692 521.71 146.08 2270.06
Faridkot 116 3756 740.68 207.39 3222.86Muktsar Sahib 190 3352 1082.70 303.15 4711.03
Moga 181 4563 1404.04 393.13 6109.24Bathinda 179 4267 1298.45 363.57 5649.81
Mansa 119 4112 831.86 232.92 3619.58Sangrur 289 4711 2314.51 648.06 10,070.91Barnala 114 4603 892.06 249.78 3881.54Patiala 235 3949 1577.63 441.74 6864.56
Fatehgarh Sahib 86 4250 621.35 173.98 2703.62Total (Punjab) 3143 86,487 21,550.85 6034.24 93,772.04
The total of the column represented by Bold digits in the table.
Table 9. Potential of crop residue, surplus residue, and bioenergy from barley and maize.
Punjab Districts Area A(000 ha) Yield Y (kg/ha) Gross Residue
Potential (M-kg)Surplus ResiduePotential (M-kg)
BioenergyPotential (TJ)
For BarleyRupnagar 0.1 3982 0.52 0.06 1.13
S.A.S. Nagar 0.1 3781 0.49 0.06 1.07Ludhiana 1.1 3822 5.47 0.66 11.91
Fazilka 1.1 3618 5.17 0.62 11.27Muktsar Sahib 0.2 3813 0.99 0.12 2.16
Moga 0.4 4002 2.08 0.25 4.54Bathinda 0.6 3352 2.61 0.31 5.70
Mansa 0.3 3644 1.42 0.17 3.10Sangrur 1.4 4270 7.77 0.93 16.94Barnala 0.3 3675 1.43 0.17 3.12Patiala 0.3 3718 1.45 0.17 3.16
Fatehgarh Sahib 0.3 2726 1.06 0.13 2.32Total (Punjab) 6.2 44,403 30.47 3.66 66.41
For MaizeGurdaspur 1 2652 6.10 1.52 25.97Pathankot 8.6 2997 59.28 14.82 252.39Amritsar 2.2 3191 16.15 4.04 68.74
Tarn Taran 2 3581 16.47 4.12 70.13Kapurthala 0.2 5662 2.60 0.65 11.09Jalandhar 6 4244 58.57 14.64 249.35
S.B.S. Nagar 77 4367 773.40 193.35 3292.73Hoshiarpur 55 3599 455.27 113.82 1938.33Rupnagar 22 3575 180.90 45.22 770.16
S.A.S. Nagar 7.8 2885 51.76 12.94 220.36Ludhiana 1 4198 9.66 2.41 41.11
Fazilka 2 2845 13.09 3.27 55.72Moga 0.4 3581 3.29 0.82 14.03Mansa 0.1 3581 0.82 0.21 3.51
Sangrur 0.1 3581 0.82 0.21 3.51Barnala 0.1 3581 0.82 0.21 3.51Patiala 0.8 2781 5.12 1.28 21.79
Fatehgarh Sahib 0.3 3581 2.47 0.62 10.52Total (Punjab) 186.6 64,482 1656.59 414.15 7052.92
The total of the column represented by Bold digits in the table.
Sustainability 2022, 14, 5077 16 of 25Sustainability 2022, 14, x FOR PEER REVIEW 18 of 27
Figure 10. Potential of cotton in Punjab Districts.
Figure 11. Potentials of sugarcane in Punjab Districts.
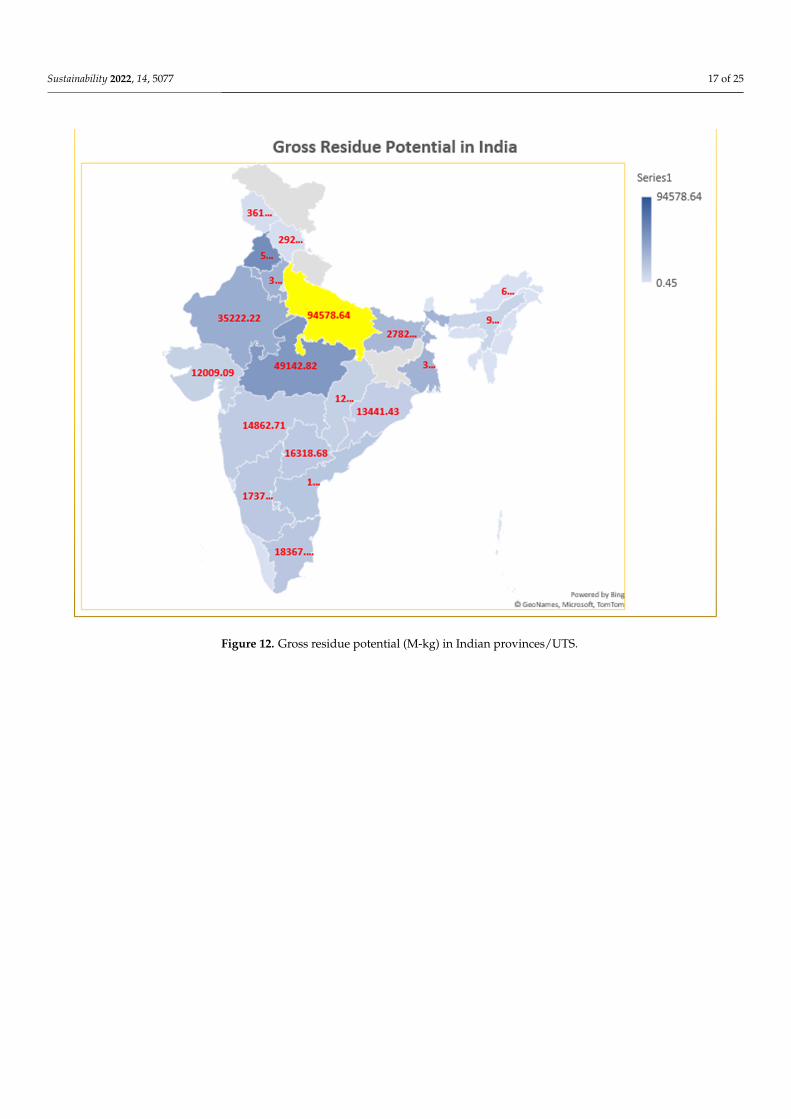
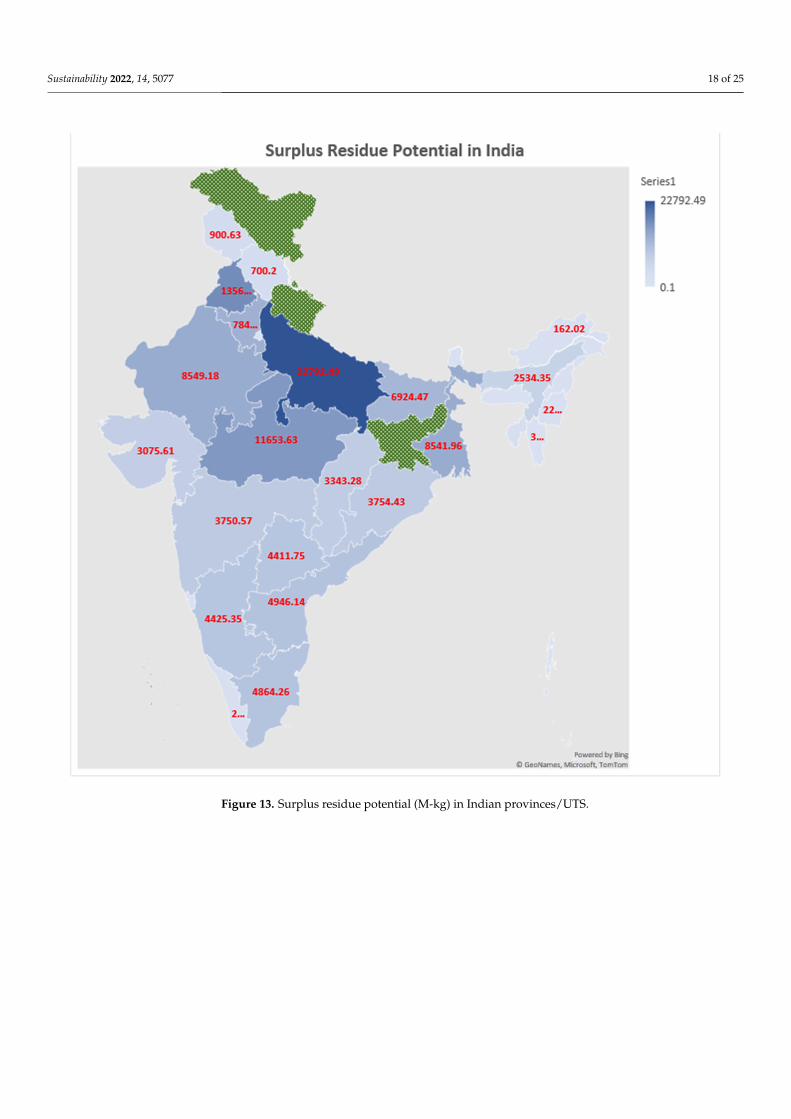
Figures 12–14 presents the total gross crop residue, surplus residue, and bioenergy potential in all Indian provinces/UTS.
0100020003000400050006000700080009000
Fazilka Faridkot MuktsarSahib
Moga Bathinda Mansa Sangrur Barnala Patiala
Potential of Cotton in Punjab
Area (000 ha) Yield (Kg/ha) Gross Potential (M-Kg) Surplus Potential (M-Kg) Bioenergy Potential (TJ)
0.001000.002000.003000.004000.005000.006000.007000.008000.009000.00
1 2 3 4 5 6 7 8 9 10 11 12 13 14 15 16 17
Potential from Sugarcane in Punjab
Gross Residue (M-Kg) Surplus Residue (M-Kg) Bioenergy (TJ)
Figure 10. Potential of cotton in Punjab Districts.
Sustainability 2022, 14, x FOR PEER REVIEW 18 of 27
Figure 10. Potential of cotton in Punjab Districts.
Figure 11. Potentials of sugarcane in Punjab Districts.
Figures 12–14 presents the total gross crop residue, surplus residue, and bioenergy potential in all Indian provinces/UTS.
0100020003000400050006000700080009000
Fazilka Faridkot MuktsarSahib
Moga Bathinda Mansa Sangrur Barnala Patiala
Potential of Cotton in Punjab
Area (000 ha) Yield (Kg/ha) Gross Potential (M-Kg) Surplus Potential (M-Kg) Bioenergy Potential (TJ)
0.001000.002000.003000.004000.005000.006000.007000.008000.009000.00
1 2 3 4 5 6 7 8 9 10 11 12 13 14 15 16 17
Potential from Sugarcane in Punjab
Gross Residue (M-Kg) Surplus Residue (M-Kg) Bioenergy (TJ)
Figure 11. Potentials of sugarcane in Punjab Districts.
Figures 12–14 presents the total gross crop residue, surplus residue, and bioenergypotential in all Indian provinces/UTS.
Sustainability 2022, 14, 5077 17 of 25Sustainability 2022, 14, x FOR PEER REVIEW 19 of 27
Figure 12. Gross residue potential (M-kg) in Indian provinces/UTS. Figure 12. Gross residue potential (M-kg) in Indian provinces/UTS.
Sustainability 2022, 14, 5077 18 of 25Sustainability 2022, 14, x FOR PEER REVIEW 20 of 27
Figure 13. Surplus residue potential (M-kg) in Indian provinces/UTS. Figure 13. Surplus residue potential (M-kg) in Indian provinces/UTS.
Sustainability 2022, 14, 5077 19 of 25Sustainability 2022, 14, x FOR PEER REVIEW 21 of 27
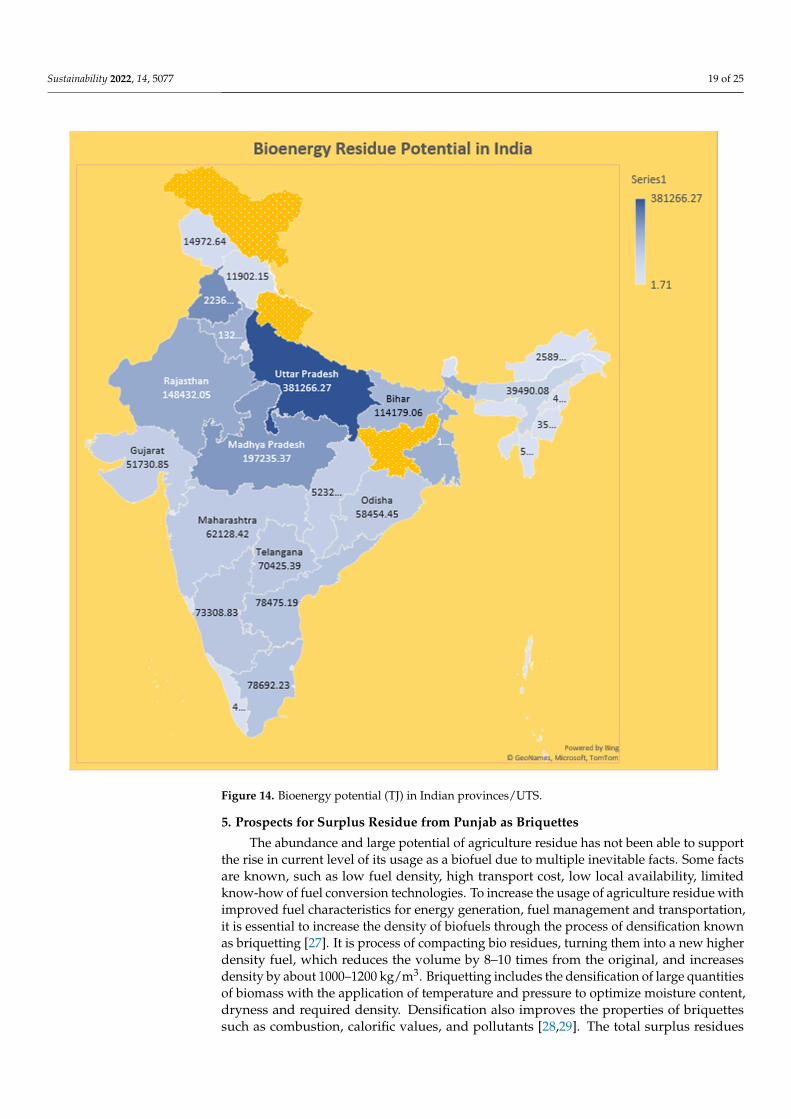
Figure 14. Bioenergy potential (TJ) in Indian provinces/UTS.
5. Prospects for Surplus Residue from Punjab as Briquettes The abundance and large potential of agriculture residue has not been able to support
the rise in current level of its usage as a biofuel due to multiple inevitable facts. Some facts are known, such as low fuel density, high transport cost, low local availability, limited know-how of fuel conversion technologies. To increase the usage of agriculture residue with improved fuel characteristics for energy generation, fuel management and transpor-tation, it is essential to increase the density of biofuels through the process of densification known as briquetting [27]. It is process of compacting bio residues, turning them into a new higher density fuel, which reduces the volume by 8–10 times from the original, and increases density by about 1000–1200 kg/m3. Briquetting includes the densification of large quantities of biomass with the application of temperature and pressure to optimize mois-ture content, dryness and required density. Densification also improves the properties of briquettes such as combustion, calorific values, and pollutants [28,29]. The total surplus residues from wheat as straw is 6034.24 M-Kg, from rice, as straw and husks, total 6034.24
Figure 14. Bioenergy potential (TJ) in Indian provinces/UTS.
5. Prospects for Surplus Residue from Punjab as Briquettes
The abundance and large potential of agriculture residue has not been able to supportthe rise in current level of its usage as a biofuel due to multiple inevitable facts. Some factsare known, such as low fuel density, high transport cost, low local availability, limitedknow-how of fuel conversion technologies. To increase the usage of agriculture residue withimproved fuel characteristics for energy generation, fuel management and transportation,it is essential to increase the density of biofuels through the process of densification knownas briquetting [27]. It is process of compacting bio residues, turning them into a new higherdensity fuel, which reduces the volume by 8–10 times from the original, and increasesdensity by about 1000–1200 kg/m3. Briquetting includes the densification of large quantitiesof biomass with the application of temperature and pressure to optimize moisture content,dryness and required density. Densification also improves the properties of briquettessuch as combustion, calorific values, and pollutants [28,29]. The total surplus residues
Sustainability 2022, 14, 5077 20 of 25
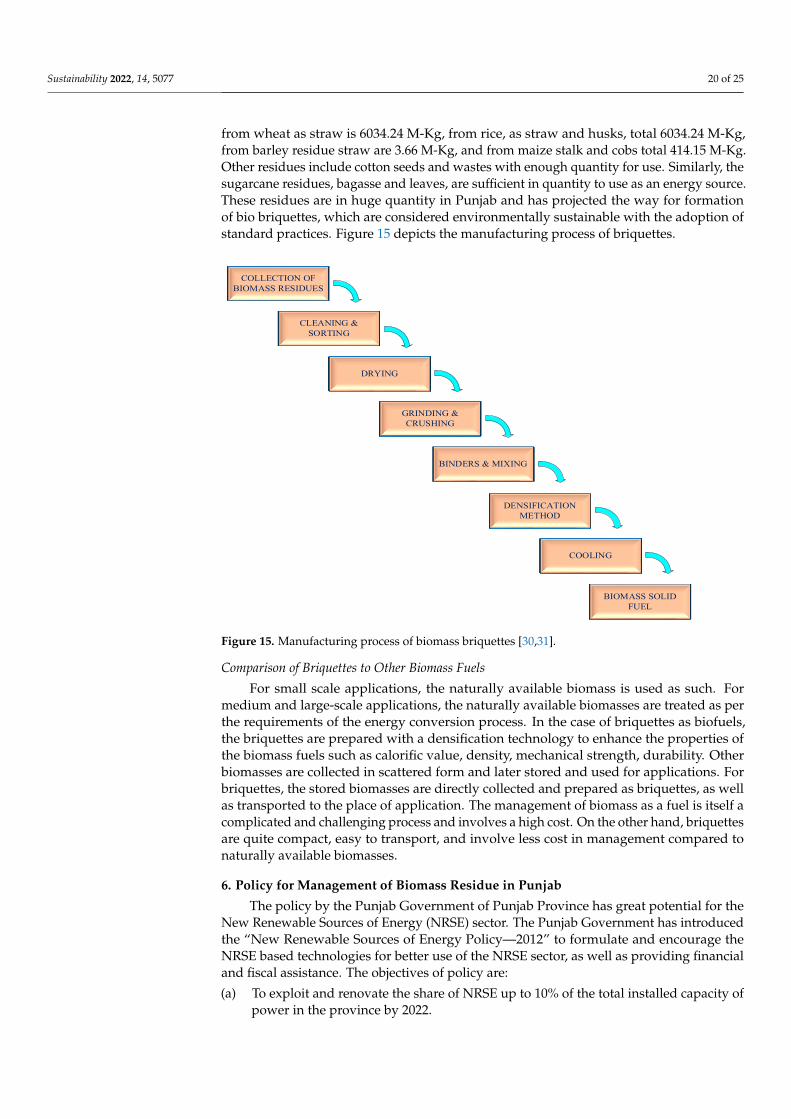
from wheat as straw is 6034.24 M-Kg, from rice, as straw and husks, total 6034.24 M-Kg,from barley residue straw are 3.66 M-Kg, and from maize stalk and cobs total 414.15 M-Kg.Other residues include cotton seeds and wastes with enough quantity for use. Similarly, thesugarcane residues, bagasse and leaves, are sufficient in quantity to use as an energy source.These residues are in huge quantity in Punjab and has projected the way for formationof bio briquettes, which are considered environmentally sustainable with the adoption ofstandard practices. Figure 15 depicts the manufacturing process of briquettes.
Sustainability 2022, 14, x FOR PEER REVIEW 22 of 27
M-Kg, from barley residue straw are 3.66 M-Kg, and from maize stalk and cobs total 414.15 M-Kg. Other residues include cotton seeds and wastes with enough quantity for use. Sim-ilarly, the sugarcane residues, bagasse and leaves, are sufficient in quantity to use as an energy source. These residues are in huge quantity in Punjab and has projected the way for formation of bio briquettes, which are considered environmentally sustainable with the adoption of standard practices. Figure 15 depicts the manufacturing process of bri-quettes.
COLLECTION OFBIOMASS RESIDUES
CLEANING & SORTING
DRYING
GRINDING & CRUSHING
DENSIFICATION METHOD
COOLING
BINDERS & MIXING
BIOMASS SOLID FUEL
Figure 15. Manufacturing process of biomass briquettes [30,31].
Comparison of Briquettes to Other Biomass Fuels For small scale applications, the naturally available biomass is used as such. For me-
dium and large-scale applications, the naturally available biomasses are treated as per the requirements of the energy conversion process. In the case of briquettes as biofuels, the briquettes are prepared with a densification technology to enhance the properties of the biomass fuels such as calorific value, density, mechanical strength, durability. Other bio-masses are collected in scattered form and later stored and used for applications. For bri-quettes, the stored biomasses are directly collected and prepared as briquettes, as well as transported to the place of application. The management of biomass as a fuel is itself a complicated and challenging process and involves a high cost. On the other hand, bri-quettes are quite compact, easy to transport, and involve less cost in management com-pared to naturally available biomasses.
6. Policy for Management of Biomass Residue in Punjab The policy by the Punjab Government of Punjab Province has great potential for the
New Renewable Sources of Energy (NRSE) sector. The Punjab Government has intro-duced the “New Renewable Sources of Energy Policy—2012” to formulate and encourage the NRSE based technologies for better use of the NRSE sector, as well as providing finan-cial and fiscal assistance. The objectives of policy are: (a) To exploit and renovate the share of NRSE up to 10% of the total installed capacity
of power in the province by 2022.
Figure 15. Manufacturing process of biomass briquettes [30,31].
Comparison of Briquettes to Other Biomass Fuels
For small scale applications, the naturally available biomass is used as such. Formedium and large-scale applications, the naturally available biomasses are treated as perthe requirements of the energy conversion process. In the case of briquettes as biofuels,the briquettes are prepared with a densification technology to enhance the properties ofthe biomass fuels such as calorific value, density, mechanical strength, durability. Otherbiomasses are collected in scattered form and later stored and used for applications. Forbriquettes, the stored biomasses are directly collected and prepared as briquettes, as wellas transported to the place of application. The management of biomass as a fuel is itself acomplicated and challenging process and involves a high cost. On the other hand, briquettesare quite compact, easy to transport, and involve less cost in management compared tonaturally available biomasses.
6. Policy for Management of Biomass Residue in Punjab
The policy by the Punjab Government of Punjab Province has great potential for theNew Renewable Sources of Energy (NRSE) sector. The Punjab Government has introducedthe “New Renewable Sources of Energy Policy—2012” to formulate and encourage theNRSE based technologies for better use of the NRSE sector, as well as providing financialand fiscal assistance. The objectives of policy are:
(a) To exploit and renovate the share of NRSE up to 10% of the total installed capacity ofpower in the province by 2022.
Sustainability 2022, 14, 5077 21 of 25
(b) To encourage renewable energy initiatives for attaining energy/lighting requirementsin rural areas and accompanying energy requirements in urban, industrial, andcommercial sectors.
The various polices enacted by Government to promote biomass waste/residue uti-lization for power generation are as follows:
• Punjab is an agricultural state that is highly capable of generating power from agricul-tural waste (Residues) such as cotton stalks, paddy straw, paddy husk etc. Due to this,the target of approximately 600 MW power generation through agricultural wastes isplanned to be achieved by 2022.
• The installation of cogeneration-based (both bagasse and non-bagasse) power plantsof capacity targets near about 500 MW is set for the year of 2022.
• Biomass IPP Project—wheat and paddy are the dominant crops in the Punjab agricul-tural sector. It is estimated that approximately 10 million tonnes of paddy straws aregenerated during the season. The production of large quantity of surplus residue (agrowastes) and industrial processed waste can be used for generation of decentralizedpower. Due to this, a target of approximately 600 MW power generation throughagricultural wastes is planned to be achieved by 2022.
• Energy plantations based small capacity biomass plants—Punjab state has areas ofwastelands and non-forest, which can be used for specific plantations of fast-growing,high yielding, plant species (e.g., Bambusa balcooa, Melia dubia etc.). Also, Lantana isavailable in forests and is encouraged for the biomass plants. These small capacityprojects up to 2 MW can be set up in technology neutral mode.
• Rice mills integrated small capacity biomass plants—rice mills, introduced as smallcapacity biomass plants in Independent Power Plan (IPP) mode that have about5 MW capacity shall be permitted to be setup with due approval of the PEDA with thecondition that at least 25% of the biomass used has to be rice straw. Rice mills that have4 TPH capacity shall be permitted to set up an about 1 MW capacity biomass plant.Rice mills of about 20 TPH and more shall be permitted to set up a 5 MW capacitybiomass plant. These small capacity projects can be set up in technology neutral modeand will not infringe upon the command area of the biomass IPP projects.
• Co-generation—Punjab state has a recognized industrial base, which is growing, andcogeneration plants have evidenced to be greatly advantageous for the industries.The sugar, paper, fertilizer, chemical, textile and other industries are still having anestimated combined potential of 500 MW, which is still to be realized. It is planned tostimulate the industry to set up co-generation plants and accomplish capacity nearabout 500 MW by 2022. These projects shall meet the qualifying criteria under atopping cycle as per CERC regulations.
• The project designers/developers are invited by Punjab Energy Development Agency(PEDA) to install biomass power plants fully dependent on use of 100% rice straw.
The various types of policy and encouragements are initiated by the central andstate governments to manage the enormous amount of biomass residues in the country.The Central Authority of India passed a policy advisory for usage of biomass residues toproduce power through a co-firing process in pulverized coal-fired boilers.
• For the implementation of this policy, all power-generating companies (public as wellas private power utility) that have pulverized coal plants or coal-based thermal powerplants are suggested to use 5% to 10% amalgam of primarily agricultural residues andbiomass residue pellets along with coal.
• The requirement of biomass residue pellets is estimated at about 146,498 tonnes. Thisincludes 53.5 million tonnes biomass crop residue annually.
• The present scenario of available biomass residues is about 750 million metric tonnesper year. Whereas the availability of agricultural biomass residues is estimated at230 million metric tonnes annually [32,33].
Sustainability 2022, 14, 5077 22 of 25
The use of biomass residues in the thermal power plant in Punjab is depicted inTable 10 [26]. There is still use of biomass residues in the thermal power plant in Punjabprovince. Even with such concrete initiatives, there is still a requirement for implementingthe innovative policy and a programme for management of biomass residues. Additionally,there is a need to promote an awareness to stimulate the private investments for the tradingof biomass residues and its collection process.
Table 10. Utilization of biomass residues in the thermal power plants.
Thermal Power Plants Installed Capacity (MW) Utilization of CropResidues (Tonnes)
Guru Gobind Singh Super Thermal Plant, Ropar 1260.00 346,500.00Guru Hargobind Thermal Power Plant, Lehra
Mohabbat, Bathinda 920.00 253,000.00
Guru Nanak Dev Thermal Power Plant, Bathinda 460.00 126,500.00
7. Discussion
Being an agricultural country, India has plenty of biomass resources and, subsequently,biomass residues, which can further act as biofuels. For the estimation of surplus cropresidues, the significant crops rice, wheat, jowar, bajra, maize and barley were considered.Those states that have crops either in much less quantity or where data was unavailable,were not considered in this study. The leading crop residues are from rice and wheat,followed by bajra, maize, jowar and barley. The top ten leading provinces for cumulativesurplus crop residues in India (in M-kg) were Uttar Pradesh (22,792.49), Punjab (13,565.82),Madhya Pradesh (11,653.63), Rajasthan (8549.18), West Bengal (8541.96), Haryana (7848.60)Bihar (6924.47), Andhra Pradesh (4952.85), Tamil Nadu (4864.26), and Karnataka (4425.35).The data show evidence of bulk surplus being available for multiple applications and alsoenergy generation. The second leading province for surplus crop residue, Punjab, has acumulative surplus residue from all significant crops of 13,428.91 M-kg, and the prominenttop five contributor districts were Sangrur (1313.77), Ludhiana (1084.25), Bathinda (913.14),Patiala (885.29), and Moga (767.14). This immense potential for surplus crops in thesedistricts is enabling the production of bio briquettes fuels, which have high heating valuesand high density. The data for surplus crops were collected by using standard researchprocedures like interviews of farmers, questionnaires, GIS, or government organizations.The use of these surplus crops are for small power generation applications, domesticapplications nowadays with briquettes and pellets. Biomass power generations at thecountry level are already in operation but contributions are minimal. The valid reasonsfor the lesser contributions are non-availability of factual surplus biomass data to enableconcrete policy planning and later implementation. In general, only 10–20% of surplusresidue is used for applications. The limitations of these applications are a lack of policy,financial assistance, and skilled staff.
8. Conclusions
The study concluded that India has abundant crop residues that are used for severalapplications, and even after use, abundant residues are available and considered as waste.Estimation of gross crop residue and surplus crop residue in this study show that cumula-tive gross crop residue in India is 480 M-tonnes and the cumulative surplus crop residue is121 M-tonnes, or remarkably 25.15% of the gross crop residue. The total geographical areaof country is 328,726 thousand hectares and area under significant crops is 94,305 thousandhectares (29%). This abundant potential has immense capability to contribute to powergeneration applications and increase the total installed capacity of renewable sources inthe country. The present study analyses and estimates the surplus potential sources ofenergy, which are otherwise considered waste, and shows data that should be a motivationto strengthen the installed power capacity of the country.
Sustainability 2022, 14, 5077 23 of 25
Author Contributions: Conceptualization and methodology of the study—S.V. and G.K. Scientificimplementation—N.K.S. and G.K. Original draft preparation—S.V. and G.K. Review, editing andvisualization—N.G. All authors have read and agreed to the published version of the manuscript.
Funding: This research and study was funded and supported by a fellowship to Sunny Vaish as aPhD research scholar of IKGPTU Jalandhar, India under All India Council of Technical EducationAICTE Doctoral Fellowship.
Institutional Review Board Statement: Not applicable.
Informed Consent Statement: Not applicable.
Data Availability Statement: The data presented in this study are available from the correspondingauthor upon a reasonable request.
Acknowledgments: Author are highly thankful to I.K. Gujral Punjab Technical University, Jalandhar,India for all technical and academic support. Thanks are due to officials of Sardar Swaran SinghNational Institute of Bioenergy, Kapurthala India for lab facilities. We thank the faculty of Departmentof Electrical Engineering, IKGPTU Jalandhar for the academic environment to successfully completethis study.
Conflicts of Interest: The authors declare no conflict of interest.
AbbreviationMW MegawattBU Billion UnitsRES Renewable Energy SourcesGW Giga WattUTs Union TerritoriesMNRE Ministry of New and Renewable EnergyMT Million Tonneskg Kilogramkg/ha Kilogram per hectare‘000’ ha Thousand hectareMJ/kg Mega Joule per KilogramTJ Tera JouleM-kg Million KilogramPEDA Punjab Energy Development Agency
CRg (j)Gross Crop Residue Potential at jth province intonnes
n Number of cropsCRs (j) Surplus Residue Potential at jth state in tonnes
SF (i, j)Surplus Residue Fraction of ith crop at jthprovince
A(i, j) Area under ith crop at jth provinceY(i, j) Yield of ith crop at jth province
RPR (i, j)Residue to Production Ratio within ith crop atjth province
E(j)Bioenergy Potential of n crops at jth province inMega Joule
HVHeating Value of ith crop at jth province, MegaJoule per tonne
NRSE New Renewable Sources of EnergyIPP Independent Power PlantTPH Total Petroleum HydrocarbonCERC Central Electricity Regulatory CommissionCFA Chartered Financial AnalystIPP Independent Power Plant
Sustainability 2022, 14, 5077 24 of 25
References1. Power Sector at a Glance All India, Ministry of Power, Government of India. Available online: https://powermin.gov.in/en/
content/power-sector-glance-all-india (accessed on 11 February 2022).2. Central Electricity Authority of India. Available online: https://cea.nic.in/annual-generation-report/?lang=en (accessed on 23
February 2022).3. Central Electricity Authority of India. 2021. Available online: https://cea.nic.in/general (accessed on 23 February 2022).4. India Brand Equity Fund (IBEF) Power. Available online: https://www.ibef.org/download/Power-September-2017.pdf (accessed
on 23 February 2022).5. India 2020 Energy Policy Review, International Energy Agency IEA, NITI Aayog India. Available online: https://niti.gov.in/
sites/default/files/2020-01/IEA-India%202020-In-depth-EnergyPolicy_0.pdf (accessed on 11 February 2022).6. Singh, J.; Gu, S. Biomass conversion to energy in India—A critique. Renew. Sustain. Energy Rev. 2010, 14, 1367–1378. [CrossRef]7. Kumar, A.; Kumar, N.; Baredar, P.; Shukla, A. A review on biomass energy resources, potential, conversion and policy in India.
Renew. Sustain. Energy Rev. 2015, 45, 530–539. [CrossRef]8. Kaur, G.; Brar, Y.S.; Kothari, D. Potential of Livestock Generated Biomass: Untapped Energy Source in India. Energies 2017, 10, 847.
[CrossRef]9. Antwi-Boasiako, C.; Acheampong, B. Strength properties and calorific values of sawdust-briquettes as wood-residue energy
generation source from tropical hardwoods of different densities. Biomass-Bioenergy 2016, 85, 144–152. [CrossRef]10. Saeed, A.; Harun, N.Y.; Bilad, M.; Afzal, M.; Parvez, A.; Roslan, F.; Rahim, S.A.; Vinayagam, V.; Afolabi, H. Moisture Content
Impact on Properties of Briquette Produced from Rice Husk Waste. Sustainability 2021, 13, 3069. [CrossRef]11. India 2020, Energy Policy Review, International Energy Agency. Available online: https://www.iea.org/events/india-energy-
policy-review-2020 (accessed on 11 February 2022).12. Hiloidhari, M.; Das, D.; Baruah, D.C. Bioenergy potential from crop residue biomass in India. Renew. Sustain. Energy Rev. 2014, 32,
504–512. [CrossRef]13. Venkatramanan, V.; Shah, S.; Prasad, S.; Singh, A.; Prasad, R. Assessment of Bioenergy Generation Potential of Agricultural Crop
Residues in India. Circ. Econ. Sustain. 2021, 1, 1335–1348. [CrossRef]14. Purohit, P. Economic potential of biomass gasification projects under clean development mechanism in India. J. Clean. Prod. 2009,
17, 181–193. [CrossRef]15. Economic and Statistical Organization; Government of Punjab. Statistical Abstract of Punjab. 2020. Available online:
https://esopb.gov.in/static/PDF/Abstract20201.pdf (accessed on 11 February 2022).16. Raj, A.; Jhariya, M.K.; Toppo, P. Cow dung for eco-friendly and Sustainable Productive Farming. Int. J. Sci. Res. 2014, 3, 201–212.17. Bhattacharyya, S.C. Energy access problem of the poor in India: Is rural electrification a remedy? Energy Policy 2006, 34, 3387–3397.
[CrossRef]18. Rao, P.V.; Baral, S.S.; Dey, R.; Mutnuri, S. Biogas generation potential by anaerobic digestion for sustainable energy development
in India. Renew. Sustain. Energy Rev. 2010, 14, 2086–2094. [CrossRef]19. Surendra, K.; Takara, D.; Hashimoto, A.G.; Khanal, S.K. Biogas as a sustainable energy source for developing countries:
Opportunities and challenges. Renew. Sustain. Energy Rev. 2014, 31, 846–859. [CrossRef]20. Mittal, S.; Ahlgren, E.O.; Shukla, P. Barriers to biogas dissemination in India: A review. Energy Policy 2018, 112, 361–370. [CrossRef]21. Mittal, S.; Ahlgren, E.O.; Shukla, P. Future biogas resource potential in India: A bottom-up analysis. Renew. Energy 2019, 141,
379–389. [CrossRef]22. Dhaliwal, H.S.; Brar, Y.S.; Brar, G.S. Optimization for biomass based plant localization using NDVI super pixels for Punjab state,
India. Int. J. Adv. Sci. Technol. 2020, 29, 2723–2733.23. Singh, M.; Brar, Y.S.; Singh, H. Critical assessment of biomass material for power generation in Punjab, India. Mater. Today: Proc.
2022, 48, 927–931. [CrossRef]24. Chauhan, S. District wise agriculture biomass resource assessment for power generation: A case study from an Indian state,
Punjab. Biomass-Bioenergy 2012, 37, 205–212. [CrossRef]25. Singh, B.; Szamosi, Z.; Siménfalvi, Z.; Rosas-Casals, M. Decentralized biomass for biogas production. Evaluation and potential
assessment in Punjab (India). Energy Rep. 2020, 6, 1702–1714. [CrossRef]26. Biomass Power Projects Completed/Commissioned Using Paddy Straw (97.50 MW). Punjab Energy Development Agency.
Available online: https://www.peda.gov.in/biomass-power-projects (accessed on 11 February 2022).27. Obi, O.F. Evaluation of the effect of palm oil mill sludge on the properties of sawdust briquette. Renew. Sustain. Energy Rev. 2015,
52, 1749–1758. [CrossRef]28. Raju, C.A.; Prem, K.; Sunil, K.; Bhimareddy, K.S.; Ramya, C. Studies on densification and conversion of wastes as fuel briquettes
for power generation. Mater. Today Proc. 2021, 44, 1090–1107. [CrossRef]29. Chen, L.; Xing, L.; Han, L. Renewable energy from agro-residues in China: Solid biofuels and biomass briquetting technology.
Renew. Sustain. Energy Rev. 2009, 13, 2689–2695. [CrossRef]30. Aransiola, E.; Oyewusi, T.; Osunbitan, J.; Ogunjimi, L. Effect of binder type, binder concentration and compacting pressure on
some physical properties of carbonized corncob briquette. Energy Rep. 2019, 5, 909–918. [CrossRef]31. Ngusale, G.; Luo, Y.; Kiplagat, J.K. Briquette making in Kenya: Nairobi and peri-urban areas. Renew. Sustain. Energy Rev. 2014, 40,
749–759. [CrossRef]

Sustainability 2022, 14, 5077 25 of 25
32. New and Renewable Sources of Energy Policy in 2012 to Promote Renewable Energy. Government of Punjab, Department ofScience, Technology, Environment and Non-conventional Energy. Available online: https://www.peda.gov.in/media/pdf/nrse%20pol%202012.pdf (accessed on 11 February 2022).
33. Invited Interested Project Developers to Participate in the Selection Process for Setting up of 100 TPD Paddy Straw Pel-letization Torrefied Plant on Build, Operate & Own (BOO) Basis. Punjab Energy Development Agency. Available online:https://www.peda.gov.in/assets/media/tender/1632288364_Setting_up_of_100_TPD_Paddy_Straw_Pelletization_Torrefied_Plant_on_Build,_Operate_Own_(BOO)_basis.pdf (accessed on 11 February 2022).
Copyright © 2022 FDOKUMEN