An evaluation of nutrient nonpoint offset trading in Virginia: A role for agricultural nonpoint...
11
Click Here for Full Article An evaluation of nutrient nonpoint offset trading in Virginia: A role for agricultural nonpoint sources? Kurt Stephenson, 1 Stephen Aultman, 2 Todd Metcalfe, 3 and Alex Miller 4 Received 20 May 2009; revised 10 October 2009; accepted 8 December 2009; published 29 April 2010. [1] Many advocates of water quality trading in the United States frequently assume that agricultural nonpoint sources will be the primary trading partner for regulated point sources. Virginia requires regulated point sources to offset new nutrient discharges. Nutrient offsets generated by agricultural nonpoint source reductions are compared against urban nonpoint source and nutrient assimilation offsets. Evidence suggests that agricultural nonpoint source offsets may not be a technically feasible or particularly cost effective compliance option for regulated point sources. Citation: Stephenson, K., S. Aultman, T. Metcalfe, and A. Miller (2010), An evaluation of nutrient nonpoint offset trading in Virginia: A role for agricultural nonpoint sources?, Water Resour. Res., 46, W04519, doi:10.1029/2009WR008228. 1. Introduction [2] Water quality trading, particularly for nutrients, is increasingly being advocated and proposed by professional economists and regulatory agencies as a means for achieving pollutant control requirements for point sources under the Clean Water Act. As commonly conceived and designed, agriculture plays an integral role in proposals designed to provide offsite compliance options (often called “offsets” or “credits”) for regulated point source dischargers. Such “point‐ nonpoint trading” has been hailed by federal agencies such as USDA, NRCS, and EPA as a significant new potential source of revenue for agricultural conservation [U.S. Department of Agriculture, 2006; Knight, 2003; Conservation Technology Information Center, 2006]. In 2006, EPA and USDA signed a Water Quality Credit Trading Agreement claiming point‐ nonpoint trading will complement existing revenue streams for water quality improvement [U.S. Department of Agriculture, 2006]. The Natural Resource Conservation Service (NRCS) is investing resources in developing a nonpoint source nutrient trading tool to facilitate the development of this possible rev- enue stream [Gross et al., 2008]. [3] Yet, the potential of nutrient trading programs to gen- erate revenue for agricultural nonpoint sources is still spec- ulative. Despite more than 10 years of state and federal agency promotion, demonstration projects, and research, the total volume and value of offsets involving regulated point source dischargers and agricultural nonpoint sources is min- imal [Stephenson and Shabman, 2008; U.S. Environmental Protection Agency, 2008]. Yet, advocates often assume, and some empirical research supports, the notion that agricultural nonpoint sources will be the favored and most economical (low‐cost) trading partner for point sources [Faeth, 2000; Friedman et al., 2007; Ribaudo et al., 2005; Hanson and McConnell, 2008]. The objective of this paper is to com- pare and evaluate agricultural nonpoint source offsets against other possible compliance options in a regional nutrient trading program in Virginia and to assess the potential of nutrient trading to provide new sources of funding for non- point source controls. The evaluative criteria used to assess the appeal of offset alternatives to regulated point sources (buyers) and regulators include cost, feasibility, certainty in achieving claimed reductions, and administrative risk. 2. Nutrient Offset Trading in Virginia [4] The state of Virginia is implementing one of the largest‐scale nutrient trading programs in the United States. The aim of the trading program is to establish a cap on nutrients from point sources that drain into the Chesapeake Bay. The Virginia program establishes strict annual mass load limits (called waste load allocation (WLA)) on nitrogen and phosphorus discharge for all municipally owned waste- water treatment plants (WWTP) and industrial point source dischargers over a minimum size limit. The mass load limits are calculated by multiplying stringent concentration stan- dards by the dischargers’ permitted design flow. The level of stringency varies across the four major Virginia tributaries to the Chesapeake Bay. Compliance is scheduled for 2011 (9 VAC 25‐820‐70C). [5] Trading options are allowed for existing and new/ expanding sources and conducted under a general permit (9 VAC 25‐820‐10 et seq). An existing source is a source that has received a WLA by 2005 (9 VAC 25‐720). These sources must file a plan for attaining their individual WLA, and are expected to make additional nutrient control invest- ments to achieve their waste load allocation. In the event that discharger exceeds WLA, a point source discharger must seek point source credits from another point source within the same river basin (James, York, Rappahannock, and Potomac River basins). A point source credit is the difference between the WLA and total pounds discharged for a given year (when WLA > total pounds discharged). 1 Department of Agricultural and Applied Economics, Virginia Polytechnic Institute and State University, Blacksburg, Virginia, USA. 2 Department of Applied Economics, University of Minnesota, Saint Paul, Minnesota, USA. 3 Social Science Program, Maxwell School of Citizenship and Public Affairs, Syracuse University, Syracuse, New York, USA. 4 Gulf States Marine Fisheries Commission, Ocean Springs, Mississippi, USA. Copyright 2010 by the American Geophysical Union. 0043‐1397/10/2009WR008228 WATER RESOURCES RESEARCH, VOL. 46, W04519, doi:10.1029/2009WR008228, 2010 W04519 1 of 11
Transcript of An evaluation of nutrient nonpoint offset trading in Virginia: A role for agricultural nonpoint...
ClickHere
for
FullArticle
An evaluation of nutrient nonpoint offset trading in Virginia:A role for agricultural nonpoint sources?
Kurt Stephenson,1 Stephen Aultman,2 Todd Metcalfe,3 and Alex Miller4
Received 20 May 2009; revised 10 October 2009; accepted 8 December 2009; published 29 April 2010.
[1] Many advocates of water quality trading in the United States frequently assumethat agricultural nonpoint sources will be the primary trading partner for regulated pointsources. Virginia requires regulated point sources to offset new nutrient discharges.Nutrient offsets generated by agricultural nonpoint source reductions are compared againsturban nonpoint source and nutrient assimilation offsets. Evidence suggests that agriculturalnonpoint source offsets may not be a technically feasible or particularly cost effectivecompliance option for regulated point sources.
Citation: Stephenson, K., S. Aultman, T. Metcalfe, and A. Miller (2010), An evaluation of nutrient nonpoint offset trading inVirginia: A role for agricultural nonpoint sources?, Water Resour. Res., 46, W04519, doi:10.1029/2009WR008228.
1. Introduction
[2] Water quality trading, particularly for nutrients, isincreasingly being advocated and proposed by professionaleconomists and regulatory agencies as a means for achievingpollutant control requirements for point sources under theClean Water Act. As commonly conceived and designed,agriculture plays an integral role in proposals designed toprovide offsite compliance options (often called “offsets” or“credits”) for regulated point source dischargers. Such “point‐nonpoint trading” has been hailed by federal agencies such asUSDA, NRCS, and EPA as a significant new potential sourceof revenue for agricultural conservation [U.S. Department ofAgriculture, 2006; Knight, 2003; Conservation TechnologyInformation Center, 2006]. In 2006, EPA and USDA signeda Water Quality Credit Trading Agreement claiming point‐nonpoint tradingwill complement existing revenue streams forwater quality improvement [U.S. Department of Agriculture,2006]. The Natural Resource Conservation Service (NRCS)is investing resources in developing a nonpoint source nutrienttrading tool to facilitate the development of this possible rev-enue stream [Gross et al., 2008].[3] Yet, the potential of nutrient trading programs to gen-
erate revenue for agricultural nonpoint sources is still spec-ulative. Despite more than 10 years of state and federalagency promotion, demonstration projects, and research, thetotal volume and value of offsets involving regulated pointsource dischargers and agricultural nonpoint sources is min-imal [Stephenson and Shabman, 2008; U.S. EnvironmentalProtection Agency, 2008]. Yet, advocates often assume, andsome empirical research supports, the notion that agricultural
nonpoint sources will be the favored and most economical(low‐cost) trading partner for point sources [Faeth, 2000;Friedman et al., 2007; Ribaudo et al., 2005; Hanson andMcConnell, 2008]. The objective of this paper is to com-pare and evaluate agricultural nonpoint source offsets againstother possible compliance options in a regional nutrienttrading program in Virginia and to assess the potential ofnutrient trading to provide new sources of funding for non-point source controls. The evaluative criteria used to assessthe appeal of offset alternatives to regulated point sources(buyers) and regulators include cost, feasibility, certainty inachieving claimed reductions, and administrative risk.
2. Nutrient Offset Trading in Virginia
[4] The state of Virginia is implementing one of thelargest‐scale nutrient trading programs in the United States.The aim of the trading program is to establish a cap onnutrients from point sources that drain into the ChesapeakeBay. The Virginia program establishes strict annual massload limits (called waste load allocation (WLA)) on nitrogenand phosphorus discharge for all municipally owned waste-water treatment plants (WWTP) and industrial point sourcedischargers over a minimum size limit. The mass load limitsare calculated by multiplying stringent concentration stan-dards by the dischargers’ permitted design flow. The levelof stringency varies across the four major Virginia tributariesto the Chesapeake Bay. Compliance is scheduled for 2011(9 VAC 25‐820‐70C).[5] Trading options are allowed for existing and new/
expanding sources and conducted under a general permit(9 VAC 25‐820‐10 et seq). An existing source is a sourcethat has received a WLA by 2005 (9 VAC 25‐720). Thesesources must file a plan for attaining their individual WLA,and are expected to make additional nutrient control invest-ments to achieve their waste load allocation. In the eventthat discharger exceeds WLA, a point source dischargermust seek point source credits from another point sourcewithin the same river basin (James, York, Rappahannock,and Potomac River basins). A point source credit is thedifference between the WLA and total pounds dischargedfor a given year (when WLA > total pounds discharged).
1Department of Agricultural and Applied Economics, VirginiaPolytechnic Institute and State University, Blacksburg, Virginia, USA.
2Department of Applied Economics, University of Minnesota, SaintPaul, Minnesota, USA.
3Social Science Program, Maxwell School of Citizenship and PublicAffairs, Syracuse University, Syracuse, New York, USA.
4Gulf States Marine Fisheries Commission, Ocean Springs, Mississippi,USA.
Copyright 2010 by the American Geophysical Union.0043‐1397/10/2009WR008228
WATER RESOURCES RESEARCH, VOL. 46, W04519, doi:10.1029/2009WR008228, 2010
W04519 1 of 11
The transfer of point source credits would typically occur orbe facilitated by an association of point source dischargers(§62.1‐44.19:17). In the event that no point source creditsare available, a point source may then pay a per pounddischarge fee to the Virginia Water Quality ImprovementFund (WQIF) (§62.1‐44.19:18.A). These fees are currently$11.06 and $5.04 per pound (1 lb = 0.4536 kg) of nitrogenand phosphorus, respectively (9VAC 25‐820‐10J). Feerevenue from this fund, administered by state agencies, wouldthen be used to sponsor point or nonpoint source reductions.Trading options are constrained by a sequencing logic. Bylaw, existing point sources must first use all available pointsource credits before exercising the WQIF option regardlessof any cost advantage of using the WQIF. Credits must alsobe generated in the same year as the excess discharge wasproduced (no credit banking).[6] It appears unlikely that existing point sources will
need to pay into the WQIF to achieve compliance. Thesetting of the WLA based on technically achievable con-centration standards and plant design flow broadly ensuresthat existing sources will be able to achieve collective pointsource compliance with a tributary point source cap. Com-pliance is aided by a significant capital grants program forWWTPs and most existing sources are expected to be ableto individually comply with individual load limits. A pointsource association (Virginia Nutrient Credit ExchangeAssociation) also coordinates point source activity to helpensure that an occasional instance of noncompliance will becovered by point source credits and some small trades areplanned among point sources. Finally, a point source cannot,by law, include purchase credits from WQIF as part of along‐term compliance plan (§62.1‐44.19:14.C.3).[7] A separate set of trading rules apply for new and
expanding sources, and compliance becomes a more diffi-cult issue in this situation. Recall, waste load allocations arebased on stringent nutrient concentration limits and 2005plant design wastewater flows. As wastewater flows grow,point sources will have increasingly limited options to remainin compliance by applying additional technology to reducenutrient concentrations in plant outflows. Thus, any futuredemand for nonpoint source credits will likely originate withnew/expanding sources. By statute, a new or expanding pointsource must acquire WLA either (1) from existing pointsource, (2) by funding nutrient reducing best managementpractices (BMPs) from nonpoint sources, (3) by other meansapproved by the Virginia Department of EnvironmentalQuality (DEQ), or (4) by purchasing credits from the WQIF(§62.1‐44.19:15.B.1). The law intends that these options tobe applied sequentially. The statute authorizes use of theWQIF only after all options have been fully exhausted.[8] All point sources acquiring WLA from nonpoint
source BMPs must secure 2 lb of reduction for every 1 lb ofpoint source WLA (2:1 trading ratio). Trading ratios forother situations will be determined on a case‐by‐case basis.New WLA for new/expanding sources are called offsets(since it “offsets” new load) and the offset must be main-tained as long as the new nutrient loads occur. Offsets, likeexisting point source compliance credits, cannot be tradedacross the four major Virginia river basins. The statute alsoallows nonpoint source offsets to be acquired through publicor private entity acting on behalf of the landowner” but anyoffset activity must be included in the point source facilitiesindividual permit (§62.1‐44.19:15.B.1b).
[9] The statute also outlines nonpoint source baselinerequirements that must be achieved before granting non-point source offsets. Establishing nonpoint source baselineis typically a challenging issue for any trades with unregu-lated sources [Office of Wastewater Management, 2007].Under the Virginia law, nonpoint source offsets are reduc-tions in nutrient loads above and beyond reductions requiredby state law or by reductions already identified in nutrient/sediment reduction plans, called the “tributary strategies”(§62.1‐44.19:15.B.1b). The tributary strategies process iden-tified general classes of actions (regulatory and voluntary) thatmust occur within each major tributary to meet ChesapeakeBay nutrient reduction targets [Virginia Secretary of NaturalResources, 2005]. With the exception of point sources, thetributary strategies did not assign specific discharge reductiontargets or regulatory requirements to individual dischargers,but rather identified the extent to which a general list ofagricultural and urban nonpoint practices must be imple-mented to achieve nutrient reduction targets in each riverbasin (e.g., number of acres of forested buffers, cover crops,urban impervious surfaces filtered, etc.). The state is notlegally required to achieve the goals outlined in the tributarystrategies, but rather serves as a general planning document.[10] The inclusion of the tributary strategies language,
however, has important implications for trading programdesign because it establishes a relatively high baseline stan-dard. To date, Virginia DEQ has only translated this stat-utory directive into detailed offset baseline policy guidancefor agricultural nonpoint sources [Virginia Department ofEnvironmental Quality, 2008]. To meet statutory baselinerequirements, DEQ requires that five minimum best man-agement agricultural practices be installed before agriculturalsources are eligible to generate offsets. These minimumcontrol measures include implementing an approved nutrientmanagement plan, soil conservation plan, cover crops, live-stock exclusion from streams, and riparian buffers (35 ftminimum). These practices were selected because eachpractice was targeted with relatively high implementationlevels in the tributary strategies process.
3. Offset Evaluative Criteria
[11] Conceptually, a large variety of possible nutrient off-set options might be available to secure offsets under theVirginia nutrient trading program. In the immediate future,new and expanding point sources may be able to securetemporary leases of WLA from existing point sources. Fur-thermore, since high levels of phosphorus control is beingachieved with the latest point source control technologies,the nitrogen point source cap will likely be the biggestregulatory challenge facing new and expanding point sources.As flows continue to grow, the question becomes how cannew/expanding point sources remain under their nitrogenmass load cap and to what extent will agricultural nonpointsources play a role in providing these offsets?[12] New/expanding point sources can conceivably secure
offsets from three general classes of offsets: agriculturalnonpoint sources, urban nonpoint sources, and nutrientassimilation services. Each broad category contains a varietyof different practices or control technologies by which toreduce nutrients in each of the four Virginia tributaries.[13] Offsets in each category are then evaluated against
four general criteria that reflect the private (point source)
STEPHENSON ET AL.: EVALUATION OF NUTRIENT NONPOINT OFFSET TRADING W04519W04519
2 of 11
and public appeal of that option as a nutrient offset. Thecriteria generally identify offset attributes that would beimportant to a regulated point source in deciding what offsetto pursue and to regulators in approving the offset underexisting statutory and regulatory rules. The evaluative cri-teria are (1) cost, (2) administrative and technical feasibility,(3) certainty in achieving claimed reductions, and (4) admin-istrative risk. No attempt is given to quantitatively rank orweigh the criteria across offset alternatives. Rather, the cri-teria are used to qualitatively assess how agricultural non-point offsets compare to other offset alternatives from theperspective of the trading program participants who willselect and approve offsets. First, achieving offsets for newpoint source loads at a low cost would be desirable from botha private discharger and societal perspective. One evaluativecriterion is the marginal cost of nutrient offset. Conceptuallythe cost of an offset is the total compensation required by theoffset provider to undertake nutrient reducing activities. Thecompensation must be sufficient to cover the implementationcost (capital and operating costs), risk, and transaction costsof the nutrient reducing activities. Given the almost completelack of experience and offset competition, almost no hardevidence exists on offset costs and the estimates availableare surrounded by considerable uncertainty. As a roughapproximation of relative magnitude, this analysis synthesizesexisting information on estimated costs of practice imple-mentation. Thus costs reported here likely underestimateactual offset costs and are used as a relative point of com-parison between offset options.[14] Second, offset options must be reasonably and prac-
ticably achievable. The indicator used to measure offsetfeasibility will be the level of activity needed to obtain anitrogen offset for a typical new/expanding point source.The level of activity for an agricultural offset could be mea-sured by the number of acres necessary to provide a referenceoffset (in perpetuity). At the most practical level, nitrogenoffsets must deliver reductions (acres of land under approvedBMPs for example) on the scale sufficient to offset increasesin point source loads. The reference offset used in this anal-ysis is the level of activity required to offset a 43.8 L/s(equal to one million gallons per day (mgd)) expansionfor a wastewater treatment plant operation (approximately9000 lb/yr of total nitrogen assuming a new source con-centration standard of 3 mg/L of total nitrogen).[15] The third criterion is a qualitative assessment of the
certainty in achieving reductions of each offset. Differentnutrient control options will each have different degrees ofuncertainty in measuring total nutrient reductions. In somecases nutrient reductions can be measured and monitoreddirectly, while in other cases changes in load must be
estimated/modeled. Furthermore, scientific and modelinguncertainty varies across control options. In general regulatorsprefer offsets with greater certainty of nutrient reduction.[16] Finally, point sources would prefer that offsets
carry low regulatory risks. Unlike many environmentaltrading programs, a regulated discharger cannot transfer legalresponsibility for achieving reductions to a nonpoint source.Under the Virginia trading program, for example, all offsetsbecome part of a point source discharger’s National PollutantDischarge Elimination System (NPDES) discharge permit.Thus, a failure of an offset to provide the claimed nutrientreduction would constitute a permit violation for the pointsource buyer with possible financial and civil penalties. Therequirement that offsets become part of a point source permitcreates an important potential source of administrative risk.Hence, a point source discharger would prefer, other factorsconstant, an offset alternative directly under their manage-ment control rather than relying on a third party for offsets.One indicator for regulatory risk would be legal and man-agement control over the offset.
4. Nutrient Offset Alternatives
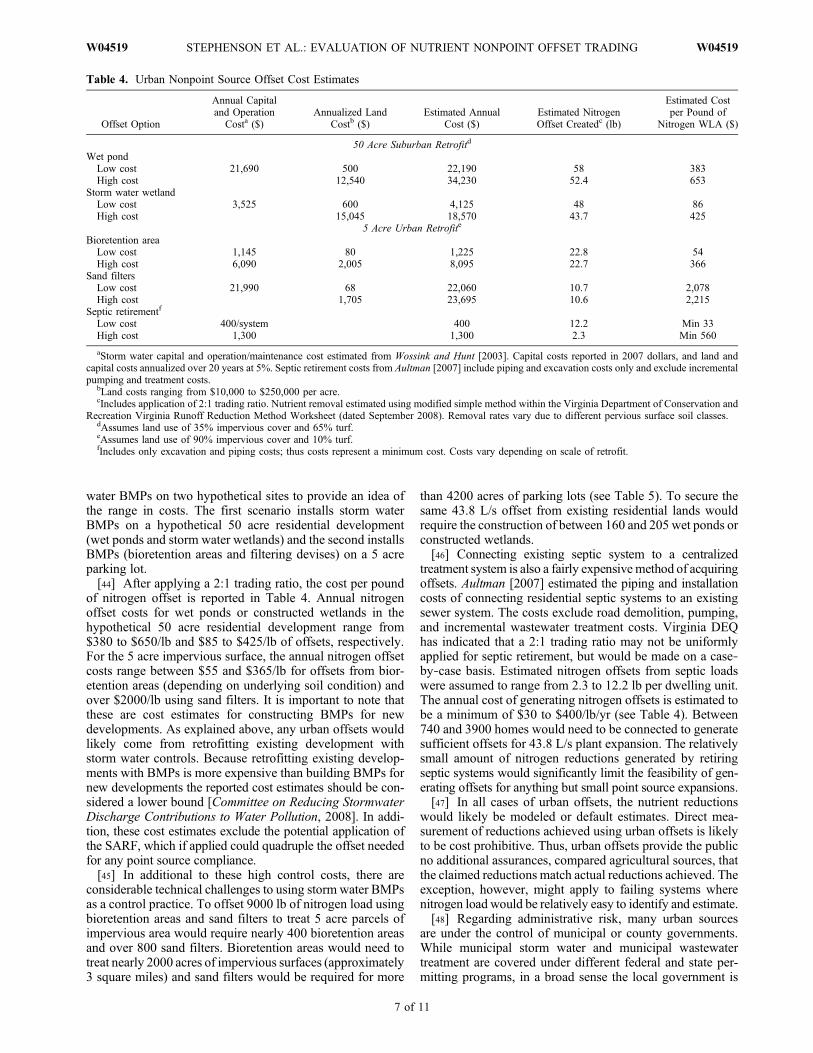
4.1. Agricultural Nonpoint Source Offsets
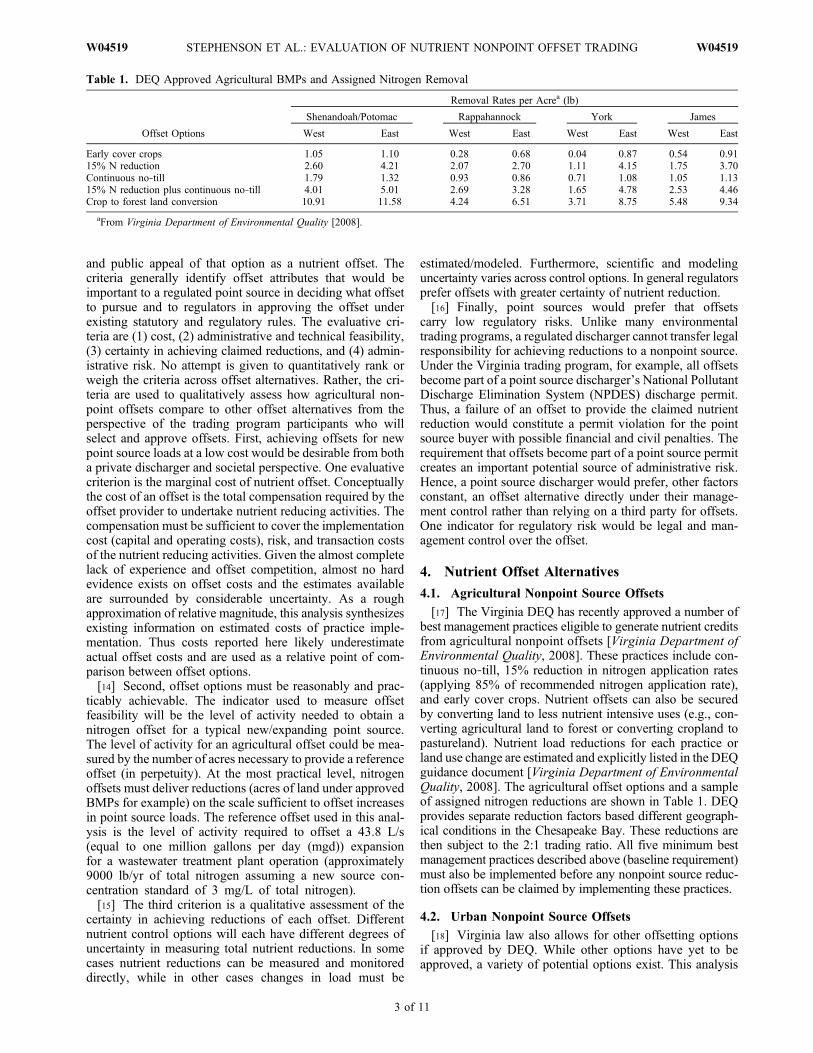
[17] The Virginia DEQ has recently approved a number ofbest management practices eligible to generate nutrient creditsfrom agricultural nonpoint offsets [Virginia Department ofEnvironmental Quality, 2008]. These practices include con-tinuous no‐till, 15% reduction in nitrogen application rates(applying 85% of recommended nitrogen application rate),and early cover crops. Nutrient offsets can also be securedby converting land to less nutrient intensive uses (e.g., con-verting agricultural land to forest or converting cropland topastureland). Nutrient load reductions for each practice orland use change are estimated and explicitly listed in the DEQguidance document [Virginia Department of EnvironmentalQuality, 2008]. The agricultural offset options and a sampleof assigned nitrogen reductions are shown in Table 1. DEQprovides separate reduction factors based different geograph-ical conditions in the Chesapeake Bay. These reductions arethen subject to the 2:1 trading ratio. All five minimum bestmanagement practices described above (baseline requirement)must also be implemented before any nonpoint source reduc-tion offsets can be claimed by implementing these practices.
4.2. Urban Nonpoint Source Offsets
[18] Virginia law also allows for other offsetting optionsif approved by DEQ. While other options have yet to beapproved, a variety of potential options exist. This analysis
Table 1. DEQ Approved Agricultural BMPs and Assigned Nitrogen Removal
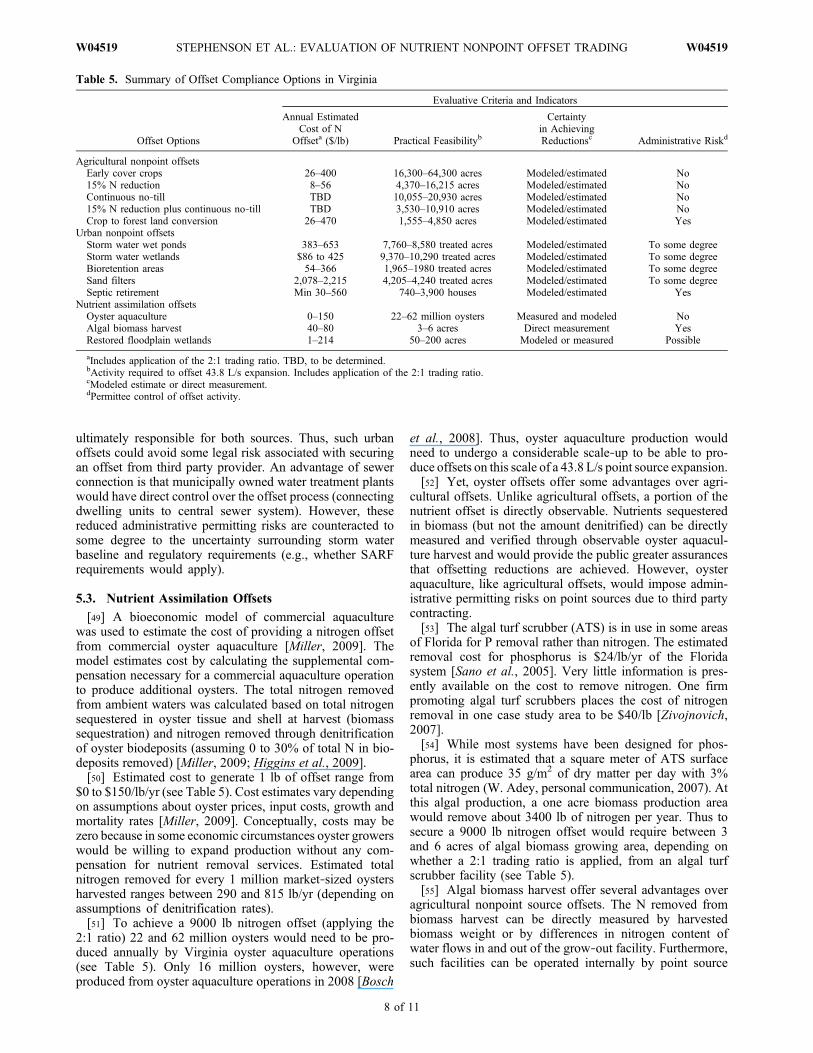
Offset Options
Removal Rates per Acrea (lb)
Shenandoah/Potomac Rappahannock York James
West East West East West East West East
Early cover crops 1.05 1.10 0.28 0.68 0.04 0.87 0.54 0.9115% N reduction 2.60 4.21 2.07 2.70 1.11 4.15 1.75 3.70Continuous no‐till 1.79 1.32 0.93 0.86 0.71 1.08 1.05 1.1315% N reduction plus continuous no‐till 4.01 5.01 2.69 3.28 1.65 4.78 2.53 4.46Crop to forest land conversion 10.91 11.58 4.24 6.51 3.71 8.75 5.48 9.34
aFrom Virginia Department of Environmental Quality [2008].
STEPHENSON ET AL.: EVALUATION OF NUTRIENT NONPOINT OFFSET TRADING W04519W04519
3 of 11
considers two general sources of urban nonpoint source off-sets, nutrient reductions from treatment and control of urbanstorm water runoff and the reduction/treatment of on‐site(e.g., septic systems) nitrogen discharge sources.[19] Conceptually, urban nonpoint source offsets may be
achieved by implementing a number of treatment practicesand strategies to reduce nutrient loads in urban storm waterrunoff. A wide variety of control options exist, but thisanalysis will focus on the more commonly employed prac-tices, wet ponds, constructed storm water wetlands, bior-etention areas, and sand filters.[20] Urban nonpoint source offset could be generated by
reducing/eliminating/treating small urban nutrient discharges.On‐site systems, or septic systems, are an acknowledgedsource of nutrients to the Chesapeake Bay (ChesapeakeBay Program, CBP Watershed Model Scenario OutputDatabase, phase 4.3, accessed 6 August 2007 from http://www.chesapeakebay.net/data/index.htm, 2007). While well‐functioning on‐site disposal systems may not dischargedirectly into surface waters, nitrogen can enter surface waterindirectly through groundwater or subsurface flows. Failingseptic systems, on the other hand, discharge nutrients andharmful bacteria into surface waters. Municipal wastewatertreatment plants with advanced biological nutrient removalmay have a greater ability to remove nitrogen from waste-water than do septic systems because of their longer reten-tion times and more consistent operation conditions designedto maximize the effectiveness of nitrogen removing bacteria[CH2M Hill, 2007]. The EPA has granted (NPDES) permitholders in Colorado and New Mexico additional nutrientwaste load allocations (1 lb of phosphorus and 23.5 lbs ofnitrogen, respectively) for retiring existing septic systems[Aultman, 2007]. Maryland recently approved use of septicremoval as an offset, with credits ranging from 4.6 to 12.2 lbof nitrogen per year per individual system (depending onlocation). Furthermore, subject to DEQ discretion, retiringfailing septic systems may or may not be subject to a 2:1trading ratio.[21] An unresolved issue for urban nonpoint offsets in
Virginia is identification of acceptable baselines. Offsetsfrom urban storm water runoff must exceed state/federalrequirements and tributary strategy reductions. A number ofstate and federal requirements will likely apply. Currently,Virginia is revising its state storm water regulations. Theproposed regulations establish stringent nutrient controlrequirements for any runoff associated with new develop-ment. Any new development (land disturbing activity) willlikely need to implement multiple storm water control prac-tices to achieve compliance. These reductions cannot beclaimed as offsets. In addition to state requirements, thefederal Clean Water Act also requires municipalities above acertain size to develop programs to manage storm waterdischarge (MS4 program). While the federal program doesnot contain numerical limits or specific mandates to installparticular practices, it does instruct permit holders to under-take effort to limit dischargers to the “maximum extentpractical.” How such language would apply to definingbaselines is uncertain.[22] Any reductions that could feasibly be claimed as
offsets could only occur on existing developed lands thatface no numerical control requirement. For this situation, thestate has yet to define baselines relative to the “Tributary
Strategies.” For example, the Shenandoah/Potomac tributarystrategy outlines a goal that 74% of suburban and urbandeveloped lands will have urban storm water BMPs. Onebaseline definition suggested by Virginia DEQ would allowonly 26% of any nutrient reductions from urban storm waterBMPs on existing developed lands to be counted as anoffset (Virginia Department of Environmental Quality,Nutrient credit exchange: Framework for creation of non-point source offsets/credits, unpublished draft discussiondocument, Richmond, Virginia, 2006). This baseline pro-posal is called the strategies allocation reduction factor(SARF). This means that for every physical pound of nitrogenreduction achieved from installing a BMP on a residentialdevelopment that, after accounting for the 2:1 trading ratioand the tributary strategies requirements, only 0.13 lb ofthat reduction can be counted toward new WLA.
4.3. Nutrient Assimilation Offsets
[23] Finally, another class of offsets could be realized bydirectly removing nutrients from ambient waters [Shabmanand Stephenson, 2007]. Increasing the capacity of theaquatic environment to remove nutrients is called a nutrientassimilation offset. These reductions can be achieved in thetarget water body independent of any changes in point andnonpoint source loads. Three nutrient assimilation offsets willbe evaluated in this analysis including nutrient reductionsfrom increasing oyster populations, algal biomass harvest,and floodplain wetland restoration.[24] The water filtering capacity of the native Chesapeake
Bay oyster is widely acknowledged. Investments in oysteraquaculture can provide additional water filtration servicesto the Bay above and beyond what is achieved throughunmanaged production. There are two ways that (or mech-anisms through which) oysters remove nutrients from theBay. First, nutrients embodied in the phytoplankton will besequestered in the biomass of oyster shell and meat. Whenoysters are harvested, nutrients are permanently removedfrom the system. In addition, oysters may remove nutrients byaccelerating a denitrification processes. When oysters feed,they expel relatively large quantities of partially digested phy-toplankton (called pseudofeces). When reaching the under-lying sediment, these biodeposits, rich in organic nitrogen,may partially undergo a nitrification and denitrification pro-cess [Newell, 2004; Newell et al., 2005]. Such a process willeventually transform a portion of the nitrogen compoundsinto N2 gas, which is biologically unavailable for plant growth.The use of shellfish aquaculture as a water quality manage-ment option has been piloted in other areas [Lindahl et al.,2005].[25] Plant biomass harvest is another way to provide
nutrient assimilation services [Sano et al., 2005; Adey et al.,1993]. While a variety of approaches exist, a basic strategyinvolves pumping ambient waster (or posttreatment waste-water) into an algal grow‐out facility. One such technologyspreads water out over prepared flat surfaces covered withan engineered geomembrane. Periphytic algae grow on theprepared surface and consume and sequester nutrients duringgrowth. The algal biomass is then periodically harvested, thusremoving nutrients from the ambient system. The filteredwater is then discharged back into the water body with lowernutrient concentrations. Such systems are used to removephosphorus from lakes in Florida and are currently being
STEPHENSON ET AL.: EVALUATION OF NUTRIENT NONPOINT OFFSET TRADING W04519W04519
4 of 11
piloted to remove nitrogen and phosphorus in the ChesapeakeBay watershed [HydroMentia, 2005].[26] Finally, restoring former floodplain wetlands can
increase the nutrient assimilative capacity of the aquatic eco-system [Hey et al., 2005]. Wetlands are a well recognizednutrient sink. Wetlands trap nutrient rich water and sedimentduring flood events. Nutrients are sequestered in plantmaterial and some nitrogen is converted to unavailable forms.Large‐scale wetland restoration is being piloted explicitlyfor a nutrient removal practice in other areas of the country(Wetlands Initiative, Illinois River nutrient farm pilot project,Chicago, Illinois, undated; available at http://www.wetlands‐initiative.org/TWIpublicationsNutrientFarming.html). In alarge‐scale pilot project in Florida, cattle ranchers are paid forenvironmental and water quality services by actively man-aging water flows through ranch wetland areas [Lynch andShabman, 2007].[27] As a potential offset option, many nutrient assimila-
tion services face no apparent baseline requirements sincepublic and private entities are not required to remove nutrientsthrough this approach. Any additional investment in nutrientremoval through these activities could be counted as an offset.The only possible exception may be wetlands. Since wetlandrestoration targets are mentioned in the Virginia TributaryStrategies documents, it is unclear whether new or enhancedwetland nutrient assimilation services would be subject tosome baseline requirements.
5. Applying Evaluation Criteria to OffsetAlternatives
[28] This section evaluates the various offset alternativesjust described against the four evaluative criteria: cost, practicalfeasibility, certainty in achieving claimed reductions, andadministrative risk.
5.1. Agricultural Nonpoint Source Offsets
[29] Despite the significant literature on agricultural BMPeffectiveness and water quality trading, remarkably littlerigorous economic analysis of BMP implementation costsexists. Many cost estimates are based on financial outlays ofdirect costs (labor, capital, material inputs, etc.). Cost esti-mates for the same agricultural BMP can vary widely, addingto the uncertainty about actual costs. Per acre BMP costs wereobtained or derived from existing literature.[30] The Chesapeake Bay Program estimates per acre
costs for early cover crops range between $13.80 and $56.50(2007 dollars), and recent analysis in Delaware estimatescosts are $30 to $40 per acre [Chesapeake Bay Program,2003; Delaware Department of Natural Resources andEnvironmental Control, 2008]. Hanson and McConnell[2008] assume incentives payments of both $20 and $30per acre to induce farm operators into trading offsets withpoint sources using early cover crops.[31] Less cost information is available on the cost of
15% N reduction. Metcalfe et al. [2007] estimated a rangeof per acre costs (adjusted to 2007 prices) of between$8.15 and $16.75. The low cost of $8.15 was the estimateof the expected lost revenue from decreased yield minusincreased savings from lowered fertilizer costs, incurred byfarmers of the program. The $16.75 estimate includes the costof insurance for profit lost associate with yield reductions.These costs, however, may underestimate the compensation
necessary for farmers to adopt this practice because of riskadverse farmer attitudes toward potential yield loss. Someprevious experience in Pennsylvania suggests that gainingfarmer participation for reduced nitrogen applications is dif-ficult even with $30/acre payments for 15% lower nitrogenapplications (B. Brandt, American Farmland Trust, personalcommunication, 2006).[32] For continuous no‐till, some studies found an increase
in farm profits, implying a negative cost [Diaz‐Zorita et al.,2004; Pendell et al., 2006]. Given that no‐till involves higherupfront, out‐of‐pocket costs from an increase in herbicideusage and equipment purchase/rental, some farmers mayneed financial incentives to adopt this practice [Massey, 1997].Furthermore, it is uncertain how farmers value the loss ofproduction flexibility that is implied by continuous no‐till.Some insight can be gained from existing public agriculturalcost share programs. Virginia Department of Conservationand Recreation currently subsidizes farmers to implementcontinuous no‐till practices (5 year contracts) at $20/acre(VDCR, Agricultural BMP Database, Richmond, Virginia,2009; available at http://webdat.dcr.virginia.gov/cfprog/dswc/bmpprm.cfm).[33] Finally, the cost of converting crop to forest was
estimated given assumptions of land costs ($1000 to$10,000/acre) and land conversion costs [Aultman, 2007].The $1000/acre land cost should be considered a lower‐bound estimate since this is the current Virginia paymentunder the Conservation Reserve Enhancement Program(CREP) for permanent open space easements on conservationbuffer areas.[34] All of the above cost estimates focus primarily on the
financial costs associated with practice implementation. Thecost of providing an offset is likely to be higher when othercosts (risk, transaction) are included. Some research has notedfarmers’ reluctance to participate in water quality tradingcontracts [Breetz et al., 2005]. Overcoming this type offarmer‐based risk aversion could drive up the costs to pointsources of securing voluntary agricultural offsets. It shouldalso be noted that the cost literature reviewed focuses onaverage costs, but how costs change with different levels ofconservation practice implementation is largely unknown.Finally, these costs include only estimates of the offsettingpractice. As noted above, many agricultural operators willlikely face additional costs to achieve baseline conditions.[35] With these caveats, the implementation costs were
used to provide a minimum estimate of per pound costs ofproviding a nitrogen offset. Per acre nitrogen reduction ratesspecified byVirginia DEQwere used to convert per acre coststo costs per pound removed. Nitrogen offsets were then cal-culated under the condition that 2 lb of nonpoint sourcereduction is required to generate 1 lb of offset (new WLA).The annual nonpoint offset costs for agricultural practices arereported in Table 2. Acquiring offsets through early covercrops would cost a minimum of $26/offset, but high‐endestimates exceed $1000. The estimated cost of reducingfertilizer applications ranges between $8 and $54/lb of offset(assuming costs between $16.75 and $30/acre). The cost ofconverting cropland to forest land ranges from $26 to $470per pound of offset.[36] It should be pointed out these are likely to be mini-
mum costs necessary for an agricultural operator to provideoffsets because these costs do not include any incrementalcosts incurred to implement the five minimum baseline
STEPHENSON ET AL.: EVALUATION OF NUTRIENT NONPOINT OFFSET TRADING W04519W04519
5 of 11
practices. Based on feedback from several county extensionagents in the Shenandoah Valley, very few farmers have fullyreached baseline conditions.[37] The feasibility of the agricultural nonpoint offsets is
measured as the amount of acres necessary to offset a 43.8 L/sexpansion in wastewater flows for each agricultural nonpointsource offset option (see Table 3). For example, the earlycover crop BMP would require between 16,000 and 64,000acres to offset a 43.8 L/s of wastewater flows (assuming 2:1trading ratio). Offsetting a 43.8 L/s expansion would requirethe application of continuous no‐till on 10,000–25,000 acresof cropland. By comparison, Virginia’s cost share programhas placed less than 5000 acres under continuous no‐till overa 4 year period (2005–2008) for the entire portion of theShenandoah/Potomac watershed. Combining both reducefertilizer application and continuous no‐till would requirebetween 3500 and 11,000 treated acres. Even converting themost N intensive agricultural land use to forest would requirebetween 1500 and 4000 acres (2.3 to 6.4 square miles).[38] To put these totals into perspective the total number
of corn acres (3 year average) in each river basin is reportedin Table 3. Corn acres are used because corn is the mostnutrient intensive field crop. A 43.8 L/s offset would requiresignificant portions of cornland in the respective watersheds.For example, there is barely enough corn grown in the entireRappahannock River basin to generate a 43.8 L/s equivalentoffset using early cover crops. A 43.8 L/s offset using con-tinuous no‐till would require approximately 10%, 26%,24%, and 20% of all cornland in the Shenandoah/Potomac,Rappahannock, York, and James River basins, respectively.These percentages appear more daunting considering veryfew farms are currently thought to be meeting baselinerequirements.[39] The individual land owner contracts necessary to
generate such offsets might present an administrative chal-lenge. Farms in many regions of the state tend to be small.Average county farm size ranges between 100 and 400 acresacross the entire four Virginia river basins, with the most
typical farm sizes ranging between 150 and 200 acres. Evenaccounting for the variation between commercial and part‐time farms, a 43.8 L/s offset could likely involve contractingwith a minimum of 30 to 70 farm operations.[40] In addition to transaction costs associated with mul-
tiple small contracts, agricultural nonpoint source offsetscarry some regulatory risks associated with noncompliancegiven the relatively large number of contracts with sourcesoutside the control of the permitted discharger. Finally, underthe Virginia program no agricultural nonpoint source loadreductions would be measured. In some cases, even fieldverification of practices such as reduce fertilizer applicationwould be challenging.
5.2. Urban Nonpoint Source Offsets
[41] Storm water BMPs fare poorly on all evaluation cri-teria except administrative risk. Achieving offsets by retiringexisting septic systems rank slightly higher on most criteria(see Table 4).[42] The cost of constructing and maintaining the four
storm water practices were calculated using capital andoperation and maintenance cost equations from Wossink andHunt [2003]. Capital costs are annualized over 20 years at5%. All storm water control practices examined here requireland. The opportunity costs of forgone land use vary widelyacross the state, but urban and suburban land costs wereassumed to range between $10,000 and $250,000 per acre.Storm water BMP nitrogen removal rates were estimatedfrom a parcel level storm water quality estimation tooldeveloped by the Virginia Department of Conservation andRecreation (DCR). Removal estimates vary depending onunderlying soil type and land cover conditions (turf, forest,and impervious cover). Dividing estimated storm water prac-tice cost by nitrogen removal produces per pound storm watercost estimates.[43] Generalizing the cost of a storm water offset is dif-
ficult because cost and effectiveness can vary widely fromsite to site. We present the cost estimates for installing storm
Table 3. Crop Acres Necessary to Generate Offset for 43.8 L/s Point Source Expansion
Offset Options
Acres Required for a 43.8 L/s Offseta
Shenandoah/Potomac Rappahannock York James
West East West East West East West East
Early cover crops 17,143 16,364 64,286 26,741 450,000 20,690 33,333 19,78015% N reduction 6,923 4,276 8,696 6,667 16,216 4,369 10,286 4,865Continuous no‐till 10,056 13,636 19,355 20,930 25,352 16,667 17,143 15,92915% N reduction plus continuous no‐till 4,489 3,529 6,691 5,488 10,909 3,766 5,488 7,115Crop to forest conversion 1,650 1,554 4,245 2,765 4,852 2,057 3,284 1,927
aTotal corn acres available in each region: Shenandoah/Potomac, 126,870; Rappahannock, 74,920; York, 82,170; James, 79,935.
Table 2. Agricultural Nonpoint Source Offset Cost Estimatesa
Offset Options
Estimated Annual Cost of Nitrogen Offsetb
Shenandoah/Potomac Rappahannock York James
Early cover crops 26–107 40–404 31–2,800 30–21015% N reduction 8–23 12–29 8–54 9–34Continuous no‐till NA NA NA NA15% N reduction plus continuous no‐till NA NA NA NACrop to forest conversion 26–160 46–411 34–470 32–318
aNA, not available.bValues are in $/lb of N offset.
STEPHENSON ET AL.: EVALUATION OF NUTRIENT NONPOINT OFFSET TRADING W04519W04519
6 of 11
water BMPs on two hypothetical sites to provide an idea ofthe range in costs. The first scenario installs storm waterBMPs on a hypothetical 50 acre residential development(wet ponds and storm water wetlands) and the second installsBMPs (bioretention areas and filtering devises) on a 5 acreparking lot.[44] After applying a 2:1 trading ratio, the cost per pound
of nitrogen offset is reported in Table 4. Annual nitrogenoffset costs for wet ponds or constructed wetlands in thehypothetical 50 acre residential development range from$380 to $650/lb and $85 to $425/lb of offsets, respectively.For the 5 acre impervious surface, the annual nitrogen offsetcosts range between $55 and $365/lb for offsets from bior-etention areas (depending on underlying soil condition) andover $2000/lb using sand filters. It is important to note thatthese are cost estimates for constructing BMPs for newdevelopments. As explained above, any urban offsets wouldlikely come from retrofitting existing development withstorm water controls. Because retrofitting existing develop-ments with BMPs is more expensive than building BMPs fornew developments the reported cost estimates should be con-sidered a lower bound [Committee on Reducing StormwaterDischarge Contributions to Water Pollution, 2008]. In addi-tion, these cost estimates exclude the potential application ofthe SARF, which if applied could quadruple the offset neededfor any point source compliance.[45] In additional to these high control costs, there are
considerable technical challenges to using storm water BMPsas a control practice. To offset 9000 lb of nitrogen load usingbioretention areas and sand filters to treat 5 acre parcels ofimpervious area would require nearly 400 bioretention areasand over 800 sand filters. Bioretention areas would need totreat nearly 2000 acres of impervious surfaces (approximately3 square miles) and sand filters would be required for more
than 4200 acres of parking lots (see Table 5). To secure thesame 43.8 L/s offset from existing residential lands wouldrequire the construction of between 160 and 205 wet ponds orconstructed wetlands.[46] Connecting existing septic system to a centralized
treatment system is also a fairly expensive method of acquiringoffsets. Aultman [2007] estimated the piping and installationcosts of connecting residential septic systems to an existingsewer system. The costs exclude road demolition, pumping,and incremental wastewater treatment costs. Virginia DEQhas indicated that a 2:1 trading ratio may not be uniformlyapplied for septic retirement, but would be made on a case‐by‐case basis. Estimated nitrogen offsets from septic loadswere assumed to range from 2.3 to 12.2 lb per dwelling unit.The annual cost of generating nitrogen offsets is estimated tobe a minimum of $30 to $400/lb/yr (see Table 4). Between740 and 3900 homes would need to be connected to generatesufficient offsets for 43.8 L/s plant expansion. The relativelysmall amount of nitrogen reductions generated by retiringseptic systems would significantly limit the feasibility of gen-erating offsets for anything but small point source expansions.[47] In all cases of urban offsets, the nutrient reductions
would likely be modeled or default estimates. Direct mea-surement of reductions achieved using urban offsets is likelyto be cost prohibitive. Thus, urban offsets provide the publicno additional assurances, compared agricultural sources, thatthe claimed reductions match actual reductions achieved. Theexception, however, might apply to failing systems wherenitrogen load would be relatively easy to identify and estimate.[48] Regarding administrative risk, many urban sources
are under the control of municipal or county governments.While municipal storm water and municipal wastewatertreatment are covered under different federal and state per-mitting programs, in a broad sense the local government is
Table 4. Urban Nonpoint Source Offset Cost Estimates
Offset Option
Annual Capitaland Operation
Costa ($)Annualized Land
Costb ($)Estimated Annual
Cost ($)Estimated NitrogenOffset Createdc (lb)
Estimated Costper Pound of
Nitrogen WLA ($)
50 Acre Suburban Retrofitd
Wet pondLow cost 21,690 500 22,190 58 383High cost 12,540 34,230 52.4 653
Storm water wetlandLow cost 3,525 600 4,125 48 86High cost 15,045 18,570 43.7 425
5 Acre Urban Retrofite
Bioretention areaLow cost 1,145 80 1,225 22.8 54High cost 6,090 2,005 8,095 22.7 366
Sand filtersLow cost 21,990 68 22,060 10.7 2,078High cost 1,705 23,695 10.6 2,215
Septic retirementf
Low cost 400/system 400 12.2 Min 33High cost 1,300 1,300 2.3 Min 560
aStorm water capital and operation/maintenance cost estimated from Wossink and Hunt [2003]. Capital costs reported in 2007 dollars, and land andcapital costs annualized over 20 years at 5%. Septic retirement costs from Aultman [2007] include piping and excavation costs only and exclude incrementalpumping and treatment costs.
bLand costs ranging from $10,000 to $250,000 per acre.cIncludes application of 2:1 trading ratio. Nutrient removal estimated using modified simple method within the Virginia Department of Conservation and
Recreation Virginia Runoff Reduction Method Worksheet (dated September 2008). Removal rates vary due to different pervious surface soil classes.dAssumes land use of 35% impervious cover and 65% turf.eAssumes land use of 90% impervious cover and 10% turf.fIncludes only excavation and piping costs; thus costs represent a minimum cost. Costs vary depending on scale of retrofit.
STEPHENSON ET AL.: EVALUATION OF NUTRIENT NONPOINT OFFSET TRADING W04519W04519
7 of 11
ultimately responsible for both sources. Thus, such urbanoffsets could avoid some legal risk associated with securingan offset from third party provider. An advantage of sewerconnection is that municipally owned water treatment plantswould have direct control over the offset process (connectingdwelling units to central sewer system). However, thesereduced administrative permitting risks are counteracted tosome degree to the uncertainty surrounding storm waterbaseline and regulatory requirements (e.g., whether SARFrequirements would apply).
5.3. Nutrient Assimilation Offsets
[49] A bioeconomic model of commercial aquaculturewas used to estimate the cost of providing a nitrogen offsetfrom commercial oyster aquaculture [Miller, 2009]. Themodel estimates cost by calculating the supplemental com-pensation necessary for a commercial aquaculture operationto produce additional oysters. The total nitrogen removedfrom ambient waters was calculated based on total nitrogensequestered in oyster tissue and shell at harvest (biomasssequestration) and nitrogen removed through denitrificationof oyster biodeposits (assuming 0 to 30% of total N in bio-deposits removed) [Miller, 2009; Higgins et al., 2009].[50] Estimated cost to generate 1 lb of offset range from
$0 to $150/lb/yr (see Table 5). Cost estimates vary dependingon assumptions about oyster prices, input costs, growth andmortality rates [Miller, 2009]. Conceptually, costs may bezero because in some economic circumstances oyster growerswould be willing to expand production without any com-pensation for nutrient removal services. Estimated totalnitrogen removed for every 1 million market‐sized oystersharvested ranges between 290 and 815 lb/yr (depending onassumptions of denitrification rates).[51] To achieve a 9000 lb nitrogen offset (applying the
2:1 ratio) 22 and 62 million oysters would need to be pro-duced annually by Virginia oyster aquaculture operations(see Table 5). Only 16 million oysters, however, wereproduced from oyster aquaculture operations in 2008 [Bosch
et al., 2008]. Thus, oyster aquaculture production wouldneed to undergo a considerable scale‐up to be able to pro-duce offsets on this scale of a 43.8 L/s point source expansion.[52] Yet, oyster offsets offer some advantages over agri-
cultural offsets. Unlike agricultural offsets, a portion of thenutrient offset is directly observable. Nutrients sequesteredin biomass (but not the amount denitrified) can be directlymeasured and verified through observable oyster aquacul-ture harvest and would provide the public greater assurancesthat offsetting reductions are achieved. However, oysteraquaculture, like agricultural offsets, would impose admin-istrative permitting risks on point sources due to third partycontracting.[53] The algal turf scrubber (ATS) is in use in some areas
of Florida for P removal rather than nitrogen. The estimatedremoval cost for phosphorus is $24/lb/yr of the Floridasystem [Sano et al., 2005]. Very little information is pres-ently available on the cost to remove nitrogen. One firmpromoting algal turf scrubbers places the cost of nitrogenremoval in one case study area to be $40/lb [Zivojnovich,2007].[54] While most systems have been designed for phos-
phorus, it is estimated that a square meter of ATS surfacearea can produce 35 g/m2 of dry matter per day with 3%total nitrogen (W. Adey, personal communication, 2007). Atthis algal production, a one acre biomass production areawould remove about 3400 lb of nitrogen per year. Thus tosecure a 9000 lb nitrogen offset would require between 3and 6 acres of algal biomass growing area, depending onwhether a 2:1 trading ratio is applied, from an algal turfscrubber facility (see Table 5).[55] Algal biomass harvest offer several advantages over
agricultural nonpoint source offsets. The N removed frombiomass harvest can be directly measured by harvestedbiomass weight or by differences in nitrogen content ofwater flows in and out of the grow‐out facility. Furthermore,such facilities can be operated internally by point source
Table 5. Summary of Offset Compliance Options in Virginia
Offset Options
Evaluative Criteria and Indicators
Annual EstimatedCost of N
Offseta ($/lb) Practical Feasibilityb
Certaintyin AchievingReductionsc Administrative Riskd
Agricultural nonpoint offsetsEarly cover crops 26–400 16,300–64,300 acres Modeled/estimated No15% N reduction 8–56 4,370–16,215 acres Modeled/estimated NoContinuous no‐till TBD 10,055–20,930 acres Modeled/estimated No15% N reduction plus continuous no‐till TBD 3,530–10,910 acres Modeled/estimated NoCrop to forest land conversion 26–470 1,555–4,850 acres Modeled/estimated Yes
Urban nonpoint offsetsStorm water wet ponds 383–653 7,760–8,580 treated acres Modeled/estimated To some degreeStorm water wetlands $86 to 425 9,370–10,290 treated acres Modeled/estimated To some degreeBioretention areas 54–366 1,965–1980 treated acres Modeled/estimated To some degreeSand filters 2,078–2,215 4,205–4,240 treated acres Modeled/estimated To some degreeSeptic retirement Min 30–560 740–3,900 houses Modeled/estimated Yes
Nutrient assimilation offsetsOyster aquaculture 0–150 22–62 million oysters Measured and modeled NoAlgal biomass harvest 40–80 3–6 acres Direct measurement YesRestored floodplain wetlands 1–214 50–200 acres Modeled or measured Possible
aIncludes application of the 2:1 trading ratio. TBD, to be determined.bActivity required to offset 43.8 L/s expansion. Includes application of the 2:1 trading ratio.cModeled estimate or direct measurement.dPermittee control of offset activity.
STEPHENSON ET AL.: EVALUATION OF NUTRIENT NONPOINT OFFSET TRADING W04519W04519
8 of 11
permit holders, thereby eliminating exposure to legal risksof noncompliance of third party offset providers.[56] Nitrogen removal from restored wetlands is highly
variable but Mitsch et al. [2000] report that sustainablenitrogen retention rates range from 100 to 400 kg/ha/yr in theEastern U.S. These rates translate into 89 to 365 lb/acre/yr ofnitrogen. Large variation in nitrogen removal rates have beenobserved across wetland types, with large connected flood-plain wetlands showing the greatest nutrient removal poten-tial [Jordan et al., 2007]. Assuming rates from Mitsch et al.,between 50 and 200 acres of wetlands would need to berestored to produce enough nitrogen reductions to offset a43.8 L/s plant expansion.[57] Like removal rates, wetland restoration costs vary
widely. The North Carolina Ecosystem Enhancement Pro-gram (NCEEP) charges $22,000 to $146,000 per acre underits wetland in lieu fee program (NCEEP, EEP schedule offees, 2009; available at http://www.nceep.net/pages/fee.htm).Program fees are established to cover the entire cost of wet-land restoration. Assuming the NCEEP wetland restorationfees are a reasonable approximation of wetland restorationcosts in the Chesapeake Bay area, the total annual offset costfor an offset would be between $32 and $214 for nitrogenremoval rates of 100 kg/ha/yr (Costs annualized over 30 yearsat 5%). Under higher removal rates (400 kg/ha/yr), restoredwetland offsets range between $8 and $54 per pound of offset(see Table 5). Cost studies in the upper Mississippi Riverbasin claim nutrient reductions using restored wetlands canbe achieved at much lower costs, approaching approximately$1 per pound of nitrogen [Hey et al., 2005]. Unlike othertypes of nutrient assimilation offsets described above, how-ever, defining baselines for offsets generated by wetlandrestoration may be more challenging, with potential reduc-tions in cost effectiveness. The Virginia Tributary documentsstrategies identify targets for the number of acres of wetlandsto be restored [Virginia Secretary of Natural Resources,2005]. Procedures have yet to be established that identifyhow or whether wetland restoration offsets would be subjectto more stringent baseline requirements.[58] As on offset option, wetland offsets projects could
remain under the exclusive control of the permitted pointsource, reducing administrative risks and increasing theappeal of this option. Wetland restoration lands could beowned and managed by the point source permittee. In addi-tion, if the inlet and outlet flows to the wetland are managed tosome degree, some field level measurement and verificationof wetland nutrient removal performance is possible, increas-ing public appeal of this offset option.
6. Discussion and Conclusions
[59] Discussions of trading programs beginwith the premisethat regulated point sources will find attractive trades withagricultural nonpoint sources. Evidence from the Virginianutrient trading program suggests this assumption may beerroneous for a number of reasons. First, agricultural non-point offsets do not appear particularly attractive compared tosome other offset alternatives, particularly nutrient assimila-tion offsets, on a strictly cost of control basis. Furthermore,the literature often claims that point‐nonpoint source tradingis economically attractive because nonpoint sources facelower control costs than point sources. This is not the case inVirginia. Agricultural offsets costs range from $8 to $500 per
pound nitrogen offset. During the initial phases of imple-mentation, marginal point source control costs range between$10 and $15 per pound of nitrogen [Aultman, 2007]. Esti-mated nonpoint source costs are high partly because Virginialaw dictates the development of fairly stringent nonpointsource baseline requirements that significantly reduces peracre nutrient reductions that can be produced.[60] Second, agricultural nonpoint sources have limited
physical potential to meet future point source offset needs.The relatively small per acre reductions assigned to approvednonpoint source practices may make it physically difficult tofind enough reductions to permanently offset even modestincreases in wastewater flows. In many watersheds, a quarterto half of all corn land would be needed to offset a 43.8 L/spoint source expansion. This acreage would require theimplementation of five mandatory baseline BMPs in addi-tion to the DEQ offset practice, making this offset optionimpractical even if other drawbacks could be overcome.[61] Finally, potentially high contracting costs and legal
risks of permit violations in the event of nonpoint sourcenoncompliance further reduce the appeal of agricultural non-point source offsets for point sources. Regulated point sourcesare reluctant to tie compliance of their NPDES permit to thethird party compliance.Agricultural land conversion, however,is an exception to this conclusion. Depending on land pricesand availability, converting intensive agricultural land use toforest could be achieved while providing the point sourcewith control over offset compliance.[62] The limited appeal of agricultural offsets to point
sources is due, in part, to the nature and structure of theexisting program rules. The trading program in Virginiaoccurs within a specific set of rules that stresses the appli-cation of on‐site point source controls (sequencing), setsstringent nonpoint source baseline requirements, and requiresoffsets be included as a new condition within a point sourcepermit (no transfer of discharge control responsibility). Thispaper highlights the importance and impact of these institu-tional details on trading program participant behavior andincentives. While the discussion here focuses on the specificset of trading rules in Virginia, other research suggests thatthese types of conditions are often derived from, and sup-ported by, the statutory and regulatory framework of theClean Water Act [Shabman and Stephenson, 2007; Shabmanet al., 2002].[63] Other types of offsets offer few improvements over
agricultural nonpoint offset options. Urban nonpoint sourceoffsets, particularly from storm water, appear prohibitivelyexpensive in addition to failing to generate offsets on the scalenecessary for most wastewater treatment plants. The one classof sources examined here that offer cost effective reductionsin quantities sufficient to cover WWTP needs are nutrientassimilation offsets. Biomass harvest and wetland restorationappear to offer potential to both produce sufficient nutrientoffsets with lower regulatory risk. Regulatory approval,however, is still needed for these nutrient offset options.[64] These conclusions must be tempered by limited
knowledge and information about offset costs. Given thesignificant interest in nonpoint source reduction practices andthe large number studies undertaken to understand and esti-mate nutrient removal effectiveness, remarkably little detailedwork as been done to estimate the cost of many these practices.The available evidence on implementation costs often exhibitlarge variations in removal costs. Even less is known about
STEPHENSON ET AL.: EVALUATION OF NUTRIENT NONPOINT OFFSET TRADING W04519W04519
9 of 11

the offset provider’s risk and transaction costs. Thus, offsetcost estimates provided here can only be interpreted as grossapproximations of the actual costs of providing offsets.[65] Given the cost and uncertainty of many offset options,
point sources appear to have strong incentives to seek anddevelop additional ways to reduce nutrient loads internally.Given in‐house expertise in effluent treatment and the appealto manage offsets under their regulatory control, point sourcedischargers may look to assume responsibility for small butstill unregulated sources of discharge. For instance, at leastone WWTP in Virginia is negotiating with Virginia DEQ toacquire WLA by assuming the treatment of septic pump‐outwaste from neighboring counties and the treating of wastefrom municipal landfill lagoons. In essence, incentives arebeing created for point sources to voluntarily treat morenutrient sources in exchange for an expanded cap. Therelatively high cost of nonpoint source offset providespoint sources and incentive to pull these small unregulatedsources under the cap.[66] Point sources can also effectively reduce their nutrient
loads by avoiding or reducing the discharge of wastewateraltogether. Point source program compliance is determinedby end‐of‐pipe discharge of mass load, with mass load beinga product of flow and effluent concentration. While limitedadditional reductions are feasible by removing additionalnutrients from wastewater (lowering concentration levels),point sources can reduce loads by reducing the total volumeof wastewater flows through water reuse and reclamationprojects. Several wastewater treatment plants are now seekingand gaining approval to use effluent wastewater for irrigationor for use in electric power production [Brockenbrough,2008]. Other uses, such as gray water reuse (toilet flush-ing), are also being explored. Every avoided direct dischargeof wastewater volume into receiving waters is a proportionalreduction in point source load discharged.[67] The cost, feasibility, and risk associated with agri-
cultural nonpoint offsets, along with other more feasible anddesirable offset alternatives cast significant doubts as towhether nutrient trading will ever generate any significantrevenues for the agricultural conservation activities inVirginia. This conclusion is consistent with the collective lackof nonpoint source trades nationwide [U.S. EnvironmentalProtection Agency, 2008]. Data and evidence from Virginia,suggests public officials will need to look beyond an agri-cultural nonpoint source offset program for what one NRCSofficial called the “next generation of incentives for conser-vation” [Knight, 2003]. The lack of nonpoint source trades,however, should not be construed as a trading program failure.The goal of the Virginia program is to maintain compliancewith an aggressive point source load cap. This can be done,and be done without the involvement of nonpoint sources.
[68] Acknowledgments. This research was partially supported bytwo grants from the Environmental Protection Agency’s Targeted Water-shed Grant Program and administered by the National Fish and WildlifeFoundation. The authors would also like to acknowledge the helpful com-ments provided by Virginia Department of Environmental Quality, LucClaessens, and three anonymous reviewers.
ReferencesAdey,W., C. Luckett, and K. Jensen (1993), Phosphorus removal from natural
waters using controlled algal production, Restor. Ecol., 1, 29–39,doi:10.1111/j.1526-100X.1993.tb00006.x.
Aultman, S. (2007), Analyzing cost implications of water quality tradingprovisions: Lessons from the Virginia Credit Exchange Act, M.S. thesis,102 pp., Va. Polytech. Inst. and State Univ., Blacksburg.
Bosch, D., N. Kuminoff, A. Harris, J. C. Pope, K. Stephenson, and P. Mason(2008), Economic implications of alternative management strategies forVirginia oysters and clams, report, Va. Coastal Zone Manage. Program,Va. Dep. of Environ. Qual., Richmond.
Breetz, H. L., K. Fisher‐Vanden, H. Jacobs, and C. Schary (2005), Trustand communication: Mechanisms for increasing farmers’ participationin water quality trading, Land Econ., 81(2), 170–190.
Brockenbrough, A. (2008), Growing under nutrient load caps in the Chesa-peake Bay Watershed in Virginia, report, Rappahannock River BasinCommiss., Fredericksburg, Va., 3 Dec.
CH2M Hill (2007), Onsite sewage disposal systems: Identification, catego-rization and prioritization, technical memorandum, Washington, D. C.
Chesapeake Bay Program (2003), Economic analyses of nutrient and sedi-ment reduction actions to restore Chesapeake Bay water quality, technicalreport, Annapolis, Md. (Available at http://www.chesapeakebay.net/content/publications/cbp_13206.pdf)
Committee on Reducing Stormwater Discharge Contributions to WaterPollution (2008), Urban Stormwater Management in the United States,Natl. Acad. Press, Washington, D. C.
Conservation Technology Information Center (2006), Getting paid forstewardship: An agricultural community water quality trading guide,Rep. CP‐83224001, West Lafayette, Ind. (Available at http://www.epa.gov/owow/watershed/trading.htm.)
Delaware Department of Natural Resources and Environmental Control(2008), Regulations governing the pollution control strategy for the Indi-an River, Indian River Bay, Rehoboth Bay and Little Assawoman Baywatersheds, Regul. 7403, Dover. (Available at http://www.dnrec.state.de.us/water2000/Sections/Watershed/ws/ib_pcs.htm)
Diaz‐Zorita, M., J. H. Grove, L. Murdock, J. Herbeck, and E. Perfect(2004), Soil structure disturbance effects on crop yields and soil propertiesin a no‐till production system, Agron. J., 96, 1651–1659.
Faeth, P. (2000), Fertile Ground: Nutrient Trading’s Potential to Cost‐Effectively Improve Water Quality, World Resour. Inst., Washington,D. C.
Friedman, S., R. Heimlich, B. Jackson, and E. McLellan (2007), Farming forclean water: Innovative solutions to reduce Chesapeake Bay farm runoff,report, Cent. for Conserv. Incentives, Environ. Def., New York. (Avail-able at http://www.edf.org/documents/7373_ChesapeakeBayReport_FarmingForCleanWater.pdf.)
Gross, C. M., J. A. Delgado, S. P. McKinney, H. Lal, H. Cover, andM. J. Shaffer (2008), Nitrogen trading tool to facilitate water quality credittrading, J. Soil Water Conserv., 63(2), 44–45.
Hanson, J. C., and K. E. McConnell (2008), Simulated trading forMaryland’s nitrogen loadings in the Chesapeake Bay, Agric. Resour.Econ. Rev., 37, 211–226.
Hey, D. L., J. A. Kostel, A. P. Hurter, and R. H. Kadlec (2005), Nutrientfarming and traditional removal: An economic comparison, Rep. 03‐WSM‐6C0, Water Environ. Res. Found., Alexandria, Va.
Higgins, C., K. Stephenson, and B. Brown (2009), Nutrient biol.‐assimila-tive capacity of aquacultured oysters: Quantification of an ecosystemservice, working paper, Dep. of Biol., Va. Commonw. Univ., Richmond.
HydroMentia (2005), Single stage Algal Turf Scrubber present worth costand by‐product market analysis, Contract C‐13933, South Fla. Manage.Water Dist., West Palm Beach.
Jordan, T., T. W. Simpson, and S. E. Weammert (2007), Wetland restorationand wetland creation best management practices: Definition and nutrientand sediment reduction efficiencies for use in calibration of the phase5.0 of the Chesapeake Bay Program Watershed model, Mid‐AtlanticWater Program, Univ. of Md., College Park.
Knight, B. I. (2003), The future of conservation trading in agriculture,paper presented at Sixth National Mitigation and Conservation BankingConference, CH2M Hill, San Diego, Calif., 24 April.
Lindahl, O., R. Hart, B. Harnroth, S. Kolberg, L. Loo, L. Olrog,A. Rehnstam‐Holm, J. Svensson, S. Svensson, and U. Syversen (2005),Improving marine water quality by mussel farming: A profitable solutionfor Swedish society, Ambio, 34(2), 131–138.
Lynch, S., and L. Shabman (2007), The Florida Ranchlands EnvironmentalServices Project: Field testing a pay‐for‐environmental services program,Resources, 165, 17–19.
Massey, R. (1997), No‐tillage and conservation tillage: Economic considera-tions, Rep. G355, Univ. of Mo., Columbia. (Available at http://extension.missouri.edu/explorepdf/agguides/agecon/g00355.pdf.)
STEPHENSON ET AL.: EVALUATION OF NUTRIENT NONPOINT OFFSET TRADING W04519W04519
10 of 11
Metcalfe, T., D. J. Bosch, J. W. Pease, M. M. Alley, and S. B. Phillips(2007), Yield reserve program costs in the Virginia Coastal Plain, Agric.Resour. Econ. Rev., 36, 197–212.
Miller, A. L. (2009), An economic evaluation of the nutrient assimilationpotential for commercial aquaculture in the Chesapeake Bay, M.S. thesis,141 pp., Va. Polytech. Inst. and State Univ., Blacksburg.
Mitsch,W. J., A. J. Horne, and R.W. Nairn (2000), Nitrogen and phosphorusretention in wetlands—Ecological approaches to solving excess nutrientproblems, Ecol. Eng., 14, 1–7.
Newell, R. (2004), Ecosystem influences of natural and cultivated popula-tions of suspension‐feeding bivalve molluscs: A review, J. Shellfish Res.,23(1), 51–61.
Newell, R., R. Fisher, R. Holyoke, and J. Cornwell (2005), Influence ofeastern oysters on nitrogen and phosphorus regeneration in ChesapeakeBay, USA, in Comparative Roles of Suspension Feeders in Ecosystems,edited by R. Dame and S. Olenin, NATO Sci. Ser., Ser. IV, 47, 93–120.
Office of Wastewater Management (2007), Water quality trading toolkit forpermit writers, Rep. EPA 833‐R‐07‐004, U.S. Environ. Prot. Agency,Washington, D. C.
Pendell, D. L., J. R. Williams, C. W. Rice, R. G. Nelson, and S. B. Boyles(2006), Economic feasibility of no‐tillage and manure for soil carbonsequestration in corn production in northeastern Kansas, J. Environ.Qual., 35, 1364–1373, doi:10.2134/jeq2005.0149.
Ribaudo, M. O., R. Heimlich, and M. Peters (2005), Nitrogen sources andgulf hypoxia: Potential for environmental credit trading, Ecol. Econ., 52,159–168, doi:10.1016/j.ecolecon.2004.07.021.
Sano, D., A. Hodges, and R. Degner (2005), Economic analysis of watertreatments for phosphorus removal in Florida, Publ. FE575, Inst. of Foodand Agric. Serv., Univ. of Fla., Gainesville.
Shabman, L., and K. Stephenson (2007), Achieving nutrient water qualitygoals: Bringing market‐like principles to water quality management,J. Am. Water Resour. Assoc., 43(4), 1076–1089, doi:10.1111/j.1752-1688.2007.00089.x.
Shabman, L., K. Stephenson, and W. Shobe (2002), Trading programs forenvironmental management: Reflections on the air and water experiences,Environ. Pract., 4(3), 153–162, doi:10.1017/S1466046602021245.
Stephenson, K., and L. Shabman (2008), Concept to reality: Commonmyths about water quality trading, paper presented at Canadian AgriculturalEconomics Society/Northeastern Agricultural and Resources EconomicsAssociation Joint Conference, Quebec City, Que., Canada, 30 June.
U.S. Department of Agriculture (2006), USDA and EPA sign waterquality credit trading agreement: Agreement offers farmers and ran-chers market‐based incentives to improve water quality, press release,Washington, D. C. (Available at www.nrcs.usda.gov/news/releases/2006/usdaepawqagreement.html.)
U.S. Environmental Protection Agency (2008), EPA water quality tradingevaluation, final report, Washington, D. C.
Virginia Department of Environmental Quality (2008), Trading nutrientreductions from nonpoint source best management practices in theChesapeake Bay Watershed: Guidance for agricultural landowners andyour potential trading partners, Richmond.
Virginia Secretary of Natural Resources (2005), Chesapeake Bay nutrientand sediment reduction tributary strategy for the Shenandoah and Potomacriver basins, Richmond.
Wossink, A., and W. Hunt (2003), An evaluation of cost and benefitsof structural stormwater best management practices in North Carolina,N. C. Coop. Ext. Serv., Raleigh.
Zivojnovich, M. (2007), Application of the Algal Turf Scrubber technologyfor point source and nonpoint source nitrogen and phosphorus control,report, U.S. Environ. Prot. Agency, Washington, D. C.
S. Aultman, Department of Applied Economics, University of Minnesota,Saint Paul, MN 55108, USA. ([email protected])T. Metcalfe, Social Science Program, Maxwell School of Citizenship
and Public Affairs, Syracuse University, Syracuse, NY 13244, USA.([email protected])A. Miller, Gulf States Marine Fisheries Commission, 2404 Government
St., Ocean Springs, MS 39564, USA. ([email protected])K. Stephenson, Department of Agricultural and Applied Economics,
Virginia Polytechnic Institute and State University, Blacksburg, VA24061, USA. ([email protected])
STEPHENSON ET AL.: EVALUATION OF NUTRIENT NONPOINT OFFSET TRADING W04519W04519
11 of 11