Project Design Document for Gold Standard Voluntary Offset ...
101
THE GOLD STANDARD: Project Design Document for Gold Standard Voluntary Offset projects (GS-VER-PDD) For more information, please contact The Gold Standard: http://www.cdmgoldstandard.org [email protected] phone +41 61 283 09 16 fax +41 61 271 10 10 April 2006 This document was developed by: The Gold Standard for VERs has received financial support from: Explanatory information on how to complete the PDD and how to obtain Gold Standard registration can be found in the project developer’s manual available on the Gold Standard website. This template of the PDD is applicable for micro-, small- and large-scale projects. Note that the shaded boxes present information on the Gold Standard VER project development procedures. Project developers should delete these shaded boxes when preparing their PDD.
-
Upload
khangminh22 -
Category
Documents
-
view
2 -
download
0
Transcript of Project Design Document for Gold Standard Voluntary Offset ...
THE GOLD STANDARD:
Project Design Document for Gold Standard Voluntary Offset projects
(GS-VER-PDD)
For more information, please contact The Gold Standard: http://www.cdmgoldstandard.org [email protected] phone +41 61 283 09 16 fax +41 61 271 10 10 April 2006 This document was developed by: The Gold Standard for VERs has received financial support from:
Explanatory information on how to complete the PDD and how to obtain Gold Standard registration can be found in the project developer’s manual available on the Gold Standard website.
This template of the PDD is applicable for micro-, small- and large-scale projects. Note that the shaded boxes present information on the Gold Standard VER project development procedures. Project developers should delete these shaded boxes when preparing their PDD.

PROJECT DESIGN DOCUMENT (GS-VER-PDD) KronoClimate 2006/2007 - Voluntary Offset Project
page 2
This template shall not be altered. It shall be completed without modifying/adding headings or logo, format or font.
THE GOLD STANDARD:
Project Design Document for Gold Standard Voluntary Offset projects
of the project
KRONOCLIMATE
for the retroactive Gold Standard registration of the
VERs 2006/07
Document prepared by:
PROJECT DESIGN DOCUMENT FORM (GS-VER-PDD) Voluntary Offset Projects - Version 01
page 3
This template shall not be altered. It shall be completed without modifying/adding headings or logo, format or font.
KRONOCLIMATE VOLUNTARY OFFSET PROJECT
PROJECT DESIGN DOCUMENT (GS-VER-PDD)
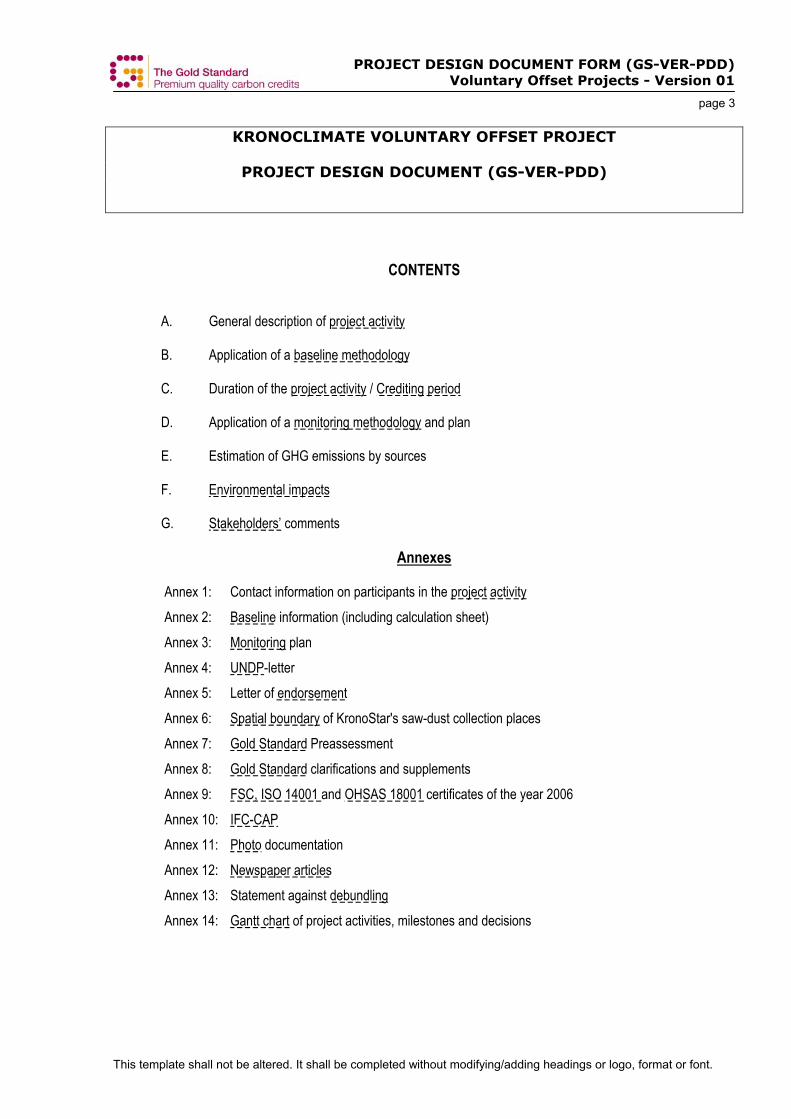
CONTENTS A. General description of project activity B. Application of a baseline methodology C. Duration of the project activity / Crediting period D. Application of a monitoring methodology and plan E. Estimation of GHG emissions by sources F. Environmental impacts G. Stakeholders’ comments
Annexes Annex 1: Contact information on participants in the project activity Annex 2: Baseline information (including calculation sheet) Annex 3: Monitoring plan Annex 4: UNDP-letter Annex 5: Letter of endorsement Annex 6: Spatial boundary of KronoStar's saw-dust collection places Annex 7: Gold Standard Preassessment Annex 8: Gold Standard clarifications and supplements Annex 9: FSC, ISO 14001 and OHSAS 18001 certificates of the year 2006 Annex 10: IFC-CAP Annex 11: Photo documentation Annex 12: Newspaper articles Annex 13: Statement against debundling Annex 14: Gantt chart of project activities, milestones and decisions
PROJECT DESIGN DOCUMENT FORM (GS-VER-PDD) Voluntary Offset Projects - Version 01
page 4
This template shall not be altered. It shall be completed without modifying/adding headings or logo, format or font.
Preliminary Remarks Overall justification of the request for Gold Standard registration: The KronoClimate project is a fuel switch and waste management project based on biomass. The key issue for the sustainability of such projects is the biomass sourcing. As a surplus sustainable activity, the project’s sourcing of biomass is based on FSC certificated forest management activities. The project’s history is as follows: In January 2005 c4c ltd submitted the KronoClimate PDD to TÜV-SÜD for validation. The layout of the PDD was at that time according to the template of the ERUPT-5 programme of SenterNovem, The Netherlands. KronoClimate is a Joint Venture of Krono Holding AG and c4c AG. TÜV-SÜD determined KronoClimate as validated after all findings had been clarified on 6th of April 2005. In autumn 2006 Krono Holding AG and c4c AG decide to generate GS VERs for the period 2006 - 2007 instead of the intended AAUs. Furthermore the PDD is up-dated with calculations regarding the new approved methodology AM0036 which wasn’t available in 2005 and which allows to quantify the avoided methane emissions as a result of the improved waste management. A request for pre-assessment of the PDD is submitted to the TAC of the Gold Standard Foundation. c4c ltd provided clarification and supplements in the request for retroactive GS VER registration 2006 / 2007. TÜV-SÜD determined the KronoClimate project as fulfilling all the requirements for GS VERs according to the Gold Standard requirements during the period 2006 and 2007 after all findings had been closed. For the sake of readability the over time accumulated separate documents have been merged into this PDD following the official GS-VER PDD layout. The contents of the PDD, extension and supplements have not been changed apart from adapted references and removed redundancies. As such the validation of the original PDD in 2005 up-dated with calculations according to the AM0036 remains valid. Identified areas where further information is needed by the Gold Standard Board have been provided with more in-depth argument in the attached supplements in Annex 8 and in this PDD itself. For better understanding articles belonging to the Waste Management PDD AM0036 calculations have been framed dotted and labelled with 'WM', articles belonging to the Fuel Switch PDD have been framed solid and labelled 'FS'. Below is given an example.
FS This is an example of an excerpt of the KronoClimate Fuel Switch PDD.
WM This is an example of an excerpt of the KronoClimate Waste Management PDD AM0036.
PROJECT DESIGN DOCUMENT FORM (GS-VER-PDD) Voluntary Offset Projects - Version 01
page 5
This template shall not be altered. It shall be completed without modifying/adding headings or logo, format or font.
SECTION A. General description of project activity A.1 Title of the project activity >> Title: KronoClimate Fuel Switch (FS) and Waste Management (WM) Project and GS-supplements. Version: 2.8 Date: May 21, 2008
PROJECT DESIGN DOCUMENT FORM (GS-VER-PDD) Voluntary Offset Projects - Version 01
page 6
This template shall not be altered. It shall be completed without modifying/adding headings or logo, format or font.
A.2. Description of the project activity >> Please include in the description: - the purpose of the project activity - the view of the project participants of the contribution of the project activity to sustainable development (max. one page). -the results from the sustainable development matrix Section 3.4 of the Gold Standard VER Project Developer’s Manual provides guidance on the methodology for assessing the project activity against the indicators of the sustainable development matrix. FS
Project Background The KronoClimate fuel switch project is a project to replace fossil fuels (mostly peat and heavy oil) by biomass in the central energy generation of the project KronoStar. The latter, the underlying investment project is an approved project of the IFC (No. 20425). It encompasses the construction of a modern state-of-the-art wood products manufacturing plant with a annual production capacity of 165,000 cubic meter per year (CMY) particleboard and 400,000 CMY medium density fiberboard (MDF). The project is a part of a long-term investment program by KronoStar Sharja, a fully-owned subsidiary of Krono Holding AG, its Swiss mother company. The KronoClimate fuel switch project is one project out of a group of climate-relevant activities accompanying the above investment project and known as the pilot programme KronoClimate. Additional projects in the framework of this programme are dealing with sourcing of raw material/fibres, forest management, as well as with production processes and products.
Project Characteristics Core element = fuel switch
Installation of 2 biomass boilers (55 MW each) for the process heat supply of the Kronostar manufacturing plant. Replacement of an equivalent amount of fossil fuels.
Project timing Go – decision in: 2001 Boilers installed in: 2003 (55 MW) and 2005 (55 MW) Climate Project with a duration of: 10 years: Project registration: 2005 Generation of AAU: 2006 – 2007 ERU Generation: 2008 – 2012 Further ERs till: 2016
Project lifetime The KronoStar project has a layout until 2022 / 2023, i.e. a lifetime of 20 years. Concerning the lifetime of the KronoClimate Fuel Switch Project, obviously, there must be a process heat production as long as the plant shall run. However, the project lifetime of the KCFS project is limited to the lifetime of the biomass boilers which is expected to last until the end of 2012 in minimum, until the end of 2017 in maximum.
Realized project phases
Phase 1 (2003): Particle Board manufacturing line: Energy need: Biomass 55 MW Energy need: Fossil Fuels (stand by, reserve) 18 MW Wood consumption 600 m3 / day Investment volume CHF 65 mio. Phase 2 (2004):
PROJECT DESIGN DOCUMENT FORM (GS-VER-PDD) Voluntary Offset Projects - Version 01
page 7
This template shall not be altered. It shall be completed without modifying/adding headings or logo, format or font.
Medium Density Fiberboard (MDF) line: Energy need - Biomass 55 MW (started Jan 2005) - Fossil Fuels (Stand by, Reserve) 2x 18 MW Wood consumption (input) 1‘500 m3 / day Investment volume CHF 195 mio. Phase 3 (2005 until 2012 ... 2017): Oriented Strand Board (OSB) line, eventually particle board: Energy need: covered through phase 1 & 2 Wood consumption (input) 2‘000 m3 / day Investment volume CHF 120 mio.
WM The general project description is identical with the KronoClimate Fuel Switch project, contracted by SenterNovem in 2005 (ERU05/20) and validated by TÜV-Süd in 2005. Due to the project activity which encompasses the process heat generation for the KronoStar factory, up to 385,000 t/a of wood residues are used as fuel instead of being dumped on a deep unmanaged landfill in the pre-project situation (process heat generation based on peat and heavy oil incineration). Further, KronoStar will source up to 190,000 t/a raw material from third parties’ wood wastes (mainly sawmills). Prior to the project activity, this biomass was also deposed on several small dump sites nearby the factories. The raw material was solely sourced as logwood directly from the forest. Deposed on landfills, these biomass residues (both, on-site produced energy biomass and sourced wood residues) would partly decay in methane due to anaerobic conditions. Methane (CH4) is a greenhouse gas with the 21-fold global warming potential than carbon dioxide (UNFCCC default value for the first commitment period). This extension to the original KCFS PDD additionally encompasses the emission reductions attributable to the alternative treatment of biomass residues by the KCFS project. This aspect was mentioned as positive leakage effect in the original KCFS PDD. The reason for the delayed inclusion of waste management activities into the project boundaries is the unavailability of a methodology (particularly the decay model) at the time of writing the original KCFS PDD. In the meantime, an applicable CDM methodology (AM0036) including an approved decay model (EB 26 Meeting Report Annex 14), both valid since 29th of September 2006, has been published by the UNFCCC. By the extension of the project boundary described in this extension, the original KCFS PDD remains unchanged.
PROJECT DESIGN DOCUMENT FORM (GS-VER-PDD) Voluntary Offset Projects - Version 01
page 8
This template shall not be altered. It shall be completed without modifying/adding headings or logo, format or font.
In the view of the project partners, the KronoStar/KronoClimate project doesn’t only contribute to climate change mitigation, but it further constitutes a showcase for a sustainable wood processing industry in Russia. Sustainability is considered in the whole production chain, starting from the raw material sourcing, by collecting unused wood residues from third parties (mostly sawmills) promoting forest management according the FSC standard in leased forest areas. Also the production processes are optimized in terms of sustainability: state-of-the-art technology is applied; a closed production water cycle with a waste water treatment station has been established; aerial emissions are cleaned by a plasmacatalytic filter, formaldehyde emissions are reduced significantly. Many specialised jobs were created and the added value is of importance for the whole region. Further, the process heat is mainly generated by wood wastes accruing during production process and dumped on landfills prior to the project implementation. Especially the uncontrolled dumps of third parties’ wood residuals outside KronoStar’s premises have been in the critics (cf. stakeholder comments). Beside FSC for the management of wood resources, KronoStar features certificates for Occupational Health and Safety (OHSAS 18’000) for an Environmental Management System (ISO 14’000) and is in certification process of a Quality Management System (ISO 9’000). Copies of the certificates are included in annex 9. In the Sustainable Development Matrix, which is developed and described in section 2 of the request for Gold Standard registration in annex 8 (further referred to as GSR) the following benefits from as sustainability point of view are achieved by the project:
• moderate positive impact (+3) on environment due to improved soil conditions (FSC prevents from soil disturbances due to forestry activities and promotes biodiversity, waste management avoids deposition and improves soil fertility, bio-fuels replace the combustion of peat and therefore contributes to the protection of highly vulnerable bog ecosystems)
• slight positive impact (+2) on social sustainability (new specialised jobs and better working conditions due to
modern technology, western production standards and FSC certification)
• slight positive impact (+2) on economic and technological development (higher self reliance in terms of energy dependency due to the generation of process heat of wood residues accruing in-house.
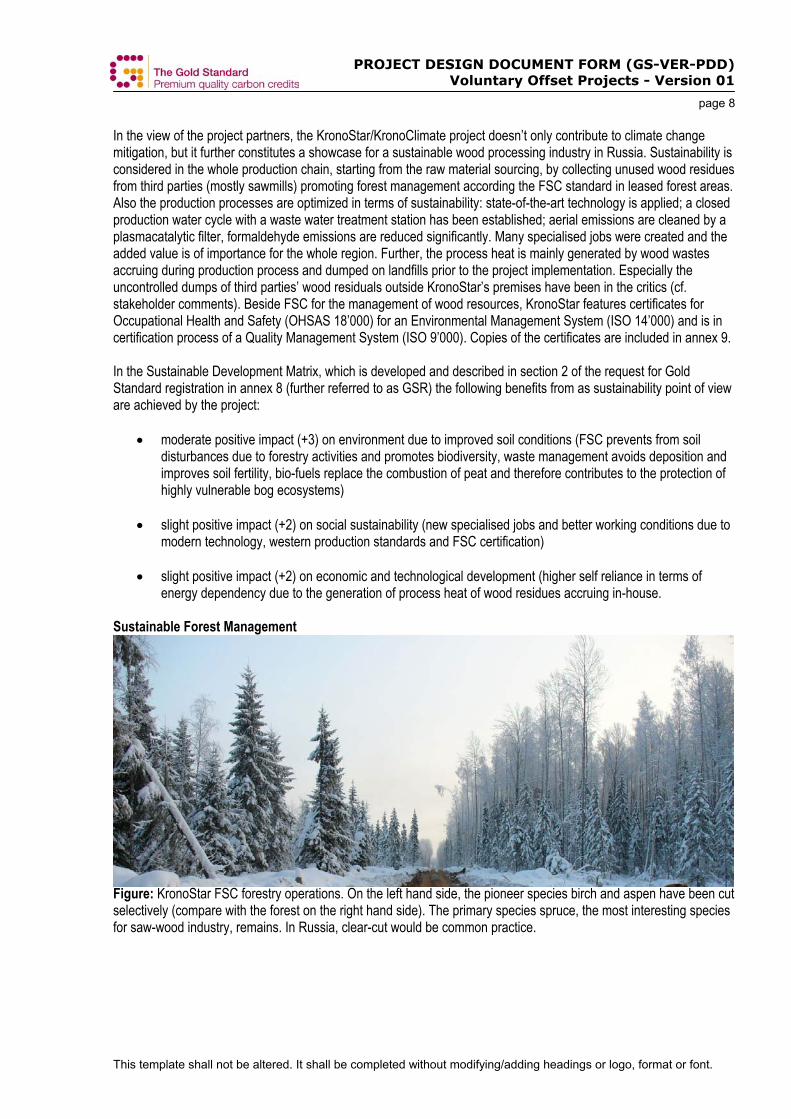
Sustainable Forest Management Figure: KronoStar FSC forestry operations. On the left hand side, the pioneer species birch and aspen have been cut selectively (compare with the forest on the right hand side). The primary species spruce, the most interesting species for saw-wood industry, remains. In Russia, clear-cut would be common practice.
PROJECT DESIGN DOCUMENT FORM (GS-VER-PDD) Voluntary Offset Projects - Version 01
page 9
This template shall not be altered. It shall be completed without modifying/adding headings or logo, format or font.
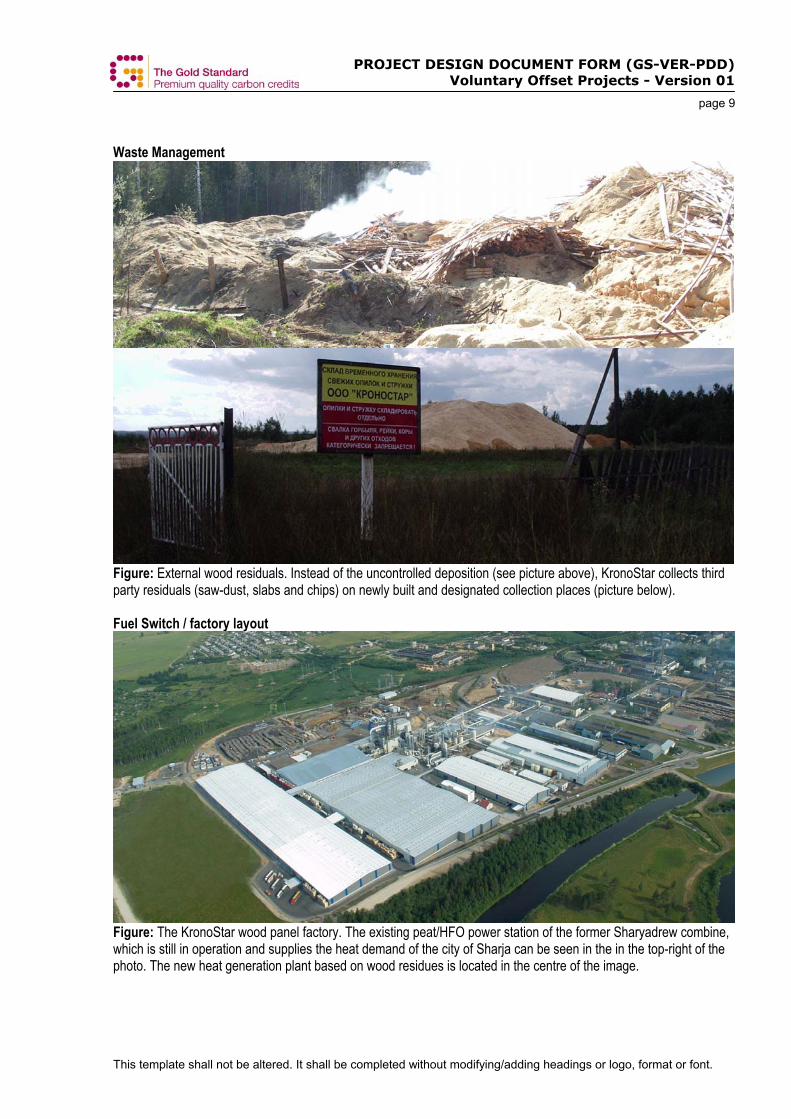
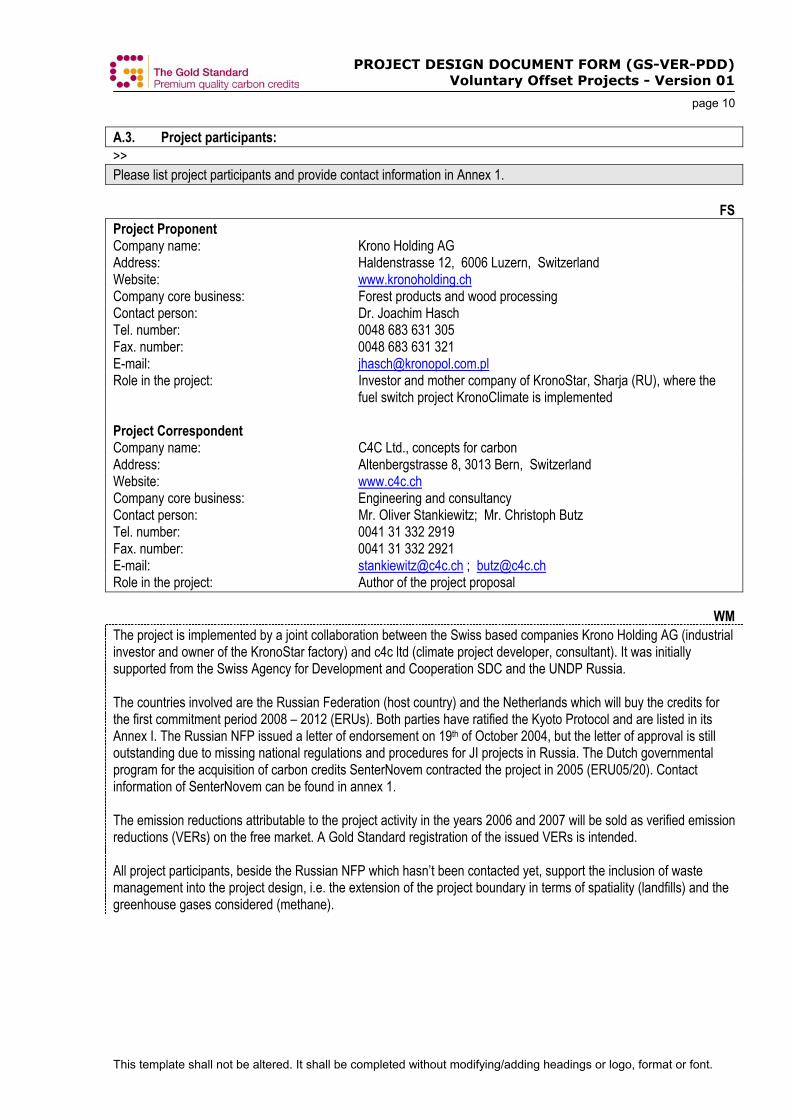
Waste Management Figure: External wood residuals. Instead of the uncontrolled deposition (see picture above), KronoStar collects third party residuals (saw-dust, slabs and chips) on newly built and designated collection places (picture below). Fuel Switch / factory layout
Figure: The KronoStar wood panel factory. The existing peat/HFO power station of the former Sharyadrew combine, which is still in operation and supplies the heat demand of the city of Sharja can be seen in the in the top-right of the photo. The new heat generation plant based on wood residues is located in the centre of the image.
PROJECT DESIGN DOCUMENT FORM (GS-VER-PDD) Voluntary Offset Projects - Version 01
page 10
This template shall not be altered. It shall be completed without modifying/adding headings or logo, format or font.
A.3. Project participants: >> Please list project participants and provide contact information in Annex 1. FS Project Proponent Company name: Krono Holding AG Address: Haldenstrasse 12, 6006 Luzern, Switzerland Website: www.kronoholding.ch Company core business: Forest products and wood processing Contact person: Dr. Joachim Hasch Tel. number: 0048 683 631 305 Fax. number: 0048 683 631 321 E-mail: [email protected] Role in the project: Investor and mother company of KronoStar, Sharja (RU), where the fuel switch project KronoClimate is implemented Project Correspondent Company name: C4C Ltd., concepts for carbon Address: Altenbergstrasse 8, 3013 Bern, Switzerland Website: www.c4c.ch Company core business: Engineering and consultancy Contact person: Mr. Oliver Stankiewitz; Mr. Christoph Butz Tel. number: 0041 31 332 2919 Fax. number: 0041 31 332 2921 E-mail: [email protected] ; [email protected] Role in the project: Author of the project proposal WM The project is implemented by a joint collaboration between the Swiss based companies Krono Holding AG (industrial investor and owner of the KronoStar factory) and c4c ltd (climate project developer, consultant). It was initially supported from the Swiss Agency for Development and Cooperation SDC and the UNDP Russia. The countries involved are the Russian Federation (host country) and the Netherlands which will buy the credits for the first commitment period 2008 – 2012 (ERUs). Both parties have ratified the Kyoto Protocol and are listed in its Annex I. The Russian NFP issued a letter of endorsement on 19th of October 2004, but the letter of approval is still outstanding due to missing national regulations and procedures for JI projects in Russia. The Dutch governmental program for the acquisition of carbon credits SenterNovem contracted the project in 2005 (ERU05/20). Contact information of SenterNovem can be found in annex 1. The emission reductions attributable to the project activity in the years 2006 and 2007 will be sold as verified emission reductions (VERs) on the free market. A Gold Standard registration of the issued VERs is intended. All project participants, beside the Russian NFP which hasn’t been contacted yet, support the inclusion of waste management into the project design, i.e. the extension of the project boundary in terms of spatiality (landfills) and the greenhouse gases considered (methane).
PROJECT DESIGN DOCUMENT FORM (GS-VER-PDD) Voluntary Offset Projects - Version 01
page 11
This template shall not be altered. It shall be completed without modifying/adding headings or logo, format or font.
A.4. Technical description of the project activity: A.4.1. Location of the project activity: >> WM Both, the heat production plants as well as the main dumpsite, used for the disposal of the wood wastes accruing during production processes disposal prior to the project implementation, are located on the premises of the KronoStar factory in Wetlushskij near Sharja, Russia. The wood residues sourced from third parties (mainly sawmills) are located inside a radius of about 200 km around Sharja (mean distance 125 km, maximum distance 276 km). The landfills used for the disposal of these third party wastes prior to the project implementation were located next to the sawmills. They were very numerous, widespread and unorganized. Till now, 20 gathering places have been established, where the wood wastes from third parties are collected (cf. annex 6). A.4.1.1. Host Party(ies): >> As specified in section 3.2.2. the Gold Standard VER Project Developer’s Manual, the project can be located in any country that does not have a quantitative reduction target under the Kyoto Protocol. FS Russian Federation The host country Russia has quantitative reduction targets under the first commitment period of the Kyoto Protocol. Therefore, the Gold Standard VER registration is only claimed for the years 06/07 of the crediting period for which no quantitative reduction targets exist. A.4.1.2. Region/State/Province etc.: >> FS Kostroma Province A.4.1.3. City/Town/Community etc: >> FS Former Scharjadrew timber combinat in Wetlushskij near Sharja (58°23'N, 45°39'E).
PROJECT DESIGN DOCUMENT FORM (GS-VER-PDD) Voluntary Offset Projects - Version 01
page 12
This template shall not be altered. It shall be completed without modifying/adding headings or logo, format or font.
A.4.1.4. Detail of physical location, including information allowing the unique identification of this project activity (maximum one page):
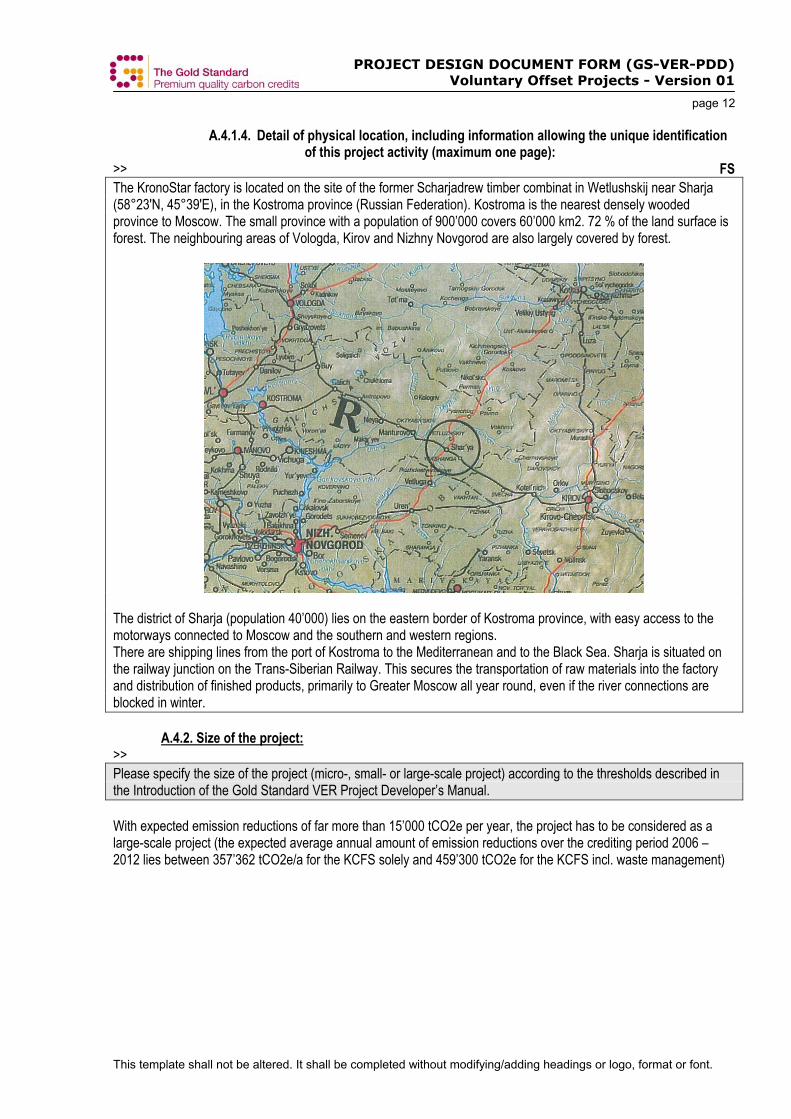
>> FS The KronoStar factory is located on the site of the former Scharjadrew timber combinat in Wetlushskij near Sharja (58°23'N, 45°39'E), in the Kostroma province (Russian Federation). Kostroma is the nearest densely wooded province to Moscow. The small province with a population of 900’000 covers 60’000 km2. 72 % of the land surface is forest. The neighbouring areas of Vologda, Kirov and Nizhny Novgorod are also largely covered by forest.
The district of Sharja (population 40’000) lies on the eastern border of Kostroma province, with easy access to the motorways connected to Moscow and the southern and western regions. There are shipping lines from the port of Kostroma to the Mediterranean and to the Black Sea. Sharja is situated on the railway junction on the Trans-Siberian Railway. This secures the transportation of raw materials into the factory and distribution of finished products, primarily to Greater Moscow all year round, even if the river connections are blocked in winter. A.4.2. Size of the project: >> Please specify the size of the project (micro-, small- or large-scale project) according to the thresholds described in the Introduction of the Gold Standard VER Project Developer’s Manual. With expected emission reductions of far more than 15’000 tCO2e per year, the project has to be considered as a large-scale project (the expected average annual amount of emission reductions over the crediting period 2006 – 2012 lies between 357’362 tCO2e/a for the KCFS solely and 459’300 tCO2e for the KCFS incl. waste management)
PROJECT DESIGN DOCUMENT FORM (GS-VER-PDD) Voluntary Offset Projects - Version 01
page 13
This template shall not be altered. It shall be completed without modifying/adding headings or logo, format or font.
A.4.3. Category(ies) of project activity: >> Please use the list of categories of project activities listed in Appendix A of the Gold Standard VER Project Developer’s Manual. The KCFS project belongs to the GS category: A.1 Renewable Energy A.1.1 Biomass, biogas and liquid biofuels A.1.1.1 Biomass including the methane emissions avoided by the alternative treatment of wood wastes (combustion instead of disposal) according the remark in Part 2, Box 1 of the Gold Standard VER Project Developer’s Manual. A.4.4. Brief explanation of how the anthropogenic emissions of anthropogenic greenhouse gas (GHGs) by sources are to be reduced by the proposed project activity, including why the emission reductions would not occur in the absence of the proposed project activity, taking into account national and/or sectoral policies and circumstances: >> Please explain briefly how anthropogenic greenhouse gas (GHG) emission reductions are to be achieved (detail to be provided in section B) and provide the estimate of anticipated total reductions in tonnes of CO2 equivalent as determined in section E. Max. length one page. Project participants should assess additionality in a conservative manner so as to avoid the crediting of business-as-usual activities. Please refer to the UNFCCC’s “Tool for the demonstration and assessment of additionality” (see http://cdm.unfccc.int/EB/Meetings/016/eb16repan1.pdf) as explained in section 3.3.2 of the Gold Standard VER Project Developer’s Manual. The KCFS-Additionality has been demonstrated according the CDM-EB Additionality-Tool (cf. section B.3.) WM In absence of the KronoClimate project activity, the factories process heat demand would continuously be supplied by the nearby communal heating station, powered by peat and heavy oil (cf. section B.1. of this document). Since the commercial activity of KronoStar remains unchanged under the climate project, the same amount of wood wastes as in the project would accrue in the baseline scenario. Since there are no alternative consumers of wood residues in the region and wood wastes are available abundantly, all wood residues used for heat generation in the KCFS project would have been deposed on the deep and unmanaged in-house landfill in the baseline scenario, as it was common practice prior to the project activity (BAU-baseline). Under anaerobic conditions, the deposed wood residues would partly decompose to methane (CH4), a much stronger greenhouse gas than CO2 with a global warming potential GWP of 21 tCO2e/tCH4. Additional to the expected emission reductions of totally 2,501,536 tCO2e in the years 2006 – 2012, being caused by the fuel switch from heavy oil / peat to biomass incineration for process heat generation (cf. section B.2. of this document), the KCFS project activity further prevents the combusted wood residues from being deposed on landfills.
PROJECT DESIGN DOCUMENT FORM (GS-VER-PDD) Voluntary Offset Projects - Version 01
page 14
This template shall not be altered. It shall be completed without modifying/adding headings or logo, format or font.
This is expected to cause further emission reductions of 713,565 tCO2e1 over the crediting period 2006 – 2012 that are not included in the original KCFS PDD. The KronoClimate program, which encompasses the climate relevancy of KronoStar’s whole chain of custody, further causes emission reductions of 183,224 tCO2e over the crediting period 2006 – 2012, due to the sourcing of formerly unused third party wood residues for raw material input. Again, as there are no alternative consumers of wood residues in the region and wood wastes are available abundantly, the residues collected by KronoStar within the KronoClimate program would otherwise decay on a multitude of smaller (less anaerobic) unmanaged landfills in the region around Sharja. Before the project has been implemented, it has been common practice to deposit these wood residues on unmanaged landfills. A.4.4.1. Estimated amount of emission reductions over the crediting period: >> Please indicate the chosen crediting period and provide the total estimation of emission reductions as well as annual estimates for the chosen crediting period in the following table. FS The results of the project are: utilization of renewable and indigenous fuel - reduction of CO2-emissions: 361’000 tons per year reduction of other atmospheric emissions of pollutants (compared to the burning of peat or heavy oil): - SO2: 1’339 tons per year - dust: 186 tons per year - NO2 31 tons per year Besides of these results further positive but somewhat less tangible effects on the environment and on sustainable regional development can be expected from the underlying project KronoStar: - pressure on improvement of sustainable forest management practices - pressure on the local use of green power
1 This figure already includes the CH4 project emission of 22,092 tCO2e caused by biomass incineration
PROJECT DESIGN DOCUMENT FORM (GS-VER-PDD) Voluntary Offset Projects - Version 01
page 15
This template shall not be altered. It shall be completed without modifying/adding headings or logo, format or font.
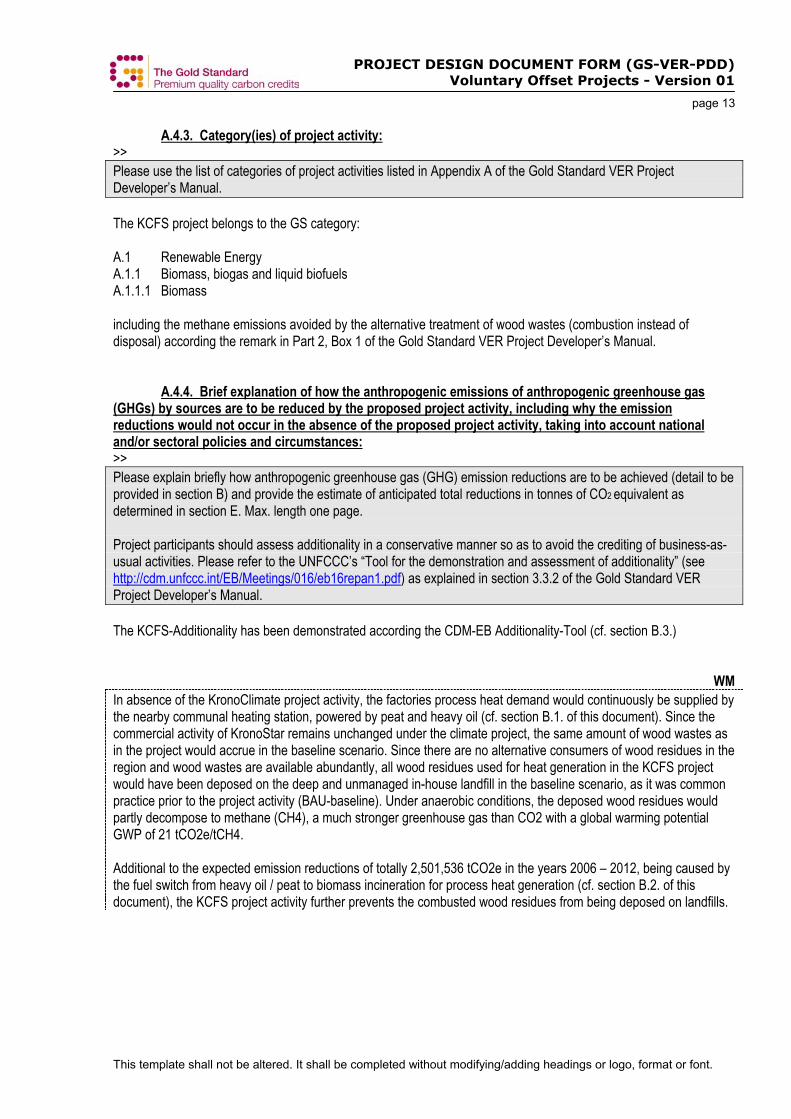
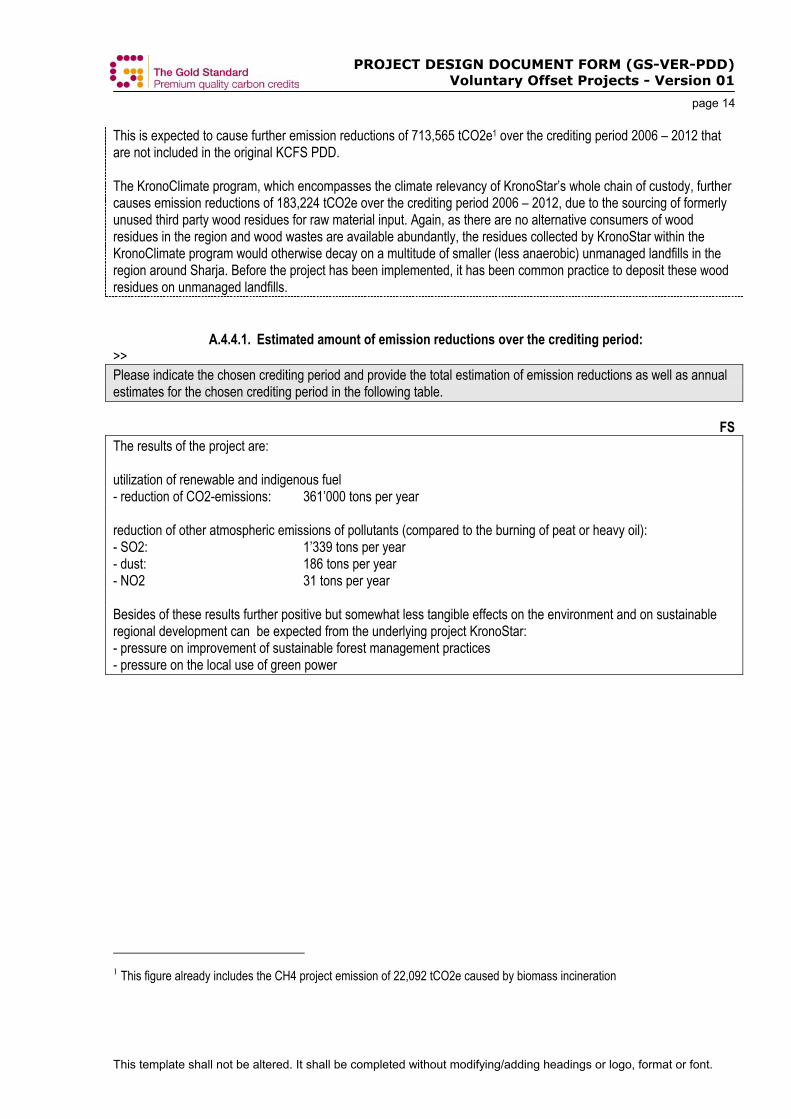
WM The following table lists the expected emission reductions by fuel switch which is covered by the original KCFS PDD, the emission reductions caused by the alternative treatment of up to 385,000 t/a wood wastes of the production process as bio-fuels (WM BF) and up to 190,000 t/a of third party wood residuals sourced as raw material (WM RM). The sizes of the waste streams derive from the assumptions made in the business plan not attached to the KCFS PDD.
Years Length of crediting period 7
Year Estimate of annual emission reductions (in tonnes of CO2 equivalents)
KCFS WM BF WM RM Total 2006 326,001 41,542 10,842 378,386 2007 337,965 61,628 15,771 415,363 2008 346,937 81,714 20,693 449,344 2009 358,900 101,940 25,655 486,495 2010 361,891 121,833 30,517 514,242 2011 382,827 142,312 35,561 560,700 2012 387,014 162,595 40,520 590,129
Total emission reductions over the crediting period
2,501,536 713,565 179,560 3,394,660
Annual average over the crediting period
357,362 101,938 25,651 484,951
Remarks: • The figures show the amount of the overall expected emission reductions under the KCFS and the Waste Management
(WM) activities of the KronoClimate program, without any uncertainty corrections and conservativeness factors being applied. For the amount of emission reductions offered within the JI process (2008 – 2012) or on the free market (2006/07) please consider the corresponding values in section E.6. tawny part.
• Methane emissions of to the project activity (combustion of biomass) are included in the figures of the WM BF (avoided disposal of bio-fuels) emission reductions. WM RM (avoided disposal of raw material) only considers the baseline emissions of the raw material wood residues decaying on landfills less a leakage factor for elongated transport distances of the wood residues (cf. section D.2.3).
Only the emission reductions of the first two years of the crediting period (2006/07) are claimed for GS registration. Afterwards (first commitment period), the host country Russia has quantitative reduction targets under the Kyoto-Protocol and ERUs should be assigned for the projects emission reductions according the JI mechanism.
GS VERs Years Length of period 2
Year Estimate of annual emission reductions (in tonnes of CO2 equivalents)
KCFS WM BF WM RM Total 2006 326,001 41,542 10,842 378,386 2007 337,965 61,628 15,771 415,363
Total emission reductions 2006 / 2007 663,966 103,170 26,613 793,749 Annual average 331,983 51,585 13,307 396,875
PROJECT DESIGN DOCUMENT FORM (GS-VER-PDD) Voluntary Offset Projects - Version 01
page 16
This template shall not be altered. It shall be completed without modifying/adding headings or logo, format or font.
SECTION B. Application of a baseline methodology Baselines must be constructed in a conservative manner in order to reduce the risk of artificially inflating the number of VERs received by a project activity. Section 3.3.4 of the Gold Standard Project Developer Manual provides further explanation on the interpretation of a conservative approach required for Gold Standard compliance. Where project participants wish to propose a new baseline methodology (other than MethPanel, SSC WG or the UNDP MDG Carbon Facility approved methodologies), please direct it to the Gold Standard TAC to be approved and validated. Due to a lack of approved methodologies at the time of writing, the baseline scenario was assessed in a project specific and conservative manner described in detail in the following section and validated by TÜV-Süd in 2005. The waste management extension to the KCFS PDD developed in 2006/07, is based partly on the project specific KCFS baseline and partly on the meanwhile approved CDM AM0036 methodology. The waste management extension has been implicitly validated by TÜV-SÜD in 2007 within initial verification. B.1. Title and reference of the approved baseline methodology applied to the project activity: >> Please refer to the UNFCCC CDM web site (http://cdm.unfccc.int/), appendix C to the simplified M&P for the small-scale CDM project activities or UNDP web site (http://www.undp.org/mdgcarbonfacility/index.html) for the title and reference list as well as the details of approved baseline methodologies or use the Gold Standard references when a new validated methodology has been used.. Please note that the table “Baseline Information” contained in Annex 2 is to be prepared in parallel to completing the remainder of this section. As mentioned above, a project specific methodology was developed for the fuel-switch PDD at the time of writing in 2004/05. As the validated fuel-switch PDD is the basis for the contract within SenterNovem’s ERUPT-5, the newly approved CDM methodology AM0036 (cf. UNFCCC) hasn’t been applied retroactively. The project-specific methodology has been judged as sufficient by TÜV-Süd; the Gold Standard TAC neither demands for the application of new methodologies in its pre-assessment of the KronoClimate PDD in January 2007. The waste management baseline developed in 2006/07 refers to the CDM methodology AM0036 (“Fuel switch from fossil fuels to biomass residues in boilers for heat generation”) wherever appropriate. The methodology, which is applicable to the KronoClimate project activities, was approved by the CDM Meth-Panel in September 2006. The selection of the baseline-scenario as well as the assessment of the additionality for both, the fuel-switch and the waste management aspects of the project, follow the “Tool for the demonstration and assessment of Additionality (version 02)” released by the CDM-EB in November 2005. For the assessment of additionality please refer to section B.3. For further explanatory information on additionality please refer to the clarifications and supplements to the Gold Standard TAC pre-assessment in annex 8.
PROJECT DESIGN DOCUMENT FORM (GS-VER-PDD) Voluntary Offset Projects - Version 01
page 17
This template shall not be altered. It shall be completed without modifying/adding headings or logo, format or font.
B.1.1. Justification of the choice of the methodology and why it is applicable to the project activity: >> Please justify the choice of methodology by showing that the proposed project activity meet the applicability conditions under which the methodology is applicable or the choice of submitting a new methodology to the Gold Standard TAC. At the time of determination of the KCFS baseline scenario in 2004/05 no approved methodology, neither for fuel switch nor for waste management, existed. Therefore, a project specific fuel-switch methodology according the requirements by ERUPT-5 and the CDM guidelines was developed and validated by TÜV-Süd. In September 2006, the methodology AM0036 “Fuel switch from fossil fuels to biomass residues in boilers for heat generation” was approved by the CDM Meth-Panel. The project is eligible under AM0036 according the eligibility scenario 4 “Installation of new boilers and retrofit and/or replacement of existing boilers” which applies to the KCFS project activity “Replacement of existing boilers by new boilers, that fire mainly or solely biomass residues”. The AM0036 hasn’t been retroactively applied on the project design document for the following reasons: • The existing fuel-switch PDD is validated and contracted with SenterNovem ERUPT-5 • The applied methodology is determined as appropriate by TÜV-Süd • Emission Reductions 2006 were verified according the validated PDD • The GS TAC didn’t demand the application of the new methodology in its pre-assessment • The whole PDD will be in-depth redesigned and revalidated according the upcoming Russian JI-regulations for
the first commitment period 2008-2012 The methodology used for the waste management extension developed in 2006/07 and validated in 2007, is based on the outcomes project specific KCFS methodology wherever necessary for consistency and on the AM0036 methodology otherwise.
PROJECT DESIGN DOCUMENT FORM (GS-VER-PDD) Voluntary Offset Projects - Version 01
page 18
This template shall not be altered. It shall be completed without modifying/adding headings or logo, format or font.
B.2. Description of how the methodology is applied in the context of the project activity: >> Please explain the basic assumptions of the baseline methodology in the context of the project activity and show that the key methodological steps are followed in determining the baseline scenario. Provide the key information and data used to determine the baseline scenario (variables, parameters, data sources etc.) in table form.
FS KEY FACTORS INFLUENCING THE BASELINE AND PROJECT EMISSIONS
Here the key factors are presented and explained. Their most likely development is given below.
Economic factors
A – Demand for wood products The demand for wood products determines the annual output of the KronoStar facility and thus the necessary process heat production. This demand itself results from three sub-factors: 1) The growth of the national economy as a whole, stimulating domestic demand, 2) Foreign demand for KronoStar’s products and 3) The competitivity of KronoStar on the domestic Russian market but also in regard with foreign competitors (for exports). We assume all three sub-factors to develop positively during the next 10 years. The Russian economy is in a stable growth phase. There is a big backlog demand in the building industry, especially a demand for modernization that can be ideally met with modern wood products. A modern, well equipped facility producing in Russia with Russian employees for the Russian market is likely to have substantial competitional advantages over any competitor from outside Russia. Indeed, the considerable financial investment of Krono Holding in the Russian KronoStar facility is the direct consequence of this very positive economic outlook. However, we do not use the positive development of the demand factor to extrapolate the process heat need beyond the project’s capacity (110 MW). Already a moderate and steady development of the demand for wood products will ascertain that the process heat generation of the project will be fully consumed during the period 2008-2012, i.e. that the project activity level underlying the KronoClimate project will be maintained during this period. The demand for wood products will not influence the relative attractivity of the project and the baseline scenario. B – Fuel prices The relative prices for fossil fuels on the one side and biomass fuel on the other side influence the cost of process heat generation in the project and the baseline scenario. If the fuel prices do not move parallely they influence the relative economic attractivity of the different scenarios and might have an influence on (ex post) additionality. Energy cost fluctuations will surely impact on margins, but as long as energy prices in Russia move within certain reasonable bands, they will not greatly alter the competitivity of the whole KronoStar facility. We assume that biomass fuel can be produced at a price which is in line with the general increase in prices since it is mainly produced on site and directly tied to the price of the plant’s main production input: industrial wood. Moreover, a market price for the biomass fuel can not yet be observed on the local energy market, since the use of biomass for energy generation is new to this region. So, for our project scenario we take into account a reasonable biomass fuel price that we found for comparable regions where the market already plays. We take as well into account that fossil fuel prices are not only market driven but that the Russian government has a strong tendency to support national industrial growth by influencing / stabilizing energy prices.
PROJECT DESIGN DOCUMENT FORM (GS-VER-PDD) Voluntary Offset Projects - Version 01
page 19
This template shall not be altered. It shall be completed without modifying/adding headings or logo, format or font.
C – Capital availability and cost The capital cost influence the relative financial attractivity of the different scenarios. High capital cost act in favour of those scenarios with lower investments and vice versa. High capital cost will thus deteriorate the investment case for the biomass boiler and the margins on the emissions reductions thus generated will decrease or eventually even become negative.
Legal factors D – Development of the environmental legislation The legal restrictions to air pollution from combustion devices set the required level of pollution abatement technologies (filters, gas washing devices, DeNOx and DeSOx devices etc.). Raw gas qualities of a gas or petrol combustion are known to be much better than those of a peat or a biomass, or even a heavy oil combustion. So more restrictive legal requirements concerning waste air quality would act in favor of a gas or petrol boiler because they would increase the need for additional investments in air pollution abatement for the biomass and the peat boiler. The Russian legislation on air pollution is focused on immissions. There are no absolute emission limits for a given type of plant but the authority calculates the immissions which result from operation of the plant taking into account the given status-ante situation in the region. It is imaginable (though unlikely) that legislation on atmospheric emissions might move towards the European kind of requirements (especially in regions with a high density of industrial production). This would mean introducing limitations on atmospheric emissions and thus a need for investment in end-of-pipe technology, also for already existing installations. E – Development of the legislation on energy It is imaginable (but as well not probable) that legal regulations could enter into force which rule out the application of specific fuels for energy production. If e.g. the use of specific fuels (like peat or gas) was to be forbidden for process heat production the respective alternative to the fuel switch project would have to be dropped. Modern western legislations on energy have a tendency to encourage the decentralized production of electricity (e.g. by renewable energy sources or by application of heat & power coupling. Such a change could make it attractive to produce electricity by a steam engine driven by the biomass boiler, an option which is not foreseen in the actual project. It is imaginable (though unlikely) that the Russian legislation would follow this tendency in period from now until 2012.
Political factors F – Policy driven influences on the climate for foreign investments It is imaginable that a change of the economic policy of the Russian government within the next 5-10 years could create an unattractive climate for foreign investors. In a worst case scenario the whole wood products branch could be nationalized. When estimating this factor we take into account that the present Russian government acts very strongly and with success into the direction of stabilizing a high economic growth by providing investment safety to foreign investors. The present government policy seems to be stable and unlikely to change in the short run. Scenarios with a breakdown of foreign investment projects like the KronoStar project are thus unlikely.
PROJECT DESIGN DOCUMENT FORM (GS-VER-PDD) Voluntary Offset Projects - Version 01
page 20
This template shall not be altered. It shall be completed without modifying/adding headings or logo, format or font.
Moreover, the financial conditions under which the underlying industrial project is being co-financed by the Worldbank/IFM are set for the life of the project. Therefore, and under all reasonable assumptions, even major changes in the investment climate in Russia should have no bearing on the project such as set out in this PDD.
Technical and technological factors G – Local availability of technology, skilled employees and knowledge The operation of a biomass boiler itself and the biomass fuel production require special know-how and skilled employees. Initially, these skills cannot be expected to be found in the project region since the biomass combustion technology is a relatively new technology to Russia. On the other hand, the required skills can be acquired and taught through special training and our experience has shown that this is possible. So the availability of specially skilled people influences project cost rather than project feasibility. B.3. Description of how the anthropogenic emissions of GHG by sources are reduced below those that would have occurred in the absence of the registered VER project activity: >> Explanation of how and why this project is additional and therefore not the baseline scenario in accordance with the selected baseline methodology. Include 1) a description of the baseline scenario determined by applying the methodology, 2) a description of the project scenario including national policies relevant to the baseline, and 3) an analysis showing why the emissions in the baseline scenario would likely exceed emissions in the project scenario. Preliminary Remark: To avoid the misunderstanding of the analysis and its findings it has to be pointed out again, that the identified peat/HFO baseline encompasses the retrofit of the still existing communal heating station which is today running on only one third of its capacity. The former Sharjadrew timber combine procured its whole heat demand from this communal heating station. With some minor upgrades (financial figures provided in the investment analysis), this heating station based on peat and HFO combustion could still supply today’s heat demand of KronoStar (see also clarification to the GS TAC pre-assessment in annex 8). This situation has been verified by TÜV-Süd during the validation of the Fuel-Switch PDD in 2005. The additionality of the project activity is assessed according the “Tool for the demonstration and assessment of Additionality (version 02)” of the CDM-EB. Step 0: Preliminary screening based on the starting date of the project activity Preliminary remark: Based on the ERUPT 5 ToR, May 2004, the project documentation had to be developed in two parts (PDD and business-plan). The timeline of the project activity, the underlying milestones and decisions are laid out and documented in the business-plan which has been validated by TÜV-Süd together with the PDD in 2005. For an overview about the project timeline and milestones, please refer to annex 14. Starting date of the project: The decision to launch the KronoClimate Project, i.e. to construct the biomass boilers despite the financial disadvantages was felled by the board of the Krono Holding in 2001. Beside Krono Holding’s aim to build up KronoStar as a state-of-the-art and environmentally sound wood panel factory, the upcoming carbon market bringing along the opportunity to payback the additional investment with carbon credits was an import factor that influenced the decision making process. The contract with the climate project developer c4c was signed in 2002. In 2003 the first 55 MW was taken into operation. Two years later, shortly after Russia’s ratification of the Kyoto
PROJECT DESIGN DOCUMENT FORM (GS-VER-PDD) Voluntary Offset Projects - Version 01
page 21
This template shall not be altered. It shall be completed without modifying/adding headings or logo, format or font.
Protocol in late 2004, the second 55 MW boiler was put in operation. During the installation of the two biomass boilers, considerable efforts were made to include and consult with important stakeholders and to register the KCFS project under the flexible mechanism of the Kyoto Protocol (PCF and ERUPT-4 PIN). In 2003, meetings with UNDP Russia, the Swiss Secretariat for Economic Affairs SECO and the Swiss Agency for Development and Cooperation SDC were held. Step 1: Identification of alternatives to the project activity consistent with current laws and regulations
FS ADDITIONALITY
For the additionality check we follow the UNFCCC guidelines for additionality of CDM projects.
Alternatives to the project activity The KronoClimate Fuel Switch project is not the single solution to the problem to provide 110 MW of process heat to the wood products factory. Generating this energy with other fuels is feasible and has actually taken place before project realization started. The three most common alternatives shall be considered for the analysis of the baseline scenario and for the further additionality checks: - Boiler operation with heavy oil and peat (as was done before the project start) - Boiler operation with natural gas (state of the art for modern plants in Russia when gas supply is
available) - Boiler operation with petrol fuel Moreover, the case of - project realisation without JI registration must be taken into account. As the project characteristics do not change due to registration or not, this alternative consists merely in a loss of financial input from the selling of ERU’s leading to higher cost of the process heat. There is a substantial barrier against the gas boiler alternative created by the fact that the nearest connection to the gas grid is 170 km away from the location of the plant. Moreover the gas system at this point of the grid is overloaded today which leads to an unpredictable and unsatisfactory availability of the needed gas quantities. It is possible but from a today’s forecast highly unlikely that these boundary conditions will improve within the next 5-10 years. Thus the option “operation with natural gas” is a rather theoretical one. It could most probably not be realised within the accounting period of the project. Nevertheless it was analysed in the context of this PDD to find out whether the baseline would also be stable in case of an optimal and reliable gas connection. Beside of the choice of the specific fuel there are no alternatives to the project since the project is a simple fuel switch project. There are no legal or regulatory requirements concerning the choice of the fuel. As mentioned under the key factor B above it is imaginable that burning of peat for energy generation could be forbidden in the future by some environmental law or regulation. However, such a law is not being prepared in Russia and in view of the foreseeable big energy demand of the country it is very unlikely that such a law could be envisaged during the next 5-10 years. Future legal requirements might, however, influence the investment necessary for the process heat generation facility due to changed maximum allowed levels of atmospheric emissions. New equipment for pollution abatement and
PROJECT DESIGN DOCUMENT FORM (GS-VER-PDD) Voluntary Offset Projects - Version 01
page 22
This template shall not be altered. It shall be completed without modifying/adding headings or logo, format or font.
control might then become necessary. This equipment would be different for boiler systems running on different fuels. This investment should and will be taken into account in the economic variation analysis.
IDENTIFICATION OF THE MOST LIKELY BASELINE SCENARIO AND THE ASSOCIATED GHG EMISSIONS
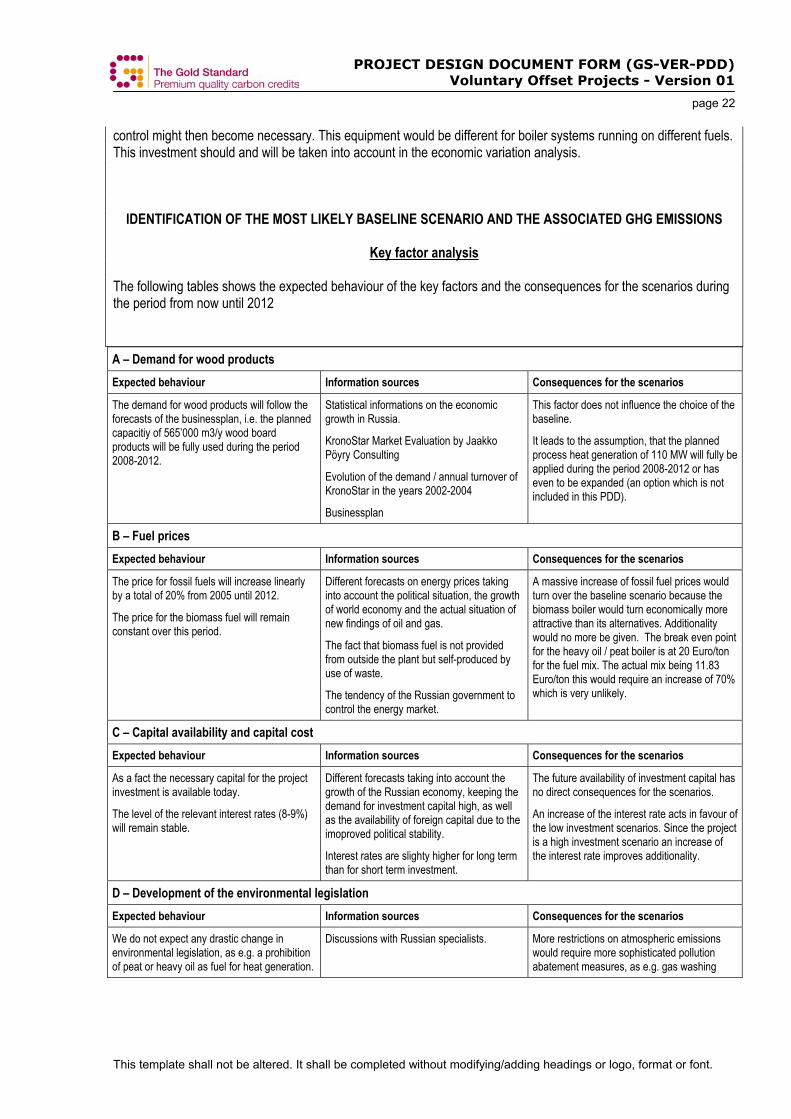
Key factor analysis The following tables shows the expected behaviour of the key factors and the consequences for the scenarios during the period from now until 2012 A – Demand for wood products Expected behaviour Information sources Consequences for the scenarios
The demand for wood products will follow the forecasts of the businessplan, i.e. the planned capacitiy of 565’000 m3/y wood board products will be fully used during the period 2008-2012.
Statistical informations on the economic growth in Russia.
KronoStar Market Evaluation by Jaakko Pöyry Consulting
Evolution of the demand / annual turnover of KronoStar in the years 2002-2004
Businessplan
This factor does not influence the choice of the baseline.
It leads to the assumption, that the planned process heat generation of 110 MW will fully be applied during the period 2008-2012 or has even to be expanded (an option which is not included in this PDD).
B – Fuel prices Expected behaviour Information sources Consequences for the scenarios
The price for fossil fuels will increase linearly by a total of 20% from 2005 until 2012.
The price for the biomass fuel will remain constant over this period.
Different forecasts on energy prices taking into account the political situation, the growth of world economy and the actual situation of new findings of oil and gas.
The fact that biomass fuel is not provided from outside the plant but self-produced by use of waste.
The tendency of the Russian government to control the energy market.
A massive increase of fossil fuel prices would turn over the baseline scenario because the biomass boiler would turn economically more attractive than its alternatives. Additionality would no more be given. The break even point for the heavy oil / peat boiler is at 20 Euro/ton for the fuel mix. The actual mix being 11.83 Euro/ton this would require an increase of 70% which is very unlikely.
C – Capital availability and capital cost Expected behaviour Information sources Consequences for the scenarios
As a fact the necessary capital for the project investment is available today.
The level of the relevant interest rates (8-9%) will remain stable.
Different forecasts taking into account the growth of the Russian economy, keeping the demand for investment capital high, as well as the availability of foreign capital due to the imoproved political stability.
Interest rates are slighty higher for long term than for short term investment.
The future availability of investment capital has no direct consequences for the scenarios.
An increase of the interest rate acts in favour of the low investment scenarios. Since the project is a high investment scenario an increase of the interest rate improves additionality.
D – Development of the environmental legislation Expected behaviour Information sources Consequences for the scenarios
We do not expect any drastic change in environmental legislation, as e.g. a prohibition of peat or heavy oil as fuel for heat generation.
Discussions with Russian specialists. More restrictions on atmospheric emissions would require more sophisticated pollution abatement measures, as e.g. gas washing
PROJECT DESIGN DOCUMENT FORM (GS-VER-PDD) Voluntary Offset Projects - Version 01
page 23
This template shall not be altered. It shall be completed without modifying/adding headings or logo, format or font.
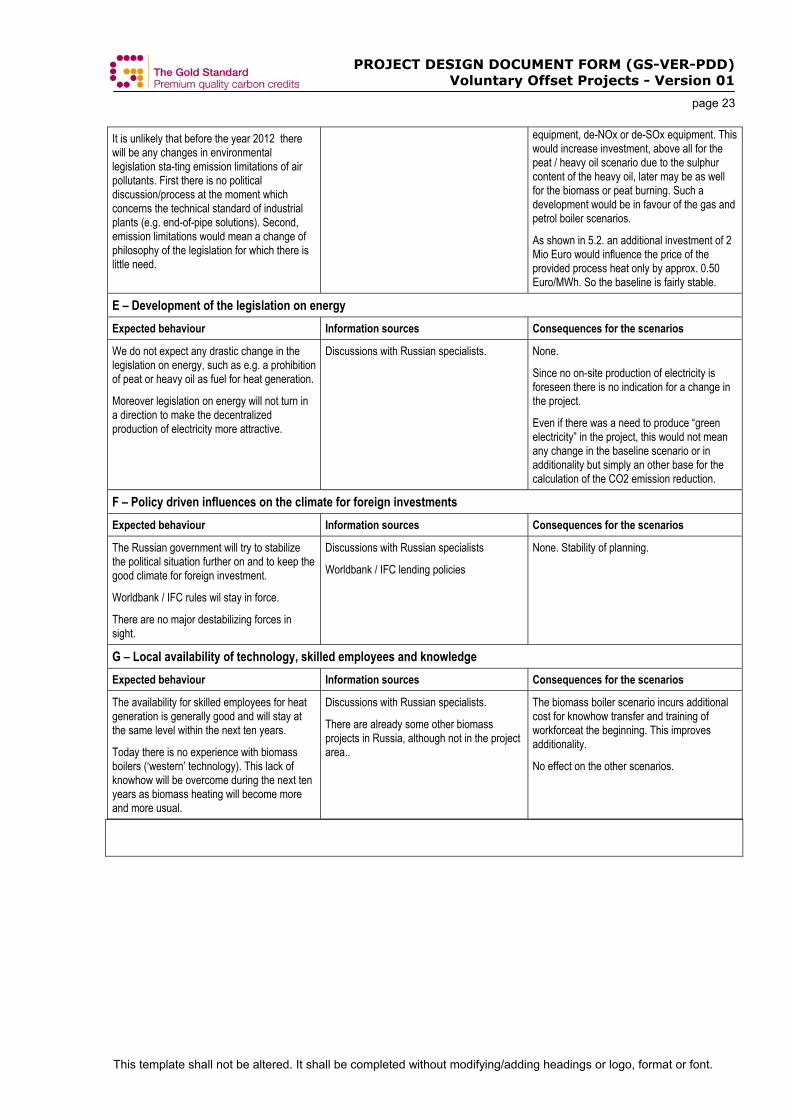
It is unlikely that before the year 2012 there will be any changes in environmental legislation sta-ting emission limitations of air pollutants. First there is no political discussion/process at the moment which concerns the technical standard of industrial plants (e.g. end-of-pipe solutions). Second, emission limitations would mean a change of philosophy of the legislation for which there is little need.
equipment, de-NOx or de-SOx equipment. This would increase investment, above all for the peat / heavy oil scenario due to the sulphur content of the heavy oil, later may be as well for the biomass or peat burning. Such a development would be in favour of the gas and petrol boiler scenarios.
As shown in 5.2. an additional investment of 2 Mio Euro would influence the price of the provided process heat only by approx. 0.50 Euro/MWh. So the baseline is fairly stable.
E – Development of the legislation on energy Expected behaviour Information sources Consequences for the scenarios
We do not expect any drastic change in the legislation on energy, such as e.g. a prohibition of peat or heavy oil as fuel for heat generation.
Moreover legislation on energy will not turn in a direction to make the decentralized production of electricity more attractive.
Discussions with Russian specialists. None.
Since no on-site production of electricity is foreseen there is no indication for a change in the project.
Even if there was a need to produce “green electricity” in the project, this would not mean any change in the baseline scenario or in additionality but simply an other base for the calculation of the CO2 emission reduction.
F – Policy driven influences on the climate for foreign investments Expected behaviour Information sources Consequences for the scenarios
The Russian government will try to stabilize the political situation further on and to keep the good climate for foreign investment.
Worldbank / IFC rules wil stay in force.
There are no major destabilizing forces in sight.
Discussions with Russian specialists
Worldbank / IFC lending policies
None. Stability of planning.
G – Local availability of technology, skilled employees and knowledge Expected behaviour Information sources Consequences for the scenarios
The availability for skilled employees for heat generation is generally good and will stay at the same level within the next ten years.
Today there is no experience with biomass boilers (‘western’ technology). This lack of knowhow will be overcome during the next ten years as biomass heating will become more and more usual.
Discussions with Russian specialists.
There are already some other biomass projects in Russia, although not in the project area..
The biomass boiler scenario incurs additional cost for knowhow transfer and training of workforceat the beginning. This improves additionality.
No effect on the other scenarios.
PROJECT DESIGN DOCUMENT FORM (GS-VER-PDD) Voluntary Offset Projects - Version 01
page 24
This template shall not be altered. It shall be completed without modifying/adding headings or logo, format or font.
The most likely baseline scenario From the investment analysis as well as from the assumed behaviour of the key factors and the project history we conclude the following scenario to be the baseline:
KronoStar would upgrade the existing boiler system based on peat and heavy oil combustion. To achieve a thermal power generation of 110 MW two additional boilers using the same technology would be built. This requires a total investment of approx. 4.6 mio Euro.
This boilers would most likely stay in action unchangedly during the whole period until 2012. Changes of the environmental legislation which would enforce the aplication of enhanced gas cleaning systems are not to be expected before 2012. Thus no additional investment (specifically for the burning of heavy oil) is taken into account during the first period of accounting.
KronoStar would use the well-known and existing technology and infrastructure for the handling of the fuel, and maintenance of the burners. Moreover, KronoStar would try to optimize fuel cost by increasing the percentage of peat in the fuel mix.
FS
Sensitivity analysis, stability of the baseline Varying the demand for wood products (key factor A)
The demand for wood products influences the activity level of the production plant, thus the demand for process heat and therefore the activity level of the project. So there is a strong influence of this factor on the final GHG emission in the baseline scenario. Variation Consequence
Decrease of the final demand by a factor of 2 Half of the process heat would be sufficient. The variable cost would decrease by the same factor.
The baseline scenario would be even more attractive because the effect of the higher investment in the biomass scenario is more important (capital cost take a bigger percentage of total cost).
The final CO2 emission reduction caused by the project would as well decrease by roughly this factor of 2
Complete breakdown of the demand KronoStar would have to close down if no alternative markets could be opened in due time. Worst case: end of project, no baseline
Increase of the demand by a factor of 2 The output of the planned amount of wood products would be guaranteed. Full process heat generation would be necessary. The outcome of the existing project would be as predicted.
Moreover additional production capacities would be planned. An enlargement of the whole KronoStar facility could be set up as a new project. A new baseline study for this project taking into account the timing of the new project could be considered.
Conclusion: The baseline scenario is very stable with respect to variations of the key factor A
PROJECT DESIGN DOCUMENT FORM (GS-VER-PDD) Voluntary Offset Projects - Version 01
page 25
This template shall not be altered. It shall be completed without modifying/adding headings or logo, format or font.
Varying the fuel prices (key factor B)
The cost of the fuel influences strongly the total cost of the process heat. So the cost differences between the fuels of the different scenarios are important for the choice of the baseline. Variation Consequence
Parallel increase or decrease of all energy prices by a factor of 2 No change of the relative financial attractivity; no change of the baseline
Increase of peat and heavy oil price by 50%. At the same time no change for the cost of biomass fuel.
The total process heat cost in the baseline scenario rises by approx. 1.50 EUR/MWh (or 32 %). It still stays approx. 0.60 EUR/MWh below the price level of the project scenario. A further significant increase would be necessary to topple the baseline.
Conclusion: The relevant indicator (EUR/MWh) is fairly sensitive to variations of the key factor B. However, a change strong enough to turn over the baseline scenario is not to be expected. The baseline is stable.
Varying the capital availability and cost (key factor C)
As explained in the key factor analysis above, capital availability has practically no influence because the project investment is only a small addendum to a much bigger investment in the KronoStar production unit. A change in capital cost will influence the relative financial attractivity of the scenarios due to their different investment needs. For the effect of a variation of the interest rate see the table sensitivity analysis of the investment comparison below. Conclusion: The baseline scenario is very stable with respect to variations of the key factor C.
Varying the environmental legislation and/or the legislation on energy (key factors D and E)
Changes in the legal requirements will have an influence on investments. Moreover it is imaginable that certain technologies / fuels etc. could be forbidden. Variation Consequence
Change of environmental legislation, forcing an investment in SO2 abatement technology
Investment in air pollution abatement technology for heavy oil burning.
An investment of 1’000’000 EUR would enhance the price of 1 MWh by 0.20 EUR. The change would be insignificant.
The heavy oil scenarios loose financial attractivity.
Prohibition of the use of peat as a fuel The baseline scenario would use heavy oil only. This would increase the mix fuel cost and lead to a rise of the price per MWh of the provided process heat in the peat/heavy oil scenario from 5.28 Euro to 6.81 Euro. This is still lower than the 7.36 Euro of the biomass scenario. But it is higher than the 6.35 Euro of the petrol boiler scenario.
So the baseline would switch to the fuel oil boiler scenario. However, additionality of the project scenario would still be given.

PROJECT DESIGN DOCUMENT FORM (GS-VER-PDD) Voluntary Offset Projects - Version 01
page 26
This template shall not be altered. It shall be completed without modifying/adding headings or logo, format or font.
New rule that demands the use of biomass (if available) for heating applications
The baseline scenario would fall. The project scenario would be the new baseline.
However, such a rule would need some time for implementation. It is likely that it would no more change the conditions during the period 2008-1012
Conclusion: The baseline scenario is stable with respect to the only realistically possible variation (enforcement of end-of-pipe technology). More generally the baseline is very sensitive with respect to massive variations of the key factor D and E. Such variations, however, are unlikely.
Varying the climate for foreign investment (key factor F)
Except for the (moderate) future investment in end of pipe pollution abatement technology no future investment is needed for the realization of the project. One of the boilers is already in operation, the other one is in the process of being set up (see section A.4.2.). Variation Consequence
A new government nationalizes all production plants in the branch None because the investment has already been done. Neither the baseline nor the CO2 reduction of the project would be affected. (However, the dispossessed project developer would perhaps lose his entitlements to sell CER’s)
Other blocking conditions for foreign investment (level of security, tax policy, etc.)
Some changes could reduce the overall attractivity of the investment. No changes in the baseline.
Conclusion: The baseline scenario is very stable with respect to variations of the key factor F. Varying the local availability of technology, skilled employees and knowledge (key factor G)
As discussed in the key factor analysis above, the key factor G is merely a cost factor for the project scenario and does not establish a real barrier. Variation Consequence
Local knowledge and skills concerning biomass boilers will not improve during the next 10 years. Biomass boilers will remain a rarely used ‘high tech option’ in the region.
The cost for special training of the new employees will be higher in the project scenario. This will increase the total process heat cost by up to 5%. Additionality will be enhanced.
There is already a sufficient skills and knowledge base from the very start of the project. No special training measures are necessary.
This will reduce the total process heat cost in the project scenario by a few cents per MWh. Additionality is still given by far.
Conclusion: The baseline scenario is very stable with respect to variations of the key factor G
PROJECT DESIGN DOCUMENT FORM (GS-VER-PDD) Voluntary Offset Projects - Version 01
page 27
This template shall not be altered. It shall be completed without modifying/adding headings or logo, format or font.
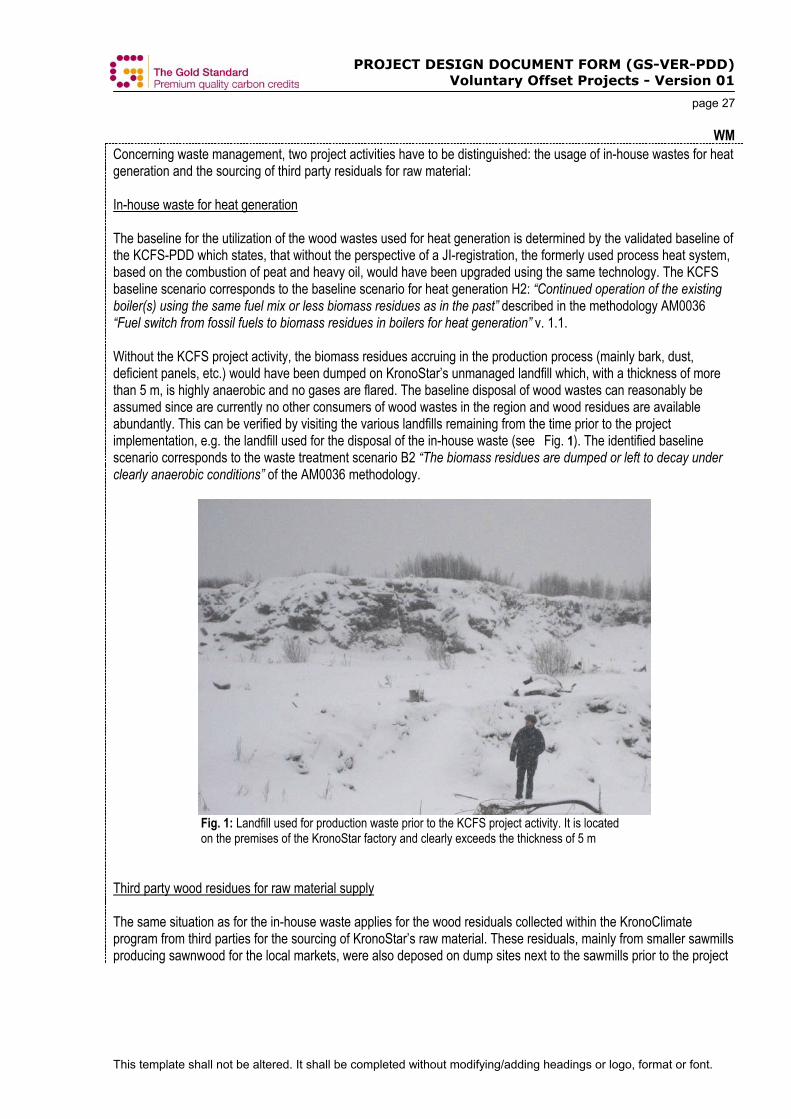
WM Concerning waste management, two project activities have to be distinguished: the usage of in-house wastes for heat generation and the sourcing of third party residuals for raw material: In-house waste for heat generation The baseline for the utilization of the wood wastes used for heat generation is determined by the validated baseline of the KCFS-PDD which states, that without the perspective of a JI-registration, the formerly used process heat system, based on the combustion of peat and heavy oil, would have been upgraded using the same technology. The KCFS baseline scenario corresponds to the baseline scenario for heat generation H2: “Continued operation of the existing boiler(s) using the same fuel mix or less biomass residues as in the past” described in the methodology AM0036 “Fuel switch from fossil fuels to biomass residues in boilers for heat generation” v. 1.1. Without the KCFS project activity, the biomass residues accruing in the production process (mainly bark, dust, deficient panels, etc.) would have been dumped on KronoStar’s unmanaged landfill which, with a thickness of more than 5 m, is highly anaerobic and no gases are flared. The baseline disposal of wood wastes can reasonably be assumed since are currently no other consumers of wood wastes in the region and wood residues are available abundantly. This can be verified by visiting the various landfills remaining from the time prior to the project implementation, e.g. the landfill used for the disposal of the in-house waste (see Fig. 1). The identified baseline scenario corresponds to the waste treatment scenario B2 “The biomass residues are dumped or left to decay under clearly anaerobic conditions” of the AM0036 methodology.
Fig. 1: Landfill used for production waste prior to the KCFS project activity. It is located
on the premises of the KronoStar factory and clearly exceeds the thickness of 5 m Third party wood residues for raw material supply The same situation as for the in-house waste applies for the wood residuals collected within the KronoClimate program from third parties for the sourcing of KronoStar’s raw material. These residuals, mainly from smaller sawmills producing sawnwood for the local markets, were also deposed on dump sites next to the sawmills prior to the project
PROJECT DESIGN DOCUMENT FORM (GS-VER-PDD) Voluntary Offset Projects - Version 01
page 28
This template shall not be altered. It shall be completed without modifying/adding headings or logo, format or font.
activity. This is affirmed by the following comments found in regional newspapers (translated by local project participants): “Peoples and nature conservation organizations are worried about wood wastes accruing in the Pyschtschug region. About 40 sawmills and other wood processing facilities produce thousands of cubic meters of sawdust that accumulate on nearby landfills. […]. During past winter, thousands of tons of wood waste were transported to the KronoStar facility near Sharja.” (27th of May 2004 Sewernaja Prawda) “The problem is very common in the regions: the wood wastes are deposed all over the place. They contaminate the forests, the roads and even promenades. […]. Nowadays, after a decision of the regional administration in collaboration with the committee for ecology, the wood wastes are used by the KronoStar facility near Sharja” (January 2004 Lesnaja Gaseta) Conclusively, the B2 baseline scenario of the AM0036 has been identified for the treatment of both kinds of wood residues, in-house wood wastes used as fuel and third party residues sourced for raw material, according to the validated baseline for heat production in the KCFS PDD and the fact, that third parties’ wastes would be dumped on landfills in absence of the project activity. For the purpose of a conservative estimation of the emission reductions attributable to the project activity, the dump sites where third party wood wastes would be deposed in the baseline scenario are altogether assumed to have a thickness lower than 5 m and are therefore less anaerobic than the landfill located on KronoStar’s premises. The following paragraphs show the additionality of the two project activites: In-house wood waste for heat generation The additionality of the KCFS project activity was assessed by the KCFS PDD according to the “Tool for the demonstration. and assessment of Additionality” provided by the CDM-EB (cf. KCFS/BL/5 “Additionality”) and validated by TÜV-Süd in 2005. The extension of the PDD with the waste treatment for heat generation (KCFS/WM) doesn’t alter the KCFS project activity in general and baseline and additionality in particular. It just alters the project boundary in terms of spatiality and greenhouse gases quantified. Third party wood residues for raw material supply To confirm the correctness of the assumed baseline (dumping of third party residuals) and the additionality of the project activity (sourcing of third party residuals for raw material) a separate baseline identification and additionality assessment, according to the CDM-EB ”Tool for the demonstration and assessment of additionality”, is conducted: Step 1: Identification of alternatives to the project activity Taking into account KronoStar’s need of raw-material (output of the project activity), two alternative scenarios for the sourcing of raw material and the treatment of external wood residues exist, that are both compatible with the current regulations in place: Sourcing of KronoStar’s needed raw-material: - exclusively from forests, while external residues are dumped on landfills. - from forests and partly from external wood residues (project activity)

PROJECT DESIGN DOCUMENT FORM (GS-VER-PDD) Voluntary Offset Projects - Version 01
page 29
This template shall not be altered. It shall be completed without modifying/adding headings or logo, format or font.
Step 2 - 5: Investment analysis, barrier analysis, common practice analysis and influence of JI registration
FS
Economic analysis Determination of the appropriate analysis method
The project is a fuel switch project for process heat generation. All the project alternatives and the project itself have the same principal output: process heat. Financial interest and so the economic attractivity of the project and its alternatives can be compared best by calculating the resulting cost for the process heat delivered (in EUR/MWh or similar). When comparing the alternatives the same standard calculation model should be applied. Moreover the same conditions for process heat supply should be assumed (i.e. 110 MW, 8400 h/y). The rules for the standard calculation model are as follows: - Divide the total annual cost for process heat generation by the total produced amount of process heat - For the calculation of the cost of process heat generation add the cost of:
- the investment / capital - fuel and on-site fuel preparation / fuel transport - operation and maintenance of all necessary equipment
- For the calculation of capital cost assume a linear depreciation of all investments to zero value within the lifetime of the boilers
- The bonus for the selling of CO2 emission rights shall not be included in a first comparison of process heat cost, but shall be shown in a second step.
The economically most attractive alternative is the one with the least resulting cost of process heat supply. Additionally and parallelly to the analysis on this base a conventional NPV analysis has been performed to test the robustness of the baseline. It led to the same results.
PROJECT DESIGN DOCUMENT FORM (GS-VER-PDD) Voluntary Offset Projects - Version 01
page 30
This template shall not be altered. It shall be completed without modifying/adding headings or logo, format or font.
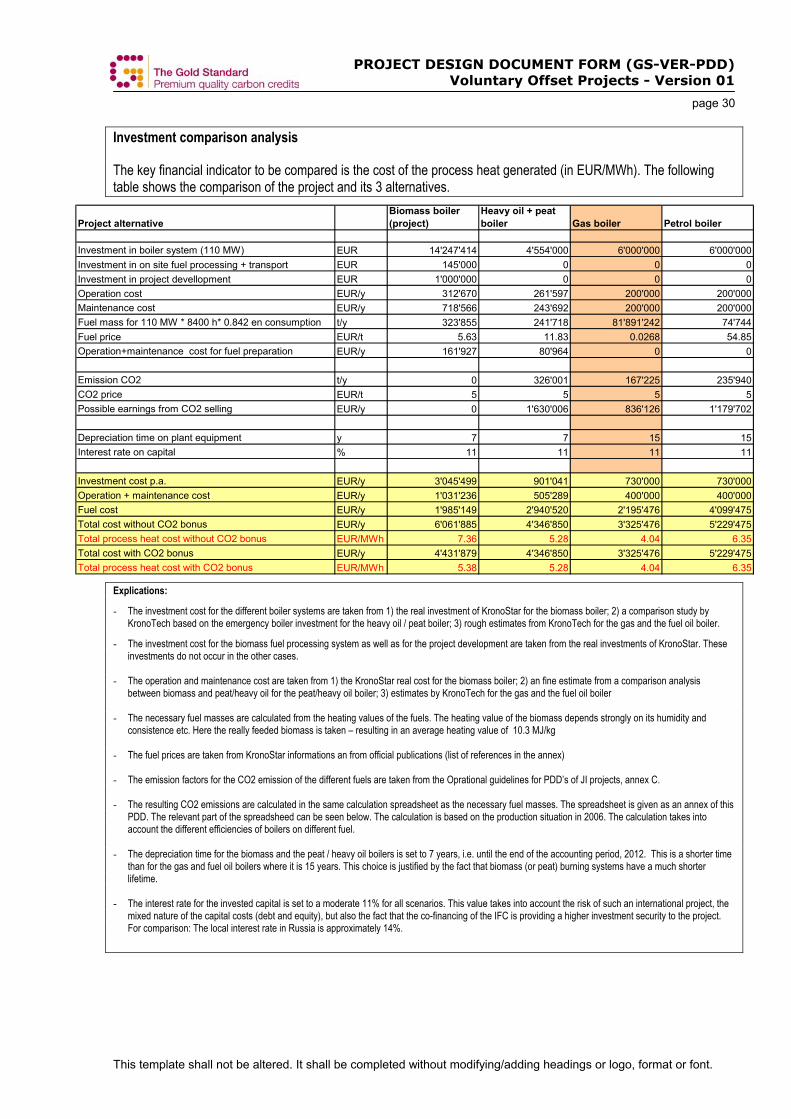
Investment comparison analysis
The key financial indicator to be compared is the cost of the process heat generated (in EUR/MWh). The following table shows the comparison of the project and its 3 alternatives.
Project alternativeBiomass boiler (project)
Heavy oil + peat boiler Gas boiler Petrol boiler
Investment in boiler system (110 MW) EUR 14'247'414 4'554'000 6'000'000 6'000'000Investment in on site fuel processing + transport EUR 145'000 0 0 0Investment in project devellopment EUR 1'000'000 0 0 0Operation cost EUR/y 312'670 261'597 200'000 200'000Maintenance cost EUR/y 718'566 243'692 200'000 200'000Fuel mass for 110 MW * 8400 h* 0.842 en consumption t/y 323'855 241'718 81'891'242 74'744Fuel price EUR/t 5.63 11.83 0.0268 54.85Operation+maintenance cost for fuel preparation EUR/y 161'927 80'964 0 0
Emission CO2 t/y 0 326'001 167'225 235'940CO2 price EUR/t 5 5 5 5Possible earnings from CO2 selling EUR/y 0 1'630'006 836'126 1'179'702
Depreciation time on plant equipment y 7 7 15 15Interest rate on capital % 11 11 11 11
Investment cost p.a. EUR/y 3'045'499 901'041 730'000 730'000Operation + maintenance cost EUR/y 1'031'236 505'289 400'000 400'000Fuel cost EUR/y 1'985'149 2'940'520 2'195'476 4'099'475Total cost without CO2 bonus EUR/y 6'061'885 4'346'850 3'325'476 5'229'475Total process heat cost without CO2 bonus EUR/MWh 7.36 5.28 4.04 6.35Total cost with CO2 bonus EUR/y 4'431'879 4'346'850 3'325'476 5'229'475Total process heat cost with CO2 bonus EUR/MWh 5.38 5.28 4.04 6.35
Explications:
- The investment cost for the different boiler systems are taken from 1) the real investment of KronoStar for the biomass boiler; 2) a comparison study by KronoTech based on the emergency boiler investment for the heavy oil / peat boiler; 3) rough estimates from KronoTech for the gas and the fuel oil boiler.
- The investment cost for the biomass fuel processing system as well as for the project development are taken from the real investments of KronoStar. These investments do not occur in the other cases.
- The operation and maintenance cost are taken from 1) the KronoStar real cost for the biomass boiler; 2) an fine estimate from a comparison analysis between biomass and peat/heavy oil for the peat/heavy oil boiler; 3) estimates by KronoTech for the gas and the fuel oil boiler
- The necessary fuel masses are calculated from the heating values of the fuels. The heating value of the biomass depends strongly on its humidity and consistence etc. Here the really feeded biomass is taken – resulting in an average heating value of 10.3 MJ/kg
- The fuel prices are taken from KronoStar informations an from official publications (list of references in the annex)
- The emission factors for the CO2 emission of the different fuels are taken from the Oprational guidelines for PDD’s of JI projects, annex C.
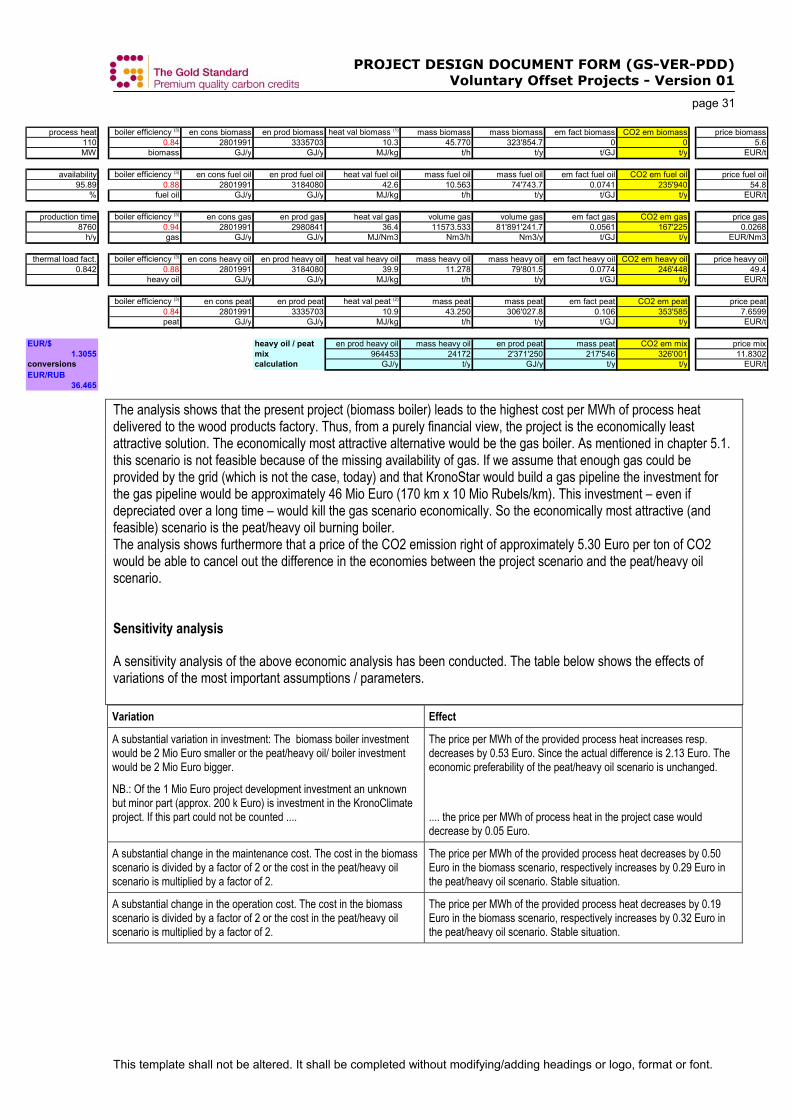
- The resulting CO2 emissions are calculated in the same calculation spreadsheet as the necessary fuel masses. The spreadsheet is given as an annex of this PDD. The relevant part of the spreadsheed can be seen below. The calculation is based on the production situation in 2006. The calculation takes into account the different efficiencies of boilers on different fuel.
- The depreciation time for the biomass and the peat / heavy oil boilers is set to 7 years, i.e. until the end of the accounting period, 2012. This is a shorter time than for the gas and fuel oil boilers where it is 15 years. This choice is justified by the fact that biomass (or peat) burning systems have a much shorter lifetime.
- The interest rate for the invested capital is set to a moderate 11% for all scenarios. This value takes into account the risk of such an international project, the mixed nature of the capital costs (debt and equity), but also the fact that the co-financing of the IFC is providing a higher investment security to the project. For comparison: The local interest rate in Russia is approximately 14%.
PROJECT DESIGN DOCUMENT FORM (GS-VER-PDD) Voluntary Offset Projects - Version 01
page 31
This template shall not be altered. It shall be completed without modifying/adding headings or logo, format or font.
process heat boiler efficiency (3) en cons biomass en prod biomass heat val biomass (1) mass biomass mass biomass em fact biomass CO2 em biomass price biomass110 0.84 2801991 3335703 10.3 45.770 323'854.7 0 0 5.6MW biomass GJ/y GJ/y MJ/kg t/h t/y t/GJ t/y EUR/t
availability boiler efficiency (3) en cons fuel oil en prod fuel oil heat val fuel oil mass fuel oil mass fuel oil em fact fuel oil CO2 em fuel oil price fuel oil95.89 0.88 2801991 3184080 42.6 10.563 74'743.7 0.0741 235'940 54.8
% fuel oil GJ/y GJ/y MJ/kg t/h t/y t/GJ t/y EUR/t
production time boiler efficiency (3) en cons gas en prod gas heat val gas volume gas volume gas em fact gas CO2 em gas price gas8760 0.94 2801991 2980841 36.4 11573.533 81'891'241.7 0.0561 167'225 0.0268
h/y gas GJ/y GJ/y MJ/Nm3 Nm3/h Nm3/y t/GJ t/y EUR/Nm3
thermal load fact. boiler efficiency (3) en cons heavy oil en prod heavy oil heat val heavy oil mass heavy oil mass heavy oil em fact heavy oil CO2 em heavy oil price heavy oil0.842 0.88 2801991 3184080 39.9 11.278 79'801.5 0.0774 246'448 49.4
heavy oil GJ/y GJ/y MJ/kg t/h t/y t/GJ t/y EUR/t
boiler efficiency (3) en cons peat en prod peat heat val peat (2) mass peat mass peat em fact peat CO2 em peat price peat0.84 2801991 3335703 10.9 43.250 306'027.8 0.106 353'585 7.6599peat GJ/y GJ/y MJ/kg t/h t/y t/GJ t/y EUR/t
EUR/$ heavy oil / peat en prod heavy oil mass heavy oil en prod peat mass peat CO2 em mix price mix1.3055 mix 964453 24172 2'371'250 217'546 326'001 11.8302
conversions calculation GJ/y t/y GJ/y t/y t/y EUR/tEUR/RUB
36.465 The analysis shows that the present project (biomass boiler) leads to the highest cost per MWh of process heat delivered to the wood products factory. Thus, from a purely financial view, the project is the economically least attractive solution. The economically most attractive alternative would be the gas boiler. As mentioned in chapter 5.1. this scenario is not feasible because of the missing availability of gas. If we assume that enough gas could be provided by the grid (which is not the case, today) and that KronoStar would build a gas pipeline the investment for the gas pipeline would be approximately 46 Mio Euro (170 km x 10 Mio Rubels/km). This investment – even if depreciated over a long time – would kill the gas scenario economically. So the economically most attractive (and feasible) scenario is the peat/heavy oil burning boiler. The analysis shows furthermore that a price of the CO2 emission right of approximately 5.30 Euro per ton of CO2 would be able to cancel out the difference in the economies between the project scenario and the peat/heavy oil scenario. Sensitivity analysis
A sensitivity analysis of the above economic analysis has been conducted. The table below shows the effects of variations of the most important assumptions / parameters. Variation Effect
A substantial variation in investment: The biomass boiler investment would be 2 Mio Euro smaller or the peat/heavy oil/ boiler investment would be 2 Mio Euro bigger.
NB.: Of the 1 Mio Euro project development investment an unknown but minor part (approx. 200 k Euro) is investment in the KronoClimate project. If this part could not be counted ....
The price per MWh of the provided process heat increases resp. decreases by 0.53 Euro. Since the actual difference is 2.13 Euro. The economic preferability of the peat/heavy oil scenario is unchanged.
.... the price per MWh of process heat in the project case would decrease by 0.05 Euro.
A substantial change in the maintenance cost. The cost in the biomass scenario is divided by a factor of 2 or the cost in the peat/heavy oil scenario is multiplied by a factor of 2.
The price per MWh of the provided process heat decreases by 0.50 Euro in the biomass scenario, respectively increases by 0.29 Euro in the peat/heavy oil scenario. Stable situation.
A substantial change in the operation cost. The cost in the biomass scenario is divided by a factor of 2 or the cost in the peat/heavy oil scenario is multiplied by a factor of 2.
The price per MWh of the provided process heat decreases by 0.19 Euro in the biomass scenario, respectively increases by 0.32 Euro in the peat/heavy oil scenario. Stable situation.
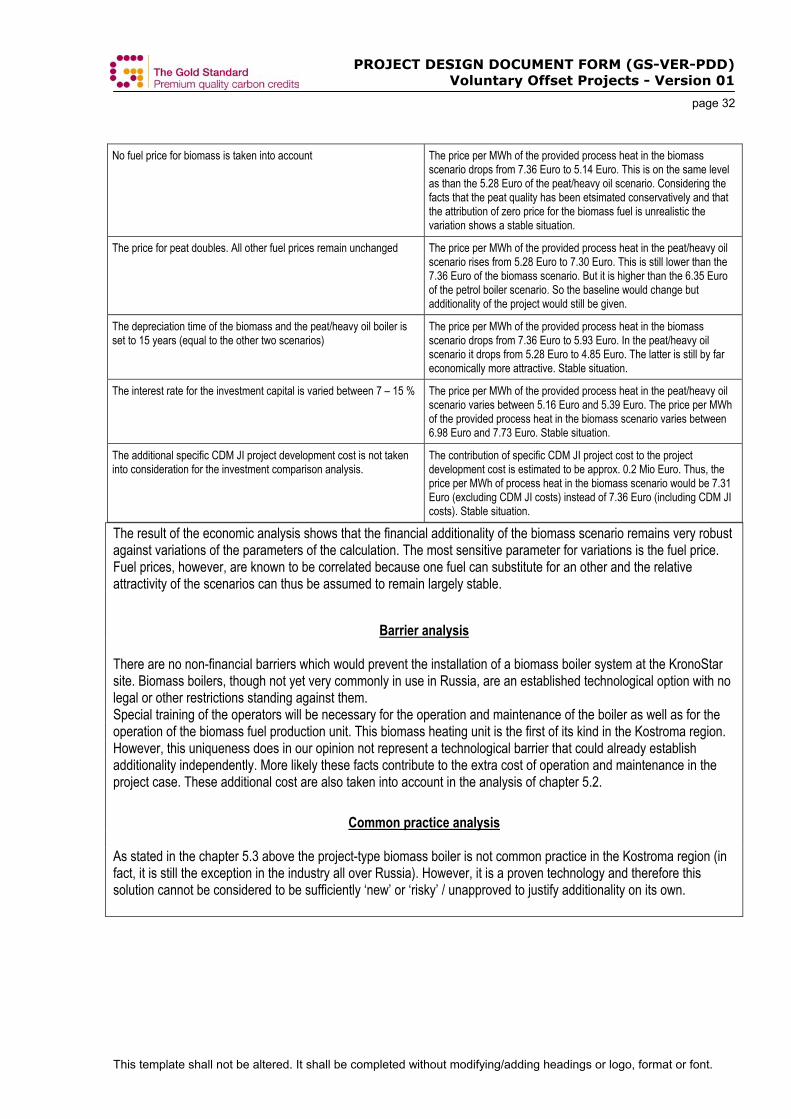
PROJECT DESIGN DOCUMENT FORM (GS-VER-PDD) Voluntary Offset Projects - Version 01
page 32
This template shall not be altered. It shall be completed without modifying/adding headings or logo, format or font.
No fuel price for biomass is taken into account The price per MWh of the provided process heat in the biomass
scenario drops from 7.36 Euro to 5.14 Euro. This is on the same level as than the 5.28 Euro of the peat/heavy oil scenario. Considering the facts that the peat quality has been etsimated conservatively and that the attribution of zero price for the biomass fuel is unrealistic the variation shows a stable situation.
The price for peat doubles. All other fuel prices remain unchanged The price per MWh of the provided process heat in the peat/heavy oil scenario rises from 5.28 Euro to 7.30 Euro. This is still lower than the 7.36 Euro of the biomass scenario. But it is higher than the 6.35 Euro of the petrol boiler scenario. So the baseline would change but additionality of the project would still be given.
The depreciation time of the biomass and the peat/heavy oil boiler is set to 15 years (equal to the other two scenarios)
The price per MWh of the provided process heat in the biomass scenario drops from 7.36 Euro to 5.93 Euro. In the peat/heavy oil scenario it drops from 5.28 Euro to 4.85 Euro. The latter is still by far economically more attractive. Stable situation.
The interest rate for the investment capital is varied between 7 – 15 % The price per MWh of the provided process heat in the peat/heavy oil scenario varies between 5.16 Euro and 5.39 Euro. The price per MWh of the provided process heat in the biomass scenario varies between 6.98 Euro and 7.73 Euro. Stable situation.
The additional specific CDM JI project development cost is not taken into consideration for the investment comparison analysis.
The contribution of specific CDM JI project cost to the project development cost is estimated to be approx. 0.2 Mio Euro. Thus, the price per MWh of process heat in the biomass scenario would be 7.31 Euro (excluding CDM JI costs) instead of 7.36 Euro (including CDM JI costs). Stable situation.
The result of the economic analysis shows that the financial additionality of the biomass scenario remains very robust against variations of the parameters of the calculation. The most sensitive parameter for variations is the fuel price. Fuel prices, however, are known to be correlated because one fuel can substitute for an other and the relative attractivity of the scenarios can thus be assumed to remain largely stable.
Barrier analysis
There are no non-financial barriers which would prevent the installation of a biomass boiler system at the KronoStar site. Biomass boilers, though not yet very commonly in use in Russia, are an established technological option with no legal or other restrictions standing against them. Special training of the operators will be necessary for the operation and maintenance of the boiler as well as for the operation of the biomass fuel production unit. This biomass heating unit is the first of its kind in the Kostroma region. However, this uniqueness does in our opinion not represent a technological barrier that could already establish additionality independently. More likely these facts contribute to the extra cost of operation and maintenance in the project case. These additional cost are also taken into account in the analysis of chapter 5.2.
Common practice analysis As stated in the chapter 5.3 above the project-type biomass boiler is not common practice in the Kostroma region (in fact, it is still the exception in the industry all over Russia). However, it is a proven technology and therefore this solution cannot be considered to be sufficiently ‘new’ or ‘risky’ / unapproved to justify additionality on its own.
PROJECT DESIGN DOCUMENT FORM (GS-VER-PDD) Voluntary Offset Projects - Version 01
page 33
This template shall not be altered. It shall be completed without modifying/adding headings or logo, format or font.
Additional Remark: Looking for projects for its MDG Carbon Facility, UNDP advertised in October 2007 a country study “Joint Implementation for promotion of biomass-based energy in Russia”. This indicates, that the usage of bio-energy still isn’t common practice in Russia.
Impact of the registration (JI) As shown above, a registration coupled with selling of CO2 emission rights at a realistic price would reduce the cost of process heat generation by about 30%. After this reduction, the price is in the same order of magnitude as the price of the financially most attractive alternative, the latter being the peat / heavy oil boiler. If future changes in the environmental legislation put some investment load on the peat / heavy oil boiler due to air pollution abatement (which is foreseeable, see chapters 4 and 6) the project alternative even turns out to be most attractive if CO2 registration is taken into account. Thus a registration and the respective selling of ERU’s would indeed help to render the project economically more attractive and competitive. A registration of the project could trigger the realization of further projects in the framework of KronoClimate as well as increase the general use of biomass in the region. Russia has a big potential for the use of biomass. Today this potential is not exploited because of the relatively low price of fossil fuels. This could change when ERU selling is taken into account. As can be seen from the project schedule and implementation, the biomass boiler project is already realised at the time of this proposal. However, the future possibility of selling carbon credits (or to eventually 'repatriate' the credits and count them against obligations that were potentially to arise from the CO2 legislation in Switzerland) was an integral part of the scenario evaluation. The project proponent coveted an eventual registration and the sale of carbon credits from the very start and mandated c4c to undertake the necessary steps to secure these emission rights. Due to the industrial logic of such a large investment project, there was simply no question to postpone the climate-relevant investment until a definite deal regarding emission reductions was struck. The company had to go forward and to shoulder the risk of an eventual failure to register the project under a JI framework. This decision is in line with the company’s commitment to sustainability and their aim to be whenever feasible at the leading edge technologically and environmentally (primarily to create intangible benefits and to enhance and secure the local acceptance of the project). Conclusion: The proposed project activity is additional, given the assumptions and explanations set out before. WM
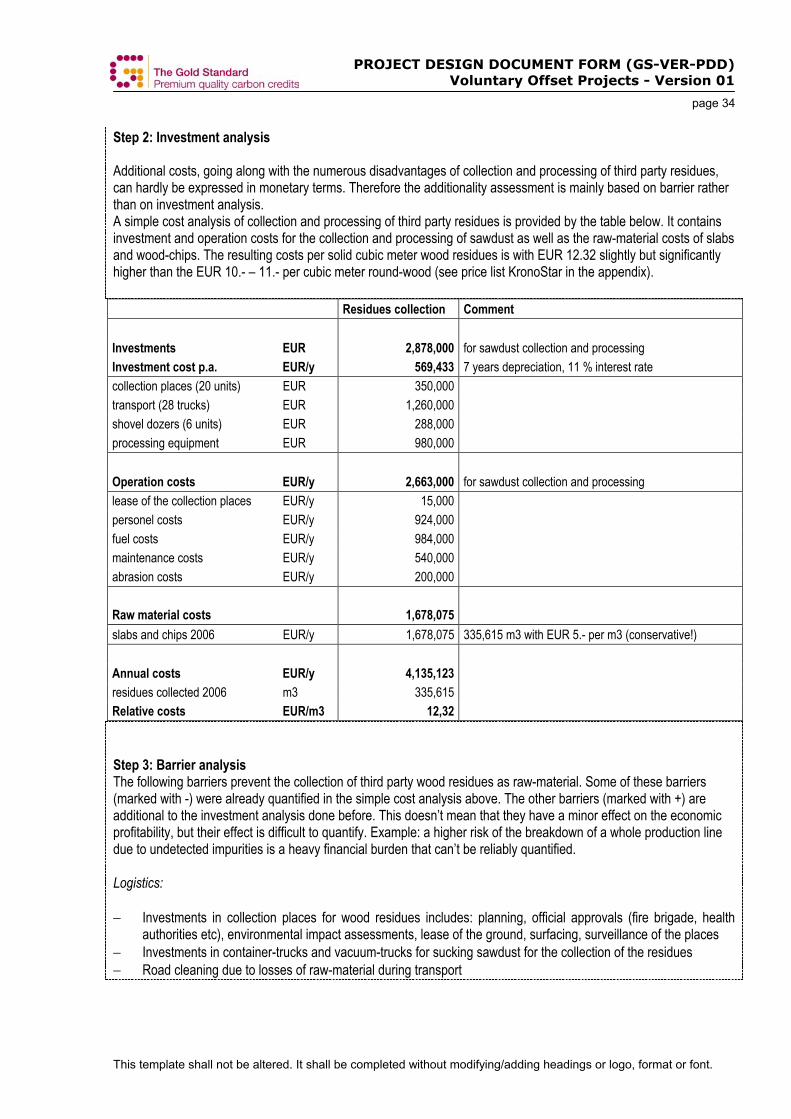
PROJECT DESIGN DOCUMENT FORM (GS-VER-PDD) Voluntary Offset Projects - Version 01
page 34
This template shall not be altered. It shall be completed without modifying/adding headings or logo, format or font.
Step 2: Investment analysis Additional costs, going along with the numerous disadvantages of collection and processing of third party residues, can hardly be expressed in monetary terms. Therefore the additionality assessment is mainly based on barrier rather than on investment analysis. A simple cost analysis of collection and processing of third party residues is provided by the table below. It contains investment and operation costs for the collection and processing of sawdust as well as the raw-material costs of slabs and wood-chips. The resulting costs per solid cubic meter wood residues is with EUR 12.32 slightly but significantly higher than the EUR 10.- – 11.- per cubic meter round-wood (see price list KronoStar in the appendix). Residues collection Comment Investments EUR 2,878,000 for sawdust collection and processing Investment cost p.a. EUR/y 569,433 7 years depreciation, 11 % interest rate collection places (20 units) EUR 350,000 transport (28 trucks) EUR 1,260,000 shovel dozers (6 units) EUR 288,000 processing equipment EUR 980,000
Operation costs EUR/y 2,663,000 for sawdust collection and processing lease of the collection places EUR/y 15,000 personel costs EUR/y 924,000 fuel costs EUR/y 984,000 maintenance costs EUR/y 540,000 abrasion costs EUR/y 200,000 Raw material costs 1,678,075 slabs and chips 2006 EUR/y 1,678,075 335,615 m3 with EUR 5.- per m3 (conservative!)
Annual costs EUR/y 4,135,123 residues collected 2006 m3 335,615 Relative costs EUR/m3 12,32 Step 3: Barrier analysis The following barriers prevent the collection of third party wood residues as raw-material. Some of these barriers (marked with -) were already quantified in the simple cost analysis above. The other barriers (marked with +) are additional to the investment analysis done before. This doesn’t mean that they have a minor effect on the economic profitability, but their effect is difficult to quantify. Example: a higher risk of the breakdown of a whole production line due to undetected impurities is a heavy financial burden that can’t be reliably quantified. Logistics: − Investments in collection places for wood residues includes: planning, official approvals (fire brigade, health
authorities etc), environmental impact assessments, lease of the ground, surfacing, surveillance of the places − Investments in container-trucks and vacuum-trucks for sucking sawdust for the collection of the residues − Road cleaning due to losses of raw-material during transport
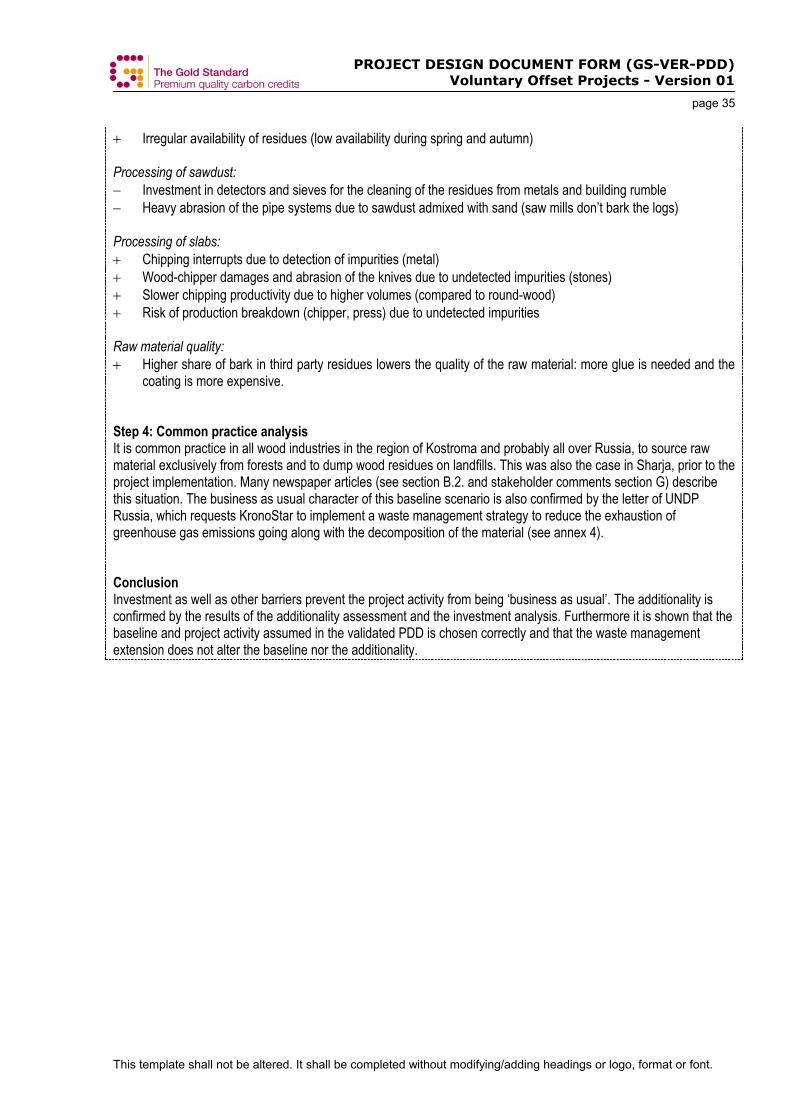
PROJECT DESIGN DOCUMENT FORM (GS-VER-PDD) Voluntary Offset Projects - Version 01
page 35
This template shall not be altered. It shall be completed without modifying/adding headings or logo, format or font.
+ Irregular availability of residues (low availability during spring and autumn) Processing of sawdust: − Investment in detectors and sieves for the cleaning of the residues from metals and building rumble − Heavy abrasion of the pipe systems due to sawdust admixed with sand (saw mills don’t bark the logs) Processing of slabs: + Chipping interrupts due to detection of impurities (metal) + Wood-chipper damages and abrasion of the knives due to undetected impurities (stones) + Slower chipping productivity due to higher volumes (compared to round-wood) + Risk of production breakdown (chipper, press) due to undetected impurities Raw material quality: + Higher share of bark in third party residues lowers the quality of the raw material: more glue is needed and the
coating is more expensive. Step 4: Common practice analysis It is common practice in all wood industries in the region of Kostroma and probably all over Russia, to source raw material exclusively from forests and to dump wood residues on landfills. This was also the case in Sharja, prior to the project implementation. Many newspaper articles (see section B.2. and stakeholder comments section G) describe this situation. The business as usual character of this baseline scenario is also confirmed by the letter of UNDP Russia, which requests KronoStar to implement a waste management strategy to reduce the exhaustion of greenhouse gas emissions going along with the decomposition of the material (see annex 4). Conclusion Investment as well as other barriers prevent the project activity from being ‘business as usual’. The additionality is confirmed by the results of the additionality assessment and the investment analysis. Furthermore it is shown that the baseline and project activity assumed in the validated PDD is chosen correctly and that the waste management extension does not alter the baseline nor the additionality.
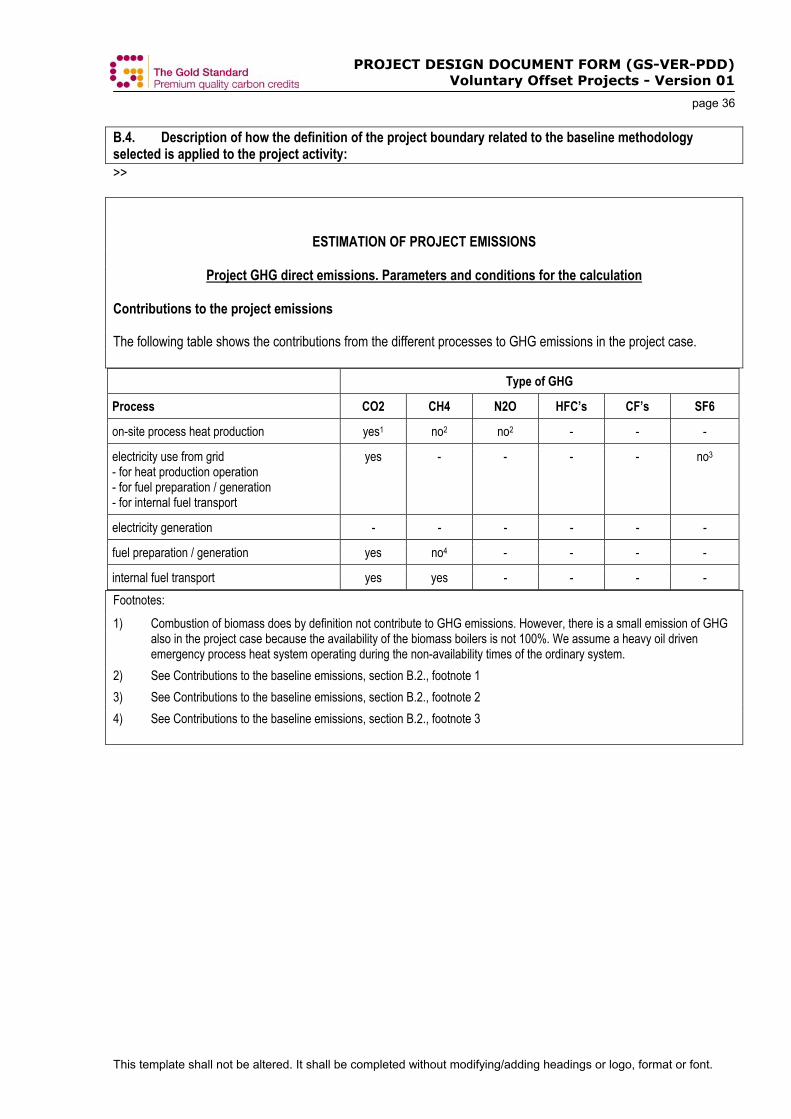
PROJECT DESIGN DOCUMENT FORM (GS-VER-PDD) Voluntary Offset Projects - Version 01
page 36
This template shall not be altered. It shall be completed without modifying/adding headings or logo, format or font.
B.4. Description of how the definition of the project boundary related to the baseline methodology selected is applied to the project activity: >>
ESTIMATION OF PROJECT EMISSIONS
Project GHG direct emissions. Parameters and conditions for the calculation Contributions to the project emissions
The following table shows the contributions from the different processes to GHG emissions in the project case. Type of GHG
Process CO2 CH4 N2O HFC’s CF’s SF6
on-site process heat production yes1 no2 no2 - - -
electricity use from grid - for heat production operation - for fuel preparation / generation - for internal fuel transport
yes - - - - no3
electricity generation - - - - - -
fuel preparation / generation yes no4 - - - -
internal fuel transport yes yes - - - - Footnotes:
1) Combustion of biomass does by definition not contribute to GHG emissions. However, there is a small emission of GHG also in the project case because the availability of the biomass boilers is not 100%. We assume a heavy oil driven emergency process heat system operating during the non-availability times of the ordinary system.
2) See Contributions to the baseline emissions, section B.2., footnote 1
3) See Contributions to the baseline emissions, section B.2., footnote 2
4) See Contributions to the baseline emissions, section B.2., footnote 3
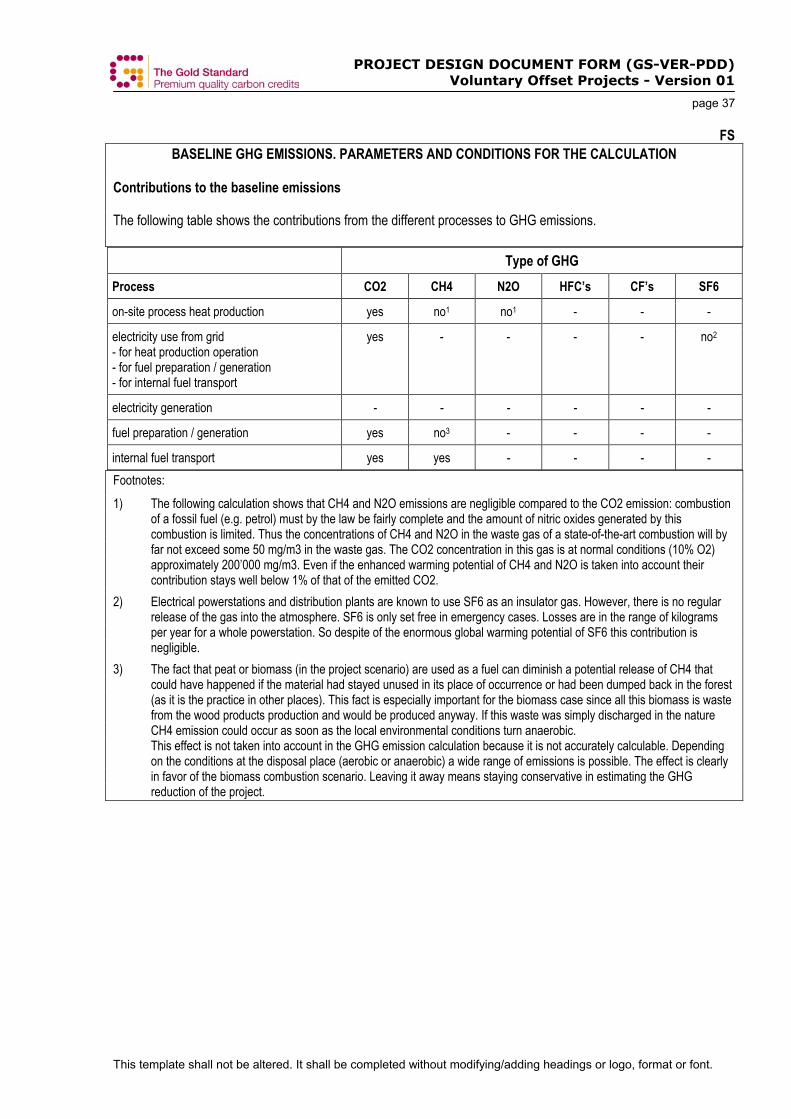
PROJECT DESIGN DOCUMENT FORM (GS-VER-PDD) Voluntary Offset Projects - Version 01
page 37
This template shall not be altered. It shall be completed without modifying/adding headings or logo, format or font.
FS BASELINE GHG EMISSIONS. PARAMETERS AND CONDITIONS FOR THE CALCULATION
Contributions to the baseline emissions
The following table shows the contributions from the different processes to GHG emissions.
Type of GHG Process CO2 CH4 N2O HFC’s CF’s SF6
on-site process heat production yes no1 no1 - - -
electricity use from grid - for heat production operation - for fuel preparation / generation - for internal fuel transport
yes - - - - no2
electricity generation - - - - - -
fuel preparation / generation yes no3 - - - -
internal fuel transport yes yes - - - - Footnotes:
1) The following calculation shows that CH4 and N2O emissions are negligible compared to the CO2 emission: combustion of a fossil fuel (e.g. petrol) must by the law be fairly complete and the amount of nitric oxides generated by this combustion is limited. Thus the concentrations of CH4 and N2O in the waste gas of a state-of-the-art combustion will by far not exceed some 50 mg/m3 in the waste gas. The CO2 concentration in this gas is at normal conditions (10% O2) approximately 200’000 mg/m3. Even if the enhanced warming potential of CH4 and N2O is taken into account their contribution stays well below 1% of that of the emitted CO2.
2) Electrical powerstations and distribution plants are known to use SF6 as an insulator gas. However, there is no regular release of the gas into the atmosphere. SF6 is only set free in emergency cases. Losses are in the range of kilograms per year for a whole powerstation. So despite of the enormous global warming potential of SF6 this contribution is negligible.
3) The fact that peat or biomass (in the project scenario) are used as a fuel can diminish a potential release of CH4 that could have happened if the material had stayed unused in its place of occurrence or had been dumped back in the forest (as it is the practice in other places). This fact is especially important for the biomass case since all this biomass is waste from the wood products production and would be produced anyway. If this waste was simply discharged in the nature CH4 emission could occur as soon as the local environmental conditions turn anaerobic. This effect is not taken into account in the GHG emission calculation because it is not accurately calculable. Depending on the conditions at the disposal place (aerobic or anaerobic) a wide range of emissions is possible. The effect is clearly in favor of the biomass combustion scenario. Leaving it away means staying conservative in estimating the GHG reduction of the project.
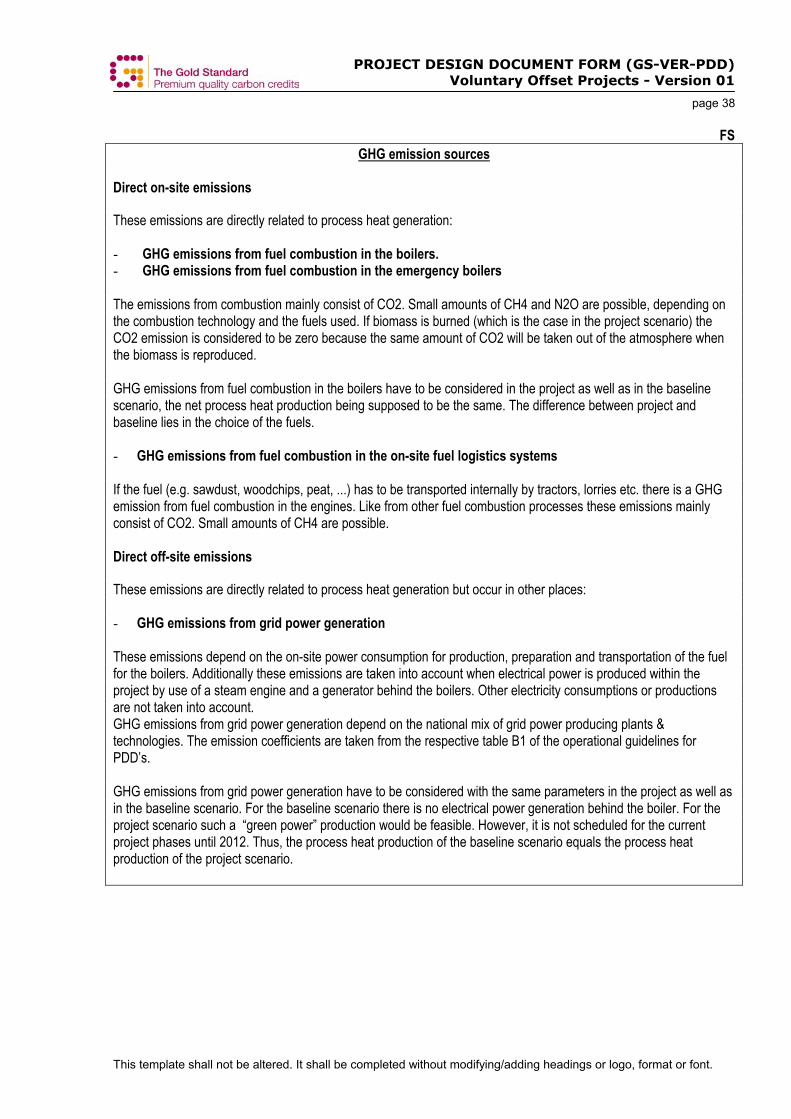
PROJECT DESIGN DOCUMENT FORM (GS-VER-PDD) Voluntary Offset Projects - Version 01
page 38
This template shall not be altered. It shall be completed without modifying/adding headings or logo, format or font.
FS GHG emission sources
Direct on-site emissions
These emissions are directly related to process heat generation: - GHG emissions from fuel combustion in the boilers. - GHG emissions from fuel combustion in the emergency boilers The emissions from combustion mainly consist of CO2. Small amounts of CH4 and N2O are possible, depending on the combustion technology and the fuels used. If biomass is burned (which is the case in the project scenario) the CO2 emission is considered to be zero because the same amount of CO2 will be taken out of the atmosphere when the biomass is reproduced. GHG emissions from fuel combustion in the boilers have to be considered in the project as well as in the baseline scenario, the net process heat production being supposed to be the same. The difference between project and baseline lies in the choice of the fuels. - GHG emissions from fuel combustion in the on-site fuel logistics systems If the fuel (e.g. sawdust, woodchips, peat, ...) has to be transported internally by tractors, lorries etc. there is a GHG emission from fuel combustion in the engines. Like from other fuel combustion processes these emissions mainly consist of CO2. Small amounts of CH4 are possible. Direct off-site emissions
These emissions are directly related to process heat generation but occur in other places: - GHG emissions from grid power generation These emissions depend on the on-site power consumption for production, preparation and transportation of the fuel for the boilers. Additionally these emissions are taken into account when electrical power is produced within the project by use of a steam engine and a generator behind the boilers. Other electricity consumptions or productions are not taken into account. GHG emissions from grid power generation depend on the national mix of grid power producing plants & technologies. The emission coefficients are taken from the respective table B1 of the operational guidelines for PDD’s. GHG emissions from grid power generation have to be considered with the same parameters in the project as well as in the baseline scenario. For the baseline scenario there is no electrical power generation behind the boiler. For the project scenario such a “green power” production would be feasible. However, it is not scheduled for the current project phases until 2012. Thus, the process heat production of the baseline scenario equals the process heat production of the project scenario.
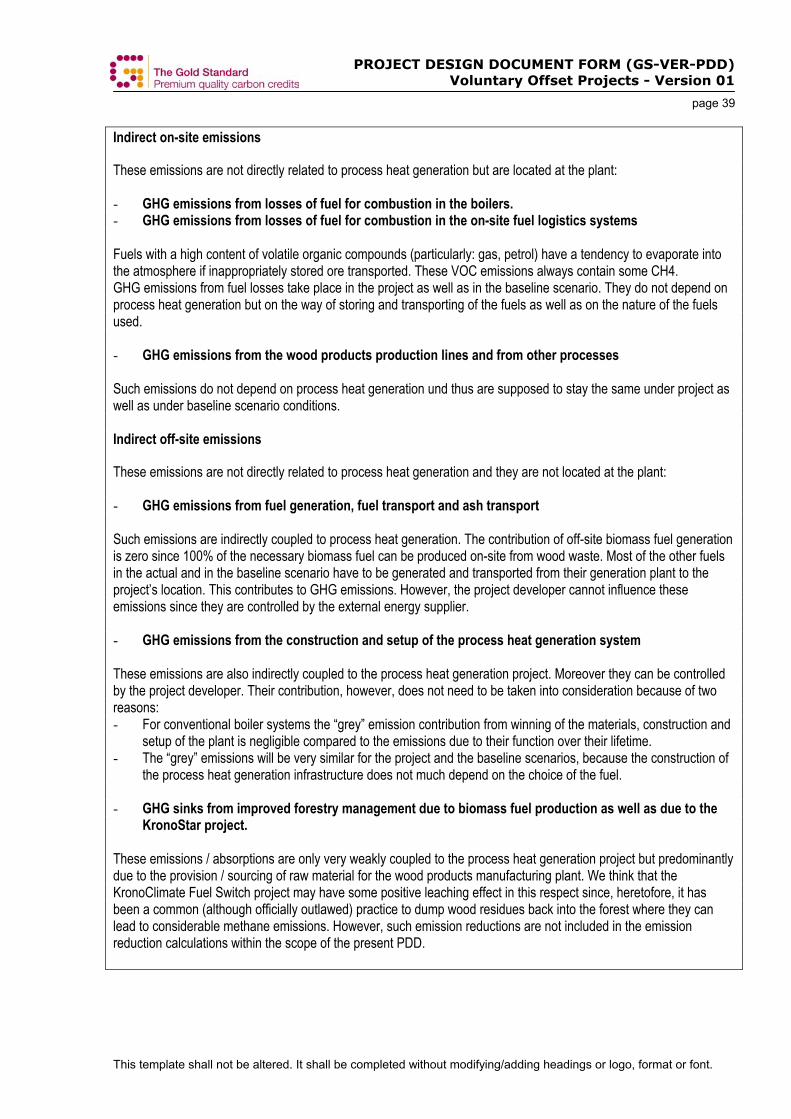
PROJECT DESIGN DOCUMENT FORM (GS-VER-PDD) Voluntary Offset Projects - Version 01
page 39
This template shall not be altered. It shall be completed without modifying/adding headings or logo, format or font.
Indirect on-site emissions
These emissions are not directly related to process heat generation but are located at the plant: - GHG emissions from losses of fuel for combustion in the boilers. - GHG emissions from losses of fuel for combustion in the on-site fuel logistics systems Fuels with a high content of volatile organic compounds (particularly: gas, petrol) have a tendency to evaporate into the atmosphere if inappropriately stored ore transported. These VOC emissions always contain some CH4. GHG emissions from fuel losses take place in the project as well as in the baseline scenario. They do not depend on process heat generation but on the way of storing and transporting of the fuels as well as on the nature of the fuels used. - GHG emissions from the wood products production lines and from other processes Such emissions do not depend on process heat generation und thus are supposed to stay the same under project as well as under baseline scenario conditions. Indirect off-site emissions
These emissions are not directly related to process heat generation and they are not located at the plant: - GHG emissions from fuel generation, fuel transport and ash transport Such emissions are indirectly coupled to process heat generation. The contribution of off-site biomass fuel generation is zero since 100% of the necessary biomass fuel can be produced on-site from wood waste. Most of the other fuels in the actual and in the baseline scenario have to be generated and transported from their generation plant to the project’s location. This contributes to GHG emissions. However, the project developer cannot influence these emissions since they are controlled by the external energy supplier. - GHG emissions from the construction and setup of the process heat generation system These emissions are also indirectly coupled to the process heat generation project. Moreover they can be controlled by the project developer. Their contribution, however, does not need to be taken into consideration because of two reasons: - For conventional boiler systems the “grey” emission contribution from winning of the materials, construction and
setup of the plant is negligible compared to the emissions due to their function over their lifetime. - The “grey” emissions will be very similar for the project and the baseline scenarios, because the construction of
the process heat generation infrastructure does not much depend on the choice of the fuel. - GHG sinks from improved forestry management due to biomass fuel production as well as due to the
KronoStar project. These emissions / absorptions are only very weakly coupled to the process heat generation project but predominantly due to the provision / sourcing of raw material for the wood products manufacturing plant. We think that the KronoClimate Fuel Switch project may have some positive leaching effect in this respect since, heretofore, it has been a common (although officially outlawed) practice to dump wood residues back into the forest where they can lead to considerable methane emissions. However, such emission reductions are not included in the emission reduction calculations within the scope of the present PDD.
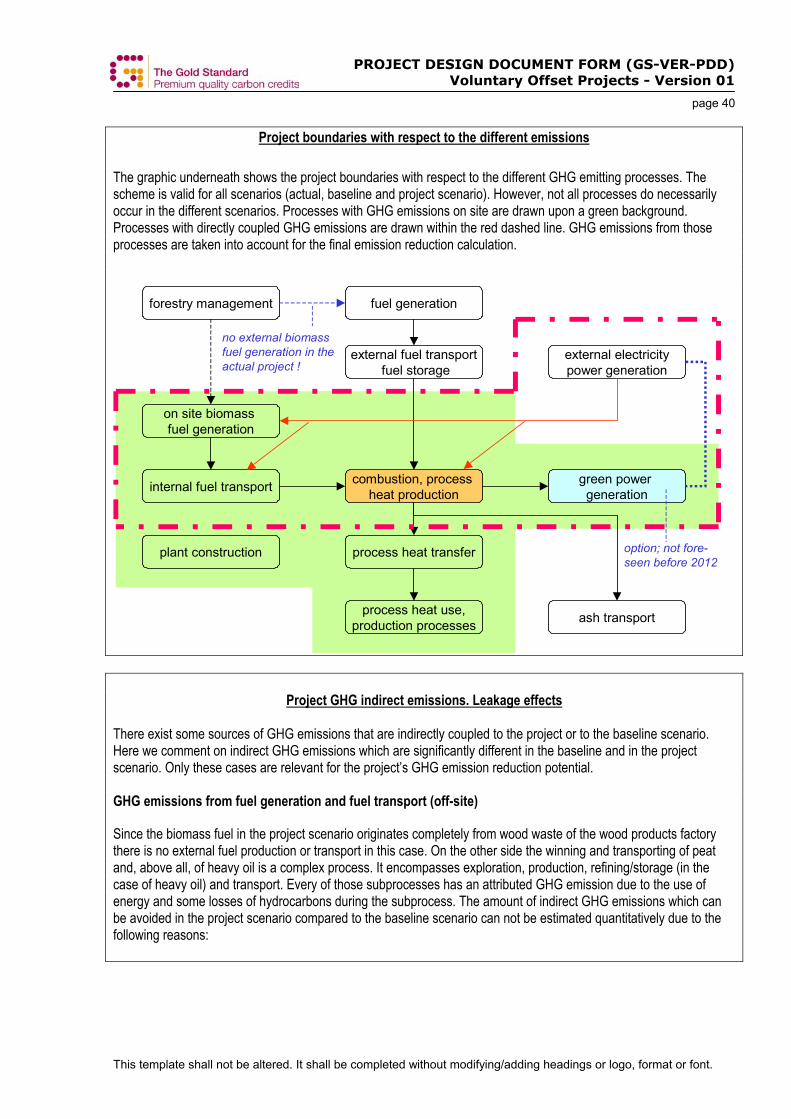
PROJECT DESIGN DOCUMENT FORM (GS-VER-PDD) Voluntary Offset Projects - Version 01
page 40
This template shall not be altered. It shall be completed without modifying/adding headings or logo, format or font.
Project boundaries with respect to the different emissions
The graphic underneath shows the project boundaries with respect to the different GHG emitting processes. The scheme is valid for all scenarios (actual, baseline and project scenario). However, not all processes do necessarily occur in the different scenarios. Processes with GHG emissions on site are drawn upon a green background. Processes with directly coupled GHG emissions are drawn within the red dashed line. GHG emissions from those processes are taken into account for the final emission reduction calculation.
combustion, process heat production
green power generation
process heat transfer
process heat use,production processes
internal fuel transport
on site biomass fuel generation
external fuel transportfuel storage
external electricitypower generation
ash transport
fuel generation
plant construction
forestry management
option; not fore-seen before 2012
no external biomass fuel generation in the actual project !
Project GHG indirect emissions. Leakage effects
There exist some sources of GHG emissions that are indirectly coupled to the project or to the baseline scenario. Here we comment on indirect GHG emissions which are significantly different in the baseline and in the project scenario. Only these cases are relevant for the project’s GHG emission reduction potential. GHG emissions from fuel generation and fuel transport (off-site)
Since the biomass fuel in the project scenario originates completely from wood waste of the wood products factory there is no external fuel production or transport in this case. On the other side the winning and transporting of peat and, above all, of heavy oil is a complex process. It encompasses exploration, production, refining/storage (in the case of heavy oil) and transport. Every of those subprocesses has an attributed GHG emission due to the use of energy and some losses of hydrocarbons during the subprocess. The amount of indirect GHG emissions which can be avoided in the project scenario compared to the baseline scenario can not be estimated quantitatively due to the following reasons:
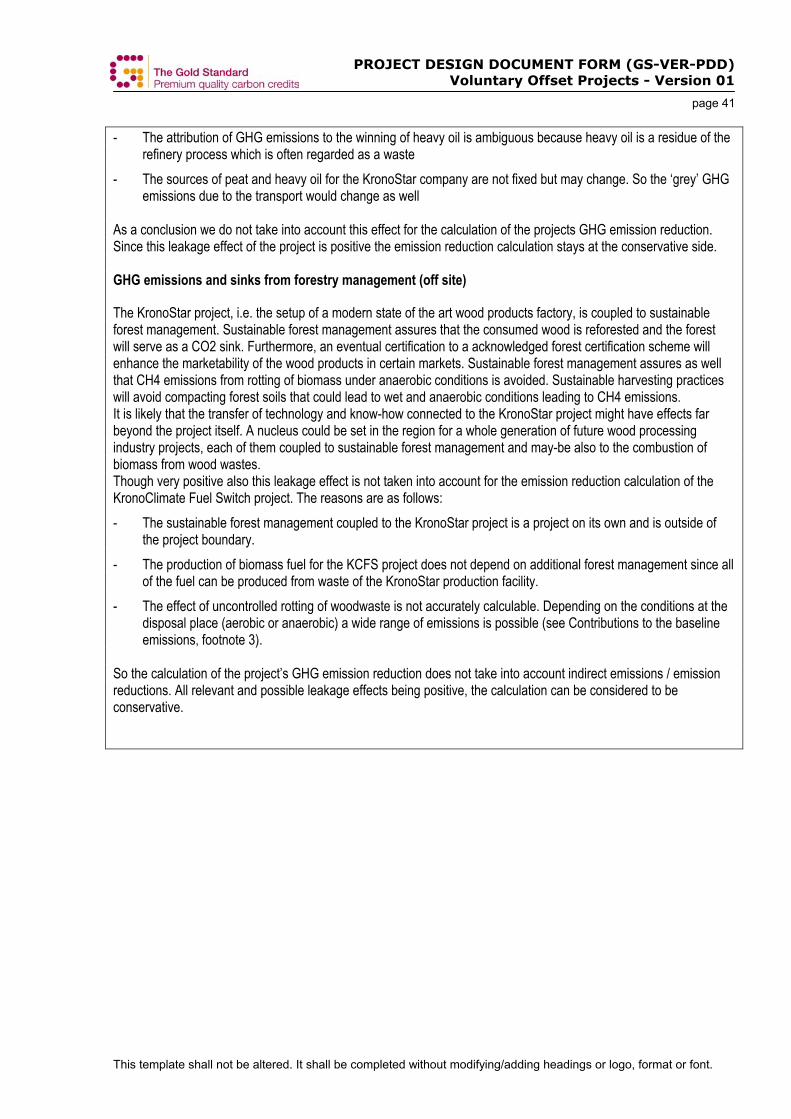
PROJECT DESIGN DOCUMENT FORM (GS-VER-PDD) Voluntary Offset Projects - Version 01
page 41
This template shall not be altered. It shall be completed without modifying/adding headings or logo, format or font.
- The attribution of GHG emissions to the winning of heavy oil is ambiguous because heavy oil is a residue of the refinery process which is often regarded as a waste
- The sources of peat and heavy oil for the KronoStar company are not fixed but may change. So the ‘grey’ GHG emissions due to the transport would change as well
As a conclusion we do not take into account this effect for the calculation of the projects GHG emission reduction. Since this leakage effect of the project is positive the emission reduction calculation stays at the conservative side. GHG emissions and sinks from forestry management (off site)
The KronoStar project, i.e. the setup of a modern state of the art wood products factory, is coupled to sustainable forest management. Sustainable forest management assures that the consumed wood is reforested and the forest will serve as a CO2 sink. Furthermore, an eventual certification to a acknowledged forest certification scheme will enhance the marketability of the wood products in certain markets. Sustainable forest management assures as well that CH4 emissions from rotting of biomass under anaerobic conditions is avoided. Sustainable harvesting practices will avoid compacting forest soils that could lead to wet and anaerobic conditions leading to CH4 emissions. It is likely that the transfer of technology and know-how connected to the KronoStar project might have effects far beyond the project itself. A nucleus could be set in the region for a whole generation of future wood processing industry projects, each of them coupled to sustainable forest management and may-be also to the combustion of biomass from wood wastes. Though very positive also this leakage effect is not taken into account for the emission reduction calculation of the KronoClimate Fuel Switch project. The reasons are as follows: - The sustainable forest management coupled to the KronoStar project is a project on its own and is outside of
the project boundary. - The production of biomass fuel for the KCFS project does not depend on additional forest management since all
of the fuel can be produced from waste of the KronoStar production facility. - The effect of uncontrolled rotting of woodwaste is not accurately calculable. Depending on the conditions at the
disposal place (aerobic or anaerobic) a wide range of emissions is possible (see Contributions to the baseline emissions, footnote 3).
So the calculation of the project’s GHG emission reduction does not take into account indirect emissions / emission reductions. All relevant and possible leakage effects being positive, the calculation can be considered to be conservative.
PROJECT DESIGN DOCUMENT FORM (GS-VER-PDD) Voluntary Offset Projects - Version 01
page 42
This template shall not be altered. It shall be completed without modifying/adding headings or logo, format or font.
WM The alternative waste treatment described in this PDD extension alters the KCFS project boundary in terms of spatiality (the inclusion of the landfill located on KronoStar’s premises and the multitude of smaller landfills outside of the KronoStar factory) and in terms of the greenhouse gases considered (CH4 greenhouse gas emissions from anaerobic decomposition in the baseline scenario and from biomass combustion in the project activity). A map showing the location of the external saw-dust collection places is provided by Annex 6 of this document (confidential). According to the AM0036, the CH4 emissions caused by the combustion are only considered in the project, but not in the baseline. This unilateral inclusion of combustion emissions might significantly contribute to a conservative assumption of the attributable emission reductions in our case, where the fuel used in the baseline isn’t a “clean” fossil fuel but peat, a non-renewable type of biomass2 combusted in an old-fashioned boiler. It can be assumed that the emissions of CH4, N2O and other atmospheric pollutants are even higher than for woody biomass fired in modern combustion chambers. B.5. Details of baseline information, including the date of completion of the baseline study and the name of person (s)/entity (ies) determining the baseline: >> Please attach detailed baseline information in Annex 2. Please provide date of completion in DD/MM/YYYY. Please provide contact information and indicate if the person/entity is also a project participant listed in Annex 1. FS Date of completion: 02/04/2005. Developer: c4c in cooperation with Krono Holding / KronoStar. Contact: Felix Martin. For detailed contact information, please refer to 'Project participants' in Annex 1. WM Date of completion: February 2007 Developer: c4c in cooperation with Krono Holding/KronoStar. Contact: Oliver Gardi. For detailed contact information, please refer to 'Project participants' in Annex 1.
2 Only renewable and sustainably harvested bio-fuels can be considered as CO2-neutral. Peat is therefore classified as a “fossil fuel” by the IPCC guidelines and good practice reports.
PROJECT DESIGN DOCUMENT FORM (GS-VER-PDD) Voluntary Offset Projects - Version 01
page 43
This template shall not be altered. It shall be completed without modifying/adding headings or logo, format or font.
SECTION C. Duration of the project activity / Crediting period C.1 Duration of the project activity: C.1.1. Starting date of the project activity: >> The starting date of a VER project activity is the date on which the implementation or construction or real action of a project activity begins. The Gold Standard accepts projects that have been working towards GS VER registration after 1st January 2006. FS Boilers installed in 2003 (55 MW) and 2005 (55 MW) WM The implementation of the project started with the installation of the first biomass boiler in 2003. A second boiler followed in 2005. The request for a retroactive GS VER registration dating back to January 1st 2006 was submitted in December 2006 and a pre-assessment has been conducted by GS-TAC in January 2007. C.1.2. Expected operational lifetime of the project activity: >> Please state the expected operational lifetime of the project activity in years and months (e.g. 2y-4m). FS The KronoStar project has a layout until 2022 / 2023, i.e. a lifetime of 20 years. Concerning the lifetime of the KronoClimate Fuel Switch Project, obviously, there must be a process heat production as long as the plant shall run. However, the project lifetime of the KCFS project is limited to the lifetime of the biomass boilers which is expected to last until the end of 2012 in minimum, until the end of 2017 in maximum.
PROJECT DESIGN DOCUMENT FORM (GS-VER-PDD) Voluntary Offset Projects - Version 01
page 44
This template shall not be altered. It shall be completed without modifying/adding headings or logo, format or font.
C.2 Choice of the crediting period and related information: >> Preliminary Remark: Since the KronoClimate project will be submitted for JI registration from 2008 onwards, only the emission reduction of the first two years 2006/07 of the project’s crediting period (2006 – 2012 / 2015) are requested for Gold Standard registration. Please state whether the project activity will use a renewable or a fixed crediting period and complete C.2.1 or C.2.2 accordingly. Note that the crediting period may only start after the date of registration of the proposed activity as a VER project activity. FS cf. section C.1. WM The crediting period of the KCFS project started on January 1st 2006 with an assigned duration until the end of the first commitment period on 31.12.2012 (7 years), but with a planned duration (depending on the lifetime of the boilers) and an optional prolongation (renewable crediting period) of further 3 years until 31st of December 2015 (cf. section A.2. of this document). The crediting period of the waste management extension shall be identical with the KCFS crediting period. It will be submitted for a retroactive validation for a crediting period dating back to January 1st 2006, considering the avoided deposition of wastes from the start of the project activity. Since the project activity isn’t altered due to the waste management PDD extension, the proposed retroactive crediting period seems reasonable, as long as the CH4 emission reductions can be verified with the data collected by the KCFS monitoring system in place (cf. D.2). The request for GS VER registration affects only the first two years 2006/07 of the crediting period 2006 - 2012
PROJECT DESIGN DOCUMENT FORM (GS-VER-PDD) Voluntary Offset Projects - Version 01
page 45
This template shall not be altered. It shall be completed without modifying/adding headings or logo, format or font.
C.2.1. Renewable crediting period >> Each crediting period shall be at most 7 years for small- and large-scale projects and 7 years for micro-scale projects and may be renewed at most two times, provided that, for each renewal, the verifier determines and informs the Gold Standard that the original project baseline is still valid or has been updated taking account of new data where applicable; The KCFS foresees the option of a renewable crediting period (7 and 3 years). However, only the first two years of the first crediting period (2006 and 2007) are subject of the GS VER registration request. Afterwards, the project is intended to be registered as a JI-project and therefore not GS VER compliant. C.2.1.1. Starting date of the first crediting period: >> Please state the dates in the following format: (DD/MM/YYYY). For a definition of the term “starting date”, please refer to the UNFCCC CDM web site. 01/01/2006 C.2.1.2. Length of the first crediting period: >> Please state the length of the first crediting period in years and months (e.g. 2y-4m). 7 years (1/1/2006 – 31/12/2012), whereof the emission reductions of the first 2 years (until 31/12/2007) are subject to GS VER registration. C.2.2. Fixed crediting period: >> Fixed crediting period shall be at most ten (10) years for small- and large-scale projects and fifteen (15) years for micro-scale projects.. n/a C.2.2.1. Starting date: >> Please state the dates in the following format: (DD/MM/YYYY). For a definition of the term “starting date”, please refer to the UNFCCC CDM web site. n/a C.2.2.2. Length: >> Please state the length of the crediting period in years and months n/a
PROJECT DESIGN DOCUMENT FORM (GS-VER-PDD) Voluntary Offset Projects - Version 01
page 46
This template shall not be altered. It shall be completed without modifying/adding headings or logo, format or font.
SECTION D. Application of a monitoring methodology and plan This section shall provide a detailed description of the monitoring plan, including an identification of the data and its quality with regard to accuracy, comparability, completeness and validity, taking into consideration any guidance contained in the methodology. The monitoring plan is to be attached in Annex 3. The Gold Standard requirements for the monitoring plan can be found in section 3.5.1 of the Gold Standard VER Project Developer’s Manual. The actual project performance must be assessed against the projected outcomes of the sustainable development assessment, on an annual basis. Where quantitative measurements are required information on the relevant data to be collected should be noted in the table presented in Annex 3. If an EIA has been conducted, then the table needs to be extended to allow: 1) Assessment of the implementation and effectiveness of the identified mitigation measures. 2) Assessment of the implementation and effectiveness of the identified compensation measures. 3) Monitoring of the impacts. Operational entities will verify that the monitoring methodology and plan have been implemented correctly and check the information in accordance with the provisions on verification. This section shall provide a detailed description of the monitoring plan, including an identification of the data to be collected, its quality with regard to accuracy, comparability, completeness and validity, taking into consideration any guidance contained in the methodology, and archiving of the data collected. Please note that data monitored and required for verification and issuance are to be kept for two years after the end of the crediting period or the last issuance of VERs for this project activity, whatever occurs later. For further information on monitoring, see section 3.5.1 of the Gold Standard Project Developer Manual. For more information on the Sustainable Development Assessment and EIA requirements, see sections 3.4.1 and 3.4.2.
PROJECT DESIGN DOCUMENT FORM (GS-VER-PDD) Voluntary Offset Projects - Version 01
page 47
This template shall not be altered. It shall be completed without modifying/adding headings or logo, format or font.
D.1. Name and reference of approved monitoring methodology applied to the project activity: >> FS: self-elaborated (see comments in B.1. for baseline methodology). WM: partly on the self-elaborated FS methodology and partly on AM0036. Please refer to the UNFCCC CDM and Gold Standard web site for the name and reference as well as details of approved methodologies. Any monitoring methodology needs to meet the Gold Standard requirements and this will be subject to validation. If a national or international monitoring standard has to be applied to monitor certain aspects of the project activity, please identify this standard and provide a reference to the source where a detailed description of the standard can be found.
PROJECT DESIGN DOCUMENT FORM (GS-VER-PDD) Voluntary Offset Projects - Version 01
page 48
This template shall not be altered. It shall be completed without modifying/adding headings or logo, format or font.
D.2. Justification of the choice of the methodology and why it is applicable to the project activity: >> see also B.1.1. (Justification of the baseline methodology) FS The proposed monitoring plan is based on the following facts: - The CO2 emission reduction is achieved by fuel switch: the common and baseline defining fuel mix of peat and heavy fuel oil is replaced by biomass. - 100% of the combusted biomass is waste wood and bark from the existing wood products manufacturing plant on site. No additional external biomass has to be
transported to the site. - For the calculation of the baseline emission we propose to proceed from the assumption that the efficiency of the baseline heat generating system is the same as for the
biomass system. Considered that the furnace systems for biomass and peat are comparable (both of grate firing type) and that the efficiency of the existing modern biomass system with economizer is good (compared with international standards), the CO2 emission reduction of the project is probably underestimated (conservative assumption, meaning that the baseline heating system would most likely have had a lower efficiency).
- For the same reason – comparable technologies for baseline and biomass system – the availability of both heat generating systems is assumed to be the same. Thus, the CO2 emissions of the emergency heat generating system (3 x 18 MW vessels with heavy fuel oil) are the same for the baseline and for the project case. The power of the emergency system is 49% of the central heat generating system, insufficient to supply the long term heat demand of the wood products manufacturing plant (just sufficient for some days with lowered level of activity). The CO2-emission of 15 days per year full power heat generating with the emergency system is 1.8% of the calculated CO2 eq. emission reduction. The consequence of a longer failure of the biomass system would be a decreased quantity of combusted (and monitored) biomass and thus a decreased CO2 emission reduction. This means that the CO2 emissions of the emergency system will not have to be monitored. (Rem.: The combusted quantity of heavy oil is nevertheless reported by the company.)
- Compared with the baseline system the electric energy consumption of the biomass system is probably a little higher (due to pressure drops in the flue gas dedusting system). The additional CO2 eq. emission is <0.2% of the calculated CO2 eq. emission reduction and can be ignored.
- The contribution of internal fuel transports and fuel preparation to the CO2 emission of the project is <0.05% of the calculated CO2 eq. emission reduction and can be ignored.
The reduction of GHG emissions by this project is based on a reduction of CO2 emissions. Other greenhouse gases like N2O and CH4 are negligible (<<1% of CO2 emission reduction).
PROJECT DESIGN DOCUMENT FORM (GS-VER-PDD) Voluntary Offset Projects - Version 01
page 49
This template shall not be altered. It shall be completed without modifying/adding headings or logo, format or font.
WM The monitoring plan chosen for the measurement of the CH4 emission reductions attributable to the project activity is based on the CDM methodology AM0036 “Fuel switch from fossil fuels to biomass residues in boilers for heat generation” v. 1.1. The monitoring plan for measuring the CH4 project emissions from biomass combustion and the CH4 baseline emissions from the biomass residues produced in-house, used for heat generation in the project and decaying under anaerobic conditions in the baseline scenario, doesn’t need any additional measures to the existing KCFS monitoring plan. The necessary measurements are for the - baseline CH4 emissions BECH4,SWDS,BF,y: The amount of wood waste derived from production processes and prevented from disposal in year y WBF,y (parID B8BF), which is
identical with the amount of bio-fuels used for heat generation in the same year BFPJ,y (parID P3), already measured by the variable dV of the original KCFS monitoring plan.
- project CH4 emissions PECH4,BF,y: The energy input of the heating system in year y, which consists of the amount of bio-fuels used for the heat production BFPJ,y (parID
P3) measured by the KCFS variable dV and its net calorific value NCV (parID P4) measured by the KCFS variable Hu. Other variables of the series parID P1 – P4 and B1 – B10 (except WRM,y parID B8RM which is explained in the following paragraph) are default values provided by the methodology AM0036. The justification of the right selection of default values (variable default values marked with “m, d” in the parameter tables) is part of the baseline assessment and will be done in the validation process. The absence of additional variables that have to be measured for the calculation of the emission reductions caused by the alternative treatment of in-house wood wastes justifies a retroactive crediting period as explained in section C.2 For the measurement of the ERs caused by the raw material sourcing from third party residues, an additional monitoring parameter has to be introduced: - baseline CH4 emissions BECH4,SWDS,RM,y: Analogous to WBF,y (parID B8BF) which is the amount of in-house wood waste prevented from disposal due to its alternative
usage as bio-fuel in year y, WRM,y (parID B8RM) is the amount of third party wood waste prevented from disposal due to its alternative usage as raw material. WRM,y has to be measured additionally to the KCFS monitoring system being in place. Since WRM,y is already measured according the KronoStar’s procedures for the monitoring of raw material input, it doesn’t prevent the application of a retroactive crediting period. WRM,y isn’t assessed directly. It is calculated from the solid volumes measured at the entrance gate SVj,x (parID B8.1RM), the solid volume to biomass default conversion factors mcfj (parID B8.2RM), and a conservative default water content wc (parID B8.3RM).
The emission reductions attributable to the project activity are calculated by subtracting the project emissions from the baseline emissions wherefore the monitoring option 1 in section D.1.1 “Monitoring of the emissions in the project scenario and the baseline scenario” is chosen. Please justify the choice of methodology by showing that the proposed project activity and the context of the project activity meet the conditions under which the methodology is applicable.
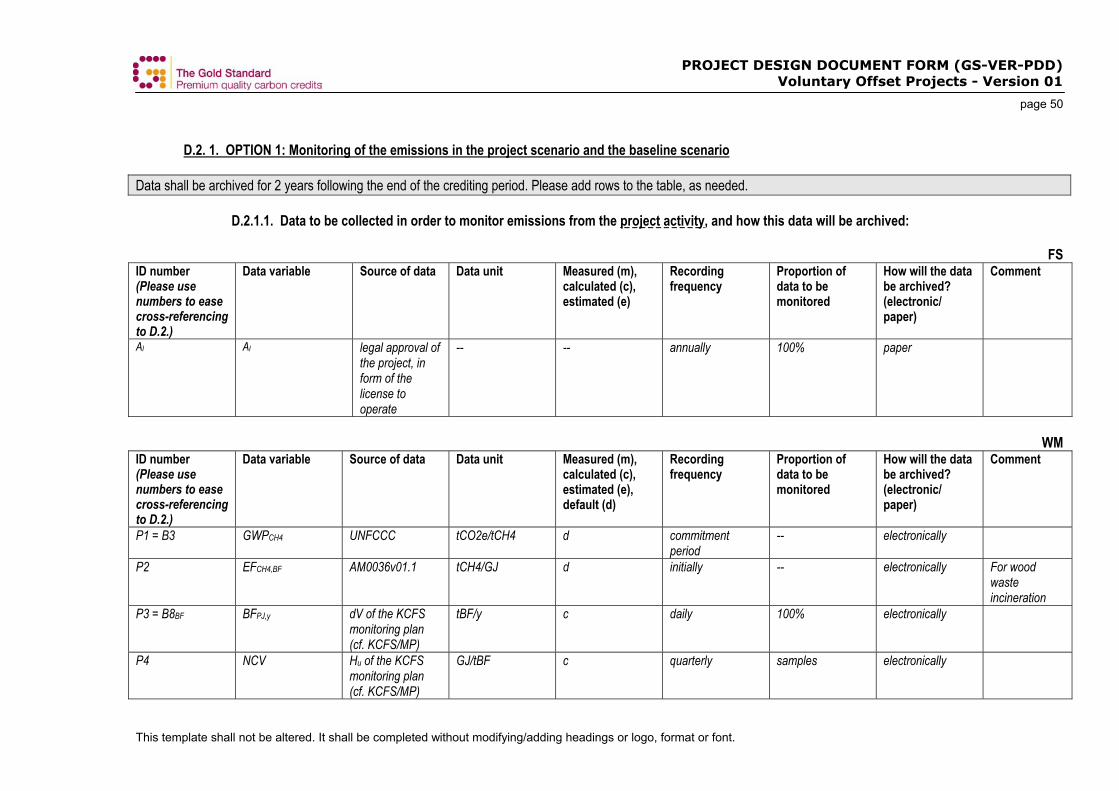
PROJECT DESIGN DOCUMENT FORM (GS-VER-PDD) Voluntary Offset Projects - Version 01
page 50
This template shall not be altered. It shall be completed without modifying/adding headings or logo, format or font.
D.2. 1. OPTION 1: Monitoring of the emissions in the project scenario and the baseline scenario Data shall be archived for 2 years following the end of the crediting period. Please add rows to the table, as needed. D.2.1.1. Data to be collected in order to monitor emissions from the project activity, and how this data will be archived: FS ID number (Please use numbers to ease cross-referencing to D.2.)
Data variable Source of data Data unit Measured (m), calculated (c), estimated (e)
Recording frequency
Proportion of data to be monitored
How will the data be archived? (electronic/ paper)
Comment
Al Al legal approval of the project, in form of the license to operate
-- -- annually 100% paper
WM ID number (Please use numbers to ease cross-referencing to D.2.)
Data variable Source of data Data unit Measured (m), calculated (c), estimated (e), default (d)
Recording frequency
Proportion of data to be monitored
How will the data be archived? (electronic/ paper)
Comment
P1 = B3 GWPCH4 UNFCCC tCO2e/tCH4 d commitment period
-- electronically
P2 EFCH4,BF
AM0036v01.1 tCH4/GJ d initially -- electronically For wood waste incineration
P3 = B8BF BFPJ,y
dV of the KCFS monitoring plan (cf. KCFS/MP)
tBF/y c daily 100% electronically
P4 NCV Hu of the KCFS monitoring plan (cf. KCFS/MP)
GJ/tBF c quarterly samples electronically
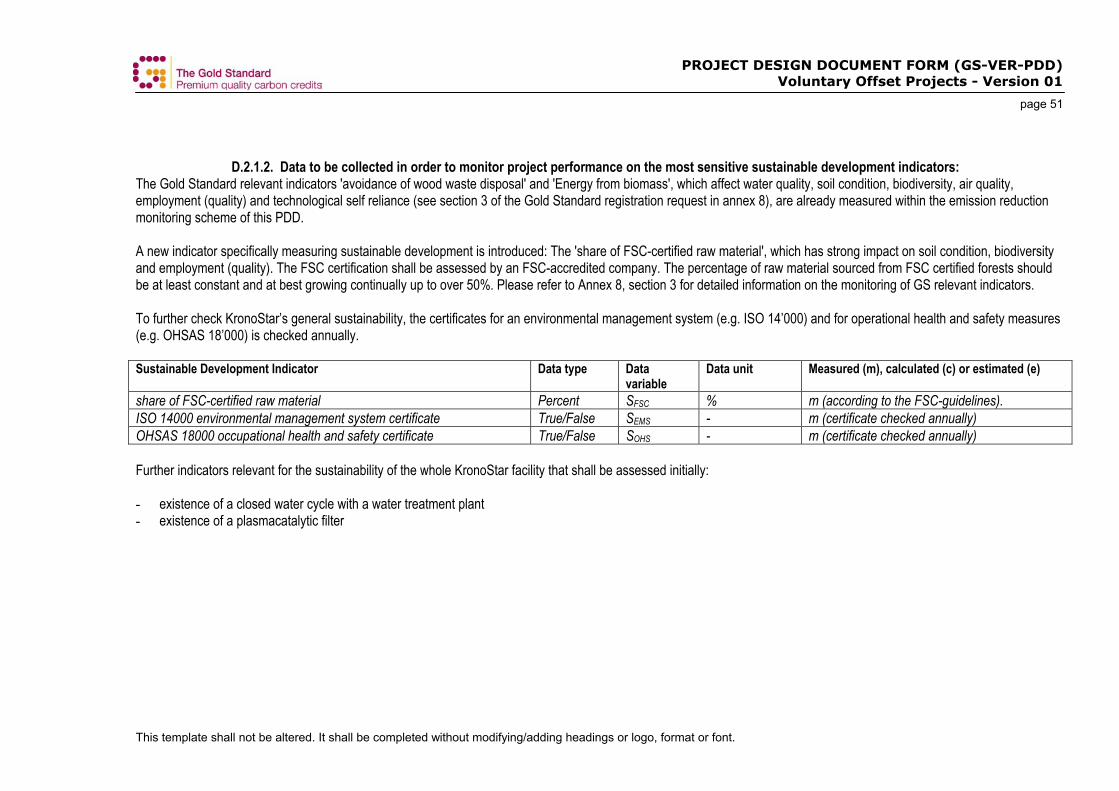
PROJECT DESIGN DOCUMENT FORM (GS-VER-PDD) Voluntary Offset Projects - Version 01
page 51
This template shall not be altered. It shall be completed without modifying/adding headings or logo, format or font.
D.2.1.2. Data to be collected in order to monitor project performance on the most sensitive sustainable development indicators: The Gold Standard relevant indicators 'avoidance of wood waste disposal' and 'Energy from biomass', which affect water quality, soil condition, biodiversity, air quality, employment (quality) and technological self reliance (see section 3 of the Gold Standard registration request in annex 8), are already measured within the emission reduction monitoring scheme of this PDD. A new indicator specifically measuring sustainable development is introduced: The 'share of FSC-certified raw material', which has strong impact on soil condition, biodiversity and employment (quality). The FSC certification shall be assessed by an FSC-accredited company. The percentage of raw material sourced from FSC certified forests should be at least constant and at best growing continually up to over 50%. Please refer to Annex 8, section 3 for detailed information on the monitoring of GS relevant indicators. To further check KronoStar’s general sustainability, the certificates for an environmental management system (e.g. ISO 14’000) and for operational health and safety measures (e.g. OHSAS 18’000) is checked annually. Sustainable Development Indicator Data type Data
variable Data unit Measured (m), calculated (c) or estimated (e)
share of FSC-certified raw material Percent SFSC % m (according to the FSC-guidelines). ISO 14000 environmental management system certificate True/False SEMS - m (certificate checked annually) OHSAS 18000 occupational health and safety certificate True/False SOHS - m (certificate checked annually) Further indicators relevant for the sustainability of the whole KronoStar facility that shall be assessed initially: - existence of a closed water cycle with a water treatment plant - existence of a plasmacatalytic filter
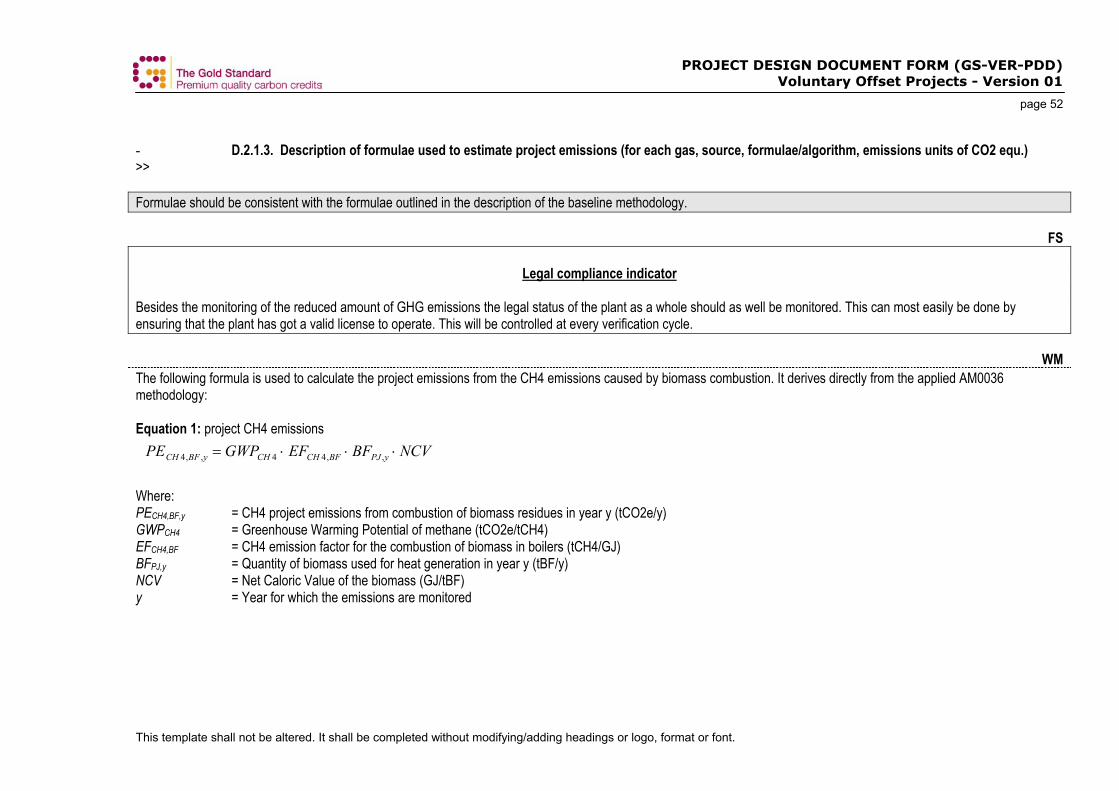
PROJECT DESIGN DOCUMENT FORM (GS-VER-PDD) Voluntary Offset Projects - Version 01
page 52
This template shall not be altered. It shall be completed without modifying/adding headings or logo, format or font.
- D.2.1.3. Description of formulae used to estimate project emissions (for each gas, source, formulae/algorithm, emissions units of CO2 equ.) >> Formulae should be consistent with the formulae outlined in the description of the baseline methodology. FS
Legal compliance indicator Besides the monitoring of the reduced amount of GHG emissions the legal status of the plant as a whole should as well be monitored. This can most easily be done by ensuring that the plant has got a valid license to operate. This will be controlled at every verification cycle. WM The following formula is used to calculate the project emissions from the CH4 emissions caused by biomass combustion. It derives directly from the applied AM0036 methodology: Equation 1: project CH4 emissions
PECH 4,BF ,y = GWPCH 4 ⋅ EFCH 4,BF ⋅ BFPJ ,y ⋅ NCV Where: PECH4,BF,y = CH4 project emissions from combustion of biomass residues in year y (tCO2e/y) GWPCH4 = Greenhouse Warming Potential of methane (tCO2e/tCH4) EFCH4,BF = CH4 emission factor for the combustion of biomass in boilers (tCH4/GJ) BFPJ,y = Quantity of biomass used for heat generation in year y (tBF/y) NCV = Net Caloric Value of the biomass (GJ/tBF) y = Year for which the emissions are monitored
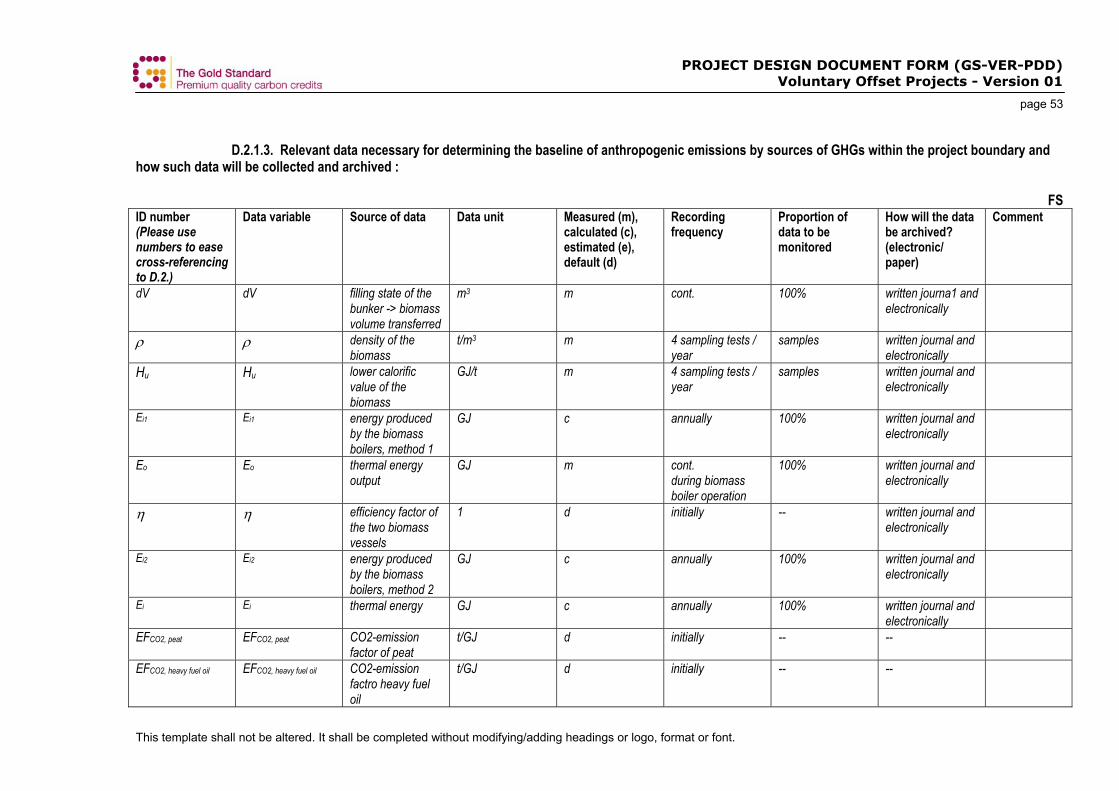
PROJECT DESIGN DOCUMENT FORM (GS-VER-PDD) Voluntary Offset Projects - Version 01
page 53
This template shall not be altered. It shall be completed without modifying/adding headings or logo, format or font.
D.2.1.3. Relevant data necessary for determining the baseline of anthropogenic emissions by sources of GHGs within the project boundary and how such data will be collected and archived : FS ID number (Please use numbers to ease cross-referencing to D.2.)
Data variable Source of data Data unit Measured (m), calculated (c), estimated (e), default (d)
Recording frequency
Proportion of data to be monitored
How will the data be archived? (electronic/ paper)
Comment
dV dV filling state of the bunker -> biomass volume transferred
m3 m cont. 100% written journa1 and electronically
ρ ρ density of the biomass
t/m3 m 4 sampling tests / year
samples written journal and electronically
Hu Hu lower calorific value of the biomass
GJ/t m 4 sampling tests / year
samples written journal and electronically
Ei1 Ei1 energy produced by the biomass boilers, method 1
GJ c annually 100% written journal and electronically
Eo Eo thermal energy output
GJ m cont. during biomass boiler operation
100% written journal and electronically
η η efficiency factor of the two biomass vessels
1 d initially -- written journal and electronically
Ei2 Ei2 energy produced by the biomass boilers, method 2
GJ c annually 100% written journal and electronically
Ei Ei thermal energy GJ c annually 100% written journal and electronically
EFCO2, peat EFCO2, peat CO2-emission factor of peat
t/GJ d initially -- --
EFCO2, heavy fuel oil EFCO2, heavy fuel oil CO2-emission factro heavy fuel oil
t/GJ d initially -- --

PROJECT DESIGN DOCUMENT FORM (GS-VER-PDD) Voluntary Offset Projects - Version 01
page 54
This template shall not be altered. It shall be completed without modifying/adding headings or logo, format or font.
EFCO2, baseline EFCO2, baseline emission factor of 90:10 mass mix of peat and heacy fuel oil
t/GJ c initially -- --
WM ID number (Please use numbers to ease cross-referencing to D.2.)
Data variable Source of data Data unit Measured (m), calculated (c), estimated (e), default (d)
Recording frequency
Proportion of data to be monitored
How will the data be archived? (electronic/ paper)
Comment
B1 φ EB26 A14 no dim d initially -- electronically B2BF fBF Baseline validation no dim m, d initially 100% electronically Baseline: no
CH4 capturing B2RM fRM Baseline validation no dim m, d initially Ca. 10% electronically Baseline: no
CH4 capturing B3 = P1 GWPCH4 UNFCCC tCO2e/tCH4 d commitment period -- electronically B4BF OXBF Baseline validation
and EB26 A14
no dim m, d initially 100% electronically Baseline: no management
B4RM OXRM Baseline validation and EB26 A14
no dim m, d initially Ca. 10% electronically Baseline: no management
B5 F EB26 A14 no dim d initially -- electronically B6 DOCf EB26 A14 no dim d initially -- electronically B7BF MCFBF Baseline validation
and EB26 A14
no dim m, d initially 100% electronically Baseline:SWDS with more than 5 m thickness
B7RM MCFRM Baseline validation and EB26 A14
no dim m, d initially Ca. 10% electronically Baseline:SWDS with less than 5 m thickness
B8BF = P3 WBF,x KCFS MR (cf. KCFS/MP)
tBF/y c continuous 100% electronically
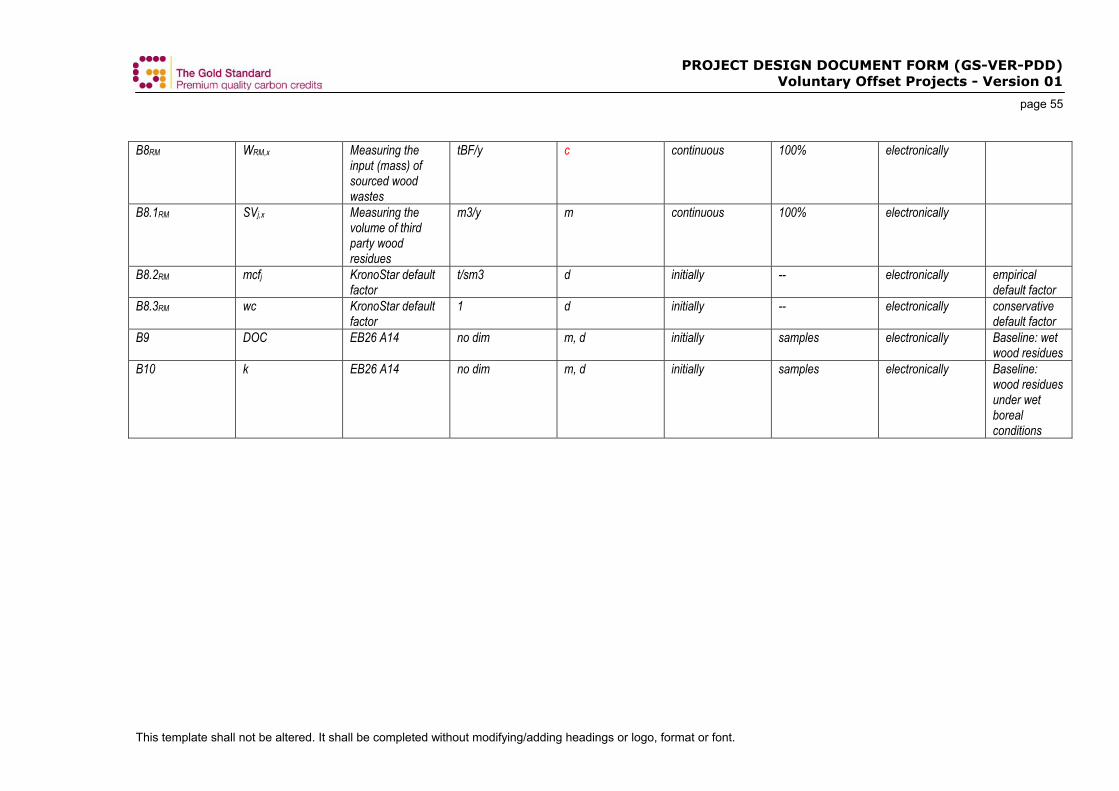
PROJECT DESIGN DOCUMENT FORM (GS-VER-PDD) Voluntary Offset Projects - Version 01
page 55
This template shall not be altered. It shall be completed without modifying/adding headings or logo, format or font.
B8RM WRM,x Measuring the input (mass) of sourced wood wastes
tBF/y c continuous 100% electronically
B8.1RM SVj,x Measuring the volume of third party wood residues
m3/y m continuous 100% electronically
B8.2RM mcfj KronoStar default factor
t/sm3 d initially -- electronically empirical default factor
B8.3RM wc KronoStar default factor
1 d initially -- electronically conservative default factor
B9 DOC EB26 A14 no dim m, d initially samples electronically Baseline: wet wood residues
B10 k EB26 A14 no dim m, d initially samples electronically Baseline: wood residues under wet boreal conditions
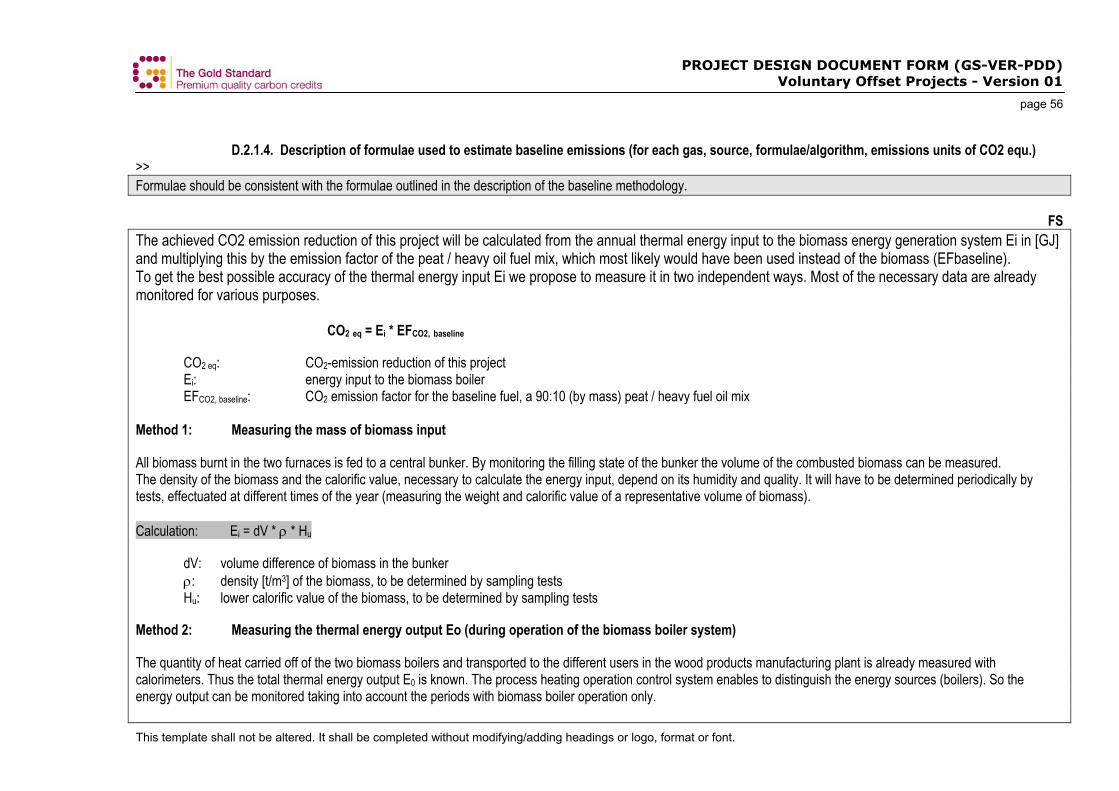
PROJECT DESIGN DOCUMENT FORM (GS-VER-PDD) Voluntary Offset Projects - Version 01
page 56
This template shall not be altered. It shall be completed without modifying/adding headings or logo, format or font.
D.2.1.4. Description of formulae used to estimate baseline emissions (for each gas, source, formulae/algorithm, emissions units of CO2 equ.) >> Formulae should be consistent with the formulae outlined in the description of the baseline methodology. FS The achieved CO2 emission reduction of this project will be calculated from the annual thermal energy input to the biomass energy generation system Ei in [GJ] and multiplying this by the emission factor of the peat / heavy oil fuel mix, which most likely would have been used instead of the biomass (EFbaseline). To get the best possible accuracy of the thermal energy input Ei we propose to measure it in two independent ways. Most of the necessary data are already monitored for various purposes. CO2 eq = Ei * EFCO2, baseline CO2 eq: CO2-emission reduction of this project Ei: energy input to the biomass boiler EFCO2, baseline: CO2 emission factor for the baseline fuel, a 90:10 (by mass) peat / heavy fuel oil mix Method 1: Measuring the mass of biomass input
All biomass burnt in the two furnaces is fed to a central bunker. By monitoring the filling state of the bunker the volume of the combusted biomass can be measured. The density of the biomass and the calorific value, necessary to calculate the energy input, depend on its humidity and quality. It will have to be determined periodically by tests, effectuated at different times of the year (measuring the weight and calorific value of a representative volume of biomass). Calculation: Ei = dV * ρ * Hu dV: volume difference of biomass in the bunker ρ: density [t/m3] of the biomass, to be determined by sampling tests Hu: lower calorific value of the biomass, to be determined by sampling tests Method 2: Measuring the thermal energy output Eo (during operation of the biomass boiler system)
The quantity of heat carried off of the two biomass boilers and transported to the different users in the wood products manufacturing plant is already measured with calorimeters. Thus the total thermal energy output E0 is known. The process heating operation control system enables to distinguish the energy sources (boilers). So the energy output can be monitored taking into account the periods with biomass boiler operation only.
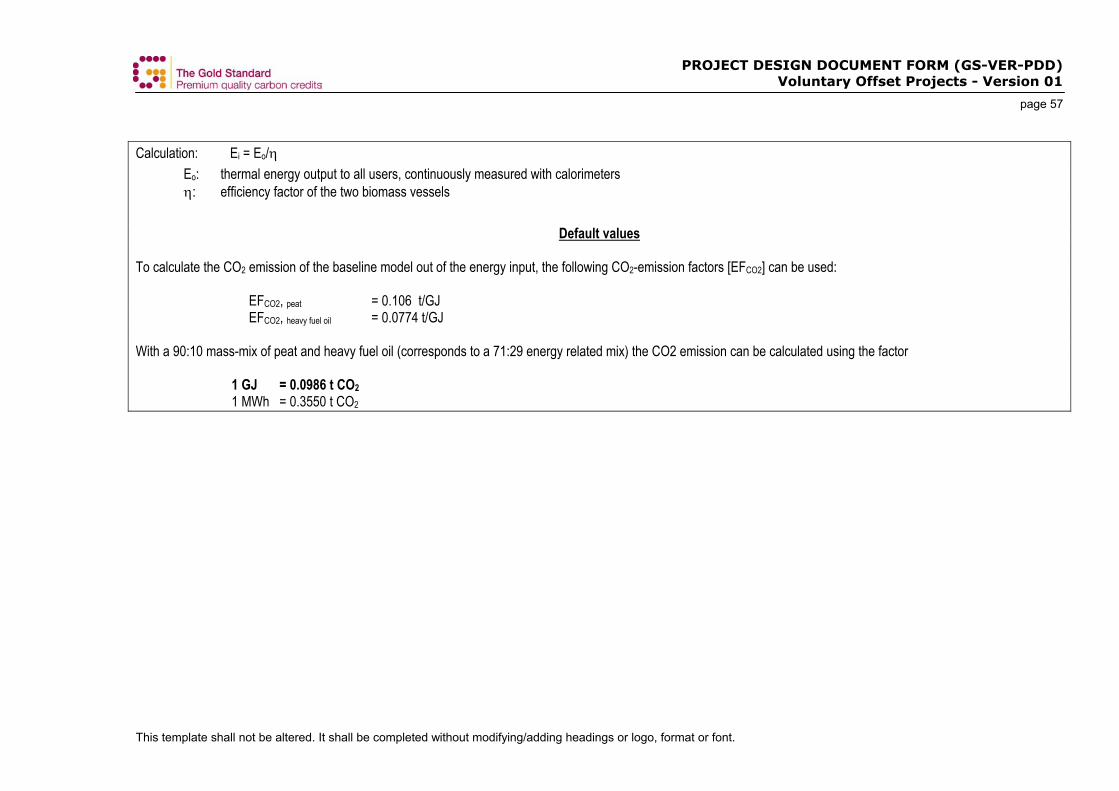
PROJECT DESIGN DOCUMENT FORM (GS-VER-PDD) Voluntary Offset Projects - Version 01
page 57
This template shall not be altered. It shall be completed without modifying/adding headings or logo, format or font.
Calculation: Ei = Eo/η Eo: thermal energy output to all users, continuously measured with calorimeters η: efficiency factor of the two biomass vessels
Default values To calculate the CO2 emission of the baseline model out of the energy input, the following CO2-emission factors [EFCO2] can be used: EFCO2, peat = 0.106 t/GJ EFCO2, heavy fuel oil = 0.0774 t/GJ With a 90:10 mass-mix of peat and heavy fuel oil (corresponds to a 71:29 energy related mix) the CO2 emission can be calculated using the factor 1 GJ = 0.0986 t CO2 1 MWh = 0.3550 t CO2
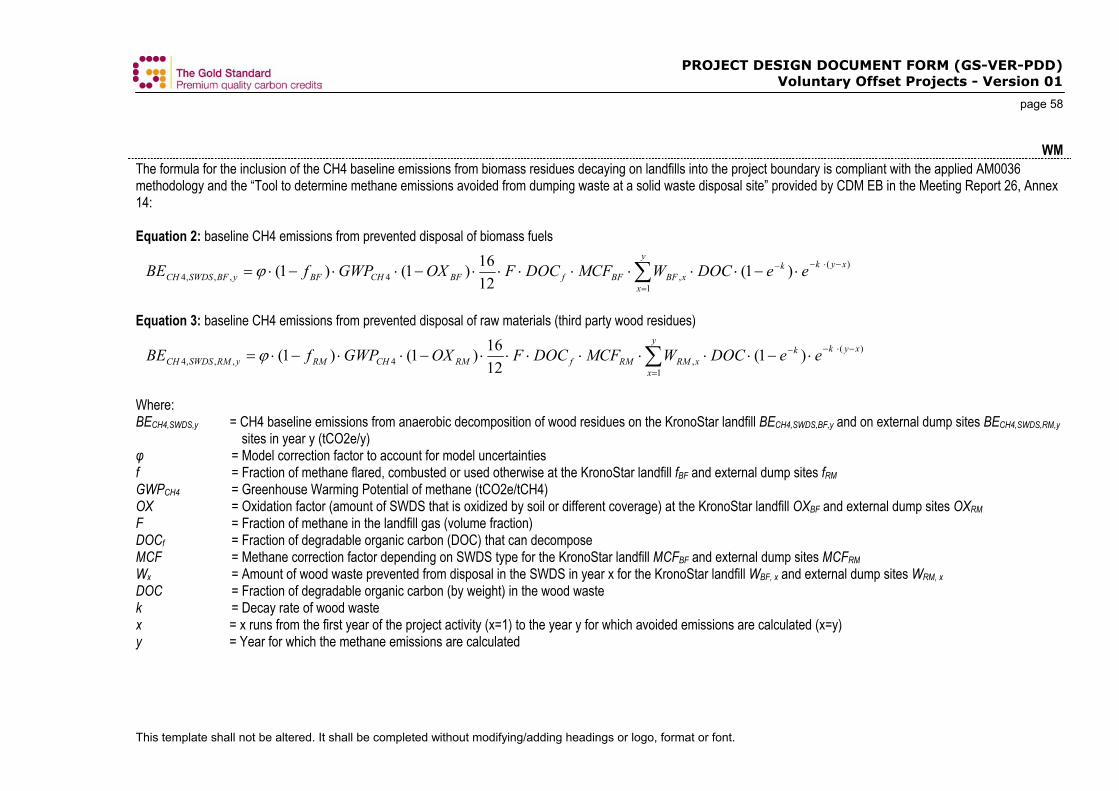
PROJECT DESIGN DOCUMENT FORM (GS-VER-PDD) Voluntary Offset Projects - Version 01
page 58
This template shall not be altered. It shall be completed without modifying/adding headings or logo, format or font.
WM The formula for the inclusion of the CH4 baseline emissions from biomass residues decaying on landfills into the project boundary is compliant with the applied AM0036 methodology and the “Tool to determine methane emissions avoided from dumping waste at a solid waste disposal site” provided by CDM EB in the Meeting Report 26, Annex 14: Equation 2: baseline CH4 emissions from prevented disposal of biomass fuels
)(
1,4,,,4 )1(
1216)1()1( xykk
y
xxBFBFfBFCHBFyBFSWDSCH eeDOCWMCFDOCFOXGWPfBE −⋅−−
=
⋅−⋅⋅⋅⋅⋅⋅⋅−⋅⋅−⋅= ∑ϕ
Equation 3: baseline CH4 emissions from prevented disposal of raw materials (third party wood residues)
)(
1,4,,,4 )1(
1216)1()1( xykk
y
xxRMRMfRMCHRMyRMSWDSCH eeDOCWMCFDOCFOXGWPfBE −⋅−−
=
⋅−⋅⋅⋅⋅⋅⋅⋅−⋅⋅−⋅= ∑ϕ
Where: BECH4,SWDS,y = CH4 baseline emissions from anaerobic decomposition of wood residues on the KronoStar landfill BECH4,SWDS,BF,y and on external dump sites BECH4,SWDS,RM,y
sites in year y (tCO2e/y) φ = Model correction factor to account for model uncertainties f = Fraction of methane flared, combusted or used otherwise at the KronoStar landfill fBF and external dump sites fRM GWPCH4 = Greenhouse Warming Potential of methane (tCO2e/tCH4) OX = Oxidation factor (amount of SWDS that is oxidized by soil or different coverage) at the KronoStar landfill OXBF and external dump sites OXRM F = Fraction of methane in the landfill gas (volume fraction) DOCf = Fraction of degradable organic carbon (DOC) that can decompose MCF = Methane correction factor depending on SWDS type for the KronoStar landfill MCFBF and external dump sites MCFRM Wx = Amount of wood waste prevented from disposal in the SWDS in year x for the KronoStar landfill WBF, x and external dump sites WRM, x DOC = Fraction of degradable organic carbon (by weight) in the wood waste k = Decay rate of wood waste x = x runs from the first year of the project activity (x=1) to the year y for which avoided emissions are calculated (x=y) y = Year for which the methane emissions are calculated
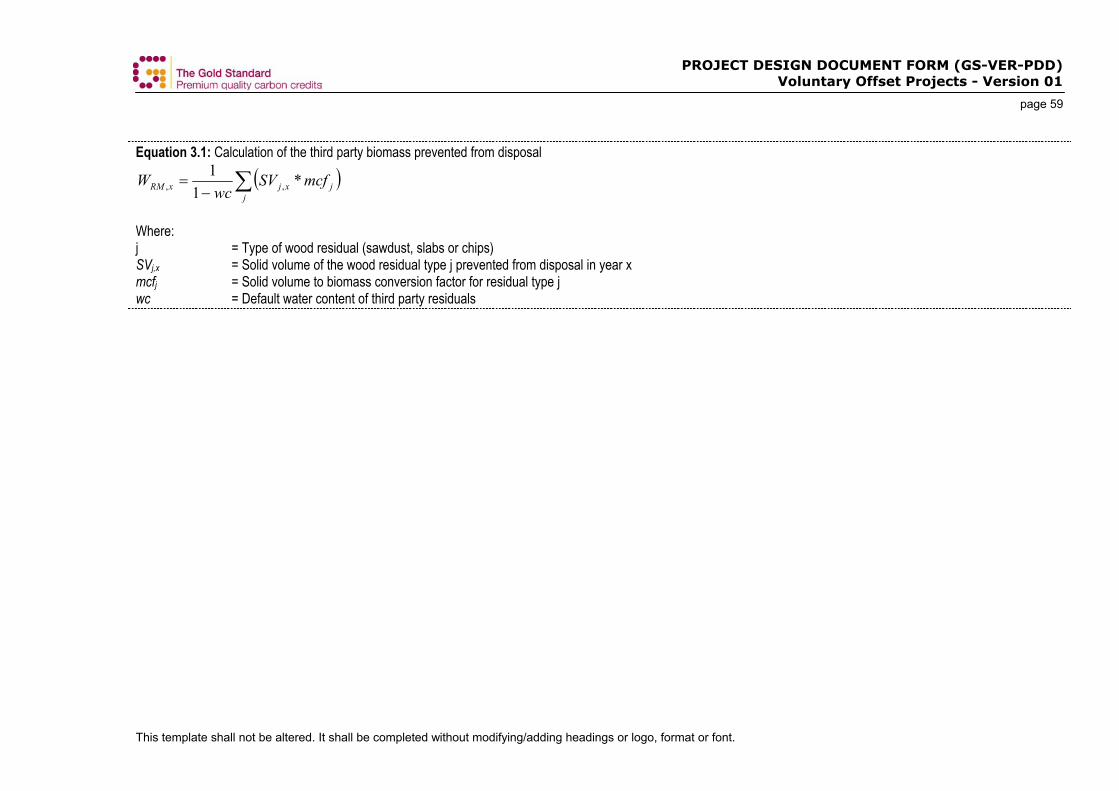
PROJECT DESIGN DOCUMENT FORM (GS-VER-PDD) Voluntary Offset Projects - Version 01
page 59
This template shall not be altered. It shall be completed without modifying/adding headings or logo, format or font.
Equation 3.1: Calculation of the third party biomass prevented from disposal
( )∑−=
jjxjxRM mcfSV
wcW *
11
,,
Where: j = Type of wood residual (sawdust, slabs or chips) SVj,x = Solid volume of the wood residual type j prevented from disposal in year x mcfj = Solid volume to biomass conversion factor for residual type j wc = Default water content of third party residuals
PROJECT DESIGN DOCUMENT FORM (GS-VER-PDD) Voluntary Offset Projects - Version 01
page 60
This template shall not be altered. It shall be completed without modifying/adding headings or logo, format or font.
D. 2.2. OPTION 2: Direct monitoring of emission reductions from the project activity (values should be consistent with those in section E). n/a D.2.2.1. Data to be collected in order to monitor emissions from the project activity, and how this data will be archived: n/a D.2.2.2. Description of formulae used to calculate project emissions (for each gas, source, formulae/algorithm, emissions units of CO2 equ.): >> Formulae should be consistent with the formulae outlined in the description of the baseline methodology. n/a
PROJECT DESIGN DOCUMENT FORM (GS-VER-PDD) Voluntary Offset Projects - Version 01
page 61
This template shall not be altered. It shall be completed without modifying/adding headings or logo, format or font.
D.2.3. Treatment of leakage in the monitoring plan Monitored data shall be archived for 2 years following the end of the crediting period. Please add rows to the table below, as needed. FS Before the installation of a biomass heating system the wood waste were simply discharged in the forest. In this case, an unknown amount of CH4 due to partly anaerobic decay of the biomass was emitted. However, the calculation of the project’s GHG emission reduction does not take into account indirect emissions / emission reductions (see baseline study). All relevant and possible leakage effects being positive, the calculation can be considered to be conservative. No other leakage issues are expected. Thus there is no need for a leakage indicator
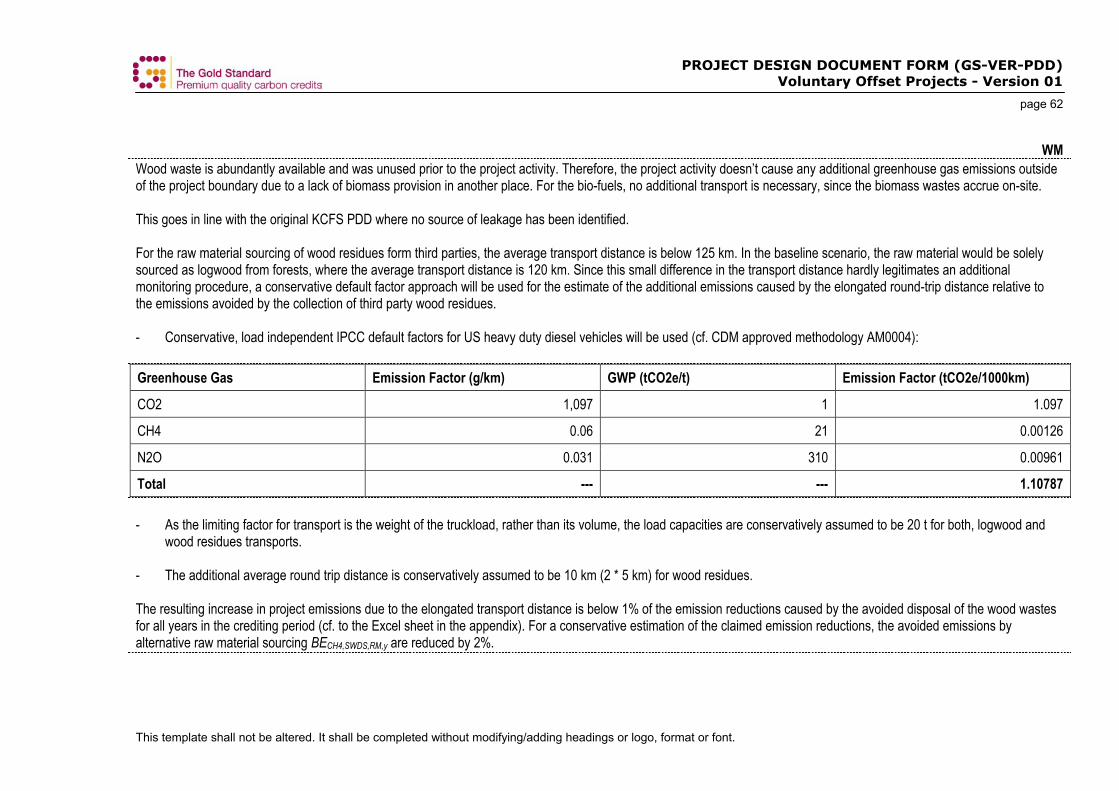
PROJECT DESIGN DOCUMENT FORM (GS-VER-PDD) Voluntary Offset Projects - Version 01
page 62
This template shall not be altered. It shall be completed without modifying/adding headings or logo, format or font.
WM Wood waste is abundantly available and was unused prior to the project activity. Therefore, the project activity doesn’t cause any additional greenhouse gas emissions outside of the project boundary due to a lack of biomass provision in another place. For the bio-fuels, no additional transport is necessary, since the biomass wastes accrue on-site. This goes in line with the original KCFS PDD where no source of leakage has been identified. For the raw material sourcing of wood residues form third parties, the average transport distance is below 125 km. In the baseline scenario, the raw material would be solely sourced as logwood from forests, where the average transport distance is 120 km. Since this small difference in the transport distance hardly legitimates an additional monitoring procedure, a conservative default factor approach will be used for the estimate of the additional emissions caused by the elongated round-trip distance relative to the emissions avoided by the collection of third party wood residues. - Conservative, load independent IPCC default factors for US heavy duty diesel vehicles will be used (cf. CDM approved methodology AM0004): Greenhouse Gas Emission Factor (g/km) GWP (tCO2e/t) Emission Factor (tCO2e/1000km)
CO2 1,097 1 1.097
CH4 0.06 21 0.00126
N2O 0.031 310 0.00961
Total --- --- 1.10787 - As the limiting factor for transport is the weight of the truckload, rather than its volume, the load capacities are conservatively assumed to be 20 t for both, logwood and
wood residues transports. - The additional average round trip distance is conservatively assumed to be 10 km (2 * 5 km) for wood residues. The resulting increase in project emissions due to the elongated transport distance is below 1% of the emission reductions caused by the avoided disposal of the wood wastes for all years in the crediting period (cf. to the Excel sheet in the appendix). For a conservative estimation of the claimed emission reductions, the avoided emissions by alternative raw material sourcing BECH4,SWDS,RM,y are reduced by 2%.
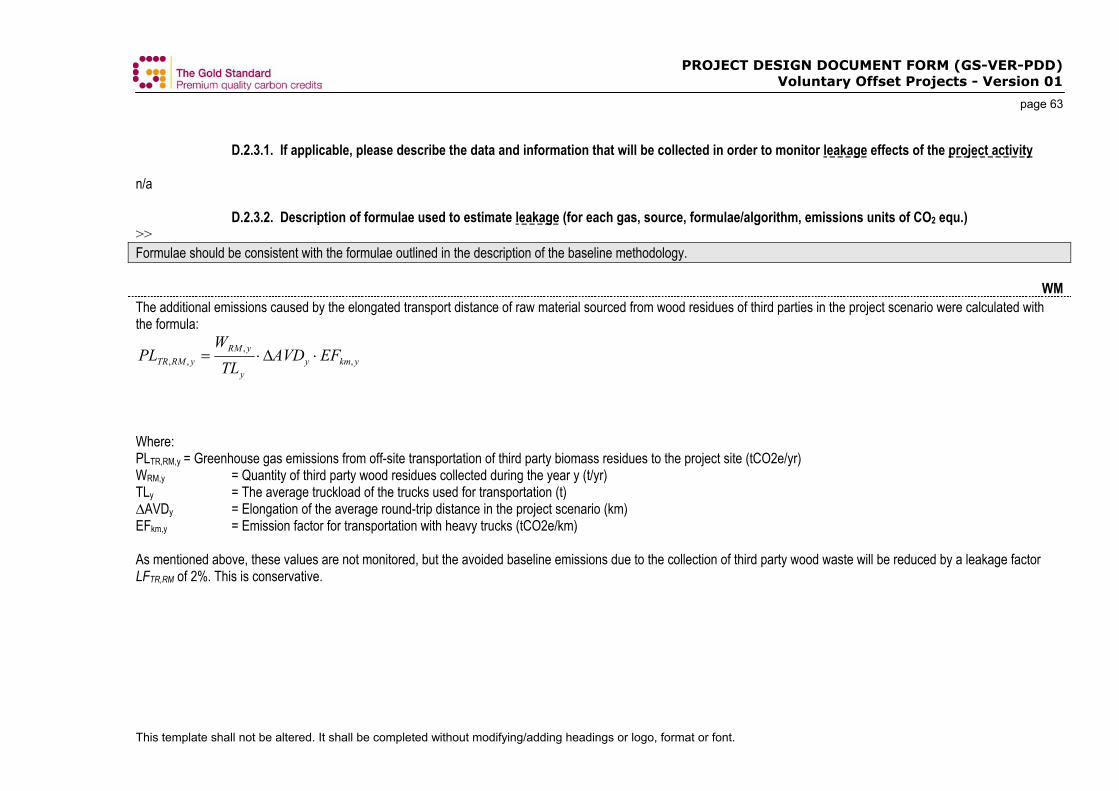
PROJECT DESIGN DOCUMENT FORM (GS-VER-PDD) Voluntary Offset Projects - Version 01
page 63
This template shall not be altered. It shall be completed without modifying/adding headings or logo, format or font.
D.2.3.1. If applicable, please describe the data and information that will be collected in order to monitor leakage effects of the project activity n/a D.2.3.2. Description of formulae used to estimate leakage (for each gas, source, formulae/algorithm, emissions units of CO2 equ.) >> Formulae should be consistent with the formulae outlined in the description of the baseline methodology. WM The additional emissions caused by the elongated transport distance of raw material sourced from wood residues of third parties in the project scenario were calculated with the formula:
ykmyy
yRMyRMTR EFAVD
TLW
PL ,,
,, ⋅∆⋅=
Where: PLTR,RM,y = Greenhouse gas emissions from off-site transportation of third party biomass residues to the project site (tCO2e/yr) WRM,y = Quantity of third party wood residues collected during the year y (t/yr) TLy = The average truckload of the trucks used for transportation (t) ∆AVDy = Elongation of the average round-trip distance in the project scenario (km) EFkm,y = Emission factor for transportation with heavy trucks (tCO2e/km) As mentioned above, these values are not monitored, but the avoided baseline emissions due to the collection of third party wood waste will be reduced by a leakage factor LFTR,RM of 2%. This is conservative.
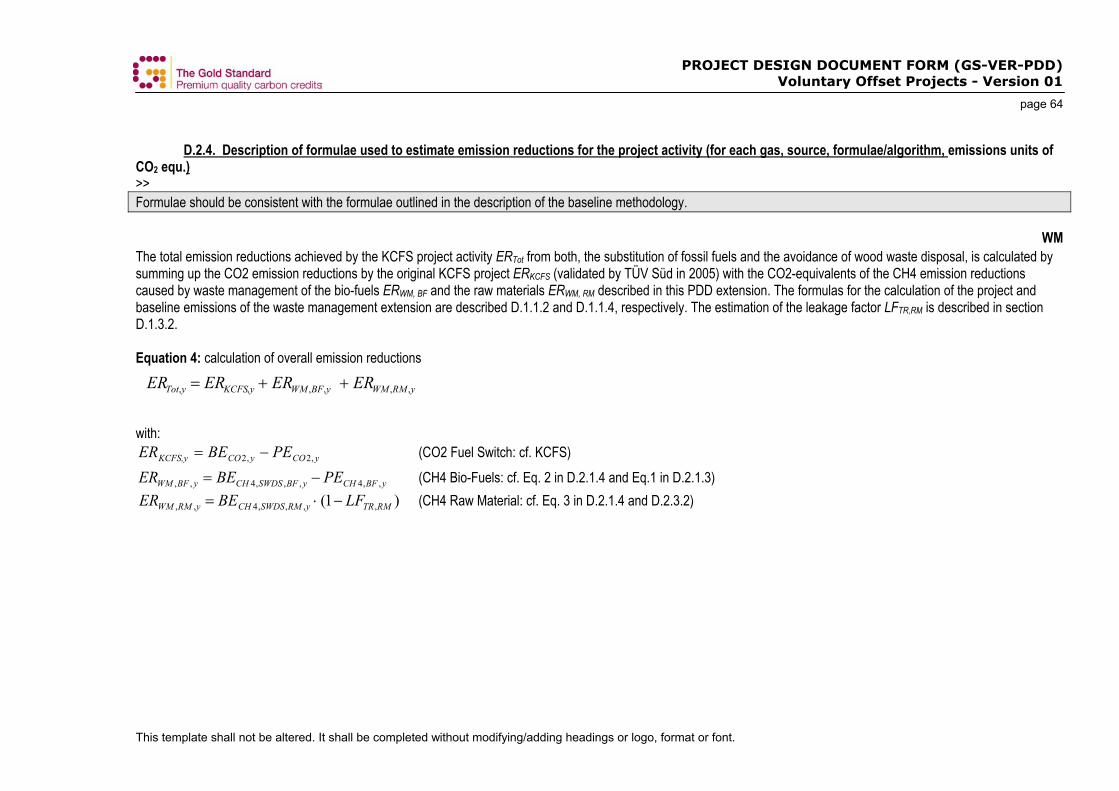
PROJECT DESIGN DOCUMENT FORM (GS-VER-PDD) Voluntary Offset Projects - Version 01
page 64
This template shall not be altered. It shall be completed without modifying/adding headings or logo, format or font.
D.2.4. Description of formulae used to estimate emission reductions for the project activity (for each gas, source, formulae/algorithm, emissions units of CO2 equ.) >> Formulae should be consistent with the formulae outlined in the description of the baseline methodology. WM The total emission reductions achieved by the KCFS project activity ERTot from both, the substitution of fossil fuels and the avoidance of wood waste disposal, is calculated by summing up the CO2 emission reductions by the original KCFS project ERKCFS (validated by TÜV Süd in 2005) with the CO2-equivalents of the CH4 emission reductions caused by waste management of the bio-fuels ERWM, BF and the raw materials ERWM, RM described in this PDD extension. The formulas for the calculation of the project and baseline emissions of the waste management extension are described D.1.1.2 and D.1.1.4, respectively. The estimation of the leakage factor LFTR,RM is described in section D.1.3.2. Equation 4: calculation of overall emission reductions
ERTot,y = ERKCFS,y + ERWM ,BF,y + ERWM ,RM ,y with:
yCOyCOKCFS,y PEBEER ,2,2 −= (CO2 Fuel Switch: cf. KCFS)
yBFCHyBFSWDSCHyBFWM PEBEER ,,4,,,4,, −= (CH4 Bio-Fuels: cf. Eq. 2 in D.2.1.4 and Eq.1 in D.2.1.3) ERWM ,RM ,y = BECH 4,SWDS,RM ,y ⋅ (1− LFTR ,RM ) (CH4 Raw Material: cf. Eq. 3 in D.2.1.4 and D.2.3.2)
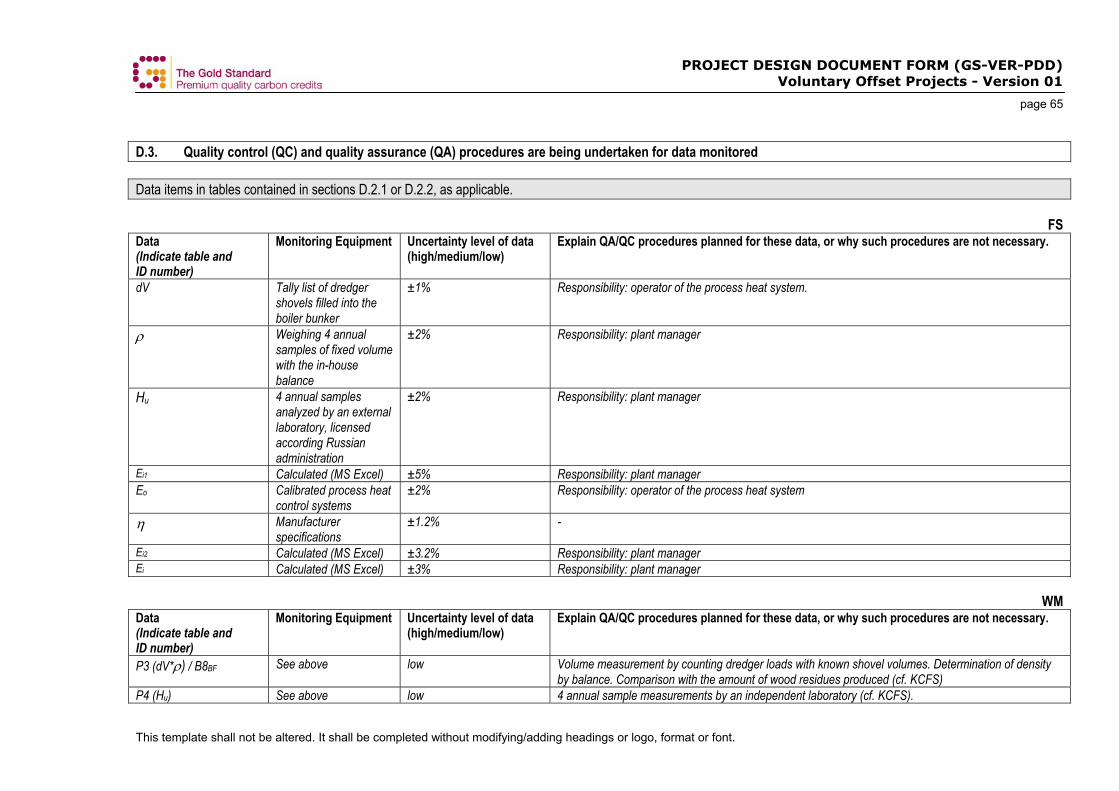
PROJECT DESIGN DOCUMENT FORM (GS-VER-PDD) Voluntary Offset Projects - Version 01
page 65
This template shall not be altered. It shall be completed without modifying/adding headings or logo, format or font.
D.3. Quality control (QC) and quality assurance (QA) procedures are being undertaken for data monitored Data items in tables contained in sections D.2.1 or D.2.2, as applicable. FS Data (Indicate table and ID number)
Monitoring Equipment Uncertainty level of data (high/medium/low)
Explain QA/QC procedures planned for these data, or why such procedures are not necessary.
dV Tally list of dredger shovels filled into the boiler bunker
±1% Responsibility: operator of the process heat system.
ρ Weighing 4 annual samples of fixed volume with the in-house balance
±2% Responsibility: plant manager
Hu 4 annual samples analyzed by an external laboratory, licensed according Russian administration
±2% Responsibility: plant manager
Ei1 Calculated (MS Excel) ±5% Responsibility: plant manager Eo Calibrated process heat
control systems ±2% Responsibility: operator of the process heat system
η Manufacturer specifications
±1.2% -
Ei2 Calculated (MS Excel) ±3.2% Responsibility: plant manager Ei Calculated (MS Excel) ±3% Responsibility: plant manager WM Data (Indicate table and ID number)
Monitoring Equipment Uncertainty level of data (high/medium/low)
Explain QA/QC procedures planned for these data, or why such procedures are not necessary.
P3 (dV*ρ) / B8BF See above low Volume measurement by counting dredger loads with known shovel volumes. Determination of density by balance. Comparison with the amount of wood residues produced (cf. KCFS)
P4 (Hu) See above low 4 annual sample measurements by an independent laboratory (cf. KCFS).
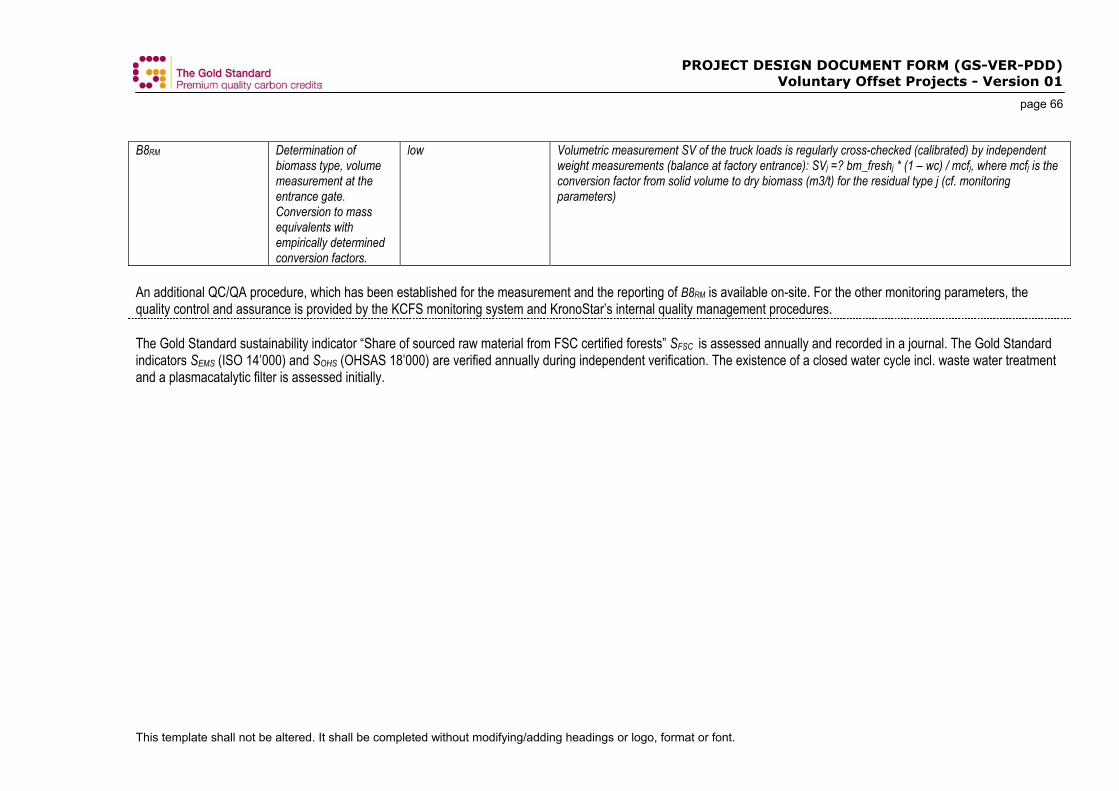
PROJECT DESIGN DOCUMENT FORM (GS-VER-PDD) Voluntary Offset Projects - Version 01
page 66
This template shall not be altered. It shall be completed without modifying/adding headings or logo, format or font.
B8RM Determination of biomass type, volume measurement at the entrance gate. Conversion to mass equivalents with empirically determined conversion factors.
low Volumetric measurement SV of the truck loads is regularly cross-checked (calibrated) by independent weight measurements (balance at factory entrance): SVj =? bm_freshj * (1 – wc) / mcfj, where mcfj is the conversion factor from solid volume to dry biomass (m3/t) for the residual type j (cf. monitoring parameters)
An additional QC/QA procedure, which has been established for the measurement and the reporting of B8RM is available on-site. For the other monitoring parameters, the quality control and assurance is provided by the KCFS monitoring system and KronoStar’s internal quality management procedures. The Gold Standard sustainability indicator “Share of sourced raw material from FSC certified forests” SFSC is assessed annually and recorded in a journal. The Gold Standard indicators SEMS (ISO 14’000) and SOHS (OHSAS 18’000) are verified annually during independent verification. The existence of a closed water cycle incl. waste water treatment and a plasmacatalytic filter is assessed initially.
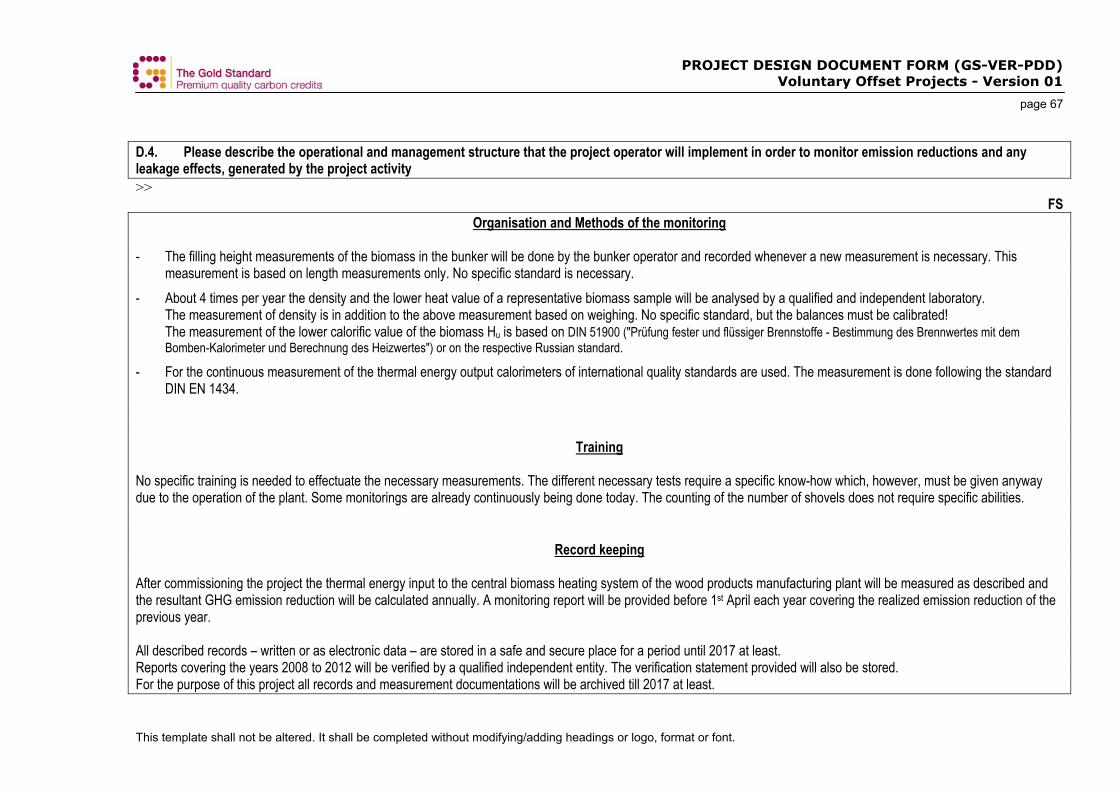
PROJECT DESIGN DOCUMENT FORM (GS-VER-PDD) Voluntary Offset Projects - Version 01
page 67
This template shall not be altered. It shall be completed without modifying/adding headings or logo, format or font.
D.4. Please describe the operational and management structure that the project operator will implement in order to monitor emission reductions and any leakage effects, generated by the project activity >> FS
Organisation and Methods of the monitoring - The filling height measurements of the biomass in the bunker will be done by the bunker operator and recorded whenever a new measurement is necessary. This
measurement is based on length measurements only. No specific standard is necessary. - About 4 times per year the density and the lower heat value of a representative biomass sample will be analysed by a qualified and independent laboratory.
The measurement of density is in addition to the above measurement based on weighing. No specific standard, but the balances must be calibrated! The measurement of the lower calorific value of the biomass Hu is based on DIN 51900 ("Prüfung fester und flüssiger Brennstoffe - Bestimmung des Brennwertes mit dem Bomben-Kalorimeter und Berechnung des Heizwertes") or on the respective Russian standard.
- For the continuous measurement of the thermal energy output calorimeters of international quality standards are used. The measurement is done following the standard DIN EN 1434.
Training No specific training is needed to effectuate the necessary measurements. The different necessary tests require a specific know-how which, however, must be given anyway due to the operation of the plant. Some monitorings are already continuously being done today. The counting of the number of shovels does not require specific abilities.
Record keeping After commissioning the project the thermal energy input to the central biomass heating system of the wood products manufacturing plant will be measured as described and the resultant GHG emission reduction will be calculated annually. A monitoring report will be provided before 1st April each year covering the realized emission reduction of the previous year. All described records – written or as electronic data – are stored in a safe and secure place for a period until 2017 at least. Reports covering the years 2008 to 2012 will be verified by a qualified independent entity. The verification statement provided will also be stored. For the purpose of this project all records and measurement documentations will be archived till 2017 at least.
PROJECT DESIGN DOCUMENT FORM (GS-VER-PDD) Voluntary Offset Projects - Version 01
page 68
This template shall not be altered. It shall be completed without modifying/adding headings or logo, format or font.
WM The technical coordinator and responsible person for the on-site monitoring system is Mr. Alexander Pottgiesser. The heads of the overall energy system, the process heat system and the wood yard are responsible for the implementation of the measurement as well as the quality control and assurance procedures. QC/QA procedures for the monitoring parameters for are available on-site. c4c ltd. is responsible for the composition of the monitoring report. The technical coordinator is supported by the quality and environmental management office to assure quality.
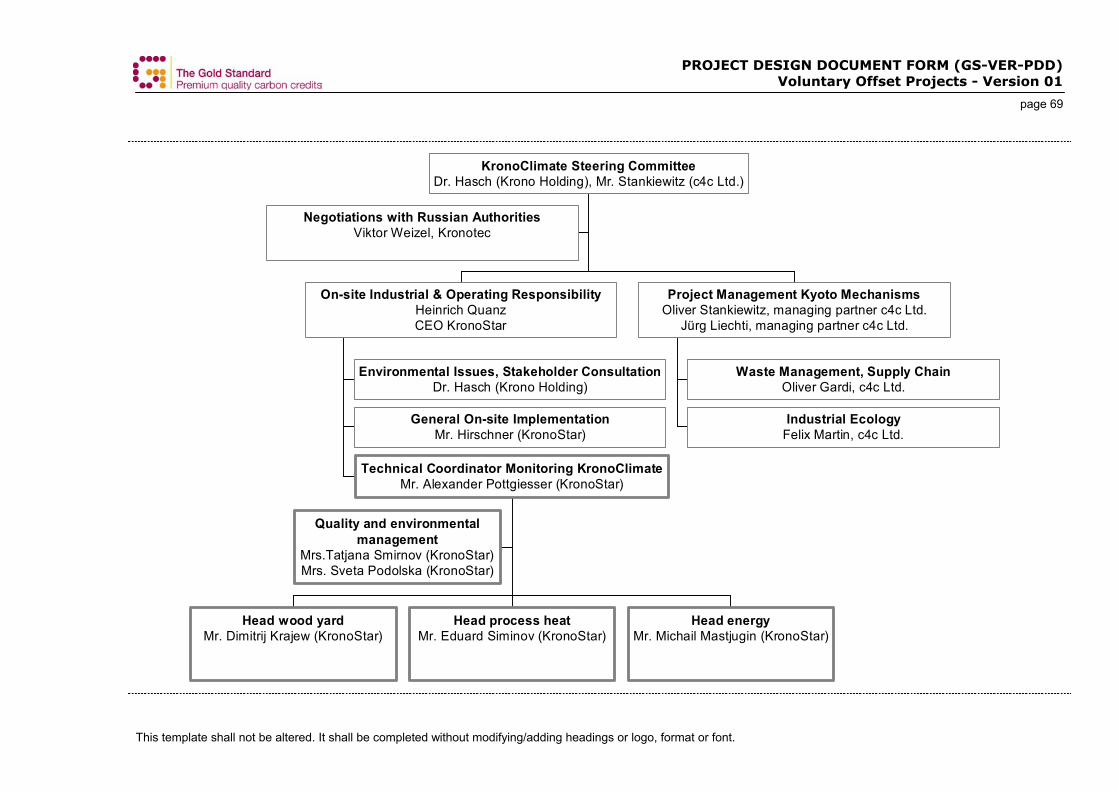
PROJECT DESIGN DOCUMENT FORM (GS-VER-PDD) Voluntary Offset Projects - Version 01
page 69
This template shall not be altered. It shall be completed without modifying/adding headings or logo, format or font.
Negotiations with Russian AuthoritiesViktor Weizel, Kronotec
Environmental Issues, Stakeholder ConsultationDr. Hasch (Krono Holding)
General On-site ImplementationMr. Hirschner (KronoStar)
Quality and environmentalmanagement
Mrs.Tatjana Smirnov (KronoStar)Mrs. Sveta Podolska (KronoStar)
Head wood yardMr. Dimitrij Krajew (KronoStar)
Head process heatMr. Eduard Siminov (KronoStar)
Head energyMr. Michail Mastjugin (KronoStar)
Technical Coordinator Monitoring KronoClimateMr. Alexander Pottgiesser (KronoStar)
On-site Industrial & Operating ResponsibilityHeinrich QuanzCEO KronoStar
Waste Management, Supply ChainOliver Gardi, c4c Ltd.
Industrial EcologyFelix Martin, c4c Ltd.
Project Management Kyoto MechanismsOliver Stankiewitz, managing partner c4c Ltd.
Jürg Liechti, managing partner c4c Ltd.
KronoClimate Steering CommitteeDr. Hasch (Krono Holding), Mr. Stankiewitz (c4c Ltd.)
PROJECT DESIGN DOCUMENT FORM (GS-VER-PDD) Voluntary Offset Projects - Version 01
page 70
This template shall not be altered. It shall be completed without modifying/adding headings or logo, format or font.
D.5 Name of person/entity determining the monitoring methodology: >> Please provide contact information and indicate if the person/entity is also a project participant listed in Annex 1 of this document. The KCFS monitoring plan, as well as the MP for the waste management extension described in this document was established by c4c ltd, in cooperation with the technical staff of the Krono Holding (Mr. R. Stadelmann and A. Pottgiesser, KronoTec). The persons responsible for the formulation of the waste management monitoring plan described in this document are Mr. O. Stankiewitz (Project Manager KronoClimate) and Mr. O. Gardi (Project Developer KronoClimate Waste Management) of c4c ltd. For contact details please refer to annex I.
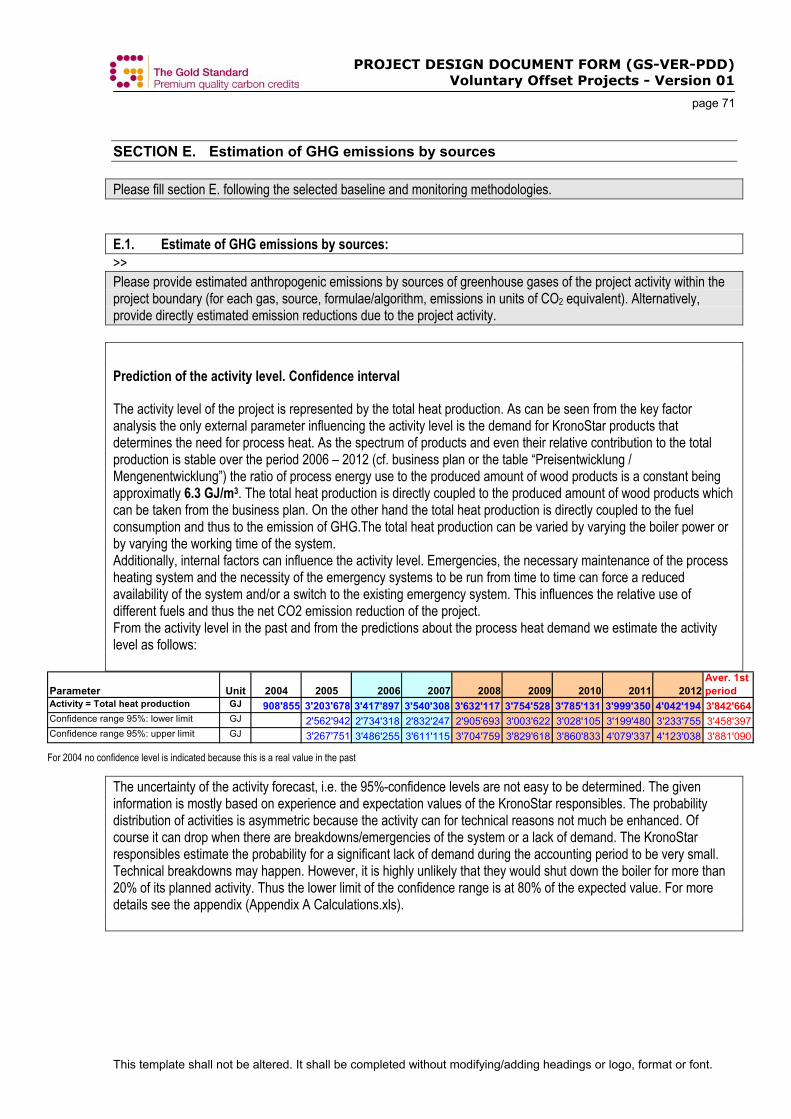
PROJECT DESIGN DOCUMENT FORM (GS-VER-PDD) Voluntary Offset Projects - Version 01
page 71
This template shall not be altered. It shall be completed without modifying/adding headings or logo, format or font.
SECTION E. Estimation of GHG emissions by sources Please fill section E. following the selected baseline and monitoring methodologies. E.1. Estimate of GHG emissions by sources: >> Please provide estimated anthropogenic emissions by sources of greenhouse gases of the project activity within the project boundary (for each gas, source, formulae/algorithm, emissions in units of CO2 equivalent). Alternatively, provide directly estimated emission reductions due to the project activity.
Prediction of the activity level. Confidence interval
The activity level of the project is represented by the total heat production. As can be seen from the key factor analysis the only external parameter influencing the activity level is the demand for KronoStar products that determines the need for process heat. As the spectrum of products and even their relative contribution to the total production is stable over the period 2006 – 2012 (cf. business plan or the table “Preisentwicklung / Mengenentwicklung”) the ratio of process energy use to the produced amount of wood products is a constant being approximatly 6.3 GJ/m3. The total heat production is directly coupled to the produced amount of wood products which can be taken from the business plan. On the other hand the total heat production is directly coupled to the fuel consumption and thus to the emission of GHG.The total heat production can be varied by varying the boiler power or by varying the working time of the system. Additionally, internal factors can influence the activity level. Emergencies, the necessary maintenance of the process heating system and the necessity of the emergency systems to be run from time to time can force a reduced availability of the system and/or a switch to the existing emergency system. This influences the relative use of different fuels and thus the net CO2 emission reduction of the project. From the activity level in the past and from the predictions about the process heat demand we estimate the activity level as follows:
Parameter Unit 2004 2005 2006 2007 2008 2009 2010 2011 2012Aver. 1st period
Activity = Total heat production GJ 908'855 3'203'678 3'417'897 3'540'308 3'632'117 3'754'528 3'785'131 3'999'350 4'042'194 3'842'664Confidence range 95%: lower limit GJ 2'562'942 2'734'318 2'832'247 2'905'693 3'003'622 3'028'105 3'199'480 3'233'755 3'458'397Confidence range 95%: upper limit GJ 3'267'751 3'486'255 3'611'115 3'704'759 3'829'618 3'860'833 4'079'337 4'123'038 3'881'090 For 2004 no confidence level is indicated because this is a real value in the past
The uncertainty of the activity forecast, i.e. the 95%-confidence levels are not easy to be determined. The given information is mostly based on experience and expectation values of the KronoStar responsibles. The probability distribution of activities is asymmetric because the activity can for technical reasons not much be enhanced. Of course it can drop when there are breakdowns/emergencies of the system or a lack of demand. The KronoStar responsibles estimate the probability for a significant lack of demand during the accounting period to be very small. Technical breakdowns may happen. However, it is highly unlikely that they would shut down the boiler for more than 20% of its planned activity. Thus the lower limit of the confidence range is at 80% of the expected value. For more details see the appendix (Appendix A Calculations.xls).
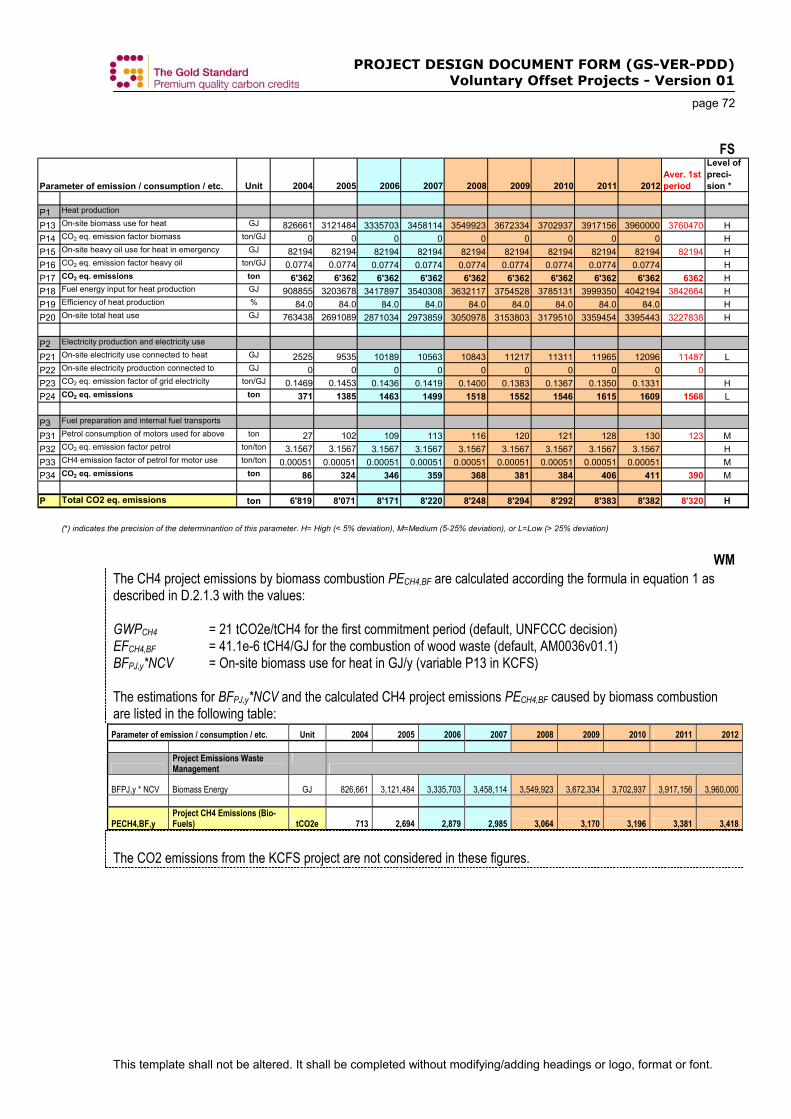
PROJECT DESIGN DOCUMENT FORM (GS-VER-PDD) Voluntary Offset Projects - Version 01
page 72
This template shall not be altered. It shall be completed without modifying/adding headings or logo, format or font.
FS
WM The CH4 project emissions by biomass combustion PECH4,BF are calculated according the formula in equation 1 as described in D.2.1.3 with the values: GWPCH4 = 21 tCO2e/tCH4 for the first commitment period (default, UNFCCC decision) EFCH4,BF = 41.1e-6 tCH4/GJ for the combustion of wood waste (default, AM0036v01.1) BFPJ,y*NCV = On-site biomass use for heat in GJ/y (variable P13 in KCFS) The estimations for BFPJ,y*NCV and the calculated CH4 project emissions PECH4,BF caused by biomass combustion are listed in the following table: Parameter of emission / consumption / etc. Unit 2004 2005 2006 2007 2008 2009 2010 2011 2012
Project Emissions Waste Management
BFPJ,y * NCV Biomass Energy GJ 826,661 3,121,484 3,335,703 3,458,114 3,549,923 3,672,334 3,702,937 3,917,156 3,960,000
PECH4,BF,y Project CH4 Emissions (Bio-Fuels) tCO2e 713 2,694 2,879 2,985 3,064 3,170 3,196 3,381 3,418
The CO2 emissions from the KCFS project are not considered in these figures.
Unit 2004 2005 2006 2007 2008 2009 2010 2011 2012Aver. 1st period
Level of preci-sion *
P1 Heat production
P13 On-site biomass use for heat GJ 826661 3121484 3335703 3458114 3549923 3672334 3702937 3917156 3960000 3760470 HP14 CO2 eq. emission factor biomass ton/GJ 0 0 0 0 0 0 0 0 0 HP15 On-site heavy oil use for heat in emergency
tGJ 82194 82194 82194 82194 82194 82194 82194 82194 82194 82194 H
P16 CO2 eq. emission factor heavy oil ton/GJ 0.0774 0.0774 0.0774 0.0774 0.0774 0.0774 0.0774 0.0774 0.0774 HP17 CO2 eq. emissions ton 6'362 6'362 6'362 6'362 6'362 6'362 6'362 6'362 6'362 6362 HP18 Fuel energy input for heat production GJ 908855 3203678 3417897 3540308 3632117 3754528 3785131 3999350 4042194 3842664 HP19 Efficiency of heat production % 84.0 84.0 84.0 84.0 84.0 84.0 84.0 84.0 84.0 HP20 On-site total heat use GJ 763438 2691089 2871034 2973859 3050978 3153803 3179510 3359454 3395443 3227838 H
P2 Electricity production and electricity use
P21 On-site electricity use connected to heat d ti
GJ 2525 9535 10189 10563 10843 11217 11311 11965 12096 11487 LP22 On-site electricity production connected to
b ilGJ 0 0 0 0 0 0 0 0 0 0
P23 CO2 eq. emission factor of grid electricity ton/GJ 0.1469 0.1453 0.1436 0.1419 0.1400 0.1383 0.1367 0.1350 0.1331 HP24 CO2 eq. emissions ton 371 1385 1463 1499 1518 1552 1546 1615 1609 1568 L
P3 Fuel preparation and internal fuel transports
P31 Petrol consumption of motors used for above ton 27 102 109 113 116 120 121 128 130 123 MP32 CO2 eq. emission factor petrol ton/ton 3.1567 3.1567 3.1567 3.1567 3.1567 3.1567 3.1567 3.1567 3.1567 HP33 CH4 emission factor of petrol for motor use ton/ton 0.00051 0.00051 0.00051 0.00051 0.00051 0.00051 0.00051 0.00051 0.00051 MP34 CO2 eq. emissions ton 86 324 346 359 368 381 384 406 411 390 M
P Total CO2 eq. emissions ton 6'819 8'071 8'171 8'220 8'248 8'294 8'292 8'383 8'382 8'320 H
(*) indicates the precision of the determinantion of this parameter. H= High (< 5% deviation), M=Medium (5-25% deviation), or L=Low (> 25% deviation)
Parameter of emission / consumption / etc.
PROJECT DESIGN DOCUMENT FORM (GS-VER-PDD) Voluntary Offset Projects - Version 01
page 73
This template shall not be altered. It shall be completed without modifying/adding headings or logo, format or font.
E.2. Estimated leakage: >> Please provide estimate of any leakage, defined as: the net change of anthropogenic emissions by sources of greenhouse gases which occurs outside the project boundary, and that is measurable and attributable to the project activity. Estimates should be given for each gas, source, formulae/algorithm, emissions in units of CO2 equivalent. WM As mentioned in D.2.3 and described by formula in D.2.3.2, the leakage identified for the transport of third party wood residues depends on the amount of wood residues sourced from third parties and is directly subtracted (- 2%) from the baseline emissions in E.4 E.3. The sum of E.1 and E.2 representing the project activity emissions: >> WM Identical with estimates in E.1
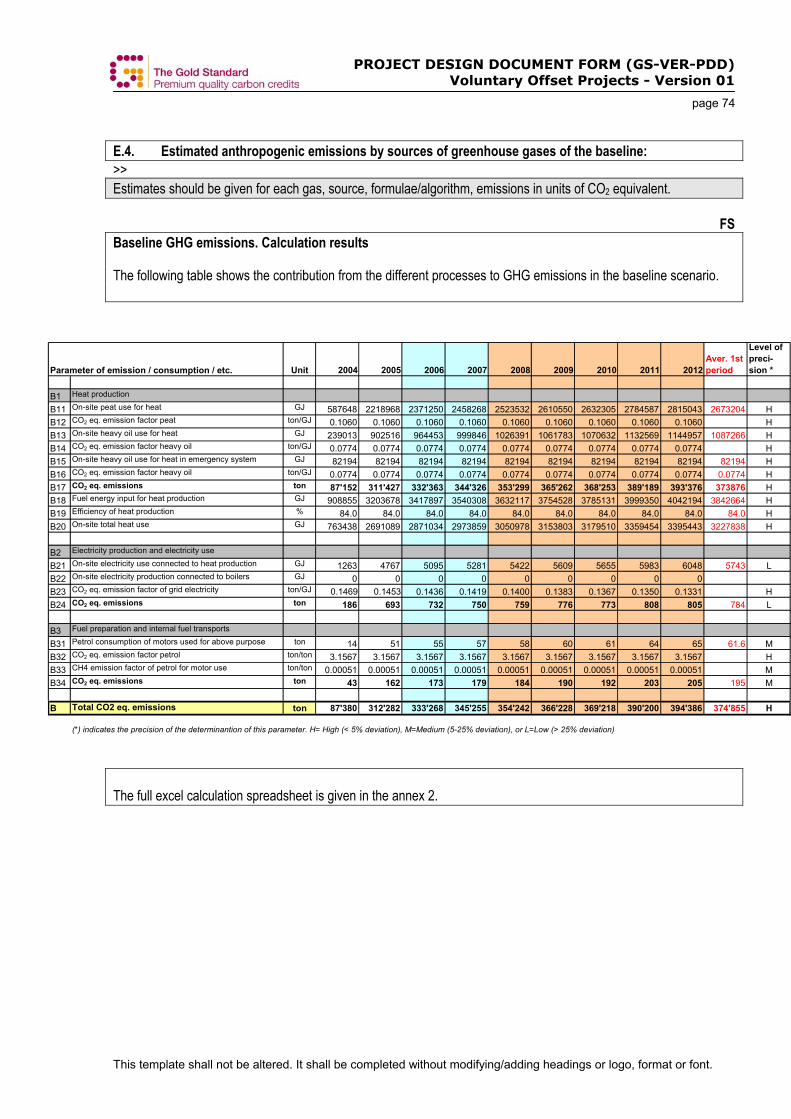
PROJECT DESIGN DOCUMENT FORM (GS-VER-PDD) Voluntary Offset Projects - Version 01
page 74
This template shall not be altered. It shall be completed without modifying/adding headings or logo, format or font.
E.4. Estimated anthropogenic emissions by sources of greenhouse gases of the baseline: >> Estimates should be given for each gas, source, formulae/algorithm, emissions in units of CO2 equivalent. FS Baseline GHG emissions. Calculation results
The following table shows the contribution from the different processes to GHG emissions in the baseline scenario.
The full excel calculation spreadsheet is given in the annex 2.
Unit 2004 2005 2006 2007 2008 2009 2010 2011 2012Aver. 1st period
Level of preci-sion *
B1 Heat production
B11 On-site peat use for heat GJ 587648 2218968 2371250 2458268 2523532 2610550 2632305 2784587 2815043 2673204 HB12 CO2 eq. emission factor peat ton/GJ 0.1060 0.1060 0.1060 0.1060 0.1060 0.1060 0.1060 0.1060 0.1060 HB13 On-site heavy oil use for heat GJ 239013 902516 964453 999846 1026391 1061783 1070632 1132569 1144957 1087266 HB14 CO2 eq. emission factor heavy oil ton/GJ 0.0774 0.0774 0.0774 0.0774 0.0774 0.0774 0.0774 0.0774 0.0774 HB15 On-site heavy oil use for heat in emergency system GJ 82194 82194 82194 82194 82194 82194 82194 82194 82194 82194 HB16 CO2 eq. emission factor heavy oil ton/GJ 0.0774 0.0774 0.0774 0.0774 0.0774 0.0774 0.0774 0.0774 0.0774 0.0774 HB17 CO2 eq. emissions ton 87'152 311'427 332'363 344'326 353'299 365'262 368'253 389'189 393'376 373876 HB18 Fuel energy input for heat production GJ 908855 3203678 3417897 3540308 3632117 3754528 3785131 3999350 4042194 3842664 HB19 Efficiency of heat production % 84.0 84.0 84.0 84.0 84.0 84.0 84.0 84.0 84.0 84.0 HB20 On-site total heat use GJ 763438 2691089 2871034 2973859 3050978 3153803 3179510 3359454 3395443 3227838 H
B2 Electricity production and electricity use
B21 On-site electricity use connected to heat production GJ 1263 4767 5095 5281 5422 5609 5655 5983 6048 5743 LB22 On-site electricity production connected to boilers GJ 0 0 0 0 0 0 0 0 0B23 CO2 eq. emission factor of grid electricity ton/GJ 0.1469 0.1453 0.1436 0.1419 0.1400 0.1383 0.1367 0.1350 0.1331 HB24 CO2 eq. emissions ton 186 693 732 750 759 776 773 808 805 784 L
B3 Fuel preparation and internal fuel transports
B31 Petrol consumption of motors used for above purpose ton 14 51 55 57 58 60 61 64 65 61.6 MB32 CO2 eq. emission factor petrol ton/ton 3.1567 3.1567 3.1567 3.1567 3.1567 3.1567 3.1567 3.1567 3.1567 HB33 CH4 emission factor of petrol for motor use ton/ton 0.00051 0.00051 0.00051 0.00051 0.00051 0.00051 0.00051 0.00051 0.00051 MB34 CO2 eq. emissions ton 43 162 173 179 184 190 192 203 205 195 M
B Total CO2 eq. emissions ton 87'380 312'282 333'268 345'255 354'242 366'228 369'218 390'200 394'386 374'855 H
(*) indicates the precision of the determinantion of this parameter. H= High (< 5% deviation), M=Medium (5-25% deviation), or L=Low (> 25% deviation)
Parameter of emission / consumption / etc.
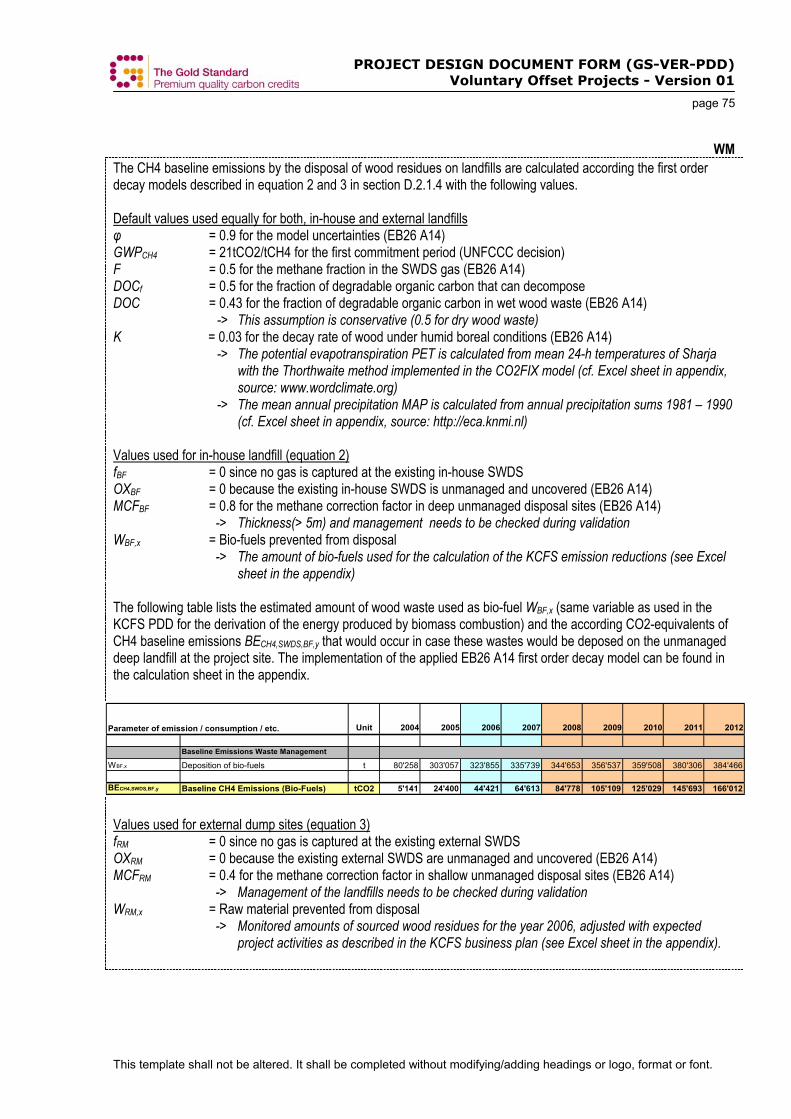
PROJECT DESIGN DOCUMENT FORM (GS-VER-PDD) Voluntary Offset Projects - Version 01
page 75
This template shall not be altered. It shall be completed without modifying/adding headings or logo, format or font.
WM The CH4 baseline emissions by the disposal of wood residues on landfills are calculated according the first order decay models described in equation 2 and 3 in section D.2.1.4 with the following values. Default values used equally for both, in-house and external landfills φ = 0.9 for the model uncertainties (EB26 A14) GWPCH4 = 21tCO2/tCH4 for the first commitment period (UNFCCC decision) F = 0.5 for the methane fraction in the SWDS gas (EB26 A14) DOCf = 0.5 for the fraction of degradable organic carbon that can decompose DOC = 0.43 for the fraction of degradable organic carbon in wet wood waste (EB26 A14) -> This assumption is conservative (0.5 for dry wood waste) K = 0.03 for the decay rate of wood under humid boreal conditions (EB26 A14) -> The potential evapotranspiration PET is calculated from mean 24-h temperatures of Sharja
with the Thorthwaite method implemented in the CO2FIX model (cf. Excel sheet in appendix, source: www.wordclimate.org)
-> The mean annual precipitation MAP is calculated from annual precipitation sums 1981 – 1990 (cf. Excel sheet in appendix, source: http://eca.knmi.nl)
Values used for in-house landfill (equation 2) fBF = 0 since no gas is captured at the existing in-house SWDS OXBF = 0 because the existing in-house SWDS is unmanaged and uncovered (EB26 A14) MCFBF = 0.8 for the methane correction factor in deep unmanaged disposal sites (EB26 A14) -> Thickness(> 5m) and management needs to be checked during validation WBF,x = Bio-fuels prevented from disposal -> The amount of bio-fuels used for the calculation of the KCFS emission reductions (see Excel
sheet in the appendix) The following table lists the estimated amount of wood waste used as bio-fuel WBF,x (same variable as used in the KCFS PDD for the derivation of the energy produced by biomass combustion) and the according CO2-equivalents of CH4 baseline emissions BECH4,SWDS,BF,y that would occur in case these wastes would be deposed on the unmanaged deep landfill at the project site. The implementation of the applied EB26 A14 first order decay model can be found in the calculation sheet in the appendix.
Unit 2004 2005 2006 2007 2008 2009 2010 2011 2012
Baseline Emissions Waste Management
WBF,x Deposition of bio-fuels t 80'258 303'057 323'855 335'739 344'653 356'537 359'508 380'306 384'466
BECH4,SWDS,BF,y Baseline CH4 Emissions (Bio-Fuels) tCO2 5'141 24'400 44'421 64'613 84'778 105'109 125'029 145'693 166'012
Parameter of emission / consumption / etc.
Values used for external dump sites (equation 3) fRM = 0 since no gas is captured at the existing external SWDS OXRM = 0 because the existing external SWDS are unmanaged and uncovered (EB26 A14) MCFRM = 0.4 for the methane correction factor in shallow unmanaged disposal sites (EB26 A14) -> Management of the landfills needs to be checked during validation WRM,x = Raw material prevented from disposal -> Monitored amounts of sourced wood residues for the year 2006, adjusted with expected
project activities as described in the KCFS business plan (see Excel sheet in the appendix).
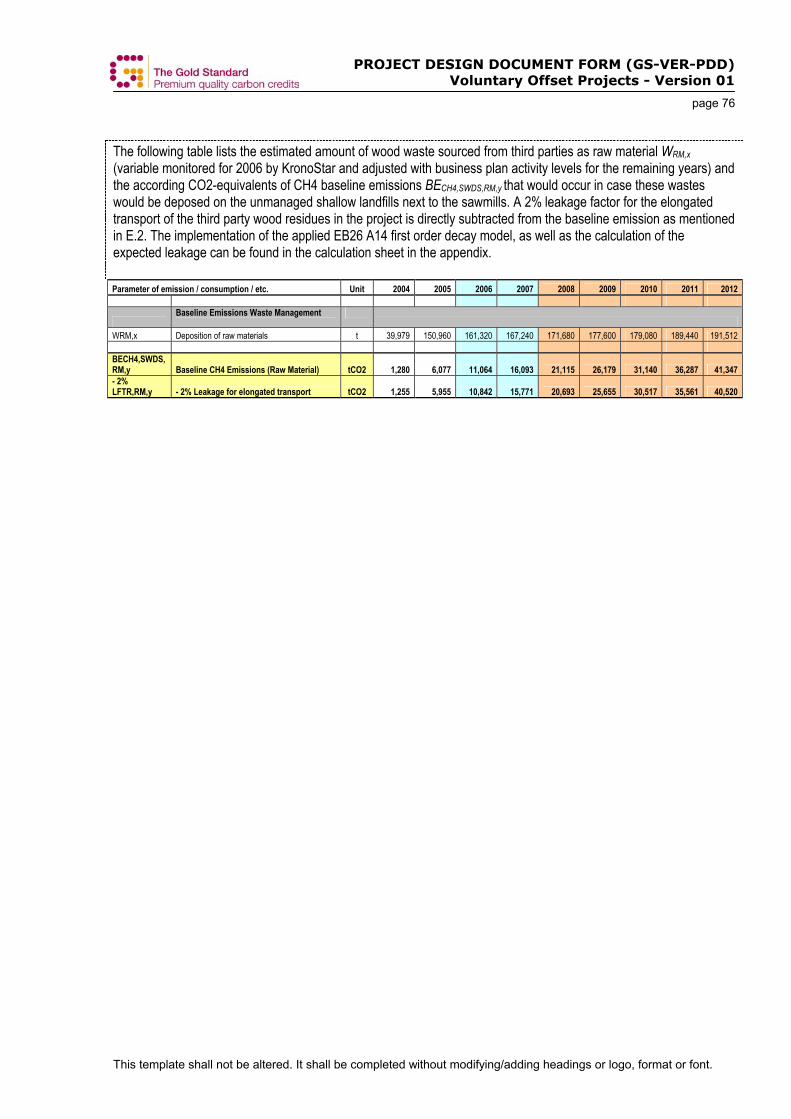
PROJECT DESIGN DOCUMENT FORM (GS-VER-PDD) Voluntary Offset Projects - Version 01
page 76
This template shall not be altered. It shall be completed without modifying/adding headings or logo, format or font.
The following table lists the estimated amount of wood waste sourced from third parties as raw material WRM,x (variable monitored for 2006 by KronoStar and adjusted with business plan activity levels for the remaining years) and the according CO2-equivalents of CH4 baseline emissions BECH4,SWDS,RM,y that would occur in case these wastes would be deposed on the unmanaged shallow landfills next to the sawmills. A 2% leakage factor for the elongated transport of the third party wood residues in the project is directly subtracted from the baseline emission as mentioned in E.2. The implementation of the applied EB26 A14 first order decay model, as well as the calculation of the expected leakage can be found in the calculation sheet in the appendix. Parameter of emission / consumption / etc. Unit 2004 2005 2006 2007 2008 2009 2010 2011 2012
Baseline Emissions Waste Management
WRM,x Deposition of raw materials t 39,979 150,960 161,320 167,240 171,680 177,600 179,080 189,440 191,512 BECH4,SWDS,RM,y Baseline CH4 Emissions (Raw Material) tCO2 1,280 6,077 11,064 16,093 21,115 26,179 31,140 36,287 41,347 - 2% LFTR,RM,y - 2% Leakage for elongated transport tCO2 1,255 5,955 10,842 15,771 20,693 25,655 30,517 35,561 40,520
PROJECT DESIGN DOCUMENT FORM (GS-VER-PDD) Voluntary Offset Projects - Version 01
page 77
This template shall not be altered. It shall be completed without modifying/adding headings or logo, format or font.
E.5. Difference between E.4 and E.3 representing the emission reductions of the project activity: >> FS
ESTIMATION OF THE EMISSION REDUCTIONS
Crediting period The crediting period is 2006 – 2012. This lies fully within the lifetime of the two biomass boilers and within the operation time of the project. As described in the chapters 1 and 2 the project started in 2002. The two biomass boilers were taken into operation in 2003 and 2005 (january). During the years 2006 and 2007 the project is considered to create AAUs which, in connection with the letter of approval for this project, will be transferred from Russia to the Netherlands. The years 2008 – 2012 correspond to the first ordinary crediting period of the Kyoto protocol.
Emission reductions. Calculation results The emission reductions result as the difference of the baseline emissions and the project emissions at the same activity level of the project. The contribution to the GHG emission reduction of the items 2 (electricity production and electricity use) and 3 (fuel preparation and internal fuel transports) is far below 1% of the resulting GHG emission reduction. It may therefore be neglected. Note: The uncertainty of the heat production measurement is much bigger, namely 5%. The resulting emission reductions are given in the table below (line R). The emission reductions of the years 2006 and 2007 are highlited on a blue background. The emission reductions of the ordinary period 2008 – 2012 are highlited on a red background. The average (last column) is taken with respect to the years 2008 – 2012.
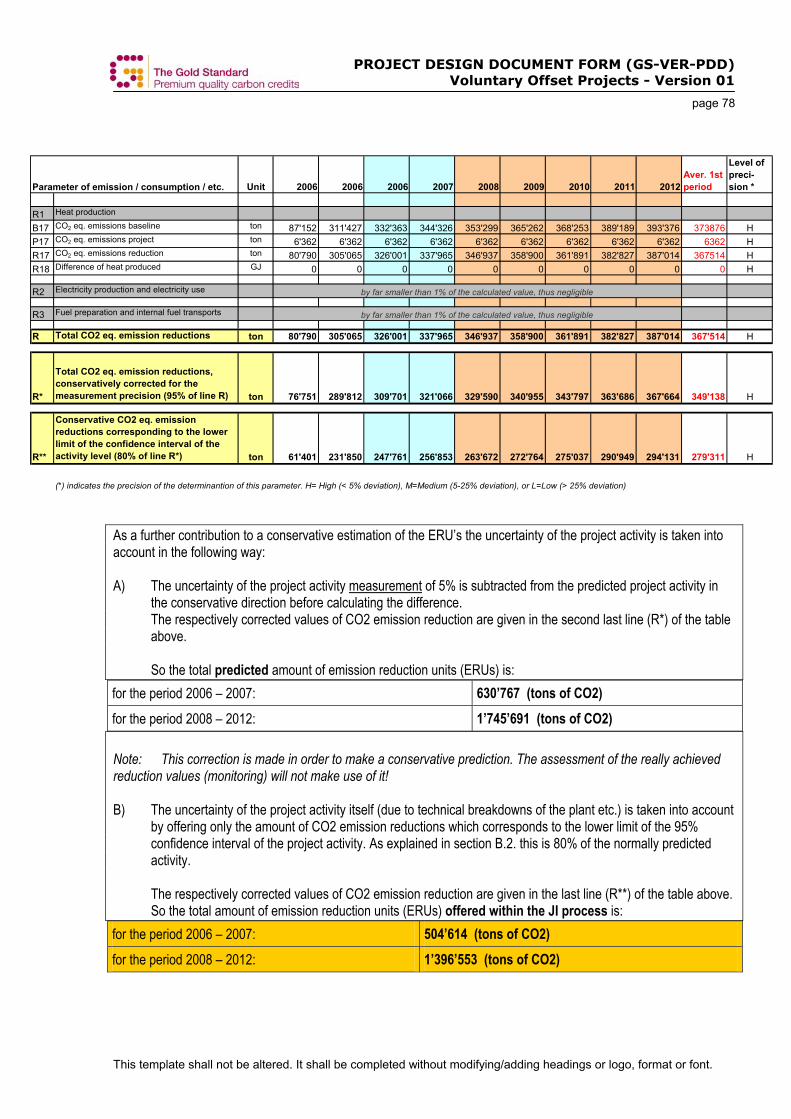
PROJECT DESIGN DOCUMENT FORM (GS-VER-PDD) Voluntary Offset Projects - Version 01
page 78
This template shall not be altered. It shall be completed without modifying/adding headings or logo, format or font.
As a further contribution to a conservative estimation of the ERU’s the uncertainty of the project activity is taken into account in the following way: A) The uncertainty of the project activity measurement of 5% is subtracted from the predicted project activity in
the conservative direction before calculating the difference. The respectively corrected values of CO2 emission reduction are given in the second last line (R*) of the table above. So the total predicted amount of emission reduction units (ERUs) is:
for the period 2006 – 2007: 630’767 (tons of CO2) for the period 2008 – 2012: 1’745’691 (tons of CO2) Note: This correction is made in order to make a conservative prediction. The assessment of the really achieved reduction values (monitoring) will not make use of it! B) The uncertainty of the project activity itself (due to technical breakdowns of the plant etc.) is taken into account
by offering only the amount of CO2 emission reductions which corresponds to the lower limit of the 95% confidence interval of the project activity. As explained in section B.2. this is 80% of the normally predicted activity. The respectively corrected values of CO2 emission reduction are given in the last line (R**) of the table above. So the total amount of emission reduction units (ERUs) offered within the JI process is:
for the period 2006 – 2007: 504’614 (tons of CO2) for the period 2008 – 2012: 1’396’553 (tons of CO2)
Unit 2006 2006 2006 2007 2008 2009 2010 2011 2012Aver. 1st period
Level of preci-sion *
R1 Heat production
B17 CO2 eq. emissions baseline ton 87'152 311'427 332'363 344'326 353'299 365'262 368'253 389'189 393'376 373876 HP17 CO2 eq. emissions project ton 6'362 6'362 6'362 6'362 6'362 6'362 6'362 6'362 6'362 6362 HR17 CO2 eq. emissions reduction ton 80'790 305'065 326'001 337'965 346'937 358'900 361'891 382'827 387'014 367514 HR18 Difference of heat produced GJ 0 0 0 0 0 0 0 0 0 0 H
R2 Electricity production and electricity use
R3 Fuel preparation and internal fuel transports
R Total CO2 eq. emission reductions ton 80'790 305'065 326'001 337'965 346'937 358'900 361'891 382'827 387'014 367'514 H
R*
Total CO2 eq. emission reductions, conservatively corrected for the measurement precision (95% of line R) ton 76'751 289'812 309'701 321'066 329'590 340'955 343'797 363'686 367'664 349'138 H
R**
Conservative CO2 eq. emission reductions corresponding to the lower limit of the confidence interval of the activity level (80% of line R*) ton 61'401 231'850 247'761 256'853 263'672 272'764 275'037 290'949 294'131 279'311 H
(*) indicates the precision of the determinantion of this parameter. H= High (< 5% deviation), M=Medium (5-25% deviation), or L=Low (> 25% deviation)
Parameter of emission / consumption / etc.
by far smaller than 1% of the calculated value, thus negligible
by far smaller than 1% of the calculated value, thus negligible
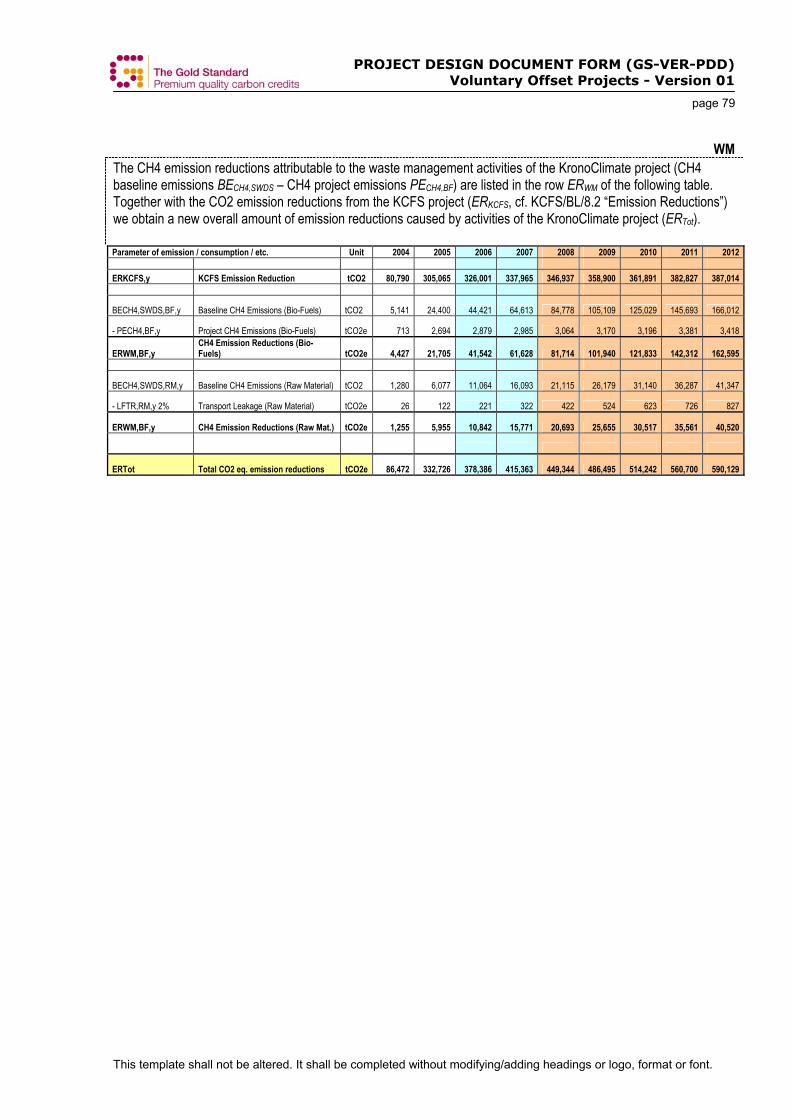
PROJECT DESIGN DOCUMENT FORM (GS-VER-PDD) Voluntary Offset Projects - Version 01
page 79
This template shall not be altered. It shall be completed without modifying/adding headings or logo, format or font.
WM The CH4 emission reductions attributable to the waste management activities of the KronoClimate project (CH4 baseline emissions BECH4,SWDS – CH4 project emissions PECH4,BF) are listed in the row ERWM of the following table. Together with the CO2 emission reductions from the KCFS project (ERKCFS, cf. KCFS/BL/8.2 “Emission Reductions”) we obtain a new overall amount of emission reductions caused by activities of the KronoClimate project (ERTot). Parameter of emission / consumption / etc. Unit 2004 2005 2006 2007 2008 2009 2010 2011 2012 ERKCFS,y KCFS Emission Reduction tCO2 80,790 305,065 326,001 337,965 346,937 358,900 361,891 382,827 387,014
BECH4,SWDS,BF,y Baseline CH4 Emissions (Bio-Fuels) tCO2 5,141 24,400 44,421 64,613 84,778 105,109 125,029 145,693 166,012
- PECH4,BF,y Project CH4 Emissions (Bio-Fuels) tCO2e 713 2,694 2,879 2,985 3,064 3,170 3,196 3,381 3,418
ERWM,BF,y CH4 Emission Reductions (Bio-Fuels) tCO2e 4,427 21,705 41,542 61,628 81,714 101,940 121,833 142,312 162,595
BECH4,SWDS,RM,y Baseline CH4 Emissions (Raw Material) tCO2 1,280 6,077 11,064 16,093 21,115 26,179 31,140 36,287 41,347
- LFTR,RM,y 2% Transport Leakage (Raw Material) tCO2e 26 122 221 322 422 524 623 726 827
ERWM,BF,y CH4 Emission Reductions (Raw Mat.) tCO2e 1,255 5,955 10,842 15,771 20,693 25,655 30,517 35,561 40,520
ERTot Total CO2 eq. emission reductions tCO2e 86,472 332,726 378,386 415,363 449,344 486,495 514,242 560,700 590,129
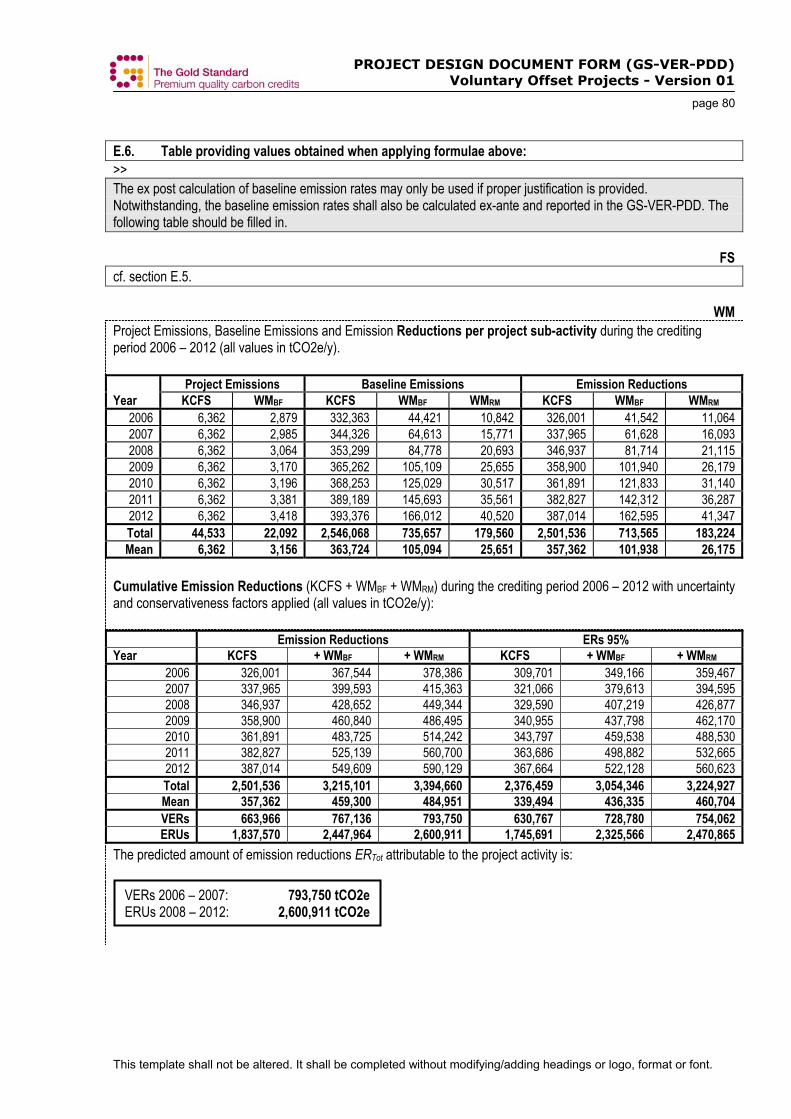
PROJECT DESIGN DOCUMENT FORM (GS-VER-PDD) Voluntary Offset Projects - Version 01
page 80
This template shall not be altered. It shall be completed without modifying/adding headings or logo, format or font.
E.6. Table providing values obtained when applying formulae above: >> The ex post calculation of baseline emission rates may only be used if proper justification is provided. Notwithstanding, the baseline emission rates shall also be calculated ex-ante and reported in the GS-VER-PDD. The following table should be filled in. FS cf. section E.5. WM Project Emissions, Baseline Emissions and Emission Reductions per project sub-activity during the crediting period 2006 – 2012 (all values in tCO2e/y). Project Emissions Baseline Emissions Emission Reductions Year KCFS WMBF KCFS WMBF WMRM KCFS WMBF WMRM
2006 6,362 2,879 332,363 44,421 10,842 326,001 41,542 11,064 2007 6,362 2,985 344,326 64,613 15,771 337,965 61,628 16,093 2008 6,362 3,064 353,299 84,778 20,693 346,937 81,714 21,115 2009 6,362 3,170 365,262 105,109 25,655 358,900 101,940 26,179 2010 6,362 3,196 368,253 125,029 30,517 361,891 121,833 31,140 2011 6,362 3,381 389,189 145,693 35,561 382,827 142,312 36,287 2012 6,362 3,418 393,376 166,012 40,520 387,014 162,595 41,347 Total 44,533 22,092 2,546,068 735,657 179,560 2,501,536 713,565 183,224 Mean 6,362 3,156 363,724 105,094 25,651 357,362 101,938 26,175
Cumulative Emission Reductions (KCFS + WMBF + WMRM) during the crediting period 2006 – 2012 with uncertainty and conservativeness factors applied (all values in tCO2e/y): Emission Reductions ERs 95% Year KCFS + WMBF + WMRM KCFS + WMBF + WMRM
2006 326,001 367,544 378,386 309,701 349,166 359,467 2007 337,965 399,593 415,363 321,066 379,613 394,595 2008 346,937 428,652 449,344 329,590 407,219 426,877 2009 358,900 460,840 486,495 340,955 437,798 462,170 2010 361,891 483,725 514,242 343,797 459,538 488,530 2011 382,827 525,139 560,700 363,686 498,882 532,665 2012 387,014 549,609 590,129 367,664 522,128 560,623 Total 2,501,536 3,215,101 3,394,660 2,376,459 3,054,346 3,224,927 Mean 357,362 459,300 484,951 339,494 436,335 460,704 VERs 663,966 767,136 793,750 630,767 728,780 754,062 ERUs 1,837,570 2,447,964 2,600,911 1,745,691 2,325,566 2,470,865
The predicted amount of emission reductions ERTot attributable to the project activity is:
VERs 2006 – 2007: 793,750 tCO2e ERUs 2008 – 2012: 2,600,911 tCO2e

PROJECT DESIGN DOCUMENT FORM (GS-VER-PDD) Voluntary Offset Projects - Version 01
page 81
This template shall not be altered. It shall be completed without modifying/adding headings or logo, format or font.
To be on the conservative side for the predicted emission reductions, some uncertainty factors are applied to the results: ERTot* is the amount of emission reductions we expect to be verified under full project performance as described in the KCFS PDD, but with a 5% measurement uncertainty.
VERs 2006 – 2007: 754,062 tCO2e ERUs 2008 – 2012: 2,470,865 tCO2e
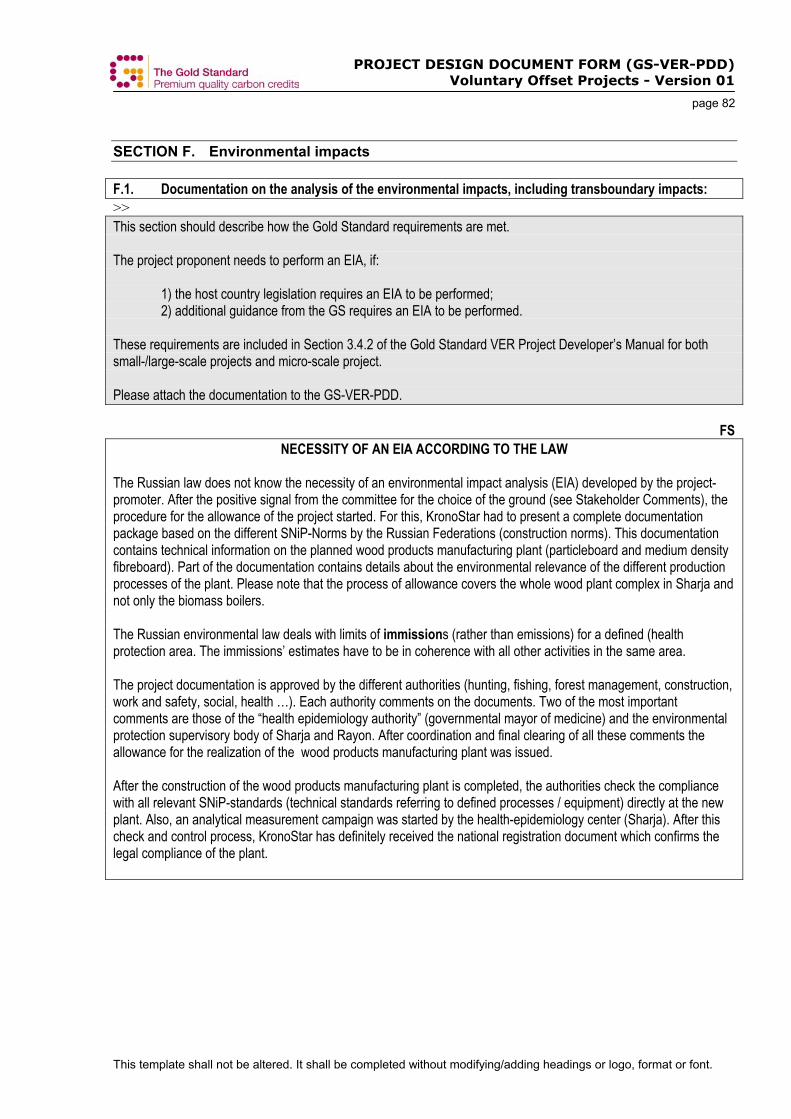
PROJECT DESIGN DOCUMENT FORM (GS-VER-PDD) Voluntary Offset Projects - Version 01
page 82
This template shall not be altered. It shall be completed without modifying/adding headings or logo, format or font.
SECTION F. Environmental impacts F.1. Documentation on the analysis of the environmental impacts, including transboundary impacts: >> This section should describe how the Gold Standard requirements are met. The project proponent needs to perform an EIA, if:
1) the host country legislation requires an EIA to be performed; 2) additional guidance from the GS requires an EIA to be performed.
These requirements are included in Section 3.4.2 of the Gold Standard VER Project Developer’s Manual for both small-/large-scale projects and micro-scale project. Please attach the documentation to the GS-VER-PDD. FS
NECESSITY OF AN EIA ACCORDING TO THE LAW The Russian law does not know the necessity of an environmental impact analysis (EIA) developed by the project-promoter. After the positive signal from the committee for the choice of the ground (see Stakeholder Comments), the procedure for the allowance of the project started. For this, KronoStar had to present a complete documentation package based on the different SNiP-Norms by the Russian Federations (construction norms). This documentation contains technical information on the planned wood products manufacturing plant (particleboard and medium density fibreboard). Part of the documentation contains details about the environmental relevance of the different production processes of the plant. Please note that the process of allowance covers the whole wood plant complex in Sharja and not only the biomass boilers. The Russian environmental law deals with limits of immissions (rather than emissions) for a defined (health protection area. The immissions’ estimates have to be in coherence with all other activities in the same area. The project documentation is approved by the different authorities (hunting, fishing, forest management, construction, work and safety, social, health …). Each authority comments on the documents. Two of the most important comments are those of the “health epidemiology authority” (governmental mayor of medicine) and the environmental protection supervisory body of Sharja and Rayon. After coordination and final clearing of all these comments the allowance for the realization of the wood products manufacturing plant was issued. After the construction of the wood products manufacturing plant is completed, the authorities check the compliance with all relevant SNiP-standards (technical standards referring to defined processes / equipment) directly at the new plant. Also, an analytical measurement campaign was started by the health-epidemiology center (Sharja). After this check and control process, KronoStar has definitely received the national registration document which confirms the legal compliance of the plant.
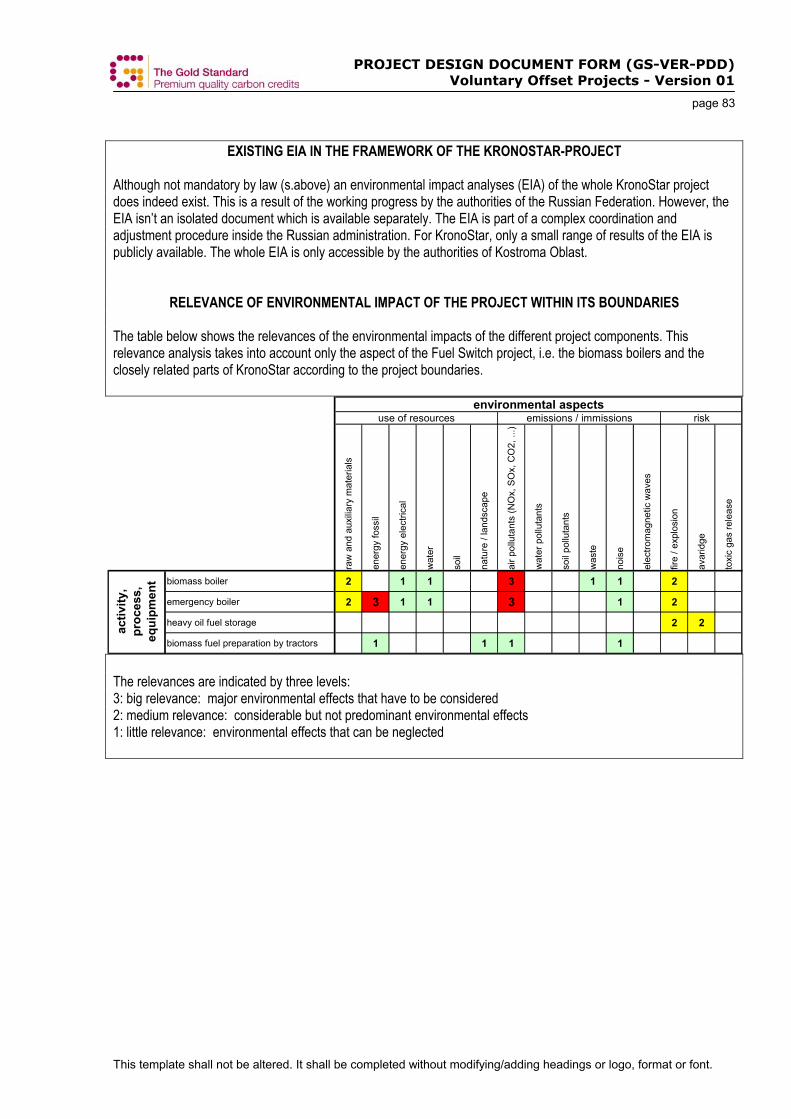
PROJECT DESIGN DOCUMENT FORM (GS-VER-PDD) Voluntary Offset Projects - Version 01
page 83
This template shall not be altered. It shall be completed without modifying/adding headings or logo, format or font.
EXISTING EIA IN THE FRAMEWORK OF THE KRONOSTAR-PROJECT Although not mandatory by law (s.above) an environmental impact analyses (EIA) of the whole KronoStar project does indeed exist. This is a result of the working progress by the authorities of the Russian Federation. However, the EIA isn’t an isolated document which is available separately. The EIA is part of a complex coordination and adjustment procedure inside the Russian administration. For KronoStar, only a small range of results of the EIA is publicly available. The whole EIA is only accessible by the authorities of Kostroma Oblast.
RELEVANCE OF ENVIRONMENTAL IMPACT OF THE PROJECT WITHIN ITS BOUNDARIES The table below shows the relevances of the environmental impacts of the different project components. This relevance analysis takes into account only the aspect of the Fuel Switch project, i.e. the biomass boilers and the closely related parts of KronoStar according to the project boundaries.
raw
and
aux
iliary
mat
eria
ls
ener
gy fo
ssil
ener
gy e
lect
rical
wat
er
soil
natu
re /
land
scap
e
air p
ollu
tant
s (N
Ox,
SO
x, C
O2,
...)
wat
er p
ollu
tant
s
soil
pollu
tant
s
was
te
nois
e
elec
trom
agne
tic w
aves
fire
/ exp
losi
on
avar
idge
toxi
c ga
s re
leas
e
biomass boiler 2 1 1 3 1 1 2
emergency boiler 2 3 1 1 3 1 2
heavy oil fuel storage 2 2
biomass fuel preparation by tractors 1 1 1 1
activ
ity,
proc
ess,
eq
uipm
ent
riskemissions / immissionsuse of resourcesenvironmental aspects
The relevances are indicated by three levels: 3: big relevance: major environmental effects that have to be considered 2: medium relevance: considerable but not predominant environmental effects 1: little relevance: environmental effects that can be neglected
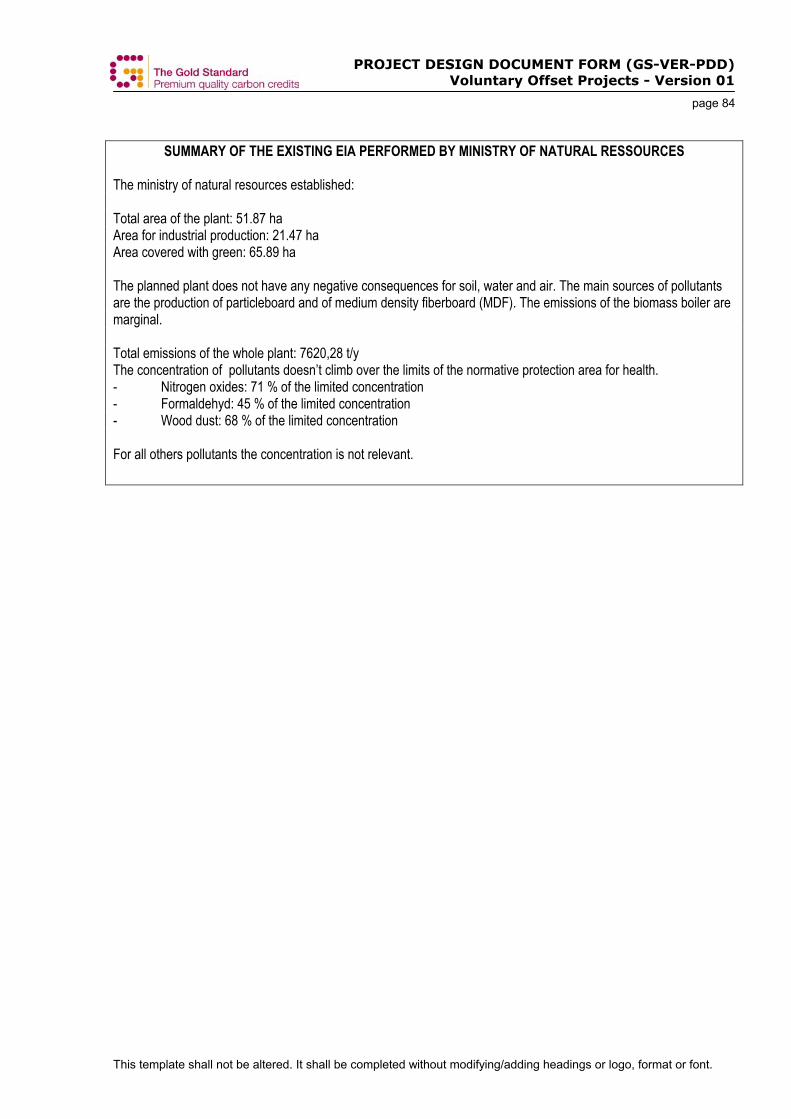
PROJECT DESIGN DOCUMENT FORM (GS-VER-PDD) Voluntary Offset Projects - Version 01
page 84
This template shall not be altered. It shall be completed without modifying/adding headings or logo, format or font.
SUMMARY OF THE EXISTING EIA PERFORMED BY MINISTRY OF NATURAL RESSOURCES The ministry of natural resources established: Total area of the plant: 51.87 ha Area for industrial production: 21.47 ha Area covered with green: 65.89 ha The planned plant does not have any negative consequences for soil, water and air. The main sources of pollutants are the production of particleboard and of medium density fiberboard (MDF). The emissions of the biomass boiler are marginal. Total emissions of the whole plant: 7620,28 t/y The concentration of pollutants doesn’t climb over the limits of the normative protection area for health. - Nitrogen oxides: 71 % of the limited concentration - Formaldehyd: 45 % of the limited concentration - Wood dust: 68 % of the limited concentration For all others pollutants the concentration is not relevant.
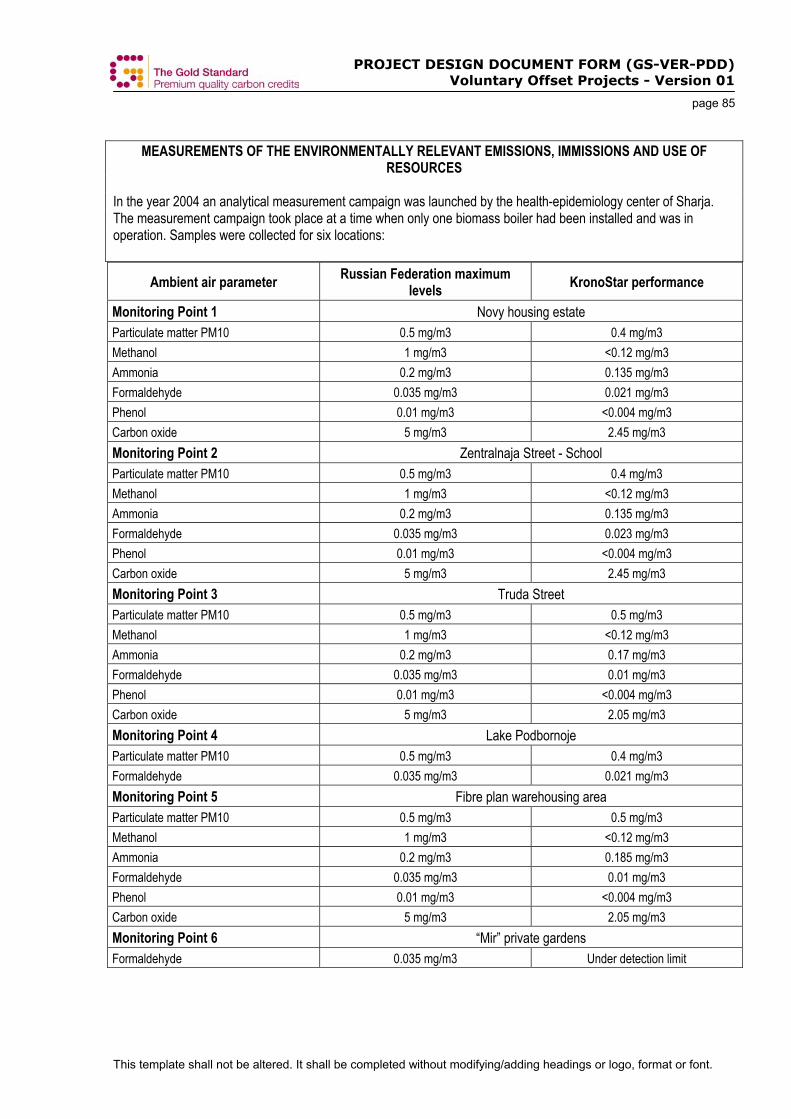
PROJECT DESIGN DOCUMENT FORM (GS-VER-PDD) Voluntary Offset Projects - Version 01
page 85
This template shall not be altered. It shall be completed without modifying/adding headings or logo, format or font.
MEASUREMENTS OF THE ENVIRONMENTALLY RELEVANT EMISSIONS, IMMISSIONS AND USE OF RESOURCES
In the year 2004 an analytical measurement campaign was launched by the health-epidemiology center of Sharja. The measurement campaign took place at a time when only one biomass boiler had been installed and was in operation. Samples were collected for six locations:
Ambient air parameter Russian Federation maximum levels KronoStar performance
Monitoring Point 1 Novy housing estate Particulate matter PM10 0.5 mg/m3 0.4 mg/m3 Methanol 1 mg/m3 <0.12 mg/m3 Ammonia 0.2 mg/m3 0.135 mg/m3 Formaldehyde 0.035 mg/m3 0.021 mg/m3 Phenol 0.01 mg/m3 <0.004 mg/m3 Carbon oxide 5 mg/m3 2.45 mg/m3 Monitoring Point 2 Zentralnaja Street - School Particulate matter PM10 0.5 mg/m3 0.4 mg/m3 Methanol 1 mg/m3 <0.12 mg/m3 Ammonia 0.2 mg/m3 0.135 mg/m3 Formaldehyde 0.035 mg/m3 0.023 mg/m3 Phenol 0.01 mg/m3 <0.004 mg/m3 Carbon oxide 5 mg/m3 2.45 mg/m3 Monitoring Point 3 Truda Street Particulate matter PM10 0.5 mg/m3 0.5 mg/m3 Methanol 1 mg/m3 <0.12 mg/m3 Ammonia 0.2 mg/m3 0.17 mg/m3 Formaldehyde 0.035 mg/m3 0.01 mg/m3 Phenol 0.01 mg/m3 <0.004 mg/m3 Carbon oxide 5 mg/m3 2.05 mg/m3 Monitoring Point 4 Lake Podbornoje Particulate matter PM10 0.5 mg/m3 0.4 mg/m3 Formaldehyde 0.035 mg/m3 0.021 mg/m3 Monitoring Point 5 Fibre plan warehousing area Particulate matter PM10 0.5 mg/m3 0.5 mg/m3 Methanol 1 mg/m3 <0.12 mg/m3 Ammonia 0.2 mg/m3 0.185 mg/m3 Formaldehyde 0.035 mg/m3 0.01 mg/m3 Phenol 0.01 mg/m3 <0.004 mg/m3 Carbon oxide 5 mg/m3 2.05 mg/m3 Monitoring Point 6 “Mir” private gardens Formaldehyde 0.035 mg/m3 Under detection limit
PROJECT DESIGN DOCUMENT FORM (GS-VER-PDD) Voluntary Offset Projects - Version 01
page 86
This template shall not be altered. It shall be completed without modifying/adding headings or logo, format or font.
CONCLUSIONS The relevant environmental impacts of the KronoStar project and, therein, the relevant environmental aspects of the KronoClimate Fuel Switch project have been analysed by the authority according to the local regulations. The analysis led to the approval of the project implementation. WM Environmental impacts are observed within KronoStar’s ISO 14001 certification assessment and by imission measurements by Russian government, necessary for the operating licence. Further, the FSC certification of KronoStar’s leased forests encompasses the environmental impacts in relation to forestry related activities (soil protection, high conservation valuable forests, etc.).
PROJECT DESIGN DOCUMENT FORM (GS-VER-PDD) Voluntary Offset Projects - Version 01
page 87
This template shall not be altered. It shall be completed without modifying/adding headings or logo, format or font.
F.2. If environmental impacts are considered significant by the project participants or the host Party, please provide conclusions and all references to support documentation of an environmental impact assessment undertaken in accordance with the procedures as required by the host Party: >> WM The KronoStar factory is considered to have few or no significant adverse impacts on environment that are sensitive, diverse or unprecedented. Accordingly, the project is classified as a category B project by the IFC. Environmental impacts of category B projects are assumed to be site-specific, few if any of them are irreversible and in many cases, mitigatory measures can be designed readily. For further information, please refer to the KCFS environmental impact assessment.
PROJECT DESIGN DOCUMENT FORM (GS-VER-PDD) Voluntary Offset Projects - Version 01
page 88
This template shall not be altered. It shall be completed without modifying/adding headings or logo, format or font.
SECTION G. Stakeholders’ comments G.1. Brief description how comments by local stakeholders have been invited and compiled: >> Please describe the process by which comments by local stakeholders have been invited and compiled. An invitation for comments by local stakeholders shall be made in an open and transparent manner, in a way that facilities comments to be received from local stakeholders and allows for a reasonable time for comments to be submitted. In this regard, project participants shall describe a project activity in a manner which allows the local stakeholders to understand the project activity. The Gold Standard Public Consultation Process requires at least two public consultations for small- and large-scale projects and one round for micro-scale projects. The exact requirements for the Stakeholder consultation are included in Section 3.4.3 of the Gold Standard VER Project Developer’s Manual. FS
GENERAL ASPECTS From the very beginning of the planning of the KronoStar project, the mission to build a economically, ecologically and socially sound factory was very important. Such a broad perception of sustainability also demands broad support from the socio-economic environment. Therefore the process of stakeholder consultation has been crucial during the whole planning and implementation phase of the project.
PURPOSE The purposes of the stakeholder consultation during the KronoClimate project is a) to inform about KronoClimate and to correctly position the project as a long-term enterprise which encompasses all climate relevant aspects of the KronoStar investment project and b) to identify and to evaluate the different stakeholders’ opinion, comments, suggestions, arguments for or against the project. Early and sufficient information of all relevant parties enable the stakeholders to inform themselves, and encourages them to express their positive and negative feedbacks. An early involvement of the stakeholders in the planning process prevents from negative encounters and surprises in advanced project phases, when the investments have been done and amendments can only be effected at a high cost. But probably the most important aspect of the stakeholder consultation is to further elaborate the project on a continuous basis of improvement in terms of sustainability by taking into account their justified needs and critique.
OFFICIAL GUIDELINES AND PROCEDURES FOR CONSIDERATION OF STAKEHOLDERS Although the Russian federal law “On environmental review” of 1995 provides governmental regulation on Environmental Impact Assessment Procedure, there do not exist any specific regulations in Russia on public involvement during the project development and implementation phase, yet. Nevertheless, the Russian law knows one instrument for stakeholder involvement before a project is started, the so-called committee for the choice of ground. This committee participates in a public hearing after a project is launched for the first time. Member of the committee are different public authorities, members of parliament (MP), representatives from relevant parties and public groups.

PROJECT DESIGN DOCUMENT FORM (GS-VER-PDD) Voluntary Offset Projects - Version 01
page 89
This template shall not be altered. It shall be completed without modifying/adding headings or logo, format or font.
After a presentation of the planned project with special focus on economically, ecologically and social consequences, there is the possibility for discussion about the project and to formulate questions. At the end of the hearing, a vote about the project is hold. A positive result of the vote establishes the permission for the project leader to continue the planning process (in collaboration with the authorities). The hearing of the committee for the localisation of the project “Rebuilding of the woodplant complex in Sharja by OOO KronoStar” was hold on 15th September 2002. Place of the hearing was on the premises of the planned plant. At the same time, KronoStar also organized a day of ‘open doors’ for everybody. In total, some 560 people were present at the committee meeting after KronoStar had placed invitations in the mass medias Narodnaja Gaseta (11.09.2002), Wetluzhskij Krai (10.09.2002) and a report in Super-TV (14.09.2002). Programme of the hearing was as follows: - Welcome from the chairman of the committee (mayor of Sharja) - Welcome from the chairman of OOO KronoStar (M. H. Quanz) - Presentation of the project - Movie of the existing wood plant KronoPol (Poland) - Question/discussion round - Voting on the permission to move on with the project All the present members of the committee voted unanimously for the project. After this hearing, the planning process could go on and the authorities engaged onto the official procedure for the allowance of the project.
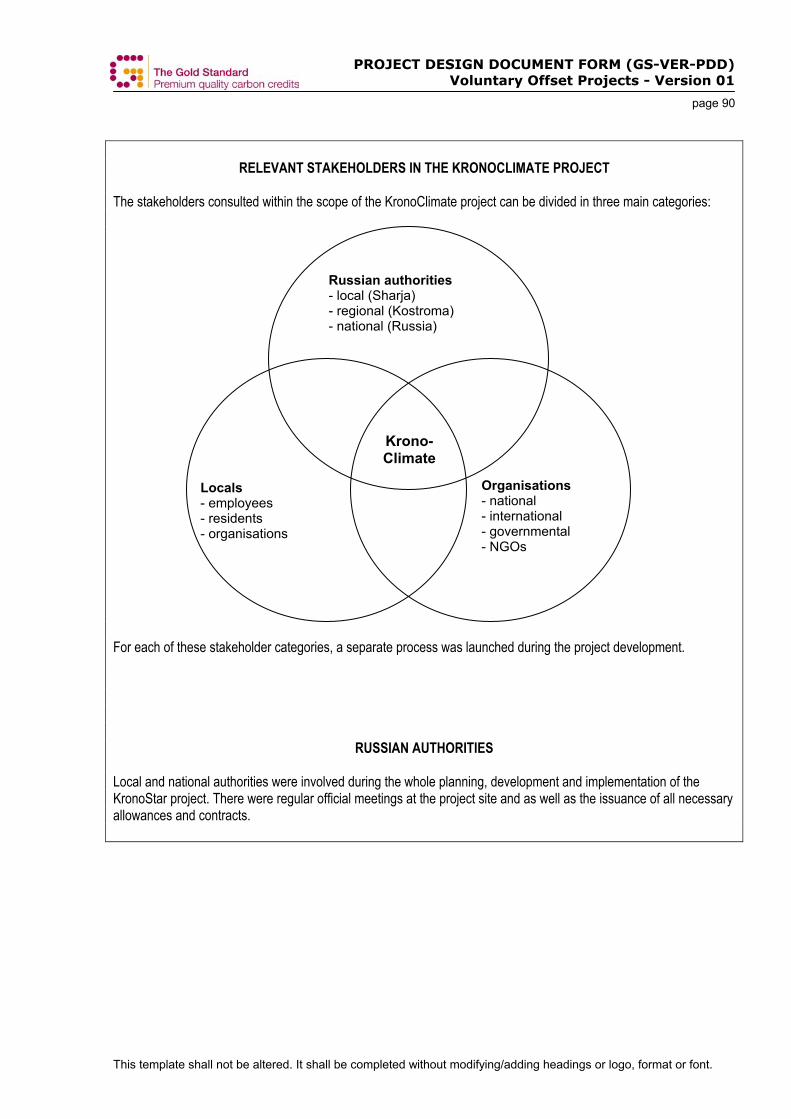
PROJECT DESIGN DOCUMENT FORM (GS-VER-PDD) Voluntary Offset Projects - Version 01
page 90
This template shall not be altered. It shall be completed without modifying/adding headings or logo, format or font.
RELEVANT STAKEHOLDERS IN THE KRONOCLIMATE PROJECT
The stakeholders consulted within the scope of the KronoClimate project can be divided in three main categories:
For each of these stakeholder categories, a separate process was launched during the project development.
RUSSIAN AUTHORITIES Local and national authorities were involved during the whole planning, development and implementation of the KronoStar project. There were regular official meetings at the project site and as well as the issuance of all necessary allowances and contracts.
Russian authorities - local (Sharja) - regional (Kostroma) - national (Russia)
Locals - employees - residents - organisations
Organisations - national - international - governmental - NGOs
Krono- Climate
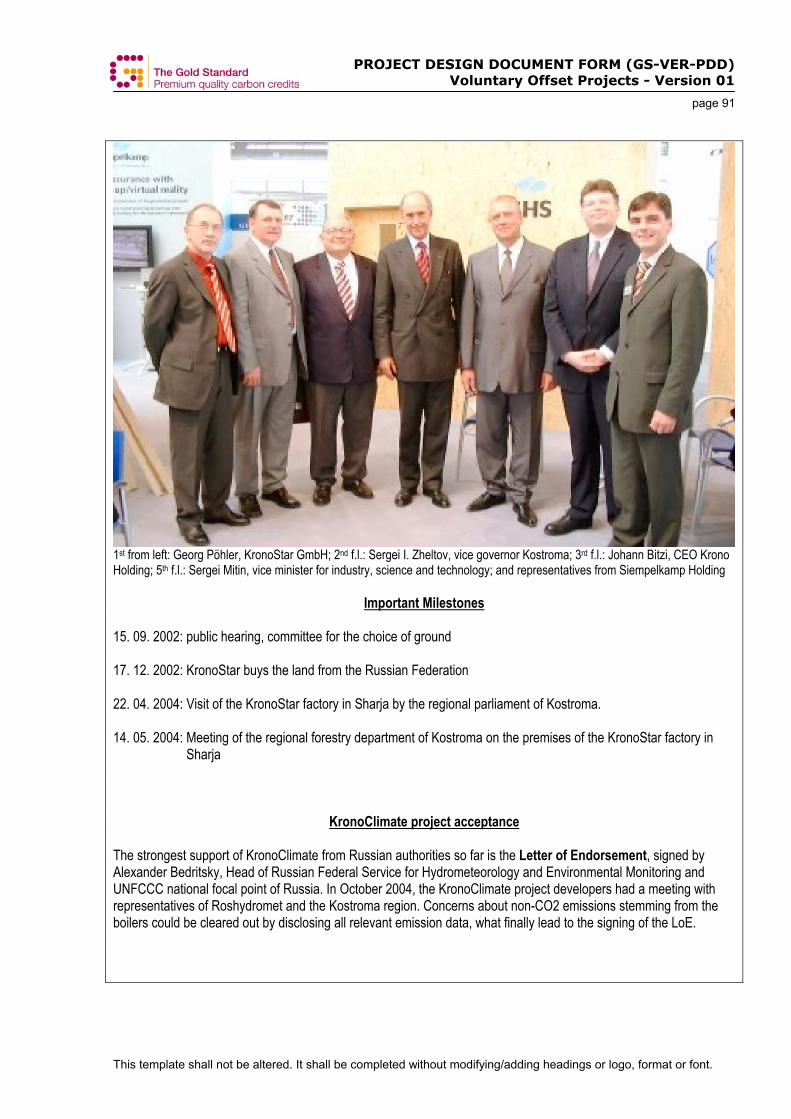
PROJECT DESIGN DOCUMENT FORM (GS-VER-PDD) Voluntary Offset Projects - Version 01
page 91
This template shall not be altered. It shall be completed without modifying/adding headings or logo, format or font.
1st from left: Georg Pöhler, KronoStar GmbH; 2nd f.l.: Sergei I. Zheltov, vice governor Kostroma; 3rd f.l.: Johann Bitzi, CEO Krono Holding; 5th f.l.: Sergei Mitin, vice minister for industry, science and technology; and representatives from Siempelkamp Holding
Important Milestones 15. 09. 2002: public hearing, committee for the choice of ground 17. 12. 2002: KronoStar buys the land from the Russian Federation 22. 04. 2004: Visit of the KronoStar factory in Sharja by the regional parliament of Kostroma. 14. 05. 2004: Meeting of the regional forestry department of Kostroma on the premises of the KronoStar factory in
Sharja
KronoClimate project acceptance The strongest support of KronoClimate from Russian authorities so far is the Letter of Endorsement, signed by Alexander Bedritsky, Head of Russian Federal Service for Hydrometeorology and Environmental Monitoring and UNFCCC national focal point of Russia. In October 2004, the KronoClimate project developers had a meeting with representatives of Roshydromet and the Kostroma region. Concerns about non-CO2 emissions stemming from the boilers could be cleared out by disclosing all relevant emission data, what finally lead to the signing of the LoE.
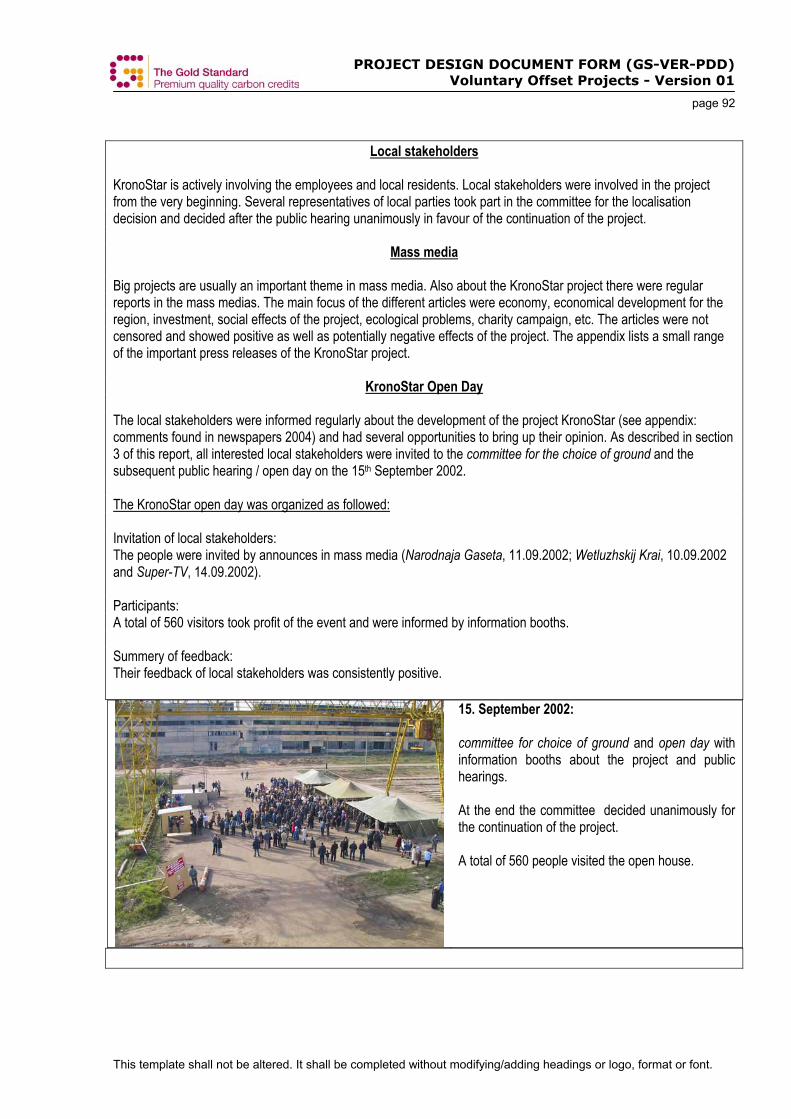
PROJECT DESIGN DOCUMENT FORM (GS-VER-PDD) Voluntary Offset Projects - Version 01
page 92
This template shall not be altered. It shall be completed without modifying/adding headings or logo, format or font.
Local stakeholders KronoStar is actively involving the employees and local residents. Local stakeholders were involved in the project from the very beginning. Several representatives of local parties took part in the committee for the localisation decision and decided after the public hearing unanimously in favour of the continuation of the project.
Mass media Big projects are usually an important theme in mass media. Also about the KronoStar project there were regular reports in the mass medias. The main focus of the different articles were economy, economical development for the region, investment, social effects of the project, ecological problems, charity campaign, etc. The articles were not censored and showed positive as well as potentially negative effects of the project. The appendix lists a small range of the important press releases of the KronoStar project.
KronoStar Open Day The local stakeholders were informed regularly about the development of the project KronoStar (see appendix: comments found in newspapers 2004) and had several opportunities to bring up their opinion. As described in section 3 of this report, all interested local stakeholders were invited to the committee for the choice of ground and the subsequent public hearing / open day on the 15th September 2002. The KronoStar open day was organized as followed: Invitation of local stakeholders: The people were invited by announces in mass media (Narodnaja Gaseta, 11.09.2002; Wetluzhskij Krai, 10.09.2002 and Super-TV, 14.09.2002). Participants: A total of 560 visitors took profit of the event and were informed by information booths. Summery of feedback: Their feedback of local stakeholders was consistently positive.
15. September 2002: committee for choice of ground and open day with information booths about the project and public hearings. At the end the committee decided unanimously for the continuation of the project. A total of 560 people visited the open house.
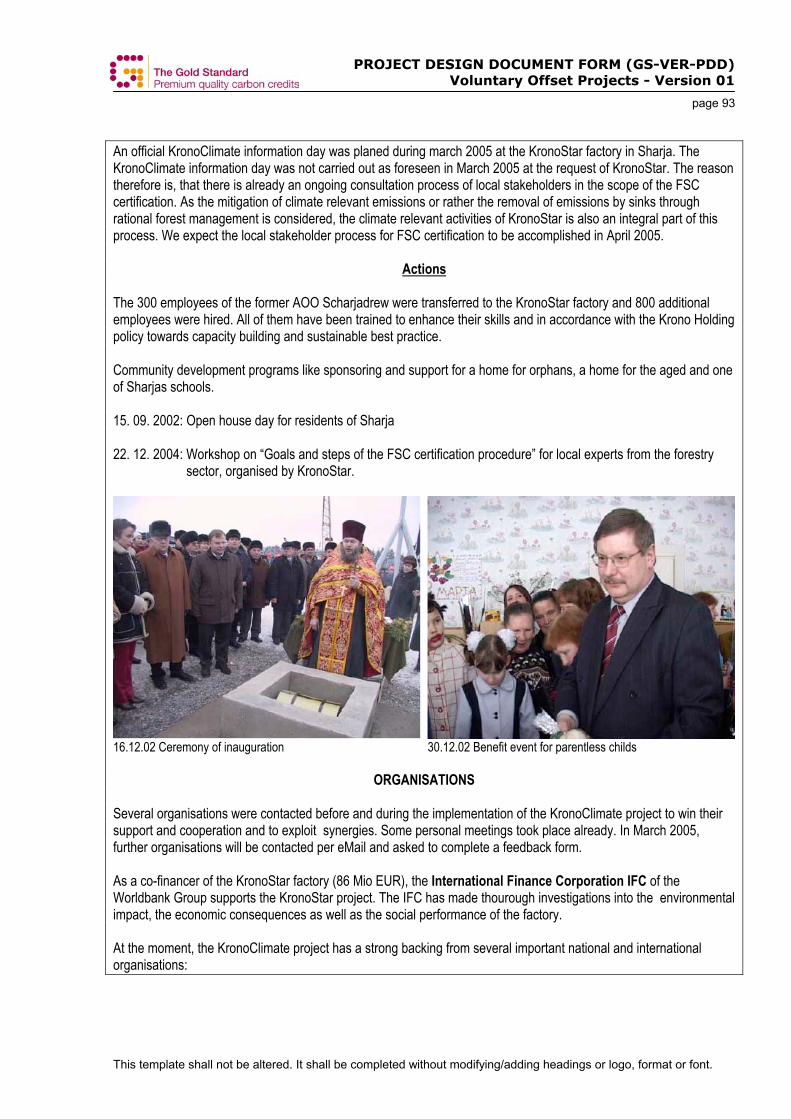
PROJECT DESIGN DOCUMENT FORM (GS-VER-PDD) Voluntary Offset Projects - Version 01
page 93
This template shall not be altered. It shall be completed without modifying/adding headings or logo, format or font.
An official KronoClimate information day was planed during march 2005 at the KronoStar factory in Sharja. The KronoClimate information day was not carried out as foreseen in March 2005 at the request of KronoStar. The reason therefore is, that there is already an ongoing consultation process of local stakeholders in the scope of the FSC certification. As the mitigation of climate relevant emissions or rather the removal of emissions by sinks through rational forest management is considered, the climate relevant activities of KronoStar is also an integral part of this process. We expect the local stakeholder process for FSC certification to be accomplished in April 2005.
Actions The 300 employees of the former AOO Scharjadrew were transferred to the KronoStar factory and 800 additional employees were hired. All of them have been trained to enhance their skills and in accordance with the Krono Holding policy towards capacity building and sustainable best practice. Community development programs like sponsoring and support for a home for orphans, a home for the aged and one of Sharjas schools. 15. 09. 2002: Open house day for residents of Sharja
22. 12. 2004: Workshop on “Goals and steps of the FSC certification procedure” for local experts from the forestry
sector, organised by KronoStar.
16.12.02 Ceremony of inauguration 30.12.02 Benefit event for parentless childs
ORGANISATIONS Several organisations were contacted before and during the implementation of the KronoClimate project to win their support and cooperation and to exploit synergies. Some personal meetings took place already. In March 2005, further organisations will be contacted per eMail and asked to complete a feedback form. As a co-financer of the KronoStar factory (86 Mio EUR), the International Finance Corporation IFC of the Worldbank Group supports the KronoStar project. The IFC has made thourough investigations into the environmental impact, the economic consequences as well as the social performance of the factory. At the moment, the KronoClimate project has a strong backing from several important national and international organisations:
PROJECT DESIGN DOCUMENT FORM (GS-VER-PDD) Voluntary Offset Projects - Version 01
page 94
This template shall not be altered. It shall be completed without modifying/adding headings or logo, format or font.
Elena Armand, head of the environmental unit from UNDP Russia is also involved in the KronoClimate project and offered to cooperate with a UNDP project on sustainable forest management in the Kostroma region, financed by the GEF. KronoStar has declared that they will give financial support to the startup phase of the UNDP project in cooperation with local forest companies (be aware: the KronoStar plant effected ca. 8000 indirectly employees in forestry industries). An official meeting between Elena Armand and representatives from KronoStar and the KronoClimate project engineers took place the 22nd September 2003 in Kostroma. The program Swiss Activities Implemented Jointly SAIJ from the Swiss State Secretariat for Economic Affairs SECO supported KronoClimate as a pilot project for all participants , i.e. by providing important information about processes at UNFCCC level, especially with regard to project registration. The Swiss Agency for Development and Cooperation SDC have also strongly supported the KronoClimate project and have been offering a cooperation with one of their projects in Russia, the “Komi Model Forest”. The Silver Taiga Foundation in Syktyvkar has considerable know-how on sustainable forest management and a technology transfer to KronoStar Sharja was planned. Unfortunately, SDC now phases out its forestry activities in Russia and further cooperation with KronoClimate seems unlikely.
STAKEHOLDER OPINION POLL Based on the KronoClimate project information in the PDD a feedback form will be sent to the following stakeholders during March 2005: Russian authorities Roshydromet, UNFCCC National Focal Point Russia Regional authorities of Kostroma Authorities of Sharja Employees, residents and local organisations As many as possible during the KronoClimate day in March 2005 in Sharja by way of publication in local media. National and international organisations WWF Russia, Climate Change Program UNDP Russia, Environmental Unit Swiss Secretariat for Economic Affairs SECO, Activities implemented jointly SAIJ Swiss Agency for Environment, Forest and Landscape SAEFL (DNA UNFCCC) International Finance Corporation IFC, KronoStar project officer
COMMENTS FOUND IN NEWSPAPERS The following comments are extracts from the German translations of some local newspaper articles that were published during the year 2004 (translated from Russian to German by KronoStar, 2005): 7. 4. 2004 Chronometer: - „Ökologische Sicherheit ist für Einwohner der Stadt wichtiger, als wirtschaftliche Vorteile.“
PROJECT DESIGN DOCUMENT FORM (GS-VER-PDD) Voluntary Offset Projects - Version 01
page 95
This template shall not be altered. It shall be completed without modifying/adding headings or logo, format or font.
- „Jetzt ist die (plasmakatalytische) Anlage für Luftreinigung in Betrieb genommen.“ - „Die Stufe der Formaldehydzerlegung in den Abgasen ist 95 %.“ - „Mit Inbetriebnahme des ganzen Komplexes wird das ganze in der Produktion genutzte Wasser zu einem
ununterbrochen zirkulierenden System gehören (closed loop). Ein geschlossener, ungefährlicher Kreis: Produktion – Reinigung – Produktion.“
27. 5. 2004 Sewernaja Prawda: - “Die Holzabfälle im Rayon Pyschtschug machen der Bevölkerung Sorgen und auch den
Naturschutzorganisationen. Etwa vierzig Sägewerke und Holzbearbeitungsstellen produzieren Tausende m3 von Sägespänen und Holzspänen, die sich auf den anliegenden Gelände und Mülldeponien gehäuft haben.”
- „Im vorigen Winter wurden über Tausend Tonnen von Sägespänen und 200-300 m3 von Schwarten und Spreißeln zum Unternehmen „KronoStar“ in der Stadt Scharja transportiert.“
- „Die Sägewerke und Holzbearbeitungsstellen werden von „KronoStar“ GmbH von den Sägespänen befreit und gleichzeitig werden die Unternehmer von den Geldstrafen für die Überschreitung des Abfalllimits befreit. So wird die Zusammenarbeit für beide Seiten vorteilhaft sein.“
Januar 2004 Lesnaja Gaseta: - „Das Problem war im Rayons weit verbreitet: die Holzabfälle ließ man überall liegen, wo man nur wollte, durch
die Holzabfälle wurden die Wälder, Straßen, Spazierwege verschmutzt.“ - „jetzt werden die Holzabfälle nach dem Beschluß der Rayonverwaltung in Zusammenarbeit mit dem Komitee für
Ökologie vom Holzbearbeitungsunternehmen „KronoStar“ GmbH in der Stadt Scharja verwertet“ 7. Juli 2004 Kostromskaja narodnaja gaseta: - Valentina Jamschtschikowa, die Abgeordnete der Gebietsduma:
“Wenn die Europäer kommen um zu bauen, bauen sie alles so, wie es sich gehört. Sie verstehen, was Ökologie, was ökologisch saubere Produktion ist. Es ist angenehm, dass alle Fragen, die der Leitung von „KronoStar“ gestellt werden, sofort gelöst werden. Man hat sie auf die Möglichkeit einer plasmakatalytischen Anlage angesprochen, und sie haben diese Anlage gekauft, hertransportiert und montiert. Und jetzt werden sie das gesammelte und gereinigte Wasser in einem geschlossenen Kreislauf einsetzen. Das ist einzigartig: denn wir alle haben bisher einfach irgendwo das saubere Wasser hergenommen und lassen dann irgendwohin das schmutzige Wasser wieder ab, und hier ist es ein geschlossener Prozess. Wir müssten für die Reinigung des Regenwassers, das in Wolga fließt, dasselbe tun.“
- Jurij Cirkunow, erster Stellvertreter des Gouverneurs des Kostromaer Gebietes: “In der „KronoStar“ macht man immer, was versprochen wurde. Das ist sehr wichtig, sonst bekommen die Leute den Eindruck, dass die Leiter des Gebietes oder die Vertreter der Firma etwas sagen, aber in der Wirklichkeit sieht es dann anders aus. Man befürchtete, dass der Betrieb das Territorium verschmutzen könnte, dass die Bewohner von Scharja leiden werden, und wir erklärten vom ersten Tag an, dass die Reinigungsanlagen des Projekt vorbildlich sind. Und heute sehen wir nicht nur das Projekt, sondern bereits die realen Objekte. Noch in ein paar Monaten wird das Gelände schon ganz anders aussehen (die Projektgenehmigung für die Gestaltung ist schon gegeben), und das Werk wird sich mit seiner Umweltverträglichkeit sogar von vielen Wohnbezirken unterscheiden, wo der Müll nicht immer entsorgt wird. Die
PROJECT DESIGN DOCUMENT FORM (GS-VER-PDD) Voluntary Offset Projects - Version 01
page 96
This template shall not be altered. It shall be completed without modifying/adding headings or logo, format or font.
Zusammenarbeit mit dieser Firma hilft der Verwaltung des Gebietes, den Bau zukünftiger Anlagen ebenfalls zu optimieren.“
Brief Nr. 3223 vom 17.10.03 - „Die stellvertretende Vorsitzende des Komitees für Naturschätze Kostroma, Frau Swetlana Weremjewa, meint,
dass kein anderes Projekt so viele Naturschutzmaßnahmen ergriffen hat wie „KronoStar“.“ - „Der heutige Betrieb des Unternehmens schafft keinerlei Probleme. Dreimal pro Jahr, seit Mai des laufenden
Jahres, machten die Ökologen die Messungen der Schadstoffemissionen in die Atmosphäre und kamen zum Schluß, dass die Schadstoffemissionen die höchst zulässige Norm nicht übersteigen.“
- „Die Meinung der Ökologen und Projektanten ist eindeutig: nach dem Bauabschluß wird „KronoStar“ das sauberste Unternehmen für Holzplattenproduktion in Russland sein.“
- „Mit dem Managementwechsel veränderte sich auch der Umgang des Unternehmens mit der Bevölkerung: sie wurde transparenter und aufrichtiger. Das Resultat dieser Politik ist die Veranstaltung eines „Runden Tisches“. Solche Veranstaltungen wurden erstmals organisiert, aber Herr Quanz versicherte, dass solche Treffen von nun an regelmässig stattfinden werden. Die Einwohner der Stadt müssen überzeugt sein: Das Werk informiert offen über alles, was im hinter den Fabriktoren geschieht. Gesundheitsschädliche Emissionen gehören der Vergangenheit an.
WM Please refer to section B.1 and the KCFS stakeholder consultation. Further, comprehensive stakeholder consultations have been conducted during the FSC certification process. G.2. Summary of the comments received: >> Please see Annex 8 for details and separate documents with stakeholder comments. Please identify stakeholders that have made comments and provide a summary of these comments. G.3. Report on how due account was taken of any comments received: >> Please see Annex 8 for details and separate documents with stakeholder comments. Please explain how due account have been taken of comments received.
PROJECT DESIGN DOCUMENT FORM (GS-VER-PDD) Voluntary Offset Projects - Version 01
page 97
This template shall not be altered. It shall be completed without modifying/adding headings or logo, format or font.
Annex 1
CONTACT INFORMATION ON PARTICIPANTS IN THE PROJECT ACTIVITY Please copy and paste table as needed. Organisation: Krono Holding AG Street/P.O.Box: Haldenstrasse 12 Building: City: Luzern State/Region: Postal code: 6006 Country: Switzerland Phone: Fax: E-mail: URL: www.kronoholding.ch Represented by: Title: CTO Kronopol Salutation: Dr. Last name: Hasch Middle name: First name: Joachim Department: Phone (direct): 0048 683 631 305 Fax (direct): 0048 683 631 321 Mobile: Personal e-mail: [email protected] Organisation: c4c AG, concepts for carbon Street/P.O.Box: Morgenstrasse 129 Building: City: Bern State/Region: Postal code: 3018 Country: Switzerland Phone: Fax: E-mail: URL: www.c4c.ch Represented by: Title: KronoClimate project manager Salutation: Mr. Last name: Stankiewitz Middle name: First name: Oliver Department: Phone (direct): 0041 313 322 919
PROJECT DESIGN DOCUMENT FORM (GS-VER-PDD) Voluntary Offset Projects - Version 01
page 98
This template shall not be altered. It shall be completed without modifying/adding headings or logo, format or font.
Fax (direct): 0041 313 322 921 Mobile: Personal e-mail: [email protected] Title: KronoClimate project manager Salutation: Mr. Last name: Butz Middle name: First name: Christoph Department: Phone (direct): 0041 313 322 919 Fax (direct): 0041 313 322 921 Mobile: Personal e-mail: [email protected] Title: KronoClimate Fuel Switch and Gold Standard project developer Salutation: Mr. Last name: Martin Middle name: First name: Felix Department: Phone (direct): 0041 313 322 919 Fax (direct): 0041 313 322 921 Mobile: Personal e-mail: [email protected] Title: KronoClimate Waste Management project developer Salutation: Mr. Last name: Gardi Middle name: First name: Oliver Department: Phone (direct): 0041 313 322 919 Fax (direct): 0041 313 322 921 Mobile: Personal e-mail: [email protected]
PROJECT DESIGN DOCUMENT FORM (GS-VER-PDD) Voluntary Offset Projects - Version 01
page 99
This template shall not be altered. It shall be completed without modifying/adding headings or logo, format or font.
Annex 2
BASELINE INFORMATION Please provide a table containing the key elements used to determine the baseline for the project activity including elements such as variables, parameters and data sources. For approved methodologies you may find a draft table on the UNFCCC CDM web site. FS Please refer to the excel-file 'Annex-2_baseline-study.xls' WM Please refer to the original KCFS baseline study validated by TÜV Süd in 2005 and KronoStar’s price list for raw material in 2006 (file “Annex-2_ Holzpreisliste-06.pdf” attached to this PDD).
Annex 3
MONITORING PLAN The actual project performance must be assessed against the projected outcomes of the sustainable development assessment as defined in section 3.5.1 of the Gold Standard VER Project Developer’s Manual, on an annual basis. Where quantitative measurements are required information on the relevant data to be collected should be noted in the table presented below. For those indictors where a qualitative assessment is to be made a narrative explanation should be provided. If an EIA has been conducted, then the table needs to be extended to allow:
1) Assessment of the implementation and effectiveness of the identified mitigation measures. 2) Assessment of the implementation and effectiveness of the identified compensation measures. 3) Monitoring of the impacts.
The information requirements for the sustainable development indicators and Environmental Impact Assessment are fully detailed in section 3.4.1 of the Gold Standard VER Project Developer’s Manual. WM Please refer to the CDM Methodology AM0036 v.1.1 (“Fuel switch from fossil fuels to biomass residues in boilers for heat generation”).
Annex 4
UNDP LETTER FS Please refer to the pdf-file 'Annex-4_UNDP-letter.pdf' attached to this PDD.
PROJECT DESIGN DOCUMENT FORM (GS-VER-PDD) Voluntary Offset Projects - Version 01
page 100
This template shall not be altered. It shall be completed without modifying/adding headings or logo, format or font.
Annex 5
LETTER OF ENDORSEMENT FS Please refer to "Annex-5_letter-of-endorsement_2004-10-19.pdf" attached to this PDD.
Annex 6
SPATIAL BOUNDARY SAW-DUST COLLECTION PLACES WM Please refer to the pdf-file “Annex-6_collection-places_confidential.pdf” attached to this PDD.
Annex 7
GOLD STANDARD PREASSESSMENT Please refer to the “Annex-7_preassesment.pdf” attached to this PDD.
Annex 8
GOLD STANDARD CLARIFICATIONS AND SUPPLEMENTS Please refer to the “Annex-8_supplements.pdf” attached to this PDD.
Annex 9
FSC, ISO 14001 and OHSAS 18001 certificates of the year 2006 Please refer to the “Annex-9_certificates.pdf” attached to this PDD.
Annex 10
IFC-CAP Please refer to the “Annex-10_IFC-CAP.pdf” attached to this PDD.
Annex 11
PHOTO DOCUMENTATION Please refer to the “Annex-11_photo-documentation.pdf” attached to this PDD.
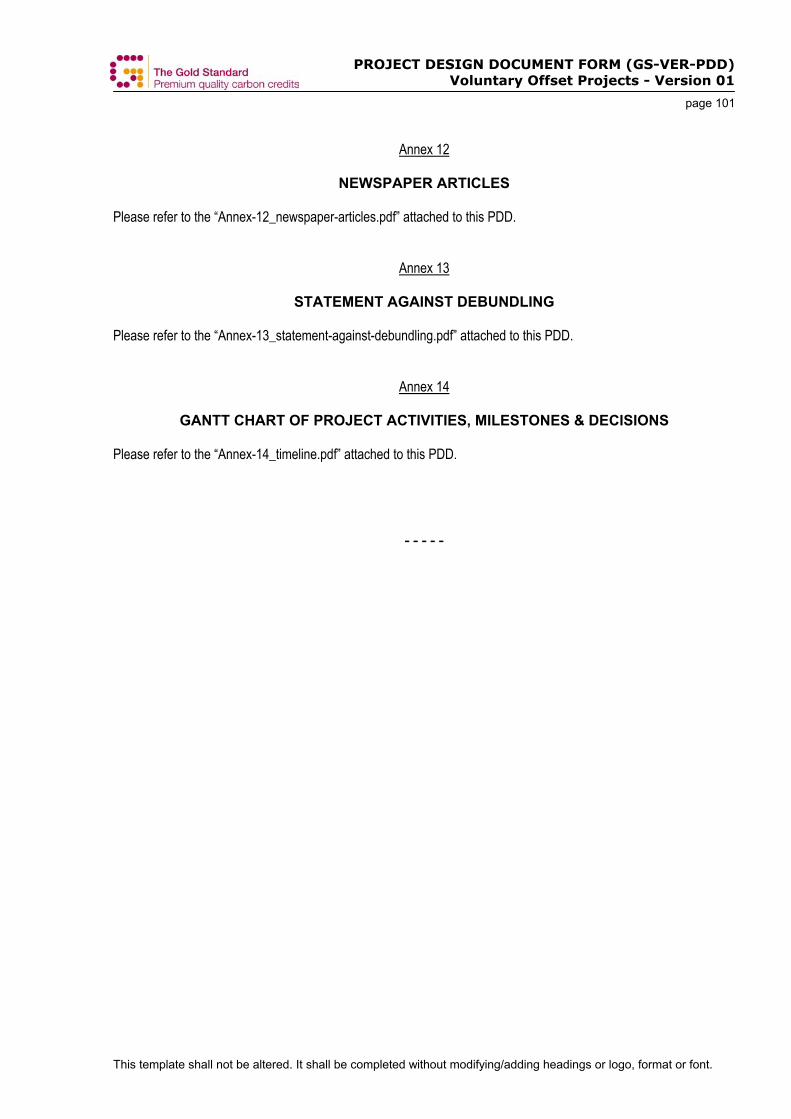
PROJECT DESIGN DOCUMENT FORM (GS-VER-PDD) Voluntary Offset Projects - Version 01
page 101
This template shall not be altered. It shall be completed without modifying/adding headings or logo, format or font.
Annex 12
NEWSPAPER ARTICLES Please refer to the “Annex-12_newspaper-articles.pdf” attached to this PDD.
Annex 13
STATEMENT AGAINST DEBUNDLING Please refer to the “Annex-13_statement-against-debundling.pdf” attached to this PDD.
Annex 14
GANTT CHART OF PROJECT ACTIVITIES, MILESTONES & DECISIONS Please refer to the “Annex-14_timeline.pdf” attached to this PDD.
- - - - -