Pectin-Supplemented Enteral Diet Reduces the Severity of Methotrexate- Induced Enterocolitis in Rats
Upload
independentCategory
view
2download
0
Bioresource Technology 168 (2014) 127–135
Contents lists available at ScienceDirect
Bioresource Technology
journal homepage: www.elsevier .com/locate /bior tech
The optimization of biomass and lipid yields of Chlorella sorokinianawhen using wastewater supplemented with different nitrogen sources
http://dx.doi.org/10.1016/j.biortech.2014.03.0640960-8524/� 2014 Elsevier Ltd. All rights reserved.
⇑ Corresponding author. Tel.: +27 31 373 2346; fax: +27 31 373 2777.E-mail address: [email protected] (F. Bux).
Luveshan Ramanna, Abhishek Guldhe, Ismail Rawat, Faizal Bux ⇑Institute for Water and Wastewater Technology, Durban University of Technology, PO Box 1334, Durban 4000, South Africa
h i g h l i g h t s
� Growth of Chlorella varies with addition of different nitrogen sources.� 1.5 g L�1 urea produced 0.218 g L�1 biomass and 61.52% lipid by relative fluorescence.� Fatty acids produced were predominantly 16 and 18 carbon chains in length.� Urea is an effective nitrogen supplement for growth of C. sorokiniana in wastewater.
a r t i c l e i n f o
Article history:Received 18 December 2013Received in revised form 12 March 2014Accepted 15 March 2014Available online 27 March 2014
Keywords:WastewaterUreaMicroalgaePAM fluorometryBiodiesel
a b s t r a c t
The potential of nitrogen sources supplementing domestic wastewater for the cultivation of microalgaewas assessed. Urea, potassium nitrate, sodium nitrate and ammonium nitrate were evaluated for theireffect on cultivation and lipid production of Chlorella sorokiniana. Urea showed the highest biomass yieldof 0.220 g L�1 and was selected for further experimentation. Urea concentrations (0–10 g L�1) wereassessed for their effect on growth and microalgal physiology using pulse amplitude modulatedfluorometry. A concentration of 1.5 g L�1 urea produced 0.218 g L�1 biomass and 61.52% lipid by relativefluorescence. Physiological stress was evident by the decrease in relative Electron Transport Rate from10.45 to 6.77 and quantum efficiency of photosystem II charge separation from 0.665 to 0.131. Gaschromatography analysis revealed that C16:0, C18:0, C18:1, C18:2 and C18:3 were the major fatty acidsproduced by C. sorokiniana. Urea proved to be an effective nitrogen supplement for cultivation ofC. sorokiniana in wastewater.
� 2014 Elsevier Ltd. All rights reserved.
1. Introduction
The development and production of biodiesel is becomingincreasingly important as an alternative to fossil fuels (Lin andLin, 2011). Microalgae have shown immense potential as afeedstock for biodiesel due to their ability to synthesize andaccumulate high amounts of lipids (Rawat et al., 2013). Biodieselproduction from microalgae is dependent on the microalgalgrowth rate and lipid productivity (Chen et al., 2011). Lipid accu-mulation in microalgae can be enhanced by changing cultivationconditions. Ammonia, urea and nitrate are often selected as thenitrogen (N) sources for the mass cultivation of microalgae(Hsieh and Wu, 2009; Kim et al., 2013; Lin and Lin, 2011). TheseN sources are frequently found in domestic wastewater. Microal-gae have been previously cultivated in domestic wastewaterstreams, as it is a readily available and cost-effective substrate,
and have proven to be efficient at removing and accumulatingnutrients, trace metals and vitamins thereby providing additionaltertiary treatment of wastewater (Rawat et al., 2011). Despite finaleffluent discharged from the wastewater treatment processeshaving lower concentrations of nutrients, it still proves to be aneffective growth substrate (Lizzul et al., 2014). Supplementingwastewater with N fertilizer for optimal growth is too expensivewhich proves to be unfeasible thus giving the requirement forcheaper sources of N to be investigated (Borowitzka andMoheimani, 2013).
Nitrogen is crucial to the cultivation of microalgae. Organic Nmay be found in numerous biological substances which includepeptides, proteins, enzymes, chlorophylls, energy transfermolecules (ADP, ATP), and genetic materials (RNA, DNA) (Caiet al., 2013). The most appropriate N source and concentrationmust be identified for each microalgal species as this is a vitalfactor which affects growth and lipid regulation (Chia et al.,2013; Hsieh and Wu, 2009). Nitrogen is available in several forms.The form of N that is supplied to the microalgae may affect the
128 L. Ramanna et al. / Bioresource Technology 168 (2014) 127–135
cellular composition of the algae, altering lipid content and fattyacid composition, as well as the decreasing the growth rate andreducing culture stability (Borowitzka and Moheimani, 2013). Allmicroalgae assimilate inorganic N in the forms of nitrate andammonium (Cai et al., 2013). Nitrogen stressed (deprivation orsurplus) conditions are effective means of inducing neutral lipidaccumulation within microalgal cells (Singh et al., 2014).
Autotrophic microalgae have been utilized in a dual role to fixthe available N in final effluents providing economical N removalas well as producing the lipids for biodiesel production (Rawatet al., 2011). However, their potential for lipid production is limiteddue to insufficient light penetration from the shading effectsamong microalgae which results in their low growth rate. The solu-tion to this dilemma may be solved by utilizing a mixotrophicstrain of microalgae, which have faster growth rates and is ableto use organic compounds as substrates (Kim et al., 2013). It wasshown that the microalga, Chlorella sorokiniana, is able to grow athigher growth rates and may have the potential for high densitycultivation in wastewater (Lizzul et al., 2014; Zheng et al., 2013).However, there are not many studies focused on this microalgain literature (Kim et al., 2013). This strain of microalga is robustand has been proven to be capable of producing a variety of lipidswhich are of interest in biodiesel industries (Lizzul et al., 2014).Therefore, evaluating the lipid profile of C. sorokiniana will be use-ful for assessing their potential as a biodiesel feedstock (Zhenget al., 2013). This microalga was isolated from the environmentand therefore has an inherent adaptability condition change andthus potentially provides a competitive advantage in open pondcultivation (Rawat et al., 2013).
This study focused on identifying the most appropriate N sourcefor supplementing domestic wastewater for the cultivation of C.sorokiniana to further improve the microalgal biomass productivityand lipid concentrations. The optimal concentration of this Nsource was assessed for achieving high cell density and oilaccumulation by microalgal physiological experiments that wereaccomplished using Pulse Amplitude Modulated (PAM) Fluorome-try. Elucidation of lipid profiles, extracted from C. sorokiniana bio-mass grown on domestic supplemented wastewater was alsoassessed for its suitability as a biodiesel feedstock.
2. Methods
2.1. Microalga and culture conditions
C. sorokiniana (GenBank accession number: AB731602.1) wasisolated from a turbid, open pond in KwaZulu-Natal, South Africa.The strain was grown and maintained in complete BG11 mediumaccording to Watanabe et al. (2000) and was exposed to an irradi-ance of 120 lmol photons m�2 s�1, a light/dark-cycle of 16/8 h at atemperature of 25 ± 1 �C on an orbital shaker (OrbiShake shaker,LabotecRepublic of South Africa) at 80 rpm. Culture purity wasmaintained by regular sub-culturing and observation using theNikon eclipse 80i microscope under 1000� magnification.
2.2. Microalgal biomass concentration
Microalgal biomass was determined indirectly by opticaldensity (OD680) (Wang et al., 2009), using a spectrophotometer(Spectroquant� Pharo 300, Merck Germany). Standard curves(Eq. (1) and (2)) were generated for biomass determination(DCW) for C. sorokiniana in wastewater and BG11 mediumrespectively:
y ¼ 0:1101x� 0:0009; R2 ¼ 0:9748 ð1Þ
y ¼ 0:1403x� 0:0764; R2 ¼ 0:9682 ð2Þ
Biomass concentrations were calculated using Eq. (1) for wastewa-ter and Eq. (2) for BG11 media, results expressed in g L�1.
2.3. Nitrogen source and concentration
Urea (1.5 g L�1), sodium nitrate (NaNO3) (1.5 g L�1), ammoniumnitrate (NH4NO3) (1.5 g L�1) and potassium nitrate (KNO3)(1.5 g L�1) were used to supplement post-chlorinated wastewatercollected from a domestic activated sludge wastewater treatmentplant. Post-chlorinated wastewater with N = 0 g L�1 was used asa control. The wastewater effluent was filtered through 0.45 lnitrocellulose filters to ensure the medium was free from bacterialcontamination. Experimentation was carried out in triplicate overa period of 21 days. Further experimentation was conducted usingfiltered wastewater supplemented with urea as it was found to bea superior N source in terms of biomass production. Urea concen-trations were varied (0; 0.25; 0.5; 0.75; 1; 1.25; 1.5; 1.75; 2; 4; 6; 8and 10 g L�1) in order to establish the optimal concentration toproduce sufficient biomass as well as high lipid content. The culti-vation period was 30 days for the urea optimization experiments,and the culture was analyzed daily for biomass and every 3 daysfor lipid accumulation as discussed under staining of algal cells(Section 2.4). Complete BG11 medium and un-supplementedwastewater ([N] 6 0.001 g L�1) were used as the positive controland the negative controls, respectively.
2.4. Semi quantitative lipid determination
BODIPY 505/515 (4,4-difluoro-1,3,5,7-tetramethyl-4-bora-3a,4a-diaza-s-indacene, Invitrogen Molecular Probes, Carlsbad,CA) was used to determine lipid content of microalgal cells viathe relative fluorescence staining technique. Quantitative estima-tion of lipids was performed using BODIPY staining as per theprotocol described by Govender et al. (2012) using a Carl ZeissAxiolab HBO 50 epi-fluorescence microscope and Zeiss Axiovision8 software (Carl Zeiss, Germany).
2.5. Pulse amplitude modulated fluorometry
Non-invasive fluorescence measurements were used to deter-mine the effect of nutrient levels on the physiology of C. sorokini-ana using a Dual-PAM 100 Chlorophyll Fluorometer (HeinzWalzGmbh, Effeltrich, Germany). Rapid light curves were gener-ated by applying a sequence of increasing actinic irradiance in 15discrete increments. The culture was exposed to a Saturation Pulse(SP) for 10 s of actinic light, before a blue light, (0.6 s at10,000 lmol photons m–2 s�1) was applied to determine the Elec-tron Transport Rate (ETR) for each irradiance level. Photon irradi-ance (400–700 nm) incident on the sample surface was measuredusing a Photosynthetically Active Radiation (PAR) micro-sensor(Spherical MicroQuantum Sensor US-SqS/W, Waltz) connected tothe PAM fluorometer control unit. Relative Electron Transport Rate(rETR) was calculated as per White et al. (2011):
rETR ¼ F 0q=F 0m � PPFD ð3Þ
where F 0q ¼ ðF0m � F 0Þ. Where F 0m is maximum fluorescence in a light
adapted sample and F0 is dark fluorescence yield. F 0q=F 0m is termedthe Photosystem II (PS II) operating efficiency and estimates theefficiency of light usage absorbed by PS II. At a given photosynthet-ically active photon flux density (PPFD) this parameter provides anestimate of the quantum yield of liner electron flux through PS II.
The quantum efficiency of PS II charge separation (Fv/Fm) wascalculated as Genty et al. (1989):
L. Ramanna et al. / Bioresource Technology 168 (2014) 127–135 129
Fv=Fm ¼ ðFm � FoÞ=Fm ð4Þ
where Fm is maximum fluorescence in a dark adapted sample and Fo
is minimum fluorescence in a dark adapted sample, resulting in thevariable fluorescence Fv. All determinations were carried out indarkness as all PS II reaction centers are open.
2.6. Cell disruption and lipid extraction
Biomass was harvested from both culture media using centrifu-gation (Heraeus multifuge 4KR, USA) and lyophilized (LTE MiniLyotrap, Lancashire, UK). Samples were analyzed in triplicate. Drybiomass (0.2 g) was crushed using a mortar and pestle and addedto 50 mL centrifuge tubes followed by the addition of 4 mL of chlo-roform–methanol (2:1 v/v) and disrupted by sonication for 2 minat 20 MHz (Misonix Ultrasonic Liquid processor XL 2000 series,NY, USA). The mixtures were then centrifuged (Heraeus multifuge4KR, USA) at 2000�g for 15 min at 4 �C. The supernatant was thentransferred into 50 mL centrifuge tubes, and the process wasrepeated. The biomass pellet was then discarded and the superna-tant was pooled. Ultrapure Water (4 mL) was added to the samplesand shaken for 5 min, followed by centrifugation, separation andfiltering of the lipid fraction. The samples were evaporated, in anincubator (Labcon, RSA) at 60 �C for 24 h to remove solvent. Theweight of the crude lipid obtained from each sample was measuredusing an analytical balance (Mettler Toledo, USA).
2.7. Fatty acid composition analysis
Fatty acid analysis was performed using Gas chromatography(GC). Lipid samples were decanted into capped vials and then sub-jected to methanolysis with 5% H2SO4 and methanol in 30:1 meth-anol to oil molar ratio at 60 �C for 4 h in presence of 1 mL hexane asreaction solvent. Stirring rate was kept constant at 200 rpm.200�lL samples were removed and washed with distilled water.Thereafter, the phase containing the fatty acids was separatedand recovered for further analysis. The fatty acid methyl esters(FAME) were then analyzed using gas chromatography (ShimadzuGC-2014, Japan) equipped with a flame ionization detector and acapillary column (SP2380, Supelco Analytical, USA). The oven tem-perature was programmed to start at 60 �C and kept at hold for2 min, then initially increased to 160 �C at a ramp rate of10 �C min�1 and then to 240 �C at a ramp rate of 7 �C min�1 andagain kept at hold for 1 min. The injector and detector temperaturewas 250 �C and N was used as carrier gas. The fatty acid compo-nents in lipids extracted from C. sorokiniana were identified bycomparing their retention times and fragmentation patterns with
0 5 10 150.0
0.5
1.0
1.5
2.0
2.5
Time (days)
Opt
ical
Den
sity
(680
nm
)
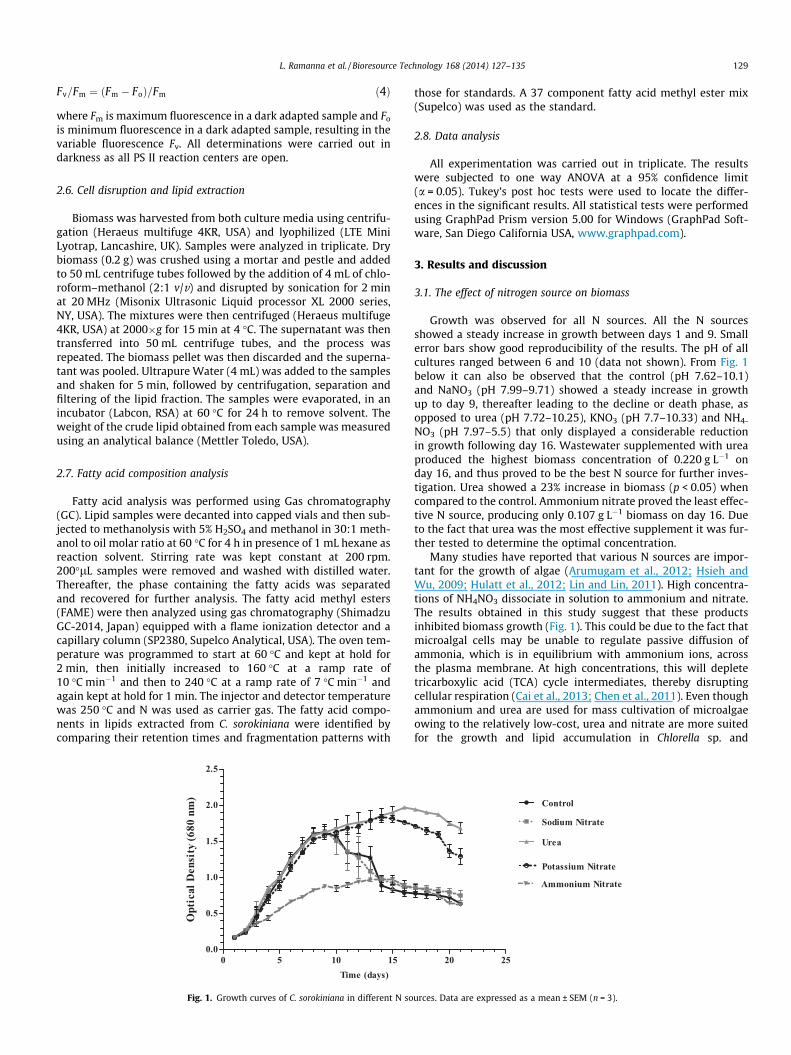
Fig. 1. Growth curves of C. sorokiniana in different N so
those for standards. A 37 component fatty acid methyl ester mix(Supelco) was used as the standard.
2.8. Data analysis
All experimentation was carried out in triplicate. The resultswere subjected to one way ANOVA at a 95% confidence limit(a = 0.05). Tukey’s post hoc tests were used to locate the differ-ences in the significant results. All statistical tests were performedusing GraphPad Prism version 5.00 for Windows (GraphPad Soft-ware, San Diego California USA, www.graphpad.com).
3. Results and discussion
3.1. The effect of nitrogen source on biomass
Growth was observed for all N sources. All the N sourcesshowed a steady increase in growth between days 1 and 9. Smallerror bars show good reproducibility of the results. The pH of allcultures ranged between 6 and 10 (data not shown). From Fig. 1below it can also be observed that the control (pH 7.62–10.1)and NaNO3 (pH 7.99–9.71) showed a steady increase in growthup to day 9, thereafter leading to the decline or death phase, asopposed to urea (pH 7.72–10.25), KNO3 (pH 7.7–10.33) and NH4-
NO3 (pH 7.97–5.5) that only displayed a considerable reductionin growth following day 16. Wastewater supplemented with ureaproduced the highest biomass concentration of 0.220 g L�1 onday 16, and thus proved to be the best N source for further inves-tigation. Urea showed a 23% increase in biomass (p < 0.05) whencompared to the control. Ammonium nitrate proved the least effec-tive N source, producing only 0.107 g L�1 biomass on day 16. Dueto the fact that urea was the most effective supplement it was fur-ther tested to determine the optimal concentration.
Many studies have reported that various N sources are impor-tant for the growth of algae (Arumugam et al., 2012; Hsieh andWu, 2009; Hulatt et al., 2012; Lin and Lin, 2011). High concentra-tions of NH4NO3 dissociate in solution to ammonium and nitrate.The results obtained in this study suggest that these productsinhibited biomass growth (Fig. 1). This could be due to the fact thatmicroalgal cells may be unable to regulate passive diffusion ofammonia, which is in equilibrium with ammonium ions, acrossthe plasma membrane. At high concentrations, this will depletetricarboxylic acid (TCA) cycle intermediates, thereby disruptingcellular respiration (Cai et al., 2013; Chen et al., 2011). Even thoughammonium and urea are used for mass cultivation of microalgaeowing to the relatively low-cost, urea and nitrate are more suitedfor the growth and lipid accumulation in Chlorella sp. and
20 25
Control
Sodium Nitrate
Urea
Potassium Nitrate
Ammonium Nitrate
urces. Data are expressed as a mean ± SEM (n = 3).

130 L. Ramanna et al. / Bioresource Technology 168 (2014) 127–135
Neochloris oleoabundans than ammonia (Lin and Lin, 2011). Ureadissociates to form CO2 and ammonium in solution via the ureaamido hydrolase pathway (urease enzyme). This ammonium isdirectly absorbed into the cell and accumulates to form aminoacids which are beneficial in the formation of chlorophylls whichare essential in the photosynthetic process (Kim et al., 2013;Wijanarko, 2011). It was also found that biomass yields and lipidproduction increased with CO2 addition. The additional CO2 disso-ciated in solution may have a dual effect by augmenting microalgalgrowth as well as providing excess carbon flux towards lipid pro-duction. This could be the reason for urea proving to be the mosteffective N source showing the highest biomass concentration of0.220 g L�1 (Arumugam et al., 2013; Lizzul et al., 2014).
Lizzul et al. (2014), found that C. sorokiniana showed a prefer-ence for ammonium as opposed to nitrate as a N source, whencomparing the growth characteristics and yield of C. sorokinianaon both wastewater and commercial medium [Bold’s basal med-ium (BBM)], whilst assessing the influence of exhaust gas on theprocess. Ammonium is favored over nitrate as a N source by mic-roalgae as there is no redox reaction required for its assimilationand thus requires less energy. Nitrate utilization only takes placewhen the ammonium is completely consumed in the medium.For this reason wastewaters with high concentrations of ammo-nium or supplemented with urea are readily used to rapidly growmicroalgae (Cai et al., 2013).
Wijanarko (2011), worked with Chlorella vulgaris Buitenzorgusing, NaNO3, urea, and NH3, as substituted N sources in Benneckmedium and diluted wastewater. They found that for industrialapplication purposes, utilization of wastewater that was supple-mented with N sources such as urea made biomass productionmore economical. Amongst the organic N sources tested, urea ispreferred for large-scale microalgal cultivation due to the fact thatit is less expensive as compared to other N sources (Hsieh and Wu,2009). C. sorokiniana cultivated in wastewater supplemented withNaNO3 showed its highest growth till day 8 and thereafter culturedeath. This may be due to the intercellular conversion of nitrate viathe nitrate reduction pathway to nitrite. Nitrite is reduced toammonium by nitrite reductase and ferredoxin. These two reac-tions require NADH to proceed. A decrease in cellular NADH would
Table 1Nitrogen source, concentration, biomass and lipid productivity of microalgal strains grow
Microalgae N source N concentration(g L�1)
Media
C. sorokiniana NOx 0.008 Final effluentNaNO3 + NOx 0.034 BBM
Scenedesmus rubescens (NH4)2CO3 48 Guilards f/2 mediuUrea 30NaNO3 85Urea + NaNO3 15 + 42.5
C. vulgaris Buitenzorg NaNO3 0.25 Benneck medium0.50.75
Urea 0.5NH3 0.047 Wastewater
C. sorokiniana Peptone 14 Kuhl medium + 20NH4ClKNO3
UreaGlycineNH4NO3
Yeast extractChlorella minutissima Ammonia 0.35 100% wastewaterC. sorokiniana NaNO3 1.5 Final effluent
UreaKNO3
NH4NO3
Urea (optimized)
a Denotes values estimated from graphical representations in figures.
reduce the production of intracellular lipid, protein and chloro-phyll formation and which would directly influence to cellulargrowth (Cai et al., 2013; Wijanarko, 2011).
Li et al. (2013) investigated the optimal N source for the hetero-trophic cultivation of C. sorokiniana. The microalga was grown onKuhl medium supplemented with glucose. One of their objectiveswas to find heterotrophic cultures, thus they used media formula-tions containing 20 g L�1 glucose and included peptone, NH4Cl,KNO3, urea, glycine, NH4NO3 or yeast extract as N sources, all hav-ing a N concentration of 0.14 g L�1. Among these N sources it wasfound that KNO3 gave the best result in producing biomass. This islikely due to the heterotrophic growth of C. sorokiniana as a resultof the presence of organic carbon. Glycine and urea were found tobe suitable N sources. Ammonium as a N source is generally pre-ferred by Chlorella sp., however, the study by Li et al. (2013)showed that NH4Cl and NH4NO3 barely supported microalgalgrowth. They concluded that growth was related to the pHdecrease (final pH 4.0) due to the assimilation of ammonium ions.Microalgae have the capability to grow over a wide pH range, butsuitable pH for growth is largely species-dependent. These findingscorrelate with our results as NH4NO3 proved to be the least affec-tive N source.
The effect of different N sources on microalgal lipid productionwas also investigated (data not shown). The results obtained showthat all N sources induced lipid production. Urea produced thehighest relative fluorescence per cell (rf/cell) lipid of 48.31%. Thecontrol, KNO3 and NH4NO3 had lipid concentrations below 35%.Potassium nitrate showed the lowest relative fluorescence per celllipid of 23.26%. A high concentration of NH4NO3 inhibited cellgrowth, and as cell growth declined, the lipids were used up as aform of storage energy. Table 1 shows comparative studies usingdifferent N sources to cultivate different strains of microalgae.
Nigam et al. (2011) studied Chlorella pyrenoidosa which wasgrown autotrophically in batch culture conditions in Fogg’smedium and tested the effect of different concentrations of Nsource (KNO3) on growth and lipid content. Their study found thatan initial concentration of 0.05 g L�1 KNO3 had the highest lipidaccumulation of 26% in the exponential phase of growth. Theirlipid values correlate with ours (KNO3 which was ±20% rf/cell). This
ing on different media formulations.
Biomass productivity(g L�1 day�1)
Lipid content (%) Reference
0.25 3.2 Lizzul et al. (2014)0.33 13
m 3.6a 26.7 Lin and Lin (2011)3.6a 30a
2.7a 35a
4.15 21.32a 30 Wijanarko (2011)2.4a 431.6a 401.8a 330.6a 57.1
g L�1 glucose 2.51 – Li et al. (2013)0.746.815.295.770.823.080.02 1 Singh et al. (2013)0.179 40.22 Present study0.220 48.310.201 23.260.107 26.250.218 61.52

L. Ramanna et al. / Bioresource Technology 168 (2014) 127–135 131
can be explained by the fact that they used a commercial mediaformulation and we used wastewater which had limited nutrientsand a low relative N concentration. Wijanarko (2011), found thatmicroalgae had a higher cellular lipid content of 57.1% in NH3
diluted wastewater than urea in Benneck medium which produced33%. They concluded that urea as a N source produced high cellularprotein within the microalgal cell which reduced cellular chloro-phyll increasing the lipid concentration.
3.2. Urea concentration optimization
The highest biomass concentrations were achieved on day 16(data not shown). Wastewater supplemented with 1.75 g L�1 ofurea showed the highest biomass concentration of 0.272 g L�1,when compared to the positive control (pc) and 1.5 g L�1 urea,which showed a biomass concentrations of 0.189 and 0.218 g L�1,respectively.
It was found that cultures supplemented with urea at 8 and10 g L�1 ceased to grow within a day of experimentation initiation.This could be attributed to the fact that there was an oversatura-tion of ammonium in solution, which is toxic to the microalgae.An excess of intracellular ammonium is known to inhibit the for-mation of adenosine triphosphate (ATP) in the chloroplast follow-ing substrate activation leading to growth inhibition (Wijanarko,2011). Wijanarko (2011), found that C. vulgaris Buitenzorg growthon Benneck medium supplemented with urea at concentrations of500 mg L�1 was impeded. Our findings are different to these in thaturea at 1.5 g L�1 proved to be optimal for biomass growth and lipid
3 6 9 12 150
20
40
(a)
Time (da
Perc
enta
ge r
f/cel
l
3 6 9 12 150
20
40
60
(b)
Time (day
Perc
enta
ge r
f/cel
l
Fig. 2. Lipid content of the microalga under varying urea concentrations as determinedData are expressed as a mean ± SEM (n = 10).
accumulation. This can be attributed to the differences in strains astheir strain was obtained from a culture collection as opposed toour indigenous wild type strain.
The pH of all cultures ranged between 6 at the start of experi-mentation to approximately 10 at the end. The rise in pH couldbe attributed to the growth of C. sorokiniana and the resultantuptake of dissolved CO2 (Lizzul et al., 2014). At the start of exper-imentation, all cultures showed an initial lipid concentration of19.23% rf/cell. (Fig. 2b) shows that 1.5 g L�1 urea showed the high-est rf/cell lipid throughout the experimentation as compared to theother concentrations. 0.25–1.75 g L�1 urea showed lipid percent-ages below 45% rf/cell lipid throughout the study and showed nolipid content by day 18. In (Fig. 2a), a fairly consistent lipid concen-tration was observed for the positive control (PC) up to day 30. Thiswas in contrast to the lipid concentration achieved for the negativecontrol which showed a high concentration of 47.75% rf/cell lipid(day 3) and decreased consistently to 4.65% rf/cell on day 18 of cul-tivation. A similar trend can be observed with 4 g L�1 from 3 to21 d�1. Even though 1.75 g L�1 urea showed the highest biomassconcentrations, the lipid concentration was low at 38.51% rf/celllipid on day 15.
The lipid content of the algae in wastewater supplemented with1.5 g L�1 urea showed a 3.35% increase from day 9 (58.14%) to day24 (61.53%). This can be attributed to the fact that adequate N wasavailable at the start of experimentation but by day 24 most if notall was utilized by the microalgae for growth. Therefore, a higherlipid value was observed for day 24. Similar results were reportedby Widjaja et al. (2009), when they investigated factors influencing
18 21 24 27 30
PC
0 gL-1
0.25 gL-1
0.5 gL-1
0.75 gL-1
1.0 gL-1
1.25 gL-1
ys)
18 21 24 27
1.5 gL-1
1.75 gL-1
2 gL-1
4 gL-1
6 gL-1
8 gL-1
s)
by relative fluorescence. (a) Positive control – 1.25 g L�1 urea. (b) 1.5–8 g L�1 urea.

132 L. Ramanna et al. / Bioresource Technology 168 (2014) 127–135
lipid production on the freshwater microalgae C. vulgaris. Theirresults suggested that lipid concentration was higher at day 20than at day 15 of incubation as N starvation resulted in higheraccumulation of lipid inside the cells. Our findings show that therewas no significant increase (p > 0.05) from day 9 to day 24 and bio-mass can be harvested for lipid extraction on day 9. This shortercultivation period could allow for higher overall productivity.Wijanarko (2011), reported that C. vulgaris Buitenzorg cultivatedusing diluted urea concentrations induce higher lipid formation.This is in accordance to our findings as a mid to lower urea concen-tration 1.5 g L�1 accumulated higher lipid content in our Chlorellastrain. This is due to the fact that urea metabolism does not con-sume NADH, which is also necessary for intracellular lipidformation.
Hsieh and Wu (2009), cultivated Chlorella sp. in batch mode onWalne’s nutrient medium made with artificial seawater supple-mented with urea to assess biomass and lipid productivity. Itwas found that an increase in the urea concentration led to adecrease in lipid content of cells. This is in accordance to our find-ings where a lower urea concentration (61.5 g L�1) induced higherlipid formation and 1.75–8 g L�1 urea showed lower lipid percent-ages per cell. Nitrogen limitation results in cellular changes includ-ing: reduction of the cellular content of the thylakoid membrane,acyl hydrolase activation and induction of phospholipid hydrolysis.These changes result in an increase in intracellular fatty acid acyl-CoA while N limitation activates diacylglycerol acyltransferase,which converts acyl-CoA to triacylglycerides (TAGs). Consequently,N deficiency ultimately leads to an increase in lipid and TAG con-tent in microalgal cells (Xin et al., 2010).
Lipid concentration for all cultures was approximately 19.23%rf/cell. At day 3 the lipid concentration increased to �43.97% rf/celland day 9 to �58.14%, whilst the highest lipid concentration of�61.53% rf/cell at day 24. The microalgal culture produced andaccumulated more lipid toward the end of the study which is incorrelation with (Fig. 2b). As per literature it can be deduced thatas N concentrations decrease in the culture medium an increasein lipid and TAG content in microalgal cells can be observed. Thisis characteristic of most oleaginous microalgae (Xin et al., 2010).
3.3. PAM fluorometry
3.3.1. The quantum efficiency of PS II charge separation (Fv/Fm)Pulse amplitude modulation fluorometry together with the sat-
urated pulse method is now a widely accepted method for non-invasive assessment of the photosynthetic electron transport inalgae and cyanobacteria (Garrido et al., 2012; Schreiber et al.,2012). This technique measures the fluorescence emitted by thepigments present in PS II which is a direct representation of thephotochemical energy conversion of PS II reaction centre’s(Garrido et al., 2012; Jiang et al., 2012; Schreiber et al., 2012).
Photosynthetic parameters were tested to determine the phys-iology of the strain at different urea concentrations. At the start ofexperimentation all cultures showed a Fv/Fm of 0.7 (Fig. 3). Micro-algal strains with Fv/Fm ratios >0.5 are typically linked with anacceptable physiological acclimation of algae to environmentalconditions, therefore, at the start of experimentation the strainunder study was adequately acclimatized (Garrido et al., 2012).As can be seen from the figure, Fv/Fm values at all urea concentra-tions declined considerably, the positive control; 1.5; 4 and 6 g L�1
showed a 34.00%; 81.50%; 98.50% and 93.68% decline, respectively.Changes in Fv/Fm provided essential information on the effects ofthe microalgal physiology under different urea concentrations(Garrido et al., 2012; White et al., 2011). It can be observed fromFig. 3a, the positive control showed a slight decline in Fv/Fm valueup till day 30. Although wastewater supplemented with 1.5 g L�1
urea showed a high initial Fv/Fm of 0.665 it slowly decreased as
the experiment proceeded to day 27, signifying the culture reach-ing death phase. The decrease in the Fv/Fm values on day 3 in bothgraphs (Fig. 3a and b) can be attributed to culture acclimation. InFig. 3b, 8 and 10 g L�1 show a Fv/Fm value of 0 at day 6. This isbecause the culture died after day 3 as these urea concentrationsproved too toxic for the microalgae to handle.
Lower Fv/Fm values have been associated with stress to thephysiology of the microalgae due to nutrient limitation. Nutrientstressed conditions alter the carbon utilization pathway from pro-duction of cellular components to energy storage components suchas lipids. Nitrogen limitation decreases the protein content whilstincreasing lipid accumulation and storage. Nitrogen limitation alsoresults in a decrease of the photosynthetic efficiency of the micro-algae (Garrido et al., 2012; Jiang et al., 2012; Wijanarko, 2011). Thisis evident in Fig. 2b as on day 24, 1.5 g L�1 urea showed the highestlipid content as well as Fv/Fm values showed a 43.3% decline on day24. A drastic decline in the normal functioning of the cell inducedthe formation and accumulation of intracellular lipids which canbe seen in Figs. 2–4 (White et al., 2011). The positive control main-tained Fv/Fm values above 0.5 throughout the duration of thisstudy, and only showed a decrease on day 27 which was consid-ered the death phase for this strain. Lowered urea concentrationsshow higher Fv/Fm values (0.25–1.75 g L�1). Higher urea concentra-tions (4–10 g L�1) were also found to have lower Fv/Fm values asammonium toxicity leads to reduced ATP formation. LoweredATP concentrations affect the efficiency of PS II, primarily as aresult of reduced photosynthetic pigments, which ultimatelydecrease the rate of photosynthesis and cellular death (Whiteet al., 2011). A decline in photosynthetic efficiency can be shownby a decrease in the Fv/Fm values.
3.3.2. Photosystem II (PS II) operating efficiency (rETR)Relative Electron Transport Rate is a measure of the rate of lin-
ear electron transport through PS II, which is correlated with theoverall photosynthetic performance of the microalgae (Whiteet al., 2011).
The strain showed an increase in rETR within the first 3 days(Fig. 4). This may be due to the acclimatization of the microalgaeto the new environment. A urea concentration of 1.5 g L�1, rETRshowed a steady state up to day 21 before decreasing. This sug-gests that PS II-dependent electron transport at this urea concen-tration was not completely inhibited when compared to theother concentrations (Hsieh and Wu, 2009). The highest rETR valuereached by cultures growing in 1.5 g L�1 was 15.23 on day 6. InFig. 4a, 1.25 g L�1 urea showed the highest rETR value of 19.13on day 12. The lowest rETR value is seen for 0.5 g L�1 urea between6 and 12 d�1 and eventually decline to an ultimate rETR value of 0showing culture death. The positive control maintained a higherrETR as opposed to urea concentrations. This can be attributed tothe fact that the positive control was complete BG11 media whichhas all the necessary nutrients to support microalgal growth. In(Fig. 4b), 8 and 10 g L�1 urea treatments show high rETR valuesof 19.3 and 19.7, respectively at day 3 and thereafter show a 0value at day 3 indicating culture death. Cultures growing in ureaconcentrations of 0; 2; 4 and 6 g L�1 died at 18; 27; 24 and 21 d�1.
White et al. (2011), used PAM fluorometry to assess microalgalnutrient stress and monitor cellular lipid formation. They foundthat with a depletion of N the microalgae showed a significantchange in the physiological parameters measured. A 75% decreasein the maximum rETR value was noted when compared to the con-trol. Our findings show that as the urea concentration increases,the rETR decreases. This is likely due to nutrient toxicity. Uptakeof ammonium reduces the efficiency of PS II, which decreases therate for photosynthesis, which ultimately leads to microalgal death(Hulatt et al., 2012). Our findings show that excess ammonium, ledto growth inhibition by disrupting the normal production of ATP in

0 3 6 9 12 15 18 21 24 27 300.0
0.2
0.4
0.6
0.8
Positive Control
0 g L-1
0.25 g L -1
0.5 g L -1
0.75 g L -1
1.00 g L -1
1.25 g L -1
(a)
Time (days)
Fv/F
m
0 3 6 9 12 15 18 21 24 27 300.0
0.2
0.4
0.6
0.8 1.5 g L-1
1.75 g L-1
2 g L-1
4 g L-1
6 g L-1
8 g L-1
10 g L-1
Time (days)
(b)
Fv/F
m
Fig. 3. The maximum quantum yield of PS II (Fv/Fm) recorded under the different urea concentrations. (a) 0.25–1.75 g L�1. (b) Positive control – 10 g L�1. Data are expressed asa mean ± SEM (n = 3).
L. Ramanna et al. / Bioresource Technology 168 (2014) 127–135 133
the cell. This is evident by the drop in the rETR and Fv/Fm values forall the concentrations tested. These conditions reduce the normalcellular functions such as photosynthesis (rETR), respiration andsome enzyme activities.
3.4. Lipid analysis and FAME conversion
Microalgae modify their metabolic pathways to produce fattyacids as a result of different environmental conditions. C. sorokini-ana grown on wastewater shown higher lipid content(10.70 ± 1.414% DCW) as compared to that grown on BG11 med-ium (8.08 ± 0.601% DCW). Nitrogen depleted environments resultin increased fatty acid accumulation (Chia et al., 2013). Day 16showed accumulation of fatty acids as most if not all of the ureain the wastewater was depleted.
Microalgae produce fatty acids to serve as building blocks forthe formation of various types of lipids (Chia et al., 2013). Gas chro-matograph analysis of lipids extracted from C. sorokiniana grownon BG11 and wastewater shows a fatty acid profile consisting offatty acids with carbon chains ranging from C12:0 to C24:0(Fig. 5). The majority of the fatty acids were C16:0, C18:0, C18:1,C18:2 and C18:3, which, are most suitable for obtaining ideal bio-
diesel properties. Most microalgae have fatty acid chains rangingfrom C11 to C26, although chain lengths of C14 to C22 are typicallyobserved (Singh et al., 2014). Singh et al. (2013) found that Chlo-rella sp. grown in wastewater also showed a similar fatty acid pro-file with the majority of fatty acids comprising of carbon chainlengths of C14–C18. Environmental conditions like nutrientconcentrations and microalgal physiological state affect the degreeof saturation in microalgal lipids (Chia et al., 2013). The fatty acidcarbon chain length and degree of unsaturation will determinebiodiesel specifications. High levels of unsaturated fatty acidsinfluence biodiesel properties such as iodine value, cetane number,oxidative stability, cold flow and viscosity which will cause theresulting biodiesel to be off specification. Furthermore, fatty acidcomposition may influence the biodiesel emission properties suchas NOx emission. A blend of polyunsaturated fatty acids (PUFA),monounsaturated fatty acid (MUFA) and saturated fatty acids(SFA) in a balanced proportion will produce biodiesel with the bestproperties (Singh et al., 2014).
Microalgae grown in BG11 had a higher polyunsaturated fattyacid (PUFA) percentage than wastewater producing 26.9 ± 11.09%and 22.01 ± 6.96%, respectively. Wastewater had higher levels ofSFA and MUFA. This can be attributed to very low N concentrations

0 3 6 9 12 15 18 21 24 27 300
5
10
15
20
25
Positive Control
0 g L-1
0.25 g L-1
0.5 g L-1
0.75 g L-1
1.00 g L-1
1.25 g L-1
(a)
Time (days)
rET
R (
rela
tive
un
its)
0 3 6 9 12 15 18 21 24 27 300
5
10
15
20
25 1.5 g L-1
1.75 g L-1
2 g L-1
4 g L-1
6 g L-1
8 g L-1
10 g L-1
(b)
Time (days)
rETR
(rel
ativ
e un
its)
Fig. 4. Relative Electron Transport Rate recorded under the different urea concentrations. (a) 0.25–1.75 g L�1. (b) Positive control – 10 g L�1. Data are expressed as amean ± SEM (n = 3).
C12
:0
C14
:0
C16
:0
C16
:1
C18
:0
C18
:1
C18
:2
C20
:0
C18
:3
C20
:1
C22
:0
C22
:1
C22
:2
C24
:0
SFA
MU
FA
PUFA
OT
HER
S
0
10
20
30
40BG11
Wastewater
Fatty acids
Perc
enta
ge c
ompo
sitio
n
Fig. 5. Fatty acid profile of C. sorokiniana grown in BG11 media and wastewater (1.5 g L�1 urea) at day 16. Data are expressed as a mean ± SEM (n = 3).
134 L. Ramanna et al. / Bioresource Technology 168 (2014) 127–135
in the wastewater by the end of the study. This would affect theamounts of fatty acids as well as the qualitative variations of fattyacids within the cell. Under N limitation, SFA increases in the pro-portion to MUFAs, and there is a decrease in the PUFAs (Chia et al.,2013).
Wastewater grown C. sorokiniana has shown a suitable lipidprofile to be used as a biodiesel feedstock; however has therequirement of acid catalysis due to the high free fatty acid (FFA)content. Biodiesel conversion was 12% higher in wastewater cul-ture than in BG11 culture yielding 62.97% and 50.36%, respectively.

L. Ramanna et al. / Bioresource Technology 168 (2014) 127–135 135
4. Conclusions
This study demonstrated the efficiency of urea as an N sourcefor microalgal cultivation using wastewater. Urea at 1.5 g L�1 wasfound to be the optimal concentration. The physiological responsesof C. sorokiniana exposed to post-chlorinated wastewatersupplemented with urea demonstrated by PAM fluorometry fur-ther justify the efficacy and suitability of this media formulation.C16:0, C18:0, C18:1, C18:2 and C18:3 fatty acids produced by C.sorokiniana are suitable for producing biodiesel. Using a relativelycheap N source like urea can certainly improve the techno-eco-nomics of large scale biodiesel production.
Acknowledgements
The authors hereby acknowledge the National Research Foun-dation (South Africa) and Durban University of Technology.
References
Arumugam, M., Agarwal, A., Arya, M.C., Ahmed, Z., 2012. Influence of organic wasteand inorganic nitrogen source on biomass productivity of Scenedesmus andChlorococcum sp.. Int. J. Energy Environ. 2 (6), 1125–1132.
Arumugam, M., Agarwal, A., Arya, M.C., Ahmed, Z., 2013. Influence of nitrogensources on biomass productivity of microalgae Scenedesmus bijugatus.Bioresour. Technol. 131, 246–249.
Borowitzka, M.A., Moheimani, N.R., 2013. Sustainable biofuels from algae. Mitig.Adapt. Strateg. Global Change 18 (1), 13–25.
Cai, T., Park, S.Y., Li, Y., 2013. Nutrient recovery from wastewater streams bymicroalgae: status and prospects. Renew. Sustain. Energy Rev. 19, 360–369.
Chen, M., Tang, H., Ma, H., Holland, T.C., Ng, K.Y.S., Salley, S.O., 2011. Effect ofnutrients on growth and lipid accumulation in the green algae Dunaliellatertiolecta. Bioresour. Technol. 102 (2), 1649–1655.
Chia, M.A., Lombardi, A.T., Melão, M.D.G.G., Parrish, C.C., 2013. Effects of cadmiumand nitrogen on lipid composition of Chlorella vulgaris (Trebouxiophyceae,Chlorophyta). Eur. J. Phycol. 48 (1), 1–11.
Garrido, M., Cecchi, P., Vaquer, A., Pasqualini, V., 2012. Effects of sampleconservation on assessments of the photosynthetic efficiency ofphytoplankton using PAM fluorometry. Deep Sea Res. 71, 38–48.
Genty, B., Briantais, J.M., Baker, N.R., 1989. The relationship between the quantumyield of photosynthetic electron transport and quenching of chlorophyllfluorescence. Biochim. Biophys. Acta 90, 87–92.
Govender, T., Ramanna, L., Rawat, I., Bux, F., 2012. BODIPY staining, an alternative tothe Nile red fluorescence method for the evaluation of intracellular lipids inmicroalgae. Bioresour. Technol. 114, 507–511.
Hsieh, C.-H., Wu, W.-T., 2009. Cultivation of microalgae for oil production with acultivation strategy of urea limitation. Bioresour. Technol. 100 (17), 3921–3926.
Hulatt, C.J., Lakaniemi, A.-M., Puhakka, J.A., Thomas, D.N., 2012. Energy demandsof nitrogen supply in mass cultivation of two commercially important
microalgal species, Chlorella vulgaris and Dunaliella tertiolecta. Bioenergy Res.,1–16.
Jiang, Y., Yoshida, T., Quigg, A., 2012. Photosynthetic performance, lipid productionand biomass composition in response to nitrogen limitation in marinemicroalgae. Plant Physiol. Biochem. 54, 70–77.
Kim, S., Lee, Y., Hwang, S.-J., 2013. Removal of nitrogen and phosphorus by Chlorellasorokiniana cultured heterotrophically in ammonia and nitrate. Int. Biodeterior.Biodegrad. 85, 511–516.
Li, T., Zheng, Y., Yu, L., Chen, S., 2013. High productivity cultivation of a heat-resistant microalga Chlorella sorokiniana for biofuel production. Bioresour.Technol. 131, 60–67.
Lin, Q., Lin, J., 2011. Effects of nitrogen source and concentration on biomass and oilproduction of a Scenedesmus rubescens like microalga. Bioresour. Technol. 102(2), 1615–1621.
Lizzul, A.M., Hellier, P., Purton, S., Baganz, F., Ladommatos, N., Campos, L., 2014.Combined remediation and lipid production using Chlorella sorokiniana grownon wastewater and exhaust gases. Bioresour. Technol. 151, 12–18.
Nigam, S., Rai, M.P., Sharma, R., 2011. Effect of nitrogen on growth and lipid contentof Chlorella pyrenoidosa. Am. J. Biochem. Biotechnol. 7 (3), 124–129.
Rawat, I., Ranjith Kumar, R., Mutanda, T., Bux, F., 2011. Dual role of microalgae:phycoremediation of domestic wastewater and biomass production forsustainable biofuels production. Appl. Energy 88 (10), 3411–3424.
Rawat, I., Ranjith Kumar, R., Mutanda, T., Bux, F., 2013. Biodiesel from microalgae: acritical evaluation from laboratory to large scale production. Appl. Energy 103,444–467.
Schreiber, U., Klughammer, C., Kolbowski, J., 2012. Assessment of wavelength-dependent parameters of photosynthetic electron transport with a new type ofmulti-color PAM chlorophyll fluorometer. Photosynth. Res. 113 (1–3), 127–144.
Singh, S.K., Bansal, A., Jha, M.K., Jain, R., 2013. Production of biodiesel fromwastewater grown Chlorella minutissima. Indian J. Chem. Technol. 20, 341–345.
Singh, B., Guldhe, A., Rawat, I., Bux, F., 2014. Towards a sustainable approach fordevelopment of biodiesel from plant and microalgae. Renew. Sustain. EnergyRev. 29, 216–245.
Wang, L., Min, M., Li, Y., Chen, P., Chen, Y., Liu, Y., Wang, Y., Ruan, R., 2009.Cultivation of green algae Chlorella sp. in different wastewaters from municipalwastewater treatment plant. Appl. Biochem. Biotechnol. 162 (4), 1174–1186.
Watanabe, M.M., Kawachi, M., Hiroki, M., Kasai, F., 2000. NIES-Collection List ofStrains, Microalgae and Protozoa. Microbial Culture Collections, sixth ed.National Institute for Environmental Studies, Tsukuba, Japan.
White, S., Anandraj, A., Bux, F., 2011. PAM fluorometry as a tool to assess microalgalnutrient stress and monitor cellular neutral lipids. Bioresour. Technol. 102 (2),1675–1682.
Widjaja, A., Chien, C.-C., Ju, Y.-H., 2009. Study of increasing lipid productionfrom fresh water microalgae Chlorella vulgaris. J. Taiwan Inst. Chem. Eng. 40 (1),13–20.
Wijanarko, A., 2011. Effect of the presence of subtituted urea and also ammonia asnitrogen source in cultivied medium on chlorella’s lipid content. In: Shaukat,S.S. (Ed.), Progress in Biomass and Bioenergy Production. InTech, pp. 273–282.
Xin, L., Hong-ying, H., Ke, G., Ying-xue, S., 2010. Effects of different nitrogen andphosphorus concentrations on the growth, nutrient uptake, and lipidaccumulation of a freshwater microalga Scenedesmus sp.. Bioresour. Technol.101 (14), 5494–5500.
Zheng, Y., Li, T., Yu, X., Bates, P.D., Dong, T., Chen, S., 2013. High-density fed-batchculture of a thermotolerant microalga Chlorella sorokiniana for biofuelproduction. Appl. Energy 108, 281–287.
Copyright © 2022 FDOKUMEN