Effect of Inulin Supplemented UHT Milk Consumption on ...
12
Mal J Nutr 21(2): 219 - 230, 2015 Effect of Inulin Supplemented UHT Milk Consumption on Faecal Bifidobacterium sp. and Lactobacillus sp. of Healthy Children in Depok, Indonesia Syafiq A 1 , Sauriasari R 2* , Fikawati S 1 , Amelia P 3 , Soemijati A 3 , Christy M 1 & Saragih F 4 1 Center for Nutrition and Health Studies, Faculty of Public Health, Universitas Indonesia, Depok Indonesia 2 Faculty of Pharmacy, Universitas Indonesia, Depok, Indonesia 3 Department of Pharmacy, Faculty of Medicine and Health Sciences, Syarif Hidayatullah State Islamic University, Indonesia 4 PT Indolakto, Jakarta ABSTRACT Introduction: This study investigated the effect of inulin-supplemented ultra- high temperature (UHT) milk consumption on the number of Lactobacillus sp. and Bifidobacterium sp. in the faeces of healthy Indonesian children. Methods: This study used a double-blind, randomised, placebo-controlled pre-post designed clinical trial of 153 healthy participants (4-12 years old children) who received UHT milk supplemented by 1 mg (n = 50), or 1.5 mg of inulin (n = 48), or placebo (n = 55). They received two servings per day over a course of 21 days with a 3-day wash-out period. Children assisted by parents were asked to complete a three-day food record prior to the course and to fill-in a FAQ over the 21-day period of this study. The faecal samples of the subjects were grown on calcium carbonate-MRS agar medium. The colonies which showed a clear zone were isolated and tested for Lactobacillus sp. and Bifidobacterium sp. using catalase test, Gram staining, and RapID™ ANA II. Results: No significant difference was found on colony counts before treatment (p = 0.986) and on inulin dosage given to all three groups (p = 0.453). Post-treatment, showed significant difference in colony counts between treatment groups (p=0.046 for 2 g/day group and p=0.049 for 3 g/day group) and placebo, but no significant difference was found between the two treatment groups. Conclusion: This study demonstrated that inulin-supplemented UHT milk could help increase the amount of faecal Lactobacillus sp. and Bifidobacterium sp. regardless of the dosage. There was no difference in the amount of faecal Lactobacillus sp. and Bifidobacterium sp between the two dosage regimes (2 g and 3 g inulin per day). Key words: Bifidobacterium sp., Inulin, Lactobacillus sp., school children, UHT milk Correspondence: Ahmad Syafiq; Email: a-syafi[email protected]; [email protected] INTRODUCTION The human body is the host for many other living creatures and the human digestive system is a natural habitat for microorganisms. A symbiotic mutualism occurs between digestive bacteria and humans, where humans provide a nutrient rich habitat for the bacteria while the bacteria provide many benefits to their host (Hooper, Midtvedt & Gordon, 2002). Bacteria can help in fermenting substrates that are naturally indigestible to the human
-
Upload
khangminh22 -
Category
Documents
-
view
1 -
download
0
Transcript of Effect of Inulin Supplemented UHT Milk Consumption on ...
Inulin Supplementation and Micro Flora Growth in Healthy Children in Depok, Indonesia 219Mal J Nutr 21(2): 219 - 230, 2015
Effect of Inulin Supplemented UHT Milk Consumption on Faecal Bifi dobacterium sp. and Lactobacillus sp. of Healthy Children in Depok, Indonesia
Syafi q A1, Sauriasari R2*, Fikawati S1, Amelia P3, Soemijati A3, Christy M1& Saragih F4 1 Center for Nutrition and Health Studies, Faculty of Public Health, Universitas Indonesia, Depok
Indonesia2 Faculty of Pharmacy, Universitas Indonesia, Depok, Indonesia3 Department of Pharmacy, Faculty of Medicine and Health Sciences, Syarif Hidayatullah State
Islamic University, Indonesia4 PT Indolakto, Jakarta
ABSTRACTIntroduction: This study investigated the effect of inulin-supplemented ultra-high temperature (UHT) milk consumption on the number of Lactobacillus sp. and Bifi dobacterium sp. in the faeces of healthy Indonesian children. Methods: This study used a double-blind, randomised, placebo-controlled pre-post designed clinical trial of 153 healthy participants (4-12 years old children) who received UHT milk supplemented by 1 mg (n = 50), or 1.5 mg of inulin (n = 48), or placebo (n = 55). They received two servings per day over a course of 21 days with a 3-day wash-out period. Children assisted by parents were asked to complete a three-day food record prior to the course and to fi ll-in a FAQ over the 21-day period of this study. The faecal samples of the subjects were grown on calcium carbonate-MRS agar medium. The colonies which showed a clear zone were isolated and tested for Lactobacillus sp. and Bifi dobacterium sp. using catalase test, Gram staining, and RapID™ ANA II. Results: No signifi cant difference was found on colony counts before treatment (p = 0.986) and on inulin dosage given to all three groups (p = 0.453). Post-treatment, showed signifi cant difference in colony counts between treatment groups (p=0.046 for 2 g/day group and p=0.049 for 3 g/day group) and placebo, but no signifi cant difference was found between the two treatment groups. Conclusion: This study demonstrated that inulin-supplemented UHT milk could help increase the amount of faecal Lactobacillus sp. and Bifi dobacterium sp. regardless of the dosage. There was no difference in the amount of faecal Lactobacillus sp. and Bifi dobacterium sp between the two dosage regimes (2 g and 3 g inulin per day).
Key words: Bifi dobacterium sp., Inulin, Lactobacillus sp., school children, UHT milk
Correspondence: Ahmad Syafi q; Email: a-syafi [email protected]; [email protected]
INTRODUCTION
The human body is the host for many other living creatures and the human digestive system is a natural habitat for microorganisms. A symbiotic mutualism occurs between digestive bacteria and
humans, where humans provide a nutrient rich habitat for the bacteria while the bacteria provide many benefi ts to their host (Hooper, Midtvedt & Gordon, 2002). Bacteria can help in fermenting substrates that are naturally indigestible to the human
Syafi q A, Sauriasari R, Fikawati S, Amelia P, Soemijati A, Christy M & Saragih F 220
digestion system. Through bacterial assistance, humans can enjoy an increased supply of short chain fatty acids (SCFA), amino acids, vitamins and ions. Important bacteria in the human body that can improve health include the Lactobacillus sp. and Bifi dobacterium sp. These bacteria can help activate the human body’s immune system (Roberfroid, 2007).
Prebiotics are food components that cannot be hydrolysed in the upper digestive tract. They are fermented by intestinal microfl ora in the large intestine, and in turn, increase the amount of intestinal microfl ora. Research suggests that prebiotics can improve the symbiosis between the host and bacteria by stimulating the activity or by supporting the growth of bacteria in the gut (Roberfroid, 2007).
Inulin (β-(2,1)-fructans) is a reserve carbohydrate in many plants and is generally consumed in moderation in people’s daily diet. Inulin is classifi ed as a non-digestible oligosaccharide because it has the β-confi guration at C anomer2 contained in fructose monomers that do not get hydrolysed by the digestive enzymes that are specifi c to α-glycoside bonds (e.g., α-glucosidase, maltase, isomaltase, sucrose, etc.) contained in the small intestine. Inulin is forwarded to the large intestine/colon (Roberfroid, 2007). However, generally about 12-14% of the inulin is lost due to digestion in the small intestine. The cause of this loss is fermentation by the microbial population growing in the ileum (Kaur & Gupta, 2002).
Inulin is also known to have a prebiotic effect because it can stimulate the growth/activity of several types of digestive bacteria found in the colon, thus playing a role in improving digestive health (Kaur & Gupta, 2002). Inulin cannot be hydrolysed by enzymes in the gut and pancreas, and is selectively fermented by bacteria living in the gut ecosystem. Inulin can be found in a wide variety of plants, including vegetables and fruits. In addition, inulin is
also known as a functional food ingredient and is with a component of various types of beverages, yogurts, biscuits, and other dietary supplements.
Inulin works to promote the growth of bacteria in the colon. Based on in vivo and in vitro studies performed by Gibson & Wang (1994), the increase in colonic fermentation of inulin may enhance the growth of bifi dobacteria population. In addition, the prebiotic inulin-type also affects the fraction of lactobacilli, or other species of bacteria such as Clostridium and Eubacterium rectale coccoides. Research conducted by Bouhnik et al. (2007) showed that the consumption of 5 g of inulin per day (taken in two servings) provides a prebiotic effect by stimulating the growth of intestinal microfl ora. However, these fi ndings were limited to an adult population using only one dose (single dose), i.e. 5 g in two feeds. In addition, physiological factors and racial differences might have also affected the results. This study is designed to determine the optimal levels of inulin supplementation in UHT milk to support the growth of fecal Bifi dobacterium sp. and Lactobacillus sp. among school children in Depok City.
METHODS
This study of healthy children was a randomised, placebo-controlled, double-blind study with three parallel arms. The whole study was performed from September 2013 to January 2014.
The sample number was determined using the software Sample Size Determination in Health Studies Version 2.0.21 (Lun, Chiam & Aaron,1998) to test one-way hypotheses on mean difference, with a signifi cance level of 0.01 and 99% power. The minimum number of children required for the sample was 44 children.
Eligible participants were kindergarten and elementary school-children aged 4 to 12 years old. They must have fulfi lled the

Inulin Supplementation and Micro Flora Growth in Healthy Children in Depok, Indonesia 221
following exclusion criteria: no history of gastro-intestinal infections for at least one month prior to the study; not allergic to milk; and not having consumed antibiotics at least one month prior to the study. One hundred and eighty-nine children aged 4 to 12 years from one local kindergaten and several elementary schools at Depok City were included in this study. Prior to the intervention, a technical briefi ng was given to the parents about the three-day wash-out period. The intervention was carried out for twenty-one days. Routine visits were conducted on each of the twenty-one days of the intervention period by the trained investigation team.
Sixteen subjects were excluded from the analysis due to poor compliance.
Hence, at the end of this study, 153 subjects, consisting of 73 kindergarten/pre-school children, and 80 elementary school children remained for analysis (Figure 1). Each child received regular UHT milk twice per day (i.e., in the morning and during the day) for 21 days. Inulin preparation was procured by PT Indolakto and added to the UHT milk product as a supplement. The experiment was double-blind, in which the investigator and the subjects did not know what the individual subject received. Product codes were stamped in the production unit (factory). An independent statistician created the randomisation code prior to the experiments to ensure that everyone had an equal chance to be placed in any intervention group.
Figure 1. Study fl ow diagram
Syafi q A, Sauriasari R, Fikawati S, Amelia P, Soemijati A, Christy M & Saragih F 222
The 153 children involved in this study were randomly divided into three groups: 50 children in the 0 g inulin dose group; 48 children in the 2 g dose group; and 55 children in the 3 g dose group. The dosage used in this study was similar to that of other studies (Moro et al., 2002; Kim, Lee & Meyer, 2007). Servings of UHT milk had to be consumed twice per day (at 08.00 am and 01.00 pm). Each serving was provided in a non-labelled carton-package containing 100 ml UHT milk. The investigation team consisted of undergraduate students from the Faculty of Public Health, Universitas Indonesia who were trained in the study procedures prior to initiating the experiments. They assisted and ensured that all procedures were followed by the subjects during the period of this study. The subjects’ compliance was determined by weighing the milk box after each intervention. Moreover, subjects were assigned to a contact person who actively reminded them of their follow-up assessments.
This study was approved by the Committee of Experts for Research and Research Ethics FKM UI No. 70/H2.F10/PPM.00/2013 and the work described has been carried out in accordance with the Code of Ethics of the World Medical Association (Declaration of Helsinki). Permission was also received from the National Unity and Politics Board (KesBangPol) Depok, Health Offi ce of Depok City, and the Department of Education of Depok City. Parents or caregivers were asked to sign consent forms after a thorough explanation about the study including procedures to be followed and possible health consequences.
Food intake and assessment of clinical history Children assisted by parents or caregivers were asked to complete a three-day food record using the FAQ collected during the study period twice a week (at days 4, 7, 11, 14, 17, and 21) and report the history
of gastrointestinal disease and antibiotic consumption in the last month. Foods included in the FAQ form were milk, banana, shallots, garlic; yogurt, and cakes with milk as one of the main ingredients. Outcome measuresThe outcome measured in this study was the growth of Lactobacillus sp. and Bifi dobacteria sp. colonies in the faeces of children. Stool was collected at the beginning and at the end of the treatment period (twenty-one days) and the number of microfl ora colonies were counted to compare the differences between data before and after the administration of inulin. To control the outcome measurement, other measurements were implemented including food intake before and during treatment using FAQ as explained above, frequency of defecation, and the condition of the faeces in terms of consistency and weight. Parents or caregivers were asked to assist their child in the measurement.
Possible source of error that might have affected the validity of this study include contamination or changes in faeces during collection, storage, and transport from school to laboratory; changes in inulin consumption during the study period; and inaccuracy in recording food intake. To minimise the error and bias caused by the above sources, several measures were implemented. Firstly, faeces handling (i.e., collection, storage, and transport) was designed to maintain zero contamination and minimise exposure to the environment. Faeces were placed in tightly closed plastic tubes, and delivered to the laboratory within six hours of collection. Faeces condition was checked to ensure that no changes occurred before they were stored in a freezer prior to analysis.
Inulin consumption during the study period was controlled through the wash-out period before the experiment was started to make sure that all subjects had a similar level of inulin intake. Inulin
Inulin Supplementation and Micro Flora Growth in Healthy Children in Depok, Indonesia 223
intake was also monitored throughout the study period using three-day food records. To assist accuracy of the records, a list of inulin-rich food and beverage was provided with the record form.
Materials Materials used in this study were children’s stool samples. The following materials were also used: distilled water; sterile saline pro-analytic; nutrient agar (NA) (oxoid); Rogosa order; deMan Rogosa Sharpe (MRS) agar (Oxoid), CaCO3, 1 set of Gram staining (crystal violet, Lugol’s solution, alcohol 96%, and safranin); immersion oil; a solution of hydrogen peroxide (H2O2); rubbing alcohol; 70% alcohol; anaerogen indicator; RapID ANA II Panel; RapID inoculation fl uid; and RapID reagent spot. The tools used were as follows: incubators; a refrigerator 4°C; laminar air fl ow generator; micropipette; anaerojar; microcentrifuge tube; colony counters; spirit burner; inoculum needle; L rods; 15 ml falcon tube; 1 ml microtube; disposable petri dish; object glass; microscope falcon rack; rack microtube; autoclave; Erlenmeyer fl ask; hotplate stirrer; analytical balance; and PC Software ERIC.
Analysis of Lactobacillus sp. and Bifi dobacterium sp.Sample preparation Stool samples were collected at baseline (pre) and at the end (post) of the intervention phase. Fresh faecal samples were collected in the morning and were put in sterilised faecal containers. Faecal containers were then put in a cool box and transported to the laboratory, maximum within 6 hours after collection. In the laboratory, faecal samples were put into test tubes and dissolved in 0.9% physiological saline solution, and then stored in a refrigerator to be analysed within two days).
Preparation of materials and toolsAn autoclave was used to prepare and sterilise NA and MRS media prior to the analyses. The autoclave was maintained at 121°C for 15 min. A total of 18.6 g of MRS agar was put into Erlenmeyer fl asks. Then, 3 g of CaCO3 was added and dissolved in 300 ml of distilled water, before being heated and homogenised until dissolved.
Standard analysis of Lactobacillus acidophilus ATCC 4356 and Bifi dobacterium bifi dum ATCC 11863Sterile CaCO3-MRS media were poured into petri dishes. Once tepid, bacteria Lactobacillus acidophilus ATCC 4356 and Bifi dobacterium bifi dum ATCC 11863 were scratched onto the media using a loop. Subsequently, the bacteria were incubated for 48 h at 42⁰C under anaerobic conditions using an anaerobic jar.
Analysis of faeces The subjects were asked to provide a fecal sample, within six hours the fecal sample was transported to the laboratory. Upon delivery to the laboratory, 1 gram of the sample was weighed, put into a falcon tube containing 9 ml of sterile physiological NaCl 0.9% and homogenised to get equal suspension. The solution was gradually diluted from 100 to 107 (for pre-test sample). Due to the large amount of colonies in post-test samples, the dilution level was increased to 108. Then 0.1 ml of the suspension was distributed on a petri disc containing CaCO3-MRS. The disc was then reversed, incubated at 37oC for 48 h in an anaerobic condition using an anaerobic jar. Colonies with appropriate morphology providing a clear zone in agar media were counted using a colony counter.
Identifi cation of bacterial isolates using Gram staining Gram staining can be used to classify bacteria phenotypically based on the
Syafi q A, Sauriasari R, Fikawati S, Amelia P, Soemijati A, Christy M & Saragih F 224
cell wall thickness and composition of peptidoglycan and lipoproteins. The peptidoglycan layer of Gram-positive bacteria is 10-15 times thicker than Gram-negative bacteria.
Identifi cation of bacterial isolates using catalase test The isolate was taken out of the petri dish, and then placed on a glass object. One to two drops of H2O2 3% were added to the isolate and covered with a glass plate. If bubbles appeared, the isolate was categorised as catalase positive bacteria, and in the absence of bubbles, as catalase-negative bacteria.
Identifi cation of bacterial isolates using the RapID ™ ANA II Panel The analysis was done using RaPID isolate colonies, which were then rejuvenated in the CaCO3-MRS medium, and inoculated in the inoculation RapID fl uid until they reached an appropriate level of turbidity of McFarland 3. The suspension was put in a 10-well test panel, incubated for 4 to 6 h at 3oC and identifi ed using RapID kits at 37°C. The result was observed and compared to the Color Guide. Two drops of the reagent from the RapID ANA II system were put into wells number 3 to number 9, whilst two drops of Indole Spot reagent were put into well number 10. Results were observed after a period of 30 sec to less than 2 min. Observations were recorded and compared to the Color Guide. The obtained codes were checked using RapID software (http://www.remel.com/ERIC/).
The RapID ANA II system was used to identify the bacteria. According to manufacturer specifi cations, the system was accurate for the intended identifi cation of Lactobacillus sp. and Bifi dobacteria sp. The new (second) generation of the system used in this study was improved in terms of an updated database and an option for refrigerated storage before reagent addition (Marler et al., 1992).
Statistical analysisTo detect statistical signifi cance in mean differences between and within groups, paired and non-paired t-tests were performed. Paired t-tests were employed to compare means of colony counts before and after the intervention for each intervention group. The null hypothesis was that there is no difference in mean of colony count before and after the interventions. The non-paired or independent t-tests were conducted to detect differences in the mean between different groups of interventions. In both tests, signifi cance level was set at α=0.05.
RESULTS
Children’s daily consumption of inulin Average consumption of inulin for each of the groups was 7.61 g/day (0 g dose group), 7.43 g/day (2 g dose group), and 8.45 g/day (3 g dose group). Statistical test results showed no signifi cant difference in the children’s daily consumption of inulin by dose (Table 2). Food sources of inulin were milk, banana, shallots, garlic, onion leaf, yogurt, prebiotic drinks, bread, noodles, biscuits, and cakes.
Colonies of Lactobacillus sp. and Bifi dobacterium sp. were observed to have the following characteristics: round-shaped colonies with edges like wool, milk or cream white in colour, measuring 2-5 mm and convex. Colonies that had similar morphology to Lactobacillus sp. and Bifi dobacterium sp., and also showed a clear zone were counted. Gram staining results for Lactobacillus sp. showed a cell shape which was elongated, nearly spherical or forming short chains, measuring 0.5 to 1.2 by 1.0-10.0 μm. Bifi dobacterium sp. cells were observed in pairs forming a ‘V’ or ‘Y’ shape.
This study used the total plate count method based on dispersive techniques (spread plate). The dispersive technique was chosen because it produced a clear zone

Inulin Supplementation and Micro Flora Growth in Healthy Children in Depok, Indonesia 225
more readily and effi ciently. In addition, the dispersive technique facilitated the subsequent identifi cation of bacteria. To ensure the validity of results, catalase tests were conducted on samples of the colony; the tests gave negative results. Colonies were also identifi ed using the RapID ANA II kit which gave results similar to those of the dispersive technique. Results from the RapID™ ANA II Panel showed positive Bifi dobacterium sp. (86 to 99.9%) or Lactobacillus sp. (99.9%).
Comparison of the number of colonies before treatment Signifi cant differences were not observed in the number of colonies of Bifi dobacterium sp. and Lactobacillus sp. in all three groups before treatment (p value = 0.986). In the 0 g inulin dose group, the average pre-treatment of intestinal bacteria colony was 50.88 colony-forming units (CFUs) per gram of faeces and after twenty-one days of treatment, it increased by 108.87% to 159.75 CFUs per gram. In the 2 g of inulin
Table 1. Baseline characteristics of participants
Characteristics of participants Number (n) Percentage (%) Total
(N) (%)
Sex Male 72 47.0 153 100 Female 81 53.0
Age 4-6 Years 97 63.4 153 100 7-12 Years 56 36.6
Milk code A (379) 50 32.7 153 100 B (851) 48 31.4 C (462) 55 35.6
Study class Kindergarten 73 47.7 153 100 Elementary School 80 52.3
Table 2. Distribution of participants by inulin dosage group
Number of participants by inulin dosage
0 g/day 2 g/day 3 g/day
Gender Boy 28 15 29 Girl 22 33 26
Class level Kindergarten Class A 4 4 4 Kindergarten Class B1 5 3 5 Kindergarten Class B2 3 6 5 Kindergarten Class B3 5 7 5 Kindergarten B4 5 6 6 Elementary 1A 8 8 6 Elementary 1B 5 5 11 Elementary 5A 6 5 7 Elementary 5B 9 4 6 Total 50 48 55
Syafi q A, Sauriasari R, Fikawati S, Amelia P, Soemijati A, Christy M & Saragih F 226
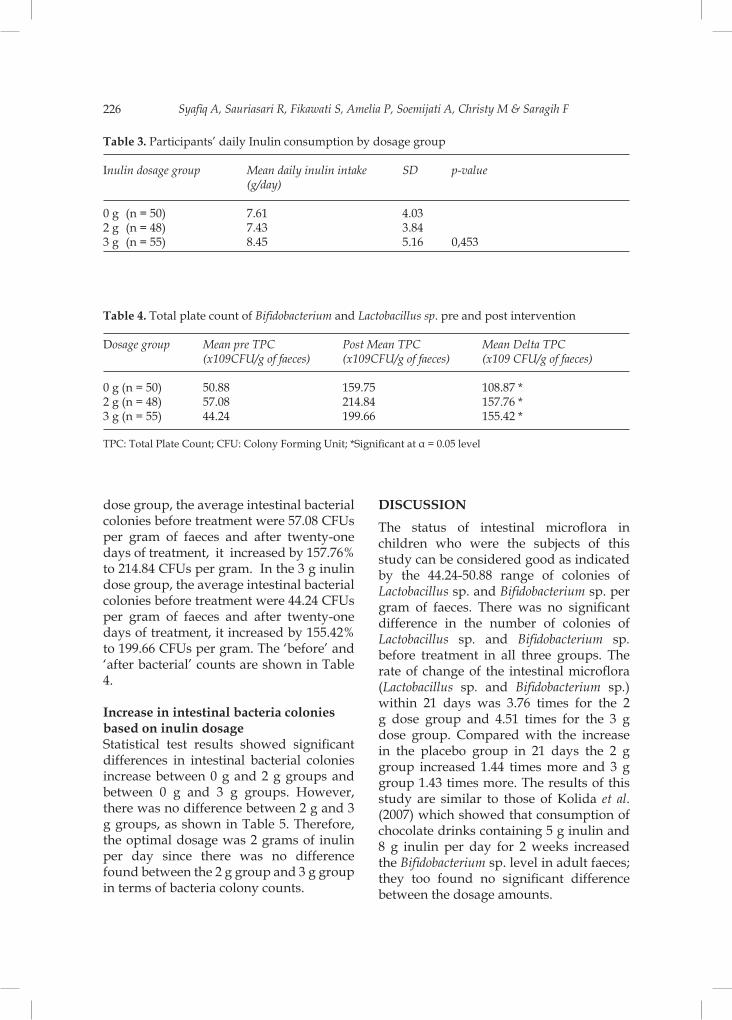
dose group, the average intestinal bacterial colonies before treatment were 57.08 CFUs per gram of faeces and after twenty-one days of treatment, it increased by 157.76% to 214.84 CFUs per gram. In the 3 g inulin dose group, the average intestinal bacterial colonies before treatment were 44.24 CFUs per gram of faeces and after twenty-one days of treatment, it increased by 155.42% to 199.66 CFUs per gram. The ‘before’ and ‘after bacterial’ counts are shown in Table 4.
Increase in intestinal bacteria colonies based on inulin dosageStatistical test results showed signifi cant differences in intestinal bacterial colonies increase between 0 g and 2 g groups and between 0 g and 3 g groups. However, there was no difference between 2 g and 3 g groups, as shown in Table 5. Therefore, the optimal dosage was 2 grams of inulin per day since there was no difference found between the 2 g group and 3 g group in terms of bacteria colony counts.
DISCUSSION
The status of intestinal microfl ora in children who were the subjects of this study can be considered good as indicated by the 44.24-50.88 range of colonies of Lactobacillus sp. and Bifi dobacterium sp. per gram of faeces. There was no signifi cant difference in the number of colonies of Lactobacillus sp. and Bifi dobacterium sp. before treatment in all three groups. The rate of change of the intestinal microfl ora (Lactobacillus sp. and Bifi dobacterium sp.) within 21 days was 3.76 times for the 2 g dose group and 4.51 times for the 3 g dose group. Compared with the increase in the placebo group in 21 days the 2 g group increased 1.44 times more and 3 g group 1.43 times more. The results of this study are similar to those of Kolida et al. (2007) which showed that consumption of chocolate drinks containing 5 g inulin and 8 g inulin per day for 2 weeks increased the Bifi dobacterium sp. level in adult faeces; they too found no signifi cant difference between the dosage amounts.
Table 3. Participants’ daily Inulin consumption by dosage group
Inulin dosage group Mean daily inulin intake SD p-value (g/day)
0 g (n = 50) 7.61 4.03 2 g (n = 48) 7.43 3.84 3 g (n = 55) 8.45 5.16 0,453
Table 4. Total plate count of Bifi dobacterium and Lactobacillus sp. pre and post intervention
Dosage group Mean pre TPC Post Mean TPC Mean Delta TPC (x109CFU/g of faeces) (x109CFU/g of faeces) (x109 CFU/g of faeces)
0 g (n = 50) 50.88 159.75 108.87 *2 g (n = 48) 57.08 214.84 157.76 *3 g (n = 55) 44.24 199.66 155.42 *
TPC: Total Plate Count; CFU: Colony Forming Unit; *Signifi cant at α = 0.05 level

Inulin Supplementation and Micro Flora Growth in Healthy Children in Depok, Indonesia 227
There was a signifi cant increase in the number of colonies of intestinal microfl ora before and after treatment in all dosage groups. A signifi cant increase also occurred in the placebo group indicating the presence of a placebo effect which is a phenomenon that is commonly encountered in clinical experimental research. The placebo effect is usually attributed to any additional treatment given to the participants (Kienle & Kiene 1997). In this study, it was the provision of milk to the placebo group. This suggests the possibility that the even the consumption of milk which does not contain inulin can improve the intestinal microfl ora count. For example, this could occur by elimination of harmful bacteria, making the environment more conducive to the growth of the intestinal microfl ora. Addition of inulin accelerates the improvement of intestinal microfl ora count (Guarner & Malagelada, 2003).
The analyses showed signifi cant differences in increase in intestinal bacterial colonies between the 0 g dosage group and the 2 g dosage group (p-value = 0.046) as well as between the 0 g dosage group and the 3 g dosage group (p-value = 0.049). This is in accordance with a study by Tokunaga et al. (1993) which found that 3 g/day consumption of pre-biotics can increase the count of Lactobacillus sp. and Bifi dobacterium
sp. signifi cantly in adults. Kim et al. (2007) had similar results in a study on infants; inulin consumption of 1 to 2 g/day was found to improve Lactobacillus sp. and Bifi dobacterium sp. counts. According to Roberfroid (2007), increased Lactobacillus sp. and Bifi dobacterium sp. in the guts of children aged 4 to 12 years old resulting from inulin consumption is due to the prebiotic characteristics of inulin. Inulin is resistant to gastric acid and can neither be hydrolysed by the digestive enzymes nor absorbed gastro-intestinally.
Inulin is also fermented by intestinal microfl ora and selectively stimulates the growth and activity of intestinal bacteria associated with health and well-being of the host (Gibson & Wang, 1994). Increased Lactobacillus sp. and Bifi dobacterium sp. can also be affected by the consumption of inulin contained in everyday foods, such as banana, onion, garlic and wheat (Loo & Coussement, 1995; Niness, 1999).
This study determined the effects of daily inulin consumption on Lactobacillus sp. and Bifi dobacterium sp. counts in the faeces of children. The analysis showed no signifi cant difference in Lactobacillus sp. and Bifi dobacterium sp counts by inulin dose (p-value = 0.453). Based on this result, it can be concluded that the increase in Lactobacillus sp. and Bifi dobacterium sp.
Table 5. Differences in the increase of intestinal bacterial colonies
Dose group Mean Delta TPC (X109CFU / g of feces) SD p-value
0 g (n = 50) 108.87 122.94 0,046 *2 g (n = 48) 157.76 116.00 Dose group Mean Delta TPC (X109CFU / g of feces) SD p-value0 g (n = 50) 108.87 122.94 0,049 *3 g (n = 55) 155.42 116.62
TPC: Total Plate Count; CFU: Colony Forming Unit; * Signifi cant at α = 0.05 level
Syafi q A, Sauriasari R, Fikawati S, Amelia P, Soemijati A, Christy M & Saragih F 228
in the intestines of children aged 4 to 12 years in this study was purely due to the consumption of inulin supplemented milk over the 21-day period.
Only two complaints appeared in this study: vomiting and abdominal sounds despite not being hungry (borborigmy) in participants after consuming inulin-supplemented UHT milk. Literature shows that inulin can be safely consumed, even by infants. Inulin is harmless, does not cause toxicity in target organs and reproductive organs or death or abnormality in the body, and is not carcinogenic. Several in vitro studies have shown that inulin does not have the potential to cause genetic mutations (Carabin & Flamm, 1999; Coussement, 1999, Clevenger et al., 1988) . In this study, there were no complaints of hypersensitivity to the provision of inulin in UHT milk products.
As inulin is found in everyday foods, the public has been exposed to inulin for several centuries and the consumption of foods containing inulin has been shown to be safe. Physiologically, carbohydrate mal-absorption can occur in the upper gastrointestinal tract, causing body intolerance to this substance. The fermentation process of complex carbohydrates may produce gas as a by-product (fl atus). When the amount of carbohydrates exceeds the capacity of the bacterial fermentation, diarrhoea can occur (Carabin & Flamm, 1999). Gastrointestinal symptoms that may occur include fl atus, fl atulence, increased frequency of bowel movements, diarrhoea, and nausea (Bonnema et al., 2010). Changes in stool consistency (diarrhoea) may occur due to the effect of inulin on the osmotic pressure in the colon which causes an increase in water content. Generally, these symptoms will increase with increasing inulin dose.
This study found an inulin dose of 2 g per day safe and benefi cial. This is far less than the dose in the study of
Bonnema et al. (2010) which found an inulin dose of up to 10 g/day to be quite safe. Tolerance evaluation was done by observing symptoms such as abdominal bloating, nausea, fl atus, abdominal pain, diarrhoea, constipation, and borborygmi. The frequency and severity of these symptoms were observed. The most commonly reported symptoms were abdominal bloating, fl atus, abdominal pain, and borborygmi with mild severity. Symptoms appeared to be related to the physiological condition of each individual. It is concluded that consumption of inulin, in reasonable doses, is harmless and can be tolerated by the human digestive tract. Symptoms that occurred within fair use were mild and harmless, which was in line with previous results reported by Bonnema et al. (2010).
The strengths of this study included the procedures to ensure compliance especially procedure of intervention provision where children drink milk in front of the researcher. The milk product was provided in non-labelled carton-packages, so the infl uence of brand bias was not a concern. The product was coded and stamped in the factory’s production unit. An independent statistician created the randomisation code prior to the study to ensure that everyone had an equal chance of inclusion in any intervention group. The drop-out rate was approximately 10% mainly due to non-compliance in faecal collection. The natural inulin content in daily food consumption was measured using the FAQ to prevent bias from baseline inulin status. In addition, analytical methods were verifi ed prior to sample analysis to ensure valid results. However, there are some limitations. First, our study results cannot be generalised as the study population was relatively homogeneous given that they were from the same school. The outcomes could not be measured molecularly (RapID ANA is a micro-method employing chromogenic

Inulin Supplementation and Micro Flora Growth in Healthy Children in Depok, Indonesia 229
substrates to confi rm the Bifi dobacterium sp. and Lactobacillus sp. isolated from faeces).
CONCLUSION
In conclusion, this study showed that inulin-supplemented UHT milk could help increase the amount of faecal Lactobacillus sp. and Bifi dobacterium sp. in school children at Depok. This study did not fi nd any signifi cant difference in the bacterial counts between the 2 g and 3 g inulin per day doses.
Confl ict of InterestThis study was supported by a grant from PT Indolakto. Although a fi nancial confl ict of interest was identifi ed, we declare that there was no intervention from PT Indolakto in study design and results.
ACKNOWLEDGEMENTS
The authors would like to thank Mardatillah, S.Gz for her contribution to this study and the study participants, their parents, kindergarten and elementary school staff and teachers for their cooperation. This work was supported by PT. Indolakto (Indonesia).
REFERENCESBonnema AL, Kolberg LW, Thomas W & Slavin
JL (2010). Gastrointestinal tolerance of chicory inulin products. J Am Diet Assoc 110(6): 865–868.
Bouhnik Y, Raskine L, Champion K, Andrieux C, Penven S & Jacobs H (2007). Prolonged administration of low-dose inulin stimulates the growth of bifi dobacteria in humans. Nutr Res 27(4): 187–193.
Carabin IG & Flamm WG (1999). Evaluation of safety of inulin and oligofructose as dietary fi bre. Regul Toxicol Pharmacol 30(3): 268–282.
Clevenger MA, Turnbull D, Inoue H, Enomoto M, Allen J A, Henderson LM & Jones E. (1988) Toxicological evaluation of neosugar: genotoxicity, carcinogenicity
and chronic toxicity. J. Am. Coll. Toxicol. 7: 643– 662.
Coussement PA. (1999). Inulin and oligofructose: safe intakes and legal status. J Nutr 129(7 Suppl):1412S-7S.
Gibson GR & Wang X (1994). Enrichment of bifi dobacteria from human gut contents by oligofructose using continuous culture. FEMS Microbiol Lett 121–127.
Guarner F & Malagelada JR (2003). Gut fl ora in health and disease. Lance 361(9356): 512–519.
Hooper L, Midtvedt T & Gordon J (2002). How host-microbial interactions shape the nutrient environment of the mammalian intestine. Annu Rev Nutr 22: 283-307.
Kaur N & Gupta AK (2002). Review Applications of inulin and oligofructose in health and nutrition. J Biosci 27(7): 703–714.
Kienle GS & Kiene H (1997). The powerful placebo effect: fact or fi ction? J Clin Epidemiol 50(12): 1311–1318.
Kim S, Lee D & Meyer D (2007). Supplementation of infant formula with native inulin has a prebiotic effect in formula-fed babies. Asia Pac J Clin Nutr 16: 172–177.
Kolida S, Meyer D & Gibson GR (2007). A double-blind placebo-controlled study to establish the bifi dogenic dose of inulin in healthy humans. Eur J Clin Nutr 61(10): 1189–1195.
Loo J Van & Coussement P (1995). On the presence of inulin and oligofructose as natural ingredients in the western diet. Crit Rev 35(6): 525–52.
Lun KC, Chiam PYW & Aaron C. (1998). Sample size determination in health studies software Version 2.0.21. WHO Collaborating Centre for Health Informatics and Medical Informatics Program National University of Singapore. Singapore.
Marler LM, Siders JA, Wolters LC, Pettigrew Y, Skitt BL, Allen SD. (1992). Comparison of fi ve cultural procedures for isolation of Clostridium diffi cile from stools. J Clin Microbiol 1992;30:514-6.

Syafi q A, Sauriasari R, Fikawati S, Amelia P, Soemijati A, Christy M & Saragih F 230
Moro G, Minoli I, Mosca M, Fanaro S, Jelinek J & Stahl B (2002). Dosage-related bifi dogenic effects of galacto- and fructooligosaccharides in formula-fed term infants. J Pediatr Gastroenterol Nutr 34: 291–295.
Niness K (1999). Inulin and oligofructose: what are they? J Nutr 1402–1406.
Roberfroid MB (2007). Introducing inulin-type fructans. Br J Nutr 93(SUPP): S13–S25.
Tokunaga T, Nakada Y, Yasuhiro T, Hirayama M & Hidaka H (1993). Effects of fructooligosaccharides intake on the intestinal microfl ora and defecation in healthy volunteers. Bifi dus 6: 143–150.