Tropical Agricultural Research
118
Tropical Agricultural Research Volume 30 Number 3 Editor-in-Chief Dr. U.W.A. Vitharana Postgraduate Institute of Agriculture University of Peradeniya Peradeniya, Sri Lanka May, 2019
-
Upload
khangminh22 -
Category
Documents
-
view
0 -
download
0
Transcript of Tropical Agricultural Research
Tropical Agricultural Research
Volume 30 Number 3
Editor-in-Chief
Dr. U.W.A. Vitharana
Postgraduate Institute of Agriculture
University of Peradeniya
Peradeniya, Sri Lanka
May, 2019

Editor-in-Chief Dr. U.W.A. Vitharana
B.Sc.(Peradeniya, Sri Lanka), M.Sc., Ph.D. (Ghent, Belgium)
Department of Soil Science,
Faculty of Agriculture,
University of Peradeniya,
Peradeniya, Sri Lanka. Editorial Advisory Board Prof. P. Abeygunawardena, Former Professor, Texas A & M University, U.S.A
Prof. B.F.A. Basnayake, University of Peradeniya, Sri Lanka
Prof. W.A.J.M. De Costa, University of Peradeniya, Sri Lanka
Prof. D.M De Costa, University of Peradeniya, Sri Lanka
Dr. H.M.V.G. Herath, University of Peradeniya, Sri Lanka
Prof. A. Hetherington, University of Bristol, United Kingdom
Dr. W. Jenner, Centre for Agriculture and Biosciences International, Switzerland
Prof. D. Kumaragamage, University of Winnipeg Winnipeg, Canada
Dr. B.E.P. Mendis, University of Peradeniya, Sri Lanka
Prof. N. Mukhopadhyay, University of Connecticut, USA
Prof. D. Pavelkova, Tomas Bata University in Zlin, Czech Republic
Prof. R. Pegg, University of Georgia, USA
Dr. B.L. Peiris, University of Peradeniya, Sri Lanka
Dr. N. Sanderatne, Postgraduate Institute of Agriculture, University of Peradeniya
Dr. U.W.A. Vitharana, University of Peradeniya, Sri Lanka
Dr. S. H. Wani, Michigan State University, USA
Prof. W.A.D.P. Wanigasundera, University of Peradeniya, Sri Lanka
Prof. M.P.B. Wijayagunawardhana, University of Peradeniya, Sri Lanka
Editorial Board Prof. D.U. Ahn, Iowa State University, USA
Prof. J.M.R.S. Bandara, University Brunei Darussalam, Brunei
Dr. R.S. Dharmakeerthi, University of Peradeniya, Sri Lanka
Prof. D. Banks, Duke University, USA
Prof. G.M. Hettiarachchi, University of Kansas, USA
Dr. N. S. Hettiarachchy, University of Arkansas, USA
Prof. V. Hurry, Swedish University of Agricultural Sciences, Sweden
Prof. K. Kawamoto, Saitama University, Japan
Prof. S. Kodithuwakku, University of Peradeniya, Sri Lanka
Dr. J. Lam, Memorial University, Canada
Prof. W.M.T. Madhujith, University of Peradeniya, Sri Lanka
Prof. B. Marambe, University of Peradeniya, Sri Lanka
Prof. J. Prohens, Universitat Politecnica de Valencia, Spain
Prof. G.L.L.P. Silva, University of Peradeniya, Sri Lanka
Prof. R.P. de Silva, University of Peradeniya, Sri Lanka
Prof. C. Sivayoganathan, Emeritus Professor, University of Peradeniya, Sri Lanka
Dr. R. Sulaiman, Centre for Research on Innovation and Science Policy (CRISP), India
Prof. R.O. Thattil, Emeritus Professor, University of Peradeniya, Sri Lanka
Prof. J. Weerahewa, University of Peradeniya, Sri Lanka
Prof. S. Wijesundara, National Institute of Fundamental Studies, Sri Lanka
Prof. C. Wilson, Queensland University of Brisbane, Australia

ISSN: 1016 – 1422 Abstracting and Indexing: The Journal is indexed by CAB Abstracts
© Postgraduate Institute of Agriculture
University of Peradeniya Peradeniya, Sri Lanka

EDITORIAL
The journal ‘Tropical Agricultural Research’ publishes the papers accepted upon rigorous
reviewing process. In the past, the journal ‘Tropical Agricultural Research’ carried
scholarly articles submitted to the annual congress. Moving a step further, the editorial
board welcomes submissions throughout the year. Further, submissions can be made
throughout the online submission system available at the official website of the PGIA. Over
the years, the journal has evolved as an international journal which is now abstracted and
indexed in CAB Abstracts. This issue of volume 30 of the journal contains an ensemble of
scholarly articles related to agriculture and allied fields those were presented at the 30th
Annual Congress of the Postgraduate Institute of Agriculture.
I extend my sincere thanks for the guidance and support rendered by the Director/PGIA, the
members of the Editorial Board, reviewers and the authors who submitted their research
work for publication.
Dr. U.W.A. Vitharana
Editor-in-Chief
May, 2019

i
CONTENTS
Research Articles
Antioxidant Potential of Selected Underutilized Fruit Crop Species Grown in Sri Lanka 1
M.A.L.N. Mallawaarachchi, W.M.T. Madhujith and D.K.N.G. Pushpakumara
Millet Phenolics as Natural Antioxidants in Food Model Systems and Human LDL/VLDL
Cholesterol in vitro 13
K.D.D. Kumari, W.M.T. Madhujith and G.A.P. Chandrasekara
Preliminary Evaluation of Probiotic Potential of Yeasts Isolated from Bovine Milk and Curd of Sri
Lanka
27
D.U. Rajawardana, I.G.N. Hewajulige, C.M. Nanayakkara, S.K.M.R.A. Athurupana and T.
Madhujith
Identification of Phosphorus Efficient Rice Cultivars under Low P Nutrition through Hydroponic
based Screening
43
D.S. Kekulandara, P.C.G. Bandaranayake, D.N. Sirisena, W.L.G. Samarasinghe and L.D.B.
Suriyagoda
Dynamics of Nitrifiers in Soils of Intensively Vegetable Cultivated Areas in Sri Lanka 55
K.K.K. Nawarathna, W.S. Dandeniya, R.S. Dharmakeerthi and P. Weerasinghe
Performance of Macrobrachium rosenbergii in Perennial Reservoirs: A Comparative Assessment of
Fisheries in Five Perennial Reservoirs in the Northern Province of Sri Lanka
69
R. Rajeevan, U. Edirisinghe and A.R.S.B. Athauda
Short Communications
Effect of Seaweed Extract (Kappaphycus alvarezii) on the Growth, Yield and Nutrient uptake of
Leafy Vegetable Amaranthus polygamous
81
S. Senthuran, B.L.W.K. Balasooriya, S.J. Arasakesary and N. Gnanavelrajah
Mineral Contents of Sri Lankan Rice Varieties as Affected by Inorganic Fertilization
89
H.M.A.J. Herath, G.A.P. Chandrasekara, U. Pulenthiraj, C.M.N.R. Chandrasekara
and D.G.N.G. Wijesinghe
Determination of Optimum Nitrogen Concentrations in Hydroponics for Tomato Grown in Coir
Medium in Tropical Greenhouse
97
H.R.U.T. Erabadupitiya, W.A.P. Weerakkody and K.A. Nandasena
Impact of Glass Ceiling on Women Career Development in Non-state Banking Sector in Colombo 105
U. K. S. M. Uduwella and M.W.A.P. Jayatilaka
Author Guide 109
Author Index 113

Tropical Agricultural Research Vol. 30 (3): 1 – 12 (2018)
Antioxidant Potential of Selected Underutilized Fruit Crop Species
Grown in Sri Lanka
M.A.L.N. Mallawaarachchi, W.M.T. Madhujith1* and D.K.N.G. Pushpakumara2
Postgraduate Institute of Agriculture
University of Peradeniya
Sri Lanka
ABSTRACT: Lyophilized aqueous extracts of four underutilized fruit species namely
Diospyros discolor (Velvet apple), Pouteria campechiana (Lavulu/Canistel), Phylanthus
acidus (Mal-Nelli/Star gooseberry) and Phyllanthus emblica (Nelli/Indian gooseberry) were
investigated for the antioxidant potential (AP) by 2,2-diphenyl-1-picrylhydrazyl (DPPH)
assay, 2,2-azino-bis-3-ethylbenzothiazoline-6-sulphonic acid (ABTS) assay and ferrous
reducing antioxidant power (FRAP) assay. Total phenolic content (TPC) and total monomeric
anthocyanin content (TMAC) were determined by Folin-Ciocalteu’s colorimetric assay and
pH differential method, respectively. Vitamin C (VitC) content of fresh fruit was evaluated
titrimertically and expressed as mg of ascorbic acid in 100 g of fresh weight (FW). The TPC
and TMAC were expressed as mg of gallic acid equivalents (GAE)/100g FW and mg of
cyanodin-3-glucoside (C3G)/100g FW. The measured parameters differed significantly among
four fruit species. The values ranged between 84.42 – 1939.70 mg GAE/100g FW, 10.41 –
55.64 mg C3G/100g FW, 0.067 – 310.63 mg FW/ml, 9 – 81.29%, 238.25 – 2891.57
Fe2+mol/100g FW and 17.12 – 523.14 mg/100g FW for TPC, TMAC, IC50, RSA, FRAP and
VitC, respectively. Phyllanthus emblica possessed highest values in all parameters while
Phyllanthus acidus showed the lowest except in TPC. The lowest TPC was observed in
Diospyros discolor. The extract of Pouteria campechiana also showed considerable amount
of TPC (640 mg C3G/100g FW), RSA (76%) and VitC of 53 mg/ 100g. The results revealed
that these underutilized fruit crops can be used as sources of natural antioxidants and
vitamin C.
Keywords: Antioxidant potential, total anthocyanin content, total phenolic content,
underutilized fruits crop species, Vitamin C
INTRODUCTION
Reactive oxygen species (ROS) are considered as harmful intermediates produced during
oxygen metabolism in biological systems. Excess ROS in the body can lead to cumulative
damage in proteins, lipids, and DNA, resulting in the condition termed as oxidative stress
(Dudonne et al., 2009). Antioxidants can effectively mitigate the oxidative damage in
biological systems by delaying or inhibiting the oxidation process caused by ROS (Shofian et
al., 2011). Numerous epidemiological studies have reported that the regular consumption of
fruits and vegetables is associated with the reduction of chronic diseases which are directly
1 Department of Food science and Technology, Faculty of Agriculture, University of Peradeniya, Sri Lanka 2 Department of Crop science, Faculty of Agriculture, University of Peradeniya, Sri Lanka
* Corresponding author: [email protected]

Mallawaarachchi et al.
2
linked with the oxidative stress. The increased intake of natural antioxidants, particularly the
antioxidative compounds present in fruits and vegetables contribute to the antioxidant capacity
of plasma and these constituents are reported to mitigate the damage caused by the oxidative
stress (Lie et al., 2005; Oviasogie et al., 2009; Vidhan et al., 2010; Bopitiya and Madhujith,
2012).
In nutritional sciences and medicine, there is much interest on analysis of vitamins such as C,
E and A as they are widely reported to have antioxidant activities via multiple mechanisms
(Rutkowski and Grzegorczyk, 2007). Vitamin C, reduces the risk of arteriosclerosis,
cardiovascular diseases and some forms of cancer (Jacob, 1996; Lee and Kader, 2000).
Vitamin C is also known to have many biological functions in collagen formation, absorption
of inorganic iron, reduction of plasma cholesterol level, inhibition of nitrosoamine formation,
enhancement of the immune system and reaction with singlet oxygen and other free radicals
(Lee and Kader, 2000). Both vitamin A and E are lipid soluble. Vitamin A is important for
normal vision, growth, ageing and reproduction (Adeolu and Enesi, 2013). Vitamin E
considered as a chain breaking antioxidant and reported that regular intakes are correlated with
a reduced risk of cardiovascular diseases (Flome and Traber, 1999) Therefore, these plant
extracts can be used as potential candidates to isolate natural antioxidants.Wide varieties of
fruit crop species are available in Sri Lanka. Besides major fruit crops, there is a large number
of fruit species that remain underutilized. As a result, their nutritive, medicinal and therapeutic
values are little known to date.
The commonly grown two members of the family Euphorbiaceae, namely Phyllanthus emblica
L. (Nelli/Indian gooseberry) and Phyllanthus acidus L. (Rata-Nelli/Star gooseberry) are
cultivated as backyard fruit species in Sri Lanka. The fruits of P. emblica eaten in fresh form
are considered as highly nutritious and therapeutic due to its high amount of Vitamin C,
antioxidant and polyphenol content (Pushpakumara and Heenkenda 2007). It is reported to use
in prevention and management of haemorrhage, anaemia, colic, acute leprosy, fits, insanity,
jaundice, cough, hiccough, indigestion, dyspepsia, asthma and other diseases in traditional
medicine (Jayaweera, 1981). P. acidus fruits may be eaten fresh after sprinkled with salt,
processed into pickle and sweetened dried fruits. In Malaysia, ripe and unripe fruits are cooked
and served as a relish, or made into a thick syrup or sweet preserve (Lim, 2012a). Ramasamy
et al. (2011) reported that leaves of P. acidus perform mild cytotoxicity on human breast cancer
cell line (MCF7), epidermal carcinoma of cervix cell line (CaSki), ovarian cancer cell line
(KO3) and colon cancer cell line (HT29). However, these fruit crops have been neglected in
Sri Lanka and their uses have not been properly exploited (Pushpakumara and Heenkenda
2007).
Pouteria campechiana (Kunth) Baehni. (Sapotaceae), Canistel locally known as Lavulu
mainly grown in home gardens of wet and intermediate zones of Sri Lanka. Due to its compact
crown and glossy leaves, the tree is used for landscaping as well. The fruit is consumed as a
dessert fruit or pickled with salt and pepper. The dehydrated pulp can be used as natural food
colorant especially in baked products. Lanerolle et al. (2008) reported that P. campechiana
fruit pulp is a rich source of pro-vitamin A carotenoids.
Diospyros discolor Willd. a member of family Ebenaceae commonly known as velvet apple,
normally grown in the home gardens of wet and intermediate zones of Sri Lanka as ornamental
and road side shade tree. It has been reported that fruits, leaves and bark of D. discolor is used
in traditional medicine to cure diarrhoea, cough, fever and dysentery. The ripe fruit is peeled
and eaten fresh or used in salad or stew or fried like a vegetable (Lim, 2012b). According to
Lee et al. (2006) the leaves of D. discolor possesses higher antioxidant activity. However to

Antioxidant Potential of Fruit Crop Species
3
the best of our knowledge, there are no previous reports on antioxidant potential of P.
campechiana and D. discolor fruit.
Present study was carried out to evaluate the antioxidant potential, total phenolic, total
anthocyanin and vitamin C contents of four underutilized fruit crop species namely,
Phyllanthus acidus, Phyllanthus emblica, Pouteria campechiana and Diospyros discolor.
METHODOLOGY
Chemicals and regents
The gallic acid, Folin-Ciocalteu’s phenol reagent, sodium carbonate, 2,2-azinobis (3-
ethylbenzothiazoline-6-sulfonic acid) diammonium salt (ABTS), 2,2-Azobis (2-
amidinopropane) dihydrochloride (AAPH), 2,2-diphenyl-1-picrylhydrazyl hydrate (DPPH), 2,
4, 6-tris (2-pyridyl)-1, 3, 5-triazine (TPTZ) and 2,6-dichlorophenolindophenol, were
purchased from Sigma, USA. All other chemicals used were of analytical grade.
Sample preparation
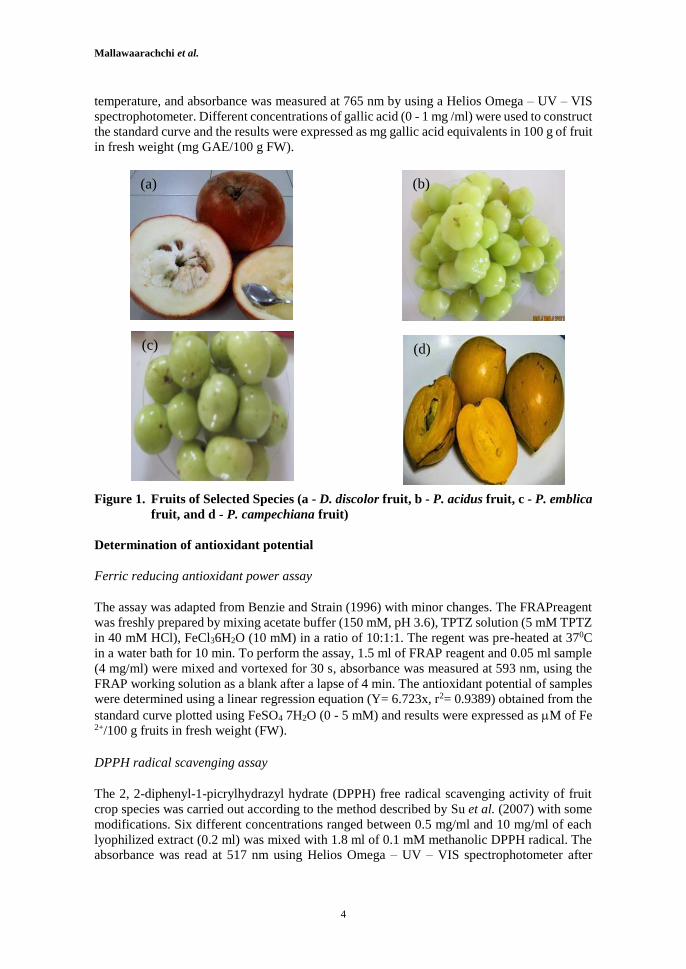
Fully matured fruits of P. acidus (Star gooseberry), P. emblica (Indian gooseberry) and fully
ripe fruits of P. campechiana (Canistel) and D. discolor (Velvet apple) (Figure 1) were
collected from the plants at mid fruiting stage from the home gardens in the Bandarawela
region belonging to the upcountry intermediate zone (IU3), Sri Lanka and transported to the
Regional Agriculture Research and Development Centre, Bandarawela under cold conditions.
The samples were sorted for physical and pest damages, washed with running tap water
followed by distilled water and drained to remove the surface water. Hundred grams of each
fruit was taken after removing seeds and outer skin of P. campechiana and D. discolor. Then
homogenized to prepare the composite sample. Six samples from each fruit were used to
prepare the composite sample. For the evaluation of total phenolic content total monomeric
anthocyanin content and antioxidant potential, 40 g of homogenates of each species were
extracted with 120 ml of distilled water by keeping on reciprocating shaker at 450 rpm for 90
min at room temperature followed by centrifugation at 4,500 rpm for 10 min. The supernatants
were collected separately and the extraction was repeated twice with residues, supernatants
were combined and lyophilized at -50 °C, 24 mbar for 96 h and subsequently stored at 20 °C
until further analysis.
To determine total phenolic content (TPC), ferric reducing antioxidant power (FRAP), total
antioxidant capacity (TAC) and total monomeric anthocyanin content (TMAC), twenty
milligrams of each lyophilized samples were dissolved in 3 ml of methanol, filtered using
whatman number one filter papers, the filtrates were volume up in the 5 ml volumetric flasks
with distilled water to have final concentration of 4 mg/ml. For the DPPH assay, 50 mg of
lyophilized samples were taken followed same procedure then six different concentrations
ranging between 0.5 mg/ml and 10 mg/ml were prepared.
Determination of total phenolic content
The TPC was measured using the method described by Yu et al. (2002) with slight
modifications. Briefly, 100 μl of 2 N Folin-Ciocalteu regent and 1.58 ml of distilled water were
added to 20 μl of each sample, vortexed, incubated at room temperature for 8 minutes,
subsequently 300 μl of 0.7 M sodium carbonate was added, incubated for 30 minutes at room
Mallawaarachchi et al.
4
temperature, and absorbance was measured at 765 nm by using a Helios Omega – UV – VIS
spectrophotometer. Different concentrations of gallic acid (0 - 1 mg /ml) were used to construct
the standard curve and the results were expressed as mg gallic acid equivalents in 100 g of fruit
in fresh weight (mg GAE/100 g FW).
Figure 1. Fruits of Selected Species (a - D. discolor fruit, b - P. acidus fruit, c - P. emblica
fruit, and d - P. campechiana fruit)
Determination of antioxidant potential
Ferric reducing antioxidant power assay
The assay was adapted from Benzie and Strain (1996) with minor changes. The FRAPreagent
was freshly prepared by mixing acetate buffer (150 mM, pH 3.6), TPTZ solution (5 mM TPTZ
in 40 mM HCl), FeCl36H2O (10 mM) in a ratio of 10:1:1. The regent was pre-heated at 370C
in a water bath for 10 min. To perform the assay, 1.5 ml of FRAP reagent and 0.05 ml sample
(4 mg/ml) were mixed and vortexed for 30 s, absorbance was measured at 593 nm, using the
FRAP working solution as a blank after a lapse of 4 min. The antioxidant potential of samples
were determined using a linear regression equation (Y= 6.723x, r2= 0.9389) obtained from the
standard curve plotted using FeSO4 7H2O (0 - 5 mM) and results were expressed as M of Fe 2+/100 g fruits in fresh weight (FW).
DPPH radical scavenging assay
The 2, 2-diphenyl-1-picrylhydrazyl hydrate (DPPH) free radical scavenging activity of fruit
crop species was carried out according to the method described by Su et al. (2007) with some
modifications. Six different concentrations ranged between 0.5 mg/ml and 10 mg/ml of each
lyophilized extract (0.2 ml) was mixed with 1.8 ml of 0.1 mM methanolic DPPH radical. The
absorbance was read at 517 nm using Helios Omega – UV – VIS spectrophotometer after
(a) (b)
(c) (d)

Antioxidant Potential of Fruit Crop Species
5
leaving the mixture for an hour in the dark at room temperature. The procedure was repeated
six times for each concentration. The control was prepared by adding 0.2 ml of methanol into
1.8 ml of DPPH radical. Using following formula, the radical scavenging activity (RSA) was
calculated as percentage of discoloration of DPPH radical.
RSA% = {1- (A sample/A control)} * 100
where; A sample is the absorbance of the sample at 517 nm and A control is the absorbance of the
control at 517 nm.
The results were expressed as IC50 values that denote the concentration of the sample required
(mg of FW/ml) to scavenge 50% of DPPH radicals, was derived from RSA vs Concentration
plot of each sample.
Determination of total antioxidant capacity
The TAC was determined using ABTS radical scavenging capacity assay. The ABTS radical
cation (ABTS•+) was generated by reacting 2,2- azino-bis (2-ethylbenzothiazoline-6-sulfonic
acid) diammonium salt (ABTS, 2.5 mM in PBS at pH 7.4) with 2,2'- azino-bis (2-
methylpropanimidamide) dihydrochloride (AAPH, 2 mM in PBS at pH 7.4) in to 1ː 1 ratio.
The mixture was kept in a water bath at 60 ºC until color developed which possess the
absorbance between 0.3 - 0.5 at 734 nm. To 40 l of each sample, 1.96 ml of stock was added
and absorbance was measured over six minutes at one minute interval at 734 nm (Zhou and
Yu, 2004), the RSA was calculated as percentage inhibition of ABTS+ radical.
Determination of total monomeric anthocyanin content
The pH differential method, previously reported by Lee et al. (2005) was used with slight
modifications to determine the total monomeric anthocyanin content of the freeze dried
extracts. In brief, two separate reaction medium were prepared with 1.80 ml of, potassium
chloride buffer (pH 1) and sodium acetate buffer (pH 4.5) with 0.2 ml of extract (4 mg/ml) for
each. Reaction medium was kept for 15 min at room temperature followed by absorbance was
measured at 520 nm and 700 nm wave lengths using Helios Omega – UV – VIS
spectrophotometer. The TMAC was calculated as follows and expressed as mg of Cyanidin-
3-glucoside in 100 g of Fresh sample.
A x MW x DF x 103
C3G =
Ɛ x 1
A = Absorbance (A 520 –A 700) pH1 - (A 520 –A 700) pH4.5
MW = Molecular weight C3G (449.2g)
DF = Dilution factor
1 = Path length (cm)
Ɛ = Molar extinction co-efficient (26 900)
Determination of the vitamin C content
Determination of vitamin C content was performed on the basis of content of L- Ascorbic acid
(AA), by using the titrimetric method described by Omale and Ugwu (2011). Accurately
weighed (5 g) of fresh sample was macerated with 0.25% Oxalic acid solution, filtered, filtrate

Mallawaarachchi et al.
6
was transferred to a 50 ml volumetric flask volume up to the mark with 0.25% oxalic acid and
10 ml of it taken for the titration with standardized 2,6 Dichlorophenolindophenol dye solution.
Statistical analysis
Data, obtained by six replicates were statistically analyzed using SAS 9.1 statistical software.
Analysis of variance and least significant difference tests were conducted to identify mean
differences. Statistical significance was declared at p = 0.05. To evaluate the relationship
between methods used, linear regression and correlation analysis of the values were performed
using MS Office Excel software.
RESULTS AND DISCUSSION
Total phenolic content
Polyphenolic compounds are commonly found in both edible and inedible plants, and reported
to have multiple biological effects, including antioxidant activity (Kähkönen et al., 1999;
Wojdylo et al., 2007). The TPC of selected fruit species was evaluated by Folin-ciocaltures’
colorimetric method, varied widely among selected fruit species ranging from 84.42 mg
GAE/100 FW in D. discolor to 1,939.70 mg GAE/100 g FW in P. emblica (Table 1). All
aqueous extracts tested, contained high TPC compared to commonly consumed fruit species.
The TPC of pineapple, mango, papaya, apple, and berries were 47.9, 56.0, 57.6, 11.9, and 28.7
mg GAE/100g, respectively (Kriengsak et al., 2006; Bopitiya and Madhujith 2012). While
Silva and Sirasa (2018) reported 80% (v/v) methanolic extracts of TPC of P. emblica was
915.7 mg GAE/100 g FW, which was lower than that of our results. The water extracts of P.
emblica prepared by boiling for 5 min, reported to have 295.94 mg GAE/g of dry weight
(Jayathilake et al., 2016). The methanolic extracts of different parts (bark, fruits and leaves) of
D. discolor reported to contain 9.16, 5.95 and 5.65 mg GAE/g of extract, respectively (Das et
al., 2010). Ethanolic extracts of oven dried fruits of P. acidus are reported to have 4.26 mg
GAE/g (Zulaikha et al., 2017). It was found that the yield in total phenolic compounds depends
on the method and the choice of solvent (Goli et al., 2005). The TPC also varies with the
growing season, soil and climatic factors, stage of maturity of the plants (Wang and Zheng,
2001).
Total monomeric anthocyanin content
Anthocyanins considered as one of the major bioactive compounds among six classes of
flavonoids (flavonols, flavanones, isoflavones, flavan-3-ois, flavones and anthocyanins)
(Haminuik et al., 2012). There is increasing interest in the anthocyanin content of food and
neutraceuticals because of possible health benefits (Lee et al., 2005). In this study, pH
differential method was adapted to measure TMAC and calculations were done based on the
cyaniding-3-glucoside (C3G), results were expressed as C3G equivalents in mg/100 g FW.
According to the results presented in Table 1, the highest (55.64 mg C3G/ 100 g FW) TMAC
was observed in P. emblica followed by P. campechiana, D. discolor and P. acidus. To the
best of our knowledge this is the first report of TMAC of these fruit species in Sri Lanka.
Vitamin C content (Vit C)
The vitamin C content was expressed as mg of ascorbic acid (AA) in 100 g of fruits in fresh
weight. The results summarized in Table 1, revealed that P. emblica had the highest AA and

Antioxidant Potential of Fruit Crop Species
7
P. acidus had the lowest. The value for the AA of P. emblica (523.14 mg AA/100 g FW) was
differed with the observation of Silva and Sirasa (2018). Lee and Kader, 2000 stated that
nutritional composition of a fruit type at harvest can vary widely depending on cultivar,
maturity, climate, soil type, and fertility.
Vitamin C (AA) is an important dietary antioxidant in humans; it acts as highly effective
antioxidant (Padayatty et al., 2003). In view of its antioxidant property, ascorbic acid and its
derivatives are widely used as preservatives in food industry. Ascorbic acid plays an important
role in the maintenance of collagen, which represents about one third of the total body protein.
Table 1. Total Phenolic Content (TPC), Total monomeric anthocyanin content (TMAC)
and Vitamin C content (VitC) of selected fruit species
Data are presented as Mean ±SD (n = 6)
Values with different letters are significantly different at p < 0.5
TPC - mg GAE/100g fruit in fresh weight (FW), TMAC - mg C3G/100g fruit in FW and VitC - mg AA/100g
fruits in FW
Antioxidant potential of fruit extracts
Antioxidant potential (AP) of plant extracts can be evaluated by using ability of scavenging of
free radicals, as they deactivated or stabilized by the antioxidants before they cause oxidative
damage towards cellular structures (Lee et al., 2014). Therefore, AP of lyophilized water
extracts were determined by their ability to scavenge DPPH• and ABTS•+ radicals and reducing
power of Ferric to Ferrous using three different assays of DPPH, ABTS and FRAP
respectively. In DPPH, results were expressed as concentration (mg/ml) of fresh sample
needed for inhibit 50% of radicals (IC50 value) in the reaction medium, which was obtained
from the graphs developed from RSA values of different concentrations of each sample (0.5 –
10 mg/ml) and higher IC50 values denote lower AP. The IC50 b values of four extracts ranged
from 0.067 to 310.63 mg FW/ml. According to the IC50 b values presented in the Table 2, the
highest AP was obtained in P. emblica followed by P. acidus, P. campechiana and D. discolor.
According to the IC50 value of less than 1 mg/ml is categorized as a fruit with extremely high
antioxidant potential (Safaa et al., 2010, Bopitiya and Madhujith, 2012). Therefore, P. Emblica
fruits can be categorized as extremely high antioxidative fruits. In ABTS assay, results are
presented as RSA values, which denote the percentage of inhibiting of ABTS•+ by the
individual sample (4 mg/ml) over six minutes. As described in the Figure 2, among the selected
fruit extracts, the highest total antioxidant capacity being observed in P. emblica (81.29%),
while least was recorded in P. acidus (9%). The extracts of D. discolor and P. campechiana
were also possessed considerably higher RSA values of 71.17% and 76.14%, respectively. But
interestingly within first minute of the reaction, more than 50% of the ABTS cation radical
was inhibit by the fruit extract of P. emblica and D. discolor and completed the reaction within
four minutes. In contrast, P. acidus started to react with ABTS•+ after first minute and showed
very slow reaction rate, finally reached to 9% of RSA within six minutes. Nevertheless, the
Fruit Species TPC TMAC VitC
P. emblica
P. campechina
P. acidus
D. discolor
1,939.70 ± 0.81a
640.01 ± 0.48b
112.89 ± 0.26c
84.42 ± 0.09d
55.64± 13.79 a
29.68± 4.33 b
10.41± 3.59 c
13.14± 3.29 c
523.14± 2.24 a
53.03± 1.04 b
17.12± 0.76 d
39.15± 0.78 c

Mallawaarachchi et al.
8
extracts of P. campechiana initially showed slow activity, reached the second highest RSA
value of 76.14% after six minutes.
Table 2. DPPH, ABTS Radical Scavenging Activity and FRAP of Fruit Extracts
Fruit species DPPH Radical Scavenging
Activity
ABTS
RSA%
FRAP Value
IC50 a IC50 b
P. emblica
P. campechina
D. discolor
P. acidus
0.01 ± 0.00d
8.97 ± 0.25a
7.19 ± 0.11b
5.60 ± 0.40c
0.067 ± 0.00c
130.49 ± 3.64b
310.63 ± 4.74a
124.14± 8.84b
81.29 ± 2.42a
76.14 ± 0.16b
71.17 ± 0.42c
9.00 ± 0.48d
2,891.57 ± 4.95a
1,941.54 ±
16.44b
405.35 ± 19.10c
238.25 ± 56.05d Data are presented as Mean ±SD (n = 6)
Values with different letters are significantly different at p < 0.5
RSA – lyophilized sample of 4 mg/ml (over six minutes), FRAP - M of Fe2+/100 g of fruit in fresh weight, IC 50 a -
mg of lyophilized sample/ml, IC 50 b – mg of fruit in fresh weight/ml
The FRAP assay was carried out to investigate the ability of selected fruit extracts to reduce
ferric ion (Fe3+) to ferrous ion (Fe2+). It quantifies the reducing power of extract which is an
integral attribute of such compounds (Bopitiya and Madhujith, 2012). The highest and lowest
reducing powers were observed in P. emblica and P. acidus, respectively. The extracts of P.
campechiana also showed higher reducing property with 1,941.54 Fe2+M/100 g FW (Table
2). In this study both P. emblica and P. campechiana fruit extracts showed higher reducing
power than the commonly consumed fruits such as mango and banana as observed by Silva
and Sirasa (2018).
Figure 2. ABTS+ radical scavenging activity of fruit crop species
Use of a single method to determine antioxidant capacity is insufficient, thus adoption of
different assays and model systems provide a better insight into the actual activity of the
extracts (Bopitiya and Madhujith, 2012). The results summarized in the Table 2, illustrates
antioxidant potential of selected fruit extracts are significant at p=0.05 except in IC50 in FW
basis. It may be due to different extraction yield of individual fruit species. Based on the
results, P. emblica exhibited the highest TPC, TMAC, VitC and AP.
-20
0
20
40
60
80
100
0 2 4 6 8
P. emblica
P. campechiana
D. discolor
P. acidus
Time (Minutes)
Rad
ical
Sca
ven
gin
g A
ctiv
ity
%

Antioxidant Potential of Fruit Crop Species
9
Correlation analysis
The Table 3 illustrates the correlation between tested parameters with R2 values. The DPPH,
FRAP, ABTS, TMAC and VitC showed strong positive correlation with TPC. The least
correlation, but positive (R2 = 0.0009) was observed between DPPH and ABTS assays, while
other four methods performed were possessed more than 0.5 R2 values. This poor correlation
may be due to different attributes of phenolic compounds. Also the reaction time of the ABTS
assay is only six minutes much shorter than that of DPPH (Surveswaran et al., 2007).
Table 3. Correlation between TPC, DPPH, ABTS, FRAP, TMAC and VitC
CONCLUSIONS
The results revealed that water extracts of the fruit crops tested have potential antioxidant
activity and vitamin C content. The extract of P. emlica exhibited significantly higher
antioxidant potential, vitamin C, TPC and TMAC than other fruit crops. This study highlighted
significance of selected underutilized fruit species as cheap sources of natural antioxidants and
Vitamin C. Further studies to identify individual phenolic compounds and also in vivo studies
to understand their mechanism of action are therefore suggested.
ACKNOLEDGEMENT
The authors acknowledge Postgraduate Institute of Agriculture, University of Peradeniya for
their financial support through Research Facilitation Fund (RFF).
REFERENCES
Adeolu, A.T. and Enesi, D.O. (2013). Assessment of proximate, mineral, vitamin and
phytochemical composition of plantain (Musa paradisiaca) bract – an agricultural waste. Int.
J. Plant Sci. 4(7), 192-197.
Benzie, I.F.F. and Strain, J.J. (1996). Ferric reducing ability of plasma (FRAP) as a measure
of “antioxidant power”: the FRAP assay. Anal. Bio-chem. 239(1), 70–76.
Bopitiya, D. and Madhujith, T. (2012). Antioxidant potential of pomegranate (Punica
granatum L.) cultivars grown in Sri Lanka. Trop. Agric. Res. 24(1), 71–81.
R2 TPC DPPH FRAP ABTS TMAC
TPC
DPPH
FRAP
ABTS
TMAC
VitC
-
0.6509
0.8803
0.9500
0.9784
0.9384
-
-
0.5591
0.0009
0.5889
0.5989
-
-
-
0.4691
0.9533
0.6781
-
-
-
-
0.4120
0.1811
-
-
-
-
-
0.8533

Mallawaarachchi et al.
10
Das, S.C., Hamid, K., Bulbul, I.J., Sultana S. and Islam, S. (2010). In Vitro Antioxidant
Activity of Different Parts of the Plant Diospyros discolor. Res. J. of Agric. and Biol. Sci. 6(4),
472-475.
Dudonne S., Vitrac, X., Coutiere, P., Woillez, M. and Merillon, J.M. (2009). Comparative
study of antioxidant properties and total phenolic content of 30 plant extracts of Industrial
interest using DPPH, ABTS, FRAP, SOD and ORAC assays. J. Agric. Food Chem. 57(5),
1768-1774.
Flohe, R.B and Traber M.G. (1999). Vitamin Eː function and metabolism. The FASEB J. 13,
1145-1155.
Goli, A.H, Barzegar, M. and Sahari, M.A. (2005). Antioxidant activity and total phenolic
compounds of pistachio (Pistachia vera) hull extracts. Food Chem. 92, 521–525.
Haminiuk, C.W.I., Maciel, G.M., Plata-Oviedo, M.S.V. and Peralta, R.M. (2012). Invited
review Phenolic compounds in fruits – an overview. Int. J. Food Sci. and Tech. 47(10), 2023-
2044.
Jacob, A.R. (1996). Chapter 01ː Introduction. pp. 1-16. In Harris, J.R. (Ed.) Subcellular
Biochemistry, Ascorbic Acid: Biochemistry and Biomedical Cell Biology, vol. 25. Plenum,
New York, NY, USA.
Jayathilake, C., Rizliya, V. and Liyanage, R. (2016). Antioxidant and free radical scavenging
capacity of extensively used medicinal plants in Sri Lanka. Procedia Food Sci. 6, 123-126.
Jayaweera, D.M.A. (1981). Medicinal plants (Indigenous and exotic) used in Ceylon. Part II.
The National Science Foundation, Sri Lanka. pp. 228-229.
Kahkonen, M. P., Hopia, A. I., Vuorela, H. J., Rauha, J.-P., Pihlaja, K., Kujala, T. S. (1999).
Antioxidant activity of plant extracts containing phenolic compounds. J. Agri. and Food Chem.
47, 3954–3962.
Kriengsak, T., Unaroj, B., Kevin, C., Luis, C. and David, H.B. (2006). Comparison of ABTS,
DPPH, FRAP, and ORAC assays for estimating antioxidant activity from guava fruit extracts.
J. Food Com. and Analysis. 19, 669-675.
Lanerolle, M.S.De, Priyadharshani, A.M.B., sumithraarachchi, D.B. and Jansz E.R. (2008).
The carotenoids of Pouteria campechiana (Sinhalaː ratalawalu). J. of the National. Science
Foundation, Sri Lanka. 36(1), 95-98.
Lee, S.K. and Kader, A.A. (2000). Preharvest and postharvest factors influencing vitamin C
content of horticultural crops. Postharvest Bio. and Tech. 20, 20-220.
Lee, J., Robert, W.D. and Ronald, E.W. (2005). Determination of total monomeric anthocyanin
pigment content of fruit juices, beverages, natural colorants, and wines by the pH differential
method: collaborative study. J. AOAC Int. 88(5), 1269-1278.
Antioxidant Potential of Fruit Crop Species
11
Lee, M.H., Jiang, C.B., Juan, S.H., Lin, R.D. and Hou, W.C. (2006). Antioxidant and heme
oxygenase-1 (HO-1)-induced effects of selected Taiwanese plants. Fitoterapia. 77(2), 109–
115.
Lee, S., Mediani, A., Nur Ashikin, A., Azliana, A. and Abas, F. (2014). Antioxidant and α-
glucosidase inhibitory activities of the leaf and stem of selected traditional medicinal plants.
Int. Food Res. J. 21(1), 165-172.
Lie-Fen, S., Jieh-Hen, T., Je-Hsin, C., Chih-Yang, C. and Chiu-Ping, L. (2005). Antioxidant
properties of extracts from medicinal plants popularly used in Taiwan. Int. J. Applied Sci. and
Eng. 3(3), 195 - 202.
Lim, T.K. (2012a). Phyllanthaceaeː Phyllanthus acidus in Edible Medicinal and non-medicinal
plants, Vol 4, Fruits, Springer Science+Business Media. London, pp. 252- 257.
Lim, T.K. (2012b). Ebinaceaeː Diospyros blancoi in Edible Medicinal and non-medicinal
plants, Vol 2, Fruits, Springer Science+Business Media. London, UK. pp. 421-424.
Omale J. and Ugwu C. E. (2011). Comparative studies on the protein and mineral composition
of some selected Nigerian vegetables. African J. Food Sci. 5(1), 22–25.
Oviasogie, P.O., Okoro, D. and Ndiokwere, C.L. (2009). Determination of total phenolic
amounts of some edible fruits and vegetables. African J. Biotech. 8(12), 2819 -2820.
Padayatty, S., Katz, A., Wang,Y., Eck, P., Lee, J., Chen, S., Corpe, C., Dutta, A., Dutta, S. and
Levine, M. (2003). Vitamin C as an antioxidant: evaluation of its role in disease prevention. J.
Am. Clin. Nutr. 22(1), 18-35.
Pushpakumara, D.K.N.G. and Heenkenda, H.M.S. (2007). Chapter 06: Nelli (Amla)
(Phyllanthus embilica L.). pp. 180-221. In Pushpakumara, D.K.N.G., Gunasena, H.P.M.,
Singh, V.P. (Ed.) Underutilized Fruit Trees in Sri Lanka Volume 1. World Agro-forestry
Centre, South Asia Regional office, New Delhi, India; National Multipurpose Tree Species
Research Network of Sri Lanka; Sri Lanka Council for Agricultural Research Policy, Asian
Centre for Underutilized Crops, Sri Lanka.
Ramasamy, S., Wahab, N.A., Abidin, N.Z. and Manickam, S. (2011). Cytotoxicity evaluation
of five Malaysian Phyllanthaceae species on various human cancer cell lines. J. Med. Plant
Res. 5(11), 2267-2273 .
Safaa, Y. Q., Abo-khatwa, A.N. and Lahwa, M.A.B. (2010). Screening of antioxidant activity
and phenolic content of selected food items cited in the Holly Quran. Europ. J. Biol. Sci. 2(1),
40-51.
Shofian, N.M., Hamid, A.A., Osman, A., Saari, N., Anwar, F., Dek, M. S. P. and Hairuddin,
M.R. (2011). Effect of freeze-drying on the antioxidant compounds and antioxidant activity
of selected tropical fruits. Int. J. Mol. Sci. 12, 4678-4692.
Silva, K.D.R.R. and Sirasa M.S.F. (2018). Antioxidant properties of selected fruit cultivars
grown in Sri Lanka. Food Chem. 238, 203-208.

Mallawaarachchi et al.
12
Su, L., Yin, J.J., Charles, D., Zhou, K., Moore, J. and Yu, L. (2007). Total Phenolic contents,
chelating capacities and radical-scavenging properties of black peppercorn, nutmeg,
hrosewhip, cinnamon and oregano leaf. J. Food Chem. 100(3), 990-997.
Surveswaran, S., Cai, Y.Z., Cork, H. and Sun, M. (2007). Evaluation of natural phenolic
antioxidant from 133 Indian medicinal plants. Food Chem. 102, 938-953.
Vidhan, J., DerMarderosian, A. and John, R.P. (2010). Anthocyanins and polyphenol oxidase
from dried arils of pomegranate (Punica granatum L.). J. Food Chem. 118(1), 11-16.
Wang, S.Y and Zheng, W. (2001). Effect of plant growth temperature on antioxidant capacity
in strawberry, J. Agric. Food Chem. 49, 4977–4982.
Wojdyło, A., Oszmianski, J. and Czemerys R. (2007). Antioxidant activity and phenolic
compounds in 32 selected herbs. Food Chem. 105, 940-949.
Yu, L., Perret, J. and Davy, B., Wilson, J. and Melby, C.L. (2002). Antioxidant properties of
cereal products. J. Food Sci. 67(7), 2600-2603.
Zhou, K. and Yu, L. (2004). Antioxidant properties of bean extracts from Trego wheat grown
at different locations. J. Agri. Food Chem. 52(5), 1112-1117.
Zulaikha, A.G.S., Mediani, A., Khoo, L.W., Lee, S.Y., Leong, S.W. and Abas, F. (2017).
Effect of different drying methods and solvent ratios on biological activities of Phyllanthus
acidus extracts. Int. Food Res. J. 24(1), 114-120.

Tropical Agricultural Research Vol. 30 (3): 13 – 26 (2018)
Millet Phenolics as Natural Antioxidants in Food Model Systems and
Human LDL/VLDL Cholesterol in vitro
K.D.D. Kumari, W.M.T. Madhujith1 and G.A.P. Chandrasekara2*
Postgraduate Institute of Agriculture
University of Peradeniya
Sri Lanka
ABSTRACT: Dehulled grain flour of finger millet (Eleusine coracana), proso millet (Panicum
miliaceum) and foxtail millet (Setaria italica) and phenolic extracts of millet hulls were
evaluated for ability to inhibit lipid oxidation in several food model systems, namely cooked
comminuted pork and fish, roasted peanut butter and gingelly oil. Food samples were kept for
14 days with added millet hull extracts and dehulled grain flours. The percentage inhibition of
production of thiobarbituric acid reactive substances (TBARS) during storage was determined.
Inhibitory activities of phenolic extracts of finger millet dehulled grain and finger millet foods,
namely, Rotti, Pittu, Halapa, Thalapa and porridge, against human very low-density
lipoprotein (VLDL) and low-density lipoprotein (LDL) oxidation were determined by
measuring the production level of conjugated dienes (CD) in vitro. Finger millet had higher
phenolic content and antioxidant activities compared to the respective proso and foxtail millet
samples. Finger millet hull extracts exhibited the highest inhibition of lipid peroxidation in
food model systems. The maximum percentage inhibition of TBARS in pork, fish, and peanut
with added finger millet hull extracts were observed at days 3, 7, 5, and 14, respectively. The
percentage inihibition of TBARS in cooked pork and fish with added millet hull extracts
ranged from 4.4 to 12.8% and 63 to 77%, respectively at the end of the second week. Millet
grains and desolventized millet phenolic extracts can act as natural sources of antioxidants at
different degrees in pork, fish, peanut and gingelly oil to prevent lipid oxidation during storage.
Keywords: Lipid oxidation inhibition, millet, natural antioxidants, meat, gingelly oil, roasted
peanut butter
INTRODUCTION
Lipid oxidation products formed in foods lead to the development of off-flavours and affect
nutritional and sensory qualities. Further, they act as atherogenic agents in addition to their
mutagenic and carcinogenic properties (Shahidi et al., 2012). Polyunsaturated fatty acids
(PUFA) in foods are susceptible to oxidation during processing and storage (Shahidi et al.,
2012). A number of factors affects the rate of lipid oxidation in foods. Special measures are
taken during processing and storage to prevent food lipid oxidation and addition of
antioxidants is a common practice among others. Butylated hydroxyanisole (BHA), butylated
hydroxytoluene (BHT) and tert-butyl hydroquinone (TBHQ) are most widely used synthetic
antioxidants in food industry (Shahidi and Zhong, 2005). There are several controversies in
1 Department of Food science and Technology, Faculty of Agriculture, University of Peradeniya, Sri Lanka 2 Department of Applied Nutrition, Wayamba University of Sri Lanka, Makandura, Gonawila, Sri Lanka
* Corresponding author: [email protected]

Kumari et al.
14
the use of synthetic antioxidants as health concerns have been raised on their addition in foods
(Shahidi and Zhong, 2005). Food additives are subjected to the most stringent toxicological
testing procedures, and only a few synthetic antioxidants have been used in foods so far. There
is a growing interest of using natural antioxidants in foods. The natural antioxidants include
phenolic compounds, tocopherols, and flavonoids (Artajo et al., 2006). Oxidized Low-density
lipoproteins (LDLs) have been detected in atherosclerotic vessels and they appear to play a
major role in the disease process (Esterbauer et al., 1992; Steinberg, 1992). Naturally occurring
antioxidants in the diet may play a role in inhibiting the oxidative modification of LDL and
hence they might act as anti-atherosclerotic agents (Shahidi et al., 2012)
Millets are recognized as potential future crops due to their nutrient contents similar to other
major cereals and rich non-nutrient profiles, especially phenolic compounds (Shahidi and
Chandrasekara, 2014; Kumari et al., 2017(. Previous work on millets have proven that phenolic
compounds present in millets are bioaccessible and may act as antioxidants within the human
body to protect against oxidative stress (Chandrasekara and Shahidi, 2012a). The aim of the
present work was to evaluate the ability of millet phenolic compounds to prevent the oxidation
of lipids present in food model systems namely, pork, fish, peanut, and gingelly oil and to
determine the ability of millet phenolics to prevent the oxidation of human LDL cholesterol in
vitro.
METHODOLOGY
Samples of finger millet (Elusine coracana) variety “Oshada”, local variety of proso millet
(Panicum miliacium) and foxtail millet (Setaria italica) grown in Sri Lanka were used in this
study. All grain materials were obtained from the Department of Agriculture, Sri Lanka. Folin-
Ciocalteu’s reagent was purchased from Research Lab Fine Chem Industries, Mumbai, India.
Vanillin, 2,2-diphenyl-1-picrylhydrazyl (DPPH), 2,2 azinobis (3-ethylbenzothiazoline-6-
sulfonate diammonium salt) (ABTS), 2,2-azobis (2-methylpropionamidine) dihydrocholride
(AAPH), ferrous chloride, sodium chloride, butylated hydroxyanisole (BHA), ferulic acid,
trolox, catechin, and ethanol were purchased from Sigma-Aldrich, St Louis, USA. Sodium
carbonate, ferric chloride, were purchased from Thomas Baker (Chemicals) Limited, Bombay,
India. Aluminium chloride, trichloroacetic acid (TCA), and potassium phosphate dibasic were
purchased from Techno Pharm Chem, India. Sodium hydroxide, and potassium phosphate
monobasic were purchased from Loba Chem Pvt Ltd, India. 3-(2-pyridyl)-5,6-diphenyl-1,2,4-
triazine-4,4-disulfonic acid sodium salt (Ferrozine) were purchased from SERVA
Electrophoresis GmbH, Heildberg, Germany. Ethylene diamine tetra acetic acid tri sodium salt
(Na3EDTA) was purchased from Needham Market Sufflock, England. 2, 2, 4-
trimethylpentane and 1,1,3,3-tetramethoxypropane were purchased from Sigma-Aldrich, St
Louis, USA.
Sample preparation
Millet whole grains were dehulled and hulls were separated from grains. Finger millet grains
were dehulled using a rice polishing machine (Rice husker and polisher PM 500, Satake
Engineering Co Ltd, Japan). Foxtail millets and proso millets were dehulled using rice milling
machine (Rice machine, Satake Engineering Co Ltd, Japan). Dehulled grains, and hulls were
separately used for the extraction of phenolics. Samples were ground using an electric grinder
and sieved (0.038 seive opening; As 200 test seiver, Retsch, Germany(. Samples were defatted
using hexane (1:5 w/v, 2 min, two times) at ambient temperature. Defatted samples packed in

Millet Phenolics as Natural Antioxidants
15
polythene pouches were stored at -80 ºC until used within a week for extraction of phenolic
compounds.
Extraction of soluble phenolic compounds
Soluble phenolic compounds were extracted from dehulled grains and hulls of millets. Defatted
meal (5 g) was mixed with 100 mL of 80% (v/v) aqueous ethanol in a capped conical flask and
placed in a shaking water bath at 50°C, stirring at 175 rpm speed for 40 minutes. The extraction
procedure was repeated two more times. Combined supernatants were evaporated in rotary
evaporator at 40ºC at 125 rpm. Concentrated samples were freeze dried at -55ºC, and 12 x 10-
3 mbar. Lyophilized crude phenolic extracts were stored at -80ºC until used for further analysis.
During all stages, extracts were protected from light by covering with aluminum foil.
Determination of oxidative stability in comminuted pork model
The samples were prepared to determine the oxidative stability of dehulled millet flour and
soluble phenolic extracts of millet hull according to Chandrasekara and Shahidi (2012b). In
brief, ground pork (80g) was mixed with 20 g deionized water in a glass jar and mixed with
testing materials, namely dehulled millet flour (2%), hull phenolic extracts (0.2%), ferulic acid
(0.02%) or BHA (0.02%) followed by thoroughly mixing with a glass rod. A control without
added compounds was maintained under same experimental conditions. Capped glass jars
were cooked in a water bath at 80 ± 2 ºC for 40 minutes while stirring with a glass rod at every
5 minutes. Samples were cooled to room temperature and were transferred to polythene bags.
Bags were stored in a refrigerator at 4 ºC and samples were drawn on days 0, 3, 5, 7 and 14 for
the analysis of thiobarbituric acid reactive substances (TBARS). The experiment of each test
material was carried out in three replications.
Determination of oxidative stability in fish model
The oxidative stability of dehulled millet grains and soluble phenolic extracts in the inhibition
of TBARS production in cooked Tuna fish (ground boneless flesh) was determined as
previously explained (Wijeratne et al., 2006). The experimental procedure was similar to the
pork model explained in the previous section.
Determination of oxidative stability in peanut model
The effect of dehulled millet grain and soluble phenolic extracts in the inhibition of TBARS
production in roasted ground peanut was determined according to Wijeratne et al. (2006).
Dehulled millet flour (2%), phenolic extracts of hulls (0.2%), ferulic acid (0.02%) and BHA
(0.02%) were added to 100 g of ground peanut and thoroughly mixed with a glass rod in a
glass jar. A separate control sample without extracts was also prepared. Samples were mixed
thoroughly and transferred into polythene bags. Samples were stored in room temperature for
14 days. Samples were drawn on days 0, 3, 5, 7 and 14 for analysis of TBARS.
Determination of oxidative stability in gingelly oil
The efficacy of soluble millet extracts to inhibit the oxidation of gingelly oil was measured
according to the method explained by Chandrasekara and Shahidi, (2011b). Hull phenolic
extracts (1%), ferulic acid (1%) and BHA (1%) were added separately into 100 mL glass jars,
and then 2 g of gingelly oil sample was added following vortexing thoroughly for 2 minutes.
Each treatment was prepared in triplicate and jars were kept in the oven at 60ºC. Samples for

Kumari et al.
16
the analysis of TBARS were drawn on 0, 6, 12, 24, 36 and 48 hours and were analyzed for the
inhibition percentage of TBARS and the production of conjugated dienes (CD). Control
samples of oil without test materials were maintained under identical experimental conditions.
Inhibition percentage of TBARS
The inhibition percentage of TBARS was determined according to the method explained by
Chandrasekara and Shahidi, (2012b). In this, 2 g from each fish, meat, or peanut sample was
weighed in a 50 mL centrifuge tube. Then 5 mL of 10% (w/v) solution of trichloroacetic acid
(TCA) were added and vortexed at high speed for 2 minutes. Thiobarbituric acid (TBA)
solution (0.02 M, 5 mL) was added to each centrifuge tube and vortexed for 30 seconds. The
samples were subsequently centrifuged at 3000 g for 10 minutes and the supernatants were
filtered through a Whatman No.3 paper. Filtrates were heated in a boiling water bath for 45
minutes and cooled to room temperature on an ice bath. The absorbance of the pink coloured
chromogen was measured at 532 nm (UV-VIS Spectrophotometer, Labomed Inc, USA).
Standard curve was prepared using 1,1,3,3-tetramethoxypropane as a precursor of the
malondialdehyde (MDA). The percentage inhibition of TBARS formation was calculated as
follows. Inhibition percentage = {(TBARS control TBARS sample) / TBARS control} x 100, where
TBARS control = TBARS formed in the control and TBARS sample = TBARS formed in the
sample. TBARS values of oil samples were determined according to the standard AOCS
method. In brief the oil (50 – 100 mg) was weighed into a 25 mL volumetric flask and made
up to volume with 1-butanol. Then 5 mL of this solution was transferred into a screw capped
test tube with added 5 mL of freshly prepared 2-TBA reagent (500 mg of TBA in 250 mL 1-
butanol). Contents were thoroughly mixed and heated in a water bath at 95ºC for 2 hours.
Samples were cooled in an ice bath and the absorbance values were measured at 532 nm.
Standard curve was prepared using 1,1,3,3-tetramethoxypropane as a precursor of the
malondialdehyde (MDA). The percentage inhibition of TBARS formation was calculated as
follows. Inhibition percentage = {(TBARS control TBARS sample) / TBARS control} x 100, where
TBARS control = TBARS formed in the control and TBARS sample = TBARS formed in the
sample.
Determination of conjugated diene (CD) in gingelly oil sample
The CD contents of oil samples were determined according to the method explained by Shahidi
and Zhong (2005). In this a sample of gingelly oil (0.02-0.03 g) was weighed into a 25 mL
volumetric flask, and made up to the mark with 2,2,4-trimethylpentane. The solution was
thoroughly mixed and the absorbance was measured at 234 nm. Pure 2, 2, 4- trimethylpentane
was used as a reference. CD values were calculated using the following equation;
CD=Absorbance of solution at 234 nm / C*L, where C= concentration of oil in g per 100 mL,
L=length of the cuvette (cm(.
Inhibition of copper-mediated human LDL and VLDL oxidation
Inhibitory activities of phenolic extracts of finger millet dehulled grain and finger millet foods
(Rotti, Pittu, Halapa, Thalapa and Porridge) against human VLDL and LDL oxidation were
determined by measuring conjugated dienes (CD) produced in the system using the method
described by Chandrasekara and Shahidi, (2012b). LDL and VLDLs from human serum were
isolated using HDL precipitating reagents. Pellets (LDL/VLDL precipitate) were obtained by
decanting the supernatant (HDL) and suspended in phosphate buffer to obtain diluted
cholesterol solution of 0.1mg/mL protein concentration in PBS (pH 7.4, 0.15M NaCl). Protein
concentrations of lipoproteins were determined using the biuret reagent test. The diluted

Millet Phenolics as Natural Antioxidants
17
solution (0.8 mL) was mixed with 100 μL of soluble extract of foods (0.5 mg / mL in PBS) in
an eppendorf tube. Oxidation of LDL was initiated by adding 0.1 mL of 100 μM CuSO4
solution in distilled water. The mixture was incubated at 37ºC for 24 hours. The initial
absorbance (t=0) was read at 234 nm immediately after mixing and CD hydroperoxides formed
were measured at 0, 3, 6, 12 and 24-hour intervals. The concentration of CD formed was
calculated using the molar extinction coefficient of 29500M-1cm-1.
Statistical analysis
All experiments were carried out in triplicates and data were reported as mean ± standard
deviation. The differences of mean values among samples were determined by one-way
analysis of variance (ANOVA) followed by Tukeys Honestly Significant Difference (HSD)
multiple rank tests at p = 0.05, significance level. All statistical analysis was performed by
SPSS version 16 (SPSS Inc., Chicago, IL).
RESULTS AND DISCUSSION
The ability of the lipid containing foods to act against oxidation is expressed as oxidative
stability of foods. TBARS values measure the level of lipid oxidation. Table 1 and 2 show the
effect of the millet extracts, ferulic acid and BHA on the inhibition of TBARS on pork and fish
models. In communited pork model BHA showed the highest inhibition of TBARS in the range
of 80 to 94 % from day 0 to end of the second week, compared to ferulic acid and millet
extracts. The inhibition percentage of TBARS in pork model with added millet extracts ranged
from 1 to 40% from day 0 and end of second week. In addition, the ability of TBARS
production inhibition decreased with time in pork model with added millet flour or extracts.
This could be due to the reduction of antioxidant power in millet extracts with the storage time.
The inhibition percentage of TBARS in the fish model with added BHA and millet
flour/extracts were 62 and 83% and 3 and 57%, respectively on day 0 and end of second week.
Generally, the highest inhibition percentage was observed on day 0 and day 14 in pork and
fish models respectively, with added millet flour/extract. Millet grain hull extracts showed high
TBARS production inhibition which ranged from 56 to 63% in fish model at the end of second
week . Further, the greater effect of the millet hull extract on inhibiting the production of
TBARS could be due to the high phenolic content and the antioxidant activities in addition to
the presence of other compounds such as, vitamin C, E, with antioxidant activities in hull
extracts compared to those of dehulled grain. Previous studies also reported the ability of plant
extracts to prevent the oxidation of lipids in meat (Rhee et al., 1996; Karwowska and
Dolatowski, 2007). The phenolics present in natural plant extracts have strong H+ donating
activity. In the present study also the phenolic extracts of millet showed high antioxidant
activity against lipid oxidation of the meat and fish samples. These results are in agreement
with several other studies that reported natural antioxidants from plant sources could prevent
the lipid oxidation of meat and meat products (Yu et al., 2002).
Table 3 shows the the effect of the millet flour/extracts, ferulic acid and BHA on production
inhibition of TBARS on roasted peanut model. BHA showed the highest inhibition percentage
of TBARS at the day 0 compared to ferulic acid and millet flour/extracts. Peanut sample with
added proso millet dehulled grain flour showed the highest ability to prevent the production of
TBARS at the end of second, third and fourth weeks. Tea catechins, as a polyphenolic
flavonoid to prevent the lipid oxidation in green tea has been demonstrated in a variety of food
systems (McCarthy, 2001; Nissen, 2004; Mitsumoto, 2005). Moreover, the use of millet

Kumari et al.
18
phenolic extracts shows antioxidant effects similar or better than those of BHA. Polyphenolic
extracts are excellent electron and proton donors, and their intermediate radicals are quite
stable due to electronic delocalization phenomenon as well as the lack of position attackable
by oxygen (Rhee et al., 2001). Therefore, millets can be used in peanut butter preparations to
improve the quality of the product.
Table 4 shows the effect of the millet flour/extracts, ferulic acid and BHA on production
inhibition of TBARS on gingelly oil model. Among those phenolic extracts of millet showed
higher ability to prevent the production of TBARS reflecting their higher antioxidant activity
for protection of gingelly oil against oxidation compared to ferulic acid and BHA.The highest
TBARS inhibition was showed at 72 hours by phenolic extracts of finger millet hull. Compared
to BHA, phenolic extracts of millet dehulled grains and hulls showed increased duration of
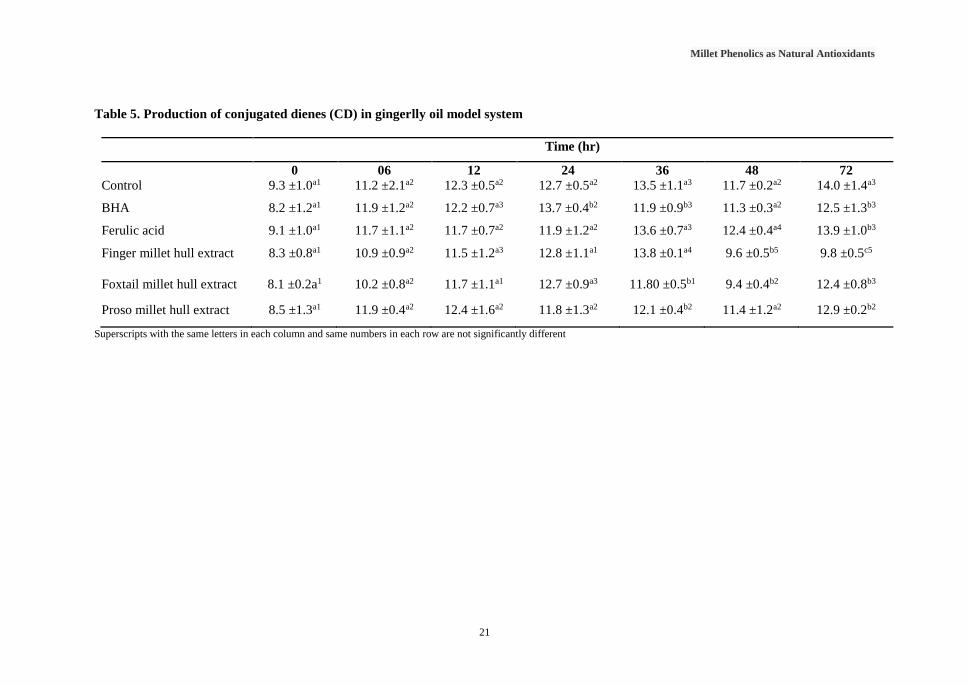
oxidative stability in oil samples. Table 5 shows the production of CD in gingelly oil model
system. Compared with the control millet hull extract added oil samples showed significantly
low CD levels at 36, 48 and 72 hours. During the 0 to 24 hours of time period there were not
any significant difference in the production of CD in oil samples with added millet hull
extracts.
Results of TBARS and CD in gingelly oil model showed that phenolic extracts of millets have
the ability to delay the oxidation of gingelly oil during storage. Previous studies showed that
natural antioxidants from plant sources have an effect to increase the oxidative stability in oil
samples (Kamali et al., 2011). Further, they showed that addition of cinnamon extracts
increased the oxidative stability of sunflower oil (Kamali et al., 2011). The antioxidant
potential of plant extracts is a result of not only the presence of the active phenolic compounds
but also of other components present in the system. Figure 1 shows the ability of phenolic
extracts of finger millet dehulled grain and finger millet foods (Rotti, Pittu, Halapa, Thalapa
and Porridge) to prevent the oxidation of human VLDL and LDL in vitro. Pittu had the highest
ability to prevent the production of conjugated dienes in oxidation of human VLDL and LDLs
in vitro while Thalapa shows the lowest ability.
The phenolic compounds which are present in finger millet foods should have the ability to
chelate cupric ions and scavenge the formed peroxyl radicals to prevent the oxidation of VLDL
and LDL cholesterol in vitro (Decker et al., 2001). According to Chandrasekara and Shahidi
(2011b) soluble phenolic extracts of pearl millet hulls and dehulled grain at a low concentration
(0.125 mg/mL) showed 1.6 and 3.9 times higher inhibition, respectively, of LDL oxidation
than that at high concentration (0.5 mg/mL). Authors explained that there is a possibility that
phenolic compounds at high concentrations may complex with protein moieties of the LDL
cholesterol molecules, which makes them unavailable to inhibit oxidation of cholesterol.
Previous studies have shown that phenolic compounds can inhibit protein oxidation by binding
of the proteins to form complexes with protein molecules (Siebert et al., 1996; Riedl and
Hagerman, 2001). Therefore, the low ability of finger millet foods with high phenolic content
to inhibit the oxidation of LDL and VLDL cholesterol in vitro might be due to the interactions
of proteins and phenolic compounds at high concentrations of phenolics.

Tropical Agricultural Research Vol. 30 (3): 13 – 26 (2018)
Table 1. Inhibition percentage of thiobarbeturic acid reactive substances (TBARS) at different time periods in the pork model system
Inhibition percentage of TBARS
Day 0 Day 3 Day 5 Day
7
Day 14
BHA 80.09 ± 0.11a1 93.66 ± 0.38a2 86.94 ± 0.69a3 88.98 ± 1.01a3 79.47 ± 0.39a1
Ferulic acid 14.39 ± 0.05b1 23.94 ± 0.03b2 19.65 ± 2.20b3 27.34 ± 2.06b4 3.67± 1.25b5
Finger millet dehulled grain flour 4.60 ± 0.61c1 18.34 ± 0.07c2 19.20 ± 1.30b2 16.76 ± 3.28c3 8.18 ± 0.63b4
Foxtail millet dehulled grain flour 10.89 ± 0.05d1 9.45 ± 0.21d1 21.07 ± 2.13b2 24.72 ± 2.43b3 12.85 ± 0.82c4
Proso millet dehulled grain flour 30.53 ± 1.78e1 10.41 ± 0.10e2 0.64 ± 0.04c3 13.40 ± 1.30c4 8.49 ± 0.04d5
Finger millet hull extract 38.06 ± 0.10e1 25.25 ± 0.83b2 18.20 ± 0.07b3 20.24 ± 1.81b4 5.09 ± 0.82e5
Foxtail millet hull extract 4.20 ± 0.45c1 18.18 ± 0.03c2 7.94 ± 0.22d3 23.58 ± 3.25b4 6.62 ± 1.02e5
Proso millet hull extract 39.71 ± 0.79e1 10.93 ± 0.83e2 15.63 ± 1.63e3 13.19 ± 0.22d4 4.51 ± 0.70e5
Superscripts with the same letters in each column and same numbers in each row are not significantly different
Table 2. Inhibition percentage of thiobarbeturic acid reactive substances (TBARS) at different time periods in fish model system
Superscripts with the same letters in each column and same numbers in each row are not significantly different
Inhibition percentage of TBARS
Day 0 Day 3 Day 5 Day 7 Day 14
BHA 81.73 ± 2.99a1 83.33 ± 1.39a1 80.63 ± 1.26a1 77.87 ± 2.54a2 61.88 ± 1.86a2
Ferulic acid 18.27 ± 2.09b1 18.13 ± 0.62b1 5.66 ± 0.19b2 20.55 ± 0.35b3 4.65 ± 0.10b4
Finger millet dehulled grain flour 22.36 ± 1.25c1 3.37 ± 0.68c2 18.93 ± 0.88c3 3.82 ± 1.62c2 5.08 ± 0.18 c4
Foxtail millet dehulled grain flour 38.03 ± 0.58d1 5.21 ± 0.16d2 16.92 ± 1.07d3 7.16 ± 1.20d4 2.61 ± 0.34d5
Proso millet dehulled grain flour 34.46 ± 1.68e1 3.91 ± 0.16c2 18.49 ± 1.24c3 8.78 ± 5.08e4 6.10 ± 0.19e5
Finger millet hull extract 33.38 ± 6.22e1 9.12 ± 0.16e2 17.48 ± 1.53e3 30.70 ± 5.06f4 56.10 ± 0.04f5
Foxtail millet hull extract 46.35 ± 5.23f1 16.83 ± 4.55f2 17.61 ± 3.60e3 21.61 ± 2.22g4 63.13 ± 0.14g5
Proso millet hull extract 49.72 ± 5.07g1 8.85 ± 3.08g2 21.51 ± 1.00f3 30.57 ± 1.73f4 56.10 ± 0.19f5

Kumari et al.
20
Table 3. Inhibition percentage of thiobarbeturic acid reactive substances (TBARS) at different time periods in peanut model system
Superscripts with the same letters in each column and same numbers in each row are not significantly different
Table 4. Inhibition percentage of thiobarbeturic acid reactive substances (TBARS) at different time periods in gingelly oil model system
Superscripts with the same letters in each column and same numbers in each row are not significantly different
Inhibition percentage of thiobarbeturic acid reactive substances (TBARS)
Day 0 Day 7 Day 14 Day 21 Day 28
BHA 63.71 ± 0.09a1 23.81 ±3.23a2 43.86 ±1.25a3 24.83 ±4.04a2 25.75 ±3.21a2
Ferulic acid 59.72 ±0.46b1 23.05 ±0.14a2 37.14 ±2.13b2 22.43 ±0.06b2 25.87 ±0.22b2
Finger millet dehulled grain flour 57.61 ±0.58c1 24.37 ±0.13b2 45.45 ±3.62c3 29.67 ±5.87c3 34.13 ±0.35c4
Foxtail millet dehulled grain flour 51.75 ±4.21d1 22.08 ±0.13c2 37.28 ±1.35d3 32.98 ±0.22d3 32.52 ±0.17d3
Proso millet dehulled grain flour 49.13 ±1.46e1 27.96 ±0.07d2 45.85 ±1.31e3 33.16 ±0.43e4 37.91 ±1.09e3
Finger millet hull extract 51.89 ±0.05d1 32.67 ±0.09e2 28.15 ±0.10f3 13.00 ±0.10f4 19.97 ±0.11f5
Foxtail millet hull extract 55.15 ±0.99f1 31.49 ±1.77f2 27.55 ±0.13g3 6.87 ±1.02g4 7.47 ±0.27g5
Proso millet hull extract 33.54 ±2.65g1 28.26 ±0.20g2 28.19 ±0.15h2 9.72 ±1.11h3 2.52 ±1.09h4
Inhibition percentage of TBARS
0 hours 6 hours 12 hours 24 hours 36 hours 72 hours
BHA 12.88 ± 3.30a1 4.90 ±0.90a2 5.00 ±1.89a2 6.26 ±1.15a3 9.90 ±2.03a4 18.71 ±1.90a5
Ferulic acid 21.46 ±3.40b1 1.96 ±0.90b2 20.71 ±1.89b1 3.68 ±1.94b3 9.20 ±0.77b4 53.00 ±2.31b5
Finger millet hull extract 28.03 ±2.00c1 13.33 ±0.68c2 32.38 ±2.89c3 23.57 ±1.39c4 41.84 ±1.17c5 61.87 ±1.25c6
Foxtail millet hull extract 20.20 ±1.10d1 10.59 ±1.18d2 19.29 ±0.71b1 32.04 ±2.53d3 8.68 ±0.80e4 56.12 ±1.90d5
Proso millet hull extract 11.62 ±1.20e1 14.12 ±2.04e2 37.86 ±0.71d3 29.47 ±2.61e4 43.23 ±2.03f5 54.68 ±0.72e6
Millet Phenolics as Natural Antioxidants
21
Table 5. Production of conjugated dienes (CD) in gingerlly oil model system
Superscripts with the same letters in each column and same numbers in each row are not significantly different
Time (hr)
0 06 12 24 36 48 72
Control 9.3 ±1.0a1 11.2 ±2.1a2 12.3 ±0.5a2 12.7 ±0.5a2 13.5 ±1.1a3 11.7 ±0.2a2 14.0 ±1.4a3
BHA 8.2 ±1.2a1 11.9 ±1.2a2 12.2 ±0.7a3 13.7 ±0.4b2 11.9 ±0.9b3 11.3 ±0.3a2 12.5 ±1.3b3
Ferulic acid 9.1 ±1.0a1 11.7 ±1.1a2 11.7 ±0.7a2 11.9 ±1.2a2 13.6 ±0.7a3 12.4 ±0.4a4 13.9 ±1.0b3
Finger millet hull extract 8.3 ±0.8a1 10.9 ±0.9a2 11.5 ±1.2a3 12.8 ±1.1a1 13.8 ±0.1a4 9.6 ±0.5b5 9.8 ±0.5c5
Foxtail millet hull extract 8.1 ±0.2a1 10.2 ±0.8a2 11.7 ±1.1a1 12.7 ±0.9a3 11.80 ±0.5b1 9.4 ±0.4b2 12.4 ±0.8b3
Proso millet hull extract 8.5 ±1.3a1 11.9 ±0.4a2 12.4 ±1.6a2 11.8 ±1.3a2 12.1 ±0.4b2 11.4 ±1.2a2 12.9 ±0.2b2

Tropical Agricultural Research Vol. 30 (3): 13 – 26 (2018)
Figure 1. The production of CD in human LDL and VLDLs samples in vitro with added
synthetic antioxidants and phenolic extracts of finger millet foods
Previous studies showed that plant phenolic compounds have potential to prevent the oxidation
of LDL cholesterols in vitro. Phenolic compounds found in wine are potent antioxidants in
inhibiting LDL oxidation in vitro (Teissedre et al., 1996; Meyer et al., 1997). According to
Heinonen et al. (1998) phenolic extracts of berries, namely black berries, red raspberries, sweet
cherries, blueberries, and strawberries demonstrated inhibition of human LDL oxidation.
Therefore, further in vivo research is warranted to reveal the effect of millet foods consumption
to prevent and control or reduce the burden of cardio vascular disease among humans. The
oxidized LDL can increase the risk of initiating vascular lesions in blood vessels leading to
atheroma formation.

Millet Phenolics as Natural Antioxidants
23
CONCLUSIONS
Millet grains and millet phenolic extracts act as natural sources of antioxidants in comminuted
pork and fish, peanut butter and gingelly oil to prevent lipid oxidation during storage. Millet
hull phenolics are potential sources of natural antioxidants which can be utilized in food
industry replacing synthetic antioxidants. Further, it is worthwhile to explore the possibility of
using millet hull phenolics as potential raw materials for the production of nutraceuticals to
attenuate LDL cholesterol oxidation.
ACKNOLEDGEMENT
This research was supported by the National Research Council of Sri Lanka (NRC 12-096).
REFERENCES
Adeolu, A.T. and Enesi, D.O. (2013). Assessment of proximate, mineral, vitamin and
phytochemical composition of plantain (Musa paradisiaca) bract – an agricultural waste. Int.
j. Plant Sci. 4(7), 192-197.
Benzie, I.F.F. and Strain, J.J. (1996). Ferric reducing ability of plasma (FRAP) as a measure
of “antioxidant power”: the FRAP assay. Anal. Bio-chem. 239(1), 70–76.
Bopitiya, D. and Madhujith, T. (2012). Antioxidant Potential of Pomegranate (Punica
granatum L.) Cultivars Grown in Sri Lanka. Trop. Agric. Res. 24(1), 71–81.
Das, S.C., Hamid, K., Bulbul, I.J., Sultana S. and Islam, S. (2010). In Vitro Antioxidant
Activity of Different Parts of the Plant Diospyros discolor. Res. J. of Agric. and Biol. Sci. 6(4),
472-475.
Dudonne S., Vitrac, X., Coutiere, P., Woillez, M. and Merillon, J.M. (2009). Comparative
study of antioxidant properties and total phenolic content of 30 plant extracts of Industrial
interest using DPPH, ABTS, FRAP, SOD and ORAC assays. J. Agric. Food Chem. 57(5),
1768-1774.
Flohe, R.B and Traber M.G. (1999). Vitamin Eː function and metabolism. The FASEB J. 13,
1145-1155.
Goli, A.H, Barzegar, M. and Sahari, M.A. (2005). Antioxidant activity and total phenolic
compounds of pistachio (Pistachia vera) hull extracts. Food Chem. 92, 521–525.
Haminiuk, C.W.I., Maciel, G.M., Plata-Oviedo, M.S.V. and Peralta, R.M. (2012). Invited
review Phenolic compounds in fruits – an overview. Int. J. Food Sci. and Tech. 47(10), 2023-
2044.
Jacob, A.R. (1996). Chapter 01ː Introduction. pp. 1-16. In Harris, J.R. (Ed.) Subcellular
Biochemistry, Ascorbic Acid: Biochemistry and Biomedical Cell Biology, vol. 25. Plenum,
New York, NY, USA.
Kumari et al.
24
Jayathilake, C., Rizliya, V. and Liyanage, R. (2016). Antioxidant and free radical scavenging
capacity of extensively used medicinal plants in Sri Lanka. Procedia Food Sci. 6, 123-126.
Jayaweera, D.M.A. (1981). Medicinal plants (Indigenous and exotic) used in Ceylon. Part II.
The National Science Foundation, Sri Lanka. pp. 228-229.
Kahkonen, M. P., Hopia, A. I., Vuorela, H. J., Rauha, J.-P., Pihlaja, K., Kujala, T. S. (1999).
Antioxidant activity of plant extracts containing phenolic compounds. J. Agri. and Food Chem.
47, 3954–3962.
Kriengsak, T., Unaroj, B., Kevin, C., Luis, C. and David, H.B. (2006). Comparison of ABTS,
DPPH, FRAP, and ORAC assays for estimating antioxidant activity from guava fruit extracts.
J. Food Com. and Analysis. 19, 669-675.
Lanerolle, M.S.De, Priyadharshani, A.M.B., sumithraarachchi, D.B. and Jansz E.R. (2008).
The carotenoids of Pouteria campechiana (Sinhalaː ratalawalu). J. of the National. Science
Foundation, Sri Lanka. 36(1), 95-98.
Lee, S.K. and Kader, A.A. (2000). Preharvest and postharvest factors influencing vitamin C
content of horticultural crops. Postharvest Bio. and Tech. 20, 20-220.
Lee, J., Robert, W.D. and Ronald, E.W. (2005). Determination of total monomeric anthocyanin
pigment content of fruit juices, beverages, natural colorants, and wines by the pH differential
method: collaborative study. J. AOAC Int. 88(5), 1269-1278.
Lee, M.H., Jiang, C.B., Juan, S.H., Lin, R.D. and Hou, W.C. (2006). Antioxidant and heme
oxygenase-1 (HO-1)-induced effects of selected Taiwanese plants. Fitoterapia. 77(2), 109–
115.
Lee, S., Mediani, A., Nur Ashikin, A., Azliana, A. and Abas, F. (2014). Antioxidant and α-
glucosidase inhibitory activities of the leaf and stem of selected traditional medicinal plants.
Int. Food Res. J. 21(1), 165-172.
Lie-Fen, S., Jieh-Hen, T., Je-Hsin, C., Chih-Yang, C. and Chiu-Ping, L. (2005). Antioxidant
properties of extracts from medicinal plants popularly used in Taiwan. Int. J. Applied Sci. and
Eng. 3(3), 195 - 202.
Lim, T.K. (2012a). Phyllanthaceaeː Phylanthus acidus in Edible Medicinal and non-medicinal
plants, Vol 4, Fruits, Springer Science+Business Media. London, pp. 252- 257.
Lim, T.K. (2012b). Ebinaceaeː Diospyros blancoi in Edible Medicinal and non-medicinal
plants, Vol 2, Fruits, Springer Science+Business Media. London, UK. pp. 421-424.
Omale J. and Ugwu C. E. (2011). Comparative studies on the protein and mineral composition
of some selected Nigerian vegetables. African J. Food Sci. 5(1), 22–25.
Oviasogie, P.O., Okoro, D. and Ndiokwere, C.L. (2009). Determination of total phenolic
amounts of some edible fruits and vegetables. African J. Biotech. 8(12), 2819 -2820.

Millet Phenolics as Natural Antioxidants
25
Padayatty, S., Katz, A., Wang,Y., Eck, P., Lee, J., Chen, S., Corpe, C., Dutta, A., Dutta, S. and
Levine, M. (2003). Vitamin C as an antioxidant: evaluation of its role in disease prevention. J.
Am. Clin. Nutr. 22(1), 18-35.
Pushpakumara, D.K.N.G. and Heenkenda, H.M.S. (2007). Chapter 06: Nelli (Amla)
(Phyllanthus embilica L.). pp. 180-221. In Pushpakumara, D.K.N.G., Gunasena, H.P.M.,
Singh, V.P. (Ed.) Underutilized Fruit Trees in Sri Lanka Volume 1. World Agro-forestry
Centre, South Asia Regional office, New Delhi, India; National Multipurpose Tree Species
Research Network of Sri Lanka; Sri Lanka Council for Agricultural Research Policy, Asian
Centre for Underutilized Crops, Sri Lanka.
Ramasamy, S., Wahab, N.A., Abidin, N.Z. and Manickam, S. (2011). Cytotoxicity evaluation
of five Malaysian Phyllanthaceae species on various human cancer cell lines. J. Med. Plant
Res. 5(11), 2267-2273 .
Safaa, Y. Q., Abo-khatwa, A.N. and Lahwa, M.A.B. (2010). Screening of antioxidant activity
and phenolic content of selected food items cited in the Holly Quran. Europ. J. Biol. Sci. 2(1),
40-51.
Shofian, N.M., Hamid, A.A., Osman, A., Saari, N., Anwar, F., Dek, M. S. P. and Hairuddin,
M.R. (2011). Effect of freeze-drying on the antioxidant compounds and antioxidant activity of
selected tropical fruits. Int. J. Mol. Sci. 12, 4678-4692.
Silva, K.D.R.R. and Sirasa M.S.F. (2018). Antioxidant properties of selected fruit cultivars
grown in Sri Lanka. Food Chem. 238, 203-208.
Su, L., Yin, J.J., Charles, D., Zhou, K., Moore, J. and Yu, L. (2007). Total Phenolic contents,
chelating capacities and radical-scavenging properties of black peppercorn, nutmeg,
hrosewhip, cinnamon and oregano leaf. J. Food Chem. 100(3), 990-997.
Surveswaran, S., Cai, Y.Z., Cork, H. and Sun, M. (2007). Evaluation of natural phenolic
antioxidant from 133 Indian medicinal plants. Food Chem. 102, 938-953.
Vidhan, J., DerMarderosian, A. and John, R.P. (2010). Anthocyanins and polyphenol oxidase
from dried arils of pomegranate (Punica granatum L.). J. Food Chem. 118(1), 11-16.
Wang, S.Y and Zheng, W. (2001). Effect of plant growth temperature on antioxidant capacity
in strawberry, J. Agric. Food Chem. 49, 4977–4982.
Wojdyło, A., Oszmianski, J. and Czemerys R. (2007). Antioxidant activity and phenolic
compounds in 32 selected herbs. Food Chem. 105, 940-949.
Yu, L., Perret, J. and Davy, B., Wilson, J. and Melby, C.L. (2002). Antioxidant properties of
cereal products. J. Food Sci. 67(7), 2600-2603.
Zhou, K. and Yu, L. (2004). Antioxidant properties of bean extracts from Trego wheat grown
at different locations. J. Agri. Food Chem. 52(5), 1112-1117.

Kumari et al.
26
Zulaikha, A.G.S., Mediani, A., Khoo, L.W., Lee, S.Y., Leong, S.W. and Abas, F. (2017).
Effect of different drying methods and solvent ratios on biological activities of Phyllanthus
acidus extracts. Int. Food Res. J. 24(1), 114-120.

Tropical Agricultural Research Vol. 30 (3): 27– 41 (2018)
Preliminary Evaluation of Probiotic Potential of Yeasts Isolated from
Bovine Milk and Curd of Sri Lanka
D.U. Rajawardana*, I.G.N. Hewajulige1, C.M. Nanayakkara2, S.K.M.R.A. Athurupana3 and
W.M.T. Madhujith3
Department of Plant Sciences, Faculty of Science
University of Colombo
Sri Lanka
ABSTRACT: There has been mounting interest in the health benefits associated with live
microorganisms commonly known as probiotics. Many probiotic bacterial species have been
identified. However, the potential of yeasts as a source of probiotics has not been well
explored. The present study was carried out to screen and identify potential probiotic yeasts
from selected dairy sources available in Sri Lanka. Yeasts from raw bovine milk and curd
were isolated, purified, selected and phenotypically characterized by performing
morphological, physiological and biochemical tests. Isolates were assessed for their ability to
survive under simulated gastro-intestinal conditions to explore their probiotic potential.
Approximately, 190 colonies similar to yeast were isolated and 45 isolates of the division
Ascomycota were selected and coded for convenience (SLDY_001-SLDY_045). Most
promising probiotic isolates (20) were genotypically identified to be species of Pichia (55%),
Candida (30%), and Kluyveromyces (15%) of the family: Saccharomycetaceae. Considering
a threshold of >95% similarity to the type strain, eight different yeast species were identified.
Isolates (SLDY_005, SLDY_006 and SLDY_039) of Kluyveromyces marxianus species
showed the highest probiotic potential from the pool. The strain confirmation and in-vitro/in-
vivo safety assessment of these isolates will further verify their suitability as probiotic starter
cultures to be used in local food and pharmaceutical industries.
Keywords: Curd, gastro-intestinal conditions, Kluyveromyces, probiotic yeast
INTRODUCTION
Yeasts constitute a large and heterogeneous group of microorganisms included in the
kingdom of Fungi. In addition to their role in the food processing industry, yeasts play
various roles in livestock feeding, veterinary practices, medical, biomedical and
pharmaceutical industries (Jakobsena and Narvhu, 1996). In recent years, yeasts are gaining
increased attention from the food industry as probiotics. FAO/WHO (2002) defines
probiotics as living microorganisms, which upon ingestion in adequate amounts confer health
benefits to the host. Accordingly, any nonpathogenic microorganism capable of surviving in
the gastro-intestinal tract (GIT) of the host and provide additional health benefits could be
considered as a candidate for probiotic use. While bacterial probiotics are common and
1 Food Technology Section, Industrial Technology Institute, Colombo, Sri Lanka 2 Department of Plant Sciences, Faculty of Science, University of Colombo, Sri Lanka 3 Department of Food Science and Technology, Faculty of Agriculture, University of Peradeniya, Sri Lanka
* Corresponding author: [email protected]

Rajawardana et al.
28
mostly studied, yeast probiotics are yet to be explored. When compared with well-known
bacterial probiotics, yeasts offer different advantages and are genetically more stable than
bacteria. They have more diverse enzymatic profiles and more versatile effects on the
immune system, natural resistance against antibiotics and can use for patients undergoing
prolonged antibiotic treatments. They also appear to be better suited for nutritional
enrichment and delivery of bioactive molecules (Nayak, 2011). Yeasts also have a long
history of safe human consumption in traditional fermented foods (Jakobsena and Narvhu,
1996). This includes buffalo curd fermented with indigenous starter cultures. Curd contains
numerous undefined species of lactic acid bacteria and yeasts, which act synergistically to
develop desirable taste, texture, flavor, aroma and extending the shelf life. As reported by
previous researches (Maccaferri et al., 2012), Saccharomyces cerevisiae var.boulardii and
kluyveromyces marxianus B0399® are live yeasts used extensively as probiotics and often
marketed as dietary supplements.Therefore, yeasts are promising candidates for the
development of novel probiotics and probiotic products.
Common yeast genera with probiotic properties include Saccharomyces, Pichia,
Metschnikowia, Yarrowia, Candida, Debaryomyces, Isaatchenkia and Kluyveromyces
(Nayak, 2011). Predominant genera of yeasts found in bovine milk and fermented dairy
products also include Saccharomyces, Pichia, Candida, Isaatchenkia, Debaryomyces,
Kluyveromyces and Rhodotorula. Therefore, dairy sources could be considered as a unique
environment for the selection of novel yeast strains. Despite the occurrence of yeasts in raw
bovine milk and many dairy related products and also in human gastrointestinal tract, studies,
which examine their probiotic features, are limited. In this backdrop, the present study was
carried out with the objective of isolation, subsequent characterization and exploration of
probiotic diversity of yeasts present in raw bovine milk and curd manufactured by home
based producers using indigenous starters.
METHODOLOGY
Sample collection, media and chemicals
Samples (cattle milk and curd, 30 samples each) were collected during October to December
2015 representing three different climatic zones of Sri Lanka as per the statistical methods
and procedures in Sri Lanka standard for milk and milk product sampling (SLSI: 1404:2010).
Samples collected to sterilized disposable polypropylene tubes (50 ml) were cooled
immediately and transported on ice to the laboratory to be stored at -20 °C for analysis, for
no longer than 3-4 hours. All microbiological media were obtained from Oxoid, UK,
chemicals from Sigma, St. Louis, USA and genomic DNA purification Kit (Wizard®),
Promega, USA.
Isolation and morphological characterization of yeast
Samples were serially diluted using 0.85% NaCl and microbial counts were taken by pour
and spread plate techniques. Yeast peptone dextrose agar (YPDA), Malt extract-yeast
extract-peptone-glucose agar (MYPG) and Potato dextrose agar (PDA) were used for the
enumeration of yeasts with 0.1 g/L chloramphenicol and incubated aerobically for 5 days at
25 °C. Colonies with distinct morphological differences were selected and purified by
repeated streaking on PDA. Isolates were preserved in YPDA slants at 4 °C and 40%
glycerol stocks at -20 °C.Colony morphologies (form, size, elevation, margin, texture and

Probiotic Potential of Yeasts Isolated from Bovine Milk and Curd
29
colony color) were visually examined and then cells were microscopically observed after wet
mounting and Methylene blue staining (Barnett et al., 2000).
Biochemical characterization of isolates
Catalase and Urease test: Catalase producing yeasts were identified by slide
method.Commercially available Christensen's urea agar base (Merck) was used to identify
urease producing yeasts (Christensen, 1946).
Sugar fermentation test: The fermentation basal medium was prepared using 0.45% (w/v)
yeast extract; 0.75% (w/v) peptone and 2% (w/v) of sugars (glucose, sucrose and lactose
independently) in distilled water. Fermentation test was carried out as described by Nahvi
and Moeini (2004). Conversion of the medium from green to yellow was taken as the
positive reaction.
Growth on 50% glucose: The growth ability of yeasts at high concentration of sugars was
tested on media having 50% (w/v) glucose, 1% (w/v) yeast extract, 3% agar and
chlorampenicol 0.01 % (w/v).
Liquid assimilation of carbon and nitrogen compounds: Assimilation of carbon compounds
was determined using bacto yeast nitrogen base medium without amino acids (Sigma,
Y0626), for sucrose, D-maltose, raffinose, L-rhamnose, glycerol and D-mannitol. Nitrogen
assimilation was checked using yeast carbon base medium (Sigma, Y3627) for potassium
nitrate, L-cysteine and L-lysine (Gadaga et al., 2000).
Survival of yeasts in physiological and simulated chemical conditions existing in the
GIT
Probiotic potential of the isolates was determined by investigating their tolerance to
temperature, pH, bile and simulated gastric enzymes following the methods explained by
Walker and Gilliland, 1993 and Aswathy et al. (2008). Fresh yeast (18 hours old) cultures
were prepared and adjusted to 0.6 OD at 600 nm (UV-Visible spectrophotometer) to
determine the temperature tolerance. Cultures were transferred to 96-well microtiter
microplate and incubated aerobically at 10 °C, 37 °C and 45 °C over 5 hours. After every
hour of incubation, samples were periodically drawn out to determine the cell concentration
by measuring OD at 600 nm. Tolerance to different pH levels was studied by incubating the
isolates in YPD broth medium adjusted to pH 1.5, 3.0 and 9 following the method described
above. To test the bile tolerance YPD broth medium was prepared by adding 0.3, 0.5 and 3%
of bile (oxgall, Sigma-Aldrich, B-8631). The best bile tolerant isolates were further studied
for their tolerance to simulated gastric enzymes by preparing YPD broth medium containing
pepsin (3 g/L, Sigma P-7000) and pancreatin (1 g/L, Sigma P-1750) separately, each with 2
different pH levels (pH 2 and 8).
Genotypic identification of the selected isolates
Isolates grown in YPD broth medium at 25 °C for 12 hours were centrifuged, and pallet was
washed twice in phosphate-buffered saline (PBS) pH (7.2). Genomic DNA was extracted and
purified using the Wizard® Genomic DAN Purification Kit, following the manufacturer’s
instructions. Selected regions of 18S rRNA gene were PCR amplified with universal primers
(ITS1 – TCCGTAGGTGAACCTGCGG, ITS4 – TCCTCCGCTTATTGATATGC) and
amplified products were subjected to DNA sequencing at Macrogen-South Korea. Resulted

Rajawardana et al.
30
sequences were analysed using online Basic Local Alignment Search Tool (BLAST) and
similarity to the type strain was conformed comparing with the National Center for
Biotechnology Information (NCBI) data base.
Statistical Analysis
Enumerations were done in triplicate, experiments were performed in duplicate and
experimental data were expressed as mean ± standard deviation (SD).
RESULTS AND DISCUSSION
Enumeration and preliminary selection of Yeasts
Differentiation of yeasts and molds
From the three different yeast isolation medias used maximum number of yeasts were
enumerated on YPDA. Hence, it was selected as the most suitable growth medium for the
isolation of yeast throughout the study. Previous researchers also have reported YPDA as a
better enumeration media for the isolation of yeast (Oda and Ouchi, 2000). From the 60
samples analyzed, 190 isolates that resembled yeasts were selected while removing the
molds based on their colony morphologies. Subsequently, eighty isolates which were closely
resembling yeast and having distinct morphological differences were selected and purified by
repeated streaking.
Catalase and Urease tests
The selected isolates were catalase positive. Yeasts are either aerobes or facultative aerobes;
hence production of catalase enzyme is an important criterion for preliminary selection.
Predominant genera of yeasts with probiotic affinities found in dairy sources belonging to the
division Ascomycota and the production of extracellular urease has been generally
considered as a universal character of Basidiomycetous yeasts shared by very few
Ascomycetous yeasts (Rij,1984). Rutherford (2014) suggests that urease positive
microorganisms have preserved roles in promoting bacterial and fungal infections.
Furthermore, enzymatic hydrolysis of urea (milk contains approximately 0.2-0.4 g/L) leads
to a slower reduction of pH during fermentation process (Spinnler and Corrieu, 1989) thus
could consider as undesirable for industrial fermentations. Considering above factors 45
distinct urease negative isolates were selected and coded for convenience (SLDY_001-
SLDY_045) for further characterization.
Colony and cell morphology
The yeast colonies generally looked similar with fewer variations. Most of the cells appeared
oval to elongate in shape, arranged singly, in pairs or in chains/ bunches. Reproduction was
by budding or by psedohypha. Isolates with closely similar morphologies were grouped into
five categories (Table 1). When compared with the colony and cell morphologies and mode
of asexual reproduction (Li et al., 2015), isolates in Group 1 resembles either Saccharomyces
sp. or Pichia sp., Group 2, Kluyveromycessp. Group 3 and 4 Candida sp. and Group 5 to
Rhodotorulasp. Our categorizations are also similar with the previously reported data of
Gadaga et al. (2000) and Kurtzman et al. (2011).
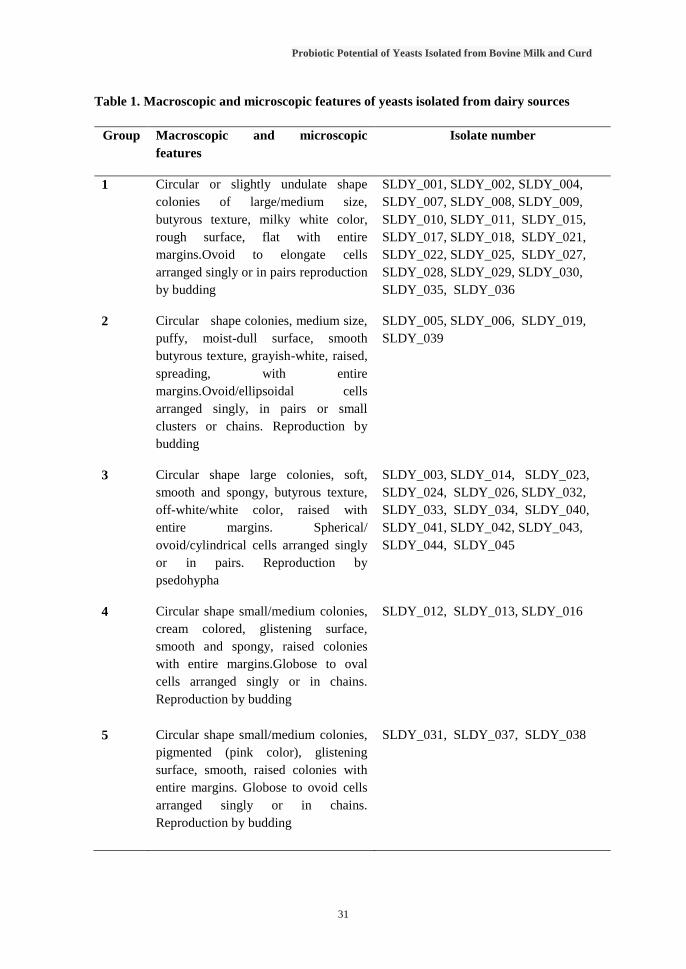
Probiotic Potential of Yeasts Isolated from Bovine Milk and Curd
31
Table 1. Macroscopic and microscopic features of yeasts isolated from dairy sources
Group Macroscopic and microscopic
features
Isolate number
1 Circular or slightly undulate shape
colonies of large/medium size,
butyrous texture, milky white color,
rough surface, flat with entire
margins.Ovoid to elongate cells
arranged singly or in pairs reproduction
by budding
SLDY_001, SLDY_002, SLDY_004,
SLDY_007, SLDY_008, SLDY_009,
SLDY_010, SLDY_011, SLDY_015,
SLDY_017, SLDY_018, SLDY_021,
SLDY_022, SLDY_025, SLDY_027,
SLDY_028, SLDY_029, SLDY_030,
SLDY_035, SLDY_036
2 Circular shape colonies, medium size,
puffy, moist-dull surface, smooth
butyrous texture, grayish-white, raised,
spreading, with entire
margins.Ovoid/ellipsoidal cells
arranged singly, in pairs or small
clusters or chains. Reproduction by
budding
SLDY_005, SLDY_006, SLDY_019,
SLDY_039
3 Circular shape large colonies, soft,
smooth and spongy, butyrous texture,
off-white/white color, raised with
entire margins. Spherical/
ovoid/cylindrical cells arranged singly
or in pairs. Reproduction by
psedohypha
SLDY_003, SLDY_014, SLDY_023,
SLDY_024, SLDY_026, SLDY_032,
SLDY_033, SLDY_034, SLDY_040,
SLDY_041, SLDY_042, SLDY_043,
SLDY_044, SLDY_045
4 Circular shape small/medium colonies,
cream colored, glistening surface,
smooth and spongy, raised colonies
with entire margins.Globose to oval
cells arranged singly or in chains.
Reproduction by budding
SLDY_012, SLDY_013, SLDY_016
5 Circular shape small/medium colonies,
pigmented (pink color), glistening
surface, smooth, raised colonies with
entire margins. Globose to ovoid cells
arranged singly or in chains.
Reproduction by budding
SLDY_031, SLDY_037, SLDY_038

Rajawardana et al.
32
Biochemical characterization of isolates
Isolates, namely SLDY_009, SLDY_010, SLDY_024, SLDY_031, SLDY_033, SLDY_034,
SLDY_037, SLDY_038 and SLDY_041 either lost their viability or got contaminated while
sub-culturing. These isolates were discontinued from further characterizations (Table 2).
Sugar fermentation
Yeasts gain carbon typically from hexose sugars, such as glucose and fructose or
disaccharides such as sucrose and maltose while some species can also metabolize pentose
sugars such as xylose, alcohols and organic acids (Ebabhi et al., 2013). However, as
mentioned by Gana et al. (2014) and Li et al. (2015), all strains of Pseudozyma and some
strains of Debaryomyces sp. are unable to ferment D-glucose whereas Saccharomyces,
Pichia, Kluyveromyces, Candida as well as Rhodotorula species easily ferment D-glucose.
All tested isolates in the pool were able to ferment D-glucose and their morphologies also
tally with the above mentioned D-glucose fermentative types indicating their suitability to
consider as isolates belonging to those species. Nearly two third (70%) of the isolates were
able to ferment lactose whereas 30% could not. Literature reveals that S. cerevisiae and
some Debaryomyces species are unable to grow and ferment lactose when it is provided as
the sole carbon source as it doesn’t possess lactose metabolizing system. Lactase or β-D-
galactosidase enzyme is present in lactose fermenting yeasts such as Kluyveromyces lactis,
Kluyveromyces fragilis, and Candida pseudotropicalis (Nahvi and Moeini, 2004). Hence,
lactose fermentative yeasts in the pool should also contain above mentioned species which has
a potential to grow in milk and whey, therefore could be promising candidates for bio
processing industries.
Growth on 50% glucose
Except, SLDY_026, SLDY_027 and SLDY_029 other isolates grown well on media
supplemented with 50% glucose thus, majority of the isolates could be considered as suitable
candidates for the production of highly concentrated food products. Gana et al. (2014),
reported that the Pseudozyma and Cryptococcus species are unable to grow under high
osmotic pressure conditions. Based on the colony characteristics and biochemical test results,
the pool of yeast isolates belong to Kluyveromyces, Pseudozyma, Cryptococcus, Candida,
Rhodotorula, Saccaromyces and Debaryomyces species.
Liquid Assimilation of Carbon and Nitrogen Compounds
Rij (1984) preferred assimilation tests than the fermentation tests for testing enzyme systems.
All tested isolates were able to assimilate D-Sucrose, Raffinose, D-Mannitol, Glycerol, and
L-Rhamnose. Majority of the pool (80%) was able to assimilate D-maltose indicating the
presence of the enzyme maltase. The whole pool of isolates was able to assimilate glycerol
indicating the presence of glycerol kinase gene (Obasi et al., 2014). All tested isolates were
also able to assimilate L-cysteine and L-lysine. Gadaga et al. (2000) reported that S.
cerevisiae could ferment sucrose, raffinose, glucose and galactose but, unable to utilize
lysine. Assimilation of L-lysine indicated the absence of S. cerevisiae isolates. This was
further confirmed by the genotypic identifications. According to Rij (1984), the inability to
utilize nitrate nitrogen is considered to be a valuable tool for characterization of yeast. Some
species of Saccharomyces, Kluyveromyces, Pichia and Debaryomycesare unable to utilize
nitrates, while the all species of other genera (e.g Hansenula) utilize nitrate. There are some
genera in which both nitrate positive and negative species occur (e.g. Candida and

Probiotic Potential of Yeasts Isolated from Bovine Milk and Curd
33
Trichosporon). Isolates, SLDY_005, SLDY_006, SLDY_015, SLDY_016, SLDY_039,
SLDY_044 were unable to assimilate potassium nitrate, therefore could consider as
belonging to Saccharomyces, Kluyveromyces, Pichia or Debaryomyces species. However,
when these results were compared with the genotypic identifications this was true to all other
genera except Pichia isolates which exhibited assimilation of potassium nitrate.
Probiotic potential of the selected isolates
Species and strain specificity are very important factors (Fijan et al., 2014) when deciding
probiotic properties and safety for consumption. Hence, known probiotic species should be
considered first for selection. Kluyveromyces species isolated from dairy sources have shown
considerable potential in commercial probiotic applications. Further, Pichia and Candida
strains are also being studied to a certain extent. Results obtained for the selected isolates of
the present study are presented in Table 3. Isolates that grown under all simulated GI
conditions were selected as potential probiotics for genotypic identifications. One fourth
(25%) of yeasts from the initial pool of isolates (80) possessed satisfactory level of probiotic
affinities.
Figure 1. Survival of K. marxianus isolates in the presence of acid (a) pH 1.5, (b) pH 9.0
(c) bile 0.3% and (d) 3.0%

Rajawardana et al.
34
Acid and alkaline tolerance
Survival under a wide range of pH conditions is an important characteristic of a probiotic
yeast to survive in human digestive tract. The selected yeasts were found to grow and survive
up to 5 hours under pH range of 1.5 to 9.0. This confirmed that the isolates can survive in the
extreme acidity and alkalinity existing in the stomach and intestines. In agreement with
Hamed and Elattar (2013) the viability of many types of yeast decreased at pH 1.5 and
growth increased at pH 9 and sustained over 5 hours. They exhibited a very low but,
consistent growth compared to initial cell count [unable to grow above one log unit (log10
CFU /ml)] within 5 hour period. However, at pH 9.0 isolates grew well and initial cell count
of 106 reached to 107 after 5 hours of incubation (log10 CFU /ml). Results obtained for the K.
marxianus isolates (SLDL_005, SLDL_006 and SLDL_039) identified from the pool is
shown in Figure.1 a and b.
Effects of bile salt on viability
According to FAO/WHO, it is mandatory to assess bile tolerance for in-vitro selection of
probiotic strains (Vinderola et al., 2008). Isolates survived and exhibited gradual increase in
cell densities during 5 hour incubation period at 0.3% and 3% of bile. As shown in Figure1. c
and d, growth of the yeast (SLDL_005, SLDL_006 and SLDL_039) was not heavily affected
by the addition of bile salts as compared to reduced pH. Although, the isolates grew
gradually in both bile concentrations, growth was higher at 0.3%. Other researchers have also
reported similar results (Sourabh et al,. 2011) in previous studies.
Effects of gastric and pancreatic juice on viability
Another critical factor that affects the viability of microorganisms during digestion is gastric
and pancreatic juices. The obtained results for the above discussed strains are presented in
Figure 2. a, b, c and d. At pH 8 isolates showed gradual growth and survival in gastric and
pancreatic juices. At pH 2 isolates exhibited a slow growth compared to pH 8 and reached
stationary phase earlier (within 3-4 hours).These findings correlate well with the earlier
findings of Chelliah et al. (2016) and Díaz-Vergara et al. (2017).
Genotypic identification of most promising probiotic yeast isolates
Above results revealed that the most promising probiotic yeasts of dairy origin were of
Pichia, Candida and Kluyveromyces genera. Considering a threshold of >95% similarity to
the type strain, 8 different yeast species were identified and listed in table 4. P. kudriavzevii,
K. marxianus and C. tropicalis were the highest 3 probiotic species in frequency of
occurrence as shown in Figure 3. These results well tally with the findings of many
researchers previously investigated about the yeast taxonomy in raw milk and dairy products
(Fleet, 1990; Wouters, et al., 2002). All identified species of our pool of isolates are there in
the Bourdichon’s list of beneficial yeasts. Based on species specificity, isolates SLDY_005,
SLDY_006 and SLDY_039 which were identified as K. marxianus (15% from the pool)
could be considered as the best candidates for further investigations. Maccaferri et al. (2012)
reported about the probiotic K. marxianus B0399 (food grade) which has favorably
modulated immune response in caco-2 cells, peripheral blood mononuclear cells and
exhibited favorable effects on health-promoting bacteria of the
genus Bifidobacterium (Bif164). Romanin et al. (2016) reports about anti-inflammatory and
anti-oxidative properties of probiotic K. marxianus CIDCA 8154.

Tropical Agricultural Research Vol. 30 (3): 27– 41 (2018)
Table 2. Biochemical Characteristics of yeast isolates
Isolate
Fermentation of
sugars
50
% g
luco
se
Carbon assimilation
Nitrogen assimilation test
Glu
co
se
Su
cro
se
La
cto
se
La
cto
se
Su
cro
se
Ra
ffin
ose
Ma
nn
ito
l
Gly
cero
l
Ma
lto
se
Rh
am
no
se
Cy
stein
e
P.n
itra
te
Ly
sin
e
1. SLDY_001 + + + + + + + + + + + + +
2. SLDY_002 + + + + + + + + + + + + +
3. SLDY_003 + + - + + + + + + + + + +
4. SLDY_004 + + + + + + + + + + + + +
5. SLDY_005 + + + + + + + + + + + - +
6. SLDY_006 + + + + + + + + + + + - +
7. SLDY_007 + + + + + + + + + + + + +
8. SLDY_008 + + + + + + + + + + + + +
9. SLDY_011 + + + + + + + + + + + + +
10. SLDY_012 + - - + + + + + + + + + +
11 .SLDY_013 + + - + + + + + + + + + +
12. SLDY_014 + + + + + + + + + + + + +
13. SLDY_015 + + - + + + + + + + + - +
14. SLDY_016 + + + + + + + + - + + - +
15. SLDY_017 + - + + + + + + + + + + +
16. SLDY_018 + + + + + + + + + + + + +
17. SLDY_019 + + - + + + + + + + + + +
18. SLDY_020 + + + + + + + + + + + + +
19. SLDY_021 + + + + + + + + + + + + +
20. SLDY_022 + + + + + + + + + + + + +
21. SLDY_023 + - - + + + + + + + + + +
22. SLDY_025 + - - + + + + + + + + + +
23. SLDY_026 + - - - + + + + + + + + +
24. SLDY_027 + - - - + + + + + + + + +
25. SLDY_028 + - - + + + + + - + + + +
26. SLDY_029 + - - - + + + + + + + + +
27. SLDY_030 + + + + + + + + - + + + +
28. SLDY_032 + + + + + + + + + + + + +
29. SLDY_035 + + + + + + + + + + + + +
30. SLDY_036 + + + + + + + + + + + + +
31. SLDY_039 + + + + + + + + + + + - +
32. SLDY_040 + + + + + + + + + + + + +
33. SLDY_042 + + + + + + + + + + + + +
34. SLDY_043 + + + + + + + + + + + + +
35. SLDY_044 + + + + + + + + + + + - +
36. SLDY_045 + + + + + + + + - + + + +

Tropical Agricultural Research Vol. 30 (3): 27– 41 (2018)
Table 3. Survival of selected yeast isolates in the presence of simulated GIT conditions
ND: Not Done
Isolate Temperature pH Bile Gastric enzymes
10 °
C
37 °
C
45 °
C
1.5
3
9
0.3
0%
0.5
0%
3.0
0%
Pep
sin (
3g/L
)
Pan
crea
tin
(3g/L
)
pH 2 pH 8 pH 2 pH 8
1. SLDY_001 √
√ √ √ √ √ √ √ √ √ √ √ √
2. SLDY_002 √
√ √ √ √ √ √ √ √ √ √ √ √
3. SLDY_003 √
√ √ √ √ √ × × × ND ND ND ND
4. SLDY_004 √
√ √ √ √ √ √ √ √ √ √ √ √
5. SLDY_005 √
√ √ √ √ √ √ √ √ √ √ √ √
6. SLDY_006 √
√ √ √ √ √ √ √ √ √ √ √ √
7. SLDY_007 √
√ √ √ √ √ √ √ √ √ √ √ √
8. SLDY_008 √
√ √ √ √ √ √ √ √ √ √ √ √
9. SLDY_011 √
√ √ × √ √ ND ND ND ND ND ND ND
10. SLDY_012 √
√ √ × √ √ ND ND ND ND ND ND ND
11 .SLDY_013 √
√ √ × √ √ ND ND ND ND ND ND ND
12. SLDY_014 √
√ √ √ √ √ √ √ √ √ √ √ √
13. SLDY_015 √
√ √ × √ √ ND ND ND ND ND ND ND
14. SLDY_016 √
√ √ √ √ √ √ √ √ √ √ √ √
15. SLDY_017 √
√ √ √ √ √ √ √ √ √ √ √ √
16. SLDY_018 √
√ √ √ √ √ √ √ √ √ √ √ √
17. SLDY_019 ×
√ √ √ × × ND ND ND ND ND ND ND
18. SLDY_020 √
√ √ √ √ √ √ √ × ND ND ND ND
19. SLDY_021 √ × × √ √ √ × × × ND ND ND ND
20. SLDY_022 √
√ √ √ √ √ √ √ √ √ √ √ √
21. SLDY_023 ×
√ √ × × √ ND ND ND ND ND ND ND
22. SLDY_025 ×
√ × × √ √ ND ND ND ND ND ND ND
23. SLDY_026 ×
√ √ × √ √ ND ND ND ND ND ND ND
24. SLDY_027 √
√ × √ √ √ × × × ND ND ND ND
25. SLDY_028 ×
√ × × √ √ ND ND ND ND ND ND ND
26. SLDY_029 √
√ √ × √ √ ND ND ND ND ND ND ND
27. SLDY_030 √
√ √ √ √ √ √ √ √ √ √ √ √
28. SLDY_032 √
× × × √ √ ND ND ND ND ND ND ND
29. SLDY_035 √
√ √ √ √ √ √ √ √ √ √ √ √
30. SLDY_036 √
√ √ √ √ √ √ √ √ √ √ √ √
31. SLDY_039 √
√ √ √ √ √ √ √ √ √ √ √ √
32. SLDY_040 ×
√ √ √ √ √ √ √ × ND ND ND ND
33. SLDY_042 √
√ √ √ √ √ √ √ √ √ √ √ √
34. SLDY_043 √
√ √ √ √ √ √ √ √ √ √ √ √
35. SLDY_044 √
√ √ √ √ √ √ √ √ √ √ √ √
36. SLDY_045 √
√ √ √ √ √ √ √ √ √ √ √ √

Probiotic Potential of Yeasts Isolated from Bovine Milk and Curd
37
Figure 2. Survival of K. marxianus isolates in the presence of pancreatin (a) pH 2, (b)
pH 8.0, (c) pepsin pH 2 and (d) pH 8.0
Pichia is the predominant probiotic genera identified from the pool (55%) which also had
exhibited probiotic potential and safety in previous studies. Greppi et al. (2017) has tested
and confirmed the probiotic potential of P.kudriavzevii strains and their ability to enhance
folate content of traditional cereal-based African fermented food. Chelliah et al. (2016) has
evaluated and confirmed the antimicrobial activity and probiotic properties of P.kudriavzevii
isolated from frozen idli batter and Ogunremi et al. (2015) has developed a cereal-based
functional food using cereal-mix substrate fermented with probiotic strain – P.kudriavzevii
OG32.Therefore, Pichia isolates could consider as the second priority for further
investigations.
Figure 3. Abundance of potentially probiotic yeast species isolated from dairy sources
of Sri Lanka

Rajawardana et al.
38
Table 4. Potentially probiotic yeast species isolated from dairy sources of Sri Lanka
with % similarity to type strain
CONCLUSIONS
This investigation provides a theoretical basis for probiotic yeast diversity of Sri Lankan
dairies. This might be an attractive solution to the steadily increasing demands of food
manufacturers looking for probiotics with viability under extreme conditions. Identified
isolates could be useful for probiotic strain selection, manufacturing dairy products for
lactose intolerant people, production of fermented foods with high concentrations of sugar,
single cell proteins (SCP) and bio ethanol production from whey, and production of
functional ingredients for food and pharmaceutical industries. P.kudriavzevii and K.
marxianus (65% from the total) were the best probiotics identified therefore, worth to study
further to establish as commercial probiotics. Moreover, remaining species of the pool (P.
AQGWD 7, C.pararugosa, C. tropicalis, C. metapsilosis, C. rugosa, C. orthopsilosis) also
could consider as promising candidates for local bio processing industries.
Code Identity Similarity to type strain
SLDY_001 Curd Pichia kudriavzevii isolate C12 100%
SLDY_002 Curd Pichia kudriavzevii strain IFM 64555 100%
SLDY_004 Curd Pichia kudriavzevii strain IFM 64555 100%
SLDY_005 Curd Kluyveromyces marxianus CBS 5673 100%
SLDY_006 Curd Kluyveromyces marxianus CBS 5673 100%
SLDY_007 Curd Pichia kudriavzevii IFM 56882 100%
SLDY_008 Curd Pichia sp. AQGWD 7 99%
SLDY_014 Curd Candida tropicalis SBKS 3 100%
SLDY_016 Curd Candida parapsilosis isolate S22811 100%
SLDY_017 Curd Pichia kudriavzevii strain IFM 64555 100%
SLDY_018 Curd Pichia kudriavzevii strain IFM 64555 100%
SLDY_022 Curd Pichia kudriavzevii isolate H-237 96%
SLDY_030 Curd Pichia kudriavzevii strain B187B 100%
SLDY_035 Raw cows’ milk Pichia kudriavzevii strain YB-25 100%
SLDY_036 Raw cows’ milk Pichia kudriavzevii strain B187B 100%
SLDY_039 Raw cows’ milk Kluyveromyces marxianus strain CBS 1555 100%
SLDY_042 Raw cows’ milk Candida rugosa strain CBS 613 100%
SLDY_043 Raw cows’ milk Candida tropicalis LEM123 99%
SLDY_044 Raw cows’ milk Candida pararugosa strain M172B 100%
SLDY_045 Raw cows’ milk Candida orthopsilosis strain IFM55182 100%

Probiotic Potential of Yeasts Isolated from Bovine Milk and Curd
39
ACKNOLEDGEMENT
The authors wish to acknowledge the financial support provided by the Industrial
Technology Institute, Colombo, Sri Lanka (TG 15/117) and National Science Foundation
Grant (RG/2016/AG/02).
REFERENCES
Aswathy, R.G., Ismail, B., John, R.P. and Nampoothiri, K.M. (2008). Evaluation of the
probiotic characteristics of newly isolated lactic acid bacteria. Applied Biochemistry and
Biotechnol.151, 244-255.
Barnett, Y.A., Payne, R.W. and Yarrow, D. (2000). Yeasts: characteristics and
identification, Cambridge Uni. Press, U.K, pp. 25-35.
Bourdichon, F., Casaregola, S., Farrokh, C., Frisvad, J.C., Gerds, M.L., Prajapati, J.P., Seto,
Y., Schure, E.T., Boven, A.V., Vankerckhoven, V., Zgoda, A., Tuijtelaars S. and Hansen,
E.B. (2012). Food fermentations: Microorganisms with technological beneficial use. Int. J. of
Food Microbiol. 154, 87-97.
Chelliah, R.P., Ramakrishnan, S.R., Prabhu, P.R. and Antony, U. (2016). Evaluation of
antimicrobial activity and probiotic properties of wild-strain Pichia kudriavzevii isolated
from frozen idli batter. Yeast special Issue; 33: 385-401.
Christensen, W. B. (1946). Urea decomposition as a means of differentiating Proteus and
paracolon cultures from each other and from Salmonella and Shigella types. J. of Bacteriol.
52, 461-466.
Díaz-Vergara, L., Pereyra, C.M., Montenegro, M., Pena, G.A., Aminahuel, C.A. and
Cavaglieri, L.R. (2017). Encapsulated whey–native yeast Kluyveromyces marxianus as a feed
additive for animal production. Food Additives and Contaminants. 34, 750-759.
Ebabhi, A.M., Adekunle, A.A., Okunowo, W.O. and Osuntoki, A.A. (2013). Isolation and
characterization of yeast strains from local food crops. J. of Yeast and Fungal Research. 4(4),
38-43.
FAO/WHO (2002). Guidelines for the evaluation of probiotics in food. Food and Agriculture
Organization of the United Nations and World Health Organization working group report,
London Ontario, Canada.
Fijan, S. (2014). Microorganisms with claimed probiotic properties: An overview of recent
literature. Int. J. Environ. Res. Public Health. 11, 4745-4767.
Fleet, G.H. (1990). Yeasts in dairy products- A review. J. Appl. Bacteriol. 68, 199–211.
Gadaga, T.H., Mutukumira, A.N. and Narvhus J.A. (2000). Enumeration and identification
of yeasts isolated from Zimbabwean traditional fermented milk. Int. Dairy J. 10, 459-466.

Rajawardana et al.
40
Gana, N.H.T., Mendoza, B.C. and Monsalud, R.G. (2014). Isolation, screening and
characterization of yeasts with amyloytic, lipolytic, and proteolytic activities from the
surface of Philippine bananas (musa spp.), Philippine J.of Sci.143 (1), 81-87.
Greppi, A., Saubade, F., Botta, C., Humblot, C., Guyot, J.P. and Cocolin, L. (2017). Potential
probiotic Pichia kudriavzevii strains and their ability to enhance folate content of traditional
cereal-based African fermented food. Food Microbiol. 62, 169-177.
Hamed, E. and Elattar, A. (2013). Identification and some probiotic potential of lactic acid
bacteria isolated from Egyptian camels milk. Life Sci. J. 10(1), 1952-1961.
Jakobsena, M. and Narvhu, J. (1996). Yeasts and their possible beneficial and negative
effects on the quality of dairy products. Dairy J.6, 755-768.
Kurtzman, C.P., Fell, J.W. and Boekhout, T. (2011). The Yeasts: A Taxonomic Study, 5th
Edn., Elsevier Science, Burlington, U.K.
Li, Y., Liu, T. and He, G. (2015). Isolation and Identification of Yeasts from Tibet Kefir.
Ad. J. of Food Sci. and Technol. 7(3): 199-203.
Maccaferri, S., Klinder, A., Brigidi, P., Cavina, P. and Costabile, A. (2012). Potential
Probiotic Kluyveromyces marxianus B0399 modulates the immune response in caco-2 cells
and peripheral blood mononuclear cells and impacts the human gut microbiota in an in-vitro
colonic model system. Appl. Environ. Microbiol, 78 (4) 956-964.
Nahvi, I. and Moeini, H. (2004). Isolation and identification of yeast strains with high β-
galactosidase activity from dairy products. Biotechnol. 3: 35-40.
Nayak S.K. (2011). Probiotics, Microbiology Monographs. 21, 29-55.
Obasi, B.C., Whong, C.M.Z., Ado, S.A. and Abdullah, I.O. (2014), Isolation and
Identification of yeast associated with fermented orange juice. Int. J. of Engineering and
Sci.3, 9, 64-69.
Oda, Y. and Ouchi, K. (2000). Saccharomyces, Encyclopedia of food microbiology. Richard
K., Robinson C.A., Batt P. and Patel D. (Ed.) Academic press, Londan, U.K. 3, 1907-1927.
Ogunremi, O.R., Agrawal, R. and Sanni, A.I. (2015). Development of cereal-based
functional food using cereal-mix substrate fermented with probiotic strain – Pichia
kudriavzevii OG32. Food Sci. and Nutrition, Wiley Periodicals, Inc. pp.486-489.
Rij, N.J.W.K. (1984). The yeasts. Elsevier Science Publishers B.V., Amsterdam. pp.75-95.
Romanin, D.E., Llopis, S., Genovés, S., Martorell, P., Ramón, V.D., Garrote, G.L. and
Rumbo, M. (2016). Probiotic yeast Kluyveromyces marxianus CIDCA 8154 shows anti-
inflammatory and anti-oxidative stress properties in in-vivo models. Beneficial Microbes. 83-
93.
Rutherford, J.C. (2014). The emerging role of urease as a general microbial virulence factor.
PLOS Pathogens | www.plospathogens.org.

Probiotic Potential of Yeasts Isolated from Bovine Milk and Curd
41
Sourabh, A., Kanwar, S.S. and Sharma, O.P. (2011). Screening of indigenous yeast isolates
obtained from traditional fermented foods of Western Himalayas for probiotic attributes. J. of
Yeast and Fungal Research. 2(8), 117 - 126.
Spinnler, H.E. and Corrieu, G. (1989). Automatic method to quantify starter activity based
on pH measurement. J. of Dairy Research. 56, 755-764.
Vinderola, G., Capellini, B., Villarreal, F., Suárez, V., Quiberoni, A. and Reinheimer, J. (
2008). Usefulness of a set of simple in-vitro tests for the screening and identification of
probiotic candidate strains for dairy use. LWT - Food Sci. and Technology, 41, 1678-1688.
Walker, D. K. and Gilliland, S. E. (1993). Relationships among bile tolerance, bile salt de-
conjugation and assimilation of cholesterol by Lactobacillus acidophilus. J. of Dairy Sci., 76-
95.
Wouters, J.T.M., Eman H.E., Jeroen, A. and Smit H.G. (2002). Microbes from raw milk for
fermented dairy products, Int. Dairy J, 12, 91-109.

Tropical Agricultural Research Vol. 30 (3): (2018)
42
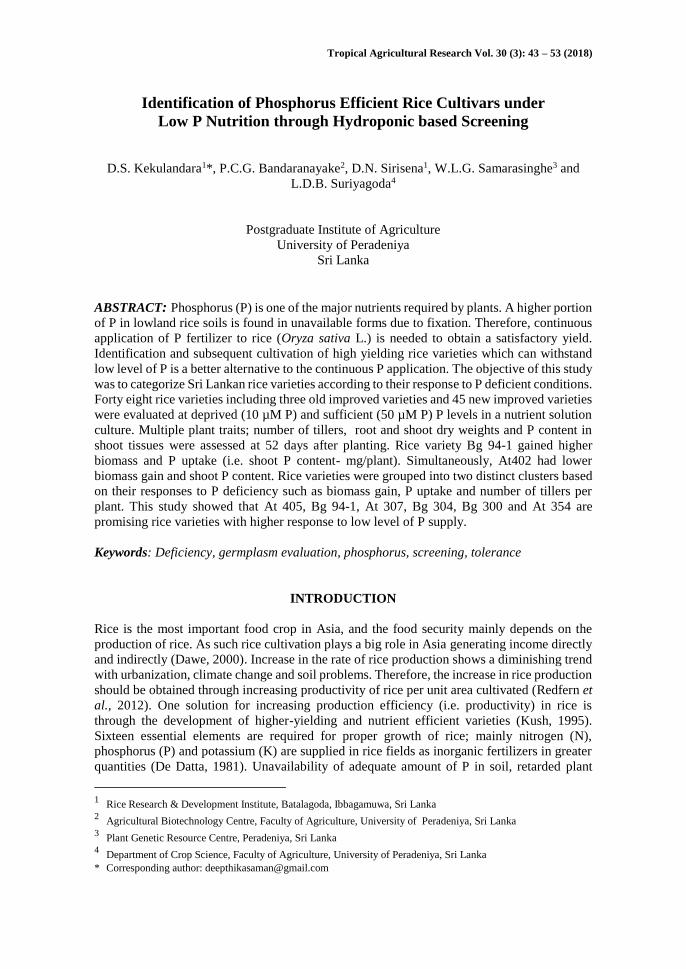
Tropical Agricultural Research Vol. 30 (3): 43 – 53 (2018)
Identification of Phosphorus Efficient Rice Cultivars under
Low P Nutrition through Hydroponic based Screening
D.S. Kekulandara1*, P.C.G. Bandaranayake2, D.N. Sirisena1, W.L.G. Samarasinghe3 and
L.D.B. Suriyagoda4
Postgraduate Institute of Agriculture
University of Peradeniya
Sri Lanka
ABSTRACT: Phosphorus (P) is one of the major nutrients required by plants. A higher portion
of P in lowland rice soils is found in unavailable forms due to fixation. Therefore, continuous
application of P fertilizer to rice (Oryza sativa L.) is needed to obtain a satisfactory yield.
Identification and subsequent cultivation of high yielding rice varieties which can withstand
low level of P is a better alternative to the continuous P application. The objective of this study
was to categorize Sri Lankan rice varieties according to their response to P deficient conditions.
Forty eight rice varieties including three old improved varieties and 45 new improved varieties
were evaluated at deprived (10 µM P) and sufficient (50 µM P) P levels in a nutrient solution
culture. Multiple plant traits; number of tillers, root and shoot dry weights and P content in
shoot tissues were assessed at 52 days after planting. Rice variety Bg 94-1 gained higher
biomass and P uptake (i.e. shoot P content- mg/plant). Simultaneously, At402 had lower
biomass gain and shoot P content. Rice varieties were grouped into two distinct clusters based
on their responses to P deficiency such as biomass gain, P uptake and number of tillers per
plant. This study showed that At 405, Bg 94-1, At 307, Bg 304, Bg 300 and At 354 are
promising rice varieties with higher response to low level of P supply.
Keywords: Deficiency, germplasm evaluation, phosphorus, screening, tolerance
INTRODUCTION
Rice is the most important food crop in Asia, and the food security mainly depends on the
production of rice. As such rice cultivation plays a big role in Asia generating income directly
and indirectly (Dawe, 2000). Increase in the rate of rice production shows a diminishing trend
with urbanization, climate change and soil problems. Therefore, the increase in rice production
should be obtained through increasing productivity of rice per unit area cultivated (Redfern et
al., 2012). One solution for increasing production efficiency (i.e. productivity) in rice is
through the development of higher-yielding and nutrient efficient varieties (Kush, 1995).
Sixteen essential elements are required for proper growth of rice; mainly nitrogen (N),
phosphorus (P) and potassium (K) are supplied in rice fields as inorganic fertilizers in greater
quantities (De Datta, 1981). Unavailability of adequate amount of P in soil, retarded plant
1 Rice Research & Development Institute, Batalagoda, Ibbagamuwa, Sri Lanka 2 Agricultural Biotechnology Centre, Faculty of Agriculture, University of Peradeniya, Sri Lanka 3 Plant Genetic Resource Centre, Peradeniya, Sri Lanka
4 Department of Crop Science, Faculty of Agriculture, University of Peradeniya, Sri Lanka
* Corresponding author: [email protected]

Kekulandara et al.
44
growth and development resulting significant yield losses (Dobermann and Fairhurst, 2000).
Phosphorus requirement and acquisition are higher during the early growth stages (Vinod
and Heuer, 2012).
Applied P is quickly converted to unavailable forms adhering to soil particles and can lead to
deficiency in available P in soil. Also P deficiency in soil can occur due to the low P content
of the parental material, low pH and soil with high P-fixing characteristics (Rose and Wissuwa,
2012). Phosphorus deficiency is one of the major limiting factors for crop production in highly
weathered soils (Sanchez and Salinas, 1981). Some soil properties, such as soil pH, clay, Fe
and Al contents are closely related to the P sorption capacity of the soils. Due to high P fixation
capacity, a greater amount of external P should be applied to reach higher productivity (Yost
et al., 1979). Excessive application of P fertilizers can cause P contamination of freshwater
bodies. This triggers the eutrophication in freshwater systems (Tirado and Allsopp, 2012).
Therefore, it is important to use a balance fertilizer for sustainable rice farming. Application
of high amounts of P fertilizers for two seasons per year has increased the accumulation of P
in Sri Lankan soils (Sirisena and Suriyagoda, 2018). Therefore, the most economical and
environmental friendly alternative is to introduce rice varieties which perform well under low
P conditions.
Rice varieties differ significantly in their P requirement under P deficient condition. To
identify P efficient varieties shoot and root dry weight can be used as a criterion for screening
(Fageria.1998). Kottearachchi et al. (2013) has reported that there is a significant difference in
root length and shoot dry weight between rice varieties grown under low P hydroponic system
although there was no such difference in high P supplied condition. Meanwhile, Aluvihare et
al. (2015) has identified Bg94-1, Bg403 and At362 as P deficiency tolerant varieties. The aim
of this work was to identify the variation in P deficiency tolerance in Sri Lankan rice varieties
under controlled P levels in hydroponic nutrient medium, and thereby identify the best
performing varieties having deficiency tolerance at vegetative stage.
METHODOLOGY
The experiment was conducted in a glasshouse at the Agricultural Biotechnology Center,
University of Peradeniya, Sri Lanka. Minimum and maximum temperatures inside the
glasshouse during this period were 26˚C and 38˚C, respectively. Forty eight locally bred rice
varieties, forty-five new improved and three old improved rice varieties under different
maturity age groups were screened in Yoshida nutrient solution with low (10 µM) and high
(50 µM) P concentrations (Table 1).
Establishment and maintenance of plants
Seeds were imbibed in water for 24 h and germinated. Seedlings were transferred in to plastic
buckets filled with full strength Yoshida nutrient solution (Yoshida, 1976) supplemented with
50 µM of P (optimal) or 10 µM P (deprived) concentrations (Kekulandara et al., 2016). Sodium
dihydrogen phosphate monohydrate (NaH2PO4.H2O) was used as the P source. Six seedlings
per bucket were maintained with equal spacing. The pH of the solution was maintained at 5.6
- 5.8 and it was replaced once a week. The experimental design was Complete Randomized
Design with 3 replicates.

Phosphorus Efficient Rice Cultivars under Low P Nutrition
45
Table 1. Rice varieties used for the study
Variety Duration
(months)
Recommendation Pedigree
New Improved Varieties
Bg 250 2 1/2 Drought/flood escaping Farmer field selection
Bg300 3 General cultivation Bg 367-7//IR 841/Bg 276-5
Bg304 3 General cultivation Co 10/IR 50//84-1587/Bg 731-2
Bg305 3 General cultivation Bg 1203/Bg 1492
Bg310 3 Saline prone areas Bg 300/Pokkali
Bw272-6B 3 Low country wet zone BW 259-3/BW 242-5-5
At303 3 General cultivation At 66-2/Bg 276-5
At306 3 General cultivation OB 2273/At 05
At307 3 General cultivation Bg 2225-1/Bg 96-3298
At 308 3 General cultivation Bg 2225-1/Bg 2426-2
Bg366 3 1/2 General cultivation Bg300/94-2236//Bg300/Bg304
Bg352 3 1/2 General cultivation Bg 380/Bg 367-4
Bg369 3 1/2 Saline prone areas Bg 94-1/Nonabokra
Bg360 3 1/2 General cultivation 84-3346/IR36//Senerang
Bg357 3 1/2 Island wide cultivation Bg797/Bg300//85-1580/
Senerang M-17
Bg358 3 1/2 General cultivation Bg 12-1/Bg1492
Bg94-1 3 1/2 General cultivation IR 262/Ld66
Bw361 3 1/2 General cultivation IR 36/Bw 267-3-11M
Bg359 3 1/2 Wet zone 88-5089/Bg 379-2
Bw364 3 1/2 Wet zone IR 36/Bw 267-3-11M
Bw363 3 1/2 General cultivation IR 36/BW 267-311M
Bw351 3 1/2 Low country wet zone Bg 90-2/Bg 401-1
Bw 367 3 1/2 General cultivation Bg 358/Bw 361
At353 3 1/2 Saline prone area Bg 94-1(R)/Bg400-1//Bg 94-1
At354 3 1/2 Saline prone area Bg 94-1/Pokkali
At 362 3 1/2 General cultivation At 85-2/Bg 380
Ld368 3 1/2 Wet Zone Ld 4-9-11/Ld 99-17-4
Ld365 3 1/2 Wet zone Selection of Ld 355
Bg380 4 Dry &Intermediate zone Bg 90-2*4/Ob 677
Bg403 4 General cultivation 83-1026/Bg 379-2
Bg406 4 Northern region Bg 73-797/Ptb 33/Ob 678
Bg450 4 1/2 General cultivation Bg 12-1 *2 /IR 42
Bg454 4 1/2 General cultivation MR 1523/87-519
Bg455 4 1/2 Submergence areas Ob2547/CR9413//IR46/Ob 2552
Bg379-2 4 1/2 Low country wet zone IR 2071-586/Bg 400-1
Bg 400-1 4 General cultivation Ob 678//IR 20/H-4
Bg11-11 4 1/2 General cultivation Engkatek/ #2H-8
Bw400 4 Saline and acid soils Bw 259-3/Bw 242-5-5
Bw451 4 1/2 Low country wet zone Bg 400-1/Bg 11-11
Bw452 4 1/2 General cultivation Hondarawala 502/C 104
Bw453 4 1/2 Low country wet zone IR 2071-586/Bg 400-1
At401 4 Costal Saline area Bg 94-1/Pokkali
At402 4 Southern province IR4432-52-6-4/Bg90-2//76-
3990/Ob 678

Kekulandara et al.
46
Table 1. cont..
At405 4 Dry and Intermediate
zones
At 402/Basmathi 442
Ld408 4 General cultivation At 01/Ld 98-152
Old Improved Varieties
H4 4 1/2 General cultivation Murungakayan 302/Mas
H7 3 1/2 General cultivation Pachchapefumal/Mas//H-5
H10 3 General cultivation Pachchaperumal/Mas/H-5
Plant trait measurements
Physiological traits of varieties were assessed by evaluating multiple plant attributes closely
related to P deficiency. Three plants were harvested as replicates from each pot at 52 days after
planting. Number of tillers, roots and shoot dry weight, and shoot P content were taken at the
time of harvesting.
Phosphorus analyses
Shoots and roots were air dried for two days and oven dried for 48 hours at 60°C. Weight of
shoots and roots were measured and 5 g of each sample was ground and made into ash at
200 °C for 2 h followed by 450 °C for 2 h. The ash was dissolved in 6% HNO3 and P
concentrations were measured by colorimetric assay using the molybdovanadophosphate
method using a spectrophotometer (Kitson and Melon, 1944). Shoot P content (SPC) was
calculated by multiplying shoot P concentration with shoot dry weight.
Data analysis
Measured and calculated data were analyzed using GLM procedure in SAS to determine the
main effects of variety, P concentration and interactions among them. Means were compared
using least significant differences at P = 0·05. All the variables of P deprived condition were
subjected to hierarchical cluster analysis using MINITAB statistical software to observe the
grouping of varieties.
RESULTS AND DISCUSSION
The effects of P concentration in the medium, variety and their interaction on shoot dry weight,
root dry weight and total dry weight were significant (P<0.05). At 50 µM P level shoot and
root dry weight among varieties were similar whereas at 10 µM P level, dry weights were
significantly different among varieties. Therefore, shoot, root and total dry weights were
compared separately at 10 µM P level for all the varieties tested. Bg 94-1 showed the highest
biomass gain in all three aspects. Similarly P content was compared among all the varieties
studied. Bg 94-1 showed a higher amount of shoot P content proving its ability to perform in
low P availability. Simultaneously, At402 has the lowest biomass gain in shoot, root and total
dry weights. Low shoot P content recorded in At 402 confirms the poor performance in P
uptake and utilization efficiency(Figure 2).

Phosphorus Efficient Rice Cultivars under Low P Nutrition
47
Figure 1. Variation of mean (a) shoot dry weight, (b) root dry weight (c) total dry weight
and (d) shoot P content among the varieties grown at low P condition (10 µM)
Grouping of varieties
0.00
0.50
1.00
1.50
2.00
At4
02
Bg3
10
At3
62
Bg3
58
Bg3
60
At3
06
Bg3
79-2
Bg4
55
Ld40
8
Bw
451
Ld36
8
H7
Bg2
50
Bg4
03
Bg3
52
At3
53
Bg4
50
Bw
367
H10
Bg3
57
Bw
272
-6B
Bw
351
Bg3
59
Bg1
1-11
Bw
453
Bg3
69
At3
08 H4
Bg4
06
At3
03
Bg3
05
Bg3
80
Bw
364
Bg4
54
Ld36
5
Bg4
00-1
Bg3
66
At3
54
Bw
363
At4
01
Bw
361
Bw
400
Bw
452
Bg3
04
At3
07
Bg3
00
At4
05
Bg9
4-1
Sho
ot
dry
wei
ght
(g/p
lan
t)
0
0.2
0.4
0.6
0.8
1
1.2
1.4
At4
02
Bg3
69
Bg3
10
At3
62
Bg3
58
Bg3
60
At3
06
Bg3
79-2
Bg4
55
Ld40
8
Bw
451
Ld36
8
H7
Bg2
50
Bg4
03
Bg3
52
At3
53
Bg4
50
Bw
367
H10
Bg3
57
Bw
272
-6B
Bg3
66
Bw
351
Bg3
59
Bg1
1-11
Bw
453
At3
08 H4
Bg4
06
At3
03
Bg3
05
Bg3
80
Bw
364
Bg4
54
Ld36
5
Bg4
00-1
At3
54
Bw
363
At4
01
Bw
361
Bw
400
Bw
452
Bg3
04
At3
07
Bg3
00
At4
05
Bg9
4-1Ro
ot
dry
wei
ght
(g/p
lan
t)
0.00
1.00
2.00
3.00
4.00
At4
02
Bg3
10
At3
62
Bg3
58
Bg3
60
At3
06
Bg3
79-2
Bg4
55
Ld40
8
Bw
451
Ld36
8
H7
Bg2
50
Bg4
03
Bg3
52
At3
53
Bg4
50
Bw
367
H10
Bg3
57
Bw
272
-6B
Bw
351
Bg3
59
Bg1
1-11
Bw
453
Bg3
69
At3
08 H4
Bg4
06
At3
03
Bg3
05
Bg3
80
Bw
364
Bg4
54
Ld36
5
Bg4
00-1
Bg3
66
At3
54
Bw
363
At4
01
Bw
361
Bw
400
Bw
452
Bg3
04
At3
07
Bg3
00
At4
05
Bg9
4-1
Tota
l D
ry w
eigh
t (g
/pla
nt)
0
300
600
900
1200
1500
1800
At4
02
Bg3
10
At3
62
Bg3
58
Bg3
60
At3
06
Bg3
79-2
Bg4
55
Ld40
8
Bw
451
Ld36
8
H7
Bg2
50
Bg4
03
Bg3
52
At3
53
Bg4
50
Bw
367
H10
Bg3
57
Bw
272
-6B
Bw
351
Bg3
59
Bg1
1-11
Bw
453
Bg3
69
At3
08 H4
Bg4
06
At3
03
Bg3
05
Bg3
80
Bw
364
Bg4
54
Ld36
5
Bg4
00-1
Bg3
66
At3
54
Bw
363
At4
01
Bw
361
Bw
400
Bw
452
Bg3
04
At3
07
Bg3
00
At4
05
Bg9
4-1
Sho
ot
P c
on
ten
t (µ
g/p
lan
t)
(a)
(b)
(c)
(d)

Kekulandara et al.
48
Crop varieties can be classified in to two different groups according to their responses to
nutrient supply such as efficient or inefficient in nutrient deficient condition and responder or
non- responder in nutrient sufficient condition (Ortiz-Monasterio et al., 2001). The
dendrogram drawn using shoot and root dry weights, shoot P concentrations and contents and
number of tillers under low P condition at 52 days after planting showed two distinct clusters.
The varieties At405, Bg94-1, At307, Bg304, Bg300 and At354 clustered in to Cluster 2 while
all other 44 varieties clustered in to Cluster 1 at similarity level at 33% (Figure 2). Varieties
belonging to each cluster are shown in Table 2 and the means of each parameter are shown in
Table 3. Means of all the P efficiency related parameters of Cluster 2 are greater than those of
Cluster 1 revealing that the varieties in Cluster 2 are tolerant to P deficiency. Bg94-1, Bg304,
At405 and At354 varieties have previously been identified as early tillering varieties at low P
available condition confirming their efficiency for P uptake and use (Kekulandara et al, 2016).
Although varieties At354 and Bg300 included in phosphorus deficiency tolerant category in
this study, they were grouped under susceptible group by Aluvihare et al. (2016). Similarly,
At362 was identified as P deficiency tolerant variety by Aluvihare et al. (2016) while an
opposite response was observed in the present experiment. Bg 94-1 has been identified as a
tolerant variety in both the studies. Each cluster consists of short, medium and long age rice
varieties. It indicates that clustering has been made irrespective of the maturity age of the
variety proving that there is no effect of the age of the variety on P deficiency tolerance.
Figure 2. Dendrogram constructed by using shoot and root dry weights, number of tillers
and shoot P concentration and contents at 10 µM P supply
At4
05Bg
94-1
At3
07Bg
304
Bg30
0A
t354
Bw45
2Bg
250
Bg35
8H
10H7
Bw27
2-6B
Bg31
0Ld
365
Bg38
0Bw
364
Bg40
0-1
Bg30
5A
t308
At3
53Bg
379-
2A
t362
Bw40
0Bw
361
At4
01Bg
366
At3
03H4
Bg36
9Bg
454
Bg40
6Bw
363
Bg11
-11
Bw45
3Bg
357
Bg35
2Bg
403
Ld36
8Bg
455
Bw45
1Ld
408
At3
06Bg
359
Bw35
1Bw
367
Bg45
0Bg
360
At4
02
0.00
33.33
66.67
100.00
Similarity

Phosphorus Efficient Rice Cultivars under Low P Nutrition
49
Table 2. Varieties in different clusters
Cluster 1 Cluster2
At 303 At308 At306 Bg403 At354
Bw400 At353 Bg455 Bw451 Bg94-1
At401 Bg400-1 Bw351 Bg359 Bg300
Bw364 Ld365 Bg352 H10 At405
Bg380 Bg454 Ld408 Bg250 A307
Bg360 Bw361 Bg450 Bg358 Bg304
Bg406 At362 Bg310 Bg369
H4 Bg379-2 H7 Bg366
Bw363 Bg272-6B At402
Bw452 Bg11-11 Bw367
Bw453 Bg305 Bg357
Ld368
Table 3. Mean values of variables in each cluster
Cluster 1 Cluster 2
Shoot dry weight (g/plant) 0.97 ± 0.08 1.45± 0.16
Root dry weight (g/plant) 0.63 ± 0.05 0.87± 0.09
Total dry weight (g/plant) 1.60 ± 0.10 2.32 ± 0.16
Shoot P concentration (µg/g) 825.7 ± 78.9 918.8±113.3
Shoot P content (µg/plant) 801.8 ± 103.5 1313.3 ± 248.2
Number of tillers per plant 1.71 ± 0.20 2.44 ± 0.33
Regression analysis
Scatter plot drawn for total dry weight of varieties against their time taken for matutity under
low P conditions is shown in Figure 3. It descriminates Bg300, Bg94-1, At405 and Bw452
producing greater biomass from the age groups of 3 month, 3½ month, 4 month and 4½ month
age groups respectively at low P supplied environment. Scatter plot drawn against maturity
age and the mean P content in shoots is shown in Figure 4. Varieties Bg300, At354, At 405
and Bg380 were the superior in 3 month, 3½ month, 4 month and 4½ month age groups,
rspectively.

Kekulandara et al.
50
Figure 3. Distribution of varieties based on total dry weight gained at low P availability
according to their maturity age classes
Figure 4. Distribution of varieties based on shoot P content at low P availability against
their maturity age classes

Phosphorus Efficient Rice Cultivars under Low P Nutrition
51
Comparison of varietal performance under high and low P availability
The scatter plot drawn for biomass gained at low P and high P availability illustrates that
varieties Bg94-1, At405, Bg300, Bg304 and At307 performed well in both at low and high P
availability, whereas H7, H4, Bg455, At306, At402 and Bg11/11 performed poorly in both
conditions (Figure 6). However, some varieties such as Bg250, Bg358, Bg310 and Bg369 have
gained comparatively higher dry weight in high P availability compared to P deprived
condition. Most of the short age varieties have shown higher dry weight at 52 days after
planting at high P supply. It is clear that dry weight of all the varieties has reduced by more
than half at low P condition compared to high P supply confirming the importance of P in plant
growth and the occurrence of P deficiency at 10 µM P supply (Figure 5).
Figure 5. Varietal performances on dry weight gained at low P vs high P availability at
52 days after planting.
Efficient genotypes possess high P uptake efficiency, whereas responders show high utilization
efficiency. As nutrient uptake and utilization processes are interdependent from each other, it
is difficult to distinguish a responder from an efficient cultivar. Therefore, efficient screening
method is important to select cultivars for low-nutrient tolerance (Agrama, 2006). Deficiency
symptoms of plants can be studied well using hydroponics, where the presence or absence of
nutrient components can be controlled precisely. Studies under controlled conditions in a
hydroponic solution generally involve giving precise P deficiency stress on seedlings over in
the field which may show a considerable level of spatial and temporal variation in P content
in the medium. In addition, it makes easier to observe deficiency symptoms that occur in the
roots, which is difficult to observe in soil-grown plants (Salisbury and Ross, 1992). Thus,
hydroponic based screening system gives more reliable data than nutrient experiments
conducted in soil although it is not the real practice adopted in rice cultivation.

Kekulandara et al.
52
CONCLUSIONS
There is a significant variation in genotypes for P deficiency tolerance in rice. The P deficiency
tolerance ability in varieties did not show any correlation with their maturity age classes.
Bg300, Bg304 and At307 in 3 month age group, Bg94-1, At354 in 3½ month age group and
At405 in 4 month age group performed well in both P uptake and dry matter production. Bg94-
1 performed extraordinarily in biomass gain and P accumulation. Simultaneously, At402
showed poor performance in biomass gain in both shoots and roots. Low amount of shoot P
content recorded in At402 confirms its poor P uptake and utilization efficiency under P
deprived conditions.
ACKNOLEDGEMENT
This work was supported by a grant from the National Science Foundation, Sri Lanka
(NSF/AG/2014/01|). We thank the Director, Rice Research and Development Institute for
providing seed materials for this research. We are very much grateful to all the staff members
of Agricultural Biotechnology Center (AgBC) for providing facilities and fullest support for
conducting research at AgBC and Mr. Gemunu Wijesuriya at the Department of Crop Science,
University of Peradeniya for technical assistance.
REFERENCES
Agrama, H. A. (2006). Application of molecular markers in breeding for nitrogen use
efficiency. Journal of Crop Improvement. 15, 175–211.
Aluwihare, Y.C., Ishan, M. , Chamikara, M.D.M., Weebedde, C. K, Sirisena, D. N.,
Samarasinghe, W. L. G., Sooriyapathirana, S. D. S. S.(2016). Characterization and selection
of phosphorus deficiency tolerant rice genotypes in Sri Lanka. Rice Science. 23, 184-195.
Dawe, D. (2000). The potential role of biological nitrogen fixation in meeting future demand
for rice and fertilizer. In: Ladha JK, Reddy PM, editors. The quest for nitrogen fixation in
rice. Philippines: International Rice Research Institute. 1–9.
De Datta,S.K. (1981) Principles and practice of rice production. Singapore: John Wiley and
Sons. 348–419.
Dobermann, A., Fairhurst, T. (2000). Rice: nutrient disorders & nutrient management. Potash
& Phosphate Institute, Potash & Phosphate Institute of Canada and International Rice Research
Institute Singapore and Los Baños.
Fageria, N. K, Wright, R. J., Baligar, R.C., (1998). Cultivar evaluation for phosphorus use
efficiency. Plant and Soil 111, 105-109.
Kekulandara, D.S., Suriyagoda, L.D.B., Bandaranayake, P.C.G., Sirisena, D.N. and
Samarasinghe, W.L.G. (2016). Temporal tillering behavior of Sri Lankan elite rice varieties in
response to phosphorus availability. Tropical Agricultural Research.28 (2), 133 – 143.

Phosphorus Efficient Rice Cultivars under Low P Nutrition
53
Khush, G. S. (1995) Modern varieties - their real contribution to food supply and
equity.Geojournal. 35 (3), 275 - 284.
Kitson, R.E., Melon, M.G. (1944). Colorimetric determination of phosphorus as
molybdovanadophosphoric acid. IndEngChem Anal Ed 16:379.
Kottearachchi, N.S. and Wijesekara, U.A.D.S.L. (2013). Implementation of Pup 1 gene based
markers for screening of donor varieties for phosphorus deficiency tolerance in rice. Indian
Journal of Plant Sciences.2 (4), 76-83.
Ortiz-Monasterio, J.I., Manske, G.G.B., van Ginkel, M. (2001). Nitrogen and phosphorus use
efficiency. In: Reynolds MP, Ortiz-Monasterio JI, McNab A, eds. Application of physiology
in wheat breeding. Mexico: CIMMYT, 200–207.
Redfern, S.K., Azzu, N., Binamira, J.S. (2012). Rice in Southeast Asia: facing risks and
vulnerabilities to respond to climate change. Building resilience for adaptation to climate
change in the agriculture sector. 23, 295–314.
Rose, T.J., Wissuwa, M. (2012) Rethinking internal phosphorus utilization efficiency: a new
approach is needed to improve PUE in grain crops. Adv. Agron. 116,183–215
Salisbury, F. B. and Ross,C.W. (1992). Plant Physiology, 4th ed. Wadsworth Publishing Co.,
Belmont, CA.
Sanchez, P. A. and Salinas, J. G. (1981) Low input technology for managing oxisols and
ultisols in tropical America. Adv. Agron. 34, 279-398.
Sirisena, D. N. and Suriyagoda, L.D.B. (2018). Towards sustainable phosphorus management
in Sri Lankan rice and vegetable-based cropping systems. Agriculture and Natural Resources.
52, 9-15.
Tirado, R. & Allsopp, M.(2012). Phosphorus in agriculture: Problems and solutions.
Vinod , K.K. and Heuer, S. (2012). Approaches towards nitrogen- and phosphorus-efficient
rice. AoB Plants, pls028. [PubMed].
Yoshida, S, Forno, D.A.,Cock, J.H., Gmez, K.A. (1976). Laboratory manual for physiological
studies of rice, IRRI.
Yost, R. S., Kamprath, E. J., Lobato, E. and Naderman, G. C. (1979). Phosphorus response of
corn on an oxisol as influenced by rates and placement. Soil Sci. Soc. Am. J. 43, 338-343.

Tropical Agricultural Research Vol. 30 (3): (2018)
54
Tropical Agricultural Research Vol. 30 (3): 55 – 68 (2018)
Dynamics of Nitrifiers in Soils of Intensively Vegetable Cultivated Areas
in Sri Lanka
K.K.K. Nawarathna1, W.S. Dandeniya2*, R.S. Dharmakeerthi2 and P. Weerasinghe1
Postgraduate Institute of Agriculture
University of Peradeniya
Sri Lanka
ABSTRACT: Nitrification tend to reduce the agronomic fertilizer use efficiency in cropping
systems because nitrate, the end product of nitrification, has high potential to loss from soil
environment due to denitrification and leaching. The population characteristics of ammonia
oxidizing and nitrite oxidizing microorganisms carrying out nitrification in soils may affect
the effectiveness of approaches taken to suppress nitrification. A study was conducted to assess
the activity and abundance of nitrifiers in soils of intensively vegetable grown regions in Sri
Lanka. Soil samples were collected from 72 locations across Nuwara Eliya, Marassana,
Kalpitiya and Gannoruwa representing vegetable cultivated fields managed conventionally
(n=45) and organically (n=9), and uncultivated areas (n=18). Basic soil characteristics were
determined using standard procedures. Potential nitrification rate (PNR) and the abundance of
ammonia oxidizers and nitrite oxidizers were estimated. Chemical characteristics of soils
varied widely with pH, EC and organic C% ranging from 3.8 to 8.5, 0.04 to 0.94 dS/m and
0.9% to 4.5%, respectively. The PNR of the studied soils ranged from 0.18 to 15.80 NO3--
N/kg/h. The abundance of ammonia oxidizers and nitrite oxidizers ranged from 1.96 to 5.97
log10CFU g-1 and 1.36 to 5.63 log10CFU g-1, respectively. The potential activity of nitrifiers
did not correlate with the abundance of ammonia oxidizers or nitrite oxidizers. Thus, the
functional and compositional diversities of nitrifying communities may be different across the
soils. PNR values for studied soils are higher compared to reported values in literature. Hence,
appropriate measures need to be taken to suppress nitrification as high nitrification rates could
lead to reduce fertilizer use efficiency and increase risk of groundwater contamination with
nitrate.
Keywords: Fertilizer use efficiency, potential nitrification rate, soil nitrifiers, vegetable
cultivation
INTRODUCTION
Nearly 11 % of the N-fertilizers (urea and ammonium sulphate) imported to Sri Lanka is being
consumed by vegetable sector, only second to tea sector (27 %) from among the systems that
dominates cultivation under unsaturated soil moisture conditions (personal communication
with National Fertilizer Secretariat, 2017). Nitrification, conversion of NH4+ to NO3
-, is a
biological transformation occurring predominantly under unsaturated soil moisture conditions
since it is mediated by aerobic microorganisms. Thus, fertilize-N is converted to NO3--N in
soils at different rates depending upon the dynamics of soil nitrifiers. Krishnapillai (1979)
1 Horticultural Crops Research and Development Institute, Gannoruwa, Peradeniya, Sri Lanka 2 Department of Soil Science, Faculty of Agriculture, University of Peradeniya, Sri Lanka
* Corresponding author: [email protected]

Nawarathna et al.
56
reported that about 35 - 50% of the ammonium and urea fertilizer applied to soils in tea
plantations in Sri Lanka were nitrified within 3 to 4 weeks after application and the produced
NO3- rapidly leached from soil under high rainfall condition. In Sri Lanka, Nuwara Eliya,
Kalpitiya and Marassana are some of the intensively vegetable grown regions that experience
heavy application of nitrogen fertilizers. According to Jayasingha et al. (2011) NO3--N in 50
% of the studied groundwater samples collected from Kalpitiya exceeded WHO standards for
drinking water (10 mg L-1) both in dry season and rainy season with values ranging from 0.20–
212.4 mg L-1. A number of studies suggest association of NO3--N in groundwater with
fertilizer-N usage for vegetable cropping in the region threatening human health (Henegama
et al., 2013; Kuruppuarachchi, 2010; Jayasingha et al., 2011; Liyanage et al., 2000). However,
little or no information is available on the diversity and dynamics of nitrifiers inhabiting soils
of Sri Lanka.
Biological nitrification was first explained by Winogradsky during 1889-1890 describing the
role of nitrifying bacteria. Two chemoautotrophic groups of bacteria broadly known as
ammonia oxidizers (e.g. Nitrosomonas spp., Nitrosospira spp., Nitrsococcus spp., etc.) and
nitrite oxidizers (Nitrobacter spp., Nitrospira spp., Nitrococcus spp., etc.) are known to oxidize
ammonia into nitrite and subsequently nitrite into nitrate (Schmidt, 1982). However, presence
of ammonia oxidizing archaea (AOA) in soil have been detected and several studies suggest
that AOA may play an important role in nitrification under low ammonium concentrations
and/or under suboptimal conditions defined for ammonia oxidizing bacteria (AOB), such as
acidic pH, high EC, and low temperature (Leininger et al., 2006; Bernhard et al., 2010;
Hofferle et al., 2010; Posser and Nicol, 2012; Hu and He, 2014). Further complete oxidation
of ammonia to nitrate by a single organism via a process known as complete ammonia
oxidation or comammox has been detected in some members of Nitrospira genus although the
responsible microorganisms have not been isolated (Kessel et al., 2015). Organisms exhibiting
comammox are considered to be having slow growth rates. Beeckman et al. (2018) also
emphasized about ammonia oxidizing Achaea and comammaox bacteria who play a critical
role in nitrification. Decaying organic matter, biologically fixed NH4+ and added fertilizers
provide NH4+-N, the substrate for nitrification (Sylivia et al., 2005). Ammonia oxidizing
bacteria seems to govern nitrification under NH4+-N rich soil conditions such as in soils that
received fertilizer-N, polluted with sewage sludge, or experienced leakages from septic tanks
(Leininger et al., 2006; Höfferle, et al., 2010).
Both NO3- and NH4
+ are considered as plant available forms of N though NO3- is a mobile ion
subjected to leaching and loss from soil through denitrification. Hence, nitrification rate
determines how quick the N is becoming unavailable for crop uptake when provides NH4+
through fertilizers in agriculture field. Potential nitrification rate (PNR) is a measure used to
identify rapidity of nitrification with the provision of ample amount of NH4+ which converts
NH4+ into NO3
- in the presence of nitrifying communities for a particular soil. Enumeration of
ammonia oxidizers and nitrite oxidizers coupled with most probable number (MPN) technique
is commonly used to estimate the abundance of these two groups (Prosser and Nicol, 2012;
Hesselsoe et al., 2001). Both PNR and MPN techniques do not discriminate between archaeal
and bacterial counterparts (Prosser and Nicol, 2012) but found to be more representative of
bacterial nitrifiers under NH4+-N rich soil conditions (Hofferle et al., 2010). Although these
techniques provide a fairly good understanding about soil nitrifiers the anomalies common for
culture based techniques should be considered when interpret results.
Intensive vegetable cultivation is practiced in several agro ecological regions in Sri Lanka in
varying intensity and types of input management with different crop rotations leading to high
diversity in vegetable grown systems. Therefore, we hypothesized that the abundance and the

Dynamics of Nitrifiers in Vegetable Grown Soils
57
activity of nitrifiers in soils will be different across different vegetable grown systems. This
study was conducted to estimate the activity of nitrifiers and their abundance in soils from
selected intensively vegetable cultivated regions using PNR and MPN techniques to generate
preliminary information on dynamics of nitrifiers in these systems. The information will be
useful in future research and planning activities to enhance N-fertilizer use efficiency and
minimize NO3- leaching to groundwater. Further this study attempted to enumerate and isolate
nitrifying bacteria for future research.
METHODOLOGY
Vegetable production under different input management systems in different agro-ecological
regions were selected in order to introduce high diversity of systems to the study. Accordingly,
four locations having contrasting climatic conditions and soil types, and also representing
popular regions for vegetable production in the country, were selected. Introducing variability
in input management, uncultivated lands under natural vegetation, vegetable cultivated fields
managed conventionally using synthetic agrochemicals, and those managed with organic
farming methods were included in the sampling scheme whenever possible. Details of the
locations used for soil sampling is given in Figure 1 and Table 1.
Figure 1. Map of Sri Lanka depicting sampling locations in three districts

Nawarathna et al.
58
Table 1. Details of the sampling locations and the number of samples collected from each
location
Location1
Nuwara Eliya Marassana Kalpitiya Gannoruwa
Agro
ecological
region
IU2 IM3c DL3 WM2b
Taxonomic
class/classes
of soil/s2
Red yellow
podsolic soils
(Typic
Paleudults)
Red yellow
podsollic soils
(Typic
Paleudults)
Sandy regosols
(Typic
Quatzepsamments)
Reddish
Brown
latasolic
(Typic
Troporthents)
Sampling
localities
Bambarakele
Seethaeliya,
Mahagastota
Katumana,
Nuwara Eliiya
Marassana Nawakkadu,
Norochcholei,
Kalpitiya,
Narakkalliya
HORDI
research fields
Number:
Conventional
farm (CF)3
Organic farm
(OF)
Natural
vegetation
6
6
5
18
-
6
18
2
5
3
1
2
Types of
crops in
cultivated
fields at the
time of
sampling
CF: Carrot,
beet, leeks
OF: Carrot
cabbage
broccoli
CF:
Tomato,
capsicum
Luffa,
cucumber,
bitter guard
CF: beet, onion,
Chilies, pumpkin,
batana, capsicum
potato, pumpkin,
Manioc, gherkin
OF: Nivithi, beet
root, long bean,
okra, capsicum
CF: brinjal,
tomato
OF: cabbage
Sampling was performed for 4 months, from October, 2016 to March in 2017. Selected
vegetable cultivated fields were having a crop at maturity stage at the time of sampling. From
each field eight random soil samples were collected at 0-15 cm depth to make a composite
sample representative of the field. Altogether 72 soil samples were collected for the study. Soil
samples were immediately transferred to the laboratory at HORDI, Peradeniya, Sri Lanka. A
subsample of the field moist soil was sieved through 4 mm sieve and refrigerated for
subsequent microbial analyses. The remaining portion of each soil sample was air dried, sieved
through 2 mm mesh sieve and stored for chemical and physical characterization.
Physico-chemical Analyses
Soil pH and electrical conductivity (EC) were measured in soil: water suspensions of 1:1 and
1:5, respectively. Soil organic carbon was analyzed using Walkley and Black method (Baruah
and Barthakur, 1997) and active carbon content was analyzed according to permanganate

Dynamics of Nitrifiers in Vegetable Grown Soils
59
oxidiazable carbon (POXC) method described by Weil et al. (2003). Soil texture was
determined by pipette method as explained in Dharmakeertihi et al. (2007).
Microbiological analyses
Soils were analyzed for total culturable bacteria, fungi, ammonia oxidizing bacteria and nitrite
oxidizing bacteria using culture based techniques. Total culturable bacteria and fungi were
enumerated on 3% triptic soy agar (TSA) and Rose Bengal agar, respectively, using serial
dilutions in spread plate technique. Plates were incubated at 28±1 °C and bacterial colony
counts were taken 2 days after inoculation and fungal colonies were counted 6 days after
inoculation. Most probable number (MPN) method as described by Schmidt and Belser (1994)
was used to estimate the abundance of ammonia oxidizers and nitrite oxidizers. Cultures were
incubated in triplicates for 21 days before making observations. Potential Nitrification Rate
(PNR) of soils was assessed following shaken slurry method (Heart et al., 1995). Optimum
time points to collect subsamples for the determination of potential nitrification rates were
identified after conducting a preliminary study. Accordingly subsamples of the slurry was
drawn at 4 h and 20 h after initiating incubation at room temperature (26±2 °C) and nitrate was
measured calorimetrically (Cataldo et al.,1975). Ammonia oxidizers were cultured in NH4+
containing P buffer medium used in MPN method and plated on to TSA to obtain single
colonies. Selected colonies were purified and screened for their ability to oxidize NH4+.
Isolates of ammonia oxidizers were cultured in NH4+ containing P buffer medium and stored
in refrigerator for future analyses.
Statistical Analysis
All the statistical analyses were performed using SPSS 16 statistical package. Data collected
were used in preliminary descriptive analysis and Pearson correlation analysis for the
measured parameters was performed at p<0.05. Principal component analysis (PCA) was
performed to identify the variables among the measured parameters contributing mostly for
the differences among soils. In here, correlation PCA was performed and the suitability of the
data set for the structure detection was confirmed by performing Kaiser-Meyer-Olkin (KMO)
Test and Bartlett's test of sphericity. Results indicated that sampling was adequate for factor
analysis (KMO test value = 0.62) and there is adequate relationship between variables for
structure detection (significance level at <0.001). Parallel analysis was performed to confirm
the number of components to be retained from PCA and accordingly first three principal
components (PC) were selected and single scores for each component for soil sample was
calculated considering the variables contributing mostly to each PC to present data graphically.
RESULTS AND DISCUSSION
Soil samples collected from the four regions belonging to different climatic regions and having
different soil types as indicated in Table 1 were diverse in terms of measured soil
characteristics (Table 2). The pH of the studied soils ranged from very strongly acidic (3.8) to
moderately alkaline (8.5). High variability in pH was observed even within the same
management system in a region (e.g.CF in Nuwara Eliya) possibly due to multitude of factors
including differences in topography and intensity of input management. Majority of the soil
samples from Nuwara Eliya region were acidic while 92% of soils found in Kalpitiya were
alkaline but none of the studied soils were saline (Table 2). Organic C percentages were high
in 56% of the soil samples from Nuwara Eliya. In contrast, 60% of soils from Kalpitiya had

Nawarathna et al.
60
Table 2. Basic statistics of chemical properties of soil collected from Nuwara Eliya,
Gannoruwa, Marassana and Kalpitiya
Location GC GO# GU KC KO KU MC MU NC NO NU
Number
of
samples
3 1 2 18 2 5 18 6 6 6 5
pH
Mean 6.6 6.7 6.3 7.6 7.8 7.7 6.6 6.9 5.6 6.5 4.9
St. Dev. 0.5 - 0.1 0.5 0.1 1.0 0.6 0.4 1.1 0.2 1.1
Minimum 6.2 - 6.3 6.4 7.7 6.0 5.2 6.1 4.5 6.3 3.8
Maximum 7.2 - 6.4 8.5 7.9 8.3 7.2 7.2 7.3 6.8 6.5
EC (dS/m)
Mean 0.19 0.06 0.08 0.12 0.13 0.25 0.25 0.18 0.37 0.2 0.12
St. Dev . 0.02 - 0.004 0.04 0.03 0.14 0.22 0.03 0.2 0.12 0.02
Minimum 0.17 - 0.08 0.06 0.10 0.09 0.04 0.10 0.12 0.13 0.09
Maximum 0.06 - 0.23 0.15 0.15 0.43 0.94 0.18 0.58 0.44 0.14
Organic Carbon (%)
Mean 1.9 1.2 4.0 0.7 0.9 1.5 1.5 1.5 2.7 3.2 3.1
St. Dev. 0.5 - 0.5 0.8 0.1 1.3 1.1 1.1 0.6 0.8 0.5
Minimum 1.6 - 3.6 0.3 0.9 0.4 1.0 0.5 1.6 2.3 2.3
Maximum 2.4 - 4.3 3.8 1.0 3.4 3.2 3.0 3.4 4.5 3.7
Active carbon (mg/kg)
Mean 248 261 207 257 395 457 307 419 290 371 563
St. Dev . 233 - 46 153 49 263 111 126 155 213 138
Minimum 34 - 174 2 360 135 120 284 103 136 419
Maximum 496 - 240 306 429 815 453 630 553 708 749 Nuwara Eliya, Gannoruwa, Marassana and Kalpitiya are denoted by N, G, M and K, respectively as first letter in data
labels representing uncultivated lands and fields cultivated with vegetables using conventional and organic practices (as denoted by U, C and O, respectively as second letter in data labels).# There was only one field sampled from
Gannoruwa representing organic vegetable production. Therefore, standard deviation, minimum and maximum are
not calculated
very low organic C content. In the present study, there was no clear effect of implementing
organic management practices on soil organic C contents. This may be partly due to the less
number of samples representing organically cultivated fields compared to conventionally
managed fields. Active carbon quantifies labile carbon in soil (Culman et al., 2013). The
amount of labile carbon influences the availability of readily utilizable carbon to
microorganisms and hence, their activity (Hurisso et al., 2016). It is considered as a sensitive
indicator of soil quality (Culman et al., 2013). The active carbon contents varied widely in
analyzed soil samples (Table 2) and the values are within the range reported previously, which
is from 24 to 1469 mg kg−1 (Culman et al., 2013; Hurisso et al., 2016). Soil texture was highly
variable among the tested samples with sand contents ranging from 6 to 97%. In overall, the
most prominent textural classes of the studied soils were Sandy clay loam (34%) and Sandy
loam (30%). The highest diversity in soil texture was found in samples collected from
Marassana with Sandy clay loam, Sandy loam, Loam, Loamy sand and Sandy clay as the
textural classes. Soil samples collected from Gannoruwa had Sandy clay loam texture. The
texture of soil samples collected from Nuwara Eliya were mostly loamy type and belonged to

Dynamics of Nitrifiers in Vegetable Grown Soils
61
textural classes of Sandy clay loam, Sandy loam, Silt loam, Loam and Clay loam. On the other
hand, the soils collected from Kalpitiya region were mostly sandy type and belonged to textural
classes of sandy clay loam, sandy loam, loamy sand and sand.
The potential activity of nitrifiers ranged from 0.1 to 16.0 NO3- -N mg/kg of dry soil/ h (Figure
2a). Mostly conventionally managed fields showed higher PNR rate compared to other
cropping histories in respective regions. This may be due to the higher ammonium levels
applied by farmers. When analyzing total ammonia oxidizing bacteria and nitrite oxidizing
bacteria referred to as nitrifying bacteria, above results cannot be explained subjected to
population size of them (Figure 2b and 2c). The efficiency of nitrifying communities under
optimum conditions when expressed as potential nitrification rate per unit of ammonia
oxidizers, who are conducting the rate limiting first step of nitrification, varied from 1 to
57,341 pg NO3- -N/ ammonia oxidizer cell/ h suggesting differences in species composition in
these communities
Table 3. The abundance of total culturable bacteria and fungi in the soil collected from
Nuwara Eliya, Gannoruwa, Marassana and Kalpitiya
Location NO NC NU GO GC GU MC MU KO KC KU
Bacteria (log10 CFU g -)
Mean 8.1 7.9 7.8 - 7.7 8.35 8.2 8.1 8.8 8.6 8.9
St. Dev. 0.3 0.2 0.2 - 0.2 0.01 0.2 0.2 0.1 0.2 0.5
Minimum 7.69 7.7 7.6 - 7.6 8.34 7.5 7.8 8.7 8.1 8.6
Maximum 8.5 8.2 8.1 - 7.9 8.36 8.5 8.4 8.9 9.0 9.9
Fungi (log10 CFU g -)
Mean 4.1 3.7 3.6 - 3.2 3.3 3.3 4.9 4.5 4.5 4.4
St. Dev. 0.8 0.5 0.2 - 0.2 0.0 0.3 0.10 0.1 0.4 0.1
Minimum 3.3 3.1 3.4 - 3.0 3.3 2.7 4.8 4.4 3.6 4.2
Maximum 5.2 4.4 3.9 - 3.0 3.3 3.9 5.1 4.5 4.9 4.5 Nuwara Eliya, Gannoruwa, Marassana and Kalpitiya are as denoted by N, G, M and K, respectively as first letter in data
labels representing uncultivated lands and fields cultivated with vegetables using conventional and organic practices (as
denoted by U, C and O, respectively as second letter in data labels)
Loamy type textures usually facilitate good air and water balance while soils with sandy type
textures are highly aerated and have less water retention. When water retention in soil is poor
it affects substrate diffusion to microbial cells and cause adverse physiological effects due to
cell dehydration; thus, affecting nitrification (Stark and Firesotne 1995). Further, oxidation of
organic matter is high in well aerated soils than poorly aerated soils when moisture level is not
limiting microbial activity and therefore, organic matter retention is less in sandy type texture
compared to loamy or clayey type soil textures. Significant negative correlations between sand
content of soils and the organic carbon and active carbon contents were seen in the present
study (Table 4). Soil pH correlated with a number of parameters measured (Table 4).
Therefore, the nitrifying communities of the studied soils may have evolved under unique sets
of environmental constraints as facilitated by interacting effects of soil properties like texture,
pH and organic carbon contents with agro-climatic conditions (O’Sullivan et al., 2013).
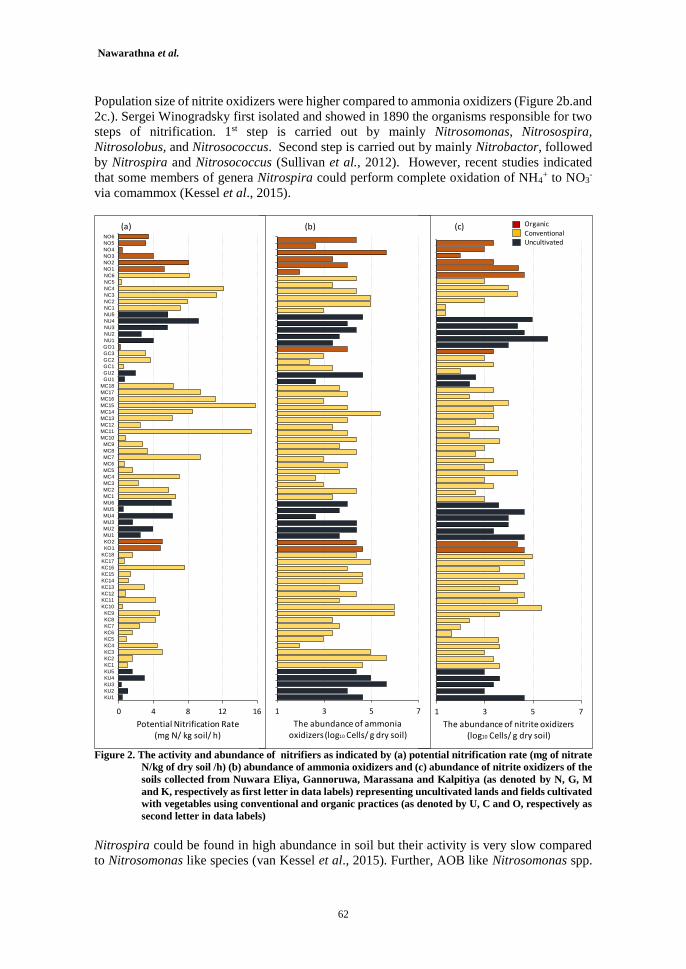
Nawarathna et al.
62
Population size of nitrite oxidizers were higher compared to ammonia oxidizers (Figure 2b.and
2c.). Sergei Winogradsky first isolated and showed in 1890 the organisms responsible for two
steps of nitrification. 1st step is carried out by mainly Nitrosomonas, Nitrosospira,
Nitrosolobus, and Nitrosococcus. Second step is carried out by mainly Nitrobactor, followed
by Nitrospira and Nitrosococcus (Sullivan et al., 2012). However, recent studies indicated
that some members of genera Nitrospira could perform complete oxidation of NH4+ to NO3
-
via comammox (Kessel et al., 2015).
Figure 2. The activity and abundance of nitrifiers as indicated by (a) potential nitrification rate (mg of nitrate
N/kg of dry soil /h) (b) abundance of ammonia oxidizers and (c) abundance of nitrite oxidizers of the
soils collected from Nuwara Eliya, Gannoruwa, Marassana and Kalpitiya (as denoted by N, G, M
and K, respectively as first letter in data labels) representing uncultivated lands and fields cultivated
with vegetables using conventional and organic practices (as denoted by U, C and O, respectively as
second letter in data labels)
Nitrospira could be found in high abundance in soil but their activity is very slow compared
to Nitrosomonas like species (van Kessel et al., 2015). Further, AOB like Nitrosomonas spp.
1 3 5 7
KU1
KU2
KU3
KU4
KU5
KC1
KC2
KC3
KC4
KC5
KC6
KC7
KC8
KC9
KC10
KC11
KC12
KC13
KC14
KC15
KC16
KC17
KC18
KO1
KO2
MU1
MU2
MU3
MU4
MU5
MU6
MC1
MC2
MC3
MC4
MC5
MC6
MC7
MC8
MC9
MC10
MC11
MC12
MC13
MC14
MC15
MC16
MC17
MC18
GU1
GU2
GC1
GC2
GC3
GO1
NU1
NU2
NU3
NU4
NU5
NC1
NC2
NC3
NC4
NC5
NC6
NO1
NO2
NO3
NO4
NO5
NO6
Theabundanceofnitriteoxidizers(log10 Cells/gdrysoil)
(c) OrganicConventionalUncultivated
1 3 5 7
KU1
KU2
KU3
KU4
KU5
KC1
KC2
KC3
KC4
KC5
KC6
KC7
KC8
KC9
KC10
KC11
KC12
KC13
KC14
KC15
KC16
KC17
KC18
KO1
KO2
MU1
MU2
MU3
MU4
MU5
MU6
MC1
MC2
MC3
MC4
MC5
MC6
MC7
MC8
MC9
MC10
MC11
MC12
MC13
MC14
MC15
MC16
MC17
MC18
GU1
GU2
GC1
GC2
GC3
GO1
NU1
NU2
NU3
NU4
NU5
NC1
NC2
NC3
NC4
NC5
NC6
NO1
NO2
NO3
NO4
NO5
NO6
Theabundanceofammoniaoxidizers(log10 Cells/gdrysoil)
(b)
0 4 8 12 16
KU1
KU2
KU3
KU4
KU5
KC1
KC2
KC3
KC4
KC5
KC6
KC7
KC8
KC9
KC10
KC11
KC12
KC13
KC14
KC15
KC16
KC17
KC18
KO1
KO2
MU1
MU2
MU3
MU4
MU5
MU6
MC1
MC2
MC3
MC4
MC5
MC6
MC7
MC8
MC9
MC10
MC11
MC12
MC13
MC14
MC15
MC16
MC17
MC18
GU1
GU2
GC1
GC2
GC3
GO1
NU1
NU2
NU3
NU4
NU5
NC1
NC2
NC3
NC4
NC5
NC6
NO1
NO2
NO3
NO4
NO5
NO6
PotentialNitrificationRate(mgN/kgsoil/h)
(a)

Dynamics of Nitrifiers in Vegetable Grown Soils
63
frequently found in agricultural soils are metabolically classified as obligate
chemolithoautotrophs that utilize NH4+ as an energy source and CO2 as the C source. Increase
in activity of this organism in the presence of organic substrates has been reported (Hommes
et al., 2003). Therefore, the activity of the same group of organism could be different with
respect to soil environmental characters such as composition and availability of labile carbon.
Techniques used in the present study to analyze PNR and the abundance of nitrite oxidizers
and ammonia oxidizers do not discriminate between bacterial and archaeal counterparts
(Prosser and Nicol, 2012). However significant differences in terms of the contribution of these
two groups of organisms for nitrification have been suggested based on molecular based
approaches in a number of studies (Leininger et al., 2006; Bernhard et al., 2010; Hofferle et
al., 2010; Posser and Nicol 2012; Hu and He, 2014). Bacterial nitrifiers are reported to
dominate nitrification under slightly acidic to neutral pH soil conditions and also under
environments receiving high NH4+ inputs (Fan et al., 2011; Tylor et al., 2011; Verhamme et
al., 2011). According to Tylor et al. (2011) fertilizer-N application and manure addition
increased AOB abundance in soils compared to unfertilized soils while AOA abundance
remained unchanged. However, the community composition of both AOB and AOA groups
changed with fertilizer treatments. They further reported that change in community
composition of AOB with crop growth stage was more prominent than that of AOA. Therefore,
there should be high variability in the dominance of AOB and AOA in the studied soils that
represent uncultivated and cultivated systems, which are different with respect to input
management and vegetation.
Higher number of archaeal nitrifiers have been reported under extreme soil conditions for
microbial growth such as high or low pH, salinity, etc. (Bernhard et al., 2010; Hofferle et al.,
2010; Posser and Nicol 2012; Hu and He, 2014). Change in abundance of these two groups
depending on temperature and soil moisture regimes and altitude has also been reported
(O’Sullivan et al., 2013; Tylor et al., 2011; Zhang et al., 2009). The altitude of the sampling
sites used in the present study varied from 8 m (e.g. Kalpitiya) to above 1860 m (e.g. Nuwara
Eliya) from mean sea level and along with the elevation gradient the climatic conditions the
soils are experiencing changes as indicated by the different agro-ecological regions the
locations belong to (Table 1). Further high diversity in soil texture is suggestive of high
variability in temperature and moisture conductivity among many other processes affecting
microbial growth. Therefore, it can be expected that even though two soils have relatively
similar abundance of ammonia oxidizers the activity can be very different because composition
of community affects the potential activity. This is evident in the present study since the
abundance of ammonia oxidizers in soils collected from Kalpitiya and Marassana are less
variable compared to the variability exist in the potential activity of nitrifiers from the same
soils (Figure 1a and 1b). Potential nitrification rate is often reported to show correlation with
AOB abundance than AOA (Bernhard et al., 2010). Lack of correlation between PNR and
AOA and AOB abundance was observed by O’Sullivan et al. (2013). In the present study,
significant correlation was observed between PNR and EC but there was no correlation
between PNR and the abundance of either ammonia oxidizer or nitrite oxidizer groups (Table
4). There may be differences in terms of the contribution of AOA and AOB for the nitrification
in soils used in present study.
Although there is high variability in the estimated characters of the nitrifying populations these
characters were not strong at defining the variability of the studied soils as indicated by PCA
(Table 5 and 6). The variability among the studied soils was captured by PC1, PC2 and PC3
at 30, 16 and 14%, respectively. Structure of data along PC1 is mostly due to soil pH and

Nawarathna et al.
64
organic C and abundance of bacteria and fungi. Potential nitrification rate and EC scored high
in PC2. O’Sullivan et al. (2013) reported that PNR was more sensitive to the soil fertility status
than the population sizes of AOA and AOB. In the present study PNR contributed for the
variability of studied soils than ammonia oxidizer or nitrite oxidizer abundance as depicted by
PCA.
Despite the differences in soil characteristics and agro-climatic conditions, the studied
vegetable production systems have one character in common, which is intensive production
with high input use (organic and/or synthetic fertilizers). Therefore, the soils receive high dose
of nitrogenous fertilizers in each cropping cycle. The intensity of cultivation considering the
number of crops per year vary as NuwaraEliya>Kalpitiya>Marassana=Gannoruwa. These
regions are environmentally sensitive areas as Nuwara Eliya, Gannoruwa and Marassana are
in tributaries of major rivers (mainly river Mahaweli) and Kalpitiya is located on a perched
water table. Therefore, contamination of groundwater and surface water bodies with nitrate
causing on-site and off-site effects is highly probable in these regions.
Table 4. Correlations between measured variables
pH EC OC AC PNR TB TF AO NO
EC -0.137
NS
OC -0.490 0.126
*** NS
AC -0.175 -0.039 0.183
NS NS NS
PNR -0.225 0.547 0.193 0.109
* *** NS NS
TB 0.500 -0.060 -0.339 0.034 -0.237
*** NS ** NS *
TF 0.296 -0.214 -0.297 0.044 -0.389 0.361
* * * NS ** **
AO 0.200 -0.075 -0.175 0.163 -0.084 0.282 0.329
NS NS NS NS NS * **
NO 0.157 -0.263 -0.096 0.203 -0.116 -0.021 0.021 0.146
NS * NS NS NS NS NS NS
sand% 0.49 0.001 -0.51 -0.496 0.014 0.004 0.18 -0.11 -0.16
*** NS *** *** NS NS NS NS NS OC-organic carbon, AC-active carbon, PNR-potential nitrification rate, TB-total bacteria, TF-total fungi, AO-ammonia oxidizers, NO-nitrite oxidizers
NS - Not significant:
Significance at probability levels: p<0.05,*: p<0.01,**: p<0.001,***
Table 5. Total Variance explained by the first three principal components (PCs)
Component Initial Eigenvalues
Total % of Variance Cumulative %
1 2.758 30.645 30.645
2 1.435 15.940 46.585
3 1.290 14.331 60.916

Dynamics of Nitrifiers in Vegetable Grown Soils
65
Table 6. Scores of each variable in Rotated Component Matrix
There are enough evidences to indicate nitrate pollution in surface and ground water due to
fertilizer usage in vegetable production is already an issue (Henegama et al., 2013;
Kuruppuarachchi, 2010; Jayasingha et al., 2011; Liyanage et al., 2000). Therefore, information
on potential activity of nitrifiers and the diversity of nitrifying communities are important to
design suitable techniques to manage N fertilizers and minimize N losses to the environment.
From among the parameters estimated in relation to nitrifiers, PNR was the only parameter
that contributed to the structured variability among soils (Table 5 and 6). Based on the PNR
values observed in the present study about 48% of soils had PNR values from 3 to 10 mg of
N/kg soil/h and 7% of soils had values greater than 10 mg of N/kg soil/h. Olsson and
Falkengren-Grerup (1999) reported PNR in soils from Oak forests in Southern Sweden ranging
from 0 to 24 nmol NO3- /g/h which is equivalent to 0 to 0.34 mg of N/kg/ h. They further
reported that PNR positively correlated with pH. Tylor et al. (2011) reported PNR rates as
high as 2.4 µmol N/g/day (equivalent to 1.46 mg of N/kg soil/h) when soil is incubated with 1
mM NH4+ supplement. Based on a study conducted on an Alfisol soil in Northeast China, Fan
et al. (2011) indicated that PNR tend to be suppressed by long term mineral fertilizer
application but enhanced by application of manures such as horse manure. The reported PNR
rates by Fan et al. (2011) ranged from 0.5 to 2.6 mg NO3-/kg soil/h (equivalent to 0.11 to 0.59
mg of N/kg soil/h). Therefore, PNR in most of the soils in this study are higher than those
reported in literature (Figure 2a). Considering the high PNR values observed in the present
study in agricultural soils there is a high potential of losing N once nitrogenous fertilizer are
added to cultivated fields, contaminating groundwater and surface water with NO3-, and
increasing emissions of N2O, a greenhouse gas with 296 times more global warming potential
than CO2 (Dalal et al., 2003). The N2O is emitted during nitrification to some extent and largely
through denitrification of NO3- produced from nitrification (Dalal et al., 2003). Hence timely
actions are needed to be taken to moderate nitrification rate as vegetable grown regions receive
high quantities of nitrogen fertilizers. Nine ammonia oxidizer isolates were made from the
studied soils to facilitate future research activities on developing suitable techniques to
suppress nitrification in vegetable cropping systems.
In the present study, the abundance of bacteria, fungi, ammonia oxidizers and nitrite oxidizers
are presented in per gram of soil basis, which is a standard expression used. However,
differences in patterns can be expected if the same has been presented in per unit soil volume
because the soil texture and organic matter content vary widely across soils and structural
properties, especially bulk density, also vary across fields (Mehlich, 1972). Since soil bulk
density measurements were not made the comparison in per volume basis cannot be performed.
Variable Component
1 2 3
Bacteria abundance 0.797 0.013 0.126
pH 0.751 -0.119 -0.109
Organic C -0.683 0.106 0.202
Fungi abundance 0.668 -0.243 0.120
EC -0.042 0.877 -0.072
Potential nitrification rate -0.280 0.796 0.101
Active C -0.176 0.062 0.829
Ammonia oxidizer abundance 0.483 0.043 0.566
Nitrite oxidizer abundance -0.005 -0.423 0.497

Nawarathna et al.
66
It is suggested that in future research of this nature it will be important to consider expressing
results in per volume of soil.
CONCLUSIONS
The soil characteristics, potential activity and abundance of nitrifiers’ populations varied
widely across the studied soils. The results indicate very high diversity in nitrifying
communities inhabiting intensively vegetable cultivated soils. PNR contributed more to
structuring the variability of soils than abundance of ammonia oxidizers and nitrite oxidizers,
thus, it is a better indicator of dynamics of nitrifiers than population size of the group. It is
revealed that potential nitrification rates of 55% of soils from the studied vegetable grown
regions were higher than the values reported in literature. Hence, moderation of nitrification
rate should be crucial, especially in vegetable grown soils, to improve agronomic fertilizer use
efficiency and reduce groundwater contamination with nitrate and emissions of N2O as these
fields receive high amounts of nitrogen fertilizers with each cropping cycle. The variability in
soils with respect to functional diversity of nitrifying communities may have to be considered
when developing mechanisms for the moderation of nitrification.
REFERENCES
Baruah, T.C and Barthakur. H.P. (1997). a text book of soil analysis. Vikas publishing house
Pvt. Ltd. New Delhi.
Beeckman, F., Motte, H. and Beeckman, T. (2018). Nitrification in agricultural soils: impact,
actors and mitigation, Current Opinion in Biotechnology. 50, 166-173.
Cataldo, D.A., Haroon, M. Schrader,L,E., and Youngs, V.L. (1975), Rapid colorimetric
determination of nitrate in plat tissue by nitration of salicylic acid. Communications in Soil
Science and Plant Analysis, 6(1), 71-80.
Culman, S. W., Snapp, S. S., Green, J. M., and Gentry, L. E. (2013). Short- and long-term
labile soil carbon and nitrogen dynamics reflect management and predict corn agronomic
performance. Agronomy Journal, 105:493–502. doi:10.2134/agronj2012.0382.
Dalal, R.C., Wang, W. Robertson, G.P. and Parton, W.J. (2003). Nitrous oxide emission from
Australian agricultural lands and mitigation options: a review. Soil Research, 41(2), 165-195.
Dharmakeerthi, R.S., Indraratne,S.P. and Kumaragamage, D. (2007), Manual of Soil Sampling
and Analysis, Special Publications, Soil Science Society of Sri Lanka.
Fan, F., Yang, Q., Li, Z., Wei, D., Cui, X.A. and Liang, Y. (2011). Impacts of organic and
inorganic fertilizers on nitrification in a cold climate soil are linked to the bacterial ammonia
oxidizer community. Microbial ecology, 62(4), 982-990.
Hart, S.C., Stark, J.M., Davidson, E.A. and Firestone, M.K. (1994). Nitrogen mineralization,
immobilization and nitrification. pp. 985-1018.In: Weaver, R.W., Angle, J.S., and Bottomley,
P.S. (Eds.) Methods of Soil Analysis, Part 2. Microbiological and Biochemical Properties. Soil
Science Society of America. Madison, WI, USA.
Dynamics of Nitrifiers in Vegetable Grown Soils
67
Henegama, H.P., Dayawansa, N.D.K. and De Silva, S. (2013). An Assessment of Social and
Environmental Implications of Agricultural Water Pollution in Nuwara Eliya. Tropical
Agricultural Research, 24(4), 304-316.
Hesselsøe, M., Brandt, K. K. and Sørensen, J. (2001). Quantification of ammonia oxidizing
bacteria in soil using microcolony technique combined with fluorescence in situ hybridization
(MCFU–FISH). FEMS microbiology ecology, 38(2-3), 87-95.
Höfferle, Š., Nicol, G. W., Pal, L., Hacin, J., Prosser, J. I. and Mandić-Mulec, I. (2010).
Ammonium supply rate influences archaeal and bacterial ammonia oxidizers in a wetland soil
vertical profile. FEMS microbiology ecology, 74(2), 302-315.
Hommes, N.G., Sayavedra-Soto, L.A. and Arp, D.J. (2003). Chemolithoorganotrophic growth
of Nitrosomonas europaea on fructose. Journal of bacteriology, 185(23), 6809-6814.
Hu, H.W. and He, J.Z. (2014). Ammonia oxidizing Achaea play a predominant role in acid
soil nitrification. Advances in Agronomy. 125, 261-302.
Hurisso, T. T., S. W. Culman, W. R. Horwath, J. Wade, D. Cass, J. W. Beniston, T. M.
Bowles, A. S. Grandy, A. J. Franzluebbers, M. E. Schipanski, et al. (2016). Comparison of
permanganate-oxidizable carbon and mineralizable carbon for assessment of organic matter
stabilization and mineralization. Soil Science Society of America Journal, 80:1352–64.
doi:10.2136/sssaj2016.04.0106.
van Kessel, M.A., Speth, D.R., Albertsen, M., Nielsen, P.H., den Camp, H.J.O., Kartal, B.,
Jetten, M.S. and Lücker, S. (2015). Complete nitrification by a single
microorganism. Nature, 528(7583), 555-559.
Krishnapillai, S. (1979). Inhibition of nitirification by waste tea (tea fluff). Plant and Soil, 51,
563-569.
Kuruppuarachchi, D.S.P. (2010). A review on the leaching of nitrate from agricultural soil and
pollution of ground water in Sri Lanka. Journal of Soil Science Society Sri Lanka, 22.
Leininger, S., Urich, T., Schloter, M., Schwark, L., Qi, J., Nicol, G.W., Prosser, J.I.,
Schuster, S.C. and Schleper, C. (2006). Archaea predominate among ammonia-oxidizing
prokaryotes in soils. Nature, 442 (7104), 806-809.
Liyanage C. E., Thabrew, M. I. and Kuruppuarachchi D.S.P. (2000). Nitrate pollution in
ground water of Kalpitiya: An evaluation of the content of nitrate in the water and food items
cultivated in the area. Journal of National Science Foundation of Sri Lanka. 28(2), 101-112.
Mapa, R.B., Somasiri, S. and Dassanayake, A.R. (2010). Soils of the Dry zone of Sri Lanka,
Soil Science Society of Sri Lanka.
Mapa, R.B., Somasiri S. and Nagarajah, S. (1999). Soils of the wet zone of Sri Lanka, Soil
Science Society of Sri Lanka.
Mehlich, A. (1972). Uniformity of expressing soil test results a case for calculating results on
a volume basis. Communications in Soil Science and Plant Analysis, 3(5), pp.417-424.
Nawarathna et al.
68
Nicol, G.W. and Prosser, J.I. (2011). Strategies to determine diversity, growth, and activity of
ammonia-oxidizing archaea in soil. In Methods in enzymology (Vol. 496, pp. 3-34). Academic
Press.
O’Sullivan, C.A., Wakelin, S.A., Fillery, I.R. and Roper, M.M. (2013). Factors affecting
ammonia-oxidising microorganisms and potential nitrification rates in southern Australian
agricultural soils. Soil Research, 51(3), 240-252.
Olsson, M.O. and Falkengren-Grerup, U. (2000). Potential nitrification as an indicator of
preferential uptake of ammonium or nitrate by plants in an oak woodland
understorey. Annals of Botany, 85(3), 299-305.
Prosser, J. I. and Nicol, G. W. (2012). Archaeal and bacterial ammonia-oxidisers in soil: the
quest for niche specialization and differentiation. Trends in microbiology, 20(11), 523-531.
Schmidt, E.L. (1982). Nitrification in Soil, In F.J. Stevenson (ed.), Nitrogen in Agricultural
Soils, Agronomy Monograph No. 22, Madison WI, ASA-CSSA-SSSA, 253–288.
Schmidt, E.L. and Belser, L.W. 1994. Autotrophic nitrifying bacteria. In Methods of Soil
Analysis, Part 2 Microbiological and Biochemical Properties. Eds. R.W. Weaver, J.S. Angle
and P.S. Bottomley. Pp 59-79. Soil Science Society of America, Inc. Madison, WI, USA.
Sylvia, D.M., Fuhrmann, J.J., Hartel, P.G. and Zuberer, D.A. eds. (2005). Principles and
applications of soil microbiology (No. QR111 S674 2005). Upper Saddle River, NJ: Pearson
Prentice Hall.
Stark, J.M. and Firestone, M.K. (1995). Mechanisms for soil moisture effects on activity of
nitrifying bacteria. Applied and environmental microbiology, 61(1), 218-221.
Sullivan, B.W., Selmants, P.C. and Hart, S.C. (2012). New evidence that high potential
nitrification rates occur in soils during dry seasons: Are microbial communities metabolically
active during dry seasons? Soil biology and biochemistry, 53, 28-31.
Taylor, A.E., Zeglin, L.H., Wanzek, T.A., Myrold, D.D. and Bottomley, P.J. (2012). Dynamics
of ammonia-oxidizing archaea and bacteria populations and contributions to soil nitrification
potentials. The ISME journal, 6(11), 2024-2032.
Verhamme, D.T., Prosser, J.I. and Nicol, G.W. (2011). Ammonia concentration determines
differential growth of ammonia-oxidizing archaea and bacteria in soil microcosms. The ISME
journal, 5(6), 1067-1071.

Tropical Agricultural Research Vol. 30 (3): 69 – 79 (2018)
Performance of Macrobrachium rosenbergii in Perennial Reservoirs: A
Comparative Assessment of Fisheries in Five Perennial Reservoirs in the
Northern Province of Sri Lanka
R. Rajeevan*, U. Edirisinghe1 and A.R.S.B. Athauda1
Postgraduate Institute of Agriculture
University of Peradeniya
Sri Lanka
ABSTRACT: The giant freshwater prawn (Macrobrachium rosenbergii), was first introduced
to the reservoirs in the Northern Province of Sri Lanka. Studies on the performances of
introduced species in reservoirs are essential for development of fisheries and management.
The objective of the present study was to evaluate and compare the performance of M.
rosenbergii production in five selected perennial reservoirs. Primary data relating to the
fisheries of the reservoirs and relevant socio-economic data were gathered through field data
collection and questionnaire survey conducted in 2016 and 2017. Unit production of M.
rosenbergii in 2017 in the Vavunikulam, Muthayankattu, Puthumurippu, Kalmadu and
Muhathankulam reservoirs was 5.3 kg/ha, 3.2 kg/ha, 13.6 kg/ha, 21.8 kg/ha, 12.9 kg/ha,
respectively with a farm-gate values of 6.84, 4.39, 2.1, 1.59, and 2.85 million Sri Lankan
rupees, respectively. Relative abundance, economic (total farm-gate price) contribution and
recapture rate of M. rosenbergii in the catch, ranged between 2.3%-20%, 13.5%-72.3% and
1.44%-6.49%, respectively across the reservoirs. Even though the recapture rate was low,
catching of M. rosenbergii improved the livelihood of fishers while increasing their interest in
fisheries. Size of the reservoir, stocking density, fishing intensity and gear specification,
rainfall, wind and socio-economic factors significantly influenced the catch of M. rosenbergii
in the selected reservoirs. The results showed that the introduction of M. rosenbergii as culture-
based fisheries in the selected five reservoirs has achieved considerable success, particularly
in terms of economic benefits.
Keywords: Macrobrachium rosenbergii, perennial reservoirs, culture-based fisheries, PL
stocking, performance
INTRODUCTION
Sri Lanka has many reservoirs of varying nature and scale including seasonal and perennial
reservoirs of large, medium and small sizes. While the primary purposes of these reservoirs
are irrigation and generation of hydroelectricity, they contribute for fisheries production too,
similar to reservoirs in other parts of Asia (Amarasinghe et al., 2001). Making use of reservoirs
for fisheries production in Asia in the past few decades have contributed to increase both
production of food protein and income of rural dwellers (De Silva, 1996; Amarasinghe et al.,
2001). There are few factors influencing the yield from reservoirs, such as reservoir
morphometry, hydro-climatic factors, species composition, fishing effort, gear specification,
1 Department of Animal Science, Faculty of Agriculture, University of Peradeniya, Sri Lanka
* Corresponding author: [email protected]

Rajeevan et al.
70
stocking of post-larvae, socioeconomic factors and behavior of fish and prawn species (Craig
et al., 1985; De Silva, 1996; Gray et al., 2005). Reservoir fisheries show unique characteristics
compared to other types of fisheries, where majority of reservoir fisheries are artisanal and
highly seasonal integrating well with the ecology of fishery resources (Welcomme, 2001). In
Sri Lanka, fishing methods mainly depend on multi-mesh gillnets which are highly selective
targeting mainly exotic tilapia species (De Silva, 1988). Due to the seasonal variations in the
size of the stocks of these target species, reservoir fishers are compelled to use different mesh
compositions of gillnets during different seasons (Pet et al., 1999).
Introducing and stocking of desirable fish species to reservoirs is commonly practiced
worldwide to improve production though the stocking is not the sole mechanism for
improvement of fishery (Quirõs and Boveri, 1999). FAO (1999) indicated that fish stocking in
Asia and Oceania is practiced for increasing yields, production of food and generation of
income. Stocking can be categorized according to the purpose, which include stocking for
pollution mitigation, for enhancement, for restoration and for creation of new fisheries. For the
purpose of creating new fisheries, a new fish stock is introduced to a river, lake or reservoir,
where the particular fish did not exist earlier due to natural habitat related barriers or
evolutionary reasons. Establishment of new fish species is also done for reasons including, to
increase diversity of species, to fulfill an existing niche gap and to increase fish yield (Cowx,
1999). Success of stocking can be measured by increase in yield, comparison between stocked
and non-stocked waters and increase of income to fishers/stakeholders. Success of a stocking
program may get impacted by factors such as stocking density and ecological carrying capacity
of the receiving environment, age and size of fish at stocking, condition and health of stocked
seed, genetic factors, suitability of habitat, feeds, competitors and predators, timing of stocking
and release methods (Li, 1999; Brown and Day, 2002). The influence of those factor could
differ among species, habitats as well as in time and space (Brown and Day, 2002).
The giant freshwater prawn, Macrobrachium rosenbergii is one of the most economically
important prawn species in the world (New, 2017). Freshwater prawn farming has become a
crucial and growing contributor to global aquaculture both in terms of quantity and value
(FAO, 2017). Capture fisheries in inland waters, culture based fisheries and shrimp farming
are part of inland fisheries in Sri Lanka (Amarasinghe, 2014). With the emerging interest in
aquaculture in Sri Lanka, M. rosenbergii has become a notable species due to its rich taste,
high price and cultivable quantities that make it a suitable candidate for extensive and intensive
culture both in fresh and brackish waters. M. rosenbergii culture in Sri Lanka is limited mainly
due to lack of freshwater prawn seeds which amounted only 60.9 million in 2017 (NAQDA,
2018). Therefore, improved breeding technique and increase in the production of seeds are
essential for increasing freshwater prawn production. As a strategy to improve and expand the
freshwater prawn production, NAQDA has launched free stocking program of M. rosenbergii
in selected perennial and seasonal reservoirs. However, fisheries development was not given
due attention in the Northern Province until recently. In this study, M. rosenbergii was
introduced for the first time in all five selected reservoirs in the Northern Province. Studies
focusing on the performances of introduced species in reservoirs are essential for planning of
reservoir fisheries development and management. Thus, the objective of the present study was
to evaluate and compare performances of introduced M. rosenbergii production in the five
selected perennial reservoirs.
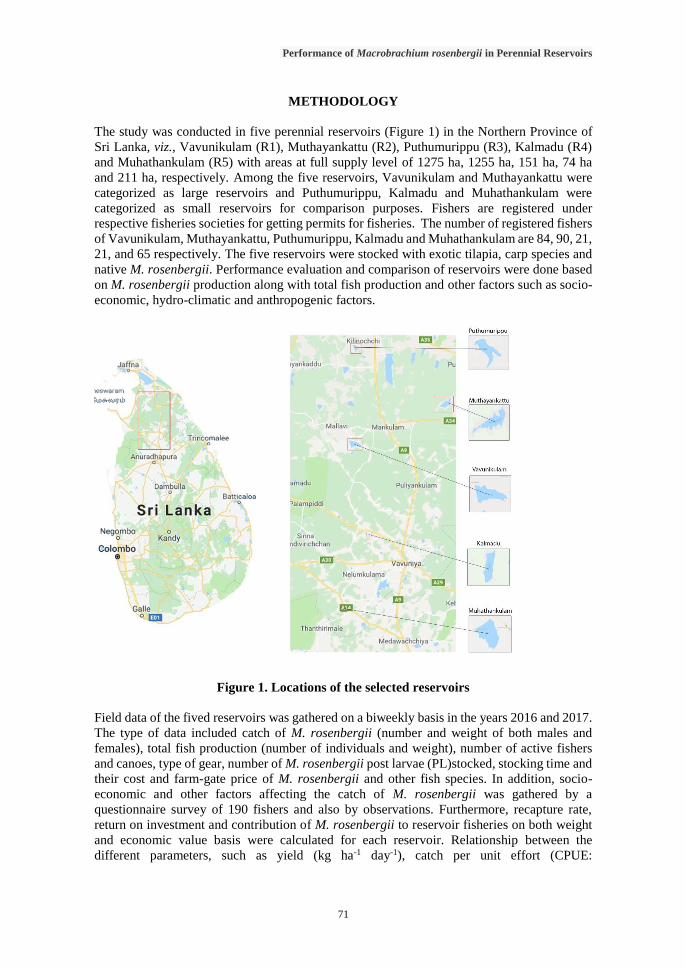
Performance of Macrobrachium rosenbergii in Perennial Reservoirs
71
METHODOLOGY
The study was conducted in five perennial reservoirs (Figure 1) in the Northern Province of
Sri Lanka, viz., Vavunikulam (R1), Muthayankattu (R2), Puthumurippu (R3), Kalmadu (R4)
and Muhathankulam (R5) with areas at full supply level of 1275 ha, 1255 ha, 151 ha, 74 ha
and 211 ha, respectively. Among the five reservoirs, Vavunikulam and Muthayankattu were
categorized as large reservoirs and Puthumurippu, Kalmadu and Muhathankulam were
categorized as small reservoirs for comparison purposes. Fishers are registered under
respective fisheries societies for getting permits for fisheries. The number of registered fishers
of Vavunikulam, Muthayankattu, Puthumurippu, Kalmadu and Muhathankulam are 84, 90, 21,
21, and 65 respectively. The five reservoirs were stocked with exotic tilapia, carp species and
native M. rosenbergii. Performance evaluation and comparison of reservoirs were done based
on M. rosenbergii production along with total fish production and other factors such as socio-
economic, hydro-climatic and anthropogenic factors.
Figure 1. Locations of the selected reservoirs
Field data of the fived reservoirs was gathered on a biweekly basis in the years 2016 and 2017.
The type of data included catch of M. rosenbergii (number and weight of both males and
females), total fish production (number of individuals and weight), number of active fishers
and canoes, type of gear, number of M. rosenbergii post larvae (PL)stocked, stocking time and
their cost and farm-gate price of M. rosenbergii and other fish species. In addition, socio-
economic and other factors affecting the catch of M. rosenbergii was gathered by a
questionnaire survey of 190 fishers and also by observations. Furthermore, recapture rate,
return on investment and contribution of M. rosenbergii to reservoir fisheries on both weight
and economic value basis were calculated for each reservoir. Relationship between the
different parameters, such as yield (kg ha-1 day-1), catch per unit effort (CPUE:

Rajeevan et al.
72
kg/fisherman/day), fishing effort (fishermen km-2), stocking density (PL/ ha) and area at full
supply level (FSL: ha) were determined by regression analyses and Pearson correlations using
Minitab 17 statistical software and MS Excel (MS Office 2016).
RESULTS AND DISCUSSION
Assessment of artisanal fisheries of five perennial reservoirs
A total of 94144 individuals were quantified in the catch between 2016 and 2017, which
comprised of 27 fish species and 2 freshwater prawn species. The larger reservoirs of
Vavunikulam (65.4%) and Muthayankattu (55.8%) were dominated with exotic species, while
Kalmadu (64.34%) and Muhathankulam reservoirs (67%) were dominated with non-stocked
native species and the Puthumurippu reservoir had almost equal amounts of stocked and non-
stocked species (Table 1). However, in all the reservoirs Nile Tilapia (O. niloticus) had the
highest abundance among all the species in the catch. After the introduction and continuous
stocking of M. rosenbergii, the relative abundance of Tilapia, Carp and most of the native
species decreased, while M. rosenbergii increased in catch.
Table 1. Relative abundance of fish and prawn species at selected reservoirs
Species Vavunikulam Muthayankattu Puthumurippu Kalmadu Muhathankulam
2016 2017 2016 2017 2016 2017 2016 2017 2016 2017
Tilapia 64.03 63.68 53.17 52.12 30.1 22.78 19.21 17.15 24.03 21.77
Carp 1.74 1.27 3.23 3.17 13.16 11.25 11.05 11.23 7.7 7.51 Native 32.94 32.47 42.7 42.05 56.74 44.3 66.8 61.88 67.34 66.63
FWP 1.28 2.59 0.91 2.64 - 21.67 2.95 9.74 0.92 4.1
FWP: Machrobrachium rosenbergii
The relationship between Yield (kg ha-1 day-1) and fishing effort was similar across all the
selected five reservoirs (Figure 2).
Figure 2. Relationship between yield and fishing effort of five reservoirs
R1:Vavunikulam, R2:Muthayankattu, R3:Puthumurippu, R4:Kalmadu,
R5:Muhathankulam and All: pooled data for the five reservoirs.
Fishing effort (Fishermen km-2) (R4) Fishing effort (Fishermen km-2) (R5) Fishing effort (Fishermen km-2) (All)
Fishing effort (Fishermen km-2) (R1) Fishing effort (Fishermen km-2) (R2) Fishing effort (Fishermen km-2) (R3)
Yie
ld (
kg/h
a/day)
Yie
ld (
kg/h
a/day)
Yie
ld (
kg/h
a/day)
Yie
ld (
kg/h
a/day)
Yie
ld (
kg/h
a/day)
Yie
ld (
kg/h
a/day)
120
100
80
60
40
20
0
80
70
60
50
40
20
0
30
10
10
8
6
4
2
0
6
5
4
3
2
1
0
14
12
8
6
2
0
4
10
16
40
140
120
80
60
20
0
100
140
160
0.5 1.0 2.5 1.5 2.0 3.0 3.5 4.0 0
0 5 10 25 15 20 30 35 0
0.1 0.2 0.5 0.3 0.4 0.6 0.7 0.8 0.9 0 1 2 5 3 4 6
0.2 0.4 1.0 0.6 0.8 1.2 1.4 1.6 0 1.8 0.5 1 2.5 1.5 2

Performance of Macrobrachium rosenbergii in Perennial Reservoirs
73
Yield tended to increase linearly with increasing fishing effort. Figure 2 suggests that the
selected reservoirs are subjected to sub-optimal fishing pressure and perhaps represent the
ascending limb of a possible Schaefar-type curve. However, this does not mean that the fishing
effort can be increased indefinitely but indicates that the relationship is valid for ranges in the
yield and effort indicated.
This study revealed that the catch per unit effort (CPUE) for a day increased with the increase
in number of fishermen per unit area in Vavunikulam, Muthayankattu, Muhathankulam
reservoir and decreased with the increase in number of fishermen per unit effort in
Puthumurippu and Kalmadu reservoir (Figure 3). However, when the CPUE per day and unit
fishing effort of the five reservoirs were considered as a whole, CPUE decreased linearly,
though M. rosenbergii catch increased linearly. This indicates that even though in all the
reservoirs fishermen had targeted more on M. rosenbergii, it is still under exploited except for
Vavunikulam and Muhathankulam reservoirs.
Figure 3. Variation of CPUE with the total catch (A) and M. rosenbergii (B) according to
the fishing effort. R1-Vavunikulam, R2-Muthayankattu, R3-Puthumurippu,
R4-Kalmadu, R5-Muhathankulam and All-pooled data for the five reservoirs
M. rosenbergii production in selected perennial reservoirs
Table 2 shows the statistics of production of M. rosenbergii in the five reservoirs. Unit
productions of M. rosenbergii in Vavunikulam, Muthayankattu, Puthumurippu, Kalmadu and
Muhathankulam were 5.3 kg/ha, 3.2 kg/ha, 13.6 kg/ha, 21.8 kg/ha, 12.9 kg/ha, respectively,
representing farm-gate values of 6.84, 4.39, 2.1, 1.59, and 2.85 million Sri Lankan rupees,
respectively. Total weight basis contribution of M. rosenbergii in 2017 was highest in
Puthumurippu (20%) and lowest in Vavunikulam (2.8%) and Muthayankattu (2.3%)
FE (Fishermen/km2) R1 (A) FE (Fishermen/km2) R1 (B) FE (Fishermen/km2) R2 (A) FE (Fishermen/km2) R2 (B)
FE (Fishermen/km2) R3 (A) FE (Fishermen/km2) R3 (B) FE (Fishermen/km2) R4 (A) FE (Fishermen/km2) R4 (B)
FE (Fishermen/km2) R5 (A) FE (Fishermen/km2) R5 (B) FE (Fishermen/km2) All (A) FE (Fishermen/km2) All (B)
CP
UE
(kg/f
ish
erm
en/d
ay)
CP
UE
(k
g/f
ish
erm
en/d
ay)
CP
UE
(kg/f
ish
erm
en/d
ay)
CP
UE
(kg/f
ish
erm
en/d
ay)
CP
UE
(kg/f
ish
erm
en/d
ay)
CP
UE
(kg/f
ish
erm
en/d
ay)
CP
UE
(kg/f
ish
erm
en/d
ay)
CP
UE
(kg/f
ish
erm
en/d
ay)
CP
UE
(kg/f
ish
erm
en/d
ay)
CP
UE
(kg/f
ish
erm
en/d
ay)
CP
UE
(kg/f
ish
erm
en/d
ay)
CP
UE
(kg/f
ish
erm
en/d
ay)
25
20
15
10
5
0
1
0.8
0.6
0.4
0.2
12
10
8
6
4
2
0
20
18
16
14
0.5
0.4
0.3
0.2
0.1
0
14 16
10
8
6
4
2
0
1.0
0.8
0.6
0.4
0.2
0
1.8
1.6
1.4
1.2
10
8
6
4
2
0
12
1.0
0.8
0.6
0.4
0.2
0
1.8
1.6
1.4
1.2
0 1 2 5 3 4 0 1 2 5 3 4
0 2 4 10 6 8 12
0 1 2 5 3 4 6 0 1 2 5 3 4 6 0 5 10 25 15 20 30 0 5 10 25 15 20 30
0 0.5 1 2.5 1.5 2 3 3.5
4
0 0.5 1 2.5 1.5 2 3 3.5 4
7
14 16 0 2 4 10 6 8 12 0 5 10 25 15 20 30 0 5 10 25 15 20 30
1.0
0.8
0.6
0.4
0.2
0
1.8
1.6
1.4
1.2
1.0
0.8
0.6
0.4
0.2
0
25
20
15
10
5
0
8
6
4
2
0

Rajeevan et al.
74
reservoirs, whereas Kalmadu and Muhathankulam recorded a contributions of 9.1% and 8.4%,
respectively. The economic contribution of M. rosenbergii harvest to the total economic value
of fish production in Vavunikulam, Muthayankattu, Puthumurippu, Kalmadu and
Muhathankulam reservoirs was 15.1%, 13.5%, 72.3%, 57.2% and 59.5%, respectively.
Table 2. Summary of M. rosenbergii (FWP) production, stocking density (SD), recapture
rate, return on investment (ROI) and economic contribution in five reservoirs†
Parameter R1 R2 R3 R4 R5
Male FWP (kg/ha) 3.28 2.5 9.99 12.28 8.94
Female FWP (kg/ha) 2.04 0.7 3.65 9.56 3.99
Total FWP (kg/ha) 5.32 3.20 13.64 21.84 12.93
Range (Min-Max) (g) 155-
680
170-
700
115-
635
70-560 65-520
Income (million Rs.) 6.84 4.39 2.1 1.59 2.85
SD (PLs/ ha) 1058.8 597.6 662.3 2702.7 3507.1
Cost (million Rs.) 2.7 1.5 0.2 0.4 1.48
ROI (%) 253.3 292.7 1050 397.5 192.6
Recapture rate 1.73 1.44 6.49 3.74 1.61
Weight % 2.77 2.3 20 9.12 8.43
Economic value % 15.06 13.47 72.28 57.22 59.52 †R1-Vavunikulam, R2-Muthayankattu, R3-Puthumurippu, R4-Kalmadu, R5-Muhathankulam
Market price of a M. rosenbergii PL was Rs. 2 including the transportation cost. The highest
return on investment (ROI) of 1050% was recorded in Puthumurippu with a 6.49% recapture
rate per year. ROI of Kalmadu was 397.5% with a 3.74% recapture rate and the Vavunikulam
and Muthayankattu major reservoirs had almost similar ROI values of 253.3% and 292.7%
with recapture rates of 1.73% and 1.44%, respectively. The lowest ROI of 192.6% was
recorded in Muhathankulam with a recapture rate of 1.61% probably owing to the
characteristic of the catch mostly represent small sized M. rosenbergii, which draws relatively
lower market price. Despite the recorded low recapture rate, due to the comparatively high
market price M. rosenbergii production was beneficial for both the investors and the fishers.
As a result, fishers had become more interested in fisheries without moving away from
fisheries activities to find secondary livelihoods, which was the case before the introduction of
M. rosenbergii to those reservoirs. After the introduction of M. rosenbergii a steady daily
income has been ensured for fishers. The lowest individual weights of M. rosenbergii
recorded in Kalmadu (70 g) and Muhathankulam (65 g) while the highest weights were
recorded in large reservoirs; i.e. Vavunikulam (680 g) and Muthayankattu (700 g).
Pearson correlation coefficient revealed that there was a strong negative (r= -0.9) correlation
between area at full supply level (ha) and yield of freshwater prawn (kg/ha/yr). The regression
relationship of yield (kg/ha/yr) and area at FSL (ha) was Yield = 14.222e-0.001(FSL) (R2 = 0.8).
Thus, the unit yield is higher in small reservoirs than large reservoirs. On the other hand, with
the exclusion of Puthumurippu reservoir, there was a strong positive (r= 0.969) correlation
between stocking density (SD: PLs/ha) and yield (kg/ha). Considering all five reservoirs
together, the relationship of yield (kg/ha) with stocking density (PLs/ha) was Yield = 0.1036
(SD)0.6245 with a (R2 = 0.4). Gear specifications and fishing intensity, reservoir morphology,
catchability and the presence of stumps could be the possible reasons for the low R2 value.
Age and experience of the fisher, catch from the previous day, degree of poverty and livelihood
diversification were the important socio-economic factors that affected the catch of M.

Performance of Macrobrachium rosenbergii in Perennial Reservoirs
75
rosenbergii. As revealed in the present study, M. rosenbergii was mostly targeted by young
fishers below 40 years of age. Older fishers considered that catching of M. rosenbergii as a
new fishery which is risky as they have no experience. In addition, the amount of catch from
the previous day was the deciding factor for most of the fishers (87%) in choosing the location
for fishing on the following day. If they got a large catch on the previous day, some fishers
choose the same location for fishing on the next day too. Instead, some others go to little
faraway places to catch fish on the next day. Also, the fishers that are poor tend to choose catch
tilapia and carps over M. rosenbergii because M. rosenbergii is required to be caught at the
bottom of the reservoir, which has a risk of catching no fish at all. Therefore, to ensure that
they get some income for their survival, poor fishers choose to fish for tilapia and carps. Also,
fishers who have diversified their livelihoods and mostly who are income secured, choose to
take the risk and invest in the catching of M. rosenbergii. On contrary, poor fishers in
Puthumurippu focused on catching M. rosenbergii because culture based fishery was relatively
new to Puthumurippu compared to the other reservoirs and hence, fisheries production
including Tilapia was comparatively low. Therefore, they focused more on M. rosenbergii due
to its high value.
Hydro-climatic factors that contributed fluctuations in fish catches were low rainfall, strong
winds and high temperature. As evident from the meteorological data and responses of fishers,
rainfall has been significantly low in the reservoir areas in the past five years resulting in low
water levels as considerable amount of water is diverted for irrigation purposes. Fishermen get
benefitted from low water levels of reservoirs in a short run. However, in the long run low
water levels lead to low species diversity in reservoirs due to the combined effects of low water
levels, increased temperature and high fishing intensity. Thus, the reasons for the observation
of fish deaths observed in 2016 in Muthayankattu, Kalmadu and Muhathankulam reservoirs
could be due to the effects of low water level, high temperature, increase in fish biomass and
vegetation, low feed availability and oxygen depletion. Strong winds limit the access to all
areas of the reservoir for fishing and hence, fishers mostly choose areas that are close to the
landing site. Therefore, fishing pressure on those nearby areas was higher than the other areas
of the reservoir. Further, fishermen refrain from applying gear close to areas where there are
tree trumps and vegetation, which is the potential area for M. rosenbergii, in order to avoid
damaging the gear. This practice also has resulted in lower fish production in large reservoirs
during the months with strong winds. Production in the Puthumurippu reservoir was not
significantly affected by strong winds as it was a small reservoir and applying gear was easy.
Gilling, wedging, snagging and entangling are the four methods used for catching fish using a
gillnet (Fonseca et al., 2005). M. rosenbergii is mostly caught in gillnet by entangling mostly
by their claw, rostrum spines and all parts of the body resulted by struggling to escape. Further,
presence of body projections such as, teeth or spines, facilitate significant proportion of prawns
being entangled in gillnets (Sparre and Venema, 1998). Mesh size, hanging ratio, twine
thickness and the colour of twine are the characteristics of gillnets that affect the selectivity
and catch size (Fonseca et al., 2005; Holst et al., 2002; Tweddle and Bodington, 1988). The
significant contribution of M. rosenbergii to the harvest in the selected reservoirs is also partly
due to the change in fishing gear technique. In those reservoirs, gillnets are generally set in
the evening and taken out on the next day morning. Therefore, during the night time deep and
turbid water contribute to low visibility of the net. Red, green or blue colour dyes are applied
in gillnets depending on the reservoirs. Different hanging ratios change the shape of the mesh
and slackness of the net. Since M. rosenbergii has a higher market value than other fish species,
fishers have strategically modified their gear by adding more sinkers with a few floats to reach
the bottom and to reduce stretch due to speedy backward movement of M. rosenbergii when
they touch or sense of strange objects. Usage of modified gillnets in small reservoirs is higher

Rajeevan et al.
76
than large reservoirs. Since Catla, Rohu and tilapia inhabit the surface and column of the
reservoir (Edirisinghe, 2007), the likelihood of catching them is low after the introduction of
M. rosenbergii. Thus, fin-fish had become a bi-catch particularly in the small reservoirs.
The observation of Puthumurippu perennial reservoir was comparable to the observation of a
study conducted in Pak Mun Dam, which is a major reservoir of 4909 ha in Thailand
(Sripatrprasite and Lin, 2003). The average weight of the male M. rosenbergii in Puthumurippu
was 389.0 ± 5.9 g while in the Pak Mun Dam reservoir average weight of the M. rosenbergii
harvested during the one-year study period was 236.5 ± 102.1g. In terms of M. rosenbergii
production, stocking of 2 million M. rosenbergii PL resulted in a production of 3 kg/ha/yr in
the Pak Mun Dam reservoir (Sripatrprasite and Lin, 2003). When the stocking was increased
to 40 million PLs, the production reached up to11.5 kg/ha/yr (Jutagate and Kwangkhang,
2015). In the present study, Vavunikulam and Muthayankattu reservoirs had a yield of 2.66
kg/ha/yr and 1.6 kg/ha/yr respectively, while Puthumurippu and Kalmadu reservoirs had
higher yields of 13.64 kg/ha/yr and 14.56 kg/ha/yr followed by Muhathankulam with a yield
of 7.76 kg/ha/yr.
Asoka et al. (2015) reported that in Sri Lankan reservoirs, the highest and the lowest mean
annual yield of freshwater prawn were from minor perennial and major perennial reservoirs,
with a yields of 41.3 kg/ha and 3.4 kg/ha stocking densities of 2062 PL/ha and 222 PL/ha
representing yield contributions of 3% and 1.6%, respectively. Despite the difference in yield
both major and minor perennial reservoirs contributed significantly to the income of the
fishers. The recapture rate of stocked fish is generally high with an average of over 10%, and
could be as high as 50% in communal ponds and swamps, whereas the recapture rate of the M.
rosenbergii is generally poor and less than 5 % (Jutagate and Rattanachai, 2010). The highest
recapture rate of about 10 % for M. rosenbergii was recorded in a natural lake, Beung Borapet
in Thailand, which had been stocked in 1995 with 3 million PLs (Jutagate and Kwangkhang,
2015). Similarly, in the present study Puthumurippu recorded a recapture rate of 6.49%. The
recapture rate in large reservoirs is comparatively lower than small reservoirs. Pak Mun Dam
major reservoir showed a lower recapture of 1% (Sripatrprasite and Lin, 2003). Similarly, in
the present study large reservoirs of Vavunikulam (1.73%) and Muthayankattu (1.44%)
showed a slightly higher recapture rate.
The economic benefit from M. rosenbergii was higher than any other stocked fish species in
the reservoirs. Sripatrprasite and Lin (2003) reported that catches of prawn contributed 53.8%
to the total fish catch by weight and 97% to the economic value of the landings in the Pak Mun
Dam Reservoir. A five-year monitoring program undertaken by Chumnongsittsthum (1987)
revealed that the profit of stocked M. rosenbergii in Ubolratana reservoir was 382 %. Jutagate
and Kwangkhang (2015) reported a 722% profit only with a recapture rate of 1.8 % of M.
rosenbergii in Bangphra reservoir. The high economic return reflects the high market demand
of M. rosenbergii and there is a large difference between the cost of production of seed and
market price of the adult freshwater prawns. In the present study, the cost of a M. rosenbergii
PL was Rs. 2.00, which was equivalent to the price of a fingerling of major carps or GIFT
tilapia. The farm-gate prices of the stocked carps and tilapia ranged between Rs. 120-200 /kg,
whereas the market price of M. rosenbergii ranged from Rs. 700-1200 /kg. Stocked M.
rosenbergii, therefore, benefits traders at various levels in the market chain and provides
employment opportunities and income for all related sectors (Jutagate and Kwangkhang,
2015). Similar experiences of introducing M. rosenbergii has also been recorded in Kerala,
India where it contributed to development of fisheries in reservoirs (Laxmappa and Krishna,
2015). Thus, stocking programs of M. rosenbergii could successfully contribute to the
improvement of fisheries in the five selected reservoirs.

Performance of Macrobrachium rosenbergii in Perennial Reservoirs
77
CONCLUSIONS
The introduction of M. rosenbergii as culture-based fisheries in the selected five reservoirs has
achieved considerable success, especially in terms of economic benefits. Even though the
recapture rate was low, catching of M. rosenbergii improved the livelihood of fishers while
increasing their interest in fisheries. Size of the reservoir, stocking density, fishing intensity
and gear specification, rainfall, wind and socio-economic factors significantly influenced the
catch of M. rosenbergii in the selected reservoirs. Further investigations on yield, growth rate,
and factors affecting the growth of M. rosenbergii in reservoirs in Northern Province over time
need to be carried out to improve culture based fisheries to utilize the reservoirs in a sustainable
manner and to improve livelihoods of fisher families. Findings of the present study would be
useful to aqua-culturists and fisheries managers for the establishment of culture-based fisheries
in reservoirs using M. rosenbergii under extensive culture.
ACKNOLEDGEMENT
The authors would like to thank the fishermen who cooperated in conducting this study, the
staffs of NAQDA Regional Office, Northern Province and Divron Bioventures (Pvt.) Ltd.,
who shared data and lent logistic support.
REFERENCES
Amarasinghe, U., Duncan, A., Moreau, J., Schiemer, F., Simon, D. and Vijverberg, J. (2001).
Promotion of sustainable capture fisheries and aquaculture in Asian reservoirs and lakes.
Hydrobiologia. 458, 181-190.
Amarasinghe, U. (2014). Fisheries resources in alleviation of hunger and malnutrition in Sri
Lanka - accomplishment and challenges. Sri Lanka Journal of Aquatic Science. 18,1–15.
Asoka, J.M., Chandraratne, P.N. and Amarasinghe, U.S. (2015). Production performance of
Macrobrachium rosenbergii in culture based fisheries in perennial reservoirs. Proceedings of
the Twenty-first Scientific Sessions of the Sri Lanka Association for Fisheries and Aquatic
Resources. Auditorium of National Aquatic Resources Research and Development Agency,
Colombo 15, Sri Lanka.
Brown, C. and Day, R.L. (2002). The future of stock enhancements: lessons for hatchery
practice from conservation biology. Fish and Fisheries, 3(2),79–94.
Chumnongsittsthum, B., (1987). Stocking of giant freshwater prawn, Macrobrachium
rosenbergii in Ubolratana Reservoir during 1981-1986. Proceedings of the seminar on
fisheries 1987 of the Department of Fisheries, Department of Fisheries, Bangkok, pp. 279 –
285.
Cowx, I.G. (1999). An appraisal of stocking strategies in the light of developing country
constraints. Fisheries Management and Ecology, 6,21-34.
Craig, J.F., Sharma, A. and Smiley, K. (1985). The variability in catches from multi-mesh
gillnets fished in three Canadian lakes. Journal of Fish Biology 28,671-688.

Rajeevan et al.
78
De Silva, S.S. (1988). Reservoirs of Sri Lanka and their fisheries. FAO Fisheries Technical
Paper 298, 128.
De Silva, S.S. (1996). The Asian inland fishery with special reference to reservoir fisheries: A
reappraisal. Pp. 321– 332. In: Schiemer F., Boland K.T. (eds.) Perspectives in tropical
limnology. SPB Academic Publishing, Amsterdam, the Netherlands.
Edirisinghe, U. (2007). Freshwater Capture Fisheries and Aquaculture of Sri Lanka. Anura
Press, Kurunegala, Sri Lanka.
FAO. (1999). Review of the state of world fishery resources: Inland fisheries. FAO Fish. Circ.
No. 942. Rome, FAO. 54 pp.
FAO. (2017). FAO Aquaculture Newsletter. No. 56 (April). Rome.
Fonseca, P., Martins, R., Campos, A. and Sobral, P. (2005). Gill-net selectivity off the
Portuguese western coast. Fisheries Research 73 (3),323–339.
Gray, C.A., Broadhurst, M.K. Johnson, D.D. and Young, D.J. (2005). Influences of hanging
ratio, fishing height, twine diameter and material of bottom-set gillnets on catches of dusky
flathead Platycephalus fuscus and non-target species in New South Wales, Australia. Fisheries
Science 71,1217–1228.
Jutagate, T. and Kwangkhang, W. (2015). Culture-based fishery of giant freshwater prawn:
Experiences from Thailand. In: Sena S. De Silva, B.A. Ingram and S. Wilkinson (eds.),
Perspectives on culture-based fisheries developments in Asia, pp. 91-97. Network of
Aquaculture Centers in Asia-Pacific, Bangkok, Thailand.
Jutagate, T., and Rattanachai, A. (2010). Inland fisheries resource enhancement and
conservation in Thailand. RAP Publication 2010/22, pp. 133–150. Regional Office for Asia
and the Pacific, FAO, Bangkok.
Holst, R., Wileman, D., and Madsen, N. (2002). The effects of twine thickness on the size
selectivity and fishing power of Baltic cod gill nets. Fisheries Research 56 (3), 303-312.
Laxmappa, B. and Krishna, S.M. (2015). Polyculture of the freshwater prawn Macrobrachium
malcolmsonii (H.M. Edwards) in Koilsagar reservoir of Mahabubnagar district (TS), India.
International J. Fish. & Aqua. Stud. 2(4), 147-152.
Li, J. (1999). An appraisal of factors constraining the success of fish stock enhancement
programmes. Fisheries Management & Ecology, 6(2), 161–169.
NAQDA, (2018). NAQDA website, Retrieved 14th of April 2018.
(http://www.naqda.gov.lk/statistics)
New, M.B. (2017). Update on global farmed freshwater prawn production statistics. In: Giant
prawn conference 2017; Thailand. (March), 1–12.
Pet, J.S., van Densen, W.L.T., and Vijverberg, J. (1999). Management options for the
exploitation of introduced tilapia and small indigenous cyprinids in Sri Lankan reservoirs. In:
Fish and fisheries of lakes and reservoirs in Southeast Asia and Africa (ed. W.L.T. van Densen
and M.J. Morris), pp. 159-185. Westbury Publishing, Otley.

Performance of Macrobrachium rosenbergii in Perennial Reservoirs
79
Quirós, R. and Boveri, M.B. (1999). Fish effects on reservoir tropical relationships. Pp. 529
546. In: Tundisi, J. G. and M. Straškraba. (Eds.). Theoretical reservoir ecology and its
applications. São Carlos, International Institute of Ecology.
Sparre, P., and Venema, S.C. (1998). Introduction to tropical fish stock assessment. Part 1.
Manual. FAO Fisheries Technical Paper No. 306.1: Rev. 2. FAO, Rome.
Sripatrprasite, P. and Lin, C. (2003). Stocking and recapture of freshwater prawn
(Macrobrachium rosenbergii De Man) in a run-of-river type dam (Pak Mun Dam) in Thailand.
Asian Fish. Sci. 16, 167-174
Tweddle, D., and Bodington, P. (1988). A comparison of the effectiveness of black and white
gillnets in Lake Malawi, Africa. Fisheries Research 6 (3), 257–269.
Welcomme, R.L. (2001). Inland fisheries: Ecology and management. FAO Rome and Fishing
News Books, Blackwell Science, Oxford, UK.

Tropical Agricultural Research Vol. 30 (3): (2018)
80

Tropical Agricultural Research Vol. 30 (3): 81–88 (2018)
Short Communication
Effect of Seaweed Extract (Kappaphycus alvarezii) on the Growth, Yield
and Nutrient uptake of Leafy Vegetable Amaranthus polygamous
S. Senthuran*, B.L.W.K. Balasooriya1, S.J. Arasakesary 23and N. Gnanavelrajah3
Postgraduate Institute of Agriculture
University of Peradeniya
Sri Lanka
ABSTRACT: A greenhouse study was conducted during the dry (March to April) season of
2018 at the District Agriculture Training Center (DATC), Thirunelvely, Jaffna, Sri Lanka to
study the effect of seaweed (Kappaphycus alvarezii) extracts (SWE) as foliar spray at the rates
of 5.0% and 10.0% (v/v) on growth and yield of common leafy vegetable crop Amaranthus
polygamous. The study was conducted as a three factor factorial with two levels of fertilizers
(100% and 50% recommended chemical fertilizer dose (CF)) and two sources of irrigation
water with different salinity levels collected from Thirunelvely (high salinity water, EC = 1
500 µS/cm) and Moolai (very high salinity water, EC = 12200 µS/cm). At the harvesting stage,
highest plant height was observed with 100% chemical fertilizer and Thirunelvely water.
However comparable plant growth was found with 50% chemical fertilizers when
supplemented with 10% (v/v) SWE. In addition, number of leaves per plant, fresh weight of
leaves, stem and whole plant (28.6 g) as well were highest in T2 (100% CF + Thirunelvely
water). Replacement of 50% of fertilizer with SWE and Thirunelvely water yielded
significantly comparable fresh plant weight (22.8 g), while addition of Moolai water resulted
in poor yield (20.1 g) even with addition of 10% SWE. Leaf N, P, K and Na content further
confirmed the effect of SWE on plant at harvesting stage. There was no significant difference
in the percentage of N in leaves between chemical fertilizer alone and foliar application of
SWE combined with 50% CF. In all treatments, which has received Moolai water contained
significantly the highest Na concentration in Amaranthus leaves. The study indicates that
foliar application of 10% (v/v) seaweed extract combined with 50% of recommended chemical
fertilizer dose and irrigation with Thirunelvely water (at 1 500µS/cm) could be an effective
alternative for sustainable cultivation of Amaranthus polygamous.
Keywords: Amaranthus polygamous, salinity, seaweed extract, Kappaphycus alvarezii
INTRODUCTION
The agricultural sector will continue to play a vital role in developing and implementing
strategies targeted towards a planned socio-economic development in Sri Lanka. Salinity is
the one of the major problems faced by agricultural areas, which decreases the crop production
drastically. In Sri Lanka, 22 300 ha (about 3% of the Island) of salt affected lands are found in
dry zone (Subasinghe, 2004). Due to rapidly growing population, there is a considerable
1 Department of Biotechnology, Faculty of Agriculture and Plantation Management, Wayamba University of Sri
Lanka 2 Regional Agricultural Research & Development Centre, Kilinochchi, Sri Lanka 3 Department of Agricultural Chemistry, Faculty of Agriculture, University of Jaffna, Sri Lanka
* Corresponding author: [email protected]

Senthuran et al.
82
pressure on limited good quality water resources. So it needs to consider the use of poor quality
water in crop irrigation for more efficient and sustainable agricultural production systems to
feed these growing populations. On the other hand, agriculture sector in the country is
threatened due to excessive use of synthetic agro-chemicals. For example, WHO-UN report in
December 2013 identified that Sri Lanka as the highest per hectare user of pesticides and the
eighth highest user of chemical fertilizers in the world. Therefore, it is very important to focus
on approaches for using naturally available renewable resources of plant nutrients
as alternatives to chemical fertilizers. Research attempts have been largely made to increase
soil fertility and crop productivity via organic farming (Roy chowdhury et al., 2013). Seaweed
extracts is known as a bio stimulant and organic fertilizer, which contain plant growth
promoters/regulators, hormones, macronutrients and micronutrients which promote faster seed
germination and a higher yield (Sasikala et al., 2016). Kappaphycus alvarezii is edible red
seaweed which is one of the largest tropical algae with relatively higher growth rate.
On this background, a pot experiment was conducted to study the effect of K.
alvarezii seaweed extract applied as a foliar spray at 5% and 10% concentration combined
with 100% and 50% recommended chemical fertilizer dose (CF) on growth of Amaranthus
polygamous which is a widely grown leafy vegetable crop.
METHODOLOGY
Preparation of Sea Weed Extract (SWE)
The seaweed extract used in this study was obtained from marine red alga Kappaphycus
alvarezii. The marine alga K. alvarezii was collected from coastal area of Jaffna (9° 77' 60.41"
N latitude, 79° 91' 22.35" E longitude), Sri Lanka during March 2018. The fresh K. alvarezii
alga were brought to the laboratory and washed thoroughly in tap water for 3 or 4 times. Then
the fresh K. alvarezii were homogenized by grinding using an electrical grinder, filtered
(Eswaran et al., 2005) and stored at 4˚С for further use. The filtrate (100% concentration) was
used as the stock solution for preparation of 5.0 % and 10.0% (volume/volume; v/v) SWE by
mixing appropriate volumes of distilled water.
Greenhouse experiment
The greenhouse pot experiment was conducted at the DATC, Thirunelvely, Jaffna, Sri Lanka
(9° 69' 61.76" N latitude, 80° 03' 20.54" E longitude). The soil of the site is characterized as
Calcic red latosols and some important soil characteristics are given in Table 1. The pot
experiment was designed with 10 treatments arranged in a completely
randomized design (CRD). The treatments are given in Table 2 and details about inorganic
fertilizer application are given in Table 3. Each treatment was replicated 3 times. Pots (cross
sectional area of 452.16 cm2 and heights of 20 cm) were filled with soil with 1.5 g/cm3 bulk
density and basal fertilizer was added according to the fertilizer treatments. Six seeds of A.
polygamous were planted per pot at 3–5 cm distance. During the growing period, 10 ml of
each SWE (5% and 10%) was applied as foliar sprays at three times, first at 7 days (seedling
stage), second at 14 days and third at 24 days after sowing.
For irrigation, two types of water sources were selected from Thirunelvely and Moolai areas
in Jaffna. Based on salinity hazard to crop (Wilcox, 1955), Moolai water (12 200 µS/cm) was
belonged to the hazard class unsuitable water (> 2,250 μS/cm), while Thirunelvely water (1
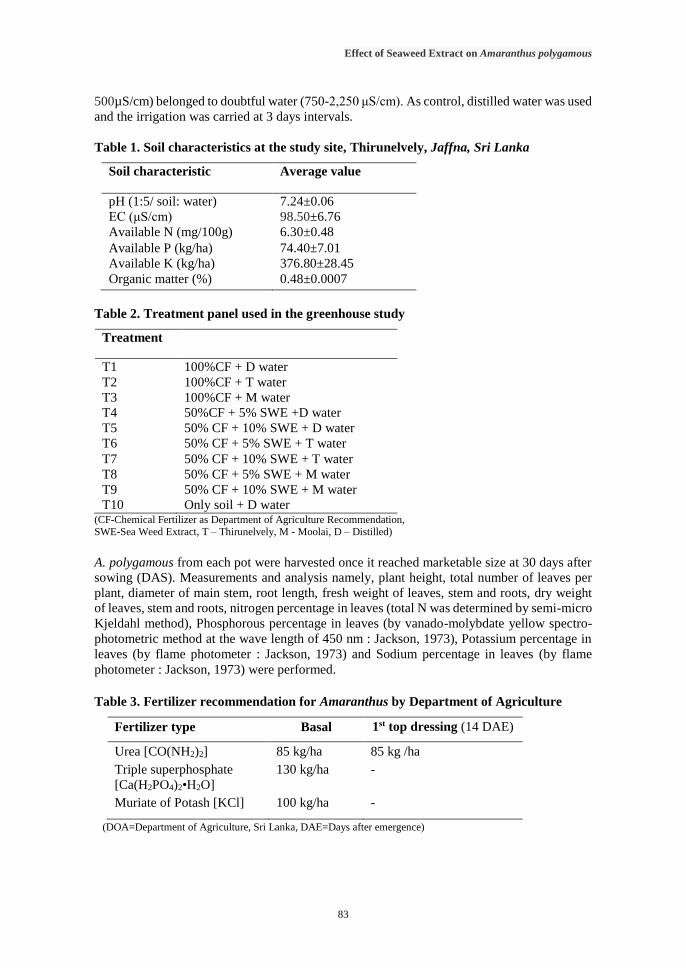
Effect of Seaweed Extract on Amaranthus polygamous
83
500µS/cm) belonged to doubtful water (750-2,250 μS/cm). As control, distilled water was used
and the irrigation was carried at 3 days intervals.
Table 1. Soil characteristics at the study site, Thirunelvely, Jaffna, Sri Lanka
Soil characteristic Average value
pH (1:5/ soil: water) 7.24±0.06
EC (μS/cm) 98.50±6.76
Available N (mg/100g) 6.30±0.48
Available P (kg/ha) 74.40±7.01
Available K (kg/ha) 376.80±28.45
Organic matter (%) 0.48±0.0007
Table 2. Treatment panel used in the greenhouse study
Treatment
T1 100%CF + D water
T2 100%CF + T water
T3 100%CF + M water
T4 50%CF + 5% SWE +D water
T5 50% CF + 10% SWE + D water
T6 50% CF + 5% SWE + T water
T7 50% CF + 10% SWE + T water
T8 50% CF + 5% SWE + M water
T9 50% CF + 10% SWE + M water
T10 Only soil + D water (CF-Chemical Fertilizer as Department of Agriculture Recommendation, SWE-Sea Weed Extract, T – Thirunelvely, M - Moolai, D – Distilled)
A. polygamous from each pot were harvested once it reached marketable size at 30 days after
sowing (DAS). Measurements and analysis namely, plant height, total number of leaves per
plant, diameter of main stem, root length, fresh weight of leaves, stem and roots, dry weight
of leaves, stem and roots, nitrogen percentage in leaves (total N was determined by semi-micro
Kjeldahl method), Phosphorous percentage in leaves (by vanado-molybdate yellow spectro-
photometric method at the wave length of 450 nm : Jackson, 1973), Potassium percentage in
leaves (by flame photometer : Jackson, 1973) and Sodium percentage in leaves (by flame
photometer : Jackson, 1973) were performed.
Table 3. Fertilizer recommendation for Amaranthus by Department of Agriculture
Fertilizer type Basal 1st top dressing (14 DAE)
Urea [CO(NH2)2] 85 kg/ha 85 kg /ha
Triple superphosphate
[Ca(H2PO4)2•H2O]
130 kg/ha -
Muriate of Potash [KCl] 100 kg/ha -
(DOA=Department of Agriculture, Sri Lanka, DAE=Days after emergence)

Senthuran et al.
84
Statistical analysis
Data were analyzed by SAS (9.1) package and the mean separation were done by Duncan
multiple range test at p=0.05.
RESULTS AND DISCUSSION
Effect of SWE and quality of irrigation water on plant growth
Plant height in each treatment increased from 18 DAP to harvesting at 30 DAP (Table 4). At
the harvesting stage, plant height was the highest in T2 followed by T1, however it was not
significantly different from T7 and T5. Therefore 10% SWE and 50% CF with Thirunelvely
water have given comparable results with 100% CF with respect to plant height. It can be due
to the presence of growth promoting hormones and nutrients in seaweed extract (Sasikala et
al., 2016). However, irrigation with Moolai water has resulted significantly lower plant height
with 100% CF or with addition of SWE. This can be due the high salinity (12200µS/cm) of
Moolai water. Salinity decreases the cell division, elongation and meristemic activity (Ruf, et
al., 1963). In the case of unsuitable water application (Moolai at 12 200 µS/cm), spraying 10%
of SWE enhanced the plant height as compared to 100% of CF. It’s obvious that addition of
foliar application (10%) of SWE reduced the salt stress on Amaranthus crop and increased the
growth of the plant under very high saline water application.
Effect on yield parameters
Yield parameters at harvesting are given in the Table 5. Maximum values for fresh weight of
leaves, fresh weight of stem and fresh weight of whole plant were recorded in T2 (100 %CF +
Thirunelvely water). In addition, highest dry weights of leaves, roots and whole plant were
observed in T2. Replacement of 50% fertilizer with SWE with Thirunelvely water (T7-50%
CF + 10% SWE + Thirunelvely water) has yielded second highest fresh plant weight, while
addition of Moolai water resulted poor yield irrespective of addition of SWE. El-Yazied et al.
(2012) also reported that fresh and dry weights of leaf and Stem per plant of Snap bean were
significantly increased by foliar application of seaweed extract at higher rate (750 ppm).
Nutrient uptake
Figures 1a to 1d illustrate the effects of K. alvarezii seaweed SWE with or without CF and
irrigated using Thirunelvely water and Moolai water compared with control. Nitrogen is the
key element required for crop growth in combination with Phosphorus and Potassium. K.
alvarezii seaweed extract contain high in macro (N: 0.45-0.70%, P: 0.007-0.010%, K: 1.60-
2.10%) and micro elements for plant growth (Zodape, et al., 2009). It was found that there was
no significant difference in the percentage of N in leaves among 100% CF alone and foliar
application of SWE combined with 50%CF treatment, due to the availability of nitrogen in K.
alvarezii seaweed extract. In the case of P% and K% in leaves, foliar application of SWE
(10%) combined with 50% CF treatments resulted higher values, compared to that in 100%
CF alone under all both types of irrigation water and control with distilled water. The reason
may be that K. alvarezii extract which was applied 3 times contains readily available forms of
P and K. Alam et al. (2013) also confirmed that seaweed extract provides a readily available
source of nutrients and organic compounds. Pramanick et al. (2013) reported that foliar sprays
of 7.5% Kappaphycus SWE with 50% recommended dose of basal CF gave the higher P and

Effect of Seaweed Extract on Amaranthus polygamous
85
K in grains of green gram compared with that of 100% of recommended dose of CF alone. K.
alvarezii extract is rich in potassium and found to affect on the regulation of stomata pore size
and protein synthesis (Karthikeyan and Shanmugam, 2016).
Table 4. Effect of K. alvarezii SWE on the plant heights of A. polygamous on 18th to 30th
day after sowing (DAS)
18th DAS
(cm)
21th DAS
(cm)
24th DAS
(cm)
27th DAS
(cm)
30th DAS
(cm)
T1
19.0±1.32 ab
29.0±5.07 ab
34.3±3.75 a
39.0 ±3.61ab
44.3 ±2.08ab
T2 21.0±1.00 a 30.0±2.59 a 35.0±2.64 a 41.3±4.72a 46.3 ±3.40a
T3 11.0±0.50e 14.7±1.60 cd 18.7±0.76 c 22.7±0.57c 27.7 ±0.76d
T4 17.7±0.76 bc 24.5±2.50 b 28.2±3.01b 33.7±1.52 b 37.3±2.51c
T5 19.3±1.60 ab 26.2±1.89 ab 31.7±2.46 ab 36.2 ±3.25 ab 42.3 ±4.61abc
T6 18.7±1.89 ab 26.5±2.59ab 30.2±2.02ab 35.0±4.58 b 38.7±6.33 bc
T7 19.7±2.02 ab 26.8±3.78 ab 33.7±5.13 a 38.2 ±4.31ab 44.2±3.68 ab
T8 12.0±2.78 e 12.8±0.57 d 18.5±3.61 c 21.7±3.51 c 24.3±3.05 d
T9 12.7±1.25 de 17.8±0.76 c 21.2±2.08 c 24.8±1.61 c 29.0±1.73 d
T10 15.0±1.50 cd 18.3±1.44 c 21.0 ±1.73c 23.3 ±2.52c 24.7±2.08 d
Values are means of triplicates with ± SD. Different letters in a single column show statistically significant differences
at P <0.05.
Table.5. Effect of K. alvarezii SWE on the yield contributing characters of
A.polygamous on 30th day after sowing
Fresh
weight of
leaves
(g)/plant
Fresh weight
of stem(g)
/ plant
Fresh
weight of
root(g)
/ plant
Fresh weight
of plant (g)
Dry weight
of plant(g)
T1
9.3±3.46ab
12.1 ±1.69bcd
1.94±0.30bc
23.3±4.97abc
3.25±0.66ab
T2 10.7±1.89a 15.4 ±0.88a 2.59±0.19a 28.6 ±1.23 a 4.07±0.28a
T3 8.8±1.18abc 7.5±1.34ef 1.65±0.31c 17.9 ±2.57 cde 2.14 ±0.47cd
T4 6.4±0.91bc 9.1±1.38ed 1.72±0.41bc 17.3 ±2.16 de 3.04 ±0.39abc
T5 8.7±1.68abc 11.9 ±2.35bcd 2.27±0.18ab 22.9 ±3.73 abcd 3.84±0.61a
T6 8.3±1.87abc 12.7 ±1.61abc 1.78±0.39bc 22.8±3.57abcd 3.92±0.73a
T7 9.1±0.47ab 13.3 ±2.30ab 2.03±0.29bc 24.5 ±2.20 ab 3.90 ±0.69a
T8 5.6 ±1.14dc 5.5±1.04gf 1.62±0.45c 12.7±1.50ef 1.98±0.49cd
T9 8.6±2.42abc 9.6 ±2.64cde 1.84±0.23bc 20.1 ±5.02 bcd 2.73 ±0.85bc
Values are means of triplicates with ± SD. Different letters in a single column show statistically significant differences
at P <0.05.

Senthuran et al.
86
Figure1. Effects of K. alvarezii seaweed extracts (SWE) on (a) nitrogen (N), (b) phosphorous (P),
(c) potassium (K) and (d) sodium (Na) percentage in leaves of A. polygamous plants
growing under different treatments. The columns marked with same lowercase letters do
not differ significantly (p>0. 05). Error bars represent standard error (n=3).
In all treatments which have received Moolai water (T3, T8 and T9), significantly highest
sodium content in leaves was observed. Observed sodium content in leaves was mostly
opposite to the percentage of potassium in leaves. Na+ has adverse effects on K+ nutrition
results a competition between uptake of Na+ and K+ by plant roots. In agreement, De Lacerda
et al. (2003) reported that salt stress leads to accumulation of Na+ and reduction of K+ content
in leaves. SWE applied with 50% CF treatments showed higher Na percentage than that of
(a)
(b)
(c)
(d)

Effect of Seaweed Extract on Amaranthus polygamous
87
100% CF alone, which can be due to the higher sodium levels in marine algae. Marine alga of
K. alvarezii extract reported to contain sodium at the rate of 0.45- 0.7 % (Eswaran et al, 2005).
CONCLUSIONS
At the harvesting stage, highest plant height was observed with 100% Chemical fertilizer and
Thirunelvely water. However comparable plant growth was found with 50% CF when
supplemented with 10% (v/v) sea weed extract. In addition, number of leaves per plant, fresh
weight of leaves, stem and whole plant (28.6 g) as well were highest in T2 (100%CF +
Thirunelvely water). Replacement of 50% of fertilizer with 10% SWE and Thirunelvely water
yielded significantly comparable fresh plant weight (24.5 g) with T2 treatment (28.6). Leaf N,
P, K and Na content in leaves further confirmed the effect of SWE on plant growth. There was
no significant difference in the percentage of N in leaves between chemical fertilizer alone and
foliar application of SWE combined with 50% CF. In the case of P and Kin leaves, foliar
application of SWE (10%) combined with 50% CF treatments resulted higher values compared
to that in chemical fertilizer alone. In contrast, all treatments which have received unsuitable
MOOLAI water indicated significantly highest sodium content in Amaranthus. It is evident
that foliar application of 10% (v/v) seaweed extract combined with reduced recommended
chemical fertilizer doses (50%) with comparatively less saline water could be an effective
alternative for sustainable cultivation of Amaranthus polygamous.
REFERENCES
Alam, M. Z., Braun, G., Norrie, J. and Hodges, D. M. (2013). Effect of Ascophyllum extract
application on plant growth, fruit yield and soil microbial communities of strawberry. Can. J.
Plant Sci., 93(1), 23-36.
De Lacerda, C. F., Cambraia, J., Oliva, M. A., Ruiz, H. A. and Prisco, J. T. (2003). Solute
accumulation and distribution during shoot and leaf development in two sorghum genotypes
under salt stress. Environ. Exp. Bot., 49(2), 107-120.
El-Yazied, A., El-Gizawy, A. M., Ragab, M. I. and Hamed, E. S. (2012). Effect of seaweed
extract and compost treatments on growth, yield and quality of snap bean. J. Am. Sci., 8(6), 1-
20.
Eswaran, K., Ghosh, P. K., Siddhanta, A. K., Patolia, J. S., Periasamy, C., Mehta, A. S., Mody,
K. H., Ramavat, B. K., Prasad, K., Rajyaguru, M. R., Reddy, S. K. C. R., Pandya, J. B. and
Tewari, A. (2005). Integrated method for production of carrageenan and liquid seaweed
fertilizer from fresh seaweeds, U S Pat 6893479, 2005.
Jackson, M.L. (1973). Soil Chemical Analysis. Prentice Hall of India Pvt. Ltd. New Delhi.
Karthikeyan, K. and Shanmugam, M. (2016). Bio-stimulant of seaweed source as an organic
alimentative to Bellary onion: Bulb yield and Pyruvic acid levels. Am. J. Agri. Res., 1(2), 1-9
Pramanick, B., Brahmachari, K. and Ghosh, A. (2013). Effect of seaweed saps on growth and
yield improvement of green gram. Afr. J. Agric. Res., 8(13), 1180-1186.

Senthuran et al.
88
Ruf, R. H., Eckert, R. E. and Gifford, R. O. (1963). Osmotic adjustment of cell sap to increases
in root medium osmotic stress. Soil Sci., 96(5), 326-330.
Sasikala, M., Indumathi, E., Radhika, S. and Sasireka, R. (2016). Effect of Seaweed Extract
(Sargassumtenerrimum) on Seed Germination and growth of Tomato Plant. Int. J. Chemtech.
Res., 9(9), 285-293.
Zodape, S.T. (2001). Seaweeds as a biofertilizer. J. Sci. Ind. Res., 60(8), 378-382.

Tropical Agricultural Research Vol. 30 (3): 89–96 (2018)
Short Communication
Mineral Contents of Sri Lankan Rice Varieties as Affected by Inorganic
Fertilization
H.M.A.J. Herath, G.A.P. Chandrasekara1*, U. Pulenthiraj1, C.M.N.R. Chandrasekara23
and D.G.N.G. Wijesinghe3
Postgraduate Institute of Agriculture
University of Peradeniya
Sri Lanka
ABSTRACT: Application of inorganic fertilizers may incorporate minerals into rice grains.
Distribution of minerals in rice grains vary in bran and kernel. The aim of the present study
was to compare mineral contents (MCs) of bran and kernels of selected newly improved rice
varieties in Sri Lanka with and without fertilizers. Twenty rice varieties were tested. Rice bran
and rice kernels were analyzed for Ca, Mg, Mn and Zn using Atomic Absorption
Spectrophotometer. Calcium contents of brans and kernels ranged from 952 to 1605 mg/kg
and 613 to 1107 mg/kg dry matter in fertilized varieties, respectively. High MCs were observed
in fertilizer applied varieties. Higher MCs were found in the bran of rice grains. The MCs of
rice grains were significantly different among the varieties and affected by fertilizer
application and processing. Applications of inorganic fertilizers strengthened the MCs of rice
kernels and bran.
Keywords: Bran, fertilizer, kernel, mineral contents, rice
INTRODUCTION
Cereals are the edible grains of Gramineae family. There are a variety of cereals including
rice, wheat, rye, oats, barley, maize, millet and sorghum. Rice is the staple food for more than
half of the worlds’ population being the second most leading cereal next to wheat
worldwide(Anjum et al., 2007). Rice grain provides 75-80% of starch, 12% water, 7% of
protein, fats, B vitamins mainly thiamine, riboflavin and niacin and minerals such as calcium,
magnesium, phosphorus, manganese, copper, and iron (Oko et al., 2012). The prominent
cultivating species of rice in Sri Lanka is Oryza sativa.
Minerals are essential nutrients for human growth and development. They play a vital role in
the effective functioning of the human systems. Ca and Mg are known as major minerals which
require >100mg/day for the body functions and Zn and Mn are known as trace minerals which
require <100mg/day. One of the major reasons for the loss of essential micronutrients from
rice is the high polishing rate (Abbas et al., 2011).
1 Department of Applied Nutrition, Wayamba University of Sri Lanka, Sri Lanka 2 Department of Agriculture, Sri Lanka School of Agriculture, Kundasale, Sri Lanka 3 Department of Food Science and Technology, Faculty of Agriculture, University of Peradeniya, Sri Lanka
* Corresponding author: [email protected]

Herath et al.
90
Department of Agriculture has introduced newly developed rice varieties having higher yield
potential, pest and disease resistance, response to fertilizers and better grain quality. The
growing environment has a great influence on the composition of the rice grain. (Abbas et al.,
2011). Urea, Triple Super Phosphate and Muriate of potash are the three key chemical
fertilizers used in Sri Lanka (Ekanayake, 2009). These chemical fertilizers commonly consist
of three major components, namely as nitrogen, phosphorus and potassium. The aim of the
current study was to determine the impact of the application of fertilizers on the mineral
contents of bran and kernel fractions of newly improved rice varieties in Sri Lanka.
METHODOLOGY
Sample preparation
Random sampling method was used to obtain the rice grain samples from rice fields in the
Rice Research and Development Institute in Bathalagoda, Rice Research Station. Twenty
inorganic fertilized (Urea, Mureate of Pottash and Triple super Phosphate in 225 : 60 : 55
kg/ha, respectively) and non-fertilized Sri Lankan rice varieties, At 353, At 362, At 303, H4,
Bw 276 - 6B, Ld 368, Bg 450, Bg 400 - 1, Bg 360, Bg 94 - 1, Bg 379 - 2, Bg 300, Bg 305, Bg
357, Bw 367, Bw 451, Ld 371, At 306, At 309 and At 405were obtained. Three representative
samples from each variety were obtained. Rice samples were dehusked using a rice milling
machine (Rice machine, Satake Engineering Co Ltd, Japan). The whole grains were polished
(up to 90%) with a rice miller (Rice husker and polisher PM 500, Satake Engineering Co Ltd,
Japan). Milling and polishing processes were performed at the Institute of Postharvest
Technology of Sri Lanka, Anuradhapura. Rice grains and bran were separately collected.
Polished raw rice grains were finely ground using a grinder (Phillips HR 2011, Koninklijke
Phillips Electronics N.V., China). The ground samples were passed through a sieve with the
mesh size of 1 mm. Rice grains and counterpart bran samples were oven dried at 105ºC for
constant weight to remove moisture. All the samples were stored in freezer (DW-86L626
Haier, U.K.) at -80ºC until further analysis.
Determination of mineral contents
A 0.5 g sample was measured into microwave digestion vessel using a top loading balance
(AdventurerTM OHAUS, U.S.A.) followed by addition of 2 ml of concentrated HCl (35%) and
2 ml of concentrated HNO3(69%).The mixture was allowed for predigesting and digested for
one hour using microwave digestion system (MARS 6 One touch technology CEM
Corporation, North Carolina). The digested samples were filtered and volume up to 50 ml
using deionized water. Mineral contents were determined using atomic absorption
spectrophotometry. A series of standards for selected minerals were prepared from the
standard stock solutions (1000 mg/l) of corresponding minerals as 1 mg/l, 2 mg/land 3 mg/l.
The mineral contents of the standards and the samples were measured using atomic absorption
spectrophotometer (iCETM 3000 series Thermo Scientific, USA). The mineral contents were
calculated on drymatter basis. All the samples were analyzed in triplicates.
Statistical Analysis
The differences of mean values among kernels and brans of fertilized and non fertilized
treatments were determined using multivariate analysis of variance (MANOVA) followed by
Tukey’s Honestly Significant Differences (HSD) multiple rank test at p ≤ 0.05 significance
level. SPSS version (16.0) was used for the statistical analysis.

Inorganic Fertilization and Mineral Contents of Sri Lankan Rice Varieties
91
RESULTS AND DISCUSSION
Tables 1 to 3 present Ca, Mg, Zn and Mn contents of rice varieties constituted of red and white
pericarps. In general, higher Ca, Mg, Zn and Mn contents were observed in bran than the kernel
for all rice varieties with red pericarp (Table 1). Further, it was noted that Ca, Mg, Zn and Mn
contents of fertilized brans and kernels were higher than those of corresponding non-fertilized
rice samples.
Ca content of rice varieties
The bran fraction of fertilizer added rice showed a range of Ca contents varying from 1368 to
1911 mg/kg (Table 1). The fertilized kernel fractions had Ca contents varying from 613 to
1107 mg/kg of rice varieties with red pericarp. The variety BG 305 reported the highest content
of Ca for fertilized bran and kernels whereas BW 451 and AT 309 had the highest contents of
Ca of non- fertilized bran and kernels, respectively.
Mg content of rice varieties
The Mg contents of fertilized and non- fertilized rice kernels varied 224-655 and 237- 452
mg/kg, respectively. Non-fertilized kernels of AT 362, AT 303 and H4 red rice varieties
showed higher Mg content than those of fertilized counterparts. The range of Mg contents of
rice bran and kernel with white pericarp ranged from 1230 to 1068 and from 487 to 212 mg/kg
of the bran and kernel, respectively.
Zn content of rice varieties
Fertilized and non-fertilized brans of rice with red pericarp had a Zn content ranged from 121-
192 and 123-163 mg/kg, respectively. In general, fertilized and non-fertilized kernels of rice
with red pericarp showed a Zn content ranged from 15 to 26 mg/kg. The Zn contents of kernels
were 6-10 times lesser than that of bran of rice with red pericarp. The Zn and Mn contents of
the rice varieties were comparatively lower than the Ca and Mg contents (Table 3). Among
non-fertilized rice brans AT 309 had the highest (210.5 mg/kg) and BG 360 had the lowest
(106.7 mg/kg) zinc contents. The rice varieties except AT 309, AT 306, BG 300 and BG 379-
2, explicated significantly higher Zn contents in fertilized brans compared to those of non-
fertilized (P<0.05).
Mn content of rice varieties
Among rice varieties with red pericarp LD 368 reported the highest content of Mn of fertilized
and non-fertilized rice bran whereas BW 276-6B had the highest content of Mn of kernels
(Table 1). The Mn contents of the rice varieties with white pericarp were comparatively lower
than those of Ca and Mg. Among fertilized bran, Mn contents varied from 214 to 131 mg/kg.
Among non-fertilized rice brans BG 450 had the highest Mn content (Table 3).

Herath et al.
92
Table 1. Mean calcium, magnesium, zinc and manganese contents of rice varieties with
red pericarp (mg/kg)
Calcium
Fertilized Non-fertilized
Bran Kernel Bran Kernel
AT 353 1368.4 ± 29.3a1 682.5 ± 6.6b* 904.9 ± 15.5c2 545.6 ± 8.2d#
AT 362 1428.6 ± 8.2a1 696.4 ± 7.7b* 903.8 ± 4.5c2 520.7 ± 7.4d#
AT 303 1604.9 ± 17.1a1 613.4 ± 12.5b* 749.5 ± 12.2c2 690.9 ± 17.1c#
H4 1571.6 ± 31.5a1 616.4 ± 4.6b* 689.1 ± 13.7c2 589.6 ± 8.2c#
BW 276-6B 1486.3 ± 14.5a1 1107.2 ± 11.7b* 671.7 ± 2.2c2 561.7 ± 6.8c#
LD 368 1911.1 ± 2.7a1 730.1 ± 4.4b* 836.2 ± 18.0c2 560.0 ± 6.2d#
Magnesium
AT 353 1208.5 ± 6.8a1 279.2 ± 0.4b* 1157.5 ± 6.3c2 242.2 ± 1.2d#
AT 362 1206.5 ± 0.6a1 224.4 ± 2.6b* 1175.3 ± 6.5c2 271.9 ± 1.8d#
AT 303 1203.8 ± 12.5a1 240.8 ± 2.1b* 1112.9 ± 6.2c2 287.6 ± 1.0d#
H4 1181.6 ± 6.0a1 223.8 ± 0.6b* 1117.4 ± 11.4c2 237.0 ± 1.6d#
BW 276-6B 1176.9 ± 13.0a1 655.0 ± 6.7b* 1094.2 ± 10.5c2 452.3 ± 2.8d#
LD 368 1204.5 ± 6.6a1 410.1 ± 1.4b* 1162.2 ± 11.5c2 344.5 ± 2.2d#
Zinc
AT 353 127.5 ± 1.2a1 17.5 ± 0.4b* 153.5 ± 0.7c* 16.1 ± 0.1d#
AT 362 192.2 ± 1.6a1 21.5 ± 0.2b* 152.0 ± 1.8c* 18.5 ± 0.3d#
AT 303 121.1 ± 1.9a1 15.1 ± 0.4b* 163.1 ± 1.3c* 24.6 ± 0.2d#
H4 188.1 ± 1.4a1 24.8 ± 0.2b* 128.7 ± 1.0c* 22.9 ± 0.3d#
BW 276-6B 144.3 ± 0.8a1 23.5 ± 0.2b* 122.8 ± 1.0c* 26.4 ± 0.2d#
LD 368 154.7 ± 0.6a1 18.4 ± 0.1b* 130.3 ± 0.7c* 22.4 ± 0.4d#
Manganese
AT 353 122.0 ± 1.6a1 20.6 ± 0.8b* 99.5 ± 2.2a1 16.8 ± 0.4c#
AT 362 157.5 ± 1.5a1 22.1 ± 1.2b* 120.6 ± 1.3c2 18.7 ± 0.8d#
AT 303 126.1 ± 0.7a1 20.0 ± 0.8b* 106.3 ± 2.3a1 19.8 ± 1.7c#
H4 125.9 ± 0.6a1 21.7 ± 1.2b* 106.6 ± 1.5a1 21.5 ± 1.4c#
BW 276-6B 203.2 ± 2.5a1 29.2 ± 0.6b* 121.8 ± 1.0c2 24.3 ± 0.9d#
LD 368 273.1 ± 2.8a1 25.1 ± 1.0b* 176.5 ± 1.7c2 26.6 ± 1.0d# Means in the same row followed by different digits (fertilized bran: fertilized kernel) /letters (fertilized bran: fertilized
krenel)/symbols (fertilized kernel:non fertilized kernel) are significantly different at 95% confidence level(p>0.05)

Inorganic Fertilization and Mineral Contents of Sri Lankan Rice Varieties
93
Nutritional significance of minerals
Ca is an important mineral for the synthesis of skeletal functions. Mg is a significant facilitator
for many of the biochemical functions. Mn and Zn which are identified as trace minerals are
important for many of the physiological functions.
Table 2. Mean calcium,and magnesium, contents of rice varieties with white pericarp
(mg/kg)
Means in the same row followed by different digits(fertilized bran: fertilized kernel) /letters(fertilized bran: fertilized
krenel)/symbols(fertilized kernel:non fertilized kernel) are significantly different at 95% confidence level. (p>0.05)
Calcium
Fertilized Non- fertilized
Bran Kernel Bran Kernel
BG 450 1296.0 ± 29.6a1 772.5 ± 10.0b* 675.3 ± 14.1c2 620.4 ± 2.5c#
BG400-1 1325.6 ± 32.9a1 670.5 ± 17.5b* 552.4 ± 5.3c2 167.8 ± 50.1d#
BG 360 1467.8 ± 4.9a1 693.7 ± 13.2b* 593.8 ± 8.0c2 760.5 ± 0.7d#
BG 94-1 1380.7 ± 17.0a1 684.4 ± 5.1b* 492.2 ± 7.9c2 522.9 ± 10.6d#
BG 379-2 1442.8 ± 5.5a1 734.3 ± 5.5b* 1251.5 ± 11.2c2 659.5 ± 14.7d#
BG 300 1456.2 ± 24.6a1 687.0 ± 0.4b* 1345.1 ± 2.0c2 629.2 ± 6.4d#
BG 305 1510.8 ± 6.2a1 829.2 ± 3.4b* 1281.1 ± 88.2c2 501.9 ± 0.9d#
BG 357 1437.6 ± 12.2a1 693.1 ± 8.5b* 1291.6 ± 17.8c2 655.2 ± 10.4d#
BW 367 1476.0 ± 6.7a1 671.0 ± 13.9b* 1309.7 ± 4.1c2 618.4 ± 16.3d#
BW 451 1162.1 ± 14.8a1 643.0 ± 7.1b* 1445.3 ± 9.7c2 603.9 ± 6.5d#
LD 371 1345.5 ± 10.6a1 709.8 ± 10.3b* 1202.0 ± 8.5c2 682.1 ± 8.4d#
AT 306 1254.2 ± 30.3a1 537.0 ± 6.3b* 1441.3 ± 26.3c2 761.4 ± 6.3d#
AT 309 1151.6 ± 31.3a1 631.1 ± 5.7b* 1418.4 ± 16.5c2 892.0 ± 9.6d#
AT 405 952.5 ± 20.6a1 616.4 ± 5.8b* 1319.9 ± 20.9c2 806.9 ± 8.8d#
Magnesium
BG 450 1174.3 ± 13.3a1 373.1 ± 3.8b* 1158.2 ± 1.9c2 384.8 ± 2.5d#
BG400-1 1173.1 ± 7.4a1 227.8 ± 1.9b* 1117.7 ± 11.3c2 227.4 ± 1.3d#
BG 360 1152.0 ± 6.8a1 285.0 ± 2.4b* 1128.5 ± 12.8c2 366.7 ± 1.5d#
BG 94-1 1178.0 ± 0.6a1 193.3 ± 2.4b* 1144.0 ± 6.2c2 211.7 ± 0.4d#
BG 379-2 1144.6 ± 6.5a1 276.5 ± 3.5b* 1172.3 ± 1.7c2 241.7 ± 3.5d#
BG 300 1124.3 ± 11.1a1 250.0 ± 0.9b* 1129.6 ± 11.6a2 338.2 ± 1.9b#
BG 305 1166.2 ± 6.9a1 272.3 ± 3.0b* 1118.4 ± 12.0c2 217.9 ± 0.4d#
BG 357 1152.2 ± 0.5a1 230.3 ± 1.9b* 1146.6 ± 0.7a2 269.2 ± 1.1b#
BW 367 1127.1 ± 0.9a1 313.8 ± 1.8b* 1136.9 ± 11.8a2 296.5 ± 0.7b#
BW 451 1184.2 ± 11.4a1 487.3 ± 3.7b* 1095.1 ± 13.1c2 254.5 ± 0.2d#
LD 371 1184.1 ± 6.3a1 353.6 ± 2.2b* 1068.2 ± 6.5c2 257.2 ± 2.2d#
AT 306 1205.7 ± 13.8a1 286.7 ± 1.5b* 1142.7 ± 7.2c2 285.0 ± 2.6d#
AT 309 1229.6 ± 8.6a1 453.0 ± 3.9b* 1192.6 ± 0.7c2 349.2 ± 1.8d#
AT 405 1132.6 ± 13.2a1 262.6 ± 1.4b* 1147.4 ± 11.4a2 348.4 ± 2.0d#

Herath et al.
94
The per capita availability of rice is 100Kg/year. Accordingly the contribution of fertilization
to the Ca, Mg, Zn content (168.5-304mg), (61.6-124mg), (4.12-7.15mg), respectively is below
the RDA value of the above minerals. The reported Mn content (505-7.4mg) is higher than the
RDA values.
Effect of processing on the mineral content of rice varieties
Sarwar et al., (2009) reported a similar trend in the variations of Ca and Mg of husk and whole
grain fractions of Pakistani rice variety with application of different levels of organic and
inorganic fertilizers compared to control (Non-fertilized). They further reported that fertilized
husk and grains showed higher Ca and Mg contents than that of control.
Table 3. Mean zinc and manganese contents of rice varieties with white pericarp
(mg/kg)
Zinc
Fertilized Non-fertilized
Bran Kernel Bran Kernel
BG 450 154.0 ± 2.6a1 18.0 ± 0.5b* 127.6 ± 0.6c2 23.7 ± 0.4d#
20.4 ± 0.3d#
26.4 ±0.3d3#
19.2 ± 0.5d#
BG400-1 146.4 ± 0.8a1 21.5 ± 0.4b* 140.7 ± 0.9c2
BG 360 168.0 ± 0.8a1 17.8 ± 0.3b* 106.7 ± 0.2c2
BG 94-1 159.9 ± 1.1a1 17.0 ± 0.4b* 153.5 ± 0.7c2
BG 379-2 139.7 ± 1.3a1 18.8 ± 0.0b* 156.4 ± 0.9c2 17.7 ± 0.0d#
BG 300 139.8 ± 2.0a1 23.0 ± 0.3b* 197.5 ± 0.8c2 23.0 ± 0.5d#
BG 305 149.7 ± 0.7a1 22.3 ± 0.4b* 143.6 ± 0.7c2 22.7 ± 0.4d#
18.3 ± 0.2d# BG 357 155.0 ± 1.7a1 17.9 ± 0.4b* 114.9 ± 0.6c2
BW 367 158.6 ± 2.2a1 16.9 ± 0.3b* 134.8 ± 2.0c2 20.0 ± 0.1d#
BW 451 171.3 ± 1.4a1 23.7 ± 0.2b* 126.9 ± 1.1c2 19.3 ± 0.3d#
LD 371 132.3 ± 1.7a1 23.1 ± 0.2b* 116.6 ± 1.4c2 25.5 ± 0.2d#
31.6 ± 0.4d#
32.9 ± 0.3d#
25.4 ± 0.1d#
AT 306 167.3 ± 1.4a1 25.3 ± 0.5b* 190.7 ± 2.3c2
AT 309 146.5 ± 0.7a1 21.9 ± 0.1b* 210.5 ± 2.4c2
AT 405 166.1 ± 1.9a1 25.2 ± 0.5b* 126.0 ± 2.2c2
Manganese
BG 450 184.3 ± 3.2a1 25.3 ± 0.5b* 175.4 ± 1.7a1 24.3 ± 0.4c#
21.6 ± 1.6d#
23.0 ± 0.5d#
19.9 ± 1.3d#
BG400-1 142.0 ± 1.5a1 20.5 ± 0.7b* 94.8 ± 0.5c2
BG 360 214.3 ± 3.3a1 25.3 ± 1.5b* 98.2 ± 1.7c2
BG 94-1 150.6 ± 2.4a1 21.3 ± 0.5b* 109.8 ± 0.6c2
BG 379-2 188.1 ± 1.1a1 34.5 ± 0.4b* 85.8 ± 0.6c2 25.7 ± 0.6d#
BG 300 151.4 ± 1.5a1 24.0 ± 1.1b* 126.5 ± 1.3c2 20.8 ± 0.6d#
BG 305 130.6 ± 0.8a1 23.6 ± 1.0b* 119.5 ± 1.2a1 18.7 ± 0.8d#
22.5 ± 1.3d# BG 357 131.9 ± 0.6a1 20.8 ± 0.6b* 102.5 ± 1.0c1
BW 367 151.3 ± 0.9a1 20.7 ± 1.1b* 158.5 ± 1.4a2 23.9 ± 0.7d#
BW 451 182.0 ± 1.0a1 25.9 ± 1.8b* 128.7 ± 0.6c2 20.9 ± 0.3d#
LD 371 164.1 ± 0.2a1 25.9 ± 0.4b* 142.5 ± 1.4a1 24.8 ± 0.2d#
19.4 ± 1.1d#
20.3 ± 0.5d#
23.3 ± 0.2d#
AT 306 193.7 ± 1.8a1 22.8 ± 0.2b* 130.5 ± 1.5c2
AT 309 169.6 ± 1.9a1 23.6 ± 0.2b* 142.3 ± 1.4c2
AT 405 210.7 ± 0.3a1 27.4 ± 0.4b* 141.2 ± 1.9c2 Means in the same row followed by different digits(fertilized bran: fertilized kernel) /letters(fertilized bran: fertilized
krenel)/symbols(fertilized kernel:non fertilized kernel) are significantly different at 95% confidence level. (p>0.05)
Inorganic Fertilization and Mineral Contents of Sri Lankan Rice Varieties
95
The Ca and Mg contents of control husk (Non fertilized) were 2007mg/kg and 401mg/kg,
respectively, whereas inorganically fertilized husk was reported 3477mg/kg and 530mg/kg of
Ca and Mg, respectively. Ca and Mg contents in control rice grains were 778mg/kg and
255mg/kg, respectively, and inorganically fertilized rice grains showed 1041mg/kg and
355mg/kg of Ca and Mg, respectively. This supported the findings of the present study that
the application of inorganic fertilizers strengthened the mineral content of rice grains and husk.
Recently, Verma and Srivastav (2017) showed that the mineral contents of polished
counterparts of some aromatic and non-aromatic rice varieties grown in India. Their results
showed that Ca, Mg and Zn contents of rice ranged 63-99 mg/kg, 83-182 mg/kg and 9-17
mg/kg, respectively. The lower levels of Ca and Mg obtained in their study compared to the
present study could be due to the variations in geographical locations, soil properties like pH,
cation exchange capacity and leaching level of minerals, fertilization rate and techniques and
the plant properties to absorb certain minerals (Leigh and Wyn Jones, 1984).The degree of
milling which removes the most of the micronutrients severely affects the mineral
composition. Processing operations of rice, namely dehulling, milling, and polishing affect the
mineral contents. The mineral content variations among 100% rough rice, 82% brown rice and
72% milling rice. The Ca contents reported were 300, 100 and 100 mg/kg for 100% rough rice,
82% brown rice and 72% milling rice, respectively (Abbas et al., 2011). In addition, Wang
and coworkers (2011) demonstrated the variations of mineral content between bran and kernel
fractions of three Indica rice cultivars. The ranges of Ca, Zn, Mn contents of bran were 682-
1331, 38 -56 and 160-232 mg/kg, respectively. Further the ranges of 52-76, 19-29 and 10-28
mg/kg of Ca, Zn and Mn, respectively were reported for kernel fractions. The trend of
variations revealed in the present work tallied with the previous study by Wang et al., (2011).
Mineral contents of the used rice varieties were significantly affected by variety, fertilization
and processing (P<0.05). In addition, the interactive effects of variety and fertilization, variety
and polishing, fertilization and processing and variety, fertilization and processing also showed
a significant effect on the mineral composition of selected rice varieties (P<0.05). There are
limited studies on the mineral content of newly improved Sri Lankan rice varieties. Further
research are warranted to validate the results obtained in this study.
CONCLUSIONS
The application of inorganic fertilizers strengthen the mineral contents (Ca, Mg, Mn, and Zn)
of rice kernels and brans of selected Sri Lankan newly improved rice varieties.
ACKNOWLEDGEMENT
This research was supported by the Wayamba University Research Grant Scheme
(SRHDC/RP/04/15-20) through a research grant to AC. Dr Gamika Prathapasinghe was
acknowledged by authors for the support extended for the mineral analysis.

Herath et al.
96
REFERENCES
Abbas, A., Murtaza, S., Faiza, A. K. and Naheed, S. R., S. (2011). Effect of processing on
nutritional value of rice (Oryza Sativa). World Med Sci, 6(2), 68-73.
Anjum, F.M., Pasha, I., Bugti, M.A. and Butt, M.S. (2007). Mineral sciences composition of
different rice varieties snd their milling fractions. Pakistan J Agric, 44(2), 332–336.
Diyabalanage, S., Navarathna, T., Abeysundara, H.T.K., Rajapakse, S. and Chandrajith, R.
(2016). Trace elements in native and improved paddy rice from different climatic regions of
Sri Lanka: implications for public health. Springer Plus, 5, 1864.
Ekanayake, H. (2009). The impact of fertilizer subsidy on paddy cultivation in Sri Lanka. Staff
studies 3, Pp 74–96.
Oko, A.O., Ubi, B.E., Efisue, A.A. and Dambaba, N. (2012). Comparative analysis of the
chemical nutrient composition of selected local and newly introduced rice varieties grown in
Ebonyi State of Nigeria. Inter J Agric Forestry, 2(2), 16–23.
Leigh R.A., and Wyn Jones, R.G. (1984). Hypothesis relating critical potassium
concentrations for growth to the distribution and functions of this ion in the plant cell. New
Phytologist 97, 1-13.
Sarwar, G., Schmeisky, H., Hussain, N., Muhammad, S., Tahir, A., and Saleem, U. (2009).
Variations in nutrient concentrations of wheat and paddy as affected by different levels of
compost and chemical fertilizer in normal soil. Pakistan J Bot 41(5), 2403-2410.
Verma, D.K. and Srivastav, P.P. (2017). Proximate composition, mineral content and fatty
acids analyses of aromatic and non-aromatic Indian rice [Online]. Rice Science, 24(1), 21–31.
Wang, K. M., Wu, J. G., Li, G., Zhang, D. P., Yang, Z. W., and Shi, C. H.(2011).Distribution
of phytic acid and mineral elements in three indica rice (Oryza sativa L.) cultivars. J Cereal
Sci, 54(1), 116–121.
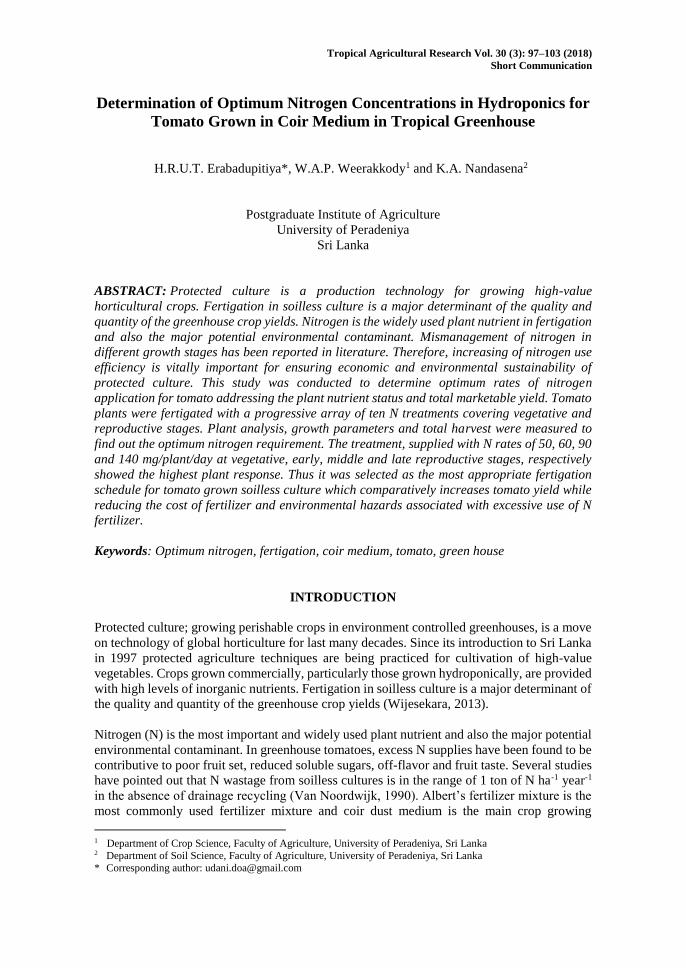
Tropical Agricultural Research Vol. 30 (3): 97–103 (2018)
Short Communication
Determination of Optimum Nitrogen Concentrations in Hydroponics for
Tomato Grown in Coir Medium in Tropical Greenhouse
H.R.U.T. Erabadupitiya*, W.A.P. Weerakkody1 and K.A. Nandasena23
Postgraduate Institute of Agriculture
University of Peradeniya
Sri Lanka
ABSTRACT: Protected culture is a production technology for growing high-value
horticultural crops. Fertigation in soilless culture is a major determinant of the quality and
quantity of the greenhouse crop yields. Nitrogen is the widely used plant nutrient in fertigation
and also the major potential environmental contaminant. Mismanagement of nitrogen in
different growth stages has been reported in literature. Therefore, increasing of nitrogen use
efficiency is vitally important for ensuring economic and environmental sustainability of
protected culture. This study was conducted to determine optimum rates of nitrogen
application for tomato addressing the plant nutrient status and total marketable yield. Tomato
plants were fertigated with a progressive array of ten N treatments covering vegetative and
reproductive stages. Plant analysis, growth parameters and total harvest were measured to
find out the optimum nitrogen requirement. The treatment, supplied with N rates of 50, 60, 90
and 140 mg/plant/day at vegetative, early, middle and late reproductive stages, respectively
showed the highest plant response. Thus it was selected as the most appropriate fertigation
schedule for tomato grown soilless culture which comparatively increases tomato yield while
reducing the cost of fertilizer and environmental hazards associated with excessive use of N
fertilizer.
Keywords: Optimum nitrogen, fertigation, coir medium, tomato, green house
INTRODUCTION
Protected culture; growing perishable crops in environment controlled greenhouses, is a move
on technology of global horticulture for last many decades. Since its introduction to Sri Lanka
in 1997 protected agriculture techniques are being practiced for cultivation of high-value
vegetables. Crops grown commercially, particularly those grown hydroponically, are provided
with high levels of inorganic nutrients. Fertigation in soilless culture is a major determinant of
the quality and quantity of the greenhouse crop yields (Wijesekara, 2013).
Nitrogen (N) is the most important and widely used plant nutrient and also the major potential
environmental contaminant. In greenhouse tomatoes, excess N supplies have been found to be
contributive to poor fruit set, reduced soluble sugars, off-flavor and fruit taste. Several studies
have pointed out that N wastage from soilless cultures is in the range of 1 ton of N ha-1 year-1
in the absence of drainage recycling (Van Noordwijk, 1990). Albert’s fertilizer mixture is the
most commonly used fertilizer mixture and coir dust medium is the main crop growing
1 Department of Crop Science, Faculty of Agriculture, University of Peradeniya, Sri Lanka 2 Department of Soil Science, Faculty of Agriculture, University of Peradeniya, Sri Lanka
* Corresponding author: [email protected]

Erabadupitiya et al.
98
medium of greenhouse farmers in Sri Lanka which contains all the essential nutrients
(Wijesekara, 2013).
In Sri Lanka, hydroponics growers mainly use Albert’s mixture without specific
recommendation and also without considering crop growth stages. Tomato plants absorb
nutrients at different rates at different stages of growth. This is especially true for nitrogen and
potassium (Ministry of Agriculture, Canada, 2010). Plant tissue analysis is a useful diagnostic
tool for developing nutrient management programs that predict when crops need additional
nutrients while avoiding negative impacts on the environment (Silveira et al., 2007). Therefore
the aim of this work was to find out the optimum level of nitrogen application at different
growth stages of tomato grown in soilless culture, in order to maintain optimum yields.
METHODOLOGY
The experiment was conducted in a semi-intensive greenhouse (100 m2) at the Meewathura
Experimental Station in the Department of Crop Science of the Faculty of Agriculture,
University of Peradeniya (agro-ecological zone, WM2) during 2017. The experiment was laid
out as a RCB design. Plantlets of tomato (Solanum lycopersicum) variety, Larisa F1 hybrid
were transplanted in18 L standard grow bags filled with sterilized coir medium when the plants
had five to six true leaves. Grow bags were placed on plastic trays to collect the leachate
separately. Plant density was maintained as 3plants/m2. The medium was fertilized with a
progressive array of a soluble fertilizer with ten fertigation treatments, keeping three replicates
and a plot size of 10 plants. Crop management practices were done according to the standard
practices for the tomato crop (Wijesekara, 2013).
Application of nitrogen treatments
In each treatment, except nitrogen, other essential nutrients were provided equally according
to the widely accepted proportion and dosages using Albert’s solution (Saparamadu et.al.,
2011); whereas the nitrogen level varied in the treatments according to each growth stages as
shown in Table1. Fertigation was done stating from 500 ml to 1200 ml of solution per day as
plant growth was progressed. The volume of irrigation water applied was decided based on the
evapo-transpiration rate at different growth stages (Mawalagedera, 2011). Nutrient solutions
of each treatment were applied manually on daily basis and the drainage collection (excess
nutrient solution) to the plates kept under the pots were circulated to each pot. The pH and EC
could be maintained at around 5.8 - 6.5 and 2-3 dS/m respectively.
Data collection and analysis
Data were collected at four different growth stages (Table 1) and vegetative growth was
examined with growth parameters of plant height, 3rd leaf length, total leaf area and total dry
matter per plants in each treatment. At the early reproductive stage plant height, total leaf area
per plant, number of clusters and flowers per plants and total plant dry weight were measured.
In the middle reproductive and late reproductive stages, mature ripened fruits were harvested
weekly for determining the marketable yield and total yield. Most information used to interpret
tissue analysis is based on the most-recently-matured whole leaf. For tomatoes, this leaf is
usually the fifth or sixth leaf from the top (Hochmuth, 1988). Thus the 5th leaf of plants were
sampled at four different growth stages (Table 1) and analysed for total N, P, K, Ca and Mg.
Total nitrogen was determined using standard Kjeldahl procedure. P in plant tissue was
determined using visible light spectrophotometer (880 nm) while Ca and Mg were determined

Optimum Nitrogen Concentrations in Hydroponics for Tomato
99
using flame photometer and atomic absorption spectrophotometer respectively (Van Ranst
et.al., 1999). The parametric data processing and statistical analysis were carried out through
ANOVA procedure and mean separation by Duncan’s multiple range Test (DMRT) at the 0.05
probability level using Statistical Analysis System (SAS).
Table1. N levels applied at different growth stages of tomato in each treatment
Treatments (T) Vegetative
stage
Reproductive stages
(N amount - mg/plant/day)
Early
(5-8WAP)
Middle
(9-12WAP)
Late
(13-18 WAP)
1 10 20 50 90
2 20 30 60 100
3 25 40 70 110
4 30 45 75 120
5 40 50 80 130
6 50 60 90 140
7 60 70 100 150
8 70 80 110 160
9 75 90 120 170
10 80 100 130 180 WAP –Week after transplanting
RESULTS AND DISCUSSION
Vegetative Stage
The treatment effect on the plant growth during the vegetative stage was analysed with respect
to several plant growth parameters/indices, as illustrated in Table 2. The means of plant height,
total leaf area and total dry matter were not significantly different among nitrogen treatments
at p≤0.05. The 3rd leaf length was also not significant. Previous studies on greenhouse tomato
has reported a stem thickness of 1cm at the 15 cm below the tip as the standard stem thickness
for a properly nourished tomato plant (Ministry of Agriculture-Canada, 2010) but the stem
diameter of this experiment did not show significant treatment effect while the treatment
means fall within the desirable plant vigour level as specified above. However, treatment 5
showed the highest diameter and treatment 2 showed the lowest (Table 2). Nutrient status of
the 5th leaf of tomato plant were analysed at the end of the vegetative stage and nitrogen
percentage of the 5th leaf was not significantly different among N treatments at (p≤ 0.05) and
it was 4-5%, within adequate range for tomato (4-5.5%) (Hochmuth et al., 2006). Plant tissue
P, Ca and Mg content also did not show a significant treatment effect and they were in
satisfactory levels. K percentage was also not significantly different among treatments and the
range was below the required level (3.5-5%) (Hochmuth et al., 2006) (Table 3). According to
the above results, the least level of N supply, treatment 1 was also found to be satisfying the
N requirement during this vegetative-stage (1-4 WAP) which was normal practices of farmers.
Application of high dosage of fertilizer further increases the cost of production.
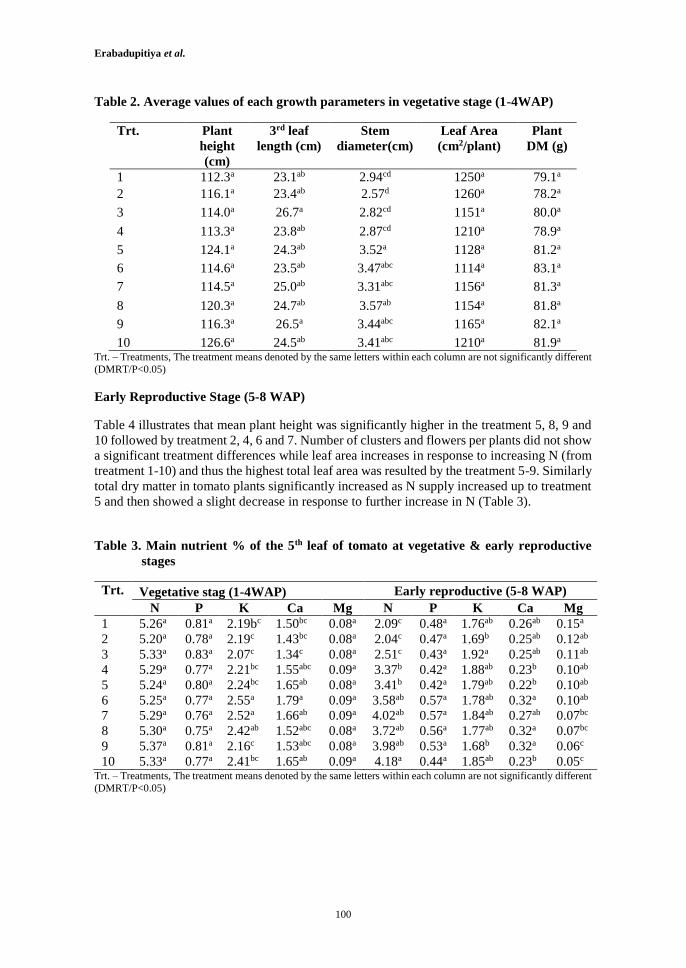
Erabadupitiya et al.
100
Table 2. Average values of each growth parameters in vegetative stage (1-4WAP)
Trt. Plant
height
(cm)
3rd leaf
length (cm)
Stem
diameter(cm)
Leaf Area
(cm2/plant)
Plant
DM (g)
1 112.3a 23.1ab 2.94cd 1250a 79.1a
2 116.1a 23.4ab 2.57d 1260a 78.2a
3 114.0a 26.7a 2.82cd 1151a 80.0a
4 113.3a 23.8ab 2.87cd 1210a 78.9a
5 124.1a 24.3ab 3.52a 1128a 81.2a
6 114.6a 23.5ab 3.47abc 1114a 83.1a
7 114.5a 25.0ab 3.31abc 1156a 81.3a
8 120.3a 24.7ab 3.57ab 1154a 81.8a
9 116.3a 26.5a 3.44abc 1165a 82.1a
10 126.6a 24.5ab 3.41abc 1210a 81.9a Trt. – Treatments, The treatment means denoted by the same letters within each column are not significantly different
(DMRT/P<0.05)
Early Reproductive Stage (5-8 WAP)
Table 4 illustrates that mean plant height was significantly higher in the treatment 5, 8, 9 and
10 followed by treatment 2, 4, 6 and 7. Number of clusters and flowers per plants did not show
a significant treatment differences while leaf area increases in response to increasing N (from
treatment 1-10) and thus the highest total leaf area was resulted by the treatment 5-9. Similarly
total dry matter in tomato plants significantly increased as N supply increased up to treatment
5 and then showed a slight decrease in response to further increase in N (Table 3).
Table 3. Main nutrient % of the 5th leaf of tomato at vegetative & early reproductive
stages
Trt.
Vegetative stag (1-4WAP) Early reproductive (5-8 WAP)
N P K Ca Mg N P K Ca Mg
1 5.26a 0.81a 2.19bc 1.50bc 0.08a 2.09c 0.48a 1.76ab 0.26ab 0.15a
2 5.20a 0.78a 2.19c 1.43bc 0.08a 2.04c 0.47a 1.69b 0.25ab 0.12ab
3 5.33a 0.83a 2.07c 1.34c 0.08a 2.51c 0.43a 1.92a 0.25ab 0.11ab
4 5.29a 0.77a 2.21bc 1.55abc 0.09a 3.37b 0.42a 1.88ab 0.23b 0.10ab
5 5.24a 0.80a 2.24bc 1.65ab 0.08a 3.41b 0.42a 1.79ab 0.22b 0.10ab
6 5.25a 0.77a 2.55a 1.79a 0.09a 3.58ab 0.57a 1.78ab 0.32a 0.10ab
7 5.29a 0.76a 2.52a 1.66ab 0.09a 4.02ab 0.57a 1.84ab 0.27ab 0.07bc
8 5.30a 0.75a 2.42ab 1.52abc 0.08a 3.72ab 0.56a 1.77ab 0.32a 0.07bc
9 5.37a 0.81a 2.16c 1.53abc 0.08a 3.98ab 0.53a 1.68b 0.32a 0.06c
10 5.33a 0.77a 2.41bc 1.65ab 0.09a 4.18a 0.44a 1.85ab 0.23b 0.05c Trt. – Treatments, The treatment means denoted by the same letters within each column are not significantly different
(DMRT/P<0.05)

Optimum Nitrogen Concentrations in Hydroponics for Tomato
101
Table 4. Average values of each vegetative growth parameters of tomato in early
reproductive stage (5-8WAP)
Trt. Plant
height(cm)
No. of
flowers
No. of
clusters
LA
(m2/plant)
Plant
DM(g)
1 89.3abc 5.43ab 3.60b 0.31d 83.9c
2 93.0ab 5.63ab 4.17ab 0.33d 75.6c
3 90.0abc 4.77b 3.63ab 0 .37cd 87.8c
4 93.5ab 10.33ab 3.60b 0.38cd 126.2b
5 97.7a 11.2a 3.63ab 0.50abc 164.7a
6 95.4ab 9.4ab 3.87ab 0.50abc 159.6a
7 92.0ab 8.4ab 4.00ab 0.51abc 134.1b
8 100.1a 7.5ab 4.53a 0.51abc 134.7b
9 102.4a 8.2ab 4.43ab 0.52ab 117.3b
10 104.8a 10.8a 3.77ab 0.54a 112.1b Trt. – Treatments, The treatment means denoted by the same letters within each column are not significantly different
(DMRT/P<0.05)
As shown in Table 3, leaf N level gradually increased in response to increase in N fertilizer,
leading to apparently highest leaf N content at treatment 10 (4.2%). When consider the rate of
increase, increasing N fertilizer up to treatment 4 was much higher, when the N fertilizer
increased with the treatments and in treatment 10 showed the significantly highest N
percentage. Meanwhile leaf P, K and Ca percentages were not influenced by the N treatments
meanwhile the leaf magnesium percentage showed a gradual decrease from treatment 1 to 10
and significantly lower percentage of Mg was present in treatment 8-10 than other treatments
(Table 3). Based on these evidences, N level in the nutrient solution applied for treatment 5 or
6 could be selected as the optimum N level in early reproductive stage because proper nutrient
absorption may lead to have highest dry mater content, and also plant leaf N, P, Ca and Mg
was within the adequate range according to the Hochmuth, et al., (2006).
Middle (8-12WAP) and late (13-18WAP) reproductive stages
Harvesting was continued to the end of the late reproductive stage in order to determine the
marketable yield. The marketable yield of treatments 5, 6 and 7 significantly higher than the
other treatment (Figure 1). Marketable yield was almost similar to the total yield in all the
treatments, indicating the quality of harvest. In Middle reproductive stage the mean nitrogen
percentage of leaf tissue in treatment 6-10 was significantly higher than the lower N fertilizer
dosages treatments. Percentage P, K and Ca levels in 5th leaf did not show treatment
differences. There was an unusual drop in leaf K percentage in treatment 5 but treatment 6
onwards it came to the normal range (Table 5). Leaf K contents were not adequate in the
middle reproductive stage, according to the Hochmuth et al. (2006). Leaf K content of
treatments was inversely related with fruit formation (yield) data, indicating K partitioning
into fruit sink. In late reproductive stage, mean leaf N, K and P percentages were statistically
insignificant within treatments despite some apparent ups and downs found for some of the
plant nutrients at some levels of N fertilizer supply (Table5). In middle and late reproductive
stages, treatment 6 could be selected as the optimum N level in the fertigation solution because
treatments 6 and 7 showed the highest yield while there was no significant difference in yield
between treatments 6 and 7. With regard to previous studies (Hochmuth etal.,2006; Ministry
of Agriculture-Canada, 2010), plant leaf N, P and Mg contents were within the adequate range
while K and Ca percentages were at sub-optimum in all the treatments.

Erabadupitiya et al.
102
In this study the highest N fertilizer applied treatments (treatments 8 to 10) showed a relatively
lower yield as reported by several authors found negative effects of high N levels in soil and
in nutrient solution on tomato shoot dry weight (SDW) and yield (Cezar, et al., 2002). The low
rate of N fertilization not only produced health-safe and environment-friendly tomato yield but
also reduces the cost of fertilization. Hence further research is needed to examine whether the
reduced rate of other nutrients use can also sustain the tomato yield and maintain the eco-
system sustainably.
Table 5. Main nutrient % of the 5th leaf of tomato at Middle and late reproductive stages
Trt. Middle reproductive (9-13WAP) Late reproductive (14-18WAP)
N P K Ca Mg N P K Ca Mg
1 2.64c 0.53a 1.88a 1.51c 0.56a 3.96a 0.63a 2.98ab 2.62a 0.62a
2 2.96c 0.58a 1.85a 1.65abc 0.50a 3.80a 0.69a 3.08a 2.88a 0.46a
3 3.63b 0.75a 1.63ab 1.81abc 0.46ab 3.73a 0.76a 2.98b 2.70a 0.43a
4 3.88a
b 0.47a 1.57ab
2.07ab
0.48a 4.35a 0.80a 2.98ab 2.83a
0.38ab
5 4.06a
b 0.55a 1.37b
2.16a
0.46ab 3.80a 0.88a 2.88ab 2.87a
0.40ab
6 4.21a 0.68a 1.66ab 1.83abc 0.47ab 4.10a 0.80a 2.97ab 1.95b 0.39ab
7 4.26a 0.59a 1.62ab 1.66abc 0.46ab 4.19a 0.90a 2.80ab 2.42ab 0.30ab
8 4.16a 0.56a 1.47ab 1.46c 0.36ab 4.28a 0.94a 2.75ab 2.35ab 0.27ab
9 4.36a 0.67a 1.63ab 1.51c 0.28bc 4.05a 0.82a 2.72ab 2.48a 0.23bc
10 4.29a 0.64a 1.66ab 1.62bc 0.26c 4.11a 0.81a 2.98ab 2.47a 0.21c Trt. – Treatments, The treatment means denoted by the same letters within each column are not significantly different (DMRT/P<0.05)
Figure1. Total tomato yield per plant, variation among the treatments
CONCLUSIONS
The optimum N levels needed for each growth stage of hydroponics tomato, grown in coir dust
medium under greenhouse conditions in the mid country wet zone (MW2) in Sri Lanka could
be identified. For the vegetative stage, N levels applied in the treatments 1 to 10 were in
satisfactory levels while for the preceding growth stages the treatment levels 5-6 were
0
1
2
3
4
5
T1 T2 T3 T4 T5 T6 T7 T8 T9 T10
To
tal
yie
ld/p
lan
t (K
g)
Treatments

Optimum Nitrogen Concentrations in Hydroponics for Tomato
103
adequate. Based on the total and marketable yields, N level used in treatment 6 could be
identified as the optimum for all growth stages of tomato plant, which were 50, 60, 90 and 140
mg/plant/day in vegetative, early, middle and late reproductive stages, respectively.
Restricting into these optimum N levels definitely reduces possible yield losses, cost of
fertilizer and environmental hazards associated with excessive N fertilizer use in hydroponics
tomato cultivation.
REFERENCES
Cezar,P., Fontes,R and Ronchi, C.P.(2002)Critical values of nitrogen indices in tomato plants
grown in soil and nutrient solution determined by different statistical procedures[online].
[Accessed on 10.01.2017] available at
http://www.scielo.br/scielo.php?script=sci_arttext&pid=S0100-204X2002001000010
Hochmuth, G. J, Maynard, D., Vavrina, C., Hanlon, E. and Simonne, E. (2006). Plant tissue
analysis and interpretation for vegetable crops in Florida: Handbook on Nutrient Management
of Vegetable and Row Crop, University of Florida IFAS Extension.
Mawalagedera, S.M.R. and Premaratne, K.P. (2011). Circulation culture of tomato for efficient
nutrient uptake and high yield in tropical green houses, Tropical Agriculture research 23 (3):
204-217.
Ministry of Agriculture.(2010). Growing greenhouse vegetable in Ontario. Publ.No.836.
Ministry of Agriculture , Canada.
Saparamadu, M.D.J.S., Weerakkody, W.A.P., Wijesekara, R.D., Gunawardhna, H.D. (2011).
Development of a low cost hydroponic system and a formulation for the tropics. Journal of
Applied Horticulture, 13p.
Silveira, M.L.,Vendramini, J.M.,Sollenberger, L.E.,Mackowiak, C.L. andNewman, Y.C.
(2007).Tissue Analysis as a Nutrient Management Tool forBahiagrass Pastures1, University
of Florida, IFAS.
Van Noordwijk, M. (1990). Synchronisation of supply and demand is necessary to increase
efficiency of nutrient use in soilless horticulture. In: van Beusichem ML, ed. Plant nutrition-
physiology and applications. The Netherlands: Kluwer Academic, Publishers, 525-531.
Van Ranst, E., Verloo, M., Demryer, A. and Pauwels, J.M. (1999). Manual for the soil
chemistry and fertility laboratory. University of Ghent, Belgium.
Wijesekara, R.S.(2013). “ArakshithaGruhathulaBogaWagawa”, Department of Agric.pub. Sri
Lanka.

Tropical Agricultural Research Vol. 30 (3): (2018)
104
Tropical Agricultural Research Vol. 30 (3): 106–108 (2018)
Short Communication
Impact of Glass Ceiling on Women Career Development in Non-state
Banking Sector in Colombo
U. K. S. M. Uduwella* and M.W.A.P. Jayatilaka1*
National Institute of Business Management
Sri Lanka
ABSTRACT: Despite banking industry having more female employees than males, women are
still underrepresented in management and senior management levels. This study focused on
the effect of glass ceiling factors (GCFs) on women’s career development in non-state banking
industry in the Colombo district. Five glass ceiling factors, namely individual, childcare and
spouse care, elder care and housework, organizational and cultural factors were considered.
The study was guided by three objectives, namely to identify the current level of women’s
career development, assess the existing level of GCFs and identify the effect of GCFs on career
development of female executives. All female executives employed in the Head Offices of four
non-state, licensed commercial banks in Colombo, Sri Lanka were selected for the study. This
study revealed significant positive and negative effects of individual factors and organizational
factors, respectively on career development of women. Other three factors, namely child care
and spouse care, elder care and housework and cultural factors did not show significant
relationship on women career development. This study recommends developing self-efficacy
by encouraging management to use social modelling, verbal encouragement and constructive
feedback. Furthermore, conducting developmental performance appraisals, instead of
traditional performance appraisals to increase their personal growth initiatives is suggested.
Keywords: Cultural and Organizational Factors, Glass Ceiling, Women’s Career
Development
INTRODUCTION
The most significant feature of the global labour market in the last half of the twentieth century,
is increasing participation of women. During the last two decades in the global labour market
there has been an increase in the proportion of women at lower and middle-level management
positions, resulting from the activities of the women’s movement, policies of the political
system, and corporate equal opportunity initiatives. However, according to Meyerson and
Fletcher (2000) women at the highest levels of business are still rare. They comprise only 10%
of senior managers in Fortune 500 companies; less than 4% of the uppermost ranks of CEO,
President, Executive Vice President, and Chief Operation Officer (COO); and less than 3% of
top corporate earners. The average share of senior management jobs held by women is 21%
globally (Strank and Dyrchs, 2012). There is strong evidence of the under-representation of
women in leadership positions in many countries all over the world. Population of women
executives in BRIC (Brazil, Russia, India and China) states is 26% and in south East Asia’s
economies, it’s 32 % (Strank and Dyrchs, 2012). Grant Thornton (2012) showed that women
1 Department of Biotechnology, Faculty of Agriculture and Plantation Management, Wayamba University of Sri
Lanka
* Corresponding author: [email protected]

Uduwella et al.
106
occupy only about 13 % of senior management jobs in Germany and 17% in U.S.A. and in
Japan, only 5% of top executives are females. Thus, the gender gap in management is
noticeable. This compelling situation is explained in literature as “Glass Ceiling” (GC). Simply
the term “Glass Ceiling” refers to invisible or artificial barriers that prevent women from
advancing past a certain level (Reich, 1997).
Female employees in the non-state banking sector in Sri Lanka have been declining during the
past few years (Gunawardena, 2010). Annual reports of nine large Commercial Banks
(according to Fitch ratings) revealed that 22% of Board of Directors are female. In the
corporate level management, 21%of managers are female. In Senior Management level the
female representation is only a mere 25%. The basic purpose of this study is to identify the
effect of Glass Ceiling on women career development in Banking Industry in Colombo
District.
METHODOLOGY
A Cross Sectional research design was used in this study. The population of this research
comprised of the licensed commercial banks in Sri Lanka those recorded as “The large banks”
according to Fitch rating. The sample of the study covers the executive level women
employees who are currently employed in head offices of Colombo district. Head offices were
selected as a range of executive job titles can be easily accessed. The sample size comprised
of 231 female employees (Table 1).
Table 1. Population of executive level women employees who are currently employed in
head offices of Colombo District and Sample
Name of the Bank Population Sample
Sampath Bank PLC 212 79
Hatton National Bank (HNB) 200 77
DFCC Bank 136 45
NDB 80 30
Total 628 231
Independent and dependent variables
This study mainly focuses on the impact of Glass Ceiling (GC) factors on women career
development (WCD). Glass Ceiling and women career development can be considered as the
independent and dependent variables, respectively. In early research studies, different factors
under glass ceiling have identified. Based on those findings, individual factors (IF)
(Okurame,2014), family factors (FF) (Cutler and Jackson, 2002), organizational factors (OF)
(Cooper, 2001) and cultural factors (CF) (Bombuwela et al., 2013) were considered as the
factors under glass ceiling in this study. Career development is the life long process of fostering
and cultivating the shape of the individual’s working life so as to make best use of inherent
talent, skills, knowledge and interests for that person’s and employer’s benefit and also to
match it as closely as possible to other aspects of the person’s life. According to Fried et al.,
(1996) equal career opportunities (including equal treatment in recruitment and selection
process, timely promotions), pay equity and networking are the main considerations in the
women career development. Therefore, based on the literature survey, three main
considerations of Fried’s study were selected to measure the women career development. The
secondary data were available in different sources such as textbooks, journals, articles,

Glass Ceiling on Women Career Development
107
research papers, reviews in the internet and newspapers. A self-administered questionnaire
was developed as the survey instrument. After formulation of the preliminary questionnaire,
for the purpose of testing the reliability, accuracy and validity of those questions it was
subjected to a pilot survey.
Statistical analysis
Correlation and regression analysis were performed to assess the GC factors on the career
development of women.
RESULTS AND DISCUSSION
Mean values of women career development were between 2.3 to 3.7. This indicated that the
women career development is at a moderate level. Mean values of individual factors were
between 3.7 and 5.0. This reflected that the existing level of individual factors such as self-
efficacy beliefs and personal growth initiatives are at a higher level. Mean values of child and
spouse care, elder care and housework indicated that these factors at higher level. Mean value
of organizational factors and cultural factors were at moderate level. Individual factors showed
significantly positive effect on women career development. Thus, self-efficacy beliefs and
personal growth initiatives favor the women career development. Factors namely, child care
and spouse care, elder care and housework had no significant effect on women career
development. Moreover, organizational factors have significant negative effect on women
career development. According to the results of multiple regression analysis, 49.5% variation
in women career development’ can be explained by two independent variables namely
individual factors and organizational factors.
This study revealed that the top level managers of selected Commercial Banks have put some
effort in using friendly human resource policies. Self-efficacy reflects an individual’s
judgment of individual capability to do well in a range of situations or tasks. Mastery
experiences are the most effective way to boost self-efficacy because people are more likely
to believe they can do something well if it is similar to what they have done well
(Bandura,1994). Therefore this study recommends developing self-efficacy by encouraging
management to use mentoring for women executives (Social Modeling). Mentoring is most
often defined as a professional relationship in which an experienced superior (the mentor)
assists women executives (the mentee) in developing specific skills and knowledge that will
enhance their professional and personal growth. An increase of self-efficacy through verbal
encouragement of management/superiors helps. Constructive feedback is important in
maintaining a sense of efficacy as it may help overcome self-doubt.
CONCLUSIONS
This study revealed a moderate level of women career development. Further glass ceiling
factors namely, individual factors, family factors, organizational factors and cultural factors
lie within the range of low level. Individual factors have a significance positive effect on
Women Career Development. Organizational factors have a significantly negative effect on
Women Career Development. This indicates that there are negative effects of Management
Policies and practices, Senior Management Beliefs and Organizational Structure on Women
Career Development. In order to reduce the negative effect of glass ceiling on women career
development, this study recommends developing self-efficacy by encouraging management to
use mentoring for women executives. Mentoring will support female executives to reduce self-

Uduwella et al.
108
limiting beliefs and lack of self-confidence, which can result in them going forward for
promotions.
REFERENCES
Bandura, A., (1977). Self-efficacy: Toward a unifying theory of behavioral change.
Psychological Review, 84, 191-215.
Bandura, A., (1994). Self-efficacy. In V.S. Ramachaundran (Ed.), Encyclopedia of human
Behaviour , 4, 71-81.
Bombuwela, P.M., and De Alwis, A. C., (2013). Effects of Glass Ceiling on Women Career
Development in Private Sector Organizations – Case of Sri Lanka, Journal of Competitiveness,
5(2), 3-19.
Cooper, J., (2001). Women middle managers’ perception of the glass ceiling, Women in
Management Review, 16(1), 30–41.
Fried, L.P., Francomano, C.A., MacDonald, M., Wagner, E.M., Stckes, E.J., Carbone, K.M.,
Bias, W.B., Newman, M.M. and Stobo, J.D.,(1996). Career development for women in
academic medicine, JAMA, 276(11), 898-905.
Gunawardena, K. (2009). Women participation in senior management positions in licensed
commercial banks in Sri Lanka. Banking in Association. [online] Available at:
https://www.researchgate.net/publication/271523276 [Accessed 18 Oct. 2017].
International Business Report, (2012). Grant Thornton International.
Meyerson, D., and Fletcher, J., (2000). A modest manifesto for shattering the glass ceiling,
Harvard Business Review, 78(1), 127–140.
Okurame, D., (2014). Individual Factors Influencing Career Growth Prospects in Contexts of
Radical Organizational Changes. International Business Research, [online] 7(10). Available
at: http://dx.doi.org/10.5539/ibr.v7n10p74 [Accessed 14 Aug. 2017].
Reich, (1997). The GC, Workplace/women’s place: an anthology, Federal GC Commission,
In Dunn D. (ed.), Los Angeles, CA: Roxbury Publishing, 226 -233.
Strank, R., and Dyrchs, S., (2012). Shattering the Glass Ceiling : An Analytical Approach to
Advancing Women in to Leadership Roles, [online]. Available at :
http://www.bcg.perspectives.com [Accessed 18 Oct. 2017].

Author Guide: Tropical Agricultural Research
109
GUIDELINES FOR PREPARATION OF MANUSCRIPTS
I. GENERAL INSTRUCTIONS
01) Research presented in the manuscript could be in any field of agriculture or allied
discipline leading to a postgraduate degree. Research data should either be from an
ongoing study or a study that has been completed within last 2 years.
02) The research work should not have been published or submitted for publication
elsewhere.
03) The postgraduate student should be identified as the first author.
04) A corresponding author who will be responsible for all communications with the
Congress Office should be stated clearly.
05) Submission of manuscripts: Manuscripts can be submitted through
06) Certificate of authenticity: Declaration form should be duly filled, signed by all
authors and uploaded to the online submission system.
07) Information of corresponding author: Please fill online form.
08) Submissions that involve human or animal trials should provide evidence of
approval obtained by an ethics review committee.
II. SPECIFIC INSTRUCTIONS TO AUTHORS
01) Documents to be submitted
Manuscript
Duly filled and signed 'Certificate of Authenticity' form.
Duly filled ‘Information of Corresponding Author’ form.
02) Format for typesetting
Paper size: A4 (210 × 297 mm) typed single sided only.
Margins: Top, bottom and right margins of 25 mm and a left margin of 30
mm.
Line spacing: 1.5 (18 points) throughout the text.
Length: Length of the manuscript including text, tables, figures and
references should not exceed 15 typed pages.(07 pages for poster).
Page and line numbering: All pages should be sequentially numbered
using Arabic numbers. All lines should also be numbered sequentially
starting from the top to the bottom of each page.
Font: Arial font, size 12.
Language/spelling: UK English only.
Software: Authors may use either MS Word® 2010 onwards format.
Author Guide: Tropical Agricultural Research
110
03) Title:
Title and running title (less than 30 characters). They should be in bold
faced letters.
Name/s and affiliation/s of author/s.
E-mail address, mailing address and contact numbers of the corresponding
author.
NOTE: Identify the corresponding author by placing an asterisk after the
name.
04) Abstract
Should be limited to a maximum of 250 words
Up to a maximum of five (05) keywords should be identified, arranged in
the alphabetical order and included immediately after the abstract.
Abstract should be typed in italics. Scientific names in the abstract should
be underlined.
No references, tables or figures should be included in the abstract.
05) Body
Introduction: Justification of the research work, objectives and
hypotheses should be included in the introduction.
Methodology: All materials, chemicals, clinical subjects and samples
used should be identified. Analytical, survey and statistical methods
should be explained concisely. Common analytical methods need not be
elaborated.
Results and Discussion: Can be combined.
Conclusions: Should be concise.
Headings: All headings should be in bold capital and centered.
E.g. INTRODUCTION
Subheadings: All subheadings should be in bold and in title case.
E.g. Preparation of Land
Non-English terms: All non-English terms should be italicized.
E.g. et al., viz, etc, in vivo, in vacuo, sous vide, Yala, Maha.
All scientific names should be italicized. Both genus and species names
should be mentioned at the first appearance and only the species name can
be mentioned with abbreviated genus name subsequently.
E.g. Clostridium botulinum and subsequently C. botulinum.
References: Refer to the authors and year of publication within the text as
follows. (Sharma, 1997); (David and Silva, 2009) and in case of three or
more authors (Gordon et al., 2009). When two or more references are to
be cited together, they should be given in the chronological order. E.g.
(Sharma, 1997; David and Silva, 2009). All publications cited in the text
should be presented in the list of references in alphabetical order following
the style mentioned below.

Author Guide: Tropical Agricultural Research
111
Journal Articles
Slavin, J., Jacobs, D. and Marquart, L. (1997). Whole grain consumption and
chronic diseases: Protective mechanism. Nutr. Cancer. 27, 14-21.
Books
Shahidi, F. and Naczk, M. (2004). Phenolics in Food and Nutraceuticals.
CRC Press, Boca Raton, FL, pp.446-448.
Edited books
Jeyarani, S. Karuppuchamy, P. and Sathiah, N. (2008). Interaction between
the egg larval parasitoid, Chelonus blackburni and Nucleopolyhedrovirus in
Helicoverpa armigera. pp. 126-130. In: Ignachimuthu and Jeyaraj. S. (Ed.)
Recent Trends in Pest Management. Elie Publishing (Pvt.) Ltd., New Delhi,
India.
Websites
Sharma, V.P. (2009). Cyber extension: Connecting farmers' in India - Some
experience [on line]. [Accessed on 12.08.2009]. Available at
http://www.gisdevelopment.net/proceedings/mapasia/2003/papers/i4d003.ht
m
Digital Object Identifier (DOI):
doi:10.1016/jphysletb.2003.10.071
06) Tables and Figures
Should be included in the exact place within the text.
Should fit into a size of 138 × 208 mm to facilitate reproduction in B5
size.
Tables should be numbered sequentially using Arabic numerals. The titles
should be self-explanatory and placed above the tables.
Tables should not contain any vertical lines.
Figures should be numbered sequentially using Arabic numerals. Captions
should be self-explanatory and placed below the figures.
Illustrations, Line drawings and Photographs (Plates), if any, should be
clear, properly numbered and captioned and ready for reproduction. They
should be of high resolution such as a minimum of 300 dpi and saved in
.tif or .bmp formats.
All lettering, graph lines and points on graphs should be sufficiently large
and bold faced to permit reproduction for inclusion in the Proceedings and
Journal.
Lines of maps, artworks and illustrations should be of appropriate
thickness. Please note that the thin lines do not reproduce well.
Please note that the illustrations, line drawings and photographs should be
placed in the appropriate location of the electronic file and numbered in
sequence with other figures.

Author Guide: Tropical Agricultural Research
112
Adjustments to the illustrations can be made to improve clarity. E.g. to
enhance brightness, contrast, or color balance. However, manipulations
that may obscure, move, remove or introduce should not be performed.
07) Acknowledgements
Only the essential individuals and/or organizations/institutes should be
included.
08) Units
SI units should be used.
A single space should be left between the numerical value and the unit.
E.g. 24 mL, 45 L, 45 g/L, 2 mg/kg.
Degree symbol for temperature should be used separated from the
numerical values by a single space as for example, 20 ºC, 37 ºF.
09) Acronyms and Abbreviations:
All acronyms should be written in full at the first time of appearance.
Abbreviations can be used subsequently.
The full stop should not be included in abbreviations, e.g. rpm (not r.p.m.),
ppb (not p.p.b.), '%' and '/' should be used in preference to 'per cent' and
'per', respectively (e.g. 45%, 2 m/s). Where abbreviations are likely to
cause ambiguity or may not be readily understood by readers, the units
should be mentioned in full.
10) On being informed of the acceptance, the manuscripts should be revised as per the
reviewers’ suggestions and re-submitted using online system. The accepted
manuscripts should be presented orally or as a poster at the Congress and they will
be published in the Journal 'Tropical Agricultural Research', vol. 30, 2815 (ISSN:
1016-1422).
11) Please note that the manuscripts that do not confirm to the above guidelines
will not be accepted.

Tropical Agricultural Research Vol. 30 (3): (2018)
113
Author Index
Author Page
Arasakesary S.J. 81
Athauda A.R.S.B. 69
Athurupana S.K.M.R.A. 27
Balasooriya B.L.W.K. 81
Bandaranayake P.C.G. 43
Chandrasekara C.M.N.R. 89
Chandrasekara G.A.P. 13,89
Dandeniya W.S. 55
Dharmakeerthi R.S. 55
Edirisinghe U. 69
Erabadupitiya H.R.U.T. 97
Gnanavelrajah N. 81
Herath H.M.A.J. 89
Hewajulige I.G.N. 27
Jayatilaka M.W.A.P. 105
Kekulandara D.S. 43
Kumari K.D.D. 13
Madhujith W.M.T. 1,13,27
Mallawaarachchi M.A.L.N. 1
Nanayakkara C.M. 27
Nandasena K.A. 97
Nawarathna K.K.K. 55
Pulenthiraj U. 89
Pushpakumara D.K.N.G. 1
Rajawardana D.U. 27
Rajeevan R. 69
Samarasinghe W.L.G. 43
Senthuran S. 81
Sirisena D.N. 43
Suriyagoda L.D.B. 43
Uduwella U. K. S. M. 105
Weerakkody W.A.P. 97
Weerasinghe P. 55
Wijesinghe D.G.N.G. 89