himachal journal of agricultural research
99
-
Upload
khangminh22 -
Category
Documents
-
view
1 -
download
0
Transcript of himachal journal of agricultural research
HIMACHAL JOURNAL OF AGRICULTURAL RESEARCH (SINCE 1973)
EDITORIAL BOARD
Patron Dr. K.K. Katoch Vice-Chancellor, CSK H.P. Krishi Vishvavidyalaya Editor-in-Chief Dr. S.S. Kanwar Director of Research Members Dr. P.K Mehta Director Extension Education Dr. D. Badiyala Dean, College of Agriculture Dr. R.C. Chauhan Professor, Department of Biology and Environmental Sci-
ences, COBS Dr. K.D. Sharma Professor, Department of Agricultural Economics,
Extension Education & Rural Sociology, COA Dr. Adarsh Kumar Professor, Department of Surgery & Radiology, DGCN
COVAS Dr. Raj Pathania Head, Department of Human Development, COHS Dr. Ajay Sood Professor, Department of Entomology, COA Dr. Vipin Hallan Principal Scientist, Institute of Himalayan Bioresource Technology (CSIR), Palampur Member-Secretary Dr. S.S. Rana Principal Scientist, Department of Agronomy, COA
Editor
Dr. S.S. Rana
Subscription
Admission Fee INR 25/- only (US $ 5) Annual Membership Fee INR 400/-only (US $ 50) Life Membership Fee INR 2000/-only (US $ 100) Institutional Fee INR 700/- only (US $ 50) Students (Annual) INR 300/- only (US $ 25)
Website: http://hillagric.ac.in
The amount on account of subscription should be remitted to the Director of Research, CSK Himachal Pradesh Krishi Vishvavidyalaya, Palampur-176 062 by bank draft or I.P.O. payable at the State Bank of India, H.P.A.U. Palampur-176 062.
This journal is covered in CAB Abstracts and Indian Science Abstracts (ISA)
Vol. 41 No. 2 December 2015
Contents
Title Page No. Alternatives to phosphine fumigation of stored grains: The Indian perspective
Gursharan Singh and Rakesh Kumar Sharma 104-113
Fertigation technology for enhancing nutrient use and crop productivity Sanjeev K Sandal and Renu Kapoor
114-121
Intensification of cropping through introduction of second crop after peas in La-haul valley of Himachal Pradesh
Anil Kumar, Sandeep Manuja, Janardan Singh, D.R. Chaudhary and Sanjay K Sharma
122-125
Effect of irrigation scheduling and NK fertigation on productivity of garden peas (Pisum sativum var. hortense L.)
Kapil Saroch, S.K. Sandal and Khushsboo Rana
126-131
Influence of weather parameters on occurrence of rice blast in mid hills of Hi-machal Pradesh
Rajendra Prasad, Anupam Sharma and Sweta Sehgal
132-136
Studies on gene action in relation to yield and quality traits in cauliflower (Brassica oleracea var. botrytis L.)
Yudhvir Singh, Rishu, Arti Verma and Sanjay Chadha
137-141
Genetic variability in biparental progenies of radish (Raphanus sativus L.) K.S. Chandel, Tirtha Raj Pokharel, Aanchal Chauhan, J. K. Sharma and R.K.
Kataria
142-145
An exploratory study on production and economics of fishing in Pong Dam wetland of district Kangra
M.S. Pathania and Gurrala Anil Kumar
146-150
Occurrence of entomopathogenic fungus, Beauveria bassiana (Bals.) on potato white grubs in Himachal Pradesh
R.S. Chandel, Monika Kalia, Saurbh Soni and P.K. Mehta
151-155
Gross and morphometrical study on the external and internal nares of Gaddi sheep
Virender Pathak and Rajesh Rajput
156-159
Short notes Performance of rice (Oryza sativa L.) varieties under aerobic cultivation in mid hills of Himachal Pradesh
Sandeep Manuja, Jahnvi Shekhar and Anil Kumar
160-161
Correlation and path analysis of agro-morphometric traits in maize (Zea mays L.)
Ankita Sood, Naresh Thakur and S. Lata
163-167
Regd. No. 8270-74 dated 13.12.1973
HIMACHAL JOURNAL OF AGRICULTURAL RESEARCH

Reactions of maize genotypes against banded leaf and sheath blight Banita Devi, S. K. Guleria and B. R. Thakur
168-171
Effect of post-emergence herbicides on productivity and profitability of garden pea (Pisum sativum L.) in Lahaul valley of Himachal Pradesh
Janardan Singh, D.R. Chaudhary and Suresh Kumar
172-176
Evaluation of ‘KL241’: a new genotype of linseed (Linum usitatissimum L.) un-der utera cultivation
Pankaj Chopra
177-179
Preliminary studies on semi-hardwood grafting technique in apple under poly-house condition in mid hill area of Himachal Pradesh
ND Negi and SK Upadhyay
180-183
Evaluation of lettuce genotypes for yield and quality under protected conditions of North-western Himalayas
Pardeep Kumar, N.K. Pathania, Parveen Sharma and Nageswer Singh
184-188
Guidelines to the contributors
Surgical removal of lingual foreign body in a buffalo-a clinical case study Amit Kumar, Som Prakash Tyagi, Priyanka Thakur and Rohit Sharma
189-190
Alternatives to phosphine fumigation of stored grains: The Indian perspective
Himachal Journal of Agricultural Research 41(2): 104-113 (2015)
Gursharan Singh and Rakesh Kumar Sharma Department of Entomology, Punjab Agricultural University, Ludhiana – 141004, Punjab, India
Email: [email protected]
Abstract Out of a total about 10% post-harvest loss of grains, a significant 6% are damaged during their storage. Fumigation of the stored grains is considered indispensable to check this avoidable loss. Methyl bromide (MB), a cheap, broad spectrum fumigant, has to be phased out honouring ‘Montreal Protocol’. Phosphine widely used worldwide, is the only fumigant currently used in India, because of its low cost, availability and residue-free treatment. But one serious limitation of use of phosphine is development of resistance in the major stored grain insect-pests. There are several other fumigants like sulfuryl fluoride, propylene oxide, car-bonyl sulphide, ethyl formate, hydrogen cyanide and methyl iodide which have been found promising but cost remains a serious factor, especially for a country like that of India. Beside fumigants, use of Modified Atmospheres (MAs) seems to be the best bet for pesticide free organic storage. However, the technology of MAs can be well adapted where cheap sources of nitrogen or carbon dioxide are available and the storage structure is well sealed. Biogas, produced from the cow dung at farm level in many households of Punjab (India) has shown promising results to control the insect-pests in stored grains and pulses without affect-ing their germination and quality. Ozone, a strong oxidant, has also been successfully tried for control of stored grain insect pests, but its corrosive property towards most of the metals, is a concern. Though many volatile plant oils have proved quite effective to check the stored grain insect-pests but lack of systematic toxicological data has limited their use as practical agents for the safe storage of food grains. In the present scenario, it seems worthwhile to continue to use phosphine as fumigant for the control of stored grain insect-pests with its improved formulations exercising all the precautionary measures, till a new one equally competent is made available. Further, experimentation with other new fumigants should be continued to explore their potential. There is need to undertake further field level trials with biogas in the stored grains.
Key words: Stored grains, insect pests, fumigants, phosphine
Received: 12 November 2015; Accepted: 20 November 2015
The swelling population of India needs to be fed by
producing more and protecting more. Protection of food
grains is the primary duty of any nation. Unfortunately, the
post-harvest losses in India remain static at 10% since dec-
ades (Dhuri 2006). That means more production of food
grains also lead to its more wastage. Out of this, huge grain
loss takes place during its storage which is estimated to be
around 6%; the major factor being improper storage result-
ing from damage by insects, moulds and rats. Higher mois-
ture contents accentuated these losses. The golden principle
of ‘storing the grain dry’ needs to be followed.
Fumigation is considered as quick and effective tool
for control of stored grain insect-pests. The concept of
‘Zero tolerance of insect-pests in food commodities’ has
made fumigants further indispensable. However, given to
the regulatory concerns and development of resistance, use
of conventional fumigants such as phosphine has become
very challenging. Therefore, strenuous efforts are being
made to find its alternatives. Environmental safety, efficacy
and cost shall determine the value of a fumigant. Fumigation
registration takes into account any adverse effect of its resi-
dues in food and the environment. Since the last 3 decades,
several fumigants have been withdrawn or discontinued on
the bases of above parameters.
Fumigants can be used: a) as a hygienic measure during
storage; b) to provide wholesome food for consumer; and c)
as a mandatory requirement in trade and in quarantine
(Rajendran 2001). Many fumigants have been withdrawn on
the grounds of environmental safety, cost, carcinogenicity
and several other factors (Navarro 2006). After phasing out
of methyl bromide in view of Montreal Protocol, the only
synthetic fumigant, phosphine is being used for protection of
104
stored grains in India. However, apart from methyl bro-
mide and phosphine, the world has seen development of
several new fumigants such as sulfuryl fluoride, carbonyl
sulphide, propylene oxide, methyl iodide, ozone, ethyl
formate and hydrogen cyanide. This article deals with the
scope and limitations of both old and new fumigants, with
special reference to the Indian scenario.
Phosphine At present, phosphine (PH3) is the only fumigant ex-
clusively used in enclosed situation for killing stored gain
insect-pests in India. The phase-out of methyl bromide has
drastically increased its use not only in quantity, but in
variety of stored products other than the food grains such
as spices, cocoa beans, dried fruit, nuts and even fresh
fruits (Horn et al. 2005). Phosphine is available both in
solid and gaseous formulations i.e. tablets of aluminium or
magnesium phosphide and in cylinders containing carbon
dioxide ECO2FUME® or nitrogen FRISIN®. The tablets
upon coming in contact with water from the grain moisture
releases phosphine gas. Phosphine acts on two enzymes,
oxydase cytochrome and catalase (Ducom 2006) which
regulate the conditioning of oxygen to enter the mitochon-
drion. Blocking their action makes it impossible for oxygen
to penetrate into the cell leading to formation of super ox-
ides which are the true biocidal agents. The deactivation of
the enzymes occurs at low phosphine concentrations, but it
proceeds according to the acquisition of resistance. For
example, in Australia, the minimum concentration to block
the enzymes went, for all species, ranges from 25 ppm in
1990 to more than 100 ppm in 2004. In other countries, 200
ppm has been chosen, like in France, the UK or Australia
(Ducom 2005).
Cylinder-based formulations allow a quick gas release
and concentrations build up very quickly (Ducom 2006).
With a solid formulation, it is necessary to introduce all at
once a quantity which takes into account sorption and
leaks. With cylinder based formulations, the dosage can be
adjusted from time to time to be above the minimum con-
centration and the total quantity delivered is then lowered.
Phosphine can also be produced very quickly and inde-
pendently of weather conditions with generators using
special solid phosphide formulation which can be put into
water without exploding. Phosphine is produced almost as
quickly as with cylinder-based formulations, without the
need to transport the cylinders.
Development of resistance in target insect pests re-
mains an all time serious issue relating to use of phosphine
as fumigant. It has developed resistance in a number of pest
species (Schlipalius et al. 2006; Aurelio et al. 2007; Lilford
et al. 2009; Ahmed et al. 2013). Apart from this, the other
limitations of use of phosphine are requirement of several
days of exposure to achieve the desired level of control.
Further, phosphine is known to erode copper and its alloys
and hence electrical and electronic items need protection
from its exposure. Phosphine is also reactive to some me-
tallic salts which are contained in sensitive items like pho-
tographic film and some inorganic pigments. Many deaths
have been reported in India where its tablets have been
used as suicidal weapon (Garg et al. 2009).
Methyl bromide Methyl bromide (MB) played significant role as a
cheap, broad spectrum, effective fumigant with remarkable
penetration ability and quick action. But it is known to
have detrimental effect on the stratospheric ozone layer.
Considering this, it has already been phased out in all the
developed countries of the world since the year 2005 and
by the end of the year 2015, its use has been banned in the
developing countries as well, including India as per the
Montreal Protocol, an international treaty signed by 175
countries in 1987. However, quarantine and pre-shipment
(QPS) treatments and critical uses where no alternative has
yet been available, the ban has been exempted (TEAP
2000). The methyl bromide exemptions, shall, however
remain a subject of review in the light of further advance-
ment of research in this area. The scientists are trying to
develop the technologies that allow the recovery of methyl
bromide to recycle or destroy instead of release it to the
atmosphere. Such technologies seem to have some scope to
be implemented in North America and Europe though these
are complex, expensive and need technical assistance
(Novarro 2006). Hence, there may be only limited use of
this technology.
Sulfuryl fluoride Sulfuryl fluoride (SF) is being used as structural fumi-
gant for dry wood termite control since over half a century.
It is an inorganic, non-flammable, odourless and colourless
gas used to fumigate buildings, transport vehicles, wood,
flour mills, food factories, dried fruits, tree nuts and cereal
grains (Cox 1997; Bell et al. 1999; Navarro 2006). It is
produced in USA under the trade names of Vikane
(998.8% SF + 0.2% inert materials) and Profume (Novarro
2006) and in China under the trade name Xunmiejin
(Guogan et al. 1999). Sulfuryl fluoride seems to have the
potential of replacing methyl bromide in terms of similar
exposure time of 24 hours at normal conditions (Emekci
2010). Moreover, it has some advantages over methyl bro-
mide such as faster diffusion rates in the treated commodi-
ties (Novarro 2006). But, the fact that it has the potential of
105
acting as a greenhouse gas, may restrain its use as a fumi-
gant, in future. The fumigant has also been observed as
highly toxic to diapausing larvae of codling moth, Cydia
pomonella in stored walnuts (Zettler et al. 1999).
Insect eggs are the most tolerant stage to the fumiga-
tion action of sulfuryl fluoride which is also a limiting
factor. To overcome the failure in the control of egg stages
of pests, use of sulfuryl fluoride in combination with other
fumigants such as hydrogen cyanide (HCN), CO2,
phosphine or heat has been proposed. In Germany, a com-
bination of 2 g m-3 of HCN and about 30 g m-3 of sulfuryl
fluoride provide successful control of the pests within 40
hours. By combining sulfuryl fluoride with heat could pro-
vide complete control of egg stages of main pests of stored
products. Further, sulfuryl fluoride can also be applied
under reduced pressure so that the exposure period can be
drastically reduced (Zettler and Arthur 2000).
Propylene oxide
Propylene oxide (PPO) is a colourless, flammable
liquid commonly used in the chemical industry as an inter-
mediate industrial product besides its use as a food emulsi-
fier, surfactant, cosmetic and starch modifier. Under nor-
mal temperature and pressure, it has relatively low boiling
point (35 °C) and a noticeable ether odour (Weast et al.
1986). It is a safe fumigant for use on food and has been
registered and used in USA since 1984 as a sterilant for
commodities such as dry and shelled walnut, spices, cocoa
powder and nutmeats (Griffith 1999). Since PPO is flam-
mable from 3 to 37% in air, it has to be used under low
pressures or in CO2-enriched atmospheres to avoid flam-
mability (Isikber et al. 2006). Therefore, PPO with low
pressure can replace methyl bromide at commercial level in
quarantine and pre-shipment (QPS) conditions where low
pressure treatments are technically and economically avail-
able and feasible. In contrast to methyl bromide, PPO is
not an ozone depletor and degrades into nontoxic, biode-
gradable, propylene glycol in the soil and in human stom-
ach (Emekci 2010).
Carbonyl sulphide
Carbonyl sulphide (COS), a major sulphur compound
naturally present in the atmosphere at 0.5 (± 0.05) ppb, is
colourless gas present in foodstuffs such as cheese and
prepared vegetables of the cabbage family (Wright 2000).
Its traces are naturally found in grains and seeds in the
range of 0.05-0.1 mg/kg (Wright 2000; Novarro 2006). As
per laboratory findings, COS is effective on a wide range
of stored-product pests in all stages, including mites, at
concentrations from 10 to 40 g/m3, at exposure time 1 to 5
days at temperature ≥ 5 °C (Desmarchelier 1994). COS as
a fumigant for fumigation of durable commodities and
structures was trademarked in Australia as COSMIC-TM
since 1992. BOC Limited has an agreement with CSIRO
for its manufacture and worldwide distribution (Ducom
2006). Studies in Australia, Germany and the USA re-
vealed that egg stage was highly tolerant to the fumigant;
the effective exposure period, however, was half that of
phosphine at temperatures above 5 °C (Rajendran 2001).
There was no adverse effect on the quality of bread, noo-
dles or sponge cake (wheat), the malting and brewing char-
acteristics of barley, nor a significant effect on germination
or plumule length (Desmarchelier et al. 1998; Wright
2003). However, there are contradictory reports in the lit-
erature on negative effects of COS on germination of cere-
als except sorghum and barley, off odours in walnuts, in
milled rice, and colour change in soybeans (Navarro 2006).
Ethyl formate Ethyl formate (EF), a volatile solvent, highly flamma-
ble, boils at 55 °C and vaporizes rapidly at normal tem-
perature (Emekci 2010) that occurs naturally in a variety of
products including beef, cheese, rice, grapes and wine. It is
generally recognized as a safe compound (Desmarchelier
1994). It is used as flavouring agent in the food industry
(Rajendran 2001; Novarro 2006). It is known to break
down into naturally occurring products i.e. formic acid and
ethanol. The mode of action seems to be the inhibition of
Cytochrome C Oxidase by the formic acid resulting of the
hydrolysis of EF (Haritos and Dojchinov 2003).
In India, extensive laboratory tests against insect-pests
of food commodities and field trials on cereals, spices,
pulses, dry fruits and oilcakes have been carried out on the
fumigant. Effective commodity dosage ranged from 300 to
400 g m-3 with 72 hour exposure period (Rajendran 2001).
EF is registered in Australia for disinfestation of dried
fruits and is particularly used for dried sultanas where it is
added as a liquid to packages of fruit before they are sealed
(Annis and Graver 2000).
To overcome flammability of EF, BOC Limited has
developed and registered Vapromate® (for use in Australia
since 2005), a cylinderised formulation of 16.7% (w/w)
ethyl formate in liquid carbon dioxide (Ducom 2006). It is
a new cereal grain, stored product and fresh produce fumi-
gant for application by pressurised cylinders. CO2 acts in
two ways: the mixture in this proportion is non-flammable
and it has a synergetic effect; its action is rapid, in a range
of 4 to 24 hours. Further, it is a safe fumigant since TLV is
100 ppm for EF and 5000 for CO2. In case of phosphine-
resistant field strain of Ryzopertha domonica (F);
106
laboratory strains of Tribolium castaneum (Herbst) and S.
oryzae, a single dose of 450 g m-3 of Vapromate was found
to be sufficient to obtain high level of mortality (> 99%) of
all stages of T. castaneum and R. dominica (Haritos et al.
2006). Forced flow application of ethyl formate and CO2
vapours through the grains by means of a pump at a flow
rate of 6 l per minute, not only provides more even distri-
bution of the fumigant but also causes very high level of
mortality of S. oryzae and T. castaneum mixed stage cul-
tures (Haritos et al. 2006). EF when used with methyl
isothiocyanate (MITC), a soil fumigant, could significantly
reduce the dosage of EF to below the flammable level. A
mixture of EF and MITC (95% EF + 5% MITC) has been
patented under the name of GLO2 (Ren et al. 2008). GLO2
has been found effective against all stages of the major
stored grain insect pests. It is fast acting (less than 24
hours) and requires a short withholding period, about 8
days, but much less with aeration.
Hydrogen cyanide Hydrogen cyanide (HCN) is a colourless liquid with
smell of bitter almonds, flammable and lighter than air.
Currently, it is registered only in India, New Zealand and
with severe restrictions in Germany (Navarro 2006). Ear-
lier HCN has been used to fumigate mills in various coun-
tries (France, Germany, Switzerland) (Rambeau et al.
2001). HCN can be used for fumigation of many dry food-
stuffs, grains and seeds.
Due to high degree of sorption at atmospheric pres-
sure, it does not have the quick effective penetration that
methyl bromide has (Emekci 2010). It is easily dissolved in
water and thus will bind with moisture and can be difficult
to ventilate. Although HCN is strongly sorbed by many
materials, this action is usually reversible when they dry,
and, given time, all the fumigant vapours are desorbed
(Navarro 2006). Further, the high dermal toxicity of the gas
makes it hazardous to applicators.
Carbon disulphide Carbon disulphide (CS2) is an old fumigant used at
the farm level in some parts of Australia and to a limited
extent in China (TEAP 2000). Though, the fumigant has
only small effect on germination, but residues of carbon
disulphide persist in treated commodities for a longer pe-
riod than that of other fumigants (Haritos et al. 1999). The
reduction in baking quality of wheat treated with this fumi-
gant was shown by Calderon et al. (1970). Some of the
limitations of the fumigant include high flammability, long
exposure period, persistence in the treated commodity, lack
of residue limits set by Codex Alimentarius and high hu-
man toxicity (Navarro 2006).
Methyl iodide Methyl iodide (MI) was patented as pre-plant soil
fumigant for the control of broad range of organisms in-
cluding nematodes, fungi and weeds (Grech et al. 1996).
The patent was subsequently expanded to include structural
fumigation against termites and wood rotting fungi (Ohr et
al. 1998). Potential of MI as a fumigant for post-harvest
pest control has been known since about 77 years
(Lindgren 1938). But its development could not be pursued
in favour of less-expensive methyl bromide. MI is most
toxic to eggs and least toxic to adults of Sitophilus
granarius, Sitophilus zeamais Motschulsky, Tribolium
confusum, and Plodia interpuntella (Goto et al. 2004).
Though, MI is considered as a carcinogenic compound, the
US Environmental Protection Agency (EPA) has registered
it as a soil fumigant since 2007 (EPA 2009).
Ethane dinitrile/Cyanogen Ethane dinitrile (EDN), also known as cyanogen
(C2N2) is a broad spectrum fumigant since it can be used
against soil insect pests, weed seeds, nematodes and fungi.
It is a colourless gas with an almond like odour and is envi-
ronmentally safe. The threshold limit value (TLV) of 10
ppm (v/v) compares favourably with that of both methyl
bromide (5 ppm) and phosphine (0.3 ppm). It is highly
toxic (much more toxic than methyl bromide) to stored
product insects and is fast acting (except Sitophilus sp.)
(Docom 2006) with good penetration capability through the
grain mass and it desorbs quickly. Germination of seeds is
affected due to phytotoxic properties of EDN.
EDN has great potential for space and flour/rice mills
fumigations (Navarro 2006). CSIRO holds patent for use of
EDN as a fumigant in the major worldwide markets
(Emekci 2010). BOC Limited has signed an exclusive
global license agreement with CSIRO for EDN as a soil,
timber fumigant and grain sterilant. It is marketed under
the trade name Sterigas 1000 Fumigant in Australia (Ryan
et al. 2006).
Biogas Biogas, containing about 35% carbon dioxide and rest
mainly the methane, primarily produced from cow dung to
be used as cooking gas, can also be used to control the
stored grain insect pests at farm level. In India, detailed
experimentation has been done on this aspect. The killing
action is because of the carbon dioxide in the biogas.
Though carbon dioxide has been found very effective
against the stored grain insect-pests, but its cost and trans-
portation to the site of actual use did not make it viable
alternative. One major advantage with biogas is that it is to
be used just from the site of production within the farm.
107
Simply we need some pipes and arrangement to divert it
through the air tight grain storage structures as and when
needed. This makes it very cheap and convenient to use.
Considerable work has been done in India and China
to prove the applicability of biogas as stored grain insect
control agent. Pioneering research work on biogas was
done in Punjab state of India by Singh and co workers in
early 1990’s where they reported that it can be used in
airtight metal or PVC bins to check infestation by major
stored grain insect pests for about 3 months with just one
exposure of 6 days (Singh et al. 1994). Continued research
(Sharma et al. 2006) also revealed control of the pulse
beetle, Callosobruchus maculatus (Fab.) resulting in 100%
mortality of both egg and adult stages of the beetle. On-
farm trials by passing biogas from the plant through the
stored wheat up to 10 quintals, showed success of the tech-
nology in ensuring insect-free wheat (Chhuneja et al.
1998). The biogas did not affect germination or quality of
the wheat.
The optimum biogas flow rate required to remove the
oxygen from an empty container and partially grain filled
container was found to be 40 ml per minute sustained up to
a time leading to an equivalent of three times the volume of
the grain container. Using these fumigation conditions
100% adult mortality was observed in Tribolium casta-
neum and Rhizopertha dominica within 24 hours and S.
oryzae within 48 hours (Chanakya et al. 2015).
Ozone Ozone (O3), a powerful oxidant and a known sterilant,
had great potential to be used as insect control agent and
inhibitor of mould spore development in the stored grain at
levels less than 45 ppm (Rajendran 2001; Navarro 2006;
Pimentel et al. 2009; Tiwari et al. 2010; McDonough et al.
2011). Ozone can be readily generated from atmospheric
oxygen on the treatment sites and is safe to the environ-
ment. However, being highly unstable, it quickly breaks
down to the molecular oxygen. But, a major disadvantage
with ozone is its corrosive property towards most of the
metals (Mason et al. 1999). This has, therefore, necessi-
tated a special ozone air delivery and return system for an
effective ozonation treatment of the storage facility
(Campabadal et al. 2007). Ozonation experiments yielded
100% mortality for Sitophilus zeamais and Tribolium cas-
taneum, placed at 0.6 m below the popcorn grain surface
(Campabadal et al. 2007). Research on ozone treatments to
kill stored product insects, including the maize weevil Sito-
philus zeamais, the rice weevil Sitophilus oryzae, the red
flour beetle Tribolium castaneum, the confused flour beetle
Tribolium confusum, the lesser grain borer Rhyzopertha
dominica, the Indian meal moth Plodia interpunctella and
the Mediterranean flour moth Ephestia kuehniella (Kells et
al. 2001; Leesch 2003; Athanassiou et al. 2008; Isikber and
Oztekin 2009; Geovana et al. 2015) is being undertaken in
different parts of the globe.
Modified Atmospheres
Use of Modified Atmospheres (MAs), rich in carbon
dioxide and low in oxygen, dates back to ancient times
when Egyptians practiced hermetic storage of grains
(White and Leesch 1996). Presently, importance of MAs
has been enhanced given to the demand for pesticide-free
organic food. Terms used in reference to MA storage for
control of storage insect pests or for preservation of food
have also appeared in the literature as CA (Controlled at-
mosphere), as sealed storage, or atmospheres used at high
or low pressures to define the same method of treatment
but using different means (Navarro 2006). Technology of
MAs can be well adapted where cheap sources of nitrogen
or carbon dioxide are available and the storage structure is
well sealed (Rajendran 2001). Till now, MAs composed of
either CO2, N2 or inert gases have classically been used in
different parts of the world for the fumigation of a variety
of commodities including grains, pulses, tree nuts, dried
fruits, coffee and cocoa beans, spices, medicinal herbs,
geophytic bulbs and historic artifacts (Adler et al. 2000;
Cheng et al. 2013).
Low-oxygen atmosphere generated on-site from air
through pressure-swing absorption and subsequent filtra-
tion through a carbon molecular sieve or through mem-
brane systems or from locally available liquid nitrogen
sources has been exploited for disinfesting and storage of
food grains in Germany and Australia. Carbon dioxide-rich
atmosphere has been found suitable for the protection of
dried fruits in Israel and Turkey and for treating grain ele-
vators in Canada (Donahaye et al 19984 Ferizli and
Emekci 2000; Emekci et al. 2007).
Carbon dioxide treatment requires a longer exposure
period of 10 days or more; this drawback can, however, be
overcome in combination with positive pressure or elevated
temperatures which increases performance of MAs. Sig-
nificant reduction in exposure time to a few hours can be
obtained with the use of high carbon dioxide under high
pressures ranging between 10-37 bars (Emekci 2010).
Eggs, especially in early stages of development were
known to be less sensitive to high pressure carbon dioxide
treatments than other stages (Adler et al 2000; Navarro
2006). Increase in temperature also helps MAs to decrease
the lethal exposure time significantly (Donahaye et al.
108
1994).
Hashem et al. (2014) studied the susceptibility of the
different life stages of the Indian meal moth Plodia inter-
puntella and almond moth Ephestia cautella to MAs con-
taining 40, 60 and 80% CO2 in air at 27 °C. They showed
that five days were adequate to kill all eggs and pupae of
the two moths under all these MAs. Exposure time needed
to be extended to 6 and 7 days at 80% CO2 to obtain com-
plete mortality of larva of Ephestia cautella and Plodia
interpuntella, respectively. Hashem et al. (2014) studies
showed that no adults were produced from 4th instar larva
of Sitotroga cereallela treated with MAs after a 264 h (11
day) exposure for 25% CO2, 240 h (10 day) for 40% CO2
and only 168 h (7 day) for 60% CO2 .
Volatile plant oils as fumigants Though plant products are known to be mixed with
stored grains to ward off insect pests since centuries ago
but application of plant oils as fumigants in the protection
of stored products is in its infancy (Cox 2002). There is
enough literature on the fumigant action of different vola-
tile essential oils of botanical origin to control stored grain
insect pests (Shaaya et al. 1997; Tunc et al. 2000; Weaver
and Subramanyam 2000; Rajendran and Muralidharan
2005; Isikber et al. 2008; Korunic et al. 2008; Rajendran
and Sriranjini 2008). Unfortunately, standard test methods
applicable for fumigants have not always been followed in
the assays (Rajendran 2001). Perhaps, mortality of insects
exposed to plant products has been assessed too early. The
time taken to express mortality response by the insect
treated with fumigants is known to vary between com-
pounds and between the doses of a particular chemical.
Besides, data on the toxicity of plant sources against mixed
-age cultures containing all developmental stages of stored
product insects are lacking (Rajendran 2001).
Most of the research with plant oils as fumigant was
carried out in empty fumigation chambers and thus may not
reflect the actual fumigation situations where penetration of
the plant extracts into deep layers fails, due to strong ab-
sorption by the commodity (Emekci 2010). Moreover,
aromatic scents of the essential oils permit them only to be
applied in empty premises or to the commodities such as
seeds where the scent of the volatile essential oil would not
present a restriction after the treatment. Another important
constraint for the use of botanical extracts is that such alter-
natives of plant origin also need toxicological and safety
data for registration for use as fumigant (Navarro 2006).
Conclusions Methyl bromide (MB), a cheap, broad spectrum fumi-
gant with remarkable penetration ability and quick action
that has been phased out honouring ‘Montreal Protocol’ is
yet to find an equally competent alternative. This is both a
challenge and urgent necessity. Phosphine is widely used
worldwide, and is the only fumigant currently used in In-
dia, because of its low cost, availability and residue-free
treatment. But limitation of use of phosphine is develop-
ment of resistance in the major stored grain insect pests, the
world over. There are several other alternative fumigants
which are location/situation specific, but cost remains a
serious factor, especially for country like India. One such
alternative is sulfuryl fluoride which has been found quite
promising to fumigate buildings, transport vehicles, wood,
flour mills, food factories, dried fruits, tree nuts and cereal
grains is marketed in USA (Vikane; Profume) and China
(Xunmiejin). But, the fact that it has the potential of acting
as a greenhouse gas, may restrain its use as a fumigant, in
future.
Propylene oxide, though a safe fumigant for use on
food and has been registered and used in USA since 1984
as a sterilant for commodities such as dry and shelled wal-
nut, spices, cocoa powder and nutmeats, is flammable and
has to be used under low pressures or in CO2-enriched
atmospheres to avoid flammability. Carbonyl sulphide, as
a fumigant for durable commodities and structures was
trademarked in Australia as COSMIC-TM since 1992. How-
ever, there are contradictory reports in the literature relat-
ing to negative effects of carbonyl sulphide on germination
of cereals except sorghum and barley, off odours in wal-
nuts, in milled rice, and colour change in soybeans.
Ethyl formate, quite effective for dried fruits and sev-
eral other stored products, is registered in Australia since
2005 (Vapromate®). To overcome its flammability a cylin-
derised formulation of 16.7% (w/w) ethyl formate) in liq-
uid carbon dioxide has been developed. Hydrogen cyanide
(HCN) is registered in India, New Zealand and Germany
(Navarro 2006), can be used for fumigation of dry food-
stuffs, grains and seeds. But, due to high degree of sorption
at atmospheric pressure, it does not have the quick effec-
tive penetration as that of methyl bromide. But high dermal
toxicity of the gas makes it hazardous to applicators.
Methyl iodide, though recommended by US EPA as soil
fumigant since 2007; but there is a question mark on its
acceptability because of having carcinogenic effect. `
109
Though efficacy of various plant oils as fumigant, is
amply on record, but lack of systematic toxicological data
utilizing standard techniques does not reflect any worth-
while future for application of the same as successful
agents to control stored grain insect-pests. Use of Modified
Atmospheres (MAs) seems to be the best bet for pesticide-
free organic storage but the technology of MAs can be well
adapted where cheap sources of nitrogen or carbon dioxide
are available and the storage structure is well sealed. This
does not appears to be very practical for developing or
under-developed countries, particularly at the farm/
farmers’ level. There is a better option for countries like
India if source of bio-gas is available at the farm level in
the form of biogas plant wherein the gas is produced from
the cow dung. Ozone (O3), a powerful oxidant and a
known sterilant, also has a great potential to be used as
insect control agent and inhibitor of mould spore develop-
ment. However, being highly unstable, it quickly breaks
down to the molecular oxygen. Further, a major disadvan-
tage with ozone is its corrosive property towards most of
the metals. This has, therefore, necessitated a special ozone
air delivery and return system for an effective ozonation
treatment of the storage facility.
Given to the kind of storage facilities in India, at pre-
sent phosphine in tablet form is the only fumigation tech-
nique adopted for disinfestations of godowns and even at
the farm level farmers are using it to save their stored
grains from the damage by insect-pests. One way to in-
crease the efficacy of phosphine could be to use it in cylin-
der-based formulations with or without carbon dioxide or
generators producing phosphine by pouring a granular form
of aluminium or magnesium phosphide in water. Though it
may not be very appropriate to use CO2 given to the filling
and transportation of CO2 cylinders but the farm houses
where bio-gas plants are installed, use of biogas will both
be economical and convenient. Though some work has
been done in this direction, more efforts are needed to
show its practicability as a cheap and convenient way of
saving the stored grains from the attack of stored grain
insect-pests at the farm level storage. This could be a good
substitutes in all those farm houses where bio-gas plants
are installed.
Adler C, Corinth HG and Reichmuth C 2000. Modified
atmospheres. In: Subramanyam B and Hagstrum DW
(Eds.) Alternatives to Pesticides in Stored Product
IPM. pp 105-146. Kluwer Academic Publishers, MA,
USA.
Ahmad A, Ahmed M, Mehmood NQ, Muhammad A and
Arif S 2013. Monitoring of resistance against
phosphine in stored grain insect pests in Sindh. Middle
-East J Sci Res 6: 1501-1507.
Annis PC and Graver JE 2000. Ethyl formate – a fumigant
with potential for rapid action. Proc Ann Int Res Conf
on Methyl Bromide Alternative and Emissions Reduc-
tions. pp 70-73. Florida, USA.
Athanassiou CG, Milonas DN and Saitanis CJ 2008. Insec-
ticidal effect of ozone against Rhyzopertha dominica
(F.) (Coleoptera: Bostrychidae), Sitophilus oryzae (L.)
(Coleoptera: Curculionidae) and Tribolium confusum
Jacquelin Du Val (Coleoptera: Tenebrionidae): influ-
ence of commodity. Proc of the 8th Int Conf on Cont
Atm and Fumigation in Stored Products. pp 61-71.
Chengdu, China.
Aurelio M, Pimentel G, FaroniLeda RDA, Totola MR and
Guedes NRC 2007. Phosphine resistance, respiration
rate and fitness consequences in stored-product in-
sects. Pest Mgmt Sci 63: 876–881.
Bell CH, Savvidou N and Smith TJW 1999. The toxicity of
sulfuryl fluoride (Vikane) to eggs of insect pests of
flourmills. Proc of the 7th Int Working Conf on Stored
Prod Prot. pp 345-350. China.
Calderon M, Navarro S and Lindner Z 1970. Effect of
common fumigants on the baking quality of wheat.
Cereal Chemistry 47: 422-428.
Campabadal CA, Maier DE, Woloshuk CP and Mason L
2007. Ozonation as non-chemical stored product
protection technology. Ann Int Res Conf on Methyl
Bromide Alternative and Emissions Reductions. pp 93
-4 .San Diego, California Florida, USA.
Chanakya HN, Parvathi C and Khuntia HK 2015. The effi-
cacy of biogas to protect stored grains from insect
pests. Carb Sci Tech 7: 42-52.
Cheng WN, Lei JX, Ahn JE, Wang Y, Lei C and Zhu-
Salzman K 2013. CO2 enhances effects of hypoxia on
References
110
mortality, development and gene expression in cow-
pea bruchid, Callosobruchus maculatus. J Stored
Prod Res 59: 1160-1168.
Chhuneja PK, Thapar VK, Singh G and Sethi PS 1998. Use
of biogas for the control of stored grain insect pests at
farm level. Dept. of Processing & Agril. Structures,
Punjab Agric. Univ., Ludhiana, p. 43.
Cox C 1997. Sulfuryl Fluoride. J of Pest Reform 17:17-20.
Cox PD 2002. Potential for using semiochemicals to pro-
tect stored products from insect infestation - A review.
J Stored Prod Res 40: 1-25.
Desmarchelier JM 1994. Carbonyl sulphide as a fumigant
for control of insects and mites. Proc of the 6th Int
Working Conf on Stored Prod Prot. pp 78-82. Austra-
lia.
Desmarchelier JM, Allen SE, Ren YL, Moss R and Vu
LT 1998. Commercial-scale Trials on the Application
of Ethyl Formate, Carbonyl Sulphide and Carbon
disulphide to Wheat. CSIRO Entomology, Technical
Report No. 75.
Dhuri AV 2006. Fumicover™ An effort in reducing losses
in stored grains at farm Levels. Proc of the 9th Int
Working Conf on Stored Prod Prot. pp 612-617. Bra-
zil.
Donahaye E, Navarro S and Rindner M 1994. The influ-
ence of temperature on the sensitivity of two nitidulid
beetles to low oxygen concentrations. Proc of the 6th
Int Working Conf on Stored Prod Prot. pp 88-90.
U.K.
Ducom P 2005. The issue of phosphine fumigation. Proc
Ann Int Res Conf on Methyl Bromide Alternative and
Emissions Reductions .San Diego, California.
Ducom P 2006. The return of the fumigants. Proc of the 9th
Int Working Conf on Stored Prod Prot. pp 510-516.
Brazil.
Emekci M 2010. Quo vadis the fumigants? Proc of the 10th
Int Working Conf on Stored Prod Prot. pp 303-313.
Portugal.
Emekci M, Ferizli AG, Tutuncu S and Navarro S 2007.
The Applicability Of Controlled Atmospheres As An
Alternative To Methyl Bromide Fumigation Of Dried
Fruits In Turkey. Proc of the Int Conf on Cont Atm
and Fumigation in Stored Products. pp 159-166.
Australia.
EPA 2009. Extension of Conditional Registration of Io-
domethane (MethylIodide), Environmental Protection
Agency http://www.epa.gov/pesticides/factsheets/
iodomethane_fs.htm.
Ferizli AG and Emekci M 2000. Carbon dioxide fumiga-
tion as a methyl bromide alternative for the dried fig
industry, Proc Ann Int Res Conf on Methyl Bromide
Alternative and Emissions Reductions pp. 81. Or-
lando, Florida.
Garg S, Chanana A, Tejpaul HR and Gargi J 2009. Fatal
period in murder-suicide celphos (aluminium pho-
shide) poisoning. J of Punjab Acad of Forensic Medi-
cine & Toxicology 9: 92-95.
Geovana DS, Karim CP and Vildes MS 2015. Reduction in
residues of deltamethrin and fenitrothion on stored
wheat grains by ozone gas. J Stored Prod Res 61: 65-
69.
Goto M, Ogawa N, Naito H and Soma Y 2004. Suscepti-
bility of four stored grain insects to methyl iodide. Res
Bull of the Plant Prot Services Japan 40: 1-6.
Grech NM, Ohr HD and Sims JJ 1996. Methyl iodide as a
soil fumigant. U.S. Patent, 5518692.
Griffith T 1999. Propylene oxide, a registered fumigant, a
proven insecticide. Proc Ann Int Res Conf on Methyl
Bromide Alternative and Emissions Reductions. pp
71.San Diego, California.
Guogan X, Zhongmei C, Zhao S and Nengzhi Q 1999. The
development of sulfuryl fluoride (SO2F2), in China –a
brief introduction. Proc of the 7th Int Working Conf
on Stored Prod Prot. pp 562-566. China.
Haritos VS and Dojchinov G 2003. Cytochrome c oxi-
dase inhibition in the rice weevil Sitophilus oryzae
(L.) by formate, the toxic metabolite of volatile alkyl
formates Comp. Biochem Physiol C Toxicol Pharma-
col. 136: 135-143.
Haritos VS and Dojchinov G 2006. Improved efficacy of
ethyl formate against stored grain insects by combina-
tion with carbon dioxide in a ‘dynamic’ application.
Pest Mngmt Sci 62: 325– 333.
Haritos VS Damcevski KA and Dojchinov G 2006. Im-
proved efficacy of ethyl formate against stored grain
insects by combination with carbon dioxide in a
‘dynamic’ application. Pest Mngmt Sci 62: 325– 333.
Haritos VS, Ren YL and Desmerchelier JM 1999. Regula-
tory toxicology of alternative fumigants. Proc of the
7th Int Working Conf on Stored Prod Prot. pp 356-
363. China.
Hashem MY, Ahmed SS, El-Mohandes MA, Hussain AE
and Ghazy SM 2014. Comparative effectiveness of
different modified atmospheres enriched with carbon
dioxide and nitrogen on larval instars of almond moth
Ephestia cautella. J. Stored Prod Res 59: 314-19.
111
Hashem MY, Risha EM, El-Sherif SI and Ahmed SS
2012. The effect of modified atmospheres, an alterna-
tive to methyl bromide, on the susceptibility of imma-
ture stages of angoumois grain moth Sitotroga ce-
realella (Olivier) (Lepidoptera:Gelechiidae). J Stored
Prod Res 50: 57-61.
Horn F, Horn P and Sullivan J 2005. Current practice in
fresh fruit fumigation with phosphine in chile. Proc
Ann Int Res Conf on Methyl Bromide Alternative and
Emissions Reductions. pp 12-19. San Diego, Califor-
nia.
Isikber AA and Oztekin S 2009. Comparison of suscepti-
bility of two stored product insects, Ephestia
kuehniella Zeller and Tribolium confusum du Val to
gaseous ozone. J Stored Prod Res 45:159-164.
Isikber AA, Alma MH, Kanat M and Karci A 2008. Fumi-
gant toxicity of essential oils from Laurus nobilis and
Rosmarinus officinalis against all life stages of Tri-
bolium confusum. Phytoparasitica 34: 167-177.
Isikber AA, Navarro S, Finkelman S, Rindner M and Dias
R 2006. Propylene oxide as a potential quarantine
fumigant for insect disinfestation of nuts. Proc of the
9th Int Working Conf on Stored Prod Prot. pp 630-
634. Brazil.
Jayaram M and Majumder SK 1984. Ethyl formate as a
safe general fumigant. Proc of the Int Conf on Cont
Atm and Fumigation in grain storages. pp. 369-393,
Australia.
Kells SA, Mason LJ, Maier DE and Woloshuk CP 2001.
Efficacy and fumigation characteristics of ozone in
stored maize. J Stored Prod Res 37: 371-382.
Korunic Z, Rozman V and Kalinovic I 2008. The Poten-
tial Use of Natural Essential Oils in the fumigation of
stored agricultural products Proc of the 8th Int Conf
on Cont Atm and Fumigation in Stored Products. pp
511-519. China.
Leesch JG 2003. The mortality of stored product insects
following exposure to gaseous ozone at high concen-
trations. Proc of the 8th Int Working Conf on Stored
Prod Prot. pp 827-831. Oxon, UK.
Lilford K, Fulford GR, Schlipalius D and Ridley A 2009.
Fumigation of stored grain insects -a two locus model
of phosphine resistance. In: 18th World IMACS/
MODSIM Congress.pp. 540-546. Cairns, Australia.
Lindgren DL 1938. Methyl iodide as a fumigant. J of Econ
Ent 31: 320.
Mason LJ, Strait CA, Woloshuk CP and Maier DE 1999.
Controlling stored grain insects with ozone fumiga-
tion. Proc of the 7th Int Working Conf on Stored Prod
Prot. pp 536-547. China.
Mason LJ, Woloshuk CP and Maier DE 1997. Efficacy
of ozone to control insects,molds and mycotoxins.
Proc of the Int Conf on Cont Atm and Fumigation in
Stored Products. pp 665-670. Cyprus Printer Ltd,
Nicosia.
McDonough MX, Campabadal CA, Mason LJ, Maier
DE, Denvir A and Woloshuk CP 2011. Ozone appli-
cation in a modified screw conveyor to treat grain for
insect pests, fungal contaminants and mycotoxins. J
Stored Prod Res 47: 249-254.
Navarro S 2006. New global challenges to the use of gase-
ous treatments in stored products. Proc of the 9th Int
Working Conf on Stored Prod Prot. pp 495-509, Bra-
zil.
Ohr HD, Grech NM and Sims JJ 1998. Methyl iodide as a
fumigant. U.S. Patent, 5753183.
Pimentel MAG, Faroni LRD, Guedes RNC, Sousa AH and
Totola MR 2009. Phosphine resistance in Brazilian
populations of Sitophilus zeamais Motschulsky
(Coleoptera: Curculionidae). J Stored Prod Res 45:
71-74.
Rajendran S 2001. Alternatives to methyl bromide as fumi-
gant for stored food commodities. Pesticide Outlook
12: 249-253.
Rajendran S and Muralidharan N 2005. Effectiveness of
allyl acetate as a fumigant against five stored grain
beetle pests. Pest Manag Sci 61: 97–101.
Rajendran S and Sriranjini V 2008. Plant products as fumi-
gants for stored-product insect control. J Stored Prod
Res 44: 126-135.
Rambeau M, Benitez D, Dupuis S and Ducom P 2001.
Hydrogen cyanide as an immediate alternative to
methyl bromide for structural fumigations. Proc. of
the Int Conf on Cont Atm and Fumigation in Stored
Products. pp 101-111. CA, U.S.A.
Ren Y, Emmeri T, Mahon D and Graver JE 2008. Ethyl
formate reformulated a potential fumigant for the
grain industry. Proc Ann Int Res Conf on Methyl Bro-
mide Alternative and Emissions Reductions. pp 98-
105. Florida, USA.
Ryan R, Martin P, Haines N, Reddi R, Beven D and
Harvey A 2006. Sterigas™ & Cosmic™: update on
proposed new fumigants. Proc Ann Int Res Conf on
Methyl Bromide Alternative and Emissions Reduc-
tions. pp 138-142. Florida, USA.
Schlipalius DI, Collins PJ, Mau Y and Ebert PR 2006. New
tools for management of phosphine resistance. Out-
looks on Pest Mgmt 17: 52–56.
112
Shaaya E, Kostjukovski M, Eilberg J and Sukprakarn C
1997. Plant oils as fumigants and contact insecticides
for the control of stored-product insects. J Stored Prod
Res 33: 7-15.
Sharma DK, Singh Jasbir, Thapar VK, Paul Shashi and
Singh G 2006. Efficacy of biogas to check infestation
of Callosobruchus maculatus fab. infesting stored
green gram, Vigna radiata Linn. Journal of Research
43: 59-62.
Singh G, Thapar VK and Sethi PS 1994. Use of biogas for
control of stored grain insect pests. J of Insect Sci 7:
40-42.
TEAP 2000. Report of the Technology and Economic As-
sessment Panel. In: Kuijpers L (Ed), April 2000.
UNEP, Nairobi.
Tiwari BK, Brennan CS, Curran T, Gallagher E, Cullen
PJ and Donnell CP 2010. Application of ozone in
grain processing. J Cereal Sci 51: 248-255.
Tunc I, Berger BM, Erler F and Dagli F 2000. Ovicidal
activity of essential oils from five plants against two
stored-product insects. J Stored Prod Res 36: 161-168.
Weast RC, Astle MJ and Beyer WH 1986. CRC Handbook
of Chemistry and Physics,67th edition, CRC Press,
Inc. Boca Raton, Florida.
Weaver DK and Subramanyam B 2000. Botanicals. In:
Subramanyam B, Hagstrum D W (Eds), Alternatives
to Pesticides in Stored-Product IPM. Pp 303-320.
Kluwer Academic Publishers, Massachusetts.
White NG and Leesch JG 1996. Chemical control in inte-
grated management of insects in stored-products.
In:Subramanyam B and Hagstrum D W (Eds), Inte-
grated Management of Insects in Stored-Products. pp.
41–70. Marceln Dekker, Inc., New York, USA,
Wright EJ 2000. Carbonyl sulfide: progress in research
and commercialization of a new commodity fumigant
Proc Ann Int Res Conf on Methyl Bromide Alternative
and Emissions Reductions. pp 86-93. Florida, USA.
Wright EJ 2003. Carbonyl sulfide (COS) as a fumigant for
stored products: progress in research and commer-
cialisation. In: Stored Grain in Australia 2003: proc of
the Australian Postharvest Tech Conf. pp. 224–229
Australia.
White NDG and Leesch JG 1996. Chemical control. In:
Integrated management of insects in stored products
(Subramanyam B and Hagstrum DW). pp. 287-330.
New York: Marcel Dekker.
Zettler JL and Arthur FH 2000. Chemical control of
stored product insects with fumigants and residual
treatments. Crop Prot 19: 577–582.
Zettler JL Leesch JG, Gill RF and Tebbets JC 1999.
Chemical alternatives for methyl bromide and
phosphine treatments for dried fruits and nuts. Proc of
the 7th Int Working Conf on Stored Prod Prot. Pp
554-561.China.
113
Fertigation technology for enhancing nutrient use and crop productivity: An overview
Himachal Journal of Agricultural Research 41(2): 114-121 (2015)
Sanjeev K Sandal and Renu Kapoor* Krishi Vigyan Kendra, CSK Himachal Pradesh Krishi Vishvavidyalaya, Kangra -176001, HP, India
* College of Horticulture & Forestry, Dr. YS Parmar University of Horticulture and Forestry, Neri, Hamirpur, HP, India
Corresponding author: [email protected]
Abstract
Fertigation - a technique of application of fertilizers along with irrigation water, provides an excellent opportunity to maximize yield and minimize environmental pollution. Fertigation ensures availability of fertilizer nutrients in the root zone in readily available form and therefore, minimize fertilizer application rate and increases fertilizer use efficiency. The associated increase in yield with minimum fertilizer application rate, increases return on the fertilizer invested. Based on experimentation, it has been observed that fertigation leads to saving of fertilizer by 25-40%, increased returns and reduced leaching of the nutrients. The present paper is an attempt to review the work done on various aspects of fertigation technology.
Key words: Fertigation, NPK behaviour, Recommended doses of fertilizers, fertilizer saving
Received: 03 November 2015; Accepted: 20 November 2015
Sustained higher yield with high yielding varieties
depends entirely on the sustainable use of the limited water
and energy resources, specifically in developing countries
with arid and semi-arid regions. Moreover, intensification
of agricultural production to meet growing market demand
requires the simultaneous application of irrigation water
and fertilizers. Fertigation - a modern agro-technique pro-
vides an excellent opportunity to maximize yield and mini-
mize environmental pollution (Hagin et al. 2002) by in-
creasing fertilizer use efficiency, minimizing fertilizer ap-
plication and increasing return on the fertilizer invested.
What is fertigation? The practice of supplying crops in the field with fertil-
izers via the irrigation water is called fertigation. In fertiga-
tion, timing, amounts and concentration of fertilizers ap-
plied are easily controlled. Fertigation allows the landscape
to absorb up to 90% of the applied nutrients, while granular
or dry fertilizer application typically result in absorption
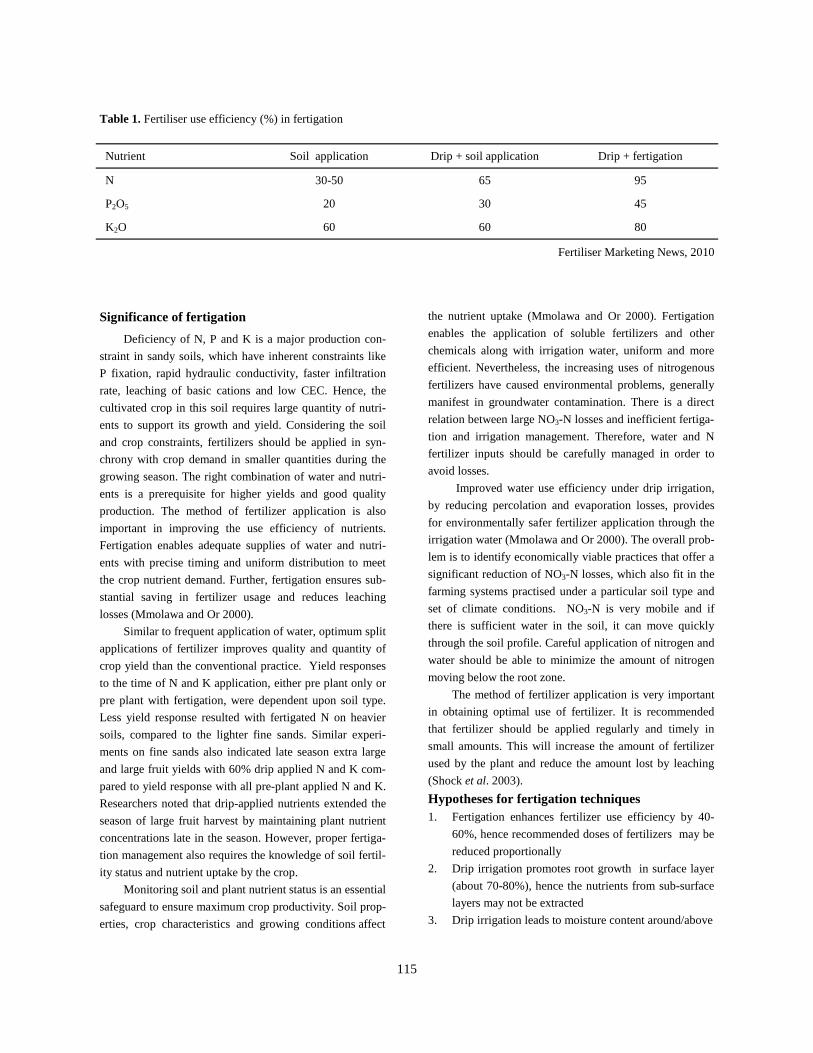
rates of 10 to 40% (Table 1). Fertigation ensures saving in
fertilizer (40-60%), due to “better fertilizer use efficiency”
and “reduction in leaching” (Kumar and Singh 2002).
Drip irrigation is often preferred over other irrigation
methods because of the high water-application efficiency on
account of reduced losses, surface evaporation and deep
percolation. Because of high frequency water application,
concentrations of salts remain manageable in the rooting
zone. The regulated supplies of water through drippers not
only affect the plant root and shoot growth but also the fertil-
izer use efficiency. Fertigation through drip irrigation re-
duces the wastage of water and chemical fertilizers, opti-
mizes the nutrient use by applying them at critical stages and
at proper place and time, which finally increase water and
nutrient use efficiency. Moreover, it is well recognized as the
most effective and convenient means of maintaining optimal
nutrient level and water supply according to crop develop-
ment stage, specific needs of each crop and type of soil.
114
Significance of fertigation
Deficiency of N, P and K is a major production con-
straint in sandy soils, which have inherent constraints like
P fixation, rapid hydraulic conductivity, faster infiltration
rate, leaching of basic cations and low CEC. Hence, the
cultivated crop in this soil requires large quantity of nutri-
ents to support its growth and yield. Considering the soil
and crop constraints, fertilizers should be applied in syn-
chrony with crop demand in smaller quantities during the
growing season. The right combination of water and nutri-
ents is a prerequisite for higher yields and good quality
production. The method of fertilizer application is also
important in improving the use efficiency of nutrients.
Fertigation enables adequate supplies of water and nutri-
ents with precise timing and uniform distribution to meet
the crop nutrient demand. Further, fertigation ensures sub-
stantial saving in fertilizer usage and reduces leaching
losses (Mmolawa and Or 2000).
Similar to frequent application of water, optimum split
applications of fertilizer improves quality and quantity of
crop yield than the conventional practice. Yield responses
to the time of N and K application, either pre plant only or
pre plant with fertigation, were dependent upon soil type.
Less yield response resulted with fertigated N on heavier
soils, compared to the lighter fine sands. Similar experi-
ments on fine sands also indicated late season extra large
and large fruit yields with 60% drip applied N and K com-
pared to yield response with all pre-plant applied N and K.
Researchers noted that drip-applied nutrients extended the
season of large fruit harvest by maintaining plant nutrient
concentrations late in the season. However, proper fertiga-
tion management also requires the knowledge of soil fertil-
ity status and nutrient uptake by the crop.
Monitoring soil and plant nutrient status is an essential
safeguard to ensure maximum crop productivity. Soil prop-
erties, crop characteristics and growing conditions affect
the nutrient uptake (Mmolawa and Or 2000). Fertigation
enables the application of soluble fertilizers and other
chemicals along with irrigation water, uniform and more
efficient. Nevertheless, the increasing uses of nitrogenous
fertilizers have caused environmental problems, generally
manifest in groundwater contamination. There is a direct
relation between large NO3-N losses and inefficient fertiga-
tion and irrigation management. Therefore, water and N
fertilizer inputs should be carefully managed in order to
avoid losses.
Improved water use efficiency under drip irrigation,
by reducing percolation and evaporation losses, provides
for environmentally safer fertilizer application through the
irrigation water (Mmolawa and Or 2000). The overall prob-
lem is to identify economically viable practices that offer a
significant reduction of NO3-N losses, which also fit in the
farming systems practised under a particular soil type and
set of climate conditions. NO3-N is very mobile and if
there is sufficient water in the soil, it can move quickly
through the soil profile. Careful application of nitrogen and
water should be able to minimize the amount of nitrogen
moving below the root zone.
The method of fertilizer application is very important
in obtaining optimal use of fertilizer. It is recommended
that fertilizer should be applied regularly and timely in
small amounts. This will increase the amount of fertilizer
used by the plant and reduce the amount lost by leaching
(Shock et al. 2003).
Hypotheses for fertigation techniques 1. Fertigation enhances fertilizer use efficiency by 40-
60%, hence recommended doses of fertilizers may be
reduced proportionally
2. Drip irrigation promotes root growth in surface layer
(about 70-80%), hence the nutrients from sub-surface
layers may not be extracted
3. Drip irrigation leads to moisture content around/above
115
Nutrient Soil application Drip + soil application Drip + fertigation
N 30-50 65 95
P2O5 20 30 45
K2O 60 60 80
Fertiliser Marketing News, 2010
Table 1. Fertiliser use efficiency (%) in fertigation
field capacity hence may promote leaching of nutri-
ents
4. Use of water soluble fertilizers (WSF) may lead to
leaching losses beyond surface layer, hence frequent
split application of WSF is desirable
5. The frequency of fertigation may increase with fertil-
izers doses in order to avoid leaching losses or toxicity
if any
Fertigation scheduling
Factors that affect fertigation module are soil type,
available NPK status, organic carbon, soil pH, soil mois-
ture at field capacity, available water capacity range, aggre-
gate size distribution, crop type and its physiological
growth stages, discharge variation and uniformity coeffi-
cient of installed drip irrigation system.
The efficient fertigation schedule needs following
considerations viz.
1. crop and site specific nutrient management,
2. timing nutrient delivery to meet crop needs and
3. controlling irrigation to minimize leaching of soluble
nutrient below the effective root zone.
In many situations, a small percentage of N and K (20
-30%) and most or all P is applied in a pre-plant broadcast
or banded application especially in the areas where either
initial soil levels are low or early season irrigation is not
required. Pre plant application of P is common since solu-
ble P sources (Phosphoric acid) are costlier than granular
forms, to avoid the chemical precipitation in drip line and
the movement of drip applied P away from the injection
point is goverened by soil texture and soil pH. Movement
of P is particularly restricted in fine textured and alkaline
soil. When making a pre-plant application of any nutrient,
it is important that the fertilizer be placed within the wet
zone of the drip system.
A crop specific fertigation schedule can be developed
using growing degree days implementation. A soil with
high N supply capacity may require substantially low N
fertilizers. Application of N and K in excess of crop re-
quirement can have adhesive effect such as ground water
contamination with nitrate N, appearance of blossom end
rot in tomato or pepper with heavy ammonical N applica-
tion, reduction in specific gravity of potato and size of
straw berry fruit with excessive K fertilization.
Nutrient can be injected daily or bimonthly depending
upon system design, soil type and farmer’s preference.
Frequent injection may be needed for sandy soil with poor
water and nutrient capacity and grower who want to reduce
injection pump size and cost. Since leaching is possible
with drip irrigation, nutrient applied in any irrigation must
not be subjected to excessive irrigation during that applica-
tion or in subsequent irrigations. It is possible to irrigate
nutrient in non continuous (bulk) or continuous
(concentration) fashion. Fertilizer should be injected in a
period such that enough time remains to permit complete
flushing of the system without over irrigation. Water that
moves below the active crop root zone carry nitrate N or K
in substantial quantities. One cm of leachate at 100 mg
nitrate N/litre would contain 10 kg N/ha.
Drip irrigation introduces possibilities for precise
application of fertilizer and other chemicals. The restricted
root growth necessitates the type of fertilizer application
"fertigation", which prevents nutrient deficiencies. The
high efficiency of water application reached in drip irriga-
tion systems is ideal for the high efficiency of applied nu-
trients in fertigation. But, some of these potential benefits
can reverse into disadvantages when the irrigation system
design or management is not correct (non uniform nutrient
distribution, over-fertigation, excessive leaching, clog-
ging).
Behaviour of Plant Nutrients during fertigation
Nitrogen In fertigation, applied urea travels with the water in
the soil. Its distribution in the soil wet zone depends on the
timing of its incorporation with the irrigation water. When
added during the third quarter of the irrigation cycle, fol-
lowed by the flushing of the remaining irrigation cycle, the
fertigated urea on reaching the boundaries of the wet zone
becomes susceptible to volatilization. Evaporation from the
soil surface results in increased urea concentration near the
soil surface. This residual urea at the soil surface is also
certain to be lost to the atmosphere as ammonia. Ammo-
nium (NH4+) carries a positive electric charge (cation) and
is adsorbed to the negatively charged sites on clay and can
also replace other adsorbed cations on the clay surfaces.
These are mainly Ca and Mg that constitute the major
sorbed cations in the soil. As a result of these interactions,
ammonium is concentrated near the dripper and the dis-
placed Ca and to a lesser extent Mg, travels with the ad-
vancing water. Within a few days, the soil ammonium is
usually oxidized by soil bacteria to the nitrate form that is
dispersed in the soil with further irrigation cycles. When
either ammonium or urea is used as nitrogen source in
fertigation, significant gaseous losses as nitrous and nitric
oxide has also been recorded (Hoffman and Van Cleemput
2004).
116

Nitrate (NO3-) carries a negative electric charge
(anion). It cannot, therefore, bind to the clay particles of
basic and neutral soils which carry negative charges. How-
ever, nitrate binds to positively charged iron and aluminum
oxides present in acid soils. As in the case of urea, nitrate
travels with the water and its distribution in the soil de-
pends on the timing of its injection to the irrigation line.
Phosphorous Phosphorus (P) in solution is subject to interactions
with inorganic and organic constituents in the soil. The
H2PO4- ion remains stable in the solution inside the irriga-
tion line as long as the pH is kept low. Once it is released
to the soil it reacts very quickly with clay minerals like,
montmorillonite and illite in basic soils and with kaolinite
clay, iron and aluminum compounds in acid soils. P reacts
mainly with lime (CaCO3) in basic soil conditions. The
range of relatively insoluble chemical products of P with
soil constituents is so large that it is generally called “fixed
P.”
The rapid reactions of phosphate with Ca (lime rich
soils) in basic soils and with Fe and Al in acid soils restrict
the distance of movement of applied P in the soil. The
higher the clay content or CaCO3 fraction of the soil, the
shorter is the distance of movement of P from the dripper.
Even in sandy soils (Ben Gal and Dudley 2003), the dis-
tance travelled by P is quite limited as compared with the
water. When the P is complexed by organic compounds
like in manures, it does not react with soil constituents and
therefore, can travel to considerable distances from its
point of application in the soil. The leaching of P through
the soil profile is commonly thought to occur only in
coarsely structured soils due to the rapid infiltration of
water and in sandy soils due to the absence of active sites
for P sorption.
Potassium Drip irrigated crops under strict water control usually
develop restricted root volume. The amounts of K present
as exchangeable cation on clay surfaces or as K within the
crystal lattice of illite clay particles in the soil might not be
sufficient to completely meet plant needs for K. Since high
K contents are present in harvested fresh vegetables, fruits,
fresh leaves, tubers and root crops, large amounts of K are
exported from the field. A continuous supply of K during
fertigation is, therefore, required to ensure plant growth,
quality and yield. In practice, the exact distribution of K in
the soil from the drip point is of less importance since the
roots can grow and find the K in the wet root zone. The
efficiency of the plant roots to take up K is so high that
whenever the root meets a K source it is easily taken up. In
sand dunes with low soil K content, fertigation with daily
supply of K and N is needed to ensure their supply to
plants, particularly if there is restricted root volume. When
the soil does not adsorb K due to low level of clay content,
K distribution is typically larger than that of P distribution,
but less than that of N. This was demonstrated in a ferti-
gated field grown tomato on soil containing 95% calcium
carbonate with low CEC (Kafkafi and Bar Yosef 1980).
Crop response to fertigation
All crops respond to fertigation. However, much work
has been concentrated on high value crops (Solaimalai et
al. 2005) such as potato (Badr et al. 2011), capsicum
(Brahma et al. 2010; Gupta et al. 2009; Srinivas and Prab-
hakar 1982), onion (Ewais et al. 2010), medicinal coleus
(Kennam 2008), cucumber (Moujabber et al. 2002), Broc-
coli (Sanchita et al. 2010), tomato (Shedeed et al. 2009),
pointed gourd (Singandhupe et al. 2007), turmeric (Syed
Sadarunnisa et al. 2010), tomato (Tan et al. 2009;
Tanaskovik et al. 2011) and some leafy vegetables (Ueta et
al. 2009). Fertigation gave 40% saving of fertilizer nutri-
ents without affecting the yield of crops compared to the
conventional method of nutrient application (Sathya et al.
2008). Keng et al. (1979) showed that the yields from
broadcast fertilizer treatments were 15.8% lower than that
from fertigation and 12.3% lower than that from banded
fertilizer application.
Sweet pepper: Kaushal et al. (2012) reported that the drip
irrigation adoption increased water use efficiency (60-
200%), saved water (20-60%), reduced fertilization re-
quirement (20-33%) through fertigation, produced better
quality crop and increased yield (7-25%) as compared with
conventional irrigation.
Lady’s finger: Rekha and Mahavishnan (2008) reported
the water and fertilizer saving by 40-70 and 30-50%, re-
spectively through drip fertigation in lady’s finger.
Celery: Kaniszewski et al. (1999) reported that fertigated
celeriac plants had greater leaf area, dry matter production,
and nitrate-N and total N contents than those given through
broadcast N with or without drip irrigation.
Cauliflower : Kapoor et al. (2014) showed that increase in
NPK fertigation level from 33.3 to 100% RDF significantly
increased number of leaves, relative leaf water content,
marketable yield of cauliflower and benefit cost ratio but
decrease in fertilizer expense efficiency. Drip based irriga-
tion along with fertigation in general had higher fruit yield
but lower benefit cost ratio in comparison to flood and
conventional fertilizer application. At Palampur fertigation
using water soluble fertilizers increased marketable yield in
117
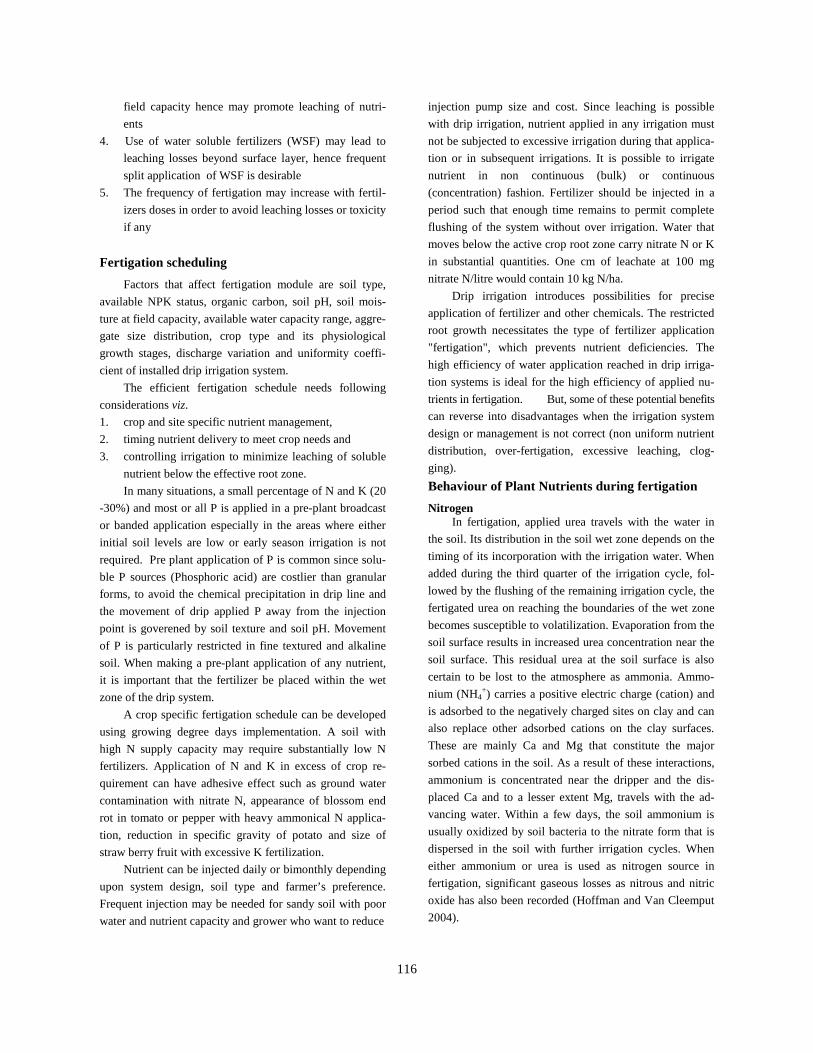
cauliflower by 21.3% as compared to conventional applica-
tion of fertilizers (Table 2).
Broccoli: At Palampur fertigation using water soluble fer-
tilizers increased marketable yield in broccoli by 21.4% as
compared to conventional application of fertilizers (Table
2). However, when 25% nutrients were applied as basal
through conventional fertilizer and 75% nutrient through
fertigation using water soluble fertilizers increase in mar-
ketable yield in broccoli was 12.3% as compared to con-
ventional application of fertilizer (Table 3).
Brinjal : At Palampur, when 25% nutrients were applied as
basal through conventional fertilizer and 75% nutrient
through fertigation using water soluble fertilizers increase
in marketable yield in brinjal was 15.4% as compared to
conventional application of fertilizer (Table 3).
Chilli : Veeranna et al. (2001) reported that 80% water
soluble fertilizer (WSF) was effective in producing about
31 and 24.7% higher chilli fruit yield over soil application
of normal fertilizers at 100% recommended level in furrow
and drip irrigation methods, respectively, with 20% of
saving in fertilizers. Roy et al. (2011) showed in capsicum
that the length and width of fruit and number of fruits per
plant increased significantly with increasing nitrogen doses
up to 100 kg N/ha. However, average weight of fruit in-
creased significantly with increasing levels of P up to 150
kg N/ha. Average weight of fruit and yield increased
significantly with increasing levels of P up to the treatment
30 kg P/ha, whereas length of fruit and number of fruits per
plant was increased significantly up to the 60 kg P/ha. Con-
sidering the combined effect of nitrogen and phosphorus,
the maximum yield was recorded in the treatment combina-
tion of 150 kg N and 30 kg P /ha. At Palampur fertigation
using water soluble fertilizers increased marketable yield in
capsicum by 15.1 as compared to conventional application
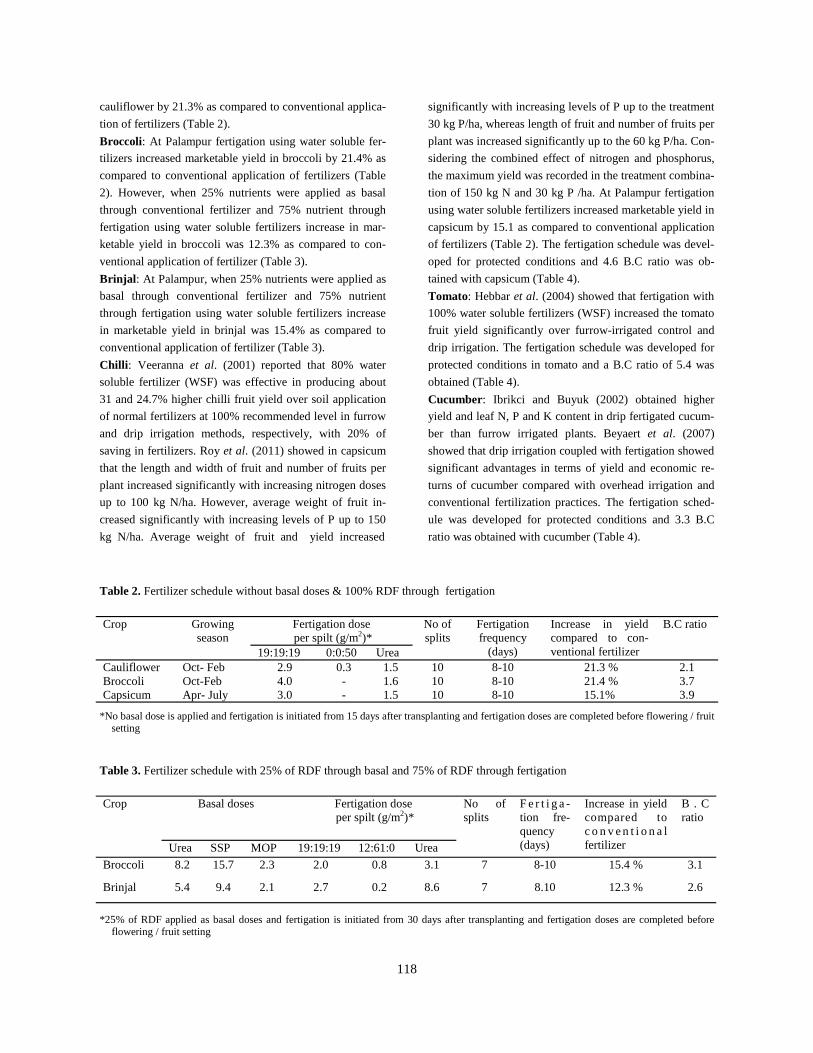
of fertilizers (Table 2). The fertigation schedule was devel-
oped for protected conditions and 4.6 B.C ratio was ob-
tained with capsicum (Table 4).
Tomato: Hebbar et al. (2004) showed that fertigation with
100% water soluble fertilizers (WSF) increased the tomato
fruit yield significantly over furrow-irrigated control and
drip irrigation. The fertigation schedule was developed for
protected conditions in tomato and a B.C ratio of 5.4 was
obtained (Table 4).
Cucumber: Ibrikci and Buyuk (2002) obtained higher
yield and leaf N, P and K content in drip fertigated cucum-
ber than furrow irrigated plants. Beyaert et al. (2007)
showed that drip irrigation coupled with fertigation showed
significant advantages in terms of yield and economic re-
turns of cucumber compared with overhead irrigation and
conventional fertilization practices. The fertigation sched-
ule was developed for protected conditions and 3.3 B.C
ratio was obtained with cucumber (Table 4).
118
Table 2. Fertilizer schedule without basal doses & 100% RDF through fertigation
Crop Growing season
Fertigation dose per spilt (g/m2)*
No of splits
Fertigation frequency
(days)
Increase in yield compared to con-ventional fertilizer
B.C ratio
19:19:19 0:0:50 Urea Cauliflower Oct- Feb 2.9 0.3 1.5 10 8-10 21.3 % 2.1 Broccoli Oct-Feb 4.0 - 1.6 10 8-10 21.4 % 3.7 Capsicum Apr- July 3.0 - 1.5 10 8-10 15.1% 3.9
*No basal dose is applied and fertigation is initiated from 15 days after transplanting and fertigation doses are completed before flowering / fruit setting
Table 3. Fertilizer schedule with 25% of RDF through basal and 75% of RDF through fertigation
Crop Basal doses Fertigation dose per spilt (g/m2)*
No of splits
F e r t i g a -tion fre-quency (days)
Increase in yield compared to c o n v e n t i o n a l fertilizer
B . C ratio
Urea SSP MOP 19:19:19 12:61:0 Urea Broccoli 8.2 15.7 2.3 2.0 0.8 3.1 7 8-10 15.4 % 3.1
Brinjal 5.4 9.4 2.1 2.7 0.2 8.6 7 8.10 12.3 % 2.6
*25% of RDF applied as basal doses and fertigation is initiated from 30 days after transplanting and fertigation doses are completed before flowering / fruit setting
Onion: Chopade et al. (1998) found that drip irrigation
with the recommended rate of solid fertilizer in two appli-
cations gave the highest onion bulb yield while drip fertiga-
tion at 50% of the recommended rate gave the highest bulb
quality. Rumpel et al. (2004) obtained higher marketable
onion yields when the 50 kg/ha N rate was applied through
drip fertigation (41% increase) and highest after applying
150 kg ha−1 N through fertigation (79% increase) as com-
pared to the control (without fertigation and irrigation).
Dingre et al. (2012) showed that drip fertigation resulted
into 12 to 74% increase in the productivity of onion seed as
compared to conventional method. The total irrigation
water applied through surface and drip system was 840 mm
and 520.45 mm indicating 39% water saving whereas, field
water use efficiency of drip fertigation was more by 2.5
times as that of control. Rajput and Patel (2006) recorded
the highest onion yield in daily fertigation followed by
alternate day fertigation. Lowest yield was recorded in
monthly fertigation frequency. Bhakare and Fatkal (2008)
showed that the onion seed yield increased and yield con-
tributing characters improved with fertigation levels with
maximum in 125% recommended dose of fertilizer (RDF)
fertigation treatment which was at par with 100% RDF
fertigation treatment. The treatment 75% RDF through
fertigation was significantly superior to application of
100% RDF through conventional fertilizer and as such,
there could be a saving of 25% of the added fertilizer..
Pea: Singh et al. (2006) showed that the increase in N
through fertigation caused increased in green pea yield at
all the levels of drip irrigation (0.5 Epan, 0.75 Epan and 1.0
Epan), but the magnitude of increase was highest at lowest
level of water supply.
119
Table 4 . Drip fertigation schedule under protected cultivation
Crop Basal dose (g/m2) Fertigation dose/spilt (g/m2) Fertigation interval (days)
B.C ratio
Urea SSP MOP 19:19:19 12:61:0 Urea No of splits
Tomato 14* 34 4 1.2 0.4 0.7 28 5 -7 5.4 Capsicum 10 22 4 1.2 0.1 0.3 28 5 -7 4.6 Cucumber 12 18 6 3.0 2.3 1.2 10 5 -7 3.3
Badr MA, Taalab AS and Tohamy El WA. 2011. Nitrogen
application rate and fertigation frequency for drip
irrigated potato. Australian J Basic and Applied Sci 5:
817-825
Ben Gal A and Dudley LM. 2003. Phosphorus availability
under continuous point source irrigation. Soil Sci. Soc.
Am. J. 67:1449-1456.
Beyaert RP, Roy RC and Coelho BBR. 2007. Irrigation and
fertilizer management effects on processing cucumber
productivity and water use efficiency. Canadian J
Plant Sci 87: 355–363
Bhakare BD and Fatkal YD. 2008. Influence of micro irri-
gation and fertilizer levels on growth, yield and qual-
ity of onion seed. J Water Mangnt 16: 35-39
Brahma S, Saikia L, Barua P, Hazarika T and Sharma B
2010. Studies on effect of fertigation with different
levels of N and K fertilizers on growth, yield, quality
and economics of early season capsicum (Capsicum
annum L. var. grossum) under cover. Veg Sci
37 :160-163.
Chopade SO, Bansode PN, Hiwase SS and Bhuyar RC
1998. Effect of drip fertigation on physiological
growth of onion. Annals Plant Physio 11: 45-48
Dingre SK, Pawar DD and Kadam KG 2012. Productivity,
water use and quality of onion (Allium cepa) seed
production under different irrigation scheduling
through drip. Indian J Agron 57:186-190
Ewais MA, Mahmoud AA and Khalil AA. 2010. Effect of
nitrogen fertigation in comparison with soil applica-
tion on onion production in sandy soils. Alexandria Jf
Agri Res 55: 75-83
Gupta AJ, Chattoo MA and Bhat FN 2009. Techno-
economic evaluation of drip irrigation and fertigation
practices in capsicum under Kashmir conditions. Veg
References
Sci 36 :309-314.
Hagin J, Sneh M and Lowengart-Aycicegi A 2002. Fertiga-
tion – Fertilization through irrigation. IPI Research
Topics No. 23. Ed. by A.E. Johnston. International
Potash Institute, Basel, Switzerland.
Hebbar SS, Ramachandrappa BK, Nanjappa HV and Prab-
hakar M. 2004. Studies on NPK drip fertigation in
field grown tomato (Lycopersicon esculentum Mill.).
European J Agron 21: 117-127
Hofman GJ and Van Cleemput O. 2004. Soil and plant
nitrogen. International Fertilizer Industry Association
(IFA), Paris, France.
Ibrikci GS and Buyuk H. 2002. Yield and elemental com-
position of cucumber as affected by drip and furrow
irrigation. Acta Hort 571: 51-57.
Kafkafi U and Bar-Yosef B. 1980. Trickle irrigation and
fertilization of tomatoes in high calcareous soils.
Agron. J. 72:893-897.
Kaniszewski S, Rumpel J and Dysko J. 1999. Effect of
drip irrigation and fertigation on growth and yield of
celeriac (Apium graveolens L. var. rapaceum (Mill.)
Gaud). Veg Crops Res Bulletin 50: 31-39
Kannan K. 2008. Effect of irrigation method, drip irrigation
regimes and fertigation schedules on growth and yield
of medicinal coleus (Coleus forskohlii). Indian J Agri
Sci 78 : 614-617
Kapoor R, Sandal SK, Sharma Sanjay K, Kumar A and
Saroch K. 2013. Effect of varying drip irrigation lev-
els and NPK fertigation on soil water dynamics, pro-
ductivity and water use efficiency of cauliflower
(Brassica oleracea var. Botrytis) in wet temperate
zone of Himachal Pradesh. Indian J Soil Cons 42: 249
-254
Kaushal A, Lodhi AS and Singh KG. 2011. Economics of
growing sweet pepper under low tunnels, Prog
Agri :67-72.
Keng JCW, Scott TW and Lugo LMA 1979. Fertilizer
management with drip irrigation in an Oxisol. Agron
J 71 : 971-980.
Kumar A and Singh AK 2002. Improving nutrient and
water use efficiency through fertigation. J Water
Mangnt 10: 42-48.
Mmolawa K and Or D 2000. Root zone solute dynamics
under drip irrigation: A review. Plant and Soil
222:163-190. Netherlands, 27 pp.
Moujabber EI, Atallah M and Darwish T. 2002. Crop
modeling and water use efficiency of protected cu-
cumber. Int Atomic Energy Agency Tech Documents
1266: 61-67
Rajput TBS and Patel N. 2006. Water and nitrate move-
ment in drip-irrigated onion under fertigation and
irrigation treatments. Agric Water Mangnt 79: 293-
311
Rekha BK and Mahavishnan K. 2008. Drip fertigation in
vegetable crops with emphasis on lady’s finger
(Abelmoschus esculentus (L.) Moench) – A Review.
Agri Rev 29 : 298 – 305.
Roy SS, Khan MSI and KK Pall 2011. Nitrogen and phos-
phorus efficiency on the fruit size and yield of capsi-
cum. J Expt Sci 2: 32-37.
Rumpel J, Kaniszewski S and Dysko J. 2004. Effect of drip
irrigation and fertilization timing and rate on yield of
onion. J Veg Crop Production 9: 65-73
Sanchita B, Phooken DB, Kachari M, Hazarika TK and
Das K. 2010. Growth, yield and economics of broc-
coli under different levels of nitrogen fertigation.
Indian J Hort 67: 279-282
Sathya S, Pitchai JG, Indirani R and Kannathasan M. 2008.
Effect of fertigation on availability of nutrients (N, P
& K) in soil – A Review. Agri Rev 29: 214-219
Shedeed SI, Zaghloul SM and Yassen AA. 2009. Effect of
method and rate of fertilizer application under drip
irrigation on yield and nutrient uptake by tomato.
Ozean J Applied Sci 2: 139-147
Shock CC, Feibert EB, Saunders LD and James SR. 2003.
Umatilla Russet’ and `Russet Legend’ Potato Yield
and Quality Response to Irrigation. Hort Sci 38:
1117 -1121.
Singandhupe RB, James BK, Edna A and Nanda P. 2007.
Response of drip irrigation and mulching on growth
and fruit yield of pointed gourd (Trichosanthes
dioica). Indian J Agri Sci 77: 8-13
Singh KG, Siag M and Mahajan G. 2006. Water and nutri-
ent requirement of drip irrigated green pea. Haryana
J Hort Sci 35: 320-322
Solaimalai A Baskar, Sadasakthi M A and Subburamu K
2005. Fertigation in high value crops, Agriculture
Review 26 :1-13.
Srinivas K and Prabhakar BS. 1982. Response of capsicum
to nitrogen fertilization. Veg Sci 9: 71-74.
120
Syed Sadarunnisa, Madhumathi C, Rao GS and Sreeni-
vasulu B 2010. Effect of fertigation on growth and
yield of turmeric cv. Mydukur. J Hort Sci 5 : 78-
80.
Tan CS, Zhang TQ, Reynolds WD, Warner J and Drury
CF. 2009. Farm-scale processing tomato production
using surface and subsurface drip irrigation and ferti-
gation. Acta Hort 823 : 77-81.
Tanaskovik V, Cukaliev O, Romic D and Ondrasek G.
2011 The influence of drip fertigation on water use
efficiency in tomato crop production. Agriculturae
Conspectus Scientificus 76: 57-63.
Ueta T, Ikeba T, Ahn-DongHyuk, Kato K, Kawano T and
Matsumoto E. 2009. Effects of drip fertigation on
yield and quality of leaf vegetables and on efficiency
of nitrogen fertilization in outdoor plant. Japanese J
Soil Sci and Plant Nutrition culture. 80: 477-486.
Veeranna HK, Kgalak abdul, AA, Sujith GM. 2001. Effect
offertigation with normal and water soluble fertiliz-
ers compared to drip andfurrow methods on yield,
fertilizer and irrigation water use efficiency in
chilli.Micro Irrigation pp. 461-466.
121
Intensification of cropping through introduction of second crop after peas in Lahaul val-ley of Himachal Pradesh
Himachal Journal of Agricultural Research 41(2): 122-125 (2015)
Anil Kumar, Sandeep Manuja*, Janardan Singh, D.R. Chaudhary and Sanjay K Sharma Highland Agricultural Research and Extension Centre,
*KrishiVigyan Kendra Kukumseri (L&S) Chaudhary Sarwan Kumar Himachal Pradesh Krishi Vishwavidyalaya, Kukumseri (Lahaul and Spiti), Himachal
Pradesh -175142 Corresponding author: [email protected]
Abstract
A field experiment consisted of seven pea based cropping sequences viz. Pea-mustard ‘NDRE 4’, Pea-mustard ‘JD 6’, Pea-toria ‘Bhawani’, Pea-local sarson ‘Yungar’, Pea-French bean ‘Contender’, Pea-buckwheat ‘Local’ and Pea-buckwheat ‘USDA’ was conducted at Kukumseri (Lahaul and Spiti) during 2010 and 2011 to find out the most remunerative second crop after main pea crop for dry temperate conditions of western Himalayas. The local sarson ’Yunger’ took the least days (58 days) for maturity closely followed by French bean. Buckwheat USDA took highest number of days (92) to mature. Among new introduced mus-tard varieties ’NDRE 4’ took 81 days. The highest pea equivalent yield (6377 kg/ha) with net return of INR 86714/ha and B: C ratio of 1.82 was obtained from pea-Frenchbean ‘Contender’ sequence followed by pea-mustard ‘NDRE 4’ (5561 kg/ha) with net return of INR 81478/ha and B: C ratio of 1.86. The increase in yield and net return with the best sequence (pea – Frenchbean ‘Contender) over the most prevalent pea- local sarson ‘Yunger’ sequence was 24.9 and 23.8%, respectively.
Key words: Pea, cropping sequence, economics
Received: 10 October 2015; Accepted: 18 October 2015
Several studies were undertaken on crop diversifica-
tion and intensification in low and mid hills of Himachal
Pradesh (Sharma et al. 2007, 2008, 2009; Rana et al. 2010,
2011). However, in the high hills zone of Himachal
Pradesh where cropping season is limited, studies on inten-
sification of cropping are scanty (Rana et al. 2003; 2005;
2006; Sharma et al. 2015). The cropping season in this dry
temperate area is very short starting from Mid March or
First week of April till October at the most. Lahaul & Spiti
district of Himachal Pradesh falls under high hill dry tem-
perate zone in north western Himalayas. In most part of
Lahaul valley only one crop mainly pea is taken. But with
increase in temperature in last few years in later part of
year i.e. August to October, a short duration second crop
was also cultivated by the farmers. The pea crop vacate the
field in early to mid July and the time left for the second
crop before onset of winter is 80-90 days. The second crop
of buckwheat or local sarson ‘Yunger’ cultivated after pea
are low yielders. Thus, there is scope for introduction of
remunerative crops with maturity duration of 80-90 days.
Keeping these facts in view, introduction of new genotypes
of rapeseed – mustard and other crops which can best fit in
the short cropping duration of this valley and help in increas-
ing the productivity and profitability per unit area and time
was required to be undertaken.
Materials and methods The experiment was conducted at Kukumseri (32o46'15''
N latitude; 76o41'23'' E longitude and 2734 m altitude) dur-
ing 2010 and 2011. The climate of the site was extremely
cold and heavy snowfall occurs during winter. The tempera-
ture remains several degrees below zero. Single cropping
season was prevailing in the region which starts from April
to September or early October when the mean minimum and
maximum temperature ranges between 12°C to 24°C.
122
There was negligible rainfall followed by high light
intensity and low humidity. Average annual rainfall of the
region was 250 mm. The soil of the site was sandy loam
with organic carbon of 0.3% and pH 6.9. Soils were shal-
low in depth and loose in texture resulting in poor water
holding capacity. The available nitrogen, phosphorus and
potassium were medium, high and low, respectively. The
experiment consisted of seven cropping sequences viz., pea
-mustard ‘NDRE 4’, pea-mustard ‘JD 6’, pea-toria
‘Bhawani’, pea-local brown sarson ‘Yunger’, pea-French
bean ‘Contender’, pea- buckwheat ‘local’ and pea- buck-
wheat ‘USDA’ was laid out in randomized block design
with three replications. The pea crop was planted on 28
March and 24 March during first and second year, respec-
tively. The pea crop was harvested on 14th and 11th July in
respective years. The second crop in a sequence was sown
immediately after the harvest within two days. All the
crops were sown with recommended package of practices
under irrigated condition. Snow-melt water, the only source
of irrigation was used to irrigate crops through sprinklers,
rain gun or Kuhl. The rest of the management practices
were in accordance with the recommended package of
practices for the individual crops. The crops were harvested
from net plot. For comparison between crop sequences, the
economic yields of crops were converted into pea equiva-
lent on price basis. Land utilization efficiency was worked
out by summation of duration of each crop under individual
crop sequence divided by 365. Production efficiency (kg/
ha/day) was obtained by dividing total production in terms
of pea equivalent in a sequence by the total duration of year
(365), while profitability (INR/ha/day) was obtained by
dividing net monetary return by 365. Economics of crop-
ping sequences was computed based on prevalent market
prices. Results and Discussion
Crop phenology and yield
The local sarson ‘Yangur’ was the earliest to mature
in 58 days followed by French bean and local variety of
buckwheat, each in 66 days (Table 1). Among the im-
proved varieties of rapeseed mustard, toria ‘Bhawani’ ma-
tured in 67 days followed by mustard variety ‘NDRE 4’ in
81 days. The only second crop to mature after 90 days was
buckwheat variety ‘USDA’. The mustard cultivar ‘JD 6’
was also late maturing (86 days). Cultivated land utilization
index owing to double cropping increased from 29.7%
under the single cropping of peas to 45.6-54.9%. This is
clearly indicated that even after the best utilization of the
land under cropping, the cropping season can hardly be
extended beyond 55% time of the year. For the next five to
six winter season months when the area faces extreme cold
with occasional snowfall, some suitable strategy needs to
be worked out for the region. In these areas the cultivated
duration can best be extended by promoting greenhouse/
polyhouse technology. For this policy and research inter-
ventions must need due attention. Similar efforts as in the
present study, few efforts were also made by earlier work-
ers to extend the cropping season in these areas (Rana et al.
2003; 2005; 2006; Sharma et al. 2015).
The data on yield of different crops are summarized in
Table 2. The highest pea equivalent yield (6377 kg/ha) was
obtained from Pea-French bean ‘Contender’ sequence fol-
lowed by Pea-mustard ‘NDRE 4’ (5561 kg/ha) and Pea-
toria ‘Bhawani’ (5239 kg/ha). The increase in pea equiva-
lent yield over the most prevalent pea – local sarson
‘Yunger’ sequence with these three better sequences was
24.9, 8.9 and 2.6%, respectively. The pea-buckwheat se-
quences were the lower yielders. The matter of caution
here is that while sowing second crop in sequence, it must
gets at least 80 days maturity duration before temperature
will go drastically down by mid October. Although pea-
French bean sequence is the highest yielder but its bulk
transfer in case of early snowfall will be a concern and at
same time it will compete with the produce from the lower
belt. Hence, the second best option after peas could be toria
variety ‘Bhawani’ or mustard variety ‘NDRE 4’ for the
marginal farmers of valley. Owing to higher pea equivalent
yield, productivity efficiency was highest under pea –
French bean ‘Contender’ (17.5 kg/ha/day) followed by pea
– mustard ‘NDRE 4’ (15.2 kg/ha/day) (Table 3).
Economics The highest net returns were obtained from Pea-
Frenchbean ‘Contender’ cropping system (INR 86,714)
followed by pea-mustard ‘NDRE 4’ (INR 81,478) (Table
3). Similarly profitability was highest under pea – French
bean ‘Contender’ cropping system (INR 238/ha/day) fol-
lowed by pea-mustard ‘NDRE 4’. However, the B:C ratio
was highest from pea-mustard ‘NDRE 4’ (1.86). This was
followed by pea – French bean ‘Contender’. The net re-
turns and the B:C ratio were lowest when buckwheat was
taken as second crop.
Conclusively the traditional pea-local sarson ‘Yunger’
sequence can be replaced with most remunerative pea –
French bean ‘Contender’ sequence. Alternatively, mar-
ginal farmers should adopt either pea - mustard ‘NDRE 4’
or Pea - toria ‘Bhawani’ if market is not available for
French bean. These sequences can meet the oil requirement
for the six months winter land locked valley.
123
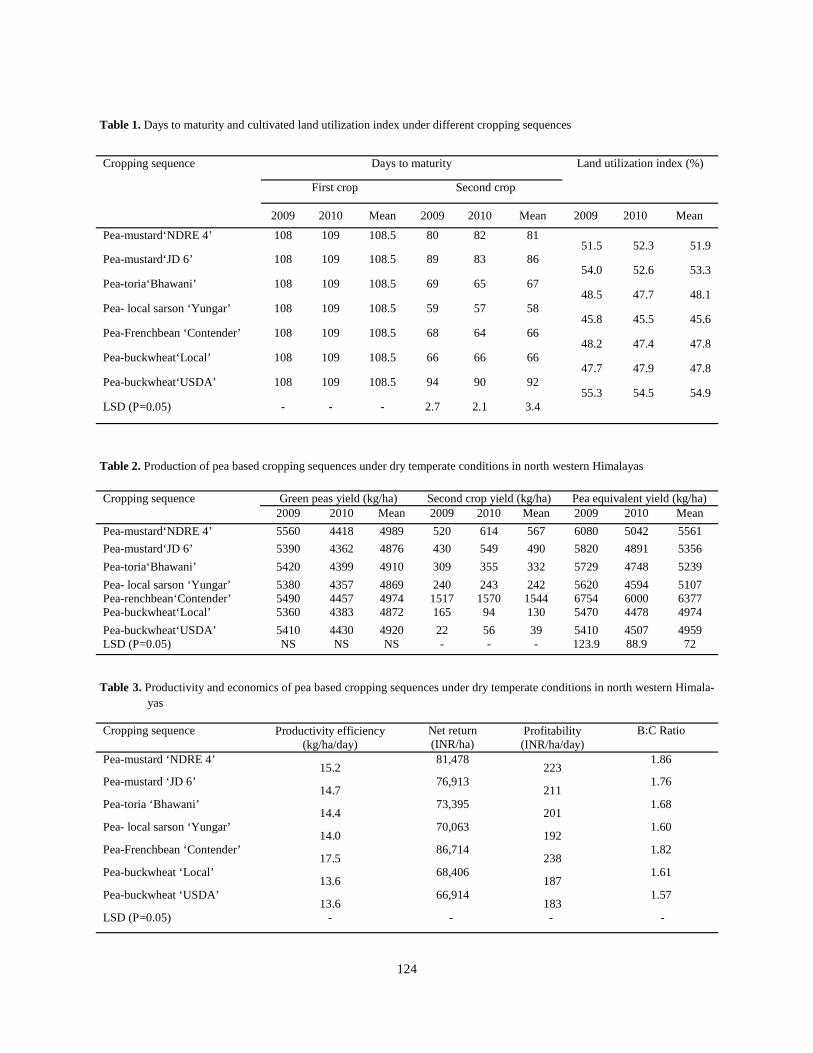
124
Table 1. Days to maturity and cultivated land utilization index under different cropping sequences
Cropping sequence Land utilization index (%)
First crop Second crop
2009 2010 Mean 2009 2010 Mean 2009 2010 Mean
Pea-mustard‘NDRE 4’ 108 109 108.5 80 82 81 51.5 52.3 51.9
Pea-mustard‘JD 6’ 108 109 108.5 89 83 86 54.0 52.6 53.3
Pea-toria‘Bhawani’ 108 109 108.5 69 65 67 48.5 47.7 48.1
Pea- local sarson ‘Yungar’ 108 109 108.5 59 57 58 45.8 45.5 45.6
Pea-Frenchbean ‘Contender’ 108 109 108.5 68 64 66 48.2 47.4 47.8
Pea-buckwheat‘Local’ 108 109 108.5 66 66 66 47.7 47.9 47.8
Pea-buckwheat‘USDA’ 108 109 108.5 94 90 92 55.3 54.5 54.9
LSD (P=0.05) - - - 2.7 2.1 3.4
Days to maturity
Table 2. Production of pea based cropping sequences under dry temperate conditions in north western Himalayas
Cropping sequence Green peas yield (kg/ha) Second crop yield (kg/ha) Pea equivalent yield (kg/ha) 2009 2010 Mean 2009 2010 Mean 2009 2010 Mean Pea-mustard‘NDRE 4’ 5560 4418 4989 520 614 567 6080 5042 5561 Pea-mustard‘JD 6’ 5390 4362 4876 430 549 490 5820 4891 5356 Pea-toria‘Bhawani’ 5420 4399 4910 309 355 332 5729 4748 5239 Pea- local sarson ‘Yungar’ 5380 4357 4869 240 243 242 5620 4594 5107 Pea-renchbean‘Contender’ 5490 4457 4974 1517 1570 1544 6754 6000 6377 Pea-buckwheat‘Local’ 5360 4383 4872 165 94 130 5470 4478 4974 Pea-buckwheat‘USDA’ 5410 4430 4920 22 56 39 5410 4507 4959 LSD (P=0.05) NS NS NS - - - 123.9 88.9 72
Table 3. Productivity and economics of pea based cropping sequences under dry temperate conditions in north western Himala-yas
Cropping sequence Productivity efficiency (kg/ha/day)
Net return (INR/ha)
Profitability
(INR/ha/day) B:C Ratio
Pea-mustard ‘NDRE 4’ 15.2
81,478 223
1.86
Pea-mustard ‘JD 6’ 14.7
76,913 211
1.76
Pea-toria ‘Bhawani’ 14.4
73,395 201
1.68
Pea- local sarson ‘Yungar’ 14.0
70,063 192
1.60
Pea-Frenchbean ‘Contender’ 17.5
86,714 238
1.82
Pea-buckwheat ‘Local’ 13.6
68,406 187
1.61
Pea-buckwheat ‘USDA’ 13.6
66,914 183
1.57
LSD (P=0.05) - - - -
Rana SS, Sood P, Mondal KK and Singh Y. 2003. Influ-
ence of varieties and fertility levels on pea and suc-
ceeding common buckwheat in pea- buckwheat crop-
ping sequence. Life Science Reporter 5 (1&2): 16-19.
Rana SS, Rajinder Pal, Mondal KK and Sood P. 2005.
Influence of seeding time of rajmash varieties inter-
cropped with kalazira under dry temperate conditions.
Indian Journal of Pulses Research 18 (2): 219-221.
Rana MC, Bindra AD and Rana SS. 2006. Identification of
suitable varieties of pea and buckwheat for double
cropping under dry temperate conditions of north-
western Himalayas. Indian Journal of Agricultural
Sciences 76 (4): 222-225.
Sharma SK, Rana SS, Sharma Sanjay K, Bhargava M,
Sharma JJ and Sharma HL. 2007. Production potential
and economic feasibility of irrigated rice based crop-
ping sequences on cultivators’ fields under sub-
montane low hill conditions of Himachal Pradesh.
Himachal Journal of Agricultural Research 33 (1):
110-112.
Sharma SK, Rana SS, Sharma Sanjay K, Subehia SK,
Sharma JJ and Sharma HL. 2008. Production potential
and economic feasibility of rice based cropping se-
quences on cultivators’ fields under sub-montane low
hills of Himachal Pradesh. Himachal Journal of Agri-
cultural Research 34 (2): 5-9.
Sharma SK, Rana SS, Subehia SK, Sharma HL, Sharma JJ
and Sharma Sanjay K. 2009. Evaluation of rice based
cropping sequences on cultivators’ fields in Una dis-
trict of Himachal Pradesh. Himachal Journal of Agri-
cultural Research 35 (2): 171-175.
Rana SS, Sharma JJ, Sharma HL, Sharma Sanjay K,
Sharma SK, Saroch Kapil and Bhargava M. 2010.
Production potential, sustainability and economic
viability of rice based crop sequences under mid hills
of Himachal Pradesh. Himachal Journal of
Agricultural Research 36 (1): 7-12.
Rana SS, Sharma HL, Subehia SK, Negi SC and Sharma
SK. 2011. Promising cropping systems for mid hill
agro-climatic conditions of Himachal Pradesh. Hi-
machal Journal of Agricultural Research 37 (2): 138-
148.
Sharma Vishal, Kalia BD, Rana SS and Gupta Rahul. 2015.
Effect of organic, biofertilizer and inorganic sources
of nutrients on productivity and nutrient status of soil
in garden pea based cropping sequence under Lahaul
valley of Himachal Pradesh. Journal of Soil and Water
Conservation 14 (2): 179-185.
125
References
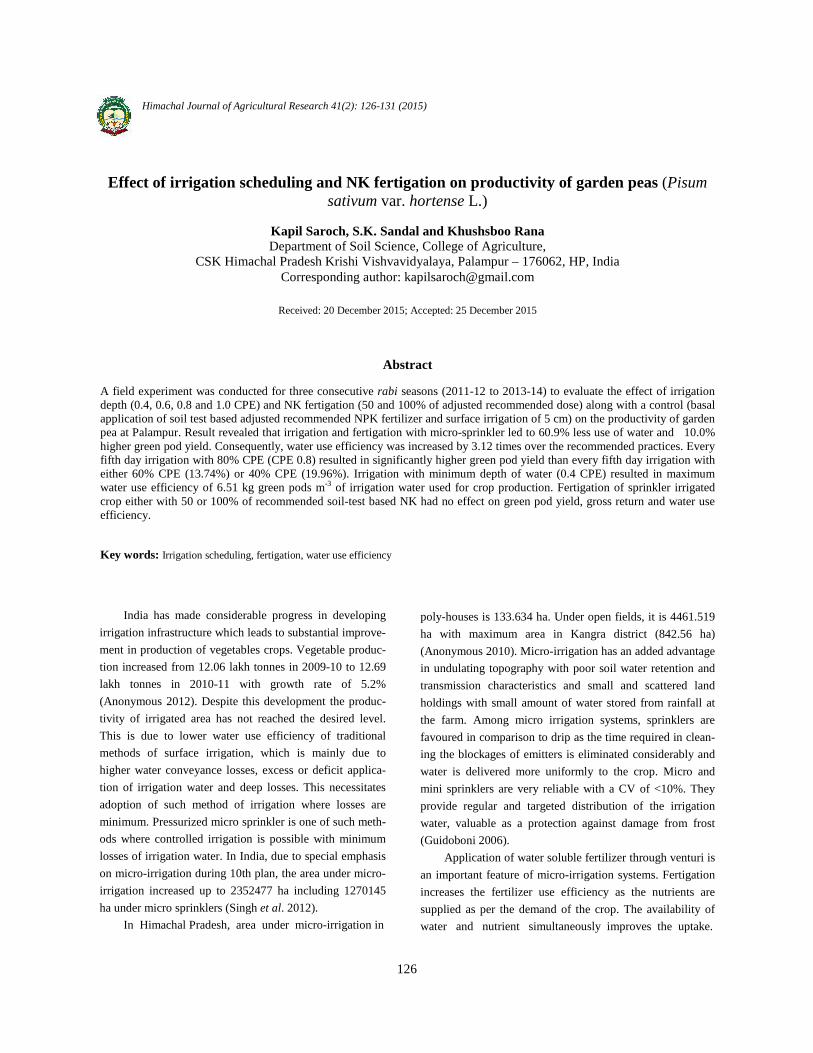
Effect of irrigation scheduling and NK fertigation on productivity of garden peas (Pisum sativum var. hortense L.)
Himachal Journal of Agricultural Research 41(2): 126-131 (2015)
Kapil Saroch, S.K. Sandal and Khushsboo Rana Department of Soil Science, College of Agriculture,
CSK Himachal Pradesh Krishi Vishvavidyalaya, Palampur – 176062, HP, India Corresponding author: [email protected]
Abstract
A field experiment was conducted for three consecutive rabi seasons (2011-12 to 2013-14) to evaluate the effect of irrigation depth (0.4, 0.6, 0.8 and 1.0 CPE) and NK fertigation (50 and 100% of adjusted recommended dose) along with a control (basal application of soil test based adjusted recommended NPK fertilizer and surface irrigation of 5 cm) on the productivity of garden pea at Palampur. Result revealed that irrigation and fertigation with micro-sprinkler led to 60.9% less use of water and 10.0% higher green pod yield. Consequently, water use efficiency was increased by 3.12 times over the recommended practices. Every fifth day irrigation with 80% CPE (CPE 0.8) resulted in significantly higher green pod yield than every fifth day irrigation with either 60% CPE (13.74%) or 40% CPE (19.96%). Irrigation with minimum depth of water (0.4 CPE) resulted in maximum water use efficiency of 6.51 kg green pods m-3 of irrigation water used for crop production. Fertigation of sprinkler irrigated crop either with 50 or 100% of recommended soil-test based NK had no effect on green pod yield, gross return and water use efficiency.
Key words: Irrigation scheduling, fertigation, water use efficiency
Received: 20 December 2015; Accepted: 25 December 2015
India has made considerable progress in developing
irrigation infrastructure which leads to substantial improve-
ment in production of vegetables crops. Vegetable produc-
tion increased from 12.06 lakh tonnes in 2009-10 to 12.69
lakh tonnes in 2010-11 with growth rate of 5.2%
(Anonymous 2012). Despite this development the produc-
tivity of irrigated area has not reached the desired level.
This is due to lower water use efficiency of traditional
methods of surface irrigation, which is mainly due to
higher water conveyance losses, excess or deficit applica-
tion of irrigation water and deep losses. This necessitates
adoption of such method of irrigation where losses are
minimum. Pressurized micro sprinkler is one of such meth-
ods where controlled irrigation is possible with minimum
losses of irrigation water. In India, due to special emphasis
on micro-irrigation during 10th plan, the area under micro-
irrigation increased up to 2352477 ha including 1270145
ha under micro sprinklers (Singh et al. 2012).
In Himachal Pradesh, area under micro-irrigation in
poly-houses is 133.634 ha. Under open fields, it is 4461.519
ha with maximum area in Kangra district (842.56 ha)
(Anonymous 2010). Micro-irrigation has an added advantage
in undulating topography with poor soil water retention and
transmission characteristics and small and scattered land
holdings with small amount of water stored from rainfall at
the farm. Among micro irrigation systems, sprinklers are
favoured in comparison to drip as the time required in clean-
ing the blockages of emitters is eliminated considerably and
water is delivered more uniformly to the crop. Micro and
mini sprinklers are very reliable with a CV of <10%. They
provide regular and targeted distribution of the irrigation
water, valuable as a protection against damage from frost
(Guidoboni 2006).
Application of water soluble fertilizer through venturi is
an important feature of micro-irrigation systems. Fertigation
increases the fertilizer use efficiency as the nutrients are
supplied as per the demand of the crop. The availability of
water and nutrient simultaneously improves the uptake.
126
Under such situation crop may need much less quantity of
nutrient as it needs under conventional method of irrigation
and fertilization. Sprinkler irrigation along with fertigation
through water soluble fertilizers especially nitrogen and
potash will optimize nutrient use and ultimately will in-
crease water and nutrient use efficiency.
Pea (Pisum sativum var. hortense L.) is a cool-season,
nutritious legume widely cultivated throughout the world.
It is a rich source of protein (25%), amino acids, sugars
(12%), carbohydrate, vitamins A and C, calcium and phos-
phorus, apart from having a small quantity of iron. Over
years with steady increase in acreage and production, it has
occupied the position of leading cash crop in Himachal
Pradesh especially in the higher and mid hill zones of Hi-
machal Pradesh. The area under pea crop in Himachal
Pradesh is 22,800 ha with an annual production of 2,54,200
metric tonnes (Anonymous 2011). In low and mid – hill
region of Himachal Pradesh, it is mostly grown as rainfed
crop which is strongly influenced by low availability of soil
moisture especially during initial growth and pod – forma-
tion/development stage as there is no rains from October-
December and March-June. Inadequate soil moisture is
usually a limiting factor in ensuring proper germination
and early growth not only in rain-fed areas but also in kuhl
(Snow fed gravity stream) irrigated areas where tail end
farmers receive sub optimal irrigation water. In recent
year’s trend has been changed from more productivity per
unit land to more productivity per unit water, as water is
becoming increasingly scarce even in those areas where it
was plentiful in recent past. It may be possible to maximize
water productivity in pea by proper scheduling of irriga-
tion. In the light of above a study was planned to study the
effect of irrigation depth and NK fertigation through micro-
sprinkler on crop productivity and water use efficiency.
Material and methods
A field experiment was conducted at Water Manage-
ment Farm, CSK HPKV, Palampur during rabi 2011-12 to
2013-14 to optimize micro sprinkler irrigation and NK
fertigation in garden pea. The area lies in Palam Valley
(32o 06' 39.1'' N latitude and 76o 32' 10.5'' E longitude)
perched in the lap of majestic snow clad Dhauladhar range
of Himalayas at an elevation of 1290 m above mean sea
level in Kangra district of Himachal Pradesh. The soil of
the experimental field was silty clay loam in texture; acidic
in reaction (pH 5.1); high in organic carbon (16.1 g/kg);
medium in available nitrogen (246.5 kg/ha); high in avail-
able phosphorus (38.08 kg/ha) and low in available potas-
sium (141.4 kg/ha). The experiment was laid out in
The experiment was laid out in factorial randomized
block design with three replications. There were nine treat-
ments, comprising of all the possible combinations of four
irrigation depths (0.4, 0.6, 0.8 and 1.0 CPE) and two NK
fertigation levels (50 and 100% of adjusted recommended
dose) plus one control (basal application of soil test based
adjusted recommended NPK fertilizer and surface irriga-
tion of 5 cm).
The irrigation was applied through micro-sprinkler
system at an interval of 4 days. The system consists of
three micro-sprinklers per plot each having wetting diame-
ter of 0.90 m. Mean evaporation rate of preceding 10 crop-
ping seasons was calculated for estimation of irrigation
water requirement. Irrigation requirement was calculated
by taking into account the difference of average evapora-
tion and rainfall (only positive values) and multiplying the
cumulative average evaporation minus actual rainfall value
with CPE ratio. In ‘recommended practice’, 5 cm deep
flood irrigation was applied at 10 days interval. To ensure
uniform crop stand, technique of water seeding of pea
seeds in furrows was followed by application of water at
0.7 l m-1 furrow length before closing them.
The fertilizer dose was calculated by adjusting the
recommended dose of NPK (50:60:60 kg/ha) based on soil
test. Since, soil available P was in higher range, its dose
was lowered by 25%. K was in lower range, so its dose was
increased by 25%. The level of available N in soil was
medium and therefore its dose was not altered. Thus, NPK
dose used in present study was 50:45:75 kg/ha. In NK ferti-
gation treatments, 1/3rd dose of NK was applied as basal.
The remaining 2/3rd NK was applied through water soluble
fertilizers viz., urea for nitrogen and 0:0:50 for potassium in
different calculated proportions through venturi system in 6
equal splits at an interval of 9 days starting at 3-leaf stage
of crop. In ‘recommended practice’, 50:45:75 kg NPK/ha
was applied as basal at the time of sowing through urea,
SSP and MOP.
'Palam Priya' cultivar of garden pea was sown in Oc-
tober at 40 cm x 8 cm spacing in 4.96 m x 2 m (9.92 m2)
plots. The seeds were pre-soaked in water overnight before
sowing. Observations on productivity and water use were
recorded every year. Yield attributes were recorded during
rabi 2012-13. Economics of treatments was worked out
based on the prevalent market prices of inputs and output.
Results and Discussion
Conventional Fertilizer application v/s fertigation During first year, fertigation with micro-sprinkler
resulted in 56.05% water saving and statistically similar
127
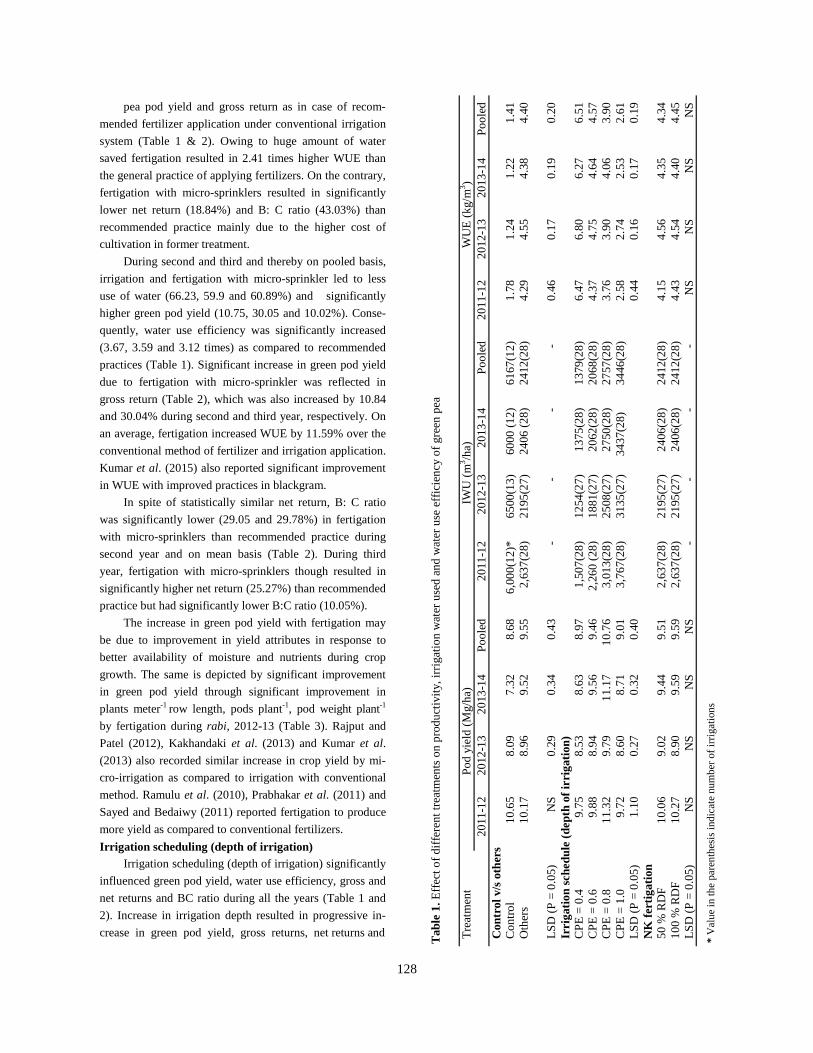
pea pod yield and gross return as in case of recom-
mended fertilizer application under conventional irrigation
system (Table 1 & 2). Owing to huge amount of water
saved fertigation resulted in 2.41 times higher WUE than
the general practice of applying fertilizers. On the contrary,
fertigation with micro-sprinklers resulted in significantly
lower net return (18.84%) and B: C ratio (43.03%) than
recommended practice mainly due to the higher cost of
cultivation in former treatment.
During second and third and thereby on pooled basis,
irrigation and fertigation with micro-sprinkler led to less
use of water (66.23, 59.9 and 60.89%) and significantly
higher green pod yield (10.75, 30.05 and 10.02%). Conse-
quently, water use efficiency was significantly increased
(3.67, 3.59 and 3.12 times) as compared to recommended
practices (Table 1). Significant increase in green pod yield
due to fertigation with micro-sprinkler was reflected in
gross return (Table 2), which was also increased by 10.84
and 30.04% during second and third year, respectively. On
an average, fertigation increased WUE by 11.59% over the
conventional method of fertilizer and irrigation application.
Kumar et al. (2015) also reported significant improvement
in WUE with improved practices in blackgram.
In spite of statistically similar net return, B: C ratio
was significantly lower (29.05 and 29.78%) in fertigation
with micro-sprinklers than recommended practice during
second year and on mean basis (Table 2). During third
year, fertigation with micro-sprinklers though resulted in
significantly higher net return (25.27%) than recommended
practice but had significantly lower B:C ratio (10.05%).
The increase in green pod yield with fertigation may
be due to improvement in yield attributes in response to
better availability of moisture and nutrients during crop
growth. The same is depicted by significant improvement
in green pod yield through significant improvement in
plants meter-1 row length, pods plant-1, pod weight plant-1
by fertigation during rabi, 2012-13 (Table 3). Rajput and
Patel (2012), Kakhandaki et al. (2013) and Kumar et al.
(2013) also recorded similar increase in crop yield by mi-
cro-irrigation as compared to irrigation with conventional
method. Ramulu et al. (2010), Prabhakar et al. (2011) and
Sayed and Bedaiwy (2011) reported fertigation to produce
more yield as compared to conventional fertilizers.
Irrigation scheduling (depth of irrigation) Irrigation scheduling (depth of irrigation) significantly
influenced green pod yield, water use efficiency, gross and
net returns and BC ratio during all the years (Table 1 and
2). Increase in irrigation depth resulted in progressive in-
crease in green pod yield, gross returns, net returns and
128
Tre
atm
ent
Po
d yi
eld
(M
g/h
a)
IWU
(m3 /h
a)
WU
E (
kg/m
3 ) 2
011
-12
20
12-1
3 2
013
-14
Po
ole
d 2
011
-12
20
12-1
3 2
013
-14
Po
ole
d 2
011
-12
20
12-1
3 2
013
-14
Po
ole
d C
ontr
ol v
/s o
ther
s
C
on
tro
l 1
0.6
5 8
.09
7.3
2 8
.68
6,0
00
(12
)*
65
00(1
3)
60
00 (
12
) 6
167
(12
) 1
.78
1.2
4 1
.22
1.4
1 O
ther
s 1
0.1
7 8
.96
9.5
2 9
.55
2,6
37
(28
) 2
195
(27
) 2
406
(2
8)
24
12(2
8)
4.2
9 4
.55
4.3
8 4
.40
LS
D (
P =
0.0
5)
NS
0
.29
0.3
4 0
.43
-
-
-
-
0.4
6 0
.17
0.1
9 0
.20
Irri
gati
on s
ched
ule
(dep
th o
f ir
riga
tion
)
C
PE
= 0
.4
9.7
5 8
.53
8.6
3 8
.97
1,5
07
(28
) 1
254
(27
) 1
375
(28
) 1
379
(28
) 6
.47
6.8
0 6
.27
6.5
1 C
PE
= 0
.6
9.8
8 8
.94
9.5
6 9
.46
2,2
60
(28
) 1
881
(27
) 2
062
(28
) 2
068
(28
) 4
.37
4.7
5 4
.64
4.5
7 C
PE
= 0
.8
11
.32
9.7
9 1
1.1
7 1
0.7
6 3
,01
3(2
8)
25
08(2
7)
2
750
(28
) 2
757
(28
) 3
.76
3.9
0 4
.06
3.9
0 C
PE
= 1
.0
9.7
2 8
.60
8.7
1 9
.01
3,7
67
(28
) 3
135
(27
) 3
437
(28
) 3
446
(28
) 2
.58
2.7
4 2
.53
2.6
1 LS
D (
P =
0.0
5)
1.1
0 0
.27
0.3
2 0
.40
0.4
4 0
.16
0.1
7 0
.19
NK
fer
tiga
tion
5
0 %
RD
F
10
.06
9.0
2 9
.44
9.5
1 2
,63
7(2
8)
21
95(2
7)
24
06(2
8)
24
12(2
8)
4.1
5 4
.56
4.3
5 4
.34
10
0 %
RD
F
10
.27
8.9
0 9
.59
9.5
9 2
,63
7(2
8)
21
95(2
7)
24
06(2
8)
24
12(2
8)
4.4
3 4
.54
4.4
0 4
.45
LSD
(P
= 0
.05
) N
S
NS
N
S
NS
-
-
-
-
N
S
NS
N
S
NS
* V
alu
e in
the
pare
nth
esis
ind
ica
te n
umb
er o
f irr
iga
tio
ns
Tab
le 1
. Effe
ct o
f diff
eren
t tr
eatm
ents
on
pro
du
ctiv
ity,
irrigat
ion
wat
er u
sed
an
d w
ater
use
effi
cien
cy o
f gre
en
pea
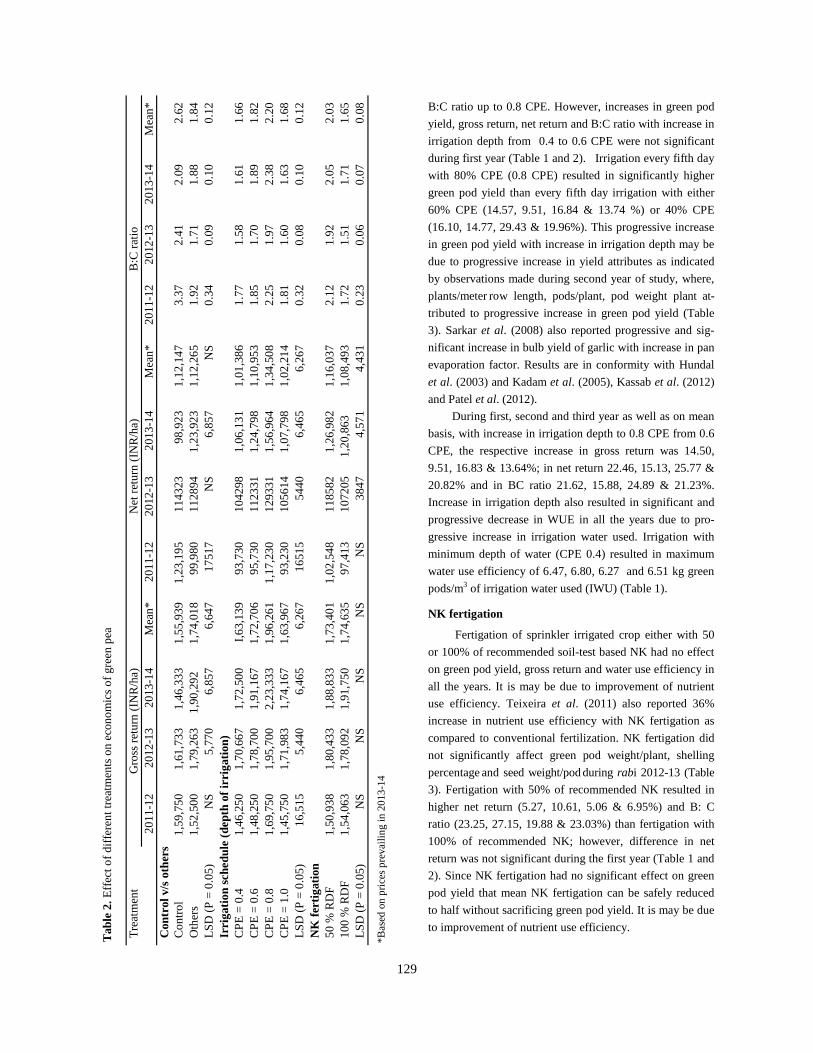
B:C ratio up to 0.8 CPE. However, increases in green pod
yield, gross return, net return and B:C ratio with increase in
irrigation depth from 0.4 to 0.6 CPE were not significant
during first year (Table 1 and 2). Irrigation every fifth day
with 80% CPE (0.8 CPE) resulted in significantly higher
green pod yield than every fifth day irrigation with either
60% CPE (14.57, 9.51, 16.84 & 13.74 %) or 40% CPE
(16.10, 14.77, 29.43 & 19.96%). This progressive increase
in green pod yield with increase in irrigation depth may be
due to progressive increase in yield attributes as indicated
by observations made during second year of study, where,
plants/meter row length, pods/plant, pod weight plant at-
tributed to progressive increase in green pod yield (Table
3). Sarkar et al. (2008) also reported progressive and sig-
nificant increase in bulb yield of garlic with increase in pan
evaporation factor. Results are in conformity with Hundal
et al. (2003) and Kadam et al. (2005), Kassab et al. (2012)
and Patel et al. (2012).
During first, second and third year as well as on mean
basis, with increase in irrigation depth to 0.8 CPE from 0.6
CPE, the respective increase in gross return was 14.50,
9.51, 16.83 & 13.64%; in net return 22.46, 15.13, 25.77 &
20.82% and in BC ratio 21.62, 15.88, 24.89 & 21.23%.
Increase in irrigation depth also resulted in significant and
progressive decrease in WUE in all the years due to pro-
gressive increase in irrigation water used. Irrigation with
minimum depth of water (CPE 0.4) resulted in maximum
water use efficiency of 6.47, 6.80, 6.27 and 6.51 kg green
pods/m3 of irrigation water used (IWU) (Table 1).
NK fertigation
Fertigation of sprinkler irrigated crop either with 50
or 100% of recommended soil-test based NK had no effect
on green pod yield, gross return and water use efficiency in
all the years. It is may be due to improvement of nutrient
use efficiency. Teixeira et al. (2011) also reported 36%
increase in nutrient use efficiency with NK fertigation as
compared to conventional fertilization. NK fertigation did
not significantly affect green pod weight/plant, shelling
percentage and seed weight/pod during rabi 2012-13 (Table
3). Fertigation with 50% of recommended NK resulted in
higher net return (5.27, 10.61, 5.06 & 6.95%) and B: C
ratio (23.25, 27.15, 19.88 & 23.03%) than fertigation with
100% of recommended NK; however, difference in net
return was not significant during the first year (Table 1 and
2). Since NK fertigation had no significant effect on green
pod yield that mean NK fertigation can be safely reduced
to half without sacrificing green pod yield. It is may be due
to improvement of nutrient use efficiency.
129
Tre
atm
ent
Gro
ss r
etu
rn (
INR
/ha)
Net
ret
urn
(IN
R/h
a) B
:C r
atio
20
11-1
2 2
012
-13
20
13-1
4 M
ean
* 2
011
-12
20
12-1
3 2
013
-14
Mea
n*
20
11-1
2 2
012
-13
20
13-1
4 M
ean
* C
ontr
ol v
/s o
ther
s
C
on
tro
l 1
,59
,75
0 1
,61
,73
3 1
,46
,33
3 1
,55
,93
9 1
,23
,19
5 1
143
23
98
,923
1
,12
,14
7 3
.37
2.4
1 2
.09
2.6
2 O
ther
s 1
,52
,50
0 1
,79
,26
3 1
,90
,29
2 1
,74
,01
8 9
9,9
80
11
2894
1
,23
,92
3 1
,12
,26
5 1
.92
1.7
1 1
.88
1.8
4 LS
D (
P =
0.0
5)
NS
5,7
70
6,8
57
6,6
47
17
517
NS
6,8
57
NS
0.3
4 0
.09
0.1
0 0
.12
Irri
gati
on s
ched
ule
(dep
th o
f ir
riga
tion
)
C
PE
= 0
.4 1
,46
,25
0 1
,70
,66
7 1
,72
,50
0 I,
63,
139
93
,730
1
042
98
1,0
6,1
31
1,0
1,3
86
1.7
7 1
.58
1.6
1 1
.66
CP
E =
0.6
1,4
8,2
50
1,7
8,7
00
1,9
1,1
67
1,7
2,7
06
95
,730
1
123
31
1,2
4,7
98
1,1
0,9
53
1.8
5 1
.70
1.8
9 1
.82
CP
E =
0.8
1,6
9,7
50
1,9
5,7
00
2,2
3,3
33
1,9
6,2
61
1,1
7,2
30
12
9331
1
,56
,96
4 1
,34
,50
8 2
.25
1.9
7 2
.38
2.2
0 C
PE
= 1
.0 1
,45
,75
0 1
,71
,98
3 1
,74
,16
7 1
,63
,96
7 9
3,2
30
10
5614
1
,07
,79
8 1
,02
,21
4 1
.81
1.6
0 1
.63
1.6
8 LS
D (
P =
0.0
5)
16
,515
5
,44
0 6
,46
5 6
,26
7 1
651
5 5
440
6
,46
5 6
,26
7 0
.32
0.0
8 0
.10
0.1
2 N
K f
erti
gati
on
50
% R
DF
1,5
0,9
38
1,8
0,4
33
1,8
8,8
33
1,7
3,4
01
1,0
2,5
48
11
8582
1
,26
,98
2 1
,16
,03
7 2
.12
1.9
2 2
.05
2.0
3 1
00
% R
DF
1,5
4,0
63
1,7
8,0
92
1,9
1,7
50
1,7
4,6
35
97
,413
1
072
05
1,2
0,8
63
1,0
8,4
93
1.7
2 1
.51
1.7
1 1
.65
LSD
(P
= 0
.05
) N
S
NS
NS
NS
NS
38
47
4,5
71
4,4
31
0.2
3 0
.06
0.0
7 0
.08
*Ba
sed
on
pric
es p
reva
ilin
g in
20
13-1
4
Tab
le 2
. Effe
ct o
f diff
eren
t tr
eatm
ents
on
eco
no
mic
s o
f gre
en
pea
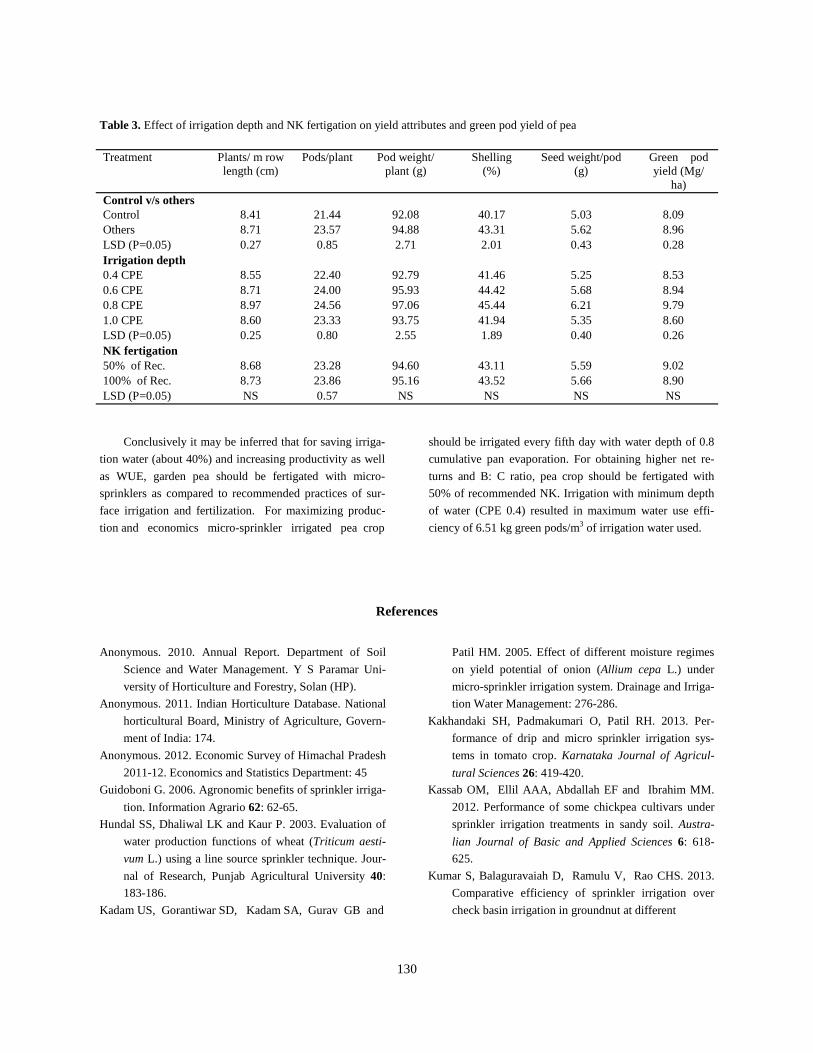
Anonymous. 2010. Annual Report. Department of Soil
Science and Water Management. Y S Paramar Uni-
versity of Horticulture and Forestry, Solan (HP).
Anonymous. 2011. Indian Horticulture Database. National
horticultural Board, Ministry of Agriculture, Govern-
ment of India: 174.
Anonymous. 2012. Economic Survey of Himachal Pradesh
2011-12. Economics and Statistics Department: 45
Guidoboni G. 2006. Agronomic benefits of sprinkler irriga-
tion. Information Agrario 62: 62-65.
Hundal SS, Dhaliwal LK and Kaur P. 2003. Evaluation of
water production functions of wheat (Triticum aesti-
vum L.) using a line source sprinkler technique. Jour-
nal of Research, Punjab Agricultural University 40:
183-186.
Kadam US, Gorantiwar SD, Kadam SA, Gurav GB and
Patil HM. 2005. Effect of different moisture regimes
on yield potential of onion (Allium cepa L.) under
micro-sprinkler irrigation system. Drainage and Irriga-
tion Water Management: 276-286.
Kakhandaki SH, Padmakumari O, Patil RH. 2013. Per-
formance of drip and micro sprinkler irrigation sys-
tems in tomato crop. Karnataka Journal of Agricul-
tural Sciences 26: 419-420.
Kassab OM, Ellil AAA, Abdallah EF and Ibrahim MM.
2012. Performance of some chickpea cultivars under
sprinkler irrigation treatments in sandy soil. Austra-
lian Journal of Basic and Applied Sciences 6: 618-
625.
Kumar S, Balaguravaiah D, Ramulu V, Rao CHS. 2013.
Comparative efficiency of sprinkler irrigation over
check basin irrigation in groundnut at different
130
Treatment Plants/ m row length (cm)
Pods/plant Pod weight/plant (g)
Shelling (%)
Seed weight/pod (g)
Green pod yield (Mg/
ha) Control v/s others Control 8.41 21.44 92.08 40.17 5.03 8.09 Others 8.71 23.57 94.88 43.31 5.62 8.96 LSD (P=0.05) 0.27 0.85 2.71 2.01 0.43 0.28 Irrigation depth 0.4 CPE 8.55 22.40 92.79 41.46 5.25 8.53 0.6 CPE 8.71 24.00 95.93 44.42 5.68 8.94 0.8 CPE 8.97 24.56 97.06 45.44 6.21 9.79 1.0 CPE 8.60 23.33 93.75 41.94 5.35 8.60 LSD (P=0.05) 0.25 0.80 2.55 1.89 0.40 0.26 NK fertigation 50% of Rec. 8.68 23.28 94.60 43.11 5.59 9.02 100% of Rec. 8.73 23.86 95.16 43.52 5.66 8.90 LSD (P=0.05) NS 0.57 NS NS NS NS
Table 3. Effect of irrigation depth and NK fertigation on yield attributes and green pod yield of pea
References
Conclusively it may be inferred that for saving irriga-
tion water (about 40%) and increasing productivity as well
as WUE, garden pea should be fertigated with micro-
sprinklers as compared to recommended practices of sur-
face irrigation and fertilization. For maximizing produc-
tion and economics micro-sprinkler irrigated pea crop
should be irrigated every fifth day with water depth of 0.8
cumulative pan evaporation. For obtaining higher net re-
turns and B: C ratio, pea crop should be fertigated with
50% of recommended NK. Irrigation with minimum depth
of water (CPE 0.4) resulted in maximum water use effi-
ciency of 6.51 kg green pods/m3 of irrigation water used.
irrigation schedules. International Journal of Plant,
Animal and Environmental Sciences 3: 9-13.
Kumar S, Choubey AK and Singh R. 2015. Analysis of
yield gaps in blackgram (Vigna mungo) in district
Bilaspur of Himachal Pradesh. Himachal Journal of
Agricultural Research 41(1): 49-54.
Patel DK, Patel BM, Patel PT, Patel DM and Patel BJ.
2012. Influence of irrigation methods along with ni-
trogen and potash management on yield and nutrient
uptake by potato. Agricultural Science Digest 32: 38-
42
Prabhakar M, Hebbar SS and Nair AK. 2011. Effect of
micro sprinkler fertigation on growth and yield of rabi
onion. Journal of Horticultural Sciences 6: 66-68.
Rajput TBS and Patel N 2012. Potential of micro-irrigation
for enhancing the water productivity in field crops in
India: An overview. Indian Journal of Agronomy 57:
186-194.
Ramulu V, Reddy MD, Rao AM. 2010. Response of rabi
maize to irrigation schedules and fertigation levels.
Agricultural Science Digest 30: 104-106.
Sarkar S, Goswami SB, Mallick S and Nanda MK. 2008.
Different indices to characterize water use pattern of
micro-sprinkler irrigated onion (Allium cepa L.). Agri-
cultural Water Management 95: 625-632.
Sayed MA and Bedaiwy MNA. 2011. Effect of controlled
sprinkler chemigation on wheat crop in a sandy soil.
Soil and Water Research 6: 61-72.
Singh B, Singh R and Singh R. 2012. Improving Water and
Nutrient Use Efficiency through Fertigation. Indian
journal of Fertilizers 8: 94-103.
Teixeira LAJ, Quaggio JA and Mellis EV. 2011. Enhanc-
ing nutrient use efficiency in banana due to irrigation
and fertigation. Revista Brasileira de Fruticultura 33(1): 272-278.
131
Influence of weather parameters on occurrence of rice blast in mid hills of Himachal
Pradesh
Himachal Journal of Agricultural Research 41(2): 132-136 (2015)
Rajendra Prasad, Anupam Sharma and Sweta Sehgal
Department of Agronomy, Forages and Grassland Management, College of Agriculture
CSK Himachal Pradesh Krishi Vishvavidyalaya, Palampur 171062, HP, India
Corresponding author: [email protected]
Abstract
Rice blast, caused by the fungus Magnaporthe grisea Sacc. is one of the most important rice diseases found throughout the globe. It usually damages leaves and panicles and reduces the photosynthetic area of the plant and may even lead to the death of the plant. However the disease does not develop until the favorable weather conditions prevail. Present work was undertaken to study the influence of weather parameters on rice blast in mid hill conditions of Himachal Pradesh. Field experiments were conducted during 1984 to 2012 at Palampur, located in mid hills of the Himachal Pradesh. Two varieties; Hasan Sarai and China 988 were sown on two dates (5th and 15th June) under upland irrigated situation. The first leaf symptoms of the disease appeared in the last week of July or the first week of August, when the mid-tillering stage synchronized with favourable weather conditions during all the years. It was observed that days with minimum temperature ≤ 20 oC, rainfall and cloud cover were important for the appearance and progress of this disease. During disease incidence, period of lower night temperature (19.1 oC), more number of days with minimum temperature ≤ 20 oC (11 days) and lower rainfall (246.6 mm) and more cloud amount (135 hrs) was observed during blast years as compared to non-blast years. It was also found that the maximum and mean temperature one week prior to disease appearance was 1.8 and 1.2 oC lower than the non-blast years indicating warmer temperature during the entire rice growing season is responsible for lower disease incidence and its further progress.
Key words: Rice blast, Magnaporthe grisea, minimum temperature, rainfall, cloud cover, disease incidence
Received: 17 August 2015; Accepted: 13 September 2015
Rice blast, caused by the fungus M. grisea is the most
important of all rice diseases and is distributed throughout
the globe. It can damage any aerial organ of rice plant and
the plants get the highest disease at maximum tillering
stage (Padmanabhan 1965). Leaf infection reduces the
photosynthetic area of the plant and may even lead to its
death. The panicle infection however causes severe yield
losses inflicting the greatest economic injury (Roumen
1992). Losses due to blast may range up to 90% depending
upon the part of plant infected (Prabhu et al. 2003; Ahmad
et al. 2011). The climate has a strong influence on the ap-
pearance of blast epidemics or its absence altogether even
if the sufficient inoculum is present (Suzuki 1975). Lower
minimum temperature and cloud cover have been reported
to be closely associated with the disease (Padmanabhan et
al. 1971; Prasad and Rana 2002). Since the weather is clearly
an important factor in the variability of disease development,
present work was undertaken to study the influence of
weather parameters on rice blast in mid hill conditions of
Himachal Pradesh.
Materials and Methods Field experiments were conducted during 1984 to 2012
in randomized block design with 4.5 m x 3 m plot size at
CSK HPKV, farm, Palampur, located in mid hills of the
Himachal Pradesh under direct seeded and upland irrigated
conditions. Variable crop growing environments under field
situation were created by two dates (5th and 15th June) of
sowing. Two varieties; Hasan Sarai and China 988 were
taken for study under two different fertility levels; 10 t/ha
132
(FYM) + 40 kg/ha of each N, P, and K (farmers' practice)
and 10 t/ha (FYM) + 120 kg/ha N (higher dose), 40 kg/ha
of each P and K. All recommended agronomical practices
were followed to raise the crop. Ten plants were randomly
selected from each plot and tagged. Disease scoring was
made on the tagged plants at different growth stages; tiller-
ing, booting, and flowering for leaf blast by following
Standard Evaluation System (IRRI 1996). Daily weather
data on maximum, minimum temperatures, rainfall, humid-
ity and cloud cover were collected from agro meteorologi-
cal observatory of the university. From these weather pa-
rameters, mean maximum and minimum temperature, days
with ≤≤≤≤20 minimum temperatures, rainfall, rainy and days
with >90% humidity and cloud cover were computed.
Data on weather parameters was calculated for three peri-
ods, one week before incidence, during the incidence and
for the complete kharif season. To assess the weather con-
dition during blast and non blast years, out of total years,
the years were referred as blast years when disease ap-
peared in severe form up to 5-7 scales in districts Kangra
and Mandi. The detail of the individual years is given be-
low:
Historical weather data temperature, relative humidity,
rainy days, cumulative daytime cloud cover, days with
relative humidity > 90% and days with minimum tempera-
ture ≤ 20 oC for the past 29 years (1984 to 2012) during
rice growing period were analyzed in relation to blast and
non- blast years. The weather during disease incidence and
disease development phases was then averaged.
Results and Discussion Weather during disease incidence period during blast and
non blast years
During incidence period of individual blast years’ (1984
and 1992) the maximum, minimum and mean temperature
varied between 25.1-26.7, 18.2-20.0 and 21.7 -23.4oC.
Rainfall 161.6- 331.6 mm, cloud cover 124.3-146.6 hours,
8-9 days with RH >90% and 7-11 days with minimum
temperature ≤ 20 oC were observed (Table 1). Lower night
temperature, more number of days with minimum tempera-
ture ≤ 20 oC and considerable differences were observed
between rainfall (32.3 mm less) and cloud amount (9 hours
more) during disease incidence period of blast as compared
to non-blast years (Table 2).
Persistence of cloudy days followed by clear nights with no
rainfall favours nocturnal cooling and gives rise to copious
dew fall. For proper growth of mycelium a thin film of
water either from rain or dew for a prolonged period is
necessary for disease incidence and further spread. It was
observed that minimum temperature along with days with
minimum temperature ≤ 20 oC, rainfall and cloud cover
was all together important for the appearance and spread of
blast. Absence of even a single favorable parameter leads
to the absence or less incidence and spread of the disease.
If one of them was not favorable, the disease will either not
appear or spread further. Low night temperature is reported
to cause partial breakdown of resistance and cause disease
(Manibhushanro and Day 1972; Prasad and Rana 2002).
Occurrence of temperature of 20 to 24 oC and relative hu-
midity of 90% had been reported to be favorable for the
blast development (Padmanabhan 1953). It was observed
that numbers of days with minimum temperature ≤ 20 oC
were more important than other weather parameters. More
the number of days experienced the minimum temperature
below ≤ 20 o C higher will be the disease as seen that in
blast years, number of days with minimum temperature ≤
20 oC were more as compared to non blast year.
Depending upon the prevailing weather conditions the
first leaf symptoms of disease appeared generally between
the last week of July to the first week of August, when the
crop was in the mid-tillering stage during 2004 to 2012
(Table 3).
Temperature during one week before incidence in blast and non- blast years
Since date of disease incidence was variable every
year, maximum, minimum and mean temperature one week
before disease incidence as an important predisposing
weather parameter for both blast and non-blast years was
also analyzed. The average values are presented in Table 4.
It was found that the maximum and mean temperature one
week before disease incidence was 24.5 and 21.8 o C i.e.,
1.8 and 1.2 oC lower than the non -blast years. Temperature
influenced both penetration and establishment phases and
partially appeared to be more critical at 25 oC (Kaur et al.
1977). It was observed that resistance to blast is governed
not only by genetic factors but also by a set of very critical
environment factors including night temperature to a large
extent (Sadsivan et al. 1971; Chakrabarti 1971).
Temperature during disease development phase during blast and non blast years
There were no perceptible differences in maximum,
minimum and mean temperature during blast and non -
blast years during the disease development phase (Table 4).
133
Particulars Year Blast years 1984 and 1992 Non blast years 1985-1991 and 1993-2012

Table 4. Temperature during disease incidence and development phases
Particular Temperature (oC) during one week before dis-ease incidence phase
Temperature (oC) during disease development phase
Maximum Minimum Mean Maximum Minimum Mean
Blast year 24.5 19.1 21.8 25.8 19.4 22.6
Non blast year 26.3 19.7 23.0 26.0 19.4 22.8
Table 1. Weather parameters during individual rice blast years during disease incidence period (25th July- 5th Aug)
Year Max (oC)
Min (oC)
Mean (oC)
RH (%) Rainfall (mm)
Rainy days
Cloud (hrs)
Days RH
>90%
Days with minimum temperature ≤ 20 o C
1984 26.7 20.0 23.4 85 161.6 11 124.3 9 7
1992 25.1 18.2 21.7 82 331.6 11 146.6 8 11
Table 2. Weather parameters during disease incidence period (25th July- 5th Aug)
Particular Max (oC)
Min (oC)
Mean (oC)
RH (%)
Rainfall (mm)
Rainy days
Cloud (hrs)
Days RH >90%
Days with minimum temperature ≤ 20 o C
Blast year 25.9 19.1 21.5 54 246.6 11 135 9 9
Non blast year
26.0 20.0 23.1 84 278.9 10 126 7 7 ̀
Table 3. Date of the disease appearance and development phase duration
Year Date of Disease incidence Disease development phase
2004 25th July 25th July-30th August
2005 5th August 5th -29th August
2006 28th July 28th July- 31st August
2007 31st July 31st July-26th August 2008 1st August 1st- 29th August
2009 3rd August 3rd – 31st August
2010 2nd August 2nd - 30th August
2011 22nd July 22nd July- 23rd August
2012 27th July 27th July -30th August
134
Weather during Kharif season in blast and non- blast
years
During individual blast year, maximum, minimum and
mean temperature varied between 25.5-25.9, 18.8-19.7 and
22.2-22.8 oC. Rainfall 1517-1827 mm, cloud cover 745-
697 hours, days with RH >90% 12-47 and days with mini-
mum temperature ≤ 20 oC 54-59 were observed. Lower day
and night temperature and higher rainfall and cloud amount
in the season was observed during blast as compared to non
-blast years (Table 5). Besides minimum temperature,
higher rainfall and more cloud cover was associated with
blast incidences. Minimum temperature and humidity of
95% and above for week or more during susceptible phase
of crop was found to be associated with the blast epidemic
(Padmanabhan et al. 1971). The mean maximum and mini-
mum temperatures, mean morning and evening relative
humidity, and rainy days per week were also reported to be
critical in mid hills of Himachal Pradesh by Kapoor and
Kaundal (2007).
The main point emanated from the study indicates that
warmer temperature during disease incidence and during
the season as a whole was responsible for lower disease
incidence and further progress. In our earlier studies it has
already been established that lower minimum temperature
of 18-20 oC was responsible for the disease during the
tillering stage of rice crop (Anonymous 2012). Incidence
and further build up of the disease was the subject of favor-
able weather parameters and not by date of sowing how-
ever higher dose of nitrogen caused higher disease
(particularly neck blast) in variety Hasan Sarai. Favourable
thermal regime and higher dose of nitrogen had however
the supplementary effect.
Conclusion Lower day (24.2 oC) and night (18.7 oC) temperature,
higher rainfall (136.7 mm more) and cloud amount (25 hrs
more) were observed during disease incidence period of
blast years as compared to non-blast years. The maximum
and mean temperature one week before disease incidence
was 24.5 and 21.8 oC, respectively which is 1.8 and 1.2 oC
lower than the non-blast years. It indicates that warmer
temperature during disease incidence and during the season
is responsible for lower disease incidence and further pro-
gress.
Table 5. Weather parameters during kharif season (25th June-7th September)
Particular Max (oC)
Min (oC)
Mean (oC)
RH (%)
Rainfall (mm)
Rainy days
Cloud (hrs)
Days RH >90%
Days with minimum temperature ≤ 20 o C
Blast year 25.8 19.1 22.5 79.3 1674.7 48.0 701.0 28.7 57
Non blast year 26.7 19. 6 23.1 79.7 1365.0 53.8 643.1 29.41 45
References
Ahmad SG, Garg VK, Pandit AK, Anwar A and Aijaz S
2011. Disease incidence of paddy seedlings in relation
to environmental factors under temperate agroclimatic
conditions of Kashmir valley. J. Res. Develop. 2: 29-
38.
Anonymous 2012. Kharif season annual progress report of
All India Coordinated Research Project on Agromete-
orology, Palampur Centre, Himachal Pradesh. p 24.
Chakrabarti NK 1971. Relationship between meteorologi-
cal factors on the development of blast. Oryzae
(suppl) 8 (2): 592-597.
IRRI (International Rice Research Institute) 1996. Stan-
dard evaluation system for rice. 4th edition, Philip-
pines. p 52.
Kaur S, Kaur P and Padmanabhan SY 1997. Influence of
temperature on the develoment of blast in rice. Indian
Phytopathol. 30: 544-546.
Manibhushanro K and Day PR 1972. Low night tempera-
ture and blast disease development on rice. Phytopa-
thology 62: 1005-1007. Padmanabhan SY 1965. Estimating losses from rice blast
in India. In: The rice blast disease. Baltimore, Mary-
land. Johns Hopkins Press. pp 201-203.
135
Padmanabhan SY 1953. Effect of nitrogenous fertilization
upon the sucsceptibilty of rice blast on rice varities.
Curr. Sci. 22: 271-272.
Padmanabhan SY, Chakrabarti NK and Rao KVSRK 1971.
Forecasting and control of rice disease. Proc. Indian
Acad. Sci. 37: 423-429.
Prabhu AS, Filippi MC and Zimmermann FJP 2003. Culti-
var response to fungicide application in relation to rice
blast control, productivity and sustainability. Pesq.
Agropec. Bras. 38: 11-17.
Prasad R and Rana RS 2002.Weather relation of rice blast
in mid hills of Himachal Pradesh. J. Agromet. 4(2):
149-152.
Kapoor AS and Kaundal R 2007. Development of weather
based forewarning systems for rice blast. Him. J. Agri.
Res. 33 (2): 211-217.
Roumen EC, 1992. Partial resistance to neck blast influ-
enced by stage of panicle development and rice geno-
type. Euphytica 64: 173-182.
Sadsivan TS, Suryanarayanan S and Ramkrishna L 1965.
Influence of temperature on rice blast disease. Johns
Hopkins Press, Baltomore, Maryland, pp 163-171.
Suzuki H 1975. Meteorological factors in the epidemiology
of rice blast. Ann. Rev. Phytopathol. 13: 239-256.
136

Studies on gene action in relation to yield and quality traits in cauliflower (Brassica ol-
eracea var. botrytis L.)
Himachal Journal of Agricultural Research 41(2): 137-141 (2015)
Yudhvir Singh, Rishu, Arti Verma and Sanjay Chadha Department of Vegetable Science and Floriculture
CSK Himachal Pradesh Krishi Vishvavidyalaya, Palampur- 1760 62, India
Corresponding author: [email protected]
Abstract
The present investigation was carried out at Palampur during rabi 2012 and 2013 to gather information on the nature of gene action by following line × tester mating design involving five lines and three testers. The analysis of variance revealed signifi-cant differences among treatments for days to marketable curd maturity from date of transplanting, gross weight per plant, mar-ketable yield per plant, curd size index, curd depth, curd diameter, per cent marketable curds, stalk length, number of leaves per plant, plant height, harvest index, ascorbic acid content and total soluble solids. The magnitude of dominance variance was higher than additive variance for all the traits except curd depth and total soluble solids which indicated the involvement of non-additive gene action which could be utilized through the development of hybrids in cauliflower. A complete correspondence was noticed between per cent contribution of line × tester interaction (crosses) and non-additive gene action (σ2D), which reaf-firm the importance of hybrids in cauliflower.
Key words: Cauliflower, gene action, GCA variance, SCA variance and line × tester
Received: 27 August 2015; Accepted: 13 September 2015
Cauliflower (Brassica oleracea var. botrytis L.)
(2n=2x=18) belongs to the cole group of vegetables. It was
probably originated in the island of Cyprus from where it
moved to other areas like Syria, Turkey, Egypt, Italy, Spain
and north-western Europe. Syria is considered to be the
place of origin for cauliflower. It is one of the important
winter vegetables grown throughout India. Today among
cole crops, it occupies the pride place in India due to its
delicious taste, flavour and being nutritive. It has been
rightly described as aristocrat of vegetables. It is grown for
its white tender curd commonly used as a vegetable, in
curry, soup and for pickling. Cauliflower is a low-calorie
food with good dietary fiber, abundant in vitamins (C, B,
A, K) and minerals like phosphorus, potassium, calcium,
sodium, iron, manganese, magnesium and molybdenum.
The leading cauliflower producing countries in the world
are China, India, Spain, Italy and France. India is the sec-
ond major cauliflower producing country after China in the
world and contributes 32 per cent in area and 36 per cent in
the world production share.
In India, cauliflower is cultivated in an area of 4,04,200
ha with the production of 78,86,700 metric tonnes and its
productivity is 19.6 metric tonnes/ ha (Anonymous, 2013),
but its potential productivity is 35-40 metric tonnes/ha and
maximum productivity of 45.25 metric tonnes/ha has been
achieved in New Zealand. In the country, area under hybrids
in cauliflower is low as compared to open pollinated and
unknown varieties. Thus, for increasing its production and
productivity at par with advanced countries, development of
hybrids is need of the hour. Hybrids are preferred over the
open pollinated varieties on account of their uniform matur-
ity, higher yield and better adaptability under adverse grow-
ing conditions. At present, the farmers are purchasing hybrid
seeds from the private firms at exorbitant rates. To tide over
the situation, there is a need to make concerted efforts to
develop quality F1 hybrids with better productivity and
adaptability so as to make available their seeds to the farmers
at a reasonable price.
137
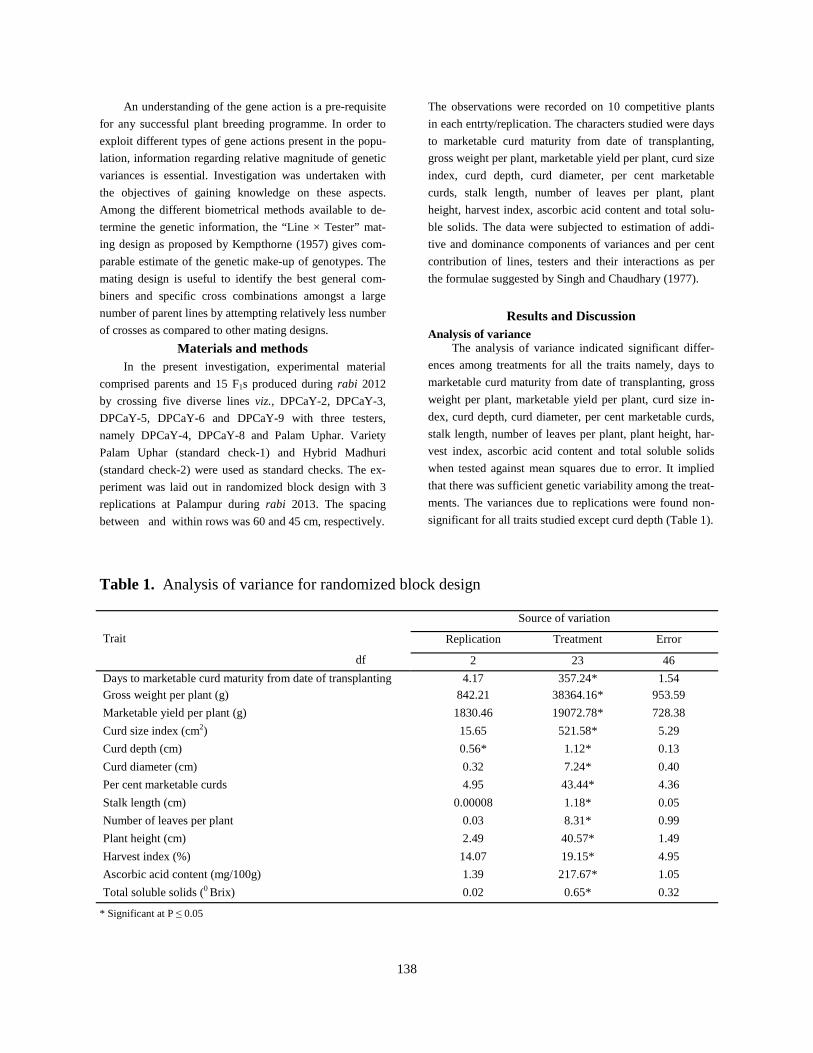
An understanding of the gene action is a pre-requisite
for any successful plant breeding programme. In order to
exploit different types of gene actions present in the popu-
lation, information regarding relative magnitude of genetic
variances is essential. Investigation was undertaken with
the objectives of gaining knowledge on these aspects.
Among the different biometrical methods available to de-
termine the genetic information, the “Line × Tester” mat-
ing design as proposed by Kempthorne (1957) gives com-
parable estimate of the genetic make-up of genotypes. The
mating design is useful to identify the best general com-
biners and specific cross combinations amongst a large
number of parent lines by attempting relatively less number
of crosses as compared to other mating designs.
Materials and methods In the present investigation, experimental material
comprised parents and 15 F1s produced during rabi 2012
by crossing five diverse lines viz., DPCaY-2, DPCaY-3,
DPCaY-5, DPCaY-6 and DPCaY-9 with three testers,
namely DPCaY-4, DPCaY-8 and Palam Uphar. Variety
Palam Uphar (standard check-1) and Hybrid Madhuri
(standard check-2) were used as standard checks. The ex-
periment was laid out in randomized block design with 3
replications at Palampur during rabi 2013. The spacing
between and within rows was 60 and 45 cm, respectively.
The observations were recorded on 10 competitive plants
in each entrty/replication. The characters studied were days
to marketable curd maturity from date of transplanting,
gross weight per plant, marketable yield per plant, curd size
index, curd depth, curd diameter, per cent marketable
curds, stalk length, number of leaves per plant, plant
height, harvest index, ascorbic acid content and total solu-
ble solids. The data were subjected to estimation of addi-
tive and dominance components of variances and per cent
contribution of lines, testers and their interactions as per
the formulae suggested by Singh and Chaudhary (1977).
Results and Discussion Analysis of variance
The analysis of variance indicated significant differ-
ences among treatments for all the traits namely, days to
marketable curd maturity from date of transplanting, gross
weight per plant, marketable yield per plant, curd size in-
dex, curd depth, curd diameter, per cent marketable curds,
stalk length, number of leaves per plant, plant height, har-
vest index, ascorbic acid content and total soluble solids
when tested against mean squares due to error. It implied
that there was sufficient genetic variability among the treat-
ments. The variances due to replications were found non-
significant for all traits studied except curd depth (Table 1).
138
Table 1. Analysis of variance for randomized block design
Source of variation
Trait Replication Treatment Error
df 2 23 46
Days to marketable curd maturity from date of transplanting 4.17 357.24* 1.54 Gross weight per plant (g) 842.21 38364.16* 953.59
Marketable yield per plant (g) 1830.46 19072.78* 728.38
Curd size index (cm2) 15.65 521.58* 5.29
Curd depth (cm) 0.56* 1.12* 0.13
Curd diameter (cm) 0.32 7.24* 0.40
Per cent marketable curds 4.95 43.44* 4.36
Stalk length (cm) 0.00008 1.18* 0.05
Number of leaves per plant 0.03 8.31* 0.99
Plant height (cm) 2.49 40.57* 1.49
Harvest index (%) 14.07 19.15* 4.95
Ascorbic acid content (mg/100g) 1.39 217.67* 1.05
Total soluble solids (0 Brix) 0.02 0.65* 0.32
* Significant at P ≤ 0.05
Estimates of genetic components of variance An important step in a breeding programme is to
choose suitable breeding methodology for purposeful man-
agement of generated variability which largely depends on
the type of gene action in the population for the trait under
genetic improvement (Cockerham, 1961; Sprague, 1966).
Among the various designs developed for this purpose, line
× tester method (Kempthorne, 1957) not only helps in
evaluating parents and crosses for combining ability but
also provides information on the nature of gene action con-
trolling the traits under consideration. The nature of gene
action has been inferred from estimates of GCA and SCA
variances. The estimates of general combining ability vari-
ances [σ2GCA (lines), σ2GCA (testers) and σ2GCA
(average)], specific combining ability variances (σ2SCA),
additive variances (σ2A), dominance variances (σ2D) and
proportional contribution of lines, testers and their interac-
tions to the total variances are presented in Table 2. The
values of σ2SCA ranged from -0.04 (TSS) to 2641.09
(gross weight), while σ2GCA (average) ranged from -1.15
(ascorbic acid content) to 456.23 (gross weight/plant).
The testers showed a higher σ2GCA than the lines for
days to marketable curd maturity from date of transplant-
ing, gross weight per plant, marketable yield per plant, curd
size index, curd depth, curd diameter, per cent marketable
curds, number of leaves per plant and plant height, whereas
σ2GCA due to lines was higher than the σ
2GCA due to the
testers for traits, stalk length, harvest index, ascorbic acid
content and total soluble solids. This indicates that both
testers and lines have more diversity for the respective
traits.
The estimates of σ2SCA were higher as compared to
σ2GCA (average) for days to marketable curd maturity
from date of transplanting, gross weight per plant, market-
able yield per plant, curd size index, curd diameter, per
cent marketable curds, stalk length, number of leaves per
plant, plant height, harvest index and ascorbic acid content
indicating the pre-dominant role of non-additive gene ac-
tion governing these traits. For rest of the traits, σ2GCA
was higher than σ2SCA. The traits in which σ2SCA was
higher than σ2GCA (average), σ2D was also higher than
σ2A. The additive gene action was observed for curd depth
and total soluble solids as reflected from their higher addi-
tive component of variance than the dominant component
of variance. The higher magnitude of σ2D indicated the
involvement of non-additive gene action. Low to moderate
heritability in narrow sense was observed, which suggested
that heterosis breeding could be useful for obtaining higher
gains for the traits studied.
Since, non additive gene action for most of the traits
has been found to be predominant, heterosis breeding can
prove to be an important tool in cauliflower improvement.
However, for the traits viz., curd depth and total soluble
solids, where additive variance is high, selection can be
followed. These results are in close conformity to the find-
ings of Gangopadhayay et al. (1997), Garg et al. (2003),
Singh et al. (2005), Jindal and Thakur (2005), Varalakshmi
(2009) and Verma and Kalia (2011).
Proportional contribution of lines, testers and their interactions
The proportional contribution of lines ranged from
5.99 (gross weight) to 48.66 per cent (stalk length). The
contribution of lines for marketable yield per plant was
13.95 per cent. The proportional contribution of testers
ranged from 2.25 (ascorbic acid content) to 86.78 per cent
(days to marketable curd maturity from date of transplant-
ing), while contribution of testers for marketable yield per
plant was 70.70 per cent. Similarly, the proportional contri-
bution of line × tester interactions ranged from 6.01 (days
to marketable curd maturity from date of transplanting) to
69.39 per cent (ascorbic acid content). The contribution of
line × tester interactions for marketable curd yield per plant
was 13.59 per cent (Table 2).
The contribution of lines was found to be higher than
individual contribution of testers and interactions between
line × tester for stalk length and total soluble solids. The
contribution of testers was found to be higher than individ-
ual contribution of lines and line × tester for days to mar-
ketable curd maturity from date of transplanting, gross
weight per plant, marketable yield per plant, curd size in-
dex, curd depth, curd diameter, per cent marketable curds
and number of leaves. The contribution of line × tester
interactions was found to be higher than individual contri-
bution of lines and testers for plant height, harvest index
and ascorbic acid content.
A complete correspondence was noticed between per
cent contribution of line × tester interaction (crosses) and
non-additive gene action (σ2D). The results of gene action
studies reaffirm the importance of hybrids in cauliflower.
The estimates of GCA and SCA variances, additive (σ2A)
and dominant (σ2D) components of variance and contribu-
tion of lines, testers and line × tester interactions revealed
that for most of the traits non additive gene action was in
preponderance or in appreciable magnitude. Therefore,
heterosis breeding will be a better option compared to other
approaches . Curd depth and total soluble solids, exhibiting
additive gene action suggests the use of selection in segre-
gating populations to develop improved inbred lines.
139

140
Tra
it D
ays
to
mar
-ke
tab
le c
urd
m
atu
rity
fro
m
dat
e o
f tra
ns-
pla
ntin
g
Gro
ss
wei
ght
per
pla
nt
(g)
Mar
keta
ble
yi
eld
per
p
lan
t (g
)
Cu
rd
size
in
dex
(c
m2 )
Cu
rd
dep
th
(cm
)
Cu
rd
dia
me-
ter
(cm
)
Mar
-ke
tab
le
curd s (%)
Sta
lk
len
gth
(c
m)
Nu
mb
er
of l
eave
s p
er p
lant
Pla
nt
hei
ght
(cm
)
Har
vest
in
dex
(%)
Asc
orb
ic
acid
co
n-
ten
t (m
g/1
00
g)
To
tal
solu
ble
solid
s
(0
Brix
)
Gen
etic
co
mp
o-
nen
t
σ2 G
CA
(lin
es)
3.2
8 -4
79.4
4 2
48.
31
6.0
8 0
.04
0.0
8 0
.44
0.0
3 0
.01
0.1
1 -0
.14
-3.7
5 0
.15
σ2 G
CA
(te
ster
s) 7
9.7
7 6
597
.54
28
74.6
6 1
47.
83
0.2
3 0
.88
12
.0 6 0
.02
1.2
1 1
.42
-0.7
6 -1
0.7
4 -0
.00
3
σ2
GC
A
(ave
rage
) 6
.34
45
6.23
2
40.
35
11
.75
0.0
2 0
.07
0.9
5 0
.00
5 0
.09
0.1
2 -0
.07
-1.1
5 0
.01
4
σ2 S
CA
6.5
1 2
641
.09
45
5.05
1
9.2
6 0
.00
3 0
.28
1.2
2 0
.02
0.6
3 4
.45
2.7
3 6
1.3
5 -0
.04
σ2 A
2
5.3
7 1
824
.91
96
1.40
4
7.0
0 0
.08
0.2
9 3
.80
0.0
2 0
.37
0.4
7 -0
.28
-4.6
2 0
.05
σ2 D
2
6.0
6 1
056
4.37
1
820
.20
77
.03
0.0
1 1
.10
4.8
8 0
.07
2.5
2 1
7.7
8 1
0.9
1 2
45.
43
-0.1
4
He
rita
bil
ity
(nar
row
se
nse
) %
64
.35
23
.55
40
.47
52
.87
46
.45
26
.19
22
.0 0 1
9.9
8 1
6.0
1 4
.55
-3.2
6 -3
.89
25
.52
Gen
etic
ad
van
ce 5
.89
30
.19
28
.73
7.2
6 0
.29
0.4
1 6
.59
0.0
9 0
.35
0.2
1 -0
.14
-0.6
2 0
.18
Pro
po
rtio
na
l co
ntr
ibu
tion
of
lines
(%
)
7.2
1 5
.99
13
.95
8.4
9 1
9.9
1 1
6.5
0 9
.72
48
.66
15
.49
24
.95
30
.34
28
.36
75
.72
Pro
po
rtio
na
l co
ntr
ibu
tion
of
test
ers
(%)
86
.78
70
.70
72
.46
82
.42
68
.86
62
.12
77
.4 0 2
5.1
0 5
4.4
1 2
8.3
8 2
.51
2.2
5 3
.79
Pro
po
rtio
na
l co
ntr
ibu
tion
of
line
×
test
er
in-
tera
ctio
ns
(%)
6.0
1 2
3.3
1 1
3.5
9 9
.09
11
.23
21
.38
12
.8 8 2
6.2
4 3
0.0
9 4
6.6
7 6
7.1
4 6
9.3
9 2
0.4
8
Tab
le 2
. E
stim
ates
of g
ene
tic c
ompo
nent
s of
va
rianc
e an
d pr
opo
rtio
nal c
ont
ribut
ion
of li
nes,
test
ers
and
thei
r in
tera
ctio
ns
Anonymous 2013. Indian Horticulture Database. National
Horticulture Board, Ministry of Agriculture, Govern-
ment of India, Gurgaon, New Delhi.
Cockerham CC 1961. Implication of genetic variances in
hybrid breeding programme. Crop Sci. 1: 47-52.
Gangopadhyay KK, Gill HS and Sharma SR 1997. Hetero-
sis and combining ability studies in early group of
Indian cauliflower involving self incompatible lines.
Veg. Sci. 24: 26-28.
Garg N, Lal T and Vashisht VK 2003. Studies on combin-
ing ability and gene action in Indian cauliflower
(Brassica oleracea var. botrytis L.). Crop Improv. 30:
169-176.
Jindal SK and Thakur JC 2005. Genetic architecture of
quantitative characters in November maturity cauli-
flower. Crop Improv. 32: 92-94.
Kempthorne O 1957. An introduction to Genetic Statistics.
John Wiley and Sons, New York, London pp 458-471.
Singh D, Varalakshmi B and Reddy MAN 2005. Combin-
ing ability studies in early cauliflower (Brassica ol-
eracea var. botrytis L.). Indian J. Hort. 62: 27-32.
Singh RK and Chaudhary BD 1977. Line × Tester analysis.
Biometrical Methods in Quantitative Genetic Analy-
sis. Kalyani Publishers, Ludhiana pp 191-200.
Sprague GF 1966. Quantitative genetic in plant improve-
ment. Proceeding of Symposium, The lowa State Uni-
versity, Amesiowa. pp 315-334.
Varalakshmi B 2009. Heterosis and combining ability for
yield and its components in early cauliflower. Indian
J. Hort. 66: 198-203.
Verma VK and Kalia P 2011. Combining ability studies in
early and mid-maturity CMS based cauliflower lines.
Indian J. Hort. 68: 503-506.
141
References
Genetic variability in biparental progenies of radish (Raphanus sativus L.)
Himachal Journal of Agricultural Research 41(1): 142-145 (2015)
K.S. Chandel, Tirtha Raj Pokharel, Aanchal Chauhan, J. K. Sharma and R.K. Kataria Department of Seed Science and Technology, CSK Himachal Pradesh Krishi Vishvavidyalaya, Palampur, HP, In-
dia-176062 Corresponding author: [email protected]
Abstract Biparental progenies (BIP’s) of inter-varietal cross Mino Early White x Pusa Himani (MEW x PH) of radish were developed in F2 generation by utilizing North Carolina Design –I suggested by Comstock and Robinson (1948 and 1952). The analysis of variance indicated significant differences among the BIP’s and F3 progenies for different horticultural and quality parameters studied indicating the presence of good quantum of variability between BIP’s and F 3 progenies. Biparental progenies when compared with F3 progenies for their overall mean values revealed that former had greater means for most of the characters except leaf weight, leaf length and nitrate content. The biparental progenies resulted in creation of more genetic variability by breakage of both coupling and repulsion phase linkages that conceal the genetic variability in F2. The phenotypic variability as revealed by the coefficient of variation (%) was greater in BIP progenies than F3 progenies. The superior performance of bipar-ental and F3 generations revealed the breakage of undesirable linkages and plateau effect for bringing further improvement in radish.
Key words: Radish, biparental progenies, F3 progenies, variability studies
Received: 20 July 2015; Accepted: 22 August 2015
Radish (Raphanus sativus L.) is an important quick
growing, herbaceous root vegetable crop grown for its
fresh edible roots throughout the world. It belongs to the
family Brassicaceae and is probably a native of Europe and
Asia. Its different preparations are useful in curing liver
and gall bladder problems. Roots are also used for treating
urinary complaints and piles (Hazra et al. 2013). Inspite of
its economic importance, no major strive has so far been
made for the improvement of its yield and quality traits. In
allogamous crops like radish, the general breeding proce-
dures have been to select desired segregants in the F2 popu-
lation, followed by mass selection or combined mass pedi-
gree selection in the subsequent generations.
These methods do not allow growing and testing of
large number of plants in F2 and succeeding generations.
These also do not permit repeated inter-crossing required
for obtaining desired recombinants better in yield and qual-
ity traits. Therefore, conventional breeding methodology is
inadequate to create maximum range of useful genetic
variability required for switching genetic amelioration
endeavour in any crop species for complex character like
yield. Inter-mating of randomly selected F2 plants may
overcome these limitations to a considerable extent by accu-
mulating favourable alleles and breaking undesirable link-
ages. This allows an additional cycle of recombination lead-
ing to transgressive segregants. The variability, thus, gener-
ated by breaking undesirable linkages can effectively be
utilized in the subsequent generations. Biparental mating in
early segregating generations would not only help in creating
new rare recombinants, but also retain greater variability by
breaking tight and unfavourable linkages for selection to be
effective for a longer period. Keeping in view the above-
mentioned facts, the present investigation based on biparen-
tal and F3 progenies have been undertaken to obtain informa-
tion on the genetic architecture of root yield and component
traits in radish as suggested by Comstock and Robinson
(1948 and 1952).
Materials and Methods The present investigation was carried out at Vegetable
Research Farm, CSKHPHV, Palampur (H.P.) in Randomized
Block Design (RBD) with three replications for root yield,
quality traits and yield contributing components. The experi-
mental material was developed from an inter-varietal cross
viz., Mino Early White x Pusa Himani (MEW x PH). The
142
parents were selected based on their genetically diverse
origin involving Asiatic and European cultivars.
Biparental progenies were developed in F2 generations of
the inter-varietal cross MEW x PH using North Carolina
Design -I as suggested by Comstock and Robinson (1948
and 1952). The biparental progenies were developed
by designating four F2 plants as male parents and
crossing each of these to four plants selected as
females. The plants used as males and females
were chosen at random for the development of bi-
parental progenies and no seed parent was used in
more than one mating. The plants used in making
the biparental progenies were also selfed. Thus,
the family consisted of sixteen progenies (four in
each male group). Twenty F3 families were de-
veloped by selfing (4 males and 16 females). The experi-
ment comprised three such sets or a total of 48 biparental
progenies and 60 F3 families. The data on BIP’s and F3
progenies were recorded for root yield, yield components
and quality parameters (Table 1).
The method o f analys is o f var iance fo l -
lowed was as proposed by Comstock and Rob-
inson (1948 and 1952) . The standard errors of s2m
and s2f were calculated as per formulae proposed by Moll
et al. (1960), whereas the standard errors of s2A and s2D
were calculated by the method proposed by Panse and Suk-
hatme (1984). Expected gains from full-sib family selec-
tion were calculated as per procedure outlined by Robinson
et al. (1949).
Results and Discussion The analysis of variance indicated significant differ-
ences among the BIP’s and F3 progenies for different
growth, yield and quality traits studied exhibiting the pres-
ence of good quantum of variability between BIP’s and F3
progenies.
Biparental progenies when compared with F3 proge-
nies for their overall mean values, in general, had greater
means for most of the characters (except leaf weight, leaf
length and nitrate content) which may be due to more het-
erozygosity in the former (biparental) progenies. The supe-
rior performance of biparental families seems to be primar-
ily due to generation of more genetic variability by break-
age of both coupling and repulsion phase linkages that
conceal the genetic variability in F2. The study confirms
the findings of Dadlani et al. (1983), Lal et al. (1990) in
cauliflower, Singh and Sharma (1983) in okra and Kumar
(1997) in brinjal. Superior mean performance of BIP’s
over F2 self’s would generally be expected when major
portion of total genetic variance is additive and additive x
additive type. In addition, even dominance and epistatic
components could play some role towards increase in the
mean of BIP’s as compared to F2 self’s. These results cor-
roborate with the findings of Kanwar and Korla (2002) and
Kumar (1997) in brinjal.
The comparison of biparental and F3 progenies for
root yield per plant revealed that the mean of BIP’s (395.2
g) was significantly higher than F3 progenies (319.3g) in
cross Mino Early White x Pusa Himani (MEW x PH). Sig-
nificantly higher mean values were also observed in case
BIP’s for root yield per plot, root weight, root diameter,
root: top ratio, days taken to maturity and dry matter con-
tent. The ‘t’ ratio for leaf weight was negative and signifi-
cant in cross Mino Early White x Pusa Himani. This sug-
gests that it could be possible to isolate early transgressive
segregants.
As regards the range in mean values for the various
characters (Table 1), it was observed that the lower value
of the range was less in F3 progenies compared to BIP’s
and the higher value was high in BIP’s as compared to F3
progenies in most of the cases. Obviously, the proportion
of desirable variants increased in the BIP’s, which was also
accompanied by an increase in the mean performance as
stated earlier. Similar results were also reported by Singh
and Sharma (1983) in okra, Dadlani et al. (1983) and
Kumar (1997) in brinjal and Kanwar and Korla (2002) in
cauliflower.
The phenotypic variability as revealed by the coeffi-
cient of variation (%), was greater in BIP progenies than F3
progenies for most of the characters. This may be due to
the breakage of both coupling and repulsion phase linkage
in BIP’s. The superiority of BIP’s progenies over F3 proge-
nies with respect to coefficient of variation has also been
reported by Singh and Sharma (1983) in okra. However,
exceptions were noted in cross for root yield per plot, root
length and root: top ratio where the coefficient of variation
was higher in F3 progenies than BIPs. These results sub-
stantiated the findings of Dadlani et al. (1983) who had
also reported superiority of F3 progenies over BIP’s with
respect to coefficient of variation in cauliflower.
The BIP’s M2 x F8, M1 x F17, M1 x F18, M1 x F20, M2 x
F24, M3 x F42 and M4 x F48 resulted in high mean values for
root yield, quality traits and yield contributing components.
The outstanding cross combinations were M1 x F18, M2 x F8
and M1 x F17. These combinations manifested increase in
root yield to the extent of 72.74, 60.91, 60.24%, 126.47,
110.95, 110.03% and 34.21, 25.02, 24.50% over the re-
spective parents viz., Mino Early White (MEW), Pusa Hi-
mani (PH) and the F1 produced from them. The increase in
143
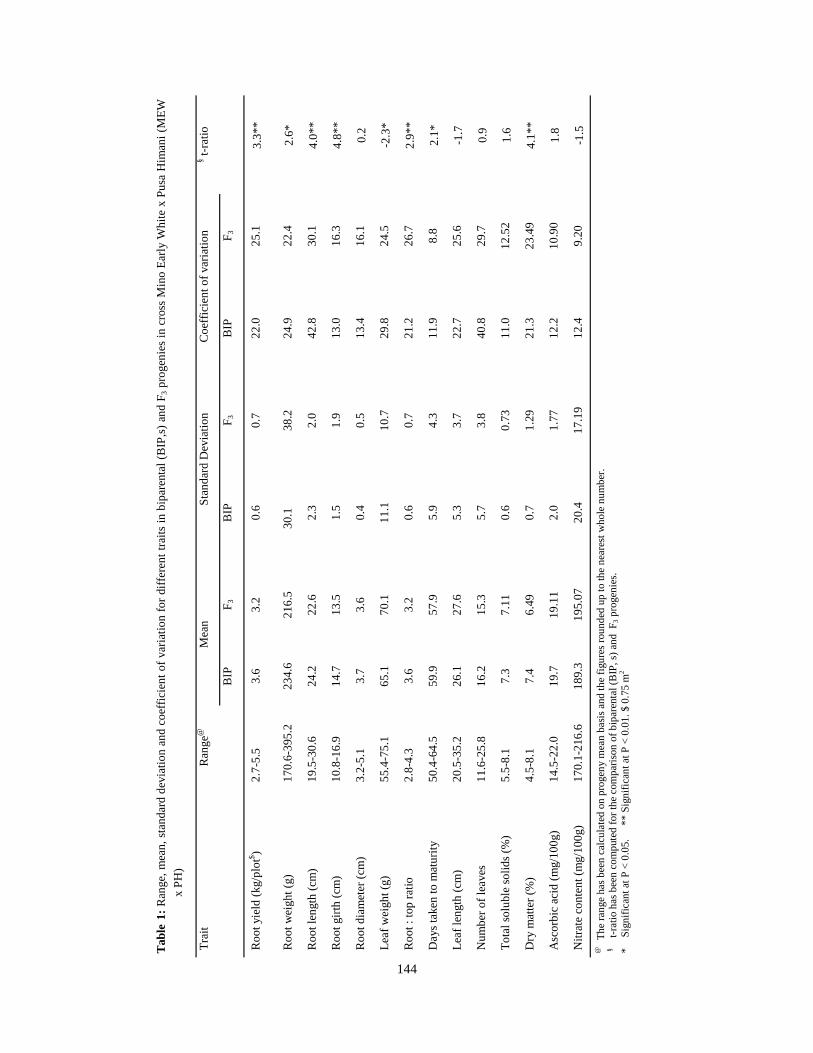
Tra
it R
ange
@
Mea
n
S
tan
dar
d D
evia
tion
Co
effic
ien
t o
f var
iatio
n § t
-rat
io
BIP
F
3 B
IP
F3
BIP
F
3
Ro
ot
yiel
d (
kg/p
lot$ )
2.7
-5.5
3.6
3
.2
0.6
0
.7
22
.0
25
.1
3.3
**
Ro
ot
wei
ght
(g)
17
0.6
-395
.2 2
34.
6 2
16.
5
30
.1 3
8.2
2
4.9
2
2.4
2
.6*
Ro
ot l
engt
h (
cm)
19
.5-3
0.6
24
.2
22
.6
2.3
2
.0
42
.8
30
.1
4.0
**
Ro
ot
girt
h (
cm)
10
.8-1
6.9
14
.7
13
.5
1.5
1
.9
13
.0
16
.3
4.8
**
Ro
ot d
iam
eter
(cm
) 3
.2-5
.1 3
.7
3.6
0
.4
0.5
1
3.4
1
6.1
0
.2
Lea
f w
eigh
t (g
) 5
5.4
-75
.1 6
5.1
7
0.1
1
1.1
1
0.7
2
9.8
2
4.5
-2
.3*
Ro
ot :
top
rat
io 2
.8-4
.3 3
.6
3.2
0
.6
0.7
2
1.2
2
6.7
2
.9**
Da
ys t
ake
n t
o m
atu
rity
50
.4-6
4.5
59
.9
57
.9
5.9
4
.3
11
.9
8.8
2
.1*
Lea
f len
gth
(cm
) 2
0.5
-35
.2 2
6.1
2
7.6
5
.3
3.7
2
2.7
2
5.6
-1
.7
Nu
mb
er o
f lea
ves
11
.6-2
5.8
16
.2
15
.3
5.7
3
.8
40
.8
29
.7
0.9
To
tal s
olu
ble
solid
s (%
) 5
.5-8
.1 7
.3
7.1
1 0
.6
0.7
3 1
1.0
1
2.5
2 1
.6
Dry
mat
ter
(%)
4.5
-8.1
7.4
6
.49
0.7
1
.29
21
.3
23
.49
4.1
**
Asc
orb
ic a
cid
(m
g/1
00
g) 1
4.5
-22
.0 1
9.7
1
9.1
1 2
.0
1.7
7 1
2.2
1
0.9
0 1
.8
Nitr
ate
con
ten
t (m
g/1
00
g) 1
70.
1-2
16.6
18
9.3
19
5.07
2
0.4
1
7.1
9 1
2.4
9
.20
-1.5
@
Th
e ra
nge
ha
s b
een
ca
lcu
late
d on
pro
gen
y m
ean
ba
sis
and
the
figu
res
rou
nd
ed u
p to
the
nea
rest
wh
ole
nu
mb
er.
§
t-
ratio
ha
s b
een
com
put
ed fo
r th
e co
mp
aris
on o
f bip
are
nta
l (B
IP,
s) a
nd
F 3 p
roge
nie
s.
*
Sig
nifi
can
t at
P <
0.0
5.
**
Sig
nifi
can
t at
P <
0.0
1. $
0.7
5 m2
Tab
le 1
: R
ange
, m
ean
, st
and
ard
dev
iatio
n an
d co
effic
ien
t o
f v
aria
tion
for
diffe
ren
t tr
aits
in b
ipar
enta
l (B
IP,
s) a
nd
F 3 p
roge
nie
s in
cro
ss M
ino
Ear
ly W
hite
x P
usa
Him
ani
(ME
W
x P
H)
144
root yield by them was 43.56, 33.73, 33.18% and 24.87,
16.32, 15.84% over F2 and F3 generations, respectively.
On comparing the coefficient of variation for various
characters, it was observed that comparatively high quan-
tum of phenotypic variability was observed in case of root
yield per plot, root weight, root length, leaf weight, root:
top ratio and number of leaves. The limited variability for
most of the characters, in parents probably resulted in nar-
row coefficient of variation in BIP’s and F3 progenies. In
spite of this narrower variability, the increase in root yield
in top 5% BIP’s was remarkable as found in the plant
breeding comparisons. Top 5% BIP’s were superior to their
corresponding top 5% F3 progenies, original parents, F1’s
and F2’s progenies. Thus, the BIP’s assume importance in
the improvement of radish by breaking the plateau effect,
which has resulted due to fixation of genes and as such
transgressive segregants are feasible in radish through bi-
parental mating which could be utilized for the develop-
ment of high yielding and quality cultivars of radish.
Comstock RE and Robinson HF 1948. The components of
genetic variance in population of biparental progenies
and their use in estimating the average degree of
dominance. Biometrics 4: 254-266.
Comstock RE and Robinson HF 1952. Estimation of aver-
age dominance of genes. In: Heterosis, ed Gowen JW,
IOWA State College Press, Ames. IOWA, pp 494-
516.
Dadlani ND, Swarup V and Chatterjee SS 1983. Studies on
biparental progenies in Indian cauliflower. Vegetable
Science 10(1): 112-122.
Hazra P, Chattopadhyay A, Karmakar A and Dutta S 2013
Radish.In: Modern Technology in Vegetable Produc-
tion, New India Publishing Agency, New Delhi, pp
256-266.
Kanwar MS and Korla BN 2002. Performance of Biparen-
tal progenies in late cauliflower variability and asso-
ciation analysis. Vegetable Science 29(1): 13-16.
Kumar P 1997. Genetic analysis of some horticultural traits
including bacterial wilt resistance genotypes in brinjal
(Solanum melongena L.). Ph D (Agri.) Thesis, Faculty
of Agriculture, CSKHPKV, Palampur.
Lal T, Chatterjee SS and Swarup V 1990. Evaluation of
biparental progenies for the improvement of Indian
cauliflower. Vegetable Science 17(2): 157-166.
Moll RH, Robinson HF and Cockerham CC 1960. Genetic
variability in an advanced generation of a cross of two
open pollinated varieties of corns. Agronomy Journal
52: 171-173.
Panse VG and Sukhatme PK 1984. Statistical methods for
Agricultural workers, ICAR, New Delhi, pp 381.
Robinson HF, Comstock RE and Harvey PH 1949. Esti-
mates of heritability and the degree of dominance in
corn. Agronomy Journal 41: 353-359.
Singh SB and Sharma BR 1983. Relative efficiency of
different mating system for improvement of Okra.
SABRAO Journal 15(2): 125-131.
References
145

Himachal Journal of Agricultural Research 41(2): 146-150 (2015)
M.S. Pathania and Gurrala Anil Kumar Department of Agricultural Economics, Extension Education and Rural Sociology
CSK Himachal Pradesh Krishi Vishvavidyalaya, Palampur-176062, HP, India
Corresponding author: [email protected]
Abstract
The Pong dam wetland is the largest man made wetland of district Kangra of Himachal Pradesh. This reservoir covers an area of 24,529 ha. The local people adjoining the Pong wetland exploit the wetland for food grain production and fishing. Thus, it provides significant role in their household system. The Department of Fisheries in Himachal Pradesh initiated commercial fishing soon after the emergence of the reservoir. Scanty attempts have been made in the past for estimation of economic bene-fits accrued from the wetland. The present study was carried out in Pong Dam wetland. The fishing households were randomly selected. The total cost of fish capture was INR 47,427 per fisherman. The fixed cost accounted for 14.44% of total cost. The total variable cost incurred on fishing was INR 40,579/fisherman/annum which accounted for 85.56% of the total cost. The gross income obtained by a fisherman from fishing was INR 96552 per annum. The net return over variable cost and total cost was positive indicating profitability of the fishing to the fishermen. The return on investment was 2.03. Season wise fish catch per fisherman was highest in winter (272.78 kg/fisherman) followed by rainy (163.24 kg/fisherman) and summer (137.61 kg/fisherman). The average production per day was about 2 kg per fisherman. The fishermen share in consumer’s rupees was high-est (75%) in winter. The per kg expenditure incurred by the contractor for marketing of fish was INR 11/kg. Since the fishing business is adopted by large population, therefore, the royalty and commission charged from the fishermen need to be reduced. The co-operative societies should provide facility of mechanized boating at subsidized rate to enhance the efficiency and in-come of the fishermen.
Key words: Wetland, fish production, return, return on investment, fishermen share in consumer’s rupees
Received: 05 September 2013; Accepted: 13 September 2013
Wetlands are recognized as the most productive ecosys-tem on the earth for their vital role in sustaining a wide array of bio-diversity and providing goods and services to the society. These support millions of people not only liv-ing in their periphery but outside the wetlands as well (Katarina 2008). The Ministry of Environment and Forests, Government of India, has declared at least 21 wetlands of national importance in the country. Out of these, three wet-lands- Pong Dam, Renuka and Chandertal are situated in Himachal Pradesh. The state of Himachal Pradesh has 27 natural wetlands covering an area of 15 km2. Besides, there are 5 manmade wetlands covering an area of 712 km2. The Pong dam wetland located in district Kangra, is one of the largest man made wetland in Himachal Pradesh. The catch-ment area of the wetland is 12560 km2. This reservoir
covers an area of 24,529 ha. The wetland portion is 15,662 ha. Pong dam wetland was declared a Ramsar wetland site on account of its rich waterfowl diversity and sustainable use of the wetland. The local people adjoining the Pong wetland exploit it for food grain production and fishing. Therefore, it provides significant role in their household system. The De-partment of Fisheries in Himachal Pradesh initiated commer-cial fishing soon after the emergence of the reservoir. The exploitation of wetland is done in common property re-sources regime. Due to the free ridership of wetlands, the pace of degradation is quite high. Scanty attempts have been made in the past for estimation of economic benefits from this wetland. Therefore, in the present study, an attempt has been made to study returns accrued to sample households from fisheries.
146
An exploratory study on production and economics of fishing in Pong Dam wetland of district Kangra
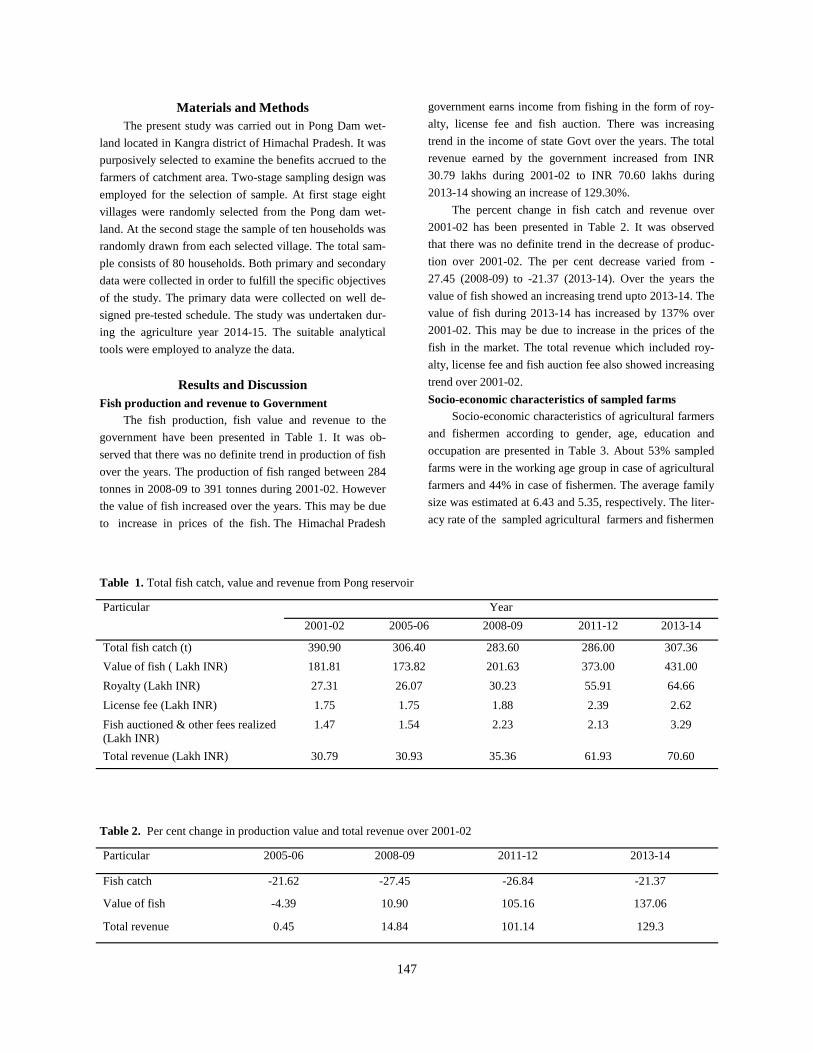
Materials and Methods The present study was carried out in Pong Dam wet-
land located in Kangra district of Himachal Pradesh. It was
purposively selected to examine the benefits accrued to the
farmers of catchment area. Two-stage sampling design was
employed for the selection of sample. At first stage eight
villages were randomly selected from the Pong dam wet-
land. At the second stage the sample of ten households was
randomly drawn from each selected village. The total sam-
ple consists of 80 households. Both primary and secondary
data were collected in order to fulfill the specific objectives
of the study. The primary data were collected on well de-
signed pre-tested schedule. The study was undertaken dur-
ing the agriculture year 2014-15. The suitable analytical
tools were employed to analyze the data.
Results and Discussion Fish production and revenue to Government
The fish production, fish value and revenue to the
government have been presented in Table 1. It was ob-
served that there was no definite trend in production of fish
over the years. The production of fish ranged between 284
tonnes in 2008-09 to 391 tonnes during 2001-02. However
the value of fish increased over the years. This may be due
to increase in prices of the fish. The Himachal Pradesh
government earns income from fishing in the form of roy-
alty, license fee and fish auction. There was increasing
trend in the income of state Govt over the years. The total
revenue earned by the government increased from INR
30.79 lakhs during 2001-02 to INR 70.60 lakhs during
2013-14 showing an increase of 129.30%.
The percent change in fish catch and revenue over
2001-02 has been presented in Table 2. It was observed
that there was no definite trend in the decrease of produc-
tion over 2001-02. The per cent decrease varied from -
27.45 (2008-09) to -21.37 (2013-14). Over the years the
value of fish showed an increasing trend upto 2013-14. The
value of fish during 2013-14 has increased by 137% over
2001-02. This may be due to increase in the prices of the
fish in the market. The total revenue which included roy-
alty, license fee and fish auction fee also showed increasing
trend over 2001-02.
Socio-economic characteristics of sampled farms Socio-economic characteristics of agricultural farmers
and fishermen according to gender, age, education and
occupation are presented in Table 3. About 53% sampled
farms were in the working age group in case of agricultural
farmers and 44% in case of fishermen. The average family
size was estimated at 6.43 and 5.35, respectively. The liter-
acy rate of the sampled agricultural farmers and fishermen
147
Particular Year
2001-02 2005-06 2008-09 2011-12 2013-14
Total fish catch (t) 390.90 306.40 283.60 286.00 307.36
Value of fish ( Lakh INR) 181.81 173.82 201.63 373.00 431.00
Royalty (Lakh INR) 27.31 26.07 30.23 55.91 64.66
License fee (Lakh INR) 1.75 1.75 1.88 2.39 2.62
Fish auctioned & other fees realized (Lakh INR)
1.47 1.54 2.23 2.13 3.29
Total revenue (Lakh INR) 30.79 30.93 35.36 61.93 70.60
Table 1. Total fish catch, value and revenue from Pong reservoir
Table 2. Per cent change in production value and total revenue over 2001-02
Particular 2005-06 2008-09 2011-12 2013-14
Fish catch -21.62 -27.45 -26.84 -21.37
Value of fish -4.39 10.90 105.16 137.06
Total revenue 0.45 14.84 101.14 129.3
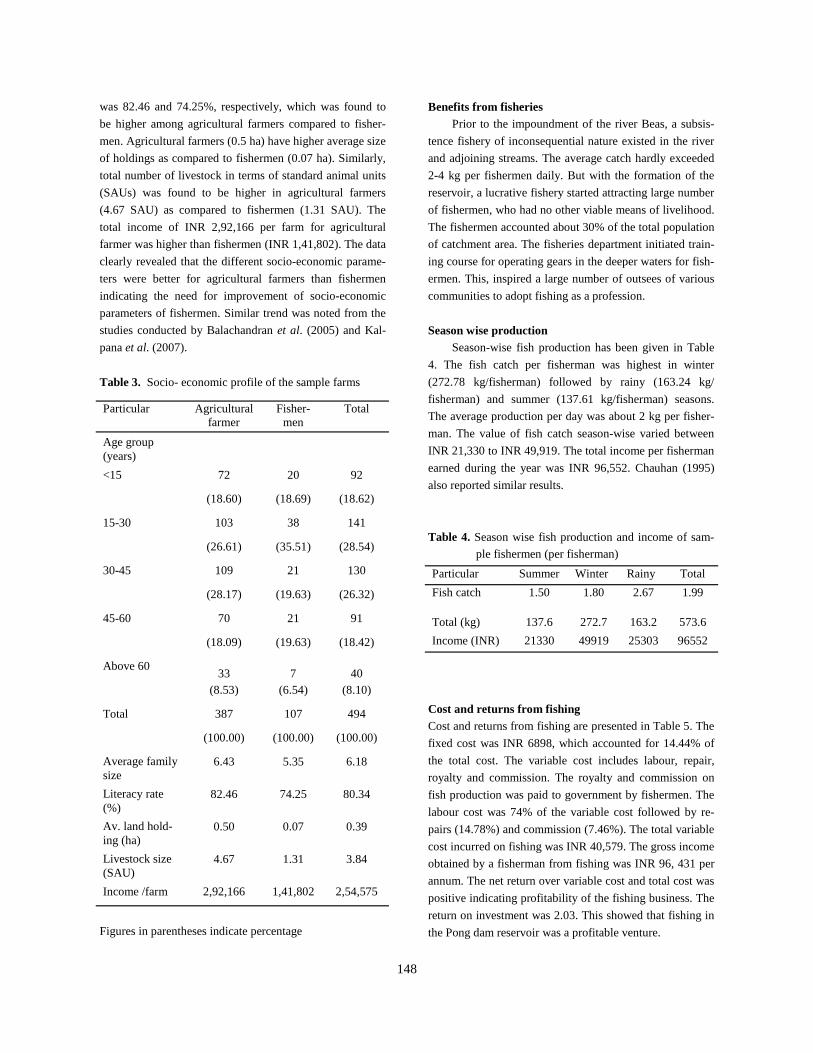
was 82.46 and 74.25%, respectively, which was found to
be higher among agricultural farmers compared to fisher-
men. Agricultural farmers (0.5 ha) have higher average size
of holdings as compared to fishermen (0.07 ha). Similarly,
total number of livestock in terms of standard animal units
(SAUs) was found to be higher in agricultural farmers
(4.67 SAU) as compared to fishermen (1.31 SAU). The
total income of INR 2,92,166 per farm for agricultural
farmer was higher than fishermen (INR 1,41,802). The data
clearly revealed that the different socio-economic parame-
ters were better for agricultural farmers than fishermen
indicating the need for improvement of socio-economic
parameters of fishermen. Similar trend was noted from the
studies conducted by Balachandran et al. (2005) and Kal-
pana et al. (2007).
Table 3. Socio- economic profile of the sample farms
Figures in parentheses indicate percentage
Benefits from fisheries Prior to the impoundment of the river Beas, a subsis-
tence fishery of inconsequential nature existed in the river
and adjoining streams. The average catch hardly exceeded
2-4 kg per fishermen daily. But with the formation of the
reservoir, a lucrative fishery started attracting large number
of fishermen, who had no other viable means of livelihood.
The fishermen accounted about 30% of the total population
of catchment area. The fisheries department initiated train-
ing course for operating gears in the deeper waters for fish-
ermen. This, inspired a large number of outsees of various
communities to adopt fishing as a profession.
Season wise production
Season-wise fish production has been given in Table
4. The fish catch per fisherman was highest in winter
(272.78 kg/fisherman) followed by rainy (163.24 kg/
fisherman) and summer (137.61 kg/fisherman) seasons.
The average production per day was about 2 kg per fisher-
man. The value of fish catch season-wise varied between
INR 21,330 to INR 49,919. The total income per fisherman
earned during the year was INR 96,552. Chauhan (1995)
also reported similar results.
Table 4. Season wise fish production and income of sam-
ple fishermen (per fisherman)
Cost and returns from fishing
Cost and returns from fishing are presented in Table 5. The
fixed cost was INR 6898, which accounted for 14.44% of
the total cost. The variable cost includes labour, repair,
royalty and commission. The royalty and commission on
fish production was paid to government by fishermen. The
labour cost was 74% of the variable cost followed by re-
pairs (14.78%) and commission (7.46%). The total variable
cost incurred on fishing was INR 40,579. The gross income
obtained by a fisherman from fishing was INR 96, 431 per
annum. The net return over variable cost and total cost was
positive indicating profitability of the fishing business. The
return on investment was 2.03. This showed that fishing in
the Pong dam reservoir was a profitable venture.
148
Particular Agricultural farmer
Fisher-men
Total
Age group (years)
<15 72 20 92
(18.60) (18.69) (18.62)
15-30 103 38 141
(26.61) (35.51) (28.54)
30-45 109 21 130
(28.17) (19.63) (26.32)
45-60 70 21 91
(18.09) (19.63) (18.42)
Above 60 33 7 40
(8.53) (6.54) (8.10)
Total 387 107 494
(100.00) (100.00) (100.00)
Average family size
6.43 5.35 6.18
Literacy rate (%)
82.46 74.25 80.34
Av. land hold-ing (ha)
0.50 0.07 0.39
Livestock size (SAU)
4.67 1.31 3.84
Income /farm 2,92,166 1,41,802 2,54,575
Particular Summer Winter Rainy Total
Fish catch 1.50 1.80 2.67 1.99
Total (kg) 137.6 272.7 163.2 573.6
Income (INR) 21330 49919 25303 96552
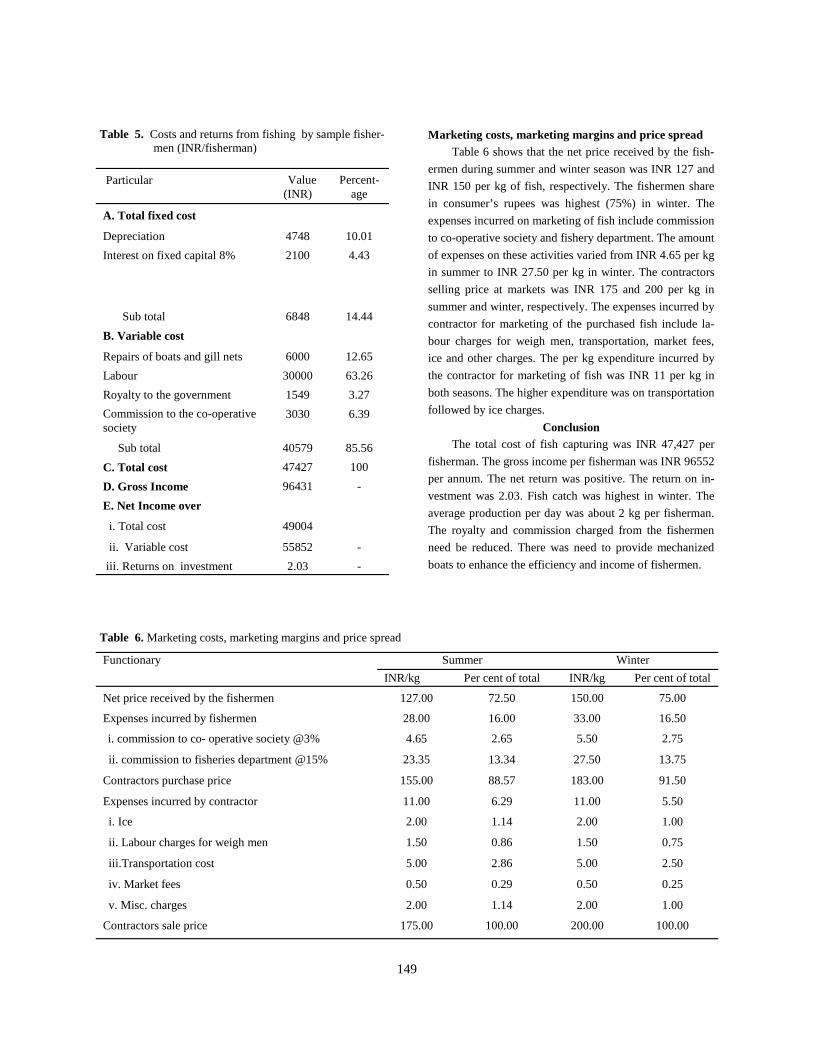
Marketing costs, marketing margins and price spread Table 6 shows that the net price received by the fish-
ermen during summer and winter season was INR 127 and
INR 150 per kg of fish, respectively. The fishermen share
in consumer’s rupees was highest (75%) in winter. The
expenses incurred on marketing of fish include commission
to co-operative society and fishery department. The amount
of expenses on these activities varied from INR 4.65 per kg
in summer to INR 27.50 per kg in winter. The contractors
selling price at markets was INR 175 and 200 per kg in
summer and winter, respectively. The expenses incurred by
contractor for marketing of the purchased fish include la-
bour charges for weigh men, transportation, market fees,
ice and other charges. The per kg expenditure incurred by
the contractor for marketing of fish was INR 11 per kg in
both seasons. The higher expenditure was on transportation
followed by ice charges.
Conclusion The total cost of fish capturing was INR 47,427 per
fisherman. The gross income per fisherman was INR 96552
per annum. The net return was positive. The return on in-
vestment was 2.03. Fish catch was highest in winter. The
average production per day was about 2 kg per fisherman.
The royalty and commission charged from the fishermen
need be reduced. There was need to provide mechanized
boats to enhance the efficiency and income of fishermen.
149
Particular Value (INR)
Percent-age
A. Total fixed cost
Depreciation 4748 10.01
Interest on fixed capital 8% 2100 4.43
Sub total 6848 14.44
B. Variable cost
Repairs of boats and gill nets 6000 12.65
Labour 30000 63.26
Royalty to the government 1549 3.27
Commission to the co-operative society
3030 6.39
Sub total 40579 85.56
C. Total cost 47427 100
D. Gross Income 96431 -
E. Net Income over
i. Total cost 49004
ii. Variable cost 55852 -
iii. Returns on investment 2.03 -
Table 5. Costs and returns from fishing by sample fisher-men (INR/fisherman)
Functionary Summer Winter INR/kg Per cent of total INR/kg Per cent of total
Net price received by the fishermen 127.00 72.50 150.00 75.00
Expenses incurred by fishermen 28.00 16.00 33.00 16.50
i. commission to co- operative society @3% 4.65 2.65 5.50 2.75
ii. commission to fisheries department @15% 23.35 13.34 27.50 13.75
Contractors purchase price 155.00 88.57 183.00 91.50
Expenses incurred by contractor 11.00 6.29 11.00 5.50
i. Ice 2.00 1.14 2.00 1.00
ii. Labour charges for weigh men 1.50 0.86 1.50 0.75
iii.Transportation cost 5.00 2.86 5.00 2.50
iv. Market fees 0.50 0.29 0.50 0.25
v. Misc. charges 2.00 1.14 2.00 1.00
Contractors sale price 175.00 100.00 200.00 100.00
Table 6. Marketing costs, marketing margins and price spread
Balachandran S, Fernandes M and Deepak S. 2005. A
preliminary analysis of the environmental economics
of Pong Dam. State Council for Science, Technology
& Environment Government of Himachal Pradesh.
Bombay Natural History Society.
Chauhan SK. 1995. Economics o f product ion
and market ing o f reservo i r f i sher ies in
Himachal P radesh. Unpubl ished Pro ject
Report , Department of Agricultural Economics,
CSKHPKV, Palampur, India. Pub No. 86.
Kalpana A, Hussain SA and Badola R. 2007. Resource
dependence and attitudes of local people toward con-
servation of Kabartal wetland: a case study from the
Indo-Gangetic plains. Wetlands Ecological Manage-
ment 15: 287-302.
Katarina Polajnar. 2008. Public awareness of wetlands and
their conservation. Acta geographica Sloenica 48: 121
-146
References
150

Occurrence of entomopathogenic fungus, Beauveria bassiana (Bals.) on potato whitegrubs in Himachal Pradesh
Himachal Journal of Agricultural Research 41(2): 151-155 (2015)
R.S. Chandel, Monika Kalia, Saurbh Soni and P.K. Mehta Department of Entomology, CSK HPKV Palampur, 176062, HP, India
Corresponding author: [email protected]
Abstract
Survey to isolate and identify the entomopathogenic fungi associated with whitegrubs was conducted in Himachal Pradesh dur-ing 2008 and 2009. The whitegrubs were collected from 14 locations and Beauveria bassiana (Bals.) was found to be associated with grubs of Brahmina coriacea (Hope) in Shillaroo and Kheradhar areas. The fungus infected grubs were observed only in higher hills of Shimla and Sirmour districts. At Shillaroo, 0.98% grubs of B. coriacea were observed to have fungal infection, whereas at Kheradhar 20.2% of the grubs showed symptoms of mycosis. When field collected grubs were reared separately location- wise in laboratory, very high percentage of mycosis (55.29%) was recorded. Kheradhar and Shillaroo populations of whitegrubs showed white muscardiane infestation in 8.72 and 5.27% of the grubs, respectively. Conidia of the fungus were globose to subglobose measuring 2.0-3.0×2.0-2.5 µm. Incubation of Shillaroo, Kheradhar, Kharapathar and Solan isolates was done at 20, 22 and 26 °C. After 15 days, the radial growth of Shillaroo isolate of B. bassiana was recorded to be 7.66 cm as compared to 7.60, 7.60 and 7.36 cm for Kharapather, Solan and Kheradhar isolates, respectively.
Key words: Beauveria bassiana, Brahmina coriacea, entomopathogenic fungi, whitegrubs
Received: 16 August 2015; Accepted: 25 December 2015
Microbes are being exploited as alternatives and com-
plimentary to chemical insecticides for the control of insect
-pests. Among the various microbes, entomopathogenic
fungi are considered as the best agents for whitegrub man-
agement (Chandel et al. 2005) because of their regular
multiplication due to good moisture available in the soil.
There is great diversity of fungus-insect interaction and
virtually all insect orders are susceptible to fungal diseases.
Rai et al. (2014) reported that approximately 750 species of
fungi from about 90 genera have been documented to be
entomopathogenic. However, only a few of these species
are currently being developed as pathogens against insect-
pests. Fungi are particularly important for control of Col-
eoptera, because viral and bacterial diseases are rare in
beetles (Hajek and Leger, 1994). The unique character of
fungi as compared to bacteria and viruses is that they pene-
trate through the insect cuticle, thus making them as valu-
able biological control agents of whitegrubs. In many sys-
tems, a reduction in feeding in an infected host is one of the
first overt changes. This response provides an often-
overlooked benefit of fungal pathogens infecting pest insects.
The search for and development of commercially viable
entomopathogenic fungi entails several steps including isola-
tion from the host insect, followed by studies on ecology and
physiology. In past years, attempts to use fungal entomopa-
thogens for inundative releases, similar to use of synthetic
chemical insecticides, have frequently been unsuccessful
(Chandel and Mehta 2005; Chandel et al. 2005). So now it is
realized to harness the potential of local entomopathogenic
fungi. The main aim of this study was to advance our knowl-
edge of fungal diseases, in general, and use it further in de-
veloping control strategies against whitegrubs by means of
local entomopathogenic fungi.
Materials and Methods Survey for entomopathogenic fungi (EPFs): Soil sampling
was done in different parts of Himachal Pradesh. A total of
153 samples from 9 districts representing 14 localities (Table
1) were collected. The samples were taken from different
habitats viz. potato, ginger, pea, maize, cabbage and fruit
orchards. Although sampling was done throughout the year,
151
but most of the samples were taken during July-November.
The grubs were collected by digging one cubic feet of soil
carefully by shovel and then by searching it by hand for
larval, pupal and adult stages. At each site, minimum 5 soil
pits were dug. Information regarding location, altitude and
total and mycosed grubs was collected for each sample.
The infested dead grubs were separated from healthy grubs
and brought to the laboratory in individual plastic vials.
The healthy grubs were placed in plastic containers in
groups of 40-50 with soil from the same collection site.
Isolation and identification of fungi: The diseased grubs
showing white mycelial growth on their body were directly
used for isolation of fungi. The fugus infected grubs were
surface sterilized by immersing them into sodium hy-
pochloride (5%) for two minutes and then rinsed with ster-
ile distilled water thrice under aseptic conditions. Then the
sterilized specimen was cut open in a sterile Petri plate and
a small portion of infected tissue was streaked on PDA
slants; which were incubated at 26+10C for further growth.
After about 15 days of incubation, the purification of fun-
gal culture was done through streak plate method. A loop
full of fungal spores was streaked on PDA in Petri plates
under aseptic conditions. These Petri plates were incubated
at 26+10C for 15-20 days, and after sporulation the fungus
was again transferred to PDA slants and maintained in
incubator. The identification of fungus was done by prepar-
ing the slides of the fungus and the final identification was
confirmed at Department of Plant Pathology, CSKHPKV
Palampur. The pathogenicity was proved using second
instar grubs of B. coriacea and Koch’s postulates were
proved.
Effect of temperature on growth of B. bassiana: Four
strains of B. bassiana isolated from Shillaroo, Kheradhar,
Kharapathar and Solan were taken for their growth studies
at different temperatures. The growth and development of
these four isolates were recorded at 20, 22 and 26 0C. The
PDA medium from the flask was poured into Petri plates
and allowed to solidify. Small fungal discs (5 mm diame-
ter) of different isolates were placed in the center of each
Petri plate (5 plates for each isolate) and the plates were
incubated at 20, 22 and 26 0C in BOD incubator. Data on
radial growth of fungus were recorded at an interval of 5,
10 and 15 days. The statistical analysis was done in Com-
pletely Randomized Design using computer based CPCS
software.
Results and Discussion
The whitegrubs were collected from 14 different loca-
tions of Himachal Pradesh. B. coriacea was found to be the
predominant species. The fungus infected grubs were
collected only in high altitude areas. However, per cent
infestation was recorded to be very low. At Shillaroo,
population of whitegrubs varied from 6 to 18 grubs/feet3,
however, only 0.98% of the grubs showed mycosis (Table
1). Kheradhar area in Sirmour district was another endemic
pocket of whitegrubs and B. coriacea was by far the most
prevalent whitegrub species encountered in soil sampling
from potato fields. At Kheradhar, a total of 321 grubs were
collected, out of which 20.2% were found to be infected
with the fungus. The dead grubs showed clear cut symp-
toms of fungal infestations and their body was completely
covered with white growth of fungus (Fig. 1). At most
other locations none of the collected grubs showed visible
symptoms of fungal infestation irrespective of altitude of
the area and species of whitegrubs. Farmers resort to fre-
quent application of pesticides like chlorpyriphos, phorate,
Ridomil and Diathane M-45 to control various insect-pests
and diseases and all these have antagonistic effects against
entomopathogenic fungi which seems to be the possible
reason for low natural infestation of entomopathogenic
fungi in soil arthropods like whitegrubs. When the field
collected grubs were reared in laboratory at Palampur,
many of the grubs died due to fungal infestation. Among
Shillaroo culture, 5.27% of the grubs showed mycosis dur-
ing rearing in laboratory. Similarly, from Kheradhar 8.72%
mycosis was observed under laboratory rearing. In Khara-
pathar population, 55.29% of the grubs were found dead
due to infection. In laboratory, proper soil moisture was
maintained through regular watering which provided ideal
conditions for growth and conidia production of fungus.
Cisneros and Vera (2000) also reported that mycelial
growth reactivates in fungus infested specimens when they
are exposed to proper moisture conditions.
The data in Table 1 clearly showed that the fungus
occurs only in high hill temperate wet zone of Himachal
Pradesh. According to Muller-Kogler (1965), the epizoot-
ics of fungi are usually associated with period of high hu-
midity particularly, rainy periods. Germination of spores is
seriously affected, since most fungi germinate only at very
high RH usually 90% or higher. Arthurs and Thomas
(2001) reported that the efficacy of fungal entomopatho-
gens is highly dependent on suitable climatic conditions, in
particular the availability of a high level of environmental
moisture. In case of B. brongniartii, high soil moisture
(50% FC) favours the development of mycelia outside the
infected insect’s body, whereas low moisture (25% FC)
favours the production of conidia.
Isolation and identification of EPFs from whitegrubs The fungus was isolated on PDA from field infected
152
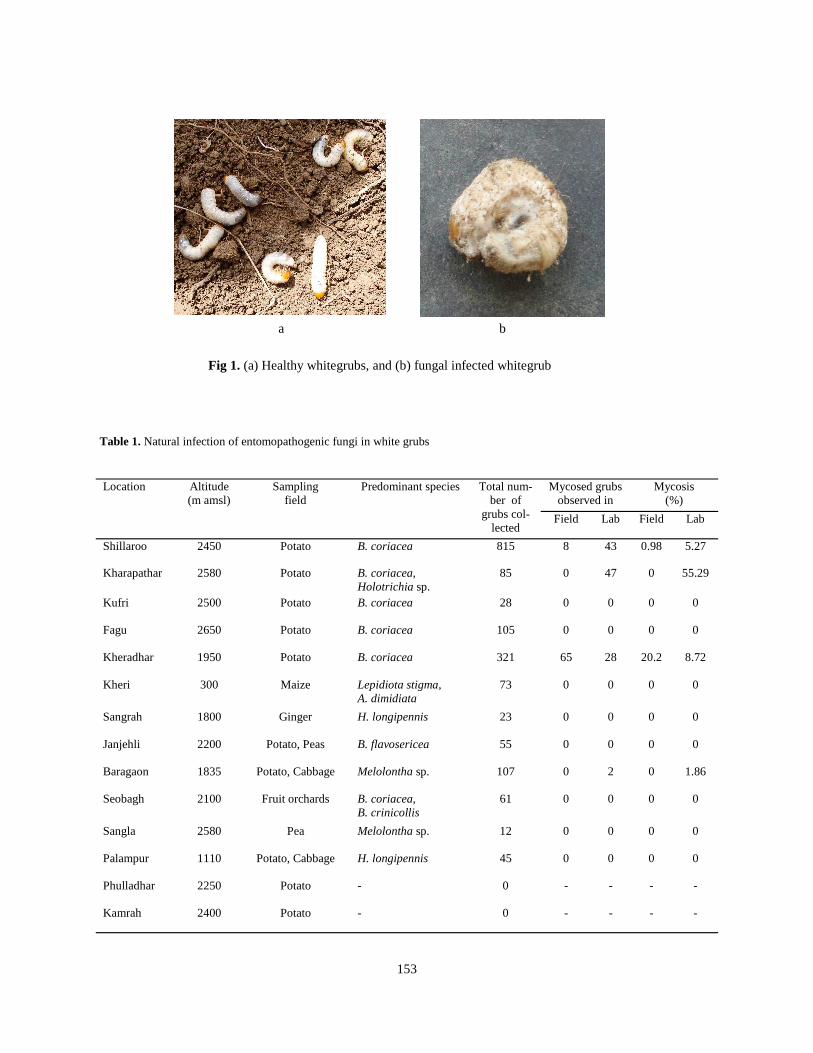
153
Fig 1. (a) Healthy whitegrubs, and (b) fungal infected whitegrub
a b
Location Altitude (m amsl)
Sampling field
Predominant species Total num-ber of
grubs col-lected
Mycosed grubs observed in
Mycosis (%)
Field Lab Field Lab
Shillaroo 2450 Potato B. coriacea 815 8 43 0.98 5.27
Kharapathar 2580 Potato B. coriacea, Holotrichia sp.
85 0 47 0 55.29
Kufri 2500 Potato B. coriacea 28 0 0 0 0
Fagu 2650 Potato B. coriacea 105 0 0 0 0
Kheradhar 1950 Potato B. coriacea 321 65 28 20.2 8.72
Kheri 300 Maize Lepidiota stigma, A. dimidiata
73 0 0 0 0
Sangrah 1800 Ginger H. longipennis 23 0 0 0 0
Janjehli 2200 Potato, Peas B. flavosericea 55 0 0 0 0
Baragaon 1835 Potato, Cabbage Melolontha sp. 107 0 2 0 1.86
Seobagh 2100 Fruit orchards B. coriacea, B. crinicollis
61 0 0 0 0
Sangla 2580 Pea Melolontha sp. 12 0 0 0 0
Palampur 1110 Potato, Cabbage H. longipennis 45 0 0 0 0
Phulladhar 2250 Potato - 0 - - - -
Kamrah 2400 Potato - 0 - - - -
Table 1. Natural infection of entomopathogenic fungi in white grubs

whitegrubs. After purification, the fungus was identified as
Beauveria bassiana (Bals.). To test the pathogenicity of
collected isolates of B. bassiana, the grubs were dipped in
a spore suspension to facilitate better fungus-insect contact.
After about 4 weeks, half of the treated whitegrubs died
due to mycosis. There was no visible growth of fungus in
some dead grubs, especially where early mortality was
recorded. This may be due to the reason that fungi secrete a
wide array of compounds that exhibit biological activity
against insects (Vey et al. 2001). B. brongniartii produces
oosporein which affects enzymes functioning by redox
reactions and is effective against cockchafer larvae (Vey et
al. 2001). Growth pattern on insect body was characterized
by formation of loose or tough mycelial mat with cushions
or areas of conidial structures. The conidia were formed
solitarily on a laterally proliferating conidiogenous cell
often showing a geniculate or zig-zag type of elongation.
However, after 5-6 weeks, most of the grubs were covered
with white mat of mycelium. The globose shape and size
(2.0-3.3x 2.0-2.5 µm) of conidia and shape and structure of
conidiogenous cells resembled the description given by
Samson (1981).
Establishing the pathogenicity of B. bassiana against whitegrubs
The pathogenicity of all four strains of B. bassiana
isolated from Shillaroo, Kheradhar, Kharapathar and Solan
was tested against second instar grubs of B. coriacea under
laboratory conditions at Palampur. The dose of each strain
was standardized to 401x104 conidia/ml. The grubs were
given dip treatment in the conidial suspension for about 10
seconds. There was no mortality of grubs up to 7 days,
however, after about 2 weeks, 20% of mortality of white-
grubs was recorded with Shillaroo strain of B. bassiana.
After about 4 weeks, considerable mortality (77%) was
recorded with all the strains. Prior to death, the whitegrubs
stopped feeding, turned sluggish and the growth was ar-
rested. After about 6 weeks, there was development of
white mycelial growth on the body of grubs. When the
fungal infested grubs were dissected, their haemocoel was
completely filled with whitish fungal growth. Koch’s pos-
tulates were proved to confirm the pathogenicity of the
isolated fungus (B. bassiana).
Effect of temperature on growth and development of B.
bassiana Growth and sporulation of 4 isolates of B. bassiana
collected from Shillaroo, Kheradhar, Kharapather and So-
lan was observed at 20 to 26 oC. There was gradual in-
crease in radial growth of fungus with increase in tempera-
ture up to 26oC as shown in Table 2. After 15 days of incu-
bation, the diameter of Shillaroo isolate was recorded to be
7.66 cm.
B. bassiana strain obtained from Solan exhibited ra-
dial growth of less than 6.0 cm at 20 oC. However, at 26 oC, both Solan and Shillaroo isolates were statistically at
par with each other. The Kharapather isolate showed
growth at par with Solan isolate both at 20 and 22 oC. At
26 oC, the Kharapather and Solan isolates produced equal
growth (7.60 cm) and were at par with Shillaroo isolate.
There was lesser growth of Kheradhar isolate at all the
temperatures as compared to all other isolates. The opti-
mum temperature for growth and sporulation of B. bassi-
ana has been reported to be ranging between 20-30 oC
(Kuberappa and Jayaramaiah 1987). Sharma et al. (1998)
demonstrated that temperature of 28 oC is most favourable
for growth and sporulation of B. bassiana and M. ani-
sopliae. They observed gradual increase in growth of B.
bassiana with temperature. The results in the present study
are totally in accordance with their findings. Among differ-
ent isolates, Shillaroo isolate showed significantly higher
multiplication in terms of mycelium development. This
higher multiplication of Shillaroo isolate may be related to
the virulence of the isolate and can cause early mortality in
whitegrubs in high hills where average soil temperature
fluctuates between 20 to 25 oC during cropping period.
154
Strain Radial growth (cm) of fungus after 15 days of incubation 20 0C 22 0C 26 0C Mean
Shillaroo 6.19 6.90 7.66 6.92 Kharapather 5.80 6.10 7.60 6.50 Solan 5.93 6.19 7.60 6.57 Kheradhar 5.50 5.80 7.36 6.22 Mean 5.85 6.25 7.55 LSD (P=0.05) Strain Temperature Strain x Temperature 0.13 0.11 0.23
Table 2. Effect of different temperatures on growth of B. bassiana
Arthurs S and Thomas MB 2001. Effects of temperature
and relative humidity on sporulation of Metarhizium
anisopliae var. acridum in mycosed cadavers of
Schistocerca gregaria. Journal of Invertebrate Pa-
thology 78: 59-65.
Chandel RS, Chandla VK and Dhiman KR 2005. Vulner-
ability of potato whitegrub to entomogenous fungi
and nematodes. Potato Journal 32 (3-4):193-194.
Chandel YS and Mehta PK 2005. Efficacy of some insecti-
cides and entomopathogenic fungi for the manage-
ment of whitegrub complex in potato. Indian Journal
of Ecology 32: 195-199
Cisneros F and Vera A 2000. Mass- producing Beauveria
brongniartii inoculum: An economical, farm level-
method. CIP Program Report, pp 155-160.
Hajek AE and St. Leger RJ 1994. Interaction between fun-
gal pathogens and insect hosts. Annual Review of
Entomology 39: 293-322.
Kuberappa GC and Jayaramaiah M 1987. Influence of
temperature and humidity on the growth and devel-
opment of the fungus, Beauveria bassiana (Bals.) A
strain on the silkworm, Bombyx mori L. Mysore
Journal of Agriculture Sciences 21: 184-209.
Muller-Kogler E 1965. Pilzkrankheiten bei Insekten. An-
wendung zur biologische Schadlingsbekampfung und
Grundlagen der Insektenmykologie. Paul Parey, Ber-
lin and Hamburg, pp 86-89.
Rai D, Updhyay V, Mehra P, Rana M and Pandey AK
2014. Potential of entomopathogenic fungi as biopes-
ticides. Indian Journal of Science Research and Tech-
nology 2:7-13.
Samson RA 1981. Identification: Entomopathogenic Deu-
teromycocetes. In: Microbial Control of Pests and
Plant Diseaeses, ed Burges HD 1970-1980. New
York, pp 93-106.
Sharma S, Gupta RBL and Yadava CPS 1998. Effect of
temperature on growth, sporulation and bioactivity of
entomofungi against whitegrub (Holotrichia consan-
guinea). Indian Journal of Entomology 60:1-7.
Vey A, Hoagland RE and Butt TM 2001. Toxic metabolites
of fungal biocontrol agents. In: Fungi as biocontrol
Agents: Progress and Potential, eds Butt TM, Jackson
CW and Magan N. CAB International UK, pp 311-
346.
155
Acknowledgement
The help rendered by Dr YS Paul, Professor (Plant Pathology), Department of Plant Pathology, Collage of Agriculture,
CSK Himachal Pradesh Krishi Vishvavidyalaya, Palampur for confirmation of identification of the fungus in the present study
is duly acknowledged.
References
Gross and morphometrical study on the external and internal nares of Gaddi sheep
Himachal Journal of Agricultural Research 41(2): 156-159 (2015)
Virender Pathak and Rajesh Rajput Department of Veterinary Anatomy, DGCN College of Veterinary and Animal Sciences
CSK HPKV Palampur (H.P)-176062
Corresponding author: [email protected]
Abstract
An anatomical and morphometrical study was undertaken on the external and internal nares of 26 Gaddi sheep at Palampur during 2013-15. The results of the study revealed that the nostrils were slit like in Gaddi sheep and situated obliquely at rostral most part of head. The mean length of the nostrils was 2.51±0.52 cm. The mean distance between the dorsal commissures and ventral commissures was 3.26±0.54 cm and 1.04±0.25 cm, respectively. Nasal cavity of sheep extended from external nares to the chonae. The nasal cavity in Gaddi Sheep was provided with the three nasal turbinate bones (choanae) viz. dorsal, ventral and middle. Length of the dorsal turbinates ranged from 10.70 cm to 12.80 cm in adult animal. The width of the dorsal turbinate had range from1.90 to 2.70 cm with mean length of 2.36±0.40 cm. The length of the ventral nasal turbinate ranged from 9.90 to 12.20 cm, whereas its width was from 2.40 to 3.50 cm.
Key words: External nares, internal nares, morphometry
Received: 11 October 2015; Accepted: 18 October 2015
Sheep (Ovis aries) are quadrupedal ruminant mam-
mals typically kept as livestock. Sheep are members of the
order Artiodactyla, the double toed ungulates. The sheep is
a multipurpose animal, which provides meat, milk, hide
and wool for human consumption and manure for the use
in improving soil fertility for crop production. Himachal
Pradesh contributes around 1.26% of the countries sheep
population (19th Livestock Census, 2012). In Himachal
Pradesh especially in Kangra, Kullu, Shimla, Sirmour and
Chamba, we find more concentration of sheep of Gaddi
breed. Here it plays a vital role in saving the rural unedu-
cated youths from unemployment. The importance of respi-
ratory system increases due to continuous migration of
animals from low hills to the high Alpine pastures and
back, depending upon the different seasons of the year. The
animals not only have to adjust their respiration to the dif-
ferent climatic zones but also have to deal with varying
oxygen levels in the atmosphere. Although many studies
have been conducted in the animals of plains but we still
lack scientifically documented studies on Gaddi sheep.
What so ever studies were conducted that were in bits and
parts. Therefore, efforts were made to study the external
and internal nares of Gaddi sheep.
Material and Methods Present study was conducted on adult, healthy 26 Gaddi
sheep from slaughter house. Heads were immediately col-
lected after sacrifice. Sagittal and frontal sections of the head
were made. The frontal sections were made at the level of
1st , 3rd , 4th palatel rugae, rostral margin of first cheek tooth;
caudal to the third cheek tooth; caudal to the last cheek tooth;
anterior to the rostral margin of orbits. With the help of hand
lens and naked eye the external nares, nasal cavity and tur-
binate bones were examined to establish their anatomical
relations. The morphometrical parameters were recorded
with the help of digital Vernier’s caliper. The data collected
were subjected to statistical analysis.
Results and Discussion External Nares Nostrils lead to the nasal cavity. The nostrils were slit like
(Plate-1) and situated obliquely at rostral most part of head.
The aperture was comparatively longer in length than that of
goat as also observed by Sinha et al. (2015) in goats. The
nostrils were comma shaped in ox (Hare, 1975b), buffalo
(Dhingra and Kumar, 1978) and dog (Hare, 1975b), semi
lunar in horse (Hare 1975a) and circular in pig (Hare 1975c).
The planum nasai situated between the nostrils was devoid of
156
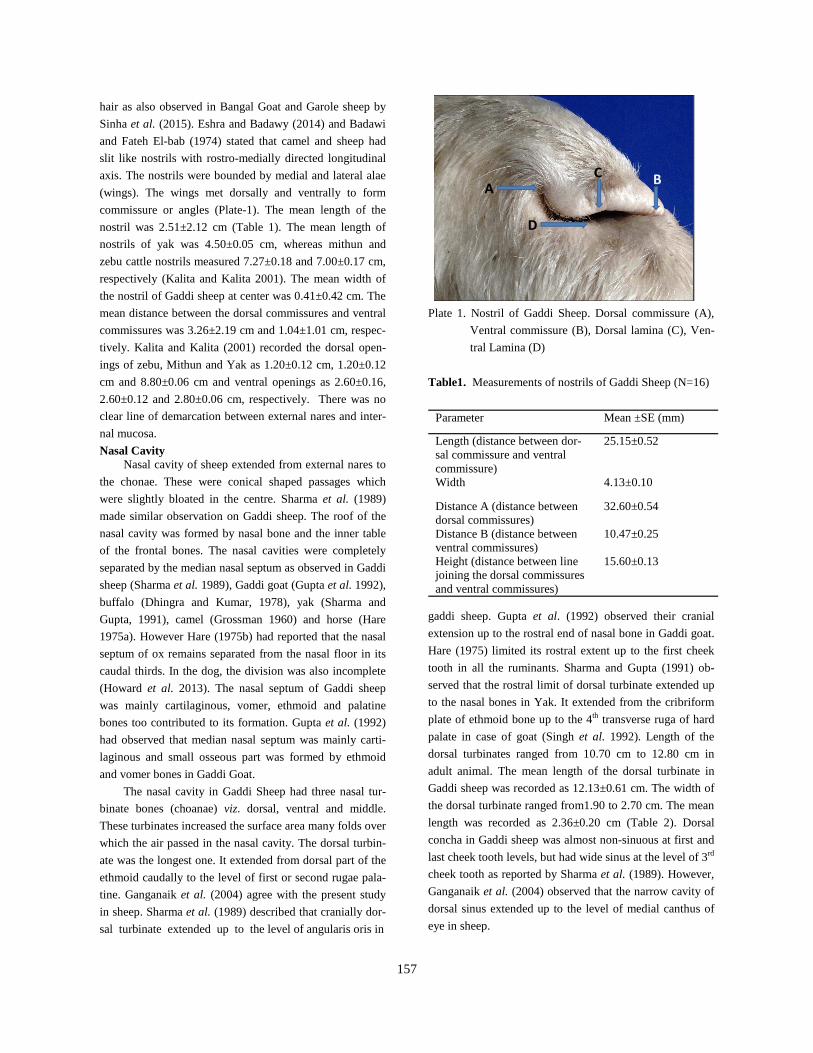
hair as also observed in Bangal Goat and Garole sheep by
Sinha et al. (2015). Eshra and Badawy (2014) and Badawi
and Fateh El-bab (1974) stated that camel and sheep had
slit like nostrils with rostro-medially directed longitudinal
axis. The nostrils were bounded by medial and lateral alae
(wings). The wings met dorsally and ventrally to form
commissure or angles (Plate-1). The mean length of the
nostril was 2.51±2.12 cm (Table 1). The mean length of
nostrils of yak was 4.50±0.05 cm, whereas mithun and
zebu cattle nostrils measured 7.27±0.18 and 7.00±0.17 cm,
respectively (Kalita and Kalita 2001). The mean width of
the nostril of Gaddi sheep at center was 0.41±0.42 cm. The
mean distance between the dorsal commissures and ventral
commissures was 3.26±2.19 cm and 1.04±1.01 cm, respec-
tively. Kalita and Kalita (2001) recorded the dorsal open-
ings of zebu, Mithun and Yak as 1.20±0.12 cm, 1.20±0.12
cm and 8.80±0.06 cm and ventral openings as 2.60±0.16,
2.60±0.12 and 2.80±0.06 cm, respectively. There was no
clear line of demarcation between external nares and inter-
nal mucosa.
Nasal Cavity Nasal cavity of sheep extended from external nares to
the chonae. These were conical shaped passages which
were slightly bloated in the centre. Sharma et al. (1989)
made similar observation on Gaddi sheep. The roof of the
nasal cavity was formed by nasal bone and the inner table
of the frontal bones. The nasal cavities were completely
separated by the median nasal septum as observed in Gaddi
sheep (Sharma et al. 1989), Gaddi goat (Gupta et al. 1992),
buffalo (Dhingra and Kumar, 1978), yak (Sharma and
Gupta, 1991), camel (Grossman 1960) and horse (Hare
1975a). However Hare (1975b) had reported that the nasal
septum of ox remains separated from the nasal floor in its
caudal thirds. In the dog, the division was also incomplete
(Howard et al. 2013). The nasal septum of Gaddi sheep
was mainly cartilaginous, vomer, ethmoid and palatine
bones too contributed to its formation. Gupta et al. (1992)
had observed that median nasal septum was mainly carti-
laginous and small osseous part was formed by ethmoid
and vomer bones in Gaddi Goat.
The nasal cavity in Gaddi Sheep had three nasal tur-
binate bones (choanae) viz. dorsal, ventral and middle.
These turbinates increased the surface area many folds over
which the air passed in the nasal cavity. The dorsal turbin-
ate was the longest one. It extended from dorsal part of the
ethmoid caudally to the level of first or second rugae pala-
tine. Ganganaik et al. (2004) agree with the present study
in sheep. Sharma et al. (1989) described that cranially dor-
sal turbinate extended up to the level of angularis oris in
Plate 1. Nostril of Gaddi Sheep. Dorsal commissure (A),
Ventral commissure (B), Dorsal lamina (C), Ven-
tral Lamina (D)
Table1. Measurements of nostrils of Gaddi Sheep (N=16)
gaddi sheep. Gupta et al. (1992) observed their cranial
extension up to the rostral end of nasal bone in Gaddi goat.
Hare (1975) limited its rostral extent up to the first cheek
tooth in all the ruminants. Sharma and Gupta (1991) ob-
served that the rostral limit of dorsal turbinate extended up
to the nasal bones in Yak. It extended from the cribriform
plate of ethmoid bone up to the 4th transverse ruga of hard
palate in case of goat (Singh et al. 1992). Length of the
dorsal turbinates ranged from 10.70 cm to 12.80 cm in
adult animal. The mean length of the dorsal turbinate in
Gaddi sheep was recorded as 12.13±0.61 cm. The width of
the dorsal turbinate ranged from1.90 to 2.70 cm. The mean
length was recorded as 2.36±0.20 cm (Table 2). Dorsal
concha in Gaddi sheep was almost non-sinuous at first and
last cheek tooth levels, but had wide sinus at the level of 3rd
cheek tooth as reported by Sharma et al. (1989). However,
Ganganaik et al. (2004) observed that the narrow cavity of
dorsal sinus extended up to the level of medial canthus of
eye in sheep.
AB
C
D
Parameter Mean ±SE (mm)
Length (distance between dor-sal commissure and ventral commissure)
25.15±0.52
Width 4.13±0.10
Distance A (distance between dorsal commissures)
32.60±0.54
Distance B (distance between ventral commissures)
10.47±0.25
Height (distance between line joining the dorsal commissures and ventral commissures)
15.60±0.13
157
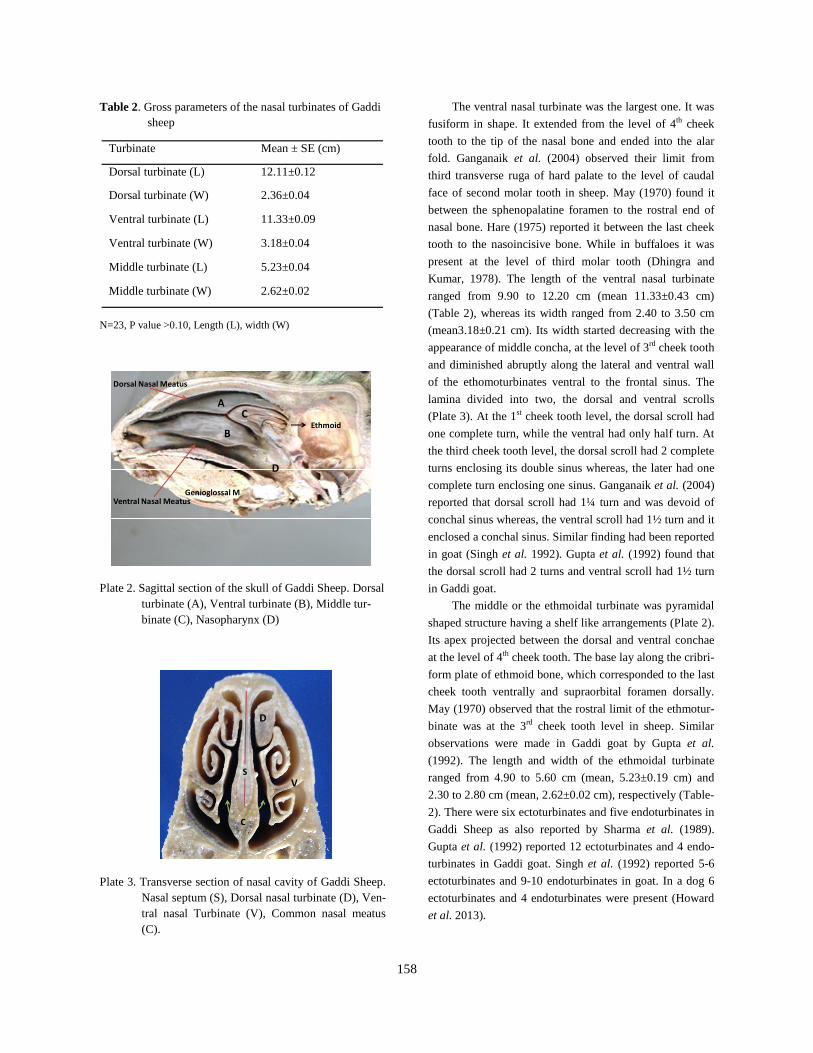
Table 2. Gross parameters of the nasal turbinates of Gaddi sheep
N=23, P value >0.10, Length (L), width (W)
Plate 2. Sagittal section of the skull of Gaddi Sheep. Dorsal turbinate (A), Ventral turbinate (B), Middle tur-binate (C), Nasopharynx (D)
Plate 3. Transverse section of nasal cavity of Gaddi Sheep. Nasal septum (S), Dorsal nasal turbinate (D), Ven-tral nasal Turbinate (V), Common nasal meatus (C).
The ventral nasal turbinate was the largest one. It was
fusiform in shape. It extended from the level of 4th cheek
tooth to the tip of the nasal bone and ended into the alar
fold. Ganganaik et al. (2004) observed their limit from
third transverse ruga of hard palate to the level of caudal
face of second molar tooth in sheep. May (1970) found it
between the sphenopalatine foramen to the rostral end of
nasal bone. Hare (1975) reported it between the last cheek
tooth to the nasoincisive bone. While in buffaloes it was
present at the level of third molar tooth (Dhingra and
Kumar, 1978). The length of the ventral nasal turbinate
ranged from 9.90 to 12.20 cm (mean 11.33±0.43 cm)
(Table 2), whereas its width ranged from 2.40 to 3.50 cm
(mean3.18±0.21 cm). Its width started decreasing with the
appearance of middle concha, at the level of 3rd cheek tooth
and diminished abruptly along the lateral and ventral wall
of the ethomoturbinates ventral to the frontal sinus. The
lamina divided into two, the dorsal and ventral scrolls
(Plate 3). At the 1st cheek tooth level, the dorsal scroll had
one complete turn, while the ventral had only half turn. At
the third cheek tooth level, the dorsal scroll had 2 complete
turns enclosing its double sinus whereas, the later had one
complete turn enclosing one sinus. Ganganaik et al. (2004)
reported that dorsal scroll had 1¼ turn and was devoid of
conchal sinus whereas, the ventral scroll had 1½ turn and it
enclosed a conchal sinus. Similar finding had been reported
in goat (Singh et al. 1992). Gupta et al. (1992) found that
the dorsal scroll had 2 turns and ventral scroll had 1½ turn
in Gaddi goat.
The middle or the ethmoidal turbinate was pyramidal
shaped structure having a shelf like arrangements (Plate 2).
Its apex projected between the dorsal and ventral conchae
at the level of 4th cheek tooth. The base lay along the cribri-
form plate of ethmoid bone, which corresponded to the last
cheek tooth ventrally and supraorbital foramen dorsally.
May (1970) observed that the rostral limit of the ethmotur-
binate was at the 3rd cheek tooth level in sheep. Similar
observations were made in Gaddi goat by Gupta et al.
(1992). The length and width of the ethmoidal turbinate
ranged from 4.90 to 5.60 cm (mean, 5.23±0.19 cm) and
2.30 to 2.80 cm (mean, 2.62±0.02 cm), respectively (Table-
2). There were six ectoturbinates and five endoturbinates in
Gaddi Sheep as also reported by Sharma et al. (1989).
Gupta et al. (1992) reported 12 ectoturbinates and 4 endo-
turbinates in Gaddi goat. Singh et al. (1992) reported 5-6
ectoturbinates and 9-10 endoturbinates in goat. In a dog 6
ectoturbinates and 4 endoturbinates were present (Howard
et al. 2013).
Turbinate Mean ± SE (cm)
Dorsal turbinate (L) 12.11±0.12
Dorsal turbinate (W) 2.36±0.04
Ventral turbinate (L) 11.33±0.09
Ventral turbinate (W) 3.18±0.04
Middle turbinate (L) 5.23±0.04
Middle turbinate (W) 2.62±0.02
A
B
C
D
Genioglossal M.
Ethmoid
Dorsal Nasal Meatus
Ventral Nasal Meatus
S
C
D
V
158
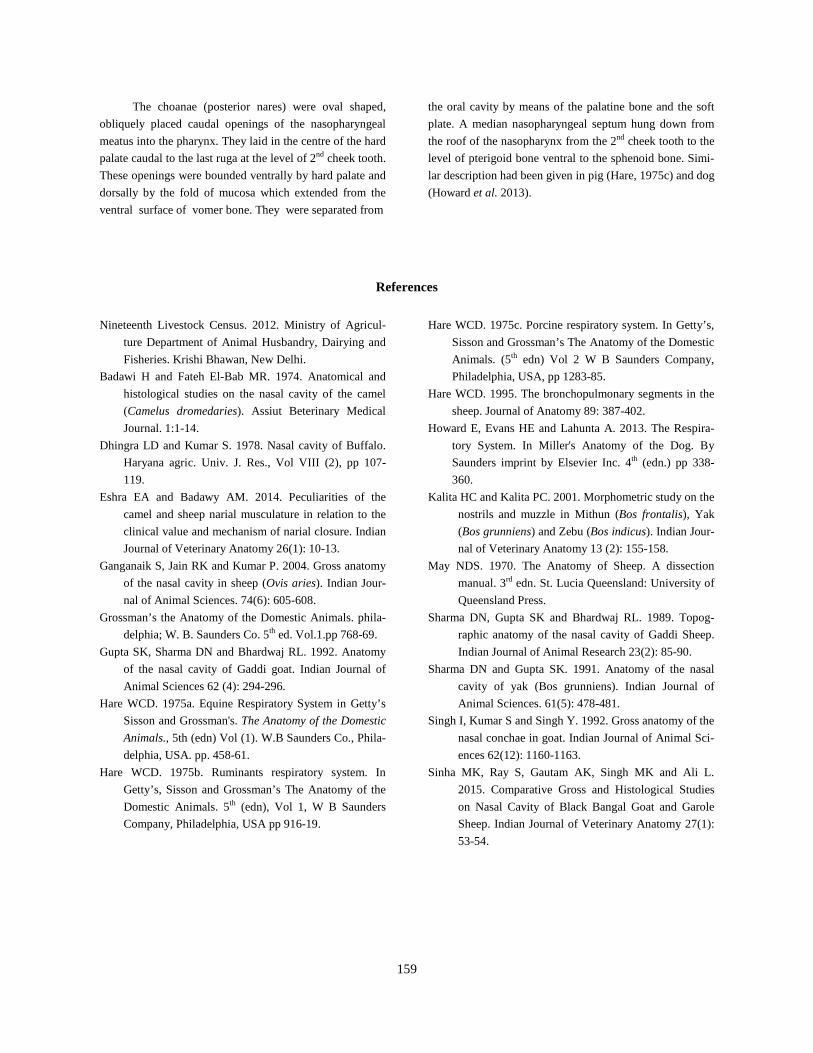
The choanae (posterior nares) were oval shaped,
obliquely placed caudal openings of the nasopharyngeal
meatus into the pharynx. They laid in the centre of the hard
palate caudal to the last ruga at the level of 2nd cheek tooth.
These openings were bounded ventrally by hard palate and
dorsally by the fold of mucosa which extended from the
ventral surface of vomer bone. They were separated from
the oral cavity by means of the palatine bone and the soft
plate. A median nasopharyngeal septum hung down from
the roof of the nasopharynx from the 2nd cheek tooth to the
level of pterigoid bone ventral to the sphenoid bone. Simi-
lar description had been given in pig (Hare, 1975c) and dog
(Howard et al. 2013).
Nineteenth Livestock Census. 2012. Ministry of Agricul-
ture Department of Animal Husbandry, Dairying and
Fisheries. Krishi Bhawan, New Delhi.
Badawi H and Fateh El-Bab MR. 1974. Anatomical and
histological studies on the nasal cavity of the camel
(Camelus dromedaries). Assiut Beterinary Medical
Journal. 1:1-14.
Dhingra LD and Kumar S. 1978. Nasal cavity of Buffalo.
Haryana agric. Univ. J. Res., Vol VIII (2), pp 107-
119.
Eshra EA and Badawy AM. 2014. Peculiarities of the
camel and sheep narial musculature in relation to the
clinical value and mechanism of narial closure. Indian
Journal of Veterinary Anatomy 26(1): 10-13.
Ganganaik S, Jain RK and Kumar P. 2004. Gross anatomy
of the nasal cavity in sheep (Ovis aries). Indian Jour-
nal of Animal Sciences. 74(6): 605-608.
Grossman’s the Anatomy of the Domestic Animals. phila-
delphia; W. B. Saunders Co. 5th ed. Vol.1.pp 768-69.
Gupta SK, Sharma DN and Bhardwaj RL. 1992. Anatomy
of the nasal cavity of Gaddi goat. Indian Journal of
Animal Sciences 62 (4): 294-296.
Hare WCD. 1975a. Equine Respiratory System in Getty’s
Sisson and Grossman's. The Anatomy of the Domestic
Animals., 5th (edn) Vol (1). W.B Saunders Co., Phila-
delphia, USA. pp. 458-61.
Hare WCD. 1975b. Ruminants respiratory system. In
Getty’s, Sisson and Grossman’s The Anatomy of the
Domestic Animals. 5th (edn), Vol 1, W B Saunders
Company, Philadelphia, USA pp 916-19.
Hare WCD. 1975c. Porcine respiratory system. In Getty’s,
Sisson and Grossman’s The Anatomy of the Domestic
Animals. (5th edn) Vol 2 W B Saunders Company,
Philadelphia, USA, pp 1283-85.
Hare WCD. 1995. The bronchopulmonary segments in the
sheep. Journal of Anatomy 89: 387-402.
Howard E, Evans HE and Lahunta A. 2013. The Respira-
tory System. In Miller's Anatomy of the Dog. By
Saunders imprint by Elsevier Inc. 4th (edn.) pp 338-
360.
Kalita HC and Kalita PC. 2001. Morphometric study on the
nostrils and muzzle in Mithun (Bos frontalis), Yak
(Bos grunniens) and Zebu (Bos indicus). Indian Jour-
nal of Veterinary Anatomy 13 (2): 155-158.
May NDS. 1970. The Anatomy of Sheep. A dissection
manual. 3rd edn. St. Lucia Queensland: University of
Queensland Press.
Sharma DN, Gupta SK and Bhardwaj RL. 1989. Topog-
raphic anatomy of the nasal cavity of Gaddi Sheep.
Indian Journal of Animal Research 23(2): 85-90.
Sharma DN and Gupta SK. 1991. Anatomy of the nasal
cavity of yak (Bos grunniens). Indian Journal of
Animal Sciences. 61(5): 478-481.
Singh I, Kumar S and Singh Y. 1992. Gross anatomy of the
nasal conchae in goat. Indian Journal of Animal Sci-
ences 62(12): 1160-1163.
Sinha MK, Ray S, Gautam AK, Singh MK and Ali L.
2015. Comparative Gross and Histological Studies
on Nasal Cavity of Black Bangal Goat and Garole
Sheep. Indian Journal of Veterinary Anatomy 27(1):
53-54.
References
159

Performance of rice (Oryza sativa L.) varieties under aerobic cultivation in mid hills of Hi-machal Pradesh
Himachal Journal of Agricultural Research 41(2): 160-162 (2015)
Sandeep Manuja, Jahnvi Shekhar and Anil Kumar Rice and Wheat Research Centre, CSK Himachal Pradesh Krishi Vishvavidyalaya, Malan, Nagrota Bag-
wan – 176047 HP, India Corresponding author: [email protected]
Abstract
Aerobic rice is a method of rice cultivation in which the crop is raised under un–puddle non–saturated aerobic condition with high external inputs with the objective of achieving higher productivity and water use efficiency. A field experiment was con-ducted during kharif 2012 at Malan to standardize seeding time for six promising rice varieties (four high yielding varieties and two locally recommended hybrids) under aerobic conditions. Each variety was sown at three different dates (10, 20 and 30 June). On an average, significantly higher grain yield was recorded when the sowing was done on 20 June though it was at par with 10 June sowing. Among the varieties, on an average hybrid PAC 807 gave significantly highest yield followed by Arize 6129. However, while comparing different combinations of seeding and variety altogether, Arize 6129 gave significantly high-est yield when sown on 10 June. Among the HYVs tested, highest yield was recorded from HPR 1068 while HPR 2143 gave lowest yield. The economic indices calculated also showed similar trend with hybrids showing higher values for gross and net return but had lower B:C ratio owing to the higher cost of seed.
Key words: Aerobic rice, date of sowing, variety
Received: 21 December 2015; Accepted: 25 December 2015
Rice (Oryza sativa L.) is the most important cereal
crop of the country. It is cultivated on an area of 43.42
million hectare with an average productivity of 2279 kg ha-
1 (Anonymous 2014a). It is a staple food for majority of the
population of Himachal Pradesh where it is cultivated on
an area of about 76.34 thousand hectare with productivity
of 1736 kg/ha (Anonymous 2014b). Rice is mostly grown
under submerged condition which results in very low water
use efficiency besides ecological consequences such emis-
sion of green house gases. With the global water crisis
looming large due to increasing alternate demands for wa-
ter, it has become imperative to develop technologies that
produce rice using lower quantities of water (Bouman
2001). Aerobic rice is water saving rice production system
in which the crop is grown in non – puddled aerobic soils
under irrigation and high external inputs (Bouman et al
2002). This system of rice cultivation saves water by elimi-
nating wetland preparation (water required for puddling)
necessary to avoid seepage and percolation and by
reducing evaporation. In this system the crop is frequently
irrigated to keep the moisture content between 70 and 100%
of water holding capacity throughout the crop growing sea-
son. However, to make this technology viable, suitable pack-
age of practices need to be developed for various rice grow-
ing areas. Considering the above facts, the present investiga-
tion was carried out to find out optimum seeding time for
different promising varieties of rice for realizing higher
yields under aerobic condition.
A field experiment was conducted at the Experimental
Farm of Rice and Wheat Research Centre, Malan during
kharif 2012 to see the performance of different rice varieties
grown at different dates of sowing under aerobic conditions.
The soil of the experimental site was silty clay loam in tex-
ture, acidic in reaction (pH 5.7) with available nitrogen,
phosphorus and potassium content of 322 kg/ha, 28.4 kg/ha
and 236 kg/ha, respectively. Six varieties (four HYVs viz.
HPR1156, HPR 1068, HPR 2143 and RP 2421 along with
two locally recommended hybrids Arize 6129 and PAC 807)
160
Short Note
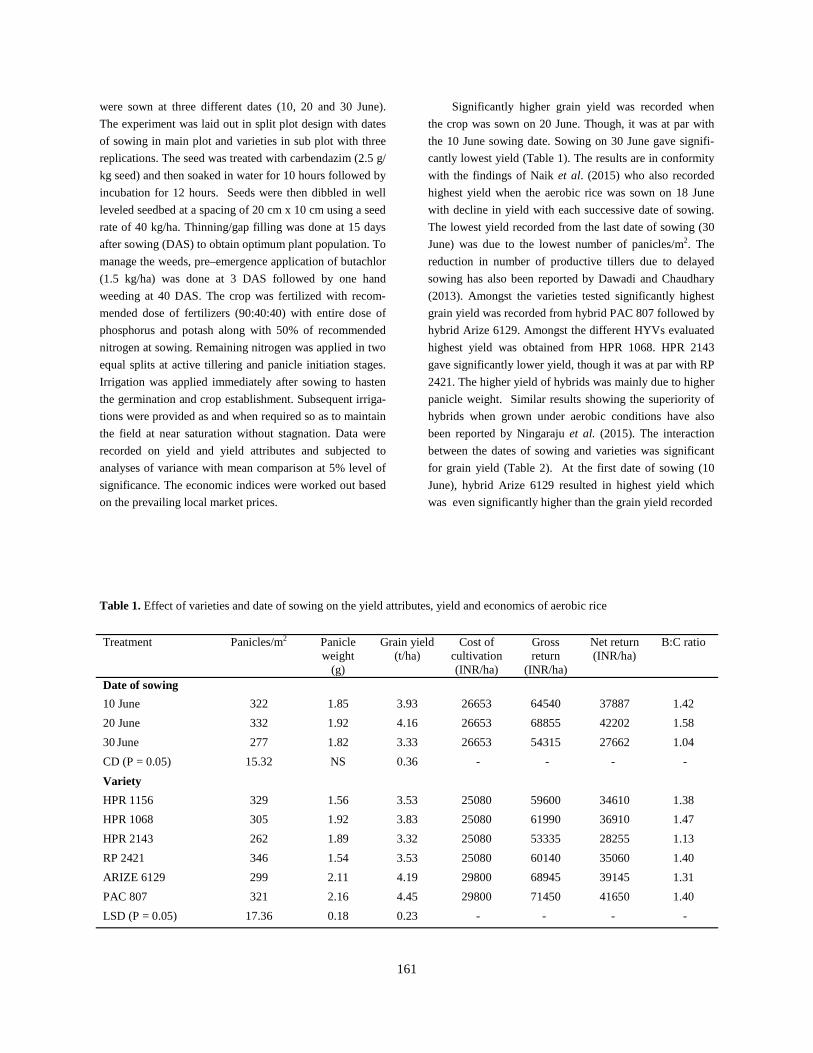
were sown at three different dates (10, 20 and 30 June).
The experiment was laid out in split plot design with dates
of sowing in main plot and varieties in sub plot with three
replications. The seed was treated with carbendazim (2.5 g/
kg seed) and then soaked in water for 10 hours followed by
incubation for 12 hours. Seeds were then dibbled in well
leveled seedbed at a spacing of 20 cm x 10 cm using a seed
rate of 40 kg/ha. Thinning/gap filling was done at 15 days
after sowing (DAS) to obtain optimum plant population. To
manage the weeds, pre–emergence application of butachlor
(1.5 kg/ha) was done at 3 DAS followed by one hand
weeding at 40 DAS. The crop was fertilized with recom-
mended dose of fertilizers (90:40:40) with entire dose of
phosphorus and potash along with 50% of recommended
nitrogen at sowing. Remaining nitrogen was applied in two
equal splits at active tillering and panicle initiation stages.
Irrigation was applied immediately after sowing to hasten
the germination and crop establishment. Subsequent irriga-
tions were provided as and when required so as to maintain
the field at near saturation without stagnation. Data were
recorded on yield and yield attributes and subjected to
analyses of variance with mean comparison at 5% level of
significance. The economic indices were worked out based
on the prevailing local market prices.
Significantly higher grain yield was recorded when
the crop was sown on 20 June. Though, it was at par with
the 10 June sowing date. Sowing on 30 June gave signifi-
cantly lowest yield (Table 1). The results are in conformity
with the findings of Naik et al. (2015) who also recorded
highest yield when the aerobic rice was sown on 18 June
with decline in yield with each successive date of sowing.
The lowest yield recorded from the last date of sowing (30
June) was due to the lowest number of panicles/m2. The
reduction in number of productive tillers due to delayed
sowing has also been reported by Dawadi and Chaudhary
(2013). Amongst the varieties tested significantly highest
grain yield was recorded from hybrid PAC 807 followed by
hybrid Arize 6129. Amongst the different HYVs evaluated
highest yield was obtained from HPR 1068. HPR 2143
gave significantly lower yield, though it was at par with RP
2421. The higher yield of hybrids was mainly due to higher
panicle weight. Similar results showing the superiority of
hybrids when grown under aerobic conditions have also
been reported by Ningaraju et al. (2015). The interaction
between the dates of sowing and varieties was significant
for grain yield (Table 2). At the first date of sowing (10
June), hybrid Arize 6129 resulted in highest yield which
was even significantly higher than the grain yield recorded
161
Treatment Panicles/m2 Panicle weight
(g)
Grain yield (t/ha)
Cost of cultivation (INR/ha)
Gross return
(INR/ha)
Net return (INR/ha)
B:C ratio
Date of sowing
10 June 322 1.85 3.93 26653 64540 37887 1.42
20 June 332 1.92 4.16 26653 68855 42202 1.58
30 June 277 1.82 3.33 26653 54315 27662 1.04
CD (P = 0.05) 15.32 NS 0.36 - - - -
Variety
HPR 1156 329 1.56 3.53 25080 59600 34610 1.38
HPR 1068 305 1.92 3.83 25080 61990 36910 1.47
HPR 2143 262 1.89 3.32 25080 53335 28255 1.13
RP 2421 346 1.54 3.53 25080 60140 35060 1.40
ARIZE 6129 299 2.11 4.19 29800 68945 39145 1.31
PAC 807 321 2.16 4.45 29800 71450 41650 1.40
LSD (P = 0.05) 17.36 0.18 0.23 - - - -
Table 1. Effect of varieties and date of sowing on the yield attributes, yield and economics of aerobic rice
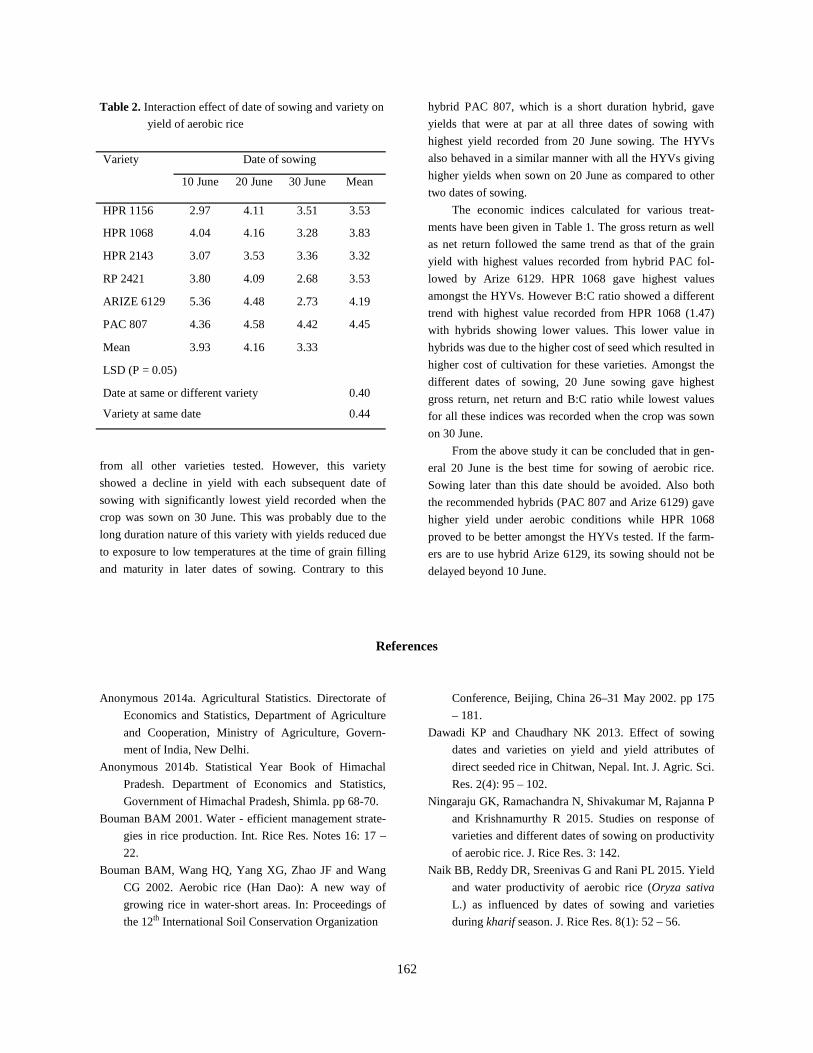
from all other varieties tested. However, this variety
showed a decline in yield with each subsequent date of
sowing with significantly lowest yield recorded when the
crop was sown on 30 June. This was probably due to the
long duration nature of this variety with yields reduced due
to exposure to low temperatures at the time of grain filling
and maturity in later dates of sowing. Contrary to this
hybrid PAC 807, which is a short duration hybrid, gave
yields that were at par at all three dates of sowing with
highest yield recorded from 20 June sowing. The HYVs
also behaved in a similar manner with all the HYVs giving
higher yields when sown on 20 June as compared to other
two dates of sowing.
The economic indices calculated for various treat-
ments have been given in Table 1. The gross return as well
as net return followed the same trend as that of the grain
yield with highest values recorded from hybrid PAC fol-
lowed by Arize 6129. HPR 1068 gave highest values
amongst the HYVs. However B:C ratio showed a different
trend with highest value recorded from HPR 1068 (1.47)
with hybrids showing lower values. This lower value in
hybrids was due to the higher cost of seed which resulted in
higher cost of cultivation for these varieties. Amongst the
different dates of sowing, 20 June sowing gave highest
gross return, net return and B:C ratio while lowest values
for all these indices was recorded when the crop was sown
on 30 June.
From the above study it can be concluded that in gen-
eral 20 June is the best time for sowing of aerobic rice.
Sowing later than this date should be avoided. Also both
the recommended hybrids (PAC 807 and Arize 6129) gave
higher yield under aerobic conditions while HPR 1068
proved to be better amongst the HYVs tested. If the farm-
ers are to use hybrid Arize 6129, its sowing should not be
delayed beyond 10 June.
162
Variety Date of sowing
10 June 20 June 30 June Mean
HPR 1156 2.97 4.11 3.51 3.53
HPR 1068 4.04 4.16 3.28 3.83
HPR 2143 3.07 3.53 3.36 3.32
RP 2421 3.80 4.09 2.68 3.53
ARIZE 6129 5.36 4.48 2.73 4.19
PAC 807 4.36 4.58 4.42 4.45
Mean 3.93 4.16 3.33
Date at same or different variety 0.40
Variety at same date 0.44
LSD (P = 0.05)
Table 2. Interaction effect of date of sowing and variety on
yield of aerobic rice
Anonymous 2014a. Agricultural Statistics. Directorate of
Economics and Statistics, Department of Agriculture
and Cooperation, Ministry of Agriculture, Govern-
ment of India, New Delhi.
Anonymous 2014b. Statistical Year Book of Himachal
Pradesh. Department of Economics and Statistics,
Government of Himachal Pradesh, Shimla. pp 68-70.
Bouman BAM 2001. Water - efficient management strate-
gies in rice production. Int. Rice Res. Notes 16: 17 –
22.
Bouman BAM, Wang HQ, Yang XG, Zhao JF and Wang
CG 2002. Aerobic rice (Han Dao): A new way of
growing rice in water-short areas. In: Proceedings of
the 12th International Soil Conservation Organization
Conference, Beijing, China 26–31 May 2002. pp 175
– 181.
Dawadi KP and Chaudhary NK 2013. Effect of sowing
dates and varieties on yield and yield attributes of
direct seeded rice in Chitwan, Nepal. Int. J. Agric. Sci.
Res. 2(4): 95 – 102.
Ningaraju GK, Ramachandra N, Shivakumar M, Rajanna P
and Krishnamurthy R 2015. Studies on response of
varieties and different dates of sowing on productivity
of aerobic rice. J. Rice Res. 3: 142. Naik BB, Reddy DR, Sreenivas G and Rani PL 2015. Yield
and water productivity of aerobic rice (Oryza sativa
L.) as influenced by dates of sowing and varieties
during kharif season. J. Rice Res. 8(1): 52 – 56.
References
Correlation and path analysis of agro-morphometric traits in maize (Zea mays L.)
Himachal Journal of Agricultural Research 41(2): 163-167 (2015)
Ankita Sood, Naresh Thakur and S. Lata
Department of Crop Improvement CSK Himachal Pradesh Krishi Vishvavidyalaya, Palampur-176 062
Corresponding author: [email protected]
Abstract
Correlation and path coefficient among eleven agro-morphometric traits of forty maize inbred lines (14 QPM lines and 26 non-QPM lines) grown during kharif 2011 were studied. Correlation analysis revealed that grain yield exhibited significant positive association with 100-seed weight implying that improvement in grain yield can be obtained by improving the latter. Further, path coefficient analysis partitioned the correlation into direct and indirect effects. Path analysis revealed highest positive direct effect of days to 50% silking on grain yield, followed by cob girth and 100-seed weight; hence selection based on these charac-ters would be more rewarding.
Key words: Maize, agro-morphometric traits, correlation, path analysis
Received: 08 December 2015; Accepted: 20 December 2015
Maize (Zea mays L.) belongs to the tribe Maydeae of
the grass family Poaceae. The genus Zea consists of four
species, of which Z. mays L. is economically important and
is one of the nature’s most efficient energy-storing cereal.
It has the highest potential for carbohydrate production per
unit area per day. It is a major food and calorie source for
the people in the developing world, with a total direct con-
sumption of 100 mt as food, contributing 15% of the pro-
tein and 19% of the calories delivered from food crops. The
crop improvement efforts are directed to increase the grain
production. Grain yield is a complex trait conditioned by
the interaction of various growth and physiological proc-
esses throughout the life cycle. A rational choice of charac-
ters on which selection is to be exercised for higher yields
requires an understanding of the association of characters
with yield and among themselves. Further path coefficient
analysis is an efficient tool to elucidate the direct and indi-
rect effect of each character towards yield. Hence, the pre-
sent investigation was taken up to study the association of
yield and its component traits in maize. The study was carried out at the Experimental Farm of
the Department of Crop Improvement, College of Agricul-
ture, CSK HPKV, Palampur (32°6’ N latitude, 76°3’ E
longitude and 1290.8 m altitude) during 2011. The experi-
mental material consisted of 40 maize inbred lines which
comprised of 14 QPM lines and 26 non-QPM lines was sown
in α-RBD design with three replications (five blocks per
replication and eight entries per block with plot size of 3.0 ×
1.2 m2) at row to row and plant to plant distance of 60 cm
and 20 cm, respectively (having 2 rows/plot). Recommended
cultural practices were followed to raise the crop. Plant
height, cob placement height, cob length, cob girth, kernel
rows per ear, grains per row and 100-seed weight were re-
corded on ten randomly selected plants in each plot. Grain
yield was harvested from net plot. Days to 50% pollen shed,
50% silking and 75% maturity were recorded on plot basis.
The phenotypic [r12 (P)] and genotypic [r12 (G)] correlation
coefficients were calculated as per formulae suggested by Al
-Jibouri et al. (1958).
r12- (P) = sp12 / √[ s2p (X1) × s2
p (X2)] r12- (G) = sg12/ √[s2
g (X1) × s2g (X2) ]
Where,
sp12 = phenotypic covariance between characters X1 and X2
sg12 = genotypic covariance between characters X1 and X2
163
Short Note
s2p(X1) and s2p(X2) = phenotypic variance of traits X1 and
X2, respectively
s2g(X1) and s2g(X2) = genotypic variance of traits X1 and
X2, respectively The path coefficient analysis was performed accord-
ing to Dewey and Lu (1959).
Py1 + Py2.r12 + Py3.r13 + …………………… + Pyn.r1n = ry1
Py1.r12 + Py2 + Py3.r23 + …………………… + Pyn.r2n = ry2
Py1.r13 + Py2.r23 + Py3 + …………,……….. + Pyn.r3n = ry3
Py1.r1n + Py2.r2n + Py3.r3n ……………….. + Pyn.r(n-1)n = ryn
Where,
Py1, Py2, Py3 ………….. Pyn are the direct path effects of 1, 2, 3, ………., n variables on the dependent variable ‘y’. r12, r13,………….. r (n-1) n are the coefficients of correla-tion between various independent variables and ry1, ry2, ry3, …………… ryn are the correlation coefficients of independent variables with dependent variable ‘y’.
The variation in the dependent variable which re-mained undetermined was assumed to be due to variables (s) not included in the present investigation. The degree of determination of such variables was calculated as follows:
Residual effect (P × R) = √(1 – R2)
where,
where,
R2 is the squared multiple correlation coefficient and
is the amount of variation in the yield that can be accounted
for any yield component characters. Morphological traits
were measured based on maize descriptors developed by
the Biodiversity International.
The estimates of phenotypic and genotypic correlation
coefficients among yield and yield attributes are presented
in Table 1. The estimates of genotypic correlations, in gen-
eral, were higher than their respective phenotypic correla-
tions for most of the traits, indicating that the interrelation-
ships were strongly inherent. The low phenotypic expres-
sion was due to environmental factors.
Days to 50% pollen shed exhibited a significant and
positive association with 50% silking and 75% maturity.
Similarly, significant positive correlation was also ob-
served for 50% silking with 75% maturity indicating that
selection for early silking would be sufficient to identify
the earliness in maturity which would ultimately result in
higher yield. Grain yield showed significant positive corre-
lation with 100-seed weight indicating that this trait can be
considered for effective selection. The grain yield was also
positively correlated with all the other traits. Liu (1997)
also reported positive correlation between grain yield and
seed weight. Similar results were reported earlier in maize
by Kaundal and Sharma (2005), Rafiq et al. (2010) and
Zarei et al. (2012) which were in confirmation with the
present study. Whereas, Barros et al. (2010) observed
negative correlation between grain yield and days to silk-
ing, this was not in accordance with the present study, as
these traits were positively correlated.
Path coefficient analysis (Table 2) provides better
means for selection by resolving the correlation coefficient
of yield and its components into direct and indirect effects.
In the present study, six traits viz., days to 50% silking,
plant height, cob placement height, 100-seed weight, cob
girth and grains per row exhibited positive correlation with
grain yield. Whereas, days to 50% pollen shed, 75% matur-
ity, cob length and kernel rows per ear exhibited negative
correlation with grain yield. Geetha and Jayaraman (2000)
reported that number of grains per row exerted a maximum
direct effect on grain yield. However, in the present study
the direct and indirect contribution of correlation revealed
the high positive direct effect of days to 50% silking only,
so this trait may be given more emphasis for selecting high
yielding maize genotypes.
The high positive direct effect of days to 50% silking
on yield was also reported by Kumar and Singh (2004)
which were in confirmation with present study. From the
present study it can be inferred that the traits showing posi-
tive direct effects on correlation with grain yield have low
direct values, indicating that selection based on these traits
for increasing the grain yield would not be effective.
Whereas, their indirect effects through days to 50% silking
were high, therefore 50% pollen shed, 75% maturity, cob
placement height and 100-seed weight contributed indi-
rectly through days to 50% silking which means that these
traits act as precursors for other traits and selection on their
basis would help in increasing the grain yield of maize.
References
Al-Jibouri HA, Miller PA and Robinson HF 1958. Genetic
and environmental variances and covariances in up-
land cotton cross of interspecific origin. J. of Ameri-
can Society of Agro. 50: 633-637.
Barros LB, Moreira RMP and Ferreira JM 2010. Pheno-
typic, additive genetic and environment correlations of
maize landraces populations in family farm systems.
Scientific Agric. 67 (6): 685-691.
164
R2 = piyriy
n
1i=∑
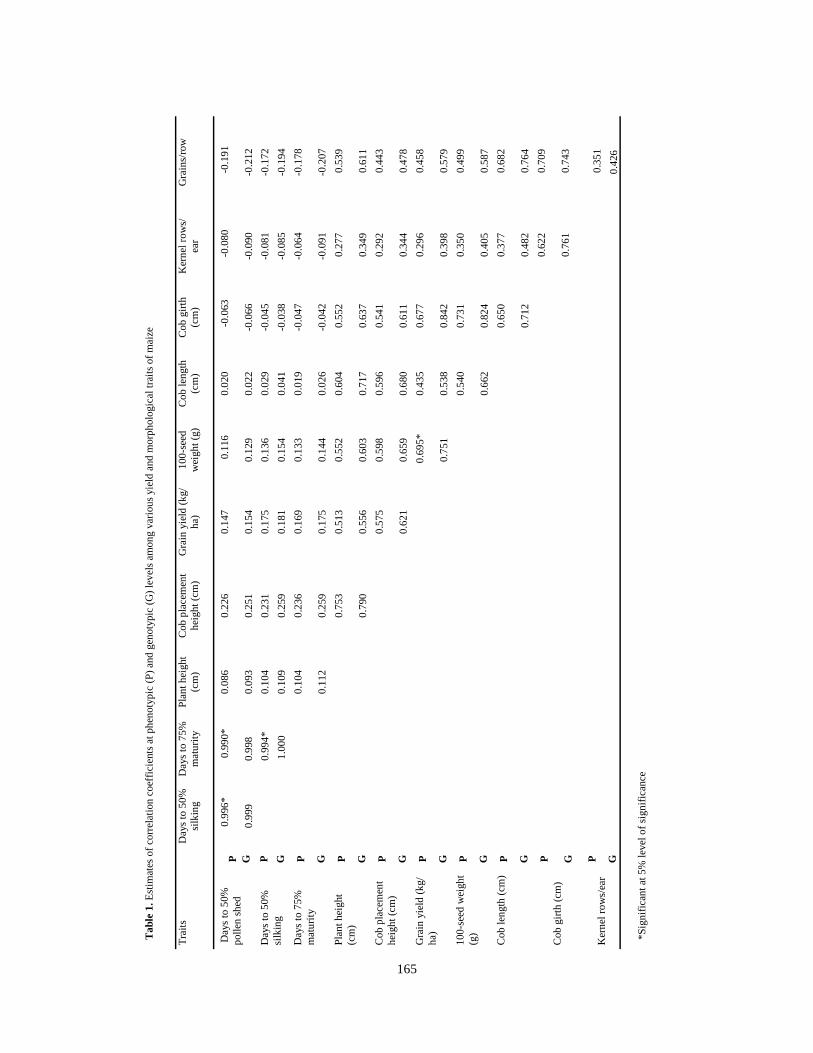
165
Tab
le 1
. Est
imat
es o
f cor
rela
tion
coe
ffic
ient
s a
t ph
enot
ypic
(P
) a
nd g
enot
ypic
(G
) le
vels
am
ong
vario
us
yiel
d a
nd m
orp
hol
ogic
al t
raits
of m
aiz
e
Tra
its
D
ays
to
50%
si
lkin
g D
ays
to
75%
m
atu
rity
Pla
nt h
eigh
t (c
m)
Cob
pla
cem
ent
hei
ght (
cm)
Gra
in y
ield
(kg
/h
a)
100
-see
d
w
eigh
t (g
) C
ob le
ngt
h
(cm
) C
ob g
irth
(cm
) K
ern
el r
ow
s/ea
r G
rain
s/ro
w
Da
ys t
o 5
0%
pol
len
sh
ed
P
0
.996
*
0.9
90
* 0
.086
0
.226
0
.147
0.11
6 0
.020
-0.
063
-0
.08
0
-0.1
91
G
0.9
99
0.9
98
0.0
93
0.2
51
0.1
54
0.1
29
0.0
22
-0.0
66
-0.0
90
-0.2
12
Da
ys t
o 5
0%
silk
ing
P
0.99
4*
0.1
04
0.2
31
0.1
75
0.1
36
0.0
29
-0.0
45
-0.0
81
-0.1
72
G
1
.00
0 0
.109
0
.259
0
.181
0
.154
0
.041
-0
.038
-0
.085
-0
.194
D
ays
to
75%
m
atu
rity
P
0.1
04
0.2
36
0.1
69
0.1
33
0.0
19
-0.0
47
-0.0
64
-0.1
78
G
0.1
12
0.2
59
0.1
75
0.1
44
0.0
26
-0.0
42
-0.0
91
-0.2
07
Pla
nt h
eigh
t (c
m)
P
0
.753
0
.513
0
.552
0
.604
0
.55
2 0
.27
7 0
.53
9
G
0
.790
0
.556
0
.603
0
.717
0
.63
7 0
.34
9 0
.61
1 C
ob p
lace
men
t h
eigh
t (cm
) P
0.5
75
0.5
98
0.5
96
0.5
41
0.2
92
0.4
43
G
0.6
21
0.6
59
0.6
80
0.6
11
0.3
44
0.4
78
Gra
in y
ield
(kg
/h
a)
P
0
.69
5*
0.4
35
0.6
77
0.2
96
0.4
58
G
0
.751
0
.538
0
.84
2 0
.39
8 0
.57
9 1
00-s
eed
wei
ght
(g)
P
0.5
40
0.7
31
0.3
50
0.4
99
G
0.6
62
0.8
24
0.4
05
0.5
87
Cob
len
gth
(cm
) P
0
.65
0 0
.37
7 0
.68
2
G
0
.71
2 0
.48
2 0
.76
4
Cob
girt
h (c
m)
P
0.6
22
0.7
09
G
0.7
61
0.7
43
Ker
nel
ro
ws/
ear
P
0
.35
1 G
0.4
26
*Sig
nifi
can
t at 5
% le
vel o
f sig
nifi
canc
e
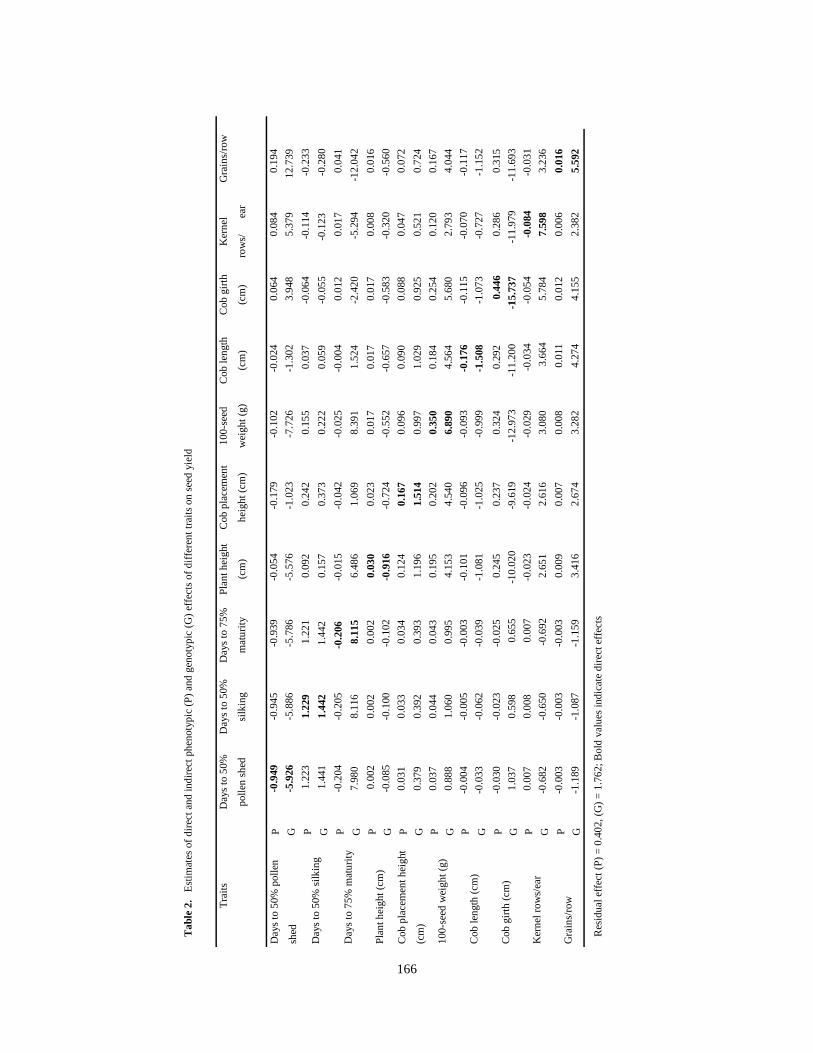
Tra
its
D
ays
to
50%
pol
len
sh
ed
Da
ys t
o 5
0%
silk
ing
Da
ys t
o 7
5%
ma
turit
y P
lan
t hei
ght
(cm
) C
ob p
lace
men
t
hei
ght (
cm)
100
-see
d
wei
ght
(g)
Cob
len
gth
(cm
) C
ob g
irth
(cm
) K
ern
el
row
s/
e
ar
Gra
ins/
row
Da
ys t
o 5
0% p
olle
n
shed
P
-0.
949
-0.9
45
-0.9
39
-0.0
54
-0.1
79
-0.1
02
-0.0
24
0
.064
0.0
84
0
.194
G
-5.
926
-5.8
86
-5.7
86
-5.5
76
-1.0
23
-7.7
26
-1.3
02
3
.948
5.3
79
12
.739
Da
ys t
o 5
0% s
ilkin
g P
1.
223
1.22
9 1
.22
1 0
.09
2 0
.24
2 0
.15
5 0
.03
7
-0.0
64
-
0.11
4
-0.2
33
G
1.44
1 1.
442
1.4
42
0.1
57
0.3
73
0.2
22
0.0
59
-0
.05
5
-0.1
23
-0
.28
0
Da
ys t
o 7
5% m
atu
rity
P -
0.2
04
-0.2
05
-0.2
06
-0.0
15
-0.0
42
-0.0
25
-0.0
04
0
.012
0.0
17
0
.041
G
7.9
80
8.1
16
8.1
15
6.4
86
1.0
69
8.3
91
1.5
24
-2
.42
0
-5.
294
-12
.04
2
Pla
nt h
eigh
t (c
m)
P
0.00
2 0
.002
0
.00
2 0
.030
0
.02
3 0
.01
7 0
.01
7
0.0
17
0
.00
8
0.0
16
G
-
0.0
85
-0.1
00
-0.1
02
-0.9
16
-0.7
24
-0.5
52
-0.6
57
-0
.58
3
-0.
320
-0
.56
0
Cob
pla
cem
ent h
eigh
t
(cm
) P
0.0
31
0.0
33
0.0
34
0.1
24
0.1
67
0.0
96
0.0
90
0
.088
0.0
47
0
.072
G
0.3
79
0.3
92
0.3
93
1.1
96
1.5
14
0.9
97
1.0
29
0
.925
0.5
21
0
.724
100
-see
d w
eigh
t (g
) P
0.0
37
0.0
44
0.0
43
0.1
95
0.2
02
0.3
50
0.1
84
0
.254
0.1
20
0
.167
G
0.8
88
1.0
60
0.9
95
4.1
53
4.5
40
6.8
90
4.5
64
5
.680
2.7
93
4
.044
Cob
len
gth
(cm
) P
-0.0
04
-0.0
05
-0.0
03
-0.1
01
-0.0
96
-0.0
93
-0.1
76
-0
.11
5
-0.
070
-0
.11
7
G
-0.0
33
-0.0
62
-0.0
39
-1.0
81
-1.0
25
-0.9
99
-1.5
08
-1
.07
3
-0.
727
-1
.15
2
Cob
girt
h (c
m)
P -0
.030
-0
.023
-0
.025
0
.24
5 0
.23
7 0
.32
4 0
.29
2
0.4
46
0
.28
6
0.3
15
G
1
.03
7 0
.598
0.65
5 -1
0.0
20
-9.6
19
-12
.97
3 -1
1.2
00
-15.
737
-1
1.9
79
-11
.69
3
Ker
nel
ro
ws/
ear
P 0
.00
7 0
.008
0.00
7 -0
.023
-0
.024
-0
.029
-
0.0
34
-0
.05
4
-0.0
84
-0
.03
1
G
-0.6
82
-0.6
50
-0
.692
2
.65
1 2
.61
6 3
.08
0
3.6
64
5
.784
7.5
98
3
.236
Gra
ins/
row
P -0
.003
-0
.003
-0
.003
0
.00
9 0
.00
7 0
.00
8
0.01
1
0.0
12
0
.00
6
0.01
6
G
-1.1
89
-1.0
87
-1.1
59
3.4
16
2.6
74
3.2
82
4.
274
4
.155
2.3
82
5.
592
Tab
le 2
. E
stim
ates
of d
irect
and
ind
irect
ph
enot
ypic
(P
) a
nd g
enot
ypic
(G
) ef
fect
s of
diff
eren
t tr
aits
on
se
ed y
ield
Res
idu
al e
ffect
(P
) =
0.4
02,
(G
) =
1.7
62;
Bol
d v
alu
es in
dic
ate
dire
ct e
ffect
s
166
Dewey DR and Lu KH 1959. A correlation and path analy-
sis of components of crested wheat grass seed produc-
tion. J. of American Society of Agro. 51: 515-518.
Geetha K and Jayaraman N 2000. Path analysis in maize
(Zea mays L.). Agric. Sci. Digest. 20 (1): 60-61.
Kaundal R and Sharma BK 2005. Genetic variability and
association studies for different yield components
over the environments in elite cultivars of (Zea mays
L.). Him. J. Agric. Res. 31 (1): 26-31.
Kumar A and Singh NN 2004. Identification of yield con-
tributors through path analysis in maize. Annals of
Agric. Res. 25 (3): 448-450.
Liu Z 1997. Correlation analysis among kernel physical
and quality characters in quality protein maize (QPM).
Maize Genetics Cooperation Newsletter. 71: 41.
Rafiq CM, Rafique M, Hussain A and Altaf A 2010. Stud-
ies on heritability, correlation and path analysis in
maize (Zea mays L.). J. of Agric. Res. 48 (1): 35-38.
Zarei B, Kahrizi D, Aboughadaresh AP and Sadeghi F
2012. Correlation and path coefficient analysis for
determining interrelationships among grain yield and
related characters in corn hybrids. Inter. J. of Agric.
and Crop Sci. 4 (20): 1519-1521.
167
Reactions of maize genotypes against banded leaf and sheath blight
Himachal Journal of Agricultural Research 41(1): 168-171 (2015)
Banita Devi, S. K. Guleria* and B. R. Thakur Department of Plant Pathology
Department of Plant Pathology, CSKHPKV, Palampur (HP), Himachal Pradesh India-176062 *HAREC, Bajaura-Kullu
Corresponding author: [email protected]
Abstract Forty inbred lines of maize were indexed against banded leaf and sheath blight (BLSB) caused by Rhizoctonia solani f. sp. sa-sakii. The lines were artificially inoculated under pot culture conditions. Out of forty, four inbred lines viz., BAJIM08-90-1-6-1, BAJIM 6128, CML437-B-B, and CML 164 were found highly resistant (HR) with disease score of 1. Bajuara Makka 1, HKI 488, HKI 1105, CML 165, CML 336, CML 439, CML 437, BML 6, CML414, L 292, CML 437-B-B, L 265, BAJIM 95-60-5, CML 460, Sarhad-HSRB, LM 13, VQL 2, CML 169, and HKI 162 were rated as resistant with disease score of 3. The remain-ing inbred lines were highly susceptible.
Key words: Reaction, maize inbred lines/hybrids, BLSB, Rhizoctonia solani f. sp. sasakii
Received: 10 November 2015; Accepted: 20 November 2015
Maize (Zea mays L.) is an important cereal crop
contributing towards world agricultural economy as food,
feed and industrial products. Banded leaf and sheath blight
(BLSB) of maize is caused by a destructive and versatile
pathogen Rhizoctonia solani f. sp. sasakii. The disease
causes huge crop losses in terms of grain and straw yield
ranging from 11.0 to 40.0% (Singh and Sharma 1976). In
India, this disease was first reported from Tarai region of
Uttar Pradesh (Payak and Renfro 1966). Afterwards, Payak
and Sharma (1981) reported the disease from Madhya
Pradesh, Rajasthan, Haryana, Punjab and Himachal
Pradesh. With the introduction of maize hybrids, the dis-
ease has become a major constraint for maize production in
the state. Since the pathogen is soil borne, the disease starts
from first leaf sheath to upward and even upto the ears to
cause maximum damage. Warm-humid weather favours
the development and spread of the disease. An op-timum
temperature of about 28°C with relative hu-midity >88%
favours rapid disease progress (Sharma 2005). The patho-
gen is characterized by formation of dull brown sclerotia
on the host (Plate 1). Characteristic symptoms include con-
centric bands and rings on infected sheaths and leaves
which are brown, tan or grey in color. The disease starts
appearing on the first and second leaf sheath above the
ground and eventually spreads to the ear causing ear rot. Ear
rot is characterized by light brown, cottony mycelium on the
ear and the presence of small, round, black sclerotia. The
pure cultures of Rhizoctonia solani f. sp. sasakii are shown in
Plate 2.
Evaluation of maize germplasm Artificial inoculation
Forty maize inbred lines procured from Hill Agricul-
tural Research and Extension Centre, Bajaura were evaluated
against BLSB under pot culture conditions in the growth
chamber of the Department of Plant Pathology, COA, CSK
HPKV, Palampur with susceptible cultivar ‘Kanchan’ as a
check. Five seeds of each entry were sown in a pot with
three replications. Pots were marked with level of entries and
kept in the green house. Twelve days old culture of R. solani
f. sp. sasakii was mass multiplied in potato broth for inocu-
lum production. Maize seedlings were artificially inoculated
with cotton bits (dipped in inoculum of the casual fungus) on
the axial of leaf sheath and blade. Pots were regularly sprin-
kled with water to maintain moisture. Watering of plants was
done regularly twice a day in the morning and evening. The
germinating seedlings of maize entry were covered with
polythene bags having pores to maintain humidity >85%.
168
Short Note
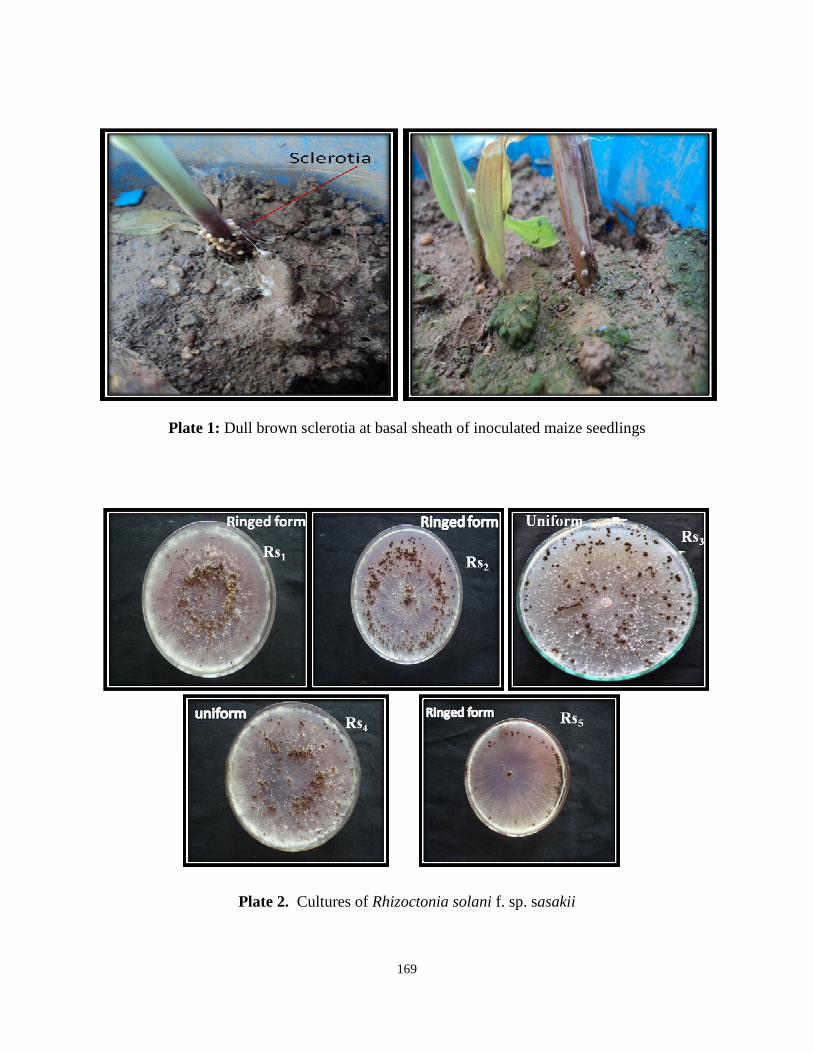
Plate 1: Dull brown sclerotia at basal sheath of inoculated maize seedlings
Plate 2. Cultures of Rhizoctonia solani f. sp. sasakii
169
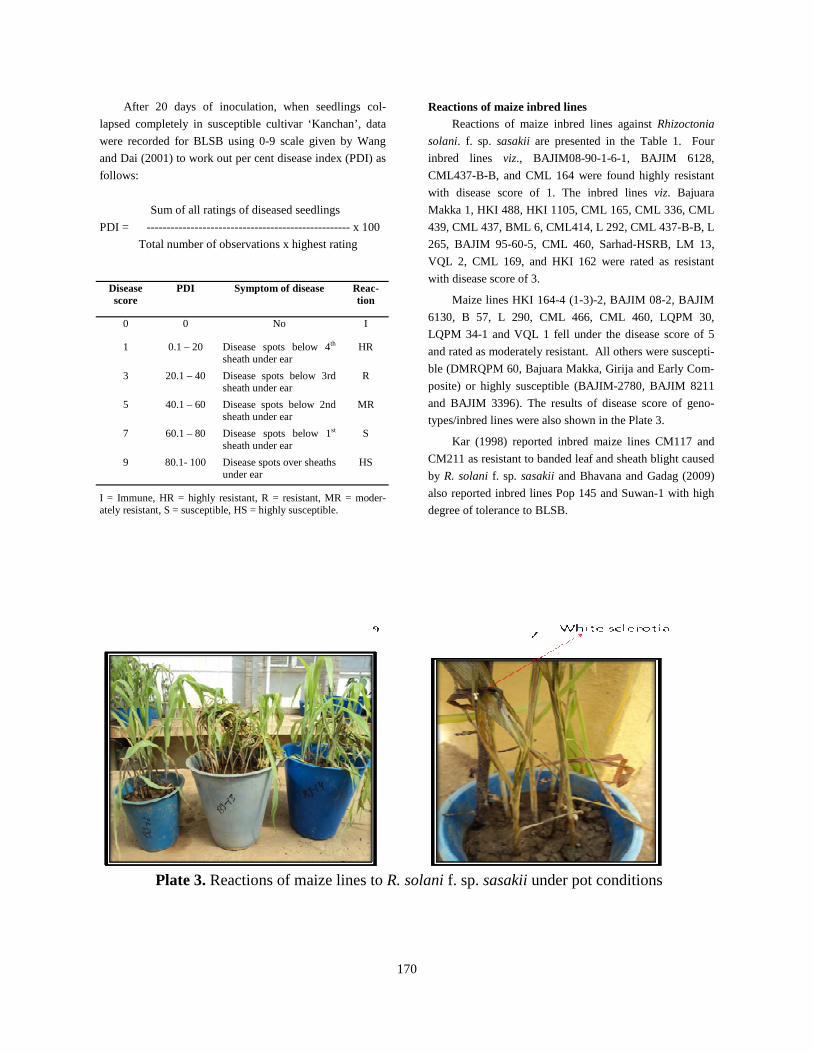
After 20 days of inoculation, when seedlings col-
lapsed completely in susceptible cultivar ‘Kanchan’, data
were recorded for BLSB using 0-9 scale given by Wang
and Dai (2001) to work out per cent disease index (PDI) as
follows:
Sum of all ratings of diseased seedlings
PDI = --------------------------------------------------- x 100
Total number of observations x highest rating
I = Immune, HR = highly resistant, R = resistant, MR = moder-ately resistant, S = susceptible, HS = highly susceptible.
Reactions of maize inbred lines Reactions of maize inbred lines against Rhizoctonia
solani. f. sp. sasakii are presented in the Table 1. Four
inbred lines viz., BAJIM08-90-1-6-1, BAJIM 6128,
CML437-B-B, and CML 164 were found highly resistant
with disease score of 1. The inbred lines viz. Bajuara
Makka 1, HKI 488, HKI 1105, CML 165, CML 336, CML
439, CML 437, BML 6, CML414, L 292, CML 437-B-B, L
265, BAJIM 95-60-5, CML 460, Sarhad-HSRB, LM 13,
VQL 2, CML 169, and HKI 162 were rated as resistant
with disease score of 3.
Maize lines HKI 164-4 (1-3)-2, BAJIM 08-2, BAJIM
6130, B 57, L 290, CML 466, CML 460, LQPM 30,
LQPM 34-1 and VQL 1 fell under the disease score of 5
and rated as moderately resistant. All others were suscepti-
ble (DMRQPM 60, Bajuara Makka, Girija and Early Com-
posite) or highly susceptible (BAJIM-2780, BAJIM 8211
and BAJIM 3396). The results of disease score of geno-
types/inbred lines were also shown in the Plate 3.
Kar (1998) reported inbred maize lines CM117 and
CM211 as resistant to banded leaf and sheath blight caused
by R. solani f. sp. sasakii and Bhavana and Gadag (2009)
also reported inbred lines Pop 145 and Suwan-1 with high
degree of tolerance to BLSB.
Disease score
PDI Symptom of disease Reac-tion
0 0 No I
1 0.1 – 20 Disease spots below 4th sheath under ear
HR
3 20.1 – 40 Disease spots below 3rd sheath under ear
R
5 40.1 – 60 Disease spots below 2nd sheath under ear
MR
7 60.1 – 80 Disease spots below 1st sheath under ear
S
9 80.1- 100 Disease spots over sheaths under ear
HS
Plate 3. Reactions of maize lines to R. solani f. sp. sasakii under pot conditions
170
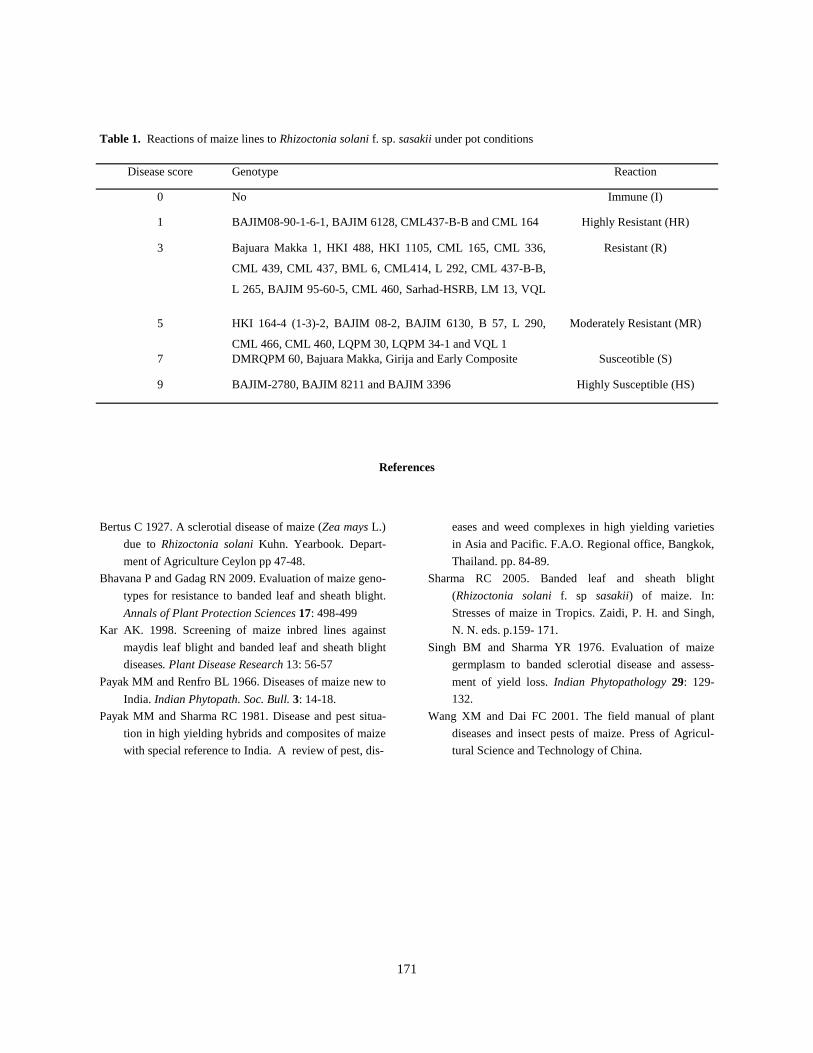
Disease score Genotype Reaction
0 No Immune (I)
1 BAJIM08-90-1-6-1, BAJIM 6128, CML437-B-B and CML 164 Highly Resistant (HR)
3 Bajuara Makka 1, HKI 488, HKI 1105, CML 165, CML 336,
CML 439, CML 437, BML 6, CML414, L 292, CML 437-B-B,
L 265, BAJIM 95-60-5, CML 460, Sarhad-HSRB, LM 13, VQL
Resistant (R)
5 HKI 164-4 (1-3)-2, BAJIM 08-2, BAJIM 6130, B 57, L 290,
CML 466, CML 460, LQPM 30, LQPM 34-1 and VQL 1
Moderately Resistant (MR)
7 DMRQPM 60, Bajuara Makka, Girija and Early Composite Susceotible (S)
9 BAJIM-2780, BAJIM 8211 and BAJIM 3396 Highly Susceptible (HS)
Table 1. Reactions of maize lines to Rhizoctonia solani f. sp. sasakii under pot conditions
References
Bertus C 1927. A sclerotial disease of maize (Zea mays L.)
due to Rhizoctonia solani Kuhn. Yearbook. Depart-
ment of Agriculture Ceylon pp 47-48.
Bhavana P and Gadag RN 2009. Evaluation of maize geno-
types for resistance to banded leaf and sheath blight.
Annals of Plant Protection Sciences 17: 498-499
Kar AK. 1998. Screening of maize inbred lines against
maydis leaf blight and banded leaf and sheath blight
diseases. Plant Disease Research 13: 56-57
Payak MM and Renfro BL 1966. Diseases of maize new to
India. Indian Phytopath. Soc. Bull. 3: 14-18.
Payak MM and Sharma RC 1981. Disease and pest situa-
tion in high yielding hybrids and composites of maize
with special reference to India. A review of pest, dis-
eases and weed complexes in high yielding varieties
in Asia and Pacific. F.A.O. Regional office, Bangkok,
Thailand. pp. 84-89.
Sharma RC 2005. Banded leaf and sheath blight
(Rhizoctonia solani f. sp sasakii) of maize. In:
Stresses of maize in Tropics. Zaidi, P. H. and Singh,
N. N. eds. p.159- 171.
Singh BM and Sharma YR 1976. Evaluation of maize
germplasm to banded sclerotial disease and assess-
ment of yield loss. Indian Phytopathology 29: 129-
132.
Wang XM and Dai FC 2001. The field manual of plant
diseases and insect pests of maize. Press of Agricul-
tural Science and Technology of China.
171
Effect of post-emergence herbicides on productivity and profitability of garden pea (Pisum sativum L.) in Lahaul valley of Himachal Pradesh
Himachal Journal of Agricultural Research 41(2): 172-176 (2015)
Janardan Singh, D.R. Chaudhary* and Suresh Kumar* Department of Agronomy, Forages and Grassland Management
* Directorate of Extension Education CSK Himachal Pradesh Krishi Vishvavidyalaya, Palampur - 176062, HP, India
Abstract
A field experiment was conducted during summer 2013 at Highland Agricultural Research and Extension Centre, CSK Himachal Pradesh Krishi Vishvavidyalaya, Kukumseri to study the effect of post-emergence herbicides viz. imazethapyr 50 and 80 g/ha, pendimethalin + imazethapyr 900 and 1200 g/ha, imazethapyr + imazamox 50 and 75 g/ha and clodinafop 60 g/ha in relation to pre-emergence pendimethalin 1200 g/ha and hand weeding twice on weeds and yield and economics of garden pea. Digitaria sanguinalis L. was the predominant grass weed while Chenopodium album L., Chenopodium botrys L., Gallin-soga parviflora L. and Malva parviflora L. were the major broad-leaf weeds. Pendimethalin at 1200 g/ha significantly reduced weed density and dry weight. This was followed by hand weeding twice (30 and 60 DAS). Pendimethalin resulted in maximum weed control efficiency (65.81%) and herbicide efficiency index (74.13%) and was followed by clodinafop 60 g/ha. Pod weight was not significantly affected. The highest pods/plant, green pods yield (2833 kg/ha), crop productivity (41.06 kg/ha/day), net returns (̀ 76294/ha), crop profitability (̀ 1105.71/ha/day) and B:C ratio (3.06) were recorded under pendimethalin 1200 g/ha. Clodinafop 60 g/ha and hand weeding twice had equal pods/plant and green pod yield. Among post-emergence herbicides, clodinafop 60 g/ha, imazethepyr 50 g/ha and imazethapyr + imazamox 50 g/ha were the economical treatments.
Key words: Garden pea, weeds, imazethapyr, imazamox, clodinafop, pendimethalin, profitability, productivity
Received: 18 November 2015; Accepted: 20 December 2015
Lahaul representing cold desert area is an important
vegetable growing region of the state. In Himachal
Pradesh, the cold desert area constitutes about 42 percent
of its total geographical area (Anonymous 2012). Garden
pea (Pisum sativum L.) is an important off-season cash
crop vegetable in the Lahaul valley. It is a major source of
income for the Lahaul farmers as it fetches higher price due
to its good aroma, sweetness and freshness. There is a great
demand of garden pea in different parts of the country.
Heavy weed infestation is one of the major reasons for
poor productivity and profitability of garden pea in the
region. The prevailing soil and climatic conditions warrant
frequent irrigation for better growth and development of
garden pea. Climatic conditions and frequent irrigation
aggravate weed growth (Singh et al. 1991; Sharma 1993).
Acute crop-weed competition occurs due to earlier weed
germination and faster weed growth than garden pea particu-
larly in initial growth stages. Lahaul farmers generally adopt
manual weed control which is not only very expensive but
also not feasible due to acute shortage of labour at the time
of peak sowing and harvesting of the crop. Delayed harvest-
ing of garden pea results in decreasing quality and green pod
yield due to birds’ attack.
Pre-and post-emergence herbicides are needed for effec-
tive weed control as there is acute weed infestation in the
region. Post-emergence herbicides would be proved to be the
best alternative in the case, when farmers could not apply
pre-emergence herbicide in their crop due to its non-
172
Short Note
availability. For effective weed control in garden pea, there
is no recommended post-emergence herbicide for the cold
desert region of the state. Hence, the present investigation
was undertaken to study the effect of post-emergence her-
bicides on weeds and yield and economics of garden pea.
A field experiment was conducted during summer
2013 at Kukumseri (32° 44' 55" N latitude, 76° 41' 23" E
longitude, and 2672 m above the mean sea level). The cli-
mate is extremely cold and heavy snowfall occurs during
winter. The temperature remains several degrees below
zero level. Single cropping season is prevailing in the re-
gion which starts from April to September or early October
when the mean minimum and maximum temperature range
between 12°C to 24°C. There is negligible rainfall followed
by high light intensity and low humidity. Average annual
rainfall of the region is 250 mm. The soil of the experimen-
tal site was sandy loam in texture and acidic in reaction
(6.1) with 10.5 g OC/kg soil, 0.9 mg Zn/kg soil, 18 kg S/ha,
280 kg available N/ha, 34 kg available P/ha and 300 kg
available K/ha. Soils are shallow in depth and loose in
texture resulting in poor water holding capacity. The ex-
periment consisting of ten treatments viz. imazethapyr 50 &
80 g/ha, pendimethalin + imazethapyr (ready mix, valor)
900 and 1200 g/ha, imazethapyr + imazamox (ready mix,
odyssey) 50 & 75 g/ha, clodinafop 60 g/ha, pendimethalin
1200 g/ha, hand weeding (30 & 60 DAS) and weedy check
(Table 1) was laid out in randomized block design with
three replications.
Garden pea cv Azad P-1 was sown on 22nd May, 2013
at 45 cm inter-row spacing with a seed rate of 100 kg/ha.
Seed was treated with bavistin at 2.5 g/kg seed. Recom-
mended dose of nutrients @ 25 kg N, 60 kg P2O5 and 60 kg
K2O/ha was applied at the time of sowing through urea,
single super phosphate and muriate of potash, respectively.
Pendimethalin was applied next day of sowing whereas
imazethapyr, odyssey, valor and clodinafop were applied at
30 days after sowing. Snow-melt water, the only source of
irrigation was used to irrigate garden pea through sprin-
klers, rain gun or Kuhl. The crop was harvested on 30th
July 2013. Other practices were in accordance with the
recommended package for the region.
Weed density (stems/m2 was noted due to dense and
compact stems with rooting from nodes touched with soil),
weed dry matter accumulation, yield attributes, green pod
yield, productivity, cost of cultivation, gross returns, net
returns, B:C ratio and profitability were recorded and/or
computed after the harvest of the crop. Weed control effi-
ciency (WCE) and herbicide efficiency index (HEI) were
worked out using the following formulae:
Yield in treated plot - Yield in control plot HEI = --------------------------------------------------- x 100 Yield in treated plot Weed dry weight in control plot - Weed dry weight in treated plot WCE (%) = --------------------------------------------x 100 Weed dry weight in control plot
Statistical differences between treatments were tested
with Fisher’s least significant difference (P=0.05) test
(Fisher and Yates 1949) using analysis of variance for ran-
domized block design as described by Panse and Sukhatme
(1967).
The experimental field was heavily infested with dif-
ferent weed flora. Digitaria sanguinalis L. was the pre-
dominant grass weed while Chenopodium album L.,
Chenopodium botrys L., Gallinsoga parviflora L. and
Malva parviflora L. were the major broad-leaf weeds.
Other weeds were Polygonum alatum L., Setaria glauca L.,
Amaranthus spinosus L., Medicago denticulata L. and Poa
annua L. (Rana et al. 2004; Kumar et al. 2015a; Kumar et
al. 2015b). Digitaria sangunalis L. was the most predomi-
nant weed.
Different weed control treatments significantly influ-
enced weed density (Table 1). Pre-emergence application
of pendimethalin 1200 g/ha significantly reduced the num-
ber of weeds. This was followed by hand weeding at 30
and 60 days after sowing and post-emergence application
of clodinafop 60 g/ha. The weed dry weight showed the
similar trend like weed density (Table 1). The lowest weed
dry weight was recorded in pendimethalin 1200 g/ha fol-
lowed by hand weeding at 30 and 60 days after sowing.
Rest of the treatments produced similar dry matter. Pre-
emergence application of pendimethalin 1200 g/ha had
maximum weed control efficiency of 65.81% and herbicide
efficiency index of 74.13%. Post-emergence application of
clodinafop 60 g/ha was found to be the next best treatment
in respect of weed control efficiency (40.17%) and herbi-
cide efficiency index (58.88%). The highest weed density
and weed dry matter accumulation was noted in weedy
check. Pre-emergence application of pendimethalin sup-
presses weeds effectively resulting in low weed density and
dry weight. Post-emergence herbicides were not as effec-
tive due to well establishment of weeds by 30 days after
sowing resulted in acute crop weed competition.
The highest number of pods per plant was recorded
with pre-emergence application of pendimethalin 1200 g/
ha while the lowest was in weedy check (Table 2). The
second highest number of pods/plant was recorded in hand
173
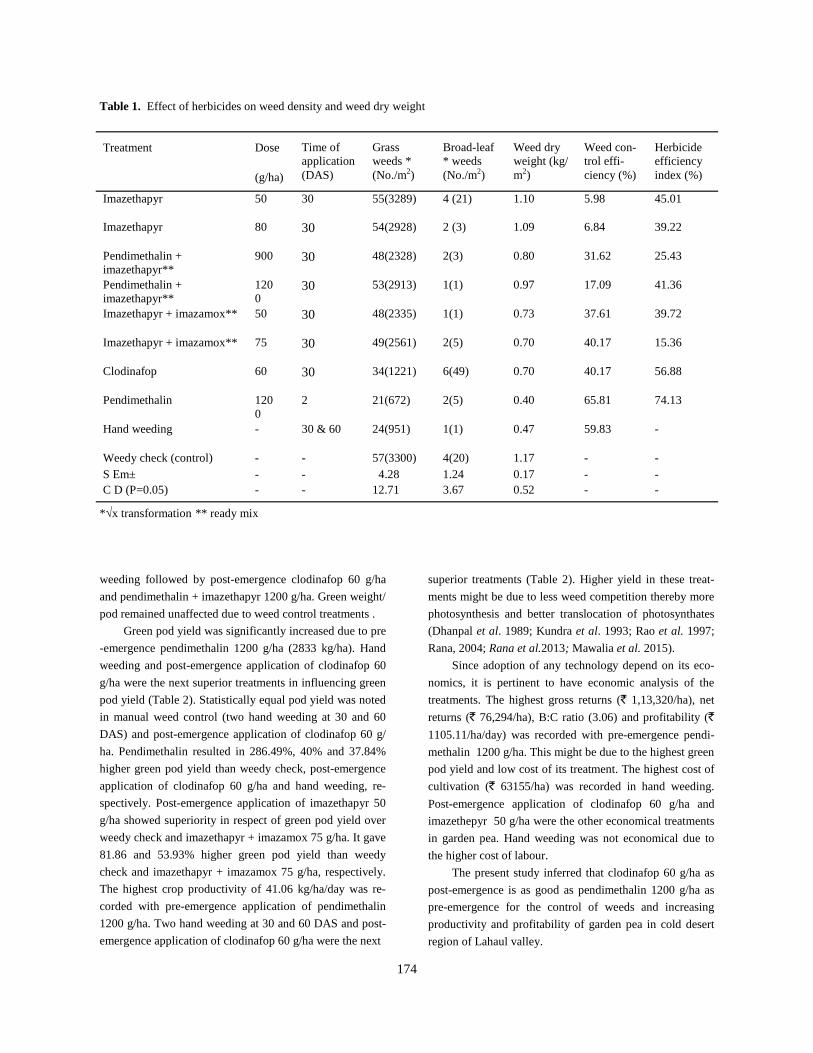
174
Treatment Dose
(g/ha)
Time of application (DAS)
Grass weeds * (No./m2)
Broad-leaf * weeds (No./m2)
Weed dry weight (kg/m2)
Weed con-trol effi-ciency (%)
Herbicide efficiency index (%)
Imazethapyr 50 30 55(3289) 4 (21) 1.10 5.98 45.01
Imazethapyr 80 30 54(2928) 2 (3) 1.09 6.84 39.22
Pendimethalin + imazethapyr**
900 30 48(2328) 2(3) 0.80 31.62 25.43
Pendimethalin + imazethapyr**
1200
30 53(2913) 1(1) 0.97 17.09 41.36
Imazethapyr + imazamox** 50 30 48(2335) 1(1) 0.73 37.61 39.72
Imazethapyr + imazamox** 75 30 49(2561) 2(5) 0.70 40.17 15.36
Clodinafop 60 30 34(1221) 6(49) 0.70 40.17 56.88
Pendimethalin 1200
2 21(672) 2(5) 0.40 65.81 74.13
Hand weeding - 30 & 60 24(951) 1(1) 0.47 59.83 -
Weedy check (control) - - 57(3300) 4(20) 1.17 - - S Em± - - 4.28 1.24 0.17 - - C D (P=0.05) - - 12.71 3.67 0.52 - -
Table 1. Effect of herbicides on weed density and weed dry weight
*√x transformation ** ready mix
weeding followed by post-emergence clodinafop 60 g/ha
and pendimethalin + imazethapyr 1200 g/ha. Green weight/
pod remained unaffected due to weed control treatments .
Green pod yield was significantly increased due to pre
-emergence pendimethalin 1200 g/ha (2833 kg/ha). Hand
weeding and post-emergence application of clodinafop 60
g/ha were the next superior treatments in influencing green
pod yield (Table 2). Statistically equal pod yield was noted
in manual weed control (two hand weeding at 30 and 60
DAS) and post-emergence application of clodinafop 60 g/
ha. Pendimethalin resulted in 286.49%, 40% and 37.84%
higher green pod yield than weedy check, post-emergence
application of clodinafop 60 g/ha and hand weeding, re-
spectively. Post-emergence application of imazethapyr 50
g/ha showed superiority in respect of green pod yield over
weedy check and imazethapyr + imazamox 75 g/ha. It gave
81.86 and 53.93% higher green pod yield than weedy
check and imazethapyr + imazamox 75 g/ha, respectively.
The highest crop productivity of 41.06 kg/ha/day was re-
corded with pre-emergence application of pendimethalin
1200 g/ha. Two hand weeding at 30 and 60 DAS and post-
emergence application of clodinafop 60 g/ha were the next
superior treatments (Table 2). Higher yield in these treat-
ments might be due to less weed competition thereby more
photosynthesis and better translocation of photosynthates
(Dhanpal et al. 1989; Kundra et al. 1993; Rao et al. 1997;
Rana, 2004; Rana et al.2013; Mawalia et al. 2015).
Since adoption of any technology depend on its eco-
nomics, it is pertinent to have economic analysis of the
treatments. The highest gross returns (` 1,13,320/ha), net
returns (̀ 76,294/ha), B:C ratio (3.06) and profitability (`
1105.11/ha/day) was recorded with pre-emergence pendi-
methalin 1200 g/ha. This might be due to the highest green
pod yield and low cost of its treatment. The highest cost of
cultivation (̀ 63155/ha) was recorded in hand weeding.
Post-emergence application of clodinafop 60 g/ha and
imazethepyr 50 g/ha were the other economical treatments
in garden pea. Hand weeding was not economical due to
the higher cost of labour. The present study inferred that clodinafop 60 g/ha as
post-emergence is as good as pendimethalin 1200 g/ha as
pre-emergence for the control of weeds and increasing
productivity and profitability of garden pea in cold desert
region of Lahaul valley.
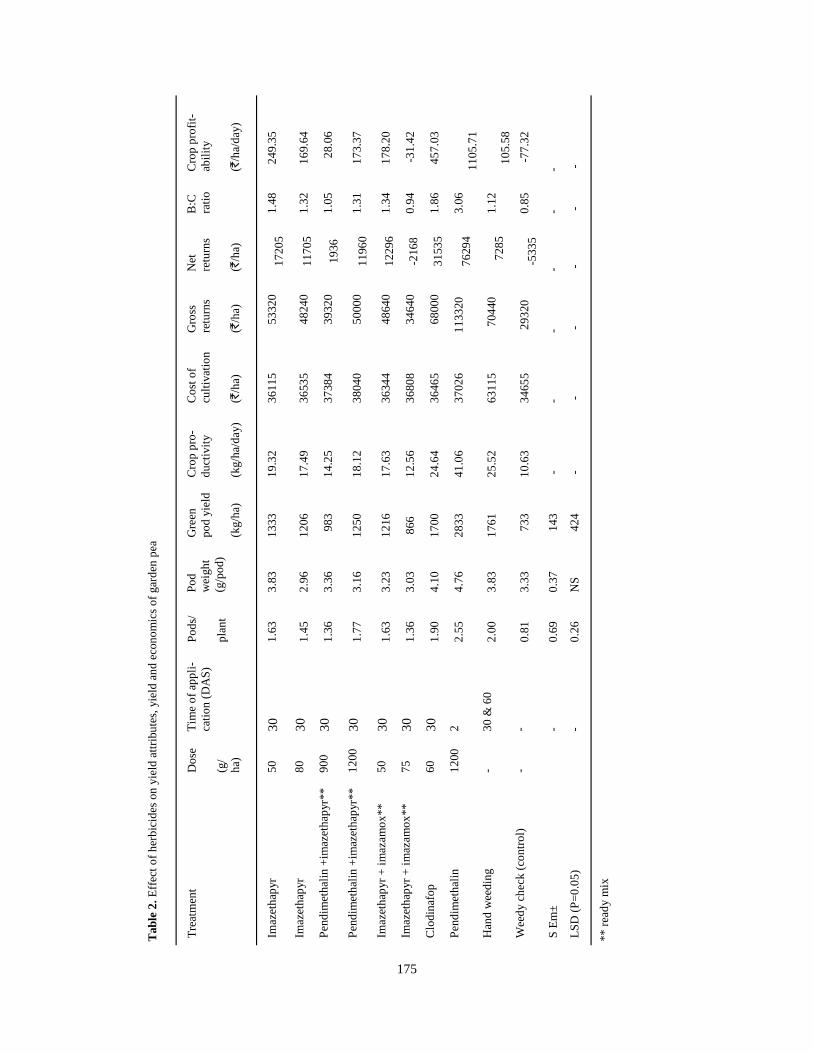
Tre
atm
ent
Do
se
(g/
ha)
Tim
e o
f ap
pli-
catio
n (
DA
S)
Po
ds/
pla
nt
Po
d w
eigh
t (g
/po
d)
Gre
en
po
d yi
eld
(kg/
ha)
Cro
p p
ro-
du
ctiv
ity
(kg/
ha/
da
y)
Co
st o
f cu
ltiva
tion
(`/h
a)
Gro
ss
retu
rns
(`/h
a)
Net
re
turn
s
(`/h
a)
B:C
ra
tio
Cro
p p
rofit
-ab
ility
(`/h
a/d
ay)
Imaz
eth
apyr
50
30
1
.63
3.8
3 1
333
1
9.3
2 3
611
5 5
332
0 1
720
5 1
.48
24
9.35
Imaz
eth
apyr
80
30
1
.45
2.9
6 1
206
1
7.4
9 3
653
5 4
824
0 1
170
5 1
.32
16
9.64
Pen
dim
eth
alin
+im
azet
hap
yr**
90
0 3
0
1.3
6 3
.36
9
83
14
.25
37
384
39
320
19
36
1.0
5
28.
06
Pen
dim
eth
alin
+im
azet
hap
yr**
12
00
30
1
.77
3.1
6 1
250
1
8.1
2 3
804
0 5
000
0 1
196
0 1
.31
17
3.37
Imaz
eth
apyr
+ im
aza
mo
x**
50
30
1
.63
3.2
3 1
216
1
7.6
3 3
634
4 4
864
0 1
229
6 1
.34
17
8.20
Imaz
eth
apyr
+ im
aza
mo
x**
75
30
1
.36
3.0
3 8
66
12
.56
36
808
34
640
-216
8 0
.94
-31
.42
Clo
din
afo
p 6
0 3
0
1.9
0 4
.10
17
00
24
.64
36
465
68
000
31
535
1.8
6 4
57.
03
Pen
dim
eth
alin
12
00
2 2
.55
4.7
6 2
833
4
1.0
6 3
702
6 1
133
20
76
294
3.0
6
11
05.7
1 H
and
wee
din
g -
30
& 6
0 2
.00
3.8
3 1
761
2
5.5
2 6
311
5
704
40
7
285
1.1
2
1
05.
58
Wee
dy
che
ck (
con
tro
l) -
- 0
.81
3.3
3
733
1
0.6
3 3
465
5 2
9320
-5
335
0.8
5
-77
.32
S E
m±
-
0.6
9 0
.37
1
43
-
-
-
-
-
-
LSD
(P
=0
.05
) -
0
.26
NS
4
24
-
-
-
-
-
-
Tab
le 2
. Effe
ct o
f her
bic
ides
on
yie
ld a
ttrib
ute
s, y
ield
an
d e
con
om
ics
of g
ard
en p
ea
** r
ead
y m
ix
175

Anonymous 2012. Status Report on Cold Arid areas of
Himachal Pradesh. Directorate of Research, CSK
Himachal Pradesh Krishi Vishvavidyalaya, Palam-
pur, Himachal Pradesh, pp 54.
Dhanpal GN, Reddy BMV and Bommegowda A 1989.
Screening of herbicide for dry land crops under Ban-
galore condition. Mysore Journal of Agricultural
Sciences 23 (2): 159-163.
Fisher RA and Yates F 1949. Statistical tables for Biologi-
cal, Agricultural and Medical Research. Oliver and
Boys, Edinburgh. Pp 112.
Kumar A, Manuja S, Singh J and Chaudhary DR 2015a.
Integrated weed management in tomato under dry
temperate climate of western Himalayas. Journal of
Crop and Weed 11(1):165-167.
Kumar A, Manuja S, Singh J and Chaudhary DR 2015b.
Integrated weed management in cauliflower
(Brassica oleracea var. botrytis) under dry temperate
climate of western Himalayas. Journal of Crop and
Weed 11(2):168-171.
Kundra, HC, Singh, G and Brar, LS 1993. Efficacy of weed
management practices in pea (Pisum sativum L.).
Indian Journal of Weed Science 25(1):1-6.
Mawalia AK, Kumar S and Rana SS 2015. Economics of
post-emergence weed control in garden pea (Pisum
sativum L.) under mid hill condition of Himachal
Pradesh. Himachal Journal of Agricultural Research
41(1): 15-29.
Panse VG and Sukhatme PV 1967. Statistical Methods for
Agricultural Workers, Indian Council of Agricul-
tural. Research, New Delhi, India, pp 381.
Rana M C, Kumar N, Sharma, A and Rana SS 2004. Man-
agement of complex weed flora in peas with herbi-
cide mixtures under Lahaul valley conditions of Hi-
machal Pradesh. Indian Journal of Weed Science. 36(1&2): 68-72.
Rana MC, Nag M, Rana SS and Sharma GD 2013. Influ-
ence of post-emergence herbicides on weeds and
productivity of garden pea (Pisum sativum L.)) under
mid hill condition of Himachal Pradesh. Indian Jour-
nal of Agronomy 58 (2): 226-230.
Rao AR, Sharma SN and Mohammad S 1997. Impact of
varying plant population and herbicide use on weeds,
crop yield and profitability of rajmash. Crop Re-
search Hisar 13(2): 293-300.
Sharma, JJ 1993. Evaluation of herbicides in peas in mid-
hills of Himachal Pradesh. Indian Journal of Weed
Science 25 (3&4): 36-39.
Singh JS, Bhan VM and Balyan RS 1991. Crop-weed com-
petition studies in pea (Pisum sativum L.). Indian
Journal of Weed Science 23 (1&2): 67-68.
176
References
Evaluation of ‘KL241’: a new genotype of linseed (Linum usitatissimum L.) under utera cultivation
Himachal Journal of Agricultural Research 41(1): 177-179 (2015)
Pankaj Chopra Department of Agronomy, Forages and Grassland Management
CSKHPKV, Palampur (HP), Himachal Pradesh India-176062
Corresponding author: [email protected]
Abstract
A field experiment was conducted during rabi 2014-15 at Palampur to evaluate a new genotype of linseed viz. ‘KL-241’ in com-parison to ‘Baner’ and ‘T-397’. The new entry ‘KL-241’ was significantly superior to national check ‘T-397’ in term of almost all growth and yield attributes viz. plant stand, number of capsules/plant and 1000-seed weight. However, number of primary and secondary branches and seeds/capsule were not significantly influenced due to genotypes. ‘Baner’ (Zonal Check) was at par with ‘KL-241’ for plant stand, number of capsules/plant and seed yield of linseed. ‘KL-241’ registered 137.9 and 10.2% higher seed yield over ‘T-397’ and ‘Baner’, respectively. Maximum net returns and B:C ratio of INR 10383/ha and 1.18, re-spectively, were obtained under ‘KL-241’, which was followed by zonal check-‘Baner’.
Key words: Linseed, Utera, Varieties, Yield, Economics
Received: 01 November 2015; Accepted: 20 November 2015
Linseed (Linum usitatissimum (L.) Griesb.) is becom-
ing increasingly popular as a nutritional and functional
food. Seed is a rich source of both non-edible and edible
oil. The oil crushed from the seeds can be used for either
industrial or edible purpose, depending on the fatty acid
composition (Burton 2007). Edible linseed oil is used for
human consumption and contains high α-linolenic acid (ω
3 fatty acid), a polyunsaturated fatty acid along with high
content of health promoting substances such as soluble and
insoluble fibre and lignans (Genser and Morris 2003 ; Mor-
ris 2005). In Himachal Pradesh, released linseed cultivars
have low linoleic and high linolenic acid composition
which make them suitable for cooking purpose. In the state,
linseed is generally broadcasted in standing paddy crop, 15
-20 days before its harvest. This relay system of cultivation
is popularly known as ‘utera’ or ‘paira’. The cultivation of
linseed in this system is under total “Nature’s care and
cure” which results in lower productivity. The use of local
land races susceptible to rust, other diseases and easily
smothered by the weeds further limits linseed production in
this system. The past efforts were limited to verification of
genotypes and agrotechniques under prepared seed bed con-
ditions and not for utera cultivation. Genotypes differ from
each others in genetic make up for growth and yield and
behave differently in different environments. Under utera
system, varieties having small seed size and deep root system
will be of much importance (Agarwal et al. 1986). A new
entry i.e. ‘KL-241’, (Giza-7 and KLS-1) having similar char-
acters and performance needs to be confirmed under this
system of cultivation.
Keeping this in view, the present study was conducted
at Main Farm of Department of Crop Improvement,
CSKHPKV, Palampur during rabi 2014-15 to evaluate the
performance of new entry (‘KL-241’) in comparison to two
checks viz. ‘T-397’ (NC) and ‘Baner’ (ZC) in randomized
block design with seven replications under Utera system of
cultivation. The soil of the experiment site was silty clay
loam in texture with pH 5.9 and medium in available nitro-
gen, phosphorus and potassium. The crop was supplied with
60 kg N/ha. The crop was sown by broadcasting seeds of
177
Short Note
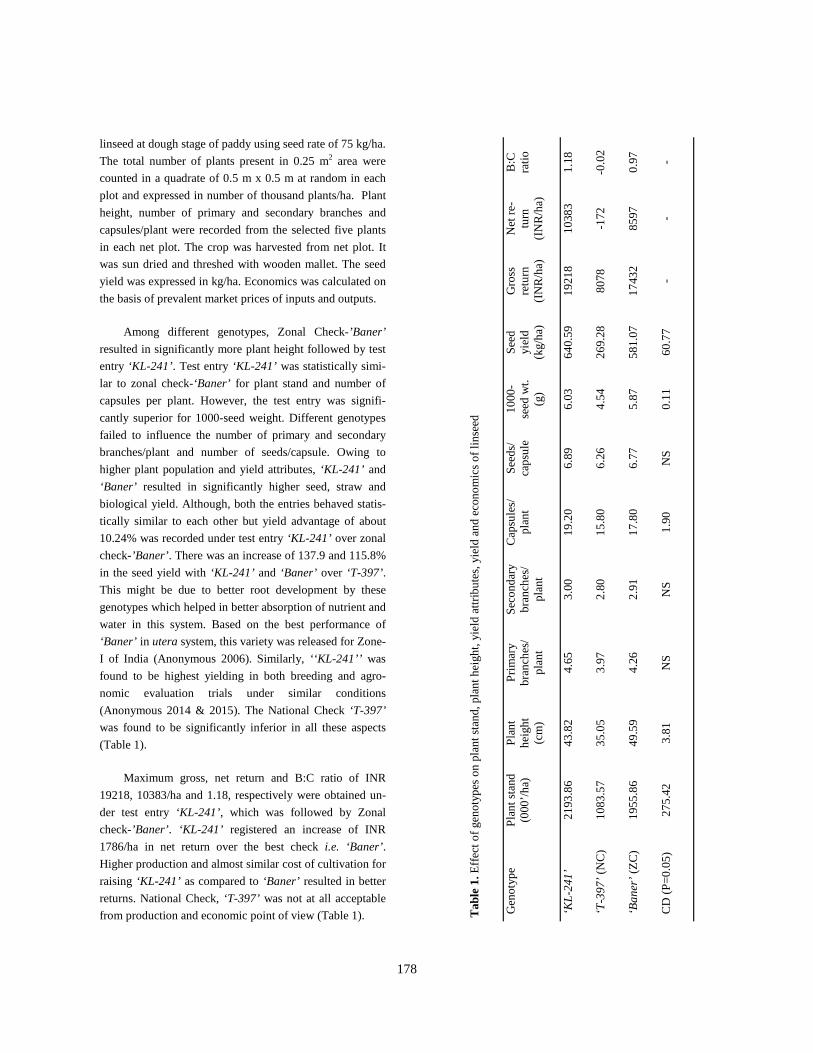
linseed at dough stage of paddy using seed rate of 75 kg/ha.
The total number of plants present in 0.25 m2 area were
counted in a quadrate of 0.5 m x 0.5 m at random in each
plot and expressed in number of thousand plants/ha. Plant
height, number of primary and secondary branches and
capsules/plant were recorded from the selected five plants
in each net plot. The crop was harvested from net plot. It
was sun dried and threshed with wooden mallet. The seed
yield was expressed in kg/ha. Economics was calculated on
the basis of prevalent market prices of inputs and outputs.
Among different genotypes, Zonal Check-’Baner’
resulted in significantly more plant height followed by test
entry ‘KL-241’. Test entry ‘KL-241’ was statistically simi-
lar to zonal check-‘Baner’ for plant stand and number of
capsules per plant. However, the test entry was signifi-
cantly superior for 1000-seed weight. Different genotypes
failed to influence the number of primary and secondary
branches/plant and number of seeds/capsule. Owing to
higher plant population and yield attributes, ‘KL-241’ and
‘Baner’ resulted in significantly higher seed, straw and
biological yield. Although, both the entries behaved statis-
tically similar to each other but yield advantage of about
10.24% was recorded under test entry ‘KL-241’ over zonal
check-’Baner’. There was an increase of 137.9 and 115.8%
in the seed yield with ‘KL-241’ and ‘Baner’ over ‘T-397’.
This might be due to better root development by these
genotypes which helped in better absorption of nutrient and
water in this system. Based on the best performance of
‘Baner’ in utera system, this variety was released for Zone-
I of India (Anonymous 2006). Similarly, ‘‘KL-241’’ was
found to be highest yielding in both breeding and agro-
nomic evaluation trials under similar conditions
(Anonymous 2014 & 2015). The National Check ‘T-397’
was found to be significantly inferior in all these aspects
(Table 1).
Maximum gross, net return and B:C ratio of INR
19218, 10383/ha and 1.18, respectively were obtained un-
der test entry ‘KL-241’, which was followed by Zonal
check-’Baner’. ‘KL-241’ registered an increase of INR
1786/ha in net return over the best check i.e. ‘Baner’.
Higher production and almost similar cost of cultivation for
raising ‘KL-241’ as compared to ‘Baner’ resulted in better
returns. National Check, ‘T-397’ was not at all acceptable
from production and economic point of view (Table 1). Tab
le 1
. Effe
ct o
f gen
oty
pes
on
pla
nt
stan
d, p
lan
t hei
ght,
yie
ld a
ttrib
ute
s, y
ield
an
d e
con
om
ics
of l
inse
ed
Gen
oty
pe
Pla
nt
stan
d
(000
’/ha)
P
lan
t h
eigh
t
(cm
)
Prim
ary
bra
nch
es/
pla
nt
Sec
on
dar
y b
ran
ches
/ p
lan
t
Cap
sule
s/
pla
nt
See
ds/
ca
psu
le 1
000
-se
ed w
t.
(g)
See
d
yiel
d
(kg/
ha)
Gro
ss
retu
rn
(IN
R/h
a)
Net
re-
turn
(I
NR
/ha)
B:C
ra
tio
‘KL
-241
’ 2
193
.86
43
.82
4.6
5 3
.00
19
.20
6.8
9 6
.03
64
0.59
1
921
8 1
038
3 1
.18
‘T-3
97’ (
NC
) 1
083
.57
35
.05
3.9
7 2
.80
15
.80
6.2
6 4
.54
26
9.28
8
078
-1
72
-0.0
2
‘Ba
ner’ (
ZC
) 1
955
.86
49
.59
4.2
6 2
.91
17
.80
6.7
7 5
.87
58
1.07
1
743
2 8
597
0
.97
CD
(P
=0
.05
) 2
75.
42
3.8
1 N
S
NS
1.9
0 N
S
0.1
1 6
0.7
7 -
- -
178
Agarwal SK, Shrivastava PS and Singh R 1986. Package of
practices for utera cultivation. Indian Farming 36: 5-
10.
Anonymous 2006. Annual Report, All India Coordinated
Research Project on Linseed, Project Coordinating
Unit, CSAUA&T, Kanpur, 2005-06, pp ii.
Anonymous 2014. Annual Report, All India Coordinated
Research Project on Linseed, Project Coordinating
Unit, CSAUA&T, Kanpur, 2013-14, pp 54.
Anonymous 2015. Annual Report, All India Coordinated
Research Project on Linseed, Project Coordinating
Unit, CSAUA & T, Kanpur, 2014-15, pp 47.
Burton A 2007. Field plot conditions for the expression and
selection of straw fiber concentration in oilseed flax.
Ph. D. Thesis, University of Saskatchewan Saskatoon,
Saskatchewan, Canada.
Genser AD and Morris ND 2003. History of cultivation
and uses of flaxseed. In: Flax -The genus Linum, eds
Muir AD and Westcott ND. Taylor and Francis. Lon-
don.
Morris DH 2005. Flax-A health and nutrition primer. (F. C.
O. Canada, ed.). Flax Council of Canada. http://
www.flaxcouncil.ca/primer.htm
References
179

Preliminary studies on semi-hardwood grafting technique in apple under polyhouse con-dition in mid hill area of Himachal Pradesh
Himachal Journal of Agricultural Research 41(2): 180-183 (2015)
ND Negi and SK Upadhyay Department of Horticulture, CSKHPKV, Palampur (HP), Himachal Pradesh India-176062
Corresponding author: [email protected] ; [email protected]
Abstract
A study was carried during 2012-13 at Palampur to investigate the possibilities of semi-hardwood grafting technique in apple under polyhouse. The tongue grafting was performed on four different dates (September 11, 18, 25 and 29, 2012). A success rate of 93.33 to 100% with proper callusing and healing of graft unions was achieved. Among different grafting dates, the plants grafted on September 11 attained the maximum height (25.10 cm) with lateral branching of 2.67 laterals/plant. The minimum plant height of 14.50 cm was recorded in plants grafted on September, 29. Similarly, total number of leaves, dry and fresh weight and chlorophyll content were also more in plants grafted on September 11. This technique needs to be investigated in apple and other temperate fruit plants under polyhouse condition for quick multiplication and reducing nursery production dura-tion.
Key words: Semi-hardwood, grafting, apple, polyhouse, chlorophyll, callus, plant height, leaf weight
Received: 10 August 2015; Accepted: 22 August 2015
Plant propagation including grafting played an impor-
tant role in mankind since the beginning of civilization
when man started to grow crops (Mahunu et al. 2012). The
grafting is a technique used to combine one plant part with
another to encourage growth as a unified plant. It is accom-
plished by inserting a piece of stem containing 3 to 4 vege-
tative buds onto the stem of the plant that will serve as the
root system for the unified plant (Hartmann et al. 2002). It
has been successful in producing fruit trees of small and
manageable sizes which are precocious, productive and
true-to-type. The basis of unity between two parts of plants
depends on mutual responsibility. Apart from tree or plant
size control, grafting produces planting stock that has suit-
able characteristics such as resistance to pest and diseases.
Additionally, it provides an opportunity to clonally propa-
gate selected trees with desirable phenotypes (Kumar et al.
2015; Rana et al. 2015). The branch top-work grafting has
been used to improve upon pollination in apple orchards
having inadequate pollinizers (Sharma and Rana, 2015).
The impact of grafting on apical dominance (Mapelli and
Kinet 1992), mineral nutrition (Jayawickrama et al. 1992),
flowering (Corbesier et al. 2007), dwarfism (White et al.
1992) and abiotic stress (Kumar et al. 2015) has been stud-
ied.
Almost all temperate fruit plants are multiplied through
grafting, budding and tissue culture. Grafting is performed
during dormant season whereas, budding in active growing
season (June-September). However, there is no scientific
research devoted to success of semi-hardwood grafting
in apple to date except the shoot tip grafting of some woody
plants including apple by grafting a small shoot tip of 0.1 to
1.0 mm, onto a young seedling rootstock growing in-vitro.
The same technique has been used with citrus, peach, cherry,
plum, apricot, apple, almond, grapevine, avocado, camellia
and sequoia (Navarro 1988).
It takes complete two years to produce plants if grafted
onto seedling rootstocks. Therefore, there is a need to invent
new techniques to reduce this time. Although, in-vitro multi-
plication gives quick and disease free planting materials but
it requires modernize and professionally qualified and com-
petent manpower. Further, to meet the ever-growing demand
and inadequate supply of quality planting materials, the semi
-hardwood grafting technique could be employed under
polyhouse condition for quick supply of plants. Moreover,
the growth in polyhouse condition is faster and remains more
as compared to open field condition. Therefore, the present
experiment was conducted to determine the possibilities of
semi-hardwood grafting in apple under polyhouse condition.
180
Short Note

A semi-hardwood grafting experiment was conducted
in apple cultivar Scarlet Gala as scion and M-7 clonal root-
stock at Palampur, (32.1167 0N latitude, 76.533 0E longi-
tude and 1280 m altitude) during 2012-13. Both the com-
ponents (scion and rootstock) were multiplied in-vitro at
The Energy and Resources Institute (TERI), New Delhi
and hardened plantlets at three leaves stage were trans-
ferred to Palampur in April, 2011. After acclimatization
and attainment of graftable size (17 month old), in poly-
house tongue grafting was done on September 11, 18, 25
and 29, 2012. On each grafting dates 21 plants were
grafted and the scionwood having the same thickness of
rootstocks was selected. While preparing scionwood, the
middle portion (semi-hardwood) of shoots with at least
three nodes was selected and leaves were removed with the
help of secateur just leaving the petioles as such on them.
Care was taken that all buds at each node were well devel-
oped and the wood was not succulent. The scionwood was
detached directly from mother plant and no curing/pre-
conditioning was done prior to the grafting, as done in most
of the evergreen plants. The average temperature within the
polyhouse was 27 0C during day time. No misting was
done except cooling the structure by exhaust fans mounted
in it. The observations were recorded from 15 representa-
tive plants selected randomly from each grafting date. The
experiment was laid out in Randomized Block Design
(RBD) with three replications. The growth of grafted plants
was recorded at weekly interval starting from October 11 to
December 5, 2012. In the following year, the plants were
kept as such in beds and observations on various growth
parameters and foliar characteristics were taken (data not
presented).
Estimation of chlorophyll content
Dimethyl sulfoxide (DMSO) solvent was used to ex-
tract the chlorophyll from leaves as described by Hiscox
and Israelstam (1979). Chlorophyll a (mg/cm2), chlorophyll
b (mg/cm2) and total chlorophyll content (mg/cm2) were
calculated from absorbance at 663nm and 645 nm in UV
Spectronic-20 according to Arnon’s (1949) equations:
Chlorophyll a= (ml of solvent) [(0.0127 x absorbance 663)-
(0.00269 x absorbance 645)]/leaf area (cm2)
Chlorophyll b= (ml of solvent) [(0.0229 x absorbance 645)
-(0.00468 x absorbance 663)]/leaf area (cm2)
Total chlorophyll content = (ml of solvent) [(0.0202 x ab-
sorbance 645) + (0.00802 x absorbance 663)]/
leaf area (cm2)
The wound healing process viz., callus formation,
cambial differentiation and connectivity and vascular tissue
formation was observed visually in both years (2012-13)
without histological studies. The data were analyzed by
using Assex, an MS-DOS based program and CPCS1 soft-
ware at 0.05 % rejection level.
Bud take The buds started bursting after 7 to 10 days of graft-
ing. There was 93.33 to 100 % success with proper callus-
ing and healing of graft wounds under different treatments
(Table 1). The callus formation and wound healing were
observed visually. It was observed that after 40 to 60 days
of grafting, wounds were healed except those plants which
were grafted on September 29, where the wound healing
was a bit slow (data not presented).
The ontogeny of graft union formation was also ob-
served in the following year (2013). There was no sign of
abnormality and incompatibility in graft unions in any of
the treatments. Although, it takes several years to check the
incompatibility but in this study the growth of all the
grafted plants was normal and no abnormality/overgrowth
or necrotic portion in graft unions was observed as usually
seen in incompatible combinations. Many workers in their
histological studies have also confirmed the cambial con-
nectivity in 45 days after grafting in fruit trees. In this
study, the maximum growth of 5.60 cm after 30 days of
grafting was recorded (Figure 1) in plants grafted on Sep-
tember 11.
It has been earlier reported that it took 30 days after
grafting for proper cambial connectivity and vesicular for-
mation in nectarine/almond combination (Tekintas and
Doigun 1996) and 45 days after grafting for cambial con-
nectivity in citrus (Tekintas 1991). Similarly, Polat and
Kaska (1992) observed 40 days in pear/Quince-C combina-
tion. Oguz et al. (2008) reported that the establishment of
cambial connectivity is vital for producing vesicular tis-
sues. After this continuity, new cambium cells start to pro-
duce new vascular tissues which are the last stage of suc-
cessful grafting. A good established vascular connection
provides a good water and nutrient flow from rootstock to
bud (Unal 1992).
Vegetative growth The observation on plant growth during the year of
grafting i.e. in 2012 was recorded at different intervals
(Table 1 and Figure 1). Among different grafting dates the
maximum growth (25.10 cm) was observed in plants
grafted on September, 11 (T1) while minimum in plants
grafted on 29 September, 2012. During the course of inves-
tigation it was observed that the growth rate of all grafted
181

plants was highest at D2 to D5 interval (Figure 1) and the
growth continued up to D7 interval in plants grafted on
September 11, 18 and 25. Whereas, the plants grafted on
September, 29 ceased their growth much earlier i.e. from
November, 16 (D6) onwards. The overall average height
was highest in plants grafted earliest (September 11) and it
decreased linearly with the advancement of grafting dates
(Table 1). Similarly, the number of lateral shoots per plant
was also significantly affected by grafting dates (Table 1).
It is clear from the table that maximum number of lateral
shoots (2.67 shoots/plant) were recorded in plants grafted
on September 11, however; it was statistically at par with
plants grafted on September 18 and 25.
The radial growth of grafted plants both above and
below graft union was also significantly influenced by
grafting dates (Table 1). Although, no abnormal growth at
graft union was observed in all plants but the radial growth
was more in case of plants grafted on September 11. This
was also an indication of healthy graft union formation as
suggested by Simon and Elsa (2007), in histological
evaluation of early graft compatibility in Uapaca kirkiana
Muell Arg. scion/stock combinations. However, they had
reported that the excess growth at graft union was first
visual indicator of incompatibility between stock and scion.
Leaf characteristics
The foliar status of plants is also an indicator of plant
health, and in this study also; these parameters were found
significantly influenced by grafting dates (Table 2). Num-
ber of leaves per plant, dry and fresh weight and chloro-
phyll contents were found significantly affected by grafting
dates and plants with healthy growth had maximum values
of these parameters. The maximum fresh and dry weight of
leaves was found in plants grafted in September 11; simi-
larly, the total chlorophyll content in terms of mg/cm2 leaf
area was also more in these plants (Table 2). The foliar
characteristics such as; leaf area, dry and fresh weight and
chlorophyll contents are major parameters in determining
the plant health and other physiological processes such as
photosynthesis.
Thus from this study it can be concluded that semi-
hardwood grafting in apple under polyhouse condition can
reduce the duration of nursery production time. Further,
this technique needs to be standardized for quick multipli-
cation of other temperate fruit plants.
Grafting date (2012) Bud take (%) Plant height (cm) Laterals/plant (No.)
Radial growth (mm)
Above graft union
Below graft union
September, 11 100 25.53 2.67 12.68 14.21
September, 18 100 20.58 2.33 12.38 14.15
September, 25 100 18.91 1.67 11.60 13.13
September, 29 93.33 14.50 1.33 12.21 13.98
SEm± -- 0.35 0.49 0.28 0.41
CD 0.05 -- 0.86 1.20 0.69 1.01
Table 1. Effect of grafting dates on bud take and vegetative growth in apple
Fig 1. Growth pattern of apple plants grafted on different dates
182
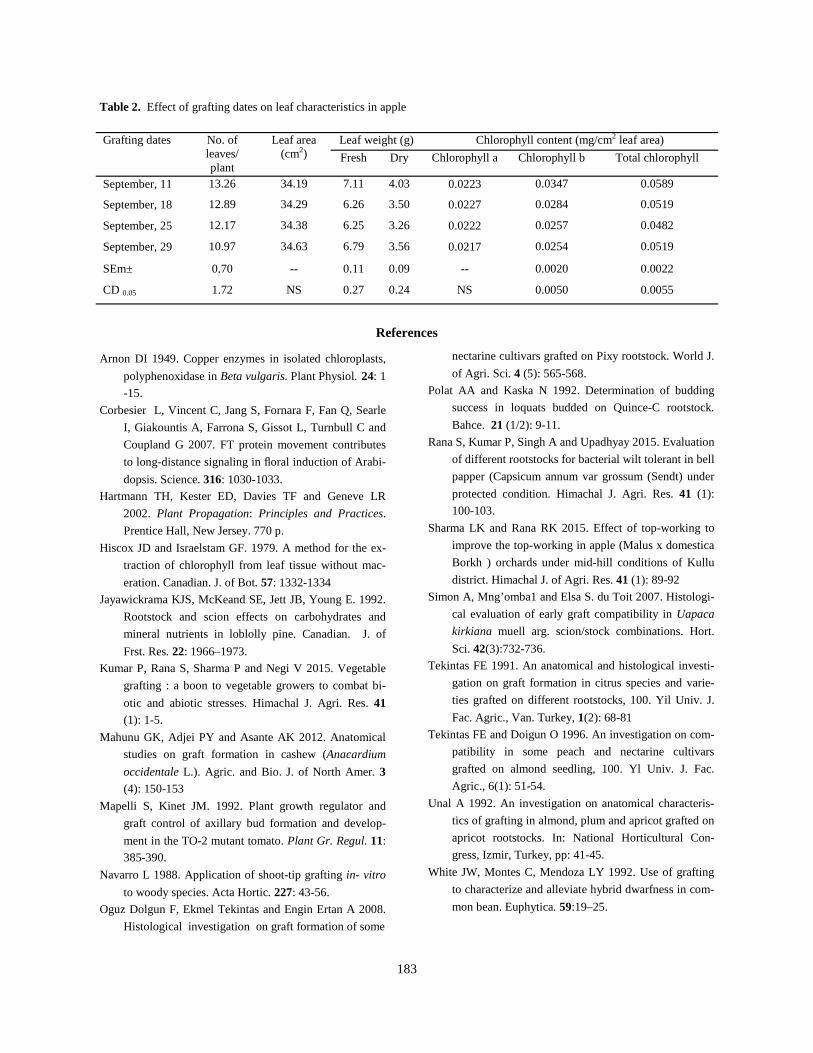
Arnon DI 1949. Copper enzymes in isolated chloroplasts,
polyphenoxidase in Beta vulgaris. Plant Physiol. 24: 1
-15.
Corbesier L, Vincent C, Jang S, Fornara F, Fan Q, Searle
I, Giakountis A, Farrona S, Gissot L, Turnbull C and
Coupland G 2007. FT protein movement contributes
to long-distance signaling in floral induction of Arabi-
dopsis. Science. 316: 1030-1033.
Hartmann TH, Kester ED, Davies TF and Geneve LR
2002. Plant Propagation: Principles and Practices.
Prentice Hall, New Jersey. 770 p.
Hiscox JD and Israelstam GF. 1979. A method for the ex-
traction of chlorophyll from leaf tissue without mac-
eration. Canadian. J. of Bot. 57: 1332-1334
Jayawickrama KJS, McKeand SE, Jett JB, Young E. 1992.
Rootstock and scion effects on carbohydrates and
mineral nutrients in loblolly pine. Canadian. J. of
Frst. Res. 22: 1966–1973.
Kumar P, Rana S, Sharma P and Negi V 2015. Vegetable
grafting : a boon to vegetable growers to combat bi-
otic and abiotic stresses. Himachal J. Agri. Res. 41
(1): 1-5.
Mahunu GK, Adjei PY and Asante AK 2012. Anatomical
studies on graft formation in cashew (Anacardium
occidentale L.). Agric. and Bio. J. of North Amer. 3(4): 150-153
Mapelli S, Kinet JM. 1992. Plant growth regulator and
graft control of axillary bud formation and develop-
ment in the TO-2 mutant tomato. Plant Gr. Regul. 11:
385-390.
Navarro L 1988. Application of shoot-tip grafting in- vitro
to woody species. Acta Hortic. 227: 43-56.
Oguz Dolgun F, Ekmel Tekintas and Engin Ertan A 2008.
Histological investigation on graft formation of some
nectarine cultivars grafted on Pixy rootstock. World J.
of Agri. Sci. 4 (5): 565-568.
Polat AA and Kaska N 1992. Determination of budding
success in loquats budded on Quince-C rootstock.
Bahce. 21 (1/2): 9-11.
Rana S, Kumar P, Singh A and Upadhyay 2015. Evaluation
of different rootstocks for bacterial wilt tolerant in bell
papper (Capsicum annum var grossum (Sendt) under
protected condition. Himachal J. Agri. Res. 41 (1):
100-103.
Sharma LK and Rana RK 2015. Effect of top-working to
improve the top-working in apple (Malus x domestica
Borkh ) orchards under mid-hill conditions of Kullu
district. Himachal J. of Agri. Res. 41 (1): 89-92
Simon A, Mng’omba1 and Elsa S. du Toit 2007. Histologi-
cal evaluation of early graft compatibility in Uapaca
kirkiana muell arg. scion/stock combinations. Hort.
Sci. 42(3):732-736.
Tekintas FE 1991. An anatomical and histological investi-
gation on graft formation in citrus species and varie-
ties grafted on different rootstocks, 100. Yil Univ. J.
Fac. Agric., Van. Turkey, 1(2): 68-81
Tekintas FE and Doigun O 1996. An investigation on com-
patibility in some peach and nectarine cultivars
grafted on almond seedling, 100. Yl Univ. J. Fac.
Agric., 6(1): 51-54.
Unal A 1992. An investigation on anatomical characteris-
tics of grafting in almond, plum and apricot grafted on
apricot rootstocks. In: National Horticultural Con-
gress, Izmir, Turkey, pp: 41-45.
White JW, Montes C, Mendoza LY 1992. Use of grafting
to characterize and alleviate hybrid dwarfness in com-
mon bean. Euphytica. 59:19–25.
Grafting dates No. of leaves/plant
Leaf area (cm2)
Leaf weight (g) Chlorophyll content (mg/cm2 leaf area)
Fresh Dry Chlorophyll a Chlorophyll b Total chlorophyll
September, 11 13.26 34.19 7.11 4.03 0.0223 0.0347 0.0589
September, 18 12.89 34.29 6.26 3.50 0.0227 0.0284 0.0519
September, 25 12.17 34.38 6.25 3.26 0.0222 0.0257 0.0482
September, 29 10.97 34.63 6.79 3.56 0.0217 0.0254 0.0519
SEm± 0.70 -- 0.11 0.09 -- 0.0020 0.0022
CD 0.05 1.72 NS 0.27 0.24 NS 0.0050 0.0055
Table 2. Effect of grafting dates on leaf characteristics in apple
References
183

Evaluation of lettuce genotypes for yield and quality under protected conditions of North-western Himalayas
Himachal Journal of Agricultural Research 41(2): 184-188 (2015)
Pardeep Kumar, N.K. Pathania, Parveen Sharma and Nageswer Singh* Department of Vegetable Science & Floriculture
* Department of Chemistry & Biochemistry CSK Himachal Pradesh Krishi Vishvavidyalaya, Palampur
Corresponding author: [email protected]
Abstract
Lettuce is a popular salad vegetable in European countries. In India its demand is also increasing. It is not possible to grow salad vegetables under open environmental conditions due to vagaries of weather. The state government in Himachal Pradesh (India) is promoting polyhouse cultivation in a very big way. But the lack of suitable cultivars under polyhouse conditions is the biggest challenge to the growers of the hilly state. Therefore, in the present study seven genotypes of lettuce viz. Red Butter Head (G1), Ice-berg (G2), Revolution (G3), Dublin (G4), Garishma (G5), Bergamo (G6) and Green Romaine (G7) were evaluated in a 36 x 6 m modified naturally ventilated polyhouse having fan pad system. Maximum gross weight (826.6 g/plant) was recorded in G2 which was statistically at par with G4 (791.6 g/plant). Minimum gross weight per plant was found in G7 (18836 g). Maximum net weight/plant was recorded in G7 (631.3 g) which was statistically at par with G2 (578.3 g), G4 (583.6 g), G5 (458.6 g) and G6 (480.3 g). Lettuce genotypes also varied in quality parameters viz. chlorophyll b and total chlorophyll, starch, reducing, non-reducing and total sugars and sodium content.
Key words: Lettuce, polyhouse, protected cultivation, salad vegetable
Received: 10 July 2015; Accepted: 22 August 2015
Lettuce (Lactuca sativa L), a member of family As-
teracae is the most important salad crop of European coun-
tries. It also occupies an important position in tropical and
subtropical countries. In temperate countries, it is mostly
grown under glass and plastic structures (Santos Filho et al.
2009; Carlo Fallovo et al 2009). In India, it is a minor com-
mercial crop grown on a small scale in home gardens. It is
an important polymorphic plant particularly with respect to
foliage characteristics. It grows to a height of 10 to 20 cm
with spread of 15 to 30 cm. Lettuce is a cool season crop.
The optimum mean temperature range for excellent growth
and good quality of lettuce is 15–25 0C. The temperature
above 25 0C accelerates seed stalk and reduces the quality
of leaves. It prefers light loam or sandy loam well drained
fertile soils with pH 6-8. Lettuce is a rich source of chloro-
phyll, water, ascorbic acid, ash, starch, sugars and sodium
which are the essential components of balanced diet.
Chlorophyll is a green pigment found in most plants is
one of the oldest and most widely consumed pigments in our
diet. As it has been in the human diet forever, it can be con-
sidered one of the most safe food components. Although all
varieties of lettuce have low calories, each variety has differ-
ent nutrient content. Romaine lettuce is the most nutrient-
dense of all the lettuce varieties and is an excellent source of
vitamins A, B1, B2, and C, folic acid, manganese and chro-
mium, while Iceberg lettuce variety provides a good source
of choline. The outer leaves may contain fifty times more
nutrients than the stem. Lettuce is a good source of chloro-
phyll and vitamin K, good for dieters because it is very low
in calories. Lettuce is a good source of iron which is the most
active element in the body. Therefore, it must be replenished
frequently to meet any sudden demand of the body such as
the rapid formation of red blood corpuscles in heavy loss of
blood.
184
Short Note
Magnesium content has exceptional vitalizing powers espe-
cially in the muscular tissues, the brain and the nerves.
Lettuce may also help to treat acid indigestion, anemia,
arthritis, catarrh, circulatory problems, colitis, constipation,
cough, diabetes, gastritis, gout, insomnia, irritable bowel,
obesity, sexual addiction, stress, tuberculosis, ulcers and
urinary tract diseases.
In recent time people are becoming health conscious
and demand for salad in food is increasing. In India pro-
tected cultivation is an emerging field and standardized
package for lettuce production as well as suitable varieties/
hybrids under protected conditions is scarce. In Himachal
Pradesh too, polyhouse technology is becoming popular
with the efforts of the state government, where 80% sub-
sidy for construction of polyhouses is being provided by
the government under “Pandit Deen Dyal Updhyay Kisan
Bagwan Samridhi Yojna” (Pandit Deen Dyal Farmers-
Horticulturists Progress Plan). Lettuce can be used as a gap
crop in the polyhouses to incur more income. The lettuce is
high-value, thermo sensitive vegetable crop which can be
grown successfully under polyhouse conditions. However,
there is no scientific information available in India on let-
tuce cultivation under polyhouses. The work on its quality
estimation has also been limited. Therefore, the present
study was conducted to evaluate different hybrids for yield
and quality traits of lettuce under protected conditions.
The present investigation was undertaken at Palampur
(320 6’ N latitude, 760 3’ E longitudes and 1290.8 m alti-
tude) during 2009. Severe winters and mild summers with
high rainfall characterize the place. Agro climatically, the
location represents the mid-hill zone of Himachal Pradesh.
It is characterized by humid sub-temperate climate with
high rainfall (2500 mm), of which 80% is received during
June to September. During October, there is no crop inside
the polyhouse, therefore, to utilize the lean period, 7 geno-
types viz. G1 - Red Butter Head, G2 - Green Ice-berg, G3 -
Revolution, G4 -Dublin, G5 - Garishma, G6 - Bergamo and
G7 -- Green Romaine were undertaken and planted in Ran-
domized Block Design with 3 replications in a 36 x 6 m
modified naturally ventilated polyhouse. The crop was
grown on 20 cm raised bed having 70 cm width. Vermi-
compost (at 5 t/ha) and chemical fertilizers (60: 40: 40
kg N, P2O5 and K2O/ha) were applied in pits before
transplanting. Plants of each genotype were planted at
inter row distance of 45 cm and intra plant distance of
30 cm. The intercultural operations i.e. hoeing and weed-
ing were carried out in accordance with recommended
package of practices to ensure a healthy crop growth and
development. The observations were recorded on various
yield contributing and quality traits in 5 randomly selected
plants in each entry. The parameters recorded on growth
and yield were: plant frame (cm2), stem length (cm), stem
diameter (cm), gross weight (g), net weight (g), polar di-
ameter (cm), equatorial diameter (cm) and quality traits
such as uniformity, heading (%), head shape, leaf colour,
leaf texture, leaf shape, taste, colour of core, firmness,
ascorbic acid content (mg/100 g), chlorophyll ‘a’/g tissue ,
chlorophyll ‘b’/g tissue, total chlorophyll/g tissue total,
moisture (%), ash (%), starch (%), total sugars, reducing
sugars (%), non-reducing sugars and Na (g/100 g) follow-
ing standard procedures (AOAC 1990; Hodege and Hofre-
iter 1962; Jayraman 1981; Miller 1972; Subbarao et al.
2003). Total chlorophyll was estimated spectrophotometri-
cally by the method of Jayraman (1981).
Extraction of total chlorophyll was carried out in
cleaned pestle and mortar by grinding fresh samples (0.2 g)
with 80% acetone. The extracts were centrifuged at 4,000
rpm for 15 min and then chlorophylls were repeatedly ex-
tracted out with 20 ml (5-5 ml repeatedly, 4 times) 80%
acetone until residues became colourless. Finally, the vol-
ume was made up to 20 ml with 80% acetone and absorb-
ance was measured at 663, 645 and 480 nm with the help
of ELICO (India) SL-159 UV-VIS Spectrophotometer. For
the estimation of ascorbic acid (AOAC, 1990), 100 g of
fresh lettuce samples were grounded with 100 ml of 2%
oxalic acid as extraction medium in order to get slurry. The
weight of slurry was recorded and 20 g of this slurry was
taken in a beaker and its volume was made up to 100 ml
with 1% oxalic acid. The content of the beaker was filtered
properly through Whatman Filter paper No. 1. Charcoal
treatment was given if any colour remained due to pig-
ments. 5 ml of this filtrate was pipetted out and titrated
against a dye solution (2,6 dichlorophenol indophenol )
prepared by taking 52 mg of dye in 200 ml volumetric flask
adding 100 ml of hot distilled water. The volume was then
made to 200 ml with distilled water. After cooling 42 mg
of NaHCO3 was added and dissolved properly. At the same
time 100 mg of ascorbic acid was dissolved in 500 ml of
1% oxalic acid solution was used as standard (always pre-
pared fresh). Moisture content in the lettuce was deter-
mined by following the oven drying method. Estimation of
starch was done by anathrone reagent method by using
various reagents such as: 0.1 to 0.5 g of the sample ho-
mogenized in hot 80% ethanol to remove sugars, centri-
fuged and retained the residue, washed the residue repeat-
edly with hot ethanol (80%) till the washings did not give
colour with anthrone reagent and dried the residue over a
water bath. To the residue 5.0 ml of water and 6.5 ml of
185
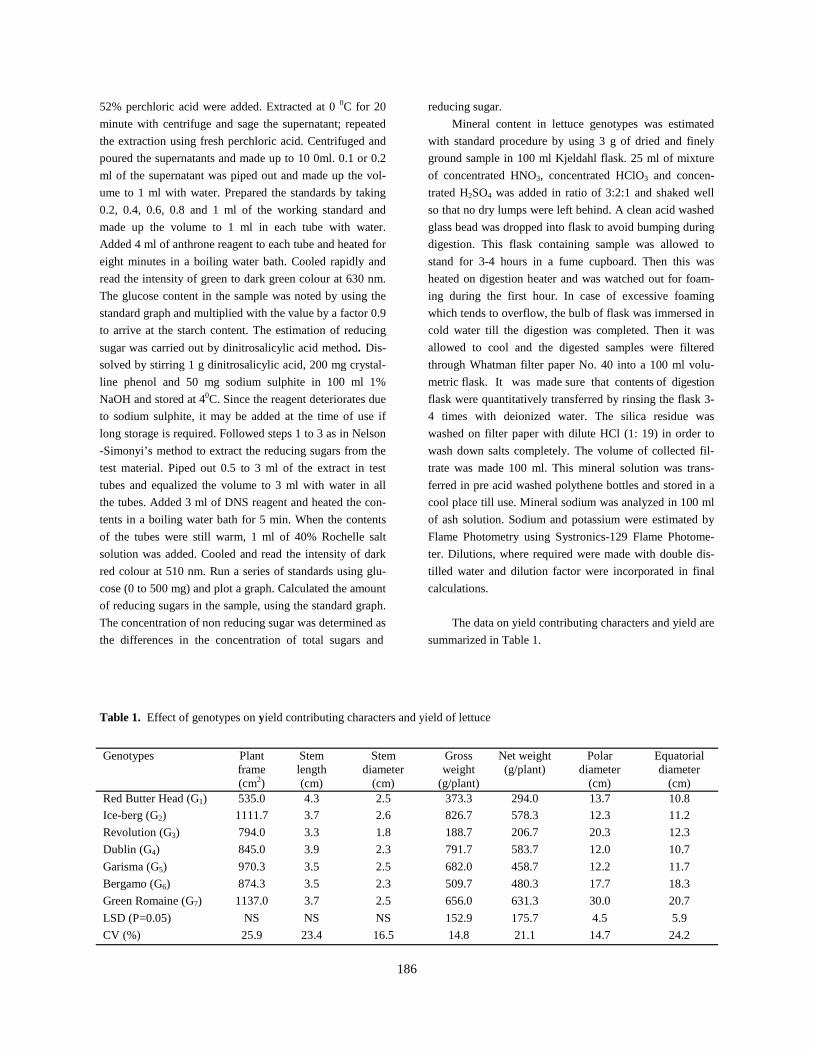
52% perchloric acid were added. Extracted at 0 0C for 20
minute with centrifuge and sage the supernatant; repeated
the extraction using fresh perchloric acid. Centrifuged and
poured the supernatants and made up to 10 0ml. 0.1 or 0.2
ml of the supernatant was piped out and made up the vol-
ume to 1 ml with water. Prepared the standards by taking
0.2, 0.4, 0.6, 0.8 and 1 ml of the working standard and
made up the volume to 1 ml in each tube with water.
Added 4 ml of anthrone reagent to each tube and heated for
eight minutes in a boiling water bath. Cooled rapidly and
read the intensity of green to dark green colour at 630 nm.
The glucose content in the sample was noted by using the
standard graph and multiplied with the value by a factor 0.9
to arrive at the starch content. The estimation of reducing
sugar was carried out by dinitrosalicylic acid method. Dis-
solved by stirring 1 g dinitrosalicylic acid, 200 mg crystal-
line phenol and 50 mg sodium sulphite in 100 ml 1%
NaOH and stored at 40C. Since the reagent deteriorates due
to sodium sulphite, it may be added at the time of use if
long storage is required. Followed steps 1 to 3 as in Nelson
-Simonyi’s method to extract the reducing sugars from the
test material. Piped out 0.5 to 3 ml of the extract in test
tubes and equalized the volume to 3 ml with water in all
the tubes. Added 3 ml of DNS reagent and heated the con-
tents in a boiling water bath for 5 min. When the contents
of the tubes were still warm, 1 ml of 40% Rochelle salt
solution was added. Cooled and read the intensity of dark
red colour at 510 nm. Run a series of standards using glu-
cose (0 to 500 mg) and plot a graph. Calculated the amount
of reducing sugars in the sample, using the standard graph.
The concentration of non reducing sugar was determined as
the differences in the concentration of total sugars and
reducing sugar. Mineral content in lettuce genotypes was estimated
with standard procedure by using 3 g of dried and finely
ground sample in 100 ml Kjeldahl flask. 25 ml of mixture
of concentrated HNO3, concentrated HClO3 and concen-
trated H2SO4 was added in ratio of 3:2:1 and shaked well
so that no dry lumps were left behind. A clean acid washed
glass bead was dropped into flask to avoid bumping during
digestion. This flask containing sample was allowed to
stand for 3-4 hours in a fume cupboard. Then this was
heated on digestion heater and was watched out for foam-
ing during the first hour. In case of excessive foaming
which tends to overflow, the bulb of flask was immersed in
cold water till the digestion was completed. Then it was
allowed to cool and the digested samples were filtered
through Whatman filter paper No. 40 into a 100 ml volu-
metric flask. It was made sure that contents of digestion
flask were quantitatively transferred by rinsing the flask 3-
4 times with deionized water. The silica residue was
washed on filter paper with dilute HCl (1: 19) in order to
wash down salts completely. The volume of collected fil-
trate was made 100 ml. This mineral solution was trans-
ferred in pre acid washed polythene bottles and stored in a
cool place till use. Mineral sodium was analyzed in 100 ml
of ash solution. Sodium and potassium were estimated by
Flame Photometry using Systronics-129 Flame Photome-
ter. Dilutions, where required were made with double dis-
tilled water and dilution factor were incorporated in final
calculations.
The data on yield contributing characters and yield are
summarized in Table 1.
186
Genotypes Plant frame (cm2)
Stem length (cm)
Stem diameter
(cm)
Gross weight
(g/plant)
Net weight (g/plant)
Polar diameter
(cm)
Equatorial diameter
(cm) Red Butter Head (G1) 535.0 4.3 2.5 373.3 294.0 13.7 10.8 Ice-berg (G2) 1111.7 3.7 2.6 826.7 578.3 12.3 11.2 Revolution (G3) 794.0 3.3 1.8 188.7 206.7 20.3 12.3 Dublin (G4) 845.0 3.9 2.3 791.7 583.7 12.0 10.7 Garisma (G5) 970.3 3.5 2.5 682.0 458.7 12.2 11.7 Bergamo (G6) 874.3 3.5 2.3 509.7 480.3 17.7 18.3 Green Romaine (G7) 1137.0 3.7 2.5 656.0 631.3 30.0 20.7 LSD (P=0.05) NS NS NS 152.9 175.7 4.5 5.9 CV (%) 25.9 23.4 16.5 14.8 21.1 14.7 24.2
Table 1. Effect of genotypes on yield contributing characters and yield of lettuce
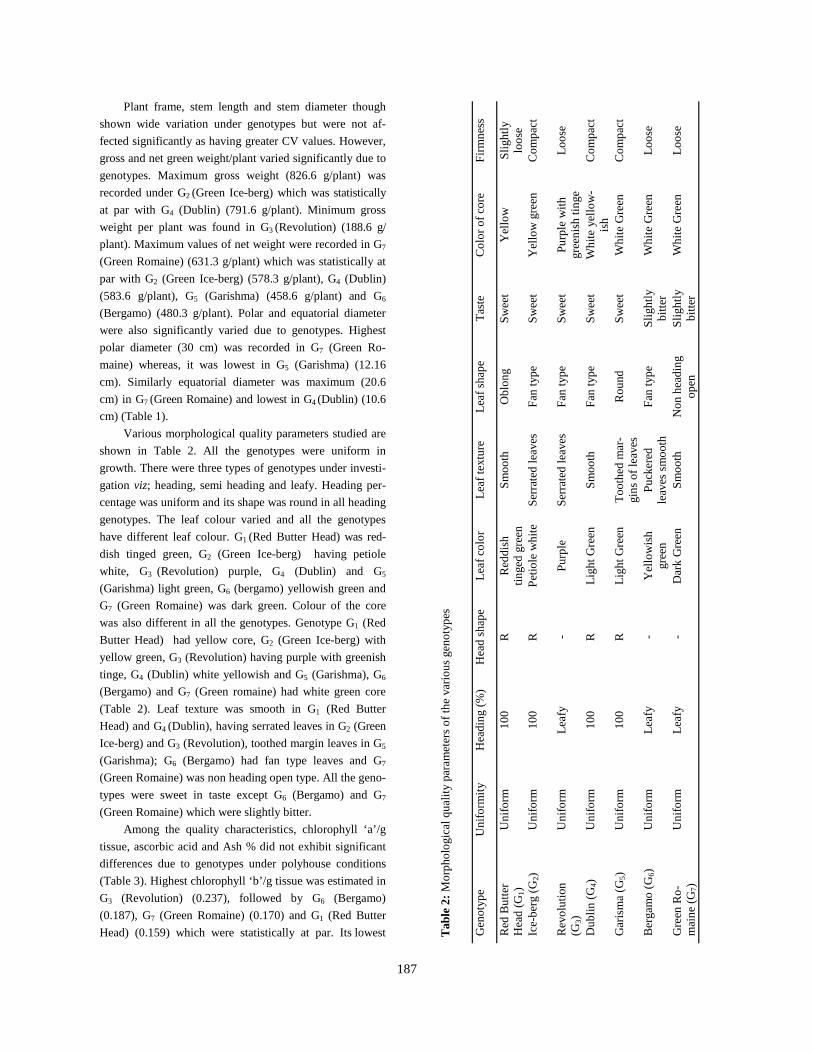
Plant frame, stem length and stem diameter though
shown wide variation under genotypes but were not af-
fected significantly as having greater CV values. However,
gross and net green weight/plant varied significantly due to
genotypes. Maximum gross weight (826.6 g/plant) was
recorded under G2 (Green Ice-berg) which was statistically
at par with G4 (Dublin) (791.6 g/plant). Minimum gross
weight per plant was found in G3 (Revolution) (188.6 g/
plant). Maximum values of net weight were recorded in G7
(Green Romaine) (631.3 g/plant) which was statistically at
par with G2 (Green Ice-berg) (578.3 g/plant), G4 (Dublin)
(583.6 g/plant), G5 (Garishma) (458.6 g/plant) and G6
(Bergamo) (480.3 g/plant). Polar and equatorial diameter
were also significantly varied due to genotypes. Highest
polar diameter (30 cm) was recorded in G7 (Green Ro-
maine) whereas, it was lowest in G5 (Garishma) (12.16
cm). Similarly equatorial diameter was maximum (20.6
cm) in G7 (Green Romaine) and lowest in G4 (Dublin) (10.6
cm) (Table 1).
Various morphological quality parameters studied are
shown in Table 2. All the genotypes were uniform in
growth. There were three types of genotypes under investi-
gation viz; heading, semi heading and leafy. Heading per-
centage was uniform and its shape was round in all heading
genotypes. The leaf colour varied and all the genotypes
have different leaf colour. G1 (Red Butter Head) was red-
dish tinged green, G2 (Green Ice-berg) having petiole
white, G3 (Revolution) purple, G4 (Dublin) and G5
(Garishma) light green, G6 (bergamo) yellowish green and
G7 (Green Romaine) was dark green. Colour of the core
was also different in all the genotypes. Genotype G1 (Red
Butter Head) had yellow core, G2 (Green Ice-berg) with
yellow green, G3 (Revolution) having purple with greenish
tinge, G4 (Dublin) white yellowish and G5 (Garishma), G6
(Bergamo) and G7 (Green romaine) had white green core
(Table 2). Leaf texture was smooth in G1 (Red Butter
Head) and G4 (Dublin), having serrated leaves in G2 (Green
Ice-berg) and G3 (Revolution), toothed margin leaves in G5
(Garishma); G6 (Bergamo) had fan type leaves and G7
(Green Romaine) was non heading open type. All the geno-
types were sweet in taste except G6 (Bergamo) and G7
(Green Romaine) which were slightly bitter.
Among the quality characteristics, chlorophyll ‘a’/g
tissue, ascorbic acid and Ash % did not exhibit significant
differences due to genotypes under polyhouse conditions
(Table 3). Highest chlorophyll ‘b’/g tissue was estimated in
G3 (Revolution) (0.237), followed by G6 (Bergamo)
(0.187), G7 (Green Romaine) (0.170) and G1 (Red Butter
Head) (0.159) which were statistically at par. Its lowest
187
Gen
oty
pe
Un
iform
ity
Hea
din
g (%
) H
ead
sh
ape
Lea
f co
lor
Lea
f te
xtu
re Le
af s
hap
e T
aste
Co
lor
of c
ore
Firm
nes
s
Red
Bu
tter
H
ead
(G 1
) U
nifo
rm
10
0 R
R
edd
ish
tin
ged
gre
en S
mo
oth
Ob
lon
g S
wee
t Y
ello
w
Slig
htly
lo
ose
Ic
e-b
erg
(G2)
U
nifo
rm
10
0 R
P
etio
le w
hite
S
erra
ted
leav
es F
an t
ype
Sw
eet
Yel
low
gre
en
Co
mp
act
Rev
olu
tion
(G
3)
Un
iform
Le
afy
-
Pu
rple
Ser
rate
d le
aves
Fan
typ
e S
wee
t P
urp
le w
ith
gree
nis
h t
inge
Loo
se
Du
blin
(G
4)
Un
iform
1
00
R
Ligh
t G
reen
S
mo
oth
Fan
typ
e S
wee
t W
hite
yel
low
-is
h C
om
pac
t
Gar
ism
a (G
5)
Un
iform
1
00
R
Ligh
t G
reen
T
oo
thed
mar
-gi
ns
of l
eave
s R
ou
nd
Sw
eet
Wh
ite G
reen
C
om
pac
t
Ber
gam
o (
G 6)
Un
iform
Le
afy
-
Yel
low
ish
gr
een
Pu
cker
ed
leav
es s
mo
oth
Fan
typ
e S
ligh
tly
bitt
er
Wh
ite G
reen
Lo
ose
Gre
en R
o-
mai
ne
(G7)
U
nifo
rm
Lea
fy
- D
ark
Gre
en
Sm
oo
th N
on
hea
din
g o
pen
S
ligh
tly
bitt
er
Wh
ite G
reen
Lo
ose
Tab
le 2
: M
orp
holo
gica
l qu
ality
par
am
eter
s o
f th
e va
riou
s ge
no
typ
es
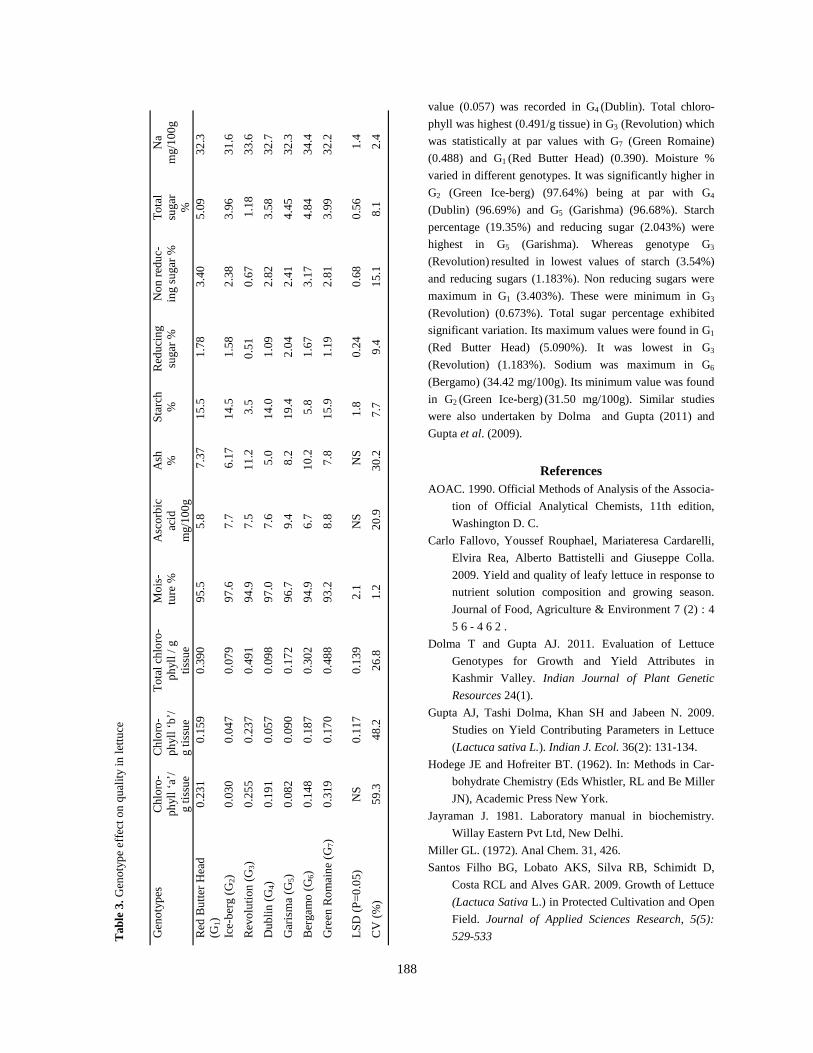
value (0.057) was recorded in G4 (Dublin). Total chloro-
phyll was highest (0.491/g tissue) in G3 (Revolution) which
was statistically at par values with G7 (Green Romaine)
(0.488) and G1 (Red Butter Head) (0.390). Moisture %
varied in different genotypes. It was significantly higher in
G2 (Green Ice-berg) (97.64%) being at par with G4
(Dublin) (96.69%) and G5 (Garishma) (96.68%). Starch
percentage (19.35%) and reducing sugar (2.043%) were
highest in G5 (Garishma). Whereas genotype G3
(Revolution) resulted in lowest values of starch (3.54%)
and reducing sugars (1.183%). Non reducing sugars were
maximum in G1 (3.403%). These were minimum in G3
(Revolution) (0.673%). Total sugar percentage exhibited
significant variation. Its maximum values were found in G1
(Red Butter Head) (5.090%). It was lowest in G3
(Revolution) (1.183%). Sodium was maximum in G6
(Bergamo) (34.42 mg/100g). Its minimum value was found
in G2 (Green Ice-berg) (31.50 mg/100g). Similar studies
were also undertaken by Dolma and Gupta (2011) and
Gupta et al. (2009).
References AOAC. 1990. Official Methods of Analysis of the Associa-
tion of Official Analytical Chemists, 11th edition,
Washington D. C.
Carlo Fallovo, Youssef Rouphael, Mariateresa Cardarelli,
Elvira Rea, Alberto Battistelli and Giuseppe Colla.
2009. Yield and quality of leafy lettuce in response to
nutrient solution composition and growing season.
Journal of Food, Agriculture & Environment 7 (2) : 4
5 6 - 4 6 2 .
Dolma T and Gupta AJ. 2011. Evaluation of Lettuce
Genotypes for Growth and Yield Attributes in
Kashmir Valley. Indian Journal of Plant Genetic
Resources 24(1).
Gupta AJ, Tashi Dolma, Khan SH and Jabeen N. 2009.
Studies on Yield Contributing Parameters in Lettuce
(Lactuca sativa L.). Indian J. Ecol. 36(2): 131-134.
Hodege JE and Hofreiter BT. (1962). In: Methods in Car-
bohydrate Chemistry (Eds Whistler, RL and Be Miller
JN), Academic Press New York.
Jayraman J. 1981. Laboratory manual in biochemistry.
Willay Eastern Pvt Ltd, New Delhi.
Miller GL. (1972). Anal Chem. 31, 426.
Santos Filho BG, Lobato AKS, Silva RB, Schimidt D,
Costa RCL and Alves GAR. 2009. Growth of Lettuce
(Lactuca Sativa L.) in Protected Cultivation and Open
Field. Journal of Applied Sciences Research, 5(5):
529-533
188
Gen
oty
pes
Ch
loro
-p
hyl
l ‘a’
/g
tissu
e
Ch
loro
-p
hyl
l ‘b
’/g
tissu
e
To
tal c
hlo
ro-
ph
yll /
g
tissu
e
Mo
is-
ture
%
Asc
orb
ic
acid
m
g/1
00
g
Ash
%
S
tarc
h
%
Red
uci
ng
suga
r %
No
n r
edu
c-in
g su
gar
% T
ota
l su
gar
%
Na
mg/
10
0g
Red
Bu
tter
Hea
d
(G1)
0
.23
1 0
.15
9 0
.39
0 9
5.5
5
.8
7.3
7 1
5.5
1
.78
3.4
0 5
.09
32
.3
Ice-
ber
g (G
2)
0.0
30
0.0
47
0.0
79
97
.6
7.7
6
.17
14
.5
1.5
8 2
.38
3.9
6 3
1.6
Rev
olu
tion
(G 3
) 0
.25
5 0
.23
7 0
.49
1 9
4.9
7
.5
11
.2
3.5
0
.51
0.6
7 1
.18
33
.6
Du
blin
(G
4)
0.1
91
0.0
57
0.0
98
97
.0
7.6
5
.0
14
.0
1.0
9 2
.82
3.5
8 3
2.7
Gar
ism
a (G
5)
0.0
82
0.0
90
0.1
72
96
.7
9.4
8
.2
19
.4
2.0
4 2
.41
4.4
5 3
2.3
Ber
gam
o (
G 6)
0.1
48
0.1
87
0.3
02
94
.9
6.7
1
0.2
5
.8
1.6
7 3
.17
4.8
4 3
4.4
Gre
en R
om
ain
e (G 7
) 0
.31
9 0
.17
0 0
.48
8 9
3.2
8
.8
7.8
1
5.9
1
.19
2.8
1 3
.99
32
.2
LSD
(P
=0
.05
) N
S
0.1
17
0.1
39
2.1
N
S
NS
1.8
0
.24
0.6
8 0
.56
1.4
CV
(%
) 5
9.3
4
8.2
2
6.8
1
.2
20
.9
30
.2
7.7
9
.4
15
.1
8.1
2
.4
Tab
le 3
. Gen
oty
pe
effe
ct o
n q
ual
ity in
lett
uce

Surgical removal of lingual foreign body in a buffalo - a clinical case study
Himachal Journal of Agricultural Research 41(2): 189-190 (2015)
Amit Kumar, Som Prakash Tyagi, Priyanka Thakur and Rohit Sharma Department of Surgery and Radiology, Dr. G C Negi College of Veterinary and Animal Sciences,
CSK Himachal Pradesh Krishi Vishvavidyalaya, Palampur -176062, HP, India Corresponding author: [email protected]; [email protected]
Abstract
This report pertains to a successful surgical removal of a sewing needle that was ingested by an eight years old buffalo. The animal was not able to ingest anything after the needle ingested. The radiographic examination on lateral and dorsal-ventral views revealed the presence of the needle in the sub mandibular area. After preparing the animal for operation, the genioglossus muscle was incised. The foreign body was reached which was too sharp and move along with movement of tongue. A flat in-strument was put in the oral cavity to stabilise the tongue. The foreign body was then removed with help of long artery fore-ceps. Antiseptic dressing with ointment Neosporin and topicure spray locally was advised till the complete healing of the wound. Retrieval of the needle seems easy but it was still difficult as it was embedded in genioglossus muscle and was moving along with the movement of tongue.
Key words: Buffalo, foreign body, radiographic examination, genioglossus muscle, surgical retrieval
Received: 22 December 2015; Accepted: 25 December 2015
Cattle commonly ingest foreign objects, because they
do not discriminate against metal materials in feed and do
not completely masticate feed before swallowing. Conse-
quently foreign bodies struck in reticulum. They may cause
diaphragmatic hernia (Krishnamurthy et al. 1985) and for-
eign body syndrome in bovines (Kohli et al. 1982). But
oral foreign bodies are rarely found and if so they are com-
monly found in Esophagus. The present case pertaining to
a buffalo which ingested a sewing needle that was embed-
ded in genioglossus muscle and was moving along with the
movement of tongue.
An 8 year old buffalo was presented with the history
of eating sewing needle a day earlier. Since then the animal
was not able to ingest anything. The radiographic examina-
tion on lateral and dorsal-ventral views (Plate A and B)
revealed the presence of linear foreign body in the sub
mandibular area. Surgical removal of the foreign body was
planned. Preoperatively the animal was given injection
xylazine 20 mg I/M along with injection meloxicam 0.2
mg/kg Body Weight I/M and injection dicrysticine 2.5 g I/M
[Streptomycin Sulphate: 2.5 g, Procaine Penicillin G:
15,00,000 units, Penicillin G Sodium: 5,00,000 units].
The animal was restrained in lateral recumbency on a
padded large animal operation table. The site was prepared
for surgery by shaving the submandibular and mandibular
area and scrubbing was done with antiseptic solution con-
taining cetrimide. Then local anaesthetic (lignocaine HCL
2%) was infiltrated (20 ml) within the skin and muscles
around the foreign body. Thereafter, the incision was made
on mid-ventral aspect of submandibular area. Digital palpa-
tion of area did not revealed any sharp foreign body. The
genioglossus muscle was incised and the foreign body was
reached which is to sharp and move along with movement of
tongue. Afterwards a flat instrument was put in the oral cav-
ity to stabilise the tongue. The foreign body was then re-
moved with help of long artery foreceps. The muscles were
sutured with polyglactin 910 (No. 2-0) in simple continuous
pattern. The skin was sutured with polypropylene (No. 1-0)
189
Short Note

in horizontal mattress pattern. Postoperatively, the buffalo
was given injection dicrysticine 2.5 g I/M bid and meloxi-
cam 0.2 mg/kg Body Weight I/M bid, belamyl 10 ml I/M
sid [Thiamine hydrochloride: 10 mg, Riboflavin: 3 mg,
Niacinamide: 100 mg, Vitamin B 12: 10 mcg, Liver injec-
tion crude: 0.66 ml (having Vitamin B 12 activity equiva-
lent to 2 mcg of Cynocobalamin per ml), Phenol: 0.5%] for
5 days. Antiseptic dressing with ointment Neosporin and
topicure spray locally was advised till complete healing of
the wound.
Retrieval of oral foreign body (sewing needle) in pre-
sent case, seems easy to perform but it was still difficult as
it was embedded in genioglossus muscle and was moving
along with the movement of tongue and its retrieval was
not possible till the tongue was stabilised by some flat sur-
gical instrument.
190
Krishnamurthy D, Nigam JM, Peshin PK, Sharma DN and
Tyagi RPS. 1985. Monograph of diaphragmatic hernia
in bovines. Harayana Agricultural University, Hisar.
Kohli RN, Kumar R, Sobti VK, Singh J, Prasad B and
Sharma SN. 1982. Diagnosis of foreign body syn-
drome in bovines. Modern Veterinary Practice. 63,
501.
References
Plate A. Linear Foreign Body in lateral Radiograph Plate B. Linear Foreign Body in dorso-ventral Radiograph
Guidelines to the Contributors
Himachal Journal of Agricultural Research The Himachal Journal of Agricultural Research publishes research papers in the fields of Agricul-
ture, Horticulture, Veterinary and Animal Sciences, Home Science, Basic Sciences, Social Sciences, Environ-
ment Sciences and other allied fields from all over the world. Review articles on current research topics are
also published.
1. Membership of Himachal Journal of Agricultural Research (HJAR) is mandatory for all the authors who
wish to contribute research/review papers for publication in the journal, published half yearly, in June and
December.
2. All papers must be in English and report the original research and reviews in the areas of agriculture and
allied sciences. The authors should clearly state that the paper has not been published or under considera-
tion for publication, elsewhere.
3. Manuscript of the paper/short communication (typed in Times New Roman with font size of 12) with one
and half spacing on one side of A4 (210 x 297 mm) paper with 30 mm wide left and right margins, should
not normally exceed 15 typed pages (full length paper) and 5-6 typed-pages (short communications), in-
cluding tables and figures should be sent to any member of the Editorial Board or Emailed to Editor (Research) ([email protected]), Directorate of Research, CSK Himachal Pradesh Krishi Vish-
vavidyalaya, Palampur-176 062 (H.P.), India. Footnotes, indicated by * or † should be kept to a mini-
mum. Abbreviations should be defined when first mentioned in the text of the paper. Do not underline any
heading. Each page should be numbered. First page of the manuscript should contain Title, Authors, Af-
filiation and Complete address. The second page should start with Title, Abstract, Key words and Intro-
duction.
4. Title should be brief, phrased to identify the contents of the article summarizing the nature of the study
essential for key word indexing and information retrieval. A short running title may also be given.
5. By-line should contain, in addition to the name(s), the initials of the authors and the institution where the
research was conducted.
6. A concise Abstract providing a preview of the research work should be restricted to 150 words. It should
be given before the introduction.
7. Key words: List (4-6 words) all the main topics incorporated in the paper, including any already given in
the title.
8. Introduction: Include a clear description of the aims of the investigation (without summarizing the work
itself) and a brief statement of previous relevant work with references.
9. Material and Methods should be in sufficient detail to enable researchers to repeat experiment using
similar materials and methods. This part should include new techniques and modifications to known
methods but known methods must be given adequate references. Give the statistical design employed for
each experiment and data interpretation.
10. Scientific names: Give the scientific names (with authority) for plants, animals, microorganisms with
generic names in full at the first mention, eg Myzus persicae (Sulzer). Thereafter, abbreviate them in the
text, eg M. persicae; give them in full (without authority) in the headings of sections, tables, figures and
key words. Cultivars need to be specified.
11. Results and Discussion should be combined. Present results concisely, using tables or illustrations and
statistical significance of the results. Avail professional assistance while presenting figures and charts.
Computer-drawn diagram must be prepared on a high quality laser or ink jet printers, not on dot matrix
printer, in black ink. Line drawings and figures should be of best quality suitable for direct reproduction.
Results should be followed by concise discussion, interpretation and conclusion. Avoid overstatements.
12. Acknowledgements: Keep these to the absolute minimum when utterly necessary. Avoid thanks for per-
mission to publish.
13. References should include published literature cited in the body of the paper. Accurate and correct style
should be followed in quoting references in the body of the paper (surname up to two authors followed by
the year of publication; in case of more than two authors use et al.) and in reference section. Ensure that
all the references cited in the text are listed under references and vice versa. In the case of periodicals,
names and initials of all authors, year of publication, title of paper, name of journal (in standard abbrevia-
tion form), volume, issue number and complete page range of article should be given. However, in case of
books, names and initials of all authors, year of publication, and title of book, name and place of publica-
tion, edition and pagination should be given.
Quote journals/periodicals as: 1. Banyal DK, Singh A and Tyagi PD. 2005. Pathogenic variability in Erysiphe pisi causing pea powdery
mildew. Himachal Journal of Agricultural Research 31 (2): 87-92.
2. Akin DE and Morrison WH. 1988. Ozone treatment of forage: structure and digestibility of different types
of lignified cell walls. Crop Science 28: 337-42.
Articles published online but not yet assigned to an issue may be cited using the Digital Object Identifier
(DOI)
Quote books as: 1. Jackson ML. 1967. Soil Chemical Analysis. Prentice Hall of India Pvt. Ltd., New Delhi.
2. Peppler HJ. 1979. Production of yeast and yeast products. In: Microbial Technology (Vol 1-Microbial
Processes), eds Peppler HJ and Perlman D. Academic Press, New York, USA, pp 157-85.
Quote thesis as: Ayiecho PO. 1992. Quantitative studies in two grain amaranth populations using two selection methods.
Ph D thesis, University of California, Davis (unpublished).
14. Units and Nomenclature: Use SI units in accordance with the recommendations of the International Or-
ganizations for Standardization (ISO). Use the form g/kg or % to specify content/composition/
concentration. However, standard practice to express in gram (g) e.g. 1000-grain weight or yield per plant
may be adopted. Use the current systematic IUPAC nomenclature throughout.
15. ‘Copyright Transfer Agreement Form’ duly filled-in may be submitted along with the manuscript. 16. The responsibility of statements, opinion expressed in the paper, rests entirely with the author (s) and not
with the editorial board or the publisher.
17. The Journal’s each issue will be printed in the university website (http//:hillagric.ac.in) and then the hard
copies will be made.
Review articles on current research topics are invited.

Copyright Transfer Agreement Form This document must be signed by all authors and submitted with the manuscript
COPYRIGHT TRANSFER AGREEMENT
The Himachal Journal of Agricultural Research (HJAR) is published biannually by the Directorate of Research,
CSK Himachal Pradesh Krishi Vishvavidyalaya, Palampur-176 062, India.
The HJAR and Authors hereby agree as follows: In consideration of HJAR reviewing and editing the following
described work for first publication on an exclusive basis:
Title of manuscript:
___________________________________________________________________________
___________________________________________________________________________
The undersigned author(s) hereby assigns, conveys, and otherwise transfers all rights, title, interest, and copyright
ownership of said work for publication. Work includes the material submitted for publication and any other related
material submitted to HJAR. In the event that HJAR does not publish said work, the author(s) will be so notified
and all rights assigned hereunder will revert to the author(s).
The assignment of rights to HJAR includes but is not expressly limited to rights to edit, publish, reproduce, distrib-
ute copies, include in indexes or search databases in print, electronic, or other media, whether or not in use at the
time of execution of this agreement, and claim copyright in said work throughout the world for the full duration of
the copyright and any renewals or extensions thereof.
All accepted works become the property of HJAR and may not be published elsewhere without prior written per-
mission from HJAR. The author(s) hereby represents and warrants that they are sole author(s) of the work, that all
authors have participated in and agree with the content and conclusions of the work, that the work is original, and
does not infringe upon any copyright, propriety, or personal right of any third party, and that no part of it nor any
work based on substantially similar data has been submitted to another publication.
Authors' Names (in sequence) Signature of Authors
1. ______________________________ ______________________________
2. ______________________________ ______________________________
3. ______________________________ ______________________________
4. ______________________________ ______________________________
5. ______________________________ ______________________________
STATEMENT ABOUT OWNERSHIP AND OTHER PARTICULARS ABO UT HIMACHAL JOURNAL OF AGRICULTURAL RESEARCH AS REQUIRED UNDER RULES OF THE REGISTRATION OF
NEWSPAPERS (CENTRAL) RULES 1956
FORM IV (See Rule 8)
1. Place of Publication CSK Himachal Pradesh Krishi Vishvavidyalaya, Palam-pur, District Kangra-176 062.
2. Periodicity of its Publication Bi-annual
3. Printer’s Name Dr. S.S. Kanwar
Whether citizen of India Yes
(If foreigner, state the country of origin) N.A
Address Director of Research, CSK Himachal Pradesh Krishi Vish-vavidyalaya, Palampur, District Kangra-176 062.
4. Publisher’s Name Dr. S.S. Kanwar
Whether citizen of India Yes
(If foreigner, state the country of origin) N.A
Address Director of Research, CSK Himachal Pradesh Krishi Vish-vavidyalaya, Palampur, District Kangra-176 062.
5. Editor’s Name Dr. S.S. Rana
Whether citizen of India Yes
(If foreigner, state the country of origin) N.A
Address Principal Scientist
Department of Agronomy, CSK Himachal Pradesh Krishi Vishvavidyalaya, Palampur, District Kangra-176 062.
6. Name and address of the individuals who
own the newspaper and partners or share-holder holding more than one per cent of the total capital
CSK Himachal Pradesh Krishi Vishvavidyalaya, Palam-pur, District Kangra-176 062 (H.P.).
I, N.K. Pathania hereby declare that the particulars given above are true to the best of my knowledge and belief.
Sd/- Palampur, January 23, 2016 (S.S. Kanwar)