African Journal of Agricultural Research
136
African Journal of Agricultural Research Volume 11 Number 24 16 June 2016 ISSN 1991-637X
-
Upload
khangminh22 -
Category
Documents
-
view
0 -
download
0
Transcript of African Journal of Agricultural Research

African Journal of
Agricultural Research Volume 11 Number 24 16 June 2016
ISSN 1991-637X

ABOUT AJAR The African Journal of Agricultural Research (AJAR) is published weekly (one volume per year) by Academic Journals.
African Journal of Agricultural Research (AJAR) is an open access journal that publishes high-quality solicited and unsolicited articles, in English, in all areas of agriculture including arid soil research and rehabilitation, agricultural genomics, stored products research, tree fruit production, pesticide science, postharvest biology and technology, seed science research, irrigation, agricultural engineering, water resources management, marine sciences, agronomy, animal science, physiology and morphology, aquaculture, crop science, dairy science, entomology, fish and fisheries, forestry, freshwater science, horticulture, poultry science, soil science, systematic biology, veterinary, virology, viticulture, weed biology, agricultural economics and agribusiness. All articles published in AJAR are peer- reviewed.
Contact Us
Editorial Office: [email protected]
Help Desk: [email protected]
Website: http://www.academicjournals.org/journal/AJAR
Submit manuscript online http://ms.academicjournals.me/

. Editors
Prof. N.A. Amusa
Editor, African Journal of Agricultural Research Academic Journals.
Dr. Panagiota Florou-Paneri Laboratory of Nutrition, Faculty of Veterinary Medicine, Aristotle University of Thessaloniki, Greece.
Prof. Dr. Abdul Majeed Department of Botany, University of Gujrat,India, Director Horticulture, and landscaping. India.
Prof. Suleyman TABAN Department of Soil Science and Plant Nutrition, Faculty of Agriculture, Ankara University, 06100 Ankara-TURKEY.
Prof.Hyo Choi
Graduate School Gangneung-Wonju National University Gangneung, Gangwondo 210-
702, Korea.
Dr. MATIYAR RAHAMAN KHAN
AICRP (Nematode), Directorate of Research, Bidhan Chandra Krishi
Viswavidyalaya, P.O. Kalyani, Nadia, PIN-741235, West Bengal. India.
Prof. Hamid AIT-AMAR University of Science and Technology, Houari Bouemdiene, B.P. 32, 16111 EL-Alia, Algiers, Algeria.
Prof. Sheikh Raisuddin Department of Medical Elementology and
Toxicology,Jamia Hamdard (Hamdard University) New Delhi, India.
Prof. Ahmad Arzani Department of Agronomy and Plant Breeding College of Agriculture Isfahan University of Technology
Isfahan-84156, Iran.
Dr. Bampidis Vasileios
National Agricultural Research Foundation (NAGREF), Animal Research Institute 58100 Giannitsa, Greece.
Dr. Zhang Yuanzhi Laboratory of Space Technology, University of Technology (HUT) Kilonkallio Espoo, Finland. Dr. Mboya E. Burudi International Livestock Research Institute (ILRI) P.O. Box 30709 Nairobi 00100, Kenya. Dr. Andres Cibils Assistant Professor of Rangeland Science
Dept. of Animal and Range Sciences Box 30003, MSC 3-I New Mexico State University Las Cruces, NM 88003 (USA). Dr. MAJID Sattari
Rice Research Institute of Iran, Amol-Iran. Dr. Agricola Odoi University of Tennessee, TN., USA.
Prof. Horst Kaiser Department of Ichthyology and Fisheries Science Rhodes University, PO Box 94, South Africa.
Prof. Xingkai Xu Institute of Atmospheric Physics, Chinese Academy of Sciences, Beijing 100029,
China.
Dr. Agele, Samuel Ohikhena Department of Crop, Soil and Pest Management, Federal University of Technology
PMB 704, Akure, Nigeria. Dr. E.M. Aregheore The University of the South Pacific, School of Agriculture and Food Technology Alafua Campus, Apia, SAMOA

Editorial Board
Dr. Bradley G Fritz Research Scientist, Environmental Technology Division, Battelle, Pacific Northwest National Laboratory, 902 Battelle Blvd., Richland, Washington, USA.
Dr. Almut Gerhardt LimCo International, University of Tuebingen, Germany.
Dr. Celin Acharya Dr. K.S.Krishnan Research Associate (KSKRA), Molecular Biology Division, Bhabha Atomic Research Centre (BARC), Trombay, Mumbai-85, India.
Dr. Daizy R. Batish Department of Botany, Panjab University, Chandigarh, India.
Dr. Seyed Mohammad Ali Razavi University of Ferdowsi, Department of Food Science and Technology, Mashhad, Iran.
Dr. Yasemin Kavdir
Canakkale Onsekiz Mart University, Department of Soil Sciences, Terzioglu Campus 17100 Canakkale Turkey.
Prof. Giovanni Dinelli Department of Agroenvironmental Science and Technology Viale Fanin 44 40100, Bologna
Italy.
Prof. Huanmin Zhou College of Biotechnology at Inner Mongolia Agricultural University, Inner Mongolia Agricultural University, No. 306# Zhao Wu Da Street, Hohhot 010018, P. R. China, China.
Dr. Mohamed A. Dawoud Water Resources Department, Terrestrial Environment Research Centre, Environmental Research and Wildlife Development Agency (ERWDA), P. O. Box 45553, Abu Dhabi, United Arab Emirates.
Dr. Phillip Retief Celliers
Dept. Agriculture and Game Management, PO BOX 77000, NMMU, PE, 6031, South Africa.
Dr. Rodolfo Ungerfeld Departamento de Fisiología, Facultad de Veterinaria, Lasplaces 1550, Montevideo 11600, Uruguay. Dr. Timothy Smith Stable Cottage, Cuttle Lane, Biddestone, Chippenham, Wiltshire, SN14 7DF. UK. Dr. E. Nicholas Odongo,
27 Cole Road, Guelph, Ontario. N1G 4S3 Canada. Dr. D. K. Singh Scientist Irrigation and Drainage Engineering Division, Central Institute of Agricultural Engineeinrg Bhopal- 462038, M.P. India.
Prof. Hezhong Dong Professor of Agronomy, Cotton Research Center, Shandong Academy of Agricultural Sciences, Jinan 250100 China.
Dr. Ousmane Youm Assistant Director of Research & Leader, Integrated Rice Productions Systems Program Africa Rice Center (WARDA) 01BP 2031, Cotonou, Benin.

Table of Contents: Volume 11 Number 24, 1 6 June, 2016
ARTICLES
Occurrence and estimated losses caused by cassava viruses in Migori County, Kenya 2064 Emily Atieno Masinde, Joshua Ondura Ogendo, Midatharahally N. Maruthi, Rory Hillocks, Richard M.S. Mulwa and Peter Futi Arama
Village poultry production system: Perception of farmers and simulation of impacts of interventions 2075 E. Wondmeneh, E. H. Van der Waaij, H. M. J. Udo, D. Tadelle and J. A. M Van Arendonk
Influence of cowpea root powder and exudates on germination and radicle length in Striga hermothica, sorghum and pearl millet strains 2082 A. A. M. Rezig, T. S. Abdelhalim, M. M. Hassan, R. M. A. Abusin, H. Amani Eltayeb, H. Samejima and A. G. T. Babiker
The decrease of potential suitable areas and the distribution tendency of staple crops in Ethiopia under future climate conditions 2092 Zhen Tan, Yuping Yang, Yanqin Wang, Lele Wang and Guojun Sun
Nutritional technological characterization and secondary metabolites in stored carioca bean cultivars 2102 Rose Mary Helena Quint Silochi, Silvia Renata Machado Coelho, Tabata Zingano Bischoff, Flávia Danieli Rech Cassol, Naimara Vieira do Prado and Priscila Zaczuk Bassinello
Toxicity and repellency of plant extracts on Thaumastocoris Peregrinus (Carpintero & Dellapé) (Hemiptera: Thaumastocoridae) 2112 Jucelaine Haas, Michele Potrich, Aline Mara dos Santos Telles, Everton Ricardi Lozano, Tatiane Luiza Cadorin Oldoni, Flavia Galvan Tedesco, Jackeline Dall Agnol de Lima and Sérgio Miguel Mazaro
Genetic diversity assay of maize (Zea mays L.) inbreds based on morphometric traits and SSR markers 2118 Madhav Pandit, Manigopa Chakraborty, Z. A. Haider, Anita Pande, Rameshwar Prasad Sah and Kumar Sourav
Evaluation of intraspecific hybrids of yellow passion fruit in organic farming 2129 Onildo Nunes de Jesus, Taliane Leila Soares, Eduardo Augusto Girardi, Raul Castro Carriello Rosa, Eder Jorge de Oliveira, Alírio José da Cruz Neto, Valeria Tebinka dos Santos and João Roberto Pereira Oliveira
African Journal of Agricultural Research

Table of Contents: Volume 11 Number 24, 1 6 June, 2016
ARTICLES
Use and management of pasture in the cerrado biome: Impacts on aggregation of an oxisol 2139 Fabiano Bertolin, José Antonio Maior Bono, Manuel Claudio Motta Macedo, Alexandre Romeiro de Araújo and Francisco de Assis Rolim Pereira
Roles of conjugated double bonds in electron-donating capacity of sorghum grains 2146 Minori Uchimiya and Ming Li Wang
Assessment of harvest and post-harvest factors affecting quality of Arabica coffee in Gamo Gofa Zone, Southern Ethiopia 2157 Gezahegn Garo, Sabura Shara and Yohanes Mare
Impact of xenobiotics on microbial activity in soil cultivated with forage cactus Opuntia ficus-indica 2166 Élica Santos Rios, Carlos Romero Ferreira de Oliveira, Cláudia Helena Cysneiros Matos de Oliveira, Julia Kuklinsky Sobral, José Alexandre da Silva, José Gomes da Silva Filho and César Auguste Badji
Control of white mold in bean plants by homeopathic medicines 2174 Bruna Broti Rissato, José Renato Stangarlin, Sidiane Coltro-Roncato, Omari Dangelo Forlin Dildey, Edilaine Della Valentina Gonçalves, Laline Broetto, Odair José Kuhn, Eloisa Lorenzetti, Thaisa Muriel Mioranza, Eliana Peliçon Pereira Figueira, Tulya Fernanda Barrientos Webler and Jéssica Cristina Urbanski Laureth
Azospirillum brasilense and nitrogen fertilization affecting wheat productivity 2179 Junia Maria Clemente, Aurinelza Batista Teixeira Condé, Alex Teixeira Andrade, Carine Rezende Cardoso, Iara da Mata Flor, Fábio Aurélio Dias Martins, Willian Tadeu de Lima and Cleiton Burnier de Oliveira
Effect of chitosan-based coating on postharvest quality of tangerines (Citrus deliciosa Tenore): Identification of physical, chemical, and kinetic parameters during storage 2185 Geovana Rocha Plácido, Richard Marins da Silva, Caroline Cagnin, Maisa Dias Cavalcante, Marco Antônio Pereira da Silva, Márcio Caliari, Maria Siqueira de Lima and Luiz Eduardo Costa do Nascimento
African Journal of Agricultural Research

Vol. 11(24), pp. 2064-2074, 16 June, 2016
DOI: 10.5897/AJAR2016.10786
Article Number: 12A8CE958959
ISSN 1991-637X
Copyright ©2016
Author(s) retain the copyright of this article
http://www.academicjournals.org/AJAR
African Journal of Agricultural Research
Full Length Research Paper
Occurrence and estimated losses caused by cassava viruses in Migori County, Kenya
Emily Atieno Masinde1, Joshua Ondura Ogendo1*, Midatharahally N. Maruthi2, Rory Hillocks2, Richard M.S. Mulwa1 and Peter Futi Arama3
1Department of Crops, Horticulture and Soils, Egerton University, P.O. Box 536-20115, Egerton, Kenya.
2Natural Resources Institute, University of Greenwich, Chatham Maritime, Kent ME4 4TB, UK.
3School of Agriculture, Natural Resources and Environmental Studies, Rongo University College, P.O. Box 103 - 40404,
Rongo, Kenya.
Received 4 January, 2016; Accepted 1 April, 2016
A farm survey was conducted in Kuria East and Suna West sub-counties to determine the incidence, severity and estimated losses of cassava brown streak disease (CBSD) and cassava mosaic disease (CMD) on cassava crops in farmers’ fields. The results showed that cassava is the second most important staple crop after maize in Migori County. CMD incidence ranged from 0.0 to 56.7%) in Kuria East and 10.0 to 55.0% in Suna West. CBSD incidences were much higher at 5.0 to 74.0% in Kuria East and 10.0 to 77.5% in Suna West. Both CMD and CBSD had an effect on yield reduction and total root loss ranged from 10.7 to 47.2% in Kuria East and 11.5 to 33.2 in Suna West. The percent mean total root loss in Kuria East was 25.9%; equivalent to 1299.6 US dollars/ha while in Suna East was 24.7%; equivalent to 1259.5 US dollars/ha. The best performing variety with regards to low CBSD and CMD incidence, low root losses and high yield were TMS 30572 and MH95/0183. The findings of this study are expected to provide impetus for the development and promotion of new high yielding, locally adapted and resistant cassava varieties. Key words: Cassava, CBSD, incidence, root necrosis, yield loss.
INTRODUCTION Cassava (Manihot esculenta Crantz) is a staple food for more than 800 million people world-wide (Lebot, 2009). It was initially adopted as a popular famine reserve crop but in recent times has emerged to be a profitable cash crop of industrial significance in the world economy (Larsson et al., 2013; Tonukari et al., 2015). In Kenya, the crop is
grown for both food and income on approximately 72,482 ha with an annual output of 1.1 million tonnes (FAOSTAT, 2013). Western Kenya, where Migori County is located, accounts for 60% of total cassava production in Kenya. In Migori County, cassava is a staple food crop occupying about 8800 ha with mean yields of 6 and 12
*Corresponding author. E-mail: [email protected].
Author(s) agree that this article remain permanently open access under the terms of the Creative Commons Attribution
License 4.0 International License

t/ha for local and improved varieties, respectively and acts as an insurance crop due to its tolerance to drought and low external input requirements (GoK, 2013a,b).
Cassava production is constrained by several diseases, the major ones being the cassava mosaic disease (CMD) and cassava brown streak disease (CBSD). The CBSD is caused by two distinct viruses: cassava brown streak virus (CBSV) and Ugandan cassava brown streak virus (UCBSV), both of which have (+)ss RNA genomes belong to the genus Ipomovirus in the family Potyviridae, and generally produce similar symptoms in infected plants (Winter et al., 2010; Ndunguru et al., 2015; Vanderschuren et al., 2012; Legg et al., 2011). UCBSV has however been reported to cause milder symptoms than CBSV, and also lower pathogenicity (Vanderschuren et al., 2012). The disease causes economic losses resulting from damage to the aboveground parts characterized by leaf chlorosis and necrosis, elongated necrotic lesions on stems and secondary and tertiary vein chlorosis (Winter et al., 2010; Hillocks and Jennings, 2003). Root spoilage occurs due to constriction caused by dry corky necrotic rot on starchy tissues and stunted growth on infected plants (Winter et al., 2010; Hillocks and Jennings, 2003).
Necrotic lesions and/or discoloration of the roots due to infection render the roots unpalatable and unmarketable, and hence an explanation for most of the quantitative and qualitative losses (Nichols, 1950). The CBSD symptoms are usually variable and irregular, and depend on many factors including plant age, cultivar (genotype), environmental conditions (that is, altitude, temperature and rainfall quantity) and virus species (Mohammed et al., 2012; Hillocks and Jennings, 2003). Control strategies for CBSD have been focussing on host plant resistance especially with Amani hybrid genotypes that is, Kaleso (Namikonga) which has been used as a source of resistance in many breeding populations.
This variety has been reported to have the highest general combining ability for CBSD resistance (Kulembeka et al., 2012). CBSD resistance studies have revealed variations of symptoms in different genotypes (Pariyo et al., 2015; Kaweesi et al., 2014). Kaweesi et al. (2014) screened for CBSD resistance by quantitative PCR and reported four disease reactions including: - Restricted disease symptoms and virus quantities which is a characteristic of resistant varieties that is, Kaleso, - Restricted virus quantities with high disease symptoms (tolerant varieties), - Restricted disease symptoms with high virus quantities (tolerant varieties) and, - Accumulation of high virus quantities and very severe symptoms which is a characteristic of susceptible varieties that is, Albert. Different disease reactions prompt the need to consider breeding of genotypes with different disease reactions in order to achieve durable resistance. Cassava mosaic disease (CMD) caused by cassava
Masinde et al. 2065 mosaic geminiviruses (CMGs) (Geminiviridae: Begomovirus) and transmitted in a persistent manner by the whitefly vector is an important constraint to cassava production in Africa (Legg and Fauquet, 2004). CMG infection results in symptoms comprising misshapen leaves with a mosaic-like chlorosis and general plant stunting, leading to reduced tuberous root production (root size and number) (Alabi et al., 2011). Most CMD-affected cassava plants produce few or no tuberous roots depending on the severity of the disease and the age of the plant at the time of infection (Alabi et al., 2011). Through the processes of virus–virus synergism, pseudo-recombination, and true recombination, CMGs have evolved into a diverse and highly successful group of plant pathogens, and seven species are currently recognized from Africa (Legg, 2008).
Rapid spread of a recombinant strain, East African cassava mosaic virus Uganda (EACMV-UG), has been associated with a pandemic of unusually severe CMD, which has affected much of East and Central Africa, leading to production losses of 47%, equivalent to nearly 14 million tonnes (Legg, 2008). Studies exploring the potential of CMD resistance in transgenic plants have been carried, and results demonstrated that resistance to ACMV could be achieved with high efficacy by expressing antisense RNAs against viral mRNAs encoding essential non-structural protein (Zhang et al., 2005). Recent control strategies have been focussing on host plant resistance and a high resolution map for dominant monogenic resistance (CMD2) discovered in local landraces was developed (Rabbi et al., 2014). This single gene resistance however lacks diversity rendering its long-term effectiveness precarious, given the potential to be overcome by CMGs due to their fast-paced evolutionary rate. Combining of the quantitative with the qualitative type of resistance may ensure that this resistance gene continues to offer protection to cassava, a crop that is depended upon by millions of people in Africa against the devastating onslaught of CMGs. High CMD (71.4 to 100%) and CSBD (20 to 100%) incidences have been observed in Western Kenya (Irungu, 2011).
A synergy effect in dual infections of CBSD and CMD was also reported where more severity was observed for both diseases compared to when the diseases are separate single infections. Mixed infections of CBSV and UCBSV with high prevalence, incidence and severity in the mid altitude areas (1181 to 1467 m above sea level (m asl)) of Western Kenya have been reported by Mware et al. (2009) and Osogo et al. (2014). In similar studies, Ndunguru et al. (2015) detected the presence of both CBSV and UCBSV in low, mid and high altitude areas of Tanzania disapproving the assumption that the viruses are limited by agro-ecological zones. The results in both studies demonstrate a wide distribution of the disease in almost all cassava-growing areas, which confirms that other areas in the East African region previously unaffected by CBSD are now at risk of spread and

2066 Afr. J. Agric. Res.
Table 1. GPS coordinates for villages where farms were surveyed.
Sub county Total no of farms surveyed Village Latitude Longitude Altitude (m asl)
Kuria East 40
Sanchawa 1.243° S 34.647° E 1608
Getongoroma 1.302° S 34.664° E 1703
Kegonga town 1.254° S 34.653° E 1653
Sakuri 1.284° S 34.658° E 1661
Nyamagenga 1.245° S 34.661°E 1596
Ntimaru west 1.341° S 34.694° E 1817
Suna West 30
Sagero 1.093° S 34.432° E 1401
Wasweta II 1.067° S 34.481° E 1478
Mubachi 1.137° S 34.327° E 1413
Giribe 1.105° S 34.290° E 1337
Nyasoko 1.076° S 34.344° E 1406
Oruba 0.968° S 34.527° E 1526
masl (meters above sea level).
increased prevalence of the disease. Extensive studies have been carried out on CMD and
CBSD diagnostics in Kenya but few have assessed cassava root losses resulting from these diseases. A farm survey was therefore conducted to determine the incidence, severity and estimated yield losses caused by CBSD and CMD on cassava crops in farmers’ fields in Migori County, Western Kenya. MATERIALS AND METHODS Farm Survey: Sampling procedures and field observations Two-stage farm surveys were conducted in Kuria East and Suna West sub-counties of Migori County, Kenya (Plate 1). The surveyed farms were located between latitude (1.243°S to 1.341°S), longitude (34.647°E to 34.694°E) and altitude (1596 to 1817 m asl) in Kuria East and latitude (0.968°S to 1.137°S), longitude (34.290°E to 34.572°E) and altitude (1337 to 1526 m asl) in Suna West. In the first survey (incidence) (June 24 to 28, 2013), a total of 70 cassava farms (40 in Kuria East and 30 in Suna West) with a crop aged 7 to 10 MAP, were sampled using stratified random sampling procedure (Levy and Lemeshow, 2008) (Table 1). The cassava farms were sampled randomly at regular intervals (5 to 10 km) along the main roads and occasionally traversing to the feeder roads. Five (5) plants were sampled per variety from the three main varieties in a diagonal manner across each field. The name of variety(ies) sampled and corresponding CBSD and CMD incidences were recorded. Each plant with CBSD symptoms was colour tagged for root necrosis sampling at crop maturity (harvest).
In the second survey (severity) (August 5 to 10, 2013), 23 and 20 farms from Kuria East and Suna West sub-counties, respectively were randomly sampled from amongst those sampled during the incidence survey. Most farmers were harvesting their crop leading to reduced number of farms sampled during the second survey. Data on CBSD root severity, root necrosis and yield traits (number and weight of roots) were obtained on cassava crops aged 9 to 12 MAP and ready for harvesting. Five (5) CBSD infected plants, previously tagged, were carefully uprooted and roots harvested. The number and weight of roots were recorded before longitudinally
cutting the roots to check for necrosis and constrictions. Roots were assigned root necrosis scores based on the standard
five point scoring scale (Hillocks et al., 2015) where 1 = no necrosis symptoms, 2 = trace of necrosis, 3 = clearly defined areas of necrosis but necrotic areas can be easily removed, 4 = most of root necrotic but may still be possible to remove necrotic areas for home consumption and 5 = most or all roots necrotic and unsuitable for human consumption (Figure 1).
Data collection and analysis
Cassava variety popularity was determined by calculating the frequency of occurrence of each variety in the two sub counties. Crop importance was determined by calculating the sum per capita acreage for each crop and diving by the number of farms where crop is grown, to get the mean per capita acreage in the two sub counties. This information gave an insight on how important cassava is the surveyed region. Data were collected on CMD leaf incidence, CBSD incidence (foliar and root), root necrosis damage and root necrosis range. Root necrosis severity and incidence data were subjected to analysis of variance (ANOVA) using ‘R’ stastical software’s generalised linear model with quasibinomial errors and a logit link (Kabacoff, 2011). Quasipoisson errors and a log link was used for analysis of count parameter (weight of roots) (Kabacoff, 2011). Variety means were separated using Tukey’s HSD test at P≤0.05. Spearman’s correlation analysis was carried out to test the effect
of both diseases on root yield. Percent mean root necrosis was estimated according to Hillocks et al. (2015) where the % of roots with root necrosis grade 3, 4 and 5 were multiplied by 25, 35 and 58% respectively. The percentages represented the average proportion of root tissue lost during cutting out of necrotic areas of the respective necrosis grades. The % sum of all the grades in a variety were divided by 100 to get % mean root necrosis loss. Percent root weight loss for each variety was estimated by comparing plants with CBSD and/or CMD symptoms with a symptomless plant in the same field. This was simillarly done for % root number loss. Percent mean root necrosis loss, % root weight loss and % root number loss were then computed into a total root loss. Yield losses in tonnes per hectare were converted to US dollars based on cassava value in Kenya (US$ 213.49/tonne)

Masinde et al. 2067
Figure 1. (A) Sub counties of Migori County; (B): Location of Migori County in Kenya.
Table 2. Mean per capita acreage and acreage allocated to different crops in Kuria East and Suna West sub-counties.
Variable MCA (Acres) Be Cas GN Ma Ban Sor S/pot Veg/Fru F/mil
Kuria East 4.84 0.94 1.04 0.57 2.29 0.47 0.39 0.38 0.29 0.31
Suna West 4.02 0.93 1.02 0.38 2.07 0.15 0.75 0.34 0.17 0
Mean capita acreage (MCA), Be – Beans, Cas - Cassava; GN - Ground nut; Ma - Maize; Ban – Banana, Sor – Sorghum, S/pot, Veg/fru – Vegetable/Fruit, F/mil – Finger millet.
(FAOSTAT, 2013). The roots harvested per variety without symptoms were weighed (kg) and the root yield (t/ha) per variety computed using formula (Equation 1):
kg 1,000x m 1
m x10,000(kg)Weight riety(t/ha)/ va Yield
2
2
(1)
The root loss (t/ha) per variety was computed as shown below
100
(t/ha) yield x lossroot Total(t/ha) Loss (2)
This was then converted to US dollars/ha. Analysis was done using excel, frequencies, averages and percentages, and correlation using the social sciences analysis software statistical package for social sciences (SPSS) version 16.
RESULTS
Socio-economic importance of cassava in Migori County
Based on mean acreage allocated to different crops,
cassava was ranked second most important crop after maize in Kuria East and Suna West sub-counties. Cassava was allocated mean acreage of 1.04 and 1.02 acres in Kuria East and Suna West, respectively compared to 2.29 and 2.07 acres, respectively, for maize (Table 2). On average, maize, cassava and beans were allocated 50, 25 and 20% of the total cultivated land per household (Table 2). Results further showed that the local cassava varieties were more popular at 88.6 and 75.6% compared to improved varieties at 11.4 and 24.4% in Kuria East and Suna West respectively (Figure 2).
CMD incidence The average CMD leaf incidence was 49.0% in Kuria East and 46.7% in Suna West (Table 3a and b). CMD incidence in local varieties (25.0 to 70.0%) was generally high compared to improved varieties (0.0 to 33.0%). Improved variety Agric however had high CMD incidence (67%) while local variety Sudhe had low CMD incidence (15.0%) (Table 3a and b).
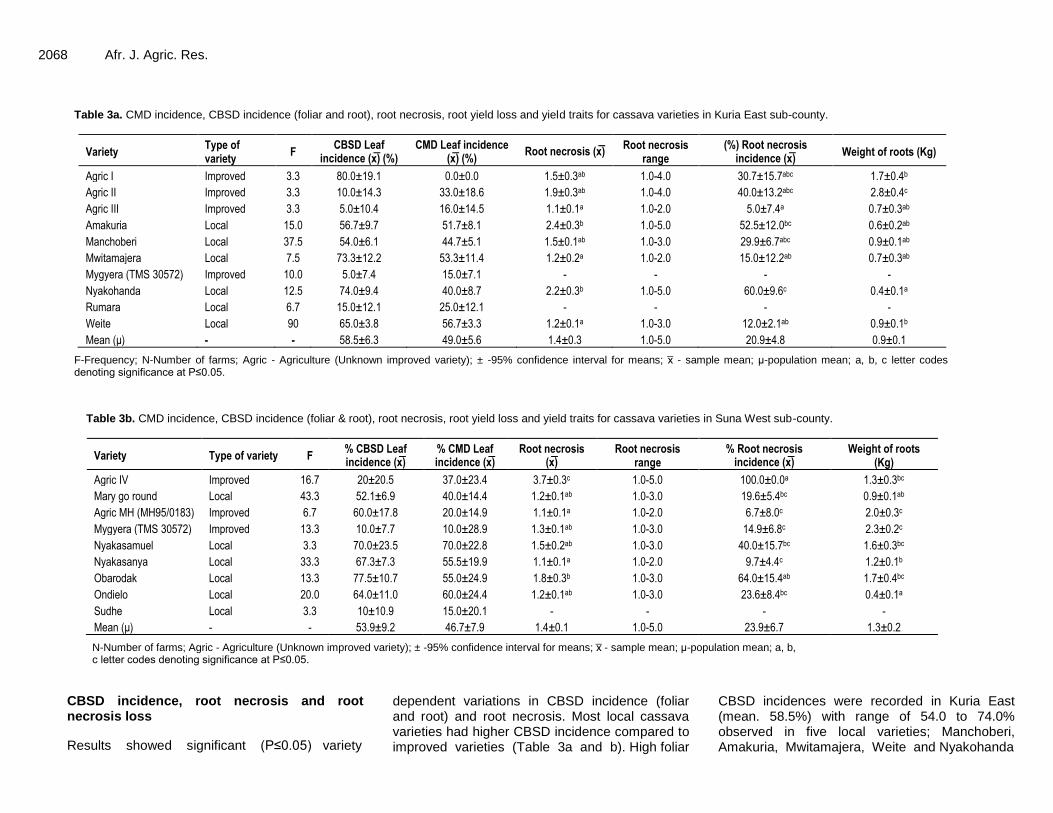
2068 Afr. J. Agric. Res.
Table 3a. CMD incidence, CBSD incidence (foliar and root), root necrosis, root yield loss and yield traits for cassava varieties in Kuria East sub-county.
Variety Type of variety
F CBSD Leaf
incidence (x ) (%) CMD Leaf incidence
(x ) (%) Root necrosis (x )
Root necrosis range
(%) Root necrosis incidence (x )
Weight of roots (Kg)
Agric I Improved 3.3 80.0±19.1 0.0±0.0 1.5±0.3ab 1.0-4.0 30.7±15.7abc 1.7±0.4b
Agric II Improved 3.3 10.0±14.3 33.0±18.6 1.9±0.3ab 1.0-4.0 40.0±13.2abc 2.8±0.4c
Agric III Improved 3.3 5.0±10.4 16.0±14.5 1.1±0.1a 1.0-2.0 5.0±7.4a 0.7±0.3ab
Amakuria Local 15.0 56.7±9.7 51.7±8.1 2.4±0.3b 1.0-5.0 52.5±12.0bc 0.6±0.2ab
Manchoberi Local 37.5 54.0±6.1 44.7±5.1 1.5±0.1ab 1.0-3.0 29.9±6.7abc 0.9±0.1ab
Mwitamajera Local 7.5 73.3±12.2 53.3±11.4 1.2±0.2a 1.0-2.0 15.0±12.2ab 0.7±0.3ab
Mygyera (TMS 30572) Improved 10.0 5.0±7.4 15.0±7.1 - - - -
Nyakohanda Local 12.5 74.0±9.4 40.0±8.7 2.2±0.3b 1.0-5.0 60.0±9.6c 0.4±0.1a
Rumara Local 6.7 15.0±12.1 25.0±12.1 - - - -
Weite Local 90 65.0±3.8 56.7±3.3 1.2±0.1a 1.0-3.0 12.0±2.1ab 0.9±0.1b
Mean (μ) - - 58.5±6.3 49.0±5.6 1.4±0.3 1.0-5.0 20.9±4.8 0.9±0.1
F-Frequency; N-Number of farms; Agric - Agriculture (Unknown improved variety); ± -95% confidence interval for means; x - sample mean; μ-population mean; a, b, c letter codes denoting significance at P≤0.05.
Table 3b. CMD incidence, CBSD incidence (foliar & root), root necrosis, root yield loss and yield traits for cassava varieties in Suna West sub-county.
Variety Type of variety F % CBSD Leaf incidence (x )
% CMD Leaf incidence (x )
Root necrosis (x )
Root necrosis range
% Root necrosis incidence (x )
Weight of roots (Kg)
Agric IV Improved 16.7 20±20.5 37.0±23.4 3.7±0.3c 1.0-5.0 100.0±0.0a 1.3±0.3bc
Mary go round Local 43.3 52.1±6.9 40.0±14.4 1.2±0.1ab 1.0-3.0 19.6±5.4bc 0.9±0.1ab
Agric MH (MH95/0183) Improved 6.7 60.0±17.8 20.0±14.9 1.1±0.1a 1.0-2.0 6.7±8.0c 2.0±0.3c
Mygyera (TMS 30572) Improved 13.3 10.0±7.7 10.0±28.9 1.3±0.1ab 1.0-3.0 14.9±6.8c 2.3±0.2c
Nyakasamuel Local 3.3 70.0±23.5 70.0±22.8 1.5±0.2ab 1.0-3.0 40.0±15.7bc 1.6±0.3bc
Nyakasanya Local 33.3 67.3±7.3 55.5±19.9 1.1±0.1a 1.0-2.0 9.7±4.4c 1.2±0.1b
Obarodak Local 13.3 77.5±10.7 55.0±24.9 1.8±0.3b 1.0-3.0 64.0±15.4ab 1.7±0.4bc
Ondielo Local 20.0 64.0±11.0 60.0±24.4 1.2±0.1ab 1.0-3.0 23.6±8.4bc 0.4±0.1a
Sudhe Local 3.3 10±10.9 15.0±20.1 - - - -
Mean (μ) - - 53.9±9.2 46.7±7.9 1.4±0.1 1.0-5.0 23.9±6.7 1.3±0.2
N-Number of farms; Agric - Agriculture (Unknown improved variety); ± -95% confidence interval for means; x - sample mean; μ-population mean; a, b, c letter codes denoting significance at P≤0.05.
CBSD incidence, root necrosis and root necrosis loss
Results showed significant (P≤0.05) variety
dependent variations in CBSD incidence (foliar and root) and root necrosis. Most local cassava varieties had higher CBSD incidence compared to improved varieties (Table 3a and b). High foliar
CBSD incidences were recorded in Kuria East (mean. 58.5%) with range of 54.0 to 74.0% observed in five local varieties; Manchoberi, Amakuria, Mwitamajera, Weite and Nyakohanda

Masinde et al. 2069
Table 4. % Necrosis losses, root weight, root number and total root loss.
Sub county Variety Total no. of
roots examined
Necrosis losses Mean % necrosis loss
% Root weight loss
% Root number loss
% Total root loss % with score 3 % with score 4 % with score 5
Kuria East
Agric I 27 11.1 3.7 0.0 4.1 44.7 0.0 16.3
Agric II 35 14.3 14.3 2.9 8.7 29.7 27.1 21.8
Agric III 51 0.0 0.0 0.0 0.0 25.7 6.3 10.7
Amakuria 34 8.8 14.7 14.7 15.9 40.0 24.4 26.7
Manchoberi 106 15.1 0.0 0.0 3.8 65.4 29.3 32.8
Mwitamajera 16 0.0 0.0 0.0 0.0 80.0 0.0 26.7
Mygyera - - - - - - - -
Nyakohanda 47 12.8 23.4 2.1 12.6 84.8 44.1 47.2
Rumara - - - - - - - -
Weite 571 4.6 0.5 0.4 1.6 47.4 25.7 24.9
Mean - - - - - - - 25.9
Suna West
Agric IV 27 25.9 14.8 37.0 33.1 48.8 10.0 30.6
MH95/0183 24 0.0 0.0 0.0 0.0 34.4 0.0 11.5
Mary go round 80 1.3 0.0 0.0 0.3 40.8 40.0 27.0
Mygyera 62 6.5 0.0 0.0 1.6 24.0 13.9 13.2
Nyakasamuel 12 25.0 0.0 0.0 6.3 58.3 35.0 33.2
Nyakasanya 87 0.0 0.0 0.0 0.0 51.6 32.5 28.0
Obarodak 15 20.0 0.0 0.0 5.0 40.0 25.0 23.3
Ondielo 33 3.0 0.0 0.0 0.8 34.3 33.3 22.8
Sudhe - - - - - - - -
Mean - - - - - - - 24.7
Estimated from research that shows on average 25, 35 and 58% of tissue is removed when necrotic areas are cut-out before processing for CBSD necrosis grades 3, 4 and 5 respectively (Hillocks et al. 2015).
(Table 3a). A similar result trend was recorded in Suna West (mean. 53.9%) with a range of 52.1 to 77.5% in six varieties; Mary go round, Agric MH (MH95/0183) (improved), Ondielo, Nyakasanya, Nyakasamuel and Obarodak (Table 3b). High root necrosis scores, root necrosis incidence and % mean necrosis loss were observed in two local varieties, Amakuria (2.4, 52.5% 15.9%) and Agric IV (3.7, 100%, 30.6%), in Kuria East and Suna
West sub-counties, respectively (Table 3a, b and 4). Varieties with high foliar and root incidence coupled with high root necrosis and necrosis loss are regarded as susceptible.
In Kuria East, lowest root necrosis, root necrosis incidence and % mean necrosis loss was observed in Weite (1.2, 12.0%, 1.6%); Mwitamajera (1.2, 15.0, 0.0) and Agric III (1.1, 5.0 0.0) (Table 3a, b and 4). A similar trend was
observed in Suna West where lowest root necrosis, root necrosis incidence and % mean necrosis loss was observed in MH95/0183 (1.1, 6.7%, 0.0%), Nyakasanya (1.1, 9.7%, 0.0%) and Mygyera (TMS 30572) (1.3, 14.9%, 1.6%) (Table 3a, b and 4). Although varieties Weite, Mwitamajera, MH95/0183 and Nyakasanya had minimal or no root necrosis losses they had high foliar incidence and could be regarded as tolerant

2070 Afr. J. Agric. Res.
Table 5. Spearman’s correlation coefficients for correlation analysis.
Variable % CMD % CBSD RN % RNI % MRL % RWL % RNL % Total root loss
% CMD 1 - - - - - - -
% CBSD 0.44ns
1 - - - - - -
RN 0.05ns
0.08ns
1 - - - - -
% RNI 0.22ns
0.26ns
0.94** 1 - - - -
% MRL 0.14ns
0.08ns
0.94** 0.87** 1 - - -
% RWL 0.42ns
0.55* 0.25ns
0.31ns
0.24ns
1 - -
% RNL 0.35ns
0.18ns
0.01ns
0.06ns
0.22ns
0.22ns
1 -
% Total root loss 0.57* 0.35ns
0.36ns
0.40ns
0.45ns
0.85** 0.59* 1
*Correlation significant at 0.05 level (2 tailed), **Correlation significant at 0.01 level (2 tailed), ns – correlation not significant, % CMD - % CMD leaf incidence, % CBSD - % CBSD leaf incidence, RN - root necrosis, RNI - Root, % MRL - % Mean necrosis root loss, %RWL - % - % Root weight loss, % RNL - % Root number loss.
compared to resistant Agric III and Mygyera (TMS 30572) which had low foliar incidence and low root necrosis loss. Cassava yield (weight of roots) Results showed that cassava yield (weight of roots) was significantly (P≤0.05) influenced by variety cultivated in both sub-counties. Improved cassava varieties had more root weight compared to the local landraces. In Kuria East, improved varieties, Agric I and II had highest mean number (4.4 to 5.4) and weight (1.7 to 2.8 kg) of harvested roots compared to (3.9 to 4.6) and (0.4 to 0.9 kg) for all the local cassava varieties (Table 3a and b). Similar results were observed in Suna West where improved varieties, Agric IV, MH95/0183 and Mygyera (TMS 30572) had highest number (5.0-5.5) and weight (1.3 to 2.3 kg) of harvested roots compared to (3.3 to 4.3)
and (0.4 to 1.7) for all local landraces. Percent root losses The highest % total loss was observed on Nyakohanda (47.2%) (Table 4). This variety had high CMD and CBSD foliar incidence, high root necrosis and root necrosis incidence, which all contributed to high total root loss. CMD and CBSD foliar incidences seems to have had negative impact on % root weigh losses and ranged from 25.7 to 84.8% in Kuria East and 24.0 to 72.7% in Suna West (Table 4). Percent root number loss was lower compared to root weight loss and ranged from 0.0 to 44.1% in Kuria East and 0.0 to 38.6% in Suna West (Table 4). This shows that most of the affected plants developed roots but they did not bulk and remained small thereby affecting subsequent root weight. The lowest % total root loss was recorded on improved varieties TMS 30572 (13.2), MH95/0183 (11.5) and Agric III (10.7) (Table 4). Local varieties like Weite, Mwitamajera, Mary go round, Nyakasanya and Ondielo had low % mean
necrosis loss comparable to the improved varieties but their % total root loss was higher due to high CMD and CBSD foliar incidence which negatively affected resultant root weight and number. This shows that even if root necrosis losses are low in most of the local varieties, farmers are still losing significant yields due to high foliar incidences. Percent total root loss ranged from 10.7 to 47.2% with a mean of 25.9% in Kuria East while in Suna West was 11.5 to 33.2% with a mean of 24.7% (Table 4). Total losses were 1299.6 US$/ha in Kuria East and 1259.6 US$/ha in Suna West (Table 6). Correlation analysis There was a moderate positive correlation (r = 0.57, p≤0.05) between % CMD leaf incidence and % total root loss, and this showed that CMD incidence had a significant effect on total root loss as all plants with CMD symptoms also had root loss (Table 5). Positive correlation (r = 0.35) between % CBSD leaf incidence and total root loss wasn’t significant since the incidence resulted into loss in root weight but not necessarily loss in root number (Table 5). Some varieties also had high CBSD incidence but with minimal or low root necrosis resulting to low total root loss that is, MH95/0183 in Suna West and Weite and Mwitamajera in Kuria East (Table 3a and b). Very high positive correlation (r = 0.94, p≤0.01) was observed between root necrosis, root necrosis incidence and % mean root necrosis loss (Table 5). Varieties with high root necrosis had high root necrosis incidence and consequently high % mean root necrosis loss that is, Agric IV (Table 5).
Dual infections for CMD and CBSD were observed in most varieties. Root weight loss (r = 0.85, p≤0.01) and root number loss (r = 0.59, p≤0.05) were positively correlated to total root loss (Table 4). These two traits contributed significantly to total root loss compared to % mean root necrosis loss and this was due to some varieties having high root weight and root number loss

Masinde et al. 2071 Table 6. Cassava yield losses converted to US dollars.
Sub county
Variety Yield of symptomless
plants (Kg/m2)
Yield of symptomless plants (tonnes/ha)
Total root loss (tonnes/ha)
Loss in US dollars/ha
Kuria East
Agric I 3 30 4.9 1046.1
Agric II 4 40 8.7 1857.4
Agric III 1.5 15 1.6 341.6
Amakuria 1 10 2.7 576.4
Manchoberi 2 20 6.6 1409.0
Mwitamajera 2 20 5.3 1131.5
Mygyera - - - -
Nyakohanda 3 30 14.2 3031.6
Rumara - - - -
Weite 1.9 19 4.7 1003.4
Mean - - - 1299.6
Suna West
Agric IV 2.5 25 7.7 1643.8
Agric MH (MH95/0183)
4 40 4.6 982.1
Mary go round 2.25 22.5 6.1 1302.3
Mygyera (TMS 30572) 3.5 35 4.6 982.1
Nyakasamuel 3 30 10.0 2134.9
Nyakasanya 2.5 25 7 1494.4
Obarodak 2.5 25 5.8 1238.2
Ondielo 0.6 6 1.4 298.5
Sudhe - - - -
Mean - - - 1259.5
Cassava value in Kenya US$ 213.49/tonne (FAOSTAT, 2013), % losses adapted from % total root loss in Table 4.
with minimal or no % mean root necrosis loss that is, Nyakasanya in Suna West and Mwitamajera and Manchoberi in Kuria East (Table 3a and b). Dual infections
of CMD and CBSD were observed in all varieties in both sub counties except Agric I which had high CBSD incidence (80.0%) but no CMD infection. CBSD incidence was also higher than CMD incidence except for varieties Agric III, TMS 30572 and Rumara. This could possibly explain the positive non-significant relationship (r = 0.44) observed between CMD and CBSD leaf incidence. DISCUSSION Farming is the predominant economic activity in Migori County with communities mainly generating income through sale of crops, cassava products, livestock and working as casual farm labourers. In the sub-counties of Kuria East and Suna West, cassava is ranked the second most important food crop after maize, which is also a staple food and the most important crop in Kenya (FAOSTAT, 2013). This is based on the amount of land resource allocated to different crop enterprises in Migori County. Farmers in Kuria East and Suna West sub-counties grew a wide range of varieties, which included
both improved and local cassava varieties. Among the improved varieties, introduced in the 1990s by the Ministry of Agriculture to combat cassava mosaic disease (CMD), included four which were only identified as Agriculture I to IV in this study (GoK, 2006).
Popular varieties in Kuria East include Weite, which ranks first, followed by Manchoberi while in Suna West, Mary go round was most popular followed by Nyakasanya. These highest-ranking varieties are local types with diverse introduction histories. A majority of farmers in both sub-counties grow only one variety, usually the most popular. According to farmers, the popular varieties possess good processing attributes and yield high quality flours for ‘ugali’ and porridge. Farmers adopted a few improved varieties introduced by Ministry of Agriculture (GoK, 2006) because of their disease resistance and high yield. These varieties were mostly developed for resistance to CMD, which had been a major cause of low crop yields on the local varieties (GoK, 2006). Despite these efforts, the varieties are sparsely spread across the two sub-counties; farmers reported that the distribution criterion was poor and therefore adoption is low. This was evident in a survey by Tana et al. (2011) which revealed that as a majority of farmers sampled from Migori county >95.0% were

2072 Afr. J. Agric. Res.
Figure 2. Cassava popularity in Kuria East and Suna West sub-counties.
growing local varieties, and only a few had adopted the improved varieties as a second option. In this study, it emerged that the improved cassava varieties were not very popular with the farmers in the two sub-counties.
The CBSD foliar incidence of about 50% in both sub-counties was relatively low and the disease was not new in the sub-counties because incidences of up to 100% and the presence of both UCBSV and CBSV has been reported in Western Kenya (Mware et al., 2009; Osogo et al., 2014). Most of the local varieties had high CMD incidences and were low yielding compared to the improved varieties. This was expected as the improved varieties are among the ones introduced to combat CMD and they are also high yielding (Dixon et al., 2010; Gok, 2006). Different CBSD disease reactions similar to previous studies done (Pariyo et al., 2015; Mohammed et al. 2012; Hillocks and Jennings, 2003) were observed, depicting differential cultivar sensitivity to CBSD in both sub counties. Pariyo et al. (2015) classified the varieties into resistant, moderately resistant, susceptible and highly susceptible. In this study varieties were also classified but with a few modifications.
Varieties with high foliar and root incidences coupled with high root necrosis and root loss were regarded as susceptible that is, Nyakohanda, Amakuria and Agric IV. The improved variety Agric IV, was seriously affected by CBSD with many of its roots displaying the severe cocky necrosis characteristic of the disease. This is an improved variety for CMD resistance but is unfortunately very susceptible to CBSD. Varieties like Weite, Nyakasanya, Mwitamajera and MH95/0183 had high foliar incidences with minimal or low root necrosis, and were regarded as tolerant. Unfortunately, high CBSD and CMD incidences in Weite, Nyakasanya and Mwitamajera resulted to more % total root losses when compared to MH95/0183. Weite has earlier been reported to have
CBSD foliar and root symptoms (Obiero et al., 2007) but in this study, even in fields with very high infection rates than other varieties, Weite produced clean roots. Most farmers reported observing CBSD root symptoms in their cassava crops for the past 2 to 3years. Literature survey showing CBSD symptoms in western Kenya were first reported by Obiero et al. (2007).
Improved variety Agric III and Mygyera (TMS 30572) were regarded as resistant since it had low foliar and root incidences coupled with low root necrosis and % root loss. The findings on TMS 30572 concur with the study of Pariyo et al. (2015) who selected this variety as one of the elite CBSD resistance sources. Overall, the best performing variety was high yielding Mygyera (TMS 30572) which had low incidence, severity and losses due to both CMD and CBSD. Apart from the high CBSD foliar incidence, MH95/0183 could also be regarded as a good performing variety with high yield, low CMD incidence and minimal root losses.
These observations may help explain why local varieties dominate cassava production in Migori County. While improved varieties are available, farmers seem to have quickly learnt that these improvements only targeted CMD resistance and not CBSD. With the new problem of CBSD, some of these new improved varieties severely succumb to it, making them unpopular with farmers due to the heavy losses incurred. Some of the local varieties grown seem to be mildly tolerant and still produce crops even with CBSD infections, hence the attraction of producers to them. To date, there are no CBSD tolerant or resistant cassava varieties released in Kenya.
High positive correlation between root necrosis, root necrosis incidence and % mean necrosis low implies that susceptible varieties suffer greatest losses necessitating the need for more tolerant/susceptible varieties. The positive correlation between CBSD, CMD and % total root

loss showed that the diseases significantly affects root yield and this concurs with the study of Alabi et al. (2011) who reported that CMD affected plants have low root yield even if incidences and severity are low. The differential variety responses to CBSD infection and observed correlations, provide hope for incorporating locally adapted local cassava landraces and some improved varieties in the development of CBSD resistant varieties suitable for increased cassava production in western Kenya. Conclusion Cassava production in Migori County suffers from medium to high CMD and CBSD infection (foliar and root necrosis) with resultant substantial loss in root yield. The strong positive correlation between root necrosis/ incidence and percent root loss implies CBSD susceptible varieties suffer greatest loss. The findings of this study are expected to provide impetus for the development and promotion of new high yielding, locally adapted and CMD and CBSD resistant cassava varieties. Conflict of interests The authors have not declared any conflict of interests. ACKNOWLEDGEMENTS The funding from African Union under the grant number AURG/2/141 is acknowledged. The authors are grateful to the staff of the Ministry of Agriculture, Livestock and Fisheries, Migori County, and respondent farmers for willingly participating in both CBSD incidence and severity surveys. REFERENCES Alabi OJ, Kumar PL, Naidu RA (2011). Cassava mosaic disease: A
curse to food security in Sub-Saharan Africa. Online. APSnet Features.
Dixon AGO, Okechukwu RU, Akoroda MO, IIona P, Ogbe F, Egesi CN, Kulakow P, Ssemakula G, Maziya-Dixon B, IIuebbey P, Yomeni MO, Geteloma C, James B, Eke-Okoro ON, Sanni L, Ntawuruhunga P, Tarawali G, Mahungu N, Lemchi J, Ezedinma CI, Okoro E, Kanju E, Adeniji AA, Nwosu K (2010). Improved cassava variety handbook. IITA Integrated Cassava Project, Ibadan, Nigeria. ISBN 978-131-3021. 129 P.
FAOSTAT (2013). Food and Agriculture Organization of the United Nations. FAOSTAT data base. Available at http://faostat3.fao.org/download/Q/QC/E
GoK (2006). Government of Kenya. Ministry of Agriculture and Rural Development. District Agriculture and Livestock Extension office. Annual report, Kuria District.
GoK (2013a). Government of Kenya. Ministry of Agriculture and Rural Development. District Agriculture and Livestock Extension office. Annual report, Migori District.
GoK (2013b). Government of Kenya. Ministry of Agriculture and Rural
Masinde et al. 2073
Development. District Agriculture and Livestock Extension office. Annual report, Kuria District.
Hillocks R, Maruthi M, Kulembeka H, Jeremiah S, Alacho F, Masinde E, Ogendo J, Arama P, Mulwa R, Mkamilo G, Kimata B (2015). Disparity between leaf and root symptoms and crop losses associated with cassava brown streak disease in four countries in eastern Africa. J. Phytopathol. 164(2):86-93.
Hillocks RJ, Jennings DL (2003). Cassava brown streak disease: A review of present knowledge and research needs. Int. J. Pest Manag. 49:225-234.
Irungu J (2011). Prevalence and co-infection of cassava with cassava mosaic geminiviruses and cassava brown streak virus in popular cultivars in Western Kenya. A thesis submitted in partial fulfilment of the requirements for the award of the degree of Master of Science in Biotechnology of Kenyatta University. Kenya.
Kabacoff RI (2011). R in Action: Data Analysis and Graphics with R, Manning Publications, New York, United States.
Kaweesi T, Kawuki R, Kyaligonza V, Baguma Y, Tusiime G, Ferguson ME (2014). Field evaluation of selected cassava genotypes for cassava brown streak disease based on symptom expression and virus load. Virol. J. 11:216.
Kulembeka HP, Ferguson M, Herselman L, Labuschagne T, Kanju E, Mkamilo G, Fregene M (2012). Diallel analysis of field resistance to cassava brown streak disease in cassava (Manihot esculenta Crantz) landraces from Tanzania. Euphytica187:277-288.
Larsson S, Lockneus O, Xiong S, Samuelsson R (2013). Cassava stem powder as an additive in biomass fuel pellet production. Energy Fuels 29(9):5902-5908.
Lebot V (2009). Tropical root and tuber crops cassava, sweet potato, yams and aroids. Wallingford, UK: CABI. P 413.
Legg JP (2008). African Cassava Mosaic Disease. In Elsevier (3rd
Edition). Encyclopedia of Virology. pp. 30-36. Legg JP, Fauquet CM (2004). Cassava mosaic geminiviruses in Africa.
Plant Mol. Biol. 56(4):585-599. Legg JP, Jeremiah SC, Obiero HM, Maruthi MN, Ndyetabula I, Okao-
Okuja G, Bouwmeester H, Bigirimana S, Tata-Hangy W, Gashaka G, Mkamil G, Alicai T, Lava KP (2011). Comparing the regional epidemiology of the cassava mosaic and cassava brown streak virus pandemics in Africa. Virus Res. 159(2):161-170.
Levy PS, Lemeshow S (2008). Stratification and Stratified Random Sampling, in Sampling of Populations: Methods and Applications, Fourth Edition, John Wiley & Sons, Inc., Hoboken, NJ, USA.
Mohammed IU, Abarshi MM, Muli B, Hillocks RJ, Maruthi MN (2012). The Symptom and Genetic Diversity of Cassava Brown Streak Viruses Infecting Cassava in East Africa. Adv. Virol. pp. 1-10.
Mware BO, Ateka EM, Songa JM, Narla RD, Olubayo F, Amata R (2009). Transmission and distribution of cassava brown streak virus disease in cassava growing areas of Kenya. J. Appl. Biosci. 16:864-870.
Ndunguru J, Sseruwagi P,
Tairo F,
Stomeo F,
Maina
S, Djinkeng
A,
Kehoe M, Boykin LM
(2015). Analyses of Twelve New Whole Genome Sequences of Cassava Brown Streak Viruses and Ugandan Cassava Brown Streak Viruses from East Africa: Diversity, Supercomputing and Evidence for Further Speciation. PLoS ONE 10(10):e0139321.
Nichols RFJ (1950). The Brown Streak Disease of Cassava: Distribution Climatic Effects and Diagnostics Symptoms. East Afr. Agric. For. J. 15:154-160.
Obiero HM, Akhwale MS, Ndolo PJ, Njarro OK, Ememwa I, Wambulwa (2007). Diagnostic Survey to determine presence and spread of cassava brown streak disease on farmers’ fields in Western Kenya. Kenya Agricultural Research Institute (KARI) Kakamega Annual Report, Root and Tuber Crops pp. 21-23.
Osogo AK, Muoma J, Nyamwamu P, Omuse CN, Were HK (2014). Occurrence and Distribution of Cassava Brown Streak Viruses in Western Kenya. J. Agric. Food Appl. Sci. 2(7):184-190.
Pariyo A, Baguma Y, Alicai T, Kawuki R, Kanju E, Bua A, Omongo CA, Gibson P, Osiro DS, Mpairwe D, Tukamuhabwa P (2015). Stability of resistance to cassava brown streak disease in major agro-ecological zones of Uganda. J. Plant Breed. Crop Sci. 7:66-78.
Rabbi IY, Hamblin MT, Lava Kumar P, Gedil MA, Ikpan
AS, Jannink J,
Kulakow PA (2014). High - resolution mapping of resistance to

2074 Afr. J. Agric. Res.
cassava mosaic geminiviruses in cassava using genotyping-by-sequencing and its implications for breeding. Virus Res. 186:87-96.
Tana PO, Onyango C, Ochola WO, Omolo PO (2011). Socio-cultural participatory monitoring and evaluation indicators used in adopting improved cassavas by Western Kenya communities. J. Dev. Agric. Econ. 3(3):113-120.
Tonukari JN, Ezedom T, Enuma CC, Sakpa SO, Avwioroko OJ, Eraga L, Odiyoma E (2015). White Gold: Cassava as an Industrial Base. Am. J. Plant Sci. 6:972-979.
Vanderschuren H, Moreno I, Anjanappa RB, Zainuddin IM, Gruissem W, Zhang T (2012). Exploiting the Combination of Natural and Genetically Engineered Resistance to Cassava Mosaic and Cassava Brown Streak Viruses Impacting Cassava Production in Africa. PLoS ONE 7(9):e45277.
Winter S, Koerbler M, Stein B, Pietruszka A, Paape M, Butgereitt A
(2010) Analysis of cassava brown streak viruses reveals the presence of distinct virus species causing cassava brown streak disease in East Africa. J. Gen. Virol. 91(5):1365-1372.
Zhang P, Vanderschuren H, Fütterer J, Gruissem W (2005). Resistance to cassava mosaic disease in transgenic cassava expressing antisense RNAs targeting virus replication genes. Plant Biotechnol. J. 3(4):385-397.

Vol. 11(24), pp. 2075-2081, 16 June, 2016
DOI: 10.5897/AJAR2015.10493
Article Number: 4C8570F58963
ISSN 1991-637X
Copyright ©2016
Author(s) retain the copyright of this article
http://www.academicjournals.org/AJAR
African Journal of Agricultural Research
Full Length Research Paper
Village poultry production system: Perception of farmers and simulation of impacts of interventions
E. Wondmeneh1,2,3*, E. H. Van der Waaij2, H. M. J. Udo4, D. Tadelle3 and J. A. M Van Arendonk2
1DebreZeit Agricultural Research Centre, P. O. Box 32, DebreZeit, Ethiopia.
2Animal Breeding and Genomics Centre, Wageningen University, P. O. Box 338, 6700 AH Wageningen, the
Netherlands. 3International Livestock Research Institute, P. O. Box, P. O. Box 5689 Addis Ababa, Ethiopia.
4Animal Production Systems group, Wageningen University, P. O. Box 338, 6700 AH, Wageningen, the Netherlands.
Received 6 October, 2015; Accepted 9 December, 2015
This study identified perception of poultry farmers’ on impact of interventions in village poultry production and quantified the impacts of interventions on flock and economic performance using modelling. A structured questionnaire was used to collect data on perceptions of poultry keeping and performances from 240 randomly selected households in two districts of Ethiopia. Crop was the major source of income, and poultry generated supplementary income. Farmers perceived that demand and price of poultry products increased. Majority of the farmers believed that additional inputs would not lead to higher income. A dynamic simulation showed that the base situation made a positive financial contribution. Vaccinations had the largest positive impact on flock performances and using improved indigenous chicken had the smallest. Application of interventions had the largest effect on flock performances in the base situation but did not lead to profitability. The sensitivity analysis showed that feed cost had the largest impact on the profitability followed by housing, vaccination and breed. Farmers’ perceptions affected their decisions regarding implementation of interventions. Simulated interventions increased productivity but only in a few cases the increased incomes outweighed the additional costs. Interventions need to be tailored towards the local situation to ensure improved productivity and improved income. Key words: Poultry, smallholders, flock performance, profitability.
INTRODUCTION It is widely acknowledged that village poultry in developing countries plays an important role as source of animal protein and income for smallholder farmers (Creevey, 1991; Alders and Pym, 2009). In village poultry
production systems,farmers raise small number of domestic fowl mainly for home consumption with small mostly seasonal surpluses being sold in villages (Farrelly, 1996). Investments in village poultry farming can improve
*Corresponding author. E-mail: [email protected].
Author(s) agree that this article remain permanently open access under the terms of the Creative Commons Attribution
License 4.0 International License

2076 Afr. J. Agric. Res. productivity and generate additional income which contributes to poverty reduction and increased food security (Mack and Otte, 2005; Pica-Ciamarra and Otte, 2010). Village poultry are often associated with good quality/size eggs and meat flavor, hard egg shells, high dressing percentages and low production costs (Gueye, 1998). Despite the contribution of village poultry to the national economies of developing countries, the main function of village chickens according to the farmers is the provision of meat and eggs for home consumption (Andrews, 1990; Cairns and Lea, 1990).
Over the last decade, the consumption of poultry products in developing countries grew by 5.8% per annum, faster than that of human population growth (Sonaiya and Swan, 2004). Commercialization of indigenous poultry production might be timely in terms of meeting the needs of the increasing population (Ondwasy et al., 2006). The profitability however, depends very much on feed costs, market prices, stock sizes, and number of birds sold and consumed (Masuku, 2013).
Commercialization of village poultry increase the dependency on modern technologies and inputs (Farrelly, 1996). Before making an investment to increase poultry production, farmers need to be convinced that the investment is economically feasible.Reddy (1998) stated that village poultry production can be more sustainable when farmers use indigenous chicken with appropriate and affordable technologies with 'low external inputs'.
A breeding program aiming at improving the productivity (egg production, survival and body weight) of an indigenous chicken population is underway in Ethiopia (Dana, 2011). The breeding program is run on a research station but the productivity of the improved chickens (Horro) is being tested in the field. To ensure successful adoption of an improved breed, farmers’ perceptions towards interventions, the extent to which the improved breed requires additional inputs (feed, housing, vaccination), and the impact on profitability need to be known. Modelling is increasingly accepted tool to increase understanding of the complex interactions of the various parts of farming systems, and to guide resource use decisions about specific technical innovations and to assess the risks and returns from such innovations (Pandey and Hardaker, 1995).
A dynamic model, Village Poultry Simulation Model (VIPOSIM) was developed at Wageningen University, the Netherlands, and was validated on data from Ethiopia (Asgedom, 2007). VIPOSIM considers the dynamics of village poultry production systems by incorporating flock off-take, egg production, egg loss, egg off-take and reproduction. The model determines the flock dynamics and performances and performs a cost-benefit analysis. It performs calculations in time steps of 3 months which represents the reproduction cycle: The period a hen needs to produce and hatch eggs and rear chicks up to an age of 8 weeks. The maximum number of steps in the model is 12, which corresponds to a period of three years
(Asgedom, 2007). It was programmed in Microsoft Excel®. The input variables include chicken production and management parameters such as initial size and composition of the flock, mortality rates for different categories, bird sales and consumption rates, egg production, reproduction parameters (incubation and hatching), egg sales, egg loss, egg consumption rates, and bird off-take limits. The economic parameters such as prices of birds and eggs and costs are also input variables. Costs are categorized into overall costs per bird per season for each intervention. As output, the model gives the values of bird off-take and egg off-take, and the final composition of the flock for each season during the three-year period of simulation.
The model can be used to perform a sensitivity analysis by varying a financial value of an individual intervention while the others are kept at their base situation (default), so showing the consequences of the change (s) of varying the value of an uncertain parameter. The outcome variable can be any performance measure or indicator. Results of a sensitivity analysis were presented in a tornado diagram (Eschenbach, 1992). This ranks a large number of variables in their order of importance without becoming over crowded. It shows the lower and upper values of the outcome variable (profit in our case) obtained from the variation of each variable (inputs), with the variable with the widest limits displayed on the top, and the parameter with smallest on the bottom, indicating the widest the limits the more attention the parameter deserves. It is important to note that the width obviously depends on the actual difference between the high and value input value which is the total cost of the base situation in this study.The objectives of this study were (1) to determine the perceptions of rural farmers towards feasibility of interventions in their village poultry system, (2) characterize the existing village poultry production system (base situation) (3) evaluate the impacts of individual and packaged interventions into the existing production system. MATERIALS AND METHODS
Research design
The study employed a structured questionnaire survey andthedynamic simulation model VIPOSIM (Asgedom, 2007). The survey was conducted in the Horro and Ada districts of Ethiopia in 2011. These districts were used for an on-farm evaluation of the improved indigenous chicken. They represent village poultry production system areas, but they differed in distance to the major market. Participatory rural appraisal was used to formulate the structured questionnaire for the survey which aimed to capture farmers understanding of the village poultry production systemand togatherbaseline input for our modelling. A two stage sampling procedure was followed to select eight villages and 30 sample households from each villagein both districts. In the first stage, four rural villages from each districtwere selected purposively based on their prior experience in applying innovations. In the second stage, individual households were selected using systematic random

Wondmeneh et al. 2077
Table 1. Interventions used in previous studies.
Interventions Description Impact References
Feed Supplementary feed 50% more eggs, 15% earlier age at first egg Tadelle (1996); Siamba et al. (1999)
Housing Night shelter and fencing Mortality from predation lowered to 0 % Okitoi et al. (2006) and Prasetyo et al. (1985)
Vaccination Mainly Newcastle disease 50-80% lower mortality Sonaiya (1990) and Gueye (1998)
Breed Improved indigenous chicken More than 45.8% increase in egg, mortality lowered to 3% Dana (2011)
Table 2. Opinions of household heads towards village poultry production system.
Characteristics [Number of respondents (n=240)] %
Which is more profitable income generating activity
Crops 89
Livestock 11
Keeping poultry support family income
Yes 54
No 46
Did you notice improvement in livelihood (past three years)
Yes 83
No 17
How do you see the demand (past three years)
Increasing 60
Decreasing 40
How do you see the current price of chicken and egg
Increasing 68
No change 21
Decreasing 11
Why did not you use more inputs
Not profitable 85
Profitable 8
Break-even 7
Does indigenous chicken produce less than exotic
Yes 77
No 27
sampling. Systematic random sampling is often used to select large samples from a long list of households by using a sampling interval (Bellhouse, 2005). A total of 240 household heads (120 from each district) were randomly selected and interviewed by 12 enumerators. Each interview took on average one and half hours. The results of both districts were analyzed and differences in responses were examined using a t-test (SPSS, 2008).
Formulation of interventions
Based on the result of the survey and previous studies (Table 1) the following interventions were hypothesized to affect the productivity of the flock positively. (1) Formulated feed that contains standard level of protein and energy. (2) Improved indigenous breed (Horro). (3) Improved housing (4) Full vaccination against major diseases along with disinfectants and vitamins. Improved indigenous chicken
demands the use of supplementary feed. The improved breed intervention was chosen to represent performance of chickens that resulted from the selective breeding program on Horro chicken at DebreZeit station (Dana et al., 2010a). The use of vaccination demands confining the chickens in a house (to avoid the potential re-infection) and provision of feed. Feed was used alone as it can be given at a fixed time of the day and chickens can be left to roam around.
RESULTS AND DISCUSSION Perceptions of farmers Perceptions of farmers towards poultry production are presented in Table 2. The majority of respondents

2078 Afr. J. Agric. Res.
Table 3. Average flock characteristics found in the survey of farms in two districts, p-value of the difference between the districts and the average value used to model the base situation.
Parameter Ada Horro P-value Average
Flock size (No.) 26 27.7 0.25 27
Mortality (%) (predation, diseases, others) 59 55.5 0.40 57
Bird off-take (%) (consumption and sale) 29.3 28.7 0.84 29
Egg production (eggs/clutch) 15.2 15 0.93 15
Egg off-take and losses ( %) consumption, sales) 51.5 50 0.57 50
Egg set for hatching (%) 52 48.3 0.09 50
Hatchability (%) 78 80 0.65 79
perceived crops as the most important income-generating activity, but over half of them keep poultry to support family income. The focus of governments in developing counties is also more oriented to crop production. Mack and Fernandez-Beca (1990) stated that improving livestock production in rural areas is restricted to providing improved forages and vaccinations rather than promoting interventions aimed at improving overall livestock’s contribution to livelihoods. The majority of respondents perceived an increasing demand of poultry products and responded that the prices for poultry products had increased in the last three years. The majorityof respondentsalso perceived that their poultry are low producing, and believed that using extra inputs in their poultry production is not profitable. The result of this study showed that the perception of rural farmers were in line with the feasibility of simulated interventions into the existing poultry production system. Farmers indicated that their livelihood was improved in the past three years. This might be associated with an increase in the prices of agricultural products in recent years in Ethiopia (Haji and Gelaw, 2012). Farmers perceived an increase in the demand for poultry products and in prices of poultry products in the last 3 years in line with earlier report (Islam, 2003). The prices of poultry products also increased which might be partly attributed to the low supply relative to the demand (Ghafoor et al., 2010). Not only the price of poultry products increased but also the price of inputs increased, leading to unsteady net returns for poultry farmers (Achoja, 2013). This could explain why farmers said they were reluctant to use interventions: spending on inputs might not pay back. Okitoi et al. (2006) stated that improvements in such systems should require limited additional resources leading to only small additional costs. Characterization of the base situation Characterization of the existing village poultry production system provides the basis for designing and evaluating interventions. The production characteristics of poultry farms in the two studied regions are presented in Table 3.
No significant differences were found between the two districts. Farmers on averagekeep mixed flocks of 15 chicks, 4 pullets, 3 cockerels, 4 hens and 1 cock. Farmers lose 57% of their flock through mortality in one year. The most important reasons reported for mortality were predation, diseases and unknown reasons in line with literature, where mortalities ranging from 50 to 80% were reported (Gueye, 1998; Gueye, 2000). A smaller proportion of birds were either consumed or sold in the village. The observed bird off-take was close to a previous study in northern Ethiopia (Udo et al., 2006). On average 15 eggs per clutch (approximately 3 months) were produced, of which half was used for hatching and lies within the range of annual egg production per hen in village poultry systems (20 to 100 eggs) reported earlier (Sonaiya, 1999). About 50% of the eggs produced were used for hatching and the rest were sold or consumed. The hatchability (79%) was close earlier findings of Kitalyi (1998). This low productivity reflects not only the low genetic potential of the chickens but also the poor feeding and management conditions. The averages of production parameter in the two districts were used in modelling the base situation. Figure 1 presents changes in flock size and flock composition in the base situation. Evaluation of interventions and cost benefit analysis Percent flock size, bird off-take, egg production and egg off-take changes as a result of simulated interventions compared to the base situation at the end of the simulated period of three years is presented in Table 4. All interventions, individually and combined had positive impact on the flock performance on flock size, bird off-take, egg production and egg-off-take. The highest effect resulted from combined use of all interventions, followed by vaccination, housing and feed. Breed resulted in the least impact.
Total costs, benefits and net returns for the interventions over the simulated period of 12 seasons are shown in Figure 2. All individual and combined interventions applied to the base situation did not lead to a higher net return. The costs associated with the

Wondmeneh et al. 2079
Figure 1. Changes of flock size and flock composition of cocks, pullets, cockerels, chicks and hens over 12 seasons for the base situation.
Table 4. Changes in bird off-take, egg production, egg off-take and flock size as a result of simulated interventions to the base situation at the end of the simulated period of 3 years.
Intervention Flock size (%) Bird off-take (%) Egg production (%) Egg off-take (%)
Feed 223 268 217 220
Housing 244 292 259 353
Vaccination 324 333 362 364
Breed 154 165 210 111
All interventions 389 317 514 434
Figure 2. Total costs, benefits and net returns for base situation, feed, vaccinations, all interventions vaccination and breed.
interventions were higher than the additional benefits. The base situation was economically feasible and the use of improved indigenous breed resulted in a break-even.
The explanation could be that whatever small village chickens produce, it is produced with a very little spending from the farmers (Smith, 1990). The results of sensitivity analyses are shown in Figure 3. Changes in
the price of feed and vaccinations resulted in negative net profit. The increase in price also resulted in negative returns in the other interventions. However, feed cost is the most sensitive as it showed thewidest range of negative impact on profitability. This might mean that with the current price of feed, it is not possible to make any profit. Masuku (2013) recommended that farmers should
0
5
10
15
20
25
30
35
1 2 3 4 5 6 7 8 9 10 11 12 13
NU
MB
ER
SEASONS
flock size
cocks
pullets
cockerels
chicks
hens
-400
-200
0
200
400
600
800
1000
US
D
Interventions
benefits costs net

2080 Afr. J. Agric. Res.
Figure 3. A tornado diagram showing the range of variables representing the net profit ($) for high and low values of feed, housing, vaccinations breed and all interventions ranked from top to down in order of magnitude of influence.
organize themselves to take advantage of discounts when purchasing feed. The simulation result showed that all interventions applied to the base situation increased flock performances. Package application resulted in the maximum flock performance followed by vaccination and housing. Vaccination is one of the most important technical possibilities to improve village chicken production (Tomo, 2009). Vaccination against Newcastle alone can save 50 to 100% of mortality caused by this disease among chickens in rural areas (Alders and Pym, 2009; Jordan and Alderson, 2009). Housed chickens produce more as predation and harsh weather can be avoided (Prasetyo et al., 1985). In the scavenging system, supplementation is rarely practiced. Application of interventions resulted in a positive flock performance but negative profit. The poor profitability seen in this study might be associated with a flock size of non-economic scale. As hypothesized, the perception of farmers influenced their decision towards the village poultry production system. Farmers’ perceptions were logical, and derived from their experiences that the productivity from this system is low but still important. At regional level, poultry production is important seeing the increasing demands. The village poultry production system in different areas seems to be very similar even though they are located farm from each other. Increased productivity was realized when more inputs were applied. However, the study clearly demonstrates that higher productivity does not necessarily lead to higher income. The simulation of the use of improved breed resulted in only a break-even.
Conclusion
In conclusion we found that Farmers’ perceptions affected their decisions regarding implementation of
interventions. Simulated interventions increased producti-vity but only in a few cases the increased incomes outweighed the additional costs. Interventions need to be tailored towards the local situation to ensure they lead not only to improved productivity but also to improved income. Conflict of interests The authors have not declared any conflict of interest. ACKNOWLEDGEMENTS We sincerely thank Koepon Foundation for funding this study and providing a scholarship for the first author, and the farmers for their participation in the study. REFERENCES Achoja FO (2013). Allocative efficiency of feeds among poultry farmers
in Delta state, Nigeria. Russ. J. Agric. Socio-Econ. Sci. 2(14). Alders RG, Pym RAE (2009). Village poultry: Still importantto millions,
eight thousand years after domestication. World Poult. Sci. J. 65:181-190.
Andrews P (1990). Rural poultry development in the Gambia. In: proceedings CTA Seminar on smallholder rural poultry production, Thessaloniki, pp. 81-85.
Asgedom HA (2007). Village Poultry in Ethiopia: Socio-technical Analysis and Learning with Farmers, PhD Thesis, Wageningen University.
Bellhouse DR (2005). Systematic Sampling Methods. Encyclopedia of Biostatistics. John Wiley & Sons, Ltd.
Cairns RI, Lea JD (1990). An agricultural survey of subsistence farmers in the Nkandla district of KwaZulu. Dev. South. Afr. 7(1):77-104.
Creevey LE (1991). Supporting small-scale enterprise for women farmers in the Sahel. J. Int. Dev. 3:355-386.
Dana N (2011). Breeding programs for indigenous chicken in Ethiopia: Analysis of diversity in production systems and chicken populations,
-192.17
-84.47
-73.78
-54.8
-29.97
-62.37
-43.98
4.8
5.13
29.63
-800 -600 -400 -200 0 200

PhD Thesis, Wageningen University. Dana N, van der Waaij EH, DessieT (2010a). Genetic and phenotypic
parameter estimates for body weights and egg production in Horro chicken of Ethiopia. Trop Anim. Health Prod. 42:1519-1529.
Eschenbach TG (1992). Spider plots versus tornado diagrams for sensitivity analysis. Interfaces 22:40-46.
Farrelly LL (1996). Transforming poultry production and marketing in developing countries: lessons learned, Michigan State University, East Lansing, Michigan.
Ghafoor A, Badar H, Hussain M, Tariq N (2010). An empirical estimation of the factors affecting demand and supply of poultry meat. Pak. Vet. J. 30:172-174
Gueye EHF (1998). Village egg and fowl meat production in Africa. World Poult. Sci J. 54:73-86.
Gueye EHF (2000). The role of family poultry in poverty alleviation food security and the promotion of gender equality in rural Africa. Outlook Agric. 29: 129-136.
Haji J, Gelaw F (2012). Determinants of the recent soaring food inflation in Ethiopia. Universal J. Educ. Gen. Stud. 1(8):225-233.
Islam AM (2003). Poultry Products Processing and Marketing System in Bangladesh. Pak. J. Biol. Sci. 6:883-886.
Jordan JW, Alderson M (2009). Scale, Skills and Sustainable livelihoods. Participatory approaches to improving poultry production in Peri-Urban communities, Evidence from South Africa. Outlook Agric. 38:83-88.
Kitalyi AJ (1998). Village chicken production systems in rural Africa Household food security and gender issues. Food and Agriculture Organization of the United Nations, Rome.
Mack SD, Fernandez-Baca S (1990). Strategies for effective extension services to guide the advancement of animal agriculture in developing countries. In: Simon M (Ed.), Strategies for sustainable animal agriculture in developing countries, Proceedings of the FAO Expert Consultation. Rome.
Mack SDH, Otte J (2005). The Contribution of Poultry to Rural Development. World Poult. Sci. J. 61:7-14.
Masuku MB (2013). Determinants of Profitability of Indigenous chickens in Swaziland. Bus. Econ. Res. 3(2).
Okitoi LO, Udo HMJ, Mukisira EA, De Jong R, Kwakkel RP (2006). Evaluation of low input inventions for improved productivity of indigenous chickens in Western Kenya. Agric. Subtrop. 39:179-182.
Ondwasy H, Wesong H, Okitoi LO (2006). Indigenous chicken production manual. Technical note series no. 18, Kenya Agricultural Research Institute.
Wondmeneh et al. 2081 Pandey S, Hardaker JB (1995). The role of modelling in the quest for
sustainable farming systems. Agric. Syst. 47:439-450. Pica-Ciamarra U, Otte J (2010). Poultry, Food Security and Poverty in
India: Looking beyond the Farm‐gate. World Poult. Sci. J. 66:309-320.
Prasetyo T, Subiharta WD, Sabrani M (1985). The effect of chick and egg separation on village chicken egg production. Research report, Research Institute for Animal Production, Indonesia.
Reddy CV (1998). Towards sustainable poultry production. Indian Poult. Rev. 29:35-47.
Smith AJ (1990). Poultry -Tropical Agriculture Series. CTA, McMillan Publishers, London, pp. 184-185.
Sonaiya EB (1999). The context and prospects for development of smallholder rural poultry production in Africa. In: CTA seminar proceedings of Smallholder Rural Poultry Production, Thessaloniki, pp. 35-52.
Sonaiya EB, Swan SEJ (2004). Small-scale poultry production: technical guide. FAO Animal production and health manual No1. Roma, Italy.
SPSS (2008). Statistical Package for the Social Science, 2008. Statistical package for Social Sciences, SPSS Inc., 17.0. Chicago, IL, USA.
Tadelle D (1996). Studies on village poultry production systems in the central Highlands of Ethiopia, MSc Thesis, Swedish University of Agricultural Sciences.
Tomo AA (2009). Economic impact of Newcastle disease control in village chickens: A case study in Mozambique, PhD Thesis, Michigan State University, USA.
Udo HMJ, Asgedom AH, Viets TC (2006). Modelling the impact of interventions on the dynamics in village poultry systems. Agric. Syst. 88:255-269.

Vol. 11(24), pp. 2082-2091, 16 June, 2016
DOI: 10.5897/AJAR2016.10989
Article Number: C08507358966
ISSN 1991-637X
Copyright ©2016
Author(s) retain the copyright of this article
http://www.academicjournals.org/AJAR
African Journal of Agricultural Research
Full Length Research Paper
Influence of cowpea root powder and exudates on germination and radicle length in Striga hermothica,
sorghum and pearl millet strains
A. A. M. Rezig1, T. S. Abdelhalim2, M. M. Hassan3, R. M. A. Abusin4, H. Amani Eltayeb1, H. Samejima5,6 and A. G. T. Babiker3*
1Sudan University of Science and Technology, College of Agricultural Studies, Sudan.
2Agricultural Research Corporation (ARC), Kosti, Sudan.
3Environment and Natural Resources and Desertification Research Institute, National Centre for Research,
Khartoum, Sudan. 4Bahri University, College of Agriculture, Pests and Plant Health, Khartoum, Sudan.
5Graduate School of Agricultural Science, Kobe University, Kobe, Japan.
6International Cooperation Center for Agricultural Education, Nagoya University, Nagoya, Japan.
Received 13 March, 2016; Accepted 23 April, 2016
The root parasitic weed Striga hermonthica constitutes a threat to cereals production in sub-Saharan Africa. Cowpea has been used as a rotational or a companion crop to combat the parasite on cereals with varying success. The present investigation was set to study the effects of root powder from 12 cowpea genotypes and root exudates from two genotypes on germination and radicle length in S. hermonthica, sorghum and millet strains. At 5 to 15 mg root powders from T198K-409-4 and T198K-317-2, the least and most active on S. hermonthica sorghum strain, induced 41-60 and 79-86% germination, respectively. Root powders from B301 and T100K-1263, the least and most active on the pearl millet strain induced 33-46 and 94-95%, germination, respectively. Maximum germination in response to root exudates of B301 and T100K-901-6, each applied at 5, 10 and 15 µl, was 54, 45 and 36% and 52, 43 and 31%, respectively for the sorghum strain and 43, 53 and 61% and 44, 49 and 53%, respectively for its pearl millet congener. B301and T100K-901-6 root exudates induced maximum germination at pH 10 and 7, respectively. Root powder reduced radicle length of both strains, while root exudates reduced radicle length of the sorghum strain, but increased that of its pearl millet congener. Employment of cowpea as a rotational or a companion crop to combat S. hermonthica on cereals implies rigorous selection through initial laboratory screening for stimulant production. Key words: Striga hermonthica strains, root powder, root exudates, germination, sorghum, pearl millet.
INTRODUCTION Sorghum [Sorghum bicolor (L.) Moench] and pearl millet [Pennisetum glaucum (L) R. BR.], are elemental crops for food security and income generation in sub-Saharan Africa, where the prevailing drought limits crop choice to
only a few (Babiker, 2007). Population pressure and market demands have led to advancement of agriculture into marginal lands and intensification of sorghum and pearl millet planting, often in monocultures (Parker and

Riches, 1993). Nevertheless, yields are by far below the international average (Babiker, 2007). The low yields are attributable to a multitude of factors among which, poor soil fertility, low inputs and heavy infestations by the root parasitic weed Striga hermonthica (Del.) Benth. are of paramount importance (Babiker, 2007). Available reports showed that Striga spp. are prevalent in over 50 million hectares of the cereals growing areas in Africa and inflict considerable damage amounting to complete crop loss under heavy infestations (Welsh and Mohamed, 2011; Spallek et al., 2013).
S. hermonthica, well adapted to its environment and tolerant to a wide range of temperature and soil moisture stress, has developed two distinct strains. The first, specific to pearl millet, is predominant in the drier northern regions of sub-Saharan Africa, while the second attacks sorghum and is found farther south in the wetter regions (Welsh and Mohamed, 2011). The parasite produces thousands of minute dust-like seeds with prolonged viability and special germination requirements. To germinate a Striga seed requires being in close vicinity of a host root, a pre-treatment (conditioning) in a warm moist environment for several days and a subsequent exposure to an exogenous stimulant. Radicles of the resulting seedlings elongate and haustoria are initiated. Haustori attach penetrate the host roots, and establish connection with the vascular system. Subsequent to establishment of connection with the host xylem, the parasite develops and remains subterranean for 6 to 8 weeks prior to emergence.
The unavoidable low crop productivity arising from the damage the parasite inflicts while subterranean makes farmers reluctant to adopt post-emergence control measures (Babiker, 2007). Post-emergence control measures are essential to curtail replenishment of the parasite seed reserves. The need for simple affordable, environmentally benign management practices which enhance seed bank demise is thus, imperative. The ubiquitous nature of strigolactones (SLs), the natural Striga germination stimulants, within the plant kingdom, confers some flexibility on designing agroecologically and socioeconomically acceptable cropping systems.
Traditional African farming, based on prolonged fallows and intercropping with legumes, particularly cowpea (Vigna unguiculata L., Walp), allowed for rejuvenation of soil fertility and demise of the parasite seed bank (Ejeta et al., 1993; Kureh et al., 2006). However, S. hermonthica sorghum and millet strains differ in their response to natural germination stimulants (Parker and Riches, 1993). The sorghum strain is more responsive to the strigol-type SLs, but less so to the orobancol-type,
Rezig et al. 2083 whereas the millet strain is less responsive to the strigol-type (Parker and Reid, 1979; Cardoso et al., 2014). Consequently performance of cowpea, reported to produce mainly orobancol-type SLs (Ueno et al., 2011), as an efficient rotational or companion crop to combat S. hermonthica on sorghum is contestable and merits further research.
The present investigation was therefore set to study the effects of root powder from 12 cowpea genotypes and root exudates from two genotypes on germination and radicle length in S. hermonthica, sorghum and millet strains. MATERIALS AND METHODS S. hermonthica, sorghum and pearl millet strains, seeds were collected in 2012 from under sorghum in the Gezira, Central Sudan, and pearl millet in Kordofan State Western Sudan, respectively. The seeds were surface disinfected by immersion in 1% sodium hypochlorite, obtained by dilution of the respective amount of commercial bleach solution, for 1 min washed with sterilized distilled water and air-dried. The seeds were subsequently conditioned as previously described by Babiker et al. (2000). Briefly the seeds (40-60) were sprinkled on glass fiber filter paper discs (8 mm) placed in Petri-dishes lined with glass fiber filter papers and sufficiently moistened with sterilized distilled water. The Petr-dishes sealed with parafilm, were incubated at 30ºC in the dark for 10 to 14 days prior to use for germination assays. Twelve cowpea genotypes were obtained from the International Institute of Tropical Agriculture (IITA) Ibadan Nigeria. GR24, a synthetic Striga germination stimulant, was a gift from Professor B. Zwanenburg Radbound University, Nijmegen the Netherlands. Cowpea seeds were surface disinfected by immersion in 1% sodium hypochlorite (NaOCl) for 5 min. The seeds were subsequently washed with sterilized distilled water, air dried in a laminar flow cabinet and stored at ambient temperature, till used. Experiments were repeated at least twice. Data presented were from typical experiments. In all experiments treatments were arranged in a complete randomized design with 5 replicates unless mentioned otherwise an aqueous and a GR24 (0.1 mg L-1) treated controls were included in each experiment for comparison.
Effects of root powder on germination and radicle length of S. hermonthica
A total of 12 cowpea genotypes, grown in pots in a screen house for 10 days, were harvested and the roots were, carefully, washed to remove soil particles. The roots, dried under ambient conditions, were ground into fine powder using a kitchen grinder and subsequently stored. The dried roots powder (5 to 15 mg equivalent to field rates of 25.5 to 76.4 kg ha-1) was assayed for germination inducing activity and effects on radicle length of the two Striga strains using the sandwich method as described by Fujii et al. (2004). Briefly, agar, nutrient-less (3 g) was added to 1000 ml of distilled water and autoclaved for 20 min at 15 bars and 121°C. The
*Corresponding author. E-mail: [email protected]. Tel: +2490912803658.
Author(s) agree that this article remain permanently open access under the terms of the Creative Commons Attribution
License 4.0 International License

2084 Afr. J. Agric. Res. agar, cooled in a water bath set at 40°C, was pipetted into multiwell plates (5 ml/well) and allowed to solidify prior to careful spreading of the test powder sample, by hand, on top. Another 5 ml of agar were placed on top, allowed to solidify, and subsequently overlaid by discs containing conditioned S. hermonthica, sorghum or pearl millet strain. The multiwell plates, sealed with parafilm and wrapped with aluminum foil, were incubated at 30°C in the dark for 48 h prior to examination for germination and radicle length, using a stereomicroscope equipped with a calibrated ocular micrometer. Controls without test samples were included for comparison. Germination, expressed as percentage, was taken on a scale where 0-49.9, 50-59.9, 60-69.9, 70.0-79.9 and 80.0-100% indicated poor, moderate, satisfactory, good and excellent germination, respectively. Radicles measuring 0.1-4.9×10⁻², 5-9.9×10⁻², 10-14.9×10⁻² and ≥15×10-2 mm were considered very short, short, medium and long, respectively.
Effects of incubation time on production of germination and radicle length effectors The genotypes B301 and T100K-901-6, expected, based on their prostrate and spreading growth habit to be less competitive under field conditions, were selected. The seeds of the two genotypes were surface sterilized and pre-germinated, at 30°C in the dark, in sterilized filter papers rolls. The seedlings, grown hydroponically, each in a 10 ml glass tube containing 40% Long Ashton solution, were maintained in a growth chamber at 30°C with a 12-h photoperiod using fluorescent lights (photosynthetic active radiation of 220 µmol m-2 s-1) for 4 days and subsequently transferred to tap water in glass tubes (100 ml capacity). The glass tubes, wrapped in aluminum foil, to exclude light, were re-incubated for 4 days prior to sampling made daily over a period of 10 days. Prior to sampling the water volume, in each tube, was allowed to drop to 50 ml or adjusted to 50 ml. The samples, 2 ml each, were subsequently tested for germination inducing activity and effects on radicle length. Aliquots (5, 10 and 20 µl) were applied, each, to an 8 mm glass fiber disc containing conditioned Striga seeds, placed in Petri dishes. The seeds were re-incubated and germination and radicle length were determined as described previously.
Effects of pH on germination inducing activity of root exudates: Root exudates from cowpea genotypes B301 and Tk100-901-6 (30 ml each) grown hydroponically for 10 days, as above, were extracted with ethylacetate (15 ml×3) as described by Yoneyama et al. (2010). The ethylacetate extracts, allowed to stand overnight at 4°C on anhydrous sodium sulphate, were evaporated to dryness at 40°C using a rotary evaporator. The residues were re-dissolved each in 2 ml of acetone. Aliquots of the acetone solution (100 µl) were added each to1.9 ml of 0.1 M Na2HPO4/NaH2PO4 buffers for pH 7 or 0.1M NaCl/HCl buffer for pH 4 and pH 10. Aliquots (5, 10 and 15 µl) from each of the respective buffered solutions were assayed for germination inducing activity, as above, using conditioned Striga sorghum and pearl millet strains. Acetone at the concentration used has no adverse effects on S. hermonthica seed germination.
Statistical analyses
Data collected from all experiments were subjected to statistical analyses using Statistix 8 statistical software, version 2.0 (UK). Means were separated for significance using the Least Significant
Difference (LSD at P≥0.05). Figures were drawn, when appropriate, using Sigma plot version 11 and Microsoft Office Excel 2013.
RESULTS
Effects of root powder on germination of S. hermonthica
For Striga sorghum strain, GR24 at 0.1 mg L-1
induced 77-90% germination. Cowpea root powder at 5 mg, poor (41%), satisfactory (60.3- 69.0%), good (73.4%) and excellent (85.5%) germination was effected by 1, 9, 1 and 1 samples, respectively (Table 1). At 10 mg moderate, satisfactory, good and excellent germination was elicited by 1, 2, 5 and 4 samples, respectively. At 15 mg poor (48.6%), moderate (50.5-56.6%), satisfactory (60.1-65.3%) and good (75.4 and 77.7%) germination was elicited by 1, 5, 4 and 2 samples, respectively. Of all cowpea root powder from the genotypes T198 K-409-4, T199 K-214-2 and Akola exhibted the lowest (50.9-59.7%) mean germination, while those from T199 K-377-1, IFE brown and T198 K-317-2 displayed the highest (72.2-81.3%) (Table 1).
For the Striga pearl millet strain, GR24 at 0.1 mgL-1
induced 55-68% germination. Cowpea root powder at 5 mg, poor (45.6%), moderate (53.1-59.3%), satisfactory (61.9-68.5%), good (71.1-79%) and excellent (94.7%) germination was achieved by 1, 3, 3, 4 and 1 sample, respectively (Table 2). At 10 mg 1 sample induced moderate (59.7%) and 4, each, resulted in satisfactory (64.2-68.4%) and good (72.5-78.6%) germination, while 3 samples achieved excellent (80.4-95 %.) germination. At 15 mg poor (33.4-49.9%), moderate (55.1-59%), good (72.2%) and excellent (94.7%) germination was induced by 4, 6, 1 and 1 samples, respectively (Table 2). Of all cowpea genotypes root powder from B301, T198 K-409-4 and T197-499-35 effected the lowest (46.8-55.8%) mean germination, whereas those from T198 K-3172, T100 K-901-6 and T100K-1263 induced the highest (72.9-94.8%) (Table 2).
Effects of incubation time on production of germination stimulant(s) Cowpea root exudates sampled 1 to 3 days after initiation of experiment (DAIOE), irrespective of volume, genotype or Striga strain, induced negligible to little germination (Figure 1). For Striga sorghum strain, GR24 at 0.1 mg L
-1
induced 80 to 89% germination. Seeds treated with distilled water displayed no germination. Root exudates from genotype B301 at 5 and 10 µl attained maximum germination, 54 and 45.1%, respectively, at 9 DAIOE (Figure 1A). At 20 µl, exudates volume, germination was maximum (41%) at 7 DAIOE, but declined to 32.9 to 35.8% on further extension of sampling time to 8 to 10

Rezig et al. 2085
Table 1. Effects of cowpea root powder on germination of S. hermonthica (sorghum strain).
Cowpea genotype
Germination (%)
Root powder weight (mg)
5 10 15 Mean
Aloka 60.3 ± 3.1 64.3 ± 1.7 54.4 ± 0.8 59.7
T198K-503-1 69.0 ± 4.5 81.2 ± 2.7 54.9 ± 1.1 68.4
T199K-214-2 62.0 ± 2.8 67.1 ± 4.6 48.6 ± 4.8 59.2
T199K-377-1 65.1 ± 6.8 86.1 ± 2.1 65.3 ± 4.6 72.2
B301 63.8 ± 1.6 74.2 ± 1.6 61.6 ± 7.2 66.6
T198K-409-4 41.0 ± 3.1 51.4 ± 0.9 60.1 ± 8.4 50.9
T197K-499-35 67.7 ± 4.9 76.9 ± 1.6 50.5 ± 1.5 65.0
T199K-573-2-1 67.4 ± 1.7 77.7 ± 4.4 56.6 ± 2.6 67.2
T100K-1263 67.4 ± 4.5 70.2 ± 8.5 61.7 ± 6.0 66.4
IFE brown 73.4 ± 3.7 86.0 ± 1.4 75.4 ± 1.8 78.3
T100K-901-6 63.2 ± 4.9 78.8 ± 3.4 52.8 ± 0.4 64.9
T198K-317-2 85.5 ± 3.7 80.7 ± 1.4 77.7 ± 5.5 81.3
Mean 65.5 74.5 59.9
LSD concentration 3.43
LSD Varieties 6.86
LSD c x v 13.73
± Standard error.
Table 2. Effects of cowpea root powder on germination of S. hermonthica (pearl millet strain).
Cowpea genotype
Germination (%)
Root powder weight (mg)
5 10 15 Mean
Aloka 64.0 ± 3.5 68.1 ± 2.0 56.3 ± 3.5 62.8
T198K-503-1 61.9 ± 2.8 81.1 ± 4.4 59.0 ± 3.1 67.3
T199K-214-2 71.1 ± 5.3 68.8 ± 2.4 49.9 ± 2.4 63.3
T199K-377-1 59.9 ± 1.8 72.5 ± 4.1 55.1 ± 4.7 62.5
B301 45.6 ± 0.7 61.3 ± 4.1 33.4 ± 5.5 46.8
T198K-409-4 53.1 ± 2.5 59.7 ± 1.5 42.2 ± 4.2 51.7
T197K-499-35 54.3 ± 11.5 64.2 ± 8.5 49.1 ± 5.0 55.8
T199K-573-2-1 75.8 ± 1.4 80.4 ± 3.1 56.9 ± 2.1 71.0
T100K-1263 94.7 ± 2.4 95.1 ± 1.9 94.7 ± 1.0 94.8
IFE brown 75.8 ± 2.5 78.6 ± 1.9 56.2 ± 2.0 70.2
T100K-901-6 79.0 (± 3.5) 74.5 ± 1.9 59.0 ± 3.8 70.8
T198K-317-2 68.5 (± 2.3) 78.1 ± 2.6 72.2 ± 3.3 72.9
Mean 66.9 73.5 57.0
LSD concentration 3.157
LSD varieties 6.31
LSD c x v 12.63
± Standard error.
DAIOE. Root exudates from genotype T100K-901-6 at 5 and 10 µl achieved maximum germination 52.1 and 43%, respectively 9 and 10 DAIOE (Figure 1B). At 20 µl
maximum germination (33.8%) was realized 8 DAIOE with no further significant change on extension of the sampling period to 10 DAIOE.

2086 Afr. J. Agric. Res.
Figure 1. Germination inducing activity of root exudates sampled daily from two cowpea genotypes, (A) B301 and (B) T100K-901-6, using S. hermonthica sorghum strain. Vertical bars with caps indicate standard error of five replications. Vertical bars without caps indicate LSD 5% (df = 120).
For Striga pearl millet strain GR24 at 0.1 mg L-1
induced 60 to 65% germination. The aqueous control displayed no germination. Root exudates from cowpea B301, sampled 4 DAIOE, at 5 and 10 µl showed low germination. However, at 20 µl a substantial germination (35.4%) was displayed (Figure 2A). Root exudates sampled 6 DAIOE and applied at 5, 10 and 20 µl induced 41.8, 52.3 and 53.4% germination, respectively. A further increase in sampling time had no significant effects on germination inducing activity at exudates volumes of 5 and 10 µl, however at 20 µl a significant increase was displayed and germination was maximal (61.4%) 9 DAIOE (Figure 2A).
Root exudates from cowpea T100K-901-6 sampled 4 DAIOE showed negligible germination at 5 µl (Figure 2 B). Increasing exudates volume to 10 and 20 µl increased germination to 13.6 and 16.4%, respectively. Exudates sampled 6 DAIOE induced 25.6, 28.7 and 34.8% germination at 5, 10 and 20 µl volume, respectively. Germination inducing activity consistently increased with sampling time and was maximal at 8 DAIOE, where germination was 43.6, 48.9 and 52.8% for the lowest, middle and highest exudates volume, respectively (Figure 2B).
Figure 2. Germination inducing activity of root exudates sampled daily from two cowpea genotypes, A) B301 and B) T100K-901-6, using S. hermonthica pearl millet strain. Vertical bars with caps indicate standard error of five replications. Vertical bars without caps indicate LSD 5% (df = 120).
Effects of pH on germination inducing activity of cowpea root exudates For Striga sorghum strain root exudates from cowpea genotype B301 at 5 µl induced 17.1 to 25.4% germination with no significant differences between pH levels (Table 3). Root exudate at 10 and 15 µl induced 16.7-21.4 and 12-14.2% germination, respectively and the attained germination was significantly higher at pH10. Across exudates volumes mean germination, invariably, decreased with volume and was 22.4, 18.7 and 13.2% at 5, 10 and 15 µl root exudates volume, respectively.
Root exudates of the genotype T100K-901-6, at 5 µl, elicited highest (35.8%) and lowest (25.5%) germination at pH 7 and 10, respectively (Table 3). Increasing exudates volume to 10 µl decreased germination at all pH levels with highest (30.9%) and lowest (21.1%) germination at pH 7 and 10, respectively. At 15 µl maximal (25.7%) and minimal (19.3%) germination were achieved at pH 7 and 4, respectively. Across exudates volume mean germination was highest (31.1%) and lowest (22.9%) at 5 and 15 µl volumes, respectively.
0.0
20.0
40.0
60.0
80.0
100.0
0 1 2 3 4 5 6 7 8 9 10 11
5
10
20
a
0
100
80
60
40
20
0 1 2 3 4 65 987 10 110
100
80
60
40
20
Days after initiation of experiment (DAIOE)
Ger
min
atio
n (
%)
Aliquot (μl)
20105
0.0
20.0
40.0
60.0
80.0
100.0
0 1 2 3 4 5 6 7 8 9 10 11
5
10
20
a
A
B
0.0
20.0
40.0
60.0
80.0
100.0
0 1 2 3 4 5 6 7 8 9 10 11
5
10
20
a
0.0
20.0
40.0
60.0
80.0
100.0
0 1 2 3 4 5 6 7 8 9 10 11
20
10
5
b
0
100
80
60
40
20
0 1 2 3 4 65 987 10 11
0.0
20.0
40.0
60.0
80.0
100.0
0 1 2 3 4 5 6 7 8 9 10 11
20
10
5
a
0
100
80
60
40
20
Days after initiation of experiment (DAIOE)
Aliquot (μl)20105
A
B
Ge
rmin
atio
n (
%)
0.0
20.0
40.0
60.0
80.0
100.0
0 1 2 3 4 5 6 7 8 9 10 11
20
10
5
a

Rezig et al. 2087
Table 3. Effects of pH on germination inducing activity of cowpea root exudates on S. hermonthica.
Cowpea genotype
pH
Germination (%)
Striga sorghum strain Striga pearl millet strain
Aliquot (µl) Aliquot (µl)
5 10 15 mean 5 10 15 Mean
B301
4 24.7 16.7 13.3 18.3 32.1 41.1 53.3 42.2
7 25.4 17.8 12.0 18.4 34.0 41.9 51.1 42.4
10 17.1 21.4 14.2 17.6 35.0 38.2 54.1 42.5
Mean 22.4 18.7 13.2 33.8 40.4 52.0
T100K-901-6
4 31.7 21.1 19.3 24.1 35.2 42.3 48.2 42.0
7 35.8 30.9 25.7 30.8 42.3 52.2 54.3 49.6
10 25.5 24.2 23.7 24.5 36.2 40.9 51.1 42.8
Mean 31.1 25.5 22.9 37.9 45.1 51.2
varieties 2.68 2.10
pH 3.29 2.58
concentration 3.29 2.58
v x pH 4.65 3.64
v x con 4.65 3.64
pH x co 5.69 4.46
v x pH xco 8.05 6.31
For Striga pearl millet strain root exudates from cowpea B301, at 5 µl induced the lowest germination (32.1%) at pH 4. Germination showed a slight non-significant increase at pH 7, but was significantly higher (35%) at pH 10 (Table 3). Increasing exudates volume to 10 and 15 µl increased germination, however, differences between pH levels were not significant. Across exudates volume mean germination was 33.8, 40.4 and 52% at 5, 10 and 15 µl , respectively (Table 3).
Cowpea genotype T100K-901-6 root exudates at 5 µl induced low germination (35%) at pH 4 (Table 3). Increasing pH to7 increased germination significantly however, a further increase in pH to10 resulted in a non-significant drop. At 10 µl the root exudates showed 42 and 41% germination at pH 4 and pH10, respectively. However, at pH 7 a significantly higher germination (52%) was attained (Table 3). At 15 µl root exudates germination was maximal (54.3%) at pH 7 and minimal (48.2%) at pH 4. Across pH levels mean germination was, significantly, the highest (59.6%) at pH 7. Across exudates volumes mean germination was highest (51.2%) and lowest (37.9%) at the highest (15 µl) and lowest (5 µl) volumes, respectively. Radicle length Root powder S. hermonthica seedlings, sorghum strain, induced by
GR24 at 0.1 mg L-1
displayed long radicles length (17.3-25.7×10
-2 mm). Cowpea root powder, invariably resulted
in seedlings with shorter radicles than GR24. At 5 mg root powder seedlings with short, medium and long radicles length were effected by 1, 8 and 3 samples, respectively (Table 4). At 10 mg 5 and 7 samples resulted in seedlings with short and medium radicle length, respectively. At 15 mg seedlings with short and medium radicle length were induced by 9 and 3 samples, respectively. Across powder levels 41% of the genotypes induced seedlings with short radicles length (7.6-9.7×10
-
2mm), 50% educed seedlings with medium radicles
length (10.6-11.6×10⁻²
mm) and 8.3% resulted in seedlings with long radicles length (15.5×10
-2 mm). Striga
seedlings educed by cowpea genotypes T198K-409-4, Aloka and IFE brown displayed the shortest radicle length (7.6-9×10
-2 mm)whereas those elicited byT198K-317-2,
T197K-499-35 and T100K-1263 exhibited the longest (11.6-15.5×10
-2 mm) radicles length.
For S. hermonthica, pearl millet strain, seedlings induced to germinate with GR24 at 0.1 mg L
-1 displayed
short to long (9.4-19 ×10-2
mm) radicles length. At 5 mg cowpea root powder seedlings with short, medium and long radicles length were induced by 2, 7 and 3 samples, respectively (Table 5). At 10 mg seedlings with short and medium radicles were length induced by 9 and 3 samples, respectively. At 15 mg seedling with short and medium radicles were induced length by 10 and 2 samples, respectively. Across powder samples 75% of the genotypes effected seedlings with short radicles (7.6-

2088 Afr. J. Agric. Res.
Table 4. Effects of cowpea root powder on radicle extension of S. hermonthica (sorghum strain).
Cowpea genotype
Radicle extension (×10-2
µm)
Root powder weight (mg)
5 10 15 Mean
Aloka 10.8 ±0.5 9.0 ±0.3 7.3 ±0.1 9.0
T198K-503-1 13.7 ±1.3 10.0 ±0.3 8.2 ±0.2 10.6
T199K-214-2 13.1 ±0.6 9.3 ±0.7 6.8 ±0.3 9.7
T199K-377-1 13.7 ±1.1 10.7 ±0.6 7.5 ±0.3 10.6
B301 15.6 ±0.6 10.8 ±0.7 5.7 ±0.8 10.7
T198K-409-4 9.5 ±0.5 7.9 ±0.4 5.3 ±0.2 7.6
T197K-499-35 15.5 ±0.4 12.4 ±0.1 10.3 ±0.1 12.7
T199K-573-2-1 11.4 ±0.1 9.7 ±0.3 7.2 ±0.1 9.4
T100K-1263 19.3 ±1.0 14.9 ±1.7 12.4 1.1 15.5
IFE brown 11.3 ±0.3 9.1 ±0.5 6.7 ±0.2 9.0
T100K-901-6 13.2 ±0.8 11.1 ±0.5 8.5 ±0.2 10.9
T198K-317-2 13.4 ±0.7 11.1 ±0.4 10.2 ±0.2 11.6
Mean 13.4 10.5 8.0
LSD concentration 0.52
LSD Varieties 1.04
LSD c x v 2.07
± Standard error.
Table 5. Effects of cowpea root powder on radicle extension of S. hermonthica (pearl millet strain).
Cowpea genotypes
Radicle extension (×10-2
µm)
Root powder weight (mg)
5 10 15 Mean
Aloka 9.9 ±0.2 9.4 ±0.1 7.4 ±0.3 8.9
T198K-503-1 10.9 ±0.3 8.6 ±0.2 7.3 ±0.2 8.9
T199K-214-2 10.3 ±0.3 8.0 ±0.3 6.5 ±0.3 8.3
T199K-377-1 11.6 ±0.3 8.3 ±0.5 8.2 ±0.3 9.4
B301 10.4 ±0.2 7.7 ±0.3 5.5 ±0.3 7.9
T198K-409-4 9.3 ±0.4 7.4 ±0.1 6.1 ±0.3 7.6
T197K-499-35 17.6 ±1.0 11.3 ±0.3 8.7 ±0.1 12.5
T199K-573-2-1 12.2 ±0.1 8.5 ±0.4 5.6 ±0.3 8.7
T100K-1263 15.9 ±0.7 13.0 ±0.2 11.6±0.3 13.5
IFE brown 10.1 ±0.1 9.4 ±0.2 7.9 ±0.4 9.1
T100K-901-6 15.2 ±0.8 11.20.3 10.6 ±1.1 12.3
T198K-317-2 10.8 ±0.2 8.6 ±0.5 7.6 ±0.2 9.0
Mean 12.0 9.3 7.8
LSD concentration 0.33
LSD varieties 0.67
LSD c x v 1.33
± Standard error.
9.4×10⁻²
mm) length and 25% resulted in seedlings with medium size (12.3-13.5×10
-2 µm) radicles length. Striga
seedlings induced by the genotypes T198K-409-4, B301 and T199K-241-2 displayed the shortest (7.6-8.3 × 10
-
2mm) radicle length, while those induced by the
genotypes T100K-901-6, T197K-499-35 and T100K1263 exhibited the longest (12.3-13.5 ×10
-2 mm) radicles length
(Table 5).

Figure 3. Root extension of S. hermonthica sorghum strain germlings induced by root exudates sampled daily from two cowpea genotypes, A) B301 and B) T100K-901-6. Vertical bars with caps indicate standard error of five replications. Vertical bars without caps indicate LSD 5% (df = 120).
Root exudates
Striga seedlings from seeds induced to germinate by cowpea root exudates sampled 1-3 DAIOE, irrespective of genotype, volume or Striga strain, displayed negligible to short radicle length (Figures 3 and 4 ). For Striga sorghum strain, seedlings induced by GR24 displayed radicle length of 28-31.2 × 10
-2mm. Cowpea root
exudates sampled at 4 DAIOE or more radicle length progressively, increased with time and decreased with volume of root exudates (Figure 3). Exudates from genotype B301collected 4-7 DAIOE at 510 and 20 µl induced seedlings with short radicle length (5.1-9.9 × 10
-2
mm). On further length of sampling time to 8 to 10 DAIOE the root exudates at 5 µl resulted in seedlings with medium (10.1-11.3 × 10
-2 mm) radicle length. However, at
10 and 20 µl only seedlings with short (7.3-9.7 × 10⁻²
mm) radicle length were displayed. For root exudates from cowpea genotype T100K-901-6 sampled length 6 DAIOE or more radicle length was maximal at 9 DAIOE. Radicle length affected by root exudates sampled 9 DAIOE at 5, 10 and 20 µl was 10.5 × 10
-2, 8.1 × 10
-2 and 6.4 × 10
-2
mm, respectively. For Striga pearl millet strain, seedlings induced by
Rezig et al. 2089
Figure 4. Radicle extension of S. hermonthica pearl millet strain germlings induced by root exudates sampled daily from two cowpea genotypes, A) B301 and B) T100K-901-6. Vertical bars with caps indicate standard error of five replications. Vertical bars without caps indicate LSD 5% (df = 120).
GR24 displayed radicle length of 16.1-18.8 × 10
-2 mm.
Radicle length of seedlings induced by cowpea genotype B301 root exudates sampled length6 DAIOE or more progressively increased with time and exudates volume, reached a maximum at 9 DAIOE where it was 5.1× 10
-2,
6.8× 10⁻²
and 8.6 × 10⁻²
mm for exudates volumes of 5, 10 and 20 µl, respectively (Figure 4A).
Radicle length in seedlings from seeds induced to germinate by roots exudates from cowpea genotype TK100-901-6 followed the same trends as those of seedlings educed by root exudates of genotype B301 (Figure 4). Radicle length was maximal at 10 DAIOE where it was 5.2 × 10
-2, 6.5 × 10
-2 and 7.9× 10
-2 mm at 5 ,
10 and 20 µl exudates volume, respectively. DISCUSSION
The general features of the germination inducing activity of cowpea root powder, irrespective of genotype or Striga strain, were an increase and a subsequent decrease with

2090 Afr. J. Agric. Res. sample weight (Tables 1 and 2). However, the magnitude of the germination varied with cowpea genotype and Striga strain. Variations in germination inducing activity with genotype, amount of root powder and Striga strains, in line with several reports could be attributed to variations in qualitative and quantitative composition of the active substances (Sato et al., 2005; Yoneyama et al., 2010), simultaneous production of germination stimulants and inhibitors (Muller et al., 1992) and to inherent differences in response of the two S. hermonthica strains to germination stimulants (Parker and Riches, 1993). The high frequency of occurrence of high germination inducers of the pearl S. hermonthica millet strain among cowpea genotypes (41.6%) compared to the low frequency (24.9%) for its sorghum congener (Tables 1 and 2) indicates better chances of success on random selection of genotypes as rotational or companion crops for combating the parasite on pearl millet. However, for sorghum, selection based on prior knowledge is critical.
The low initial germination inducing activity of root exudates observed 1 to 3 DAIOE, irrespective of cowpea genotype or Striga strain may be attributed to a lag phase in stimulant production (Figure 1). A similar initial lag phase in stimulant production was reported for hydro-ponically grown cotton (Sato et al., 2005) and was attributed to an acclimatization process. In general the highest germination inducing activity was attained by root exudates sampled 8 DAIOE and was maintained without a significant change throughout the experiment (Figure 1).
The contrasting response of S. hermonthica pearl millet and sorghum strains to germination stimulants from cowpea root exudates (Figures 1 and 2 and Table 3) is in line with their differential response to root exudates of their respective true hosts (Parker and Riches, 1993). It is noteworthy that sorghum produces, mainly, strigol-type SLs, while cowpea produces, mainly, orobancol-type (Awad et al., 2006; Uneo et al., 2011; Yoneyama et al., 2013). However, the presence of unidentified novel SLs and/or other germination stimulants cannot be ruled out based on bioassay assessments. Germination assays were reported to be at least 100-fold more sensitive than mass spectrometry (Yoneyama et al., 2010).
The high germination induced by the root powder relative to the root exudates (Tables 1 and 2 and Figures 1 and 2) could be due to differences in conditions under which cowpea plants were grown. The root powder was obtained from plants grown in potted soil while the root exudates were obtained from hydroponically grown plants. However, more subtle interactions involving release of the germination stimulants and/or inhibitors from root powder and the balance between production, transport and exudation of the active compounds from intact plants cannot be ruled out. It is noteworthy that plants roots are considered to be the main sites for SLs
biosynthesis and that the cut root technique developed by Berner et al. (1996) is claimed to be more reliable for screening plants for SLs activity than root exudates.
The inconsistent effects of solution pH on germination inducing activity of root exudates of cowpea genotype B301 compared to the consistent effects of pH on germination inducing activity of root exudates of the genotype T100K-901-6 which was invariably significantly higher at pH 7, in line with the results obtained with root powder (Tables 1 and 2), suggest qualitative and /or quantitative differences in composition of the root exudates. Differences in stability and lipophilicity were reported to influence SLs germination inducing activity on Striga spp. (Yoneyama et al., 2010). The likelihood of qualitative and quantitative differences in composition of the root exudates is further substantiated by the high germination response of Striga pearl millet strain and its increase with exudates volume compared to the relatively low germination response of the sorghum strain and its decrease with increasing exudates volume (Table 3 and Figures 1 and 2).
Radicle length in Striga seedlings induced by cowpea root powder, irrespective of Striga strain or cowpea genotype, was by far shorter than those induced by the concurrent GR24 control treatments. GR24 at 0.1 mg L
-1
elicited seedlings with radicle length of 17.3-25.7 × 10⁻²
mm and 9.4-19 × 10
-2mm in S. hermonthica sorghum
strain and its pearl millet congener, respectively. The influence of root powder on radicle length varied with, cowpea genotype, amount of powder and Striga strain. However, minimum and maximum inhibition of radicle length, in both strains, was achieved by powder from the genotypesT100K-1263 and T198K-409-4, respectively (Tables 4 and 5).
The proportions of short radicles, irrespective of Striga strain or cowpea genotype, increased with increasing amount of powder (Tables 4 and 5). For S. hermonthica sorghum strain the proportion of samples eliciting seedlings with short radicles was 8.3, 41.7 and 75% at powder amounts of 5, 10 and 15 mg/well, respectively. The corresponding figures for the pearl millet strain were 16.7, 75 and 83.3% thus suggesting that the pearl millet strain is more prone to radicle shorting than its sorghum congener. Shortening of Striga radicles due to curtailment of cell extension and/or precocious initiation of haustoria away from host roots, may, as observed with Desmodium spp. for S. hermonthica and a variety of resistant sorghum genotypes for S. asiatica, lessen the frequency of attachment and subsequently parasitism (Riopel and Timko, 1995; Khan et al., 2002, 2008).
Radicle length in seedlings from seeds induced to germinate with root exudates often mirrored imaged the germination inducing activity of the exudates (Figures 1 to 4). Synonymous with germination, radicle length pro-gressively increased with sampling time and decreased with exudates volume for Striga sorghum strain, but,

conversely, both germination and radicle length increased with sampling time and exudates volume for the pearl millet congener (Figures 3 and 4).
The decrease in germination inducing activity and reduction in radicle length in Striga sorghum strain with increasing exudates volume corroborate the results obtained in this study with the root powder (Table 1 and Figures 1 and 2) and suggest interactions involving allelochemicals as pre and post-germination and radicle growth inhibitors. A similar shorting in S. hermonthica radicle, on exposure to root exudates of Desmodium uncinatum (Jacq), attributable to allelochemicals including di-C-glycosylflavone, was reported by Khan et al. (2008). The contrasting effects of cowpea root exudates on germination and radicle length of the pearl millet S. hermonthica strain are of interest and suggest high sensitivity to the germination stimulants and/or low sensitivity to inhibitors in the roots exudates. However, the possibility of involvement of different stimulants in the germination and radicle length of the two S. hermonthica strains cannot be ruled out and is consistent with the notable host specificity of the two strains previously reported by Wilson-Jones (1955). Recent studies showed that a plant species may produce several strigolactones with differing germination inducing activity and that the stereochemistry of a stimulant plays a crucial role in germination and in host specificity (Matusova et al., 2005).
The results of the present study revealed that germination inducing activity and effects on radicle length of cowpea root powder and exudates are influenced by genotype and the parasite strains. Furthermore, the results suggest that selection of cowpea genotypes for trap cropping should be based on initial laboratory screening for stimulant production. However, for intercropping growth vigour and habit, among other factors, have to be taken into consideration. Conflict of Interests The authors have not declared any conflict of interests. ACKNOWLEDGMENTS The authors are indebted to JST/JICA SATREPS (Japan Science and Technology Agency, Tokyo Japan and International Cooperation Agency, Tokyo, Japan) for financial support. REFERENCES Awad AA, Sato D, Kusumoto D, Kamioka H, Takeuchi Y, Yoneyama K
(2006). Characterization of strigolactones, germination stimulants for the root parasitic plants Striga and Orobanche, produced by maize and sorghum. Plant Growth Regul. 48:221-227.
Rezig et al. 2091 Babiker AGT (2007). Striga: The spreading scourge in Africa.
Regulation of Plant Growth and Development 42:74-87. Babiker AGT, Ma Y, Sugimoto Y, Inanaga S (2000). Conditioning period,
CO2 and GR24 Influence ethylene biosynthesis and germination of Striga hermonthica. Physiol. Plant. 109:75-80.
Berner K, Ikie FO, Aigbokhan EI (1996). Methods for soil infestation with Striga hermonthica seeds. Agron. J. 88:33-37.
Cardoso C, Charnikhova T, Jamil M, Delaux PM, Verstappen F, Amini M, Lauressergues D, Ruyter-Spira C, Bouwmeester H (2014). Differential activity of Striga hermonthica seed germination stimulants and Gigaspora rosea hyphal branching factors in rice and their contribution to underground communication Plos One 9 e1410(9):1-11.
Ejeta G, Butler LG, Babiker AGT (1993). New approaches to the control of Striga. Striga Research at Purdue. Agricultural Experimental Station. Purdue Univ. Res. Bull. 991:27.
Fujii Y, Shibuya T, Nakatani K, Itani T, Hiradate S, Parvez MM (2004). Assessment method for allelopathic effect from leaf litter leachates. Weed Biol. Manage. 4:19-23.
Khan Z, Hassanali A, Overholt W, Khamis TM, Hopper AM, Picket JA, Wadhams LJ, Woodcock C (2002). Control of Witchweed Striga hermonthica by Intercropping with Desmodium spp., and the mechanism defined as allelopathic. J. Chem. Ecol. 28:1871-1885.
Khan ZR, Pickett, JA, Hassanali A, Hooper AM, Midgea CAO (2008). Desmodium species and associated biochemical traits for controlling Striga species: Present and future prospects. Weed Res. 43:302-306.
Kureh I, Kamara AY, Tarfa BD (2006). Influence of cereal-legume rotation on Striga control and maize grain yield in farmers, fields in Northern Guinea Savanna of Ngeria. J. Agric. Rural Dev. Trop. Subtrop. 107:41-54.
Matusova R, Rani K, Verstappen FWA, Franssen MCR, Beale MH, Bouwmeester HJ (2005). The strigolactone germination stimulants of the plant-parasitic Striga and Orobanche are derived from the carotenoid pathway. Plant Physiol. 139:920-934.
Muller S, Hauck C, Schildknecht H (1992). Germination stimulants produced byVigna unguiculata Walp cv. Saunders Upright. J. Plant Growth Regul. 11:77-84.
Parker C, Reid DC (1979). Host specificity in Striga species-some preliminary observations. In: Supplement to Proceedings, 2
nd
International Symposium on Parasitic Weeds. Raleigh USA. (eds LJ Musselman EDITOR, AD Worsham EDITOR & R Eplee) North Carolina State University, Raligh. pp. 79-90.
Parker C, Riches CR (1993). Parasitic Weeds of the World: Biology and Control. CAB International, Wallingford, UK.
Riopel JL, Timpko MP (1995). Haustorial initiation and differentiation. In: Parasitic Plants (eds MC Press Editor & JD Graves Editor). Chapman and Hall London, UK. 332 p.
Sato D, Awad AA, Takeuchi Y, Yoneyama K (2005). Confirmation and quantification of strigolactones, germination stimulants for root parasitic plants Striga and Orobanche, produced by cotton. Biosci. Biotechnol. Biochem. 69:98-112. Spallek T, Mutuku, JM, Shirasu K (2013). The genus Striga: A witch profile. Molec. Plant Pathol. 69(1):98-102.
Ueno K, Nomura S, Muranaka S, Masaharu M, Takikawa H, Sugimoto Y (2011). Ent-2/-epi-orobanchol and its acetate as germination stimulants for Striga gesnerioides seeds isolated from cowpea and red clover. J. Agric. Food Chem. 59:10485-10490.
Welsh AB, Mohamed IK (2011). Genetic diversity of Striga hermonthica populations in Ethiopia. Evaluating the role of Geography and host specificity in shaping population structure. Int. J. Plant Sci. 172:773-782.
Wilson-Jones K (1955). Further experiments on witchweed control II. The existence of physiological strains of Striga hermonthica. Empire J. Exp. Agric. 23:206-213.
Yoneyama K, Awad AA, Xie X, Yoneyama K, Takeuchi Y (2010). Strigolactones as germination stimulants for root parasitic plants. Plant Cell Physiol. 51:1095-1103.
Yoneyama K, Ruyer-Spira C, Bouwmeester H (2013). Induction of germination. In: Parasitic Orobanchaceae Parasitic Mechanisms and Control Strategies (eds DM Joel, J Gressel, & LJ Musselman), Springer Verlag, Berlin Heidelberg, Germany pp. 164-194.

Vol. 11(24), pp. 2092-2101, 16 June, 2016
DOI: 10.5897/AJAR2015.10734
Article Number: 92A2C2358968
ISSN 1991-637X
Copyright ©2016
Author(s) retain the copyright of this article
http://www.academicjournals.org/AJAR
African Journal of Agricultural Research
Full Length Research Paper
The decrease of potential suitable areas and the distribution tendency of staple crops in Ethiopia under
future climate conditions
Zhen Tan, Yuping Yang, Yanqin Wang, Lele Wang and Guojun Sun*
Institute of Arid Agroecology, School of Life Sciences, Lanzhou University, Lanzhou 730000, China.
Received 13 December, 2015; Accepted 23 April, 2016
Rain-fed agriculture is the most common pattern for Ethiopian smallholders, while it is sensitive to climate change in the future. In order to predict the impact of climate change and decrease the risk of food crisis in Ethiopia, the potential crops suitability of teff (Eragrostis tef), maize (Zea mays), wheat (Triticum aestivum Linn.) were simulated and suitable distribution were analyzed by using GIS-MCE (Multi-Criteria Evaluation) Planting Ecological Adaptability model under both current and future (2080s) climate conditions. The simulation showed that climate change will decrease the 14% potential suitable areas of teff from 41 to 27% and also reduce that of wheat from 33 to 29% in the future, while the potential suitable regions for maize will remain almost stable, or even slightly more (1%) in the future (46%) compared to the current conditions (45%). Overall, agriculture will suffer negative impacts on the main crops in Ethiopia. All these three crops’ potential suitable lands are gathering to higher altitude which is in the centre of the whole nation because of warmer temperature. Thus, maize may become more widely grown and compete for lands with teff and wheat in high and mid-altitude. In this study, our model results can help both the policymakers and the smallholders to amend the existing limitations, as well as to plan better long-term strategies under the future climate scenarios. Key words: Climate change, Ethiopia, geographical information system, multi-criteria evaluation, potential suitability.
INTRODUCTION Reductions in agricultural production caused by future climate change could seriously weaken food security and worsen the livelihood conditions in most developing countries (Franks, 2005). Climate changes cause 46% of the cultivated areas in the world and are not suitable for
rain fed agriculture (Valipour, 2015). Particularly, many countries in Africa were suffered by climate changes and supreme weather events (Deressa and Hassan, 2009). The IPCC (2007) demonstrated that warming is supposed to be greater than global average in sub-
*Corresponding author. E-mail: [email protected].
Author(s) agree that this article remain permanently open access under the terms of the Creative Commons Attribution
License 4.0 International License

Saharan Africa which is likely to exceed 3°C over next century (Parry et al., 2007; Thompson et al., 2010) and the rainfall in parts of these area will decline (Bryan et al., 2009). In sub-Saharan Africa countries, most of the countries relying on rain-fed farming will face the great threat that land area available for agriculture is limited (Herrero et al., 2012; Thompson et al., 2010). The amount of water-managed areas as share of cultivated areas in Africa is significantly lower than the world, this signifies that water management is particularly poorly in rainfed cultivated areas (Valipour, 2013). Therefore, Ethiopia will be suffered more from changing climate scenarios as it is a typical sub-Saharan country and lack effective strategies to cope with agricultural change caused by climate variable (Thompson et al., 2010; Washington et al., 2012).
Ethiopia is a tropical land-locked country in East Africa with high levels of population density. Although agriculture makes a great contribution to the Ethiopian GDP and four-fifths of the population live in rural areas that rely on agriculture-related industries (Diao et al., 2010), most of agriculture is under rain-fed condition in Ethiopia engaged by small farm management form (Araya et al., 2010). Besides, owing to the poor knowledge about agricultural water requirement, irrigation efficiency is low and crops are under water stress (Valipour, 2012). It is critical in light of low crop productivity dominantly in Ethiopian agriculture, which causes chronic food insecurity with recurrent drought and rapid population growth (Gebre-Selassie and Bekele; Hordofa et al., 2008; Taffesse, 2008). For centuries, the principal grains, overriding three cereals – teff, maize and wheat, have fed peasant farmers and their communities in Ethiopia (Se et al., 2012; Yumbya et al., 2014). These staple cereals are the foremost component in the most Ethiopians’ diet and also the key to food security in rural Africa. However, the effects of climactic changes on these three crops’ suitability are varied and not fully understood.
Teff is an annual grass which is widely cultivated throughout the whole Ethiopia and accounts for about a quarter of the Ethiopian total grain output. The most preferred staple food Injera, traditionally made out of teff flour, is a national dish which is unique in Ethiopia and Eritrea (Chamberlin and Schmidt, 2012; Girma and Ababa, 2010). Maize is also a major crop in Ethiopia. It is a kind of warm-weather grain widely cultivated and grown mostly at lower altitudes. Besides, maize is second only to teff in cultivated area coverage, but first in total production among all the cereals (Worku et al., 2012). For wheat, Ethiopia is the largest wheat producer in sub-Saharan Africa (Mariam, 1991). The Ministry of Agriculture of Ethiopia (2002) shows that wheat is one of the most general cereals which have grown predominantly in the Ethiopian highlands and cultivated merely under rain-fed conditions.
This paper analyzes potential suitable distribution of staple crops in Ethiopia under both current and future
Tan et al. 2093 climate conditions and aims to provide information for appropriate adaptive policies at national or regional level so as to minimize the adverse impacts of climate change on agriculture. In this study, the climate and geographical data (input data) are combined and transformed into a consequent decision (output) using the GIS-MCE model. Finally, the potential suitable level of Ethiopia agriculture under both current and future climate conditions are simulated and evaluated.
Our objectives were to: (1) grade the climatic suitability of teff, maize and wheat planting distribution under current climate conditions in Ethiopia; (2) simulate and predict the suitable cultivation regions of teff, maize and wheat under future (2080s) climate conditions; (3) further analyze the tendency of these three crops suitability and the variability of cultivating structure primarily owing to climate changes. It is expected that the study can provide crop planning strategies, improve land use and promote the sustainable development of agriculture which adapt to climate changes in the circumstance of national scale.
MATERIALS AND METHODS Study area Ethiopia lies from longitudes 33°E to 55°E and latitudes from 3.5°N to 15°N, covering a land area of 1.13 million km² and including large areas of flat land and gently rolling hilly areas as well as steep mountains and ragged valleys. There is an uneven distribution among regions, mainly varies with regional altitude changes from slightly below sea level to more than 4,000 m above sea level (Figure 1). Thus, the climate of Ethiopia is quite variable across the country. Ethiopia's climate is mainly tropical steppe climate and subtropical forest climate, the annual average temperature is from 10 to 27°C and the tropical zone receives less than 510 mm rain per annum, while the subtropical zone, which includes most of the highlands, receives 510 to 1,530 mm of rain annually (Mati, 2006).
Despite it is difficult to make agricultural planning due to variable rainfall, a large proportion of the Ethiopia gets sufficient for rain-fed crop production. In the north of the country, the rainfall pattern is mainly bimodal, with the shorter starts around March/April and the second one begins around June/July. In some regions, the two seasons combine into a unimodal pattern, which the main crop planting season is from June to October and it almost depends on rain. The main crops in Ethiopia are teff (Eragrostis tef), maize (Zea mays) and wheat (Triticum aestivum Linn.), etc.
Meteorological data and climate index
Considering meteorological data is vital to the distribution of cultivation areas, we choose several climate indexs, including: a) accumulative daily mean temperature (AT); b) monthly average maximum temperature (T-max); c) monthly average minimum temperature (T-min); d) monthly precipitation (PRE) (Doss et al., 2003; Feleke and Zegeye, 2006; Laekemariam et al., 2012; Mariam, 1991; Tesemma et al., 1998).
Meteorological data, both under current and future conditions, are downloaded from the Website of World Clim-Global Climate Data (http://www.worldclim.org). The future conditions (2080s) data is global climate model (GCM) data from Fourth Coupled Model Intercomparison Project (CMIP4) (Parry et al., 2007; Solomon, 2007). Coupled Global Climate Model (CGCM3) was selected

2094 Afr. J. Agric. Res.
Figure 1. Altitude and provincial boundary of Ethiopia.
under SRA1B emission scenarios as our model, developed by Canadian Centre for Climate Modeling and Analysis (CCCma) (Solomon, 2007). The A1 family scenarios are distinguished by their technological emphasis in an alternative directions of energy system and they are divided into three groups (A1FI, A1B, A1T). A1B scenario is not only relying heavily on one particular energy source and it assume that similar improvement rates are applied to all end-use technologies and energy supply (Gaffin et al., 2004; Parry et al., 2007).
The resolution of this data is 30 s and it can be used for many research field, such as agriculture, environment and life sciences, etc. It simulates to the future conditions well in seasonality of temperature and precipitation patterns especially for the sub-Saharan Africa (Washington et al., 2012). Elevation and soil data The Digital Elevation Modal (DEM) in this study is downloaded from ASTER GDEM which is available online (http://www.jspacesystems.or.jp/ersdac/GDEM/E/4.html). The resolution of this data is 30 m.
The soil data contains soil pH and soil texture data, which is selected from Harmonized World Soil Database (http://webarchive.iiasa.ac.at/Research/LUC/External-World-soil-database/HTML/). The field moisture capacity (FMC) data is calculated by using the following equation (Gupta and Larson, 1979):
FMC = 0.008039×Cl+0.005886×Si+0.003075×Sa+
0.002208×SOM-0.1434×BD.
where FMC: field moisture capacity; Cl: soil clay content (%); Si: soil silt content (%); Sa: soil sand content (%), the US system; SOM: soil organic matter content (%); BD: soil bulk density (g/cm3).
Planting ecological adaptability model based on GIS-MCE
Planting ecological adaptability model plays a vital role in predicting the distribution of crops and evaluating crop adaptability (Ceballos-Silva and Lopez-Blanco, 2003; He et al., 2014; Jia et al., 2014; Malczewski, 2004). It is usually based on geographical information system (GIS). The multi-criteria evaluation (MCE) can be seen as a method that transforms and combines spatial geographical data (input) into a resultant decision (output) (Cobuloglu and Büyüktahtakın, 2015). The flow chart of GIS-MCE procedure is as shown in Figure 2.
Firstly, according to the eight meteorological data (elevation, monthly mean temperature-max (T-max), monthly mean temperature-min (T-min), accumulative temperature (AT), monthly precipitation (PRE), soil pH, soil texture and field moisture capacity (FMC)), several thematic layers were created by using GIS. In this study, we adopted FAO system which classifies land suitability rating based on meteorological and soil indices. The indices were classified into five levels which represent very high, high, medium,
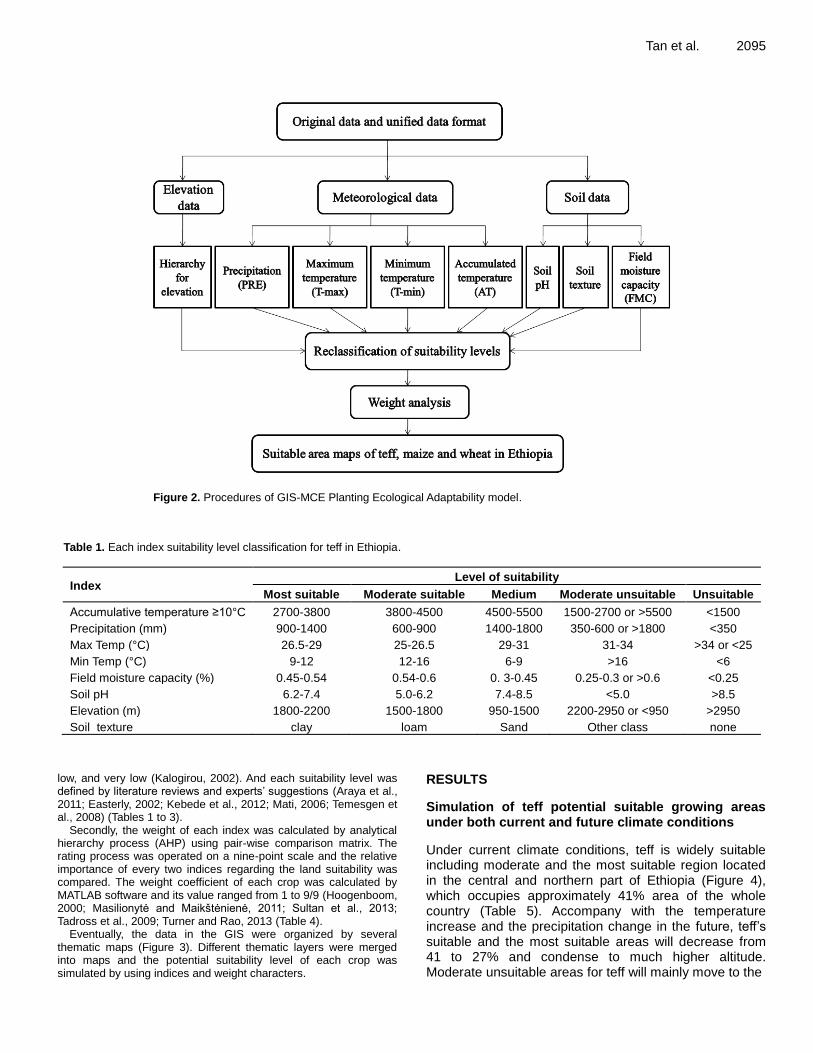
Tan et al. 2095
Figure 2. Procedures of GIS-MCE Planting Ecological Adaptability model.
Table 1. Each index suitability level classification for teff in Ethiopia.
Index Level of suitability
Most suitable Moderate suitable Medium Moderate unsuitable Unsuitable
Accumulative temperature ≥10°C 2700-3800 3800-4500 4500-5500 1500-2700 or >5500 <1500
Precipitation (mm) 900-1400 600-900 1400-1800 350-600 or >1800 <350
Max Temp (°C) 26.5-29 25-26.5 29-31 31-34 >34 or <25
Min Temp (°C) 9-12 12-16 6-9 >16 <6
Field moisture capacity (%) 0.45-0.54 0.54-0.6 0. 3-0.45 0.25-0.3 or >0.6 <0.25
Soil pH 6.2-7.4 5.0-6.2 7.4-8.5 <5.0 >8.5
Elevation (m) 1800-2200 1500-1800 950-1500 2200-2950 or <950 >2950
Soil texture clay loam Sand Other class none
low, and very low (Kalogirou, 2002). And each suitability level was defined by literature reviews and experts’ suggestions (Araya et al., 2011; Easterly, 2002; Kebede et al., 2012; Mati, 2006; Temesgen et al., 2008) (Tables 1 to 3).
Secondly, the weight of each index was calculated by analytical hierarchy process (AHP) using pair-wise comparison matrix. The rating process was operated on a nine-point scale and the relative importance of every two indices regarding the land suitability was compared. The weight coefficient of each crop was calculated by MATLAB software and its value ranged from 1 to 9/9 (Hoogenboom, 2000; Masilionytė and Maikštėnienė, 2011; Sultan et al., 2013; Tadross et al., 2009; Turner and Rao, 2013 (Table 4).
Eventually, the data in the GIS were organized by several thematic maps (Figure 3). Different thematic layers were merged into maps and the potential suitability level of each crop was simulated by using indices and weight characters.
RESULTS
Simulation of teff potential suitable growing areas under both current and future climate conditions
Under current climate conditions, teff is widely suitable including moderate and the most suitable region located in the central and northern part of Ethiopia (Figure 4), which occupies approximately 41% area of the whole country (Table 5). Accompany with the temperature increase and the precipitation change in the future, teff’s suitable and the most suitable areas will decrease from 41 to 27% and condense to much higher altitude. Moderate unsuitable areas for teff will mainly move to the

2096 Afr. J. Agric. Res. Table 2. Each index suitability level classification for maize in Ethiopia.
Index
Level of suitability
Most suitable
Moderate suitable
Medium Moderate unsuitable
Unsuitable
Accumulative temperature ≥10°C 2500-3600 3600-4200 4200-5000 1000-2500 <1000 or >5000
Precipitation (mm) 800-1200 1200-1500 1500-1700 or 500-800 >1700 <500
Max Temp (°C) 20-25 25-31 15-20 or 31-35 >35 <15
Min Temp (°C) 10-17 17-20 0-10 >20 <0
Field moisture capacity (%) 0.37-0.46 0.46-0.55 0. 3-0.37 0.18-0.3 or >0.55 <0.18
Soil pH 6.5-7.0 5.0-6.5 7.0-8.0 <5.0 >8.0
Elevation (m) 1000-1500 1500-2000 600-1000 or 2000-2300 >2300 <600
Soil texture Loam Sand Clay Other class none
Table 3. Each index suitability level classification for wheat in Ethiopia.
Index Level of suitability
Most suitable Moderate suitable Medium Moderate unsuitable Unsuitable
Accumulative temperature ≥10°C 2400-3100 3100-4000 4000-5200 1500-2400 or >5200 <1500
Precipitation (mm) 600-1200 1200-1700 >1700 350-600 <350
Max Temp (°C) 21-23 23-25.5 or 19-21 19-21 25.5-30 <19 or >30
Min Temp (°C) 6-9.3 9.3-11 2-6 or 11-15 >15 <2
Field moisture capacity (%) 0.4-0.52 0.52-0.6 0. 35-0.4 0.25-0.35 or >0.6 <0.25
Soil pH 6.5-7.0 7.0-7.5 7.5-8.5 <6.0 >8.5
Elevation (m) 1500-2300 800-1500 2300-2700 2700-3000 or <800 >3000
Soil texture Loam clay Sand Other class none
Table 4. Weight coefficient of each index using AHP calculated.
Crop Index
Elevation PRE T-max T-min AT Soil pH Soil texture FMC total
Teff 0.0684 0.2045 0.1363 0.1591 0.1818 0.0454 0.0909 0.1136 1
Maize 0.0454 0.2045 0.1591 0.1364 0.1818 0.0628 0.0909 0.1136 1
Wheat 0.0684 0.2045 0.1363 0.1591 0.1818 0.0454 0.0909 0.1136 1
south of Oromia province and most areas of moderate unsuitable part, especially in the south of Afar and the whole Somali province, are turning to the most unsuitable regions (Figure 4). Thus, the proportion of most unsuitable area soars from 16 to 38% of the nation (Table 5). Simulation of maize potential suitable growing areas under both current and future climate conditions Under the current climate scenarios, both moderate and the most suitable distribution of maize is about 45% in total which is located in the west of the country, nearly half of the Ethiopia. In contrast, unsuitable area only
accounts for one fourth of the nation (Table 6). Under the future conditions, except for Somali province becomes more unsuitable, the suitability of maize shows a decreasing tendency in Tigray province and demonstrates a rising trend in the south of Oromia province, which presents a southward tendency of suitable area (Figure 5).
Although the warmer temperature and changing rainfall will decrease the most suitable areas about 4% (from 23 to 19%), the moderate suitable areas will increase about 5% (from 22 to 27%) of the total areas (Table 6). That means, the suitable regions for growing maize, both moderate and the most, will remain almost stable, or even slightly more (1%) in the future (46%) compared to the current conditions (45%).
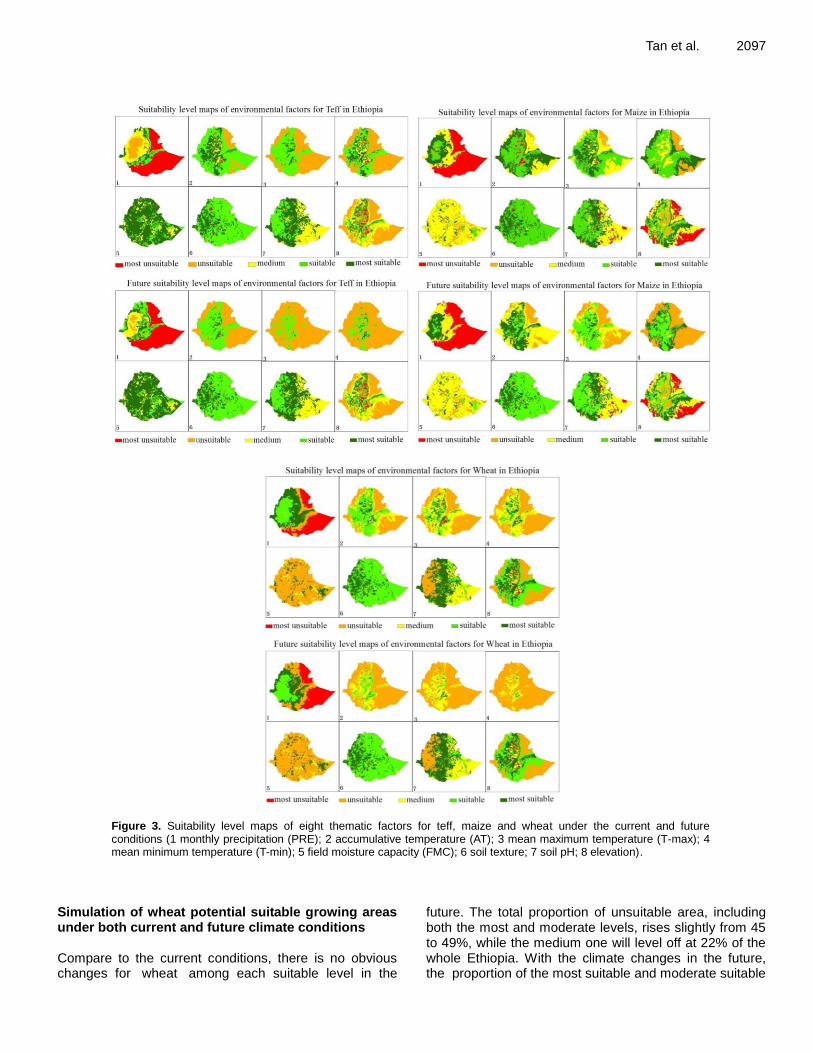
Tan et al. 2097
Figure 3. Suitability level maps of eight thematic factors for teff, maize and wheat under the current and future conditions (1 monthly precipitation (PRE); 2 accumulative temperature (AT); 3 mean maximum temperature (T-max); 4 mean minimum temperature (T-min); 5 field moisture capacity (FMC); 6 soil texture; 7 soil pH; 8 elevation).
Simulation of wheat potential suitable growing areas under both current and future climate conditions Compare to the current conditions, there is no obvious changes for wheat among each suitable level in the
future. The total proportion of unsuitable area, including both the most and moderate levels, rises slightly from 45 to 49%, while the medium one will level off at 22% of the whole Ethiopia. With the climate changes in the future, the proportion of the most suitable and moderate suitable

2098 Afr. J. Agric. Res.
Figure 4. Potential suitable distribution areas of teff under both current and future conditions.
Figure 5. Potential suitable distribution areas of maize under both current and future conditions.
Table 6. Proportion of maize suitable levels under both current and future conditions in Ethiopia.
Parameter Suitable levels
Most insuitable Moderate insuitable Medium Moderate suitable Most suitable
Current conditions (%) 15 10 30 22 23
Future conditions (%) 21 20 13 27 19
decreases 2% respectively, and its suitable area even more centralizes to higher altitude (Table 7). DISCUSSION Teff can be grown with a wide range of altitudes from near sea level to over 3000 m (Mekonnen et al., 2013). For the teff in Ethiopia, it is grown in the highlands at the best performance between 1800 and 2400 m, because it
is a cool-resistant crop (Yumbya et al., 2014). And the average annual precipitation in teff-growing areas is 1000 mm, with a range of 300 to 2500 mm (Mekonnen et al., 2013). Primarily, due to the increasing temperature and the varying rainfall, the suitable areas for teff will be centralized to the plateau of Ethiopia in 2080s. Maize is grown chiefly at approximately 1500 to 2000 m in southern, south-central, and southwestern parts of Ethiopia (Abate et al., 2015). The most suitable planting area of maize is simulated at lower altitudes along the

Tan et al. 2099
Figure 6. Potential suitable distribution areas of wheat under both current and future conditions.
Table 7. Proportion of wheat suitable levels under both current and future conditions in Ethiopia.
Parameter Suitable levels
Most unsuitable Moderate unsuitable Medium Moderate suitable Most suitable
Current conditions 30 15 22 18 15
Future conditions 27 22 22 16 13
country's western peripheries under the current conditions. However, it is moving eastward and also competing for lands with teff and wheat in the high and mid-altitudes (Figure 5). For wheat in Ethiopia, it is an important cool-weather crop predominantly in highlands which is typically produced at the altitudes of 1600 to 3200 m (Chamberlin and Schmidt, 2012). And the average annual rainfall required for wheat is 400 to 1200 mm with the average annual temperatures of 15 to 25°C (Mekonnen et al., 2013).
There is a generally consensus that in the tropical and sub-tropical climatic zones, most of the crops’ suitability decreased as the warming trend of climate change (Turner and Rao, 2013). If increased temperature is above the threshold of crops, it will lead to the death of crops (Thornton et al., 2009). In addition, evapotranspiration (ET) is one of the major components of the hydrologic cycle and it is supreme important for many investigations such as irrigation scheduling, crop yield simulation and farm management, particularly in arid environments (Khoshravesh et al., 2015; Valipour, 2014a, b). Thus, higher temperature and erratic rainfall will be expected to have a negative influence on the suitability of these three crops (teff, maize, wheat) (Figures 4, 5, and 6) through decreasing their growth and duration (Gregory et al., 2005). Under the future climate conditions, the increasing trend of temperature is projected continuously to be +0.03°C year
-1 (Jury and Funk, 2013). Altitude plays
a vital role in the distribution of crops as its impact of temperature (Mariam, 1991). The simulated result is
in agreement with the IPCC report that suitable altitude of crops will move up 100 m when the temperature rises 1°C (Alexander, 2013). Different from teff and wheat, maize is a common warm-weather cereal and it is less tolerant of cold (Chamberlin and Schmidt, 2012; Yumbya et al., 2014). Crops with cooler optimal thresholds (such as teff and wheat) may be adversely affected by higher temperatures. Teff can be planted up to 2800 m, while limited production of maize occurs above 2400 m (Chamberlin and Schmidt, 2012). Although there is a common feature of these three crops’ potential suitability, that is, the most suitable areas are all gathering to high altitudes, maize is becoming more widely grown throughout Ethiopia.
Teff has always occupied the biggest share of cultivated crop area since the start of national agricultural statistics in 1960s. However, the share of teff lands has gradually decreased by 5.8 percent over the past five decades from the 1960 to 2000s, by contrast, the share of maize areas has increased by 7.8%, while wheat remained relatively stable over this time (Se et al., 2012). In addition, maize was also the single most significant cereal in term of the number of small landholders involved in cultivation (Worku et al., 2012). It is interesting to notice that, different from the cultivated area, production growth was faster than the expansion of acreages during this period. The annual average growth of maize production was the fastest, followed by teff yield (Se et al., 2012). The average productivity of wheat in Ethiopia was very low compared to the yield in other

2100 Afr. J. Agric. Res. countries (Mekonnen et al., 2013).
The irrigation in agricultural management is a vital component to achieve the sustainable development in the world. But the value of irrigation-equipped areas as share of cultivated areas in Africa is substantially lower than the world (Valipour, 2013). Grasping the accurate knowledge about the phases of irrigation is helpful to scheduling and forecasting (Valipour et al., 2015) which may mean that these crops can be grown even in ‘unsuitable’ areas. Conclusions This study has attempted to estimate the climate change impact on rain dependent agriculture in Ethiopia by using GIS-MCE Planting Ecological Adaptability model. The result indicates that an increase in temperature and a frequent changing rainfall have negative impacts on the potential suitability of maize and wheat, especially on teff. Crops with cooler optimal thresholds (teff and wheat) are facing more adverse challenges in the future.
Hence, it was concluded that the nation and all other stakeholders should respond to climate change by formulating and implementing adaptive measures to minimize the negative effects on agriculture. Some recommended adaptation strategies are listed. Firstly, plant teff, maize and wheat to plateau and decrease the planting areas of these crops in the low altitude regions, as the suitability of these crops in low elevation has transferred into unsuitable levels. Secondly, transfer some parts of crops which are cool resistant, such as teff and wheat, into heat resistant crop, e.g. maize. Conflict of Interests The authors have not declared any conflict of interests. REFERENCES
Abate T, Shiferaw B, Menkir A, Wegary D, Kebede Y, Tesfaye K, Kassie
M, Bogale G, Tadesse B, Keno T (2015). Factors that transformed maize productivity in Ethiopia. Food Security 7:965-981.
Alexander L (2013). Summary for policymakers, Cambridge University Press. pp. 3-29.
Araya A, Keesstra S, Stroosnijder L (2010). A new agro-climatic classification for crop suitability zoning in northern semi-arid Ethiopia. Agric. For. Meteorol. 150:1057-1064.
Araya A, Stroosnijder L, Girmay G, Keesstra S (2011). Crop coefficient, yield response to water stress and water productivity of teff (Eragrostis tef (Zucc.). Agric. Water Manage. 98:775-783.
Bryan E, Deressa TT, Gbetibouo GA, Ringler C (2009). Adaptation to climate change in Ethiopia and South Africa: options and constraints. Environ. Sci. Policy 12:413-426.
Ceballos-Silva A, Lopez-Blanco J (2003). Delineation of suitable areas for crops using a Multi-Criteria Evaluation approach and land use/cover mapping: a case study in Central Mexico. Agric. Syst. 77:117-136.
Chamberlin J, Schmidt E (2012) Ethiopian agriculture: A dynamic geographic perspective. Food and Agriculture in Ethiopia: Progress and policy challenges 74:21.
Cobuloglu HI, Büyüktahtakın IE (2015). A stochastic multi-criteria
decision analysis for sustainable biomass crop selection. Expert Syst. Appl. 42:6065-6074.
Deressa TT, Hassan RM (2009). Economic impact of climate change on crop production in Ethiopia: evidence from cross-section measures. J. Afr. Econ. ejp002.
Diao X, Hazell P, Thurlow J (2010). The role of agriculture in African development. World Dev. 38:1375-1383.
Doss CR, Mwangi W, Verkuijl H, De Groote H (2003) Adoption of maize and wheat technologies in Eastern Africa: A synthesis of the findings of 22 case studies International Maize and Wheat Improvement Center.
Easterly W (2002). Growth in Ethiopia: retrospect and prospect. Center for Global Development, Institute of International Studies, Washington, DC.
Feleke S, Zegeye T (2006). Adoption of improved maize varieties in Southern Ethiopia: Factors and strategy options. Food Policy 31:442-457.
Franks S (2005). Our common interest: Report of the commission for Africa. Polit. Q. 76:446-450.
Gaffin SR, Rosenzweig C, Xing X, Yetman G (2004). Downscaling and geo-spatial gridding of socio-economic projections from the IPCC Special Report on Emissions Scenarios (SRES). Glob. Environ.Change 14:105-123.
Gebre-Selassie A, Bekele T (2014). A Review of Ethiopian Agriculture: Roles, Policy and Small-scale Farming Systems. http://global-growing.org/sites/default/files/GGC_Ethiopia.pdf
Girma A, Ababa A (2010). Teff: The Story of Ethiopia’s Biodiversity. Gregory PJ, Ingram JS, Brklacich M (2005). Climate change and food
security. Philosophical Transactions of the Royal Society B: Biol. Sci. 360:2139-2148.
Gupta S, Larson W (1979). Estimating soil water retention characteristics from particle size distribution, organic matter percent, and bulk density. Water Resour. Res. 15:1633-1635.
He WY, Luo Xl, Sun GJ (2014). The Trend of GIS-Based Suitable Planting Areas for Chinese Soybean Under the Future Climate Scenario, Ecosystem Assessment and Fuzzy Systems Management, Springer pp. 325-338.
Herrero M, Thornton P, Notenbaert A, Msangi S, Wood S, Kruska R, Dixon J, Bossio D, Steeg J, Freeman H (2012). Drivers of change in crop–livestock systems and their potential impacts on agro-ecosystems services and human wellbeing to 2030: A study commissioned by the CGIAR Systemwide Livestock Programme.
Hoogenboom G (2000). Contribution of agrometeorology to the simulation of crop production and its applications. Agric. For. Meteorol. 103:137-157.
Hordofa T, Menkir M, Awulachew SB, Erkossa T (2008). Irrigation and rain-fed crop production system in Ethiopia.
Jia CJ, Luo XI, Zhou WH, Chen YX, Sun GJ (2014). Evaluation of Suitability Areas for Maize in China Based on GIS and Its Variation Trend on the Future Climate Condition, Ecosystem Assessment and Fuzzy Systems Management, Springer. pp. 285-299.
Jury MR, Funk C (2013). Climatic trends over Ethiopia: regional signals and drivers. Int. J. Climatol. 33:1924-1935.
Kalogirou S (2002) Expert systems and GIS: an application of land suitability evaluation. Comput. Environ. Urban Syst. 26:89-112.
Kebede M, Beyene S, Abera Y (2012). Modeling the Influence of Floriculture Effluent on Soil Quality and Dry Matter Yield of Wheat on Vertisols at Debre Zeit, Ethiopia. J. Environ. Earth Sci. 2:40-50.
Khoshravesh M, Sefidkouhi MAG, Valipour M (2015). Estimation of reference evapotranspiration using multivariate fractional polynomial, Bayesian regression, and robust regression models in three arid environments. Appl. Water Sci. pp. 1-12.
Laekemariam F, Gidago G, Taye W (2012). Participatory Seeding Rates Evaluation on Teff (Eragrostis teff (Zucc.) Trotter) Using Seed Spreader in Wolaita, South Ethiopia: Farmers Evaluation and Economic Analysis. Adv. Life Sci. Technol. 5:37-42.
Malczewski J (2004). GIS-based land-use suitability analysis: a critical overview. Progress Plan. 62:3-65.
Gebre-Mariam H (1991). Wheat production and research in Ethiopia. Wheat Research in Ethiopia: A Historical Perspective, pp.1-16.
Masilionytė L, Maikštėnienė S (2011). The effect of agronomic and

meteorological factors on the yield of main and catch crops. Zemdirbyste Agric. 98:235-244.
Mati BM (2006). Overview of water and soil nutrient management under smallholder rain-fed agriculture in East Africa IWMI.
Mekonnen K, Duncan A, Kefyalew D, Bekele T, Wubet A, Amede T (2013). Enhancing communities’ adaptive capacity to climate change in drought-prone hotspots of the Blue Nile Basin in Ethiopia.
Parry M, Canziani O, Palutikof J, Van der Linden P, Hanson C (2007). Contribution of working group II to the fourth assessment report of the intergovernmental panel on climate change, 2007. Climate Change 2007: Working Group II: Impacts, Adaptation and Vulnerability.
Se AST, Dorosh P, Gemessa SA (2012). 3 Crop Production in Ethiopia: Regional Patterns and Trends. Food and agriculture in Ethiopia: Progress and Policy Challenges 74:53.
Solomon S (2007). Climate change 2007-the physical science basis: Working group I contribution to the fourth assessment report of the IPCC Cambridge University Press.
Sultan B, Roudier P, Quirion P, Alhassane A, Muller B, Dingkuhn M, Ciais P, Guimberteau M, Traore S, Baron C (2013). Assessing climate change impacts on sorghum and millet yields in the Sudanian and Sahelian savannas of West Africa. Environ. Res. Lett. 8:014040.
Tadross M, Suarez P, Lotsch A, Hachigonta S, Mdoka M, Unganai L, Lucio F, Kamdonyo D, Muchinda M (2009). Growing-season rainfall and scenarios of future change in southeast Africa: implications for cultivating maize. Climate Res. 40:147-161.
Taffesse AS (2008). Decomposition of growth in cereal production in Ethiopia. DFID funded study" Understanding the constraints to continued rapid growth in Ethiopia: the role of agriculture.
Temesgen M, Rockstrom J, Savenije H, Hoogmoed W, Alemu D (2008). Determinants of tillage frequency among smallholder farmers in two semi-arid areas in Ethiopia. Physics and chemistry of the earth, parts A/B/C 33:183-191.
Tesemma T, Tsegaye S, Belay G, Bechere E, Mitiku D (1998). Stability of performance of tetraploid wheat landraces in the Ethiopian highland. Euphytica 102:301-308.
Thompson HE, Berrang-Ford L, Ford JD (2010). Climate change and food security in sub-Saharan Africa: A systematic literature review. Sustainability 2:2719-2733.
Thornton PK, Jones PG, Alagarswamy G, Andresen J (2009). Spatial variation of crop yield response to climate change in East Africa. Glob. Environ. Change 19:54-65.
Turner NC, Rao K (2013). Simulation analysis of factors affecting sorghum yield at selected sites in eastern and southern Africa, with emphasis on increasing temperatures. Agric. Syst. 121:53-62.
Tan et al. 2101 Valipour M (2012). Hydro-module determination for vanaei village in
Eslam Abad Gharb, Iran. ARPN J. Agric. Biol. Sci. 7:968-976. Valipour M (2013). Evolution of irrigation-equipped areas as share of
cultivated areas. Irrig. Drain. Syst. Eng. 2:e114. Valipour M (2014a). Analysis of potential evapotranspiration using
limited weather data. Appl. Water Sci. pp. 1-11. Valipour M (2014b). Application of new mass transfer formulae for
computation of evapotranspiration. J. Appl. Water Eng. Res. 2:33-46. Valipour M (2015). Assessment of Important Factors for Water
Resources Management in European Agriculture. J. Resour. Hydraulic Eng. 4:171-180.
Valipour M, Sefidkouhi MAG, Eslamian S (2015). Surface irrigation simulation models: a review. International J. Hydrol. Sci. Technol. 5:51-70.
Washington R, New M, Hawcroft M, Pearce H, Rahiz M, Karmacharya J (2012). Climate change in CCAFS regions: Recent trends, current projections, crop-climate suitability, and prospects for improved climate model information.
Worku M, Twumasi Afriyie S, Wolde L, Tadesse B, Demisie G, Bogale G, Wegary D, Prasanna B (2012). Meeting the challenges of global climate change and food security through innovative maize research. Proceedings of the National Maize Workshop of Ethiopia, 3; Addis Ababa, Ethiopia; 18-20 April, 2011 CIMMYT.
Yumbya J, De Vaate MB, Kiambi D, Kebebew F, Rao KPC (2014). Geographic information systems for assessment of climate change effects on teff in Ethiopia. Afr. Crop Sci. J. 22:847-858.
Vol. 11(24), pp. 2102-2111, 16 June, 2016
DOI: 10.5897/AJAR2016.11013
Article Number: D4445BC58971
ISSN 1991-637X
Copyright ©2016
Author(s) retain the copyright of this article
http://www.academicjournals.org/AJAR
African Journal of Agricultural Research
Full Length Research Paper
Nutritional technological characterization and secondary metabolites in stored carioca bean cultivars
Rose Mary Helena Quint Silochi1*, Silvia Renata Machado Coelho1, Tabata Zingano Bischoff1, Flávia Danieli Rech Cassol1, Naimara Vieira do Prado2 and Priscila Zaczuk Bassinello3
1Program in Agricultural Engineering – PGEAGRI, Western Paraná State University, Cascavel, Brazil.
2ESALQ, University of São Paulo Piracicaba, SP, Brazil.
3Food Science Researcher, Embrapa Rice and Beans, Santo Antônio de Goiás, Goiás State, Brazil.
Received 17 March, 2016; Accepted 20 May, 2016
The recommendation of bean cultivars and the use of appropriate storage techniques allow the quality characteristics of these grains to be preserved for human consumption. The aim of this study was to characterize the effects of storage on three cultivars of the common carioca bean in raw form and to determine the relationships between storage time and technological quality parameters involved in the darkening and hardening of grains, the chemical composition of the beans and the presence of secondary metabolites. The experiment followed a completely randomized design (CRD) with a full factorial scheme consisting of two factors: bean cultivars, with three levels and storage time, with five levels. The color parameters and the storage times significantly differed between the cultivars. The cooking time, when compared to the water absorption index, indicated that the cultivars had, on average, a high percentage of moisture (>95%) and an average cooking time of 17 min., this applies to the control, while values increase during the storage time. Storage under ambient conditions led to a reduction in grain brightness parameters, characterized by darkening and hardening; no reduction in protein and mineral content; and an increase in iron, phosphorous, tannin, and phytic acid contents at 180 days. Key words: Cooking time, grain color, multivariate analysis, phaseolus vulgaris.
INTRODUCTION The common bean (Phaseolus vulgaris L.) is one of the most important foods in the Brazilian diet, as it is an excellent source of essential nutrients, with significant concentrations of protein, carbohydrates (especially
starch), fiber, vitamins, and minerals (Borém and Carneiro, 2011). Ensuring and preserving nutritional qualities is a primary and essential condition to safeguard the technological quality of beans, as they are the staple
*Corresponding author. E-mail: [email protected]
Author(s) agree that this article remain permanently open access under the terms of the Creative Commons Attribution
License 4.0 International License

food of the Brazilian population in both rural and urban areas (Ramírez-Cárdenasi et al., 2008).
Brazil ranks first and third in the global consumption and production of the common bean, respectively. Among the many commercial groups, beans of the carioca group stand out, as they are a preferred type and represent approximately 70% of the domestic consumer market (Albrecht and Carvalho, 2006). Therefore, they receive greater attention from genetic breeding programs, in which characteristics related to chemical composition (as a function of storage conditions), such as mineral content and secondary metabolites, have been gaining importance for research because they are determinants of the nutritional quality of these legumes.
The quality of beans is determined by two factors: their technological characteristics, which determine acceptance and consumption by consumers, and their nutritional value. Technological characteristics include physical attributes, such as color, brightness, and texture, and they are related to cooking time. Their nutritional value specifies the chemical composition of beans with respect to protein, vitamin, and mineral content. Cooking or technological qualities include, in particular, the ability to be rapidly hydrated, which contributes to reduced cooking time, thick broth, good flavor, and pleasing texture, as well as moderately split beans, thin skin, and good color stability (Bassinello, 2016).
Depending on the variety, the color of the bean tegument is an influential trait at the time of purchase by the final consumer. For example, the carioca cultivar has a light-beige color with brown stripes, and its darkening indicates longer storage time, which contributes to an increase in cooking time (Coelho et al., 2009). The colorful varieties, such as yellow, pink, red, and black beans, have teguments rich in anthocyanins and other phenolic compounds that give the beans antioxidant properties (McGee, 2014), which are associated with desirable nutritional quality by consumers. which are associated with desirable nutritional quality by consumers. This variability is important for diets based on food chemical composition tables, which normally do not have specific values for different bean cultivars or their possible changes in the course of harvest years. In addition, beans of improved nutritional quality and with specific characteristics could be provided to populations worldwide and thus meet their consumption (Prolla et al., 2010) and nutritional needs.
The technological and nutritional quality of different bean cultivars stored under ambient conditions has been little studied. It is important to evaluate the effect of this factor during the storage period at ambient conditions, considering that in Brazil, beans are cultivated for the most part on small, rural properties, where storage conditions are inadequate (Embrapa, 2016). From the point of view of consumers, aspects related to the physical characteristics of beans, such as color, size, shape, and cooking quality, including fast hydration, low
Silochi et al. 2103
cooking time, thick broth, flavor, and texture are the most essential. However, improper storage causes undesirable alterations in the final product (Bassinello, 2008).
This aim of this study was to characterize the effects of storage on three carioca cultivars of the common bean (P. vulgaris L.) in its raw form and to determine the relationships between storage and technological quality parameters involved in the darkening and hardening of the beans (color and cooking time), the chemical composition of the beans (proteins, iron (Fe), manganese (Mn), zinc (Zn), and phosphorus (P)), and the presence of secondary metabolites (phytic acid and tannins). MATERIALS AND METHODS
The experiment was conducted at the Laboratory for Quality Control of Agricultural Products of Western Paraná State University (Universidade Estadual do Oeste do Paraná—UNIOESTE), Cascavel campus, in partnership with The Brazilian Agricultural Research Corporation (EMBRAPA) – Rice and Beans, in Santo Antônio de Goiás, Goiás (GO) and EMBRAPA, Ponta Grossa research station, Paraná (PR), from October 2012 to July 2014.
The samples were three cultivars of the common bean (P. vulgaris L.) – carioca commercial group (BRS Estilo, BRS Madrepérola, and BRS Pontal), produced by EMPRAPA – Rice and Beans, from the wet season crop (2012-2013), planted on November 26, 2012 in Ponta Grossa (PR). The area sampled measured 1000 m2, and the topography was slightly sloping and well drained. It had approximately 25 years of use with prior bean cultivation, and it originally had field vegetation. The area was fertilized with 300 kg per hectare of monoammonium phosphate (MAP) (11% N and 52% P2O5), with 0.45 m spacing between rows and 12 plants per linear meter. Plots were manually harvested, and the pods were mechanically threshed. Next, the beans were naturally dried to 13% (wet basis) moisture. After harvest, the samples were allocated into three replicates for each cultivar (for each storage period) and placed in brown paper bags with 500 g capacity each, in their own room, in the Laboratory for Quality Control of Agricultural Products – LACON.
The beans of the three cultivars were stored on open shelves with natural ventilation, at room temperature with an annual mean of 25°C, and away from direct light for a total of 180 days with no humidity control. This location experiences little influence from external conditions (light, temperature, and humidity) and resembles storage in small family farms where, for the most part, the storage environment does not have temperature or humidity control.
In whole beans, the parameters color and water content (moisture) of control cultivars were analyzed at 20 days after harvest. When each storage period was complete, the beans were separated into samples of whole beans and ground beans, packaged in polyethylene bags, and stored in a domestic freezer (-18°C) until analysis.
The tegument color of the recently harvested cultivars (control) and of the stored grains were determined by direct reading in a Konica Minolta® CR-410 colorimeter with an aperture of 50 mm. The colorimeter used the color coordinates L*, a*, and b*. The coordinate L* represent the luminosity, the color parameter a* has positive values for reddish colors and negative values for greenish tones (-60 to 60), and the color component b* has positive values for colors with yellow tones and negative values for blue tones (-60 to 60) (Granato and Masson, 2010). The beans were placed in the granular material attachment (model CR-A50), and the readings were performed in triplicate for each cultivar (Oomah et al., 2011).

2104 Afr. J. Agric. Res. From the L*, a*, and b* values, the following colorimetric indices were calculated: chroma (C*), which defines the intensity and purity of a color, and Hue angle (H°). The parameters color angle Hue (H*), Chromaticity (C*), and Δe, which is the total difference in color compared with the initial color, were determined. The color results were expressed in terms of Cielab scale parameters, as follows:
*
*tan* 1
a
bH
(1) H* = color angle Hue; a* = color component read-green; b* = color component yellow-blue.
22*** baC
(2) C* = Chroma; b* = color component red-green; color component yellow-blue.
222*)(***e baL
(3) Δe* = difference between the of the sample relative to the standard or control; ΔL*= difference between the luminosity of the sample relative to the control; Δa* = difference between the coordinate a* of the sample relative to the control; Δb* = difference between the coordinate b* of the sample relative to the control. For moisture content, three replicates of 10 g of each sample (whole beans) were weighed, following the standard oven method (Brasil, 2009).
Cooking time was determined with the aid of a modified Mattson cooker method (Proctor and Watts, 1987). The modified Matsson cooker had 25 rods measuring 20 cm in length and weighing 82 g each. Cooking time was considered complete when 50% plus 1 of the beans were pierced by the drop of the 13th rod, that is, by the drop of 52% of the rods.
To evaluate electrical conductivity, the method described by Corrêa and Afonso Júnior (1999), was used. The electrical conductivity of the solution was obtained with a conductivity meter (TECNAL, model TEC–4MP). The values of the reading were divided by the sample weight in grams, and the results are expressed as µS·cm-1g-1.
The hydrogen potential (pH) was obtained with a portable digital pH meter with automatic temperature compensation, model pH – 221, following the technique described by the Adolfo Lutz Institute (IAL, 2008; Rigueira et al., 2009). The protein content was determined from the total nitrogen (N) content of the samples using the micro-Kjeldahl method (Silva and Queiroz, 2009). The contents of Fe, Mn, and Zn were determined with an atomic absorption spectrophotometer following the method proposed by Malavolta (2006). A 0.2 g aliquot of sample (50 mesh flour). The results for Fe, Mn, and Zn are expressed in mg·kg-1.
P was determined by colorimetry (flow injection analysis - FIA) in a spectrophotometer (FEMTO – 700 Plus), was read in a colorimetric (725 nm). The results for P are expressed in g·kg-1 (Malavolta et al., 1997). Phytic acid was analyzed using the colorimetric method described by Latta and Eskin (1980), with modification of the resin to DOWEX – AGX-4. After extraction, the samples were read in a spectrophotometer (500 nm). The tannins in the beans were determined using the Folin-Denis spectro-photometric method (Horwitz, 1995), with adaptations. The absorbance was read at 765 nm and the results are expressed in g
phenols (tannic acid) g-1 ms-1. The experiment followed a completely randomized desig with full factorial scheme, with two factors: carioca bean cultivars (Factor 1) with three levels (BRS Estilo, BRS Madrepérola, and BRS Pontal) and storage time (Factor 2) with five levels (initial period (control) and 60, 90, 135, and 180 days of storage).
An exploratory analysis of the results was conducted, in which the following were calculated: mean, variance, standard deviation, and coefficient of variation. The data obtained were tested for normality (Shapiro-Wilk test) and homogeneity of variances (Hartley test), both at a significance level of 5%. Analysis of variance and comparison of means (Tukey’s test) were performed considering a significance level equal to or less than 5% probability (p<0.05). After these analyses, the data were subjected to multivariate analysis to determine whether there was a correlation between the studied variables. Multivariate analysis of variance (MANOVA) was used to evaluate whether the effects of the factors on the response variables were significant, with a significance level equal to or less than 5%. All statistical analyses were performed using the software R (Development Core Team R, 2016).
RESULTS AND DISCUSSION
The mean luminosity L* values, indicative of the brightness of the tegument of the three bean cultivars in the five storage periods, decreased over time, contributing to the darkening of the bean, which is considered a negative trait in beans of the carioca class because it can indicate an undesirable, hard texture with increased cooking time. The mean luminosity L* value among the evaluated control cultivars was L* 55.93, which is 2.93 points higher than the L* value of 53.00, the standard mean for carioca beans reported by Carneiro et al. (2000).
The cultivar BRS Madrepérola had the highest brightness, with a mean L* of 58.51. It is worth noting that the evaluated cultivars had higher luminosity values compared with other studies (Silva et al., 2009; Lopes, 2011; Schoeninger et al., 2014; Siqueira et al. 2014), and can be characterized as having light teguments, and consequently may achieve a higher market value. As there was no interaction among cultivars (p-value = 0.4631), Tukey’s test was used to compare the mean L* for each cultivar and at each time. Figure 1 (a) and (b) show the differences in color among cultivars and storage times for the parameter L*.
There was a decrease in the variables a* and b* for all cultivars stored for 180 days compared to those stored for 60, 90, and 135 days. The chromaticity a* values of the control beans, whose variation in color ranged from green to red, indicated that BRS Pontal had a higher a* value, 5.04 (reddish coloration), compared to BRS Estilo and to BRS Madrepérola. The chromaticity values a* and b* in carioca beans reported in the literature are on average a* = 7.21 and b* = 12.92 as reported by Silva et al. (2009); a* = 8.20 and b* = 14,36 as reported by Schoeninger et al., (2014); and a* = 6.85 and b* = 12.05 for carioca beans grown in the rainy season as reported by Lopes (2011). Regarding the influence of storage time on b*, the analysis of variance was significant (p-value =

Silochi et al. 2105
(a) (b)
Figure 1. Comparison of mean L* values (a) for each genotype (BRS Estilo (E), BRS Madrepérola (M) and BRS Pontal (P)) and (b) for each storage time (0, 60, 90, 135 and 180 days).
0.0198) for the interaction between cultivar and storage time for the cultivars BRS Estilo, Madrepérola, and Pontal.
For the values that measured the intensity and purity of color, represented by the chroma index C*, beans of the cultivar BRS Estilo had greater color intensity at all storage periods, with values ranging between 11 and 12. The lowest C* value was associated with the shortest storage time, confirming that color intensity increased with the aging of the bean. The higher the C* value, the more noticeable the product will be to human vision (Granato and Masson, 2010). This characteristic could be the differentiating factor in the quality of carioca beans at the time of purchase by the consumer.
For the H° of the three cultivars in the initial period (control), the largest angle was observed for BRS Madrepérola (H° 72.20), with a predominance of yellow color. This result reinforces the value found for chromaticity b* in the same cultivar (BRS Madrepérola), which was close to yellow. The mean value found in this study for the cultivars and storage times was H° = 61.42. A similar H° value (60.27) was reported for raw carioca beans by Schoeninger et al. (2013).
In general, the color parameters (L*, a*, b*, C*, and H°) analyzed for the three cultivars and storage times significantly differed (p < 0.05), except for the interaction between cultivar and time for L* and C* (p-value = 0.0681). The total color difference between the control
beans and the cultivars in their respective storage periods was calculated by the difference in color between samples, using the values obtained for L*, a*, and b* (Table 1).
The cultivar that had the lowest color variation (Δe*) across the four storage periods was BRS Madrepérola. The longer the storage period, the greater the color difference, that is, the more noticeable the difference was between samples over time and the recently harvested bean (control). The smaller the color difference between carioca beans of the same cultivar over the storage period, especially under ambient conditions, the higher their market value will be.
Table 2 shows the results of the analyses of technological quality. The mean water content values for the three bean cultivars decreased over the five storage times evaluated. This reduction may have been due to hygroscopic equilibrium between the initial moisture content of the beans and the environment in which they were stored, for the three cultivars in time (control, 60, 90, 135 and 180 days).
There was a significant difference (p = 0.0000) in the water content of the bean cultivar across storage times. The water absorption percentages before cooking, obtained for the control beans of evaluated cultivars, were, on average, 100.57%. There was an interaction between the factors, indicating differences (p-value = 0.0017) among the cultivars according to time of analysis.

2106 Afr. J. Agric. Res.
Table 1. Differences in color parameters (ΔL*, Δa*, Δb*, Δe*) of the cultivars BRS Estilo (E), BRS Madrepérola (M), and BRS Pontal (P) at the different storage times (60, 90, 135, 180 days).
Genotype ΔL* Δa* Δb* Δe*
BRS E60 1.28 2.15 0.45 2.54
BRS E90 1.39 2.15 0.57 2.62
BRS E135 1.83 2.44 0.25 3.07
BRS E180 2.57 2.29 0.04 3.44
BRS P60 2.38 1.60 0.03 2.86
BRS P90 2.27 1.99 0.04 3.02
BRS P135 2.72 1.96 0.01 3.36
BRS P180 3.27 1.13 0.01 3.46
BRS M60 0.71 0.85 1.30 1.72
BRS M90 0.73 0.87 1.14 1.61
BRS M135 0.72 0.96 1.16 1.67
BRS M180 2.08 0.26 0.14 2.10
ΔL* = difference between the L* of the stored sample and the control L*; Δa* = difference between the a* of the stored sample and the control a*; Δb* = difference between the b* of the stored sample and the control b*; Δe* = difference between the color parameters of the stored sample and the control.
When compared with the water absorption index, the results for cooking time demonstrated that the cultivars had, on average, a high percentage of hydration, above 95%, which might have contributed to the rapid cooking time observed, with an overall mean of 17.66 min.
According to the reference values for cooking time proposed by Proctor and Watts (1987), the three cultivars (BRS Estilo, BRS Madrepérola, BRS Pontal) had an average susceptibility level of resistance to cooking (16 to 20 min), with BRS Pontal having the lowest susceptibility to the hardening phenomenon, also known as hard-to-cook (HTC).
Nyakuni et al. (2008) evaluated four common bean cultivars stored at room temperature found that the cooking time increased over storage for 4 cultivars.
It is worth mentioning that the water absorption characteristics of the cultivars had unexpected values, such as the increase in percentage with the increase in days in storage. Therefore, this factor could have influenced the cooking time results starting at 90 days of storage. For the cultivar Pontal, for example, an increase in cooking time was observed at 60 days and a decrease at 90, 135, and 180 days (Table 2).
The values obtained for the parameter electrical conductivity indicated the deterioration of beans during storage. The overall mean electrical conductivity among cultivars in the initial period (control) was 40.23 μS·cm
-1,
reaching 76.00 μS·cm-1
at the end of storage. In the last storage period (180 days), there was an increase in this value for all cultivars, with BRS Pontal leaching the most mineral ions. That is, there was a degradation of the cell wall in this cultivar, suggesting that it is more susceptible to aging when stored under normal ambient conditions. ANOVA confirmed that there was an interaction for electrical conductivity between the factors cultivar and
storage time (p = 0.0000), confirming the variability among cultivars and during storage.
The mean pH values of the recently harvested (control) and stored (60, 90, 135, and 180 days) beans were close to 7.0 for the three cultivars (pH = 6.69), a required factor for the technological and nutritional quality of beans. An acidic pH value is a characteristic of aged beans, occurring especially due to inadequate storage and/or storage for long periods. The ANOVA results revealed a significant interaction (p-value = 0.0071) between cultivar and storage time, with different performance for both factors.
The reduction in pH stored beans is associate with an increase in acidity over storage time (Coelho et al., 2013) and we believe that the differences reported up to this point can be attributed to genetic differences among the evaluated cultivars. The crude protein content in beans varies according to the genotype, the environment, and the conditions to which they were subjected during cultivation. The average composition of proteins in common raw beans of the carioca group, as reported in national studies, is 20% (Unicamp, 2011). The results obtained in this study were within the expected protein values, with averaging 19% (Table 3). The cultivar BRS Madrepérola had on average the highest protein content (20%) throughout storage. The percentage of protein in the beans was preserved during storage, a required factor considering that the cooking process significantly reduces the protein composition of cooked beans. These results corroborate those reported by Coelho et al. (2012) who found the following protein contents in raw beans stored under normal ambient conditions: control (21.24%), and 12 months (21.37%) of storage. There was a significant interaction for protein content between the factors cultivar and storage time (p-value = 0.0023),

Silochi et al. 2107
Table 2. Means of the technological quality parameters water content, water absorption, cooking time, electrical conductivity, and pH of carioca bean cultivars stored for 0 (control) 60, 90, 135, and 180 days.
Cultivars/Time Control 60 90 135 180
Water Content (%)
BRS Estilo 18.21±0.08Ba
14.39±0.31Cb
14.45±0.19Cb
11.13±0.10Bc
9.63±0.09Ac
BRS Mpérola 28.32±1.83Aa
12.25±0.04Bcb
13.21±0.50Bb
13.89±3.68Bb
9.62±0.48Ac
BRS Pontal 19.68±1.55Ba
15.67±0.04Cb
14.93±0.36Cb
11.16±0.28Bc
9.26±0.02Ac
Cultivars Water Absorption (%)
BRS Estilo 94.08±1.06Bc
93.19±0.75Bc
104.18±3.53Ab
100.36±2.64Aab
115.10±6.75Aa
BRS Mpérola 99.52±0.71Aa
99.77±4.06Aa
96.35±2.30Aa
102.83±1.14Aa
105.00±10.01Aa
BRS Pontal 93.61±1.28Bb
93.69±1.49ABb
103.54±4.6Aa
103.92±0.75Aa
103.47±1.17Aa
Cultivars Cooking Time (min)
BRS Estilo 16.30±0.26Cc
33.57±0.49Aa
30.98±0.69Aa
26.00±2.65Bb
31.33±1.15Aa
BRS Mpérola 19.00±0.00Ac
31.92±0.98Aa
30.71±0.65Aa
30.71±0.65Aa
24.26±1.69Bb
BRS Pontal 17.67±0.58Bc
31.92±0.98Aa
29.50±3.68Aa
19.74±1.46Cc
24.26±1.69Bb
Cultivars Electrical Conductivity (µS.cm-1
)
BRS Estilo 36.60±1.64Ac
75.11±4.63Aa
57.55±2.28Ab
70.04±3.36Ba
69.97±4.08Ba
BRS Mpérola 42.79±3.82Ac
37.40±1.30Cc
36.41±2.02Bc
80.67±2.08Aa
63.89±2.10Bb
BRS Pontal 41.32±3.43Ad 65.08±2.85
Bb 56.08±2.95
Ac 55.45±3.07
Cc 94.14±1.57
Aa
Cultivars Hydrogen Potential (pH)
BRS Estilo 6.72±0.01Aa
6.58±0.01Ab
6.55±0.07ABb
6.55±0.04ABb
6.57±0.03Ab
BRS Mpérola 6.63±0.05Aa
6.59±0.02Aa
6.63±0.03Aa
6.63±0.04Aa
6.53±0.02Aa
BRS Pontal 6.71±0.12Aa
6.55±0.10Ab
6.47±0.02Bb
6.48±0.02Bb
6.46±0.02Bb
BRS Mpérola = Madrepérola; the mean of three replicates ± standard deviation; the same lowercase letters in rows (time) represent statistically equal means at 5% significance; the same uppercase letters in columns (cultivar) represent statistically equal means at 5% significance.
indicating that at least part of the differences could be attributed to the genetic differences between the evaluated cultivars.
The mineral composition of the cultivars (Table 3) included micronutrients essential to the daily diet, namely Fe, Mn, Zn, and P. Regarding the Fe concentrations, the cultivars BRS Estilo, BRS Madrepérola, and BRS Pontal differed significantly (p-value = 0.0000) among storage periods (60, 90, 135, and 180 days), indicating the existence of an interaction between cultivar and storage time. Storage promoted an increase in the Fe content, with means of 47 to 144 mg·kg
-1 Fe/sample, with
differences among the cultivars (p-value = 0.0000*) and greater variation from 135 to 180 days. This increase could be due to the genetic differences among the cultivars and to the storage time and environment. Buratto (2012) investigated the Fe content in three tissues (cotyledon, embryonic axis, and tegument) in 10 different bean cultivars and found a higher fraction of Fe in the embryonic axis, at 95 to 128 mg·kg
-1, and there
were differences among cultivars (p-value < 0.01). In the cotyledons, the Fe content was similar in 100% of
cultivars (33.69 to 42.17 mg·kg-1
). This increase could be due to the genetic differences
among the cultivars and to the storage time and environment. For manganese (Mn), the interaction between cultivar and time was significant (p-value = 0.0000); storage promoted an increase in Mn content, except at 180 days. In 21 strains of beans, Mesquita et al. (2007) found Mn contents of 14.93 to 28.9 mg·kg
-1,
results corroborated by the present study. Similar results were reported by Silva et al. (2013) for Mn, with means of 17.18 in raw beans (Pontal and commercial). Buratto (2012) evaluated the effect of genetic variability on mineral accumulation in the tegument, cotyledon, and embryonic axis and found Mn concentrations between 3.60 and 5.38 mg·kg
-1 in the tegument, 11.00 and 18.60
mg·kg-1
in the cotyledon, and 14.80 and 17.20 mg·kg-1
in the embryonic axis.
Our results for P concentration are close to those reported by Prolla et al. (2010), who reported P contents varying between 3.35 and 3.58 g·kg
-1 per sample of raw
beans in 16 cultivars. The mean content of P in raw beans reported by Oliveira (2009) was 4.73 g·kg
-1, and
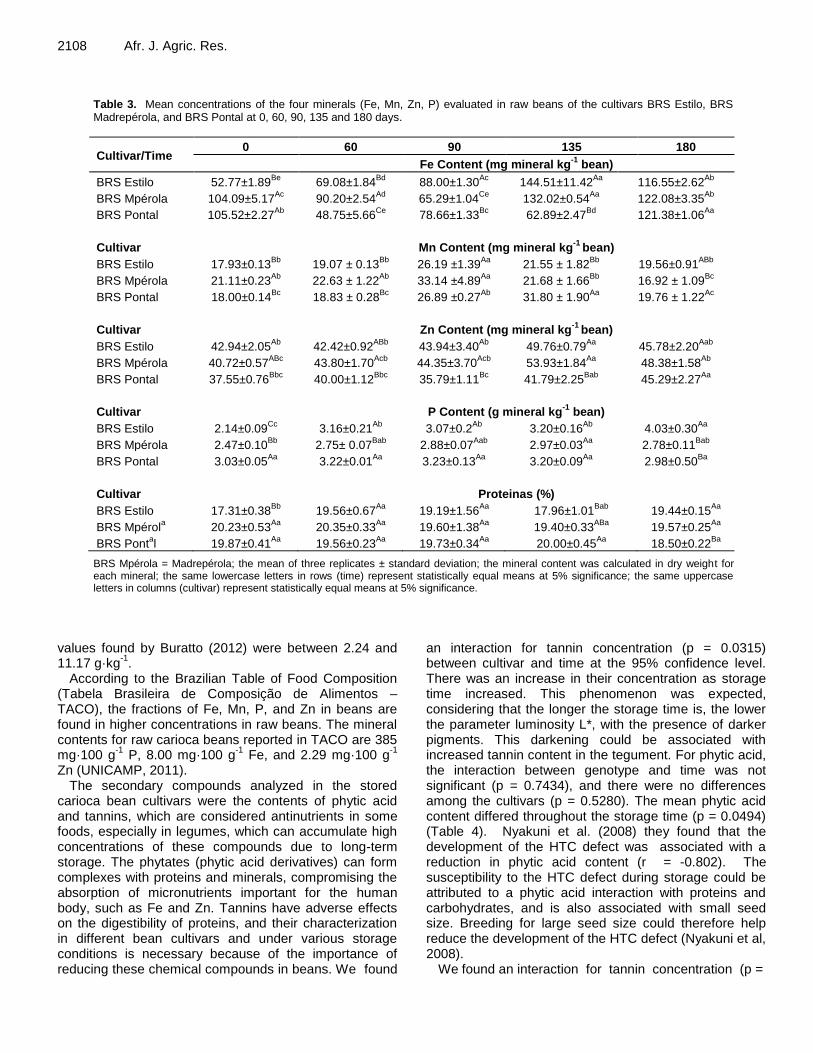
2108 Afr. J. Agric. Res.
Table 3. Mean concentrations of the four minerals (Fe, Mn, Zn, P) evaluated in raw beans of the cultivars BRS Estilo, BRS Madrepérola, and BRS Pontal at 0, 60, 90, 135 and 180 days.
Cultivar/Time 0 60 90 135 180
Fe Content (mg mineral kg-1
bean)
BRS Estilo 52.77±1.89Be
69.08±1.84Bd
88.00±1.30Ac
144.51±11.42Aa
116.55±2.62Ab
BRS Mpérola 104.09±5.17Ac
90.20±2.54Ad
65.29±1.04Ce
132.02±0.54Aa
122.08±3.35Ab
BRS Pontal 105.52±2.27Ab
48.75±5.66Ce
78.66±1.33Bc
62.89±2.47Bd
121.38±1.06Aa
Cultivar Mn Content (mg mineral kg-1
bean)
BRS Estilo 17.93±0.13Bb
19.07 ± 0.13Bb
26.19 ±1.39Aa
21.55 ± 1.82Bb
19.56±0.91ABb
BRS Mpérola 21.11±0.23Ab
22.63 ± 1.22Ab
33.14 ±4.89Aa
21.68 ± 1.66Bb
16.92 ± 1.09Bc
BRS Pontal 18.00±0.14Bc
18.83 ± 0.28Bc
26.89 ±0.27Ab
31.80 ± 1.90Aa
19.76 ± 1.22Ac
Cultivar Zn Content (mg mineral kg-1
bean)
BRS Estilo 42.94±2.05Ab
42.42±0.92ABb
43.94±3.40Ab
49.76±0.79Aa
45.78±2.20Aab
BRS Mpérola 40.72±0.57ABc
43.80±1.70Acb
44.35±3.70Acb
53.93±1.84Aa
48.38±1.58Ab
BRS Pontal 37.55±0.76Bbc
40.00±1.12Bbc
35.79±1.11Bc
41.79±2.25Bab
45.29±2.27Aa
Cultivar P Content (g mineral kg-1
bean)
BRS Estilo 2.14±0.09Cc
3.16±0.21Ab
3.07±0.2Ab
3.20±0.16Ab
4.03±0.30Aa
BRS Mpérola 2.47±0.10Bb
2.75± 0.07Bab
2.88±0.07Aab
2.97±0.03Aa
2.78±0.11Bab
BRS Pontal 3.03±0.05Aa
3.22±0.01Aa
3.23±0.13Aa
3.20±0.09Aa
2.98±0.50Ba
Cultivar Proteinas (%)
BRS Estilo 17.31±0.38Bb
19.56±0.67Aa
19.19±1.56Aa
17.96±1.01Bab
19.44±0.15Aa
BRS Mpérola 20.23±0.53
Aa 20.35±0.33
Aa 19.60±1.38
Aa 19.40±0.33
ABa 19.57±0.25
Aa
BRS Pontal 19.87±0.41
Aa 19.56±0.23
Aa 19.73±0.34
Aa 20.00±0.45
Aa 18.50±0.22
Ba
BRS Mpérola = Madrepérola; the mean of three replicates ± standard deviation; the mineral content was calculated in dry weight for each mineral; the same lowercase letters in rows (time) represent statistically equal means at 5% significance; the same uppercase letters in columns (cultivar) represent statistically equal means at 5% significance.
values found by Buratto (2012) were between 2.24 and 11.17 g·kg
-1.
According to the Brazilian Table of Food Composition (Tabela Brasileira de Composição de Alimentos – TACO), the fractions of Fe, Mn, P, and Zn in beans are found in higher concentrations in raw beans. The mineral contents for raw carioca beans reported in TACO are 385 mg·100 g
-1 P, 8.00 mg·100 g
-1 Fe, and 2.29 mg·100 g
-1
Zn (UNICAMP, 2011). The secondary compounds analyzed in the stored
carioca bean cultivars were the contents of phytic acid and tannins, which are considered antinutrients in some foods, especially in legumes, which can accumulate high concentrations of these compounds due to long-term storage. The phytates (phytic acid derivatives) can form complexes with proteins and minerals, compromising the absorption of micronutrients important for the human body, such as Fe and Zn. Tannins have adverse effects on the digestibility of proteins, and their characterization in different bean cultivars and under various storage conditions is necessary because of the importance of reducing these chemical compounds in beans. We found
an interaction for tannin concentration (p = 0.0315) between cultivar and time at the 95% confidence level. There was an increase in their concentration as storage time increased. This phenomenon was expected, considering that the longer the storage time is, the lower the parameter luminosity L*, with the presence of darker pigments. This darkening could be associated with increased tannin content in the tegument. For phytic acid, the interaction between genotype and time was not significant (p = 0.7434), and there were no differences among the cultivars (p = 0.5280). The mean phytic acid content differed throughout the storage time (p = 0.0494) (Table 4). Nyakuni et al. (2008) they found that the development of the HTC defect was associated with a reduction in phytic acid content (r = -0.802). The susceptibility to the HTC defect during storage could be attributed to a phytic acid interaction with proteins and carbohydrates, and is also associated with small seed size. Breeding for large seed size could therefore help reduce the development of the HTC defect (Nyakuni et al, 2008).
We found an interaction for tannin concentration (p =

Silochi et al. 2109
Table 4. Mean tannin (mg·kg-1) and phytic acid (µg·µg-1) content in stored carioca bean cultivars.
Cultivar/Time 0 60 90 135 180
Tannin Content (mg.100 g-1
)
BRS Estilo 243.03Bb
298.72±1.89Ab
234.77±1.20Bb
277.52±1.1Bab
316.30±0.56Aa
BRS Mpérola 237.51Bc
315.15±1.75Aab
275.67±1.45ABbc
273.84±1.03Bbc
342.78±2.02Aa
BRS Pontal 359.21Aa
342.38±1.02Aa
352.10±1.59Aa
314.24±1.49Aa
365.95±0.70Aa
Phytic Acid Content (µg.µg-1
)
BRS Estilo 0.14±0.02Aa
0.11± 0.03Aab
0.14± 0.04Aab
0.10±0.01Ab
0.14± 0.01Aa
BRS Mpérola 0.10±0.04Aab
0.12± 0.01Aab
0.12± 0.01Aab
0.10± 0.01Ab
0.14± 0.01Aa
BRS Pontal 0.10±0.03Aab
0.11± 0.01Aab
0.10± 0.01Aab
0.10± 0.00Ab
0.14± 0.00Aa
BRS Mpérola = Madrepérola; the mean of three replicates ± standard deviation; the tannin and phytic acid contents were calculated in dry weight; the same lowercase letters in rows (time) represent statistically equal means at 5% significance; the same uppercase letters in columns (cultivar) represent statistically equal means at 5% significance.
Table 5. Correlation matrix Spearmann for the variables pH, conductivity and storage time.
Variables pH Storage Time
pH 1 -0.809
Storage time -0.809 1
Variables Conductivity Storage Time
Conductivity 1 0.929
Storage time 0.929 1
in bold are different from 0 with a significance level alpha = 0.05.
0.0315) between cultivar and time at the 95% confidence level. There was an increase in their concentration as storage time increased (Table 4), for all the cultivars. This phenomenon was expected, considering that the longer the storage time is, the lower the parameter luminosity L*, with the presence of darker pigments. This darkening could be associated with increased tannin content in the tegument.
The total content of beans in 50 cultivars studied, phytic acid myo-inositol hexaphosphate, or their phytate salts represented 54 to 82% with an average of 69.30%. The phytic acid content of the beans varies from 0.54 to 1.58%, more than 99% in soluble form, the total phos-phorus from 0.26 to 0.56%, the inorganic phosphorus 0.021 to 0.044 and% organic phosphorus, which does not phytic acid, 0.05 to 0.135% (Lolas et al., 1976). It should be noted that phytic acid contains approximately 70% of the phosphate content of legume seeds (Lolas et al., 1976).
Correlation analysis was used to determine which variables were correlated. Our intention was to detect whether the technological and chemical (nutritional) variables were correlated with the cultivar or the storage time. As pH and electrical conductivity are quickly obtainable measurements, in addition to being
inexpensive, it is worth noting the behavior of these variables and their respective correlations. Some cultivars had high correlations between various parameters and pH. The cultivar BRS Pontal had a correlation coefficient between L* and pH of 0.63, which means that when the pH increased, the brightness of the bean (L*) was also likely to increase. It also had correlations between pH and moisture content (0.87); pH and weight of 100 beans (0.73); and pH and WA% (-0.92), implying that an increase in the pH of the solution for this genotype causes a decrease in water absorption.
For the chemical variables of the BRS Pontal cultivar, there was a negative correlation between pH and Mn content (-0.64). BRS Estilo had correlations between pH and L* (0.65), pH and a* (-0.62), pH and Fe content (-0.73), and pH and Mn content (-0.65). For the storage periods analyzed, the variable pH and conductivity had a correlation with the variable storage time (0, 60, 90, 135, and 180 days), indicating that pH had a negative correlation (Table 5) with storage time that is, the beans became more acidic with storage time. The variable electrical conductivity had a positive correlation which indicated that electrical conductivity increased as storage time increased (Table 5).
The correlations between the electrical conductivity

2110 Afr. J. Agric. Res. values of the cultivars and the availability of minerals was low (< 40.00) to moderate (< 70.00). The following minerals had positive correlations: Fe (0.48), Zn (0.54), and P (0.68) in the cultivar Estilo; iron (0.96), Zn (0.68), and P (0.45) in the cultivar Madrepérola; and P (0.36) and Zn (0.45) in the cultivar Pontal. Fe was the micronutrient that had the highest concentration in each cultivar, and the results of the analyses indicate an increase in this mineral during storage, which corroborates the high positive correlation found for electrical conductivity and iron content, probably due to the analyses having been performed on raw beans without maceration, which preserved some minerals.
The correlations between electrical conductivity and cultivar for secondary metabolites and fractions of fiber were as follows: cultivar BRS Estilo: positive correlations for tannins (0.79); cultivar BRS Madrepérola and cultivar BRS Pontal: positive correlations for phytic acid (0.72) in raw beans. Kon and Sanshuck (1981) studying the quality of baked beans, found a inverse correlation between cooking time and phytic acid content of the beans, that is, higher cooking time less phytate content.
These results confirm that the availability of these compounds did not occur in a similar fashion between cultivars. Another factor that explains these results is the phytic acid content, which had a high positive correlation in the cultivar BRS Pontal, indicating an increase in electrical conductivity associated with an increase in this compound with storage time. Conclusions The cultivar BRS Madrepérola is recommended for storage under ambient conditions with no temperature and moisture control, as it had the best performance in the characterization of technological and nutritional variables. The biggest influence on technological and chemical characterization of cultivars found in this study is due to the factor storage time. Overall, storage promoted the increase of these minerals. Multivariate analysis identified important correlations over time for pH and for electrical conductivity, as observed in the color parameters and protein content in the raw beans of the cultivars. Conflict of Interests
The authors have not declared any conflict of interests.
REFERENCES
Albrecht JC, Carvalho WP (2006). BRS Pontal: cultivar de feijoeiro
comum de tipo de grão carioca com alto potencial produtivo no Distrito Federal e Goiás. Planaltina, DF: Embrapa Cerrados. 2 p. (Embrapa Cerrados. Comunicado Técnico, 125).
Bassinello PZ (2008). Qualidade na escolha de variedades de feijão
para o mercado consumidor. Atualidades em micotoxinas e armazenagem qualitativas de grãos ll. 1. ed. Florianópolis: Imprensa Universitária.
Bassinello PZ (2016). Qualidade dos grãos. Available at: http://www.agencia.cnptia.embrapa.br/gestor/feijao/arvore/CONTAG01_2_28102004161635.html
Borém A, Carneiro JES (2011). A Cultura. In: Vieira C, Paula Júnior TJ. Feijão. 2nd ed. Atualizada. Viçosa: Editora UFV 1:13-18.
Brasil (2009). Ministério da Agricultura, Pecuária e Abastecimento . Secretaria de Defesa Agropecuária. Regras Para Análise de Sementes. Brasília: Mapa/Acs 1:399.
Buratto JS (2012). Teores de minerais e proteínas em grãos de feijão e estimativas de parâmetros genéticos. 148 f. Tese (Doutorado em Genética e Melhoramento de Plantas) - Universidade Federal de Lavras, Lavras.
Carneiro, GES, Soares DM, Costa JGC (2000). Resultados do ensaio sul-brasileiro de avaliação de linhagens de feijão nos anos 1997/98 e 1998/99. Santo Antônio de Goiás: Embrapa Arroz e Feijão 1:77. Available at: http://agris.fao.org/agris-search/search.do?recordID=BR20001207877.
Coelho SEM, Prudêncio SH, Nóbrega LHP, Leite CFR (2009). Alterações no tempo de cozimento e textura dos grãos de feijão comum durante o armazenamento. Ciênc. Agrotecnol. 33(2):539-544.
Coelho SRM, Branco EM,, Fonseca Jr. NS, Schoeninger V (2012). Nutritional and cooking variability of some genotypes of common beans (Phaseolus vulgaris L.) grown in Brazil. In: International Conference of Agricultural Engineering, AGENG - 2012, Valencia. Anais. International Conference of Agricultural Engineering.
Coelho SRM, Prudencio SH, Christ D, Sampaio SC, Schoeninger V (2013). Physico-chemical properties of common beans under natural and accelerated storage conditions. Cienc. Investig. Agraria 40(3):637-644.
Corrêa PC, Afonso-Júnior R (1999). Uso do teste de condutividade elétrica na avaliação dos danos provocados por diferentes taxas de secagem. Rev. Bras. Prod. Agroindustriais 1:21-26.
Development Core Team R (2016). A language and environment for statistical computing. Available at: http://www.R.project.org.
Embrapa (2016). Empresa Brasileira De Pesquisa Agropecuária. Variáveis experimentais da Embrapa Arroz e Feijão. Versão 1.0. Santo Antônio de Goiás: Embrapa Arroz e Feijão (Documentos, 250).
Granato D, Masson ML (2010). Instrumental color and sensory acceptance of soy-based emulsions: a response surface approach. Ciênc. Tecnol. Alimentos 30:1090-1096.
Horwitz H (1995). Official method of analysis of the Association of Official Agricultural Chemists. Washington, DC: Association of Official Agricultural Chemists. 956 p.
IAL (2008). Instituto Adolfo Lutz. Métodos físico-químicos para análises de alimentos, São Paulo: Instituto Adolfo Lutz, 4. ed., 1. ed. Digital
Kon S, Sanshuck DW (1981). Phytate content and its effect on cooking quality of beans. J. Food Process. Preserv. 5(3):169-178.
Latta M, Eskin M (1980). A simple and rapid colorimetric method for phytate determination. J. Agric. Food Chem. 28(6):1313-1315.
Lolas GM, Palamidas N, Markatis P (1976). The phytic acid-total phosphorus relationship in barley, oats, soybeans, and wheat. Cereal Chem. 53(6):867-871.
Lopes RLT (2011). Características tecnológicas de genótipos de feijoeiro em razão de épocas de cultivo e períodos de armazenamento. 2011. 77 f. Dissertação (Mestrado em Agricultura Tropical e Subtropical) - Instituto Agronômico - IAC, Campinas.
Malavolta E (2006). Manual de nutrição mineral de plantas. São Paulo: Agronômica Ceres. 631 p.
Malavolta E, Vitti GC, Oliveira AS (1997). Avaliação do estado nutricional de plantas: princípios e aplicações. 2nd ed. Piracicaba: POTAFOS. P 319.
Mcgee H (2014). Comida e cozinha: ciência e cultura da culinária. Trad. Marcelo Brandão Cipolla. 2nd ed. São Paulo: Editora WMF; Martins Fontes. P 977.
Mesquita FR, Corrêa AD, Abreu CMP, Lima RAZ, Abreu AFB (2007). Linhagens de feijão (Phaseolus vulgaris L.): composição química e digestibilidade proteica. Ciência Agrotécnica, Lavras 31(2):1114-1121.

Nyakuni GA, kikafunda JK, Muyonga JH, kyamuhangire WM,
nakinkugwe D, Ugen M (2008). Chemical and nutritional changes associated with the development of the hard-to cook defect in common beans. Int. J. Food Sci. Nutr. 59(7):652-659.
Oliveira VR (2009). Análise Físico-Química, Microbiológica e Sensorial de Cultivares de Feijão. 96 f. Tese (Doutorado em Agronomia), Universidade Federal de Santa Maria, Santa Maria, 2009.
Oomah BD, Luc G, Leprelle C, Drover JC, Harrison JE, Olson M (2011). Phenolics, Phytic Acid, and phytase in Canadian-grown low-tannin Faba bean (Vicia faba L.) genotypes. J. Agric. Food Chem. 59:3763-3771.
Proctor JR, Watts BM (1987). Development of a modified Mattson bean cooker procedure based on sensory panel cookability evaluation. Can. Institute Food Sci. Technol. J. 20:9-14.
Prolla IRD, Barbosa RG, Veeck AP L, Augusti PR, Silva LP, Ribeiro ND, Emanuelli T (2010). Cultivar, harvest year, and storage conditions affecting nutritional quality of common beans (Phaseolus vulgaris L.). Ciênc. Tecnol. Alimentos 30(1):96-102.
Ramírez-Cárdenas L, Leonel AJ, Costa NMB (2008). Efeito do processamento domestic sobre o teor de nutrientes e de fatores antinutricionais de diferentes cultivares de feijão comum. Ciênc. Tecnol. Aliment. 28(1):200-213.
Rigueira RJA, Lacerda Filho AF, Volk MBS (2009). Avaliação da qualidade do feijão armazenado em ambiente refrigerado. Alimentação Nutrição 20(4):649-655.
Silochi et al. 2111 Schoeninger V, Coelho SRM, Christ D, Sampaio SC (2014).
Processing parameter optimization for obtaining dry beans with reduced cooking time. Food Sci. Technol. 56:49-57.
Schoeninger V, Coelho SRM, Christ D, Sampaio SC, Almeida AJB (2013). Pre-processing of aged carioca beans: soaking effect in sodium salts in the cooking and nutrition quality. Int. J. Food Agric. Environ. 11:184-189.
Silva AG, Rocha LC, Canniatti-Brazaca SG (2009). Caracterização físico-química, digestibilidade proteica e atividade antioxidante de feijão comum. Alimentos Nutrição 20(4):591-598.
Silva JD, Queiroz AC (2009). Análise de Alimentos: métodos químicos e biológicos. 3 ed. – 4. reimpressão – Viçosa. P 235.
Siqueira BS, Pereira WJ, Batista KA, Oomah DB, Fernandes KF, Bassinello PZ (2014). Influence of storage on darkening and hardening of slow – and regular – carioca bean (Phaseolus vulgaris l.) genotypes. J. Agric. Stud. 2(2):2166-0369.
Unicamp (2011). Universidade Estadual de Campinas. Tabela brasileira de composição dos alimentos: TACO. Versão 4. Campinas. Available at: http://www.unicamp.br/nepa/taco.

Vol. 11(24), pp. 2112-2117, 16 June, 2016
DOI: 10.5897/AJAR2016.10816
Article Number: CB2A0A258976
ISSN 1991-637X
Copyright ©2016
Author(s) retain the copyright of this article
http://www.academicjournals.org/AJAR
African Journal of Agricultural Research
Full Length Research Paper
Toxicity and repellency of plant extracts on Thaumastocoris Peregrinus (Carpintero & Dellapé)
(Hemiptera: Thaumastocoridae)
Jucelaine Haas1*, Michele Potrich1, Aline Mara dos Santos Telles1, Everton Ricardi Lozano1, Tatiane Luiza Cadorin Oldoni2, Flavia Galvan Tedesco1, Jackeline Dall Agnol de Lima1 and
Sérgio Miguel Mazaro1
1Federal University of Technology, Parana, Campus Dois Vizinhos, UTFPR-DV, Dois Vizinhos, Parana, Brazil. 2Federal University of Technology, Parana, Campus Pato Branco, UTFPR-PB, Pato Branco, Parana, Brazil.
Received 18 January, 2016; Accepted 23 April, 2016
The eucalyptus bronze bug, Thaumastocoris peregrinus, is an exotic pest of eucalyptus crops that has spread worldwide. The objective of this study was to evaluate the toxicity of aqueous plant extracts at 5% of Matricaria chamomilla, Echinodorus grandiflorus, Punica granatum, Maytenus ilicifolia and Origanum majorana on T. peregrinus. For this, choice and no-choice tests were performed. Eucalyptus leaf disks were treated with 5% aqueous extract and two experiments were conducted: (1) the leaf disks were put inside a tube with T. peregrinus adults and their longevity was evaluated. Each repetition was one leaf disk/tube (no-choice test); (2) one leaf disk of each treatment was put inside a Petri dish, and offered to T. peregrinus. Faecal deposits on each leaf disk were quantified (choice test). In addition, high performance liquid chromatography (HPLC) was carried out to verify phenolic compounds present in the plant extracts. All plant extracts reduce the survival of T. peregrinus adults up to nearly 50%. Regarding the choice experiment, T. peregrinus fed with eucalyptus disk leaves containing E. grandiflorus, M. chamomilla and Maytenus ilicifolia extracts produced less faecal deposits when compared wiht the other plant extracts and the control group. In addition, HPLC detected gallic, ferulic, caffeic, coumaric and vanillic acid in the extracts samples. These results suggest that these three plant extracts had a repellent effect on T. peregrinus adults, aside from reducing its survival, and the phenolic compounds may have contributed to these results. Key words: Bronze bug, phenolic compounds, Eucalyptus.
INTRODUCTION Thaumastocoris peregrinus (Carpintero and Dellapé) (Hemiptera: Thaumastocoridae), known as the bronze
bug, is a small insect from Australia (Carpintero and Dellape, 2006; Noack et al., 2011; Nadel and Noack,
*Corresponding author. E-mail: [email protected].
Author(s) agree that this article remain permanently open access under the terms of the Creative Commons Attribution
License 4.0 International License

2012). It has spread globally and has become a major pest in various species of eucalyptus in Africa, South America, Europe and New Zealand (Martínez and Bianchi, 2010; Nadel et al., 2010; Wilcken et al., 2010; Laudonia and Sasso, 2012; Sopow et al., 2012).
T. peregrinus feeds on the floem-sap of eucalyptus leaves, causing clorosis and defoliation. Heavy feeding causes reddening of the canopy leaves, known as “winter bronzing”. Severe infestations may lead to canopy thinning and decreased tree growth due to the reduced photosynthetic area (Nadel et al., 2010; Wilcken et al., 2010). This insect reaches not more than 4 mm when in adult stage. It has a short life cycle (an average of 35 days) and the female can lay up to 60 eggs during her lifespan (Jacobs and Neser, 2005; Noack and Rose, 2007; Soliman et al., 2012). This high biotic potential enables T. peregrinus to have several generations per year, and to have the potential to spread and rapidly establish into new environments (Nadel et al., 2015; Saavedra et al., 2015).
Chemical control has been proven to be effective in urban areas in Australia (Noack et al., 2009), although it raises issues about potential environmental problems. Biological control strategies are being studied to manage T. peregrinus population. To date, the egg-parasitic wasp Cleruchoides noackae Lin and Hubner (Hymenoptera: Mymaridae) is the most promising, though there are no available published data to confirm its efficiency (Barbosa et al., 2010; Mascarin et al., 2012; Garcia et al., 2013; Santadino et al., 2013; Dias et al., 2014). Plants with insecticidal activity could also be a viable alternative to control T. peregrinus. Botanicals are having renewed importance, due to their eco-toxicological properties and for being a source of bioactive compounds (Zoubiri and Baaliouamer, 2014).
Insecticidal plants have several effects. When not leading to insect mortality, it may cause repellency, deterrence, deformation in pupae and adults, reduce intestinal motility, interfere in the synthesis of ecdysone and chitin (Schmutterer, 1990), growth rate (Nathan et al., 2008), life span and fecundity (Isikber et al., 2006). Most of the studies that verified these effects on insects have been carried out on disease vectors and agricultural pests. Research confirming insecticidal plants efficiency to control forest pests have been performed (Kanat and Alma, 2004; Sharma et al., 2006; Parel et al., 2014) but no information is available regarding T. peregrinus.
Therefore, the objective of this study was to evaluate the toxicity of the aqueous extracts of Matricaria chamomilla (Asteraceae), Echinodorus grandiflorus (Alismataceae), Punica granatum (Punicaceae), Maytenus ilicifolia (Celastraceae) and Origanum majorana (Lamiaceae) on T. peregrinus in the laboratory. MATERIALS AND METHODS
The bioassays and chemical analysis of the plant extracts
Haas et al. 2113 components (high performance liquid chromatography - HPLC) were performed at the Laboratory of Biological Control, and Central of Analysis of the Federal University of Technology - PR, in Dois Vizinhos and Pato Branco (Parana State, Brazil), respectively. Insects T. peregrinus eggs were obtained from a well-established colony kept at the Laboratory of Forest Entomology (Embrapa Florestas, Brazilian Corporation of Agricultura Research), reared on Eucalyptus bentamii Maiden et Cambage (Myrtaceae) (23 ± 2°C, 60 ± 10% RH and 12 h photoperiod) as described by Beltramin (2014) and the experiments were run under the same conditions.
Nymphs and adults of T. peregrinus were reared in branches of E. benthamii (23 ± 2°C, 60 ± 10% RH and 12 h photoperiod) and strips of paper towel were distributed along the leaves for oviposition. Strips were checked for eggs daily and were replaced after the eggs collection. Eggs recovered were used in the experiments. Plant extracts Leaves of E. grandiflorus and P. granatum (collected in Dois Vizinhos, Parana State, Brazil and voucher specimens deposited at the Herbarium of the Federal University of Technology – Paraná, UTFPR), Maytenus ilicifolia, O. majorana and flowers of M. chamomilla (acquired from COOPERFLORA, Turvo, PR) were used to prepare the extracts.
Plant material was dried in oven (60°C for 48 h) and ground in a Willy mill lab grinder. Each of the five plant extracts was prepared at a concentration of 5% w/v by adding 5 g of the plant powder to 100 mL of distilled water and the mixture was kept away from the light from 48 h. Filtration was performed with filter paper (grade 1 : 11 µm), shortly before the start of the experiment. This high concentration was chosen as a standard concentration to be sure if the aqueous plant extracts would affect the insects. Toxicity (no-choice test) Fully expanded leaves of E. dunni Maiden were washed in sodium hypochlorite 2%, dried and immersed for 5 s in the plant extracts. The control group was immersed in sterile distilled water. After that, the leaves were left to dry in a laminar flow cabinet (5 min, 23°C). Circles of 2.4 cm in diameter were cut from the leaves with a circle cutter near the petiole and put inside sterile flat bottom glass tubes (10 x 9 mm) with hydrogel. One T. peregrinus adult (< 2 days old) was placed on each disk leaf. To prevent scape, each tube was covered with voile. One tube was considered a replicate. A total of 12 replicates were conducted per each treatment.
The bioassay was kept in a germination chamber (26 ± 2°C, 60 ± 10% RH and 12 h photoperiod) and T. peregrinus survival time was evaluated every six hours, for 144 h. The experimental design was totally randomized and the obtained data was submitted to one-way ANOVA followed by Scott-Knott Test (p < 0.05) (Assistat 7.7®, Silva, 2014).
Repellence activity (free-choice test)
Leaf disks, one from each treatment, were prepared as described above, and put inside glass Petri dishes (150 x 20 mm) lined with filter paper (grade 1 : 11 µm) dampened with water, randomly, at the same distance from each other. In the centre of each disk, 10 adults (< 2 days old) were placed. The dishes were closed and kept in germination chamber (26 ± 2°C, 60 ± 10% RH, 12 h

2114 Afr. J. Agric. Res.
Table 1. Chromatographic parameters of phenolic compounds from the 5% (w/v) aqueous plant extracts analysed by HPLC.
Phenolic compound R.T. (min) UV band (nm) Linear equation R2
LOD
(µg.mL-1
)
LOQ
(µg.mL-1
)
Gallic acid 8.6 272 Y= 0.313 X – 0.017 0.996 0.10 0.34
Vanillic acid 24.3 260, 280 Y = 0.263 X + 0.023 0.998 0.81 2.72
Caffeic acid 24.6 323 Y = 0.691 X – 0.001 0.997 0.03 0.11
Coumaric acid 28.7 309 Y = 0.540 X – 0.360 0.999 0.02 0.08
Ferulic acid 29.5 322 Y = 0.657 X + 0.007 0.999 0.10 0.36
R.T: Retention time; LOD: detection limit; LOQ: quantification limit.
Table 2. Mean survival time, in hours (± SE) of Thaumastocoris peregrinus confined with Eucalyptus dunni leaves treated with 5% (w/v) aqueous plant extracts under laboratory conditions.
Treatment Survival (hours) Survival (days)
Control group 133.0 ± 7.41 a 5.5
Punica granatum 98.0 ± 7.91 b 4.0
Maytenus ilicifolia 89.0 ± 10.82 b 3.7
Echinodorus grandiflorus 77.0 ± 10.22 b 3.2
Origanum majorana 70.0 ± 8.90 b 2.9
Matricaria chamomilla 68.5 ± 6.66 b 2.8
F 7,1024**
*Means followed by the same letter do not differ by Scott-Knott Test (p < 0.05).
photoperiod), and the number of faecal drops on each leaf disc was evaluated every 24 h for seven days (daily faecal drops (DFD) = total of faecal drops (TFD) – previous day total of faecal drops (PFD)).
Each dish was considered a repetition and 24 repetitions were used for this experiment. The experimental design was split-plot and the data was submitted to ANOVA followed by Tukey Test (p < 0.05) (Assistat 7.7®, Silva, 2014). Qualitative analysis of high performance liquid chromatography (HPLC) profiling The qualitative analysis of extracts compounds was carried out using reversed-phase HPLC (Francisco and Ressurreccion, 2009) with slight modifications. Each aqueous extract sample (10 µL) was injected in an HPLC equipment with photodiode array and fluorescence detection, reverse-phase column C18 (250 x 4.6 mm, 5 m). The mobile phase consisted of water/acetic acid (0.1%, v/v) (solvent A) and methanol/acetic acid (0.1% v/v) (solvent B), at 1 mL/min. The gradient conditions were as follows: 5-7% solvent B in 7 min, 17% of B in 75 min, 45% of B in 110 min, 70% of B in 117 min, 100% of B in 124 min and 5% of B in 129 min. The column was kept at 30°C and the chromatograms processed with GalaxieTM software.
Identification of unknown compounds was based on matching their retention times with those of pure standards and by the absorption spectra at the wavelengths 272, 313 and 360 nm of the ultraviolet region with photodiode detector. Quantification was determined with external standardization with identical standards of ferulic, gallic, vanillic, caffeic and coumaric acid in concentrations from 0.5 to 7.5 µg.mL-1 (Table 1). The detection limit (DOL) and
quantification limit (QOL) values were obtained with the calibration curve equation according to ICH (1996).
RESULTS All plant extracts affected T. peregrinus adults, reducing their survival, when compared with the control group (Table 2). Analysis of faecal deposits in the free-choice bioassay, showed that they did not differ significantly between treatments at 24, 48, or 144 h after starting the experiment. Nevertheless, T. peregrinus fed with eucalyptus disk leaves containing E. grandiflorus, M. chamomilla and Maytenus ilicifolia extracts produced less faecal deposits when compared with the other plant extracts and the control group (Table 3).
High performance liquid chromatography
The phenolic compounds, gallic, vanillic, caffeic, coumaric and ferulic acid were identified and quantified from the plant extracts (Table 4). The highest and lowest concentration of gallic acid was found on P. granatum (1.84 mg.g
-1) and O. majorana (0.72 mg.g
-1), respectively.
Vanillic acid was found only in Maytenus ilicifolia (0.35 mg.g
-1). Caffeic acid was detected in both M. chamomilla

Haas et al. 2115
Table 3. Mean of Thaumastocoris peregrinus faecal drops (± SE) in Eucalyptus dunni disk leaves treated with 5% (w/v) aqueous plant extracts in a free-choice trial, under laboratory conditions.*
Treatments Number of faecal drops over time (hrs)
24 48 72 96 120 144 168
Control group 2.87 ± 0.98 ns 1.04 ± 2.47 ns 22.88 ± 2.70 a 27.58 ± 3.49
a 29.54 ± 3.49
a 29.13 ± 3.36 ns 34.33 ± 4.01
a
Punica granatum 1.58 ± 0.41 6.63 ± 1.19 14.42 ± 1.81 ab
19.00 ± 1.613 ab
23.67 ± 1.56 ab
26.04 ± 1.54 30.87 ± 1,17 ab
Maytenus ilicifolia 2.00 ± 0.47 8.00 ± 1.51 11.08 ± 1.93 b 13.96 ± 2.25
b 18.17 ± 2.61
b 21.79 ± 2.44 27.66 ± 2.76
ab
Echinodorus grandiflorus 1.25 ± 0.52 8.08 ± 1.83 12.17 ± 2.56 b 16.04 ± 2.84
b 18.46 ± 3.14
b 22.63 ± 3.36 25.12 ± 3.42
ab
Origanum majorana 3.16 ± 0.64 12.00 ± 1.87 15.96 ± 2.22 ab
20.33 ± 2.40 ab
25.63 ± 3.16 ab
29.88 ± 3.36 33.97 ± 3,41 a
Matricaria chamomilla 1.87 ± 0.61 8.42 ± 1.93 12.42 ± 2.47 b 15.75 ± 2.90
b 19.67 ± 3.01
ab 21.97 ± 3.05 23.54 ± 3.16
b
Dms 10068
F 1.9875*
*Means followed by different letters in the same column differ significantly according to Tukey Test (p < 0.05); ns – not significant.
Table 4. Relative concentrations of phenolic compounds obtained from 5% (w/v) aqueous plant extracts.
Extract Concentration mg.g
-1
Gallic acid Vanillic acid Caffeic acid Coumaric acid Ferulic acid
Punica granatum 1.84 n.d n.d n.d n.d
Maytenus ilicifolia n.d 0.35 0.06 n.d n.d
Echinodorus grandiflorus 0.30 n.d n.d 0.01 0.46
Origanum majorana 0.72 n.d n.d n.d n.d
Matricaria chamomilla 0.23 n.d 0.72 n.d 1.41
n.d.- Not discovered. and M. ilicifolia (0.72 mg.g
-1 and 0.06 mg.g
-1),
respectively. Coumaric acid was only found in E. grandiflorus (0.01 mg.g
-1). Ferullic acid was found
in both M. chamomilla (1.41 mg.g-1
) and E. grandiflorus (0.46 mg.g
-1).
DISCUSSION The plant extracts from P. granatum, O. majorana,
M. chamomilla, M. ilicifolia and E. grandiflorus reduced survival of T. peregrinus adults. The leaf disks treated with the last three extracts presented a reduced number of faecal drops, indicating a repellent/deterrent effect.
The presence of phenolic compounds might have had an important role in these results. Phenolic compounds are generally regarded as antifeedants, digestibility reducers and toxic to insects (Rani and Pratyusha, 2013). The same
compounds found in this research have been encountered in elevated levels in rice after these plants were attacked by insect pests, indicating their production as a result of induced plant defence (Rani and Jyothsna, 2010), corroborating with our findings.
Assays regarding the effect of plant extracts on heteropterans have been carried out with other plants, other forms of extraction and other insects (Carneiro et al., 2013; González et al., 2011;

2116 Afr. J. Agric. Res. Krinski and Massaroli, 2014). Essential oils were tested on the behaviour of Bemisia tabaci (Gennadius) (Hemiptera: Aleyrodidae), indicating repellent, irritant and toxic effects (Emilie et al., 2015), and Mentha piperita L. demonstrated repellent and insecticidal activity against Brevicoryne brassicae L. (Homoptera: Aphididae) (Wubie et al., 2014); but there was no research on the group Thaumastocoridae.
Phenols like coumaric and ferulic acid, found in the plant extracts used in our bioassays, may be found in the insoluble or cell wall, as reservoir for lignin biosynthesis, which by itself may be a defence mechanism (Lattanzio et al., 2006). In addition to toxic and deterrent action of phenolic compounds, oxidation of phenols to polymers, catalysed by polyphenol oxidase (PPO) and peroxidase (POD) is another potential defence mechanism in plants against herbivorous insects, which reduce digestibility, palatability and nutritional value. Quinones formed by oxidation of phenols, for instance, bind covalently to leaf proteins and inhibit the protein digestion in herbivores (Bhonwong et al., 2009). Artemisia annua L. (Asteraceae), for example, reduces digestive enzymes activity in Eurygaster integriceps Puton (Heteroptera: Scutelleridae) (Zibaee and Bandani, 2010).
Quinones also exhibit direct toxicity on insects (Duffey and Stout, 1996; Bhonwong et al., 2009). Alkylation of amino acids reduces the nutritional value of plant proteins for insects, which in turn negatively affects the insect growth and development (Bhonwong et al., 2009). Phenols also play an important role in cyclic reduction of reactive oxygen species (ROS) such as superoxide anion and hydroxide radicals, which in turn activate a cascade of reactions leading to the activation of defensive enzymes (Maffei et al., 2007).
Thus, the phenolic compounds present in M. chamomilla, E. grandiflorus, M. ilicifolia, O. majorana and P. granatum extracts may have played an important role in the obtained results of this experiments, both in repellent and toxic effect.
These results represent basic research, consequently they should be used to help select plants with insecticidal/repellent properties; and from there, obtain extracts by different extraction methods, detect the active compounds responsible for the action on the insects, and develop environmental-friendly insecticides.
Conflict of Interests
The authors have not declared any conflict of interests. REFERENCES Barbosa LR, Santos F, Barddal HPO, Machado BO, Wilcken CF,
Soliman EP (2010). Predação de Thaumastocoris peregrinus por Chrysoperla extrerna. Inf. Embrapa. http://ainfo.cnptia.embrapa.br/digital/bitstream/item/24479/1/CT257.pdf
Beltramin FS (2014). Estratégias para o controle biológico de
Thaumastocoris peregrinus Carpintero & Dellapé, 2006 (Heteroptera: Thaumastocoridae) [monography]. Curitiba, PR: Universidade Federal do Paraná.
Bhonwong A, Stout MJ, Attajarusit J, Tantasawat P (2009). Defensive role of tomato polyphenol oxidases against cotton bollworm (Helicoverpa armigera) and beet armyworm (Spodoptera exigua). J. Chem. Ecol. 35:28-38.
Carneiro AP, Pereira MJB, Galbiati C (2013). Biocide activity of Annona coriacea extract on fourth and fifth instars nymphs and adults of the vector Rhodnius neglectus (Hemiptera, Reduviidae). Revista de Biologia tropical 61(1):419-427.
Carpintero DL, Dellapé PMA (2006). New species of Thaumastocoris kirkaldy from Argentina (Heteroptera: Thaumastocorinae). Zootaxa 1228:61-68.
Dias TKR, Wilcken CF, Soliman EP, Barbosa LR, Serrao JE, Zanuncio JC (2014). Predation of Thaumastocoris peregrinus (Hemiptera: Thaumastocoridae) by Atopozelus opsimus (Hemiptera: Reduviidae) in Brazil. Invertebrate Surviv. J. 11:224-227.
Duffey SS, Stout MJ (1996). Antinutritive and toxic components of plant defense against insects. Arch. Insect Biochem. Physiol. 32:3-37.
Emilie D, Mallent M, Menut C, Chandre F, Martin T (2015). Behavioral response of Bemisia tabaci (Hemiptera: Aleyrodidae) to 20 plant extracts. J. Econ. Entomol. pp. 1-12.
Francisco MLD, Ressurreccion AVA (2009). Development of a far reversed-phase high performance liquid chromatography (RP-HPLC) procedure for the simultaneous determination of phenolic compounds in peanut skin extracts. Food Chem. 119:356-363.
González JW, Gutiérrez MM, Ferrero AA (2011). Repellency assays with plant extracts and essential oils from Schinus molle var. areira (L) (Anacardiaceae) and DEET against Nezara viridula L. (Hemiptera: Pentatomidae). BioAssay 6(8):1-4.
Garcia A, Figueiredo E, Valente C, Monserrat VJ, Branco M (2013). First record of Thaumastocoris peregrinus in Portugal and of the neotropical predator Hemerobius bolivari in Europe. Bull. Insectol. 66(2):251-256.
Isikber AA, Alma MH, Kanat M, Karci A (2006). Fumigant toxicity of essential oils from Laurus nobilis and Rosmarinus officinalis against all life stages of Tribolium confusum. Phytoparasitica 34(2):167-177.
Jacobs DH, Neser S (2005). Thaumastocoris australicus Kirkaldy (Heteroptera: Thaumastocoridae): a new insect arrival in South Africa, damaging to Eucalyptus trees. South Afr. J. Sci. 101:233-236.
Kanat M, Alma MH (2004). Insecticidal effects of essential oils from various plants against larvae of pine processionary moth (Thaumetopoea pityocampa Schiff) (Lepidoptera: Thaumetopoeidae). Pest Manag. Sci. 60(2):173-177.
Krinski D, Massaroli A (2014). Nymphicidal effect of vegetal extracts of Annona mucosa and Anonna crassiflora (Magnoliales, Annonaceae) agains rice stalk stink bug, Tibraca limbativentris (Hemiptera, Pentatomidae). Rev. Bras. Frutic. 36:217-224.
Lattanzio V, Lattanzio VMT, Cardinali A (2006). Role of phenolics in the resistance mechanisms of plants against fungal pathogens and insects. In: Imperato F. Phytochem. Adv. Res. pp. 23-67.
Laudonia S, Sasso R (2012). The bronze bug Thaumastocoris peregrinus: a new insect recorded in Italy, damaging Eucalyptus trees. Bull. Insectol. 65(1):89-93.
Maffei ME, Mithöfer A, Boland W (2007). Insects feeding on plants: rapid signals and responses preceding the induction of phytochemical release. Phytochem. 68:2946-2959.
Martínez G, Bianchi M (2010). First record in Uruguay of the bronze bug, Thaumastocoris peregrinus Carpintero and Dellappé, 2006 (Heteroptera: Thaumastocoridae). Agrociencia 14(1):15-18.
Mascarin GM, Duarte VS, Brandao MM, Delalibera I (2012). Natural occurrence of Zoophthora radicans (Entomophthorales: Entomophthoraceae) on Thaumastocoris peregrinus (Heteroptera: Thaumastocoridae), an invasive pest recently found in Brazil. J. Invertebr. Path. 110(3):401-404. Nadel RL, Noack AE (2012). Current understanding of Thaumastocoris peregrinus in a quest for its management and control. Int. J. Pest Manag. 58(03):257-266.
Nadel RL, Slippers B, Scholes MC, Lawson SA, Noack AE, Wilcken CF, Bouvet JP, Wingfield MJ (2010). DNA bar-coding reveals source and

patterns of Thaumastocoris peregrinus invasions in South Africa and South America. Biol. Invasions 12(5):1067-1077.
Nadel RL, Wingfield MJ, Scholes MC, Garnas JR, Lawson SA, Slippers B (2015). Population dynamics of Thaumastocoris peregrinus in Eucalyptus plantations of South Africa. J. Pest Sci. 88(1):97-106.
Nathan SS, Hishan A, Jayakumar G (2008). Larvicidal and growth inhibition of the malaria vector Anopheles stephensi by triterpenes from Dysozylum malabaricum and Dysoxylum beddomei. Fitoterapia 79:106-111.
Noack AE, Cassis G, Rose HA (2011). Systematic revision of Thaumastocoris Kirkaldy (Hemiptera: Heteroptera: Thaumastocoridae). Zootaxa 3121:1-60.
Noack AE, Kaapro J, Bartimote-Aufflick K, MansField S, Rose HA (2009). Efficacy of imidacloprid in the control of Thaumastocoris peregrinus on Eucalyptus scoparia in Sydney. Arboric. Urban For. 35:192-196.
Noack AE, Rose HA (2007). Life-history of Thaumastocoris peregrinus and Thaumastocoris sp. in the laboratory with some observations on behaviour. Gen. Appl. Entomol. 36:27-33.
Parel RN, Patel D, Bhandari R, Homkar U, Gill AK (2014). Potential of botanicals for the management of forest insect pests of Madhya Pradesh, India an overview. Int. J. Multidiscip. Res. Dev. 1(7):135-139.
Rani PU, Jyothsna Y (2010). Biochemical and enzymatic changes in rice plants as a mechanism of defense. Acta Physiol. Plant 32:695-701.
Rani PU, Pratyusha S (2013). Defensive role of Gossypium hirsutum L. anti-oxidative enzymes and phenolic acids in response to Spodoptera litura F. feeding. J. Asia-Pacific Entomol. 16(2):131-136.
Saavedra MC, Withers TM, Holwell GI (2015). Susceptibility of four Eucalyptus host species for the development of Thaumastocoris peregrinus Carpintero and Dellapé (Hemiptera: Thaumastocoridae). For. Ecol. Manag. 336:210-216.
Sharma R, Negi DS, Shin WKP, Gibbons S (2006). Characterization of an insecticidal coumarin from Boenninghausenia albiflora. Phytother. Res. 20(7):607-609.
Schmutterer H (1990). Properties and potential of natural pesticides from the neem tree, Azadirachta indica. Ann. Rev. Entomol. 35(2):217-297.
Haas et al. 2117 Silva FAS (2014). Statistical Assistance 7.7. Departamento de
Engenharia Agrícola [DEAG], CTRN, Universidade Federal de Campina Grande [UFCG], Paraíba, Brasil. http://www.assistat.com/
Soliman E, Wilcken C, Pereira J, Dias T, Zaché B, Dal Pogetto M, Barbosa L (2012). Biology of Thaumastocoris peregrinus in different eucalyptus species and hybrids. Phytoparasitica 40(3):223-230.
Sopow S, George S, Ward N (2012). Bronze Bug, Thaumastocoris peregrinus: a new Eucalyptus pest in New Zealand. Surveill. 39(2):43-46.
Wilcken CF, Soliman EP, Sá LAN, Barbosa LR, Dias TKR, Ferreira-Filho PJ (2010). Bronze Bug Thaumastocoris peregrinus Carpintero and Dellapé (Hemiptera: Thaumastocoridae) onEucalyptus in Brazil and its distribution. J. Plant Prot. Res. 50(2):201-205.
Wubie M, Negash A, Guadie F, Molla G, Kassaye K, Raja N (2014). Repellent and insecticidal activity of Mentha piperita (L.) Plant extracts against cabbage aphid Brevicoryne brassicae Linn. (Homoptera: Aphididae). Am-Euras. J. Sci. Res. 9(5):150-156.
Zibaee A, Bandani AR (2010). Effects of Artemisia annua L. (Asteraceae) on the digestive enzymatic profiles and the cellular immune reactions of the Sunn pest, Eurigaster integriceps (Heteroptera: Scutellaridae), against Beauveria bassiana. Bull. Entomol. Res. 100(2):185-196.
Zoubiri S, Baaliouamer A (2014). Potentiality of plants as source of insecticide principles. J. Saudi Chem. Soc. 18:925-938.

Vol. 11(24), pp. 2118-2128, 16 June, 2016
DOI: 10.5897/AJAR2015.10404
Article Number: 6B2A68258979
ISSN 1991-637X
Copyright ©2016
Author(s) retain the copyright of this article
http://www.academicjournals.org/AJAR
African Journal of Agricultural Research
Full Length Research Paper
Genetic diversity assay of maize (Zea mays L.) inbreds based on morphometric traits and SSR markers
Madhav Pandit1*, Manigopa Chakraborty1, Z. A. Haider1, Anita Pande1, Rameshwar Prasad Sah2 and Kumar Sourav1
1Department of Plant Breeding and Genetics, Birsa Agricultural University (BAU), Kanke, Ranchi-834006,
Jharkhand, India. 2Indian Grassland and Fodder Research Institute (IGFRI), Jhansi, Uttar Pradesh, India.
Received 18 September, 2015; Accepted 17 February, 2016
Twenty maize genotypes (19 inbred lines and a commercial hybrid) were studied assessing the extent of genetic diversity for 21 qualitative and quantitative morpho-metric traits and 18 expressed sequence tags-simple sequence repeats (EST-SSR) markers. A wide range of variation was observed among the 20 maize genotypes for quantitative traits predominantly for plant height, ear height, days to tasseling, days to silking, and kernel yield per plant. Among the qualitative traits, green-glume base, green inter-node, conico-cylindrical, flint grain texture, and white stone type were found predominant. The 18 primer pairs produced 92 different markers with polymorphism information content (PIC) value ranging from 0 to 0.87. Three different dendrograms based upon the dis/similarity coefficients were constructed. Poor and no correlations were observed among the sets of dendrograms patterns depicted from qualitative and quantitative traits and molecular markers. However, wide variation among genotypes of different clusters and within clusters was observed for different methods of clustering. It was concluded that the selection of suitable clustering system of genotypes should be determined by the purpose of clustering. Key words: Genetic diversity, maize, morphometric traits, simple sequence repeats (SSR) markers, cluster analysis.
INTRODUCTION Among cereals, maize (Zea mays L., 2n = 2x = 20) with the highest average yield per hectare ranks third after wheat and rice in total area and production in the world (FAOSTAT, 2012). Being a cheap source of nutrition, it is used as staple food, livestock feed/forage, and industrial raw material in developing countries. Increased utilisation
as poultry feed and its potential use as a forage and biofuel source makes it an important cereal crop for the future. Bearing the C4 physiological pathway and depicting a wide range of genetic variability and wider adaptability, maize is grown in most parts of the world up to 3000 m above sea level (masl) (Dowswell et al., 1996).
*Corresponding author. E-mail: [email protected]. Tel: +919162965588.
Author(s) agree that this article remain permanently open access under the terms of the Creative Commons Attribution
License 4.0 International License

Pandit et al. 2119
Table 1. List of the maize genotypes used in experiment.
S/N Genotypes Source S/N Genotypes Source
1 BAUIM-2 BAU, Ranchi 11 K-1105 Karnal
2 BAUIM-3 BAU, Ranchi 12 HKI-323 Karnal
3 BAUIM-4 BAU, Ranchi 13 CML-163-1 Karnal
4 BQPM-4 BAU, Ranchi 14 BQPM-2 BAU, Ranchi
5 BAUIM-5 BAU, Ranchi 15 HKI-1532 Hybrid (FF)(Karnal)
6 BAUIM-1 BAU, Ranchi 16 HKI-335 Antigua Gr.1(Karnal)
7 CM-500 DMR, New Delhi 17 HKI-577 Karnal
8 CM-111 DMR, New Delhi 18 HKI-209 Karnal
9 CML-169 DMR, New Delhi 19 HKI-488 Cargil-501(Karnal)
10 HKI-193-1 CCSHAU (Karnal) 20 BIO-9637 Bioseed Company Pvt. Ltd.
The existence of adequate genetic variability in populations is crucial for the success of maize improvement programmes. Although, serious threats to maize diversity for over a half century have been suggested around its centres of origin (Dyer et al., 2014), the maize breeders do not only preserved, but created more useable genetic diversity at various research centres in the world. It is now well recognised that better understanding of existing genetic diversity helps in developing heterotic pools for breeding superior hybrids and composites and line development (Ranatunga et al., 2009). The high level of heterosis can be exploited in new hybrids when parents are genetically diverse belonging to contrasting pools than closely related groups (Mungoma and Pollack, 1988).
The assessment of genetic diversity among genotypes based on morphological data may not reliably portray the exact genetic relationships due to environmental interactions (Voichita et al., 2011). Therefore, molecular markers have been used along with phenotypic traits in assessing the genetic diversity. In maize, various types of molecular markers have been used to investigate relationships among inbred lines from different heterotic groups (Melchinger et al., 1991; Lubberstedt et al., 2000; Pop et al., 2010).
Inbred lines in maize represent the basic resource in maize improvement since 1908 when Shull (1908) and East (1908) showed that the loss of vigour of inbred lines was completely restored with higher yield of hybrids than the varieties from which inbred lines were derived. The limitation of poor seed production from inbred lines was overcome by producing double cross hybrids (Jones, 1918, 1922) and eventually by developing improved inbred lines to produce single cross hybrids since 1960s. However, the use of maize inbreds is not only restricted to hybrid maize production (Anderson and Brown, 1952), but they are critical for various types of genetic studies including quantitative trait locus mapping (Austin et al., 2001), development of linkage maps (Burr et al., 1988), molecular evolution (Henry and Damerval, 1997), physiological studies (Crosbie et al., 1978) and in studying
the molecular genetic diversity (Kejun et al., 2003). A meaningful exploitation of maize inbred lines for
genetic analysis requires a detailed knowledge of genetic relationship and an understanding of genetic diversity among them. Therefore, utilization of molecular markers that directly evaluate genetic differences between inbred lines along with morphological traits will give a better way to group the inbreds and to understand their heterotic relationships. The ultimate exploitation of genetic diversity among inbred lines is expected to boost maize production particularly in the poor yielding state of Jharkhand, India. Therefore, in the present study, an attempt was made to assess the extent of genetic diversity available among a set of maize inbred lines maintained at Birsa Agricultural University using qualitative and quantitative traits, and through DNA based expressed sequence tags-simple sequence repeats (EST-SSR) markers. MATERIALS AND METHODS
A total of 20 maize genotypes (19 inbred lines and one commercial hybrid, that is, BIO-9637) were selected (Table 1) from a large collection of various sources being maintained at the Birsa Agricultural University (BAU), Ranchi, Jharkhand. The six BAUIM series inbred lines were developed at BAU through continuous inbreeding from 2005 onward. The other inbred lines were from Directorate of Maize Development, New Delhi and Haryana Agricultural University that being maintained at BAU for use in the hybrid breeding programme.
Observations taken
The 20 maize genotypes were grown for evaluation in the research field of Plant Breeding and Genetics Department of BAU, Jharkhand in a randomized complete block design (RCBD) with three replications. Each entry was planted in 2 rows of 4 m in length. The plant to plant spacing within rows was maintained at 20 and 70 cm between rows. All the recommended package of practices was followed to obtain normal growth of the crop. All the 20 genotypes were observed for three different observation/marker systems (9 qualitative traits, 14 quantitative traits from 10 randomly

2120 Afr. J. Agric. Res.
Table 2. Qualitative traits used for cluster analysis and their existing variability.
S/N Characters Code Stage of observation Expression Score No. of genotypes
1 Anther; Glume base anthocyanin colouration
GBC Recorded after tasseling
Green 1 15
Pink tinged 3 2
Pink 5 1
Red 7 1
Purple 9 1
2 Anther: Glume colouration
AC -do-
Green 1 4
Pink tinged 3 2
Pink 5 9
Red 7 5
Purple 9 0
3 Silk colour at emergence
SC Recorded after 2-3 days after silk emergence
Green 1 7
Pink tinged 3 7
Pink 5 3
Red 7 3
Purple 9 0
4 First leaf sheath colour
FLSC Recorded at knee-height stage
Green 1 6
Slightly purple 2 7
Purple 3 7
5 Inter-node colour INC Recorded at the initiation of reproductive phase
Green 1 14
Light purple tinged 3 4
Dark purple tinged 5 2
6 Ear shape ES Recorded after harvesting
Conical 1 2
Conico-cylindrical 2 17
Cylindrical 3 1
7 Kernel colour KC -do- Yellow 1 20
White 2 0
8 Grain texture GT -do-
Flint 1 19
Semi flint 2 0
Dent 3 1
9 Stone colour STC Recorded after threshing
White 1 15
Intermediate 2 1
Red 3 4
selected plants from each replication as per the reference from UPOV standards (Geneva) with some modifications and DNA markers from 18 SSR primers) (Tables 2 and 3).
DNA marker analysis
DNA isolation, quality and quantity check
Fresh green leaf samples for DNA isolation were collected from each genotype and the extraction and purification of the genomic DNA from each accession was carried out following the CTAB method with minor modifications. DNA quality and quantity of each genotype was assessed by electrophoresing the DNA in 0.8%
agarose gel (Sigma A9539) with known standards. All the DNA samples were uniformly diluted to have a final concentration of 10 ng/μl.
SSR analysis
A total of 18 EST-SSR primer pairs, designed using Primer-3 according to the sequences conferring for several drought related traits available on Maize GDB (Maize Genetics and Genomics Database, www.maizegdb.org/ssr.php) and GRAMENE, from SIGMA Aldrich Inc. were used for PCR amplification of repeat sequences from the genomic DNA of each sample. The primer pairs used are shown in Table 4. PCR reactions were performed

Pandit et al. 2121
Table 3. Quantitative traits used for cluster analysis.
S/N Characters Code Stage of observation
1 Days of 50% tasseling DT Recorded as days from the sowing to 50% of plants in the row have emerged tassel
2 Days of 50% silking DS Recorded as days from the sowing to 50% of plants in the row have emerged silks
3 Tassel length TL After tasseling
4 Tassel: main axis length TML -do-
5 Tassel: no. of branches NB -do-
6 Plant height PH measured from ground level to the tip of the tassel (after milk stage)
7 Ear height EH measured from base of the plant to the point bearing the first ear
8 Days to 75% dry husk 75% DDH Recorded as days from sowing to 75% dry husk of upper ear of >50% of plants in the row
9 Ear length EL Measured from the base to the tip of ear for 5 ears
10 Ear diameter ED Measured at the central part of the cob for 5 cobs
11 Kernel rows per ear KR/Ear Recorded for 5 cobs
12 Kernels per row K/Row Recorded as average no. of kernels per row for 5 cobs
13 100 kernel weight 100 KW Recorded for 5 cobs
14 Kernel yield per plant KY/Plant Recorded for 10 plants
using programmable thermal cycler from 10 μl volume containing 1 μl DNA, 0.10 μl (50 pmole/μl of each primer, 1 μl (10x) PCR buffer, 0.80 μl (10 mM) dNTPs, 0.5 μl (1 U/μl) Taq polymerase and 6.5 μl sterile water. Amplifications were done under conditions of 94°C for 4 min followed by 35 cycles of 94°C for 30 s, 40°C for 30 s, 72°C for 30 s and final extension at 72°C for 4 min. PCR products were electrophoresed in 2% agarose gel at constant power (90 Volts) for 3 to 4 h using Gen-X gel apparatus.
Scoring and data analysis
Qualitative multistate traits that depict ordinal scale of data were converted into binary characters (Sneath and Sokal, 1973) based on the variations present in each trait. The presence and absence of phenotypes were given the score of ‘1’ and ‘0’, respectively. The quantitative data recorded on different traits were transformed to standardised Z-scores with zero mean and a unit standard deviation or variance using MS-EXCEL. Only clear and unambiguous bands of SSR markers were scored. Markers were scored for the presence and absence of the corresponding band among the genotypes. The scores ‘1’ and ‘0’ were assigned for the presence and absence of bands, respectively. The three sets of data gathered (qualitative traits, quantitative traits, and SSR markers) were subjected to cluster analysis based on similarity coefficient values. Sequential Agglomerative Hierarchical Non-overlapping (SAHN) clustering was performed on three similarity coefficient matrices obtained from observations on three different marker systems utilizing the Unweighted Pair Group Method with Arithmetic Averages (UPGMA) to prepare dendrograms. The correspondence between the qualitative traits, quantitative traits, and SSR based similarity coefficient matrices were tested for their correlation in clustering patterns using the Matrix Comparison Plot procedure (Mantel’s Test, 1967). A scatter plot was produced taking a pair of matrices on axes and third matrix as residual effect. Data analysis was done using NTSYSpc version 2.02i (Rohlf, 1998).
Polymorphism information content (PIC)
PIC values or expected heterozygosity scores for SSR (polyallelic) markers were calculated in MS-EXCEL using the formula: Hj = 1 – Σp2
i,
where pi is the frequency for the i-th allele (Nei, 1973).
RESULTS AND DISCUSSION
Polymorphism analysis
Categorisation of experimental materials for qualitative traits was made as shown in Table 2. The majority of genotypes possessed green glume base, green inter-node, conico-cylindrical ear shape, flint grain texture, and white stone. There were fewer genotypes under scoring categories of other traits. In general, wide variation was observed among the genotypes as was also observed by Ranatunga et al. (2009).
The mean, range, standard deviation, and standard error (SE) of mean for each of the 14 quantitative traits observed are given in Table 5. Among the 14 traits, wider range of variation was observed across the 20 different maize genotypes for plant height (PH), ear height (EH), days to tasseling (DT), days to silking (DS) and kernel yield per plant (KY/Plant) with standard deviation of 25.88, 17.72, 7.41, 8.33, and 17.24, respectively. The existing range of these traits indicated possibilities for grouping the maize genotypes into various groups of poor performers and good performers. Better understanding of

2122 Afr. J. Agric. Res. Table 4. List of the EST-SSR primers used for molecular characterization, allele no., and PIC.
SN Name Repeats Primer Sequence 5’-3’ Alleles PIC
1 p-umc1566 (GCC)6 F CGTCTACCTAACCCACCCTC
7 0.74 R AGGCTGAAGAGGAAGTCGAC
2 p-umc1542 (AG)10 F CAAAGACGACGTTCCTGCAT
10 0.87 R CCCTGACCATCGATCTGCTA
3 p-umc2189 (CAG)4 F AGTACAGTACACCAATGGGC
9 0.83
R CGACTACAAGCCTCTCAACT
4 p-bnlg1016 (AG)20 F CCGACTGACTCGAGCTAACC
4 0.69 R CCGTAACTTCCAAGAACCGA
5 p-bnlg1014 (AG)14 F CACGCTGTTTCAGACAGGAA
4 0.66 R CGCCTGTGATTGCACTACAC
6 1 (GRMZM2G098290) (TCG)6 F TGCGCACAGGAGGAGATC
8 0.84 R TCCCTTTTCCGACTCCGC
7 p-umc2225 (AGAGAGAGAGAGAG)4 F AAGGGAACAATCGGAAGGGT
12 0.87 R GCATGCGATTTTACCGGGTT
8 p-umc1083 (GA)16 F TCAAACATGTGACCCGGGAG
2 0.29 R TTCTTCGTCTTGTTCCCCGA
9 p-umc1075 (ATTGC)5 F TGACAGACACATCCTTGGCA
4 0.67 R ACCTTCACGAGCTAGCACAT
10 p-umc1519 (TC)8 F CTCGAGACTCTGGTTCAATCCAAT
4 0.61 R CATGCACGTACTTCCCTGATTTTT
11 p-umc1507 (CACAA)4 F CACACGTGGAAATGAACTCC
1 0.00 R CTCGAACCTTGCTGTGTGTT
12 p-bnlg1767 (AG)16 F AATTTCACGGTAGGGACACG
5 0.76 R AATCCGCGTGTTTTCATAGG
13 GRMZM2G005887 (TA)28 F CATGGATGGTTTGCTGTGGG
2 0.43 R CATCAGTGCTGCTCAGTTCA
14 p-bnlg1017 (AG)18 F ATTGGAAGGATCTGCGTGAC
5 0.76 R CAGCTGGTGGACTGCATCTA
15 p-umc1489 (GCG)5 F TTAATAGCTACCCGCAACCAAGAA
4 0.71 R CTGAGCCACAGTACCTTGCTGTT
16 p-bnlg1917 (AG)26 F ACCGGAACAGACGAGCTCTA
3 0.67 R TTTGCTTCCAACTCACATGC
17 GRMZM2G098290 (CTC)6 F CAACACAAGGACAAGGCTGG
6 0.82 R TGGCTATGGAGGTGAAGCAG
18 GRMZM2G081557
(CGC)4, (TGG)4
F CCGTCAGTGGAGTTGGAAAC 2 0.50
R GAGACACGAGAAGAGGCCTG
Mean
5.11 0.65
PIC: Polymorphism information content.

Pandit et al. 2123
Table 5. Descriptive statistics for 14 quantitative traits under study.
S/N Trait Mean Range SD SE (±)
1 DT 100.33 84.67-104.67 7.41 1.66
2 DS 106.15 86.67-120.33 8.33 1.86
3 TL 32.19 24.17-37.00 3.66 0.82
4 TML 22.79 13.50-27.42 3.39 0.76
5 NB 10.62 5.17-21.67 4.25 0.95
6 PH 131.03 82.33-175.67 25.88 5.79
7 EH 67.48 40.67-106.67 17.72 3.97
8 75%DDH 140.28 126.67-151.33 6.98 1.56
9 EL 15.88 8.27-22.67 3.83 0.86
10 ED 4.48 3.70-5.50 0.56 0.13
11 KR/Ear 14.18 10.67-21.00 2.67 0.60
12 K/Row 22.77 12.78-29.50 4.54 1.02
13 100 KW 25.25 16.03-32.17 3.71 0.83
14 KY/Plant 52.26 27.73-104.00 17.24 3.86
the influence of environment on these quantitative traits would help in grouping these genotypes with better accuracy (Ranatunga et al., 2009). Yadav and Singh, (2010) also reported that the traits tassel branching, plant height, kernels/row, ear height, ear length, and ear width are important in discriminating the inbred lines. Azad et al. (2012) recognized greater contribution of plant height, ear length, ear diameter, number of grains/ear, thousand kernels weight, and kernel yield/plant to the existing variability among 30 inbred lines.
All the primer pairs were found to be multi loci except UMC-1507 and the number of alleles per locus in the lines ranged from 1 to 12 with an average of 5.11 for a total of 92 alleles. The average number of alleles per locus was in accordance to Morales et al. (2010), who used 21 SSR primers in heterotic maize populations and reported an average of 5.14 and Saavedra et al. (2013) who obtained an average of 4.81 from 11 SSR primers. The PIC value for the primer pairs ranged from 0.00 to 0.87 with an average of 0.65 (Table 4). Seventy seven percent primers had PIC value greater than 0.50 and 50% greater than 0.70. These results suggest that the genotypes were holding a substantial amount of polymorphism at DNA level. These values are similar to those reported by other researchers. Shiri (2011) obtained average PIC value of 0.53 for 40 SSR primers having a range from 0.23 to 0.79 and Karen et al. (2013) reported average PIC value of 0.68 with a range of 0.23 to 0.82. Cluster analysis and dendrograms Dendrograms constructed from the dis/similarity coefficients (table not given) based on three types of observations on qualitative, quantitative, and molecular
markers revealed the existence of considerable amount of distances across the genotypes. Cluster analysis using nine qualitative traits resulted in grouping of genotypes into three major clusters of 14, 5 and 1 (K-1105) genotype/s (Figure 1). The similarity coefficient ranged between 0.69 and 0.97. The pair of maize genotypes BAUIM-1 and CM-111 in cluster-I was almost genetically similar with a similarity coefficient of 0.97 but exhibiting considerable variation from others. Inbred CML-163-1 was found to be most diverse from inbreds BAUIM-4, BQPM-4, CM-500, and K-1105 having similarity coefficient less than 0.60 (table not given). Similarly, BQPM-4 was also different from BAUIM-3 and K-488 with similarity index of 0.56 and 0.59, respectively (Figure 1). The dendrogram constructed on quantitative traits comprised four major clusters: cluster-I with 9 genotypes, cluster-II with 8 genotypes, cluster-III with 1 genotype (CML-169), and the cluster-IV with 2 genotypes (BAUIM-5 and K-488) (Figure 2). The similarity coefficient ranged from 0.04 to 0.50, showing a poor similarity between the genotypes among and between the clusters. This clustering was distinctly different from that based on other two methods using quantitative traits and SSR markers. BAUIM-5 and K-488 (under same cluster) had a similarity coefficient of almost zero value. These inbreds were the most distinct from other inbred lines. Similarly, inbreds BAUIM-4, CML-169 and HKI-209 (under same cluster) with very low similarity coefficient were also distinctly differing from other inbreds such as BAUIM-5, BQPM-2, HKI-577, and K-488 belonging to different clusters.
Clustering pattern of 20 genotypes based on EST-SSR markers (Figure 3) revealed that the genotypes were differing among themselves with similarity coefficients ranging from 0.60 to 0.77. Out of 20 genotypes, 9 genotypes were under cluster-I and one genotype (BAUIM-5) in cluster-II but linked with cluster-III, which

2124 Afr. J. Agric. Res.
Coefficient
0.69 0.76 0.83 0.90 0.97
OTU-10
OTU-1
OTU-7
OTU-14
OTU-16
OTU-3
OTU-4
OTU-20
OTU-5
OTU-17
OTU-6
OTU-8
OTU-9
OTU-10
OTU-12
OTU-2
OTU-19
OTU-15
OTU-13
OTU-18
OTU-11
OTU-1: BAUIM-2
OTU-7: CM-500
OTU-14: BQPM-2
OTU-16: HKI-335
OTU-3: BAUIM-4
OTU-4: BQPM-4
OTU-20: BIO-9637
OTU-5: BAUIM-5
OTU-17: HKI-577
OTU-6: BAUIM-1
OTU-8: CM-111
OTU-9: CML-169
OTU-10: HKI-193-1
OTU-12: K-323
OTU-2: BAUIM-3
OTU-19: K-488
OTU-15: HKI-1532
OTU-13: CML-163-1
OTU-18: HKI-209
OTU-11: K-1105
Figure 1. Dendrogram of 20 genotypes based on 9 qualitative traits.
Coefficient
0.04 0.16 0.27 0.39 0.50
OTU-10
OTU-1
OTU-13
OTU-17
OTU-2
OTU-4
OTU-15
OTU-20
OTU-6
OTU-14
OTU-3
OTU-8
OTU-18
OTU-11
OTU-12
OTU-16
OTU-10
OTU-7
OTU-9
OTU-5
OTU-19
OTU-1: BAUIM-2
OTU-13: CML-163-1
OTU-17: HKI-577
OTU-2: BAUIM-3
OTU-4: BQPM-4
OTU-15: HKI-1532
OTU-20: BIO-9637
OTU-6: BAUIM-1
OTU-14: BQPM-2
OTU-3: BAUIM-4
OTU-8: CM-111
OTU-18: HKI-209
OTU-11: K-1105
OTU-12: K-323
OTU-16: HKI-335
OTU-10: HKI-193-1
OTU-7: CM-500
OTU-9: CML-169
OTU-5: BAUIM-5
OTU-19: K-488
Figure 2. Dendrogram of 20 genotypes based on 14 quantitative traits.
included the rest 10 genotypes. Genotypes HKI-488 and BIO-9637 were found almost genetically similar with similarity coefficient of 0.77 under the cluster-III. Inbreds BQPM-4 and CML-163-1 were found to be most diverse
with similarity coefficient 0.49. Based on the similarity coefficient between paired inbreds, CML-163-1 and K-488 were found to be the most distinct from other inbreds and themselves too.

Pandit et al. 2125
Coefficient
0.60 0.64 0.68 0.73 0.77
OTU-10
OTU-1
OTU-3
OTU-12
OTU-2
OTU-10
OTU-18
OTU-15
OTU-11
OTU-13
OTU-5
OTU-4
OTU-8
OTU-17
OTU-6
OTU-9
OTU-7
OTU-14
OTU-16
OTU-19
OTU-20
OTU-1: BAUIM-2
OTU-3: BAUIM-4
OTU-12: K-323
OTU-2: BAUIM-3
OTU-10: HKI-193-1
OTU-18: HKI-209
OTU-15: HKI-1532
OTU-11: K-1105
OTU-13: CML-163-1
OTU-5: BAUIM-5
OTU-4: BQPM-4
OTU-8: CM-111
OTU-17: HKI-577
OTU-6: BAUIM-1
OTU-9: CML-169
OTU-7: CM-500
OTU-14: BQPM-2
OTU-16: HKI-335
OTU-19: K-488
20-BIO-9637
Figure 3. Dendrogram depicted for 20 genotypes based on EST-SSR markers.
similarity.NTS - residual
-0.14 -0.07 -0.00 0.07 0.14
qualitative-similarity.NTS - residual
-0.20
-0.09
0.01
0.12
0.23
Qu
alit
ativ
e-s
imila
rity
NTS
-re
sid
ual
Similarity NTS-residual
Figure 4. Matrix comparison scatter plot of similarity coefficients based on three factors (X-axis: molecular, Y-axis: qualitative traits and residual: quantitative traits).
The clustering pattern derived from qualitative traits was the most distinct with many sub-clusters. The dendrogram constructed from molecular data revealed that the genotypes were more alike, which is evident from the higher similarity coefficient value. The dendrogram based on quantitative traits showed that the genotypes were much diverse based on their performance and was not in accordance with the other methods of clustering. Thus, under the study of morphometric traits and SSR markers genotyped for 20 maize genotypes used in the
present study were clearly differentiated from one another. In the previous studies of Ranatunga et al. (2009), Ben-Har et al. (1995) and Smith et al. (1997) found no correlation in the clustering patterns from different methods and Yadav and Singh, (2010) also reported little agreement among the different methods of cluster analysis.
The comparison of matrices also revealed no or poor correlated pattern between the similarity coefficients (Figures 4, 5 and 6). However, some level of agreement

2126 Afr. J. Agric. Res.
qual.similarity.NTS - residual
-0.18 -0.08 0.02 0.12 0.23
quant.similarity.NTS - residual
-0.13
-0.00
0.12
0.25
0.38
Qu
anti
tati
ve-s
imila
rity
NTS
-res
idu
al
Quantitative similarity NTS-residual
Figure 5. Matrix comparison scatter plot of similarity coefficients based on three factors (X-axis: qualitative traits, Y-axis: quantitative traits & residual effect: molecular markers).
mol.similarity.NTS - residual
-0.17 -0.08 -0.00 0.08 0.16
quant.similarity.NTS - residual
-0.17
-0.04
0.09
0.22
0.35
Molecular similarity NTS-residual
Qu
anti
tati
ve-s
imila
rity
NTS
-res
idu
al
Figure 6. Matrix comparison scatter plot of similarity coefficients based on three factors (X-axis: molecular markers, Y-axis: quantitative traits and residual effect: qualitative traits)
in paired similarity coefficient matrix was observed in matrix comparison plot in Figure 4; which is also evident in clustering pattern based on qualitative traits and molecular markers, where some genotypes were found to be under same clusters in both dendrograms. Such
disagreement in the clustering pattern might arise when the gene sequences for the morpho-metric traits under study were not covered by those sequences by the primers used. Laviola et al. (2012) suggested that this disparity between data corresponding to molecular

variability and those related to the variability available for breeding purposes (phenotypic variability) could arise from the fact that neutral molecular markers, such as RAPD or SSR, commonly used in molecular diversity studies, may be located in non-coding regions of the genome (Collard et al., 2005) and therefore be of limited use in predicting the phenotypic diversity of individuals, especially in complex quantitative traits, such as yield. Therein, Yadav and Singh (2010) suggested that lines that display high phenotypic dissimilarity need not be genetically dissimilar and vice-versa.
The three methods of diversity assessment revealing different clustering patterns suggested that preference for a particular method should be determined by the purpose of clustering; for instance, grouping of genotypes for quantitative traits should be done on quantitative traits. Molecular markers can be used for any traits; however, their use should be in a more exhaustive way. The inbreds under the present diversity analysis were found to be distinct between clusters and within clusters. So, the inbreds from distinct clusters having high genetic distance can be used as parents to exploit heterosis for quantitative traits such as grain yield. The results of the present study would be a valuable source of information for future maize breeding programme that could be established on the basis of genetic distances among the inbred lines studied.
ACKNOWLEDGEMENTS
This study was a part of the M.Sc. thesis research of the first author. The first author highly acknowledges the Directorate of Agricultural Research and Education (DARE), Ministry of Agriculture, Government of India and Government of Nepal for providing opportunity to pursue the M.Sc. (Ag.) program in Department of Plant Breeding and Genetics, Birsa Agricultural University (BAU), Kanke, Ranchi, under the Nepal Aid Fund Scholarship Scheme-2013. The authors also acknowledge the ICAR and the BAU for providing research platform and materials.
Conflict of Interests The authors have not declared any conflict of interests. REFERENCES Anderson E, Brown WL (1952). Origin of corn belt maize and its genetic
significance. In: Gowen JW (Eds.). Heterosis, Iowa State Univ. Press, Ames. pp. 124-148.
Austin DF, Lee M, Veldboom LR (2001). Genetic mapping in maize with hybrid progeny across testers across testers and generations: plant height ad flowering. Theor. Appl. Genet. 102:163-176.
Azad MAK, Biswas BK, Alam N, Alam SkS (2012). Genetic diversity in maize (Zea mays L.) inbred lines. The Agriculturists 10(1):64-70.
Ben-Har A, Charcoset A, Bourgoin M, Guiard J (1995). Relationships between genetic markers and morphological traits in a maize inbred lines collection. Euphytica 84:145-154.
Pandit et al. 2127 Burr B, Burr FA, Thompson KH, Albertsen MC, Stuber C (1988). Gene
mapping with recombinant inbreds in maize. Genetics 118:519-526. Collard BCY, Jahufer MZZ, Brouwer JB, Pang ECK (2005). An
introduction to markers, quantitative trait loci (QTL) mapping and marker-assisted selection for crop improvement: The basic concepts. Euphytica 142:169-196.
Crosbie TM, Mock JJ, Pearce RB (1978). Inheritance of photosynthesis in a diallel among eight maize inbred lines from Iowa Stiff Stalk Synthetic. Euphytica 27:657-664.
Dowswell CR, Paliwal RL, Cantrell RP (1996). Maize in Third World. West View Press, Colorado, USA.
Dyer GA, Lopez-Feldman A, Yunnez-Naude A, Taylor JE (2014). Genetic erosion in maize’s center of origin. Proc. Natl. Acad. Sci. 111(39).
East EM (1908). Inbreeding in corn. Rep. Conn. Agric. Exp. Stn. pp. 419-428.
FAOSTAT (2012). Statistical Database of the Food and Agriculture of the United Nations. http://www.fao.org [Online].
Henry AM, Damerval C (1997). High rates of polymorphism and recombination at the opaque-2 locus in cultivated maize. Mol. Gen. Genet. 256:147-157.
Jones DF (1918). The effects of inbreeding and crossbreeding upon development. Conn. Agric. Exp. Stn. Bull. 107:100.
Jones DF (1922). The productiveness of single and double first generation corn hybrids. J. Am. Soc. Agron. 14:242-252.
Karen V, Hidalgo P, Méndez‐Marroquín KP, Alvarez EV, Vez-ontiveros JC, Nchez pe ña P, On-tiznado JG, Vega-garc ía MO, ló pez-valenzuela JA (2013). Microsatellite-based genetic diversity among accessions of maize landraces from Sinaloa in México. Hereditas 150:53-59.
Kejun L, Goodman M, Muse S, Smith JS, Buckler E, Doebley J (2003). Genetic structure and diversity among maize inbred lines as inferred from DNA microsatellites. Genetics 165:2117-2128.
Laviola BG, Alves AA, Gurgel FD, Rosado TB, Rocha RB, Albrecht JC (2012). Estimates of genetic parameters for physic nut traits based in the germplasm two years evaluation. Ciênc. Rural 42:429-435.
Lübberstedt T, Melchinger AE, Dußle C, Vuylsteke M, Kuiper M (2000). Relationships among Early European Maize Inbreds IV. Genetic Diversity Revealed with AFLP Markers and Comparison with RFLP, RAPD, and Pedigree Data. Crop Sci. 40:783-791.
Mantel NA (1967). The detection of disease clustering and a generalized regression approach. Cancer Res. 27:209-220.
Melchinger AE, Messmer MM, Lee M, Woodman WL, Lamkey KR (1991). Diversity and relationships among U.S. maize inbreds revealed by restriction length polymorphism. Crop Sci. 31:669-678.
Morales M, Decker V, Ornella L (2010). Analysis of genetic diversity in Argentinean heterotic maize populations using molecular markers. Ciencia e Investigación Agraria 37:151-160.
Mungoma C, Pollack LM (1988). Heterotic patterns among ten corn belt and exotic maize populations. Crop Sci. 28:500-504.
Nei M (1973). Analysis of gene diversity in subdivided populations. Proc. Natl. Acad. Sci. 70:3321-3323.
Pop R, Pamfil D, Harta M, Has I, Pop I (2010). Use of RAPD technique for characterization of genotypical variability of maize germplasm from SCDA Turda. Bull. UASVM Agric. 67(1):226-231.
Ranatunga MAB, Meenakshisundaram P, Arumugachamy S, Maheswaran M (2009). Genetic diversity analysis of maize (Zea mays L.) inbreds determined with morphometric traits and simple sequence repeat markers. Maydica 54:113-123.
Rohlf FJ (1998). NTSYS-pc numerical taxonomy and multivariate analysis system, version 2.02i. Exeter Publications, New York.
Saavedra J, Silva TA, Mora F, Scapim CA (2013). Bayesian analysis of the genetic structure of a Brazilian popcorn germplasm using data from simple sequence repeats (SSR). Chilean J. Agric. Res. 73(2).
Shiri M (2011). Identification of informative simple sequence repeats (SSR) markers for drought tolerance in maize. Afr. J. Biotechnol.10 (73):16414-16420.
Shull GH (1908). The composition of a field of maize. Am. Breed. Assoc. Rep. 4:296-301.
Smith JSC, Chin ECL, Shu H, Smith OS, Wall SJ, Senior ML, Mitchell SE, Kresobitch S, Ziegle J (1997). An evaluation of the utility of SSR loci as molecular markers in maize (Zea mays L): Comparisons with

2128 Afr. J. Agric. Res.
data from RFLPs and Pedigree. Theor. Appl. Genet. 95:163-173. Sneath P, Sokal R (1973). Numerical Taxonomy. Freeman Publication,
San Francisco. Voichita H, Rodica P, Ioan H, Ana C (2011). Genetic variability in a set
of early maize inbred lines. Bull. UASVM Agric. 68(1):155-164.
Yadav VK, Singh IS (2010). Comparative evaluation of maize inbred
lines (Zea mays L.) according to DUS testing using morphological, physiological and molecular markers. Agric. Sci. 1(3):131-142.

Vol. 11(24), pp. 2129-2138, 16 June, 2016
DOI: 10.5897/AJAR2016.10819
Article Number: 3DB852558983
ISSN 1991-637X
Copyright ©2016
Author(s) retain the copyright of this article
http://www.academicjournals.org/AJAR
African Journal of Agricultural Research
Full Length Research Paper
Evaluation of intraspecific hybrids of yellow passion fruit in organic farming
Onildo Nunes de Jesus1*, Taliane Leila Soares1, Eduardo Augusto Girardi1, Raul Castro Carriello Rosa1, Eder Jorge de Oliveira1, Alírio José da Cruz Neto2,
Valeria Tebinka dos Santos3 and João Roberto Pereira Oliveira1
1Embrapa Cassava and Fruits, P. O. Box 007, ZIP Code 44380-000 Cruz das Almas, BA, Brazil.
2State University of Feira de Santana, ZIP Code 44036-900 Feira de Santana, BA, Brazil.
3Organic Bionergy, Zip Code 46960-000 Lençois, BA, Brazil.
Received 19 January, 2015; Accepted 17 March, 2016
The objective of this work was to evaluate 14 hybrids intraspecific of yellow passion fruit aiming to select those with higher performance in an organic production system in Lençóis, Bahia, Brazil. The following variables were evaluated: Plant growth rate index, segregation for peel color, accumulated productivity, fruit physical-chemical attributes, severity of virus disease in plants and fruits, scabs in fruits and overall state of health of plants. Hybrids HFOP-05, BRS Sol do Cerrado and BRS Gigante Amarelo presented highest plant vigor with no direct relation to the percentage of flowering and fruitification of plants. Some hybrids presented yellow, light purple and dark purple peel color. Fruits with dark purple peel presented interesting chemical characteristics, such as lower acidity and greater ratio, providing sweeter flavor of the fruits. There was no differentiated response of the hybrids as to severity of the diseases evaluated. Leaf analysis showed relatively low concentration only for N, P and K. The hybrids selected, BRS Gigante Amarelo, BRS Sol do Cerrado, HFOP-08, HFOP-09, HFOP-11 and HFOP-12 are highlighted for productivity, physical characteristics of fruits and preference of the consumer market being considered an alternative for passion fruit producers that opt for a more environmental friendly production with greater market value. Key words: Breeding, fruit quality, Passiflora edulis f. flavicarpa, sustainable cultivation, productivity.
INTRODUCTION In 2014, crop of yellow passion fruit (Passiflora edulis f. flavicarpa O. Deg.) in Brazil was 823,000 tons in 57,000 ha (14.48 t ha
-1), and 71% of the production was obtained
in the Northeast region (IBGE, 2015). Brazil is the largest producer and consumer of passion fruit in the world, with 95% of the national production of passion fruit being
represented by the yellow variety, also known as yellow passion fruit vine (Janzantti and Monteiro, 2014). The culture of yellow passion fruit has shown strong expansion, awakening interest of fruit growers because of the possibility of growing in almost all regions of Brazil, quick start of production, and its excellent acceptance
*Corresponding author. E-mail: [email protected]. Tel: +55-75-33128052.
Author(s) agree that this article remain permanently open access under the terms of the Creative Commons Attribution
License 4.0 International License

2130 Afr. J. Agric. Res. in the fresh market and industry (Rocha et al., 2001; Malacrida and Jorge, 2012). Other tropical regions have been increasing the production of this fruit crop, such as Colombia, Kenya and Ecuador, alongside traditional producers such as Australia and South Africa, because of the increasing international demand (FIBL and IFOAM, 2014).
In Brazil, the State of Bahia has 42% of the production, the regions of Sertão Produtivo and Chapada Diamantina being among the main passion fruit production centers (IBGE, 2015). These regions have similar characteristics, such as tropical semi-arid climate, compulsory irrigation, high incidence of diseases of shoot and root system, and nomadic farming conducted mainly in family farming system. The yellow passion fruit production system is predominantly based on conventional techniques, with mineral fertilization of soil and applications of pesticide to ensure high yields of culture, thus potentially causing major impacts to the environment and to human health (Calle et al., 2010; Wyckhuys et al., 2011).
In recent years, numerous studies have been directed to meeting the consumers’ growing demand for food that is healthier and has minimum environmental impact, seeking preservation of the ecosystem, biological conservation of soil, water and air quality, as well as obtaining reduced production cost (Conti et al., 2014; Siegmeier et al., 2015; Henneron et al., 2015; Reganold and Wachter, 2016). Although being a good alternative, aimed at differentiated markets (Motta et al., 2008), organic agriculture is usually labeled as a system of low-productivity, high-risk production, and high-cost certification (Acs et al., 2009; Nelson et al. 2004; Meier et al., 2015; Ponisio et al., 2015), in addition to being unable to produce enough food to feed the World’s population (Seufert et al., 2012; Ponti et al., 2012).
On the other hand, the global market for organic products has increased considerably in recent years. In 2013, turnover was USD 72 billion, growth over 11% compared to 2012 (FIBL and IFOAM, 2014). In Brazil, this market is growing every year, being considered the largest market for organic products in Latin America. One of the contributing factors is the position occupied by the country in terms of organically managed area, with over 706,000 ha, second only to Argentina and Uruguay. Regarding the number of organic producers in this activity, Brazil has about 13,000 producers, with 90% of them being small farmers using family labor. Organic farming is an option to increase the incomes of family farmers, enabling increases in the prices of the products sold, since the cost and benefit relation is easily understood by the consumer (Ponti et al., 2012).
The vast majority of commercial plantations of passion fruit in Brazil and abroad is based on the conventional production system (Medeiros et al., 2009; Calle et al., 2010; Wyckhuys et al., 2011). Although there is some research on the cultivation of passion fruit in organic system (Motta et al., 2008; Macoris et al., 2011; Janzantti
et al., 2012; Costa et al., 2013; Janzantti and Monteiro, 2014), most studies focus on economic analysis of production and nutritional and biochemical attributes of the fruits produced, with scarce reports on the agronomic performance of the varieties (Amaro and Monteiro, 2001; Fischer et al., 2007). Nevertheless, the use of genetic materials that are more adapted to organic farming is a decisive factor for their viability, because they have attributes such as pest tolerance, production stability, and more efficient use of resources such as water and nutrients (Ponti et al., 2012; Forster et al., 2013; Seufert et al., 2012).
Thus, the objective of this study was to select intraspecific hybrids of yellow passion fruit for organic production system, based on agronomic performance and quality of fruits from hybrids with different peel colorings aiming at industrial processing and fresh market for new market niches.
MATERIALS AND METHODS
Experiment location and cultural practices
The study was conducted in a commercial production area in the municipality of Lençóis, State of Bahia, Brazil (12º17’37’’ S, 42º39’27” W, 700 m). According to the Köppen classification, the climate in Lençóis is classified as mesothermal type of Cwb . The soil is classified as Red oxisol, dystrophic, alic with clayey texture (Embrapa, 1999). Correction of soil acidity was performed by the use of dolomitic limestone, following cultivation of soil enhancing plant cocktail consisting of pearl millet (Pennisetum americanum L.), sorghum (Sorghum bicolor L.), jack bean (Canavalia ensiformis L.) and estilo plants (Stylosanthes macrocephala M. B. Ferr. et S.). Thereafter, mowing was performed for the deposition of plant biomass on the ground. The soil of the experimental area had the following chemical attributes in the 0 to 20 cm layer before installation and by the end of the study, respectively: pH (H2O) 6.50 and 6.90; P 18 and 126 (mg dm-3); K 0.15 and 0.41; Ca 4.30 and 7.27; Mg 2.30 and 3.85; Al 0.0 and 0.0; H + Al 3.08 and 1.10; CTC 9.91 and 13.01 (cmolc dm-3); V 69 and 92 (%); M.O. 47.6 and 54.0 g kg-1 soil).
Seedlings were grown in a screened nursery in plastic bags of 2 L, containing decomposed pine bark mixed with organic compound consisting of 20 g of Bokashi per liter of pine bark. Ninety days after sowing, transplanting to the field was conducted in December 2012, and the work was conducted until February 2014. Plant spacing was 2.5 m between rows and 4.0 m between plants (1000 plant ha-
1) and the plant conduction system was espalier or fence trellis with a single stand of flat galvanized wire with 2.77 mm of gauge. Upright wood posts were set at 6.0 m intervals in the row to support the wire, which was set at 2 m above soil. Pollination was natural by carpenter bees (Xilocopa spp.) and the irrigation system was dripping, with two emitters of 4 L h-1 per plant.
During the experiment, cultivation with adaptations to the organic production system was carried out according to the recommendations for the yellow passion fruit in Brazil and to the federal laws of organic agriculture (Borges et al., 2001, 2003; Brasil, 2011, 2014). Thirty days before planting, the pits (0.4 x 0.4 x 0.4 m) were opened and fertilized with 10 L of tanned cattle manure, 1 kg of rock dust (ground calcosilicated pyroxenite), 500 g of agricultural gypsum, 300 g of dolomite limestone, and 1 kg of Bokashi organic fertilizer produced at the farm (300 kg of wood soil of the 0 to 0.05 m layer + 200 kg of cattle manure + 200 kg of rock

dust + 250 kg of castor bean cake + 25 kg of micronutrients “fried” BR 12 + 10 kg of magnesium oxide + 20 L of molasses, mixed daily for 10 days, slightly moistened).
After planting, fertilizations were carried out every 90 days in coverage, consisting of the application of 10 L of cattle manure and 1 kg of the fertilizer Bokashi around the plant (circle of approximately 0.6 m radius away 0.15 m from the passion fruit vine stem). A layer of approximately 0.1 m of dry mass of S. macrocephala and Stylosantes capitata was added under each fertilization, forming a laminar microcomposting around the stem. Control of spontaneous vegetation was carried out by means of mechanized weeding between rows and hoeing in rows when needed.
There was no previous cultivation of passion fruit in the experimental area and in its vicinity, and no measures of pest and disease control were carried out during the evaluation period.
Plant material 14 intraspecific hybrids of yellow passion fruit P. edulis Sims were evaluated with 12 hybrids of the HFOP-01–12 series, derived from crosses between parental individuals selected by Embrapa Cassava and Tropical Fruits, due to the higher productivity and desirable fruit physicochemical attributes (Neves et al., 2013), and two commercial hybrids released by Embrapa, BRS Sol do Cerrado and BRS Gigante Amarelo. Seeds were collected in matrices of Embrapa Cassava and Fruits and immediately sown for the formation of seedlings. Plant growth evaluation Plant growth was evaluated weekly between 88 and 159 days after planting (DAP), calculating the percentage of plants with tertiary branches (branches that arise from the secondary branches and form the productive branches or “production curtain”) and of plants with the presence of flowers and fruits. The plant growth speed index (GSIb) was calculated as given by Maguire (1962), by GSIb = D1/N1 + D2/N2 + ... + Dn/Nn, where D1, D2, and Dn are the percentage of plants with tertiary branches in the first, second, and last dates of evaluation after planting, and N1, N2, and Nn are the number of days after the first, the second, and the last dates of evaluation after planting. The same rationale was performed to calculate the flowering speed index (GSIfl), computing the percentage of plants with flowers in each date, and for the fruiting speed index (GSIfr), computing the percentage of plants with fruits in each date. Thus, higher values for general GSI correspond to greater plant growth speed in terms of formation of curtain, flowering, and fructifying of plants. The climatic conditions in the evaluation period ranging from maximum temperature 28 to 32°C, minimum 16 to 20°C, relative humidity 59 to 77% and rainfall of 0.31 to 7.37 mm (INMET, 2015).
Production, physicochemical quality of fruits and evaluation of diseases The evaluations of production and physicochemical quality of fruits were held throughout the production cycle. Variables evaluated were total accumulated production (t ha-1) in the three harvests, that is, at 184, 334, and 441 DAP, percentage of production for each harvest in relation to total production, fruit mass (FM), fruit length (FL), and fruit diameter (FD), the fruit length/diameter ratio (LDR), peel thickness (PT), peel mass (PeM), seedless pulp mass (PuM), juice yield (JY) given by PuM divided by FM in percentage terms, total soluble solids content (SS), total titratable acidity (TTA) and ratio given by SS/TTA.
Nunes de Jesus et al. 2131 For each harvest, five fruits were analyzed per plot, proceeding to the analysis on the mean of the three harvests.
Evaluation of the phenotypic stability of the hybrids was also carried out concerning the coloring of the fruit peel. The plants were classified as yellow fruits (without anthocyanin pigment), light purple (light or moderate anthocyanin pigmentation), and dark purple (strong anthocyanin pigmentation). Result was shown with the percentage of plants with fruits with a particular peel color in relation to the total of experimental plants of the respective hybrid. To verify the capability of the progenies with the aforementioned peel colorations, 10 fruits of each color were selected. Analysis consisted in verifying, on average, the differences between the three fruit peel color classes depending on the chemical characteristics SS, TA, and ratio.
For evaluation of diseases scab and passion fruit woodiness virus five fruits per plot were evaluated at 474 DAP (Junqueira et al., 2003). Fruits were collected randomly in the plot at the beginning of the maturation process and evaluated by grading scale (Junqueira et al., 2003; Oliveira et al., 2013). To evaluate viral disease in plants, assessments were performed considering the onset of symptoms on plants per plot using grading scale (Oliveira et al., 2013). Evaluation of the plants’ nutritional status At 300 DAP, 20 leaves were collected randomly per plot, removing the fifth leaf from the apex, ten leaves from each side of the espalier. Samples were stored and analyzed for macro and micronutrients, in accordance with Malavolta et al. (1997) and Jackson (1958), respectively. As the standard for interpreting the results of foliar nutrient concentrations, the concentration range proposed in other studies (Haag et al., 1973; Robinson, 1986; Malavolta et al., 1989; Menzel et al., 1993) were used. Data statistical analysis Experimental design comprised of randomized blocks, with 14 treatments, five replicates, and 12 plants in the unit. Results were submitted to analysis of variance and the means were grouped by the Scott-Knott test (p ≤ 0.05). Tukey test was used for variables concerning to the three classes of fruit peel color. When necessary, transformation type of the angular arc sine of square root of x/100 was carried out to meet standardization and homogeneity of variances. RESULTS
Plant growth
Overall, there was no difference for the presence of tertiary branches among hybrids, except for HFOP-01 which was less vigorous with GSIb of 3.31 (Table 1). It was expected that the increase in the tertiary branches were also accompanied by the presence of flowers and fruits. The last hybrid with the presence of flowers was the HFOP-01, with GSIfl of 2.56, thus being related to the slower formation of curtain in that genotype, followed by the hybrids HFOP-05, BRS Sol do Cerrado and BRS Gigante Amarelo (Table 1). Similar behavior was observed for the presence of fruit. On the other hand, for these three hybrids, the greatest vegetative vigor, expressed by the percentage of plants with tertiary

2132 Afr. J. Agric. Res. Table 1. Plant growth speed indices (GSI) for percentage of formation of tertiary branches (GSIb), of flowering (GSIfl), and of fructi fying (GSIfr) up to 159 days after planting (DAP), cumulative percentage of yield per harvest and cumulative yield at 441 DAP of 14 hybrids of yellow passion fruit grown under organic production system.
Genotype1 Growth speed indices (GSI) Cumulative percentage of yield per harvest (%) Cumulative yield
(t ha-1
) GSIb GSIfl GSIfr 184 DAP 334 DAP 441 DAP
BRS-GA 5.97a 4.41
b 3.16
b 13.34
a 10.05c 76.60
a 29.54
b
BRS-SC 6.53a 4.47
b 2.95
b 16.23
a 29.53
a 54.24
b 36.98
a
HFOP-01 3.31b 2.56c 1.76
b 7.80
b 17.37
b 74.80
a 32.20
a
HFOP-02 5.64a 5.17
a 3.60
a 10.12
b 25.17
a 64.70
b 26.42
b
HFOP-03 6.37a 5.96
a 4.60
a 12.41
a 22.08
a 65.50
b 33.69
a
HFOP-04 6.90a 5.79
a 4.29
a 15.80
a 19.34
a 64.81
b 27.55
b
HFOP-05 5.19a 3.76
b 2.51
b 8.19
b 24.92
a 66.89
b 30.07
b
HFOP-06 7.27a 5.74
a 4.24
a 11.43
b 28.49
a 60.08
b 28.07
b
HFOP-07 6.72a 5.58
a 4.14
a 15.32
a 23.39
a 62.29
b 26.19
b
HFOP-08 5.97a 6.19
a 4.65
a 16.72
a 24.06
a 59.21
b 24.49
b
HFOP-09 5.80a 5.52
a 3.73
a 21.43
a 26.50
a 52.06
b 25.07
b
HFOP-10 6.90a 6.69
a 4.97
a 18.09
a 23.66
a 58.24
b 25.10
b
HFOP-11 6.48a 6.15
a 4.78
a 14.57
a 21.34
a 64.09
b 32.45
a
HFOP-12 6.03a 5.06
a 3.76
a 12.68
a 26.37
a 60.96
b 33.44
a
CV (%) 22.0 23.39 26.05 18.80 15.13 8.68 20.43
F value 2.67** 4.07** 4.33** 3.57** 4.63** 4.37** 2.08*
Mean yield of passion fruit in the region of this study in 2014 (IBGE, 2015): 12.43 t ha-1
1Means followed by the same letter in the column do not differ by the Scott–Knott (p ≤ 0.05).
1BRS SC: BRS Sol do Cerrado e BRS GA: BRS
Gigante Amarelo. DAP = Days after planting branches, was not directly related to the earliness of flowering and fructifying (Table 1). Genotypes considered ideal are selected when they combine vegetative vigor to early production set. Production, physicochemical quality of fruits, and evaluation of diseases It was observed that the production of the hybrids in the first cycle, at 184 DAP, was low, ranging from 7.8 to 11.4% of total cumulative production, and the second crop was greater, at 334 DAP, ranging from 13.3 to 21.4% (Table 1). In the third harvest, at 441 DAP, the highest average relative yield was obtained, and the commercial hybrids BRS Gigante Amarelo and HFOP-01 were late bearing, with 76.6 and 74.8% of their cumulative percentage of yield per harvest recorded in the third cycle, respectively. These two hybrids were also the later in the production of flowers and fruits (Table 1).
Cumulative production ranged from 24.5 to 36.9 t ha-1
in 18 months of production, with average production of 29.4 t ha
-1 for all genotypes (Table 1). Hybrids HFOP-01,
HFOP-11, HFOP-12, and HFOP-03 and BRS Sol do Cerrado had the highest cumulative production (32.20 to 36.98 t ha
-1).
For most physicochemical characteristics evaluated, except for soluble solids (SS), there were differences (p ≤
0.05) among the hybrids of yellow passion fruit (Table 2). Considering fruit mass (FM), it was observed that the group consisting of hybrids BRS Gigante Amarelo, BRS Sol do Cerrado, HFOP-09, and HFOP-12 had the highest fruit masses averaging 207.2 g. In contrast, the lowest values for this variable were recorded for HFOP-07, HFOP-02, and HFOP-06 (142.6 g on average). For the characteristic fruit length (FL), hybrid BRS Gigante Amarelo stood out with 9.9 cm, while hybrids HFOP-02 and HFOP-06 had the lowest length values with 7.5 cm for both (Table 2). Concerning the variable fruit diameter (FD), it was observed that BRS Gigante Amarelo had greater diameter with 8.2 cm, while hybrids HFOP-06 and HFOP-07 had the lowest values with 7.0 cm for both (Table 2).
In assessing peel thickness, four hybrids of yellow passion fruit had fruits averaging less than 5.9 mm, with a range of variation from 5.2 mm (HFOP-01) to 7.6 mm (HFOP-09) (Table 2). Length to diameter ratio (FL/FD) is used to evaluate fruit shape, with oval fruits being preferred by consumers. Based on this premise, the following hybrids stood out: BRS Gigante Amarelo, HFOP-11, HFOP-12, HFOP-08, and HFOP-09. Juice yield was significantly different only for HFOP-01 with 33.5% with the others hybrids in a second group, in which means ranged from 26.2 to 29.9% (Table 2).
Concentration of soluble solids was similar among all hybrids studied, with range of variation from 13.2 to 14.1
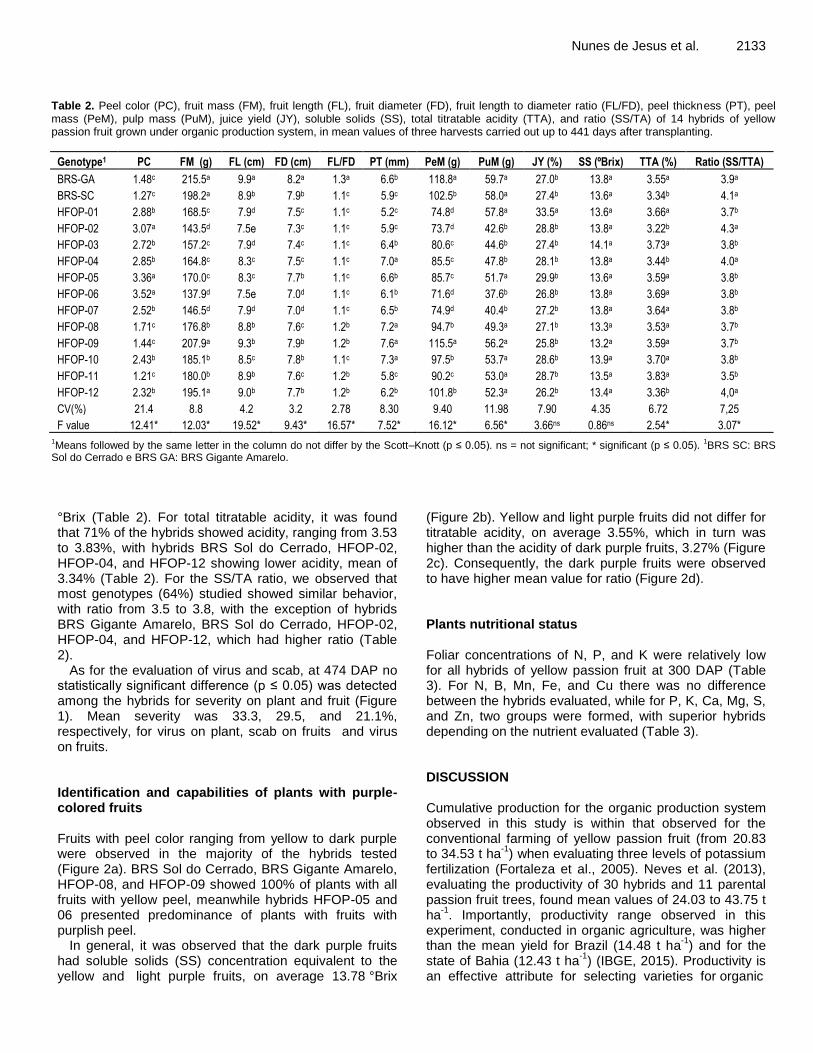
Nunes de Jesus et al. 2133
Table 2. Peel color (PC), fruit mass (FM), fruit length (FL), fruit diameter (FD), fruit length to diameter ratio (FL/FD), peel thickness (PT), peel mass (PeM), pulp mass (PuM), juice yield (JY), soluble solids (SS), total titratable acidity (TTA), and ratio (SS/TA) of 14 hybrids of yellow passion fruit grown under organic production system, in mean values of three harvests carried out up to 441 days after transplanting.
Genotype1 PC FM (g) FL (cm) FD (cm) FL/FD PT (mm) PeM (g) PuM (g) JY (%) SS (ºBrix) TTA (%) Ratio (SS/TTA)
BRS-GA 1.48c 215.5a 9.9a 8.2a 1.3a 6.6b 118.8a 59.7a 27.0b 13.8a 3.55a 3.9a
BRS-SC 1.27c 198.2a 8.9b 7.9b 1.1c 5.9c 102.5b 58.0a 27.4b 13.6a 3.34b 4.1a
HFOP-01 2.88b 168.5c 7.9d 7.5c 1.1c 5.2c 74.8d 57.8a 33.5a 13.6a 3.66a 3.7b
HFOP-02 3.07a 143.5d 7.5e 7.3c 1.1c 5.9c 73.7d 42.6b 28.8b 13.8a 3.22b 4.3a
HFOP-03 2.72b 157.2c 7.9d 7.4c 1.1c 6.4b 80.6c 44.6b 27.4b 14.1a 3.73a 3.8b
HFOP-04 2.85b 164.8c 8.3c 7.5c 1.1c 7.0a 85.5c 47.8b 28.1b 13.8a 3.44b 4.0a
HFOP-05 3.36a 170.0c 8.3c 7.7b 1.1c 6.6b 85.7c 51.7a 29.9b 13.6a 3.59a 3.8b
HFOP-06 3.52a 137.9d 7.5e 7.0d 1.1c 6.1b 71.6d 37.6b 26.8b 13.8a 3.69a 3.8b
HFOP-07 2.52b 146.5d 7.9d 7.0d 1.1c 6.5b 74.9d 40.4b 27.2b 13.8a 3.64a 3.8b
HFOP-08 1.71c 176.8b 8.8b 7.6c 1.2b 7.2a 94.7b 49.3a 27.1b 13.3a 3.53a 3.7b
HFOP-09 1.44c 207.9a 9.3b 7.9b 1.2b 7.6a 115.5a 56.2a 25.8b 13.2a 3.59a 3.7b
HFOP-10 2.43b 185.1b 8.5c 7.8b 1.1c 7.3a 97.5b 53.7a 28.6b 13.9a 3.70a 3.8b
HFOP-11 1.21c 180.0b 8.9b 7.6c 1.2b 5.8c 90.2c 53.0a 28.7b 13.5a 3.83a 3.5b
HFOP-12 2.32b 195.1a 9.0b 7.7b 1.2b 6.2b 101.8b 52.3a 26.2b 13.4a 3.36b 4,0a
CV(%) 21.4 8.8 4.2 3.2 2.78 8.30 9.40 11.98 7.90 4.35 6.72 7,25
F value 12.41* 12.03* 19.52* 9.43* 16.57* 7.52* 16.12* 6.56* 3.66ns 0.86ns 2.54* 3.07* 1Means followed by the same letter in the column do not differ by the Scott–Knott (p ≤ 0.05). ns = not significant; * significant (p ≤ 0.05).
1BRS SC: BRS
Sol do Cerrado e BRS GA: BRS Gigante Amarelo. °Brix (Table 2). For total titratable acidity, it was found that 71% of the hybrids showed acidity, ranging from 3.53 to 3.83%, with hybrids BRS Sol do Cerrado, HFOP-02, HFOP-04, and HFOP-12 showing lower acidity, mean of 3.34% (Table 2). For the SS/TA ratio, we observed that most genotypes (64%) studied showed similar behavior, with ratio from 3.5 to 3.8, with the exception of hybrids BRS Gigante Amarelo, BRS Sol do Cerrado, HFOP-02, HFOP-04, and HFOP-12, which had higher ratio (Table 2).
As for the evaluation of virus and scab, at 474 DAP no statistically significant difference (p ≤ 0.05) was detected among the hybrids for severity on plant and fruit (Figure 1). Mean severity was 33.3, 29.5, and 21.1%, respectively, for virus on plant, scab on fruits and virus on fruits. Identification and capabilities of plants with purple-colored fruits Fruits with peel color ranging from yellow to dark purple were observed in the majority of the hybrids tested (Figure 2a). BRS Sol do Cerrado, BRS Gigante Amarelo, HFOP-08, and HFOP-09 showed 100% of plants with all fruits with yellow peel, meanwhile hybrids HFOP-05 and 06 presented predominance of plants with fruits with purplish peel.
In general, it was observed that the dark purple fruits had soluble solids (SS) concentration equivalent to the yellow and light purple fruits, on average 13.78 °Brix
(Figure 2b). Yellow and light purple fruits did not differ for titratable acidity, on average 3.55%, which in turn was higher than the acidity of dark purple fruits, 3.27% (Figure 2c). Consequently, the dark purple fruits were observed to have higher mean value for ratio (Figure 2d). Plants nutritional status Foliar concentrations of N, P, and K were relatively low for all hybrids of yellow passion fruit at 300 DAP (Table 3). For N, B, Mn, Fe, and Cu there was no difference between the hybrids evaluated, while for P, K, Ca, Mg, S, and Zn, two groups were formed, with superior hybrids depending on the nutrient evaluated (Table 3). DISCUSSION Cumulative production for the organic production system observed in this study is within that observed for the conventional farming of yellow passion fruit (from 20.83 to 34.53 t ha
-1) when evaluating three levels of potassium
fertilization (Fortaleza et al., 2005). Neves et al. (2013), evaluating the productivity of 30 hybrids and 11 parental passion fruit trees, found mean values of 24.03 to 43.75 t ha
-1. Importantly, productivity range observed in this
experiment, conducted in organic agriculture, was higher than the mean yield for Brazil (14.48 t ha
-1) and for the
state of Bahia (12.43 t ha-1
) (IBGE, 2015). Productivity is an effective attribute for selecting varieties for organic

2134 Afr. J. Agric. Res.
Figure 1. Mean severity of the passion fruit woodiness virus in plant (VIFP) and fruit (VIRF) and scab on fruit (SCFR) of 14 hybrids of yellow passion fruit.
Figure 2. Percentage of plants with yellow, light purple, and dark purple peel color for 14 hybrids of yellow passion fruit grown in organic production system (A); soluble solids concentration (B), total titratable acidity (C) and ratio (D) of juice for each fruit peel color category (yellow, light purple, and dark purple). Means followed by the same letter in the column do not differ by the Tukey Test (p ≤ 0.05).
B
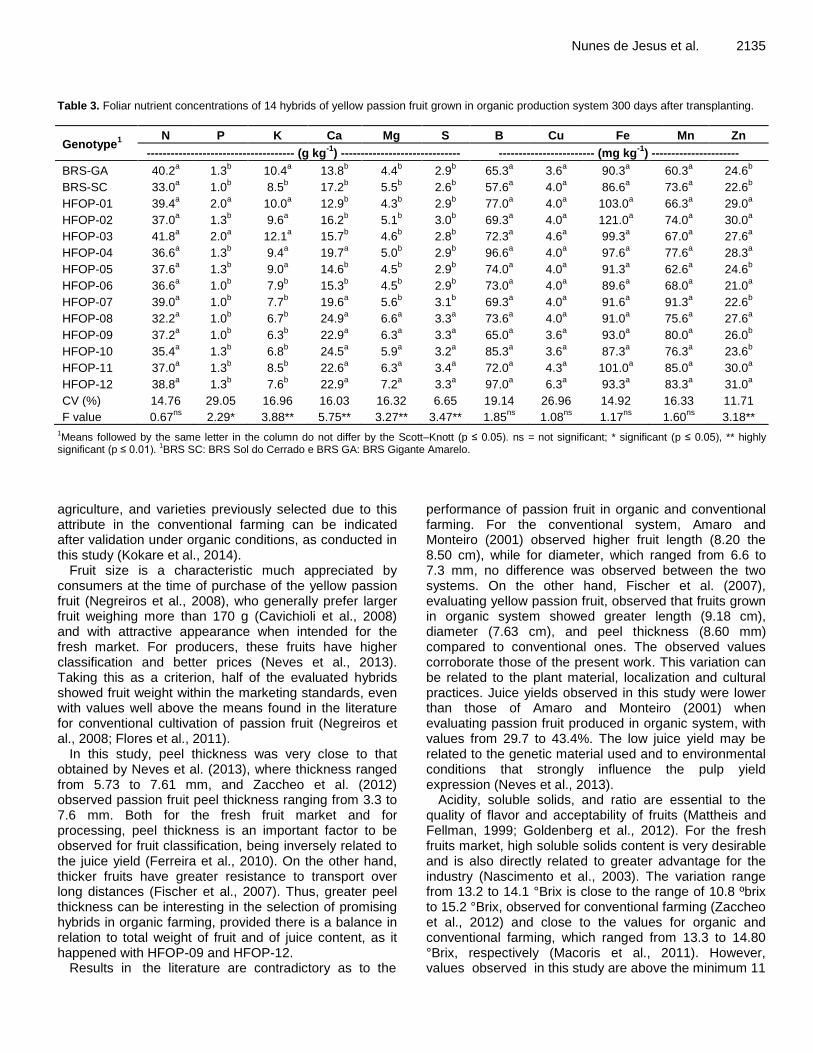
Nunes de Jesus et al. 2135 Table 3. Foliar nutrient concentrations of 14 hybrids of yellow passion fruit grown in organic production system 300 days after transplanting.
Genotype1 N P K Ca Mg S B Cu Fe Mn Zn
------------------------------------- (g kg-1
) ------------------------------ ------------------------ (mg kg-1
) ----------------------
BRS-GA 40.2a 1.3
b 10.4
a 13.8
b 4.4
b 2.9
b 65.3
a 3.6
a 90.3
a 60.3
a 24.6
b
BRS-SC 33.0a 1.0
b 8.5
b 17.2
b 5.5
b 2.6
b 57.6
a 4.0
a 86.6
a 73.6
a 22.6
b
HFOP-01 39.4a 2.0
a 10.0
a 12.9
b 4.3
b 2.9
b 77.0
a 4.0
a 103.0
a 66.3
a 29.0
a
HFOP-02 37.0a 1.3
b 9.6
a 16.2
b 5.1
b 3.0
b 69.3
a 4.0
a 121.0
a 74.0
a 30.0
a
HFOP-03 41.8a 2.0
a 12.1
a 15.7
b 4.6
b 2.8
b 72.3
a 4.6
a 99.3
a 67.0
a 27.6
a
HFOP-04 36.6a 1.3
b 9.4
a 19.7
a 5.0
b 2.9
b 96.6
a 4.0
a 97.6
a 77.6
a 28.3
a
HFOP-05 37.6a 1.3
b 9.0
a 14.6
b 4.5
b 2.9
b 74.0
a 4.0
a 91.3
a 62.6
a 24.6
b
HFOP-06 36.6a 1.0
b 7.9
b 15.3
b 4.5
b 2.9
b 73.0
a 4.0
a 89.6
a 68.0
a 21.0
a
HFOP-07 39.0a 1.0
b 7.7
b 19.6
a 5.6
b 3.1
b 69.3
a 4.0
a 91.6
a 91.3
a 22.6
b
HFOP-08 32.2a 1.0
b 6.7
b 24.9
a 6.6
a 3.3
a 73.6
a 4.0
a 91.0
a 75.6
a 27.6
a
HFOP-09 37.2a 1.0
b 6.3
b 22.9
a 6.3
a 3.3
a 65.0
a 3.6
a 93.0
a 80.0
a 26.0
b
HFOP-10 35.4a 1.3
b 6.8
b 24.5
a 5.9
a 3.2
a 85.3
a 3.6
a 87.3
a 76.3
a 23.6
b
HFOP-11 37.0a 1.3
b 8.5
b 22.6
a 6.3
a 3.4
a 72.0
a 4.3
a 101.0
a 85.0
a 30.0
a
HFOP-12 38.8a 1.3
b 7.6
b 22.9
a 7.2
a 3.3
a 97.0
a 6.3
a 93.3
a 83.3
a 31.0
a
CV (%) 14.76 29.05 16.96 16.03 16.32 6.65 19.14 26.96 14.92 16.33 11.71
F value 0.67ns
2.29* 3.88** 5.75** 3.27** 3.47** 1.85ns
1.08ns
1.17ns
1.60ns
3.18** 1Means followed by the same letter in the column do not differ by the Scott–Knott (p ≤ 0.05). ns = not significant; * significant (p ≤ 0.05), ** highly
significant (p ≤ 0.01). 1BRS SC: BRS Sol do Cerrado e BRS GA: BRS Gigante Amarelo.
agriculture, and varieties previously selected due to this attribute in the conventional farming can be indicated after validation under organic conditions, as conducted in this study (Kokare et al., 2014).
Fruit size is a characteristic much appreciated by consumers at the time of purchase of the yellow passion fruit (Negreiros et al., 2008), who generally prefer larger fruit weighing more than 170 g (Cavichioli et al., 2008) and with attractive appearance when intended for the fresh market. For producers, these fruits have higher classification and better prices (Neves et al., 2013). Taking this as a criterion, half of the evaluated hybrids showed fruit weight within the marketing standards, even with values well above the means found in the literature for conventional cultivation of passion fruit (Negreiros et al., 2008; Flores et al., 2011).
In this study, peel thickness was very close to that obtained by Neves et al. (2013), where thickness ranged from 5.73 to 7.61 mm, and Zaccheo et al. (2012) observed passion fruit peel thickness ranging from 3.3 to 7.6 mm. Both for the fresh fruit market and for processing, peel thickness is an important factor to be observed for fruit classification, being inversely related to the juice yield (Ferreira et al., 2010). On the other hand, thicker fruits have greater resistance to transport over long distances (Fischer et al., 2007). Thus, greater peel thickness can be interesting in the selection of promising hybrids in organic farming, provided there is a balance in relation to total weight of fruit and of juice content, as it happened with HFOP-09 and HFOP-12.
Results in the literature are contradictory as to the
performance of passion fruit in organic and conventional farming. For the conventional system, Amaro and Monteiro (2001) observed higher fruit length (8.20 the 8.50 cm), while for diameter, which ranged from 6.6 to 7.3 mm, no difference was observed between the two systems. On the other hand, Fischer et al. (2007), evaluating yellow passion fruit, observed that fruits grown in organic system showed greater length (9.18 cm), diameter (7.63 cm), and peel thickness (8.60 mm) compared to conventional ones. The observed values corroborate those of the present work. This variation can be related to the plant material, localization and cultural practices. Juice yields observed in this study were lower than those of Amaro and Monteiro (2001) when evaluating passion fruit produced in organic system, with values from 29.7 to 43.4%. The low juice yield may be related to the genetic material used and to environmental conditions that strongly influence the pulp yield expression (Neves et al., 2013).
Acidity, soluble solids, and ratio are essential to the quality of flavor and acceptability of fruits (Mattheis and Fellman, 1999; Goldenberg et al., 2012). For the fresh fruits market, high soluble solids content is very desirable and is also directly related to greater advantage for the industry (Nascimento et al., 2003). The variation range from 13.2 to 14.1 °Brix is close to the range of 10.8 ºbrix to 15.2 °Brix, observed for conventional farming (Zaccheo et al., 2012) and close to the values for organic and conventional farming, which ranged from 13.3 to 14.80 °Brix, respectively (Macoris et al., 2011). However, values observed in this study are above the minimum 11

2136 Afr. J. Agric. Res. °Brix required by the standard recommendation for yellow passion fruit commercialization in Brazil (Brasil, 2003).
Acidity gives greater difficulty of spoilage by microorganisms and allows for greater flexibility in the addition of sugar to beverages, thus being important for processing (Dell'Orto Morgado et al., 2010) as it decreases as the addition of acidifying substances and provides nutritional improvement, food safety, and organoleptic quality. In this study, it was found that the values observed for the hybrids satisfactorily meet the minimum total acidity required by law (2.5%) (Brasil, 2003). Fischer et al. (2007) observed similarity in the titratable acidity of yellow passion fruits grown under organic and under conventional conditions. Macoris et al. (2011), in a similar study, found higher acidity in fruits conventionally grown. The highest ratios were observed for hybrids HFOP-02, HFOP-12, HFOP-04, BRS Gigante Amarelo, and BRS Sol do Cerrado, being very close to those observed by Zaccheo et al. (2012), when investigating progenies of yellow passion fruit in conventional farming. Fischer et al. (2007) found no differences among organic and conventional fruits.
Some hybrids exhibit uniformity as to peel color and other hybrids showed segregation for yellow and purple colors. Traditionally, yellow peel fruits are preferred by the Brazilian fresh market, either due to ignorance concerning the qualities of purple fruits or even because of consumer tradition. In Colombia, a kind of purple passion fruit called “Gulupa” (P. edulis Sims) is cultivated with interesting organoleptic and nutritional characteristics, which is exported to many countries in Europe (Franco et al., 2014). In this study, dark purple fruits showed interesting characteristics to be explored, with lower acidity and high ratio, giving the sweeter flavor of these fruits. Other authors reported sweeter and more perfumed flavor of purple passion fruit in relation to the yellow one (Pinzón et al., 2007). In purple passion fruit, degradation of acids in the juice is faster in the summer due to increased temperature and, therefore, ratio increases hence, the flavor of the fruit is sweeter (Goldenberg et al., 2012). This fact may also have contributed to the values observed in this study, since the average local temperature was high most of the year. The data presented here reinforce the importance of intensifying the studies with purple peel passion fruit, since it has interesting organoleptic characteristics, especially for the organic market niche, in which fruit appearance is a less important attribute than flavor or nutritional quality.
Identification of genetic material resistant to the passion fruit woodiness virus is an elementary activity in breeding programs, as it is considered a widespread disease in the main producing regions of Brazil (Oliveira et al., 2013). Evaluation of virus in plant, and of scab and virus on fruits, showed a low severity in this work (33.3, 29.5, and 21.1%, respectively), which may be related to some factors such as the location, still little exploited for
passion fruit cultivation, or climate conditions of the region with low relative humidity of the air, high incidence of light and high temperature, which are unfavorable to these diseases.
In the present study, intervention was not required to control these diseases, probably because it was a new cultivation area and located in the surroundings of a permanent reserve park at Chapada Diamantina. Therefore, it was not possible to select the most tolerant genotypes based on their direct reaction to these diseases in the locality. However, the weather conditions were very favorable to the growth of passion fruit plants, which reflected in high productivity and longevity of the orchard (Table 1).
On the other hand, cultivation of passion fruit plants in new areas, without the presence of virus inoculum sources, such as old plants and alternative hosts, is one of the best practices recommended for preventing viruses, in the absence of resistant genotypes or as preventive measures (Cerqueira-Silva et al., 2014). Results obtained in this study under organic agriculture corroborate this recommendation.
Foliar concentrations of N, P and K were relatively low in all hybrids of yellow passion fruit at 300 DAP (Table 3), while for the other nutrients the concentrations observed are in the range considered adequate for the culture (Carvalho et al., 2001, 2011; Menzel et al., 1993). The low concentrations in leaves, particularly of N, P and K, were expected, since this was the first crop in a deforested area with a soil with naturally low fertility and with no application of soluble and concentrated fertilizers. However, the highest yield values obtained by the superior genotypes in this study (Table 1) are equivalent to the results obtained by Carvalho et al. (2001) for a population of high productivity that was used as a standard for the preparation of nutrient sufficiency ranges of passion fruit under conventional cultivation. Therefore, in the evaluation period, the organic fertilization provided and the nutritional levels shown by the hybrids in general did not result in apparent limitation to cumulative productivity. Moreover, the lowest values of concentration of N, P, and K in foliar tissue obtained in organic cultivation may evidence a higher efficiency of use of these nutrients in this system when compared to the values of the ranges considered appropriate in conventional farming, obtained for the same phenological stage of cultivation and with similar yields, approximately 36 t ha
-1. Nutrients absorption efficiency is one of the
critical factors for selection of plant genotypes aimed at adaptation to organic farming (Wolfe et al., 2008).
Importantly, the lower foliar concentrations of some nutrients observed in this study (Table 3), when compared to the appropriate ranges (Carvalho et al., 2001), did not cause visual symptoms of deficiency in plants and did not limit their production nor the quality of fruits (Tables 1 and 2). Although there was no mineral supplementation in the form of potassium sulfate for the

culture in this study – only through organic fertilizers, there are indications that the practices of green cover and organic fertilization adopted contributed to correct the deficiency of this element in the soil, according to the chemical analysis of the soil carried out at the beginning and at the end of the cultivation. On the other hand, the higher foliar concentration of some elements may be indication of greater capacity for absorption and assimilation of a particular nutrient by the genotype (Table 3), or of less precocious production, due to collection of leaves being conducted at 300 DAP, and even of its better adaptation to the organic agriculture, characterized by lower availability of nutrients in the soil solution. However, the highest foliar nutrient concentrations were not directly related to higher yields and fruit quality indices observed for the evaluated hybrids (Tables 1 and 2).
Overall, results obtained in this study allowed selecting intraspecific hybrids of yellow passion fruit with high horticultural performance in organic farming. Fruit yield and physicochemical attributes were adequate traits for selection of genotypes for organic farming, and hybrids with purple peel fruits showed high potential for this niche market. Cultivation of intraspecific hybrids of yellow passion fruit led to high fruit yields under organic farming, in spite of the low N, P, and K foliar concentrations under this system. The cultivation of these genotypes is an alternative for passion fruit producers who opt for a more conservationist production system and with the possibility of adding value due to the quality of fruits and absence of pesticide use. Conclusion
The intraspecific hybrids of yellow passion fruit BRS Gigante Amarelo, BRS Sol do Cerrado, HFOP-08, HFOP-09, HFOP-11, and HFOP-12 were selected for cultivation under organic farming because they combine high yield, lack of nutritional deficiencies, and fruit quality attributes valued by the market.
Conflict of Interests The authors have not declared any conflict of interests. ACKNOWLEDGEMENTS The authors gratefully acknowledge the Bahia State Research Foundation (Fundação de Amparo à Pesquisa do Estado da Bahia) (FAPESB, process RED0004/2012) for financial support, Bioenergia Orgânicos (Agreement FUNARBE 7697) for technical and financial support and for allowing the use of the experimental area, and researchers Zilton José Maciel Cordeiro and Ana Lúcia
Nunes de Jesus et al. 2137 Borges for technical collaboration. REFERENCES Acs S, Berentsen P, Huirne R, van Asseldonk M (2009). Effect of yield
and price risk on conversion from conventional to organic farming. Aust. J. Agric. Res. Econ. 53:393-411.
Amaro AP, Monteiro M (2001). Rendimento de extração da polpa e características físico-químicas do maracujá amarelo (Passiflora edulis f. flavicarpa Sims. Deg.) produzido por cultivo orgânico e convencional em relação à cor da casca. Alim. Nutr. 12:171-184.
Borges AL, Caldas RC, Anjos MS, Sousa AP (2001). Adubação NPK na produção de maracujá-amarelo. Magistra 13:43-50.
Borges AL, Rodrigues MGV, Lima AA, Almeida IE, Caldas RC (2003). Produtividade e qualidade de maracujá-amarelo irrigado, adubado com nitrogênio e potássio. Rev. Bras. Frut. 25:259-262.
BRASIL (2003). MINISTÉRIO DA AGRICULTURA E DO ABASTECIMENTO. INSTRUÇÃO NORMATIVA Nº 12 DE 4 DE SETEMBRO DE 2003. DIÁRIO
OFICIAL, BRASÍLIA, 2003. SEÇÃO1 PP. 72-76. BRASIL. Ministério da Agricultura e do Abastecimento (2011). Instrução
Normativa nº 46, de 6 de outubro de 2011. BRASIL. Ministério da Agricultura e do Abastecimento (2014). Instrução
Normativa nº 17, de 18 de junho de 2014. Calle Z, Guariguata MR, Giraldo E, Chara J (2010). The production of
passion fruit (Passiflora edulis) in Colombia: perspectives for habitat conservation through pollination services. Intercienc. 35:207-212.
Carvalho AJC, Fontes PSF, Mendonça MS, Monnerat PH, Fontes AG (2011). Yellow passion fruit plant nutritional diagnosis at diferente phenological stages by the diagnosis and recommendation integrated system method. J. Plant Nutr. 34:614-626.
Carvalho AJC, Martins DP, Monnerat PH, Bernardo S, Silva JA (2001). Teores de nutrientes foliares no maracujazeiro amarelo associados à estação fenológica, adubação potássica e lâminas de irrigação. Rev. Bras. Frut. 23:403-408.
Cavichioli Jc, Rug|Giero C, Volpe Ca (2008). Caracterização físico-química de frutos de maracujazeiro amarelo submetidos à iluminação artificial, irrigação e sombreamento. Rev. Bras. Frut. 30:649-656.
Cerqueira-Silva CBM, Conceição LDHCS, Souza AP, Corrêa RX (2014). A history of passion fruit woodiness disease with emphasis on the current situation in Brazil and prospects for Brazilian passion fruit cultivation. Euro. J. Plant Pathol. 139:261-270.
Conti S, Villari G, Faugno S, Melchionna G, Somma S, Caruso G (2014). Effects of organic vs. conventional farming system on yield and qualityof strawberry grown as an annual or biennial crop in southern Italy. Sci. Hort. 180:63-71.
Costa JN, Figueiredo RW, Souza PHM, Gonzaga MLC, Constant PBL, Soares DJ (2013). Study of the stability of passion fruit (Passiflora edulis f. flavicarpa) powder from organic farming. Cienc. Agra. 34:705-716.
Ponti T, Rijk B, van Ittersum MK (2012). The crop yield gap between organic and conventional agriculture. Agric. Syst. 108:1-9.
Dell’Ort Morgado MA, Santos CEM, Linhales H, Bruckner CH (2010). Correlações fenotípicas em características físicoquímicas do maracujazeiro-amarelo. Acta Agron. 59:457-461.
Embrapa – Empresa Brasileira de Pesquisa Agropecuária (1999). Manual de análises químicas de solos, plantas e fertilizantes. Brasília: Embrapa Solos/Embrapa Informática Agropecuária/Embrapa Comunicação para Transferência de Tecnologia. 370p.
Ferreira FM, Neves LG, Bruckner CH, Viana AP, Cruz CD, Barelli MAA
(2010). Formação de super-caracteres para seleção de famílias de maracujazeiro amarelo. Acta Sci. 2:247-254.
FIBL, IFOAM (2014) Research Institute of Organic Agriculture, International Federation of Organic Agriculture Movements The word of organic agriculture. Statistics and emerging trends. Available in http://www.organic-world.net/yearbook/yearbook2015.html. Accessed in: 09.22.2015.
Fischer IH, Arruda MC, Almeida AM, Garcia MJM, Jeronimo EM, Pinotti RN, Bertani RMA (2007). Doenças e características físicas e químicas pós-colheita em maracujá amarelo de cultivo convencional

2138 Afr. J. Agric. Res.
e orgânico no Centro Oeste Paulista. Rev. Bras. Frut. 29:254-259. Flores PS, Silva DFP, Bruckner CH, Oliveira SP, Salomão LCC (2011).
Caracterização físico-química de frutos de maracujazeiro amarelo provenientes da irradiação com raios gama. Cienc. Rural 41:1903-1906.
Forster D, Andres C, Verma R, Zundel C, Messmer MM, Mäder P (2013). Yield and Economic Performance of Organic and Conventional Cotton-Based Farming Systems – Results from a Field Trial in India. Plos One 8:1-15.
Fortaleza JM, Peixoto JR, Junqueira NJV, Oliveira AT, Rangel LEP
(2005). Características físicas e químicas em nove genótipos de maracujá-amarelo cultivada sob três níveis de adubação potássica. Rev. Bras. Frut. 27:124-127.
Franco G, Valenzuela JRC, Londoño GAC, Rojano BA, Correa, AMP, Ibarz, A, Falguera V (2014). Actividad Enzimática en Precosecha y Poscosecha en Frutos de Gulupa (Passiflora edulis Sims), en Condiciones del Bosque Húmedo Montano Bajo de Colombia. Rev. Fac. Nac. Agron. 67:7201-7208.
Goldenberg L, Feygenberg O, Samach A, Pesis E (2012). Ripening attributes of new passion fruit line featuring seasonal non-climacteric behavior. J. Agric. Food Chem. 60:1810-1821.
Haag HP, Oliveira GD, Borducchi AS, Sarruge JR (1973). Absorção de nutrientes por duas variedades de maracujá. Anais da ESALQ, Piracicaba, pp. 267-279.
Henneron L, Bernard L, Hedde M, Pelosi C, Villenave C, Chenu C, Bertrand M, Girardin C, Blanchart E (2015). Fourteen years of evidence for positive effects of conservation agriculture and organic farming on soil life. Agron. Sustain. Dev. 35:169-181.
IBGE (2015). Banco de Dados Agregados. Sistema IBGE de Recuperação Automática - SIDRA. Available in: http://www.ibge.gov.br. Accessed in: 03.10.2015.
INMET (2015). Rede de Estações Climatológicas. Instituto Nacional de Meteorologia. Available in: http://www.inmet.gov.br/portal/index.php?r=home/index. Accessed in: 12.08.2015.
Jackson ML (1958). Soil Chemical Analysis. Prentice Hall of India. Pvt. Ltd., New Delhi, 498 p.
Janzantti NS, Macoris MS, Garruti DS, Monteiro M (2012). Influence of the cultivation system in the aroma of the volatile compounds and total antioxidant activity of passion fruit. Lwt-Food Sci. Technol. 46:511-518.
Janzantti NS, Monteiro M. (2014). Changes in the aroma of organic passion fruit (Passiflora edulis Sims f. flavicarpa Deg.) during ripeness. Lwt-Food Sci. Technol. 59:612-624.
Junqueira NTV, Anjos JRN, Silva APO, Chaves RC, Gomes AC (2003). Reação as doenças e produtividade de onze cultivares de maracujá-amarelo cultivados sem agrotóxicos. Pesq. Agropec. Bras. 38:1005-1010.
Kokare A, Legzdina L, Beinarovica I, Maliepaard C, Niks RE, Lammerts van Bueren ET (2014). Performance of spring barley (Hordeum vulgare) varieties under organic and conventional conditions. Euphytica. 197:279-293.
Macoris MS, Janzantti NS, Garruti DS, Monteiro M (2011). Volatile compounds from organic and conventional passion fruit (Passiflora edulis f. flavicarpa) pulp. Ciênc. Tecnol. Aliment. 31:430-435.
Maguire JD (1962). Speed of germination-aid in selection in evaluation for seedling emergence and vigor. Crop Sci. 2:176-177.
Malacrida CR, Jorge N (2012). Yellow passion fruit Seed Oil (Passiflora edulis f. flavicarpa): Physical and Chemical Characteristics. Braz. Arch. Biol. Technol. 55:127-134.
Malavolta E, Vitti GC, Oliveira AS (1989). Avaliação do estado nutricional das plantas: princípios e aplicações. Piracicaba: Associação Brasileira para Pesquisa da Potassa e do Fosfato. 201p.
Malavolta E, Vitti GC, Oliveira SA (1997). Avaliação do estado nutricional das plantas: princípios e aplicações. 2.ed. Piracicaba: Potafos, 319p.
Mattheis JP, Fellman JK (1999). Preharvest factors influencing flavor of fresh fruit and vegetables. Postharvest Biol. Technol. 15:227−232.
Medeiros SAF, Yamanishi OK, Peixoto JR, Pires MC, Junqueira NTV,
Ribeiro GBL (2009). Caracterização físico-química de progênies de maracujá-roxo e maracujá-amarelo cultivados no distrito federal. Rev. Bras. Frut. 31:492-499.
Meier MS, Stoessel F, Jungbluth N, Juraske R, Schader C, Stolze M (2015). Environmental impacts of organic and conventional agricultural products - Are the differences captured by life cycle assessment? J. Environ. Manage. 49:193-208.
Menzel CM, Haydon GE, Doogan VJ, Simpson DR (1993). New standard leaf nutrient concentrations for passion fruit based on seasonal phenology and leaf composition. J. Hort. Sci. 68:215-230.
Motta IS, Cunha FAD, Sena JOA, Clemente E, Caldas RG, Lorenzetti ER (2008). Análise econômica da produção do maracujazeiro amarelo em sistemas orgânico e convencional. Cienc. Agrot. 32:1927-1934.
Nascimento WMO, Tomé AT, Oliveira MSP, Müller CH, Carvalho JEU (2003). Seleção de progênies de maracujazeiro-amarelo (Passiflora edulis f. flavicarpa) quanto à qualidade de frutos. Rev. Bras. Frut. 25:186-188.
Negreiros JRS, Araújo Neto SE, Álvares VS, Lima, VAL, Oliveira TK (2008). Caracterização de frutos de progênies de meios-irmãos de maracujazeiro-amarelo em Rio Branco – Acre. Rev. Bras. Frut. 30:431-437.
Nelson L, Giles J, Macilwain C, Gewin V. Organic FAQs (2004). Nature 428:796-798.
Neves CG, Jesus ON, Ledo CAS, Oliveira EJ (2013). Avaliação Agronômica de parentais e Híbridos de mudas de maracujazeiro-amarelo. Rev. Bras. Frut. 35:191-198.
Oliveira EJ, Soares TL, Barbosa CJ, Santos Filho HP, Jesus ON (2013). Severidade de doenças em maracujazeiro para identificação de fontes de resistência em condições de campo. Rev. Bras. Frut. 35:485-492.
Pinzón IMP, Fischer G, Corredor G (2007). Determination of the maturity stages of purple passion fruit (Passiflora edulis Sims.). Agron. Colomb. 25:83-95.
Ponisio LC, M’gonigle LK, Mace KC, Palomino J, Valpine P, kremen C
(2015). Diversification practices reduce organic to conventional yield gap. Proc. R. Soc. Lond. Ser. B 282:1-7.
Reganold JP, Wachter JM (2016). Organic agriculture in the twenty-first century. Nature 2:1-8.
Robinson JB (1986). Fruits, Vines e Nuts. Eds., Reuter DJ, Robinson JB. Plant analysis: an interpretation manual. Melbourne, Inkata Press, pp. 120-147.
Rocha MC, Bonelli ALS, Almeida A, Collad FH (2001). Efeito do uso de biofertilizante AGROBIO sobre as características físico-químicas na pós-colheita do maracujá-amarelo (Passiflora edulis f. flavicarpa Deg.) no município de Taubaté. Rev. Biocienc. 7:7-13.
Seufert V, Ramankutty N, Foley JA (2012). Comparing the yields of organic and conventional agriculture. Nature. 485(7397):229-232.
Siegmeier T, Blumenstein B, Möller D (2015). Farm biogas production in organic agriculture: System implications. Agric. Sys. 139:196-209.
Wolfe MS, Baresel JP, Desclaux D, Goldringer I, Hoad S, Kovacs G, Löschenberger F, Miedaner T, Ostergard H , van Bueren LET (2008). Developments in breeding cereals for organic agriculture. Euphytica 163:323-346.
Wyckhuys KAG, Acosta FL, Rojas M, O’campo J (2011). The relationship of farm surroundings and local infestation pressure to pest management in cultivated Passiflora species in Colombia? Int. J. Pest. Manage. 57:1-10.
Zaccheo PVC, Aguiar RS, Stenzel NMC, Sera T, Janeiron NCSV
(2012). Produção e características qualitativas dos frutos de híbridos de maracujazeiro-amarelo. Rev. Bras. Frut. 34:1113-1120.

Vol. 11(24), pp. 2139-2145, 16 June, 2016
DOI: 10.5897/AJAR2015.10059
Article Number: EEDCCFE58989
ISSN 1991-637X
Copyright ©2016
Author(s) retain the copyright of this article
http://www.academicjournals.org/AJAR
African Journal of Agricultural Research
Full Length Research Paper
Use and management of pasture in the cerrado biome: Impacts on aggregation of an oxisol
Fabiano Bertolin*, José Antonio Maior Bono, Manuel Claudio Motta Macedo, Alexandre Romeiro de Araújo and Francisco de Assis Rolim Pereira
University Anhanguera-Uniderp, Brazil.
Received 23 June, 2015; Accepted 17 March, 2016
The objective of this study was to evaluate the physical quality of a dystrophic Oxisol in the Cerrado biome, by means of its aggregation, after 19 years of use and management with pasture. The treatments were soil with natural vegetation (CERR); and soil with Brachiaria decumbens cultivar Basilisk pasture, under the following four types of management: soil with maintenance-level fertilization, every two years, and with legumes (PAML); soil with maintenance-level fertilization, every two years (PAM); soil with fertilization only at implantation (PAI); and soil with degraded pasture without fertilization (PD). In November 2012, after 19 years of land use in the treatments, soil samples were collected at four locations per plot, and at two depths, 0 to 10 and 10 to 20 cm. The study evaluated the size distribution of air-dried aggregates and the distribution of water-stable aggregates, determining the water-stable weighted mean diameters (WMDws), the efficiency ratio of aggregates (ERA) and organic matter content of soil. The management of grassland with fertilizer favors the formation of larger aggregates in the soil, as well as WMDsw, ERA and the content of organic matter, improving soil physical quality, both in the 0 to 10 cm and in the 10 to 20 cm layer. Impacts on soil aggregates caused by the removal of native vegetation can be improved with the use of soil under pasture and managed with fertilization in the 10 to 20 cm layer. Key words: Soil physics, sustainability, organic matter.
INTRODUCTION The use of the soil for pasture in the Cerrado, Brazil’s highland savanna, is of great importance for the Brazilian agribusiness sector. Since the expansion of the agricultural frontier in the 1970s, boosted by the opening of new areas, the Cerrado soils have undergone
significant transformations, occasioned by the use of various technologies, especially alterations in fertilization and soil management, breeding and diversification of crops (Macedo, 2009).
In Brazil, extensive systems of exploitation for animal
*Corresponding author. E-mail: [email protected].
Author(s) agree that this article remain permanently open access under the terms of the Creative Commons Attribution
License 4.0 International License

2140 Afr. J. Agric. Res. production, mainly for beef cattle, are carried out principally in pastures, either native or cultivated. However, more than half of the cultivated pastures in the Cerrado are degraded or in the process of degradation, with reduced soil fertility, increased invasive plants, pests, soil compacted by animal hooves and erosive processes, culminating in the loss of pasture to sustain the levels of production and quality demanded by stock (Souza et al., 2008; Macedo, 2009; Parente and Maia, 2011).
The effects of pasture degradation include an alteration in the physical quality of the soil, an increase in density, reduction in porosity and more resistance to penetration when conditions are dry (Mapfumo et al., 2000; Fidalski et al., 2008). Well-managed pasture, be it continuous pasture or integrated with crops, avoids physical degradation of the soil and protects against the impact of raindrops. It also prevents the soil surface structure from deteriorating and increases the infiltration of water into the soil; furthermore, the root system promotes improvements in soil structure (Salton et al., 2008; Bono et al., 2012).
The physical quality of the soil can be evaluated by soil properties, such as total porosity, soil density and aggregation, and the availability of water for plants. These properties influence the growth and development of plants and maintain the diversity of organisms that inhabit the soil (Bono et al., 2013; Carneiro et al., 2009). When the soil is submitted to the productive process its physical characteristics undergo alterations, and because there is then a tendency to lose structural quality and increase the susceptibility to erosion, it is vital to evaluate these characteristics after the introduction of anthropic activities, to look for more sustainable management strategies (Wendling et al., 2012).
A parameter that has been used in the evaluation of sustainability of use and management systems is the physical quality of the soil. Aggregation is one of the ways of checking this quality, and it is measured by distribution of aggregated classes, weighted mean diameter (WMD), geometric mean diameter (GMD) and Aggregate Stability Index (ASI) (Wendling et al., 2012; Demarchi et al., 2011).
The objective of this study was to verify the influence of different management systems for soil under pasture on the physical quality of a dystrophic oxisol in the Cerrado biome, in the municipality of Campo Grande in Brazil’s Mato Grosso do Sul state. MATERIALS AND METHODS The experimental area used in this long-term experiment is located within the National Center for Beef Cattle Research (Embrapa Gado de Corte), in the municipality of Campo Grande, Mato Grosso state, at geographical coordinates: latitude 20°25’03” and longitude 54°42’20” at an altitude of 559 m. The soil was described as a dystrophic oxisol (Embrapa, 2013), and its natural vegetation, which was cut down in the agricultural year of 1972/73, was typical of
‘cerradão’, which is forested savanna. In October 1987, the area was heavily tilled, roots were removed, and there was an application of lime (1.0 t ha-1 - PRNT-100%) and fertilizer (350 kg ha-1 of simple superphosphate, 100 kg ha-1 of potassium chloride and 40 kg ha-1 of FTE), incorporated with a harrow. It was used in the general maintenance of the herd of the Beef Cattle Center at Embrapa Gado de Corte until August, 1993, and in July 1994 the soil was prepared for the start of the experiment. Treatments For this study the following treatments for soil management were considered: 1. CERR – soil with natural vegetation. 2. PAML – soil with pasture of B. decumbens cultivar Basilisk, with maintenance-level fertilization every two years and with legumes. 3. PAM - soil with pasture of B. decumbens cultivar Basilisk, with maintenance-level fertilization every two years; 4. PAI - soil with pasture of B. decumbens cultivar Basilisk, with fertilization at implantation; 5. PD - soil with degraded pasture of B. decumbens cultivar Basilisk, without fertilization. All the pasture areas had animal management controlled by means of a supply of uniform forage. Description of treatments In treatments of PAML, PAM, PAI and PD, implantation of the B. decumbens cv. Basilisk pasture was done in plots measuring 140 m x 50 m (7000 m2). In treatments PAML and PAM the areas were corrected with lime to maintain saturation at bases from 40 to 45%, with an application of dolomitic limestone with TNP of 80%. Maintenance-level fertilizer was applied every two years, using 400 kg ha-1 of machine-spread 0-20-20 formula. These applications took place each November, and in the PAM treatment, there was also an annual application of 50 kg ha-1 of N, based on urea, which took place between December and January. In the PAML treatment, legumes were introduced every two years, composed of a mixture of calopo (Calopogonium mucunoides) and stylosanthes (cultivar Campo Grande) directly on the B. decumbens pasture, using a pasture planter. The stocking rate in these treatments was 1.6 Animal Units (AU) ha-1.
In the PAI treatment, the area was corrected with 1500 kg ha-1 of dolomitic limestone (TNP 80%) and fertilized only at implantation stage with 80 kg ha-1 of P2O5 using simple superphosphate as source, 100 kg ha-1 of K2O using potassium chloride as source and 50 kg ha-1 of N from animal urea ha-1. The stocking rate in this treatment was 0.8 AU ha-1. In the PC treatment, the pasture was implanted without correction or fertilizer and the stocking rate was 0.6 AU ha-1. In the CERR treatment, plots of 140 m x 50 m (7000 m2) of native vegetation beside the experiment were considered. Parameters evaluated In November 2012, after 19 years of soil use, samples were collected from the treatments, from four places in each plot and at two depths, at 0 to 0.10 and 0.10 to 0.20 m. The samples, under friable conditions in the field (soil consistency when damp), were put through a sieve with a mesh of 8 mm and collected in a 4 mm sieve, in accordance with Guedes et al. (1996). Next, the analysis took place to calculate the size distribution of air-dried aggregates and water-stable aggregates, shaken as described by Veiga (2011). For this, 100 g of air-dried aggregates were used, placed in the

upper part of a set of five sieves with mesh of 2.00; 1.00; 0.50; 0.25 and 0.105 mm, and shaken vertically with 46 oscillations per minute in the water, for 10 min. In the samples of air-dried aggregates, moisture was determined by the gravimetric method (Embrapa, 2011), to correct the humidity in aggregates submitted to shaking. By means of the sieves used, the aggregates were distributed in the following classes: 8 to 2; 2 to 1; 1 to 0.5; 0.5 to 0.21 and 0.21 to 0.105 mm. From the different sizes of aggregates separated in water, the organic matter (OM) content in the soil was determined, in accordance with Embrapa (2011). From the values of the size distribution of air-dried and water-stable aggregates the weighted mean diameters were determined for air-dried (WMDad) and water-stable (WMDws) aggregates to obtain their efficiency ratio (ERA) in accordance with Veiga (2011), by means of the equations below (equation 1 and equation 2):
(1)
(2)
i represents the class of aggregates (8 to 4; 4 to 2; 2 to 1; 1 to 0.5; and < 0.5 mm); pi is the proportion of aggregates present in the respective class in relation to the total mass of aggregates; and d is the mean diameter of the class (respectively 6; 3; 1.5; 0.75 and 0.25 mm). With the values of WMDad and WMDws the Efficiency Ratio of Aggregation (ERA) was calculated with equation 3 (eq. 3):
(3)
Statistical analyses
A randomized block design with four repetitions was used. The values obtained for size distribution of the water-stable aggregates, WMDad, WMDws, ERA and OM, were submitted to analysis of variance, and to compare means between treatments. The Waller-Duncan test was run at 5% of probability. The levels of sizes of aggregates and organic matter, were Submitted for linear regression analysis to establish the mathematical models.
RESULTS AND DISCUSSION
Table 1 shows the values obtained for classes of water-stable aggregates (AG), weighted mean diameter (WNDws) of the aggregates’ stability, efficiency ratio of aggregation (ERA), and organic matter in the classes of aggregates for various systems of pasture management, at layers from 0 to 10 and from 10 to 20 cm. At both depths, both for the sampling site and for the site-treatment interaction, there was no significant effect (P<0.05). In the layers from 0 to 10 cm and from 10 to 20 cm, there was a significant effect of the treatments for all the analyzed parameters (P<0.05), with the exception of the aggregates in class AG 1 to 0.5 mm in the 10 to 20 cm layer, which was not significant (P>0.05). The mean percentage values of the water-stable aggregates under the different pasture management systems in a Cerrado dystrophic oxisol are presented in Table 2.
Bertolin et al. 2141 The treatments with pasture fertilized every two years,
in aggregate classes 8 to 2 mm and 2 to 1 mm, and pasture fertilized every two years and with legumes, in aggregate classes 8 to 2 mm, presented water-soluble aggregate percentages equal to those from the soil with native vegetation in both layers studied, showing the effect of this pasture management on soil aggregation.
The beneficial effects of greater aggregation in the soil are greater water infiltration capacity, lower soil density, greater aeration space and improvements in hydraulic conductivity. This means that water can infiltrate and move better within the soil profile, the characteristic curve for water retention improves and there is less resistance to root system penetration, as discussed in the works of Carvalho et al. (2004) and Bono et al. (2012).
According to Conte et al. (2011) and Salton et al. (2008), the stability of aggregates can increase the OM content and consequently the carbon content. The presence of the root system is fundamental for the existence of larger aggregates. Bono et al. (2013) and Salton et al. (2008) worked in the same experimental area and also noted the positive effect on soil management of pasture managed with fertilizer and legumes. This also corroborates the results of Ayarza et al. (1993) and Alvarenga and Davide (1999), reporting that soil cultivated with pasture showed the same percentage of aggregates as soil with natural vegetation. Stable aggregates provide good structure for the soil, with porous spaces occurring within the soil. These allow roots to develop without interference, fauna to increase and air and water to circulate (Ferreira et al., 2010).
This aggregation in the pasture fertilized every two years, as well as in pasture with legumes, is attributed to soil fertilization, which favors intense growth. The root biomass will consequently renew itself and will contribute to the formation of larger aggregates (Corazza et al., 1999; Six et al., 2004; Marchão et al., 2007). More plant residue over the soil will also protect it from compression and fracturing by animal hooves, thus preparing it for a greater stocking rate (Fidalski et al., 2008; Bono et al., 2013).
Table 3 shows the greater percentage of aggregation in the classes from 8 to 2 mm and 2 to 1 mm, for both depths. In this table, WMDad is compared with WMDws, evidencing a significant effect of treatments only for WMDws, which indicates that water is the main agent in reducing the diameter of aggregates, as reflected in the efficiency rate of aggregation (ERA). The WMDws and the ERA for pasture fertilized every two years and pasture fertilized every two years with legumes, at both depths, follow the same tendency for the percentage of soil aggregation as they did under native vegetation, not differing statistically.
The pasture without fertilizer presented the lowest percentage of ERA among the studied systems, demonstrating the effect of fertilizer on soil aggregation.

2142 Afr. J. Agric. Res.
Table 1. Values of the F statistic and its significance for the classes of water-stable aggregates (AG), weighted mean diameter (WNDws) of the aggregates’ stability, efficiency ratio of aggregation (ERA), and organic matter in aggregate classes for various management systems in a dystrophic red oxisol in the Cerrado region of Campo Grande, Mato Grosso do Sul, under pasture at the layers of 0 to 10 cm and 10 to 20 cm. Campo Grande, MS, 2014.
Properties evaluated
Cause of variation
CV%
Cause of variation
CV% Block Treatments Block Treatments
Value of F Value of F
0 to 10 cm 10 to 20 cm
AG 8 to 2 mm 0.01ns
29.47** 20.8 0.05ns
11.62** 29.9
AG 2 to 1 mm 0.05ns
12.90** 23.0 0.04ns
7.42* 22.9
AG 1 to 0.5 mm 0.03ns
11.22** 35.8 0.32ns
0.79ns
35.8
AG 0.5 to 0. 25 mm 0.32ns
7.27** 22.5 1.53ns
10.95** 22.5
AG 0.25 to 0.105 mm 0.57ns
4.40* 37.4 1.67ns
4.66* 37.4
WMDad 0.79ns
3.61* 5.2 0.80ns
57.47** 5.2
WMDws 0.01ns
39.91** 17.1 0.10ns
14.28** 17.1
ERA 0.02ns
29.53** 17.9 0.24ns
23.19** 17.9
OM 8 to 2 mm 0.22ns
56.00** 10.6 1.27ns
15.19** 10.6
OM 2 to 1 mm 0.76ns
54.12** 5.0 1.78ns
71.37** 5.2
OM 1 to 0.5 mm 0.05ns
72.78** 5.6 1.09ns
51.60** 5.8
OM 0.5 to 0. 25 mm 0.51ns
53.50** 4.1 1.27ns
84.26** 4.2
OM 0.25 to 0.105 mm 0.34ns
45.18** 10.0 1.08ns
54.84** 8.9
ns= non significant * = significant at 5% and **=significant at 1% AG= Class size of water-stable aggregates; OM= organic matter in the aggregates.
Table 2. Mean values of the percentage of water-stable aggregates for different pasture management systems for a dystrophic red oxisol in the Cerrado biome of Campo Grande-MS, under pasture, at the layers from 0 to 10 cm and 10 to 20 cm. Campo Grande, MS, 2014.
Treatments
Classes dos agregados estáveis em água (mm)
8 to 2 2 to 1 1 to 0,5 0,5 to 0,21 021 to 0,105
%
0 to 10 cm
CERR 31.04a 27.11
a 21.75
b 15.29
c 4.81
c
PAI 20.02b 13.73
c 25.15
b 27.69
a 13.41
a
PAM 30.32a 28.62
a 16.69
c 16.79
c 7.59
b
PAML 29.49a 25.50
a 13.50
c 23.35
b 8.15
b
PC 8.79c 17.37
b 32.56
a 30.63
a 10.65
a
10 to 20 cm
CERR 26.38a 22.57
a 23.02
a 21.02
c 7.01
a
PAI 17.20b 13.49
c 25.11
a 34.34
b 9.86
a
PAM 26.43a 20.95
ab 25.79
a 22.27
c 4.57
b
PAML 25.85a 14.44
c 19.33
b 30.44
b 9.94
a
PC 9.47c 18,99
b 22.34
a 39,64
a 9.56
a
Means followed by the same letter in the column do not differ among themselves by the Waller-Duncan test at 5% probability.
This effect was also seen over time, when the pasture that received fertilizer only at implantation showed higher values for WMDws at the 0 to10 cm layer and the ERA at both depths than the unfertilized pasture. These data support those obtained by Reichert et al. (2004), Ayarza
et al. (1993) and Salton et al. (1999), which reported similar WMDws and ERA for well-managed pasture and native vegetation.
The greater the WMDws, the higher the percentage of aggregates in classes from 8 to 2 mm and 2 to 1 mm.

Table 3. Mean values for the weighted mean diameter of air-dried aggregates (WMDad) and water-stable aggregates (WMDws) and the efficiency rate of aggregation (ERA) for different pasture management treatments in a dystrophic oxisol in the Cerrado biome in Campo Grande-MS, under pasture at depths of 0 to 10 cm and 10 to 20 cm. Campo Grande, MS, 2014.
Treatments
WMDad WMDws ERA
0 to 10 cm
mm
CERR 4.67a 2.18
a 0.47
a
PAI 4.49a 1.51
b 0.34
b
PAM 4.70a 2.14
a 0.46
a
PAML 4.66a 2.05
a 0.44
a
PC 4.57a 1.07
c 0.20
c
10 to 20 cm
CERR 4.27a 1.92
a 0.45
a
PAI 4.43a 1.39
b 0.32
b
PAM 4.61a 1.92
a 0.42
ab
PAML 4.50a 1.78
a 0.39
b
PC 4.32a 1.08
b 0.18
c
Means followed by the same letter in the column do not differ among themselves by the Waller-Duncan test at 5% probability.
These aggregates will be physically protected as OM adheres to the soil mineral particles, while smaller aggregates will be chemically protected, since they also adhere to mineral particles (Resck, 1996). Larger aggregates will be more likely to undergo disaggregation and other processes linked to soil degradation. Table 4 shows OM content found in the aggregate classes. The highest content was found at both depths in classes from 2 to 1 mm and 1 to 0.5 mm. Soil with native vegetation presented OM in the aggregates that was significantly higher than in other treatments in the classes from 2 to 1 mm and 1 to 0.5 mm at the layer from 0 to 10 cm. However, in the layer from 10 to 20 cm, the pastures managed with fertilizer and with legumes presented the highest OM content in each class, showing the effect of organic carbon on depth.
The largest aggregates, which have temporary binding agents (roots or fungal hyphae), are closely related to the present of plants and addition of residues to the soil. They become unprotected from the moment at which the soil becomes uncovered or left fallow, reducing the quantity and stability of these aggregates, and decreasing OM in the soil (Pillon et al., 2002). This may explain the effect of management without fertilizer, where the production of less plant matter exposes the soil surface to the impact of raindrops, favoring the disaggregation process.
Pasture with fertilizer every two years, pasture with
Bertolin et al. 2143
fertilizer every two years and legumes, and pasture with fertilizer at implantation all act on soil aggregation through the root system. They promote an increase in OM, boost the soil carbon content and lead to root growth (Salton et al., 2008; Conte et al., 2011; Costa et al., 2012). In the treatment without fertilizer, the OM content was lower than in other treatments, in all aggregate classes, indicating that pastures managed with fertilizer have higher OM in the aggregates. Costa et al. (2012) state that OM is needed for carbon accumuluation and to favor the activity of soil microbiota, such as fungi that help to aggregate soil particles.
The root system in rapid-cycle pasture provokes an increase in the appearance of plant material in the most superficial layers, and also boosts carbon storage when the soil is not dressed. In well-managed pasture, in which OM is conserved in the soil, the carbon stocks in the soil can thus be higher than under native vegetation, according to Jakelaitis et al. (2008), Ferreira et al. (2010) and Wendling et al. (2012).
Jakelaitis et al. (2008) mention that in the literature, there are works that are contradictory in relation to differences in carbon found in soils under native vegetation and under pasture. It is known that carbon content can vary from soil to soil, even with a single production and deposition of biomass in the soil, depending on the quality of the material and the influence of various factors on the soil microbiota and the decomposition rate. The contribution of carbon to the soil, via the roots, is vital for the existence of larger aggregates, as has been seen in systems with permanent pasture, which present significantly higher WMD than systems with pasture that is unfertilized and receives no legumes, according to Salton et al. (2008).
Soil aggregation is related to the OM content up to a certain size, after which the values drop. In this study, OM content was highest in classes from 2 to 1 and 1 to 0.5 mm, at both depths (Figure 1). Soil aggregation in pasture is due to root growth, which helps the process by stimulating microbial activity, increasing the quantity of exudates that work as agents for soil aggregation, fostering the grouping of smaller aggregates, and resulting in the formation of larger ones (Costa et al., 2012).
The OM content of soil falls when there are fewer organisms decomposing. When decomposition rates rise, due to alterations in natural factors, the soil structure is damaged and degradation results. Soil management will impact on OM, which is one of the main agents in aggregate formation and stability, as reported also by Resck (1998), Ferreirra et al. (2010) and Demarchi et al. (2011). Fertilization of pastures thus increases soil aggregation and water-stability of aggregates, contributing to better physical quality for the soil and reaching levels comparable to those seen under natural vegetation.
In turn, better physical quality for the soil improves root growth, according to Araújo et al. (2012); water and

2144 Afr. J. Agric. Res.
Table 4. Mean values for organic matter content (OM) of water-stable aggregates for different pasture management treatments in a dystrophic oxisol in the Cerrado biome in Campo Grande-MS, under pasture at depths of 0 to 10 cm and 10 to 20 cm. Campo Grande, MS, 2014.
Treatments
Classes of water-stable aggregates (mm)
8 to 2 2 to 1 1 to 0.5 0.5 to 0.21 0.21 to 0.105
%
0 to 10 cm
CERR 30.16a 41.55
a 42.06
a 33.72
a 27.16
a
PAI 26.09c 24.07
c 27.87
c 21.17
c 16.58
b
PAM 27.95b 32.61
b 35.53
b 27.84
b 27.15
a
PAML 28.87ab
34.75b 27.96
c 25.33
b 25.43
b
PC 19.25d 20.23
d 14.00
d 9.30
d 13.58
c
10 to 20 cm
CERR 18.67b 23.95
a 18.64
bc 16.56
bc 16.76
b
PAI 18.11b 20.22
b 21.69
ab 15.79
c 15.40
b
PAM 20.12ab
25.23a 24.56
a 22.26
a 21.65
a
PAML 21.96a 23.23
a 21.38
b 18.15
b 19.16
a
PC 14.59c 17.06
c 17.08
c 16.29
bc 10.10
c
Means followed by the same letter in the column do not differ among themselves by the Waller-Duncan test at 5% probability.
Figure 1. Organic matter in the water-stable aggregates for different pasture management treatments in a dystrophic oxisol in the Cerrado biome in Campo Grande-MS, under pasture at depths of 0 to 10 cm and 10 to 20 cm. Campo Grande, MS, 2014.
nutrients are stored and supplied to plants with greater efficiency, and gas exchange and biological activity also improve and contribute to sustainability. Alves et al. (2007) mention the use of pasture and legumes to recover degraded areas, improving OM content and boosting soil aggregation, as confirmed in this study.
Conclusions Pasture with fertilization favors the formation of larger soil aggregates, improving the physical quality of the soil at depths of not only 0 to 10 cm but also 10 to 20 cm. The impacts of removing native vegetation on soil aggregates can be reduced by covering soil with pasture, fertilizing it appropriately and controlling stock levels. Conflicts of interest The authors have none to declare. REFERENCES Alvarenga MIM, Davide AV (1999). Características físicas e químicas de
um Latossolo Vermelho-Escuro e a sustentabilidade de agroecossistemas. Rev. Bras. Ciênc. Solo. 23:933-942.
Alves MC, Suzuki LGAS, Suzuki LEAS (2007). Densidade do solo e infiltração de água como indicadores da qualidade física de um latossolo vermelho distrófico em recuperação. Rev. Bras. Ciênc. Solo 31:617-625.
Araújo EA, Ker JC, Neves JCL, Lani JL (2012). Qualidade do solo: conceitos, indicadores e avaliação. Revista Brasileira de Tecnologia Aplicada Ciênc. Agr. 5(1):187-206.
Ayarza M, Vilela L, Rauscher F (1993). Rotação de culturas e pastagens em um solo de Cerrado: Estudo de caso. In: Congresso Brasileiro De Ciência Do Solo. P 24.
Bono JAM, Macedo MCM, Tormena CA, Nanni MR, Gomes EP, Muller MML (2012). Infiltração de Água no solo em um Latossolo Vermelho da região sudoeste dos cerrados com diferentes sistemas de uso e manejo. Rev. Bras. Ciênc. Solo 36(6):1845-1853.
Bono JAM, Macedo MCM, Tormena CA (2013). Qualidade física do solo em um Latossolo Vermelho da região sudoeste dos cerrados sob diferentes sistemas de uso e manejo. Rev. Bras. Ciênc. Solo 37(3):743-753.
Carneiro MAC, Souza ED, Reis EF, Pereira HS, Azevedo WR (2009). Atributos físicos, químicos e biológicos de solo de cerrado sob diferentes sistemas de uso e manejo. Rev. Bras. Ciênc. Solo 33(1):147-157.
Carvalho JRP, Dechen SCF, Dufranc G (2004). Variabilidade espacial da agregação do solo avaliada pela geometria fractal e geoestatística. Rev. Bras. Ciênc. Solo 28(1):1-9.
Conte O, Flores JPC, Cassol LC, Anghinoni I, Carvalho PCF, Levien R, Wesp CL ((2011). Evolução de atributos físicos de solo em sistema de integração lavoura-pecuária. Pesq. Agropec. Bras. 46(10):1301-1309.
Corazza EJ, Silva JE, Resck DVS, Gomes AC (1999). Comportamento de diferentes sistemas de manejo como fonte ou depósito de carbono em relação à vegetação de Cerrado. Rev. Bras. Ciênc. Solo 23(2):425-432.
Costa Jr C, Píccolo MC, Siqueira Neto M, Camargo PB, Cerri CC, Bernoux M (2012). Carbono em agregados do solo sob vegetação nativa, pastagem e sistemas agrícolas no bioma Cerrado. Rev. Bras. Ciênc. Solo 36(4):1311-1321.
Demarchi JC, Perusi MC, Piroli EL (2011). Análise da estabilidade de agregados de solos da microbacia do Ribeirão São Domingos, Santa
Bertolin et al. 2145
Cruz do Rio Pardo – SP, sob diferentes tipos de uso e ocupação. Rev. Bras. Tecnol. Apl. Ciênc. Agr. 4(2):07–29.
EMBRAPA (2013). Sistema Brasileiro de Classificação do Solo, 3ª ed. Rev. Ampl. Bras. P 353.
EMBRAPA (2011). Manual de método de análise de solo, org. Kangussu, G. D., Rio de Janeiro P 230.
Ferreira RRM, Tavares Filho J, Ferreira VM (2010). Efeitos de sistemas de manejo de pastagens nas propriedades físicas do solo. Semina: Ciênc. Agr. 31(4):913-932.
Fidalski J, Tormena CA, Cecato U, Barbero LM, Lugão SMB, Costa MAT (2008). Qualidade física do solo em pastagem adubada e sob pastejo contínuo. Pesq. Agropec. Bras. 43(11):1583-1590.
Guedes HM, Resck MVS, Perreira IS, Silva JE, Catro LHR (1996). Caracterização da distribuição de tamanho de agregados de diferentes sistemas de manejo e seu conteúdo de carbono em Latossolo Vermelho-Escuro Brasil In: Perreira RC, Nasser LCB (1996). Simpósio Sobre O Cerrado, 7, International Symposium On Tropical Savannas, 1, Brasília, 1996. Anais... Planaltina: EMBRAPA-CPAC. 1:329-333.
Jakelaitis A, Silva AA, Santos JB, Vivian R (2008). Qualidade da camada superficial de solo sob mata, pastagens e áreas cultivadas. Pesq. Agropec. Trop. 38(2):118-127.
Macedo MCM (2009). Integração lavoura e pecuária: o estado da arte e inovações tecnológicas. Rev. Bras. Zootec. 38:133-146.
Mapfumo E, Chanasyk DS, Baron VS, Naeth MA (2000). Grazing impacts on selected soil parameters under short-term forage sequences. J. Range. Manage. USDA 53(5):466-470.
Marchão RL, Balbino LC, Silva EM, Santos Jr JDG, Sá MAC, Vilela L, Becquer T (2007). Qualidade física de um Latossolo Vermelho sob sistemas de integração lavoura-pecuária no Cerrado. Pesq. Agropec. Bras. 42:873-882.
Parente HN, Maia M (2011). Impacto do pastejo sobre a compactação dos solos com ênfase no Semiárido. Revista Trópica – Ciênc. Agr. Biol. 5(3):3-5.
Pillon CN, Mielniczuk J, Martin Neto L (2002). Dinâmica da material orgânico no ambiente. Embrapa Clima Temperado. Pelotas.: (EMBRAPA- Clima Temperado – Documento, 105).
Reichert JM, Reinert JD, Silva VR (2004). Compactação do solo em sistema de plantio direto: Limites críticos e mitigação, In: Couto. E.G. e Bueno, J.F., orgs. Reunião Brasileira de Manejo E Conservação do Solo e da Água, 14. Cuiabá, 2004. Anais... Cuiabá, SBCS/UFMT 1:167-198.
Resck DVS (1996). Manejo de solo e sustentabilidade dos sistemas agrossilvipastoris na região dos cerrados, In: Pereira, R. C.; Nasser, L. C. B. Simpósio Sobre o Cerrado, 8, 1996, Brasília, Anais..., Planaltina: CPAC. 1:81-89.
Resck DVS (1998). Agricultural intensification systems and their impact on soil and water quality in the Cerrados of Brazil. In: Lal, R. Soil quality and agricultural sustainability, Michigan. Ann. Arbor. Press 1:288-300.
Salton JC, Hernani LC, Broch DL, Fabrício AC (1999). Alterações em atributos físicos do solo decorrentes da rotação soja-pastagem, no sistema plantio direto. Dourados: Embrapa Agropecuária Oeste. 5p. (Comunicado Técnico, 10).
Salton JC, Mielniczuk J, Bayer C, Boeni M, Conceição PC, Fabrício AC, Carvalho A, Macedo M, Cláudio M, Broch, Lz D (2008). Agregação e estabilidade de agregados do solo em sistemas agropecuários em mato grosso do sul. Revista Brasileira de Ciência do Solo 32:11-21.
Six J, Bossuyt H, Degryze S, Denef K (2004). A history of research on the link between (micro) aggregates, soil biota, and soil organic matter dynamics. Soil Till. Res. 79:7-31.
Souza ED, Carneiro MAC, Banys VL (2008). Atributos físicos e químicos de um Latossolo Amarelo e distribuição do sistema radicular da soja sob diferentes sistemas de preparo no cerrado maranhense. Acta Sci. Agron. 30(4):525-531.
Veiga M (2011). Metodologia para coleta de amostras e análises físicas de solo. Florianópolis: EPAGRI. 52p.
Wendling B, Vinhal-Freitas IC, Oliveira RC, Babata MM, Borges EN (2012). Densidade, agregação e porosidade do solo em áreas de conversão do cerrado em floresta de pinus, pastagem e plantio direto. Biosci. J. 28(1):256-265.

Vol. 11(24), pp. 2146-2156, 16 June, 2016
DOI: 10.5897/AJAR2015.10065
Article Number: 52138FD58991
ISSN 1991-637X
Copyright ©2016
Author(s) retain the copyright of this article
http://www.academicjournals.org/AJAR
African Journal of Agricultural Research
Full Length Research Paper
Roles of conjugated double bonds in electron-donating capacity of sorghum grains
Minori Uchimiya1* and Ming Li Wang
2
1USDA-ARS Southern Regional Research Center, 1100 Robert E. Lee Boulevard, New Orleans, Louisiana 70124, USA.
2USDA-ARS Plant Genetic Resources Conservation Unit, Griffin, Georgia, 30223, USA.
Received 24 June, 2015; Accepted 10 February, 2016
Sorghum bicolor is cultivated worldwide as a staple food and forage, and is receiving a renewed interest as a bioenergy crop. The objective of this study was to understand the relationships between the function (redox and metal complexation) and structural properties (aromaticity and ionizable functionalities) of (poly) phenolic pigments in the pericarp of sorghum grain which will ultimately control its antioxidant and bird/mold resistance behaviors. As compared to white seeds lacking condensed tannins, brown seeds (with and without pigmented testa) contained (i) 0.08-0.01 wt% cyanidin-equivalent condensed tannins, (ii) higher aromaticity (which decreases the reduction potential of polyphenols), and (iii) as much as 6-fold greater Fe
III reduction capacity. The degree of aromaticity
was determined by (i) UV absorbance at 360 nm and (ii) fluorescence excitation-emission (EEM) peak position. Basic (0.1 M NaOH) extracts of all seeds contained EEM peaks (230/330 and 280/330) attributable to protein. Addition of Fe
III resulted in a new aromatic EEM peak (320/440) only for the brown
seeds which could be used as a fingerprint for the redox and coordination chemistry of sorghum grain pigments. Key words: Proanthocyanidin, cereal, sweet sorghum, colorimetric method, transition metal.
INTRODUCTION Sorghum (Sorghum bicolor (L.) Moench) grain color ranges from white, yellow, red, to brown, depending on the pericarp (external layer composed of ≤6 wt% of kernel) color and thickness (8-160 μm), endosperm color, mesocarp thickness and the presence of pigmented testa (Pedersen and Toy, 2001). Regardless of grain color, sorghum contains phenolic acids in pericarp, testa, aleurone layer and endosperm: hydroxybenzoic (e.g., gallic, vanillic and protocatechuic) and hydroxycinnamic (e.g., caffeic and coumaric) acids (Dykes and Rooney,
2006). While most sorghum varieties also contain flavonoids, only varieties having a pigmented testa contain condensed tannins (proanthocyanidins) (Dykes and Rooney, 2006). Sorghum seed extracts have been intensively characterized for toxicity (Scalbert, 1991), antioxidant property (Hagerman et al., 1998), the ability to precipitate protein (Ali et al., 2009), mold/bird resistance (Wu et al., 2012), and their effects on the fuel ethanol production (Yan et al., 2011). Sorghum tannins are a strong antioxidant even when complexed with
*Corresponding author. E-mail: [email protected]. Tel: (504) 286-4356. Fax: (504) 286-4367.
Author(s) agree that this article remain permanently open access under the terms of the Creative Commons Attribution
License 4.0 International License

Uchimiya and Wang 2147
pH
2 3 4 5 6 7 8 9 10
E (
vo
lts
)
-0.4
-0.3
-0.2
-0.1
0.0
0.1
0.2
0.3
0.4
0.5
0.6
0.7
(A)
pH 4.46
(B)
(C)
FeIII
/FeII
pH 6.38
pH 8.25
OH
OH
OH
OH
OH
OH
SO3-
-O3S
Figure 1. Thermodynamics of dihydroxybenzene (model polyphenols) oxidation by iron. Initial conditions: 50 µM dihydroxybenzene, 100 µM Fe(OH)3(s), 0.10 M NaCl. Fe(OH)3(s) (*Kso = 10+3.00) is employed as the FeIII solubility-limiting phase. Figure adopted from Uchimiya and Stone (2010).
proteins (Riedl and Hagerman, 2001). Although pigmented testa adversely affects the nutritional quality of grain, it improves resistance to mold, bird and preharvest seed germination on farm (Earp et al., 2004a).
The unique chemical properties underlying the above-described functions of sorghum seed pigments (phenolic acids, flavonoids, and condensed tannins) are the reversible electron-transfer (Hagerman et al., 1998) and metal complexation (Martell et al., 2004). Antioxidant activity of polyphenols and flavonoids, e.g., by quenching Fenton reaction, originates from the redox reactions as well as the complexation of Fe and Cu (Mira et al., 2002). As illustrated in Figure 1 adopted from Uchimiya and Stone (2010), two-electron reduction potential (E in volts) of polyphenols progressively decrease with the number of aromatic rings. Oxidation by Fe
III is thermodynamically
favorable when E of a given polyphenol is lower than E of iron. This corresponds to acidic pH range in Figure 1 where metal complexation by polyphenol is minimal (Martell et al., 2004). As illustrated in detail in the present study, different electron-donating capacities (E in Figure 1) of seeds are reflected in the amount of Fe
III reduced at
a given pH. Our subsequent papers in this series will utilized approaches developed in this study to examine the relationships between the chemical properties of sorghum pericarp and phenotypes, with a particular emphasis on the on-farm bird resistance.
The degree of aromaticity and the number of conjugated π electrons are observable in the characteristic peaks of
fluorescence excitation-emission (EEM) spectro-photometry, a sensitive, rapid, and non-destructive tool widely employed on dairy and other food products (Andersen and Mortensen, 2008). A shift towards longer excitation and emission wavelengths indicate more aromatic, condensed, and higher molecular weight (MW) structures (Lichtman and Conchello, 2005). The peak position and intensity of EEM depend not only on the structure, MW, quantum yield and concentration of each fluorophore, but on solvent (and pH and ionic strength). To the best of the author’s knowledge, no prior report utilized fluorescence EEM to characterize sorghum seed extracts.
The objective of this study was to understand the relationships between the function (redox and metal complexation) and structural properties (aromaticity and ionizable functionalities) of sorghum pericarp which will ultimately control its antioxidant and bird/mold resistance behaviors. Available chemical characterization methods of sorghum seeds heavily rely on the colorimetric targeting of structural groups, e.g., acid-butanol and vanillin assays for condensed tannins (Dykes and Rooney, 2006). Because colorimetric methods can be influenced by interferences, are often kinetically controlled, and could involve toxic reagents (e.g., ferricyanide in Prussian blue assay) (Schofield et al., 2001), refined methods have emerged for the quantification of proanthocyanidins (Grabber et al., 2013) and metal complexation (Karamać and Pegg, 2009). This
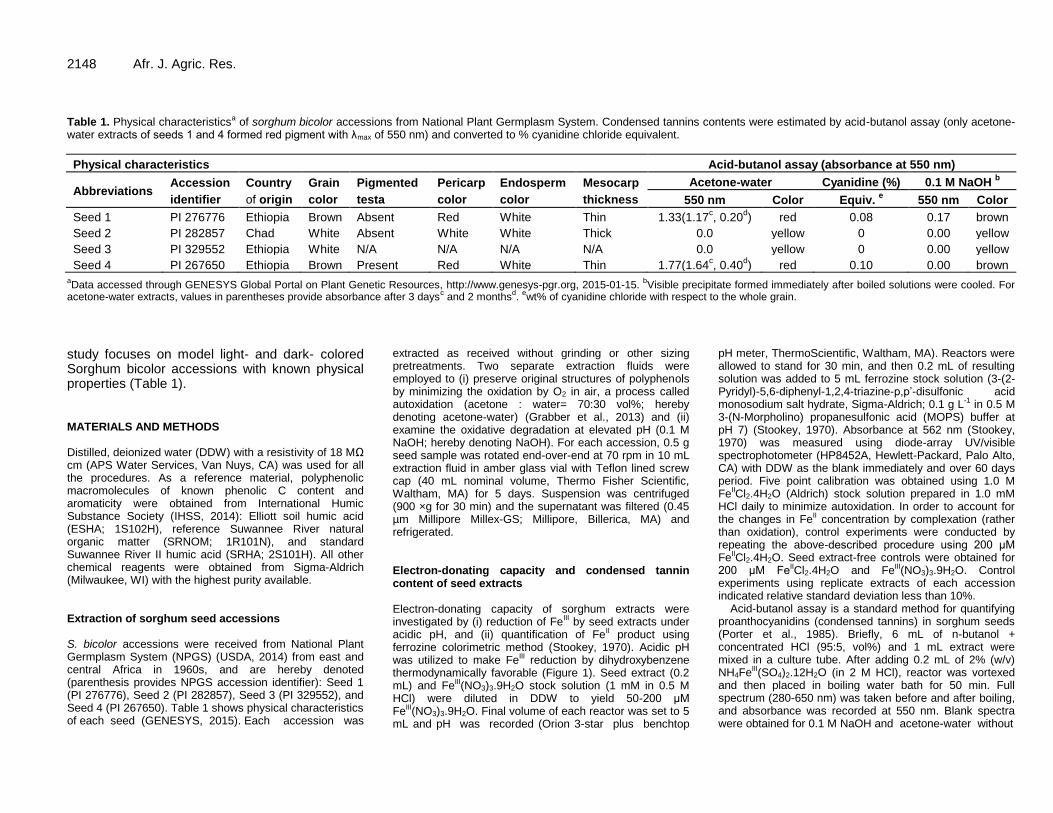
2148 Afr. J. Agric. Res. Table 1. Physical characteristicsa of sorghum bicolor accessions from National Plant Germplasm System. Condensed tannins contents were estimated by acid-butanol assay (only acetone-water extracts of seeds 1 and 4 formed red pigment with λmax of 550 nm) and converted to % cyanidine chloride equivalent.
Physical characteristics Acid-butanol assay (absorbance at 550 nm)
Abbreviations Accession
identifier
Country
of origin
Grain
color
Pigmented
testa
Pericarp
color
Endosperm
color
Mesocarp
thickness
Acetone-water Cyanidine (%) 0.1 M NaOH b
550 nm Color Equiv. e 550 nm Color
Seed 1 PI 276776 Ethiopia Brown Absent Red White Thin 1.33(1.17c, 0.20
d) red 0.08 0.17 brown
Seed 2 PI 282857 Chad White Absent White White Thick 0.0 yellow 0 0.00 yellow
Seed 3 PI 329552 Ethiopia White N/A N/A N/A N/A 0.0 yellow 0 0.00 yellow
Seed 4 PI 267650 Ethiopia Brown Present Red White Thin 1.77(1.64c, 0.40
d) red 0.10 0.00 brown
aData accessed through GENESYS Global Portal on Plant Genetic Resources, http://www.genesys-pgr.org, 2015-01-15.
bVisible precipitate formed immediately after boiled solutions were cooled. For
acetone-water extracts, values in parentheses provide absorbance after 3 daysc and 2 months
d.
ewt% of cyanidine chloride with respect to the whole grain.
study focuses on model light- and dark- colored Sorghum bicolor accessions with known physical properties (Table 1). MATERIALS AND METHODS Distilled, deionized water (DDW) with a resistivity of 18 MΩ cm (APS Water Services, Van Nuys, CA) was used for all the procedures. As a reference material, polyphenolic macromolecules of known phenolic C content and aromaticity were obtained from International Humic Substance Society (IHSS, 2014): Elliott soil humic acid (ESHA; 1S102H), reference Suwannee River natural organic matter (SRNOM; 1R101N), and standard Suwannee River II humic acid (SRHA; 2S101H). All other chemical reagents were obtained from Sigma-Aldrich (Milwaukee, WI) with the highest purity available. Extraction of sorghum seed accessions S. bicolor accessions were received from National Plant Germplasm System (NPGS) (USDA, 2014) from east and central Africa in 1960s, and are hereby denoted (parenthesis provides NPGS accession identifier): Seed 1 (PI 276776), Seed 2 (PI 282857), Seed 3 (PI 329552), and Seed 4 (PI 267650). Table 1 shows physical characteristics of each seed (GENESYS, 2015). Each accession was
extracted as received without grinding or other sizing pretreatments. Two separate extraction fluids were employed to (i) preserve original structures of polyphenols by minimizing the oxidation by O2 in air, a process called autoxidation (acetone : water= 70:30 vol%; hereby denoting acetone-water) (Grabber et al., 2013) and (ii) examine the oxidative degradation at elevated pH (0.1 M NaOH; hereby denoting NaOH). For each accession, 0.5 g seed sample was rotated end-over-end at 70 rpm in 10 mL extraction fluid in amber glass vial with Teflon lined screw cap (40 mL nominal volume, Thermo Fisher Scientific, Waltham, MA) for 5 days. Suspension was centrifuged (900 ×g for 30 min) and the supernatant was filtered (0.45 µm Millipore Millex-GS; Millipore, Billerica, MA) and refrigerated. Electron-donating capacity and condensed tannin content of seed extracts Electron-donating capacity of sorghum extracts were investigated by (i) reduction of FeIII by seed extracts under acidic pH, and (ii) quantification of FeII product using ferrozine colorimetric method (Stookey, 1970). Acidic pH was utilized to make FeIII reduction by dihydroxybenzene thermodynamically favorable (Figure 1). Seed extract (0.2 mL) and FeIII(NO3)3.9H2O stock solution (1 mM in 0.5 M HCl) were diluted in DDW to yield 50-200 μM FeIII(NO3)3.9H2O. Final volume of each reactor was set to 5 mL and pH was recorded (Orion 3-star plus benchtop
pH meter, ThermoScientific, Waltham, MA). Reactors were allowed to stand for 30 min, and then 0.2 mL of resulting solution was added to 5 mL ferrozine stock solution (3-(2-Pyridyl)-5,6-diphenyl-1,2,4-triazine-p,p’-disulfonic acid monosodium salt hydrate, Sigma-Aldrich; 0.1 g L-1 in 0.5 M 3-(N-Morpholino) propanesulfonic acid (MOPS) buffer at pH 7) (Stookey, 1970). Absorbance at 562 nm (Stookey, 1970) was measured using diode-array UV/visible spectrophotometer (HP8452A, Hewlett-Packard, Palo Alto, CA) with DDW as the blank immediately and over 60 days period. Five point calibration was obtained using 1.0 M FeIICl2.4H2O (Aldrich) stock solution prepared in 1.0 mM HCl daily to minimize autoxidation. In order to account for the changes in FeII concentration by complexation (rather than oxidation), control experiments were conducted by repeating the above-described procedure using 200 μM FeIICl2.4H2O. Seed extract-free controls were obtained for 200 μM FeIICl2.4H2O and FeIII(NO3)3.9H2O. Control experiments using replicate extracts of each accession indicated relative standard deviation less than 10%.
Acid-butanol assay is a standard method for quantifying proanthocyanidins (condensed tannins) in sorghum seeds (Porter et al., 1985). Briefly, 6 mL of n-butanol + concentrated HCl (95:5, vol%) and 1 mL extract were mixed in a culture tube. After adding 0.2 mL of 2% (w/v) NH4FeIII(SO4)2.12H2O (in 2 M HCl), reactor was vortexed and then placed in boiling water bath for 50 min. Full spectrum (280-650 nm) was taken before and after boiling, and absorbance was recorded at 550 nm. Blank spectra were obtained for 0.1 M NaOH and acetone-water without
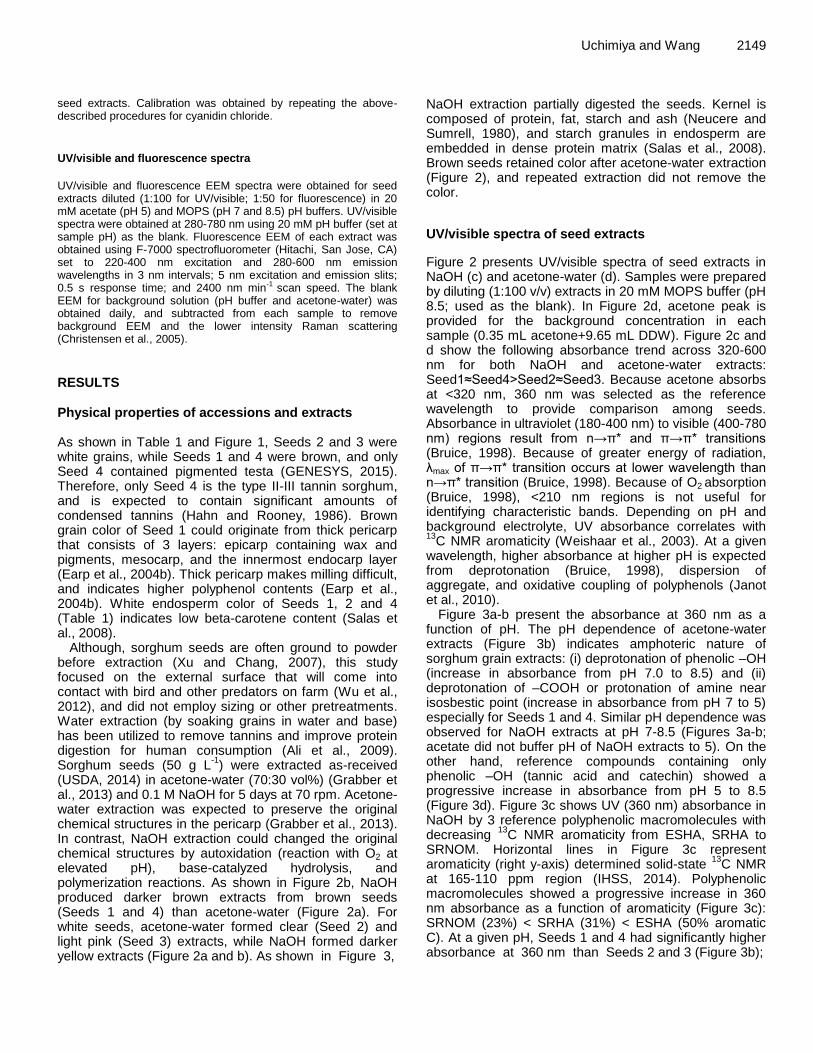
seed extracts. Calibration was obtained by repeating the above-described procedures for cyanidin chloride.
UV/visible and fluorescence spectra
UV/visible and fluorescence EEM spectra were obtained for seed extracts diluted (1:100 for UV/visible; 1:50 for fluorescence) in 20 mM acetate (pH 5) and MOPS (pH 7 and 8.5) pH buffers. UV/visible spectra were obtained at 280-780 nm using 20 mM pH buffer (set at sample pH) as the blank. Fluorescence EEM of each extract was obtained using F-7000 spectrofluorometer (Hitachi, San Jose, CA) set to 220-400 nm excitation and 280-600 nm emission wavelengths in 3 nm intervals; 5 nm excitation and emission slits; 0.5 s response time; and 2400 nm min-1 scan speed. The blank EEM for background solution (pH buffer and acetone-water) was obtained daily, and subtracted from each sample to remove background EEM and the lower intensity Raman scattering (Christensen et al., 2005).
RESULTS Physical properties of accessions and extracts As shown in Table 1 and Figure 1, Seeds 2 and 3 were white grains, while Seeds 1 and 4 were brown, and only Seed 4 contained pigmented testa (GENESYS, 2015). Therefore, only Seed 4 is the type II-III tannin sorghum, and is expected to contain significant amounts of condensed tannins (Hahn and Rooney, 1986). Brown grain color of Seed 1 could originate from thick pericarp that consists of 3 layers: epicarp containing wax and pigments, mesocarp, and the innermost endocarp layer (Earp et al., 2004b). Thick pericarp makes milling difficult, and indicates higher polyphenol contents (Earp et al., 2004b). White endosperm color of Seeds 1, 2 and 4 (Table 1) indicates low beta-carotene content (Salas et al., 2008).
Although, sorghum seeds are often ground to powder before extraction (Xu and Chang, 2007), this study focused on the external surface that will come into contact with bird and other predators on farm (Wu et al., 2012), and did not employ sizing or other pretreatments. Water extraction (by soaking grains in water and base) has been utilized to remove tannins and improve protein digestion for human consumption (Ali et al., 2009). Sorghum seeds (50 g L
-1) were extracted as-received
(USDA, 2014) in acetone-water (70:30 vol%) (Grabber et al., 2013) and 0.1 M NaOH for 5 days at 70 rpm. Acetone-water extraction was expected to preserve the original chemical structures in the pericarp (Grabber et al., 2013). In contrast, NaOH extraction could changed the original chemical structures by autoxidation (reaction with O2 at elevated pH), base-catalyzed hydrolysis, and polymerization reactions. As shown in Figure 2b, NaOH produced darker brown extracts from brown seeds (Seeds 1 and 4) than acetone-water (Figure 2a). For white seeds, acetone-water formed clear (Seed 2) and light pink (Seed 3) extracts, while NaOH formed darker yellow extracts (Figure 2a and b). As shown in Figure 3,
Uchimiya and Wang 2149 NaOH extraction partially digested the seeds. Kernel is composed of protein, fat, starch and ash (Neucere and Sumrell, 1980), and starch granules in endosperm are embedded in dense protein matrix (Salas et al., 2008). Brown seeds retained color after acetone-water extraction (Figure 2), and repeated extraction did not remove the color.
UV/visible spectra of seed extracts
Figure 2 presents UV/visible spectra of seed extracts in NaOH (c) and acetone-water (d). Samples were prepared by diluting (1:100 v/v) extracts in 20 mM MOPS buffer (pH 8.5; used as the blank). In Figure 2d, acetone peak is provided for the background concentration in each sample (0.35 mL acetone+9.65 mL DDW). Figure 2c and d show the following absorbance trend across 320-600 nm for both NaOH and acetone-water extracts: Seed1≈Seed4>Seed2≈Seed3. Because acetone absorbs at <320 nm, 360 nm was selected as the reference wavelength to provide comparison among seeds. Absorbance in ultraviolet (180-400 nm) to visible (400-780 nm) regions result from n→π* and π→π* transitions (Bruice, 1998). Because of greater energy of radiation, λmax of π→π* transition occurs at lower wavelength than n→π* transition (Bruice, 1998). Because of O2 absorption (Bruice, 1998), <210 nm regions is not useful for identifying characteristic bands. Depending on pH and background electrolyte, UV absorbance correlates with 13
C NMR aromaticity (Weishaar et al., 2003). At a given wavelength, higher absorbance at higher pH is expected from deprotonation (Bruice, 1998), dispersion of aggregate, and oxidative coupling of polyphenols (Janot et al., 2010).
Figure 3a-b present the absorbance at 360 nm as a function of pH. The pH dependence of acetone-water extracts (Figure 3b) indicates amphoteric nature of sorghum grain extracts: (i) deprotonation of phenolic –OH (increase in absorbance from pH 7.0 to 8.5) and (ii) deprotonation of –COOH or protonation of amine near isosbestic point (increase in absorbance from pH 7 to 5) especially for Seeds 1 and 4. Similar pH dependence was observed for NaOH extracts at pH 7-8.5 (Figures 3a-b; acetate did not buffer pH of NaOH extracts to 5). On the other hand, reference compounds containing only phenolic –OH (tannic acid and catechin) showed a progressive increase in absorbance from pH 5 to 8.5 (Figure 3d). Figure 3c shows UV (360 nm) absorbance in NaOH by 3 reference polyphenolic macromolecules with decreasing
13C NMR aromaticity from ESHA, SRHA to
SRNOM. Horizontal lines in Figure 3c represent aromaticity (right y-axis) determined solid-state
13C NMR
at 165-110 ppm region (IHSS, 2014). Polyphenolic macromolecules showed a progressive increase in 360 nm absorbance as a function of aromaticity (Figure 3c): SRNOM (23%) < SRHA (31%) < ESHA (50% aromatic C). At a given pH, Seeds 1 and 4 had significantly higher absorbance at 360 nm than Seeds 2 and 3 (Figure 3b);

2150 Afr. J. Agric. Res.
Wavelength (nm)
250 300 350 400 450 500 550 600
Ab
so
rba
nc
e
0.0
0.2
0.4
0.6
0.8
1.0
1.2
1.4
Seed3Seed2
Seed4
Seed1
(d) acetone-water extracts(blank=buffer)
250 300 350 400 450 500 550 600
Ab
so
rba
nc
e
0.0
0.1
0.2
0.3
0.4
0.5
0.6
0.7
0.8
0.9
1.0
360 nm
Seed3
Seed2
Seed4
Seed1(c) 0.1 M NaOH extracts(1:100 dilution in pH 8.5 MOPS buffer)
360 nm
acetone
Figure 2. (a) Acetone-water extraction after 5 days rotation at 70 rpm of Seeds 4, 3, 2, 1 (from left to right) and (b) 0.1 M NaOH for Seeds 1, 2, 3, 4 (from left to right). UV/visible spectra of 50 g L-1 seed extracts in 0.1 M NaOH (c) and acetone-water (70:30 v/v, d) diluted to 1:100 (v/v) in 20 mM MOPS buffer (pH 8.5; used as the blank).
this trend was maintained for acetone-water extracts without dilution: Seed 1 (1.39 absorbance at 360 nm) ≈ Seed 4 (1.00) << Seed 2 (0.30) ≈ Seed 3 (0.12). In conclusion, acetone-water extracts of Seeds 1 and 4 showed pH-dependent absorbance at 360 nm indicative of amophoteric nature. Seed 1 had 360 nm absorbance as high as ESHA and slightly lower than catechin (50 g·L
-1
at pH 8.5 for all). Absorbance at 360 nm is a useful measure for (i) aromaticity and (ii) deprotonating (from
pH 7 to 8.5) and protonating (from pH 7 to 5) functional groups of sorghum seeds. Acid-butanol assay and reduction of Fe
III
In Table 1, acid-butanol assay was employed to determine the presence of proanthocyanidins (condensed, flavanoid-based tannins) (Porter et al., 1985). In acid-butanol

Uchimiya and Wang 2151
Figure 3. UV (360 nm) absorbance of 0.1 M NaOH (a) and acetone : water=70:30 (v/v) (b) seed extracts (50 g·L -1), model polyphenols with known aromaticity (c), and reference compounds (d) diluted (1:100) in 20 mM buffer (MOPS for pH 7 and 8.5; acetate for pH 5). The pH buffer (20 mM) was used as the blank, and absorbance of acetone is negligible at 360 nm. Horizontal lines in (c) represent aromaticity determined by 13C NMR (IHSS, 2014).
assay, proanthocyanidins are oxidatively cleaved at 4,8 linkages to form red anthocyanidin pigment having λmax of 550 nm (Porter et al., 1985). For samples containing water, acid-butanol assay yields higher reproducibility than vanillin method that measures both condensed tannins and flavanols (Burns, 1971). As summarized in Table 1 and described in detail in the Appendix, only acetone-water extracts of Seeds 1 and 4 formed red pigment after boiling. Slightly higher absorbance was observed for Seed 4 (0.10 wt% cyanidin chloride
equivalent per whole grain (Table 1) containing pigmented testa than Seed 1 (0.08 wt%). Acid-butanol assay was kinetically controlled, and the absorbance progressively decreased over 3 days period (Appendix).
The presence of condensed tannins in Seeds 1 and 4 suggests their ability to reduce iron. Acidic pH was utilized to (i) make Fe
III reduction by dihydroxybenzene
thermodynamically favorable (Figure 1), (ii) minimize oxidation of Fe
II product by O2 (Kanzaki and Murakami,
2013) and (iii) minimize FeII complexation by phenolic

2152 Afr. J. Agric. Res.
0 10 20 30 40 50 60
[Fe
II] 2
00
M (
M)
0
15
30
45
60
75
90
105
120
135
0 10 20 30 40 50 600
5
10
15
20
25
30
35
40
1 2 3 4
[Fe
II] re
du
ced (
M)
0
5
10
15
20
25
30
35
40
0
20
40
60
80
100
120
140
160
180
200
1 2 3 4
[Fe
II] re
du
ced (
M)
0
5
10
15
20
25
30
35
40
0
20
40
60
80
100
120
140
160
180
200
(a) acetone-water (1h)
Seed
[Fe
II] c
om
ple
x (
M)
(b) NaOH (1h)
Seed
[Fe
II] c
om
ple
x (
M)
200 M Fe(III)
50 M Fe(III)
200 M Fe(II)
200 M Fe(III)
50 M Fe(III)
200 M Fe(II)
[Fe
II] 5
0
M (
M)
time (d)
(d) 0.1M NaOH
extracts FeII
formation kinetics
[Fe
II] 5
0
M (
M)
0 10 20 30 40 50 600
5
10
15
20
25
30
35
40
45
0 10 20 30 40 50 60
[Fe
II] 2
00
M (
M)
0
15
30
45
60
75
90
105
120
135
time (d)
(c) acetone-water
extracts FeII
formation kinetics
Seed1
Seed2
Seed3
Seed4
Figure 4. FeII concentration (by ferrozine method) after the reaction of 50 (diamonds, right y-axis) and 200 μM FeIII(NO3)3 (crosses, left y-axis), and 200 μM FeIICl2 (triangles, right y-axis) with acetone-water (a) and NaOH (b) seed extracts (1:25 v/v dilution at pH 1.5) for 1 h. Over 60 days period, additional FeII formed in ferrozine (pH 7 in 0.5 M MOPS buffer) for both acetone-water (c) and NaOH (d) extracts. In c-d, initial FeIII(NO3)3 concentrations were 200 (left panel, left y-axis) and 50 μM (right panel, right y-axis).
components of seed extracts (Martell et al., 2004). These conditions will allow us to quantify the electron-donating capacity of seed extracts. Figures 4a-b present the amount of Fe
II produced by the reaction between seed
extracts and FeIII(NO3)3 (50 and 200 μM at pH 1.5 set by
HCl) for 1 h. For a given seed, acetone-water produced higher Fe
II concentration than NaOH. For both extraction
fluids, FeII production was significantly higher for Seeds 1
and 4 than Seeds 2 and 3. These results indicate greater antioxidant (electron-donating) capacity of Seeds 1 and 4 than Seeds 2 and 3. Figure 4a-b (triangles for right y-axis) show negligible Fe
II loss by complexation and autoxidation
under acidic pH in all cases. Values in Figures 4a-b were obtained immediately after the addition of ferrozine. As
shown in Figure 4c-d, FeII continued to be formed in
ferrozine solution at pH 7 over 60 days period. Similarly to acid-butanol assay (Table 1 and Appendix), NaOH extracts formed yellow precipitates during the reaction with Fe
III(NO3)3 at pH 1.5. The precipitates could be
dispersed by hand shaking, and was likely formed by charge neutralization involving protein in digested seed (Figure 3) at acidic pH. The formation of visible precipitate could contribute to lower electron-donating capacity of NaOH extracts than acetone-water (Figures 4a-b).
Colorimetric methods are used to study FeII
com-plexation by tannins, and ferrozine has been suggested as a replacement for Prussian blue test (Karamać and Pegg, 2009). Ferrozine method has also been employed
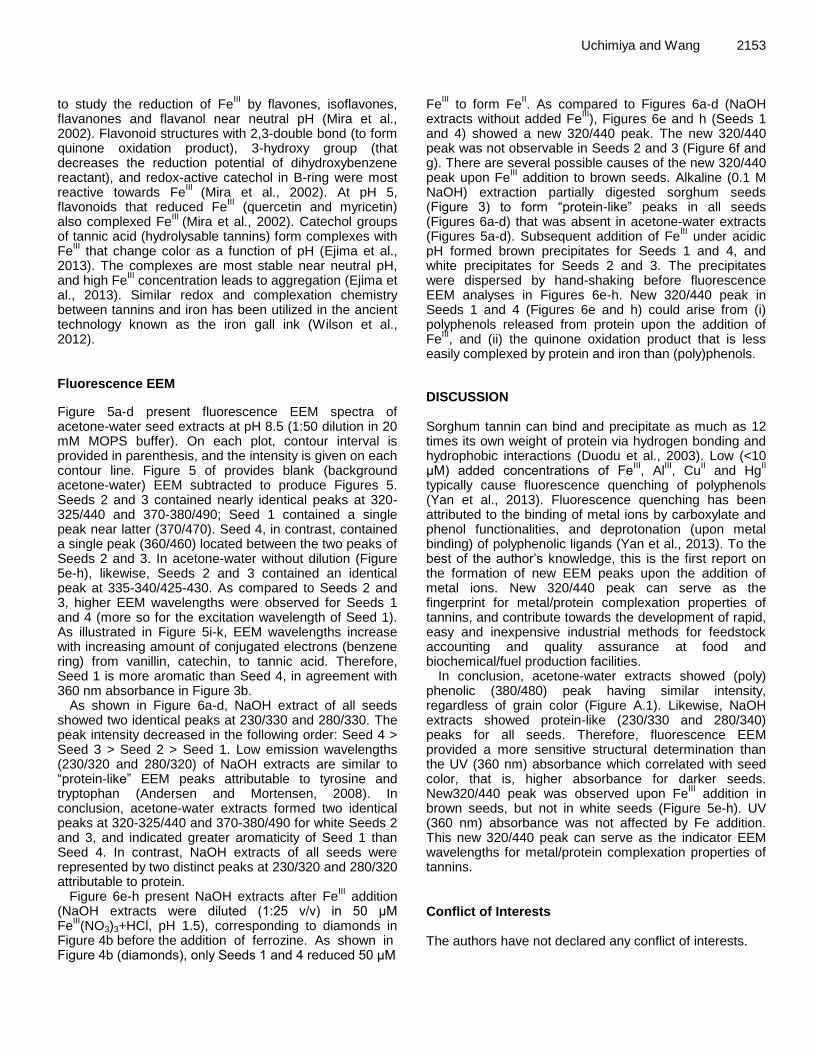
to study the reduction of Fe
III by flavones, isoflavones,
flavanones and flavanol near neutral pH (Mira et al., 2002). Flavonoid structures with 2,3-double bond (to form quinone oxidation product), 3-hydroxy group (that decreases the reduction potential of dihydroxybenzene reactant), and redox-active catechol in B-ring were most reactive towards Fe
III (Mira et al., 2002). At pH 5,
flavonoids that reduced FeIII (quercetin and myricetin)
also complexed FeIII
(Mira et al., 2002). Catechol groups of tannic acid (hydrolysable tannins) form complexes with Fe
III that change color as a function of pH (Ejima et al.,
2013). The complexes are most stable near neutral pH, and high Fe
III concentration leads to aggregation (Ejima et
al., 2013). Similar redox and complexation chemistry between tannins and iron has been utilized in the ancient technology known as the iron gall ink (Wilson et al., 2012). Fluorescence EEM
Figure 5a-d present fluorescence EEM spectra of acetone-water seed extracts at pH 8.5 (1:50 dilution in 20 mM MOPS buffer). On each plot, contour interval is provided in parenthesis, and the intensity is given on each
contour line. Figure 5 of provides blank (background acetone-water) EEM subtracted to produce Figures 5. Seeds 2 and 3 contained nearly identical peaks at 320-325/440 and 370-380/490; Seed 1 contained a single peak near latter (370/470). Seed 4, in contrast, contained a single peak (360/460) located between the two peaks of Seeds 2 and 3. In acetone-water without dilution (Figure 5e-h), likewise, Seeds 2 and 3 contained an identical peak at 335-340/425-430. As compared to Seeds 2 and 3, higher EEM wavelengths were observed for Seeds 1 and 4 (more so for the excitation wavelength of Seed 1). As illustrated in Figure 5i-k, EEM wavelengths increase with increasing amount of conjugated electrons (benzene ring) from vanillin, catechin, to tannic acid. Therefore, Seed 1 is more aromatic than Seed 4, in agreement with 360 nm absorbance in Figure 3b.
As shown in Figure 6a-d, NaOH extract of all seeds showed two identical peaks at 230/330 and 280/330. The peak intensity decreased in the following order: Seed 4 > Seed 3 > Seed 2 > Seed 1. Low emission wavelengths (230/320 and 280/320) of NaOH extracts are similar to “protein-like” EEM peaks attributable to tyrosine and tryptophan (Andersen and Mortensen, 2008). In conclusion, acetone-water extracts formed two identical peaks at 320-325/440 and 370-380/490 for white Seeds 2 and 3, and indicated greater aromaticity of Seed 1 than Seed 4. In contrast, NaOH extracts of all seeds were represented by two distinct peaks at 230/320 and 280/320 attributable to protein.
Figure 6e-h present NaOH extracts after FeIII addition
(NaOH extracts were diluted (1:25 v/v) in 50 μM Fe
III(NO3)3+HCl, pH 1.5), corresponding to diamonds in
Figure 4b before the addition of ferrozine. As shown in Figure 4b (diamonds), only Seeds 1 and 4 reduced 50 μM
Uchimiya and Wang 2153 Fe
III to form Fe
II. As compared to Figures 6a-d (NaOH
extracts without added FeIII), Figures 6e and h (Seeds 1
and 4) showed a new 320/440 peak. The new 320/440 peak was not observable in Seeds 2 and 3 (Figure 6f and g). There are several possible causes of the new 320/440 peak upon Fe
III addition to brown seeds. Alkaline (0.1 M
NaOH) extraction partially digested sorghum seeds (Figure 3) to form “protein-like” peaks in all seeds (Figures 6a-d) that was absent in acetone-water extracts (Figures 5a-d). Subsequent addition of Fe
III under acidic
pH formed brown precipitates for Seeds 1 and 4, and white precipitates for Seeds 2 and 3. The precipitates were dispersed by hand-shaking before fluorescence EEM analyses in Figures 6e-h. New 320/440 peak in Seeds 1 and 4 (Figures 6e and h) could arise from (i) polyphenols released from protein upon the addition of Fe
III, and (ii) the quinone oxidation product that is less
easily complexed by protein and iron than (poly)phenols.
DISCUSSION Sorghum tannin can bind and precipitate as much as 12 times its own weight of protein via hydrogen bonding and hydrophobic interactions (Duodu et al., 2003). Low (<10 μM) added concentrations of Fe
III, Al
III, Cu
II and Hg
II
typically cause fluorescence quenching of polyphenols (Yan et al., 2013). Fluorescence quenching has been attributed to the binding of metal ions by carboxylate and phenol functionalities, and deprotonation (upon metal binding) of polyphenolic ligands (Yan et al., 2013). To the best of the author’s knowledge, this is the first report on the formation of new EEM peaks upon the addition of metal ions. New 320/440 peak can serve as the fingerprint for metal/protein complexation properties of tannins, and contribute towards the development of rapid, easy and inexpensive industrial methods for feedstock accounting and quality assurance at food and biochemical/fuel production facilities.
In conclusion, acetone-water extracts showed (poly) phenolic (380/480) peak having similar intensity, regardless of grain color (Figure A.1). Likewise, NaOH extracts showed protein-like (230/330 and 280/340) peaks for all seeds. Therefore, fluorescence EEM provided a more sensitive structural determination than the UV (360 nm) absorbance which correlated with seed color, that is, higher absorbance for darker seeds. New320/440 peak was observed upon Fe
III addition in
brown seeds, but not in white seeds (Figure 5e-h). UV (360 nm) absorbance was not affected by Fe addition. This new 320/440 peak can serve as the indicator EEM wavelengths for metal/protein complexation properties of tannins. Conflict of Interests The authors have not declared any conflict of interests.
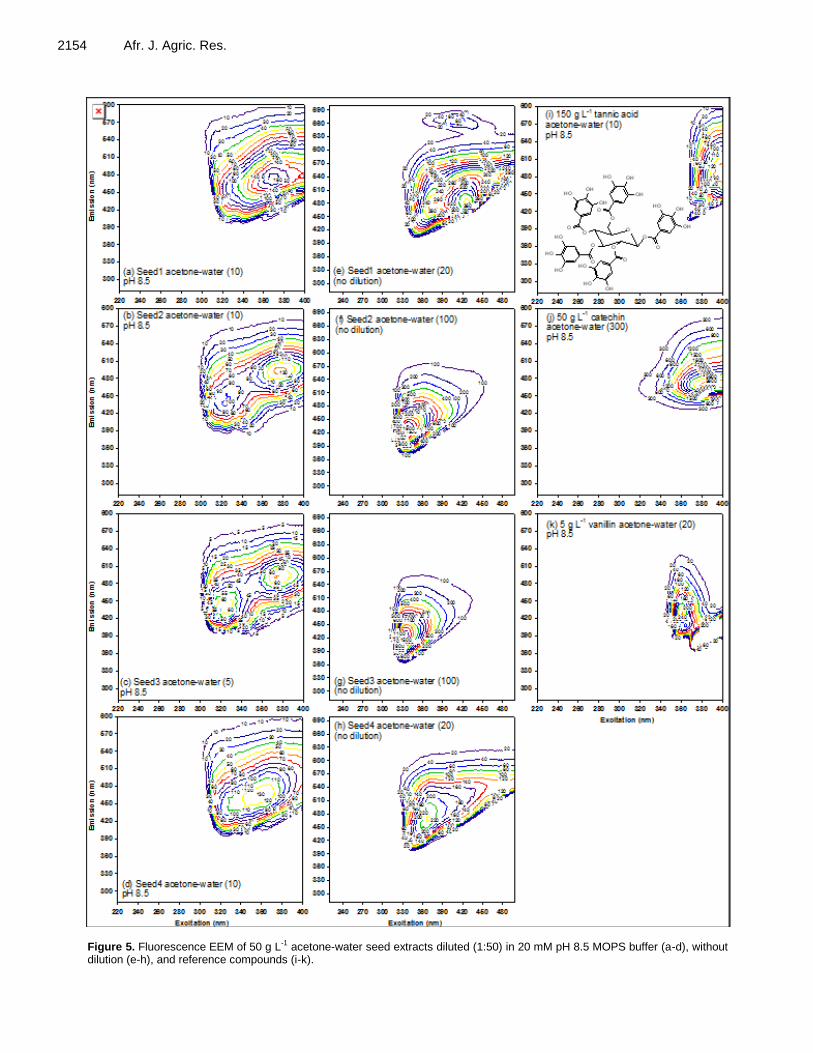
2154 Afr. J. Agric. Res.
Figure 5. Fluorescence EEM of 50 g L-1 acetone-water seed extracts diluted (1:50) in 20 mM pH 8.5 MOPS buffer (a-d), without dilution (e-h), and reference compounds (i-k).

Uchimiya and Wang 2155
4040
8080
80
120120
120
120
120200
200
200
160
160
160
320
320
320280
280
280240
240
240
520
520
520480
480
480
440
440
440400
400
400
360
360
360
600
600
600560
560
560
600
600
600
560
560
560
520
520
520
480
480
480
440
440
440
400
400
400
360
360
360
320
320
320
280
280
280
240
240
240
200
200
200
160
160
160
120
120
120
80
80
8040
40
40
160
160
160 160
160
200
200
200200
200
200
200200
200
240
240240
240
240
240
240
240
280
280280
280
280
280
280
280
320
320
320
320
320
320
160
160
160
160
360 360
360
360
360
120
120
120
120
120
400400
400
400
400
440
440
440
80
80
480
480
520
520
560
80
8080 40
40
40
40
480
160160120
120
80
80
40
40600560
520480440400
360
360
320
320
280
280
240
240
200
200
80
440
440
560
480
120
440
400
400
360
440
160
120
120
80
80
40
40
40
40
80
80
320
320
320
320
40
40
240
120
80
160
40
200
120
Excitation (nm)220 240 260 280 300 320 340 360 380
Em
iss
ion
(n
m)
300
330
360
390
420
450
480
510
540
570
600
500
500
500
5001000
500
500
1000
1000
1500100015002000
1000
15001500
1000
150015002000
500
500500
2000
1000
1000
1500
1500
2500
500
2000
2000
2500
2500
2500
3000
3000 2000
2000
500
500
500
3500
3500
4000
4000
45005000
1500
1000 1000500 500
1000
1500
1500
2000
2000
2500
2500
3000
3500
220 240 260 280 300 320 340 360 380
Em
issio
n (
nm
)
300
330
360
390
420
450
480
510
540
570
600
100
100100
100
200200
200
200
200
200
200
100
100100
100
300
300
200
200
500
500
400
400
800
700600
600
9001000900
800
800
700
700
600
600
500
500
400
400
300
300
300
200
200
200
100
100
100
100012001100
800900
900
300 300 300
300
300
10001000
12001100
700120011001000900
900
800
800900
400
400
400
100012001100100
100
200200
200
300
300
300400
400
700600500500
110010009008001200
300
200
500
500
600
600
700
700
800
400
900
900
1000
1000
1100
1100
1200
1200
700600
100 100
800700
400
400
100
300
400
400500
500
600600
700
500300
220 240 260 280 300 320 340 360 380
Em
issio
n (
nm
)
300
330
360
390
420
450
480
510
540
570
600
(a) Seed1 NaOH (100)
300
300
300
600
600
600
300
300
300900600900
600
9009001200
6001200
1200
900
900
15001200
15001800
300
600
300300
600
600
1200900180015002100
300
300
300
900
900
900
1200
1200
1500
1500
2100
1800
1800
2100
2100
2400
2400
2400
2700
2700
1500
30003300
1200900
600 600300 300
300
600
900
900
1200
1200
1500
1500
18001800
21002400
900
220 240 260 280 300 320 340 360 380
Em
issio
n (
nm
)
300
330
360
390
420
450
480
510
540
570
600
(b) Seed2 NaOH (300)
(c) Seed3 NaOH (500)
6060
60
60
120
120
120
120
180
180
180
180
240240240
240
240
240
240
240240
180
180
180
120
120
120
60
60120180
18012060240
300
300
300
300
300
300
300300
300
60
360360
360
360
360
360
60
60
120
120
180360300240180
60
6012018024060
420
420
60
60120240180360300600540480420960900840780720660
60
480
60
420
420
120
480
480
480
540
540600
180
660
180
180120
12060
60
420
360
360
60
60
360
360
300
300
420
120
120
480
60
420
240
240
360
300
60
360
300
60
300
60
180
Excitation (nm)
220 240 260 280 300 320 340 360 380
Em
iss
ion
(n
m)
300
330
360
390
420
450
480
510
540
570
600
(d) Seed4 NaOH (60)
4040
80
8080
120
120
120
120
200
200
200
160
160
160
280
280
280240
240
240
400
400
400360
360
360320
320
320640
640
640
600
600
600560
560
560520
520
520480
480
480440
440
440
680
680
680
680
680
680
640
640
640
600
600
600
560
560
560
520
520
520
480
480
480
440
440
440
400
400
400
360
360
360
320
320
320
280
280
280
240
240
240
200
200
200
160
160
160
120
120
12080
80
80
40
40
40
160
160
160
160
160
160
160
200
200 200
200
200
200
200
200
240
240 240
240
240
240240
280
280
280
280
280
280280
280
320
320
320
320
320
320
360
360360
360
360
360
400
400
400
120
120
120
120
440
440
480
480
80
80
80
520
40
40
480440
200
200200
200160
160
160
120
120
120
80
80
40
40
40
680
680
680
680
640
640
640
640
600
600
600
600
560
560
560
560
520
520
520
520
480
480
480
480440
440
440
440
440
400
400
400
400
400
360
360
360
360
360
320
320
320
320280
280280
280240
240 240
240
80
400
400
400
440
440
400
480
480 520
120
120
120 8080 40
160
40
200
240
280
320
320
320
40
40
320
240
160
280
120
2402001601208040
200
80
240
80
80
80
240200
200
200
240
280
220 240 260 280 300 320 340 360 380
300
330
360
390
420
450
480
510
540
570
600
(e) Seed1 NaOH
+50 M FeIII (40)
200
200
400
400
800
800
800600
600
600
1400
1400
14001200
1200
12001000
1000
1000
2400
2400
2400
2200
2200
22002000
2000
2000
1800
1800
1800
1600
1600
16003000
3000
3000
2800
2800
2800
2600
2600
2600
3000
3000
3000
2800
2800
2800
2600
2600
2600
2400
2400
2400
2200
2200
2200
2000
2000
2000
1800
1800
1800
1600
1600
1600
1400
1400
1400
1200
1200
1200
1000
1000
1000
800
800
800
600
600
600
400
400
400
200
200
200
200200
200
200
400400
400
400
200
200 200
200
3000
3000
3000
3000
3000
2800
2800
2800
2800
2800
2600
2600
2600
2600
2600
2400
2400
2400
2400
2400
2200
2200
2200
2200
2200
2000
2000
2000
2000
2000
1800
1800
1800
1800
1800
1600
1600
1600
1600
1600
1400
1400
1400
1400
1400
1200
1200
1200
1200
1200
1000
1000
1000
1000
1000
800
800
800
800
800
600
600600
600
600
400
400
400
400
600
600
600
600
800
800
1000
1000
1200
1200
1400
1400
1600180020002200
2200
2400
200018001600140012001000
800800
600600
400200
400
800
400
1000
1000
1200
400
14001400
160018002000
200
1200
220 240 260 280 300 320 340 360 380
300
330
360
390
420
450
480
510
540
570
600
(f) Seed2 NaOH
+50 M FeIII (200)
300
300
600
600
900
900
900
1800
1800
1800
1500
1500
1500
1200
1200
1200
2700
2700
2700
2400
2400
2400
2100
2100
21003900
3900
3900
3600
3600
36003300
3300
33003000
3000
3000
3900
3900
3900
3600
3600
3600
3300
3300
3300
3000
3000
3000
2700
2700
2700
2400
2400
2400
2100
2100
2100
1800
1800
1800
1500
1500
1500
1200
1200
1200
900
900
900
600
600
600
300
300
300
300
300
300300
600
600
600
600300
300 300
300
3900
3900
3900
3900
3900
3600
3600
3600
3600
3600
3300
3300
3300
3300
3300
3000
3000
3000
3000
3000
2700
2700
2700
2700
2700
2400
2400
2400
2400
2400
2100
2100
2100
2100
2100
1800
1800
1800
1800
1800
1500
1500
1500
1500
1500
1200
1200
1200
1200
1200
900
900
900
900
900
600
600
600
900
900
900
1200
1200
1500
1500
1800
1800
2100240027003000
3000
3300
27002400210018001500
1200 1200
900 900600
300
600
1200
1500
1500
18002100
300
1800
220 240 260 280 300 320 340 360 380
300
330
360
390
420
450
480
510
540
570
600
(g) Seed3 NaOH
+50 M FeIII (300)
(h) Seed3 NaOH
+50 M FeIII (40)
320/440
320/440
Figure 6. Fluorescence EEM of 50 g L-1 NaOH seed extracts before (a-d) and after (e-h) 50 μM FeIII addition at pH 1.5. Subtracted background was 20 mM pH 8.5 MOPS buffer in a-d, and DDW in e-h.

2156 Afr. J. Agric. Res. ACKNOWLEDGEMENTS The authors acknowledge Ms. Li Wu for laboratory assistance. Mention of trade names or commercial products in this publication is solely for the purpose of providing specific information and does not imply recommendation or endorsement by the U.S. Department of Agriculture. USDA is an equal opportunity provider and employer. REFERENCES Ali NMM, El Tinay AH, Elkhalifa AEO, Salih OA, Yousif NE (2009).
Effect of alkaline pretreatment and cooking on protein fractions of a high-tannin sorghum cultivar. Food Chem. 114: 646-648.
Andersen CM, Mortensen G (2008). Fluorescence spectroscopy: A rapid tool for analyzing dairy products. J. Agric. Food Chem. 56:720-729.
Bruice PY (1998). Organic Chemistry. Prentice Hall, New Jersey. Burns RE (1971). Method for estimation of tannin in grain sorghum.
Agron. J. 63: 511-512. Christensen JH, Hansen AB, Mortensen J, Andersen O (2005).
Characterization and matching of oil samples using fluorescence spectroscopy and parallel factor analysis. Anal. Chem. 77:2210-2217.
Duodu KG, Taylor JRN, Belton PS, Hamaker BR (2003). Factors affecting sorghum protein digestibility. J. Cereal Sci. 38: 117-131.
Dykes L, Rooney LW (2006). Sorghum and millet phenols and antioxidants. J. Cereal Sci. 44: 236-251.
Earp CF, McDonough CM, Awika J, Rooney LW (2004a). Testa development in the caryopsis of Sorghum bicolor (L.) Moench. J. Cereal Sci. 39: 303-311.
Earp CF, McDonough CM, Rooney LW (2004b). Microscopy of pericarp development in the caryopsis of Sorghum bicolor (L.) Moench. J. Cereal Sci. 39: 21-27.
Ejima H, Richardson JJ, Liang K, Best JP, Van Koeverden MP, Such GK, Cui J, Caruso F (2013). One-step assembly of coordination complexes for versatile film and particle engineering. Science 341:154-157.
GENESYS (2015). Data accessed through GENESYS Global Portal on Plant Genetic Resources, http://www.genesys-pgr.org, 2015-01-15 (2015).
Grabber JH, Zeller WE, Mueller-Harvey I (2013). Acetone enhances the direct analysis of procyanidin- and prodelphinidin-based condensed tannins in lotus species by the butanol-HCl-iron assay. J. Agric. Food Chem. 61: 2669-2678.
Hagerman AE, Riedl KM, Jones GA, Sovik KN, Ritchard NT, Hartzfeld PW, Riechel TL (1998). High molecular weight plant polyphenolics (tannins) as biological antioxidants. J. Agric. Food Chem. 46: 1887-1892.
Hahn DH, Rooney LW (1986). Effect of genotype on tannins and phenols of sorghum. Cereal Chem. 63: 4-8.
International Humic Substance Society (2014). 13
C NMR Estimates of Carbon Distribution in IHSS Samples; IHSS, St. Paul, Minnesota. Available: http://www.humicsubstances.org/ (24 September 2014). (2014).
Janot N, Reiller PE, Korshin GV, Benedetti MF (2010). Using spectrophotometric titrations to characterize humic acid reactivity at environmental concentrations. Environ. Sci. Technol. 44: 6782-6788.
Kanzaki Y, Murakami T (2013). Rate law of Fe(II) oxidation under low O2 conditions. Geochim. Cosmochim. ActaGeochim. Cosmochim. Ac. 123: 338-350.
Karamać M, Pegg RB (2009). Limitations of the tetramethylmurexide assay for investigating the Fe(II) chelation activity of phenolic compounds. J. Agric. Food Chem. 57: 6425-6431.
Lichtman JW, Conchello JA (2005). Fluorescence microscopy. Nat. Methods 2: 910-919.
Martell AE, Smith RM, Motekaitis RJ , (2004). Critically Selected
Stability Constants of Metal Complexes Database. U.S. Department of Commerce, National Institute of Standards and Technology, Gaithersburg, MD.
Mira L, Fernandez MT, Santos M, Rocha R, Florêncio MH, Jennings KR (2002). Interactions of flavonoids with iron and copper ions: A mechanism for their antioxidant activity. Free Radic.al Res. 36: 1199-1208.
Neucere NJ, Sumrell G (1980). Chemical composition of different varieties of grain sorghum. J. Agric. Food Chem. 28: 19-21.
Pedersen JF, Toy JJ (2001). Seed physiology, production & technology: Germination, emergence, and yield of 20 plant-color, seed-color near-isogenic lines of grain sorghum. Crop Sci. 41: 107-110.
Porter LJ, Hrstich LN, Chan BG (1985). The conversion of procyanidins and prodelphinidins to cyanidin and delphinidin. Phytochemistry 25: 223-230.
Riedl KM, Hagerman AE (2001). Tannin−protein complexes as radical scavengers and radical sinks. J. Agric. Food Chem. 49: 4917-4923.
Salas Fernandez MG, Hamblin MT, Li L, Rooney WL, Tuinstra MR, Kresovich S (2008). Quantitative trait loci analysis of endosperm color and carotenoid content in sorghum grain. Crop Sci. 48: 1732-1743.
Scalbert A (1991). Antimicrobial properties of tannins. Phytochemistry 30: 3875-3883.
Schofield P, Mbugua DM, Pell AN (2001). Analysis of condensed tannins: A review. Anim. Feed Sci. Tech. 91: 21-40.
Stookey LL (1970). Ferrozine - A new spectrophotometric reagent for iron. Anal. Chem. 42: 779-781.
Uchimiya M, Stone AT (2010). Reduction of substituted p-benzoquinones by Fe
II near neutral pH. Aquat. Geochem. 16: 173-
188. USDA, ARS, National Genetic Resources Program Germplasm
Resources Information Network - (GRIN) (2014). [Online Database]; National Germplasm Resources Laboratory, Beltsville, Maryland. Available: http://www.ars-grin.gov/cgi-bin/npgs/acc/display.pl?1201506 (2014).
Weishaar JL, Aiken GR, Bergamaschi BA, Fram MS, Fujii R, Mopper K (2003). Evaluation of specific ultraviolet absorbance as an indicator of the chemical composition and reactivity of dissolved organic carbon. Environ. Sci. Technol. 37: 4702-4708.
Wilson H, Carr C, Hacke M (2012). Production and validation of model iron-tannate dyed textiles for use as historic textile substitutes in stabilisation treatment studies. Chem. Cent. J. 6.
Wu Y, Li X, Xiang W, Zhu C, Lin Z, Wu Y, Li J, Pandravada S, Ridder DD, Bai G, Wang ML, Trick HN, Beane SR, Tuinstra MR, Tesso TT, Yu J (2012). Presence of tannins in sorghum grains is conditioned by different natural alleles of Tannin1. Proc. Natl. Acad. Sci. USA 109: 10281-10286.
Xu BJ, Chang SKC (2007). A comparative study on phenolic profiles and antioxidant activities of legumes as affected by extraction solvents. J. Food Sci. 72: S159-S166.
Yan M, Benedetti MF, Korshin GV (2013). Study of iron and aluminum binding to Suwannee River fulvic acid using absorbance and fluorescence spectroscopy: Comparison of data interpretation based on NICA-Donnan and Stockholm humic models. Water Res. 47: 5439-5446.
Yan S, Wu X, Bean SR, Pedersen JF, Tesso T, Chen YR, Wang D (2011). Evaluation of waxy grain sorghum for ethanol production. Cereal Chem. 88: 589-595.
Appendix Color of sorghum grains before and after extraction, acid-butanol assay, and background fluorescence EEM spectra subtracted in Figures 5-6. This materials is available free of charge online.

Vol. 11(24), pp. 2157-2165, 16 June, 2016
DOI: 10.5897/AJAR2015.10449
Article Number: 90FF1DC58987
ISSN 1991-637X
Copyright ©2016
Author(s) retain the copyright of this article
http://www.academicjournals.org/AJAR
African Journal of Agricultural Research
Full Length Research Paper
Assessment of harvest and post-harvest factors affecting quality of Arabica coffee in Gamo Gofa Zone,
Southern Ethiopia
Gezahegn Garo1*, Sabura Shara1 and Yohanes Mare2
1Department of Horticulture, Arba Minch University College of Agricultural Sciences, P.O. Box 21, Arba Minch, Ethiopia. 2Department of Rural Development and Agricultural extension, Arba Minch University College of Agricultural Sciences,
P.O. Box 21, Arba Minch, Ethiopia.
Received 25 September, 2015; Accepted 3 February, 2016
The quality of coffee produced in Gamo Gofa zone is declining from time to time due to improper harvesting and post-harvest management practices. Consequently, coffee produced under home garden is recognized as forest coffee at national market. Therefore, this study was conducted during 2012-2013 with the objective of assessing factors affecting coffee quality during and after harvest. Totally, 160 household respondents were used from three Woredas for data collection from relevant stakeholders, that is, farmers, middlemen (agents and traders) coffee processors and extension workers. Secondary data on coffee grades was also collected from the Ethiopian Commodity Exchange (ECX) coffee inspection laboratory located at Wolaita Soddo. Finally, quantitative data was analyzed by employing SPSS (version 20). The results indicated that most of respondents (79.4%) harvest their coffee at majority red ripe stage. Concerning harvesting method, 51.3% of respondents practice selective hand picking, while the rest 48.1% harvest by striping on the ground and collect together with previously dropped cherries. However, appropriate harvesting materials which were reported to have no contact with other chemicals were used by 95% of respondents. From post-harvest handling point of view, coffee drying places (69.4%), lack of appropriate drying (53.8%) and method of harvesting (48.1%) were the top three factors which are significantly affecting coffee quality in Gamo Gofa zone among others. However, 95% of respondents used appropriate harvesting materials, that is, local containers which were reported to have no contact with other chemicals. The results of ECX coffee grading showed that majority of coffee received grade seven, eight and nine out of nine scale commercial grades. Even through, inherent quality of coffee being grown in Gamo Gofa zone is good with bold beans. Thus, improvement on the way people harvest and handle their coffee to maintain inherent coffee quality in Gamo Gofa zone is recommended. Key words: Coffee quality, harvest, post-harvest, forest coffee, Gamo Gofa.
INTRODUCTION Coffee is produced in more than 70 countries and is the mainstay of most of these countries, accounting for over a large proportion of their total export earnings. Over 97%
of the total coffee production in the world is, however, produced by 45 producing countries. For most of these coffee producing countries, it is the major source of

2158 Afr. J. Agric. Res. foreign currency earnings as well as a significant proportion of tax income and gross domestic product. Ethiopia produces large volume of coffee beans every year with 397, 500,000 kg in 2014 alone, ranking first in Africa and fifth in world (ICO, 2015).
Coffee growing and drinking spread around the world starting in the Horn of Africa, specifically Southwestern highlands of Ethiopia are the birth place and home to Arabica coffee. The majority of coffee produced in Ethiopia is forest-based traditional coffee production systems which mainly include: forest coffee, semi-forest coffee, garden coffee and plantation coffee. The level of management intensities vary from a little (none) on forest coffee to recommended agronomic practice on plantation coffee. Accordingly, over one million small-scale coffee farming households produce about 90% of Ethiopia‟s coffee. Moreover, about 25% of the Ethiopian population depends, directly or indirectly on coffee production, processing and marketing (Esayas, 2005).
It is estimated that 40% of coffee quality is determined in the field, 40% at post-harvest primary processing and 20% at secondary/export processing and handling including storage (Richard, 2007). Ethiopia is known to have broad diversities of coffee varieties each with its own unique liquor attributes: aroma, taste, and flavor, that vary significantly among the different coffee growing regions owing to different botanical, ecological, and environmental conditions in different areas. There is a growing commercial interest in the international market to trace and access single origin coffee, pure and unmixed with other origins in the specialty coffee concept.
Quality is a determining factor in the price of coffee beans. In fact, in Ethiopia, the quality determines whether it can be exported or must be sold locally. Moreover, quality defines whether the coffee will be bought at a standard commodity price or may acquire a “specialty” price, which is much higher. Generally, coffee quality comes from a combination of the botanical variety, topographical conditions, weather conditions, and the care taken during growing, harvesting, processing, storage, export preparation and transport (ITC, 2002). Interestingly, the quality of Arabica coffee in Ethiopia has its own reputation, not only because of the richness in coffee genetic diversity, but also in agro-ecology and vegetation covers. Ethiopia‟s wet-processed coffee is well known for its high quality in the world market. Thus, there is a focus in the country to have more wet-processed coffee. The Southern Nations, Nationalities and People Regional State (SNNPRS) is the largest producer of wet-processed (washed) coffee which accounts for more than 60% of the washed coffee produced in the country (ECXA, 2008). However, in Gamo Gofa zone, there is no single wet-processing station, all of coffee produced in
the zone is processed in dry method (unwashed coffee).
Gamo Gofa zone is one of coffee producing areas in Southern Nations, Nationalities and People Regional State (SNNPRS), which is previously considered as a place where wild coffee existed and one of the coffee originating places. Despite the favorable climatic conditions, irrigable land and ample amount of irrigation water, long history of coffee production in Gamo Gofa midlands, coffee quality and productivity is declining from time to time due to several improper pre-and post-harvest management practices. Currently, there is no any forest coffee in Gamo Gofa zone, entire coffee is produced under home garden categories with shading (agroforestry systems); however, it is recognized as forest coffee at national level. For this reason farmers and traders are getting unfair value for their product, since minimum or no attention has been given to pre-and post-harvest management practices in the area though, coffee grows in suitable agro-ecology to have maximum coffee quality. Moreover, coffee produced in near boarder to Gamo
Gofa zone, like Yirgacheffee and Sidama brands are now internationally recognized and registered as property right to Ethiopia with their distinct character/flavor and taste (IPO, 2008). Therefore, coffee from this area is always sold at premium prices both at international and domestic markets, because of its distinctive fine inherent quality was maintained with appropriate pre and post-harvest management practices. In current situation production and supply of coffee with excellent quality seems more crucial than ever before, therefore it urges the zone to help producers get out of the coffee crisis by improving their coffee quality. Therefore, this research is concerned with identifying harvest and post-harvest factors which could be responsible for the decline in the quality and receipt of the brand forest coffee.
RESEARCH METHODOLOGY
Study area
This assessment work was conducted in Gamo Gofa zone, Southern Ethiopia in a year 2012-2013 at the three Woredas, namely; Geze Gofa, Bonke and Kamba. They are located 278, 54 and 115 km away from Arba Minch town, capital of the zone, respectively. Coffee is produced currently in all 15 Woredas in the zone, of which five (Melokoza, Bonke, Kamba, Geze Gofa and Boreda) are the major producers. The selected Woredas are accessible and supposed to represent the three agro-ecological zones where coffee is produced. The mean annual temperature of Geze Gofa and Bonke Woredas is in a range of 12.6 to 27.5°C, 10.1 to 27.5°C and the rainfall ranges from 1401 to 1600 and 810 to 1600 mm/annum, respectively. The average temperature and rainfall of Kamba Woreda is 10.1 to 27.5°C and 801 to 1600 mm/annum. The altitude of Geze Gofa, Kamba and Bonke ranges
*Corresponding author. E-mail: [email protected].
Author(s) agree that this article remain permanently open access under the terms of the Creative Commons Attribution
License 4.0 International License

Garo et al. 2159
Table 1. Harvesting stages and harvesting methods of coffee used in the area.
Harvesting stages Frequency % Harvesting methods Frequency %
All red ripe 1 0.6 Selective hand picking 82 51.3
Majority red ripe 127 79.4 Stripe on ground and collect in bulk 56 35.0
Mixed yellow and green 29 18.1 Collect dropped cherries from the ground 21 13.1
Dried on tree 2 1.3 Other method 1 0.6
At green stage 1 0.6 - - -
Total 160 100 - 160 100
from 1500 to 3000, 501 to 3500, 800 to 3500 m.a.s.l, respectively. However, majority of the coffee is produced in the middle altitudes of the woreda.
Sampling techniques
Three Woredas and three Kebeles from each Woreda were selected purposively based on level of production among the 15 Woredas of the zone. Thirty key informants were drawn from all category, that is, middleman (traders‟ agents and traders) and extension workers (development agents [Das] and Woreda and zonal level experts). From the three Woredas, 130 household farmers were selected for interview following the sample size determination procedures of probability proportional to size technique to point out their views on coffee quality and how they handle their coffee after harvest. Totally, 160 respondents were used for the whole study.
Data collection
The assessment was conducted at farmers, trader and processors level. It involved both quantitative and qualitative data. For primary data acquisition, questionnaire was prepared and administered to concerned stakeholders, namely, extension workers (front level DAs, experts at Woreda and zonal level), middleman (traders‟ agents and traders), and coffee processors.
Farmers were interviewed to generate major coffee harvesting and post-harvest handling practices in the area and also key informant interview was held with farmers and DAs in three Woredas, to strengthen information gathered from interviewed farmers on harvest and post-harvest handling problems that contributes reduction in coffee quality in the area. Additionally, focus group discussion was held with farmers to strengthen and cross-check the data obtained from different stakeholders.
Secondary data on the amount of coffee delivered to central market as well as grades the coffee received was collected from central market in Addis Ababa and coffee inspection center of Ethiopian Commodity Exchange laboratory located at Wolaita Sodo.
Data analysis
Quantitative data collected from different sources was analyzed using SPSS version 20 software. Qualitative data gathered from various sources was organized, triangulated, interpreted, discussed and narrated. Problem ranking was done to identify the magnitude of different factors which are affecting coffee quality in study the area.
RESULTS AND DISCUSSION Harvest related factors
Coffee harvesting stages and methods used It is widely agreed that traditional hand pricking and husbandry labor, as opposed to mechanical harvest, produce the best quality green coffee by decreasing the percentage of defects in coffee batches. Harvesting stages and methods practiced in the study area is shown in Table 1.
The result indicated that most of the respondents (79.4%) harvest their coffee at majority red ripe stage (Table 1). This implies that in the study area, majority of the farmers harvest their coffee at better stage to maintain coffee quality. A significant number (18.1%) of farming households harvest their coffee at mixed yellow and green stages. According to Adriana et al. (2009) in order to maintain and protect the coffee beverage quality, aroma, thickness of the brew, taste and flavor as well as acidity in cup analysis, coffee should be harvested at red ripe stage whether it is processed in dry or wet-method. Though, in this area coffee is processed in dry method only, it is possible to maintain inherent coffee quality without deterioration by harvesting red ripe cherries. In line with this, an assessment done in Jimma zone Gomma Woreda indicated that, harvesting stage is currently not a major problem when coffee quality is concerned as a result of comprehensive effort exerted to reduce harvesting unripe cherries in the area (Techale et al., 2013).
Concerning harvesting method, surveyed farmers exercised commonly three methods of harvesting (Table 1), that is, selective hand picking (51.3%), striping on the ground and collecting in bulk (35%) and collecting from the ground which was dropped from the tree (13.1%). During the coffee harvesting, most practices were focused on quantity and speed, not quality. Around 48% of respondents in the area were harvested only once, and all ripe and unripe beans are striped together. Striping is much faster than picking only red ripe cherries, by doing so farmers are harming their coffee quality, besides decreasing the potential buds which will result in a good yield in the coming season. Coffee cherries which had

2160 Afr. J. Agric. Res.
Table 2. Materials used for harvesting in the study area.
Material used Frequency %
Basket made of bamboo 103 64.4
Local wooden containers 50 31.3
Plastic sacks 6 3.8
Other material 1 0.6
Total 160 100
Table 3. Coffee drying methods practiced in the study area.
Method of coffee drying Frequency %
Raised wire mesh beds 1 0.6
Cemented ground 1 0.6
Mats made of bamboo 47 29.4
Ground leveled with mud 38 23.8
Ground leveled with cow dung 73 45.6
Total 160 100
contact with ground (soil) resulted in earthy flavor in the final cup taste and also the raw coffee quality was less attractive. Materials used for harvesting and method of coffee drying From the survey, it was revealed that around 95.7% (Table 2) of the respondents used appropriate harvesting materials, that is, local containers (bamboo and wooden made) which were reported to have no contact with other chemicals. However, 3.8% of respondents used plastic sacks. They need to avoid using plastic/polyethylene sacks for harvesting since it has an opportunity to contaminate coffee quality especially when the container is used for transporting grains and/or chemical fertilizers. Generally, in the research area, harvesting material was not the main problem of coffee quality. Postharvest related factors Methods of coffee drying With regard to coffee drying methods, about 69.4% (Table 3) dry their coffee on the ground leveled with mud and cow dung.
As the result confirmed, use of raised wire mesh beds and cemented ground for coffee drying is very small in the study area. These were used by the traders who collect non-dried and partially dried coffee from farmers and brokers and dry by their own efforts. The finding showed that use of inappropriate drying methods can be
considered as one of the main problems contributing to low coffee quality in the study area. In disagreement with present result, 49.9% dry on raised drying beds and 2.5% dry on cemented floor in south western Ethiopia (Richard et al., 2007), drying coffee on the ground by large number of farmers (48%) was also a problem in this area. The appropriate drying method for coffee is on raised wire mesh beds, cemented ground and if not, better to use mats made of bamboo. As coffee is a hygroscopic commodity, it can easily absorb foreign materials from inappropriate post-harvest management areas. In line with this, the secondary data from ECX (Tables 6 and 7) indicated that coffee supplied from Gamo Gofa zone has got an average grade eight, even if coffee from this area is inherently larger in bean size (bold beans). This result is in line with Getachew et al. (2015), who reported drying coffee on mesh wire and bamboo mats with thin layer thicknesses earned better raw quality attributes. Given the potential problems associated with drying on this surface, and its negative image, the practice of direct drying of coffee on ground leveled with mud and cow dung should be strongly discouraged. Methods moisture content determination and mold development Coffee producing farmers and traders in the studied Woredas have no coffee moisture testers; hence, both farmers and traders use their sense organs to determine moisture contents of the coffee (Table 4).
The result in Table 4 shows that half of the respondents (51.3%) determine moisture content by its sound, 32.5% test by crashing with their teeth and around 13.1%
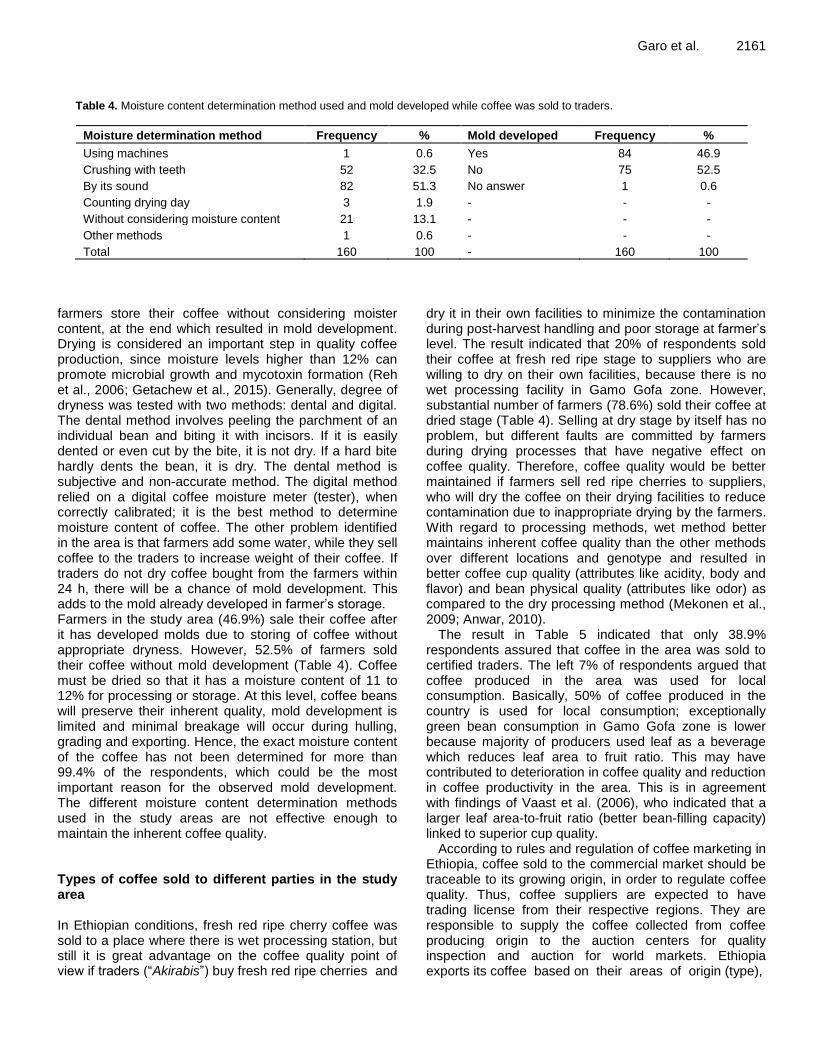
Garo et al. 2161
Table 4. Moisture content determination method used and mold developed while coffee was sold to traders.
Moisture determination method Frequency % Mold developed Frequency %
Using machines 1 0.6 Yes 84 46.9
Crushing with teeth 52 32.5 No 75 52.5
By its sound 82 51.3 No answer 1 0.6
Counting drying day 3 1.9 - - -
Without considering moisture content 21 13.1 - - -
Other methods 1 0.6 - - -
Total 160 100 - 160 100
farmers store their coffee without considering moister content, at the end which resulted in mold development. Drying is considered an important step in quality coffee production, since moisture levels higher than 12% can promote microbial growth and mycotoxin formation (Reh et al., 2006; Getachew et al., 2015). Generally, degree of dryness was tested with two methods: dental and digital. The dental method involves peeling the parchment of an individual bean and biting it with incisors. If it is easily dented or even cut by the bite, it is not dry. If a hard bite hardly dents the bean, it is dry. The dental method is subjective and non-accurate method. The digital method relied on a digital coffee moisture meter (tester), when correctly calibrated; it is the best method to determine moisture content of coffee. The other problem identified in the area is that farmers add some water, while they sell coffee to the traders to increase weight of their coffee. If traders do not dry coffee bought from the farmers within 24 h, there will be a chance of mold development. This adds to the mold already developed in farmer‟s storage. Farmers in the study area (46.9%) sale their coffee after it has developed molds due to storing of coffee without appropriate dryness. However, 52.5% of farmers sold their coffee without mold development (Table 4). Coffee must be dried so that it has a moisture content of 11 to 12% for processing or storage. At this level, coffee beans will preserve their inherent quality, mold development is limited and minimal breakage will occur during hulling, grading and exporting. Hence, the exact moisture content of the coffee has not been determined for more than 99.4% of the respondents, which could be the most important reason for the observed mold development. The different moisture content determination methods used in the study areas are not effective enough to maintain the inherent coffee quality. Types of coffee sold to different parties in the study area In Ethiopian conditions, fresh red ripe cherry coffee was sold to a place where there is wet processing station, but still it is great advantage on the coffee quality point of view if traders (“Akirabis”) buy fresh red ripe cherries and
dry it in their own facilities to minimize the contamination during post-harvest handling and poor storage at farmer‟s level. The result indicated that 20% of respondents sold their coffee at fresh red ripe stage to suppliers who are willing to dry on their own facilities, because there is no wet processing facility in Gamo Gofa zone. However, substantial number of farmers (78.6%) sold their coffee at dried stage (Table 4). Selling at dry stage by itself has no problem, but different faults are committed by farmers during drying processes that have negative effect on coffee quality. Therefore, coffee quality would be better maintained if farmers sell red ripe cherries to suppliers, who will dry the coffee on their drying facilities to reduce contamination due to inappropriate drying by the farmers. With regard to processing methods, wet method better maintains inherent coffee quality than the other methods over different locations and genotype and resulted in better coffee cup quality (attributes like acidity, body and flavor) and bean physical quality (attributes like odor) as compared to the dry processing method (Mekonen et al., 2009; Anwar, 2010).
The result in Table 5 indicated that only 38.9% respondents assured that coffee in the area was sold to certified traders. The left 7% of respondents argued that coffee produced in the area was used for local consumption. Basically, 50% of coffee produced in the country is used for local consumption; exceptionally green bean consumption in Gamo Gofa zone is lower because majority of producers used leaf as a beverage which reduces leaf area to fruit ratio. This may have contributed to deterioration in coffee quality and reduction in coffee productivity in the area. This is in agreement with findings of Vaast et al. (2006), who indicated that a larger leaf area-to-fruit ratio (better bean-filling capacity) linked to superior cup quality.
According to rules and regulation of coffee marketing in Ethiopia, coffee sold to the commercial market should be traceable to its growing origin, in order to regulate coffee quality. Thus, coffee suppliers are expected to have trading license from their respective regions. They are responsible to supply the coffee collected from coffee producing origin to the auction centers for quality inspection and auction for world markets. Ethiopia exports its coffee based on their areas of origin (type),

2162 Afr. J. Agric. Res.
Table 5. Types of coffee sold to different parties by farmers.
Types of coffee sold to traders Frequency % Majority of coffee sold to Frequency %
Fresh ripe cherries 33 20.6 *Certified traders 63 39.4
Dried cherries 125 78.1 Locale consumers 12 7.5
Green bean 2 1.3 different areas through smuggling 85 53.1
Total 160 100 - 160 100
*Local traders who supply coffee to central market, suppliers (“Akirabs”).
Figure 1. Variation in coffee storage duration in study area.
which are known for their own distinct quality and agronomic characters (MoARD, 2008). The result confirmed that, 39.4% of respondents sale their coffee to certified trader, but more than half (53.1%) of respondents (Table 5), perceived as coffee from this area has been transported to different areas through smuggling. This affects not only the volume of coffee supplied from Gamo Gofa zone to central market, but also its quality associated the handling practices of farmers and smugglers. Moreover, smuggling of coffee to other areas can affect the coffee quality of specific origin as it adulterates the coffee with which it is mixed. Coffee storage duration in the area Coffee storage is an important step, since the dried coffee can easily absorb bad flavors or moisture that degrades the quality from the storage area. Once the
samples reached their target moisture, farmers or traders should put into a cool dry area away from the potential contaminants, such as cow dung, soils, chickens and smoke sources. The moisture levels were checked frequently to ensure that the levels had equilibrated and stabilized at the target moisture levels. Besides this, due to the inherent imbalance between supply and demand in the coffee market, it is sometimes necessary to store coffee for long period of time in which the length of storage affects the quality of coffee. Majority (40.8%) of farmers in the study area store coffee for about 4 to 6 months, 25.4% for about 7 to 12 months, 19.7% stores for <4 months and 14.2% stores coffee for more than a year (Figure 1). According to Wintegens (2004), green coffees stored for a longer period described as „aged coffee‟ may suffer a loss of their acidity, which is needed for a coffee to have a specialty coffee grade. On the other hand, length and condition of bean storage also affect cup quality (Yigzaw, 2005). Moreover, long time storage

Garo et al. 2163
Table 6. Grades and amount of coffee supplied in a year 2004 E.C (2011/2012) from different woreds of the zone.
Coffee
Grades
Woreda
% Denba Gofa Arba Minch Mellokoza Geze Gofa
Total Unwashed Unwashed Unwashed Unwashed
Bags kg Bags kg Bags kg Bags kg Bags kg
1 - - - - - - - - - - -
2 - - 120 10200 - - - - 120 10200 0.75
3 - - 720 61200 - - - - 720 61200 4.48
4 60 5100 240 20400 - - 60 5100 360 30600 2.24
5 240 20400 60 5100 - - 60 5100 360 30600 2.24
6 - - 120 10200 - - 420 35700 540 45900 3.36
7 900 76500 60 5100 480 40800 2280 193800 3720 316200 23.13
8 2220 188700 - - 4200 357000 1320 112200 7740 657900 48.13
9 600 51000 - - 960 81600 300 25500 1860 158100 11.6
UG (under grade) - - - - 240 20400 - - 240 20400 1.49
Local (1-5C) 180 15300 240 20400 - - - - 420 35700 2.61
Summary of ECX Wolaita Sodo coffee inspection laboratory 2004 E.C. Grade 1&2 is a specialty coffee with excellent quality, grades from 3 up to UG are exportable grades but UG is poorest of exportable grades.
Table 7. Grades and amount of coffee supplied in a year 2005 E.C (2012/13) from different woreds of the zone.
Coffee
Grades
Woreda
% Denba Gofa Arba Minch Mellokoza Geze Gofa
Total Unwashed Unwashed Unwashed Unwashed
Bags kg Bags kg Bags kg Bags kg Bags kg
1 - - - - - - - - - - -
2 - - - - - - - - - - -
3 - - 327 27595.89 - - - - 327 27595.89 3.49
4 60 5104.2 876 74804.69 - - - - 936 79908.89 10.10
5 - - 641 54503.87 - - - - 641 54503.87 6.89
6 165 13986.15 73 6212.11 - - 60 5084.2 298 25282.46 3.19
7 - - - - 300 25281 480 40933.6 780 66214.6 8.37
8 268 22729.96 - - 2249 190808.1 1473 124890.1 3990 338428.16 42.80
9 - - - - 1393 117648.3 270 11480.9 1663 129129.2 16.30
UG - - - - 84 7201.92 120 10208.4 204 17410.32 2.20
Local (1-5C) 210 18162.5 244 20483.65 209 14241.9 - - 663 52888.05 6.68
Summary of ECX Wolaita Sodo coffee inspection laboratory 2005 E.C. Grade 1&2 is a specialty coffee with excellent quality, grades from 3 up to UG are exportable grades but UG is poorest of exportable grades.
under high relative humidity and warm conditions increase bean moisture content and consequently reduce quality in terms of raw and roasted appearance as well as liquor (Woelore, 1995). Even under adequate or optimal storage conditions, coffee beans deteriorate with age. This phenomenon is accelerated when the environment is hot and/or humid and the bean takes off-flavor due to the oxidation of its own fats. If longer storage is sought, it is better to store at a temperature blow 20°C and 65% relative humidity. The generally accepted time for green coffee storage under normal conditions is one year.
As shown in Figure 1, 60% of respondents stored their coffee up to 6 months. This storage duration would be better to maintain the quality of coffee in the study area, but above one year storage duration practiced by 15% of respondents does not seem to be appropriate as the storage conditions do not meet the normal standards. Grades of coffee from the study area The coffee supplied to the auction centers from the

2164 Afr. J. Agric. Res. Table 8. Major factors affecting coffee quality in the area in their order of importance.
Order Major factor Problem faced % of HH respondent
1 Coffee drying place Drying on ground leveled with mud and cow dung 69.4
2 Coffee transportation out of the origin Mixing of coffee from different origin and miss handling of coffee beans
54.1
3 Storage condition Mold developed on coffee 53.8
4 Method of harvesting Striping and collecting from the round 48.1
5 Storage duration About 4-6 months 40.8
different part of country is inspected to set standards and grades. The grades and standards are used to categorize the coffee supplied based on its quality by coffee quality inspection laboratory.
The secondary data from Ethiopia Commodity Exchange (ECX) supported the miss harvesting and post-harvest handling practices of coffee in Gamo Gofa zone. Results indicated that coffee supplied from this zone scored lower grades (Table 6). The best grade scored was grade 2 with only one sample, that is, 0.75% of the coffee supplied in 2011/2012 production year. The majority of coffee supplied scored grade seven, eight and nine 23.13, 48.13 and 11.6%, respectively out of the coffee supplied in same production year. The same conditions was repeated in the year 2012/2013 from coffee grade point of view, that is, grade seven, eight and nine with 8.37, 42.80, and 16.30%, respectively shared the majority weight of coffee supplied in the year to inspection laboratory. Not only the quality declined but also the volume of coffee supplied to the central market decreased in 2012/2013. The two year data showed that grades of coffee supplied from Arba Minch (Kamba, Bonke, Boreda and Arba Minch Zuria) woreda is relatively better than coffee supplied from Gofa areas (Denba Gofa, Geze Gofa and Mellokoza). Even though Mellokoza is the major supplier of coffee in Gamo Gofa zone, its quality is much lower (below grade six). Inappropriate harvesting and post-harvest handling practices could have reduced grades of coffee from this area among other factors. This is in agreement with findings of Alemayehu and Esayas (2008) who pointed out that inadequate systems of harvesting, processing, storage and transportation are responsible for the wide spread failure to maintain the inherent quality of coffee produced in Ethiopia. Problem ranking As indicated among harvest and post-harvest handling practices in the area, coffee drying places (69.4%), storage condition(lack of appropriate drying) (53.8%),and method of harvesting (48.1%) are the top three factors significantly affecting coffee quality in Gamo Gofa zone (Table 8).
Conclusion The coffee categorized as forest coffee at national market could be due to the existence of maximum primary defects but currently no coffee is growing in the forest in the area. The coffee grown in Gamo Gofa zone has competitive agro-ecological advantages like that of Sidama and Yirgacheffe locations in southern Ethiopia, to have maximum coffee quality. However, according to annual summary of ECX (Ethiopian Commodity Exchange), majority of coffee in the area has been receiving significantly lower grades i.e. grade six, grade seven and grade eight. Inappropriate harvesting methods, lack of appropriate drying and drying place are the major factors that could be limiting coffee quality and lowering market prices supplied from this area. To maintain quality of coffee, great effort is needed in creating awareness, encouraging use of raised beds, drying to proper moisture level and use of suitable storage facilities which inhibit the growth of molds. Additionally, it is important to promote wet processed coffee in the area to reduce influence of post-harvest handling practices from the farmer‟s side in a view of specialty coffee promotion. Thus, improvement in quality leading to receipt of its own brand name is important to drive maximum benefit from coffee sector. In addition, research in pre-harvest coffee husbandry is needed to reach to a comprehensive recommendation. Conflict of Interests The authors have not declared any conflict of interests. ACKNOWLEDGEMENTS The authors wish to thank Arba Minch University for financial support. Supports of Ethiopian Commodity Exchange (ECX) in delivering secondary data on coffee quality is highly acknowledged. Special thank goes to Mekonen H/Michael and Wadillo Wana, ECX quality

control staffs. Farmers, extension staffs and coffee traders deserve heartfelt thanks for their willingness in providing the required information. REFERENCES Alemayehu T, Esayas K, Kassu K (2008). Coffee development and
marketing improvement plan in Ethiopia. In Proceedings of the National Workshop of Four Decades of Coffee Research and Development in Ethiopia, Aug pp. 14-17.
Anwar A (2010). Evaluation of coffee quality and its problem in Oromia regional state. MSc thesis, submitted to post graduate school of Jimma University College of Agriculture and Veterinary Medicine.
ECXA (2008). Ethiopia Commodity Exchange Authority. Understanding commodities to be traded at Ethiopia commodity exchange. Analysis of coffee supply, production, utilization and marketing issues and challenges in Ethiopia, Coffee profile 1.
Esayas A (2005). Molecura genetic diversity study of forest coffee tree population in Ethiopia: Implication for conservation and Breeding. Doctoral thesis, Alnarp, Sweden.
Franca AS, Oliveira LS, Franca AS (2009). Coffee processing solid wastes: current uses and future perspectives. Agric. Wastes 9:155-189.
Getachew E, Berhanu T, Ali M, Tesfaye S, Yehenew G (2015). Influence of sun drying methods and layer thickness on quality of midland arabica coffee varieties at Gomma-II, Southe West Ethiopia. Glob. J. Agric. Sci. 3(2):203-212.
ICO (2015). International Coffee Organization. Total Production by exporting countries. Available at: http://www.ico.org/prices/po-production.pdf
IPO (2008). Intellectual Property Office of the United Kingdom. ITC (2002). International Trade Center. Coffee, product and market
development, an exporter‟s guide. UNSTAD / WTO. Geneva. Mekonen H (2009). Influence of genotype, location and processing
methods on the quality of coffee (coffea arabica l.). Msc. thesis, Hawassa University, Ethiopia.
Garo et al. 2165 MoARD (2008). Ministry of Agricultural and Rural Development.
Sustainable production and supply of fine Arabica Coffee to the World. Addis Ababa, Ethiopia.
Nicholas P (2007). Ethiopia‟s coffee sector: a bitter or a better future? J. Agr. Change 7(2):225-263.
Reh CT, Gerber A, Prodoillet J, Vuataz G (2006). Water content determination in green coffee- Method comparison to study specificity and accuracy. Food Chem. 96:423-430.
Richard M, Charles A, Mitiku M (2007). Primary coffee processing in Ethiopia: Patterns, constraints and determinates. Afr. Crop Sci. Conf. Proceed. 8:1417-1421.
Techale B, Musema A, Kasahun M (2013). Prevalence of some coffee quality problems in Gomma Woreda, Jimma Zone. Int. J. Agric. Sci. 3(8):621-627.
Vaast P, Bertrand B, Perriot J-J, Guyot B, Génard M (2006). Fruit thinning and shade improve bean characteristics and beverage quality of coffee (Coffea arabica L.) under optimal conditions. J. Sci. Food Agric. 86:197-204.
Wintegens JN (2004). Coffee: Growing, processing, sustainable production, a guide book for growers, processors, traders, and researchers.
Woelore WM (1995). Parchment arabica coffee storage. In: the proceedings of the 16th International Scientific Colloquium on Coffee, Kyoto, Japan. pp. 565-573.
Yigzaw D (2005). Assessment of cup quality, morphological, biochemical and molecular diversity of C. arabica L. genotypes of Ethiopia. PhD thesis, University Free State. P 97.

Vol. 11(24), pp. 2166-2173, 16 June, 2016
DOI: 10.5897/AJAR2016.11087
Article Number: 79FC06258984
ISSN 1991-637X
Copyright ©2016
Author(s) retain the copyright of this article
http://www.academicjournals.org/AJAR
African Journal of Agricultural Research
Full Length Research Paper
Impact of xenobiotics on microbial activity in soil cultivated with forage cactus Opuntia ficus-indica
Élica Santos Rios1, Carlos Romero Ferreira de Oliveira2, Cláudia Helena Cysneiros Matos de Oliveira2, Julia Kuklinsky Sobral3, José Alexandre da Silva3, José Gomes da Silva Filho3 and
César Auguste Badji3*
1Programa de Pós-Graduação em Agronomia, Universidade Federal da Paraíba, Campus II, Areia, PB, CEP
58397-000, Brasil. 2Unidade Acadêmica de Serra Talhada, Universidade Federal Rural de Pernambuco, Serra Talhada, PE, CEP
56900-000, Brasil. 3Unidade Acadêmica de Garanhuns, Universidade Federal Rural de Pernambuco, Garanhuns, PE, CEP
55292-910, Brasil.
Received 5 April, 2016; Accepted 16 May, 2016
Changes on soil microbial activity may be triggered by different management approaches and the study of the effects of such changes on xenobiotics, of non-target populations, may represent a valuable strategy to evaluate their environmental risk potential. The objective of the present study was to evaluate the effect of Phytosanitary control measures over microbial activity and genetic variability of bacteria in soil cultivated under the forage cactus Opuntia ficus-indica. The experiment was performed at Caetés region in Pernambuco, Brazil. Three days after the application of the xenobiotics (water (control); detergent + sodium hypochlorite; Neem oil; Methomyl and Thiamethoxam + Lambda-cyhalotrin), soil samples (0-20 cm) were collected and transported to laboratory. Respirometry, density of bacterial population and morphologic and genetic variability of bacteria were evaluated with molecular techniques, using BOX-PCR in a completely randomized statistical design. Regarding to respirometry, the amount of CO2 released from the soil samples was greater within the plots where the insecticide Thiamethoxam + Lambda-cyhalotrin was applied, when compared with control. Soil treatments with only water and water + sodium hypochlorite showed the highest population densities (0.96 and 0.94 × 10
2 CFU.g
-1, respectively). Concerning to morphological characteristics (color), there
was prevalence of white color colonies, with a little visual phenotypic variability. However, the use of molecular techniques revealed high genetic variability among the white colored colonies evaluated, demonstrating the importance of more detailed studies on the effects of xenobiotics on soil microbiota prior to its use of recommendation. Key words: Respirometry, microbiological indicators, BOX-PCR, ecotoxicology, pesticides.
INTRODUCTION Barbary fig, Opuntia ficus-indica, is a cactus species native to Mexico introduced in Brazil at the end of the 19th century. Under the edaphoclimatic conditions of the semi-arid region in Brazil, this cactus assumes a relevant
role within livestock farming, due to its high resistance against drought and high temperatures, allied to its adaptability to low fertility soils. Its high efficiency in the use of water contributes to increase economic feasibility

of intermediate and small farm producers of low incomes within the Brazilian semi-arid region (Santos et al., 2013; Ramos et al., 2014).
Brazil has the largest Barbary fig planted area in the world, however, over the last few years, the incidence of the cochineal insect (Dactylopius opuntiae Cockerell) has threated the viability of the main variety of Barbary fig within, where this insect has become the leading pest of this cactus plant (Santos et al., 2013). Farmers have accomplished control of the insect with the use of xenobiotics, registered or not for this pest. The compounds used for this purpose are constituted by a great number of molecules with different modes of action and toxicity, and its impact over non-target organisms within the agricultural ecosystem of the Barbary fig was not yet been evaluated.
According to Ros et al. (2006), the ideal xenobiotic must be toxic to aim only target organisms, totally biodegradable and able to not leaving any intermediary compounds in the environment or being lixiviated to underground waters. In a general way, the main problems resulting from the use of such compounds in agriculture are their toxicity to non-target organisms, their persistence in the soil, the development of resistant species and their influence over soil microorganism dynamics. Thus, the study of pesticide’s effects on non-target populations represents an acceptable strategy to evaluate their potential environmental risk (Ferreira et al., 2009). Soil microorganisms promote organic matter breakdown, formation and stabilization of soil aggregates, bio-geo-chemical nutrient cycling within the soil, pathogen suppression, production of phytohormones, breakdown of xenobiotic compounds, among others (Reis et al., 2009; Pôrto et al., 2009).
Little changes in the activity of soil microorganism may be associated with distresses caused by management (Reis et al., 2008). Biochemical and microbiological criteria are the most responsive, in short time, due to the higher sensibility to distresses from the improper management (Chaer and Tótola, 2007). Amongst the most remarkable soil quality microbiological indicators, respiratory rate, microbial quantification and bacterial diversity studies are fundamental parameters to understand the ecosystem functioning.
According to Zilli et al. (2003), the analysis of genetic variability is a soil quality indicator. Nowadays, the structure of microbial diversity it’s being studied trough methods based on the research of parts of DNA sequences, with emphasis onthe 16S rDNA gene, through the BOX-PCR technique. The bacterium are primarily in combination with different species, forming the bacterial community, occupies all terrestrial niches and colonize environments such as soil, water, air, plants
Rios et al. 2167 and animals (Andreote et al., 2009).
Based on these considerations, the objective of the present study was to evaluate the effect of phytosanitary control measures on microbial activity and the genetic variability of bacteria in soils planted with Barbary fig. MATERIALS AND METHODS The experiment was performed in a private farm at the county of Caetés in the State of Pernambuco, Brazil, where the xenobiotics were applied on plants naturally infected with the carmine cochineal, D. opuntiae. A completely randomized design with five treatments (xenobiotics) and three replicates was used. Treatments consisted in: Only water (control); Detergent (3%) + sodium hypochlorite (1.5%); Commercial Neem oil (0.66%); Methomyl (0.3%) and Thiamethoxam + Lambda-cyhalotrin (0.01%), that were sprayed with the aid of a 20 L capacity back sprayer, directly over the plant’s cladodes, until the initial signs of runoff. Sprayings were performed to avoid interference between treatments, with the use of parcels of 20 × 15 m (width x length).
Soils were collected three days after application of the xenobiotics, in order to quantify CO2 released by the microorganisms and for bacterial evaluation. Soil samples were collected near Barbary fig plants, at a 0 to 20 cm depth, collecting three simple random samples within each parcel to form a final compound sample. Sterile centrifuge tubes were filled with 50 g soil and conditioned inside Styrofoam boxes containing ice and water soaked paper to refrigerate samples. These samples were used for bacterial isolation. With the purpose of quantify CO2, approximately 1.000 g of soil samples were conditioned into clean plastic bags. Soil samples were transported to the Laboratory of Microbial Genetics and Biotechnology from the Garanhuns Academic Unity (UFRPE/UAG) and to the Applied Entomology Laboratory (UFRPE/UAG), respectively, both in the city of Garanhuns - Brazil, to proceed with the sample processing.
To quantify respiration produced by microbes present in the soil, samples were dried for a period of 24 h in the dark, before determining their field capacity, using 500 g of soil for 500 mL of water. During the assays, 100 g of dried soil were incubated in 600 mL capacity glass containers, moistened with distilled water at 70% field capacity. Plastic vases (40 mL) containing 10 mL NaOH (0,91 mol L-1) were placed inside the glass containers. Containers were closed hermetically and preserved at room temperature (± 26ºC) for a period of 30 days. Vase without soil, containing NaOH to capture CO2 from the environment were used as control.
Quantification of CO2 production was performed 3, 6, 9, 13, 16, 20 and 30 days after soil incubation. For each incubation period the plastic pots were removed from the glass containers. Then, the sodium hydroxide (NaOH) of each sample, 5 mL of BaCl2 (1 mol.L-
1) and 3 drops of phenolphthalein 1% were placed in separated Beaker. Later, this solution was titrated with hydrochloric acid (HCl 0.45 mol.L-1), and the volume of HCl was registered. After removing NaOH, new solutions were changed for the subsequent incubation periods. The same procedure was performedfor pots without the addition of soil (control).
The quantity of CO2 released, in mg.kg-1 of C-CO2 in the soil, was calculated according Stotzky (1965): C-CO2 mg = (B-V) *M*E. Where B = volume of HCl in mL, used for titration of NaOH from control; V = volume of HCl in mL, used for titration of NaOH from the sample; M = molar concentration of the acid used (HCl 0.45
*Corresponding author. E-mail: [email protected].
Author(s) agree that this article remain permanently open access under the terms of the Creative Commons Attribution
License 4.0 International License

2168 Afr. J. Agric. Res.
Table 1. Quantity of CO2 (C-CO2) gathered, as a function of the application of xenobiotics and the incubation period in Caetés region, Pernambuco - Brazil.
Treatment
Incubation period (Days)
3 6 9 13 16 20 30
CO2 Gathered (mg)
Control 4.6 ± 1.7a 9.6 ± 1.4
a 13.0 ± 0.5
b 17.6 ± 1.0
b 22.6 ± 1.9
bc 26.6 ± 3.0
c 38.0 ± 4.2
c
D. + S.H* 5.3 ± 0.4a 9.3 ± 1.1
a 11.3 ± 0.7
ab 15.6 ± 2.0
b 20.0 ± 2.5
bc 24.6 ± 3.0
c 33.0 ± 3.8
c
N. O.** 6.0 ± 0.8a 10.0 ± 0.9
a 12.6 ± 0.9
ab 18.6 ± 1.7
ab 24.0 ± 1.8
bc 29.3 ± 1.7
bc 39.6 ± 0.4
bc
Methomyl 6.6 ± 0.9a 11.6 ± 1.6
a 16.6 ± 2.5
ab 24.6 ± 5.4
ab 30.6 ± 6.7
ab 37.0 ± 7.4
ab 48.3 ± 9.4
bc
T.+Lambda.*** 10.0 ± 0.8a 16.0 ± 1.4
a 21.6 ± 0.3
a 28.0 ± 2.0
a 34.6 ±2.6
a 42.0 ± 4.4
a 55.3 ± 6.5
a
*Detergent + sodium hypochlorite; **Neem oil; ***Thiamethoxam + Lambda-cyhalotrin. Mean values followed by different lower case letters, within the column, are significantly different by the Tukey test at 5% probability
mol/L); E = carbon equivalent weight. For each of the five products applied on the field three replicates were used, consisting in two vase each (duplicate) for each incubation period, in a factorial 5 × 7 (xenobiotics x incubation period) design. Data underwent a variance analysis and means were compared by the Tukey test at 5% probability, using SISVAR® software.
The procedures for bacterial isolation followed the methodology described by Araújo et al. (2010), with modifications. From each soil sample collected within the parcel, 5 g were transferred to Erlenmayer flasks (125 mL) containing 50 mL of PBS (Phosphate Buffered Saline: NaCl 8.0 g L-1; KCl 0.20 g L-1; Na2HPO4 1.44 g L-1; KH2 PO4 0.24 g L-1; pH 7.4) per liter and about 5 g of glass beads (0.1 cm diameter). Then, these flasks were located in a shaker table during 30 min at 100 rpm. After agitation, serial dilution (10-4 and 10-
5) were executed in PBS buffer and aliquots of 100 µL were inoculated in Petri dishes containing TSA 10% (Triptone Soy Agar: Triptone 1.5 g L-1; Peptone 0.5 g L-1; NaCl 1.5 g L-1; Agar 15 g; pH 7.3) culture medium per liter, plus the fungicide Cercobin 700 (50 µg mL-1). Then, flasks were incubated at 28ºC and evaluated after 24, 48 and 72 h. Population density was evaluated by counting colonies and expressed in grams of fresh soil (CFU g-1 of soil). In addition, time of bacterial growth and morphology (color) were also evaluated.
The experiment was performed under completely random design with five treatments (applied products) and three replicates. Data underwent variance analysis and the means were compared by the Scott-Knott test at 5% probability, using SISVAR® software. To evaluate genetic variability, 19 bacterial colonies of white color were selected, isolated from culture dishes and individually identified with a UAGtx nomenclature. With the aid of sterile wood-needles, each isolated colony was re-inoculated in a tube containing 4 mL TSA 10% liquid medium and preserved in shaker table (100 rpm) during 24 h. After the bacterial growth period, the culture was transferred to microtubules of 2 mL and centrifuged for 5 min at 12.000 G to precipitate bacterial cells, discharging supernatant. The resulting pellet was re-suspended in 300 uL of TE (10 mMTris-HCl; 1 mM EDTA; pH 8,0), and used as a DNA source for molecular analysis. Samples were preserved at a temperature of -20ºC. The evaluation of genetic diversity of the bacterial isolates was performed by means of the BOX-PCR technique, using the primer BOX 1AR (‘5 – CTACGGCAAGGCGACGCTGAC G-3’). The polymerase chain reactions (PCR) were prepared to a final volume of 25 µL, containing the sequence: Ultra-pure water; 1 × Taq Buffer; 3.5 mM MgCl2; 1 mM of each dNTP; 0.4 µM of the primer BOX 1AR; 1 × DMSO (dimethyl sulfoxide) and 0.08U/µL of enzyme Taq DNA Polymerase. After mix preparation, micro tubes were placed in a thermal cycler programed to perform initial denaturation at 95°C
during 2 min, followed by 35 cycles for denaturation at 94ºC during 2 s, 92ºC during 30 s, 50ºC during 1 min, 65ºC during 8 min, 65ºC during 10 min and 4ºC during 59 min. After amplification PCR reactions were evaluated in agarose gel (1.5%) electrophoresesat 1 × TAE (40 mMTris-Aacetate; 1 mM ETDA) buffer with addition of 10 µL of each reaction and 2 µL of Blue Green Loading Dye (LGC Bio), ending with observation under UV light and photo documentation. Lanes obtained by amplification were transformed in binary data (lane presence or absence) and used to obtain a similarity dendrogram calculated by Jaccard’s coefficient and clustered using the algorithm UPGMA (Unweighted Pair-Group Method with Arithmetical Average), using PAST® 1.90 software.
RESULTS AND DISCUSSION
The evaluation of CO2 quantity captured from soils in parcels where the plants were treated with different xenobiotics, showed effects of the applied products on the microbiota. In accordance with a similar study conducted by Sebiomo et al. (2011) evaluating effect of herbicides on microbial population, in the present study, the synthetic organic insecticides (Methomyl (0.3%) and Thiamethoxam + Lambda-cyhalotrin) promoted significant microbial activity. A higher respiration rate of the soil, with 48.33 and 55.33 mg of CO2 gathered at the end of the evaluation period, was found compared to the other treatments. Neem oil and detergent + sodium hypochlorite, did not differed from the control treatment when regarding to the quantity of CO2 released (Table 1).
All incubation periods showed increments regarding CO2 quantification. According Sá et al. (2000), a greater microbial activity is revealed by a higher respiratory rate, causing the breakdown of organic matter of the soil and consequently, allowing nutrient availability for the plants. On the other hand, Islam and Weil (2000) quoted that higher respiratory rates may be related to the high level of productivity of the soil ecosystem or to ecological disturbance (that may be caused by the use of agrotoxics).
During the initial incubation periods (3 and 6 days), no difference between xenobiotics was noticed concerning microbial respiration, demonstrating that the effect of the

Rios et al. 2169
Figure 1. Quantification of bacterial population in soil treated with xenobiotics in the Caetés region, in Pernambuco - Brazil.
products on the soil microbiota, does not happen immediately. Starting from 9 days of incubation becomes apparent that released CO2 quantities within soil samples was higher in parcels with the use of the insecticide Thiamethoxam + Lambda-cyhalotrin, if compared to control, but not differing from the other treatments. From 16 days of incubation until the last record (30 days), the same tendency was observed for the insecticides Thiamethoxam + Lambda-cyhalotrin and Methomyl, regarding to the accumulated CO2, being higher when compared with the other treatments (control and detergent + sodium hypochlorite).
The lowest quantity of C-CO2, in the last reading from parcels with use of water and detergent + sodium hypochlorite, may be an evidence of the higher efficiency in the use of soil resources by the microorganisms. The microbial biomass uses death cells as source of C and energy. In that manner, according Reis et al. (2008), it is reasonable, at least in part, to observe an increase in C-CO2 production. However, Castro et al. (2006), while studying the effect of xenobiotics on soil microbiota, verified that some compounds are easier metabolized and used as energy and nutrient sources, thus increasing activity due to a higher CO2 release, probably due to promote higher stimuli and consequently, increasing the soil microbiota.
Moreno et al. (2007), while evaluating high dosages of the herbicide Atrazine in semi-arid soil, verified a tendency to an increasing microbial respiration with the incubation period. According to the authors, this may be explained by the ability of a small fraction of the microbial population to completely reduce Atrazine to produce CO2 and H2O. Tironi et al. (2009), while studding the effect of herbicides on soil microbial activity, verified higher accumulated C-CO2 progression when using two times the reference dosages (10 mg dm
-3 of soil) of the
herbicide Ametryn, with the lowest evolution ratio of C-CO2 registered in soils without application of herbicide
(control). The authors observed that in treatments using a mixture of Trifloxysulfuron-sodium + Ametryn, C-CO2
progression were higher when using two, four and eight times the reference dosages, differing form the one time dosage and the control, without herbicide.
With dosages 10 times higher to the field recommendation, Zabaloy et al. (2008) verified that in general, the herbicides 2.4-D, Metsulfuron-methyl and Glyphosate had little effect over soil microbial communities. Araújo et al. (2003) verified that soils with application of Glyphosate exhibited higher microbial respiration during the beginning of incubation, showing that microorganisms are the main responsible by the biodegradation of the herbicide in the soil. However, Reis et al. (2009) did not detected any alteration in respiratory rates in soils treated with Fomesafen + Fuazifop-p-butyl and Glyphosate and with or without application of the mixture of insecticide (Endosulfan) + fungicide (Tebuconaloze). We highlight that scarce studies are available concerning the effect of insecticides on soil microbiology.
The products used for carmine cochineal control substantially affected bacterial community. Soils treated with only water (control) and detergent + sodium hypochlorite showed the highest quantities of colony forming units (CFU), with 0.96 and 0.94 × 10
2 UFC/g of
soil, respectively, but not differing among them self. In the remaining treatments a reduction in the quantity of CFU’s was observed. Neem oil, though being a natural product, affected the bacterial community in a similar way, when compared to synthetic insecticides (Figure 1).
Oliveira (2004), while evaluating microbial diversity in different agricultural systems in the semi-arid region, verified population densities of 18, 21 and 127 CFU x 10 g/soil, for bacteria, fungi and actinomycetes respectively, in an area planted with Barbary fig (O. ficus-indica). In the present study, a mean value of 0.93 × 10
2 UFC.g
-1
bacteria were registered, thus showing a low CFU rate.

2170 Afr. J. Agric. Res.
Figure 2. Bacterial growth in soil treated with xenobiotics, after 24, 48 and 72 h of incubation in the Caetés region, Pernambuco - Brazil.
This difference must be related to the content of organic matter, temperature and humidity, once the abundance and activity of microorganisms are susceptible to seasonal variations (Zilli et al., 2003). Absence of rain fall during the period of the experiments may have been another factor that influenced the lower densities of CFU in this soil. According to Costa and Melo (2012), a considerable number of bacterial species, particularly those associated with plant’s rhizosphere, exert beneficial effects for plant growth.
Kuklinsky-Sobral et al. (2004), while evaluating the total density of bacterial community in soybean cultivars growth in areas with and without pre-planting application of the herbicide Glyphosate, observed densities of about 10
4 to 10
6 CFU/g and 10
8 to 10
10 CFU/g in endophytic
and epiphytic bacterial communities, respectively. The author evidences the occurrence of interactions between densities and other factors analyzed, as cultivar, vegetal tissue, seasonal variation and developmental stage of the host.
Soils with application of only water (control) and detergent + sodium hypochlorite, showed a slower growth of bacteria, within the three evaluation periods (24, 48 and 72 h). It is evident that for the other treatments (Neem oil, Methomyl and Thiamethoxam + Lambda-cyhalotrin), bacterial growth increased after 24 h, with a decrease starting at 48 h of incubation. At 72 h there was an absence of new colonies formation in the treatments with insecticides Methomyl and Thiamethoxam + Lambda-cyhalotrin (Figure 2).
Studying growth of the diazotrophic bacteria Herbaspirillum seropedicae, Fernandes et al. (2012), verified that insecticides Imidacloprid, Fipronil and Thiamethoxam had no effect in bacterial growth when used at a concentration corresponding to the commercial dosage. However, when using dosages two times higher they verified that insecticides Endosulfan and Carbofuran resulted in growth reduction of H. seropedicae. According
to this author, the use of insecticide molecules and less aggressive formulations must be pursued for all those using such technologies to increase food and energy production, without compromising sustainability of the agricultural ecosystems. Different results were found by Shamsuddeen and Inuwa (2013) which reported slow growth of bacteria Pseudomonas aeruginosa up to four hours after application of Cipermetrine and after this period there was rapid growth, showing that this bacteria used the Cipermetrine as carbon source up to certain limits, which thereby stimulating their growth. This way, demostrating that can serve as a tool for environmental mitigation.
Castro et al. (2006), when evaluating the number of bacterial colonies with 1 and 13 days of incubation, verified a variation in the control treatment, pure Glyphosate (95%) and commercial Glyphosate (43%), respectively from 1.78; 1.33; 1.11 × 10
5 CFU g soil, in the
first day of incubation, to 2.63; 2.89; 2.45 × 10⁵ UFC g soil
after 30 days of incubation. By means of morphological characterization (color) it
was possible to verify that bacterial colonies showed white, beige, pale pink, yellowish color and dull appearance. White colonies were predominant, independently of xenobiotic application (Figure 3).
Although this feature points morphological similarity, visually assuming low genetic variability among colonies, the BOX-PCR technique allowed to observe a high genetic variability among colonies, demonstrating that such morphological variable is not always efficient to show genetic variability, becoming indispensable the use of different and complementary methods, as for example molecular techniques (PCR).
Analysis of genetic variability through the BOX-PCR technique was completed by amplification of bacterial genomic DNA repetitive sequences, using the primer BOX A1R. A similarity dendrogram, with absence and presence of bands was constructed based on the

Rios et al. 2171
Figure 3. Frequency of bacterial coloration, derived from soils treated with xenobiotics from the Caetés region, Pernambuco
Figure 4. Similarity dendrogram showing clustering of white colored bacteria in soils treated with xenobiotics: (1) control; (2) detergent + sodium hypochlorite; (3) Neem oil; (4) Methomyl; (5) Thiamethoxam + Lambda-cyhalotrin, associated to Barbary fig, based on sequences obtained with the primer BOX A1R thought the Jaccard’s coefficient and the UPGMA (unweighted pair-group method with arithmetical average) method.
analysis of the band’s profiles. Similarity index of Jaccard showed high genetic diversity among bacterial colonies. Only colonies UAGtx 6 and UAGtx 15 showed a higher
similarity rate (60%), all the other colonies evaluated showed similarity under 60%, confirming high genetic diversity (Figure 4).

2172 Afr. J. Agric. Res. Colonies UAGtx 6 and UAGtx 15 were isolated from soils with the application of different xenobiotics. The first colony is original from an area with application of water (control), while the second is original form an area with application of detergent + sodium hypochlorite. A clear effect of the xenobiotics applied was not showed by the dendrogram obtained. Given the importance of the Barbary fig for the semi-arid region it is of the foremost importance to advance with more detailed studies regarding the effects of xenobiotics on the microbiota and the associated insects. In association, using a slow liberation of xenobiotics in soils in order to prolong its action could promote the environmental protection. For example, the microencapsulation could be used to reach this propose (Barbat et al., 2013). In this study, we demonstrate the insecticides Methomyl and Thiamethoxam + Lambda-cyhalotrin, applied to the soil, increased CO2 release by the soil microbiota, the higher bacterial densities occurred in soils treated with water (control) and with detergent + sodium hypochlorite, when compared with the rest of xenobiotics that reduced bacterial community, soils with application of water (control) and detergent + sodium hypochlorite, showed a slower growth of bacteria, while the other treatments showed an accelerated growth with 24 h incubation, to reduce growth from 48 h until the end of the incubation periods; concerning the morphological characteristic (color) of the colonies, a higher frequency of white colored colonies was observed, independently of the xenobiotic applied in the treatment and the BOX-PCR molecular technique, revealed high genetic variability amongst the white colored bacteria analyzed.
In this study, it was found that the amount of CO2
released from the soil samples was greater within the plots where synthetics insecticides were used. However, we found lowest bacteria population densities in those same plots. More detailed studies on the effects of xenobiotics on soil microbiota in forage cactus agroecosytem must be done prior to recommend its use in the fields. Conflict of Interests The authors have not declared any conflict of interests.
ACKNOWLEDGMENT The Fundação de Amparo à Ciência e Tecnologia do Estado de Pernambuco (FACEPE) for granting the study scholarship to the first author. REFERENCES Andreote FD, Azevedo JL, Araújo W (2009). Assessing the diversity of
bacterial communities associated with plants. Braz. J. Microb. 40:417-432.
Araújo ASF, Monteiro RTR, Abakerli RB, Souza LSD (2003). Biodegradação de glifosato em dois solos brasileiros. Pesticidas 13:157-164.
Araújo WL, Lacava PT, Marcon J, Lima AOS, Sobral JK, Pizzirani-Kleiner AA, Azevedo JL (2010). Guia prático: Isolamento e caracterização de microrganismos endofíticos. Cop. Luiz de Queiroz, Piracicaba 167 p.
Barbat C, Rodino S, Petrache P, Butu M, Butnariu M (2013). Microencapsulation of the allelochemical compounds and study of their release from different products. Digest J. Nanomater. Biostruct. 8:945-953.
Castro JJV, Selbach PA, Záchiaayub MA (2006). Avaliação do efeito do herbicida glifosato na microbiota do solo. Pest.: Rev. de Ecotox. e Meio Amb. 16:16-30.
Chaer MC, Tótola MR (2007). Impacto do manejo de resíduos orgânicos durante a reforma de plantios de eucalipto sobre indicadores de qualidade do solo. Rev. Bras. Ciênc. Solo 31:1381-1396.
Costa FEC, Melo IS (2012). Endophytic and rhizospheric bactéria from Opuntia ficus-indica milland their ability to promote plant growth in cowpea, Vigna unguiculata (L.) Walp. Afr. J. Microbiol. Res. 6(6):1345-1353.
Fernandes MF, Procópio SO, Teles DA, Sena FJG, Cargnelutti FA, Machado TNM (2012). Toxicidade de inseticidas utilizados na cultura da cana-de-açúcar para a bactéria diazotrófica Herbaspirillum seropedicae. Rev. Ciênc. Agrár. 55:318-326.
Ferreira EPB, Dusi AN, Costa JR, Xavier GR, Rumjanek NG (2009). Assessing insecticide and fungicide effects on the culturable soil bacterial community by analyses of variance of their DGGE fingerprinting data. Europ. J. Soil Biol. 45:466-472.
Islam KR, Weil RR (2000). Land use effects on soil quality in a tropical forest ecosystem of Bangladesh. Agricult. Ecosyst. Sand Environ. 79:9-16.
Kuklinsky–Sobral J, Araújo WL, Mendes R, Geraldi IO, Pizzirani-Kleiner AA, Azevedo JL (2004). Isolation and characterization of soybean associated bacteria and their potential for plant growth promotion. Environ. Microbiol. 12:1244-1251.
Moreno JL (2007). Effects of atrazine on microbial activity in semiarid soil. Appl. Soil Ecol. 35:120-127.
Oliveira VC (2004). Atividade enzimática, população e análise de DNA da biodiversidade microbiana do solo em agroecossistemas do Semi-Árido. 2004. 127 f. Dissertação (Mestrado em Desenvolvimento e Meio Ambiente: Área de Concentração em Desenvolvimento Regional) - Universidade Federal de Sergipe, São Cristóvão.
Pôrto ML, Alves JC, Diniz AA, Souza AP, Santos D (2009). Indicadores biológicos de qualidade do solo em diferentes sistemas de uso no brejo paraibano. Ciênc. Agrotec. 33:1011-1017.
Ramos JPF, Santos EM, Freitas FF, Candido EP, Lima Junior AC, Leite MLV, Oliveira Jr S (2014). Caracterização técnica dos sistemas de produção de palma forrageira em Soledade, PB. Agropec. Téc. 35:23-30.
Reis MR, Silva AA, Costa MD, Guimarães AA, Ferreira EA, Santos JB, Cecon PR (2008). Atividade microbiana em solo cultivado com cana-de-açúcar após aplicação de herbicidas. Plan. Danin. 26:323-331.
Reis MR, Silva AA, Freitas MAM, Pereira JL, Costa MD, Picanço MC, Ferreira EA, Belo AF, Coelho ATCP, Silva GR (2009). Impacto do glyphosate associado a inseticida e fungicida na atividade microbiana e no potencial de solubilização de fosfato em solo cultivado com soja Roundup Ready®. Plan. Danin. 27:729-737.
Ros M, Goberna M, Moreno JL, Hernandez T, García C, Insam H, Pascual JA (2006). Molecular and physiological bacterial diversity of a semi-arid soil contaminated with different levels of formulated atrazine. Appl. Soil Ecol. 34:93-102.
Sá TCLL, Marques M, Vasconcelos CA, Pereira Filho I, França GE, Cruz JC (2000). Envolvimento de dióxido de carbono e mineralização de nitrogênio em Latossolo vermelho-escuro com diferentes manejos. Pesq. Agrop. Bras. 35:581-589.
Santos DC, Silva MC, Dubeux Júnior JCB, Lira MA, Silva RM (2013). Estratégias para Uso de Cactáceas em Zonas semiáridas: Novas Cultivares e Uso Sustentável das Espécies Nativas. Rev. Cienc. Prod. Anim. 15:111-121.
Sebiomo A, Ogundero VW, Bankole SA (2011). Effect of four herbicides

on microbial population, soil organic matter and dehydrogenase activity. Afr. J. Biotechnol. 10:770-778.
Shamsuddeen U, Inuwa AB (2013). Utilization of cypermethrin by bacteria isolated from irrigated soils. Bay. J. Pure Appl. Sci. 6:19-22.
Stotzky G (1965). Microbial respiration. In: BLACK CA (Ed.). Methods of soil analysis. Madison: Am. Soc. Agron. 2:1551-1572.
Tironi SP, Belo AF, Fialho CMT, Galon L, Ferreira EA, Silva AA, Costa MD, Barbosa MHP (2009). Efeito de herbicidas na atividade microbiana do solo. Planta Daninha 27:995-1004.
Zabaloy MC, Garland LJ, Gomez MA (2008). Na integrated approach to evaluate the impacts of the herbicides glyphosate, 2,4-D and metsulfuron-methyl on soil microbial communities in the Pampas region, Argent. Appl. Soil Ecol. 40:1-12.
Rios et al. 2173 Zilli JE, Rumjanek NG, Xavier GR, CoutinhO HLC, Neves MCP (2003).
Diversidade microbiana como indicador de qualidade do solo. Cad. Ciênc. Tecnol. 20:391-411.

Vol. 11(24), pp. 2174-2178, 16 June, 2016
DOI: 10.5897/AJAR2016.10988
Article Number: 8231F3458980
ISSN 1991-637X
Copyright ©2016
Author(s) retain the copyright of this article
http://www.academicjournals.org/AJAR
African Journal of Agricultural Research
Full Length Research Paper
Control of white mold in bean plants by homeopathic medicines
Bruna Broti Rissato*, José Renato Stangarlin, Sidiane Coltro-Roncato, Omari Dangelo Forlin Dildey, Edilaine Della Valentina Gonçalves, Laline Broetto, Odair José Kuhn, Eloisa Lorenzetti, Thaisa Muriel Mioranza, Eliana Peliçon Pereira Figueira, Tulya Fernanda
Barrientos Webler and Jéssica Cristina Urbanski Laureth
State University of West Paraná - UNIOESTE, Marechal Cândido Rondon, Paraná, Brazil.
Received 13 March, 2016; Accepted 23 April, 2016
Common bean (Phaseolus vulgaris) is one of the main Brazilian agricultural crop. It is affected by numerous diseases during its life cycle; one of these includes the white mold caused by the fungus Sclerotinia sclerotiorum. The objective of this study was to verify the control of white mold in bean plants by homeopathic medicines. Two tests were performed: In the first test, the medicine Calcarea carbonica was used, while phosphorus was used in the second test. Both medicines were administered at dynamizations of 6, 12, 24, 36, and 48 CH (Hahnemanniana Centesimal). In the control treatment, 30% hydroalcoholic solution was used. The study was conducted using a completely randomized design, analyzing the following variables: Area under the disease progress curve and percentage of dead plants. The results were submitted to Tukey’s test and regression analysis (p > 0.05). Calcarea carbonica at 6 CH and Phosphorus at 6 CH, 12 CH, 24 CH, 36 CH, and 48 CH reduced the intensity of white mold in bean plants. With the exception of Calcarea carbonica at 12 CH and 24 CH, no other medicine reduced the percentage of plant death due to white mold disease. Key words: Homeopathy, alternative control, Sclerotinia sclerotiorum, Phaseolus vulgaris.
INTRODUCTION The common bean plant (Phaseolus vulgaris L.) is one of the most important edible legumes, and is distributed from the tropics to the temperate zones across the five continents. It is also one of the most important components of the Brazilian diet and represents the main source of income for a considerable number of farmers (Borém and Carneiro, 2008).
In Brazil, one of the main causes for the low yield of bean plants is diseases, they lower the physiological, sanitary, nutritional, and commercial quality of the product, thus limiting its production (Carneiro et al., 2015). Among these diseases is white mold. It affects large areas of bean production in Brazil, causing losses in excess of 50% (Meyer and Campos, 2009).
*Corresponding author. E-mail: [email protected].
Author(s) agree that this article remain permanently open access under the terms of the Creative Commons Attribution
License 4.0 International License

The fungus, Sclerotinia sclerotiorum that causes white
mold. It is a polyphagous pathogen with over 300 host species belonging to approximately 200 botanical genera (Fancelli and Neto, 2007). An adequate combination of methods must be used, whenever possible, to control it, adapting the available strategies to keep the pathogen population below the threshold of economic damage and, at the same time, minimizing negative effects on the environment (Zambolin and Paula, 2008).
In this regard, alternative methods, such as homeopathy, may emerge as an innovative and effective practice to control diseases in plants. According to homeopathic science, the causes of illness in living systems are the suppressive procedures that act contrary to the vital principle, and once suppressive forces are internalized, symptoms are caused by the purging of everything that affects the vital equilibrium (Lisboa et al., 2005).
This disequilibrium in the vital energy, when somatized, causes diseases or physiological disturbance in plants, which may lead to the death of plants or reduction in yield. However, when homeopathic medicine is applied, it leads to minimization of the harmful effects caused to the vital energy through biotic and abiotic factors (Bonato and Silva, 2003) and the restoration of equilibrium through the stimulation of the plant’s defense systems. Therefore, plants can resist diseases and pests, combat viruses, fungi, bacteria, and other types of agents with their own means (Lisboa et al., 2005). At present, the activity of homeopathic substances has already been verified in many types of biological systems and for many variables; biochemical, morphological, or physiological (Castro, 2013).
Thus, homeopathy emerges as an alternative for production systems, with a view toward preserving the ecological equilibrium of the cultivated plants (Casali, 2004). Hence, the goal of this study was to verify the control of white mold in bean plants by the use of the homeopathic medicines Phosphorus and Calcarea carbonica. MATERIALS AND METHODS Two tests, using a completely randomized design, were conducted in a greenhouse. C. carbonica was used as the treatment in the first test and Phosphorus in the second. In both cases, the homeopathic medicines were in dynamizations of 6, 12, 24, 36, and 48 CH. As a control, distilled water and 30% hydroalcoholic solution was used, totaling seven treatments with five repetitions per test.
The homeopathic medicines were selected by means of repertorization using the program HomeoPro. Based on past studies (Modolon et al., 2009; Toledo et al., 2009; Modolon et al., 2012), dynamizations of 0, 6, 12, 24, 36, and 48 CH were selected for this study.
The medicines were obtained from a homeopathic pharmacy in a dynamization of 6 CH and manipulated to 12, 24, 36, and 48 CH in accordance with the Brazilian Homeopathic Pharmacopoeia (Farmacopéia Homeopática Brasileira 1997), diluting 1:100 and succussing 100 times. Next, the pluralist dilution proposed by Hahnemann was followed, where a flask was used for each
Rissato et al. 2175
dilution, and suction was applied in unidirectional, sequential, and vertical movements using a mechanical stirrer.
Bean seeds of the cultivar IPR Tuiuiu were disinfested in 70% alcohol for 1 min, in a sodium hypochlorite solution (3:1) for 2 min, and washed in running distilled water. Next, the seeds were placed equidistant inside Gerbox plates on three sheets of germitest paper moistened with autoclaved distilled water in the proportion of 2.5:1 (1 mL of water for every 2.5 g of germitest paper).
The bean seeds were kept in biochemical oxygen demand (BOD) incubators and removed for permanent planting after three days. Seedlings free of disease with the potential to develop into normal plants and with a complete and proportional radicle were selected for planting. Three-liter pots were used for planting, which contained a mixture of soil, sand, and organic material in the proportion of 2:1:1, which had been autoclaved at 120°C for 60 min to sterilize.
When the plants grew their first fully expanded trifoliate leaf (stage V2), a 7-mm diameter disk replete with S. sclerotiorum mycelia were inoculated at the base of each plant. It was later covered with soil and straw to provide the fungus the required conditions for development: Constant humidity and absence of light. The treatments were administered in the soil three days before inoculation, on the day of inoculation, and 3, 10, and 17 days after inoculation. They were applied to the soil at a concentration of 0.1%, based on other works (Damin et al., 2014; Sukul et al., 2006)
Daily measurements of the lesions caused by S. sclerotiorum were taken using a caliper as soon as the first symptoms appeared at the base of the plants, and ceased when the control plants were dead. The values for the area under the disease progress curve (AUDPC) for each treatment were obtained through the equation:
Where: AUDPC = area under the disease progress curve (adimensional); Yi and Yi+1 = size of lesion of the disease observed in two consecutive evaluations (cm); I = interval between two consecutive evaluations (days).
The evaluation of plant mortality from white mold disease took place after the tests were completed when the number of dead plants per treatment was counted. The percentage of dead plants (PDP) was obtained through the equation:
Where: PDP = Percentage of dead plants for the treatment in question; NDP = Number of dead plants in the treatment; TNP = Total number of plants in the treatment. The original data of PDP was transformed into √ ( x + 0.5). To analyze the data, an analysis of variance (ANOVA) was performed and, when relevant, regression analysis and the test of averages at a 5% probability of error were conducted using the statistical program GENES (Cruz, 2006).
RESULTS AND DISCUSSION In terms of the resistance-inducing activity of the homeopathic medicine C. carbonica, both the variables studied showed statistical significance (Table 1). For the AUDPC, only the 12 CH dynamization differed from the control treatment and was able to reduce the progression of the disease by 67%. Similarly, the dynamizations of 12 CH and 24 CH reduced plant mortality by 61%.
𝐴𝑈𝐷𝑃𝐶 = (𝑌1 + 𝑌1+1)
2 ∗ 𝐼 +
(𝑌2 + 𝑌2+1)
2 ∗ 𝐼 …
(𝑌𝑛 + 𝑌𝑛+1)
2 ∗ 𝐼
𝑃𝐷𝑃 =𝑁𝐷𝑃
TNP∗ 100

2176 Afr. J. Agric. Res.
Table 1. Area under the disease progress curve (AUDPC) and percentage of dead plants (PDP) of common bean of the cultivar IPR Tuiuiu treated with the homeopathic medicine Calcarea carbonica at different dynamizations
Dynamization (CH) AUDPC PDP
6 1.138A 10.02
A
12 0.578D 3.90
B
24 2.09BC
3.90B
36 1.90BC
7.83AB
48 2.36BC
7.83AB
Control 3.73AB
10.02A
CV(%) 37.83 17.48
Regression equation for AUDPC y = 0.0076x2 - 0.3852x + 9.708; R² = 0.8077
Averages followed by the same letter in the column do not differ significantly at 5% in the Tukey test.
White mold is difficult to control in bean plants,
furthermore, there are only two registered and approved products with no restrictions for use in cultivation: Cantus®, Rovral®, Spot®, Trichodermax® e Unix® (SEAB, 2016). This complicates and at times even hinders the rotation of active ingredients; consequently, it elevates the resistance of the pathogen to them. Thus, C. carbonica at 12 CH emerges as a promising alternative to control and reduce the severity of white mold in bean plants, as well as a tool for rural farmers to manage crops in an integrated and sustainable manner.
Furthermore, healing through homeopathy is based primarily on the Law of Similars and o vitalism (Boericke, 2003). Thus, the cure from a disease, from the homeopathic point of view, occurs when the vital force that distinguishes living beings (both animals and plants) from inanimate beings is reestablished (Bonato, 2007). However, this healing goes beyond this. It is not enough for the symptoms of the disease to disappear. The manner in which producers manage their crops must change in order for bean plants to maintain their vital force and become less susceptible to the development of the disease (Boff, 2009).
We observed that the replicates of the control treatment showed 100% plant mortality, whereas those treated with C. carbonica 12 CH exhibited continuous resistance to the progression of the disease, emphasizing its role in resistance induction. Barros and Leonel (2013) observed a similar finding when using homeopathic preparations to control coffee rust (Hemileia vastatrix). They noted that after three months without applying any product, coffee rust on the crops was controlled, demonstrating that the residual effect of homeopathy is a result of the stimulus provided to plant metabolism.
On the other hand, plants treated with the same medicine with a dynamization of 6 CH exhibited grater disease severity than plants in the control treatment, and showed 100% plant death before the end of the evaluations. These results stress the importance of using
various dynamizations in experiments, because the responses may vary according to the dynamization of the medicine under study (Bonato and Silva, 2003). In addition, because it acts on the vital energy, which represents a dynamic, immaterial principle, distinct from the body and integrating the totality of the organism, organizing all the physiological phenomena, the same medicine may apply to various organisms and distinct situations (Boff, 2009).
Fonseca et al. (2006), when evaluating the effect of a single application of C. carbonia on Porophyllum ruderale plants, observed an increase in the concentration of polyphenols in the plant leaves, demonstrating the resistance-inducing character of the homeopathic medicine. The C. carbonica preparation is also mentioned for its effects in inhibiting the production of ethylene in tomatoes, reducing the proportion of fruits for sauce, and increasing the proportion of colorful salad fruits.
In terms of area under the disease process curve, all the dynamizations of Phosphorus (Table 2) differed statistically from the control treatment. Thus, there was a significant reduction in the severity of the disease, with a reduction of up to 78% in the progression of white mold. Regarding the percentage of dead plants, the analysis did not show a difference between the treatment and control.
In the tests performed, it was generally observed that the plants did not respond to the dynamizations tested in a linear manner. The same medicine that was capable of increasing the values of AUDPC and PDP also showed a suppressive effective with different dynamizations, such that the same medicine that proved to be innocuous for one variable was efficient for the same variable under a different dynamization.
The potential of a certain medicine and dynamization to activate plant defense mechanisms in only a few cases may be explained by the absence of similarities between the vital energy of the homeopathic solution and the

Rissato et al. 2177
Table 2. Area under the disease progress curve (AUDPC) and percentage of dead plants (PDP) of common bean of the cultivar IPR Tuiuiu treated with the homeopathic medicine Phosphorus at different dynamizations.
Dynamization (CH) AUDPC PDPns
6 2.73B 8.56
12 2.66B 8.56
24 2.86B 8.56
36 3.52B 10.02
48 2.57B 8.56
Control 11.83A 10.02
CV(%) 34.08 17.48
Regression equation for AUDPC y = 0.0051x2 - 0.3158x + 6.7603; R² = 0.8301
Averages followed by the same letter in the column do not differ significantly at 5% in the Tukey test.
ns, Non-significant.
organism, leading to disorder in the plant’s metabolic system and resulting in deterioration of plant development and growth. Thus, the lack of significance for some treatments in the control of white mold in bean plants may have occurred because of the dissimilarity between the vital energy of the medicine and/or the dynamization of the plant treated. Thus, as Bonato (2007) stated, taking into consideration that each substance has a different dynamic, it is important to emphasize that when conducting an experiment with plants, various dynamizations of the homeopathic medicine should be used. Otherwise, there is the risk of not achieving results, or even erroneously concluding that the homeopathic medicine is inefficient. Conclusions
This study confirms that C. carbonica is effective in controlling the moth in common beans. C. carbonica at 6 CH and Phosphorus at 6 CH, 12 CH, 24 CH, 36 CH, and 48 CH reduced the intensity of white mold in bean plants. However, no other medicine reduced the percentage of plant death due to white mold disease with the exception of C. carbonica at 12 CH and 24 CH. However, this findings needs to be evaluated further for efficacy at higher doses and combinations of doses. Conflict of interests The authors have not declared any conflict of interests. REFERENCES Barros BHR, Leonel AH (2013). Use of homeopathic reparations to
control coffee leaf rust (Hemileia vastratrix) in the region of Alta Mogiana. Resumos do VIII Congresso Brasileiro de Agroecologia. Cadernos Agroecol. 8:2. http://www.aba-agroecologia.org.br/revistas/index.php/cad/article/viewFile/14155/9005
Boericke WO (2003). Manual de Materia Medica Homeopatica [Compendium of homeopathic materia medica]. São Paulo: Ed. Robe. P 638.
Boff P (2009). Saúde Vegetal e a Contribuição da Homeopatia na Transição Ecológica da Agricultura. Rev. Bras. Agroecologia 4(2):3963-3966.
Bonato CM (2007). Homeopatia em modelos vegetais. Cultura Homeopática 2:24-28.
Bonato CM, Silva EP (2003). Effect of the homeopathic solution Sulphur on the growth and productivity of radish. Acta Sci. Agron. 25(2):259-263.
Borém A, Carneiro JES (2008). A cultura. In: Vieria C, Júnior TJ de P, Borém A. Feijão. Viçosa: Ed. UFV. P 600.
Carneiro JES, Paula Júnior TJ de, Borém A (2015). Feijão: do plantio à colheita. Viçosa: Ed. UFV. P 384.
Casali VWD (2004). Utilização da homeopatia em vegetais. In: Seminário Brasileiro Sobre Homeopatia Na Agropecuária Orgânica, 5., Toledo. Anais. Toledo. pp. 89-11.
Castro DM (2013). Homeopathy: principles and applications. In: International Conference on Homeopathy in Agriculture P 2.
Cruz CD (2006). Programa Genes: Biometria. Viçosa: UFV. P. 382. Damin S, Alves LFA, Alexandre TM, Bonini AK, Bonato CM (2014).
Homeopathic preparations on the activity of the entomopathogenic Beauveria bassiana (Bals.) Vuill. (Ascomycota: Cordycipitaceae). Rev. Bras. Agroecologia 9(3):41-53.
Fancelli AL, Dourado ND (2007). Produção de Feijão. 2 ed. Piracicaba: Os Autores. P 386.
Farmacopéia Homeopática Brasileira (1997). 2 ed, parte 1. São Paulo, SP: Atheneu Editora São Paulo.
Fonseca MCM, Casali VWD, Cecon PR (2006). Efeito de aplicação única dos preparados homeopáticos Calcarea carbonica, Kalium phosphoricum, Magnesium carbonicum, Natricum muriaticum e Silicea terra no teor de tânico em Porophyllum ruderale (Jacq.) Cassini. Rev. Cultura Homeopática 4(6):6-8.
Lisboa SP, Cupertino MC, Arruda VM, Casali VWD (2005). Nova visão dos organismos vivos e o equilíbrio pela homeopatia. Viçosa, MG. P 103.
Meyer MC, Campos HD (2009). Guerra ao mofo. Cultivar Grandes Culturas 120(11):16-18.
Modolon TA, Boff P, Rosa JM, Sousa PMR, Miquelluti DJ (2012). Qualidade pós-colheita de frutos de tomateiro submetidos a preparados em altas diluições. Hortic. Bras. 30(1):58-63.
Modolon TA, Boff P, Boff MIC, Borghezan SF (2009). Preparados homeopáticos na produção de tomate em sistemas orgânicos. Rev. Bras. Agroecologia 4(2):702-705.
Secretaria da Agricultura e do Abastecimento do Paraná (SEAB) (2016). Agrotóxicos registrados para o controle de mofo branco em feijoeiro. Disponível em http://celepar07web.pr.gov.br/agrotoxicos/legislacao.asp
Sukul NC, Ghosh S, Sukul A, Sinhababu P (2006). Amelioration of root-

2178 Afr. J. Agric. Res.
knot disease of lady's finger plants by potentizes Cina and Santonin. Homeopathy 95:144-147.
Toledo MV, Stangarlin JR, Bonato CM (2009). Uso dos medicamentos homeopáticos Sulphur e Ferrum sulphuricum no controle da doença pinta preta em tomateiro. Rev. Bras. Agroecol. 4(2):475-478.
Zambolin L, Paula TJ de (2008). Doenças. In: Vieria C, Júnior TJ de P,
Borém. Feijão. 2 ed. Viçosa: Ed. UFV. P 600.

Vol. 11(24), pp. 2179-2184, 16 June, 2016
DOI: 10.5897/AJAR2016.11132
Article Number: A53B6A558975
ISSN 1991-637X
Copyright ©2016
Author(s) retain the copyright of this article
http://www.academicjournals.org/AJAR
African Journal of Agricultural Research
Full Length Research Paper
Azospirillum brasilense and nitrogen fertilization affecting wheat productivity
Junia Maria Clemente1*, Aurinelza Batista Teixeira Condé2, Alex Teixeira Andrade2, Carine Rezende Cardoso3, Iara da Mata Flor3, Fábio Aurélio Dias Martins3, Willian Tadeu de Lima3
and Cleiton Burnier de Oliveira3
1Pós-Doutora - Faculdade do Noroeste de Minas, FINOM, Brazil.
2Bolsistas BIP da FAPEMIG; Empresa de Pesquisa Agropecuária de Minas Gerais – EMBRAPA, Brazil.
3Laboratório de Biocontrole Farroupilha, Brazil.
Received 15 April, 2016; Accepted 20 May, 2016
In order to optimize the use of nitrogen (N), the aim of this work was to evaluate the efficiency of foliar application of Azospirillum brasilense Ab-V5 strain, as regards the productivity of wheat plantations combined with different N doses. The experiments were carried out in four municipalities in Minas Gerais (Brazil) under randomized block design with four replications. Forty percent of the N dose was applied at planting time and 60% as topdressing at tillering stage of the crop. Azospirillum brasilense was applied as foliar spray at a dose of 500 ml/ha. The treatments consisted of: (1) Control-without N or Ab-V5; (2) 50% of the N recommended; (3) 100% of the N; (4) Application of Ab-V5 strain; (5) 50% of N and Ab-V5 strain; (6) 100% of N and Ab-V5 strain; (7) 100% of N and seed inoculation with a commercial product (Master Fix). For all the locations, productivity increased with application of 100% of N recommended and foliar spray containing A. brasilense compared to the treatment that had only 100% of N recommended. Key words: Foliar spray, nitrogen fertilization, diazotrophic bacteria, Triticum aestivum L.
INTRODUCTION Wheat is the second cereal most produced in the world. In Brazil, it is grown in the South, Southeast and Midwest regions. In the 2015 to 2016 crop season, the cultivated area with wheat in Brazil was 2103 million hectares; with an average yield of 2770 kg ha
-1 (Conab, 2016).
Nitrogen fertilization is essential, in order to ensure the production and quality of grains. This is the most limiting nutrient for wheat productivity (Rodrigues et al., 2014).
Adequate N supplying determines the number of tillers, which may favor the nodes formation and cause the stem elongation. The increase in the number of tillers and greater elongation of the stem allow higher uptake of solar radiation and, therefore, greater productivity (Fornasieri Filho, 2008). In addition, the number of ears per area and the number of spikelets per ears increase the adequate availability and application of this nutrient
*Corresponding author. E-mail: [email protected].
Author(s) agree that this article remain permanently open access under the terms of the Creative Commons Attribution
License 4.0 International License

2180 Afr. J. Agric. Res.
Table 1. Chemical and physical characteristics of the soil at 0 to 20 cm depth.
Chemical and physical attributes Madre de Deus de Minas Uberaba Lambari Patos de Minas
pH in water 6.00 5.89 5.90 5.50 9P-rem mg/ dm
3 14.17 41.08 12.93 6.05
11Organic matter dag/kg 3.84 1.58 3.99 3.28
1P
mg/dm3
42.85 72.15 10.64 50.31 1K 114.00 76.00 74.00 69.00
2Ca
cmol/dm3
2.90 1.74 2.50 1.11 2Mg 0.80 0.61 0.90 0.37
2Al 0.00 0.04 0.10 0.15
7H+Al 3.24 1.74 3.62 4.62
3CTC (t) 3.99 2.58 3.69 1.81
4CTC (T) 7.23 4.28 7.21 6.28
6m
% 0.00 1.55 2.71 8.30
Base saturation 55.22 59.42 49.79 26.40
B
mg/dm3
0.19 0.16 0.24 0.22 1Cu 2.55 1.20 1.31 11.30
1Fe 29.38 25.10 32.77 41.70
1Mn 29.38 8.50 12.57 82.20
1Zn 10.71 8.50 5.51 4.00
10S 20.59 2.63 21.20 25.04
5Clay
dag/kg
41.00 204.00 54 280.00 5Silt 42.00 26.00 13 226.00
5Sandy 17.00 770.00 33 494.00
12COT - 0.92 - 1.90
1P, K, Fe, Zn, Mn, Cu - Mehlich I;
2Ca, Mg, Al - KCl 1 mol/l;
3CTC (t), effective cation exchange capacity;
4CTC (T), total exchange capacity at
pH 7; 5Texture, pipette method;
6m, aluminum saturation;
7H + Al, SMP method;
8B, hot water;
9P-rem, remaining phosphorus, concentration of
P of the equilibrium solution after stirring the air‐dry soil during 1 h with CaCl2 solution at 10 mmol/L, containing 60 mg/L of P (1:10); 10
S, monocalcium phosphate in acetic acid;
11Oxidation, Na2Cr2O7 4N + H2SO4 10N;
12COT, total organic carbon - oxidation with Na2Cr2O7 4N +
H2SO4 10 mol/L.
(Megda et al., 2009). Bacteria that belong to the Azospirillum genus are
known to associate symbiotically with grass forming specialized structures in the roots in which there is conversion of N2 to NH3 (Radwan et al., 2004). For the establishment of a symbiotic relationship, germinating seeds and roots exude molecules that chemically attract the N fixing bacteria and stimulate its development in the rhizosphere and the gene expression of the bacteria related to the biological N fixation (Hungria et al., 2001).
The use of Azospirillum spp. in the development of grasses has been researched in recent years, not only regarding the yields but also regarding physiological effects. Recent reports states its positive effects on the growth and on the N accumulation in wheat plants (Sala et al., 2005), maintaining the fertile tillers, higher extraction and N accumulation in grains (Jezewski et al., 2010), more efficient translocation of N to the grains, heavier and full grains, better distribution of N in the grains biomass (Didonet et al., 2000) and root development. However, some authors did not find any difference between treatments with or without inoculation
(Campos et al., 1999). Studies on the application of Azospirillum brasilense via foliar spray in wheat plants are inconclusive and scarce. Farther, N fertilization is one of the most expensive management practices for the growers and the application of A. brasilense may increase the profits as well the use efficiency of this nutrient.
The objective of this study was to evaluate in field conditions the efficiency of foliar application of A. brasilense, Ab-V5 strain, as regard to the productivity of wheat cultivated with different N doses.
MATERIALS AND METHODS The experiments were carried out in four experimental fields located in the following municipalities of Minas Gerais state: Madre de Deus de Minas, Uberaba, Lambari and Patos de Minas. The plots were 6.0 m long and 4.0 m wide and presented 10 rows spaced at 0.17 m with 80 seeds/linear meter at sowing; the four central rows were considered the useful plot (12 m2). The experiment was designed as randomized block with 4 replications. The chemical and physical characteristics of the soil are presented in Table 1.
The dose of N indicated for the crop under irrigation was 60 kg

Table 2. Variance analysis for the productivity of wheat (bags/ha) evaluated in Madre de Deus de Minas, Uberaba, Lambari and Patos de Minas municipalities.
FV FD Mean square
Location 3 3443.34**
Treatment 6 920.43**
Location * Treatment 18 341.96**
Replication 3 426.71
Residue 18 114.32
CV (%) 16.86
Average 63.40
**Significant at 1% probability by the F test.
per hectare. It was applied as 40% of the N dose at planting time and 60% as topdressing at tillering stage. The A. brasilense strain Ab-V5 was used at a concentration of 1×10⁸ colony forming units per ml. The Ab-V5 bacterium has been widely studied by “Embrapa Soja” and Federal University of Paraná; nowadays it is in the list of inoculant bacteria approved by Ministry of Agriculture, Livestock and Food Supply (MAPA) for corn and wheat. Ab-V5 was applied via foliar spray at the dose of 500 ml/ha at the beginning of tillering stage with a flow of 200 l/ha.
Nitrogen fertilization varied according to the treatments as it follows: (1) Absolute control, without N or Ab-V5 strain; (2) 50% of the N dose recommended for the crop; (3) 100% of the N dose recommended for the crop; (4) Ab-V5 without N; (5) 50% of the N recommended for the crop with Ab-V5; (6) 100% of the N recommended for the crop with Ab-V5; (7) 100% of the N recommended for the crop and seeds inoculation with Master Fix (100 ml/20 kg of seeds) which is a commercial product containing A. brasilense.
Inoculation with the commercial product “Master Fix” composed by A. brasilense (Ab-V5 and Ab-V6 strains) was directly performed in the seed previous to sowing at a dose of 100 ml ha-1 of the inoculant liquid, containing around 2.0 × 10⁸ colony forming units/ ml.
The crop management practices were uniform in all the experiments, except for N fertilization and in the experiment of Madre de Deus de Minas city where the wheat was grown in rainfed system. Sowing was made using a seeder for grooves opening, as well as marking the sowing lines and the N fertilizer was manually distributed. The experiments were performed in four different locations, as described as follow: (a) Madre de Deus de Minas municipality in a field of “Fazenda Liberdade” located at ''21°27’04” S and ''44°19’14” W at the altitude of approximately 1026 m. Coodetec 108 wheat cultivar was cultivated. Sowing was performed on February 29th 2012 and the harvest was done on June 08th 2012. (b) Uberaba municipality in a field of IFTM (Federal Institute of Triângulo Mineiro) located at ''19°43'6.94'' S and ''47°57'28.29'' W at the altitude of approximately 810 m. Coodetec 108 wheat cultivar was cultivated. Sowing was performed on May 24th 2012 and the harvest on September 02nd 2012. (c) Lambari municipality in a field of EPAMIG (Agricultural Research Company of Minas Gerais) located at ''21°56´40.85'' S and ''45°18´40.91'' W at the altitude of approximately 883 m. Coodetec 207 cultivar was cultivated. Sowing was performed on April 03rd 2013 and harvest on September 15th 2013. (d) Patos de Minas municipality in a field of EPAMIG (Agricultural Research Company of Minas Gerais) located at ''18°31´01.90'' S and ''46°26´19.08'' W at the altitude of approximately 926 m.
Clemente et al. 2181 Coodetec 207 cultivar was cultivated. Sowing was performed on May 17th 2013 and the harvest on September 17th 2013. In all experiments, the ears were harvested from the useful plots, corresponding to 12 m2 (four central rows). To determine the grain yield, the ears were threshed and weighed in threshing electric machine. The grains had moisture corrected to 13% on wet basis. The experimental data were submitted to variance analysis and the effects of treatments and interactions were evaluated by F test, whereas the treatment means were compared by the Scott-Knott test (Ferreira et al., 2014).
RESULTS AND DISCUSSION
The individual variance analyses showed significant results for productivity. In this experiment, for most of the treatments, wheat cultivars showed higher yield than the national average which is 47.65 bags/ha (Conab, 2016). The analysis showed significant results for different locations, treatments and their interaction (Table 2).
Three groups of treatments were performed in Uberaba and Patos de Minas municipalities and two groups in Lambari and Madre de Deus de Minas. For all of them, the use of 100% N + Azospirillum via foliar spray yielded the best results. For the treatments with no application of A. brasilense (0, 50 and 100% of N) the productivity was significantly lower compared to the treatments with Azospirillum, however they belonged to the same group (Table 3). This lack of response may be related to the residual effect of N fertilizers applied to cultivate previous crops in all of these areas. In these regions the adoption of crop rotation system with leguminous and horticulture crops which leaves high amounts of N in the soil is common. It ensures the positive effect of Azospirillum on the N use efficiency.
As this bacterium was applied via foliar spray, probably this increasing productivity might be related to changes in phytohormone metabolism and N metabolism, even in rainfed systems such as Lambari municipality. However, Azospirillum`s action on the plant`s metabolism is found to be controversial.
Recent reports states its increasing ability to fix N from atmosphere (Huergo et al., 2008); increasing effects on activity of nitrate reductase when they grow endophytically (Cassán et al., 2008), production of hormones such as auxins, cytokinins (Tien et al., 1979), gibberellins (Bottini et al., 1989); ethylene (Strzelczyk et al., 1994) and a variety of other molecules in the cell (Perrig et al., 2007); phosphate solubilization (Rodriguez et al., 2004) and biological control of pathogens (Correa et al., 2008). So they are able to promote the development of roots and shoots, increase water and mineral absorption and optimize the tolerance to abiotic stresses such as salinity or drought (Roscoe and Miranda, 2013).
It is widely known that nitrate reduction occurs in the cytosol and involves the action of the nitrate reductase producing nitrite; it enters the plastids of roots or chloroplasts of leaves and it is reduced to ammonia by the action of the enzyme nitrite reductase, which is
2182 Afr. J. Agric. Res.
Table 3. Average of the grain productivity of wheat evaluated in Madre de Deus de Minas, Uberaba, Lambari and Patos de Minas and conjoint analysis of the locations.
Treatments Madre de Deus de Minas Uberaba Lambari Patos de Minas Conjoint analysis
0% N 64.06b 50.26
c 54.68
b 54.38
b 55.85
b
50% N 58.37b 56.83
b 56.29
b 59.22
b 57.68
b
100% N 68.12b 59.17
b 58.54
b 59.48
b 61.33
b
0% N + Ab-V5 92.62a 46.37
c 59.75
b 34.77
c 58.53
b
50% N + Ab-V5 88.50a 47.08
c 66.86
a 51.20
b 63.41
b
100% N + Ab-V5 93.50a 66.62
a 75.27
a 72.37
a 76.95
a
100% N + Master Fix 90.31a 56.38
b 64.56
a 68.89
a 70.04
a
1Means followed by the same letter in the columns do not differ at 5% probability, except in Lambari that was 10% probability, by Scott Knott
test.
attached via glutamate synthase/glutamine synthase (GS/GOGAT) in amino acids such as glutamine and glutamate which, in its turn serve as substrate for transamination reactions that are essential for the production of amino acids and proteins (Donato et al., 2004).
Nitrate reductase is one of the most sensitive enzymes to any stress in the plants, because it is highly dependent on NADPH derived from photosynthesis. Therefore, factors that enhances the photosynthetic efficiency, probably improves the N use efficiency. Nitrate reductase has been widely studied, because it controls protein synthesis in plants that absorbs nitrate as the main source of N (Marschner, 2011).
Possibly A. brasilense applied via foliar spray had a great effect on nitrate reductase and it increased the use efficiency of N applied via fertilization. Besides this, A. brasilense can also work fixing N from the atmosphere, which may help the plants save energy with the N reduction. Adequate nitrate reductase activity is primordial to guarantee high productivity; once N is one of the most limiting nutrients to form organic molecules (Taiz and Zeiger, 2013). This effect was observed in this experiment.
According to Sala et al. (2007) some wheat cultivars may present increases around 27 to 45% on grain production with A. brasilense inoculation. Nozaki et al. (2013) observed a significant increase on wheat productivity applying 290 kg/ha with 1.5 ml of Azzospirillum spp. Martins et al. (2012) observed that A. brasilense inoculation as foliar spray was more efficient in different corn hybrids and showed an excellent choice for use on grass, because it coincided with the herbicide application phase. However, Mendes et al. (2011) did not observed any difference between the treatments with reduction of the N fertilization and inoculation of A. brasilense for the number of tillers, number of ears and weight of 1000 grains.
According to Kapulnik et al. (1983), wheat plants inoculated with A. brasilense increased the contents of N, P and K. The contents of nitrate in the vacuole are
directly related to nitrate reductase activity (Li and Gresshoff, 1990). Panwar (1991) observed that seeds of wheat inoculated with A. brasilense increased intensively the activity of this enzyme. Didonet et al. (2000) inoculated 245 strains with 10 isolates of A. brasilense in wheat plants with different doses of N and concluded that they provide better use of N accumulated in the biomass, translocating N more efficiently. Swędrzyńska (2000) concluded that A. brasilense can be a factor to increase vigor and yield of wheat. In water stress conditions the author observed an increase of 27% in wheat productivity.
Initially, some authors expected that the benefits with the use of A. brasilense were basically derived from biological N fixation (Dobbelaere et al., 2004). But it seems that the positive effects provided by these microorganisms are mainly derived from the morpho-logical and physiological changes in the roots of inoculated plants, causing an increase in the uptake of water and nutrients (Okon and Vanderleyden, 1997).
Probably this is the reason that the productivity had been so high, even in rainfed systems such as in Lambari municipality. Previous studies show an increasing concentration of the following phytohormones when Ab-V5 strain was inoculated in the plants: Kinetin which induces root growth; salicylic acid which may have an acclimatization effect providing increased tolerance to many different kinds of abiotic stresses; jasmonic acid that may induce gene expression regarding stress defense; indolbutyric acid which is a root promoter; indoleacetic acid which is growth promoter and gibberellic acid that stimulates plant growth.
Quadros et al. (2014) concluded that the use of Azospirillum stimulated the growth of plants in the vegetative period, which increased the uniformity of plant stand, greater resistance to stress and greater concentration of chlorophyll in leaves. The Ab-V5 strain induces the production of these phytohormones in a balanced way and possibly is capable to be absorbed by leaves, demonstrating the effectiveness of foliar application. Therefore, in the present study the use of A.

brasilense may have a combined effect on wheat productivity, by phytohormones and N metabolism. Conclusion The foliar application of A. brasilense, Ab-V5 strain, promotes an increasing productivity combined with 100% of the N dose. A. brasilense is a complementary technology focused on increasing wheat productivity especially under water stress conditions. Conflict of Interests The authors have not declared any conflict of interests.
ACKNOWLEDMENTS
The authors appreciate the Foundation of the State of Minas Gerais Research (FAPEMIG) for financial support and the grants awarded and Biocontrol Laboratory Farrukhabad for their help in conducting the tests. REFERENCES Bottini R, Fulchieri M, Pearce D, Pharis R (1989). Identification of
gibberelins A1, A3, and iso-A3 in cultures of A. lipoferum. Plant Physiol. 90:45-47.
Campos BHC, Theisen S, Gnatta V (1999). Inoculante "Graminante" nas culturas de trigo e aveia. Cienc. Rural 23(3): 401-407.
Cassán F, Sgroy V, Perrig D, Masciarelli O, Luna V (2008). Producción de fitohormonas por Azospirillum sp. Aspectos fisiológicos y tecnológicos de la promoción del crecimiento vegetal. In: Cassán FD, Garcia de Salamone I (Eds) Azospirillum sp.: cell physiology, plant interactions and agronomic research in Argentina. Argentina: Asoc. Argent. Microbiol. pp. 61-86.
Conab (2016). Companhia Nacional de Abastecimento : Acompanhamento da safra brasileira de grãos. Available at: http://www.conab.gov.br acessed date May 2016.
Correa OS, Romero AM, Soria MA, De Estrada M (2008). Azospirillum brasilense-plant genotype interactions modify tomato response to bacterial diseases, and root and foliar microbial communities. In: Cassán FD, Garcia de Salamone, I. (Eds) Azospirillum sp.: cell physiology, plant interactions and agronomic research in Argentina. Argentina: Asoc. Argent. Microbiol. pp. 87-95.
Didonet AD, Lima OS, Candaten AA, Rodrigues O (2000). Realocação de nitrogênio e de biomassa para os grãos, em trigo submetido a inoculação de Azospirillum. Pesq. Agropec. Bras. 35:401-411.
Dobbelaere S, Croonenborghs A, Thys A, Ptacek D, Donato VMTS, Andrade AG, Souza ES, França JGE, Maciel GA (2004). Atividade enzimática em variedades de cana-de-açúcar cultivadas in vitro sob diferentes níveis de nitrogênio. Pesq. Agropec. Bras. 39(11):1087-1093.
Donato VMTS, Andrade AG, Souza ES, França JGE, Maciel GA (2004). Atividade enzimática em variedades de cana-de-açúcar cultivadas in vitro sob diferentes níveis de nitrogênio. Pesq. Agropec. Bras. 39(11):1087-1093.
Ferreira DF (2014). Sisvar a Guide for its Bootstrap procedures in multiple comparisons. Cien. Agrotecnologia 38:109-112.
Fornasieri FD (2008). Manual da cultura do trigo. Jaboticabal: Fundação de Apoio à Pesquisa, Ensino e Extensão P 338.
Huergo LF, Monteiro RA, Bonato AC, Rigo LU, Steffens MBR, Cruz LM, Chubatsu LS, Souza EM, Pedrosa FO (2008). Regulation of nitrogen
Clemente et al. 2183
fixation in Azospirillum brasilense. In: Cassán FD, Garcia de Salamone I. Azospirillum sp.: cell physiology, plant interactions and agronomic research in Argentina. Asociación Argentina de Microbiologia, Ciudad de Buenos Aires, Argentina P 268.
Hungria M, Campo RJ, Mendes IC (2001). Fixação biológica do nitrogênio na cultura da soja. Londrina: Embrapa Soja, (Circular Técnica 35).
Jezewski TJ, Silva JAG, Fernandes SBV (2010). Efeito da inoculação de Azospirillum em trigo, isolado e associado a estimulante de crescimento no noroeste do RS. In: Congresso de Iniciação Científica da UFPEL, Pelotas/RS. XIX Congresso de Iniciação Científica, XII Encontro de Pós-Graduação e II Mostra Científica da UFPEL. Anais... Pelotas 1:568-571.
Kapulnik Y, Sarig S, Nur I, Okon Y (1983). Effect of Azospirillum inoculation on yield of field-grown wheat. Ca. J. Microbiol. 29:895-899.
Li ZZ, Gresshoff PM (1990). Developmental and biochemical regulation of constitutive' nitrate reductase activity in leaves of nodulating soybean. J. Exp. Bot. 41:1231-1238.
Marschner P (2011). Mineral Nutrition of Higher Plants, Third Edition. Acad. Press P 672.
Martins FAD, Andrade AT, Condé ABT, Godinho DB, Caixeta CG, Costa RL, Pomela AWV, Soares CMS (2012). Avaliação de híbridos de milho inoculados com Azospirillum brasilense. Pesq. Agrop. Gaúcha 18(2):113-128.
Megda MM, Buzetti S, Andreotti M, Teixeira Filho MMC, Vieira MX (2009). Resposta de cultivares de trigo ao nitorgênio em relação às fontes e épocas de aplicação sob plantio direto e irrigação por aspersão. Cienc. Agrotec. 33:1055-1060.
Mendes MC, Rosário JG do, Faria MV, Zocche JC, Walter AL (2011). Avaliação da eficiência agronômica deAzospirillum brasilense na cultura do trigo e os efeitos na qualidade de farinha. Rev. Bras. Tecnol. Aplicada nas Ciênc. Agrárias 4:95-102.
Nozaki MH, Lorenzatto R, Mancini M (2013). Efeito do Azospirillum spp. em associação com diferentes doses de adubação mineral na cultura do trigo. Ensaios e Ciência: Ciências Biológicas, Agrárias da Saúde 17(6):27-35.
Okon Y, Vanderleyden J (1997). Root-associated Azospirillum species can stimulate plants. Appl. Environ. Microbiol. 63(7):364-370.
Panwar JDS (1991). Effect of VAM and Azospirillum brasilense on photosynthesis nitrogen metabolism and grain yield in wheat. Indian J. Plant Physiol. 34:357-361.
Perrig D, Boeiro L, Masciarelli O, Penna C, Cassán F, Luna V (2007). Plant growth promoting compounds produced by two agronomically important strains of Azospirillum brasiliense, and their implications for inoculants formulation. Appl. Environ. Microbiol. 75:1143-1150.
Quadros PD, Roesch LFW, Silva PRF, Vieira VM, Roehrs DD, Camargo FAO (2014). Desempenho agronômico a campo de híbridos de milho inoculados com Azospirillum. Rev. Ceres 61:209-218.
Radwan TEE, Mahamed ZK, Reis VM (2004). Efeito de inoculação de Azzospirillum e Herbaspirillum na produção de compostos indólicos em plântulas de milho e arroz. Pes. Agropec. Bras. 39:987-994.
Rodrigues LFOS, Guimarães VF, Silva MB, Pinto Junior AS, Klein J, Costa ACPR (2014). Características agronômicas do trigo em função de Azospirillum brasiliense, ácidos húmicos e nitrogênio em casa de vegetação. R. Bras. Eng. Agríc. Amb. 18:31-37.
Rodriguez H, Gonzalez T, Goire I, Bashan Y (2004). Gluconic acid production and phosphate solubilization by the plant growth-promoting bacterium Azospirillum spp. Naturwissenschaften 91:552-555.
Roscoe R, Miranda RAS (2013). Fixação Biológica de Nitrogênio e Promoção de Crescimento em Milho Safrinha. In: Roscoe R, Lourenção ALF, Grigolli JFJ, Melotto AM, Pitol C, Miranda RAS. Tecnologia e produção: milho safrinha e culturas de inverno. Midiograf, Curitiba, Brasil P 70.
Sala VMR, Cardoso EJBN, Freitas JG, Silveira APD. (2007). Resposta de genótipos de trigo à inoculação de bactérias diazotróficas em condições de campo. Pesqui. Agropecu. Bras. 42:833-842.
Sala VMR, Freitas SS, Donzeli VP, Freitas JG, Gallo PB, Silveira APD (2005). Ocorrência e efeito de bactérias diazotróficas em genótipos de trigo. Rev. Bras. Cienc. Solo 29(3):345-352.
Strzelczyk E, Kamper M, Li C (1994). Cytocinin-like-substances and

2184 Afr. J. Agric. Res.
ethylene production by Azospirillum in media with different carbon sources. Microbiol. Res. 149:55-60.
Swędrzyńska D (2000). Effect of inoculation with Azospirillum brasilense on development and yielding of winter wheat and oat under different cultivation conditions. Pol. J. Environ. Stud. 9(5):423-428.
Taiz L, Zeiger E (2013). Fisiologia Vegetal. Porto Alegre: Artmed, P 954.
Tien TM, Gaskins MH, Hubbell DH (1979) Plant growth substances
produced by Azospirillum brasilense and their effect on the growth of pearl millet (Pennisetum americanum L.). Appl. Environ. Microbiol. 37:1016-1024.

Vol. 11(24), pp. 2185-2192, 16 June, 2016
DOI: 10.5897/AJAR2014.9355
Article Number: 793480858972
ISSN 1991-637X
Copyright ©2016
Author(s) retain the copyright of this article
http://www.academicjournals.org/AJAR
African Journal of Agricultural Research
Full Length Research Paper
Effect of chitosan-based coating on postharvest quality of tangerines (Citrus deliciosa Tenore): Identification of
physical, chemical, and kinetic parameters during storage
Geovana Rocha Plácido1*, Richard Marins da Silva2, Caroline Cagnin1, Maisa Dias Cavalcante1, Marco Antônio Pereira da Silva1, Márcio Caliari3, Maria Siqueira de Lima1 and
Luiz Eduardo Costa do Nascimento1
1Instituto Federal Goiano - Campus Rio Verde, Rodovia Sul Goiana, Km 01, P. O. Box 66, Zip Code 75901-970, Rio
Verde, GO, Brazil. 2Departamento de Tecnologia de Alimentos. Universidade Federal de Viçosa, Avenida Peter Henry Rolfs, Campus
Universitário, Zip Code 36570-900, Viçosa, MG, Brasil. 3Universidade Federal de Goiás, Escola de Agronomia e Engenharia de Alimentos, Campus Samambaia, Rodovia
Goiânia-Nova Veneza, Km-0, P.O. Box 131, Zip Code 74690-900, Goiânia, GO, Brasil.
Received 19 November, 2015; Accepted 17 February, 2016
In this study, chitosan-based coating was used in tangerines in a 30-day storage period, at controlled temperature of 10°C. The selected fruits presented green surface (± 90%); they were sanitized in chlorinated water (100 mg/L) then immersed in chitosan solutions at chitosan concentrations of 0.5 g/100 ml (T2), 1 g/100 ml (T3), and 2 g/100 ml (T4) and a lot was placed aside as control treatment (T1). Tangerines were evaluated in terms of loss of mass, skin color, soluble solids, vitamin C, and titratable acidity in a 30-day storage period and weight loss kinetics was evaluated through mathematical models. The results showed that chitosan coating was effective in delaying weight loss of tangerines and the mathematical models used in the evaluation could properly explain the weight loss. The polynomial model showed better adaptation to experimental data. Tangerines with higher chitosan concentration showed small color alteration during storage. Chitosan-based coatings were effective in keeping soluble solids, vitamin C, and titratable acidity during storage. In all physicochemical characteristics analyzed, chitosan-based coating in tangerines were superior when compared with control fruits. Key words: Citrus, chitosan, postharvest, shelf life, quality.
INTRODUCTION Brazil is one of the largest citrus producers in the world, producing more than 128,000 tons a year (FAO, 2012).
Citrus fruits are consumed all year long, in natura, or in the form of processed juice, compote and jelly (Rodrigo
*Corresponding author. E-mail: [email protected]. Tel: +556481249504.
Author(s) agree that this article remain permanently open access under the terms of the Creative Commons Attribution
License 4.0 International License

2186 Afr. J. Agric. Res. et al., 2013); however, they are perishable products and tend to postharvest degradation and reduced quality due to their physical aspects, such as loss of mass, and their chemical characteristics, like vitamin C (Mannheim and Soffer, 1996). The quality of citrus fruits is extremely important for marketing reasons, either for in natura consumption or industrial processing. The quality characteristics refer to citrus aspect, taste, smell, texture, and nutritive value. Recently, due to people‟s increasing concern about human health and environmental protection issues, a growing interest has been seen in the development of biodegradable edible natural coatings to keep postharvest quality of fruits and vegetables (Arnon et al., 2014). In general, edible natural coatings comprised polysaccharides, proteins or lipids, or several compounds (Valencia-Chamorro et al., 2010; Dhall, 2013).
Amariz et al. (2010) and Silva et al. (2011) observed that edible coatings are an alternative to extend the shelf life of fruits and vegetables and they are nontoxic, preserve product quality, delaying deterioration, as they regulate metabolic activity, improving the appearance of stored fruits and ensuring brightness as an attractive factor for consumers. Chitosan, a cationic polysaccharide of high molecular
weight, obtained by deacetylation of chitin, extracted from the exoskeleton of crustaceans, fungi, and insects, and has innumerous agricultural and horticultural applications, due to its excellent ability to create an antimicrobial and antifungal film with biocompatibility, biodegradability and nontoxicity to human beings (Muzzarelli et al., 2012).
Chitosan creates a semipermeable film that regulates gas exchange, reducing transpiration, and consequently, ripening (Baustista-Baños et al., 2006). This coating has antimicrobial properties (Dutta et al., 2009) and studies showed that chitosan can control or delay postharvest deterioration of fruits and vegetables. Han et al. (2004) extend the shelf life of strawberries, Romanazzi et al. (2003) inhibited the deterioration of cherries with chitosan and Joas et al. (2005) delayed litchi pericarp browning. Storing products at low temperatures is one of the main techniques used to extend the shelf life of fresh fruits and vegetables and reduce the decomposition and respiration processes (Zahid et al., 2013). Coatings combined with controlled temperature may extend the shelf life of fresh products, keeping the nutrition and sensory properties (Hancock et al., 2008; Cantin et al., 2011, 2012).
Based on the aforementioned considerations, the purpose of this study was to study the effect of different concentrations of chitosan on postharvest tangerines, associated with low storage temperature, to evaluate the physicochemical characteristics and the kinetic parameters of weight loss. MATERIALS AND METHODS
The study was conducted in the Fruit & Vegetable Laboratory from
the Food Engineering Sector of the IFGoiano –Rio Verde Campus. The study used tangerines (Citrus deliciosa Tenore) of green surface (±90%) harvested manually in a rural property located in the region of Rio Verde – GO. The study was realized in May of 2014. The fruits were rinsed with running water, satinized with a solution of sodium hypochlorite at 100 mg/L for 15 min and dried with hand tissue. Then, they were separated in four groups: tangerines without any coating (control treatment (T1)), tangerines coated with a chitosan solution at 0.5 g/100 ml (T2), tangerines coated with a chitosan solution at 1 g/100 ml (T3) and tangerines coated with a chitosan solution at 2 g/100 ml (T4). Preparation of chitosan-based solutions For preparation of the filmogenic solution, the following proportions of chitosan were used (formulation 1 L): 5 g (T2); 10 g (T3) and 20 g (T4). First, the chitosan was solubilized in glacial acetic acid and water, with pH adjusted to 4 with sodium 0.1 mol/L hydroxide, and 800 ml of distilled water and 50 ml of acetic acid. The formulations were homogenized in a blender for 30 s until chitosan gelation. After the preparation, the tangerines were immersed in different solutions (± 1 min) and placed on hollow metallic grilles until they dried naturally, creating chitosan biofilms.
Then, the fruits were placed on Styrofoam trays to be stored in BOD TECNAL TE – 371, at controlled temperature of 10 ± 0.1°C for 30 days, with analyses conducted every 10 days during the 30-day storage period.
Physical analysis
For the evaluation of physical characteristics of tangerines, the fruit dirt was eliminated with a hand tissue. Length (mm) and equatorial diameter (mm) were measured with a Digimess digital caliper. The (L/D) ratio (length/diameter) was calculated. Volume was determined with fruit immersion in a grade polypropylene jar with distilled water, by recording the amount of fluid displaced (ml). Fruit weight was determined using an analytical scale of three decimal places and the results were expressed in grams (g). A lot of 100 fruits were used to produce the physical analyses.
To determine the weight loss of tangerines, three repetitions were performed for every treatment and every repetition contained five fruits. Fruit weight was conducted with one CELTC FA 2104 Manalytical scale, with results expressed in grams. The same fruits were evaluated for weight loss during the 30-day storage period.
The experimental data of weight loss were adjusted to frequently used mathematical models to represent the water loss of tangerines (Table 1).
The colorimetric evaluation was conducted in a Hunter Lab colorimeter, Color Quest II model, in the Fruit & Vegetable Laboratory from the Food Engineering Sector of the IF Goiano –Rio Verde Campus (Hunterlab, 1998), and the values of luminosity L* index and chroma a* and b* indexes were recorded. The results were expressed in values L*, a* and b*, where L* (luminosity or brightness) values range from black (0) to white (100), a* values range from green (-60) to red (+60) and b* values range from blue (-60) to yellow (+60).
Chemical analysis
During storage, the tangerines were evaluated for the following chemical characteristics: total acidity was determined according to methodology n° 942.15 described by AOAC (1997), through titration with NaOH 0.1 M, and the results were expressed in g of total acid/100 ml; soluble solids were determined through direct reading in one Atago N-2 E refractometer, according to the methodology n°

Plácido et al. 2187
Table 1. Mathematical models used to represent the weight loss (WL) of agricultural products.
Model Model description
Newton PM = exp (- k ∙ t)
Linear PM = k · t
Midilli PM = a ∙ exp(-k ∙ t) + b ∙ t
Logarithm PM = a ∙ exp (- k ∙ t) + c
Handerson and Pabis PM = a ∙ exp (- k ∙ t)
Two terms PM = a ∙ exp (k0 ∙ t) + b ∙ exp (k1 ∙ t)
Polynomial PM = k0 + k1· t + k2· t2 + k3 ·t3
t: Storage time (days); k, ko, k1, k2, k3: constants of models, days-1; and a, b, c, n :
coefficients of models.
Table 2. Mean values of equatorial diameter, length, length/equatorial diameter ratio, (L/D), weight and volume of tangerines (Citrus deliciosa Tenore) during May of 2014.
Statistical parameter Physical parameter
Equatorial diameter (cm) Length (cm) L/D ratio Weight (g) Volume (cm3)
Maximums 8.63 8.69 1.20 260.00 336.54
Minimums 6.04 5.33 0.80 113.86 115.37
Mean 7.33 6.74 1.09 180.41 211.32
Variation coefficient (%) 8.52 11.38 6.33 16.73 25.56
Standard deviation 0.62 0.77 0.07 30.19 54.01
983.17 described by AOAC (1999), and the results were expressed in brix; the vitamin C content was determined according to methodology n° 939.13 and 966.18 described by AOAC (1999), through titration with potassium iodide, and the results were expressed in mg of vitamin C/100 ml of juice.
Statistical analysis
The study used a completely randomized design, in a factorial scheme of 4 × 3 × 4, using four treatments (control – no chitosan coating; tangerines coated with chitosan at 0.5 g/100 ml; 1.0 g/100 ml and 2.0 g/100 ml), three temperatures (10, 20 and 30°C) and four storage times (0, 10, 20 and 30 days). The models were selected according to the coefficient of determination and its significance using the F test.
Kinetic data of weight loss were adjusted to mathematical models through a non-linear regression analysis using the Gauss-Newton method, with the help of statistical software. The models were selected considering the magnitude of the coefficient of
determination (R2), chi-square test (2) and standard error of the estimate (SE), according to Equations 5 and 6:
Where Y is the value observed in the experiment; Ŷ is the value estimated using the model; GLR is the degrees of freedom in the model (number of experimental observations minus the number of coefficients in the model).
RESULTS AND DISCUSSION
Physical parameters
Table 2 shows the results of equatorial diameter, length, length/equatorial diameter ratio, weight and volume of tangerines.
The mean values of equatorial diameter and length of tangerines and the relation between these parameters showed the fruits presented a round shape. Tangerines (Citrus deliciosa Tenore) morphologically present a less pronounced peduncle, a characteristic of this type of fruit. Studies evaluating these physical parameters in tangerines have not been conducted. The mean weights of tangerines in this study were higher than the average weight of 212.86 g of Ponkan tangerine cultivated in Western Paraná (Detoni et al., 2009).
Kinetic parameters
Table 3 shows the values of R2, SE, and
2. When
analyzing coefficient determination R2, the polynomial
model obtained the highest values for all treatments and the Newton model presented the lowest values. According to Doymaz (2012), calculating the coefficient of determination is one of the main criteria to select the model that better adjusts to the drying process; however,
besides R², parameters SE and ² are used to determine the adjustment quality. Togrul and Aslan (2004), working
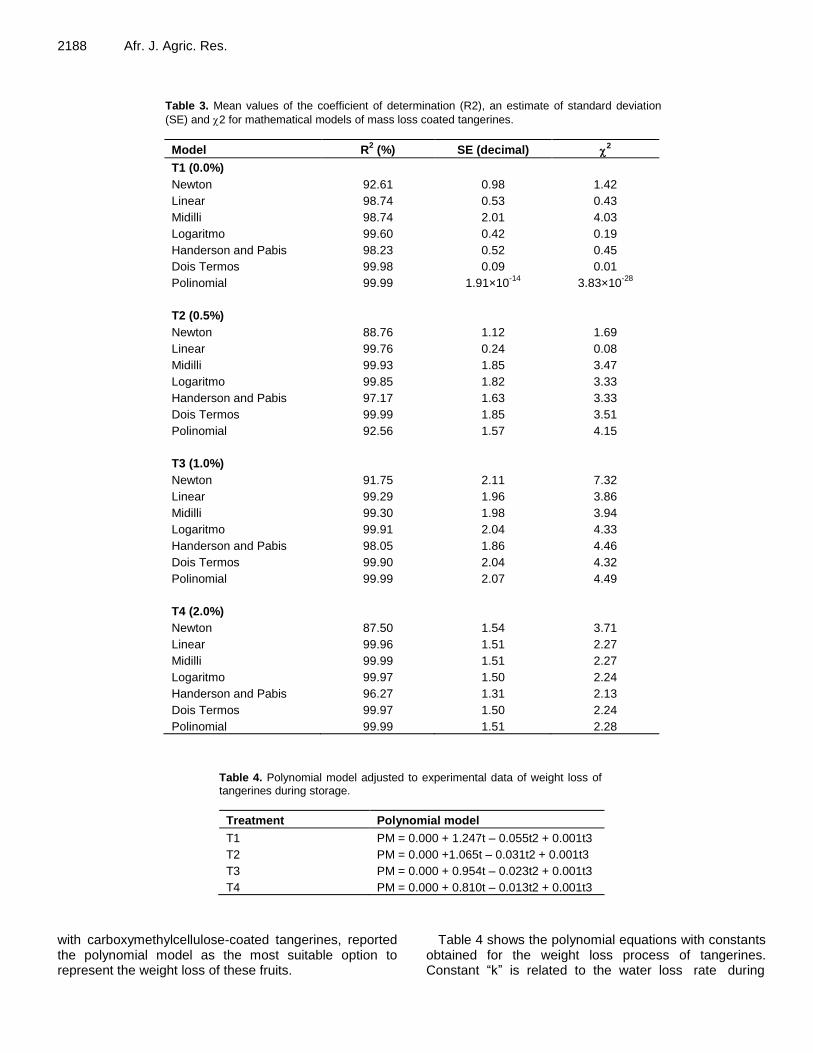
2188 Afr. J. Agric. Res.
Table 3. Mean values of the coefficient of determination (R2), an estimate of standard deviation
(SE) and 2 for mathematical models of mass loss coated tangerines.
Model R2 (%) SE (decimal)
2
T1 (0.0%)
Newton 92.61 0.98 1.42
Linear 98.74 0.53 0.43
Midilli 98.74 2.01 4.03
Logaritmo 99.60 0.42 0.19
Handerson and Pabis 98.23 0.52 0.45
Dois Termos 99.98 0.09 0.01
Polinomial 99.99 1.91×10⁻¹⁴
3.83×10⁻²⁸
T2 (0.5%)
Newton 88.76 1.12 1.69
Linear 99.76 0.24 0.08
Midilli 99.93 1.85 3.47
Logaritmo 99.85 1.82 3.33
Handerson and Pabis 97.17 1.63 3.33
Dois Termos 99.99 1.85 3.51
Polinomial 92.56 1.57 4.15
T3 (1.0%)
Newton 91.75 2.11 7.32
Linear 99.29 1.96 3.86
Midilli 99.30 1.98 3.94
Logaritmo 99.91 2.04 4.33
Handerson and Pabis 98.05 1.86 4.46
Dois Termos 99.90 2.04 4.32
Polinomial 99.99 2.07 4.49
T4 (2.0%)
Newton 87.50 1.54 3.71
Linear 99.96 1.51 2.27
Midilli 99.99 1.51 2.27
Logaritmo 99.97 1.50 2.24
Handerson and Pabis 96.27 1.31 2.13
Dois Termos 99.97 1.50 2.24
Polinomial 99.99 1.51 2.28
Table 4. Polynomial model adjusted to experimental data of weight loss of tangerines during storage.
Treatment Polynomial model
T1 PM = 0.000 + 1.247t – 0.055t2 + 0.001t3
T2 PM = 0.000 +1.065t – 0.031t2 + 0.001t3
T3 PM = 0.000 + 0.954t – 0.023t2 + 0.001t3
T4 PM = 0.000 + 0.810t – 0.013t2 + 0.001t3
with carboxymethylcellulose-coated tangerines, reported the polynomial model as the most suitable option to represent the weight loss of these fruits.
Table 4 shows the polynomial equations with constants obtained for the weight loss process of tangerines. Constant “k” is related to the water loss rate during

Plácido et al. 2189
Tempo (dias)
0 5 10 15 20 25 30
Per
da
de
Mas
sa (
%)
0
5
10
15
20
25
30
T1
T2
T3
T4
Valores Estimados
Estimated values
Time (days)
Wei
gh
t lo
ss (
%)
Figure 1. Weight loss variation in relation to different coatings adjusted with the polynomial model.
storage processes, and the coatings, as a barrier against water loss, influenced “k” values. Data shows constant “k” is reduced in absolute values as chitosan concentrations increase in fruits, which is expected, as larger concentrations of coatings lead to lower water transfer to the environment. Weight loss parameters Figure 1 shows the behavior of weight loss along the storage time of tangerines coated with different chitosan concentrations, adjusted through the polynomial model. The weight loss analysis shows the coating was effective in delaying weight loss of tangerines. The positive effects of coatings on fruits include improved aspect and lower weight loss. Machado et al. (2012) report a highly significant interaction between coatings and storage time of fruits, reducing the weight loss of fruits. Shi et al. (2013), when evaluating the effect of coatings on postharvest longan fruits, confirm that coatings significantly reduce the weight loss of fruits.
The mathematical models describe weight loss in relation to storage time. The experimental data from this study are closely related to data estimated with the polynomial model, which indicates the model adequacy for the weight loss description of coated and non-coated fruits.
Mathematical models have not been widely used to explain the weight loss of fruits during storage, however, these models can efficiently explain the process and they may be used more frequently, as they present reliable results. Color parameters Color is one of the most influent attributes for consumers. Chlorophyll pigments are responsible for the green color of many fruits, including tangerines. When analyzing Figure 2, coatings caused small alteration to fruit color. On the first 10 days, the variations were small in all color parameters, increasing only after day 10.
Delay in color change may be attributed to low respiration and reduced ethylene, leading to a modified fruit atmosphere (Ali et al., 2011). Chitosan coating creates a semipermeable film, delaying ripening and senescence, and then, inhibiting color alteration (Han et al., 2014).
In the beginning of the storage period, the skin color of fruits was greener, and at the end of the storage period, the skin color was yellowish for the fruits with lower chitosan concentrations and control fruits, with increased parameter L for these fruits; therefore, increased luminosity is associated with yellow skin (Vale et al., 2006). The progress observed in b* values indicates the
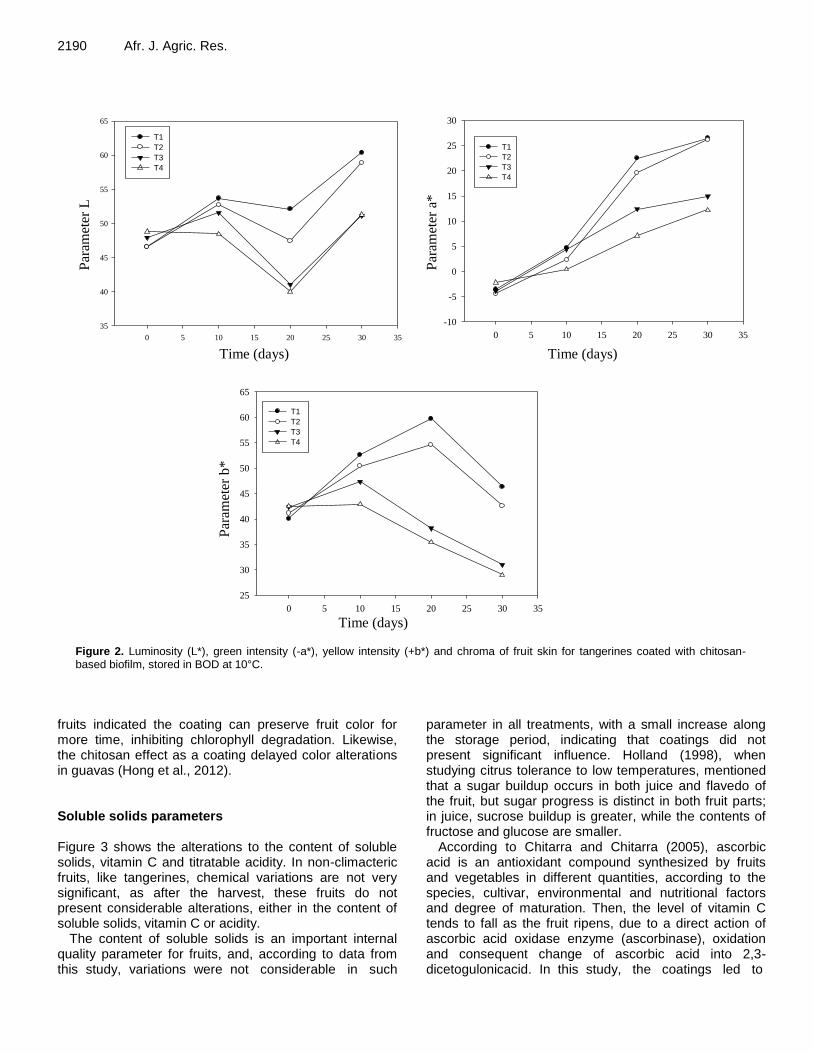
2190 Afr. J. Agric. Res.
Tempo (dias)
0 5 10 15 20 25 30 35
Par
âmet
ro L
35
40
45
50
55
60
65
T1
T2
T3
T4
Tempo (dias)
0 5 10 15 20 25 30 35
Pa
râm
etr
o a
*
-10
-5
0
5
10
15
20
25
30
T1
T2
T3
T4
Tempo (dias)
0 5 10 15 20 25 30 35
Pa
râm
etr
o b
*
25
30
35
40
45
50
55
60
65
T1
T2
T3
T4
Time (days) Time (days)
Par
amet
er a
*
Par
amet
er L
Time (days)
Par
amet
er b
*
Tempo (dias)
0 5 10 15 20 25 30 35
Par
âmet
ro L
35
40
45
50
55
60
65
T1
T2
T3
T4
Tempo (dias)
0 5 10 15 20 25 30 35
Pa
râm
etr
o a
*
-10
-5
0
5
10
15
20
25
30
T1
T2
T3
T4
Tempo (dias)
0 5 10 15 20 25 30 35
Pa
râm
etr
o b
*
25
30
35
40
45
50
55
60
65
T1
T2
T3
T4
Time (days) Time (days)
Par
amet
er a
*
Par
amet
er L
Time (days)
Par
amet
er b
*
Figure 2. Luminosity (L*), green intensity (-a*), yellow intensity (+b*) and chroma of fruit skin for tangerines coated with chitosan-based biofilm, stored in BOD at 10°C.
fruits indicated the coating can preserve fruit color for more time, inhibiting chlorophyll degradation. Likewise, the chitosan effect as a coating delayed color alterations in guavas (Hong et al., 2012). Soluble solids parameters Figure 3 shows the alterations to the content of soluble solids, vitamin C and titratable acidity. In non-climacteric fruits, like tangerines, chemical variations are not very significant, as after the harvest, these fruits do not present considerable alterations, either in the content of soluble solids, vitamin C or acidity.
The content of soluble solids is an important internal quality parameter for fruits, and, according to data from this study, variations were not considerable in such
parameter in all treatments, with a small increase along the storage period, indicating that coatings did not present significant influence. Holland (1998), when studying citrus tolerance to low temperatures, mentioned that a sugar buildup occurs in both juice and flavedo of the fruit, but sugar progress is distinct in both fruit parts; in juice, sucrose buildup is greater, while the contents of fructose and glucose are smaller.
According to Chitarra and Chitarra (2005), ascorbic acid is an antioxidant compound synthesized by fruits and vegetables in different quantities, according to the species, cultivar, environmental and nutritional factors and degree of maturation. Then, the level of vitamin C tends to fall as the fruit ripens, due to a direct action of ascorbic acid oxidase enzyme (ascorbinase), oxidation and consequent change of ascorbic acid into 2,3- dicetogulonicacid. In this study, the coatings led to

Figure 3. Soluble solids, vitamin C and total titratable acidity for tangerines coated with chitosan-based biofilm, stored in BOD at 10°C.
increased content of vitamin C, possibly because the coating reduces the gas exchange rate with the environment, inhibiting the ascorbic acid exposure to O2
Plácido et al. 2197 and concentrating it in the fruit. Han et al. (2014) reported delayed degradation of vitamin C in chitosan-coated luffa fruits (Luffa cylindrica). Total titratable acidity parameters Regarding total titratable acidity in fruits with chitosan concentrations of 1 g/100 ml and 2 g/100 ml, a reduction was observed in this parameter and in fruits with 0.5 g/100 ml and control fruits, an increase in acidity was seen. Scalon et al. (2012) explained the compounds responsible for acidity (organic acids) in fruits release hydrogen ions, contributing to increased acidity, and showing the senescence stage progress. However, in fruits with greater chitosan concentrations, peaks of acidity were observed between days 10 and 20, and reducing again to the initial level. This variation may be explained by the fruit variability; however, this tendency suggests delayed senescence of tangerines due to chitosan coatings.
Conclusion
Coatings are a simple and inexpensive way to significantly extend the shelf life of fruits. The mathematical models are effective in explaining the weight loss of fruits, with the coatings presenting a positive effect on delayed weight loss of fruits. Chitosan-based coating at the concentrations of 1 and 2 g/100 ml were efficient in delaying the yellow color of tangerines, which is the main indication of fruit ripening. Regarding the chemical parameters, coatings also ensured better maintenance in relation to soluble solids, vitamin C, and total titratable acidity, showing the positive effect of coatings. Conflict of Interests The authors have not declared any conflict of interests. ACKNOWLEDGEMENTS The authors would like to thank FAPEG (Research Support Foundation of the State of Goiás) for the financial support to this project and CAPES (Coordination for the Improvement of Higher Level Personnel) for the postdoctoral fellowship granted to the second and fourth authors. REFERENCES Ali A, Muhammad MTM, Sijam K, Siddiqui Y (2011). Effect of chitosan
coating son the physicochemical characteristics of Eksotika II papaya (Carica papaya L.) fruit during cold storage. Food Chem. 124:620-626.

2192 Afr. J. Agric. Res. Amariz A, Lima MAC, Trindade DCG, Santos ACN, Ribeiro TP (2010).
Coatings based on carboximethyl cellulose and dextrin in 'Tommy Atkins' mango fruit stored under refrigeration. Ciência Rural 40(10):199-205.
AOAC (1999). Official Methods of Analysis of the Association Analytical Chemists. 1999. 16th Edition, 5th Reversion, AOAC International, Gaithersburg, MD.
AOAC (1997). Official methods of analysis of the Association Analytical Chemists. 18.ed. Gaithersburg, Maryland.
Arnon H, Zaitsev Y, Porat R, Poverenov E (2014). Effects of carboxymethyl cellulose and chitosan bilayer edible coating on postharvest quality of citrus fruit. Postharv. Biol. Technol. 87:21-26.
Bautista-Baños S, Hernández-Lauzardo AN, Velázques-del Valle MG, Hernández-López, M, Ait Barka E, Bosquez-Molina E, Wilson CL (2006). Chitosan as a potential natural compound to control pre and postharvest diseases of horticultural commodities. Crop Protection 25(2):108-118.
Cantín CM, Minas IS, Goulas V, Jiménez M, Manganaris GA, Michailides TJ, Crisosto CH (2012). Sulfur dioxide fumigation alone or in combination with CO2-enriched atmosphere extends the market life of highbush blueberry fruit. Postharv. Biol. Technol. 67:84-91.
Cantín CM, Palou L, Bremer V, Michailides TJ, Crisosto CH (2011). Evaluation of the use of sulfur dioxide to reduce postharvest losses on dark and green figs. Postharv. Biol. Technol. 59:150-158.
Chitarra MIF, Chitarra AB (2005). Post-harvest of fruits and vegetables: physiology and handling. 2.ed. Lavras: UFLA. 785 p.
Detoni IAM, Herzog NFM, Ohland T, Kotz T, Clemente E (2009). Sun influence on the physical and chemical characteristics of 'Ponkan' tangerine cultivated in the west of Paraná state. Ciência e agrotecnologia 33(2):624-628.
Dhall R (2013). Advances in edible coatings for fresh fruits and vegetables: a review. Crit. Rev. Food Sci. Nutr. 53:435-450.
Doymaz I (2012). Evaluation of some thin-layer drying models of persimmon slices (Diospyros kaki L.). Journal Energy Conversion and Management, 56:199-205.
Dutta PK, Tripathi S, Mehrotra GK, Dutta J (2009). Perspectives for chitosan based antimicrobial films in food applications. Food Chem. 114:1173.
FAO (2012). Food and Agriculture Organization of the United Nations. Available in: file:///C:/Users/ADAIR-PC/Downloads/CitrusRT_34_1.pdf. Acessed in: 08/22/2015.
Han C, Zhao Y, Leonard SW, Traber MG (2004). Edible coatings to improve storability and enhance nutritional value of fresh and frozen strawberries (Fragaria × ananassa) and raspberries (Rubus ideaus). Postharvest Biology and Technology 33:67-78.
Han C, Zuo J, Wang Q, Xu L, Zhai B, Wang Z, Dong H, Gao L (2014). Effects of chitosan coating on postharvest quality and shelf life of sponge gourd (Luffa cylindrica) during storage. Scientia Hortic. 166:1-8.
Hancock J, Callow P, Serçe S, Hanson E, Beaudry R (2008). Effect of cultivar, controlled atmosphere storage, and fruit ripeness on the long-term storage of highbush blueberries. Hortic. Technol. 18:199-205.
Holland N (1998). Carbohydrate metabolism and tolerance of citrus fruits at low temperatures. PhD thesis - State University of Campinas. Faculty of Food Engineering 173 p.
Hong K, Xie J, Zhang L, Sun D, Gong D. (2012). Effects of chitosan coating onpostharvest life and quality of guava (Psidium guajava L.) fruit during cold storage. Acta Hortic. 144:172-178.
Hunterlab (1998). User‟s manual with software versions 3.5, Reston. Instituto Adolf Lutz (1985). Analytical standards of Adolf Lutz Institute: v. 1, chemical and physical methods for analysis of food 3:393.
Joas J, Caro Y, Ducamp MN, Reynes M (2005). Postharvest control of pericarp browning of litchi fruit (Litchi chinensisSonn cv Kwaï Mi) by treatment with chitosan and organic acids I. Effect of pH and pericarp dehydration. Postharv. Biol. Technol. 38:128-136.
Machado FLC, Costa JMC, Batista EN (2012). Application of carnauba-
based wax maintains postharvest quality of „Ortanique‟ tangor. Ciênc. Tecnol. Alimentos 32:261-266.
Mannheim C, Soffer T (1996). Permeability of different wax coatings and their effect on citrus fruit quality. Food Chem. 44:919-923.
Muzzarelli RAA, Boudrant J, Meyer D, Manno N, DeMarchis M, Paoletti MG (2012). Current views on fungal chitin/chitosan, human chitinases, food preservation, glucans, pectins and inulin: A tribute to Henri Braconnot, precursor of the carbohydrate polymers science on the chitin bicentennial. Carbohydr. Polymers 87(2):995-1012.
Rodrigo MJ, Alquézar B, Alós E, Lado J, Zacarías L (2013). Biochemical bases and molecular regulation of pigmentation in the peel of Citrus fruit. Sci. Hortic. 163:46-62.
Romanazzi G, Nigro F, Ippolito A (2003). Short hypobaric treatments potentiate the effect of chitosan in reducing storage decay of sweet cherries. Postharv. Biol. Technol. 29:73-80.
Scalon SPQ, Oshiro AM, Dresch DM (2012). Postharvest conservation of guavira (Campomanesia Adamantium Camb.) under different coating and temperatures of storage. Rev. Bras. Frutic. 34:1022-1029.
Shi S, Wang W, Liu L, Wu S, Wei Y, Li W (2013). Effect of chitosan/nano-silica coating on the physicochemical characteristics of longan fruit under ambient temperature. J. Food Eng. 118:125-131.
Silva DFP, Siqueira DL, Santos D, Machado DLM, Salomão LCC (2011). Edible coatings on postharvest life of „mexerica-do-rio‟. Rev. Bras. Frutic. 33:357-362.
Togrul H, Arslan N (2004). Carboxymethyl cellulose from sugar beet pulp cellulose as a hydrophilic polymer in coating of mandarin. J. Food Eng. 62:271-279.
Vale AAS, Santos CD, Abreu CMP, Corrêa AD, Santos JA (2006). Chemical, physical and physical–chemical changes on tangerina 'ponkan' (Citrus reticulata Blanco) under refrigerated storage. Ciênc. Agrotecnol. 30:778-786.
Valencia-Chamorro S, Perez-Gago M, Del Rio M, Palou L (2010). Effect of antifungal hydroxypropyl methylcellulose-lipid edible composite coatings on Penicilliumdecay development and postharvest quality of cold-stored „Ortanique‟ mandarins. J. Food Sci. 75:418-426.
Zahid N, Ali A, Siddiqui Y, Maqbool M (2013). Efficacy of ethanolic extract of propolis in maintaining postharvest quality of dragon fruit during storage. Postharv. Biol. Technol. 79:69-72.

African Journal of
Agricultural Research
Related Journals Published by Academic Journals
African Journal of Environmental Science & Technology
Biotechnology & Molecular Biology Reviews
African Journal of Biochemistry Research
African Journal of Microbiology Research
African Journal of Pure & Applied Chemistry
African Journal of Food Science
African Journal of Biotechnology
African Journal of Pharmacy & Pharmacology
African Journal of Plant Science
Journal of Medicinal Plant Research
International Journal of Physical Sciences
Scientific Research and Essays