Towards a minimum data set to assess soil organic matter quality in agricultural soils
Upload
khangminh22Category
view
0download
0
LandbauforschungJournal of Sustainable and
Organic Agricultural Systems
Vol. 69 (1) 2019
Exploration and mitigation of greenhouse gas emissions in ruminant and grassland systems
LandbauforschungJournal of Sustainable and
Organic Agricultural Systems
Vol. 69 (1) 2019
EditorJohann Heinrich von Thünen InstituteInstitute of Organic FarmingTrenthorst 3223847 WesterauGermany
www.landbauforschung.net
ISSN 0458-6859Price 8 €
Main keywords in this issue
agricultural methane
ruminants
food security
Nitrous oxide �ux
soil organic carbon
GHG emissions livestock
farming
CH4
N2O nitrogen
climate change
wet agriculture
feed crops
enteric fermentation
know
ledg
e ex
chan
ge
stakeholders
food systems
heal
thy
diet
s
dietary change
land-use change
mitigation strategy
fertilising
energy
energy
GHG reduction potential
agri
cultu
re
spot measurements
man
ure
man
agem
ent
GH
G m
itiga
tion
peat
land
met
hane
em
issi
ons
ammonia
food security
carb
on c
redi
ts
ecosystem services
pasture grazing
veri�cation e�ciency
agricultural extension
agri-
food
syst
ems
policy transaction cost
dairy cow
gree
nhou
se g
ases
carbon sequestration
Types of papers Research articles present original new research results. The material should not have been previously published elsewhere. The novelty of results and their possible use in further development of sustainable and organic agricultural systems should be clearly claimed.
Review articles present new overviews generated from existing scientific literature to analyse the current state of knowledge. Conclusions on necessary consequences for further sustainable development of agricultural systems and research needs shall be drawn.
Position Papers present sciencebased opinions on new, or possibly disruptive, developments in sustainable agricultural systems. Authors should use scientific references to validate and approve arguments for a position. These papers shall allow the reader to understand controversial positions and to find an own position.
Interdisciplinary contributions, approaches and perspectives from all scientific disciplines are needed and welcome to cover the broad scope of the journal. We also aim at publishing review processes and positions in agreement with the authors. Authors are responsible for the content of their articles and contributions. The publishers are not liable for the content.
With the submission of a manuscript, the authors grant permission for publication. The guidelines for the submission of manuscripts can be found under https://www.landbauforschung.net/instructions/forauthors/ or obtained from the publishers.
Landbauforschung Journal of Sustainable and Organic Agricultural Systems
C A L L F O R P A P E R S F O R T H E S P E C I A L I S S U E
Exploration and mitigation of greenhouse gas emissions in ruminant and grassland systems
Today the pure numbers of ruminants, their methane emissions, their worldwide feedstuff demand and the related emissions, as well as improper and inefficient use of their excrements make them one of the biggest sources for greenhouse gas emissions in agriculture. We also face grassland systems that are overfertilised, overgrazed and destroyed due to missing concepts for their use under protection of their ecosystem services and soil carbon stocks.
This situation still evokes many scientific questions how to build appropriate and climate friendly ruminant and grassland production systems in different parts of the world. Also we need to find ways to curb the consumers demand, e.g. for milk and meat from ruminants. We have to develop strategies for a rapid worldwide conversion of production and consumption to mitigate greenhouse gas emissions.
We would be very pleased if you could contribute to this issue. We publish (1) original research and review papers and (2) science based position papers from all science disciplines. We are interested in worldwide experiences and views.
Landbauforschung – Journal of Sustainable and Organic Agricultural Systems is a peerreviewed interdisciplinary journal for scientists concerned with new developments towards sustainable agricultural systems. Of special interest is the further development of agricultural systems to generally fulfil the sustainable development goals of the United Nations’ Agenda 2030, and also of organic farming systems.
Each issue addresses a previouslyannounced special topic. The journal is published in English, electronic only. Submissions are subject to a doubleblind peer review. All contributions are available open access and are available online after acceptance.
Landbauforschung is peerreviewed and indexed in: CAB International, Science Citation Index Expanded, Current Contents/Agriculture, Biology & Environmental Sciences, Scopus, Web of Science.
Publisher Johann Heinrich von Thünen Institute, Institute of Organic Farming
Editor in Chief Dr. Hans Marten Paulsen
Editorial team Dr. Karen Aulrich Dr. Kerstin Barth Dr. Solveig March Prof. Dr. Gerold Rahmann Ute Rather, M.A.
Editorial office Landbauforschung – Journal of Sustainable and Organic Agricultural Systems Thünen Institute of Organic Farming Trenthorst 32 23847 Westerau Germany Phone +49 4539 8880 0 Fax + 49 4539 8880 120 [email protected] www.landbauforschung.net www.thuenen.de
Follow us @landbauforsch
Graphic design and typesetting Ute Rather, Thünen Institute of Organic Farming
Cover photos alphafotos/stock.adobe.com
ISSN 27008711
Copyright
Since 2019, all articles in Landbauforschung are provided according to the Creative Commons Attribution 4.0 Internati onal Licence (CC BY 4.0). To view a copy of this license, please visit http://creativecommons.org/licenses/by/4.0/
L A N D B A U F O R S C H · J Sustainable Organic Agric Syst · 69(1)2019
V O L . 6 9 (1) 2 019
ContentsExploration and mitigation of greenhouse gas emissions in ruminant and grassland systems
E D I T O R I A L Hans Marten Paulsen and Claudia Heidecke
P O S I T I O N P A P E R Livestock and climate change: what are the options? 1–4 Henning Steinfeld
P O S I T I O N P A P E R Recognize the high potential of paludiculture on rewetted peat soils to mitigate climate change Jeroen J. M. Geurts, Gert-Jan A. van Duinen, Jasper van Belle, Sabine Wichmann, Wendelin Wichtmann, 5–8 and Christian Fritz
P O S I T I O N P A P E R Farm-level digital monitoring of greenhouse gas emissions from livestock systems could facilitate control, optimisation and labelling 9–12 Uwe A. Schneider, Livia Rasche, and Kerstin Jantke
R E S E A R C H A R T I C L E Applying a conceptual framework for effective implementation of on-farm greenhouse gas mitigation: Evaluation of knowledge exchange methods in Wales and Uruguay13–24 Richard P. Kipling and Gonzalo Becoña
P O S I T I O N P A P E R Reducing ruminant numbers and consumption of animal source foods are aligned with environmental and public health demands25–30 Benjamin Leon Bodirsky, Prajal Pradhan, and Marco Springmann
P O S I T I O N P A P E R Greenhouse gases from pastoral farming – a New Zealand perspective31–36 Alan Thatcher
R E S E A R C H A R T I C L E Modelling greenhouse gas emissions from organic and conventional dairy farms37–46 Helmut Frank, Harald Schmid, and Kurt-Jürgen Hülsbergen
R E S E A R C H A R T I C L E Modified approach to estimating daily methane emissions of dairy cows by measuring filtered eructations during milking47–56 Matt. J. Bell, Phil Garnsworthy, Dimitris Mallis, Richard Eckard, Peter Moate, and Tianhai Yan
R E S E A R C H A R T I C L E – A C C E P T E D B Y T H E F O R M E R S C O P E O F L A N D B A U F O R S C H U N G Pork production in Thuringia – management effects on ammonia and greenhouse gas emissions. 2. Reduction potentials and projections Ulrich Dämmgen, Wilfried Brade, Hans-Dieter Haenel, Claus Rösemann, Heinrich Kleine Klausing, 57–74 J. Webb, and Andreas Berk
A C K N O W L E D G E M E N T S T O O U R R E V I E W E R S Ute Rather
V O L . 6 9 (1) 2 019
EditorialExploration and mitigation of greenhouse gas emissions in ruminant and grassland systems
In this first issue of Landbauforschung in 2019 we focus on the ‘Exploration and mitigation of greenhouse gas emissions in ruminant and grassland systems’. In our call for papers, we highlighted the environmental and climate burdens related to methane and nitrogen emissions from worldwide ruminant production systems. We also addressed the role of soil carbon storage in grassland when it is threatened by mismanagement or when it is replaced by arable cultures. And on the other hand we highlighted that, more efficient management offers chances to improve ruminant productivity, to reduce its num-bers worldwide and to alleviate its product-related climate burden. We asked scientists from all disciplines to contribute their knowledge on the multi-faceted role of ruminants and grassland and its management in today’s international agriculture, and for efficient ways to mitigate their greenhouse gas emissions. Also we got some interesting research contributions from the ‘International Conference on Agricultural Greenhouse Gas Emissions and Food Security: Connecting Research to Policy and Practice‘ that took place from September 10–13, 2018 in Berlin, Germany. Please find also a subsequently included article on pig production and greenhouse gases as accepted by the former scope of the journal.
One initiative of the new Landbauforschung editorial office, beyond the new focus as Journal of Sustainable and Organic Agricultural Systems from 2019 on, was to implement five new elements to increase visibility, quality and interest:
• A focus on a special topic announced in advance for each issue. • A new ‘Position Paper‘ format. This is a shorter scientific communication on ideas and new developments or demands or
an innovative summary of developments. • A strict international and interdisciplinary focus. • A double-blind international review process with publication of all reviewers’ comments on the website. • Possibilities to place online comments to all forms of articles.
Particularly the new format ‘Position Paper’ challenged the authors to find focus. It was sometimes hard to claim the exclusivi-ty and innovation of their position with the limited space available and at the same time to satisfy the reviewers’ demands for scientific quality. We hope that with transparency in the review process we can show that discussions were already started here. We will also use this new format to stimulate scientific discussion and future topics.
With all mentioned changes it was a long but interesting path to finishing this first issue. We hope you enjoy the articles and position papers selected for publication. We would like to thank all reviewers who helped to select and improve the submis-sions. With their consent, all participating reviewers are listed at the end of this issue.
Hans Marten Paulsen and Claudia Heidecke
L A N D B A U F O R S C H · J Sustainable Organic Agric Syst · 69(1)2019
For the editorial teamHans Marten PaulsenChief editor LandbauforschungThünen Institute of Organic Farming, Germany
As guest editor from the conference in BerlinClaudia HeideckeCoordination Unit ClimateThünen Institute, Germany
Hans Marten Paulsen Claudia Heidecke
© p
rivat
e
© p
rivat
e
Dear colleagues, authors, reviewers and readers!
1Steinfeld (2019) · L A N D B A U F O R S C H · J Sustainable Organic Agric Syst · 69(1):1–4
P O S I T I O N P A P E R
Livestock and climate change: what are the options?Henning Steinfeld1
1 FAO Livestock Information, Sector Analysis and Policy Branch (AGAL), Italy
C O N TA C T: [email protected]
1 The tension around livestock
Our food and agriculture systems are both broken. On the food side: hunger, food insecurity and malnutrition are ma king a resurgence, while excess weight, obesity and diet-related diseases have become a global epidemic (FAO, IFAD, UNICEF, WFP, and WHO, 2019). On the agriculture side: growing resource depletion and rapidly accelerating envi-ronmental degradation are breaching planetary boundaries (Rockström et al., 2009; Steffen et al., 2015), most notably in the form of climate change (IPCC, 2019).
Livestock systems, in particular, have been singled out as a major driver of environmental change (FAO, 2006). Specifical-ly, ruminant grazing systems play a major role in land and bio-mass use (Gerber et al., 2013). The majority of human appro-priation of net primary production (HANPP) goes to livestock (Haberl et al., 2007). The sector is responsible for around 2/3 of emissions from agriculture and land use (FAOSTAT, 2016). It uses 80 % of agricultural land, most of which is pasture but around 30 % of total arable land is used for feed production (Mottet et al., 2017). Through habitat occupation and change (Leadley et al., 2010; Mitloehner, 2010), the sector affects bio-diversity in numerous direct and indirect ways (Dise et al., 2011; Bobbink et al., 2010). It draws heavily on nutrients: con-suming around 65 Tg of nitrogen (Uwizeye, 2019) and some 111,000 km³ (approximately 10 %) of annual global water flows (Deutsch et al., 2010). Animals are also involved in the
emergence and spread of diseases affecting human health (SOFA, 2009).
Currently, a total of six billion metric tons of biomass (dry matter) is needed annually for farmed animals to live and grow (Mottet et al., 2017). Around 3/4 are roughage, made up of grass, leaves, crop residues and cultivated fodder. Grains are responsible for around 13 % of total feed consumption but account for one third of all cereals cultivated – a share that continues to grow (Mottet et al., 2017). Oilseed rape and its by-products make up the rest.
Current projections indicate a continued growth in demand for meat, milk and eggs, driven by population and income growth in low and middle income countries (OECD/FAO, 2019). Livestock systems are dynamic and are engaged in rapid structural change. Productivity growth results from intensification associated with an increased use of concen-trate feed, a shift from ruminants to monogastrics (poultry in particular), growing volumes of production and process-ing, and strong vertical integration. Livestock production has become more geographically concentrated in areas with good access to feed and urban markets. Trade in feed and livestock has grown, implying large volumes of transferred resources and emissions. There are significant regional differ-ences, with increases in demand and future transformation likely to be most prominent in Africa, where demand is pro-jected to triple by 2050 (FAO, 2017).
Received: August 28, 2019 Revised: November 24, 2019Accepted: November 29, 2019
K E Y W O R D S agri-food systems, livestock, climate change, ruminants
Henning Steinfeld
© p
rivat
e
DOI:10.3220/LBF1579517165000
2 Steinfeld (2019) · L A N D B A U F O R S C H · J Sustainable Organic Agric Syst · 69(1):1–4
2 Emissions and livestock
The transformation of feed into livestock products is associ-ated with direct and indirect emissions of greenhouse gases (GHG), amounting to 7.1 Gt of CO2eq annually, which equates to around 14.5 % of all anthropogenic emissions (Gerber et al., 2013). Direct emissions are produced from the animal and are associated with biological processes such as enteric fermen-tation as well as manure and urine excretion. Ruminants pro-duce large amounts of methane – a short-lived climate gas – through enteric fermentation. Methane and N2O emissions are produced via the nitrification/denitrification of manure and urine. Indirect emissions come from the production of fertiliser for feed production (CO2), feed production itself (CO2 and N2O), manure storage and application (N2O and CH4), as well as the processing and transportation of feed, animals and livestock products (CO2). Comparisons within the sys-tem point to large variations in production efficiency and, therefore, to considerable potential for emission reductions through the adoption of best practices.
Emission intensities vary widely among different livestock species and foods. On average, they are highest for ruminant products, especially beef and small ruminant meat (295 and 201 kg of CO2eq per kg of protein). Cattle milk stands at 86 kg. Emission intensities are lowest for poultry products (eggs at 31 kg and poultry meat at 35 kg) and somewhat higher for pork at 55 kg of CO2 eq per kg of protein (Gerber et al., 2013).
The scale of the emissions and the abatement poten-tial have drawn livestock, and meat in particular, into the climate debate. On an international level, that debate must take into account the role that livestock play in food securi-ty and for the poor. They provide nutritious and appetising food, and play a key role in many rural economies. Livestock are an important buffer in local and national food systems, represent the largest asset for many farmers, and are vital for the poor in rural communities. They provide income and employment, fertiliser (manure), energy (biogas and traction) and other products such as leather, hair and wool. Livestock feature prominently in various cultures and are part of many cultural identities.The debate also needs to be held in the context of maintain-ing a healthy diet. Eating habits are changing worldwide, often for the worse, and obesity and diet-related diseases have become global public health concerns, heavily impact-ing human lives at high costs. Dietary requirements differ a great deal between individuals and population groups. Ani-mal food products convey distinct nutritional advantages to humans because of the quality and availability of key nutrients.
3 What can be done
How, then, can livestock and climate change be reconciled? There are four major ways of alleviating this conflict: increas-ing efficiency at all levels, creating offsets and other environ-mental benefits, recycling nutrients and energy, and seeking alternatives across the spectrum.
Firstly, the ongoing process of increasing productivity in livestock systems makes resource use more efficient. In
many parts of the world, technological innovations – such as improved feeding, genetics, animal health and information technology – and organisational innovations are driving up productivity and reducing resource use and environmental impact, relative to the amount of livestock produced. There is also considerable scope for greater efficiency in fertiliser production, by using renewable energy, for example, and in its application in feed production, through precision applica-tion for instance. This productivity growth has mostly been in response to increasing demand rather than any climate con-siderations. However, the intensification process could be steered towards low emissions if the appropriate incentives were set. For example, productivity is still stubbornly low in large parts of Sub-Saharan Africa, Latin America and South Asia. It is low because their systems serve purposes other than production, such as asset building in the form of stock (as in Africa and South Asia), or through rising land prices (as in Latin America). In these cases, policies are required that encourage efficiency and better agro-ecological integra-tion, and discourage the keeping of animals for asset accu-mulation. Extensive, labour-intensive livestock systems with low productivity, prevalent in many low and middle-income countries, are obvious targets for low carbon investments (Mitloehner, 2010).
Secondly, regenerative forms of grazing can generate car-bon offsets and other environmental benefits. Well-adapted grazing systems with improved pasture and optimised graz-ing regimes have the potential to stimulate plant growth and capture soil carbon, particularly in areas where degradation is not yet severe. In particular, the introduction of trees in trop-ical pastures on previously forested land (silvo-pastoralism) and other forms of agro-ecology (Bonaudo et al., 2014) can help to stabilise productivity and generate multiple social and environmental benefits. Whilst the potential for carbon sequestration and the permanence of such capturing meth-ods are still subject to much debate, the extent of pasture degradation and loss of productivity is such that urgent action is required even if large carbon gains may not be real-ised in the short term. Regenerative grazing can also contrib-ute to improved biodiversity and water efficiency. Such pos-itive externalities need to be recognised through payments for environmental services. At the same time, slowing down and reversing the expansion of pastures into forests remains the most effective way for grazing systems to contribute to mitigation. The same applies to forest clearance for produc-ing feed crops.
Thirdly, emissions can be reduced by reverting to one of the original reasons for keeping livestock: recycling nutrients and energy. Traditional links between livestock and arable farming have become increasingly severed over the course of intensification, and livestock operations have become con-centrated in areas with limited arable land on which to apply manure. This disrupts nutrient cycles and creates depletion upstream as well as excesses downstream. Cycles can oper-ate on various levels, for instance, within farms, on the water-shed level or globally. While there are considerable differ-ences in recycling practices, large amounts of potential feed such as crop residues, agro-industrial by-products and food
3Steinfeld (2019) · L A N D B A U F O R S C H · J Sustainable Organic Agric Syst · 69(1):1–4
waste are unused, often with direct adverse environmental impact as well as a loss of opportunity for recycling. Similarly, only a fraction of the nutrients contained in animal waste are returned to the land in a useful way. A combination of regula-tions and spatial planning is required to create opportunities and incentives for recycling, which will reduce the impact on our climate.
Fourthly, there are alternative paths to the one which depends on conventional feed and livestock. Bio-techno-logical innovations are revolutionising the way protein can be produced and used. This includes established practices such as the use of synthetic amino acids, novel techniques involving algal, fungal and microbial proteins, replacing con-ventional feed protein such as soy, and making its use more efficient. The use of insects has also been growing, both for feed and food.
There is a rapidly growing interest in substitutes for live-stock products. Most of them are plant-based imitations of the original product, however, there is a rapidly growing field of application in microbial protein. While their actual environmental impact varies, there can be little doubt that low-carbon alternatives to today’s livestock products can be developed rapidly, given the massive start-up investments that are taking place. Plant-based alternatives also appeal to concerns around animal welfare and healthy diets. Efforts are also underway to generate synthetic meat through cellular agriculture based on stem cells. Policies that discourage the consumption of high-emission food products, such as beef, through awareness-building and taxation are also being con-sidered.
Each of these approaches has considerable potential to reduce livestock emissions, and they will be even more pow-erful in combination, with different approaches being more relevant to different social contexts and food systems.
4 Time to act
Livestock play a large role in natural resource use, and, as such, have taken centre stage in the climate change debate as an obvious target for mitigation. The pressure to reduce emis-sions will only increase, fuelled by consumer concerns around diet, health and animals. Plant-based alternatives have recently seen a rapid upsurge. Livestock systems will have to adapt, not only to climate change and market demands, but also as a result of upcoming policy changes aimed at low-cost mitigation options. It is only a matter of time before livestock become a direct target of climate change policies.
Ruminant systems, particularly beef, are being challenged the most. Research is underway to reduce enteric methane emissions by manipulating the rumen flora, however, related techniques are not yet practical or cost-effective. For now, the only way to substantially reduce emissions is through offsets from afforestation and soil carbon.
Climate change calls the place of livestock in food and agriculture into question. Finding that place, and renewing the license to operate, is urgent. Such efforts need to be built on transparency and a consensus on methods for measur-ing emissions and tracking progress. Pricing and regulations
must encourage best practice and responsible consumption. Engagement from all stakeholders is required in conjunction with local solutions to tap the potential of livestock systems and contribute to climate action.
R E F E R E N C E S
Bobbink R, Hicks K, Galloway J, Spranger T, Alkemade R, Ashmore M, Busta-mante M, Cinderby S, Davidson E, Dentener F, Emmett B (2010) Global assessment of nitrogen deposition effects on terrestrial plant diversity: a synthesis. Ecological Applications 20(1):30–59, doi:10.1890/08-1140.1
Bonaudo T, Bendahan AB, Sabatier R, Ryschawy J, Bellon S, Leger F, Magda D, Tichit M (2014) Agroecological principles for the redesign of integrated crop–livestock systems. Eur J Agron 57:43–51, doi:10.1016/j.eja.2013.09.010
Deutsch L, Falkenmark M, Gordon L, Rockström J, Folke C, Steinfeld H, Mooney HA, Schneider F, Neville LE (2010) Water-mediated ecological conse quences of intensification and expansion of livestock production. In: Steinfeld H, Mooney H, Schneider F, Neville F (eds) Livestock in a Changing Landscape: Drivers, Consequences and Responses, Island Press (1):97–111
Dise N, Ashmore M, Belyazid S, Bleeker A, Bobbink R, de Vries W, Erisman JW, Spranger T, Stevens CJ, van den Berg L (2011) Nitrogen as a threat to European terrestrial biodiversity. In: Sutton MA (ed) The European nitro-gen assessment. Cambridge University Press, Cambridge, 463–494
FAO (2006) Livestock‘s long shadow: environmental issues and options. Rome, FAO
FAO, IFAD, UNICEF, WFP and WHO (2019) The State of Food Security and Nutri-tion in the World 2019. Safeguarding against economic slowdowns and downturns. Rome, FAO
FAO (2017) The future of food and agriculture – Trends and challenges. RomeFAOSTAT (2016) FAOSTAT. Food and Agriculture Organization of the United
Nations, RomeGerber PJ, Steinfeld H, Henderson B, Mottet A, Opio C, Dijkman J, Falcucci A,
Tempio G (2013) Tackling climate change through livestock: A global assessment of emissions and mitigation opportunities. Food and Agriculture Organization of the United Nations, FAO, Rome
Haberl H, Erb KH, Krausmann F, Gaube V, Bondeau A, Plutzar C, Gingrich S, Lucht W, Fischer-Kowalski M (2007) Quantifying and mapping the human appropriation of net primary production in earth‘s terrestrial ecosystems. PNAS 104(31): 12942–12947, doi:10.1073/pnas.0704243104
IPCC (2018) Global warming of 1.5°C. An IPCC Special Report on the impacts of global warming of 1.5°C above pre-industrial levels and related global greenhouse gas emission pathways, in the context of strengthening the global response to the threat of climate change, sustainable develop-ment, and efforts to eradicate poverty [Masson-Delmotte et. al. (eds.), online]. Retrieved from <https://www.ipcc.ch/sr15/> [at 10 Dec. 2019]
Leadley P, Pereira HM, Alkemade R, Fernandez-Manjarrés JF, Proença V, Schar-lemann JPW, Walpole, MJ (2010) Biodiversity Scenarios: Projections of 21st century change in biodiversity and associated ecosystem services. A technical report for the global biodiversity outlook 3. Secretariat of the Convention on Biological Diversity, Montreal. Technical Series No. 50, 132 pp
Mitloehner FM (2010) Is the rising demand for animal protein fuelling climate change? Journal of Animal Breeding and Genetics 127: 421–422, doi:10.1111/j.1439-0388.2010.00909.x
Mottet A, de Haan C, Falcucci A, Tempio G, Opio C, Gerber P (2017). Livestock: On our plates or eating at our table? A new analysis of the feed/food de-bate. Global Food Security 14, 1–8, doi:10.1016/j.gfs.2017.01.001
OECD/FAO (2019) OECD-FAO Agricultural Outlook 2019-2028, OECD Publi-shing, Paris. Food and Agriculture Organization of the United Nations, Rome, doi:10.1787/agr_outlook-2019-en
Rockström J, Steffen W, Noone K, Persson Å, Chapin III FS, Lambin EF, Lenton TM, Scheffer M, Folke C, Schellnhuber HJ et al. (2009) A safe operating space for humanity. Nature 461:472–475, doi:10.1038/461472a
SOFA (2009) The State of Food and Agriculture. 2009. Livestock in the balance. Rome, FAO

4 Steinfeld (2019) · L A N D B A U F O R S C H · J Sustainable Organic Agric Syst · 69(1):1–4
Steffen W, Richardson K, Rockström J, Cornell SE, Fetzer I, Bennett EM, Biggs R, Carpenter SR, De Vries W, De Wit CA et. al. (2015) Planetary boundaries: Guiding human development on a changing planet. Science 347 (6223):1259855, doi:10.1126/science.1259855
Uwizeye A (2019) Nutrient challenges in global livestock supply chains: an assessment of nitrogen use and flows. Wageningen University, Thesis in-ternal PhD, doi:10.18174/469578
5Geurts et al. (2019) · L A N D B A U F O R S C H · J Sustainable Organic Agric Syst · 69(1):5–8
P O S I T I O N P A P E R
Recognize the high potential of paludiculture on rewetted peat soils to mitigate climate changeJeroen J. M. Geurts1, Gert-Jan A. van Duinen 2, Jasper van Belle3, Sabine Wichmann 4, Wendelin Wichtmann 4, and Christian Fritz5
1 Radboud University Nijmegen, Department of Aquatic Ecology & Environmental Biology and B-Ware Research Centre, Nijmegen, The Netherlands
2 Bargerveen foundation, Nijmegen and Waterboard De Dommel, Boxtel and Waterboard Aa & Maas, Den Bosch, The Netherlands
3 Van Hall Larenstein University of Applied Sciences, Leeuwarden, The Netherlands
4 University of Greifswald, Institute of Botany and Landscape Ecology, Germany
5 Radboud University Nijmegen, Department of Aquatic Ecology & Environmental Biology, The Netherlands
C O N TA C T: [email protected]
1 Introduction
Draining peat soils leads to oxidation of the peat and soil subsidence. In Germany, drained peatlands account for only 7 % of the agricultural land but are responsible for 37 % of the agricultural greenhouse gas (GHG) emissions (GMC, 2018). Rewetting peat soils appears to be a cost efficient GHG mitigation measure (Röder et al., 2015). The ideal situation would be a natural colonisation with peat forming plants after rewetting and a return to a carbon sequestrating sys-tem without harvesting. However, the productive function can often not be relinquished and paludiculture, the practice of productive use of wet and rewetted peatlands, should be considered. In paludiculture, harvesting wet crops for food, fodder, fibre and fuel is combined with the provision of vital ecosystem services (Wichtmann et al., 2016). This concept provides production opportunities for the necessary, funda-mental change in land use of drained peatlands to a more sustainable, wetter land use, which should benefit both the regional economy and the climate. Peatlands used for palu-diculture maintain a productive function under permanent-
ly wet, peat preserving conditions. The average groundwater level in the growing season is 20 cm below the soil surface or higher, and the minimum groundwater level is never more than 40 cm below the soil surface (Geurts and Fritz, 2018). This implies that drained grasslands and croplands can be converted into peat moss lawns, reed and cattail plantations, or wet meadows with grass species adapted to a higher soil moisture content. The biomass can be used for a whole range of products and applications, including human consumption and fodder, or wet grasslands can still be used as pastures (e.g. by light dairy cows or water buffaloes).
2 Paludicrops
There are various types of peatland cultivation systems with crops grown under wet conditions, so-called paludicrops. Many of these are ready to be implemented on a larger scale, including on farms. Biomass yields of 15 to 30 t dry matter per ha are potentially possible (Heinz, 2012; Köbbing et al., 2013; Grosshans, 2014), which is comparable to conven-tional crops. Paludicrops can be used as fodder, as protein
DOI:10.3220/LBF1576769203000
Received: July 8, 2019 Revised: August 26, 2019Accepted: August 26, 2019
K E Y W O R D S peatland, wet agriculture, GHG reduction potential, ecosystem services, carbon credits, food security
Jeroen J. M. Geurts Gert-Jan A. van Duinen
© S
usan
Geu
rts
© B
arge
rvee
n Fo
unda
tion
6
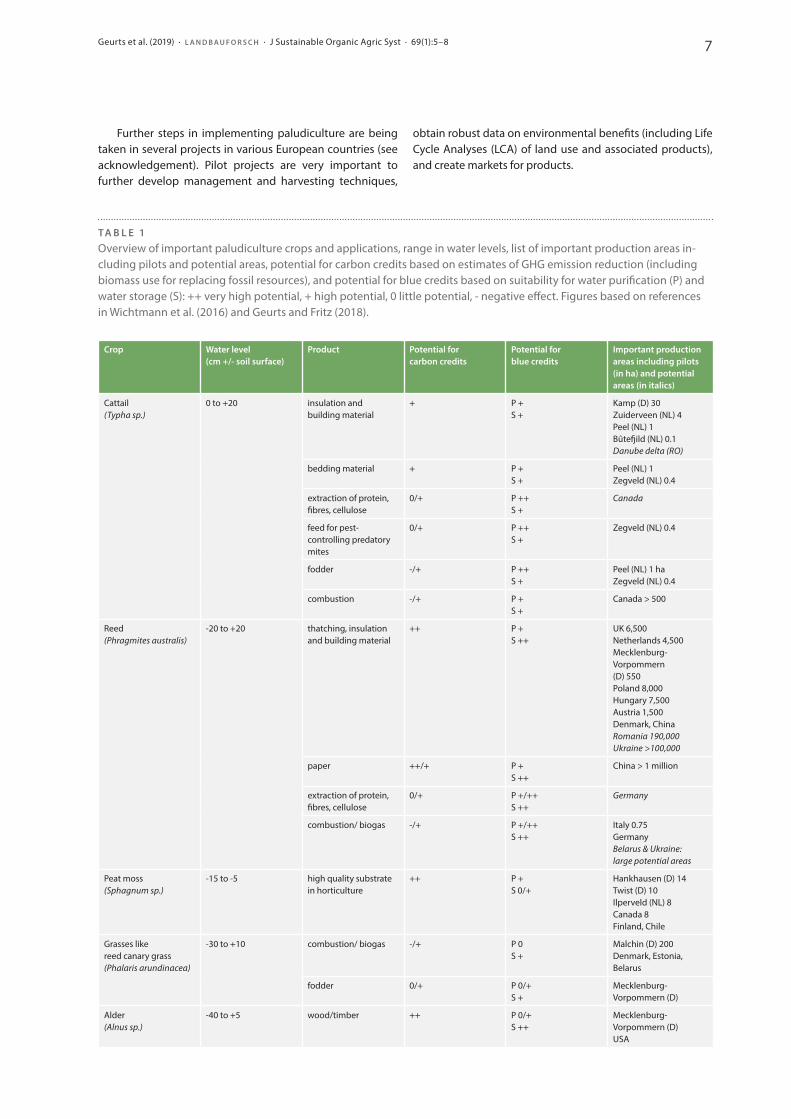
source, or as raw material for the production of horticultural growing substrates, or alternatively for bio-energy and as a resource for bio-based materials (insulation, building materi-als, paper, bioplastics). Paludicrops differ in their soil chemical and hydrological requirements, and growers need to adapt to these requirements (Geurts and Fritz, 2018). Table 1 lists promising paludicrops, their preferred range in water levels, applications for which they are grown (both on-farm and off-farm), existing pilots and large-scale implementation, and to which extent they have potential for carbon and blue cred-iting systems (see below). Moreover, usage of biomass for bio-based materials will prolong the lifecycle of carbon, as compared to fodder for ruminants where part of the carbon is rapidly emitted again as CH4 and CO2.
3 Payments for ecosystem services
There is a large GHG emission reduction potential when rewetting drained and fertilised peat soils, commonly 40 to 60 t CO2-eq ha-1 a-1 for productive and fertilised grasslands. Firstly, CO2 emissions become lower at higher groundwater levels and approach zero in waterlogged soil. Secondly, emis-sions of N2O, a very strong GHG, are reduced as N fertilisa-tion will usually be decreased and N2, rather than N2O, will be formed during denitrification when oxygen availability is low in wet conditions (Tiemeyer et al., 2016). In addition to biomass use, the GHG emission reduction creates opportuni-ties for business models based on carbon crediting schemes (e.g. Moorfutures®; Joosten et al., 2015; Günther et al., 2018). The climate mitigation potential is partly counteracted by methane emissions that are largely driven by summer inun-dation, topsoil chemistry, vegetation type, availability of easi-ly decomposable biomass, and nutrient or carbon input (Cou-wenberg and Fritz, 2012). Guidelines for low GHG emission (< 10 t CO2-eq ha-1 a-1) production cycles on rewetted peat-lands are available (Tiemeyer et al., 2016; Günther et al., 2017; Geurts and Fritz, 2018). In addition, every hectare of drained peatland that is converted to paludiculture is as effective as taking climate mitigation actions on 10 to 100 ha of mineral soils for food production, which would have led to a lower productivity (e.g. lower use of fertilisers).
In addition to climate benefits, paludiculture can reduce nutrients in surface water and reduce flood risks and droughts by acting as temporary water storage areas, and increase biodiversity compared with conventional agriculture. In so-called blue crediting schemes, farmers could be paid for these water management related ecosystem services (Bohlen et al., 2009; Grygoruk et al., 2013). However, these schemes are still in the development stage.
4 Pilot projects
Paludiculture pilots and demonstration sites on a farm-scale already exist in various countries (Table 1). Preliminary results suggest that peat forming paludicrops (e.g. peat moss, reed and alder) grown at groundwater levels 10 cm below the soil surface are the optimal compromise between biomass pro-duction, climate mitigation, and peat preservation (Schäfer
and Joosten, 2005; Jurasinski et al., 2016; Günther et al., 2017). However, some crops, such as cattail, perform better at water levels 5 to 20 cm above the surface, which may lead to sub-stantial methane emissions in case of adverse circumstances (high carbon input or presence of fresh litter (Couwenberg and Fritz, 2012). Harvesting belowground biomass is not eli-gible since causing regular soil disturbance conflicts with the preservation of the peat carbon stock as a primary con-cern of paludiculture. In addition, caution should be taken if using exotic plant species as paludicrops (e.g. wild rice, rice, giant reed, miscanthus), because they may become invasive (Matthews et al., 2015).
5 Opportunities and bottlenecks for implementation
For large-scale implementation of paludiculture, long-term schemes and income security for farmers is required. In this respect, paludicrops need to acquire the general eligibility for agricultural payments in the first and second pillar of the EU’s Common Agricultural Policy (CAP) as currently exist for conventional CO2-intensive crops from drainage-based agri-culture (Wichmann, 2018). So far, most paludicrops lack the status of agricultural crops despite centuries of productive use (e.g. reed for thatching, willow for wattle fences). With-in the next funding period, any kind of cultivation for food, fibre, or energy on rewetted peat soils should become eli-gible for direct CAP payments. Furthermore, future public payment schemes need to set a new course by considering the external effects of peatland use, i.e. phasing out any sup-port for drainage-based peatland use, supporting the shift to paludiculture (e.g. investments for planning, planting, special machinery), and paying for reduced GHG emissions and other ecosystem services provided by wet and rewetted peatlands (Wichmann, 2018). Moreover, the application of the ‘polluter pays principle’ (e.g. used in the Water Framework Directive; Correljé et al., 2007) on drainage-based peatland use may promote CO2-neutral and economically sustainable produc-tion systems on peat such as paludiculture.
An obstacle that still exists is the fact that water manage-ment in agricultural areas is usually tailored to serve drain-age-based agriculture, which often makes rewetting expen-sive when surrounding fields are still drained. Furthermore, while special machinery and certain important production chains are already available, the scale of production is currently too small to feed supply chains of e.g. peat moss for bulk grow-ing substrate, and cattail for insulation and building materi-al. As a result, the market for most paludiculture products as raw materials for bioenergy and bio-based materials is not yet functional and business models are still under development.
Next to biomass revenues and harmonised subsidies, eco-system services should be rewarded and incentives should be developed to stimulate the implementation of paludiculture, including the accounting for reduced GHG emissions (car-bon credits), water purification, climate change-related water retention and storage (blue credits), and biodiversity. In the Netherlands, this has already been done for some forms of nature-inclusive agriculture (Runhaar, 2017).
Geurts et al. (2019) · L A N D B A U F O R S C H · J Sustainable Organic Agric Syst · 69(1):5–8
7
Further steps in implementing paludiculture are being taken in several projects in various European countries (see acknowledgement). Pilot projects are very important to further develop management and harvesting techniques,
obtain robust data on environmental benefits (including Life Cycle Analyses (LCA) of land use and associated products), and create markets for products.
TA B L E 1Overview of important paludiculture crops and applications, range in water levels, list of important production areas in-cluding pilots and potential areas, potential for carbon credits based on estimates of GHG emission reduction (including biomass use for replacing fossil resources), and potential for blue credits based on suitability for water purification (P) and water storage (S): ++ very high potential, + high potential, 0 little potential, - negative effect. Figures based on references in Wichtmann et al. (2016) and Geurts and Fritz (2018).
Crop Water level (cm +/- soil surface)
Product Potential for carbon credits
Potential for blue credits
Important production areas including pilots (in ha) and potential areas (in italics)
Cattail (Typha sp.)
0 to +20 insulation and building material
+ P + S +
Kamp (D) 30 Zuiderveen (NL) 4 Peel (NL) 1 Bûtefjild (NL) 0.1Danube delta (RO)
bedding material + P + S +
Peel (NL) 1 Zegveld (NL) 0.4
extraction of protein, fibres, cellulose
0/+ P ++ S +
Canada
feed for pest- controlling predatory mites
0/+ P ++ S +
Zegveld (NL) 0.4
fodder -/+ P ++ S +
Peel (NL) 1 ha Zegveld (NL) 0.4
combustion -/+ P + S +
Canada > 500
Reed (Phragmites australis)
-20 to +20 thatching, insulation and building material
++ P + S ++
UK 6,500Netherlands 4,500Mecklenburg- Vorpommern (D) 550Poland 8,000Hungary 7,500Austria 1,500Denmark, ChinaRomania 190,000Ukraine >100,000
paper ++/+ P + S ++
China > 1 million
extraction of protein, fibres, cellulose
0/+ P +/++ S ++
Germany
combustion/ biogas -/+ P +/++ S ++
Italy 0.75GermanyBelarus & Ukraine: large potential areas
Peat moss (Sphagnum sp.)
-15 to -5 high quality substrate in horticulture
++ P + S 0/+
Hankhausen (D) 14Twist (D) 10Ilperveld (NL) 8Canada 8Finland, Chile
Grasses like reed canary grass (Phalaris arundinacea)
-30 to +10 combustion/ biogas -/+ P 0S +
Malchin (D) 200Denmark, Estonia, Belarus
fodder 0/+ P 0/+S +
Mecklenburg- Vorpommern (D)
Alder (Alnus sp.)
-40 to +5 wood/timber ++ P 0/+ S ++
Mecklenburg- Vorpommern (D) USA
Geurts et al. (2019) · L A N D B A U F O R S C H · J Sustainable Organic Agric Syst · 69(1):5–8
8
To convince landowners, producers/farmers, and man-ufacturers, long-term schemes and certificates for CO2 and other ecosystem services have to be developed and experi-ences from existing paludiculture pilots in Europe and large-scale implementation in peat-rich regions in the world should be shared. The second pillar of the CAP already provides some incentives for all steps of implementation that can be used and refined (cf. Wichmann, 2018).
6 Conclusions
• Farm carbon footprints benefit largely from raising water levels to the peat surface resulting in substantial GHG emission reduction.
• Small areas of drained peatlands converted to climate mitigation optimised paludiculture can offset the need to take climate mitigation actions on 10 to 100 times larger areas of mineral soils for food production.
• Sustainable wet agriculture can also be economically viable. New business models are being created, which can often be combined with conventional farming (fod-der, bedding material, meat/milk with CO2 certificate), but high quality off-farm applications also exist already.
• Society is responsible for creating essential preconditions for large-scale peatland rewetting and paludiculture, including the provision of the necessary infrastructure and recognition of the sustainability value of paludicul-ture.
• Techniques and tools for paludiculture are available and under optimal conditions comparable biomass yields and revenues as in conventional agriculture are potentially possible.
• Water level management, nutrient availability, and crop choice are the main determinants for productivity. Other aspects are GHG emission reduction, costs of implemen-tation, and the provision of other ecosystem services.
• CAP funding schemes need to be revised to facilitate sus-tainable solutions for wet peatland agriculture.
• Well-documented, long-term pilot projects and the gen-eration of LCAs are very important to gain insight into long-term yields and income from paludiculture and are necessary for innovations and further market develop-ment.
Acknowledgement
This position paper was made possible by the Interreg pro-jects NWE Carbon Connects, NWE CarePeat, EDR Bio- economy Green-Chemistry, BSR DESIRE, and NSR CANAPE, the ERA-Gas project Peatwise, and the ERA-NET Plus project CINDERELLA.
R E F E R E N C E S
Bohlen PJ, Lynch S, Shabman L, Clark M, Shukla S, Swain H (2009) Paying for environmental services from agricultural lands: an example from the northern Everglades. Front Ecol Environ 7(1):46–55, doi: 10.1890/080107
Correljé A, François D, Verbeke T (2007) Integrating water management and principles of policy: towards an EU framework? J Clean Prod 15(16):1499–1506, doi:10.1016/j.jclepro.2006.07.034
Couwenberg J, Fritz C (2012) Towards developing IPCC methane ‘emission factors‘ for peatlands (organic soils). Mires Peat 10, Article 03:1–17
Geurts JJM, Fritz C (eds) (2018) Paludiculture pilots and experiments with focus on cattail and reed in the Netherlands. Technical report of the CINDERELLA project, Radboud University Nijmegen, 72 p
GMC (2018) Informationspapier zur Rolle der Moore in der Gemeinsamen Agrarpolitik (GAP) ab 2021 [online]. Greifswald Moor Centrum, 5 p, retrieved from <https://greifswaldmoor.de/files/dokumente/1806_%20GMC%20Moore%20in%20GAP_final.pdf> [at 18 Dec 2019]
Grygoruk M, Mirosław-Świątek D, Chrzanowska W, Ignar S (2013). How much for water? Economic assessment and mapping of floodplain water stor-age as a catchment-scale ecosystem service of wetlands. Water 5(4): 1760–1779, doi:10.3390/w5041760
Günther A, Jurasinski G, Albrecht K, Gaudig G, Krebs M, Glatzel S (2017). Greenhouse gas balance of an establishing Sphagnum culture on a former bog grassland in Germany. Mires Peat 20, Article 02:1–16, doi:10.19189/MaP.2015.OMB.210
Günther A, Böther S, Couwenberg J, Hüttel S, Jurasinski G (2018) Profitability of Direct Greenhouse Gas Measurements in Carbon Credit Schemes of Peatland Rewetting. Ecol Econ 146:766–771, doi:10.1016/j.ecolecon.2017.12.025
Jurasinski G, Günther A, Huth V, Couwenberg J, Glatzel S (2016) Greenhouse gas emissions. In: Wichtmann W, Schröder C, Joosten H (eds) Paludicul-ture – productive use of wet peatlands. Chapter 5.1, Stuttgart: Schweizer-bart Science Publishers, 79–93
Grosshans R (2014) Cattail (Typha spp.) biomass harvesting for nutrient cap-ture and sustainable bioenergy for integrated watershed management. Thesis, University of Manitoba, Winnipeg, 274 p
Heinz SI (2012) Population biology of Typha latifolia L. and Typha angustifo-lia L.: establishment, growth and reproduction in a constructed wetland. Shaker Verlag, Aachen, Technische Universität München, Dissertation
Joosten H, Brust K, Couwenberg J, Gerner A, Holsten B, Permien T, Schäfer A, Tanneberger F, Trepel M, Wahren A (2015) MoorFutures®: Integration of additional ecosystems services (including biodiversity) into carbon cred-its: Standard, Methodology and Transferability to Other Regions. Bundes-amt für Naturschutz, Bonn, Germany, 119 p
Köbbing JF, Thevs N, Zerbe S (2013) The utilisation of reed (Phragmites austra-lis): a review. Mires Peat 13, Article 01:1–14
Matthews J, Beringen R, Huijbregts MAJ, van der Mheen HJ, Odé B, Trindade L, van Valkenburg JLCH, van der Velde G, Leuven RSEW (2015) Horizon scanning and environmental risk analyses of non-native biomass crops in the Netherlands. Nijmegen: Radboud University Nijmegen, Institute for Water and Wetland Research, 253 p, Reports Environmental Science 506
Röder N, Henseler M, Liebersbach H, Osterburg B (2015) Evaluation of land use-based greenhouse gas abatement measures in Germany. Ecol Econ 117:193–202, doi:10.1016/j.ecolecon.2015.06.007
Runhaar H (2017) Governing the transformation towards ‘nature-inclusive‘ ag-riculture: insights from the Netherlands. Int J Agr Sustain 15(4):340–349, doi:10.1080/14735903.2017.1312096
Schäfer A, Joosten H (eds) (2005) Erlenaufforstung auf wiedervernässten Niedermooren. Greifswald: Institute for Sustainable Development of Landscapes of the Earth, 68 p
Tiemeyer B, Albiac Borraz E, Augustin J, Bechtold M, Beetz S, Beyer C, Drösler M, Ebli M, Eickenscheidt T, Fiedler S et al. (2016) High emissions of green-house gases from grasslands on peat and other organic soils. Glob Change Biol 22(12):4134–4149, doi:10.1111/gcb.13303
Wichmann S (2018) Economic incentives for climate smart agriculture on peatlands in the EU. Greifswald Mire Centre, 38 p, Proceedings of the Greifswald Mire Centre
Wichtmann W, Schröder C, Joosten H (eds) (2016) Paludiculture – productive use of wet peatlands. Stuttgart: Schweizerbart Science Publishers
Geurts et al. (2019) · L A N D B A U F O R S C H · J Sustainable Organic Agric Syst · 69(1):5–8
9Schneider et al. (2019) · L A N D B A U F O R S C H · J Sustainable Organic Agric Syst · 69(1):9–12DOI:10.3220/LBF1580734769000
P O S I T I O N P A P E R
Farm-level digital monitoring of greenhouse gas emissions from livestock systems could facilitate control, optimisation and labellingUwe A. Schneider1, Livia Rasche 1, and Kerstin Jantke2
1 Universität Hamburg, Research Unit Sustainability and Global Change, Center for Earth System Research and Sustainability (CEN), Germany2 Universität Hamburg, Center for Earth System Research and Sustainability (CEN), Germany
C O N TA C T: [email protected]
1 Greenhouse gas emissions from livestock
Societal efforts to limit climate change necessitate the par-tici pation of all major emitters. Global livestock production of both ruminant and non-ruminant animals contri butes annually about 7.1 Gt CO₂-eq (14.5 %) of anthropogenic greenhouse gas (GHG) emissions (Gerber et al., 2013). Unfor-tunately, diffuse non-point sources make accurate monitor-ing systems expensive and prevent an efficient implementa-tion of emission regulations in both the crop and livestock sectors. Proposed remedies include subsidies and taxes on management regimes, which are correlated with emissions. The available farm-level GHG calculators comprise auto-mated web-, Excel-, or other software-based calculation tools, which rely on coarse approaches used in national GHG inventories (e.g. IPCC Tier 1 and 2 GHG emission factors) and are therefore too simplistic to depict farm-level emission fluxes in sufficient detail (Denef et al., 2012).
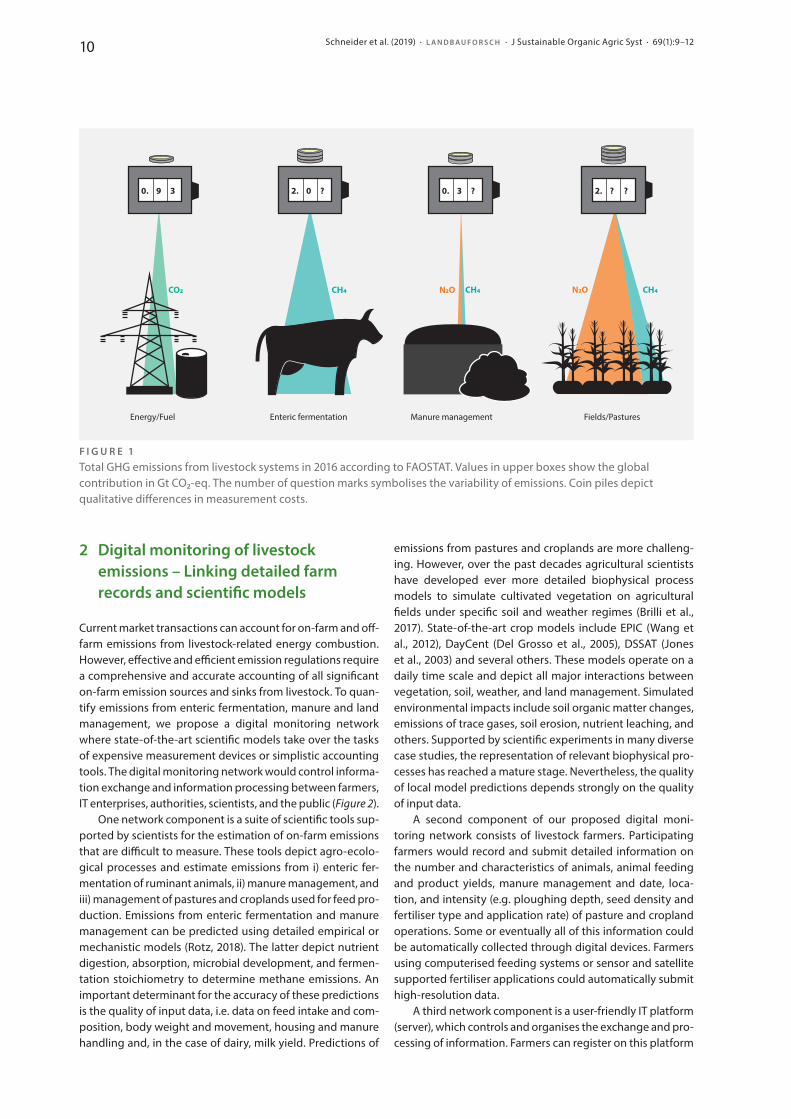
GHG emissions from livestock systems involve up to four distinct categories (Figure 1). Firstly, machinery used for land management, operation of livestock facilities, and transpor-tation and processing of livestock commodities requires fuel and electrical power. Also fertilisers, pesticides, buildings,
and machinery contain embedded energy. Emissions from fuel and power use are generally easy to monitor because most energy is accounted at power meters or fuel nozzles, whereas embedded energy is more difficult to define and would need agreed tabulated values to enable selection options for famers.
Secondly, enteric fermentation from ruminant animals causes methane emissions. The magnitude of these emis-sions depends on the breed of animal, feeding regime, and various operational and environmental factors (Hristov et al., 2018). Thirdly, livestock manure leads to methane and nitrous oxide emissions. The breed of livestock, diet, manure stor-age and handling, and environmental factors affect emission levels (Chadwick et al., 2011). Respiration chambers are the state-of-the-art measuring method for emissions from both enteric fermentation and manure.
Fourthly, carbon dioxide, methane, and nitrous oxide are emitted on pastures and livestock-related croplands. These emissions vary highly across local soil and weather conditions and land management regimes. Vegetation composition, stocking density, applications of manure, mineral fertilisers, and pesticides, and intensity of irrigation affect emissions also on pastures (Bolan et al., 2004). Emissions from croplands are further impacted by the choice of crop rotation and soil tillage.
Received: August 2, 2019 Revised: September 19, 2019Accepted: November 11, 2019
K E Y W O R D S agricultural methane, soil organic carbon, nitrous oxide flux, feed crops, pasture grazing, enteric fermentation, manure management, non-point externality, verification efficiency, policy transaction cost
Uwe A. Schneider Livia Rasche Kerstin Jantke
© p
rivat
e
© p
rivat
e
© p
rivat
e
10 Schneider et al. (2019) · L A N D B A U F O R S C H · J Sustainable Organic Agric Syst · 69(1):9–12
2 Digital monitoring of livestock emissions – Linking detailed farm records and scientific models
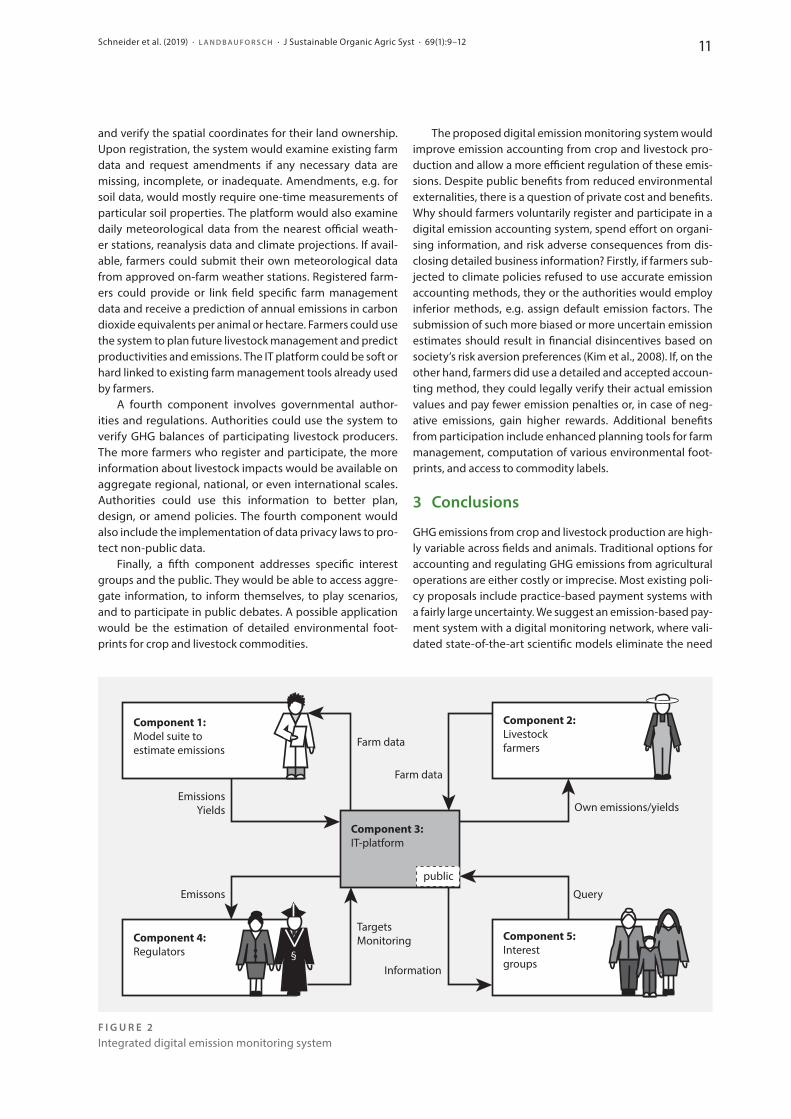
Current market transactions can account for on-farm and off-farm emissions from livestock-related energy combustion. However, effective and efficient emission regulations require a comprehensive and accurate accounting of all significant on-farm emission sources and sinks from livestock. To quan-tify emissions from enteric fermentation, manure and land management, we propose a digital monitoring network where state-of-the-art scientific models take over the tasks of expensive measurement devices or simplistic accounting tools. The digital monitoring network would control informa-tion exchange and information processing between farmers, IT enterprises, authorities, scientists, and the public (Figure 2).
One network component is a suite of scientific tools sup-ported by scientists for the estimation of on-farm emissions that are difficult to measure. These tools depict agro-ecolo-gical processes and estimate emissions from i) enteric fer-mentation of ruminant animals, ii) manure management, and iii) management of pastures and croplands used for feed pro-duction. Emissions from enteric fermentation and manure management can be predicted using detailed empirical or mechanistic models (Rotz, 2018). The latter depict nutrient digestion, absorption, microbial development, and fermen-tation stoichiometry to determine me thane emissions. An important determinant for the accuracy of these predictions is the quality of input data, i.e. data on feed intake and com-position, body weight and movement, housing and manure handling and, in the case of dairy, milk yield. Predictions of
emissions from pastures and croplands are more challeng-ing. However, over the past decades agricultural scientists have developed ever more detailed biophysical process models to simulate cultivated vegetation on agricultural fields under specific soil and weather regimes (Brilli et al., 2017). State-of-the-art crop models include EPIC (Wang et al., 2012), DayCent (Del Grosso et al., 2005), DSSAT (Jones et al., 2003) and several others. These models operate on a daily time scale and depict all major interactions between vegetation, soil, weather, and land management. Simulated environmental impacts include soil organic matter changes, emissions of trace gases, soil erosion, nutrient leaching, and others. Supported by scientific experiments in many diverse case studies, the representation of relevant biophysical pro-cesses has reached a mature stage. Nevertheless, the quality of local model predictions depends strongly on the quality of input data.
A second component of our proposed digital moni-toring network consists of livestock farmers. Participating farmers would record and submit detailed information on the number and characteristics of animals, animal feeding and product yields, manure management and date, loca-tion, and intensity (e.g. ploughing depth, seed density and fertiliser type and application rate) of pasture and cropland operations. Some or eventually all of this information could be automatically collected through digital devices. Farmers using compute rised feeding systems or sensor and satellite supported fertiliser applications could automatically submit high-resolution data.
A third network component is a user-friendly IT platform (server), which controls and organises the exchange and pro-cessing of information. Farmers can register on this platform
Energy/Fuel Enteric fermentation Manure management Fields/Pastures
0. 39 2. ??0. ?32. ?0
CO2 CH4 CH4 N2O CH4N2O
F I G U R E 1Total GHG emissions from livestock systems in 2016 according to FAOSTAT. Values in upper boxes show the global contribution in Gt CO₂-eq. The number of question marks symbolises the variability of emissions. Coin piles depict qualitative differences in measurement costs.
11Schneider et al. (2019) · L A N D B A U F O R S C H · J Sustainable Organic Agric Syst · 69(1):9–12
The proposed digital emission monitoring system would improve emission accounting from crop and livestock pro-duction and allow a more efficient regulation of these emis-sions. Despite public benefits from reduced environmental externalities, there is a question of private cost and benefits. Why should farmers voluntarily register and participate in a digital emission accounting system, spend effort on organi-sing information, and risk adverse consequences from dis-closing detailed business information? Firstly, if farmers sub-jected to climate policies refused to use accurate emission accounting methods, they or the authorities would employ inferior methods, e.g. assign default emission factors. The submission of such more biased or more uncertain emission estimates should result in financial disincentives based on society’s risk aversion preferences (Kim et al., 2008). If, on the other hand, farmers did use a detailed and accepted accoun-ting method, they could legally verify their actual emission values and pay fewer emission penalties or, in case of neg-ative emissions, gain higher rewards. Additional benefits from participation include enhanced planning tools for farm ma nagement, computation of various environmental foot-prints, and access to commodity labels.
3 Conclusions
GHG emissions from crop and livestock production are high-ly variable across fields and animals. Traditional options for accounting and regulating GHG emissions from agricultural operations are either costly or imprecise. Most existing po li-cy proposals include practice-based payment systems with a fairly large uncertainty. We suggest an emission-based pay-ment system with a digital monitoring network, where va li-dated state-of-the-art scientific models eliminate the need
and verify the spatial coordinates for their land ow nership. Upon registration, the system would examine existing farm data and request amendments if any necessary data are missing, incomplete, or inadequate. Amendments, e.g. for soil data, would mostly require one-time measurements of particular soil properties. The platform would also examine daily meteorological data from the nearest official weath-er stations, reanalysis data and climate projections. If avail-able, farmers could submit their own meteorological data from approved on-farm weather stations. Registered farm-ers could provide or link field specific farm management data and receive a prediction of annual emissions in carbon dioxide equivalents per animal or hectare. Farmers could use the system to plan future livestock management and predict productivities and emissions. The IT platform could be soft or hard linked to existing farm management tools already used by farmers.
A fourth component involves governmental author-ities and regulations. Authorities could use the system to verify GHG balances of participating livestock producers. The more farmers who register and participate, the more information about livestock impacts would be avail able on aggregate regional, national, or even internatio nal scales. Authorities could use this information to better plan, design, or amend policies. The fourth component would also include the implementation of data privacy laws to pro-tect non-public data.
Finally, a fifth component addresses specific interest groups and the public. They would be able to access aggre-gate information, to inform themselves, to play scenarios, and to participate in public debates. A possible application would be the estimation of detailed environmental foot-prints for crop and livestock commodities.
Component 1:Model suite toestimate emissions
Component 2:Livestockfarmers
Component 3:IT-platform
Component 4:Regulators §
Component 5:Interestgroups
public
EmissionsYields
Emissons
TargetsMonitoring
Farm data
Own emissions/yields
Query
Farm data
Information
F I G U R E 2Integrated digital emission monitoring system
12 Schneider et al. (2019) · L A N D B A U F O R S C H · J Sustainable Organic Agric Syst · 69(1):9–12
for costly measurement devices. This network would be app-lica ble to all agricultural operations including specialised crop or livestock businesses and mixed farms.
Emission measurements would still be needed for mod-el validation, however, only at certain intervals on selected sites. Suitable models are already used in scientific assess-ments and for national GHG inventories. However, the often low qua lity of input data severely limits the quality of mo del-based assessments. We therefore propose to combine sophis ticated scientific models with detailed and compre-hensive management information available at farm level. The reduced uncertainty of otherwise crudely estimated emissions should translate into a financial incentive for far-mers to participate. The increasing digitalisation of agricul-tural ope rations could faci litate automatic or semi-automatic exchange of data between farmers, scientific tools, author-ities, and the public.
The complex modelling system would also permit mo ni-toring of agro-environmental impacts beyond greenhouse gases, including nutrient and pesticide leakages to water bodies and soil erosion. Participating farmers could also be ne fit from access to new market labels based on ecological footprints rather than on a crude distinction between organ-ic and conventional agriculture.
Acknowledgements
This publication received financial support from the Kompe-tenzzentrum Nachhaltige Universität, Universität Hamburg and the Deutsche Forschungsgemeinschaft (DFG, German Research Foundation) under Germany‘s Excellence Strategy – EXC 2037 'CLICCS – Climate, Climatic Change, and Society' – Project Number: 390683824, contribution to the Center for Earth System Research and Sustainability (CEN) of Univer sität Hamburg, Germany.
R E F E R E N C E S
Bolan NS, Saggar S, Luo JF, Bhandral R, Singh J (2004) Gaseous emissions of nitrogen from grazed pastures: Processes, measurements and modelling, environmental implications, and mitigation. In: Sparks DL (ed) Advances in Agronomy. Vol 84, San Diego: Elsevier Academic Press Inc, 37–120
Brilli L, Bechini L, Bindi M, Carozzi M, Cavalli D, Conant R, Dorich CD, Doro L, Ehrhardt F, Farina R et al. (2017) Review and analysis of strengths and weaknesses of agro-ecosystem models for simulating C and N fluxes. Sci Total Environ 598:445–470, doi:10.1016/j.scitotenv.2017.03.208
Chadwick D, Sommer S, Thorman R, Fangueiro D, Cardenas L, Amon B, Mis-selbrook T (2011) Manure management: Implications for greenhouse gas emissions. Anim Feed Sci Tech 166–167:514–531, doi:10.1016/j.ani-feedsci.2011.04.036
Del Grosso SJ, Mosier AR, Parton WJ, Ojima DS (2005) DAYCENT model analy-sis of past and contemporary soil N2O and net greenhouse gas flux for major crops in the USA. Soil Tillage Res 83(1):9–24, doi:10.1016/j.still.2005.02.007
Denef K, Paustian K, Archibeque S, Biggar S, Pape D (2012) Report of green-house gas accounting tools for agriculture and forestry sectors. ICF In-ternational and Colorado State University, Interim report to USDA un-der Contract No. GS-23F-8182H
Gerber PJ, Steinfeld H, Henderson B, Mottet A, Opio C, Dijkman J, Falcucci A, Tempio G (2013) Tackling climate change through livestock: a global assessment of emissions and mitigation opportunities. Food and Agriculture Organization of the United Nations, FAO, Rome
Hristov AN, Kebreab E, Niu M, Oh J, Bannink A, Bayat AR, Boland TM, Brito AF, Casper DP, Crompton LA et al. (2018) Symposium review: Uncertainties in enteric methane inventories, measurement techniques, and predic-tion models. J Dairy Sci 101(7):6655–6674, doi:10.3168/jds.2017-13536
Jones JW, Hoogenboom G, Porter CH, Boote KJ, Batchelor WD, Hunt LA, Wilkens PW, Singh U, Gijsman AJ, Ritchie JT (2003) The DSSAT cropping system model. Eur J Agron 18(3–4):235–265, doi:10.1016/S1161-0301(02)00107-7
Kim MK, McCarl BA, Murray BC (2008) Permanence discounting for land-based carbon sequestration. Ecol Econ 64(4):763–769, doi:10.1016/j.ecolecon.2007.04.013
Rotz CA (2018) Modeling greenhouse gas emissions from dairy farms. J Dairy Sci 101(7):6675–6690, doi:10.3168/jds.2017-13272
Wang X, Williams JR, Gassman PW, Baffaut C, Izaurralde RC, Jeong J, Kiniry JR (2012) EPIC and APEX: Model Use, Calibration, and Validation. Trans ASAE 55(4):1447–1462, doi:10.13031/2013.42253
13Kipling and Becoña (2019) · L A N D B A U F O R S C H · J Sustainable Organic Agric Syst · 69(1):13–24DOI:10.3220/LBF1581687621000
R E S E A R C H A R T I C L E
Applying a conceptual framework for effective implementation of on-farm greenhouse gas mitigation: Evaluation of knowledge exchange methods in Wales and UruguayRichard P. Kipling1 and Gonzalo Becoña2
Abstract
Globally, agriculture must tackle many complex challenges to ensure food security for a growing population while safeguarding biodiversity and ecosystem services and contributing to greenhouse gas (GHG) emissions reduction. Effective agricultural knowledge exchange (KE) strategies are vital to implementing GHG emissions mitigation measures. Here, KE activities undertaken by publicly funded extension services in Wales (in the global north) and Uruguay (in the global south) were compared using a previously developed conceptual framework.
The main goals were to assess the utility of the framework and to evaluate KE methods in terms of i) potential challenges to initial engagement, ii) categories of challenge they could address and their potential mode of op era tion, iii) their potential impacts on nontarget stakeholder groups, including iv) the interests and limitations of KE practi tioners. Use of the framework highlighted issues including the need to i) tackle initial challenges potentially affecting engagement with mitigation narratives, ii) widen the outlook of stakeholders on climate change and emissions
reduction, iii) recognise how KE may affect, and be affected by, nontarget stakeholders and, iv) address KE practitioners’ needs and outlooks. Priorities for improved implementation of mitigation measures include the use of technical (e.g. modelling) and social (e.g. discussions involving nonfood chain actors) KE methods that act on stakeholder interests, with the potential to engage farmers in empowering KE processes for GHG emissions mitigation. A renewed research focus on agricultural extension systems is needed to more effectively apply KE resources to meet sectoral GHG emissions targets.
1 Introduction
The agricultural sector faces the challenge of ensuring food security in the context of a growing world population, requiring increases in food production that can be sustained in the long term, while enhancing ecosystem services and minimising greenhouse gas (GHG) emissions. Transformative change may be needed to achieve these goals (Martin et al., 2013) and solutions must be integrated, recognising impacts and needs across interacting spheres (environmental, economic
Received: June 30, 2019 Revised: September 4, 2019Accepted: November 7, 2019
K E Y W O R D S agricultural extension, farming, greenhouse gas mitigation, knowledge exchange, stakeholders
H I G H L I G H T S
• Agricultural knowledge exchange methods used in two countries • Potential impacts on challenges to greenhouse gas mitigation
assessed• Methods for initial engagement and widening farmers’ perspectives
highlighted• Resources for and a renewed research focus on extension
systems is vital
1 Aberystwyth University, Institute of Biological, Environmental and Rural Sciences, United Kingdom
2 Instituto Plan Agropecuario, Uruguay
C O N TA C T: [email protected]
Kipling and Becoña (2019) · L A N D B A U F O R S C H · J Sustainable Organic Agric Syst · 69(1):13–2414
and social) to avoid unintended consequences and identify multiwin solutions (Garibaldi et al., 2017). In the face of these challenges, identification not only of solutions but also of effective implementation strategies is essential if required changes are to be realised on the ground. Effective agricultural knowledge exchange (KE) is therefore vital in the context of challenges to implementing GHG emissions mitigation measures in the agricultural sector (Wreford et al., 2017).
Over time, theory and practice in agricultural extension has shifted, from an emphasis on the topdown transfer of knowledge and regulation (from researchers and policymakers to farmers), to more interactive KE which empowers stakeholders to determine and drive the direction of change (Leeuwis, 2004). This trend reflects a similar change from hard to soft systems approaches to communicating and implementing scientific research (van Paassen et al., 2007). Despite these trends, there remain tensions between local, stakeholder driven processes of change in agricultural practice and preexisting topdown structures of governance (Colvin et al., 2014).
At the same time, previously unified public provision of KE has fragmented and been replaced with KE provided by a mix of public, private and nongovernmental organisations, as marketdriven agricultural extension models have become favoured for their assumed efficiency benefits (Knuth and Knierim, 2015). In Europe, these changes have occurred in the context of the Common Agricultural Policy (CAP) which has been criticised for reducing social capital in farming communities through its individualised focus (Leventon et al., 2017).
Against this backdrop of theoretical development and policy change, many practical resources have been developed to support best practice in KE, exemplified by the Global Forum for Rural Advisory Services (GFRAS) Global Good Practice Notes report (Davis et al., 2018) which brings together practical summaries of a wide range of advisory methods to inform KE practitioners, especially those working in the developing world. Still, at different levels agriculture has made slow progress in relation to many of the challenges it faces, such as the need to substantially reduce farming related GHG emissions.
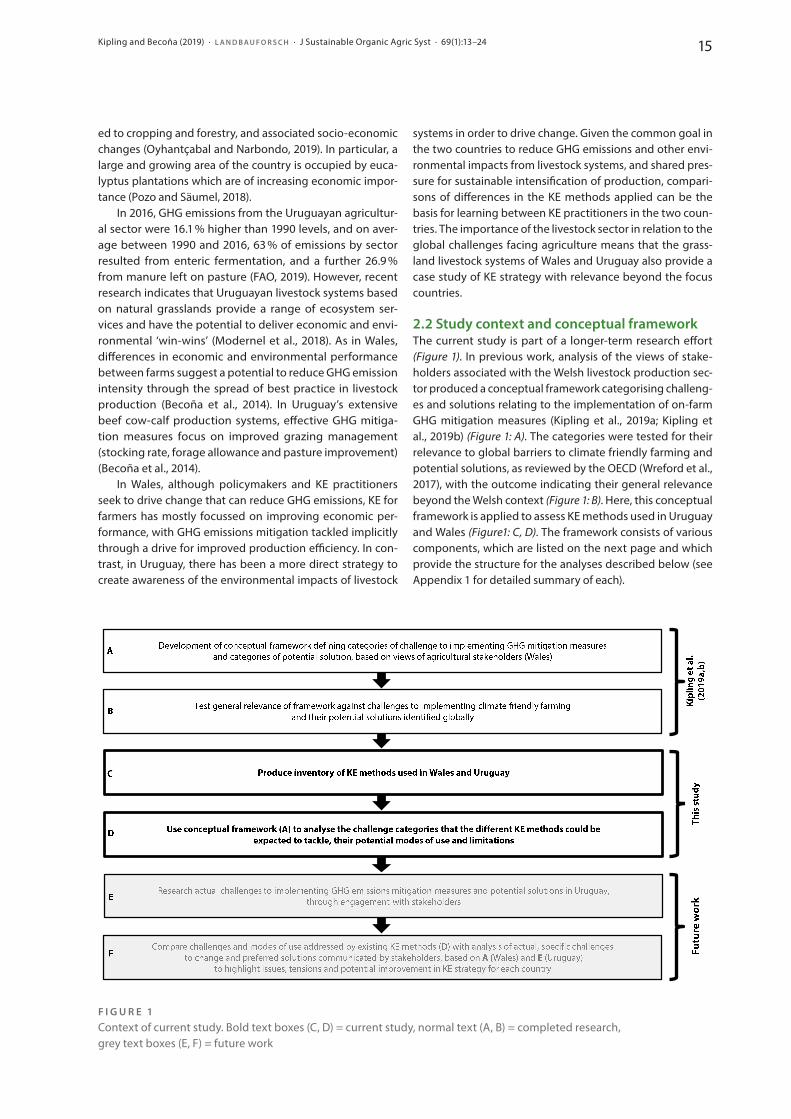
Recent work on implementing GHG mitigation measures on Welsh livestock farms analysed the views of stakeholders on challenges to change and solutions, forming a framework categorising challenges and strategies for improved implementation (Kipling et al., 2019a; Kipling et al., 2019b). This work augmented existing resources which provide information on the practical requirements, strengths and weaknesses of different tools for KE, with a conceptual framework that facilitates critical analysis of the potential impacts of implementation strategies, not only on farmers but also on other rural stakeholders. The main goal of the current study was to apply this conceptual framework to evaluate KE methods used by practitioners in two contrasting countries (Wales, in the global north, and Uruguay in the global south) in order to both, i) test the usefulness of the framework and ii) provide an overview of KE strategies in these countries, their potential to address different challenges, their likely impacts and gaps in capacity.
2 Materials and methods
2.1 Study countries and mitigation measures Agriculture in Wales falls under the European Union’s CAP which provides payments to farmers based on the area of land farmed and adherence to practices aligned with sustainability objectives. Eighty percent of agricultural land in Wales has been classified as ‘Less Favoured Areas’ for farming (Welsh Government, 2013), reflecting the extent of exposed uplands. A large proportion of farm businesses provide low income levels for an ageing farming population (Morris et al., 2017). The climate is oceanic, with warm winters and wet summers ideal for grass growth. Due to the topography and conditions grassbased sheep and beef production dominate agriculture, with a growing dairy industry in more lowland areas of the country (Morris et al., 2017).
In relation to the challenges facing farming, the Welsh Government is pursuing a target of an 80 % reduction in GHG emissions against 1990 levels across the Welsh economy by 2050. However, by 2015 farming emissions had only fallen by 15 % (Jones et al., 2017) driving the commissioning of research to improve performance (Kipling et al., 2019b). Studies have shown wide differences between the most and least productionefficient farms, indicating potential to improve efficiency and reduce GHG emissions intensity by spreading best practice (Hyland et al., 2016b). A wide range of mitigation measures have been suggested for livestock systems at the UK level (including Wales) and indicate that no single solution will achieve desired emissions reductions; rather, improvements in practice throughout farm systems are required, focussing on measures that avoid carbon leakage by improving production efficiency without altering production levels (Kipling et al., 2019b).
Uruguay lies within the South American Campos, an ecological region of grasslands and pastures with scattered trees and shrubs. Uruguay’s climate is temperate, moderate and rainy. The temperature of the coldest month is between 3 °C and 18 °C and the temperature of the warmest months exceeds 22 °C. Precipitation shows high interannual variability with an annual total reaching 1300 mm in the north of the country; according to the Koeppen climate classification Uruguay is classified in the ‘Cfa’ category (Bidegain and Caffera, 1997).
Livestock production is mainly in the form of extensive grasslandbased beef and sheep systems. Due to edaphic and climatic conditions, and specifically low phosphorous levels, these systems face agricultural issues including low productivity resulting from poor nutrient value and digestibility of grasses (Royo Pallarés et al., 2005). Sheep production has fal len over recent decades as a result of factors including declining domestic mutton consumption, falling wool prices and issues with sheep rustling (Royo Pallarés et al., 2005). While cattle numbers have risen from 8.69 million head in 1991 to 11.74 million head in 2017, sheep numbers have fallen from a high of 26.6 million in 1991 to 6.6 million in 2017 (FAO, 2019). An historic trend towards agricultural land concentration has increased in recent years, with changing patterns of ow nership, rising land prices, increases in land devot
Kipling and Becoña (2019) · L A N D B A U F O R S C H · J Sustainable Organic Agric Syst · 69(1):13–24 15
ed to cropping and forestry, and associated socioeconomic changes (Oyhantçabal and Narbondo, 2019). In particular, a large and growing area of the country is occupied by eucalyptus plantations which are of increasing economic importance (Pozo and Säumel, 2018).
In 2016, GHG emissions from the Uruguayan agricultural sector were 16.1 % higher than 1990 levels, and on average between 1990 and 2016, 63 % of emissions by sector resulted from enteric fermentation, and a further 26.9 % from manure left on pasture (FAO, 2019). However, recent research indicates that Uruguayan livestock systems based on natural grasslands provide a range of ecosystem services and have the potential to deliver economic and environmental ‘winwins’ (Modernel et al., 2018). As in Wales, differences in economic and environmental performance between farms suggest a potential to reduce GHG emission intensity through the spread of best practice in livestock production (Becoña et al., 2014). In Uruguay’s extensive beef cowcalf production systems, effective GHG mitigation measures focus on improved grazing management (stocking rate, forage allowance and pasture improvement) (Becoña et al., 2014).
In Wales, although policymakers and KE practitioners seek to drive change that can reduce GHG emissions, KE for farmers has mostly focussed on improving economic performance, with GHG emissions mitigation tackled implicitly through a drive for improved production efficiency. In contrast, in Uruguay, there has been a more direct strategy to crea te awareness of the environmental impacts of livestock
systems in order to drive change. Given the common goal in the two countries to reduce GHG emissions and other environmental impacts from livestock systems, and shared pressure for sustainable intensification of production, comparisons of differences in the KE methods applied can be the basis for learning between KE practitioners in the two countries. The importance of the livestock sector in relation to the global challenges facing agriculture means that the grassland livestock systems of Wales and Uruguay also provide a case study of KE strategy with relevance beyond the focus countries.
2.2 Study context and conceptual frameworkThe current study is part of a longerterm research effort (Figure 1). In previous work, analysis of the views of stakeholders associated with the Welsh livestock production sector produced a conceptual framework categorising challenges and solutions relating to the implementation of onfarm GHG mitigation measures (Kipling et al., 2019a; Kipling et al., 2019b) (Figure 1: A). The categories were tested for their relevance to global barriers to climate friendly farming and potential solutions, as reviewed by the OECD (Wreford et al., 2017), with the outcome indicating their general relevance beyond the Welsh context (Figure 1: B). Here, this concep tual framework is applied to assess KE methods used in Uruguay and Wales (Figure1: C, D). The framework consists of various components, which are listed on the next page and which provide the structure for the analyses described below (see Appendix 1 for detailed summary of each).
F I G U R E 1Context of current study. Bold text boxes (C, D) = current study, normal text (A, B) = completed research, grey text boxes (E, F) = future work
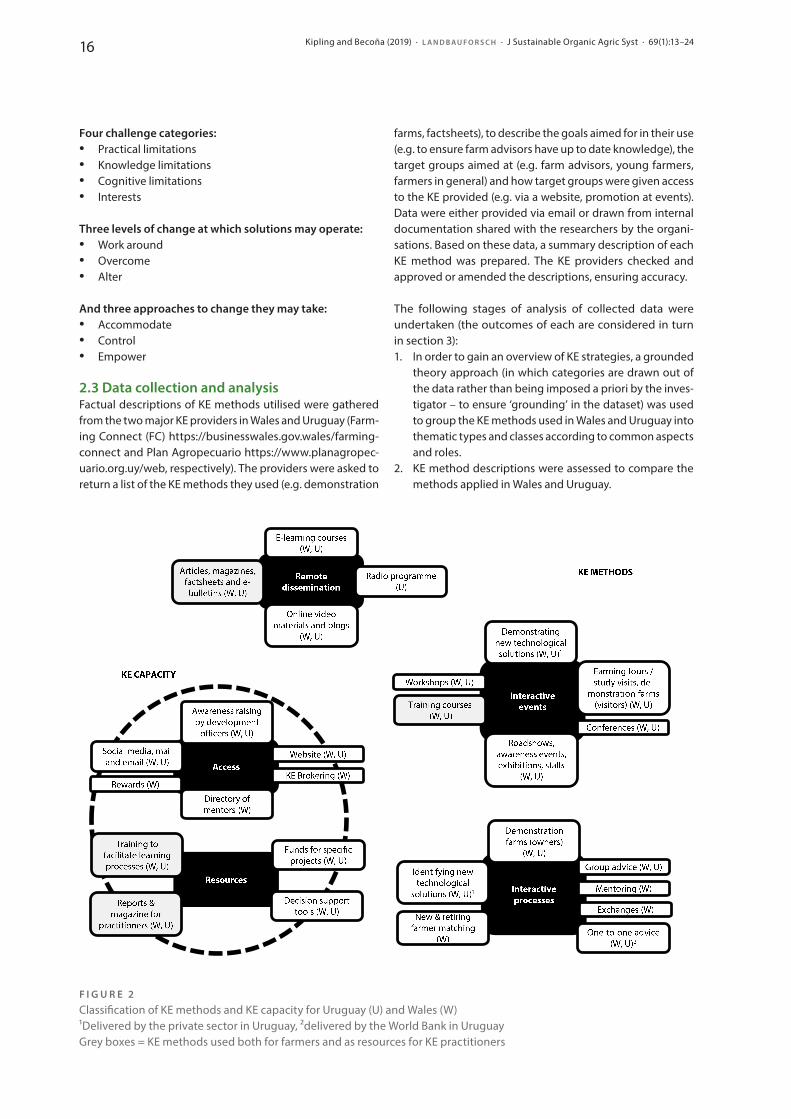
Kipling and Becoña (2019) · L A N D B A U F O R S C H · J Sustainable Organic Agric Syst · 69(1):13–2416
Four challenge categories:• Practical limitations • Knowledge limitations • Cognitive limitations • Interests
Three levels of change at which solutions may operate:• Work around• Overcome• Alter
And three approaches to change they may take:• Accommodate• Control• Empower
2.3 Data collection and analysisFactual descriptions of KE methods utilised were gathered from the two major KE providers in Wales and Uruguay (Farming Connect (FC) https://businesswales.gov.wales/farmingconnect and Plan Agropecuario https://www.planagropecuario.org.uy/web, respectively). The providers were asked to return a list of the KE methods they used (e.g. demonstration
farms, factsheets), to describe the goals aimed for in their use (e.g. to ensure farm advisors have up to date knowledge), the target groups aimed at (e.g. farm advisors, young farmers, farmers in general) and how target groups were given access to the KE provided (e.g. via a website, promotion at events). Data were either provided via email or drawn from internal documentation shared with the researchers by the organisations. Based on these data, a summary description of each KE method was prepared. The KE providers checked and approved or amended the descriptions, ensuring accuracy.
The following stages of analysis of collected data were undertaken (the outcomes of each are considered in turn in section 3): 1. In order to gain an overview of KE strategies, a grounded
theory approach (in which categories are drawn out of the data rather than being imposed a priori by the investigator – to ensure ‘grounding’ in the dataset) was used to group the KE methods used in Wales and Uruguay into thematic types and classes according to common aspects and roles.
2. KE method descriptions were assessed to compare the methods applied in Wales and Uruguay.
F I G U R E 2Classification of KE methods and KE capacity for Uruguay (U) and Wales (W) 1Delivered by the private sector in Uruguay, 2delivered by the World Bank in Uruguay Grey boxes = KE methods used both for farmers and as resources for KE practitioners
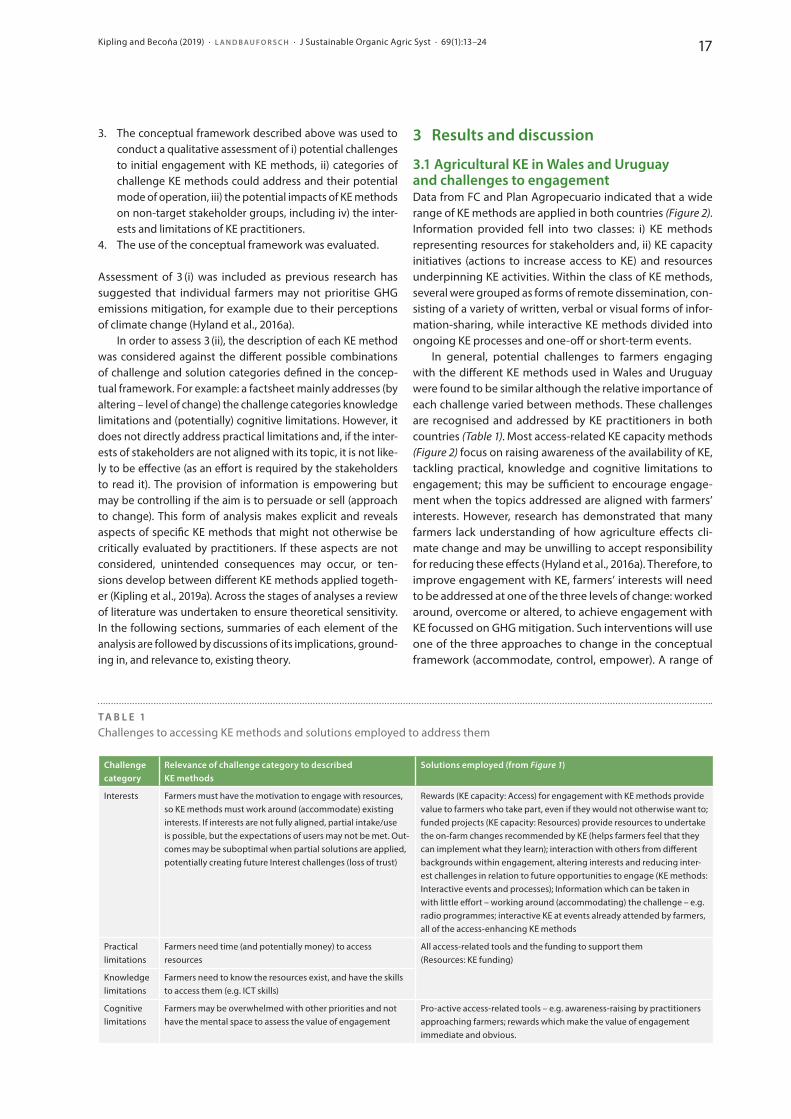
Kipling and Becoña (2019) · L A N D B A U F O R S C H · J Sustainable Organic Agric Syst · 69(1):13–24 17
3. The conceptual framework described above was used to conduct a qualitative assessment of i) potential challenges to initial engagement with KE methods, ii) categories of challenge KE methods could address and their potential mode of operation, iii) the potential impacts of KE methods on nontarget stakeholder groups, including iv) the interests and limitations of KE practitioners.
4. The use of the conceptual framework was evaluated.
Assessment of 3 (i) was included as previous research has suggested that individual farmers may not prioritise GHG emissions mitigation, for example due to their perceptions of climate change (Hyland et al., 2016a).
In order to assess 3 (ii), the description of each KE method was considered against the different possible combinations of challenge and solution categories defined in the conceptual framework. For example: a factsheet mainly addresses (by altering – level of change) the challenge categories knowl edge limitations and (potentially) cognitive limitations. However, it does not directly address practical limitations and, if the interests of stakeholders are not aligned with its topic, it is not likely to be effective (as an effort is required by the stakeholders to read it). The provision of information is empowering but may be controlling if the aim is to persuade or sell (approach to change). This form of analysis makes explicit and reveals aspects of specific KE methods that might not otherwise be critically evaluated by practitioners. If these aspects are not considered, unintended consequences may occur, or tensions develop between different KE methods applied to gether (Kipling et al., 2019a). Across the stages of analyses a review of literature was undertaken to ensure theoretical sensitivity. In the following sections, summaries of each element of the analy sis are followed by discussions of its implications, grounding in, and relevance to, existing theory.
3 Results and discussion
3.1 Agricultural KE in Wales and Uruguay and challenges to engagementData from FC and Plan Agropecuario indicated that a wide range of KE methods are applied in both countries (Figure 2). Information provided fell into two classes: i) KE methods representing resources for stakeholders and, ii) KE capac ity initiatives (actions to increase access to KE) and resources underpinning KE activities. Within the class of KE methods, several were grouped as forms of remote dissemination, consisting of a variety of written, verbal or visual forms of informationsharing, while interactive KE methods divided into ongoing KE processes and oneoff or shortterm events.
In general, potential challenges to farmers engaging with the different KE methods used in Wales and Uruguay were found to be similar although the relative importance of each challenge varied between methods. These chal lenges are recognised and addressed by KE practitioners in both countries (Table 1). Most accessrelated KE capacity methods (Figure 2) focus on raising awareness of the availability of KE, tackling practical, knowledge and cognitive limitations to engagement; this may be sufficient to encourage engagement when the topics addressed are aligned with farmers’ interests. However, research has demonstrated that many farmers lack understanding of how agriculture effects climate change and may be unwilling to accept responsibility for reducing these effects (Hyland et al., 2016a). Therefore, to improve engagement with KE, farmers’ interests will need to be addressed at one of the three levels of change: worked around, overcome or altered, to achieve engagement with KE focussed on GHG mitigation. Such interventions will use one of the three approaches to change in the conceptual framework (accommodate, control, empower). A range of
T A B L E 1Challenges to accessing KE methods and solutions employed to address them
Challenge category
Relevance of challenge category to described KE methods
Solutions employed (from Figure 1)
Interests Farmers must have the motivation to engage with resources, so KE methods must work around (accommodate) existing interests. If interests are not fully aligned, partial intake/use is possible, but the expectations of users may not be met. Outcomes may be suboptimal when partial solutions are applied, potentially creating future Interest challenges (loss of trust)
Rewards (KE capacity: Access) for engagement with KE methods provide value to farmers who take part, even if they would not otherwise want to; funded projects (KE capacity: Resources) provide resources to undertake the onfarm changes recommended by KE (helps farmers feel that they can implement what they learn); interaction with others from different backgrounds within engagement, altering interests and reducing interest challenges in relation to future opportunities to engage (KE methods: Interactive events and processes); Information which can be taken in with little effort – working around (accommodating) the challenge – e.g. radio programmes; interactive KE at events already attended by farmers, all of the accessenhancing KE methods
Practical limitations
Farmers need time (and potentially money) to access resources
All accessrelated tools and the funding to support them (Resources: KE funding)
Knowledge limitations
Farmers need to know the resources exist, and have the skills to access them (e.g. ICT skills)
Cognitive limitations
Farmers may be overwhelmed with other priorities and not have the mental space to assess the value of engagement
Proactive accessrelated tools – e.g. awarenessraising by practitioners approaching farmers; rewards which make the value of engagement immediate and obvious.
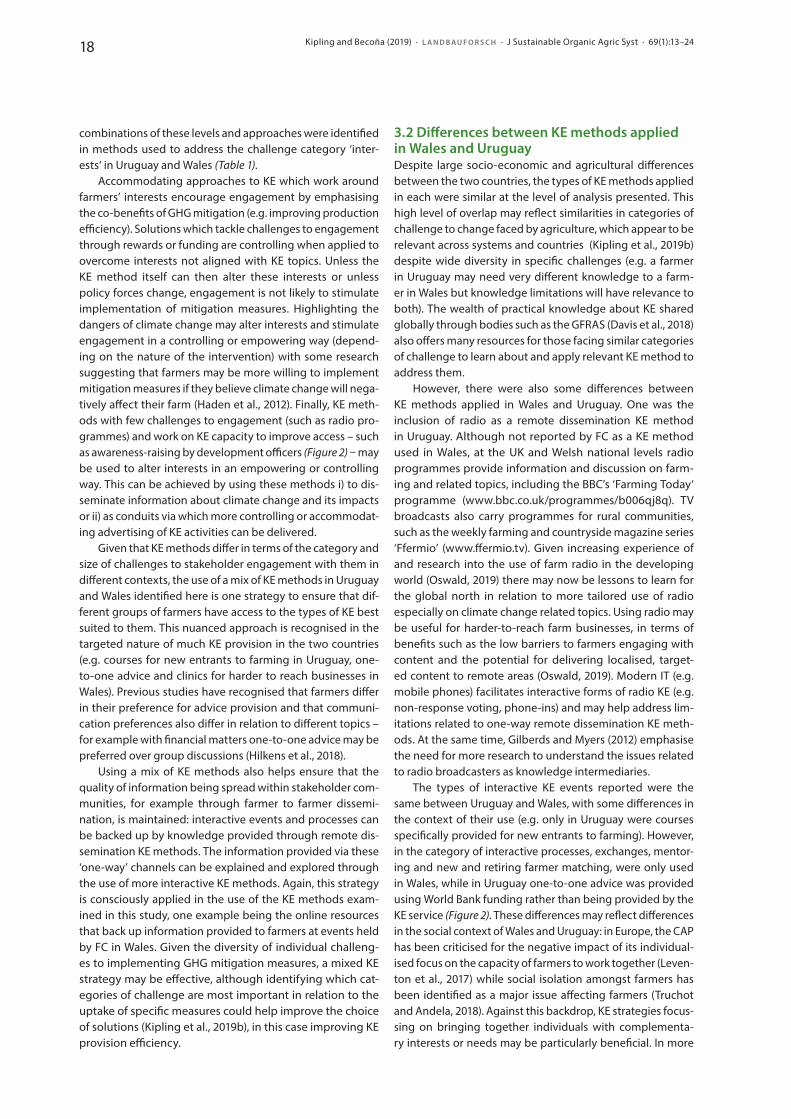
Kipling and Becoña (2019) · L A N D B A U F O R S C H · J Sustainable Organic Agric Syst · 69(1):13–2418
combinations of these levels and approaches were identified in methods used to address the challenge category ‘interests‘ in Uruguay and Wales (Table 1).
Accommodating approaches to KE which work around farmers’ interests encourage engagement by emphasising the cobenefits of GHG mitigation (e.g. improving production efficiency). Solutions which tackle challenges to engagement through rewards or funding are controlling when applied to overcome interests not aligned with KE topics. Unless the KE method itself can then alter these interests or unless policy forces change, engagement is not likely to stimulate implementation of mitigation measures. Highlighting the dangers of climate change may alter interests and stimulate engagement in a controlling or empowering way (depending on the nature of the intervention) with some research suggesting that farmers may be more willing to implement mitigation measures if they believe climate change will negatively affect their farm (Haden et al., 2012). Finally, KE methods with few challenges to engagement (such as radio programmes) and work on KE capacity to improve access – such as awarenessraising by development officers (Figure 2) – may be used to alter interests in an empowering or controlling way. This can be achieved by using these methods i) to disseminate information about climate change and its impacts or ii) as conduits via which more controlling or accommodating advertising of KE activities can be delivered.
Given that KE methods differ in terms of the category and size of challenges to stakeholder engagement with them in different contexts, the use of a mix of KE methods in Uruguay and Wales identified here is one strategy to ensure that different groups of farmers have access to the types of KE best suited to them. This nuanced approach is recognised in the targeted nature of much KE provision in the two countries (e.g. courses for new entrants to farming in Uruguay, onetoone advice and clinics for harder to reach businesses in Wales). Previous studies have recognised that farmers differ in their preference for advice provision and that communication preferences also differ in relation to different topics – for example with financial matters onetoone advice may be preferred over group discussions (Hilkens et al., 2018).
Using a mix of KE methods also helps ensure that the quality of information being spread within stakeholder communities, for example through farmer to farmer dissemination, is maintained: interactive events and processes can be backed up by knowledge provided through remote dissemination KE methods. The information provided via these ‘oneway’ channels can be explained and explored through the use of more interactive KE methods. Again, this strategy is consciously applied in the use of the KE methods examined in this study, one example being the online resources that back up information provided to farmers at events held by FC in Wales. Given the diversity of individual challenges to implemen ting GHG mitigation measures, a mixed KE strat egy may be effective, although identifying which categories of challenge are most important in relation to the uptake of specific measures could help improve the choice of solutions (Kipling et al., 2019b), in this case improving KE provision efficiency.
3.2 Differences between KE methods applied in Wales and UruguayDespite large socioeconomic and agricultural differences between the two countries, the types of KE methods applied in each were similar at the level of analysis presented. This high level of overlap may reflect similarities in categories of challenge to change faced by agriculture, which appear to be relevant across systems and countries (Kipling et al., 2019b) despite wide diversity in specific challenges (e.g. a farmer in Uruguay may need very different knowledge to a farmer in Wales but knowledge limitations will have relevance to both). The wealth of practical knowledge about KE shared globally through bodies such as the GFRAS (Davis et al., 2018) also offers many resources for those facing similar categories of challenge to learn about and apply relevant KE method to address them.
However, there were also some differences between KE methods applied in Wales and Uruguay. One was the inclusion of radio as a remote dissemination KE method in Uruguay. Although not reported by FC as a KE method used in Wales, at the UK and Welsh national levels radio programmes provide information and discussion on farming and related topics, including the BBC’s ‘Farming Today‘ programme (www.bbc.co.uk/programmes/b006qj8q). TV broadcasts also carry programmes for rural communities, such as the weekly farming and countryside magazine series ‘Ffermio’ (www.ffermio.tv). Given increasing experience of and research into the use of farm radio in the developing world (Oswald, 2019) there may now be lessons to learn for the global north in relation to more tailored use of radio especially on climate change related topics. Using radio may be useful for hardertoreach farm businesses, in terms of benefits such as the low barriers to farmers engaging with content and the potential for delivering localised, targeted content to remote areas (Oswald, 2019). Modern IT (e.g. mobile phones) facilitates interactive forms of radio KE (e.g. nonresponse voting, phoneins) and may help address limitations related to oneway remote dissemination KE methods. At the same time, Gilberds and Myers (2012) emphasise the need for more research to understand the issues related to radio broadcasters as knowledge intermediaries.
The types of interactive KE events reported were the same between Uruguay and Wales, with some differences in the context of their use (e.g. only in Uruguay were courses specifically provided for new entrants to farming). However, in the category of interactive processes, exchanges, mentoring and new and retiring farmer matching, were only used in Wales, while in Uruguay onetoone advice was provided using World Bank funding rather than being provided by the KE service (Figure 2). These differences may reflect differ ences in the social context of Wales and Uruguay: in Europe, the CAP has been criticised for the negative impact of its individu alised focus on the capacity of farmers to work together (Leventon et al., 2017) while social isolation amongst farmers has been identified as a major issue affecting farmers (Truchot and Andela, 2018). Against this backdrop, KE strategies focussing on bringing together individuals with complementary interests or needs may be particularly beneficial. In more
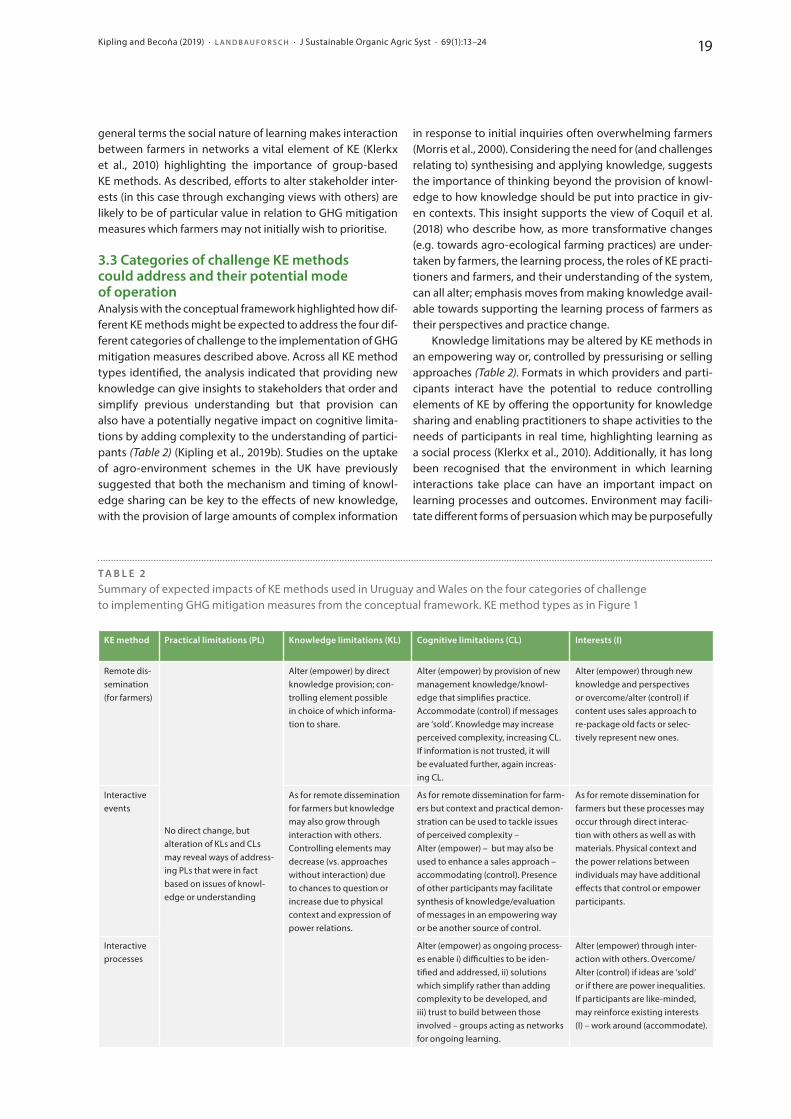
Kipling and Becoña (2019) · L A N D B A U F O R S C H · J Sustainable Organic Agric Syst · 69(1):13–24 19
general terms the social nature of learning makes interaction between farmers in networks a vital element of KE (Klerkx et al., 2010) highlighting the importance of groupbased KE methods. As described, efforts to alter stakeholder interests (in this case through exchanging views with others) are likely to be of particular value in relation to GHG mitigation measures which farmers may not initially wish to prioritise.
3.3 Categories of challenge KE methods could address and their potential mode of operationAnalysis with the conceptual framework highlighted how different KE methods might be expected to address the four different categories of challenge to the implementation of GHG mitigation measures described above. Across all KE method types identified, the analysis indicated that providing new knowledge can give insights to stakeholders that order and simplify previous understanding but that provision can also have a potentially negative impact on cognitive limitations by adding complexity to the understanding of participants (Table 2) (Kipling et al., 2019b). Studies on the uptake of agroenvironment schemes in the UK have previously suggested that both the mechanism and timing of knowledge sharing can be key to the effects of new knowledge, with the provision of large amounts of complex information
in response to initial inquiries often overwhelming farmers (Morris et al., 2000). Considering the need for (and challenges relating to) synthesising and applying knowledge, suggests the importance of thinking beyond the provision of knowledge to how knowledge should be put into practice in given contexts. This insight supports the view of Coquil et al. (2018) who describe how, as more transformative changes (e.g. towards agroecological farming practices) are undertaken by farmers, the learning process, the roles of KE practitioners and farmers, and their understanding of the system, can all alter; emphasis moves from making knowledge available towards supporting the learning process of farmers as their perspectives and practice change.
Knowledge limitations may be altered by KE methods in an empowering way or, controlled by pressurising or selling approaches (Table 2). Formats in which providers and partici pants interact have the potential to reduce controlling el ements of KE by offering the opportunity for knowledge sha ring and enabling practitioners to shape activities to the needs of participants in real time, highlighting learning as a social process (Klerkx et al., 2010). Additionally, it has long been recognised that the environment in which learning interactions take place can have an important impact on learning processes and outcomes. Environment may facilitate different forms of persuasion which may be purposefully
T A B L E 2Summary of expected impacts of KE methods used in Uruguay and Wales on the four categories of challenge to implementing GHG mitigation measures from the conceptual framework. KE method types as in Figure 1
KE method Practical limitations (PL) Knowledge limitations (KL) Cognitive limitations (CL) Interests (I)
Remote dissemination (for farmers)
No direct change, but alteration of KLs and CLs may reveal ways of addressing PLs that were in fact based on issues of knowledge or understanding
Alter (empower) by direct knowledge provision; controlling element possible in choice of which information to share.
Alter (empower) by provision of new management knowledge/knowledge that simplifies practice. Accommodate (control) if messages are ‘sold’. Knowledge may increase perceived complexity, increasing CL. If information is not trusted, it will be evaluated further, again increasing CL.
Alter (empower) through new knowledge and perspectives or overcome/alter (control) if content uses sales approach to repackage old facts or selectively represent new ones.
Interactive events
As for remote dissemin ation for farmers but knowledge may also grow through interaction with others. Controlling elements may decrease (vs. approaches without interaction) due to chances to question or increase due to physical context and expression of power relations.
As for remote dissemination for farmers but context and practical demonstration can be used to tackle issues of perceived complexity – Alter (empower) – but may also be used to enhance a sales approach – accommodating (control). Presence of other participants may facilitate synthesis of knowledge/evaluation of mes sages in an empowering way or be another source of control.
As for remote dissemination for farmers but these processes may occur through direct interaction with others as well as with materials. Physical context and the power relations between individuals may have additional effects that control or empower partici pants.
Interactive processes
Alter (empower) as ongoing processes enable i) difficulties to be identified and addressed, ii) solutions which simplify rather than adding complexity to be developed, and iii) trust to build between those involved – groups acting as networks for ongoing learning.
Alter (empower) through interaction with others. Overcome/Alter (control) if ideas are ‘sold’ or if there are power inequalities. If parti cipants are likeminded, may reinforce existing interests (I) – work around (accommodate).
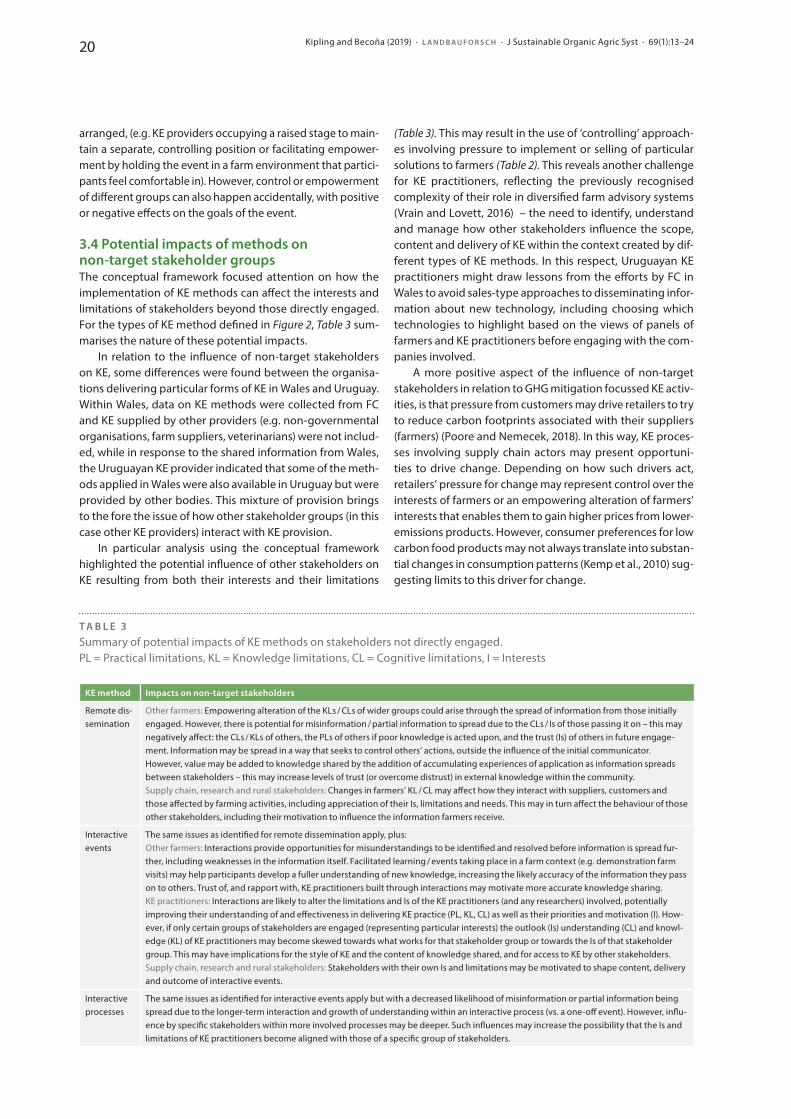
Kipling and Becoña (2019) · L A N D B A U F O R S C H · J Sustainable Organic Agric Syst · 69(1):13–2420
arranged, (e.g. KE providers occupying a raised stage to maintain a separate, controlling position or facilitating empowerment by holding the event in a farm environment that participants feel comfortable in). However, control or empowerment of different groups can also happen accidentally, with positive or negative effects on the goals of the event.
3.4 Potential impacts of methods on non-target stakeholder groupsThe conceptual framework focused attention on how the implementation of KE methods can affect the interests and limitations of stakeholders beyond those directly engaged. For the types of KE method defined in Figure 2, Table 3 summarises the nature of these potential impacts.
In relation to the influence of nontarget stakeholders on KE, some differences were found between the organisations delivering particular forms of KE in Wales and Uruguay. Within Wales, data on KE methods were collected from FC and KE supplied by other providers (e.g. nongovernmental organisations, farm suppliers, veterinarians) were not included, while in response to the shared information from Wales, the Uruguayan KE provider indicated that some of the methods applied in Wales were also available in Uruguay but were provided by other bodies. This mixture of provision brings to the fore the issue of how other stakeholder groups (in this case other KE providers) interact with KE provision.
In particular analysis using the conceptual framework highlighted the potential influence of other stakeholders on KE resulting from both their interests and their limitations
(Table 3). This may result in the use of ‘controlling’ approaches involving pressure to implement or selling of particular solutions to farmers (Table 2). This reveals another challenge for KE practitioners, reflecting the previously recognised complexity of their role in diversified farm advisory systems (Vrain and Lovett, 2016) – the need to identify, understand and manage how other stakeholders influence the scope, content and delivery of KE within the context created by different types of KE methods. In this respect, Uruguayan KE practitioners might draw lessons from the efforts by FC in Wales to avoid salestype approaches to disseminating information about new technology, including choosing which technologies to highlight based on the views of panels of farmers and KE practitioners before engaging with the companies involved.
A more positive aspect of the influence of nontarget stakeholders in relation to GHG mitigation focussed KE activities, is that pressure from customers may drive retailers to try to reduce carbon footprints associated with their suppliers (farmers) (Poore and Nemecek, 2018). In this way, KE processes involving supply chain actors may present opportunities to drive change. Depending on how such drivers act, retailers’ pressure for change may represent control over the interests of farmers or an empowering alteration of farmers’ interests that enables them to gain higher prices from lower emissions products. However, consumer preferences for low carbon food products may not always translate into substantial changes in consumption patterns (Kemp et al., 2010) suggesting limits to this driver for change.
T A B L E 3Summary of potential impacts of KE methods on stakeholders not directly engaged. PL = Practical limitations, KL = Knowledge limitations, CL = Cognitive limitations, I = Interests
KE method Impacts on non-target stakeholders
Remote dissemination
Other farmers: Empowering alteration of the KLs / CLs of wider groups could arise through the spread of information from those initially engaged. However, there is potential for misinformation / partial information to spread due to the CLs / Is of those passing it on – this may negatively affect: the CLs / KLs of others, the PLs of others if poor knowledge is acted upon, and the trust (Is) of others in future engagement. Information may be spread in a way that seeks to control others’ actions, outside the in fluence of the initial communicator. How ever, value may be added to knowledge shared by the addition of accu mulating experiences of application as information spreads between stakeholders – this may increase levels of trust (or overcome distrust) in external knowledge within the community.Supply chain, research and rural stakeholders: Changes in farmers’ KL / CL may affect how they interact with suppliers, customers and those affected by farming activities, including appreciation of their Is, limitations and needs. This may in turn affect the behaviour of those other stakeholders, including their motivation to influence the information farmers receive.
Interactive events
The same issues as identified for remote dissemination apply, plus:Other farmers: Interactions provide opportunities for misunderstandings to be identified and resolved before information is spread further, including weaknesses in the information itself. Facilitated learning / events taking place in a farm context (e.g. demonstration farm visits) may help participants develop a fuller understanding of new knowledge, increasing the likely accuracy of the information they pass on to others. Trust of, and rapport with, KE practitioners built through interactions may motivate more accurate knowledge sharing.KE practitioners: Interactions are likely to alter the limitations and Is of the KE practitioners (and any researchers) involved, potentially improving their understanding of and effectiveness in delivering KE practice (PL, KL, CL) as well as their priorities and motivation (I). However, if only certain groups of stakeholders are engaged (representing particular interests) the outlook (Is) understanding (CL) and knowledge (KL) of KE practitioners may become skewed towards what works for that stakeholder group or towards the Is of that stakeholder group. This may have implications for the style of KE and the content of knowledge shared, and for access to KE by other stakeholders.Supply chain, research and rural stakeholders: Stakeholders with their own Is and limitations may be motivated to shape content, delivery and outcome of interactive events.
Interactive processes
The same issues as identified for interactive events apply but with a decreased likelihood of misinformation or partial information being spread due to the longerterm interaction and growth of understanding within an interactive process (vs. a oneoff event). However, influence by specific stakeholders within more involved processes may be deeper. Such influences may increase the possibility that the Is and limitations of KE practitioners become aligned with those of a specific group of stakeholders.
Kipling and Becoña (2019) · L A N D B A U F O R S C H · J Sustainable Organic Agric Syst · 69(1):13–24 21
Another revealed potential impact of KE methods on nontarget stakeholders (Table 3) is how peer to peer spread of shared information could lead to issues with the quality of knowledge being shared. The use of more interactive KE methods and ongoing KE processes could be expected to reduce such problems by providing interactions with providers and opportunities to clarify or question information given. This benefit of KE processes may be particularly relevant in relation to information about GHG mitigation measures, which farmers may not prioritise without engagement in interestaltering interactive activities.
3.5 Interests and limitations of KE practitionersIn both Uruguay and Wales, some KE methods were used as resources for KE practitioners (Figure 2: KE capacity: Re sources). This recognises the need to support KE practitioners given their key role in how KE methods will be applied and the subsequent outcomes. Previous studies have found that the climate change perspectives of farm advisors can feed through into the advice they give to farmers (Church et al., 2018) suggesting the need to address the interests and limitations of KE practitioners when considering how to improve onfarm implementation of GHG mitigation measures.
In this context, while the use of a mixture of KE methods in Wales and Uruguay may reflect a conscious choice to fulfil strategic goals (see section 3.1) it may also be a pragmatic response to KE practitioners’ interests and limitations. In relation to practical limitations (practitioners’ time and resources) the indepth and therefore expensive nature of KE methods (grouped as interactive processes, Figure 2) may limit their use in the context of the withdrawal of government funds from KE provision over recent decades (Vrain and Lovett, 2016), as may a lack of skills in facilitating such processes (knowledge limitations). Given the already highly complex role of KE practitioners in diversified advisory landscapes (Vrain and Lovett, 2016) cognitive limitations may affect the extent to which they consider the importance of, learn and use more involved KE methods. Finally, the influence of factors such as the professional selfimage of KE practitioners (interests) may also affect the types of KE method made available to farmers.
Considering KE practitioners’ interests and limitations highlights that they face challenges in changing their practice. In this study it was observed that, in Wales and Uruguay, KE methods involving more ambitious levels of interaction were reported in discrete, funded, projects (Figure 2: KE capacity: Resources) or with limited capacity, relative to broadly available remote dissemination resources. This suggests limitations in the capacity of KE providers to roll out such interactive processes more widely. Addressing these issues, Nettle et al. (2018) examined factors that could support the adoption of novel techniques by KE practitioners, emphasising the need for a supportive context for learning and the importance of processes of experimentation.
Just as potential challenges to farmers accessing KE were identified, analysis of KE methods used as re sources for KE practitioners revealed similar potential challenges to engagement by practitioners. However, some unique
aspects were revealed. Firstly, the provision of technical information to KE practitioners (Figure 2: KE capacity: Reports and magazine for practition ers) highlights the need to effectively bridge the gap between the knowledge domains of researchers and KE practitioners in order to facilitate the integration and cocreation of knowledge from research and practice (Paschen et al., 2018). Differences in the communities or networks of practice (Tagliaventi and Mattarelli, 2006) of these groups can be expected to affect exchange and understanding between them, just as arises between KE practitioners and farmers. This point emphasises the importance of sharing solutions across the research disciplines involved in analysing both researchpracti tioner and practitionerstakeholder relationships.
Secondly, analysis using the framework drew attention to how the type and content of KE provided by practitioners may be influenced by the demands of KE recipients (farmers) and other stakeholders, in turn affecting the nature of the topics practitioners themselves demand and engage with for their own development. Such influences may not be conducive to the more transformative changes required to achieve significant reductions in agricultural GHG emissions, given that processes of engagement in which stakeholders are more empowered most often deliver incremental change (Martin et al., 2013). However, KE processes in which farmers are expected to implement externallyderived policies or directions (such as GHG emissions reduction) are more likely to be characterised by bias in power towards the KE practitioner and prescriptiveness in their role, which can have nega tive consequences on stakeholder attitudes and outcomes (Hilkens et al., 2018; Vrain and Lovett, 2016). A farmer’s trust in KE practitioners and the feeling that they are acting in their interests can be vital to the relationship (Ingram, 2008) and this may well be undermined under such circum stances. This tension in KE provision is played out in the way that the privatisation of KE services has led to gaps in provision (Nettle et al., 2017) with demand from farmers (and therefore the supply by KE practitioners reliant on their patronage) not necessarily aligned with policy agendas such as GHG emissions reduction and sustainability.
One potential solution for reducing tensions between the KE topics demanded by stakeholders and societal requirements for agricultural KE came from a specific project in Uruguay. This involved advisors providing farmers with information about the impacts of farming practices on other stakeholders to give the farmers a better understanding of the environmental consequences of their actions and induce them to make changes. Providing open platforms for exchanges between different types of stakeholder has been recommended within processes aimed at developing hybrid, cogenerated knowledge to tackle challenges related to agriculture (Nguyen et al., 2014). In this respect, the Uruguayan example may both represent a way to empower bottomup change towards lower GHG emissions practices by altering farmers’ perceptions and enable KE practitioners facilitating such processes to maintain a balanced view of issues without losing the trust of farmers. However, multistakeholder interactions must be carefully planned and managed to avoid the
Kipling and Becoña (2019) · L A N D B A U F O R S C H · J Sustainable Organic Agric Syst · 69(1):13–2422
damaging consequences of processes in which farmers feel outnumbered, and to address the challenges of developing trust between farmers and other stakeholder groups (Inman et al., 2018). The application of such techniques as a widely used KE method require changes to be made by farm advisors in terms of their skills and practice, highlighting the need for the provision of carefully designed resources for KE practitioners, including the development of networks for the development and sharing of new knowledge and practice (Nettle et al., 2018).
In addition to KE methods used to provide information and training to KE practitioners, other resources can support improvements in KE practice, including the use of decision support tools to facilitate effective interactions with farmers, for example as ‘boundary objects’ in social learning processes (Eastwood et al., 2012). Given that one of the advantages of modelling is to make invisible processes visible (van Paassen et al., 2007) they have a clear role in helping tackle issues relating to farmers’ understanding of how their systems contribute to GHG emissions (Hyland et al., 2016a). Modelling is used in KE in Wales and Uruguay (Figure 2: KE capacity: Resources). However, while in Wales modelling used by FC within its KE programme mainly supports improved farm economic performance, in Uruguay it is being directly applied to investigate how farmers might best reduce emissions through the ‘Evaluación Medio Ambiental Ganadera’ (EMAG) model (https://www.planagropecuario.org.uy/web/102/contenido/evaluación medioambientalganadera.html) (Becoña et al., under review). Participatory modelling of Uruguayan farming systems has also been used to inform best practice in climate change adaptation, demonstrating that in these extensive systems adaptive management rather than rigid prescriptions are most likely to be economically resilient (Dieguez Cameroni et al., 2014). In terms of the conceptual framework applied here, this finding reinforces the importance of empowering KE approaches which build the capacity of stakeholders themselves to manage change and (through this) the need to alter farmer interests in relation to mitigation, rather than simply controlling them. Therefore, if any initial interestrelated challenges to engagement with KE methods can be overcome, modelling provides an important resource to support KE. However, processes involving modelling must be transparent about limitations and assumptions in their characterisation of systems, in order to ensure findings are appropriately interpreted and used.
3.6 Use of the conceptual frameworkThe conceptual framework used here facilitated a systematic appraisal of KE methods used in Uruguay and Wales in terms of their capacity to tackle different categories of potential challenge to the implementation of GHG emissions mitigation measures on livestock farms, including consideration of impacts on nontarget stakeholder groups and the challenges to farmer engagement associated with each method. This use of the framework represents a technique for systematically organising the thoughts of the implementers of KE strat egies including, forcing them to address aspects of proposed actions that would otherwise have remained implicit or
unexplored. Combining this form of analysis of KE methods with an exploration of the actual challenges to change and preferred solutions in a specific location (or for a specific GHG mitigation measure) can facilitate the development of effective KE tailored to specific circumstances. In the context of KE in Wales and Uruguay, further exploration of specific applications of KE methods in each country is also important in order to draw lessons from subtle differences in how the KE methods examined here are actually implemented on the ground. Despite these limitations, this study has highlighted important issues to be addressed by practitioners and researchers in relation to the KE methods reviewed, their strengths and limitations, and has explored differences between the two countries in terms of the KE methods they apply.
4 Conclusions
Analysis of KE methods used in Wales and Uruguay using the conceptual framework highlighted i) the focus of current KE methods in terms of the categories of challenge they are likely to address most effectively, and their different modes of working, ii) the need to recognise how nontarget stakeholders may affect the use of (and outcomes associated with) KE methods and, iii) the importance of recognising the particular challenges of delivering KE on GHG emissions mitigation measures versus delivering advice on other topics. KE professionals in the two countries may be able to learn from differences in the KE methods they use and how they are applied (such as, in Uruguay: the use of processes in which farmers engage with nonagricultural stakeholders or the use of modelling that demonstrates to farmers the emissions impacts of their practices and, in Wales: the use of exchanges to share knowledge). This study indicated the utility of the conceptual framework in facilitating critical evaluation of KE methods, going beyond an assessment of their practical efficacy to explore the ways that they could be used to drive change, their limitations and the likely impacts of their application, both on farmers and nontarget stakeholder groups. Taking these factors into account can support more effective and efficient KE strategies for onfarm GHG emissions mitigation. It forms the basis for aligning the use of KE methods to the actual mix of challenges experienced in particular locations or environments.
Acknowledgements
The authors would like to thank Farming Connect and Plan Agropecuario for their support in providing data and critically assessing text relating to their agricultural extension activ ities in Wales and Uruguay respectively.
Kipling and Becoña (2019) · L A N D B A U F O R S C H · J Sustainable Organic Agric Syst · 69(1):13–24 23
Appendix 1
Summary of challenge and solution types within the concep tual framework described by Kipling et al. (2019a); challenges fully described in Kipling et al. (2019b). Descriptions focus on farmers but the challenge categories apply to all stakeholder groups.
A 1.1 Categories of challenge to changePractical limitations: A range of challenges relating to resources, including the availability of finance, time limitations and the practicality of adjusting existing systems to allow the adoption of changed practices or equipment (e.g. relating to infrastructure or to the environmental context of the farm).Knowledge limitations: Relating to stakeholders’ awareness of novel management options or technological solutions, level of knowledge about the risks and benefits of a change, and whether they had the skills to implement them.Cognitive limitations: Refers to how the complexity of the farm system and the economic, social, environmental and policy pressures on farmers can restrict the mental space available to weigh up the benefits of and synthesise new information about technology or changes to management. Complexity can be added to when information is not trusted (requiring additional evaluation) and when there are many sources of information.Interests: All aspects of decision making relating to what stakeholders want to do: an umbrella for widely researched areas relating to the many influences on decisionmaking.A 1.2 Solutions CategoriesLevels of Change: Three levels of change were identified: i) Work around: solutions which do not change or seek to overcome a challenge, but instead avoid it (e.g. aligning all actions with the existing interests of farmers, rather than seeking to change them), ii) Overcome: solutions which do not remove or reduce a challenge, but give stakeholders the ability (or force them) to overcome it (e.g. providing funds to buy expensive new equipment), iii) Alter: solutions that actually alter a particular challenge (e.g. new technology may make a particular task much less time consuming, reducing the practical challenge to its implementation).Approaches to Change: Three approaches to change were identified, relating to how a specific solution is implemented: i) Accommodate: accepts that a challenge exists and takes it into account when making changes (e.g. bringing in new roles incrementally to give time for practical changes to be made), ii) Control: forces or directs change (e.g. regulation to overcome interests that are not aligned to implementation, or providing resources for only certain types of activity), iii) Empower: enables the stakeholder to take control of the situation and drive change (e.g. providing training in strategic decision making to reduce cognitive limitations and help the stakeholder achieve what they want to).
R E F E R E N C E S
Becoña G, Astigarraga L, Picasso VD (2014) Greenhouse gas emissions of beef cowcalf grazing systems in Uruguay. Sustain Agric Res 3(2):89–105, doi:10.22004/ag.econ.230526
Becoña G, Ledgard S, Astigarraga L, Dieguez F, Morales H (under review) EMAG – National model to evaluate environmental impacts of cattle production systems in Uruguay.
Bidegain M, Caffera R (1997) Clima del Uruguay [Online]. Retrieved from <https://www.rau.edu.uy/uruguay/geografía/Uy_cinfo.htm> [at 15 Nov 2019]
Church SP, Dunn M, Babin N, Mase AS, Haigh T, Prokopy LS (2018) Do advisors perceive climate change as an agricultural risk? An indepth examination of Midwestern U.S. Ag advisors’ views on drought, climate change, and risk management. Agr Hum Values 35(2):349–365, doi:10.1007/s1046001798273
Colvin J, Blackmore C, Chimbuya S, Collins K, Dent M, Goss J, Ison R, Roggero PP, Seddaiu G (2014) In search of systemic innovation for sustainable development: A design praxis emerging from a decade of social learning inquiry. Research Policy 43(4):760–771, doi:10.1016/j.respol.2013.12.010
Coquil X, Cerf M, Auricoste C, Joannon A, Barcellini F, Cayre P, Chizallet M, Dedieu B, Hostiou N, Hellec F et al. (2018) Questioning the work of farmers, advisors, teachers and researchers in agroecological transition. A review. Agron Sustain Dev 38: 47, doi:10.1007/s1359301805244
Davis K, Bohn A, Franzel S, Blum M, Rieckmann U, Raj S, Hussein K, Ernst N (eds) (2018) What works in rural advisory services? Global Good Practice Notes. Lausanne, Switzerland: GFRAS, 148 p
Dieguez Cameroni FJ, Terra R, Tabarez S, Bommel P, Corral J, Bartaburu D, Pereira M, Montes E, Duarte E, Morales Grosskopf H (2014) Virtual experiments using a participatory model to explore interactions between clima tic variability and management decisions in extensive grazing systems in the basaltic region of Uruguay. Agric Syst 130(C):89–104, doi:10.1016/j.agsy.2014.07.002
Eastwood CR, Chapman DF, Paine MS (2012) Networks of practice for co construction of agricultural decision support systems: Case studies of precision dairy farms in Australia. Agric Syst108(C):10–18, doi:10.1016/j.agsy.2011.12.005
FAO (2019) FAOSTAT [online]. Retrieved from <http://www.fao.org/faostat/en/#data> [at 15 Nov 2019]
Garibaldi LA, GemmillHerren B, D’Annolfo R, Graeub BE, Cunningham SA, Breeze TD (2017) Farming approaches for greater biodiversity, livelihoods, and food security. Trends Ecol Evol 32(1):68–80, doi:10.1016/j.tree.2016.10.001
Gilberds H, Myers M (2012) Radio, ICT convergence and knowledge brokerage: Lessons from SubSaharan Africa. IDS Bulletin 43(5):76–83, doi:10.1111/j.17595436.2012.00366.x
Haden VR, Niles MT, Lubell M, Perlman J, Jackson LE (2012) Global and local concerns: What attitudes and beliefs motivate farmers to mitigate and adapt to climate change? PLOS ONE 7(12):e52882, doi:10.1371/journal.pone.0052882
Hilkens A, Reid JI, Klerkx L, Gray DI (2018) Money talk: How relations between farmers and advisors around financial management are shaped. J Rural Stud 63:83–95, doi:10.1016/j.jrurstud.2018.09.002
Hyland JJ, Jones DL, Parkhill KA, Barnes AP, Williams AP (2016a) Farmers’ perceptions of climate change: identifying types. Agr Hum Values 33(2):323–339, doi:10.1007/s1046001596089
Hyland JJ, Styles D, Jones DL, Williams AP (2016b) Improving livestock production efficiencies presents a major opportunity to reduce sectoral greenhouse gas emissions. Agric Syst147:123–131, doi:10.1016/j.agsy.2016.06.006
Ingram J (2008) Agronomist–farmer knowledge encounters: an analysis of knowledge exchange in the context of best management practices in England. Agr Hum Values 25(3):405–418, doi:10.1007/s1046000891340
Inman A, Winter M, Wheeler R, Vrain E, Lovett A, Collins A, Jones I, Johnes P, Cleasby W (2018) An exploration of individual, social and material factors influencing water pollution mitigation behaviours within the farm
Kipling and Becoña (2019) · L A N D B A U F O R S C H · J Sustainable Organic Agric Syst · 69(1):13–2424
ing community. Land Use Policy 70:16–26, doi:10.1016/j.landusepol.2017.09.042
Jones L, Thistlethwaite G, Kilroy E, Brown P, MacCarthy J, Walker C, Salisbury E, Hampshire K, Buys G, Cardenas L (2017) Greenhouse gas inventories for England, Scotland, Wales and Northern Ireland: 1990–2015. Oxfordshire: National Atmospheric Emissions Inventory (NAEI)
Kemp K, Insch A, Holdsworth DK, Knight JG (2010) Food miles: Do UK consumers actually care? Food Policy 35(6):504–513, doi:10.1016/j.foodpol.2010.05.011
Kipling RP, Taft HE, Chadwick D, Styles D, Moorby JM (2019a) Implementation solutions for greenhouse gas mitigation measures in livestock agriculture: A framework for coherent strategy. Environ Sci Policy 101:232–244, doi:10.1016/j.envsci.2019.08.015
Kipling RP, Taft HE, Chadwick DR, Styles D, Moorby J (2019b) Challenges to implementing greenhouse gas mitigation measures in livestock agriculture: A conceptual framework for policymakers. Environ Sci Policy 92:107–115, doi:10.1016/j.envsci.2018.11.013
Klerkx L, Aarts N, Leeuwis C (2010) Adaptive management in agricultural innovation systems: The interactions between innovation networks and their environment. Agric Syst103(6):390–400, doi:10.1016/j.agsy.2010.03.012
Knuth U, Knierim A (2015) Interaction with and governance of increasingly pluralistic AKIS: A changing role for advisory services. In: EU SCAR (ed) Agricultural knowledge and innovation systems towards the future: a foresight paper. Brussels: European Commission, 104–118, doi:10.2777/388087
Leeuwis C (2004) Communication for rural innovation: rethinking agricultural extension, 3rd Edition. Oxford: Blackwell Science Ltd, 424 p
Leventon J, Schaal T, Velten S, Dänhardt J, Fischer J, Abson DJ, Newig J (2017) Collaboration or fragmentation? Biodiversity management through the common agricultural policy. Land Use Policy 64:1–12, doi:10.1016/j.landusepol.2017.02.009
Martin G, MartinClouaire R, Duru M (2013) Farming system design to feed the changing world. A review. Agron Sustain Dev 33:131–149, doi:10.1007/s1359301100754
Modernel P, Dogliotti S, Alvarez S, Corbeels M, Picasso V, Tittonell P, Rossing WAH (2018) Identification of beef production farms in the Pampas and Campos area that stand out in economic and environmental performance. Ecol Indic 89:755–770, doi:10.1016/j.ecolind.2018.01.038
Morris J, Mills J, Crawford IM (2000) Promoting farmer uptake of agrienvironment schemes: the countryside stewardship arable options scheme. Land Use Policy 17(3):241–254, doi:10.1016/S02648377(00)000211
Morris W, Henley A, Dowell D (2017) Farm diversification, entrepreneurship and technology adoption: Analysis of upland farmers in Wales. J Rural Stud 53:132143, doi:10.1016/j.jrurstud.2017.05.014
Nettle R, Crawford A, Brightling P (2018) How privatesector farm advisors change their practices: An Australian case study. J Rural Stud 58:20–27, doi:10.1016/j.jrurstud.2017.12.027
Nettle R, Klerkx L, Faure G, Koutsouris A (2017) Governance dynamics and the quest for coordination in pluralistic agricultural advisory systems. The Journal of Agricultural Education and Extension 23(3):189–195, doi:10.1080/1389224x.2017.1320638
Nguyen TPL, Seddaiu G, Roggero PP (2014) Hybrid knowledge for understanding complex agrienvironmental issues: nitrate pollution in Italy. Int J Agr Sustain 12(2):164–182, doi:10.1080/14735903.2013.825995
Oswald F (2019) Agricultural information on air: Analysing farm radio through contemporary models of science communication. A comparison of three cases in rural Kenya. Karlsruhe, 196 p, Karlsruhe Institute of Technology (KIT), Master Thesis
Oyhantçabal G, Narbondo I (2019) Land grabbing in Uruguay: new forms of land concentration. Can J Dev Stud 40(2):201–219, doi:10.1080/02255189.2018.1524749
Paschen JA, Shovelton J, Evers A, Hollier C, Nettle R, Ayre M, King B, Reichelt N (2018) Facilitating the collaboration of practitioner and scientific knowledge: experiences from an Australian action research intervention. 13th European International Farming Systems Association Symposium, Mediterranean Agronomic Institute of Chania, Greece, 1–5 Jul 2018
Poore J, Nemecek T (2018) Reducing food’s environmental impacts through producers and consumers. Science 360(6392):987–992, doi:10.1126/science.aaq0216
Pozo P, Säumel I (2018) How to bloom the green desert: Eucalyptus plantations and native forests in Uruguay beyond black and white perspectives. Forests 9(10):614–630, doi:10.3390/f9100614
Royo Pallarés O, Berretta E, Maraschin G (2005) The South American campos ecosystem. In: Suttle J, Reynolds S, Batello C (eds) Grassland of the World. 5 Rome: FAO, 171–212
Tagliaventi MR, Mattarelli E (2006) The role of networks of practice, value sharing, and operational proximity in knowledge flows between professional groups. Human Relations 59(3):291–319, doi:10.1177/0018 726706064175
Truchot D, Andela M (2018) Burnout and hopelessness among farmers: The farmers stressors inventory. Soc Psychiatry Psychiatr Epidemiol 53(8):859–867, doi:10.1007/s0012701815288
van Paassen A, Roetter RP, van Keulen H, Hoanh CT (2007) Can computer models stimulate learning about sustainable land use? Experience with LUPAS in the humid (sub)tropics of Asia. Agric Syst 94(3):874–887, doi:10.1016/j.agsy.2006.11.012
Vrain E, Lovett A (2016) The roles of farm advisors in the uptake of measures for the mitigation of diffuse water pollution. Land Use Policy 54:413–422, doi:10.1016/j.landusepol.2016.03.007
Welsh Government (2013) Welsh Agricultural Statistics 2012 and 2013. Cardiff: Gov.Wales
Wreford A, Ignaciuk A, Gruère G (2017) Overcoming barriers to the adoption of climatefriendly practices in agriculture. OECD Food, Agriculture and Fisheries Papers 101, Paris: OECD Publishing, 40 p, doi:10.1787/97767de8en
25Bodirsky et al. (2019) · L A N D B A U F O R S C H · J Sustainable Organic Agric Syst · 69(1):25–30DOI:10.3220/LBF1581688226000
P O S I T I O N P A P E R
Reducing ruminant numbers and consumption of animal source foods are aligned with environ-mental and public health demandsBenjamin Leon Bodirsky1, Prajal Pradhan 1, and Marco Springmann2
1 Potsdam Institute for Climate Impact Research, Member of Leibniz Association, Germany2 Oxford Martin Programme on the Future of Food and Nuffield Department of Population Health, University of Oxford, United Kingdom
C O N TA C T: [email protected], [email protected], and [email protected] (authors shares equal contributions)
1 The environmental burden of ruminants
There are many ways for efficient management of ruminant systems to provide more food with less environmental impact, such as to improve feeding quality, avoid overgrazing, intro-duce silvopasture, control parasites, or even feed specific ingredients that reduce the emissions of climate-heating methane (Lemaire et al., 2014; Schader et al., 2015; Landholm et al., 2019). The technical potential for climate change miti-gation of these options ranges from 0.2 to 2.4 Gt CO2-eq yr -1 in comparison to the current emissions of 4.1±1.2 Gt CO2-eq yr -1 from the livestock sector (Mbow et al., 2019). Therefore, even the best ruminant production systems cannot avoid putting pressure on the environment. Ruminants inevitably pro-duce methane in their rumens, require land for their feed, and their excretion leads to emissions of ammonia, nitrate, and nitrous oxide, responsible for air pollution, water pol-lution, and global warming (Steinfeld et al., 2006). Produ-cing 1 kg of boneless ruminant meat requires an average of 2.8 kg human-edible feed that varies between 0.1 to 9.4 kg human-edible feed depending on region and intensity of production – e.g. ruminants in grazing and mixed systems mainly consume roughages (about 90 %; Mottet et al., 2017).
However, despite the relatively large environmental impact, ruminant systems produce a relatively modest 18 % of the per capita protein supply in comparison to 60 % from crops (FAO, 2019).
The dimension of the global ruminant livestock produc-tion system further amplifies its already high per-product impact. The global ruminant livestock population of around 4 billion in 2017, consisting of 38 % cattle, 31 % sheep, 26 % goats, and 5 % buffaloes (FAO, 2019), has a bodyweight that is more than 10 times the bodyweight of all wild mammals (Bar-On et al., 2018). Their feed requirements and nutrient excretion are exceeding the absorption capacity of natural systems, even when fed sustainably. The environmental foot-print of diets containing livestock products is consider ably higher than those of plant-based diets (Poore and Nemecek, 2018). The ruminant supply chain emit 5.7 Gt CO2-eq yr -1 (Opio et al., 2013), which is roughly one-tenth of global greenhouse gas emissions. Even if the most efficient and currently avail-able management practices were adopted in the entire agricul tural sector, a food system with high levels of ani-mal source foods in general, and ruminant meat and milk in particular, would risk to exceed key planetary bounda-ries (Springmann et al., 2018a). These include those for cli-mate change, land use, freshwater extraction, nitrogen and
Received: August 1, 2019 Revised: November 1, 2019Accepted: December 20, 2019
K E Y W O R D S food systems, healthy diets, ruminants, dietary change, fruits and vegetables, red meat
Benjamin L. Bodirsky Prajal Pradhan Marco Springmann
© K
arko
w/P
IK
© L
. Kru
mm
enau
er
© p
rivat
e
26 Bodirsky et al. (2019) · L A N D B A U F O R S C H · J Sustainable Organic Agric Syst · 69(1):25–30
phospho rus. Model- based analyses showed that the food system has a chance of staying within planetary boundaries only when efficient management practices were combined with dietary changes towards less animal source foods and less food waste (Springmann et al., 2018a).
From an environmental perspective, reducing animal source foods, in particular ruminant-source ones, is impera tive in most regions to meet emission reduction targets and other environmental concerns. However, as such calls become loud-er, they are also facing several prevalent counter- narratives. Here, we provide a novel discussion on three of these narra-tives that relate to the social, economic, and environmental threats of reducing animal source foods, including i) food and nutrition security, ii) development and livelihoods, and iii) conservation of biodiversity and cultural landscapes. For each point, we highlight how the reduc t ion of animal source foods, in particular ruminant-source ones, can go hand-in-hand with concomitant improvements rather than threats. Our discussion is focused on ruminant systems because ruminants emit higher amounts of greenhouse gases and often have a higher environmental impact than mono gastric animals; however, our arguments also hold for monogastric systems.
2 Food and nutrition security
Globally, 821 million people are facing hunger and under-nourishment (FAO et al., 2019). Animal source foods can pro-vide protein and micronutrients in food-insecure countries and help diversify mainly starch-based diets (Willett et al., 2019). In large parts of Sub-Saharan Africa, an increase in ani-mal source foods could contribute to improving nutritional status and reduce stunting, in particular for children (Neu-mann et al., 2002; Bwibo and Neumann, 2003). However, this can also be achieved by environmentally sustainable options that do not include livestock. Bhutta et al. (2013) showed in a comprehensive review that micronutrient supplementation programmes together with the promotion of breastfeeding are the most cost-effective options for improving maternal and child nutrition in low-income countries. But also the broad category of complementary food supplementation has a role to play. Among food-based interventions, the role of home gardening, optionally expanded by some backyard animal husbandry or fish ponds, has been widely discussed as a promising option for improving dietary diversity and strengthening the women’s role in the household (Darn-ton-Hill, 2014). Other interventions, such as conditional cash transfers, have also shown effectiveness in some instances (Lagarde et al., 2009; Pega et al., 2015). Thus, a wide range of options exist for improving maternal and child health, many of which can be considered less environmentally intensive than the promotion of ruminant-source foods.
An additional benefit of promoting more holistic food system options is for long-term health. In 2015, the Inter-national Agency for Research on Cancer (IARC), the cancer agency of the World Health Organisation, classified the con-sumption of red meat, which includes beef, lamb, and pork, as ‘carcinogenic to humans’ if eaten in processed form, and
as ‘prob ably carcinogenic to humans’ if eaten unprocessed (Bouvard et al., 2015). In addition to being linked with cancer, the consumption of red and processed meat has also been associated with increased rates of coronary heart disease (Micha et al., 2010), stroke (Chen et al., 2013), type 2 diabetes mellitus (Feskens et al., 2013), and overall mortality (Sinha et al., 2010; Larsson and Orsini, 2014). Although some research-ers have questioned the need for recommending reductions in red and processed meat consumption (Johnston et al, 2019), such opinions are not shared by the public health and nutrition community1, nor by the available epidemiological evidence2. At a population level, the public health impacts of red and processed meat consumption are large (GBD 2017 Dietary Collaborators, 2019) and carry a substantial cost burden, in particular in countries with high consumption (Springmann et al., 2018b).
The consumption of red and processed meat exceeds rec-ommended levels in most high and middle-income countries and increasingly in several low-income countries (Figure 1a). By 2030, the average consumption of red meat in low-in-come countries is projected to exceed values recommend-ed on health grounds by the EAT-Lancet Commission on Healthy Diets from Sustainable Food Systems (Springmann et al., 2018c). Conversely, the consumption of fruits and veg-etables, which is consistently associated with reduction in chronic disease mortality (Aune et al., 2017), is often too low in low-income countries (Figure 1b). Thus, also from a health perspective, a focus on promoting nutritious plant-based foods, such as fruits, vegetables, legumes, and nuts, has arguably greater prospects for contributing to food and nutrition security in the medium- and long-term than the promotion of ruminant-source foods.
3 Development and livelihoods
Livestock creates income and livelihoods for the poorest of the world, with about two-thirds of households in develop-ing countries receiving part of their income from livestock farming, and with almost two thirds of poor livestock keepers being rural women (Davis et al., 2010; Herrero et al., 2013a). In addition to income, animals are often used to provide trac-tion, for asset formation, or as insurance, and their manure can transfer nutrients from grassland into smallholder ar a-ble systems (Herrero et al., 2013a). However, such statistics deserve to be put into perspective. Livestock contributes a lower share of income than cropping (Davis et al., 2010), and a dietary transition from animal source foods towards healthier, more plant-based diets may create opportunities that could be more beneficial for smallholders than the fore-gone income from livestock farming. However, these oppor-tunities may not hold for regions where farmers have limit-ed possibilities for alternative agricultural activities besides livestock farming (e.g. pastoralism in Mongolia, Himalaya,
1 https://www.sciencemediacentre.org/expert-reaction-to-new-papers-looking-at-red-and-processed-meat-consumption-and-health/
2 https://www.hsph.harvard.edu/nutritionsource/2019/09/30/flawed-guidelines-red-processed-meat/
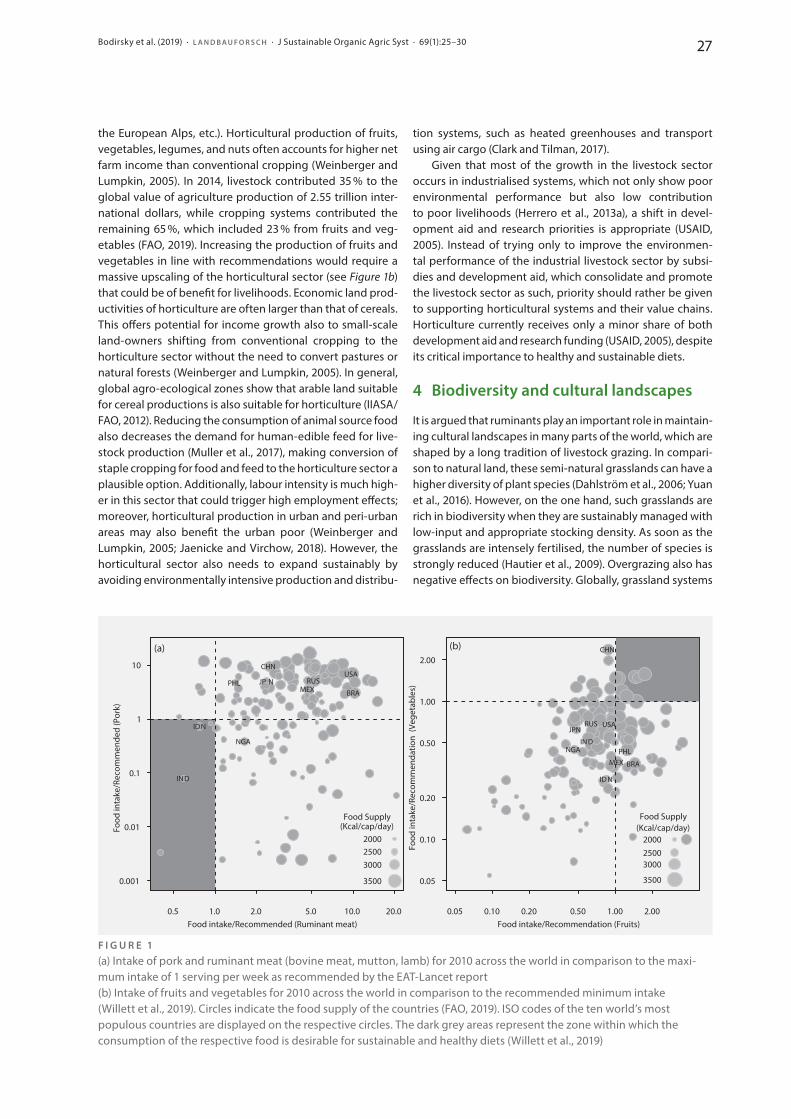
27Bodirsky et al. (2019) · L A N D B A U F O R S C H · J Sustainable Organic Agric Syst · 69(1):25–30
tion systems, such as heated greenhouses and transport using air cargo (Clark and Tilman, 2017).
Given that most of the growth in the livestock sector occurs in industrialised systems, which not only show poor environmental performance but also low contribution to poor livelihoods (Herrero et al., 2013a), a shift in devel-opment aid and research priorities is appropriate (USAID, 2005). Instead of trying only to improve the environmen-tal performance of the industrial livestock sector by subsi-dies and development aid, which consolidate and promote the livestock sector as such, priority should rather be given to supporting horticultural systems and their value chains. Horticulture currently receives only a minor share of both development aid and research funding (USAID, 2005), despite its critical importance to healthy and sustainable diets.
4 Biodiversity and cultural landscapes
It is argued that ruminants play an important role in maintain-ing cultural landscapes in many parts of the world, which are shaped by a long tradition of livestock grazing. In compari-son to natural land, these semi-natural grasslands can have a higher diversity of plant species (Dahlström et al., 2006; Yuan et al., 2016). However, on the one hand, such grasslands are rich in biodiversity when they are sustainably managed with low-input and appropriate stocking density. As soon as the grasslands are intensely fertilised, the number of species is strongly reduced (Hautier et al., 2009). Overgrazing also has negative effects on biodiversity. Globally, grassland systems
the European Alps, etc.). Horticultural production of fruits, veg etables, legumes, and nuts often accounts for higher net farm income than conventional cropping (Weinberger and Lumpkin, 2005). In 2014, livestock contributed 35 % to the global value of agriculture production of 2.55 trillion inter-national dollars, while cropping systems contributed the remaining 65 %, which included 23 % from fruits and veg-eta bles (FAO, 2019). Increasing the production of fruits and vegetables in line with recommendations would require a massive upscaling of the horticultural sector (see Figure 1b) that could be of benefit for livelihoods. Economic land prod-uctivities of horticulture are often larger than that of cereals. This offers potential for income growth also to small-scale land-owners shifting from conventional cropping to the horticulture sector without the need to convert pastures or natural forests (Weinberger and Lumpkin, 2005). In general, global agro-ecological zones show that arable land suitable for cereal productions is also suitable for horticulture (IIASA/FAO, 2012). Reducing the consumption of animal source food also decreases the demand for human-edible feed for live-stock production (Muller et al., 2017), making conversion of staple cropping for food and feed to the horticulture sector a plausible option. Additionally, labour intensity is much high-er in this sector that could trigger high employment effects; moreover, horticultural production in urban and peri- urban areas may also benefit the urban poor (Weinberger and Lumpkin, 2005; Jaenicke and Virchow, 2018). How ever, the horticultural sector also needs to expand sustainably by avoiding environmentally intensive production and distribu-
CHN
IND
USA
IDN
BRA
NGA
RUSJP NMEX
PHL
3500
300025002000
Food Supply(Kcal/cap/day)
(a)
0.001
0.01
0.1
1
10
0.5 1.0 2.0 5.0 10.0 20.0Food intake/Recommended (Ruminant meat)
Food
inta
ke/R
ecom
men
ded
(Por
k)
CHN
IND
USA
IDN
BRA
NGA
RUSJPN
MEXPHL
3500
300025002000
Food Supply(Kcal/cap/day)
(b)
0.05
0.10
0.20
0.50
1.00
2.00
0.05 0.10 0.20 0.50 1.00 2.00Food intake/Recommendation (Fruits)
Food
inta
ke/R
ecom
men
datio
n (V
eget
able
s)
F I G U R E 1(a) Intake of pork and ruminant meat (bovine meat, mutton, lamb) for 2010 across the world in comparison to the maxi-mum intake of 1 serving per week as recommended by the EAT-Lancet report(b) Intake of fruits and vegetables for 2010 across the world in comparison to the recommended minimum intake (Willett et al., 2019). Circles indicate the food supply of the countries (FAO, 2019). ISO codes of the ten world’s most populous countries are displayed on the respective circles. The dark grey areas represent the zone within which the consumption of the respective food is desirable for sustainable and healthy diets (Willett et al., 2019)
28 Bodirsky et al. (2019) · L A N D B A U F O R S C H · J Sustainable Organic Agric Syst · 69(1):25–30
produce relatively low amounts of animal source foods in comparison to other systems. Mixed crop-livestock systems are the most important ruminant production systems in both developed and developing countries, producing 69 % of milk and 61 % of ruminant meat globally (Herrero et al., 2013b). Interestingly, the industrial livestock system or overgrazing often dominates in those regions that argue for the need of livestock for maintaining their cultural landscapes (Herrero et al., 2013b). Hence, a much-reduced number of ruminants with sustainable grassland management would be sufficient to maintain cultural landscapes across the world. Such land-scape maintenance can be guided by policies to preserve cultural and biodiverse pasture landscapes, producing ani-mal source foods in the meantime.
On the other hand, multiple studies have shown that sub-stitution of animal source foods by plant products in diets would reduce deforestation and the expansion of croplands due to a reduced demand for feed crops (e.g. Weindl et al., 2017; Stehfest et al., 2009; Alexander et al., 2016; Kastner et al., 2012). Additionally, Weindl et al. (2017) showed that low consump tion of animal source foods has clear positive net-im-pact on the carbon stocks by avoiding land use changes from forests to pasture and from pasture to cropland for livestock feeding. There is a vast potential to create diff erent cultural landscapes through afforestation and to increase biodiver-sity through rewilding (Bakker and Svenning, 2018), which would provide additional climate benefits through carbon sequestering (Bastin et al., 2019). A recent study shows that 205 gigatonnes of carbon can be stored by afforesting are-as that would naturally support forest growth, except cur-rent agricultural and urban areas (Bastin et al., 2019). How-ever, high level of reforestation, forest restoration, and affor estation can have moderate negative impacts on food security (IPCC, 2019). Nevertheless, the current expansion of ruminant systems is a major driver of deforestation world-wide (Gibbs et al., 2010; Curtis et al., 2018), being responsible for around 70 % of deforestation in South America in 2017 (De Sy et al., 2015). This deforestation is widely associ ated with negative impacts on climate, biodiversity, and eco-system services, rather than with the appraisal of new cul-tural landscapes.
5 Conclusion
The evidence provided shows that the counter-narratives presented for discussion do not offer pertinent arguments against a drastic reduction in animal source foods, in par-ticular from ruminants, as recommended for planetary and public health (Willett et al., 2019). Instead, dietary change towards plant-based diets with a limited amount of ani-mal source foods presents major opportunities for climate change mitigation and adaptation with human health co-benefits (IPCC, 2019). While a world without any livestock production could indeed have negative trade-offs, the cur-rent scale of livestock production and consumption of animal source foods in the large majority of world regions exceeds the amounts appropriate for good health food security, development, biodiversity, and cultural landscapes.
Public perception may be misled by world views dating back several decades, when obesity and diabetes was not yet an issue in developing countries, the world population was smaller, environmental pollution from livestock farm-ing was not so pervasive, and ruminants in developed coun-tries were mostly grassland-based. These world views have to be updated, future situations have to be anticipated, and the inertia of the system has to be considered. Today's world population of almost eight billion people cannot sustain ably feed four billion ruminant animals. Encouraging intensive livestock systems in many countries may not be farsighted when considering the high growth rates of animal source foods that are already inherent.
Importantly, we do not argue that ruminants and grass-land systems cannot be made more productive and sustain-able. The innovation here is indeed needed. But we argue that priority should be given to a shift from animal source foods to more healthy and sustainable plant-based foods. Such a shift in priorities implies, for example, that sustain-able ruminant systems are incentivised by taxes rather than by subsidies, and that development cooperation, is realigned from supporting the ruminant industry towards promoting horticulture, in line with the shift from undernutrition to overconsumption.
Acknowledgements
Benjamin Leon Bodirsky acknowledges funding from the German Federal Ministry of Education and Research (BMBF) under the reference number FKZ 031B0170A for the SUSTAg project, funded in the frame of the EU H2020 ERA-NET FACCE SURPLUS (grant agreement No 652615).
Prajal Pradhan is thankful to the German Federal Ministry of Education and Research (grant agreement No 01DP17035) for financially supporting this research.
Marco Springmann acknowledges funding from the Wellcome Trust, Our Planet Our Health (Livestock, Environ-ment and People – LEAP), award number 205212/Z/16/Z. The funders had no role in study design, data collection, analysis, decision to publish, or preparation of the manuscript.
R E F E R E N C E S
Alexander P, Brown C, Arneth A, Finnigan J, Rounsevell MDA (2016) Human appropriation of land for food: The role of diet. Glob Environ Chang 41:88–98, doi:10.1016/J.GLOENVCHA.2016.09.005
Aune D, Giovannucci E, Boffetta P (2017) Fruit and vegetable intake and the risk of cardiovascular disease, total cancer and all-cause mortality – a systematic review and dose-response meta-analysis of prospective studies. Int J Epidemiol 46(3):1029–1056, doi:10.1093/ije/dyw319
Bakker ES, Svenning J (2018) Trophic rewilding: impact on ecosystems under global change. Philos Trans R Soc Lond B Biol Sci 373(1761):20170432, doi:10.1098/rstb.2017.0432
Bar-On YM, Phillips R, Milo R (2018) The biomass distribution on Earth. Proc Natl Acad Sci USA 115(25):6506-6511, doi:10.1073/pnas.1711842115
Bastin J, Finegold Y, Garcia C et al. (2019) The global tree restoration poten-tial. Science 365(6448):76–79, doi:10.1126/science.aax0848
Bhutta ZA, Das JK, Rizvi A, Gaffey MF, Walker N, Horton S, Webb P, Lartey A, Black RE (2013) Evidence-based interventions for improvement of
29Bodirsky et al. (2019) · L A N D B A U F O R S C H · J Sustainable Organic Agric Syst · 69(1):25–30
maternal and child nutrition: what can be done and at what cost? The Lancet 382(9890):452-477, doi:10.1016/S0140-6736(13)60996-4
Bouvard V, Loomis D, Guyton KZ, Grosse Y, Ghissassi FE, Benbrahim-Tallaa L, Guha N, Mattock H, Straif K (2015) Carcinogenicity of consumption of red and processed meat. Lancet Oncol 16(16):1599-1600, doi:10.1016/S1470-2045(15)00444-1
Bwibo NO, Neumann CG (2003) The need for animal source foods by Kenyan Children. J Nutr 133(11)3936S-3940S, doi:10.1093/jn/133.11.3936S
Chen GC, Lv DB, Pang Z, Liu QF (2013) Red and processed meat consumption and risk of stroke: a meta-analysis of prospective cohort studies. Eur J Clin Nutr 67:91–95, doi:10.1038/ejcn.2012.180
Clark M, Tilman D (2017) Comparative analysis of environmental impacts of agricultural production systems, agricultural input efficiency, and food choice. Environ Res Lett 12(6): 064016, doi:10.1088/1748-9326/aa6cd5
Curtis PG, Slay CM, Harris NL, Tyukavina A, Hansen MC (2018) Classifying drivers of global forest loss. Science 361(6407):1108–1111, doi:10.1126/science.aau3445
Dahlström [Westin] A, Cousins SAO, Eriksson O (2006) The history (1620–2003) of land use, people and livestock, and the relationship to present plant species diversity in a rural landscape in Sweden. Environ Hist 12(2):191–212, doi:10.3197/096734006776680218
Darnton-Hill I (2014) The underestimated impact of food-based interven-tions. In: Thompson B, Amoroso L (eds) Improving diets and nutrition: food-based approaches. Rome: Food and Agriculture Organization of the United Nations, FAO, 74–88
Davis B, Winters P, Carletto G, Covarrubias K, Quiñones EJ, Zezza A, Stamou-lis K, Azzarri C, DiGiuseppe S (2010) A cross-country comparison of rural income generating activities. World Dev 38(1):48–63, doi:10.1016/j.worlddev.2009.01.003
De Sy V, Herold M, Achard F et al. (2015) Land use patterns and related car-bon losses following deforestation in South America. Environ Res Lett 10(12):124004. doi:10.1088/1748-9326/10/12/124004
FAO (2019) FAOSTAT, FAO – Statistical databases: agriculture, fisheries, for-estry, nutrition [online]. Retrieved from <http://www.fao.org/faostat/en/> [at 19 Dec 2019]
FAO, IFAD, UNICEF, WFP and WHO (2019) The state of food security and nu-tri tion in the world 2019. Safeguarding against economic slowdowns and downturns. Rome: FAO, 214 p
Feskens EJM, Sluik D, van Woudenbergh GJ (2013) Meat consumption, diabe tes, and its complications. Curr Diab Rep 13(2):298–306, doi:org/10.1007/s11892-013-0365-0
GBD 2017 Dietary Collaborators (2019) Health effects of dietary risks in 195 countries, 1990–2017: a systematic analysis for the Global Burden of Disease Study 2017. The Lancet 393(10184):1958–1972, doi:10.1016/S0140-6736(19)30041-8
Gibbs HK, Ruesch AS, Achard F, Clayton MK, Holmgren P, Ramankutty N, Foley JA (2010) Tropical forests were the primary sources of new agricul tural land in the 1980s and 1990s. Proc Natl Acad Sci USA 107(38):16732–16737, doi:10.1073/pnas.0910275107
Hautier Y, Niklaus PA, Hector A (2009) Competition for light causes plant biodi versity loss after eutrophication. Science 324(5927):636–638, doi:10.1126/science.1169640
Herrero M, Grace D, Njuki J, Johnson N, Enahoro D, Silvestri S, Rufino M (2013a) The roles of livestock in developing countries. Animal 7(S1):3–18, doi:10.1017/S1751731112001954
Herrero M, Havlík P, Valin H, Notenbaert A, Rufino MC, Thornton PK, Blümmel M, Weiss F, Grace D, Obersteiner M (2013b) Biomass use, production, feed efficiencies, and greenhouse gas emissions from global livestock systems. Proc Natl Acad Sci USA 110(52):20888–20893, doi:10.1073/pnas.1308149110
IIASA/FAO (2012) Global agro-ecological zones (GAEZ v3.0). Rome: IIASA, Laxenburg and FAO, 179 p
IPCC (2019) Summary for policymakers. In: Climate change and land: an IPCC special report on climate change, desertification, land degradation, sustainable land management, food security, and greenhouse gas fluxes in terrestrial ecosystems [online]. Retrieved from: <https://www.ipcc.ch/srccl/chapter/summary-for-policy-makers/> [at 19 Dec 2019]
Jaenicke H, Virchow D (2018) The contribution of horticulture to sustainable development. Acta Hortic 1205:13–20, doi:10.17660/ActaHor-tic.2018.1205.2
Johnston BC, Zeraatkar D, Han MA, Vernooij RWM, Valli C, El Dib R, Marshall C, Stover PJ, Fairweather-Taitt S, Wójcik G et al. (2019) Unprocessed red meat and processed meat consumption: Dietary guideline recom-mendations from the Nutritional Recommendations (NutriRECS) Consor tium. Ann Intern Med 171(10):756–764, doi:10.7326/M19-1621
Kastner T, Rivas MJI, Koch W, Nonhebel S (2012) Global changes in diets and the consequences for land requirements for food. Proc Natl Acad Sci USA 109(18):6868–6872, doi:10.1073/pnas.1117054109
Lagarde M, Haines A, Palmer N (2009) The impact of conditional cash trans-fers on health outcomes and use of health services in low and middle income countries. Cochrane Database of Syst Rev 4:CD008137, doi:10.1002/14651858.CD008137
Landholm DM, Pradhan P, Wegmann P, Sánchez MAR, Salazar JCS, Kropp JP (2019) Reducing deforestation and improving livestock productivity: greenhouse gas mitigation potential of silvopastoral systems in Caquetá. Environ Res Lett 14(11):114007, doi:10.1088/1748-9326/ab3db6
Larsson SC, Orsini N (2014) Meat and processed meat consumption and all-cause mortality: a meta-analysis. Am J Epidemiol 179(3):282–289, doi:10.1093/aje/kwt261
Lemaire G, Franzluebbers A, César P, Dedieu B (2014) Integrated crop-live-stock systems: Strategies to achieve synergy between agricultural produc tion and environmental quality. Agric Ecosyst Environ 190:4–8, doi:10.1016/j.agee.2013.08.009
Mbow C, Rosenzweig C, Barioni LG, Benton TG, Herrero M, Krishnapillai M, Liwenga E, Pradhan P, Rivera-Ferre MG, Sapkota T et al (2019) Food secu rity. In: Climate change and land: an IPCC special report on climate change, desertification, land degradation, sustainable land manage-ment, food security, and greenhouse gas fluxes in terrestrial ecosys-tems. Chapter 5 [online]. Retrieved from: <https://www.ipcc.ch/site/as-sets/uploads/sites/4/2019/11/08_Chapter-5.pdf> [at 19 Dec 2019)
Micha R, Wallace SK, Mozaffarian D (2010) Red and processed meat consump tion and risk of incident coronary heart disease, stroke, and dia betes mellitus. A systematic review and meta-analysis. Circulation 121(21):2271–2283, doi:10.1161/CIRCULATIONAHA.109.924977
Mottet A, de Haan C, Falcucci A, Tempio G, Opio C, Gerber P (2017) Livestock: on our plates or eating at our table? A new analysis of the feed/food de-bate. Glob Food Sec 14:1–8, doi:10.1016/J.GFS.2017.01.001
Muller A, Schader C, Scialabba NE, Brüggemann J, Isensee A, Erb K-H, Smith P, Klocke P, Leiber F, Stolze M, Niggli U. (2017) Strategies for feeding the world more sustainably with organic agriculture. Nat Commun 8:1290, doi:10.1038/s41467-017-01410-w
Neumann C, Harris DM, Rogers LM (2002) Contribution of animal source foods in improving diet quality and function in children in the developing world. Nutr Res 22(1–2):193–220, doi:10.1016/S0271-5317(01)00374-8
Opio C, Gerber P, Mottet A, Falcucci A, Tempio G, MacLeod M, Vellinga T, Henderson B, Steinfeld H (2013) Greenhouse gas emissions from rumi-nant supply chains: A global life cycle assessment. Rome: Food and Agri culture Organization of the United Nations, FAO, 191 p
Pega F, Liu SY, Walter S, Lhachimi SK (2015) Unconditional cash transfers for assistance in humanitarian disasters: effect on use of health services and health outcomes in low- and middle-income countries. Cochrane Database Syst Rev 9:CD011247, doi:10.1002/14651858.CD011247.pub2
Poore J, Nemecek T (2018) Reducing food’s environmental impacts through producers and consumers. Science 360(6392):987–992, doi:10.1126/sci-ence.aaq0216
Schader C, Muller A, Scialabba NEH, Hecht J, Isensee A, Erb KH, Smith P, Makkar HPS, Klocke P, Leiber F et al. (2015) Impacts of feeding less food-competing feedstuffs to livestock on global food system sustain-ability. J R Soc Interface 12(113):20150891, doi:10.1098/rsif.2015.0891
Sinha R, Cross AJ, Graubard BI, Leitzmann MF, Schatzkin A. (2010) Meat in-take and mortality: a prospective study of over half a million people. Arch Intern Med 169(6):562–571, doi:10.1001/archinternmed.2009.6
Springmann M, Clark M, Mason-D’Croz D, Wiebe K, Bodirsky BL, Lassaletta L, de Vries W, Vermeulen SJ, Herrero M, Carlson KM et al. (2018a) Options for keeping the food system within environmental limits. Nature 562(7728):519–525, doi:10.1038/s41586-018-0594-0
30 Bodirsky et al. (2019) · L A N D B A U F O R S C H · J Sustainable Organic Agric Syst · 69(1):25–30
Springmann M, Mason-D’Croz D, Robinson S, Wiebe K, Godfray HCJ, Rayner M, Scarborough P (2018b) Health-motivated taxes on red and processed meat: A modelling study on optimal tax levels and associated health impacts. PLoS ONE 13(11): e0204139, doi:10.1371/journal.pone.0204139
Springmann M, Wiebe K, Mason-D’Croz D, Sulser TB, Rayner M, Scarbor-ough P (2018c) Health and nutritional aspects of sustainable diet strategies and their association with environmental impacts: a global modelling analysis with country-level detail. Lancet Planet Heal 2(10):Pe451–E461, doi:10.1016/S2542-5196(18)30206-7
Stehfest E, Bouwman L, Vuuren DP, den Elzen MGJ, Eickhout B, Kabat P (2009) Climate benefits of changing diet. Clim Change 95:83–102, doi:10.1007/s10584-008-9534-6
Steinfeld H, Gerber P, Wassenaar T, Castel V, Rosales M, de Haan C (2006) Livestock’s long shadow: environmental issues and options. Rome: Food and Agriculture Organization of the United Nations, FAO, 390 p
De Sy V , Herold M, Achard F, Beuchle R, Clevers JGWP, Lindquist E, Verchot L (2015) Land use patterns and related carbon losses following deforesta-tion in South America. Environ Res Lett 10(12):124004, doi:10.1088/1748-9326/10/12/124004
USAID (2005) Global Horticulture Assessment. Scripta Horticulturae 3. Davis: University of California, 134 p
Weinberger KM, Lumpkin TA (2005) Horticulture for poverty alleviation – the unfunded revolution. AVRDC Working Paper 15, 28 p, doi:10.2139/ssrn.781784
Weindl I, Popp A, Bodirsky BL, Rolinski S, Lotze-Campen H, Biewald A, Humpenöder F, Dietrich JP, Stevanović M (2017) Livestock and human use of land: productivity trends and dietary choices as drivers of future land and carbon dynamics. Glob Planet Change 159:1–10, doi:10.1016/j.gloplacha.2017.10.002
Willett W, Rockström J, Loken B, Springmann M, Lang T, Vermeulen S, Garnett T, Tilman D, DeClerck F, Wood A et al. (2019) Food in the anthropocene: the EAT-Lancet Commission on healthy diets from sustainable food systems. The Lancet 393(10170):447–492, doi:10.1016/S0140-6736(18)31788-4
Yuan ZY, Jiao F, Li YH, Kallenbach RL (2016) Anthropogenic disturbances are key to maintaining the biodiversity of grasslands. Sci Rep 6:22132, doi:10.1038/srep22132
31Thatcher (2019) · L A N D B A U F O R S C H · J Sustainable Organic Agric Syst · 69(1):31–36DOI:10.3220/LBF1582798632000
P O S I T I O N P A P E R
Greenhouse gases from pastoral farming – a New Zealand perspectiveAlan Thatcher1
1 Massey University, School of Veterinary Science, New Zealand
C O N TA C T: [email protected]
1 Introduction
New Zealand has a unique greenhouse gas (GHG) profile amongst developed countries in that around half of the emissions in carbon dioxide equivalents (CO₂-eq), some 38 Mt, consist of methane and nitrous oxide (N₂O) origi nating from agriculture. Since 1990, farming has undergone signifi-cant changes with sheep numbers more than halving (now 27 million) and dairy cattle numbers doubling to 6.5 million (including young stock). The geography of New Zealand dic-tates farming systems. Much of the North Island is rolling to steep upland (known as hill country), suitable only for sheep and beef farming. Along its western side, a chain of moun-tains runs the length of the South Island. About one quar-ter of the total agricultural area is sufficiently flat and at a low enough altitude to allow pastoral dairy farming. Eastern areas of both islands are prone to summer drought. In recent years, much lowland has been converted from sheep and beef to dairy farming accompanied by irrigation and an intensive pastoral system utilising substantial fertiliser inputs. New Zealand exports 95 % of its dairy products which supply 30 % of those traded on the world market.
Average herd size is 430 milking cows per 150 ha (2.86 cows per ha). Total effective dairying area is 1.76 million ha with another 0.6 million ha devoted to dairy support, i.e. grazing of young stock, off-farm grazing of dry cows, and cropping.
Approximately half the cow population is Holstein-Friesian/Jersey crossbred, one-third Holstein-Friesian and 10 % Jersey. Farmers are paid on kg of milk solids (MS). A separate dollar value is assigned to fat and protein with a minor penalty for milk volume. Most farms milk seasonally, with all cows calv-ing in the spring (July, August, September) and being dried off by the end of May. Average production varies with sea-sonal weather patterns but is typi cally 380 kg MS per cow or 1,080 kg MS per ha (approximately equivalent to 9,800 kg fat and protein corrected (FPC) milk)2. DairyNZ defines farming systems by numbering from 1 to 5, with System 1 consisting of all-grass home-grown feed through to System 5, where 30 to 50 % of feed is grown off-farm (LIC and DairyNZ, 2018). The majority of farms fall somewhere between these two extremes, but there is a considerable year-to-year variation depending on weather and milk price.
Much sheep and beef farming is now carried out on poorer producing hill country in the North Island and sub-al-pine areas in the South Island. These are the core breeding flocks and herds which provide young animals for finishing on better producing, lower altitude farms. Feedlots are rare; the vast majority of animals destined for the meat industry are finished on pasture. The total area used for grazing ani-mals for meat industry is about three times that of dairying. Grain growing and horticulture are practiced only on a small scale, totaling some 70,000 ha.
2 Definition International Dairy Foods Association, Washington, D.C: Milk is approximately 87 % water and 13 % solids. As it comes from the cow, the solids portion of milk contains approximately 3.7 % fat and 9 % solids-not-fat.
Received: June 27, 2019 Revised: July 23, 2019Accepted: December 15, 2019
K E Y W O R D S agriculture, emissions, nitrogen, methane, nitrous oxide
Alan Thatcher
© p
rivat
e
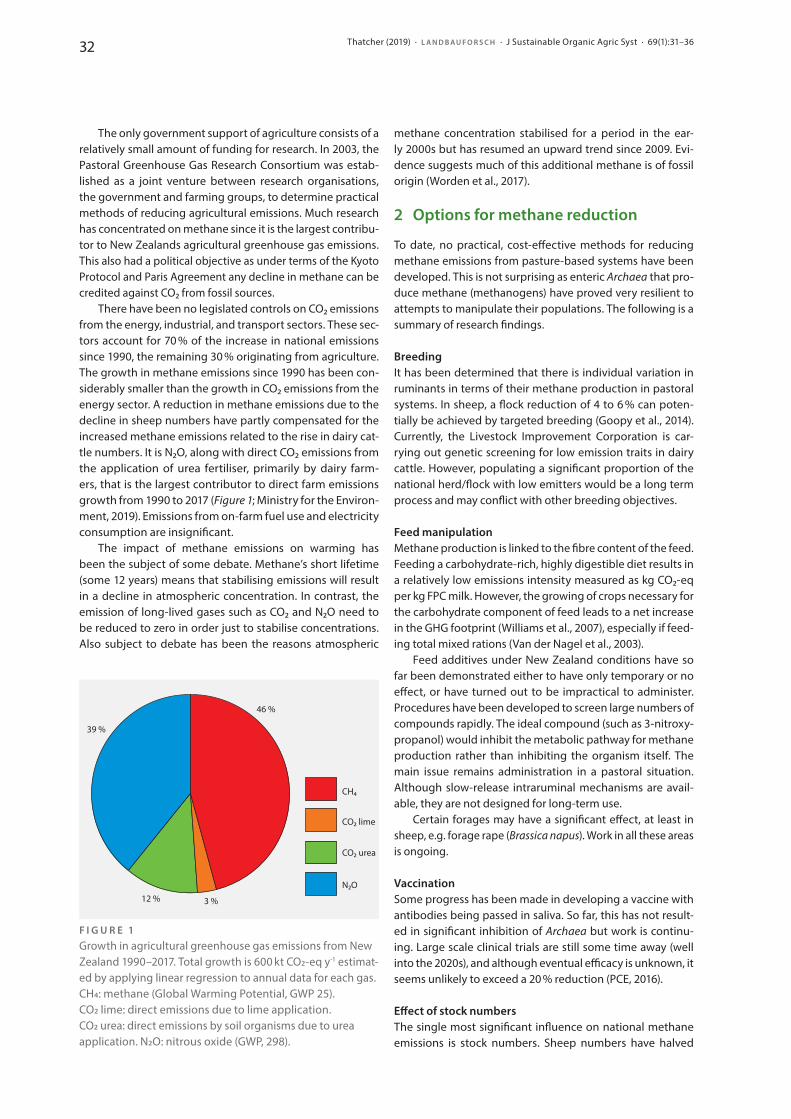
32 Thatcher (2019) · L A N D B A U F O R S C H · J Sustainable Organic Agric Syst · 69(1):31–36
The only government support of agriculture consists of a relatively small amount of funding for research. In 2003, the Pastoral Greenhouse Gas Research Consortium was estab-lished as a joint venture between research organisations, the government and farming groups, to determine practical methods of reducing agricultural emissions. Much research has concentrated on methane since it is the largest contribu-tor to New Zealands agricultural greenhouse gas emissions. This also had a political objective as under terms of the Kyoto Protocol and Paris Agreement any decline in methane can be credited against CO₂ from fossil sources.
There have been no legislated controls on CO₂ emissions from the energy, industrial, and transport sectors. These sec-tors account for 70 % of the increase in national emissions since 1990, the remaining 30 % originating from agriculture. The growth in methane emissions since 1990 has been con-siderably smaller than the growth in CO₂ emissions from the energy sector. A reduction in methane emissions due to the decline in sheep numbers have partly compensated for the increased me thane emissions related to the rise in dairy cat-tle numbers. It is N₂O, along with direct CO₂ emissions from the application of urea fertiliser, primarily by dairy farm-ers, that is the largest contributor to direct farm emissions growth from 1990 to 2017 (Figure 1; Ministry for the Environ-ment, 2019). Emissions from on-farm fuel use and electricity consumption are insignificant.
The impact of methane emissions on warming has been the subject of some debate. Methane’s short lifetime (some 12 years) means that stabilising emissions will result in a decline in atmospheric concentration. In contrast, the emission of long-lived gases such as CO₂ and N₂O need to be reduced to zero in order just to stabilise concentrations. Also subject to debate has been the reasons atmos pheric
me thane concentration stabilised for a period in the ear-ly 2000s but has resumed an upward trend since 2009. Evi-dence suggests much of this additional methane is of fossil origin (Worden et al., 2017).
2 Options for methane reduction
To date, no practical, cost-effective methods for reducing methane emissions from pasture-based systems have been developed. This is not surprising as enteric Archaea that pro-duce methane (methanogens) have proved very resilient to attempts to manipulate their populations. The following is a summary of research findings.
BreedingIt has been determined that there is individual variation in ruminants in terms of their methane production in pastoral systems. In sheep, a flock reduction of 4 to 6 % can poten-tially be achieved by targeted breeding (Goopy et al., 2014). Current ly, the Livestock Improvement Corporation is car-rying out genetic screening for low emission traits in dairy cattle. However, populating a significant proportion of the national herd/flock with low emitters would be a long term process and may conflict with other breeding objectives.
Feed manipulationMethane production is linked to the fibre content of the feed. Feeding a carbohydrate-rich, highly digestible diet results in a relatively low emissions intensity measured as kg CO₂-eq per kg FPC milk. However, the growing of crops necessary for the carbohydrate component of feed leads to a net increase in the GHG footprint (Williams et al., 2007), especially if feed-ing total mixed rations (Van der Nagel et al., 2003).
Feed additives under New Zealand conditions have so far been demonstrated either to have only temporary or no effect, or have turned out to be impractical to administer. Procedures have been developed to screen large numbers of compounds rapidly. The ideal compound (such as 3-nitroxy-propanol) would inhibit the metabolic pathway for methane production rather than inhibiting the organism itself. The main issue remains administration in a pastoral situation. Although slow-release intraruminal mechanisms are avail-able, they are not designed for long-term use.
Certain forages may have a significant effect, at least in sheep, e.g. forage rape (Brassica napus). Work in all these areas is ongoing.
VaccinationSome progress has been made in developing a vaccine with antibodies being passed in saliva. So far, this has not re sult-ed in significant inhibition of Archaea but work is continu-ing. Large scale clinical trials are still some time away (well into the 2020s), and although eventual efficacy is unknown, it seems unlikely to exceed a 20 % reduction (PCE, 2016).
Effect of stock numbersThe single most significant influence on national methane emissions is stock numbers. Sheep numbers have halved
N2O
CO2 urea
CO2 lime
CH4
39 %
46 %
3 %12 %
F I G U R E 1Growth in agricultural greenhouse gas emissions from New Zealand 1990–2017. Total growth is 600 kt CO2-eq y-1 estimat-ed by applying linear regression to annual data for each gas. CH4: methane (Global Warming Potential, GWP 25). CO2 lime: direct emissions due to lime application. CO2 urea: direct emissions by soil organisms due to urea application. N2O: nitrous oxide (GWP, 298).
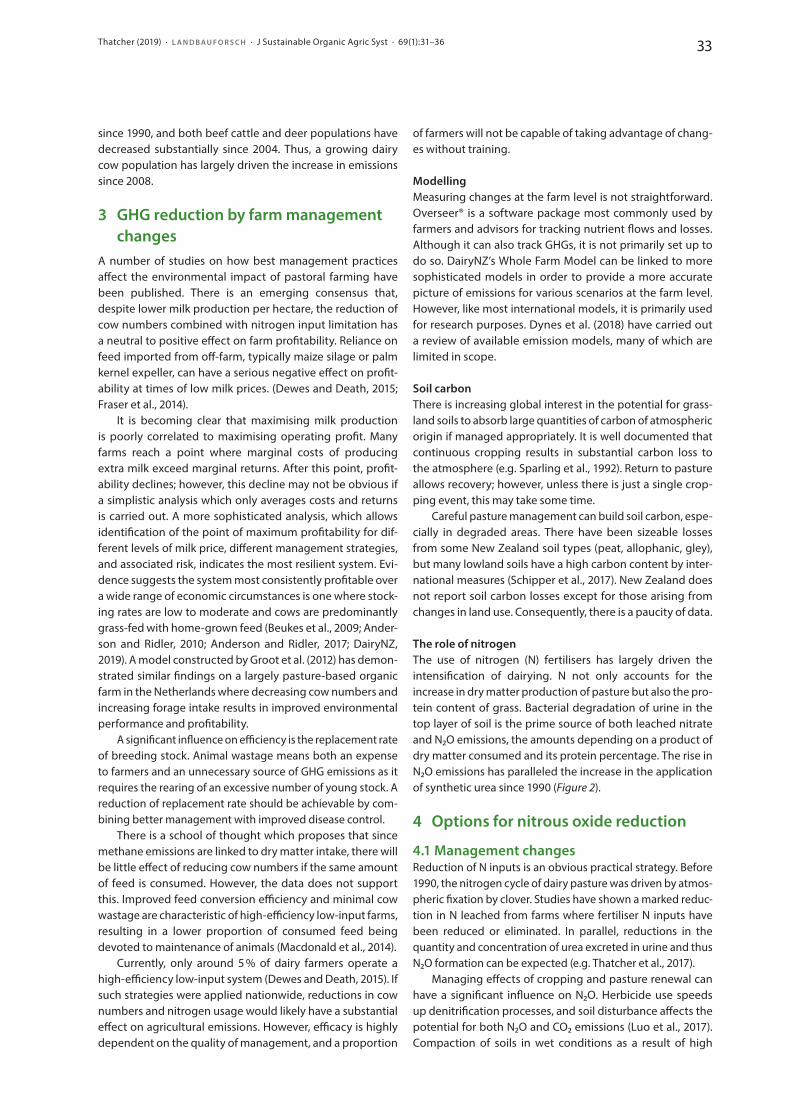
33Thatcher (2019) · L A N D B A U F O R S C H · J Sustainable Organic Agric Syst · 69(1):31–36
of farmers will not be capable of taking advantage of chang-es without training.
ModellingMeasuring changes at the farm level is not straightforward. Overseer® is a software package most commonly used by farmers and advisors for tracking nutrient flows and losses. Although it can also track GHGs, it is not primarily set up to do so. DairyNZ’s Whole Farm Model can be linked to more sophisticated models in order to provide a more accurate picture of emissions for various scenarios at the farm level. However, like most international models, it is primarily used for research purposes. Dynes et al. (2018) have carried out a review of available emission models, many of which are limited in scope.
Soil carbonThere is increasing global interest in the potential for grass-land soils to absorb large quantities of carbon of atmospheric origin if managed appropriately. It is well documented that continuous cropping results in substantial carbon loss to the atmosphere (e.g. Sparling et al., 1992). Return to pasture allows recovery; however, unless there is just a single crop-ping event, this may take some time.
Careful pasture management can build soil carbon, espe-cially in degraded areas. There have been sizeable losses from some New Zealand soil types (peat, allophanic, gley), but many lowland soils have a high carbon content by inter-national measures (Schipper et al., 2017). New Zealand does not report soil carbon losses except for those arising from changes in land use. Consequently, there is a paucity of data.
The role of nitrogenThe use of nitrogen (N) fertilisers has largely driven the intensi fication of dairying. N not only accounts for the increase in dry matter production of pasture but also the pro-tein content of grass. Bacterial degradation of urine in the top layer of soil is the prime source of both leached nitrate and N₂O emissions, the amounts depending on a product of dry matter consumed and its protein percentage. The rise in N₂O emissions has paralleled the increase in the application of synthetic urea since 1990 (Figure 2).
4 Options for nitrous oxide reduction
4.1 Management changesReduction of N inputs is an obvious practical strategy. Before 1990, the nitrogen cycle of dairy pasture was driven by atmos-pheric fixation by clover. Studies have shown a marked reduc-tion in N leached from farms where fertiliser N inputs have been reduced or eliminated. In parallel, reductions in the quantity and concentration of urea excreted in urine and thus N₂O formation can be expected (e.g. Thatcher et al., 2017).
Managing effects of cropping and pasture renewal can have a significant influence on N₂O. Herbicide use speeds up denitrification processes, and soil disturbance affects the potential for both N₂O and CO₂ emissions (Luo et al., 2017). Compaction of soils in wet conditions as a result of high
since 1990, and both beef cattle and deer populations have decreased substantially since 2004. Thus, a growing dairy cow population has largely driven the increase in emissions since 2008.
3 GHG reduction by farm management changes
A number of studies on how best management prac tices affect the environmental impact of pastoral farming have been published. There is an emerging consensus that, despite lower milk production per hectare, the reduction of cow numbers combined with nitrogen input limitation has a neutral to positive effect on farm profitability. Reliance on feed imported from off-farm, typically maize silage or palm kernel expeller, can have a serious negative effect on profit-ability at times of low milk prices. (Dewes and Death, 2015; Fraser et al., 2014).
It is becoming clear that maximising milk production is poorly correlated to maximising operating profit. Many farms reach a point where marginal costs of producing extra milk exceed marginal returns. After this point, profit-ability declines; however, this decline may not be obvious if a simplistic analysis which only averages costs and returns is carried out. A more sophisticated analysis, which allows identification of the point of maximum profitability for dif-ferent levels of milk price, different management strategies, and associated risk, indicates the most resilient system. Evi-dence suggests the system most consistently profitable over a wide range of economic circumstances is one where stock-ing rates are low to moderate and cows are predominantly grass-fed with home-grown feed (Beukes et al., 2009; Ander-son and Ridler, 2010; Anderson and Ridler, 2017; DairyNZ, 2019). A model constructed by Groot et al. (2012) has demon-strated similar findings on a largely pasture-based organic farm in the Netherlands where decreasing cow numbers and increasing forage intake results in improved environmental performance and profitability.
A significant influence on efficiency is the replacement rate of breeding stock. Animal wastage means both an expense to farmers and an unnecessary source of GHG emissions as it requires the rearing of an excessive number of young stock. A reduction of replacement rate should be achievable by com-bining better management with improved disease control.
There is a school of thought which proposes that since methane emissions are linked to dry matter intake, there will be little effect of reducing cow numbers if the same amount of feed is consumed. However, the data does not support this. Improved feed conversion efficiency and minimal cow wastage are characteristic of high-efficiency low-input farms, resulting in a lower proportion of consumed feed being devoted to maintenance of animals (Macdonald et al., 2014).
Currently, only around 5 % of dairy farmers operate a high- efficiency low-input system (Dewes and Death, 2015). If such strategies were applied nationwide, reductions in cow numbers and nitrogen usage would likely have a substantial effect on agricultural emissions. However, efficacy is highly dependent on the quality of management, and a proportion
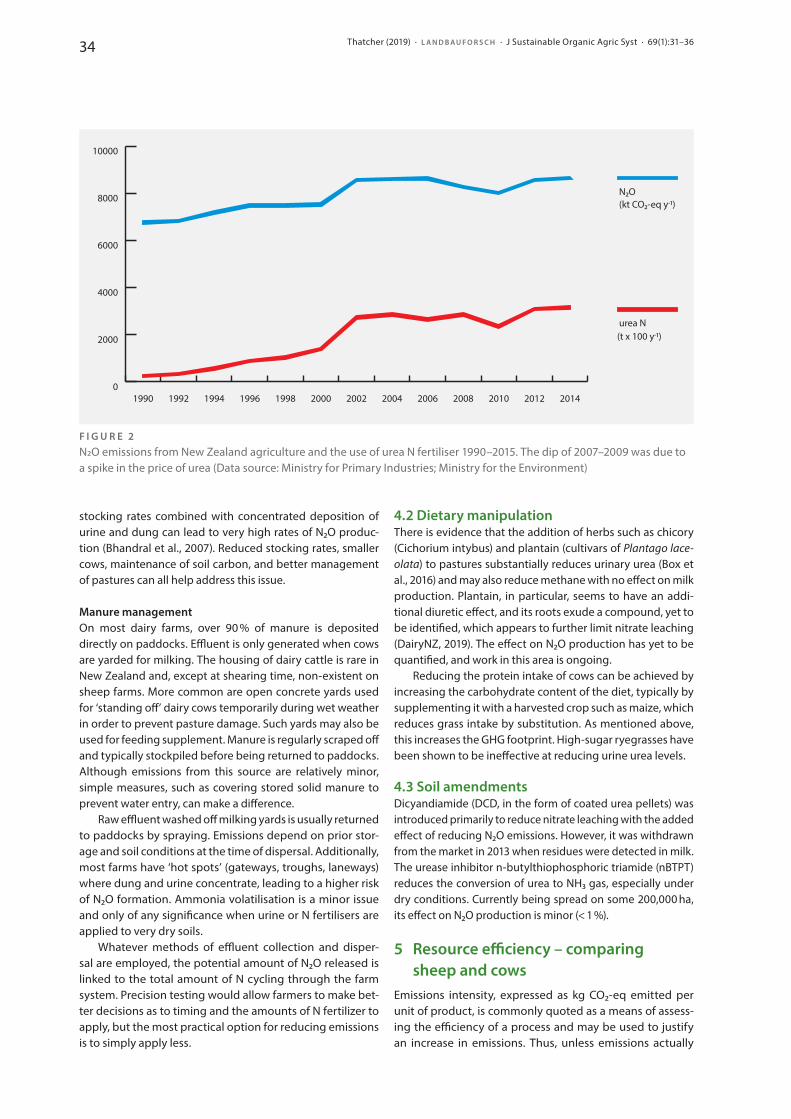
34 Thatcher (2019) · L A N D B A U F O R S C H · J Sustainable Organic Agric Syst · 69(1):31–36
stocking rates combined with concentrated deposition of urine and dung can lead to very high rates of N₂O produc-tion (Bhandral et al., 2007). Reduced stocking rates, smaller cows, maintenance of soil carbon, and better management of pastures can all help address this issue.
Manure managementOn most dairy farms, over 90 % of manure is deposited directly on paddocks. Effluent is only generated when cows are yarded for milking. The housing of dairy cattle is rare in New Zealand and, except at shearing time, non-existent on sheep farms. More common are open concrete yards used for ‘standing off’ dairy cows temporarily during wet weather in order to prevent pasture damage. Such yards may also be used for feeding supplement. Manure is regularly scraped off and typically stockpiled before being returned to paddocks. Although emissions from this source are relatively minor, simple measures, such as covering stored solid manure to prevent water entry, can make a difference.
Raw effluent washed off milking yards is usually returned to paddocks by spraying. Emissions depend on prior stor-age and soil conditions at the time of dispersal. Additionally, most farms have ‘hot spots’ (gateways, troughs, laneways) where dung and urine concentrate, leading to a higher risk of N₂O formation. Ammonia volatilisation is a minor issue and only of any significance when urine or N fertilisers are applied to very dry soils.
Whatever methods of effluent collection and disper-sal are employed, the potential amount of N₂O released is linked to the total amount of N cycling through the farm system. Precision testing would allow farmers to make bet-ter decisions as to timing and the amounts of N fertilizer to apply, but the most practical option for reducing emissions is to simply apply less.
4.2 Dietary manipulationThere is evidence that the addition of herbs such as chicory (Cichorium intybus) and plantain (cultivars of Plantago lace-olata) to pastures substantially reduces urinary urea (Box et al., 2016) and may also reduce methane with no effect on milk production. Plantain, in particular, seems to have an addi-tional diuretic effect, and its roots exude a compound, yet to be identified, which appears to further limit nitrate leaching (DairyNZ, 2019). The effect on N₂O production has yet to be quantified, and work in this area is ongoing.
Reducing the protein intake of cows can be achieved by increasing the carbohydrate content of the diet, typically by supplementing it with a harvested crop such as maize, which reduces grass intake by substitution. As mentioned above, this increases the GHG footprint. High-sugar ryegrasses have been shown to be ineffective at reducing urine urea levels.
4.3 Soil amendmentsDicyandiamide (DCD, in the form of coated urea pellets) was introduced primarily to reduce nitrate leaching with the added effect of reducing N₂O emissions. However, it was withdrawn from the market in 2013 when residues were detected in milk. The urease inhibitor n-butylthiophosphoric triamide (nBTPT) reduces the conversion of urea to NH3 gas, especially under dry conditions. Currently being spread on some 200,000 ha, its effect on N₂O production is minor (< 1 %).
5 Resource efficiency – comparing sheep and cows
Emissions intensity, expressed as kg CO₂-eq emitted per unit of product, is commonly quoted as a means of assess-ing the efficiency of a process and may be used to justify an increase in emissions. Thus, unless emissions actually
0
2000
4000
6000
8000
10000
urea N
N2O
2014201220102008200620042002200019981996199419921990
(kt CO2-eq y-1)
(t x 100 y-1)
F I G U R E 2N2O emissions from New Zealand agriculture and the use of urea N fertiliser 1990–2015. The dip of 2007–2009 was due to a spike in the price of urea (Data source: Ministry for Primary Industries; Ministry for the Environment)
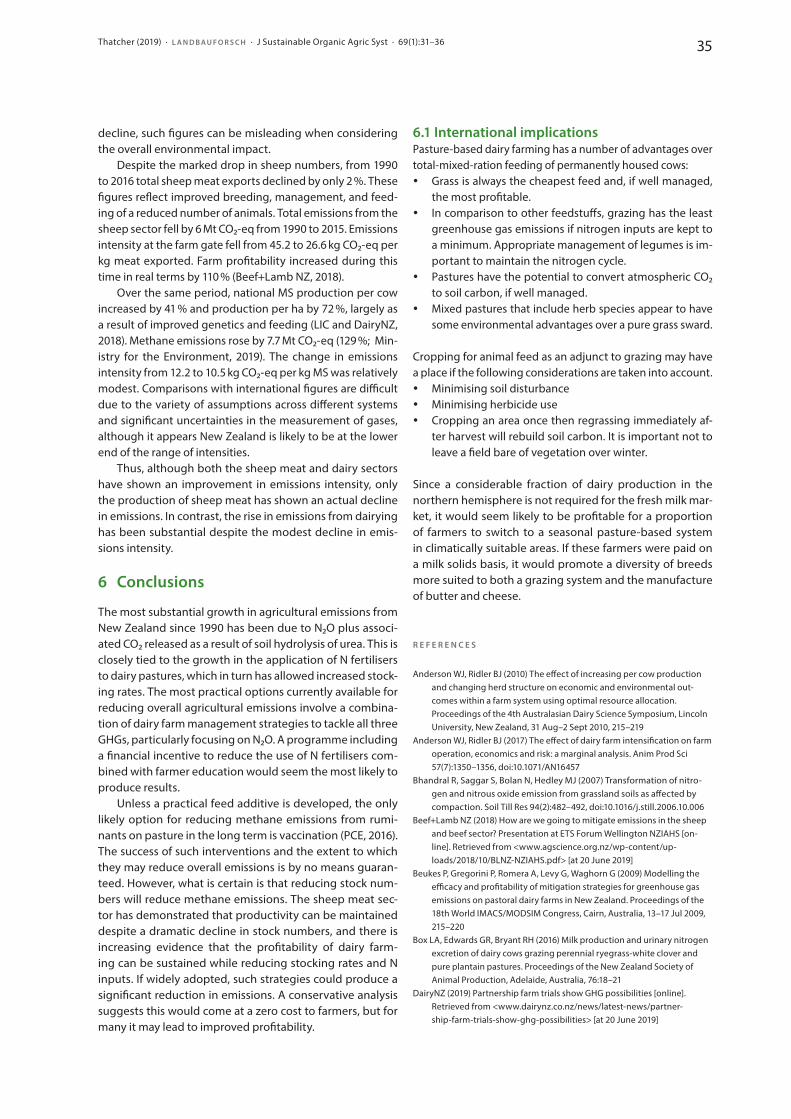
35Thatcher (2019) · L A N D B A U F O R S C H · J Sustainable Organic Agric Syst · 69(1):31–36
decline, such figures can be misleading when considering the overall environmental impact.
Despite the marked drop in sheep numbers, from 1990 to 2016 total sheep meat exports declined by only 2 %. These figures reflect improved breeding, management, and feed-ing of a reduced number of animals. Total emissions from the sheep sector fell by 6 Mt CO₂-eq from 1990 to 2015. Emissions intensity at the farm gate fell from 45.2 to 26.6 kg CO₂-eq per kg meat exported. Farm profitability increased during this time in real terms by 110 % (Beef+Lamb NZ, 2018).
Over the same period, national MS production per cow increased by 41 % and production per ha by 72 %, largely as a result of improved genetics and feeding (LIC and DairyNZ, 2018). Methane emissions rose by 7.7 Mt CO₂-eq (129 %; Min-istry for the Environment, 2019). The change in emissions intensity from 12.2 to 10.5 kg CO₂-eq per kg MS was relatively modest. Comparisons with international figures are difficult due to the variety of assumptions across different systems and significant uncertainties in the measurement of gases, although it appears New Zealand is likely to be at the lower end of the range of intensities.
Thus, although both the sheep meat and dairy sectors have shown an improvement in emissions intensity, only the production of sheep meat has shown an actual decline in emissions. In contrast, the rise in emissions from dairying has been substantial despite the modest decline in emis-sions intensity.
6 Conclusions
The most substantial growth in agricultural emissions from New Zealand since 1990 has been due to N₂O plus associ-ated CO₂ released as a result of soil hydrolysis of urea. This is closely tied to the growth in the application of N fertilisers to dairy pastures, which in turn has allowed increased stock-ing rates. The most practical options currently available for reducing overall agricultural emissions involve a combina-tion of dairy farm management strategies to tackle all three GHGs, particularly focusing on N₂O. A programme including a financial incentive to reduce the use of N fertilisers com-bined with farmer education would seem the most likely to produce results.
Unless a practical feed additive is developed, the only likely option for reducing methane emissions from rumi-nants on pasture in the long term is vaccination (PCE, 2016). The success of such interventions and the extent to which they may reduce overall emissions is by no means guaran-teed. However, what is certain is that reducing stock num-bers will reduce methane emissions. The sheep meat sec-tor has demonstrated that productivity can be maintained despite a dramatic decline in stock numbers, and there is increasing evidence that the profitability of dairy farm-ing can be sustained while reducing stocking rates and N inputs. If widely adopted, such strategies could produce a significant reduction in emissions. A conservative analysis suggests this would come at a zero cost to farmers, but for many it may lead to improved profitability.
6.1 International implicationsPasture-based dairy farming has a number of advantages over total-mixed-ration feeding of permanently housed cows:
y Grass is always the cheapest feed and, if well managed, the most profitable.
y In comparison to other feedstuffs, grazing has the least greenhouse gas emissions if nitrogen inputs are kept to a minimum. Appropriate management of legumes is im-portant to maintain the nitrogen cycle.
y Pastures have the potential to convert atmospheric CO₂ to soil carbon, if well managed.
y Mixed pastures that include herb species appear to have some environmental advantages over a pure grass sward.
Cropping for animal feed as an adjunct to grazing may have a place if the following considerations are taken into account.
y Minimising soil disturbance y Minimising herbicide use y Cropping an area once then regrassing immediately af-
ter harvest will rebuild soil carbon. It is important not to leave a field bare of vegetation over winter.
Since a considerable fraction of dairy production in the northern hemisphere is not required for the fresh milk mar-ket, it would seem likely to be profitable for a proportion of farmers to switch to a seasonal pasture-based system in climatically suitable areas. If these farmers were paid on a milk solids basis, it would promote a diversity of breeds more suited to both a grazing system and the manufacture of butter and cheese.
R E F E R E N C E S
Anderson WJ, Ridler BJ (2010) The effect of increasing per cow production and changing herd structure on economic and environmental out-comes within a farm system using optimal resource allocation. Proceedings of the 4th Australasian Dairy Science Symposium, Lincoln University, New Zealand, 31 Aug–2 Sept 2010, 215–219
Anderson WJ, Ridler BJ (2017) The effect of dairy farm intensification on farm operation, economics and risk: a marginal analysis. Anim Prod Sci 57(7):1350–1356, doi:10.1071/AN16457
Bhandral R, Saggar S, Bolan N, Hedley MJ (2007) Transformation of nitro-gen and nitrous oxide emission from grassland soils as affected by compaction. Soil Till Res 94(2):482–492, doi:10.1016/j.still.2006.10.006
Beef+Lamb NZ (2018) How are we going to mitigate emissions in the sheep and beef sector? Presentation at ETS Forum Wellington NZIAHS [on-line]. Retrieved from <www.agscience.org.nz/wp-content/up-loads/2018/10/BLNZ-NZIAHS.pdf> [at 20 June 2019]
Beukes P, Gregorini P, Romera A, Levy G, Waghorn G (2009) Modelling the effi cacy and profitability of mitigation strategies for greenhouse gas emissions on pastoral dairy farms in New Zealand. Proceedings of the 18th World IMACS/MODSIM Congress, Cairn, Australia, 13–17 Jul 2009, 215–220
Box LA, Edwards GR, Bryant RH (2016) Milk production and urinary nitrogen excretion of dairy cows grazing perennial ryegrass-white clover and pure plantain pastures. Proceedings of the New Zealand Society of Animal Production, Adelaide, Australia, 76:18–21
DairyNZ (2019) Partnership farm trials show GHG possibilities [online]. Retrieved from <www.dairynz.co.nz/news/latest-news/partner-ship-farm-trials-show-ghg-possibilities> [at 20 June 2019]
36 Thatcher (2019) · L A N D B A U F O R S C H · J Sustainable Organic Agric Syst · 69(1):31–36
Dewes A, Death R (2015) Getting ahead of the game. Maximising profit and environmental protection on 21st century dairy farms. Proceedings of the Society of Dairy Cattle Veterinarians of the NZVA Annual Confer-ence, 3–24
Dynes RA, Vogeler I, Ledgard S, Wall A, Dennis S, Vibart R, White T, Brown M, Beukes P, Adler A, et al. (2018) Systems analysis to quantify the role of farm management in GHG emissions and sinks for pastoral sector. Wellington: Ministry of Primary Industries, 24p, MPI Technical Paper 2018/18
Fraser PJ, Ridler BJ, Anderson WJ (2014) The intensification of the NZ dairy Indus try – Ferrari cows being run on two-stroke fuel on a road to no-where? New Zealand Agricultural and Resource Economics Society (NZARES), Aug 28–29, 2014, Nelson, New Zealand, doi:10.22004/ag.econ.187491
Groot J, Oomen G, Rossing W (2012) Multi-objective optimization and design of farming systems. Agri Syst 110:63–77, doi:10.1016/j.agsy.2012.03.012
LIC, DairyNZ (2018) New Zealand Dairy Statistics 2017–18 [online]. Retrieved from <www.lic.co.nz/about/dairy-statistics> [at 10 Dec 2019]
Macdonald KA, Waghorn GC, Pryce JE, Spelman RJ, Williams Y, Wales WJ, Davis SR, Green TC (2014) An overview of the feed conversion efficiency trial for dairy cows – getting more from less. Proceedings of the 5th Australasian Dairy Science Symposium 2014
Ministry for the Environment (2019) New Zealand’s greenhouse gas inven-tory 1990–2017. New Zealand Government, ME1411
PCE (2016) Climate change and agriculture: Understanding the biological greenhouse gases. Parliamentary Commissioner for the Environment, New Zealand Government, 100p
Schipper LA, Mudge PL, Kirschbaum MUF, Hedley CB, Golubiewski NE, Smaill SJ, Kelliher FM (2017) A review of soil carbon change in New Zealand’s grazed grasslands. New Zeal J Agr Res (NZJAR) 60(2):93-118, doi:10.1080/00288233.2017.1284134
Thatcher A, Horne D, Brookes I (2017) A comparison of the impacts of organic and conventional dairying on the aquatic environment. Proceedings of the scientific track at the 19th Organic World Congress: ISOFAR, NCOF, TIPI, Delhi, India, 9–11 Nov 2017, Thünen Rep 54 (1):174-177, doi:10.3220/REP1510907717000
Williams ID, Ledgard SF, Edmeades GO, Densley RJ (2007) Comparative environ mental impacts of intensive all-grass and maize silage-supple-mented dairy farm systems: a review. Proceedings of the New Zealand Grassland Association 69:137–143
Worden JR, Bloom AA, Pandey S, Jiang Z, Worden HM, Walker TW, Houwe-ling S, Röckmann T (2017) Reduced biomass burning emissions recon-cile conflicting estimates of the post–2006 atmospheric methane budget. Nat Commun 8:2227, doi:10.1038/s41467-017-02246-0.
Frank et al. (2019) · L A N D B A U F O R S C H · J Sustainable Organic Agric Syst · 69(1):37–46DOI:10.3220/LBF1584375588000
37
R E S E A R C H A R T I C L E
Modelling greenhouse gas emissions from organic and conventional dairy farmsHelmut Frank1, Harald Schmid 1, and Kurt-Jürgen Hülsbergen 1
Abstract
Dairy farming is a major source of greenhouse gas (GHG) emissions in agriculture. There are numerous scientific studie s analysing GHG flows and testing GHG reduction methods in dairy farming, yet very few scientific papers cover all the relevant GHG flows. GHG flows that are difficult to quantify, such as C sequestration in soils, the effects of land-use change (LUC) or the energy input used to produce capi tal equipment, are not always considered.
This paper describes the development and application of a model for energy and GHG accounting in dairy farming. This new model enables all relevant nutrient, energy and GHG flows to be modelled at farm level. This then forms the basis for system analysis and derivation of GHG mitigation strategies. The model was used on 18 organic and 18 con-ventional farms in Germany. Calculated CO2-eq emissions per kg of Energy Corrected Milk (ECM) were 995 g on average for organic farms (org) and 1,048 g on average for conven tional farms (con). The largest contribution (55 % (org) and 43 % (con)) to total GHG emissions came from enteric me thane emissions (549 g CO2-eq (kg ECM)-1 (org) and 449 g CO2-eq (kg ECM)-1 (con)). On the organic dairy farms, there was an increase in soil humus and therefore carbon storage and sequestration in soils, whereas the GHG emissions for the conventional farms included CO2 emissions from LUC due to soybean usage. The significantly higher energy input in the conventional systems resulted from the production of
energy- intensive concentrates, mineral fertilisers and pesti-cides, and transportation (imported feed).
This study shows that there are many factors that influ-ence GHG emissions in dairy farming, and that these factors often interact with each other. An increase in productivity is one of several optimisation strategies; however, it must not be at the expense of productive lifetime or require an extremely high amount of concentrates. GHG reduction in dairy farm-ing requires farm-specific optimisation approaches due to the heterogeneity of production systems.
1 Introduction 2
1.1 Problem description and research gapDairy farming is a major source of greenhouse gas (GHG) emis-sions in agriculture, both nationally and globally (FAO, 2006), and is the focus of public debate on the climate impacts of livestock farming, mainly due to methane emissions.
There are numerous scientific studies which analyse GHG flows and test GHG reduction methods in dairy farm-ing (Thomassen et al., 2008; FAO, 2010; Bell et al., 2011;
2 This article is based on results published as part of the German research report Frank et al., 2015: Energy and greenhouse gas footprints of dairy farming – Research in the pilot farm network, doi:10.3220/REP_29_2015. Compared with the German research report, the number of farms and years analysed for this paper has been significantly increased, which scientifically substantiates our results and conclusions.
Received: August 2, 2019 Revised: October 14, 2019Accepted: November 11, 2019
K E Y W O R D S energy balance, methane emissions, modelling, system approach, land-use change, carbon sequestration, mitigation strategy
H I G H L I G H T S
• Our new greenhouse gas (GHG) accounting model includes all relevant farm-scale GHG flows
• The model is sensitive enough to take into account management changes• Our new model is able to identify the causes of high GHG emissions• The dairy farms analysed showed an enormous variability in GHG flows• GHG reduction in dairy farming requires farm-specific optimisation
approaches• C sequestration and land-use change affect GHG footprints
1 Technische Universität München, Chair of Organic Farming and Agronomy, Germany
C O N TA C T [email protected]
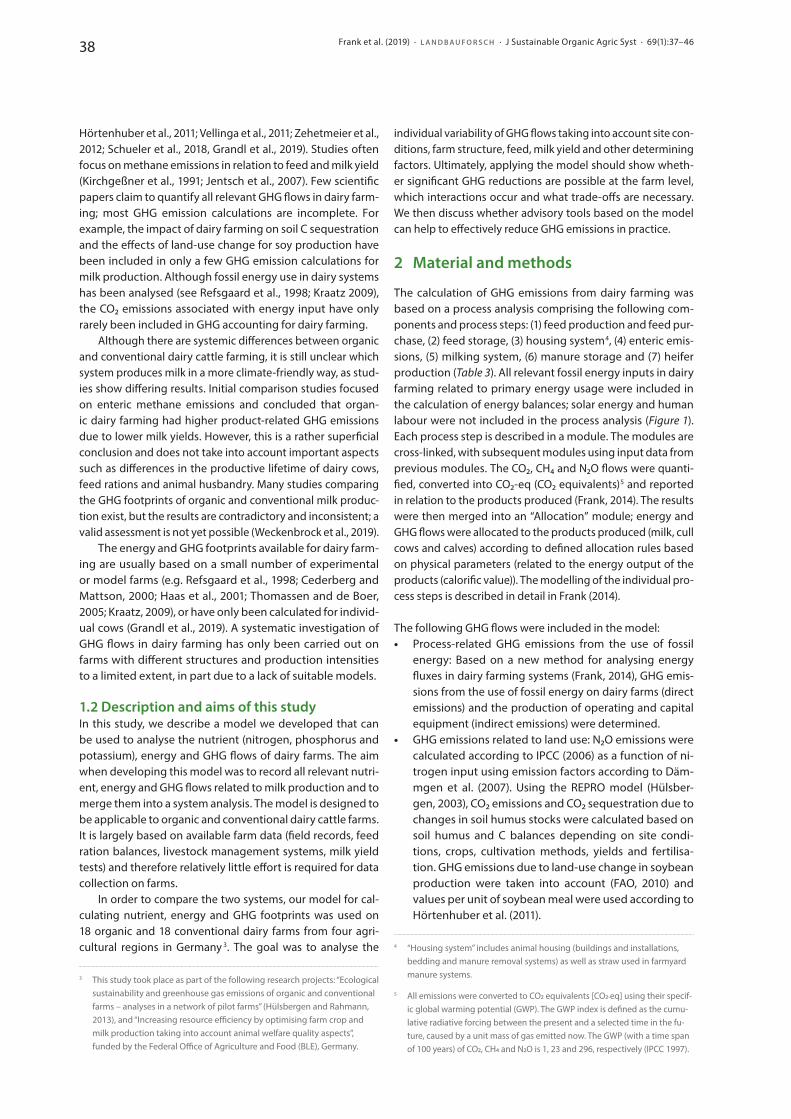
Frank et al. (2019) · L A N D B A U F O R S C H · J Sustainable Organic Agric Syst · 69(1):37–4638
Hörtenhuber et al., 2011; Vellinga et al., 2011; Zehetmeier et al., 2012; Schueler et al., 2018, Grandl et al., 2019). Studies often focus on methane emissions in relation to feed and milk yield (Kirchgeßner et al., 1991; Jentsch et al., 2007). Few scientific papers claim to quantify all relevant GHG flows in dairy farm-ing; most GHG emission calculations are incomplete. For example, the impact of dairy farming on soil C sequestration and the effects of land-use change for soy production have been included in only a few GHG emission calculations for milk production. Although fossil energy use in dairy systems has been analysed (see Refsgaard et al., 1998; Kraatz 2009), the CO2 emissions associated with energy input have only rarely been included in GHG accounting for dairy farming.
Although there are systemic differences between organic and conventional dairy cattle farming, it is still unclear which system produces milk in a more climate-friendly way, as stud-ies show differing results. Initial comparison studies focused on enteric methane emissions and concluded that organ-ic dairy farming had higher product-related GHG emissions due to lower milk yields. However, this is a rather superficial conclusion and does not take into account important aspects such as differences in the productive lifetime of dairy cows, feed rations and animal husbandry. Many studies comparing the GHG footprints of organic and conventional milk produc-tion exist, but the results are contradictory and inconsistent; a valid assessment is not yet possible (Weckenbrock et al., 2019).
The energy and GHG footprints available for dairy farm-ing are usually based on a small number of experimental or model farms (e.g. Refsgaard et al., 1998; Cederberg and Mattson, 2000; Haas et al., 2001; Thomassen and de Boer, 2005; Kraatz, 2009), or have only been calculated for individ-ual cows (Grandl et al., 2019). A systematic investigation of GHG flows in dairy farming has only been carried out on farms with different structures and production intensities to a limited extent, in part due to a lack of suitable models.
1.2 Description and aims of this studyIn this study, we describe a model we developed that can be used to analyse the nutrient (nitrogen, phosphorus and potassium), energy and GHG flows of dairy farms. The aim when developing this model was to record all relevant nutri-ent, energy and GHG flows related to milk production and to merge them into a system analysis. The model is designed to be applicable to organic and conventional dairy cattle farms. It is largely based on available farm data (field records, feed ration balances, livestock management systems, milk yield tests) and therefore relatively little effort is required for data collection on farms.
In order to compare the two systems, our model for cal-culating nutrient, energy and GHG footprints was used on 18 organic and 18 conventional dairy farms from four agri-cultural regions in Germany 3. The goal was to analyse the
3 This study took place as part of the following research projects: “Ecological sustainability and greenhouse gas emissions of organic and conventional farms – analyses in a network of pilot farms” (Hülsbergen and Rahmann, 2013), and “Increasing resource efficiency by optimising farm crop and milk production taking into account animal welfare quality aspects”, funded by the Federal Office of Agriculture and Food (BLE), Germany.
individual variability of GHG flows taking into account site con-ditions, farm structure, feed, milk yield and other determining factors. Ultimately, applying the model should show wheth-er significant GHG reductions are possible at the farm level, which interactions occur and what trade-offs are neces sary. We then discuss whether advisory tools based on the model can help to effectively reduce GHG emissions in practice.
2 Material and methods
The calculation of GHG emissions from dairy farming was based on a process analysis comprising the following com-ponents and process steps: (1) feed production and feed pur-chase, (2) feed storage, (3) housing system 4, (4) enteric emis-sions, (5) milking system, (6) manure storage and (7) heifer production (Table 3). All relevant fossil energy inputs in dairy farming related to primary energy usage were included in the calculation of energy balances; solar energy and human labour were not included in the process analysis (Figure 1). Each process step is described in a module. The modules are cross-linked, with subsequent modules using input data from previous modules. The CO2, CH4 and N2O flows were quanti-fied, converted into CO2-eq (CO2 equivalents) 5 and reported in relation to the products produced (Frank, 2014). The results were then merged into an “Allocation” module; energy and GHG flows were allocated to the products produced (milk, cull cows and calves) according to defined allocation rules based on physical parameters (related to the energy output of the products (calorific value)). The modelling of the individual pro-cess steps is described in detail in Frank (2014).
The following GHG flows were included in the model: • Process-related GHG emissions from the use of fossil
energy: Based on a new method for analysing energy fluxes in dairy farming systems (Frank, 2014), GHG emis-sions from the use of fossil energy on dairy farms (direct emissions) and the production of operating and capital equipment (indirect emissions) were determined.
• GHG emissions related to land use: N2O emissions were calculated according to IPCC (2006) as a function of ni-trogen input using emission factors according to Däm-mgen et al. (2007). Using the REPRO model (Hülsber-gen, 2003), CO2 emissions and CO2 sequestration due to changes in soil humus stocks were calculated based on soil humus and C balances depending on site condi-tions, crops, cultivation methods, yields and fertilisa-tion. GHG emissions due to land-use change in soybean production were taken into account (FAO, 2010) and values per unit of soybean meal were used according to Hörtenhuber et al. (2011).
4 “Housing system” includes animal housing (buildings and installations, bedding and manure removal systems) as well as straw used in farmyard manure systems.
5 All emissions were converted to CO2 equivalents [CO2-eq] using their specif-ic global warming potential (GWP). The GWP index is defined as the cumu-lative radiative forcing between the present and a selected time in the fu-ture, caused by a unit mass of gas emitted now. The GWP (with a time span of 100 years) of CO2, CH4 and N2O is 1, 23 and 296, respectively (IPCC 1997).
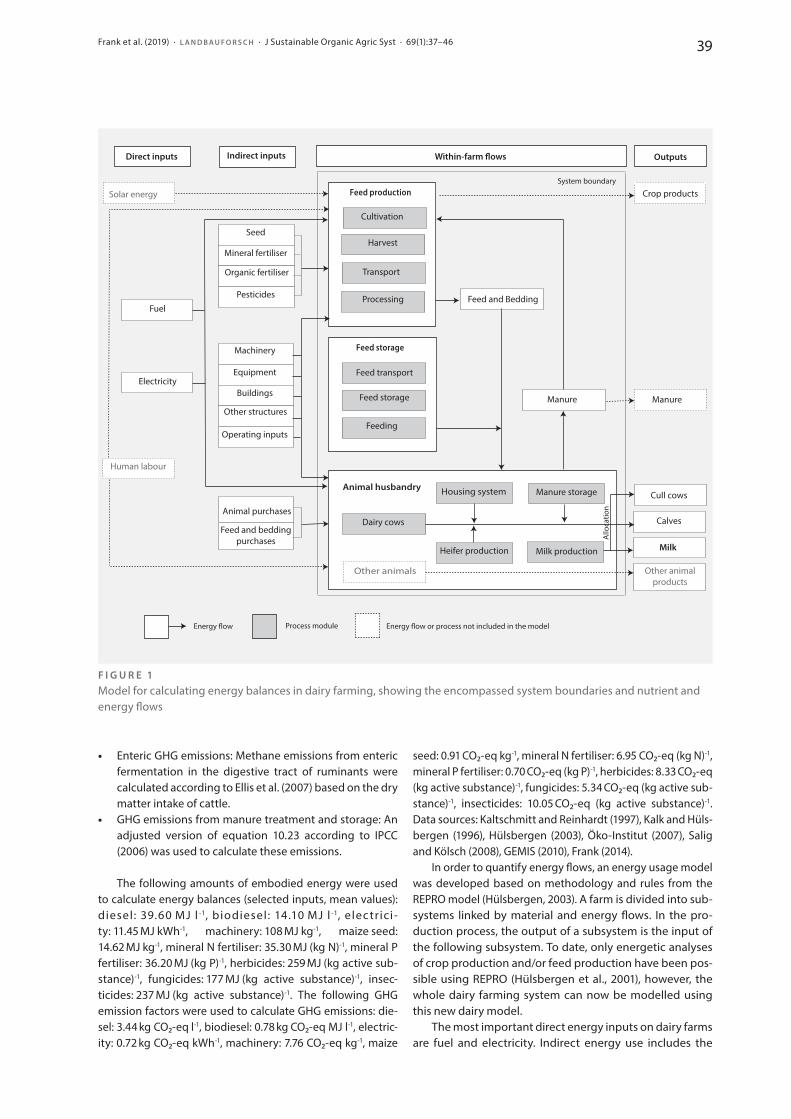
Frank et al. (2019) · L A N D B A U F O R S C H · J Sustainable Organic Agric Syst · 69(1):37–46 39
• Enteric GHG emissions: Methane emissions from enteric fermentation in the digestive tract of ruminants were calculated according to Ellis et al. (2007) based on the dry matter intake of cattle.
• GHG emissions from manure treatment and storage: An adjusted version of equation 10.23 according to IPCC (2006) was used to calculate these emissions.
The following amounts of embodied energy were used to calculate energy balances (selected inputs, mean values): diesel: 39.60 MJ l -1, biodiesel: 14.10 MJ l -1, e lec tr ici -ty: 11.45 MJ kWh-1, machinery: 108 MJ kg-1, maize seed: 14.62 MJ kg-1, mineral N fertiliser: 35.30 MJ (kg N)-1, mineral P fertiliser: 36.20 MJ (kg P)-1, herbicides: 259 MJ (kg active sub-stance)-1, fungicides: 177 MJ (kg active substance)-1, insec-ticides: 237 MJ (kg active substance)-1. The following GHG emission factors were used to calculate GHG emissions: die-sel: 3.44 kg CO2-eq l-1, biodiesel: 0.78 kg CO2-eq MJ l-1, electric-ity: 0.72 kg CO2-eq kWh-1, machinery: 7.76 CO2-eq kg-1, maize
seed: 0.91 CO2-eq kg-1, mineral N fertiliser: 6.95 CO2-eq (kg N)-1, mineral P fertiliser: 0.70 CO2-eq (kg P)-1, herbicides: 8.33 CO2-eq (kg active substance)-1, fungicides: 5.34 CO2-eq (kg active sub-stance)-1, insecticides: 10.05 CO2-eq (kg active substance)-1. Data sources: Kaltschmitt and Reinhardt (1997), Kalk and Hüls-bergen (1996), Hülsbergen (2003), Öko-Institut (2007), Salig and Kölsch (2008), GEMIS (2010), Frank (2014).
In order to quantify energy flows, an energy usage mo del was developed based on methodology and rules from the REPRO model (Hülsbergen, 2003). A farm is divided into sub-systems linked by material and energy flows. In the pro-duction process, the output of a subsystem is the input of the following subsystem. To date, only energetic analyses of crop production and/or feed production have been pos-sible using REPRO (Hülsbergen et al., 2001), however, the whole dairy farming system can now be modelled using this new dairy model.
The most important direct energy inputs on dairy farms are fuel and electricity. Indirect energy use includes the
Direct inputs Indirect inputs
Solar energy Crop products
Within-farm �ows Outputs
Feed production
Feed storage
Allo
catio
n
Cultivation
Harvest
Transport
Processing
Feed transport
Feed storage
Feeding
Feed and Bedding
Housing system Manure storage
Heifer production Milk production
Dairy cows
Animal husbandry
Seed
Mineral fertiliser
Organic fertiliser
Pesticides
Machinery
Equipment
Buildings
Other structures
Operating inputs
Animal purchases
Feed and bedding purchases
Fuel
Electricity
Human labour
System boundary
Other animals
Cull cows
Calves
Milk
Other animal products
Manure Manure
Energy �ow Process module Energy �ow or process not included in the model
Allo
catio
n
F I G U R E 1Model for calculating energy balances in dairy farming, showing the encompassed system boundaries and nutrient and energy flows
Frank et al. (2019) · L A N D B A U F O R S C H · J Sustainable Organic Agric Syst · 69(1):37–4640
energy input required for the production, maintenance and disposal of inputs and capital equipment 6 (Kalk and Hüls-bergen, 1996; Hülsbergen et al., 2001; Frank, 2014). The most important indirect energy inputs are machinery and equip-ment, animal housing and other buildings or structures, and inputs such as seed, fertilisers and pesticides, as well as the purchase of animals and feed. The outputs of a dairy farm are milk, cull cows, calves and heifers, manure and, if applicable, feed. Energy inputs and outputs are assessed using energy equivalents (Gaillard et al, 1997; Kalk and Hülsbergen, 1996; Hülsbergen et al., 2001; Frank, 2014). The energy equivalents used have been adjusted to represent the latest figures.
Our model was used on 18 organic and 18 conventional dairy farms in southern, western, eastern and northern Ger-many 7, all forming a pilot farm network. Farm selection was based on the following criteria: affiliation with a study region, good data documentation, willingness to actively participate in the project. Farms were also selected based on location; organic farms were paired with a conventional farm in the immediate vicinity (and vice versa), in order to ensure com-parable soil and climatic conditions. The modelled energy balances and GHG emissions were evaluated together with the farmers in the pilot farm network, the causes of high emissions were discussed and options for reducing emis-sions were derived in regional optimisation workshops.
The farm data presented in Table 1 are mean values for the study years 2009 to 2012. The farms included in the study represent a wide range of soil and climatic conditions, farm sizes and farm structures. The average milk yield (Ener-gy Corrected Milk 8, ECM) of the organic farms (6,491 kg a-1) was significantly lower than that of the conventional farms (8,555 kg a-1). Dairy cows had a longer productive lifetime on the organic dairy farms. The proportion of roughage and forage from pasture in the feed ration was significantly higher in organic than in conventional dairy farming. There were also differences in manure systems, e.g. higher pro-portions of solid manure systems and grazing on pasture for cows and heifers in organic dairy farming.
6 An average useful life for machinery and capital equipment was assumed; the actual useful life on the farms could differ. In order to reduce data col-lection complexity, buildings and structures (e.g. animal housing and feed storage) were categorised to define storage and housing categories. The cumulative energy input for construction, particularly for producing steel, concrete and other building materials, was determined for each building category, and this cumulative energy input was allotted according to use-ful life. The animal housing used on the dairy farms was allocated to the appropriate category. This pragmatic approach has proven to be appro-priate; collecting more detailed information about the building materials used or the actual useful life of animal housing is not possible in practice. For dairy cattle housing, the energy input was calculated per cubicle accord ing to the values calculated by Kraatz (2009), taking into account a useful life of 25 years (see Kalk and Hülsbergen 1996).
7 Scientists, farmers and farm advisors have been collaborating as part of the pilot farm network since 2009.
8 Energy Corrected Milk (ECM): values for Energy Corrected Milk (ECM) were determined based on the milk yield and milk constituents in relation to standard milk with 4.0 % fat and 3.4 % protein according to the equation: ECM (kg) = Milk (kg) x [0.38 x (Fat %) + 0.21 x (Protein %) + 1.05] / 3.28
3 Results
Mean CO2-eq emissions per kg of ECM (delivered milk) calcu-lated using the model were 995 g in the organic farms (org) and 1,048 g in the conventional farms (Table 2).
Methane emissions (dairy cows, including replacement calves and heifers) calculated based on milk yield and feed ration made up the largest share of total GHG emissions, with an average of 549 g CO2-eq (kg ECM)-1 (org) and 449 g CO2-eq (kg ECM)-1 (con) (55 % and 43 %, respectively). Me thane emis-sions per kg of ECM from conventional farms were signifi-cantly lower than from organic farms, mainly due to higher milk yields and feed rations with a lower proportion of fibre. Methane emissions from manure storage were much lower than emissions from enteric fermentation and did not differ between the two systems (org: 85, con: 77 g CO2-eq (kg ECM)-1).
The N2O emissions calculated for crop cultivation (soil emissions) and from manure storage are the second most important source of GHG emissions. Emissions were similar for both systems, 253 (org) and 248 (con) g CO2-eq (kg ECM)-1.
There were significant differences in CO2 fluxes on farms with organic and conventional milk production due to differ-ences in C sequestration and land-use change. According to our calculations, there was C sequestration on the organic farms on average (-57 g CO2-eq (kg ECM)-1) due to an increase in soil humus (attributable to the use of pastures, clover grass leys and fertilisation with farmyard manure). There were also no changes in land use (e.g. no conversion of pasture to ara-ble, no imported soybeans were used). On the convention-al dairy farms, on the other hand, CO2 emissions were cal-culated as being 82 g CO2-eq (kg ECM)-1) mainly due to LUC, related to the use of soybeans. However, there was mostly no change in humus stocks (see Table 3).
GHG emissions from conventional dairy farming associ-ated with the use of fossil energy (192 g CO2-eq (kg ECM)-1) significantly exceeded the GHG emissions from organic dairy farming (165 g CO2-eq (kg ECM)-1). Energy input in milk pro-duction was high due to high electricity consumption and the materials needed for milking systems.
Table 3 shows the calculated values for the most impor-tant GHG flows for different processes on a dairy farm. The GHG emissions from feed production differed signifi-cantly between organic and conventional dairy farming (org: 123 g CO2-eq (kg ECM)-1, con: 308 g CO2-eq (kg ECM)-1), which applies to feed production and feed purchases. The signifi cant ly higher energy input in the conventional sys-tems resulted primaril y from the use of energy-intensive concentrates (including e.g. soybean or rapeseed meal), as well as from the use of mineral fertilisers and pesticides. On conventional farms, the share of GHG emissions from pur-chased feed was 11 % (including LUC). There was a higher proportion of energy-efficient pasture (mainly low-input feed production systems) on the organic farms. In addition, ley production (particu larly clover grass) was energy effi-cient. However, the variability of energy utilisation in feed production between individual farms was very high due to the different yield potentials of the various sites and large dif-ferences in feed production systems (e.g. harvest frequency
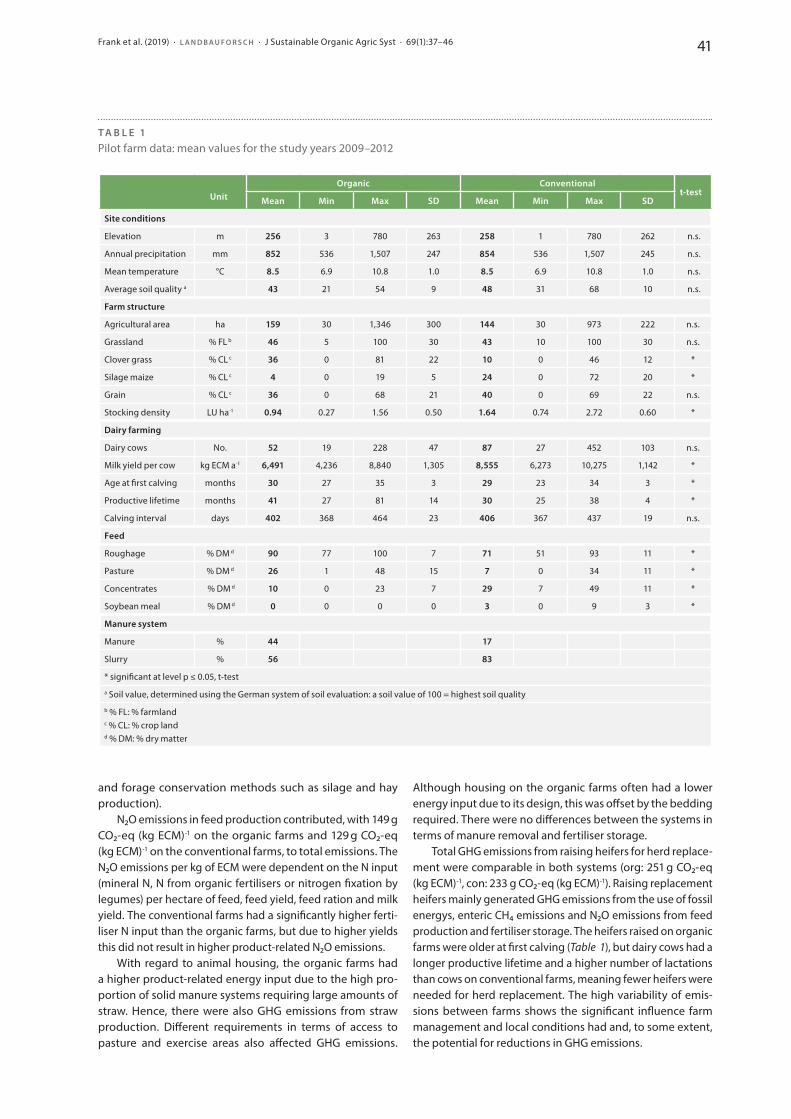
Frank et al. (2019) · L A N D B A U F O R S C H · J Sustainable Organic Agric Syst · 69(1):37–46 41
and forage conservation methods such as silage and hay production).
N2O emissions in feed production contributed, with 149 g CO2-eq (kg ECM)-1 on the organic farms and 129 g CO2-eq (kg ECM)-1 on the conventional farms, to total emissions. The N2O emissions per kg of ECM were dependent on the N input (mineral N, N from organic fertilisers or nitrogen fixation by legumes) per hectare of feed, feed yield, feed ration and milk yield. The conventional farms had a significantly higher ferti-liser N input than the organic farms, but due to higher yields this did not result in higher product-related N2O emissions.
With regard to animal housing, the organic farms had a higher product-related energy input due to the high pro-portion of solid manure systems requiring large amounts of straw. Hence, there were also GHG emissions from straw production. Different requirements in terms of access to pasture and exercise areas also affected GHG emissions.
Although housing on the organic farms often had a lower energy input due to its design, this was offset by the bedding required. There were no differences between the systems in terms of manure removal and fertiliser storage.
Total GHG emissions from raising heifers for herd replace-ment were comparable in both systems (org: 251 g CO2-eq (kg ECM)-1, con: 233 g CO2-eq (kg ECM)-1). Raising replacement heifers mainly generated GHG emissions from the use of fossil energys, enteric CH4 emissions and N2O emissions from feed production and fertiliser storage. The heifers raised on or ganic farms were older at first calving (Table 1), but dairy cows had a longer productive lifetime and a higher number of lactations than cows on conventional farms, meaning fewer heifers were needed for herd replacement. The high variability of emis-sions between farms shows the significant influence farm management and local conditions had and, to some extent, the potential for reductions in GHG emissions.
T A B L E 1Pilot farm data: mean values for the study years 2009–2012
Unit
Organic Conventionalt-test
Mean Min Max SD Mean Min Max SD
Site conditions
Elevation m 256 3 780 263 258 1 780 262 n.s.
Annual precipitation mm 852 536 1,507 247 854 536 1,507 245 n.s.
Mean temperature °C 8.5 6.9 10.8 1.0 8.5 6.9 10.8 1.0 n.s.
Average soil quality a 43 21 54 9 48 31 68 10 n.s.
Farm structure
Agricultural area ha 159 30 1,346 300 144 30 973 222 n.s.
Grassland % FL b 46 5 100 30 43 10 100 30 n.s.
Clover grass % CL c 36 0 81 22 10 0 46 12 *
Silage maize % CL c 4 0 19 5 24 0 72 20 *
Grain % CL c 36 0 68 21 40 0 69 22 n.s.
Stocking density LU ha-1 0.94 0.27 1.56 0.50 1.64 0.74 2.72 0.60 *
Dairy farming
Dairy cows No. 52 19 228 47 87 27 452 103 n.s.
Milk yield per cow kg ECM a-1 6,491 4,236 8,840 1,305 8,555 6,273 10,275 1,142 *
Age at first calving months 30 27 35 3 29 23 34 3 *
Productive lifetime months 41 27 81 14 30 25 38 4 *
Calving interval days 402 368 464 23 406 367 437 19 n.s.
Feed
Roughage % DM d 90 77 100 7 71 51 93 11 *
Pasture % DM d 26 1 48 15 7 0 34 11 *
Concentrates % DM d 10 0 23 7 29 7 49 11 *
Soybean meal % DM d 0 0 0 0 3 0 9 3 *
Manure system
Manure % 44 17
Slurry % 56 83
* significant at level p ≤ 0.05, t-test
a Soil value, determined using the German system of soil evaluation: a soil value of 100 = highest soil quality
b % FL: % farmlandc % CL: % crop landd % DM: % dry matter
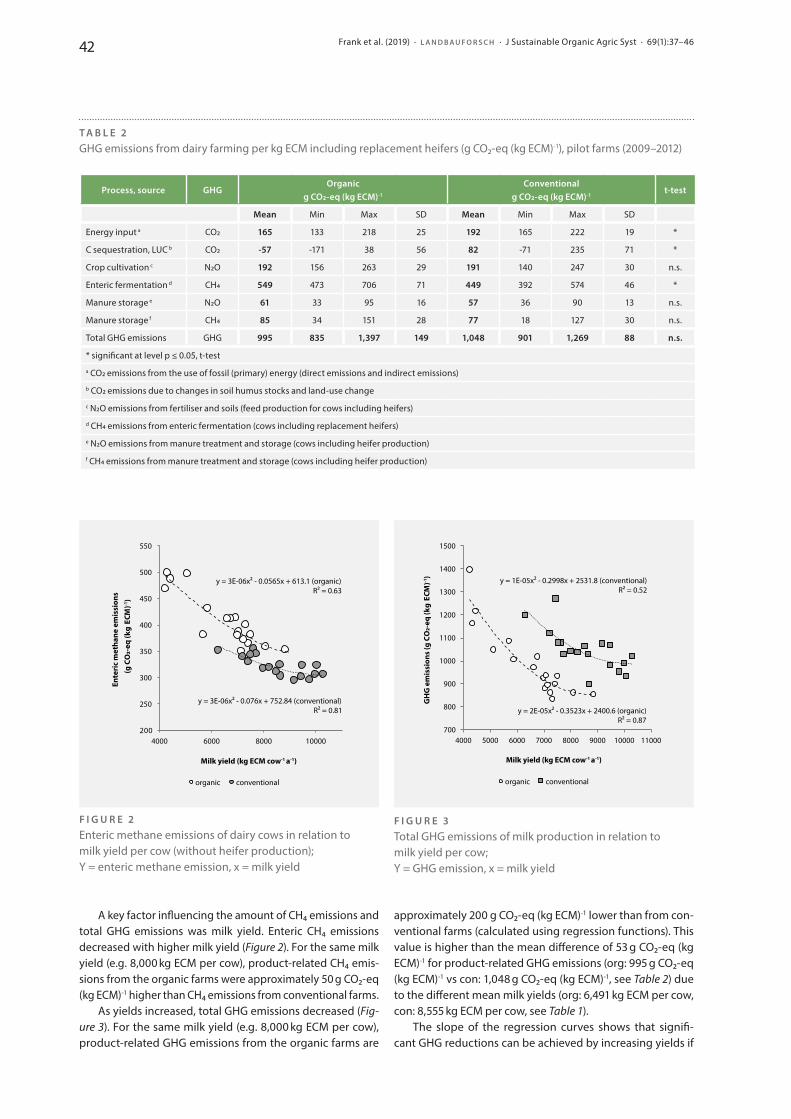
Frank et al. (2019) · L A N D B A U F O R S C H · J Sustainable Organic Agric Syst · 69(1):37–4642
A key factor influencing the amount of CH4 emissions and total GHG emissions was milk yield. Enteric CH4 emissions decreased with higher milk yield (Figure 2). For the same milk yield (e.g. 8,000 kg ECM per cow), product-related CH4 emis-sions from the organic farms were approximately 50 g CO2-eq (kg ECM)-1 higher than CH4 emissions from conventional farms.
As yields increased, total GHG emissions decreased (Fig-ure 3). For the same milk yield (e.g. 8,000 kg ECM per cow), product- related GHG emissions from the organic farms are
approxi mate ly 200 g CO2-eq (kg ECM)-1 lower than from con-ven tional farms (calculated using regression functions). This value is higher than the mean difference of 53 g CO2-eq (kg ECM)-1 for product-related GHG emissions (org: 995 g CO2-eq (kg ECM)-1 vs con: 1,048 g CO2-eq (kg ECM)-1, see Table 2) due to the different mean milk yields (org: 6,491 kg ECM per cow, con: 8,555 kg ECM per cow, see Table 1).
The slope of the regression curves shows that signifi-cant GHG reductions can be achieved by increasing yields if
T A B L E 2GHG emissions from dairy farming per kg ECM including replacement heifers (g CO2-eq (kg ECM)-1), pilot farms (2009–2012)
Process, source GHGOrganic
g CO2-eq (kg ECM)-1
Conventionalg CO2-eq (kg ECM)-1
t-test
Mean Min Max SD Mean Min Max SD
Energy input a CO2 165 133 218 25 192 165 222 19 *
C sequestration, LUC b CO2 -57 -171 38 56 82 -71 235 71 *
Crop cultivation c N2O 192 156 263 29 191 140 247 30 n.s.
Enteric fermentation d CH4 549 473 706 71 449 392 574 46 *
Manure storage e N2O 61 33 95 16 57 36 90 13 n.s.
Manure storage f CH4 85 34 151 28 77 18 127 30 n.s.
Total GHG emissions GHG 995 835 1,397 149 1,048 901 1,269 88 n.s.
* significant at level p ≤ 0.05, t-test
a CO2 emissions from the use of fossil (primary) energy (direct emissions and indirect emissions)
b CO2 emissions due to changes in soil humus stocks and land-use change
c N2O emissions from fertiliser and soils (feed production for cows including heifers)
d CH4 emissions from enteric fermentation (cows including replacement heifers)
e N2O emissions from manure treatment and storage (cows including heifer production)
f CH4 emissions from manure treatment and storage (cows including heifer production)
F I G U R E 2Enteric methane emissions of dairy cows in relation to milk yield per cow (without heifer production);Y = enteric methane emission, x = milk yield
200
250
300
350
400
450
500
550
4000 6000 8000 10000
Ente
ric
met
hane
em
issi
ons
organic conventional
y = 3E-06x2 - 0.076x + 752.84 (conventional) R2 = 0.81
y = 3E-06x2 - 0.0565x + 613.1 (organic) R2 = 0.63
Milk yield (kg ECM cow-1 a-1)
(g C
O2-
eq (k
g EC
M)-1
)
700
800
900
1000
1100
1200
1300
1400
1500
4000 5000 6000 7000 8000 9000 10000 11000
organic conventional
Milk yield (kg ECM cow-1 a-1)
GH
G e
mis
sion
s (g
CO
2-eq
(kg
ECM
)-1) y = 1E-05x2 - 0.2998x + 2531.8 (conventional)
R2 = 0.52
y = 2E-05x2 - 0.3523x + 2400.6 (organic) R2 = 0.87
F I G U R E 3Total GHG emissions of milk production in relation to milk yield per cow;Y = GHG emission, x = milk yield
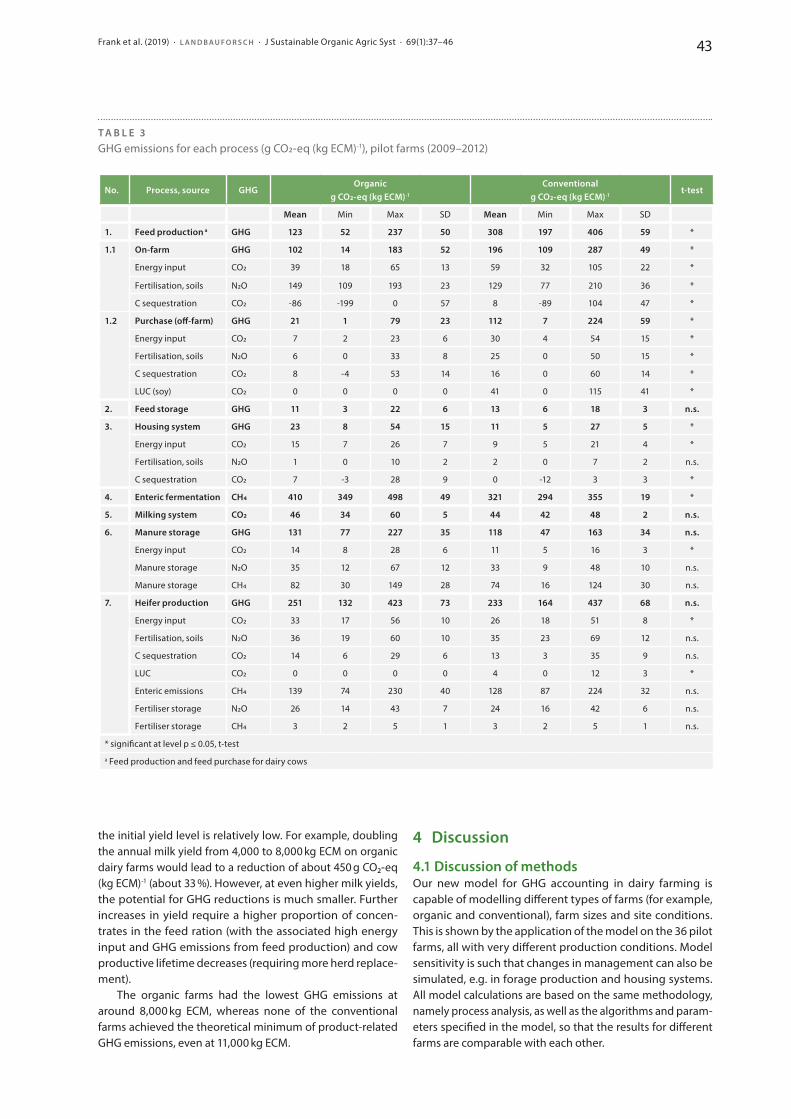
Frank et al. (2019) · L A N D B A U F O R S C H · J Sustainable Organic Agric Syst · 69(1):37–46 43
the initial yield level is relatively low. For example, doubling the annual milk yield from 4,000 to 8,000 kg ECM on organic dairy farms would lead to a reduction of about 450 g CO2-eq (kg ECM)-1 (about 33 %). However, at even higher milk yields, the potential for GHG reductions is much smaller. Further increases in yield require a higher proportion of concen-trates in the feed ration (with the associated high energy input and GHG emissions from feed production) and cow productive lifetime decreases (requiring more herd replace-ment).
The organic farms had the lowest GHG emissions at around 8,000 kg ECM, whereas none of the conventional farms achieved the theoretical minimum of product-related GHG emissions, even at 11,000 kg ECM.
4 Discussion
4.1 Discussion of methodsOur new model for GHG accounting in dairy farming is capable of modelling different types of farms (for example, organic and conventional), farm sizes and site conditions. This is shown by the application of the model on the 36 pilot farms, all with very different production conditions. Model sensitivity is such that changes in management can also be simulated, e.g. in forage production and housing systems. All model calculations are based on the same methodology, namely process analysis, as well as the algorithms and pa ram-eters specified in the model, so that the results for different farms are comparable with each other.
T A B L E 3GHG emissions for each process (g CO2-eq (kg ECM)-1), pilot farms (2009–2012)
No. Process, source GHGOrganic
g CO2-eq (kg ECM)-1
Conventionalg CO2-eq (kg ECM)-1
t-test
Mean Min Max SD Mean Min Max SD
1. Feed production a GHG 123 52 237 50 308 197 406 59 *
1.1 On-farm GHG 102 14 183 52 196 109 287 49 *
Energy input CO2 39 18 65 13 59 32 105 22 *
Fertilisation, soils N2O 149 109 193 23 129 77 210 36 *
C sequestration CO2 -86 -199 0 57 8 -89 104 47 *
1.2 Purchase (off-farm) GHG 21 1 79 23 112 7 224 59 *
Energy input CO2 7 2 23 6 30 4 54 15 *
Fertilisation, soils N2O 6 0 33 8 25 0 50 15 *
C sequestration CO2 8 -4 53 14 16 0 60 14 *
LUC (soy) CO2 0 0 0 0 41 0 115 41 *
2. Feed storage GHG 11 3 22 6 13 6 18 3 n.s.
3. Housing system GHG 23 8 54 15 11 5 27 5 *
Energy input CO2 15 7 26 7 9 5 21 4 *
Fertilisation, soils N2O 1 0 10 2 2 0 7 2 n.s.
C sequestration CO2 7 -3 28 9 0 -12 3 3 *
4. Enteric fermentation CH4 410 349 498 49 321 294 355 19 *
5. Milking system CO2 46 34 60 5 44 42 48 2 n.s.
6. Manure storage GHG 131 77 227 35 118 47 163 34 n.s.
Energy input CO2 14 8 28 6 11 5 16 3 *
Manure storage N2O 35 12 67 12 33 9 48 10 n.s.
Manure storage CH4 82 30 149 28 74 16 124 30 n.s.
7. Heifer production GHG 251 132 423 73 233 164 437 68 n.s.
Energy input CO2 33 17 56 10 26 18 51 8 *
Fertilisation, soils N2O 36 19 60 10 35 23 69 12 n.s.
C sequestration CO2 14 6 29 6 13 3 35 9 n.s.
LUC CO2 0 0 0 0 4 0 12 3 *
Enteric emissions CH4 139 74 230 40 128 87 224 32 n.s.
Fertiliser storage N2O 26 14 43 7 24 16 42 6 n.s.
Fertiliser storage CH4 3 2 5 1 3 2 5 1 n.s.
* significant at level p ≤ 0.05, t-test
a Feed production and feed purchase for dairy cows
Frank et al. (2019) · L A N D B A U F O R S C H · J Sustainable Organic Agric Syst · 69(1):37–4644
Our model is closely linked with the REPRO environ-mental management model (Hülsbergen, 2003). The REPRO model analyses crop production, i.e. feed production and energy balance in crop production (Hülsbergen et al., 2001), soil humus dynamics (Brock et al., 2012; Leithold et al., 2015) and farm nutrient cycles (Lin et al., 2016). In the REPRO mod-el, feed production processes are analysed for each field and include the use of organic fertiliser along with its resulting GHG flows (NH3, N2O and CO2 emissions, and C sequestration). These results are included in the calculation of GHG emissions for dairy farming (see Table 3, process 1.1).
Our dairy model uses relevant data from REPRO, however, the process steps – feed storage, housing system, metabolism, milk production and manure storage – are modelled using the new dairy model. By combining both models, all the relevant GHG flows in dairy farming can be simulated in detail.
Modelling dairy systems is challenging due to the extremely complex and numerous subsystems, processes and interactions in dairy farming. In addition, animal housing and technical systems are highly variable, and are often specially designed for each individual farm. Therefore, simplifications were required to make the model applicable. For example, structures for feed storage and animal housing were grouped into categories, and corresponding parameters were derived for each of these storage and housing categories, such as the energy input and GHG emissions required for production. Buildings and structures on the pilot farms were assigned to these storage and housing categories. Comparable methodo logical approaches were used by Kraatz (2009) and Dux et al. (2009) to calculate energy input in dairy farming. Defined standard procedures were also used to simplify the analysis of heifer production, whereby a reduction in accura-cy was expected. Using exact, farm-specifi c data would have been extremely complex and fraught with uncertainties.
Modelling the GHG flows in dairy farming requires the collection of operating data from farms, and thus good data documentation and cooperation from farm managers. To minimise the effort required for data acquisition, less signifi-cant subprocesses can be simplified and aggregated. How-ever, processes that are critical to the energy and GHG foot-prints, such as feed production, require detailed modelling. Our model is designed for use on farms and to process opera-tional data. Despite some uncertainties, our model can calcu-late complete energy and GHG footprints for dairy farms. The model was designed to enable a comparison of results.
Uncertainties and errors in the model result from • (a) inaccuracies in the collection of production data on
the farms. For example, the grassland (pasture) feed yield can only be estimated based on feed intake and checked for feasibility using feed balances
• (b) errors in calculating nutrient and energy balances. For example, energy balances assume average energy equivalents that do not correspond exactly to operational or regional conditions. Due to the complexity of animal husbandry systems (buildings for animal housing and milking systems) and the required model simplifications, farm-specific conditions can only be approximated by the
model. The humus balance can only indicate approximate C sequestration values, since only the most important drivers are included
• (c) GHG accounting using GHG emission factors and algo rithms that are a drastic simplification of complex conversion processes
• (d) including LUC and the modelling of the associated GHG flows is highly controversial; there are different methodological approaches for the quantification of GHG emissions caused by LUC.
Overall, it should be noted that the new dairy farm-ing model is a compromise between the scientific goal of describing all GHG flows as completely and accurately as possible, and practicality, which necessitates simplifications of complex milk production systems. Sensitivity analyses and error analyses of the individual model components can be found in Hülsbergen (2003) and Frank (2014).
4.2 Discussion of resultsThe analysis of GHG flows in dairy farming shows that many interacting factors determine GHG emissions. An increase in productivity is one of several optimisation strategies; how-ever, it must not be at the expense of productive lifetime (number of lactations, effort required for herd replacement) or require an extremely high proportion of con centrate in the feed ration. On the farms we analysed, organic farms with milk yields of 7,000 to 9,000 kg ECM a-1 had the lowest GHG emissions of 800 to 900 g CO2-eq (kg ECM)-1. On the other hand, conventional farms with an output of 9,000 to 10,500 kg ECM a-1 had GHG emissions of 900 to 1,050 g CO2-eq (kg ECM)-1.
As frequently described in the literature (e.g. Flachowsky and Brade, 2007), an increase in milk yield per cow results in a decrease in enteric methane emissions per kg ECM. An increase from 4,000 to 8,000 kg of ECM cow-1 a-1 resulted in a CH4 reduction of around 100 g CO2-eq (kg ECM)-1 for the organic pilot farms. For the conventional pilot farms, the potential for reducing CH4 if output were to be increased from 7,000 to 10,000 kg of ECM cow-1 a-1 was only around 30 g CO2-eq (kg ECM)-1. Methane emissions can be reduced by changing feed quality and feed composition (Flachowsky and Brade, 2007), however, this may only be possible to a limited extent due to specific site and production con ditions (e.g. regions where permanent pasture is dominant), or due to certain requirements in organic farming. However, our research also shows that increasing milk yield is just one of many GHG mitigation strategies and that an increase in per-formance is neither possible nor plausible for every farm. Among other things, it could conflict with other goals, such as replacing roughage produced in an extensive system with concentrates that require a lot of energy to produce, or nega-tive effects on productive lifetime and animal health. Intensi-fication of feed production and grassland should also not be exaggerated in order to avoid negative environmental effects, such as a reduction in biodiversity. The pilot farms network gives us the opportunity to study the trade-offs between the intensity of milk production systems, product-related GHG emissions, and other environmental effects.
Frank et al. (2019) · L A N D B A U F O R S C H · J Sustainable Organic Agric Syst · 69(1):37–46 45
Feed production contributes significantly to energy use and greenhouse gas emissions from milk production (see Table 3). Although higher amounts of nitrogen fertiliser are used on conventional than on organic farms (Hülsbergen and Rahmann, 2013), when higher forage yields and milk yields are taken into account, the product-related N2O emissions from feed production are at about the same level (Table 3). The farms studied did not show significant over-fertilisation of feed production areas, which is due in part to moderate stocking rates (livestock farming based on available land area) (see Table 1).
There was enormous variability in the GHG flows with-in individual processes and in the product-related GHG total emissions for the pilot farms. One reason was the wide variety of site conditions and milk production systems on the farms (Table 1). Farm management also had a significant impact. Although systemic differences between organic and conven-tional dairy farming were found in some GHG flows (Table 2 and Table 3), the differences between farms within each system were much greater. In future, system comparisons between organic and conventional agriculture should take this variability in results, as well as uncertainties and pos-sible errors, better into consideration. A simple comparison between organic and conventional farming without taking variability into account could lead to incorrect assessments.
In order to identify the site-specific productivity optimi-sations necessary to achieve the largest possible reduction in GHG emissions, additional farms and locations need to be analysed and included. Model calculations and sensi tivity analyses (Frank, 2014), in which the influencing parameters are varied and a wide range of productivity values are ana-lysed, could supplement the farm analysis, since insignifi-cant and random farm-specific factors are eliminated from the analysis.
5 Conclusion
Our investigations show that a GHG reduction in dairy farm-ing requires farm-specific optimisation approaches due to the heterogeneity of production and operating systems. A one-size-fits-all approach is not particularly effective. Our new model is able to identify the causes of high GHG emissions and to compare farms (see, for example, benchmarking in Figures 2 and 3). Within the pilot farm network, measures for reducing GHG emissions were derived during optimi-sation workshops with the farmers, and their effects on GHG footprints were analysed using the model. It has often been shown that individual measures (for example, increas-ing milk yield to the maximum) do not solve the problem because they can have a negative impact elsewhere (such as higher concentrate requirements and decreasing cow productive lifetime).
As our study confirms, organic dairy farming can increase soil humus and contribute to soil carbon sequestration. Dairy cattle can use grassland biomass and therefore contribute to the conservation of ecologically valuable grassland. Overall optimisation which takes into account interactions between feed production, animal husbandry, fertilisation, humus and
nutrient management, among others, is required. It should also be emphasised that the assessment and optimisation of environmental sustainability in dairy farming should include other relevant environmental areas, such as soil protection and the preservation of potable water sources and biodi ver-sity, in addition to GHG flows and impacts on the climate.
Our experience with the pilot farms shows that farm managers are increasingly interested in implementing climate change mitigation measures in dairy farming. Our model should therefore be developed further so that it can be used successfully, not only for scientific research, but also by farm advisory services.
Acknowledgements
This study was funded by the German Federal Ministry of Food and Agriculture within the research programme “Federal Organic Farming Scheme and other forms of sustain-able agriculture” (BÖLN) under the project title “Increasing resource use efficiency by optimising crop and milk produc-tion on whole farm level under consideration of animal wel-fare aspects”. Many thanks to our farmers in the pilot farm network for their time and hospitality.
R E F E R E N C E S
Bell MJ, Wall E, Russell G, Simm G, Stott AW (2011) The effect of improving cow productivity, fertility, and longevity on the global warming potential of dairy systems. J Dairy Sci 94(7):3662–3678, doi:10.3168/jds.2010-4023
Brock C, Hoyer U, Leithold G, Hülsbergen KJ (2012) The humus balance model (HU-MOD): a simple tool for the assessment of management change impact on soil organic matter levels in arable soils. Nutr Cycl in Agroecosys 92(3):239–254, doi:10.1007/s10705-012-9487-z
Cederberg A, Mattson B (2000) Life cycle assessment of milk production: A comparison of conventional and organic farming. J Clean Prod 8(1):49–60, doi:10.1016/S0959-6526(99)00311-X
Dämmgen U, Lüttich M, Haenel H-D, Döhler H, Eurich-Menden B, Oster-burg B (2007) Berechnungen der Emissionen aus der deutschen Land-wirtschaft – Nationaler Emissionsbericht (NIR) 2007 für 2005. In: Dämmgen U (ed) Berechnungen der Emissionen aus der deutschen Landwirtschaft – Nationaler Emissionsbericht (NIR) 2007 für 2005: Einführung, Methoden und Daten (GAS-EM)/Calculations of emissions from German agriculture – National Emission Inventory Report (NIR) 2007 for 2005: introduction, methods and data (GAS-EM). Landbau-forsch Volk Agric Res 304(2007), 343 p
Dux D, Alig M, Herzog D (2009) Umweltwirkung von landwirtschaftlichen Gebäuden. Agrarforsch Schweiz 16(8):284–289
Ellis JL, Kebreab E, Odongo NE, McBride BW, Okine EK, France J (2007) Prediction of methane production from dairy and beef cattle. J Dairy Sci 90(7):3456–3466, doi:10.3168/jds.2006-675
FAO (2006) Livestock´s long shadow: environmental issues and options. Rome, FAO
FAO (2010) Greenhouse gas emissions from the dairy sector. A life cycle assess ment. Rome, FAO
Flachowsky G, Brade W (2007) Potenziale zur Reduzierung der Methan-Emissi onen bei Wiederkäuern. Zuechtungskunde 79(6):417–465
Frank H (2014) Entwicklung und Anwendung eines Modells zur Energie- und Treibhausgasbilanzierung landwirtschaftlicher Betriebssysteme mit Milchviehhaltung. Dissertation, Technische Universität München, Germany, 206 p
Frank H, Schmid H, Hülsbergen K-J (2015): Energie- und Treibhausgasbilanz der Milchviehhaltung – Untersuchungen im Netzwerk der Pilotbetriebe
Frank et al. (2019) · L A N D B A U F O R S C H · J Sustainable Organic Agric Syst · 69(1):37–4646
(Energy and greenhouse gas footprints of dairy farming – Research in the pilot farm network). In: Hülsbergen K-J, Rahmann G (eds) Klima-wirkungen und Nachhaltigkeit ökologischer und konventioneller Be-triebssysteme – Untersuchungen in einem Netzwerk von Pilotbetrie-ben. Forschungsergebnisse 2013–2014. Braunschweig: Johann Heinrich von Thünen-Institut, Thünen Rep 29, 25–48, doi:10.3220/REP_29_2015
Gaillard G, Crettaz P, Hausheer J (1997) Umweltinventar der landwirtschaftli-chen Inputs im Pflanzenbau. Daten für die Erstellung von Energie- und Öko bilanzen in der Landwirtschaft. Eidgenössische Forschungsanstalt für Agrarwirtschaft und Landtechnik, FAT Schriftenreihe 46(Tech Rep)
Grandl F, Furger M, Kreuzer M, Zehetmeier M (2019) Impact of longevity on greenhouse gas emissions and profitability of individual dairy cows an-alysed with different system boundaries. Animal 13(1):198–208, doi:10.1017/S175173111800112X
Haas G, Wetterich F, Köpke U (2001) Comparing intensive, extensified and organic grassland farming in southern Germany by process life cycle assessment. Agr Ecosys Environ 83(1–2):43–53, doi:10.1016/S0167-8809(00)00160-2
Hörtenhuber SJ, Lindenthal T, Zollitsch W (2011) Reduction of greenhouse gas emissions from feed supply chains by utilizing regionally produced protein sources: the case of Austrian dairy production. J Sci Food Agric 91(6):1118–1127, doi:10.1002/jsfa.4293
Hülsbergen K-J, Feil B, Biermann S, Rathke GW, Kalk WD, Diepenbrock W (2001) A method of energy balancing in crop production and its appli-cation in a long-term fertilizer trial. Agr Ecosys Environ 86(3):303–321, doi:10.1016/S0167-8809(00)00286-3
Hülsbergen K-J (2003) Entwicklung und Anwendung eines Bilanzierungs-modells zur Bewertung der Nachhaltigkeit landwirtschaftlicher Sys-teme. Aachen: Shaker-Verlag, 240 p
Hülsbergen K-J, Rahmann G (eds.) (2013) Klimawirkungen und Nachhaltig-keit ökologischer und konventioneller Betriebssysteme – Untersuch-ungen in einem Netzwerk von Pilotbetrieben (Ecological sustainability and greenhouse gas emissions of organic and conventional farms – analyses in a network of pilot farms). Braunschweig: Johann Heinrich von Thünen-Institut, 412 p, Thünen Rep 8
International Panel on Climate Change (IPCC) (1997) 1996 IPCC Guidelines for National Greenhouse Gas Inventories
International Panel on Climate Change (IPCC) (2006) 2006 IPCC Guidelines for National Greenhouse Gas Inventories
Jentsch W, Schweigel M, Weissbach F, Scholze H, Pitroff W, Derno M (2007) Methane production in cattle calculated by the nutrient composition of the diet. Arch of Anim Nutr 61(1):10–19, doi:10.1080/174503906011 06580
Kalk WD, Hülsbergen K-J (1996) Methodik zur Einbeziehung des indirekten Energieverbrauchs mit Investitionsgütern in Energiebilanzen von Land-wirtschaftsbetrieben. Kühn-Archiv 90:41–56
Kaltschmitt M, Reinhardt GA (Hrsg.) (1997) Nachwachsende Energieträger – Grundlagen, Verfahren, ökologische Bilanzierung. Braunschweig: Vieweg Verlag, 527 p
Kirchgessner M, Windisch W, Müller HL, Kreuzer M (1991) Release of meth-ane and of carbon dioxide by dairy cattle. Agribiol Res (44):91–102
Kraatz S (2009) Ermittlung der Energieeffizienz in der Tierhaltung am Beispiel der Milchviehhaltung. Dissertation, Humboldt-Universität zu Berlin, Germany, doi:10.18452/15940
Leithold G, Hülsbergen K-J, Brock C (2015) Organic matter returns to soils must be higher under organic compared to conventional farming. J Plant Nutr Soil Sc 178(1):4–12, doi:10.1002/jpln.201400133
Lin HC, Huber JA, Gerl G, Hülsbergen K-J (2016) Nitrogen balances and nitro-gen-use efficiency of different organic and conventional farming sys-tems. Nutr Cycl in Agroecosys 105:1–23, doi:10.1007/s10705-016-9770-5
Öko-Institut (2010) Globales Emissions-Modell Integrierter Systeme (GEMIS)Refsgaard K, Halberg N, Kristensen ES (1998) Energy utilization in crop and
dairy production in organic and conventional livestock production systems. Agr Syst 57(4):599–630, doi:10.1016/S0308-521X(98)00004-3
Saling P, Kölsch D (2008) Ökobilanzierung: Energieverbräuche und CO2-Emissionen von Pflanzenschutzmitteln. In: Döhler H, Boxberger J, Krötzsch S (eds) Energieeffiziente Landwirtschaft. KTBL-Schrift 463: 65–71
Schüler M, Hansen S, Paulsen HM (2018) Discrimination of milk carbon foot-prints from different dairy farms when using IPCC Tier 1 methodology for calculation of GHG emissions from managed soils. J Clean Prod 177:899–907, doi:10.1016/j.jclepro.2017.12.227
Thomassen MA, de Boer IJM (2005) Evaluation of indicators to assess the en-vironmental impact of dairy production systems. Agriculture, Ecosys-tems & Environment 111(1–4):185–199, doi:10.1016/j.agee.2005.06.013
Thomassen MA, van Calker KJ, Smits MCJ, Iepema GL, de Boer IJM (2008) Life cycle assessment of conventional and organic milk production in the Netherlands. Agric Syst 96(1–3):95–107, doi:10.1016/j.agsy.2007.06.001
Vellinga TV, de Haan MHA, Schils RLM, Evers A, van den Pool, van Dasse-laar A (2011) Implementation of GHG mitigation on intensive dairy farms: Farmers‘ preferences and variation in cost effectiveness. Livest Sci 137(1–3):185–195, doi:10.1016/j.livsci.2010.11.005
Weckenbrock P, Sanchez‐Gellert HL, Gattinger A (2019) Klimaschutz. In: Sanders J, Hess J (eds) Leistungen des ökologischen Landbaus für Um-welt und Gesellschaft. Braunschweig: Johann Heinrich von Thünen-In-stitut, Thünen Rep 65:164–190, doi:10.3220/REP1576488624000
Zehetmeier M, Baudracco J, Hoffmann H, Heissenhuber A (2012) Does in-creasing milk yield per cow reduce greenhouse gas emissions? A sys-tem approach. Animal 6(1):154–166, doi:10.1017/S1751731111001467
Bell et al. (2019) · L A N D B A U F O R S C H · J Sustainable Organic Agric Syst · 69(1):47–56DOI:10.3220/LBF15841062570004
47
R E S E A R C H A R T I C L E
Modified approach to estimating daily methane emissions of dairy cows by measuring filtered eructations during milkingMatt. J. Bell 1, Phil Garnsworthy 1, Dimitris Mallis 2, Richard Eckard 3, Peter Moate 4, and Tianhai Yan 5
Abstract
The aim of this study was to compare metrics for quantifying enteric methane (CH4) emissions from individual cows during milking using frequent spot measurements and peak analysis methods. An infrared gas analyser was used to measure the CH4 emitted by cows, and eructation peaks were identi fied using a Signal Processing Toolbox provided by Matlab. CH4 emissions were quantified by gas peak height, peak ampli-tude and average concentration, and were expressed in grams per day and CH4 yield (grams per kilogram of dry mat-ter intake (DMI)). Peak analysis measurements of CH4 were obtained from 36 cows during 2,474 milkings, during which cows were fed a ration containing between 39 and 70 % for-age. Spot measurements of CH4 were compared to a separate dataset of 196 chamber CH4 records from another group of 105 cows, which were fed a ration containing between 25 and 80 % forage. The results showed that the metrics of CH4 peak height and CH4 peak amplitude demonstrated simi-lar positive relationships between daily CH4 emissions and DMI (both r = 0.37), and a negative relationship between CH4 yield and DMI (r = -0.43 and -0.38 respectively) as observed in the chamber measurements (r = 0.57 for daily emissions and r = -0.40 for CH4 yield). The CH4 metrics of peak height and peak amplitude were highly repeatable (ranging from 0.76
to 0.81), comparable to the high repeatability of production traits (ranging from 0.63 to 0.99) and were more repeat able than chamber CH4 measurements (0.31 for daily emissions and 0.03 for CH4 yield). This study recommends quantifying CH4 emissions from the maximum amplitude of an eructation.
1 Introduction
The process by which ruminants convert plant material into useful products such as meat and milk through rumen fer-mentation results in a loss of energy in the form of CH4 emis-sions. The animal removes CH4 building up in its rumen by repeated eructations of gas through its mouth and nostrils. Globally, dairy farming contributes to 20 % of total green-house gas emissions coming from the livestock sector, with enteric CH4 being the largest source of dairy emissions (Gerber et al., 2013). Historically, CH4 produced by livestock was regarded as wasted dietary energy and an inefficiency in feed utilisation. This is still the case, but CH4 is also now seen as a pollutant and potent greenhouse gas. Although a large proportion of the variation in CH4 emissions can be explained by diet composition and feed intake (Bell and Eck-ard, 2012; Niu et al., 2018), there is additional variation among animals, which may allow selective breeding (de Haas et al., 2011; Garnsworthy et al., 2012; Breider et al., 2019).
Received: April 24, 2019 Revised: August 3, 2019Accepted: November 25, 2019
K E Y W O R D S dairy cow, enteric methane, spot measurement, sampling
H I G H L I G H T S
• Maximum eructation measured by peak height or peak amplitude can provide reliable metrics to estimate daily CH4 emissions
• We recommend using peak amplitude as it removes any background emissions
1 The University of Nottingham, School of Biosciences, United Kingdom2 The University of Nottingham, School of Computer Science, United Kingdom3 University of Melbourne, Melbourne School of Land and Environment, Australia4 Agriculture Victoria Research, Australia5 Agri-Food and Biosciences Institute, United Kingdom
C O N TA C T [email protected]
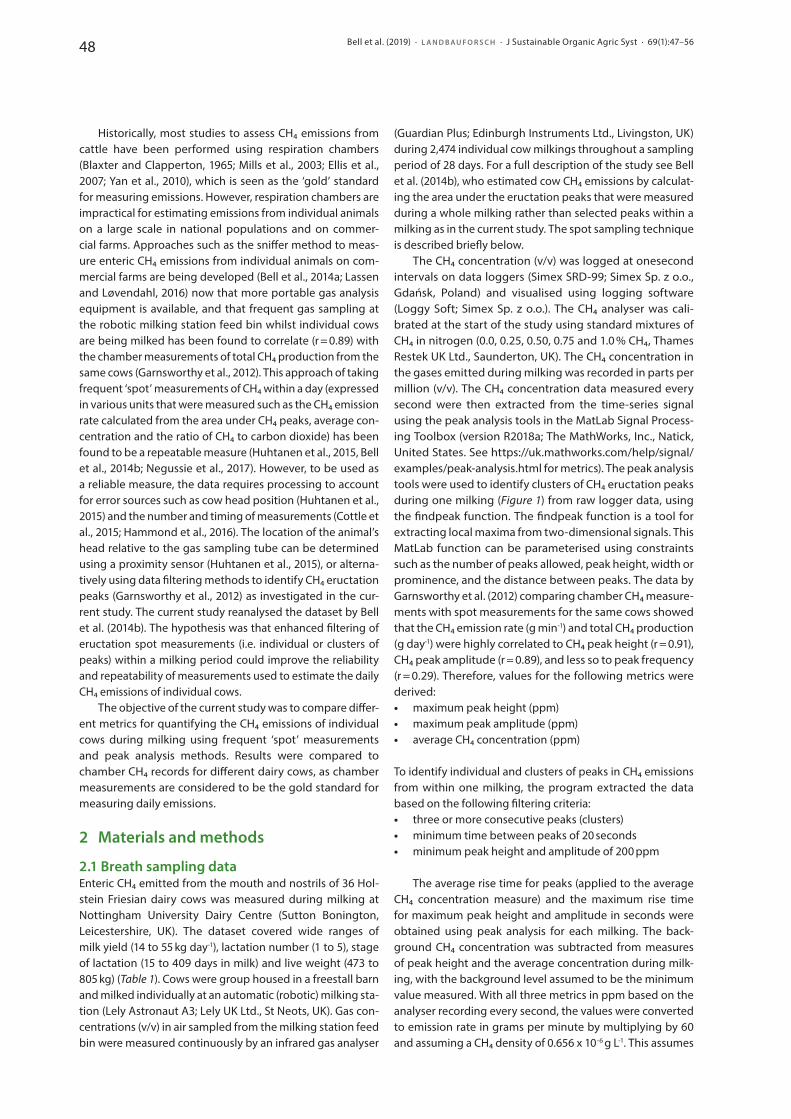
Bell et al. (2019) · L A N D B A U F O R S C H · J Sustainable Organic Agric Syst · 69(1):47–5648
Historically, most studies to assess CH4 emissions from cattle have been performed using respiration chambers (Blaxter and Clapperton, 1965; Mills et al., 2003; Ellis et al., 2007; Yan et al., 2010), which is seen as the ‘gold’ standard for measuring emissions. However, respiration chambers are impractical for estimating emissions from individual animals on a large scale in national populations and on commer-cial farms. Approaches such as the sniffer method to meas-ure enteric CH4 emissions from individual animals on com-mercial farms are being developed (Bell et al., 2014a; Lassen and Løvendahl, 2016) now that more portable gas analysis equipment is available, and that frequent gas sampling at the robotic milking station feed bin whilst individual cows are being milked has been found to correlate (r = 0.89) with the chamber measurements of total CH4 production from the same cows (Garnsworthy et al., 2012). This approach of taking frequent ‘spot’ measurements of CH4 within a day (expressed in various units that were measured such as the CH4 emission rate calculated from the area under CH4 peaks, average con-centration and the ratio of CH4 to carbon dioxide) has been found to be a repeatable measure (Huhtanen et al., 2015, Bell et al., 2014b; Negussie et al., 2017). However, to be used as a reliable measure, the data requires processing to account for error sources such as cow head position (Huhtanen et al., 2015) and the number and timing of measurements (Cottle et al., 2015; Hammond et al., 2016). The location of the animal’s head relative to the gas sampling tube can be determined using a proximity sensor (Huhtanen et al., 2015), or alterna-tively using data filtering methods to identify CH4 eructation peaks (Garnsworthy et al., 2012) as investigated in the cur-rent study. The current study reanalysed the dataset by Bell et al. (2014b). The hypothesis was that enhanced filtering of eructation spot measurements (i.e. individual or clusters of peaks) within a milking period could improve the reliability and repeatability of measurements used to estimate the daily CH4 emissions of individual cows.
The objective of the current study was to compare differ-ent metrics for quantifying the CH4 emissions of individual cows during milking using frequent ‘spot’ measurements and peak analysis methods. Results were compared to chamber CH4 records for different dairy cows, as chamber measurements are considered to be the gold standard for measuring daily emissions.
2 Materials and methods
2.1 Breath sampling dataEnteric CH4 emitted from the mouth and nostrils of 36 Hol-stein Friesian dairy cows was measured during milking at Nottingham University Dairy Centre (Sutton Bonington, Leicestershire, UK). The dataset covered wide ranges of milk yield (14 to 55 kg day-1), lactation number (1 to 5), stage of lacta tion (15 to 409 days in milk) and live weight (473 to 805 kg) (Table 1). Cows were group housed in a freestall barn and milked individually at an automatic (robotic) milking sta-tion (Lely Astronaut A3; Lely UK Ltd., St Neots, UK). Gas con-centrations (v/v) in air sampled from the milking station feed bin were measured continuously by an infrared gas analyser
(Guardian Plus; Edinburgh Instruments Ltd., Livingston, UK) during 2,474 individual cow milkings throughout a sampling period of 28 days. For a full description of the study see Bell et al. (2014b), who estimated cow CH4 emissions by calculat-ing the area under the eructation peaks that were measured during a whole milking rather than selected peaks within a milking as in the current study. The spot sampling technique is described briefly below.
The CH4 concentration (v/v) was logged at onesecond intervals on data loggers (Simex SRD-99; Simex Sp. z o.o., Gdańsk, Poland) and visualised using logging software (Loggy Soft; Simex Sp. z o.o.). The CH4 analyser was cali-brated at the start of the study using standard mixtures of CH4 in nitrogen (0.0, 0.25, 0.50, 0.75 and 1.0 % CH4, Thames Restek UK Ltd., Saunderton, UK). The CH4 concentration in the gases emitted during milking was recorded in parts per million (v/v). The CH4 concentration data measured every second were then extracted from the time-series signal using the peak analysis tools in the MatLab Signal Process-ing Toolbox (version R2018a; The MathWorks, Inc., Natick, United States. See https://uk.mathworks.com/help/signal/examples/peak-analysis.html for metrics). The peak analysis tools were used to identify clusters of CH4 eructation peaks during one milking (Figure 1) from raw logger data, using the findpeak function. The findpeak function is a tool for extrac ting local maxima from two-dimensional signals. This MatLab function can be parameterised using constraints such as the number of peaks allowed, peak height, width or prominence, and the distance between peaks. The data by Garnsworthy et al. (2012) comparing chamber CH4 measure-ments with spot measurements for the same cows showed that the CH4 emission rate (g min-1) and total CH4 production (g day-1) were highly correlated to CH4 peak height (r = 0.91), CH4 peak amplitude (r = 0.89), and less so to peak frequency (r = 0.29). Therefore, values for the following metrics were derived: • maximum peak height (ppm) • maximum peak amplitude (ppm) • average CH4 concentration (ppm)
To identify individual and clusters of peaks in CH4 emissions from within one milking, the program extracted the data based on the following filtering criteria: • three or more consecutive peaks (clusters) • minimum time between peaks of 20 seconds • minimum peak height and amplitude of 200 ppm
The average rise time for peaks (applied to the average CH4 concentration measure) and the maximum rise time for maximum peak height and amplitude in seconds were obtained using peak analysis for each milking. The back-ground CH4 concentration was subtracted from measures of peak height and the average concentration during milk-ing, with the background level assumed to be the minimum value measured. With all three metrics in ppm based on the analyser recording every second, the values were converted to emission rate in grams per minute by multiplying by 60 and assuming a CH4 density of 0.656 x 10⁻⁶ g L-1. This assumes
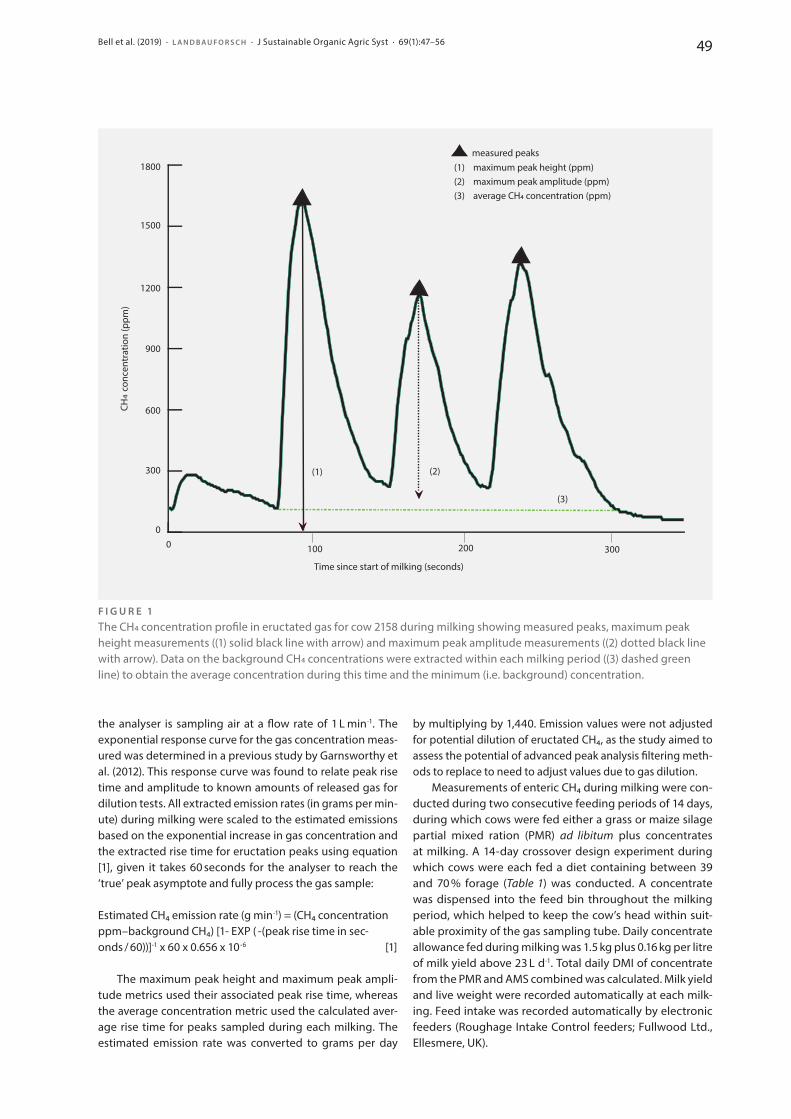
Bell et al. (2019) · L A N D B A U F O R S C H · J Sustainable Organic Agric Syst · 69(1):47–56 49
the analyser is sampling air at a flow rate of 1 L min-1. The exponential response curve for the gas concentration meas-ured was determined in a previous study by Garnsworthy et al. (2012). This response curve was found to relate peak rise time and amplitude to known amounts of released gas for dilution tests. All extracted emission rates (in grams per min-ute) during milking were scaled to the estimated emissions based on the exponential increase in gas concentration and the extracted rise time for eructation peaks using equation [1], given it takes 60 seconds for the analyser to reach the ‘true’ peak asymptote and fully process the gas sample:
Estimated CH4 emission rate (g min-1) = (CH4 concentration ppm–background CH4) [1- EXP ( -(peak rise time in sec-onds / 60))]-1 x 60 x 0.656 x 10-6 [1]
The maximum peak height and maximum peak ampli-tude metrics used their associated peak rise time, whereas the average concentration metric used the calculated aver-age rise time for peaks sampled during each milking. The estimated emission rate was converted to grams per day
by multiplying by 1,440. Emission values were not adjusted for potential dilution of eructated CH4, as the study aimed to assess the potential of advanced peak analysis filtering meth-ods to replace to need to adjust values due to gas dilution.
Measurements of enteric CH4 during milking were con-ducted during two consecutive feeding periods of 14 days, during which cows were fed either a grass or maize silage partial mixed ration (PMR) ad libitum plus concentrates at milking. A 14-day crossover design experiment during which cows were each fed a diet containing between 39 and 70 % forage (Table 1) was conducted. A concentrate was dispensed into the feed bin throughout the milking period, which helped to keep the cow’s head within suit-able proximity of the gas sampling tube. Daily concentrate allowance fed during milking was 1.5 kg plus 0.16 kg per litre of milk yield above 23 L d-1. Total daily DMI of concentrate from the PMR and AMS combined was calculated. Milk yield and live weight were recorded automatically at each milk-ing. Feed intake was recorded automatically by electronic feeders (Roughage Intake Control feeders; Fullwood Ltd., Ellesmere, UK).
0
300
600
900
1200
1500
1800
0 100 200 300
Time since start of milking (seconds)
(1) maximum peak height (ppm)(2) maximum peak amplitude (ppm)(3) average CH4 concentration (ppm)
(1) (2)
(3)
measured peaks
F I G U R E 1The CH4 concentration profile in eructated gas for cow 2158 during milking showing measured peaks, maximum peak height measurements ((1) solid black line with arrow) and maximum peak amplitude measurements ((2) dotted black line with arrow). Data on the background CH4 concentrations were extracted within each milking period ((3) dashed green line) to obtain the average concentration during this time and the minimum (i.e. background) concentration.
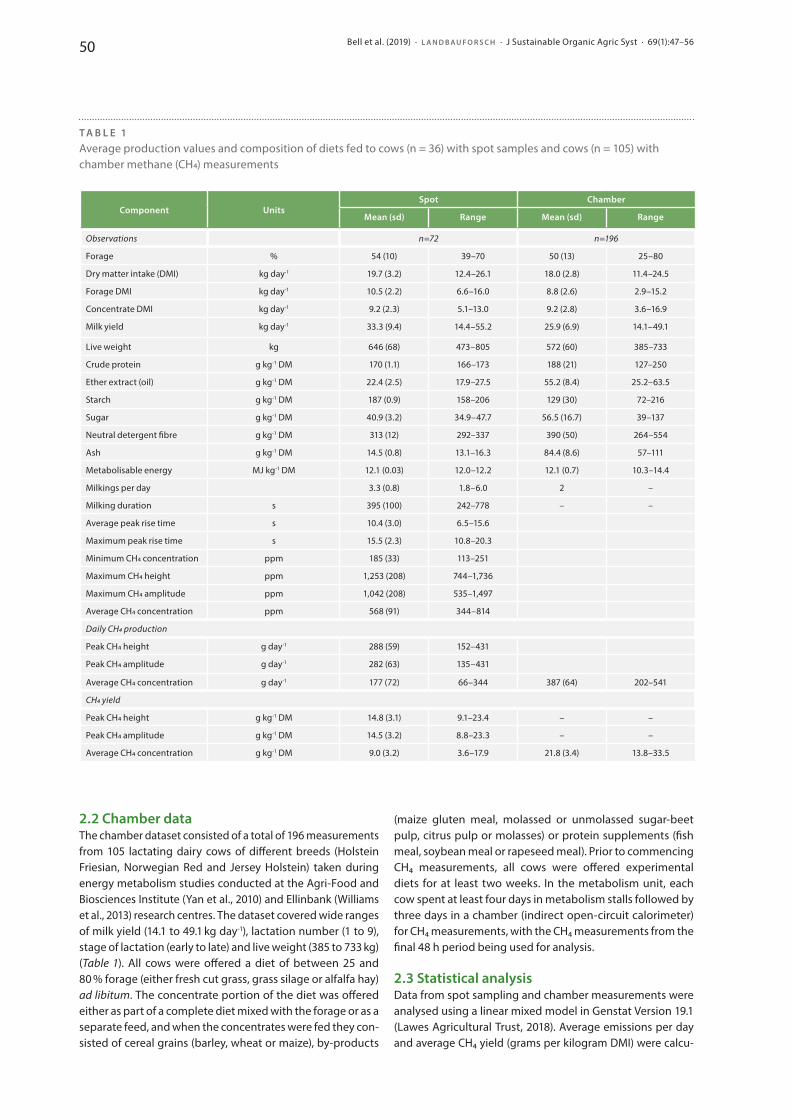
Bell et al. (2019) · L A N D B A U F O R S C H · J Sustainable Organic Agric Syst · 69(1):47–5650
2.2 Chamber dataThe chamber dataset consisted of a total of 196 measurements from 105 lactating dairy cows of different breeds (Holstein Friesian, Norwegian Red and Jersey Holstein) taken during energy metabolism studies conducted at the Agri-Food and Biosciences Institute (Yan et al., 2010) and Ellinbank (Williams et al., 2013) research centres. The dataset covered wide ranges of milk yield (14.1 to 49.1 kg day-1), lactation number (1 to 9), stage of lactation (early to late) and live weight (385 to 733 kg) (Table 1). All cows were offered a diet of between 25 and 80 % forage (either fresh cut grass, grass silage or alfalfa hay) ad libitum. The concentrate portion of the diet was offered either as part of a complete diet mixed with the forage or as a separate feed, and when the concentrates were fed they con-sisted of cereal grains (barley, wheat or maize), by- products
(maize gluten meal, molassed or unmolassed sugar-beet pulp, citrus pulp or molasses) or protein supplements (fish meal, soybean meal or rapeseed meal). Prior to com mencing CH4 measurements, all cows were offered experimental diets for at least two weeks. In the metabolism unit, each cow spent at least four days in metabolism stalls followed by three days in a chamber (indirect open-circuit calorimeter) for CH4 measurements, with the CH4 measurements from the final 48 h period being used for analysis.
2.3 Statistical analysisData from spot sampling and chamber measurements were analysed using a linear mixed model in Genstat Version 19.1 (Lawes Agricultural Trust, 2018). Average emissions per day and average CH4 yield (grams per kilogram DMI) were calcu-
T A B L E 1Average production values and composition of diets fed to cows (n = 36) with spot samples and cows (n = 105) with chamber methane (CH4) measurements
Component UnitsSpot Chamber
Mean (sd) Range Mean (sd) Range
Observations n=72 n=196
Forage % 54 (10) 39–70 50 (13) 25–80
Dry matter intake (DMI) kg day-1 19.7 (3.2) 12.4–26.1 18.0 (2.8) 11.4–24.5
Forage DMI kg day-1 10.5 (2.2) 6.6–16.0 8.8 (2.6) 2.9–15.2
Concentrate DMI kg day-1 9.2 (2.3) 5.1–13.0 9.2 (2.8) 3.6–16.9
Milk yield kg day-1 33.3 (9.4) 14.4–55.2 25.9 (6.9) 14.1–49.1
Live weight kg 646 (68) 473–805 572 (60) 385–733
Crude protein g kg-1 DM 170 (1.1) 166–173 188 (21) 127–250
Ether extract (oil) g kg-1 DM 22.4 (2.5) 17.9–27.5 55.2 (8.4) 25.2–63.5
Starch g kg-1 DM 187 (0.9) 158–206 129 (30) 72–216
Sugar g kg-1 DM 40.9 (3.2) 34.9–47.7 56.5 (16.7) 39–137
Neutral detergent fibre g kg-1 DM 313 (12) 292–337 390 (50) 264–554
Ash g kg-1 DM 14.5 (0.8) 13.1–16.3 84.4 (8.6) 57–111
Metabolisable energy MJ kg-1 DM 12.1 (0.03) 12.0–12.2 12.1 (0.7) 10.3–14.4
Milkings per day 3.3 (0.8) 1.8–6.0 2 –
Milking duration s 395 (100) 242–778 – –
Average peak rise time s 10.4 (3.0) 6.5–15.6
Maximum peak rise time s 15.5 (2.3) 10.8–20.3
Minimum CH4 concentration ppm 185 (33) 113–251
Maximum CH4 height ppm 1,253 (208) 744–1,736
Maximum CH4 amplitude ppm 1,042 (208) 535–1,497
Average CH4 concentration ppm 568 (91) 344–814
Daily CH4 production
Peak CH4 height g day-1 288 (59) 152–431
Peak CH4 amplitude g day-1 282 (63) 135–431
Average CH4 concentration g day-1 177 (72) 66–344 387 (64) 202–541
CH4 yield
Peak CH4 height g kg-1 DM 14.8 (3.1) 9.1–23.4 – –
Peak CH4 amplitude g kg-1 DM 14.5 (3.2) 8.8–23.3 – –
Average CH4 concentration g kg-1 DM 9.0 (3.2) 3.6–17.9 21.8 (3.4) 13.8–33.5
Bell et al. (2019) · L A N D B A U F O R S C H · J Sustainable Organic Agric Syst · 69(1):47–56 51
lated for each cow during each feeding period (two-weeks for spot measurement values and two days for chamber values) and used in the analysis. Equation [2] was used to calculate variance components for feed intake (DMI, forage DMI and concentrate DMI), milk production, live weight and various metrics for CH4 per individual cow:
yijkl =µ + Pi + Dj + Lk + Lk.Cl + Eijkl [2]
where yijk is the dependent variable; µ = overall mean; Pi = fixed effect of measurement period; Dj = fixed effect of diet; Lk = fixed effect of lactation number (k = 1, 2 or 3 and more); Lk.Cl = random effect of individual cow; Eijkl = random error term.
Repeatability of animal production variables and gas emission measures were assessed by σ2 animal (σ2 animal + σ2 residual)-1, where σ2 is the variance. The between-cow and residual coefficient of variation (CV) were calculated from variance components as root mean square error divided by the mean. The Pearson correlation coefficient was used to assess the association between CH4 emission metrics and total DMI, forage DMI, concentrate DMI, milk yield and live weight across all individual cow records. The results for the three metrics of CH4 from peak analysis (peak height, peak amplitude and average concentration) were compared with each other after converting to daily emissions and CH4 yield, which allowed comparison to CH4 emissions from cham-ber measurements. Significance was attributed at P<0.05. Equation 1 was validated on peak analysis data from spot measure ments and chamber measurements from the same ten cows from the study by Garnsworthy et al. (2012). The maximum peak amplitude (mean ± sd of 1054 ± 313 ppm and ranging from 625 to 1592 ppm) and peak rise time (mean ± sd of 10.9 ± 0.4 seconds and ranging from 10.2 to 11.5 seconds) were derived within milking periods and the total daily CH4 production (mean ± sd of 370 ± 28 g day-1 and ranging from 332 to 407 g/day) whilst in the chamber. For this data, the Pearson correlation coefficient (r), Lin’s bias correction factor (Cb) and concordance correlation coefficient (CCC) were used to test the association between total CH4 production estimat-ed from spot measurements using Equation 1 and chamber measurements from the same cows. Coefficient r was multi-plied by Lin’s bias correction factor (Cb), which measures how far the best-fit line deviates from the 45° line through the origin, in order to derive the CCC (Lin, 1989).
3 Results and discussion
3.1 Methane and its association with production traitsAfter filtering spot measurements for peaks in emissions during milking, ranges of 66 to 431 g CH4 day-1 and 3.6 to 23.4 g CH4 kg-1 DM were observed across CH4 metrics from peak analysis (Table 1). The average CH4 concentration values (177 g day-1 and 9 g kg-1 DM) were lower than those for peak height (288 g day-1 and 14.8 g kg-1 DM) and peak ampli-tude (282 g day-1 and 14.8 g kg-1 DM) metrics, which were all lower than the average CH4 emissions measured for dairy
cows in the chamber data (387 g day-1 and 21.8 g kg-1 DM). After de riving CH4 emission metrics it is noticeable that the peak height and peak amplitude metrics produce similar results. Both metrics have been found to be associated with total CH4 produc tion (Garnsworthy et al., 2012). Furthermore, using input data of maximum peak amplitude and peak rise time from the study by Garnsworthy et al. (2012) in Equation 1 of the current study, found that estimates of total CH4 produc-tion (mean ± sd of 388 ± 31 g day-1 and ranging from 334 to 430 g day-1) are corre lated to chamber CH4 values (r = 0.75 and CCC = 0.62; mean ± sd of 370 ± 28 g day-1 and ranging from 332 to 407 g day-1) (Figure 2).
Although peak analysis can help to identify when the animal’s head is in close proximity to the gas sampling tube (i.e. from maximum peak height and peak amplitude during one milking), the difference in average daily CH4 emissions (Figure 3) and CH4 yield (Figure 4) between spot measure-ments and chamber measurements would suggest that some di lution or loss of spot measurement CH4 emissions occurred between the emissions being expelled by the cow and sam-pled by the gas analyser. Metrics for spot measurement CH4 were not adjusted for any dilution effect. Further refinement of the breath sampling approach to capture more of the eruc-tation produced by the animal may improve estimates and is worth comparing to the current proposed approach.
This study found a positive relationship between total DMI (Figure 3), forage DMI and CH4 emissions per day (Table 2), and a negative relationship between DMI and CH4 yield (Figure 4 and Table 2) estimated from peak height and peak amplitude. The magnitude of the correlation between DMI and CH4 yield estimated from peak height (r = -0.43) and peak amplitude (r = -0.38) were noticeably similar to the correlation between DMI and CH4 yield from chamber measurements (r = -0.40). As observed in chamber meas-urements, CH4 yield declined with increasing concentrate DMI but not forage DMI for metrics of peak height and peak amplitude.
When a highly energy-dense diet is formulated to meet the nutrient requirements of a high milk yielding animal (with spot sampled cows averaging 33 kg milk day-1 com-pared to 26 kg milk day-1 for chamber cows), often through feeding a higher proportion of concentrates in the diet, the CH4 yield can be 19 g kg-1 DMI or less (Mills et al., 2003 and Figure 3 for cows with high DMI). The CH4 yield would be expected to be higher (21 g kg-1 DM or more, see Moate et al, 2011) for predominantly forage-based diets. Bell and Eck-ard (2012) found that in lactating dairy cows fed a diet with a high or low proportion of forage content, the relationship between CH4 production and DMI appears to be linear up to an average intake of 15 kg DMI day-1. Above this level of intake (as the majority of cows in this study), the CH4 yield declines, with the lower CH4 yield for spot measurements potentially being influenced by the allocation of concen-trates during milking (Figure 3).
The improved relationship between DMI, forage DMI and CH4 emissions found in the current research compared to the results published in a previous study by Bell et al. (2014b) (r = 0.19 to 0.29) can be attributed to the extraction and
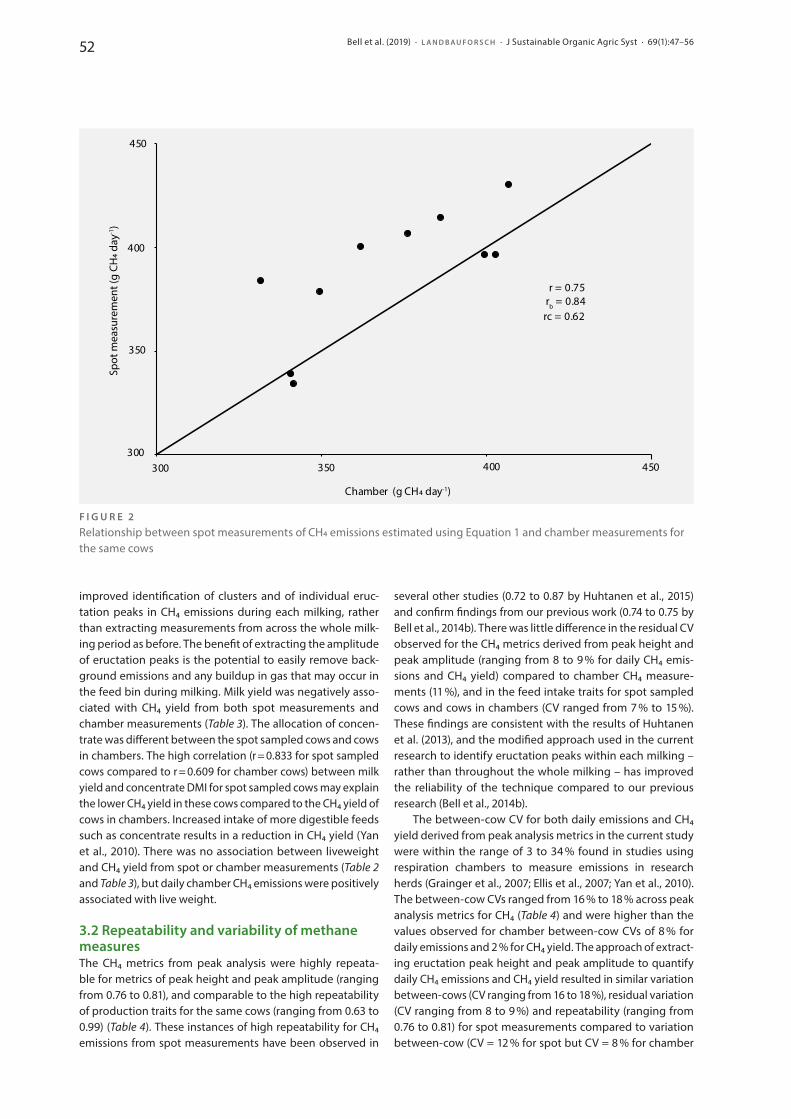
Bell et al. (2019) · L A N D B A U F O R S C H · J Sustainable Organic Agric Syst · 69(1):47–5652
improved identification of clusters and of individual eruc-tation peaks in CH4 emissions during each milking, rather than extracting measurements from across the whole milk-ing period as before. The benefit of extracting the amplitude of eructation peaks is the potential to easily remove back-ground emissions and any buildup in gas that may occur in the feed bin during milking. Milk yield was negatively asso-ciated with CH4 yield from both spot measurements and chamber measurements (Table 3). The allocation of concen-trate was different between the spot sampled cows and cows in chambers. The high correlation (r = 0.833 for spot sampled cows compared to r = 0.609 for chamber cows) between milk yield and concentrate DMI for spot sampled cows may explain the lower CH4 yield in these cows compared to the CH4 yield of cows in chambers. Increased intake of more digestible feeds such as concentrate results in a reduction in CH4 yield (Yan et al., 2010). There was no association between liveweight and CH4 yield from spot or chamber measurements (Table 2 and Table 3), but daily chamber CH4 emissions were positively associated with live weight.
3.2 Repeatability and variability of methane measuresThe CH4 metrics from peak analysis were highly repeata-ble for metrics of peak height and peak amplitude (ranging from 0.76 to 0.81), and comparable to the high repeatability of production traits for the same cows (ranging from 0.63 to 0.99) (Table 4). These instances of high repeatability for CH4 emissions from spot measurements have been observed in
sever al other studies (0.72 to 0.87 by Huhtanen et al., 2015) and confirm findings from our previous work (0.74 to 0.75 by Bell et al., 2014b). There was little difference in the resid ual CV observed for the CH4 metrics derived from peak height and peak amplitude (ranging from 8 to 9 % for daily CH4 emis-sions and CH4 yield) compared to chamber CH4 measure-ments (11 %), and in the feed intake traits for spot sampled cows and cows in chambers (CV ranged from 7 % to 15 %). These findings are consistent with the results of Huhtanen et al. (2013), and the modified approach used in the current research to identify eructation peaks within each milking – rather than throughout the whole milking – has improved the reliability of the technique compared to our previous research (Bell et al., 2014b).
The between-cow CV for both daily emissions and CH4 yield derived from peak analysis metrics in the current study were within the range of 3 to 34 % found in studies using respira tion chambers to measure emissions in research herds (Grainger et al., 2007; Ellis et al., 2007; Yan et al., 2010). The between-cow CVs ranged from 16 % to 18 % across peak analy sis metrics for CH4 (Table 4) and were higher than the values observed for chamber between-cow CVs of 8 % for daily emissions and 2 % for CH4 yield. The approach of extract-ing eructation peak height and peak amplitude to quantify daily CH4 emissions and CH4 yield resulted in simi lar variation between-cows (CV ranging from 16 to 18 %), residual variation (CV ranging from 8 to 9 %) and repeatability (ranging from 0.76 to 0.81) for spot measurements compared to variation between-cow (CV = 12 % for spot but CV = 8 % for chamber
300
350
400
450
300 350 400 450
r = 0.75rb = 0.84rc = 0.62
Chamber (g CH4 day-1)
Spot
mea
sure
men
t (g
CH4 d
ay-1
)
F I G U R E 2Relationship between spot measurements of CH4 emissions estimated using Equation 1 and chamber measurements for the same cows
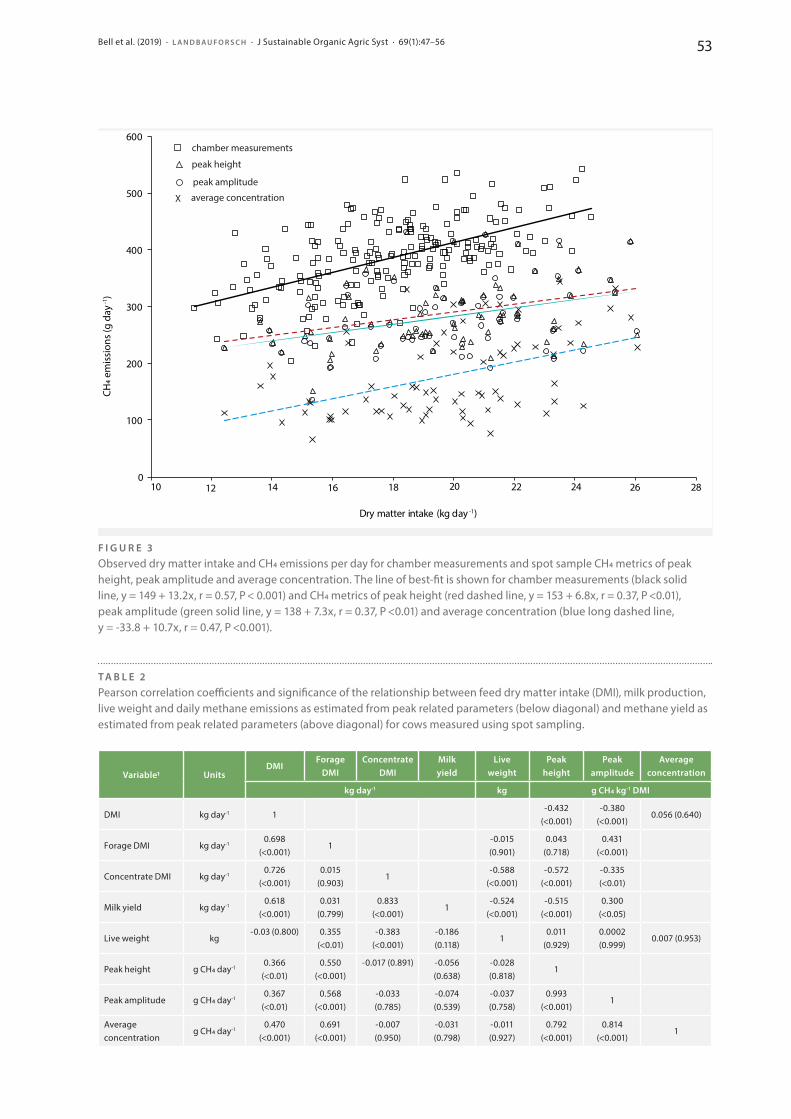
Bell et al. (2019) · L A N D B A U F O R S C H · J Sustainable Organic Agric Syst · 69(1):47–56 53
0
100
200
300
400
500
600
10 12 14 16 18 20 22 24 26 28
CH4 e
mis
sion
s (g
day
-1)
Dry matter intake (kg day -1)
average concentration
peak height
X
chamber measurements
peak amplitude
F I G U R E 3Observed dry matter intake and CH4 emissions per day for chamber measurements and spot sample CH4 metrics of peak height, peak amplitude and average concentration. The line of best-fit is shown for chamber measurements (black solid line, y = 149 + 13.2x, r = 0.57, P < 0.001) and CH4 metrics of peak height (red dashed line, y = 153 + 6.8x, r = 0.37, P <0.01), peak amplitude (green solid line, y = 138 + 7.3x, r = 0.37, P <0.01) and average concentration (blue long dashed line, y = -33.8 + 10.7x, r = 0.47, P <0.001).
T A B L E 2Pearson correlation coefficients and significance of the relationship between feed dry matter intake (DMI), milk production, live weight and daily methane emissions as estimated from peak related parameters (below diagonal) and methane yield as estimated from peak related parameters (above diagonal) for cows measured using spot sampling.
Variable1 UnitsDMI
Forage DMI
Concentrate DMI
Milk yield
Live weight
Peak height
Peak amplitude
Average concentration
kg day-1 kg g CH4 kg-1 DMI
DMI kg day-1 1-0.432
(<0.001)-0.380
(<0.001)0.056 (0.640)
Forage DMI kg day-10.698
(<0.001)1
-0.015 (0.901)
0.043 (0.718)
0.431 (<0.001)
Concentrate DMI kg day-10.726
(<0.001)0.015
(0.903)1
-0.588 (<0.001)
-0.572 (<0.001)
-0.335 (<0.01)
Milk yield kg day-10.618
(<0.001)0.031
(0.799)0.833
(<0.001)1
-0.524 (<0.001)
-0.515 (<0.001)
0.300 (<0.05)
Live weight kg-0.03 (0.800) 0.355
(<0.01)-0.383
(<0.001)-0.186 (0.118)
10.011
(0.929)0.0002 (0.999)
0.007 (0.953)
Peak height g CH4 day-10.366
(<0.01)0.550
(<0.001)-0.017 (0.891) -0.056
(0.638)-0.028 (0.818)
1
Peak amplitude g CH4 day-10.367
(<0.01)0.568
(<0.001)-0.033 (0.785)
-0.074 (0.539)
-0.037 (0.758)
0.993 (<0.001)
1
Average concentration
g CH4 day-10.470
(<0.001)0.691
(<0.001)-0.007 (0.950)
-0.031 (0.798)
-0.011 (0.927)
0.792 (<0.001)
0.814 (<0.001)
1
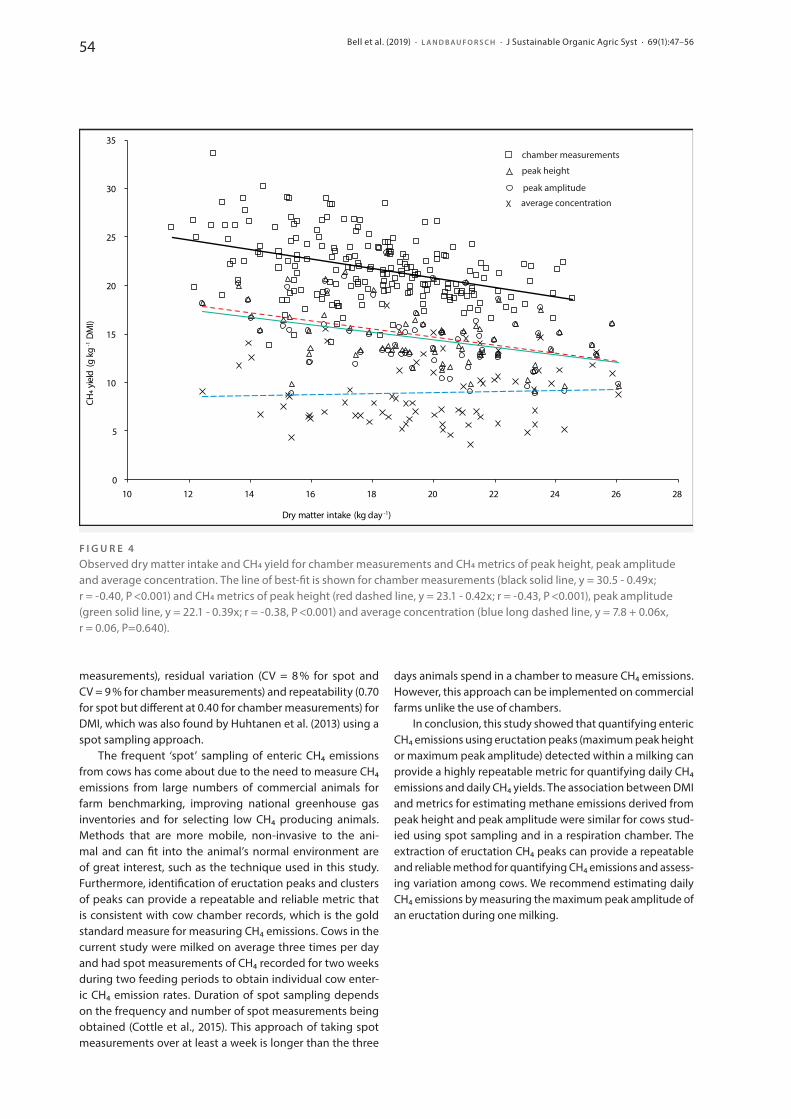
Bell et al. (2019) · L A N D B A U F O R S C H · J Sustainable Organic Agric Syst · 69(1):47–5654
measurements), residual variation (CV = 8 % for spot and CV = 9 % for chamber measurements) and repeatability (0.70 for spot but different at 0.40 for chamber measurements) for DMI, which was also found by Huhtanen et al. (2013) using a spot sampling approach.
The frequent ‘spot’ sampling of enteric CH4 emissions from cows has come about due to the need to measure CH4 emissions from large numbers of commercial animals for farm benchmarking, improving national greenhouse gas inventories and for selecting low CH4 producing animals. Methods that are more mobile, non-invasive to the ani-mal and can fit into the animal’s normal environment are of great interest, such as the technique used in this study. Furthermore, identification of eructation peaks and clusters of peaks can provide a repeatable and reliable metric that is consistent with cow chamber records, which is the gold standard measure for measuring CH4 emissions. Cows in the current study were milked on average three times per day and had spot measurements of CH4 recorded for two weeks during two feeding periods to obtain individual cow en ter-ic CH4 emission rates. Duration of spot sampling depends on the frequency and number of spot measurements being obtained (Cottle et al., 2015). This approach of taking spot measurements over at least a week is longer than the three
days animals spend in a chamber to measure CH4 emissions. However, this approach can be implemented on commercial farms unlike the use of chambers.
In conclusion, this study showed that quantifying enteric CH4 emissions using eructation peaks (maximum peak height or maximum peak amplitude) detected within a milking can provide a highly repeatable metric for quantifying daily CH4 emissions and daily CH4 yields. The association between DMI and metrics for estimating methane emissions derived from peak height and peak amplitude were similar for cows stud-ied using spot sampling and in a respiration chamber. The extraction of eructation CH4 peaks can provide a repeatable and reliable method for quantifying CH4 emissions and assess-ing variation among cows. We recommend estimating daily CH4 emissions by measuring the maximum peak amplitude of an eructation during one milking.
F I G U R E 4Observed dry matter intake and CH4 yield for chamber measurements and CH4 metrics of peak height, peak amplitude and average concentration. The line of best-fit is shown for chamber measurements (black solid line, y = 30.5 - 0.49x; r = -0.40, P <0.001) and CH4 metrics of peak height (red dashed line, y = 23.1 - 0.42x; r = -0.43, P <0.001), peak amplitude (green solid line, y = 22.1 - 0.39x; r = -0.38, P <0.001) and average concentration (blue long dashed line, y = 7.8 + 0.06x, r = 0.06, P=0.640).
0
5
10
15
20
25
30
35
10 12 14 16 18 20 22 24 26 28
CH4 y
ield
(g k
g -1
DM
I)
Dry matter intake (kg day -1)
average concentration
peak height
X
chamber measurements
peak amplitude
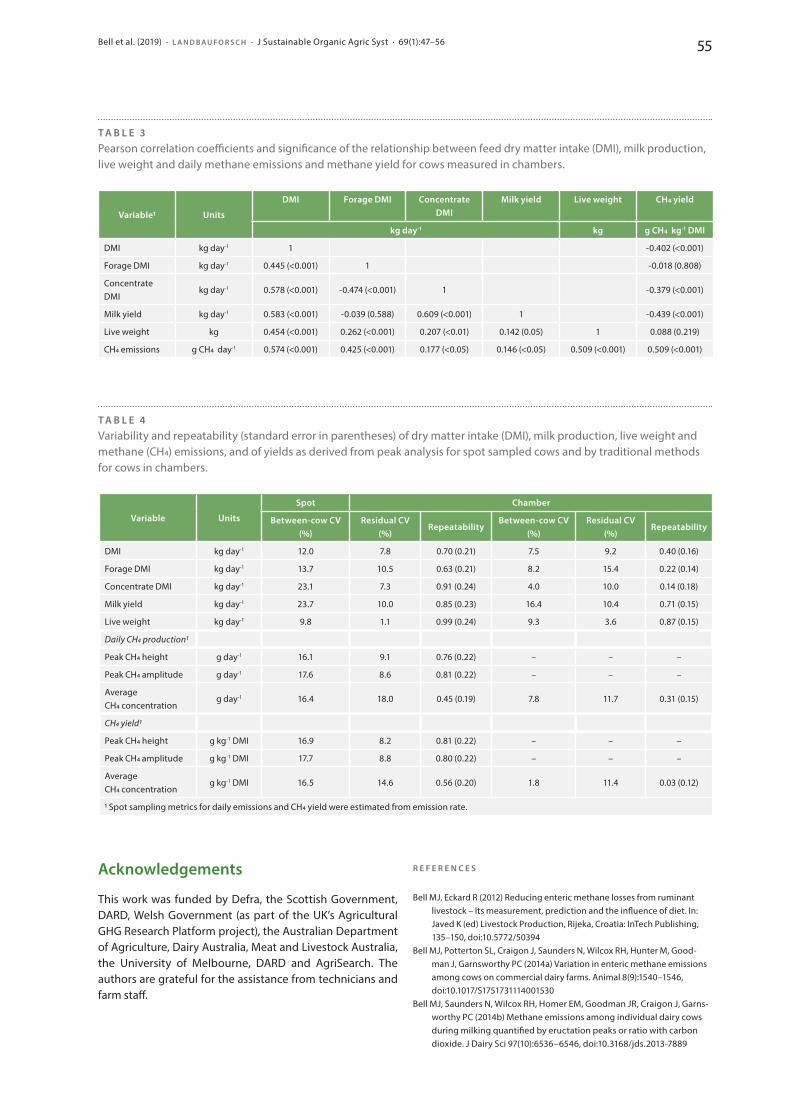
Bell et al. (2019) · L A N D B A U F O R S C H · J Sustainable Organic Agric Syst · 69(1):47–56 55
Acknowledgements
This work was funded by Defra, the Scottish Government, DARD, Welsh Government (as part of the UK’s Agricultural GHG Research Platform project), the Australian Department of Agriculture, Dairy Australia, Meat and Livestock Aus tralia, the University of Melbourne, DARD and AgriSearch. The authors are grateful for the assistance from technicians and farm staff.
R E F E R E N C E S
Bell MJ, Eckard R (2012) Reducing enteric methane losses from ruminant livestock – Its measurement, prediction and the influence of diet. In: Javed K (ed) Livestock Production, Rijeka, Croatia: InTech Publishing, 135–150, doi:10.5772/50394
Bell MJ, Potterton SL, Craigon J, Saunders N, Wilcox RH, Hunter M, Good-man J, Garnsworthy PC (2014a) Variation in enteric methane emissions among cows on commercial dairy farms. Animal 8(9):1540–1546, doi:10.1017/S1751731114001530
Bell MJ, Saunders N, Wilcox RH, Homer EM, Goodman JR, Craigon J, Garns-worthy PC (2014b) Methane emissions among individual dairy cows during milking quantified by eructation peaks or ratio with carbon dioxide. J Dairy Sci 97(10):6536–6546, doi:10.3168/jds.2013-7889
T A B L E 3Pearson correlation coefficients and significance of the relationship between feed dry matter intake (DMI), milk production, live weight and daily methane emissions and methane yield for cows measured in chambers.
Variable1 Units
DMI Forage DMI Concentrate DMI
Milk yield Live weight CH4 yield
kg day-1 kg g CH4 kg-1 DMI
DMI kg day-1 1 -0.402 (<0.001)
Forage DMI kg day-1 0.445 (<0.001) 1 -0.018 (0.808)
Concentrate DMI
kg day-1 0.578 (<0.001) -0.474 (<0.001) 1 -0.379 (<0.001)
Milk yield kg day-1 0.583 (<0.001) -0.039 (0.588) 0.609 (<0.001) 1 -0.439 (<0.001)
Live weight kg 0.454 (<0.001) 0.262 (<0.001) 0.207 (<0.01) 0.142 (0.05) 1 0.088 (0.219)
CH4 emissions g CH4 day-1 0.574 (<0.001) 0.425 (<0.001) 0.177 (<0.05) 0.146 (<0.05) 0.509 (<0.001) 0.509 (<0.001)
T A B L E 4Variability and repeatability (standard error in parentheses) of dry matter intake (DMI), milk production, live weight and methane (CH4) emissions, and of yields as derived from peak analysis for spot sampled cows and by traditional methods for cows in chambers.
Variable Units
Spot Chamber
Between-cow CV (%)
Residual CV (%)
RepeatabilityBetween-cow CV
(%)Residual CV
(%)Repeatability
DMI kg day-1 12.0 7.8 0.70 (0.21) 7.5 9.2 0.40 (0.16)
Forage DMI kg day-1 13.7 10.5 0.63 (0.21) 8.2 15.4 0.22 (0.14)
Concentrate DMI kg day-1 23.1 7.3 0.91 (0.24) 4.0 10.0 0.14 (0.18)
Milk yield kg day-1 23.7 10.0 0.85 (0.23) 16.4 10.4 0.71 (0.15)
Live weight kg day-1 9.8 1.1 0.99 (0.24) 9.3 3.6 0.87 (0.15)
Daily CH4 production1
Peak CH4 height g day-1 16.1 9.1 0.76 (0.22) – – –
Peak CH4 amplitude g day-1 17.6 8.6 0.81 (0.22) – – –
Average CH4 concentration
g day-1 16.4 18.0 0.45 (0.19) 7.8 11.7 0.31 (0.15)
CH4 yield1
Peak CH4 height g kg-1 DMI 16.9 8.2 0.81 (0.22) – – –
Peak CH4 amplitude g kg-1 DMI 17.7 8.8 0.80 (0.22) – – –
Average CH4 concentration
g kg-1 DMI 16.5 14.6 0.56 (0.20) 1.8 11.4 0.03 (0.12)
1 Spot sampling metrics for daily emissions and CH4 yield were estimated from emission rate.
Bell et al. (2019) · L A N D B A U F O R S C H · J Sustainable Organic Agric Syst · 69(1):47–5656
Blaxter KL, Clapperton JL (1965) Prediction of the amount of methane pro-duced by ruminants. Br J Nutr 19(4):511–522, doi:10.1079/bjn19650046
Breider IS, Wall, E, Garnsworthy PC (2019) Heritability of methane produc-tion and genetic correlations with milk yield and body weight in Hol-stein-Friesian dairy cows. J Dairy Sci 102(8):7277–7281, doi:10.3168/jds.2018-15909
Cottle DJ, Velazco J, Hegarty RS, Mayer DG (2015) Estimating daily methane production in individual cattle with irregular feed intake patterns from short-term methane emission measurements. Animal 9(Suppl 12):1949–1957, doi:10.1017/S1751731115001676
de Haas Y, Windig JJ, Calus MPL, Dijkstra J, de Haan M, Bannink A, Veer-kamp RF (2011) Genetic parameters for predicted methane production and the potential for reducing enteric emissions through genomic selection. J Dairy Sci 94(12):6122–6134, doi:10.3168/jds.2011-4439
Ellis JL, Kebreab E, Odongo NE, McBride BW, Okine EK, France J (2007) Prediction of methane production from dairy and beef cattle. J Dairy Sci 90(7):3456–3467, doi:10.3168/jds.2006-675
Garnsworthy PC, Craigon J, Hernandez-Medrano JH, Saunders N (2012) On-farm methane measurements during milking correlate with total methane production by individual dairy cows. J Dairy Sci 95(6):3166–3180, doi:10.3168/jds.2011-4605
Gerber PJ, Steinfeld H, Henderson B, Mottet A, Opio C, Dijkman J, Falcucci A, Tempio G (2013) Tackling climate change through livestock – A global assessment of emissions and mitigation opportunities; Rome: Food and Agriculture Organization of the United Nations (FAO), 115 p
Grainger C, Clarke T, McGinn SM, Auldist MJ, Beauchemin KA, Hannah MC, Waghorn GC, Clark H, Eckard RJ (2007). Methane emissions from dairy cows measured using the sulfur hexafluoride (SF6) tracer and chamber techniques. J Dairy Sci 90(6):2755–2766, doi:10.3168/jds.2006-697
Hammond KJ, Crompton LA, Bannink A, Dijkstra J, Yáñez-Ruiz DR, O’Kiely P, Kebreab E, Eugenè MA, Yu Z, Shingfield KJ, Schwarm A, Hristov AN, Reynolds CK (2016) Review of current in vivo measurement techniques for quantifying enteric methane emission from ruminants. Anim Feed Sci Technol 219:13–30, doi:10.1016/j.anifeedsci.2016.05.018
Huhtanen P, Krizsan SJ, Hetta M, Gidlund H, Cabezas Garcia EH (2013) Repeat ability and between cow variability of enteric CH4 and total CO2 emissions. Proceedings of the 5th Greenhouse Gases and Animal Agriculture conference (GGAA 2013), Dublin, Ireland, 23–27 June 2013, Adv Anim Biosci 4(2):588, doi:10.1017/S2040470013000125
Huhtanen P, Cabezas-Garcia EH, Utsumi S, Zimmerman S (2015) Comparison of methods to determine methane emissions from dairy cows in farm conditions. J Dairy Sci 98(5):3394–3409, doi:10.3168/jds.2014-9118
Lassen J, Løvendahl P (2016) Heritability estimates for enteric methane emissions from Holstein cattle measured using noninvasive methods. J Dairy Sci 99(3):1959-1967, doi:10.3168/jds.2015-10012
Lawes Agricultural Trust (2018) Genstat 19, Version 19.1 Reference Manual. London: Clarendon Press, UK
Lin LI (1989) A concordance correlation coefficient to evaluate reproducibi-lity. Biometrics 45(1):255–268, doi:10.2307/2532051
Mills JAN, Kebreab E, Yates CM, Crompton LA, Cammell SB, Dhanoa MS, Agnew RE, France J (2003) Alternative approaches to predicting methane emissions from dairy cows. J Anim Sci 81(12):3141–3150, doi:10.2527/2003.81123141x
Moate PJ, Williams SRO, Grainger C, Hannah MC, Ponnampalam EN, Eckard R (2011) Influence of cold-pressed canola, brewers grains and hominy meal as dietary supplements suitable for reducing enteric methane emissions from lactating dairy cows. Anim Feed Sci Technol 166–167:254–264, doi:10.1016/j.anifeedsci.2011.04.069
Negussie E, Lehtinen J, Mäntysaari P, Bayat AR, Liinamo AE, Mäntysaari EA, Lidauer MH (2017) Non-invasive individual methane measurement in dairy cows. Animal 11(5):890–899, doi:10.1017/S1751731116002718
Niu M, Kebreab E, Hristov AN, Oh J, Arndt C, Bannik A, Bayat AR, Brito AF, Bo-land T, Casper D et. al. (2018) Prediction of enteric methane production, yield, and intensity in dairy cattle using an intercontinental database. Global Change Biol 24(8):3368–3389, doi:10.1111/gcb.14094
Williams SRO, Clarke T, Hannah M, Marett LC, Moate PJ, Auldist MJ, Wales WJ (2013) Energy partitioning in herbage-fed dairy cows offered supple-mentary grain during an extended lactation. J Dairy Sci 96(1):484–494, doi:10.3168/jds.2012-5787
Yan T, Mayne CS, Gordon FG, Porter MG, Agnew RE, Patterson DC, Ferris CP, Kilpatrick DJ (2010) Mitigation of enteric methane emissions through improving efficiency of energy utilization and productivity in lactating dairy cows. J Dairy Sci 93(6):2630–2638, doi:10.3168/jds.2009-2929
Dämmgen et al. (2019) · L A N D B A U F O R S C H · J Sustainable Organic Agric Syst · 69(1):57–74DOI:10.3220/LBF1587135088000
57
R E S E A R C H A R T I C L E
Pork production in Thuringia – management effects on ammonia and greenhouse gas emissions. 2. Reduction potentials and projectionsUlrich Dämmgen1, Wilfried Brade 2, Hans-Dieter Haenel 1, Claus Rösemann1, Heinrich Kleine Klausing 3, J. Webb 4, and Andreas Berk 5
Abstract
Measures to reduce emissions from pork production have been evaluated for fattening pigs in Thuringia, where fat-tening dominates emissions. Next, an expert team provided data sets for emission scenarios for the entire pork produc-tion chain (including breeding, piglet production, fattening as well as feed production, fertiliser use and production, provision of water and energy) in 2020 and 2025. Moderate increases in performance and reduction of ani-mal losses had almost no effect. Substantial emission reduc-tions were found for feeds with reduced protein contents, filtering exhaust air from buildings through scrubbers and reduced emission slurry application procedures. Manure systems using solid farmyard manure emit greater quanti-ties than slurry based systems.
A combination of the measures anticipated for 2025 in a comprehensive (fictive) reference enterprise could result in a NH3 emission reduction by about one fifth as compared to 2015. A minor reduction of greenhouse gas emissions is a welcome side effect.
1 Introduction
Compared with other German regions, pork production in Thuringia (Thüringen) is characterised by a low livestock density (expressed as pigs per unit of productive land). Major changes occurred due to the restructuring of agricultural production after the German unification. Currently about 750.000 animal places with about 320.000 fattening places can be regarded as standard (StatBA, 2017).
During the past two decades, numerous new livestock buildings have been erected that comply with the regulations on best available techniques, including measures to reduce environmental pollution. Thuringian production units are larger than the German mean (StatBA, 2017) which contributes to the competitiveness of its respective enterprises. Hence, pork production will have a promising future within Thurin-gian agricultural production.
However, pork production will have to adapt to restrictions imposed by German and European legislation on atmos pheric emissions and ground water pollution, such as EU (2016) or the Thuringian enactment on air scrubbers (TMfUEN, 2016). At present, German administrations are reluctant to enforce these regulations. For agriculture, the overall nitrogen
Received: September 1, 2018Revised: December 1, 2018Accepted: December 7, 2018
K E Y W O R D S pork production, ammonia, greenhouse gases, area under cultivation, fertilising, energy, water
H I G H L I G H T S
• Analysis of the mass flows within the entire pork production chain reveals several minor emission reduction potentials for ammonia
• Diets with reduced protein content improve health and reduce ammonia emissions significantly without additional costs
1 Johann Heinrich von Thünen Institute, Institute for Climate-Smart Agriculture, Germany2 Norddeutsches Tierzucht-Beratungsbüro, Germany3 Gesellschaft für Tierernährung mbH, Germany4 University of Wolverhampton, Faculty of Science and Engineering, United Kingdom5 Friedrich Loeffler Institute, Institute of Animal Nutrition, Federal Research Institute for Animal Health, Germany
C O N TA C T [email protected]
Dämmgen et al. (2019) · L A N D B A U F O R S C H · J Sustainable Organic Agric Syst · 69(1):57–7458
problem (eutrophication and acidification of ecosystems, nitrate pollution of drinking water sources) will remain of immense importance. If a reduction of livestock numbers is to be avoided, these ambitious emission reduction goals can only be achieved by introduction of greatly advanced techniques not only in livestock husbandry itself, but also in feed production and the provision of water and energy.
Pork production is a complicated multi-stage process. Earlier investigations showed that the entire production chain has to be analysed in order to identify and assess reduction potentials (e.g. Dämmgen et al., 2016). The pre-ceding paper (Dämmgen et al., 2018a) elucidated that in pork production ammonia (NH3) from livestock buildings and from feed production has to be addressed with priority. In comparison, emission reductions of greenhouse gases (GHG) from pork production are minor. However, their reduction is a welcome side effect.
This paper reports a detailed systematic analysis of those factors that are related to herd management, with a clear emphasis on fattening. Productive lifetime and fertil-ity of sows were the subject of a separate paper (Dämmgen et al., 2018b). Estimates of future emissions related to pork were estimated using information provided by a Thuringian expert team. 6
2 Methods
Investigations make use of a fictive ‘reference enterprise’ which comprises the fattening of pigs, raising of piglets and weaners, basic production (boars) and pure breeding (altogeth er named ‘the herd’) as well as production of feed and fertilisers and the provision of water and energy.
2.1 The herd1,000 pigs (30 to 122 kg pig -1) are fattened at a time (all in all out). Piglet production supplies the right number of piglets at the right time with the necessary number of sows (as a function of the number of piglets weaned per sow). Basic production and pure breeding are taken into account to provide the sows and breeding boars.
As a whole, the example of a comprehensive pork pro-duction enterprise reflects the mean Thuringian situation. For details see section 4.2 and Dämmgen et al. (2018b).
2.2 Emission modellingThe quantification of emissions relies on mass flow model-ling. Internationally accepted methods (EMEP, 2016; IPCC, 2006) are used to generate comparable results. In addition, national approaches deal with the determination of livestock excretion rates as a function of livestock performance and feed properties. For German pork production these can be found in Haenel et al. (2011) and Dämmgen et al. (2011, 2012, 2017). The work at hand makes use of many data describing
6 Thuringian State Institute for Agriculture (TLL), Germany: Thomas Bauer, Simone Müller, Jürgen Müller, Gerd Reinhold, Hubert Schröter, Wilfried Zorn. Thuringian Ministry for Infrastructure and Agriculture: Michael Mußlick. Qnetics GmbH: Brigitte Neues
non-agricultural processes. Data and methods were described in Dämmgen et al. (2016). The Thuringian data set used was described in detail in the first paper of this series (Dämmgen et al., 2018a).
3 Identifying and assessing reduction potentials – a systematic analysis
The rearing of fattening pigs (fattening hybrids) dominates both NH3 and GHG emissions in Thuringia (Dämmgen et al., 2018b). Hence, the following detailed examination of reduc-tion potentials is restricted to fattening, including the related direct emissions from feed and fertiliser production as well as indirect emissions resulting from the deposition of reactive N species emitted during this part of the entire production chain. It should be kept in mind that any reduction in NH3 emissions results in reduced requirements for N fertilisers, and thus at the same time in less emissions from fertiliser production and application.
Reduction potentials are discussed for each single aspect of the production process. They are then compared with the respective projections made by the Thuringian expert team for 2020 and 2025. Drawings contain the absolute emissions for the entire herd of fattening pigs (fp-herd) and the emis-sions per unit of carcass produced.
3.1 Assumptions for a baselineAssumptions are similar to the state of pork production in Thuringia in 2015 using statistically available data for animal performance and losses, as well as information provided by the expert panel. However, figures are rounded, and numbers of options are reduced (e.g. for feed, housing, spreading and incorporation).
Animal performance: • daily weight gain 845 g pig-1 d-1, start weight 30 kg pig-1,
final weight 122 kg pig-1, carcass dressing percentage 79 %Animal losses: • 4 % of fattening pigs housed initially
Feed: • standard feed only
Housing: • fully slatted floor only, no exhaust air scrubbers
Storage: • conventional round tank without cover or natural crust,
no fermentation for biogasSlurry spreading and incorporation: • trailing hose only; 50 % to bare soil, incorporation within
4 h, rest to short vegetationN lost to surface and ground waters: • 5 % of the amount actually available
3.2 Structure of figuresFigures 1 to 10 show the effect of systematic changes of input parameters, such as weight gain, on the left hand side, and the emissions resulting from the mix of parameters for 2015, 2020 and 2025 on the right hand side. The situation for 2015 is not the baseline.
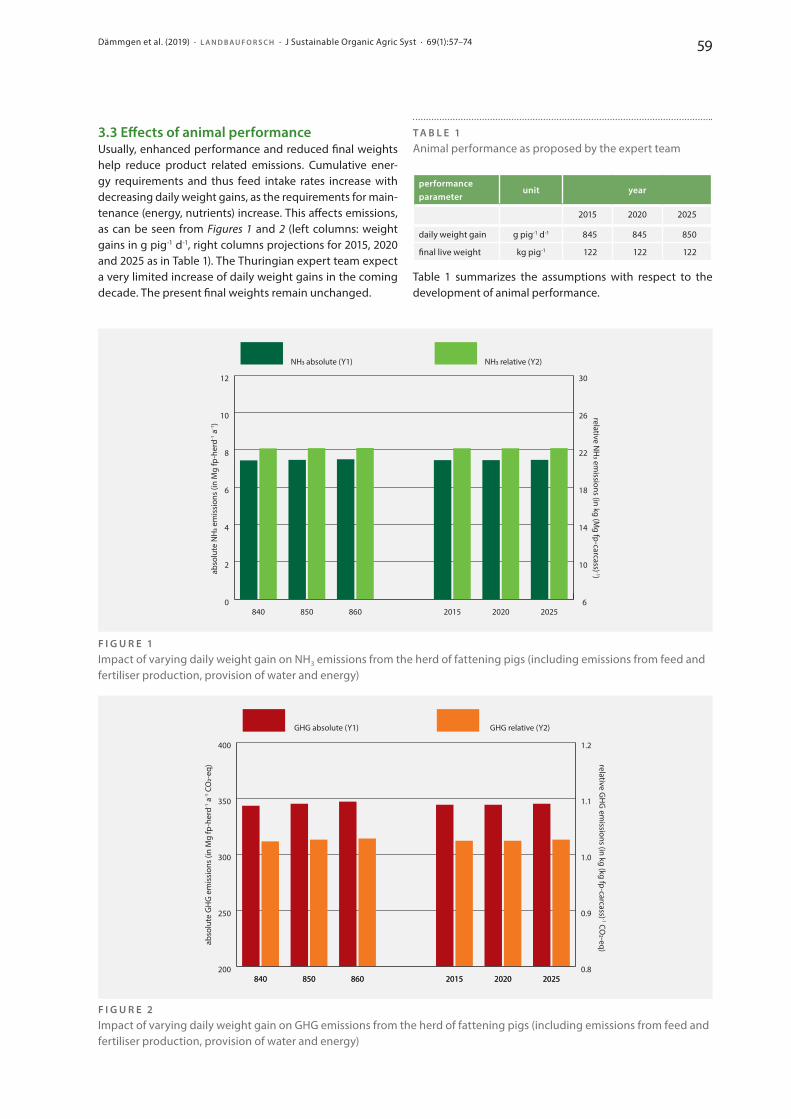
Dämmgen et al. (2019) · L A N D B A U F O R S C H · J Sustainable Organic Agric Syst · 69(1):57–74 59
3.3 Effects of animal performanceUsually, enhanced performance and reduced final weights help reduce product related emissions. Cumulative ener-gy requirements and thus feed intake rates increase with decreasing daily weight gains, as the requirements for main-tenance (energy, nutrients) increase. This affects emissions, as can be seen from Figures 1 and 2 (left columns: weight gains in g pig-1 d-1, right columns projections for 2015, 2020 and 2025 as in Table 1). The Thuringian expert team expect a very limited increase of daily weight gains in the coming decade. The present final weights remain unchanged.
T A B L E 1Animal performance as proposed by the expert team
performance parameter
unit year
2015 2020 2025
daily weight gain g pig-1 d-1 845 845 850
final live weight kg pig-1 122 122 122
Table 1 summarizes the assumptions with respect to the development of animal performance.
0
2
4
6
8
10
12
NH3 relative (Y2)NH3 absolute (Y1)
202520202015860850840
abso
lute
NH
3 em
issi
ons
(in M
g fp
-her
d-1 a
-1)
relative NH
3 emissions (in kg (M
g fp-carcass) -1)
6
10
14
18
22
26
30
F I G U R E 1Impact of varying daily weight gain on NH3 emissions from the herd of fattening pigs (including emissions from feed and fertiliser production, provision of water and energy)
200
250
300
350
400
GHG relative (Y2)GHG absolute (Y1)
202520202015860850840
abso
lute
GH
G e
mis
sion
s (in
Mg
fp-h
erd-1
a-1
CO
2-eq
) relative GH
G em
issions (in kg (kg fp-carcass) -1 CO2-eq)
0.8
0.9
1.0
1.1
1.2
202520202015860850840
F I G U R E 2Impact of varying daily weight gain on GHG emissions from the herd of fattening pigs (including emissions from feed and fertiliser production, provision of water and energy)
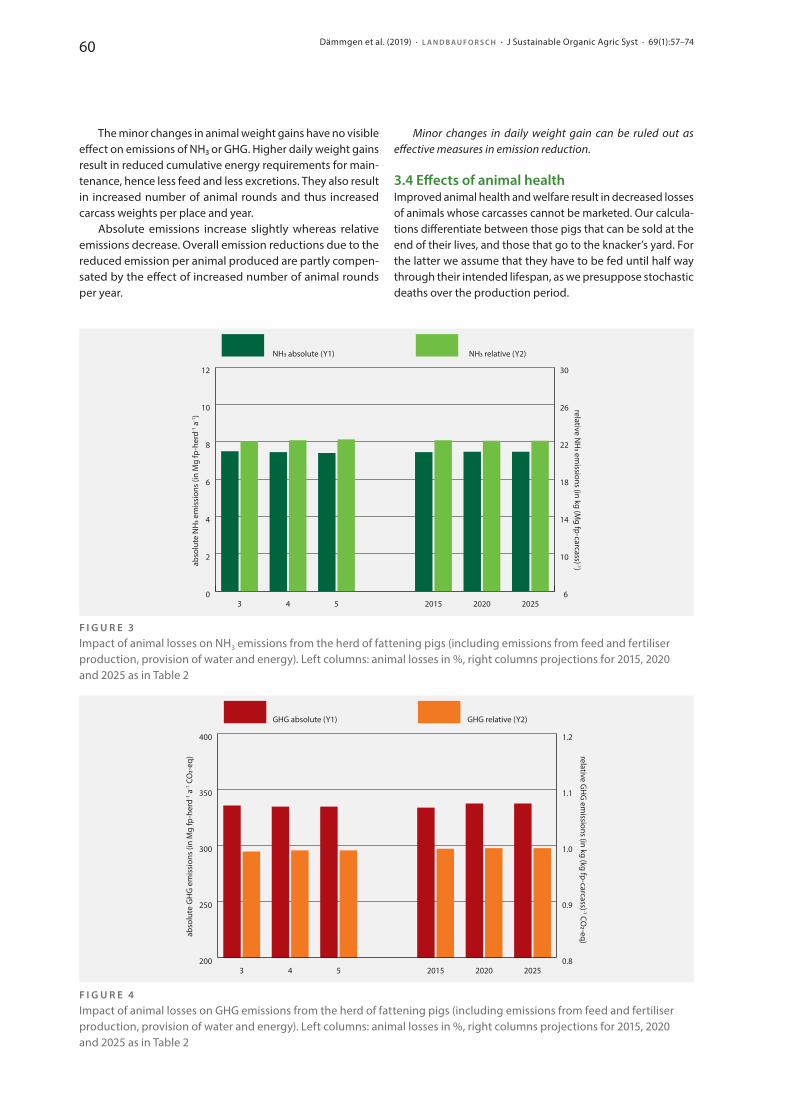
Dämmgen et al. (2019) · L A N D B A U F O R S C H · J Sustainable Organic Agric Syst · 69(1):57–7460
The minor changes in animal weight gains have no visible effect on emissions of NH3 or GHG. Higher daily weight gains result in reduced cumulative energy requirements for main-tenance, hence less feed and less excretions. They also result in increased number of animal rounds and thus increased carcass weights per place and year.
Absolute emissions increase slightly whereas relative emissions decrease. Overall emission reductions due to the reduced emission per animal produced are partly compen-sated by the effect of increased number of animal rounds per year.
Minor changes in daily weight gain can be ruled out as effective measures in emission reduction.
3.4 Effects of animal healthImproved animal health and welfare result in decreased losses of animals whose carcasses cannot be marketed. Our calcula-tions differentiate between those pigs that can be sold at the end of their lives, and those that go to the knacker’s yard. For the latter we assume that they have to be fed until half way through their intended lifespan, as we presuppose stochastic deaths over the production period.
0
2
4
6
8
10
12
NH3 relative (Y2)NH3 absolute (Y1)
202520202015543
abso
lute
NH
3 em
issi
ons
(in M
g fp
-her
d-1 a
-1)
relative NH
3 emissions (in kg (M
g fp-carcass) -1)
6
10
14
18
22
26
30
F I G U R E 3Impact of animal losses on NH3 emissions from the herd of fattening pigs (including emissions from feed and fertiliser production, provision of water and energy). Left columns: animal losses in %, right columns projections for 2015, 2020 and 2025 as in Table 2
200
250
300
350
400
GHG relative (Y2)GHG absolute (Y1)
202520202015543
abso
lute
GH
G e
mis
sion
s (in
Mg
fp-h
erd-1
a-1
CO
2-eq
) relative GH
G em
issions (in kg (kg fp-carcass) -1 CO2-eq)
0.8
0.9
1.0
1.1
1.2
F I G U R E 4Impact of animal losses on GHG emissions from the herd of fattening pigs (including emissions from feed and fertiliser production, provision of water and energy). Left columns: animal losses in %, right columns projections for 2015, 2020 and 2025 as in Table 2
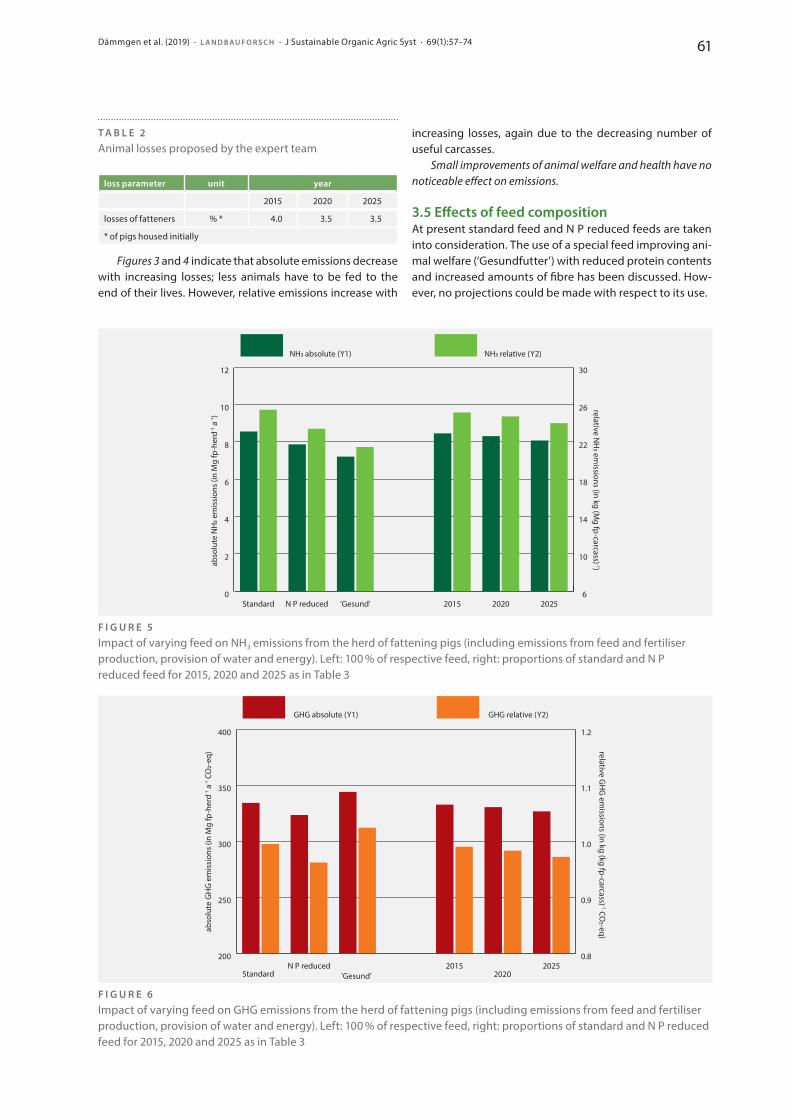
Dämmgen et al. (2019) · L A N D B A U F O R S C H · J Sustainable Organic Agric Syst · 69(1):57–74 61
T A B L E 2Animal losses proposed by the expert team
loss parameter unit year
2015 2020 2025
losses of fatteners % * 4.0 3.5 3.5
* of pigs housed initially
Figures 3 and 4 indicate that absolute emissions decrease with increasing losses; less animals have to be fed to the end of their lives. However, relative emissions increase with
increasing losses, again due to the decreasing number of useful carcasses.
Small improvements of animal welfare and health have no noticeable effect on emissions.
3.5 Effects of feed compositionAt present standard feed and N P reduced feeds are taken into consideration. The use of a special feed improving ani-mal welfare (‘Gesundfutter’) with reduced protein contents and increased amounts of fibre has been discussed. How-ever, no projections could be made with respect to its use.
0
2
4
6
8
10
12
NH3 relative (Y2)NH3 absolute (Y1)
202520202015'Gesund'N P reducedStandard
abso
lute
NH
3 em
issi
ons
(in M
g fp
-her
d-1 a
-1)
relative NH
3 emissions (in kg (M
g fp-carcass) -1)
6
10
14
18
22
26
30
F I G U R E 5Impact of varying feed on NH3 emissions from the herd of fattening pigs (including emissions from feed and fertiliser production, provision of water and energy). Left: 100 % of respective feed, right: proportions of standard and N P reduced feed for 2015, 2020 and 2025 as in Table 3
200
250
300
350
400
GHG relative (Y2)GHG absolute (Y1)
20252020
2015'Gesund'
N P reducedStandard
abso
lute
GH
G e
mis
sion
s (in
Mg
fp-h
erd-1
a-1
CO
2-eq
) relative GH
G em
issions (in kg (kg fp-carcass) -1 CO2-eq)
0.8
0.9
1.0
1.1
1.2
F I G U R E 6Impact of varying feed on GHG emissions from the herd of fattening pigs (including emissions from feed and fertiliser production, provision of water and energy). Left: 100 % of respective feed, right: proportions of standard and N P reduced feed for 2015, 2020 and 2025 as in Table 3
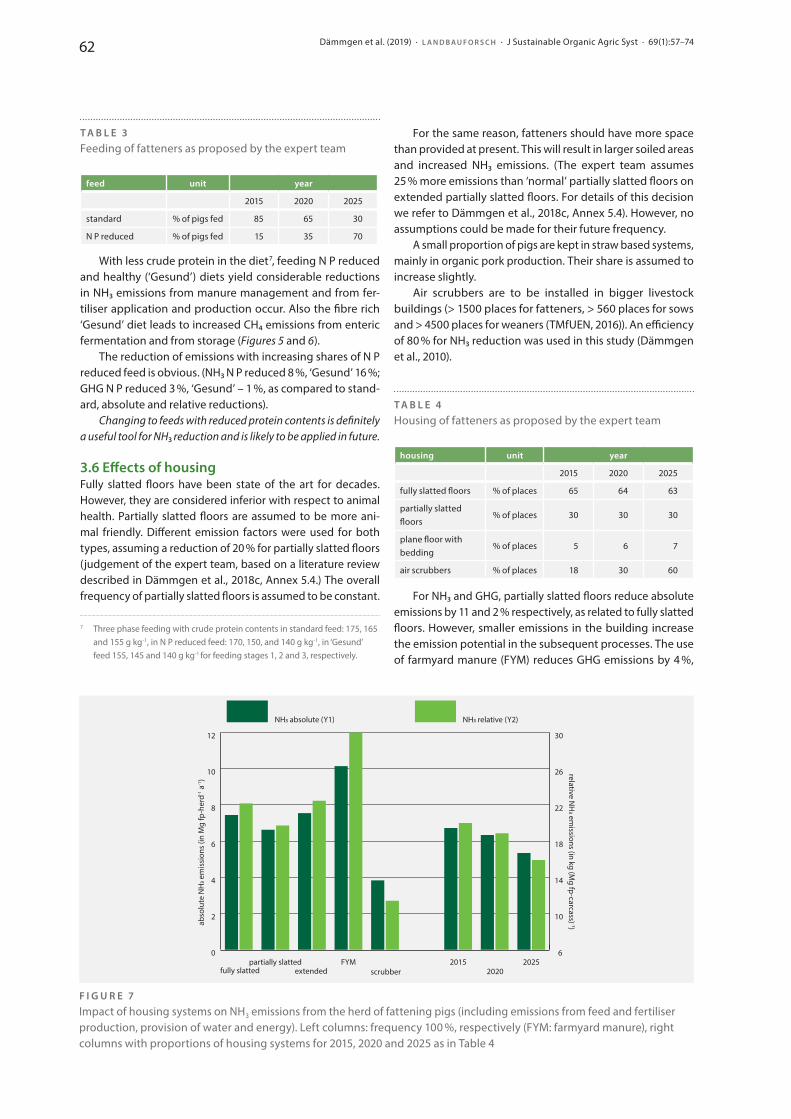
Dämmgen et al. (2019) · L A N D B A U F O R S C H · J Sustainable Organic Agric Syst · 69(1):57–7462
T A B L E 3Feeding of fatteners as proposed by the expert team
feed unit year
2015 2020 2025
standard % of pigs fed 85 65 30
N P reduced % of pigs fed 15 35 70
With less crude protein in the diet 7, feeding N P reduced and healthy (‘Gesund’) diets yield considerable reductions in NH3 emissions from manure management and from fer-tiliser application and production occur. Also the fibre rich ‘Gesund’ diet leads to increased CH4 emissions from enteric fermentation and from storage (Figures 5 and 6).
The reduction of emissions with increasing shares of N P reduced feed is obvious. (NH3 N P reduced 8 %, ‘Gesund’ 16 %; GHG N P reduced 3 %, ‘Gesund’ – 1 %, as compared to stand-ard, absolute and relative reductions).
Changing to feeds with reduced protein contents is definitely a useful tool for NH3 reduction and is likely to be applied in future.
3.6 Effects of housingFully slatted floors have been state of the art for decades. However, they are considered inferior with respect to animal health. Partially slatted floors are assumed to be more ani-mal friendly. Different emission factors were used for both types, assuming a reduction of 20 % for partially slatted floors (judgement of the expert team, based on a literature review described in Dämmgen et al., 2018c, Annex 5.4.) The overall frequency of partially slatted floors is assumed to be constant.
7 Three phase feeding with crude protein contents in standard feed: 175, 165 and 155 g kg -1, in N P reduced feed: 170, 150, and 140 g kg -1, in ‘Gesund’ feed 155, 145 and 140 g kg-1 for feeding stages 1, 2 and 3, respectively.
For the same reason, fatteners should have more space than provided at present. This will result in larger soiled areas and increased NH3 emissions. (The expert team assumes 25 % more emissions than ‘normal’ partially slatted floors on extended partially slatted floors. For details of this decision we refer to Dämmgen et al., 2018c, Annex 5.4). However, no assumptions could be made for their future frequency.
A small proportion of pigs are kept in straw based systems, mainly in organic pork production. Their share is assumed to increase slightly.
Air scrubbers are to be installed in bigger livestock buildings (> 1500 places for fatteners, > 560 places for sows and > 4500 places for weaners (TMfUEN, 2016)). An efficiency of 80 % for NH3 reduction was used in this study (Dämmgen et al., 2010).
T A B L E 4Housing of fatteners as proposed by the expert team
housing unit year
2015 2020 2025
fully slatted floors % of places 65 64 63
partially slatted floors
% of places 30 30 30
plane floor with bedding
% of places 5 6 7
air scrubbers % of places 18 30 60
For NH3 and GHG, partially slatted floors reduce absolute emissions by 11 and 2 % respectively, as related to fully slatted floors. However, smaller emissions in the building increase the emission potential in the subsequent processes. The use of farmyard manure (FYM) reduces GHG emissions by 4 %,
0
2
4
6
8
10
12
NH3 relative (Y2)NH3 absolute (Y1)
20252020
2015scrubber
FYMextended
partially slattedfully slatted
abso
lute
NH
3 em
issi
ons
(in M
g fp
-her
d-1 a
-1)
relative NH
3 emissions (in kg (M
g fp-carcass) -1)
6
10
14
18
22
26
30
F I G U R E 7Impact of housing systems on NH3 emissions from the herd of fattening pigs (including emissions from feed and fertiliser production, provision of water and energy). Left columns: frequency 100 %, respectively (FYM: farmyard manure), right columns with proportions of housing systems for 2015, 2020 and 2025 as in Table 4
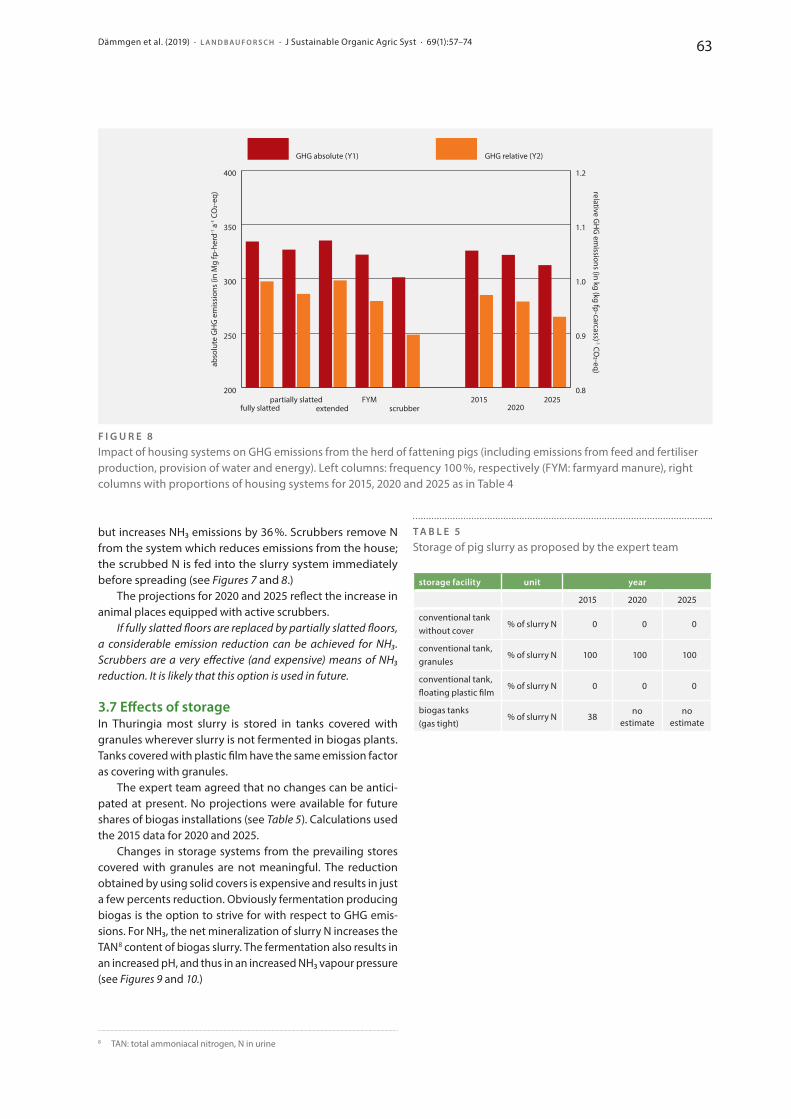
Dämmgen et al. (2019) · L A N D B A U F O R S C H · J Sustainable Organic Agric Syst · 69(1):57–74 63
but increases NH3 emissions by 36 %. Scrubbers remove N from the system which reduces emissions from the house; the scrubbed N is fed into the slurry system immediately before spreading (see Figures 7 and 8.)
The projections for 2020 and 2025 reflect the increase in animal places equipped with active scrubbers.
If fully slatted floors are replaced by partially slatted floors, a considerable emission reduction can be achieved for NH3. Scrubbers are a very effective (and expensive) means of NH3 reduction. It is likely that this option is used in future.
3.7 Effects of storageIn Thuringia most slurry is stored in tanks covered with granules wherever slurry is not fermented in biogas plants. Tanks covered with plastic film have the same emission factor as covering with granules.
The expert team agreed that no changes can be antici-pated at present. No projections were available for future shares of biogas installations (see Table 5). Calculations used the 2015 data for 2020 and 2025.
Changes in storage systems from the prevailing stores covered with granules are not meaningful. The reduction obtained by using solid covers is expensive and results in just a few percents reduction. Obviously fermentation producing biogas is the option to strive for with respect to GHG emis-sions. For NH3, the net mineralization of slurry N increases the TAN 8 content of biogas slurry. The fermentation also results in an increased pH, and thus in an increased NH3 vapour pressure (see Figures 9 and 10.)
8 TAN: total ammoniacal nitrogen, N in urine
T A B L E 5Storage of pig slurry as proposed by the expert team
storage facility unit year
2015 2020 2025
conventional tank without cover
% of slurry N 0 0 0
conventional tank, granules
% of slurry N 100 100 100
conventional tank, floating plastic film
% of slurry N 0 0 0
biogas tanks (gas tight)
% of slurry N 38no
estimateno
estimate
200
250
300
350
400
GHG relative (Y2)GHG absolute (Y1)
20252020
2015scrubber
FYMextended
partially slattedfully slatted
abso
lute
GH
G e
mis
sion
s (in
Mg
fp-h
erd-1
a-1
CO
2-eq
) relative GH
G em
issions (in kg (kg fp-carcass) -1 CO2-eq)
0.8
0.9
1.0
1.1
1.2
F I G U R E 8Impact of housing systems on GHG emissions from the herd of fattening pigs (including emissions from feed and fertiliser production, provision of water and energy). Left columns: frequency 100 %, respectively (FYM: farmyard manure), right columns with proportions of housing systems for 2015, 2020 and 2025 as in Table 4
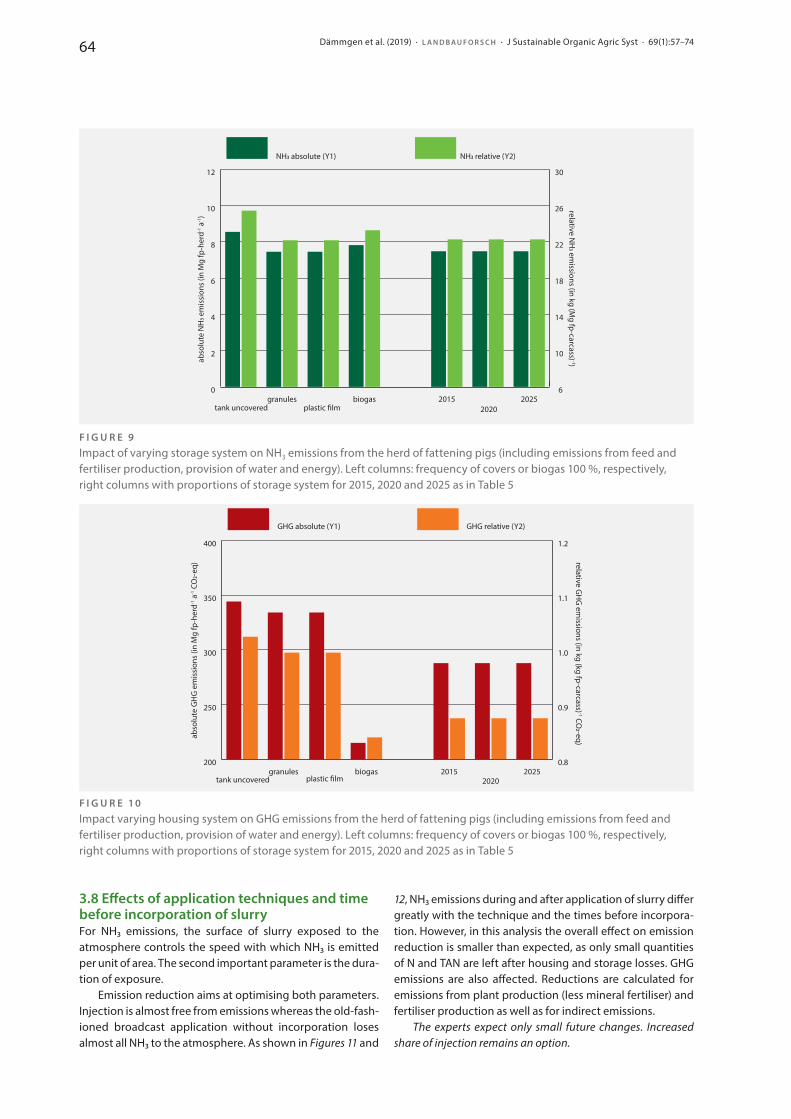
Dämmgen et al. (2019) · L A N D B A U F O R S C H · J Sustainable Organic Agric Syst · 69(1):57–7464
3.8 Effects of application techniques and time before incorporation of slurryFor NH3 emissions, the surface of slurry exposed to the atmosphere controls the speed with which NH3 is emitted per unit of area. The second important parameter is the dura-tion of exposure.
Emission reduction aims at optimising both parameters. Injection is almost free from emissions whereas the old-fash-ioned broadcast application without incorpo ration loses almost all NH3 to the atmosphere. As shown in Figures 11 and
12, NH3 emissions during and after application of slurry differ greatly with the technique and the times before incorpora-tion. However, in this analysis the overall effect on emission reduction is smaller than expected, as only small quantities of N and TAN are left after housing and storage losses. GHG emissions are also affected. Reductions are calculated for emissions from plant production (less mineral fertiliser) and fertiliser production as well as for indirect emissions.
The experts expect only small future changes. Increased share of injection remains an option.
0
2
4
6
8
10
12
NH3 relative (Y2)NH3 absolute (Y1)
20252020
2015biogasplastic �lm
granulestank uncovered
abso
lute
NH
3 em
issi
ons
(in M
g fp
-her
d-1 a
-1)
relative NH
3 emissions (in kg (M
g fp-carcass) -1)
6
10
14
18
22
26
30
F I G U R E 9Impact of varying storage system on NH3 emissions from the herd of fattening pigs (including emissions from feed and fertiliser production, provision of water and energy). Left columns: frequency of covers or biogas 100 %, respectively, right columns with proportions of storage system for 2015, 2020 and 2025 as in Table 5
200
250
300
350
400
GHG relative (Y2)GHG absolute (Y1)
20252020
2015biogasplastic �lm
granulestank uncovered
abso
lute
GH
G e
mis
sion
s (in
Mg
fp-h
erd-1
a-1
CO
2-eq
) relative GH
G em
issions (in kg (kg fp-carcass) -1 CO2-eq)
0.8
0.9
1.0
1.1
1.2
F I G U R E 1 0Impact varying housing system on GHG emissions from the herd of fattening pigs (including emissions from feed and fertiliser production, provision of water and energy). Left columns: frequency of covers or biogas 100 %, respectively, right columns with proportions of storage system for 2015, 2020 and 2025 as in Table 5
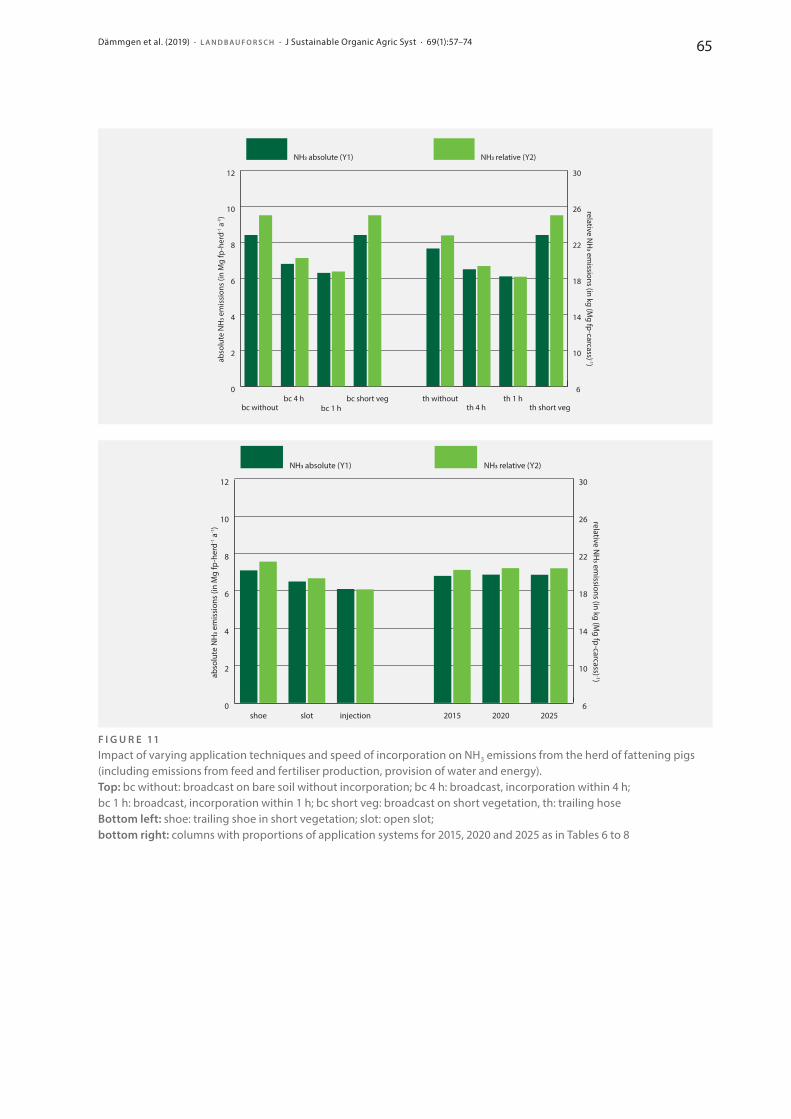
Dämmgen et al. (2019) · L A N D B A U F O R S C H · J Sustainable Organic Agric Syst · 69(1):57–74 65
0
2
4
6
8
10
12
NH3 relative (Y2)NH3 absolute (Y1)
th short vegth 1 h
th 4 h th withoutbc short veg
bc 1 hbc 4 h
bc without
abso
lute
NH
3 em
issi
ons
(in M
g fp
-her
d-1 a
-1)
relative NH
3 emissions (in kg (M
g fp-carcass) -1)
6
10
14
18
22
26
30
0
2
4
6
8
10
12
NH3 relative (Y2)NH3 absolute (Y1)
202520202015injectionslotshoe
abso
lute
NH
3 em
issi
ons
(in M
g fp
-her
d-1 a
-1)
relative NH
3 emissions (in kg (M
g fp-carcass) -1)
6
10
14
18
22
26
30
F I G U R E 11Impact of varying application techniques and speed of incorporation on NH3 emissions from the herd of fattening pigs (including emissions from feed and fertiliser production, provision of water and energy). Top: bc without: broadcast on bare soil without incorporation; bc 4 h: broadcast, incorporation within 4 h; bc 1 h: broadcast, incorporation within 1 h; bc short veg: broadcast on short vegetation, th: trailing hoseBottom left: shoe: trailing shoe in short vegetation; slot: open slot; bottom right: columns with proportions of application systems for 2015, 2020 and 2025 as in Tables 6 to 8
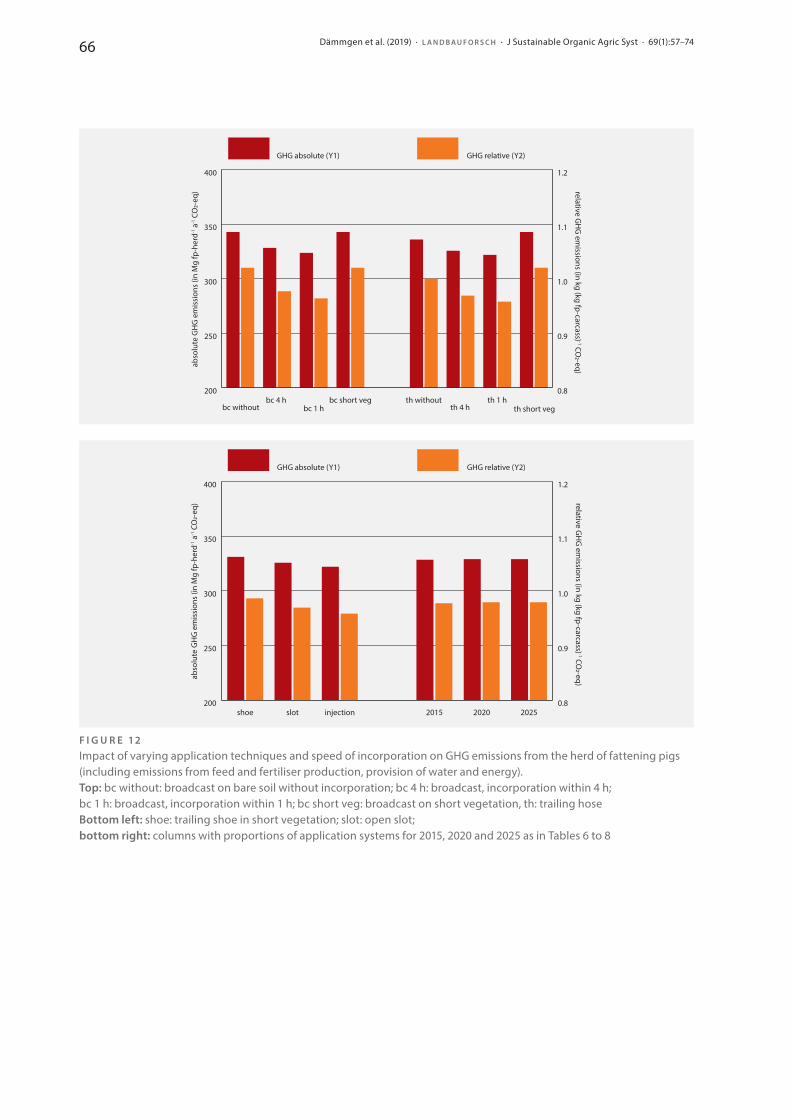
Dämmgen et al. (2019) · L A N D B A U F O R S C H · J Sustainable Organic Agric Syst · 69(1):57–7466
200
250
300
350
400
GHG relative (Y2)GHG absolute (Y1)
th short vegth 1 h
th 4 h th withoutbc short veg
bc 1 hbc 4 h
bc without
abso
lute
GH
G e
mis
sion
s (in
Mg
fp-h
erd-1
a-1
CO
2-eq
) relative GH
G em
issions (in kg (kg fp-carcass) -1 CO2-eq)
0.8
0.9
1.0
1.1
1.2
200
250
300
350
400
GHG relative (Y2)GHG absolute (Y1)
202520202015injectionslotshoe
abso
lute
GH
G e
mis
sion
s (in
Mg
fp-h
erd-1
a-1
CO
2-eq
) relative GH
G em
issions (in kg (kg fp-carcass) -1 CO2-eq)
0.8
0.9
1.0
1.1
1.2
F I G U R E 12Impact of varying application techniques and speed of incorporation on GHG emissions from the herd of fattening pigs (including emissions from feed and fertiliser production, provision of water and energy). Top: bc without: broadcast on bare soil without incorporation; bc 4 h: broadcast, incorporation within 4 h; bc 1 h: broadcast, incorporation within 1 h; bc short veg: broadcast on short vegetation, th: trailing hoseBottom left: shoe: trailing shoe in short vegetation; slot: open slot; bottom right: columns with proportions of application systems for 2015, 2020 and 2025 as in Tables 6 to 8
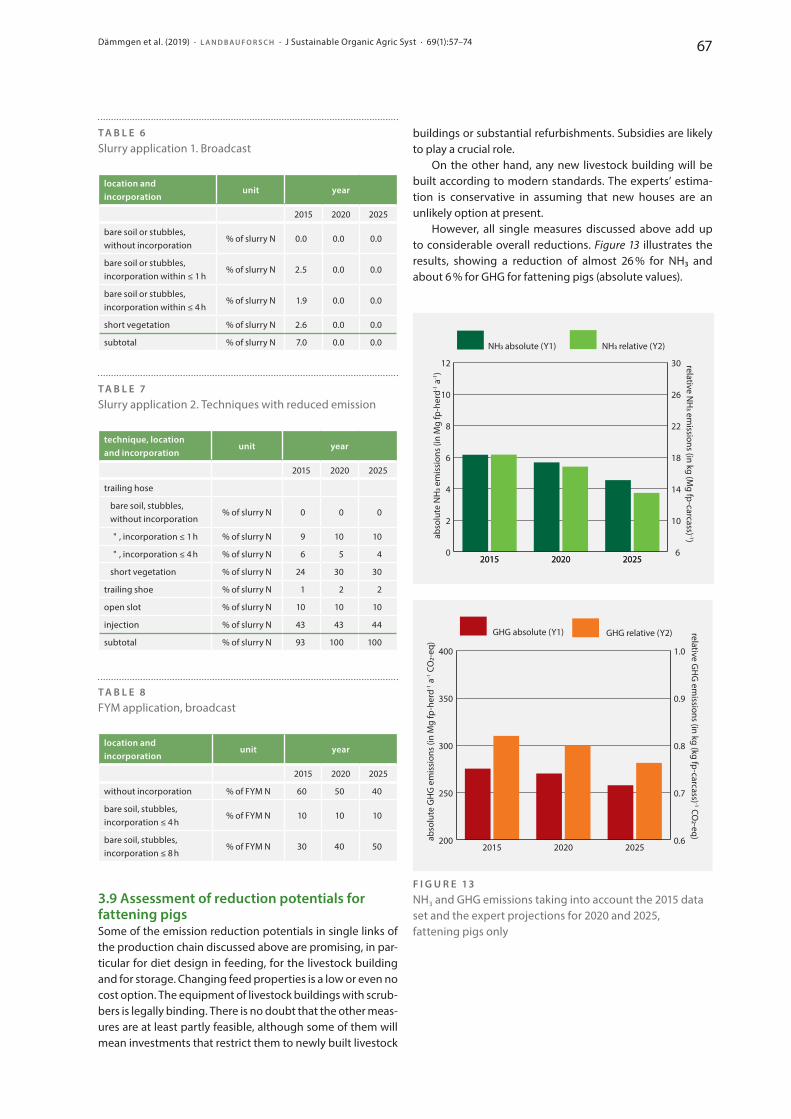
Dämmgen et al. (2019) · L A N D B A U F O R S C H · J Sustainable Organic Agric Syst · 69(1):57–74 67
T A B L E 6Slurry application 1. Broadcast
location and incorporation
unit year
2015 2020 2025
bare soil or stubbles, without incorporation
% of slurry N 0.0 0.0 0.0
bare soil or stubbles, incorporation within ≤ 1 h
% of slurry N 2.5 0.0 0.0
bare soil or stubbles, incorporation within ≤ 4 h
% of slurry N 1.9 0.0 0.0
short vegetation % of slurry N 2.6 0.0 0.0
subtotal % of slurry N 7.0 0.0 0.0
T A B L E 7Slurry application 2. Techniques with reduced emission
technique, location and incorporation
unit year
2015 2020 2025
trailing hose
bare soil, stubbles, without incorporation
% of slurry N 0 0 0
" , incorporation ≤ 1 h % of slurry N 9 10 10
" , incorporation ≤ 4 h % of slurry N 6 5 4
short vegetation % of slurry N 24 30 30
trailing shoe % of slurry N 1 2 2
open slot % of slurry N 10 10 10
injection % of slurry N 43 43 44
subtotal % of slurry N 93 100 100
T A B L E 8FYM application, broadcast
location and incorporation
unit year
2015 2020 2025
without incorporation % of FYM N 60 50 40
bare soil, stubbles, incorporation ≤ 4 h
% of FYM N 10 10 10
bare soil, stubbles, incorporation ≤ 8 h
% of FYM N 30 40 50
3.9 Assessment of reduction potentials for fattening pigsSome of the emission reduction potentials in single links of the production chain discussed above are promising, in par-ticular for diet design in feeding, for the livestock building and for storage. Changing feed properties is a low or even no cost option. The equipment of livestock buildings with scrub-bers is legally binding. There is no doubt that the other meas-ures are at least partly feasible, although some of them will mean investments that restrict them to newly built livestock
buildings or substantial refurbishments. Subsidies are likely to play a crucial role.
On the other hand, any new livestock building will be built according to modern standards. The experts’ estima-tion is conservative in assuming that new houses are an unlikely option at present.
However, all single measures discussed above add up to considerable overall reductions. Figure 13 illustrates the results, showing a reduction of almost 26 % for NH3 and about 6 % for GHG for fattening pigs (absolute values).
0
2
4
6
8
10
12
NH3 relative (Y2)NH3 absolute (Y1)
202520202015
abso
lute
NH
3 em
issi
ons
(in M
g fp
-her
d-1 a
-1)
relative NH
3 emissions (in kg (M
g fp-carcass) -1)
6
10
14
18
22
26
30
202520202015
200
250
300
350
400
GHG relative (Y2)GHG absolute (Y1)
202520202015
abso
lute
GH
G e
mis
sion
s (in
Mg
fp-h
erd-1
a-1
CO
2-eq
)
relative GH
G em
issions (in kg (kg fp-carcass) -1 CO2-eq)
0.6
0.7
0.8
0.9
1.0
F I G U R E 13NH3 and GHG emissions taking into account the 2015 data set and the expert projections for 2020 and 2025, fattening pigs only
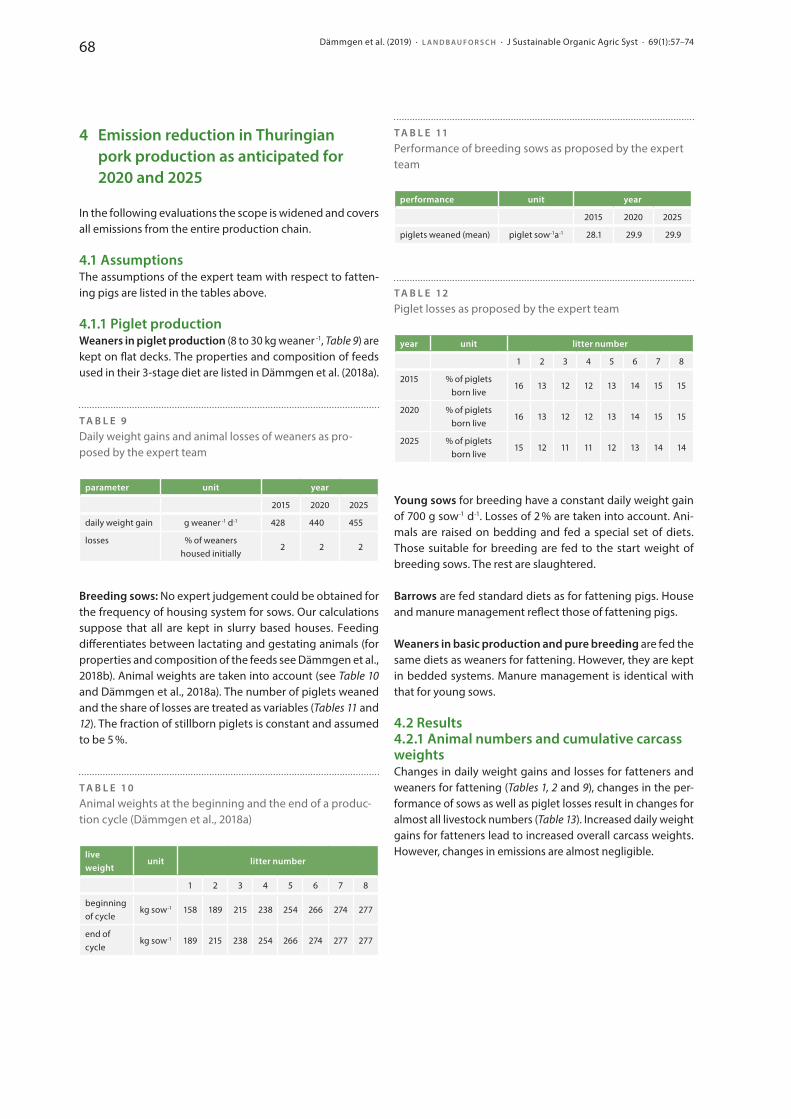
Dämmgen et al. (2019) · L A N D B A U F O R S C H · J Sustainable Organic Agric Syst · 69(1):57–7468
4 Emission reduction in Thuringian pork production as anticipated for 2020 and 2025
In the following evaluations the scope is widened and covers all emissions from the entire production chain.
4.1 AssumptionsThe assumptions of the expert team with respect to fatten-ing pigs are listed in the tables above.
4.1.1 Piglet productionWeaners in piglet production (8 to 30 kg weaner -1, Table 9) are kept on flat decks. The properties and composition of feeds used in their 3-stage diet are listed in Dämmgen et al. (2018a).
T A B L E 9Daily weight gains and animal losses of weaners as pro-posed by the expert team
parameter unit year
2015 2020 2025
daily weight gain g weaner -1 d-1 428 440 455
losses % of weaners housed initially
2 2 2
Breeding sows: No expert judgement could be obtained for the frequency of housing system for sows. Our calculations suppose that all are kept in slurry based houses. Feeding differentiates between lactating and gestating animals (for properties and composition of the feeds see Dämmgen et al., 2018b). Animal weights are taken into account (see Table 10 and Dämmgen et al., 2018a). The number of piglets weaned and the share of losses are treated as variables (Tables 11 and 12). The fraction of stillborn piglets is constant and assumed to be 5 %.
T A B L E 1 0Animal weights at the beginning and the end of a produc-tion cycle (Dämmgen et al., 2018a)
live weight
unit litter number
1 2 3 4 5 6 7 8
beginning of cycle
kg sow -1 158 189 215 238 254 266 274 277
end of cycle
kg sow -1 189 215 238 254 266 274 277 277
T A B L E 11Performance of breeding sows as proposed by the expert team
performance unit year
2015 2020 2025
piglets weaned (mean) piglet sow -1a-1 28.1 29.9 29.9
T A B L E 12Piglet losses as proposed by the expert team
year unit litter number
1 2 3 4 5 6 7 8
2015 % of piglets born live
16 13 12 12 13 14 15 15
2020 % of piglets born live
16 13 12 12 13 14 15 15
2025 % of piglets born live
15 12 11 11 12 13 14 14
Young sows for breeding have a constant daily weight gain of 700 g sow-1 d-1. Losses of 2 % are taken into account. Ani-mals are raised on bedding and fed a special set of diets. Those suitable for breeding are fed to the start weight of breeding sows. The rest are slaughtered.
Barrows are fed standard diets as for fattening pigs. House and manure management reflect those of fattening pigs.
Weaners in basic production and pure breeding are fed the same diets as weaners for fattening. However, they are kept in bedded systems. Manure management is identical with that for young sows.
4.2 Results4.2.1 Animal numbers and cumulative carcass weightsChanges in daily weight gains and losses for fatteners and weaners for fattening (Tables 1, 2 and 9), changes in the per-formance of sows as well as piglet losses result in changes for almost all livestock numbers (Table 13). Increased daily weight gains for fatteners lead to increased overall carcass weights. However, changes in emissions are almost negligible.
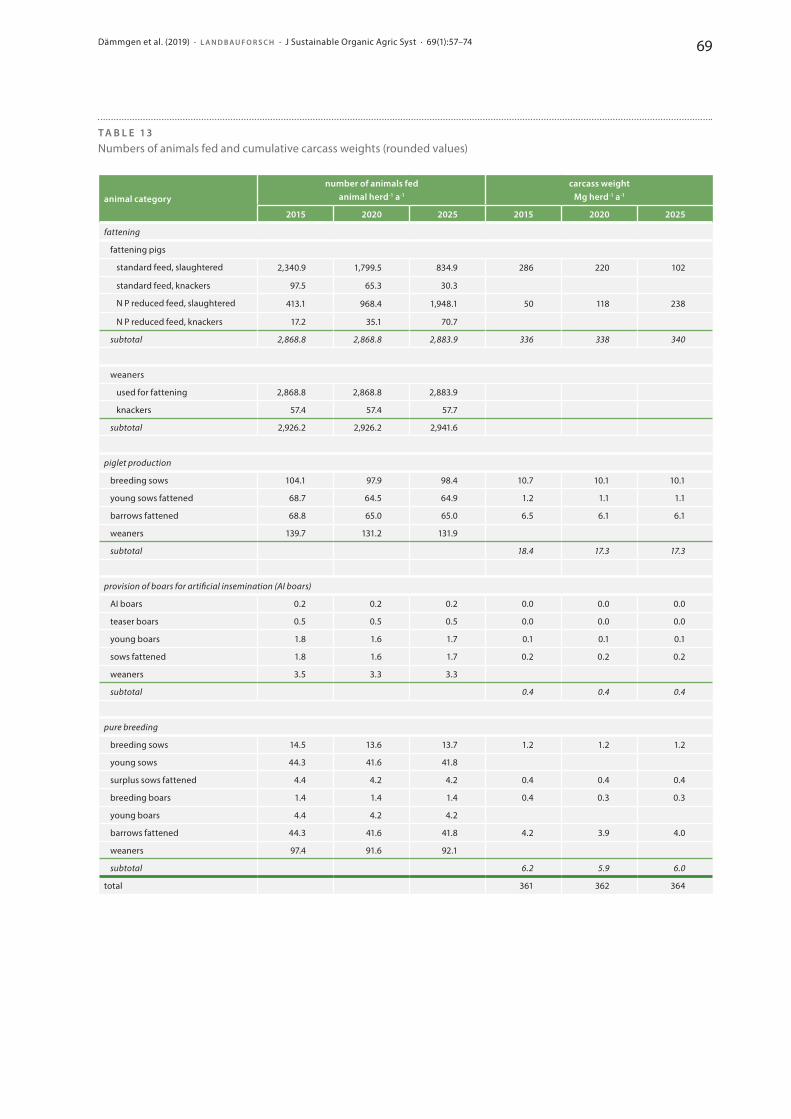
Dämmgen et al. (2019) · L A N D B A U F O R S C H · J Sustainable Organic Agric Syst · 69(1):57–74 69
T A B L E 13Numbers of animals fed and cumulative carcass weights (rounded values)
animal category
number of animals fedanimal herd -1 a-1
carcass weightMg herd -1 a-1
2015 2020 2025 2015 2020 2025
fattening
fattening pigs
standard feed, slaughtered 2,340.9 1,799.5 834.9 286 220 102
standard feed, knackers 97.5 65.3 30.3
N P reduced feed, slaughtered 413.1 968.4 1,948.1 50 118 238
N P reduced feed, knackers 17.2 35.1 70.7
subtotal 2,868.8 2,868.8 2,883.9 336 338 340
weaners
used for fattening 2,868.8 2,868.8 2,883.9
knackers 57.4 57.4 57.7
subtotal 2,926.2 2,926.2 2,941.6
piglet production
breeding sows 104.1 97.9 98.4 10.7 10.1 10.1
young sows fattened 68.7 64.5 64.9 1.2 1.1 1.1
barrows fattened 68.8 65.0 65.0 6.5 6.1 6.1
weaners 139.7 131.2 131.9
subtotal 18.4 17.3 17.3
provision of boars for artificial insemination (AI boars)
AI boars 0.2 0.2 0.2 0.0 0.0 0.0
teaser boars 0.5 0.5 0.5 0.0 0.0 0.0
young boars 1.8 1.6 1.7 0.1 0.1 0.1
sows fattened 1.8 1.6 1.7 0.2 0.2 0.2
weaners 3.5 3.3 3.3
subtotal 0.4 0.4 0.4
pure breeding
breeding sows 14.5 13.6 13.7 1.2 1.2 1.2
young sows 44.3 41.6 41.8
surplus sows fattened 4.4 4.2 4.2 0.4 0.4 0.4
breeding boars 1.4 1.4 1.4 0.4 0.3 0.3
young boars 4.4 4.2 4.2
barrows fattened 44.3 41.6 41.8 4.2 3.9 4.0
weaners 97.4 91.6 92.1
subtotal 6.2 5.9 6.0
total 361 362 364
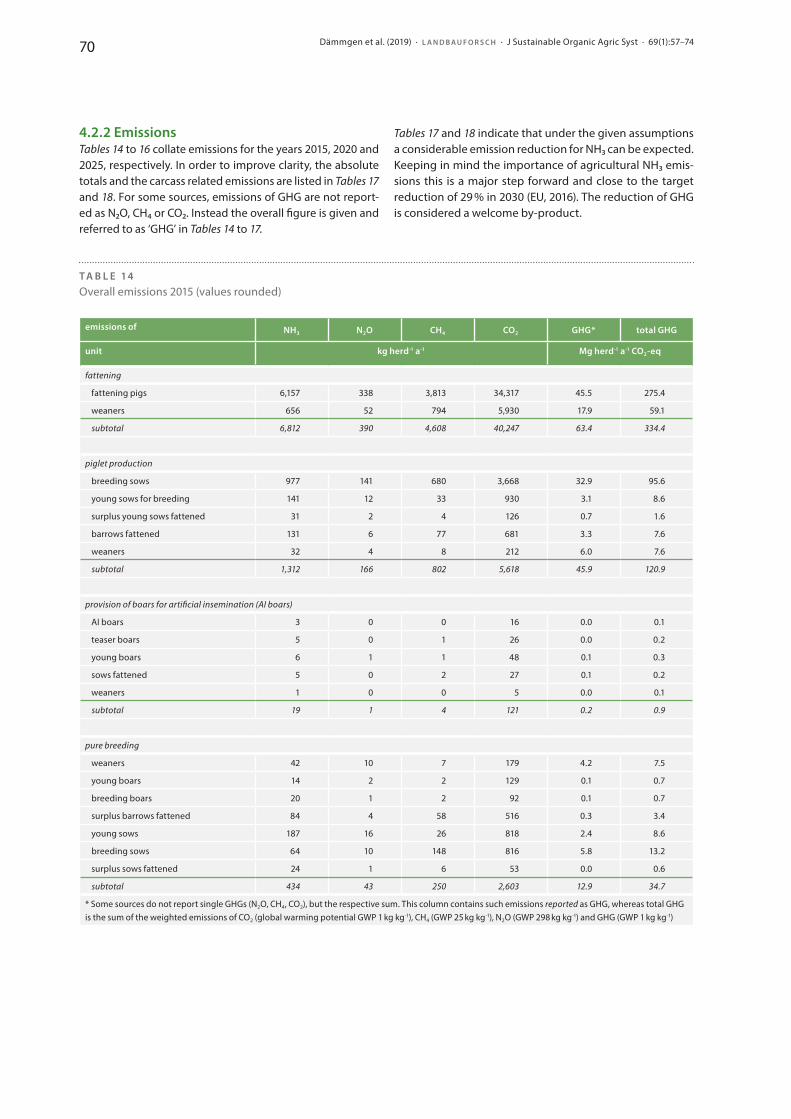
Dämmgen et al. (2019) · L A N D B A U F O R S C H · J Sustainable Organic Agric Syst · 69(1):57–7470
4.2.2 EmissionsTables 14 to 16 collate emissions for the years 2015, 2020 and 2025, respectively. In order to improve clarity, the absolute totals and the carcass related emissions are listed in Tables 17 and 18. For some sources, emissions of GHG are not report-ed as N2O, CH4 or CO2. Instead the overall figure is given and referred to as ‘GHG’ in Tables 14 to 17.
Tables 17 and 18 indicate that under the given assumptions a considerable emission reduction for NH3 can be expected. Keeping in mind the importance of agricultural NH3 emis-sions this is a major step forward and close to the target reduction of 29 % in 2030 (EU, 2016). The reduction of GHG is considered a welcome by-product.
T A B L E 1 4Overall emissions 2015 (values rounded)
emissions of NH3 N2O CH4 CO2 GHG * total GHG
unit kg herd-1 a-1 Mg herd-1 a-1 CO2-eq
fattening
fattening pigs 6,157 338 3,813 34,317 45.5 275.4
weaners 656 52 794 5,930 17.9 59.1
subtotal 6,812 390 4,608 40,247 63.4 334.4
piglet production
breeding sows 977 141 680 3,668 32.9 95.6
young sows for breeding 141 12 33 930 3.1 8.6
surplus young sows fattened 31 2 4 126 0.7 1.6
barrows fattened 131 6 77 681 3.3 7.6
weaners 32 4 8 212 6.0 7.6
subtotal 1,312 166 802 5,618 45.9 120.9
provision of boars for artificial insemination (AI boars)
AI boars 3 0 0 16 0.0 0.1
teaser boars 5 0 1 26 0.0 0.2
young boars 6 1 1 48 0.1 0.3
sows fattened 5 0 2 27 0.1 0.2
weaners 1 0 0 5 0.0 0.1
subtotal 19 1 4 121 0.2 0.9
pure breeding
weaners 42 10 7 179 4.2 7.5
young boars 14 2 2 129 0.1 0.7
breeding boars 20 1 2 92 0.1 0.7
surplus barrows fattened 84 4 58 516 0.3 3.4
young sows 187 16 26 818 2.4 8.6
breeding sows 64 10 148 816 5.8 13.2
surplus sows fattened 24 1 6 53 0.0 0.6
subtotal 434 43 250 2,603 12.9 34.7
* Some sources do not report single GHGs (N2O, CH4, CO2), but the respective sum. This column contains such emissions reported as GHG, whereas total GHG is the sum of the weighted emissions of CO2 (global warming potential GWP 1 kg kg-1), CH4 (GWP 25 kg kg-1), N2O (GWP 298 kg kg-1) and GHG (GWP 1 kg kg-1)
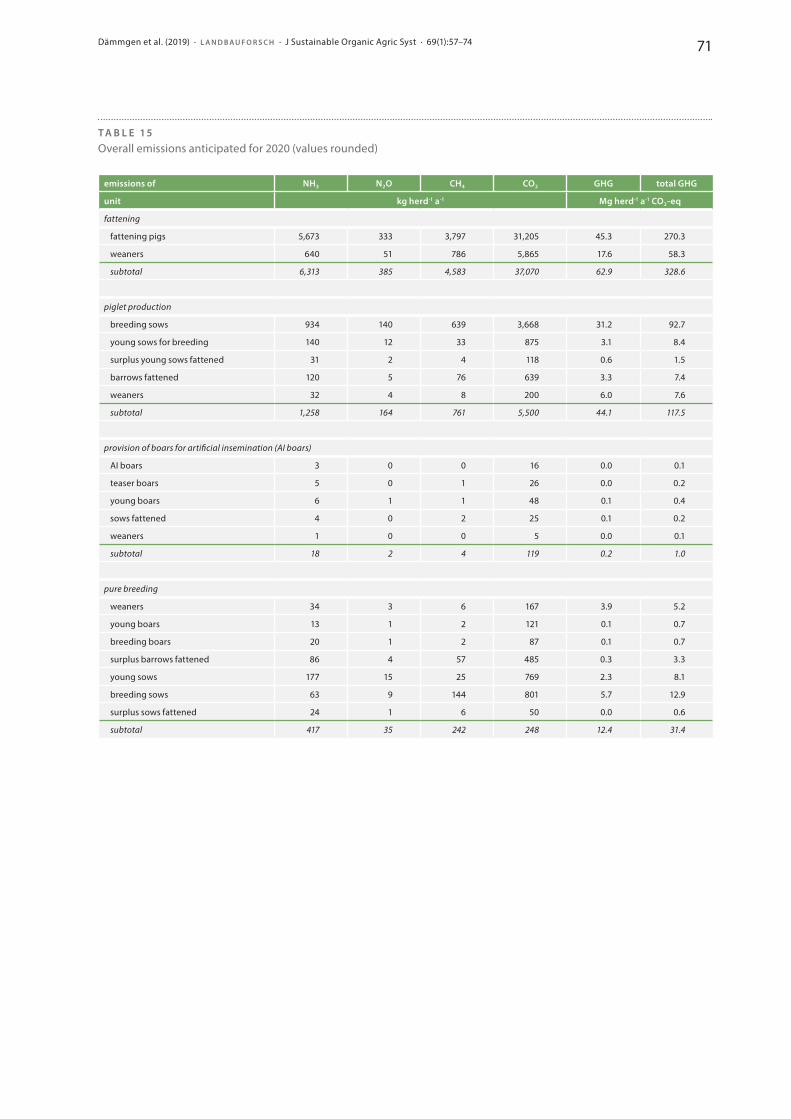
Dämmgen et al. (2019) · L A N D B A U F O R S C H · J Sustainable Organic Agric Syst · 69(1):57–74 71
T A B L E 1 5Overall emissions anticipated for 2020 (values rounded)
emissions of NH3 N2O CH4 CO2 GHG total GHG
unit kg herd-1 a-1 Mg herd-1 a-1 CO2-eq
fattening
fattening pigs 5,673 333 3,797 31,205 45.3 270.3
weaners 640 51 786 5,865 17.6 58.3
subtotal 6,313 385 4,583 37,070 62.9 328.6
piglet production
breeding sows 934 140 639 3,668 31.2 92.7
young sows for breeding 140 12 33 875 3.1 8.4
surplus young sows fattened 31 2 4 118 0.6 1.5
barrows fattened 120 5 76 639 3.3 7.4
weaners 32 4 8 200 6.0 7.6
subtotal 1,258 164 761 5,500 44.1 117.5
provision of boars for artificial insemination (AI boars)
AI boars 3 0 0 16 0.0 0.1
teaser boars 5 0 1 26 0.0 0.2
young boars 6 1 1 48 0.1 0.4
sows fattened 4 0 2 25 0.1 0.2
weaners 1 0 0 5 0.0 0.1
subtotal 18 2 4 119 0.2 1.0
pure breeding
weaners 34 3 6 167 3.9 5.2
young boars 13 1 2 121 0.1 0.7
breeding boars 20 1 2 87 0.1 0.7
surplus barrows fattened 86 4 57 485 0.3 3.3
young sows 177 15 25 769 2.3 8.1
breeding sows 63 9 144 801 5.7 12.9
surplus sows fattened 24 1 6 50 0.0 0.6
subtotal 417 35 242 248 12.4 31.4
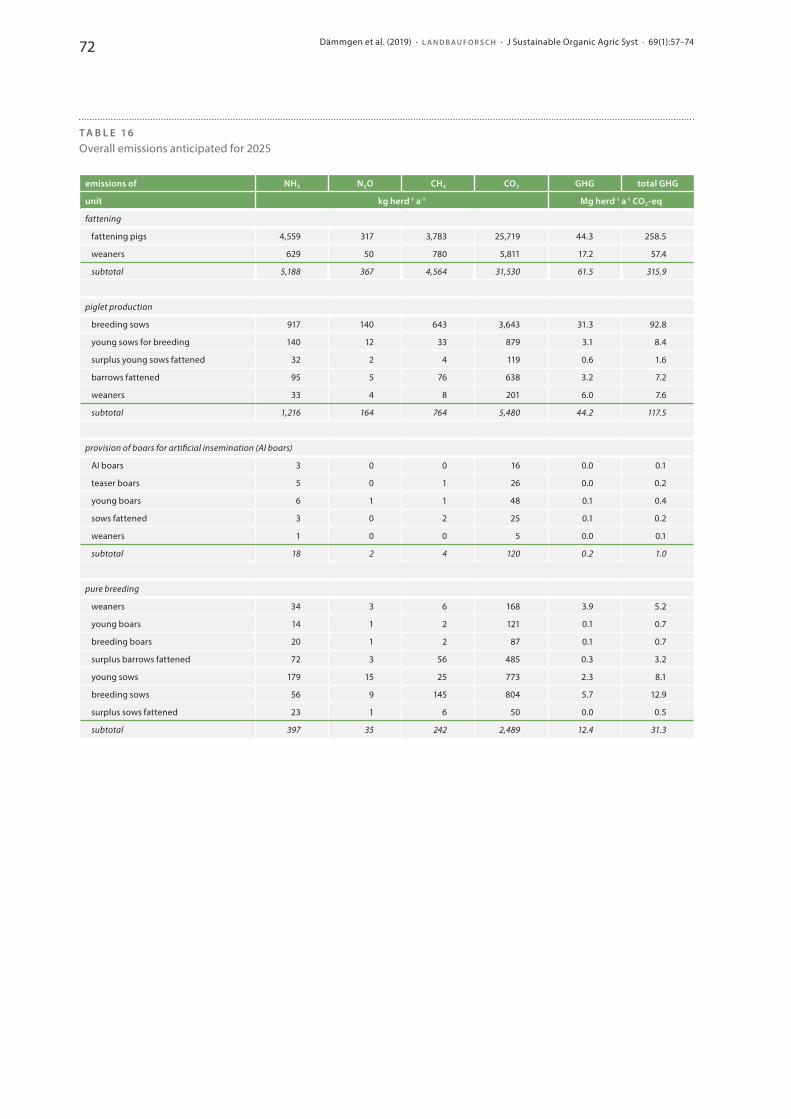
Dämmgen et al. (2019) · L A N D B A U F O R S C H · J Sustainable Organic Agric Syst · 69(1):57–7472
T A B L E 1 6Overall emissions anticipated for 2025
emissions of NH3 N2O CH4 CO2 GHG total GHG
unit kg herd-1 a-1 Mg herd-1 a-1 CO2-eq
fattening
fattening pigs 4,559 317 3,783 25,719 44.3 258.5
weaners 629 50 780 5,811 17.2 57.4
subtotal 5,188 367 4,564 31,530 61.5 315.9
piglet production
breeding sows 917 140 643 3,643 31.3 92.8
young sows for breeding 140 12 33 879 3.1 8.4
surplus young sows fattened 32 2 4 119 0.6 1.6
barrows fattened 95 5 76 638 3.2 7.2
weaners 33 4 8 201 6.0 7.6
subtotal 1,216 164 764 5,480 44.2 117.5
provision of boars for artificial insemination (AI boars)
AI boars 3 0 0 16 0.0 0.1
teaser boars 5 0 1 26 0.0 0.2
young boars 6 1 1 48 0.1 0.4
sows fattened 3 0 2 25 0.1 0.2
weaners 1 0 0 5 0.0 0.1
subtotal 18 2 4 120 0.2 1.0
pure breeding
weaners 34 3 6 168 3.9 5.2
young boars 14 1 2 121 0.1 0.7
breeding boars 20 1 2 87 0.1 0.7
surplus barrows fattened 72 3 56 485 0.3 3.2
young sows 179 15 25 773 2.3 8.1
breeding sows 56 9 145 804 5.7 12.9
surplus sows fattened 23 1 6 50 0.0 0.5
subtotal 397 35 242 2,489 12.4 31.3
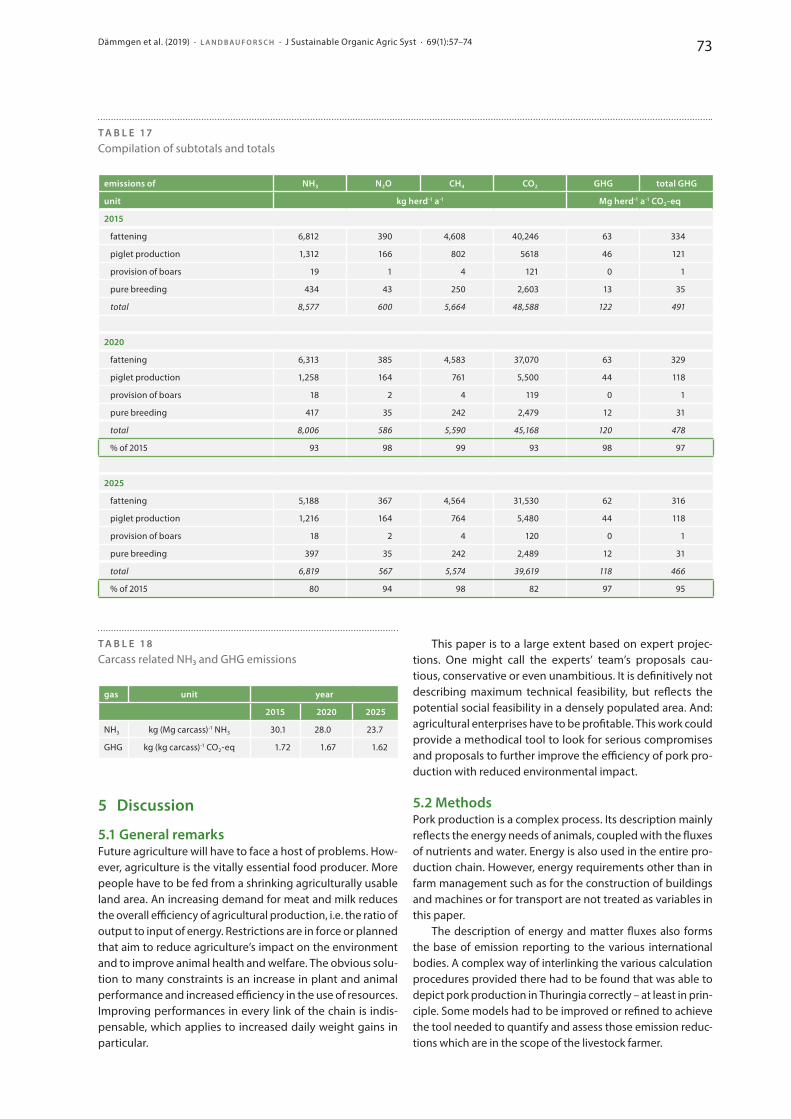
Dämmgen et al. (2019) · L A N D B A U F O R S C H · J Sustainable Organic Agric Syst · 69(1):57–74 73
T A B L E 17Compilation of subtotals and totals
emissions of NH3 N2O CH4 CO2 GHG total GHG
unit kg herd-1 a-1 Mg herd-1 a-1 CO2-eq
2015
fattening 6,812 390 4,608 40,246 63 334
piglet production 1,312 166 802 5618 46 121
provision of boars 19 1 4 121 0 1
pure breeding 434 43 250 2,603 13 35
total 8,577 600 5,664 48,588 122 491
2020
fattening 6,313 385 4,583 37,070 63 329
piglet production 1,258 164 761 5,500 44 118
provision of boars 18 2 4 119 0 1
pure breeding 417 35 242 2,479 12 31
total 8,006 586 5,590 45,168 120 478
% of 2015 93 98 99 93 98 97
2025
fattening 5,188 367 4,564 31,530 62 316
piglet production 1,216 164 764 5,480 44 118
provision of boars 18 2 4 120 0 1
pure breeding 397 35 242 2,489 12 31
total 6,819 567 5,574 39,619 118 466
% of 2015 80 94 98 82 97 95
T A B L E 1 8Carcass related NH3 and GHG emissions
gas unit year
2015 2020 2025
NH3 kg (Mg carcass)-1 NH3 30.1 28.0 23.7
GHG kg (kg carcass)-1 CO2-eq 1.72 1.67 1.62
5 Discussion
5.1 General remarksFuture agriculture will have to face a host of problems. How-ever, agriculture is the vitally essential food producer. More people have to be fed from a shrinking agriculturally usable land area. An increasing demand for meat and milk reduces the overall efficiency of agricultural production, i.e. the ratio of output to input of energy. Restrictions are in force or planned that aim to reduce agriculture’s impact on the environment and to improve animal health and welfare. The obvious solu-tion to many constraints is an increase in plant and animal performance and increased efficiency in the use of resources. Improving performances in every link of the chain is indis-pensable, which applies to increased daily weight gains in particular.
This paper is to a large extent based on expert projec-tions. One might call the experts’ team’s proposals cau-tious, conservative or even unambitious. It is definitively not describing maximum technical feasibility, but reflects the potential social feasibility in a densely populated area. And: agricultural enterprises have to be profitable. This work could provide a methodical tool to look for serious compromises and proposals to further improve the efficiency of pork pro-duction with reduced environmental impact.
5.2 MethodsPork production is a complex process. Its description mainly reflects the energy needs of animals, coupled with the fluxes of nutrients and water. Energy is also used in the entire pro-duction chain. However, energy requirements other than in farm management such as for the construction of buildings and machines or for transport are not treated as variables in this paper.
The description of energy and matter fluxes also forms the base of emission reporting to the various international bodies. A complex way of interlinking the various calculation pro cedures provided there had to be found that was able to depict pork production in Thuringia correctly – at least in prin-ciple. Some models had to be improved or refined to achieve the tool needed to quantify and assess those emission reduc-tions which are in the scope of the livestock farmer.
Dämmgen et al. (2019) · L A N D B A U F O R S C H · J Sustainable Organic Agric Syst · 69(1):57–7474
In most cases, the methods provided in the respective guidebooks are best approximations. In some cases they are ‘rules of thumb’. However, it is better to use them than not to use them; they are at least internationally accepted tools.
5.3 UncertaintiesGeneral remarks on the uncertainty of model calculations of emissions can be found in Part 1 of this work (Dämmgen et al., 2018a). The number of digits in the above tables does not reflect the uncertainty. It allows for an easy comparison of the emissions originating from the various animal categories.
5.4 Comparability and comparative dataAs shown in the respective Chapter in Part 1 (Chapter 4.2), the results obtained in this work are in line with most o ther similar investigations. However, a direct intercomparison suffers from inadequate information on details. For exam-ple, this paper uses the official German recommendations for the application of mineral fertilisers. However, the basis for these recommendations has not been fully docu mented. For example, there is no mention of the impacts on atmospheric deposition of N and no adjustments in the recommendations according to the risks of run-off and leaching.
Furthermore, the Thuringian results for 2015, 2020 and 2025 illustrate the range of potential variations. This is what this paper wants to emphasize: changes to management practices in order to reduce emissions are feasible, and they are likely to be required in order to meet commitments to reduce emissions.
Acknowledgements
The Thuringian State Institute for Agriculture (TLL) provided the necessary data and estimates; it also partially funded UD and WB.
R E F E R E N C E S
Dämmgen U, Amon B, Gyldenkærne S, Hutchings NJ, Kleine Klausing H, Haenel H-D, Rösemann C (2011) Reassessment of the calculation pro-cedure for the volatile solids excretion rates of cattle and pigs in the Austrian, Danish and German agricultural emission inventories. Land-bauforsch vTI Agric Forestry Res 61(2):115–126
Dämmgen U, Brade W, Kleine Klausing H, Berk A, Haenel H-D, Müller J, Müller S, Rösemann C (2018c) Modellierung der Emissionen von Treib-hausgasen und Ammoniak bei der Schweinefleischerzeugung in Thüringen unter Berücksichtigung der gesamten Produktionskette. Abschlussbericht Projekt 25.10. Jena: Thüringer Landesanstalt für Landwirtschaft [online]. Retrieved from <https://www.db-thueringen.de/receive/dbt_mods_00039553> [at 25 March 2020]
Dämmgen U, Brade W, Kleine Klausing H, Rösemann C, Haenel H-D, Berk A (2018b) Hat die Nutzungsdauer von Zuchtsauen in der Ferkelerzeu-gung Einfluss auf die Ammoniak- und Treibhausgas-Emissionen? (Is the productive life of breeding sows relevant with respect to emis-sions in piglet production?) Landbauforsch Appl Agric Forestry Res 68(3/4):1–18, doi:10.3220/LBF1530177613000
Dämmgen U, Brade W, Haenel H-D, Rösemann C, Kleine Klausing H, Webb J, Berk A (2018a) Pork production in Thuringia – management effects on ammonia and greenhouse gas emissions. 1. Depiction of the state in 2015. Landbauforsch Appl Agric Forestry Res 68(3/4):19–38, doi:10.3220/LBF1547712205000
Dämmgen U, Haenel H-D, Rösemann C, Kleine Klausing H, Webb J, Brade W, Berk A (2017) Energy requirements and excretion rates of pigs used for reproduction (young sows, young boars, breeding sows and boars) – a compilation and assessment of models. Landbauforsch Appl Agric Forestry Res 67(2):53–70, doi:10.3220/LBF1501498873000
Dämmgen U, Hahne J, Haenel H-D, Rösemann C (2010) Die Modellierung der Emissionen von Stickstoffspezies, NMVOC und Staub aus Abluftreini-gungsanlagen in der Schweinehaltung im deutschen landwirtschaft-lichen Emissionsinventar. Gefahrstoffe – Reinhalt Luft 70(10):437–443
Dämmgen U, Liermann W, Böschen V, Berk A, Dänicke S (2016) Der Einfluss der Futterkonfektionierung bei Mastschweinen und Broilern auf die Emission von Treibhausgasen und Ammoniak – Betrachtung der ge-samten Produktionskette (The effect of feed conditioning and com-position on greenhouse gas and ammonia emissions from fattening pigs and broilers along the entire production chain). Landbauforsch Appl Agric Forestry Res 66(1):45–69, doi:10.3220/LBF1461660679000
Dämmgen U, Schulz J, Kleine Klausing H, Hutchings NJ, Haenel H-D, Röse-mann C (2012) Enteric methane emissions from German pigs. Land-bauforsch vTI Agric Forestry Res 62(3):83–96
EMEP (2016) EMEP/EEA air pollutant emission inventory guidebook 2016. Copenhagen: European Environment Agency, 26 p, EEA Report 21/2016, doi:10.2800/247535
EU – European Union (2016) Directive (EU) 2016/2284 of the European Par-liament and of the Council of 14 December 2016 on the reduction of nation al emissions of certain atmospheric pollutants, amending Direc-tive 2003/35/EC and repealing Directive 2001/81/EC [online]. Retrieved from <http://data.europa.eu/eli/dir/2016/2284/oj> [at 15 March 2020]
Haenel H-D, Dämmgen U, Laubach P, Rösemann C (2011) Update of the cal-culation of metabolizable energy requirements for pigs in the German agricultural emission inventory. Landbauforsch vTI Agric Forestry Res 61(3):217–228.
IPCC – Intergovernmental Panel on Climate Change (2006) 2006 IPCC Guide-lines for National Greenhouse Gas Inventories, Volume 2 Energy [online]. Retrieved from <https://www.ipcc-nggip.iges.or.jp/public/2006gl/vol2.html> [at 25 March 2020]
IPCC – Intergovernmental Panel on Climate Change (2006) 2006 IPCC Guide-lines for National Greenhouse Gas Inventories, Volume 3 Industrial Pro-cesses and Product Use [online].Retrieved from <https://www.ipcc-ng-gip.iges.or.jp/public/2006gl/vol3.html> [at 25 March 2020]
IPCC – Intergovernmental Panel on Climate Change (2006) 2006 IPCC Guide-lines for National Greenhouse Gas Inventories, Volume 4 Agriculture, Forestry and Other Land Use [online]. Retrieved from <https://www.ip-cc-nggip.iges.or.jp/public/2006gl/vol4.html> [at 25 March 2020]
StatBA – Statistisches Bundesamt (2017), Fachserie 3, Reihe 4 – 2017, Vieh-bestand und tierische Erzeugung [online]. Retrieved from <https://www.destatis.de/DE/Themen/Branchen-Unternehmen/Landwirt-schaft-Forstwirtschaft-Fischerei/Tiere-Tierische-Erzeugung/Publi-kationen/Downloads-Tiere-und-tierische-Erzeugung/viehbestand- tierische-erzeugung-2030400177004.pdf?__blob=publicationFile> [at 25 March 2020]
TMfUEN – Thüringisches Ministerium für Umwelt, Energie und Naturschutz (2016) Immissionsschutzrechtliche Anforderungen an Tierhaltungsan-lagen und Einführung der Geruchs-Immissionsrichtlinie (GIRL) [online]. Retrieved from <https://umwelt.thueringen.de/fileadmin/001_TMUEN/Unsere_Themen/Boden_Wasser_Luft_Laerm/Immissionsschutz/fil-tererlass_thuringen_2016.pdf> [at 25 March 2020]
L A N D B A U F O R S C H · J Sustainable Organic Agric Syst · 69(1)2019
V O L . 6 9 (1) 2 019
Acknowledgements to our ReviewersExploration and mitigation of greenhouse gas emissions in ruminant and grassland systems
y Karen Beauchemin, Agriculture and Agri-Food Canada (AAFC), Canada
y Tommy Boland, University College Dublin (UCD), Ireland
y Gabriela Cruz Brasesco, University of the Republic (UDELAR), Uruguay
y Ulrich Dämmgen, Thünen Institute of Climate-Smart Agriculture, Germany
y Heinz Flessa, Thünen Institute of Climate-Smart Agriculture, Germany
y Annette Freibauer, Bavarian State Research Center for Agriculture (LfL), Germany
y Margaret (Maggie) Gill, University of Aberdeen, United Kingdom
y Cécile Ginane, Institut National de la Recherche Agronomique et Environnement (INRAE), France
y John Goopy, International Livestock Research Institute (ILRI), Kenya
y Ab (Albert Pieter) Grootjans, University of Groningen (RUG), The Netherlands
y Jochen Hahne, Thünen-Institute of Agricultural Technology, Germany
y Nora Hammer, German Livestock Association (BRS), Germany
y Brian G. Henning, Gonzaga University, United States of America
y Matthias Koesling, Norwegian Institute of Bioeconomy Research (NIBIO), Norway
y David Landholm, Potsdam Institute for Climate Impact Research (PIK), Germany
y Adrian Leip, European Commission, Joint Research Centre (JRC), Belgium
y Peter Løvendahl, Aarhus University, Denmark y Florencia Montagnini, Yale School of Forestry &
Environmental Studies (F&ES), United States of America
y Ole-Kenneth Nielsen, Aarhus University, Denmark y Urs Niggli, Research Institute of Organic Agriculture
(FiBL), Suisse y Tim Pagella, Bangor University,
United Kingdom y Valentin D. Picasso Risso, University of Wisconsin-
Madison, United States of America y Thorsten Reinsch, Kiel University (CAU), Germany y Florence Renou-Wilson, University College Dublin
(UCD), Ireland y Angela Schwarm, Norwegian University of Life Sciences
(NMBU), Norway y Diego Thompson, Mississippi State University (MSU),
United States of America y Stephan Welp, Verein zur Förderung der bäuerlichen
Veredelungswirtschaft (VzF), Germany y Adrian G. Williams, Cranfield University,
United Kingdom y Werner J. Zollitsch, University of Natural Resources and
Life Sciences Vienna (BOKU), Austria
For the editorial teamUte RatherEditor LandbauforschungThünen Institute of Organic Farming
Ute Rather ©
priv
ate
T H A N K Y O U V E R Y M U C H ! It was a pleasure working with you all.
All manuscripts submitted for publication in Landbauforschung – Journal of Sustainable and Organic Agricultural Systems undergo a double-blind peer review process. We, the whole editorial team and the publisher, would like to express our gratitude to all colleagues listed below who acted as reviewers for this special issue. We are grateful to the time and effort reviewers donate reviewing the papers in all versions.
LandbauforschungJournal of Sustainable and
Organic Agricultural Systems
Vol. 69 (1) 2019
Exploration and mitigation of greenhouse gas emissions in ruminant and grassland systems
LandbauforschungJournal of Sustainable and
Organic Agricultural Systems
Vol. 69 (1) 2019
EditorJohann Heinrich von Thünen InstituteInstitute of Organic FarmingTrenthorst 3223847 WesterauGermany
www.landbauforschung.net
ISSN 2700-8711 Price 8 €
Main keywords in this issue
agricultural methane
ruminants
food security
Nitrous oxide �ux
soil organic carbon
GHG emissions livestock
farming
CH4
N2O nitrogen
climate change
wet agriculture
feed crops
enteric fermentation
know
ledg
e ex
chan
gestakeholders
food systems
heal
thy
diet
sdietary change
land-use change
mitigation strategy
fertilising
energy
energy
GHG reduction potential
agri
cultu
re
spot measurements
man
ure
man
agem
ent
GH
G m
itiga
tion
peat
land
met
hane
em
issi
ons
ammonia
food securityca
rbon
cre
dits
ecosystem services
pasture grazing
veri�cation e�ciency
agricultural extension
agri-
food
syst
ems
policy transaction cost
dairy cowgr
eenh
ouse
gas
es
carbon sequestration
Copyright © 2022 FDOKUMEN