Influence of agricultural management on soil organic carbon: A compendium and assessment of Canadian...
18
Influence of agricultural management on soil organic carbon: A compendium and assessment of Canadian studies A. J. VandenBygaart 1 , E. G. Gregorich 1 , and D. A. Angers 2 1 Eastern Cereal and Oilseed Research Centre, Agriculture and Agri-Food Canada, KW Neatby Building, 960 Carling Avenue, Ottawa, Ontario, Canada K1A 0C6 (e-mail: [email protected]); 2 Soils and Crops Research and Development Centre, Agriculture and Agri-Food Canada, Sainte-Foy, Quebec, Canada G1V 2J3. Received 13 February 2003, accepted 30 May 2003. VandenBygaart, A. J., Gregorich, E. G. and Angers, D. A. 2003. Influence of agricultural management on soil organic carbon: A compendium and assessment of Canadian studies. Can. J. Soil Sci. 83: 363–380. To fulfill commitments under the Kyoto Protocol, Canada is required to provide verifiable estimates and uncertainties for soil organic carbon (SOC) stocks, and for changes in those stocks over time. Estimates and uncertainties for agricultural soils can be derived from long-term studies that have measured differences in SOC between different management practices. We compiled published data from long-term studies in Canada to assess the effect of agricultural management on SOC. A total of 62 studies were compiled, in which the difference in SOC was determined for conversion from native land to cropland, and for different tillage, crop rotation and fertilizer management practices. There was a loss of 24 ± 6% of the SOC after native land was converted to agricultural land. No-till (NT) increased the storage of SOC in western Canada by 2.9 ± 1.3 Mg ha –1 ; however, in eastern Canada conversion to NT did not increase SOC. In general, the potential to store SOC when NT was adopted decreased with increasing background levels of SOC. Using no-tillage, reducing summer fallow, including hay in rotation with wheat (Triticum aestivum L.), plowing green manures into the soil, and applying N and organic fertilizers were the practices that tended to show the most consistent increases in SOC storage. By relat- ing treatment SOC levels to those in the control treatments, SOC stock change factors and their levels of uncertainty were derived for use in empirical models, such as the United Nations Intergovernmental Panel on Climate Change (IPCC) Guidelines model for C stock changes. However, we must be careful when attempting to extrapolate research plot data to farmers’ fields since the his- tory of soil and crop management has a significant influence on existing and future SOC stocks. Key words: C sequestration, tillage, crop rotations, fertilizer, cropping intensity, Canada VandenBygaart, A. J., Gregorich, E. G. et Angers, D. A. 2003. Effet des pratiques agricoles sur le carbone organique dans le sol : compendium et évaluation des études canadiennes. Can. J. Soil Sci. 83: 363–380. Pour satisfaire à ses engagements du protocole de Kyoto, le Canada doit soumettre des estimations et des conjectures vérifiables sur les réserves de carbone organique dans ses sols (COS) et leur évolution dans le temps. Pour les sols agricoles, pareilles estimations et conjectures peuvent être dérivées des études de longue haleine mesurant la fluctuation des réserves en fonction de diverses pratiques agricoles. Les auteurs ont colligé les résultats d’études à long terme publiées au Canada afin d’évaluer l’incidence de telles pratiques sur le COS. En tout, 62 études ont été rassemblées et ont servi à établir la variation du COS lorsque les terres passent de l’état naturel à celui de cul- ture, pour divers régimes de travail du sol, d’assolement et d’amendement. Les réserves de COS diminuent de 24 ± 6 % quand on se met à cultiver les terres en friche. Dans l’ouest du pays, le non-travail du sol (NT) accroît les réserves de COS de 2,9 ± 1,3 mg par hectare, mais on n’assiste à aucune hausse de ce genre dans l’Est. En général, le potentiel d’accumulation du COS par le non- travail du sol diminue avec la hausse de la concentration naturelle de COS. Le non-travail du sol, la diminution des jachères esti- vales, l’intégration du foin et du blé de printemps (Triticum aestivum L.) au régime d’assolement, les engrais verts et l’application de N et d’engrais minéraux figurent parmi les pratiques qui tendent à augmenter de la manière la plus soutenue les réserves de COS. Les auteurs sont parvenus à dériver les facteurs de variation des réserves de COS et les niveaux d’incertitude en comparant la concentration de COS résultant de divers traitements à celle des traitements témoins, en vue d’une utilisation dans les modèles empiriques comme celui des lignes directrices du GIEC sur l’évolution des réserves de C. Néanmoins, on doit faire preuve de pru- dence quand on extrapole les données recueillies sur les parcelles expérimentales aux cultures, car les antécédents pédologiques et agricoles exercent une influence sensible sur les réserves actuelles et futures de COS. Mots clés: Séquestration du C, travail du sol, assolement, engrais, densité des cultures, Canada Canada requires verifiable estimates and uncertainties of soil organic carbon (SOC) stocks and changes over time for agricultural soils, to fulfill commitments under the United Nations Framework Convention on Climate Change and the Kyoto Protocol. Such estimates can be derived from exist- ing long-term research studies that have documented changes in, or differences between, SOC in various agricul- tural systems (Janzen et al. 1998). More specifically, we need simple factors that can be used to estimate the existing SOC stock and its change through time for a given system based on existing and future soil management practices. These factors can be used in simple empirical models to 363
-
Upload
independent -
Category
Documents
-
view
0 -
download
0
Transcript of Influence of agricultural management on soil organic carbon: A compendium and assessment of Canadian...

Influence of agricultural management on soil organic carbon: A compendium and assessment of
Canadian studies
A. J. VandenBygaart1, E. G. Gregorich1, and D. A. Angers2
1Eastern Cereal and Oilseed Research Centre, Agriculture and Agri-Food Canada, KW Neatby Building, 960 Carling Avenue, Ottawa, Ontario, Canada K1A 0C6 (e-mail: [email protected]); 2Soils and CropsResearch and Development Centre, Agriculture and Agri-Food Canada, Sainte-Foy, Quebec, Canada G1V 2J3.
Received 13 February 2003, accepted 30 May 2003.
VandenBygaart, A. J., Gregorich, E. G. and Angers, D. A. 2003. Influence of agricultural management on soil organic carbon:A compendium and assessment of Canadian studies. Can. J. Soil Sci. 83: 363–380. To fulfill commitments under the KyotoProtocol, Canada is required to provide verifiable estimates and uncertainties for soil organic carbon (SOC) stocks, and forchanges in those stocks over time. Estimates and uncertainties for agricultural soils can be derived from long-term studies that havemeasured differences in SOC between different management practices. We compiled published data from long-term studies inCanada to assess the effect of agricultural management on SOC. A total of 62 studies were compiled, in which the difference inSOC was determined for conversion from native land to cropland, and for different tillage, crop rotation and fertilizer managementpractices. There was a loss of 24 ± 6% of the SOC after native land was converted to agricultural land. No-till (NT) increased thestorage of SOC in western Canada by 2.9 ± 1.3 Mg ha–1; however, in eastern Canada conversion to NT did not increase SOC. Ingeneral, the potential to store SOC when NT was adopted decreased with increasing background levels of SOC. Using no-tillage,reducing summer fallow, including hay in rotation with wheat (Triticum aestivum L.), plowing green manures into the soil, andapplying N and organic fertilizers were the practices that tended to show the most consistent increases in SOC storage. By relat-ing treatment SOC levels to those in the control treatments, SOC stock change factors and their levels of uncertainty were derivedfor use in empirical models, such as the United Nations Intergovernmental Panel on Climate Change (IPCC) Guidelines model forC stock changes. However, we must be careful when attempting to extrapolate research plot data to farmers’ fields since the his-tory of soil and crop management has a significant influence on existing and future SOC stocks.
Key words: C sequestration, tillage, crop rotations, fertilizer, cropping intensity, Canada
VandenBygaart, A. J., Gregorich, E. G. et Angers, D. A. 2003. Effet des pratiques agricoles sur le carbone organique dans lesol : compendium et évaluation des études canadiennes. Can. J. Soil Sci. 83: 363–380. Pour satisfaire à ses engagements duprotocole de Kyoto, le Canada doit soumettre des estimations et des conjectures vérifiables sur les réserves de carbone organiquedans ses sols (COS) et leur évolution dans le temps. Pour les sols agricoles, pareilles estimations et conjectures peuvent êtredérivées des études de longue haleine mesurant la fluctuation des réserves en fonction de diverses pratiques agricoles. Les auteursont colligé les résultats d’études à long terme publiées au Canada afin d’évaluer l’incidence de telles pratiques sur le COS. En tout,62 études ont été rassemblées et ont servi à établir la variation du COS lorsque les terres passent de l’état naturel à celui de cul-ture, pour divers régimes de travail du sol, d’assolement et d’amendement. Les réserves de COS diminuent de 24 ± 6 % quand onse met à cultiver les terres en friche. Dans l’ouest du pays, le non-travail du sol (NT) accroît les réserves de COS de 2,9 ± 1,3 mgpar hectare, mais on n’assiste à aucune hausse de ce genre dans l’Est. En général, le potentiel d’accumulation du COS par le non-travail du sol diminue avec la hausse de la concentration naturelle de COS. Le non-travail du sol, la diminution des jachères esti-vales, l’intégration du foin et du blé de printemps (Triticum aestivum L.) au régime d’assolement, les engrais verts et l’applicationde N et d’engrais minéraux figurent parmi les pratiques qui tendent à augmenter de la manière la plus soutenue les réserves deCOS. Les auteurs sont parvenus à dériver les facteurs de variation des réserves de COS et les niveaux d’incertitude en comparantla concentration de COS résultant de divers traitements à celle des traitements témoins, en vue d’une utilisation dans les modèlesempiriques comme celui des lignes directrices du GIEC sur l’évolution des réserves de C. Néanmoins, on doit faire preuve de pru-dence quand on extrapole les données recueillies sur les parcelles expérimentales aux cultures, car les antécédents pédologiques etagricoles exercent une influence sensible sur les réserves actuelles et futures de COS.
Mots clés: Séquestration du C, travail du sol, assolement, engrais, densité des cultures, Canada
Canada requires verifiable estimates and uncertainties ofsoil organic carbon (SOC) stocks and changes over time foragricultural soils, to fulfill commitments under the UnitedNations Framework Convention on Climate Change and theKyoto Protocol. Such estimates can be derived from exist-ing long-term research studies that have documented
changes in, or differences between, SOC in various agricul-tural systems (Janzen et al. 1998). More specifically, weneed simple factors that can be used to estimate the existingSOC stock and its change through time for a given systembased on existing and future soil management practices.These factors can be used in simple empirical models to
363

364 CANADIAN JOURNAL OF SOIL SCIENCE
assess changes in SOC from field to regional levels (Ellertet al. 2001). The United Nations Intergovernmental Panelon Climate Change (IPCC) has derived a simple methodfor calculating SOC stocks in different agricultural land-useand management systems (IPCC 1997) in order to estimateCO2 emissions from agricultural soils around the world:
Soil Carbonmanaged = Soil Carbonnative × Base × Tillage × Input (1)
where Soil Carbonnative is the carbon content in the nativesystem; the base factor represents changes in SOC contentdue to conversion of native to agricultural land; the tillagefactor and input factors are used to estimate the effect ofchanges in management practices that occur over the inven-tory period relative to standard conditions [i.e., conservationtillage vs. conventional tillage; crop rotation vs. monocul-ture (IPCC 1997)]. However, the IPCC Guidelines for theNational Greenhouse Gas Inventories reference manual(IPCC 1997) provides only general base, tillage and inputfactors that are available for situations where the existinginformation for a given country is scarce. In Canada, con-siderable long-term plot research has been focused on deter-mining the effect of soil management practices on SOC.Consequently, there is potential to use data from thisresearch to derive more realistic estimates for the tillage andinput factors in the IPCC model, and their levels of uncer-tainty. This will allow us to make more accurate estimatesof existing SOC stocks and the changes that can be expect-ed if management practices are modified. The IPCCGuidelines for the National Greenhouse Gas Inventoriesmethod can be used to estimate anthropogenic emissions bysources, and removals by sinks, of greenhouse gases for thecalculation of legally binding targets during the first com-mitment period of the Kyoto Protocol.
The purpose of this paper is: (1) to compile a database onthe effects of native-land conversion and management prac-tices on SOC levels in agricultural soils of Canada fromlong-term studies; (2) to develop factors, and their uncer-tainties, from the database for use in developing simpleempirical models to estimate the existing SOC stock and thechanges in SOC stocks due to a change in a managementpractice in agricultural soils; and (3) to identify informationgaps and limitations in estimating agricultural managementeffects on SOC.
METHODS
Data Compilation and AnalysisWe compiled 291 pairs of treatments from long-term fieldexperiments of tillage, rotation and fertilizer inputs, andcomparison of native and adjacent agricultural soils, from62 studies in Canada (Tables 1 and 2). There were at least3666 soil profiles taken and 4070 treatment years in whichSOC was compared between management treatments.Information taken from the studies included SOC content onan area basis (Mg ha–1) from the control and treatment soils,mean annual precipitation and temperature, potential evapo-transpiration, soil classification to the Great Group level in
the Canadian System of Soil Classification (AgricultureCanada Expert Committee on Soil Survey 1998), texturalclass, clay content (where available), experiment duration,cropping rotation, fertilizer inputs, tillage treatment, depthof sampling, the number of soil profiles sampled and thetype of comparison (i.e., change over time or comparison bytreatment). For studies in which agricultural managementpractices were compared, only those studies in which bothbulk density and SOC were determined were reported. Forthose studies comparing native and cultivated land, and inwhich organic fertilizers were added, most reported onlySOC concentration data; thus relative differences were ana-lyzed. For the treatment duration in each study, we compiledmean annual temperature and precipitation for the meteoro-logical station nearest to the study site (EnvironmentCanada 2002). We also obtained mean annual potentialevapotranspiration by summing daily measurements for agiven year and averaging over the duration of the treatmentperiod of each study. All data were compiled in a spread-sheet so that analyses could be performed on the entire dataset. Data were grouped and assessed based on the type ofcomparisons being made (i.e., native land conversion,tillage, fertilization, crop rotation) and separate spreadsheetswere created for analyses. Data were then grouped basedon common characteristics such that the effect of soil, cli-matic and management factors on changes in SOC withdifferent management treatments could be determined(e.g., effect of tillage on SOC in the different GreatGroups; rotation effects on SOC in no-tillage relative toconventional tillage).
Simple regression was used to relate the SOC levels to acontrol treatment. Since the comparisons of SOC were rela-tive, we forced the trend line through zero, thereby giving asimple multiplicative factor (i.e., if the factor was >1 therewas storage of SOC, and if <1 there was a loss of SOC dueto the treatment). Since degrees of uncertainty in estimates ofSOC storage are critical, we used a conservative estimate ofuncertainty and determined 95% confidence intervals for therelationship between SOC in the controls and treatments:
(2)
where x is the arithmetic mean, s is the standard deviation,Z is the z score at the given level of significance (at 95%confidence Z = 1.96), and n is the number of comparisons.
AssumptionsNo-till was assumed to have minimal soil disturbance annu-ally, and this disturbance was limited to direct seeding.Depth of soil sampling varied for the studies, but we did notattempt to normalize the data for depth of sampling forSOC. We assumed that the researchers conducting the stud-ies had chosen a sampling depth to adequately determine themanagement effects on SOC for each study. Of the studiescomparing native and cultivated levels of SOC, most wereconducted by comparing existing cultivated fields with adja-cent native land. In these cases the assumption is implicit
x Zs
n±

VANDENBYGAART ET AL. — AGRICULTURAL MANAGEMENT ON SOIL CARBON 365
Table 1. Effect of converting native land to agricultural land on SOC
Soil Depth ofLocation great sampling Years ∆(by province MAPz MATz groupy/ Textural (cm) or since Soil Cfrom west to east) (mm) (°C) soil type class Relative treatment horizon conversion (%) Reference
72 farms in AB NAx NA Variable Variable Native conversion NA Variable –24% Reinl (1984)AB, SK and MB NA NA BC Variable Grassland conversion 30 Variable –21% Newton et al. (1945)AB, SK and MB NA NA DBC Variable Grassland conversion 30 Variable –22% Newton et al. (1945)AB, SK and MB NA NA BlC Variable Grassland conversion 30 Variable –18% Newton et al. (1945)AB, SK and MB NA NA DGC Variable Grassland conversion 30 Variable –27% Newton et al. (1945)SK NA NA BlC SiL Grassland conversion A horizon 60 –32% Tiessen et al. (1982)SK NA NA BlC SiL Grassland conversion A horizon 90 –58% Tiessen et al. (1982)SK NA NA DBC C Grassland conversion A horizon 70 –37% Tiessen et al. (1982)SK NA NA DBC SL Grassland conversion A horizon 65 –46% Tiessen et al. (1982)central SK NA NA Luvisolic NA Forest conversion 45 <=20 –11% Pennock and van Kessel (1997)central SK NA NA Brunisolic NA Forest conversion 45 <=20 –36% Pennock and van Kessel (1997)central SK NA NA BlC SiCL Grassland conversion 45 >70 –15% Pennock and van Kessel (1997)central SK NA NA BlC CL Grassland conversion 45 >70 –35% Pennock and van Kessel (1997)central SK NA NA BlC LS Grassland conversion 45 >70 11% Pennock and van Kessel (1997)Matador, SK NA NA BC C Grassland conversion 10 20 –19% Martel and Paul (1974)Quinton, SK NA NA BlC L Grassland conversion 10 15 –35% Martel and Paul (1974)Quinton, SK NA NA BlC L Grassland conversion 12 60 –59% Martel and Paul (1974)Hafford, SK NA NA BlC L Grassland conversion 10 30 –33% Martel and Paul (1974)Swift Current, SK 358 3.5 BC CL Grassland conversion 12 14 –27% Doughty et al. (1954)Swift Current, SK 358 3.5 BC CL Grassland conversion 12 14 –24% Doughty et al. (1954)Swift Current, SK 358 3.5 BC C Grassland conversion 12 12 –17% Doughty et al. (1954)Bond Head, ON 1083 5 GBL SiL Forest conversion A horizon 68 –24% Ellert and Gregorich (1996)C. Blondeau, ON 1176 4.9 HFP S Forest conversion A horizon 25 –20% Ellert and Gregorich (1996)Delhi, ON 1009 7.8 GBL S Forest conversion A horizon NA –55% Ellert and Gregorich (1996)Edwards, ON 915 5.8 MB SiL Forest conversion A horizon NA –68% Ellert and Gregorich (1996)Exeter, ON 985 7.3 GBL SiL Forest conversion A horizon 170 –38% Ellert and Gregorich (1996)Fonthill, ON 936 7.4 GBL SiCL Forest conversion A horizon 195 –23% Ellert and Gregorich (1996)Highgate, ON 824 8 HG SCL Forest conversion A horizon NA –8% Ellert and Gregorich (1996)Kapuskasing, ON 861 0.5 MB SiCL Forest conversion A horizon 53 –4% Ellert and Gregorich (1996)Kemptville, ON 996 5.8 MB SL Forest conversion A horizon NA –30% Ellert and Gregorich (1996)Panmure, ON 776 6 HG SL Forest conversion A horizon 145 –24% Ellert and Gregorich (1996)Plainfield, ON 852 7.5 GBL SiCL Forest conversion A horizon 91 –40% Ellert and Gregorich (1996)Ste. Anne, ON 836 8.6 MB SiL Forest conversion A horizon 85 –34% Ellert and Gregorich (1996)Vineland, ON 836 8.6 GBL SL Forest conversion A horizon 145 –29% Ellert and Gregorich (1996)Winchester, ON 996 5.8 HG SiCL Forest conversion A horizon 105 –49% Ellert and Gregorich (1996)Woodslee, ON 875 8.7 HG C Forest conversion A horizon NA –47% Ellert and Gregorich (1996)Ottawa, ON 846 5.9 MB SL Forest conversion 30 >35 21% Coote and Ramsey (1983)Ottawa, ON 846 5.9 MB LS Forest conversion 30 >35 –6% Coote and Ramsey (1983)Ottawa, ON 846 5.9 HG C Forest conversion 30 >35 –15% Coote and Ramsey (1983)Ottawa, ON 846 5.9 MB C Forest conversion 30 >35 –12% Coote and Ramsey (1983)Ste–Anne–de– 1020 6 Gleysolic C Forest conversion approx. 25 NA 24% Carter et al. (1998)
Bellevue, QCBeauce, QC 1008 4 Brunisolic CL Forest conversion approx. 25 NA 31% Carter et al. (1998)Lennoxville, QC 1058 5.2 Brunisolic L Forest conversion approx. 25 NA 19% Carter et al. (1998)La Pocatiere, QC 967 4.2 Podzolic SCL Forest conversion approx. 25 NA –54% Carter et al. (1998)Isle aux Coudes, NA NA HG CL Grassland conversion A and NA –33% Martel and Deschenes (1976)
QC B horizonCharlevoix, QC NA NA HFP SL Grassland conversion A and NA –30% Martel and Deschenes (1976)
B horizonCantonsde l'Est, NA NA HFP SiL Grassland conversion A and NA –36% Martel and Deschenes (1976)
QC B horizonHarrington, PEI 1077 5.9 Podzolic FSL Forest conversion approx. 25 NA –11% Carter et al. (1998)Kelvin Grove, PEI 1000 5.7 Podzolic FSL Forest conversion approx. 25 NA –29% Carter et al. (1998)Mt. Herbert, PEI 1077 5.9 Podzolic FSL Forest conversion approx. 25 NA –11% Carter et al. (1998)
Eastern Canadaw –22 ± 9%Western Canadaw –28 ± 7%
Canada –24 ± 6%zMAP = mean annual precipitation, MAT = mean annual temperature.yGBL = Gray-Brown Luvisol, HFP = Humo-Ferric Podzol, MB = Melanic Brunisol, HG = Humic Gleysol, BC = Brown Chernozem, DBC = Dark BrownChernozem, BlC = Black Chernozem, DGC = Dark Gray Chernozem.xNot applicable or not available.wOntario-Manitoba border as boundary between eastern and western Canada.

366 CANADIAN JOURNAL OF SOIL SCIENCE
Table 2. Differences in SOC as a result of agricultural management practices
Net C C Location SOC diff- storage(by province Soil Text- Depth Soil control erence ratefrom west MAP MAT great ural Duration sampled profiles (Mg (Mg (g Cto east) (mm) (°C) PET groupz class (yr) Treatmentx (cm) sampled ha–1) ha–1) m–2 yr–1) Reference
Summerland, BC 290 9.0 711 BC LS 4 organic fertilizer 15 8 44.6 3.1 78.7 Zebarth et al. (1999)Summerland, BC 290 9.0 711 BC LS 3 organic fertilizer 15 8 44.6 15.5 515.3 Zebarth et al. (1999)Summerland, BC 290 9.0 711 BC LS 4 organic fertilizer 15 8 44.6 54.8 1369.3 Zebarth et al. (1999)Lethbridge, AB 402 5.0 732 BC CL 41 cont. w vs. f-w 30 20 58.3 2.1 5 Bremer et al. (1994)Lethbridge, AB 402 5.0 732 BC CL 41 cont. w vs. f-w 30 20 57.9 3.0 7 Bremer et al. (1994)Lethbridge, AB 402 5.0 732 BC CL 41 organic fertilizer 30 20 57.8 4.9 12 Bremer et al. (1994)Lethbridge, AB 402 5.0 732 BC CL 41 hay in rotation 30 20 57.8 6.4 16 Bremer et al. (1994)Bow Island, AB 370 5.0 732 BC CL 6 f-w-w vs. f-w 30 16 20.2 0.7 12 Bremer et al. (2002)Bow Island, AB 370 5.0 732 BC CL 6 cont. w vs. f-w 30 16 20.2 1.5 25 Bremer et al. (2002)Bow Island, AB 370 5.0 732 BC CL 6 crested w-grass vs. f-w-w 30 16 20.9 2.3 38 Bremer et al. (2002)Bow Island, AB 370 5.0 732 BC CL 6 crested w-grass vs. f-w 30 16 20.2 3.0 50 Bremer et al. (2002)Lethbridge, AB 402 5.0 758 DBC L 9 straw 20 12 42.7 0.2 3 Dormaar and Carefoot (1998)Lethbridge, AB 402 5.0 758 DBC L 9 NT variable rotation 20 12 42.7 8.2 91 Dormaar and Carefoot (1998)Lethbridge, AB 402 5.0 758 DBC L 9 inorganic fertilizer 20 12 41.5 2.3 25 Dormaar and Carefoot (1998)Lethbridge, AB 402 5.0 758 DBC L 9 inorganic fertilizer 20 12 20.8 3.0 33 Dormaar and Carefoot (1998)Lethbridge, AB 402 5.0 736 DBC L 10 organic fertilizer 20 5 38.0 12.0 120 Dormaar and
Sommerfeld (1986)Lethbridge, AB 402 5.0 736 DBC L 10 organic fertilizer 20 5 38.0 30.0 300 Dormaar and
Sommerfeld (1986)Beaverlodge, AB 468 2.0 568 GL CL 7 NT variable rotation 20 32 140.4 15.4 221 Franzluebbers and
Arshad (1996)Lethbridge, AB 402 5.0 777 DBC CL 4 NT w-sugar beet-legume 30 128 28.3 1.8 45 Hao et al. (2001)Lethbridge, AB 402 5.0 736 BC CL 16 NT f-w 15 30 27.1 2.1 13 Larney et al. (1997)Lethbridge, AB 402 5.0 736 BC CL 16 NT f-w 15 30 27.6 1.6 10 Larney et al. (1997)Lethbridge, AB 402 5.0 736 BC CL 16 NT f-w 15 30 30.4 –1.2 –8 Larney et al. (1997)Lethbridge, AB 402 5.0 754 BC CL 8 NT cont. w 15 25 31.0 2.0 25 Larney et al. (1997)Lethbridge, AB 402 5.0 754 BC CL 9 cont. w vs. f-w (CT) 15 30 38.5 2.8 31 Larney et al. (1997)Lethbridge, AB 402 5.0 739 DBC CL 24 NT f-w 20 12 37.1 –3.2 –13 Miller et al. (1999)Crossfield, AB 450 2.3 646 BlC NAw 27 inorganic fertilizer 30 60 112.9 18.5 68 Malhi et al. (1997)Crossfield, AB 450 2.3 646 BlC NA 27 inorganic fertilizer 30 60 112.9 23.4 87 Malhi et al. (1997)Crossfield, AB 450 2.3 646 BlC NA 27 inorganic fertilizer 30 60 112.9 24.6 91 Malhi et al. (1997)Crossfield, AB 450 2.3 646 BlC NA 27 inorganic fertilizer 30 60 112.9 18.4 68 Malhi et al. (1997)Crossfield, AB 450 2.3 641 BlC L 23 inorganic fertilizer 15 60 71.8 4.0 17 Malhi et al. (2002)Crossfield, AB 450 2.3 641 BlC L 23 inorganic fertilizer 15 60 71.8 3.4 15 Malhi et al. (2002)Breton, AB 547 2.1 580 GL L 42 inorganic fertilizer Apu 2t 20.3u 0.8 2 Izaurralde et al. (2001)Breton, AB 547 2.1 580 GL L 42 organic fertilizer Apu 2t 20.3u 7.5 18 Izaurralde et al. (2001)Breton, AB 547 2.1 580 GL L 42 inorganic fertilizer Apu 5t 32.4u 4.7 11 Izaurralde et al. (2001)Breton, AB 547 2.1 580 GL L 49 inorganic fertilizer Apu 4t 20.3u –0.8 –2 Izaurralde et al. (2001)Breton, AB 547 2.1 580 GL L 49 organic fertilizer Apu 4t 20.3u 9.5 19 Izaurralde et al. (2001)Breton, AB 547 2.1 580 GL L 49 inorganic fertilizer Apu 20t 34.7u 4.7 10 Izaurralde et al. (2001)Breton, AB 547 2.1 580 GL L 60 inorganic fertilizer Apu 2t 16.6u 1.2 2 Izaurralde et al. (2001)Breton, AB 547 2.1 580 GL L 60 organic fertilizer Apu 2t 16.6u 15.2 25 Izaurralde et al. (2001)Breton, AB 547 2.1 580 GL L 60 inorganic fertilizer Apu 10t 34.7u 4.7 8 Izaurralde et al. (2001)Breton, AB 547 2.1 580 GL L 18 f-w from time 0 Apu 2t 21.1u –3.2 –18 Izaurralde et al. (2001)Breton, AB 547 2.1 580 GL L 11 NT cont. barley 15 40 32.1 5.9 53.4 Nyborg et al. (1995)Breton, AB 547 2.1 580 GL L 11 NT cont. barley 15 40 34.5 7.5 68.2 Nyborg et al. (1995)Breton, AB 547 2.1 580 GL L 11 NT cont. barley 15 40 30.3 1.8 16.5 Nyborg et al. (1995)Breton, AB 547 2.1 580 GL L 11 straw 15 40 30.5 1.6 14.1 Nyborg et al. (1995)Breton, AB 547 2.1 580 GL L 11 straw 15 40 28.7 1.5 14.0 Nyborg et al. (1995)Breton, AB 547 2.1 580 GL L 11 NT cont. barley 15 40 30.3 0.3 2.5 Nyborg et al. (1995)Ellersie, AB 455 1.9 560 BlC L 11 NT cont. barley 15 40 88.3 1.8 15.9 Nyborg et al. (1995)Ellersie, AB 455 1.9 560 BlC L 11 NT cont. barley 15 40 87.8 1.9 17.1 Nyborg et al. (1995)Ellersie, AB 455 1.9 560 BlC L 11 NT cont. barley 15 40 83.6 0.8 7.4 Nyborg et al. (1995)Ellersie, AB 455 1.9 560 BlC L 11 straw 15 40 83.6 4.2 38.4 Nyborg et al. (1995)Breton, AB 547 2.1 570 GL L 12 inorganic fertilizer 15 32 34.9 2.0 16.7 Solberg et al. (1997)Breton, AB 547 2.1 570 GL L 12 inorganic fertilizer 15 32 34.9 7.7 64.2 Solberg et al. (1997)Breton, AB 547 2.1 570 GL L 12 inorganic fertilizer 15 32 34.9 8.1 67.5 Solberg et al. (1997)Breton, AB 547 2.1 570 GL L 12 straw 15 32 36.8 –2.8 –23.3 Solberg et al. (1997)Ellersie, AB 455 1.9 580 BlC L 12 inorganic fertilizer 15 32 146.0 3.0 25.2 Solberg et al. (1997)Ellersie, AB 455 1.9 580 BlC L 12 inorganic fertilizer 15 32 146.0 4.0 33.7 Solberg et al. (1997)Ellersie, AB 455 1.9 580 BlC L 12 inorganic fertilizer 15 32 146.0 7.2 59.7 Solberg et al. (1997)Ellersie, AB 455 1.9 580 BlC L 12 straw 15 32 146.2 –0.2 –1.7 Solberg et al. (1997)Ellersie, AB 455 1.9 580 BlC L 12 straw 15 32 146.2 –0.2 –1.7 Solberg et al. (1997)Ellersie, AB 455 1.9 580 BlC L 12 straw 15 32 146.6 2.5 20.7 Solberg et al. (1997)Ellersie, AB 455 1.9 580 BlC L 12 straw 15 32 148.8 1.2 10.2 Solberg et al. (1997)Ellersie, AB 455 1.9 580 BlC L 12 straw 15 32 153.0 0.2 1.3 Solberg et al. (1997)Breton, AB 547 2.1 570 GL L 12 straw 15 32 36.8 –1.9 –15.8 Solberg et al. (1997)Breton, AB 547 2.1 570 GL L 12 straw 15 32 33.5 3.4 28.3 Solberg et al. (1997)

VANDENBYGAART ET AL. — AGRICULTURAL MANAGEMENT ON SOIL CARBON 367
Table 2. Continued
Breton, AB 547 2.1 570 GL L 12 straw 15 32 38.4 4.2 35.0 Solberg et al. (1997)Breton, AB 547 2.1 570 GL L 12 straw 15 32 42.7 0.3 2.5 Solberg et al. (1997)Breton, AB 547 2.1 633 GL SiL 63 legumes in rotation 15 6 17.0 10.0 16 Grant et al. (2001)Breton, AB 547 2.1 633 GL SiL 63 organic fertilizer 15 6 19.0 13.0 21 Grant et al. (2001)Swift Current, SK 358 3.5 684 BC SiL 16 f-w-w vs. f-w 15 9 32.8 –0.7 –5 Biederbeck et al. (1984)Swift Current, SK 358 3.5 684 BC SiL 16 f-w-w vs. f-w 15 9 32.2 –2.7 –17 Biederbeck et al. (1984)Swift Current, SK 358 3.5 684 BC SiL 16 flax in rotation 15 9 32.0 –0.4 –2 Biederbeck et al. (1984)Swift Current, SK 358 3.5 684 BC SiL 16 rye in rotation 15 9 34.8 –1.5 –9 Biederbeck et al. (1984)Swift Current, SK 358 3.5 684 BC SiL 16 f-w-w vs. f-w 15 9 30.9 0.7 5 Biederbeck et al. (1984)Swift Current, SK 358 3.5 684 BC SiL 16 oats in rotation 15 9 34.4 –0.2 –1 Biederbeck et al. (1984)Swift Current, SK 358 3.5 684 BC SiL 16 flax in rotation 15 9 38.1 –2.2 –14 Biederbeck et al. (1984)Swift Current, SK 358 3.5 684 BC SiL 16 cont. w vs. f-w 15 9 37.3 0.5 3 Biederbeck et al. (1984)Swift Current, SK 358 3.5 684 BC SiL 16 inorganic fertilizer 15 9 32.2 1.1 7 Biederbeck et al. (1984)Swift Current, SK 358 3.5 693 BC SiL 6 gm in rotation 10 16 20.4 1.1 18 Biederbeck et al. (1998)Swift Current, SK 358 3.5 693 BC SiL 6 cont. w vs. f-w 10 16 20.4 1.2 21 Biederbeck et al. (1998)Swift Current, SK 358 3.5 683 BC SL 18 f-w-w vs. f-w 15 6 30.9 0.5 3 Campbell and Zentner (1993)Swift Current, SK 358 3.5 683 BC SL 18 flax in rotation 15 6 31.4 –2.8 –16 Campbell and Zentner (1993)Swift Current, SK 358 3.5 683 BC SL 18 rye in rotation 15 6 31.4 1.6 9 Campbell and Zentner (1993)Swift Current, SK 358 3.5 683 BC SL 18 inorganic fertilizer 15 6 31.4 2.9 16 Campbell and Zentner (1993)Swift Current, SK 358 3.5 683 BC SL 18 legumes in rotation 15 6 34.3 0.9 5 Campbell and Zentner (1993)Swift Current, SK 358 3.5 683 BC SL 18 cont. w vs. f-w 15 6 30.9 3.4 19 Campbell and Zentner (1993)Swift Current, SK 358 3.5 683 BC SL 18 cont. w vs. f-w-w 15 6 31.4 2.9 16 Campbell and Zentner (1993)Swift Current, SK 358 3.5 683 BC SL 18 inorganic fertilizer 15 6 30.2 1.2 7 Campbell and Zentner (1993)Swift Current, SK 358 3.5 671 BC SiL 12 NT cont. w 7.5 18 14.6 1.3 11 Campbell et al. (1995a)Swift Current, SK 358 3.5 671 BC SiL 12 NT f-w 7.5 18 13.9 0.9 8 Campbell et al. (1995a)Swift Current, SK 358 3.5 671 BC SiL 12 cont. w vs. f-w 7.5 18 14.8 1.1 9 Campbell et al. (1995a)Stewart Valley, SK 409 4.3 684 BC CL 11 NT f-w 15 18 24.3 5.2 47 Campbell et al. (1996a)Stewart Valley, SK 409 4.3 684 BC CL 11 NT cont. w 15 18 25.8 2.7 25 Campbell et al. (1996a)Stewart Valley, SK 409 4.3 684 BC CL 11 cont. w vs. f-w 15 18 29.4 –0.9 –8 Campbell et al. (1996a)Swift Current, SK 358 3.5 671 BC SL 11 NT f-w 15 18 19.6 0.0 0 Campbell et al. (1996b)Swift Current, SK 358 3.5 671 BC SL 11 NT cont. w 15 18 18.0 1.0 9 Campbell et al. (1996b)Swift Current, SK 358 3.5 671 BC SL 11 cont. w vs. f-w 15 18 19.0 0.6 6 Campbell et al. (1996b)Indian Head, SK 427 2.5 675 BlC HC 39 inorganic fertilizer 15 8 30.4 2.0 5 Campbell et al. (1998)Indian Head, SK 427 2.5 675 BlC HC 39 f-w-w vs. f-w 15 8 32.4 3.8 10 Campbell et al. (1998)Indian Head, SK 427 2.5 675 BlC HC 39 gm in rotation 15 8 33.9 0.0 0 Campbell et al. (1998)Indian Head, SK 427 2.5 675 BlC HC 39 inorganic fertilizer 15 8 34.3 1.9 5 Campbell et al. (1998)Indian Head, SK 427 2.5 675 BlC HC 39 hay in rotation 15 8 35.6 2.3 6 Campbell et al. (1998)Indian Head, SK 427 2.5 675 BlC HC 39 cont. w vs. f-w 15 8 32.4 7.3 19 Campbell et al. (1998)Indian Head, SK 427 2.5 675 BlC HC 39 inorganic fertilizer 15 8 32.6 7.1 18 Campbell et al. (1998)Indian Head, SK 427 2.5 675 BlC HC 39 cont. w vs. f-w-w 15 8 32.4 7.3 19 Campbell et al. (1998)Swift Current, SK 358 3.5 676 BC SL 29 inorganic fertilizer 15 6 30.0 3.4 12 Campbell et al. (2000a)Swift Current, SK 358 3.5 676 BC SL 29 f-w-w vs. f-w 15 6 30.0 2.8 10 Campbell et al. (2000a)Swift Current, SK 358 3.5 676 BC SL 29 rye in rotation 15 6 30.0 6.9 24 Campbell et al. (2000a)Swift Current, SK 358 3.5 676 BC L 10 f-w-w from time 0 30 6 29.5 3.9 39 Campbell et al. (2000b)Swift Current, SK 358 3.5 676 BC L 10 f-w-w from time 0 30 6 29.9 1.9 19 Campbell et al. (2000b)Swift Current, SK 358 3.5 676 BC L 10 f-w-w from time 0 30 6 31.0 2.2 22 Campbell et al. (2000b)Swift Current, SK 358 3.5 676 BC L 10 gm in rotation 30 6 27.8 4.4 44 Campbell et al. (2000b)Swift Current, SK 358 3.5 676 BC L 10 f-w-w-w from time 0 30 6 27.3 5.8 58 Campbell et al. (2000b)Swift Current, SK 358 3.5 676 BC L 10 cont. w from time 0 30 6 29.2 6.0 60 Campbell et al. (2000b)Swift Current, SK 358 3.5 676 BC L 10 crested w-grass 30 6 29.4 1.7 17 Campbell et al. (2000b)
from time 0Indian Head, SK 427 2.5 675 BlC NA 10 NT f-w 15 8 28.8 2.6 26 Campbell et al. (2001a)Indian Head, SK 427 2.5 675 BlC NA 10 NT f-w 15 8 29.1 3.9 39 Campbell et al. (2001a)Indian Head, SK 427 2.5 675 BlC NA 10 NT f-w-w 15 8 29.8 –1.8 –18 Campbell et al. (2001a)Indian Head, SK 427 2.5 675 BlC NA 10 NT f-w-w 15 8 29.9 5.2 52 Campbell et al. (2001a)Indian Head, SK 427 2.5 675 BlC NA 10 NT f-w-w 15 8 28.6 4.9 49 Campbell et al. (2001a)Indian Head, SK 427 2.5 675 BlC NA 10 NT gm 15 8 32.5 –1.3 –13 Campbell et al. (2001a)Indian Head, SK 427 2.5 675 BlC NA 10 NT f-w-w-hay 15 8 33.6 0.9 9 Campbell et al. (2001a)Indian Head, SK 427 2.5 675 BlC NA 10 NT cont. w 15 8 30.8 0.0 0 Campbell et al. (2001a)Indian Head, SK 427 2.5 675 BlC NA 10 NT cont. w 15 8 34.5 2.0 20 Campbell et al. (2001a)Swift Current, SK 358 3.5 676 BC L 32 f-w-w vs. f-w 15 32 54.3 4.8 15 Campbell et al. (2001b)Swift Current, SK 358 3.5 676 BC L 32 f-w-w-w-w-w vs. f-w 15 32 54.3 4.8 15 Campbell et al. (2001b)Swift Current, SK 358 3.5 676 BC L 32 f-w-w vs. f-w-w-w-w-w 15 32 59.1 0.0 0 Campbell et al. (2001b)Indian Head, SK 427 2.5 657 BlC NA 29 inorganic fertilizer 15 12 36.3 1.6 6 Campbell et al. (1991a)Indian Head, SK 427 2.5 657 BlC NA 29 f-w-w vs. f-w 15 12 36.3 0.1 0 Campbell et al. (1991a)Indian Head, SK 427 2.5 657 BlC NA 29 f-w-w vs. f-w 15 12 37.9 0.6 2 Campbell et al. (1991a)Indian Head, SK 427 2.5 657 BlC NA 29 gm in rotation 15 12 36.4 3.1 11 Campbell et al. (1991a)Indian Head, SK 427 2.5 657 BlC NA 29 gm in rotation 15 12 36.4 3.5 12 Campbell et al. (1991a)Indian Head, SK 427 2.5 657 BlC NA 29 hay in rotation 15 12 36.4 5.8 20 Campbell et al. (1991a)Indian Head, SK 427 2.5 657 BlC NA 29 hay in rotation 15 12 36.4 5.1 18 Campbell et al. (1991a)Indian Head, SK 427 2.5 657 BlC NA 29 cont. w vs. f-w 15 12 36.3 3.3 11 Campbell et al. (1991a)Indian Head, SK 427 2.5 657 BlC NA 29 cont. w vs. f-w 15 12 37.9 4.0 14 Campbell et al. (1991a)Indian Head, SK 427 2.5 657 BlC NA 30 inorganic fertilizer 15 12 36.4 2.1 7 Campbell et al. (1991a)Indian Head, SK 427 2.5 657 BlC NA 30 straw 15 12 38.5 –0.3 –1 Campbell et al. (1991a)

368 CANADIAN JOURNAL OF SOIL SCIENCE
Table 2. Continued
Melfort, SK 506 0.8 588 BlC NA 31 f-w-w vs. f-w 15 12 62.4 –1.2 –4 Campbell et al. (1991b)Melfort, SK 506 0.8 588 BlC NA 31 gm in rotation 15 12 62.4 –0.4 –1 Campbell et al. (1991b)Melfort, SK 506 0.8 588 BlC NA 31 gm in rotation 15 12 62.4 3.7 12 Campbell et al. (1991b)Melfort, SK 506 0.8 588 BlC NA 31 cont. w vs. f-w-w 15 12 61.4 3.9 13 Campbell et al. (1991b)Melfort, SK 506 0.8 588 BlC NA 31 cont. w vs. f-w 15 12 62.4 3.0 10 Campbell et al. (1991b)Melfort, SK 506 0.8 588 BlC NA 31 inorganic fertilizer 15 12 65.3 0.1 0 Campbell et al. (1991b)Melfort, SK 506 0.8 588 BlC NA 31 hay in rotation 15 12 61.4 4.1 13 Campbell et al. (1991b)Melfort, SK 506 0.8 588 BlC NA 31 hay in rotation 15 12 61.4 5.2 17 Campbell et al. (1991b)Melfort, SK 506 0.8 588 BlC NA 31 hay in rotation 15 12 61.4 2.3 7 Campbell et al. (1991b)Melfort, SK 506 0.8 588 BlC NA 31 hay in rotation 15 12 61.2 4.7 15 Campbell et al. (1991b)Melfort, SK 506 0.8 588 BlC NA 31 hay in rotation 15 12 61.2 2.3 7 Campbell et al. (1991b)Melfort, SK 506 0.8 588 BlC NA 31 hay in rotation 15 12 61.2 0.1 0 Campbell et al. (1991b)Scott, SK 350 0.8 DBC L 24 f-can-w vs. f-can 7.5 12 35.5 –2.6 –11 Campbell et al. (1992)Scott, SK 350 0.8 DBC L 24 cont w. vs. f-can 7.5 12 35.5 –1.8 –8 Campbell et al. (1992)Scott, SK 350 0.8 DBC L 24 cont w. vs. f-can-w 7.5 12 32.9 0.8 3 Campbell et al. (1992)Swift Current, SK 358 3.5 676 BC L 10 crested w-grass vs. f-w-w 15 6 29.2 1.8 18 Curtin et al. (2000a)Swift Current, SK 358 3.5 676 BC L 10 crested w-grass vs. f-w-w 15 6 33.7 –2.7 –27 Curtin et al. (2000a)Swift Current, SK 358 3.5 676 BC L 10 crested w-grass vs. f-w-w 15 6 33.1 –2.1 –21 Curtin et al. (2000)Swift Current, SK 358 3.5 678 BC SL 8 crested w-grass 15 6 32.0 –1.0 –13 Curtin et al. (2000a)Swift Current, SK 358 3.5 678 BC SL 8 gm in rotation 15 6 30.6 0.5 6 Curtin et al. (2000b)Indian Head, SK 427 2.5 681 BlC HC 4 NT variable rotation 15 4 46.8 3.7 93 Grant and Lafond (1994)Indian Head, SK 427 2.5 681 BlC HC 4 NT variable rotation 15 4 46.8 3.9 98 Grant and Lafond (1994)Melfort, SK 411 0.3 588 BlC SiCL 25 NT f-w 15 12 77.2 12.0 48 McConkey et al. (2003)Elstow, SK 355 1 625 BlC CL 16 NT variable rotation 15 12 52.2 4.4 28 McConkey et al. (2003)Indian Head, SK 427 2 577 BlC C 8 NT variable rotation 15 12 39.5 4.1 51 McConkey et al. (2003)Canwood, SK 456 0.3 624 DGC L 12 inorganic fertilizer 30 80 89.2 3.9 32.3 Nyborg et al. (1999)Canwood, SK 456 0.3 620 BlC SL-SCL 12 inorganic fertilizer 37.5 28 114.0 –10.0 –83.3 Nyborg et al. (1998)Canwood, SK 456 0.3 620 BlC SL-SCL 12 inorganic fertilizer 37.5 28 114.0 0.0 0.0 Nyborg et al. (1998)Canwood, SK 456 0.3 620 BlC SL-SCL 12 inorganic fertilizer 37.5 28 114.0 6.0 50.0 Nyborg et al. (1998)Canwood, SK 456 0.3 620 BlC SL-SCL 12 inorganic fertilizer 37.5 28 114.0 –11.0 –91.7 Nyborg et al. (1998)Melfort, SK 506 0.8 557 BC SiCL 3 inorganic fertilizer 15 40 NA NA NA Pare et al. (1999)y
Melfort, SK 506 0.8 557 BC SiCL 3 organic fertilizer 15 40 NA NA NA Pare et al. (1999)Melfort, SK 506 0.8 557 BC SiCL 3 organic fertilizer 15 40 NA NA NA Pare et al. (1999)Ottawa, ON 846 5.9 633 MB SL 5 NT cont. c 60 16 74.8 6.0 120 Angers et al. (1997)Ottawa, ON 846 5.9 633 MB SL 5 NT cont. w 60 16 65.9 14.8 297 Angers et al. (1997)Delhi, ON 935 7.8 720 GBL SL 4 NT cont. c 60 16 30.0 –3.1 –77 Angers et al. (1997)Harrow, ON 819 8.7 673 LG CL 11 NT cont. c 60 16 82.7 –0.9 –8 Angers et al. (1997)Woodlsee, ON 875 8.7 720 HG CL 32 inorganic fertilizer 42 4 81.3 8.0 25 Gregorich et al. (1996)Woodlsee, ON 875 8.7 720 HG CL 35 legumes in rotation 70 3 115.5 14.1 40 Gregorich et al. (2001)
vs. cont. cWoodlsee, ON 875 8.7 720 HG CL 35 legumes in rotation 70 3 109.2 24.6 70 Gregorich et al. (2001)
vs. cont. cThorndale, ON 800 7.9 686 GBL SiL 15 NT c-w-s 45 1 75.1 –2.1 –13.7 VandenBygaart et al. (2002)Thorndale, ON 800 7.9 686 GBL SiL 15 NT c-w-s 45 1 76.0 –12.7 –85.0 VandenBygaart et al. (2002)Thorndale, ON 800 7.9 686 GBL SiL 15 NT c-w-s 45 1 48.8 11.6 77.4 VandenBygaart et al. (2002)Thorndale, ON 800 7.9 686 GBL SiL 15 NT c-w-s 45 1 84.1 –2.0 –13.4 VandenBygaart et al. (2002)Thorndale, ON 800 7.9 686 GBL SiL 15 NT c-w-s 45 1 62.7 –3.8 –25.5 VandenBygaart et al. (2002)Thorndale, ON 800 7.9 686 GBL SiL 15 NT c-w-s 45 1 39.8 22.0 146.5 VandenBygaart et al. (2002)Thorndale, ON 800 7.9 686 GBL SiL 15 NT c-w-s 45 1 79.1 –38.2 –254.9 VandenBygaart et al. (2002)Thorndale, ON 800 7.9 686 GBL SiL 15 NT c-w-s 45 1 88.2 –20.5 –136.4 VandenBygaart et al. (2002)Thorndale, ON 800 7.9 686 GBL SiL 15 NT c-w-s 45 1 47.4 1.9 13.0 VandenBygaart et al. (2002)Paris, ON 855 7.9 657 GBL SL 15 NT c-w-s 45 1 41.1 –1.3 –8.6 VandenBygaart et al. (2002)Paris, ON 855 7.9 657 GBL SL 15 NT c-w-s 45 1 46.7 –12.3 –82.1 VandenBygaart et al. (2002)Paris, ON 855 7.9 657 GBL SL 15 NT c-w-s 45 1 37.7 –1.5 –10.0 VandenBygaart et al. (2002)Paris, ON 855 7.9 657 GBL SL 15 NT c-w-s 45 1 36.0 –0.9 –5.8 VandenBygaart et al. (2002)Paris, ON 855 7.9 657 GBL SL 15 NT c-w-s 45 1 20.5 4.0 26.6 VandenBygaart et al. (2002)Paris, ON 855 7.9 657 GBL SL 15 NT c-w-s 45 1 42.4 0.9 5.9 VandenBygaart et al. (2002)Paris, ON 855 7.9 657 GBL SL 15 NT c-w-s 45 1 33.1 –1.9 –12.6 VandenBygaart et al. (2002)Paris, ON 855 7.9 657 GBL SL 15 NT c-w-s 45 1 30.0 0.2 1.5 VandenBygaart et al. (2002)Paris, ON 855 7.9 657 GBL SL 15 NT c-w-s 45 1 36.4 –2.2 –14.7 VandenBygaart et al. (2002)Paris, ON 855 7.9 657 GBL SL 15 NT c-w-s 45 1 21.1 12.5 83.3 VandenBygaart et al. (2002)Paris, ON 855 7.9 657 GBL SL 15 NT c-w-s 45 1 49.5 –9.5 –63.4 VandenBygaart et al. (2002)Paris, ON 855 7.9 657 GBL SL 15 NT c-w-s 45 1 31.3 7.5 50.2 VandenBygaart et al. (2002)Paris, ON 855 7.9 657 GBL SL 15 NT c-w-s 45 1 24.8 3.3 21.8 VandenBygaart et al. (2002)Paris, ON 855 7.9 657 GBL SL 15 NT c-w-s 45 1 33.3 –0.8 –5.5 VandenBygaart et al. (2002)Paris, ON 855 7.9 657 GBL SL 15 NT c-w-s 45 1 45.9 –2.5 –16.9 VandenBygaart et al. (2002)Dresden, ON 817 8.3 725 GBL CL 15 NT c-w-s 45 1 56.0 –6.1 –41.0 VandenBygaart et al. (2002)Dresden, ON 817 8.3 725 GBL CL 15 NT c-w-s 45 1 53.3 –2.0 –13.4 VandenBygaart et al. (2002)Dresden, ON 817 8.3 725 GBL CL 15 NT c-w-s 45 1 40.8 5.1 34.0 VandenBygaart et al. (2002)Dresden, ON 817 8.3 725 GBL CL 15 NT c-w-s 45 1 36.3 8.3 55.2 VandenBygaart et al. (2002)Strathroy, ON 958 7.9 681 GBL SL 15 NT c-w-s 45 1 61.6 –20.2 –134.4 VandenBygaart et al. (2002)Strathroy, ON 958 7.9 681 GBL SL 15 NT c-w-s 45 1 47.7 –0.4 –2.7 VandenBygaart et al. (2002)Strathroy, ON 958 7.9 681 GBL SL 15 NT c-w-s 45 1 43.8 –4.6 –30.5 VandenBygaart et al. (2002)Strathroy, ON 958 7.9 681 GBL SL 15 NT c-w-s 45 1 47.0 –9.1 –60.6 VandenBygaart et al. (2002)

VANDENBYGAART ET AL. — AGRICULTURAL MANAGEMENT ON SOIL CARBON 369
that the baseline or starting point for SOC was the same atboth locations in the landscape. Furthermore, all but three ofthe studies comparing SOC in native and cultivated landmade comparisons on a concentration basis, and differencesin bulk density were not accounted for. In five of the sevensites compared by Carter et al. (1998), and 11 of 15 sitescompared by Ellert and Gregorich (1996), the bulk densitywas lower in the forested sites relative to adjacent cultivat-ed soils, suggesting there can be varying effects of plowingcultivated soils on soil bulk density, which will further influ-ence SOC stock measurements.
Only two of the agricultural management studies wereside-by-side comparisons on transects; most studies wereconducted in block designs in which the comparison of SOCwas taken as a difference due to treatment. It was assumedthat this difference represented the change in SOC in a
farmer’s field that occurred as a result of a similar treatmentover the period that the study was conducted. Only threestudies involved measuring SOC levels at the beginning andend of the experiment to determine the net change. In allcases the assumption was made that the SOC was at steadystate at the start of the experiment and that any changes inSOC were due to the treatments imposed thereafter withinthe time period. We determined the rates of change of SOCfor the given treatments by dividing the difference in SOCby the number of years since the treatment was imposed. Werecognize that such changes in SOC are usually nonlinearand often approach an asymptote. However, due to thenature of most of the experimental designs, we assumed therates of change in SOC to be linear and acknowledge thatthe rates would likely decrease with time as SOCapproached a new steady state (Janzen et al. 1998).
Table 2. Continued
Strathroy, ON 958 7.9 681 GBL SL 15 NT c-w-s 45 1 38.9 –10.1 –67.5 VandenBygaart et al. (2002)Strathroy, ON 958 7.9 681 GBL SL 15 NT c-w-s 45 1 46.6 –14.3 –95.3 VandenBygaart et al. (2002)Strathroy, ON 958 7.9 681 GBL SL 15 NT c-w-s 45 1 41.1 3.0 19.7 VandenBygaart et al. (2002)Strathroy, ON 958 7.9 681 GBL SL 15 NT c-w-s 45 1 44.1 –3.9 –26.2 VandenBygaart et al. (2002)Strathroy, ON 958 7.9 681 GBL SL 15 NT c-w-s 45 1 44.2 –10.9 –72.9 VandenBygaart et al. (2002)Delhi, ON 935 7.8 710 GBL LS 6 NT cont. c 50 20 23.4 –1.3 –21.0 Wanniarachchi et al. (1999)Elora, ON 939 6.3 610 MB SiL 29 NT cont. c 50 20 72.2 –0.5 –1.7 Wanniarachchi et al. (1999)Elora, ON 939 6.3 637 MB SiL 19 NT cont. c 15 4 21.9 0.2 0.8 Winter et al. (1990)Elora, ON 939 6.3 628 MB SiL 20 NT c-w-s 40 20 81.9 6.8 34.0 Yang and Kay (2001a)Elora, ON 939 6.3 628 MB SiL 20 legumes in 40 20 81.2 4.3 21.8 Yang and Kay (2001a)
rotation vs. cont. cClinton, ON 943 7.3 642 GBL SL 19 NT c-w-s 30 4 105.1 70.1 369.2 Yang and Kay (2001b)Clinton, ON 943 7.3 642 GBL LS 19 NT c-w-s 30 6 112.9 14.7 77.4 Yang and Kay, (2001b)Clinton, ON 943 7.3 642 GBL CL 19 NT c-w-s 30 8 61.9 –4.7 –24.7 Yang and Kay, (2001b)St-Lambert, QC 1200 4 653 OG SiL 11 NT cont. c 24 12 91.3 2.7 25 Angers et al. (1993)St-Lambert, QC 1200 4 653 OG SiL 11 NT cont. c 24 12 65.9 17.3 157 Angers et al. (1995)St-Lambert, QC 1200 4 653 OG SiL 11 NT cont. c 24 12 64.9 3.8 35 Angers et al. (1995)La Pocatiere, QC 967 4.2 552 HG C 6 NT cont. barley 60 16 91.0 –20.3 –338 Angers et al. (1997)Normandin, QC 866 0.9 584 HG CL 4 NT cont. barley 60 16 71.7 –6.5 –162 Angers et al. (1997)Normandin, QC 866 0.9 584 HG SiC 3 NT cont. barley 60 16 111.9 –5.5 –182 Angers et al. (1997)Normandin, QC 866 0.9 584 HG SiC 3 NT cont. barley 60 16 111.9 2.7 90 Angers et al. (1997)Ste-Anne-de-
Bellevue, QC 557 DB SCL 6 inorganic fertilizer 20 NA 40.7 2.4 40 Liang and Mackenzie (1992)Fourchette, QC HG SL 9 organic fertilizer 15 NA NA NA NA N'dayegamire and
Angers (1993)y
Fourchette, QC HG SL 9 organic fertilizer 15 NA NA NA NA N'dayegamire and Angers (1993)
Fourchette, QC HG SL 9 organic fertilizer 15 NA NA NA NA N'dayegamire and Angers (1993)
Fourchette, QC HG SL 9 inorganic fertilizer 15 NA NA NA NA N'dayegamire and Angers (1993)
Harrington, PEI 1077 5.9 487 HFP FSL 8 NT w-barley-s 60 16 92.9 –8.0 –99 Angers et al. (1997)Charlottetown, 1077 5.9 487 GBL L 8 NT w-barley-s 60 16 44.8 –0.7 –9 Angers et al. (1997)
PEICharlottetown, 1077 5.9 487 HFP SL 3 NT cont. potato 30 20 70.7 –4.2 –141 Carter and Kunelius (1986)
PEIHarrington, PEI 1200 5.2 487 HFP FSL 5 NT barley-potato 8 18 16.6 0.5 9 Carter and Sanderson (2001)Harrington, PEI 1200 5.2 487 HFP FSL 5 NT barley-forage-potato 8 18 16.7 1.7 34 Carter and Sanderson (2001)Charlottetown, 1077 5.9 487 HFP NA 6 NT cont. c 16 4 15.2 1.9 32 Carter et al. (2002)
PEIPEI 1077 5.9 487 GL L 8 NT variable 40 20 47.4 –5.9 –74 Carter (1996)zOG = Orthic Gleysol, GBL = Gray-Brown Luvisol, HFP = Humo-Ferric Podzol, MB = Melanic Brunisol, HG = Humic Gleysol, BC = Brown Chernozem, DBC = DarkBrown Chernozem, BlC = Black Chernozem, DGC = Dark Gray Chernozem, GL = Gray Luvisol, OG = Orthic Gleysol, LG = Luvic Gleysol.ySOC in concentration only.xNT relative to CT, c = corn, cont. c = continuous corn, can. = canola, w = wheat, b = barley, h = hay, cont. w = continuous wheat, f-w = fallow-wheat rotation, f-w-w= fallow-wheat-wheat rotation, gm = green manure, c-w-s = corn-wheat-soybean in rotation; treatments “in rotation”, organic fertilizer, inorganic fertilizer and straware relative to an unamended control.wNA, not available in publication or not applicable.vCanola assumed to have similar carbon inputs relative to wheat (C. Campbell, personal communication, Agriculture and Agri-Food Canada, Ottawa, ON).uSamples taken in Ap horizon and Ap thickness and bulk density from one sample period used in calculation of SOC on an area basis.tMinimum since number of samples varied between plots.

370 CANADIAN JOURNAL OF SOIL SCIENCE
RESULTS AND DISCUSSION
Native Conversion Effects on SOCWhen native soil was converted to agricultural land therewas an average loss of 24 ± 6% of SOC based on 50 com-parisons across Canada (Table 1). In the Chernozemic soilsof the Prairie provinces, Newton et al. (1945) found thatconverting native grassland to arable land resulted in a lossof 22 ± 4% SOC, while Reinl (1984) found a loss of 24% ofthe native SOC for 72 farms in Alberta. In Ontario, Ellertand Gregorich (1996) reported that soils have lost 32 ± 9%of their original SOC across a broad range of soil types. InPodzolic soils of PEI and Quebec, there was 35% less SOCin cultivated soils relative to adjacent forests (Carter et al.1998). Most losses of SOC occured within the first decadeafter implementing annual tillage and cropping (Mann 1986;Schlesinger 1986).
Although usually attributed to the physical breakdown ofsoil aggregates due to tillage, Janzen et al. (1997) suggest-ed that the loss of SOC after plowing native land is theresult of a combination of factors when one ecosystem isreplaced with another. A major effect may be the fact thatagriculture is in essence marketing carbon; carbon in various forms is removed from agricultural lands and soldfor consumption.
However, SOC levels were not always lower in cultivat-ed soils. In three soils in Quebec there was an average of25% more SOC in one Gleysolic and two Brunisolic culti-vated soils, relative to adjacent forest land (Carter et al.(1998), and Coote and Ramsey (1983) found that a sandyloam Melanic Brunisol had 21% more SOC than an adjacentforested soil in Ottawa. Although Carter et al. (1998) did not
elaborate on the reasons for the greater SOC in the Gleysolicand Brunisolic cultivated soils, Coote and Ramsey (1983)stated that the Melanic Brunisol had had corn stoverchopped and returned to the soil annually for many years,and therefore could have had larger inputs of residue carbonthan the forest system.
Tillage Management and C StorageThe effects of tillage management on SOC were assessed in23 tillage studies with 98 treatment comparisons and 1191soil profiles (Table 2). A regression of SOC in NT versusthat in conventional tillage (CT) for all treatments acrossCanada showed no net effect of tillage on SOC (Table 3).The storage rate of SOC in NT in Canada was calculated as5 ± 16 g m–2 yr–1. This is much lower relative to that deter-mined by West and Post (2002) of 57 ±14 g m–2 yr–1 in theirglobal analysis of 93 tillage comparisons.
There was an inverse relationship between SOC contentand the effect of tillage on SOC, with gains due to adoptionof NT occurring mainly at SOC levels of less than 45 Mgha–1 (Fig. 1). The effectiveness of C storage in NT isreduced and can be negative when the background SOCcontent increases (Fig. 1). Paustian et al. (1997; Fig. 9),using data from 11 long-term studies in North Americafound a similar relationship. They speculated that the lowereffectiveness of NT in soil with higher SOC levels was dueto higher clay contents and higher soil moisture limitinggrowth potential and inputs of surface residues. However,soil erosion and redistribution over a prolonged period canalso affect SOC storage under NT. VandenBygaart et al.(2002) concluded that soils that had lost SOC through soilerosion had a high potential to gain SOC when converted
Table 3. Effect of NT on SOC in Great Groups of the Canadian System of Soil Classification (1998), for Eastern and Western Canada and for all of Canada
Net difference Relative difference Storage rate Regression Mean duration Comparisons Soil profilesGreat groupz (Mg ha–1) (%) (g C m–2 yr–1) coefficienty (yr) (n) (n) Referencesw
BC 1.6 ± 1.0 6.9 ± 3.9 13 ± 9 1.07 ± 0.05* 12.3 ± 2.3 11 223 1-4BlC 3.5 ± 1.6 8.6 ± 3.8 37 ± 16 1.06 ± 0.03*** 10.6 ± 2.4 17 236 5-8DBC 5.3 ± 3.7 14.6 ± 7.0 63 ± 24 1.16 ± 0.04* 8.0 ± 3.5 4 144 9-11GL 2.8 ± 4.1 7.6 ± 10.0 28 ± 49 1.07 ± 0.13 9.8 ± 1.5 6 212 5,12,13GBL –2.7 ± 3.6 –0.2 ± 9.8 –20 ± 24 0.90 ± 0.07** 14.4 ± 0.8 38 108 14-16HFP –1.6 ± 3.8 2.2 ± 8.2 –33 ± 71 0.93 ± 0.05* 5.4 ± 1.6 5 76 17-20HG –3.0 ± 6.2 –1.7 ± 9.8 –70 ± 101 0.95 ± 0.09 9.5 ± 4.1 10 64 16,19LG -0.9 –1.1 –9 NA 11 1 16 19OG 3.8 3.8 35 NA 11 1 76 21MB 5.5 ± 5.4 7.8 ± 8.1 90 ± 110 1.09 ± 0.11† 15.6 ± 9.1 5 36 19,22,23
Western Canada 2.9 ± 1.3 7.3 ± 2.6 32 ± 15 1.07 ± 0.02*** 11.4 ± 1.5 35 795 1-12Eastern Canada –0.1 ± 3.4 –0.1 ± 5.0 –7 ± 27 0.96 ± 0.04† 12.9 ± 1.2 63 396 13-23
Canada 0.4 ± 1.5 3.7 /- 4.0 5 ± 16 0.99 ± 0.03 12.3 ± 1.0 98 1191 1-23zGBL = Gray-Brown Luvisol, HFP = Humo-Ferric Podzol, MB = Melanic Brunisol, HG = Humic Gleysol, BC = Brown Chernozem, DBC = Dark BrownChernozem, BlC = Black Chernozem, DGC = Dark Gray Chernozem, GL = Gray Luvisol, OG = Orthic Gleysol, LG = Luvic Gleysol.yDerived by linear regression as the slope between SOC in management treatment versus the SOC in the control treatment and forced through zero.xCampbell et al. (1996a) (1), Campbell et al. (1996b) (2), Campbell et al. (1995a) (3), Larney et al. (1997) (4), Nyborg, et al. (1995) (5), Campbell et al. (2001a) (6), Grant and Lafond (1994) (7), McConkey et al. (2003) (8), Hao et al. (2001) (9), Elliott and Efetha (1999) (10), Doormar and Carefoot (1998) (11),Franzluebbers and Arshad (1996) (12), Carter (1996) (13), Yang and Kay, (2001a) (14), Wanniarachchi et al., (1999) (15), VandenBygaart et al. (2002) (16),Carter et al. (2002) (17), Carter and Sanderson 2001 (18), Angers, et al. (1997) (19), Carter and Kunelius 1986 (20), Angers et al. 1995 (21), Winter et al. 1990 (22), Yang and Kay (2001b) (23).†,*,**,*** denote coefficient significantly different than 1 at P < 0.10, P < 0.05, P < 0.01, P < 0.001 respectively.

VANDENBYGAART ET AL. — AGRICULTURAL MANAGEMENT ON SOIL CARBON 371
from CT to NT, whereas in depressional landscape positions(with high SOC from a history of soil deposition) the poten-tial to gain SOC was lower when converted to NT, withsome soils even losing SOC.
The effect of tillage on SOC (NT vs. CT) was assessedbased on soil classification (Table 3). Chernozemic soils ofthe Canadian Prairies showed a greater ability to store SOCunder NT relative to CT than other soil orders, especially inthe more humid Chernozemic Great Groups (DBC andBlC)(Table 3). Only 4 of 33 comparisons had lower SOClevels under NT than CT when the mean annual precipita-tion was less than 600 mm, and 28 of these 33 treatmentpairs were in soils of the Chernozemic order. There was amuch lower storage potential and greater uncertainty forsoils in the Gleysolic and Podzolic orders in cooler, moisterclimates (Table 3). In Humic Gleysols, in which SOC isgreater than 2.0% in the A horizon (Agriculture CanadaExpert Committee on Soil Survey 1998) SOC was general-ly lower under NT than under CT (Table 3). Angers et al.(1997) evaluated SOC storage in cool, humid climates ofeastern Canada, and concluded that there tended to be lowerSOC at or below the plow layer in NT soils than in CT soils,a trend also observed by VandenBygaart et al. (2002). Incooler, more humid climates there may be a reduction in the
rate of decomposition of crop residues that are buried aftersoil inversion by the moldboard plow (Angers et al. 1997).This may limit the ability of NT soils to store SOC in cool,moist climates, since residues are no longer buried after converting to NT, resulting in a net loss of SOC(VandenBygaart et al. 2002).
As a consequence of these trends, we subdivided thedataset based on whether the study was conducted in western or eastern Canada (i.e., Ontario-Manitoba border as boundary)(Table 3, Fig. 2). In western Canada, the rate of SOC storage in NT soils was 32 ± 15 g m–2 yr–1
(Table 3), whereas in eastern Canada the rate of storagewas –7 ± 27 g m–2 yr–1 (Table 3). These data could also besegregated based on temperature and precipitation: forwestern Canada all studies had a mean annual precipita-tion (MAP) of less than 550 mm, while eastern Canadastudies had a MAP of at least 800 mm. All but 4 of the 35comparisons showed a gain of SOC when the MAP wasless than 550 mm, whereas only 23 of 63 comparisons ineastern Canada where the MAP was greater than 800 mmshowed gains in SOC in NT. Western Canadian studieshad mean annual temperatures of 5°C or less, whereaseastern Canadian studies were mostly in areas with a MATof 4°C or greater. A number of factors may be responsible
Fig. 1. Effect of SOC in CT on the difference in SOC between NT and CT for Canadian long-term field studies. Solid line is regression fit;dashed lines are upper and lower 95% confidence bands for the regression. One outlier removed (Yang and Kay 2001b). Data from Carterand Kunelius (1986), Winter et al. (1990), Angers et al. (1993a, 1995, 1997), Grant and Lafond (1994), Campbell et al. (1995a, 1996a, b,2001a), Nyborg et al. (1995), Carter (1996), Franzluebbers and Arshad (1996), Larney et al. (1997), Dormaar and Carefoot (1998), Milleret al. (1999), Wanniarachchi et al. (1999), Carter and Sanderson (2001), Hao et al. (2001), Yang and Kay (2001a), Carter et al. (2002),VandenBygaart et al. (2002) and McConkey et al. (2003).

372 CANADIAN JOURNAL OF SOIL SCIENCE
for the apparent lower SOC storage ability of NT in east-ern Canada:1. Soils of eastern Canada are usually moldboard plowed,
and this inverts and mixes the residues deep in the soil(15–30 cm), whereas in western Canada, tillage is muchshallower (10–15 cm) and there is no inversion. In cool-
er, more moist soils of eastern Canada, aeration can belimiting at depth, reducing decomposition of the buriedresidues (Angers et al. 1997); converting to NT mayeventually lead to the decomposition of these previouslyburied crop residues (VandenBygaart et al. 2002);
2. Moisture levels near the soil surface (where residues areconcentrated in NT systems) are likely greater throughthe year in eastern Canada, thus favouring greaterdecomposition of surface crop residues;
3. Cropping systems of eastern Canada are often corn (Zeamays L.)-based, whereas in western Canada they tend tobe wheat-based. Residue quality differs in these systems,with cereals having higher lignin contents (16 to 24%)than corn (11 to 16%) (Paustian et al. 1997); higherlignin content slows decomposition of organic matter(Stevenson 1994).
4. Tillage effects on crop yield can differ between corn-based and wheat-based systems. In corn-based systemsyield effects under NT relative to CT are variable, withsome studies showing only slight improvements in yieldin NT (Hussain et al. 1999; Karunatilake et al. 2000),while others have shown negative or little effect of NT ongrain yields (Ball-Coelho et al. 1998; Linden et al. 2000).In western Canada, significant yield advantages in favourof NT in wheat-based systems have been shown to occurin the Black soil zone (Larney et al. 1994; McAndrew etal. 1994) and in Gray Luvisols (Arshad et al. 2002), withlittle or no differences between NT and CT in the drierDark Brown and Brown soil zones (Brandt 1992;McConkey et al. 1996). Greater crop yields under NT rel-ative to CT in some areas of western Canada may con-tribute to greater SOC contents in NT systems.
5. Soil organisms may vary in population and diversitybetween eastern and western Canada. For example,nightcrawler earthworms (Lumbricus terrestris L.) havehigher populations in NT soils relative to CT (Kladivkoet al. 1997; VandenBygaart et al. 1998), but they are notpresent in soils of western Canada (Clapperton et al.1997). Assimilation of surface residues into the soil bynightcrawler earthworms may enhance residue decompo-sition, thus limiting SOC storage in eastern Canadiansoils under NT.We also assessed the effect of cropping practices on the
ability of the soil to store SOC under NT (Table 4). Corn andwheat under monoculture had the highest storage rates underNT relative to CT. Although the uncertainty level is high,barley (Hordeum vulgare L.), either in rotation or growncontinuously, tended to show the lowest rates of storageunder NT, and the data suggest that it can result in a net lossof SOC (Table 4). No-till conversion in fallow-wheat sys-tems resulted in storage rates of 14 ± 13 g C m–2 yr–1. Thisis higher than the rate of 2 ± 19 g C m–2 yr–1 determined byWest and Post (2002) in their global analysis of long-termstudies, in which they suggest that C storage does not occurin wheat-fallow systems when moving from CT to NT.However, their analysis included some of the data used inthis review, suggesting that data from the Prairie Provincesskews the global data towards lower SOC storage rates. Ouranalysis of these data suggests that SOC storage can be
Fig. 2. SOC in NT relative to CT for studies conducted in (a) west-ern Canada and (b) eastern Canada. Solid line is regression; dashedline is 1:1. Outliers removed from Yang and Kay (2001b). Datafrom Carter and Kunelius (1986), Winter et al. (1990), Angers etal. (1993a, 1995, 1997), Grant and Lafond (1994), Campbell et al.(1995a, 1996a, b, 2001a), Nyborg et al. (1995), Carter (1996),Franzluebbers and Arshad (1996), Larney et al. (1997), Dormaarand Carefoot (1998), Miller et al. (1999), Wanniarachchi et al.(1999), Carter and Sanderson (2001), Hao et al. (2001), Yang andKay (2001a), Carter et al. (2002), VandenBygaart et al. (2002),McConkey et al. (2003).

VANDENBYGAART ET AL. — AGRICULTURAL MANAGEMENT ON SOIL CARBON 373
achieved, although at low rates, in wheat-fallow systemsconverted to NT in cool, semi-arid climates such as those inthe Canadian Prairies (Table 4).
Crop Management and C StorageWe compiled 87 comparisons over a total of 1669 treatmentyears from studies assessing the effect of crop rotation onSOC, with most (96%) of the comparisons located in west-ern Canada (Table 2).
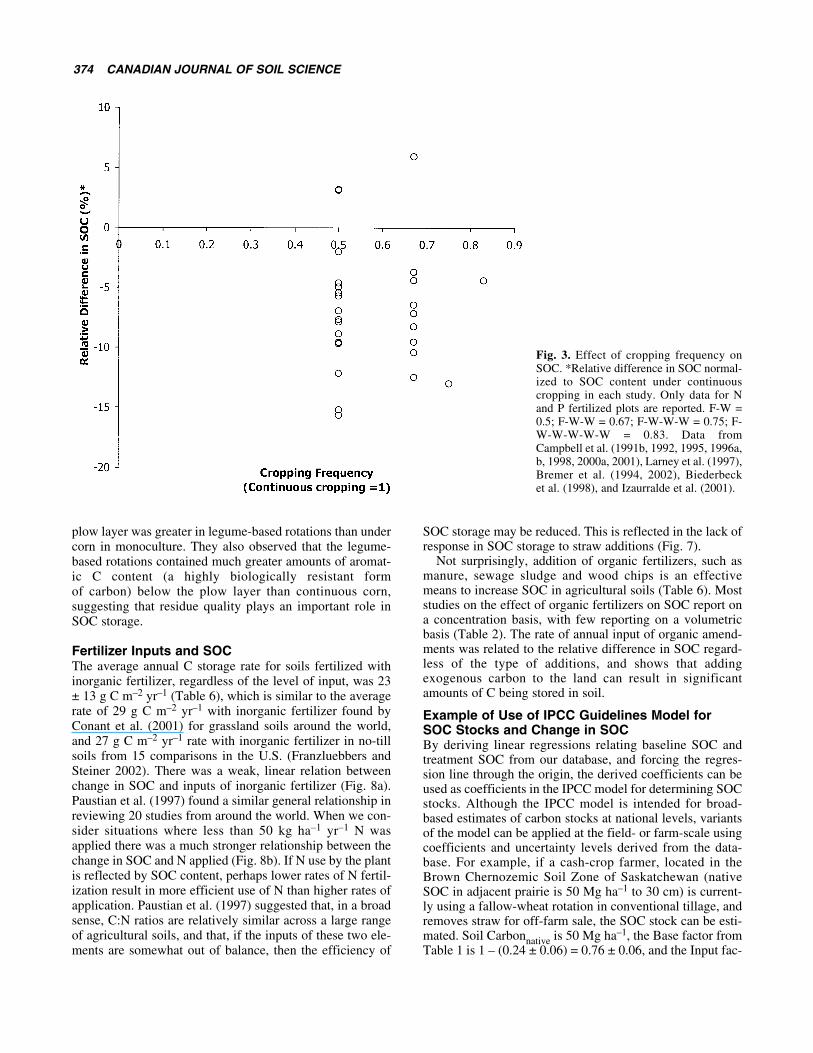
Regardless of tillage treatment, more frequent fallowingresulted in a lower potential to gain SOC (Fig. 3). When fallow was removed and wheat grown continuously, SOCwas stored at a rate of 15 ± 6 g C m–2 yr–1 (Fig. 4, Table 5).Replacement of fallow with wheat grass (Agropyron crista-tum L. or A. trichophorum) may also result in a gain in SOC(Table 5). This reflects the reduced residue C inputs duringfallow periods and increased mineralization of SOC due tohigher soil moisture in fallow (Campbell et al. 2001a).Campbell et al. (2001b) estimated that the Brown and DarkBrown Chernozems of the Prairie Provinces store 7.5 and16.5 g C m–2 yr–1 of SOC, respectively, due to reduction insummer fallow.
Replacing wheat with flax (Linum usitatissimum L.)resulted in lower SOC at a rate of –15 ± 2 g C m–2 yr–1
(Table 5). Flax contributes smaller amounts of residue withhigher lignin contents to the soil than wheat, and flax strawtends to be more easily blown off fields after harvest thanwheat straw (Campbell and Zentner 1993).
When hay is included in rotation with fallow and wheat,there is a potential to gain substantial amounts of SOC
(Fig. 5) at a rate of 22 ± 19 g C m–2 yr–1 (Table 5). Thisreflects the greater inputs of above- and below-groundresidues associated with hay (Campbell et al. 1998).
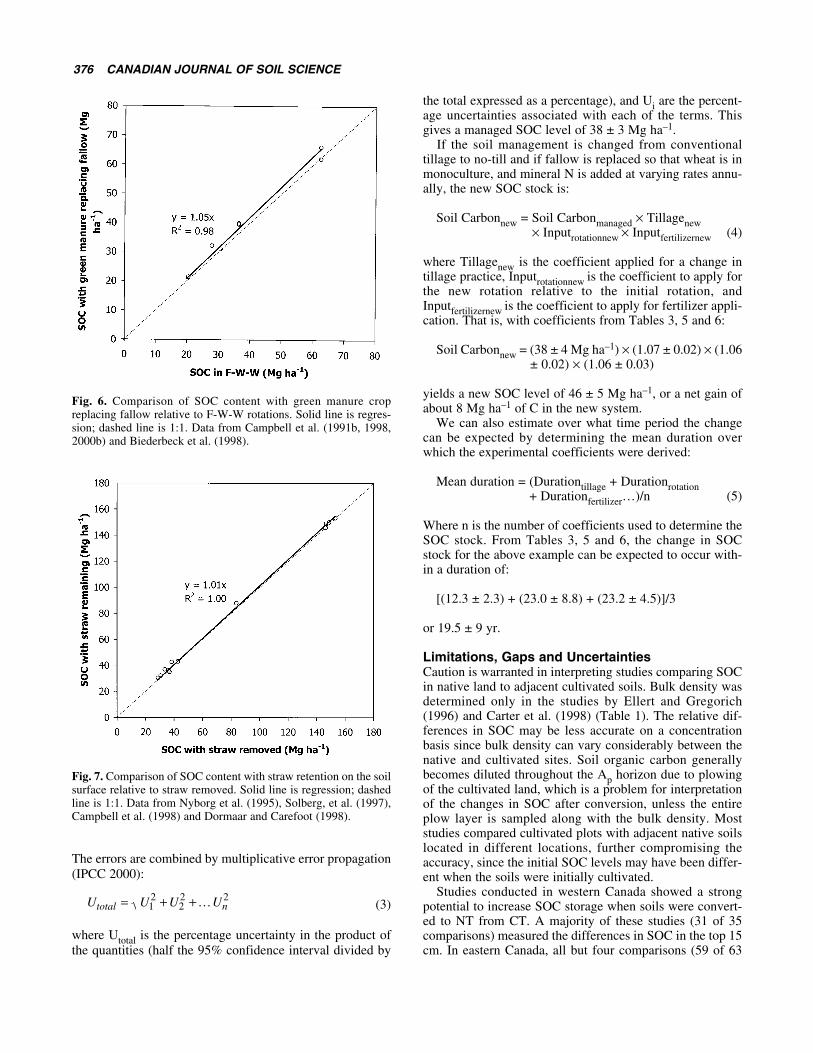
Replacement of fallow with legume “green manures” suchas lentil (Lens culinaris M.) and red clover (Trifoliumpratense L.) appears to be an effective C storage practice(Fig. 6), with rates of C storage of 15 ± 11 g C m–2 yr–1
(Table 5). Plowing legume crops as green manures into thesoil results in large inputs of mineralizable N to the soil, whichhelp to maintain higher C levels (McGill and Bailey 1999).
Replacing wheat with fall rye (Lolium perenne L.) in fal-low-wheat-wheat rotations can increase storage of SOC, butat lower rates and with high variability (10 ± 14 g C m–2 yr–1)(Table 5). Systems with fall rye (cereal) included in a crop-ping sequence make efficient use of N during the growingseason, which can increase SOC relative to fallow-springwheat systems (Campbell and Zentner 1993).
When straw is not removed, SOC storage occurs,although the gains are small (12 ± 9 g C m–2 yr–1) (Table 5,Fig. 7). Campbell et al. (1991c) suggested that the lower-than-expected effect of straw retention on SOC might bedue to roots contributing more to SOC storage than residuesin these systems, and increases in residues from straw incor-poration, which widen the C:N ratio and increase microbialdecomposition of humus in the soil.
Although the level of uncertainty is high, includinglegumes such as alfalfa (Medicago sativa L.) or red clover inrotation with corn can result in large gains in SOC contentrelative to corn grown in monoculture (44 ± 28 g C m–2 yr–1)(Table 5). Gregorich et al. (2001) found that SOC below the
Table 4. Effect of cropping practices on SOC in NT relative to CT in Canadian long-term field studies
Cropping Net Relative Storage Soil practice difference difference rate Regression Duration Comparisons profileswith NT (Mg ha–1) (%) (g C m–2 yr–1) coefficientz (yr) (n) (n) Referencesy
Wheat-fallow 1.3 ± 1.7 5.7 ± 5.9 14 ± 13 1.04 ± 0.08† 14.0 ± 3.0 10 184 1-4,6,8,10Wheat w/ fallow at 2.3 ± 3.3 7.8 ± 11.3 23 ± 33 1.07 ± 0.18 10.0 ± 0.0 4 32 6
most every 3rd yrContinuous corn 2.6 ± 3.4 3.9 ± 6.0 26 ± 40 1.05 ± 0.07 11.3 ± 4.5 10 132 15,17,19,21,22Continuous wheat 3.4 ± 3.8 8.5 ± 5.2 53 ± 80 1.14 ± 0.09* 10.7 ± 2.4 7 111 1-4,6,19Continuous barley –0.9 ± 4.5 1.7 ± 7.1 –37 ± 78 0.97 ± 0.06 8.5 ± 2.1 11 344 5,19Corn-wheat-soybean 0.0 ± 11.68 2.8 ± 23.2 –3 ± 70 1.01 ± 0.09 15.4 ± 0.9 42 76 14,16,23Barley in variable –1.6 ± 4.3 0.7 ± 7.7 –16 ± 57 0.93 ± 0.07 7.0 ± 1.7 4 68 18,19
rotationUnknownx/variable 4.5 ± 5.7 6.7 ± 8.4 79 ± 76 1.09 ± 0.08* 6.4 ± 1.8 6 172 7,9,11-13
rotation
All rotationw 0.6 ± 3.1 3.6± 6.1 7.3 ± 20.3 1.02 ± 0.06 13.4 ± 1.0 66 532 1-4,6,8-14,16, 18,19,23Monoculturev 1.2 ± 1.6 3.8 ± 2.5 2.8 ± 26.7 1.01 ± 0.04 9.8 ± 1.3 28 587 1-6,15,17,19,
21,22zDerived by linear regression as the slope between SOC in management treatment versus the SOC in the control treatment and forced through zero.yCampbell et al. (1996a) (1), Campbell et al. (1996b) (2), Campbell et al. (1995a) (3), Larney et al. (1997) (4), Nyborg, et al. (1995) (5), Campbell et al.(2001a) (6), Grant and Lafond (1994) (7), McConkey et al. (2003) (8), Hao et al. (2001) (9), Miller et al. (1999) (10), Dormaar and Carefoot (1998) (11),Franzluebbers and Arshad (1996) (12), Carter (1996) (13), Yang and Kay (2001a) (14), Wanniarachchi et al. (1999) (15), VandenBygaart et al. (2002) (16),Carter et al. (2002) (17), Carter and Sanderson (2001) (18), Angers, et al. (1997) (19), Carter and Kunelius (1986) (20), Angers et al. (1995) (21), Winter et al. (1990) (22), Yang and Kay (2001b) (23).xNot listed or unclear from publication.wIncludes green manure-w-w rotation from Campbell et al. (2001a).vIncludes Carter and Kunelius 1986 cont. potato.†,* denote coefficient significantly different than 1 at P < 0.10 and P < 0.05 respectively.
374 CANADIAN JOURNAL OF SOIL SCIENCE
plow layer was greater in legume-based rotations than undercorn in monoculture. They also observed that the legume-based rotations contained much greater amounts of aromat-ic C content (a highly biologically resistant form of carbon) below the plow layer than continuous corn, suggesting that residue quality plays an important role inSOC storage.
Fertilizer Inputs and SOCThe average annual C storage rate for soils fertilized withinorganic fertilizer, regardless of the level of input, was 23± 13 g C m–2 yr–1 (Table 6), which is similar to the averagerate of 29 g C m–2 yr–1 with inorganic fertilizer found byConant et al. (2001) for grassland soils around the world,and 27 g C m–2 yr–1 rate with inorganic fertilizer in no-tillsoils from 15 comparisons in the U.S. (Franzluebbers andSteiner 2002). There was a weak, linear relation betweenchange in SOC and inputs of inorganic fertilizer (Fig. 8a).Paustian et al. (1997) found a similar general relationship inreviewing 20 studies from around the world. When we con-sider situations where less than 50 kg ha–1 yr–1 N wasapplied there was a much stronger relationship between thechange in SOC and N applied (Fig. 8b). If N use by the plantis reflected by SOC content, perhaps lower rates of N fertil-ization result in more efficient use of N than higher rates ofapplication. Paustian et al. (1997) suggested that, in a broadsense, C:N ratios are relatively similar across a large rangeof agricultural soils, and that, if the inputs of these two ele-ments are somewhat out of balance, then the efficiency of
SOC storage may be reduced. This is reflected in the lack ofresponse in SOC storage to straw additions (Fig. 7).
Not surprisingly, addition of organic fertilizers, such asmanure, sewage sludge and wood chips is an effectivemeans to increase SOC in agricultural soils (Table 6). Moststudies on the effect of organic fertilizers on SOC report ona concentration basis, with few reporting on a volumetricbasis (Table 2). The rate of annual input of organic amend-ments was related to the relative difference in SOC regard-less of the type of additions, and shows that addingexogenous carbon to the land can result in significantamounts of C being stored in soil.
Example of Use of IPCC Guidelines Model forSOC Stocks and Change in SOCBy deriving linear regressions relating baseline SOC andtreatment SOC from our database, and forcing the regres-sion line through the origin, the derived coefficients can beused as coefficients in the IPCC model for determining SOCstocks. Although the IPCC model is intended for broad-based estimates of carbon stocks at national levels, variantsof the model can be applied at the field- or farm-scale usingcoefficients and uncertainty levels derived from the data-base. For example, if a cash-crop farmer, located in theBrown Chernozemic Soil Zone of Saskatchewan (nativeSOC in adjacent prairie is 50 Mg ha–1 to 30 cm) is current-ly using a fallow-wheat rotation in conventional tillage, andremoves straw for off-farm sale, the SOC stock can be esti-mated. Soil Carbonnative is 50 Mg ha–1, the Base factor fromTable 1 is 1 – (0.24 ± 0.06) = 0.76 ± 0.06, and the Input fac-
Fig. 3. Effect of cropping frequency onSOC. *Relative difference in SOC normal-ized to SOC content under continuouscropping in each study. Only data for Nand P fertilized plots are reported. F-W =0.5; F-W-W = 0.67; F-W-W-W = 0.75; F-W-W-W-W-W = 0.83. Data fromCampbell et al. (1991b, 1992, 1995, 1996a,b, 1998, 2000a, 2001), Larney et al. (1997),Bremer et al. (1994, 2002), Biederbecket al. (1998), and Izaurralde et al. (2001).

VANDENBYGAART ET AL. — AGRICULTURAL MANAGEMENT ON SOIL CARBON 375
tor from Table 5 is 1 – (1.01 ± 0.01) = 0.99 ± 0.01 sincestraw was removed:
Soil Carbonmanaged = 50 × [0.76 ± 0.06] × 1.0 × [0.99 ± 0.01].T
able
5. E
ffec
t of
cro
ppin
g pr
acti
ces
and
rota
tion
s on
SO
C in
Can
adia
n lo
ng-t
erm
fie
ld s
tudi
es
Net
dif
fere
nce
Rel
ativ
e di
ffer
ence
Stor
age
rate
Reg
ress
ion
Ave
rage
Dur
atio
nC
ompa
riso
nsSo
il pr
ofile
sC
ropp
ing
prac
tice
(Mg
ha–1
)(%
)(g
C m
–2yr
–1)
coef
fici
entz
(yr)
(n)
(n)
Ref
eren
ce(s
)y
Fallo
w r
emov
ed; r
epla
ced
w/ w
heat
; (i.e
. con
t. w
heat
)2.
2 ±
0.7
6.7
±2.
215
±6
1.06
±0.
02**
*23
.0 ±
8.8
1926
31-
8,10
,11
Fallo
w-w
heat
sys
tem
; rep
lace
d w
/ con
t. w
heat
gra
ssx
2.3
±0.
710
.6 ±
5.1
35 ±
191.
09 ±
0.12
7.3
±2.
63
309,
11W
heat
rep
lace
d w
/ fla
x–2
.4 ±
0.5
–7.2
±2.
1–1
5 ±
20.
93 ±
0.05
*16
±1.
63
5410
,12,
13H
ayw
(var
iabl
e fr
eq.)
w/ f
allo
w-w
heat
sys
tem
4.0
±1.
38.
7 ±
4.3
22 ±
191.
07 ±
0.04
**31
.3 ±
4.5
913
34-
6, 1
3L
egum
e gr
een
man
ure
repl
acin
g fa
llow
of
f-w
-w2.
3 ±
1.4
6.6
±4.
015
±11
1.05
±0.
04*
20.6
±8.
27
944,
6,7,
9W
heat
rep
lace
d w
/ rye
in f
allo
w w
heat
rot
atio
n2.
3 ±
3.4
7.7
±11
.110
±14
1.07
±0.
1819
.3 ±
6.6
451
8,10
,12,
13St
raw
not
rem
oved
1.3
±1.
02.
7 ±
2.4
12 ±
91.
01 ±
0.01
13.6
±4.
213
464
6,14
-16
Leg
umes
in r
otat
ion
with
cor
n vs
. con
t. co
rn14
.4 ±
11.5
13.4
±9.
844
±28
1.15
±0.
2030
.0 ±
9.8
326
17,1
8W
heat
rep
lace
d w
/ len
til in
2 y
r ro
tatio
n1.
95.
4n/
an/
aap
prox
. 20v
136
8z D
eriv
ed b
y lin
ear
regr
essi
on a
s th
e sl
ope
betw
een
SOC
in m
anag
emen
t tre
atm
ent v
ersu
s th
e SO
C in
the
cont
rol t
reat
men
t and
for
ced
thro
ugh
zero
.y C
ampb
ell e
t al.
(199
6a)
(1),
Cam
pbel
l et a
l. (1
996b
) (2
), C
ampb
ell e
t al.
(199
5) (
3), C
ampb
ell,
et a
l. (1
991b
) (4
), B
rem
er e
t al.
(199
4) (
5), C
ampb
ell e
t al.
1998
(6)
, B
iede
rbec
k et
al.
(199
8) (
7), C
ampb
ell
et a
l. (2
000a
) (8
), C
ampb
ell
et a
l. (2
000b
) (9
), C
ampb
ell
and
Zen
tner
(19
93)
(10)
, Bre
mer
et
al. (
2002
) (1
1), L
arne
y et
al.
(199
7) (
12),
Bie
derb
eck
et a
l. (1
984)
(13
), N
ybor
g et
al.
(199
5) (
14),
Sol
berg
et
al.
(199
7) (
15),
Dor
maa
r an
d C
aref
oot (
1998
) (1
6), G
rego
rich
et a
l. 20
01 (
17),
Yan
g an
d K
ay (
2001
b) (
18).
x Cut
for
hay
.w
Alf
alfa
-gra
ss m
ixtu
re c
ut f
or h
ay.
v Mea
n of
six
sam
plin
g pe
riod
s be
twee
n 10
and
30
yr a
fter
exp
erim
ent w
as in
itiat
ed.
*,**
,***
den
ote
coef
fici
ent s
igni
fica
ntly
dif
fere
nt th
an 1
at P
< 0
.05,
P<
0.0
1, P
< 0
.001
res
pect
ivel
y.
Fig. 4. Comparison of SOC content in continuous wheat relative tofallow-wheat rotation. Solid line is regression; dashed line is 1:1.Data from Campbell, et al. (1991b, 1995, 1996a, b, 1998, 2000a),Campbell and Zentner (1993), Bremer et al. (1994, 2002), Larneyet al. (1997) and Biederbeck et al. (1998).
Fig. 5. Comparison of SOC content with hay in rotation relative toF-W-W rotations. Solid line is regression; dashed line is 1:1. Datafrom Biederbeck et al. (1984), Campbell et al. (1991b, 1998) andBremer et al. (1994).
376 CANADIAN JOURNAL OF SOIL SCIENCE
The errors are combined by multiplicative error propagation(IPCC 2000):
(3)
where Utotal is the percentage uncertainty in the product ofthe quantities (half the 95% confidence interval divided by
the total expressed as a percentage), and Ui are the percent-age uncertainties associated with each of the terms. Thisgives a managed SOC level of 38 ± 3 Mg ha–1.
If the soil management is changed from conventionaltillage to no-till and if fallow is replaced so that wheat is inmonoculture, and mineral N is added at varying rates annu-ally, the new SOC stock is:
Soil Carbonnew = Soil Carbonmanaged × Tillagenew× Inputrotationnew × Inputfertilizernew (4)
where Tillagenew is the coefficient applied for a change intillage practice, Inputrotationnew is the coefficient to apply forthe new rotation relative to the initial rotation, andInputfertilizernew is the coefficient to apply for fertilizer appli-cation. That is, with coefficients from Tables 3, 5 and 6:
Soil Carbonnew = (38 ± 4 Mg ha–1) × (1.07 ± 0.02) × (1.06 ± 0.02) × (1.06 ± 0.03)
yields a new SOC level of 46 ± 5 Mg ha–1, or a net gain ofabout 8 Mg ha–1 of C in the new system.
We can also estimate over what time period the changecan be expected by determining the mean duration overwhich the experimental coefficients were derived:
Mean duration = (Durationtillage + Durationrotation+ Durationfertilizer…)/n (5)
Where n is the number of coefficients used to determine theSOC stock. From Tables 3, 5 and 6, the change in SOCstock for the above example can be expected to occur with-in a duration of:
[(12.3 ± 2.3) + (23.0 ± 8.8) + (23.2 ± 4.5)]/3
or 19.5 ± 9 yr.
Limitations, Gaps and UncertaintiesCaution is warranted in interpreting studies comparing SOCin native land to adjacent cultivated soils. Bulk density wasdetermined only in the studies by Ellert and Gregorich(1996) and Carter et al. (1998) (Table 1). The relative dif-ferences in SOC may be less accurate on a concentrationbasis since bulk density can vary considerably between thenative and cultivated sites. Soil organic carbon generallybecomes diluted throughout the Ap horizon due to plowingof the cultivated land, which is a problem for interpretationof the changes in SOC after conversion, unless the entireplow layer is sampled along with the bulk density. Moststudies compared cultivated plots with adjacent native soilslocated in different locations, further compromising theaccuracy, since the initial SOC levels may have been differ-ent when the soils were initially cultivated.
Studies conducted in western Canada showed a strongpotential to increase SOC storage when soils were convert-ed to NT from CT. A majority of these studies (31 of 35comparisons) measured the differences in SOC in the top 15cm. In eastern Canada, all but four comparisons (59 of 63
Fig. 6. Comparison of SOC content with green manure cropreplacing fallow relative to F-W-W rotations. Solid line is regres-sion; dashed line is 1:1. Data from Campbell et al. (1991b, 1998,2000b) and Biederbeck et al. (1998).
Fig. 7. Comparison of SOC content with straw retention on the soilsurface relative to straw removed. Solid line is regression; dashedline is 1:1. Data from Nyborg et al. (1995), Solberg, et al. (1997),Campbell et al. (1998) and Dormaar and Carefoot (1998).
U U U Utotal n= + +…12
22 2
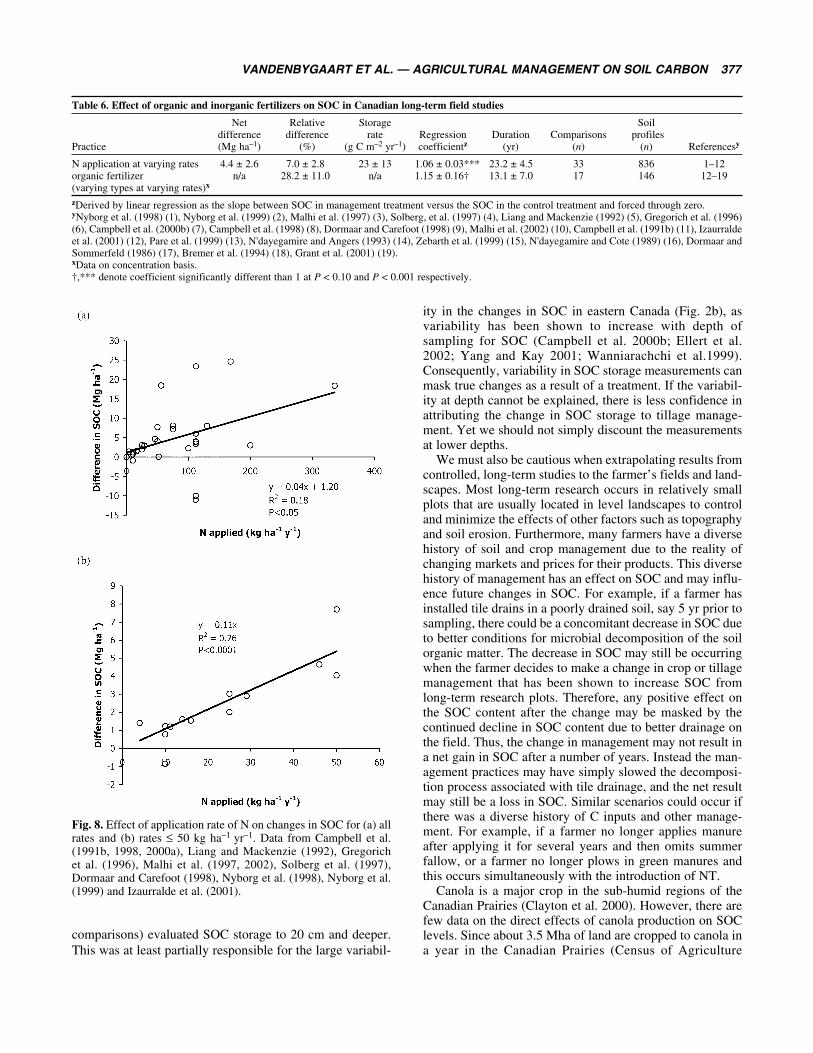
VANDENBYGAART ET AL. — AGRICULTURAL MANAGEMENT ON SOIL CARBON 377
comparisons) evaluated SOC storage to 20 cm and deeper.This was at least partially responsible for the large variabil-
ity in the changes in SOC in eastern Canada (Fig. 2b), asvariability has been shown to increase with depth of sampling for SOC (Campbell et al. 2000b; Ellert et al. 2002; Yang and Kay 2001; Wanniarachchi et al.1999).Consequently, variability in SOC storage measurements canmask true changes as a result of a treatment. If the variabil-ity at depth cannot be explained, there is less confidence inattributing the change in SOC storage to tillage manage-ment. Yet we should not simply discount the measurementsat lower depths.
We must also be cautious when extrapolating results fromcontrolled, long-term studies to the farmer’s fields and land-scapes. Most long-term research occurs in relatively smallplots that are usually located in level landscapes to controland minimize the effects of other factors such as topographyand soil erosion. Furthermore, many farmers have a diversehistory of soil and crop management due to the reality ofchanging markets and prices for their products. This diversehistory of management has an effect on SOC and may influ-ence future changes in SOC. For example, if a farmer hasinstalled tile drains in a poorly drained soil, say 5 yr prior tosampling, there could be a concomitant decrease in SOC dueto better conditions for microbial decomposition of the soilorganic matter. The decrease in SOC may still be occurringwhen the farmer decides to make a change in crop or tillagemanagement that has been shown to increase SOC fromlong-term research plots. Therefore, any positive effect onthe SOC content after the change may be masked by thecontinued decline in SOC content due to better drainage onthe field. Thus, the change in management may not result ina net gain in SOC after a number of years. Instead the man-agement practices may have simply slowed the decomposi-tion process associated with tile drainage, and the net resultmay still be a loss in SOC. Similar scenarios could occur ifthere was a diverse history of C inputs and other manage-ment. For example, if a farmer no longer applies manureafter applying it for several years and then omits summerfallow, or a farmer no longer plows in green manures andthis occurs simultaneously with the introduction of NT.
Canola is a major crop in the sub-humid regions of theCanadian Prairies (Clayton et al. 2000). However, there arefew data on the direct effects of canola production on SOClevels. Since about 3.5 Mha of land are cropped to canola ina year in the Canadian Prairies (Census of Agriculture
Table 6. Effect of organic and inorganic fertilizers on SOC in Canadian long-term field studies
Net Relative Storage Soildifference difference rate Regression Duration Comparisons profiles
Practice (Mg ha–1) (%) (g C m–2 yr–1) coefficientz (yr) (n) (n) Referencesy
N application at varying rates 4.4 ± 2.6 7.0 ± 2.8 23 ± 13 1.06 ± 0.03*** 23.2 ± 4.5 33 836 1–12organic fertilizer n/a 28.2 ± 11.0 n/a 1.15 ± 0.16† 13.1 ± 7.0 17 146 12–19(varying types at varying rates)x
zDerived by linear regression as the slope between SOC in management treatment versus the SOC in the control treatment and forced through zero.yNyborg et al. (1998) (1), Nyborg et al. (1999) (2), Malhi et al. (1997) (3), Solberg, et al. (1997) (4), Liang and Mackenzie (1992) (5), Gregorich et al. (1996)(6), Campbell et al. (2000b) (7), Campbell et al. (1998) (8), Dormaar and Carefoot (1998) (9), Malhi et al. (2002) (10), Campbell et al. (1991b) (11), Izaurraldeet al. (2001) (12), Pare et al. (1999) (13), N'dayegamire and Angers (1993) (14), Zebarth et al. (1999) (15), N'dayegamire and Cote (1989) (16), Dormaar andSommerfeld (1986) (17), Bremer et al. (1994) (18), Grant et al. (2001) (19).xData on concentration basis.†,*** denote coefficient significantly different than 1 at P < 0.10 and P < 0.001 respectively.
Fig. 8. Effect of application rate of N on changes in SOC for (a) allrates and (b) rates ≤ 50 kg ha–1 yr–1. Data from Campbell et al.(1991b, 1998, 2000a), Liang and Mackenzie (1992), Gregorichet al. (1996), Malhi et al. (1997, 2002), Solberg et al. (1997),Dormaar and Carefoot (1998), Nyborg et al. (1998), Nyborg et al.(1999) and Izaurralde et al. (2001).

378 CANADIAN JOURNAL OF SOIL SCIENCE
2001), there is a need to characterize the effects of canola onSOC dynamics and storage.
CONCLUSIONSManagement of soils in Canadian agricultural systems has asignificant effect on SOC storage. However, the effective-ness of different management practices varies across thecountry, and under certain management conditions. Forexample, conversion to no-till from conventional tillage wasmost effective in increasing C storage in the Chernozemicsoil zones of the Canadian Prairies, but did not increaseSOC storage in moister soils of eastern Canada, suggestingthat climate affects the ability of soils to store SOC underNT. Replacing fallow with wheat generally resulted in anincrease in SOC storage, but replacement with flax canresult in a net loss in SOC. Including hay in rotation withwheat was an effective practice for increasing SOC storage.Addition of inorganic and organic fertilizers generallyresulted in an increase in SOC, while straw removal did notaffect SOC levels.
Developing a database of studies from Canada allowed usto derive coefficients that could be used in the IPCC modelfor soil C stocks, along with uncertainty levels in the esti-mates. Using a modified version of the IPCC model, theSOC response to changes in management practices within agiven system was estimated.
ACKNOWLEDGEMENTSThe Model Farm Program for Canadian Agriculture projectprovided funding for this work. We thank Con Campbell forhis thorough review and recommendations that greatlyimproved the manuscript.
Agriculture Canada Expert Committee on Soil Survey. 1998.The Canadian system of soil classification. 3rd ed. NRC ResearchPress, Ottawa, ON. Publ. 1646, 187 pp.Angers, D. A., Bissonnette, N., Legere, A. and Samson, N. 1993.Microbial and biochemical changes induced by rotation and tillagein a soil under barley production. Can. J. Soil Sci. 73: 39–50.Angers, D. A., Bolinder, M. A., Carter M. R., Gregorich, E. G.,Voroney, R. P., Drury, C. F., Liang, B. C., Simard, R. R.,Donald, R. G., Beyaert, R. P. and Martel, J. 1997. Impact oftillage practices on organic carbon and nitrogen storage in coolhumid soils of eastern Canada. Soil Tillage Res. 41: 191–201.Angers, D. A., Voroney, R. P. and Cote, D. 1995. Dynamics ofsoil organic matter and corn residues affected by tillage practices.Soil Sci. Soc. Am. J. 59: 1311–1315.Arshad, M. A., Soon, Y. K. and Azooz, R. H. 2002. Modified no-till and crop sequence effects on spring wheat production in north-ern Alberta, Canada. Soil Tillage Res. 65: 29–36.Ball-Coelho, B. R., Roy, R. C. and Swanton, C. J. 1998. Tillagealters corn root distribution in coarse-textured soils. Soil TillageRes. 45: 237–249.Biederbeck, V. O., Campbell, C. A. and Zentner, R. P. 1984.Effect of crop rotation and fertilization on some biological proper-ties of a loam in southwestern Saskatchewan. Can. J. Soil Sci. 64:355–367.Biederbeck, V. O., Campbell, C. A., Rasiah, V., Zentner, R. P.and Wen, G. 1998. Soil quality attributes as influenced by annuallegumes used as green manures. Soil Biol. Biochem. 30(8/9):1177–1185.
Brandt, S. A. 1992. Zero vs. conventional tillage and their effectson crop yield and soil moisture. Can. J. Plant Sci. 72: 679–688.Bremer, E., Janzen, H. H. and Johnston, A. M. 1994. Sensitivityof total, light fraction and mineralizable organic matter to manage-ment practices in a Lethbridge soil. Can. J. Soil Sci. 74: 131–138.Bremer, E., Janzen, H. H. and McKenzie, R. H. 2002. Short-term impact of fallow frequency and perennial grass on soil organ-ic carbon in a Brown Chernozem in southern Alberta. Can. J. SoilSci. 82: 481–488.Campbell, C. A. and Zentner, R. P. 1993. Soil organic matter asinfluenced by crop rotations and fertilization. Soil Sci. Soc. Am. J.57: 1034–1040.Campbell, C. A., Biederbeck, V. O., Zentner, R. P. andLaFond, G. P. 1991a. Effect of crop rotations and cultural prac-tices on soil organic matter, microbial biomass and respiration in athin Black Chernozem. Can. J. Soil Sci. 71: 363–376.Campbell, C. A., Bowren, K. E., Schnitzer, M., Zentner, R. P.and Townley-Smith, L. 1991b. Effect of crop rotations and fertil-ization on soil organic matter and some biochemical properties ofa thick Black Chernozem. Can. J. Soil Sci. 71: 377–387.Campbell, C. A., Brandt, S. A., Biederbeck, V. O., Zentner, R.P. and Schnitzer, M. 1992. Effect of crop rotations and rotationphase on characteristics of soil organic matter in a Dark BrownChernozemic soil. Can. J. Soil Sci. 72: 403–416.Campbell, C. A., Lafond, G. P., Zentner, R. P. and Biederbeck,V. O. 1991c. Influence of fertilizer and straw baling on soil organ-ic matter in a thin Black Chernozem in Western Canada. Soil Biol.Biochem. 23: 443–446.Campbell, C. A., McConkey, B. G., Zentner, R. P., Dyck, F. B.,Selles, F. and Curtin, D. 1995. Carbon sequestration in a BrownChernozem as affected by tillage and rotation. Can. J. Soil Sci. 75:449–458.Campbell, C. A., McConkey, B. G., Zentner, R. P., Selles, F.and Curtin, D. 1996a. Long-term effects of tillage and crop rota-tions on soil organic C and total N in a clay soil in southwesternSaskatchewan. Can. J. Soil Sci. 76: 395–401.Campbell, C. A., McConkey, B. G., Zentner, R. P., Selles, F.and Curtin, D. 1996b. Tillage and crop rotation effects on soilorganic C and N in a coarse-textured Typic Haploboroll in south-western Saskatchewan. Soil Tillage Res. 37: 3–14.Campbell, C. A., Selles, F., LaFond, G. P., McConkey, B. G. andHahn, D. 1998. Effect of crop management on C and N in long-termcrop rotations after adopting no-tillage management: Comparison ofsoil sampling strategies. Can. J. Soil Sci. 78: 155–162.Campbell, C. A., Selles, F., LaFond, G. P. and Zentner, R. P.2001a. Adopting zero tillage management: impact on soil C and Nunder long-term crop rotations in a thin Black Chernozem. Can. J.Soil Sci. 81: 139–148.Campbell, C. A., Zentner, R. P., Liang, B.-C., Roloff, G.,Gregorich, E. G. and Blomert B. 2000a. Organic C accumulationin soil over 30 years in semiarid southwestern Saskatchewan —Effect of crop rotations and fertilizers. Can. J. Soil Sci. 80: 179–192.Campbell, C. A., Zentner, R. P., Selles, F., Biederbeck, V. O.,McConkey, B. G., Blomert, B. and Jefferson, P. G. 2000b.Quantifying short-term effects of crop rotations on soil organiccarbon in southwestern Saskatchewan. Can. J. Soil Sci. 80:193–202. Campbell, C. A., Zentner, R. P., Selles, F., Liang, B. C. andBlomert, B. 2001b. Evaluation of a simple model to describe car-bon accumulation in a Brown Chernozem under varying fallowfrequency. Can. J. Soil Sci. 81: 383–394.Carter, M. R. 1996. Characterization of soil physical propertiesand organic matter under long-term primary tillage in a humid cli-mate. Soil Tillage Res. 38: 251–263.

VANDENBYGAART ET AL. — AGRICULTURAL MANAGEMENT ON SOIL CARBON 379
Carter, M. R. and Kunelius, H. T. 1986. Comparison of tillageand direct drilling for Italian ryegrass on the properties of a finesandy loam soil. Can. J. Soil Sci. 66: 197–208.Carter, M. R. and Sanderson, J. B. 2001. Influence of conserva-tion tillage and rotation length on potato productivity, tuber diseaseand soil quality parameters on a fine sandy loam in eastern Canada.Soil Tillage Res. 63: 1–13.Carter, M. R., Gregorich, E. G., Angers, D. A., Donald, R. G.and Bolinder, M. A. 1998. Organic C and N storage, and organicC fractions, in adjacent cultivated and forested soils of easternCanada. Soil Tillage Res. 47: 253–261.Carter, M. R., Sanderson, J. B., Ivany, J. A. and White, R. P.2002. Influence of rotation and tillage on forage maize productivi-ty, weed species, and soil quality of a fine sany loam in the cool-humid climate of Atlantic Canada. Soil Tillage Res. 67: 85–98.Clapperton, M. J., Miller, J. J., Larney, F. J. and Lindwall, C.W. 1997. Earthworm populations as affected by long-term tillagepractices in southern Alberta, Canada. Soil Biol. Biochem. 29:631–633.Clayton, G., Turkington, K., Harker, N., O’Donovan, J. andJohnston, A. 2000. High yielding canola production. Better Crops.84: 26–27.Conant, R. T., Paustian, K. and Elliott, E. T. 2001. Grasslandmanagement and conversion into grassland: effects on soil carbon.Ecol. Appl. 11: 343–355.Coote, D. R. and Ramsey, J. F. 1983. Quantification of the effectsof over 35 years of intensive cultivation on four soils. Can. J. SoilSci. 63: 1–14.Curtin, D., Selles, F., Wang, H., Zentner, R. P. and Campbell,C. A. 2000a. Restoring organic matter in cultivated, semiarid soilusing crested wheatgrass. Can. J. Soil Sci. 80: 429–435.Curtin, D., Wang, H., Selles, F., Zentner, R. P., Biederbeck, V.O. and Campbell, C. A. 2000b. Legume green manure as partialfallow replacement in semiarid Saskatchewan: Effect on carbonfluxes. Can. J. Soil Sci. 80: 499–505.Dormaar, J. F. and Carefoot, J. M. 1998. Effect of straw man-agement and nitrogen fertilizer on selected soil properties as poten-tial soil quality indicators of an irrigated Dark Brown Chernozem.Can. J. Soil Sci. 78: 511–517.Dormaar, J. F. and Sommerfeldt, T. G. 1986. Effect of excessfeedlot manure on chemical constituents of soil under non-irrigat-ed and irrigated management. Can. J. Soil Sci. 66: 303–314.Doughty, J. L., Cook, F. D. and Warder, F. G. 1954. Effect ofcultivation on the organic matter and nitrogen of Brown soils. Can.J. Soil Sci. 34: 406–411.Ellert, B. H. and Gregorich, E. G. 1996. Storage of carbon, nitro-gen and phosphorus in cultivated and adjacent forested soils ofOntario. Soil Sci. 161: 587–604.Ellert, B. H., Janzen, H. H. and McConkey, B. G. 2001.Measuring and comparing soil carbon storage. Pages 131–146 in R.Lal, J.M., Kimble, R.F. Follett, and B.A. Stewart, eds. Assessmentmethods for soil carbon. Lewis Publishers, Boca Raton, FL. Ellert, B. H., Janzen, H. H. and Entz, T. 2002. Assessment of amethod to measure temporal changes in soil carbon storage. SoilSci. Soc. Am. J. 66: 1687–1695.Elliott, J. A. and Efetha, A. A. 1999. Influence of tillage andcropping system on soil organic matter, structure and inflitration ina rolling landscape. Can. J. Soil Sci. 79: 457–463.Environment Canada 2002. Canadian daily climate data temper-ature and precipitation. Environment Canada, Climate and WaterSystems Branch, Downsview, ON. [CD Rom Database].Franzluebbers, A. J. and Arshad, M. A. 1996. Soil organic mat-ter pools with conventional and zero tillage in a cold, semiarid cli-mate. Soil Tillage Res. 39: 1–11.
Franzluebbers, A. J. and Steiner, J. L. 2002. Climatic influenceson soil organic carbon storage with no tillage. Pages 71–86 in J.MKimble, R. Lal, and R.F. Follett, eds. Agricultural practices andpolicies for carbon sequestration in soil. Lewis Publishers, CRCPress, Boca Raton, FL.Grant , C. A. and Lafond, G. P. 1994. The effects of tillage sys-tems and crop rotations on soil chemical properties of a BlackChernozemic soil. Can. J. Soil Sci. 74: 301–306.Grant, R. F., Juma, N. G., Robertson, J. A., Izaurralde, R. C.and McGill, W. B. 2001. Long-term changes in soil carbon underdifferent fertilizer, manure and rotation: Testing the mathematicalmodel ecosys with data from the Breton Plots. Soil Sci. Soc. Am.J. 65: 205–214.Gregorich, E. G., Ellert, B. H., Drury, C. F. and Liang, B. C.1996. Fertilization effects on soil organic matter turnover and cornresidue C storage. Soil Sci. Soc. Am. J. 60: 472–476.Gregorich, E. G., Drury, C. F. and Baldock, J. A. 2001.Changes in soil carbon under long-term maize in monculture andlegume-based rotation. Can. J. Soil Sci. 81: 21–31.Hao, X., Chang, C. and Lindwall, C. W. 2001. Tillage and cropsequence effects on organic carbon and total nitrogen content in anirrigated Alberta soil. Soil Tillage Res. 62: 167–169.Hussain, I., Olson, K. R. and Ebelhar, S. A. 1999. Impacts oftillage and no-till on production of maize and soybean on an erod-ed Illinois silt loam soil. Soil Tillage Res. 52: 37–49.Intergovernmental Panel on Climate Change. 1997. Revised1996 IPCC Guidelines for National Greenhouse Gas InventoriesReference Manual. 74 pp.Intergovernmental Panel on Climate Change. 2000. Good prac-tice guidance and uncertainty management in national greenhousegas inventories. [Online] Available: http://www.ipcc-nggip.iges.or.jp/public/gp/gpgaum.html [12 May 2003].Izaurralde, R. C., McGill, W. B., Robertson, J. A., Juma, N. G.and Thurston, J. J. 2001. Carbon balance of the Breton classicalplots over half a century. Soil Sci. Soc. Am. J. 65: 431–441.Janzen, H. H., Campbell, C. A., Gregorich, E. G. and Ellert, B.H. 1997. Soil carbon dynamics in Canadian Agroecosystems.Pages 57–80 in R. Lal, J.M. Kimble, R.F. Follet, and B.A. Stewart,eds. Soil processes and the carbon cycle/Advances in soil science.CRC Press, Boca Raton, FL.Janzen, H. H., Campbell, C. A., Izaurralde, R. C., Ellert, B. H.,Juma, N., McGill, W. B. and Zentner, R. P. 1998. Managementeffects on soil C storage on the Canadian prairies. Soil Tillage Res.47: 181–195.Karunatilake, U., van Es, H. M. and Schindelbeck, R. R. 2000.Soil and maize response to plow and no-tillage after alfalfa-to-maize conversion on a clay loam soil in New York. Soil TillageRes. 55: 31–42.Kladivko, E. J., Akhouri, N. M. and Weesies, G. 1997.Earthworm populations and species distribution under no-till andconventional tillage in Indiana and Illinois. Soil Biol. Biochem. 29:613–615.Larney, F. J., Bremer, E., Janzen, H. H., Johnston, A. M. andLindwall, C. W. 1997. Changes in total, mineralizable, and light fraction soil organic matter with cropping and tillage intensi-ties in semiarid southern Alberta, Canada. Soil Tillage Res. 42:229–240.Larney, F. J., Lindwall, C. W., Izaurralde, R. C. and Moulin,A. P. 1994. Tillage systems for soil and water conservation. Pages305–328 in M. R. Carter, ed. Conservation tillage in temperateagroecosystems. Lewis Publishers, Boca Raton, FL.Liang, B. C. and Mackenzie, A. F. 1992. Changes in soil organ-ic carbon and nitrogen after six years of corn production. Soil Sci.153: 307–313.

380 CANADIAN JOURNAL OF SOIL SCIENCE
Linden, D. R., Clapp, C. E. and Dowdy, R. H. 2000. Long termcorn grain and stover yields as a function of tillage and residueremoval in east central Minnesota. Soil Tillage Res. 56: 167–174.Malhi, S. S., Harapiak, J. T., Nyborg, M., Gill, K. S. and Flore,N. A. 2002. Autumn and spring applications of ammonium nitrateand urea to bromegrass influence total and light fraction organic Cand N in a thin Black Chernozem. Can. J. Soil Sci. 82: 211–217.Malhi, S. S., Nyborg, M., Harapiak, J. T., Heier, K. and Flore,N. A. 1997. Increasing organic C and N in soil under bromegrasswith long-term N fertilization. Nutr. Cycl. Agroecosyst. 49:255–260.Mann, L. K. 1986. Changes in soil carbon storage after cultiva-tion. Soil Sci. 142: 279–288.Martel, Y. A. and Deschenes, J. M. 1976. Les effets de la miseen culture et de la prairies prolongée sur le carbone, l’azote et lastructure de quelques sols du Québec. Can. J. Soil Sci. 56:373–383.Martel, Y. A. and Paul, E. A. 1974. Effects of cultivation on theorganic matter of grassland soils as determined by fractionationand radiocarbon dating. Can. J. Soil Sci. 54: 419–426.McAndrew, D. W., Fuller, L. G. and Wetter, L. O. 1994. Grainand straw yields of barley under farm tillage systems in northeast-ern Alberta. Can. J. Plant. Sci. 74: 713–722.McConkey, B. G., Campbell, C. A., Zentner, R. P., Dyck, F. B.and Selles, F. 1996. Long-term tillage effects on spring wheat pro-duction on three soil textures in the Brown soil zone. Can. J. SoilSci. 76: 747–756.McConkey, B. G., Liang, B. C., Campbell, C. A., Curtin, D.,Moulin, A., Brandt, S. A. and Lafond, G. P. 2003. Crop rotationand tillage system impact on carbon sequestration in CanadianPrairie soils. Soil Tillage Res. (in press).McGill, W. B. and Bailey, V. L. 1999. The state of soil organicmatter on the Canadian Prairies 1983–1999. Report for PFRA. 69 pp.Miller, J. J., Larney, F. J. and Lindwall, C. W. 1999. Physicalproperties of a Chernozemic clay loam soil under conventionaltillage and no-till. Can. J. Soil Sci. 79: 325–331.N’Dayegamiye, A. and Angers, D. A. 1993. Organic matter char-acteristics and water-stable aggregation of a sandy loam soil after9 years of wood residue applications. Can. J. Soil Sci. 73: 115–122.N’Dayegamiye, A. and Cote, D. 1989. Effect of long-term pigslurry and solid cattle manure application on soil chemical and bio-logical properties. Can. J. Soil Sci. 69: 39–47.Newton, J. D., Wyatt, F. A. and Brown, A. L. 1945. Effects ofcultivation and cropping on the chemical composition of somewestern Canadian soils: Part III. Sci. Agric. 25: 718–737.Nyborg, M., Malhi, S. S., Solberg, E. D. and Izaurralde, R. C.1999. Carbon storage and light fraction C in a grassland Dark GrayChernozem soil as influenced by N and S fertilization. Can. J. SoilSci. 79: 317–320.Nyborg, M., Molina-Ayala, M., Solberg, E. D., Izaurralde, R.C., Malhi, S. S. and Janzen, H. H. 1998. Carbon storage in grass-land soils as related to N and S fertilizers. Pages 421–432 in R. Lal,J. M. Kimble, R. F. Follet, and B. A. Stewart, eds. Management ofcarbon sequestration in soil/Advances in soil science CRC Press,Boca Raton, FL.Nyborg, M., Solberg, E. D., Mahli, S. S. and Izaurralde, R. C.1995. Fertilizer N, crop residue and tillage alter soil C and N con-tent in a decade. Pages 93–100 in R.Lal, J. Kimble, E. Levine, andB. A. Stewart, eds. Soil management and the greenhouse effect.Lewis Publishers, CRC Press, Boca Raton, FL.
Pare, T., Dinel, H., Moulin, A. P. and Townley-Smith, L. 1999.Organic matter quality and structural stability of a BlackChernozemic soil under different manure and tillage practices.Geoderma 91: 311–326.Paustian, K., Collins, H. P. and Paul, E. A. 1997. Managementcontrols on soil carbon. Pages 15–50 in E. A Paul, K. Paustian, E.T. Elliott, and C. V. Cole, eds. Soil organic matter in temperateagroecosystems: Long-term experiments in North America. CRCPress, Boca Raton, FL.Pennock, D. J. and van Kessel, C. 1997. Effect of agriculture andof clear-cut forest harvest on landscape-scale soil organic carbonstorage in Saskatchewan. Can. J. Soil Sci. 77: 211–218.Reinl, E. 1984. Changes in soil organic carbon due to agriculturalland use in Alberta. M.Sc. Thesis. University of Alberta.Edmonton, AB.Schlesinger, W. H. 1986. Changes in soil carbon storage and asso-ciated properties with disturbance and recovery. Pages 194–220 inJ. R. Trabalka and D. E. Reichle, eds. The changing carbon cycle— A global analysis. Springer-Verlag, New York, NY.Solberg, E. D., Nyborg, M., Izaurralde, R. C., Malhi, S. S.,Janzen, H. H. and Molina-Ayala, M. 1997. Carbon storage insoils under continuous grain cropping: N fertilizer and straw. Pages235–254 in R. Lal, J. Kimble, E. Levine, and B. A. Stewart, eds.Management of carbon sequestration in soil. Lewis Publishers,CRC Press, Boca Raton, FL.Stevenson, F. J. 1994. Humus chemistry. 2nd ed. John Wiley &Sons, Inc., New York, NY. 512 pp.Tiessen, H., Stewart, J. W. B. and Bettany, J. R. 1982.Cultivation effects on the amounts and concentration of carbon,nitrogen, and phosphorus in grassland soils. Agron. J. 74: 831–835.VandenBygaart, A. J., Protz, R., Tomlin, A. D. and Miller, J. J.1998. 137Cs as an indicator of earthworm activity in soils. Appl.Soil Ecol. 9: 167–173.VandenBygaart, A. J., Yang, X. M., Kay, B. D. and Aspinall, J.D. 2002. Variability in carbon sequestration potential in no-till soillandscapes of southern Ontario. Soil Tillage Res. 65: 231–241.Wanniarachchi, S. D., Voroney, R. P., Vyn, T. J., Beyaert, R.P. and MacKenzie, A. F. 1999. Tillage effects on the dynamics oftotal and corn-residue-derived soil organic matter in two southernOntario soils. Can. J. Soil Sci. 79: 473–480.West, T. O and Post, W. M. 2002. Soil organic carbon sequestra-tion rates by tillage and crop rotation: A global data analysis. SoilSci. Soc. Am. J. 66: 1930–1946.Winter, J. P., Voroney, R. P. and Ainsworth, D. A. 1990. Soilmicroarthropods in long-term no-tillage and conventional tillagecorn production. Can. J. Soil Sci. 70: 641–653.Yang, X. M. and Kay, B. D. 2001a. Impacts of tillage practices ontotal, loose- and occluded-particulate, and humified organic carbonfractions in soils within a field in southern Ontario. Can. J. Soil Sci.81: 149–156.Yang, X. M. and Kay, B. D. 2001b. Rotation and tillage effectson soil organic carbon sequestration in a typic Hapludalf in south-ern Ontario. Soil Tillage Res. 59: 107–114Zebarth, B. J., Neilson, G. H., Hogue, E. and Neilson, D. 1999.Influence of organic waste amendments on selected soil physicaland chemical properties. Can. J. Soil Sci. 79: 501–504.