
Estimating the “memory of landscape” to predict changes in archaeological settlement patterns
17
Estimating the “memory of landscape” to predict changes in archaeological settlement patterns Philip Verhagen Laure Nuninger Frédérique Bertoncello Angelo Castrorao Barba CAA2015 Siena Session 5D – 2 April 2015
Transcript of Estimating the “memory of landscape” to predict changes in archaeological settlement patterns
Estimating the “memory of landscape” to predict
changes in archaeological settlement patterns
Philip VerhagenLaure Nuninger
Frédérique BertoncelloAngelo Castrorao Barba
CAA2015 SienaSession 5D – 2 April 2015
VU University Amsterdam
THE ROLE OF SOCIO-ENVIRONMENTAL DYNAMICS
2
• settlement patterns are dynamic with creations, abandonments, reoccupations …
• where did communities settle during the past ?
• what drives their choices? – the environmental conditions? – the landscape’s potential for movement or control
of territories?– socio-economic considerations? – all of them?
analysing the settling conditions of archaeological sites can help to assess the factors that play a role in the transformations of ancient settlement systems
VU University Amsterdam
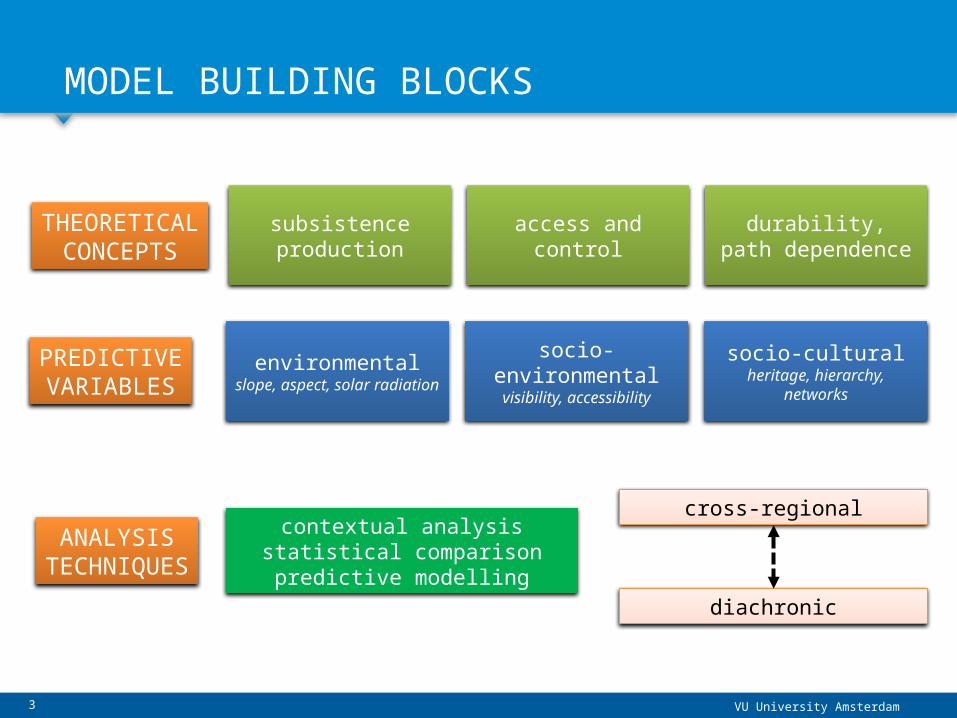
socio-environmental
visibility, accessibility
environmentalslope, aspect, solar radiation
socio-culturalheritage, hierarchy,
networks
PREDICTIVEVARIABLES
subsistence production
access and control
durability, path dependence
THEORETICALCONCEPTS
contextual analysisstatistical comparisonpredictive modelling
cross-regional
diachronic
ANALYSISTECHNIQUES
MODEL BUILDING BLOCKS
3
VU University Amsterdam
THE “MEMORY OF LANDSCAPE”
4
• where people settle, they manage the landscape– clearing– parcellation– soil improvement
• managed landscapes can be attractive to new settlement– even when they have been abandoned for some time
• the “memory of landscape” may therefore be a predictive variable
VU University Amsterdam
CALCULATING HERITAGE
AB
CD
E
300 400 5002001001-100-200-300-400-500
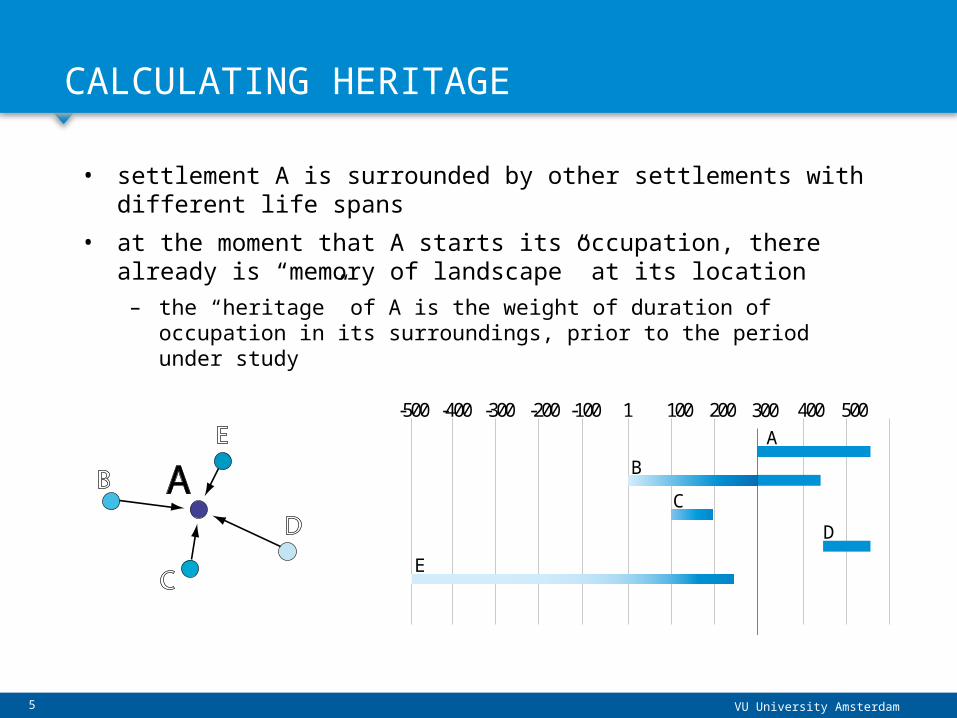
• settlement A is surrounded by other settlements with different life spans
• at the moment that A starts its occupation, there already is “memory of landscape” at its location– the “heritage” of A is the weight of duration of
occupation in its surroundings, prior to the period under study
5
VU University Amsterdam
TEMPORAL WEIGHT
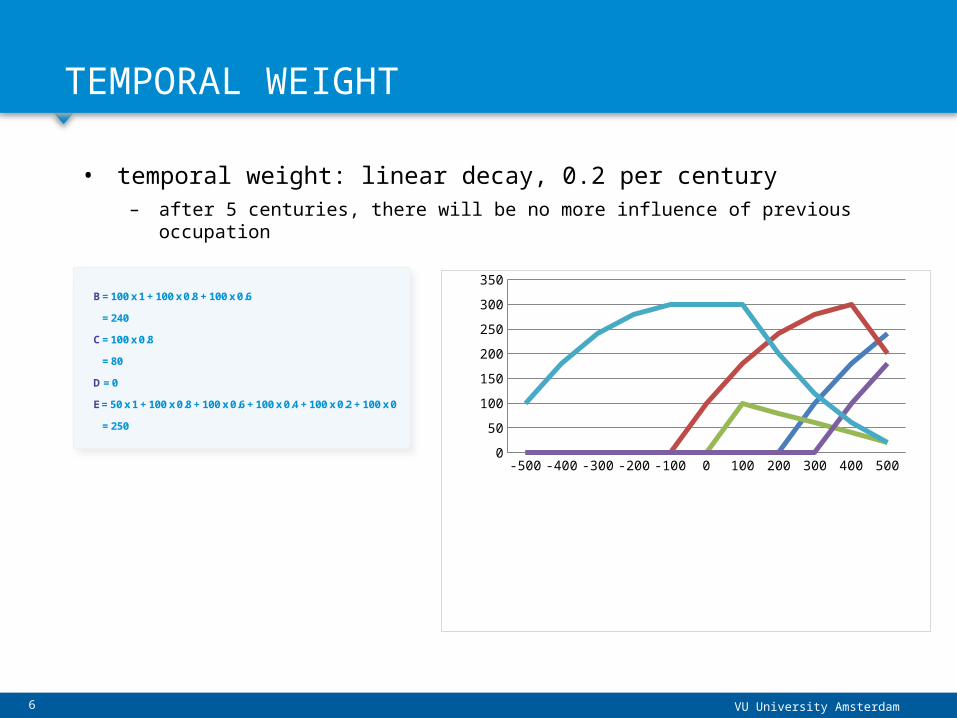
B = 100 x 1 + 100 x 0.8 + 100 x 0.6
= 240
C = 100 x 0.8
= 80
D = 0
E = 50 x 1 + 100 x 0.8 + 100 x 0.6 + 100 x 0.4 + 100 x 0.2 + 100 x 0
= 250
• temporal weight: linear decay, 0.2 per century– after 5 centuries, there will be no more influence of previous
occupation
-500 -400 -300 -200 -100 0 100 200 300 400 5000
50100150200250300350
6
VU University Amsterdam
SPATIAL WEIGHT
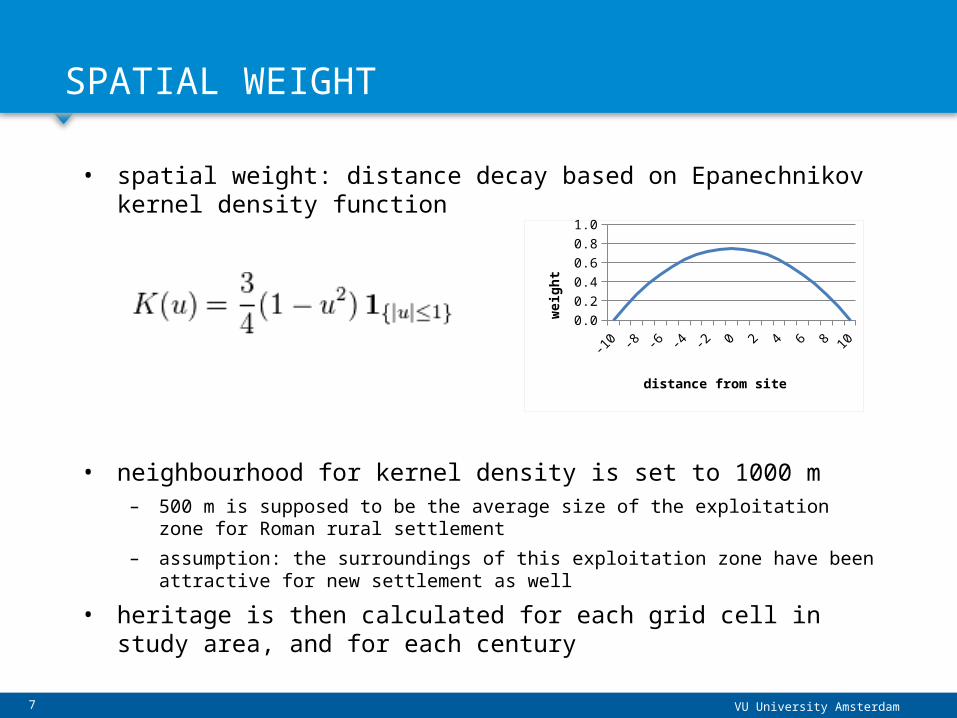
• spatial weight: distance decay based on Epanechnikov kernel density function
• neighbourhood for kernel density is set to 1000 m– 500 m is supposed to be the average size of the exploitation
zone for Roman rural settlement– assumption: the surroundings of this exploitation zone have been
attractive for new settlement as well• heritage is then calculated for each grid cell in
study area, and for each century
7
0.00.20.40.60.81.0
distance from site
weig
ht
VU University Amsterdam
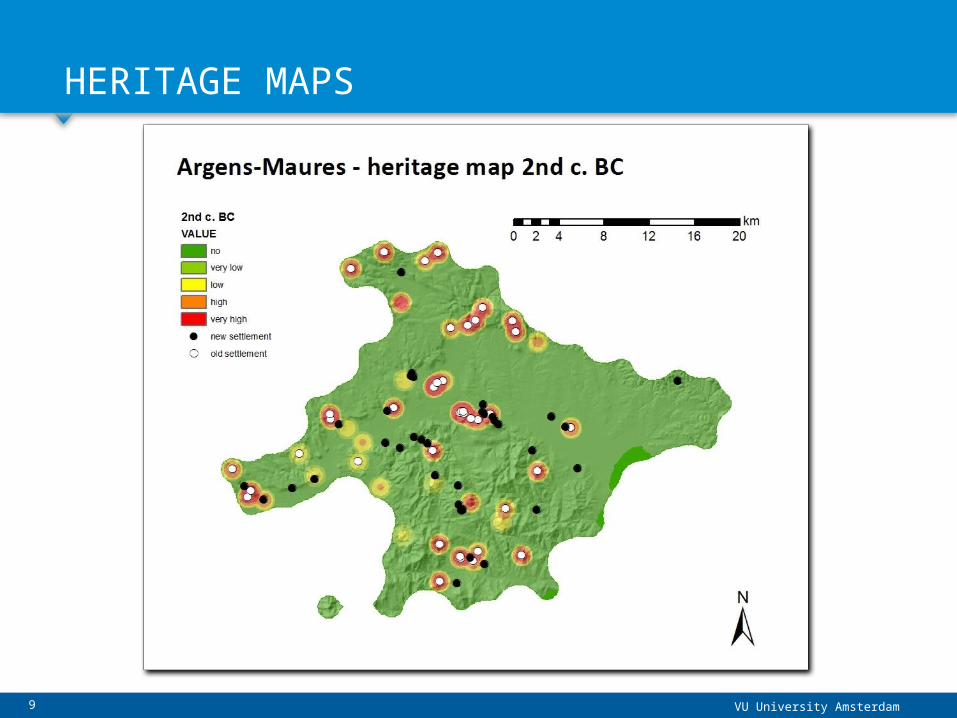
STUDY AREA
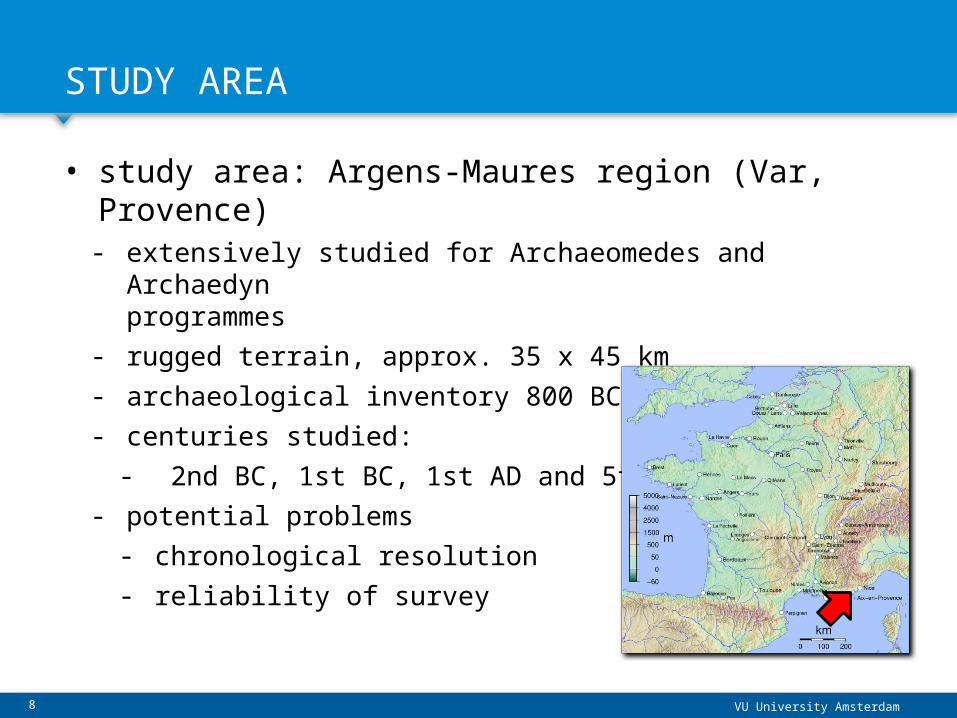
• study area: Argens-Maures region (Var, Provence)- extensively studied for Archaeomedes and
Archaedyn programmes
- rugged terrain, approx. 35 x 45 km- archaeological inventory 800 BC – 800 AD- centuries studied:- 2nd BC, 1st BC, 1st AD and 5th AD
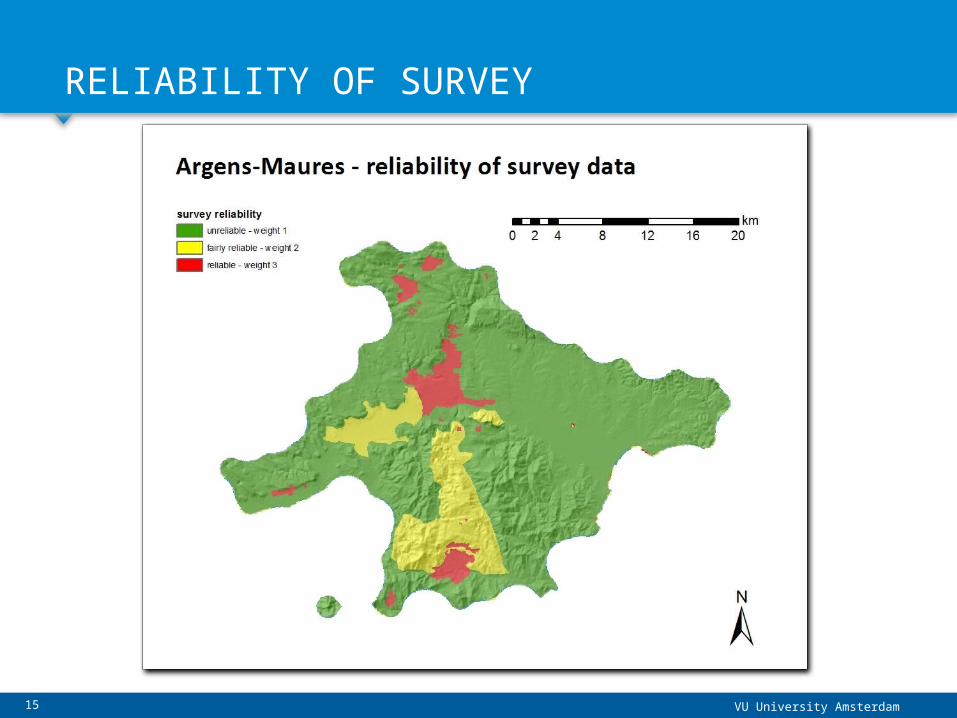
- potential problems- chronological resolution- reliability of survey
8
VU University Amsterdam
HERITAGE MAPS
9
VU University Amsterdam
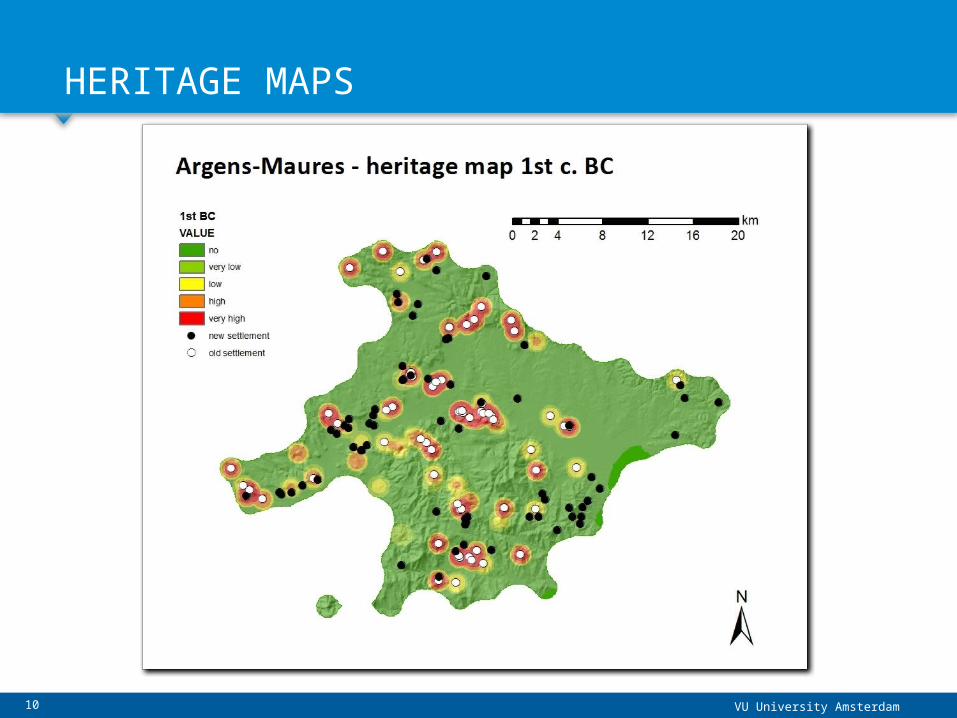
HERITAGE MAPS
10
VU University Amsterdam
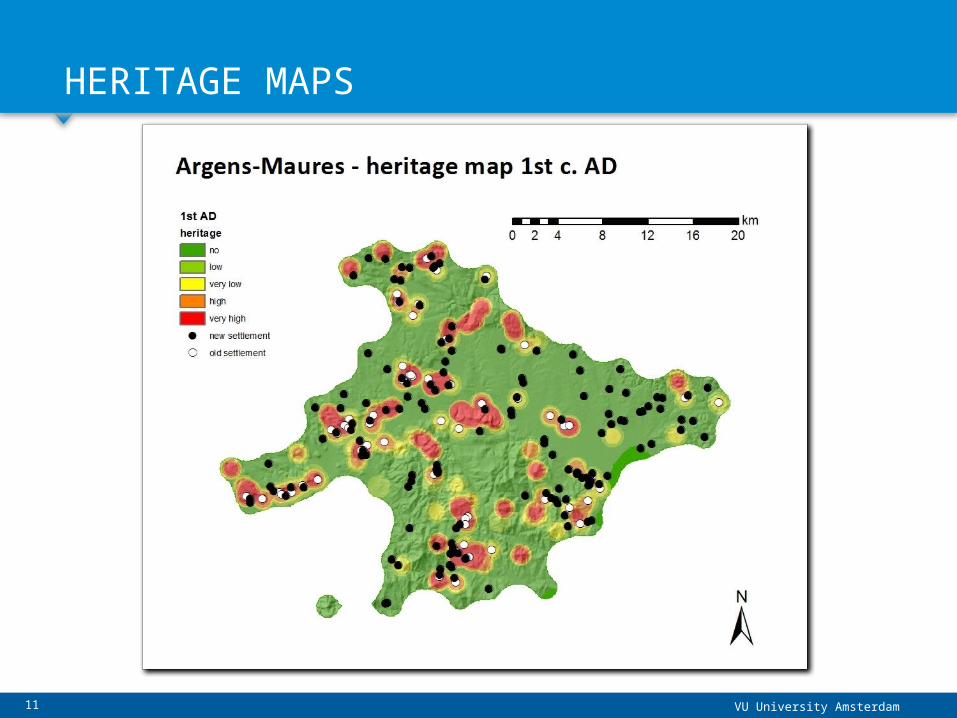
HERITAGE MAPS
11
VU University Amsterdam
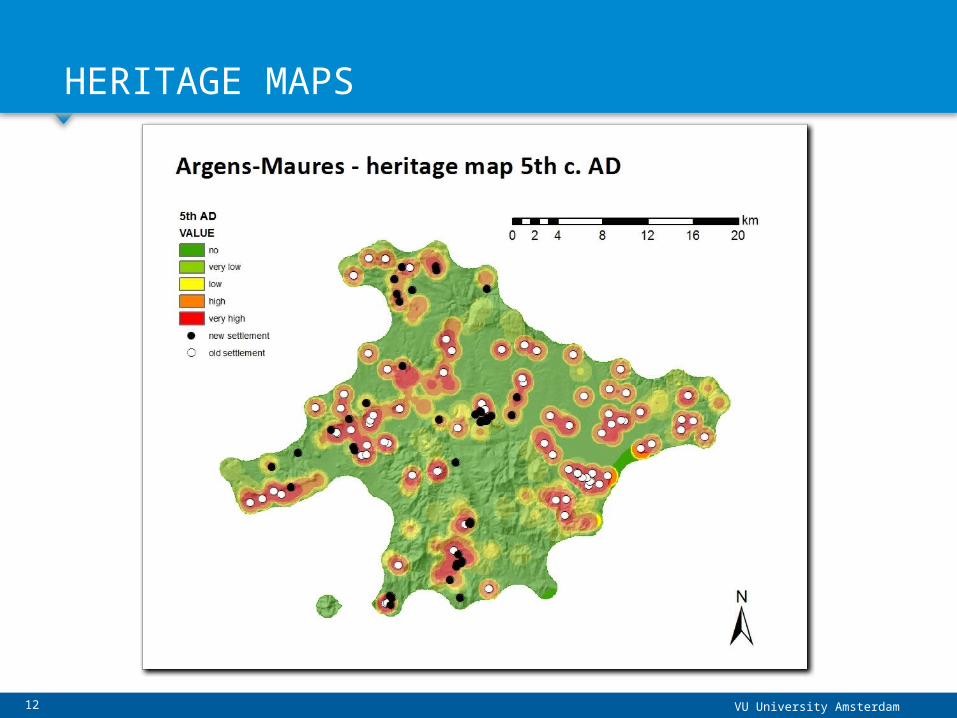
HERITAGE MAPS
12

VU University Amsterdam
SITE LOCATION ANALYSIS
• location of new settlements per century
- no-heritage areas (HER0)underrepresented-> effect of survey reliability?
- areas with strongheritage (HER3-4) become more important with time- -> path dependency?
% heritage class in the
landscape
% heritage class new
settlements
13
VU University Amsterdam
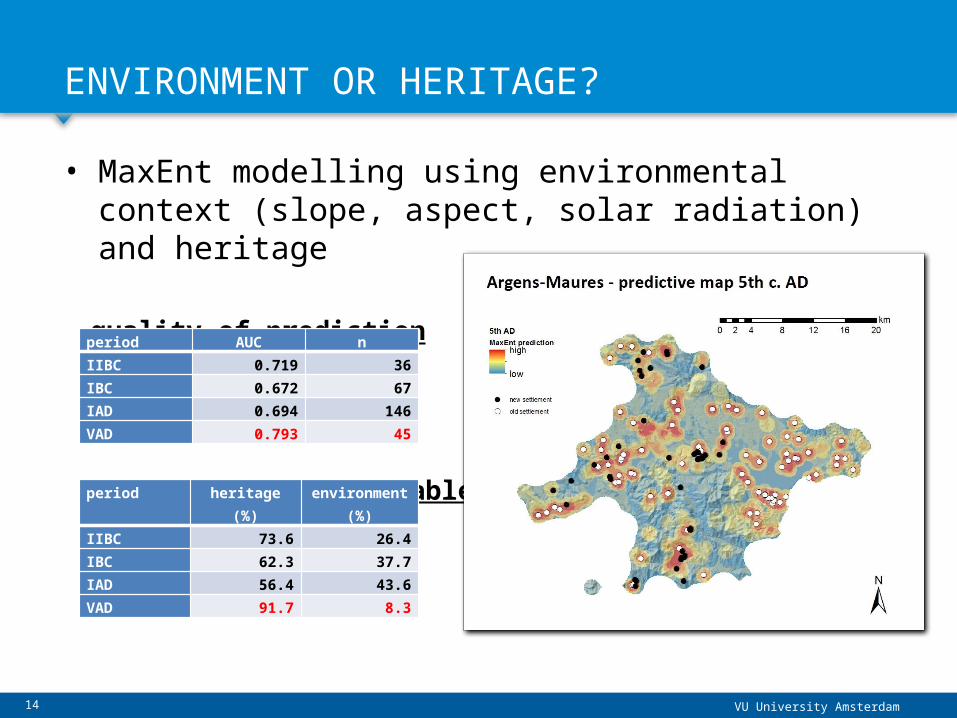
ENVIRONMENT OR HERITAGE?
• MaxEnt modelling using environmental context (slope, aspect, solar radiation) and heritage
quality of prediction
contribution of variablesperiod heritage (%)
environment (%)
IIBC 73.6 26.4IBC 62.3 37.7IAD 56.4 43.6VAD 91.7 8.3
period AUC nIIBC 0.719 36IBC 0.672 67IAD 0.694 146VAD 0.793 45
14
VU University Amsterdam
RELIABILITY OF SURVEY
15
VU University Amsterdam
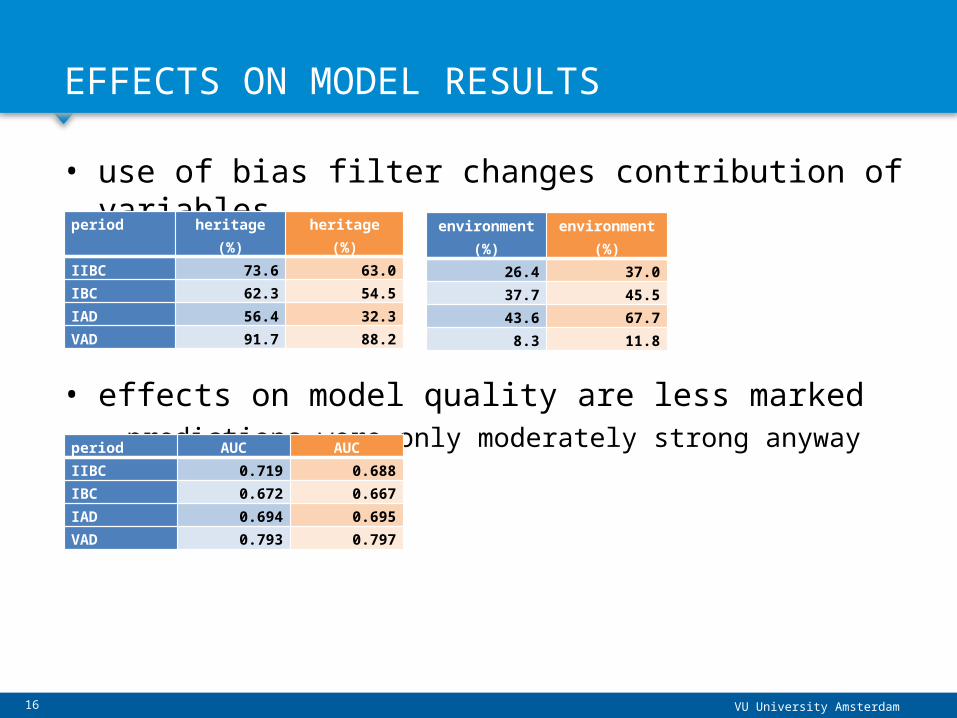
• use of bias filter changes contribution of variables
• effects on model quality are less marked- predictions were only moderately strong anyway
EFFECTS ON MODEL RESULTS
environment (%)
environment (%)
26.4 37.037.7 45.543.6 67.78.3 11.8
period heritage (%)
heritage (%)
IIBC 73.6 63.0IBC 62.3 54.5IAD 56.4 32.3VAD 91.7 88.2
16
period AUC AUCIIBC 0.719 0.688IBC 0.672 0.667IAD 0.694 0.695VAD 0.793 0.797
VU University Amsterdam
CONCLUSIONS
• “memory of landscape” seems to influence the location of new settlements- predictive power is only moderately strong - though
stronger thanenvironmental context
- path dependency can be hypothesized- survey intensity should be taken into account
• heritage variable needs closer scrutiny- potentially conflates two variables1. heritage of abandoned settlements and their
surroundings2. heritage in surroundings of existing settlements -> these settlements are not available for reoccupation
• testing in other areas necessary17