Estimating the “memory of landscape” to predict changes in archaeological settlement patterns
Upload
chandernagorecollegeCategory
view
1download
0
The On-Line Indian Journal of Spatial Science
Vol. I No. 1 — 2010
Article 1
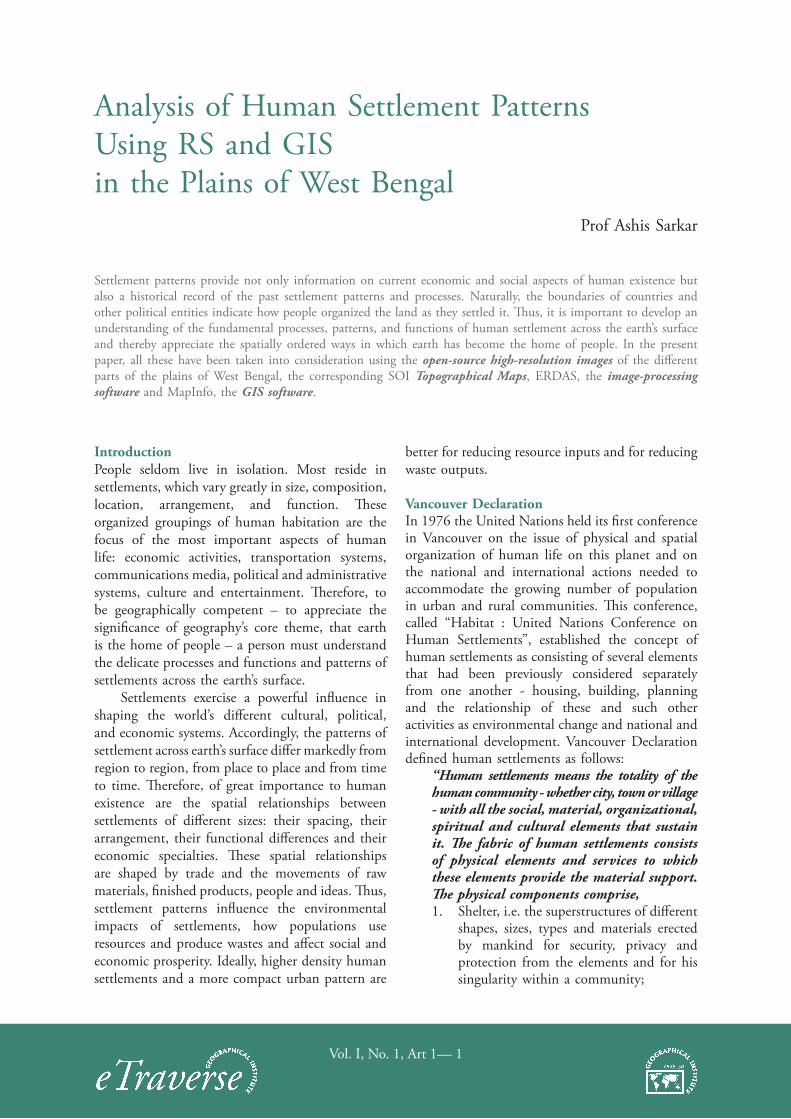
Analysis of Human Settlement Patterns Using RS and GIS
in the Plains of West Bengal
Prof Ashis Sarkar

The On-Line Indian Journal of Spatial Science
Vol. I No. 1 — 2010
Article 1Analysis of Human Settlement Patterns
Using RS and GISin the Plains of West Bengal
Prof Ashis Sarkar
Paper accepted on 15.01.2010
© The Geographical Institute, 2010
Published by Prof Ashis Sarkar
on behalf ofThe Geographical InstituteDepartment of Geography
Presidency College86/1 College Street, Kolkata 700073, India
[email protected]. +91 33 2241 1960 Ext. 206
Typeset and layout by Computer Club
Vol. I, No. 1, Art 1— 1
IntroductionPeople seldom live in isolation. Most reside in settlements, which vary greatly in size, composition, location, arrangement, and function. These organized groupings of human habitation are the focus of the most important aspects of human life: economic activities, transportation systems, communications media, political and administrative systems, culture and entertainment. Therefore, to be geographically competent – to appreciate the significance of geography’s core theme, that earth is the home of people – a person must understand the delicate processes and functions and patterns of settlements across the earth’s surface.
Settlements exercise a powerful influence in shaping the world’s different cultural, political, and economic systems. Accordingly, the patterns of settlement across earth’s surface differ markedly from region to region, from place to place and from time to time. Therefore, of great importance to human existence are the spatial relationships between settlements of different sizes: their spacing, their arrangement, their functional differences and their economic specialties. These spatial relationships are shaped by trade and the movements of raw materials, finished products, people and ideas. Thus, settlement patterns influence the environmental impacts of settlements, how populations use resources and produce wastes and affect social and economic prosperity. Ideally, higher density human settlements and a more compact urban pattern are
Analysis of Human Settlement Patterns Using RS and GISin the Plains of West Bengal
Prof Ashis Sarkar
Settlement patterns provide not only information on current economic and social aspects of human existence but also a historical record of the past settlement patterns and processes. Naturally, the boundaries of countries and other political entities indicate how people organized the land as they settled it. Thus, it is important to develop an understanding of the fundamental processes, patterns, and functions of human settlement across the earth’s surface and thereby appreciate the spatially ordered ways in which earth has become the home of people. In the present paper, all these have been taken into consideration using the open-source high-resolution images of the different parts of the plains of West Bengal, the corresponding SOI Topographical Maps, ERDAS, the image-processing software and MapInfo, the GIS software.
better for reducing resource inputs and for reducing waste outputs.
Vancouver Declaration In 1976 the United Nations held its first conference in Vancouver on the issue of physical and spatial organization of human life on this planet and on the national and international actions needed to accommodate the growing number of population in urban and rural communities. This conference, called “Habitat : United Nations Conference on Human Settlements”, established the concept of human settlements as consisting of several elements that had been previously considered separately from one another - housing, building, planning and the relationship of these and such other activities as environmental change and national and international development. Vancouver Declaration defined human settlements as follows:
“Human settlements means the totality of the human community - whether city, town or village - with all the social, material, organizational, spiritual and cultural elements that sustain it. The fabric of human settlements consists of physical elements and services to which these elements provide the material support. The physical components comprise,1. Shelter, i.e. the superstructures of different
shapes, sizes, types and materials erected by mankind for security, privacy and protection from the elements and for his singularity within a community;
Vol. I, No. 1, Art 1— 2
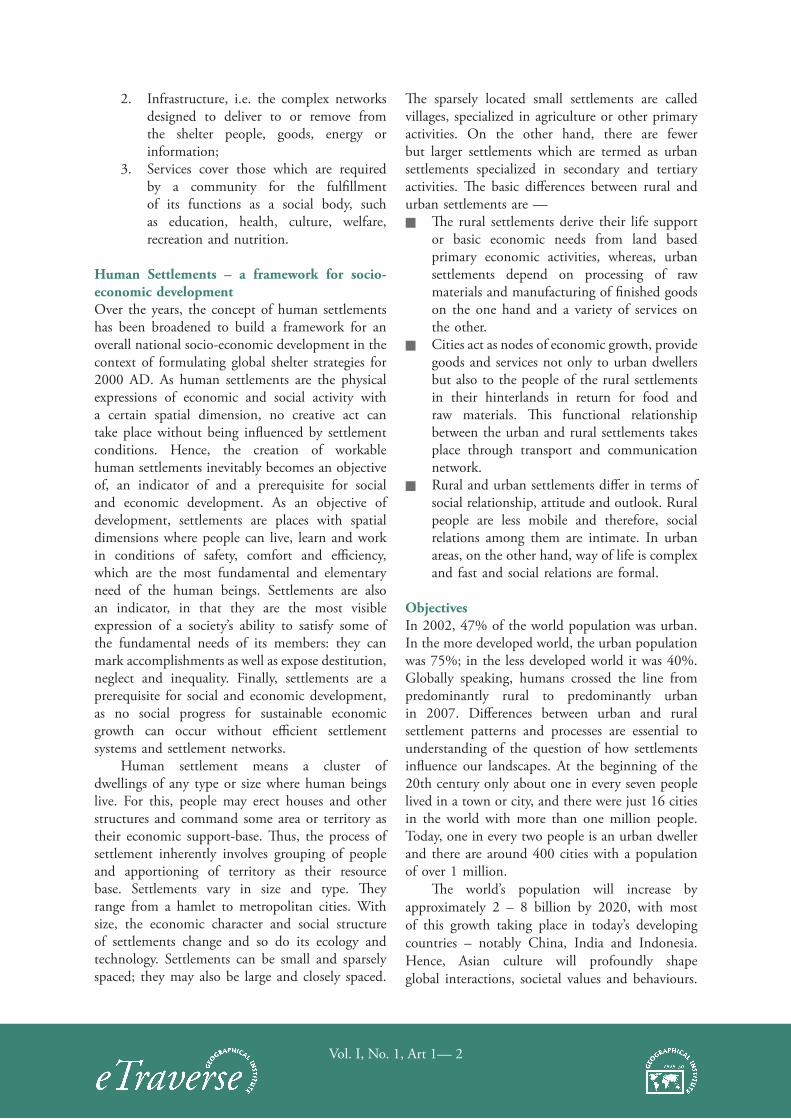
2. Infrastructure, i.e. the complex networks designed to deliver to or remove from the shelter people, goods, energy or information;
3. Services cover those which are required by a community for the fulfillment of its functions as a social body, such as education, health, culture, welfare, recreation and nutrition.
Human Settlements – a framework for socio-economic developmentOver the years, the concept of human settlements has been broadened to build a framework for an overall national socio-economic development in the context of formulating global shelter strategies for 2000 AD. As human settlements are the physical expressions of economic and social activity with a certain spatial dimension, no creative act can take place without being influenced by settlement conditions. Hence, the creation of workable human settlements inevitably becomes an objective of, an indicator of and a prerequisite for social and economic development. As an objective of development, settlements are places with spatial dimensions where people can live, learn and work in conditions of safety, comfort and efficiency, which are the most fundamental and elementary need of the human beings. Settlements are also an indicator, in that they are the most visible expression of a society’s ability to satisfy some of the fundamental needs of its members: they can mark accomplishments as well as expose destitution, neglect and inequality. Finally, settlements are a prerequisite for social and economic development, as no social progress for sustainable economic growth can occur without efficient settlement systems and settlement networks.
Human settlement means a cluster of dwellings of any type or size where human beings live. For this, people may erect houses and other structures and command some area or territory as their economic support-base. Thus, the process of settlement inherently involves grouping of people and apportioning of territory as their resource base. Settlements vary in size and type. They range from a hamlet to metropolitan cities. With size, the economic character and social structure of settlements change and so do its ecology and technology. Settlements can be small and sparsely spaced; they may also be large and closely spaced.
The sparsely located small settlements are called villages, specialized in agriculture or other primary activities. On the other hand, there are fewer but larger settlements which are termed as urban settlements specialized in secondary and tertiary activities. The basic differences between rural and urban settlements are —n The rural settlements derive their life support
or basic economic needs from land based primary economic activities, whereas, urban settlements depend on processing of raw materials and manufacturing of finished goods on the one hand and a variety of services on the other.
n Cities act as nodes of economic growth, provide goods and services not only to urban dwellers but also to the people of the rural settlements in their hinterlands in return for food and raw materials. This functional relationship between the urban and rural settlements takes place through transport and communication network.
n Rural and urban settlements differ in terms of social relationship, attitude and outlook. Rural people are less mobile and therefore, social relations among them are intimate. In urban areas, on the other hand, way of life is complex and fast and social relations are formal.
ObjectivesIn 2002, 47% of the world population was urban. In the more developed world, the urban population was 75%; in the less developed world it was 40%. Globally speaking, humans crossed the line from predominantly rural to predominantly urban in 2007. Differences between urban and rural settlement patterns and processes are essential to understanding of the question of how settlements influence our landscapes. At the beginning of the 20th century only about one in every seven people lived in a town or city, and there were just 16 cities in the world with more than one million people. Today, one in every two people is an urban dweller and there are around 400 cities with a population of over 1 million.
The world’s population will increase by approximately 2 – 8 billion by 2020, with most of this growth taking place in today’s developing countries – notably China, India and Indonesia. Hence, Asian culture will profoundly shape global interactions, societal values and behaviours.

Vol. I, No. 1, Art 1— 3
By 2015, for the first time in human history, a majority of the world’s population will live in cities and by 2030, 60% of the population is expected to live in cities. Cities are the nodes of human society. However, they are not the same all over the world; they differ in shape, size and function, density of population, transportation networks and the patterns in which people live and work within the city.
Geographers are mainly interested in rural-urban relations, rural-urban interactions and rural-urban dynamics for decades. Work on themes such as urban peasants, the role of intermediate urban centers and urban bias in development are all ‘old’ concerns. There is a strong case, however, that these old themes need to be re-examined in the light of new and intensifying processes. Lives and livelihoods are being profoundly re-worked as processes of globalization, market integration, modernization and industrializations are brought to bear in new and more intense ways. Peasants are becoming post-peasants; households are being divided by generation and gender; livelihoods are becoming increasingly delocalized; interlocking livelihoods and occupational multiplicity are displacing more singular ways of making a living; and de-agrarianisation is replacing the more familiar process of agrarian transition. It is these changes that result in the need for a new look at old concerns, like settlement pattern analysis, the major objectives of which are to—n develop a fuller understanding of how
settlements relate to their physical settings over time, i.e., the processes that cause settlements to grow and decline in relation to their physical environment, more precisely, their evolution.
n find the nature and functions of settlements, i.e., to know about life in a settlement and its relationship to its surrounding.
n make sense of the distribution and concentrations of human populations, i.e., how settlements are related to their market areas or hinterlands in relation to the patterns of land use and value, population density, housing type, ethnicity, socioeconomic status, and age distribution in settled areas.
MethodologyIt is very easy to identify features with naked eye in a high resolution image. These are easily available
from the various websites in the internet, Google Earth, being the most popular open source. To begin with about 21 sample images from various parts of West Bengal have been downloaded, cropped and stored as image files to analyze the site, situation, and morphology of the settlements. Next, another set of 10 sample images have been downloaded, cropped and stored as image files to study the nature of spatial pattern of settlements, particularly in the plains of West Bengal. Each of these images are then registered in MapInfo environment. Settlements are then digitized as point data layers, channels and roads as separate segment data layers. These are combined to extract the ‘point pattern maps of settlements’, all of which are then used for spatial analysis, viz., nearest neighbour analysis (NNA). The flowchart is—
Step – 1: Sampling: Choice of AreaStep – 2: Acquisition of High Resolution
Image Samples from Open Sources, and Topographical Maps containing Landscapes of Settlements
Step – 3: Observation and Image Processing – Identification of Sites from Image Samples
Step – 4: Observation and Image Processing – Identification of Situations from Image Samples
Step – 5: Cartographic Transformation of Images into Point Pattern Map using GIS
Step – 6: Nearest Neighbour Analysis of the Point Pattern yielding Rn Values
Step – 7: Spatial Patterns: Explanations with Principles of Human Geography
Site and Situation of SettlementsBased on morphology, Roy (1972) identified five major groups of settlements in India : (1) block pattern : rectangular, checkerboard, compact and semi-compact, (2) linear / elongated pattern: fishbone, and strings along levee, river front, ridge, coast, and road, (3) fan pattern, (4) circular pattern: hollow circular, and radial, and (5) others: dispersed, sprinkled, hamleted, amorphous, deserted, L-shaped, T-shaped, etc. Sometimes a settlement is fragmented into several units physically separated from each other despite bearing a common name. These units are locally called panna, para, palli,
Vol. I, No. 1, Art 1— 4
nagla, dhani, etc. in various parts of our country. This segmentation of a large village is often motivated by social and ethnic factors. Such villages are more frequently found in the middle and lower Ganga plain, Chhattisgarh and lower valleys of the Himalayas. Strings are groups of houses arranged in a linear pattern along a transportation artery that leads to a place of work.
Way stations are groups of houses and other buildings that serve a transportation artery. Concentration of truck terminals, repair shops, motels and restaurants commonly occur on freeway interchanges or other sites that just happen to be the right distance away from a major traffic center. Sprawl is common at the fringes of an expanding urban area. In its classic form, sprawl consists of some densely populated residential areas interspersed with open fields, isolated houses, older clusters, commuter strings, and/or other rural settlement forms. The spacing of the buildings is often a good indicator of the price of the houses in a sprawl. Rips are small (2 to 10 acres) landholdings taken out of (“ripped from”) larger farms, usually within commuting distance of a city but beyond the sprawl zone. Garages and small sheds usually surround the houses on a typical rip lot. Rips occur when farmers sell small tracts in order to meet rising taxes or unusual expenses. Once an area is dominated by rips, it becomes difficult for a developer to put together enough land for efficient subdivision-style building. Resorts are strings or small clusters of residential and specialized commercial structures that occur near lakes, ski slopes, golf courses or other scenic or recreational areas. The houses in a resort may be occupied only during favorable seasons. The residential areas are interspersed with parking lots and other facilities that serve visitors who come for only a day.
As a component of location, site forms the horizontal plane, defined by the physical conditions of the landscape, while situation comprises the vertical plane, defined by the human elements of the social, economic and political landscapes. Tamaskar (1972) identified three groups of sites for plateau settlements of India. These are – (1) dry-points, (2) wet-points, viz., river bank, stream-dips, confluences, meander-loops, stream islands, and sheltered recesses of deep valley, and (3) others, viz., springs, tanks, wells, summits, depressions, and piedmonts. In the present study the 15 image
samples show that settlements have grown based on various sites of landscape. The most common ones in the plains of West Bengal are formed by— n the tributary junctions / confluences, n the water bodies, viz., ponds, wetlands / bils,
etcn the fluvial features, viz., cut-offs, paleo-channel,
river banks, meander bends, meander scrolls, riverine islands, etc
n the coastal and deltaic features, viz., dunes, levees, etc
n the forest features, viz., clearings, fringe areas, etc
n the character of land, viz., wastelands, badlands, etc (Fig. 1 – Fig. 15).
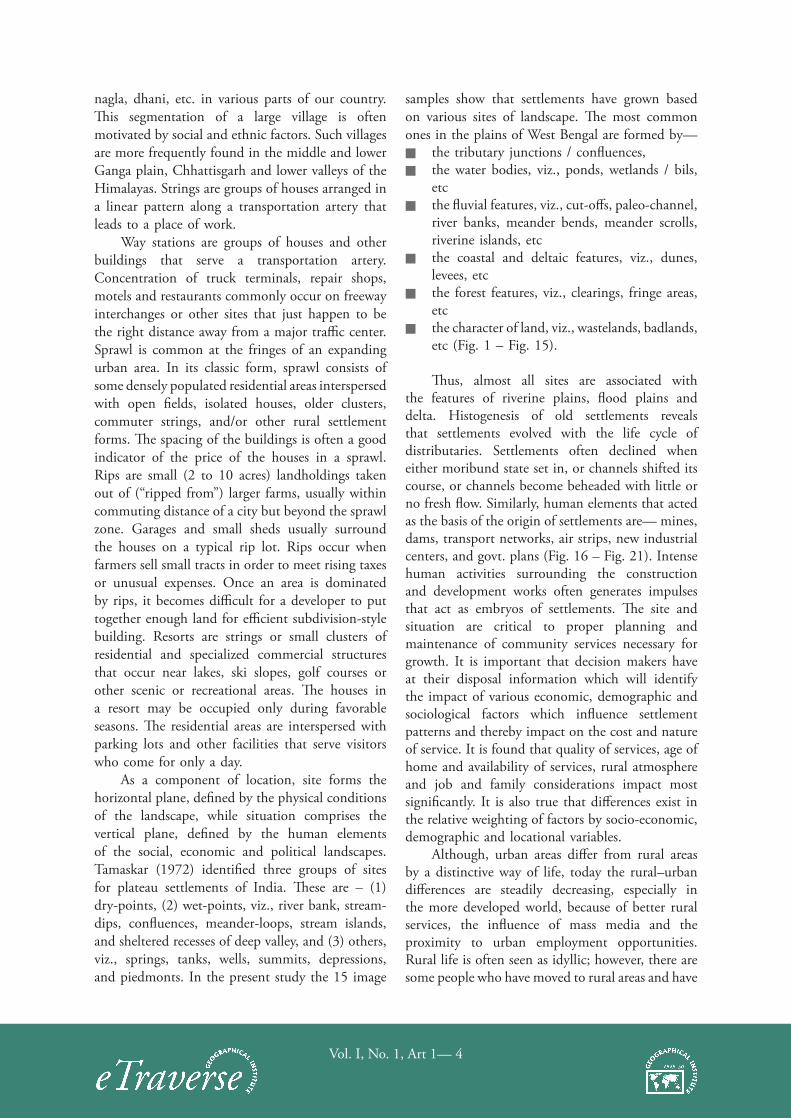
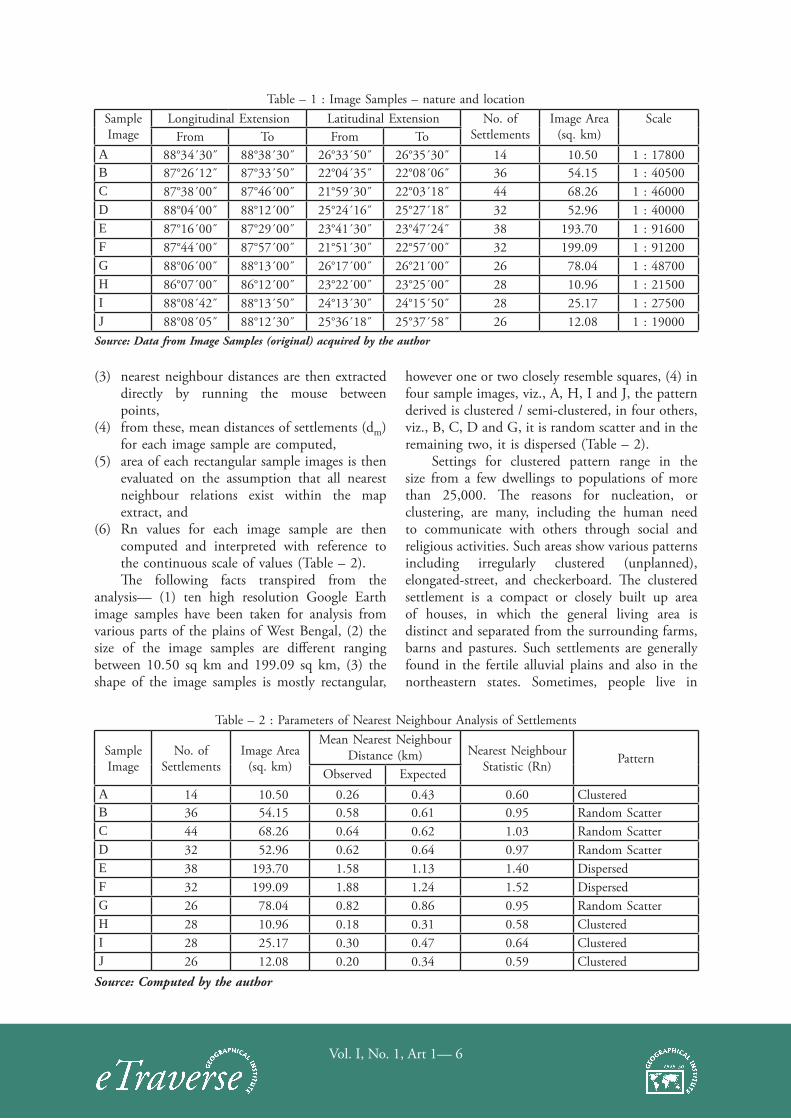
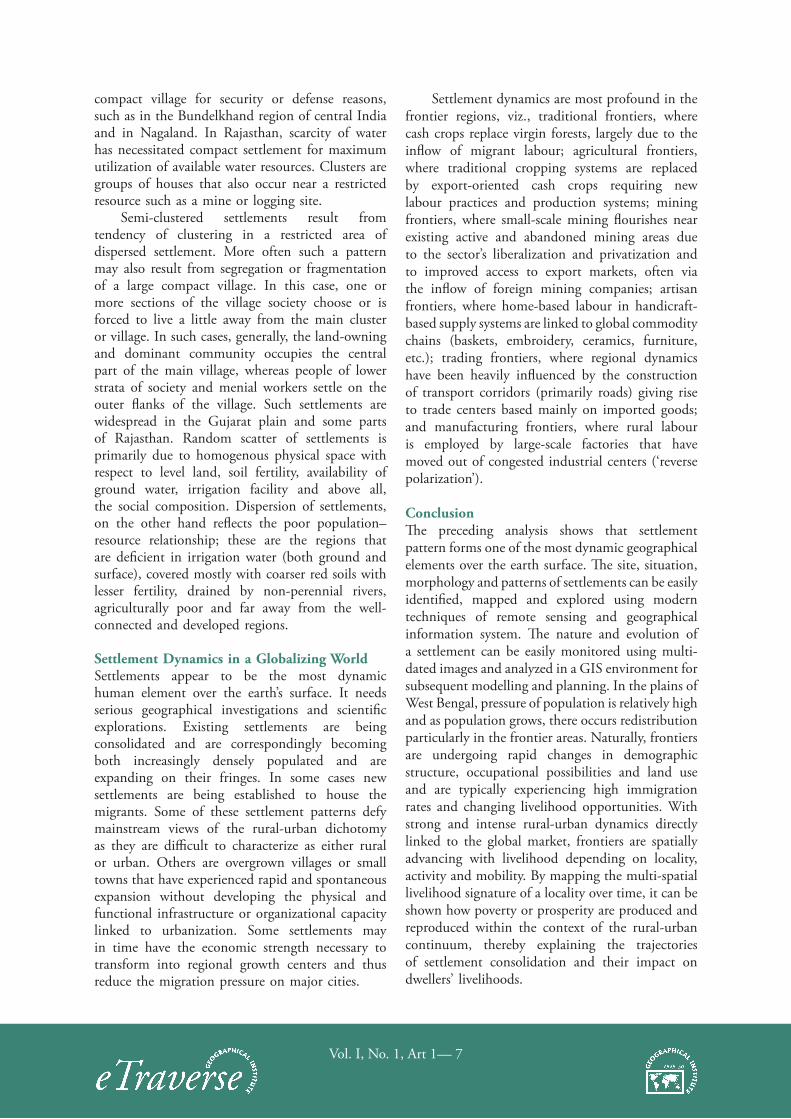
Thus, almost all sites are associated with the features of riverine plains, flood plains and delta. Histogenesis of old settlements reveals that settlements evolved with the life cycle of distributaries. Settlements often declined when either moribund state set in, or channels shifted its course, or channels become beheaded with little or no fresh flow. Similarly, human elements that acted as the basis of the origin of settlements are— mines, dams, transport networks, air strips, new industrial centers, and govt. plans (Fig. 16 – Fig. 21). Intense human activities surrounding the construction and development works often generates impulses that act as embryos of settlements. The site and situation are critical to proper planning and maintenance of community services necessary for growth. It is important that decision makers have at their disposal information which will identify the impact of various economic, demographic and sociological factors which influence settlement patterns and thereby impact on the cost and nature of service. It is found that quality of services, age of home and availability of services, rural atmosphere and job and family considerations impact most significantly. It is also true that differences exist in the relative weighting of factors by socio-economic, demographic and locational variables.
Although, urban areas differ from rural areas by a distinctive way of life, today the rural–urban differences are steadily decreasing, especially in the more developed world, because of better rural services, the influence of mass media and the proximity to urban employment opportunities. Rural life is often seen as idyllic; however, there are some people who have moved to rural areas and have

Vol. I, No. 1, Art 1— 5
attempted to alter the landscape by adding urban elements into it. Areas that were once dominant rural areas and faced decline have been given new lease of life by urbanites moving into those areas and bringing in new economic activities. This migration into the rural space by those who have never ‘experienced rural life’ before, brings about changes in the cultural aspects of rural areas, ranging from cultural activities (plays, movies, bookstores) to music, religion, and schooling. The location of rural settlements depends primarily on two variables — distance from the parent settlement and relative attractiveness of the land (Bylund 1962). Hudson (1969) proposed three stages of the evolution of rural settlement of an area—n colonization, by which the occupied territory
of a population expands : when people move into an unoccupied area (one concentric ring),
n spread, through which settlement density increases with a tendency to short distance dispersal: the filling up of the area with off-springs of the colonizers leading to nucleated settlements (forming nebula-like clusters), and
n competition, the process which produces regularity in settlement pattern when rural dwellers are found in sufficient numbers to compete for space: created between the new clusters as they try to get support for their activities from surrounding rural areas (lattice pattern).
Empirical investigations reveal that the expected increase in regularity of settlement patterns does occur and is a reality. The map analysis of settlement patterns shows that (1) the variance-mean ratios declined over time with changes in the farm economy, requiring fewer, but larger farms, (2) the negative binomial appears to fit best for the early, more clustered distributions, and (3) the regular Poisson series fit the recent data best. However, these theories fail to incorporate social, culture, political, and other human factors. Rural areas are increasingly being depopulated as a result of the concentration of economic activities in urban areas and such areas generally lose basic services because the market bases decline. There are some rural repopulation that are taking place as a result of current industrial expansions in a less spatially concentrated economy, particularly in the developing countries. But, people repopulating the rural areas certainly come from various socio-
economic backgrounds and never form a cohesive social group.
Spatial Pattern of SettlementsThe pattern of human settlement of rural areas has two separate but related components: the way in which the land is divided among its owners and the way in which the owners arrange buildings on their land. Thus, types of the settlement are determined by the extent of the built-up area and the inter-house space. Naturally, the pattern of fields is an important component of rural settlement landscapes and is an essential landscape feature that often contributes greatly to the character of a place. There are various factors and conditions responsible for different types of rural settlements. These are: physical features – nature of terrain, altitude, climate and availability of water, cultural and ethnic factors – social structure, caste and religion, and security factors – defense against thefts and robberies. As India is a geographically diverse country, patterns of settlements found in its different parts are also varied; however, five major types can be easily identified, viz., clustered, agglomerated or nucleated, semi-clustered or fragmented, hamleted, and dispersed or isolated.
Nearest neighbour analysis is a very useful technique for evaluating the spacing of points on a map. Its principle is based on a comparison of the straight line distances separating points from their nearest neighbour points with the distances which might be expected if these points were distributed in a random manner within the same area. The nearest neighbour statistic is given by—
Rn = 2.dm. √(N/A)where, Rn = nearest neighbour statistic, dm = mean observed nearest neighbour distance between points, N = number of points, and A = area concerned
The computed values of Rn lie on a continuous scale which ranges between 0 and 2.15, and where, 0 denotes complete clustering, 1.00 denotes random scatter and 2.15 denotes complete regularity, i.e., each point equidistant from six other points. The procedure followed is— (1) image samples are acquired, and then digitally
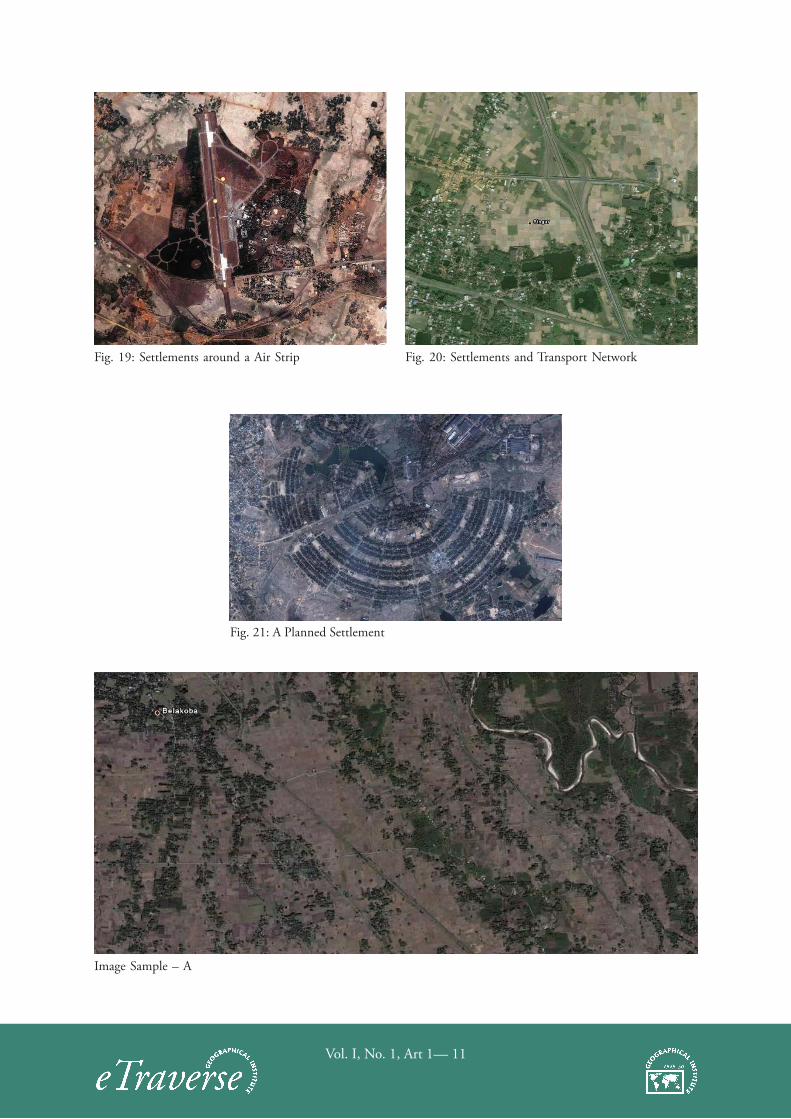
processed for enhancement so that all settlements can be easily identified and saved in a separate folder as raster files (Sample Images : A – J; Table – 1),
(2) the raster files are then registered in MapInfo and settlements are digitized in point layers,
Vol. I, No. 1, Art 1— 6
(3) nearest neighbour distances are then extracted directly by running the mouse between points,
(4) from these, mean distances of settlements (dm) for each image sample are computed,
(5) area of each rectangular sample images is then evaluated on the assumption that all nearest neighbour relations exist within the map extract, and
(6) Rn values for each image sample are then computed and interpreted with reference to the continuous scale of values (Table – 2). The following facts transpired from the
analysis— (1) ten high resolution Google Earth image samples have been taken for analysis from various parts of the plains of West Bengal, (2) the size of the image samples are different ranging between 10.50 sq km and 199.09 sq km, (3) the shape of the image samples is mostly rectangular,
however one or two closely resemble squares, (4) in four sample images, viz., A, H, I and J, the pattern derived is clustered / semi-clustered, in four others, viz., B, C, D and G, it is random scatter and in the remaining two, it is dispersed (Table – 2).
Settings for clustered pattern range in the size from a few dwellings to populations of more than 25,000. The reasons for nucleation, or clustering, are many, including the human need to communicate with others through social and religious activities. Such areas show various patterns including irregularly clustered (unplanned), elongated-street, and checkerboard. The clustered settlement is a compact or closely built up area of houses, in which the general living area is distinct and separated from the surrounding farms, barns and pastures. Such settlements are generally found in the fertile alluvial plains and also in the northeastern states. Sometimes, people live in
Table – 1 : Image Samples – nature and locationSample Image
Longitudinal Extension Latitudinal Extension No. of Settlements
Image Area (sq. km)
ScaleFrom To From To
A 88°34´30˝ 88°38´30˝ 26°33´50˝ 26°35´30˝ 14 10.50 1 : 17800B 87°26´12˝ 87°33´50˝ 22°04´35˝ 22°08´06˝ 36 54.15 1 : 40500C 87°38´00˝ 87°46´00˝ 21°59´30˝ 22°03´18˝ 44 68.26 1 : 46000D 88°04´00˝ 88°12´00˝ 25°24´16˝ 25°27´18˝ 32 52.96 1 : 40000E 87°16´00˝ 87°29´00˝ 23°41´30˝ 23°47´24˝ 38 193.70 1 : 91600F 87°44´00˝ 87°57´00˝ 21°51´30˝ 22°57´00˝ 32 199.09 1 : 91200G 88°06´00˝ 88°13´00˝ 26°17´00˝ 26°21´00˝ 26 78.04 1 : 48700H 86°07´00˝ 86°12´00˝ 23°22´00˝ 23°25´00˝ 28 10.96 1 : 21500I 88°08´42˝ 88°13´50˝ 24°13´30˝ 24°15´50˝ 28 25.17 1 : 27500J 88°08´05˝ 88°12´30˝ 25°36´18˝ 25°37´58˝ 26 12.08 1 : 19000
Source: Data from Image Samples (original) acquired by the author
Table – 2 : Parameters of Nearest Neighbour Analysis of Settlements
Sample Image
No. of Settlements
Image Area (sq. km)
Mean Nearest Neighbour Distance (km) Nearest Neighbour
Statistic (Rn) PatternObserved Expected
A 14 10.50 0.26 0.43 0.60 ClusteredB 36 54.15 0.58 0.61 0.95 Random ScatterC 44 68.26 0.64 0.62 1.03 Random ScatterD 32 52.96 0.62 0.64 0.97 Random ScatterE 38 193.70 1.58 1.13 1.40 DispersedF 32 199.09 1.88 1.24 1.52 DispersedG 26 78.04 0.82 0.86 0.95 Random ScatterH 28 10.96 0.18 0.31 0.58 ClusteredI 28 25.17 0.30 0.47 0.64 ClusteredJ 26 12.08 0.20 0.34 0.59 Clustered
Source: Computed by the author
Vol. I, No. 1, Art 1— 7
compact village for security or defense reasons, such as in the Bundelkhand region of central India and in Nagaland. In Rajasthan, scarcity of water has necessitated compact settlement for maximum utilization of available water resources. Clusters are groups of houses that also occur near a restricted resource such as a mine or logging site.
Semi-clustered settlements result from tendency of clustering in a restricted area of dispersed settlement. More often such a pattern may also result from segregation or fragmentation of a large compact village. In this case, one or more sections of the village society choose or is forced to live a little away from the main cluster or village. In such cases, generally, the land-owning and dominant community occupies the central part of the main village, whereas people of lower strata of society and menial workers settle on the outer flanks of the village. Such settlements are widespread in the Gujarat plain and some parts of Rajasthan. Random scatter of settlements is primarily due to homogenous physical space with respect to level land, soil fertility, availability of ground water, irrigation facility and above all, the social composition. Dispersion of settlements, on the other hand reflects the poor population–resource relationship; these are the regions that are deficient in irrigation water (both ground and surface), covered mostly with coarser red soils with lesser fertility, drained by non-perennial rivers, agriculturally poor and far away from the well-connected and developed regions.
Settlement Dynamics in a Globalizing WorldSettlements appear to be the most dynamic human element over the earth’s surface. It needs serious geographical investigations and scientific explorations. Existing settlements are being consolidated and are correspondingly becoming both increasingly densely populated and are expanding on their fringes. In some cases new settlements are being established to house the migrants. Some of these settlement patterns defy mainstream views of the rural-urban dichotomy as they are difficult to characterize as either rural or urban. Others are overgrown villages or small towns that have experienced rapid and spontaneous expansion without developing the physical and functional infrastructure or organizational capacity linked to urbanization. Some settlements may in time have the economic strength necessary to transform into regional growth centers and thus reduce the migration pressure on major cities.
Settlement dynamics are most profound in the frontier regions, viz., traditional frontiers, where cash crops replace virgin forests, largely due to the inflow of migrant labour; agricultural frontiers, where traditional cropping systems are replaced by export-oriented cash crops requiring new labour practices and production systems; mining frontiers, where small-scale mining flourishes near existing active and abandoned mining areas due to the sector’s liberalization and privatization and to improved access to export markets, often via the inflow of foreign mining companies; artisan frontiers, where home-based labour in handicraft-based supply systems are linked to global commodity chains (baskets, embroidery, ceramics, furniture, etc.); trading frontiers, where regional dynamics have been heavily influenced by the construction of transport corridors (primarily roads) giving rise to trade centers based mainly on imported goods; and manufacturing frontiers, where rural labour is employed by large-scale factories that have moved out of congested industrial centers (‘reverse polarization’).
ConclusionThe preceding analysis shows that settlement pattern forms one of the most dynamic geographical elements over the earth surface. The site, situation, morphology and patterns of settlements can be easily identified, mapped and explored using modern techniques of remote sensing and geographical information system. The nature and evolution of a settlement can be easily monitored using multi-dated images and analyzed in a GIS environment for subsequent modelling and planning. In the plains of West Bengal, pressure of population is relatively high and as population grows, there occurs redistribution particularly in the frontier areas. Naturally, frontiers are undergoing rapid changes in demographic structure, occupational possibilities and land use and are typically experiencing high immigration rates and changing livelihood opportunities. With strong and intense rural-urban dynamics directly linked to the global market, frontiers are spatially advancing with livelihood depending on locality, activity and mobility. By mapping the multi-spatial livelihood signature of a locality over time, it can be shown how poverty or prosperity are produced and reproduced within the context of the rural-urban continuum, thereby explaining the trajectories of settlement consolidation and their impact on dwellers’ livelihoods.

Vol. I, No. 1, Art 1— 8
Fig. 1: Settlement at Tributary Confluence
Fig. 2: Settlements around Wetlands / Bils
Fig. 3: Settlements in a Wasteland
Fig. 4: Settlements and Waterbody
Fig. 5: Settlement and Ponds
Fig. 6: Settlements on the Forest Clearings

Vol. I, No. 1, Art 1— 9
Fig. 7: Settlements on the Forest Fringe
Fig. 8: Settlements along a Paleo-Channel
Fig. 9: Settlements ring around a Cut-off
Fig. 10: Cut-off controls the shape of landholding and orientation of Settlements
Fig. 11: Settlements on both sides of a stabilized Longitudinal Coastal Dune
Fig. 12: Settlements on the Banks of a River

Vol. I, No. 1, Art 1— 10
Fig. 13: Linear Settlements along Banks of Channels
Fig. 14: Settlements in Meander Bends
Fig. 15: Settlements in a Floodplain with Meander Scrols
Fig. 16: Mining Settlements
Fig. 17: Settlements around a Dam
Fig. 18: Settlements around a New Industry
Vol. I, No. 1, Art 1— 11
Fig. 19: Settlements around a Air Strip Fig. 20: Settlements and Transport Network
Fig. 21: A Planned Settlement
Image Sample – A

Vol. I, No. 1, Art 1— 12
Image Sample – B
Image Sample – C
Image Sample – D

Vol. I, No. 1, Art 1— 13
Image Sample – E
Image Sample – F

Vol. I, No. 1, Art 1— 14
Image Sample – G
Image Sample – H

Vol. I, No. 1, Art 1— 15
Image Sample – I
Image Sample – J
Bibliography1. Barnes J A and Robinson A H (1940): A New
Method for the Representation of Dispersed Rural Population, Geog. Rev., Vol – 30, pp134
2. Chauhan V S (1972): Rural Settlements in Upper Yamuna Khadar Region in India, in Selected Papers Vol – III, 21st International Geographical Congress, National Committee for Geography, pp 49 – 60
3. Hudson John C (1969): A Location Theory for Rural Settlement, Ann. Assoc. Am. Geog., Vol – 59, No. 2, June 1969, pp365 – 381
4. Meynen E (1972): Universal Decimal Classification for Settlements, in Selected Papers Vol – IV, ibid, pp 398 – 400
5. Pinder D A and Witherick M E (1972): The Principles, Practice and Pitfalls of Nearest Neighbour Analysis, Geography, Vol – 57, pp 281
6. Prasad A (1972): The Types of Rural Settlements in Chhotanagpur Plateau, in Selected Papers Vol – III, ibid, pp207 – 211
7. Roy B K (1972): Cartographical Application in the Mapping of Morphogenesis and Economic Data of Settlements in India, in Singh R L (ed. 1972): ibid
8. Sarkar A (1991): Tendency of the Urban Settlement Patterns in West Bengal, 1901 – 1981, Ind. Jour. Lands. Sys. Ecol. Stud., Vol – 14, No. – 2, pp 50 – 55

Vol. I, No. 1, Art 1— 16
9. Sarkar A (1994): Size and Spacing of Urban Settlements in West Bengal, 1901 – 1981, Ind. Jour. Lands. Sys. Ecol. Stud., Vol – 17, No. – 2, pp 53 – 61
10. Schott C (1972): Settlement Development in the Atlantic Provinces of Canada, in Selected Papers Vol – III, ibid, pp 223 – 228
11. Singh R L (ed. 1972): Rural Settlements in Monsoon Asia, Proceedings of the IGU Symposia at Varanasi and Tokyo, National Geographical Society of India, Varanasi
12. Sinha V N P (1972): Evolution of Settlements in Chhotanagpur, India, in Selected Papers Vol – III, ibid, pp 262 – 264
13. Tamaskar B G (1972): The Sites of Rural Settlements on the Sagar – Damoh Plateau, in Singh R L (ed. 1972): ibid ,
14. Verma R V (1972): The Evolution of Rural Settlements in Avadh, India, in Selected Papers Vol – III, ibid , pp305 – 315
15. Wonders W C (1972): Dispersed Rural Settlement Patterns in Alberta, Canada, in Selected Papers Vol – III, ibid , pp342 – 349
16. Worthington B D R and Gant R (1975): Techniques in Map Analysis, Macmillan Education Ltd., London
Prof Ashis SarkarHead, Dept. of Geography, Presidency College, KolkataEmail: [email protected]
Copyright © 2022 FDOKUMEN