Plasmodium falciparum DOZI, an RNA helicase interacts with eIF4E

BioMed CentralMalaria Journal
ss
Open AcceResearchHuman population, urban settlement patterns and their impact on Plasmodium falciparum malaria endemicityAndrew J Tatem*1,2, Carlos A Guerra1,2, Caroline W Kabaria2, Abdisalan M Noor2,3 and Simon I Hay1,2Address: 1Spatial Ecology and Epidemiology Group, Tinbergen Building, Department of Zoology, University of Oxford, South Parks Road, Oxford, OX1 3PS, UK, 2Malaria Public Health and Epidemiology Group, Centre for Geographic Medicine, KEMRI – Univ. Oxford – Wellcome Trust Collaborative Programme, Kenyatta National Hospital Grounds (behind NASCOP), P.O. Box 43640-00100, Nairobi, Kenya and 3Centre for Tropical Medicine, John Radcliffe Hospital, University of Oxford, Oxford, OX3 9DS, UK
Email: Andrew J Tatem* - [email protected]; Carlos A Guerra - [email protected]; Caroline W Kabaria - [email protected]; Abdisalan M Noor - [email protected]; Simon I Hay - [email protected]
* Corresponding author
AbstractBackground: The efficient allocation of financial resources for malaria control and the optimaldistribution of appropriate interventions require accurate information on the geographicdistribution of malaria risk and of the human populations it affects. Low population densities in ruralareas and high population densities in urban areas can influence malaria transmission substantially.Here, the Malaria Atlas Project (MAP) global database of Plasmodium falciparum parasite rate (PfPR)surveys, medical intelligence and contemporary population surfaces are utilized to explore theserelationships and other issues involved in combining malaria risk maps with those of humanpopulation distribution in order to define populations at risk more accurately.
Methods: First, an existing population surface was examined to determine if it was sufficientlydetailed to be used reliably as a mask to identify areas of very low and very high population densityas malaria free regions. Second, the potential of international travel and health guidelines (ITHGs)for identifying malaria free cities was examined. Third, the differences in PfPR values betweensurveys conducted in author-defined rural and urban areas were examined. Fourth, the ability ofvarious global urban extent maps to reliably discriminate these author-based classifications of urbanand rural in the PfPR database was investigated. Finally, the urban map that most accuratelyreplicated the author-based classifications was analysed to examine the effects of urbanclassifications on PfPR values across the entire MAP database.
Results: Masks of zero population density excluded many non-zero PfPR surveys, indicating thatthe population surface was not detailed enough to define areas of zero transmission resulting fromlow population densities. In contrast, the ITHGs enabled the identification and mapping of 53malaria free urban areas within endemic countries. Comparison of PfPR survey results showedsignificant differences between author-defined 'urban' and 'rural' designations in Africa, but not forthe remainder of the malaria endemic world. The Global Rural Urban Mapping Project (GRUMP)urban extent mask proved most accurate for mapping these author-defined rural and urban
Published: 27 October 2008
Malaria Journal 2008, 7:218 doi:10.1186/1475-2875-7-218
Received: 24 September 2008Accepted: 27 October 2008
This article is available from: http://www.malariajournal.com/content/7/1/218
© 2008 Tatem et al; licensee BioMed Central Ltd. This is an Open Access article distributed under the terms of the Creative Commons Attribution License (http://creativecommons.org/licenses/by/2.0), which permits unrestricted use, distribution, and reproduction in any medium, provided the original work is properly cited.
Page 1 of 17(page number not for citation purposes)

Malaria Journal 2008, 7:218 http://www.malariajournal.com/content/7/1/218
locations, and further sub-divisions of urban extents into urban and peri-urban classes enabled theeffects of high population densities on malaria transmission to be mapped and quantified.
Conclusion: The availability of detailed, contemporary census and urban extent data for theconstruction of coherent and accurate global spatial population databases is often poor. Theseknown sources of uncertainty in population surfaces and urban maps have the potential to beincorporated into future malaria burden estimates. Currently, insufficient spatial information existsglobally to identify areas accurately where population density is low enough to impact upontransmission. Medical intelligence does however exist to reliably identify malaria free cities.Moreover, in Africa, urban areas that have a significant effect on malaria transmission can bemapped.
BackgroundThe public health burden posed by malaria has put itscontrol high on the international development agenda.Recent improvements in the levels of funding for malariacontrol and their disbursement have resulted in anincrease in use of insecticide treated nets and access toeffective antimalarial drugs in many malaria endemiccountries that are starting to have demonstrable publichealth impact [1-8]. The rapidly changing malaria land-scape (epidemiological and political) requires an accurateand contemporary description of risk with which to helpaudit future needs objectively and guide resource alloca-tions effectively and equitably [9].
The extremes of both low and high population densitymodify malaria transmission and have profound conse-quences for estimates of its public health burden [10-14].In areas of exceptionally low population density, theremay be insufficient numbers of people to support trans-mission [10], while urban areas cause marked entomolog-ical, parasitological and behavioural effects that result inreduced risks [13]. These effects need to be assessed tohelp estimate their impact on the risks of Plasmodium fal-ciparum malaria globally. Recent studies have examinedthe potential of global population and urban extent sur-faces for mapping the risks of malaria and identifyingpopulations at risk. Guerra et al [15,16] estimated the glo-bal extent of malaria transmission for 2005 by using a setof rules, including the exclusion of i) all areas where pop-ulation density was less than one person per km2; ii)urban extents of cities identified as malaria free in travelguidelines; and iii) urban extents of cities with popula-tions greater than one million. Further, the effects ofurbanization (measured by population density-basedclassifications of urban extents) on P. falciparum entomo-logical inoculation rate (EIR) were also used to reduceendemicity in urban areas by stepwise reductions in cate-gorized endemicity classes, before estimating populationsat risk and the mortality attributable to P. falciparummalaria in Africa [13]. A similar logic was used to down-grade endemicity classes for the hypothesized effect ofurbanization in recent global estimates of the P. falci-
parum morbidity burden [17]. Finally, population countsand a compilation of medical intelligence on malaria riskin large cities were used to define the limits of unstable P.falciparum malaria transmission globally [18].
This paper documents efforts to use a global populationdatabase, medical intelligence and urban extent maps toidentify and describe spatially those areas of the malariaendemic world where human population densities arelowest and highest, resulting in modified transmissionand, thus, impact upon malaria burden. Further, theMalaria Atlas Project (MAP) global P. falciparum ParasiteRate (PfPR) survey database is used to explore relation-ships between human population density, settlement pat-terns and P. falciparum malaria transmission, in order torefine rules for data exclusion and transmission reductionrequired in estimating populations at risk for future map-ping initiatives and burden estimates. Finally, the prob-lems and drawbacks that exist in using global spatialpopulation databases and counterpart urban maps asdemographic components for malaria risk mapping arehighlighted.
MethodsDatasetsThe MAP PfPR databaseThe rigorous process of identifying, assembling and geo-locating community-based survey estimates of P. falci-parum parasite prevalence undertaken since 1985 hasbeen described previously [19,20], where PfPR estimateshave been reported in a wide variety of age groupings. Tostandardize to a single, epidemiologically important agerange (2.00–9.99 years), an algorithm based on catalyticconversion models first adapted for malaria by Pull andGrab [21] and described in detail elsewhere [22] wasapplied. Surveys that could only be geo-referenced toadministrative unit polygons, rather than precise loca-tions, were removed before analysis to ensure that onlythe most accurately geo-located surveys were used [23]. Atotal of 3,525 geo-referenced survey points were used inthe analyses, of which, 2,376 (903 rural, 292 urban, 1,144unclassified) were in Africa, 109 (97 rural, two urban,
Page 2 of 17(page number not for citation purposes)

Malaria Journal 2008, 7:218 http://www.malariajournal.com/content/7/1/218
seven unclassified) in the Americas and 1,040 (428 rural,15 urban, 506 unclassified) in the central and south-eastAsia region. Figure 1 shows the distribution of PfPR sur-veys used in this study overlaid on the spatial limits ofmalaria transmission [18], with dividing lines showingthe 'Africa+' region (Africa, Yemen and Saudi Arabia). Thiswas analysed separately from the rest of the world in thispaper.
Global population databasesThe principal source of human population distributiondata used for assessing the effects of low and high popula-tion densities on PfPRs in this study was the Global RuralUrban Mapping Project (GRUMP). The GRUMP spatialpopulation database provides global gridded populationdensity estimates at ~1 km spatial resolution. The dataand methods used to construct GRUMP are describedelsewhere [24,25]. In brief, the most recent census, andother demographic data at the highest possible adminis-trative boundary level available, were obtained for everycountry in the World, and areal weighted [26]. An urbanextent mask, GRUMP-UE (described below), was thenused to adjust population numbers within each extent tomatch estimated totals for each settlement in question.Finally, the individual national population surfaces wereprojected to the years 1990, 1995 and 2000 and adjustedto match the national population totals estimated by theUnited Nations' Population Division [27]. The clearly
documented methods, the substantially larger number ofadministrative units used to create the database, and testsshowing its higher accuracy over other products [26,28],have led to the use of GRUMP for the current analyses.
UN-adjusted population counts and densities for the year2000 were obtained from [27]. For Burundi, Kenya,Rwanda, Tanzania and Uganda, the mapped surfaces werereplaced with those described in Tatem et al. [28], as theyhave been shown to be more accurate. Prior to replace-ment the surfaces were adjusted to 2000 and degraded tothe same approximate 1 km spatial resolution as GRUMP.The entire global surface was projected to 2007 by apply-ing national, medium variant, inter-censal growth rates bycountry [27], using methods previously described [26].Figure 2 shows the resultant population density surface,alongside the year and administrative boundary unit levelof the census data used to make the surface. Each ismasked by the limits of malaria transmission [18], asdefined in Figure 1.
The use of an urban extent mask to adjust populationtotals and densities within areas defined as urban, meansthat GRUMP estimates of urban population densities arebiased by the specific features of this mask. Moreover, themask has been shown to overestimate consistently theextent of urban areas [29,30]. Given the aim of this studyto also examine the effects of population densities on
The spatial limit of Plasmodium falciparum malaria risk defined by P. falciparum annual parasite incidence (PfAPI) with tempera-ture and aridity masks [18]Figure 1The spatial limit of Plasmodium falciparum malaria risk defined by P. falciparum annual parasite incidence (PfAPI) with temperature and aridity masks [18]. Areas were defined as stable (dark grey areas, where PfAPI ≥ 0.1‰ pa), unstable (middle grey areas, where PfAPI < 0.1‰ pa) or no risk (light grey) [17-19]. The borders of the 87 countries defined as P. falciparum endemic are shown. The community surveys of P. falciparum prevalence conducted between 1985 and 01 March 2008 are plotted. Of the 4,887 surveys that could be geo-positioned, 4,077 fell within the predicted limits of P. falci-parum malaria risk. The data shown are age-standardized (PfPR2–10) and shown as a continuum from 0–100%. The dashed lines indicate the separation between the area defined as 'Africa+' (Africa, Yemen and Saudi Arabia) and the rest of the world used in the analyses.
Page 3 of 17(page number not for citation purposes)

Malaria Journal 2008, 7:218 http://www.malariajournal.com/content/7/1/218
Page 4 of 17(page number not for citation purposes)
(a) Modified GRUMP [24] masked by the limits of Pf malaria transmission [18] and projected to 2007 [27]Figure 2(a) Modified GRUMP [24] masked by the limits of Pf malaria transmission [18] and projected to 2007 [27]. The red border highlights where data from Tatem et al [28] were inserted. (b) The date of the census data used in the construction of the population surface in (a), and (c) the administrative unit level of census data used in the construction of the population surface in (a).
� � �
� � �
� � �

Malaria Journal 2008, 7:218 http://www.malariajournal.com/content/7/1/218
PfPRs within urban areas, subsequent to the choice of themost accurate urban map, a population database unbi-ased by choice of urban definition was required. For this,the Gridded Population of the World version 3 (GPW3)[24] population density database was obtained and pro-jected to 2007. GPW3 uses the same areal weighted censusdata as GRUMP as input, but implements no urbanadjustments and therefore, unlike GRUMP, is independ-ent of urban definition, making it useful for examiningpopulation density variations within urban extents thathave been mapped independently.
Global urban mapsTo assess the ability of existing datasets to identify areaswhere urbanization has a significant effect on malariatransmission, a set of public domain global urban mapswas obtained (Table 1) [13,15,27,31-36]. The ambiguityover what constitutes an urban area and consequently,urbanization, has led to several attempts to generate glo-bal and continental-scale urban maps using consistentmethods, and many of these were analysed in Tatem et al[29]. For this study, the maps documented in Table 1,which include the 'urban' classes from two global satellitesensor-derived land cover maps (Advanced Very High Res-olution Radiometer, AVHRR, and Moderate ResolutionImaging Spectroradiometer, MODIS) and the 'populatedbuilt up area' features from military mapping data(VMAP0), were acquired. The full GRUMP-UE map, cre-ated principally using night-time lights satellite imagery[24,37], was also acquired, as was an edited version ofGRUMP-UE containing only the extents of those 123 cit-ies within the limits of malaria transmission with popula-tions greater than 750,000, as defined by the UnitedNations World Urbanization Prospects 2005 database[38] (Edited GRUMP-UE). Finally, population density
based urban extent maps were created following the rulesoutlined in Guerra et al [15] and Hay et al [13]. In eachcase more contemporary population projections [27] andurban population totals [38] were used. Moreover, theHay et al methodology was applied to both GRUMP andGPW3, with the 'urban' and 'peri-urban' (areas aroundurban extents with substantially higher population densi-ties than the surrounding rural areas) classes merged intoa single urban class, alongside also maintaining the'urban' class and assigning the remaining classes to 'rural'.
International travel and health guidelines (ITHGs)Some urban areas within malaria endemic regions areknown to be malaria free, and thus can be eliminatedfrom further analyses. Information on such areas are pro-vided by ITHGs, the two most comprehensive of which,the 'Health Information for International Travel' pro-duced by the Centers for Disease Control [39] and the'World malaria risk chart' produced by the InternationalAssociation for Medical Assistance to Travellers [40], wereobtained. These were then cross-referenced to identify anyurban areas within malaria endemic countries identifiedexplicitly as malaria free.
Satellite vegetation index stratificationTo provide a basic division between high and low Pf trans-mission areas for analyses, while maintaining sufficientdata, a vegetation index-based stratification was created.High and low vegetation zones were defined by the meanannual Normalized Difference Vegetation Index (NDVI)[41], as measured by the AVHRR satellite sensor. Thisimagery is described in detail elsewhere [42]. The NDVIimage was split into two classes that have proven to be rel-evant to malaria ecology [13,43,44], whilst ensuring thatsufficient numbers of surveys remained in each class for
Table 1: Features of each of the six global urban maps tested in this study
Urban Map Spatial Resolution Production Year Reference/Source/Data used
AVHRR 1 km 1998 [31]VMAP0 Vector polygons: 1:1000000 1997 [32]GRUMP-UE 1 km 2004 [33,34]Edited GRUMP-UE 1 km 2008 [27,33,34]GUERRA 1 km 2008 [15]MODIS 1 km 2002 [35,36]HAY-GPW-U 5 km 2008 [13]HAY-GPW-U-PU 5 km 2008 [13]HAY-GRUMP-U 1 km 2008 [13]HAY-GRUMP-U-PU 1 km 2008 [13]
GRUMP-UE = Global Rural-Urban Mapping Project Urban Extents; AVHRR = AVHRR Global Land Cover Classification urban land cover class; MODIS = MODIS Land Cover Product Binary Data from Boston University; VMAP0 = Vector map level zero; GUERRA = Population density based map described in Guerra et al. [15]; HAY-GPW-U = Population density based map described in Hay et al. [13], maintaining 'urban' class as urban and the remaining 3 classes merged to form the rural class; HAY-GPW-U-PU = Same as previous map, but merging 'urban' and 'peri-urban' classes into a single urban class; HAY-GRUMP-U = Same as previous map, but classes were defined using GRUMP and maintaining 'urban' class as urban and the remaining 3 classes merged to form the rural class; HAY-GRUMP-U-PU = same as previous map, but merging 'urban' and 'peri-urban' classes into a single urban class.
Page 5 of 17(page number not for citation purposes)

Malaria Journal 2008, 7:218 http://www.malariajournal.com/content/7/1/218
statistical tests. These classes were, class 1: NDVI < 0.35(1036 surveys), corresponding to drier, less vegetatedareas and class 2: NDVI > = 0.35 (2489 surveys), corre-sponding to wetter, more vegetated areas (Figure 3). Foreach of the following tests, analyses were performed glo-bally and then separated between Africa+, and the remain-der of the world. This division allowed thebiogeographically, entomologically and epidemiologi-cally distinct regions [45,46] to be considered separately,whilst retaining sufficient data in each region for mean-ingful analysis.
AnalysesIdentifying low population densitiesTo assess the effects of applying different thresholds oflow population density on land area, population num-bers and PfPR surveys excluded, the modified GRUMPsurface was reclassified to highlight those areas wherepopulation density was = 0, < = 0.01, < = 0.02.... < = 0.9,< = 1 persons per km2. For each classification, the totalarea covered by the class in question was calculated, aswell as the total population numbers and details of PfPRsurveys included. These data were plotted to visualise theeffects of the different low population density thresholds.For each threshold, the mean PfPR of the surveys excludedwas compared to those remaining using a Mann-WhitneyU-test [47], to determine if such thresholds identified sur-veys with significantly lower PfPRs. Additionally, theeffects of using different categories of areas gazetted asnational parks, reserves, etc, to identify low populationdensities were investigated, and are described in addi-tional file 1: Gazetted Areas.
High population densities and urbanizationA simplified summary of the main steps taken in the anal-ysis of the effects of high population densities and urban-ization on PfPR is shown in Figure 4. Firstly, the featuresof the PfPR surveys falling within those areas defined asurban by each map detailed in Table 1 were examined toassess whether spatial information on urban extents canbe used as a mask of zero transmission, as has been imple-mented in the past [15,16].
Secondly, author defined rural/urban classifications ofPfPR surveys were used to examine whether previouslydocumented effects of urbanization on malaria transmis-sion, based on an examination of EIR and other healthmetric data [13], existed for PfPRs, both globally andbetween Africa+ and the rest of the world. Of the 3525PfPR surveys considered in this paper, 50.5% included anauthor-defined indicator of whether the survey was car-ried out in a 'rural' or 'urban' community. With the inac-curacies, inconsistencies and difficulties that exist inmapping urban extents over the malaria endemic regionsof the world [29,48,49], these author-defined assign-ments, while resulting from partly subjective decisionsand perceptions, represent the most reliable indicatorsavailable on the rural/urban setting of each PfPR survey,and are made using criteria cognisant of local malaria epi-demiology. To assess whether significant differences inurban and rural transmission existed, sets of proximate(spatially and temporally) urban and rural surveys wereidentified for comparison. For every survey identified bythe survey author as being carried out within an urbanarea, the nearest surveys carried out in rural locations
The Normalized Difference Vegetation Index (NDVI) classes used in this studyFigure 3The Normalized Difference Vegetation Index (NDVI) classes used in this study. The NDVI was calculated from AVHRR, then classified into NDVI < 0.350, corresponding to drier, relatively less vegetated areas and NDVI > = 0.35, corre-sponding to wetter, relatively more vegetated areas.
Page 6 of 17(page number not for citation purposes)

Malaria Journal 2008, 7:218 http://www.malariajournal.com/content/7/1/218
Page 7 of 17(page number not for citation purposes)
Steps taken in the analysis of the effects of high population densities and urbanization on PfPRsFigure 4Steps taken in the analysis of the effects of high population densities and urbanization on PfPRs. Analyses were undertaken globally and split between Africa+ and the rest of the world.
Malaria Journal 2008, 7:218 http://www.malariajournal.com/content/7/1/218
(again defined by the survey author) within 100 km and5 years were identified. If no such surveys were found,then this urban survey was dropped from the analyses. Ofthe rural surveys (conducted within 100 km and 5 years ofeach urban survey in question) identified, the mean PfPRwas calculated and assigned to that urban survey to makea rural-urban pair of PfPRs for analysis. These rules pro-duced a set of urban-rural PfPR survey pairs, from whichtests of the difference between urban PfPR values againstrural values could be made. Given the skewed distributionof PfPR values in the MAP database [20], the Wilcoxonsigned-ranks test for paired variables [50], a nonparamet-ric alternative to the t-test, was used to assess the differ-ences. Tests were undertaken globally, by NDVI class andby continent (Africa+ compared with the rest of theworld) to identify differing trends.
Third, if significant differences were found to existbetween the author-defined urban and rural PfPR values,a map which replicated these definitions accurately wasrequired to provide a consistent, malaria-relevant basis foridentifying those areas that are urbanized sufficiently toaffect transmission. Moreover, the map would enable theconsistent assignment of an urban/rural class to the entireset of PfPR surveys, when only 50.5% of surveys currentlyhave an author-defined classification. Again taking theauthor-defined urban/rural classification as being mostreliable in terms of local malaria epidemiology, the tendifferent maps of urban extent (Table 1) were tested toexamine which one described this author-based assign-ment most accurately. The PfPR surveys with an author-defined rural/urban assignment were overlaid on eachurban extent map using GIS software and the urban/ruralmap class was extracted for each point. These class assign-ments were then compared to the author assignmentsusing confusion matrix-based statistics: percentage cor-rect, producer's accuracy, user's accuracy and kappa [51].
Fourth, the urban map determined to be the most accu-rate in matching the author-defined classifications wasthen tested to examine the influence of urbanization onPfPR using the entire set of PfPR surveys with their newurban-rural assignments from the map. The PfPR surveylocations were overlaid on the chosen urban map and theurban/rural class assignment was extracted for each point.As described above, sets of spatially and temporally prox-imate urban and rural surveys were again identified tocheck for significant differences between urban and ruralPfPRs. For each point classified as urban, the surveys clas-sified as rural within 100 km and 5 years were identifiedand their PfPRs averaged, to create a set of map-definedurban-rural PfPR pairs. This set was subject to Wilcoxonsigned-rank tests to ascertain if significant differences inPfPR values existed between urban and rural surveys.
Fifth, to examine local variations in urban-rural PfPRs,where possible, the corresponding urban extents withinthe chosen urban map of the 123 UN-defined cities, asdescribed in Table 1, were identified, and the centroids ofeach extent calculated. For each city, a 100 km wide circu-lar buffer centred on the city centroid was created. Citiesfor which at least two PfPR surveys fell within the cityextent (urban) and at least two PfPR surveys fell within theremainder of the 100 km buffer (rural) were identified.For these cities, the urban and rural PfPR values were com-pared and Mann-Whitney U-tests were undertaken toassess the significance of any differences seen.
Finally, given the known difficulties in mapping urbanextents that lead to extent overestimation [29,30] and theeffects of 'peri-urban' areas on transmission [13], the dis-tribution of population densities within urban areas wasexamined to assess whether mapped peri-urban areas hada discernible effect on PfPRs, when compared to thosefrom urban and rural areas. As described above, its inde-pendence from urban adjustment meant that GPW3 wasused to map these peri-urban areas. The threshold indefining 'urban' populations, of 1000 people per km2 orabove, as shown to be relevant to malaria transmission byHay et al. [13], was mapped within urban areas, as definedby the chosen urban map. The urban PfPRs above andbelow this threshold were then examined to ascertain ifsignificant differences existed. For each PfPR survey withinthe high population density urban area ('urban'), a corre-sponding set of lower population density urban area sur-veys ('peri-urban') and rural area surveys were identified,ensuring that these two sets of surveys were undertakenwithin 100 km and 10 years (to ensure sufficient numbersof points for testing) of the 'urban' survey. The averages ofthe peri-urban and rural sets of PfPR surveys were calcu-lated and assigned to their urban PfPR counterpart tomake location-specific sets of urban, peri-urban and ruralPfPRs for testing of any trends in transmission rates byurban gradation. The nonparametric Friedman's rankingtest for related samples [52] was undertaken to assess thesignificance of any differences.
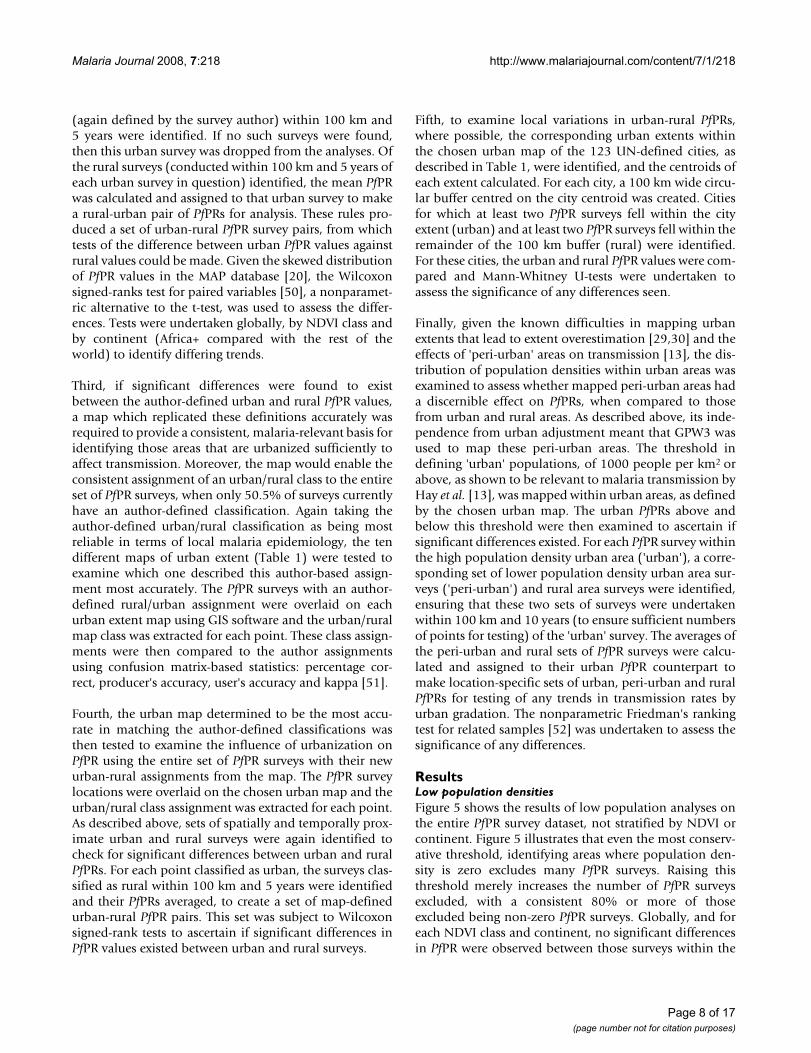
ResultsLow population densitiesFigure 5 shows the results of low population analyses onthe entire PfPR survey dataset, not stratified by NDVI orcontinent. Figure 5 illustrates that even the most conserv-ative threshold, identifying areas where population den-sity is zero excludes many PfPR surveys. Raising thisthreshold merely increases the number of PfPR surveysexcluded, with a consistent 80% or more of thoseexcluded being non-zero PfPR surveys. Globally, and foreach NDVI class and continent, no significant differencesin PfPR were observed between those surveys within the
Page 8 of 17(page number not for citation purposes)

Malaria Journal 2008, 7:218 http://www.malariajournal.com/content/7/1/218
low population density exclusion zones and the remain-der of the surveys at any threshold.
High population densities and urbanizationThose cities within malaria endemic countries that areidentified explicitly as malaria free by the ITHGs are listedin Table 2. Table 3 shows the features of PfPR surveys con-ducted within urban areas as defined by various criteria.In every case, over 87% of surveys conducted in areasmapped as 'urban' found PfPRs greater than zero, thoughin many cases, only a small number of those areasmapped as urban had a survey conducted within them.
The results of Wilcoxon signed-ranks tests between PfPRvalues from the paired urban and rural sites, as defined bythe survey author, are shown in Table 4. Results indicateclearly that strong significant differences exist betweenPfPRs sampled in urban and rural locations globally, withurban areas exhibiting consistently lower values (averagedifference = 30.54%). This difference is due to Africa+only, as similar results were not found for the PfPR surveysacross the rest of the world, with no significant differencesfound between rural and urban surveys, though the sam-ple size was small. Figure 6 shows boxplots for these pairs,
stratified by NDVI class, and emphasises the differencebetween author-defined urban and rural PfPRs in Africa+,with the surveys conducted in the higher NDVI classshowing a greater separation.
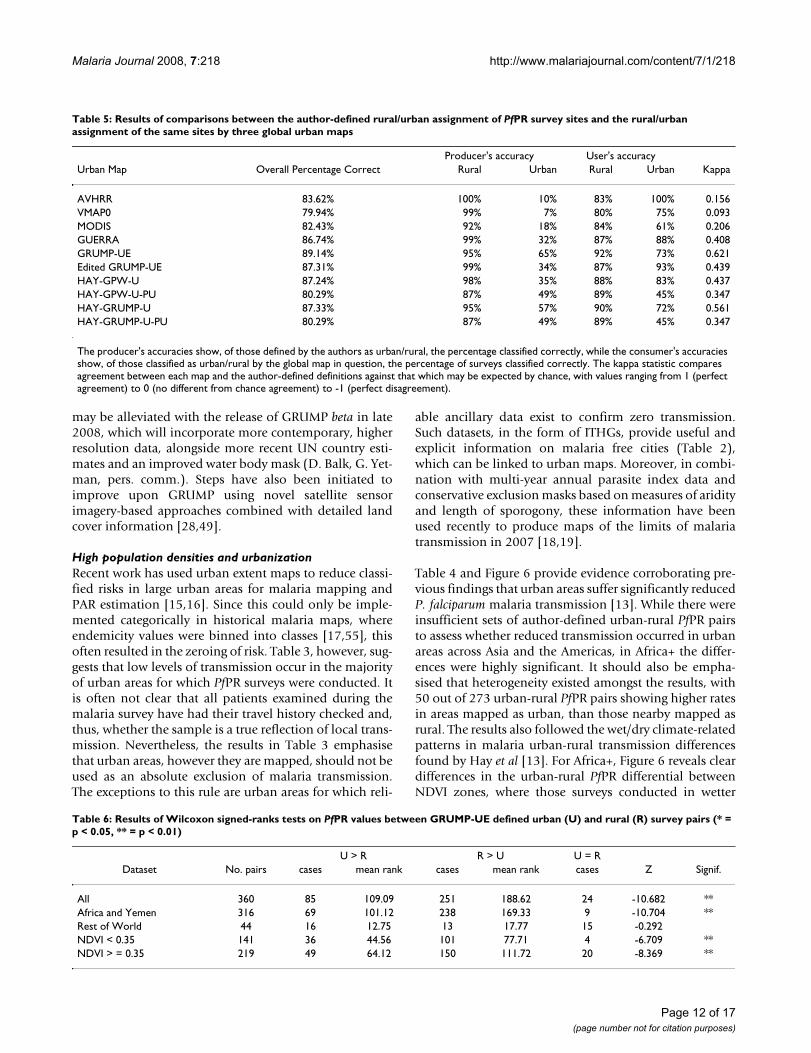
Table 5 shows the results of the accuracy assessments car-ried out to determine which global urban map bestdescribed the author-defined urban/rural assignments.GRUMP-UE produced the most accurate match, with thelargest percentage correct and a kappa of 0.624. Followingthis, Table 6 shows the results of Wilcoxon signed-rankstests between PfPR values from paired urban and ruralsites, as defined by GRUMP-UE. Results again showclearly that strong significant differences exist betweenurban and rural PfPRs in Africa+, while no significant dif-ferences are found outside of Africa+, though sample sizeswere small. Stratification by NDVI values shows that theurban-rural differential in PfPR values is again more pro-nounced in the wetter, greener areas than in the drierareas, where NDVI is low. The Z values highlight, how-ever, that the differences are not quite as clear as they arewhen defined by the survey author (Table 4), indicatingboth the difficulties in mapping urban areas globally andpotential inconsistencies in author definitions of urban.
Land area and number of PfPR surveys excluded by varying population density thresholdsFigure 5Land area and number of PfPR surveys excluded by varying population density thresholds. GRUMP was reclassi-fied using the thresholds on the x-axis, and for each threshold level, the land area below the threshold was calculated, as well as the number of PfPR surveys within this area.
Page 9 of 17(page number not for citation purposes)

Malaria Journal 2008, 7:218 http://www.malariajournal.com/content/7/1/218
Boxplots of PfPR values by GRUMP-UE urban/ruralassignments for individual African cities where more thanone urban and one rural PfPR survey were available areshown in Figure 7. The consistent pattern of lower PfPRvalues in urban areas than found in the surrounding ruralregions is again evident. Overall, and for many individualcities, these differences are highly significant. For thosecities where the differences seen in the boxplots were notfound to be significant, this is likely due to insufficientnumbers of survey points to achieve significance.
The urban extents in GRUMP-UE were reclassified tourban and peri-urban based on the GPW3 populationdensity threshold, and 121 individual sets of proximateurban, peri-urban and rural PfPR surveys were identifiedfor Africa+. Figure 8 shows the boxplots of all of thesecombined, and stratified by NDVI class. In each case, cleardifferences are seen, with the Friedman test indicating thatthese differences are highly significant (p < 0.01). Figure 9shows the peri-urban and urban extents mapped globally,within the limits of malaria transmission.
DiscussionThe rapid demographic shifts occurring across the devel-oping world [53] are having profound effects on rates ofmorbidity and mortality attributed to many diseases andconditions [54]. These shifts impact upon malaria trans-mission and create a need for accurate and epidemiologi-cally relevant spatial information on populationdistributions and urbanization to calibrate populations atrisk (PAR) for disease burden estimation. Here medicalintelligence and the newly assembled MAP PfPR databasehave been used to examine how existing spatial demo-graphic databases can be used to improve PAR estimation.It is important to emphasise that these results are based onan opportunistic sample of the malaria endemic world.
Low population densitiesThe mapping of areas of low population density has beenused in the past to create masks of zero malaria transmis-sion [15-17]. Results here suggest that contemporary spa-tial population databases are of insufficient detail toachieve this effectively. Figure 5 shows that, even using theglobal population database with the greatest number ofinput census units (GRUMP) and a zero population den-sity threshold, 37 PfPR surveys are excluded, with themajority of malaria surveys exhibiting prevalences abovezero. As this threshold is increased, the number of surveysexcluded rises. Moreover, no significant differences inPfPR values were found at any of these thresholds betweenthose surveys in the excluded areas and those surroundingthem. Low population definitions cannot, therefore, be
Table 2: Cities within malaria endemic countries that are reported by the ITHGs as being malaria free
COUNTRY CITY COUNTRY CITY
Bangladesh Dhaka Panama ColonBrazil Belem city Panama Panama cityCambodia Phnom Penh Peru LimaColombia Barranquilla Philippines ManilaColombia Bogota Saudi Arabia JiddahColombia Cali Saudi Arabia MeccaColombia Cartagena Saudi Arabia MedinaColombia Manizales Saudi Arabia Tai'ifColombia Medellin Sri Lanka ColomboEcuador Cuenca Thailand BangkokEcuador Guayaquil Thailand Chiang MaiEcuador Quito Thailand SonghklaEritrea Asmara Venezuela BarinasEthiopia Addis Ababa Venezuela CaracasGuatemala Guatemala city Venezuela Isla de MargaritaGuyana Georgetown Venezuela MacutoGuyana New Amsterdam Venezuela MaracaiboIndonesia Denpasar Vietnam Da NangIndonesia Jakarta Vietnam HaipongIndonesia Surabaya Vietnam HanoiLao DPR Vietiane Vietnam Ho Chi MinhMyanmar Magwe Vietnam Nha TrangMyanmar Mandalay Vietnam Qui NhonMyanmar Pegu Yemen Sana'aMyanmar Sagaing Zimbabwe BulawayoMyanmar Yangon Zimbabwe HarareNepal Kathmandu
Table 3: Features of PfPR surveys mapped as urban by the various global urban maps outlined in Table 1
Urban Map No. PfPR points in 'urban' areas No. PfPRs > 0
AVHRR 40 39VMAP0 35 34GRUMP-UE 423 371Edited GRUMP-UE 134 125GUERRA 150 92MODIS 127 101HAY-GPW-U 210 194HAY-GPW-U-PU 943 713HAY-GRUMP-U 360 317HAY-GRUMP-U-PU 998 827
Page 10 of 17(page number not for citation purposes)

Malaria Journal 2008, 7:218 http://www.malariajournal.com/content/7/1/218
used to identify zero risk in malaria endemicity maps.Similar results were also found for the gazetted areas andare provided in additional file 1: Gazetted Areas.
Figure 2 demonstrates why the masking of epidemiologi-cally relevant low population density areas is problematic.
GRUMP incorporates the majority of the most contempo-rary and highest resolution spatially-referenced censusdata available, but for much of the malaria endemicworld, this data is still many years old (Figure 2(b)) andat an administrative boundary level too low to identifysmall settlements (Figure 2(c)). Some of these problems
Boxplots showing the differences in PfPRs by author-defined rural-urban survey pairs for surveys where mean annual NDVI is (a) less than 0.35 and (b) greater than or equal to 0.35 (* = p < 0.05, ** = p < 0.01)Figure 6Boxplots showing the differences in PfPRs by author-defined rural-urban survey pairs for surveys where mean annual NDVI is (a) less than 0.35 and (b) greater than or equal to 0.35 (* = p < 0.05, ** = p < 0.01).
� � �
� � �
Table 4: Results of Wilcoxon signed-ranks tests on PfPR values between author-defined urban
U > R R > U U = RDataset No. pairs cases mean rank cases mean rank cases Z Signif.
All 286 57 81.62 218 152.74 11 -10.85 **Africa and Yemen 273 50 70.07 212 145.99 11 -11.178 **Rest of World 13 6 4.5 7 9.14 0 -1.293
(U) and rural (R) survey pairs (* = p < 0.05, ** = p < 0.01).
Page 11 of 17(page number not for citation purposes)
Malaria Journal 2008, 7:218 http://www.malariajournal.com/content/7/1/218
may be alleviated with the release of GRUMP beta in late2008, which will incorporate more contemporary, higherresolution data, alongside more recent UN country esti-mates and an improved water body mask (D. Balk, G. Yet-man, pers. comm.). Steps have also been initiated toimprove upon GRUMP using novel satellite sensorimagery-based approaches combined with detailed landcover information [28,49].
High population densities and urbanizationRecent work has used urban extent maps to reduce classi-fied risks in large urban areas for malaria mapping andPAR estimation [15,16]. Since this could only be imple-mented categorically in historical malaria maps, whereendemicity values were binned into classes [17,55], thisoften resulted in the zeroing of risk. Table 3, however, sug-gests that low levels of transmission occur in the majorityof urban areas for which PfPR surveys were conducted. Itis often not clear that all patients examined during themalaria survey have had their travel history checked and,thus, whether the sample is a true reflection of local trans-mission. Nevertheless, the results in Table 3 emphasisethat urban areas, however they are mapped, should not beused as an absolute exclusion of malaria transmission.The exceptions to this rule are urban areas for which reli-
able ancillary data exist to confirm zero transmission.Such datasets, in the form of ITHGs, provide useful andexplicit information on malaria free cities (Table 2),which can be linked to urban maps. Moreover, in combi-nation with multi-year annual parasite index data andconservative exclusion masks based on measures of aridityand length of sporogony, these information have beenused recently to produce maps of the limits of malariatransmission in 2007 [18,19].
Table 4 and Figure 6 provide evidence corroborating pre-vious findings that urban areas suffer significantly reducedP. falciparum malaria transmission [13]. While there wereinsufficient sets of author-defined urban-rural PfPR pairsto assess whether reduced transmission occurred in urbanareas across Asia and the Americas, in Africa+ the differ-ences were highly significant. It should also be empha-sised that heterogeneity existed amongst the results, with50 out of 273 urban-rural PfPR pairs showing higher ratesin areas mapped as urban, than those nearby mapped asrural. The results also followed the wet/dry climate-relatedpatterns in malaria urban-rural transmission differencesfound by Hay et al [13]. For Africa+, Figure 6 reveals cleardifferences in the urban-rural PfPR differential betweenNDVI zones, where those surveys conducted in wetter
Table 5: Results of comparisons between the author-defined rural/urban assignment of PfPR survey sites and the rural/urban assignment of the same sites by three global urban maps
Producer's accuracy User's accuracyUrban Map Overall Percentage Correct Rural Urban Rural Urban Kappa
AVHRR 83.62% 100% 10% 83% 100% 0.156VMAP0 79.94% 99% 7% 80% 75% 0.093MODIS 82.43% 92% 18% 84% 61% 0.206GUERRA 86.74% 99% 32% 87% 88% 0.408GRUMP-UE 89.14% 95% 65% 92% 73% 0.621Edited GRUMP-UE 87.31% 99% 34% 87% 93% 0.439HAY-GPW-U 87.24% 98% 35% 88% 83% 0.437HAY-GPW-U-PU 80.29% 87% 49% 89% 45% 0.347HAY-GRUMP-U 87.33% 95% 57% 90% 72% 0.561HAY-GRUMP-U-PU 80.29% 87% 49% 89% 45% 0.347
The producer's accuracies show, of those defined by the authors as urban/rural, the percentage classified correctly, while the consumer's accuracies show, of those classified as urban/rural by the global map in question, the percentage of surveys classified correctly. The kappa statistic compares agreement between each map and the author-defined definitions against that which may be expected by chance, with values ranging from 1 (perfect agreement) to 0 (no different from chance agreement) to -1 (perfect disagreement).
Table 6: Results of Wilcoxon signed-ranks tests on PfPR values between GRUMP-UE defined urban (U) and rural (R) survey pairs (* = p < 0.05, ** = p < 0.01)
U > R R > U U = RDataset No. pairs cases mean rank cases mean rank cases Z Signif.
All 360 85 109.09 251 188.62 24 -10.682 **Africa and Yemen 316 69 101.12 238 169.33 9 -10.704 **Rest of World 44 16 12.75 13 17.77 15 -0.292NDVI < 0.35 141 36 44.56 101 77.71 4 -6.709 **NDVI > = 0.35 219 49 64.12 150 111.72 20 -8.369 **
Page 12 of 17(page number not for citation purposes)

Malaria Journal 2008, 7:218 http://www.malariajournal.com/content/7/1/218
areas showed a clearer separation between urban andrural PfPRs. The ratio between the medians remained thesame between zones, however, with the median PfPR inurban areas being around 40% of that in rural areas. Inhigh transmission areas, where, for example rural PfPR =
60%, this equates to a significant drop in entomologicalinoculation rate (EIR) from around 20 to 1 between ruraland urban areas, respectively [56]. In lower transmissionareas, this change is less substantial due to the non-linearPR-EIR relationship [56], with an EIR difference between
Boxplots showing the differences in PfPR values by GRUMP-UE defined rural/urban assignment for cities where mean annual NDVI is (a) less than 0.35 and (b) greater than or equal to 0.35 (* = p < 0.05, ** = p < 0.01)Figure 7Boxplots showing the differences in PfPR values by GRUMP-UE defined rural/urban assignment for cities where mean annual NDVI is (a) less than 0.35 and (b) greater than or equal to 0.35 (* = p < 0.05, ** = p < 0.01). The number of points in each class is shown in brackets below each plot.
� � �
� � �
Page 13 of 17(page number not for citation purposes)

Malaria Journal 2008, 7:218 http://www.malariajournal.com/content/7/1/218
rural and urban areas of just 0.9, for areas where ruralPfPR = 20%. These results are consistent with previousfindings on the effects of urbanization on EIR, with trans-mission reduction being significantly larger in high trans-mission areas [13].
It is clear from Tables 5 and 6 that only the urban maskused to create GRUMP is of sufficient detail to identifythose urban areas which have a significant effect onmalaria transmission. Moreover, for those cities wheresufficient PfPR surveys exist within and near mappedextents, there are again clear differences in prevalence
(Figure 7). The over-estimation of large urban extentsexists within GRUMP-UE due to the 'over-glow' effectpresent in the night-time lights imagery used to produce it[29,48]. This effect means that the mapped extent of manywell-electrified large settlements may also include lessintensely-urban areas at their periphery, where malariatransmission may be significantly higher than that in thecentre. Given the lack of globally consistent data on urban'intensities', results here have shown that population den-sity measures within urban extents can be used to discrim-inate between malaria-relevant urban and 'peri-urban'
Boxplots showing the differences in PfPRs by GRUMP-UE/GPW3-defined rural, peri-urban, urban survey sets for (a) all surveys in Africa+ and those where mean annual NDVI is (b) less than 0.35 and (c) greater than or equal to 0.35 (* = p < 0.05, ** = p < 0.01)Figure 8Boxplots showing the differences in PfPRs by GRUMP-UE/GPW3-defined rural, peri-urban, urban survey sets for (a) all surveys in Africa+ and those where mean annual NDVI is (b) less than 0.35 and (c) greater than or equal to 0.35 (* = p < 0.05, ** = p < 0.01).
����� � � � � � � ���� � � � � � � ����
Peri-urban and urban extents for all malaria endemic countries within the limits of Pf malaria transmissionFigure 9Peri-urban and urban extents for all malaria endemic countries within the limits of Pf malaria transmission. The extents are a combination of GRUMP urban extents and GPW thresholded population densities, defined using the MAP PfPR database.
Page 14 of 17(page number not for citation purposes)

Malaria Journal 2008, 7:218 http://www.malariajournal.com/content/7/1/218
areas, identifying significant gradations that distinguishdifferent levels of transmission (Figure 8).
Various recent studies have adjusted for urbanization inestimating malaria risk, PAR and burden over continentalto global scales [13,15-17,57-60], but few have attemptedto make use of medical intelligence information andassess the accuracy of the urban maps used, the epidemi-ological relevance of the urban-rural division adopted andthe possibility of incorporating gradations of urbaniza-tion into these stratifications. This study highlights severalways that these data and relationships can be used in themapping of Pf malaria endemicity. First, the ITHGs andother medical intelligence provide a valuable first step inidentifying malaria free urban areas [18,19]. Second,when wanting to assign the urban/rural status for amalaria survey for which such information was notreported, the GRUMP-UE surface should be used. Third,incorporation of GPW population densities also enablesdiscrimination of an epidemiologically relevant peri-urban class for survey assignment. Fourth, the significantrelationships shown in Figure 7 indicate that, in theAfrica+ region, rural, peri-urban and urban regions shouldbe treated separately when the aim is to produce continu-ous prevalence or endemicity class predictions. Outside ofAfrica there is insufficient evidence from malaria surveysto support an informed decision.
Increasing computer power, the proliferation of geo-graphical information systems (GIS) and the widespreadavailability of spatially-referenced human populationcensus data have enabled significant advances in globalspatial demography in the last decade [61], facilitatingdemographic denominators of disease risk to be esti-mated at sub-national scales, matching the spatial fidelityof advanced disease risk maps themselves. Such advancespotentially facilitate the incorporation of sub-nationalspatial variations and burden estimates into major globaldisease burden assessments for the first time [62]. Recenttrends are increasingly towards the use of spatial data-bases of human population and urbanization to estimatepopulations at risk, burdens, urbanization effects andinfectious disease spread, e.g. [19,63-68]. Nevertheless,while emphasis is being placed more than ever upon map-ping and incorporating spatial uncertainty into diseaserisk modelling, the uncertainties inherent in the estimatesof the demographic denominators are often overlooked.Figures 2(b) and 2(c) highlight that, even in GRUMP, thepopulation database with the most contemporary andhighest resolution census data, much of the input dataused is well over 10 years old and at low administrativeunit level. The spatial and temporal errors and uncertain-ties that inevitably arise upon using these data for estimat-ing present populations at risk at high resolution have yetto be quantified. Future work will examine approaches for
estimating these uncertainties inherent in gridded popula-tion databases, to enable complete assessments of uncer-tainty in disease burden estimation. Moreover, the highresolution population mapping work will be extendedbeyond East Africa [28] to increase spatial detail and accu-racies.
Competing interestsThe authors declare that they have no competing interests.
Authors' contributionsAJT conceived, designed and implemented the researchand wrote the paper. SIH aided with ideas, methodologi-cal and editorial input. CAG, CWK and AMN providedsupport in data compilation. The final version of the man-uscript was seen and approved by all authors.
Additional material
AcknowledgementsThe authors are grateful to Bob Snow, Pete Gething, Fred Piel, Marianne Sinka and Anand Patil for comments on the original manuscript. Bob Snow is also thanked for guidance and intellectual input throughout the work. CAG is supported by a Wellcome Trust Project grant (#076951). SIH and AJT are funded by a Senior Research Fellowship from the Wellcome Trust (#079091 to SIH). AMN is supported by the Wellcome Trust as a Research Training Fellow (#081829). All authors acknowledge the support of the Kenyan Medical Research Institute. This work forms part of the output of the Malaria Atlas Project (MAP, http://www.map.ox.ac.uk), principally funded by the Wellcome Trust, U.K.
References1. Barat LM: Four malaria success stories: how malaria burden
was successfully reduced in Brazil, Eritrea, India and Viet-nam. Am J Trop Med Hyg 2006, 74:12-16.
2. Barnes KI, Durrheim DN, Little F, Jackson A, Mehta U, Allen E,Dlamini SS, Tsoka J, Bredenkamp B, Mthembu DJ, White NJ, Sharp BJ:Effect of artemether-lumefantrine policy and improved vec-tor control on malaria burden in KwaZulu-Natal, SouthAfrica. PLoS Med 2005, 2:e330.
3. Bhattarai A, Ali A, Kachur S, Martensson A, Abbas A, Khatib R, Al-Mafazy A, Ramsan M, Rotllant G, Gerstenmaier J, Molteni F, AbdullaS, Montgomery SM, Kaneko A, Bjorkman A: Impact of artemisinin-based combination therapy and insecticide-treated nets onmalaria burden in Zanzibar. PLoS Med 2007, 4:e309.
4. Fegan GW, Noor AM, Akhwale WS, Cousens S, Snow RW: Effect ofexpanded insecticide-treated bednet coverage on child sur-vival in rural Kenya: a longitudinal study. Lancet 2007,370:1035-1039.
5. Noor A, Amin A, Akhwale W, Snow RW: Increasing coverage anddecreasing inequity in insecticide-treated bed net use amongrural Kenyan children. PLoS Med 2007, 4:1341-1348.
6. Nyarango P, Gebremeskel T, Mebrahtu G, Mufunda J, AbdulmuminiU, Ogbamariam A, Kosia A, Gebremichael A, Gunawardena D, Ghe-brat Y, Okbaldet Y: A steep decline of malaria morbidity and
Additional file 1Gazetted Areas. Description and analyses based on gazetted areas data.Click here for file[http://www.biomedcentral.com/content/supplementary/1475-2875-7-218-S1.pdf]
Page 15 of 17(page number not for citation purposes)

Malaria Journal 2008, 7:218 http://www.malariajournal.com/content/7/1/218
mortality trends in Eritrea between 2000 and 2004: theeffect of combination of control methods. Malar J 2006, 5:33.
7. Okiro E, Hay S, Gikandi P, Sharif S, Noor A, Peshu N, Marsh K, SnowRW: The decline in paediatric malaria admissions on thecoast of Kenya. Malar J 2007, 6:151.
8. UNICEF: Malaria and children: progress in intervention cov-erage. New York, USA: UNICEF; 2007.
9. Hay SI, Snow RW: The Malaria Atlas Project: developing globalmaps of malaria risk. PLoS Med 2006, 3:e473.
10. Snow RW, Craig M, Deichmann U, Marsh K: Estimating mortality,morbidity and disability due to malaria among Africa's non-pregnant population. Bull World Health Organ 1999, 77:624-640.
11. Cox J, Hay SI, Abeku TA, Checci F, Snow RW: The uncertain bur-den of Plasmodium falciparum epidemics in Africa. TrendsParasitol 2007, 23:142-148.
12. Snow RW, Omumbo JA: Malaria. In Disease and mortality in sub-Saha-ran Africa Edited by: Jamison DT, Feachem RG, Makgoba MW, Bos ER,Baingana FK, Hofman KJ, Rogo KO. Washington DC: The WorldBank; 2006.
13. Hay SI, Guerra CA, Tatem AJ, Atkinson PM, Snow RW: Urbaniza-tion, malaria transmission and disease burden in Africa. NatRev Microbiol 2005, 3:81-90.
14. Robert V, MacIntyre K, Keating J, Trape JF, Duchemin JB, Warren M,Beier JC: Malaria transmission in urban sub-Saharan Africa.Am J Trop Med Hyg 2003, 68:169-176.
15. Guerra CA, Snow RW, Hay SI: Defining the global spatial limitsof malaria transmission in 2005. Adv Parasitol 2006, 62:157-179.
16. Guerra CA, Snow RW, Hay SI: Mapping the global extent ofmalaria in 2005. Trends Parasitol 2006, 22:353-358.
17. Snow RW, Guerra CA, Noor AM, Myint HY, Hay SI: The global dis-tribution of clinical episodes of Plasmodium falciparummalaria. Nature 2005, 434:214-217.
18. Guerra CA, Gikandi PW, Tatem AJ, Noor AM, Smith DL, Hay SI,Snow RW: The limits and intensity of Plasmodium falciparumtransmission: implications for malaria control and elimina-tion worldwide. PLoS Med 2008, 5:e38.
19. Guerra CA: Mapping the contemporary global distributionlimits of malaria using empirical data and expert opinion.University of Oxford, Department of Zoology; 2007.
20. Guerra CA, Hay SI, Lucioparades LS, Gikandi PW, Tatem AJ, NoorAM, Snow RW: Assembling a global database of malaria para-site prevalence for the Malaria Atlas Project. Malar J 2007,6:17.
21. Pull JH, Grab B: A simple epidemiological model for evaluatingthe malaria inoculation rate and the risk of infection ininfants. Bull World Health Organ 1974, 51:507-516.
22. Smith DL, Guerra CA, Snow RW, Hay SI: Standardizing estimatesof the Plasmodium falciparum parasite rate. Malar J 2007, 6:131.
23. Wieczorek J, Guo Q, Hijmans RJ: The point-radius method forgeoreferencing locality descriptions and calculating associ-ated uncertainty. Int J GIS 2004, 18:745-767.
24. Balk DL, Deichmann U, Yetman G, Pozzi F, Hay SI, Nelson A: Deter-mining global population distribution: methods, applicationsand data. Adv Parasitol 2006, 62:119-156.
25. Socioeconomic data and applications center: Gridded Popu-lation of the World [http://sedac.ciesin.columbia.edu/gpw/]
26. Hay SI, Noor AM, Nelson A, Tatem AJ: The accuracy of humanpopulation maps for public health application. Trop Med IntHealth 2005, 10:1-14.
27. United Nations Population Division: World population prospects,2006 revision. New York: United Nations; 2006.
28. Tatem AJ, Noor AM, von Hagen C, di Gregorio A, Hay SI: High res-olution population maps for low income nations: combiningland cover and census in East Africa. PLoS One 2007, 2:e1298.
29. Tatem AJ, Noor AM, Hay SI: Assessing the accuracy of satellitederived global and national urban maps in Kenya. Rem SensEnv 2005, 96:87-97.
30. Potere D, Schneider A: A critical look at representations ofurban areas in global maps. GeoJournal 2007, 69:55-80.
31. Hansen M, DeFries R, Townshend JRG, Sohlberg R: Global landcover classification at 1 km resolution using a decision treeclassifier. Int J Rem Sens 2000, 21:1331-1365.
32. MapAbility [http://www.mapability.com]33. Balk D, Pozzi F, Yetman G, Nelson A, Deichmann U: Methodologies
to improve global population estimates in urban and ruralareas. New York: CIESIN, Columbia University; 2004.
34. Center for International Earth Science Information Network(CIESIN), Columbia University, International Food Policy ResearchInstitute (IFPRI), The World Bank, Centro International de Agricul-tura Tropical (CIAT): Global Rural-Urban Mapping Project(GRUMP): Urban Extents. Palisades, New York: CIESIN, Colum-bia University; 2004.
35. Strahler A, Friedl MA, Schaaf CLB, Zhang X, Hodges JCF: Validationof the consistent-year v003 MODIS land cover product. Bos-ton: Boston University; 2003.
36. MODIS/Terra land cover type [http://lpdaac.usgs.gov/modis/mod12q1v4.asp]
37. Elvidge C, Hobson VR, Nelson IL, Safran JM, Tuttle BT, Dietz JB,Baugh K: Overview of DMSP OLS and scope of applications.In Remotely Sensed Cities Edited by: Mesev V. London: Taylor and Fran-cis; 2003:281-299.
38. United Nations Population Division: World urbanization pros-pects, 2005 revision. New York: United Nations; 2005.
39. CDC: Health information for international travel 2005–2006 Atlanta:Centers for Disease Control and Prevention; 2006.
40. IAMAT: World Malaria Risk Chart Guelph: International Associationfor Medical Assistance to Travellers; 2007.
41. Tucker CJ: Red and photographic infrared linear combina-tions for monitoring vegetation. Rem Sens Env 1979, 8:127-150.
42. Hay SI, Tatem AJ, Goetz SJ, Rogers DJ: Global environmental datafor mapping infectious diseases. Adv Parasitol 2006, 62:293-343.
43. Hay SI, Snow RW, Rogers DJ: From predicting mosquito habitatto malaria seasons using remotely sensed data: Practice,problems and perspectives. Parasitol Today 1998, 14:306-313.
44. Hay SI, Snow RW, Rogers DJ: Predicting malaria seasons inKenya using multitemporal meteorological satellite sensordata. Trans Roy Soc Trop Med Hyg 1998, 92:12-20.
45. Macdonald G: The epidemiology and control of malaria London: OxfordUniversity Press; 1957.
46. Mouchet J, Carnevale P, Coosemans M, Julvez J, Manguin S, Richard-Lenoble D, Sircoulon J: Biodiversité du paludisme dans le monde Mon-trouge, France: John Libbey Eurotext; 2004.
47. Mann HB, Whitney DR: On a test of whether one of two ran-dom variables is stochastically larger than the other. AnnMath Stat 1947, 18:50-60.
48. Hay SI, Tatem AJ: Remote sensing of malaria in urban areas:two scales, two problems. Am J Trop Med Hyg 2005, 72:655-657.
49. Tatem AJ, Hay SI: Measuring urbanization pattern and extentfor malaria research: a review of remote sensingapproaches. J Urban Health 2004, 81(3):363-376.
50. Wilcoxon F: Individual comparisons by ranking methods. Bio-metrics 1945, 1:80-83.
51. Campbell J: Introduction to Remote Sensing London: The GuildfordPress; 1996.
52. Friedman M: The use of ranks to avoid the assumption of nor-malitry implicit in the analysis of variance. J Am Stat Assoc 1937,32:675-701.
53. Montgomery MR: The urban transformation of the developingworld. Science 2008, 319:761-764.
54. Dye C: Health and urban living. Science 2008, 319:766-769.55. Lysenko AJ, Semashko IN: Geography of malaria. A medico-geographic
profile of an ancient disease Moscow: Academy of Sciences; 1968. 56. Smith DL, Dushoff J, Snow RW, Hay SI: The entomological inoc-
ulation rate and Plasmodium falciparum infection in Africanchildren. Nature 2005, 438:492-495.
57. Keiser J, Utzinger J, Caldas de Castro M, Smith TA, Tanner M, SingerBH: Urbanization in sub-Saharan Africa and implication formalaria control. Am J Trop Med Hyg 2004, 71(2 Suppl ):118-127.
58. Rowe AK, Steketee RW: Predictions of the impact of malariacontrol efforts on all-cause child mortality in sub-SaharanAfrica. Am J Trop Med Hyg 2007, 77(6 Suppl ):48-55.
59. Teklehaimanot A, McCord GC, Sachs JD: Scaling up malaria con-trol in Africa: an economic and epidemiological assessment.Am J Trop Med Hyg 2007, 77(6 Suppl ):138-144.
60. Roca-Feltrer A, Carneiro I, Schellenberg JRMA: Estimates of theburden of malaria morbidity in Africa in children under theage of 5 years. Trop Med Int Health 2008, 13:771-783.
61. Salvatore M, Pozzi F, Ataman E, Huddleston B, Bloise M: Mappingglobal urban and rural population distributions. Rome: FAO;2005.
Page 16 of 17(page number not for citation purposes)

Malaria Journal 2008, 7:218 http://www.malariajournal.com/content/7/1/218
Publish with BioMed Central and every scientist can read your work free of charge
"BioMed Central will be the most significant development for disseminating the results of biomedical research in our lifetime."
Sir Paul Nurse, Cancer Research UK
Your research papers will be:
available free of charge to the entire biomedical community
peer reviewed and published immediately upon acceptance
cited in PubMed and archived on PubMed Central
yours — you keep the copyright
Submit your manuscript here:http://www.biomedcentral.com/info/publishing_adv.asp
BioMedcentral
62. Lopez AD, Mathers CD, Ezzati M, Jamison DT, Murray CJL: Globalburden of disease and risk factors. Geneva: World HealthOrganization; 2006.
63. Ferguson NM, Cummings DAT, Fraser C, Cajka JC, Cooley PC, BurkeDS: Strategies for mitigating an influenza pandemic. Nature2006, 442:448-452.
64. Riley S: Large-scale spatial-transmission models of infectiousdisease. Science 2007, 316:1298-1301.
65. Storeygard A, Balk D, Levy M, Deane G: The global distribution ofinfant mortality: a subnational spatial view. Pop, space and place2008, 14:209-229.
66. Rogers DJ, Wilson AJ, Hay SI, Graham AJ: The global distributionof yellow fever and dengue. Adv Parasitol 2006, 62:181-220.
67. Brooker S, Clements ACA, Hotez PJ, Hay SI, Tatem AJ, Bundy DAP,Snow RW: The co-distribution of hookworm and Plasmodiumfalciparum among African schoolchildren. Malar J 2006, 5:99.
68. Jones KE, Patel NG, Levy MA, Storeygard A, Balk D, Gittleman JL,Daszak P: Global trends in emerging infectious diseases.Nature 2008, 451:990-994.
Page 17 of 17(page number not for citation purposes)
Copyright © 2022 FDOKUMEN