Impact of child malnutrition on the specific anti-Plasmodium falciparum antibody response
Upload
khangminh22Category
view
0download
0
Open Research OnlineThe Open University’s repository of research publicationsand other research outputs
The Diversity Landscape of Plasmodium falciparum varGenesThesisHow to cite:
Githinji, George Lloyd (2016). The Diversity Landscape of Plasmodium falciparum var Genes. PhD thesis TheOpen University.
For guidance on citations see FAQs.
c© 2016 The Author
https://creativecommons.org/licenses/by-nc-nd/4.0/
Version: Version of Record
Link(s) to article on publisher’s website:http://dx.doi.org/doi:10.21954/ou.ro.0000ef9d
Copyright and Moral Rights for the articles on this site are retained by the individual authors and/or other copyrightowners. For more information on Open Research Online’s data policy on reuse of materials please consult the policiespage.
oro.open.ac.uk

The Diversity Landscape of Plasmodium falciparum Genes
George Githinji
A thesis submitted for the degree of Doctor of Philosophy
The Open University (UK)
Affiliated Research Centre
KEMRI-Wellcome Trust Research Programme Center for Geographic Medicine Research-Coast
Kilifi, Kenya

ProQuest Number: 13834797
All rights reserved
INFORMATION TO ALL USERS The quality of this reproduction is dependent upon the quality of the copy submitted.
In the unlikely event that the author did not send a com p le te manuscript and there are missing pages, these will be noted. Also, if material had to be removed,
a note will indicate the deletion.
uestProQuest 13834797
Published by ProQuest LLC(2019). Copyright of the Dissertation is held by the Author.
All rights reserved.This work is protected against unauthorized copying under Title 17, United States C ode
Microform Edition © ProQuest LLC.
ProQuest LLC.789 East Eisenhower Parkway
P.O. Box 1346 Ann Arbor, Ml 48106- 1346
Abstract
Plasmodium falciparum Erythrocyte Membrane Protein 1 (PfEMPl) is an
important group of cytoadhesive multi-domain Plasmodium falciparum
surface antigens that are inserted onto the surface of infected erythro
cytes and are encoded by the var multi-gene family. PfEMPl antigens are
thought to be important targets of naturally acquired immunity to mal
aria. This thesis describes nucleotide variation in DBLa sequence tags, a
semi-conserved region within the DBLa domain that can be PCR amplified
using universal primers. PfEMPl can be classified using a number of ap
proaches some of which are associated with particular expression patterns
in severe, non-severe and asymptomatic malaria. This work compared
the classification approaches with an aim of understanding the extent of
overlap or discordance between them. To explore non-random distribu
tion of variation in respect to var’s functional specialization, a clustering
approach was developed and applied in exploring patterns of nucleotide
variation among var subsets from different geographical locations in ad
dition to distribution of predicted B and T-cell epitopes among the var
subsets. In summary the sequences showed distinct patterns of nucleotide
substitution that suggests that var sequences are under both diversifying
and purifying selection.
Dedication
Mum, Teresiah George
Dad,Late Jeffrey Kamanu Gathura
Julie and Leon,Love you

Acknowledgements
I would like to give special thanks to my advisor Dr Peter Bull, for offering
me an opportunity to join his research group and for providing supervi
sion and mentorship in the course of my studies. I am extremely grateful
to Prof Kevin Marsh and Dr Britta Urban for co-supervising this work. I
would also like to thank, Dr Vandana Thathy, Prof James Nokes and Dr
Samson Kinyanjui who constituted my student monitoring and appraisal
committee (SMAC).
Much gratitude to my colleagues Dr Cheryl Andisi and Dr George Warimwe
for allowing me to use the sequence data that they had collected and for
useful discussions on malaria immunity. To Dr Carol, Dr Abdi, Faiz, Joshua,
Michelle and Esther, I am grateful for our scientific discussions during the
lab meetings and a lot of light moments at Pete’s "pizza nights". I would
like to extend my gratitude to Michael and Jennifer for maintaining the
laboratory cultures and for their patience in teaching me to culture malaria
parasites when I joined the group.
My sincere appreciation to Dr Vandana and Priscilla for useful discussions
and challenging questions which offered good insights on the biology of
the malaria parasite. I am very grateful to Dr Greg Fegan for his tech

nical and social support. It was enjoyable talking and sharing insights and
opinions on just about everything!
I would like to extend my thank you note to Dr Mathew Berimman for
inviting me to the Wellcome Trust Sanger Center in Cambridge, UK and
to Prof Chris Newbold for useful discussions on this work. Thank you to
Dr Thomas Otto for challenging ideas and for offering a computational
platform and support.
A special thank you to Dr Sammy Assefa for making my short stay in
Cambridge interesting and memorable and thank you for the exchange of
ideas and Dr Sammy Oyola for great friendship.
To my colleagues and office mates Yaw, Victor and James. Thank you for
the laughter and useful discussions on immunology and infinite social
topics!
Special thanks to my best friend Julie, it is not enough to say thank you
for your endless support and to Leon I have reason to begin all over again.
Special thanks to Mrs Elizabeth Murabu, our liaison with the University
who tirelessly organized all the official documentation and presentation.
Thank you to the Wellcome-Trust for funding this work through the Stra
tegic Award.
Last and not the least, I am very grateful to the malaria study participants
who consented to the malaria studies and provided samples.

Statement of Originality
I hereby declare that this thesis is my own work and contains nothing that
is an outcome of collaboration with others unless where stated and that it
has not been submitted for award of any degree or diploma.
Sample collection and consenting was conducted as part of a larger integ
rated study on the development of naturally acquired immunity to malaria
in children in Kilifi district.
Samples were sequenced at the Beijing Genomics Institute and the Wellcome-
Trust Sanger Institute. These samples were part of a larger study on ex
pression profiling of PfEMPl sequences.
George Githinji
September 2015

Contents
1 Introduction 1
1.1 Background.................................................................................................... 1
1.2 Geographic distribution and life-cycle of malaria p a ra s i te s ................... 2
1.2.1 Liver stage in fe c tio n ....................................................................... 4
1.2.2 Blood stage infection....................................................................... 5
1.2.3 Sexual stage in the m o s q u ito ........................................................ 7
1.3 Immunity to m a la r ia .................................................................................... 8
1.4 The molecular structure of var g e n e s ........................................................ 11
1.5 Expression of var genes .............................................................................. 14
1.6 The role of PfEMPl in sequestration ........................................................ 15
1.6.1 CD36 ................................................................................................ 16
1.6.2 IC A M -1...................................................................... 16
1.6.3 Chondroitin sulfate-A .................................................................... 17
1.6.4 E P C R ................................................................................................ 18
1.6.5 Complement receptor 1 ................................................................. 18
1.7 Functional classification of var g e n e s ........................................................ 18
1.7.1 Working with DBLa sequence t a g s ................................................... 21
1.8 Diversity in var genes........................................................................................ 24
1.8.1 Role of recombination in generation of var diversity......................25
1.8.2 The role of point mutations in generation of var diversity . . . . 26
1.9 Evidence for immunological specialization...................................................26
vi
1.10 Thesis overview................................................................................................. 28
1.10.1 Molecular diversity of var genes......................................................... 29
1.10.2 Immunological diversity in var g e n e s ................................................29
1.11 Summary of research q u es tio n s ..................................................................... 30
2 Materials and methods 31
2.1 Study location.....................................................................................................31
2.2 Sample collection and processing .................................................................. 32
2.3 Sequence data from Kilifi ...............................................................................34
2.4 Sequence data from laboratory iso la tes .........................................................34
2.5 The global data s e t ........................................................................................... 34
2.6 DNA am plifica tion ........................................................................................... 35
2.7 Scripting and code management .................................................................. 35
2.8 Scripting languages and statistical tools ......................................................36
3 Development of a sequence clustering and epitope prediction framework
37
3.1 Background........................................................................................................37
3.2 Generating random substitu tions .................................................................. 38
3.3 General approach for computer programs . ............................................ 39
3.4 Assembling high quality DBLa sequences......................................................41
3.4.1 Assembling DBLa sequences with p h r a p ..........................................41
3.4.2 CAP3 app ro ach ......................................................................................43
3.5 Defining clusters of similar high quality sequences...................................... 48
3.5.1 Reducing noise due to potential PCR e r r o r s ....................................48
3.5.2 CD-HIT c lu s te r in g ................................................................................49
3.5.3 Vsearch c lu s te r in g ................................................................................50
3.6 Aligning and finding m ism atch es .................................................................. 52
vii
3.7 Computer programs ........................................................................................ 53
3.7.1 DBLa finder............................................................................................ 54
3.7.2 DBLa-Classifier...................................................................................... 55
3.7.3 Bio-CD-HIT-Report................................................................................55
3.7.4 Block-sharing networks .......................................................................56
3.7.5 Find-DBLa-m utations..........................................................................56
3.7.6 DBLa-assembly...................................................................................... 57
3.7.7 DBLa CAF P a rse r ................................................................................... 57
3.8 Epitope p re d ic tio n ........................................................................................... 57
3.8.1 B-cell epitope prediction .......................................................................58
3.8.2 Shannon diversity in d e x .......................................................................59
3.8.3 Hydrophobicity p ro file ..........................................................................59
3.8.4 Prediction of T-cell e p ito p e s ................................................................ 59
3.8.5 Predivac-util ......................................................................................... 62
Evaluation of classification approaches used to measure expression of var
genes in clinical isolates 64
4.1 Background.................................................................................................... 64
4.2 M ethods.............................................................................................................. 66
4.2.1 Data collection and sequence classification........................................66
4.2.2 Sequence a lig n m e n t............................................................................. 67
4.2.3 Defining block-sharing groups of sequences using a network
a p p ro a c h ............................................................................................... 67
4.3 Results and d iscussion ......................................................................................67
4.3.1 Distinct Cys/PoLV groups are associated with u p s A ......................... 70
4.3.2 DC8 and DC13 sequences exhibit distinct recombining patterns 74
4.3.3 Newly described DBLa domains could consist of genetically
heterogeneous sequences................................................................... 76
4.3.4 Cys/PoLV groups cannot predict DC8 sequences given a global
collection of sequences but may do so within a restricted geo
graphical location ............................................................................... 77
4.3.5 Other significant DC g ro u p s ................................................................81
4.4 Conclusion ................................................................................................... 81
5 The role of point mutations in generating var diversity 83
5.1 Background.......................................................................................................83
5.2 M ethods............................................................................................................. 84
5.3 Results................................................................................................................ 85
5.3.1 DBLa sequences are d iv erse ................................................................85
5.3.2 Pattern of random substitutions in DBLa sequences.......................88
5.3.3 The correlation between frequency of substitutions in random
model and in actual s e q u e n c e s ......................................................... 95
5.3.4 Distribution of variation at each c o d o n .............................................97
5.3.5 Density of substitutions in conserved and polymorphic regions
of the DBLa sequence t a g ...................................................................98
5.3.6 Variation in homology block D and H ...............................................100
5.3.7 Overall distribution of point mutations in DBLa sequence tags . 102
5.3.8 Distribution of point mutations in DBLa sequences from other
geographical reg io n s ...........................................................................107
5.3.9 Variation in group A and non-group A se q u e n c e s .........................I l l
5.3.10 Sequence conservation in multiple iso lates..................................... 113
5.3.11 Substitution patterns in varl sequences ........................................ 114
5.3.12 Insertion/deletions in v a r l ................................................................. 117
5.3.13 varl sequences may contain two co-evolving s ite s .........................118
5.4 Discussion.........................................................................................................119
5.4.1 Limitations of this s tu d y .................................................................... 123
ix
5.4.2 Future work 124
6 Identifying potential epitopes 125
6.1 Background..................................................................................................... 125
6.2 Results...............................................................................................................126
6.2.1 Linear B-cell epitopes are correlated with sequence diversity . . 126
6.2.2 The DBLa sequence region contains potential MHC class II T-
cell epitopes.......................................................................................... 129
6.2.3 Predicting peptides with stable peptide-MHC complexes in DBLa
sequences............................................................................................. 132
6.2.4 Overlapping peptides predicted by both NetMHCII and Predivac
were f e w ............................................................................................. 134
6.2.5 The frequency of predicted promiscuous epitopes is limited . . 135
6.2.6 Promiscuous peptides from group A-like sequences are conservedl37
6.2.7 Predicted promiscuous peptides were expressed largely in group-
A sequences.......................................................................................... 139
6.2.8 Relationship with clinical classification........................................... 141
6.2.9 Relationship between peptide expression and age of the h o s t. . 141
6.3 Discussion.........................................................................................................142
6.3.1 Linear B-cell epitopes are prevalent in polymorphic regions . . 142
6.3.2 Promiscuous T-cell epitopes are conserved in sequences associ
ated with expression in severe m a la r ia ........................................... 143
6.4 Conclusion ......................................................................................................145
7 Conclusion 146
7.1 Molecular d iversity ......................................................................................... 146
7.2 A recap of the aims of the s tu d y ................................................................... 149
7.3 Summary of m ethods...................................................................................... 149
x

7.4 Understanding relationships between sequences and classification ap
proaches .............................................................................................................150
7.5 The role of mutations in generating diversity.............................................. 150
7.6 Prediction of epitopes and relationship with age and expression . . . . 152
7.7 Further work and conclusion ....................................................................... 153
References 155
A Source code 175
A.l A script to search for DBLa sequence t a g s ......................................... 175
A.2 A Ruby program to classify DBLa sequence t a g s ................................179
A.3 A Ruby program to extract DBLa sequence tags from chromatograms . 191
A.4 A bash pipeline to cluster DBLa sequences using an identity cutoff. . . 194
A.5 A program to cluster sequences within isolates........................................... 196
A. 6 A program to parse cd-hit formatted cluster files..................................... 196
A.7 A Ruby program to translate DNA sequences to amino acid sequences . 199
A.8 A Ruby program to find pairwise nucleotide differences from a se
quence alignm ent............................................................................................. 200
A.9 A bash program to cluster sequences using u c lu s t ..................................... 200
A. 10 A bash program to generate random substitutions based on a reference
sequence ..........................................................................................................201
A. 11 A Perl program to generate random su b stitu tio n s.................................. 204
A. 12 An R program to simulate random substitu tions..................................... 204
A. 13 A script to extract regions from a DBLa se q u e n c e .................................. 205
A. 14 A bash program to find variation co n tex t..................................................206
A. 15 A Python programm for submitting epitope prediction requests to the
Predivac s e rv e r ................................................................................................ 207
A. 16 A program to predict netMHCII epitopes using a parallel approach . . 2 1 0

A. 17 A Ruby program to print block-sharing networks in csv fo rm a t............211
A. 18 A Ruby program to print homology blocks and hypervarible blocks
from sequence t a g s ..........................................................................................213
A. 19 A Ruby program to generate random nucleotide su b s titu tio n s 214
A.20 A Ruby program to parse and work with DBLa sequences from CAF
formatted files ................................................................................................ 216
Miscellaneous 226
B.l Regions of diversity in the DBLa sequence tags ........................................226
B.2 Length polymorphism in DBLa sequence t a g s ...........................................228
B.3 Dinucleotide frequency................................................................................... 229
B.4 Relative synonymous codon usage(RSCU) in DBLa seq u e n c e s .............. 231
B.5 Pattern of variation in var2csa in isolates collected from around the
w o r l d ................................................................................................................ 234
B.6 Frequency of substitutions in sequences collected from different parts
of the w o r ld .......................................................................................................236
B.7 Clustering r a t io ................................................................................................237
B.8 Differences in the distance between polymorphic sites ........................... 239
B.9 Homology block F contained relatively more m ism atches........................240
B.9.1 Within-isolate variation in homology block D and H ..................... 241
B.10 HLA prevalence.................................................................................................243
4
7
12
14
22
23
24
32
33
40
44
45
46
47
53
69
73
List of Figures
The life-cycle of Plasmodium falciparum p a ra s ite s ...................................
A venn diagram depicting the overlap in severe malaria syndromes . .
The general structure of the var gene molecule ......................................
Chromosomal arrangement of var g e n e s ..................................................
The general structure of a DBLa sequence t a g .........................................
A summary of Cys/PoLV classification a p p ro a c h ......................................
A block sharing layout of sequences from Kilifi.........................................
A map of Kilifi county . ...........................................................................
Malaria admissions in Kilifi Hospital in the period 1989 - 2012 .............
A figure showing the approach for generating random and uniform
substitutions .................................................................................................
The DBLa sequence assembly w o rk f lo w ..................................................
CAP3 consensus building e r ro r s ..................................................................
Examples of contigs with multiple DBLa sequence t a g s .........................
A summary of DBLa sequence tags and contigs in sequences collected
between 2008 and 2010 assembly ............................................................
The sequence clustering workflow...............................................................
DBLa sub-domains (x-axis) correspondence with other classification
var ap p ro ach es ..............................................................................................
Predicting upsA,DC8 and DC13 sequences from Cys/PoLV groups . . .
xiii
4.3 DBLa block-sharing netw ork..................................................................... 75
4.4 The correspondence between domain cassettes and the Cys/PoLV groups 78
4.5 Bar plots showing the constitution of block sharing groups among the
22 domain cassettes.................................................................................... 79
4.6 A sequence alignment of DC8 sequences from Tanzania and sig2-like
sequences from K ilifi.................................................................................. 80
4.7 An neighbour-joining tree of DC8 sequences from Tanzania and sig2-
like sequences from Kilifi............................................................................ 81
5.1 DBLa sequence clusters generated using Vsearch at 98% similarity . . 86
5.2 DBLa sequence clusters generated using Vsearch at 88% similarity . . 87
5.3 Frequency of random substitu tions.........................................................91
5.4 Average substitution frequencies in random and observed sequences . 93
5.5 Frequency of random substitutions scaled by the ratio of transitions to
tran sv ersio n s...............................................................................................94
5.6 Spearman correlations between frequency of random substitutions,
random substitutions scaled with TI:TV ratio and substitutions from
observed sequences......................................................................................96
5.7 Codon base composition statistics for DBLa and AMA1 sequences . . . 98
5.8 The nucleotide diversity between polymorphic(hp) and homology (hb)
blocks at 98% and 96% sim ilarity .............................................................99
5.9 Distribution of nucleotide substitution in homology block D and homo
logy block H ................................................................................................. 101
5.10 The distribution of random substitutions and substitutions from DBLa
sequences from K ilifi................................................................................. 103
5.11 Nucleotide content in DBLa sequences from Kilifi, K enya.................. 105
5.12 Distribution of nucleotide substitutions in DBLa sequences collected
between 2008 and 2 0 1 0 ........................................................................... 106
xiv
5.13 Distribution of variation in sequences from Amele in Papua New Guineal08
5.14 Distribution of substitutions in sequences from Ariquemes and Porto
Velho in Brazil ................................................................................................ 110
5.15 Frequency of substitutions in group A-like and non group-A sequences 112
5.16 Frequency of identical sequences in a population of var sequences . . . 114
5.17 The nucleotide content in varl sequences ................................................. 116
5.18 The substitution profile of 103 varl DBLa seq u en ces ...............................116
5.19 Insertion/deletion event in varl sequences................................................. 117
5.20 Neighbour joining tree of varl DBLa seq u en ces........................................ 118
6.1 Correlation between Bepipred scores and sequence d iversity .................. 128
6.2 The frequency of predicted binders per HLA class II allele........................ 131
6.3 The binding frequency of predicted immunodominant peptides using
Predivac s e rv e r ................................................................................................ 133
6.4 A Venn diagram of the overlapping core peptides predicted by NetMH-
CII and Predivac server....................................................................................134
6.5 Proportion of Cys/POLV groups among sequences containing promis
cuous p e p t id e s ................................................................................................ 138
7.1 Random mutations contribute to new antigenic ty p e s ...............................148
B.l Diversity in DBLa sequences.......................................................................... 227
B.2 Distribution of clusters generated with CD-HIT and UCLUST algorithms 228
B.3 Length distribution in DBLa sequence tags from Kilifi . ........................ 229
B.4 A plot of dinucleotide frequencies in DBLa sequences...............................231
B.5 Distribution of substitutions in sequences from 19,578 DBLa sequences
t a g s ...................................................................................................................234
B.6 Distribution of polymorphisms in sequences from 69 var2csa sequences 235
xv

B.7 Frequency of substitutions from 367 sequences collected from different
geographical re g io n s .......................................................................................237
B.8 Distribution of substitutions in 162 sequences from Madang in Papua
New G uinea ...................................................................................................... 239
B.9 Dotplots showing the nucleotide distance between adjacent substitu
tions in sequences clustered at different th re sh o ld s ..................................240
B.10 Within Isolate distribution of substitutions in homology block F . . . . 241
B .ll Frequency of substitutions in homology block D sequences of the same
is o la te ................................................................................................................242
B.12 Within isolate distribution of substitutions in homology block H . . . . 243
B.13 HLA alleles in a sample of individuals from Kilifi.................................. 244
xvi
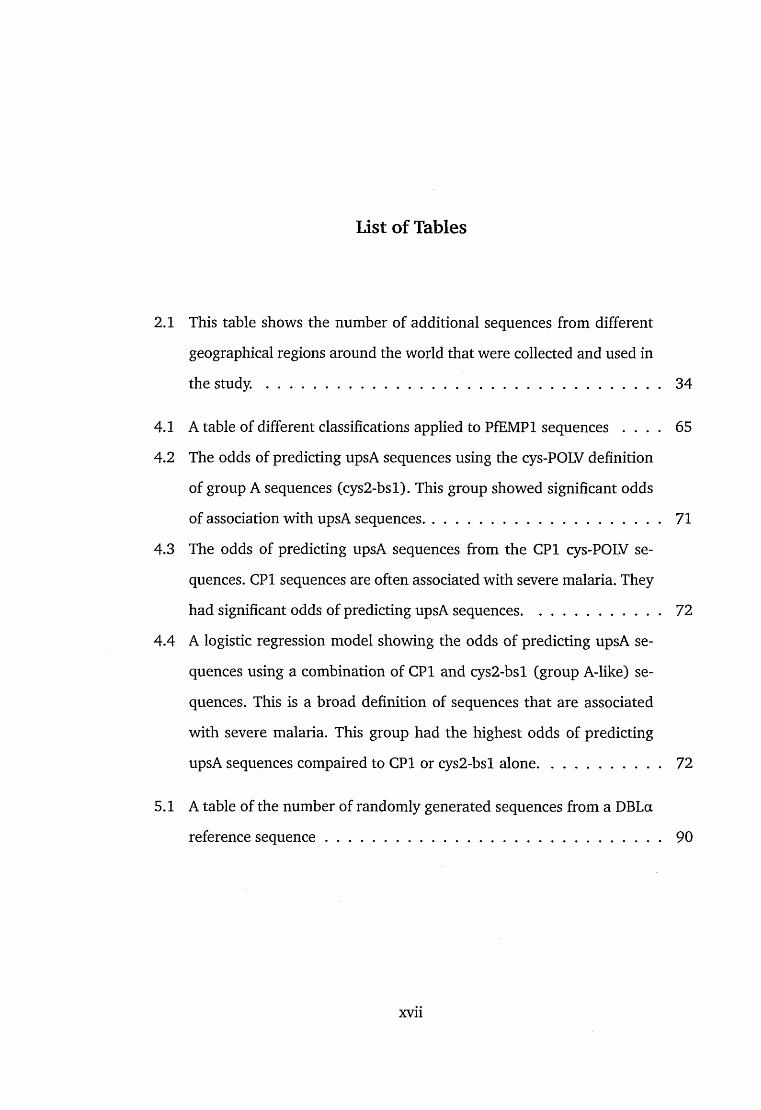
List of Tables
2.1 This table shows the number of additional sequences from different
geographical regions around the world that were collected and used in
the s tu d y . ............................................................................................................34
4.1 A table of different classifications applied to PfEMPl sequences . . . . 65
4.2 The odds of predicting upsA sequences using the cys-POLV definition
of group A sequences (cys2-bsl). This group showed significant odds
of association with upsA sequences.............................................................. 71
4.3 The odds of predicting upsA sequences from the CPI cys-POLV se
quences. CPI sequences are often associated with severe malaria. They
had significant odds of predicting upsA sequences.........................................72
4.4 A logistic regression model showing the odds of predicting upsA se
quences using a combination of CPI and cys2-bsl (group A-like) se
quences. This is a broad definition of sequences that are associated
with severe malaria. This group had the highest odds of predicting
upsA sequences compaired to CPI or cys2-bsl alone.................................... 72
5.1 A table of the number of randomly generated sequences from a DBLa
reference sequence............................................................................................ 90
xvii
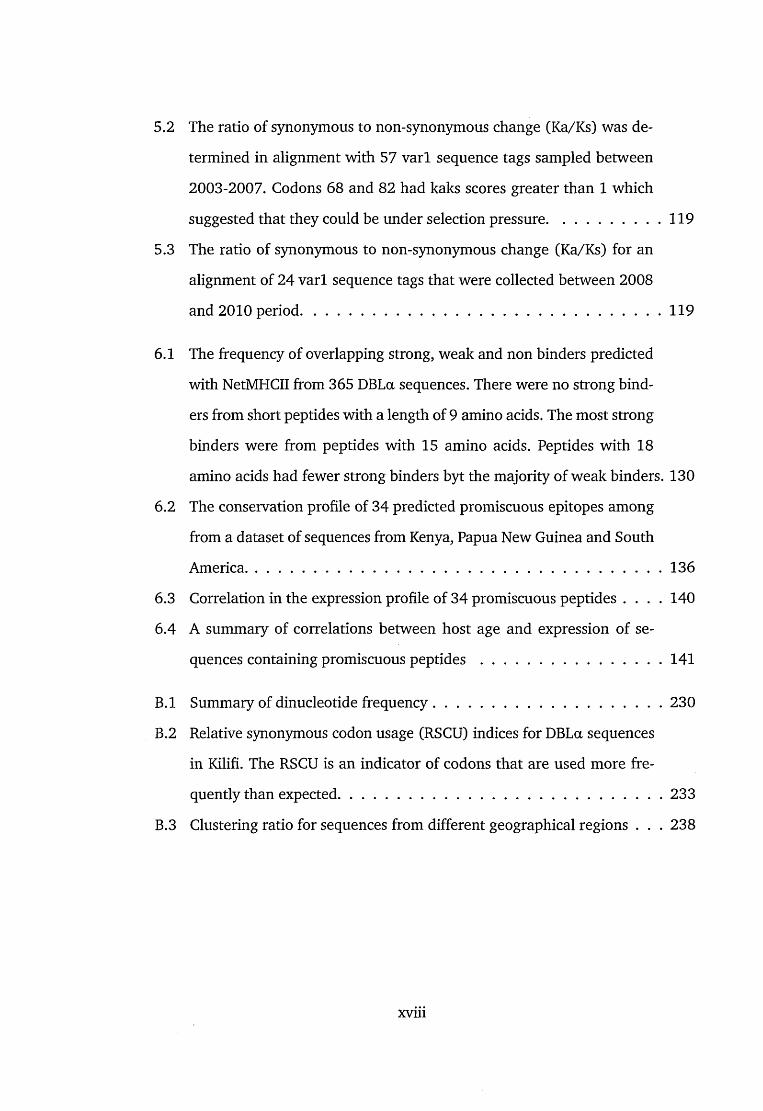
5.2 The ratio of synonymous to non-synonymous change (Ka/Ks) was de
termined in alignment with 57 varl sequence tags sampled between
2003-2007. Codons 68 and 82 had kaks scores greater than 1 which
suggested that they could be under selection pressure................................ 119
5.3 The ratio of synonymous to non-synonymous change (Ka/Ks) for an
alignment of 24 varl sequence tags that were collected between 2008
and 2010 period................................................................................................. 119
6.1 The frequency of overlapping strong, weak and non binders predicted
with NetMHCII from 365 DBLa sequences. There were no strong bind
ers from short peptides with a length of 9 amino acids. The most strong
binders were from peptides with 15 amino acids. Peptides with 18
amino acids had fewer strong binders byt the majority of weak binders. 130
6.2 The conservation profile of 34 predicted promiscuous epitopes among
from a dataset of sequences from Kenya, Papua New Guinea and South
America................................................................................................................136
6.3 Correlation in the expression profile of 34 promiscuous peptides . . . . 140
6.4 A summary of correlations between host age and expression of se
quences containing promiscuous p e p t id e s ..................................................141
B.l Summary of dinucleotide frequency.............................................................. 230
B.2 Relative synonymous codon usage (RSCU) indices for DBLa sequences
in Kilifi. The RSCU is an indicator of codons that are used more fre
quently than expected....................................................................................... 233
B.3 Clustering ratio for sequences from different geographical regions . . . 2 3 8
xviii

Chapter 1 Introduction
1.1 Background
Malaria is a major public health and social-economic burden in resource poor settings
(Sachs and Malaney 2002). An approximate 1.3% reduction in economic growth in
countries with the highest burden of disease is attributed to malaria (Greenwood
et al. 2005). Despite a 42% decline in mortality rate in the last decade (World Health
Organization 2013), the incidence of malaria in most parts of Africa remains high
(Noor et al. 2014). In 2012, the World Health Organization (WHO) reported nearly
207 million cases of malaria, of which an estimated 627 thousand resulted in death
(World Health Organization 2013).
Global efforts in eradication and control of malaria indicate a decline in malaria
cases in Africa (O’Meara et al. 2008; Okiro et al. 2009a; WHO 2010). Reports of
pockets of high malaria prevalence in several regions (Noor et al. 2014) highlight the
challenges in malaria eradication efforts.
Malaria is caused by plasmodium parasites. Species of parasites in this genus infect
a wide array of vertebrates including humans, reptiles, birds, rodents and monkeys.
There are five species of Plasmodium that infect humans; P. falciparum, P. vivax,
P. ovale, P. malariae and P. knowlesi. P. knowlesi was recently described to infect
1
humans (Cox-Singh et al. 2008). The focus of this thesis is Plasmodium falciparum the
causative agent of the most lethal form of human malaria. P. falciparum is transmitted
by infected female Anopheles mosquitoes.
1.2 Geographic distribution and life-cycle of malaria parasites
The malaria parasite life-cycle involves asexual reproduction in the vertebrate host
and sexual reproduction in the insect vector. The life-cycle is characterized by several
morphological stages as illustrated in figure 1.1.
The Plasmodium species that infect humans are remotely related to each other
which suggests that adaptation to humans may have occurred independently. The
true origin of these species is a subject of debate (Ollomo et al. 2009; Prugnolle
et al. 2010). Duval and colleagues study showed that the great apes are reservoirs for
several Plasmodium species (Duval et al. 2010) that are closely related to P. falciparum.
However, there is still little agreement on which of these closely related plasmodium
species is a progenitor to P. falciparum. Liu and colleagues suggested a reassessment
of the origin of P. falciparum based on the available sequence data obtained from
plasmodium parasites infecting the great apes (Liu et al. 2010).
P. falciparum is more prevalent in Africa than in other parts of the world (World
Health Organization 2013). P. malariae is prevalent in sub-saharan Africa, south
east Asia, Indonesia, the Pacific islands and the Amazon basin. P. ovale is prevalent
in sub-saharan Africa and Asia (Collins and Jeffery 2005). An accurate diagnosis
for P. ovale is difficult because it presents with non-specific symptoms, for example,
digestive and respiratory symptoms which are also characteristic of viral infections.
2
Most rapid diagnostic and detection kits are not sensitive enough for diagnosis. Unlike
in P. falciparum infections, P. ovale infections are rarely characterized with anaemia.
Plasmodium vivax is predominant in Asia partly because of the wide-spread pre
valence of the duffy antigen in the population. The duffy antigen is the receptor for P.
vivax malaria parasites (Mason et al. 1977; Miller et al. 1976). A case of P. vivax like
infection has been reported in duffy negative individuals in Kenya (Ryan et al. 2006).
Occasionally, a patient may harbour another Plasmodium infection in addition to P.
falciparum (Genton et al. 2008; Douglas et al. 2011). P. vivax diagnosis is a challenge
because of the low number of parasites in peripheral circulation. Most P. vivax infec
ted patients often harbour a dormant liver stage infection (see section 1.2.1) that is
only detectable upon relapse (Mueller et al. 2009).
3
Erythrocyte' C Q O
Merozoites °
Sporozoites
TrophozoiteSporozoitesSchizont
Fertilization
Gametocytes
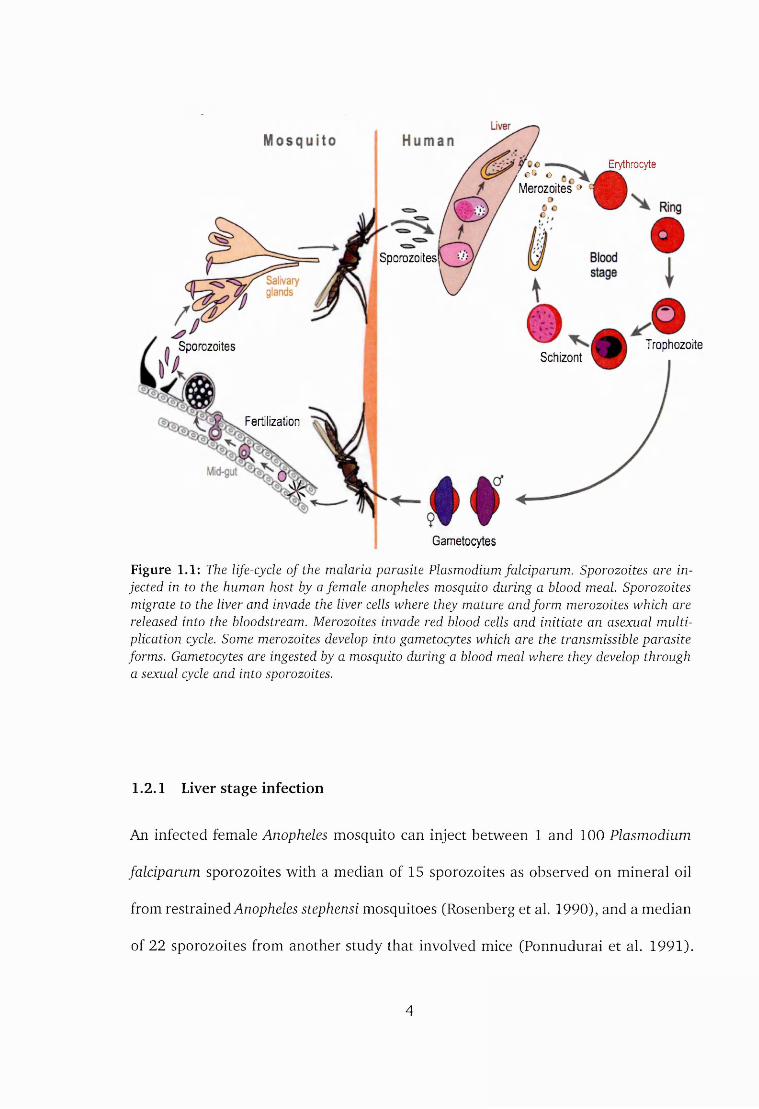
Figure 1.1: The life-cycle o f the malaria parasite Plasmodium falciparum. Sporozoites are injected in to the human host by a female anopheles mosquito during a blood meal. Sporozoites migrate to the liver and invade the liver cells where they mature and form merozoites which are released into the bloodstream. Merozoites invade red blood cells and initiate an asexual multiplication cycle. Some merozoites develop into gametocytes which are the transmissible parasite forms. Gametocytes are ingested by a mosquito during a blood meal where they develop through a sexual cycle and into sporozoites.
1.2.1 Liver stage infection
An infected female Anopheles mosquito can inject between 1 and 100 Plasmodium
falciparum sporozoites with a median of 15 sporozoites as observed on mineral oil
from restrained Anopheles stephensi mosquitoes (Rosenberg et al. 1990), and a median
of 22 sporozoites from another study that involved mice (Ponnudurai et al. 1991).
4
The studies also showed that the number of sporozoites on the skin correlated with
the size of the innoculum but not with the number of sporozoites in the salivary glads.
Upon successful invasion, the sporozoites lounge in the hepatocytes and within
2-10 days, depending on the parasite species, they asexually replicate during exo-
erythrocytic schizogony culminating in the production of merozoites. P. vivax and P.
ovale parasites can remain dormant in the liver for a period of time (Krotoski et al.
1980; Markus 2011b) and reactivate weeks to months after the primary infection.
This phenomena is attributed to relapses that are observed in vivax and ovale malaria
infections although some reports have refuted the idea that relapse emanate from the
so called "hypnozoite" dormant stages (Markus 2015; Markus 2011a).
1.2.2 Blood stage infection
After maturation, merozoites exit the liver cells and invade the red blood cells. This
marks the beginning of the disease development stage and the associated symptoms
are usually observed at this stage. Inside the red blood cells, they divide asexually
for a period of 1-3 days during which time the parasite goes through a 48-hour
morphological transformation; from a ring form, to a trophozoite and a schizont form.
P. malariae exhibits a 72-hour cycle unlike the other Plasmodium species.
In Plasmodium falciparum, red blood cells containing rings circulate within the
peripheral blood, whereas red blood cells containing trophozoite and schizont para
site forms, may adhere to andothelial cells (Gitau et al. 2012a; Miller 1969). This
phenomenon is called sequestration and is involved in pathogenesis and parasite
survival. These stages are key to the special pathology observed in P. falciparum com
5

pared to other parasites. Sequestration is aided by variant surface molecules that
also mediate antigenic switching. Sequestration assists the parasite in escaping from
splenic clearance (Wyler et al. 1979). Additionally antigenic switching helps Plas
modium falciparum in establishing a chronic blood stage infection in humans. The
exact mechanisms of establishing chronic infections have not been fully elucidated.
During a chronic infection, parasites invade and cause the lysis of red blood cells.
Parasite-derived molecules produced by the parasite lead to overproduction of serum-
bound factors some of which result in inflammatory responses by host-derived cy
tokines and subsequently lead to the observed intermittent fever episodes given the
synchronous lysis of red blood cells. Severe red blood cell lysis leads to anaemia. Fur
thermore, sequestration and adhering to vascular endothelial surfaces is associated
with development of malaria pathogenesis.
In general symptomatic malaria is often defined based on presence of fever and
clinical manifestations observed at the time of presentation. Since clinical manifest
ations and parameters vary with age and geographical location and are often very
similar to those observed in other diseases, it is difficult to accurately define severe
and non-severe malaria, therefore, severe malaria has been defined using a para
sitemia cutoff and in terms of symptoms that are most strongly associated with death.
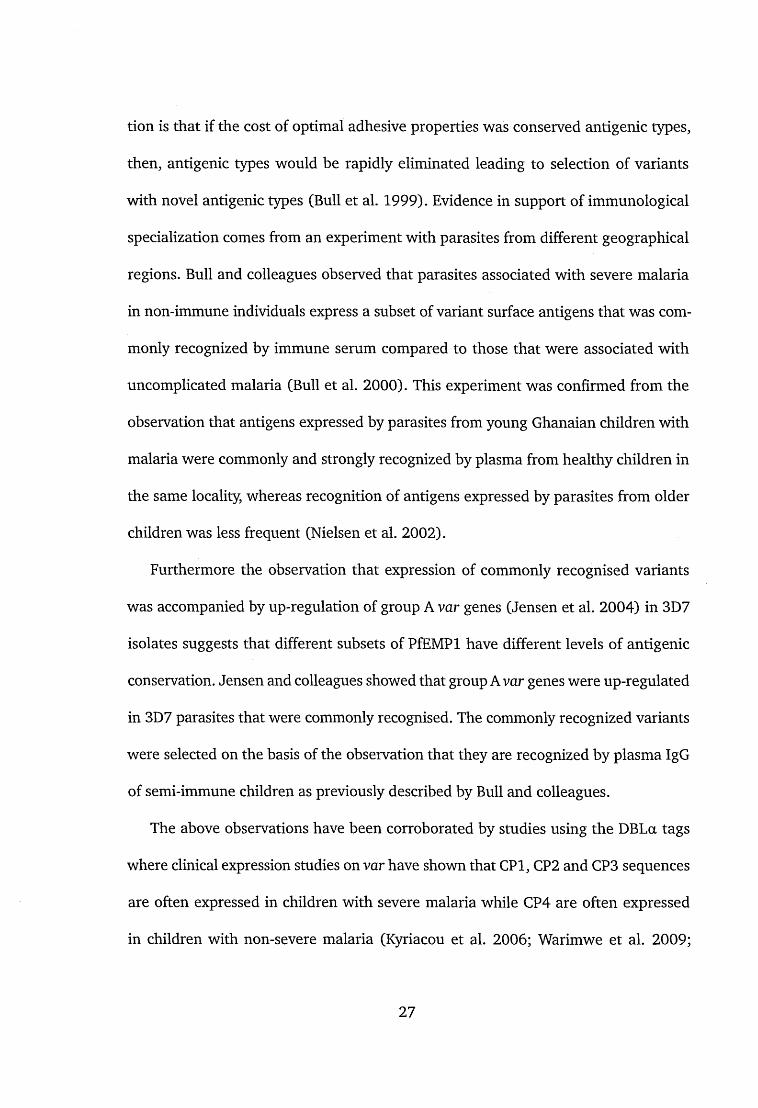
In 1994, Marsh and colleagues, showed that severe malaria is composed of different
overlapping clinical syndromes (figure 1.2), i.e. severe anaemia, respiratory distress,
and impaired consciousness (Marsh et al. 1995; Berkley et al. 2009).
6

16.3%(49)
Malaria without impaired consciousn ess, severe respira
tory distress, or severe anem ia (1027)
0 .6%
Malaria with severe anemia
(506)
Malaria with impaired
con sciou sness (332)
Malaria with severe
respiratory distress
(132)
Figure 1 .2 : A venn diagram showing the overlap in clinical malaria syndromes. The associated prevalence and mortality are also shown. (Marsh et al. 1995)
1.2.3 Sexual stage in the mosquito
A few of the merozoites differentiate into gametocytes which are the transmissible
forms of the parasite. The gametocytes are picked by a mosquito during a blood meal
and form male and female gametes within the mosquito. They fuse and form a diploid
zygote within the intestinal wall and ultimately differentiate into oocysts. Inside the
oocysts, repeated mitotic divisions form thousands of active sporozoites. Eventually
the oocysts burst and release the sporozoites into the body cavity and they migrate
to the mosquito’s salivary glands where they are injected into a human host during a
blood meal.
7

1.3 Immunity to malaria
The risk and burden of severe malaria in children under five years of age is not well
understood and little is known about malaria in infancy (children < 6 months). It
is thought that passive transfer of maternal antibodies (Snow et al. 1998; Kitua et
al. 1999; Hviid and Staalsoe 2004) and fetal hemoglobin (Amaratunga et al. 2011)
could play a role in conferring resistance to severe malaria among these very young
children.
In malaria endemic regions, susceptibility to severe life-threatening malaria in
creases in the first year of life but after the age of five years susceptibility to life
threatening disease decreases but sterile immunity to severe malaria is often never
achieved. Immunity to non-severe malaria is established slowly in individuals from
malaria endemic regions (Gupta et al. 1999). Clinical attacks are rarely encountered
in adults although adults often carry asymptomatic infections as reviewed by Marsh
and Kinyanjui (2006) and Baird et al. (1998).
Some studies have suggested that immunity to severe non-cerebral malaria is ac
quired after only a few infections (Gupta et al. 1999) and that protection is often lost
if individuals migrate to areas of low transmission (Jelinek et al. 2002) which could
suggest that intense and sustained transmission is necessary in order to maintain
naturally acquired immunity. In a recent study from Tanzania, Gobcalves and col
leagues observed that resistance to severe malaria was not acquired after one or two
infections (Gongalves et al. 2014) as has been proposed by earlier studies. It is likely
that lack of exposure and thereby failure to develop naturally acquired immunity may
8

lead to large-scale epidemics if interventions are not put in place. An instance of this
phenomenon was described in areas where malaria was re-introduced after successful
eradication measures (Mouchet et al. 1997).
Evidence that antibodies are important in control of malaria parasites came from
work by Cohen and colleagues who successfully treated children with y-globulin pur
ified from adult individuals who were exposed to malaria in the Gambia. Cohen
showed that treatment with purified y-globulin from individuals in malaria endemic
region in the Gambia, cleared parasites and resolved malaria symptoms in young
children (Cohen et al. 1961). This experiment was built upon work by Coggeshall and
Kumm who in 1937 demonstrated passive transfer of malaria immunity to normal
rhesus monkeys from rhesus monkeys with chronic P. knowlesi and P. inui parasites,
which suggested the presence of protective antibodies to malaria parasites (Cogge
shall and Kumm 1937). In addition McGregor found that Gambian children who used
weekly doses of chloroquine had significantly lower levels of y-globulin than children
that did not take the weekly dose, suggesting that parasites were important in genera
tion of antibodies (McGregor et al. 1956). These studies did not establish whether the
antibodies were protective. Edozien attempted to establish the relationship between
serum y-globulin in protected and unprotected children (Edozien et al. 1960). Their
observations were reproduced by later studies using y-globulin from adults in Cote
d’Ivoire which showed reduction in parasite density in Thai patients (Sabchareon et al.
1991). From these studies it was evident that antibodies are important in control of
malaria parasites. To link antibodies and protective immunity, it was important to
establish the antigenic source that elicited the antibodies.
9

In 1938, Eaton demonstrated that the serum of eight repeatedly infected mon
keys agglutinated parasites more readily and better at lower dilutions than that
of two chronically infected monkeys (Eaton 1938). Building on Eaton’s agglutin
ation experiments, Brown used P. knowlesi parasite in agglutination experiments
to demonstrate antigenic variation in Rhesus macaques (Brown and Brown 1965).
Later studies that explored agglutination of malaria parasites used homologous and
non-homologous serum from children and adults and with human malaria parasites
(Marsh and Howard 1986). They proposed that P. falciparum protein antigens that are
present on the surface of the infected erythrocyte are important targets of protective
immunity (Marsh: 1989uy; Bull et al. 1998).
Of the several parasite proteins on the surface of infected red blood cells, Plas
modium falciparum erythrocyte membrane protein 1 (PfEMPl) are the most studied.
Evidence that PfEMPl are important targets from protective immunity comes in
directly from observations that antibody levels are correlated with protection from
clinical malaria in individuals from West Africa (Ofori et al. 2002) and East Africa
(Kinyanjui et al. 2004). Furthermore serological experiments have showed that chil
dren are more likely to be recognized by pre-existing homologous antibodies (anti
bodies elicited by the infecting parasite) more than the heterologous antibodies (Bull
et al. 1998) and that agglutination by diverse plasma is associated with severe disease
(Bull et al. 2000). Evidence that PfEMPl are targets of protective antibodies came
from gene knockout studies by Chan and colleagues in an experiment where they
used gene knockout to modify P. falciparum parasite lines to silence the expression of
PfEMPl molecules by using a drug selectable marker under the control of a promoter
10

from a gene encoding native PfEMPl that was transfected into the parasites. The
parasites were grown under drug pressure and expression of the marker allowed the
transfectants to grow and silence endogenous PfEMPl transcription. A significant
reduction in the recognition of PfEMPl-silenced infected red blood cells by sera from
immune adults was observed. The PfEMPl-silenced parasites were characterized by
a decline in opsonic phagocytosis and in-vitro binding to host receptors (Chan et
al. 2012). This experiment confirmed that in laboratory isolates, PfEMPl are major
targets of antibodies.
This experiment, together with evidence that PfEMPl are the targets of antibodies
(Leech et al. 1984) as inferred from serological studies (Bull et al. 1998; Piper et al.
1999) support a role of PfEMPl as targets of naturally acquired immunity.
1.4 The molecular structure of var genes
Var genes are 6-13kb two exon molecules (Gardner et al. 2002; Su et al. 1995)
that encode the PfEMPl molecule. Exon 1 encodes an extra-cellular region which
has a modular structure and exon 2 encodes an intra-cellular region that anchors
the molecule on the surface of the infected erythrocyte (Gardner et al. 2002). P.
falciparum’s haploid genome contains approximately 60 var genes (ibid.). A schematic
diagram of a var gene is shown in figure 1.3.
11
EXON 1 EXON 2
C 'fU n l/m n nmmnt/M- .■nniAB SGITli-COnSGrVSCl
Polymorphic extracellular conserved intracellular
sub-type specific adhesive domain mtron region---------- -------------
0.8-1.3 kb 3.5-9 kb 1-1.3 kb
DBL1 CIDR1 DBL2 other domains
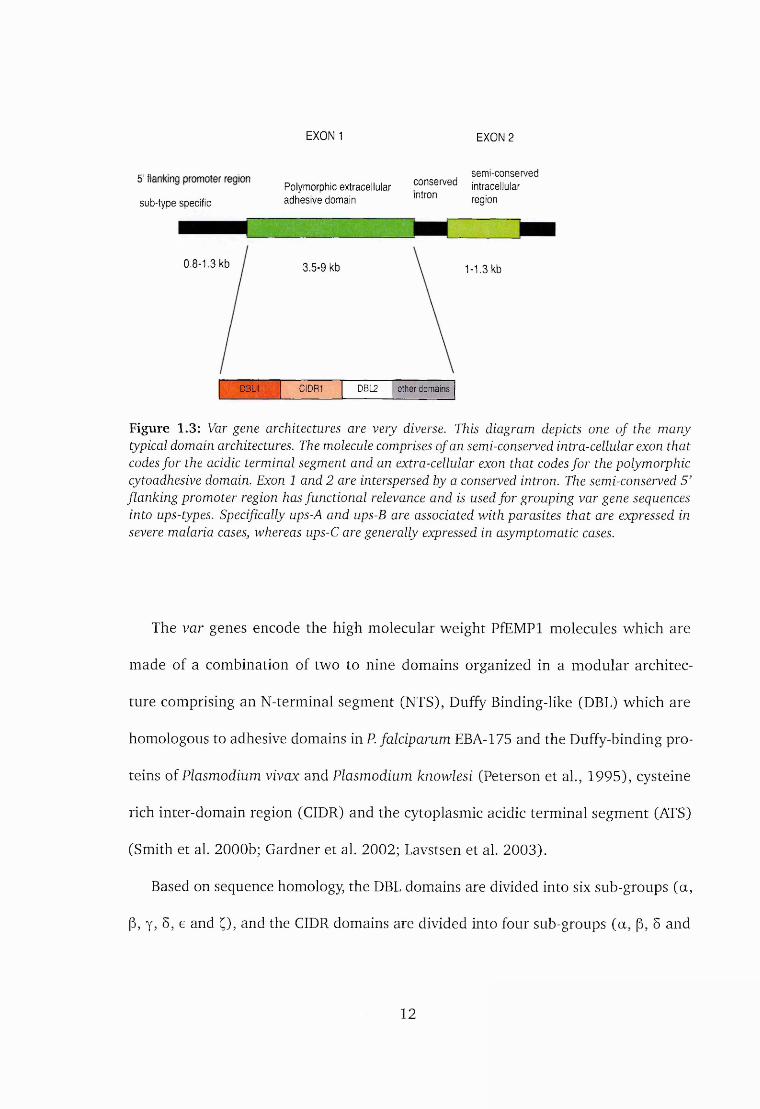
Figure 1.3: Var gene architectures are very diverse. This diagram depicts one o f the many typical domain architectures. The molecule comprises of an semi-conserved intr a-cellular exon that codes for the acidic terminal segment and an extra-cellular exon that codes for the polymorphic cytoadhesive domain. Exon 1 and 2 are interspersed by a conserved intron. The semi-conserved 5 ’ flanking promoter region has functional relevance and is used for grouping var gene sequences into ups-types. Specifically ups-A and ups-B are associated with parasites that are expressed in severe malaria cases, whereas ups-C are generally expressed in asymptomatic cases.
The var genes encode the high molecular weight PfEMPl molecules which are
made of a combination of two to nine domains organized in a m odular architec
ture comprising an N-terminal segment (NTS), Duffy Binding-like (DBL) which are
homologous to adhesive domains in P. falciparum EBA-175 and the Duffy-binding pro
teins of Plasmodium vivax and Plasmodium knowlesi (Peterson et al., 1995), cysteine
rich inter-domain region (CIDR) and the cytoplasmic acidic terminal segment (ATS)
(Smith et al. 2000b; Gardner et al. 2002; Lavstsen et al. 2003).
Based on sequence homology, the DBL domains are divided into six sub-groups (a ,
(5, y, 5, e and Q, and the CIDR domains are divided into four sub-groups (a , (5, 5 and
12
y) (Su et al. 1995; Lavstsen et al. 2003; Kraemer et al. 2007; Smith et al. 2000a). The
DBL domains are further divided into homology blocks A-J that are interspersed by
hyper-variable regions (Smith et al. 2000a) and also by three structural sub-domains
S I-S3 (Higgins 2008). A study by Rask and colleagues has suggested further divisions
of the DBL and CIDR domains based on full length sequence data of 7 laboratory
parasite lines (Rask et al. 2010) (Discussed in section 1.7.)
Var genes are found in all fourteen chromosomes of the parasite genome. In
the 3D7 genome, the majority are encoded in the subtelomeric and the rest in the
centromeric regions (Gardner et al. 2002). Telomeric genes are transcribed in a tail-
tail, head-to-tail or head-to-head orientation in respect to each other. Occasionally a
member of the repetitive interspersed families of polypeptides (rifin) is found between
the var genes. Centromeric var genes are found in tandem in a head to tail orientation
of 3-7 genes (Kyes et al. 2007).
The var gene orientation is often associated with the ups type of the 5’-flanking re
gions (Gardner et al. 2002; Lavstsen et al. 2003). UpsA genes are transcribed towards
the telomere while upsB are often transcribed towards the centromere. upsC var genes
are located at the centromeres. The structural arrangement of var genes is depicted
on figure 1.4. This structural arrangement is thought to be functionally important
and to influence recombination patterns (Kraemer et al. 2007) and regulation of gene
expression (Ralph et al. 2005; Howitt et al. 2009).
13

B B
subterom eric regions internal var clusters subterom eric regions
A ssociated with sev ere d isea se and rapid "switching" rates
A ssociated with chronic infectionsand slow "switching" rates
A ssociated with severe d isea se and rapid "switching" rates
Figure 1.4: Chromosomal arrangement o f var genes. The upstream promoter classification is denoted by letters A-C. Group A genes are transcribed towards the telomere and group B are transcribed away from the telomere. The internal var clusters are found on chromosome 4,6,7,8, and 12 wheres the subteromeric vars are on most chromosomes. Preferential recombination occurs among the group A genes and similarly among the group B var genes.
Unusually conserved var genes across most isolates include the varl, the var2csa
and the type 3 var genes. Varl and var2csa have distinct upstream promoters re
gions that were described as ups-D and ups-E respectively by Lavstsen and colleagues
(Lavstsen et al. 2003).
1.5 Expression of var genes
Regulation of expression in var genes is controlled at the transcription initiation,
translation and epigenetic levels for example through nuclear localization. Var genes
are expressed in a mutually exclusive m anner (Scherf et al. 1998; Kyes et al. 2007)
16-18 hours post invasion. Transcription control involves interaction of the 5’ var
promoter situated upstream of the first exon and the var intron promoter. Epigenetic
control of var gene expression involves histone acytylation and methylation (Lopez-
Rubio et al. 2007; Freitas-Junior et al. 2005).
14
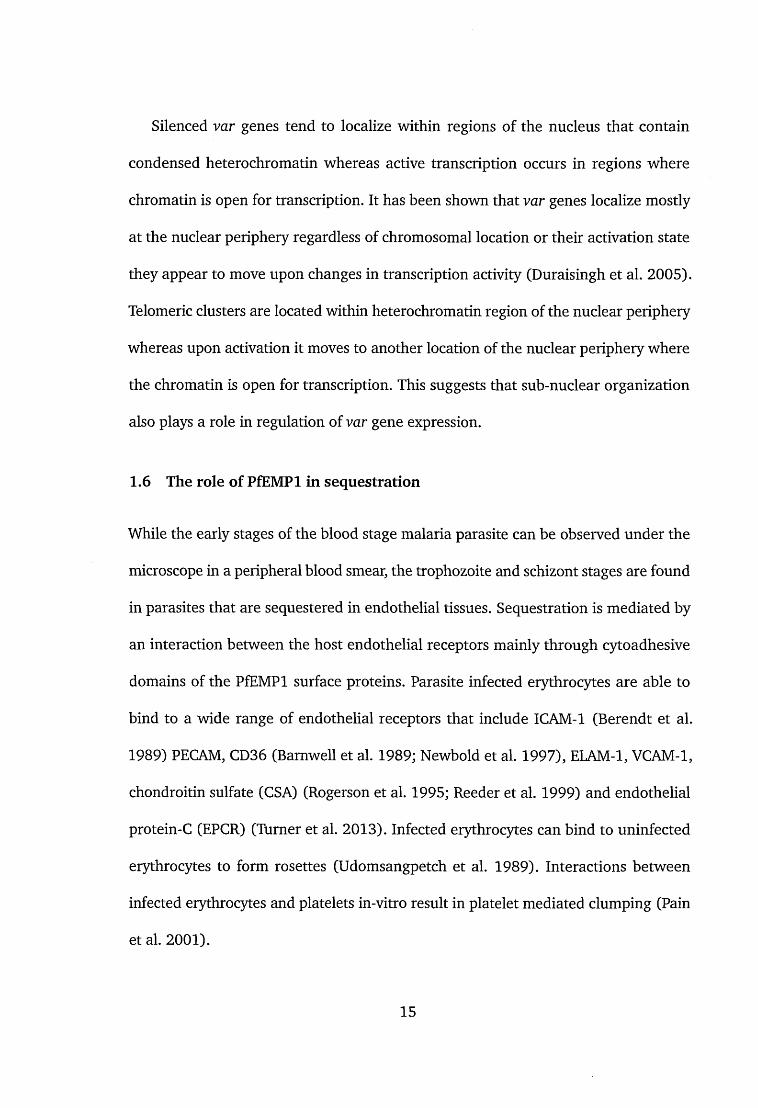
Silenced var genes tend to localize within regions of the nucleus that contain
condensed heterochromatin whereas active transcription occurs in regions where
chromatin is open for transcription. It has been shown that var genes localize mostly
at the nuclear periphery regardless of chromosomal location or their activation state
they appear to move upon changes in transcription activity (Duraisingh et al. 2005).
Telomeric clusters are located within heterochromatin region of the nuclear periphery
whereas upon activation it moves to another location of the nuclear periphery where
the chromatin is open for transcription. This suggests that sub-nuclear organization
also plays a role in regulation of var gene expression.
1.6 The role of PfEMPl in sequestration
While the early stages of the blood stage malaria parasite can be observed under the
microscope in a peripheral blood smear, the trophozoite and schizont stages are found
in parasites that are sequestered in endothelial tissues. Sequestration is mediated by
an interaction between the host endothelial receptors mainly through cytoadhesive
domains of the PfEMPl surface proteins. Parasite infected erythrocytes are able to
bind to a wide range of endothelial receptors that include ICAM-1 (Berendt et al.
1989) PECAM, CD36 (Barnwell et al. 1989; Newbold et al. 1997), ELAM-1, VCAM-1,
chondroitin sulfate (CSA) (Rogerson et al. 1995; Reeder et al. 1999) and endothelial
protein-C (EPCR) (Turner et al. 2013). Infected erythrocytes can bind to uninfected
erythrocytes to form rosettes (Udomsangpetch et al. 1989). Interactions between
infected erythrocytes and platelets in-vitro result in platelet mediated clumping (Pain
et al. 2001).
15

Several studies have shown that sequestration of infected erythrocytes to the
endothelial receptors contributes to development of malaria pathology using different
host ligands such as CD36, ICAM-1, CSA, CRl,and EPCR as outlined below.
1.6.1 CD36
CD36 is expressed by several types of cells that include endothelial and epithelial cells,
macrophages, monocytes, platelets, erythrocyte precursors and adipocytes (Udom-
sangpetch et al. 1997). Most parasite infected erythrocytes bind to CD36 (Newbold et
al. 1997). Most CD36 studies are small and related to a single functional investigation
nonetheless most studies have shown that the CIDR domain of PfEMPl mediate bind
ing to CD36 (Baruch et al. 1997; Smith et al. 1998). Recombinant PfEMPl fragments
can bind to CD36 and antibodies raised against these fragments can block adherence
of infected erythrocytes from different isolates to CD36 (Baruch et al. 1997). Parasites
that express var group B and C, are important in CD36 binding (Robinson et al. 2003).
1.6.2 ICAM-1
Inter-cellular adhesion molecule 1 also known as CD56 is 90-115kDA transmembrane
glyco-protein and a member of the immunoglobulin super family that is expressed on
a variety of cell types. It is involved in signal transduction and is a receptor for several
ligands. Binding to ICAM-1 by infected erythrocytes may play a role in development
of cerebral malaria syndrome pathogenesis (Ochola et al. 2011). Ochola et al. (ibid.)
analyzed the role of ICAM-1 binding variants under static and flow adhesion assays
to show that parasites from children with cerebral malaria bound more to ICAM-1
16

under flow conditions. A subset of PfEMPl molecules with the DBLp» domain pair
bind to ICAM1. ICAM1-binding molecules are encoded mainly by group B and group
C PfEMPl proteins (Howell et al. 2008), although some group A PfEMPl have been
shown to encode ICAM-1 binders (Oleinikov et al. 2009). The strength and the level
of binding varies. One study reported that infected erythrocytes from children with
cerebral malaria tend to bind more to ICAM-1 than from children with asymptomatic
malaria (Newbold et al. 1997). In another study there was no difference in binding
in children with severe malaria compared to those with non-severe cases (Rogerson
et al. 1999). A frequent polymorphism in the ICAM-1 gene in African populations
is not associated with protection against severe malaria (Craig et al. 2000) but is
reported to be protective against febrile illness in infants (Jenkins et al. 2005). It has
been suggested that ICAM-1 could work in a synergistic way with CD36 to enhance
static adhesion (McCormick et al. 1997; Yipp et al. 2007).
1.6.3 Chondroitin sulfate-A
P. falciparum parasites adhere to CSA (Rogerson et al. 1995) and a distinct PfEMPl
variant protein, var2csa, binds to chondroitin sulphate-A (Salanti et al. 2004) which
results in parasite sequestration in the placenta of pregnant and infected women
(Fried: 1996ws). Pregnancy associated malaria is a major cause of poor birth out
comes that include abortion, still-birth and low-birth weight mostly in first-time moth
ers in malaria endemic regions. Most women develop antibodies that inhibit binding
of parasites to the placenta and are less affected in the second, third and later preg
nancies (Fried et al. 1998). This observation forms a basis for developing protective
17

PfEMPl based vaccine and serves as a model for PfEMPl based immunity to malaria.
1.6.4 EPCR
Endothelial protein-C receptor (EPCR) is a receptor for activated protein-C, a serine
protease involved in the blood coagulation pathway. In 2013 Turner and colleagues
reported that parasites causing severe malaria in a group of children expressed EPCR-
binding PfEMPl. They showed that EPCR binding was associated with PfEMPl mo
lecules carrying domain cassette 8 (DC8) and 13 (DC13) (Turner et al. 2013). Domain
cassettes are discussed in section 1.7. Importantly they showed that parasite bind
ing to human brain micro-vascular endothelial cells through EPCR was significantly
higher in isolates from patients with severe malaria than in children with non-severe
malaria.
1.6.5 Complement receptor 1
The complement receptor 1 (CR1) is a complement regulatory protein that is ex
pressed by erythrocytes, leukocytes and dendritic cells. CR1 is implicated in roset-
ting (Rowe et al. 1997), a parasite phenotype that is associated with severe malaria
(Carlson: 1990fq; Warimwe et al. 2012).
1.7 Functional classification of var genes
Var genes exhibit extreme molecular diversity. Only a limited set of functional phen
otypes are associated with parasites. Var classification is important to distinguish
var types that may be associated with particular virulent phenotypes. Methods used
18

to classify var genes are based on homology in coding, non-coding and upstream
sequence regions (Voss et al. 2003; Voss et al. 2000; Vazquez-Macfas et al. 2002;
Gardner et al. 2002) as well as conservation of domain architecture across multiple
isolates. On the other hand, the Cys/PoLV DBLa classification method is based on
sequence properties of a short PCR amplified region of the DBLla (see figure 1.3)
domain rather than sequence homology.
Based on the conservation of the 5’-flanking region var genes were classified into
three major groups, upsA, upsB and upsC (Gardner et al. 2002). A number of studies
have associated upsA var sequence expression with severe and life-threatening disease
outcomes. First, Rottmann et al. (2006) using real time PCR primers showed that var
group A and B transcripts were more abundant in severe malaria patients than in pa
tients with uncomplicated malaria. A study from Kenya associated group A genes with
rosetting (Warimwe et al. 2012), a phenotype that has been associated with disease
severity in African children (Doumbo et al. 2009). Studies by Warimwe et al. (2009)
and Kyriacou et al. (2006) provided indirect association using var DBLa sequence
tags. Both studies provided evidence to support that a subset of tag sequences with 2
cysteines tend to be associated with group A var genes.
Expression of upsB sequences is associated with severe and mild malaria (Rottmann
et al. 2006; Kaestli et al. 2006) while a large proportion of upsC sequences are associ
ated with expression in asymptomatic cases (Rottmann et al. 2006; Falk et al. 2009).
However, significant expression of upsC sequences in severe malaria cases has been
reported (Kalmbach et al. 2010)
These observations suggest that the ups classification is very broad and does not al
19
ways discriminate between disease phenotypes. Although there are clear associations
between function and features associated with upsA, lack of a distinct sequence signa
ture within var genes means that the relationship between sequence and functional
role or phenotype cannot be direct.
In 2010, Rask and colleagues described twenty-three non-random domain arrange
ments that were commonly found in full-length sequences of seven parasite genomes
(Rask et al. 2010). These non-random domain arrangements were designated as do
main cassettes (DC). Var gene segments can be classified based on conservation of
these domain structures or cassettes.
A couple of studies have shown that var sequences that are characterized with
DC8 and DC 13 domain cassettes are associated with expression in severe malaria
(Lavstsen et al. 2012; Bertin et al. 2013). DC8 and DC13 are important in binding
to the endothelial protein-C receptor (EPCR) (Turner et al. 2013). DC8 var-encoded
genes from the IT4 line were shown to bind to endothelial cells from various organs
and notably from the brain endothelial cells (Avril et al. 2012; Claessens et al. 2012).
The major drawback with this approach is that the domains were defined based on
homology and most variation is not in the parts of the sequences that are directly
linked with adhesive function, and the nature of molecular sequence diversity is not
correlated with the extent of functional diversity. Therefore, sequencing large numbers
of clinical parasites coupled with functional assays is important in order to establish
the relationship between sequence conservation and cytoadhesive properties.
20

1.7.1 Working w ith DBLa sequence tags
Given the challenges of sequencing full-length var genes and classification, a lot of
clinical studies have sequenced the DBLa region of in the DBL1 domain because it
can be amplified using universal primers.
The DBLa sequence tag is a short 300-500 nucleotide segment found in the DBLla
domain of the var gene. DBLla domains are found in nearly all var genes. While the
DBL1 domain is not very conserved in sequence, it is characterized by the presence
of semi-conserved homology blocks that can be targeted by universal primers (Taylor
et al. 2000a). It is likely that the tag region is in linkage disequilibrium with genetic
or structural features upstream or downstream of the molecule. Figure 1.5 shows a
schematic diagram of the DBLa sequence tag highlighting the major characteristic
features. The MFK and REY motifs are not present at the same time in a given tag
(Bull et al. 2007).
21

T ag
P O L V 4P O L V 1 P O L V 2 P O L V 3
M F K R E Y V ariable c y s tie n e s
Figure 1.5: A diagram depicting the size o f the DBLa sequence tag relative to the full length var gene and the features that are characteristic of the tag regions. Relatively conserved regions within the tag are shown and they are interspersed with polymorphic regions. The relatively location of two important motifs MFK and REY is shown (Bull et al. 2007)
DBLa sequence tags are characterized by relatively conserved N-terminal and C-
terminal regions, distinct number of cysteine residues, two mutually exclusive motifs
and a distinct length distribution (Bull et al. 2005). DBLa sequence tags can be
classified into six groups depending on the combination of the its features. The six
groups are CPI (cys2-MFK+ve), CP2 (cys2-REY+ve), CP3 (cys2 REY~ve MFK_VC), CP4
(cys4-REY-ue MFK-ve), CP5 (Cys4-REY+ue) and CP6. CP6 is the default group for
sequences that do not fall into any of the previous five groups. Figure 1.6 shows a
summary of Cys/PoLV classification system.
22

all
Figure 1.6: DBLa sequence tags can be classified into six sequence groups. Group 1 (CPI) sequences contain 2 cysteines and an MFK m otif group 2 (CP2) contain 2 cysteines and an REY m otif Group 3 (CP3) contain 2 cysteines without any o f the motifs. Group 4 (CP4) contain 4 cysteines and Group 5 (CP5) contain 4 cysteines and an REY motif. Sequences that do not fall into any o f the previous groups are classified as group 6 (CP6). Some sequences share short sequences blocks with each other such that they form a network o f block sharing sequences. The largest components o f this network were termed as Block-Sharing group 1 and Block-sharing group 2. The group-A sequences contain 2 cysteines and tend to fall on block-sharing group 1.
A study by Bull et al. (2008) showed that sequences that shared 14 amino-acid
sequence blocks with each other formed an unbroken network of sequences that
comprised of a major and a minor component. Sequences that were connected in
the major component were termed as the block-sharing group 2 and those that fell
on the minor component were termed as block-sharing group 1. The majority of the
sequences did not fall in these components. Sequences in the block-sharing group 1
corresponded well with group A sequences (ibid.).
Not all sequences fitted into these networks and therefore a few sequences were
connected to both bsl and bs2 networks. Figure 1.7 shows a layout of sequences on
•group 1
•group 2
0group 3
•group 4
©group 5
0group 6
(v ) G r o u p A
23
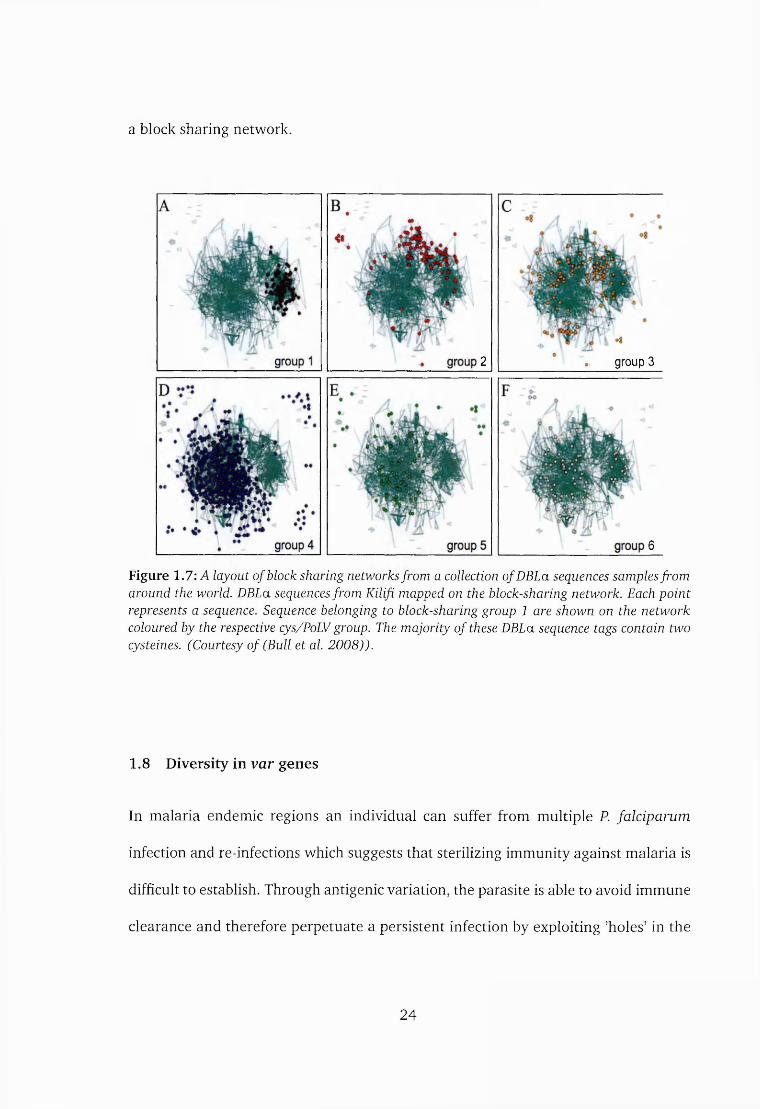
a block sharing network.
2
«8. group 3
6_
Figure 1.7: A layout of block sharing networks from a collection of DBLa sequences samples from around the world. DBLa sequences from Kilifi mapped on the block-sharing network. Each point represents a sequence. Sequence belonging to block-sharing group 1 are shown on the network coloured by the respective cys/PoLV group. The majority of these DBLa sequence tags contain two cysteines. (Courtesy of (Bull et al. 2008)).
1.8 Diversity in var genes
In malaria endemic regions an individual can suffer from multiple P. falciparum
infection and re-infections which suggests that sterilizing immunity against malaria is
difficult to establish. Through antigenic variation, the parasite is able to avoid immune
clearance and therefore perpetuate a persistent infection by exploiting ’holes’ in the
24

immunity of the host as reviewed by Bull and Marsh (Bull and Marsh 2002).
Several studies (Falk et al. 2009; Freitas-Junior et al. 2000; Kraemer et al. 2007;
Taylor et al. 2000a) suggest that var recombination occurs in coding sequences; and
that it generates rapid variation in the encoded proteins (Taylor et al. 2000a; Ward
et al. 1999).
1.8.1 Role of recombination in generation of var diversity
Recombination in var genes is generated during meiosis (Taylor et al. 2000b; Freitas-
Junior et al. 2000) and mitosis (Claessens et al. 2014; Bopp et al. 2013). Deitsch
and colleagues showed evidence for intra-cluster recombination of var genes in chro
mosome 12 that was characterized with spontaneous switches in the transcription of
genes (Deitsch et al. 1999). Using a HB3xDd2 genetic cross in hybridization study,
Freitas-Junior showed that parasites from genetically diverse backgrounds can share
sequenced blocks with other var genes (Freitas-Junior et al. 2000). Zilversmit and
colleagues defined large and continuous blocks of homologous sequences among P.
falciparum and P. reichenowi DBLa domains (Zilversmit et al. 2013). This suggests
that recombination accounts for diversity within and between species.
Variation in the level of recombination between different var gene subsets appears
to play a role in structuring var genes in the populations. For example group A var
genes tend to recombine with fellow group A and less with non-group A (Kraemer and
Smith 2003; Kraemer et al. 2007). This could be important in maintaining overall var
function. Despite this, the architectures of var genes are poorly maintained between
different parasite genomes (Kraemer et al. 2007).
25

Few studies have looked at sequence diversity in var genes due to lack of epi
demiological sampling frameworks given the challenges of obtaining, sequencing and
classifying var genes from clinical isolates. In a study by Barry and colleagues, DBLa
sequences were grouped into "sequence types". By sampling from global population
of sequences, a "type" plateau was never arrived at because of the immense number of
sequence "types" suggesting extreme diversity within the DBLa region of the PfEMPl
(Barry et al. 2007).
1.8.2 The role of point mutations in generation of var diversity
The role of point mutations and nucleotide substitution in generation of sequence
diversity in var genes is still poorly understood. While it is known that point mutation
occurs in DNA sequences it is difficult to ascertain to what extent point mutation is
important in generation of diversity in var sequences especially with the long history
of recombination. It is important to distinguish the biological processes that generate
specific types of point mutations. Relating mutation to specific selective pressure could
provide insight on processes maintaining diversity but the challenge is on approaches
to quantify and separate diversity that is generated through recombination from
diversity occurring through random mutation processes.
1.9 Evidence for immunological specialization
Building on the idea of functional specialization discussed in section 1.7, several stud
ies suggest that distinct var groups tend to associate with particular adhesive proper
ties provides evidence for functional specialization. The idea of functional specializa
26
tion is that if the cost of optimal adhesive properties was conserved antigenic types,
then, antigenic types would be rapidly eliminated leading to selection of variants
with novel antigenic types (Bull et al. 1999). Evidence in support of immunological
specialization comes from an experiment with parasites from different geographical
regions. Bull and colleagues observed that parasites associated with severe malaria
in non-immune individuals express a subset of variant surface antigens that was com
monly recognized by immune serum compared to those that were associated with
uncomplicated malaria (Bull et al. 2000). This experiment was confirmed from the
observation that antigens expressed by parasites from young Ghanaian children with
malaria were commonly and strongly recognized by plasma from healthy children in
the same locality, whereas recognition of antigens expressed by parasites from older
children was less frequent (Nielsen et al. 2002).
Furthermore the observation that expression of commonly recognised variants
was accompanied by up-regulation of group A var genes (Jensen et al. 2004) in 3D7
isolates suggests that different subsets of PfEMPl have different levels of antigenic
conservation. Jensen and colleagues showed that group A var genes were up-regulated
in 3D7 parasites that were commonly recognised. The commonly recognized variants
were selected on the basis of the observation that they are recognized by plasma IgG
of semi-immune children as previously described by Bull and colleagues.
The above observations have been corroborated by studies using the DBLa tags
where clinical expression studies on var have shown that CPI, CP2 and CP3 sequences
are often expressed in children with severe malaria while CP4 are often expressed
in children with non-severe malaria (Kyriacou et al. 2006; Warimwe et al. 2009;
27
Kirchgatter and Portillo 2002). Additional evidence comes from studies which show
that group A var genes are often expressed in samples collected from young individual
that are less immune (Kyriacou et al. 2006; Warimwe et al. 2009).
Using data from full length var genes, Buckee and Recker reported an association
between the number of domains in a var gene and sequence conservation (Buckee and
Recker 2012). From the same group of sequences, they also showed that upsA genes
were more conserved relative to upsB and upsC, suggesting some level of structural
specialization that is consistent with known recombination patterns (Kraemer et al.
2007) and correlates with functional specialization as discussed in section 1.7.
Taken together, these studies suggest that var gene subsets have distinct antigenic
properties and that some subsets are more antigenically conserved than others.
1.10 Thesis overview
This thesis work explores molecular and predicted epitope diversity in var sequences
by analyzing the DBLa sequence tags. The DBLa sequence tags used in this study
were largely from samples collected in Kilifi during two study periods 2003-2007 and
2008-2010 and also from published sequences from laboratory parasites and clinical
isolates from Papua New Guinea and South America. The sequences from Kilifi were
sequenced from samples that were collected from sick children who presented at the
County hospital. One of the advantages of using the DBLa sequence tags is that they
can be PCR amplified from most var genes that contain a DBLla domain. The thesis
work focused on the molecular and immunological diversity of DBLa sequences as
explained in the next two sections.
28

1.10.1 Molecular diversity of var genes
The first and the second research questions were investigated by exploring the nature
of molecular diversity in the DBLa sequences. The molecular diversity of var genes
is poorly described given the extensive diversity and recombination that is present
in var sequences. Recombination presents a challenge in describing the nature of
variation and the role of variation in shaping immunological differentiation and influ
ences sensitivity and specificity in methods that are used to measuring var expression.
Chapter 3 of this thesis explores this aspect of diversity. Chapter 4 explores the nature
of diversity in DBLa nucleotide sequences of known similarity with an aim of under
standing and describing the extent to which processes other than recombination are
involved in generation of diversity.
1.10.2 Immunological diversity in var genes
Majority of var genes contain a DBLa domain but raising cross-reactive and protective
antibodies against the DBLa domain is difficult. In a recent study, Blomqvist and col
leagues reported success in ability to raise cross-reactive antibodies against conserved
peptides in the DBLa domain (Blomqvist et al. 2013). In their experiment antibodies
were raised against conserved motifs that were identified in sequences associated with
severe malaria from a study in Uganda (Normark et al. 2007). In another study 15-20
mer-long peptides with high binding activity and therefore referred to as high activity
binding peptides (HABPs) were used to create highly immunogenic and protection
inducing modified HAPBs (Patarroyo et al. 2014).
29
In chapter 5 of the thesis putative novel epitopes are described based on B-cell and
T-cell epitope predictions using the DBLa sequences. The epitopes are analyzed in the
context of the expression profile of the respective var sequences and the corresponding
relationship with age of the host and data on their molecular diversity. Part of the
aim of this work was to test the feasibility of raising cross-reactive antibodies against
short linear immunodominant epitopes.
1.11 Summary of research questions
1. How does the var classification approaches used to measure expression in clin
ical isolates compare?
2. Is there evidence for non-random distribution of variation in different subsets of
var sequences given that PfEMPl functional and antigenic properties potentially
impose different selection pressures?
3. Are predicted linear epitopes associated with sequences expressed in severe mal
aria and in young individuals? How do they differ between previously defined
var sequence groups?
30

Chapter 2 Materials and methods
This chapter provides an overview of the study site, the demography and general
methods that were used to process and analyze data.
2.1 Study location
This work was carried out using sequence data that was generated from two immun
ology studies (Warimwe 2010; Andisi 2014) at the KEMRI-Wellcome Trust Research
Programme in Kilifi County, published sequences collected from a studies in Brazil
(Albrecht et al. 2010) and Papua New Guinea (Barry et al. 2007) and sequences that
were generated from sequenced laboratory isolates (Rask et al. 2010).
The KEMRI-Wellcome Trust Research Programme is located at the Kilifi County
Hospital (KCH) situated along the Kenyan coast, 56 kilometers northeast of Mombasa
by road and lies on the Kilifi creek as shown in figure 2.1 (Scott et al. 2012). Kilifi
county has a population of more than 122,889 people based on data from the 2009
National Demographic Survey and Census.
Kilifi region experiences two rainy seasons in a year; the long rains (April-July)
and the short rains (October-November). Most malaria transmission and infection
occur during these wet seasons. The estimated entomological inoculation rate is
31

about 21.7 bites per person per year (Midega et al. 2012). The northern part of the
Kilifi County has a relatively lower transmission rate compared to the south (Snow
et al. 1997). The region has observed a decline in malaria transmission over the last
20 years (Okiro et al. 2009b; O’Meara et al. 2008; Hay et al. 2010). Malaria decline
has been attributed to multiple interventions that include widespread use of bed-nets,
a change in weather patterns, vector densities and a shift in the feeding patterns of
the vectors (Mwangangi et al. 2013) among other social-economic factors.
Kilifi D istrict
Annual paediatric adm ission rate per 10,000 total
□ 0-4□ 5-24□ 25-49□ 50-74 H 75-99 ■ >100
0 10 20 40Kilometres
Figure 2.1: A map of Kilifi district now the Kilifi county. The map on the left shows the location of the county in relation to the rest o f the country and the one on the right shows the study area. The rate o f pediatric admissions to Kilifi County Hospital by administrative sub-location are colored based on the legend. The dark bold line represents the boundary o f the Kilifi Health and Demographic Surveillance System (KHDSS). Courtesy o f Scott et al. (2012)
2.2 Sample collection and processing
The study samples were collected at the Kilifi County Hospital during 2003-2007 and
2008-2010 periods. The period between 2003 and 2007 was a period of rapid decline
in malaria admissions in relation to previous years. Malaria admissions w ere at the
population
Hospital ©
Major ro a d .........
E th io p ia
Kilifi District
Ind ian
O cean
32

lowest during the 2008 to 2010 period as shown in figure 2.2.
An informed consent was obtained at the time of admission. Consent from minors
was obtained from the parent or guardian. Parasite samples were classified as severe
or non-severe based on clinical information at the time of admission. Severe malaria
cases were defined based on Marsh and colleagues case definitions (Marsh et al.
1995).
2500-1
2003/072 0 0 0 -
■g 1500-
n 1 0 0 0 -
2008/10Z 500-
05 O t -oo o> o>0 0) 0)
oo in co n co o>05 05 05 05 05 05 o05 05 05 05 05 o> o>
oooCMoo
<3- ino oo oCDoo
00o 05ooo CMoo oo oo
Y ear
Figure 2.2: A plot showing the sample collection periods in the background of malaria admission at the Kilifi County Hospital Sequence data were obtained during the 2003-07period and 2008- 10 period. The 2003-2007 was a period o f rapid decline in malaria admissions and during the 2008-10 period malaria admissions were at the lowest. There was a trend towards increasing age for patients who were admitted at the hospital as depicted by the black line (data not shown). Adapted from Andisi (2014)
The collection and processing of parasites was done prior to sequence analysis
using standard and published methods as described in Bull et al. (2005), Warimwe
(2010) and Andisi (2014). Sample preparation and parasite culture constituted a
separate piece of work which is not included this thesis.
33

2.3 Sequence data from Kilifi
A total of 8,118 sequences from Kilifi was generated from 450 isolates that were col
lected in Kilifi in the period 2003-2007. Another dataset was generated from isolates
collected in 2008-2010. These sequences were generated using the methods described
by Andisi (2014).
2.4 Sequence data from laboratory isolates
Full-length PfEMPl sequences from seven laboratory isolates were downloaded from
sources as described by Rask and colleagues (Rask et al. 2010). These isolates were
Dd2 (n=47), 3D7 (n=60), HB3 (n=43), IT4 (n=55), PFCLIN (n=58), R ajll6 (n=37)
and Preich (n=16) (Otto et al. 2014). DBLa sequence tags were extracted from the
full length sequences using the DBLa-finder program.
2.5 The global data set
A total of 354 sequences from 10 geographical regions were downloaded from Gen-
bank and constituted the global dataset as shown in table 2.1.
India Sudan Kenya Cape Verde Solomon Isl Phillipines Vanuaitu PNG Thailand Brazil Africa
25 22 47 8 90 55 7 22 22 33 23
Table 2.1: This table shows the number of additional sequences from different geographical regions around the world that were collected and used in the study.
Data from Papua New Guinea comprised of 460 sequences from Amele and Ma-
34
dange regions that was downloaded from Genbank based on the accession numbers
provided by Barry and colleagues (Barry et al. 2007).
An extra dataset of 980 var2CSA sequences were also downloaded from Genbank.
Only 68 sequence tags met the tag extraction criteria as set out in the DBL-alpha-finder
program (A.1). This is not surprising because var2CSA sequences cannot be amplified
using the DBLa (section A.1) primer target regions which also form definition of the
tag.
2.6 DNA amplification
Samples that were collected before 2008 were amplified using Amplitaq Gold poly
merase and those that were collected between 2007-2010 were amplified using the
Bio-X-ACT DNA polymerase, a high fidelity polymerase with proof-reading activity.
Low fidelity enzymes can result in PCR errors that are difficult to account for and
bias the distribution of mutations. The effect of PCR errors were minimized using
the sequence clustering and selection methods described in later sections. The tag
region was amplified in both directions on an ABI Gene Amp PCR system 9700
thermocycler using the DBLa-AF GCACG(A/C)AGTTT(CVT)GC and DBLa-BR GC-
CCATTC(G/C)TCGAACCA degenerate primers (Bull et al. 2005).
2.7 Scripting and code management
This thesis was prepared and typeset using Latex and Knitr. Coding and file manage
ment was done using the git revision control ( h t tp s : / / g i t - s c m . c o m / ) . Source
code was committed to Github repository under a 5 year generous private repository
35
student plan provided by Github team. All source code is provided and released under
the open source public plan.
2.8 Scripting languages and statistical tools
Perl, Ruby, Python, Awk and R were used to in the data processing, management and
analysis. Notable programs and scripts are listed in appendix A and they are also
available from the Github repository (http: / /github. com/biorelated).
Statistical analysis was done using RStudio (http: //rstudio. org) and the R
statistical language (https : / /www. r-pro ject. org/). Majority of the plots were
created based on the grammar of graphics as implemented in the ggplot2 package
(Wickham 2009). The dplyr package was used to manage data transformation and
cleaning. The phylosim and Ape packages were used work with alignment and phylo
genetic trees. Layouts were prepared with the gridExtra and Cowplot packages. The
Seqinr package and Bioconductor were used in analysis of nucleotide and protein se
quences. The Ape package was used for reading and manipulating multiple sequence
alignments. Xtable and stargazer packages were used to format tabular data into
presentable tables. The work-flows were written using multiple programs written in
any of the languages mentioned earlier and they were "glued" together using the Bash
programming language and interpreter.
36
Chapter 3 Development of a sequence clustering and epitope prediction
framework
3.1 Background
This chapter describes the methods and approaches that were developed to support
the work described in chapter 5 and 6. It describes approaches and tools that were de
veloped to identify high quality DBLa sequence tags, a sequence clustering approach
for identifying nucleotide substitutions in groups of similar sequences and methods
and tools for predicting both B-cell and T-cell epitopes in DBLa sequences.
Following from chapter 2, there were two main sources of data in this study;
immunological studies that were carried out between 2003 and 2007 (Warimwe 2010)
and between 2008 and 2010 (Andisi 2014) in Kilifi and sequences that were collected
from published sources (Barry et al. 2007; Albrecht et al. 2010; Rask et al. 2010). The
sequences from Kilifi formed the bulk of sequences used in the analysis. Data from
2003 - 2007 was downloaded as compressed archives of trace files while the data
from 2008 - 2010 was downloaded from the Beijing Genomics Insitute as compressed
archive of ABI files and as described in chapter 2. The computer programs described
in section 3.7 were developed to unpack the compressed files, process and assemble
the raw reads into contigs and then to identify "high quality DBLa sequences" (see
37

section 3.4). The high quality sequences were then clustered, classified using the
tag analysis approach described in chapter 1 section 1.7.1 and as described in later
sections of this chapter.
3.2 Generating random substitutions
Random substitutions were generated for comparison with substitutions that were
observed from clinical sequences. Two approaches were used to generate random
substitutions in DBLa sequences. The first approach inserted random substitutions
at random nucleotide positions in a randomly selected DBLa reference sequence.
A total of 5001 sequences were generated at each identity threshold. An identity
threshold was a percent global similarity value that was used to group sequences such
that sequences within a cluster were similar at greater than or equal to a specified
threshold (see section 3.5). DBLa sequences without stop codons were extracted
from the simulated sequences using DBLFinder and clustered at 98%-92% identity
using Vsearch. Table 5.1 shows a summary of the DBLa tags at each identity threshold.
Lower identities resulted in more substitutions and fewer DBLa sequence tags without
stop codons.
In the second approach, substitutions were generated based on a random model
and the number of sample sequence alignments was equivalent to the number of
clusters at each percent identity. A seed sequence was randomly selected from each
actual cluster that contained two or more members to generate random substitutions
using the phylosim R package. A neighbour-joining tree from the actual tag sequence
data was used as input to the simulation method. The tree from actual sequences
38
ensured that an equivalent number of substitutions were generated in respect to
each actual cluster and that the tree topology was maintained. This approach is
summarized in figure 3.1.
The main differences in the two approaches was that the first approach used
information derived from a single sequence whereas the second approach utilised
information from a wide range of sequences and therefore accounted for differences
in nucleotide proportions. Therefore the second model was preferred and used in
later analysis.
3.3 General approach for computer programs
The computer programs developed in this thesis can be grouped into 1) utility pro
grams, 2) specific programs and 3) work-flows. Utility programs provided funda
mental functions such as DNA translation, classification of DBLa sequence tags, sli
cing and extraction of homology and hyper-variable blocks. Specific programs were
developed to provide features that were not available from existing tools or involved
novel ways of interacting with the tools for example parsing clustering results, as
sembling DBLa tags, building networks, mutation analysis as well as plotting results.
Work-flows automated repetitive tasks that involved two or more programs to accom
plish a task.
Specific programs were packaged for local installation and also released as open
source tools to the wider bioinformatics community. The source code for core pro
grams is outlined in the appendix A section and also is available online under open
source licenses.
39
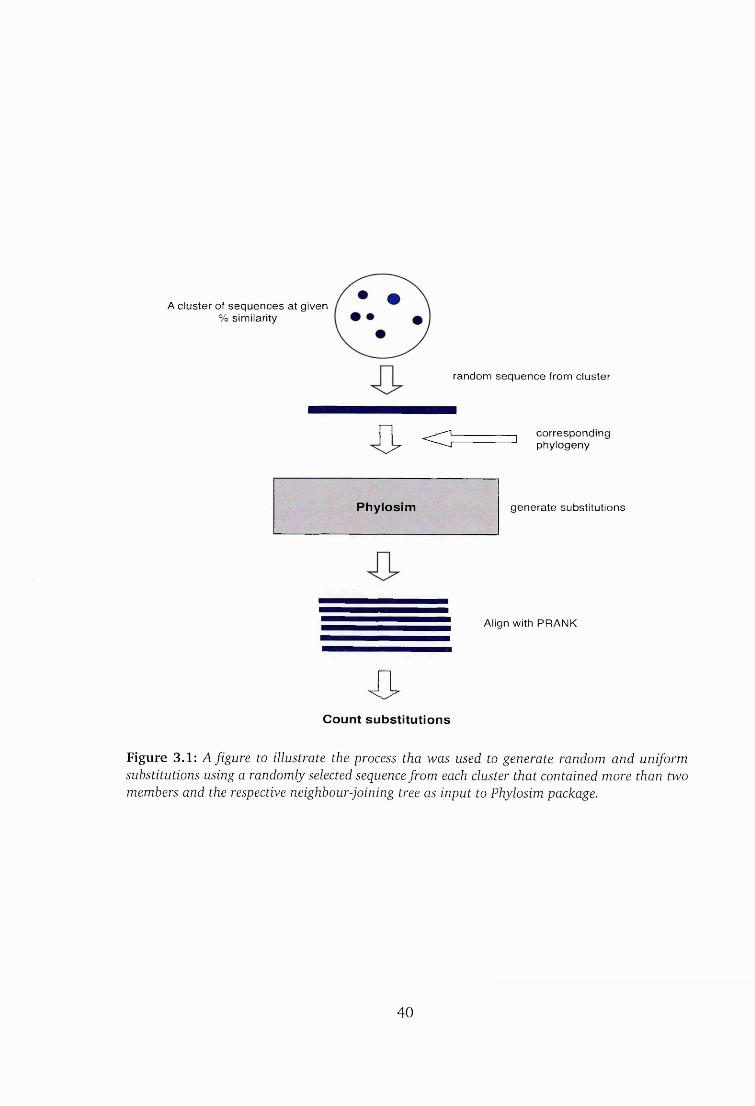
A cluster of sequences at given % sim ilarity
random sequence from cluster
corresponding phylogeny
generate substitutions
Align with PRANK
43-Count substitutions
Figure 3.1: A figure to illustrate the process tha was used to generate random and uniform substitutions using a randomly selected sequence from each cluster that contained more than two members and the respective neighbour-joining tree as input to Phylosim package.
4 J . < 5
Phylosim
40

3.4 Assembling high quality DBLa sequences
A total of 96 colonies per sample were sequenced from data collected between 2003
and 2007 and a total of 32 colonies per sample was sequenced from samples that were
collected between 2008 and 2010. Each colony was sequenced in both forward and
reverse directions. Two assembly programs were used to assemble the reads, phrap
and CAP3.
3.4.1 Assembling DBLa sequences with phrap
Phrap is a program for assembling shot-gun DNA sequences. It was adapted by Bull
and colleagues to assemble DBLa sequences based on Sanger capillary sequencing
(Bull et al. 2007; Warimwe et al. 2009) and also by other research groups (Blomqvist
et al. 2010; Normark et al. 2007) to assemble DBLa sequences in experiments aimed
at quantifying the expression of var sequences. The assembly process included base
quality trimming, vector and primer sequences removal and generation of consensus
sequences from reads in each isolate.
A fasta file containing forward and reverse reads with the respective base quality
information in a separate file is provided as phrap input. The reads are aligned to
produce a collection of high scoring local alignments (Altschul et al. 1990) between
pairs of reads, based on a filter for determining which pairs of reads are likely to
yield high scoring alignments. Finding every single high scoring alignment is not
guaranteed. If two reads have a high-scoring alignment with a region of identity but
one read’s quality scores are low over this region while in the other they are high,
41

quality scores in the first read are boosted, while in a region of the alignment where
there is disagreement, the quality scores of one or both reads are reduced. The reads
are then assembled into contigs.
A contig was defined as a set of reads that appear to form an uninterrupted stretch
of contiguous bases. First each read is assigned to a contig by itself. Then they are
aligned and the alignments are considered from the highest to the lowest scoring one.
The contigs containing two aligned reads are merged into a single contig unless the
algorithm fails to meet the requirements imposed by the set parameters. The lists of
reads and alignments assigned to each contig are used to construct a sequence with
quality annotations. After grouping together positions on the individual reads that
the alignments suggest have a common origin on the target, a dynamic programming
method is used to find the best sequence for each group.
Phrap utilizes local alignment to align and group sequence reads. A possible short
coming with local alignment is that it can assign tags from the same isolate into a
consensus if they share substantial local identities and create contigs from sequences
that are globally different. One study showed that phrap produces more errors in
consensus sequences compared to CAP3 (Huang and Madan 1999). The phrap-based
pipeline as was implemented by Bull and Keane, was more suitable for expression ana
lysis and yielded the protein sequences. It was important to assemble tag sequences
based on global similarities and to yield nucleotide sequences as output.
42
3.4.2 CAP3 approach
CAP3 was used to assemble 192 reads per isolate from the dataset that was collected
in 2003-2007 period and 64 reads per isolate for the 2008-2010 dataset. Data from
each read was in the form of an Abl chromatogram file. The reads were screened to
remove read-pairs that did not have a corresponding forward or reverse mate. Each
chromatogram was converted into a fastq file which was later split into a fasta file
and a phred formatted quality files. The respective fasta and quality file were then
provided as CAP3 input files.
CAP3 assembled each read-pair into a consensus contig. For each CAP3 read-pair
assembly an ace, contig and a quality file were generated. The particulars of each
successive CAP3 execution were saved to a log file. The contig file was then renamed
for consistency with the assigned colony and isolate name as was provided in each
plate. The respective contig and base quality files were converted into fastq format.
All the contigs belonging to each isolate were saved in a file. The DBLa sequence tags
were extracted using the DBLa-finder (3.7.1).
The final output was a DBLa sequence tag for each sequenced colony per isol
ate. All the tag sequences in each isolate were clustered at 96% identity using the
Vsearch version vl.l.l_osx_x86_64 clustering program (https : / /github. com/
torognes/vsearch). Vsearch is an open source 64-bit drop-in replacement for
Usearch. Figure 3.2 shows a summary of this work-flow.
43
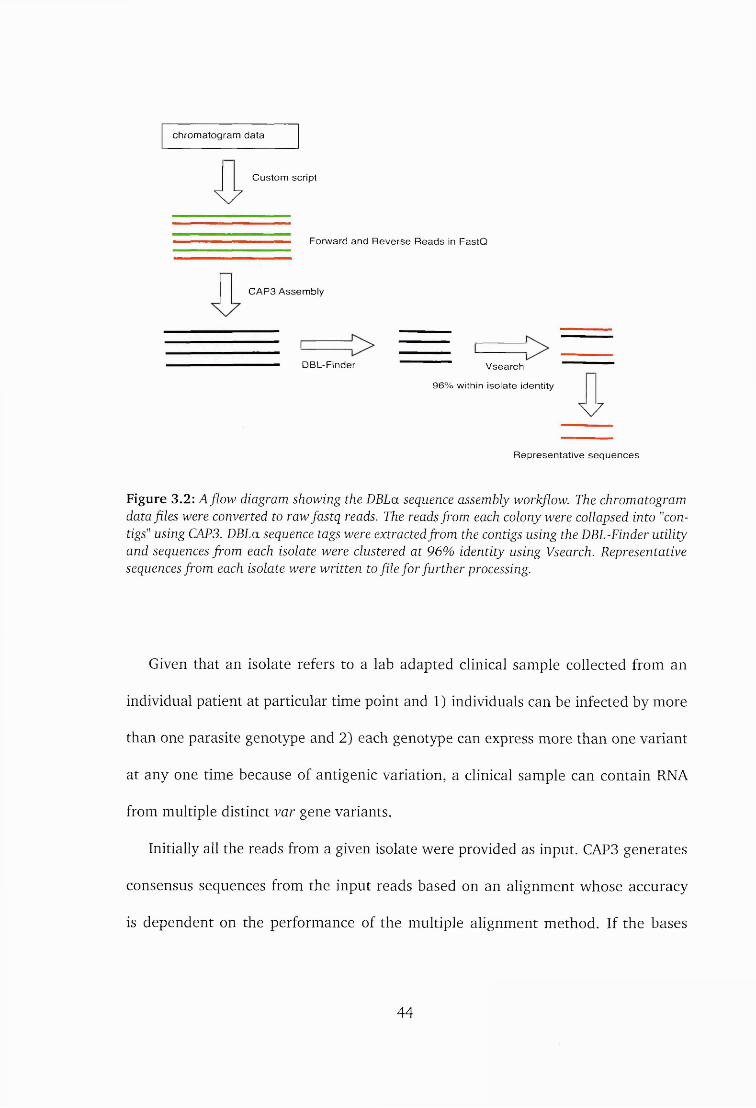
chrom atogram d a ta
C ustom script
V 7
Forw ard and R e v e rse R e a d s in F astQ
C A P3 A ssem bly
IDBL-Finder “ “ “ “ V search
96% within iso late identity
V 7
R e p resen ta tiv e s e q u e n c e s
Figure 3.2: A flow diagram showing the DBLa sequence assembly workflow. The chromatogram data files were converted to raw fastq reads. The reads fl'om each colony were collapsed into "contigs'' using CAP3. DBLa sequence tags were extracted from the contigs using the DBL-Finder utility and sequences from each isolate were clustered at 96% identity using Vsearch. Representative sequences from each isolate were written to file for further processing.
Given that an isolate refers to a lab adapted clinical sample collected from an
individual patient at particular time point and 1) individuals can be infected by more
than one parasite genotype and 2) each genotype can express more than one variant
at any one time because of antigenic variation, a clinical sample can contain RNA
from multiple distinct var gene variants.
Initially all the reads from a given isolate were provided as input. CAP3 generates
consensus sequences from the input reads based on an alignment whose accuracy
is dependent on the performance of the multiple alignment method. If the bases
44
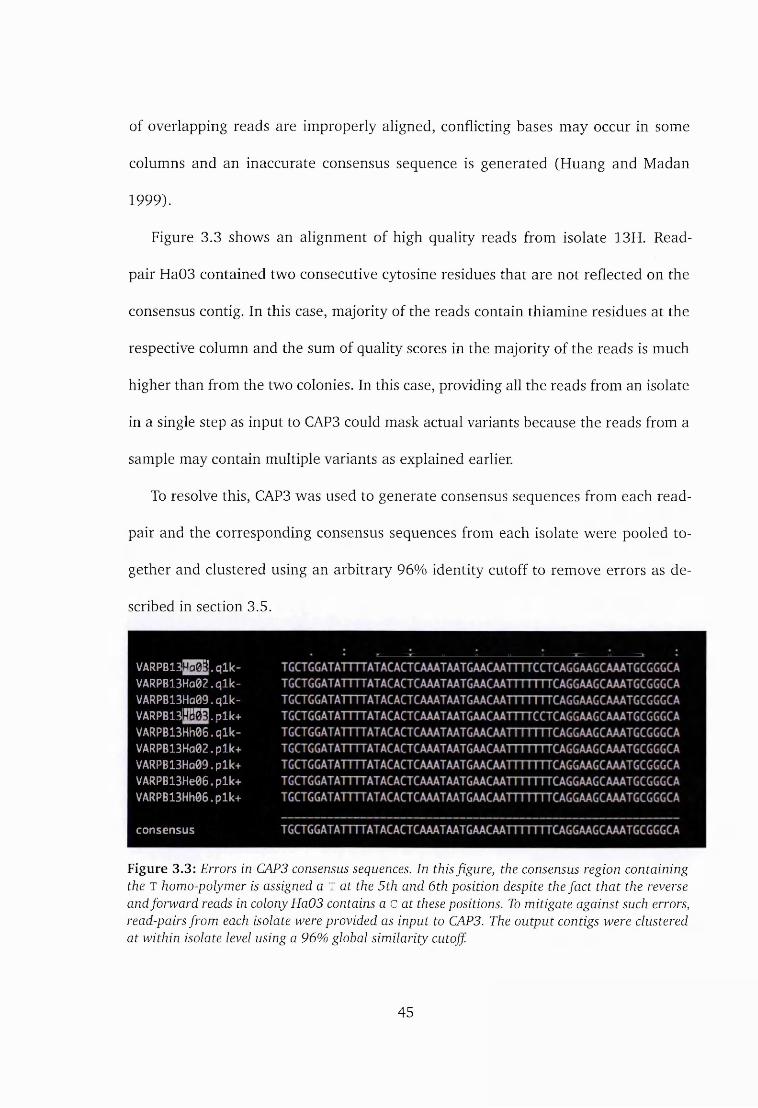
of overlapping reads are improperly aligned, conflicting bases may occur in some
columns and an inaccurate consensus sequence is generated (Huang and Madan
1999).
Figure 3.3 shows an alignment of high quality reads from isolate 13H. Read-
pair Ha03 contained two consecutive cytosine residues that are not reflected on the
consensus contig. In this case, majority of the reads contain thiamine residues at the
respective column and the sum of quality scores in the majority of the reads is much
higher than from the two colonies. In this case, providing all the reads from an isolate
in a single step as input to CAP3 could mask actual variants because the reads from a
sample may contain multiple variants as explained earlier.
To resolve this, CAP3 was used to generate consensus sequences from each read-
pair and the corresponding consensus sequences from each isolate were pooled to
gether and clustered using an arbitrary 96% identity cutoff to remove errors as de
scribed in section 3.5.
VARPBl3W51.Qlk- VARPB13Ha02.qlk- VARPB13Ha09.qlk- VARPB13l!l!EE-plk+ VARPB13Hh06.qlk- VARPB13Ha02.plk+ VARPB13Ha09.plk+ VARPB13He06.plk+ VARPB13Hh06.plk+
consensus
Figure 3.3: Errors in CAP3 consensus sequences. In this figure, the consensus region containing the T homo-polymer is assigned a T at the 5th and 6th position despite the fact that the reverse and forward reads in colony Ha03 contains a C at these positions. To mitigate against such errors, read-pairs from each isolate were provided as input to CAP3. The output contigs were clustered at within isolate level using a 96% global similarity cutoff.
45

An assembly of reads from isolate 14G, generated two long contigs, contig 3 and
contig 6. Both contigs contained more than one DBLa tag as shown in figure 3.4.
»M II I I III I II I I III I lllll I HIM II I III I I I Mil II I 111 I I III I II INI m m sm m m i l II I III II I III I III I i >CDS CDS
III II I llli III II 11 il I III r t || 11 i i i> I ill lCDS CDS.. t> 1 & 1 & tContigl Contifl Coatig3 coatig4 contigs contig6[300 [600 [900 [1200 [1500 [lSOO [2100 [2400 [2700 [3000
,-.-JI I III INI II Mil III III I llllll HI I II II III I I I II I II llll IcosI I I llll I II 11 I II III I II II I I II
lllll llllll li l« III I hi I 11 11 i in i II I ill ll II I I ll li III IICDS
Figure 3.4: An example of contigs containing multiple DBLa tags. Contig3 contained two DBLa tags in opposite orientation and contig 6 contained two DBLa tags in the same orientation.
Most of the reads were assembled into contigs and high quality DBLa sequences
were extracted as shown in figure 3.5. The black bars represent the consensus se
quences and the red bars represent the number of high quality sequence tags from
the respective contigs in each sample. High quality sequence tags were defined as
sequence tags that did not contain stop codons, had a length of between 300 and 500
bases long, and passed the conservative quality trimming criteria that discarded any
read if a nucleotide had a base quality less than 20.
46

B 8 2 §E m m1.6 La i8iassia os i. a
9 ta 26 l-a
i9a ea
s eza t o i a
t s a ezza z n aM B
s s a 86a aza
so l a00 IB Z9ZB t t 2 8 6ZL9
IB 9S28
6L8 Z0L8
89 8 t t 8e ta
2928sszaL l ZB 9 n a
S IBe n az n a
8 taS29
s tz a 2028 z s lb s n a so ia
oza zc a te a te a 8ia 09a se a
lzz aZ928 0928 9228 S 228 % 9L28 o L028 <2 0ZL8 2 La
ZLL8 L88 Z8
osa6C28t2 2 80228
96899a998
s a Lta
s t z a L928 l z z a9LZ9
ZL8 0218 0LL8 80 i a eoLa
s s a 6za z sa
9928Lsza9 t2 8i t z a2928oeza62286L28oozat6La9SL89018
9 saz t a
6928osza6 tz a
2 28iz a
66 La 98 La SZL8 LL8 S928s sz aO L z as e ia
b
A o u a n b a jj IX,
47
phre
d sc
ore
>20
. Th
e gre
y ba
rs in
dica
te
sing
lets
. A
singl
et w
as
defin
ed
as a
sequ
ence
th
at d
id no
t ha
ve
a co
rres
pond
ing
forw
ard
or re
vers
e re
ad,
or wh
ere
one
of the
re
ads
was
signi
fican
tly
diffe
rent
fro
m the
co
rres
pond
ing
forw
ard
or re
vers
e re
ad.
Sing
lets
were
di
scar
ded
from
the f
inal
lis
t of
high
qual
ity
sequ
ence
s.
23235353535348234848235323234823485353234823534823534823484853
3.5 Defining clusters of similar high quality sequences
CAP3 only provided an approach for merging forward and reverse reads and taking
the base quality information into consideration. It provided a robust approach for
defining DBLa sequence contigs per colony per isolate. It did not however take care
of PCR errors or minimize their effect. The next sections describe the approaches
that were adopted to define high quality tag sequences and to minimize the effect of
sequencing and PCR errors in the final batch of tags.
3.5.1 Reducing noise due to potential PCR errors
Base mis-incorporation during PCR leads to substitution bias (Acinas et al. 2005). PCR
amplifications in the 2007-2010 dataset used the Bio-X-ACT high fidelity polymerase
for amplifications. To reduce the number of unspecific substitutions that could have
arisen due to PCR errors, all the sequences were clustered using a global identity cut
off of 96% within each isolate. Only the representative sequences from each cluster
in each isolate were considered in between isolate comparisons.
Sequence identity depends largely on how gaps are treated given a local or global
alignment. Having established a set of high quality assembled sequences, sequence
identity was defined as the proportion of matching residues for a given set of se
quences based on global pairwise comparison. Letters were identical if they matched
at the same position in an alignment. The two widely used clustering tools CD-HIT
(Li and Godzik 2006; Fu et al. 2012) and Usearch (Edgar 2010) as implemented in
Vsearch were evaluated.
48
3.5.2 CD-HIT clustering
CD-HIT is a greedy incremental fast sequence clustering algorithm using global pair
wise comparisons. It uses a word filtering algorithm that reduces the number of
comparisons in each character along a pair of sequences.
The sequences are first sorted based on decreasing length. The longest sequence is
considered as the representative sequence in the first cluster, each remaining sequence
is compared to the representative sequence in the existing clusters. If similarity with
any representative sequence is above a given threshold, that sequence is grouped
into that cluster, otherwise a new cluster is created and the particular sequence is
designated as the representative sequence.
The word filtering approach is based on the idea that two sequences with a certain
sequence identity must have at least a specific number of identical di-peptides and
tri-peptides. For example, for two sequences to have 85% identity over a 100-residue
window they have to have at least 70 identical di-peptides, 55 identical tri-peptides,
and 25 identical penta-peptides. Based on the short word requirement, CD-HIT skips
most pairwise alignments because it assumes that the similarity of two sequences is
below certain threshold based on the simple word counts.
Unfortunately, short word filtering is limited to specific cluster identity thresholds.
If the mismatches are evenly distributed along an alignment, the numbers of common
short words are minimal which results in poor clusters.
The greedy incremental algorithm has a known issue. This can be summarized
as follows: if there are two clusters, say the first cluster has 3 sequences A, X and
49
Y where A is the representative sequence, and the second cluster has 2 sequences B
and Z where B is the representative, if sequence Y is more similar to sequence B than
to A, it is placed in the first cluster, simply because Y found A first during clustering
process.
Occasionally, CD-HIT gives lower rather than higher identities due to misalignment
caused by banding errors. The banding errors occur if the difference in length in a
segment between two conserved regions exceeds the band width (as defined by CD-
HIT) and therefore one or both of the conserved regions are misaligned. Furthermore,
CD-HIT gap open penalty is lower than that of BLAST or Usearch. Therefore, CD-HIT
alignments are more unreliable because they contain more gaps than BLAST and
Usearch.
CD-hit defines the percent identity based on equation 3.1
number o f matches ^length o f shorter sequence
With CD-HIT gaps in the longer sequence can result in bias in percent identity but
gaps in the shorter sequence do not. The percent identity as defined by CD-HIT does
not correspond with evolutionary distance of the sequences. CD-HIT clustering was
used to cluster sequences in the earlier stages of this work.
3.5.3 Vsearch clustering
The bulk of sequence clustering was performed using Vsearch, an open source imple
mentation of the Usearch algorithm and tool. Usearch is a fast and sensitive sequence
50

clustering tool (Edgar 2010) that can cluster sequences at low percent identity. Given
a percent identity threshold t, Usearch attempts to find sequence clusters that fulfill
these two criteria,
i. All centroids have similarity < t to each other and
ii. All member sequences have similarity > = t to a centroid.
Most clusters satisfy the two criteria but the first criteria is not always guaranteed.
If a sequence matches two different centroids with identity > t, it is assigned to
the closest centroid. But if there are two or more centroids at the same distance,an
arbitrary cluster assignment choice is made for the particular sequence.
The DBLa tag sequences were sorted by length and saved into a separate file. The
sorted file was provided as input to the Vsearch program and thereafter sequences
were processed in the order they appear in the input file using the cluster-smallmem
command. Sorting sequences by length ensured that appropriate centroids were des
ignated to the longer sequences. If the next sequence in the file matched an existing
centroid, it was assigned to that cluster, otherwise it became the centroid for a new
cluster. Clustering was done at using 98 - 88% identity cutoffs.
Sequence identity was defined as the number of matching residues in a sequence
divided by the number of columns. This definition is based on the BLAST definition
of sequence identity and is calculated as shown equation 3.2.
A T C G A A A A
1 * * * 1 I I I A C T A A A A A
For example, the two sequences shown above have a total of 8 bases of which 5
are identical. From equation 3.2 the percent identity is 62.5%.
51
Identity is defined as shown in equation 3.2
. 7 number o f matches ^identity = ------------ — --------- (3.2)number oj columns
Figure 3.6 shows a summary of the clustering work-flow. The input was a set of
reads and the output was a set of clusters at each identity threshold. Each cluster
comprised of an alignment from reads that were similar at the respective identity.
These alignments were used to determine the location and frequency of mismatches.
3.6 Aligning and finding mismatches
Sequences in each cluster were aligned using PRANK (Loytynoja and Goldman 2005),
a sequence alignment tool that aims to produce correct and accurate alignments rel
ative to other alignment tools. The number and location of mismatches was obtained
from PRANK alignments using the DBLMutationFinder (https://github.com/
biorelated/find-dbla-mutations) described in section 3.7.5.
A mismatch was defined as a base inconsistency between a sequence and the most
common residue in a particular position in an alignment of sequences. The mismatch
finding script produced a tab delimited file that contained, the mismatch position,
the type of mismatch, the codon position and the context of the mismatch which on
a linear sequence was defined as 5 bases in the 5’ direction and 5 bases in the 3’
direction relative to the mismatch position. All mismatches at each identity threshold
were pooled together into a single file.
52

S equence da ta from d iffe re n t iso la tes
\ 7
V search C lus te ring at 98 -88 % iden tity
\ 7
prank
S equence C lus te rs
o Prank Alignments
V V VM ism a tch es d N /d S T rees
Figure 3.6: Sequences from different isolates were clustered at different percent identities. Sequences from each cluster were aligned using PRANK and mismatches identified in each alignment using the polymorphisms finder script. The tree output files were later used to generate random sequences using phylosim package. Mismatches were tabulated based on the frequency at different codon positions.
3.7 Computer programs
The computer programs described in this section were developed to support the
analysis work discussed in the previous sections and also in chapter 4, 5 and 6. The
full source code is listed in appendix (A) under their respective subsections. The
source code was also released online at Github (www. github. com/biorelated).
53
3.7.1 DBLa finder
Online: https://github.com/georgeG/bioruby-dbla-finder
The DBLa-finder (see listing A.1) was developed as a Bioruby plugin (Bonnal et al.
2012) that extends the Bio: : Sequence: :NA class and takes advantage of existing
sequence manipulation methods available in the Bioruby sequence class. The main
aim of this program is to extract DBLa-like sequences from DBLa assembled contigs
sequences. It can also extract the tags from full-length var sequences.
The program takes sequences in fasta and fastq formats as input. The input se
quence is translated in all reading frames. The frames containing the least number of
stop codons are flagged. For each open-reading-frame, the program searches for the
DIGDI two amino-acid degenerate motif at the N-terminal and the PQYLR degenerate
motif at the C-terminal. This step uses a hamming distance metric to generate the
degenerate motifs. The hamming distance was preferred because it measures the min
imum number substitutions required to change one string into the other and therefore
it captures majority of permutations of these motifs. In the strict mode no stop codons
in the tag sequences are allowed and the relaxed mode can allow a specified number
of stop codons. The extracted sequence tags is orientated in the first reading frame.
The program uses a brute force approach and evaluates all the reading-frames
even when they do not contain DBLa sequences. This has impact on the run-time and
memory particularly when working with long contigs. For the purpose of this work
this was not an issue since the var contigs under consideration were relatively short.
54
3.7.2 DBLa-Classifier
Availability: https ://github.com/georgeG/bioruby-dbla-classifier
DBLa-classifier is a Cys/POLV classification program that was developed based on
a Perl classification script by Bull et al. (2007). The program took advantage of existing
sequence manipulation methods in Bioruby to add DBLa specific functionality to
the Bio: : Sequence : : NA and Bio: : Sequence : : AA classes. It implements more
features than the Perl script some of which includes,
• Classify DBLa sequence tags
• Identify the position specific polymorphic blocks (PSPB)
• Identify and print positions of limited variability (POLV) regions
• Identify varl and sig2 like sequences based on sequence motifs that define these
sequences.
• Identify group A-like sequence tags
• Identify homology blocks D, F and H given the location of PSPBs, PoLVs, WW
and VW motifs.
3.7.3 Bio-CD-HIT-Report
Availability: https://github.com/georgeG/bioruby-cd-hit-report
Bio-CD-HIT-Report was developed to parse CD-Hit cluster files using a convenient
and consistent interface. It was developed as a library with a standard interface to call
55
methods for processing clusters and to plug in to the sequence clustering workflow.
Given an input cluster file, Bio-CD-HIT-Report can generate a report containing the
following information,
• The number of sequences in each cluster.
• A list of sequence names in each cluster.
• A list of representative sequences in each cluster.
Bio-CD-HIT-Report made it easier to process multiple cluster files by embedding
its method calls in existing scripts.
3.7.4 Block-sharing networks
Availability: https ://github. com/georgeG/block-sharing-networks
This is a command-line application that depends on the DBLa-classifier to generate
group-sharing networks for DBLa sequences. It returns a list of nodes if sequences
share PSPB blocks. The source code is available on listing A.24 of the appendix.
3.7.5 Find-DBLa-mutations
Availability: https : //github. com/biorelated/f ind-dbla-mutations
This library was developed to explore polymorphisms in the DBL tag sequences.
It contains two main classes, the Mutation class and the Selection class. The
mutation class provides methods for locating and describing polymorphisms given
a fasta formatted file of DNA sequences. The selection class provides methods for
working with multiple sequence alignments in fasta format. This class is dependent
56

on the Bio-alignment library . Bio-alignment implements a functional approach in
parsing alignment files.
3.7.6 DBLa-assembly
DBLa-assembly was initially developed to assemble DBL sequence tags. It implemen
ted functions to 1) read and parse DBL sequences from CAF files and 2) to extract
and cluster sequences based on sequence length and sequence identity.
It groups the sequences by length, then it creates an identity matrix from pairwise
comparisons. Sequences are clustered based on the pairwise comparisons. The clus
tering does not account for insertions or deletions and therefore it is only suitable for
clustering uniform length sequences.
Given that there are more optimized and published tools for performing sequence
clustering, the clustering module was deprecated in favour of CD-HIT and Vsearch
clustering approaches.
3.7.7 DBLa CAF Parser
Availability: https : //github. com/biorelated/dbla-caf-parser
DBLa CAF Parser is a library that was written to provide a functionality for extract
ing DBLa sequences and sequencing information stored as CAF files.
3.8 Epitope prediction
B-cell and MHC class-II T cell epitopes prediction methods were used as described
in section 3.8.1 and section 3.8.4. A total of 100 randomly selected sequences from
57

Kenya, Papua New Guinea, Brazil were used in B-cell epitope prediction using Bepi-
pred and a total of 365 non-redundant sequences were used for MHC-class II epitope
predictions using NetMHCII-pan and the predivac server.
3.8.1 B-cell epitope prediction
Bepipred (Larsen et al. 2006), a B-cell epitope prediction method was used to explore
potential B-cell epitopes in DBLa sequences. Bepipred is a combination of Parker
propensity scale (Parker et al. 1986) and a hidden markov model that was trained
using the Pellequer (Pellequer et al. 1993) and AntiJen (McSparron et al. 2003)
epitope data set. It predicts linear B-cell epitopes from amino acid sequences.
A propensity scale method assigns a score to each amino acid in a poly-peptide
and applies a running window average to the raw scores. Other notable propensity
scale methods other than Parker’s scale are Chou and Fasman, Levitt’s secondary
structure scale (Levitt 1978) and Emini, an accessibility scale (Emini et al. 1985).
Many propensity scale methods have poor prediction and only marginally better than
a random model according to a study by Blythe (Blythe and Flower 2005). Although
bepipred has a low sensitivity, it is more accurate than the propensity methods and it
is an improvement to the random model.
Bepipred assigned a prediction score to each amino acid in each input sequence.
The default cutoff score was 0.35 which corresponded to a sensitivity of 0.49 and a
specificity of 0.75. A mean of the raw score was calculated using a 10 amino acid
sliding window approach over the prediction space.
58

3.8.2 Shannon diversity index
In this work, Shannon’s diversity is an index of residue conservation and it was cal
culated with equation 3.3. The values were calculated in each alignment column and
averaged over a running window of 10 amino acids.
where p a>i is the frequency of the amino-acid a at column i.
3.8.3 Hydrophobicity profile
Kyte-Doolittle (Kyte and Doolittle 1982) hydropathy scores were calculated in spe
cified sequences. The scores was averaged using a 10 amino-acid window in the
respective sequence.
3.8.4 Prediction of T-cell epitopes
Studies using recombinant peptides from laboratory lines (Allsopp et al. 2002; Sanni
et al. 2002) suggest that individuals in endemic regions elicit interferon-y and interleukin-
10. An analysis of CD4+ T-cell responses to DBLa tags to which a child is exposed to
was reported to be associated with protection from future malaria episodes suggesting
a role for CD4+ T-cells in protection (Gitau et al. 2012b; Gitau et al. 2014). Given the
extreme sequence diversity in the DBLa tag and based on the idea that CD4+ T-cells
are important for a functional B-cell response.
Only a few studies have found associations between the MHC class II immune
(3.3)
59

responses and P. falciparum surface antigens (Troye-Blomberg et al. 1991). The failure
to detect associations can be attributed to contribution of non-MHC induced factors
and the lack of epitope specificity given the sequence diversity in surface antigens. One
study explored HLA class II restriction among a group of 2000 individuals in Gambia
and reported that DRB1*1302 - DQB1*0501 are associated with reduced susceptibility
to severe malaria. This suggested that MHC polymorphism is maintained by altering
susceptibility to infectious pathogens (Hill et al. 1991). Nonetheless, more work is
require to explore the possibility of MHC restriction against immuno-dominant CD4+
epitopes in PfEMPl.
The major histo-compatibility molecules (MHC) bind short peptide molecules. The
MHC-peptide is presented to the T-cell receptors each of which can only bind particular
MHC-peptide combinations. The first studies to report MHC class II association with
immune responses used small panels of antigens derived from three P. falciparum
surface proteins, namely the merozoite surface protein, the circumsporozoite proteins
and Pfl55/RESA proteins (Riley et al. 1992).
T-cell epitopes were predicted using NetMHCIIpan-3 (Karosiene et al. 2013; Nielsen
et al. 2010) and Predivac (Oyarzun et al. 2013). NetMHCII-pan is a pan-specific epi
tope prediction tool that uses hidden markov models and machine learning to predict
MHC class-II T-cell epitopes from amino acid sequences. NetMHCIIpan-3 is based
on artificial neural networks that were trained on more than 50,000 quantitative
peptide-binding measurements covering HLA-DR, HLA-DP, HLA-DQ and two murine
molecules (Karosiene et al. 2013).
Predivac is based on an algorithm that identifies specificity determining residues
60
(SDRs) (Oyarzun et al. 2013) that identifies the residues involved in forming a stable
peptide-MHC complex. Specifity Determining Residues (SDRs) are a small set of
structurally conserved positions in the peptide-binding interaction interface that are
responsible for specific recognition events. The approach was first described for sub
strate specificity prediction of protein kinases (Ellis and Kobe 2011; Kobe and Boden
2012; Saunders et al. 2008; Saunders and Kobe 2008). Predivac works by establish
ing a correlation between the SDRs in the HLA class II query protein and the SDRs
associated with HLA proteins of known specificity. The process involves the following
steps:
i. SDRs for each binding position are identified in the query HLA class II protein
sequence.
ii. PredivacDB, a purposed-built database of SDRs and high affinity binding data
(IC5o < 50nM, which is a measure of the effectiveness of binding), is queried
and amino acid frequencies and weights are calculated for peptide sequences
associated with allotypes sharing similar SDRs as the query protein at each
binding position.
iii. A position-specific scoring matrix (PSSM) is built based on the binding data.
T-cell epitope mapping is carried out by parsing query protein sequences into
overlapping peptides, each of which is assigned a binding score using the PSSM.
The outcome of Predivac is a relative score between 0 and 100. For a given HLA
class II protein, a peptide is a "better" candidate to be a MHC class II high-affinity
binder, and therefore a CD4+ T cell epitope, if it scores higher than another peptide
61

from a given protein. Given that, most of the immune response in protein-based
vaccination is mounted against a few dominant epitopes, despite the presence of many
potential epitopes within a given antigen. Vaccine formulations built on epitopes that
do not dominate the immune response do not induce effective protection in the
vaccinated organism, therefore; it is important to identify immunodominant epitopes.
The peptide-MHC kinetic stability is important in controlling MHC class II pep
tide’s immunogenicity. Predivac was developed on the assumption that positive bias
in capturing peptide features correlates with promiscuity and immunodominance
(Oyarzun et al. 2013).
Predivac web-server could accept one sequence per MHC allele at the time of ana
lysis. Predivac-util (listing A.22), a python library was developed to submit multiple
sequences for multiple MHC class II alleles. Promiscuous epitopes were defined as
peptides that bound strongly or weakly to multiple MHC class II alleles.
3.8.5 Predivac-util
The Predivac online server allows a user to submit one sequence and one allele per
request. Given hundreds of sequences and over 20 HLA alleles, it would have taken a
lot of repetitive and time consuming effort to get prediction results using the Predivac
web interface.
Predivac-util (listing A.22) was developed to automate bulk sequence submission
to Predivac server. This command line utility was written in Python and is run with
two arguments. The first argument is a list of sequences in fasta format and the second
argument is a list of HLA DR alleles, one allele per line. A three seconds delay between
62

submissions is enforced to avoid overwhelming the server with multiple requests. This
delay can be adjusted upwards or eliminated. Upon a successful run, Predivac-util
produces a tab delimited file containing the predictions. Predivac-util relies on an
uninterrupted Internet connection. It does not have the capacity to resume jobs if the
connection fails during a run. Future versions may fix the issue.
63

Chapter 4Evaluation of classification approaches used to measure
expression of var genes in clinical isolates
4.1 Background
As discussed in chapter 1 section 1.7, var classification approaches depend on the
conserved upstream promoter region, the coding regions (Lavstsen et al. 2003; Smith
et al. 2000a), the semi-conserved DBLa region of the DBLla domain (Bull et al. 2007)
and the organization of the domain architecture in full-length sequences (Rask et al.
2010) to capture putative functional attributes used in grouping var genes.
The classification approaches are evaluated on ability to discriminate between
severe and non-severe malaria and ability to discriminate severe malaria syndromes
such as impaired consciousness, respiratory distress, anaemia and cerebral malaria.
The extent to which the var sequence grouping approaches are consistent with each
other and whether they measure the same functional properties has not been ad
equately addressed.
This chapter compares the Cys/POLV (Bull et al. 2007), domain cassettes (Rask
et al. 2010) and the classification based on the 5’ upstream promoter in classifying
var genes. The results suggest that, functional correspondence between the DBLa
domains, the domain cassettes (DC) and the Cys/PoLV (CP) tag classification is not
64
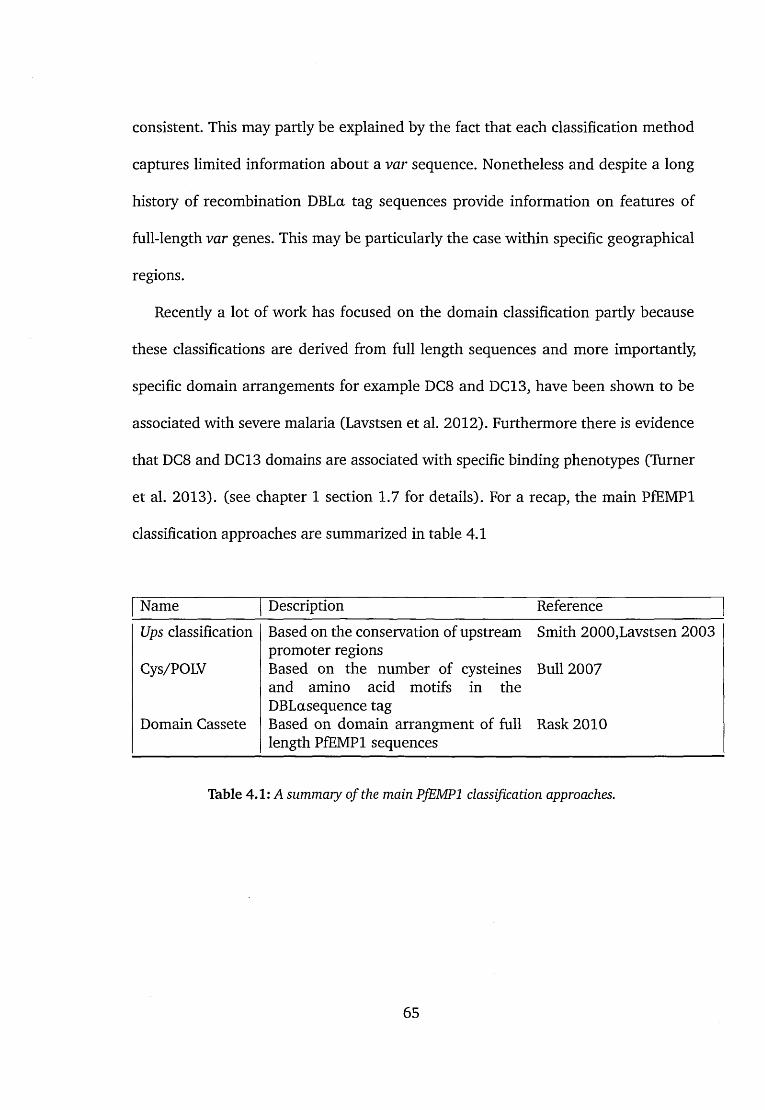
consistent. This may partly be explained by the fact that each classification method
captures limited information about a var sequence. Nonetheless and despite a long
history of recombination DBLa tag sequences provide information on features of
full-length var genes. This may be particularly the case within specific geographical
regions.
Recently a lot of work has focused on the domain classification partly because
these classifications are derived from full length sequences and more importantly,
specific domain arrangements for example DC8 and DC13, have been shown to be
associated with severe malaria (Lavstsen et al. 2012). Furthermore there is evidence
that DC8 and DC 13 domains are associated with specific binding phenotypes (Turner
et al. 2013). (see chapter 1 section 1.7 for details). For a recap, the main PfEMPl
classification approaches are summarized in table 4.1
Name Description Reference
Ups classification
Cys/POLV
Domain Cassete
Based on the conservation of upstream Smith 2000,Lavstsen 2003 promoter regionsBased on the number of cysteines Bull 2007 and amino acid motifs in the DBLasequence tagBased on domain arrangment of full Rask 2010 length PfEMPl sequences
Table 4 .1 : A summary o f the main PfEMPl classification approaches.
65

4.2 Methods
4.2.1 Data collection and sequence classification
DBLa sequence tags were extracted from 403 full-length var sequences in seven gen
omes from a study of var sequence diversity and classification of PfEMPl sequences
(Rask et al. 2010). The dataset comprised sequences from the 3D7, IT4, HB3, DD2,
RAJ116, IGH-CR14, and the PFCLIN isolates. The sequence tags were classified based
on the Cys/POLV approach (Bull et al. 2007) and information on each upstream
promoter region and domain cassette was derived from the data set.
A total of 314 sequences were used in the analysis after removing var2csa se
quences and those that did not have upsA classification data available. The var2csa
sequences were excluded because they are associated with expression in pregnant
women and they cannot be amplified using the DBLa universal primers. Sequences
whose 5’ upstream promoter regions were missing were removed from the analysis.
The Cys/POLV classification used sequences from 3D7 and IT4 to define the block-
sharing groups 1 and 2 (Bull et al. 2008) (see chapter 1 section 1.7.1). The block
sharing groups were defined based on a global collection of sequences that included
sequences from 3D7 and IT4 laboratory isolates. In this analysis, sequences from 3D7
and IT4 isolates were excluded because they comprised the blocks-sharing groups
definition and they create bias in the analysis.
66

4.2.2 Sequence alignment
Sequence alignments were performed using Muscle, a fast and accurate protein align
ment program (Edgar 2004).
4.2.3 Defining block-sharing groups of sequences using a network approach
A total of 1,317 published DBLa sequences was obtained from Kilifi (Bull et al. 2008)
and from published parasite genomes (Rask et al. 2010) together with three DC8
sequences from a study that was conducted in Tanzania (Lavstsen et al. 2012).
Sequences that shared 10 amino acid sequence blocks were identified and used
to draw a network of sequences that shared common sequences herein referred to
as a block-sharing network from the laboratory isolates. The block-sharing networks
were visualized using Cytoscape (Shannon et al. 2003) an open source platform
for visualizing molecular interaction networks. Similar to the Kilifi network (Bull
et al. 2008) the network from the laboratory isolates formed two large connected
components, a major component and a minor component as shown in figure 4.3.
4.3 Results and discussion
Figure 4.1 shows the association between ups classification and Cys/PoLV groups
based on 33 DBLa sub-domains from seven laboratory isolates. This figure was con
sistent with previous comparisons of Cys/POLV and ups classifications (Bull et al.
2007; Bull et al. 2005). While the majority of sequences containing two cysteines
were confined within sequences containing the upsA promoter, a number of them was
67

also found in sequences that are associated with upsB and upsC promoters. Sequences
with the DBLa-0.3 domain were exclusively from the upsB group and contained
proportionately higher number of sequences with two cysteines. The DBLa-0.3 is
associated with sequences with the DC13 domain architecture.
Sequences with DBLa-2 domain were exclusively from upsB and contained both 2
and 4 cysteines. They also appear to contain sequences from both group sharing block
1 and 2. DBLa-2 sequences tend to belong to domain cassette 8 (DC8) (explained
further in chapter 1 section 1.7). DBLa-2 domain is associated with sequences with a
DC8 domain architecture.
68
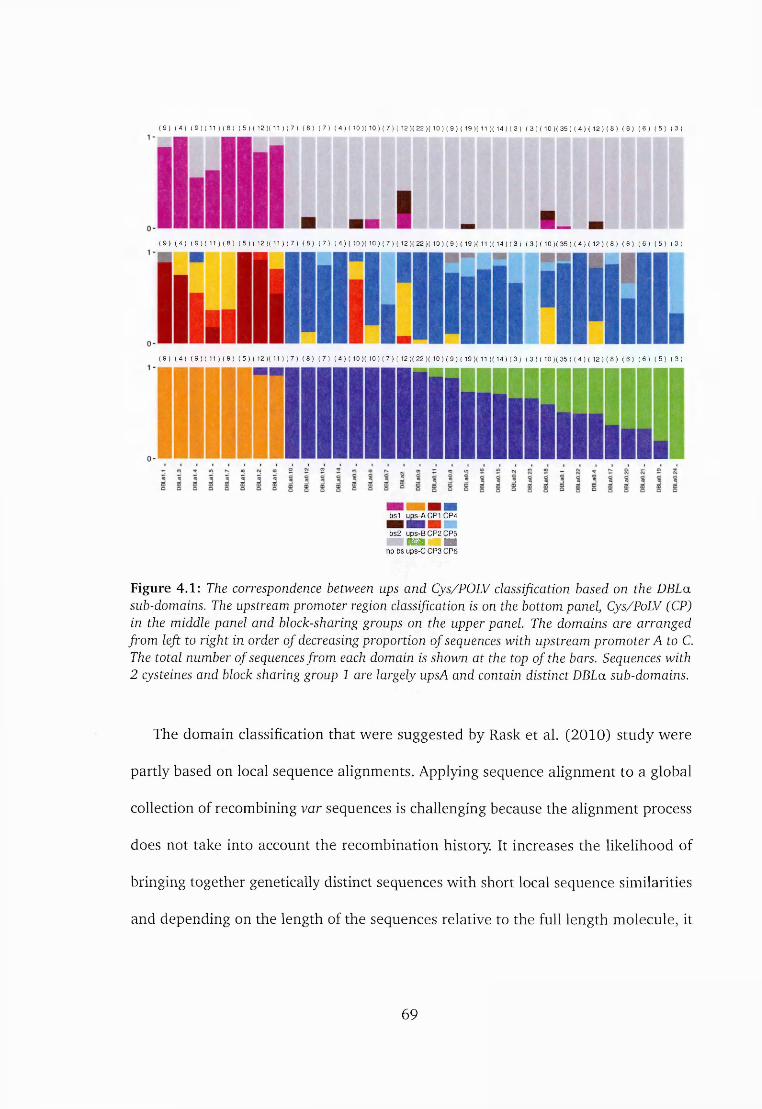
( 9 ) ( 4 ) ( 9 ) ( 11 } ( 8 ) ( 5 ) (1 2 )(11 ) ( 7 ) ( 8 ) ( 7 ) ( 4 ) ( 10 )(1 0 ) ( 7 ) (1 2 )( 22 ){10 ) ( 9 ) ( 19 )(11 )(14 ) ( 3 ) ( 3 ) (1 0 )( 35 ) ( 4 ) ( 12 ) ( 8 ) ( 6 ) ( 6 ) ( 5 ) ( 3 )
( 9 ) ( 4 ) ( 9 ) ( 11 ) ( 8 ) ( 5 ) ( 12 )(11 ) ( 7 ) ( 8 ) ( 7 ) ( 4 ) ( 10 )(10 ) ( 7 ) ( 12 )( 22 )( 10 ) ( 9 ) ( 19 )( 11 )(14 ) ( 3 ) ( 3 ) ( 10 )( 35 ) ( 4 ) (1 2 ) ( 8 ) ( 6 ) ( 6 ) ( 5 ) ( 3 )
( 9 ) ( 4 ) ( 9 ) (11 ) ( 8 ) ( 5 ) (1 2 )( 11 ) ( 7 ) ( 8 ) ( 7 ) ( 4 ) (1 0 )(10 ) ( 7 ) (12 )( 22 )( 10 ) ( 9 ) ( 19 )( 11 )(14 ) ( 3 ) ( 3 ) ( 10 )( 35 ) ( 4 ) ( 12 ) ( 8 ) ( 6 ) ( 6 ) ( 5 ) ( 3 )
bs1 ups-A C PI C P4
bs2 ups -B C P2 CP5■ i ■■ 9 9no bs ups -C CP3 C P6
Figure 4.1: The correspondence between ups and Cys/POLV classification based on the DBLa sub-domains. The upstream promoter region classification is on the bottom panel, Cys/PoLV (CP) in the middle panel and block-sharing groups on the upper panel. The domains are arranged from left to right in order of decreasing proportion of sequences with upstream promoter A to C. The total number of sequences from each domain is shown at the top o f the bars. Sequences with 2 cysteines and block sharing group 1 are largely upsA and contain distinct DBLa sub-domains.
The domain classification that were suggested by Rask et al. (2010) study were
partly based on local sequence alignments. Applying sequence alignment to a global
collection of recombining var sequences is challenging because the alignment process
does not take into account the recombination history. It increases the likelihood of
bringing together genetically distinct sequences with short local sequence similarities
and depending on the length of the sequences relative to the full length molecule, it
69

is also possible to define sequences as distinct while they are actually part of the same
group of recombining sequences.
Cys/POLV classification studies suggest that the MFK and the REY motifs are
mutually exclusive, which implies that sequences containing MFK or REY motifs are
genetically distinct. Though this genetic distinctness may only apply to a specific
homology block within the sequence rather than the full-length sequence. From the
analysis of sequence data in the seven genomes, a few sequences with DBLal.5, 1.2
and 1.6 domains, were identified to belong to CPl-MFK+ue and CP2-REY+ue (figure
4.1) suggesting that the domain classification approach brought together what are
otherwise functionally distinct sequences. This has two implications, first, the tag
region may not always contain enough information to enable molecular typing of the
entire domain. Second, the Rask domain classification may contain little distinctive
nucleotide features that are functionally informative given the amount of genetic
diversity in var genes.
4.3.1 Distinct Cys/PoLV groups are associated with upsA
There has been much interest in the idea that specific var genes are associated with
severe forms of malaria. This is based on the idea that specific cytoadhesive functions
may be associated with pathogenic patterns of sequestration. Var gene sequences that
are found to be associated with severe disease would be of potential importance and
good candidates for studies on antibodies that are associated with naturally acquired
immunity. As was discussed in section 1.7 in chapter 1, sequences from the upsA
group and those that are characterized by domain cassette 8 and 13 have been shown
70
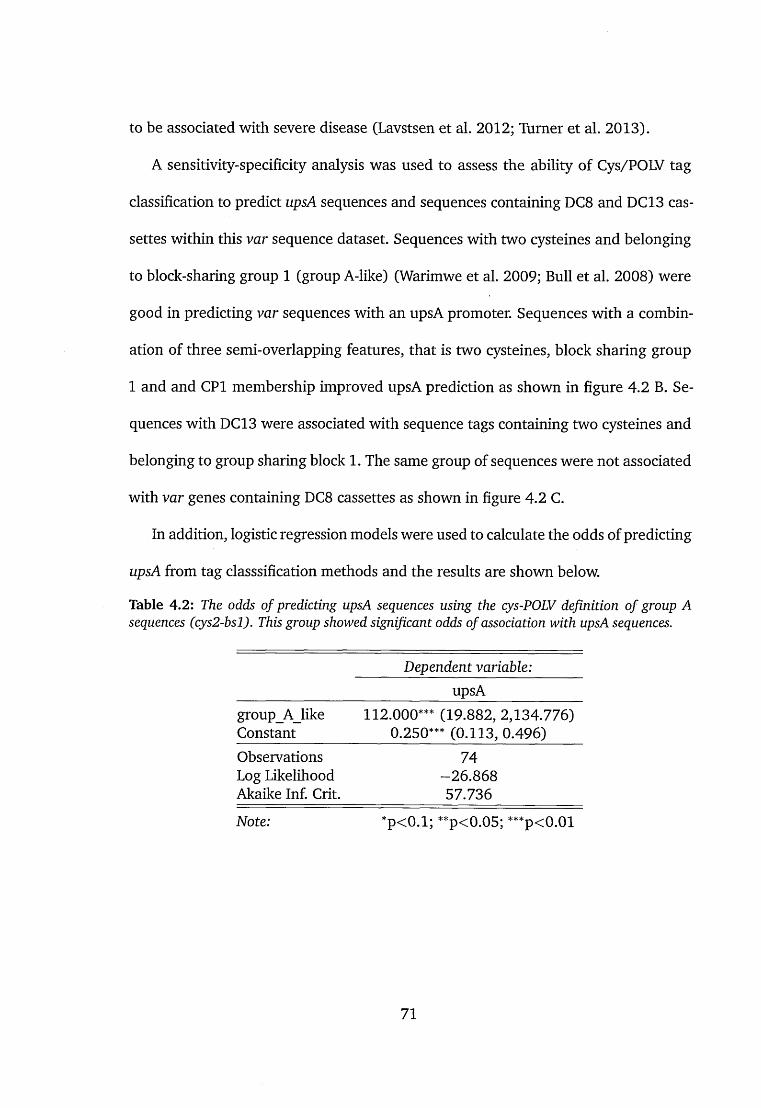
to be associated with severe disease (Lavstsen et al. 2012; Turner et al. 2013).
A sensitivity-specificity analysis was used to assess the ability of Cys/POLV tag
classification to predict upsA sequences and sequences containing DC8 and DC13 cas
settes within this var sequence dataset. Sequences with two cysteines and belonging
to block-sharing group 1 (group A-like) (Warimwe et al. 2009; Bull et al. 2008) were
good in predicting var sequences with an upsA promoter. Sequences with a combin
ation of three semi-overlapping features, that is two cysteines, block sharing group
1 and and CPI membership improved upsA prediction as shown in figure 4.2 B. Se
quences with DC 13 were associated with sequence tags containing two cysteines and
belonging to group sharing block 1. The same group of sequences were not associated
with var genes containing DC8 cassettes as shown in figure 4.2 C.
In addition, logistic regression models were used to calculate the odds of predicting
upsA from tag classsification methods and the results are shown below.
Table 4 .2 : The odds o f predicting upsA sequences using the cys-POLV definition o f group A sequences (cys2-bsl). This group showed significant odds of association with upsA sequences.
Dependent variable:upsA
group_A_like 112.000*** (19.882, 2,134.776)Constant 0.250*** (0.113, 0.496)Observations 74Log Likelihood -26.868Akaike Inf. Crit. 57.736
Note: *p<0.1; **p<0.05; ***p<0.01
71

Table 4 .3 : The odds of predicting upsA sequences from the CPI cys-POLV sequences. CPI sequences are often associated with severe malaria. They had significant odds of predicting upsA sequences.
Dependent variable:upsA
CPI 38.000*** (7.024, 710.078)Constant 0.500** (0.278, 0.868)Observations 74Log Likelihood -38.342Akaike Inf. Crit. 80.684
Note: *p<0.1; **p<0.05; ***p<0.01
Table 4 .4 : A logistic regression model showing the odds of predicting upsA sequences using a combination of CPI and cys2-bsl (group A-like) sequences. This is a broad definition of sequences that are associated with severe malaria. This group had the highest odds o f predicting upsA sequences compaired to CPI or cys2-bsl alone.
Dependent variable:upsA
CP l_plus_groupA 130.500*** (22.856, 2,503.821)Constant 0.222*** (0.096, 0.454)Observations 74Log Likelihood -25.246Akaike Inf. Crit. 54.493
Note: *p<0.1; **p<0.05; ***p<0.01
72
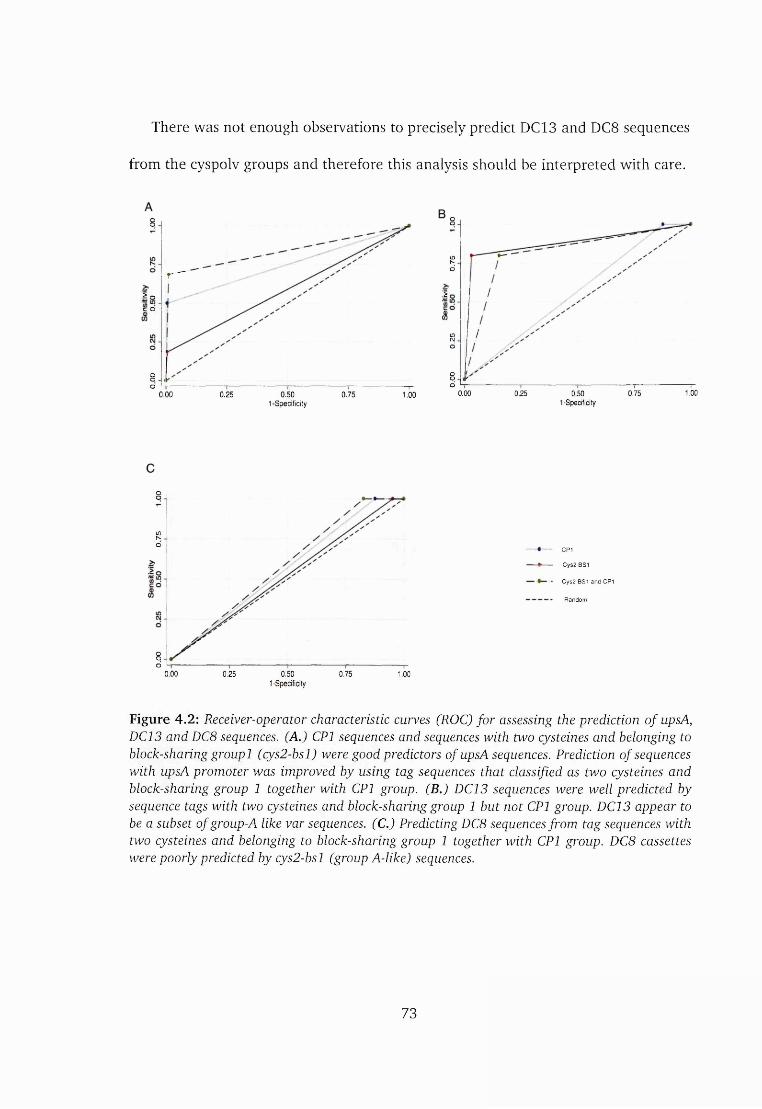
There was not enough observations to precisely predict DC 13 and DC8 sequences
from the cyspolv groups and therefore this analysis should be interpreted with care.
8
r "S i•- o
c o
ooo
0.00 0.25 0.50 0.75 1.00
oo
inNo
I,
inwd
ood
1.000.250.00 0.50 0.751 -Specificity 1-Specificity
8
inNo
ooo0.00 0.50 0.750.25 1.00
CP1
Cys2 BS1
Cys2 BS1 and CP1
Random
1-Specificity
Figure 4.2: Receiver-operator characteristic curves (ROC) for assessing the prediction o f ups A, DC13 and DC8 sequences. (A.) CPI sequences and sequences with two cysteines and belonging to block-sharing group 1 (cys2-bsl) were good predictors of upsA sequences. Prediction o f sequences with upsA promoter was improved by using tag sequences that classified as two cysteines and block-sharing group 1 together with CPI group. (B.) DC13 sequences were well predicted by sequence tags with two cysteines and block-sharing group 1 but not CPI group. DC13 appear to be a subset of group-A like var sequences. (C.) Predicting DC8 sequences from tag sequences with two cysteines and belonging to block-sharing group 1 together with CPI group. DC8 cassettes were poorly predicted by cys2-bsl (group A-like) sequences.
73
4.3.2 DC8 and DC13 sequences exhibit distinct recombining patterns
Recombination networks and structuring can be visualized based on sequence blocks
that are shared between sequences. Recombining segments can vary in length and
therefore several recombination structures can be defined depending on the length
of shared blocks. To address this, Bull et al. (2008) used amino acid blocks with a
variable number of amino acids to draw a network of shared sequence blocks. Using 14
amino acids, the network segregated into two main components, which were referred
to as block-sharing group 1 and 2. DC8 sequences were restricted to block-sharing
group 2 component while DC13 were restricted to block-sharing group 1. Sequences
from Lavstsen et al. (2012) study in Tanzania belonging to block-sharing group 2
shared sequence blocks and were connected to a component of Kilifi sequences as
shown in figure 4.3.
74

Figure 4.3: A network o f block-sharing sequences collected from Kilifi(Bull et al. 2008), laboratory (Rask et a l 2010) and Tanzanian isolates (Lavstsen et a l 2012). The diamond shaped enlarged nodes represent DC13 sequences. The circular-shaped and enlarged nodes represent DC8 sequences. Red nodes represents block sharing group 1 and the blue nodes represent block-sharing group 2 based on the Cys/POLV classification. All DC13 sequences (diamond shape) appear on the right-most part o f the network. DC8 sequences (circular nodes) appear on the larger component but also in between the smaller and the larger component. Two of the DC8 sequences classified as block-sharing group 1 are overlaid on the larger component on this network.
75

4.3.3 Newly described DBLa domains could consist of genetically heterogen
eous sequences.
The Rask et al. (2010) study (see chapter 1 section 1.7) used sequence alignments
to stratify sequences into different sub-domains. Sequence alignments of diverse and
recombining global collection of var sequences require careful interpretation because
multiple alignments ignore the recombination history. Sequences that are otherwise
functionally distinct could be brought together by local alignments of recombining
segments as discussed in 4.1.
Examination of DBLa tags shows that MFK and REY motifs are never found on the
same sequence, suggesting that they contain genetically distinct regions. The DBLal.5,
DBLal.2 and DBLal.6 groups defined by Rask and colleagues comprise of a mixture
of sequences which contain both MFK and REY motifs. This suggests that the newly
defined sub-domains do not always classify sequences into genetically distinct groups.
This point is supported by a study by Larremore et al. (2013) that explored community
structuring in var gene sequences. Larremore defined distinct highly variable sequence
blocks from a collection of var sequences and showed that recombination constraints
shaped the network structures in distinctive ways that agreed with known clinical
phenotypes (ibid.). Importantly, the study showed that highly variable regions tend
to differ from each other but their recombination communities correspond to known
ups classification. They did not explore the var sub-domains as defined by Rask. This
is the discordance that we present here.
76

4.3.4 Cys/PoLV groups cannot predict DC8 sequences given a global collection
of sequences but may do so within a restricted geographical location
Similar to group A-like sequences, DC8 sequences are associated with severe mal-
aria(Lavstsen et al. 2012; Rask et al. 2010; Bengtsson et al. 2013; Bertin et al. 2013)
and associate with a specific class of DBLa2 sequences that could result from a re
combination event at a recombination hotspot situated 3’ of the DBLa tag region
(Lavstsen et al. 2012).
This suggests that the DBLa tag provides no information on this group of var
genes. This is consistent with the observation that DC8 sequences also correspond
to CP2, CP3 and CP4 Cys/PoLV groups as shown in figure 4.4 and figure 4.5 and in
block-sharing group 1 and 2. This suggests that DC8 cassette comprises of a genetic
ally diverse group of sequences and that it is not possible to predict DC8 sequences
using the Cys/PoLV groups. In other words DBLa tag analysis is limited in making
predictions about important full length molecules.
77
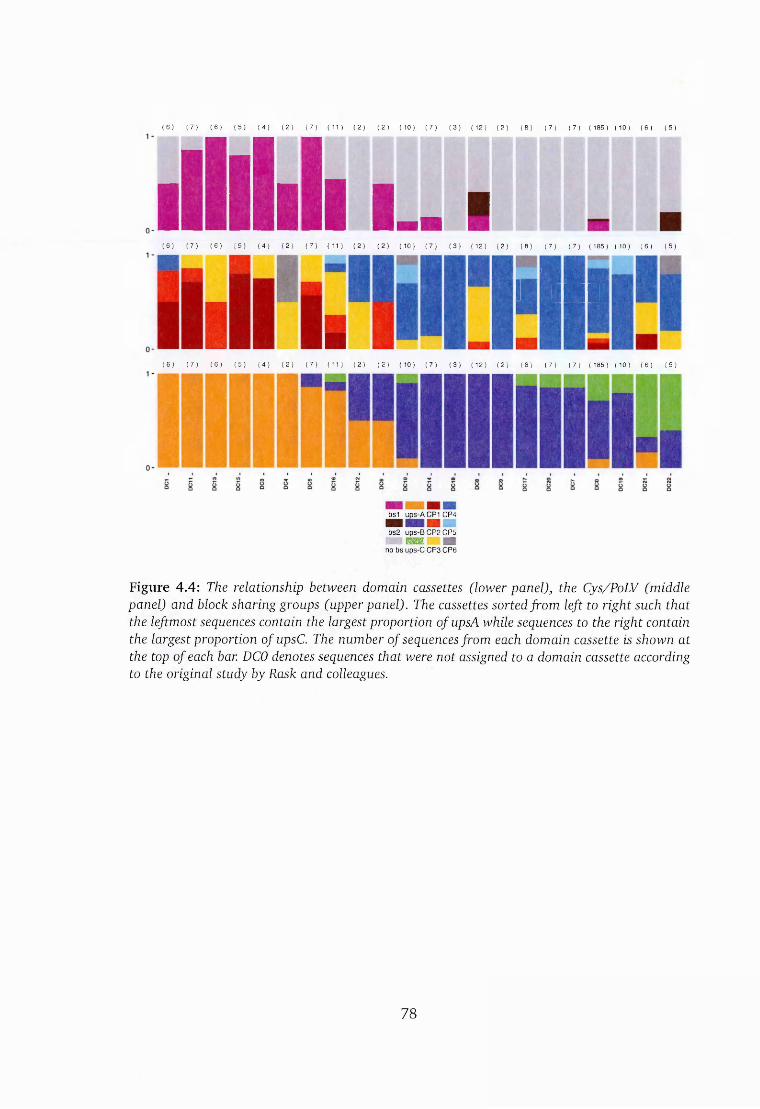
( 6 ) ( 7 ) ( 6 ) ( 5 ) ( 4 ) ( 2 ) ( 7 ) ( 1 1 ) ( 2 ) ( 2 ) ( 1 0 ) ( 7 ) ( 3 ) ( 1 2 ) ( 2 ) ( 8 ) ( 7 ) ( 7 ) ( 1 8 5 ) ( 1 0 ) ( 6 ) ( 5 )
Mli L . I( 6 ) ( 7 ) ( 6 ) ( 5 ) ( 4 ) ( 2 ) ( 7 ) ( 1 1 ) ( 2 ) ( 2 ) ( 1 0 ) ( 7 ) ( 3 ) ( 1 2 ) ( 2 ) ( 8 ) ( 7 ) ( 7 ) ( 1 8 5 ) ( 1 0 ) ( 6 ) ( 5 )
I ' w '
*( 6 ) ( 7 ) ( 6 ) ( 5 ) ( 4 ) ( 2 ) ( 7 ) ( 1 1 ) ( 2 ) ( 2 ) ( 1 0 ) ( 7 ) ( 3 ) ( 1 2 ) ( 2 ) ( 8 ) ( 7 ) ( 7 ) ( 1 8 5 ) ( 1 0 ) ( 6 ) ( 5 )
bs1 ups-A CP1 C P4
bs 2 ups -B C P2 CP5m i am mno bs ups-C C P3 C P6
Figure 4.4: The relationship between domain cassettes (lower panel), the Cys/PoLV (middle panel) and block sharing groups (upper panel). The cassettes sorted from left to right such that the leftmost sequences contain the largest proportion of upsA while sequences to the right contain the largest proportion ofupsC. The number of sequences from each domain cassette is shown at the top of each bar. DCO denotes sequences that were not assigned to a domain cassette according to the original study by Rask and colleagues.
78

CP6 -
LC P5 -
CP3 -
C P5 -C P4 -
DC10C P6 -CP5 -1
DC12 DC13
-CP6 -
C P4 -
CP6 - C P5 - CP4 CP3 CP2 CP1 -
C P6 - CP5 - CP4 - CP3 - CP2 - CP1 -
|b s l|b s 2n o -b s
CP3 -
absolute frequency
Figure 4.5: Bar plots showing the distribution o f block sharing groups among 23 domain cassettes. All the sequences with DC13 cassettes were block-sharing group 1. Sequences with DC8 cassettes were block-sharing group 1 or 2. Some o f them did not belong to either block-sharing group 1 or 2. Sequences with DC5 cassettes were from different Cys/PoLV groups all o f which belonged to block-sharing group 1. A CP4 sequence from block-sharing group 2 was found to have a DC22 cassette.
The highest proportion of observed block-sharing group 2 sequences was found
in sequences with DC8 cassettes as illustrated in figure 4.5. In addition the DC8 se
quences identified in Tanzania (Lavstsen et al. 2012) were similar to "sig2" sequences
as show in the alignment in figure 4.6. "sig2" sequences have a LYLD-VREY-KAIT-PTNL
distinct sequence identifier. Sequences from the Lavstsen et al. (ibid.) study in Tan-
79

zania those from Bull et al. (2008) study in Kilifi corresponded with CP2 sequences in
block-sharing group 2. This suggests that DC8 sequences are associated with specific
tag types within a particular region during a specific time of sampling. These "sig2"
sequences were found in two severe malaria cases by Bull and colleagues (Bull et al.
2005)
1983 3 DIGDIIRGKDLYLD HE GKQHLEERLER IFANIQN 351983_1 DIGDIIRGKDLYLD HE GKQHLEERLEQ FENIKN 354187.dom2 DIGDIIRGKDLYLD HE GKQHLEERLER IFANIQK 351965_1 DIGDIVRGKDLHLR HE G IQHLEKRLE S FEKIQK 354140.dom DIGDIIRGKDLYLD HE GKQHLEERLEQ FENIKN 354187.doml DIGDIIRGKDLYLD HE GKQHLEERLEQ FENIKN 354187.dom3 DIGDIIRGKDLYLD HE GKQHLEERLEQ FENIKN 354187B DIGDIIRGKDLYLD HE KQHLEERLEQ FENIKN 35
1983_3 1983_1 4187.dom2 1965_1 414 0.dom 4187.doml 4187.dom3 4187B
K N - E K L K D N N —E K L K D E N - G D I N T N N N N K L S N N N A A K L S E N N A A K L S E N N A A K L S E N N A A K L S E
l p :l p :LK
IT :g a t 69IT NAE 69IT RAE 69IT KAK 70IT RAE 70IT KAK 70IT KAK 70IT KAK 70
1983 3 KDISSKN IRDAK ILFHYN GHH— NDKAQ TYLDY 1031983_1 GTDKYFKKSSGGDYLFSGGK GRN-EEKV TYLDY 1034187.dom2 EKDIYSKTTDNGKLILWNYN GHHVNQDV TNLDY 1041965_1 EGDIYSKT —ANGNT T LWNDN GHHVNQDV TNLDY 104414 0.dom EKD T YFKNRENGKLLLWNYK GHHVNQDV TNLDY 1054187.doml EGDIYSKT NNGN VFWY K GHHVKQDV TNLDY 1054187.dom3 EGDIYSKT -ANGNTTLWNYN GHHVNQDV TNLDY 1044187B EGDIYSKT -ANGSTTLWNYN GHHVNQDV TNLDY 104
1983 3 V QYLR 1091983_1 V QFLR 1094187.dom2 V QFLR 1101965_1 V QFLR 1104140.dom V QFLR 1114187.doml V QFLR 1114187.dom3 V QFLR 1104187B V QFLR 110
Figure 4.6: An amino acid sequence alignment o f DC8 sequences from Lavstsen et al. (2012) study in Tanzania and sig2-like sequences from Kilifi collected by Bull et al. (2005). Although these sequences were collected at different times and from two different locations within East- Africa, it is interesting that they were similar based on the amino acid sequence and contained a signature h e p g motif.
80
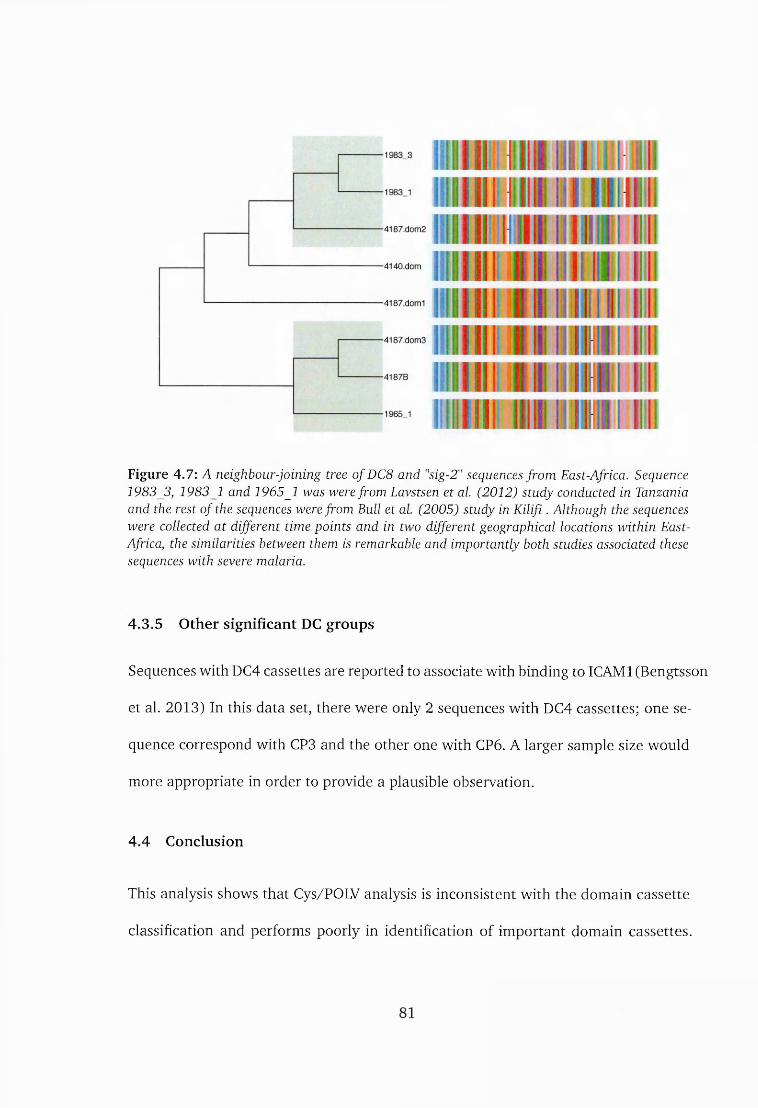
Figure 4.7: A neighbour-joining tree ofDC8 and "sig-2" sequences from East-Africa. Sequence 1983_3, 1983_1 and 1965_1 was were from Lavstsen et al. (2012) study conducted in Tanzania and the rest of the sequences were from Bull et a l (2005) study in K ilifi. Although the sequences were collected at different time points and in two different geographical locations within East- Africa, the similarities between them is remarkable and importantly both studies associated these sequences with severe malaria.
4.3.5 Other significant DC groups
Sequences with DC4 cassettes are reported to associate with binding to ICAM1 (Bengtsson
et al. 2013) In this data set, there were only 2 sequences with DC4 cassettes; one se
quence correspond with CP3 and the other one with CP6. A larger sample size would
more appropriate in order to provide a plausible observation.
4.4 Conclusion
This analysis shows that Cys/POLV analysis is inconsistent with the domain cassette
classification and performs poorly in identification of im portant domain cassettes.
04
The Rask et al. (2010) DBLa domains are not associated with particular functional
groups and that functional and distinct groups of sequences may have geographical
restriction.
An important consideration when interpreting these results is that the sequences
that were analyzed were from laboratory isolates and therefore they are not represent
ative of var sequences from clinical isolates. Second, it is possible for var sequences to
belong to multiple domain cassettes and presumably the domain cassettes described
by Rask et al. (ibid.) could have missed novel cassettes if more clinical parasites were
sampled.
The observations show that Cys/PoLV groups containing two cysteines and block-
sharing group 1 can predict upsA sequences with high sensitivity and specificity and
that they can distinguish var genes with DC8 domain architecture, at least within a
restricted geographical area and at specific time points.
A distinct group of sequence tags contain a HEPG motif correspond to var genes
with a DC8 architecture (figure 4.6). DC8 sequences also contain a known recombin
ation break-point and carry both CP4 and CP2 DBLa sequence features suggest that
when they arise, DC8 sequences could spread rapidly within a population.
The Cys/POLV classification corresponds well with the ups classification but is
poorly informative on domain architectures. Therefore it is a poor method of assessing
the molecular diversity of full-length var genes. As highlighted earlier, more sequence
data from clinical isolates are required to understand the correspondence between
the various expression classification approaches and to provide appropriate data for
a detailed thorough analysis.
82
Chapter 5The role of point mutations in generating var diversity
5.1 Background
Diversity in var sequences is generated through recombination (Freitas-Junior et al.
2000; Taylor et al. 2000a; Kraemer et al. 2007; Falk et al. 2009). Recent studies have
shown evidence for mitotic recombination (Bopp et al. 2013; Claessens et al. 2014)
as discussed in chapter 1 section 1.8). Mitotic recombination adds another level
of diversity and is also associated with DNA and chromosomal structural changes
(Sander et al. 2013; Claessens et al. 2014). Despite immense molecular diversity, var
genes are able to maintain discrete functional properties as described in chapter 1
section 1.7.
Among other approaches such as recombination, nucleotide substitution contrib
utes to genetic variation upon which selection acts. It is difficult to estimate substi
tution patterns in var sequences for several reasons. First, var genes are long and
diverse molecules that undergo extensive recombination events. Secondly, var genes
are characterized by length differences which hinders direct comparison of sequences
without taking into account how insertion and deletions are treated. Thirdly, the pres
ence of PCR and sequencing errors can add significant noise when profiling mutation
patterns. These factors provide significant challenges of estimating selection. Despite
83
these challenges, it is important to understand how the pattern of nucleotide variation
is structured to gain an understanding of how it is shaped by immune selection
Molecular diversity studies make use of multiple sequence alignments, distance
metrics, and tree building methods to infer sequence relatedness and selection pres
sure. Regrettably, in presence of recombination, the basic assumptions of many phylo
genetic methods are violated (Schierup and Hein 2000; Anisimova et al. 2003).
Zilversmit et al. (2013) developed a statistical method based on a Hidden Markov
Model to show the evolutionary history of genes that are suggested to overcome
some of these challenges. In order to describe patterns of single nucleotide variation
in DBLa, sequences were grouped into clusters of known similarity and therefore
sequences in the same cluster were assumed to be closely related and thereby com
parable. The pattern of variation was obtained from a profile of substitutions and
described based on nucleotide type and codon position within isolates and between
isolates as well as in hyper-variable and conserved regions of the DBLa.
5.2 Methods
The full methods and approach are described in chapter 2 and chapter 3 of this thesis.
In summary, input sequences were clustered at predefined global identity thresholds
ranging from 98 to 88 percent with a 2% step to yield six identity thresholds. At each
level of identity, sequences were grouped into clusters and nucleotide differences
between pairs of sequences from each cluster were identified, annotated and pooled
together. For comparison purposes, random substitutions were generated from or
based on the respective input files as discussed in chapter 3 section 3.1.
84

To minimize the effect of PCR generated errors, sequences from each isolate were
clustered at 96% identity and only representative sequences from each cluster were
considered for analysis. While this approach was aimed at ensuring that the overall
quality of sequences was high and that the number of substitutions that were attrib
utable to PCR misincorporations were minimized and resulted in decrease number of
sequences.
5.3 Results
5.3.1 DBLa sequences are diverse
Figure 5.1 and figure 5.2 shows an illustration of how the sequences clustered at 98%
and at 88% global identities. Each dot represents a sequence and the colors denote
group A (red) and non-group A (blue) sequences. The largest clusters corresponded
with sequences that had the least amount of intra cluster variation.
85

86
iden
tity.
Inp
ut s
eque
nces
we
re
cluste
red
into
grou
ps
base
s on
sequ
ence
co
mpa
riso
ns
to see
d se
quen
ce
defin
ed
as the
re
pres
enta
tive
sequ
ence
. In
thi
s fig
ure,
the
repr
esen
tativ
e se
quen
ce
is the
no
de
with
the
mos
t ou
t-deg
rees
ag
ains
t wh
ich
all t
he
sequ
ence
s in
each
clu
ster
were
co
mpa
red
agai
nst.
Red
node
s re
pres
ent
grou
p-A-
like
sequ
ence
s an
d blu
e no
des
repr
esen
t no
n-gr
oup
A se
quen
ces.
The
cluste
rs
are
sorte
d fro
m lef
t to
right
in
the
orde
r of
size.
Only
cluste
rs
with
at lea
st tw
o m
embe
rs
are
show
n.
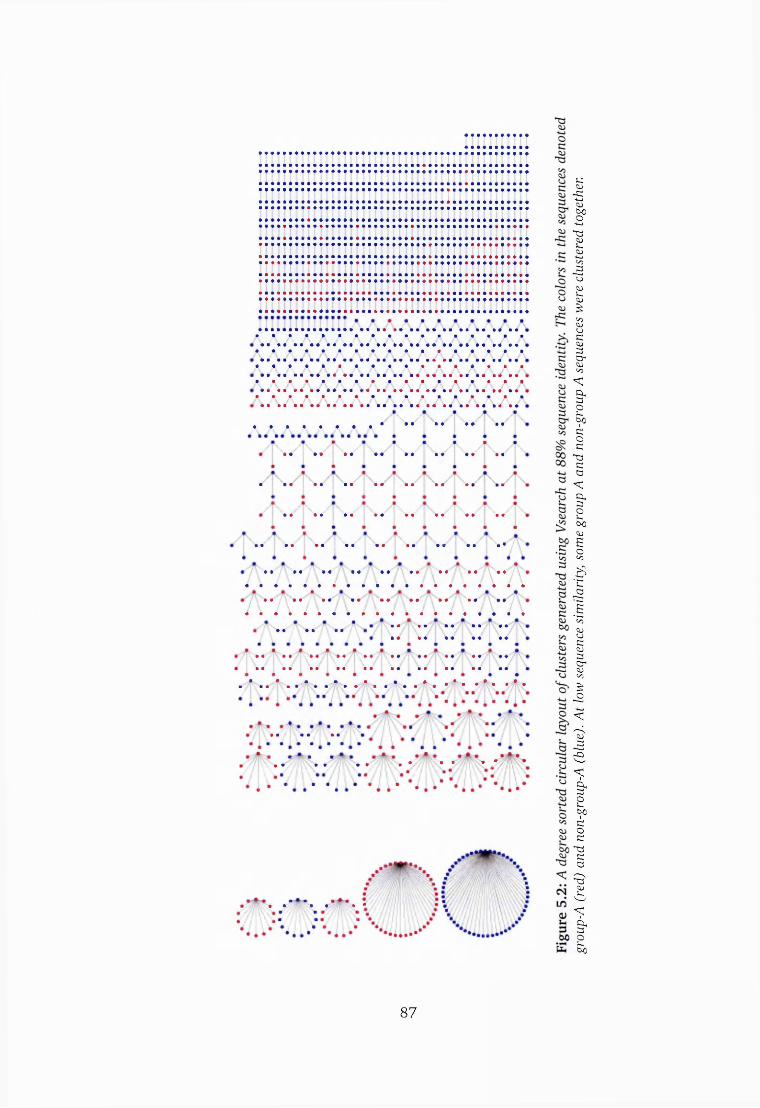
87
grou
p-A
(red)
an
d no
n-gr
oup-
A (b
lue)
. At
low
sequ
ence
si
mila
rity
, so
me
grou
p A
and
non-
grou
p A
sequ
ence
s we
re
clus
tered
to
geth
er.
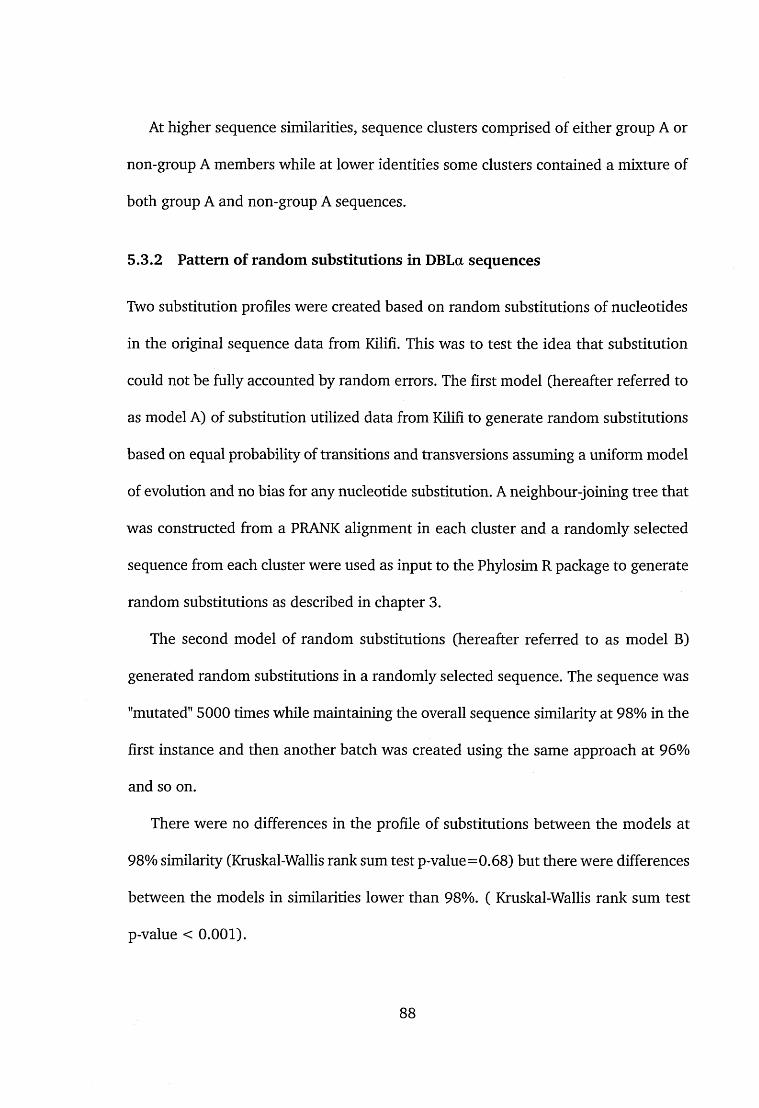
At higher sequence similarities, sequence clusters comprised of either group A or
non-group A members while at lower identities some clusters contained a mixture of
both group A and non-group A sequences.
5.3.2 Pattern of random substitutions in DBLa sequences
Two substitution profiles were created based on random substitutions of nucleotides
in the original sequence data from Kilifi. This was to test the idea that substitution
could not be fully accounted by random errors. The first model (hereafter referred to
as model A) of substitution utilized data from Kilifi to generate random substitutions
based on equal probability of transitions and transversions assuming a uniform model
of evolution and no bias for any nucleotide substitution. A neighbour-joining tree that
was constructed from a PRANK alignment in each cluster and a randomly selected
sequence from each cluster were used as input to the Phylosim R package to generate
random substitutions as described in chapter 3.
The second model of random substitutions (hereafter referred to as model B)
generated random substitutions in a randomly selected sequence. The sequence was
"mutated" 5000 times while maintaining the overall sequence similarity at 98% in the
first instance and then another batch was created using the same approach at 96%
and so on.
There were no differences in the profile of substitutions between the models at
98% similarity (Kruskal-Wallis rank sum test p-value=0.68) but there were differences
between the models in similarities lower than 98%. ( Kruskal-Wallis rank sum test
p-value < 0.001).
88

Model A was preferred for comparing profiles with actual tag sequences because
it constitutes a pool of changes derived froma larger number of seed sequences with
different lengths and variable nucleotide composition.
89

Identity (%) sequences Total DBL tags Clusters Distinct types Diversity ratio
98 5001 3364 578 2257 0.256096 5001 2205 127 2011 0.063194 5001 1592 70 1500 0.046692 5001 1184 61 1100 0.0554
Table 5 .1 : A table showing the number of randomly generated sequences using a single template sequence. The clusters column refers to the number of groups of sequences that was generated and excludes ’one-member* clusters whereas the distinct types were the total number o f groups including one-member clusters. The diversity ratio refers to the fraction o f clusters that were used to generate the pairwise comparisons.
90
> . 1000 -
500-
C-A C-T G-A G-C G-T T-A
>96%
' 1000 -
<i> 500-
500-
HHHHPIa
8’400'§3 0 0 -§■200-* 100-
0- in H
C-A C-T G-A G-C G-T T-A
>94%
C-A C-T G-A G-C
c 2 0 0 -£ 1000
4= 500
C-A C-T G-A G-C G-T T-A C-A C-T G-A G-C
o 200 0 -
$ 1000 -
0-
>92% M >9
IMHifflH ‘ HhHC-A C-T G-A G-C G-T T-A C-A C-T G-A G-C
G-T
G-T
G-T
T-A
T-A
T-A
Figure 5.3: The frequency o f random substitutions in DBLa sequence tags generated with two random models. Figure A,C,E,G represent the model A and the rest represent model B’s substitution profile. The type o f nucleotide substitutions are shown along the x-axis and the inner bars represent the frequency of a substitution at codon position 1 (red), position 2 (yellow) and position 3 (green). The gray bar represents the sum of substitutions for each type of substitution.
91

Figure 5.3 shows the distribution of substitutions at each identity threshold in each
random model. In model A , the frequency of each type of change was proportionately
higher than in model B.
92

Random model Observed
19.69%
14.65%18.62% 17.59%
15.91 %
13.51%
9.6 %
33.3 %49.1 % 3.72 %
2.1 %
2.0 %
Figure 5.4: The average frequency of different substitution in percent (%) in based on random model B and sequences collected in 2008-2010 period. The orange arrows indicate transitions and blue arrows indicate transversions. On average G-A transitions accounted for nearly half o f all the observed substitutions in sequences from Kilifi.
93

>94%
C-A C-T G-A G-C G-T T-A C-A C-T G-A G-C G-T T-A
Figure 5.5: The frequency o f random substitutions. Figure A-D shows the relative frequency o f random substitutions that were generated based on model B. Figure E-H shows the frequency of the same random substitutions scaled by the ratio o f transitions to transversions from actual DBLa sequences collected between 2008-2010 as described in chapter 3 section 3.1. The codon position frequencies were omitted to avoid over adjusting.
94
The simplest models of evolution assume that nucleotide changes arises independ
ently and that the transition to transversion ratio (TI:TV) are identical across sites.
The second codon position is often constrained. A substitution at the second codon
position results in a change in the encoded amino acid. The third codon position is
the least constrained and a change in the third codon position does not always result
in a change in the encoded amino acid.
The tag sequences showed a strong bias for transition substitutions. The average
frequency of transitions and transversions in the random models versus from the
observed sequences from Kilifi was calculated and is shown in figure 5.4. The purpose
of this calculation was to show the relative differences in the number of substitutions
between randomly generated substitutions and from actual sequences.
5.3.3 The correlation between frequency of substitutions in random model and
in actual sequences
To assess the distribution of substitutions between the random unsealed profiles and
that from actual sequences, a scatter plot of the correlation between the frequency of
substitutions in a random model and from sequences in Kilifi sequences is shown in
figure 5.6. In summary there was no evidence for a positive correlation between the
observed substitutions and the random unsealed substitutions.
95

98%rho = 0.444 ( 0.065 )
-a 400-
cn 300 -
100 2000 300 400observed
98%rho = 0.444 (0.065 )
-o 400 -
300 -
2000 100 300 400observed
94%rho = 0.362 (0 .139 )
700-
600-
E 500-
400-
0 200 400 600observed
92%rho = 0.354 (0 .1 5 )
1000 -
I 900-^ 800- D• i 700-C/3
600-
500-200 400 600 800
98% rho = 0.884 ( 0 )
300■o
2 0 0 -
1 0 0 -
0 100 200 300 400observed
96% rho = 0.889 ( 0 )
-o 300' ©| 2 0 0 - '55
1 0 0 -
0 200 400observed
94% rho = 0.854 ( 0 )
400-"O ©300-
Ew 2 0 0 -
100• •
200 400observed
92% rho = 0.862 ( 0
600
600-
T3 500-
^ 400-
« 300-
2 0 0 -
200 800400 600observed observed
Figure 5.6: Spearman correlation between frequency o f substitutions from randomly generated substitutions and substitutions derived from DBLa sequences collected between 2008 and 2010. Figure A-D shows the random substitutions against the actuals sequences. Figure E-H shows the correlation between the scaled random substitutions and the actual substitutions from Kilifi sequences. The scaling was based on the transition:transversion ratio derived from DBLa sequences. Each point represents the frequency of each type o f substitution at the respective codon. Rho indicated above each plot refers to the overall correlation and the p-value is indicated in brackets.
96

Figure 5.6 shows that the ratio of transistion and transversion was important in
describing the susbstitution models. Without scaling or accounting for this ratio the
random and uniform model could not fully account for differences in the substitution
profiles. Another way to put it is that that random based on Jukes-Cantor model of
substitutions could not fully account for the observed profile of subsititutions. A more
through analysis would be important to fully account for this observation.
5.3.4 Distribution of variation at each codon
Nucleotide composition varies widely among genomes and the G + C content differs
between genes and organisms. The mechanisms of codon variation are related to
codon and amino acid compositions. In most genes composition bias reflects the action
of mutation and selection and can be linked to polymerase and transcription efficiency.
The most likely factor that determines codon or amino acid usage is mutational bias
that shapes GC composition constantly when genomes are either replicated or repaired
by DNA polymerases
Figure 5.7 shows the G + C content and the proportion of purines at each codon for
a group DBLa sequences from Kilifi that were collected between 2008 and 2010. The
purines were more frequent at codon position 1 and 2 when compared to pyrimidines.
The 3rd codon had the least G+C content and comprised of about an equal proportion
of purines and pyrimidines.
97

A 1 . 0 0 - B 1 . 00-
0.75- 0.75
Pu
rin
eso cn o *
m
c o d o n• 1st
2nd• 3rd P
ur
ines
o <J1 o
0.25- 0.25
o . o o - 0.00
c o d o n
• 1st 2nd
• 3rd
0.00 0.25 0.50 0.75 1.00G + C
0.00 0.25 0.50 0.75 1.00G + C
Figure 5.7: A scatter plot showing the percent GC content (x-axis) and the average proportion of purines at each of the codon positions in DBLa andAM Al sequences. DBLa sequence tag regions are purine rich, codon position 2 is more GC-rich than codon position 1 and 3. The plot was generated by calculating the average purine content and the average G+C content o f the bases at each codon. The figure implies that variation is likely to be influenced by base composition.
5.3.5 Density of substitutions in conserved and polymorphic regions of the
DBLa sequence tag
Based on sequence alignment of PfEMPl sequences, the DBLa sequence region falls
within the homology block D to H (Smith et al. 2000a). The homology blocks are
the most relatively conserved regions of the sequence and are interspersed by the
polymorphic blocks which are denoted with abbreviation HP in this thesis. Nucleotide
diversity (ti) scores were calculated to explore differences in density of substitutions
between the homology and the polymorphic regions. Nucleotide diversity scores in
homology block D and H and the polymorphic regions HP1 and HP2 in each cluster
were calculated as shown in figure 5.8. In the figure, the density of substitutions was
plotted in sequences containing randomly substitutions (simulated) and the actual
sequences collected from Kilifi (observed). Figure 5.8 shows the substitution profile
of sequences clustered at 98% similarity.
98

Akilifi random
0 .4 -
random
Figure 5.8: The figure shows the nucleotide diversity (n ) from polymorphic blocks (hp) and homology blocks (hb) in alignments of sequences that were similar at 98% (A) and 96% (B) that were collected. A similar profile was calculated in sequences that contained random substitutions. Each line is a diversity score from a single alignment and the grey shade shows the distribution. The homology blocks from Kilifi sequences showed a higher proportion o f substitutions than the polymorphic blocks.
99

5.3.6 Variation in homology block D and H
The homology blocks are relatively conserved regions of the PfEMPl molecule (Smith
et al. 2000a). Here we considered the distribution of variation in homology block
D and block H which are at the 5’ and 3’ ends of the tag region. Figure 5.9 shows
the distribution of point mutations in homology block D and in homology block H.
Clusters of homology blocks for comparison were extracted from alignments of full-
length sequence tags. The complete DBLa sequences were first aligned using different
cutoffs and then the homology blocks were extracted from full length alignments of
the tag region. This ensured that the substitutions were from sequences that were
similar at the global level.
100
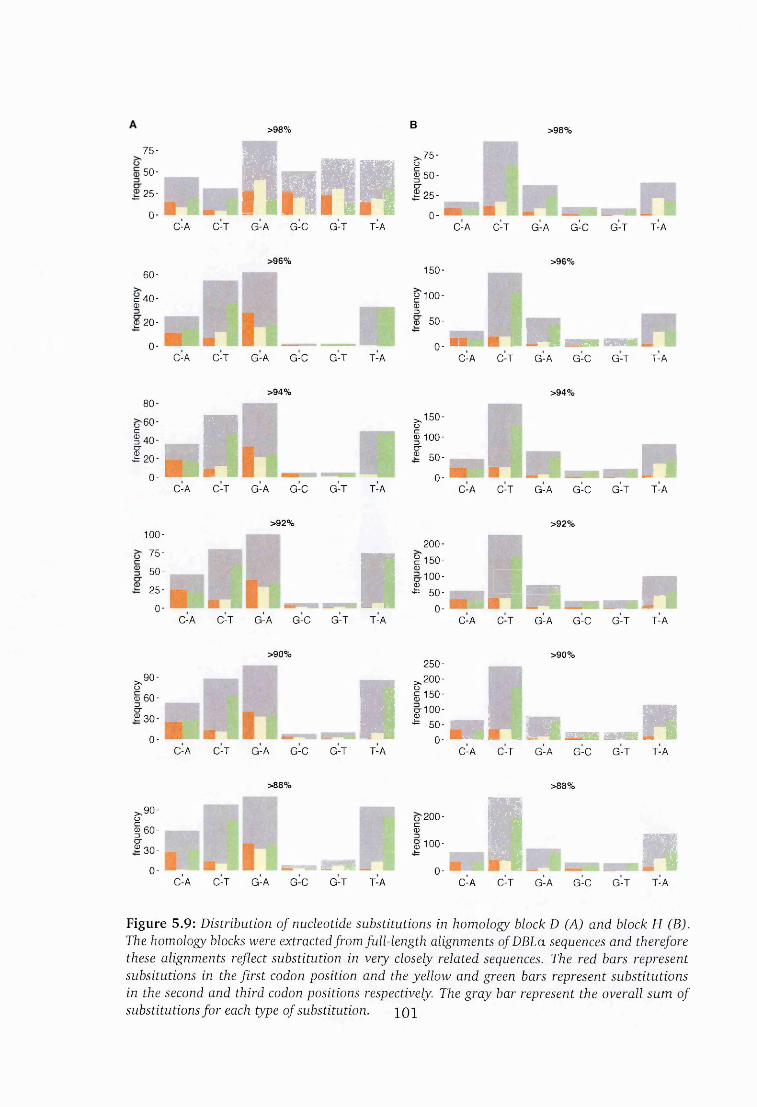
>98%
7 5 -
5 0 -
-25-0- n
gftgp M gflHHC-A C -T G -A G -C G -T T-A
B
> .7 5 -o§ 5 0 -O"£ 2 5 -
0-
>98%
C -A C-T G -A G -C G -T T-A
>96%
6 0 -
c 4 0 -CD
£ 2 0 -
0-
8 0 -
o60-§ 4 0 - cr1 20 -
o-
C-A C -T G -A G -C G -T T-A
>94%
■HC-A C-T G -A G -C G -T T-A
>92%1 0 0 -
■ 7 5 -
5 0 -
2 5 -
0-
> ,90"o© 6 0 -OO’£ 3 0 -
o-
RC-A C -T G -A G -C G -T T-A
>90%
R
1 5 0 -
g 100- 0 o© 5 0 -
0-
>,150-o
§ 100- o-£ 5 0 -
0-
200 -
£-\50-0o" 155" ©*= 5 0 -
>96%
0-
2 5 0 -
> , 200 -
§ 1 5 0 -
a-100-©* 5 0 -
0-
■ a
■ »■'
B Em ■ ■ m m mC-A C -T G -A G -C
>94%
G -T T-A
nS I
C -A C -T G -A G -C
>92%
G -T T-A
i n nC -A C -T G -A G -C
>90%
G -T T-A
1
HI P rP I sw n■ ■
C-A C -T G -A G -C G -T T-A C -A C-T G -A G -C G -T T-A
>88%
> .9 5 -o § 6 0 - O"£ 30 -
o- ■-w | | IIHM C -A C -T G -A G -C G -T T-A
o 2 0 0 -c0|ioo-
o- I>88%
nC -A C-T G -A G -C G -T T-A
Figure 5.9: Distribution of nucleotide substitutions in homology block D (A) and block H (B). The homology blocks were extracted from full-length alignments of DBLa sequences and therefore these alignments reflect substitution in very closely related sequences. The red bars represent subsitutions in the first codon position and the yellow and green bars represent substitutions in the second and third codon positions respectively. The gray bar represent the overall sum of substitutions fo r each type of substitution. 1Q1

The profile of substitutions within the conserved regions of the DBLa tag was
different from that observed from full-length sequence tags. The homology blocks
showed a remarkable bias in substitutions at the third codon compared to the full tag
sequences.
5.3.7 Overall distribution of point m utations in DBLa sequence tags
The DBLa sequence tags are A-T rich as illustrated in figure 5.11. Nucleotide composi
tion varied across the codon positions as illustrated in the figure 5.11. The proportion
of T residues at the first codon was higher compared with that at the second and the
third codon position. The proportion of C was the lowest at all the codons positions.
The proportion of T at the third codon position was relatively higher than that of C
and G and almost equal to that of A.
The most frequent type of substitutions in DBLa sequences were the G-A/C-T
transitions. Generally, the frequency of G-A transitions was higher than C-T in most
sequence groups and as illustrated in figure 5.10 and figure 5.12. The G-A transitions
were more frequent at the first and the second codons positions. The proportion of
Guanine (G) and Adenine (A) was proportionately higher at the first and the second
codon position compared to the third codon position (shown in figure 5.7).
There was relatively higher number of C-T transitions at the third codon position.
The most common transversions in sequences from Kilifi were T-A and C-A nucleotide
changes. The T-A transversions were more common at the third codon position and the
C-A transversions were proportionately higher at the first and second codon positions.
102

A2 0 -
C-A C-T G-A G-C G-T T-A
40-
30-
2 0 -
10-
C-A C-T G-A G-C G-T T-A
B 20-
C-A C-T G-A G-C G-T T-A
40-
30-
20-10-
C-A C-T G-A G-T T-AG-C
10-
C-A C-T G-A G-C G-T T-A
40-
30-
20-10-
C-A C-T G-A G-C G-T T-A
D 20-
C-A C-T G-A G-C G-T T-A
40-
30-
2010-
C-A C-T T-AG-A G-C G-T
Figure 5.10: The overall distribution o f random substitutions (A-D) and from actual sequences tags from Kilifi collected between 2008 and 2010 (E-H). This plot shows the mean frequency o f each type o f substitution that were selected at random. In each figure, 50 random substitution were selected from the pool of all substitutions with replacement and the process was repeated 100 times. The mean number of each type o f substitution is shown, the error bars indicate the 95% confidence internal. There was significant difference between the distribution o f substitutions (Kruskal-Wallis rank test p-value < 0.001).
103
Figure 5.10 suggests that substitutions in the DBLa sequences are not just random
but are also shaped by the evolutionary pressures acting on the sequences. The figure
also provides evidence that the subsitutions cannot be fully accounted by PCR errors.
More analysis of codon usage and selection pressures pressures is required to fully
account for these substitution profiles.
104

A (Kilifi1 .0 0 -
0 .7 5 -
o 0 .5 0 -
o .
0 .2 5 -
0.00-CA
1 .0 0 -
0 .75
o 0 .5 0 -
Q.
0 .25
0.00A2 A3A1
1.0 0 -
0 .7 5 -
o 0 .5 0 -
Q.0 .2 5 -
0.00-
1 .0 0 -
0 .7 5 -
o 0 .5 0 -Q.
0 .2 5 -
0.00-
1 .0 0 -
0 .7 5
o 0 .5 0 -
Q.0 .2 5 -
0.00-T1 T2 T3
0 .7 5 -
O 0 .50CL
0 .2 5 -
0.00-
1 .0 0 -
0 .7 5 -
o 0 .5 0 -
0 .2 5
0.00-A1 A2 A3
1 .0 0 -
0 .7 5 -
O 0 .5 0 - Q.
CL
0 .2 5 -
0.00-
1 .0 0 -
0 .7 5 -
o 0 .50
0 .2 5 -
0.00-
1 .0 0 -
0 .7 5 -
o 0 .5 0 -Q.
CL
0 .2 5 -
0.00-T2 T3T1
Figure 5.11: The distribution of nucleotide content in DBLa sequences tags from Kilifi andAmele region o f Papua New Guinea is shown in the figure. Panel A shows the overall distribution o f A,C,T and G nucleotides while panels B-E shows the distribution of each type of nucleotide at each respective codon for both Kilifi andAmele. The green lines represent individual observations and the grey area shows the respective distribution.
105

>98% >96%
,>■1000
ST 500-
C-A C-T G-A G-C G-T T-A
1500-
1000 -
0- HC-A C-T G-A G-C G-T T-A
>94% >92%
1500-
1000 -
500-
0- hHC-A C-T G-A G-C G-T
>90%
T-A
> > 2000 -
O - 1 0 0 0 -
0- H h HC-A C-T G-A G-C G-T T-A
2000 -
o 1500-
§ 1000-
■§ 500-
3000->NOS 2000-
hHC-A C-T G-A G-C G-T
HT-A
>88%
P J 1 1000- H HnC-A C-T G-A G-C G-T T-A
Figure 5.12: The per codon nucleotide substitution distribution from 4817 DBLa sequence tags collected in Kilifi. Each plot shows the absolute frequency o f each type of substitution. In comparison to the random substitution model, there was significant different in the pattern of changes (Kruskal-Wallis test p-value < 0.001). C/T and G/A transitions were the dominant type of substitution changes.
106

5.3.8 Distribution of point mutations in DBLa sequences from other geograph
ical regions
Transmission and host immunity varies between geographical regions which in turn
can impose different selection pressures on the expressed var repertoire. In this section
the distribution of nucleotide substitutions was explored in sequences from two geo
graphic locations other than Kilifi. Sequences from Papua New Guinea were obtained
from a published genomic epidemiology study (Barry et al. 2007), and sequences
from South America were obtained from a var diversity study (Albrecht et al. 2010).
The distribution of the proportion of nucleotide content in sequences from Papua
New Guinea was similar compared to sequences from Kilifi (figure 5.11). The G-A/C-T
transitions were the most frequent transitions. The frequency of G-A was relatively
higher than that of C-T. In both cases there were more variation at the third codon
position as shown in figure 5.13.
C-A changes were the most frequent types of transversion substitutions and unlike
the Kilifi sequences the number of T-A changes was relatively low. The transversions
occurred more regularly at the third codon. The distribution of substitutions was a
remarkable departure from the random model and also from what was observed in
Kilifi sequences.
107
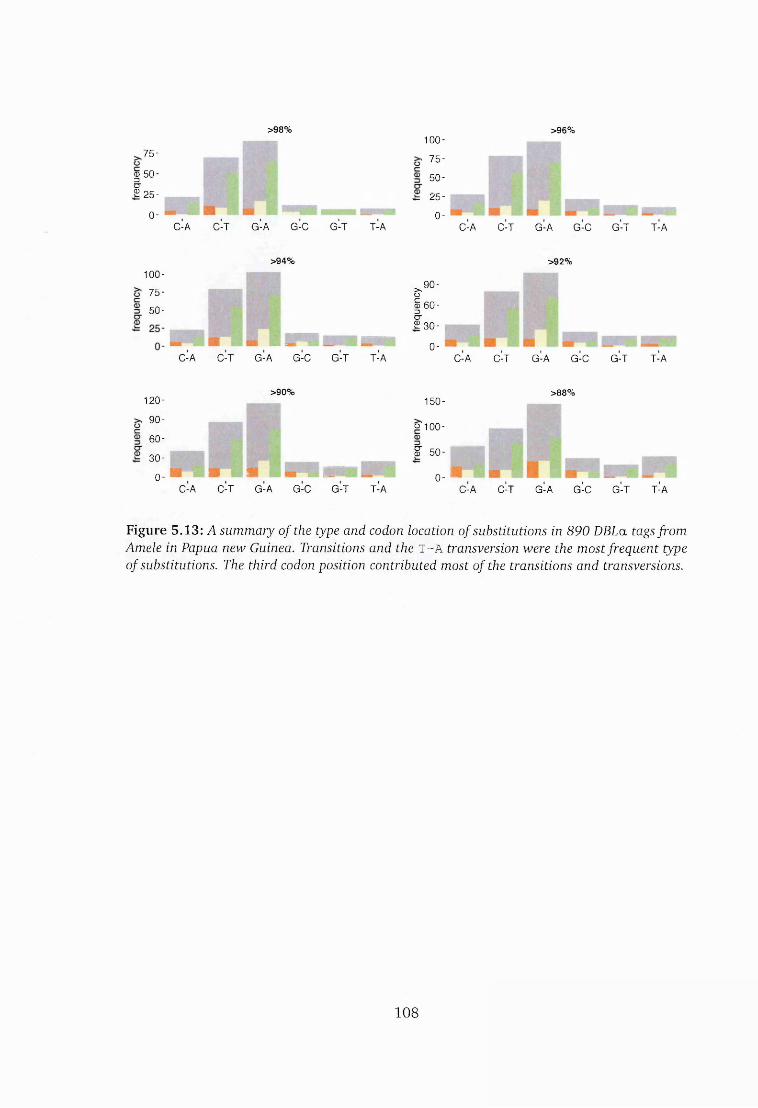
>98%
75-
cu 50-3cr2 25-
0-
>96%100 -
• 75-
50-
2b-
o -C-AC-A C-T G -A G -C G -T T-A C-T G -A G -C G -T T-A
100 -
' 75-
50-
>94%
C -A C -T
n mG -A G -C G -T T-A
>.90'o§ 60- 3cr2 30-
0-
>92%
C -A C-T G -A G -C G -T T-A
>90% >88%120- _ _ 150-
90-
60-
30-
0-
o 100 -
S' 50- - i*? iSi n i i h m I o- ®
C -A C -T G -A G -C G -T T-A C -A C -T G -A G -C G -T T-A
Figure 5.13: A summary o f the type and codon location of substitutions in 890 DBLa tags from Amele in Papua new Guinea. Transitions and the T - A transversion were the most frequent type of substitutions. The third codon position contributed most of the transitions and transversions.
108
The var repertoire from parasites in the amazon basin has been described as
relatively conserved (Albrecht et al. 2010; Bopp et al. 2013). Following from the
observations in Amele region, it was interesting to describe the substitution profile of
sequences from this region. There were no differences in the distribution of nucleotide
content in sequences from Brazil compared to sequences from Kilifi or Amele. Overall,
the frequency of transitions was higher than that of the transversions. T-A and C-A
transvertions were the most dominant across all the similarity thresholds and similar
to what was observed in sequences from Kilifi and Amele. C-T transitions were more
frequent at the third codon. G-A transitions occurred proportionately frequent across
all the codons as shown in figure 5.14.
109
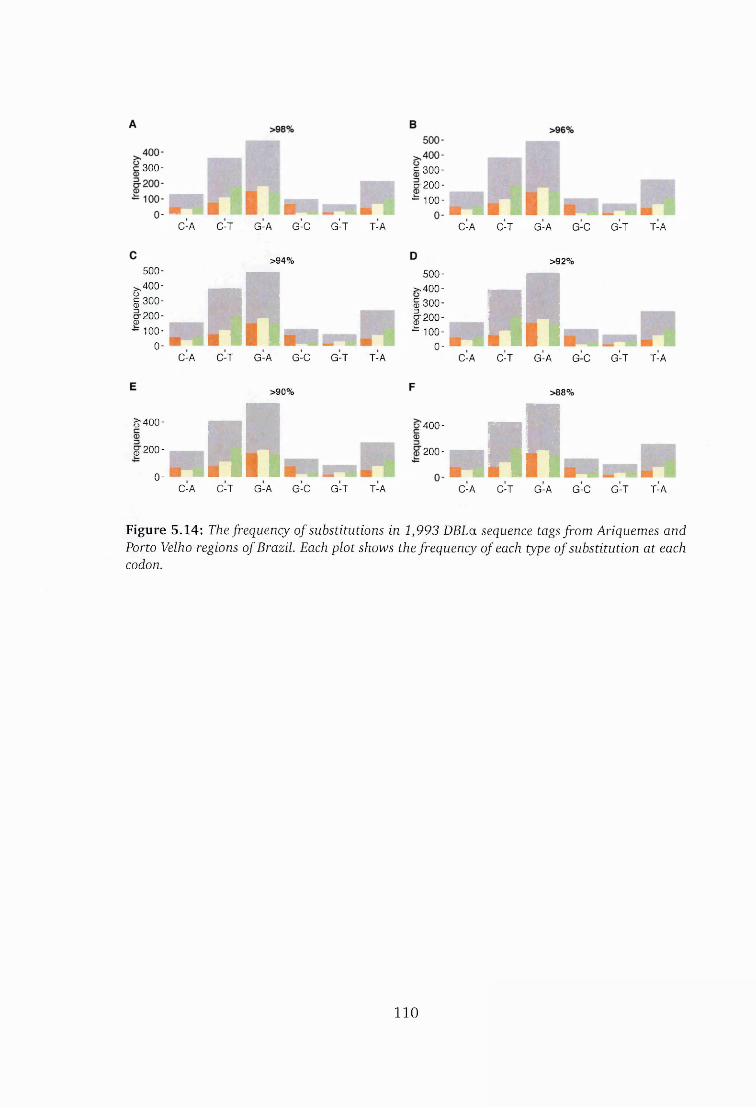
c 300- E 300-C5-200-
- 1 0 0 -
500->,400-§300-i - 2 0 0 -<u
- 1 0 0 -
o-
C -A C -T G -A G -C G -T T-A
>94%
hHC -A C -T G -A G -C G -T T-A
>90%
7?400-
§ ■ 200 -
o- hH
C -A C-T G -A G -C G -T T-A
>92%500-
>,400- S 300- | 200 -
^ 100 -
o- n HC-A C -T G -A G -C G -T T-A
>88%
o 400-
' 200 - h HC-A C -T G -A G -C G -T T-A C -A C-T G -A G -C G -T T-A
Figure 5.14: The frequency o f substitutions in 1,993 DBLa sequence tags from Ariquemes and Porto Velho regions o f Brazil Each plot shows the frequency o f each type o f substitution at each codon.
1 1 0

5.3.9 Variation in group A and non-group A sequences
Group-A var genes are relatively conserved and are associated with expression in
severe malaria (Warimwe et al. 2009) and are of considerable importance as dis
cussed in chapter 1 section 1.7. Group-A like DBLa sequences were defined as se
quences characterized by two cysteine residues and belong to group-sharing block
1 as discussed in chapter 1 section 1.7.1 and elaborated further in chapter 4. Given
the role of group A var in immunity, it was hypothesized that they could be under
different selection pressure from non-group A sequences.
A total of 1000 sequences from each group were randomly selected and clustered
as described in chapter 3. Figure 5.15 shows the distribution of substitutions using
an equal number of randomly selected group A and non-group A sequence tags from
Kilifi and that were collected in the 2008 - 2010 time period.
I l l

C-A C-T G-A G-C G-T T-A
>96%
C-A C-T G-A G-C G-T T-A
>96%
C-A C-T G -A G -C G -T T-A
>94%
C -A C-T G -A G -C G -T T-A
>90% >90%
Figure 5.15: The frequency of substitutions in group A-like and non group A sequences (column B). Group A-like sequences were defined as sequences with 2 cysteines and belonging to block- sharing group 1. In each case 1000 randomly selected sequences were clustered and the number of substitutions in each cluster at each identity threshold is shown..
1 1 2
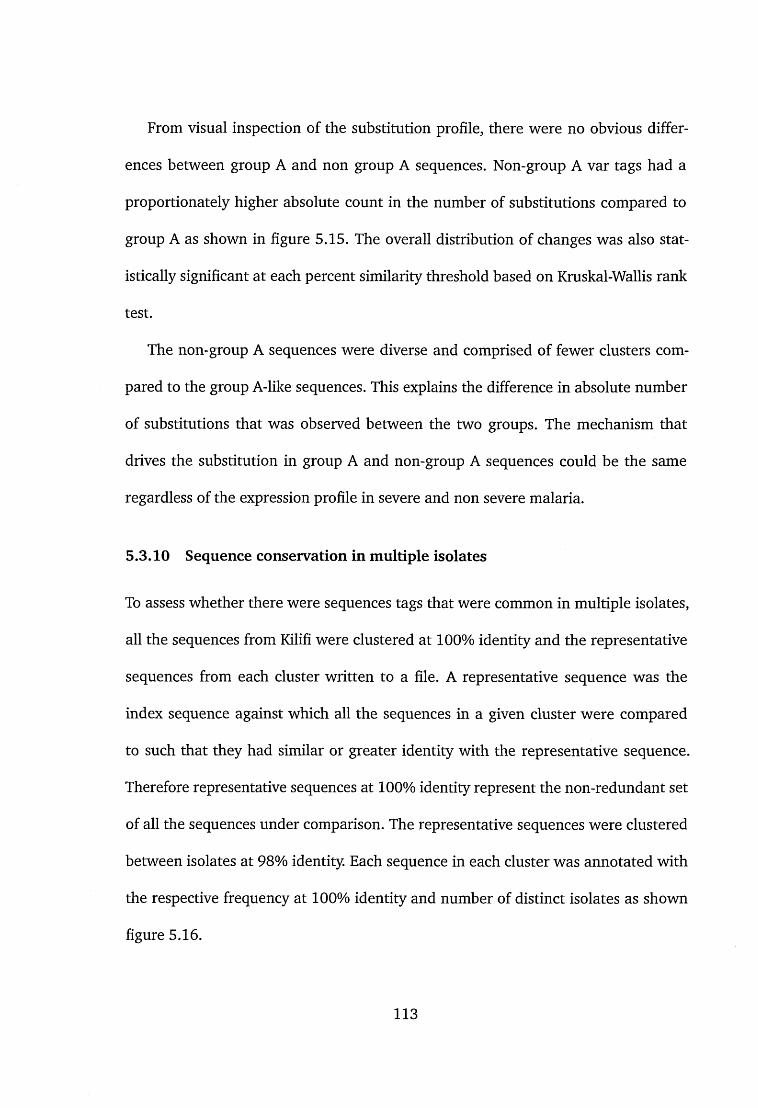
From visual inspection of the substitution profile, there were no obvious differ
ences between group A and non group A sequences. Non-group A var tags had a
proportionately higher absolute count in the number of substitutions compared to
group A as shown in figure 5.15. The overall distribution of changes was also stat
istically significant at each percent similarity threshold based on Kruskal-Wallis rank
test.
The non-group A sequences were diverse and comprised of fewer clusters com
pared to the group A-like sequences. This explains the difference in absolute number
of substitutions that was observed between the two groups. The mechanism that
drives the substitution in group A and non-group A sequences could be the same
regardless of the expression profile in severe and non severe malaria.
5.3.10 Sequence conservation in multiple isolates
To assess whether there were sequences tags that were common in multiple isolates,
all the sequences from Kilifi were clustered at 100% identity and the representative
sequences from each cluster written to a file. A representative sequence was the
index sequence against which all the sequences in a given cluster were compared
to such that they had similar or greater identity with the representative sequence.
Therefore representative sequences at 100% identity represent the non-redundant set
of all the sequences under comparison. The representative sequences were clustered
between isolates at 98% identity. Each sequence in each cluster was annotated with
the respective frequency at 100% identity and number of distinct isolates as shown
figure 5.16.
113
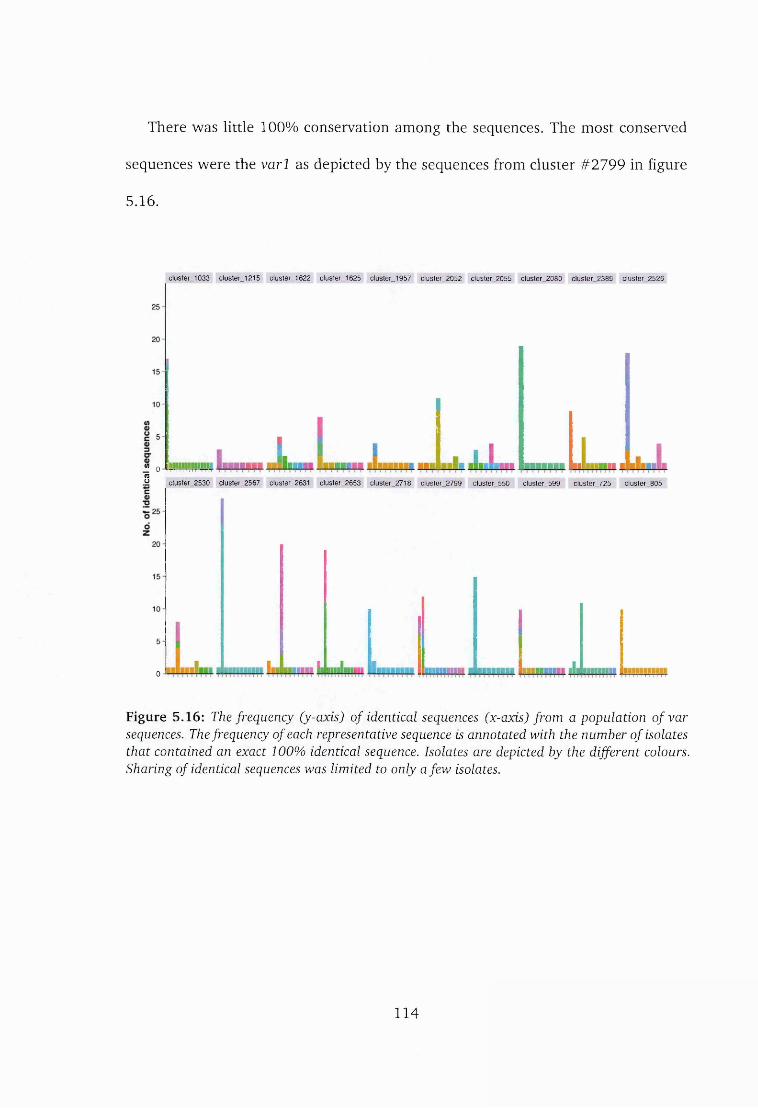
There was little 100% conservation among the sequences. The most conserved
sequences were the varl as depicted by the sequences from cluster #2799 in figure
5.16.
cluster_1033 cluster_1215 cluster__1622 cluster_1625 cluster_1957 cluster_2052 duster_2055 cluster_2080 cluster_2389 cluster_2526
w n •' - ._ _ U rTTTTTTTTTTTTTI CO.2 d uster_2530 cluster_2567 cluster_2631 d u ster_2653 d u ster_2718 d uster_2799 cluster_550 cluster_599 cluster_725 d u ster_ 8 0 5
0 “ i ______T T T T T T T T T T i
Figure 5.16: The frequency (y-cocis) o f identical sequences (x-axis) from a population o f var sequences. The frequency of each representative sequence is annotated with the number o f isolates that contained an exact 100% identical sequence. Isolates are depicted by the different colours. Sharing of identical sequences was limited to only a few isolates.
114

5.3.11 Substitution patterns in varl sequences
The varl sequences were analyzed in more detail following the observation that they
were the least diverse group and that they formed clusters with the most number of
sequences across all the identity thresholds that were considered as shown in figure
5.1, figure 5.2 and figure 5.16. Furthermore, varl sequences are thought not to be
expressed on the surface of the parasite (Winter et al. 2003) and presumably they are
not under the same selection pressure as other var genes and in particular group A
var genes.
Varl had a similar profile of nucleotide content as non varl sequences as shown
in figure 5.17. The G -A /C -T transitions were over represented in the varl sequences.
There was little variation at 98% identity compared to 88% identity. The overall num
ber of substitutions at the various identity thresholds were relatively low compared
to what was observed in other DBLa sequences.
115
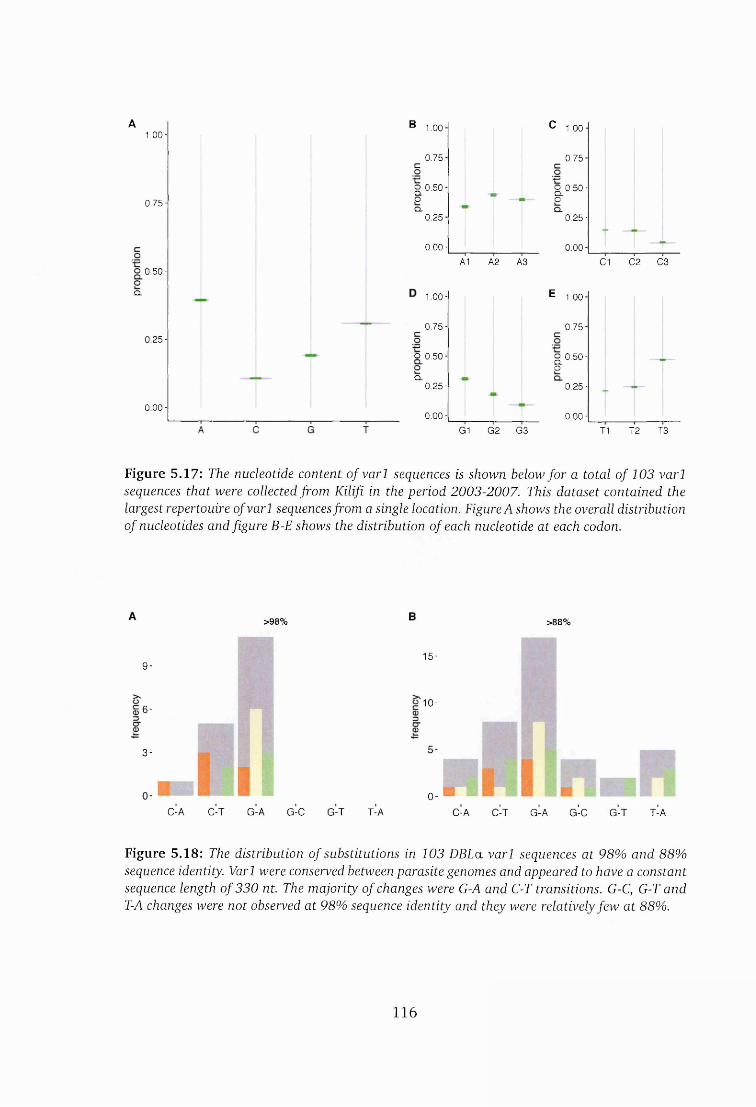
A1 .0 0 -
0 .7 5 -
0 .5 0 -
a.
0 .2 5 -
0.00-
B 1.00
0 .75
o 0 .5 0 -Q.OQ.
0 .25
0.00-A1 A2 A3
1 .0 0 -
0 .7 5 -
O 0 .5 0 -
Q.0 .2 5 -
0.00-
C 1.00-1
0 .7 5
O 0 .5 0 -Q.O0 .2 5 -
0.00
E 1.00
0 .7 5
C1 C 2 C3
o 0 .5 0 -Q.O
0 .2 5 -
0.00-G1 G 2 G3 T1 T2 T3
Figure 5.17: The nucleotide content o f varl sequences is shown below for a total o f 103 varl sequences that were collected from Kilifi in the period 2003-2007. This dataset contained the largest repertouire of varl sequences from a single location. Figure A shows the overall distribution of nucleotides and figure B-E shows the distribution of each nucleotide at each codon.
>98% >88%
9-
6-
3-
15-
'10-
C-A C-T G-A G-C G-T T-A0-
C-A C-T G-A G-C G-T T-A
Figure 5.18: The distribution o f substitutions in 103 DBLa varl sequences at 98% and 88% sequence identity. Varl were conserved between parasite genomes and appeared to have a constant sequence length o f 330 nt. The majority o f changes were G-A and C-T transitions. G-C, G-T and T-A changes were not observed at 98% sequence identity and they were relatively few at 88%.
116

5.3.12 Insertion/deletions in varl
Varl DBLa sequences contained several substitutions as profiled in figure 5.18. Ma
jority of varl substitutions were confined to a region that was between codon 68 and
109.
The sequences from the varl alignment had deletions/insertions at two locations
relative to the varl sequence 6 0 A - l c 0 8 . The first was a codon deletion at position
246-248 and the second was a two nucleotide deletion at position 281-282. Interest
ingly, sequence 6 0 A - l c 0 8 contained a 5 nucleotide deletion from position 294-298.
This somewhat appeared to compensate for the length of the molecule.
0 250 260 270 2 S 0 290 300. . . . i . . . . i i . i . . . . i . . . • i . . . . i . . . . i . . . . i . j , . i . i . , i , , . . i . . . . i >
G G ? 7 A c | ? A A A 7 7 7 ? c | a | ? H - A A $ 7 G 7 C-G | c A | a A |g fif.’t A Gg|a A C G G --------7 7 |:G A C C 7 A A A 7 7 7 7 C 7 A G 7 G A 7 A G G 7 G 7 G G A C A 7 A A 7 7 A — 7 A A C G G 7 G A 7 C C 7 C 7 7G A C C 7 A A A 7 . 7 H e 7 A G 7 G A 7 A G G 7 G 7 G G A C A 7 A A 7 7 A - - 7 A A C G G 7 G A 7 C C 7 C 7 .G - - - A C C 7 A A A 7 7 7 7 C 7 A G 7 G A 7 A G G 7 G 7 G G A C A 7 A A 7 7 A - - 7 A A C G G 7 G A 7 C 7 - C 7 .G A C C 7 A A A 7 7 7 7 C 7 A G 7 G A 7 A G G 7 G 7 G G A C A 7 A A 7 7 A — 7 A A C G G 7 G A 7 C C 7 C 7 7
G A 7 Ale - - - A C C 7 A A A 7 7 7 7 C 7 A G 7 G A 7 A G G 7 G 7 G G A C A 7 A A 7 7 A - - 7 A A C G G 7 G A 7 C C 7 77 .
G A 7 G A 7 G A 7 G A 7 G A
Figure 5.19: A truncated image showing an unusual insertion/deletion events in varl sequences. Deletions at position 246-248 and 281-282 were observed in 102 sequences relative to the first sequence which contained a five nucleotide deletion at position 294-298 thereby maintaining the overall length of the molecule at 330 nucleotides. The above alignment was generated as a codon alignment using the PRANK alignment tool.
Although this observation is interesting and raises questions on role of v a rl se
quences, it is also difficult to interprate given that it was only observed once. It could
be that the v a rl sequence is a more recent recombinant and that the alignm ent is
largely made of ancient sequences. It would be important to explore more sequences
from multiple isolates.
117
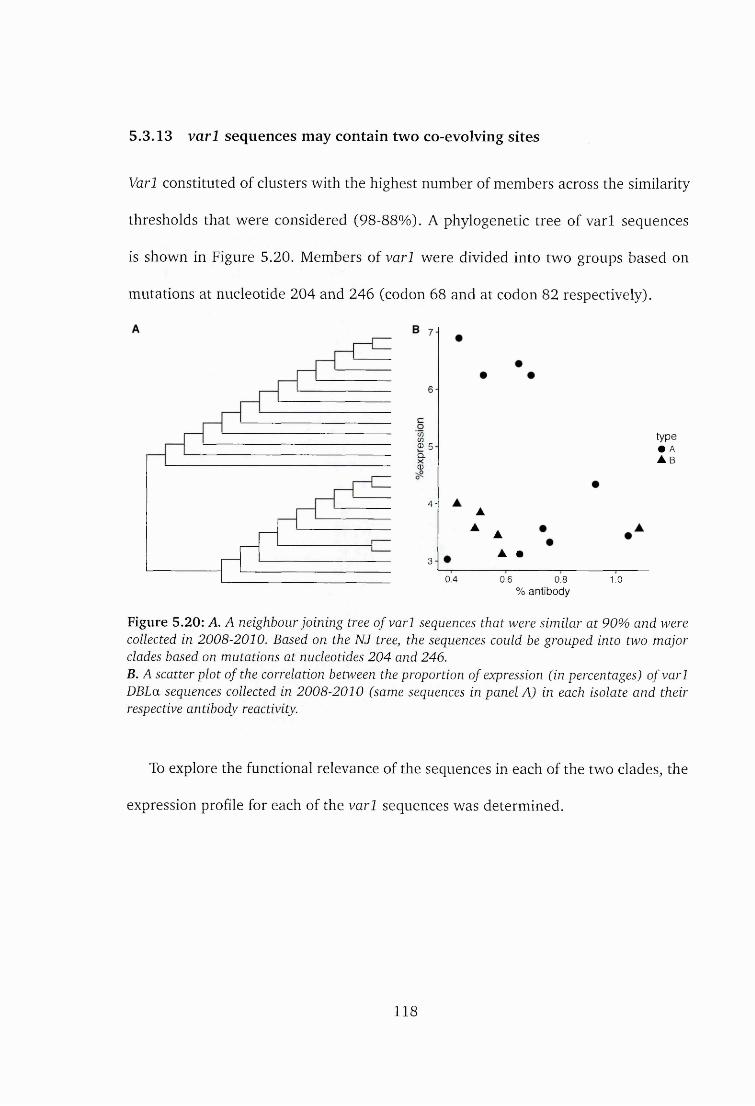
5.3.13 varl sequences may contain two co-evolving sites
Varl constituted of clusters with the highest number of members across the similarity
thresholds that were considered (98-88%). A phylogenetic tree of va rl sequences
is shown in Figure 5.20. Members of varl were divided into two groups based on
mutations at nucleotide 204 and 246 (codon 68 and at codon 82 respectively).
COCO© 5Q.XCD
4 -
3-
ty p e • A ▲ B
▲A A
A •
0 .4 0.6 0 .8 1.0% antibody
Figure 5.20: A. A neighbour joining tree o f varl sequences that were similar at 90% and were collected in 2008-2010. Based on the NJ tree, the sequences could be grouped into two major clades based on mutations at nucleotides 204 and 246.B. A scatter plot o f the correlation between the proportion o f expression (in percentages) of varl DBLa sequences collected in 2008-2010 (same sequences in panel A) in each isolate and their respective antibody reactivity.
To explore the functional relevance of the sequences in each of the two clades, the
expression profile for each of the varl sequences was determined.
118
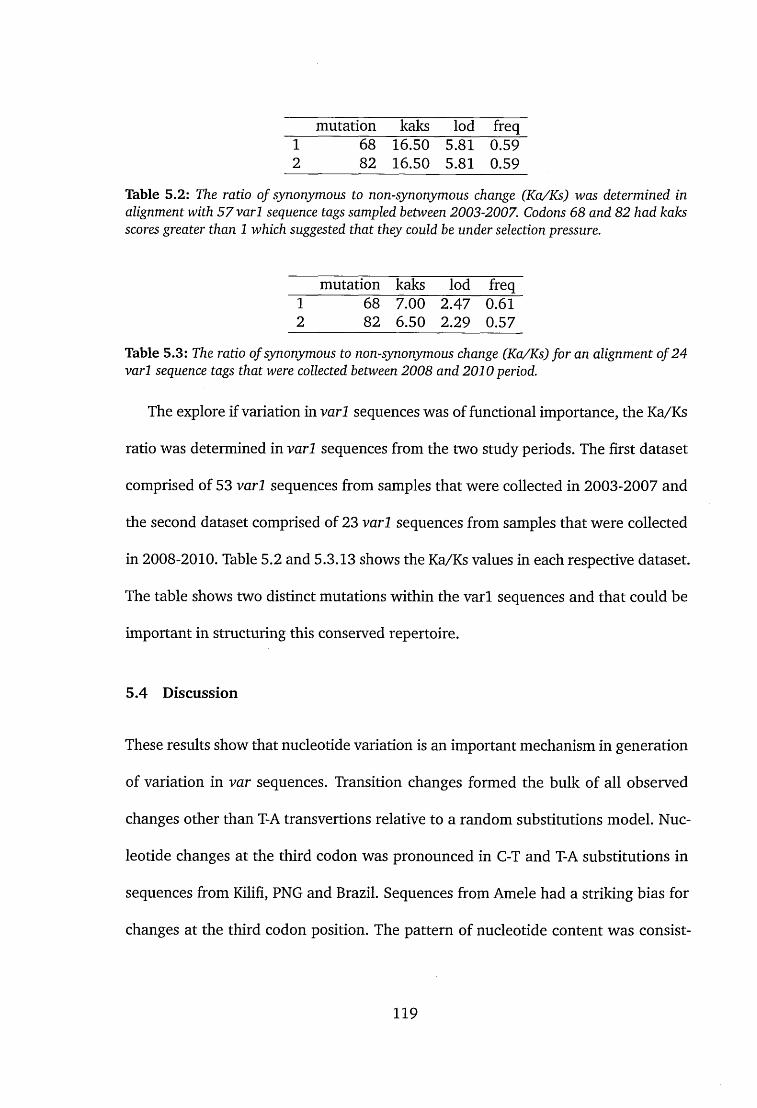
mutation kaks lod freq1 68 16.50 5.81 0.592 82 16.50 5.81 0.59
Table 5 .2 : The ratio o f synonymous to non-synonymous change (Ka/Ks) was determined in alignment with 5 7 va rl sequence tags sampled between 2003-2007. Codons 68 and 82 had kaks scores greater than 1 which suggested that they could be under selection pressure.
mutation kaks lod freq1 68 7.00 2.47 0.612 82 6.50 2.29 0.57
Table 5 .3 : The ratio of synonymous to non-synonymous change (Ka/Ks) fo r an alignment of 24 varl sequence tags that were collected between 2008 and 20 1 0 period.
The explore if variation in varl sequences was of functional importance, the Ka/Ks
ratio was determined in varl sequences from the two study periods. The first dataset
comprised of 53 varl sequences from samples that were collected in 2003-2007 and
the second dataset comprised of 23 varl sequences from samples that were collected
in 2008-2010. Table 5.2 and 5.3.13 shows the Ka/Ks values in each respective dataset.
The table shows two distinct mutations within the varl sequences and that could be
important in structuring this conserved repertoire.
5.4 Discussion
These results show that nucleotide variation is an important mechanism in generation
of variation in var sequences. Transition changes formed the bulk of all observed
changes other than T-A transvertions relative to a random substitutions model. Nuc
leotide changes at the third codon was pronounced in C-T and T-A substitutions in
sequences from Kilifi, PNG and Brazil. Sequences from Amele had a striking bias for
changes at the third codon position. The pattern of nucleotide content was consist
119

ent across all the sequences from different geographical regions although there was
variation in the actual distributions. Interestingly diversity in homology blocks was
relatively higher than in the previously described polymorphic blocks.
There was little variation in the pattern of changes between group A and non
group A sequences but there were differences in the absolute number of changes
in which case, non group A sequence tags were more diverse than the group A var
sequences. This independently confirmed other studies that suggest that group A var
genes are more conserved. Varl sequences were very conserved and they split into
two groups based on two mutations. A thorough analysis with a larger data set is
required to confirm these observations.
The distribution of transition and transversions was consistent across sequences
from different geographical regions although the profile of substitutions by codon
position was remarkably different between sequences from Kilifi, Amele and Brazil. In
conserved sequences the majority of substitutions occurred at the third codon position
compared to substitutions from random substitution profiles.
The samples that were collected between 2003-2007 had been amplified using the
Amplitaq Gold polymerase. Amplitaq has an error rate of 2.6 x 10⁻⁵ and like most
Taq polymerases it lacks the 3’-5’ proof-reading exonuclease activity. Samples that
were collected in 2008-2010 period were amplified with Bio-X-ACT, a proprietary mix
of high fidelity enzymes that contain 5’-3’ DNA polymerase activity and 3’-5’ proof
reading activity to prevent nucleotide misincorporation during a reaction. The profile
of substitutions between sequences that were amplified with Bio-X-ACT and those
that were amplified with Amplitaq gold suggested that the choice of polymerase had
120
little effect on distribution of substitutions and presumably PCR errors.
Sequences from Kilifi exhibited a higher density of substitutions in conserved
regions that in polymorphic regions in sequences that were very similar to each other.
The distribution of changes in these sequences was not contiguous but as the percent
threshold was relaxed from 98% to 88%, the number of contiguous changes increased.
Sequences from Amele region that were collected in 2006, showed an interesting
profile in the distribution of substitutions (figure 5.13). There was a strong bias for
transition changes accompanied by a strong bias for substitutions at the 3rd codon.
These sequences were identified as relatively conserved at the amino acid sequence
level. The nucleotide content was similar to sequences in Kilifi. This might be ex
plained by a strong purifying selection on these sequences.
DBLa sequences from Brazil are less diverse compared to sequences from African
parasites (Albrecht et al. 2010). It has been reported that Brazilian sequences are
characterized by high type sharing (Barry et al. 2007). These sequences formed larger
clusters at 98% similarity but the distribution of substitutions was not different from
sequence in Kilifi and was unlike that which was observed in PNG isolates.
Network-based non-alignment approaches (Bull et al. 2007; Bull et al. 2008; Lar-
remore et al. 2013) have been used to study DBLa sequence tag expression in clinical
cases. These studies have reported differences in expression profile of sequences that
are expressed in younger children compared to older individuals (Bull et al. 2008;
Warimwe et al. 2009). They have also shown that the var expression profile is modi
fied by the host immunity (Warimwe et al. 2009), which could suggest that immunity
exerts selection pressure on var genes.
121

Varl (Kyes et al. 2003) is an unusual conserved molecule in P. falciparum parasite
genomes (Lavstsen et al. 2003; Kraemer et al. 2007) with a distinct 5’ promoter
region (Vazquez-Maci'as et al. 2002). Varl is constitutively transcribed throughout
the intra-erythrocytic stages (Kyes et al. 2003; Lavstsen et al. 2005) and expressed by
parasites in nearly all disease phenotypes (Rottmann et al. 2006). These observations
suggest that varl does not have a specialized function,nonetheless, varl is actively
expressed and maintained in the parasite var repertoire.
The function of varl sequences in P. falciparum genomes is not well understood.
Initially it was thought that varl could be as important as the pregnancy associated
and geographically conserved var2csa, but the fact that varl is expressed in all dis
ease phenotypes and across the erythrocytic cycle is enigmatic. Figure 5.18 shows
the distribution of point mutations in varl sequences. Transition changes were the
primary sources of single point variation in generating nucleotide diversity in v a r l .
Interesting mutations at position 204 and 246 suggested that varl can be divided into
two separate groups. It would be interesting to explore the functional or structural
relevance of such mutations.
In one group of varl sequences most of the substitutions were confined between
nucleotide position 68 and 109. From table 5.2 and table 5.3.13 an estimate of the
Ka/Ks ratio suggests evidence of diversifying selection on the respective codon sites.
And raises the question of whether this region is an active recombination site given
that the changes appear in a non-random manner and only within this region. The
observation that all the changes were confined to these contiguous positions would
support this idea. The varl orthologue in Plasmodium reichenowi is reported to be
122

1,584 nucleotides longer than in the 3D7 parasite line (Otto et al. 2014) suggesting
that varl may have lost a functional component.
Varl sequences are largely conserved in multiple parasites. Point mutations at
two distinct positions partition the varl sequences into two groups and both position
could be under diversifying selection. A thorough examination using varl full-length
sequences from different geographical locations across different time points is re
quired to ascertain and confirm these observations.
In summary, there were interesting differences in the distribution of substitutions
at the third codon in sequences from Amele in Papua New Guinea compared to
sequences from Kilifi and from Ariquemes in Brazil. Although varl are conserved,
a number of substitutions were observed at different similarity thresholds. It would
be important to investigate these in relation to functional relevance and structure.
A more rigorous population genetic analysis would be required to understand the
nature of substitution distribution within the tag sequences and if there is a relation
with immune selection. In addition is would be important to re-sequence some of the
isolates to confirm the observations.
5.4.1 Limitations of this study
The total number of sequences in most clusters was relatively small and therefore
these sequences or clusters could not be considered for population genetic analysis.
Secondly, it was not possible to fully account for PCR errors and to derive a quantifi
able error rate partly due to lack of appropriate reference sequences. Thirdly, it was
not possible to assign the direction of a substitution and therefore the total number
123

of substitutions from one nucleotide to another were pooled together.
5.4.2 Future work
This study developed a simple approach to explore substitution patterns in highly
diverse and recombining sequences. Some of the methods are adhoc and could benefit
if more sophisticated approaches of molecular evolution are applied.
The study of selection and the question of validity of observed subsitutions could
easily be done with deep sequencing. This would allow more sophisticated and state
of the art approaches to be applied in the study. By setting coverage thresholds for
known mutations, it would be possible to analyze structural changes, SNPs as well as
minority variants in multiple clinical samples.
Although, mosaicism is a challenge in assembly of full length var genes, this study
would have benefited from looking at how changes are distributed along the entire
length of PfEMPl sequence in parasite isolates collected from areas that are under dif
ferent transmission intensities. It would also be important to compare the substitution
bias across the genome relative to the telomeric genes.
One of the interesting observations was that varl sequences had a similar distri
bution of substitutions compared to other var sequences. This raises an important
question on the role of va r l. On the other hand varl sequences had an unsual pat
tern of variation which raises the question on whether varl contain a recombination
break-point?
Further investigation should focus on comparing the distribution of changes in
recent var sequences relative to ancient sequences.
124

Chapter 6Identifying potential epitopes using a predictive approach
6.1 Background
In this chapter, a computational approach is described which was used to explore the
epitope diversity in DBLa sequences and to identify commonly occurring epitopes
and epitope positions. Epitope predictions were performed against linear B-cell epi
topes and T-cell epitopes using a limited group of MHC class II T-cell alleles. Two
main approaches were used to investigate immune selection on predicted epitopes as
outlined below,
1. Explored whether the regions associated with these epitopes were associated
with specific patterns of nucleotide substitution using methods described in
chapter 5.
2. By using an existing data set of var expression data to test whether expression of
commonly occurring predicted MHC-class II PfEMPl epitopes were correlated
with host age, to explore whether expression of common epitopes within these
key parasite antigens are selected against as children develop naturally acquired
immunity.
125
6.2 Results
B and T-cell epitopes were identified using an in-silico epitope prediction approach as
described in the methods development chapter 3 section 3.8.4 and in section 3.8.1.
For Bepipred based B-cell epitope predictions the cutoff threshold for epitope was
the default score of 0.35 as described in chapter 3. NetMHC-II T-cell epitopes were
identified as overlapping sets of peptides. They were categorized as strong binders,
weak binders (IC50 >50nM and IC50 < 500nM) and non-binders (IC50 > 500nM)
based on the predicted IC50. The predicted IC50 was a surrogate measure of the
strength of binding.
The Predivac server was used to predict and score peptides based on their ability
to form stable MHC-peptide complexes. Predivac assigns values between 1 and 100 to
the predictions. Peptides with a prediction value of >60 are assigned as epitopes. In
this study, a conservative approach was adopted and only predicted peptides that were
within an arbitrary 95th percentile of the scores were considered as immunodominant.
The T-cell prediction results were presented based on the predicted affinity scores
and the predicted ability to bind to five or more HLA alleles. A conservative approach
was adopted such that only predicted strong binders were considered for further
investigation.
6.2.1 Linear B-cell epitopes are correlated with sequence diversity
Linear B-cell epitopes were predicted with Bepipred (Larsen et al. 2006) (http: //
www. cbs . dtu. dk/services/BepiPred/) as described in chapter 3 section 3.8.1.
126
The mean Bepipred scores for an alignment of sequences are shown in figure 6.1. The
predicted linear B-cell epitope scores were significantly correlated with hydrophobicity
(Kyte and Doolittle 1982) and sequence diversity, calculated using Shannon’s diversity
index (Shannon 1948). Regions with high Bepipred epitope scores were the most
diverse as shown in figure 6.1. Group-A and non-group-A sequences had a slightly
different binding profile which was more detectable in the 3’ region of the molecule.
127

AGroup • group A • non group A
3 - x*x
2
1
*** f t
K f A ' f wV V
100
0
-1
500 150position
w a . ••0.5
• •
8- o o • •
-0.5-
0 1 2 3
c
0.5
Q-Q.(D
CD
-0.5
0 1 2 3entropy entropy
Figure 6.1: Figure A shows a plot of the mean Bepipred scores and sequence diversity in aligned and randomly selected DBLa sequences. The red dots represents Bepipred scores at each position in group-A sequences and the black are the Bepipred scores from non-group-A sequences. The blue crosses represent the mean Shannon diversity index calculated using a window size o f 5 amino acids along the alignment columns. There was a significant positive correlation(rho=0.3,p-value < 0.001) between the mean Bepipred scores and the sequence diversity. Differences in the Bepipred scores between group-A and non-group-A sequences were more pronounced towards C-terminus. The black and blue lines on figure A represent the homology blocks D and H respectively. Figure B and C shows the correlation between diversity and Bepipred scores in both group A and non-group A respectively.
128

6.2.2 The DBLa sequence region contains potential MHC class II T-cell epitopes
There are several approaches and tools for predicting T-cell epitopes. NetMHCIIpan
(Nielsen et al. 2010; Karosiene et al. 2013) is a pan-specific approach to epitope
prediction and was shown to outperform several other prediction tools and therefore
it was adopted for the purpose of T-cell epitope prediction in this analysis and as
described in chapter 3 section 3.8.4. Because it is known that the length of a peptide
often correlates with binding strength (O’Brien et al. 2008), the length of the peptides
were arbitrary chosen as 9 amino-acids 15 and 18 amino acids to represent short
medium and long peptides respectively. A total of 39 arbitrarily chosen HLA alleles
were used in the predictio; 13 were HLA-DP-DQ and 26 were HLA-DR alleles. A total
of 365 non-redundant DBLa sequence tags from Kilifi collected between 2008 and
2010 were used as input. It was not computationally possible to use all the HLA alleles
for prediction given the limited resources. Secondly, fi there was an important signal,
the rationalle should have picked it with predictions from the limited HLA predictions.
The binding profiles for predicted strong binders are shown in figure 6.2. The
upper and lower panels represents peptides with 15 and 18 amino-acids respectively.
There were no predicted strong binders for peptides with 9 amino-acids presumably
because they were too short for MHC class II binding.
A peptide was considered a strong binder if the predicted binding affinity in IC50
was less than 50nM and a weak binder if the binding affinity was between 50nM and
500nM. Peptides with IC50 above 500nM were considered as a non binders. These
are the defined cutoff thresholds for binders and non-binders. The total number of
129

predicted binders and non-binders for each peptide group is summarized in table 6.1.
strong_binders weak_binders nonjoinders9 amino acids 0 334 1339961
15 amino acids 11956 122173 113575218 amino acids 9376 157241 1068251
Table 6 .1 : The frequency of overlapping strong, weak and non binders predicted w ith NetMHCII from 365 DBLa sequences. There were no strong binders from short peptides w ith a length o f 9 amino acids. The most strong binders were from peptides with 15 amino acids. Peptides with 18 amino acids had fewer strong binders byt the majority of weak binders.
130

A5000-
Frequency of strong binders
4000-
p e p tid e length1 18 aa
15 aa
I
Frequency of w eak binders
p e p tid e length| i s aa
15 aa
CD CD DO CD 03 CD CD CD 03 CD CD CD 03
2 03 03 CD
Figure 6.2: The frequency (y-cucis) o f predicted NetMHCII peptide cores per HLA allele (x-axis). Figure A shows the frequency of strong binders. The frequency of 18-mers and 15-mers is shown in black and grey respectively Within the strong binders, there was a lot of variation in the frequency o f predicted binders for each HLA allele under consideration. The peptides with 18 amino acids were largely weak binders.
131
3096
6.2.3 Predicting peptides with stable peptide-MHC complexes in DBLa sequences
Formation of stable peptide-MHC (p-MHC) complexes is important for immunodomin
ant epitopes. Mutations in a peptide alter the strength of binding and it is important to
identify the key residues that are important for a peptide-MHC interaction. The most
immunodominant epitopes could not be identified based on NetMHCIIpan affinity
values. The Predivac server (Oyarzun et al. 2013) was used to predict core epitopes
that form stable peptide-MHC complexes. The pMHC kinetic stability is important in
controlling the MHC class II peptide immunogenicity.
Immunodominant epitopes were defined as peptides that are predicted to induce
the most potent immune responses from a set of immunogenic peptides competing
that bind to the same MHC molecule. The Predivac server allowed only one sequence
and one HLA-DR allele input at a time. A Python script, predivac-util (listing A.22,
described in chapter 3 section 3.8.5), was developed to automate sequence submission
and retrieval from predivac server.
Predivac was developed using high-affinity binding data in the belief that there
are peptide features that correlate with promiscuity and immunodominance. Based
on the prediction criteria, peptides are assigned a normalized binding score between 1
and 100 where 100 are the strongest binder. These scores are obtained by establishing
a correlation between the specificity determining residues (SDRs) in the HLA query
protein and the SDRs associated with HLA proteins of known specificity as described
in chapter 3 section 3.8.4. According to Predivac developers a predicted peptide score
>60 was used to discriminate potential epitopes from non-epitopes.
132

For the purpose of this analysis, an arbitrary conservative definition of a Predivac
epitope was defined to only consider peptides that were in the top 5% of the scores.
Promiscuous binders were defined as peptides that were within the top 5% of the
predicted binders and could bind to an arbitrary chosen minimum of 5 of the 27
number of HLA alleles that were tested.
400-
300-
2 0 0 -
1 0 0 -
o o o o o o o c j o o oJ 3 J J J 3 3 3 3 3 J 3 J 3 ' 2 J J } ' J 1 3 3ma J t u t DOJ Ooc oa i c Da J CD_ 4 _ 4 _ 4 _ 4 _ 4 _ 4 _ 4 _ 4 _ 4 _ 4 . | ^
o □JJ nCD CD- 4 a i
- 4 _4 _4
(O -4 -4 -4
Figure 6.3: A bar plot of the frequency of predicted immunodominant HLA class II peptides using the Predivac server. Predivac scores predicted core peptides on a scale o f 1 - 100. Peptides with scores >60 are defined as epitopes. Only the 95th percentile of epitopes are shown. HLA allele DRB1 *0410 had the highest frequency of predicted peptides.
In relation to NetMHCII predictions, Predivac predictions shown in figure 6.3 were
considerably fewer. This would be explained by the fact that only a few epitopes are
likely to be immunodominant. It is also im portant to note that a very conservative
threshold was considered and that could partly explain the fewer numbers.
133
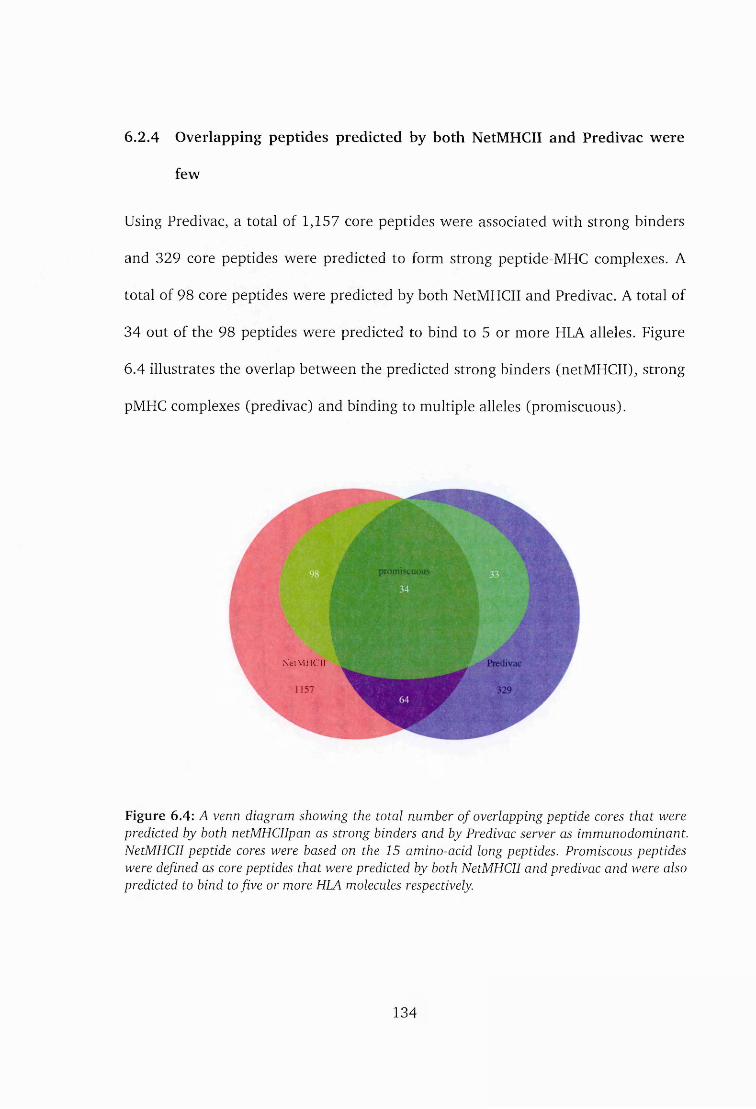
6.2.4 Overlapping peptides predicted by both NetMHCII and Predivac were
few
Using Predivac, a total of 1,157 core peptides were associated with strong binders
and 329 core peptides were predicted to form strong peptide-MHC complexes. A
total of 98 core peptides were predicted by both NetMHCII and Predivac. A total of
34 out of the 98 peptides were predicted to bind to 5 or more HLA alleles. Figure
6.4 illustrates the overlap between the predicted strong binders (netMHCII), strong
pMHC complexes (predivac) and binding to multiple alleles (promiscuous).
NetM HCII
Figure 6.4: A venn diagram showing the total number o f overlapping peptide cores that were predicted by both netMHCIIpan as strong binders and by Predivac server as immunodominant. NetMHCII peptide cores were based on the 15 amino-acid long peptides. Promiscous peptides were defined as core peptides that were predicted by both NetMHCII and predivac and were also predicted to bind to five or more HLA molecules respectively.
134
6.2.5 The frequency of predicted promiscuous epitopes is limited
Conservation of the 34 promiscuous epitopes among DBLa sequence tags from Kilifi,
Amele and Brazil was calculated using the epitope conservation tool (Bui et al. 2007)
(http://tools.immuneepitope.org/tools/conservancy/iedb_input). Pep
tide conservation was defined as the best local alignment of a peptide in a DBLa
sequence. The percentage identity was calculated from the number of peptides that
matched the aligned sequences above 90%. Table 6.2 shows the name of the peptide,
the number of identical hits, the sequence search space, and the percent conservation
in each of the 34 promiscuous epitopes and listed from the most to the least conserved.
The sequence search space comprised of sequences from Kilifi, Papua New Guinea
and South America.
135
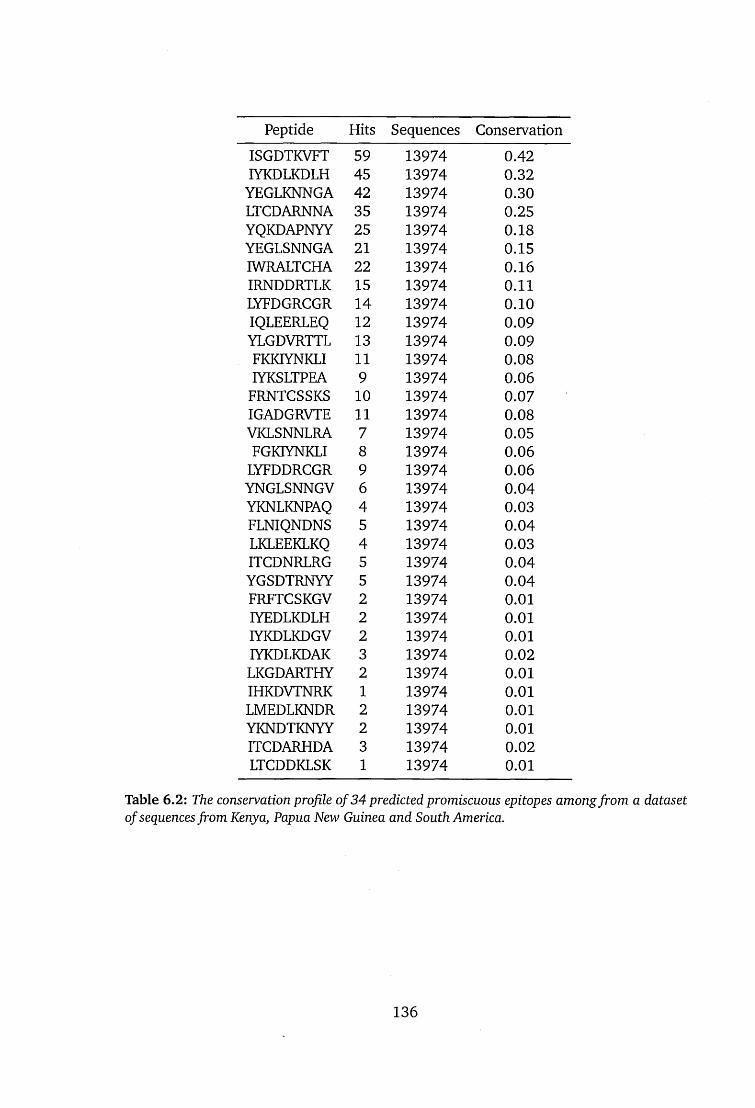
Peptide Hits Sequences ConservationISGDTKVFT 59 13974 0.42IYKDLKDLH 45 13974 0.32
YEGLKNNGA 42 13974 0.30LTGDARNNA 35 13974 0.25YQKDAPNYY 25 13974 0.18YEGLSNNGA 21 13974 0.15IWRALTCHA 22 13974 0.16IRNDDRTLK 15 13974 0.11LYFDGRCGR 14 13974 0.10IQLEERLEQ 12 13974 0.09YLGDVRTTL 13 13974 0.09FKKIYNKLI 11 13974 0.08IYKSLTPEA 9 13974 0.06
FRNTCSSKS 10 13974 0.07IGADGRVTE 11 13974 0.08VKLSNNLRA 7 13974 0.05FGKIYNKLI 8 13974 0.06
LYFDDRCGR 9 13974 0.06YNGLSNNGV 6 13974 0.04YKNLKNPAQ 4 13974 0.03FLNIQNDNS 5 13974 0.04LKLEEKLKQ 4 13974 0.03ITCDNRLRG 5 13974 0.04YGSDTRNYY 5 13974 0.04FRFTCSKGV 2 13974 0.01IYEDLKDLH 2 13974 0.01IYKDLKDGV 2 13974 0.01IYKDLKDAK 3 13974 0.02LKGDARTHY 2 13974 0.01IHKDVTNRK 1 13974 0.01LMEDLKNDR 2 13974 0.01YKNDTKNYY 2 13974 0.01ITCDARHDA 3 13974 0.02LTCDDKLSK 1 13974 0.01
Table 6 .2 : The conservation profile o f 34 predicted promiscuous epitopes among from a dataset of sequences from Kenya, Papua New Guinea and South America.
136

6.2.6 Promiscuous peptides from group A-like sequences are conserved
Sequence hits from table 6.2 were classified based on the Cys-POLV classification
as shown in figure 6.5. The most conserved peptides were from group A-like se
quences with the exception of peptide LTCDARNNA which is conserved largely in
CP4 sequences.
137
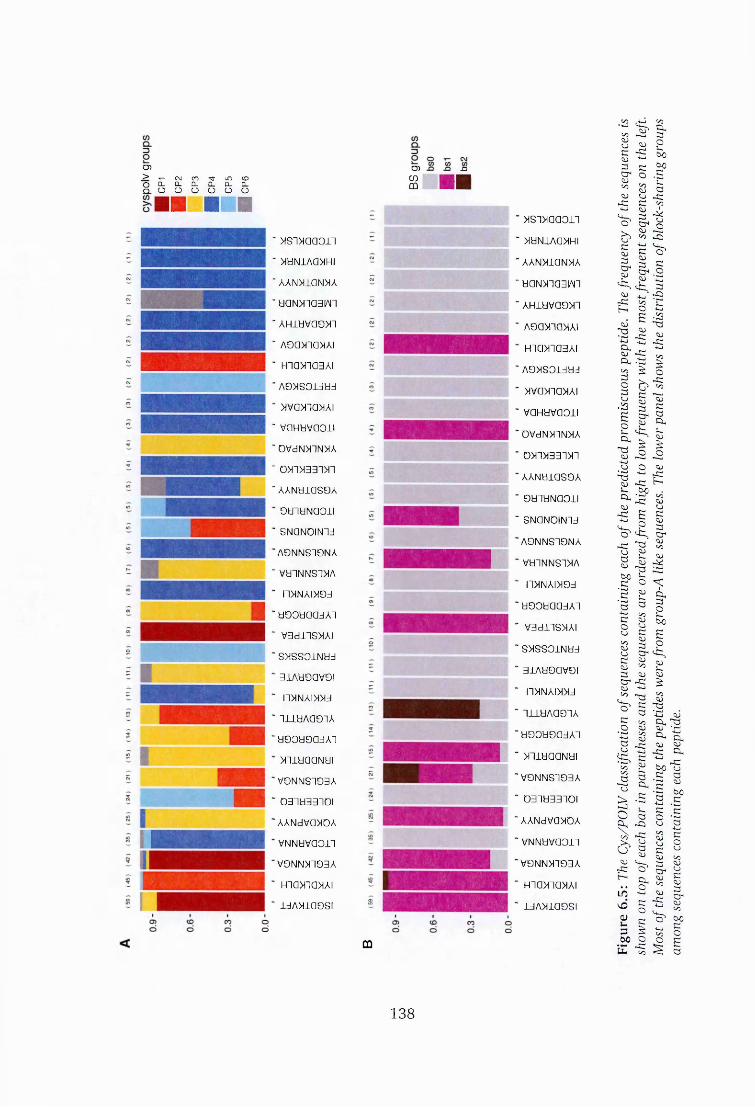
o>_> T- CM CO "d- LO <oo □. CL CL Q_ CL Q.Q. 0 0 0 0 0 0urn ■ s
O) JD% ■■' >tsiMaaoii
' >IUN1AQ»HI
' AANHiaiSMA
'baNXiaam ' A H ib v a o x i
' A oa»ia»A i
■ ma>na3Ai
' A 0 » S 0 I3 H 3
' Mva>na Ai ' v a H H v a o n
' DVdN>i3N»A
' o>n>i33i>n ' AANH1QS9A
' o a i a N a o n
' SNQNOINld ’A9NNS19NA ' Vb1NNS1»A ' raNAI»9d 'b90baadA1 ' V3dl1S>iAI ' S>1SS01Nbd ' 31Ab9aV9l ' IINNAIWd ' 1ULbA091A ' b90b90dAl ' >nibaaNbi 'V9NNS193A ' 031b3310l ’ AANdVa>iDA ' vNNbvaon V9NN>T193A
■ ma>na>ui
' ldA>lia9SI
»si»aaon' >lbNI7\a>1HI
' AAN»10N>W
' daNMiadm ' A H ib va9> n
' A9a>na»Ai ‘ m c m a 3 A i' A9>1S0idbd
' »va>na>iAi ' vaHbvaon ' OVdNHINHA ' 0>i3)H331>n 'AANbiaS9A ' 9dldNa01l ’ SNQNOINld ’A9NNS19NA ' VblNNSDHA ' H»NAI>l9d 'b90baadA1 ' vadiiSMAi ' S^SSOlNbd ' 31Ab9QV9l ' HXNAIXMd ' 111b AO 93 A 'b90b9adA1 ' »iibaaNbi 'V9NNS193A ’ D31b331D!' AANdV0>10A
' V N N bV aO ll
V 9N N »193A
HIOXiaMAI
' UAX1CI9SI
CD
138
Figu
re
6.5:
The
Cy
s/POL
V cl
assif
icat
ion
of se
quen
ces
cont
aini
ng
each
of
the
pred
icte
d pr
omis
cuou
s pe
ptid
e. T
he f
requ
ency
of
the
sequ
ence
s is
show
n on
top
of ea
ch
bar
in pa
rent
hese
s an
d the
se
quen
ces
are
orde
red
from
high
to low
fre
quen
cy
with
the
mos
t fr
eque
nt s
eque
nces
on
the
left.
M
ost
of the
se
quen
ces
cont
aini
ng
the p
eptid
es
were
fro
m gr
oup-
A lik
e se
quen
ces.
The
lowe
r pa
nel
show
s the
di
strib
utio
n of
bloc
k-sh
arin
g gr
oups
am
ong
sequ
ence
s co
ntai
ning
ea
ch
pept
ide.
From figure 6.5 (A), the least conserved peptides were from non group A like
sequences. The most conserved peptides came from sequences belonging to block-
sharing group 1. Three of the peptides were from sequences containing block-sharing
group 2 as shown in figure 6.5 (B).
6.2.7 Predicted promiscuous peptides were expressed largely in group-A se
quences
The relation between the 34 promiscuous peptides and var expression was evaluated
using data from clinical isolates collected in Kilifi. Another evaluation was carried
out using a randomly chosen set of 34 sequences that had been predicted as strong
binders. The random peptides were selected from a collection of strong binders. The
aim was to determine if the peptides were expressed in a subset of PfEMPl proteins
from commonly recognized parasites. Table 6.3 shows the correlation between the 34
peptides and expression based on Cys-POLV groups.
139
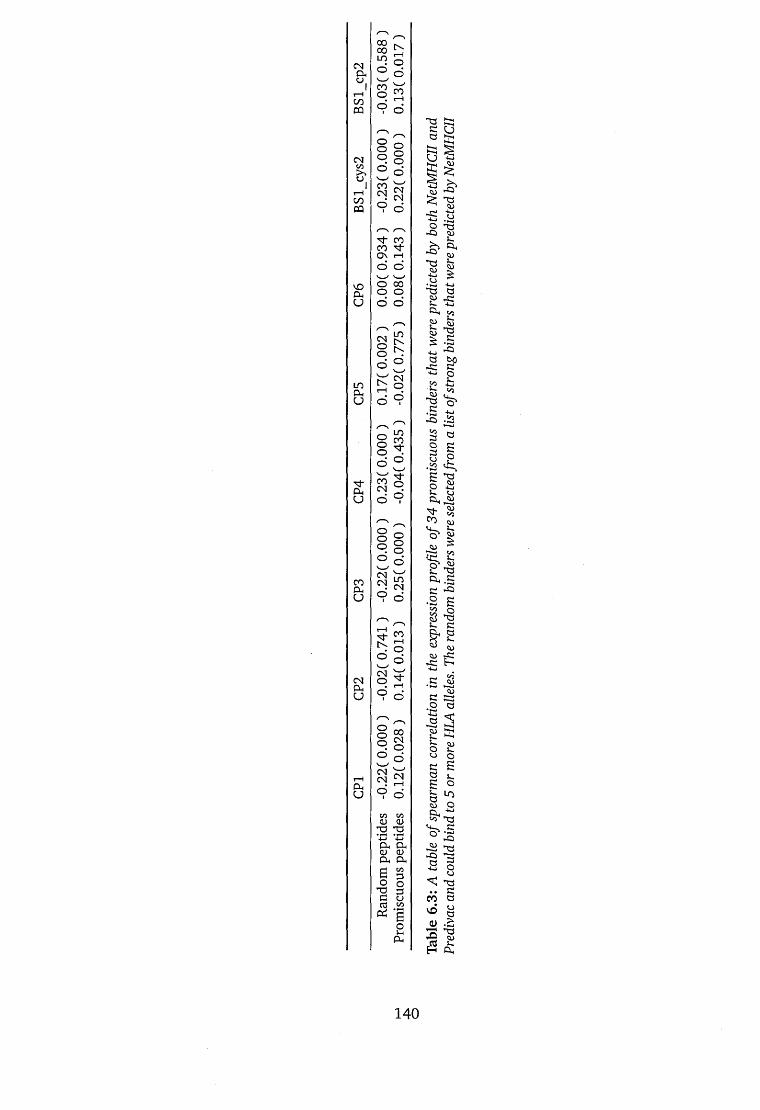
CMPCoC/DCP
CM
COCQ
vOPCV
LOa.u
pcu
COPl,u
CMPCu
PCu
§ 8 9 §O ^
M" CO CO ^ Ov T—io o / V /O 00o o o d
CMO
I s
§ o 9 §° d
9 CM O
^ o ° dV /
CM ^ O ^
O 009 § ° d
CO COa) a>
*•4-1 *4-1PC PC a) a; (X PC
cs COos 'g
p.
<U
-Q -52
140
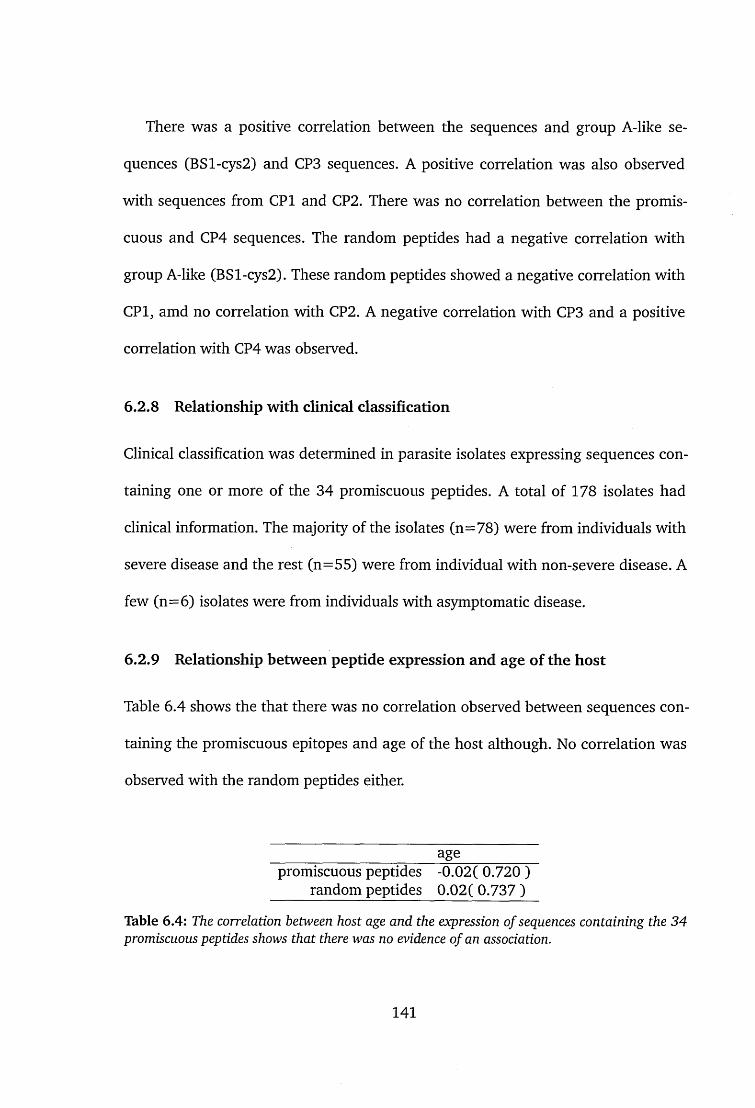
There was a positive correlation between the sequences and group A-like se
quences (BSl-cys2) and CP3 sequences. A positive correlation was also observed
with sequences from CPI and CP2. There was no correlation between the promis
cuous and CP4 sequences. The random peptides had a negative correlation with
group A-like (BSl-cys2). These random peptides showed a negative correlation with
CPI, amd no correlation with CP2. A negative correlation with CP3 and a positive
correlation with CP4 was observed.
6.2.8 Relationship with clinical classification
Clinical classification was determined in parasite isolates expressing sequences con
taining one or more of the 34 promiscuous peptides. A total of 178 isolates had
clinical information. The majority of the isolates (n=78) were from individuals with
severe disease and the rest (n=55) were from individual with non-severe disease. A
few (n=6) isolates were from individuals with asymptomatic disease.
6.2.9 Relationship between peptide expression and age of the host
Table 6.4 shows the that there was no correlation observed between sequences con
taining the promiscuous epitopes and age of the host although. No correlation was
observed with the random peptides either.
_____________________ age__________promiscuous peptides -0.02( 0.720 )
random peptides 0.02( 0.737 )
Table 6.4: The correlation between host age and the expression of sequences containing the 34 promiscuous peptides shows that there was no evidence of an association.
141

6.3 Discussion
The results show that linear B-cell epitopes are associated with diverse regions and
that a few MHC-class II epitope peptides that were widely recognized by HLA alleles
are conserved in sequences that were expressed by individuals with severe disease
and were associated with young host age. The most conserved promiscous T-cell
epitopes were identified in a subset of DBLa sequences that were associated with
severe disease and young host age as shown in figure 6.5.
6.3.1 Linear B-cell epitopes are prevalent in polymorphic regions
Predicted linear B-cell epitope scores were higher in amino acid residues that were
found in polymorphic and hydrophobic regions of the DBLa sequence tag as shown in
figure 6.1. One explanation for this is that Bepipred takes into account Parker’s hydro-
philicity scale to predict B-cell epitopes, therefore it is not surprising that hydrophobic
residues provided high Bepipred scores. What is interesting is that, variation in these
regions appears to converge to residues with specific physico-chemical properties
which may suggest surface exposure and potentially an interaction with antibodies.
Using a Markov model derived from known antibody-antigen binding data is an im
provement to the prediction accuracy (Larsen et al. 2006).
Evidence to support the importance of short linear epitopes comes from laboratory
studies using peptide arrays and predicted linear epitopes. A predicted linear peptide
in AMA1 was shown to be recognized by serum samples that also recognized domain
II of Plasmodium vivax AMA-1 (Bueno et al. 2010). Ditlev et al. (2011) used Bepipred
142

to identify B-cell epitopes in DBL4e of var2CSA in the FCR3 isolate (Ditlev et al. 2011).
These studies showed that ELISA derived peptides could be predicted in-silico and
that the peptides showed high reactivity to sera from multi-gravid women. There is
evidence to suggest that rosetting is mediated by the variable regions of the PfEMPl
protein and that short linear-peptides in sub-domain 1 and 2 of the DBL1 alpha domain
contain anti-rosetting features (Albrecht et al. 2013).
One of the main drawbacks of linear B-cell epitopes is that B-cell cross-reactive
epitopes are likely to be discontinuous and that the prediction accuracy of linear
B-cell epitopes is poor (Blythe and Flower 2005). Discontinuous epitopes rely on
prediction of accurate antigen-antibody structures. In relation to this work, regions
that interact with antibodies would be under diversifying selection. There was not
enough evidence to suggest that diversifying selection was acting on regions that
were identified with high B-cell epitopes. Moreover the DBLa sequence tag is short
relative to the full-length molecule and may not be key to B-cell immunity, at least
not in a direct way.
6.3.2 Promiscuous T-cell epitopes are conserved in sequences associated with
expression in severe malaria
To identify potential important regions of the DBLa molecule, two pan-specific meth-}
ods were used to predict MHC class II T-cell epitopes from 39 arbitrary selected
HLA-alleles. A total of 34 promiscuous peptides were identified based on a conser
vative filtering criteria. The peptides were not very conserved in a majority of the
sequences. The most conserved peptide was only present in a subset of sequences
143
containing the MFK motif. Although the MFK motif is often associated with cys2 se
quences, this motif was found in a cys4 sequence that contained an MFK motif and a
few sequences in CP3 (figure 6.5). This observation may be a sequencing error. It is
difficult to ascertain or drawn any conclusion from the single observation.
Peptide elongation has been reported to increase the MHC class II binding affinity
(O’Brien et al. 2008). From table 6.1 the frequency of strong binders was high in
15 amino acid peptides suggesting that this was the preferred optimal length for a
peptide. Nonetheless, it is still difficult to discern the optimal length of the binders
without experimentation. There were no strong binders with 9 amino acid peptides,
which suggests the importance of residues other than the core peptides.
Although pan-specific methods are developed to cope with HLA class II allele
diversity (Nielsen et al. 2010), most pan-specific tools predict epitopes for only a
single locus (mostly the HLA DR). HLA restriction was a major challenge in T-cell
epitope prediction given that HLA alleles identify peptides with varying affinities. If
an allele recognizes a peptide, it is not guaranteed that a different HLA allotype will
recognize and bind to the same or similar peptide. Another challenge in MHC class-II
T-cell epitope prediction is the breadth of available tools and the respective accuracy.
An important epitope must be recognized by a sufficiently large number of MHC class
II alleles and at the same time it should be sufficiently conserved among the PfEMPl
molecules.
144

6.4 Conclusion
Based on the limited data set, sequences containing the predicted and promiscuous
epitopes were found to be expressed in individuals with severe disease. It would be
important to confirm the ability to raise T-cell immune responses against the predicted
binders and seroprevalence studies on recombinant tags would be potentially useful.
145

Chapter 7 Conclusion
7.1 Molecular diversity
The immense molecular diversity in var genes (Barry et al. 2007) is generated largely
through recombination (Kirkman et al. 2014; Sander et al. 2013; Zilversmit et al.
2013; Duffy et al. 2009; Freitas-Junior et al. 2000; Kerr et al. 1994). Mitotic recom
bination could account for majority of the sequence variation that is observed within
an isolate (Bopp et al. 2013; Claessens et al. 2014) and meiotic recombination ac
counts for the majority of observed variation between different isolates and between
populations. Lack of a suitable or defined var gene epidemiological sampling frame
work is challenge for exploring both sequence and molecular diversity including the
role of single nucleotide substitutions. Due to recombination, sequences from diverse
isolates tend to contain sequence blocks with disparate "ages" which complicates
measures of evolution and tests of selection.
Figure 7.1 shows how new antigenic determinants can be generated through
random mutations and selected by antibodies and thereby shape the var gene reper
toire. Evidence for geographical conservation of antigenic determinants came from
the Aguiar study that showed that despite presence of antigenic diversity, there was
considerable pan-agglutination of parasite samples by serum collected from diverse
146
malaria endemic geographical regions (Aguiar et al. 1992). This suggested that there
are shared surface antigen epitopes between isolates from different geographic re
gions.
A functional role may constrain serological diversity and is particularly important
to identify such proteins because they are potential vaccine candidates and they can
protect against specific forms of malaria. On the other hand, and as illustrated in
figure 7.1 serological diversity may be restricted by functional constraints that restrict
diversity.
147
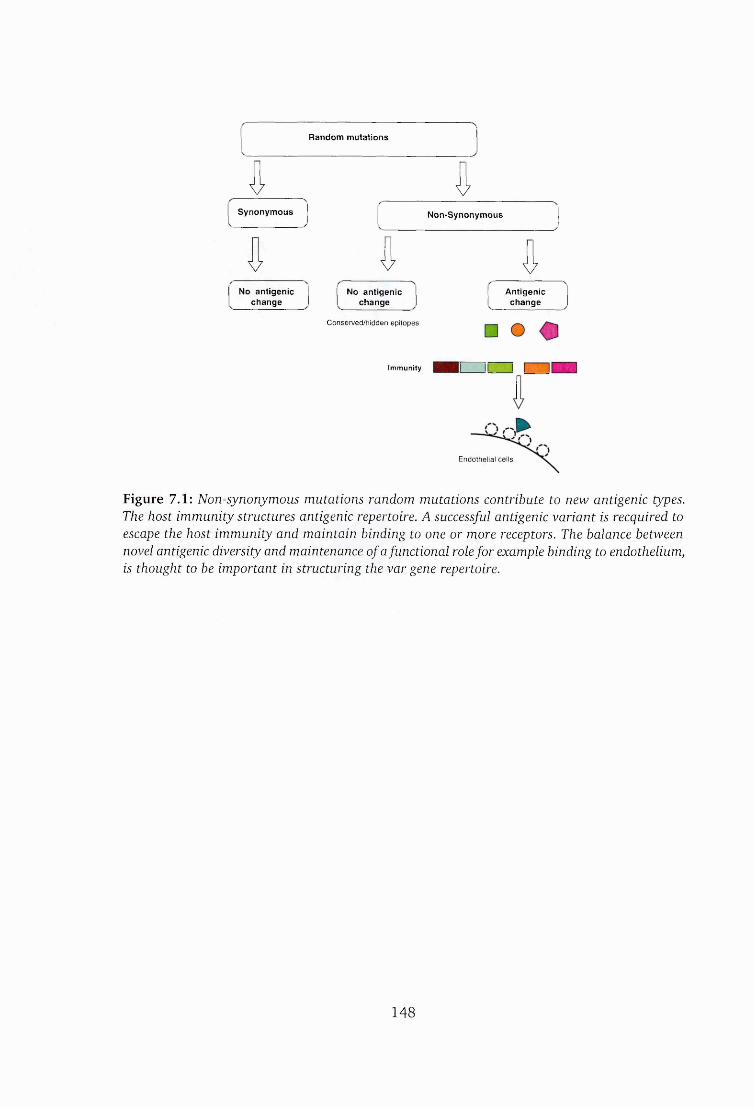
Random mutations
V VS ynonym ous N on-Synonym ous
V V VNo antigenic
changeNo antigenic
changeA ntigenic
change
C o n serv e d /h id d e n ep ito p es
Immunity
Endothelial ce lls
Figure 7.1: Non-synonymous mutations random mutations contribute to new antigenic types. The host immunity structures antigenic repertoire. A successful antigenic variant is recquired to escape the host immunity and maintain binding to one or more receptors. The balance between novel antigenic diversity and maintenance of afunctional role for example binding to endothelium, is thought to be important in structuring the var gene repertoire.
148

7.2 A recap of the aims of the study
This study attempted to understand the relationship between sampled sets of var
sequences from clinical parasite isolates by comparing approaches for classifying
var sequences. The study was extended to explore the pattern of sequence diversity
in DBLa sequences by comparing pairwise differences between groups of similar
sequences at different sequence identity thresholds and later comparing patterns of
changes in relation to predicted epitopes regions.
An unexpected observation was that at 98% and 96% similarities, the frequency
of substitutions within DBLa homology blocks between isolates was relatively higher
compared to substitutions within the polymorphic blocks.
7.3 Summary of methods
Sequences data in this study was prepared using approach than utilized a consensus
reads read alignment using CAP3, a sequence assembly tool (version date 12-21-07)
(Huang and Madan 1999) and Vsearch (version 1.0.16), a tool for processing meta-
genomic sequences, including searching, clustering, sorting, masking and shuffling.
Sequences were clustered using a global alignment procedure and then grouped into
clusters based on similarity at a given thresholds. An immunoinformatic approach
was used to identify potentially immunogenic peptides in the DBLa tag. Predicted epi
topes were evaluated based on the expression profile in samples that were collected
in Kilifi and the age of the host.
149
7.4 Understanding relationships between sequences and classification approaches
In chapter four, approaches for measuring the expression of var genes from clinical
studies were compared with Cys/PoLV classification using 306 published sequences
from 3D7, DD2, HB3, IT4, RAJ116, PFCLIN and IGH3 laboratory isolates (Rask et al.
2010). Results from chapter four showed that;
• Distinct Cys/PoLV groups are associated with upsA genes. Here we developed an
approach to rapidly identify group-A sequences which highlights the importance
of the Cys/PoLV classification method in predicting features of the full-length
molecule.
• DBLa domains represent very heterogeneous sequences. Therefore using trees
to define these sequences maybe misleading. Mutually exclusive sequences can
be found among collections of sequences that have been placed in different
subgroups of the Cys/POLV classification.
• Cys/PoLV groups do not predict sequences with DC8 cassettes given global
collection of sequences but may do so within a restricted geographical location
such as East Africa.
7.5 The role of mutations in generating diversity
Data from chapter five showed that point mutations contribute to the overall var
diversity. The analysis approach attempted to minimize the effect of PCR errors, but
without a quantifiable approach of accounting for PCR errors, it is difficult to make a
150

firm statement on the role of these substitutions. In summary,
• In similar sequences, diversity in the homology blocks was relatively higher
than in the polymorphic blocks in sequences. The known homology blocks
were defined based on collection of DBL domains from diverse sequences and
presumably they contain recombining sequence blocks of different ages. By
looking at sequences collected from the same geographic area and that were
clustered at high similarity, the observed differences can be attributed to real
substitutions.
• The T-A substitution was the most frequent transversion and had higher fre
quency at the third codon compared to the first and the second codon. From the
random model of substitutions, there was no difference in the number of T-A
substitutions. Even upon accounting for the ratio of transitions to transversions,
the relative frequency of T-A substitution did not differ in a proportionally. Se
quences from Kilifi, differed in a statistically significant way in the distribution
of substitutions. Therefore the differences in distribution of T-A changes cannot
be fully accounted by T-A proportion in the sequences.
• Sequences from Kilifi isolates showed a different substitution pattern compared
to sequences from Papua New Guinea. Sequences from the Amele region in
Papua New Guinea had a striking substitution bias at the third codon position
across all types of substitutions. We considered the possibility that this differ
ence might merely be due to composition bias at the third codon within these
sequences. Interestingly there were no differences in the substitution profile
151

compared to sequences from Kilifi.
• Substitutions within the homology blocks were less frequent and they were pre
dominant at the third codon. c-T transversion was more prevalent in homology
block H than homology block D.
• Substitution bias at the third codon was observed in homology blocks D and H
from distantly related sequences.
Previously we have identified varl DBLa sequences using sequence motifs. The
clustering approach was successful in independently identifying varl sequences based
sequence similarity. Chapter 5 showed that varl genes are characterized by a muta
tion hot-spot that may be under diversifying selection or active recombination, varl
showed a different pattern of substitutions in that GT changes were rare at 98% and
88% similarities. Overall the proportion of GA and CT changes was similar to what
was observed in other var sequences. Unlike other var sequences, varl sequences that
were sampled in this study had a distinct uniform length of 330 nucleotides.
7.6 Prediction of epitopes and relationship with age and expression
Chapter 7 explored predicted linear B-cell epitopes and MHC class II T-cell epitopes
in relation to expression in var sequences and host age. Predicting B-cell and T-cell
epitopes is not trivial given the sequence diversity and MHC allele diversity. The
predictions were limited to a few arbitrary selected MHC class II alleles. Linear B-cell
epitopes scores were correlated with sequence diversity and the hydrophobicity profile
which could be due to the fact that Bepipred linear B-cell epitope prediction partly
152
relies on propensity scales. The most diverse regions were potent B-cell epitopes and
there was a difference in B-cell epitope predictions between group-A and non-group-A
DBLa sequences towards the N-terminal as shown in figure 6.1.
In this study a conservative approach was adopted and only 34 promiscuous pep
tides were identified using two MHC class II T-cell epitope prediction tools. This is
a very limited set of peptides to make general conclusions about predicted epitopes.
Furthermore, the number of HLA alleles that were considered were also a limited
set. Nonetheless, it is important to appreciate that these limited set of epitopes were
associated with expression in group-A var genes, secondly a large proportion of the
sequences containing these peptides were from severe malaria individuals and the
rest from non-severe cases. Only a tiny proportion (n=6) was from asymptomatic
individuals but that may be because there was only a few asymptomatic individuals.
7.7 Further work and conclusion
This work was an exploratory description of variation in var sequences based on
the 300-500 base-pair DBLa sequence tag. For a more comprehensive analysis focus
should shift to full length sequences. This could be better achieved by making use of
parasite cloning and sequencing of var genes to confirm the variation bias in C-T/G-A
transitions as well as collection of newly available sequences from around the world.
It would be interesting to investigate role of potential mutagenic events in plas-
modium parasites. An interesting focus is the role of cytosine deamination during
transcription. It has been shown that B-cell-specific-activation-induced cytidine deam
inase (AID) works directly on DNA to deaminate deoxycytidine (Petersen-Mahrt et al.
153

2002). AID is thought to be responsible for antibody gene diversification through
gene conversion and class-switch recombination although the exact mechanism is not
well understood.
Studies in E. coli have shown that deamination of cytosine leads to uracil U, uracil
simulates thymine (T) in DNA and pairs with adenine (A), and after two rounds of
replication the substitution from C/T is generated (Francino and Ochman 2001). In
the human genome, CpG dinucleotides have been shown to mutate at a higher rate
because of cytosine deamination. Methylated CpG dinucleotides go through deamina
tion of 5-methylcytosine to produce thymidine (Coulondre et al. 1978). Given these
accounts, it would be interesting to investigate the role of mutagenic events and in
particular, DNA polymerases and mismatch repair in var sequences. This study showed
an relatively higher number of G-A and C-T substitutions although it was difficult to
assign direction to an observed substitution. It is possible that some substitutions
maybe generated during replication or transcription. Whether this is a deliberate
effort by the parasite to allow errors to persist remains to be investigated.
B and T-cell epitopes should be confirmed by peptide synthesis and testing for live
cell surface reactivity and induction of T-cell responses respectively. Furthermore the
predictions should be based on a wider panel of HLA alleles that comprise of alleles
from the local population from where the acute samples were collected. Potential
source of this data is whole genome sequences. A combination of prediction and
empirical epitope discovery may be more useful in exploring PfEMPl based epitopes.
Examples include the approaches that were considered by Patarroyo et al. (2014) and
Albrecht et al. (2013) and discussed in chapter 1 section 1.10.2
154
References
Arinas, Silvia G, Ramahi Sarma-Rupavtarm, Vanja Klepac-Ceraj and Martin F Polz (2005). ‘PCR-induced sequence artifacts and bias: insights from comparison of two 16S rRNA clone libraries constructed from the same sample.’ Applied and environmental microbiology 71.12, pp. 8966-8969.
Aguiar, J C, G R Albrecht, P Cegielski, Brian M Greenwood, J B Jensen, G Lallinger, A Martinez, IA McGregor, J N Minjas, J Neequaye, M E Patarroyo, J A Sherwood and R J Howard (1992). ‘Agglutination of Plasmodium falciparum-infected erythrocytes from east and west African isolates by human sera from distant geographic regions.’ The American journal of tropical medicine and hygiene 47.5, pp. 621-632.
Albrecht, Letusa, Catarina Castineiras, Bruna O Carvalho, Simone Ladeia-Andrade, Natal Santos da Silva, Erika H E Hoffmann, Rosimeire C dalla Martha, Fabio T M Costa and Gerhard Wunderlich (2010). ‘The South American Plasmodium falciparum var gene repertoire is limited, highly shared and possibly lacks several antigenic types.’ Gene 453.1-2, pp. 37-44.
Albrecht, Letusa, Davide Angeletti, Kirsten Moll, Karin Blomqvist, Davide Valentini, Fabio Luiz D’Alexandri, Markus Maurer and Mats Wahlgren (2013). ‘B-cell epitopes in NTS-DBLla of PfEMPl recognized by human antibodies in Rosetting Plasmodium falciparum.’ PLoS ONE 9.12, e l 13248-el 13248.
Allsopp, Catherine E M, Latifu A Sanni, Lieke Reubsaet, Francis Ndungu, Christopher I Newbold, Tabitha Mwangi, Kevin Marsh and Jean Langhorne (2002). ‘CD4 T cell responses to a variant antigen of the malaria parasite Plasmodium falciparum, erythrocyte membrane protein-1, in individuals living in malaria-endemic areas.’ The Journal of infectious diseases 185.6, pp. 812-819.
Altschul, S F, W Gish, W Miller, E W Myers and D J Lipman (1990). ‘Basic local alignment search tool.’ Journal of Molecular Biology 215.3, pp. 403-410.
Amaratunga, Chanaki, Tatiana M Lopera-Mesa, Nathaniel J Brittain, Rushina Cholera, Takayuki Arie, Hisashi Fujioka, Jeffrey R Keefer and Rick M Fairhurst (2011). ‘A role for fetal hemoglobin and maternal immune IgG in infant resistance to Plasmodium falciparum malaria.’ PLoS ONE 6.4, el4798.
Andisi, Cheryl (2014). ‘Profiling PfEMPl Variants Associated With Severe Malaria And Low Host Immunity Over Time’. PhD thesis. Milton-Keynes.
155
Anisimova, Maria, Rasmus Nielsen and Ziheng Yang (2003). ‘Effect of recombination on the accuracy of the likelihood method for detecting positive selection at amino acid sites.’ Genetics 164.3, pp. 1229-1236.
Avril, Marion, Abhai K Tripathi, Andrew J Brazier, Cheryl Andisi, Joel H Janes, Vijaya L Soma, David J Sullivan, Peter C Bull, Monique F Stins and Joseph D Smith(2012). ‘A restricted subset of var genes mediates adherence of Plasmodium falciparum-infected erythrocytes to brain endothelial cells.’ Proceedings of the National Academy of Sciences of the United States of America 109.26, E1782-90.
Baird, J K JK, S S Masbar, H H Basri, S S Tirtokusumo, B B Subianto and S L SL Hoffman (1998). ‘Age-dependent susceptibility to severe disease with primary exposure to Plasmodium falciparum.’ The Journal o f infectious diseases 178.2, pp. 592- 595.
Barnwell, J W, A S Asch, R L Nachman, M Yamaya, M Aikawa and P Ingravallo (1989). ‘A human 88-kD membrane glycoprotein (CD36) functions in vitro as a receptor for a cytoadherence ligand on Plasmodium falciparum-infected erythrocytes.’ Journal of Clinical Investigation 84.3, pp. 765-772.
Barry, Alyssa E, Aleksandra Leliwa-Sytek, Livingston Tavul, Heather Imrie, Florence Migot-Nabias, Stuart M Brown, Gilean A V McVean and Karen P Day (2007). ‘Population genomics of the immune evasion (var) genes of Plasmodium falciparum.’ PLoS Pathogens 3.3, e34.
Baruch, D I, X C Ma, H B Singh, X Bi, B L Pasloske and R J Howard (1997). ‘Identification of a region of PfEMPl that mediates adherence of Plasmodium falciparum infected erythrocytes to CD36: conserved function with variant sequence.’ Blood 90.9, pp. 3766-3775.
Bengtsson, Anja, Louise Joergensen, Thomas S Rask, Rebecca W Olsen, Marianne A Andersen, Louise Turner, Thor G Theander, Lars Hviid, Matthew K Higgins, Alister Craig, Alan Brown and Anja T R Jensen (2013). ‘A novel domain cassette identifies Plasmodium falciparum PfEMPl proteins binding ICAM-1 and is a target of cross-reactive, adhesion-inhibitory antibodies.’ The Journal of Immunology 190.1, pp. 240-249.
Berendt, A R, D L Simmons, J Tansey, Christopher I Newbold and Kevin Marsh (1989). ‘Intercellular adhesion molecule-1 is an endothelial cell adhesion receptor for Plasmodium falciparum.’ Nature 341.6237, pp. 57-59.
Berkley, James A, Philip Bejon, Tabitha Mwangi, Samson Gwer, Kathryn Maitland, Thomas N Williams, Shebe Mohammed, Faith Osier, Samson Kinyanjui, Greg Fegan, Brett S Lowe, Mike English, Norbert Peshu, Kevin Marsh and Charles R J C Newton (2009). ‘HIV infection, malnutrition, and invasive bacterial infection among children with severe malaria.’ Clinical infectious diseases : an official publication of the Infectious Diseases Society of America 49.3, pp. 336-343.
156
Bertin, Gwladys I, Thomas Lavstsen, Frangois Guillonneau, Justin Doritchamou, Christian W Wang, Jakob S Jespersen, Sem Ezimegnon, Nadine Fievet, Maroufou J Alao, Francis Lalya, Achille Massougbodji, Nicaise Tuikue Ndam, Thor G Theander and Philippe Deloron (2013). ‘Expression of the domain cassette 8 Plasmodium falciparum erythrocyte membrane protein 1 is associated with cerebral malaria in Benin/ PLoS ONE 8.7, e68368.
Blomqvist, Karin, Johan Normark, Daniel Nilsson, Ulf Ribacke, Judy Orikiriza, Petter Trillkott, Justus Byarugaba, Thomas G Egwang, Fred Kironde, Bjorn Andersson and Mats Wahlgren (2010). ‘var gene transcription dynamics in Plasmodium falciparum patient isolates’. Molecular and biochemical parasitology 170.2, pp. 74— 83.
Blomqvist, Karin, Letusa Albrecht, Maria del Pilar Quintana, Davide Angeletti, Nicolas Joannin, Arnaud Chene, Kirsten Moll and Mats Wahlgren (2013). ‘A sequence in subdomain 2 of DBLla of Plasmodium falciparum erythrocyte membrane protein 1 induces strain transcending antibodies.’ PLoS ONE 8.1, e52679.
Blythe, Martin J and Darren R Flower (2005). ‘Benchmarking B cell epitope prediction: underperformance of existing methods.’ Protein science : a publication of the Protein Society 14.1, pp. 246-248.
Bonnal, R J P, J Aerts, George Githinji, N Goto, D MacLean, C A Miller, H Mishima, M Pagani, R Ramirez-Gonzalez, G Smant, F Strozzi, R Syme, R Vos, T J Wennblom, B J Woodcroft, T Katayama and P Prins (2012). ‘Biogem: an effective tool-based approach for scaling up open source software development in bioinformatics’. 28.7, pp. 1035-1037.
Bopp, Selina E R, Micah J Manary, A Taylor Bright, Geoffrey L Johnston, Neekesh V Dharia, Fabio L Luna, Susan McCormack, David Plouffe, Case W McNamara, John R Walker, David A Fidock, Eros Lazzerini Denchi and Elizabeth A Winzeler(2013). ‘Mitotic evolution of Plasmodium falciparum shows a stable core genome but recombination in antigen families.’ PLoS Genetics 9.2, el003293.
Brown, K N and I N Brown (1965). ‘Immunity to malaria: antigenic variation in chronic infections of Plasmodium knowlesi.’ Nature 208.5017, pp. 1286-1288.
Buckee, Caroline O and Mario Recker (2012). ‘Evolution of the multi-domain structures of virulence genes in the human malaria parasite, Plasmodium falciparum.’ PLoS Computational Biology 8.4, e l 002451.
Bueno, Lilian Lacerda, Francisco Pereira Lobo, Cristiane Guimaraes Morais, Luiza Carvalho Mourao, Ricardo Andrez Machado de Avila, Irene Silva Soares, Cor Jesus Fontes, Marcus Vinicius Lacerda, Carlos Chavez Olortegui, Daniella Castanheira Bartholomeu, Ricardo Toshio Fujiwara and Erika Martins Braga (2010). ‘Identification of a highly antigenic linear B cell epitope within Plasmodium vivax apical membrane antigen 1 (AMA-1).’ PLoS ONE 6.6, e21289-e21289.
157

Bui, Huynh-Hoa, John Sidney, Wei Li, Nicolas Fusseder and Alessandro Sette (2007). ‘Development of an epitope conservancy analysis tool to facilitate the design of epitope-based diagnostics and vaccines.’ BMC Bioinformatics 8.1, p. 361.
Bull, P C, B S Lowe, M Kortok, C S Molyneux, Christopher I Newbold and Kevin Marsh (1998). ‘Parasite antigens on the infected red cell surface are targets for naturally acquired immunity to malaria.’ Nature Medicine 4.3, pp. 358-360.
Bull, P C, B S Lowe, M Kortok and Kevin Marsh (1999). ‘Antibody recognition of Plasmodium falciparum erythrocyte surface antigens in Kenya: evidence for rare and prevalent variants.’ Infection and Immunity 67.2, pp. 733-739.
Bull, P C, M Kortok, O Kai, F Ndungu, A Ross, B S Lowe, Christopher I Newbold and Kevin Marsh (2000). ‘Plasmodium falciparum-infected erythrocytes: agglutination by diverse Kenyan plasma is associated with severe disease and young host age.’ The Journal of infectious diseases 182.1, pp. 252-259.
Bull, Peter C and Kevin Marsh (2002). ‘The role of antibodies to Plasmodium falciparum- infected-erythrocyte surface antigens in naturally acquired immunity to malaria.’ Trends in microbiology 10.2, pp. 55-58.
Bull, Peter C, Matthew Berriman, Sue A Kyes, Michael A Quail, Neil Hall, Moses M Kortok, Kevin Marsh and Christopher I Newbold (2005). ‘Plasmodium falciparum variant surface antigen expression patterns during malaria.’ PLoS Pathogens 1.3, e26.
Bull, Peter C, Sue A Kyes, Caroline O Buckee, Jacqui Montgomery, Moses M Kortok, Christopher I Newbold and Kevin Marsh (2007). ‘An approach to classifying sequence tags sampled from Plasmodium falciparum var genes.’ Molecular and biochemical parasitology 154.1, pp. 98-102.
Bull, Peter C, Caroline O Buckee, Sue A Kyes, Moses M Kortok, Vandana Thathy, Bernard Guyah, Jose A Stoute, Christopher I Newbold and Kevin Marsh (2008). ‘Plasmodium falciparum antigenic variation. Mapping mosaic var gene sequences onto a network of shared, highly polymorphic sequence blocks.’ Molecular microbiology 68.6, pp. 1519-1534.
Chan, Jo-Anne, Katherine B Howell, Linda Reiling, Ricardo Ataide, Claire L Mackintosh, Freya J I Fowkes, Michaela Petter, Joanne M Chesson, Christine Langer, George M Warimwe, Michael F Duffy, Stephen J Rogerson, Peter C Bull, Alan F Cowman, Kevin Marsh and James G Beeson (2012). ‘Targets of antibodies against Plasmodium falciparum-infected erythrocytes in malaria immunity.’ Journal o f Clinical Investigation 122.9, pp. 3227-3238.
Claessens, Antoine, Yvonne Adams, Ashfaq Ghumra, Gabriella Lindergard, Caitlin C Buchan, Cheryl Andisi, Peter C Bull, Sachel Mok, Archna P Gupta, Christian W Wang, Louise Turner, Monica Arman, Ahmed Raza, Zbynek Bozdech and J Alexandra Rowe (2012). ‘A subset of group A-like var genes encodes the malaria parasite
158
ligands for binding to human brain endothelial cells.’ Proceedings of the National Academy of Sciences of the United States of America 109.26, E1772-81.
Claessens, Antoine, William L Hamilton, Mihir Kekre, Thomas D Otto, Adnan Faizullab- hoy, Julian C Rayner and Dominic Kwiatkowski (2014). ‘Generation of Antigenic Diversity in Plasmodium falciparum by Structured Rearrangement of Var Genes During Mitosis.’ PLoS Genetics 10.12, el004812-el004812.
Coggeshall, L T and H W Kumm (1937). ‘Demostration of Passive Immunity in Experimental Monkey Malaria’. The Journal of experimental medicine 66.2, pp. 177- 190.
Cohen, S, IA McGregor and S CARRINGTON (1961). ‘Gamma-globulin and acquired immunity to human malaria.’ Nature 192, pp. 733-737.
Collins, William E and Geoffrey M Jeffery (2005). ‘Plasmodium ovale: parasite and disease.’ Clinical microbiology reviews 18.3, pp. 570-581.
Coulondre, C, J H Miller, P J Farabaugh and W Gilbert (1978). ‘Molecular basis of base substitution hotspots in Escherichia coli.’ Nature 274.5673, pp. 775-780.
Cox-Singh, J, T M E Davis, K S Lee, S S G Shamsul, A Matusop, S Ratnam, H A Rahman, D J Conway and B Singh (2008). ‘Plasmodium knowlesi Malaria in Humans Is Widely Distributed and Potentially Life Threatening’. Clinical Infectious Diseases 46.2, pp. 165-171.
Craig, A, D Fernandez-Reyes, M Mesri, A McDowall, D C Altieri, N Hogg and C New- bold (2000). ‘A functional analysis of a natural variant of intercellular adhesion molecule-1 (ICAM-lKilifi).’ Human molecular genetics 9.4, pp. 525-530.
Deitsch, K W, A del Pinal and T E Wellems (1999). ‘Intra-cluster recombination and var transcription switches in the antigenic variation of Plasmodium falciparum.’ Molecular and biochemical parasitology 101.1-2, pp. 107-116.
Ditlev, Sisse B, Morten A Nielsen, Mafalda Resende, Mette 0 Agerbaek, Vera V Pinto, Pernille H Andersen, Pamela Magistrado, John Lusingu, Madeleine Dahlback, Thor G Theander and Ali Salanti (2011). ‘Identification and characterization of B-cell epitopes in the DBL4s domain of VAR2CSA.’ PLoS ONE 7.9, e43663-e43663.
Douglas, Nicholas M, Francois Nosten, Elizabeth A Ashley, Lucy Phaiphun, Michele van Vugt, Pratap Singhasivanon, Nicholas J White and Ric N Price (2011). ‘Plasmodium vivax recurrence following falciparum and mixed species malaria: risk factors and effect of antimalarial kinetics.’ Clinical infectious diseases : an official publication of the Infectious Diseases Society of America 52.5, pp. 612-620.
Doumbo, Ogobara K, Mahamadou A Thera, Abdoulaye K Kone, Ahmed Raza, Louisa J Tempest, Kirsten E Lyke, Christopher V Plowe and J Alexandra Rowe (2009). ‘High levels of Plasmodium falciparum rosetting in all clinical forms of severe malaria in African children.’ The American journal of tropical medicine and hygiene 81.6, p p .987-993.
159
Duffy, Michael F, Timothy J Byrne, Celine Carret, Alasdair Ivens and Graham V Brown (2009). ‘Ectopic recombination of a malaria var gene during mitosis associated with an altered var switch rate.’ Journal of Molecular Biology 389.3, pp. 453-469.
Duraisingh, Manoj T, Till S Voss, Allison J Marty, Michael F Duffy, Robert T Good, Jennifer K Thompson, Lucio H Freitas-Junior, Artur Scherf, Brendan S Crabb and Alan F Cowman (2005). ‘Heterochromatin Silencing and Locus Repositioning Linked to Regulation of Virulence Genes in Plasmodium falciparum’. Cell 121.1, pp. 13-24.
Duval, Linda, Mathieu Fourment, Eric Nerrienet, Dominique Rousset, Serge A Sadeuh, Steven M Goodman, Nicole V Andriaholinirina, Milijaona Randrianarivelojosia, Richard E Paul, Vincent Robert, Francisco J Ayala and Frederic Ariey (2010). ‘African apes as reservoirs of Plasmodium falciparum and the origin and diversification of the Laverania subgenus.’ Proceedings o f the National Academy of Sciences of the United States of America 107.23, pp. 10561-10566.
Eaton, M D (1938). ‘The Agglutination of Plasmodium knowlesi by Immune Serum.’ The Journal of experimental medicine 67.6, pp. 857-870.
Edgar, R C (2004). ‘MUSCLE: multiple sequence alignment with high accuracy and high throughput’. Nucleic Acids Research 32.5, pp. 1792-1797.
Edgar, Robert C (2010). ‘Search and clustering orders of magnitude faster than BLAST.’ 26.19, pp. 2460-2461.
Edozien, J C, A E Boyo and D C Morley (1960). ‘The relationship of serum gammaglobulin concentration to malaria and sickling.’ Journal o f Clinical Pathology 13, p p .118-123.
Ellis, Jonathan J and Bostjan Kobe (2011). ‘Predicting protein kinase specificity: Predikin update and performance in the DREAM4 challenge.’ PLoS ONE 6.7, e21169.
Emini, E A, J V Hughes, D S Perlow and J Boger (1985). ‘Induction of hepatitis A virus- neutralizing antibody by a virus-specific synthetic peptide.’ Journal of virology 55.3, pp. 836-839.
Falk, Nicole, Mirjam Kaestli, Weihong Qi, Michael Ott, Kay Baea, Alfred Cortes and Hans-Peter Beck (2009). ‘Analysis of Plasmodium falciparum var genes expressed
• in children from Papua New Guinea.’ The Journal of infectious diseases 200.3, pp. 347-356.
Francino, M P and H Ochman (2001). ‘Deamination as the basis of strand-asymmetric evolution in transcribed Escherichia coli sequences.’ Molecular biology and evolution 18.6, pp. 1147-1150.
Freitas-Junior, L H, E Bottius, L A Pirrit, K W Deitsch, C Scheidig, F Guinet, U Nehrbass, T E Wellems and A Scherf (2000). ‘Frequent ectopic recombination of virulence factor genes in telomeric chromosome clusters of P. falciparum.’ Nature 407.6807,p p .1018-1022.
160
Freitas-Junior, Lucio H, Rosaura Hernandez-Rivas, Stuart A Ralph, Dvorak Montiel- Condado, Omar K Ruvalcaba-Salazar, Ana Paola Rojas-Meza, Liliana Mancio-Silva, Ricardo J Leal-Silvestre, Alisson Marques Gontijo, Spencer Shorte and Artur Scherf (2005). ‘Telomeric heterochromatin propagation and histone acetylation control mutually exclusive expression of antigenic variation genes in malaria parasites.’Cell 121.1, pp. 25-36.
Fried, M, F Nosten, A Brockman, B J Brabin and P E Duffy (1998). ‘Maternal antibodies block malaria.’ Nature 395.6705, pp. 851-852.
Fu, Limin, Beifang Niu, Zhengwei Zhu, Sitao Wu and Weizhong Li (2012). ‘CD-HIT: accelerated for clustering the next-generation sequencing data.’ 28.23, pp. 3150- 3152.
Gardner, Malcolm J, Neil Hall, Eula Fung, Owen White, Matthew Berriman, Richard W Hyman, Jane M Carlton, Arnab Pain, Karen E Nelson, Sharen Bowman, Ian T Paulsen, Keith James, Jonathan A Eisen, Kim Rutherford, Steven L Salzberg, Alister Craig, Sue A Kyes, Man-Suen Chan, Vishvanath Nene, Shamira J Shallom, Bernard Suh, Jeremy Peterson, Sam Angiuoli, Mihaela Pertea, Jonathan Allen, Jeremy Selengut, Daniel Haft, Michael W Mather, Akhil B Vaidya, David M A Martin, Alan H Fairlamb, Martin J Fraunholz, David S Roos, Stuart A Ralph, Geoffrey I Mc- Fadden, Leda M Cummings, G Mani Subramanian, Chris Mungall, J Craig Venter, Daniel J Carucci, Stephen L Hoffman, Christopher I Newbold, Ronald W Davis, Claire M Fraser and Bart Barrell (2002). ‘Genome sequence of the human malaria parasite Plasmodium falciparum.’ Nature 419.6906, pp. 498-511.
Genton, Blaise, Valerie D’Acremont, Lawrence Rare, Kay Baea, John C Reeder, Michael P Alpers and Ivo Muller (2008). ‘Plasmodium vivax and mixed infections are associated with severe malaria in children: a prospective cohort study from Papua New Guinea.’ PLoS Medicine 5.6, el27.
Gitau, Evelyn N, James Tuju, Liz Stevenson, Eva Kimani, Henry Karanja, Kevin Marsh,Peter C Bull and Britta C Urban (2012a). ‘T-Cell Responses to the DBLa-Tag, a Short Semi-Conserved Region of the Plasmodium falciparum Membrane Erythrocyte Protein 1’. PLoS ONE 7.1, e30095.
— (2012b). ‘T-cell responses to the DBLa-tag, a short semi-conserved region of the Plasmodium falciparum membrane erythrocyte protein 1.’ PLoS ONE 7.1, e30095.
Gitau, Evelyn N, James Tuju, Henry Karanja, Liz Stevenson, Pilar Requena, Eva Kimani, Ally Olotu, Domtila Kimani, Kevin Marsh, Peter Bull and Britta C Urban(2014). ‘CD4+ T cell responses to the Plasmodium falciparum erythrocyte membrane protein 1 in children with mild malaria.’ The Journal of Immunology 192.4, pp. 1753-1761.
Gonqalves, Bronner P, Chiung-Yu Huang, Robert Morrison, Sarah Holte, Edward Kabyemela, D Rebecca Prevots, Michal Fried and Patrick E Duffy (2014). ‘Parasite burden and severity of malaria in Tanzanian children.’ The New England journal o f medicine 370.19, pp. 1799-1808.
161
Greenwood, Brian M, Kalifa Bojang, Christopher J M Whitty and Geoffrey A T Targett (2005). ‘Malaria.’ Lancet 365.9469, pp. 1487-1498.
Gupta, S, R W Snow, G A Donnelly, Kevin Marsh and C Newbold (1999). ‘Immunity to non-cerebral severe malaria is acquired after one or two infections.’ Nature Medicine 5.3, pp. 340-343.
Hay, Simon I, Emelda A Okiro, Peter W Gething, Anand P Patil, Andrew J Tatem, Carlos A Guerra and Robert W Snow (2010). ‘Estimating the global clinical burden of Plasmodium falciparum malaria in 2007.’ PLoS Medicine 7.6, el000290.
Higgins, Matthew K (2008). ‘The structure of a chondroitin sulfate-binding domain important in placental malaria.’ The Journal of biological chemistry 283.32, pp. 21842- 21846.
Hill, A V, C E Allsopp, D Kwiatkowski, N M Anstey, P Twumasi, P A Rowe, S Bennett, D Brewster, A J McMichael and Brian M Greenwood (1991). ‘Common west African HLA antigens are associated with protection from severe malaria.’ Nature 352.6336, pp. 595-600.
Howell, Dasein P-G, Emily A Levin, Amy L Springer, Susan M Kraemer, David J Phip- pard, William R Schief and Joseph D Smith (2008). ‘Mapping a common interaction site used by Plasmodium falciparum Duffy binding-like domains to bind diverse host receptors.’ Molecular microbiology 67.1, pp. 78-87.
Howitt, Cali A, Daniel Wilinski, Manuel Llinas, Thomas J Templeton, Ron Dzikowski and Kirk W Deitsch (2009). ‘Clonally variant gene families in Plasmodium fal- ciparumshare a common activation factor’. Molecular microbiology 73.6, pp. 1171- 1185.
Huang, X and A Madan (1999). ‘CAP3: A DNA sequence assembly program.’ Genome research 9.9, pp. 868-877.
Hviid, Lars and Trine Staalsoe (2004). ‘Malaria immunity in infants: a special case of a general phenomenon?’ Trends in parasitology 20.2, pp. 66-72.
Jelinek, T, C Schulte, R Behrens, M P Grobusch, J P Coulaud, Z Bisoffi, A Matteelli, J Clerinx, M Corachan, S Puente, I Gj0rup, G Harms, H Kollaritsch, A Kotlowski, A Bjorkmann, J P Delmont, J Knobloch, L N Nielsen, J Cuadros, C Hatz, J Beran, M L Schmid, M Schulze, R Lopez-Velez, K Fleischer, A Kapaun, P McWhinney, P Kern, J Atougia, G Fry, S da Cunha and G Boecken (2002). ‘Imported Falciparum malaria in Europe: sentinel surveillance data from the European network on surveillance of imported infectious diseases.’ Clinical infectious diseases : an official publication of the Infectious Diseases Society of America 34.5, pp. 572-576.
Jenkins, Neil E, Tabitha W Mwangi, Moses Kortok, Kevin Marsh, Alister G Craig and Thomas N Williams (2005). ‘A polymorphism of intercellular adhesion molecule- 1 is associated with a reduced incidence of nonmalarial febrile illness in Kenyan children.’ Clinical infectious diseases : an official publication of the Infectious Diseases Society of America 41.12, pp. 1817-1819.
162

Jensen, Anja T R, Pamela Magistrado, Sarah Sharp, Louise Joergensen, Thomas Lavst- sen, Antonella Chiucchiuini, Ali Salanti, Lasse S Vestergaard, John P Lusingu, Rob Hermsen, Robert Sauerwein, Jesper Christensen, Morten A Nielsen, Lars Hviid, Colin Sutherland, Trine Staalsoe and Thor G Theander (2004). ‘Plasmodium falciparum associated with severe childhood malaria preferentially expresses PfEMPl encoded by group A var genes.’ The Journal of experimental medicine 199.9, pp. 1179- 1190.
Kaestli, Mirjam, Ian A Cockburn, Alfred Cortes, Kay Baea, J Alexandra Rowe and Hans- Peter Beck (2006). ‘Virulence of malaria is associated with differential expression of Plasmodium falciparum var gene subgroups in a case-control study.’ The Journal of infectious diseases 193.11, pp. 1567-1574.
Kalmbach, Yvonne, Matthias Rottmann, Maryvonne Kombila, Peter G Kremsner, Hans- Peter Beck and Jurgen F J Kun (2010). ‘Differential varGene Expression in Children with Malaria and Antidromic Effects on Host Gene Expression’. Journal of Infectious Diseases 202.2, pp. 313-317.
Karosiene, Edita, Michael Rasmussen, Thomas Blicher, Ole Lund, S0ren Buus and Morten Nielsen (2013). ‘NetMHCIIpan-3.0, a common pan-specific MHC class II prediction method including all three human MHC class II isotypes, HLA-DR, HLA-DP and HLA-DQ.’ Immunogenetics 65.10, pp. 711-724.
Kerr, P J, L C Ranford-Cartwright and D Walliker (1994). ‘Proof of intragenic recombination in Plasmodium falciparum.’ Molecular and biochemical parasitology 66.2, pp. 241-248.
Kinyanjui, Samson M, Tabitha Mwangi, Peter C Bull, Christopher I Newbold and Kevin Marsh (2004). ‘Protection against clinical malaria by heterologous immunoglobulin G antibodies against malaria-infected erythrocyte variant surface antigens requires interaction with asymptomatic infections.’ The Journal of infectious diseases 190.9, pp. 1527-1533.
Kirchgatter, Karin and Hernando del A Portillo (2002). ‘Association of severe noncerebral Plasmodium falciparum malaria in Brazil with expressed PfEMPl DBL1 alpha sequences lacking cysteine residues.’ Molecular medicine (Cambridge, Mass.)8.1, pp. 16-23.
Kirkman, Laura A, Elizabeth A Lawrence and Kirk W Deitsch (2014). ‘Malaria parasites utilize both homologous recombination and alternative end joining pathways to maintain genome integrity.’ Nucleic Acids Research 42.1, pp. 370-379.
Kitua, A Y, H Urassa, M Wechsler, T Smith, P Vounatsou, N A Weiss, P L Alonso and M Tanner (1999). ‘Antibodies against Plasmodium falciparum vaccine candidates in infants in an area of intense and perennial transmission: relationships with clinical malaria and with entomological inoculation rates.’ Parasite immunology 21.6, pp. 307-317.
163
Kobe, Bostjan and Mikael Boden (2012). ‘Computational modelling of linear motif- mediated protein interactions.’ Current topics in medicinal chemistry 12.14, pp. 1553- 1561.
Kraemer, Susan M and Joseph D Smith (2003). ‘Evidence for the importance of genetic structuring to the structural and functional specialization of the Plasmodium falciparum var gene family.’ Molecular microbiology 50.5, pp. 1527-1538.
Kraemer, Susan M, Sue A Kyes, Gautam Aggarwal, Amy L Springer, Siri O Nelson, Zoe Christodoulou, Leia M Smith, Wendy Wang, Emily Levin, Christopher I Newbold, Peter J Myler and Joseph D Smith (2007). ‘Patterns of gene recombination shape var gene repertoires in Plasmodium falciparum: comparisons of geographically diverse isolates.’ BMC Genomics 8, p. 45.
Krotoski, W A, D M Krotoski, P C Garnham, R S Bray, R Killick-Kendrick, C C Draper,G A Targett and M W Guy (1980). ‘Relapses in primate malaria: discovery of two populations of exoerythrocytic stages. Preliminary note.’ British medical journal 280.6208, pp. 153-154.
Kyes, Sue A, Zoe Christodoulou, Ahmed Raza, Paul Horrocks, Robert Pinches, J Alexandra Rowe and Christopher I Newbold (2003). ‘A well-conserved Plasmodium falciparum var gene shows an unusual stage-specific transcript pattern.’ Molecular microbiology 48.5, pp. 1339-1348.
Kyes, Sue A, Susan M Kraemer and Joseph D Smith (2007). ‘Antigenic variation in Plasmodium falciparum: gene organization and regulation of the var multigene family.’ Eukaryotic cell 6.9, pp. 1511-1520.
Kyriacou, Helen M, Graham N Stone, Richard J Challis, Ahmed Raza, Kirsten E Lyke, Mahamadou A Thera, Abdoulaye K Kone, Ogobara K Doumbo, Christopher V Plowe and J Alexandra Rowe (2006). ‘Differential var gene transcription in Plasmodium falciparum isolates from patients with cerebral malaria compared to hyperparasit- aemia.’ Molecular and biochemical parasitology 150.2, pp. 211-218.
Kyte, J and R F Doolittle (1982). ‘A simple method for displaying the hydropathic character of a protein’. Journal of Molecular Biology.
Larremore, Daniel B, Aaron Clauset and Caroline O Buckee (2013). ‘A network approach to analyzing highly recombinant malaria parasite genes.’ PLoS Computational Biology 9.10, el003268.
Larsen, Jens Erik Pontoppidan, Ole Lund and Morten Nielsen (2006). ‘Improved method for predicting linear B-cell epitopes.’ Immunome research 2, p. 2.
Lavstsen, Thomas, Ali Salanti, Anja T R Jensen, David E Amot and Thor G Theander (2003). ‘Sub-grouping of Plasmodium falciparum 3D7 var genes based on sequence analysis of coding and non-coding regions.’ Malaria Journal 2, p. 27.
Lavstsen, Thomas, Pamela Magistrado, Cornelus C Hermsen, Ali Salanti, Anja T R Jensen, Robert Sauerwein, Lars Hviid, Thor G Theander and Trine Staalsoe (2005).
164

‘Expression of Plasmodium falciparum erythrocyte membrane protein 1 in experimentally infected humans.’ Malaria Journal 4.1, p. 21.
Lavstsen, Thomas, Louise Turner, Fredy Saguti, Pamela Magistrado, Thomas S Rask, Jakob S Jespersen, Christian W Wang, Sanne S Berger, Vito Baraka, Andrea M Marquard, Andaine Seguin-Orlando, Eske Willerslev, M Thomas P Gilbert, John Lusingu and Thor G Theander (2012). ‘Plasmodium falciparum erythrocyte membrane protein 1 domain cassettes 8 and 13 are associated with severe malaria in children.’ Proceedings of the National Academy of Sciences o f the United States of America 109.26, E l791-800.
Leech, J H, J W Barnwell, Louis H Miller and R J Howard (1984). ‘Identification of a strain-specific malarial antigen exposed on the surface of Plasmodium falciparum- infected erythrocytes.’ The Journal of experimental medicine 159.6, pp. 1567-1575.
Levitt, M (1978). ‘Conformational preferences of amino acids in globular proteins.’ Biochemistry 17.20, pp. 4277-4285.
Li, Weizhong and Adam Godzik (2006). ‘Cd-hit: a fast program for clustering and comparing large sets of protein or nucleotide sequences.’ 22.13, pp. 1658-1659.
Liu, Weimin, Yingying Li, Gerald H Learn, Rebecca S Rudicell, Joel D Robertson, Brandon F Keele, Jean-Bosco N Ndjango, Crickette M Sanz, David B Morgan, Sabrina Locatelli, Mary K Gonder, Philip J Kranzusch, Peter D Walsh, Eric Delaporte, Eitel Mpoudi-Ngole, Alexander V Georgiev, Martin N Muller, George M Shaw, Mar- tine Peeters, Paul M Sharp, Julian C Rayner and Beatrice H Hahn (2010). ‘Origin of the human malaria parasite Plasmodium falciparum in gorillas.’ Nature 467.7314, pp. 420-425.
Lopez-Rubio, Jose Juan, Alisson M Gontijo, Marta C Nunes, Neha Issar, Rosaura Hernandez-Rivas and Artur Scherf (2007). ‘5 ' flanking region of var genes nucleate histone modification patterns linked to phenotypic inheritance of virulence traits in malaria parasites’. Molecular microbiology 66.6, pp. 1296-1305.
Loytynoja, Ari and Nick Goldman (2005). ‘An algorithm for progressive multiple alignment of sequences with insertions.’ Proceedings of the National Academy of Sciences of the United States of America 102.30, pp. 10557-10562.
Markus, Miles B (2011a). ‘Malaria: origin of the term "hypnozoite".’ Journal of the history of biology 44.4, pp. 781-786.
— (2011b). ‘The hypnozoite concept, with particular reference to malaria.’ Parasitology research 108.1, pp. 247-252.
— (2015). ‘Do hypnozoites cause relapse in malaria?’ Trends in parasitology.
Marsh, Kevin and R J Howard (1986). ‘Antigens induced on erythrocytes by P. falciparum: expression of diverse and conserved determinants.’ Science 231.4734, p p .150-153.
165

Marsh, Kevin and S Kinyanjui (2006). ‘Immune effector mechanisms in malaria.’ Parasite immunology 28.1-2, pp. 51-60.
Marsh, Kevin, D Forster, C Waruiru, I Mwangi, M Winstanley, V Marsh, C Newton, P Winstanley, P Warn and N Peshu (1995). ‘Indicators of life-threatening malaria in African children.’ The New England journal of medicine 332.21, pp. 1399-1404.
Mason, S J, Louis H Miller, T Shiroishi, J A Dvorak and M H McGinniss (1977). ‘The Duffy blood group determinants: their role in the susceptibility of human and animal erythrocytes to Plasmodium knowlesi malaria.’ British journal of haematology 36.3, pp. 327-335.
McCormick, C J, A Craig, D Roberts, Christopher I Newbold and A R Berendt (1997). ‘Intercellular adhesion molecule-1 and CD36 synergize to mediate adherence of Plasmodium falciparum-infected erythrocytes to cultured human microvascular endothelial cells.’ Journal o f Clinical Investigation 100.10, pp. 2521-2529.
McGregor, I A, H M Gilles, J H Walters, A H Davies and F A Pearson (1956). ‘Effects of heavy and repeated malarial infections on Gambian infants and children; effects of erythrocytic parasitization.’ British medical journal 2.4994, pp. 686-692.
McSparron, Helen, Martin J Blythe, Christianna Zygouri, Irini A Doytchinova and Darren R Flower (2003). ‘JenPep: a novel computational information resource for immunobiology and vaccinology.’ Journal o f chemical information and computer sciences 43.4, pp. 1276-1287.
Midega, Janet T, Dave L Smith, Ally Olotu, Joseph M Mwangangi, Joseph G Nzovu, Juliana Wambua, George Nyangweso, Charles M Mbogo, George K Christophides, Kevin Marsh and Philip Bejon (2012). ‘Wind direction and proximity to larval sites determines malaria risk in Kilifi District in Kenya.’ Nature communications 3, p. 674.
Miller, Louis H (1969). ‘Distribution of mature trophozoites and schizonts of Plasmodium falciparum in the organs of Aotus trivirgatus, the night monkey.’ The American journal o f tropical medicine and hygiene 18.6, pp. 860-865.
Miller, Louis H, S J Mason, D F Clyde and M H McGinniss (1976). ‘The resistance factor to Plasmodium vivax in blacks. The Duffy-blood-group genotype, FyFy.’ The New England journal of medicine 295.6, pp. 302-304.
Mouchet, J, S Laventure, S Blanchy, R Fioramonti, A Rakotonjanabelo, P Rabarison, J Sircoulon and J Roux (1997). ‘The reconquest of the Madagascar highlands by malaria.’ Bulletin de la Societe depathologie exotique (1990) 90.3, pp. 162-168.
Mueller, Ivo, Mary R Galinski, J Kevin Baird, Jane M Carlton, Dhanpat K Kochar, Pedro L Alonso and Hernando A del Portillo (2009). ‘Key gaps in the knowledge of Plasmodium vivax, a neglected human malaria parasite.’ The Lancet infectious diseases 9.9, pp. 555-566.
166
Mwangangi, Joseph M, Charles M Mbogo, Benedict O Orindi, Ephantus J Muturi, Janet T Midega, Joseph Nzovu, Hellen Gatakaa, John Githure, Christian Borge- meister, Joseph Keating and John C Beier (2013). ‘Shifts in malaria vector species composition and transmission dynamics along the Kenyan coast over the past 20 years.’ Malaria Journal 12.1, p. 13.
Newbold, C, P Warn, G Black, A Berendt, A Craig, B Snow, M Msobo, N Peshu and Kevin Marsh (1997). ‘Receptor-specific adhesion and clinical disease in Plasmodium falciparum.’ The American journal of tropical medicine and hygiene 57.4, pp. 389- 398.
Nielsen, Morten, Sune Justesen, Ole Lund, Claus Lundegaard and S0ren Buus (2010). ‘NetMHCIIpan-2.0 - Improved pan-specific HLA-DRpredictions using a novel concurrent alignmentand weight optimization training procedure’. Immunome research 6.1, p. 9.
Nielsen, Morten A, Trine Staalsoe, J0rgen A L Kurtzhals, Bamenla Q Goka, Daniel Dodoo, Michael Aliffangis, Thor G Theander, Bartholomew D Akanmori and Lars Hviid (2002). ‘Plasmodium falciparum variant surface antigen expression varies between isolates causing severe and nonsevere malaria and is modified by acquired immunity.’ Journal of immunology (Baltimore, Md. : 1950) 168.7, pp. 3444-3450.
Noor, Abdisalan M, Damaris K Kinyoki, Clara W Mundia, Caroline W Kabaria, Jones- mus W Mutua, Victor A Alegana, Ibrahima Soce Fall and Robert W Snow (2014). ‘The changing risk of Plasmodium falciparum malaria infection in Africa: 2000- 10: a spatial and temporal analysis of transmission intensity.’ Lancet 383.9930, pp. 1739-1747.
Normark, Johan, Daniel Nilsson, Ulf Ribacke, Gerhard Winter, Kirsten Moll, Craig E Wheelock, Justus Bayarugaba, Fred Kironde, Thomas G Egwang, Qijun Chen, Bjorn Andersson and Mats Wahlgren (2007). ‘PfEMPl-DBLlalpha amino acid motifs in severe disease states of Plasmodium falciparum malaria.’ Proceedings of the National Academy of Sciences of the United States of America 104.40, pp. 15835- 15840.
O’Brien, Cathal, Darren R Flower and Conleth Feighery (2008). ‘Peptide length significantly influences in vitro affinity for MHC class II molecules.’ Immunome research 4, p. 6.
Ochola, Lucy B, Bethsheba R Siddondo, Harold Ocholla, Siana Nkya, Eva N Kimani, Thomas N Williams, Johnstone O Makale, Anne Liljander, Britta C Urban, Peter C Bull, Tadge Szestak, Kevin Marsh and Alister G Craig (2011). ‘Specific receptor usage in Plasmodium falciparum cytoadherence is associated with disease outcome.’ PLoS ONE 6.3, el4741.
Ofori, Michael F, Daniel Dodoo, Trine Staalsoe, J0rgen A L Kurtzhals, Kwadwo Koram, Thor G Theander, Bartholomew D Akanmori and Lars Hviid (2002). ‘Malaria- induced acquisition of antibodies to Plasmodium falciparum variant surface antigens.’ Infection and Immunity 70.6, pp. 2982-2988.
167

Okiro, Emelda A, Abdullah Al-Taiar, Hugh Reyburn, Richard Idro, James A Berkley and Robert W Snow (2009a). ‘Age patterns of severe paediatric malaria and their relationship to Plasmodium falciparum transmission intensity5. Malaria Journal8.1, p. 4.
Okiro, Emelda A, Victor A Alegana, Abdisalan M Noor, Juliette J Mutheu, Elizabeth Juma and Robert W Snow (2009b). ‘Malaria paediatric hospitalization between 1999 and 2008 across Kenya.’ BMC medicine 7.1, p. 75.
Oleinikov, Andrew V, Emily Amos, Isaac Tyler Frye, Eddie Rossnagle, Theonest K Mutabingwa, Michal Fried and Patrick E Duffy (2009). ‘High throughput functional assays of the variant antigen PfEMPl reveal a single domain in the 3D7 Plasmodium falciparum genome that binds ICAM1 with high affinity and is targeted by naturally acquired neutralizing antibodies.’ PLoS Pathogens 5.4, el000386- el000386.
Ollomo, Benjamin, Patrick Durand, Franck Prugnolle, Emmanuel Douzery, Celine Arnathau, Dieudonne Nkoghe, Eric Leroy and Francois Renaud (2009). ‘A new malaria agent in African hominids.’ PLoS Pathogens 5.5, el000446.
O’Meara, Wendy P, Phillip Bejon, Tabitha W Mwangi, Emelda A Okiro, Norbert Peshu, Robert W Snow, Charles RJC Newton and Kevin Marsh (2008). ‘Effect of a fall in malaria transmission on morbidity and mortality in Kilifi, Kenya’. The Lancet 372.9649, pp. 1555-1562.
Otto, Thomas D, Julian C Rayner, Ulrike Bohme, Arnab Pain, Natasha Spottiswoode, Mandy Sanders, Michael Quail, Benjamin Ollomo, Frangois Renaud, Alan W Thomas, Franck Prugnolle, David J Conway, Christopher I Newbold and Matthew Berriman (2014). ‘Genome sequencing of chimpanzee malaria parasites reveals possible pathways of adaptation to human hosts.’ Nature communications 5, p. 4754.
Oyarzun, Patricio, Jonathan J Ellis, Mikael Boden and Bostjan Kobe (2013). ‘PREDI- VAC: CD4+ T-cell epitope prediction for vaccine design that covers 95% of HLA class II DR protein diversity.’ BMC Bioinformatics 14, p. 52.
Pain, A, D J Ferguson, O Kai, B C Urban, B Lowe, Kevin Marsh and D J Roberts (2001). ‘Platelet-mediated clumping of Plasmodium falciparum-infected erythrocytes is a common adhesive phenotype and is associated with severe malaria.’ Proceedings of the National Academy of Sciences of the United States of America 98.4, pp. 1805- 1810.
Parker, J M, D Guo and R S Hodges (1986). ‘New hydrophilicity scale derived from high-performance liquid chromatography peptide retention data: correlation of predicted surface residues with antigenicity and X-ray-derived accessible sites.’ Biochemistry 25.19, pp. 5425-5432.
Patarroyo, Manuel E, Martha Patricia Alba, Hernando Curtidor, Magnolia Vanegas, Hannia Almonacid and Manuel A Patarroyo (2014). ‘Using the PfEMPl head struc-
168
ture binding motif to deal a blow at severe malaria.’ PLoS ONE 9.2, e88420- e88420.
Pellequer, J L, E Westhof and M H Van Regenmortel (1993). ‘Correlation between the location of antigenic sites and the prediction of turns in proteins.’ Immunology letters 36.1, pp. 83-99.
Petersen-Mahrt, Svend K, Reuben S Harris and Michael S Neuberger (2002). ‘AID mutates E. coli suggesting a DNA deamination mechanism for antibody diversification.’ Nature 418.6893, pp. 99-103.
Piper, K P, D J Roberts and K P Day (1999). ‘Plasmodium falciparum: analysis of the antibody specificity to the surface of the trophozoite-infected erythrocyte.’ Experimental parasitology 91.2, pp. 161-169.
Ponnudurai, T, A H Lensen, G J van Gemert, M G Bolmer and J H Meuwissen (1991). ‘Feeding behaviour and sporozoite ejection by infected Anopheles stephensi.’ Transactions of the Royal Society of Tropical Medicine and Hygiene 85.2, pp. 175-180.
Prugnolle, Franck, Patrick Durand, Cecile Neel, Benjamin Ollomo, Francisco J Ayala, Celine Arnathau, Lucie Etienne, Eitel Mpoudi-Ngole, Dieudonne Nkoghe, Eric Leroy, Eric Delaporte, Martine Peeters and Frangois Renaud (2010). ‘African great apes are natural hosts of multiple related malaria species, including Plasmodium falciparum.’ Proceedings of the National Academy of Sciences of the United States of America 107.4, pp. 1458-1463.
Ralph, Stuart A, Christine Scheidig-Benatar and Artur Scherf (2005). ‘Antigenic variation in Plasmodium falciparum is associated with movement of var loci between subnuclear locations.’ Proceedings of the National Academy of Sciences of the United States of America 102.15, pp. 5414-5419.
Rask, Thomas S, Daniel A Hansen, Thor G Theander, Anders Gorm Pedersen and Thomas Lavstsen (2010). ‘Plasmodium falciparum erythrocyte membrane protein 1 diversity in seven genomes-divide and conquer.’ PLoS Computational Biology 6.9.
Reeder, J C, Alan F Cowman, K M Davern, J G Beeson, J K Thompson, S J Rogerson and G V Brown (1999). ‘The adhesion of Plasmodium falciparum-infected erythrocytes to chondroitin sulfate A is mediated by P. falciparum erythrocyte membrane protein 1.’ Proceedings of the National Academy of Sciences of the United States of America 96.9, pp. 5198-5202.
Riley, E M, O Olerup, S Bennett, P Rowe, S J Allen, M J Blackman, M Troye-Blomberg, A A Holder and Brian M Greenwood (1992). ‘MHC and malaria: the relationship between HLA class II alleles and immune responses to Plasmodium falciparum.’ International immunology 4.9, pp. 1055-1063.
Robinson, Bridget A, Teresa L Welch and Joseph D Smith (2003). ‘Widespread functional specialization of Plasmodium falciparum erythrocyte membrane protein 1 family members to bind CD36 analysed across a parasite genome.’ Molecular microbiology 47.5, pp. 1265-1278.
169
Rogerson, S J, S C Chaiyaroj, K Ng, J C Reeder and G V Brown (1995). ‘Chondroitin sulfate A is a cell surface receptor for Plasmodium falciparum-infected erythrocytes.’ The Journal of experimental medicine 182.1, pp. 15-20.
Rogerson, S J, R Tembenu, C Dobano, S Plitt, T E Taylor and M E Molyneux (1999). ‘Cytoadherence characteristics of Plasmodium falciparum-infected erythrocytes from Malawian children with severe and uncomplicated malaria.’ The American journal of tropical medicine and hygiene 61.3, pp. 467-472.
Rosenberg, R, R A Wirtz, I Schneider and R Burge (1990). ‘An estimation of the number of malaria sporozoites ejected by a feeding mosquito.’ Transactions of the Royal Society of Tropical Medicine and Hygiene 84.2, pp. 209-212.
Rottmann, Matthias, Thomas Lavstsen, Joseph Paschal Mugasa, Mirjam Kaestli, Anja T R Jensen, Dania Muller, Thor Theander and Hans-Peter Beck (2006). ‘Differential expression of var gene groups is associated with morbidity caused by Plasmodium falciparum infection in Tanzanian children.’ Infection and Immunity 74.7, pp. 3904- 3911.
Rowe, J A, J M Moulds, Christopher I Newbold and Louis H Miller (1997). ‘P. falciparum rosetting mediated by a parasite-variant erythrocyte membrane protein and complement-receptor 1 .’Nature 388.6639, pp. 292-295.
Ryan, Jeffrey R, Jose A Stoute, Joseph Amon, Raymond F Dunton, Ramadhan Mtalib, Joseph Koros, Boaz Owour, Shirley Luckhart, Robert A Wirtz, John W Barnwell and Ronald Rosenberg (2006). ‘Evidence for transmission of Plasmodium vivax among a duffy antigen negative population in Western Kenya.’ The American journal of tropical medicine and hygiene 75.4, pp. 575-581.
Sabchareon, A, T Burnouf, D Ouattara, P Attanath, H Bouharoun-Tayoun, P Chant- avanich, C Foucault, T Chongsuphajaisiddhi and P Druilhe (1991). ‘Parasitologic and clinical human response to immunoglobulin administration in falciparum malaria.’ The American journal of tropical medicine and hygiene 45.3, pp. 297-308.
Sachs, Jeffrey and Pia Malaney (2002). ‘The economic and social burden of malaria.’ Nature 415.6872, pp. 680-685.
Salanti, Ali, Madeleine Dahlback, Louise Turner, Morten A Nielsen, Lea Barfod, Pamela Magistrado, Anja T R Jensen, Thomas Lavstsen, Michael F Ofori, Kevin Marsh, Lars Hviid and Thor G Theander (2004). ‘Evidence for the involvement of VAR2CSA in pregnancy-associated malaria.’ The Journal o f experimental medicine 200.9, p p .1197-1203.
Sander, Adam F, Thomas Lavstsen, Thomas S Rask, Michael Lisby, Ali Salanti, Sarah L Fordyce, Jakob S Jespersen, Richard Carter, Kirk W Deitsch, Thor G Theander, Anders Gorm Pedersen and David E Arnot (2013). ‘DNA secondary structures are associated with recombination in major Plasmodium falciparum variable surface antigen gene families.’ Nucleic Acids Research 42.4, pp. 2270-2281.
170

Sanni, Latifu A, Catherine E M Allsopp, Lieke Reubsaet, Ambaliou Sanni, Christopher I Newbold, Virander S Chauhan and Jean Langhorne (2002). ‘Cellular responses to Plasmodium falciparum erythrocyte membrane protein-1: use of relatively conserved synthetic peptide pools to determine CD4 T cell responses in malaria- exposed individuals in Benin, West Africa.’ Malaria Journal 1, p. 7.
Saunders, Neil F W and Bostjan Kobe (2008). ‘The Predikin Webserver: improved prediction of protein kinase peptide specificity using structural information.’ Nucleic Acids Research 36.Web Server issue, W286-90.
Saunders, Neil F W, Ross I Brinkworth, Thomas Huber, Bruce E Kemp and Bostjan Kobe (2008). ‘Predikin and PredikinDB: a computational framework for the prediction of protein kinase peptide specificity and an associated database of phosphorylation sites.’ BMC Bioinformatics 9.1, p. 245.
Scherf, A, R Hernandez Rivas and P Buffet (1998). ‘Antigenic variation in malaria: in situ switching, relaxed and mutually exclusive transcription of var genes during intra-erythrocytic development in Plasmodium . . . ’ The EMBO . . .
Schierup, M H and J Hein (2000). ‘Consequences of recombination on traditional phylogenetic analysis.’ Genetics 156.2, pp. 879-891.
Scott, J Anthony G, Evasius Bauni, Jennifer C Moisi, John Ojal, Hellen Gatakaa, Christopher Nyundo, Catherine S Molyneux, Francis Kombe, Benjamin Tsofa, Kevin Marsh, Norbert Peshu and Thomas N Williams (2012). ‘Profile: The Kilifi Health and Demographic Surveillance System (KHDSS).’ International journal of epidemiology 41.3, pp. 650-657.
Shannon, C E (1948). ‘A mathematical theory of communication’. Bell System Technical Journal, The 27.3, pp. 379-423.
Shannon, Paul, Andrew Markiel, Owen Ozier, Nitin S Baliga, Jonathan T Wang, Daniel Ramage, Nada Amin, Benno Schwikowski and Trey Ideker (2003). ‘Cytoseape: a software environment for integrated models of biomolecular interaction networks.’ Genome research 13.11, pp. 2498-2504.
Smith, J D, S Kyes, A G Craig, T Fagan, D Hudson-Taylor, Louis H Miller, D I Baruch and Christopher I Newbold (1998). ‘Analysis of adhesive domains from the A4VAR Plasmodium falciparum erythrocyte membrane protein-1 identifies a CD36 binding domain.’ Molecular and biochemical parasitology 97.1-2, pp. 133-148.
Smith, J D, G Subramanian, B Gamain, D I Baruch and Louis H Miller (2000a). ‘Classification of adhesive domains in the Plasmodium falciparum erythrocyte membrane protein 1 family.’ Molecular and biochemical parasitology 110.2, pp. 293-310.
Smith, J D, A G Craig, N Kriek, D Hudson-Taylor, S Kyes, T Fagan, T Fagen, R Pinches, D I Baruch, Christopher I Newbold and Louis H Miller (2000b). ‘Identification of a Plasmodium falciparum intercellular adhesion molecule-1 binding domain: a parasite adhesion trait implicated in cerebral malaria.’ Proceedings of the National Academy of Sciences of the United States of America 97.4, pp. 1766-1771.
171
Snow, R W, J A Omumbo, B Lowe, C S Molyneux, J O Obiero, A Palmer, M W Weber,M Pinder, B Nahlen, C Obonyo, C Newbold, S Gupta and Kevin Marsh (1997). ‘Relation between severe malaria morbidity in children and level of Plasmodium falciparum transmission in Africa.’ The Lancet 349.9066, pp. 1650-1654.
Snow, R W, B Nahlen, A Palmer, C A Donnelly, S Gupta and Kevin Marsh (1998). ‘Risk of severe malaria among African infants: direct evidence of clinical protection during early infancy.’ The Journal of infectious diseases 177.3, pp. 819-822.
Su, X Z, V M Heatwole, S P Wertheimer, F Guinet, J A Herrfeldt, D S Peterson, J A Ravetch and T E Wellems (1995). ‘The large diverse gene family var encodes proteins involved in cytoadherence and antigenic variation of Plasmodium falciparum- infected erythrocytes.’ Cell 82.1, pp. 89-100.
Taylor, H M, S A Kyes, D Harris, N Kriek and Christopher I Newbold (2000a). ‘A study of var gene transcription in vitro using universal var gene primers.’ Molecular and biochemical parasitology 105.1, pp. 13-23.
Taylor, H M, S A Kyes and Christopher I Newbold (2000b). Var gene diversity in Plasmodium falciparum is generated by frequent recombination events.’ Molecular and biochemical parasitology 110.2, pp. 391-397.
Troye-Blomberg, M, O Olerup, A Larsson, K Sjoberg, H Perlmann, E Riley, J P Lepers and P Perlmann (1991). ‘Failure to detect MHC class II associations of the human immune response induced by repeated malaria infections to the Plasmodium falciparum antigen Pfl55/RESA.’ International immunology 3.10, pp. 1043-1051.
Turner, Louise, Thomas Lavstsen, Sanne S Berger, Christian W Wang, Jens E V Petersen, Marion Avril, Andrew J Brazier, Jim Freeth, Jakob S Jespersen, Morten A Nielsen, Pamela Magistrado, John Lusingu, Joseph D Smith, Matthew K Higgins and Thor G Theander (2013). ‘Severe malaria is associated with parasite binding to endothelial protein C receptor.’ Nature 498.7455, pp. 502-505.
Udomsangpetch, R, B Wahlin, J Carlson, K Berzins, M Torii, M Aikawa, P Perlmann and M Wahlgren (1989). ‘Plasmodium falciparum-infected erythrocytes form spontaneous erythrocyte rosettes.’ The Journal of experimental medicine 169.5, pp. 1835- 1840.
Udomsangpetch, R, P H Reinhardt, T Schollaardt, J F Elliott, P Kubes and M Ho (1997). ‘Promiscuity of clinical Plasmodium falciparum isolates for multiple adhesion molecules under flow conditions.’ Journal of immunology (Baltimore, Md. : 1950) 158.9, pp. 4358-4364.
Vazquez-Macias, Aleida, Perla Martmez-Cruz, Maria Cristina Castaneda-Patlan, Christine Scheidig, Jurg Gysin, Artur Scherf and Rosaura Hernandez-Rivas (2002). ‘A distinct 5’ flanking var gene region regulates Plasmodium falciparum variant erythrocyte surface antigen expression in placental malaria.’ Molecular microbiology 45.1, pp. 155-167.
172
Voss, T S, J K Thompson, J Waterkeyn, I Felger, N Weiss, Alan F Cowman and H P Beck (2000). ‘Genomic distribution and functional characterisation of two distinct and conserved Plasmodium falciparum var gene 5’ flanking sequences.’ Molecular and biochemical parasitology 107.1, pp. 103-115.
Voss, Till S, Mirjam Kaestli, Denise Vogel, Selina Bopp and Hans-Peter Beck (2003). ‘Identification of nuclear proteins that interact differentially with Plasmodium falciparum var gene promoters.’ Molecular microbiology 48.6, pp. 1593-1607.
Ward, C P, G T Clottey, M Dorris, D D Ji and D E Amot (1999). ‘Analysis of Plasmodium falciparum PfEMP-l/var genes suggests that recombination rearranges constrained sequences.’ Molecular and biochemical parasitology 102.1, pp. 167-177.
Warimwe, George M, Thomas M Keane, Gregory Fegan, Jennifer N Musyoki, Charles R J C Newton, Arnab Pain, Matthew Berriman, Kevin Marsh and Peter C Bull (2009). ‘Plasmodium falciparum var gene expression is modified by host immunity.’ Proceedings of the National Academy of Sciences of the United States o f America 106.51, pp. 21801-21806.
Warimwe, George M, Gregory Fegan, Jennifer N Musyoki, Charles R J C Newton, Michael Opiyo, George Githinji, Cheryl Andisi, Francis Menza, Barnes Kitsao, Kevin Marsh and Peter C Bull (2012). ‘Prognostic indicators of life-threatening malaria are associated with distinct parasite variant antigen profiles.’ Science Translational Medicine 4.129, 129ra45.
Warimwe, George Mbugua (2010). ‘Studies on PfEMPl Expression in Clinical Isolates From Kenyan Children With Malaria’. PhD thesis. Milton-Keenes: Open Univer- sity(UK).
WHO (2010). ‘World Malaria Report:2010’, pp. 1-220.
Wickham, Hadley (2009). ggplot2: elegant graphics for data analysis. New York: Springer.
Winter, Gerhard, Qijun Chen, Kirsten Flick, Peter Kremsner, Victor Fernandez and Mats Wahlgren (2003). ‘The 3D7var5.2 (var COMMON) type var gene family is commonly expressed in non-placental Plasmodium falciparum malaria.’ Molecular and biochemical parasitology 127.2, pp. 179-191.
World Health Organization (2013). ‘World Malaria Report:2013’. World Health Organization, pp. 1-286.
Wyler, D J, C N Oster and Quinn T C (1979). The role of the spleen in malaria infections. Basel, Switzerland.
Yipp, Bryan G, Michael J Hickey, Graciela Andonegui, Allan G Murray, Sornchai Looareesuwan, Paul Kubes and May Ho (2007). ‘Differential roles of CD36, ICAM- 1, and P-selectin in Plasmodium falciparum cytoadherence in vivo.’ Microcirculation (New York, N.Y. : 1994) 14.6, pp. 593-602.
173

Zilversmit, Martine M, Ella K Chase, Donald S Chen, Philip Awadalla, Karen P Day and Gil McVean (2013). ‘Hypervariable antigen genes in malaria have ancient roots.’ BMC Evolutionary Biology 13, p. 110.
174
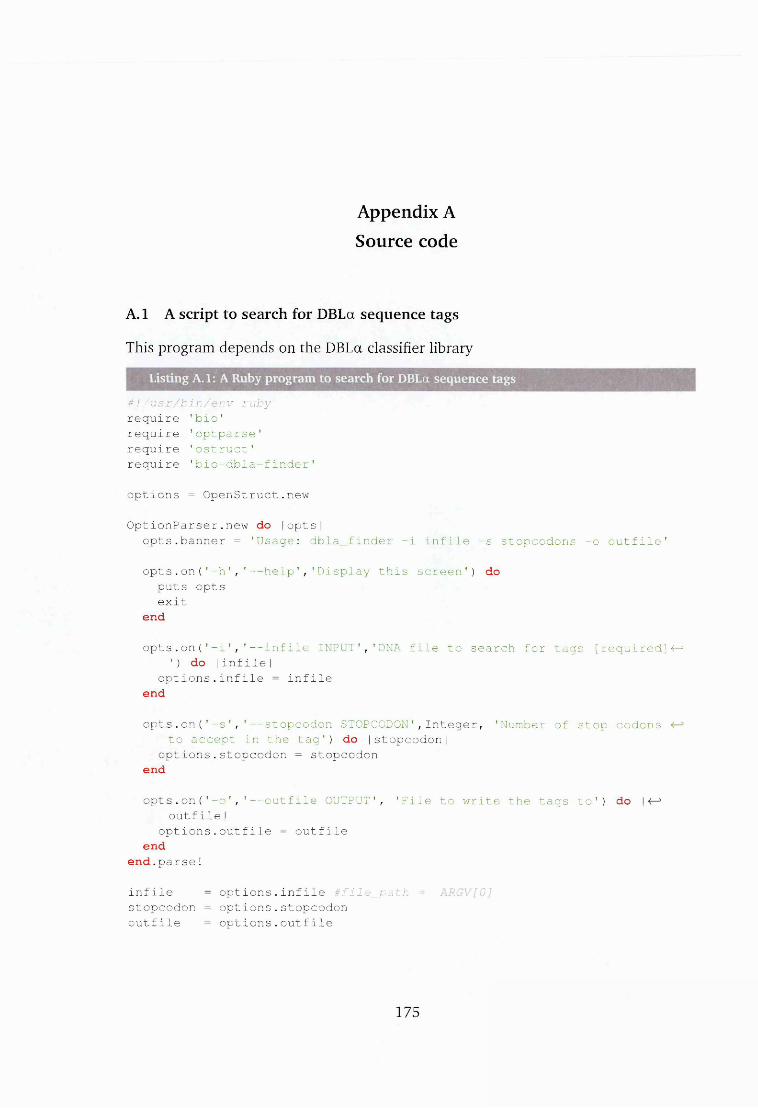
Appendix A Source code
A. 1 A script to search for DBLa sequence tags
This program depends on the DBLa classifier library
Listing A.l: A Ruby program to search for DBLa sequence tags
# ! / u s r / b i n / e n v r u b y require 'bio' require 'optparse' require 'ostruct' require 'bio-dbla-finder'
options = OpenStruct.new
OptionParser.new do |opts|opts.banner = 'Usage: dbla_finder -i infile -s stopcodons -o outfile'
opts.o n ('-h', '— help','Display this screen') do puts opts exit
end
opts.o n ('-i', '— infile INPUT','DNA file to search for tags [required]^ ') do |infile|
options.infile = infile end
opts . on ( '-s ' , '--stopcodon STOPCODON', Integer, 'Number of stop codons to accept in the tag') do |stopcodon|
options.stopcodon = stopcodon end
opts.o n ('-o','--outfile OUTPUT', 'File to write the tags to') do | outfile|
options.outfile = outfile end
end.parse!
infile = options.infile * f i l e _ p a t h = stopcodon = options.stopcodon outfile = options.outfile
175

#create a finder class in this case named robot robot = Bio::Finder.new(infile)
begin#cali the find_tags method to list the tags to the stderr tags = robot.find_tags
if outfile.nil?$stdout.puts tags
elseoutput = File.open(outfile,'w ') output << robot.find_tags output.close
end#$stderr.puts "#{tags.size} tags found!"
r e s c u e #Bio::FlatFile::UnknownDataFormatError $stderr.puts "bad_contigs_format"
end
Listing A. 2: nucleotide class
class Bio::Sequence::NA
#translate the sequence to protein def to_protein(frame)
seq.translate(frame) end
#get the hamming distance of 2 strings of equal length def hamming_dist?(strl,str2,mismatches=l)
strl.chars.zip(str2.chars).count{|ca,cb| ca!=cb} <= mismatches end
ifind strings that are similar based on the hamming distance def find_similar(haystack,needle, mismatches)
haystack.chars.each_cons(needle.length).map(&:join).select{|s| ^ hamming_dist? (s,needle,mismatches)}
end
#given a tag return the potential motifs in the n-terminus def n_term_motifs(protein)
find_similar(protein,'DIGDI',2) end
#given a tag return the potential motifs in the c-terminus def c_term_motifs(protein)
find_similar(protein,'PQYLR',2) end
#positions for all n_terminus motifs def n_term_positions(motifs, protein)
motifs.map{ |motif| protein.match(/ xp.qucte (mot if) >/) .offsets( 0 ) [ 0 ] }
176
end
#posit ions for all c_terminus motifs def c_term_positions(motifs,protein)
motifs.map{|motif| protein.match ( / # {Regexp.quote(motif) ■).offsets ( 0 ) [ 1 ] }
end
ipairwise length differences for each n_terminus and c_terminus pair def tag_len_diffs(c_term_pos,n_term_pos)
c_term_pos.map{|i| n_term_pos.map{|j| i - j}} end
#potential tagsdef candidate_tag_lens(tag_len_diffs,tag_range)
tag_len_dif fs .map{ | list | list. each_with_index .map { | i, index | index -f-° if tag_range.include? i}}
end
#get the tag regiondef clip_tag(start,stop,step=0,num_sc=0)
tag = seq.subseq(start + step,stop + step) amino_tag = tag.translate last_5 = amino_tag[-5..-1] || amino_tagstop_codons = amino_tag.scan(/\*/).size tag if stop_codons <= num_sc && last_5 != 'PTYLD'
end end
Listing A.3: finder class
module Bioclass Finder
attr_accessor :tag_range attr_accessor :stop_codons
def initialize(path)0file ||= path
end
def findwarn "[DEPRECATION] find' is deprecated, use ' extract_tags' 4-
instead" extract_tags
end
def extract_tagsext = File.extname(@file) if ext == ! .fastq' I I ext == ' .fq'
find_tags_fastq(@file) elsif ext == ' .fasta' | | ext == ' . fna' I I ext == ' .fas'
$stderr.puts 'Only Fastq input is supported!' •@file)
else
177
$stderr.puts "File Read Error: '#{ext}' is not a supportedsequence file format"
endend
def find_tags_fastq(file)fastq = Bio::Faster.new(file) tags = []fastq.each_record do |seq_header, sequence, quality|
tags << find_tags(seq_header,sequence,quality) endtags # . m a p { j r I r .j o i n ( " \ n " ) } . f l a t t e n . j o i n
end
def get_frames(bioseq)orfs = 6.times.map{|frame| bioseq.translate(frame+1)}.map{|trans|
trans.split('*')} orfs.each_with_index.map{|orf,frame| frame + 1 unless orf.map{ |e |
e if e.seq.size > 99}.compact.empty?}.compactend
def b ioseq_obj(sequence_string)Bio::Sequence::N A .new(sequence_string)
end
def to_bioseq_generic(sequence_string)Bio::Sequence.new(sequence_string)
end
def to_fastq(name,sequence, qualities) output_array = [] output_array << "@f(name}" output_array << sequence output_array << "+#{name}" unless qualities.empty?
if qualities.is_a? Arrayoutput_array << qualities.map{|score| (score + 33).chr}.join
elseoutput_array << qualities.split(/\s+/).map{|score| (score.
to_i + 33).chr}.joinend
elseoutput_array << 'D' * sequence.length # a d e f a u l t v a l u e i n c a s e
n o q u a l i t y r d a t a i s p r o v i d e dendoutput_array
end
def find_tags(seq_header, sequence, quality=[]) bio_seq = bioseq_obj(sequence) frames = get_frames(bio_seq)
frames.each do |frame|protein = bio_seq.to_protein(frame)
178

n_term_motifs = bio_seq. n_term__motifs (protein) c_term_motifs = bio_seq.c_term_motifs(protein)
n_term_positions = bio_seq.n_term_positions(n_term_motifs, protein)
c_term_positions = bio_seq. c_term_positions (c_term_motifs, •<—> protein)
tag_len_diffs = bio_seq.tag_len_diffs(c_term_positions, 4- n_term_positions)
candidate_tag_lens = bio_seq.candidate_tag_lens(tag_len_diffs, tag_range)
candidate_tag_lens.each_with_index do |list,index| unless list.compact.empty?
aa_start = n_term_positions[list.compact.flatten.pop] aa_stop = c_term_positions[index]
tag_start = ((aa_start +1) *3) - 2 tag_stop = (aa_stop * 3)
frame > 3 ? 0bioseq = bio_seq. reverse_complement : 0bioseq = bio_seq.seq
frame > 3 ? qualities = quality.reverse : qualities = ’quality
tag_quals = qualities[tag_start..tag_stop]
case frame when 1,4
tag = 0bioseq.clip_tag(tag_start,tag_stop,0,stop_codons) return to_fastq(seq_header,tag,tag_quals) if tag
when 2,5tag = 0bioseq.clip_tag(tag_start,tag_stop,1,stop_codons) return to_fastq(seq_header,tag,tag_quals) if tag
when 3,6tag = 0bioseq.clip_tag(tag_start,tag_stop,2,stop_codons) return to_fastq(seq_header,tag,tag_quals) if tag
elseend 4case statement
end funless statement end #candidate_tag_lens
end #frames loop end ffi nd_tags method
end #class end #module
A. 2 A Ruby program to classify DBLa sequence tags
179

Listing A.4: A program to classify DBLa sequence
iThis script depends on the bio-dbla-alpha classifier package.
#!/usr/bin/env rubyrequire 1/Users/george/Code/Ruby/bioruby-dbla-classifier/lib/bio-dbla—
classifier' seq_file = ARGV[0]
Bio::FlatFile.open(seq_file).each do |entry| tag = Bio::Sequence::AA.new(entry.seq)puts "#{entry.definition}\t#{tag.cyspolv_group}\t#{tag.dsid}\t#{tag.e^
bs_group} \ t# {tag. cys_count} \ t # {tag. length} \ t# {tag. varl_status } \t# {-<—3 tag.sig2_status}\t#{tag.groupA_status}"
end
Listing A. 5: The nucleotide class
class Bio::Sequence::NA attr_accessor :mut_pos
#position specific polymorphic block 1 def pspbl_dna(anchor_pos=0,win_len=42)
self [42 + anchor_pos,win_len] end
#position specific polymorphic block 2 def pspb2_dna(anchor_pos=0,win_len=42)
if !ww_missing?return self[(ww_pos * 3) - 12 - anchor_pos - win_len, win_len]
elsif !vw_missing?return self[(vw_pos * 3) - 36 - win_len - anchor_pos, win_len]
elsereturn
endend
#position specific polymorphic block 3 def pspb3_dna(anchor_pos=0,win_len=42)
if !ww_missing?return self[(ww_pos * 3) + 42 + anchor_pos, win_len]
elsif !vw_missing?return self[(vw_pos * 3) + 8 + anchor_pos, win_len]
elsereturn
endend
#position specific polymorphic block 4 def pspb4_dna(anchor_pos=0,win_len=42)
self[self.length - 36 - win_len - anchor_pos, win_len] end
180
def polvl_dna_posmut_pos.map{|mut| mut - (aa_seq.polvl_pos * 3)}
end
def polv2_dna_posmut_pos.map{|mut| mut - (aa_seq.polv2_pos * 3)}
end
def polv3_dna_posmut_pos.map{|mut| mut - (aa_seq.polv3_pos * 3)}
end
def polv4_dna_posmut_pos.map{|mut| mut - (aa_seq.polv4_pos * 3)}
end
#return an array of distances from each polv def dist_from_polvs
[polvl_dna_pos, polv2_dna_pos, polv3_dna_pos, polv4_dna_pos] end
ireturn the homology block D #def block_D# self[0,36]#end
ireturn the sequences in homology block E #def block_H# self[-36..-1]#end
def block_Dself[0, ((aa_seq.polvl_pos + 1) * 3) + 9]
end
def block_d_start 1
end
def block_d_stop((aa_seq.polvl_pos +1) * 3) + 9
end
#+14 aa at the end of PSPB1 def block_E
start = index(pspbl_dna) + 42 myend = start + 42 self[start..myend]
end
def block_e_startindex(pspbl_dna) + 42
end
181

def bl ock_e_stop block_e_start + 42
end
def block_Fmystart = index(pspb2_dna) + 42 myend = index(pspb3_dna) self[mystart..myend]
end
def block_f_startindex(pspb2_dna) + 42
end
def block_f_stop index(pspb3_dna)
end
def block_Hself [ (aa_seq.polv4_pos * 3)..-1]
end
def block_h_stop self.size
end
def block_h_startaa_seq.polv4_pos * 3
end
#catch all methof missing. iTODO: do i really need it? def method_missing(m, *args, &block)
puts 'undefined block' end
privatedef accepted_length
aa_seq.accepted_length #300..50 end
def aa_seqself.translate
end
def ww_posaa_seq.ww_pos #rindex("NW")
end
def vw_posaa_seq. vw_pos # r m d e x ("'010")
end
def ww_missing?
182
aa_seq.ww_missing? 4 t r u e u n l e s s a a _ s e q =~ /WW/1 end
def vw_missing?aa_seq.vw_missing? e u n l e s s a a _ s e q = ~
end
def vw_ww_mi s s i ng ?aa_seq.vw_ww_missing? #true i f w w _ r n i s s i n g ? && v w _ m i s s i n g ?
end end
Listing A. 6: amino acid class
class Bio::Sequence::AABS1 = /DDDVEKGLKIVFEK|DKGEKKKLEKNLKD|DSRTDKLEENLRKI|GGGGRKKLEDNLKE| F-
GGRGRKKLEDNLIE GGRGRKKLEDNLKE GGRGRKQLEENLQK GKKKEKEKIYGNIEGPKQEKKELEENLK GPSQEKIKLEENLK GPSQEKKKLEENLK HEQGNNKLEAILKT F-3HEQGNNKLEARLKT HEQGYNKLEAILKT HEQGYNKLEAISKT HNHIKKPLLENLEQ A-’HNHKKKPLLDNLEK HNHKKKPLLENLEQ HNNKKKALLDNLEK HNQKKINLEKSLHR f-1HQQRKGKLEENLRN HQQRKRKLEENLRN HSKEKEKLQTNLKN KNESEIKRKEKLQRKNESEKNTKKKLQG KNESEKRTKEKLQG NDADKVEKGLQWF NDADKVQKGLQVVF F—3NDDVEKGLKIVFEK NDEDDVEKGLKIVF NDKDAAQKVLRTVF NDKDAVQKGLRAVF F—3NDKDAVRHGLKWF NDKDYVENGLKKVF NDKEKDQRKKLDEI NDKEKDQRKKLDEN f-’NDKVEKGLQVVFGK NDKVEKGLREVFKK NDKVEKGLREVFRK NDKVENGLKKVFDK F-“NDKVENGLREVFKK NDNVEKGLKAVFRK NDNVEKGLKKVFDK NDNVENGLREVFKK F-5NDQDDVEKGLKIVF NDQDEVWNGLRSVF NEDDKVQKGLQWF NEDVEKGLKVVFKK F—3NEDVEKGLKVVFQK NEEDAVQKGLKKVF NEEDAVQKGLKWF NEEDAVQKGLRAVF F^NEKDAVQNGLKKVF NEKVEIGLKKVFDK NEKVEIGLKKVFEK NERVEIGLKKVFKK F—3NEKVEYGLRKLFKK NEMVEIGLKKVFKK NENVEKGLKIVFEK NENVEKGLKKVFDK F—3NENVEKGLQVVFGK NEQDEVWKGLRDVF NGDYKEKVSNNLKT NGDYKEKVSNNLRA F—’NGDYKKKVSNNLKT NKDDKIEKSLRAIF NKDDKVEKGLRAIF NKDDKVQKGLRAVF F—3NKDDKVQKGLQWF NKDDKVQKGLRAVF NKHDNIEKGLREVF NKNVEIGLKKVFDK F—3NKNVEIGLKNVFKN NKQEKEKREKLDEN NKQRKKILQEKLEN NNDDDKIKKGKLRG F—3NNDNDKIKKEKLQE NNDNDKIKKEKLRG NNDNDKIKKGKLRG NNDNDRVKKEKLQN F^NNDNDKVKKEKLRG NNDNDRVKKEKLQN NNDVEKGLDWFKK NNDVEKGLKVVFKK F^NNDVVKGLDVVFKK NNEKDMREKQKLQS NNEKDMTEKQKLQS NNESEIKRKEKLRG F—3NNESEKKKREELQG NNETDKEQKVKLEK NNHDNVEKGLKAVF NNHDNVEKGLKKVF F—3NNHDNVENGLKAVF NNHDNVENGLREVF NNKEKEKIEKSLQN NNKENEKLQENLKR F—3NNVDAVQEGLKWF NPEDKVHEGLKVVF NPEVEKGLKAVFRK NPEVENGLREVFNK F—3NPQDKVQEGLKNVF NPQDKVQEGLKVVF NPQDKVQKGLREVF NQEDKVQEGLKVVF F-3NRKEKGKLQTNLKN NSDDKVEKGLREVF NSDDKVENGLKKVF NTVDKIHEGLKWF F^NTVDKVHEGLKWF NVHDKVEKGLQVVF NVHDKVEKGLQVVL NVHDKVERGLREVF F—5NVHDKVERGLREVF NVHDKVETGLREVF SERVEYGLRKLFKK SNKEKEKIENSLQN F-3TDKDAVQKGLRAVF TDKDDVENGLREVF TDKDEVKEGLKVVF TDKDEVWKGLRAVF F-3TDKDYVENGLKAVF TDKDYVENGLKKVF TDKVENGLKEVFDK TDKVENGLKKVFDK F^TDKVENGLKKVFDN TDNDAVQKGLRAVF TDNDEVWKGLGSVF TDNDEVWKGLRSVF F-3TDNDEVWTGLRSVF TDNVEKGLRAVFGK TDNVENGLREVFKK TEKDDVEKGLKIVF F—3VNGNDKLESNLKKI YDEKEKNRRKQLEN YNERDRAQKKKLQD YNERDRDKKRKLQE F—3YNERDREKKRKLQD AKNDYTGDHPNYYK ALKHYKDDTKNYYQ ARYKKDEEDGNYYK F^ARYKKDEEDGNYYQ DKNRGKLGALSLDD DNNSDKLRDLSVDK EHYEDVDGSGNYLK F—3EHYKDVDGSGNYYK EKNYPDDGSGNYSK EKNYYNDGTGNYYK EYYEDKDPDKNYYQ F—3EYYNDTNNKINYVK GIIDYDHDGPHYYK GINAYNDGSENYYK GINDCDRDGPEYYK F—5GINDYDGDGPEYYK GINDYDRDGPEHYK GINDYDRDGPEYYK GINDYNDGSGNYFK F-3
183
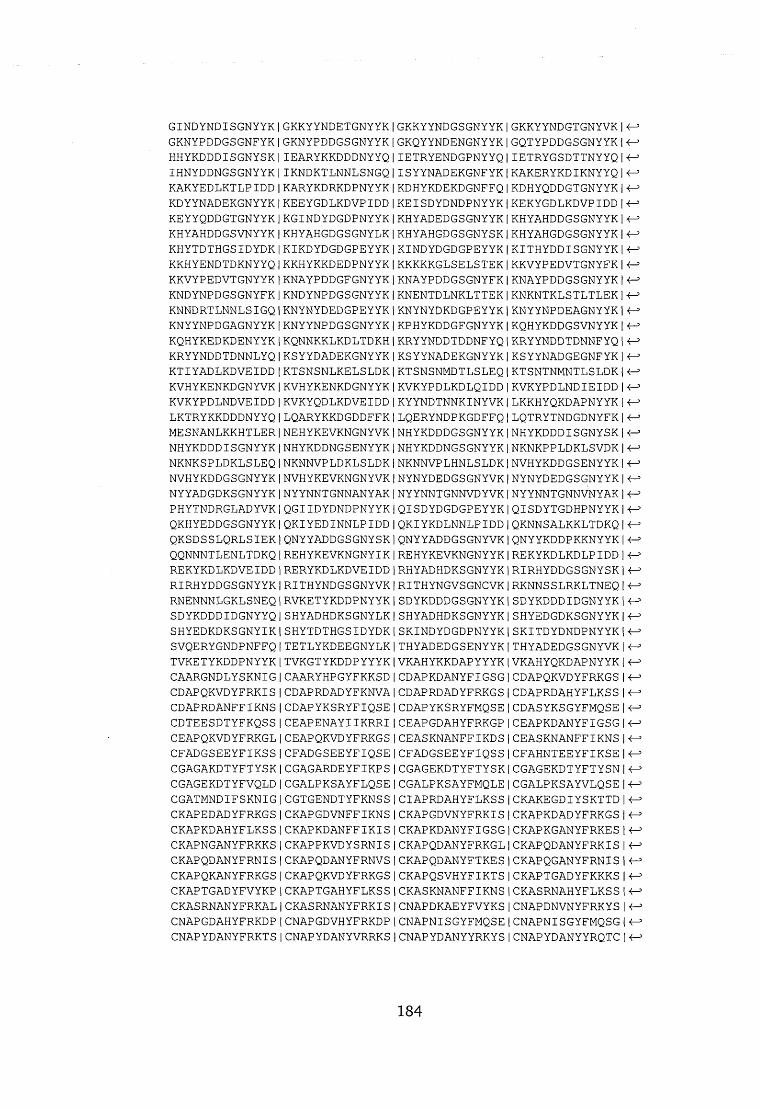
G I N D Y N D I S G N Y Y K
G K N Y P D D G S G N F Y K
H H Y K D D D I S G N Y S K
I H N Y D D N G S G N Y Y K
K A K Y E D L K T L P I D D
K D Y Y N A D E K G N Y Y K
K E Y Y Q D D G TG N Y Y K
K H Y A H D D G S V N Y Y K
K H Y T D T H G S I D Y D K
K K H Y E N D T D K N Y Y Q
K K V Y P E D V T G N Y Y K
K N D Y N P D G S G N Y F K
K N N D R T L N N L S I G Q
K N Y Y N P D G A G N Y Y K
KQ H Y K E D K D E N Y Y K
K R Y Y N D D T D N N L Y Q
K T I Y A D L K D V E I D D
KV H Y K E N K D G N Y VK
K V K Y P D L N D V E I D D
L K T R Y K K D D D N Y Y Q
M E S N A N L K K H T L E R
N H Y K D D D I S G N Y Y K
N K N K S P L D K L S L E Q
N V H Y K D D G S G N Y Y K
N Y Y A D G D K S G N Y Y K
P H Y T N D R G L A D Y V K
Q K H Y E D D G S G N Y Y K
Q K S D S S L Q R L S I E K
Q Q N N N T L E N L T D K Q
R E K Y K D L K D V E I D D
R I R H Y D D G S G N Y Y K
R N E N N N L G K L S N E Q
S D Y K D D D I D G N Y Y Q
S H Y E D K D K S G N Y I K
S V Q E R Y G N D P N F F Q
T V K E T Y K D D P N Y Y K
C A A R G N D L Y S K N I G
C D A P Q K V D Y F R K I S
C D A P R D A N F F I K N S
C D T E E S D T Y F K Q S S
C E A P Q K V D Y F R K G L
C F A D G S E E Y F I K S S
C G A G A K D T Y F T Y S K
C G A G E K D T Y F V Q L D
C G A T M N D I F S K N I G
C K A P E D A D Y F R K G S
C K A P K D A H Y F L K S S
C K A P N G A N Y F R K K S
C K A P Q D A N Y F R N I S
C K A P Q K A N Y F R K G S
C K A P T G A D Y F V Y K P
C K A S R N A N Y F R K A L
C N A P G D A H Y F R K D P
C N A P Y D A N Y F R K T S
|G K K Y Y N D E T G N Y Y K
| G K N Y P D D G S G N Y Y K
| I E A R Y K K D D D N Y Y Q
| I K N D K T L N N L S N G Q
|K A R Y K D R K D P N Y Y K
I K E E Y G D L K D V P I D D
| K G I N D Y D G D P N Y Y K
|K H Y A H G D G S G N Y L K
| K I K D Y D G D G P E Y Y K
| K K H Y K K D E D P N Y Y K
| K N A Y P D D G F G N Y Y K
| K N D Y N P D G S G N Y Y K
|K N Y N Y D E D G P E Y Y K
| K N Y Y N P D G S G N Y Y K
|K Q N N K K L K D L T D K H
|K S Y Y D A D E K G N Y Y K
| K T S N S N L K E L S L D K
|K V H Y K E N K D G N Y Y K
|K V K Y Q D L K D V E I D D
|L Q A R Y K K D G D D F F K
|N E H Y K E V K N G N Y V K
|N H Y K D D N G S E N Y Y K
|N K N N V P L D K L S L D K
|N V H Y K E V K N G N Y V K
|N Y Y N N T G N N A N Y A K
| Q G I I D Y D N D P N Y Y K
| Q K I Y E D I N N L P I D D
| Q N Y Y A D D G S G N Y S K
| R E H Y K E V K N G N Y I K
| R E R Y K D L K D V E I D D
| R I T H Y N D G S G N Y V K
| R V K E T Y K D D P N Y Y K
| S H Y A D H D K S G N Y L K
| S H Y T D T H G S I D Y D K
|T E T L Y K D E E G N Y L K
|T V K G T Y K D D P Y Y Y K
|C A A R Y H P G Y F K K S D
|C D A P R D A D Y F K N V A
| C D A P Y K S R Y F I Q S E
| C E A P E N A Y I I K R R I
| C E A P Q K V D Y F R K G S
| C F A D G S E E Y F I Q S E
| C G A G A R D E Y F I K P S
C G A L P K S A Y F L Q S E
C G T G E N D T Y F K N S S
C K A P G D V N F F I K N S
C K A P K D A N F F I K I S
C K A P P K V D Y S R N I S
C K A P Q D A N Y F R N V S
C K A P Q K V D Y F R K G S
C K A P T G A H Y F L K S S
C K A S R N A N Y F R K I S
C N A P G D V H Y F R K D P
C N A P Y D A N Y V R R K S
|G K K Y Y N D G S G N Y Y K
|G K Q Y Y N D E N G N Y Y K
I I E T R Y E N D G P N Y Y Q
| I S Y Y N A D E K G N F Y K
|K D H Y K D E K D G N F F Q
I K E I S D Y D N D P N Y Y K
I K H Y A D E D G S G N Y Y K
|K H Y A H G D G S G N Y S K
| K I N D Y D G D G P E Y Y K
|K K K K K G L S E L S T E K
| K N A Y P D D G S G N Y F K
|K N E N T D L N K L T T E K
|K N Y N Y D K D G P E Y Y K
|K P H Y K D D G F G N Y Y K
| K R Y Y N D D T D D N F Y Q
|K S Y Y N A D E K G N Y Y K
| K T S N S N M D T L S L E Q
|K V K Y P D L K D L Q I D D
| K Y Y N D T N N K I N Y V K
|L Q E R Y N D P K G D F F Q
|N H Y K D D D G S G N Y Y K
|N H Y K D D N G S G N Y Y K
| N K N N V P L H N L S L D K
| N Y N Y D E D G S G N Y V K
|N Y Y N N T G N N V D Y V K
| Q I S D Y D G D G P E Y Y K
| Q K I Y K D L N N L P I D D
I Q N Y Y A D D G S G N Y V K
|R E H Y K E V K N G N Y Y K
|R H Y A D H D K S G N Y Y K
| R I T H Y N G V S G N C V K
| S D Y K D D D G S G N Y Y K
| S H Y A D H D K S G N Y Y K
| S K I N D Y D G D P N Y Y K
|T H Y A D E D G S E N Y Y K
|V K A H Y K K D A P Y Y Y K
| C D A P K D A N Y F I G S G
|C D A P R D A D Y F R K G S
| C D A P Y K S R Y F M Q S E
I C E A P G D A H Y F R K G P
I C E A S K N A N F F I K D S
| C F A D G S E E Y F I Q S S
| C G A G E K D T Y F T Y S K
I C G A L P K S A Y F M Q L E
| C I A P R D A H Y F L K S S
| C K A P G D V N Y F R K I S
| C K A P K D A N Y F I G S G
| C K A P Q D A N Y F R K G L
|C K A P Q D A N Y F T K E S
| C K A P Q S V H Y F I K T S
I C K A S K N A N F F I K N S
| C N A P D K A E Y F V Y K S
| C N A P N I S G Y F M Q S E
|C N A P Y D A N Y Y R K Y S
| G K K Y Y N D G T G N Y V K |
| G Q T Y P D D G S G N Y Y K |
| I E T R Y G S D T T N Y Y Q |
| K A K E R Y K D I K N Y Y Q |
| K D H Y Q D D G T G N Y Y K |
| K E K Y G D L K D V P I D D |
| K H Y A H D D G S G N Y Y K |
| K H Y A H G D G S G N Y Y K |
| K I T H Y D D I S G N Y Y K | «->
| K K V Y P E D V T G N Y F K |
| K N A Y P D D G S G N Y Y K |
| K N K N T K L S T L T L E K | f - 1
| K N Y Y N P D E A G N Y Y K | ^
| K Q H Y K D D G S V N Y Y K | ^
| K R Y Y N D D T D N N F Y Q | ^
| K S Y Y N A D G E G N F Y K |
| K T S N T N M N T L S L D K | ^
| K V K Y P D L N D I E I D D | ^
| L K K H Y Q K D A P N Y Y K | 4-^>
| L Q T R Y T N D G D N Y F K | <!->
| N H Y K D D D I S G N Y S K |
| N K N K P P L D K L S V D K |
| N V H Y K D D G S E N Y Y K |
|N Y N Y D E D G S G N Y Y K |
| N Y Y N N T G N N V N Y A K | +->
| Q I S D Y T G D H P N Y Y K | ^
|Q K N N S A L K K L T D K Q |
| Q N Y Y K D D P K K N Y Y K |
| R E K Y K D L K D L P I D D | ^
| R I R H Y D D G S G N Y S K | «->
| R K N N S S L R K L T N E Q | f - 1
| S D Y K D D D I D G N Y Y K | ^
| S H Y E D G D K S G N Y Y K |
| S K I T D Y D N D P N Y Y K | ^
|T H Y A D E D G S G N Y V K |
| V K A H Y Q K D A P N Y Y K | ^
| C D A P Q K V D Y F R K G S | <->
| C D A P R D A H Y F L K S S | ^
| C D A S Y K S G Y F M Q S E |
| C E A P K D A N Y F I G S G | ^
| C E A S K N A N F F I K N S |
| C F A H N T E E Y F I K S E |
| C G A G E K D T Y F T Y S N | «->
C G A L P K S A Y V L Q S E |
C K A K E G D I Y S K T T D |
C K A P K D A D Y F R K G S |
C K A P K G A N Y F R K E S | <->
C K A P Q D A N Y F R K I S | «->
C K A P Q G A N Y F R N I S |
C K A P T G A D Y F K K K S | <->
C K A S R N A H Y F L K S S | ^
C N A P D N V N Y F R K Y S |
C N A P N I S G Y F M Q S G | <->
C N A P Y D A N Y Y R Q T C |
184

BS2
C N A P Y E A Q Y F I K P S
CN A P Y K A W Y F M H SE
C R A P K N A H Y F I K S S
C S A D D S E D Y F I Q S E
C S A D G S E E Y F K K Q S
C S A P D N A K Y V K Y F P
C S A P G D V N Y F R K E S
C S A P H N A Q Y V K Y V P
C S A P Y D A N Y V R R K S
C S A P Y H P G Y F R Q S K
C S A P Y Y A D Y F K K K S
C S V P Y E A Y Y F T Y K S
C V A G E G N T Y F I Q L D
C Y I P Y Y V N Y F K D I S
C Y I P Y Y V N Y F K N I S
Y K A P R K A N Y F I Y K S
FE N A G K C G H N D N R V
F S D N G P C G R K E L I V
F S N E Y C G H Y K N G D P
F S N R G P C G R N E T D V
F S N S K C G H H N N D G P
F S S H G K C G H N E G A P
F T D G H C G R T Q E G H V
F T D I G K C G H N E G A P
F T N D G K C G H T E G T V
F T N D G K C G H Y E N N I
F T S A G K C R R N D N S V
F T S E G Q C G H N D K S V
F T S E G R C G H S E T N V
F T S Q G Q C G H K E G T V
F T S Q G Y C G H S E T N V
F T S V G Y C G H N K G S V
F W D R K C G H S N E G A P
I V S F D Q C G H N D V D V
L F D Y N C G H H K D N N V
L F S D Y K C G H Y E G S P
L F S N P K C G H E Q G T V
L F S N R Q C G H G E H E V
L F S N S K C G H E Q G N V
L L F S N Y K C G H Y E G S
N L I L T H P K C G H D T D
S F A D A Y C G R G D E N V
S F S D R K C G H Y E G A P
S F S N G Q C G H R D E N V
S F S N P K C G H N E N K V
S F S S E Y C G H R Q G S A
S F T N P K C G H G D N E V
SQ G Q C G R N E N N G Y P
T F S N D Y C G H G E H E V
T V S F D Q C G H N D M H V
V F S N R Q C G H Y E D V P /
= /D K G E K K K L E
D Q Q E K L Y L E N N L K K
H E P G I Q H L E K R L E S
C N A P Y E A Q Y F I K S S
C N A P Y K S R Y F I Q S E
C R A P N E A N Y F K N V A
C S A D D S E D Y F I R S E
C S A G P K D T Y F I K S G
C S A P D Y A K Y F R Q T C
C S A P G D V N Y F R K F S
C S A P R D A D Y F I K N S
C S A P Y E A Q Y F I K S S
C S A P Y K S Q Y F I K S S
C S A P Y Y A D Y F K S V A
C T A P D K A N Y F I Y K S
C V A P E N A Y F R K T E A
C Y I P Y Y V N Y F K K K S
Y K A P K D A H Y F L K S S
A V S S N K C G H N D M N V
F E N A G K C R R N D N K V
F S N E H C G H H N N D D P
F S N N G P C G R N E T D V
F S N S G K C G G K E A P V
F S S D R C G H N N N D G P
F S S Q G Q C G H T E G T V
F T D I G K C G G K E A P V
F T D I G K C G H N K G S V
F T N D G K C G H Y E D A P
F T N D G K C G R Y E G A P
F T S E G K C G H N D N R V
F T S E G Q C G H S E T N V
F T S H G K C G H S E G A P
F T S Q G Q C G H S E T N V
F T S Q G Y C G R K E A P V
F T T E G Y C G R D E G A P
F W D R K C G H S N G G D P
K F S E R K C G H D E N A P
L F S D G H C G N K D G T V
L F S N A Y C G H Y E G S P
L F S N P K C G H K Q G K V
L F S N R Q C G H N E G A P
L F S N S K C G H R Q G N V
LW NDK CG HHVDKDV
P S Y I K C G H N N K D D P
S F S D H K C G H D E N A P
S F S N D Y C G H N E N K V
S F S N P K C G H E Q G N V
S F S N S K C G H G E H E V
S F S S E Y C G H R Q G S V
S F T N P K C G H G E H E V
S S T N T Q C R C A T N D V
T F T Y T K C G H D E N K V
T V S N A K R R E G D E N P
E N L K N | D Q E R K H L L E
D R K E K V K L E E N L K N
H E P G I Q Y L E K R L E S
C N A P Y E A Q Y Y I K S S
C N A P Y K S R Y F M H S E
C R A P N G A N Y F R K G L
C S A D G S E D Y F I K S S
C S A G Q K D T Y F I K P N
C S A P G D A K Y V K N F P
C S A P G D V N Y F R K G L
C S A P R D A Q Y F I K S S
C S A P Y E A Y Y F T Y K S
C S A P Y N A H Y F I K S S
C S A P Y Y A D Y F R K G S
C T A P D N V N Y F R K Y S
C Y A P N N A N Y F I G S G
C Y I P Y Y V N Y F K K T P
Y K A P Q D A N Y F R N V S
E F T G G Y C G R D E T D V
F L Y P K C G H N N K N D L
F S N E H C G H Y K N G D P
F S N N K C G H S N G G D P
F S N S G P C G R K E L T V
F S S E G K C G H K E G T V
F S S S G P C G R D E A P V
F T D I G K C G H G D K D V
F T G G G Q C G R N E T D V
F T N D G K C G H Y E D N V
F T R Q G Y C G H S E T N V
F T S E G K C G R N E T N V
F T S E G Q C R R N D N S V
F T S H G K C G R N E T N V
F T S Q G Q C G H T E G T V
F T S Q G Y C G R K E L T V
F T T E G Y C G R N E G A P
I F S N E H C G H K Q G S V
K F S E R K C G H N E G S P
L F S D H K C G H E E S R V
L F S N D Y C G H K Q G N V
L F S N R Q C G H D E N K V
L F S N S K C G H D E N K V
L F S N Y K C G H Y E D A P
N F S N P K C G H D E G I V
P S Y L K C G H N N K D D P
S F S D H K C G H G D K D V
S F S N D Y C G H R Q G S V
S F S N P K C G H G D N E V
S F S S E Y C G H E Q G N V
S F T N G Q C G H N E E N V
S F T N P K C G R G D N E V
T E G Y C G R N E N N G Y P
T S E G Q C G H N D K M R P
T V S S N K C G H N D M D V
K R L E T | D Q E R K Q H L E
G P D Q E K K K L E E N L R
H E P G K Q H L E E R L E Q
C N A P Y K A Q Y Y I K S S
C N A P Y K S R Y F M Q S E
C R A P Q K A N Y F K N V A
C S A D G S E E Y F I Q S E
C S A P D N A K Y F K P P K
C S A P G D A K Y V K Y F P
C S A P G D V N Y F R K I S
C S A P Y C A D Y F K K K S
C S A P Y G A N Y Y R K Y S
C S A P Y Y A D Y F K K K P
C S A Q N N E V Y F I N S E
C T A P Y G A N Y Y R K Y S
C Y I P Y C V N Y F K N I S
C Y I P Y Y V N Y F K K T S
Y K A P R K A D Y F R N I S
E F T S G Y C G R N E T N V
F S D N G H C G R N E T N V
F S N E Y C G H K K N E D P
F S N P K C G H S N G G D P
F S N S G T R G R K E L T V
F S S E Y C G H Y K N G D P
F T D D G K C G H Y E G A P
F T D I G K C G H K Q G N V
F T G G G Q C R R N D N S V
F T N D G K C G H Y E G A P
F T S A G K C R H N D N S V
F T S E G Q C G H D E N K V
F T S E G Q R G H S E T N V
F T S I G K C G H N K G S V
F T S Q G Q C G R N E R N V
F T S V G Y C G H N K G I R
F W D R K C G H S N E G A L
I V S F D Q C G H N D M D V
K F S S D R C G H N E G D P
L F S D Y K C G H Y E D A P
L F S N P K C G H E Q G N V
L F S N R Q C G H E Q G N V
L F S N S K C G H D E S K V
L F W D R K C G H D E R N V
N F S N P K C G H K Q G N V
S E G K C G H K E T E R D L
S F S D H K C G H Y E G A P
S F S N E Y C G H R Q G S V
S F S N P K C G H G E H E V
S F S S E Y C G H G D N E V
S F T N P K C G H D E N K V
S L I L P Y S K C G R D T D
T F S G Y W C G H Y E G A P
T V S F D Q C G H N D M D V
V F S N R Q C G H Y E D A P
K R L E T | D Q Q E K A K L E
G P N Q E K K L L E N K L K
H E P G K Q H L E E R L E R
G 3
G - 3
G-3G 3
G ^
G 3
G ^
G ^
• G 5
G 3*
G31G 3
G 3
GGG
G
G
GG
G
GGG
G
GG
G
G
G
GG
GG
GG
G
GG
G
G
G
G
GG
G
G
N N L K R | G
G
G
185

HEPGKQHLGERLEQ HEQGINRLEARLKT HEQGNNRLEARLKT HEQGYNRLEARLKTHNRRKEKLETRLEE HQQRKHLLEKRLET KKKLEENLRNIFKN NDEEKKKRDELEKN e3NTHESAQRKKLEEN REKGKSRLEARLKT REPGKQHLEERLER YNEKDQEEKRKLQE f-1YNETDKVQKAILQQ YSQKYKDEKSKLEE AKNHYNDTSKNYYK ARDHYNDTSGNYYQDAKKHYGDDENYYK IEHYKDDPEENFYE IKSNYNDSEGNYFK IKSQYDDNEGNYFK •<—3KDHYKGDEANNYFQ KDNNTKLNDLSIQE KKTNPALKSFTNEE KNNNNELNNLSLDKKNNNNKLSNLSTKE KSSYNDDGTGNYFK KSYYKNDNDRNYFK NKNKSPLDKLSLDKNKNNPPLYKLSLEK NNNAAKLSELSTAQ NYYEDNDTDKNYYQ QKENGDINTLKPEE f-3QNKNENLKSLSLDK QNNNTKLQNIPLHE QRNNIKLQNIPLHE QRNNIKLQTLTLHQSAKEHYQDTENYYK TRYKKDDEDGNFFQ VKDRYQNDGPDFFK CDAGAADEYFKKSG e3CDAGQKDTYFKQSS CEAGTSDKYFRKTA CEAKSDDKYNVIGP CGAGMKDIYSKTMNCGAPKEAKYFRKTA CGAPSDAQYFRNTC CGASEDAKYKVIGP CGATMNDIFSKNIR -e3CGATVDDIFSKNIR CGATVDDISSKNIR CGTEDKDTYFIKSG CGVEENAKYFRESS r3'CHAPPDAQYTKKGP CKAEVDDIYSKTAN CKAKEGDIYSKTAN CKAKEGDIYSKTMN 3CKAKKGDIYSKTMN CKAKKGGIYSKTMN CKANDDAEYFRKKD CKAPDKANYFEPPKCKAPDKANYFKPPK CKAPEEDHYFKPAQ CNAPKDANYFEYNS CNAPTGADYFVYKP e3CNAWGNTYFRKTCS CRAEEKDIYSKTTD CRAEEKDTYFKNRE CRAEEKEIYSKTTD e3CRAEEKGTYFKNRE EFSGGKCGHKDNNV EFTDGHCGHNEENV EFTDGHCGHRQGNVEFTGGQCGRDGENV ESNKGQCRCFSGDP ESNMGQCRCFSGDP ESNMVQCRCFSGDPETHGYCRCVNRVDV FSNDQCGHNNGGAP FSNDQCGHNNRGDP FWYPKCGHHVKQDVFWYPKCGHHVKQEV FWYPKCGHHVRQDV FWYPKCSHHVKQDV GANAIKAGDNVSIV -e3GGHYKNCHCIGGDV GGTYKNCRCASGNV ILFDYKCAHDNDKV KFSNPKCGHNEGSP e-3LFYYKCGHYVYKDV LWNDKCGHHVKQDV LWNYKCGHHVNQDV LWNYNCGHHVNQDV e->LWNYNCGHHVNRDV PCSVQKCTCINGDP PNKCRCEDANADQV SFTNGQCGRDGENV e3SWYPKCGHHVKQDV TLFDYKCGHDENAP TLWNEKCGHGDYNL TPTQGKCHCIDGTNTPTQGKCHCIDGTV/
SIG2 = /AKLSELSTAQ|CRAEEKDTYF|KCGHHVNQDV|HEPGKQHLEE|EPGKQHLEER| R3PGKQHLEERL GKQHLEERLE KQHLEERLEQ QHLEERLEQM HLEERLEQMF LEERLEQMFE •e3EERLEQMFEN ERLEQMFENI RLEQMFENIK LEQMFENIKN EQMFENIKNN QMFENIKNNNMFENIKNNNA FENIKNNNAA ENIKNNNAAK NIKNNNAAKL IKNNNAAKLS KNNNAAKLSENNNAAKLSEL NNAAKLSELS NAAKLSELST AAKLSELSTA RAEEKDTYFK AEEKDTYFKN f3EEKDTYFKNR EKDTYFKNRE KDTYFKNREN DTYFKNRENG TYFKNRENGK YFKNRENGKL f3FKNRENGKLL KNRENGKLLL NRENGKLLLW RENGKLLLWN ENGKLLLWNY NGKLLLWNYK R3GKLLLWNYKC KLLLWNYKCG LLLWNYKCGH LLWNYKCGHH LWNYKCGHHV WNYKCGHHVN ■<—3NYKCGHHVNQ YKCGHHVNQD AKLSELSTAQ CKAKEGDIYS NCGHHVNQDV HEPGKQHLEE R3EPGKQHLEER PGKQHLEERL GKQHLEERLE KQHLEERLEQ QHLEERLEQM HLEERLEQMF R3LEERLEQMFE EERLEQMFEN ERLEQMFENI RLEQMFENIK LEQMFENIKN EQMFENIKNN •<—3QMFENIKNNN MFENIKNNNA FENIKNNNAA ENIKNNNAAK NIKNNNAAKL IKNNNAAKLS f3KNNNAAKLSE NNNAAKLSEL NNAAKLSELS NAAKLSELST AAKLSELSTA KAKEGDIYSK f3AKEGDIYSKT KEGDIYSKTA EGDIYSKTAN GDIYSKTANG DIYSKTANGN IYSKTANGNT R3YSKTANGNTT SKTANGNTTL KTANGNTTLW TANGNTTLWN ANGNTTLWNY NGNTTLWNYN •f-3GNTTLWNYNC NTTLWNYNCG TTLWNYNCGH TLWNYNCGHH LWNYNCGHHV WNYNCGHHVN •<—5NYNCGHHVNQ YNCGHHVNQD GDINTLKPEE CRAEEKDIYS NCGHHVNQDV HEPGKQHLEE f3EPGKQHLEER PGKQHLEERL GKQHLEERLE KQHLEERLER QHLEERLERI HLEERLERIF •A3LEERLERIFA EERLERIFAN ERLERIFANI RLERIFANIQ LERIFANIQK ERIFANIQKERIFANIQKEN IFANIQKENG FANIQKENGD ANIQKENGDI NIQKENGDIN IQKENGDINT R3QKENGDINTL KENGDINTLK ENGDINTLKP NGDINTLKPE RAEEKDIYSK AEEKDIYSKT A3EEKDIYSKTT EKDIYSKTTD KDIYSKTTDN DIYSKTTDNG IYSKTTDNGK YSKTTDNGKL t-3SKTTDNGKLI KTTDNGKLIL TTDNGKLILW TDNGKLILWN DNGKLILWNY NGKLILWNYN A3GKLILWNYNC KLILWNYNCG LILWNYNCGH ILWNYNCGHH LWNYNCGHHV WNYNCGHHVN R3NYNCGHHVNQ YNCGHHVNQD/
def has_ _accepted_length?true if accepted_length.include? self.length
186
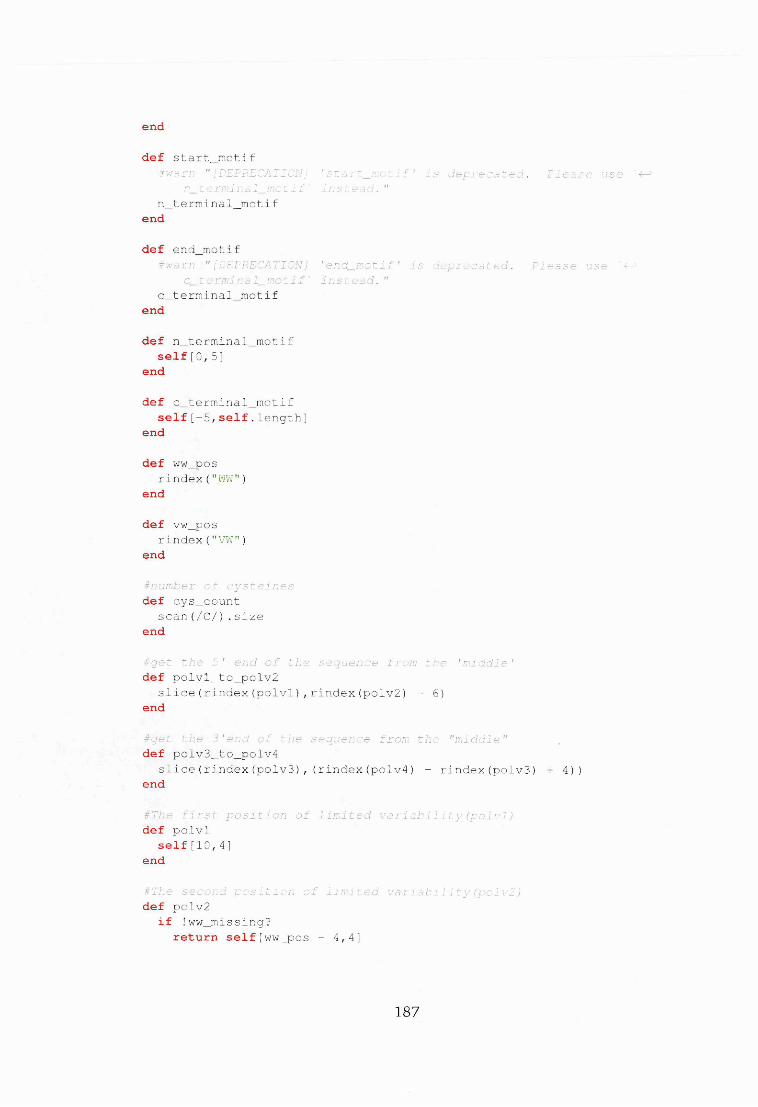
end
def start_motifHwarn " [DEPRECATION] ' start_motif' is deprecated. Please use '
n_terminal_motif' instead." n_te rmi n al_moti f
end
def end_motif#warn " [DEPRECATION] 'end_motif' is deprecated. Please use '■<—11
c_terminal_motif' instead." c_terminal_motif
end
def n_terminal_motif self[0,5]
end
def c_terminal_motif self[-5,self.length]
end
def ww_pos rindex(" WW")
end
def vw_posrindex("VW")
end
#number of cysteines def cys_count
scan(/C/).size end
#get the 5 ’ end of the sequence from the 'middle' def polvl_to_polv2
slice(rindex(polvl),rindex(polv2) - 6) end
#get the 3 'end of the sequence from the "middle" def polv3_to_polv4
slice(rindex(polv3), (rindex(polv4) - rindex(polv3) + 4)) end
4The first position of limited variability (polvl) def polvl
self [ 1 0 , 4 ] end
#The second position of limited variability (polv2) def polv2
if !ww_missing?return self[ww_pos - 4,4]
187
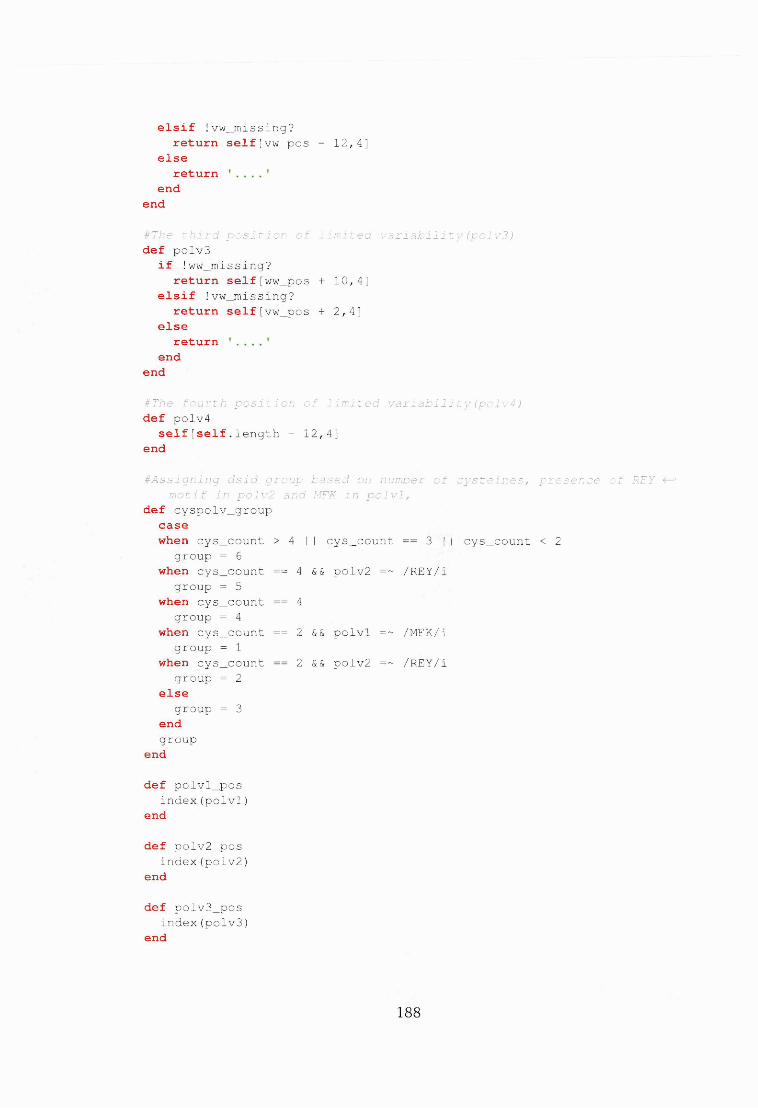
elsif !vw_missing?return self[vw_pos - 12,4]
elsereturn
endend
#The third position of limited variability (polv3) def polv3
if !ww_missing?return self[ww_pos + 10,4]
elsif !vw_missing?return self[vw_pos + 2,4]
elsereturn
endend
#The fourth position of limited variability(polvl) def polv4
self[self.length - 12,4] end
#Assigning dsid group based on number of cysteines, presence of REY 1 motif in polv2 and MFK in polvl,
def cyspolv_group casewhen cys_count > 4 || cys_count == 3 || cys_count < 2
group = 6when cys_count == 4 && polv2 =~ /REY/i
group = 5 when cys_count == 4
group = 4when cys_count == 2 && polvl =~ /MFK/i
group = 1when cys_count = = 2 && polv2 =~ /REY/i
group = 2 else
group = 3 end group
end
def polvl_pos index(polvl)
end
def polv2_pos index(polv2)
end
def polv3_pos index(polv3)
end
188
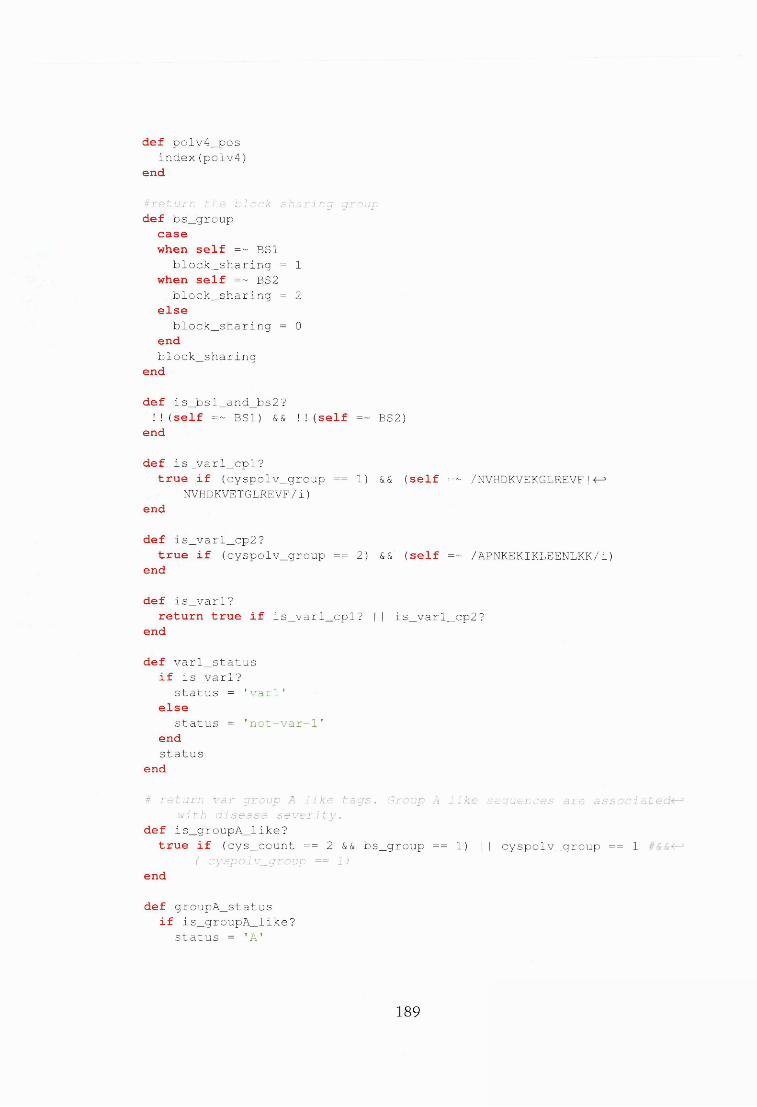
def polv4_pos index(polv4)
end
#return the block sharing group def bs_group
casewhen self =~ BS1
block_sharing = 1 when self =~ BS2
block_sharing = 2 else
block_sharing = 0 endblock_sharing
end
def is_bsl_and_bs2?!!(self =~ BS1) && !!(self =~ BS2)
end
def is_ _varl_cpl?true if (cyspolv_group ==1) && (self =~ /NVHDKVEKGLREVF|
NVHDKVETGLREVF/i)end
def is_ _varl_cp2 ?true if (cyspolv_group == 2) && (self =~ /APNKEKIKLEENLKK/i)
end
def is_varl?return true if is_varl_cpl? || is_varl_cp2?
end
def varl_status if is_varl?
status = 'varl' else
status = 'not-var-l' end status
end
# return var group A like tags. Group A like sequences are associated with disease severity.
def is_groupA_like?true if (cys_count == 2 && bs_group ==1) || cyspolv_group == 1
( cyspolv_group == 1)end
def groupA_status if is_groupA_like?
status = 'A'
189

elsestatus = 'other'
end status
end
idistict sequence identifier(DSID) def dsid
"#{polvl}-#{polv2}-#{polv3}-#{cys_count.to_s}-#{polv4}-#{self length}"
end
#position s p e d fic polymorphic block 1 def pspbl(anchor_pos=0,win_len=14)
self[14 + anchor_pos,win_len] end
#position specific polymorphic block 2 def pspb2(anchor_pos=0,win_len=14)
if !ww_missing?return self[ww_pos - 4 - anchor_pos - win_len, win_len]
elsif !vw_missing?return self[vw_pos - 12 - win_len - anchor_pos, win_len]
elsereturn
endend
iposition specific polymorphic block 3 def pspb3(anchor_pos=0,win_len=14)
if !ww_missing?return self[ww_pos + 14 + anchor_pos, win_len]
elsif !vw_missing?return self[vw_pos + 6 + anchor_pos, win_len]
elsereturn
endend
#position specific polymorphic block 4 def pspb4(anchor_pos=0,win_len=14)
self[self.length - 12 - win_len - anchor_pos, win_len] end
def accepted_length 100..168
end
def ww__missing?true unless self =~ /WW/i
end
def vw_missing?true unless self =~ /VW/i
190

end
def vw_ww_mis s i ng ?true if ww_missing? && vw_missing?
end
def group6_bsltrue if cyspolv_group == 6 && bs_group == 1
end
def sig2_like?return true if self =~ SIG2
end
def sig2_status if sig2_like?
sig2 = 'sig2' else
sig2 = 'non-sig2' end sig2
end end
A.3 A Ruby program to extract DBLa sequence tags from chrom atogram s
Listing A. 7: Extracting DBLa sequence tags from chromatograms
# ! / b i n / b a s h
# T h i s s c r i p t s h o u l d b e r u n f r o m t h e g r o u p e d _ b y _ c l o n e s f o l d e r , i . e a l l -i—9 t h e s e q u e n c e s f o r e a c h i s o l a t e ' s c l o n e s a r e l o c a t e d
#run t h e c o p y _ p e r _ c o l o n y s c r i p t f i r s t t o g e n e r a t e t h i s l i s t o f •<—> s e q u e n c e s
i g e t t h e l i s t o f i s o l a t e s f r o m I s t h e c u r r e n t f o l d e r echo "generating a list of isolate names"
4 1 s -1 I awk ' { p r i n t $ 9 } ' / p e r i - l n e ' p r i n t / (AB [ 0 - 9 ] {1, 3 } ) / ' / s o r t —f-3 k l . 2 n r / u n i q > i s o l a t e _ n a m e s . t x t
find . -type f -name '*.fasta' | grep -Eo 'B[0 — 9] {1, }' I sort -kl.2n | uniq >isolate_names.txt
sed '/A$/d' isolate_names.txt >isolate_names
while read isolate do
mkdir -p ../$isolate
echo "copying data for $isolate"cp $isolate\-* . ./$isolate
cd ../$i solate
191

#Is I p e r i - l n e ' p r i n t / B [ 0 - 9 ] {1 , 3 } - ( [ 0 - 9 ] {1, 2 } ) / ' > $ i s o l a t e \ _ c l o n e s . t x t
Is *.fasta | peri -lne 'print /B[0-9] {1,3}-( [0-9] {1,2})/' >$isolate\-(—1 _clones.txt
#r e m o v e e m p t y l i n e ssed '/A$/d' $isolate\_clones.txt | uniq >temp.txt mv temp.txt $isolate\_clones.txt
while read clone do
echo "creating clone $clone directory"
mkdir -p $isolate\_$clone
echo "copying $isolate-$clone.fasta and $isolate-$clone.fasta.qual files to directory $clone"
mv $isolate\-$clone\_* $isolate\_$clone
cd $isolate\_$clone
# c h a n g e t h e name o f t h e q u a l f i l e t o * . f a s t a . q u a l#mv $ i s o l a t e \ _ $ c l o n e \ - M l 3 . q u a l $ i s o l a t e \ _ $ c l o n e \ - M l 3 .f a s t a . q u a l
f e c h o " r u n n i n g c a p 3 f o r $ c l o n e r e a d p a i r s "~/cap3/cap3 $isolate\-$clone\_M13.fasta $isolate\-$clone\_M13.fastaf^’
.qual >$isolate\_$clone\.cap.txt
i a p p e n d t h e c l o n e n a m e s t o t h e c o n t i g s r e n a m e t h e c o n t i g s sed "s/A>/>$isolate\-$clone\_/" $isolate\-$clone\_M13.fasta.cap.
contigs >$isolate\_$clone.renamed.contigs.fasta sed "s/A>/>$isolate\-$clone\_/" $isolate\-$clone\_M13.fasta.cap.
contigs.qual >$isolate\_$clone.renamed.contigs.qual
f c r e a t e a s i n g l e l i n e f a s t a a n d q u a l f o r t h e a s s e m b l e s a n d r e n a m e d 4- c o n t i g s
awk '/A>/ {printf("\n%s\n",$0) ;next; } { printf (" %s", $0); } END printf("\n");}' < $isolate\_$cl one . renamed, contigs . fasta >4- $isolate\_$clone.SL.renamed.contigs.fasta
awk '/A>/ {printf("\n%s\n",$0);next; } { printf("%s",$0);} END printf ("\n" );} ' < $isolate\_$clone . renamed, contigs . qual $isolate\_$clone.SL.renamed.contigs.qual
sed '/A$/d' $is olate\_$clone.SL.renamed.contigs.qual >temp.txt mv temp.txt $isolate\_$clone.SL.renamed.contigs.qual
sed '/A$/d' $isolate\_$clone.SL.renamed.contigs.fasta >temp.txt mv temp.txt $isolate\_$clone.SL.renamed.contigs.fasta
i c r e a t e a f a s t q f i l e f r o m t h e a s s e m b l e d c o n t i g a n d t h e c o r r e s p o n d i n g q u a l i t y f i l e
echo "creating a fastq file"
192
peri -/Softwares/makefastq. pi $isolate\_$clone . SL . renamed. contigs . 4- fasta $isolate\_$clone . SL. renamed, contigs . qual >$isolate\_$clone4—5 .SL.renamed.contigs.fastq
# r u b y ~/ S o f t w a r e s / t o _ f a s t q . r b $ i s o l a t e \ _ $ c l o n e . S L . r e n a m e d . c o n t i g s . 4- f a s t a $ i s o l a t e \ _ $ c l o n e . S L . r e n a m e d .c o n t i g s . q u a l > $ i s o l a t e \ _ $ c l o n e e — . S L . r e n a m e d . c o n t i g s . f a s t q
echo "calling dbla tags for $clone contig"ruby ~/Code/Ruby/bioruby-dbla-finder/lib/bio-dbla-finder.rb 4-
$isolate\_$clone.SL.renamed.contigs.fastq >$isolate\_$clone. SL. 4- tag.renamed.contigs.fastq
# e c h o " a p p e n d i n g c l o n e n a m e s t o t h e d b l a t a g s "#sed " s / ' " > / > $ i s o l a t e \ _ $ c l o n e \ _ / " $ i s o l a t e \ _ $ c l o n e . t a g s . c o n t i g s >4-
S i s o l a t e \ _ $ c l o n e . r e n a m e d . t a g s . c o n t i g s
# e c h o " a p p e n d i n g c l o n e name t o t h e c o n t i g s "# s e d "s / ^ > / > $ i s o l a t e \ _ $ c l o n e \ _ / " $ i s o l a t e \ _ $ c l o n e - M l 3 . f a s t a . c a p .4-°
c o n t i g s > $ i s o l a t e \ _ $ c l o n e . r e n a m e d . f a s t a . c a p . c o n t i g s
# e c h o " t r a n s l a t i n g d b l a t a g s f o r $ c l o n e "# t r a n s l a t e $ i s o l a t e \ _ $ c l o n e . r e n a m e d . t a g s . c o n t i g s > $ i s o l a t e \ _ $ c l o n e . 4—1
t r a n s l a t e d . d b l a . t a g s . c o n t i g s
cd . .
done <$isolate\_clones.txt
cd ../data_per_colony
done <isolate_names
cd . .
echo "concatenate the fastq files"
find . -type f -name SL.tag.renamed.contigs.fastq' -printO | xargs 4--0 cat >tags.fastq
i p r i n t t a g s . f a s t aruby ~/Softwares/read_fastq.rb tags.fastq seq >tags.fasta
i c o u n t t h e t o t a l n u m b e r o f p o t e n t i a l t a g scountseqs tags.fasta
# s o m e t i m e s t h e d b l f i n d e r d e t e c t s m u l t i t p l e t a g l i k e r e g i o n s i n l o n g e r 4-c o n t i g s .
i T h e s e n e e d t o b e c o r r e c t e d / r e m o v e d m a n u a l l ygrep ">" tags.fasta | sort | uniq -c | sort -nk 1 | uniq | awk '{if($l4-J
>1) print}' >duplicated_tags.txt
193
A.4 A bash pipeline to cluster DBLa sequences using an identity cutoff
This bash script uses Vsearch to cluster sequences, Bio-CDHIT-report to parse clustered files.
Listing A.8: A program to duster sequences using an identity cut-offs
# ! / b i n / b a s h# # # # # # # # # # # # # # # # # # # # # # # # # # # # # # # # # # # # # # # # # # # # # # # # # # # # # # ## T h i s b a s h s c r i p t t a k e s a s e q u e n c e f i l e a n d c l u s t e r s t h e s e q u e n c e s a t ■<—“
p r e d i f i n e d i d e n t i t i e s (98 - 88) i F o r e a c h c l u s t e r i n e a c h i d e n t i t y , we a l i g n t h e s e q u e n c e s a n d s e a r c h
f o r c h a n g e s , p o s i t i o n s o f t h e c h a n g e s a n d t h e t y p e o f c h a n g e s .#We t a l l y a l l t h e c h a n g e s i n e a c h i d e n t i t y
#D e p e n d e n c i e s# B i o - c d - h i t - r e p o r t# R u b y#AWKi s e d#t r a n s l a t e . r b #m ut 3. t i o n . r b
( ( A u t h o r : G e o r g e G i t h i n j i# E m a i l : g g i t h i n j i @ k e m r i - w e l l c o m e . o r g#MIT L i c e n c e# # # # # # # # # # # # # # # # # # # # # # # # # # # # # # # # # # # # # # # # # # # # # # # # # # # # # # #
seqfile=$l
[ $# -eg D ] && { e c h o " U s a g e : $0 n u c l e o t i d e _ f i l e e x i t 1 ; }
identities=(98 96 94 92 90 88)
seqfilefullpath=$( cd $ (dirname $seqfile); pwd)/$(basename $seqfile)
# s o r t t h e i n p u t s e q u e n c e w i t h u s e a r c h s o r t b y l e n g t h command vsearch -sortbylength $seqfile — output $seqfile.sorted.fasta
sortedfilefullpath=$( cd $ (dirname $seqfile); pwd)/$(basename $seqfile.-e^ sorted.fasta)
# c r e a t e t h e d i r e c t o r i e s t o h o l d o u t p u t f o r e a c h c l u s t e r i d e n t i t y for id in ${identities[@] }; do
mkdir -p "${id}"fr_id=$(bc<<<"scale=2; $id/100") echo $fr_id
f u s e c d - h i t t o c l u s t e r# c d - h i t - e s t - i $ s e q f i l e - o $ i d / c l u s t e r . $ { i d } - c $ f r _ i d #r e t i r e c d - h i t
f u s e t h e u c l u s t a l g o r i t h m t o p e r f o r m t h e c l u s t e r i n gf u c l u s t — i n p u t $ s o r t e d f i l e f u l l p a t h — u c $ i d / c l u s t e r . $ { i d } . u c - - i d ${<r^
f r _ i d ) - - o p t i m a l
194
fuse vsearchl.1.1vsearch -cluster_smallmem $sortedfilefullpath -id ${fr_id} -centroidsf-"
$id/cluster.${id}.nr.fasta -uc $id/cluster.${id}.uc
#convert the output to cd-hit formatuclust — uc2clstr $id/cluster.${id}.uc — output $id/cluster. $ { id} . e->
clstr
cd "${id}"
fWrite a file containing the cluster-id and respective list of cluster members
fecho "Parsing clusters"
ruby ~/Softwares/parse-cdhit.rb cluster . $id. clstr member >-f-j seqs_per_cluster.txt
ruby ~/Softwares/parse-cdhit.rb cluster.$id.clstr size >P-> seq_numbers_per_cluster.txt
echo "Sorting cluster numbers"sort -t$',' -k2 -nr seq_numbers_per_cluster.txt >sorted.fJ
seq_numbers_per_cluster.txt awk -F, '{if($2 > 1) print $1}'< sorted.seq_numbers_per_cluster.txt >f^
most_clusters.txt
#create directories for each cluster in most_cluster.txt while read clustr; do
echo "processing $clustr"
mkdir cluster_$clustr cd cluster_$clustr
fwrite the fasta members for clustr $namegrep " /s$ { clustr}: " . ./seqs_per_cluster . txt | awk -F : '{print $2}'-<-J
| tr , '\n' >members.txtfastagrep -F -X -f members.txt $sortedfilefullpath >f^
cluster_$clustr.fasta
fecho "Translating"fruby ^/Softwares/translate.rb -i cluster_$clustr.fasta -f 1 -o 4—'
cluster_$clustr.aa.fasta
fecho "Aligning sequences"fmuscle -in cluster_$clustr.fasta -out cluster_$clustr.aln #-f^
physout cluster_$clustr.phylip prank -d=cluster_$clustr.fasta -o=cluster_$clustr -codon -F —f-5
showtree -quiet
freplace mutation.rb with polymorphic_sites. rb fecho "Searching for polymorphic sites"fruby ~/Code/Ruby/blocks/lib/polymorphic_sites.rb cluster_$clustre-
.aln >cluster_$clustr.snps.muscle.txt ruby ~/Code/Ruby/blocks/lib/polymorphic_sites.rb cluster_$clustr.
best.fas >cluster_$clustr.snps.prank.txt
195
#echo "searching dN and dS changes"^-/Softwares/selection.rb -i cluster_$clustr.aln -S I awk '{prints
$4}' I sort I uniq -c / sed -e 's/^[ \t]*//' >cluster_$clustr<- . dN_dS. txt
~/Softwares/selection . rb -i cluster_$clustr.best. fas -S | awk 1 {-f- print $4}' | sort | uniq -c | sed -e 's/A [ \t]*//' >■<—>cluster_$clustr.dN_dS_prank.txt
cd . .done <most_clusters.txt
echo "collect snps in $id identity threshold"#find . -type f -name *. snps .muscle. txt / xargs cat I sed -e 's/^[ \t-f-
]*//' >all.snps.muscle.txt find . -type f -name *.snps.prank.txt | xargs cat | sed -e 's/A [ \ t<-^
]*//' >all.snps.prank.txt
cd . . done
A. 5 A program to cluster sequences within isolates
Listing A.9: A program to cluster sequences within isolates
# ! / b i n / b a s h
# f i n d t h e i s o l a t e f i l e name i n s e q s f o l d e r for file in ../seqs/*.fa do
fullpath=$(cd $ (dirname $file); pwd)/$(basename $file) filepath="${file##*/}" filename="${filepath%.*} " mkdir -p $filename cd $f ilenameruby ~/Softwares/get_blocks.rb $fullpath >$filename.block_H.fasta clusteringpipeline $filename.block_H.fasta cd . .
done
mkdir block_H mv *.nr block_H
A. 6 A program to parse cd-hit form atted cluster files
Listing A. 10: A program to parse CD-HIT clusters
require 'bio-cd-hit-report'
clusterfile=ARGV[0] out = ARGV[1]
def print_members(report)
196

report.each_cluster{|c| puts "#{c .cluster_id}:#{c .members}"} end
def print_sizes(report)report.each_cluster{|c| puts "# {c .cluster__id},# {c .size}"}
end
report = Bio::CdHitReport.new(clusterfile)
if out == "member"print_members(report)
elsif out == "size" print_sizes(report) else
puts "Error" end
Listing A. 11: parser class
class CdHitParserattr_accessor :report_file
def eachdata,header = nil, nil File.open(report_file).each do |line|
if line[0].chr == '>'yield Cluster.new(:name => header,:data => data) if data data = ''header = line[1..-1].strip
elsedata << line
end endyield Cluster.new(:name => header, :data => data)
end end
Listing A. 12: cluster class
class Clusterattr_accessor :name, :data
def initialize(arg={}) self .name = arg[:name] self.data = arg[:data]
end
def cluster_idname.scan(/Cluster\s(.*)/).join
end
def membersentries.join(' , ' )
197

end
def representativedata.split("\n").map{|line|line.scan(/>(.+)\.{3}\s\*/)}.join
endalias :rep_seq :representative
def sizeentries.size
endalias :length :size
def entriesdata.split("\n") .map{|line|line.scan(/>(.+)\.{3}/) }
end end
Listing A. 13: report class
module Biorequire_relative 'cluster' require_relative 'parser'
class CdHitReport include Enumerable
def initialize(file)@report = CdHitParser.new @report.report_file = file
end
def cl usters els = []greport.each do |c|
els << c end els
end
def each_cluster(&block) clusters.each(&block)
end
def total_clusters clusters.size
end
def get_members(cluster_id)clusters.select {|cluster| cluster.cluster_id == cluster_id.to_sfJ
}.map{Ic|c.members}endalias :get_cluster :get_members
end end
198
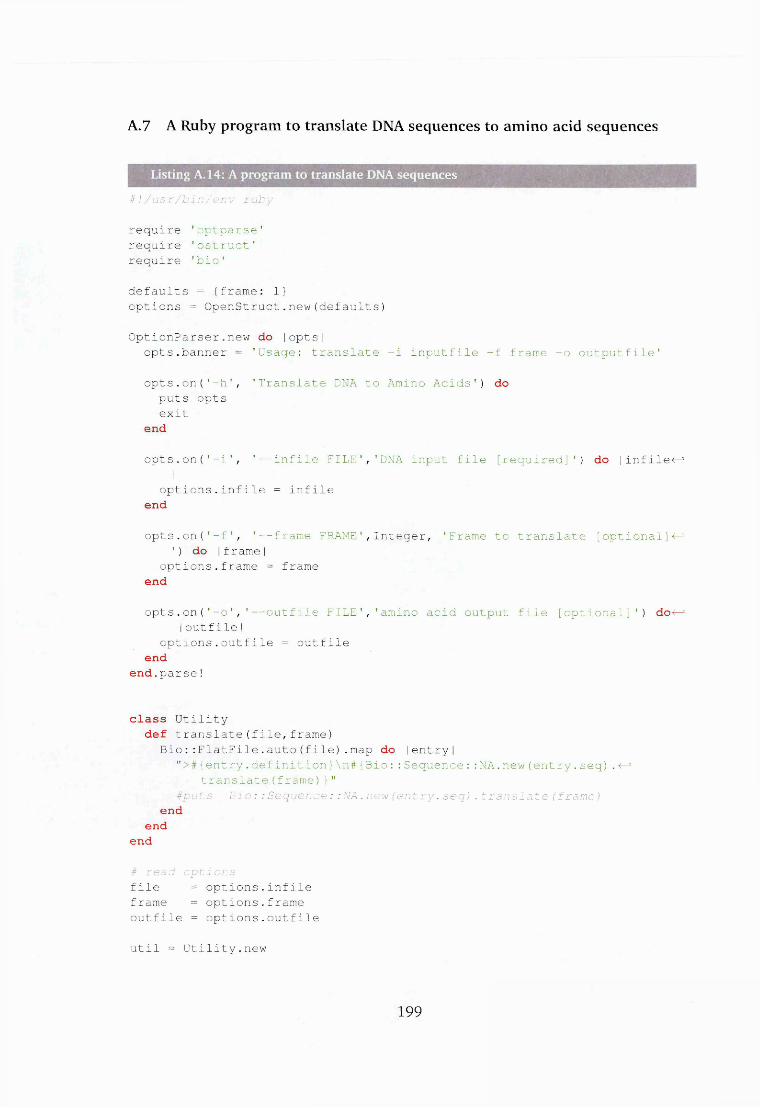
A. 7 A Ruby program to translate DNA sequences to amino acid sequences
Listing A. 14: A program to translate DNA sequences
# !/ u s r / b i n / e n v ru by
require 'optparse' require 'ostruct' require 'bio1
defaults = {frame: 1}options = OpenStruct.new(defaults)
OptionParser.new do |opts|opts.banner = 'Usage: translate -i inputfile -f frame -o outputfile'
opts.o n ('-h', 'Translate DNA to Amino Acids') do puts opts exit
end
opts.o n ('-i', '— infile FILE','DNA input file [required]') do |infile-^I
options.infile = infile end
opts.o n ('-f', '— frame FRAME',Integer, 'Frame to translate [optional]^1) do |frame|
options.frame = frame end
opts.o n ('-o', '— outfile FILE', 'amino acid output file [optional]') do4—’ Ioutfile|
options.outfile = outfile end
end.parse!
class Utilitydef translate(file,frame)
Bio::FlatFile.auto(file).map do lentryl">#{entry.definition}\n#{Bio::Sequence::N A .new(entry.seq).4-°
translate(frame)}"# p u t s B i o : : S e q u e n c e : : N A . n e w ( e n t r y . s e q ) . t r a n s l a t e ( f r a m e )
end end
end
# r e a d o p t i o n s file = options.infileframe = options.frameoutfile = options.outfile
util = Utility.new
199
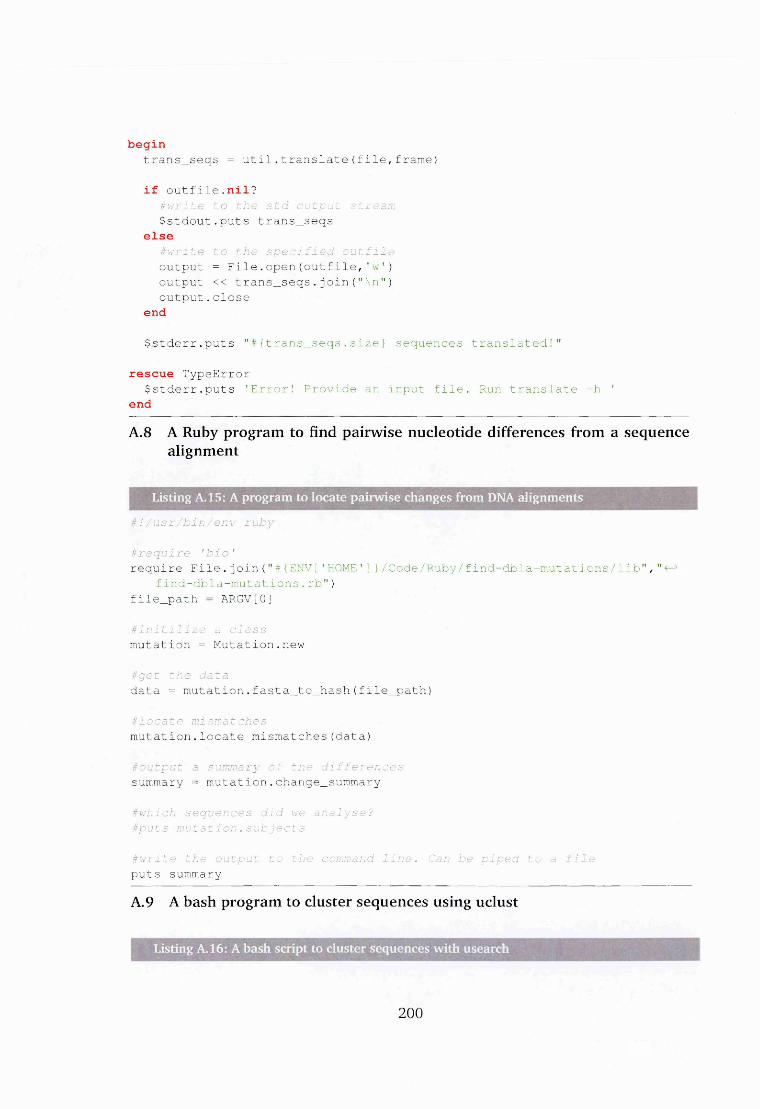
begintrans_seqs = util.translate(file,frame)
if outfile.nil?f w r i t e t o t h e s t d o u t p u t s t r e a m $stdout.puts trans_seqs
elsef w r i t e t o t h e s p e c i f i e d o u t f i l e output = File.open(outfile,'w ') output << trans_seqs.join("\n") output.close
end
$stderr.puts "#{trans_seqs.size} sequences translated!"
rescue TypeError$stderr.puts 'Error! Provide an input file. Run translate -h '
end
A.8 A Ruby program to find pairwise nucleotide differences from a sequence alignment
Listing A. 15: A program to locate pairwise changes from DNA alignments
# ! / u s r / b i n / e n v r u b y
# r e q u i r e ' b i o 'require File.join("#{ENV['HOME 1] }/Code/Ruby/find-dbla-mutat ions/lib","•*-*
find-dbla-mutations.rb") file_path = ARGV[0]
f i n i t i l i z e a c l a s s mutation = Mutation.new
f g e t t h e d a t adata = mutation.fasta_to_hash(file_path)
f l o c a t e m i s m a t c h e smutation.locate_mismatches(data)
# o u t p u t a s u m m a r y o f t h e d i f f e r e n c e s summary = mutation.change_summary
f w h i c h s e q u e n c e s d i d we a n a l y s e ? f p u t s m u t a t i o n . s u b j e c t s
f w r i t e t h e o u t p u t t o t h e command l i n e . Can b e p i p e d t o a f i l e puts summary
A.9 A bash program to cluster sequences using uclust
Listing A. 16: A bash script to cluster sequences with usearch
200
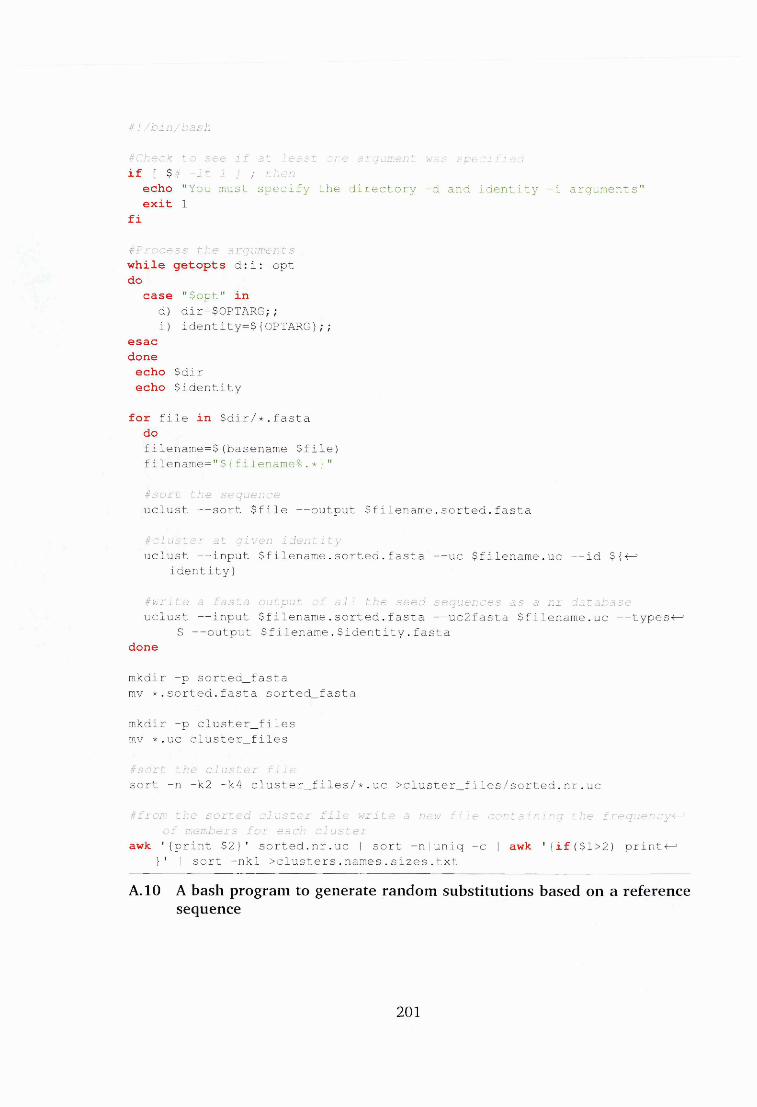
# ! / b i n / b a s h
i C h e c k t o s e e i f a t l e a s t o n e a r g u m e n t was s p e c i f i e d if [ $# -It 1 ] ; t h e n
echo "You must specify the directory -d and identity -i arguments" exit 1
fi
i P r o c e s s t h e a r g u m e n t s while getopts d:i: opt do
case "$opt" in d) dir=$OPTARG; ; i) identity=${OPTARG};;
esac done echo $dir echo $identity
for file in $dir/*.fasta dofilename=$(basename $file) filename="${filename%.*}"
f s o r t t h e s e q u e n c euclust — sort $file — output $filename.sorted.fasta
# c l u s t e r a t g i v e n i d e n t i t yuclust — input $filename.sorted.fasta — uc $filename.uc — id ${-P
identity}
f w r i t e a f a s t a o u t p u t o f a l l t h e s e e d s e q u e n c e s a s a n r d a t a b a s e uclust — input $filename . sorted. fasta --uc2fasta $filename.uc — types-f—’
S — output $filename.$identity.fastadone
mkdir -p sorted_fastamv *.sorted.fasta sorted_fasta
mkdir -p cluster_files mv *.uc cluster_files
f s o r t t h e c l u s t e r f i l esort -n -k2 -k4 cluster_files/*.uc >cluster_files/sorted.nr.uc
f f r o m t h e s o r t e d c l u s t e r f i l e w r i t e a ne w f i l e c o n t a i n i n g t h e f r e q u e n c y ■<—3 o f m e m b e r s f o r e a c h c l u s t e r
awk '{print $2}' sorted.nr.uc | sort -n|uniq -c | awk *{if($l>2) print-P-1 }' | sort -nkl >clusters.names.sizes.txt
A. 10 A bash program to generate random substitutions based on a reference sequence
201

Listing A. 17: A script to create random substitutions given a reference sequence in fasta format
# ! / u s r / b i n e n v r u b y
require 'optparse' require 'ostruct' require 'bio' require 'securerandom1 require 'pickup'
options = OpenStruct.new
OptionParser.new do |opts|opts.o n ('-h', 'shows this help screen') do
puts opts exit
end
opts.o n ('-i', '— infile FILE','input fasta file') do |infile|options.infile = infile
end
opts.o n ('-r','— error_rate Error', Float, 'Error rate per nucleotide ' ^ ) do |error_rate|
options.error_rate = error_rate end
opts.o n ('-o','— outfile FILE','Output file') do |outfile| options.outfile = outfile
end
opts.on('-w' '— weights Weight',Float,'weighting levels') do Iweights^I
options.weights = weights end
end.parse!
class Bio::Sequenceattr_accessor :substitutions attr_accessor :weights
NUCLEOTIDES = ['A','C ', 'T ','G ']
# The n u m b e r o f r a n d o m p o s i t i o n s t o c h a n g e def positions_to_sub
(1..self. length).to_a.sample(substitutions) end
# W e i g h t e d r a n d o m n u c l e o t i d e s def weighted_random_nucleotides
weights = []weighted_nt = Pickup.new(weights)
202
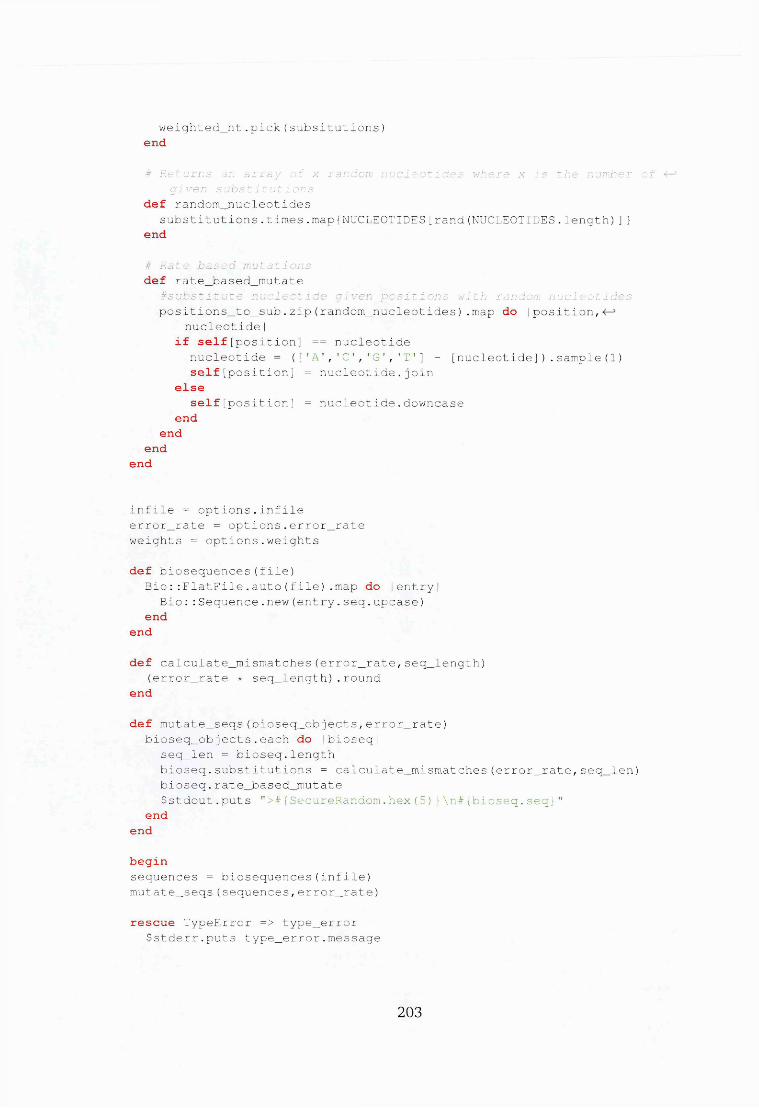
weighted_nt.pick(subsitutions) end
# R e t u r n s an a r r a y o f x r a n d o m n u c l e o t i d e s w h e r e x i s t h e n u m b e r c fg i v e n s u b s t i t u t i o n s
def random_nucleotidessubstitutions.times.map{NUCLEOTIDES[rand(NUCLEOTIDES.length)]}
end
# R a t e b a s e d m u t a t i o n s def rate_based_mutate
# s u b s t i t u t e n u c l e o t i d e g i v e n p o s i t i o n s w i t h r a n d o m n u c l e o t i d e s positions_to_sub.zip(random_nucleotides) .map do | position,
nucleotide| if self[position] == nucleotide
nucleotide = (['A ','C ','G ', 'T '] - [nucleotide]).sample(1) self[position] = nucleotide.join
elseself[position] = nucleotide.downcase
end end
end end
infile = options.infile error_rate = options.error_rate weights = options.weights
def b iosequences(file)Bio::FlatFile.auto(file).map do |entry|
Bio::Sequence.new(entry.seq.upcase) end
end
def calculate__mismatches(error_rate,seq_length)(error_rate * seq_length).round
end
def mutate_seqs(bioseq_objects,error_rate) bioseq_objects.each do |bioseq|
seq_len = bioseq.lengthbioseq.substitutions = calculate_mismatches(error_rate,seq_len) bioseq.rate_based_mutateSstdout.puts ">#{SecureRandom.hex(5)}\n#{bioseq.seq}"
end end
beginsequences = biosequences(infile) mutate_seqs(sequences,error_rate)
rescue TypeError => type_error $stderr.puts type_error.message
203

rescue Bio::FlatFile::UnknownDataFormatError =>format_error $stderr.puts format_error.message << "provide a fasta format"
end
A. 11 A Perl program to generate random substitutions
Listing A. 18: A peri script to generating random mutations given a sequence
# ! / u s r / b i n / p e r l
use strict; use warnings; use Bio::Seq; use Bio::SeqIO;use Bio::SeqEvolution::Factory; use Getopt::Long;
#read command l i n e a r g s my $seqfile = ' #= $ARGV[ 0 ] ;
# % i d e n t i t y w i t h t h e t e m p l a t e s e q u e n c e my $identity = '1;
#t r a n s i t i o n : t r a n s v e r s i o n r a t i o my $rate = 2;
GetOptions('seqfile=s'=>\$seqfile, 'identity=i'=>\$identity, 'rate=i1=>\<—> $rate);
my $inputstream = Bio::SeqIO->new(-file -> $seqfile,-format => 'Fasta',
) ;
my $seqobj = $inputstream->next_seq(); my $seq = l c ($seqobj->seq);
my $tempseq = Bio::Seq->new(-seq => $seq, -alphabet => 'dna');
my $evolve = Bio::SeqEvolution::Factory->new (-rate => $rate, -seq => $tempseq, -identity => $identity);
my @mutated;for (1..10) { push @mutated, $evolve->next_seq }
foreach(@mutated){print $_-> seq ."\n";}
A. 12 An R program to simulate random substitutions
Listing A. 19: A script to simulate substitutions based on a model
# !/ b i n / b a s h
204
clusterfile=$l
clusterFileFullPath=$( cd $ (dirname $clusterfile); pwd)/$(basename$clusterfile)
directory=$(dirname ${clusterFileFullPath})
while read cluster_no; do
i c r e a t e a n e i g h b o u r j o i n i n g t r e e# m u s c l e - m a k e t r e e - i n $ d i r e c t o r y / c l u s t e r _ $ c l u s t e r _ n o / e -
c l u s t e r _ $ c l u s t e r _ n o . f a s t a - o u t c l u s t e r _ $ c l u s t e r _ n o . t r e e - c l u s t e r n e i g h b o r j o i n i n g
#awk ' { p r i n t f ( "%s ", $ 0 ) } ' < c l u s t e r _ $ c l u s t e r _ n o . t r e e >-f-J c l u s t e r _ $ c l u s t e r _ n o _ 2 . t r e e
#o v e r w r i t e t h e o r i g i n a l t r e e f i l e#mv c l u s t e r _ $ c l u s t e r _ n o _ 2 . t r e e c l u s t e r _ $ c l u s t e r _ n o . t r e e
# g e t a r a n d o m s e q u e n c e f r o m t h i s c l u s t e r# T h i s s o l u t i o n i s b a s e d on r e s e r v o i r s a m p l i n g . I t i s o p t i m a l i n -f—5
t e r m s o f b o t h t i m e a n d s p a c e c o m p l e x i t y a n d vsorks w i t h an 4-* a r b i t r a r i l y l a r g e i n p u t f i l e .
#h t t p s : / / w w w . b i o s t a r s .o r g / p / 1 8 8 3 1 /bioawk -c fastx -v k=l 1{y=x++<k?x-l:int(rand()*x);i f (y<k)a[y]=">"«— 1
$name"\n"$seq}END{for (z in a)print a[z]}' $directory/-f-J cluster_$cluster_no/cluster_$cluster_no . fasta >•(—5 cluster_$cluster_no.fa
Rscript ~/Code/R/phylosim_simulation.R cluster_$cluster_no.fa > $directory/cluster_$cluster_no/cluster_$cluster_no.best.dnd ^ cluster_$cluster_no.s .fa
ruby ~/Code/Ruby/blocks/lib/polymorphic_sites.rb cluster_$cluster_no. • s .fa >cluster_$cluster_no.snps.txt
done <$clusterfile
# f i n d . - t y p e f - n a m e * . s n p s . t x i a l l . s n p s
x a r g s c a t / s e d - e ' s / * [ \ t ] * / / ' ><
A. 13 A script to extract regions from a DBLa sequence
Listing A.20: A script to extract sequence regions of interest
# // u s r / b i n / e n v r u b y require 'bio1require 'commander/import'
program :version, '0.0.1'program :description, 'This program extracts sequence regions given a •<—>
position and a window length' program rauthor, 'George Githinji emai1 :[email protected]'
205

command :regions do |r|r.syntax = 'extract region [option]'r.summary = 'find and extract a region of sequence given a variant
position'r .description = 'Extracts overlapping sequence regions from given a
MSA variant position and a window length.'
r.example 'extract region', 'extract region — infile FILE — pos INTEGER — win INTEGER'
r.option '— infile FILE', 'Input file'r.option '— pos INTEGER', Integer, 'A variant position' r.option '— win INTEGER', Integer, 'Window length'
r.action do |args,options| infile = options.infile pos = options.poswin = options.win
# R e a d i n a F A S T A - f o r m a t t e d m u l t i p l e s e q u e n c e a l i g n m e n t fasta_seqs = Bio: :Alignment: : Mult iFastaFormat. new (File . open (inf ile) '
.read)
fasta_seqs.entries.each do |e| for i in 0..win
$stdout.puts e.seq[(pos - 1) - i, win] unless pos - i <= 0 end
end end
end
A. 14 A bash program to find variation context
Listing A.21: A simple pipeline to find the frequency of isolates sharing sequence regions around a variant position
# ! / b i n / b a s hdb="/Users/george/454_data/blast-db/454"classified="/Users/george/454_data/blast-db/4 54.classified.txt"
cluster=$lposition=$2window=$3
clsname=$(basename "$cluster") clsext="${clsname##*.}" clsname="${clsname%.*}"
i r e m o v e s u f f i x f r o m a l i g n m e n t~/Code/Ruby/Blocks/lib/extract regions — infile $cluster — pos
$position — win $window | sort | \uniq | awk -v cl=$clsname.$position '{print ">"cl"." FNR "\n" $0}' \>"$clsname.$position.$window.fa"
206

blastn -query $clsname.$position.$window.fa -db $db -outfmt 6 |\ awk -v win=$window '{if ($3 == 100 && $4 == win) print $2}' | \sort -n | uniq >hits.454.$clsname.$position.$window.txt
grep -wFf hits.454.$clsname.$position.$window.txt $classified |\awk '{print $1,$7,$2}' | sort -k2 | sed 's/\..*$//g' | sort -n | uniq-e-3
-c
A. 15 A Python program m for submitting epitope prediction requests to the Predivac server
Listing A. 22: Automated prediction of T-cell epitopes using the Predivac online server.
# ! / u s r / b i n / e n v p y t h o n
from bs4 import BeautifulSoupfrom urllib2 import urlopenfrom ClientForm import ParseResponsefrom optparse import OptionParserfrom Bio import SeqIOimport sysimport time
# m a in c l a s s #4-
class Predivac(object):rr rr rt
S c r a p p i n g t h e p r e d i v a c web d a t a b a s e u s i n g b e a u t i f u l o u p a n d p y t h o nff ft ft
def _ _init (self,Sequence,Allele):i f rr tr
I n i t i a l i z e c l a s s p a r a m e t e r sft rt rr
self.Sequence = Sequence self.Allele = Alleleself.PredivacLink = 'http://predivac.biosci.uq.edu.au/cgi-bin/e-^
binding.p y '
def FillForm(self):i f ft rt
F i l l t h e w e b f o r mtt ft ft
ProtString = "\n".join(self.Sequence) webpage = urlopen(self.PredivacLink) forms = ParseResponse(webpage) form = forms[0]form['subtype'] = {'protein'] form['sequence'] = ProtString form['allele'] = [self.Allele] form['threshold'] = ['3']
207

response = urlopen(form.click()) soup = BeautifulSoup(response) return soup
def ParseResults(self):ff ft nP a r s e t h e p r e d i c t i o n t a b l err rr rr
soup = Predivac.FillForm(self)table = soup.find("table", id = "prediction-table") predictions = [] try:
for row in table.findAll('tr'): tds = row('t d ') if len(tds) > 1:
id = tds[0].text nanomer = tds[l].text score = tds[2].text start = tds[3].text end = tds[4].textfull_entry = id + ":" + nanomer + ":" H
+ start + ":" + end predictions.append(full_entry)
except AttributeError: return
return join(predictions)
# s p l i t t i n g t h e p r o t e i n s e q u e n c e t o a c c o m o d a t e p r e d i v a c
def chunks(s, n) :" " " P r o d u c e h i ' - c h a r a c t e r c h u n k s f r o m ' s ' . " " " for start in range(0, len(s), n):
yield s [start:start+n]
# P a r s e f a s t a e n t r i e s
def ParseFasta(infile):
handle = open(infile, "rU")FastaResult = []for record in SeqIO.parse(handle, "fasta"):
Id = record.id Sequence = record.seq Entry = (Id,Sequence)FastaResult.append(Entry)
return FastaResult
# P a r s e a l l e l e l i s t
score + " :
208

def ParseAllele(infile):Alleles = []for line in open(infile, "rU"):
Alleles.append(line.strip()) return Alleles
#S e t t i n g c o m m a n d l i n e o p t i o n s # v -
def commandline_options() :
parser = OptionParser(usage="usage: %prog [options]") parser.add_option("-p", "— proteins",
type="string", dest="protein_file", help="Fasta file with proteins")
parser.add_option("-a", "— allele",type="string", dest="allele_file", help="File with list of alleles")
parser.add_option("-d" , "— delay" , type="int", dest="time_delay", default=3,help="Minimum time delay before hitting server (■<-J
Default 3s)") parser.add_option("-o", "--output",
action="store", type="string", dest="result_file", default="results.txt" , help="The final output file")
(options, args) = parser.parse_args() options_args_parser = [options,args,parser]
return options_args_parser
t tmain#
def main () :options, args, parser = commandline_options() ProteinFile = options.protein_file AlleleFile = options.allele_file TimeDelay = options.time_delay OutputFile = options.result_file
209
if ProteinFile is None or AlleleFile is None:sys.stderr.write("\nError: A mandatory option is missing!\n") parser.print_help() sys.exit(-1)
else:FastaFile = ParseFasta(ProteinFile)Alleles = ParseAllele(AlleleFile)FOut = open(OutputFile, 'w ' ) for Entry in FastaFile:
for Allele in Alleles:ProtId,ProtSeq = Entry ProtId_M = ’>' + Protld ProtSeq = str(ProtSeq)SeqPieces = [ProtId_M] f r d i v i n d t h e s e q u e n c e i n t o p i e c e s for chunk in chunks(ProtSeq, 50):
SeqPieces.append(chunk)
sys . stderr . write ( "predicting %s with %s\n" % (Protld,-t-* Allele))
soup = Predivac(SeqPieces,Allele) soup.FillForm()Results = soup.ParseResults()FOut.write("%s\t%s\t%s\n" % (Protld,Allele,Results)) time.sleep(TimeDelay)
sys.stderr.write("\nPrediction complete, results written to to 1 %s\n" % (OutputFile))
#Run i t
if name == ' main 1 :main ()
A. 16 A program to predict netMHCII epitopes using a parallel approach
Listing A. 23: A script to predict MHC-class II epitopes
# 1/ b i n / s h## T h i s s c r i p t s h o u l d b e i m p r o v e d w i t h GNU p a r a l l e l ! :)
prediction_method="NetMHCII-pan-3"
fasta_file=$l allele_file=$2 peptide_len=$3# o u t p u t _ f i l e = $ 4
echo "Predicting class II T-cell epitopes" # $ f i l e _ n o " #>> $LOG_FILE
function wait_run_in_parallel(){local number_to_run_concurrently=$l
210

if [ 'jobs -np | wc -1' -gt $number_to_run_concurrently ]; thenwait 'jobs -np | head -1' # w a i t f o r t h e e l d e s t or.e t o f i n i s h
fi}
# r u n t h e p r e d i c t i o n a n d s a n i t i z e t h e o u t p u t t o c s v f i l e function predict(){
local allele=$lnetmhcpan3 -f $fasta_file -a $allele -length $peptide_len |sed 1/\#/d' I s e d ' / ---/ d ' /sed 1/Pos/d1 | sed ’/Number/d1 | sed 's/A *//' I sed 's/[ \t]*$//' |sed 's/<=WB//' | sed 's/<=SB//' |tr -s 1 [:blank:] ' ', ' |sed '//s$/d'| sed 's/,$//'
# f u n c t i o n t o r u n MHCII p r o g r a m f o r e a c h a l l e l e s a n d s e n d t h e j o b s t o t h e b a c k g r o u n d
run_prediction () {# R e a d t h e a l l e l e f i l e while read mhc_allele do
predict $mhc_allele >>"$mhc_allele.pred.temp" &wait_run_in_parallel 10 # r u n 10 j o b s a t a t i m e a n d wait t o e x e c u t e .
done <$allele_file}
i e x e c u t e t h e j o b s run_predictioni w a i t f o r a l l b a c k g r o u n d j o b s wait
# c o n c a t e n a t e t h e f i l e scat *.pred.temp >>all.hla.preds
i c l e a n u p ! rm *.pred.temp
A. 17 A Ruby program to print block-sharing networks in csv form at
Listing A. 24: A script to print block-sharing networks
# ! / u s r / b i n / e n v r u b y
require 1bio-dbla-classifier' require 'commander/import'
program :version, '0.0.1'program :description, 'Generates a network from DBL-alpha amino acid
sequence tags'program :author, 'George Githinji email: [email protected]'
command :create do |c|
211

#A s t r u c t u r e t o h o l d t h e name a n d p s p b t y p e sclass Pspb < Struct.new(:id,:name,:pspbl,:pspb2,:pspb3,:pspb4)
def all_pspbs[pspbl,pspb2,pspb3,pspb4]
endend
c.syntax = 'network create [options]'c.summary = 'creates a network given a list of amino acid sequences^
T
c .description = 'This command generates a tab-separated list of 2 P columns where each entry in each column is a node.'
c. example 'network', 'create — infile FILENAME — blocksize INTEGER •<—’ — outfile FILENAME'
c.option '— infile FILE', 'Specify an input file(amino acid only)' c.option '--blocksize INTEGER', Integer, 'specify the length of t h e ^
pspb block. Default is 10'
c.action do |args, options|options.default :blocksize => 10 seq_file = options.infile blocksize = options.blocksize
pspbs = Bio::FlatFile.open(seq_file) .each_with_index.map do | entry,index|pspbl = Bio::Sequence::AA.new(entry.seq).pspbl(0,blocksize) pspb2 = Bio::Sequence::A A .new(entry.seq).pspb2(0,blocksize) pspb3 = Bio::Sequence::A A .new(entry.seq).pspb3(0,blocksize) pspb4 = Bio::Sequence::A A .new(entry.seq).pspb4(0,blocksize)
Pspb.new(index + 1,entry.definition,pspbl,pspb2,pspb3,pspb4-ej )
end
puts "nodel\tnode2"pspbs.combination (2) .each do |i|
puts "#{ i [0 ]. name }\t# { i [ 1 ]. name} " if (i [ 0 ] . all_pspbs & i-F[1].all_pspbs).size > 0
endend
command :attribute do |a|a.syntax = 'network attribute [options]' a.summary = 'generate network attributes file'a .description = 'This command generates a network attributes A-3
file for loading into cystoscape'
a.example 'network', 'attribute — infile FILENAME'a.option '—f ' , '— infile FILE', 'specify the sequence input file-*-3
I
#a s t r u c t u r e t o h o l d t h e c y s p o l v c l a s s i f i c a t i o n a n d b s s h a r i n g -f-3 g r o u p s
class Attr < Struct.new(:id,:name,:cyspolv,:bsgroup);end
212

a.action do |args, options| seqfile = options.infile
attrs = Bio :: FlatFile . open (seqfile) . each_with_index . map do I entry,index|cyspolv = Bio::Sequence::AA.new(entry.seq) 3
cyspolv_group bsgroup = Bio::Sequence::AA.new(entry.seq) .bs_group Attr.new(index + 1,entry.definition,cyspolv,bsgroup)
end
puts "geneXtcyspolvgroupXtbsgroup" attrs.each do |attri|
puts "# {attri . name } \ t# { attri . cyspolv} \ t# { att ri . bsgroup} A-’ff
endend
endend
A. 18 A Ruby program to print homology blocks and hypervarible blocks from sequence tags
Listing A.25: A program to print the homology blocks D and H and hypervarible blocks HP1 and HP2
# ! / u s r / b i n / e n v r u b y require 'bio' require 'bio-alignment' require 'bio-alignment/bioruby' include Bio::BioAlignment
file = ARGV[0]
include Bio::BioAlignment
aln = Alignment.newBio::FlatFile.auto(file).map.each_entry do |entry|
aln << Sequence.new(entry.definition,entry.seq) end
seq_len = aln[0].to_s.length
block_H_start = seq_len - 39
ww_motif_pos = aln[0].to_s.rindex(/TGGTGG/)
hp2__start = ww_motif_pos + 4 2
hpl_start = 42hpl_stop = ww_motif_pos - 21
213
# b l o c k Dputs aln.columns[0..42].map{|c| c .to_a}.transpose.each_with_index.map{|
s,i| ">seq_#{i+1}\n#{s .join}"}
#b e f o r e WW h y p e r v a r i a b l e r e g i o n# p u t s a l n . c o l u m n s [ h p l _ s t a r t . . h p l _ _ s t o p ] . m a p { I d c . t o _ a } . t r a n s p o s e .
e a c h _ w i t h _ i n d e x . m a p { /s , i I "> s e q ^ # { i + 1 } \ n # { s . j o i n } " }
t a f t e r WW h y p e r v a r i b l e b l o c k# p u t s a l n . c o l umns [ h p 2 _ s t a r t . . b l o c k _ H _ s t a r t ] . map { I c I c . t o _ a } . t r a n s p o s e .
e a c h _ w i t h _ i n d e x . m a p { I s , i I "> s e q _ # {i + 1 } \ n # { s . j o i n } " }
# b l o c k _ Hi p u t s a l n . c o l u m n s [ b l o c k _ H _ s t a r t . . s e q _ l e n ] .m a p{ / c / c . t o _ a } . t r a n s p o s e .
e a c h _ w i t h _ i n d . e x . map { / s , i / " > s e q _ # { i + 1 } \ n # { s . j o i n } "}
A. 19 A Ruby program to generate random nucleotide substitutions
Listing A. 26: A Ruby implementation of a program to generate random substitutions
#// u s r / b i n e n v r u b y
require 'optparse' require 'ostruct' require 'bio' require 'securerandom1 require 'pickup'
options = OpenStruct.new
OptionParser.new do |opts|opts.o n (1-h', 'shows this help screen') do
puts opts exit
end
opts.o n ('-i' , '— infile FILE', 'input fasta file') do |infile|options.infile = infile
end
opts.o n ('-r','— error_rate Error', Float, 'Error rate per nucleotide' ) do |error_rate|
options.error_rate = error_rate end
opts.o n ('-o', '— outfile FILE','Output file') do |outfile| options.outfile = outfile
end
opts.on('-w' '— weights Weight', Float,'weight ing levels') do |weights-<—> I
options.weights = weights end
214

end.parse!
class Bio::Sequenceattr_accessor :substitutions attr_accessor rweights
NUCLEOTIDES = [ ' A ' , ' C ' , ' T ' , ' G ' ]
# The n u m b e r o f r a n d o m p o s i t i o n s t o c h a n g e def positions_to_sub
(1. .self. length).to_a.sample(substitutions) end
# W e i g h t e d r a n d o m n u c l e o t i d e s def weighted_random_nucleotides
weights = []weighted_nt = Pickup.new(weights) weighted_nt.pick(subsitutions)
end
# R e t u r n s an a r r a y o f x r a n d o m n u c l e o t i d e s w h e r e x i s t h e n u m b e r o fg i v e n s u b s t i t u t i o n s
def random_nucleotidessubstitutions.times.map{NUCLEOTIDES[rand(NUCLEOTIDES.length)]}
end
# R a t e b a s e d m u t a t i o n s def rate_based_mutate
# s u b s t i t u t e n u c l e o t i d e g i v e n p o s i t i o n s w i t h r a n d o m n u c l e o t i d e s positions_to_sub.zip(random_nucleotides).map do |position,^
nucleotide| if self[position] == nucleotide
nucleotide = (['A 1, 1C ', 'G ', 'T 1] - [nucleotide]).sample (1) self[position] = nucleotide.join
elseself[position] = nucleotide.downcase
end end
end end
infile = options.infile error_rate = options.error_rate weights = options.weights
def biosequences(file)Bio::FlatFile.auto(file).map do |entry|
Bio::Sequence.new(entry.seq.upcase) end
end
def calculate_mismatcb.es (error_rate, seq_length)
215
(error_rate * seq_length).round end
def mutate_seqs(bioseq_objects,error_rate) bioseq_objects.each do Ibioseql
seq_len = bioseq.lengthbioseq.substitutions = calculate_mismatches(error_rate,seq_len) bioseq.rate_based_mutate$stdout.puts ">#{SecureRandom.hex(5)}\n#{bioseq.seq}"
end end
beginsequences = biosequences(infile) mutate_seqs(sequences,error_rate)
rescue TypeError => type_error $stderr.puts type_error.message
rescue Bio::FlatFile::UnknownDataFormatError =>format_error $stderr.puts format_error.message << "provide a fasta format"
end
A.20 A Ruby program to parse and work with DBLa sequences from CAF form atted files
Listing A.27: assemble tags
require 'bio'['caf', 'cafrecord', 'phrap'].each do |name|require File.join(File.expand_path(File.dirname( FILE )),"#{name } " )
end
puts "Processing . . . . "dir_path = "#{ENV['HOME']}/Batchl_files_from_thomas/batchl_cafs"
Dir.chdir(dir_path) dop = Caf::Parser.new('batchi.caf')
puts "Total caf records = #{p.caf_records.size}"
# r e j e c t e d _ r e a d s = p . r e j e c t e d _ _ s e q s#p.t o _ f i l a ( ' r e j e c t e d _ r e a d s _ 2 . f a s t a ' , r a j e c t e d _ r e a d s )
puts 'removing vector sequences'
without_vector_seqs = p .no_vector_seqsp . to_f ile ( ' batchl__without_vector_seqs_2 8_07_2 011 .fasta ' , p .
no_vector_seqs)
end
puts "Finished successfuly"
216

Listing A. 28: caf class
module Caf class Parser
def initialize(file)@file = file
end
def caf_records $/ = "\n\n" records = []
File.open(@file) do |f| f.each_line do |line|
read = CafRecord.new case line
when /^DNA/records << CafRecord.new records.last.dna_data = line.strip
when /^BaseQuality/records.last.quality_data = line.strip
when /^Sequence/records.last.metadata = line.strip
elseputs "Unrecognized line: #{line}"
endend
endrecords
end
def sequence_listcaf_records.map {|read| read.sequence}
end
def name_list caf_records.map {|readl read.name}
end
def no_vector_seqscaf_records.map {|read| read.trimmed_fasta if read.'H
passes_vector_filter?}.compact #r e m o v e n i l send
def re jected_seqscaf_records.map {|read| read.raw_fasta unless read.f-^
passes_vector_filter?}.compact f r e m o v e n i l send
def no_primer_seqscaf_records.map {|read|read.deprimed_fasta if read.passes_filtersfJ
?}.compact # r e m o v e n i l send
def no_primer_seqs_quals
217
caf_records .map { | read | read. deprimed_base_qual_fasta if read.-S- passes_filters?}.compact #ren :ov e n i l s
end
def raw_caf_readscaf_records.map {|read| read.raw_fasta}.compact
end
i w r i t e an o u t p u t t o a p h y s i c a l f i l e def to_file(path,contents)
File.open("#{p a t h w ') do |f| f.puts contents
end end
end i c l a s s end i m o d u l e
Listing A. 29: cafrecord class
class CafRecordattr_accessor :dna_data,:quality_data,rmetadata
#r e t u r n t h e name def name
# d n a _ d a t a = d n a _ d a t a . t o _ s# p o s s i b l e b u g f o r d i f f e r e n t r e c o r d s n a m e s# f o r g e o r g e s s e q u e n c e s# n a m e _ r e g = c r e a t e _ r e g e x p ( " (VARPB. * ) $ " )name_reg = create_regexp(" (VAR[PBI BP] .*)$") f a l l o w m i s t y p e d r e a d 3
n a m e s VARPB/VARBP# n a m e _ r e g = c r e a t e _ r e g e x p ( " ( V A R P B \ \ d \ \ d . .\\d.\ \ d \ \ d \ \ ..\ \ d . *) ") dna_data.to_s.scan(name_reg).join
end
§ r e t u r n t h e r a w r e a d dn a s e q u e n c e def sequence# n a m e _ r e g = c r e a t e _ r e g e x p ( " ( AD N A \ \ s : \ \ s V A R P B \ \ d \ \ d . . \ \ d . \ \ d \ \ cR—>
\\. . \ \ d . *) ") name_reg = create_regexp(" (ADNA : VARPB.*)$")# d n a _ d a t a . t o _ s [25 , d n a _ d a t a . t o _ s . s i z e ] . d e l e t e ( " \ n " ) . s t r i p r e s c u e "" #<—1
i f d n a _ d a t adna_data.to_s.gsub(name_reg,'').delete("\n").strip
end
t f s t r i n g o f b a s e q u a l i t y s c o r e s def quality_scores
# q u a l i t y _ d a t a = q u a l i t y _ d a t a . t o _ s score_regexp = create_regexp(" (A\\d.*)") quality_data.to_s.scan(score_regexp).to_s
end
# g e t t h e v e c t o r p o s i t i o n s x x x x x x x a c a t a t a t a t a x x x x x x x def vector_positions
218
seqvector = create_regexp("/'Seq_vec\\s+SVEC\\s+(\\d+\\s+\\d+)")i g e t t h e v e c t o r p o s i t i o n s# s v e c l _ s t a r t , s v e c l _ s t o p , s v e c 2 _ s t a r t r s v e c 2 _ s t o p get_vector_positions(seqvector,metadata.to_s)i r e t u r n s v e c l _ s t a r t , s v e c l _ s t o p , s v e c 2 _ s t a r t , s v e c 2 _ s t o p
end
def clip_positionsclipping = create_regexp("^Clipping\\s+QUAL\\s+(\\d+\\s+\\d+)") get_clip_positions(clipping, metadata.to_s)i r e t u r n c l i p _ q u a l _ s t a r t , c l i p _ q u a l _ s t o p
end
# r e t u r n s a s e q u e n c e w i t h n o v e c t o r r e g i o n s def trimmed_seq
beginhighest_start = vector_clips[0] lowest_end = vector_clips[1]
clip_len = lowest_end.to_i - highest_start.to_i clip_leni l e n _ r a n g e = ( 3 0 0 . . 5 0 0 )i i f l e n _ r a n g e . i n c l u d e ? c l i p _ l e n
trimmed_seq = sequence[highest_start, clip_len]i e l s e
# t r i m m e d _ s e q = "" i e n d
i p u t s "c l i p _ l e n : # {c l i p _ l e n } "i p u t s " t r i m m e d _ s e q _ s i z e : # { t r i m m e d _ s e q . t o _ s . s i z e } "
return trimmed_seq if trimmed_seq.to_s.size > 300 rescue end
end
i r e t u r n s b a s e q u a l i t i e s d e v o i d o f v e c t o r q u a l i t y s c o r e s . def t rimmed_base_qualities
highest_start = vector_clips[0] lowest_end = vector_clips[1]
clip_len = lowest_end.to_i - highest_start.to_i clip_lenlen_range = (300..500) if len_range.include? clip_len
t rimmed_base_q = quality_scores . split ( / /). slice (highest_start, clip_len).join(" ")
elsetrimmed_base_q = ""
endtrimmed_base_q
end
i r e t u r n s h i g h e s t s t a r t a n d l o w e s t e n d s f o r e a c h r e a d def vector_clips
219

# f i r s t s t e p : s e t h i g h e s t _ s t a r t t o s v e c l _ s t o p a n d l o w e s t _ e n d t o 10 000
highest_start = vector_positions[1] lowest_end = 10_000
# s e c o n d s t e pi c h e c k w h e t h e r s v e c 2 _ s t a r t i s l e s s t h a n 10 00 0; i f t r u e s e t
l o w e s t _ e n d t o s v e c t 2 _ s t a r t unless vector_positions[2] == 0
lowest_end = vector_positions[2] if vector_positions[2] < 3lowest_end
elselowest_end = clip_positions[1] #i f we o n l y h a v e 1 s v e c e n t r y ,
endhighest_start = clip_positions[0] if highest_start <
clip_positions[0]lowest_end = clip_positions[1] if lowest_end > clip_positions<-J
[1]return highest_start, lowest_end
end
# a g o o d r e a d i . e s i z e > 1 a f t e r r e m o v i n g t h e v e c t o r s e q u e n c e s def passes_vector_filter?
true if trimmed_seq.to_s.size > 1l e n g t h o f r e a d t o a c c e p t
end
i r e t u r n t h e r e a d ' s r e g i o n w i t h o u t p r i m e r s def deprimed
seq = Bio::Sequence::NA.new(trimmed_seq) start_pos = primer_boundaries[0] end_pos = primer_boundaries[1]
if start_pos.nil? or end_pos.nil?start_pos, end_pos = 0 , 0
end
clip_len = end_pos - start_pos seq.to_s[start_pos, clip_len + 1].upcase
end
i r e t u r n t h e b a s e q u a l i t i e s o f t h e r e a d w i t h o u t p r i m e r s def deprimed_base_qual
start_pos = primer_boundaries[0] end_pos = primer_boundaries[1]
if start_pos.nil? or end_pos.nil?start_pos, end_pos = 0 , 0
end
clip_len = end_pos - start_postrimmed_base_qualities.split(/ /).slice(start_pos,clip_len + 1) .
join(" ")end
220
def deprimed_base_qual_fasta">#{name}\n#{deprimed_base_qual}"
end
i r e t u r n s t h e s t a r t a n d e n d p o s i t i o n s o f u n m a s k e d r e g i o n def primer_boundaries
seq = Bio::Sequence::N A .new(trimmed_seq) primer_regs.each do |reg|
seq.gsub!(reg) { |x| "X" * x.length }end
# R e p l a c e a l l 5 ' b a s e s b e f o r e "X" w i t h "X" .# s e q . s u b ! ( / \ A [ * X ] + X / ) { /x/ "X" * x . l e n g t h }
# R e p l a c e a l l 3 ' b a s e s a f t e r "X" w i t h " X " .i s e q . s u b ! ( / X [ * X ] + \ z / ) { I x l "X" * x . l e n g t h }
# l a s t _ m a t c h _ s i z e = s e q . s c a n ( / [ * ( X + ) ] * $ / ) [ 0 ] .s i z e#R e p l a c e a n y l e f t e n d b a s e on t h e 3 ' e n d w i t h a ' ' o n l y i f
X X X c g c t c t X X X t c a n d n o t X X X c g c t c t g c t c seq.sub!(/[A (X+)]*$/,'1) if seq.scan(/[A (X+)]*$/)[0].size < 20
# G e t t h e s t a r t a n d e n d p o s i t i o n s o f t h e u n m a s k e d r e g i o n .# s t a r t _ p o s = s e q . i n d e x ( / [ * X ] / ) i s t a r t p o s i t i o n# e n d _ p o s = s e q . r i n d e x ( / [ * X ] / ) f e n d p o s i t i o n
return seq.index(/[AX]/),seq.rindex(/[AX]/)end
i r e m o v e a n y r e a d w h e r e s t o p c o d o n s >= 6 o r o r r e a d l e n g t h > 5 0 0 def passes_sc_filter?
^ t r a n s l a t e r e a d s e q u e n c e i n a l l 6 f r a m e s passed = []6.times do |frame|
stop_codons = Bio::Sequence::N A .new(deprimed).translate(frame +1).scan(/\*/).size
passed << deprimed unless stop_codons > = 6 | | deprimed.size > G-1500 i h a v e a l o o k a t t h i s l i n e ! !
endtrue if passed.size > 0
end
def passes_filters?passes_vector_filter? && passes_sc_filter?
end
def raw_fasta fasta(sequence)
end
def trimmed_fasta fasta(trimmed_seq)
end
221
def deprimed_fasta fasta(deprimed)
end
def six_ _frame_traslate_deprimed six_frame_translate(deprimed)
end
private# c r e a t e s a r e g u l a r e x p r e s s i o n g i v e n a s t r i n g def create_regexp(expression, opts={}) options = {:case_sensitive=>true}.merge!(opts)
i n s e n t i v e b y d e f a u l t Regexp.new("#{expression}",options)
end
def get_vector_positions(seqvector, value)vector_positions = metadata.to_s.scan(seqvector) svecl_startq, svecl_stopq = vector_positions[0].to_s.split(/ /) svec2_startq, svec2_stopq = vector_positions[1].to_s.split(/ /) return svecl_startq.to_i, svecl_stopq.to_i, svec2_startq.to_i, f
svec2_stopq.to_iend
def get_clip_positions(clipping, value) clipping_positions = metadata.to_s.scan(clipping) clip_qual_startq, clip_qual_stopq = clipping_positions[0].to_s.
split(/ /)return clip_qual_startq.to_i, clip_qual_stopq.to_i
end
def get_sequence(sequence,start,clip_len)sequence[start + 1, clip_len] if clip_len >= 300
end
def get_qualities(qualities,clip_len,start)# s p l i t t h e q u a l i t y d a t a t o g e t an a r r a y q = qualities.to_s.split(/ /)q.slice(start,clip_len).join(" ") if clip_len > 300
end
Ireturn t h e l e n g t h o f t h e s e q u e n c e def size(seq) seq.size
end
#re t u r n a b i o s e q u e n c e o b j e c t def b iosequence(seq)
Bio::Sequence.new(seq)end
i c r e a t e a f a s t a f o r m a t f o r t h e r e a d def fasta(seq)
222
# p u t s n a m e . c l a s sbiosequence(seq).output(:fasta,:header =>name.to_s,:width=>500)
end
#r e t u r n s t h e g + c c o n t e n t f o r t h e s e q u e n c e def gc_contect(seq) biosequence(seq).gc_content
end
i r e t u r n s a l i s t o f s i x f r a m e t r a n s l a t i o n s def six_frame_translate(seq)
content = []6 .times do |i|
content << Bio::Sequence::N A .new(seq).translate(i+1)endcontent
end
i c r e a t e s a c o l l e c t i o n o f p r i m e r s e q u e n c e s t o l o o k f o r def p rimer_regsprimers = ['G*CACG[A IC ]AGTTT[C |T]G C ', 'G*CCCATTC[G |C ]TCGAACCA', 'GC[G|
A]AAACT[T |G]CGTGC1, 'TGGTTCGA[C|G]GAATGGGC'] primers.collect! { |primer| create_regexp(primer) }
end
end
Listing A.30: Phrap wrapper
module Phrap class Runner
# r u n t h e p h r a p p r o g r a m def bull_phrap(fasta_file)phrap_out = %x(phrap_99 -retain_duplicates -ace -preassemble
group_delim . -minscore 200 # { f a s t a _ f i l e }) puts phrap_out end
# r u n t h i s f o r r e a d s f r o m t h e sa m e i s o l a t e def bloqvist_phrap(fasta_file)
phrap_out = %x(phrap_99 -retain_duplicates -ace ’ repeat_stringency 0.9 -minmatch 20 " { f a s t a _ f i l e })
end
end
end
Listing A.31: Caf to Phrap
require 'bio' class Caf2phrap
i i n s t a l l c a f 2 p h r a p e x e c u t a b l e def run(caf_file,fasta_name)
223

caf2phrap_out = %x(caf2phrap -caf # { c a f _ f i l e end
i c r e a t e s a r e g u l a r e x p r e s s i o n g i v e n a s t r i n g def create_regexp(expression, opts={})
options = {:case_sensitive=>true}.merge! (opts) i n s e n t i v e b y d e f a u l t
Regexp.new("#(expression}",options) end
def primer_regs['G*CACG[A|C]AGTTT[C[T]GC' , 'G*CCCATTC[G|C]TCGAACCA', 1GC[G|A]AAACT[TA-
IG]CGTGC','TGGTTCGA[CIG]GAATGGGC'].map! { | primer | createjegexpf^(primer) }
end
def trim(filename) seqs = []Bio::FlatFile.auto(filename) { |f| f.map {|entry| entry} }.each do |
entry|i p u t s e n t r y . s e qstart_pos = entry.seq.index(/[Ax]/).to_i stop_pos = entry.seq.rindex(/[^x]/).to_i
clipped = stop_pos - start_pos seq = entry.seq[start_pos, clipped + 1] seq_len_range = (300..500) if seq_len_range.include? seq.size
i r e m o v e t h e p r i m e r s primer_regs.each do Ireg|
seq.gsub!(reg) { |x| "x" * x.length }end
seq. sub ! ( / [ (x+) ] * $/, 1 ' ) if seq. scan ( / [ (x+ )]*$/)[ 0 ]. size < 20
primer_start_pos = seq.index(/[^x]/) primer_stop_pos = seq.rindex(/[Ax]/) tag = primer_stop_pos - primer_start_posseqs << Bio :: Sequence . new (seq [primer_start_pos, tag + 1] .upcasef-^
). output(:fasta, :header => entry.definition, :width=>600)else
puts "#{entry.definition} does not meet the upper(500) or lowers (300) nt thresholds"
endendseqs
end
# w r i t e d a t a t o f i l edef t o_file(path,contents)
File.open("#{path}",'w 1) do |f| f.puts contents
end end
224
end
input_file = "#{ENV['HOME']}/Batch2_files_from_thomas/batch2_cafs/e^ batch2_caftools.fasta"
output_file = "#{ENV['HOME']}/Batch2_f iles_f rom_thomas/batch2__caf s / ^ batch2_caftools_no_primer.fasta" # c a f t o o l s _ n o _ p r i m e r s . f a s t a
puts 'initializing1
caf2 = Caf2phrap.new
puts 'trimming reads'
reads = caf2.trim(input_file)
puts 'writing to file'caf2.to_file(output_file,reads)
puts 'Done!'
225

Appendix B Miscellaneous
This chapter includes work that supports specific sections of the main text. Some of
this analysis was too short or inconclusive on its own and may require additional data
or experiments that could not be conducted given the time and budget restrictions.
B.l Regions of diversity in the DBLa sequence tags
Figure B.l shows the codon diversity (upper panel) and pairwise distance (lower
panel) for a group of 100 randomly selected DBLa sequence tags from Kilifi. This
figure shows that relative sequence conservation is confined within specific regions of
homology that are interspersed by very diverse regions. The codon usage is also not
uniform even in conserved amino acid columns. The mean pairwise identity along
the alignment positions is shown by the black line in the lower panel.
226

Codon diversity
Position
Position
Figure B .l: A codon diversity plot (upper panel) and a pairwise distance plot (lower panel) summarizing the extent o f codon and nucleotide diversity in a group o f 100 randomly selected DBLa sequence tags from Kilifi. Each codon is shown by a different colour. The pairwise distances (y-axis) were calculated using a 10 nucleotide sliding-window along the length o f the alignment (x-axis). The black line shows the mean pairwise distance for each column o f the alignment.
227
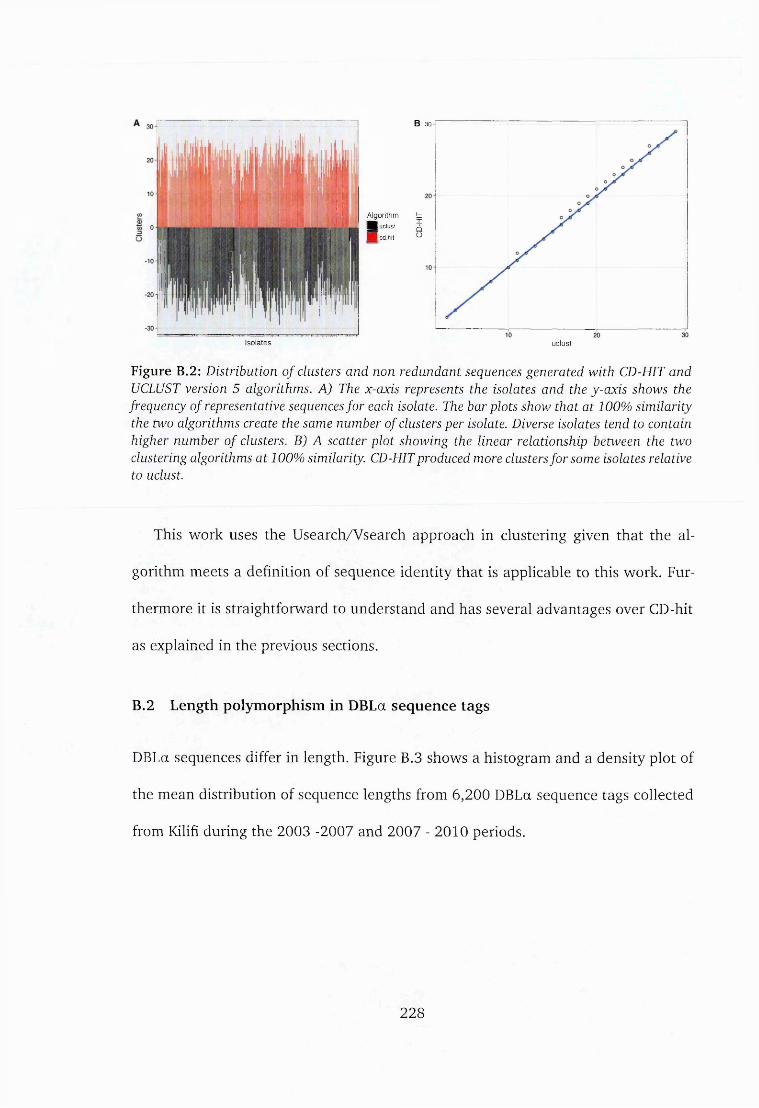
B 30
Algorithm tmm x■ ■ uclust jJj
H ffcd .h it °
Figure B.2: Distribution o f clusters and non redundant sequences generated with CD-HIT and UCLUST version 5 algorithms. A) The x-cucis represents the isolates and the y-axis shows the frequency of representative sequences for each isolate. The bar plots show that at 100% similarity the two algorithms create the same number of clusters per isolate. Diverse isolates tend to contain higher number of clusters. B) A scatter plot showing the linear relationship between the two clustering algorithms at 100% similarity. CD-HIT produced more clusters for some isolates relative to uclust.
This work uses the Usearch/Vsearch approach in clustering given that the al
gorithm meets a definition of sequence identity that is applicable to this work. Fur
thermore it is straightforward to understand and has several advantages over CD-hit
as explained in the previous sections.
B.2 Length polymorphism in DBLa sequence tags
DBLa sequences differ in length. Figure B.3 shows a histogram and a density plot of
the mean distribution of sequence lengths from 6,200 DBLa sequence tags collected
from Kilifi during the 2003 -2007 and 2007 - 2010 periods.
Iso la te s uclust
228

0.04-
ir) c CD■o
0 .0 2 -
o.oo-
350300 400 450length
Figure B.3: A distribution o f length in 6,200 DBLa sequences collected between 2003-2007 and 2007-2010 time periods in Kilifi. The red plot shows the mean density in length o f the tag sequences. Although the upper limit for DBLa sequences is defined at 500 nucleotides majority of sequences did not surpass 450nt in length. The mean length was normally distributed.
B.3 Dinucleotide frequency
Because dinucleotide frequency is known to affect codon bias, which in turn can affect
the pattern of substitutions, a comparison of the expected and the actual frequency
of 16 dinucleotides was assessed. If a particular dinucleotide was over-represented,
it meant that it occurred many more times than what was expected by chance and if
was under-represented, it meant it occurred fewer times than expected.
The p (rho) statistic was calculated for the observed and expected dinucleotides.
Rho is a measure of over or under-represented dinucleotides. If a DNA sequence had
a frequency fx of a 1-nucleotide DNA word x, and a frequency f y of a 1-nucleotide
DNA word y , then the frequency of the dinucleotide xy is expected to be the product
229
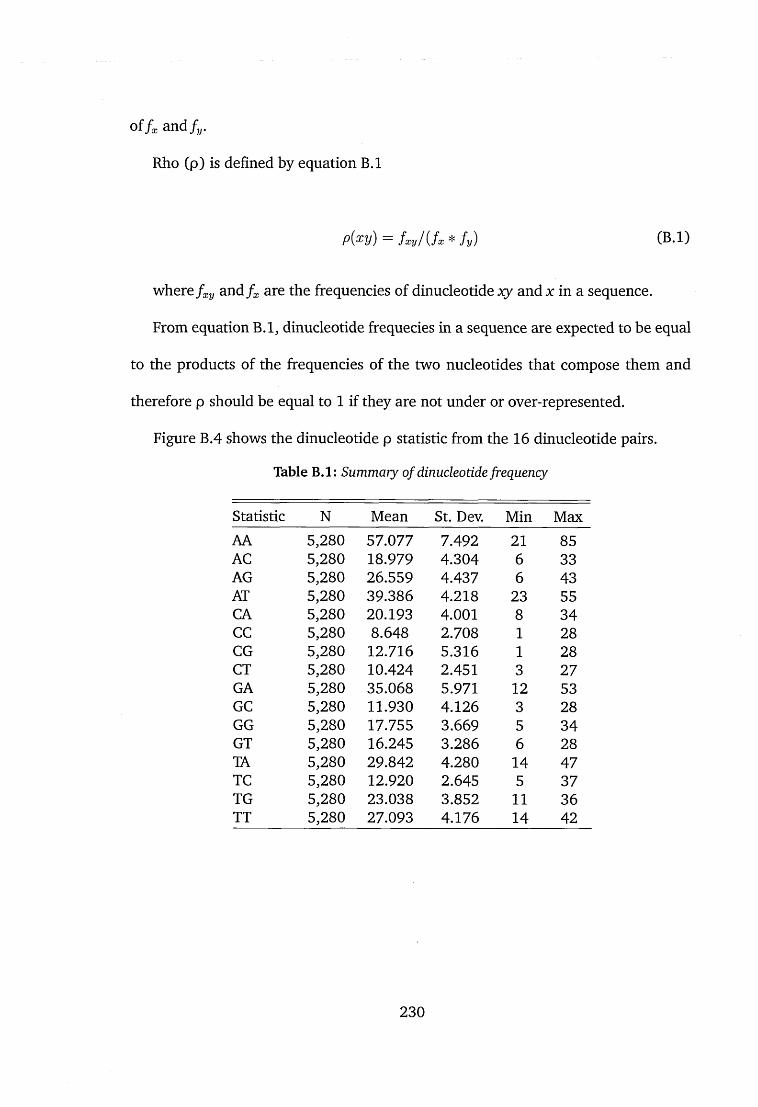
offx and fy.
Rho (p) is defined by equation B.l
P M = f x y / U x * f y ) (B.l)
where f xy a n d /x are the frequencies of dinucleotide xy and x in a sequence.
From equation B.l, dinucleotide frequecies in a sequence are expected to be equal
to the products of the frequencies of the two nucleotides that compose them and
therefore p should be equal to 1 if they are not under or over-represented.
Figure B.4 shows the dinucleotide p statistic from the 16 dinucleotide pairs.
Table B .l: Summary of dinucleotide frequency
Statistic N Mean St. Dev. Min MaxAA 5,280 57.077 7.492 21 85AC 5,280 18.979 4.304 6 33AG 5,280 26.559 4.437 6 43AT 5,280 39.386 4.218 23 55CA 5,280 20.193 4.001 8 34CC 5,280 8.648 2.708 1 28CG 5,280 12.716 5.316 1 28CT 5,280 10.424 2.451 3 27GA 5,280 35.068 5.971 12 53GC 5,280 11.930 4.126 3 28GG 5,280 17.755 3.669 5 34GT 5,280 16.245 3.286 6 28TA 5,280 29.842 4.280 14 47TC 5,280 12.920 2.645 5 37TG 5,280 23.038 3.852 11 36TT 5,280 27.093 4.176 14 42
230
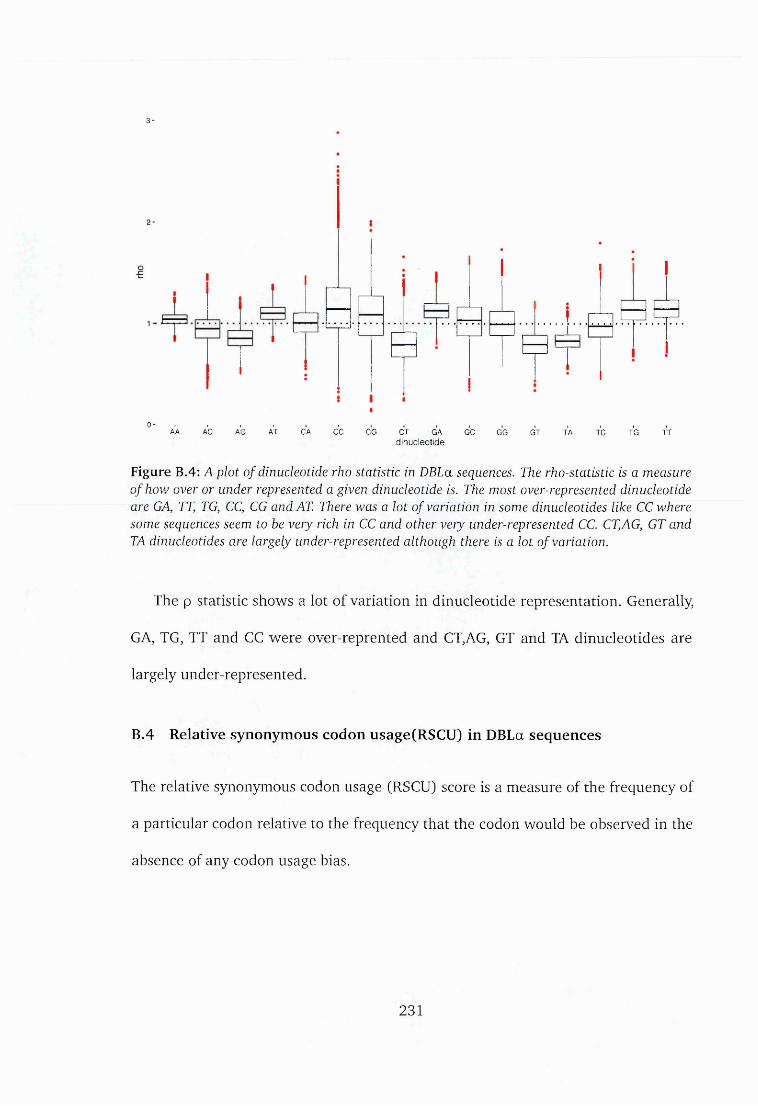
3-
0- . . . . i iAA AC AG AT CA CC CG CT GA GC GG GT TA TC TG TT
dinucleotide
Figure B.4: A plot o f dinucleotide rho statistic in DBLa sequences. The rho-statistic is a measure of how over or under represented a given dinucleotide is. The most over-represented dinucleotide are GA, TT, TG, CC, CG and AT. There was a lot of variation in some dinucleotides like CC where some sequences seem to be very rich in CC and other very under-represented CC. CT,AG, GT and TA dinucleotides are largely under-represented although there is a lot of variation.
The p statistic shows a lot of variation in dinucleotide representation. Generally,
GA, TG, TT and CC were over-reprented and CT,AG, GT and TA dinucleotides are
largely under-represented.
B.4 Relative synonymous codon usage(RSCU) in DBLa sequences
The relative synonymous codon usage (RSCU) score is a measure of the frequency of
a particular codon relative to the frequency that the codon would be observed in the
absence of any codon usage bias.
231
The RSCU score was calculated using equation B.2
RSCU = 9ii ni (B.2)E m v J
j 9ij
where g{j is the observed number of the ith codon for j th amino acid which had
type rii synonymous codons.
A codon that is used less frequently than expected had a value of less than 1 and
a value >1.0 indicated positive codon bias meaning that the codon was used more
than expected.
232
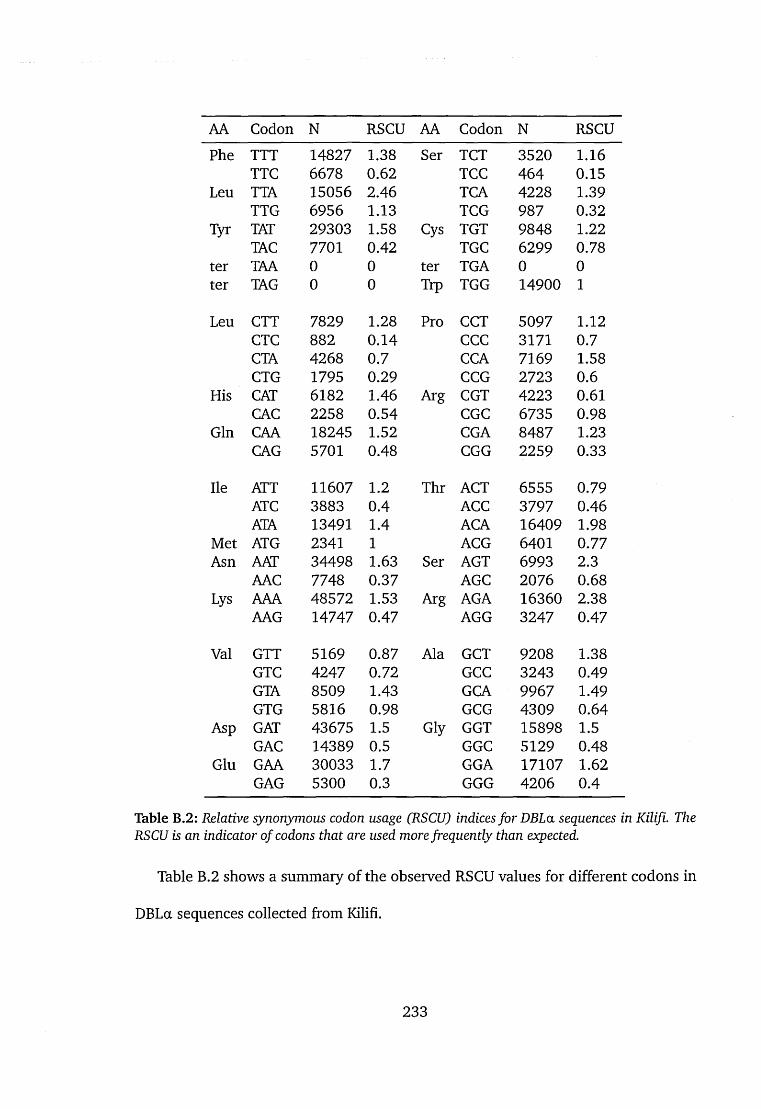
AA Codon N RSCU AA Codon N RSCU
Phe TTT 14827 1.38 Ser TCT 3520 1.16TTC 6678 0.62 TCC 464 0.15
Leu TTA 15056 2.46 TCA 4228 1.39TTG 6956 1.13 TCG 987 0.32
Tyr TAT 29303 1.58 Cys TGT 9848 1.22TAC 7701 0.42 TGC 6299 0.78
ter TAA 0 0 ter TGA 0 0ter TAG 0 0 Trp TGG 14900 1
Leu CTT 7829 1.28 Pro CCT 5097 1.12CTC 882 0.14 CCC 3171 0.7CTA 4268 0.7 CCA 7169 1.58CTG 1795 0.29 CCG 2723 0.6
His CAT 6182 1.46 Arg CGT 4223 0.61CAC 2258 0.54 CGC 6735 0.98
Gin CAA 18245 1.52 CGA 8487 1.23CAG 5701 0.48 CGG 2259 0.33
He ATT 11607 1.2 Thr ACT 6555 0.79ATC 3883 0.4 ACC 3797 0.46ATA 13491 1.4 ACA 16409 1.98
Met ATG 2341 1 ACG 6401 0.77Asn AAT 34498 1.63 Ser AGT 6993 2.3
AAC 7748 0.37 AGC 2076 0.68Lys AAA 48572 1.53 Arg AGA 16360 2.38
AAG 14747 0.47 AGG 3247 0.47
Val GTT 5169 0.87 Ala GCT 9208 1.38GTC 4247 0.72 GCC 3243 0.49GTA 8509 1.43 GCA 9967 1.49GTG 5816 0.98 GCG 4309 0.64
Asp GAT 43675 1.5 Gly GGT 15898 1.5GAC 14389 0.5 GGC 5129 0.48
Glu GAA 30033 1.7 GGA 17107 1.62GAG 5300 0.3 GGG 4206 0.4
Table B.2: Relative synonymous codon usage (RSCU) indices fo r DBLa sequences in Kilifi. The RSCU is an indicator of codons that are used more frequently than expected.
Table B.2 shows a summary of the observed RSCU values for different codons in
DBLa sequences collected from Kilifi.
233

20000 -
15000-
10000 -
5000-
>88% >90%
HIM I h u H H20000 -
15000->o§ 10000-CT241 5000-
0-
20000 -
15000-
10000 -
5000-
0-
>92% >94%
p m H>96% >98%
C-A C-T G-A G-C G-T T-A C-A C-T G-A G-C G-T T-A
Figure B.5: A summary o f substitutions from DBLa sequence tags that were sequenced using the 454-platform. The y-cocis shows the frequency o f substitutions and the x-axis shows the substitution type and the frequencies at the respective codon positions. G-A, C-T, C-A and T-A substitutions were predominant. Substitutions at the 3rd codon position were preferred by C-T, G-T and T-A substitutions. C-A, G-A and G-C substitutions showed preference for 1st codon positions. The frequency o f C-A substitutions was remarkably higher in this data-set compared to the capillary sequenced data-set.
B.5 Pattern of variation in var2csa in isolates collected from around the world
A total of 978 full-length and partial var2csa sequences were downloaded from Gen-
bank using a keyword search. The DBLa-finder was used to search for published
DBLa tags and the 68 sequences that were identified by the program, were clustered
as explained previously
234
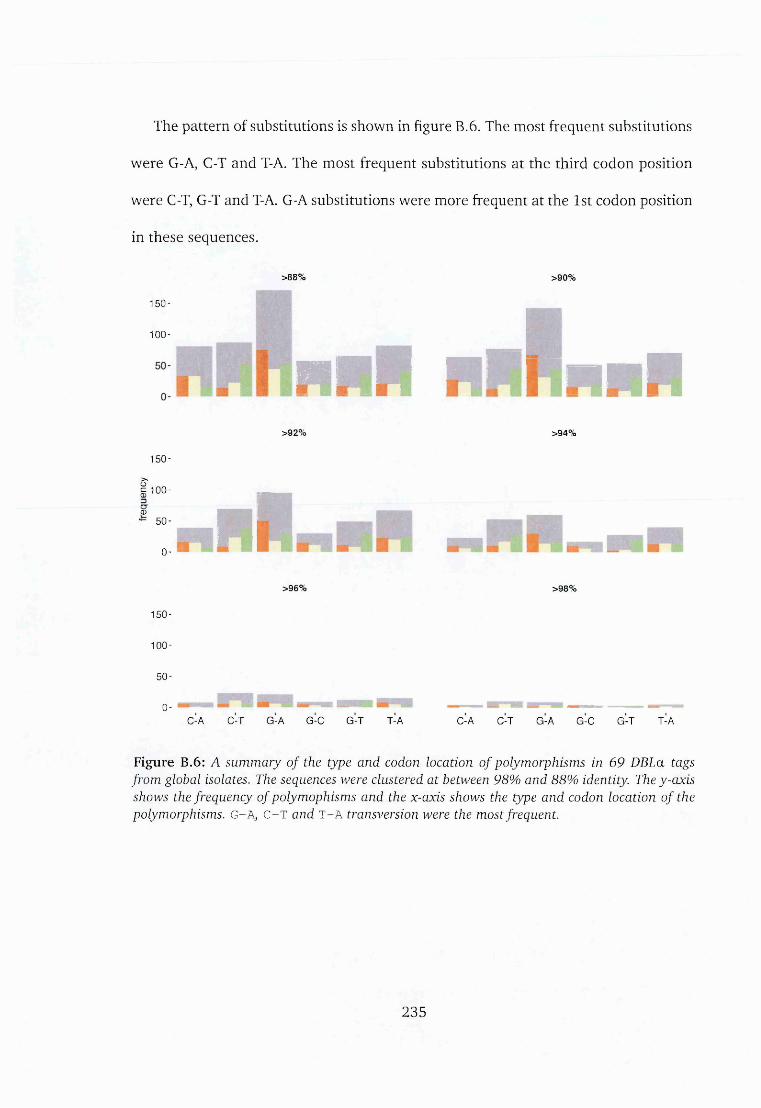
The pattern of substitutions is shown in figure B.6. The most frequent substitutions
were G-A, C-T and T-A. The most frequent substitutions at the third codon position
were C-T, G-T and T-A. G-A substitutions were more frequent at the 1st codon position
in these sequences.
>88% >90%
1 5 0 -
1 0 0 - nun nHnnnH>92% >94%
1 5 0 -
1 100-O'CD~ 5 0 -
0-
1 5 0 -
1 0 0 -
5 0 -
0-
n l>96% >98%
C-A C-T G-A G-C G-T T-A C-A C-T G-A G-C G-T T-A
Figure B.6: A summary of the type and codon location of polymorphisms in 69 DBLa tags from global isolates. The sequences were clustered at between 98% and 88% identity. The y-cucis shows the frequency of polymophisms and the x-axis shows the type and codon location o f the polymorphisms. G-A, C-T and T-A transversion were the most frequent.
235

B.6 Frequency of substitutions in sequences collected from different parts of
the world
398 sequences from India, Sudan, Cape Verde, Solomon islands, Philippines, Kenya,
Brazil, Thailand, Africa,Vanuatu were retrieved to form a global collection of DBLa
sequences. The full list of accession is provided in appendix B.
The sequences were clustered and substitutions were enumerated and plotted.
Figure B.7 shows a summary of the distribution of the substitutions.
236

>88% >90%
>96% >98%100 -
7 5 -
5 0 -
2 5 -
0. m *m — P I ____ __________C-A C-T G-A G-C G-T T-A C-A C-T G-A G-C G-T T-A
Figure B.7: The frequency o f 367 DBLa tags collected from different geographical regions. The sequences were clustered at between 98 and 88 percent sequence identity. The y-axis represents the frequency o f substitutions and the x-axis represents the type and codon position in each of the substitution type. G -A and C -T substitutions were more prevalent which is consistent with previous observation from particular geographical regions.
B.7 Clustering ratio
Table B.3 shows the number of clusters and the fraction of clusters that were used for
pairwise comparisons.
Sequences from Kilifi had the lowest clustering ratio compared to sequences from
other regions in the world. The sequences from Brazil has relatively higher clustering
ratios. This could be explained by the fact that the sequences were collected from
237

Region % Identity Clusters Total clusters Ratio
Amele 98 77 180 0.43896 76 172 0.44194 74 170 0.43592 75 168 0.44690 75 165 0.45588 75 163 0.460
Kilifi 98 465 2725 0.17196 479 2665 0.18094 496 2617 0.19092 526 2553 0.20690 543 2497 0.21788 571 2422 0.236
Global 98 47 309 0.15296 48 306 0.15794 48 303 0.15892 52 299 0.17490 52 295 0.17688 53 291 0.182
Brazil 98 160 213 0.75196 152 192 0.79294 152 192 0.79292 152 189 0.80490 150 186 0.81288 149 182 0.824
Table B.3: The clustering ratio fo r sequences collected in various geographical regions are given. The cluster ratio is the proportion of sequences that were used in the pairwise comparisons to the total number of clusters that were created a t a given identity threshold. For very diverse sequences the ratio is close to 0 and for more conserved dataset clustering ratio is close to 1. The clustering ratio increased with decrease in sequence identity within each dataset. Sequences from Brazil were more conserved compared to sequences from Kilifi.
238
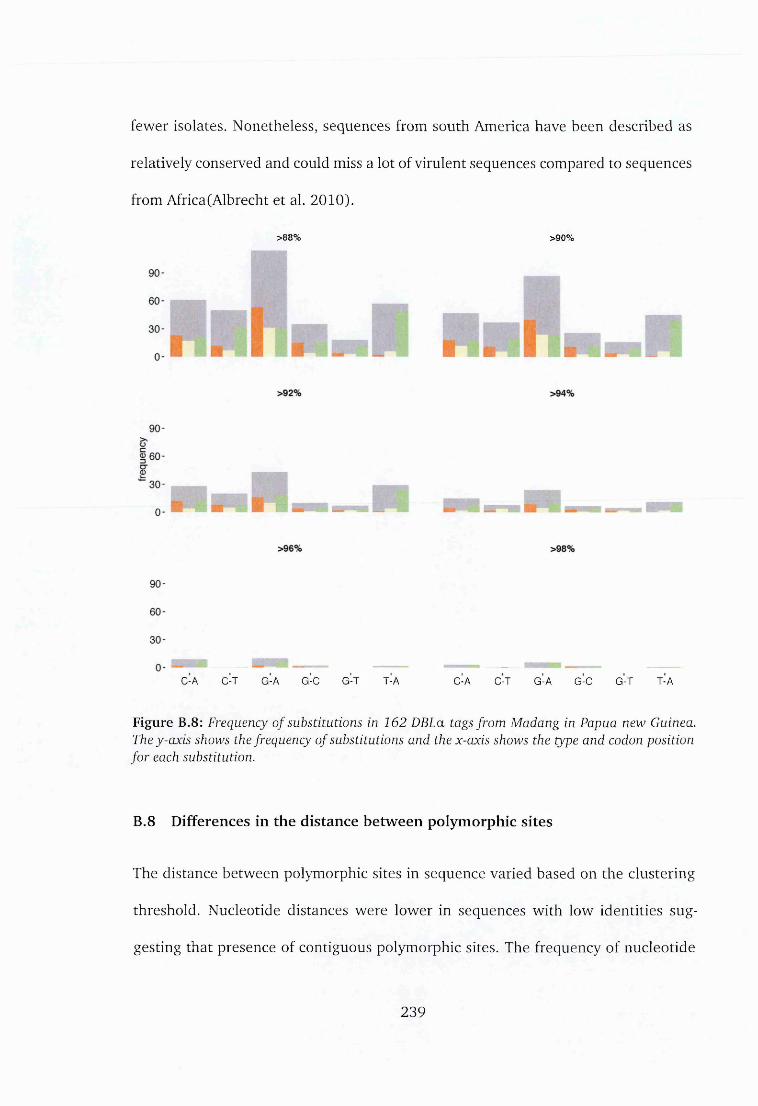
fewer isolates. Nonetheless, sequences from south America have been described as
relatively conserved and could miss a lot of virulent sequences compared to sequences
from Africa (Albrecht et al. 2010).
>88% >90%
C-A C-T G-A G-C G-T T-A C-A C-T G-A G-C G-T T-A
Figure B.8: Frequency o f substitutions in 162 DBLa tags from Madang in Papua new Guinea. They-axis shows the frequency of substitutions and the x-axis shows the type and codon position for each substitution.
B.8 Differences in the distance between polymorphic sites
The distance between polymorphic sites in sequence varied based on the clustering
threshold. Nucleotide distances were lower in sequences with low identities sug
gesting that presence of contiguous polymorphic sites. The frequency of nucleotide
239
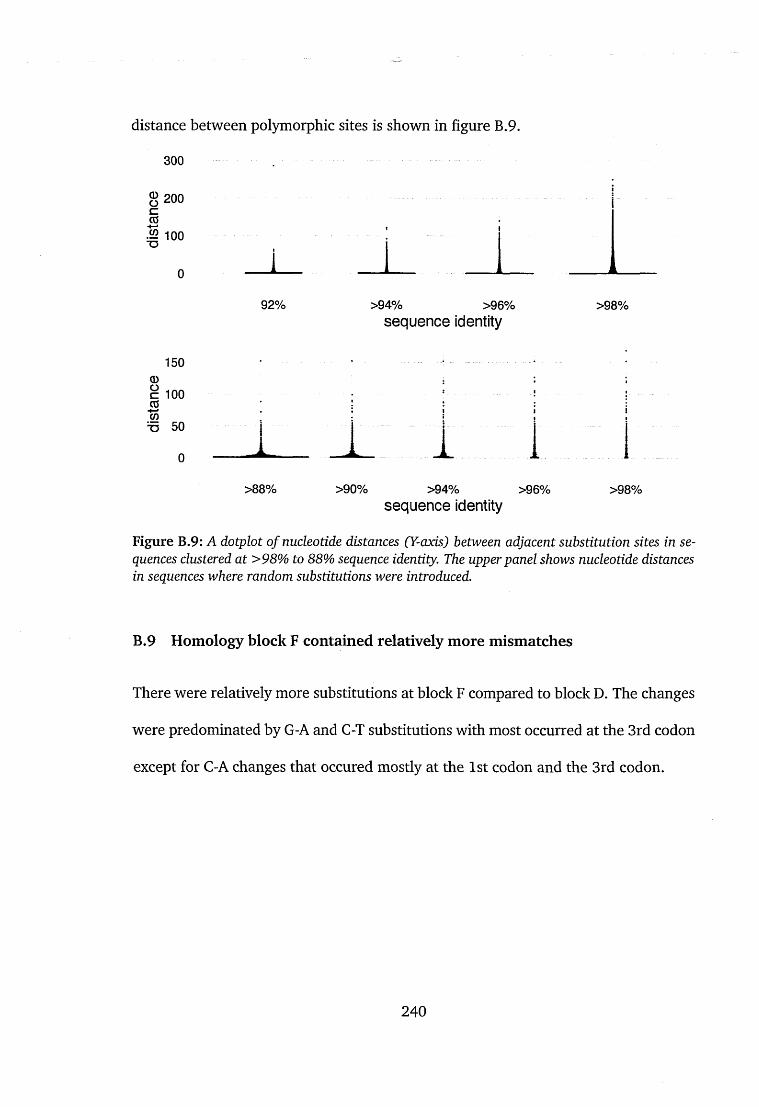
distance between polymorphic sites is shown in figure B.9.
300
g 200c05
.22 100 TD
150CDc 100 05H—></)T3 50
92%
1
>88%
>94% >96%sequence identity
i i>90% >94% >96%
sequence identity
>98%
>98%
F igure B.9: A dotplot o f nucleotide distances (Y-axis) between adjacent substitution sites in sequences clustered a t >98% to 88% sequence identity. The upper panel shows nucleotide distances in sequences where random substitutions were introduced.
B.9 Homology block F contained relatively more mismatches
There were relatively more substitutions at block F compared to block D. The changes
were predominated by G-A and C-T substitutions with most occurred at the 3rd codon
except for C-A changes that occured mostly at the 1st codon and the 3rd codon.
240

88 901 50 -
98
9 0 0 -
600-
300-
92 94
900-
2 600-
""" 300-
0-
900-
600-
300-
0-
H i
96 98
C-A C-T G-A G-C G-T T-A C-A C-T G-A G-C G-T T-A
1 0 0 -
50-
0- HC-A C-T G-A G-C G-T T-A
Figure B.10: A summary of within isolate distribution of polymorphisms in homology block F
B.9.1 Within-isolate variation in homology block D and H
Figure 4.4 shows the distribution of substitutions in homology blocks D and H in
sequences from the same isolate.
Sequences from the same isolate were clustered and aligned and the pairwise
differences were tallied across all the isolates. The frequency of substitution was sum
marized using the frequency plots shown in figure B .ll (block D), figure B. 10(block
F) and figure B.12 (block H).
Block D region is relatively conserved and very few mutations were counted at
241
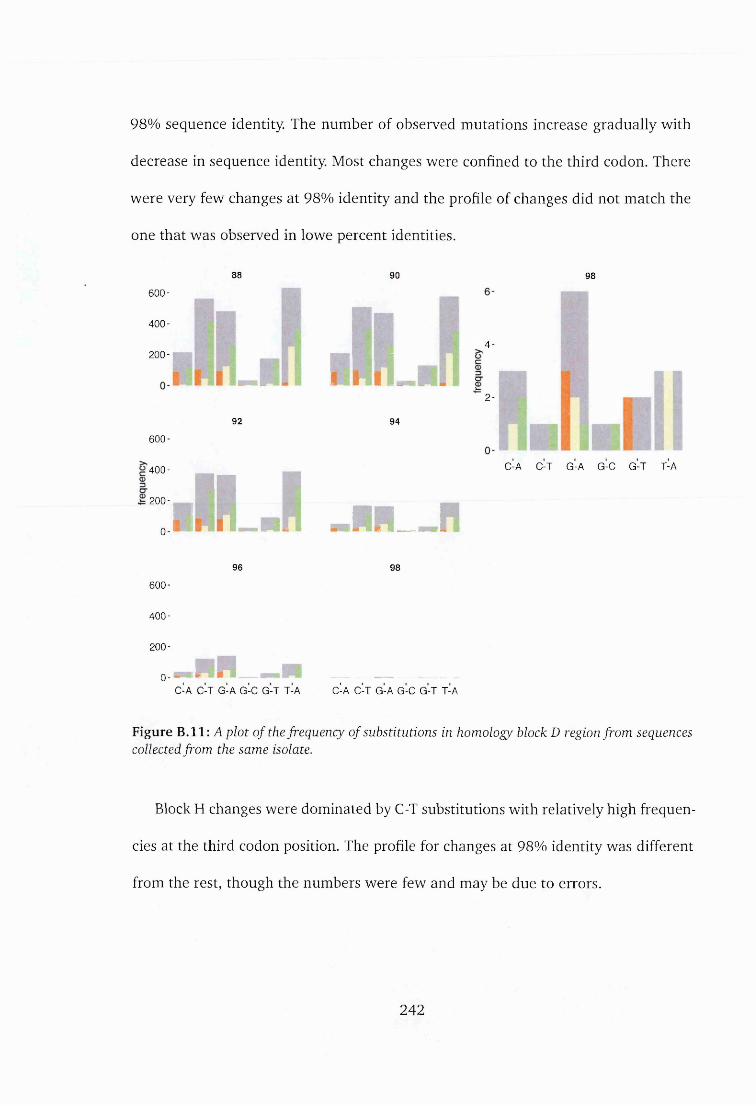
98% sequence identity. The number of observed mutations increase gradually with
decrease in sequence identity. Most changes were confined to the third codon. There
were very few changes at 98% identity and the profile of changes did not match the
one that was observed in lowe percent identities.
88 90 98
6 0 0 -
4 0 0 -
200 -
9 2 94
6 0 0 -
. Hi.4 -
2 -
4 0 0 -
200 -
J sIHLrbHC -A C -T G -A G -C G -T T-A
jnt__n96 98
6 0 0 -
4 0 0 -
200 -
0-1 m mC -A C -T G -A G -C G -T T-A C-A C -T G -A G -C G -T T-A
Figure B . l l : A plot o f the frequency of substitutions in homology block D region from sequences collected from the same isolate.
Block H changes were dominated by C-T substitutions with relatively high frequen
cies at the third codon position. The profile for changes at 98% identity was different
from the rest, though the numbers were few and may be due to errors.
242
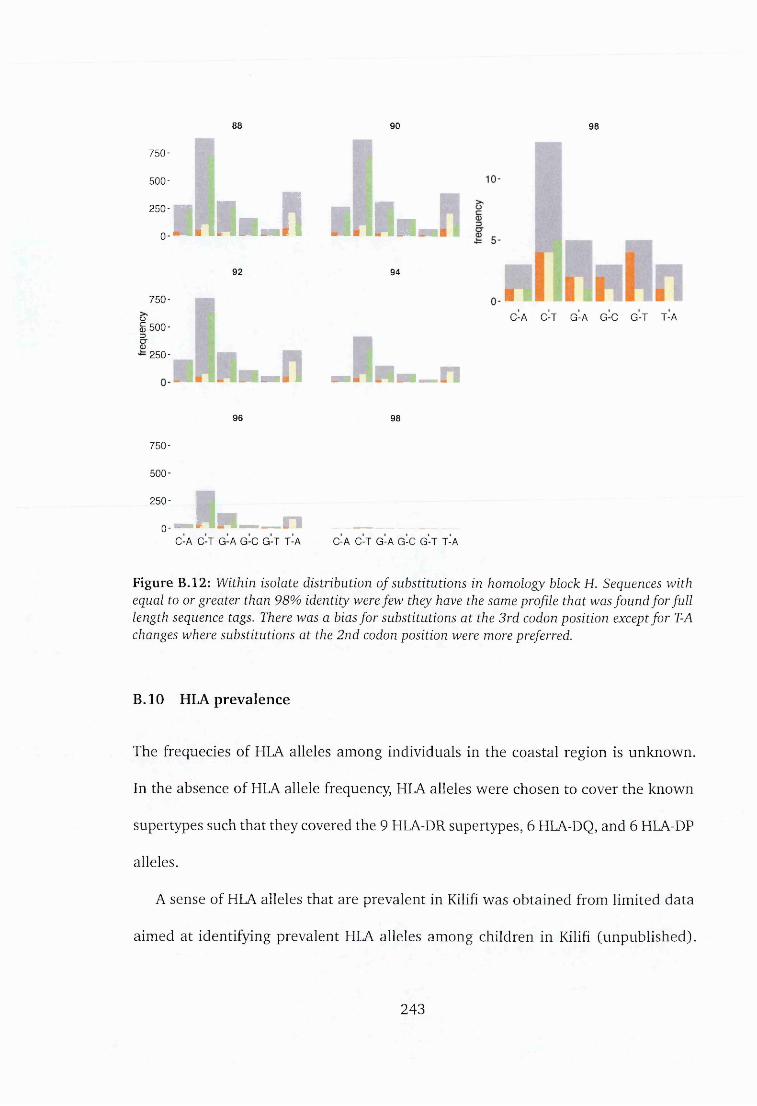
88 90 98
7 5 0 -
5 0 0 -
2 5 0 -
0-
7 5 0 -
§ 5 0 0 -3CTCD- 2 5 0 -
l n l i . R I n in9 2 94
C -A C -T G -A G -C G -T T-A
. n . R h h _ n9 6 98
7 5 0 -
5 0 0 -
2 5 0 -
— n m nio-1C -A C -T G -A G -C G -T T-A C-A C -T G -A G -C G -T T-A
Figure B.12: Within isolate distribution o f substitutions in homology block H. Sequences with equal to or greater than 98% identity were few they have the same profile that was found for full length sequence tags. There was a bias for substitutions at the 3rd codon position except for T-A changes where substitutions at the 2nd codon position were more preferred.
B. 10 HLA prevalence
The frequecies of HLA alleles among individuals in the coastal region is unknown.
In the absence of HLA allele frequency, HLA alleles were chosen to cover the known
supertypes such that they covered the 9 HLA-DR supertypes, 6 HLA-DQ, and 6 HLA-DP
alleles.
A sense of HLA alleles that are prevalent in Kilifi was obtained from limited data
aimed at identifying prevalent HLA alleles among children in Kilifi (unpublished).
243
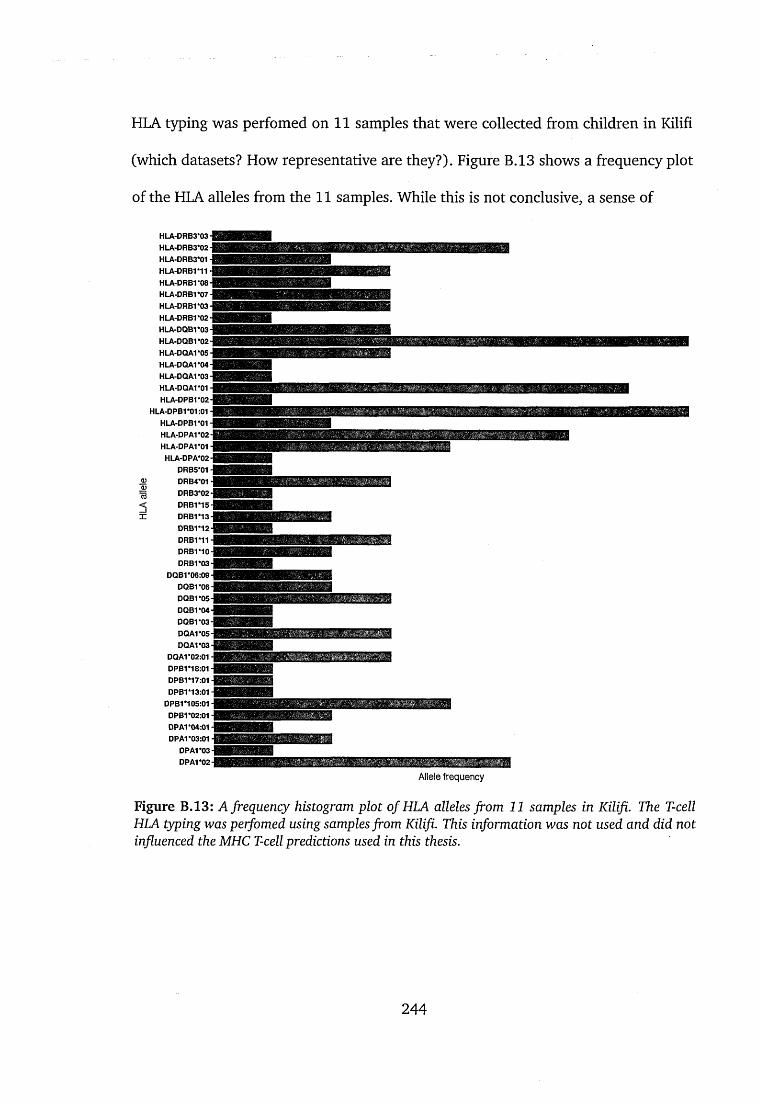
HLA typing was perfomed on 11 samples that were collected from children in Kilifi
(which datasets? How representative are they?). Figure B.13 shows a frequency plot
of the HLA alleles from the 11 samples. While this is not conclusive, a sense of
HLA-DRB3*03 HLA-DRB3*02 HLA-DRB3*01 HLA-DRB1*1H HLA-DRB1*08 HLA-DRBV07 HLA-DRB1*03 HLA-DRB1*02 HLA-DQB1*03- HLA-DQB1'02 HLA-DQA1*05- HLA-DQA1*04 HLA-DQA1*03 HLA-DQA1*01 - HLA-DPB1*02
HLA-DPB1*01:01 HLA-DPB1*01 HLA-DPA1*02 HLA-DPA1*01 HLA-DPA*02
DRB5*01 DRB4*01 DRB3*02 DRB1M5 DRB1*13 DRB1*12 DRB1M1 DRB1M0 DRB1*03
DQB1 *06:09 DQB1*06 DQB1*05 DQB1*04 DQB1*03 DQA1*05 DQA1*03
DQA1 *02:01 DPB1*18:01 DPB1 *17:01 DPB1*13:01
DPB1*105:01 DPB1 *02:01 DP A1 *04:01 DPA1 *03:01
DPA1*03 DPA1*02
A l l e l e f r e q u e n c y
Figure B.13: A frequency histogram plot of HLA alleles from 11 samples in Kilifi. The T-cell HLA typing was perfomed using samples from Kilifi. This information was not used and did not influenced the MHC T-cell predictions used in this thesis.
244
Copyright © 2022 FDOKUMEN