assessing antimalarial cidality in plasmodium falciparum ...
293
ASSESSING ANTIMALARIAL CIDALITY IN PLASMODIUM FALCIPARUM PARASITES A Dissertation submitted to the Faculty of the Graduate School of Arts and Sciences of Georgetown University in partial fulfillment of the requirements for the degree of Doctor of Philosophy in Chemistry By Katy S. Sherlach, B.S. Washington, DC April 23, 2014
-
Upload
khangminh22 -
Category
Documents
-
view
0 -
download
0
Transcript of assessing antimalarial cidality in plasmodium falciparum ...

ASSESSING ANTIMALARIAL CIDALITY IN PLASMODIUM FALCIPARUM PARASITES
A Dissertation
submitted to the Faculty of the
Graduate School of Arts and Sciences
of Georgetown University
in partial fulfillment of the requirements for the
degree of
Doctor of Philosophy
in Chemistry
By
Katy S. Sherlach, B.S.
Washington, DC
April 23, 2014

ii
Copyright 2014 by Katy S. Sherlach
All Rights Reserved

iii
ASSESSING ANTIMALARIAL CIDALITY IN PLASMODIUM FALCIPARUM PARASITES
Katy S. Sherlach, B.S.
Thesis Advisor: Paul D. Roepe, Ph.D.
ABSTRACT
The rise of resistance to commonly used antimalarial medications, such as chloroquine, has
exacerbated a global health burden. Years of study of chloroquine resistance has focused on low
concentrations of drug that result in an inhibition of parasite growth, known as cytostatic activity.
In a clinical setting, the concentration of chloroquine peaks at much higher concentrations and
kills parasites. Defined as “cytocidal” activity, the ability of higher concentrations of
antimalarials to kill parasites has only recently been explored. Comparing in vitro chemical
models of hemozoin inhibition (the predicted mechanism of action of drugs like chloroquine) to
the in vivo activities supports that there is a different target at cytocidal concentrations. To probe
these possible targets, a novel activity-based protein profiling probe was synthesized, relying on
copper-catalyzed azide-alkyne cycloaddition to conjugate a photoaffinity probe of chloroquine to
biotin, for mass-spectroscopy proteomics, and fluorophores, for subcellular-localization by
fluorescence microscopy.
In addition to understanding the cellular effects of cytocidal drug activity, the concept of
cytocidality is integrated into the search for new combination therapies. High throughput
screening of combinations of known antimalarials and compounds currently under clinical
review identified a series of compounds that showed possible synergistic activities with known
antimalarials. One class of these compounds was found to be phosphitidylinositol 3-phosphate
kinase (PI3K) inhibitors, known to bind to human PI3K and effect its action in autophagy and
iv
other signaling pathways. Autophagy has only recently been explored in Plasmodium
falciparum, and has been implicated in the cytocidal activity of chloroquine. Therefore, these
PI3K inhibitors were paired with each of the drugs of the currently used therapy Coartem
(artemether and lumefantrine), and their interaction was defined as synergistic, additive, or
antagonistic under both the cytostatic and cytocidal conditions. Cytocidal, but not cystatic,
synergy was observed when another PI3K inhibitor, GSK2126458, was paired with either
artemether or lumefantrine in both chloroquine sensitive and chloroquine resistant strains.
Understanding how drug activities change under cytostatic vs. cytocidal conditions will facilitate
a better understanding of resistance and the identification of novel therapies.

v
This work is dedicated to my friends and family for their love and support,
but especially to my mom, Mary,
who always knew that I would make it here, even when I did not.
Many thanks and much love,
Katy S. Sherlach

vi
TABLE OF CONTENTS
Chapter I Introduction .................................................................................................. 1
1.1 General Malaria Background ...................................................................... 1
1.2 Hemozoin and Quinoline Antimalarials ...................................................... 3
1.3 Chloroquine Resistance............................................................................... 7
1.4 Chloroquine Resistance and PfCRT ............................................................ 8
1.5 Cytostatic vs. Cytocidal Activity ............................................................... 11
1.6 Autophagy in Plasmodia ........................................................................... 13
1.7. Drug Target Identification by Activity-Based Protein Profiling ................ 18
1.8 Drug Combination Analysis ...................................................................... 23
1.9 Objectives ................................................................................................. 28
Chapter II Materials and Methods .............................................................................. 30
2.1 Materials ................................................................................................... 30
2.1.1 Parasite Strains ............................................................................ 31
2.2 Methods ..................................................................................................... 31
2.2.1 General Spectroscopic Methods .................................................. 31
2.2.2 Plasmodium falciparum Culturing .............................................. 31
2.2.3 Synthesis of Alkynylated Azido Chloroquine ............................. 33
2.2.4 Synthesis of Chloroquine Analogs .............................................. 39
2.2.5 Synthesis of epi-Quinine and epi-Quinidine ................................ 40
2.2.6 β-Hematin Inhibition Assay ........................................................ 42

vii
2.2.6.1 Effect of SDS on Absorbance of FPIX ........................... 42
2.2.6.2 Assay Optimization ....................................................... 43
2.2.6.3 Hz Inhibition Assay ....................................................... 43
2.2.6.4 Vacuolar Accumulation Ratio Calculations ................... 44
2.2.7 Drug-Heme Affinity Measurements ............................................ 45
2.2.8 Heme Aggregation Studies ......................................................... 46
2.2.9 Antiplasmodial Assays ............................................................... 48
2.2.10 Trypan Blue Staining of P. falciparum ..................................... 49
2.2.11 Drug Combination Assays Using the Chou-Talalay Method ..... 50
2.2.12 High-Throughput Screening of Drug Combinations .................. 52
2.2.13 Photolabeling PfCRT Proteoliposomes with AzBCQ and
AAzCQ………………………………………………… …………….. 56
2.2.14 Photolabeling P. falciparum with AzBCQ and AAzCQ for
Fluorescence Microscopy ................................................................... 57
2.2.15 Photolabeling P. falciparum for Gel Electrophoresis and Proteomic
Analysis .............................................................................................. 58
2.2.16 Mass Spectroscopy-Based Proteomics ...................................... 60
2.2.17 Immunofluorescence Assays of P. falciparum ATG8 Puncta .... 61
2.2.18 Single-Cell Photometry of P. falciparum Intracellular Ca2+
Concentrations .................................................................................... 62
Chapter III Examining the Cytocidal versus Cytostatic Effects of Antimalarial Drugs
Through Biochemical Growth Assays and In Vitro Chemical Methods ....................... 65
3.1 Background .............................................................................................. 65
3.1.1 Part 1: The Need for Cytocidal Assays for P. falciparum ............ 65
viii
3.1.2 Part 2: Is Hz a Cytocidal Target? ................................................ 67
3.1.3 Part 3: Cytocidality in QN vs. CQ .............................................. 70
3.2 Results ...................................................................................................... 74
3.2.1 Part 1: Developing a Cytocidal Assay with Trypan Blue is
Difficult ............................................................................................. 74
3.2.2 Part 2: Hz is not a Likely CQ Cytocidal Target ........................... 79
3.2.3 Part 3: Hz is not Likely to be a CQ Cytocidal Target .................. 92
3.3 Discussion .............................................................................................. 103
3.4 Acknowledgements ................................................................................. 112
Chapter IV Synthesis, Purification, and Characterization of a Novel Chloroquine
Photoaffinity Probe that Utilizes Click Chemistry for Investigating Targets in
P. falciparum Parasites ............................................................................................. 114
4.1 Background ............................................................................................ 114
4.2 Results .................................................................................................... 122
4.3 Discussion .............................................................................................. 146
4.4 Acknowledgements ................................................................................. 151
Chapter V Identifying Novel Drug Combinations and Defining Their Interactions at
Cytostatic and Cytocidal Doses ................................................................................ 152
5.1 Background ............................................................................................ 152
5.2 Results .................................................................................................... 159
5.3 Discussion .............................................................................................. 174
5.4 Acknowledgements ................................................................................. 179
Chapter VI Overall Conclusions ............................................................................... 181
Chapter VII Additional Published/In Preparation Work ............................................ 188

ix
7.1 Quantification of Perchloroethylene Residues in Dry Cleaned Fabrics .... 188
7.1.1 Introduction ............................................................................. 188
7.1.2 Materials and Methods ............................................................. 190
7.1.3 Results ..................................................................................... 194
7.1.4 Discussion ................................................................................ 205
7.1.5 Acknowledgements .................................................................. 208
7.2 Natural Functions of Drug Resistance Associated Membrane Proteins .... 209
7.2.1 Acknowledgements .................................................................. 216
7.3 Determination of the Cytostatic and Cytocidal Activities of Antimalarial
Compounds and their Combination Interactions ............................................ 217
7.3.1 Introduction ............................................................................. 217
7.3.2 Cytostatic (IC50) Growth-Inhibition Assay ................................ 219
7.3.3 Cytocidal (LD50) Cell-Kill Assay.............................................. 222
7.3.4 Limiting Serial-Dilution Assay ................................................. 224
7.3.5 Modifying the Cytostatic and Cytocidal Assays for Assessing
Synergy of Drug Combinations ......................................................... 229
7.3.6 Reagents and Solutions ............................................................. 231
7.3.7 Commentary ............................................................................. 231
7.3.8 Acknowledgements .................................................................. 235
Bibliography ............................................................................................................ 236

x
LIST OF FIGURES AND SCHEMES
Figure 1.1. Life Cycle of Plasmodium .......................................................................... 3
Scheme 1.1. Structures of Known Antimalarials ........................................................... 4
Figure 1.2. Diagram of an Infected Erythrocyte and Chloroquine Distribution.............. 5
Figure 1.3. Map of the Origin and Spread of Resistance ............................................... 8
Figure 1.4. Quantified PfATG8 Puncta Distribution for Synchronized Trophozoite
Parasites…………….. ................................................................................................ 17
Figure 1.5. Integrating Bioorthogonal Chemistry into Activity Based Protein
Profiling…………….................................................................................................. 22
Figure 1.6. CuAAC Reaction Scheme ........................................................................ 23
Figure 1.7. Example of Possible Drug Interactions on an Isobologram ....................... 26
Figure 2.1. P. falciparum Life Cycle Stages as Seen on a Giemsa Smear .................... 33
Scheme 2.1. Synthesis of AAzCQ .............................................................................. 33
Figure 2.2. Structures of Quinolines and Chloroquine Analogs ................................... 39
Scheme 2.2. Synthesis of epi-Quinine and epi-Quinidine by one-pot Mitsunobu
Esterification-Saponification ...................................................................................... 40
Figure 2.3. Example of Heat Map Generated by High-Throughput Screening at
NCATS ...................................................................................................................... 53
Figure 2.4. Example of an Unacceptable Heat Map Generated by High-Throughput
Screening at NCATS .................................................................................................. 55
Scheme 3.1. Structures of Common Antimalarials, and Chloroquine Analogs ............ 70
Scheme 3.2. Structures of Common Antimalarials, Epimers and Analogs of Quinine
and Quinidine............................................................................................................. 74
Figure 3.1. Microscopic Images of Unstained and Stained Parasites ........................... 75
xi
Figure 3.2. Staining of Untreated Parasites by Trypan Blue ........................................ 76
Figure 3.3. Representative Images of Trypan-Blue Stained Parasites .......................... 77
Figure 3.4. Change in Percentage of Parasites Stained Versus Lethal Dose ................. 78
Figure 3.5. SDS Effects on the Absorbance Spectrum of FPIX ................................... 80
Figure 3.6. Optimization of Lipid Catalyst ................................................................. 82
Figure 3.7. pH-Dependent Kinetics for the Production of Hz ...................................... 84
Figure 3.8. Effect of pH on the Hz Inhibition ............................................................. 86
Figure 3.9. Correlation Plots Between the Hz inhibition (β-hematin inhibitory activity
[BHIA]) IC50 and Antiplasmodial Activities ............................................................. 88
Figure 3.10. Antiplasmodial Activity of a Series of QN analogues ............................. 96
Figure 3.11. Drug-Heme Binding Curves ................................................................... 97
Figure 3.12. Drug Effects on pH-Dependent Heme Aggregation ................................ 99
Figure 3.13. Fluorescence Excitation and Emission Spectra...................................... 100
Figure 3.14. ESI Mass Spectra ................................................................................. 102
Figure 4.1. Structure of AzBCQ ............................................................................... 115
Figure 4.2. UV-Activation of an Aryl Azide ............................................................. 117
Figure 4.3. Structure of Photoaffinity CQ Probed used by Foley et al. ...................... 119
Scheme 4.1. Synthesis of AAzCQ ............................................................................ 122
Figure 4.4. 1H NMR of AAzCQ ............................................................................... 123
Figure 4.5. 13
C NMR of AAzCQ .............................................................................. 124
Figure 4.6. 19
F NMR of AAzCQ............................................................................... 125
Figure 4.7. AAzCQ Labeling of PfCRT is Concentration Dependent…… ................ 126

xii
Scheme 4.2. Protocol for Fluorescence Imaging of Probe-Labeled Parasites…… ..... 129
Figure 4.8. Photolabeling P. falciparum with AzBCQ for Fluorescence Microscopy 130
Figure 4.9. Photolabeling HB3 P. falciparum with IC50 Concentrations of AAzCQ
for Fluorescence Microscopy ................................................................................... 131
Figure 4.10. Photolabeling Dd2 P. falciparum with IC50 Concentrations of AAzCQ
for Fluorescence Microscopy ................................................................................... 132
Figure 4.11. Photolabeling HB3 P. falciparum with LD50 Concentrations of AAzCQ
for Fluorescence Microscopy ................................................................................... 133
Figure 4.12. Photolabeling Dd2 P. falciparum with LD50 Concentrations of AAzCQ
for Fluorescence Microscopy ................................................................................... 134
Scheme 4.3. Protocol for Separation of Biotin-Labeled Targets with 2D Gel
Electrophoresis......................................................................................................... 136
Figure 4.13. Two-Dimensional Gel Electrophoresis of Bulk P. falciparum Labeled
with AzBCQ. ........................................................................................................... 137
Scheme 4.4. Method for Avidin Enrichment of Biotin-Labeled Targets. .................. 141
Figure 4.14. Avidin Enrichment of Biotin Acceptor Domain-Linked PfCRT from
Yeast Crude Membranes .......................................................................................... 142
Figure 4.15. One-Dimensional Gel Electrophoresis of Bulk P. falciparum Labeled
with AAzCQ and AzBCQ with CQ Competition in HB3 Parasites ........................... 144
Figure 4.16. One-Dimensional Gel Electrophoresis of Bulk P. falciparum Labeled
with AAzCQ and AzBCQ with CQ Competition in Dd2 Parasites ............................ 145
Figure 5.1. Example of Possible Drug Interactions on an Isobologram ..................... 156
Figure 5.1. Single agent and combination analysis of a large collection of approved
and investigational drugs for antimalarial activity..................................................... 161
Scheme 5.1. Structures of tested PI3K inhibitors, as well as antimalarials artemether
and lumefantrine ...................................................................................................... 162
Figure 5.3. Calcium Loss Under Cytocidal Chloroquine in Dd2 Parasites ................. 164
xiii
Figure 5.4. Representative Data from an IC50 C-T Analysis using NVP and ATM .... 167
Figure 5.5. Representative Data from an LD50 C-T Analysis using NVP and ATM .. 168
Figure 5.6. Combination FICindices ............................................................................ 170
Figure 5.7. Combination FLDindices ........................................................................... 171
Figure 5.8. Analysis of Autophagosomal Body Puncta Formation and Trafficking in
Response to Environmental and/or Pharmacological Stress ...................................... 173
Figure 7.1. PCE Extraction from Wool Fabric Dry Cleaned at Establishment F vs.
Time ........................................................................................................................ 192
Figure 7.2. Standard Curve Generation Using Known PCE Peak Area vs.
Concentration ........................................................................................................... 195
Figure 7.3. Representative Chromatograms of Control (Non-Dry Cleaned) Fabric.... 196
Figure 7.4. Representative Mass Spectra of a 1 mM PCE Standard and a Polyester
Extract Sample form Dry Cleaner A. ........................................................................ 197
Figure 7.5. Representative Chromatograms of Fabric Samples ................................ 199
Figure 7.6. The Amount of Residual PCE Per Unit Area of Fabric ........................... 201
Figure 7.7. Volitization of Residual PCE from Wool Fabric Dry Cleaned at
Establishment A at Ambient Room Temperature Either in Open Air or Under Dry
Cleaner-Provided Garment Plastic. ........................................................................... 203
Figure 7.8. Accumulation of PCE Within Different Fabric Types over Multiple Dry
Cleaning Cycles ....................................................................................................... 204
Figure 7.9. Plating of the Limiting Dilutions ............................................................ 226

xiv
LIST OF TABLES
Table 2.1. Diagram of Plate for Chou-Talalay Method Assay ..................................... 51
Table 3.1. Initial rates of production of Hz in the presence of PC, pMAG, and sMAG
and in the absence of lipid catalysts ............................................................................ 85
Table 3.2. IC50 for Hz inhibition at pH 5.2 for common antimalarials in the presence
of PC, pMAG, or sMAG ............................................................................................ 87
Table 3.3. Physical and pharmacokinetic properties, antiplasmodial IC50 and LD50,
and BHIA IC50 for antimalarial drugs and drug analogues used in this work ............... 89
Table 3.4. Antiplasmodial IC50s and LD50s for QNS strain HB3, QNR strain Dd2,
and the K76I strain ..................................................................................................... 93
Table 3.5. β-Hematin inhibitory IC50 data at pH 5.2 and 5.6 ....................................... 95
Table 3.6. Drug-heme affinity coefficients for binding monomeric FPIX .................... 98
Table 3.7. Drug-monomeric heme adduct properties.................................................. 101
Table 4.1. Plasmodium Proteins Identified Through Trypsin-Digestion and Mass
Spectroscopic Analysis of Bulk P. falciparum Labeled with AzBCQ ........................ 138
Table 5.1. Antiplasmodial Activities of PI3K Inhibitors, Artemether, and Lumefantrine
.. ............................................................................................................................... 165
Table 5.2. Average FICindices ...................................................................................... 169
Table 5.3. Average FLDindices .................................................................................... 171
Table 7.1. Calculated Residual PCE from Seven Dry Cleaners ................................. 200
Table 7.2. Diagram of Plate for Cytostatic Assay ...................................................... 220
Table 7.3. Diagram of Cytostatic Assay Plate with Standard Curve Cultures ............. 221
Table 7.4. Hypothetical Number of Parasites in Each Dilution of the Limiting
Dilution Assay .......................................................................................................... 227
xv
LIST OF ABBREVIATIONS
AAzCQ- alkynylated azido-chloroquine
ABPP- activity-based protein profiling
ACN- acetonitrile
ACT – artemisinin combination therapy
AQ – amodiaquine
ATM- artemether
ART – artemisinin
ATG- autophagy-related protein
ATP- adenosine triphosphate
ATSU- artusenate
AzBCQ- azido biotinylated chloroquine
BHIA – β-hematin inhibitory activity
CAR – cellular accumulation ratio
CD – cinchonidine
CDC – Centers for Disease Control and Prevention
CN – cinchonine
CM- complete media
CQ – chloroquine
CQR – chloroquine resistant or chloroquine resistance
CQS – chloroquine sensitive or chloroquine sensitivity
CT- Chou-Talalay method of defining drug interaction

xvi
CuAAC- copper-catalyzed azide-alkyne cycloaddition
DAG – diacylglycerol
DG – 1,2-dipalmitoyl-sn-glycerol-3-phosphatidylcholine
DHLA – dihydrolipoic acid
DIAD – diisopropyl azodicarboxylate
DIC- differential interference contrast
DMAP- 4-dimethylaminopyridine
DMSO – dimethyl sulphoxide
DNA- deoxyribonucleic acid
DRAMPs- drug resistance associated membrane proteins
DT – 1,2-dioctanoyl-sn-glycerol-3-phosphatidylcholine
DV – digestive vacuole
DVM – digestive vacuolar membrane
EPA- United States Environmental Protection Agency
eQD – 9-epi-quinidine
eQN – 9-epi-quinine
ESI – electrospray ionization
EtOH- ethanol
FIC – fractional inhibitory concentration
FICindex – fractional inhibitory concentration index, or combination index
FLD – fractional lethal dose
FICindex – fractional lethal dose index, or combination index

xvii
FPIX – ferriprotoporphyrin IX
FT – Fourier transform
GCMS- gas chromatography mass spectroscopy
GSK212- GSK2126458
Hb – hemoglobin
HEPES – 4-(2-hydroxyethyl)-1-piperazineethanesulfonic acid
HIV/AIDS- human immunodeficiency virus/acquired immune deficiency syndrome
HPLC- high performance liquid chromatography
Hr(s)- hour(s)
Hs- Homo sapiens
Ht – % hematocrit
H-T – head-to-tail dimer
huMDR1- Human Multidrug Resistance Protein 1
Hz – hemozoin
IARC- International Agency for Research on Cancer
IC50 – 50% growth inhibitory concentration
IM- incomplete media
iRBC- infected red blood cell
LA – lipoic acid
LD50 – 50% lethal dose
LF- lumefantrine
LiOH- lithium hydroxide
xviii
mA- milliamperes
MAG – monoacylglycerol
MDR- multi-drug resistance
MDR1- human multi-drug resistance transporter
MeOH – methanol
MES – 2-(N-morpholino)ethanesulfonic acid
metHb – methemoglobin
Min(s)- minute(s)
MOA- mechanism of action
MQ – mefloquine
MS – mass spectrometry
mTOR- mammalian target of rapamycin
MW – molecular weight
m/z – mass-to-charge ratio
NaOH- sodium hydroxide
NCATS- National Center for Advancing Translational Science
NIH- National Institutes of Health
NMR – nuclear magnetic resonance
NVP- NVP BGT228
%p – % parasitemia
PAGE- polyacrylamide gel electrophoresis
PBS- phosphate buffered saline
xix
PBS-T- phosphate buffered saline with Tween 20
PC – phosphatidylcholine
PCE- perchloroethylene
P. falciparum/Pf – Plasmodium falciparum
PfATG8- Plasmodium falciparum autophagy-related protein 8
PfCRT – Plasmodium falciparum chloroquine resistance transporter
pfcrt – Plasmodium falciparum chloroquine resistance transporter gene
PfMDR1 – Plasmodium falciparum multi-drug resistance transporter
PfNHE – Plasmodium falciparum sodium-proton exchanger
PHIL – Public Health Image Library
PI3P- phosphotidylinositol 3-phosphate
PI3K- phosphotidylinositol 3-kinase
pMAG – 1-monopalmitin
PNBA – para-nitrobenzoic acid
PVM – parasitophorous vacuolar membrane
QD – quinidine
QN – quinine
QNR – quinine resistant or quinine resistance
QNS – quinine sensitive or quinine sensitivity
QTL- quantitative trait loci
RBC – red blood cell
Rf – resistance factor

xx
SDCM- spinning disk confocal microscopy
SDS – sodium dodecyl sulfate
SEM – standard error of the mean
SM- starvation media
sMAG – 1-monostearin
TAG – triacylglycerol
TAMRA- tetramethylrhodamine
TgATG8- Toxoplasma gondii autophagy-related protein 8
THF- tetrahyrdofuran
TLC – thin layer chromatography
Tris – tris(hydroxymethyl)methylamine
UV – ultraviolet
V- volts
v/v – volume per volume
VAR – vacuolar accumulation ratio
VIS – visible
WHO – World Health Organization
w/v – weight per volume
VPL- verapamil
Vps34- vacuolar protein sorting 34 protein
ZnPIX – zinc(II)protoporphyrin IX
1
CHAPTER I
INTRODUCTION
1.1.General Malaria Background
Malaria is a disease of global importance. Across the globe, 3.3 billion people (roughly half
the world’s population) live in malaria-endemic areas spread throughout 104 countries. Among
those 104 countries, 35 account for 98% of all deaths due to the disease (30 of these are in sub-
Saharan Africa) (Centers for Disease Control. Malaria Facts). In 2010 alone, the World Health
Organization (WHO) recorded over 210 million cases of malaria, leading to nearly 655,000
deaths. Malaria is the cause of 20% of all childhood deaths in Africa (World Health
Organization. World Malaria Report 2010). Despite global eradication efforts, malaria remains
the 5th
leading cause of death from infectious disease worldwide, and the second-leading cause of
death from infectious disease in Africa, behind HIV/AIDS (Centers for Disease Control. Malaria
Facts).
Malaria is caused by parasitic infection of one of 5 or 6 species of Plasmodia: malariae,
ovale, vivax, knowlesi (zoonotic), and falciparum (which is responsible for the most severe cases
and the most mortality) (Centers for Disease Control. Malaria Disease). Recent reports have
identified a possible second zoonotic infection of a human with P. cynomolgi (Ta et al. 2014).
Malaria infections can range from uncomplicated, where the patient experiences a two-day cycle
of fevers, chills, vomiting and headaches, to severe cases. In a severe case of malaria, the
repeated lysing of erythrocytes can lead to severe anemia, along with seizures, low blood
pressure, kidney failure, coma, and death (Centers for Disease Control. Malaria Disease).

2
The Plasmodium parasite has 2 hosts: humans, and the female Anopheles mosquito vector.
Throughout the two hosts, the parasite transforms from sexually-reproducing forms (mosquito),
and asexually-reproducing forms (human), as shown in Figure 1.1. When the female mosquito
bites a human to consume a blood meal, sporozoites are injected into the blood stream. The
sporozoite invades a hepatocyte in the liver. During the liver infection, a single sporozoite can
reproduce into 30,000-40,000 daughter merozoites. The asexually-reproducing form then moves
into the blood stream, infecting host erythrocytes. The red-blood cell (RBC) stage is responsible
for the symptomatic phase of the disease. Over the course of the 48-hour life cycle, the merozoite
invades a red-blood cell, consumes host hemoglobin during the trophozoite stage, and replicates
in schizongony to form new merozoites that burst from the erythrocyte to continue the next life
cycle (Centers for Disease Control. Malaria Facts; Centers for Disease Control. Malaria
Biology). During the asexual blood-stage reproduction, the parasite will also occasionally form a
sexually-segregated gametocyte, which, when consumed by another mosquito, can begin sexual
reproduction and produce sporozoites within 10-18 days (Centers for Disease Control. Malaria
Biology).

3
Figure 1.1. Life Cycle of Plasmodium. Credit CDC, Alexander J. da Silva, PhD, and Melanie
Moser, 2002 (Centers for Disease Control. Malaria Biology). Public domain content available
from the Public Health Image Library (PHIL), ID# 3405.
1.2. Hemozoin and Quinoline Antimalarials
The symptomatic phase of malaria, which is the predominant target of
chemotherapeutics, is the RBC stage. Common antimalarials, including quinolines and
artemisinins, are shown in Scheme 1.1.

4
Scheme 1.1. Structures of Known Antimalarials. Reprinted with permission from Gorka et al.
2013c. Copyright 2013 American Chemical Society
As the parasite grows and moves through its intraerythrocytic life stages, ring,
trophozoite, and schizont, the host hemoglobin is ingested and trafficked to the digestive vacuole
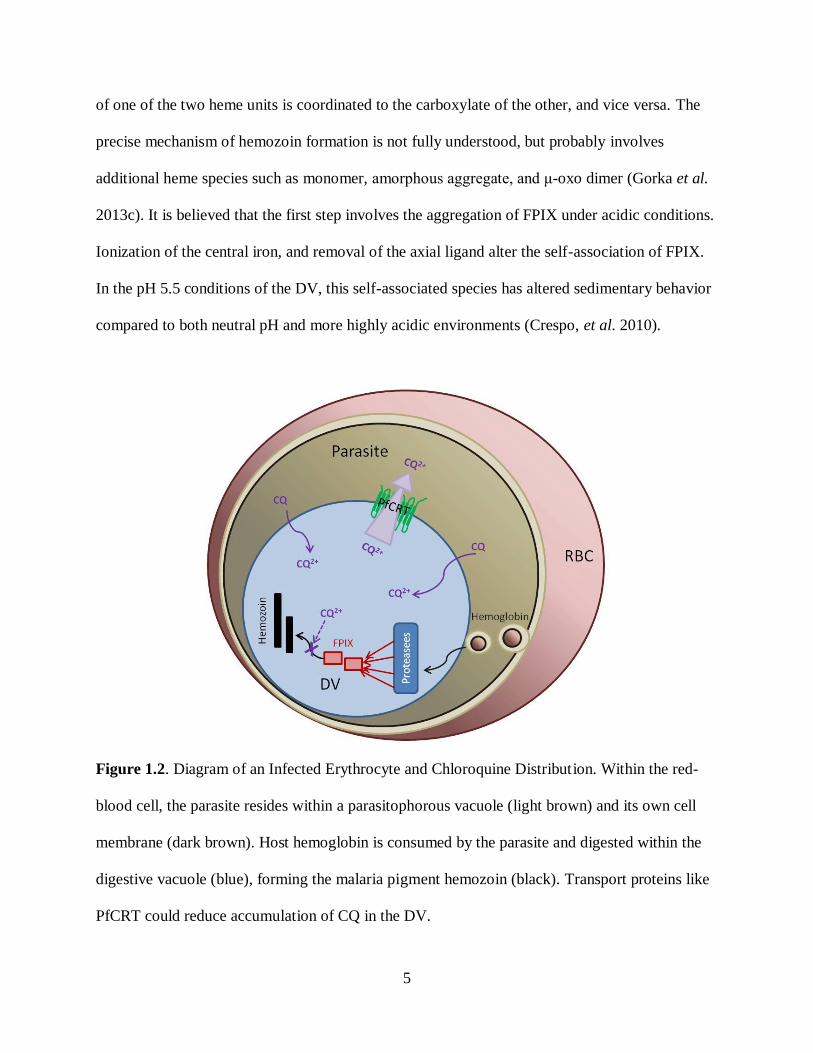
(DV), as seen in Figure 1.2. The DV is a lysosome-like organelle where proteases digest
hemoglobin (Hb), releasing toxic ferriprotoporphoryin IX (FPIX). Approximately 85% of the
RBC Hb is digested by the trophozoite (Gligorijevic et al. 2006a). FPIX release can result in
lipid peroxidation and disruption of membrane integrity. In order to avoid the deleterious effects
of free FPIX, the parasite sequesters the free heme as crystalline hemozoin (Hz). Hemozoin’s
unit cell is comprised of head-to-tail dimers of the FPIX. In a head-to-tail dimer, the iron center
5
of one of the two heme units is coordinated to the carboxylate of the other, and vice versa. The
precise mechanism of hemozoin formation is not fully understood, but probably involves
additional heme species such as monomer, amorphous aggregate, and μ-oxo dimer (Gorka et al.
2013c). It is believed that the first step involves the aggregation of FPIX under acidic conditions.
Ionization of the central iron, and removal of the axial ligand alter the self-association of FPIX.
In the pH 5.5 conditions of the DV, this self-associated species has altered sedimentary behavior
compared to both neutral pH and more highly acidic environments (Crespo, et al. 2010).
Figure 1.2. Diagram of an Infected Erythrocyte and Chloroquine Distribution. Within the red-
blood cell, the parasite resides within a parasitophorous vacuole (light brown) and its own cell
membrane (dark brown). Host hemoglobin is consumed by the parasite and digested within the
digestive vacuole (blue), forming the malaria pigment hemozoin (black). Transport proteins like
PfCRT could reduce accumulation of CQ in the DV.
6
Due to their weak-base nature, some antimalarial compounds, particularly quinolines
such as quinine and chloroquine, will accumulate in the DV by acid trapping. Nanomolar levels
of external CQ can accumulate within the DV to millimolar levels (Chong, et al. 2003). The
proposed mechanism of action of these compounds involves interrupting the hemozoin formation
process, releasing toxic FPIX (Gorka et al. 2013c). Examination of hemozoin formation in live
parasites can be performed through the use of differential interfering contrast on a spinning-disk
confocal microscope. Treatment of infected RBCs with twice their 50% inhibition concentration
(2xIC50) concentrations of CQ resulted in a reduction of hemozoin by 30%, while the parasite
continued to progress normally through the cell cycle (Gligorijevic et al. 2006a). It is possible
that the quinolines interrupt hemozoin formation by incorporating into the crystal face to block
further growth, or by sequestering pre-crystalline forms away from the growing crystal (Chong,
et al. 2003). Studies of the pH-dependent solubility of FPIX show a change in the titration curve
in the presence of quinoline antimalarials. The concentration of the quinolines in this aggregate
form is not stoichiometric, and suggests a novel, still yet undefined, nucleation phenomenon,
which could impact the crystallization pathway (Ursos, et al. 2001).
Another technique used to examine quinoline-FPIX interactions that could interfere with
hemozoin formation is nuclear magnetic resonance (NMR) spectroscopy. Studies have shown
that CQ, quinine, and quinidine can form π-complexes with μ-oxo dimers, while CQ can also
form a dative complex with monomer FPIX (Leed et al. 2002; de Dios et al. 2003). When
quinolines bind, they can alter the pH-dependent equilibrium of the various forms of FPIX.
Chloroquine binds to FPIX and promotes the μ-oxo form, while quinine promotes the formation
of monomer (Casabianca et al. 2008). The formation of hemozoin is associated with lipid
droplets inside the DV (Gorka et al. 2013c). μ-oxo dimer has been observed to partition into
7
detergent micelles, where CQ is not very soluble. It is possible, with the interaction of CQ and μ-
oxo dimer, that the drug is able to remove μ-oxo dimer from lipid environments and thereby
slow the crystallization (Casabianca et al. 2009). Quinine forms a complex with monomeric
FPIX that is stabilized by hydrogen bonds and ion-dipole interactions. This complex can form an
insoluble, non-crystalline aggregate that could prevent the proper crystallization of hemozoin
(Alumasa et al. 2011).
In vitro analysis of the growth of β-hematin (a synthetic version of hemozoin) has been
used to predict the activity of potential antimalarial drugs. Various systems have been used,
ranging from acidic aqueous solutions, with more biological relevance, to those run in high
levels of organic solvent, which are less applicable to the conditions of the DV. Histidine-rich
proteins and lipids were shown to accelerate the formation of crystals when added to the assay
(Egan 2008). However, if in vitro studies are meant to model in vivo activity, the assays would
need to be biologically-relevant as far as solution composition, pH, temperature, and the
presence of catalysts.
1.3. Chloroquine Resistance
After centuries of use of the naturally-occurring quinoline quinine, the synthetic 4,7-
quinoline chloroquine was discovered in 1934, with wide-spread use beginning after the end of
World War II. Chloroquine (CQ) was inexpensive, with a full course of treatment costing around
$0.10, and effective, leading to a drop in mortality and the hope of eradication. Using CQ
extensively in this effort resulted in the rise of resistant strains of P. falciparum initially along
the Thai-Cambodian border in the late 1950s. Through the 1960s and 70s, resistance spread
throughout Southeast Asia, India, and South America. Resistance in Africa was initially seen in

8
Kenya and Tanzania in the 1970s, and spread across the continent within a decade, as shown in
Figure 1.3. The rise of resistance lead to a dramatic increase in mortality and morbidity,
rendering CQ ineffective in many areas of the world (Wellems et al. 2001, Hartl 2004).
Figure 1.3. Map of the Origin and Spread of Resistance. Reprinted by permission from
Macmillan Publishers Ltd: [Nature Reviews Microbiology] (Hartl 2004), copyright (2004).
1.4. Chloroquine Resistance and PfCRT
In order to explore the possible causes of resistance, the progeny generated from a cross
between CQ sensitive (CQS) HB3 and CQ resistant (CQR) Dd2 was analyzed by quantitative
trait loci (QTL) analysis of the resistance phenotype. The possible resistance-related gene was
initially identified within a 36 kilobase pair region on chromosome 7; looking within that region
9
yielded pfcrt, where a series of mutations segregated with drug-response phenotype (Wellems et
al. 1991; Fidock et al. 2000). Pfcrt encodes the protein Plasmodium falciparum chloroquine
resistance transporter (PfCRT), which is localized to the DV membrane. Resistance was seen to
require a series of genetic mutations in the gene pfcrt, in contrast to pyrimethamine resistance,
which requires a single mutation in a gene (Wellems et al. 2001). Transfecting a sensitive line
with “resistant” isoforms of the genes resulted in reduced susceptibility, confirming the role of
PfCRT in resistance (Sidhu et al. 2002) Additionally, when a CQS strain, Sudan 106/1, that
harbors 6 out of the 7 common Old World CQR mutations (missing K76T) was pressured with
CQ, generation of alternative mutations at the same location in PfCRT (K76N, K76I) result in a
decrease in susceptibility (Cooper et al. 2002).
The DV-localization of PfCRT suggests that the protein may transport CQ, moving it
away from its target. Heterologous expression of PfCRT in yeast allowed for closer examination
of its interaction with CQ, where it was shown to bind with a KD of around 400 nM (Zhang et al.
2004). Similarly, both heterologously-expressed and native PfCRT were labeled by a
photoaffinity-analog of CQ, Azido-Biotinylated Chloroquine (AzBCQ). Successful competition
of the probe with “cold”, underivitized, CQ, supported an overlapping binding site which was
then explored by trypsin digestion and mass-spectroscopic analysis (Lekostaj et al. 2008). The
presence of extracellular CQ resulting in the increased transport of PfCRT expressed in
Dictyoselium discoideum suggested that trans-stimulated efflux may reduce the CQ present in the
DV, removing it from its target. (Sanchez et al. 2007). Studies involving a fluorescent analog of
chloroquine, NBD-CQ, and proteoliposomes containing purified PfCRT, were performed in
order to determine a model of transport. In this study, trans-stimulation was not observed. The
model proposed was that PfCRT acts like a channel, allowing the movement of CQ down an

10
electrochemical gradient, with more efficient transport for CQR parasites compared to CQS
(Paguio et al. 2009). In support of this theory, decreased accumulation of [3H]CQ was observed
in CQR parasites under low nanomolar concentrations of extracellular CQ (Roepe 2011). In
some studies, other anti-malarials and resistance-reversing compounds were hypothesized to be
transported by PfCRT (Lehane et al. 2011).
In addition to altered drug transport, studies have observed effects of mutant PfCRT on
the pH of the DV. Lehane and Kirk propose that protons are removed from the DV through the
efflux of protonated CQ, termed a “proton leak” (Lehane et al. 2008). Bennet, et al., however,
observed a difference in steady state pH of the resistant strains. In CQS strains, the DV pH is at
5.5; in CQR strains, this value decreases to 5.2 (Bennet et al. 2004a). Alteration in the pH of the
DV can impact the pH-related solubility of FPIX isoforms, and therefore the availability of the
proposed target of quinoline drugs.
In addition to PfCRT, another protein has been associated with CQR, PfMDR1.
PfMDR1, when heterologously-expressed, binds the AzBCQ photoaffinity-analog of CQ (Pleeter
et al. 2010). Although PfMDR1 does not segregate with CQR like PfCRT, it is possible that it
modulates the accumulation of drug within the DV. Rorhbach et al. (2006) proposed that it can
import solutes into the DV, including drugs like CQ. Transfection and drug-pressure studies with
PfCRT recapitulate only 70-90% of the 50% growth inhibitory concentration (IC50) values of
naturally-occurring resistant strains, suggesting that resistance could be multifactorial, although
the lower values could be also due to lower levels of expression compared to the isoform’s
parent strain (Waller et al. 2003; Roepe 2011). The involvement of other proteins, such as
PfMDR1, is expected.
11
1.5. Cytostatic vs. Cytocidal Activity
Definition of PfCRT as the major cause of CQR relies on the effect on growth of culture
in the continuous presence of low nanomolar levels of drug, resulting in definition of a shifted
growth-inhibitory concentration, or IC50 value. However, clinically relevant concentrations of
CQ often reach the micromolar range (Salako et al. 1987; Khalil et al. 2011). Aside from one
study of the effects of deferoxamine on P. falciparum (Whitehead et al. 1990), the ability of a
drug to kill parasites has not been routinely quantified. Resistance could be due to a more
complicated resistance mechanism than just altered accumulation in the consistent presence of
low levels of drug. Studies of the stage-specificity of CQ show activity and resistance at every
intraerythrocytic life stage, even those where hemozoin is not being formed (Gligorijevic et al.
2008). Additionally, CQ-treated parasites showed a reduced multiplicity of daughter nuclei
during schizongeny, as well as a reduced viability of parasites in the following cell cycle. These
observations are not consistent with hemozoin formation being the sole target of CQ treatment
(Gligorijevic et al. 2008). Further studies of CQ accumulation showed that when incubated with
several different concentrations of external CQ, CQR parasites can accumulate CQ within their
DVs to levels above that of CQS parasites while still retaining their viability. This study by
Cabrera et al. (2009) showed that reduced accumulation in the DV resulting in reduced
accessibility to target is not the sole cause of resistance.
In order to quantify the effects of high-concentration (cytocidal) bolus doses of drug, new
assays were developed. In 2011, Paguio et al. modified the previously-used SYBR Green growth
inhibition assay to wash drugs away after a set incubation time and monitor growth into the
following cell cycle, generating the 50% cytocidal dose (LD50). Examination of resistance to
these bolus doses resulted in altered trends when contrasted with cytostatic activity defined by
12
IC50. The ten-fold increase of IC50 values between CQS and CQR strains that is seen in cytostatic
growth assays becomes 100-fold under bolus dose, cytocidal conditions. Relatedly, verapamil,
which has been shown to chemosensitize certain strains of resistance parasites at cytostatic
concentrations of CQ, has no effect on the cytocidal activity (Paguio et al. 2011). Another
cytocidal assay that has been developed utilizes transfection with an overexpressed luciferase.
Reduction in the generation of bioluminescence over an eight-hour incubation is determined to
be due to cell death, allowing for examination of cell stage-specific effects and examination of
the rate of kill for different drugs (Hasenkamp et al. 2013).
As mentioned earlier, transfection of CQS strains with CQR isoforms of PfCRT was
shown to raise the IC50 values to 70-80% of that seen in CQR strains (Waller et al. 2003; Roepe
2011). However, when CQR isoforms of PfCRT are transfected into a CQS background and
examined for the resulting cytocidal activity, only 7-23% of the parent strain LD50 is
recapitulated (Gaviria et al. 2013). While the 20-30% reduction in IC50 at the cytostatic level
could conceivably be attributed to differences in expression level due to the transfection process,
that cannot be the reason behind such a low value of LD50 compared to the parent strain. Where
the PfCRT isoform dictates the majority of cytostatic resistance, it does not contribute nearly as
significantly to cytocidal resistance. Most likely, there is another process or other targets of CQ
that are altered in CQR parasites that result in the high LD50 values observed (Gaviria et al.
2013).
QTL analysis of a cross between CQS HB3 and CQR Dd2 parasite strains at the
cytostatic level (using IC50 data) led to the identification of pfcrt as the predominant source of
resistance, with added contribution from a locus on chromosome 5 that includes the gene for
PfMDR1. Repeating this process at the with LD50 data, however, does not yield the same results.
13
The section of chromosome 7 that includes pfcrt is detected, but at a lower significance than in
the cytostatic analysis. The PfMDR1 locus on chromosome 5 was not detected in this screen.
Additional contributions to cytocidal resistance were identified on chromosomes 6 and 8, with
additive interactions between the two loci. Within these loci are genes that code for proteins
involved in vesicle traffic, proteosome function, and lipid metabolism. The QTL analysis
supports the hypothesis that the classical drug mechanism of hemozoin inhibition in the DV with
reduced DV-levels of drug leading to resistance is not as applicable at the cytocidal level
(Gaviria et al. 2013).
1.6 Autophagy in Plasmodia
These shifts in LD50 data for drug resistant parasites indicate resistance to parasite cell
death (not merely resistance to drug induced growth inhibition). The mechanism of drug-induced
death in the malaria parasite has been debated. The identification of metacaspases encoded in the
Plasmodium genome, along with observed disruption of mitochrondrial electrochemical
potential, DNA fragmentation, chromatin condensation, and externalization of
phosphotidylserine by some drugs led some to propose that the parasite can undergo a modified
version of apoptosis (Meslin et al. 2007; Deponte et al. 2004). However this is disputed by
others who did not observe features of apoptosis in drug-treated parasites (Nyakeriga et al. 2006;
Totino et al. 2008). Ultrastructural analysis of parasites showed no chromatin condensation, a
nuclear morphology inconsistent with apoptosis. Any DNA fragmentation that was observed was
seen in very few parasites, and it is possible that any apoptotic death may only account for a
small percentage of the bulk population (Totino et al. 2008). In the cytocidal QTL analysis, no
genes involved in the apoptosis programmed cell death pathway were observed within the

14
identified genomic regions, suggesting that the parasite does not die by that process (Gaviria et
al. 2013). Additionally, the tell-tale signs of necrosis: swelling, disruption of the plasma
membrane, precipitation of proteins, and nuclear dissolution, were not present. What has been
observed following drug treatment, however, is vacuolarization of the cytoplasm suggesting
another pathway of cell death, autophagy (Totino et al. 2008, Gaviria et al. 2013).
Autophagy, or “self-eating”, is a cellular process where, during periods of nutrient
deprivation, a cell can recycle biomolecules through degradation in lysosomes, as well as
breaking down damaged molecules and organelles. A survival mechanism in periods of
starvation, autophagy has also been designated as a method of programmed cell death, alongside
apoptosis and necrosis. Over 30 autophagy-related (ATG) proteins have been defined, initially in
S. cervisiae yeast. Typically, autophagy is present only at a low constitutive level. The
mammalian target of rapamycin (mTOR) initiates the autophagic process when activated.
Downstream, the ATG1 complex begins the formation of a perivacuolar structure known as the
phagophore, the proposed nucleation site for vesicle formation. Nucleation of the phagophore
requires enrichment of the membrane with phosphotidylinositol 3-phosphate (PI3P) by a class III
phosphotidylinositol 3-kinase (PI3K) called VPS34. The phagophore is enlarged through the
generation of lipidated ATG8 by an ATG7/ATG3 complex, which surrounds the selected cargo.
The completed phagophore, with lipidated ATG8 on the surface, then fuses with the lysosome or
vacuole (Brennard et al. 2011).
While well-defined in higher eukaryotes and yeast, autophagy in early-diverging parasitic
protists like Plasmodia had only recently been explored. Despite the lack of a clear mTOR
homolog in the Plasmodium genome, there are signs that the cascade does exist (Sinai and Roepe
2012). The metamorphosis between life cycle stages of the parasite suggest that autophagy is
15
active in some form in the parasite. Additionally, treatment of parasites with 3-methyladenine (3-
MA), a VPS34 inhibitor, slows sporozoite differentiation (Brennand et al. 2011). Genomic
analysis suggests the presence of a VPS34 ortholog, along with homologs of other ATG proteins
(Brennand et al. 2011). The lipid essential for the generation of the phagophore, PI3P, has been
found to be present in the membranes of the DV as well as the plastid apicoplast, and in single-
membraned vesicles (Tawk et al. 2010).
Another ATG protein homolog that has been identified is PfATG8, which has been
determined to be essential for survival of the parasite, and may have other functions in the cell
besides just in the autophagy cascade (Brennand et al. 2011). Intraerythrocytic parasites, as well
as liver-stage parasites show localization of GFP and mCherry-conjugated ATG8 to the
apicoplast, with no vesicles observed (Kitamura et al. 2012; Eickel et al. 2013). However, later
studies demonstrated the presence of ATG8-positive vesicles. Tomlins et al. identified vesicles
that co-localize with RAB7, a known autophagy regulator in the periphery of the DV. The same
study showed PfATG8 present in both its lipidated and delipidated forms (Tomlins et al. 2013)
Cervantes et al. observed PfATG8-positive vesicles, as well as apicoplast localization,
throughout the intraerythrocytic life cycle as well as gametogenesis. Additionally, relocalization
of the vesicles was observed under high doses of CQ, as well as bafilomycin A, but not under
mild nutrient deprivation or artemisinin treatment (Cervantes et al. 2014). In the Roepe Lab,
ATG8 puncta have been detected upon starvation, suggesting that these may be classic
autophagic vesicles (Sinai and Roepe, 2012; Gaviria et al. 2013). Immunofluorescence
microscopy of parasites labeled with an antibody generated against the ATG8 of the fellow
Apicomplexan parasite Toxoplasma gondii show a punctate distribution indicative of active
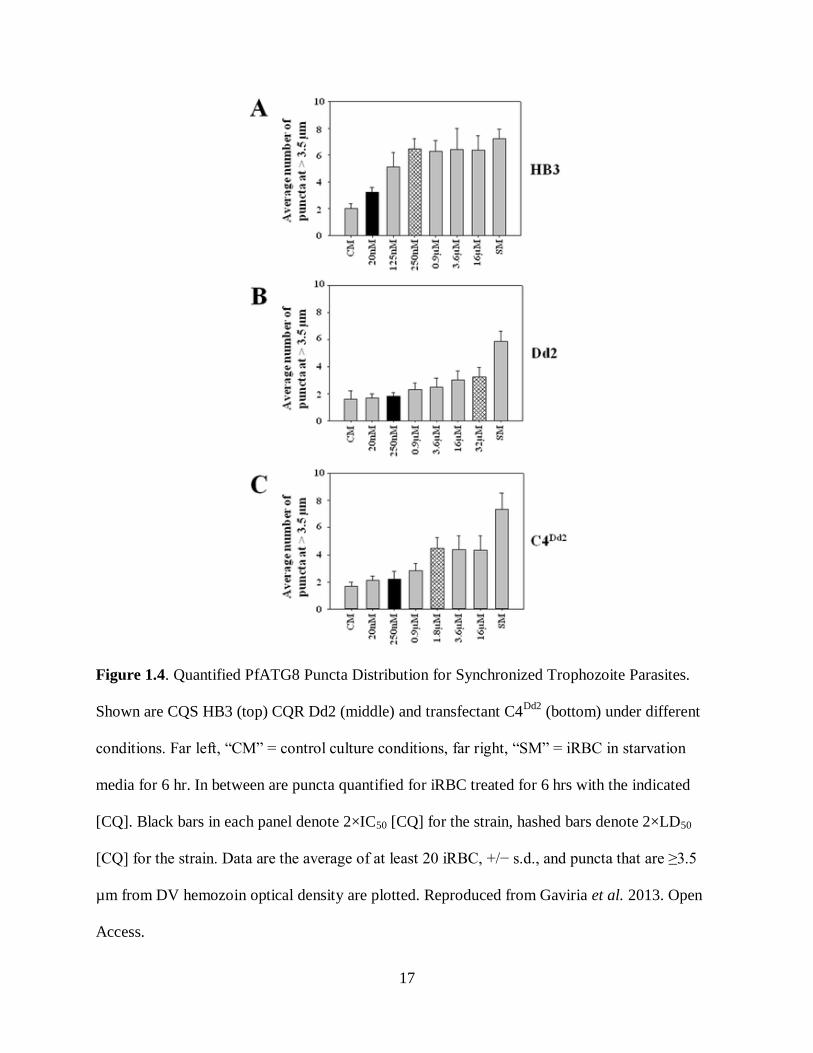
autophagy (Ghosh et al. 2012). A redistribution of ATG8 puncta in P. falciparum occurs after

16
cytocidal CQ treatment, but not cytostatic, and is altered in CQR parasites versus CQS, as shown
in Figure 1.4 (Gaviria et al. 2013). While starvation of CQR parasites produces a redistribution
phenomenon similar to that seen in CQS parasites, treatment with pharmacologically-equivalent
amounts of CQ (2xLD50) does not. Transfection of CQS with a CQR PfCRT isoform (C4Dd2
)
produces a response in between that of the CQS and CQR strains. Western blot analysis of
parasite extracts through utilization of the same anti-TgATG8 antibody shows the expected
PfATG8 bands at 15 and 17 kDa, representing the lipidated and delipidated ATG8 forms
(Gaviria et al. 2013).
17
Figure 1.4. Quantified PfATG8 Puncta Distribution for Synchronized Trophozoite Parasites.
Shown are CQS HB3 (top) CQR Dd2 (middle) and transfectant C4Dd2
(bottom) under different
conditions. Far left, “CM” = control culture conditions, far right, “SM” = iRBC in starvation
media for 6 hr. In between are puncta quantified for iRBC treated for 6 hrs with the indicated
[CQ]. Black bars in each panel denote 2×IC50 [CQ] for the strain, hashed bars denote 2×LD50
[CQ] for the strain. Data are the average of at least 20 iRBC, +/− s.d., and puncta that are ≥3.5
µm from DV hemozoin optical density are plotted. Reproduced from Gaviria et al. 2013. Open
Access.
18
The presence of a single mitochondrion within the malaria parasite makes classical
autophagy of mitochondria under starvation less desirable. The presence of possible vesicles
containing ATG8 near Maurer’s clefts, external to the parasite, which have been proposed to be
involved in vesicle traffic, suggests that the stimulation of autophagy in Plasmodia may result in
increased uptake of host hemoglobin or in extracellular nutrients (Gaviria et al. 2013). The
presence of lysosomotrophic compounds, like CQ, might then preclude the fusion of the
autophagic/endocytotic vesicles with the DV (Gaviria et al. 2013). In fact, previous studies had
shown an increase in the presence of hemoglobin-containing vesicles in the parasite following
CQ treatment (Hoppe et al. 2004). Genetic comparisons of CQR and CQS genomes have
discovered that 16 of 42 possible orthologs of ATG genes lay within regions identified by
various drug resistance QTL analyses. Within these 16, looking for mutations that segregate with
resistance phenotype leads to the PI3PK PfVPS34, which contains mutations in the calcium-
binding region for CQR parasites. Since P. falciparum lack an mTOR ortholog, mutating VPS34
may have resulted in the altered autophagy cascade observed in resistant parasites (Gaviria et al.
2013).
1.7. Drug Target Identification by Activity-Based Protein Profiling
With a renewed focus on cytocidal drug treatment and the possible causes of cytocidal
resistance, I propose that a technique known as Activity-Based Protein Profiling (ABPP) can be
used to identify possible cytocidal drug targets in parasite cells. ABPP relies on covalent
attachment to link small-molecule probes to their biomolecule targets, along with the ability to
detect the covalently-linked product by such methods as radioactive isotope labeling,
fluorescence, and affinity labels. The advent of high-throughput screening has facilitated the

19
development of new drugs, but techniques like ABPP are needed to elaborate the mechanism of
action of a novel therapeutic, along with potential on and off-target interactions in whole cells or
cell-lysates (Raghavan et al. 2009; Best 2009). ABPP has been used to investigate the activity of
human cytochrome P450s, serine hydrolases, proteasomes, and cathepsin proteases, as well as
the targets of phenyl sulfonates (Wright et al. 2007; Wright et al. 2009; Liu et al. 1999; Sletten et
al. 2009; Speers et al. 2003).
ABPP requires generation of a probe that can form a covalent bond with the target of
interest. An ABPP probe is comprised of 3 parts: the pharmacophore, the reactive cross-linker (if
the drug is not an irreversible inhibitor), and a purification/visualization handle. The reactive
cross-linkers are typically photo-reactive compounds such as aryl azides. UV-illumination of aryl
azides results in the generation of N2 and a reactive nitrene, which inserts into nearby C-H sigma
bonds (Burdinski et al. 2006; Keana et al. 1990). In order to avoid ring-expansion reactions,
which reduce the cross linking efficiency, aryl azides can be perfluoronated, resulting in
approximately 45% bond insertion. These perfluoronated aryl azides do absorb in the same UV
region as most biopolymers, but the differences in molar absorptivity result in the activation of
the probe with minimal biomolecular degradation (Keana et al. 1990).
Labeling of the targets by ABPP probes is typically followed by proteome analysis
techniques. Typically, proteomes are investigated either through gel-based (single or two-
dimensional separation) or chromatography-based (HPLC or avidin-affinity) techniques.
Following separation of the identified proteins, mass spectrometry can be used for identification
of the trypsin digestion products of the target proteins (Salisbury et al. 2007). ABPP allows for
selectivity in proteomic methods that is not necessarily possible in global methods. The use of

20
separation methods and detection of probe-labeled proteins reduces the background signal
present from unrelated proteins, particularly those that may be in high abundance (Best 2009).
ABPP has been used previously to study drug binding in P. falciparum. Foley et al.
utilized an iodine-125 labeled CQ analog, which labeled 2 proteins (42 and 33 kDa). However,
the photoreactive group is directly attached to the aromatic pharmacophore, severely altering the
electronic structure of the drug (Foley et al. 1994) and biasing drug-drug target binding. Lekostaj
et al. utilized a biotinylated analog of CQ that also contained a perfluoroazido cross-linking
group to study the binding of CQ to PfCRT, both endogenously and in heterologously-expressed
and purified protein. The photoreactive group was attached to an aliphatic linker, preventing
electronic interactions with the quinoline ring. Competition with underivitized CQ supported
overlap of the binding site of the probe and the drug, and trypsin digestion and mass-
spectroscopic analysis allowed for identification of the binding pocket (Lekostaj et al. 2008). A
similar probe for artemisinin has also been synthesized (Barton et al. 2010). The reactive radical
mechanism of artemisinin results in covalent attachment to its target. Coupling artemisinin
(ART) to biotin creates a probe that could be used to identify in vivo targets (Barton et al. 2010).
Global proteomic analyses performed on Plasmodium include: comparison of resistance and
sensitive strains (Koncarevic, et al. 2007), variations in protein levels across the various life-
stages (Florens, et al. 2002), comparison of proteomes under ART and CQ pressure (Prieto, et al.
2008), and the oxidative damage caused by CQ (Rafar, et al. 2008). In theory, ABPP could be
used to more directly probe the possible targets for CQ in a more selective manner than just
surveying expression differences or oxidative damage.
Purification of the cross-linked target is typically achieved through conjugation to biotin,
while conjugation to a fluorophore allows for visualization. These bulky reporter tags can
21
become an issue in competition experiments that examine the overlap of binding pockets,
particularly since the added size of the cross-linking tag and purification handle can be roughly
50% of the size of the probe. This added steric bulk and altered hydrophobic/hydrophilic
properties can alter the bioavailability and binding of the probe as compared to the drug of
interest. One way to reduce the impact of added moieties is to split the probe into 2 parts to be
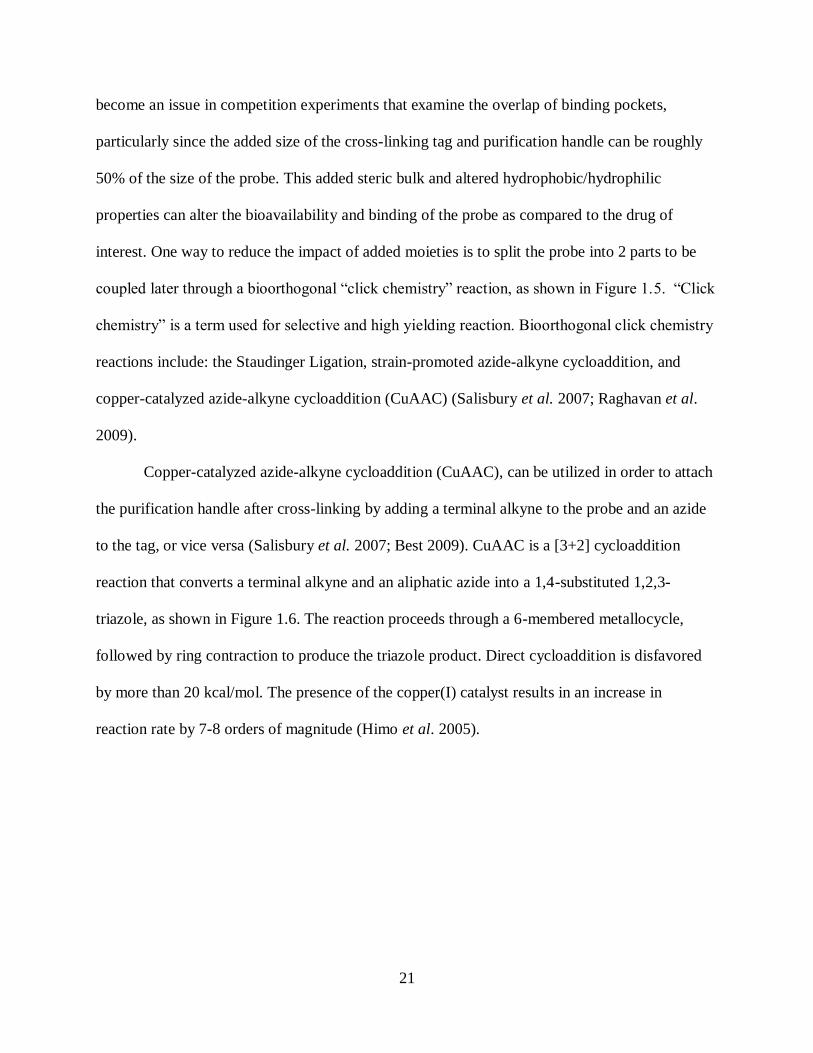
coupled later through a bioorthogonal “click chemistry” reaction, as shown in Figure 1.5. “Click
chemistry” is a term used for selective and high yielding reaction. Bioorthogonal click chemistry
reactions include: the Staudinger Ligation, strain-promoted azide-alkyne cycloaddition, and
copper-catalyzed azide-alkyne cycloaddition (CuAAC) (Salisbury et al. 2007; Raghavan et al.
2009).
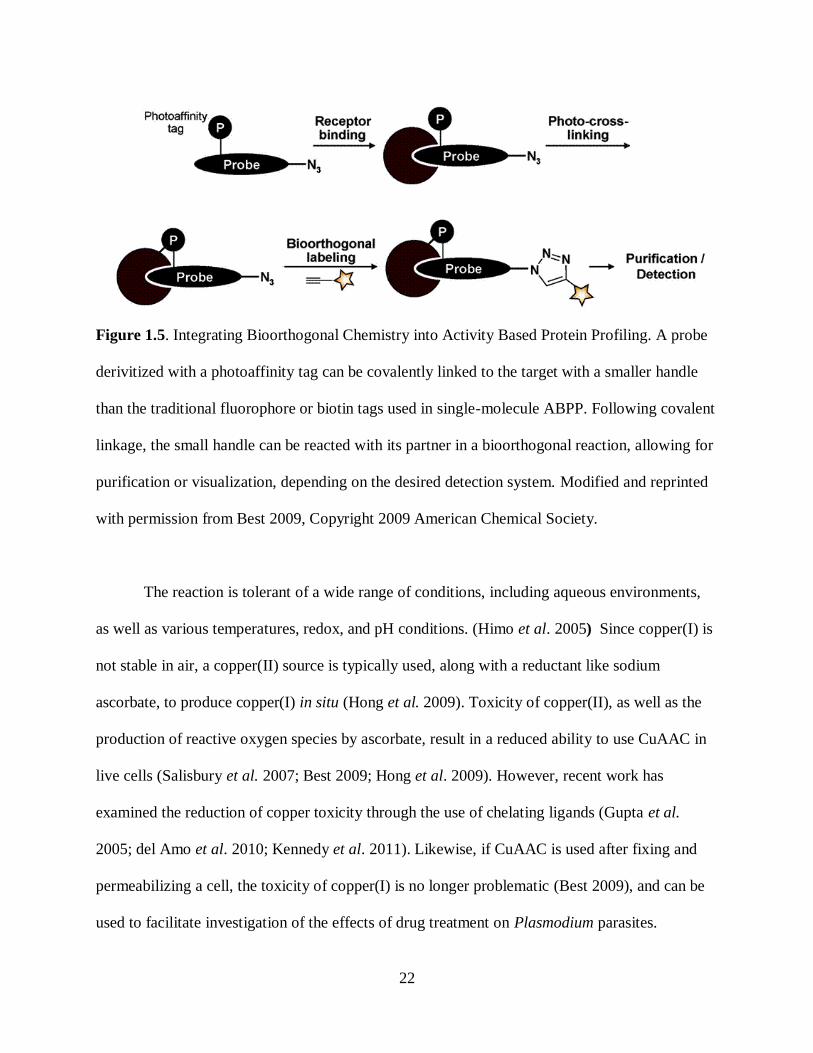
Copper-catalyzed azide-alkyne cycloaddition (CuAAC), can be utilized in order to attach
the purification handle after cross-linking by adding a terminal alkyne to the probe and an azide
to the tag, or vice versa (Salisbury et al. 2007; Best 2009). CuAAC is a [3+2] cycloaddition
reaction that converts a terminal alkyne and an aliphatic azide into a 1,4-substituted 1,2,3-
triazole, as shown in Figure 1.6. The reaction proceeds through a 6-membered metallocycle,
followed by ring contraction to produce the triazole product. Direct cycloaddition is disfavored
by more than 20 kcal/mol. The presence of the copper(I) catalyst results in an increase in
reaction rate by 7-8 orders of magnitude (Himo et al. 2005).
22
Figure 1.5. Integrating Bioorthogonal Chemistry into Activity Based Protein Profiling. A probe
derivitized with a photoaffinity tag can be covalently linked to the target with a smaller handle
than the traditional fluorophore or biotin tags used in single-molecule ABPP. Following covalent
linkage, the small handle can be reacted with its partner in a bioorthogonal reaction, allowing for
purification or visualization, depending on the desired detection system. Modified and reprinted
with permission from Best 2009, Copyright 2009 American Chemical Society.
The reaction is tolerant of a wide range of conditions, including aqueous environments,
as well as various temperatures, redox, and pH conditions. (Himo et al. 2005) Since copper(I) is
not stable in air, a copper(II) source is typically used, along with a reductant like sodium
ascorbate, to produce copper(I) in situ (Hong et al. 2009). Toxicity of copper(II), as well as the
production of reactive oxygen species by ascorbate, result in a reduced ability to use CuAAC in
live cells (Salisbury et al. 2007; Best 2009; Hong et al. 2009). However, recent work has
examined the reduction of copper toxicity through the use of chelating ligands (Gupta et al.
2005; del Amo et al. 2010; Kennedy et al. 2011). Likewise, if CuAAC is used after fixing and
permeabilizing a cell, the toxicity of copper(I) is no longer problematic (Best 2009), and can be
used to facilitate investigation of the effects of drug treatment on Plasmodium parasites.
23
Figure 1.6. CuAAC Reaction Scheme. A terminal alkyne forms an activated copper acetylide
(1), that is attacked by the first azide nitrogen (2). Formation of a 6-membered metallocycle (3),
is followed by contraction of the ring (4), and release of the copper catalyst, yielding the triazole
product (5) (Himo et al. 2005).
1.8. Drug Combination Analysis
The rise of resistance to many forms of malaria treatment, from CQ and fellow quinolines
like QN, to the combination therapy of sulfadoxine and pyrimethamine, has lead to the discovery
of new antimalarials and a renewed focus on novel combination drug therapies. The current front
line of malaria therapy is ART combination therapy (ACT). ART is a natural product that was
isolated in the 1970s with a reactive endoperoxide that undergoes a rapid onset of action.
Optimization of the drug for solubility led to the generation of a series of related compounds
including artesunate (ATSU), artemether (ATM), and dihydroartemisinin (DHA) (Olliaro et al.
24
1995), see Scheme 1.1. Artemisinins are rapidly cleared in vivo. In formulating a ACT
combination, the artemisinin derivative is typically paired with a partner drug with a longer half-
life, to ensure full clearance of the infection. When ATM was partnered with the pseudo-
quinoline lumefantrine (LF), also shown in Scheme 1.1, preclinical studies reported synergistic
interactions between the two drugs. These studies are not available outside China and are not
described in any level of detail (Olliaro et al. 1995). When ATM is administered, it is rapidly
taken up and partially metabolized into DHA, which both have a half-life of about 1 hour. LF,
which is absorbed much more slowly, is also eliminated slowly; its half-life is between 3 and 6
days. A fixed ratio of 1:6 ATM:LF was observed to be the optimum combination to administer,
which is now used under the name “Coartem”, and resulted with higher parasite clearance
compared to monotherapy of either drug (White et al. 1999; Novartis Pharmaceuticals
Corporation. CoArtem Product Information).
The available reports of ART-LF synergy trace back to a study by Alin et al. in 1999 that
utilized a commonly-used technique known as checkerboard analysis to quantify the interaction
via a probit method of data analysis. Examining two strains, T-996 and LS-21, the authors noted
synergy at the IC50, IC90, and IC99 levels, by converting growth data into quantile units. The
determination of synergy is based on predicted growth of the two compounds acting
independently (derivation not discussed) (Alin et al. 1999). Additionally, a study in 2007 by
Thriemer et al. identified synergy between LF and the ATM metabolite DHA at their IC50 values
utilizing the isobologram method, and Wong et al. (2011) identified slight synergy between
DHA and the LF metabolite desbutyl-lumefantrine utilizing the same technique at IC50 values.
Reports of ART tolerance in the Thai-Cambodian border region (Dondorp et al. 2009)
and the generation of temporary tolerance to LF in vitro (Mwai et al. 2012) suggest that novel
25
drug combinations should be explored before Coartem loses efficacy. Techniques to identify
synergistic partner drugs, as mentioned above, include altering the concentrations and relative
ratios of drugs through a checkerboard pattern on the assay plate, as well as fixed-ratio serial
dilutions. Either technique can be used to generate the plot used to identify the interaction,
known as an isobologram. Isobologram analysis requires comparison of the growth curve data of
the drug in the presence of its partner with its monotherapy activity, generating a ratio known as
a fractional inhibitory concentration (FIC), which is calculated for each compound at a series of
fixed ratios between the two. When these data are plotted, the results are typically either a
straight line between (1,0) and (0,1), a concave curve, or a convex curve. If the plot is a straight
line, the interaction is known as additive. When the curve is concave, and lies below the line that
defines additivity, the interaction is synergistic. If the curve is convex, the interaction is
antagonistic. Three sample curves are shown in Figure 1.7. More complex curves are possible, if
the interaction depends on the ratio between the two compounds (Berenbaum 1978).
A clear definition of synergy vs. additivity vs. antagonism is needed to avoid confusion.
For instance, if the presence of an inactive compound simply augments the activity of a drug, this
is not synergy; it is potentiation. Synergy requires the presence of two active compounds.
Additionally, the combined activity of drugs A and B being less than the monotherapies does not
mean the combination is necessarily synergistic; such a result could be cause by additive or
slight antagonistic interactions (Chou 2006). In addition to the isobolograms focused on the
ATM and LF combination, other antimalarial combinations have been studied. These include
atovaquone/proguanil, atovaquone/DHA, 9-epi-ART/ART, artemisitene/ART, 9-epi-
ART/ATSU, artemisitene/ATSU (Fivelman et al. 2004; Suberu et al. 2013).

26
Figure 1.7. Example of Possible Drug Interactions on an Isobologram. Hypothetical drugs A and
B are examined to calculate their FIC values at 5 fixed ratios, and then plotted and the shape of
the curve identified as it compares to the mathematical additive line (dotted) that connects (1,0)
and (0,1).
Generating a full isobologram requires the analysis of various ratios between the two
drugs, and results in a large number of required assays. Derived from the Law of Mass Action, a
simpler method of identifying drug interaction type was developed by Chou and Talalay (known
as the Chou-Talalay Method [C-T]), which only examines one ratio at a time (Chou et al. 1984).
The FICs for each drug are calculated for that ratio in the same way as one would for an
isobologram. However, instead of plotting them on a graph, these values are summed to generate

27
a combination index, or fractional inhibitory concentration index (FICindex). Based on their
calculations, Chou and Talalay define additivity when the FICindex equals 1. When the FICindex is
less than 1, the interaction is synergistic; when it is greater than 1, the interaction is antagonistic
(Chou et al. 1984). Synergy could potentially arise from inhibition of pathways that undergo
downstream cross-talk, or perhaps through interacting with the same pathway in two different
locations. The isobologram or C-T analysis only determines the nature of the interaction, not
how it comes to be.
Although those cut-offs hold mathematically, experimental variance leads to alteration.
The cut-offs used in experimental analysis can vary from synergy less than 0.5 and antagonism
greater than 4 (Bell 2005), to just expanding the additive range to run from 1 to 2 (Matthews et
al. 2013). The choice of cut-offs can be somewhat arbitrary (Bell 2005). The Chou-Talalay
method has been used to investigate the interaction of artemisinin with other natural products
isolated from ART tea (Suberu et al. 2013), the analysis of possible drug partners emetine/DHA
(Matthews et al. 2013), tapsigargin/ART, tapsigargin/OZ227 (Abiodun et al. 2013), and the
interaction of chalcone derivatives and ART (Bhattacharya et al. 2009).
Importantly, until recently all examination of drug combinations in vitro focused on
cytostatic conditions. Recent examination of combinations at both the cytostatic and cytocidal
levels demonstrates the possibility of altered interaction, both between CQS and CQR strains,
but also within the same strain at different levels (Gorka et al. 2013b). For instance, the
combination of CQ and amodiaquine (AQ) in Dd2 parasites is additive at the cytostatic level, but
highly antagonistic under cytocidal conditions. Differences like this reinforce the need to
examine possible novel combination therapies at both levels to generate a complete description
of the interaction (Gorka et al. 2013b).
28
1.9. Objectives
In order to understand CQR, particularly at the cytocidal level, it is important to
understand the trends associated with resistance, as well as identifying the targets of CQ
treatment. Investigating in vitro chemical models of the proposed mechanism of action of
antimalarials will be performed. The ability of an antimalarial to inhibit the formation of a
synthetic version of Hz known as β-hematin will be measured and compared to both the
cytostatic and cytocidal activities. Similarly, the effect of changing the stereochemistry of QN
derivatives on heme-interactions will be examined and compared to their activities at the static
and cidal levels. Comparing in vitro chemical data to the in vivo activity can shed light on
whether the conventional Hz-inhibition mechanism of action is applicable under cytocidal
conditions.
In order to probe the possible targets of cytocidal chloroquine treatment, a photoaffinity-
based ABPP probe will be synthesized that will allow for investigation of the subcellular
localization of CQ at IC50 and LD50 doses, as well as the potential target proteins, through
microscopy and mass spectrometry, respectively. Previously, a probe known as AzBCQ was
synthesized and used to probe binding to PfCRT both in parasites as well as purified from
heterologous expression in yeast. In order to add experimental flexibility, as well as reduce the
size of the probe, the large biotin moiety of AzBCQ will be removed and replaced with a
terminal alkyne that can be coupled to fluorophores or biotin, depending on the experiment.
Coupling will be performed selectively and in high yields in an aqueous environment through the
use of CuAAC. This new probe, alkynylated azido chloroquine (AAzCQ) will be used to probe
purified protein labeling, as a method of comparing it to the previous probe.

29
In investigating cidality in Plasmodium falciparum, identifying the targets of one
antimalarial that has suffered from the evolution of resistance in the field can be complimented
by investigation of novel therapies that will be active against strains known to be sensitive and
resistant to chloroquine. In order to prevent the rise of resistance to new therapies, the WHO
recommends identification of combination therapies, such as ACTs. Identification of novel
compounds that are active against malarial parasites is step one; these compounds must also be
screened in combination with other compounds to properly define their interaction. Isobolograms
and C-T are commonly-employed methods to identify combinations as synergistic, additive, or
antagonistic. A high-throughput screen of compounds in the clinical trial process alongside
known antimalarials, performed in collaboration with the National Center for Advancing
Translational Science (NCATS), can generate isobologram data and provide leads for new
combinations. These leads will be examined in further detail by C-T at both the cytostatic and
cytocidal levels. In thinking down the pipeline to clinical use, combinations should be
understood at their bolus, cidal levels, and their longer-lasting, lower level, cytostatic
concentrations.
By examining the characteristics of cytocidal activity, probing the cytocidal targets, and
exploring new combinations, more can be defined concerning what cidality is in Plasmodium
falciparum, and how it impacts the search for new antimalarial therapies.
.

30
CHAPTER II
MATERIALS AND METHODS
2.1 Materials
Routine chemicals, media, and solvents were reagent grade or better, purchased from
Sigma-Aldrich (St. Louis, MO) or Fisher Scientific (Newark, DE), and used without further
purification, unless otherwise noted. Sterile tissue culture treated, black, flat bottom and non-
sterile, clear polystyrene 96-well plates, and all other laboratory plastics were purchased from
Fisher Scientific (Newark, DE). Kieselgel 60 silica and flexible thin layer chromatography
(TLC) plates were purchased from Selecto Scientific (Suwanee, GA).
Dimethyl sulfoxide-d6 (DMSO-d6), methanol-d4 (CD3OD), chloroform-d (CDCl3), and
other deuterated solvents were purchased from Cambridge Isotope Laboratories, Inc. (Andover,
MA), and used without further purification. SYBR Green I nucleic acid gel stain, and Alexa
Fluor and tetramethylrhodamine (TAMRA) dyes conjugated to streptavidin or azides were
purchased from Invitrogen (Eugene, OR). 1,4-Diaminobutane, Cinchonine (CN), and QN
monohydrochloride dihydrate were purchased from Acros Organics (Geel, Belgium). AQ
dihydrochloride dihydrate, CQ diphosphate, and QD hydrochloride monohydrate were purchased
from Sigma-Aldrich (St. Louis, MO). Compounds for high-throughput screening were obtained
from suppliers such as Tocris Bioscience, Selleck Chemicals, Santa Cruz Biotechnology and
Sigma Aldrich. GSK212, NVP BGT226, Torin2, and PIK 93 were provided by the Thomas
Laboratory at the National Center for Advancing Translational Science (NCATS) at the National
Institutes of Health (NIH). Anti-TgATG8 antibodies as antisera, monoclonal antibodies, and
purified IgG were provided by the Sinai Lab (University of Kentucky, Lexington, KY).
31
2.1.1 Parasite Strains
Plasmodium falciparum clone HB3 (Honduras, CQS), Dd2 (Indochina, CQR), and D10
(Papua New Guinea, CQS) were obtained from the Malaria Research and Reference Reagent
Resource Center (Manassass, VA). P. falciparum line K76I, selected under CQ drug pressure of
the CQS 106/1 (Sudan) clone (Cooper 2002), was a generous gift of Dr. Roland Cooper
(Dominican University of California, San Rafael, CA).
2.2 Methods
2.2.1 General Spectroscopic Methods
NMR spectra were obtained on a Varian FT-NMR spectrometer with the following
frequencies: 1H- 400 MHz,
13C- 100 MHz,
19F- 376 MHz. Spectra were obtained with either
CDCl3 or CD3OD, as specified, with the residual solvent peak used as reference. ESI- mass
spectra were collected in positive ion mode on a Varian 500MS mass spectrometer using LC-MS
grade acetonitrile as a solvent. The electrospray needle was operated at 5 kV using N2 as both
the nebulizing gas (35 lb/in2) and the drying gas (350
oC, 10 lb/in
2). Sample was delivered using
a syringe pump employing a 1 mL syringe at a constant flow rate of 200 μL/min.
2.2.2 Plasmodium falciparum Culturing
Off-the-clot, heat-inactivated pooled type O+ human serum and type O
+ human whole
blood were purchased from Biochemed Services (Winchester, VA). Custom 5% O2/5%
CO2/90% N2 gas blend was purchased from Robert’s Oxygen (Rockville, MD).

32
All P. falciparum strains were maintained using the method of Trager and Jensen (Trager
1976) with minor modifications. Briefly, cultures were maintained under an atmosphere
containing 5% CO2, 5% O2, and 90% N2 gaseous mix at 2% hematocrit and 1-2% parasitemia in
RPMI 1640 supplemented with 10% type O+ human serum, 25 mM HEPES (pH 7.4), 23 mM
NaHCO3, 11 mM glucose, 0.75 mM hypoxanthine, and 20 μg/L gentamicin, with regular media
changes every 48 h. Culture health was verified through smearing 3 µL of culture onto a glass
slide. Following fixation in methanol for 3 minutes, slides were stained with Giemsa Stain
(Sigma Aldrich, St. Louis, MO). Giemsa-stained smears would also be counted to calculate
percent parasitemia, or the percentage of total red blood cells that are infected by parasites.
Giemsa smears can also be used to identify life cycle stages (ring, trophozoite, schizont,
see Figure 2.1), for use in generating synchronized cultures. Parasite culture at predominately
the ring stage is synchronized to by treatment with 5% (w/v) sorbitol for 10 min. Pelleted red
blood cells are resuspended in 5 volumes of 5% sorbitol for every 1 volume of the cell pellet and
shaken vigorously. After leaving the mixture undisturbed at room temperature for 10 min, 5 mL
of CM is added, and the culture is centrifuged again at 1500 rpm for 3 min. The supernatant is
aspirated off; this completes the 1st wash. The pellet is resuspended in 10 ml fresh CM and
transferred to a new sterile culture flask. The culture is allowed to grow for 4 hours and then the
procedure is repeated (this is the 2nd wash); at hour 40 the procedure is repeated again to yield
triple-synchronized culture. Before each sorbitol wash, the culture should be smeared and
checked to ensure it is in the ring stage.
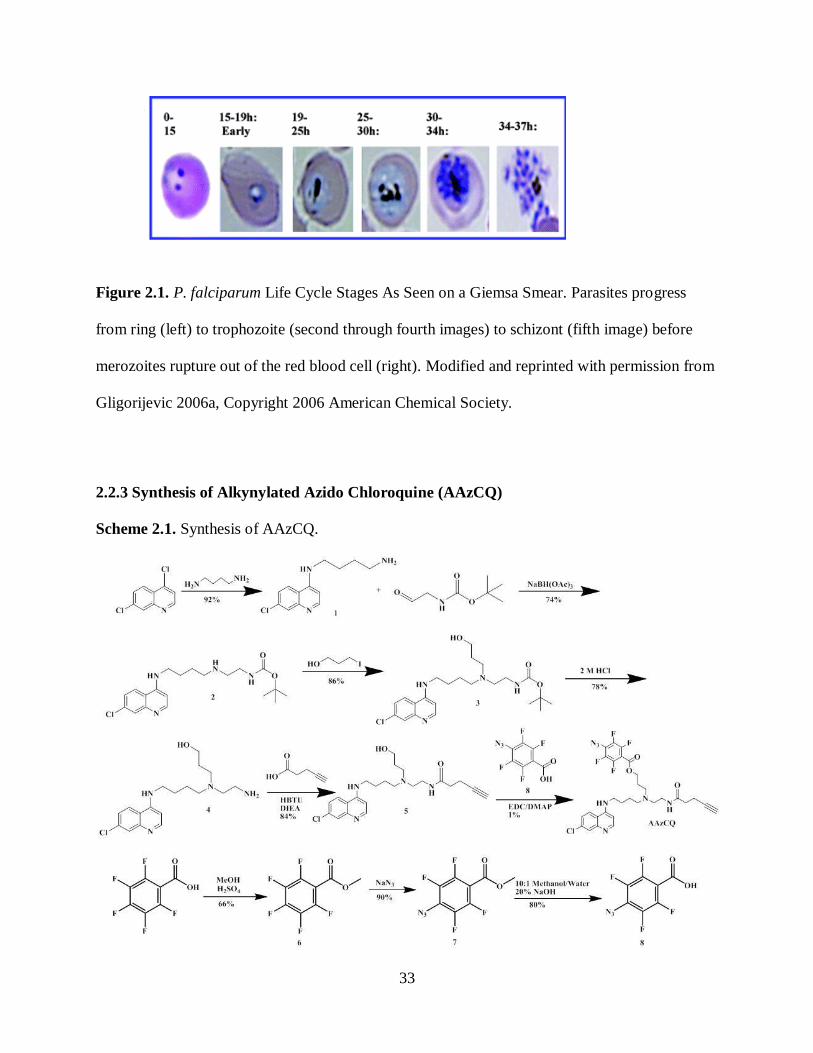
33
Figure 2.1. P. falciparum Life Cycle Stages As Seen on a Giemsa Smear. Parasites progress
from ring (left) to trophozoite (second through fourth images) to schizont (fifth image) before
merozoites rupture out of the red blood cell (right). Modified and reprinted with permission from
Gligorijevic 2006a, Copyright 2006 American Chemical Society.
2.2.3 Synthesis of Alkynylated Azido Chloroquine (AAzCQ)
Scheme 2.1. Synthesis of AAzCQ.
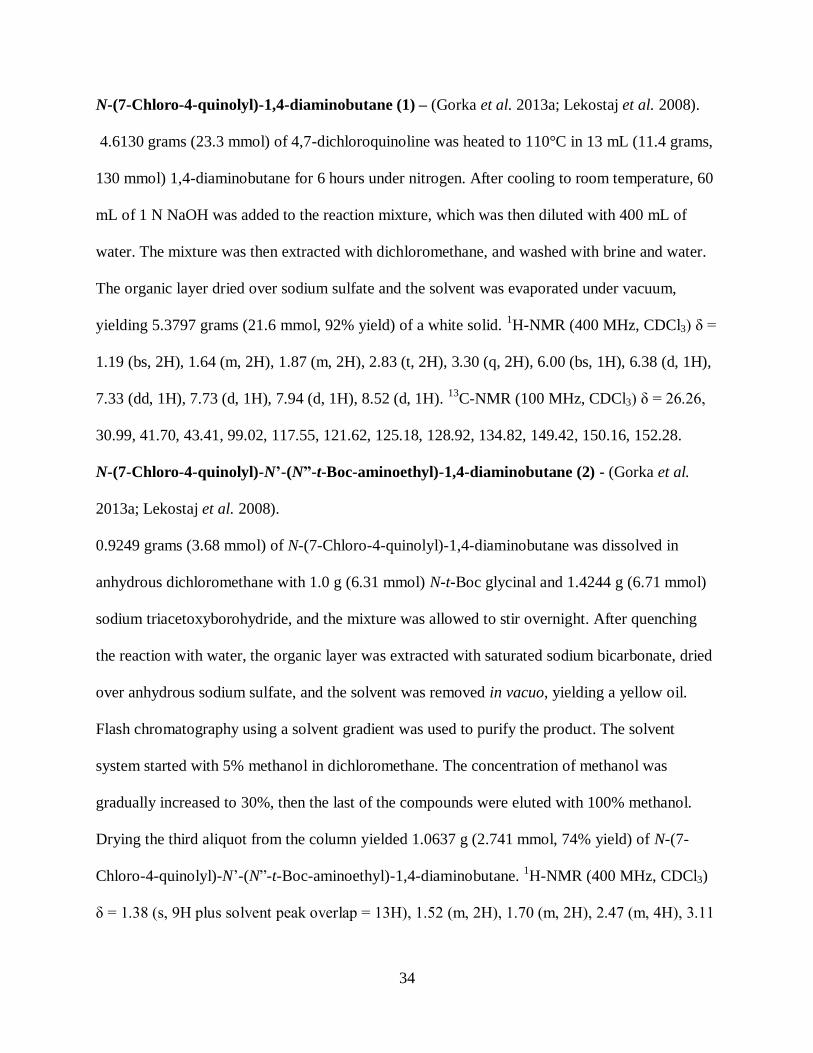
34
N-(7-Chloro-4-quinolyl)-1,4-diaminobutane (1) – (Gorka et al. 2013a; Lekostaj et al. 2008).
4.6130 grams (23.3 mmol) of 4,7-dichloroquinoline was heated to 110°C in 13 mL (11.4 grams,
130 mmol) 1,4-diaminobutane for 6 hours under nitrogen. After cooling to room temperature, 60
mL of 1 N NaOH was added to the reaction mixture, which was then diluted with 400 mL of
water. The mixture was then extracted with dichloromethane, and washed with brine and water.
The organic layer dried over sodium sulfate and the solvent was evaporated under vacuum,
yielding 5.3797 grams (21.6 mmol, 92% yield) of a white solid. 1H-NMR (400 MHz, CDCl3) δ =
1.19 (bs, 2H), 1.64 (m, 2H), 1.87 (m, 2H), 2.83 (t, 2H), 3.30 (q, 2H), 6.00 (bs, 1H), 6.38 (d, 1H),
7.33 (dd, 1H), 7.73 (d, 1H), 7.94 (d, 1H), 8.52 (d, 1H). 13
C-NMR (100 MHz, CDCl3) δ = 26.26,
30.99, 41.70, 43.41, 99.02, 117.55, 121.62, 125.18, 128.92, 134.82, 149.42, 150.16, 152.28.
N-(7-Chloro-4-quinolyl)-N’-(N”-t-Boc-aminoethyl)-1,4-diaminobutane (2) - (Gorka et al.
2013a; Lekostaj et al. 2008).
0.9249 grams (3.68 mmol) of N-(7-Chloro-4-quinolyl)-1,4-diaminobutane was dissolved in
anhydrous dichloromethane with 1.0 g (6.31 mmol) N-t-Boc glycinal and 1.4244 g (6.71 mmol)
sodium triacetoxyborohydride, and the mixture was allowed to stir overnight. After quenching
the reaction with water, the organic layer was extracted with saturated sodium bicarbonate, dried
over anhydrous sodium sulfate, and the solvent was removed in vacuo, yielding a yellow oil.
Flash chromatography using a solvent gradient was used to purify the product. The solvent
system started with 5% methanol in dichloromethane. The concentration of methanol was
gradually increased to 30%, then the last of the compounds were eluted with 100% methanol.
Drying the third aliquot from the column yielded 1.0637 g (2.741 mmol, 74% yield) of N-(7-
Chloro-4-quinolyl)-N’-(N”-t-Boc-aminoethyl)-1,4-diaminobutane. 1H-NMR (400 MHz, CDCl3)
δ = 1.38 (s, 9H plus solvent peak overlap = 13H), 1.52 (m, 2H), 1.70 (m, 2H), 2.47 (m, 4H), 3.11

35
(m, 2H), 3.25 (m, 2H), 5.06 (bs, 1H), 5.63 (bs, 1H), 6.33 (d, 1H), 7.25 (dd, 1H), 7.79 (d, 1H),
7.78 (d, 1H), 8.42 (d, 1H). 13
C-NMR (100 MHz, CDCl3) δ = 24.62, 25.98, 28.24, 38.33, 42.92,
49.90, 53.52, 79.06, 98.50, 117.01, 121.87, 124.90, 127.37, 134.78, 148.16, 150.32, 151.02,
156.19.
N-(7-Chloro-4-quinolyl)-N’-(N”-t-Boc-aminoethyl)-N’-(3-hydroxypropyl)1,4-
diaminobutane (3) - (Gorka et al. 2013a; Lekostaj et al. 2008).
2.4355 grams (6.24 mmol) N-(7-chloro-4-quinolyl)-N’-(N”-t-Boc-aminoethyl)-1,4-
diaminobutane and 0.5805 grams (0.30 mL, 3.12 mmol) 3-iodo-1-propanol were refluxed in
anhydrous acetonitrile for 8 hours. The reaction mixture was concentrated in vacuo, yielding a
brown-yellow oil. The oil was dissolved in ~60 mL of dichloromethane, extracted with saturated
sodium bicarbonate, dried over anhydrous sodium sulfate, and concentrated in vacuo. The crude
oil was purified by flash chromatography with 5% methanol in dichloromethane, followed by a
gradual increase in the amount of methanol to 30%. Evaporation of the solvent, and drying under
vacuum, yielded 1.2154 grams (2.69 mmol) of a brownish-yellow oil (86 % yield). 1H-NMR
(400 MHz, CDCl3) δ = 1.37 (s, 9H plus solvent peak overlap = 15H), 1.57 (m, 2H), 1.81 (m,
2H), 2.13 (m, 2H), 2.54 (m, 6H), 3.14 (m, 4H), 3.61 (m, 4H), 4.12 (bs, 1H), 5.14 (bs, 1H), 5.25
(bs, 1H), 6.69 (d, 1H), 7.51 (d, 1H), 7.82 (s, 1H), 7.94 (s, 1H), 8.62 (d, 1H). 13
C-NMR (100
MHz, CDCl3) δ = 25.46, 25.74, 28.35, 30.91, 38.39, 43.35, 50.36, 51.82, 53.4, 57.48, 79.11,
98.30, 98.88, 116.72, 127.42, 127.84, 138.25, 140.73, 147.13, 155.02, 156.32.
N-(7-Chloro-4-quinolyl)-N’-(N”-aminoethyl)-N’-(3-hydroxypropyl)1,4-diaminobutane (4) -
(Gorka et al. 2013a; Lekostaj et al. 2008).
0.1262 grams (0.28 mmol) N-(7-Chloro-4-quinolyl)-N’-(N”-t-Boc-aminoethyl)-N’-(3-
hydroxypropyl)1,4-diaminobutane was dissolved in 10 mL anhydrous methanol. 2 mL of 2 M

36
HCl (4 mmol) was added, and the reaction was left to stir overnight. After concentration in
vacuo, the product was dissolved in dichloromethane, and extracted with 1 M NaOH. The
combined organic layers were dried over anhydrous sodium sulfate, and the solvent was removed
in vacuo, yielding 0.077 grams (0.22 mmol, 78%) of a brown oil. 1H-NMR (400 MHz, CDCl3) δ
= 1.53 (m, 2H), 1.70 (m, 2H), 1.85 (m, 2H), 2.42 (m, 4H), 2.66 (m, 4H), 3.22 (t, 2H), 3.52 (t,
2H), 3.91 (t, 2H), 5.72 (t, 1H), 6.29 (d, 1H), 7.24 (d, 1H), 7.77 (d, 1H), 7.83 (d, 1H), 8.40 (d,
1H). 13
C-NMR (100 MHz, CDCl3) δ =25.13, 30.60. 39.51, 48.55, 53.49, 54.26, 57.06, 57.62,
78.89, 98.60, 98.65, 114.16, 123.15, 127.03, 136.18, 139.03, 154.30, 156.05.
N-(7-Chloro-4-quinolyl)-N'-(2-aminoethyl)-N'-(3-hydroxypropyl)-N"-(4-pentynylamidyl)-
1,4-diaminobutane (5) -Adapted from Hsu et al. 2007.
0.372 grams (1.06 mmol) N-(7-Chloro-4-quinolyl)-N’-(aminoethyl)-N’-(3-hydroxypropyl)1,4-
diaminobutane dissolved in dimethylformamide along with 0.102 grams (1.04 mmol) 4-
pentynoic acid, 0.826 grams (2.18 mmol) O-(benzotriazol-1-yl)-N,N,N’,N’-tetramethyluronium
hexafluorophosphate, and 0.1 mL (0.367 g, 2.85 mmol) diisopropylethylamine. The mixture was
allowed to react at room temperature for 3 hours. The mixture was concentrated in vacuo, and
the residue was dissolved in chloroform and extracted with saturated sodium bicarbonate. The
organic phase was then washed with 1 M NaOH, dried over anhydrous sodium sulfate, and the
solvent was removed in vacuo, yielding 0.379 grams (0.879 mmol, 84% yield). 1H-NMR (400
MHz, CDCl3) δ = 1.53 (m, 2H), 1.74 (t, 2H), 1.89 (s, 1H), 2.12 (t, 2H), 2.44 (m, 4H), 2.54 (m,
4H), 3.28 (m, 4H), 3.69 (t, 2H), 3.96 (t, 2H), 4.59 (t, 1H), 6.75 (d, 1H), 7.42 (m, 1H), 7.64 (m,
1H), 7.86 (m, 1H), 8.53 (d, 1H). 13
C-NMR (100 MHz, CDCl3) δ = 15.61, 26.62, 28.75, 34.29,
35.92, 38.87, 44.68, 52.70, 54.94, 59.06, 62.79, 70.38, 83.57, 100.14, 112.38, 119.01, 126.68,
128.60, 140.15, 141.73, 148.44, 157.10, 174.52.
37
Alkynylated Azido-Chloroquine (AAzCQ) -Adapted from (Lekostaj et al. 2008).
0.321 grams (1.37 mmol) 8, 0.147 grams (1.21 mmol) 4-dimethylaminopyridine (DMAP), and
0.284 grams (1.48 mmol) EDC·HCl were placed under a nitrogen atmosphere. 0.189 grams
(0.439 mmol) of N-(7-Chloro-4-quinolyl)-N'-(2-aminoethyl)-N'-(3-hydroxypropyl)-N"-(4-
pentynylamidyl)-1,4-diaminobutane was dissolved in anhydrous dichloromethane, and injected
into the flask, along with anhydrous dimethylformamide. The final solvent was 25%
dimethylformamide in dichloromethane. The mixture was allowed to stir 4 days at room
temperature. The reaction was dried and the residue was dissolved in dichloromethane, extracted
with water, and washed with brine and sodium bicarbonate. After drying over anhydrous sodium
sulfate, the solvent was removed in vacuo. Column chromatography was run using a gradient
elution (5-50% methanol in dichloromethane), yielding a fraction that contains AAzCQ plus
residual DMAP-8. A second column was used to purify AAzCQ, using a gradient elution of 10-
50% methanol in ethyl acetate, followed by 100% methanol to ensure full elution. The column
yielded 14 mg of AAzCQ (0.022 mmol, 5% yield). 1H-NMR (400 MHz, CD3OD) δ = 1.25 (m,
2H), 1.59 (m, 2H), 1.74 (m, 2H), 2.20 (s, 1H), 2.37 (m, 4H), 2.56 (m, 4H), 3.13 (m, 2H), 3.27
(m, 4H), 3.48 (m, 2H), 6.68 (d, 1H), 7.51 (dd, 1H), 7.78 (d, 1H), 8.20 (d, 1H), 8.32 (d, 1H). 13
C-
NMR (100 MHz, CD3OD) δ = 15.70, 25.62, 26.95, 28.82, 36.03, 38.41, 39.42, 44.34, 54.53,
54.99, 70.31, 80.09, 83.53, 99.72, 117.90, 124.08, 125.13, 127.25, 138.55, 140.56, 142.94,
145.04, 145.44, 148.24, 155.09, 158.57, 165.01, 174.09. 19
F-NMR (376 MHz, CD3OD) δ = -
154.66 (m, 2F), -145.70 (m, 2F).
Methyl Pentafluorobenzoate (6) - Adapted from (Lekostaj et al. 2008).
5.0 grams (23.6 mmol) pentafluorobenzoic acid was dissolved in 30 mL of anhydrous methanol,
and 1.6 mL of concentrated sulfuric acid was added. The mixture was refluxed for 24 hours. The
38
reaction mixture was concentrated in vacuo, dissolved in dichloromethane, and extracted with
saturated sodium bicarbonate. The organic layer was dried over anhydrous sodium sulfate, and
concentrated in vacuo to yield 3.5237 grams (15.6 mmol, 66% yield) of a yellow oil. 1H-NMR
(400 MHz, CDCl3) δ = 3.96 (s, 3H) . 19
F-NMR (376 MHz, CDCl3) δ = -161.09 (m, 2F), -149.15
(tt, 1F), -138.64 (m, 2F).
Methyl 4-Azidotetrafluorobenzoate (7) - Adapted from (Lekostaj et al. 2008).
3.5237 grams (15.6 mmol) of methyl pentafluorobenzoate was dissolved in 33.0 mL of a 8:3
acetone:water mixture. 1.0182 grams (15.7 mmol) of sodium azide was added, and the mixture
was refluxed for 5 hours. The solvents were evaporated, yielding a crude light brown solid. The
dried reaction mixture was dissolved in diethyl ether and extracted with water. The combined
organic phases were dried over anhydrous sodium sulfate and the solvent removed in vacuo,
yielding 3.5123 grams (14.1 mmol, 90% yield) of white powder. 1H-NMR (400 MHz, CD3OD) δ
= 3.97 (s, 3H). 19
F-NMR (376 MHz, CD3OD) δ = -153.78 (m, 2F), -142.10 (m, 2F).
4-Azidotetrafluorobenzoic Acid (8) - Adapted from (Lekostaj et al. 2008).
0.4290 grams (1.716 mmol) methyl 4-azidotetrafluorobenzoate was dissolved in 10 mL of
methanol and 1 mL of water. 1.1 mL (5.5 mmol) of 20% NaOH was added, and the reaction was
left to stir overnight. After acidifying the reaction solution to a pH<2 with 2 M HCl, the reaction
mixture was extracted with ethyl acetate and dried over anhydrous sodium sulfate. The solvent
was evaporated in vacuo, yielding 0.3251 grams (1.381 mmol) of a light brown solid, an 80%
yield. 1H-NMR (400 MHz, CD3OD) no resonances seen.
19F-NMR (376 MHz, CD3OD) δ =-
153.96 (m, 2F), -142.25 (m, 2F).
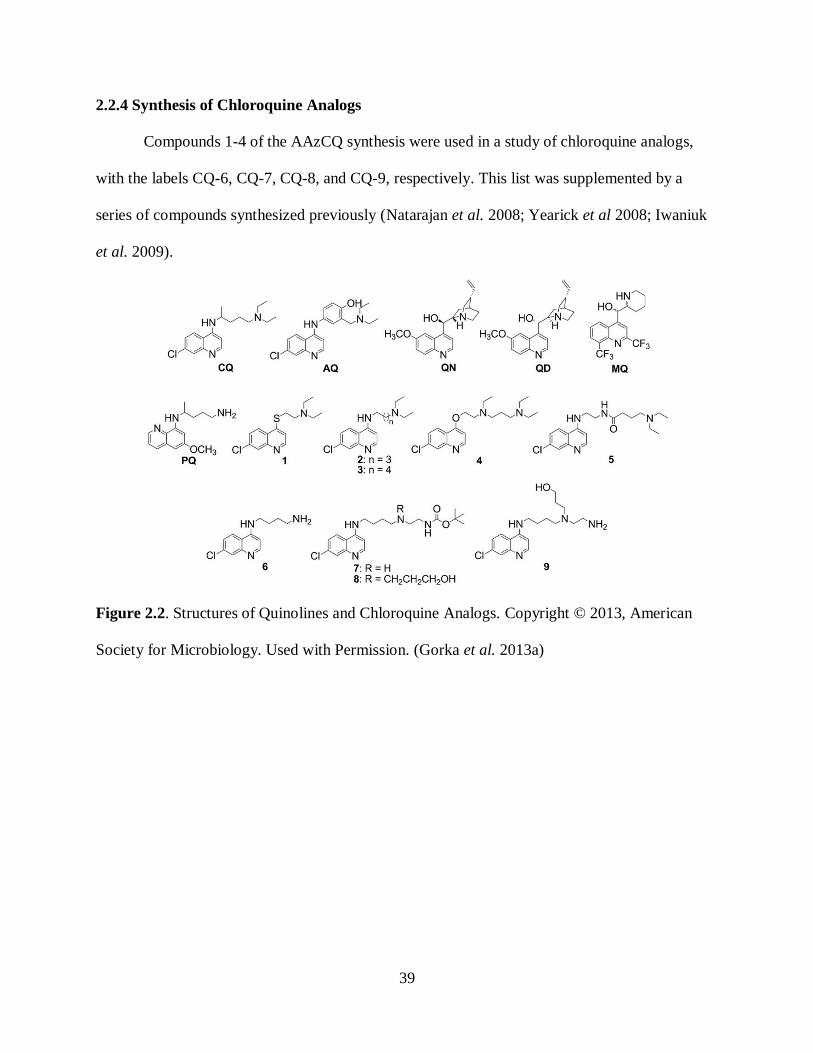
39
2.2.4 Synthesis of Chloroquine Analogs
Compounds 1-4 of the AAzCQ synthesis were used in a study of chloroquine analogs,
with the labels CQ-6, CQ-7, CQ-8, and CQ-9, respectively. This list was supplemented by a
series of compounds synthesized previously (Natarajan et al. 2008; Yearick et al 2008; Iwaniuk
et al. 2009).
Figure 2.2. Structures of Quinolines and Chloroquine Analogs. Copyright © 2013, American
Society for Microbiology. Used with Permission. (Gorka et al. 2013a)

40
2.2.5 Synthesis of epi-Quinine and epi-Quinidine
Synthesis of epi-quinine and epi-quinidine was carried out by fellow Roepe group
member Mr. Alexander Gorka (Gorka et al. 2013d).
Scheme 2.2. Synthesis of epi-Quinine and epi-Quinidine by one-pot Mitsunobu esterification-
saponification. Copyright © 2013, American Society for Microbiology. Used with Permission.
(Gorka et al. 2013d)
Synthesis of eQN and eQD
(S)-(6-Methoxyquinolin-4-yl) [(2S,4S,8R)-8-vinylquinuclidin-2-yl]methanol (eQN) and (R)-(6-
methoxyquinolin-4-yl) [(2R,4S,8R)-8-vinylquinuclidin-2-yl]methanol (eQD) were prepared by
one-pot Mitsunobu esterification-saponification (Sidorowicz, et al. 2011). A stirred solution of
QN or QD (500 mg, 1.5 mmol, 1.0 equivalent), triphenylphosphine (Ph3P; 525 mg, 2.0 mmol,
1.3 equivalents), and p-nitrobenzoic acid (PNBA; 284 mg, 1.7 mmol, 1.1 equivalents) in
anhydrous tetrahydrofuran (THF; 15 ml) was cooled to 0°C in an ice water bath, and diisopropyl
azodicarboxylate (DIAD, 0.33 ml, 1.7 mmol, 1.1 equivalents) was added drop wise. The
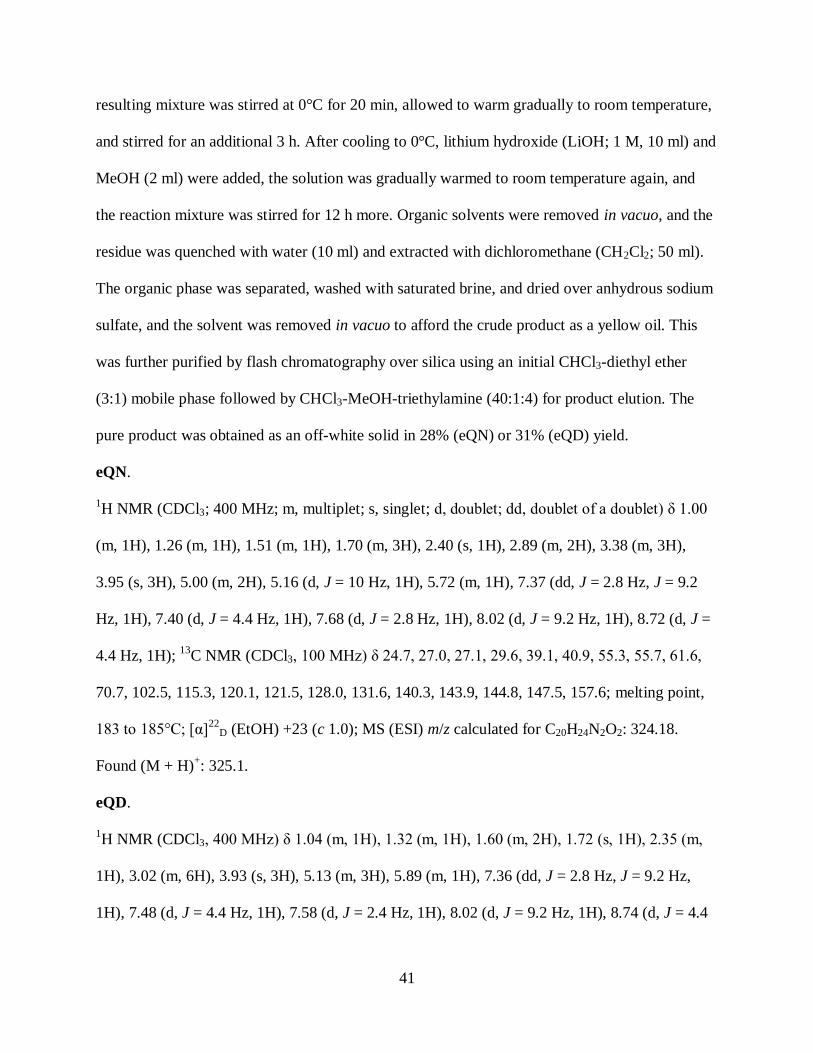
41
resulting mixture was stirred at 0°C for 20 min, allowed to warm gradually to room temperature,
and stirred for an additional 3 h. After cooling to 0°C, lithium hydroxide (LiOH; 1 M, 10 ml) and
MeOH (2 ml) were added, the solution was gradually warmed to room temperature again, and
the reaction mixture was stirred for 12 h more. Organic solvents were removed in vacuo, and the
residue was quenched with water (10 ml) and extracted with dichloromethane (CH2Cl2; 50 ml).
The organic phase was separated, washed with saturated brine, and dried over anhydrous sodium
sulfate, and the solvent was removed in vacuo to afford the crude product as a yellow oil. This
was further purified by flash chromatography over silica using an initial CHCl3-diethyl ether
(3:1) mobile phase followed by CHCl3-MeOH-triethylamine (40:1:4) for product elution. The
pure product was obtained as an off-white solid in 28% (eQN) or 31% (eQD) yield.
eQN.
1H NMR (CDCl3; 400 MHz; m, multiplet; s, singlet; d, doublet; dd, doublet of a doublet) δ 1.00
(m, 1H), 1.26 (m, 1H), 1.51 (m, 1H), 1.70 (m, 3H), 2.40 (s, 1H), 2.89 (m, 2H), 3.38 (m, 3H),
3.95 (s, 3H), 5.00 (m, 2H), 5.16 (d, J = 10 Hz, 1H), 5.72 (m, 1H), 7.37 (dd, J = 2.8 Hz, J = 9.2
Hz, 1H), 7.40 (d, J = 4.4 Hz, 1H), 7.68 (d, J = 2.8 Hz, 1H), 8.02 (d, J = 9.2 Hz, 1H), 8.72 (d, J =
4.4 Hz, 1H); 13
C NMR (CDCl3, 100 MHz) δ 24.7, 27.0, 27.1, 29.6, 39.1, 40.9, 55.3, 55.7, 61.6,
70.7, 102.5, 115.3, 120.1, 121.5, 128.0, 131.6, 140.3, 143.9, 144.8, 147.5, 157.6; melting point,
183 to 185°C; [α]22
D (EtOH) +23 (c 1.0); MS (ESI) m/z calculated for C20H24N2O2: 324.18.
Found (M + H)+: 325.1.
eQD.
1H NMR (CDCl3, 400 MHz) δ 1.04 (m, 1H), 1.32 (m, 1H), 1.60 (m, 2H), 1.72 (s, 1H), 2.35 (m,
1H), 3.02 (m, 6H), 3.93 (s, 3H), 5.13 (m, 3H), 5.89 (m, 1H), 7.36 (dd, J = 2.8 Hz, J = 9.2 Hz,
1H), 7.48 (d, J = 4.4 Hz, 1H), 7.58 (d, J = 2.4 Hz, 1H), 8.02 (d, J = 9.2 Hz, 1H), 8.74 (d, J = 4.4

42
Hz, 1H); 13
C NMR (CDCl3, 100 MHz) δ 23.9, 26.4, 27.3, 38.7, 46.8, 49.1, 55.4, 62.4, 69.8,
101.9, 115.0, 120.0, 121.7, 128.0, 131.6, 139.8, 144.7, 144.8, 147.5, 157.5; melting point, 185 to
187°C; [α]22
D (EtOH) +75 (c 1.0); MS ESI m/z calculated for C20H24N2O2: 324.18. Found (M +
H)+: 325.0.
2.2.6 β-Hematin Inhibition Assay
The initial design of this assay was completed prior to beginning research in the lab:
Gorka, A. P.; Alumasa, J. N.; Sherlach, K. S.; Jacobs, L. M.; Nickley, K. B.; Brower, J. P.; de
Dios, A. C.; Roepe, P. D. Cytostatic versus Cytocidal Activities of Chloroquine Analogues and
Inhibition of Hemozoin Crystal Growth. Antimicrob. Agents Chemother. 2013, 57, 356-364.
Copyright © 2013, American Society for Microbiology. [Antimicrobial Agents and
Chemotherapy, 57, 2013, 356-364, doi: 10.1128/AAC.01709-12]
2.2.6.1 Effect of SDS on absorbance of FPIX (Gorka et al. 2013a).
The effect of SDS on FPIX absorbance was analyzed in two ways. First, a solution of
FPIX (5 mM) was prepared in 0.1 M NaOH and diluted to 10 μM in 0.1 M bicarbonate buffer
(pH 9.1), and aliquots of an SDS stock solution (50%, wt/vol; 1.734 M) were added to 1 ml of
the FPIX solution in a stirred cuvette. Titration with SDS (to a final concentration of 0.5 to 5%,
wt/vol) was monitored with an Agilent 8453 UV-visible spectrophotometer (Santa Clara, CA).
Also, a 5 mM FPIX stock was diluted to 1 mM in 0.1 M bicarbonate buffer (pH 9.1) containing
different concentrations of SDS (0, 0.5, 1.0, 2.5, and 5%, wt/vol). These solutions were then
serially diluted in 1.5-μl microcentrifuge tubes such that the final FPIX concentration ranged
from 0 to 20 μM. Equal volumes (200 μL) of these solutions were then transferred in triplicate to
43
microtiter plate wells. Absorbance readings from the wells were obtained at 405 nm using a
BioTek ELx800 absorbance microplate reader (Winooski, VT).
2.2.6.2 Assay optimization (Gorka et al. 2013a).
The heme concentration was optimized by comparing the Hz yield upon various starting
heme concentrations. The optimal concentration of catalyst was determined in the presence of
100 μM FPIX, propionate buffer (1 M) at 37°C in a 16-h assay format. We compared the Hz
yield in the presence of sonicated lipids, phosphatidylserine (PS), PC, pMAG, sMAG, DO, DG,
and DT, as well as mixtures of PC, pMAG, and sMAG, versus pH and at a range of lipid
concentrations. PC, pMAG, and sMAG produced the highest Hz yields when used at ≥0.5
mg/ml. Additionally, catalytic efficiency was assessed at pH 5.2 versus pH 5.6 (Huy et al. 2007)
in kinetic assays using PC, pMAG, or sMAG. The optimal buffer concentration was determined
in the presence of 100 μM FPIX, propionate buffer (pH 5.2), and 0.5 mg/ml PC at 37°C using a
16-h assay as described below, with the greatest Hz yield achieved at 1 M propionate.
2.2.6.3. Hz inhibition assay (Gorka et al. 2013a).
The optimized assay is based on the differential solubility of crystalline and
noncrystalline forms of FPIX in 2.5% (wt/vol) SDS (86.7 mM) and alkaline bicarbonate buffer
(0.1 M, pH 9.1). Hemin (2 mM) in 0.1 M NaOH was titrated to the desired pH with propionate
buffer. Ten-microliter volumes from the hemin stock were then transferred to 96-well plates,
followed by addition of propionate buffer (180 μL per well) and previously sonicated lipid
catalyst (10 μL). Appropriate blanks and controls (e.g., no lipid catalyst, no drugs) were included
in each plate. Plates were wrapped in plastic wrap and incubated at 37°C with gentle shaking. Hz
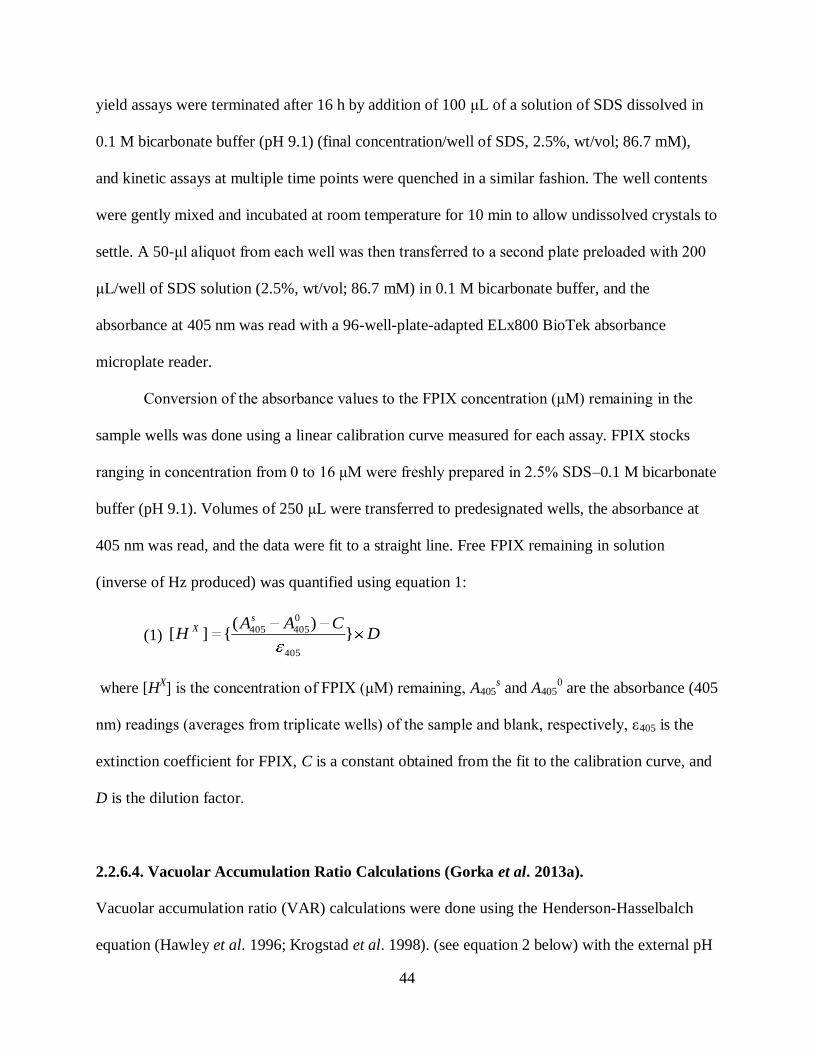
44
yield assays were terminated after 16 h by addition of 100 μL of a solution of SDS dissolved in
0.1 M bicarbonate buffer (pH 9.1) (final concentration/well of SDS, 2.5%, wt/vol; 86.7 mM),
and kinetic assays at multiple time points were quenched in a similar fashion. The well contents
were gently mixed and incubated at room temperature for 10 min to allow undissolved crystals to
settle. A 50-μl aliquot from each well was then transferred to a second plate preloaded with 200
μL/well of SDS solution (2.5%, wt/vol; 86.7 mM) in 0.1 M bicarbonate buffer, and the
absorbance at 405 nm was read with a 96-well-plate-adapted ELx800 BioTek absorbance
microplate reader.
Conversion of the absorbance values to the FPIX concentration (μM) remaining in the
sample wells was done using a linear calibration curve measured for each assay. FPIX stocks
ranging in concentration from 0 to 16 μM were freshly prepared in 2.5% SDS–0.1 M bicarbonate
buffer (pH 9.1). Volumes of 250 μL were transferred to predesignated wells, the absorbance at
405 nm was read, and the data were fit to a straight line. Free FPIX remaining in solution
(inverse of Hz produced) was quantified using equation 1:
(1) DCAA
Hs
X })(
{][405
0
405405
where [HX] is the concentration of FPIX (μM) remaining, A405
s and A405
0 are the absorbance (405
nm) readings (averages from triplicate wells) of the sample and blank, respectively, ε405 is the
extinction coefficient for FPIX, C is a constant obtained from the fit to the calibration curve, and
D is the dilution factor.
2.2.6.4. Vacuolar Accumulation Ratio Calculations (Gorka et al. 2013a).
Vacuolar accumulation ratio (VAR) calculations were done using the Henderson-Hasselbalch
equation (Hawley et al. 1996; Krogstad et al. 1998). (see equation 2 below) with the external pH

45
at 7.33 and the DV pH at either 5.2 or 5.6 (Bennet et al 2004b). Our calculations also assume
that (i) charged (protonated) drugs are >105-fold less membrane permeant than neutral drugs and
(ii) initial rapid accumulation is not limited by binding to the drug target(s):
(2) )pHpKapKa(pKapHpKapKapHpKa
pHv)pKapKa(pKapHpKapKapHpKa
E
V
EEE
vv
Drug
Drug3)2()(
3)2()(
321211
321211
1010101
1010101
][
][
where V denotes DV, E denotes external (blood), and pKa1, pKa2, and pKa3 correspond to
titratable N on the CQ analogues. DV-scaled in vivo activities for drugs were obtained by
multiplying the raw antiplasmodial IC50s and LD50s by the corresponding calculated VAR
values.
2.2.7 Drug-Heme Affinity Measurements (Gorka et al. 2013d).
Gorka, A. P.; Sherlach, K. S.; de Dios, A. C.; Roepe, P. D. Relative to Quinine and Quinidine,
Their 9-Epimers Exhibit Decreased Cytostatic Activity and Altered Heme Binding but Similar
Cytocidal Activity versus Plasmodium falciparum. Antimicrob. Agents. Chemother. 2013, 57,
365-374.
Copyright © 2013, American Society for Microbiology.[ Antimicrobial Agents and
Chemotherapy, 57, 2013, 365-374, doi: 10.1128/AAC.01234-12].
Drug-heme affinity measurements, made primarily by Roepe group member Dr.
Alexander Gorka, were performed by monitoring the changes in the absorbance of the Soret
band of heme in the presence of increasing concentrations of drug. Hemin was dissolved in
DMSO or 0.1 M NaOH to 5 mM, followed by serial dilution to 5 μM in 40% DMSO–0.2 M
HEPES (pH 7.4) for measuring binding to monomer (Casabianca et al. 2008). Drug solutions

46
were prepared by dissolving the compound in DMSO and diluting to 3 mM in 40% DMSO–0.02
M HEPES (pH 7.4). A cuvette containing 3 ml of freshly prepared heme (5 μM) was titrated with
increasing concentrations of drug (final concentration, 0 to 210 μM), the sample was mixed
following each addition, and the absorbance of heme at 402 nm was recorded using an Agilent
8453 UV-visible (VIS) spectrophotometer (Santa Clara, CA). Solvent dilution controls were
similarly performed (final volume dilution, 6.54%) using the relevant drug-free medium.
Spectral and data analyses were performed using Kaleida Graph and SigmaPlot (version 11.0)
software. Nonlinear least-squares curve fitting of the raw data was done using the Levenberg-
Marquardt algorithm (Egan et al. 1997; Marques et al. 1996) (initial affinity coefficient [Ka]
input, 0.01 μM−1
) and Kas were computed.
2.2.8 Heme aggregation studies (Gorka et al. 2013d).
Gorka, A. P.; Sherlach, K. S.; de Dios, A. C.; Roepe, P. D. Relative to Quinine and Quinidine,
Their 9-Epimers Exhibit Decreased Cytostatic Activity and Altered Heme Binding but Similar
Cytocidal Activity versus Plasmodium falciparum. Antimicrob. Agents. Chemother. 2013, 57,
365-374.
Copyright © 2013, American Society for Microbiology.[ Antimicrobial Agents and
Chemotherapy, 57, 2013, 365-374, doi: 10.1128/AAC.01234-12].
I measured the effect of various drugs on the pH-dependent solubility of FPIX as
previously performed (Ursos et al. 2001), with minor modification. Briefly, drug stocks were
prepared in 24 mM morpholineethanesulfonic acid (MES)-Tris buffer–0.1 M NaCl (pH 6.6) to a
concentration of 1 mM. Hemin was dissolved in 0.1 M NaOH to 18 mM. Test solutions were
47
prepared by combining 20 μL of drug, 10 μL of FPIX, and 980 μL of 24 mM MES-Tris buffer–
0.1 M NaCl at the desired pH, for final drug and FPIX concentrations of 20 μM and 178 μM,
respectively. Samples were mixed and incubated at room temperature for 30 min, during which
time aggregates of FPIX form that are visible to the naked eye. These aggregated FPIX species
were pelleted by centrifugation at 1.61 × 10⁴ × g for 3 min using an Eppendorf 5415 D
microcentrifuge (Hauppauge, NY), removing the aggregated FPIX from that which is still
soluble at the pH tested. The supernatant, containing the soluble FPIX, was removed for
quantitative analysis to determine concentration using UV-Vis spectroscopy, taking advantage of
the 405 nm absorbance profile of FPIX, see Figure 3.5A for the UV-Vis absorbance spectrum of
FPIX.
In order to ensure that the transmitted light exceeds the lower limit of detection, the
supernatant is added to a 96-well plate containing 24 mM MES-Tris buffer–0.1 M NaCl (pH
6.6), resulting in a 1:4 (vol/vol) dilution. A standard curve of known FPIX concentration was
generated for each assay. The absorbance at 405 nm was measured using a 96-well-plate-adapted
ELx800 BioTek absorbance microplate reader (Winooski, VT). Data were analyzed using the
Microsoft Excel 2007 program, calculating the initial concentration of FPIX that remained in
solution before the 1:4 dilution. This concentration was plotted vs. the pH examined, and the pH
at half FPIX solubility (pH1/2) was extracted from sigmoidal curve fits to FPIX concentration-
versus-pH data using SigmaPlot (version 11.0) software. Values are averages of three replicates,
each performed in triplicate (nine determinations total), and are reported ± SEM.

48
2.2.9 Antiplasmodial Assays
Antiplasmodial cytostatic (growth inhibitory, or IC50) and cytocidal (cell killing, or LD50)
activity was determined for the strains discussed above essentially as previously described
(Bennet et al 2004a; Paguio et al. 2011), with minor modifications. The cytocidal assay utilizes
a 6 h bolus dose with high concentrations of drug followed by washing drug away and growth in
the absence of drug for 48 h, while the cytostatic assay utilizes continuous growth for 72 h in the
constant presence of low concentrations of drug. For both assays, test compounds were
dissolved in deionized water, 50% EtOH, or DMSO.
In the cytostatic assay, serial drug dilutions were made using complete media and 100 μL
aliquots were transferred to 96-well clear-bottom black plates. Culture for plate examination is
prepared by generating a Giemsa smear to count parasitemia (see Section 2.2.2). Enough culture
is prepared to add 100 µL to each well that contains drug concentrations or the no-drug control.
From that total volume, the total red blood cell pellet is set at 4% (4% hematocrit). From the
calculated parasitemia, the culture parasitemia is set at 1%, by “diluting” the pellet with fresh
uninfected red blood cell using a standard Concentration1Volume1=Concentration2Volume2
calculation. Following addition of 100 μL of asynchronous or sorbitol-synchronized culture to
the plated drug concentrations, the cultures in the plate are now at 1% parasitemia, 2%
hematocrit) (see Section 2.2.2 for a full description of synchronous culture), plates were
transferred to an airtight chamber gassed with 5% CO2/5% O2/90% N2 and incubated at 37 °C.
For the cytocidal assay, drug/parasite mixture was incubated for 6 h followed by
centrifugation with an Eppendorf 5415 D microcentrifuge (Hauppauge, NY) at 1800 rpm for 1
min. Drug-containing media was removed and cell pellets resuspended three times with drug-
49
free complete media, using the same centrifuge settings, before plating of washed samples into a
96-well plate.
Washed plates along with the cytostatic assay plates were incubated at 37 °C for 48 h.
After 48 h, 50 μL of 50X SYBR Green I dye (diluted using complete media from a 10,000X
DMSO stock) was added and plates incubated for an additional 1 hr at 37 °C to allow DNA
intercalation. Fluorescence was measured at 538 nm emission (485 nm excitation) using a
Spectra GeminiEM plate reader (Molecular Devices; Sunnyvale, CA) fitted with a 530 nm long-
pass filter. Linear standard curves of measured fluorescence vs. known parasitemia were
prepared immediately prior to plate analysis. Background controls included fluorescence from
un-infected red blood cells. Data was analyzed using MS Excel 2007 and IC50 and LD50 values
obtained from sigmoidal curve fits to % growth/survival vs. drug concentration data using
SigmaPlot 11.0. Reported values are the average of three independent assays, with each assay
conducted in triplicate (nine determinations total) and reported ± standard error of the mean
(S.E.M.), unless otherwise noted.
2.2.10. Trypan Blue Staining of P. falciparum
Staining of live versus dead parasites was carried out using the dye Trypan Blue (0.4%)
(Strober 1997), from MP Biomedical (Santa Ana, CA). Briefly, synchronized parasites in the
trophozoite stage (see Section 2.2.2. for description of synchronous culture) were magnetically
enriched using a MACS LD column (Miltenyi Biotec, Inc., Auburn, CA) that utilize
superparamagnetic ferromagnetic beads and a strong magnet to isolate paramagnetic infected
RBCs from uninfected RBCs. The columns, which had a void volume of 1.35 mL, were run as
follows: 2 mL serum-free media (to condition the column and prepare it for culture), 2 mL

50
culture (initially 10 mL at 2% hematocrit, resuspended as 2 mL at 10% hematocrit), and 2 mL
serum-free media (to rinse the uninfected red blood cells off). 2 mL serum-free media forced
through, in the absence of the magnetic field to release the infected red blood cells. The enriched
sample was centrifuged and the serum-free media was aspirated. The remaining pellet (volume
varied due to differences in parasitemia) was suspended in 0.08% saponin for 5 minutes, to
permeabilize the red blood cell membrane. An equal volume of trypan blue was added, and the
sample was mounted for microscopic examination at 100x (final concentration of saponin was
0.04%) using a Micromaster Digital Microscope (Fisher Scientific) with Micron Software
(Westover Scientific). Images of 3 independent fields of view were taken, and the parasites were
counted stained versus unstained, at least 100 total. Negative control (no drug), and positive
control (24 h at 5xLD50 CQ) were run with each sample (6 h at LD50 CQ)
2.2.11. Drug Combination Assays Using the Chou-Talalay Method
The effect of combining two drugs together was assayed through use of the Chou-Talalay
method of fixed-ratio analysis (Chou et al. 1984; Suberu et al 2013). Briefly, the two compounds
were initially screened for their individual cytostatic and cytocidal activities, as described in
Section 2.2.9. Combination analysis was initially run at fixed ratios of these determined values
(1:1 unless noted). This results in a set of concentrations all at a multiple or fraction of the
compounds’ monotherapy IC50s or LD50s. A combination stock, set at four times the IC50 or
LD50, is serially diluted seven times to yield a range of concentrations that can generate a
combination growth or survival curve, see Table 2.1 for a diagram of the plate layout.
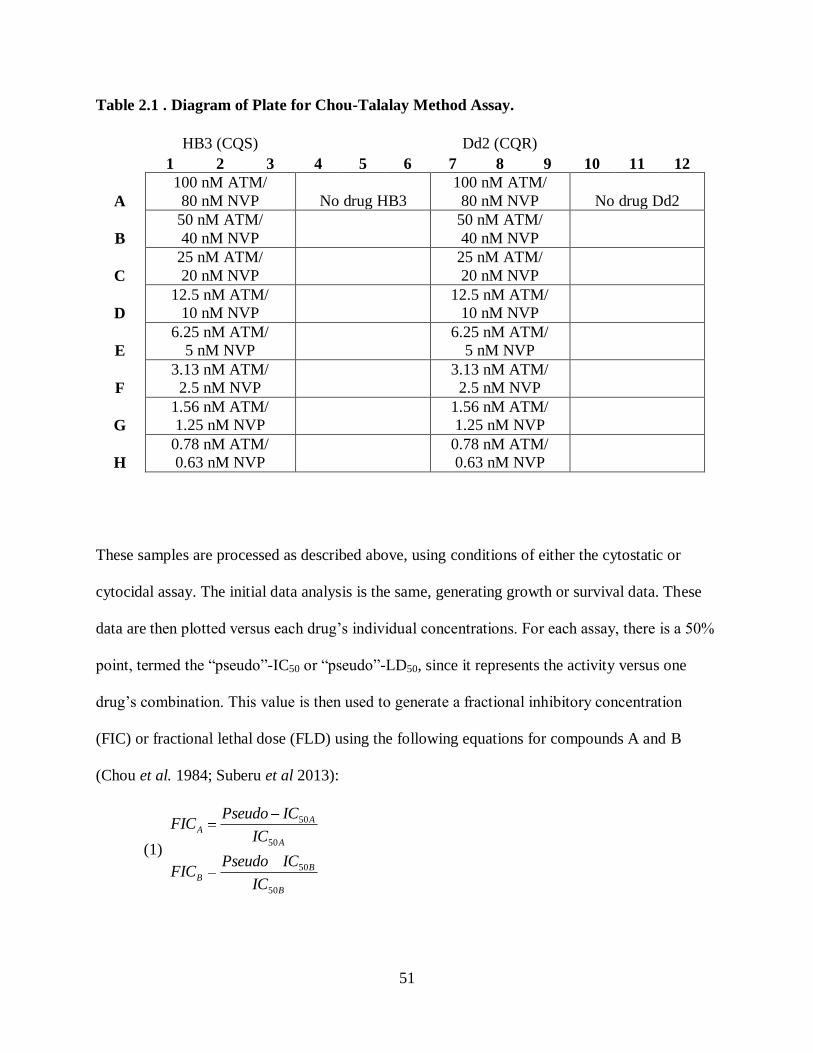
51
Table 2.1 . Diagram of Plate for Chou-Talalay Method Assay.
HB3 (CQS)
Dd2 (CQR)
1 2 3 4 5 6 7 8 9 10 11 12
A
100 nM ATM/
80 nM NVP No drug HB3
100 nM ATM/
80 nM NVP No drug Dd2
B
50 nM ATM/
40 nM NVP
50 nM ATM/
40 nM NVP
C
25 nM ATM/
20 nM NVP
25 nM ATM/
20 nM NVP
D
12.5 nM ATM/
10 nM NVP
12.5 nM ATM/
10 nM NVP
E
6.25 nM ATM/
5 nM NVP
6.25 nM ATM/
5 nM NVP
F
3.13 nM ATM/
2.5 nM NVP
3.13 nM ATM/
2.5 nM NVP
G
1.56 nM ATM/
1.25 nM NVP
1.56 nM ATM/
1.25 nM NVP
H
0.78 nM ATM/
0.63 nM NVP
0.78 nM ATM/
0.63 nM NVP
These samples are processed as described above, using conditions of either the cytostatic or
cytocidal assay. The initial data analysis is the same, generating growth or survival data. These
data are then plotted versus each drug’s individual concentrations. For each assay, there is a 50%
point, termed the “pseudo”-IC50 or “pseudo”-LD50, since it represents the activity versus one
drug’s combination. This value is then used to generate a fractional inhibitory concentration
(FIC) or fractional lethal dose (FLD) using the following equations for compounds A and B
(Chou et al. 1984; Suberu et al 2013):
(1)
B
BB
A
AA
IC
ICPseudoFIC
IC
ICPseudoFIC
50
50
50
50
52
By summing these two values, a combination index (or FICindex, FLDindex) can be generated
(Chou et al. 1984; Suberu et al 2013):
(2) BAIndex FICFICFIC
The FICindex of a combination can be used to assign synergy, additivity, or antagonism. The cut-
off values for these designations vary (Bell 2005), but those selected for this work were
(Matthews et al. 2013):
Synergy- FICindex ≤1.0
Additivity- 1.0< FICindex ≤2.0
Antagonism- FICindex >2.0
FICindex and FLDindex values were averaged from at least 2 independent trials (with standard error
of the mean calculated).
2.2.12. High-Throughput Screening of Drug Combinations
Initial IC50-based screening for drug synergies were performed in the Thomas Laboratory,
National Center for Advancing Translational Sciences (NCATS), National Institutes of Health
(NIH)
Parasites, parasite culture, quantitative high throughput drug assay and matrix combination
screening
Methods for the SYBR qHTS and calculation of IC50 and definition of curve classes have
been described (Yuan et al. 2009; Inglese et al. 2006; Dodge 2003). Plating of compounds in
matrix formation using acoustic droplet ejection and numerical characterization of synergy,
additivity and/or antagonism have also been described (Mathews Griner et al. 2014).
Compound screening collection

53
The compound screening collection consisted of most known antimalarials and an
annotated set of all FDA approved drugs for all disease indications as well as commercially
available molecules in advanced clinical stages of development. The latter were obtained by
NCATS, from suppliers such as Tocris Bioscience, Selleck Chemicals, Santa Cruz
Biotechnology and Sigma Aldrich (among others). Priority was given to compounds based on
known or generally accepted mechanisms of action, clinical status, FDA approval, or novelty in
MOA.
Quality Control Criteria
The quality control score is a numerical characterization of the quality of a combination
that attempts to take into account single agent performance and the presence of noise in the dose
combination region of the matrix (Mathews Griner et al. 2014).
Figure 2.3. Example of Heat Map Generated by High-Throughput Screening at NCATS.

54
It is composed of a number of heuristics, developed by examination of a series of matrix
screening runs (Mathews Griner et al. 2014). The calculation, done at NCATS, is performed on
the bounded (0-100) response matrix and considers the following conditions:
DMSO negative control response lies between 80 and 100. Both single agents should
display a valid dose response curve and provide a valid IC50 value. If single agents have a valid
curve fit, the range of growth responses should have a relative standard deviation greater than 20
(Dodge 2003). For a combination matrix, the relative standard deviation of the dose combination
sub-matrix should be greater than 25. The responses in the dose combination should also not
exhibit random distribution across the matrix. This is measured by Morans I (Moran 1950). We
consider a combination to exhibit spatial autocorrelation if the p-value is less than 0.05.
Each combination is tested against the five conditions and the result is expressed as a
vector, defined as
where Ci=1 if the i’th condition is true, 0 otherwise.
The final score is obtained by computing the dot product of the binary vector and a
weight vector, W of the same length as C. The latter allows us to assign an importance to each of
the five conditions noted above. The final score is given by
Currently, the weight vector is defined as W={2,5,3,5,3}, allowing for a minimum score of 0 (the
combination passes all QC criterion) and maximum score of 18 (combination fails all QC
criterion). A combination with a score of 0 is deemed as good quality and suitable for further
consideration. Increasing values of the QCScore indicate poorer quality combination responses.

55
It should be noted that the score can identify false positive – combinations that are scored well,
but on visual inspection turn out to be poor quality. The score is meant to provide an initial
ranking and should not preclude manual inspection.
Figure 2.4. Example of an Unacceptable Heat Map Generated by High-Throughput Screen at
NCATS.
In addition to the previously described metrics (Mathews Griner et al. 2014) analysis of
combinations at NCATS to include two other quantifiers of synergy - DBsumPos and
DBsumNeg. These are defined as the sum of positive deviations from the Bliss model and the
sum of the negative deviations from the Bliss model, which defines synergy and antagonism in
terms of predicted additive activity as the sum of the monotherapy activities minus their product.
Positive deviations in the observed activity denote antagonism, while negative deviations denote
synergy (Petraitis et al. 2009). In contrast to simply summing all the deviations from the Bliss

56
model, these two variables characterize the extent of synergy and antagonism within a set of dose
combinations.
2.2.13. Photolabeling PfCRT Proteoliposomes with AzBCQ and AAzCQ, (adapted from
Lekostaj et al. 2008).
Proteoliposomes (PLs) containing purified PfCRT with hexa-histidine and V5 epitope
tags were synthesized as described in Lekostaj et al. 2008 by Mr. Paul Callaghan of the Roepe
group. 0.1 nmol PfCRT was suspended in a 50 mM MES/Tris buffer and mixed with diluted
AzBCQ or AAzCQ, with or without the presence of underivatized (“cold”) CQ, to achieve the
desired concentration in a 96-well plate. The plate was mixed at 650 rpm for 30 sec in the
MixMate (Eppindorf) and incubated for 10 min at 37°C. The samples were then illuminated
with 254 nM UV light using a hand-held lamp (Spectroline model ENF-280C, 115 V, 60 Hz, 200
mA; 8 W bulb emitting approximately 500 μW/cm2 approximately 10 cm from the bulb surface)
for 10 minutes. Samples were quenched by mixing with an equal volume of 2x click solution for
a final solution containing 150 µM Biotin Azide, 200 µM copper(II) sulfate, 2 mM sodium
ascorbate, 200 µM bathophenanthrolinedisulfonic acid, and 1% sodium dodecylsulfate (SDS),
AzBCQ samples were just diluted with SDS-containing water. The samples were incubated for
30 minutes while mixing at 500 rpm on the MixMate for 30 min. Protein was precipitated with
50% trichloroacetic acid (TCA) (one-third the sample volume), incubated at -80°C for 20 min,
and pelleted at 13,200 rpm in an Eppendorf 5415 D microcentrifuge (Hauppauge, NY), followed
by washing with 1:1 EtOH:diethyl ether three time. Samples were then prepared for SDS-PAGE
separation by dissolving with Laemmli buffer. Samples are run on a 12% acrylamide gel for 1
57
hour at 150 V, and transferred onto a PDVF membrane overnight at 50 mA for Western Blot
analysis with streptavidin-HRP and either anti-hex-his or anti-V5 HRP.
2.2.14. Photolabeling P. falciparum with AzBCQ and AAzCQ for Fluorescence Microscopy.
Synchronized trophozoite cultures were photolabeled with AzBCQ and AAzCQ by UV-
irradiation at 254 nM using a hand-held lamp (Spectroline model ENF-280C, 115 V, 60 Hz, 200
mA; 8 W bulb emitting approximately 500 μW/cm2 approximately 10 cm from the bulb surface).
Various incubation times of cells in probe-containing media were used before illumination,
which was varied in its time. Following fixation of the sample with 4% formaldehyde and
0.0075% glutaraldehyde for 30 min at 37°C, membranes were permeabilized with 0.1% Triton-X
at 37°C for 10 minutes (Tonkin et al. 2004; Gaviria et al. 2013).
Cells labeled with AzBCQ were then incubated with a streptavidin-linked Alexa Fluor
488 conjugate, while AAzCQ-treated cells were blocked with azide-labeled TAMRA in the
absence of coupling agents, and then coupled to azide-labeled Alexa Fluor 488. Coupling was
performed using 200 µM copper(II) sulfate and bathophenanthroline disulfonic acid (a
hydrophilic chelator- Gupta et al. 2005), with 800 µM sodium ascorbate to reduce copper(II) to
copper(I). Cells were then adhered to poly-lysine-coated #1.5 coverslips and mounted using
Fluorogel Mounting Media to glass slides for imaging on Nikon Eclipse TE 2000-U spinning
disk confocal microscope with 405, 491, 561, and 642 nm laser lines at 200 ms exposure and
35% laser power. Image files, obtained using Differential Interferance Contrast and Fluorescence
Channels, were deconvolved using a point spread function with multiple iterations using
AutoQuantX2. Images were processed and overlays constructed using and Imaris 7.4.2 Software
58
as described in earlier Roepe group publications (see Gligorijevic et al. 2006a; Gligorijevic et al.
2008; Gaviria et al. 2013).
2.2.15. Photolabeling P. falciparum for Gel Electrophoresis and Proteomic Analysis
10% parasitemia cultures at 600 uL pellet volume in 30 mL of complete media were used
for photolabeling. The pellet was washed 3 times with PBS and resuspended in 0.5% saponin
(w/v) in PBS for 5 min at 37°C with occasional agitation. The isolated parasites were collected
by centrifugation at 1500 g for 10 min, and washed 3 times with PBS. The parasites were
resuspended in either 10 µM AzBCQ (2D gel electrophoresis) or 200 nM (HB3) or 15 µM (Dd2)
AzBCQ or AAzCQ (avidin-enrichment) in PBS in a 96-well plate. The samples were incubated
for 10 min at 37°C in the dark, and then illuminated with 254 nM UV light using a hand-held
lamp (Spectroline model ENF-280C, 115 V, 60 Hz, 200 mA; 8 W bulb emitting approximately
500 μW/cm2 approximately 10 cm from the bulb surface) for 10 minutes. The pellet was then
washed 3 times with PBS, half was used for visualization with a biotin Western blot, and the
other half for downstream mass spectroscopy through Coomassie Staining.
Two-Dimensional Gel Electrophoresis
For the 2D gel electrophoresis experiment, the second fraction was stored in PBS-
Tween20. Stored samples were spun down and washed with PBS before precipitated with 50%
trichloroacetic acid (one-third the sample volume) and washed three times with 1:1 EtOH:diethyl
ether. Pelleted samples were resuspended in BioRad 2D Rehydration buffer (125 µL) (8 M urea,
2% CHAPS, 50 mM DTT, 0.2% Bio-Lyte® 3/10 ampholyte, 0.001% Bromophenol Blue) and
incubated overnight to rehydrate pH 3-10 IPG strips. Strips were focused at 250 V for 20 min
(linear increase), followed by 4,000 V for 2 hours (linear increase), then 4,000 V at 10,0000 Vhrs
59
(rapid increase). The strips were then washed with BioRad Equilibration Buffer I (6 M urea, 2%
SDS, 0.375 M Tris-HCl (pH 8.8), 20% glycerol, and 2% (w/v) DTT), Equilibration Buffer II (M
urea, 2% SDS, 0.375 M Tris-HCl (pH 8.8), 20% glycerol, 2.5% iodoacetamide), and running
buffer (Tris-HCl/Glycine/SDS) before imbedding the strip into a pre-cast gradient gel (BioRad)
and electrophoresed at 200 V for 36 min. Samples for biotin Western blot were transferred to a
PVDF membrane overnight at 50 mA. Samples for mass spectroscopy proteomics were washed
twice with deionized water, stained with Bio-Safe Coomassie stain (Bio Rad) overnight, washed
twice with deionized water, and destained with 10% methanol/7.5% acetic acid in deionized
water until the background was no longer stained.
Avidin-Affinity Enrichment and One Dimensional Electrophoresis
Following the probe crosslinking and the PBS wash, samples were mixed with and equal volume
of a 2x click solution containing 150 uM azido biotin, 100 uM copper(II) sulfate and
bathophenanthroline disulfonic acid, 1 mM sodium ascorbate and 2% SDS, if the sample was
labeled with AAzCQ. AzBCQ samples were just mixed with an equal volume of 2% SDS. The
proteins were precipitated with 50% TCA, and washed three times with 1:1 ethanol:diethyl ether
before drying. Dried protein was resuspended in 1% SDS before loading onto 100 µL Pierce
Avidin Agarose (Thermo Scientific, Waltham, MA) that had been washed three times with 1%
SDS. The protein was incubated at room temperature on the avidin agarose with rotation for 1
hour. The agarose was then washed three times, saving the washes for running on a 1D SDS-
PAGE gel after precipitation with TCA and washing with ethanol/diethyl ether. After the
washes, proteins were eluted off the agarose by boiling for 2 min in 1x Laemmli buffer. Initial
supernatant was run alongside each gel, with the first and third wash of each sample and the
eluents. Half of the sample was loaded onto a gel for visualization with a biotin Western blot,
60
while the other half was loaded onto a companion gel for Coomassie Blue staining (see Two
Dimensional Gel Electrophoresis) for mass spectroscopic proteomic analysis.
2.2.16. Mass Spectroscopy-Based Proteomics
Protein spots were excised from the gel in the Radoslav Goldman Laboratory (GUMC)
and destained by 50% ACN in 10 mM ammonium bicarbonate. In-gel trypsin digestion was
performed by adding 10 mM ammonium bicarbonate at pH 7.8 and 0.2 ug trypsin (Promega)
followed by incubation at 37°C overnight. Peptides were extracted in 3 steps with gradient ACN
20-60% in 1% trifluoroacetic acid by sonication. Peptide mixture was separated by reversed
phase chromatography (Tempo Eksigent-AB Sciex, Framingham, MA) on a ChromXP C18-CL
(3μm, 120Å, 180μm, 20 mm) trap column and ChromXP C18-CL (3μm, 120 Å, 75μm, 150 mm)
HPLC capillary chip column (Eksigent-AB Sciex) interfaced with a 5600 TripleTOF mass
spectrometer (AB Sciex, Framingham, MA). Chromatographic method was composed from 10-
min trapping/washing step (2% ACN, 0.1% formic acid (FA)) at 3 μL/min flow rate and 45 min
analytical step/gradient elution at a flow rate of 300 nL/min (Solvent A: 2% ACN with 0.1% FA;
Solvent B: 100% ACN with 0.1% FA) using timetable: 5-40% Solvent B 0-23 min; 45-100%
Solvent B 23-25 min; 100% Solvent B 25-30min.
Mass spectrometric parameters were set to ion spray voltage 2400 V, ion source gas
(GS1) 13, declustering potential 90 and interface heater temperature 150°C. Mass spectrometer
was operated in data-dependent mode; 1x survey scan (m/z 400 to 1800) followed by the MS/MS
experiments from 50 precursor ions selected for collision-induced dissociation, collision energy
was set automatically according to charge state and m/z of precursor ion. Range for recording of
MS/MS spectra was set to m/z 100 - 1600, with the dynamic exclusion time set to 6 sec, and 150

61
counts threshold, for two repeated precursor. Mass spectrometric data were processed by Protein
pilot (AB Sciex) and Mascot (Matrix Science) software.
.
2.2.17. Immunofluorescence Assays of P. falciparum ATG8 Puncta
For drug treatments, highly synchronized mid stage trophozoites were treated as
described (Paguio et al., 2011) using drug concentrations noted in the text. Resultant cell pellets
were resuspended in PBS and treated as below. Cells were washed 3 times with PBS, fixed with
4% formaldehyde/0.0075% glutaraldehyde in PBS for 30 minutes, permeabilized with 0.1%
Triton X-100 for 10 minutes, reduced with 0.3 mg mL-1
sodium triacetoxyborohydride for 10
minutes, blocked with 5% goat serum for 1 hour, and sequentially treated with antibodies diluted
in 5% goat serum/PBS Tween-20 with PBS Tween-20 washes in between. The primary antibody
was raised in rabbit (TgATG8); the secondary antibody was raised in goat against rabbit and
conjugated to DyLight 649 fluorophores (Jackson Immunoresearch). Cells were attached to #1.5
coverslips and mounted using “Fluorogel” mounting media. Samples were imaged using a
customized Nikon Eclipse TE 2000-U spinning disk confocal microscope with 405, 491, 561,
and 642 nm laser lines at 200 ms exposure and 35% laser power. For primary antibodies raised in
rabbit, primary solutions were prepared at 1:250 and secondary solutions (goat anti rabbit
DyLight649) at 1:500.
Images were iteratively deconvolved using a point spread function obtained under
identical imaging conditions (via doping one sample with fluorescent beads) and running
multiple iterations in AutoQuantX2 (Gligorejivic et al., 2006). Images were further processed
and overlayed using Imaris 7. 5. 2 software. Using the “spots” routine in Imaris 7.5.2, puncta
were defined and distances were measured from each spot to a single point within the DV as

62
defined by the center of hemozoin optical density (Gligorejivic et al., 2006 and Gaviria et al.,
2013). These distances were exported to excel and the resulting data were plotted as number of
puncta vs. distance from hemozoin
2.2.18. Single-Cell Photometry of P. falciparum Intracellular Ca2+
Concentrations.
For calibrations, perfusates were prepared from 2 stocks: 1) HBSS + 25 mM HEPES + 10
mM EGTA (pH 7.4); 2) HBSS + 10 mM EGTA +25 mM HEPES + 10 mM CaCl2 (pH 7.4).
Solutions of designated concentrations of free calcium were prepared by mixing both stocks at
different ratios. The free calcium concentration was calculated using the “MAXCHELATOR”
program (provided by Professor Chris Patton from Stanford University
http://maxchelator.stanford.edu/index.html); parameters were set at pH 7.4, 37ºC, EGTA, ionic
strength 150 mM. Before experiments, 10 µM ionomycin was added in order to clamp the
internal free calcium concentration to the concentration in the perfusate. Intact trophozoite-stage
parasites were first perfused with calcium-free buffer (without ionomycin) at a rate of 1 mL/min.
Ratiometric measurements were performed in 5 cells corresponding to resting free calcium. This
process was repeated for each perfusate containing ionomycin and a designated level of calcium
(54, 127, 217, 488, 1,000, and 23,700 nM); ratiometric data were collected for ~15 cells at each
calcium concentration. Data were processed and analyzed with Microsoft Excel and SigmaPlot
11.0. Calibration curves were fitted to sigmoidal curves and calcium concentrations were
extrapolated from the best fit.
Coverslips were prepared by pipetting 500 µL of 0.1% (w/v) poly-L-lysine over them and
letting it sit for 10 min; they were then dried and stored at 4º C until used. Trophozoite-infected
RBCs were resuspended at 0.5% hematocrit in IM with 25 mM HEPES pH 7.4 and 200 µL were
63
placed on a poly-L-lysine coated coverslip; the cells were incubated for 3 min under standard
cell culture atmosphere. Non-adherent cells were washed off and the coverslip was mounted on a
custom-designed perfusion chamber for microscopy work. For perfusion experiments, the
parasites were always maintained under constant perfusion at 1 mL/min of a physiologic buffer
(HBSS with 5% O2, 5%CO2, and 90% N2 at 37º C). Fura-2 AM (in DMSO stocks) was added to
the samples at a final concentration of 5 µM. 0.1% v/v Pluronic F-127 was added to improve dye
loading into iRBCs. Samples were kept at 37 º C for 45 min. The ratiometric values of ~15 intact
cells were measured for controls and each drug concentration.
The single cell photometry (SCP) apparatus consisted of a custom-built Nikon Diaphot
epifluorescence microscope equipped with a 100X oil immersion objective capable of UV
transmission (Fluoro, N.A. 1.25, 160/017); a 16-bit Sensys CCD camera (Tucson, AR) was
attached to the side port of the microscope. Excitation light was provided by a computer
controlled xenon arc lamp (LAMBDA LS, Novato, CA). 2 band-pass filters at 340 nm and 380
nm filtered UV light for ratiometric illumination of Fura-2 (Asahi Spectra Co., Ltd., San Jose,
CA). The filters were housed in a Lambda-10 filter wheel controlled through the acquisition
software (Imaging Workbench). The excitation light was transported by a liquid light guide
(Novato, CA), collimated, and passed through the microscope optics. A filter cube housing a 400
nm dichroic mirror combined with a 410 nm long-pass filter was used to separate excitation from
emission light. The power before objective was measured with a near UV power meter
(Metrologic Model No. 45-545). In our experiments, the exposure time was set at 500 ms
followed by a 10 sec recovery in total darkness. For ratiometric measurements, data from 2
excitations (340 and 380 nm) were collected from a region of interest (ROI) within the parasite.
A second region of interest was drawn in the vicinity of the parasite for background subtraction.
64
To obtain the transient changes in cytosolic Ca2+
with cytostatic and cytocidal dosages of
drugs, in real time, the drugs were perfused at the required concentration using a custom-
designed perfusion chamber at 1 mL/min and the ratiometric measurements were obtained.

65
CHAPTER III
EXAMINING THE CYTOCIDAL VERSUS CYTOSTATIC EFFECTS OF ANTIMALARIAL DRUGS
THROUGH BIOCHEMICAL GROWTH ASSAYS AND IN VITRO CHEMICAL METHODS
3.1 Background
Parts of this section were previously published as:
Gorka, A. P.; Alumasa, J. N.; Sherlach, K. S.; Jacobs, L. M.; Nickley, K. B.; Brower, J. P.; de
Dios, A. C.; Roepe, P. D. Cytostatic versus Cytocidal Activities of Chloroquine Analogues and
Inhibition of Hemozoin Crystal Growth. Antimicrob. Agents Chemother. 2013, 57, 356-364.
Copyright © 2013, American Society for Microbiology.[ Antimicrobial Agents and
Chemotherapy, 57, 2013, 356-364, doi: 10.1128/AAC.01709-12].
Gorka, A. P.; Sherlach, K. S.; de Dios, A. C.; Roepe, P. D. Relative to Quinine and Quinidine,
Their 9-Epimers Exhibit Decreased Cytostatic Activity and Altered Heme Binding but Similar
Cytocidal Activity versus Plasmodium falciparum. Antimicrob. Agents. Chemother. 2013, 57,
365-374.
Copyright © 2013, American Society for Microbiology. [Antimicrobial Agents and
Chemotherapy, 57, 2013, 365-374, doi: 10.1128/AAC.01234-12].
3.1.1. Part 1: The Need for Cytocidal Assays for P. falciparum
Recent work has shed light on the difference between growth-inhibitory (or cytostatic)
effects and cell-kill (cytocidal) effects for antimalarial drugs. The commonly-referenced cause of
CQR, that reduced accumulation in the DV limits its ability to inhibit the crystallization of heme,
does not necessarily correlate with additional observations of reduced daughter nuclei and
66
reduced viability of the next generation following invasion following a cytocidal dose of CQ
(Gligorijevic et al. 2008). Similarly, CQR parasites are able to survive intra-DV concentrations
of CQ that are lethal to CQS stains (Cabrera et al. 2009a). Hz crystallization may be a target of
low-dose growth inhibition, but the targets and resistance trends of cytocidal treatment still need
to be defined.
The quantification of the cytocidal effects of antimalarial compounds on Plasmodia has
not been perfected, despite the previous optimization of several different assays to quantify the
cytostatic growth inhibitory effect (Bennet et al. 2004b). Assays that have been published
include those that rely on the growth of limiting dilutions of culture to yield single parasite
aliquots that will either grow or not grow in a binary measure of viability (Sanz et al. 2012), and
an assay that relies on the overexpression of luciferase in transfectant parasites and the
bioluminescence that the luciferase generates (Hasenkamp et al. 2013). In order to properly
quantify death, one can in theory utilize cell viability assays such as the trypan blue exclusion
assay. These assays rely on the ability of viable cells’ membranes to exclude certain dyes. When
a culture of cells is mixed with one of these dyes, microscopy can be used to count those which
exclude the dye, and are still viable, and those which are stained, which are dead (Hathaway et
al. 1964; Strober 1997).
The use of live-dead cells stains such as trypan blue, however, are made more difficult
due to the parasite’s location within the red blood cell and the parasitophorous vacuolar
membrane. Those dyes that rely on membrane integrity to delineate viable cells would have to
circumvent these other membranes before any degradation of the parasite plasma membrane can
be observed. It is not known if the loss of viability in the parasite coincides with any alteration
of the membrane integrity of the RBC membrane. However, infected RBCs are noted to have
67
increased permeability to select metabolites such as sodium and calcium ions, but the integrity is
maintained to avoid osmotic swelling by the consumption of host Hb (Lew et al. 2003). Fully
permeabilizing the RBC plasma membrane and the parasitophorous vacuole can be achieved
through treatment with saponin, potentially allowing for the use of membrane-integrity dyes. The
plant-derived detergent permeablizes cholesterol-containing membranes to macromolecules,
while the parasites retain viability as demonstrated by: the ability to extrude trypan blue,
metabolic inclusion of radio-labeled isoleucine, and the presence of millimolar levels of ATP
within the parasite (Saliba et al. 1999). It may be possible to define cytocidal action through
permeabilization of the outer membranes and staining with a dye like trypan blue. In part 1 of
this chapter, I explore this idea.
3.1.2. Part 2: Is Hz a Cytocidal Target?
The Hz crystallization pathway is an important target for antimalarial chemotherapy at
cytostatic doses, both whether it is relevant for cytocidal doses is not entirely clear. Quinoline
antimalarials, such as CQ, quinine (QN) and amodiaquine (AQ), are known to bind to multiple
precrystalline forms of heme in different ways and thus presumably inhibit crystal growth by
sequestration of monomeric and/or dimeric heme (de Dios et al. 2004; de Dios et al. 2003; Egan
et al. 2005; Egan et al. 1994; Leed et al. 2002; Sullivan et al. 1996a, reviewed in Gorka et al.
2013c). During the trophozoite stage of the intraerythrocytic cycle, P. falciparum actively
degrades host red blood cell hemoglobin, producing millimolar quantities of toxic
ferriprotoporphyrin IX (FPIX) heme within the digestive vacuole (DV) of the parasite (Banerjee
et al. 2002; Gamboa de Domínguez et al. 1996). Due to the lack of a heme oxygenase pathway
(Yoshida et al. 2000), the malaria parasite maintains a low concentration of toxic free heme by
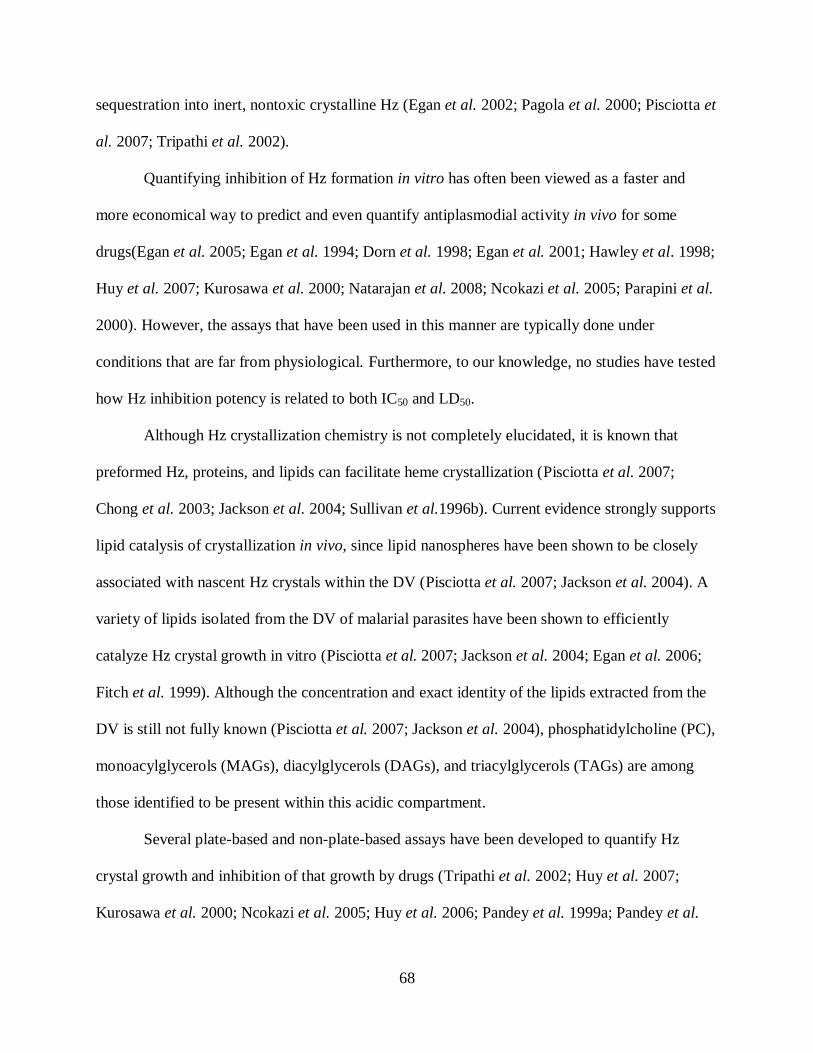
68
sequestration into inert, nontoxic crystalline Hz (Egan et al. 2002; Pagola et al. 2000; Pisciotta et
al. 2007; Tripathi et al. 2002).
Quantifying inhibition of Hz formation in vitro has often been viewed as a faster and
more economical way to predict and even quantify antiplasmodial activity in vivo for some
drugs(Egan et al. 2005; Egan et al. 1994; Dorn et al. 1998; Egan et al. 2001; Hawley et al. 1998;
Huy et al. 2007; Kurosawa et al. 2000; Natarajan et al. 2008; Ncokazi et al. 2005; Parapini et al.
2000). However, the assays that have been used in this manner are typically done under
conditions that are far from physiological. Furthermore, to our knowledge, no studies have tested
how Hz inhibition potency is related to both IC50 and LD50.
Although Hz crystallization chemistry is not completely elucidated, it is known that
preformed Hz, proteins, and lipids can facilitate heme crystallization (Pisciotta et al. 2007;
Chong et al. 2003; Jackson et al. 2004; Sullivan et al.1996b). Current evidence strongly supports
lipid catalysis of crystallization in vivo, since lipid nanospheres have been shown to be closely
associated with nascent Hz crystals within the DV (Pisciotta et al. 2007; Jackson et al. 2004). A
variety of lipids isolated from the DV of malarial parasites have been shown to efficiently
catalyze Hz crystal growth in vitro (Pisciotta et al. 2007; Jackson et al. 2004; Egan et al. 2006;
Fitch et al. 1999). Although the concentration and exact identity of the lipids extracted from the
DV is still not fully known (Pisciotta et al. 2007; Jackson et al. 2004), phosphatidylcholine (PC),
monoacylglycerols (MAGs), diacylglycerols (DAGs), and triacylglycerols (TAGs) are among
those identified to be present within this acidic compartment.
Several plate-based and non-plate-based assays have been developed to quantify Hz
crystal growth and inhibition of that growth by drugs (Tripathi et al. 2002; Huy et al. 2007;
Kurosawa et al. 2000; Ncokazi et al. 2005; Huy et al. 2006; Pandey et al. 1999a; Pandey et al.

69
1999b; Trang et al. 2006; Tripathi et al. 2001; Tripathi et al. 2004). Most previously reported
assays require centrifugation and/or filtration and are performed under nonphysiological
conditions (an exception being low-throughput assays performed previously [Pisciotta et al.
2007]). Some of these studies have hinted at a correlation between Hz inhibition potency and
antiplasmodial IC50, but contrasting results have also been reported (Dorn et al. 1999; Hawley et
al. 1998; Kaschula et al. 2002). For previously reported high-throughput assays, multiple steps
involved in the processing of Hz crystals are cumbersome and can add additional error. Some use
hazardous reagents or require expensive equipment, such as microfiltration plates.
Additional development of several classes of antimalarial drugs would benefit from a
more complete understanding of the relationship between drug potency against malarial parasites
and their ability to inhibit Hz formation. As part of this effort, high-throughput assays that more
closely mimic the physiological conditions of Hz formation would be helpful. The Roepe Lab
has developed such an assay that uses physiologically relevant lipid catalysts, ionic strength, and
temperature and that incorporates inexpensive, readily attainable, nonhazardous reagents (Gorka
et al. 2013a). Using this assay and working alongside my colleague Dr. Alexander Gorka, I
helped to quantify the effect of pH on Hz inhibition for common antimalarials, CQ, QN, AQ, and
quinidine (QD) and evaluated the catalytic efficiencies of different lipids. We also tested for a
correlation between Hz inhibition and antiplasmodial IC50 and LD50 for a series of CQ analogues
with a wide range of antiplasmodial activities (Scheme 3.1) (Natarajan et al. 2008; Ekoue-Kovi
et al. 2009; Iwaniuk et al. 2009; Yearick et al. 2008). The compounds I contributed, 6-9, allow
for a range of side-chain properties including: primary, secondary, and tertiary amines that are
either diprotic or triprotic, and with alcohol and carbamate functional groups.
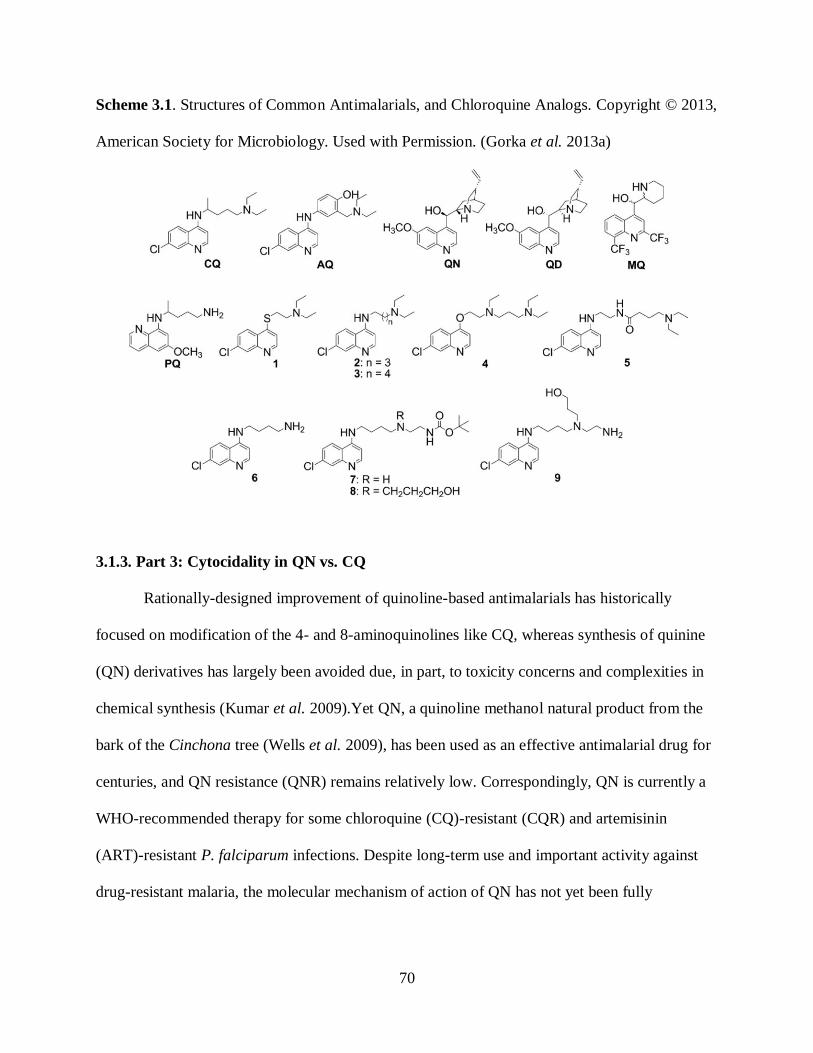
70
Scheme 3.1. Structures of Common Antimalarials, and Chloroquine Analogs. Copyright © 2013,
American Society for Microbiology. Used with Permission. (Gorka et al. 2013a)
3.1.3. Part 3: Cytocidality in QN vs. CQ
Rationally-designed improvement of quinoline-based antimalarials has historically
focused on modification of the 4- and 8-aminoquinolines like CQ, whereas synthesis of quinine
(QN) derivatives has largely been avoided due, in part, to toxicity concerns and complexities in
chemical synthesis (Kumar et al. 2009).Yet QN, a quinoline methanol natural product from the
bark of the Cinchona tree (Wells et al. 2009), has been used as an effective antimalarial drug for
centuries, and QN resistance (QNR) remains relatively low. Correspondingly, QN is currently a
WHO-recommended therapy for some chloroquine (CQ)-resistant (CQR) and artemisinin
(ART)-resistant P. falciparum infections. Despite long-term use and important activity against
drug-resistant malaria, the molecular mechanism of action of QN has not yet been fully

71
elucidated. Understanding similarities versus differences relative to CQ would assist with the
additional development of effective quinoline antimalarial drugs.
Resistance to QN is multifactorial and in various studies has been linked to mutations
and/or overexpression of several genes, including those encoding the P. falciparum chloroquine
resistance transporter (PfCRT) (Cooper et al. 2002; Griffin et al. 2012), multidrug resistance
protein (PfMDR1) (Sidhu et al. 2005), and Na+/H
+ exchanger (PfNHE) (Ferdig et al. 2004). One
theory for why QN remains active against some CQR phenotypes is that certain mutant PfCRT
isoforms that confer reduced CQ accumulation via increased PfCRT-mediated transport of CQ
do not accommodate increased transport of QN, even though CQ and QN are structurally similar
(Cooper et al. 2007; Roepe 2011; Sidhu et al. 2002). Our laboratory has recently discovered that
the mechanism of resistance to the cytocidal (cell-killing) activity of CQ is likely distinct from
the mechanism of resistance to the cytostatic (growth-inhibitory) activity of CQ (Roepe 2011;
Cabrera et al. 2009a; Paguio et al. 2011). Yet, other than one recent report (Paguio et al. 2011),
there has been no quantification of the cytostatic versus the cytocidal doses for QN and its
stereoisomers; therefore, it is currently not known how these parameters differ for various strains
and isolates of P. falciparum.
The behavior of QN stereoisomers (see Scheme 3.2) is particularly interesting and is in
theory a quite useful tool for elucidating QN pharmacology. Karle and coworkers reported that
while QN (8S,9R) and its 8,9-diastereomer quinidine (QD) (8R,9S) potently inhibit the growth of
malarial parasites, 9-epi-QN (eQN) (8S,9S) and 9-epi-QD (eQD) (8R,9R) do not, showing
strongly elevated IC50s against CQ-sensitive (CQS) strain D6 and CQR strain W2 (Karle et al.
1992). Curiously, W2 was found to be approximately 3-fold more sensitive to eQN and eQD
than D6. Albeit under nonphysiological conditions, Egan et al. demonstrated that the 9-epimers
72
inhibit hemozoin formation less well in vitro than QN and QD (Egan et al. 1994). These
findings, along with structural analysis of the compounds, led Karle et al. to hypothesize that the
altered orientation of intermolecular hydrogen bonds with cellular receptor sites for the threo
alkaloids eQN and eQD relative to that of their erythro counterparts, QN and QD (Karle et al.
1992), reduces Cinchona alkaloid potency. Recent work (Alumasa et al. 2011; Egan et al. 2005;
Leed et al. 2002; Cooper et al. 2002; Sidhu et al. 2005; Ferdig et al. 2004; Cooper et al. 2007;
Roepe 2011; Sidhu et al. 2002; Warhurst et al. 2003) has suggested that the cellular receptor
sites alluded to by Karle et al. may be one or more forms of free FPIX heme within the DV.
Warhurst and coworkers investigated the physicochemical properties of the erythro versus threo
isomers and calculated that the latter have an elevated aliphatic N pKa (9.5 versus 8.6 for the
erythro isomer) and a reduced log D at pH 7.4, predicting decreased membrane transfer
(Warhurst et al. 2003). Thus, intrinsic differences in the antiplasmodial activities of the isomer
pairs may result from (i) a different chemical interaction(s) with heme, (ii) a decreased ability of
eQN and eQD to partition from aqueous to lipid phase (i.e., to cross membranes) (Warhurst et al.
2003), or (iii) perhaps altered binding to other (nonheme) cellular receptors. In parasites that are
resistant to quinoline drugs, mutations in DV membrane transporters with stereospecific drug
interactions (Sidhu et al. 2005; Cooper et al. 2007; Roepe 2011; Sidhu et al. 2002) might be
predicted to further affect 9-epimer activity for these QNR or CQR strains.
To further distinguish between these possibilities, we hypothesized, based on a recent
model for QN-heme adducts (Alumasa et al. 2011), that it is possible that the lack of hemozoin
inhibition by eQN and eQD is due to altered monomeric heme binding arising from the change in
configuration at the 9-position carbon. Consistent with solution and solid-state nuclear magnetic
resonance (NMR) data, Alumasa and coworkers recently suggested that QN forms a highly
73
fluorescent 1:1 complex with FPIX through a dative Fe—O interaction which is stabilized by an
intramolecular five-membered ring formed via hydrogen bonding between the hydroxyl proton
and quinuclidine nitrogen (Alumasa et al. 2011). Alumasa et al. also showed that, in solution,
QN and QD bind to monomeric FPIX with high affinity and perturb the FPIX monomer-dimer
equilibrium in favor of monomer (Alumasa et al. 2011).
In collaboration with my colleague, Dr. Alexander Gorka, we performed similar in vivo
and in vitro experiments with the isomeric pairs to further elucidate Cinchona alkaloid
antiplasmodial activity and resistance. We also measured the cytostatic (IC50) and cytocidal
(LD50) activities for QN-susceptible (QNS) versus QNR strains, hemozoin inhibitory activities,
heme binding affinity, magnetic moment for drug-heme solutions, drug effects on pH-dependent
heme aggregation, and heme ring current effects on bound drug. We isolated eQN- and eQD-
heme complexes formed in aqueous solution and determined their stoichiometry and
fluorescence properties. In sum, the data elucidate key differences in heme interactions for the
isomeric pairs, suggest a novel model for eQN and eQD complexation with heme, and shed light
on the relevance of heme interactions for the cytostatic versus cytocidal activities of the
Cinchona alkaloids.

74
Scheme 3.2. Structures of Common Antimalarials, Epimers and Analogs of Quinine and
Quinidine. Copyright © 2013, American Society for Microbiology. Used with Permission.
(Gorka et al. 2013d)
3.2 Results
3.2.1. Part 1: Developing a Cytocidal Assay with Trypan Blue is Difficult
In order to potentially distinguish live vs. dead parasites following staining with trypan
blue, the erythrocyte plasma membrane must be permeabilized in order for the dye to come in
contact with the potentially-damaged parasite membrane. Saponin is known to permeabilize the
RBC membrane selectively (Siddiqui et al. 1979). In order to observe the potential uptake of
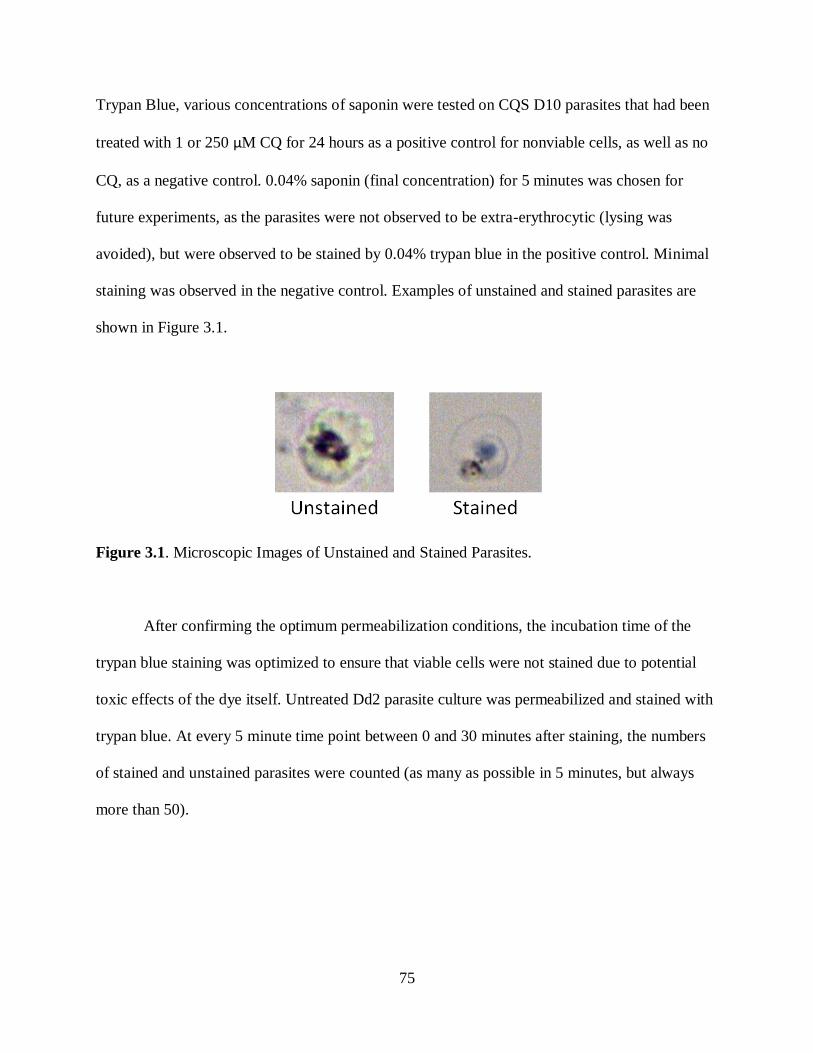
75
Trypan Blue, various concentrations of saponin were tested on CQS D10 parasites that had been
treated with 1 or 250 µM CQ for 24 hours as a positive control for nonviable cells, as well as no
CQ, as a negative control. 0.04% saponin (final concentration) for 5 minutes was chosen for
future experiments, as the parasites were not observed to be extra-erythrocytic (lysing was
avoided), but were observed to be stained by 0.04% trypan blue in the positive control. Minimal
staining was observed in the negative control. Examples of unstained and stained parasites are
shown in Figure 3.1.
Figure 3.1. Microscopic Images of Unstained and Stained Parasites.
After confirming the optimum permeabilization conditions, the incubation time of the
trypan blue staining was optimized to ensure that viable cells were not stained due to potential
toxic effects of the dye itself. Untreated Dd2 parasite culture was permeabilized and stained with
trypan blue. At every 5 minute time point between 0 and 30 minutes after staining, the numbers
of stained and unstained parasites were counted (as many as possible in 5 minutes, but always
more than 50).

76
Figure 3.2. Staining of Untreated Parasites by Trypan Blue Over Time.
The staining of viable parasites increases over the period, as shown in Figure 3.2. In order
to minimize unwanted staining, the stain would be added to the sample and immediately
processed by obtaining color images of bright-field microscopy under 100x magnification, see
Figure 3.3. Parasites within the images can then be counted, stained vs. unstained. Treating Dd2
parasites with LD50 CQ (21.6 µM) for 6 hours yields images like that shown in Figure 3.3, which
also contains untreated (no CQ) and 5xLD50 (180 µM) for 24 hours as negative and positive
controls, respectively.

77
Figure 3.3. Representative Images of Trypan-Blue Stained Parasites. Parasites circled in blue are
stained, while parasites circled in red are not.

78
The percentage of parasites stained vs. the calculated LD dose (0 μM [no drug], 50 μM
for 6 hour LD50 dose, 100 μM for 24 hour 5xLD50), can be plotted, as shown in Figure 3.4. The
plot is fairly linear, but the variation between percentage stained in different fields of view
results in high levels of error. Additionally, the no-drug negative control shows high levels of
background staining, suggesting that an assay based on this approach would have poor signal-to-
noise ratios.
Figure 3.4. Change in Percentage of Parasites Stained Versus Lethal Dose Value. Each point is
the average of 3 independent fields of view, with the error bars representing the standard error of
the mean, 3 determinations total.

79
In light of these results, our laboratory abandoned this approach and focused on another,
SYBR Green I dye-based approach that proved successful (Paguio et al. 2011), see “Discussion”
and Chapter VII, section 7.3.
3.2.2. Part 2: Hz is not a Likely CQ Cytocidal Target.
Previously Published as: Gorka, A. P.; Alumasa, J. N.; Sherlach, K. S.; Jacobs, L. M.; Nickley,
K. B.; Brower, J. P.; de Dios, A. C.; Roepe, P. D. Cytostatic versus Cytocidal Activities of
Chloroquine Analogues and Inhibition of Hemozoin Crystal Growth. Antimicrob. Agents
Chemother. 2013, 57, 356-364.
Copyright © 2013, American Society for Microbiology. [Antimicrobial Agents and
Chemotherapy, 57, 2013, 365-374, doi: 10.1128/AAC.01234-12]
The broad FPIX absorbance peak observed in the absence of SDS, characteristic of the μ-
oxo dimer (Casabianca et al. 2008), exhibits maximum absorbance (λmax) at 389 nm (Fig. 3.5A,
arrow 2), with a shoulder at 359 nm (Fig. 3.5A, arrow 1). My colleagues Drs. Gorka and
Alumasa found that simple titration of the μ-oxo dimer with SDS results in a red shift of the
FPIX Soret band from 389 nm to 405 nm (Fig. 3A, arrow 3), as well as a concentration-
dependent increase in absorbance. This is presumably because upon addition of SDS at
concentrations above the critical micelle concentration, free μ-oxo dimeric heme is converted to
its monomeric form (Casabianca et al. 2009), generating the λmax shift to 405 nm and a
concomitant increase in the extinction coefficient to 99,690 (M−1
cm−1
). This effect is also easily
measured in 96-well plate format (Fig. 3.5B), and the linear increase in absorbance then allows

80
for calibration of free FPIX at a known SDS concentration. That is, conversion of FPIX tο Ηz
can be quantified via simple addition of SDS, without plate-washing steps.
Figure 3.5. (A) SDS Effects on the Absorbance Spectrum of FPIX. Increasing amounts of SDS
were titrated into a cuvette containing 10 μM FPIX while the absorbance spectrum was recorded
after each addition. Results are shown for no SDS (red), 0.1% (3.47 mM) SDS (brown), 0.5%
(17.3 mM) SDS (green), 1% (34.7 mM) SDS (black), 2.5% (86.7 mM) SDS (blue), and 5% (173
mM) SDS (pink). (Inset) Peak height at 405 nm versus SDS concentration. a.u., absorbance

81
units. (B) Effect of SDS on the concentration-dependent absorbance (Abs.) of FPIX in the 96-
well plate format. Results are shown for no SDS (●, R2 = 0.996), 0.1% (3.47 mM) SDS (○, R
2 =
0.988), 0.5% (17.3 mM) SDS (▼, R2 = 0.992), 1% (34.7 mM) SDS (■, R
2 = 0.996), 2.5% (86.7
mM) SDS (□, R2 = 0.998), and 5% (173 mM) SDS (Δ, R
2 = 0.999). Increasing the concentration
of SDS increases the absorbance of FPIX to a maximum at ∼2.5% SDS. Each data point is an
average of three independent measurements, each performed in triplicate (9 determinations
total). Copyright © 2013, American Society for Microbiology. Used with Permission. (Gorka et
al. 2013a)
An assay was previously developed in the Roepe Lab that takes advantage of this
observation and that also mimics formation of Hz in vivo at physiological temperature, pH, and
ionic strength. The Hz-crystallization catalytic abilities of various lipids that are suggested from
recent reports to reside within the DV, were systematically compared to the catalytic efficiency
of PC and of other lipids, as well as mono- or diacyl glycerols (Fig. 3.6) (Tripathi et al. 2002;
Jackson et al. 2004). At physiological temperature, catalysis by PC was comparable to if not
better than that found for all other lipids tested, including a blend of PC, pMAG, and sMAG
(Fig. 3.6, BD). The lipid-catalyzed formation of Hz is pH dependent, with the strongest pH
dependence found for PS and the weakest found for PC and the PC-pMAG-sMAG blend. More
acidic aqueous conditions favor formation of the heme head-to-tail dimer (Egan et al. 2001);
thus, acceleration of Hz formation at lower pH is expected.
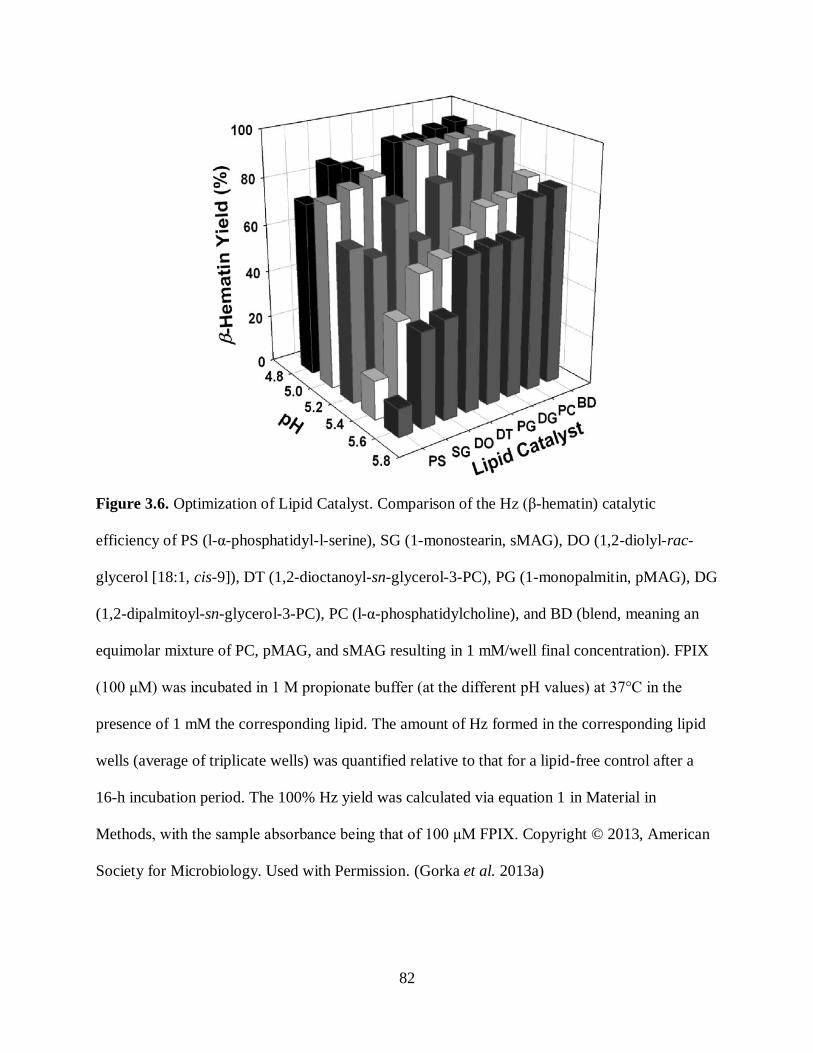
82
Figure 3.6. Optimization of Lipid Catalyst. Comparison of the Hz (β-hematin) catalytic
efficiency of PS (l-α-phosphatidyl-l-serine), SG (1-monostearin, sMAG), DO (1,2-diolyl-rac-
glycerol [18:1, cis-9]), DT (1,2-dioctanoyl-sn-glycerol-3-PC), PG (1-monopalmitin, pMAG), DG
(1,2-dipalmitoyl-sn-glycerol-3-PC), PC (l-α-phosphatidylcholine), and BD (blend, meaning an
equimolar mixture of PC, pMAG, and sMAG resulting in 1 mM/well final concentration). FPIX
(100 μM) was incubated in 1 M propionate buffer (at the different pH values) at 37°C in the
presence of 1 mM the corresponding lipid. The amount of Hz formed in the corresponding lipid
wells (average of triplicate wells) was quantified relative to that for a lipid-free control after a
16-h incubation period. The 100% Hz yield was calculated via equation 1 in Material in
Methods, with the sample absorbance being that of 100 μM FPIX. Copyright © 2013, American
Society for Microbiology. Used with Permission. (Gorka et al. 2013a)
83
PC was chosen as the catalyst for additional work because it performed similarly to the
blend yet is less expensive and more easily handled. The optimal FPIX concentration was
determined to be 100 μM, since this provides a wide dynamic range (>0.6 absorbance unit), as it
is converted to Hz over approximately 16 h. Also, under control assay conditions, conversion of
100 μM FPIX to Ηz was near 100%. Again, PC was found to be the most efficient catalyst at
either pH (Fig. 3.7; Table 1), and Hz formation appeared to plateau at about 16 h. For the initial
rates of Hz formation at pH 5.2, PC catalysis was 1.5-, 2-, and 5-fold faster than that with
pMAG, sMAG, and the control (no lipid), respectively, and that the rate for PC-catalyzed Hz
formation in this assay was very similar to that defined for the rate of Hz growth in live parasites
(Pisciotta et al. 2007).

84
Figure 3.7. pH-Dependent Kinetics for the Production of Hz (β-hematin) in the presence of PC
(●), pMAG (○), or sMAG (▼) or the absence of a catalyst (Δ). Sonicated lipids were incubated
at 37°C with 100 μM FPIX in 200 μL of propionate buffer for 16 h at pH 5.2 (A) and pH 5.6 (B).
Curve fitting was performed with SigmaPlot (version 10.0) software using the equation y = a(1 −
bx). (Insets) The corresponding initial rate plots from time zero (t0) to 4 h (t4) (Table 3.1). Inset
data are fit to linear regressions, and the initial rates were extracted from the slopes. Each data
point is an average of three independent measurements, each performed in triplicate (9
determinations total).

85
Table 3.1. Initial rates of production of Hz in the presence of PC, pMAG, and sMAG and in the
absence of lipid catalysts. Copyright © 2013, American Society for Microbiology. Used with
Permission. (Gorka et al. 2013a)
Catalyst Initial rate
a (M s
−1 [10
−8])
pH 5.2 pH 5.6
No lipid 0.67 0.57
PC 3.61 1.77
pMAG 2.39 1.51
sMAG 1.78 1.66 aInitial rates were calculated within the first 4 h of the reaction (see insets in Fig. 3.7).
Using this standardized assay, the inhibition of Hz formation by common antimalarials
(CQ, QN, QD, and AQ) was quantified at several pHs. Overall, similar to other studies (Dorn et
al. 1998; Huy et al. 2007, Ncokazi et al. 2005), we found that potencies were AQ > CQ ≈ QD >
QN across the range of pHs (Fig. 3.8). We noted that different absolute IC50s were obtained at
the same pH when the identity of the lipid catalyst was changed (Table 3.2) but that the trends
for the drugs remained similar. For CQ and AQ, the differences observed when PC versus
pMAG catalysts were used were relatively small (2- to 3-fold); however, interestingly, QN and
QD IC50s were more perturbed by altering the lipid composition. This is consistent with the
differences in CQ versus QN lipid partitioning behavior noted earlier (Casabianca et al. 2009).
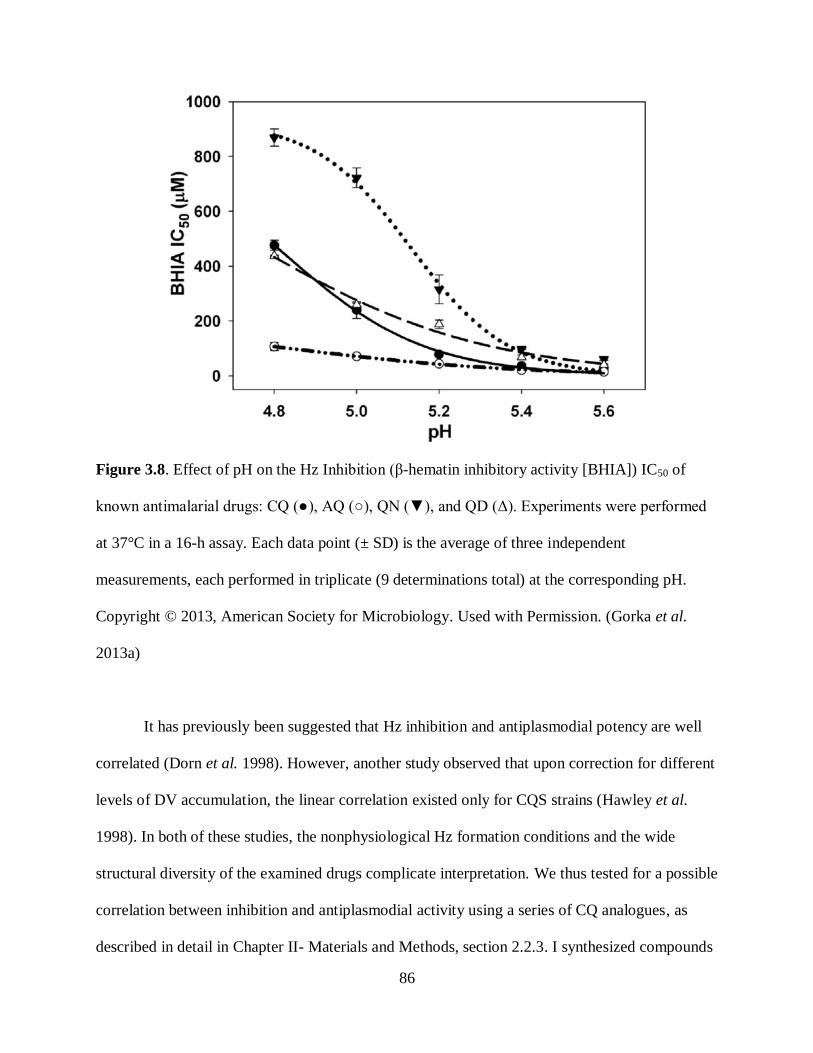
86
Figure 3.8. Effect of pH on the Hz Inhibition (β-hematin inhibitory activity [BHIA]) IC50 of
known antimalarial drugs: CQ (●), AQ (○), QN (▼), and QD (Δ). Experiments were performed
at 37°C in a 16-h assay. Each data point (± SD) is the average of three independent
measurements, each performed in triplicate (9 determinations total) at the corresponding pH.
Copyright © 2013, American Society for Microbiology. Used with Permission. (Gorka et al.
2013a)
It has previously been suggested that Hz inhibition and antiplasmodial potency are well
correlated (Dorn et al. 1998). However, another study observed that upon correction for different
levels of DV accumulation, the linear correlation existed only for CQS strains (Hawley et al.
1998). In both of these studies, the nonphysiological Hz formation conditions and the wide
structural diversity of the examined drugs complicate interpretation. We thus tested for a possible
correlation between inhibition and antiplasmodial activity using a series of CQ analogues, as
described in detail in Chapter II- Materials and Methods, section 2.2.3. I synthesized compounds
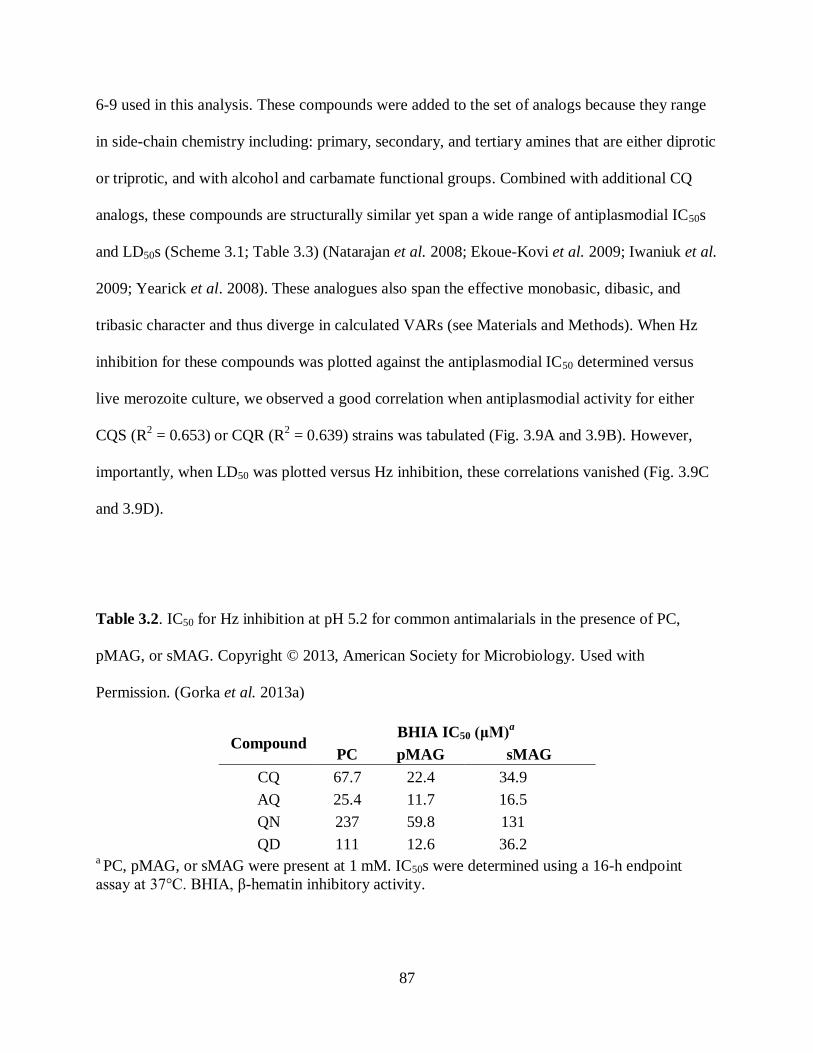
87
6-9 used in this analysis. These compounds were added to the set of analogs because they range
in side-chain chemistry including: primary, secondary, and tertiary amines that are either diprotic
or triprotic, and with alcohol and carbamate functional groups. Combined with additional CQ
analogs, these compounds are structurally similar yet span a wide range of antiplasmodial IC50s
and LD50s (Scheme 3.1; Table 3.3) (Natarajan et al. 2008; Ekoue-Kovi et al. 2009; Iwaniuk et al.
2009; Yearick et al. 2008). These analogues also span the effective monobasic, dibasic, and
tribasic character and thus diverge in calculated VARs (see Materials and Methods). When Hz
inhibition for these compounds was plotted against the antiplasmodial IC50 determined versus
live merozoite culture, we observed a good correlation when antiplasmodial activity for either
CQS (R2 = 0.653) or CQR (R
2 = 0.639) strains was tabulated (Fig. 3.9A and 3.9B). However,
importantly, when LD50 was plotted versus Hz inhibition, these correlations vanished (Fig. 3.9C
and 3.9D).
Table 3.2. IC50 for Hz inhibition at pH 5.2 for common antimalarials in the presence of PC,
pMAG, or sMAG. Copyright © 2013, American Society for Microbiology. Used with
Permission. (Gorka et al. 2013a)
Compound BHIA IC50 (μM)
a
PC pMAG sMAG
CQ 67.7 22.4 34.9
AQ 25.4 11.7 16.5
QN 237 59.8 131
QD 111 12.6 36.2 a PC, pMAG, or sMAG were present at 1 mM. IC50s were determined using a 16-h endpoint
assay at 37°C. BHIA, β-hematin inhibitory activity.

88
Figure 3.9. Correlation Plots Between the Hz inhibition (β-hematin inhibitory activity [BHIA])
IC50 and Antiplasmodial Activities for CQ analogs against HB3 (A, C) or Dd2 (B, D) for a series
of CQ analogues. Best-fit plots of the data were generated by the least-squares method using
SigmaPlot software. (A) Plot of BHIA IC50 versus antiplasmodial IC50 for CQS HB3 parasites
(R2 = 0.653); (B) plot of BHIA IC50 versus antiplasmodial IC50 for CQR Dd2 parasites (R
2 =
0.639); (C) plot of BHIA IC50 versus antiplasmodial LD50 for HB3 parasites (R2 = 0.015); (D)
plot of BHIA IC50 versus antiplasmodial LD50 for Dd2 parasites (R2 = 0.057). IC50 and LD50
values are those found in Table 3.3. Copyright © 2013, American Society for Microbiology.
Used with Permission. (Gorka et al. 2013a).

Table 3.3. Physical and pharmacokinetic properties, antiplasmodial IC50 and LD50, and BHIA IC50 for antimalarial drugs and drug
analogues used in this work (See Scheme 3.1). Copyright © 2013, American Society for Microbiology. Used with Permission. (Gorka
et al. 2013a)
Antiplasmodial IC50
(nM)d
Antiplasmodial LD50
(µM)e
BHIA IC50 (µM)d
Cpd
IC
MW
(g/mol) pKa
a ClogP
b
Diffusion
Coefficient
(x 10-6
cm2/s)
c
HB3 Dd2 HB3 Dd2 pH 5.6 pH 5.2
CQ 318.19 7.65
9.86 4.65 5.00 19.6 (0.4) 201.5 (9.1) 0.12 (0.01) 16.5 (2.1) 52.9 (8.0) 194.9 (5.6)
QN 324.42 5.69
9.10 3.26 5.00 107.2 (12.4) 265.6 (14.6) 9.1 (0.4) 36.3 (9.1) 42.5 (8.3)
255.4
(22.7)
QD 324.42 5.69
9.10 3.26 5.00 41.9 (6.0) 174.1 (3.1) 0.43 (0.1) 33.6 (0.1) 27.2 (2.7) 176.2 (4.9)
AQ 355.86 5.84
9.88 4.09 4.82 10.0 (3.3) 27.7 (2.9)
0.04
(0.007)f
0.05
(0.004)f
22.1 (0.9) 70.1 (1.3)
1 294.95 5.11
8.59 4.58 5.26
9530.0
(39.5)
5500.0
(28.2) 79.9 (0.1) 94.4 (0.8) 39.6 (2.2)
312.6
(10.1)
2 305.9 7.50
9.81 4.34 4.99 6.0 (0.7) 26.0 (3.5) 0.23 (0.01) 0.52 (0.01) 8.2 (0.9) 37.8 (6.2)
3 319.9 7.56
9.84 4.82 4.82 12.0 (0.9) 199.0 (11.1) 3.8 (0.1) 15.7 (1.0) 11.2 (2.0) 65.2 (8.1)
4 363.92
4.93
7.48
9.58
5.16 4.45 95.0 (10.6) 169.0 (16.2) 7.1 (0.1) 41.3 (0.1) 17.0 (2.5) 117.0
(12.6)
89

5 362.9 7.70
9.35 3.15 4.48 79.0 (5.9) 94.0 (10.7) 0.80 (0.01) 51.5 (5.1) 7.2 (1.2)
142.4
(14.9)
6 249.74 7.65
10.04 2.44 5.97
2990.0
(31.8)
2390.0
(33.4) 45.2 (0.1) 17.4 (1.3) 44.5 (7.5)
209.0
(17.1)
7 292.92 7.44
9.17 4.4 4.46 > 10000
3720.0
(42.5) 2.8 (0.02) 2.7 (0.01) 53.0 (8.2) 96.0 (12.4)
8 451 7.64
8.05 4.39 4.13
1680.0
(23.5)
6970.0
(51.2) 2.8 (0.02) 3.9 (0.07) 52.5 (6.1)
172.5
(16.3)
9 350.89
7.64
8.99
9.55
1.4 4.82 1390.0
(19.5)
8070.0
(62.3) 8.6 (0.05) 2.8 (0.01)
117.5
(19.2)
121.5
(18.3)
a Calculated using the SPARC online calculator (sparc.chem.uga.edu/sparc/liqpka/index.cfm?ionize=N13). pKas are for the quinolinyl
and side chain aliphatic nitrogens, respectively, with the former listed from left to right beginning at the quinoline branch point (see
Figure 3.7).
b Calculated for octanol/water using the SPARC online calculator.
c Calculated for water diffusion using the SPARC online calculator.
d IC50 values are an average of three independent trials, each performed in triplicate (9 replicates total). SEM is shown in parentheses.
e LD50 values are an average of two independent trials, each performed in triplicate (6 replicates total). SEM is shown in parentheses.
f Paguio et al. 2011
90

91
As described earlier (Natarajan et al. 2008), replacement of the anilinal N by S or O for
some of these compounds significantly lowers the quinolinal N pKa (to values near those seen
for QN or QD; see Natarajan et al. 2008). In vivo antiplasmodial IC50s are presumably defined,
in part, by the fold accumulation of the drug at the site of Hz formation (i.e., the acidic DV
interior). We therefore scaled antiplasmodial IC50s and LD50s by multiplying by the calculated
VARs for each molecule, such that the in vivo IC50s were normalized to predicted vacuolar
accumulation (see Materials and Methods). However, this did not improve the correlation
between either IC50 or LD50 and Hz inhibition (data not shown).
LD50 versus IC50 data highlight interesting trends for the cytocidal and cytostatic
activities observed in the correlation analysis (Fig. 3.9). For CQ, CQR strain Dd2 was ∼10-fold
resistant by IC50 but ∼140-fold resistant by LD50 (Paguio et al. 2011) (Table 3.3). In contrast,
AQ has low-nM LD50s, with no significant differences for HB3 versus Dd2 (Paguio et al. 2011).
Interestingly, for compounds 1 and 7, Dd2 is hypersensitive by IC50 (more sensitive than CQS
strain HB3) but is either slightly resistant relative to HB3 (compound 1) or has sensitivity similar
to that of HB3 (compound 7) when potency is quantified by LD50. Dd2 is hypersensitive to
compounds 6 and 9 by LD50 but is resistant to compounds 2 to 5 and 8. Interestingly, some
compounds with high IC50s (low cytostatic activity) are more active by LD50 (high cytocidal
potency) (compounds 7 to 9). Overall, then, the good correlation between Hz inhibition and IC50,
with a lack of a correlation between Hz inhibition and LD50 for the same drugs, spans a range of
CQ compound behavior for CQS versus CQR strains.

92
3.2.3. Part 3: Hz is Not Likely to be a QN Cytocidal Target
Previously published as:
Gorka, A. P.; Sherlach, K. S.; de Dios, A. C.; Roepe, P. D. Relative to Quinine and Quinidine,
Their 9-Epimers Exhibit Decreased Cytostatic Activity and Altered Heme Binding but Similar
Cytocidal Activity versus Plasmodium falciparum. Antimicrob. Agents. Chemother. 2013, 57,
365-374.
Copyright © 2013, American Society for Microbiology.[ Antimicrobial Agents and
Chemotherapy, 57, 2013, 356-364, doi: 10.1128/AAC.01709-12].
eQN and eQD were prepared by Dr. Alexander Gorka via a one-pot Mitsunobu
esterification-saponification reaction, as described previously (Sidorowicz et al. 2011). QN and
QD were converted to the p-nitrobenzoate ester using p -nitrobenzoic acid and
triphenylphosphine (oxidized to triphenylphosphine oxide via DIAD), followed by in situ
saponification with lithium hydroxide, to afford eQN and eQD, respectively and purified (see
Material and Methods).
Cytostatic and cytocidal antiplasmodial activities of the compounds shown in Scheme 3.2
were determined for HB3 (QNS), Dd2 (QNR), and K76I (QN-hypersensitive) strains of P.
falciparum using the SYBR green I assay (Bennet et al. 2004b; Paguio et al. 2011) (Table 3.4)
by Dr. Alexander Gorka. Previously, strain K76I was found to be similarly CQR and QD
resistant (QDR) relative to Dd2 (as defined by IC50 data) yet hypersensitive to QN, owing to a
PfCRT mutation at position 76 (Dd2 harbors a K76T mutation) (Cooper et al. 2002; Griffin et al.
2012). Similar to previous work (Karle et al. 1992), we found that eQN has an IC50 ∼60-fold
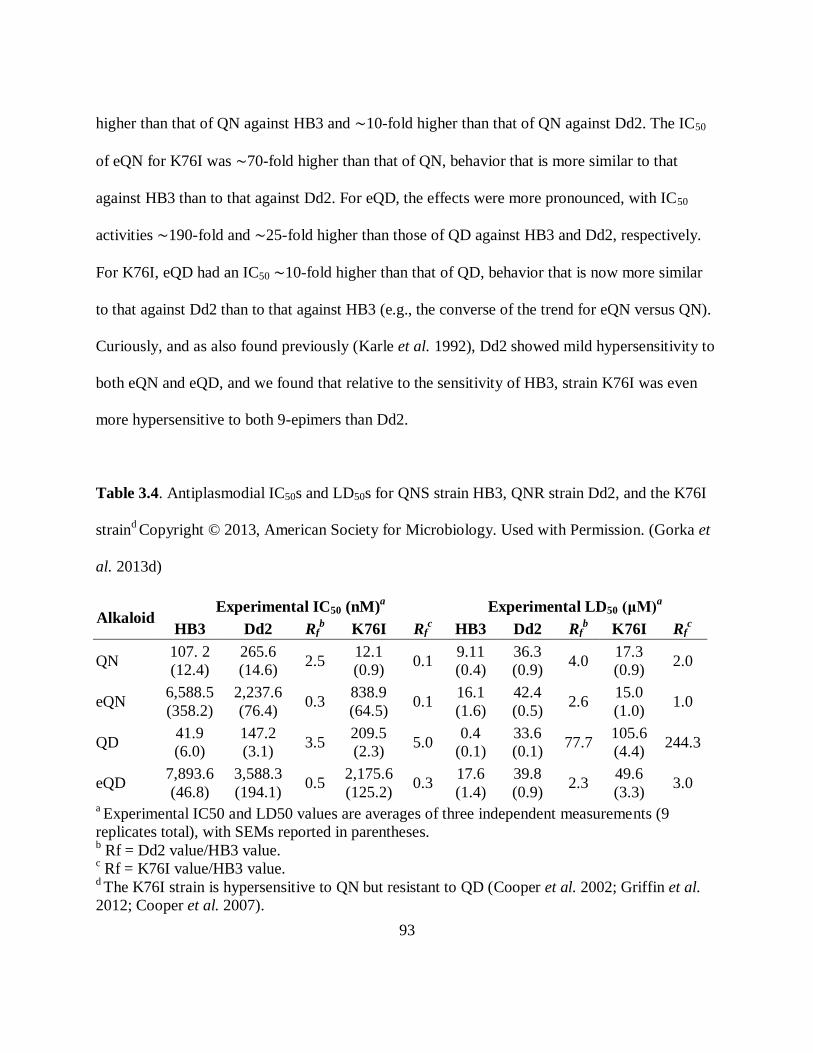
93
higher than that of QN against HB3 and ∼10-fold higher than that of QN against Dd2. The IC50
of eQN for K76I was ∼70-fold higher than that of QN, behavior that is more similar to that
against HB3 than to that against Dd2. For eQD, the effects were more pronounced, with IC50
activities ∼190-fold and ∼25-fold higher than those of QD against HB3 and Dd2, respectively.
For K76I, eQD had an IC50 ∼10-fold higher than that of QD, behavior that is now more similar
to that against Dd2 than to that against HB3 (e.g., the converse of the trend for eQN versus QN).
Curiously, and as also found previously (Karle et al. 1992), Dd2 showed mild hypersensitivity to
both eQN and eQD, and we found that relative to the sensitivity of HB3, strain K76I was even
more hypersensitive to both 9-epimers than Dd2.
Table 3.4. Antiplasmodial IC50s and LD50s for QNS strain HB3, QNR strain Dd2, and the K76I
straind Copyright © 2013, American Society for Microbiology. Used with Permission. (Gorka et
al. 2013d)
Alkaloid Experimental IC50 (nM)
a Experimental LD50 (μM)
a
HB3 Dd2 Rfb K76I Rf
c HB3 Dd2 Rf
b K76I Rf
c
QN 107. 2
(12.4)
265.6
(14.6) 2.5
12.1
(0.9) 0.1
9.11
(0.4)
36.3
(0.9) 4.0
17.3
(0.9) 2.0
eQN 6,588.5
(358.2)
2,237.6
(76.4) 0.3
838.9
(64.5) 0.1
16.1
(1.6)
42.4
(0.5) 2.6
15.0
(1.0) 1.0
QD 41.9
(6.0)
147.2
(3.1) 3.5
209.5
(2.3) 5.0
0.4
(0.1)
33.6
(0.1) 77.7
105.6
(4.4) 244.3
eQD 7,893.6
(46.8)
3,588.3
(194.1) 0.5
2,175.6
(125.2) 0.3
17.6
(1.4)
39.8
(0.9) 2.3
49.6
(3.3) 3.0
a Experimental IC50 and LD50 values are averages of three independent measurements (9
replicates total), with SEMs reported in parentheses. b Rf = Dd2 value/HB3 value.
c Rf = K76I value/HB3 value.
d The K76I strain is hypersensitive to QN but resistant to QD (Cooper et al. 2002; Griffin et al.
2012; Cooper et al. 2007).
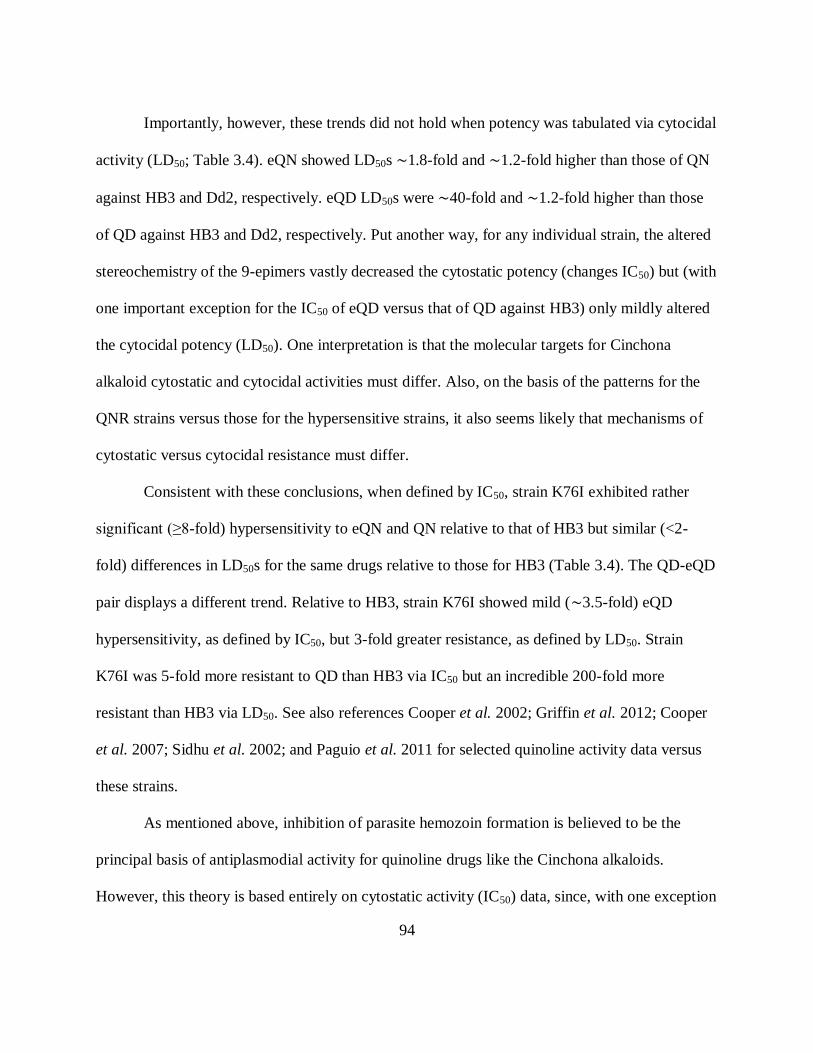
94
Importantly, however, these trends did not hold when potency was tabulated via cytocidal
activity (LD50; Table 3.4). eQN showed LD50s ∼1.8-fold and ∼1.2-fold higher than those of QN
against HB3 and Dd2, respectively. eQD LD50s were ∼40-fold and ∼1.2-fold higher than those
of QD against HB3 and Dd2, respectively. Put another way, for any individual strain, the altered
stereochemistry of the 9-epimers vastly decreased the cytostatic potency (changes IC50) but (with
one important exception for the IC50 of eQD versus that of QD against HB3) only mildly altered
the cytocidal potency (LD50). One interpretation is that the molecular targets for Cinchona
alkaloid cytostatic and cytocidal activities must differ. Also, on the basis of the patterns for the
QNR strains versus those for the hypersensitive strains, it also seems likely that mechanisms of
cytostatic versus cytocidal resistance must differ.
Consistent with these conclusions, when defined by IC50, strain K76I exhibited rather
significant (≥8-fold) hypersensitivity to eQN and QN relative to that of HB3 but similar (<2-
fold) differences in LD50s for the same drugs relative to those for HB3 (Table 3.4). The QD-eQD
pair displays a different trend. Relative to HB3, strain K76I showed mild (∼3.5-fold) eQD
hypersensitivity, as defined by IC50, but 3-fold greater resistance, as defined by LD50. Strain
K76I was 5-fold more resistant to QD than HB3 via IC50 but an incredible 200-fold more
resistant than HB3 via LD50. See also references Cooper et al. 2002; Griffin et al. 2012; Cooper
et al. 2007; Sidhu et al. 2002; and Paguio et al. 2011 for selected quinoline activity data versus
these strains.
As mentioned above, inhibition of parasite hemozoin formation is believed to be the
principal basis of antiplasmodial activity for quinoline drugs like the Cinchona alkaloids.
However, this theory is based entirely on cytostatic activity (IC50) data, since, with one exception

95
(Paguio et al. 2011), in vitro antiplasmodial activity is always routinely quantified via IC50. Data
produced by Dr. Alexander Gorka shows that QN and QD actively inhibit the formation of
hemozoin under physiological conditions in the low- to mid-μM range at both pH 5.2 and 5.6,
eQN and eQD do not, with inhibitory IC50s being above several mM (Table 3.5). We use
measurement at both pH 5.2 and 5.6 to mimic variable physiological conditions, since different
DV pHs for sensitive (HB3) versus resistant (Dd2) strains have been measured in some studies
(Bennet et al. 2004a). These data suggest that the loss of cytostatic activity for the 9-epimers is
due to an inability to prevent hemozoin formation, as also suggested by Egan et al. (2004).
Table 3.5. β-Hematin inhibitory IC50 data at pH 5.2 and 5.6a Copyright © 2013, American
Society for Microbiology. Used with Permission. (Gorka et al. 2013d)
Alkaloid β-Hematin IC50 (μM)
pH 5.2 pH 5.6
QN 255.4 (22.7) 42.5 (8.3)
eQN >1,000 >3,000
QD 176.2 (4.9) 27.2 (2.7)
eQD >1,000 >3,000 a Less than 10% inhibition is seen for the 9-epimers at 1 mM, leading to an estimated IC50 above
several mM. Experimental IC50 and values are averages of three independent measurements (9
replicates total), with SEMs reported in parentheses.
We next plotted the hemozoin (β-hematin) inhibitory IC50 (β-hematin inhibitory activity
[BHIA]) against a series of QN analogues with variable cytostatic potency (Dinio et al. 2012) to
test for possible correlations (Fig. 3.10). The antiplasmodial IC50 was indeed mildly correlated
96
with the BHIA IC50 across the series (R2 > 0.54). However, interestingly, the correlation
vanished when LD50 data were plotted (R2 < 0.01; Fig. 3.10, caption). Consistent with the data in
Table 3.4, this further suggests that Cinchona alkaloid targets for cytostatic versus cytocidal
activities differ.
Figure 3.10. Antiplasmodial Activity of a Series of QN analogues (Dinio et al. 2012). (A) BHIA
IC50 versus antiplasmodial IC50; (B) BHIA IC50 versus antiplasmodial LD50. The IC50s shown are
averages of three independent measurements, each done in triplicate (9 replicates total) as
reported previously (Dinio et al. 2012). LD50 values are averages ± SEMs of three replicates and
are as follows: CN-2, 2,337.9 ± 4.3 nM; CN-4, 2,360.6 ± 13.4 nM; QD-2, 2,234.1 ± 7.4 nM; QN-
8, 2,251.4 ± 28.4 nM; QN-12, 2,346.5 ± 13.2 nM. Copyright © 2013, American Society for
Microbiology. Used with Permission. (Gorka et al. 2013d)
As described below, the 9-epimers promote stabilization of monomeric heme. Ideally,
experiments to determine the affinity of the isomeric pairs for binding monomeric FPIX would
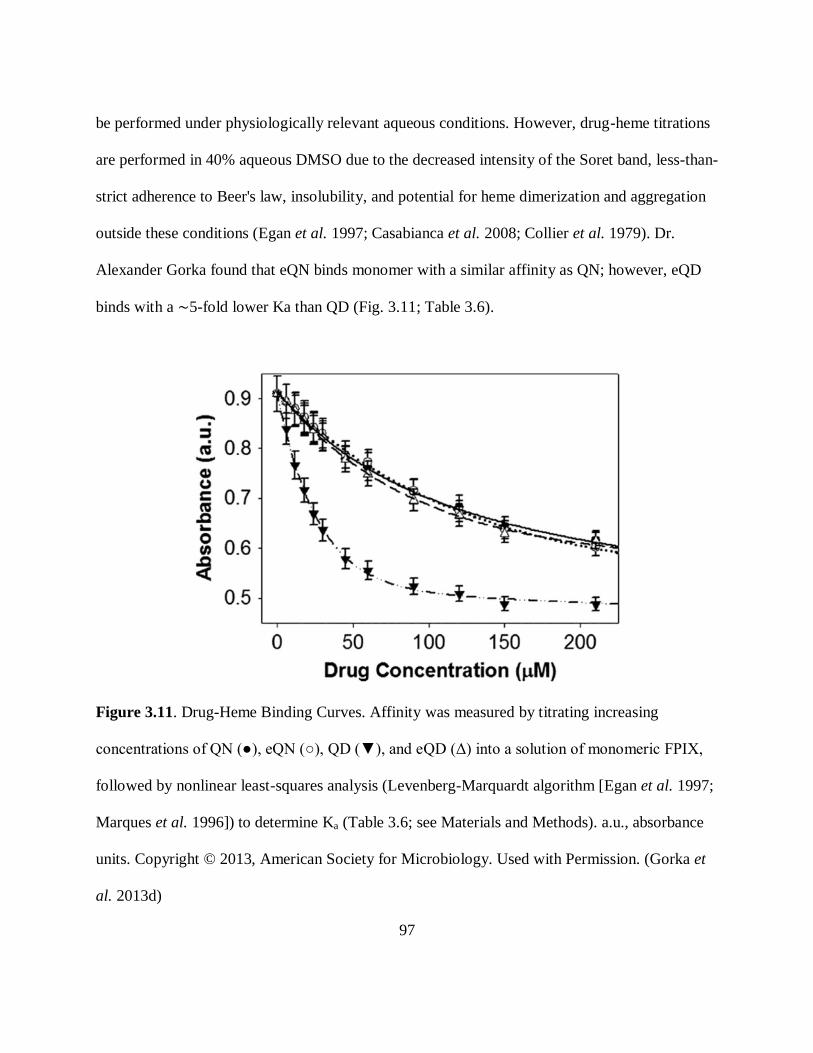
97
be performed under physiologically relevant aqueous conditions. However, drug-heme titrations
are performed in 40% aqueous DMSO due to the decreased intensity of the Soret band, less-than-
strict adherence to Beer's law, insolubility, and potential for heme dimerization and aggregation
outside these conditions (Egan et al. 1997; Casabianca et al. 2008; Collier et al. 1979). Dr.
Alexander Gorka found that eQN binds monomer with a similar affinity as QN; however, eQD
binds with a ∼5-fold lower Ka than QD (Fig. 3.11; Table 3.6).
Figure 3.11. Drug-Heme Binding Curves. Affinity was measured by titrating increasing
concentrations of QN (●), eQN (○), QD (▼), and eQD (Δ) into a solution of monomeric FPIX,
followed by nonlinear least-squares analysis (Levenberg-Marquardt algorithm [Egan et al. 1997;
Marques et al. 1996]) to determine Ka (Table 3.6; see Materials and Methods). a.u., absorbance
units. Copyright © 2013, American Society for Microbiology. Used with Permission. (Gorka et
al. 2013d)

98
Table 3.6. Drug-heme affinity coefficients for binding monomeric FPIXb Copyright © 2013,
American Society for Microbiology. Used with Permission. (Gorka et al. 2013d)
Alkaloid Experimental Ka for monomer (M−1
[104])
a R
2
QN 0.75 (0.07) 1.00
eQN 0.61 (0.11) 1.00
QD 4.40 (0.04) 0.99
eQD 0.94 (0.10) 1.00
a Experimental Ka values are averages of three independent measurements (9 replicates total),
with SEMs reported in parentheses. b Drug-heme affinity coefficients for binding monomeric FPIX were obtained via nonlinear least-
squares analysis of binding data using the Levenberg-Marquardt algorithm, which is described
elsewhere (Egan et al. 1997; Marques et al. 1996). See the caption to Fig. 3.11 for binding data.
I studied the effect of various drugs on the pH-dependent solubility of monomeric FPIX
by varying the pH versus a constant FPIX concentration (178 μM) and drug concentration (20
μM). Previous studies of the pH-dependent aggregation of FPIX, and the effect of quinolines on
this phenomenon determined that the effect of quinolines on the aggregation of FPIX does not
depend on the identity of the quinoline, for example CQ and AQ result in the same shift of pH-
dependent solubility. The alteration is also not stoichiometric, suggesting an as-yet not fully
defined nucleation phenomenon, where variations of drug concentration up to 8 orders of
magnitude do not impact the shift in solubility (Ursos et al. 2001). We found that eQN and eQD
did not affect the pH-dependent solubility of FPIX, whereas QN, QD, CQ, and AQ produced a
marked effect over a relatively narrow pH range (Fig. 3.12A; see also Ursos et al. 2001). This
effect is immediately apparent when the midpoints of each solubility curve are quantified (Fig.
3.12B). Just as QN and QD differ from their 9-epimers in their inhibition of Hz, a difference is
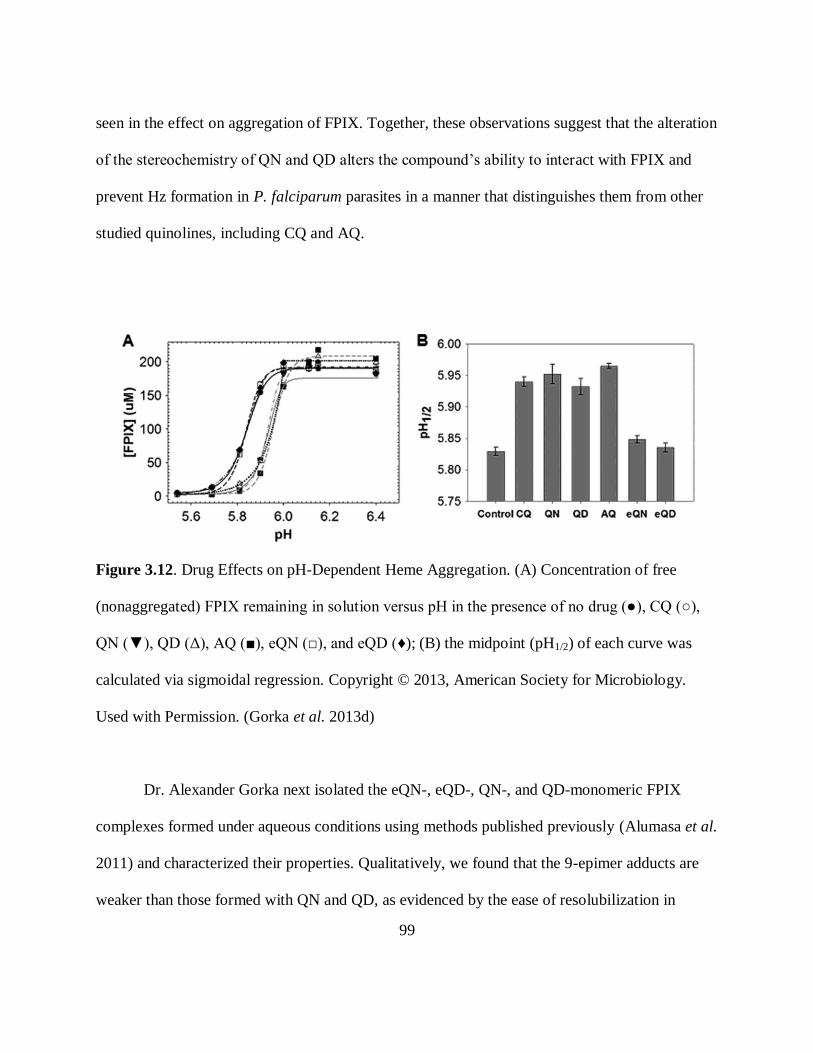
99
seen in the effect on aggregation of FPIX. Together, these observations suggest that the alteration
of the stereochemistry of QN and QD alters the compound’s ability to interact with FPIX and
prevent Hz formation in P. falciparum parasites in a manner that distinguishes them from other
studied quinolines, including CQ and AQ.
Figure 3.12. Drug Effects on pH-Dependent Heme Aggregation. (A) Concentration of free
(nonaggregated) FPIX remaining in solution versus pH in the presence of no drug (●), CQ (○),
QN (▼), QD (Δ), AQ (■), eQN (□), and eQD (♦); (B) the midpoint (pH1/2) of each curve was
calculated via sigmoidal regression. Copyright © 2013, American Society for Microbiology.
Used with Permission. (Gorka et al. 2013d)
Dr. Alexander Gorka next isolated the eQN-, eQD-, QN-, and QD-monomeric FPIX
complexes formed under aqueous conditions using methods published previously (Alumasa et al.
2011) and characterized their properties. Qualitatively, we found that the 9-epimer adducts are
weaker than those formed with QN and QD, as evidenced by the ease of resolubilization in

100
Figure 3.13. Fluorescence Excitation and Emission Spectra for 5 μM QN-FPIX adduct (gray
dotted line, top), QD-FPIX adduct (gray dash-dot-dot line, second from top), QD (gray
continuous line, third from top), QN (gray dashed line, fourth from top), eQD (black dash-dot
line, fifth from top), eQN (black dotted line, sixth from top), eQN-FPIX adduct (black dash-dot-
dot line, seventh from top), eQD-FPIX adduct (black continuous line, eighth from top), and FPIX
(black dashed line, bottom) performed in 1:1 methanol–0.2 M HEPES (pH 7.2) at an excitation λ
of 334 nm and an emission λ of 371 nm. Copyright © 2013, American Society for Microbiology.
Used with Permission. (Gorka et al. 2013d)
neutral buffer following precipitation and the fact that yields were significantly lower than those
for QN and QD under the same conditions. The eQN- and eQD-FPIX adducts were also ∼20-
and 10-fold less fluorescent, respectively, than the QN- and QD-FPIX adducts (Fig. 3.13; Table

101
Table 3.7. Drug-monomeric heme adduct properties. Copyright © 2013, American Society for
Microbiology. Used with Permission. (Gorka et al. 2013d)
Species
Fluorescence maximum
(103)
a Adduct stoichiometry
b for
drug-FPIX
ESI molecular ion(s)
observed (m/z)c λex (334
nm)
λem (371
nm)
FPIX 1.13 1.15 -- 616
QN-
FPIX 360 363 0.9 (0.1) 325, 616, 938, 940, 941
eQN-
FPIX 17.6 17.8 2.0 (0.3) 325, 616
QD-
FPIX 255 256 1.2 (0.1) 325, 616, 938, 940, 941
eQD-
FPIX 21.7 21.9 2.4 (0.1) 325, 616
a Data correspond to those in Fig. 3.13. λex and λem, excitation and emission λ's maxima,
respectively. b Values are averages of measurements performed in methanol, acetonitrile, and 40% (vol/vol)
DMSO–0.2 M HEPES (pH 7.2), with SEMs reported in parentheses. c m/z 325, (M + H)
+ for QN or QD free base; m/z 616, (M)
+ for FPIX; m/z 938, 940, and 941, (M
− 2H)+, (M)
+, and (M + H)
+, respectively, for C54H55FeN6O6, corresponding to a 1:1 drug-heme
complex. Peaks at m/z 498, 771, and 860 were also observed and were possible FPIX and adduct
fragments. See also Fig. 3.14.
3.7). ESI-MS analysis of the QN and QD complexes gave rise to peaks at m/z 325 and 616,
corresponding to free QN H+/QD H
+ and free FPIX monomer, respectively, and clear major
peaks at m/z 938, 940, and 941 (Table 3.7; see Fig. 3.14). These findings coincide with the
calculated m/z values of (M − 2H)+ equal to 938.6, (M)
+ equal to 940.4, and (M + H)+ equal to
941.4 for C54H55FeN6O6, corresponding to 1:1 drug-FPIX complexes (Alumasa et al. 2011). The
9-epimer adducts, however, did not survive electrospray ionization, as evidenced by peaks at m/z

102
325 and 616 only (Table 3.7; Fig. 3.14), which again suggests that these are drug-heme
complexes weaker than those formed by QN and QD (Alumasa et al. 2011).
Figure 3.14. ESI Mass Spectra for A) QN-FPIX adduct, B) QD-FPIX adduct, C) eQN-FPIX
adduct, and D) eQD-FPIX adduct. m/z 325: (M + H)+ for QN or QD free base, 616: (M)+ for
FPIX, 938, 940, 941: (M – 2H)+, (M)+, and (M + H)+ for C54H55FeN6O6, corresponding to a 1:1
drug-heme complex. Peaks at m/z 498, 771, and 860 are possible FPIX and adduct fragments.
Copyright © 2013, American Society for Microbiology. Used with Permission. (Gorka et al.
2013d)
103
3.3 Discussion
Parts of this section were previously published as:
Gorka, A. P.; Alumasa, J. N.; Sherlach, K. S.; Jacobs, L. M.; Nickley, K. B.; Brower, J. P.; de
Dios, A. C.; Roepe, P. D. Cytostatic versus Cytocidal Activities of Chloroquine Analogues and
Inhibition of Hemozoin Crystal Growth. Antimicrob. Agents Chemother. 2013, 57, 356-364.
Gorka, A. P.; Sherlach, K. S.; de Dios, A. C.; Roepe, P. D. Relative to Quinine and Quinidine,
Their 9-Epimers Exhibit Decreased Cytostatic Activity and Altered Heme Binding but Similar
Cytocidal Activity versus Plasmodium falciparum. Antimicrob. Agents. Chemother. 2013, 57,
365-374.
Quantifying cytocidal activity typically relies on the ability to distinguish the difference
between organisms that are alive, and those that are dead. One convenient method is the use of
fluorescent or visible dyes that label based on normal physiological conditions or evidence of
damage. In the case of Plasmodia, the organism resides within a host cell, isolating it from the
extracellular dye. By permeabilizing the RBC membrane with saponin, it is possible to stain
intraerythrocytic P. falciparum with the live/dead stain trypan blue. As seen in Figure 3.1, the
stained versus unstained parasites can be identified when photographed under 100x
magnification. By taking images of several fields of view, seen in Figure 3.3, it is possible to
count up to 100 parasites within a short period of time, which is important as the dye itself is
toxic. However, overcoming the two membranes that separate the parasite plasma membrane
from the extracellular dye poses a procedural problem. The use of saponin to permeabilize the
RBC membrane suffers from a tendency to lyse the membrane completely if the sample is

104
incubated too long or agitated too vigorously (data not shown). Additionally, the mere presence
of trypan blue can alter staining of viable cells over time (Figure 3.2). Attempts to construct a
standard curve of staining, using 5xLD50 for 24 hours as a “LD100”, results in a linear trend
(Figure 3.4), but even when the sample is not treated with drug, approximately 50% of the
parasites are observed to be stained. This high level of background staining, combined with the
variability between sample preparations, and even fields of view of one sample, precludes its use
in a cytocidal assay, as the dynamic range from no drug to toxic levels is not great enough to be
used to plot a full growth curve. Additionally, counting cells with microscopy is not amenable to
scaling to higher-throughput methods.
At about the same time as I was doing this work, Paguio et al. (2011) examined
additional “live/dead” stains such as hydroethidine and carbocyanines, and they were found to
also have low dynamic ranges and high levels of variability in staining. Instead of trying to
utilize these stains, which suffer from low signal (hydroethidine) or high background
(carbocyanines and trypan blue- see Figure 3.3), the widely-used cytostatic assay based on the
fluorescence of DNA-intercalating SYBR Green I (Bennet et al. 2004b) was adapted for short-
term bolus dosing, followed by washing the drug away and growth for 48 hours (one parasite life
cycle). Using this assay, cytocidal activities were determined, and altered cytocidal resistance
phenomenon were described. For example, the compound verapamil, which is known to
chemosensitize Dd2 parasites to CQ at static levels, was determined to not alter the resistance to
bolus-dose levels of resistance (no reduction in LD50 value) (Paguio et al. 2011).
In order to further explore the difference between cytostatic and cytocidal drug effects, a
more physiologically relevant high-throughput assay for quantifying inhibition of Hz formation
105
was developed, and examined for correlation with antiplasmodial activity. Consistent with most
data from other Hz formation assays, Hz inhibition measured under physiological conditions
decreases for all drugs examined upon decreasing pH. Presumably, more acidic conditions
require a higher drug concentration to inhibit crystal growth because crystallization is accelerated
and the solubility of precrystalline heme intermediates to which drugs bind is decreased at these
pHs. We found that the efficiency of phosphotidylcholine in catalyzing Hz formation is
comparable to if not better than the efficiency of catalysis by other lipids found in DV lipid
nanospheres harboring nascent Hz crystals. It is currently not known specifically which of the
lipids accelerates the Hz formation, but the data suggest that all known components of these
nanospheres are excellent catalysts (Pisciotta et al. 2007; Jackson et al. 2004).
This assay was tested for correlations between Hz inhibition and the antiplasmodial IC50
in order to ascertain if more close-to-physiological conditions for Hz formation modified those
conclusions. Dorn et al. (1998) were the first to directly test the hypothesis that antiplasmodial
activity was correlated with Hz inhibition by examining a small set of common antimalarials
(quinoline methanols, 4-aminoquinolines, acridines, and nonquinolines). Although Cohen (1964)
and Macomber and Spintz (1969) proposed that heme was a target for quinoline antimalarial
drugs more than 30 years before this study, results from Dorn et al. (1998) have been crucial for
exploring the molecular pharmacology of antimalarial drugs and have been highly influential in
guiding additional antimalarial drug development. Using a CQS strain (NF54), a linear
correlation was observed between the potency of Hz inhibition and antiplasmodial IC50 for
common antimalarials, now known as “heme-acting” antimalarial drugs. Hawley et al. (1998)
further investigated this concept using CQS (3D7) and CQR (K1) strains and a similar series of
106
quinoline methanols, 4-aminoquinolines, and acridines, however, these authors observed no
apparent correlation between the two activities when comparing raw IC50 data for either CQS or
CQR strains. After using a VAR correction, Hawley and coworkers (1998) did observe a
correlation for the CQS strain only. A third study by Kaschula et al. (2002), utilizing a series of
2-carbon 4-aminoquinoline derivatives with variable functionalities at position 7, observed a
correlation between the two activities, but again, only when the antiplasmodial IC50 was scaled to
the relative VAR. There are logical explanations for these differing results. First, the use of a
nonhomologous series of compounds (e.g., quinolines versus acridines) with very different
bioavailability profiles, as well as the nonphysiological conditions of the Hz formation assays
that were used, makes interpretation more complex. There are multiple Hz precursors (FPIX
monomer, μ-oxo dimer, and head-to-tail dimer) against which this range of pharmacophores
interact (de Dios et al. 2004; de Dios et al. 2003; Leed et al. 2002; Casabianca et al. 2008;
Casabianca et al. 2009; Alumasa et al. 2011), and the relative effectiveness of monomeric heme-
drug versus dimeric heme-drug complexes for inhibiting Hz formation likely differs.
A complete understanding of the correlation between antiplasmodial IC50 activity and Hz
inhibition requires more detailed chemical information on the nature of solid-state aggregates of
heme and quinoline compounds. Earlier studies clearly showed that the solubilities of
monomeric and dimeric forms of FPIX are dramatically affected by the presence of quinolines
(Casabianca et al. 2008; Ursos et al. 2001), that CQ and other quinoline antimalarials bind with
different affinities to monomeric versus dimeric FPIX (de Dios et al. 2003; Leed et al. 2002;
Casabianca et al. 2008), and that the solubility of drug-heme complexes in hydrophobic phase
may be more relevant to Hz inhibition potency (Pisciotta et al. 2007; Casabianca et al. 2009).

107
Taken together, these data show that quinoline drug-heme interactions are significantly more
complex than simple aqueous equilibria predict.
Regardless, the principle conclusion of Dorn et al. (1998) has continued to strengthen the
notion that the site of quinoline antimalarial drug action must be the DV, where the drug then
binds to free heme to prevent Hz crystallization. Altered DV biochemistry then reduces drug-
heme interaction and causes resistance to these drugs, a prediction that has been validated by
studies on the function of mutant P. falciparum chloroquine resistance transporter (PfCRT; a DV
membrane protein), which causes an elevated CQ IC50 in P. falciparum malaria (Roepe 2011).
A good correlation was observed between antiplasmodial IC50s and Hz inhibition across a
series of CQ analogues with a wide range of activities (Fig. 3.9), similar to the conclusions of
Dorn et al. (1998). Using Hz inhibition quantified under physiological conditions with lipid
catalyst, the correlation is not necessarily improved when estimated VARs, or other
pharmacokinetic properties (Table 3.3), are applied to the data set. Regardless, although the IC50s
of our set of CQ analogues span a very wide range, they are not necessarily representative of all
CQ analogues studied to date, and correlation between antiplasmodial IC50 and Hz inhibition
IC50 for quinoline antimalarials may be dependent (at least in part) upon the specific drugs that
are assessed.
Critically, however, and in distinct contrast to the correlation with the IC50, there is a
complete lack of correlation between the Hz inhibition IC50 and antiplasmodial LD50 for the
same series of CQ analogues (Fig. 3.9C and D). The test series of CQ analogues were chosen
because they exhibit a wide range of cytostatic and cytocidal activities (Table 3.3) and also show
a variety of other interesting trends. Strain Dd2 resistance to CQ is 10-fold by IC50 but 140-fold
108
by LD50, suggesting that a significantly different pharmacology may be relevant to understanding
the different modes of action for CQ (Paguio et al. 2011). AQ does not exhibit significant
differences in IC50 and LD50 activity for HB3 versus Dd2 and is quite potent (low nM) by both
antiplasmodial measurements (Table 3.3). This suggests to us that the cytocidal targets for CQ
versus AQ may differ and/or that the mechanism of CQ cytocidal resistance is distinct from that
for AQ.
With these results, we suggest that three critical principles are becoming increasingly
apparent: (i) potent IC50 activity can but does not always indicate potent LD50 activity for
quinoline antimalarials, (ii) resistance to cytostatic drug effects does not always correlate with
resistance to cytocidal drug effects, and (iii) for CQ and CQ analogues, the ability to inhibit Hz
formation correlates strongly with IC50 potency but not with LD50 potency. The large differences
between IC50 and LD50 measures of activity against HB3 and Dd2 parasites suggest that the
molecular mechanisms of resistance to the cytostatic and cytocidal effects of quinoline
antimalarial drugs likely differ (see Cabrera et al. 2009a). For CQ, cytostatic resistance (elevated
IC50) is mediated by PfCRT and/or P. falciparum multidrug resistance protein (PfMDR1)
mutations that alter the electrochemical potential-driven DV transport of the protonated drug
(Roepe 2011; Cooper et al. 2002; Cooper et al. 2007; Ferdig et al. 2004; Sidhu et al. 2005; Sidhu
et al. 2002) and, hence, access to heme. However, mounting experimental evidence (Paguio et al.
2011; Cabrera et al. 2009a; Gaviria et al. 2013) suggests the possibility of additional (non-DV)
cytocidal targets for CQ, which then predicts the possibility of additional cytocidal resistance
mechanisms that are mechanistically distinct from cytostatic resistance mechanisms (Sinai et al.
2012; Gaviria et al. 2013).

109
For quinoline methanols quinine and quinidine, the differences in fold resistance are less
dramatic than CQ. At cytostatic levels, QN shows 2-fold resistance in Dd2 vs. HB3, while QD
shows 7-fold resistance. At cytocidal levels, the compounds are 4- and 60-fold resistant for Dd2
vs. HB3. Similar to Karle et al. (1992), we observed vast differences in IC50 activity between QN
and QD and their 9-epimers, with the epimers showing significantly reduced potency (Table 3.6).
In contrast, the activities measured by LD50 tell a different story. While eQN and eQD were less
potent than QN and QD for each strain when measured by IC50, the fold differences in LD50
between the isomer pairs were far lower, and in some cases (e.g., strain K76I), the 9-epimer
LD50s were lower (they had higher cytocidal potency than QN and QD). We found that relative
to strain HB3, Dd2 was resistant to QN and hypersensitive to eQN when potency was defined via
IC50 but that the strain was resistant to both when potency was defined by LD50. Overall, these
observations and others lead to several major conclusions.
First, the large differences in IC50s (but not LD50s) observed for these isomers support the
hypothesis that the molecular mechanisms of resistance to the cytostatic and cytocidal effects of
quinoline antimalarial drugs likely differ (see also Paguio et al. 2011), which is consistent with
conclusions from previous drug transport analyses (Cabrera et al. 2009a). Cytostatic resistance to
QN (i.e., elevated IC50) is believed to be mediated at least in part by PfCRT and/or PfMDR1
mutations that alter electrochemical potential-driven DV transport of the protonated drug (Sidhu
et al. 2005; Ferdig et al. 2004; Roepe 2011; Sidhu et al. 2002). A lack of eQN cytostatic
resistance in Dd2 (lower IC50 relative to that of HB3) is easily rationalized by the finding that
stereochemically distinct eQN was not transported as well as QN by the Dd2 mutant PfCRT,
since substrate recognition by transporters is often quite stereoselective (Roepe 2011).
110
We also suggest that the highly altered cytostatic activities but more similar cytocidal
activities of the 9-epimers relative to those of QN and QD indicate that the stereochemistry of the
9-epimers negatively affects the interaction with the predominant cytostatic (IC50) target but does
not necessarily affect the interaction with the predominant cytocidal (LD50) target(s). Consistent
with the hemozoin inhibition data presented here, as well as in other studies (Egan et al. 2005;
Egan et al. 1994; Leed et al. 2002), we favor the interpretation that the predominant IC50 target
for quinoline antimalarials is one or more forms of uncrystallized heme within the DV,
specifically, monomeric FPIX heme in the case of QN and QD (Alumasa et al. 2011). This is
consistent with the reduced hemozoin inhibition activity of the 9-epimers, and the lack effect on
pH-dependent heme aggregation that is believed to facilitate hemozoin crystallization (Ursos et
al. 2001). The BHIA IC50s versus antiplasmodial activities for a series of five structurally related
QN analogs synthesized previously (Dinio et al. 2012) shows a strong correlation with cytostatic
potency but not cytocidal potency, similar to the findings described above for CQ analogs. The
9-epimers do not inhibit formation of hemozoin under physiological conditions, and although
they promote the high-spin FPIX monomer in solution (data not shown) and form complexes
with FPIX that precipitate from aqueous solution, they do not do so with the same affinity,
stoichiometry, and fluorescence properties as the complexes formed with QN and QD. The
former are qualitatively weaker and less favored, as evidenced by the ease of resolubilization in
neutral buffer following precipitation and significantly lower yield. Moreover, the 9-epimer
complexes do not survive electrospray ionization, leading to sole peaks corresponding to free
drug and FPIX in the mass spectrum (Table 3.7, Figure 3.14).

111
The 9-epimers also do not have a measureable effect on pH-dependent heme aggregation
(Fig. 3.12). The potent cytostatic compounds, CQ, QN, QD, and AQ, all shift the midpoint of the
pH-dependent solubility curve by about 0.15-0.2 pH units. By shifting the solubility curve, the
aggregation of heme at a set pH is altered, which could effect the various equilibria associated
with the hemozoin formation pathway (see Alumasa et al. 2011 for a full description); possibly
this is a factor in the reduced Hz production observed in drug-treated parasites. (Gligorijevic et
al. 2006a). This altered interaction with pre-crystalline heme species is consistent with the
weakly-bound complex discussed previously, as well as the inability of eQN and eQD to inhibit
hemozoin formation.
The recent revelation that there are altered patterns of resistance to antimalarials when
used under cytostatic versus cytocidal conditions has resulted in a push to define the death
pathway caused by antimalarial treatment and quantify its dynamics. The existence of two
additional membranes between the parasite plasma membrane and the extracellular environment
makes it difficult to use the traditional method of live/dead stains, both those that rely on
membrane integrity (i.e. trypan blue), and those that rely on normal metabolic function and
electrochemical differentials (i.e. hydroethidine and carbocyanines- see Paguio et al. 2011).
However, the altered patterns of resistance have been quantified, via an adaptation of the
traditional SYBR Green I cytostatic assay (Bennet et al. 2004b; Paguio et al. 2011).
Quantifying the cytocidal activity has allowed for examination of the correlation between
in vitro measures of drug activity, such as the ability to inhibit the formation of β-hematin and
the shift of the pH-dependent solubility curve of FPIX, and the drug’s activity. These in vitro
methods that focus on heme and hemozoin correlate well with the cytostatic activities, both
112
across a series of CQ analogs and in the 9-epimers of quinine and quinidine. However, the
association between β-hematin inhibition and activity at cytocidal activities is virtually non-
existent. Similarly, although the 9-epimers of quinine and quinidine show little to no cytostatic
activity, their cytocidal activities are within the same range as their parent compounds. It would
seem that the heme crystallization pathway is a target of cytostatic quinoline drug treatment, but
not cytocidal; more examination is needed to indentify the targets of cytocidal treatment.
3.4 Acknowledgements
We thank Changan Xie for insightful discussions and the C. Wolf laboratory at the
Georgetown University Department of Chemistry for providing additional aliquots of
compounds 1 to 5 of the chloroquine analogs. We thank Jeremy Morgan and Theresa Dinio
(University of North Carolina, Wilmington, NC) for providing QN structural analogs, Roland
Cooper (Dominican University) for providing strain K76I, John Alumasa (The Pennsylvania
State University) for helpful advice, Ansley Brown (University of South Florida Morsani
College of Medicine) and Lauren Jacobs (Memorial Sloane-Kettering Cancer Center) for
technical assistance, and the Georgetown University Chemistry Department for synthetic
chemistry support.
This work was supported by NIH grants AI045957 and R0I AI056312 (to P.D.R.) and
AI060792 (to A.C.D.D. and P.D.R. and to C. Wolf, Georgetown University), as well as the
Georgetown Department of Chemistry (Espenschied Fellowship) and the Achievement Rewards
for College Scientists Foundation (both to K.S.S.).

113
K. S. S. would like to especially thank: Dr. Michelle Paguio Frising and Ms. Kelly Bogle
for advice and assistance on the trypan blue study; Drs. Alexander Gorka and John Alumasa for
the work previously done to optimize the β-hematin assay alongside Ms. Katherine Nickely and
Mr. Jonathan Brower; and Dr. Alexander Gorka again for antiplasmodial measurements, the
synthesis of epi-QN and epi-QD, and the drug-heme affinity measurements.
114
CHAPTER IV
SYNTHESIS, PURIFICATION, AND CHARACTERIZATION OF A NOVEL CHLOROQUINE
PHOTOAFFINITY PROBE THAT UTILIZES CLICK CHEMISTRY FOR INVESTIGATING TARGETS IN
P. FALCIPARUM PARASITES
This work to be published as:
Sherlach, K. S.; Callaghan, P. S.; Hasset, M.; Siriwardana, A.; Sanda, M.; Goldman, R.; Roepe,
P. D. Use of a Novel Photoaffinity Chloroquine Probe to Define Cytocidal Drug Targets. In
preparation.
4.1. Background
Resistance to chloroquine (CQR) in P. falciparum has been linked to multiple point
mutations in the pfcrt gene that encode multiple amino acid substitutions for a digestive vacuole
(DV) localized protein, Plasmodium falciparum Chloroquine Resistance Transporter (PfCRT)
(Fidock et al. 2000; Roepe 2011). The protein was initially hypothesized to impact resistance by
either altering the pH of the acidic DV, thereby altering the accumulation of the dibasic drug, or
through altering the transport of CQ across the vacuolar membrane (Fidock et al. 2000). A key
prediction of the later is that PfCRT should bind CQ with meaningful affinity. Equilibrium
binding studies and noted affinity constants for wild type and mutant (CQR-associated) PfCRT
(Zhang et al. 2004) consistent with these conclusions. In addition, recently, direct evidence of
CQ transport has been obtained (Paguio et al. 2009).
In order to further investigate PfCRT drug binding, and to hopefully map a CQ binding
site within PfCRT, a probe, known as azido-biotinylated chloroquine (AzBCQ) (shown in Figure
4.1), was previously synthesized in our lab for use in the labeling and subsequent isolation of

115
target molecules, through the process known as “Activity-Based Protein Profiling” (ABPP)
(Lekostaj et al. 2008; Salisbury et al. 2007).
Figure 4.1. Structure of AzBCQ. Reprinted (adapted) with permission from (Lekostaj et al.
2008). Copyright (2008) American Chemical Society.
This process, has been previously used to identify in vivo targets of small molecule
probes. The probe must contain two reactive subunits: one which allows it to be covalently
attached to the target, and another which is used for detection or purification. The probe can be
either an irreversible enzyme inhibitor, or a reversible inhibitor labeled with a photo-active tag,
such as a diazirine, an aryl azide, or benzophenone, which will covalently bind to biomolecules;
both the target molecules and other molecules in the periphery (Salisbury et al. 2007). Labeling
of the targets is typically followed by proteome analysis techniques. Typically, proteomes are
investigated either through gel-based (single or two-dimensional separation) or chromatography-
based (HPLC or avidin-affinity) techniques. Following separation of the identified proteins, mass
spectrometry can be used for identification of the trypsin digestion products of the target proteins

116
(Salisbury et al. 2007). ABPP allows for selectivity in proteomic methods that is not necessarily
possible with global methods. Global methods examine the identities and relative levels of
proteins from cell lysates, and are typically geared towards examination of proteins that are
present in larger quantities. The use of separation methods and detection of probe-labeled
proteins reduces background signal present from unrelated proteins, facilitating detection of
proteins that may be in lower abundance (Best 2009). ABPP has been used to study the targets of
small molecule inhibitors of enzymes such as human cytochrome P450s, serine hydrolases,
proteasomes, and cathepsin proteases, as well as the targets of phenyl sulfonates, and enzymes
that are poorly understood (Wright et al. 2007; Wright et al. 2009; Liu et al. 1999; Sletten et al.
2009; Speers et al. 2003; Mollering and Cravatt 2012).
In previous PfCRT studies, AzBCQ was derivatized with a photo-activated cross-linker,
perfluorophenyl azide, as well as a biotin tag for purification (Lekostaj et al. 2008). The aryl
azide photo-active label, after irradiation with ultraviolet light, will lose a molecule of dinitrogen
to form a highly reactive nitrene, which can insert itself into a carbon-hydrogen bond, with the
singlet nitrene more efficient at insertion than the triplet (Keana et al. 1990; Burdinski et al.
2006) as shown in Figure 4.2. In order to avoid ring-expansion reactions, which reduce the cross
linking efficiency, aryl azides are typically perfluoronated, resulting in approximately 45% bond
insertion. These perfluoronated aryl azides do absorb in the same UV region as most
biopolymers, but the differences in molar absorptivity result in the activation of the probe with
minimal biomolecular degradation (Keana et al. 1990).
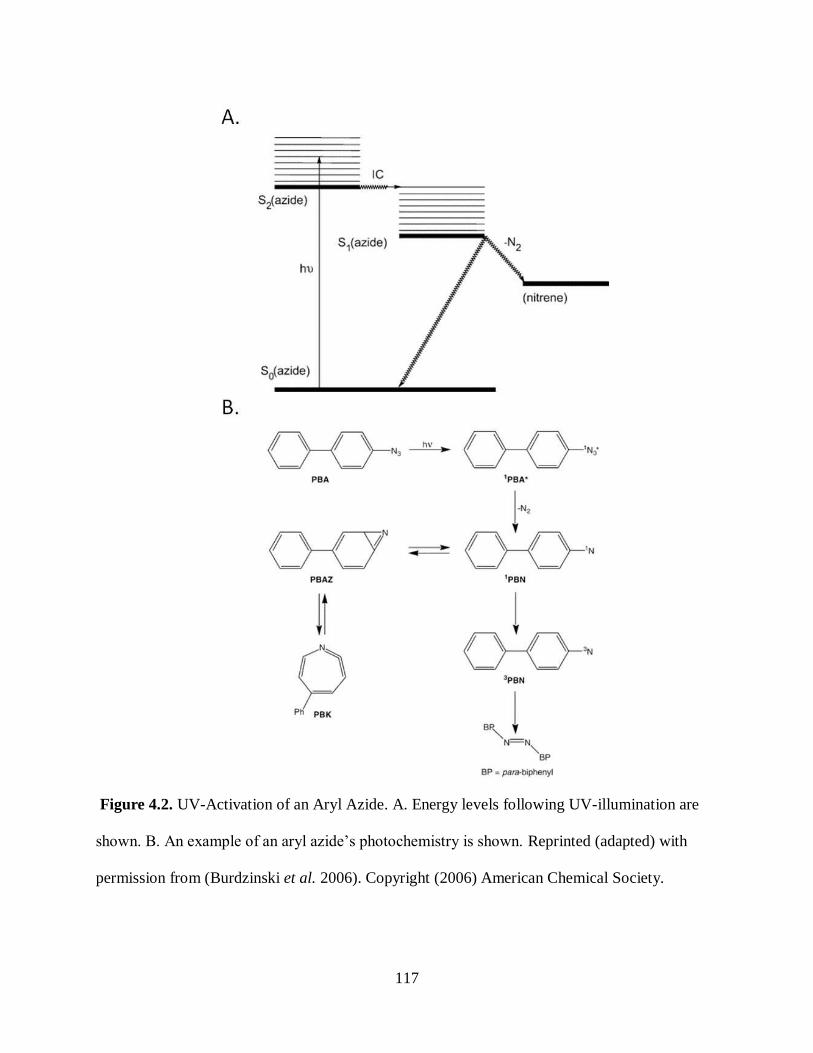
117
Figure 4.2. UV-Activation of an Aryl Azide. A. Energy levels following UV-illumination are
shown. B. An example of an aryl azide’s photochemistry is shown. Reprinted (adapted) with
permission from (Burdzinski et al. 2006). Copyright (2006) American Chemical Society.
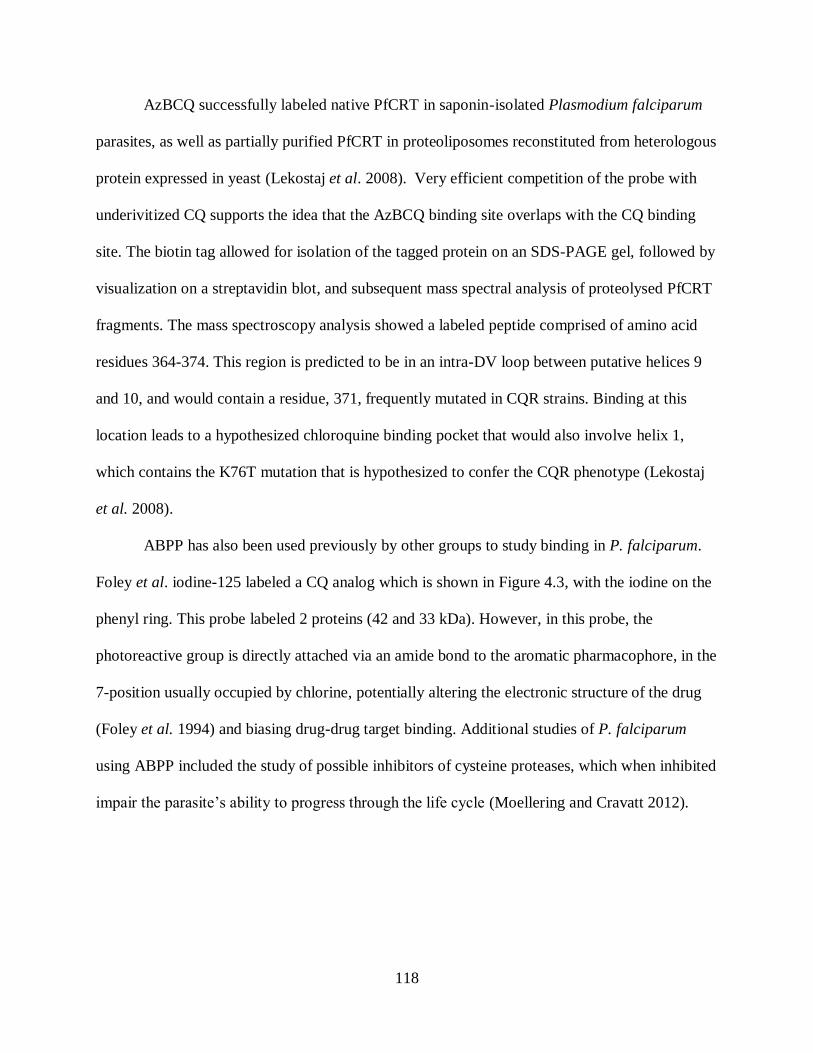
118
AzBCQ successfully labeled native PfCRT in saponin-isolated Plasmodium falciparum
parasites, as well as partially purified PfCRT in proteoliposomes reconstituted from heterologous
protein expressed in yeast (Lekostaj et al. 2008). Very efficient competition of the probe with
underivitized CQ supports the idea that the AzBCQ binding site overlaps with the CQ binding
site. The biotin tag allowed for isolation of the tagged protein on an SDS-PAGE gel, followed by
visualization on a streptavidin blot, and subsequent mass spectral analysis of proteolysed PfCRT
fragments. The mass spectroscopy analysis showed a labeled peptide comprised of amino acid
residues 364-374. This region is predicted to be in an intra-DV loop between putative helices 9
and 10, and would contain a residue, 371, frequently mutated in CQR strains. Binding at this
location leads to a hypothesized chloroquine binding pocket that would also involve helix 1,
which contains the K76T mutation that is hypothesized to confer the CQR phenotype (Lekostaj
et al. 2008).
ABPP has also been used previously by other groups to study binding in P. falciparum.
Foley et al. iodine-125 labeled a CQ analog which is shown in Figure 4.3, with the iodine on the
phenyl ring. This probe labeled 2 proteins (42 and 33 kDa). However, in this probe, the
photoreactive group is directly attached via an amide bond to the aromatic pharmacophore, in the
7-position usually occupied by chlorine, potentially altering the electronic structure of the drug
(Foley et al. 1994) and biasing drug-drug target binding. Additional studies of P. falciparum
using ABPP included the study of possible inhibitors of cysteine proteases, which when inhibited
impair the parasite’s ability to progress through the life cycle (Moellering and Cravatt 2012).
119
Figure 4.3. Structure of Photoaffinity CQ Probe Used by Foley et al. This research was
originally published in The Journal of Biological Chemistry. Foley, M.; Deady, L. W.; Ng, K.;
Cowman, A. F.; Tilley, L. Photoaffinity Labeling of Chloroquine-binding Proteins in
Plasmodium falciparum. The Journal of Biological Chemistry. 1994, 269, 6955-6961. © the
American Society for Biochemistry and Molecular Biology.
In order to detect proteins labeled during ABPP, a detection handle (typically either
biotin or a fluorophore) must be attached. However, the relatively large size of the tag, compared
with the size of the small-molecule the probe is modeling, could conceivably alter or reduce
cellular interactions. Some of these reporter tags even render the probe less cell-permeant
(Galmozzi et al. 2014), inhibiting the probe’s use in intact cells as opposed to cell lysates (Speers
and Cravatt 2004). Bioorthogonal click chemistry, or more specifically copper-catalyzed azide-
alkyne cycloaddition (CuAAC), can be utilized in order to attach the purification handle after
cross-linking, making the probe more cell-permeant (Galmozzi et al. 2014). This is done by
adding a terminal alkyne to the probe and an azide to the tag, or vice versa (Salisbury et al. 2007;
Best 2009). ABPP with click chemistry has been used to study enzyme function in adipocytes
(Galmozzi et al. 2014), targets of possible anticancer drugs (Wang et al. 2014; Speers and
Cravatt 2004), as well the protein targets of oxidized lipids (Vila et al. 2008).
120
Beyond ABPP, photoaffinity probes can also be used to visualize sub-cellular localization
through the use of fluorescence microscopy. Similar to the biotin handle, large fluorophores can
alter a probe’s ability to cross the cell membrane and to localize in a manner similar to the drug
of interest. Replacing the tag with a small CuAAC handle allows for the probe to diffuse into the
cell and crosslink to the target. Following a fixation method, the probe can then be tagged with a
complementary fluorophore and visualized. CuAAC has been used to localize platinum-based
anticancer drugs (Qiao et al. 2014), to visualize protein synthesis inhibition by an analog of
puromycin (Liu et al. 2012), and to label lipids (Neef and Schultz 2009). The Bertozzi group has
done extensive cell-surface glycan labeling utilizing azide-derivatives of sugars and a strain-
promoted copper-free version of CuAAC (Dehnert et al. 2012; Baskin et al. 2010; Laughlin et al.
2008; Baskin et al. 2007).
The CuAAC reaction is tolerant of a wide range of conditions, including aqueous
environments, as well as various temperatures, redox conditions, and pHs (Himo et al. 2005).
Since copper(I) is not stable in air, a copper(II) source is typically used, along with a reductant
like sodium ascorbate, to produce copper(I) in situ (Hong et al. 2009). Toxicity of copper(II), as
well as the production of reactive oxygen species by ascorbate, result in an inability to use
CuAAC in live cells (Salisbury et al. 2007; Best 2009; Hong et al. 2009). Copper-chelating
ligands have been designed to stabilize the active copper(I) in solution that have been optimized
to reduce toxicity (Hong et al. 2009), or increase solubility of the ligand in aqueous solutions
(Gupta et al. 2005). However, if CuAAC is used with purified protein, or following cellular
fixation or lysis, the toxicity of copper(I) is not a concern. Furthermore, for photo-activatible
probes, the probe itself is not amenable for studies of dynamic labeling, since activation results
in covalent cross-linking and the inability to remove the probe from the target.
121
Taking all of the above into consideration, a new ABPP probe was designed, in order to
incorporate CuAAC to attach the detection tag after photo-cross linking. Synthesis of a terminal
alkyne probe of CQ was modeled after the synthesis of AzBCQ (Lekostaj et al. 2008). Instead of
coupling a biotin on to the free terminal amine, a terminal alkyne was coupled onto the probe,
yielding alkynylated azido chloroquine (AAzCQ), as shown in Scheme 4.1. The ability of
AAzCQ probe to bind to PfCRT was then investigated through photolabeling of heterologously-
expressed PfCRT purified and reconstituted into proteoliposomes photolabeling was compared to
AzBCQ photolabeling. Subcellular localization of approximate cytocidal and cytostatic doses of
CQ was investigated through the use of AAzCQ along with a commercially-available azide-
derived fluorophore. Proteomics analyses, utilizing 2 dimensional gel electrophoresis with mass
spectrometry, as well as avidin-enrichment with SDS-PAGE and mass spectrometry, was
undertaken with the original AzBCQ probe, as well as AAzCQ, in order to identify cellular
targets of chloroquine.
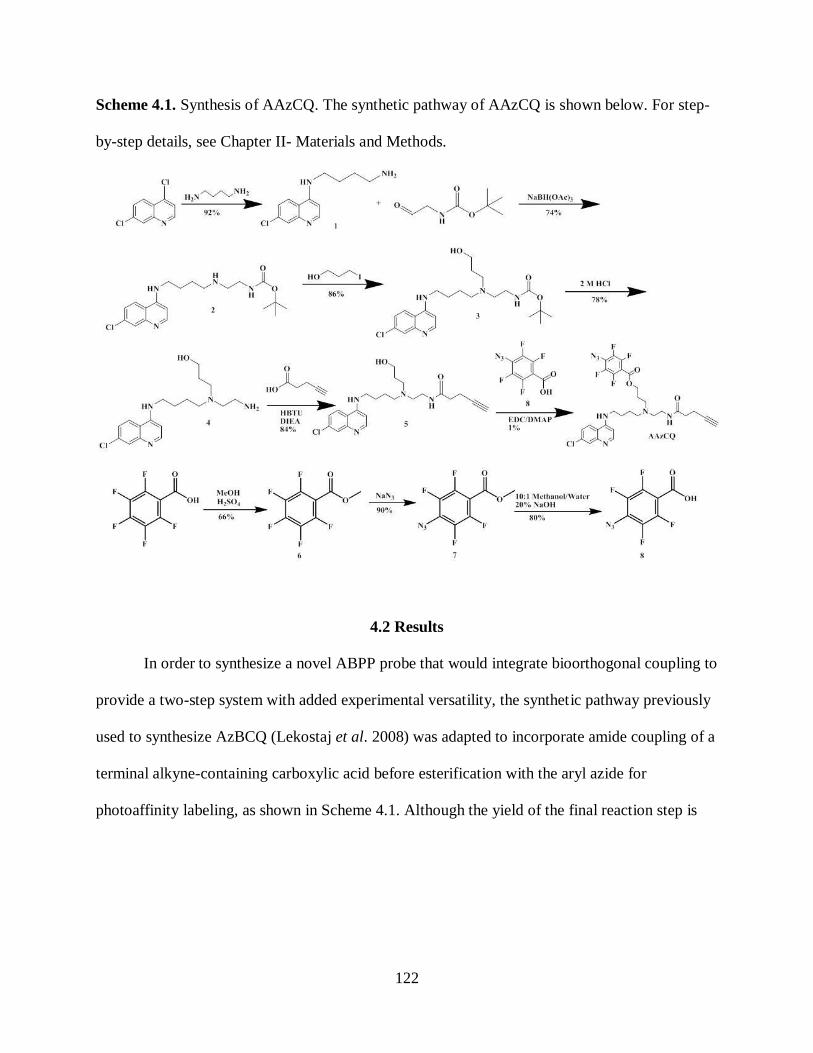
122
Scheme 4.1. Synthesis of AAzCQ. The synthetic pathway of AAzCQ is shown below. For step-
by-step details, see Chapter II- Materials and Methods.
4.2 Results
In order to synthesize a novel ABPP probe that would integrate bioorthogonal coupling to
provide a two-step system with added experimental versatility, the synthetic pathway previously
used to synthesize AzBCQ (Lekostaj et al. 2008) was adapted to incorporate amide coupling of a
terminal alkyne-containing carboxylic acid before esterification with the aryl azide for
photoaffinity labeling, as shown in Scheme 4.1. Although the yield of the final reaction step is
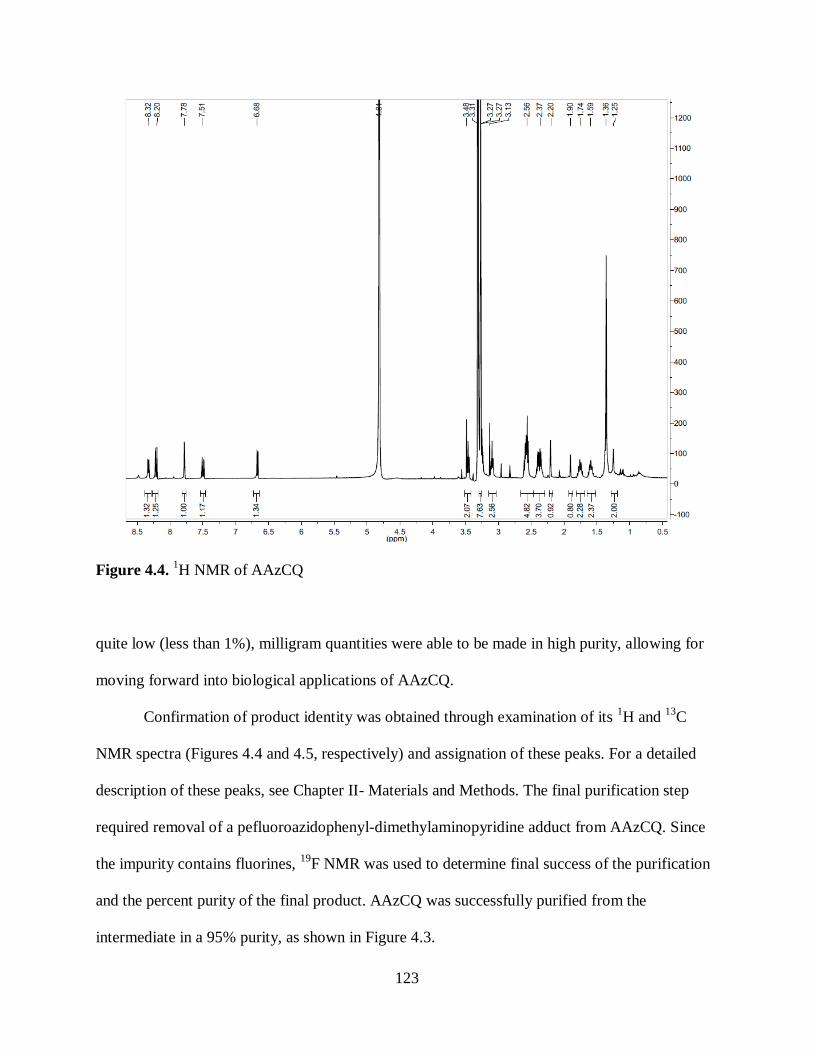
123
Figure 4.4. 1H NMR of AAzCQ
quite low (less than 1%), milligram quantities were able to be made in high purity, allowing for
moving forward into biological applications of AAzCQ.
Confirmation of product identity was obtained through examination of its 1H and
13C
NMR spectra (Figures 4.4 and 4.5, respectively) and assignation of these peaks. For a detailed
description of these peaks, see Chapter II- Materials and Methods. The final purification step
required removal of a pefluoroazidophenyl-dimethylaminopyridine adduct from AAzCQ. Since
the impurity contains fluorines, 19
F NMR was used to determine final success of the purification
and the percent purity of the final product. AAzCQ was successfully purified from the
intermediate in a 95% purity, as shown in Figure 4.3.
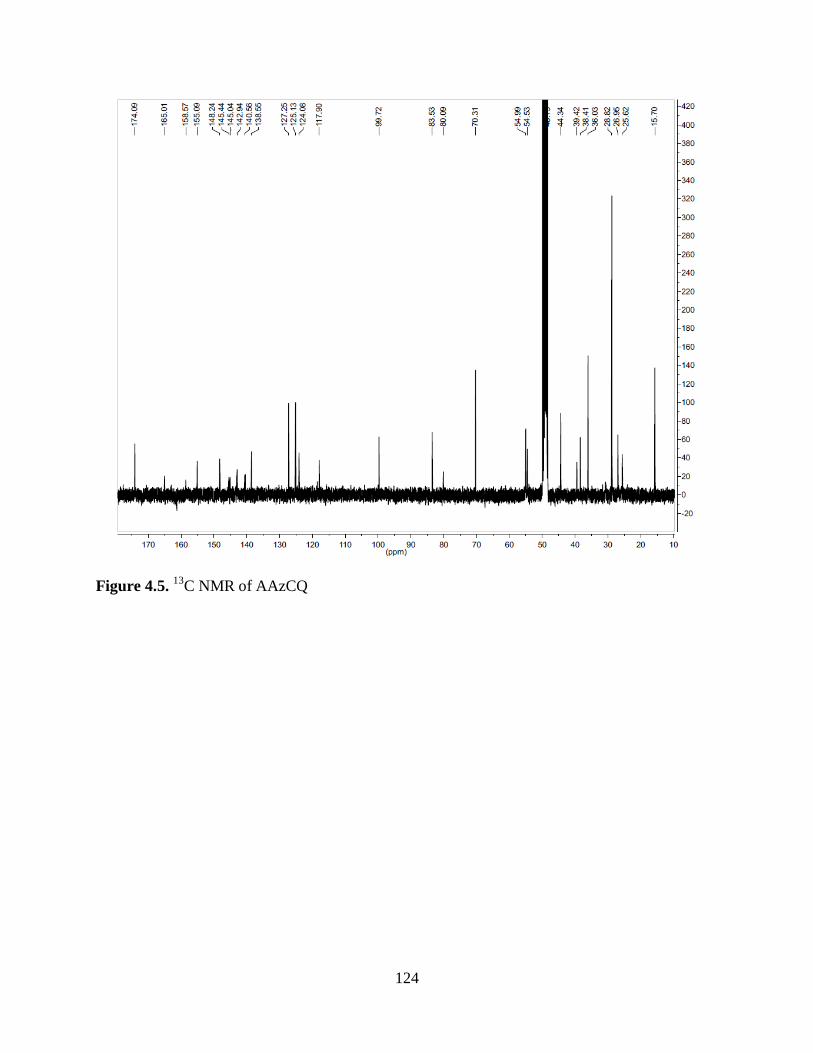
124
Figure 4.5. 13
C NMR of AAzCQ
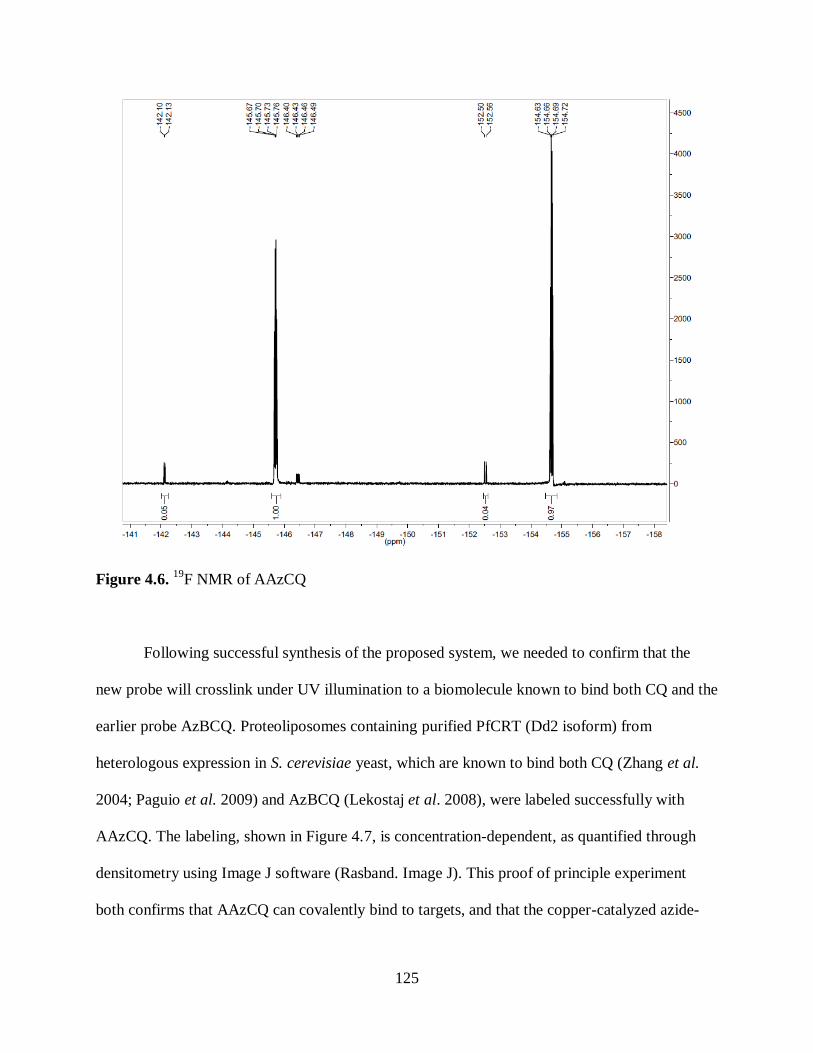
125
Figure 4.6. 19
F NMR of AAzCQ
Following successful synthesis of the proposed system, we needed to confirm that the
new probe will crosslink under UV illumination to a biomolecule known to bind both CQ and the
earlier probe AzBCQ. Proteoliposomes containing purified PfCRT (Dd2 isoform) from
heterologous expression in S. cerevisiae yeast, which are known to bind both CQ (Zhang et al.
2004; Paguio et al. 2009) and AzBCQ (Lekostaj et al. 2008), were labeled successfully with
AAzCQ. The labeling, shown in Figure 4.7, is concentration-dependent, as quantified through
densitometry using Image J software (Rasband. Image J). This proof of principle experiment
both confirms that AAzCQ can covalently bind to targets, and that the copper-catalyzed azide-

126
Figure 4.7. AAzCQ Labeling of PfCRT is Concentration Dependent. PfCRT (Dd2 isoform) in
proteoliposomes (0.1 nmol protein) was labeled by 100 µM AzBCQ as a positive control (A.
lane 2), as well as various concentrations of AAzCQ (100-500 µM). Coupled to 150 µM biotin
azide after photolabeling, AAzCQ shows an increase in labeling with an increase in the initial
probe concentration, (A. plot). UV illumination times were varied from 10 min (A. lanes 3-6) to
20 min (A. lane 7) and 40 min (A. lane 8) to ensure that the probe would crosslink. 10 minutes
was long enough to see a signal on the blot. Blots were vs. biotin (A) and hexahistidine (B) as a
loading control. Plot shown is the concentration of AAzCQ vs. the pixel density ratio (his:biotin)
generated by Image J. software (Rasband. Image J.).
127
alkyne cycloaddition reaction that will be used to attach the visualization/purification handle to
the probe following crosslinking will proceed under biologically-relevant conditions, as the
probe was successfully crosslinked to azide-labeled biotin and visualized via streptavidin
Western blot. Additional UV-illumination time beyond the 10 min used for AzBCQ was
determined to not be needed.
In order to begin probing the P. falciparum parasite for additional targets at cytostatic and
cytocidal levels of CQ, a method for fluorescence microscopy was developed, as shown in
Scheme 4.2. This method crosslinks the ABPP probe within live parasites, and is then followed
by fixation and labeling with a fluorophore. For AzBCQ, the fluorophore used was a strepavidin-
linked Alexa Fluor 488 that in theory should bind to the biotin group on AzBCQ; for AAzCQ,
the fluorophore used was an azide-labeled Alexa Fluor 488 that should attach to the crosslinked
AAzCQ via CuAAC. Utilizing the same fluorophore core allows for better comparison between
the two systems, as the two probes will have identical spectral properties. Initial experiments
(data not shown) utilizing AAzCQ resulted in a high level of background labeling by azide-
linked fluorophores within the parasite cytoplasm during the CuAAC. I found that this labeling
did not depend on UV illumination, fixation procedures, permeabilization of the membranes,
presence or absence of the CuAAC catalysts, or the fluorophore core structure. In order to
prevent this non-copper catalyzed labeling from interfering with the examination of AAzCQ’s
targets, an azide-labeled tetramethylrhodamine (TAMRA) was incubated with samples in the
absence of the CuAAC-catalyst prior to fluorophore labeling of AAzCQ.
Examination of AzBCQ labeling at 2xLD50 concentrations in both HB3 (CQS) and Dd2
(CQR) parasites shows clear fluorescence, (Figure 4.8). This labeling, however, seems to
include labeling within the RBC cytosol. It is possible that the streptavidin fluorophore’s large
128
size prevents complete access of the probe-labeled targets even after membranes are
permeabilized, leading to non-specific staining. The high (μM) concentrations of probe required
for cytocidal labeling result in the need for high concentrations of fluorescent probe This method
is compromised by the cost of obtaining the fluorophore-labeled antibody, as well as additional
steps to fully reduce the formaldehyde used to fix the cells in order to avoid cross-reaction with
the avidin protein.. Overall, AzBCQ was determined to be a less than optimal probe for
subcellular-localization experiments.
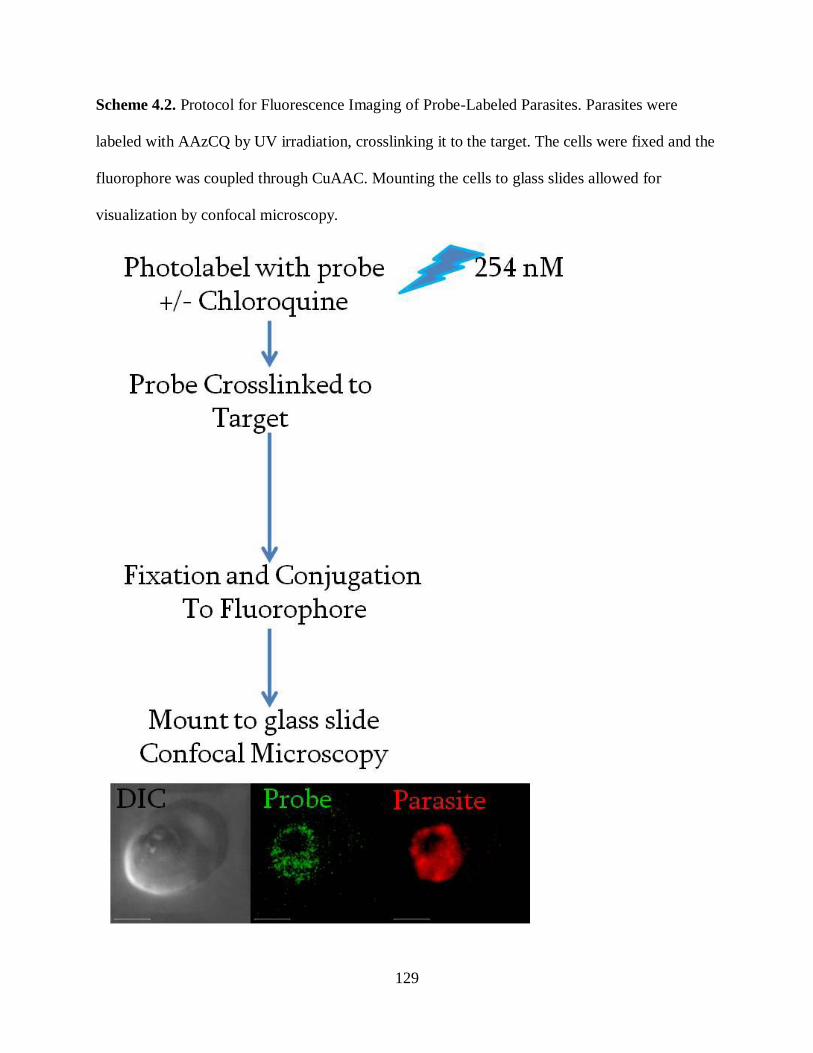
129
Scheme 4.2. Protocol for Fluorescence Imaging of Probe-Labeled Parasites. Parasites were
labeled with AAzCQ by UV irradiation, crosslinking it to the target. The cells were fixed and the
fluorophore was coupled through CuAAC. Mounting the cells to glass slides allowed for
visualization by confocal microscopy.
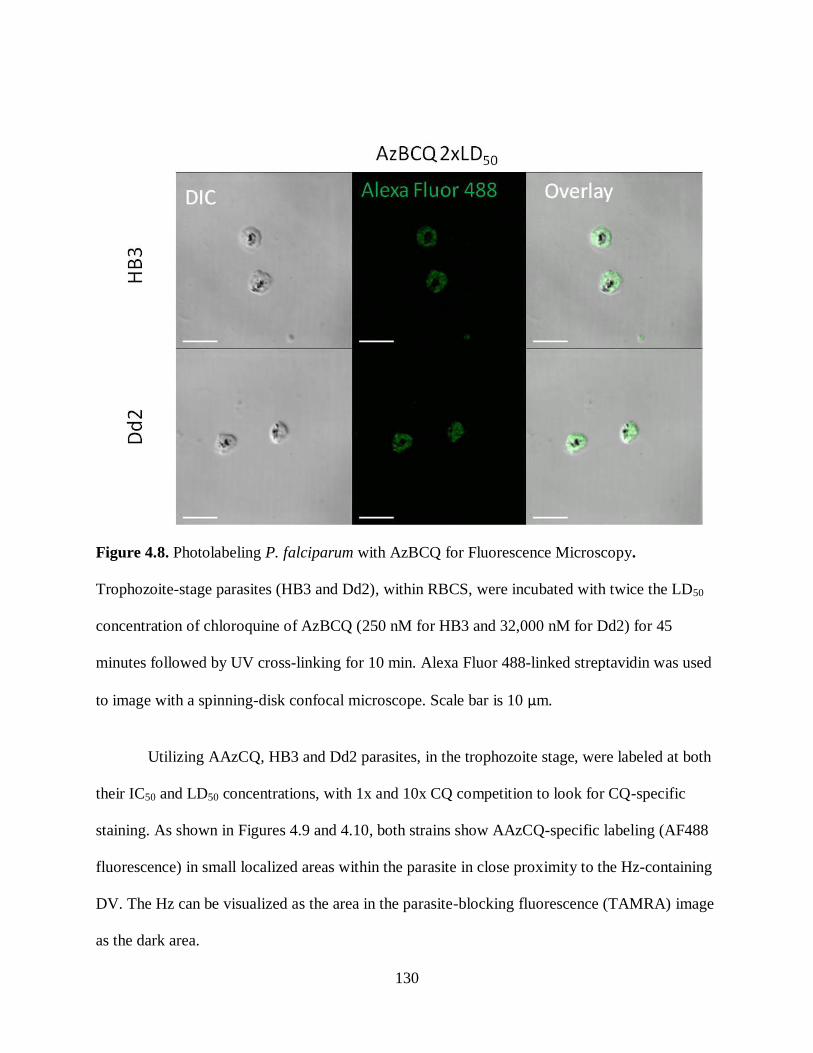
130
Figure 4.8. Photolabeling P. falciparum with AzBCQ for Fluorescence Microscopy.
Trophozoite-stage parasites (HB3 and Dd2), within RBCS, were incubated with twice the LD50
concentration of chloroquine of AzBCQ (250 nM for HB3 and 32,000 nM for Dd2) for 45
minutes followed by UV cross-linking for 10 min. Alexa Fluor 488-linked streptavidin was used
to image with a spinning-disk confocal microscope. Scale bar is 10 µm.
Utilizing AAzCQ, HB3 and Dd2 parasites, in the trophozoite stage, were labeled at both
their IC50 and LD50 concentrations, with 1x and 10x CQ competition to look for CQ-specific
staining. As shown in Figures 4.9 and 4.10, both strains show AAzCQ-specific labeling (AF488
fluorescence) in small localized areas within the parasite in close proximity to the Hz-containing
DV. The Hz can be visualized as the area in the parasite-blocking fluorescence (TAMRA) image
as the dark area.
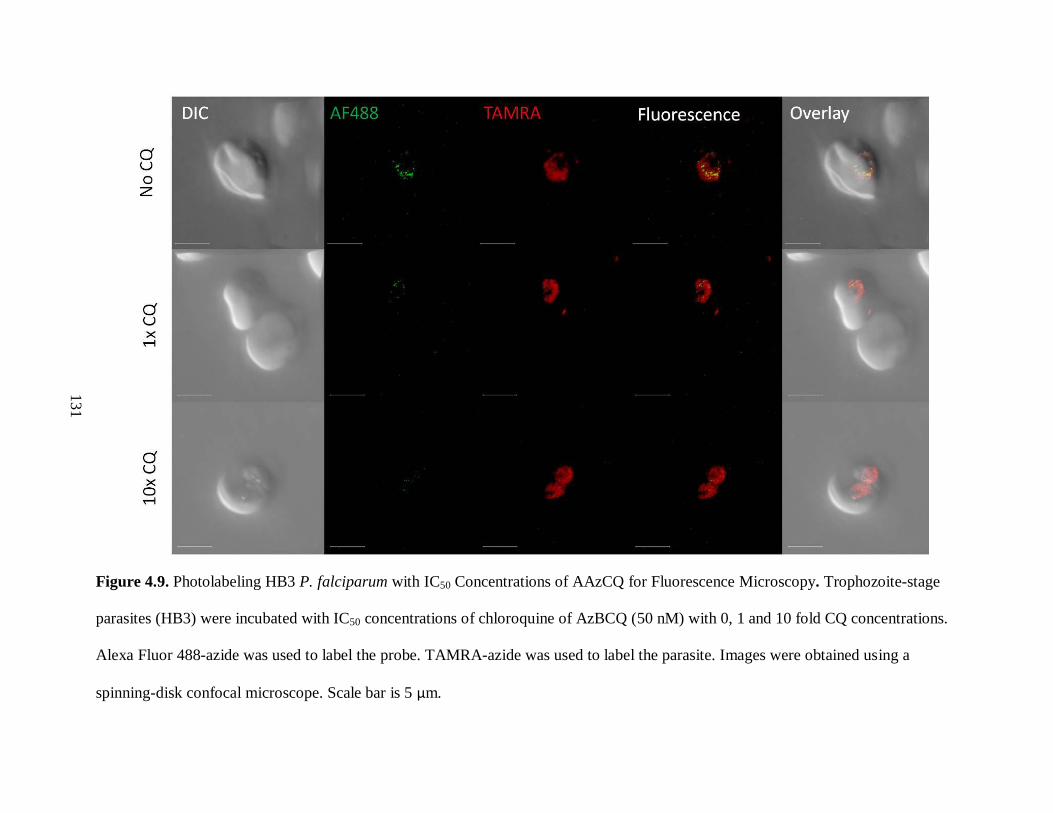
Figure 4.9. Photolabeling HB3 P. falciparum with IC50 Concentrations of AAzCQ for Fluorescence Microscopy. Trophozoite-stage
parasites (HB3) were incubated with IC50 concentrations of chloroquine of AzBCQ (50 nM) with 0, 1 and 10 fold CQ concentrations.
Alexa Fluor 488-azide was used to label the probe. TAMRA-azide was used to label the parasite. Images were obtained using a
spinning-disk confocal microscope. Scale bar is 5 µm.
131

Figure 4.10. Photolabeling Dd2 P. falciparum with IC50 Concentrations of AAzCQ for Fluorescence Microscopy. Trophozoite-stage
parasites (Dd2) were incubated with IC50 concentrations of chloroquine of AzBCQ (200 nM) with 0, 1 and 10 fold CQ concentrations.
Alexa Fluor 488-azide was used to label the probe. TAMRA-azide was used to label the parasite. Images were obtained using a
spinning-disk confocal microscope. Scale bar is 5 µm.
132

Figure 4.11. Photolabeling HB3 P. falciparum with LD50 Concentrations of AAzCQ for Fluorescence Microscopy. Trophozoite-stage
parasites (HB3) were incubated with LD50 concentrations of chloroquine of AzBCQ (150 nM) with 0, 1 and 10 fold CQ
concentrations. Alexa Fluor 488-azide was used to label the probe. TAMRA-azide was used to label the parasite. Images were
obtained using a spinning-disk confocal microscope. Scale bar is 5 µm.
133
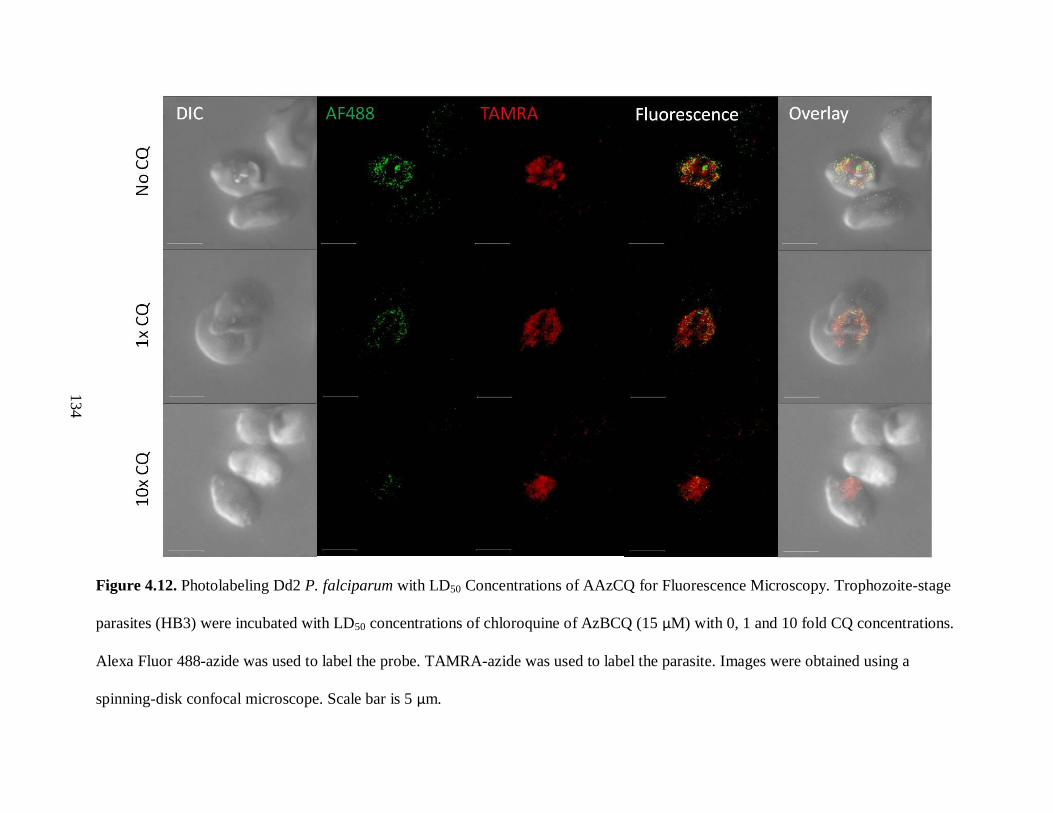
Figure 4.12. Photolabeling Dd2 P. falciparum with LD50 Concentrations of AAzCQ for Fluorescence Microscopy. Trophozoite-stage
parasites (HB3) were incubated with LD50 concentrations of chloroquine of AzBCQ (15 µM) with 0, 1 and 10 fold CQ concentrations.
Alexa Fluor 488-azide was used to label the probe. TAMRA-azide was used to label the parasite. Images were obtained using a
spinning-disk confocal microscope. Scale bar is 5 µm.
134

135
surrounded by fluorescence. In both strains, this IC50 labeling is competed by the underivatized
CQ, resulting in little-to-no fluorescence of AAzCQ in the samples containing 10x CQ.
Under LD50 conditions, both strains show more fluorescence intensity spread throughout
the entirety of the parasite cytoplasm, as shown in Figures 4.11 and 4.12. Like the cytostatic
concentration labeling, this cytocidal labeling is also competed away by the presence of
underivatized CQ, particularly at a ten-fold excess. The difference in localization of the AAzCQ-
specific fluorescence is not due to concentration alone. The IC50 concentration used for Dd2, 200
nM, Figure 4.7, is actually higher than the LD50 concentration used for HB3, 150 nM, Figure 4.8.
If the labeling redistribution were purely from the addition of more probe, we would not expect
to see the lower amount of labeling seen in IC50 Dd2 labeling, which is limited in its spatial
distribution compared to the HB3 LD50.
The fluorescence microscopy shows that the AAzCQ probe can label different spatial
regions of the parasite at cytocidal concentrations as compared to cytostatic. In order to try to
identify what the targets might be that are labeled at cytocidal concentrations, bulk quantities of
parasites can be labeled for proteomic analysis. Scheme 4.3 shows one method of analyzing
whole-cell parasite lysates for labeled proteins. Following covalent crosslinking of the probe to
its target, the cells can be lysed, and AAzCQ conjugated to biotin. If AzBCQ is used, the
conjugation step is not needed. Two-dimensional gel electrophoresis can then be used to separate
the proteins; with Western blotting against biotin used to identify what spots could be conjugated
to the probe. A companion gel that has been stained with Coomassie Blue can then be used for
spot excision and trypsin digestion of the protein for mass spectroscopic analysis.

136
Scheme 4.3. Protocol for Separation of Biotin-Labeled Targets with 2D Gel Electrophoresis.
Parasites are incubated with, and crosslinked to the probe with UV light. Conjugation to biotin
allows for visualization of protein targets via Western blot after 2D gel electrophoresis. Excision
of labeled spots allows for MS analysis of trypsin-digested peptides and protein identification.
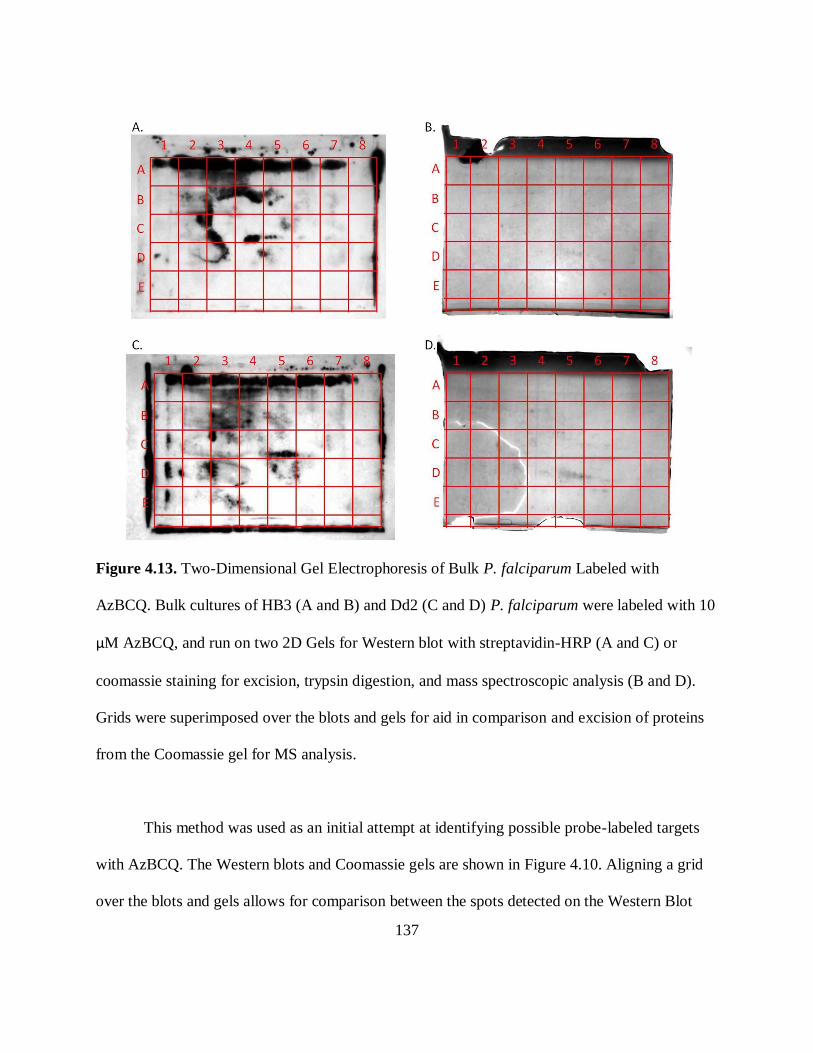
137
Figure 4.13. Two-Dimensional Gel Electrophoresis of Bulk P. falciparum Labeled with
AzBCQ. Bulk cultures of HB3 (A and B) and Dd2 (C and D) P. falciparum were labeled with 10
µM AzBCQ, and run on two 2D Gels for Western blot with streptavidin-HRP (A and C) or
coomassie staining for excision, trypsin digestion, and mass spectroscopic analysis (B and D).
Grids were superimposed over the blots and gels for aid in comparison and excision of proteins
from the Coomassie gel for MS analysis.
This method was used as an initial attempt at identifying possible probe-labeled targets
with AzBCQ. The Western blots and Coomassie gels are shown in Figure 4.10. Aligning a grid
over the blots and gels allows for comparison between the spots detected on the Western Blot
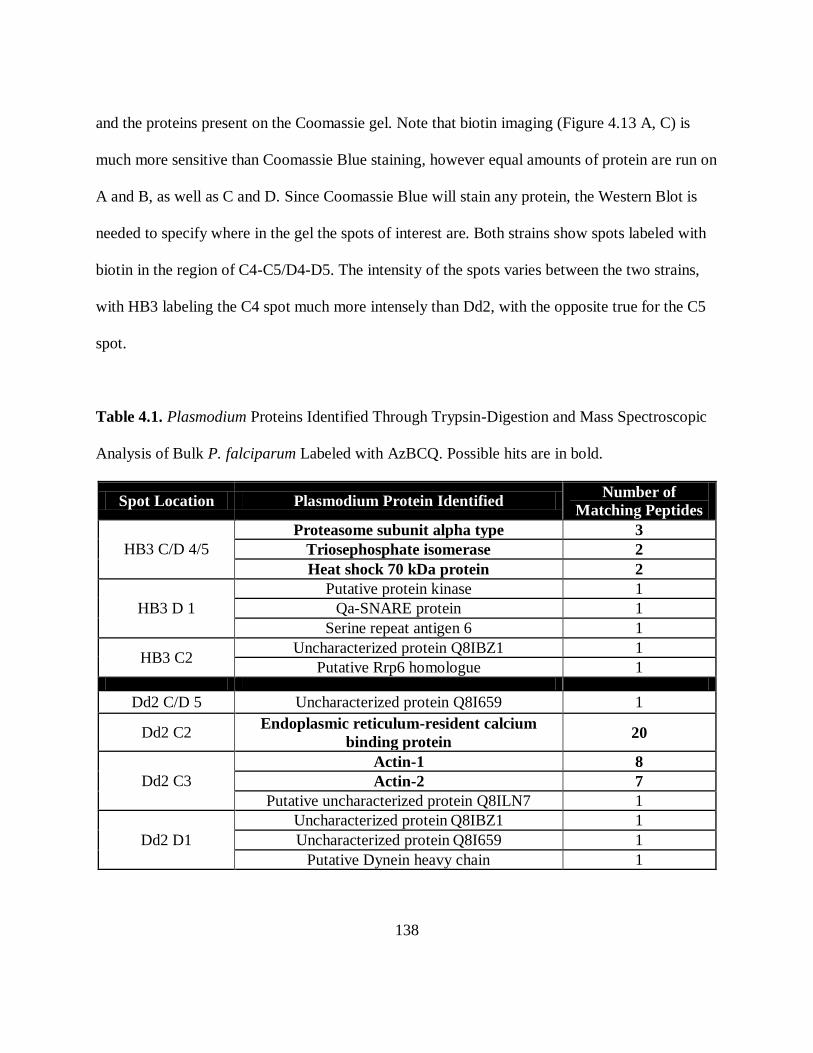
138
and the proteins present on the Coomassie gel. Note that biotin imaging (Figure 4.13 A, C) is
much more sensitive than Coomassie Blue staining, however equal amounts of protein are run on
A and B, as well as C and D. Since Coomassie Blue will stain any protein, the Western Blot is
needed to specify where in the gel the spots of interest are. Both strains show spots labeled with
biotin in the region of C4-C5/D4-D5. The intensity of the spots varies between the two strains,
with HB3 labeling the C4 spot much more intensely than Dd2, with the opposite true for the C5
spot.
Table 4.1. Plasmodium Proteins Identified Through Trypsin-Digestion and Mass Spectroscopic
Analysis of Bulk P. falciparum Labeled with AzBCQ. Possible hits are in bold.
Spot Location Plasmodium Protein Identified Number of
Matching Peptides
HB3 C/D 4/5
Proteasome subunit alpha type 3
Triosephosphate isomerase 2
Heat shock 70 kDa protein 2
HB3 D 1
Putative protein kinase 1
Qa-SNARE protein 1
Serine repeat antigen 6 1
HB3 C2 Uncharacterized protein Q8IBZ1 1
Putative Rrp6 homologue 1
Dd2 C/D 5 Uncharacterized protein Q8I659 1
Dd2 C2 Endoplasmic reticulum-resident calcium
binding protein 20
Dd2 C3
Actin-1 8
Actin-2 7
Putative uncharacterized protein Q8ILN7 1
Dd2 D1
Uncharacterized protein Q8IBZ1 1
Uncharacterized protein Q8I659 1
Putative Dynein heavy chain 1

139
The D4/5 spot in HB3 is possibly shifted to a higher pI value in the Dd2 gel, as the spot
resides within D5 alone. The same possible shift is observed in the C2 spot in HB3, which
resides on the border of C2 and C3 in Dd2. D1 also shows variation between the two strains, as
the spot in HB3 is much less intense than Dd2, with Dd2 having an additional spot on the border
with D2.
Mass spectroscopy of trypsin-digested peptides was used to investigate what proteins
may be present in these spots of interest. The identified proteins are listed in Table 4.1. Some
possible identifications were made through only 1 peptide, making these assignations not very
strong. Proteins identified with more than 1 peptide include a component of the proteosome,
triosephosphate isomerase and a 70 kDa heat shock protein in HB3, and an a calcium-binding
protein from the endoplasmic reticulum and two types of actin in Dd2. Further examination of
the peptide masses shows no peptide masses that could also include the added 765.25 amu of
AzBCQ above the lower-limit cut-off of the system, (no peptides below 400 Da are detected).
Without confirmation of AzBCQ binding to a measured peptide, it is not possible to
unequivocally prove what proteins in the excised region were actually crosslinked to the probe.
A second method of protein isolation and separation was developed that utilizes avidin-
enrichment of biotin-containing proteins, as shown in Scheme 4.4. In order to optimize the
protocol and choose between monomeric avidin (lower affinity) or streptavidin (higher affinity)
resin for enrichment a pilot “proof of principle” experiment was performed. In brief, a
biotinylated PfCRT from crude membranes of S. cerevisiae were enriched and run on one-
dimensional SDS-PAGE gels for visualization of biotin-containing proteins with Western blot
and a visualization of total protein with a silver stain, as shown in Figure 4.11. Monomeric

140
avidin enrichment, shown in Figure 4.14 A and B, shows biotin-containing proteins in the first
washes (lanes 3 and 8), and not in the elutions (lanes 5 and 10), suggesting that the biotin-avidin
interaction in these beads is not strong enough to enrich an elution with biotinylated proteins.
Streptavidin enrichment, shown in Figure 4.14 C and D shows less biotinylated protein in the
first wash, particularly for 2 µg of initial protein (lane 3). The fourth wash for both 2 and 10 µg
of initial protein shows no biotinylated protein. In both samples, elution of the avidin-captured
proteins by boiling in Laemmli buffer (lanes 5 and 10) yields biotinylated proteins with little
contaminating protein seen in the silver stain. The higher affinity of streptavidin is preferable to
the lower affinity of monomeric avidin, especially since boiling samples in Laemmli buffer
before gel electrophoresis is acceptable for downstream mass spectroscopy analysis.
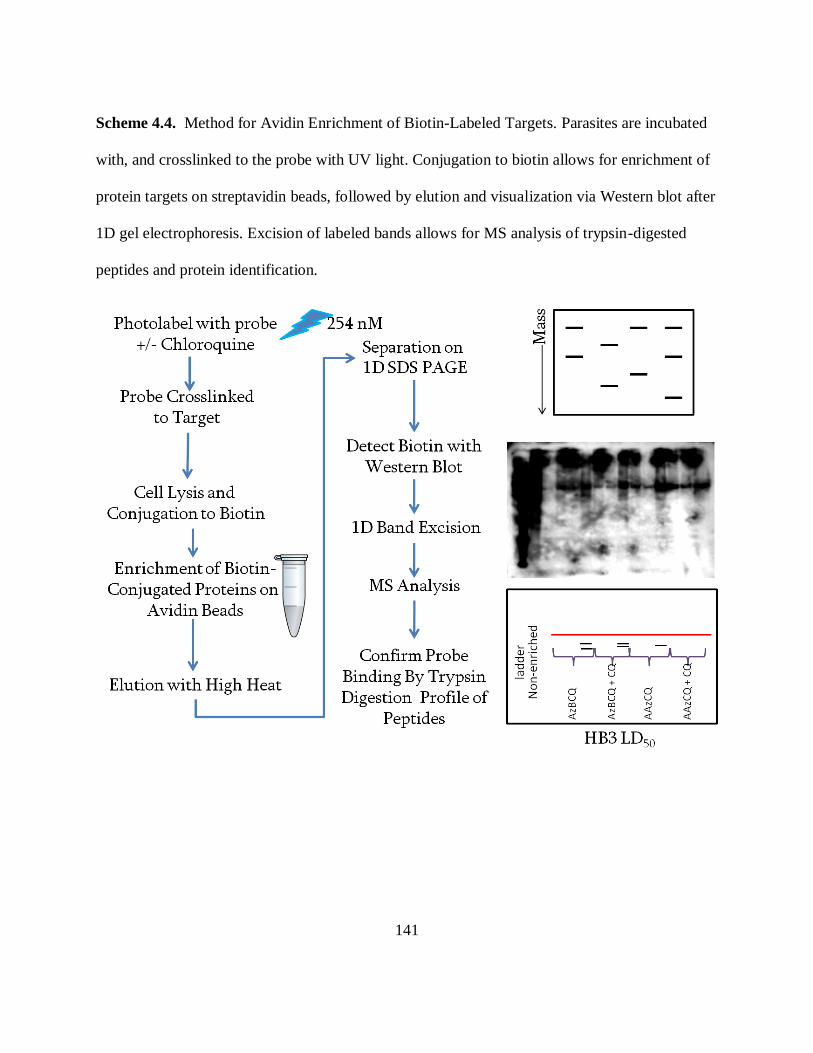
141
Scheme 4.4. Method for Avidin Enrichment of Biotin-Labeled Targets. Parasites are incubated
with, and crosslinked to the probe with UV light. Conjugation to biotin allows for enrichment of
protein targets on streptavidin beads, followed by elution and visualization via Western blot after
1D gel electrophoresis. Excision of labeled bands allows for MS analysis of trypsin-digested
peptides and protein identification.
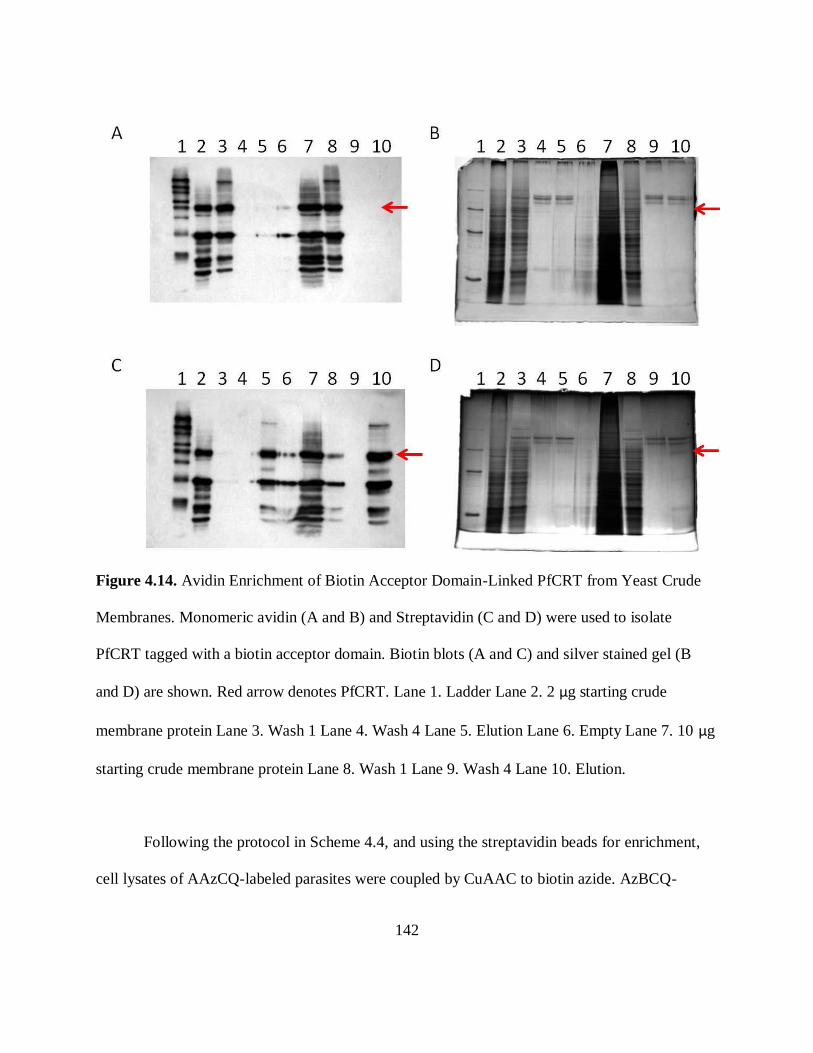
142
Figure 4.14. Avidin Enrichment of Biotin Acceptor Domain-Linked PfCRT from Yeast Crude
Membranes. Monomeric avidin (A and B) and Streptavidin (C and D) were used to isolate
PfCRT tagged with a biotin acceptor domain. Biotin blots (A and C) and silver stained gel (B
and D) are shown. Red arrow denotes PfCRT. Lane 1. Ladder Lane 2. 2 µg starting crude
membrane protein Lane 3. Wash 1 Lane 4. Wash 4 Lane 5. Elution Lane 6. Empty Lane 7. 10 µg
starting crude membrane protein Lane 8. Wash 1 Lane 9. Wash 4 Lane 10. Elution.
Following the protocol in Scheme 4.4, and using the streptavidin beads for enrichment,
cell lysates of AAzCQ-labeled parasites were coupled by CuAAC to biotin azide. AzBCQ-

143
labeled parasites were lysed and continued alongside the coupled AAzCQ samples. Following
precipitation of proteins to remove excess biotin, the resolubilized proteins were incubated with
streptavidin-linked beads, where proteins without a biotin moiety were washed away. Separation
of the eluted biotin-containing proteins was then performed by one-dimensional SDS-PAGE for
excision of bands of interest. CQ-competition (1,000x) was also utilized to look for bands with
CQ-specific labeling.
An advantage to this method is that unlike two-dimensional gel electrophoresis, where
each individual sample must be run on its own gel, all samples for each strain can be run on the
same gel with avidin-enrichment. This allows for more direct comparison between the two
probes as well as labeling in the presence vs. absence of CQ-competition. Figure 4.15 shows a
biotin Western blot for HB3 parasites labeled with both probes. An intense band is observed in
every sample, both the washes and the elutions, which is denoted in the cartoon by the red line.
In the AzBCQ-labeled elutions (lanes 3 and 6), below this band are two less-intense bands that
are present but reduced upon CQ competition, denoted by the purple and green bands. The green
band is also present in the AAzCQ-labeled elution (lane 9) alongside a band above the red line
(blue) and both are competed away by CQ (elution in lane 12). These bands of interest, unlike
the red band, are not very intense and are probably present in amounts reaching the lower limit of
detection in biotin Western blotting thus they are not easily visible by Coomassie staining. The
Coomassie Blue-stained gel only shows clear bands in the non-enriched sample and the washes.
Nonetheless, excision of the areas of interest in the elution lanes are directed by the biotin blot,
and corresponding regions from the Coomassie gel using grids (similar to those shown in Figure
4.13) are then excised for MS analysis.
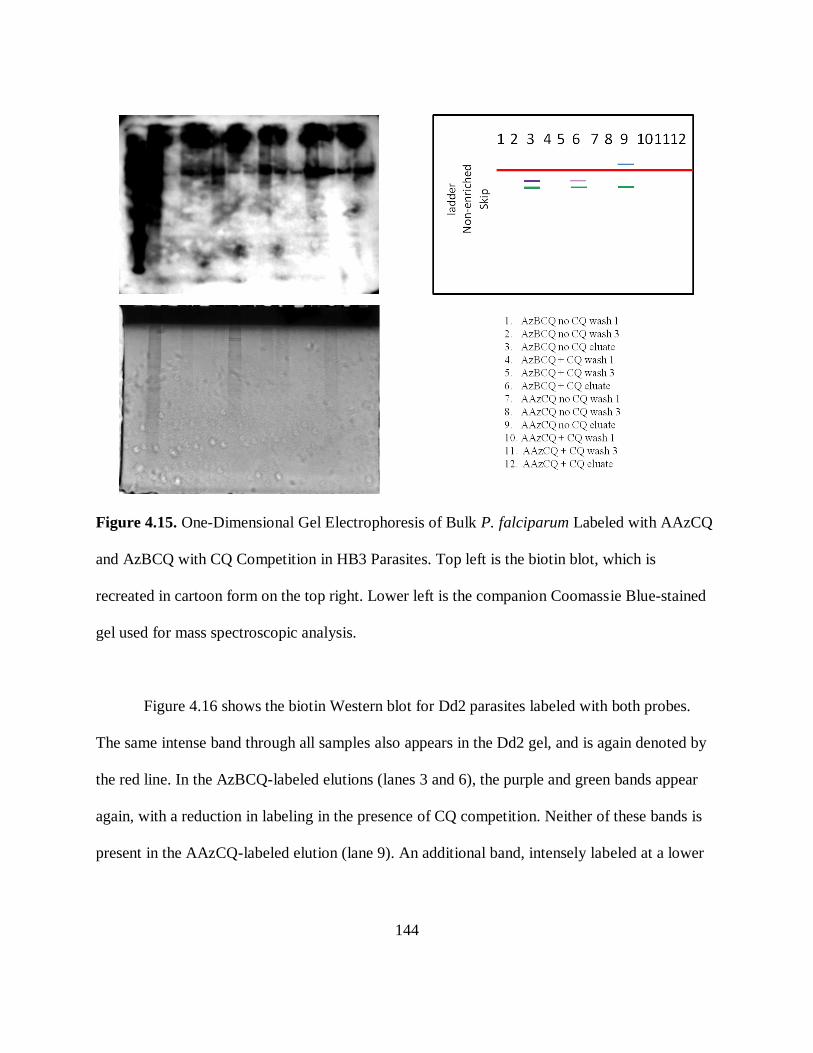
144
Figure 4.15. One-Dimensional Gel Electrophoresis of Bulk P. falciparum Labeled with AAzCQ
and AzBCQ with CQ Competition in HB3 Parasites. Top left is the biotin blot, which is
recreated in cartoon form on the top right. Lower left is the companion Coomassie Blue-stained
gel used for mass spectroscopic analysis.
Figure 4.16 shows the biotin Western blot for Dd2 parasites labeled with both probes.
The same intense band through all samples also appears in the Dd2 gel, and is again denoted by
the red line. In the AzBCQ-labeled elutions (lanes 3 and 6), the purple and green bands appear
again, with a reduction in labeling in the presence of CQ competition. Neither of these bands is
present in the AAzCQ-labeled elution (lane 9). An additional band, intensely labeled at a lower

145
Figure 4.16. One-Dimensional Gel Electrophoresis of Bulk P. falciparum Labeled with AAzCQ
and AzBCQ with CQ Competition in Dd2 Parasites. Top left is the biotin blot, which is recreated
in cartoon form on the top right. Lower left is the companion Coomassie Blue-stained gel used
for mass spectroscopic analysis.
mass value, marked by the orange bar, occurs in the AzBCQ-labeled sample and is competed by
CQ. Like the HB3 gels, these bands of interest are not very intense yet excision of the areas of
interest in the elution lanes will be directed by the biotin blot. Proteomic analysis of these
provocative data is ongoing. In the future, similar experiments will be done with other CQS and
CQR strains.

146
4.3. Discussion
AAzCQ, an ABPP probe with increased experimental flexibility compared to AzBCQ
was synthesized and utilized to probe for cytocidal targets of CQ in P. falciparum parasites. This
crosslinking interaction is extremely fast. Singlet nitrenes have lifetimes in the femptosecond
lifetimes (Burdinski et al. 2006), so if the target is weakly bound, it is likely that the nitrene will
decay through a side reaction and not insert into a neighboring C-H single bond. Utilizing CQ
competition helps to identify specific targets, but must be present before UV-crosslinking due to
the short lifetime of the nitrene.
I find that accurately analyzing subcellular distribution of ABPP probes of CQ strongly
benefits from the use of AAzCQ. Initial experiments utilizing AzBCQ with a streptavidin-linked
fluorophore showed additional fluorescence within the cytoplasm of the RBC, not within the
parasite, even with permeabilization of the membranes. It is possible that the large size of the
streptavidin compared to that of small molecules like AzBCQ prevents it from labeling
specifically. Nonspecific protein-protein interactions could be the cause of the high background
staining observed, particularly since cell are fixed with paraformaldehyde (a protein crosslinker)
and mounted to coverslips through the electrostatic interaction of the phosphate head groups of
the membrane with polylysine.
AAzCQ, since it utilizes a small-molecule fluorophore, does not seem to suffer from the
same shortcomings. Early experiments, however, yielded a different problem with background
staining. Despite the bioorthogonal-nature of aliphatic azides, there was non-probe specific
staining of the parasite cytoplasm by azide-linked fluorophores. This staining was not
determined to be due to UV illumination, fixation procedures, permeabilization of the
147
membranes, presence or absence of the CuAAC catalysts, or the fluorophore core structure, data
not shown. In order to reduce the non-probe specific labeling, “blocking” was adopted.
Following probe crosslinking and fixation/permeabilzation of the cells, the samples were
incubated in the presence of TAMRA-azide in the absence of the catalysts, and then washed.
Incubation in Alexa Fluor 488-azide with the catalysts afterwards yielded probe-specific
labeling. The TAMRA-azide could be used to visualize the parasite cytoplasm, with the areas of
no fluorescence corresponding to the hemozoin-containing DV.
Imaging HB3 and Dd2 parasites at their IC50 levels with AAzCQ yields labeling that is
limited in its spatial distribution through the parasite cytosol, and is typically within close
proximity of the low-TAMRA fluorescence regions containing Hz. Excess CQ concentrations
successfully reduce this labeling, suggesting that the labeled targets’ binding sites overlap with
those of CQ. The distribution of LD50 concentrations of the probe, as well as the intensity, is
increased in both strains, even though the LD50 concentration for HB3 is actually lower than the
IC50 concentration for Dd2. This suggests that the increased labeling under cytocidal conditions
is not a simple increase in signal resulting from an increase in absolute concentration, but due to
an alteration of the localization of the targets. It is possible that under cytocidal conditions, the
probe is labeling new protein targets that are not labeled under cytostatic conditions, and that
these targets are spread throughout the cytosol. This labeling is CQ-competed as well, suggesting
that the targets are CQ-specific. This data supports the hypothesis that cytostatic and cytocidal
targets of CQ in P. falciparum are distinct. This is consistent with other studies published
recently in our lab that cytocidal doses target more than just Hz. These observations include: a
redistribution of ATG8 following cytocidal CQ treatment (Gaviria et al. 2013), activity of high
148
CQ doses against non-Hz forming stages, and an alteration of the number of daughter nuclei and
viability of the following cell cycle (Gligorijevic et al. 2008).
The subcellular localization of AAzCQ can suggest distinct targets, but proteomic
analysis is needed to determine what those targets could be. Initial exploration of possible
cytocidal CQ targets was performed with AzBCQ, with my logic being that the signal would not
be reduced by adding the CuAAC reaction step that could conceivably lower overall yield.
Separation of cellular lysates was performed by two-dimensional gel electrophoresis. Western
blots detected biotin-labeled proteins in both strains, but comparison of the distribution of these
spots is made difficult by the lower reproducibility of 2D gels. Since each sample has to be run
on its own gel, samples cannot be run side-by-side with standards. And although the individual
gels can be run side-by-side, this technique is more susceptible to slight variations in absorbing
protein lysates into the isoelectric focusing strip, and mounting the focusing strip into the SDS-
PAGE gel for mass separation. Additionally, few proteins were detected on the Coomassie
stained gel, making excision more difficult. This may have been due to lower amounts of protein
that could be absorbed by the focusing strip due to incomplete solubilization of the lysate in the
nonionic detergent required for 2D gel electrophoresis.
Nonetheless, the mass spectrometric analysis of the 2D gels provides some possible
proteins in the regions of interest that include, in the HB3 sample, a proteosome subunit and heat
shock protein 70. Proteosomes are an integral part of the ubitiquin-dependent protein degradation
pathway and are localized to the cytoplasm and the nucleus. The alpha subunits, of which the
identified protein would be a part, act as a substrate gate, allowing substrates access to the beta
subunit for degradation (Sridhar et al. 2013). The localization of the proteosome to the cytoplasm
149
is consistent with the subcellular localization observed with AAzCQ, as well as the hypothesis
that cellular survival pathways that rely on degradation of damaged biomolecules may be
involved in the action of antimalarial compounds. Heat shock protein 70, and ATP-dependent
cellular chaperone involved in maintaining proper protein folding, is found in all cellular
compartments, including the cytosol, parasitophorous vacuole, and Maurer’s clefts (Shonhai et
al. 2007). An additional protein hit was triose phosphate isomerase, which has been localized to
the Maurer’s clefts and PVM in Plasmodia (Aurrecoechea et al. 2009). Isoforms of that protein
have localized to both the apicoplast and the cytosol (depending on the isoform) in the fellow
Apicomplexan parasite Toxoplasma gondii (Fleige et al. 2007).
The Dd2 gel MS analysis did not include any stress-response proteins, with the only
proteins identified through more than 1 matching peptide including a calcium-binding protein
from the endoplasmic reticulum, as well as the structural protein actin. Endoplasmic reticulum-
resident calcium-binding protein localizes, as expected, localizes to the endoplasmic reticulum.
The protein has been hypothesized to be involved in protein trafficking (La Greca et al. 1997),
and has been identified as a target of synthetic endoperoxides N-89 and N-251 (Mortia et al.
2012). The Plasmodium falciparum genome encodes 2 isoforms of actin, both of which were
identified in the two-dimensional gel electrophoresis MS analysis. Actin I has been determined
to have functions in several processes, including host cell invasion, cell motility, and vesicle
trafficking. Interestingly, it has been hypothesized to be involved in host Hb uptake (Deligianni
et al. 2011). Hoppe et al. (2004) have observed that CQ treatment results in an increase in Hb-
containing vesicles in the parasite possibly due to the inability to be properly trafficked to the
DV for proper fusion. Actin II was also identified in the MS analysis. Gene deletion experiments

150
have determined that actin II is not necessary for asexual-stage viability, but is involved in
generation of male gametocytes, and is necessary for generation of their flagella (Deligianni et
al. 2011).
Although differential labeling in CQS vs. CQR parasites is expected, in order to identify
targets present in the CQS strain that are not in the CQR, the low peptide matching, as well as
the inability to assign any peptides as having AzBCQ crosslinked to it, suggests that this
technique may not be the best method of proteomic analysis of CQ targets.
A second protocol was designed based on biotin-avidin affinity, and optimized through
the use of crude membranes of yeast containing a biotinylated PfCRT. Enriching cell lysates for
biotin-containing proteins allows for one-dimensional separation through SDS-PAGE, and the
side-by-side running of multiple samples with mass standards. Analysis of HB3 and Dd2
parasites labeled with both probes with CQ competition shows both differential labeling between
the strains and between the two probes. The set of green bands, of a mass around 50 kDa, are
labeled, and competed with CQ, by both probes in HB3, with the competition of AAzCQ
reducing labeling below the ability to detect it. The purple band is labeled by AzBCQ in HB3
with CQ competition reducing labeling. These bands are also labeled by AzBCQ, and competed
with CQ, in Dd2, but not AAzCQ. HB3 labeled by AAzCQ shows an additional band above 60
kDa that is competed with CQ; while Dd2 shows an intense band in AzBCQ at about 30 kDa that
is competed with CQ, but not labeled with AAzCQ. MS analysis of these provocative bands is
underway.
AAzCQ provides an important new tool in identifying possible targets of CQ cytocidal
treatment in P. falciparum parasites. Examination of additional sensitive and resistance strains,

151
as well as comparison of identified proteins with genomic regions identified as being associated
with cytocidal CQR (see Gaviria et al. 2013), can help to identify how parasites have evolved to
resist CQ’s toxic effects, allowing for an understanding of the mechanisms of resistance utilized
by this deadly pathogen.
4.4 Acknowledgements
This work was supported by NIH grant AI045957 (to P.D.R), as well as the Achievement
Rewards for College Scientists and Luce Foundations (to K.S.S.).
K. S. S would like to thank Dr. David Gaviria for assistance in the AzBCQ fluorescence
imaging, and Amila Siriwardana for assistance in the AAzCQ fluorescence imaging, Sam
Callaghan and Matthew Hassett for assistance in the proteoliposome-labeling and gel
electrophoresis experiments, as well as for optimization of the avidin enrichment protocol, and
Miloslav Sanda and Dr. Radoslav Goldman for help with the mass-spectrometry proteomics.

152
CHAPTER V
IDENTIFYING NOVEL DRUG COMBINATIONS AND DEFINING THEIR INTERACTIONS AT
CYTOSTATIC AND CYTOCIDAL DOSES
This work to be published as:
Mott, B. T.; Eastman, R. T.; Sherlach, K. S.; Siriwardana, A.; Guha, R.; Shinn, P.; McKnight,
C.; Michael, S.; Lacerda-Queiroz, N.; Khine, P.; Sun, H.; Kasbekar, M.; Aghdam, N.; Fontaine,
S. D.; Liu, D.; Mierzwa1, T.; Mathews, L.; Ferrer, M.; Cheng, K. C. C.; Renslo, A. R.; Inglese,
J.; Yuan, J.; Roepe, P. D.; Su, X.; Thomas, C. J. “High-throughput screening identifies
synergistic antimalarial drug combinations.” 2014. In preparation
5.1 Background
The rise of resistance against many forms of malaria treatment, from chloroquine and
fellow quinolines to the combination therapy of sulfadoxine-pyrimethamine, has lead to the
search for new antimalarial drugs and a renewed focus on development of combination therapies.
The WHO currently recommends drug combinations including: CQ, AQ, or MQ with
sulfadoxine-pyrimethamine, atovaquone/proguanil, QN with either tetracycline or doxycycline,
as well as artemisinin combination therapies (ACTs), which include the artemisinin (ART)
derivatives artesunate (ATSU), artemether (ATM), and dihydroartemisinin (DHA). ACTs
include: ATSU/CQ, ATSU/AQ, ATSU/sulfadoxine-pyramethamine, ASTU/MQ, and ATM/LF
(Greyer, ed. 2001). Combinations of two or more drugs are advantageous because it should
delay the rise of resistance due to the impact of multiple targets within the same pathway or
spread between multiple pathways by requiring additional mutations to overcome the toxic insult
153
of both compounds. The parasite would have to evolve to alter both targets (or their pathways) as
well as any additional negative impacts that could result from synergistic interaction of the
partner drugs. The presence of partner drugs help to eliminate any mutations within the
population that might result in resistance against either drug as a monotherapy (Hastings et al.
2002).
In formulating an ACT pairing, the ART derivative is typically used alongside a partner
drug with a longer half-life, to ensure full clearance of the infection, as well as a different
mechanism of action (MOA), if known. When ATM was partnered with the pseudo-quinoline
lumefantrine (LF), preclinical studies reported synergistic interactions between the two drugs
(Olliaro et al. 1995). Much discussion on ATM and LF as partner drugs focuses on their
complementary pharmacokinetics. When ATM is administered, it is rapidly absorbed and
partially metabolized to DHA, which both have a plasma half-life of about 1 hour. LF, which is
absorbed much more slowly, is also eliminated slowly; its half-life is between 3 and 6 days. The
use of a rapidly-absorbed, highly-active compound like ATM alongside a slowly-absorbed,
slowly-cleared compound like LF is meant to ensure quick mitigation of the symptoms via a
rapid drop in parasitemia (from 109-10
12 to 10-10
4 parasites) as well as full clearance over a
longer period of time to prevent relapse (White et al. 1999). A fixed amount ratio of 1:6
ATM:LF, now used under the trade name “Coartem”, was observed to be the optimum
combination to administer in early trials, and resulted in higher parasite clearance and a higher
cure rate, when compared to monotherapy with either drug (White et al. 1999; Novartis
Pharmaceuticals Corporation. Coartem Product Information). This pairing is also meant to help
avoid the rise of resistance, due to differing hypothesized mechanisms of action between the
154
reactive endoperoxide of ATM that results in radical alkylation of target proteins and the pseudo-
quinoline properties of LF, which may inhibit the growth of hemozoin.
The reports of in vitro synergy of ATM and LF typically trace back to a study by Alin
and coworkers in 1999 that utilized a commonly-used technique known as checkerboard analysis
to quantify the interaction via a probit method of data analysis. Examining two strains, T-996
and LS-21, the authors noted synergy at the IC50, IC90, and IC99 levels at 100:1, 30:1, 1:100
(ATM:LF) concentration ratios, by converting growth data into quantile units for probit analysis.
Probit analysis is a weighted regression system that allows inclusion of all data from 0-100% as a
linear trend, as opposed to the sigmoidal curve-fitting common in our laboratory (Tallarida
1992). The determination of synergy is based on predicted growth inhibition by two compounds
acting independently (derivation not discussed) (Alin et al. 1999).
Additionally, a study in 2007 by Thriemer et al. identified synergy between LF and the
DHA on a series of isolates from Bangladesh by utilizing the isobologram method. However, the
use of isolates, rather than laboratory-adapted strains, makes it more difficult to generate growth
data over a 72 hour period; antiplasmodial activity could only be generated for half of the 10
isolates collected (Thriemer et al. 2007). By using two quantitative methods (isobologram and
combination index analyses) that rely on growth curve data, and that take into account the shape
(provided it remains the same between monotherapy and combination therapy), this study
provides reliable quantification, and clear assignation of the synergistic effect of DHA and LF
within those 5 tested isolates.
In another examination of the impact of metabolism, Wong et al. identified slight synergy
between DHA and the LF metabolite desbutyl-lumefantrine utilizing the same technique as the

155
Thriemer study. While not as clearly synergistic as the Thriemer results, the Wong study does
utilize laboratory-adapted strains. This allows for repetition of the assays performed, and more
statistically-rigorous results. The study also looked for possible interactions between LF and
desbutyl-lumefantrine (designated additive), but did not examine LF and ATM, or LF and DHA.
If these two combinations were studied, it would be possible to know if the trends observed by
Alin and Thriemer extended to other, more commonly studied strains (3D7 and W2mef) (Wong
et al. 2011).
Techniques to experimentally identify synergistic partner drugs in vitro include altering
the concentrations and relative ratios of drugs through a checkerboard pattern on the assay plate,
as well as fixed-ratio serial dilutions. Either technique can be used to generate the most
commonly used plot of the interaction, known as an isobologram. Isobologram analysis requires
comparison of the growth curve data of the drug in the presence of its partner with its
monotherapy activity, generating a ratio of the activity in combination with the activity as a
monotherapy, known as a fractional inhibitory concentration (FIC). FIC values are calculated for
each compound at a series of fixed ratios between the two. When these data are plotted, the
results can be a straight line between (1,0) and (0,1) (additive), a concave curve (synergistic), or
a convex curve (antagonistic) (see Figure 5.1). More complex curves that are a mixture of these
shapes are also possible, if the interaction depends on the ratio between the two compounds,
meaning that some combinations may in fact be synergistic at certain ratios and additive or
antagonistic at others (Berenbaum 1978).
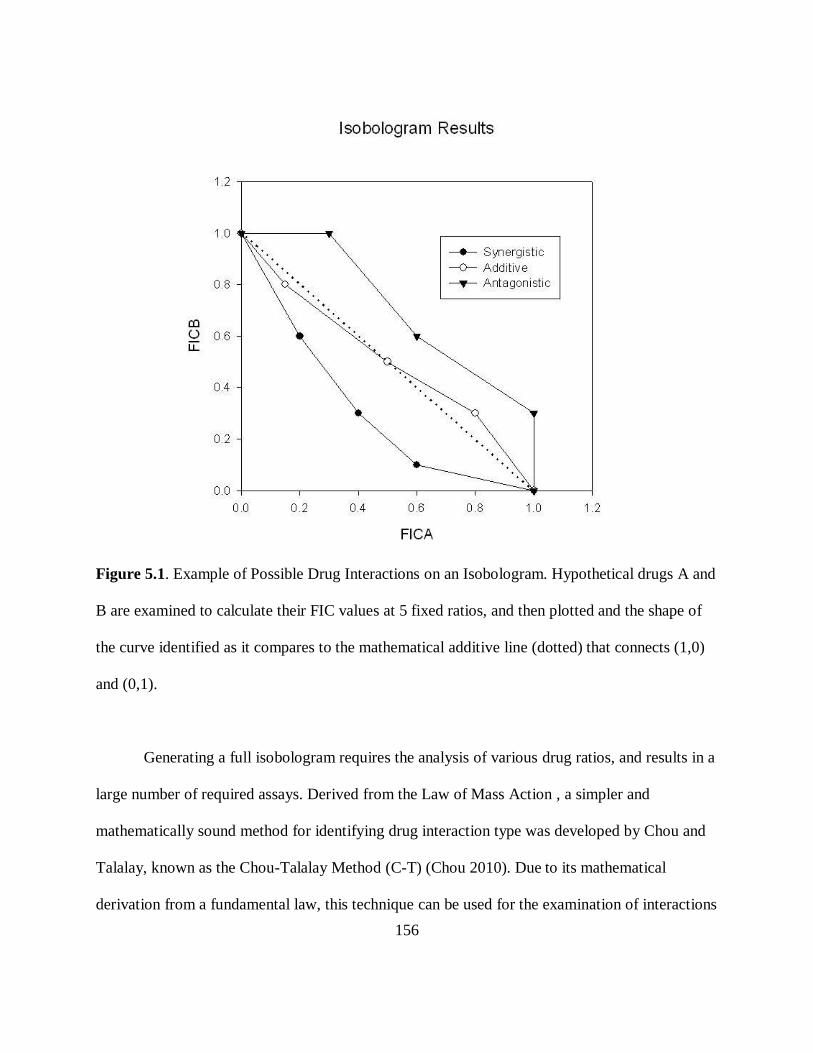
156
Figure 5.1. Example of Possible Drug Interactions on an Isobologram. Hypothetical drugs A and
B are examined to calculate their FIC values at 5 fixed ratios, and then plotted and the shape of
the curve identified as it compares to the mathematical additive line (dotted) that connects (1,0)
and (0,1).
Generating a full isobologram requires the analysis of various drug ratios, and results in a
large number of required assays. Derived from the Law of Mass Action , a simpler and
mathematically sound method for identifying drug interaction type was developed by Chou and
Talalay, known as the Chou-Talalay Method (C-T) (Chou 2010). Due to its mathematical
derivation from a fundamental law, this technique can be used for the examination of interactions

157
in vitro and in vivo, is applicable for primary and secondary ligands, and is not dependent on the
mechanism of action of any tested compound. In any analysis of possible synergy, the
fundamental core of defining interactions is in defining additivity. Where other techniques can
only do so for mutually-exclusive (isobologram) or non-mutually-exclusive (fractional-product
method) compounds, the definition of additivity in the Chou-Talalay Method is tolerant of both
types on interaction (Chou et al. 1984).
In order to analyze a combination at a certain ratio of the test compounds by C-T, the
FICs are calculated in the same way as one would do for an isobologram. These values must be
calculated from a dose-response curve generated from multiple data points. Examination of a
single growth data point does not incorporate the shape of the curve into the quantification,
negating one of the advantages of C-T analysis. Once the FIC values are calculated, instead of
plotting them on a graph, these values are summed to generate a combination index, or fractional
inhibitory concentration index (FICindex). Based on their derivation, Chou and Talalay assigned
additivity as occurring when the FICindex equals 1. When the FICindex is less than 1, the interaction
is synergistic; when it is greater than 1, the interaction is antagonistic. This methodology can be
applied to a combination of any number of different compounds, although the experimental
requirements for data generation may limit the number of compounds in the combination (Chou
et al. 1984). Although the assigned cut-offs hold mathematically, experimental variance leads to
deviation from these values. The cut-offs used in experimental analysis can vary from synergy
less than 0.5 and antagonism greater than 4 (Bell 2005), to just expanding the additive range to
between 1 and 2 (Matthews et al. 2013). The choice of cut-offs can be somewhat arbitrary,
depending on experimental error and variability (Bell 2005).
158
Until recently, all examination of antimalarial drug combinations in vitro focused on
cytostatic conditions, where the effects of low concentrations of drug on growth rates are
examined. Recent work has shown that, in addition to these cytostatic effects, many antimalarial
compounds have cytocidal (or parasite-kill) properties (Paguio et al. 2011; Gaviria et al. 2013).
When compared to cytostatic effects, different patterns of drug susceptibility and resistance can
be identified under cytocidal conditions (Paguio et al. 2011; Gorka et al. 2013a; Gorka et al.
2013d). When applying this distinction to combination analysis, it is possible that the interaction
of two compounds may vary between low-dose growth inhibition and high-dose cell kill, both
between susceptible and resistant strains, but also within the same strain under different dosing
conditions. One study, by Gorka and coworkers in 2013, explored both of these conditions with
common quinoline antimalarials using isobologram analysis. In some cases, the cytostatic
combination could vary quite significantly between susceptible HB3 and resistant Dd2. For
example, amodiaquine and tafenoquine are additive in HB3 but quite antagonistic in Dd2.
Between low and high dose the interaction can vary quite significantly as well. The combination
of CQ and amodiaquine in Dd2 parasites is additive at the cytostatic level, but highly
antagonistic under cytocidal conditions. This combination analysis was able to identify synergy
between tafenoquine and methylene blue under static and cidal conditions in Dd2, with HB3
synergistic at cidal, and additive at cytostatic doses. Differences like this reinforce the need to
examine possible novel combination therapies at both levels to ensure additive or synergistic
interaction in a malaria patient (Gorka et al. 2013b). Additive interactions do not preclude the
use of a certain combination, particularly if higher, cytocidal doses can result in an increase in
synergy.

159
Circumventing the drug resistance currently observed in clinical isolates and laboratory
strains, and slowing the advent of future resistance, requires the identification of novel drug
combinations (Lukens et al. 2014). By clearly defining synergistic, additive, and antagonistic
effects in vitro, it is possible to identify drug pairings that exert maximal antiplasmodial activity
at minimal doses, possibly reducing negative off-target effects in the host. However, it is
necessary to explore these interactions at both the cytostatic and cytocidal level. Just because
synergy or additivity is observed at one dose does not mean the same is seen at the other. As the
concentration of a drug is taken up by the host, it can reach cytocidal levels, and then approach
cytostatic as the drug clears the system; potential combination therapies should be examined
under both sets of conditions to avoid antagonistic pairings that will reduce treatment efficacy.
Combinations of the selected PI3K inhibitors and currently-used antimalarials were analyzed for
the nature of their interaction in vitro, as well as their impact on cellular autophagy with the goal
of identifying novel combinations that are active against sensitive and multidrug-resistant lines
of Plasmodium falciparum.
5.2 Results
High throughput screening of a library of antimalarials, FDA approved drugs, and
compounds under clinical review at the National Center for Advancing Translational Science
(NCATS) was performed by our collaborators on 4650 combinations to date. A comprehensive
set of 240 combinations of interest were then screened in duplicate against two individual
cultures for each of the three parasite strains (3D7, HB3 and Dd2) as shown in Figure 5.2A (Mott
et al. 2014, in preparation). After removing assays that failed to meet QC criteria (see Materials

160
and Methods), several metrics were applied to determine the combination response in order to
prioritize those that could be explored as potential antimalarial therapies, including hierarchical
clustering and mechanism of action relationships. Some compounds were selected for closer
analysis as partner drugs to currently-used antimalarials artemether and lumefantrine. Shown in
Scheme 5.1, these compounds included GSK2126458 (GSK212), NVP BGT226 (NVP), Torin 2,
and PIK 93. All four of these compounds are known to be inhibitors of phosphotidylinositol 3-
kinases (PI3Ks). PI3Ks are a large family of enzymes, but include enzymes involved in the
autophagy cascade. Genomic analysis has yet to identify an mTOR (class IV PI3K) homolog in
Plasmodia (Hanson et al. 2013), but a homolog of the class I PI3K VPS34 has been identified
(Gaviria et al. 2013).

161
Figure 5.2. Single agent and combination analysis of a large collection of approved and
investigational drugs for antimalarial activity. (A) Heat map representation of approved and
investigational drugs (data available at http://pubchem.ncbi.nlm.nih.gov/). (B) Combination data
(10×10 plots) for drug combinations representing the standard of care (ATM + LF, ATSU +
MQ) and for novel combinations (MQ + nicardipine (NIC), ATM + Alvespimycin, Atovaquone
+ ML238, Amodiaquin + BIX-01294, Methylene Blue + Tafenoquine. ATM + NVP-BGT226).
Growth data from the heat map presentation can be processed for identification of synergy
through generation of an isobologram, or calculation of deviations from the Bliss Model (see
Chapter II- Materials and Methods, section 2.2.12 High-Throughput Screening of Drug
Combinations).
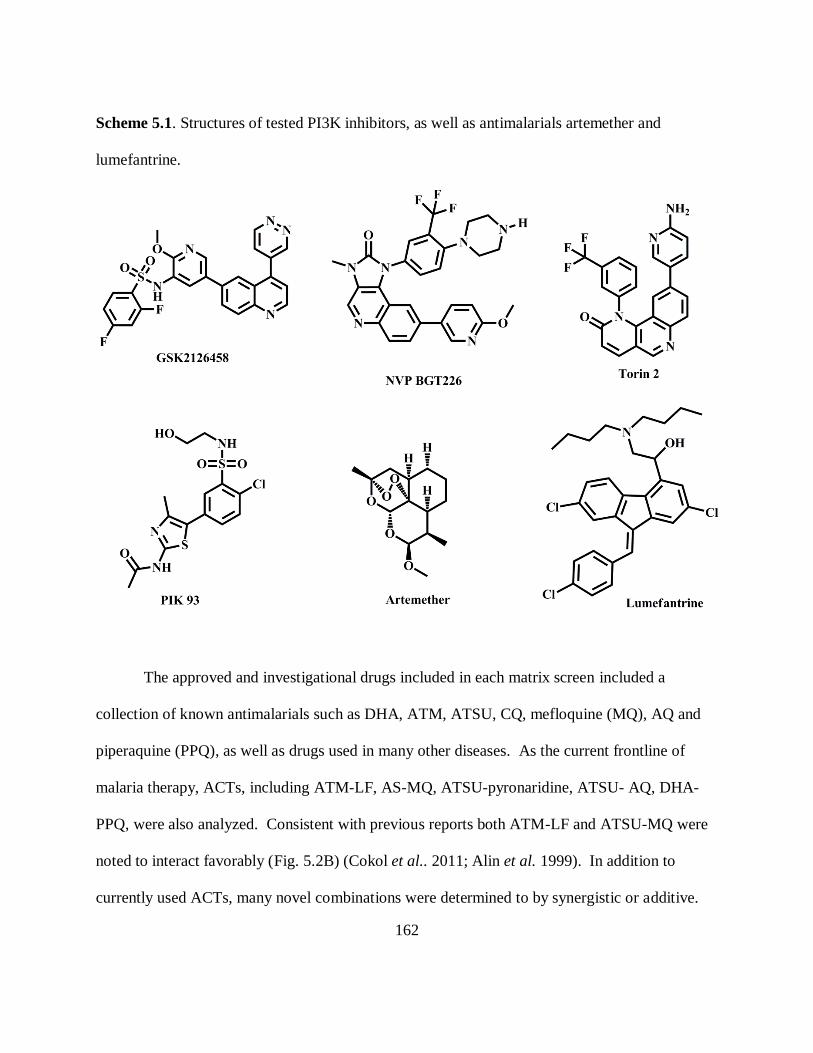
162
Scheme 5.1. Structures of tested PI3K inhibitors, as well as antimalarials artemether and
lumefantrine.
The approved and investigational drugs included in each matrix screen included a
collection of known antimalarials such as DHA, ATM, ATSU, CQ, mefloquine (MQ), AQ and
piperaquine (PPQ), as well as drugs used in many other diseases. As the current frontline of
malaria therapy, ACTs, including ATM-LF, AS-MQ, ATSU-pyronaridine, ATSU- AQ, DHA-
PPQ, were also analyzed. Consistent with previous reports both ATM-LF and ATSU-MQ were
noted to interact favorably (Fig. 5.2B) (Cokol et al.. 2011; Alin et al. 1999). In addition to
currently used ACTs, many novel combinations were determined to by synergistic or additive.

163
These included combinations of currently approved antimalarial drugs with compounds such as
ion channel modulators (e.g. nicardipine), novel mitochondrial targeting agents (e.g. ML238),
drugs targeting human enzymes and receptors (e.g. BIX-01294, alvespimycin and NVP-
BGT226), as well as agents currently undergoing single agent clinical assessment in malaria
trials (e. g. tafenoquine) (Fig. 5.2B). Further examination of these combinations yielded certain
classes of compounds that trended towards favorable interactions, including compounds
targeting the mitochondrion, ion channel blockers, HSP90 and PI3K targeting drugs, and known
antimalarials were noted.
One class of compounds identified in the high throughput screen were drugs that modify
ion homeostasis in combination with the ART class. Ion homeostasis plays a significant role in
parasite biology and the interaction of ion channel blockers and antimalarial drugs had
previously been documented (Garcia 1999). Ion channel antagonists such as nicardipine (shown
in Fig 5.2B), manidipine, manoalide (Ca2+
) and propafenone (Na+) (data not shown) were
synergistic with the ARTs and quinolines (Weisman et al. 2006). Other modulators of ion
homeostasis such as the small molecule KN-62 demonstrated strong synergy with many
approved antimalarial drugs (Fig 5.2B). This agent is an inhibitor of the human
Ca2+
/calmodulin-dependent protein kinase II (CaMKII), which previously has been shown to
perturb cytosolic Ca2+
flux and disrupt or modulate cell signaling pathways in Plasmodium
(Mahata et al. 1996). Single cell photometry was used to study calcium homeostasis for parasites
treated with these drugs, and some drug combinations. My colleagues Dr. David Gaviria and
Amila Siriwardana observed an acute release of Ca2+
from the parasites digestive vacuole (DV)
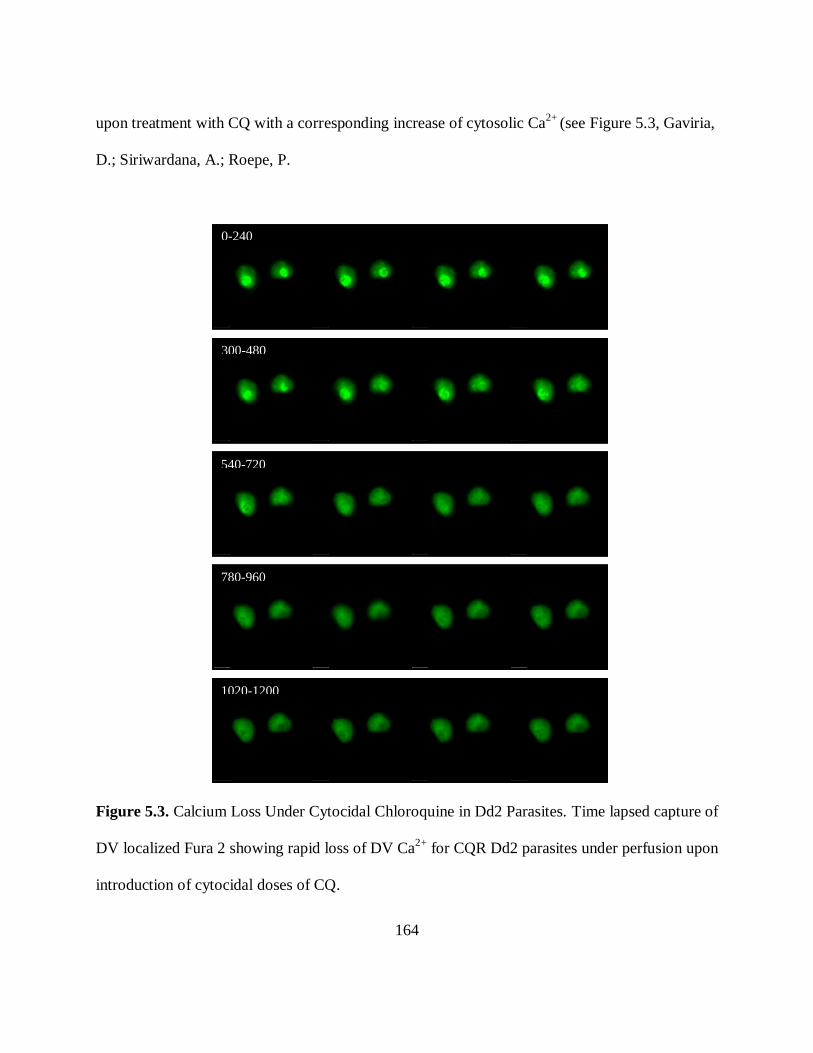
164
upon treatment with CQ with a corresponding increase of cytosolic Ca2+
(see Figure 5.3, Gaviria,
D.; Siriwardana, A.; Roepe, P.
Figure 5.3. Calcium Loss Under Cytocidal Chloroquine in Dd2 Parasites. Time lapsed capture of
DV localized Fura 2 showing rapid loss of DV Ca2+
for CQR Dd2 parasites under perfusion upon
introduction of cytocidal doses of CQ.
0-240
sec
300-480
sec
1020-1200
sec
780-960 sec
540-720
sec
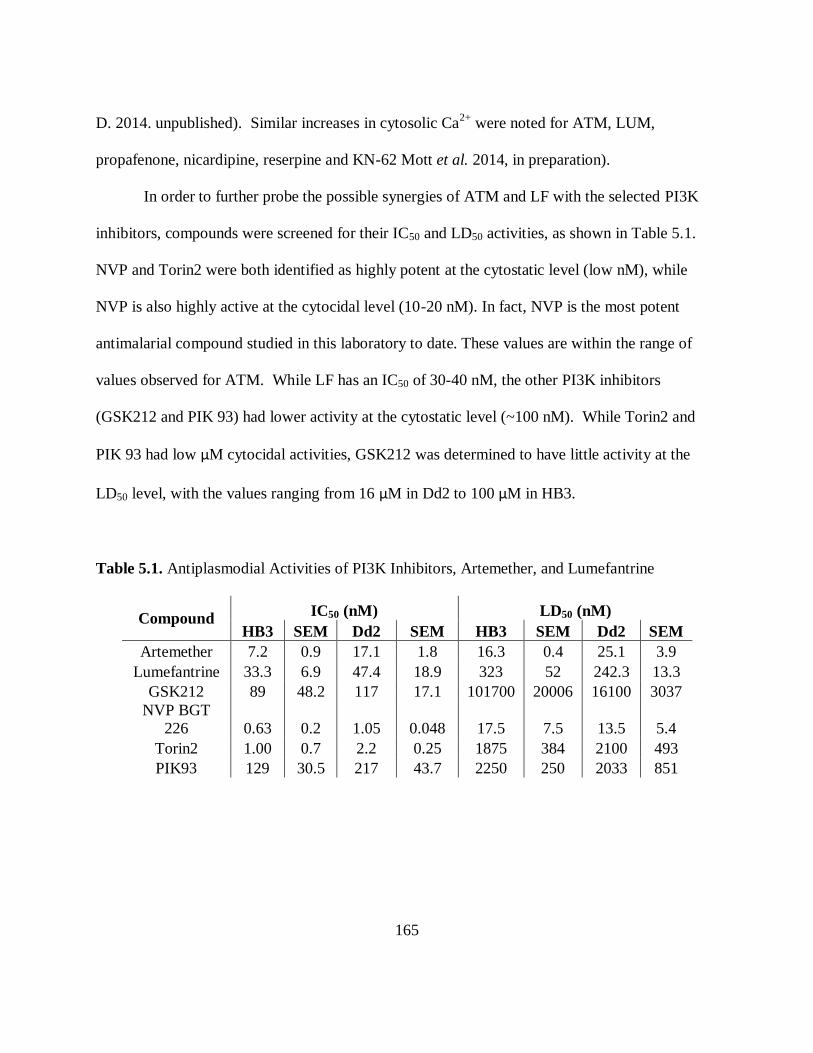
165
D. 2014. unpublished). Similar increases in cytosolic Ca2+
were noted for ATM, LUM,
propafenone, nicardipine, reserpine and KN-62 Mott et al. 2014, in preparation).
In order to further probe the possible synergies of ATM and LF with the selected PI3K
inhibitors, compounds were screened for their IC50 and LD50 activities, as shown in Table 5.1.
NVP and Torin2 were both identified as highly potent at the cytostatic level (low nM), while
NVP is also highly active at the cytocidal level (10-20 nM). In fact, NVP is the most potent
antimalarial compound studied in this laboratory to date. These values are within the range of
values observed for ATM. While LF has an IC50 of 30-40 nM, the other PI3K inhibitors
(GSK212 and PIK 93) had lower activity at the cytostatic level (~100 nM). While Torin2 and
PIK 93 had low μM cytocidal activities, GSK212 was determined to have little activity at the
LD50 level, with the values ranging from 16 μM in Dd2 to 100 μM in HB3.
Table 5.1. Antiplasmodial Activities of PI3K Inhibitors, Artemether, and Lumefantrine
Compound IC50 (nM) LD50 (nM)
HB3 SEM Dd2 SEM HB3 SEM Dd2 SEM
Artemether 7.2 0.9 17.1 1.8 16.3 0.4 25.1 3.9
Lumefantrine 33.3 6.9 47.4 18.9 323 52 242.3 13.3
GSK212 89 48.2 117 17.1 101700 20006 16100 3037
NVP BGT
226 0.63 0.2 1.05 0.048 17.5 7.5 13.5 5.4
Torin2 1.00 0.7 2.2 0.25 1875 384 2100 493
PIK93 129 30.5 217 43.7 2250 250 2033 851
166
These calculated monotherapy activities were used to probe for possible synergy in drug
combinations at both the cytostatic and cytocidal levels using the Chou-Talalay method (C-T) of
fixed-ratio analysis, at a ratio of 1:1 based on the activities of the two compounds. For example,
the cytostatic combination assay of ATM and LF uses a range of concentrations dictated around
their activities, 7 and 33 nM, respectively for HB3. A full growth curve was generated by using
both multiples and fractions of those activity values. The ratio between the activity in
combination and the activity as a monotherapy generates the fractional inhibitory concentration
(FIC). When summed, the FICs for a chosen combination generate the FICindex, which is used to
assign synergy, additivity, or antagonism. Figure 5.4 shows an example of generating the FICindex
for a combination of GSK212 and LF. The same process is used to analyze these combinations at
the cytocidal level, generating FLDs and FLDindices, as shown in Figure 5.5 for GSK212 and LF.

167
GSK212/Lumefantrine IC50 CT
Concentration (nM)
1 10 100 1000 10000
% G
row
th
0
20
40
60
80
100
120
140
GSK HB3
Lumefantrine HB3
GSK Dd2
Lumefantrine Dd2
HB3
Compound pseudoIC50 (nM) IC50 (nM) FIC FICindex
GSK212 71.4 137 0.5211679 1.115
Lumefantrine 21.4 36 0.5944444
Dd2
Compound pseudoIC50 (nM) IC50 (nM) FIC FICindex
GSK212 67.2 97 0.6927835 1.061
Lumefantrine 20.2 55 0.3672727 Figure 5.4. Representative Data of an IC50 C-T Analysis using GSK and LF.

168
GSK212/Lumefantrine LD50 CT
Concentration (uM)
0.001 0.01 0.1 1 10 100 1000
% S
urv
ival
0
20
40
60
80
100
GSK212 HB3
Lumefantrine HB3
GSK212 Dd2
Lumefantrine Dd2
HB3
Compound pseudoLD50 (µM) LD50 (µM) FLD FLDindex GSK212 7.4 101 0.073267
0.141 Lumefantrine 0.022 0.323 0.068111
Dd2
Compound pseudoLD50 (µM) LD50 (µM) FLD FLDindex GSK212 2 16 0.125
0.290 Lumefantrine 0.04 0.242 0.165289
Figure 5.5. Representative Data of an LD50 C-T Analysis using NVP and ATM.
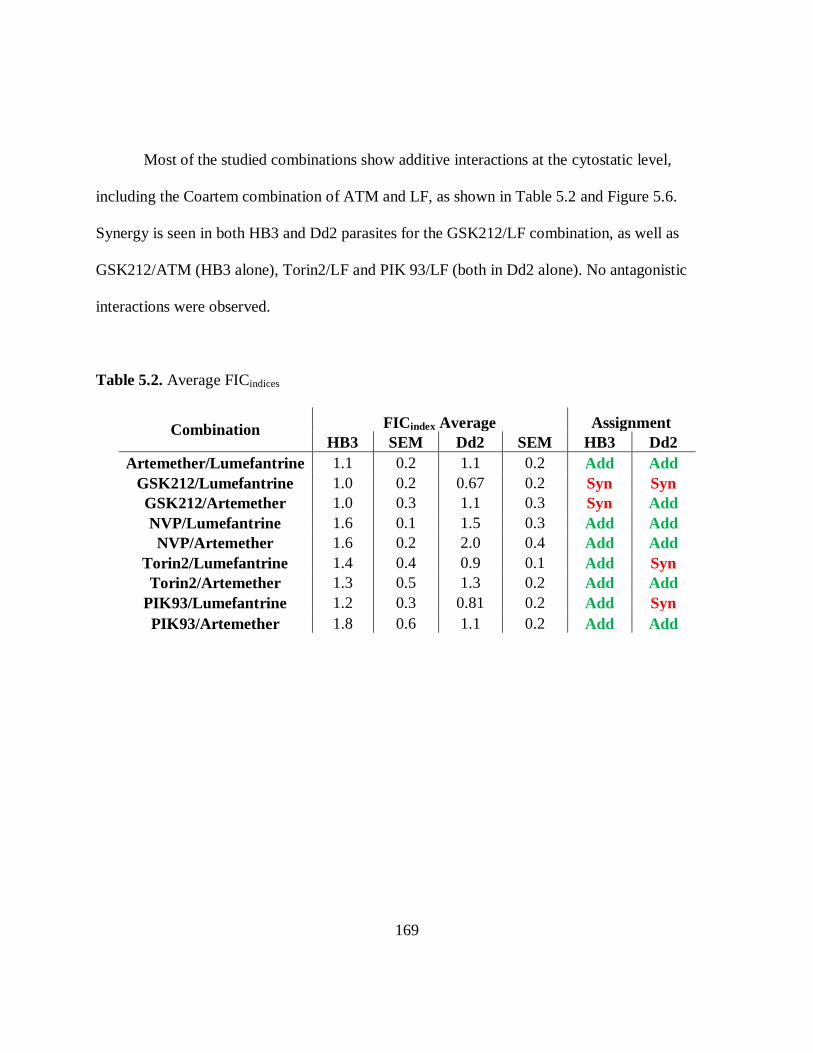
169
Most of the studied combinations show additive interactions at the cytostatic level,
including the Coartem combination of ATM and LF, as shown in Table 5.2 and Figure 5.6.
Synergy is seen in both HB3 and Dd2 parasites for the GSK212/LF combination, as well as
GSK212/ATM (HB3 alone), Torin2/LF and PIK 93/LF (both in Dd2 alone). No antagonistic
interactions were observed.
Table 5.2. Average FICindices
Combination FICindex Average Assignment
HB3 SEM Dd2 SEM HB3 Dd2
Artemether/Lumefantrine 1.1 0.2 1.1 0.2 Add Add
GSK212/Lumefantrine 1.0 0.2 0.67 0.2 Syn Syn
GSK212/Artemether 1.0 0.3 1.1 0.3 Syn Add
NVP/Lumefantrine 1.6 0.1 1.5 0.3 Add Add
NVP/Artemether 1.6 0.2 2.0 0.4 Add Add
Torin2/Lumefantrine 1.4 0.4 0.9 0.1 Add Syn
Torin2/Artemether 1.3 0.5 1.3 0.2 Add Add
PIK93/Lumefantrine 1.2 0.3 0.81 0.2 Add Syn
PIK93/Artemether 1.8 0.6 1.1 0.2 Add Add

170
Figure 5.6. Combination FICindices. HB3 (dark grey bars) and Dd2 (light grey bars) parasites were
examined for their interactions. Plots are the average of three independent trials run in triplicate
(nine determinations total). Error bars are +/- standard error of the mean.
Under cytocidal conditions, many more of the combinations were determined to be
synergistic, as shown in Table 5.3 and Figure 5.7. Additive interactions were observed only for
ATM/LF and NVP/ATM for HB3 and NVP/LF and PIK 93/LF for Dd2. Unlike the cytostatic
analyses, two combinations were observed to be antagonistic under cytocidal conditions,
NVP/LF in HB3 and PIK 93/ATM in Dd2. Among the synergistic combinations, the
combinations of GSK212 and NVP with both ATM and LF show moderate to high levels of
synergy with FLDindices ranging from 0.18-0.62. GSK212 is the most potent synergy partner,
yielding the lowest FLDindices.

171
Table 5.3. Average FLDindices
Combination FLDindex Average Assignment
HB3 SEM Dd2 SEM HB3 Dd2
Artemether/Lumefantrine 1.3 0.4 1.0 0.3 Add Syn
GSK212/Lumefantrine 0.18 0.04 0.35 0.1 Syn Syn
GSK212/Artemether 0.62 0.1 0.39 0.3 Syn Syn
NVP/Lumefantrine 2.8 0.7 2.0 1.0 Ant Add
NVP/Artemether 1.4 0.2 0.93 0.3 Add Syn
Torin2/Lumefantrine 0.28 0.2 0.5 0.4 Syn Syn
Torin2/Artemether 0.46 0.2 0.94 0.4 Syn Syn
PIK93/Lumefantrine 0.90 0.3 1.5 0.03 Syn Add
PIK93/Artemether 0.85 0.3 2.1 0.4 Syn Ant
Figure 5.7. Combination FLDindices. HB3 (dark grey bars) and Dd2 (light grey bars) parasites
were examined for their interactions. Plots are the average of at least two independent trials run
in triplicate. Error bars are +/- standard error of the mean.
172
Previous study of the cellular effects of cytocidal drug treatment of CQ suggests the
involvement of the autophagy pathway in parasite death (Gaviria et al. 2013). In eukaryotes,
ATG8 positive vesicle formation indicates initiation of autophagy and is downstream from
Vps34, a specialized PI3K. As reported previously, an ortholog of Vps34 has been identified in
P. falciparum, the only PI3K identified to date. Radial redistribution of puncta in also occurs in
response to ATM at LD50 dose (Fig. 5.8B) compared to IC50 dose (Fig. 5.8A). The application of
Coartem (ATM+LF) induced an even greater response (Fig. 5.8C). Interestingly, both NVP-
BGT226 and GSK-2126458 blocked increased autophagosomal trafficking induced by ARTs,
CQ and LMF (Fig. 5.8D,E). Similar to other eukaryotes, this suggests a role for PfVps34, as the
sole PI3K, and PI3P in the parasite autophagy response and also suggests that targeting this
response is a common theme for synergistic drug combinations identified in this study.

173
Figure 5.8. Analysis of Autophagosomal Body Puncta Formation and Trafficking in Response to
Environmental and/or Pharmacological Stress. Imaging and quantification of PfAtg8 containing
puncta within parasite infected erythrocytes under differential interference contrast (panel 1),
anti-PfAtg8 peptide antibody imaging (ex: 450-490, em: 500 to 550)(panel 2), DAPI nuclei
staining (ex: 340-380, em: 450 to 490)(panel 3), a merged image of all three views (panel 4)
following a 6 hour exposure to (A) ATM at the defined IC50 value. (B) ATM at the defined LD50
A
B
C
D
E
1 2 3 4

174
value. (C) ATM and LF at their respectively defined LD50 values. (D) ATM at the defined LD50
value and GSK-2126458 at 102 µM. (E) ATM at the defined LD50 value and NVP-BGT226 at 24
nM. Scale bar equals 5 µm.
5.3. Discussion
Much of the early laboratory results of ATM/LF combination, commonly known as
Coartem, are either not available outside China, or are only published in Chinese, making
examination of the path to WHO support difficult. Studies from 1979 report antimalarial activity,
and “preclinical studies” claim to show synergy between LF and ATM. Unfortunately, this claim
is not supported in the WHO report with a verifiable citation (Olliaro et al. 1995). Other sources
that reference synergy typically include discussion of the pharmacokinetic properties of ATM
and LF and results for parasite clearance in animal models (White et al. 1999; Makanga et al.
2009). Unfortunately, the lack of a firm definition for “drug synergy” in malarial science has led
to its use in conditions like complementary pharmacokinetics, which are not proper synergy as
defined mathematically. I have therefore revisited this critical issue using C-T methods.
The combined activity of partner drugs being greater than a monotherapy alone does not
mean the combination is necessarily synergistic; such a result could be caused by additive or
even slightly antagonistic interactions. A clear mathematical definition of synergy vs. additivity
vs. antagonism is needed to avoid confusion. By definition, synergy is activity that is greater than
that of an additive interaction; antagonism is activity that is less than additive. The typical way to
describe the all-important additive effect is by envisioning the mixing two unknown drug
solutions that are actually comprised of the same compound. The resulting data and combination
175
analysis is, by definition, additive. Additionally, synergy requires the presence of two active
compounds. If the presence of an inactive compound augments the activity of an active drug, this
is not synergy; it is potentiation (Chou 2006; Chou 2010). It is important to remember that in
situations like the one described, just because a pair of compounds are not mathematically
synergistic does not mean that they are not a viable treatment option. An additive drug
combination may be better clinically than a synergistic one, depending on additional factors such
as pharmacokinetics, pharmacodynamics, and therapeutic windows for the compounds.
Reports of ART tolerance in the Thai-Cambodian border region (Dondorp et al. 2009)
and the generation of temporary tolerance to LF in vitro (Mwai et al. 2012) suggest that novel
drug combinations must be explored before Coartem begins to lose efficacy. In addition to the
isobolograms focused on the ATM and LF combination, as described earlier, other antimalarial
combinations have been studied. These include: atovaquone/proguanil, atovaquone/DHA
(Fivelman et al. 2004); 9-epi-ART/ART, artemisitene/ART, 9-epi-ART/ATSU,
artemisitene/ATSU (Suberu et al. 2013). The Chou-Talalay method, which was used in the
Thriemer and Wong studies detailed previously, has been also been used to investigate the
interaction of ART with other natural products isolated from ART tea (Suberu et al. 2013), the
analysis of possible drug partners emetine/DHA (Matthews et al. 2013), tapsigargin/ART,
tapsigargin/OZ227 (Abiodun et al. 2013), and the interaction of chalcone derivatives and ART
(Battacharya et al. 2009).
High-throughput screening of a library of compounds identified a series of PI3K
inhibitors for further screening. A selected set of these compounds, GSK212, NVP, Torin2 and
PIK 93, were partnered with both LF, ATM, and quinolines (preliminary data not shown) in

176
combination analyses at cytostatic and cytocidal levels. Overall, most pairings under cytostatic
conditions were additive, including the Coartem pairing of ATM and LF. Under cytocidal
conditions, most were synergistic, with NVP/LF being the worst overall pairing under those
conditions. ATM/LF was additive under these conditions as well. Interestingly, the ATM/LF
combination, when studied for its effects on ATG8 puncta distribution shows an increase in
ATG8-positive puncta, suggesting that the presence of two sources of oxidative stress have
increased the cellular response via autophagy.
The most potently synergistic PI3K with ATM and LF was GSK212, even with its
moderate cytostatic activity and low cytocidal activity. GSK212 is a potent inhibitor of both
human class I PI3Ks and the mammalian target of rapamycin (mTOR) neither of which have
direct orthologs that have been identified in P. falciparum. It has been shown to have low
picomolar inhibitory activity against PI3Kα isolated from cancer cell lines. The selectivity for
class I and IV PI3Ks over other protein kinases is in excess of 200 fold (Knight et al. 2010). In
mammalian cell lines, GSK212 has shown both growth inhibitory and cell kill effects through
inhibition of the PI3K/mTOR signaling pathway (Leung et al. 2011). Although class I and IV
PI3Ks have not been identified, an alteration of the ATG8-puncta phenotype resulting from
ATM treatment suggests that GSK212 is active against the Vps 34 PI3K within the Plasmodium
autophagy pathway.
NVP is another dual PI3K/mTOR inhibitor previously studied in cancer cell lines. NVP
has been observed to inhibit p110α, β, δ, and γ isoforms at nanomolar concentrations, as well as
mTOR (Markman et al. 2012). It has been shown to have growth inhibitory and cytocidal effects.
The absence of DNA fragmentation in these studies suggests that it does not promote apoptosis;
177
however the presence of autophagic vesicles following treatment has been observed, which was
hypothesized to be the cell-death pathway following treatment (Chang et al. 2011). Clinical
investigation of its use against cancer was halted, as the plasma concentration never reached
therapeutic concentrations within the tolerated dose window (Markman, et al. 2012). As a
monotherapy, NVP shows antiplasmodial activities in the same range of ART-based compounds
(low nM). In combination with ATM and LF at cytostatic doses, the result was an additive
designation, with NVP/ATM low additive to synergistic and NVP/LF high additive to
antagonistic under cytocidal conditions. As in the case for GSK212, the presence of ATG8-
positive puncta resulting from ATM treatment is reduced when treated with NVP and ATM at
cytocidal doses. Although NVP is selective for class I PI3Ks and mTOR, there must be a target
for it in the parasite’s authophagy cascade, likely the Vps34 PI3K.
Torin2 inhibits of various phosphatidylinositol kinases at all concentrations, including
PI3Kα. However, it is over 800-fold more selective for mTOR than PI3Ks. Treatment of cancer
cell lines with Torin2 over the course of 72 hrs showed a dose-dependent increase in
autophagosomes, while higher concentrations resulted in signs of cellular apoptosis (Liu et al.
2013). Torin2 has been studied in both liver and erythrocyte stages of Plasmodia, with hundreds
nanomolar activity against liver stages and low single-digit nanomolar activity against the
erythrocyte stages (Hanson et al. 2013). Its effectiveness against both stages shows that host-cell
mTOR is not involved, as red blood cells do not contain a functioning mTOR. Torin2 treatment
results in altered export of proteins to the parasitophorous vacuolar membrane in liver cells, but
the effect of Torin2 treatment on intraerythrocytic parasites is not known (Hanson et al. 2013).
Combining Torin2 with ATM and LF results in low additivity to slight synergy under cytostatic
178
conditions, while all combinations are solidly synergistic under cytocidal conditions. Further
investigation is still needed to probe Torin2’s impact on the autophagy response to treatment
with known antimalarials. The antiplasmodial activity, as well as the previously-observed
alteration of PVM trafficking suggests that Torin2 is able to inhibit the Plasmodium autophagy
cascade.
PIK 93 is a PI3K inhibitor that has been noted as potent against p110γ isoforms, as well
as inhibiting other isoforms. However, it is a highly potent inhibitor of human PI4 kinases,
particularly the IIIβ isoform which it is 100-fold more potent against as compared to human
PI4KIIIα (Knight et al. 2006; Balla et al. 2008). In fact it is used as a method of delineating the
activity of one human enzyme versus the other (Tóth et al. 2006). PI4Ks are involved in cellular
signaling and trafficking (particularly calcium signaling) (McNamara et al. 2013; Knight et al.
2006). PI4K inhibitors have recently been studied for their antimalarial activity (McNamara et
al. 2013). The identified target, PfPI(4)K is deemed a functional complement to yeast Pik1, a
PI(4)KIIIβ that regulates membrane trafficking involved in the membrane alteration required for
the completion of the asexual growth cycle. This target was identified through the use of other
inhibitors, imidazolepyrazine and quinoxaline, but not PIK 93 (McNamara et al. 2013).
Partnering PIK 93 with LF and ATM results in interesting differences between CQS and CQR
parasites. Under cytostatic conditions, HB3 parasites showed lower additivity as compared to
Dd2, which had synergy when PIK 93 was paired with LF. Under cytocidal conditions, HB3
showed synergy for both combinations, while the Dd2 was additive with LF and antagonistic
with ATM. Examining the ATG8 puncta phenotype of these combinations can shed light on
179
whether or not PIK 93 combinations result in an altered autophagy cascade, or if its activity is
due to inhibiting PI4Ks.
Autophagy is both a recovery response to toxic shock and a programmed cell death
pathway. When compounds such as ATM and LF cause oxidative stress and damage, the
autophagy pathway can help the parasite withstand the shock and remain viable, or if it
progresses too far, it can die. In combination therapy, it is possible for one drug, like GSK212 or
NVP, to interfere with the life-saving aspect of autophagy, preventing the restoration of cellular
viability. It is also possible for the two partner drugs to both promote autophagy, and cause it to
run out of control and kill the parasite, which may be the case for ATM and LF , which show
increased ATG8 puncta. Further exploration of the interactions between PI3K inhibitors and
known antimalarials could result in a new very attractive therapy, particularly if the human PI3K
inhibitors identified here are optimized against PfVps34 or other kinases in the Plasmodium
genome.
5.4 Acknowledgements
High-throughput robotics screening of the library of compounds was performed by the Thomas
Laboratory at the National Center for Advancing Translational Science (NCATs), National
Institutes of Health (NIH), Rockville, MD.
This work was supported by NIH grant AI045957 (to P.D.R), as well as the Luce Foundation (to
K.S.S.).
K. S. S. would like to thank Mr. Amila Siriwardana for the cytosolic calcium measurements and
the immunofluorescence assays, as well as Mr. Nima Aghdam for assistance on the

180
antiplasmodial and combination assays, as well as the cytosolic calcium measurements and
immunofluorescence assays.

181
CHAPTER VI
OVERALL CONCLUSIONS
Recent focus on cytocidal drug effects vs. Plasmodium falciparum malarial parasites has
suggested that multiple drug targets may exist within the parasite. The prevailing theory of CQ’s
mechanism of action, that it interferes with the Hz crystallization pathway, may not fully explain
drug action at higher doses (Gorka et al. 2013a; Paguio et al. 2011; Cabrera et al. 2009a;
Gligorijevic et al. 2008). By modeling the ability of quinolines like CQ and QN to interfere with
the crystallization of beta-hematin, the measured activity indeed correlates with cytostatic (IC50)
activity, but not with cytocidal (LD50) activity (Gorka et al. 2013a,d). Similarly, compounds that
do not inhibit beta-hematin, such as epi-QN and epi-QD, and also do not alter the pH-dependent
solubility of FPIX, have low IC50 activity, but have LD50 activities closer to those of their 9-
epimers (Gorka et al. 2013d). Additional observations of altered daughter nuclei distribution,
reduced viability of the next cell cycle (Gligorijevic et al. 2008), and the ability of resistant
parasites to survive concentrations of CQ in the DV that are toxic to susceptible parasites suggest
that the targets of cytocidal drug treatment, particularly CQ, are different from that of cytostatic
doses (Cabrera et al. 2009a).
QTL analysis of the cytocidal resistance phenotype does identify the region of
chromosome 7 that contains the pfcrt loci, but also identifies regions that include genes that code
for proteins involved in cellular pathways that include lipid metabolism, proteosome function,
and vesicle transport, all of which could be implicated in the autophagy programmed cell death
pathway (Gaviria et al. 2013). Visualizing the distribution of ATG8-positive puncta following

182
cytocidal CQ treatment has identified an altered autophagic response in CQR parasites compared
to CQS (Gaviria et al. 2013). The components of this pathway are outside of the DV, supporting
the hypothesis that DV targets are applicable under cytostatic conditions, but additional cellular
targets are impacted under cytocidal conditions.
In order to identify possible targets of cytocidal CQ, a novel ABPP probe was
synthesized based on the framework of a previously used probe, AzBCQ (Lekostaj et al. 2008).
By incorporating bioorthogonal click chemistry, the experimental versatility of the new probe
exceeds that of AzBCQ. Labeling the probe with an azide-coupled fluorophore in fixed cells,
followed by examination through fluorescence microscopy, shows that at IC50 concentrations,
the staining is contained within a smaller area of the parasite, typically within close proximity to
the optically-dense Hz, possibly through labeling of PfCRT. Although no staining is observed
within the DV, this may be due to the weak interactions of CQ and FPIX compared to protein
binding. The association constant of CQ and FPIX were determined to be only about 4x10⁵ M
-1
(Dorn et al. 1998). Additionally, if the photoaffinity tag is not in close proximity to a heme C-H
sigma bond, it may not undergo insertion before the nitrene decays. CQ has been observed to
bind to FPIX in both its monomer (de Dios et al. 2003) and μ-oxo dimer (Leed et al. 2002)
forms. CQ binds monomer FPIX through a dative bond between the quinoline nitrogen and the
iron center (de Dios et al. 2003), leaving the aliphatic side chains oriented away from the
porphryin ring. When CQ binds to μ-oxo dimer FPIX, the aromatic quinoline ring is oriented
over the porphyrin ring, with the aliphatic side chains oriented in a plane approximately parallel
to the other half of the porphyin ring (Leed et al. 2002). The distance between the side chain and
the porphyrin, however, ranges between 4.2 and 5.8 Å, which could be too large of a distance for

183
the nitrene to efficiently insert (Leed et al. 2002). Since FPIX is a planar molecule, the aliphatic
side chain that contains the photoaffinity tag is probably not close enough to successfully
crosslink. Alternatively, however, when the probe is bound within a binding pocket of a protein,
the reactive nitrene could be in closer proximity, making it more likely to insert into a bond
within the pocket.
Under cytocidal dosages, AAzCQ staining is observed more intensely and more widely
distributed throughout the parasite cytosol. Efficient competition with CQ supports that this
staining is CQ-specific, and not an artifact of non-specific labeling. If the PfCRT-mediated
transport of CQ out of the DV away from the FPIX target is more applicable at cytostatic
concentrations, it may mean that at cytocidal doses, the targets are spread throughout the cell,
and not localized to the DV and its membrane. Authophagy, as a cellular survival and death
pathway, would occur throughout the cytosol, clearly evident in the ATG8 staining of parasites
following starvation or cytocidal CQ treatment in Gaviria et al. (2013).
If cytocidal targets are outside the DV, then alterations or mutations in these targets
would be relevant for elevated LD50 values in CQR parasites (Gaviria et al. 2013). Initial
examination of the binding of AzBCQ to protein targets in HB3 and Dd2 parasites shows some
promising possible protein hits. In the CQS HB3, labeling of proteins such as heat shock protein
70 and a subunit of the proteosome, suggest that protein degradation and proper folding could be
a response to CQ treatment, possibly in responding to the toxic insult of CQ treatment. Neither of
these proteins were identified in the CQR Dd2 parasites, which identified a calcium-binding
protein from the endoplasmic reticulum and the two isoforms of actin present in P. falciparum.
This could mean that alterations in the processes of cellular response to toxic insult could be

184
contributing to the elevated LD50 in Dd2 parasites. This is consistent with the altered autophagy
response noted in Gaviria et al. (2013). An alternative to this hypothesis is that the toxic insult of
cytocidal CQ that results in the initiation of processes involving heat shock protein 70 and the
proteosome in HB3 parasites does not also initiate these responses in Dd2 parasites due to a
possible alteration of the pathway. Further investigation of cellular targets and the nature of CQ
binding could further elucidate the involvement of heat shock protein 70 and the proteosome.
Labeling parasites for proteomic analysis with both AAzCQ and AzBCQ at the respective
LD50 values of HB3 and Dd2 shows differential labeling between CQS and CQR strains that is
successfully competed by CQ. This labeling is not necessarily the same between the two probes.
The large size of the biotin moiety of AzBCQ might either prevent successful binding to CQ
targets or increase the non-specific interactions with off-target proteins. If the mechanism of
cytocidal resistance relies on reduced ability of CQ to bind to its cytoplasmic target, one would
expect that labeling of the protein would be reduced or eliminated in resistant strains as
compared to susceptible ones. If, however, resistance arises due to enhanced transport away from
the potential target, much in the way mutant PfCRT removes CQ from FPIX targets at cytostatic
concentrations, one would expect that the transport protein would then be labeled more so in the
resistant strains than the susceptible. Differential labeling observed by labeling parasites at their
respective cytocidal doses leads to both the presence of enhanced labeling in susceptible strains
as well as the presence of labeled proteins in resistant strains that are not labeled in susceptible
ones. Further study of the identity of these proteins, currently underway, should help to shed
light on the nature of the differential labeling targets. In order to confirm that the protein does
indeed bind CQ, it can be expressed in a yeast system for further study of a purified protein
185
though use of the photoaffinity probes and possibly, if transport of CQ is of concern, the use of
fluorescently-tagged CQ analogs (Cabrera et al. 2009b).
Understanding resistance needs to be partnered with development of new therapies that
are effective against resistant strains. In order to prevent the rise of resistance, combination
therapies are now used (Greyer, ed. 2001; Hastings et al. 2002). Instead of mutating to avoid the
toxic effect of one compound, the parasite must now evolve to avoid the toxic effect of both, as
well as any synergistic effects that may come from their interactions. High-throughput screening
performed at NCATS has identified multiple classes of compounds that show synergy with
currently-used antimalarial drugs. One of these classes is the PI3K inhibitors. Analysis of PI3K
inhibitors in combination with ATM and LF has shown mostly additive interactions when
studied under cytostatic conditions, but shows high levels of synergy under cytocidal conditions.
Preliminary analyses of combinations of these PI3K inhibitors with quinolines show high levels
of synergy, particularly in combination with CQ, which will be studied further.
If autophagy is involved in response to cytocidal drug treatment, it is not, then,
coincidental that PI3K inhibitors would augment the activity of antimalarial compounds since
PI3K activity is essential to induction of autophagy (Brennand et al. 2011). As autophagy is a
cellular survival pathway, inhibition of the proper function of this pathway would prevent the
cell from recovering. When these combinations are examined for their effects on ATG8-puncta
distribution, the ATM/LF pairing shows a possible increase in puncta, but upon pairing ATM
with either GSK212 or NVP BGT 226, the puncta response is severely diminished. Autophagy is
both a cell-survival and cell-death pathway. After the toxic stress of ATM, the parasite could
initiate autophagy as a way to survive. By inhibiting Vps 34 (the only identified PI3K in

186
Plasmodium), PI3K inhibitors would prevent the parasite from utilizing autophagy to survive,
and therefore die.
In the same manner, it is possible that CQ acts as its own partner drug by having multiple
effects that are likely dose-dependent. After suffering from the oxidative stress generating from
the interaction of CQ with FPIX within the DV, the parasite appears to initiate autophagy in
order to survive (Gaviria et al. 2013). But, as is observed in cancer cell lines, CQ has the
characteristic of being lysosomotropic, meaning that it penetrates the lysosome and accumulates
there by acid-trapping, as CQ is a weak base. The net effect of this lysosomotrophic activity is
collapse of lysosome pH gradients, thereby preventing the binding of autophagosomes with
lysosomes to complete autophagy (Seitz et al. 2012). Perhaps related to this idea, in Hoppe et al.
2004, study of the effect of CQ and ART on the trafficking of endocytotic vesicles was
examined. Vesicles containing host Hb were observed to increase in number following treatment
with either drug, possibly due to the inability of the vesicles to fuse with the DV. Similarly,
pairings like ATM/LF could interact by accelerating toxic stress or inhibiting autophagy
downstream, possibly by preventing the fusion of autophagosomes with the DV. Further
exploration of the pairing of PI3K inhibitors with currently-used antimalarials would benefit
from expressing the binding and catalytic sites of Vps 34 in a yeast model system and
examination of the binding of inhibitors and their effect on the enzyme’s activity. Optimization
of compounds targeting PfVsp 34 could lead to even greater synergistic interactions, and
possible new combination therapies.

187
Understanding resistance, its rise and the cellular mechanisms that underlie it, as well as
developing novel combination therapies active against resistant strains are key tools to use in the
battle against the global health crisis that is malaria.

188
CHAPTER VII
ADDITIONAL PUBLISHED/IN PREPARATION WORK
7.1 Quantification of Perchloroethylene Residues in Dry Cleaned Fabrics
Previously Published as: Sherlach, K. S.; Gorka, A. P.; Dantzler, A.; Roepe, P. D.
Quantification of perchloroethylene (PCE) residues in dry cleaned fabrics. Environmental
Chemistry and Toxicology. 2011, 30(11), 2481-2487. Copyright © 2011 SETAC. Used with
Permission.
7.1.1. Introduction
Concerns over ozone depletion led the US Environmental Protection Agency (EPA) to
recommend a switch in dry-cleaning solvent from 1,1,1-trichloroethane to the more photostable,
yet more toxic perchloroethylene (PCE) and trichloroethylene (Roy et al. 2002). As of 1994,
more than 90% of clothing dry cleaners in the US and Europe used PCE, raising concerns over
its toxic effects to dry cleaning workers and to the surrounding environment (Aggazzotti et al.
1994). Studies have detected hazardous levels of PCE in ground water and drinking water, as
well as in the air of buildings containing dry cleaners, and in areas where dry cleaned clothes are
stored (Aggazzotti et al. 1994; Furuki et al. 2000).
PCE has a longer in vivo lifetime than other organic solvents, and can be absorbed
through inhalation, mouth, or skin contact, preferring to distribute to hydrophobic tissue,
particularly adipose tissue (Aggazzotti et al. 1994). Toxic effects that have been observed in
animal models include fatty liver degeneration, liver enlargement and abnormal function,

189
necrosis, decreased levels of cellular adenosine triphosphate (ATP), lesions on the liver and
kidneys, and cancer (Yoshioka et al. 2002; White et al. 2002). Although controversial, human
PCE exposure has been suggested to be linked to elevated risk of cancer, infertility, spontaneous
abortion, and depression of the central nervous system (Aggazzotti et al. 1994; Yoshioka et al.
2002; Coyle et al. 2005). Conflicting carcinogenic effects in animal models, as well as some
inconclusive epidemiological results have resulted in the EPA labeling PCE as a possible (class
C) or probable (class B2) carcinogen and the International Agency for Research on Cancer
(IARC) listing PCE as a probable (class 2A) human carcinogen (Brand et al. 1999; Poli et al.
2005).
The vast majority of PCE exposure studies have focused on inhalation of vapors in
occupational environments. In only two studies to our knowledge have PCE residues in dry
cleaned fabrics been examined. Brand and colleagues examined levels of residual PCE in dry
cleaned acetate fabric, focusing in particular on whether pressing dry cleaned acetate increased
worker inhalation risk (Brand et al. 1999). In this work, Brand and colleagues used gas
chromatography with a flame ionization detector to quantify PCE based on retention time (Brand
et al. 1999). Statistically-significant differences were seen between several dry cleaners, with all
values within a four-fold window, and pressing was determined to lower PCE retained on the
fabric (Brand et al. 1999). Kawauchi et al examined PCE residues in a few fabric types dry
cleaned at several different establishments, using a hexane extraction protocol with gas
chromatographic detection (Kawauchi et al. 1989). They also reported a limited number of air
concentrations in storage outlets and consumer’s homes (Kawauchi et al. 1989).

190
In this study we develop an improved gas chromatography/mass spectrometry approach
to unambiguously quantify the level of residual PCE extracted with a non organic solvent
(methanol) from four common fabrics (wool, cotton, polyester, and silk). For the first time, PCE
is analyzed vs. number of drug cleaning cycles from seven different commercial locations. The
advantage of using mass spectroscopy over absorbance, flame ionization or electron capture is
that the mass spectrum simultaneously and unambiguously verifies the chemical identity of the
compound(s) being eluted at various GC retention times.
The results are provocative and suggest further work aimed at PCE surveillance for
different fabric types is likely warranted.
7.1.2. Materials and Methods
Materials
Wool, polyester, cotton, and silk were purchased as 1.47 by 0.91 m bolts from Jo-Anne
Fabrics in either Manassas, VA or Leesburg, VA. Fabric specifications were: Papyrus 100%
white wool suiting manufactured in China, 100% white polyester or white satin taffeta
manufactured in Japan, 100% white cotton manufactured in the United States, and 100% white
Dupioni silk manufactured in India. Perchloroethylene was purchased from Flinn Scientific
(Batavia, IL). High-resolution GC-grade methanol, 5 mL class A volumetric pipettes (± 0.01 mL
tolerance), Whatman 70 mm diameter qualitative filter papers, Target LoVial, 2 mL clear glass I-
D GC vials, and borosilicate glass scintillation vials were purchased from Fisher Scientific
(Newark, DE).
191
Fabric dry cleaning
Each fabric bolt was cut into approximately 5 cm2 swatches and attached beneath the
lining of a men’s suit jacket. The lining at the bottom of the jacket was gently undone and the
four cloth swatches sewn along one edge onto the interior of the pocket lining, ensuring it was
both secure and undetectable. The lining opening was re-sewn and the jacket subjected to a
single dry cleaning cycle, without pressing. For multiple cycle tests, the jacket was kept intact
and returned to the same dry cleaner to undergo additional cycles of cleaning. Upon removal
from the jacket lining, the cloth swatches were immediately transferred to a sealed, zip-top
plastic bag and stored at -20 °C until analysis.
Extraction of PCE from fabric samples
A 0.5 x 2.0 inch swatch of 100% wool, polyester, cotton, or silk dry cleaned for zero
(negative control) or 1 cycle at each of 7 Northern Virginia dry cleaners was placed in a capped
20 mL borosilicate glass scintillation vial. Additionally, the same size swatch of each type of
fabric subjected to multiple dry cleaning cycles (2 to 6) at dry cleaning establishment A was
similarly prepared. Five mL of GC-grade methanol was added to each vial using a volumetric
pipette and the vial re-capped. Extraction was allowed to proceed at room temperature for 24 h
(time dependence of extraction is shown in “supplemental data”, Fig. 7.1 at which time the
extract was passed through standard qualitative filter paper and transferred to a clean scintillation
vial. Extracts were stored at 4 °C while awaiting GCMS analysis.

192
Figure 7.1. PCE extraction from wool fabric dry cleaned at establishment F vs. time. Fabric
samples were extracted for 5 min, 15 min, or 1, 12, 24, and 48 h as described in the Materials
and Methods section. Three replicates were run for each time point except 12 h (n = 2). The data
were averaged; error bars represent standard error of the mean.
GCMS analysis
Samples were run on a Varian 3900 gas chromatograph with a model 2100 ion trap mass
spectrometer using electron-impact ionization. The column was an Agilent “HP-5” column with
a (5%phenyl)-methylpolysiloxane stationary phase, with a diameter of 0.25 mm and a length of

193
30 m. A temperature profile was generated to ensure resolution of PCE. The injection port was
maintained at 250 °C. Following a solvent delay of 2.75 minutes, the oven temperature of 50 °C
was held for 5 minutes, increased to 120 °C at 10 °C per minute, and held at that temperature for
2 minutes, for a total run time of 17 minutes. This temperature profile resulted in a PCE retention
time of 5 minutes. In order to minimize instrumental error, a set of PCE standards were run
before each set of samples.
Calculation of PCE levels in fabric extracts
Standardized solutions of PCE: 10, 50, 100, 500 μM and 1 mM, diluted in GC-grade
methanol were used to calculate PCE concentration in the fabric methanol extracts. A negative
control, comprised of the methanol with no PCE, was also run. Each day fabric samples were
analyze, three injections of each sample were analyzed, integrating the PCE peak at a retention
time of 5 minutes, for each injection, using Varian MS Workstation software. Peak area for
three injections of each PCE standard were averaged, and a standard curve generated by plotting
averaged area versus the known concentration.
Once the concentration of PCE in a fabric methanol extract was calculated using a
standard curve obtained under the same conditions, the injection volume (1 μL) and the known
area of the fabric sample were used to calculate the amount of PCE in the fabric in units of
nmol/cm2. Fabric samples were analyzed in triplicate; the mean and the standard error of the
mean were calculated.

194
7.1.3. Results
In order to develop a simple method for quantifying PCE residue in common clothing
fabrics, we inspected several possible solvents for extraction. One in particular that appeared
useful to us was pure methanol, since PCE is miscible with methanol, does not degrade common
fabrics, is an appropriate solvent for GCMS analysis, and is purged from the column in
approximately 3 minutes, which is a suitable solvent delay.
Figure 7.2A shows representative chromatograms of methanol, and two known
concentrations of PCE in methanol. The truncated peak at about 2.5 minutes is the tail end of the
(very large) methanol solvent peak. Degradation of the column stationary phase led to several
small peaks including a residual peak near 5 minutes in the methanol blanks, which was included
in calculation of the standard curve. Integration of the prominent PCE peak at 5 minutes
increased with increasing concentration. Figure 7.2B shows a representative standard curve
calculated using integrated peak area. A strong linear correlation was observed, thus linear
regression was used to quantify fabric sample extracts.
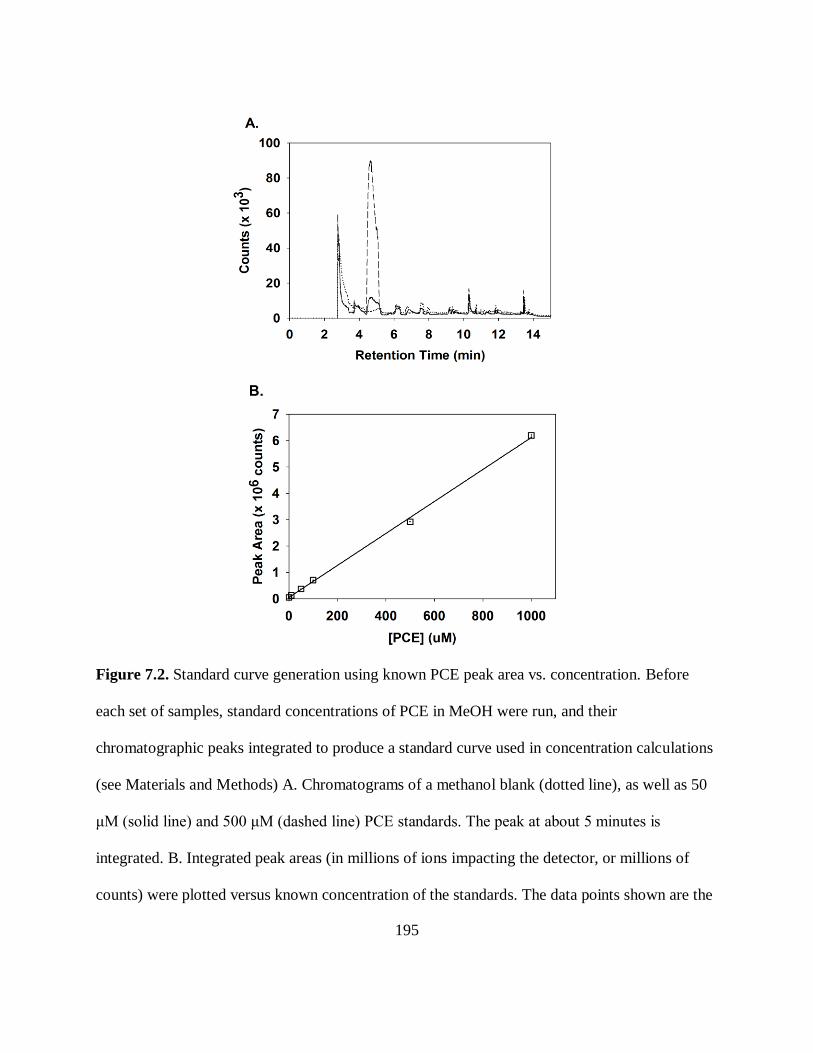
195
Figure 7.2. Standard curve generation using known PCE peak area vs. concentration. Before
each set of samples, standard concentrations of PCE in MeOH were run, and their
chromatographic peaks integrated to produce a standard curve used in concentration calculations
(see Materials and Methods) A. Chromatograms of a methanol blank (dotted line), as well as 50
μM (solid line) and 500 μM (dashed line) PCE standards. The peak at about 5 minutes is
integrated. B. Integrated peak areas (in millions of ions impacting the detector, or millions of
counts) were plotted versus known concentration of the standards. The data points shown are the
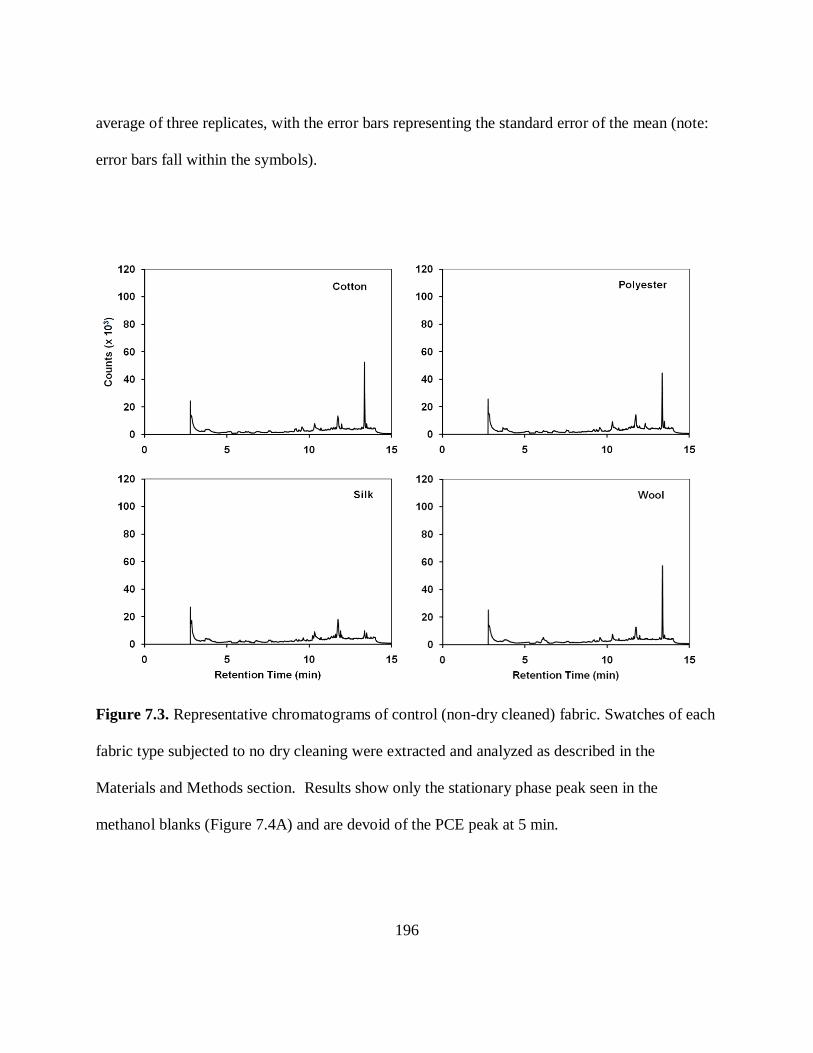
196
average of three replicates, with the error bars representing the standard error of the mean (note:
error bars fall within the symbols).
Figure 7.3. Representative chromatograms of control (non-dry cleaned) fabric. Swatches of each
fabric type subjected to no dry cleaning were extracted and analyzed as described in the
Materials and Methods section. Results show only the stationary phase peak seen in the
methanol blanks (Figure 7.4A) and are devoid of the PCE peak at 5 min.

197
A.
B.
Figure 7.4. Representative mass spectra of a 1 mM PCE standard (A) and a polyester extract
sample from dry cleaner A (B). The mass spectrum associated with the integrated peak verifies
the presence of PCE. Peaks labeled with an asterisk represent the loss of 3, 2, and 1 chlorine
atoms expected via this method of detection

198
Methanol extractions on control (non-dry cleaned) swatches of each fabric showed only the
stationary phase peak seen in the methanol blanks (Figure 7.3), which is calculated as no
detectable PCE concentration. The lack of a significant peak area detected for control fabric
samples supports that the peak area increase for test fabric samples (see below) is indeed due to
PCE, not to fabric contaminants (see also discussion of Fig 7.4, below).
Even though identical peak shape and retention time would be strongly suggestive that
PCE is indeed extracted from these samples (see below), we confirmed the presence of PCE by
examining the mass spectrum of each sample. Figure 7.4. shows representative mass spectra of
the 1 mM PCE standard (Fig. 7.4A), and a polyester sample from dry cleaner A (Fig. 7.4B). The
molecular ion peak is seen at m/z = 166, with peaks associated with successive loss of chlorine
atoms at m/z = 131 (trichloroethylene), 94 (dichloroethylene), and 59 (monochloroethylene). The
presence of this molecular ion peak fingerprint confirms of the presence of PCE. Degradation of
the column stationary phase was observed at very low PCE concentrations, with the largest peak
at m/z = 207.
Figure 7.5 shows representative chromatograms of all four fabrics from two of the seven
dry cleaners. Integration of the PCE peaks at a retention time of 5 minutes yielded areas that
varied among fabric type as well as between different dry cleaners. The amount of PCE was
calculated using a standard curve (e.g. Figure 7.2B), the injection volume, and the measured area
of the fabric swatch. Data from three independent extractions for each fabric from each dry
cleaner were averaged, and the standard error of the mean calculated, as shown in Table 7.1 and
Figure 7.6.
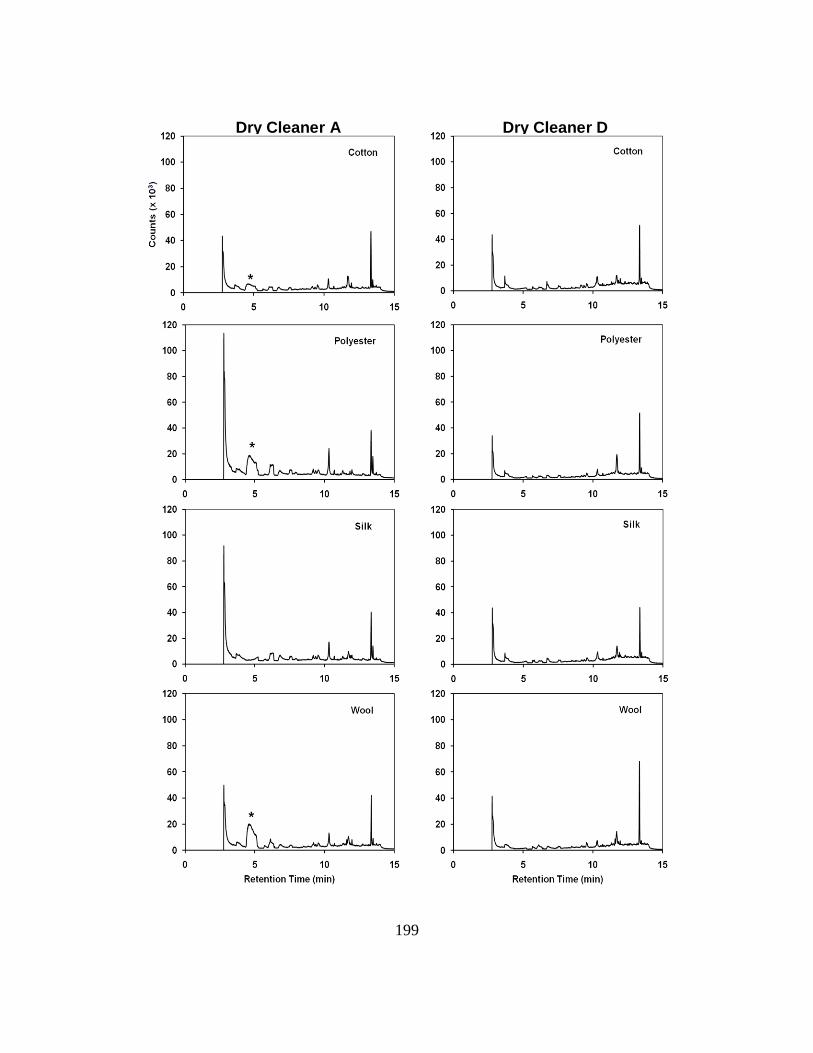
199
Dry Cleaner A Dry Cleaner D
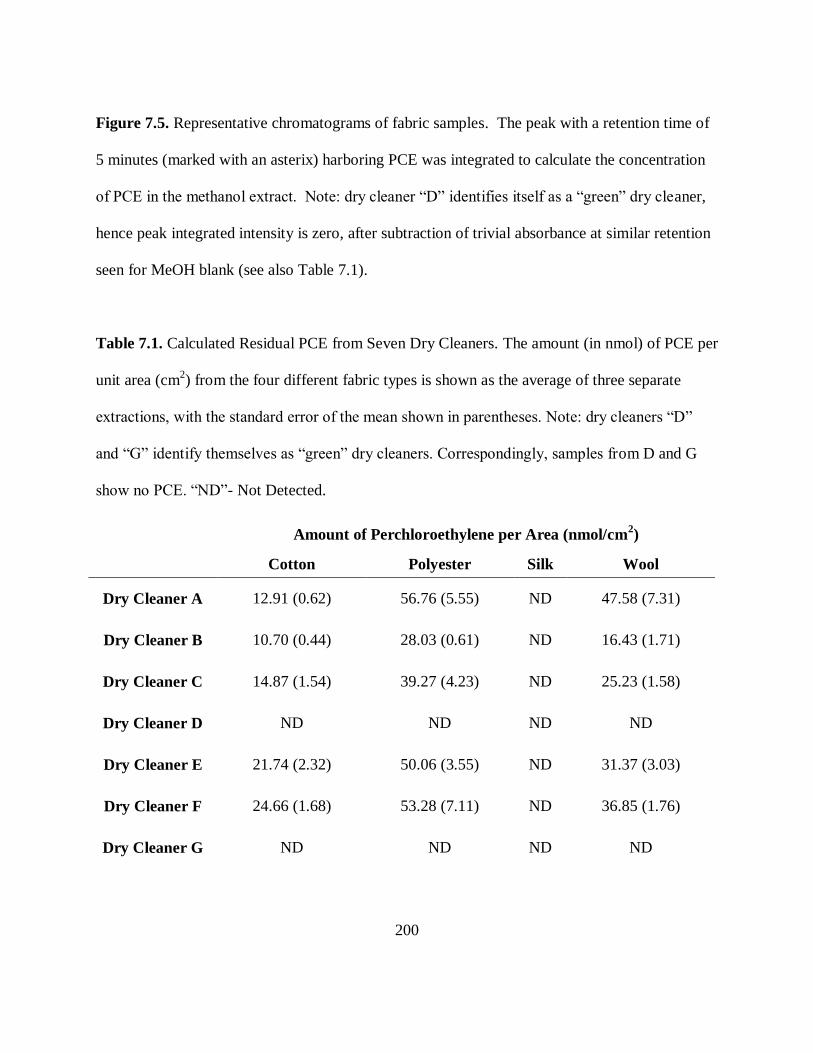
200
Figure 7.5. Representative chromatograms of fabric samples. The peak with a retention time of
5 minutes (marked with an asterix) harboring PCE was integrated to calculate the concentration
of PCE in the methanol extract. Note: dry cleaner “D” identifies itself as a “green” dry cleaner,
hence peak integrated intensity is zero, after subtraction of trivial absorbance at similar retention
seen for MeOH blank (see also Table 7.1).
Table 7.1. Calculated Residual PCE from Seven Dry Cleaners. The amount (in nmol) of PCE per
unit area (cm2) from the four different fabric types is shown as the average of three separate
extractions, with the standard error of the mean shown in parentheses. Note: dry cleaners “D”
and “G” identify themselves as “green” dry cleaners. Correspondingly, samples from D and G
show no PCE. “ND”- Not Detected.
Amount of Perchloroethylene per Area (nmol/cm2)
Cotton Polyester Silk Wool
Dry Cleaner A 12.91 (0.62) 56.76 (5.55) ND 47.58 (7.31)
Dry Cleaner B 10.70 (0.44) 28.03 (0.61) ND 16.43 (1.71)
Dry Cleaner C 14.87 (1.54) 39.27 (4.23) ND 25.23 (1.58)
Dry Cleaner D ND ND ND ND
Dry Cleaner E 21.74 (2.32) 50.06 (3.55) ND 31.37 (3.03)
Dry Cleaner F 24.66 (1.68) 53.28 (7.11) ND 36.85 (1.76)
Dry Cleaner G ND ND ND ND

201
Figure 7.6. The amount of residual PCE per unit area of fabric. All four fabrics were tested
from each dry cleaner: dry cleaner A (solid bars), B (dashed bars), C (open bars), D (diamond
bars), E (striped bars), F (dotted bars), G (checkered bars). No PCE was detected for dry
cleaners D and G, hence their bars are not visible. The concentrations are the average of three
extractions, with error bars representing standard error of the mean/
Interestingly, for all seven dry cleaners, the silk samples did not show any detectible
levels of PCE (Fig. 7.6). Also, dry cleaners “D” and “G” showed no detectible levels of PCE in
any of the fabrics (Fig. 7.6, Table 7.1). Not coincidentally, these two dry cleaners advertise
themselves as “green” dry cleaners, meaning, presumably, no PCE is used in the cleaning
202
process. The chromatogram of dry cleaner D did not show any significant additional peaks
relative to MeOH blank, as seen in Figure 7.5 (see also Fig. 7.2A, dotted line). The lack of any
other compounds extracted by the methanol suggests that this dry cleaner likely employs
supercritical carbon dioxide in the cleaning process. On the other hand, dry cleaner G showed no
PCE peak at 5 minutes, but did reveal a peak at about 13 minutes with a mass spectrum
consistent with a long-chain alkane (peaks at m/z = 57, 71, 85, and 169, data not shown). With a
molecular ion of m/z = 282, the compound may be one or many isomers of eicosane, C20H42,
which is a component of alternative petroleum-based hydrocarbon mixtures (EPA 2002). Such
dry cleaning solvents are typically comprised of varied composition linear and branched
saturated alkanes and cycloalkanes (EPA 2002).
We next wondered whether PCE residue remaining from traditional dry cleaning
establishments is volatilized from fabric samples, and if so, at what rate. Wool samples from dry
cleaner A were left exposed to open air at room temperature, as well as wrapped under dry
cleaner-provided plastic. No significant differences were seen between the two environments
(Figure 7.7). Over the course of 7 days, the amount of PCE found in either wool sample from
either environment was reduced by about half (Figure 7.7).

203
Figure 7.7. Volatilization of residual PCE from wool fabric dry cleaned at establishment A at
ambient room temperature either in open-air (solid circles) or under dry cleaner-provided
garment plastic (open circles). A 1.3 x 5.0 cm swatch was placed on filter paper and allowed to
stand either exposed to open-air or loosely folded in dry cleaner-provided garment plastic for 1,
2, 3, 4, 5, and 7 days. Samples were left undisturbed on the laboratory bench under normal
airflow conditions. Each was then extracted with MeOH for 24 h and extract analyzed for PCE
content as described in Materials and Methods. Three replicates were analyzed for each time
point, the data were averaged; error bars represent standard error of the mean.
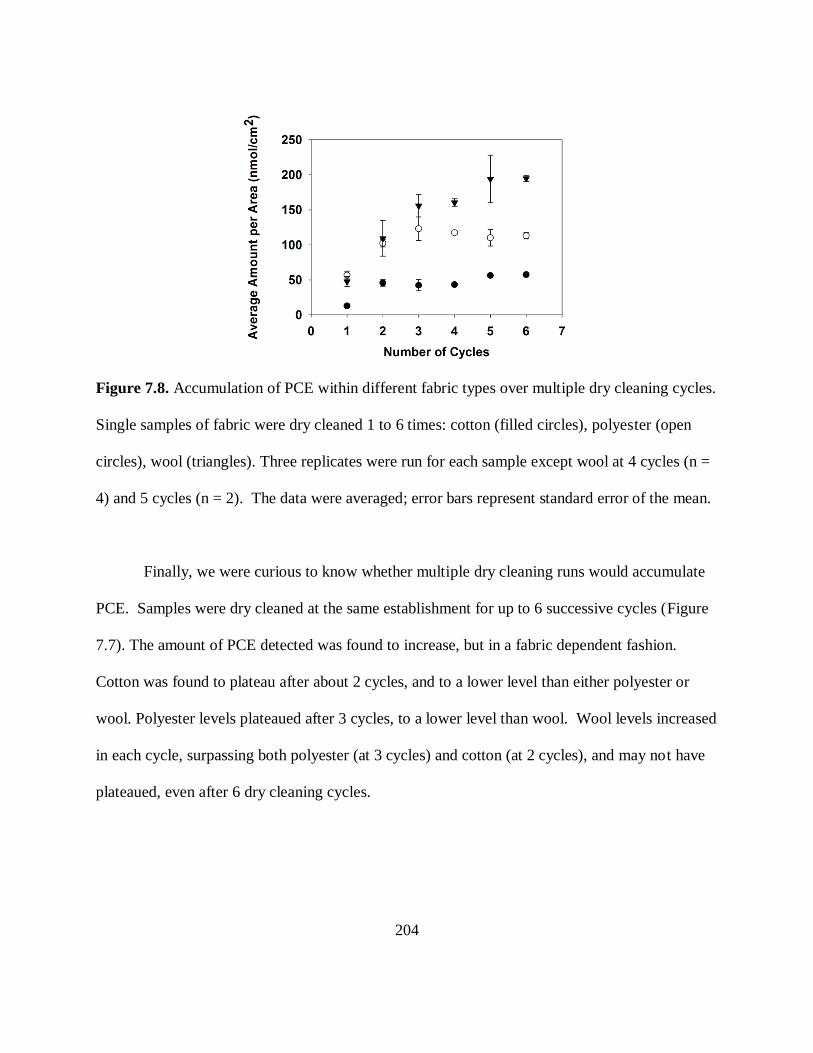
204
Figure 7.8. Accumulation of PCE within different fabric types over multiple dry cleaning cycles.
Single samples of fabric were dry cleaned 1 to 6 times: cotton (filled circles), polyester (open
circles), wool (triangles). Three replicates were run for each sample except wool at 4 cycles (n =
4) and 5 cycles (n = 2). The data were averaged; error bars represent standard error of the mean.
Finally, we were curious to know whether multiple dry cleaning runs would accumulate
PCE. Samples were dry cleaned at the same establishment for up to 6 successive cycles (Figure
7.7). The amount of PCE detected was found to increase, but in a fabric dependent fashion.
Cotton was found to plateau after about 2 cycles, and to a lower level than either polyester or
wool. Polyester levels plateaued after 3 cycles, to a lower level than wool. Wool levels increased
in each cycle, surpassing both polyester (at 3 cycles) and cotton (at 2 cycles), and may not have
plateaued, even after 6 dry cleaning cycles.

205
7.1.4. Discussion
Our analysis of PCE extracted from conventionally dry cleaned fabric shows surprisingly
high levels in cotton, polyester, and wool, ranging from 10 to 56 nmol/cm2. After a single cycle
of dry cleaning, polyester showed the highest retention, followed by wool and cotton. From all
seven dry cleaners, no silk samples showed detectable PCE. Two dry cleaners, which advertised
as “green”, had no detectible levels of PCE in any fabric, but one did show evidence of long-
chain alkanes that are found in “green” petroleum-based hydrocarbon solvents (EPA 2002) in a
peak eluting at a retention time of 13 minutes. Cotton, wool, and polyester showed accumulation
of PCE over multiple dry cleaning cycles. Over multiple cycles, cotton had lower measured total
amounts relative to polyester or wool. Cotton and polyester plateau at 2 and 3 cycles,
respectively. Wool continued to increase steadily, having nearly two times the amount as
polyester and nearly four times the amount of cotton after 6 dry cleaning cycles. These levels of
PCE volatilize into ambient room air, regardless if they are wrapped in conventional dry cleaner
plastic wrap.
The observation that silk does not contain residual PCE by our extraction method
suggests either that the fabric does not absorb appreciable PCE during the cleaning process, or
that silk may be less permeant to methanol. The later seems unlikely. Raw silk fibers produced
by the Bombyx mori silkworm are comprised primarily of two proteins: an outer coating of
sericin and fibroin (Taddei et al. 2007). The former has adherent properties and the latter is a
fibrous protein primarily composed of the amino acids Gly, Ser, and Ala (Taddei et al. 2007).
The approximately 50% Gly composition enables tight packing of silk fibers, while hydrogen
bonding between the backbone and Ser side chains affords significant tensile strength (Taddei et
206
al. 2007). This tight packing and sequestration of hydrophilic Ser residues in hydrogen bonding,
coupled with the sericin coating might explain silk’s resistance to PCE absorption. In contrast,
wool exhibits a heterogeneous protein composition leading to an overall amino acid sequence
spanning the full range of charged, hydrophobic, and hydrophilic side chains, with the majority
being the former two (Corfield et al. 1955). This amphoteric nature of wool combined with the
arrangement of its fibers relative to silk explains, at least in part, why wool retains considerable
residual PCE and continues to do so as the number of dry cleaning cycles increase (see also
Kawauchi et al. 1989; Brodmann et al. 1975).
More work testing for PCE levels in other fabric types and other locations is clearly
warranted. However, a key question arises from these initial data. Namely, do the measured
PCE residues found in these fabric samples constitute risk to human health? PCE is classified as
a class II carcinogen, but to have health effects the solvent must also be ingested or absorbed.
One obvious route for transfer of clothing PCE residue to humans is absorption through the skin
from fabric that makes skin contact. However, another would be PCE vapor emanating from
fabric, particularly when it has been dry cleaned multiple times and is placed in a warm, closed
environment such as the interior of an automobile on a sunny day. It is important to note that
although the boiling point of liquid PCE is 120 °C, some evaporation from fabrics is observed
even under ambient room temperature, with the amount extracted reduced by half after 7 days.
It is difficult to extrapolate actual human dose from either of these scenarios without
additional data. However, we note that a pair of adult wool pants has approximately 30,000 cm2
of material. Extrapolating from Table 7.1, such a clothing item could contain as much as 1300
µmol (160 mg) of PCE. Poet et al observed an average absorption of 167 ± 64 μmol PCE at a

207
rate of 0.0009 ± 0.0003 cm/h through the skin of human subjects following immersion of a
human hand in 4 kg of soil containing approximately 1 mol PCE (Poet et al. 2002). This
corresponds to absorption of 0.017% of the available PCE (Poet et al. 2002). If a similar
percentage of the PCE in the clothing article discussed above was absorbed through skin, and if
120 such items were worn over a one-year period the person wearing these garments would have
received a dose of PCE corresponding to 27 μmol (approximately 3 mg). However, it is
important to note that hand skin tissue was not exposed to the entire 1 mol of PCE in (Poet et al.
2002) and that the efficiency of soil/skin partitioning vs. fabric/skin partitioning likely differs
considerably (hand derma is much thicker), leading to an underestimation of the above calculated
“dose” from a wool garment. Also, PCE prefers partitioning to fat tissue which is largely absent
from the hand but prevalent elsewhere in to torso.
Alternatively, if 10 such items remained in a sealed closet area, then 6.5 mmol of PCE
would presumably be released into the closet air supply over a period of 7 days. For an average-
sized closet of 3.4 m3, this corresponds to a total exposure of 2.0 mmol/m
3 (0.24 g/m
3) or 50.0
ppm (EPA 1994). By similar logic, four wool sweaters subjected to six dry cleaning cycles
placed in a warm 3.4 m3 car interior would result in 5.13 mmol/m
3 (0.62 g/m
3) or approximately
126 ppm, assuming all residual PCE is vaporized.
The question of whether such dosages are carcinogenic is difficult to answer given the
highly inconclusive and conflicting nature of only a handful of rat carcinogenicity studies
reported in the literature. Of nine such studies conducted, three focused on PCE administration
by inhalation and six by oral gavage (Ishmael and Dugard 2006). Two of the inhalation studies
reported the incidence of mononuclear cell leukemia (MCL) in Fisher 344 (F344) inbred rats and

208
increases in hepatocellular adenomas and/or carcinomas in mice. A National Toxicology
Program Technical Report (1986) indicated a 18% increase above control in male rats exhibiting
MCL and a 24% increase in females following a PCE dose of 200 ppm (8.2 μmol/cm3, 8200
mmol/m3) for 6 h/d (EPA 1994; NTP 1986). Nagano et al report a 33% increase in MCL
incidence for male F344 rats and a 12% increase for female F344 rats receiving this same dose of
PCE (Nagano et. al 1998). However, in both cases and the results were deemed unsuitable for
extrapolation to humans (Ishmael and Dugard 2006; NTP 1986; Nagano et. al 1998). We
suggest definitive conclusion can only be made when skin absorption parameters for these levels
of PCE that we detect are rigorously defined.
For these reasons, we suggest further detailed quantification of PCE residues is
warranted. We also suggest that studies human exposure to these residues be carefully
evaluated, particularly PCE absorption through the skin, post-absorption bioavailability, and
carcinogenic vs. toxic levels of absorbed vs. inhaled PCE.
7.1.5. Acknowledgements
We thank the Dantzler family of Manassas, VA for assistance with dry cleaning samples;
Dr. Ron Davis, Jr. for instrumental guidance and support; Mrs. Doreen Curtin, Science
Department Chair at Bishop O'Connell High School for assistance and Ms. Rebecca Dzubow
(MPH, MEM) of the U.S. E.P.A. for helpful discussions. This work was supported by the
Georgetown University Department of Chemistry, and a grant–in–aid from the Georgetown
University Graduate School.

209
7.2. Natural Functions of Drug Resistance Associated Membrane Proteins.
Previously Published as: Sherlach, K. S.; Roepe, P. D. Natural Functions of Drug Resistance
Associated Membrane Proteins. Frontiers in Physiology. 5:108. Doi:10.3389/fphys.2014.00108.
Open Access.
Study of drug resistance began in the late 1940’s, and recognition that altered membrane
transport of drug was often related to cellular drug resistance followed approximately 20 years
later. Identification and isolation of specific membrane proteins that influence this altered drug
transport began in the 1970’s and is a major ongoing endeavor to this day. In this article, I refer
to such proteins as “drug resistance associated membrane proteins”, or “DRAMPs”. In over 40
years, dozens of books and tens of thousands of research articles have asked how drug resistance
is mediated by DRAMPs. By comparison, relatively few studies have probed the normal
physiological function of these proteins. In many cases, deletion of the gene encoding a
DRAMP is not lethal, showing that the function of the protein is non-essential, but in some cases
(e.g. PfCRT protein involved in antimalarial drug resistance) deletion is not possible, suggesting
an essential function. For some DRAMPs a clear role in specific cell biological processes has
been established (e.g. Jin et al. 2002; Ishikawa et al. 1997; Quazi et al. 2013; Baugh et al. 2012),
but in most cases we are no closer to a detailed molecular definition of the physiologic function
of DRAMPs than we were when these proteins were first discovered. When they are involved in
drug resistance, DRAMPs are often either mutated or overexpressed, and in some cases both.
Quantitative comparison between wild type and mutant isoforms of DRAMPs, or between
210
normal and higher levels, is often quite difficult for a variety of technical reasons, and this has
probably slowed elucidation of their physiologic function.
The vast majority of genetic, biochemical, biophysical, and cell biological studies with
DRAMPs have emphasized their putative interactions with drugs, and dozens of review articles
summarize decades of such work (e.g. Saidijam et al. 2006; Blair et al. 2009; Bay et al. 2008;
Damme et al. 2011). The known array of DRAMPs is now dizzying, with hundreds of proteins
now organized into five families (ABC, MATE, MFS, SMR, RND), as described elsewhere
(Alvarez-Ortega et al. 2013). Members of each family can be found in multiple phyla, but
sequence conservation across phyla is typically quite low. Individual members of these families
have been implicated in anticancer, antibacterial, antifungal, and antiparasitic drug resistance
phenomena. Other papers in this volume describe specific proteins in detail. Collectively, these
data related to DRAMP structure and function and their roles in drug resistance are exceedingly
rich and illuminating, and encompass a remarkable diversity of function. It is therefore a
challenge (and perhaps less effective) to view them as a single class of proteins, since their only
common thread is participation in drug resistance phenomena, which are biologically and
chemically quite diverse.
To add additional complexity, there are four possible routes to cellular drug resistance: 1)
catabolism of the drug, 2) mutation and/or altered expression of the drug target, 3) switching off
a relevant metabolic pathway or 4) altered cellular transport of the drug. All operate simply to
reduce the efficiency of interaction between the drug and its molecular target, and membrane
proteins involved in drug resistance phenomena could in theory influence any of the four routes.
To date, most DRAMPs studied in depth have been associated with altered drug transport

211
phenomena that act to promote lower drug-drug target association. The most famous of these is
human MDR1 protein (P-glycoprotein), which mediates decreased accumulation of anticancer
drugs in tumor cells (Quazi et al. 2013; Roepe et al. 1996). Early on it was appreciated that
altered drug transport induced by overexpression of huMDR1 could in theory be direct or
indirect (10), meaning huMDR1 could mediate direct translocation of drugs back out of the cell
to reduce net accumulation, or indirectly influence accumulation of drugs through physical
chemical effects, such as changes in membrane potential that would then effect passive influx of
some drugs (Wadkins and Roepe 1997). Decades later, multiple examples of both direct and
indirect phenomena can be found for various examples of drug resistance mediated by DRAMPs.
Another question raised early on was whether degrees of resistance or patterns of drug “cross
resistance” were mediated solely by huMDR1 and other DRAMPs. In addressing this question,
of note is the fact that many early models of drug resistant cells were created by incremental
exposure to increasing concentrations of a single drug (Biedler et al. 1970), protocols that induce
a variety of “epi-phenomena” that are now known to add to drug resistance, along with
DRAMPs. For example, it is now appreciated that the 100’s to 1000’s-fold levels of drug
resistance observed in early drug selected tumor cell models are clearly not due to huMDR1
overexpression alone. A crucial concept that emerged from this period is that altered cell
signaling related to programmed cell death is likely more relevant for high levels of drug
resistance in many cancers, relative to the contribution made by ABC DRMPs (Lowe et al. 1993;
Borst 2012).
A central, remaining question for most of these proteins is what functions do DRAMPs
have in the absence of drugs to which resistance has been selected? Even if not essential in

212
many cases, clearly these functions are important since the proteins are chromosomally encoded,
are found in all phyla, and have been evolving for millions of years. Even in the absence of man-
made drug pressure for isolated microbiomes, bacteria have been discovered with a wide-range
of resistance phenotypes suggesting that one normal physiologic function is conferring resistance
to commensal defensins or other excreted natural antibiotics (Bhullar et al. 2012). Most drug
resistance researchers believe that molecular definition of these “normal” or “physiologic”
functions will better illuminate the molecular mechanism of how the membrane proteins confer
drug resistance. Presumably, mutations or increased expression seen for these proteins in drug
selected cells confers drug resistance phenomena because the normal function is “hijacked” or
altered in such a way as to reduce interaction between drug and drug target. But beyond the
example of “naturally resistant” bacteria (Bhullar et al. 2012), what are those normal functions?
DRAMPs in bacteria have identified natural functions that include: spermidine
degradation, pH homeostasis, alkali tolerance, as well as removal of naturally-produced
antibiotics, toxic fatty acids, bile salts, homoserine lactones, and aromatic hydrocarbons
(Neyfakh 1997; Krulwich et al. 2005; Fernandez et al. 2012). For huMDR1 and its many
relatives in the ABC transporter superfamily, the most illuminating early experiments came from
gene knockout experiments with mice (Smit et al. 1993). Here, Borst and colleagues showed a
distinct tissue/cellular phenotype associated with deletion of murine orthologues of huMDR1,
namely, altered traffic of phospholipids. This suggests that the normal function of huMDR1 may
include maintenance of cell membrane lipid disposition, or direct transport of phospholipids and
related molecules. These hypotheses were supported in several follow-up reports (e.g. van
Helvoort et al. 1996; Raggers et al. 2000; Romsicki et al. 2001). Work in this area remains
213
ongoing, and the only universally accepted conclusion at this point seems to be that there is a
wider-than-expected diversity of natural substrates for ABC transporters involved in drug
resistance phenomena.
Another important class of DRAMPs is comprised of those involved in anti-parasitic drug
resistance. Although they are not the only mechanism that confers resistance, transporters have
been implicated in drug resistance for the microorganisms that cause schistosomiasis
(Kasinathan et al. 2012), leishmaniasis (Ait-Oudhia et al. 2011), sleeping sickness (Wilkinson
and Kelly 2009), malaria (Roepe 2011), and other parasitic diseases. Perhaps the most heavily
studied to data are malaria DRAMPs. These include orthologues of huMDR1 and huMRP that
are found in multiple species of malarial parasites, including P. falciparum and P. vivax. Early
on (Foote et al. 1990; Wilson et al. 1989), PfMDR1 was thought to be the major contributor to
the most widespread form of antimalarial drug resistance (chloroquine [CQ] resistance, [CQR]),
however, mutations in a novel DRAMP with no known orthologues in other eukaryotes, called
PfCRT, was subsequently found to be responsible for a much larger portion of the shift in CQ
cytostatic activity (CQ IC50) observed for CQR P. falciparum (Fidock et al. 2000). Multiple
mutations in the pfcrt gene are required for CQR, and these confer patterns of amino acid
substitutions in the encoded PfCRT protein. The patterns reveal the geographic origin of the
CQR strain or isolate and also suggest different cross-resistance patterns to related drugs
(Summers et al. 2012). There are now at least 17 distinct isoforms of PfCRT known to exist,
with each isoform selected by different drug-use histories in the respective geographic origin
(Baro et al. 2013). For at least a decade, it has been widely suspected that these PfCRT
214
mutations may be all that is necessary to confer resistance to multiple quinoline antimalarial
drugs, and perhaps other compounds.
Recently however, in set of observations oddly reminiscent of the now-accepted concept
that huMDR1 protein overexpression is only part of the explanation for tumor multidrug
resistance, we now know that PfCRT mutations are only part of the story for CQR. From cancer
cells to malarial parasites, altered signaling related to drug induced programmed cell death also
appears necessary for high-level drug resistance (e.g. Lowe et al. 1993; Gaviria et al. 2013).
Using progeny of an available CQR x CQS parasite genetic cross, a very recent paper shows that
the genetics of “cytostatic CQR” (resistance to cytostatic, or growth inhibitory, effects of the
drug) are distinct from those of cytocidal CQR (resistance to cytocidal, or parasite kill, effects of
the drug) (Gaviria et al. 2013). That is, similar to high levels of tumor cell multidrug resistance,
and other examples of bacterial, fungal, and parasite drug resistance, it now appears likely that a
DRAMP (PfCRT) is responsible for one key layer to antimalarial drug resistance, with altered
signaling related to parasite cell death adding to the phenotype upon acquisition of high levels of
cytocidal drug resistance (Gaviria et al. 2013; Sinai and Roepe 2012; Roepe 2014).
Returning to the question at hand, what does this tell us about studies that probe DRAMP
physiologic function? An important lesson is that studies attempting to define physiologic
function using drug pressured or drug selected cell lines can confuse analysis due to the presence
of unforeseen epi-phenomena, such as altered metabolism and signal transduction related to cell
death pathways. Similar to defining the precise contribution of the DRAMP to drug resistance, it
can be difficult in these drug selected systems to unambiguously define physiologic function
because other epi-phenomena are present. Direct gene knockout experiments can in some cases

215
be more informative, except of course in examples where the DRAMP is essential for cell
viability (Waller et al. 2003). The ultimate goal for molecular definition of DRAMP function is
purification and reconstitution into a lipid bilayer or proteoliposome preparation, followed by
direct molecular assays. A number of such experiments have been done for huMDR1 and other
eukaryotic ABC transporters (e.g. Sharom et al. 1993; Ambudkar et al. 1998; Howard and Roepe
2003), bacterial DRAMPs (e.g. Yershalmi et al. 1995) and even malarial DRAMPs (Paguio et al.
2009). Some of these studies have been used to query possible natural substrates, but many more
such experiments are needed.
Even once the protein is purified and reconstituted, functional assays for DRAMPs can
be quite difficult, in part because the suspected transporter substrates are often hydrophobic
molecules or lipophilic metabolites. Also, some DRAMPs may not even be transporters, but
signaling receptors involved in cell death that require yet unknown co-factors. In the case of
hydrophobic substrates, routine transport assays that separate proteoliposomes from substrate at
various time points via centrifugation or filtration have very high background due to the substrate
adhering to lipid, filters, etc. Another approach that shows promise, at least for known
substrates, is to use a fluorometric substrate analogue wherein a fluorescent signal can be used to
distinguish drug on one side of a membrane vs. another. For example, this has recently been
used to monitor CQ transport by PfCRT (Paguio et al. 2009). This analysis reveals features of
drug transport by PfCRT that are not possible to monitor with other approaches (Roepe 2011).
Yet, similar to most other DRAMPs, for PfCRT and PfMDR1, we still have no
unequivocal molecularly defined function for the protein in normal cell physiology. For PfCRT
cell biological clues abound, and in particular include some evidence for a role in organellar
216
volume regulation, ionic equilibria, hemoglobin metabolism, and perhaps glutathione traffic
(Gligorijevic et al. 2006b; Bennet et al. 2004a; Lewis et al. 2014; Patzewitz et al. 2013). Further
testing these hypotheses, with purified protein in reconstituted systems such as proteoliposomes
and bilayers, remains an important goal as is the case for all DRAMPs. The papers in this
volume offer invaluable guidance in this ongoing endeavor.
7.2.1. Acknowledgments
Work in the Roepe laboratory mentioned here has been supported by the NIH, the
Burroughs Wellcome Fund, DoD, and the Luce Foundation.

217
7.3. Determination of the Cytostatic and Cytocidal Activities of Antimalarial Compounds
and their Combination Interactions
To Be Submitted: Sherlach, K. S.; Roepe, P. D. Current Protocols in Chemical Biology.
7.3.1 Introduction
The rise of antimalarial multidrug resistance and the failure of current antimalarial
therapies necessitate the identification of new drugs and drug combination therapies.
Notwithstanding difficulties inherent in live malaria parasite cell culture that typically requires
co – culture with human erythrocytes, this protocol describes simple and inexpensive assays that
can be used to investigate the activity of potential antimalarials. The use of the fluorescent
reporter SYBR Green I takes advantage of the lack of nuclei in erythrocytes, and minimizes
background due to its increase in fluorescence intensity upon intercalation with double stranded
DNA (Bennet et al. 2004). This improves upon earlier assays that required expensive reagents
such as radioactive-labeled hypoxanthine (Desjardins et al. 1979), monoclonal antibodies
(Druilhe et al. 2001), or extensive washing to prevent quenching due to hemoglobin (Quashie et
al. 2006).
Assays can be tailored to study cytostatic growth inhibition (Bennet et al. 2004), higher-
dose cytocidal cell kill (Paguio et al. 2011), as well as the effect of drug combinations following
methods described by Chou and Talalay (Chou and Talalay 1984; Suberu et al. 2013). The
differences between the cytostatic and cytocidal assays include constant vs. bolus dosing,
altering drug concentrations and adding washing steps. Where necessary, quantification of
cytocidal potency (e.g. determination of LD50) can be further tested using a long-term limiting
218
dilution assay adapted from a recently described rate of cell-kill assay (Sanz et al. 2012).
Adapting any of these assays for drug combination analysis requires the generation of serial
dilutions at multiple fixed drug ratios near the pharmacologically-relevant doses for each drug in
the combination.
Materials
Plasmodium falciparum culture at 2% hematocrit (volume packed RBC/volume media)
Complete Media
Type O+ human serum (off-the-clot, heat-inactivated)
Fresh O+ human whole blood, washed to isolate the erythrocytes, and stored in Incomplete
Media.
10% Giemsa Dye
Drug stocks (in DMSO, deionized water, or 50% ethanol)
96-well plate, clear well bottom with opaque well sides to prevent fluorescence interference
10,000x SYBR Green I stock from the vendor (Invitrogen), or synthesized (see Bennett et al.,
2004)
5% CO2, 5% O2, and 90% N2 gas mix
Specialized Equipment
Air-tight chamber
37°C Incubator
Eppendorf 5804 centrifuge with A-2-DWP rotor
Spectra Max Gemini EM Microplate Reader, or similar bottom-read fluorescence plate-reader
Microsoft Excel, Sigma Plot, or other data-analysis program that allows non-linear curve fitting
219
7.3.2. Cytostatic (IC50) Growth-Inhibition Assay- (adapted from Bennet et al. 2004)
This protocol is used to assess the ability of a compound to slow the growth of bulk
intraerythrocytic P. falciparum culture. Where possible, this should be measured over the course
of more than 1 parasite life cycle (more than 48 hours). The compound, in various
concentrations, is continuously incubated with low parasitemia culture, and growth is assessed
relative to a no-drug control through use of a fluorescent DNA-intercalating dye, SYBR Green I.
The 50% growth inhibitory concentration (IC50) is determined through non-linear curve fitting of
the data. The use of multiwell-plates and a fluorescence plate reader allows for high-throughput
screening, and the assay has been successfully adapted to 384 and even 1536 – well plate
formats.
1. Using a Giemsa smear, calculate P. falciparum culture parasitemia and adjust culture to
4% hematocrit and 1% parasitemia in culture media (% parasitemia is the percentage of
red blood cells that are infected, hematocrit is the volume percent of packed red blood
cells).
2. Generate drug solutions at 2x the desired target concentrations in complete media.
Aliquot 100 µL of each concentration into each of three wells in a 96-well plate. We
recommend 3 wells for each drug concentration such that each assay is done in triplicate,
and we recommend 3 independent assays (9 determinations in total) for each drug to
compute reliable IC50. Include no-drug controls for each strain of P. falciparum that is
being analyzed, as shown schematically in Table 7.2.

220
Table 7.2. Diagram of Plate for Cytostatic Assay.
HB3 (CQS)
Dd2 (CQR)
1 2 3 4 5 6 7 8 9 10 11 12
A 1 µM CQ No drug HB3 10 µM CQ No drug Dd2
B 500 nM CQ 5 µM CQ
C 250 nM CQ 2.5 µM CQ
D 100 nM CQ 1 µM CQ
E 50 nM CQ 500 nM CQ
F 10 nM CQ 100 nM CQ
G 5 nM CQ 50 nM CQ
H 1 nM CQ 10 nM CQ
3. Add 100 µL of the 4% hematocrit/1% parasitemia culture to each of the assigned wells,
producing a sample at 1x drug concentration and 2% hematocrit/1% parasitemia, mixing
well to ensure the RBCs are fully suspended in the media.
4. Place the plate in an air-tight incubator chamber and flush with a 5% CO2, 5% O2, and
90% N2 gaseous mix for 3 minutes to ensure a proper atmosphere.
5. Incubate at 37°C for 72 hours, flushing the chamber once a day with new gas.
6. Prepare a parasite-standard curve by counting a Giemsa smear and setting up small
cultures at 2% hematocrit and a range of predetermined % parasitemias and add to plate
wells in triplicate. Include a 0% parasitemia (RBCs in culture media) to account for
background fluorescence, as shown in Table 7.3.
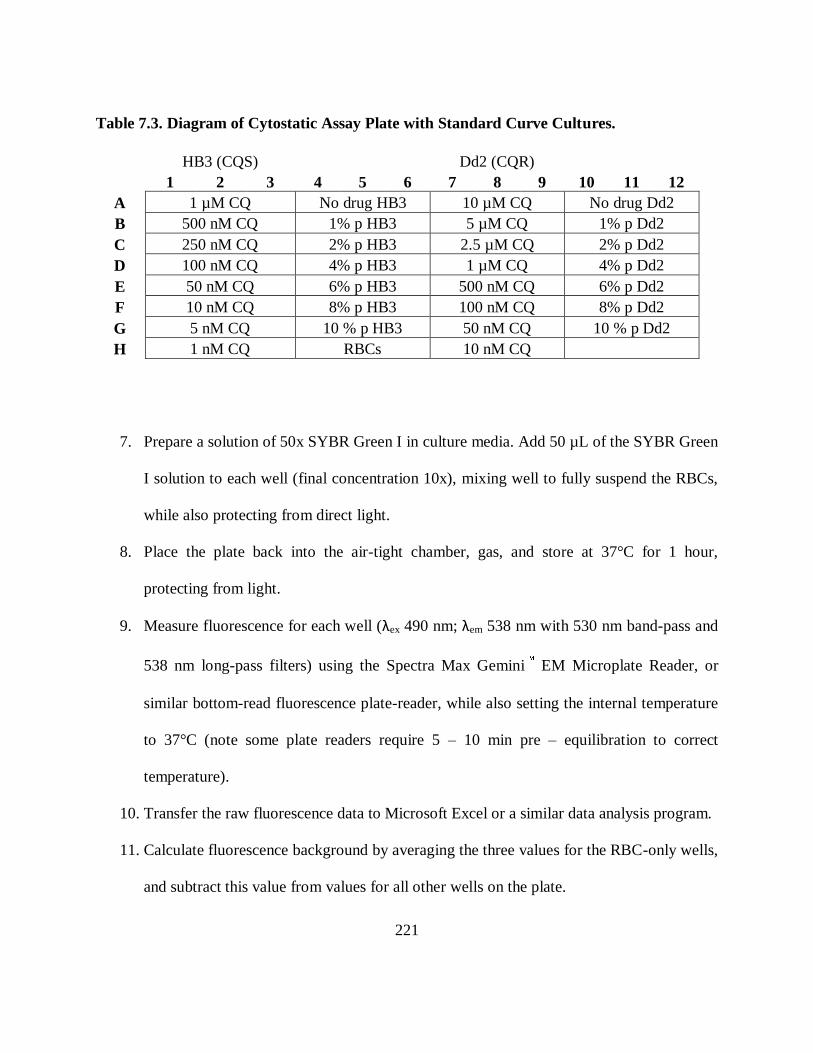
221
Table 7.3. Diagram of Cytostatic Assay Plate with Standard Curve Cultures.
HB3 (CQS)
Dd2 (CQR)
1 2 3 4 5 6 7 8 9 10 11 12
A 1 µM CQ No drug HB3 10 µM CQ No drug Dd2
B 500 nM CQ 1% p HB3 5 µM CQ 1% p Dd2
C 250 nM CQ 2% p HB3 2.5 µM CQ 2% p Dd2
D 100 nM CQ 4% p HB3 1 µM CQ 4% p Dd2
E 50 nM CQ 6% p HB3 500 nM CQ 6% p Dd2
F 10 nM CQ 8% p HB3 100 nM CQ 8% p Dd2
G 5 nM CQ 10 % p HB3 50 nM CQ 10 % p Dd2
H 1 nM CQ RBCs 10 nM CQ
7. Prepare a solution of 50x SYBR Green I in culture media. Add 50 µL of the SYBR Green
I solution to each well (final concentration 10x), mixing well to fully suspend the RBCs,
while also protecting from direct light.
8. Place the plate back into the air-tight chamber, gas, and store at 37°C for 1 hour,
protecting from light.
9. Measure fluorescence for each well (λex 490 nm; λem 538 nm with 530 nm band-pass and
538 nm long-pass filters) using the Spectra Max Gemini EM Microplate Reader, or
similar bottom-read fluorescence plate-reader, while also setting the internal temperature
to 37°C (note some plate readers require 5 – 10 min pre – equilibration to correct
temperature).
10. Transfer the raw fluorescence data to Microsoft Excel or a similar data analysis program.
11. Calculate fluorescence background by averaging the three values for the RBC-only wells,
and subtract this value from values for all other wells on the plate.
222
12. Generate a standard curve for each parasite strain by plotting the average fluorescence vs.
predetermined parasitemia, and fit to a linear equation.
13. Average the fluorescence for each sample (and the no-drug control), and use the
respective standard curve to convert these values to % parasitemia.
14. Divide the % parasitemia for each drug treated sample by the % parasitemia of the no-
drug control and plot % growth vs. [drug].
15. These growth curves can be fit to a sigmoidal function, which is then used to calculate
the drug concentration that would yield 50% growth. This is the IC50.
7.3.3. Cytocidal (LD50) Cell-Kill Assay- (Paguio et al 2011).
This protocol adapts similar methods to determine the concentration of a bolus dose of
drug that kills 50% of parasites (e.g. calculates the LD50). Choice of the length of time for the
bolus dose can be varied to reflect drug lifetime in media or plasma, as well as to probe any
parasite stage specificity for the activity of the drug. The parasites are incubated with the
compound for less than 1 life-cycle (typically 6 hours as a starting point, see Paguio et al., 2011)
and then the drug is washed away. The surviving parasites are allowed to grow through one
complete life cycle before staining with the same SYBR Green I dye. Comparison to no-drug
control allows for determination of the 50% lethal dose (LD50). The LD50 that is calculated often
(but not always) depends on the bolus incubation time and can be parasite stage – specific
(Paguio et al., 2011). Also, additional control experiments that calculate LD50 at different
endpoints should be done for drugs that might potentially induce extended quiescence
phenomena along with death, if distinction between these is desired.

223
1. Using a Giemsa smear, count the P. falciparum and set up a culture at 4% hematocrit and
2% parasitemia in culture media
2. As in the cytostatic assay, generate a series of drug concentrations at 2x the desired target
concentration in complete media and aliquot 100 µL into each of three wells in the 96-
well plate, as well as no-drug controls for each strain.
3. Add 100 µL of the 4% hematocrit/2% parasitemia culture to each of the assigned wells,
producing a sample at 1x drug concentration and 2% hematocrit/1% parasitemia, mixing
well to ensure the RBCs are suspended in the media.
4. Place the plate in an air-tight incubator chamber and flush with a 5% CO2, 5% O2, and
90% N2 gaseous mix for 3 minutes to ensure a proper atmosphere.
5. Incubate at 37°C for 6 hours.
6. Wash the plate by spinning in an Eppendorf 5804 centrifuge with A-2-DWP rotor at 700g
for 3 min, removing the supernatant from each well carefully to avoid disturbing the
pellet (using a multichannel pipette), and resuspending in 200 µL of culture media.
Repeat three times, for a total of 3 washes.
7. Return the plate to the air-tight chamber, flush with gas, and incubate at 37°C for 48
hours, flushing the chamber with new gas each day.
8. Repeat steps 6-15 from the cytostatic assay protocol. Plot as % survival vs. drug dose to
compute LD50.
224
7.3.4. Limiting Serial-Dilution Assay- Adapted from (Sanz et al. 2012).
Warning: this assay requires extensive parasite culturing and 30 days to complete. It is
more expensive and (much) more tedious than the above two assays.
To rigorously test conclusions from the cytocidal assay described above, this assay
determines the cell-kill ability of a compound through a limiting dilution method. Comparison
between parasite-free controls and cultures diluted down to (in theory) 1 parasite per well can be
used to back-calculate the number of viable parasites that survived a bolus drug dose. Plotting
this survival vs. concentration of bolus drug treatment allows calculation of the LD50.
1. Using a Giemsa smear, count the P. falciparum and set up a culture at 4% hematocrit and
2% parasitemia in culture media
2. As in the cytostatic and Paguio cytocidal assays, generate a series of drug concentrations
at 2x the desired target concentration in complete media and aliquot 100 µL into each
well in the 96-well plate.
3. Add parasites as in the above two assays, to generate final 2% hematocrit / 0.5 %
parasitemia. Note that % parasitemia can be adjusted, but in general a lower initial
parasitemia is used because these plates will develop for a much longer time (30 days)
and culture will “crash” if parasitemia becomes too high.
4. Place the plate in an air-tight incubator chamber and flush with a 5% CO2, 5% O2, and
90% N2 gaseous mix for 3 minutes to ensure a proper atmosphere.
5. Incubate at 37°C for 6 hours (6 hours bolus drug treatment; again, time can be varied
depending on what concepts are being explored, see Paguio et al.,2011).

225
6. While the parasites are incubating with the drug, prepare 2% hematocrit RBCs in
complete media (40 mL per strain being analyzed). This large amount of culture will be
needed for making serial dilutions for the limiting dilution approach
7. Wash the drug treatment plate by spinning in an Eppendorf 5804 centrifuge with A-2-
DWP rotor at 700g for 3 min, removing the supernatant from each well carefully (using a
multichannel pipette), and resuspending in 200 µL of culture media. Repeat two more
times, for a total of 3 washes. This step should remove drug; note that some antimalarial
drugs (e.g. artemether, artemisinin and artesunate) covalently modify their target(s) and
cannot be completely washed away. This adds some level of additional complexity to
interpretation of the results.
8. Dilute 40 µL of the drug treated wells into 160 µL of fresh RBCs, serially, to reduce
parasite load per well from 400,000 (starting parasitemia) to 16,000, see Figure 7.9.
9. Dilute 35 µL of the 16,000 parasite / well culture into 165 µL fresh RBCs in the first
column of a new plates, reducing the parasite load per well to 1,400, see Figure 7.9.
10. Serially-dilute this mixture by diluting 100 µL of this mixture into 100 µL of fresh RBCs
for the well in the next column, continue for each of the remaining columns. Discard 100
µL from the last (11th
) column, reserve the 12th
column for a background measurement
(RBCs only; no parasites), see Figure 7.9. Each plate is a single assay; in a standard 96
well plate the additional rows can be used for replicates, additional strains, or additional
culture treated with different bolus drug dose. Note that to calculate LD50 6 – 10
different drug doses will be needed. As for the Bennett and Paguio assays, we represent
3 independent assays, each done in triplicate, for 9 determinations in total. If each drug

226
dose in analyzed in triplicate, the assay requires 4 plates per strain per drug (e.g. 4 plates
are required to calculate CQ LD50 for one strain of P. falciparum).
Figure 7.9. Plating of the Limiting Dilutions. 400,000 drug-treated (and washed) parasites are
diluted to achieve a final concentration of 1 parasite per well utilizing the original plate (Drug
Treatment Plate) as well as a second plate (Parasite Dilution Plate).

227
11. The number of parasites per well should (in theory) now be as shown in Table 7.4.
Table 7.4. Hypothetical Number of Parasites in Each Dilution of the Limiting Dilution
Assay.
Column # of Parasites
per well
1 1,400 2 700 3 350 4 175 5 87 6 43 7 21 8 10 9 5
10 2 11 1 12 0
12. Place the plate in an air-tight incubator chamber and flush with a 5% CO2, 5% O2, and
90% N2 gaseous mix for 3 minutes to ensure a proper atmosphere.
13. Incubate at 37°C for 4 weeks, with maintenance (see below), flushing the chamber with
balanced gas every day.
14. After 1 week of incubation, make a new batch of 2% hematocrit RBCs in complete
media, and add 100 µL to each well to feed the culture. Put back in the chamber, gas, and
return to 37°C incubator.
228
15. On week 3, centrifuge the plates to pellet the cells, and replace 50 µL of the supernatant
with 50 µL of fresh culture media. Put back in the chamber, gas, and return to 37°C
incubator.
16. Develop the plates as described in steps 7-10 of the cytostatic assay protocol, but using a
10x SYBR Green I solution instead of 50x.
17. Average the values for each drug concentration at each dilution factor.
18. Count the wells that show fluorescence signal above the RBC alone background (the 12th
column).
19. Back-calculate the number of starting parasites that have survived (P) using the following
formula, where X is the dilution factor of the culture (2 if done as described above), and n
is the number of wells that showed parasite growth:
20. Plot the calculated number of parasites that have survived vs. the drug concentration. It
can be helpful to display the concentration axis in log scale.
21. Fit the data to a sigmoidal curve and determine the LD50 by identifying the concentration
that produces 50 % effect, relative to complete parasite kill.
229
7.3.5. Modifying the Cytostatic and Cytocidal Assays for Assessing Synergy of Drug
Combinations- Adapted from (Chou and Talalay 1984; Suberu et al. 2013)
In order to investigate potential drug combination therapies, the cytostatic and cytocidal
assays can be adapted to standard methods for defining whether drug interactions are synergistic,
additive, or antagonistic. Typically this starts with two different drugs mixed at a defined ratio,
but in theory drug combinations of three or higher can also be analyzed in an iterative approach.
Using serial dilutions of a fixed ratio of the drugs near their individual pharmacologically-
relevant doses, a growth or survival curve is generated vs. the concentration of each compound
and the fractional inhibitory concentration / fractional lethal dose of each compound is
determined. In the “1 point” Chou – Talalay approach, summation of these FIC values allows for
determination of the combination index and designation of the type of interaction.
1. Both the cytostatic and cytocidal assays can be adapted for the identification of synergy,
additivity, and antagonism between two drugs in a fixed-ratio combination.
2. In order to analyze a combination, the individual (monotherapy) activity of each
compound must first be determined as described above.
3. Make a stock solution of each drug at 16 x IC50 (or LD50) in complete culture media. Mix
these solutions to generate a fixed volume ratio (each drug now at 8 x). The ratio may be
expressed in terms of absolute concentration (molar ratio of each drug) or in terms of
relative IC50 / LD50 (i.e. we often express a ratio that contains IC50 for drug A and IC50 for
drug B as a “1:1 IC50” ratio.
4. Serially dilute the mixture two-fold across a 96 well plate, 7 times to yield a set of 8
samples.

230
5. Add 100 µL of each dilution to 96-well plate in triplicate, also include no-drug control
wells.
6. Add 4% hematocrit culture to the plate (suggested 2% parasitemia for cytocidal, 1%
parasitemia for cytostatic), 100 µL in each well, including the no-drug control.
7. Follow steps 4-15 of the cytostatic assay protocol. However, when plotting the
growth/survival data, two are required, and each must be plotted versus the absolute
concentration of either drug in the mixture. The curve fits then generate not an IC50 or
LD50, but what is often termed the “pseudo IC50” or “pseudo LD50”. Pseudo IC50 and
LD50 are often specific for the drug ratio that is being examined. Different drug ratios
can produce different pseudo IC50 or LD50, revealing different drug interactions (i.e. in
theory a drug combination can show synergy at one ratio but antagonism at another).
8. Convert the pseudo IC50/ pseudo LD50 into a fractional inhibitory concentration
(FIC)/fractional lethal dose (FLD) for each compound using the following equations:
9. Calculate the combination index (CI) by summing the two FIC/FLD values for the two
compounds:
231
10. Use the CI to assign synergy (CI ≤ 1), additivity (1 < CI ≤ 2), or antagonism (CI > 2)
(Bhattacharya et al. 2009; Matthews et al. 2013). Note that the choice of cutoff values for
determining additivity vs. antagonism can be somewhat arbitrary in the literature.
7.3.6. Reagents and Solutions
Complete Media- store at 4°C for up to one week
Incomplete Media
10% type O+ human serum
25 mM HEPES
20 μg/L gentamicin
Adjust pH to 7.4 when at 37°C
Incomplete Media- store at 4°C for up to one month
RPMI 1640
23 mM NaHCO3
11 mM glucose
0.75 mM hypoxanthine
7.3.7. Commentary
Background Information
The rise of multidrug resistance in P. falciparum malaria has renewed interest in the
identification of novel candidate drugs and novel drug combination therapies. In order to screen
for new drugs, various in vitro assays have been developed that utilize radioactive hypoxanthine
232
incorporation (Desjardins et al. 1979), ELISA detection of parasite lactate dehydrogenase
(Druilhe et al. 2001), or various DNA-intercalating dyes which take advantage of the lack of
nuclei in red blood cells (RBCs) (e.g. Bennet et al. 2004; Quashie et al. 2006). In order to
simplify these growth-inhibition assays, and to avoid the cost of radioactive-labeled compounds,
lysing and extensive washing of cells, as well as dyes that require removal of hemoglobin or the
use of UV illumination, 10 years ago we developed an assay that used SYBR Green I added
directly to the infected RBCs (no washing steps required), with measurement via a fluorescence-
capable well-plate spectrophotometer (Bennet et al. 2004). The combination of ease of use and
the use of multiwell plates allows for the rapid and much less expensive screening of multiple
compounds and multiple strains at once.
Recent molecular studies of drug resistance phenomena have generated considerable
interest in more rapidly defining the ability of antimalarial compounds to kill Plasmodium
parasites, not merely inhibit their growth. The classical mode-of-action of chloroquine that is
typically invoked involves inhibiting the crystallization of toxic free heme that is released upon
catabolism of host RBC hemoglobin by the intraerythrocytic parasite. However, a number of
studies show that this activity does not correlate with the ability of the drug to kill parasites
(Gligorijevic et al. 2008; Cabrera et al. 2009a; Paguio et al. 2011; Gaviria et al. 2013; Gorka et
al. 2013a; Gorka et al. 2013b). In order to fully define the activity of an antimalarial drug,
quantification of both cytostatic and cytocidal activity is required, leading recently to the
development of newer assays that probe cytocidal potency (Paguio et al. 2011; Hasenkamp et al.
2013), or the rate at which a set concentration of a drug will kill parasites in vitro (Sanz et al.
2012). Adaptations of the SYBR Green I assay have been used to probe the differences between

233
cytostatic (lower dose, constant long-term drug exposure growth inhibition) and cytocidal
(higher dose, short-term exposure cell kill) activities of common antimalarials and the cellular
biochemistry that may be related to the resistance to either activity (Paguio et al. 2011; Gaviria et
al. 2013).
Since the advent of artemisinin combination therapies (ACTs), it has become necessary
to more thoroughly investigate drug combinations in vitro. Much of the work in developing drug
combinations is (quite justly) focused on defining complementary pharmacokinetics and clinical
efficacy, but it is also imperative to understand possible interactions the two compounds have
within the parasite. These can be essential in analyzing potential cross-resistance for drug
combinations (Burrows et al. 2013). Also, thorough investigation can in theory lead to
identification of combinations where each compound selects against resistance to the other
(Lukens et al. 2014). Determination of the type of interaction between potential combinations,
(synergistic versus additive versus antagonistic), is a key layer to in vitro screening.
Mathematical derivations performed by Chou and Talalay years ago are equally applicable to
malaria drug screening. These have lead to hybrid techniques that entail assigning interactions
based on fixed-ratio combinations (Chou and Talalay 1984). The Chou Talalay Method allows
for investigation of possible synergy at a minimum of one combination ratio, as opposed to the
generation of a full isobologram, which requires analysis of at several ratios (Berenbaum 1978).
Critical Parameters
In order to obtain a full growth/survival curve, it may be necessary to run a 3 or 4 point
titration across several orders of magnitude in order to determine the appropriate range for a
complete 8-point assay. For reliable quantification, typically the 8-point range will need to cover
234
about 3 orders of magnitude in order to cover the full parasite response of 100% growth/survival
to 0% growth/survival regions. In order to account for error intrinsic to the use of parasite cell
culture, the assay should be run independently at least 3 times with 3 different culture
preparations. The triplicate wells run in a single assay account only for in-assay variations
(SYBR Green loading, plate-reader instrumental error, aliquoting of culture into the plate, etc.).
Troubleshooting
In order to obtain reliable curve-fits, every attempt should be made to include
concentrations that fall between 0 and 100% growth/survival. If the initial 8-point assay does not
encompass the full range of activity, it should be run again since the fit may not accurately
quantify IC50 or LD50. The largest source of inconsistency in these assays is in the growth of the
culture. In order to maximize signal-to-noise in the fluorescence readings, additional no-drug
controls can be included on a separate plate and developed with SYBR Green at different times
(e.g. 48 hrs vs. 54 hrs, etc). If the dynamic range between the background RBC fluorescence and
the culture fluorescence is not at least 4-fold, it may be necessary to let the plates incubate for up
to 24 hours longer in order to allow for additional growth and higher signal to noise.
Alternatively, starting parasitemia can be adjusted to fine tune dynamic range. We find it useful
to include well characterized reference strains (e.g. CQS HB3 and CQR Dd2) and a well
characterized reference drug (e.g. CQ) in all our assays as an “internal control” for these and
other variables. If IC50 or LD50 for the well characterized example is not found, trouble shooting
is called for!
235
Anticipated Results
Typically, the growth/survival curve will show plateau at 100 and 0%, respectively, with
the slope of the curves requiring a span of about 2 orders of magnitude in drug concentration.
However, it is possible for these plateaus to occur slightly above 100%, or to not fully reach 0%.
These deviations from theory can be due to culture conditions, or to more complex drug
pharmacology / drug interactions than space permits here.
Time Considerations
Setting up a cytostatic assay should only require about 2-3 hours, depending on the
number of compounds tested and the time required to make serial dilutions. Similarly, setting up
the Paguio cytocidal assay will require 2-3 hours, depending on the number of compounds
assayed. Following the 6 hour incubation, washing of the plates will require 1-2 hours.
Incubation of the plates to allow for full growth requires about 72 hours for cytostatic and 48
hours for cytocidal assays.
7.3.8. Acknowledgements
The authors would like to thank Drs. Michelle Paguio Frising and Alexander Gorka and Ms.
Kelly Bogle for their work in developing and optimizing the described assays. This work was
funded by NIH grants AI045957 and AI056312.
236
BIBLIOGRAPHY
Abiodun, O. O.; Brun, R.; Wittlin, S. In vitro interaction of artemisinin derivatives or the fully
synthetic peroxidic anti-malarial OZ277 with thapsigargin in Plasmodium falciparum
strains. Malaria J. 2013, 12, 43-46.
Aggazzotti, G.; Fantuzzi, G.; Righi, E.; Predieri, G. Occupational and environmental exposure to
perchloroethylene (PCE) in dry cleaners and their family members. Arch Environ Health
1994. 49, 487-492.
Aït-Oudhia, K.; Gazanion, E.; Vergnes, B.; Oury, B.; Sereno, D. Leishmania antimony
resistance: what we know what we can learn from the field. Parasitol Res. 2011. 109,
1225-1232.
Alin, M. H.; Björkman, A.; Wernsdorfer, W. H. Synergism of Benflumetol and Artemether in
Plasmodium falciparum. Am. J. Top. Med. Hyg. 1999, 61, 439-445.
Alumasa, J. N.; Gorka, A. P.; Casabianca, L. B.; Comstock, E.; de Dios, A. C.; Roepe, P. D. The
Hydroxyl Functionality and a Rigid Proximal N are Required for Forming a Novel Non-
Covalent Quinine-Heme Complex. J. Inorg. Biochem. 2011, 105, 467-475.
Alvarez-Ortega, C.; Olivares, J.; Martínez, J. L. RND multidrug efflux pumps: what are they
good for? Front Microbiol. 2013. 4, 7.
Ambudkar, S. V.; Lelong, I. H.; Zhang, J.; Cardarelli, C. Purification and reconstitution of
human P-glycoprotein. Methods Enzymol. 1998. 292, 492-504.
Aurrecoechea, C; Brestelli, J.; Brunk, B. P.; Dommer, J.; Fischer, S.; Gajria, B.; Gao, X.;
Gingle, A.; Grant, G.; Harb, O. S.; Heiges, M.; Innamorato, F.; Iodice, J.; Kissinger, J.
237
C.; Kraemer, E.; Li, W.; Miller, J. A.; Nayak, V.; Pennington, C.; Pinney, D. F.; Roos,
D.S. Ross, C.; Stoeckert , C. J.; Treatman, C.; Wang, H. PlasmoDB: a functional genomic
database for malaria parasites. Nucleic Acids Res. 2009, 37, D539-D543.
Balla, A.; Tuymetova, G.; Toth, B.; Szentpetery, Z.; Zhoa, X.; Knight, Z. A.; Shokat, K.;
Steinbach, P. J.; Balla, T. Design of Drug-Resistant Alleles of Type-III
Phosphatidylinositol 4-Kinases Using Mutagenesis and Molecular Modeling.
Biochemistry. 2008, 47, 1599-1607.
Banerjee, R.; Liu, J.; Beatty, W.; Pelosof, L.; Klemba, M.; Goldberg, DE. Four plasmepsins are
active in the Plasmodium falciparum food vacuole, including a protease with an active-
site histidine. Proc. Natl. Acad. Sci. U. S. A. 2002, 99, 990–995.
Baro, N. K.; Callaghan, P. S.; Roepe, P. D. Function of resistance conferring Plasmodium
falciparum chloroquine resistance transporter isoforms. Biochemistry. 2013. 52, 4242-
4249.
Barton, V.; Ward, S. A.; Chadwick, J.; Hill, A.; O’Neill, P. M. Rationale Design of Biotinylated
Antimalarial Endoperoxide Carbon Centered Radical Prodrugs for Applications in
Proteomics. J. Med. Chem. 2010, 53, 4555-4559.
Baskin, J. M.; Dehnert, K. W.; Laughlin, S. T.; Amacher, S. L.; Bertozzi, C. R. Visualizing
enveloping layer glycans during zebrafish early embryogenesis. Proc Natl Acad Sci U S
A. 2010, 107, 10360-10365.
Baskin, J. M.; Prescher, J. A.; Laughlin, S. T.; Agard, N. J.; Chang, P. V.; Miller, I. A.; Lo, A.;
Codelli, J. A.; Bertozzi, C. R. Copper-free click chemistry for dynamic in vivo imaging.
Proc Natl Acad Sci U S A. 2007, 104, 16793-16797.

238
Baugh. S.; Ekanayaka, A. S.; Piddock, L. J.; Webber, M. A. Loss of or inhibition of all multidrug
resistance efflux pumps of Salmonella enterica serovar Typhimurium results in impaired
ability to form a biofilm. J Antimicrob Chemother. 2012. 67, 2409-2417.
Bay, D. C.; Rommens, K. L.; Turner, R. J. Small multidrug resistance proteins: a multidrug
transporter family that continues to grow. Biochim Biophys Acta. 2008. 1778(9):1814-
1838.
Bell, A. Antimalarial drug synergism and antagonism: Mechanistic and clinical significance.
FEMS Microbiology Letters. 2005, 253, 171-184.
Bennett, T. N.; Kosar, A. D.; Ursos, L. M.; Dzekunov, S.; Singh-Sidhu, A. B.; Fidock, D. A.;
Roepe, P. D. Drug Resistance-Associated pfCRT Mutations Confer Decreased
Plasmodium falciparum Digestive Vacuolar pH. Mol. Biochem. Parasitol. 2004a, 133,
99-114.
Bennett, T. N.; Paguio, M.; Gligorijevic, B.; Seudieu, C.; Kosar, A. D.; Davidson, E.; Roepe, P.
D. Novel, Rapid, and Inexpensive Cell-Based Quantification of Antimalarial Drug
Efficacy. Antimicrob. Agents Chemother. 2004b, 48, 1807-1810.
Berenbaum, M. C. A Method for Testing for Synergy with Any Number of Agents. The Journal
of Infectious Diseases. 1978, 137, 122-130.
Best, M. D. Click Chemistry and Bioorthogonal Reactions: Unprecedented Selectivity in the
Labeling of Biological Molecules. Biochemistry. 2009, 48, 6571-6584.
Bhattacharya, A.; Mishra, L. C.; Sharma, M.; Awasthi, S. K.; Bhasin, V. K. Antimalarial
pharmacodynamics of chalcone derivatives in combination with artemisinin against
239
Plasmodium falciparum in vitro. European Journal of Medicinal Chemistry. 2009, 44,
3388-3393.
Bhullar, K.; Waglechner, N.; Pawlowski, A.; Koteva, K.; Banks, E. D.; Johnston, M. D.; Barton,
H. A.; Wright, G. D. Antibiotic Resistance Is Prevalent in an Isolated Cave Microbiome.
PLoS One. 2012. 7, e34953.
Biedler. J. L.; Riehm, H. Cellular resistance to actinomycin D in Chinese hamster cells in vitro:
cross-resistance, radioautographic, and cytogenetic studies. Cancer Res. 1970. 30, 1174-
1184.
Blair, J. M.; Piddock, L. J. Structure, function and inhibition of RND efflux pumps in Gram-
negative bacteria: an update. Curr Opin Microbiol. 2009. 5, 512-519.
Borst, P. Cancer drug pan-resistance: pumps, cancer stem cells, quiescence, epithelial to
mesenchymal transitition, blocked cell death pathways, persisters or what? Open Biol.
2012. 2 120066.
Brand, K. P.; Jang, C. J.; Park, J. H.; Serrano, P. I.; Weker, R. A.; Lee, K.; Yanagisawa, Y.
Residual perchloroethylene in dry-cleaned acetate: the effect of pressing and the extent of
inter-dry cleaner variability. J Air and Waste Manage Assoc 1999. 49, 213-218.
Brennand, A.; Gualdrón-López, M.; Coppens, I.; Rigden, D. J.; Ginger, M. L.; Michels, P. A. M.
Autophagy in parasitic protists: Unique features and drug targets. Molecular &
Biochemical Pharmacology. 2011, 177, 83-99.
Brodmann, G. L. Retention of chlorinated solvents in fabrics. Textile Chemist and Colorist 1975.
7, 20-23.
240
Burdzinski, G.; Hackett, J. C.; Wang, J.; Gustafson, T. L.; Hadad, C. M.; Platz, M. S. Early
Events in the Photochemistry of Aryl Azides from Femtosecond UV/Vis Spectroscopy
and Quantum Chemical Calculations. J. Am. Chem. Soc. 2006, 128, 13402-13411.
Burrows, J.N., van Huijsduijnen, R.H., Möhrle, J.J., Oeuvray, C., and Wells, T.N.C. 2013.
Designing the next generation of medicines for malaria control and eradication. Malaria
J. 12:187-207.
Cabrera, M.; Paguio, M. F.; Xie, C.; Roepe, P. D. Reduced Digestive Vacuolar Accumulation of
Chloroquine Is Not Linked to Resistance to Chloroquine Toxicity. Biochemistry. 2009a,
48, 11152-11154.
Cabrera, M.; Natarajan, J.; Paguio, M. F.; Wolf, C.; Urbach, J. S.; Roepe, P. D. Chloroquine
transport in Plasmodium falciparum. 1. Influx and efflux kinetics for live trophozoite
parasites using a novel fluorescent chloroquine probe. Biochemistry. 2009b, 48, 9471-
9481.
Caner, H.; Biedermann, P. U.; Agranat, I. Conformational spaces of Cinchona alkaloids.
Chirality. 2003, 15, 637–645.
Casabianca, L. B.; de Dios, A. C. 13
C NMR Study of the Self-Association of Chloroquine,
Amodiaquine, and Quinine. J. Phys. Chem. A. 2004, 108, 8505-8513.
Casabianca, L. B.; An, D.; Natarajan, J. K.; Alumasa, J. N.; Roepe, P. D.; Wolf, C.; de Dios, A.
C. Quinine and Chloroquine Differentially Perturb Heme Monomer-Dimer Equilibrium.
Inorg. Chem. 2008, 47, 6077-6081.

241
Casabianca, L. B.; Kallgren, J. B.; Natarajan, J. K.; Alumasa, J. N.; Roepe, P. D.; Wolf, C.; de
Dios, A. C. Antimalarial drugs and heme in detergent micelles: An NMR Study. Journal
of Inorganic Biochemistry. 2009, 103, 745-748.
Centers for Disease Control. Malaria Biology. Center for Disease Control and Prevention,
Atlanta, GA. http://www.cdc.gov/malaria/about/biology.html. Updated 8 February 2010.
Centers for Disease Control. Malaria Disease. Center for Disease Control and Prevention,
Atlanta, GA. http://www.cdc.gov/malaria/about/disease.html. Updated 8 February 2010.
Centers for Disease Control. Malaria Facts. Center for Disease Control and Prevention, Atlanta,
GA. http://www.cdc.gov/malaria/about/facts.html. Updated 8 February 2010.
Chang, K.Y.; Tsai, S. Y.; Wu, C. M.; Yen, C. J.; Chuang, B. F.; Chang, J. Y. Novel
Phosphoinositide 3-Kinase/mTOR Dual Inhibitor, NVP-BGT226, Displays Potent
Growth-Inhibitory Activity against Human Head and Neck Cancer Cell In Vitro as In
Vivo. Clin. Cancer Res. 2011, 17, 7116-7126.
Chong, C. R.; Sullivan, D. J. Jr. Inhibition of heme crystal growth by antimalarials and other
compounds: implications for drug discovery. Biochemical Pharmacology. 2003, 66,
2201-2212.
Chou, T. C.; Talalay, P. Quantitative Analysis of Dose-Effect Relationships: The Combined
Effects of Multiple Drugs of Enzyme Inhibitors. Advances in Enzyme Regulation. 1984,
22, 27-55.
Chou, T. C. Theoretical basis, Experimental Design, and Computerized Simulation of Synergism
and Antagonism in Drug Combination Studies. Pharmacological Reviews. 2006, 58, 621-
681.
242
Chou, T. C. Drug Combination Studies and Their Synergy Quantification Using the Chou-
Talalay Method. Cancer Research. 2010, 70, 440-446.
Cervantes, A.; Bunnik, E. M.; Saraf, A.; Conner, C. M.; Escalante, A.; Sardiu, M. E.; Ponts, N.;
Prudhomme, J.; Florens, L.; Le Roch, K. G. The multifunctional autophagy pathway in
the human malaria parasite, Plasmodium falciparum. Autophagy. 2014, 10, 80-92.
Cohen, S. N.; Phifer, K. O.; Yielding, K. L. Complex formation between chloroquine and
ferrihaemic acid in vitro, and its effect on the antimalarial action of chloroquine. Nature.
1964, 202, 805–806.
Cokol, M.; Chua, H. N.; Tasan, M.; Mutlu, B.; Weinstein, Z. B.; Suzuki, Y.; Nergiz, M. E.;
Costanzo, M.; Baryshnikova, A.; Giaever, G.; Nislow, C.; Myers, C. L.; Andrews, B. J.;
Boone, C.; Roth, F. P. Systematic exploration of synergistic drug pairs. Mol. Syst. Biol.
2011, 7, 544-552.
Collier, G. S.; Pratt, J. M.; De Wet, C. R.; Tshabalala, C. F. Studies on haemin in dimethyl
sulphoxide/water mixtures. Biochem. J. 1979, 179, 281–289.
Cooper, R. A.; Ferdig, M. T.; Su, X.-Z.; Ursos, L. M. B.; Mu, J.; Nomura, T.; Fujioka, H.;
Fidock, D. A.; Roepe, P. D.; Wellems, T. E. Alternative Mutations at Position 76 of the
Vacuolar Transmembrane Protein PfCRT Are Associated with Chloroquine Resistance
and Unique Stereospecific Quinine and Quinidine Responses in Plasmodium falciparum.
Mol. Pharmacol. 2002, 61, 35-42.
Cooper, R. A.; Lane, K. D.; Deng, B.; Mu, J.; Patel, J. J.; Wellems, T. E.; Su, X.; Ferdig, M. T.
Mutations in transmembrane domains 1, 4 and 9 of the Plasmodium falciparum

243
chloroquine resistance transporter alter susceptibility to chloroquine, quinine and
quinidine. Mol. Microbiol. 2007, 63, 270–282. (Erratum, 64, 1139–1148.)
Corfield, M. C.; Robson, A. The amino acid composition of wool. Biochem J 1955. 59, 62-68.
Coyle, Y. M.; Hynan, L. S.; Euhus, D. M.; Minhajuddin, A. T. M. An ecological study of the
association of environmental chemicals on breast cancer incidence Texas. Breast Cancer
Res Treatment 2005. 92, 107-114.
Crespo, M. P.; Tilley, L.; Klonis, N. Solution behavior of hematin under acidic conditions and
implications for its interactions with chloroquine. J. Biol. Inorg. Chem. 2010, 15, 1009-
1022.
Damme, K.; Nies, A. T.; Schaeffeler, E.; Schwab, M.
Mammalian MATE (SLC47A) transport proteins: impact on efflux of endogenous
substrates and xenobiotics. Drug Metab Rev. 2011. 43, 499-523.
de Dios, A. C.; Tycko, R.; Ursos, L. M. B.; Roepe, P. D. NMR Studies of Chloroquine-
Ferriprotoporphyrin IX Complex. J. Phys. Chem. A. 2003, 107, 5821-5825.
de Dios, A. C.; Casabianca, L. B.; Kosar, A.; Roepe, P. D. Structure of the amodiaquine-FPIX
mu-oxo dimer solution complex at atomic resolution. Inorg. Chem. 2004, 43, 8078–8084.
Dehnert, K. W.; Baskin, J. M.; Laughlin, S. T.; Beahm, B. J.; Naidu, N. N.; Amacher, S. L.;
Bertozzi, C. R. Imaging the sialome during zebrafish development with copper-free click
chemistry. Chembiochem. 2012. 13, 353-357.
del Amo, D. S.; Wang, W.; Jiang, H.; Besanceney, C.; Yan, A. C.; Levy, M.; Liu, Y.; Marlow, F.
L.; Wu, P. Biocompatible Copper(I) Catalysts for in Vivo Imaging of Glycans. J. Am.
Chem. Soc. 2010, 132, 16893–16899.
244
Deligianni, E.; Morgan, R. N.; Bertuccini, L.; Kooji, T. W. A.; Laforge, A.; Nahar, C.;
Poulakakis, N.; Schüler, H.; Louis, C.; Matuschewski, K.; Siden-Kiamos, I. Critical role
for a stage-specific actin in male exflagellation of the malaria parasite. Cellular
Microbiology. 2011, 13, 1714-1730.
Deponte, M.; Becker, K. Plasmodium falciparum- do killers commit suicide? TRENDS in
Parasitology. 2004, 20, 165-169.
Desjardins, R.E., Canfield, C.J., Haynes, J.D., and Chulay, J.D. 1979. Antimicrob. Agents
Chemother. 16:710-718.
Dinio, T.; Gorka, A. P.; McGinniss, A.; Roepe, P. D.; Morgan, J. B. Investigating the activity of
quinine analogs versus chloroquine resistant Plasmodium falciparum. Bioorg. Med.
Chem. 2012, 20, 3292–3297.
Dodge, Y. The Oxford Dictionary of statistical Terms, Oxford, UK: Oxford University Press,
2003.
Dondorp, A. M.; Nosten, F.; Yi, P.; Das, D.; Phyo, A. P.; Tarning, J.; Lwin, K. M.; Ariey, F.;
Hanpithakpong, W.; Lee, S. J.; Ringwald, P.; Silamut, K.; Imwong, M.; Chotivanich, K.;
Lim, P.; Herdman, T.; An, S. S.; Yeung, S.; Singasivanon, P.; Day, N. P. J.; Lindegardh,
N.; Soceat, D.; White, N. J. Artemisinin Resistance in Plasmodium falciparum Malaria.
N. Engl. J. Med. 2009, 361, 455-467.
Dorn, A.; Vippagunta, S. R.; Matile, H.; Jaquet, C.; Vennerstrom, J. L.; Ridley, R. G. An
assessment of drug-haematin binding as a mechanism for inhibition of haematin
polymerisation by quinoline antimalarials. Biochem. Pharmacol. 1998, 55, 727–736.

245
Druilhe, P., Moreno, A., Blanc, C., Brasseur, P.H., and Jaquier, P. A Colorimetric In Vitro Drug
Sensitivity Assay for Plasmodium falciparum Based on a Highly Sensitive Double-Site
Lactate Dehydrogenase Antigen-Capture Enzyme-Linked Immunosorbent Assay. 2001.
Am. J. Trop. Med. Hyg. 64:233-241.
Egan, T. J.; Ross, D. C.; Adams, P. A. Quinoline anti-malarial drugs inhibit spontaneous
formation of beta-haematin (malaria pigment). FEBS Lett. 1994, 352, 54–57.
Egan, T. J.; Mavuso, W. W.; Ross, D. C.; Marques, H. M. Thermodynamic Factors Controlling
the Interaction of Quinoline Antimalarial Drugs with Ferriprotoporphyrin IX. J. Inorg.
Biochem. 1997, 68, 137-145.
Egan, T. J.; Mavuso, W. W.; Ncokazi, K. K. The mechanism of beta-hematin formation in
acetate solution. Parallels between hemozoin formation and biomineralization processes.
Biochemistry. 2001, 40, 204–213.
Egan, T. J.; Combrinck, J. M.; Egan, J.; Hearne, G. R.; Marques, H. M.; Ntenteni, S.; Sewell, B.
T.; Smith, P. J.; Taylor, D.; van Schalkwyk, D. A.; Walden, J. C. Fate of haem iron in the
malaria parasite Plasmodium falciparum. Biochem. J. 2002, 365, 343–347.
Egan, T. J.; Ncokazi, K. K. Quinoline antimalarials decrease the rate of beta-hematin formation.
J. Inorg. Biochem. 2005, 99, 1532–1539.
Egan, T. J.; Chen, J. Y.; de Villies, K. A.; Mabotha, T. E.; Naidoo, J. J.; Ncokazi, K. K.;
Langford McNaughton, S. J.; Pandiancherii, S.; Wood, B. R. Hemozoin (beta-hematin)
biomineralization occurs by self-assembly near the lipid/water interface. FEBS Lett.
2006, 580, 5105–5110.

246
Egan, T. J. Recent advances in understanding the mechanism of hemozoin (malaria pigment)
formation. Journal of Inorganic Biochemistry. 2008, 102, 1288-1299.
Eickel, N.; Kaiser, G.; Prado, M.; Burda, P. C.; Roelli, M.; Stanway, R. R.; Heussler, V. T.
features of autophagic cell death in Plasmodium liver-stage parasites. Autophagy. 2013,
9, 568-580.
Ekoue-Kovi, K.; Yearick, K.; Iwaniuk, D. P.; Natarajan, J. K.; Alumasa, J.; de Dios, A. C.;
Roepe, P. D.; Wolf, C. Synthesis and antimalarial activity of new 4-amino-7-
chloroquinolyl amides, sulfonamides, ureas and thioureas. Bioorg. Med. Chem. 2009,17,
270–283.
EPA. Chemical summary for perchloroethylene. Technical Report. 1994. Office of Pollution
Prevention and Toxics, U.S. Environmental Protection Agency, Washington, DC.
EPA. Chemicals used in dry cleaning operations. Technical Report. State Coalition for
Remediation of Dry Cleaners. 2002. U.S. Environmental Protection Agency,
Washington, DC.
Evans, D. F. The Determination of the Paramagnetic Susceptibility of Substances in Solution by
Nuclear Magnetic Resonance. J. Chem. Soc. 1959, 2003-2005.
Ferdig, M. T.; Cooper, R. A.; Mu, J.; Deng, B.; Joy, D. A.; Su, X. Z.; Wellems, T. E. Dissecting
the loci of low-level quinine resistance in malaria parasites. Mol. Microbiol. 2004, 52,
985–997.
Fernández, L.; Hancock, R. E. W. Adaptive and Mutational Resistance; Role of Porins and
Efflux Pumps in Drug Resistance. Clin. Microbiol. Rev. 2012. 25, 661-681.
247
Fidock, D. A.; Nomura, T.; Talley, A. K.; Cooper, R. A.; Dzekunov, S. M.; Ferdig, M. T.; Ursos,
L. M. B.; Sidhu, A. B. S.; Naudé, B.; Deitsch, K. W.; Su, X.; Wootton, J. C.; Roepe, P.
D.; Wellems, T. E. Mutations inf the P. falciparum Digestive Vacuole Transmembrane
Protein PfCRT and Evidence for Their Role in Chloroquine Resistance. Molecular Cell.
2000, 6, 861-871.
Fitch, C. D.; Cai, G. Z.; Chen, Y. F.; Shoemaker, J. D. Involvement of lipids in
ferriprotoporphyrin IX polymerization in malaria. Biochim. Biophys. Acta. 1999, 1454,
31–37.
Fivelman, Q. L.; Adagu, I. S.; Warhurst, D. C. Modified Fixed-Ratio Isobologram Method for
Studying In Vitro Interactions between Atovaquone and Proguanil or Dihydroartemisinin
against Drug-Resistant Strains of Plasmodium falciparum. Antimicrobial Agents and
Chemotherapy. 2004, 48, 4097-4102.
Fleige, T.; Fishcher, K.; Ferguson, D. J. P.; Grow, U.; Bohne, W. Carbohydrate Metabolism in
the Toxoplasma gondii Apicoplast: Localization of Three Glycolytic Isoenzymes, the
Single Pyruvate Dehydrogenase Complex, and a Plastid Phosphate Translocator.
Eukaryotic Cell. 2007, 6, 984-995.
Florens, L.; Washburn, M.P.; Raine, J.D.; Anthony, R.M.; Grainger, M.; Haynes, J.D.; Moch,
J.K.; Muster, N.; Sacci, J.B.; Tabb, D.L.; Witney, A.A.; Wolters, D.; Wu, Y.; Gardner,
M.J.; Holder, A.A.; Sinden, R.E.; Yates, J.R.; Carucci, D.J. A proteomic view of the
Plasmodium falciparum life cycle. Nature. 2002, 419, 520-526.
248
Foley, M.; Deady, L. W.; Ng, K.; Cowman, A. F.; Tilley, L. Photoaffinity Labeling of
Chloroquine-binding Proteins in Plasmodium falciparum. The Journal of Biological
Chemistry. 1994, 269, 6955-6961.
Foote, S. J.; Kyle, D. E.; Martin, R. K.; Oduola, A. M.; Forsyth, K.; Kemp, D. J.; Cowman, A. F.
Several alleles of the multidrug-resistance gene are closely linked to chloroquine
resistance in Plasmodium falciparum. Nature. 1990. 345, 255-258.
Furuki, K.; Ukai, H.; Okamoto, S.; Takada, S.; Kawai, T.; Miyama, Y.; Mitsuyoshi, K.; Zhang,
Z. W.; Higashikawa, K.; Ikeda, M. Monitoring of occupational exposure to
tetrachloroethyene in blood and urine in comparison with urinalysis for trichloroacetic
acid. Int Arch Occup Environ Health 2000. 73, 221-227.
Galmozzi, A.; Dominguez, E.; Cravatt, B. J.; Saez, E. Application of Activity-Based Protein
Profiling to Study Enzyme Function in Adipocytes. Models in Enzymology. 2014, 538,
151-169.
Gamboa de Domínguez, N. D.; Rosenthal, P. J. Cysteine proteinase inhibitors block early steps
in hemoglobin degradation by cultured malaria parasites. Blood. 1996, 87, 4448–4454.
Garcia, C. Calcium homeostasis and signaling in the blood-stage malaria parasite. Parasitol.
Today. 1999, 15, 488-491.
Gaviria, D.; Paguio, M. F.; Turnbull, L. B.; Tan, A.; Siriwardana, A.; Ghosh, D.; Ferdig, M. T.;
Sinai, A. P.; Roepe, P. D. A Process Similar to Autophagy Is Associated with Cytocidal
Chloroquine Resistance in Plasmodium falciparum. PLoS One. 2013, 8, e79059.
Ghosh, D.; Walton, J. L.; Roepe, P. D.; Sinai, A. P. Autophagy is a cell death mechanism in
Toxoplasma gondii. Cell Microbiol. 2012, 14, 589-607.

249
Gligorijevic, B.; McAllister, R.; Urbach, J. S.; Roepe, P. D. Spinning Disk Confocal Microscopy
of Live, Intraerythrocytic Malarial Parasites. 1. Quantification of Hemozoin Development
for Drug Sensitive versus Resistant Malaria. Biochemistry. 2006a, 45, 12400-12410.
Gligorijevic, B.; Bennett, T.; McAllister, R.; Urbach, J. S.; Roepe, P. D. Spinning disk confocal
microscopy of live, intraerythrocytic malarial parasites. 2. Altered vacuolar volume
regulation in drug resistant malaria. Biochemistry. 2006b. 45, 12411-12423
Gligorijevic, B.; Purdy, K.; Elliot, D. A.; Cooper, R. A.; Roepe, P. D. Stage independent
chloroquine resistance and chloroquine toxicity revealed via spinning disk confocal
microscopy. Molecular & Biochemical Parasitology. 2008, 159, 7-23.
Gorka, A. P.; Alumasa, J. N.; Sherlach, K. S.; Jacobs, L. M.; Nickley, K. B.; Brower, J. P.; de
Dios, A. C.; Roepe, P. D. Cytostatic versus Cytocidal Activities of Chloroquine
Analogues and Inhibition of Hemozoin Crystal Growth. Antimicrob. Agents Chemother.
2013a, 57, 356-364.
Gorka, A. P.; Jacobs, L. M.; Roepe, P. D. Cytostatic versus cytocidal profiling of quinoline drug
combinations via modified fixed-ratio isobologram analysis. Malaria J. 2013b, 12, 333-
340.
Gorka, A. P.; de Dios, A.; Roepe P. D. Quinoline Drug-Heme Interactions and Implications for
Antimalarial Cytostatic versus Cytocidal Activities. J. Med. Chem. 2013c, 56, 5231-
5246.
Gorka, A. P.; Sherlach, K. S.; de Dios, A. C.; Roepe, P. D. Relative to Quinine and Quinidine,
Their 9-Epimers Exhibit Decreased Cytostatic Activity and Altered Heme Binding but
250
Similar Cytocidal Activity versus Plasmodium falciparum. Antimicrob. Agents.
Chemother. 2013d, 57, 365-374.
Greyer, M. ed. Antimalarial Drug Combination Therapy. WHO Technical Consulation. 2001.
Geneva, Switzerland.
Griffin, C. E.; Hoke, J. M.; Samarakoon, U.; Duan, J.; Mu, J.; Ferdig, M. T.; Warhurst, D. C.;
Cooper, R. A. Mutation in the Plasmodium falciparum CRT protein determined the
stereospecific activity of antimalarial Cinchona alkaloids. Antimicrob. Agents Chemother.
2012, 56, 5356–5364.
Gupta, S. S.; Kuzella, J.; Singh, P.; Lewis, W. G.; Manchester, M.; Finn, M. G. Accelerated
Bioorthogonal Conjugation: A Practical Method for the Ligation of Diverse Functional
Molecules to a Polyvalent Virus Scaffold. Bioconjugate Chem. 2005, 16, 1572-1579.
Hanson, K. K.; Ressurreição, A. S.; Buchholz, K.; Prudêncio, M.; Herman-Ornelas, J. D.;
Rebelo, M.; Beatty, W. L.; Wirth, D. F.; Häscheid, T.; Moreira, R.; Marti, M.; Mota, M.
M. Torins are potent antimalarials that block liver stage parasitophorous vacuole
membrane proteins. Proc. Natl. Acad. Sci. 2013, E2838-2847,
doi:10.1073/pnas.1306097110.
Hartl, D. L. The Origin of Malaria: Mixed Messages from Genetic Diversity. Nature Reviews
Microbiology. 2004, 2, 15-22.
Hasenkamp, S.; Sidaway, A.; Devine, O.; Roye, R.; Horrocks, P. Evaluation of bioluminescence-
based assays of anti-malarial drug activity. Malaria J. 2013, 12, 58-67.
Hastings, I. M.; Watkins, W. M.; White, N. J. The evolution of drug-resistant malaria: the role of
drug elimination half-life. Phil Trans. R. Soc. Lond. B. 2002, 357, 505-517.
251
Hathaway, W. E.; Newby, L. A.; Githens, J. H. The Acridine Orange Viability Test Applied to
Bone Marrow Cells I. Correlation with Typan Blue and Eosin Dye Exclusion and Tissue
Culture Transformation. Blood. 1964, 23, 517-525.
Hawley, S. R.; Bray, P. G.; O’Niel, P. M.; Park, B. K.; Ward, S. A. The Role of Drug
Accumulation in 4-Aminoquinoline Antimalarial Potency. Biochem. Pharmacol. 1996,
52, 723-733.
Hawley, S. R.; Bray, P. G.; Mungthin, M.; Atkinson, J. D.; O'Neill, P.M.; Ward, S. A.
Relationship between antimalarial drug activity, accumulation, and inhibition of heme
polymerization in Plasmodium falciparum in vitro. Antimicrob. Agents Chemother.
1998,42, 682–686.
Himo, F.; Lovell, T.; Hilgraf, R.; Rostovtsev, V. V.; Noodleman, L.; Sharpless, K. B.; Fokin, V.
V. Copper(I)-Catalyzed Synthesis of Azoles. DFT Study Predicts Unprecedented
Reactivity and Intermediates. J. Am. Chem. Soc. 2005, 127, 210-216.
Hong, V.; Presolski, S. I.; Ma, C.; Finn, M. G. Analysis and Optimization of Copper-Catalyzed
Azide-Alkyne Cycloaddition for Bioconjugation. Angew. Chem. Int. Ed. 2009, 48, 9879-
9883.
Hoppe, H. C.; van Schalkwyk, D. A.; Wihart, U. I. M.; Meredith, S. A.; Egan, J.; Weber, B. W.
Antimalarial Quinolines and Artemisinin Inhibit Endocytosis in Plasmodium falciparum.
Antimicrobial Agents and Chemotherapy. 2004, 48, 2370-2378.
Howard, E. M.; Roepe, P. D. Purified human MDR 1 modulates membrane potential in
reconstituted proteoliposomes. Biochemistry. 2003. 42, 3544-3555

252
Hsu, T. L.; Hanson, S. R.; Kishikawa, K.; Wang, S. K.; Sawa, M.; Wong, C. H. Alkynyl sugar
analogs for the labeling and visualization of glycoconjugates in cells. Proc. Natl. Acad.
Sci.. 2007, 104, 2614-2619.
Huy, N. T.; Uyen, D. T.; Sasai, M.; Trang, D. T.; Shiono, T.; Harada, S.; Kamei, K. A simple
and rapid colorimetric method to measure hemozoin crystal growth in vitro. Anal.
Biochem. 2006, 354, 305–307.
Huy, N.T.; Uyen, D. T.; Maeda, A.; Trang, D. T.; Oida, T.; Harada, S.; Kamei, K. Simple
colorimetric inhibition assay of heme crystallization for high-throughput screening of
antimalarial compounds. Antimicrob. Agents Chemother. 2007,51, 350–353.
Inglese, J.; Auld, D. S.; Jadhav, A.; Johnson, R. L.; Simeonov, A.; Yasgar, A.; Zheng, W.
Austin, C. P. Quantitative high-throughput screening: A titration-based approach that
efficiently identifies biological activities in large chemical libraries. Proc. Natl. Acad.
Sci. 2006, 103, 11473–11478.
Ishikawa, T.; Li, Z. S.; Lu, Y. P.; Rea, P. A. The GS-X pump in plant, yeast, and animal cells:
structure, function, and gene expression. Biosci Rep. 1997. 17, 189-207.
Ishmael, J.; Dugard, P. H. A review of perchloroethylene and rat mononuclear cell leukemia.
Regulatory Toxicol and Pharmacol 2006. 45, 178-184.
Iwaniuk, D. P.; Whetmore, E. D.; Rosa, N.; Ekoue-Kovi-K.; Alumasa, J.; de Dios, A. C.; Roepe,
P. D.; Wolf, C. Synthesis and Antimalarial Activity of New Chloroquine Analogues
Carrying a Multifunctional Linear Side Chain. Bioorg. Med. Chem. 2009, 17, 6560-6566.

253
Jackson, K. E.; Klonis, N.; Ferguson, D. J.; Adisa, A.; Dogovski, C.; Tilley, L. Food vacuole-
associated lipid bodies and heterogeneous lipid environments in the malaria parasite,
Plasmodium falciparum. Mol. Microbiol. 2004, 54, 109–122.
Jin, J.; Guffanti, A. A.; Bechhofer, D. H.; Krulwich, T. A. Tet(L) and tet(K) tetracycline-divalent
metal/H+ antiporters: characterization of multiple catalytic modes and a mutagenesis
approach to differences in their efflux substrate and coupling ion preferences. J Bacteriol.
2002. 184, :4722-4732.
Karle, J. M.; Karle, I. L.; Gerena, L.; Milhous, W. K. Stereochemical evaluation of the relative
activities of the cinchona alkaloids against Plasmodium falciparum. Antimicrob. Agents
Chemother. 1992, 36, 1538–1544.
Kaschula, C. H.; Egan, T. J.; Hunter, R.; Basilico, N.; Parapini, S.; Taramelli, D.; Pasini, D. E.;
Monti, D. Structure-activity relationships in 4-aminoquinoline antiplasmodials. The role
of the group at the 7-position. J. Med. Chem. 2002, 45, 3531–3539.
Kasinathan, R. S.; Greenberg, R. M. Pharmacology and potential physiological significance of
schistosome multidrug resistance transporters. Exp Parasitol. 2012. 132, 2-6.
Kawauchi ,T.; Nishiyama, K. Residual tetrachloroethylene in dry-cleaned clothes. Environ Res
1989. 48, 296-301.
Keana, J.F.W.; Cai, S.X. New Reagents for Photoaffinity Labeling: Synthesis and Photolysis of
Functionalized Perfluorophenyl Azides. J. Org. Chem. 1990, 55, 3640-36473.
Kennedy, D. C.; McKay, C. S.; Legault, M. C. B.; Danielson, D. C.; Blake, J. A.; Pegoraro, A.
F.; Stolow, A.; Mester, Z.; Pezacki, J. P. Cellular Consequences of Copper Complexes

254
Used To Catalyze Bioorthogonal Click Reactions. J. Am. Chem. Soc. 2011, 133, 17993-
18001.
Khalil, I. F.; Alifrangis, M.; Recke, C.; Hoegberg, L. C.; Ronn, A.; Bygbjerg, I. C.; Koch, C.
Development of ELISA-based methods to measure the anti-malarial drug chloroquine in
plasma and in pharmaceutical formulations. Malaria J. 2011, 10, 249-255.
Kitamura, K.; Kishi-Itakura, C.; Tsuboi, T.; Sato, S.; Kita, K.; Ohta, N.; Mizushima, N.
Autophagy-Related Atg8 Localizes to the Apicoplast of the Human Malaria Parasite
Plasmodium falciparum. PLoS One. 2012, 7, e42977.
Knight, S. D.; Adams, N. D.; Burgess, J. L.; Chaudhari, A. M.; Darcy, M. G.; Donatelli, C. A.;
Luengo, J. I.; Newlander, K. A.; Parrish, C. A.; Ridgers, L. H.; Sarpong, M. A.; Schmidt,
S. J.; Van Aller, G. S.; Carson, J. D.; Diamond, M. A.; Elkins, P. A.; Gardiner, C. M.;
Garver, E.; Gilbert, S. A.; Gontarek, R. R.; Jackson, J. R.; Kershner, K. L.; Luo, L.; Raha,
K.; Sherk, C. S.; Sung, C. M.; Sutton, D.; Tummino, P. J.; Wegrzyn, R. J.; Auger, K. R.;
Dhanak, D. Discovery of GSK2126458, a Highly Potent Inhibitor of PI3K and the
Mammalian Target of Rapamycin. ACS Med. Chem. Lett. 2010, 1, 39-43.
Knight, Z. A.; Gonzalez, B.; Feldman, M. E.; Zunder, E. R.; Goldenberg, D. D.; Williams, O.;
Loewith, R.; Stokoe, D.; Balla, A.; Toth, B.; Balla, T.; Weiss, W. A.; Williams, R. L.;
Shokat, K. M. A Pharmacological Map of the PI3-K Family Defines a Role for p110α in
Insulin Signaling. Cell. 2006, 125, 733-747.
Koncarevic, S.; Bogumil, R.; Bekcer, K. SELDI-TOF-MS analysis of chloroquine resistant and
sensitive Plasmodium falciparum strains. Proteomics. 2007, 7, 711-721.
255
Krishna, S.; White, N. J. Pharmacokinetics of quinine, chloroquine, and amodiaquine. Clinical
Implications. Clin. Pharmacokinetics. 1996, 30, 263-299.
Krogstad, D. J.; Schlesinger, P. H. A Perspective on Antimalarial Action: Effects of Weak Bases
on Plasmodium falciparum. Biochem. Pharmacol. 1998, 35, 793-798.
Krulwich, T. A.; Lewinson, O.; Padan, E.; Bibi, E. Do physiological roles foster persistence of
drug/multidrug-efflux transporters? A case study. Nature Reviews Microbiology. 2005, 3,
566-572.
Kumar, V.; Mahajan, A.; Chibale, K. Synthetic medicinal chemistry of selected antimalarial
natural products. Antimicrob. Agents Chemother. 2009, 17, 2236–2275.
Kurosawa, Y.; Dorn, A.; Kitsuji-Shirane, M.; Shimada, H.; Satoh, T.; Matile, H.; Hofheinz, W.;
Masciadri, R.; Kansy, M.; Ridley, R. G. Hematin polymerization assay as a high-
throughput screen for identification of new antimalarial pharmacophores. Antimicrob.
Agents Chemother. 2000, 44, 2638–2644.
La Greca, N.; Hibbs, A. R.; Riffkin, C.; Foley, M.; Tilley, L. Identification of an endoplasmic
reticulum-resident calcium-binding protein with multiple EF-hand motifs in asexual
stages of Plasmodium falciparum. Mol. Biochem. Parasitol. 1997, 89, 283-293.
Laughlin, S.T.; Baskin, J. M.; Amacher, S. L.; Bertozzi, C. R. In vivo imaging of membrane-
associated glycans in developing zebrafish. Science. 2008, 320, 664-667.
Leed, A.; DuBay, K.; Ursos, L. M. B.; Sears, D.; de Dios, A. C.; Roepe, P. D. Solution
Structures of Antimalarial Drug-Heme Complexes. Biochemistry. 2002, 41, 10245-
10255.

256
Lehane, A. M.; Kirk, K. Chloroquine Resistance-Coferring Mutations in pfcrt Give Rise to a
Chloroquine-Associated H+ Leak from the Malaria Parasite’s Digestive Vacuole.
Antimicrobial Agents and Chemotherapy. 2008, 52, 4374-4380.
Lehane, A. M.; Kirk, K. Efflux of a range of antimalarial drugs and ‘chloroquine resistance
reversers’ from the digestive vacuole in malaria parasites with mutant PfCRT. Molecular
Microbiology. 2010, 77, 1039–1051.
Lekostaj, J. K.; Natarajan, J. K.; Paguio, M. F.; Wolf, C.; Roepe, P. D. Photoaffinity Labeling of
the Plasmodium falciparum Chloroquine Resistance Transporter with a Novel
Perfluorophenylazido Chloroquine. Biochemistry. 2008, 47, 10394-10406.
Leung, E.; Kim, J. E.; Rewcastle, G. W.; Finlay, G. J.; Baguley, B. Comparison of the effects of
the PI3K/mTOR inhibitors NVP-BEZ235 and GSK2126458 on tamoxifen-resistant breast
cancer cells. Cancer Biology & Therapy. 2011, 11, 938-946.
Lew, V. L.; Tiffert, T.; Ginsburg, H. Excess hemoglobin digestion and the osmotic stability of
Plasmodium falciparum-infected red blood cells. Blood. 2003, 101, 4189-4194.
Lewis, I. A.; Wacker, M.; Olszewski, K. L.; Cobbold, S. A.; Baska, K. S.; Tan, A.; Ferdig, M.
T.; Llinás, M. Metabolic QTL Analysis Links Chloroquine Resistance in Plasmodium
falciparum to Impaired Hemoglobin Catabolism. PLoS Genet. 2014. 10, e1004085.
Li, H.; Ponder, E. L.; Verdoes, M.; Asbjornsdottir, K. H.; Deu, E.; Edgington, L. E.; Lee, J. T.;
Kirk, C. J.; Demo, S. D.; Williamson, K. C.; Bogyo, M. Validation of the Proteasome as
a Therapeutic Target in Plasmodium Using an Epoxyketone Inhibitor with Parasite-
Specific Toxicity. Chem. Biol. 2012, 19, 1535-1545.
257
Liu, J.; Xu, Y.; Stoleru, D.; Salic, A. Imaging protein synthesis in cells and tissues with an
alkyne analog of puromycin. Proc. Natl. Acad. Sci. 2012, 109, 413-418.
Liu, Q.; Xu, C.; Kirubakaran, S.; Zhang, X.; Hur, W.; Liu, Y.; Kwiatkowski, N. P.; Wang, J.;
Westover, K. D.; Gao, P.; Ercan D.; Niepel, M.; Thoreen, C. C.; Kang, S. A.; Patricelli,
M. P.; Wang, Y.; Tupper, T.; Altabef, A.; Kawamura, H.; Held, K. D.; Chou, D. M.;
Elledge, S. J.; Janne, P. A.; Wong, K. K.; Sabatani, D. M.; Gray, N. S. Characterization
of Torin2, and ATP-Competitive Inhibitor of mTOR, ATM, and ATR. Cancer Res. 2013,
73, 2574-2586.
Liu, Y.; Patricelli, M. P.; Cravatt, B. F. Activity-based protein profiling: The serine hydrolases.
Proc. Natl. Acad. Sci. 1999, 96, 14694-14699.
Lowe, S. W.; Ruley, H. E.; Jacks, T.; Housman, D. E. p53-dependent apoptosis modulates the
cytotoxicity of anticancer agents. Cell. 1993. 74, 957-967.
Lukens, A. K.; Ross, L. S.; Heidebrecht, R.; Gamo, F. J.; Lafuente-Monasterio, M. J.; Booker,
M. L.; Hartl, D.; Wiegand, R. C.; Wirth, D. F. Harnessing evolutionary fitness in
Plasmodium falciparum for drug discovery and suppressing resistance. Proc. Natl. Acad.
Sci. 2014, 111, 799-804.
Macomber, P. B.; Spintz, H. Morphological effects of chloroquine on Plasmodium berghei in
mice. Nature. 1967, 214, 937–939.
Mahata, M.; Mahata, S. K.; Parmer, R. J.; O'Connor, D. T. Vesicular monoamine transport
inhibitors novel action at calcium channels to prevent catecholamine secretion.
Hypertension 1996, 28, 414-420.
258
Makanga, M.; Krudsood, S. The clinical efficacy of artemether/lumefantrine (Coartem®).
Malaria J. 2009, 8, S5-S17.
Markman, B.; Tabernero, J.; Krop, I.; Shapiro, G. I.; Siu, L.; Chen, L. C.; Mita, M.; Melendez
Cuero, M.; Sutvoet, S.; Birle, D.; Anak, Ö.; Hackl, W.; Baselga, J. Phase I safety,
pharmacokinetic, and pharmacodynamic study of the oral phosphatidylinositol-3-kinase
and mTOR inhibitor BGT226 in patients with advanced solid tumors. Annals of
Oncology. 2012, 23, 2399-2408.
Marques, H. M.; Voster, K.; Egan, T. J. The Interaction of the Heme Octapeptide, N-
Acetylmicroperoxidase-8 with Antimalarial Drugs: Solution Studies and Modeling by
Molecular Mechanics Methods. J. Inorg. Biochem. 1996, 64, 7-23.
Mathews Griner, L. A.; Guha, R.; Shinn, P.; Young, R. M.; Keller, J. M.; Liu, D.; Goldlust, I. S.;
Yasgar, A.; McKnight, C.; Boxer, M. B.; Duveau, D. Y.; Jiang, J. K.; Michael, S.;
Mierzwa, T.; Huang, W.; Walsh, M. J.; Mott, B. T.; Patel, P.; Leister, W.; Maloney, D. J.;
Leclair, C. A.; Rai, G.; Jadhav, A.; Peyser, B. D.; Austin, C. P.; Martin, S. E.; Simeonov,
A.; Ferrer, M.; Staudt, L. M.; Thomas, C. J. High-throughput combinatorial screening
identifies drugs that cooperate with ibrutinib to kill activated B-cell-like diffuse large B-
cell lymphoma cells. Proc. Natl. Acad. Sci. 2014, 111, 2349-2354.
Matthews, H.; Usman-Idris, M.; Khan, F.; Read, M.; Nirmalan, N. Drug repositioning as a route
to anti-malarial drug discovery: preliminary investigation of the in vitro anti-malarial
efficacy of emetine dihydrochloride hydrate. Malaria J. 2013, 12, 359-370.
McNamara, C. W.; Lee, M. C. S.; Lim, C. S.; Lim, S. H. Roland, J.; Nagle, A.; Simon, O.;
Yeung, B. K. S.; Chatterjee, A. K.; McCormack, S. L.; Manary, S. L.; Zeeman, A. M.;

259
Dechering, K. J.; Kumar, T. R. S.; Henrich, P. P.; Gagaring, K.; Ibanez, M.; Kato, N.;
Kuhen, K. L.; Fischli, C.; Rottmann, M.; Plouffe, D. M.; Bursulaya, B.; Meister, S.;
Rameh, L.; Trappe, J.; Haasen, D.; Timmerman, M.; Sauerwein, R. W.; Suwanarusk, R.;
Russell, B.; Renia, L.; Nosten, F.; Tully, D. C.; Kocken, C. H. M.; Glynne, R. J.;
Bodenreider, C.; Fidock, D. A.; Diagana, T. T.; Winzeler, E. A. Targeting Plasmodium
PI(4)K to eliminate malaria. Nature. 2013, 504, 248–253.
Meslin, B.; Barnadas, C.; Boni, V.; Latour, C.; De Monbrison, F.; Kaiser, K.; Picot, S. Features
of Apoptosis in Plasmodium falciparum Erythrocytic Stage through a Putative Role of
PfMCA1 Metacaspase-Like Protein. JID. 2007, 195, 1852-1859.
Moellering, R. E.; Cravatt, B. F. How Chemoproteomics Can Enable Drug Discovery and
Development. Chemistry & Biology. 2012, 19, 11-22.
Moran, P. A. P. Notes on Continuous Stochastic Phenomena. Biometrika 1950, 37, 17-23.
Morita, M.; Sanai, H.; Sato, A.; Hiraoka, O.; Sakura, T.; Kaneko, O.; Masuyama, A.; Nojima,
M.; Wataya, Y.; Kim, H. S. Plasmodium falciparum Endoplasmic Reticulum-Resident
Calcium Binding Protein is a Possible Target of Synthetic Antimalarial Endoperoxides,
N-89 and N-251. J. Proteome Res. 2012, 11, 5704-5711.
Munster, P. N., van der Noll, R.; Voest, E. E.; Dees, E. C.; Tan, A. R.; Specht, J. M.; Falchook,
G. S.; Daud, A.; Lolkema, M. P.; Grilley-Olson, J. E.; Yu, E. Y.; Fu, S.; Bergsland, E. K.;
Kleha, J.; Peng, S.; Smith, D. A.; Lampkin, T. A.; Schellens, J. H. M.; Morris, S. R.;
Kurzrock, R. Phase I first-in-human study of the PI3 kinase inhibitor GSK2126458
(GSK458) in patients with advanced solid tumors (study P3K112826). J. Clin. Oncol.
2011, 29, (suppl; abstr 3018).

260
Mwai, L.; Diriye, A.; Masseno, V.; Muriithi, S.; Feltwell, T.; Musyoki, J.; Lemieux, J.; Feller,
A.; Mair, G. R.; Marsh, K.; Newbold, C.; Nzila, A.; Carret, C. K. Genome Wide
Adaptations of Plasmodium falciparum in Respons to Lumefantrine Selective Drug
Pressure. PLoS One. 2012, 7, e31623.
Nagano, K.; Nishizawa, T.; Yamamoto, S.; Matsushima, T. Inhalation carcinogenesis studies of
six halogenated hydrocarbons in rats and mice. 1998. In: Chiyotani K, Hosoda Y, Aizawa
Y (Eds.), Advances in the Prevention of Occupational Respiratory Diseases Proceedings
of the 9th International Conference on Occupational Respiratory Diseases, Kyoto, Japan.
Natarajan, J. K.; Alumasa, J. N.; Yearick, K.; Ekoue-Kovi, K. A.; Casabianca, L. B.; de Dios, A.
C.; Wolf, C.; Roepe, P. D. 4-N-, 4-S-, and 4-O-Chloroquine Analogues: Influence of Side
Chain Length and Quinolyl Nitrogen pKa on Activity vs Chloroquine Resistant Malaria.
J. Med. Chem. 2008, 51, 3466-3479.
Ncokazi, K. K.; Egan, T. J. A colorimetric high-throughput beta-hematin inhibition screening
assay for use in the search for antimalarial compounds. Anal. Biochem. 2005, 338, 306–
319.
Neef, A. B.; Schultz, C. Selective Fluorescence Labeling of Lipids in Living Cells. Angew.
Chem. Intl. Ed. 2009, 48, 1498-1500.
Neyfakh, A. A. Natural functions of bacterial multidrug transporters. Trends in Microbiology.
1997. 5, 309-313.
Novatis Pharmaceuticals Corporation. Coartem Product Information. Novartis Pharmaceuticals
Corporation. East Hanover, New Jersey. Updated April 2013.

261
NTP. Toxicology and carcinogenesis studies of tetrachloroethylene (perchloroethylene) (CAS
No 127-18-4) in F344/N rats and B6C3F 1 mice (inhalation studies). 1986. National
Toxicology Program Technical Report No 311, Dept. of Health and Human Services
U.S.A., Washington, DC.
Nyakeriga, A. M.; Perlmann, H.; Hagstedt, M.; Berzins, K.; Troye-Blomberg, M.; Zhivotovsky,
B.; Perlmann, P.; Grandien, A. Drug-induced death of the asexual blood stages of
Plasmodium falciparum occurs without typical signs of apoptosis. Microbes and
Infection. 2006, 8, 1560-1568.
Olliaro, P. L.; Trigg, P. I. Status of antimalarial drugs under development. Bulletin of the World
Health Organization. 1995, 73, 565-571.
Pagola, S.; Stephens, P. W.; Bohle, D. S.; Kosar, A. D.; Madsen, S. K. The structure of malaria
pigment beta-haematin. Nature. 2000, 404, 307–310.
Paguio, M. F.; Cabrera, M.; Roepe, P. D. Chloroquine Transport in Plasmodium falciparum. 2.
Analysis of PfCRT-Mediated Drug Transport Using Proteoliposomes and a Fluorescent
Chloroquine Probe. Biochemistry. 2009, 48, 9482–9491.
Paguio, M.F.; Bogle, K. L.; Roepe, P. D. Plasmodium falciparum Resistance to Cytocidal versus
Cytostatic Effects of Chloroquine. Mol. Biochem. Parasitol. 2011, 178, 1-6.
Pandey, A. V.; Joshi, S. K.; Tekwani, B. L.; Chauhan, V. S. A colorimetric assay for heme in
biological samples using 96-well plates. Anal. Biochem. 1999a, 268, 159–161.
Pandey, A. V.; Singh, N.; Tekwani, B. L.; Puri, S. K.; Chauhan, V. S. Assay of beta-hematin
formation by malaria parasite. J. Pharm. Biomed. Anal. 1999b, 20, 203–207.
262
Parapini, S.; Basilico, N.; Pasini, E.; Egan, T. J.; Olliaro, P.; Taramelli, D.; Monti, D.
Standardization of the physicochemical parameters to assess in vitro the beta-hematin
inhibitory activity of antimalarial drugs. Exp. Parasitol. 2000, 96, 249–256.
Patzewitz, E. M.; Salcedo-Sora, J. E.; Wong, E. H.; Sethia, S.; Stocks, P. A.; Maughan, S. C.;
Murray, J. A.; Krishna, S.; Bray, P. G.; Ward, S. A.; Müller, S. Glutathione transport: a
new role for PfCRT in chloroquine resistance. Antioxid Redox Signal. 2013. 19, 683-695.
Petraitis, V.; Petritiene, R.; Hope, W. W.; meletiadis, J.; Mickiene, D.; Hughes, J. E.; Cotton, M.
P.; Stergiopoulou, T.; Kasai, M.; Francesconi, A.; Schaufele, R. L.; Sein, T.; Avila, N.
A.; Bacher, J.; Walsh, T. J. Combination Therapy in Treatment of Experimental
Pulmonary Aspergillosis: In Vitro and In Vivo Correlations of the Concentration- and
Dose-Dependent Interactions between Anidulafungin and Voriconazole by Bliss
Independence Drug Interaction Analysis. Antimicrob. Agents and Chemother. 2009, 53,
2382- 2391.
Pisciotta, J. M.; Coppens, I.; Tripathi, A. K.; Scholl, P. F.; Shuman, J.; Bajad, S.; Shulaev, V.;
Sullivan, D. J. Jr. The role of neutral lipid nanospheres in Plasmodium falciparum haem
crystallization. Biochem. J. 2007, 402, 197–204.
Pleeter, P.; Lekostaj, J. K.; Roepe, P. D. Purified Plasmodium falciparum multi-drug resistance
protein (PfMDR1) binds a high affinity chloroquine analogue. Molecular & Biochemical
Parasitology. 2010, 173, 158-161.
Poet, T. S.; Weitz, K. K.; Gies, R. Z.; Edwards, J. A.; Thrall, K. D.; Corley, R. A.; Tanojo, H.;
Hui, X.; Maibach, H. I.; Wester, R. C. PBPK modeling of the percutaneous absorption of

263
perchloroethylene from a soil matrix in rats and humans. Toxicological Sciences 2002.
67, 17-31.
Poli, D.; Manini, P.; Andreoli, R.; Franchini, I.; Mutti, A. Determination of dichloromethane,
trichloroethylene, and perchloroethylene in urine samples by headspace solid phase
microextraction gas chromatography-mass spectrometry. J Chromatog B 2005. 820, 95-
102.
Prieto, J.H.; Koncarevic, S.; Park, S.K.; Yates, J. III; Becker, K. Large-Scale Differential
Proteome Analysis in Plasmodium falciparum under Drug Treatment. PLoS One. 2008,
3, e4098.
Qiao, X.; Ding, S.; Liu, F.; Kucera, G. L.; Bierbach, U. Investigating the cellular fate of a DNA-
targeted platinum-based anticancer agent by orthogonal double-click chemistry. J. Biol.
Inorg. Chem. 2014, 19, 415-426.
Quashie, N.B., de Koning, H.P., and Ranford-Cartwright, L.C. 2006. An improved and highly
sensitive microfluorimetric method for assessing susceptibility of Plasmodium
falciparum to antimalarial drugs in vitro. Malaria J. 5:95-101.
Quazi. F.; Molday, R. S. Differential phospholipid substrates and directional transport by ATP-
binding cassette proteins ABCA1, ABCA7, and ABCA4 and disease-causing mutants. J
Biol Chem. 2013. 288, 34414-34426.
Radfar, A.; Diez, A.; Bautista, J.M. Chloroquine mediates specific proteome oxidative damage
across the ertythocytic cycle of resistant Plasmodium falciparum. Free Radical Biology
& Medicine. 2008, 44, 2034-2042.

264
Raggers, R. J.; Pomorski, T.; Holthuis, J. C.; Kälin, N.; van Meer G. Lipid traffic: the ABC of
transbilayer movement. Traffic. 2000. 3, 226-234.
Raghavan, A. S.; Hang, H. C. Seeing small molecules in action with bioorthogonal chemistry.
Drug Discovery Today. 2009, 14, 178-184.
Ramdhave, A. S.; Patel, D.;. Ramya, I.; Nandave, M.; Kharkar, P. S. Targeting Heat Shock
Protein 90 for Malaria. Mini-Rev. Med. Chem. 2013, 13, 1903-1920.
Rasband, W.S., ImageJ, U. S. National Institutes of Health, Bethesda, Maryland, USA,
http://imagej.nih.gov/ij/, 1997-2014.
Roepe, P. D.; Wei, L. Y.; Hoffman, M. M.; Fritz, F. Altered drug translocation mediated by the
MDR protein: direct, indirect, or both? J Bioenerg Biomembr. 1996. 28, 541-555.
Roepe, P. D. PfCRT-Mediated Drug Transport in Malarial Parasites. Biochemistry. 2011, 50,
163-171.
Roepe, P. D. To Kill or Not to Kill, That is the Question: Cytocidal Chloroquine Resistance.
Trends Parasitol. 2014. 30, 130-135.
Rohrbach, P.; Sanchez, C. P.; Hayton, K.; Friedrich, O.; Patel, J.; Sidhu, A. B. S.; Ferdig, M. T.;
Fidock, D. A.; Lanzer, M. Genetic linkage of pfmdr1 with food vacuolar solute import in
Plasmodium falciparum. The EMBO Journal. 2006, 25, 3000-3011.
Romsicki, Y.; Sharom, F. J. Phospholipid flippase activity of the reconstituted P-
glycoproteinmultidrug transporter. Biochemistry. 2001. 40, 6937-6947.
Roy, G.; Mielczarski, J. A. Infrared detection of chlorinated hydrocarbons in water at ppb levels
of concentrations. Water Research 2002. 36, 1902-1908.

265
Saidijam, M.; Benedetti, G.; Ren, Q.; Xu, Z.; Hoyle, C. J.; Palmer, S. L.; Ward, A.; Bettaney, K.
E.; Szakonyi, G.; Meuller, J.; Morrison, S.; Pos, M. K.; Butaye, P.; Walravens, K.;
Langton, K.; Herbert, R. B.; Skurray, R. A.; Paulsen, I. T.; O'Reilly, J.; Rutherford, N.
G.; Brown, M. H.; Bill, R. M.; Henderson, P. J. Microbial drug efflux proteins of the
major facilitator superfamily. Curr Drug Targets. 2006. 7, 793-811.
Salako, L. A.; Aderounmu, A. F.; Walker, O. Influence of route or administration on the
pharmacokinetics of chloroquine and desethylchloroquine. Bulletin of the World Health
Organization. 1987, 65, 47-50.
Saliba, K. J.; Kirk, K. pH Regulation in the Intracellular Malaria Parasite Plasmodium
falciparum: H+ Extrusion via a V-Type H+-ATPase. The Journal of Biological
Chemistry. 1999, 274, 33213-33219.
Salisbury, C. M.; Cravatt, B. F. Click Chemistry-Led Advances in High Content Functional
Proteomics. QSAR Comb. Sci. 2007, 26, 1229-1238.
Sanchez, C. P.; Rorhbach, P.; McLean, J. E.; Fidock, D. A.; Stein, W. D.; Lanzer, M. Differences
in trans-stimulated chloroquine efflux kinetics are linked to PfCRT in Plasmodium
falciparum. Molecular Microbiology. 2007, 64, 407-420.
Sanz, L.M., Crespo, B., De-Cósar, C., Ding, X.C., Llergo, J.L., Burrows, J.N.; García-Bustos,
J.F., and Gamo, F.J. 2012. P. falciparum In Vitro Killing Rates Allow to Discriminate
between Different Antimalarial Mode-of Action. PLoS One. 2012, 7:e30949.
Seitz, C.; Hugle, M.; Cristofanon, S.; Tchoghandjian, A.; Fulda, S. The dual PI3K/mTOR
inhibitor NVP-BEZ235 and chloroquine synergize to trigger apoptosis via mitochondrial-
lysosomal cross-talk. Int J Cancer. 2013, 132, 2682-2693.

266
Sharom, F. J.; Yu, X.; Doige, C. A. Functional reconstitution of drug transport and ATPase
activity in proteoliposomes containing partially purified P-glycoprotein. J Biol Chem.
1993. 268, 24197-24202.
Shonhai, A.; Boshoff, A.; Blatch, G. L. The structural functional diversity of Hsp70 proteins
from Plasmodium falciparum. Protein Science. 2007, 16, 1803-1818.
Siddiqui, W. A.; Kan, S. C.; Kramer, K.; Richmond-Crum, S. M. In vitro production and partial
purification of Plasmodium falciparum antigen. Bull World Health Organ. 1979, 57, 75-
82.
Sidhu, A. B. S.; Verdier-Pinard, D.; Fidock, D. A. Chloroquine Resistanc in Plasmodium
falciparum Malaria Parasites Conferred by pfcrt Mutations. Science. 2002, 298, 210-213.
Sidhu, A. B. S.; Valderramos, S. G.; Fidock, D. A. pfmdr1 mutations contribute to quinine
resistance and enhance mefloquine and artemisinin sensitivity in Plasmodium falciparum.
Mol. Microbiol. 2005, 57, 913–926.
Sidorowicz, L.; Skarzewski, J. Easy Access to 9-Epimers of Cinchona Alkaloids: One-Pot
Inversion by Mitsunobu Esterification-Saponification. Synthesis. 2011, 5, 708-710.
Sinai, A. P.; Roepe, P. D. Autophagy in Apicomplexa: a life sustaining death mechanism?
Trends in Parasitology. 2012, 28, 358-364.
Sletten, E. M.; Bertozzi, C. R. Bioorthogonal Chemistry: Fishing for Selectivity in a Sea of
Functionality. Angew. Chem. Intl. Ed. 2009, 48, 6974-6998.
Smit, J. J.; Schinkel, A. H.; Oude Elferink, R. P.; Groen, A. K.; Wagenaar, E.; van Deemter, L.;
Mol, C. A.; Ottenhoff, R.; van der Lugt, N. M.; van Roon, M. A.; van der Valk, M. A.;
Offerhaus, G. J. A.; Berns, A. J. M.; Borst, P. Homozygous disruption of the murine
267
mdr2 P-glycoprotein gene leads to a complete absence of phospholipid from bile and to
liver disease. Cell. 1993. 75, 451-462.
Speers, A. E.; Cravatt, B. J. Profiling Enzyme Activities In Vivo Using Click Chemsitry
Methods. Chemistry & Biology. 2004, 11, 535-546.
Speers, A. E.; Adam, G. C.; Cravatt, B. F. Activity-Based Protein Profiling in Vivo Using a
Copper(I)-Catalyzed Aide-Alkyne [3 + 2] Cycloaddition. J Am. Chem. Soc. 2003, 125,
4686-4687.
Sridhar, S.; Bhat, G.; Guruprasad, K. Analysis of bortezomib inhibitor docked within the
catalytic subunits of the Plasmodium falciparum 20S proteosome. SpringerPlus. 2013, 2,
566.
Strober, W. Trypan Blue Exclusion Test of Cell Viability. Current Protocols in Immunology.
1997, A.3B.1-A.3B.2.
Su, X.; Kirkman, L. A.; Fujioka, H.; Wellems, T.E. Complex Polymorphism in an ~330 kDa
Protein Are Linked to Chloroquine-Resistant P. falciparum in Southeast Asia and Africa.
Cell. 1997, 91, 593-603.
Suberu, J. O.; Gorka, A. P.; Jacobs, L.; Roepe, P. D.; Sullivan, N.; Barker, G. C.; Lapkin, A. A.
Anti-Plasmodial Polyvalent Interactoins in Artemisia annua L. Aqueous Extract- Possible
Synergistic and Resistance Mechanisms. PLoS One. 2013, 8, e80790.
Sullivan, D. J. Jr,; Gluzman, I. Y.; Russell, D. G.; Goldberg, D. E. On the molecular mechanism
of chloroquine's antimalarial action. Proc. Natl. Acad. Sci. U. S. A. 1996a, 93, 11865–
11870.
268
Sullivan, D. J. Jr,; Gluzman, I. Y.; Goldberg, D. E. Plasmodium hemozoin formation mediated
by histidine-rich proteins. Science. 1996b, 271, 219–222.
Summers, R. L.; Nash, M. N.; Martin, R. E. Know your enemy: understanding the role of PfCRT
in drug resistance could lead to new antimalarial tactics. Cell Mol Life Sci. 2012. 69,
1967-1995.
Ta, H. T.; Hisam, S.; Lanza, M.; Jiram, A. I.; Ismail, N.; Rubio, J. M. Malaria J. 2014, 13, 68-
74.
Taddei, P.; Arosio, C.; Monti, P.; Tsukada, M.; Arai, T.; Freddi, G. Chemical and physical
properties of sulfonated silk fabrics. Biomacromolecules 2007. 8: 1200-1208.
Tallarida, R. J. Statistical analysis of drug combinations for synergism. Pain. 1992, 49, 93-97.
Tawk, L.; Chicanne, G.; Dubremetz, J. F.; Richard, V.; Payrastre, B.; Vial, H. J.; Roy, C.;
Wengelnik, K. Phosphotidylinositol 3-Phosphate, an Essential Lipid in Plasmodium,
Localizes to the Food Vacuole Membrane and the Apicoplast. Eukaryotic Cell. 2010, 9,
1519-1530.
Thriemer, K.; Khan, W. A.; Starzengruber, P.; Haque, R.; Vossen, M. G.; Marma, A. S. P.;
Akther, S.; Fukuda, M.; Noedl, H. In vitro interaction of dihydroartemisinin and
lumefantrine in clinical field isolates form Bangladesh. Wien Klin Wochenschr. 2007,
119, 67-70.
Tomlins, A. M.; Ben-Rached, F.; Williams, R. A. M.; Proto, W. R.; Coppens, I.; Ruch, U.;
Gilberger, T. W.; Coombs, G. H.; Mottram, J. C.; Müller, S.; Langsley, G. Plasmodium
falciparum ATG8 implicated in both autophagy and apicoplast formation. Autophagy.
2013, 9, 1540-1552.

269
Tonkin, C. J.; van Dooren, G. G.; Spurck, T. P.; Struck, N. S.; Good, R. T.; Handman, E.;
Cowman, A. F.; McFadden, G. I. Localization of organellar proteins in Plasmodium
falciparum using a novel set of transfection vectors and a new immunofluorescence
fixation method. Mol. Biochem. Parasitol. 2004, 137, 13-21.
Tóth, B.; Balla, A.; Ma, H.; Knight, Z. A.; Shokat, K. M.; Balla, T. Phosphatidylinositol 4-
Kinase IIIβ Regulates the Transport of Ceramide between the Endoplasmic Reticulum
and Golgi. J. Biol. Chem. 2006, 281, 36369-36377.
Totino, P. R. R.; Daniel-Ribiero, C. T.; Corte-Real, S.; Ferreira-da-Cruz, M. d. F. Plasmodium
falciparum: Erythrocytic stages die by autophagic-life cell death under drug pressure.
Experimental Parasitology. 2008, 118, 478-486.
Trager, W.; Jensen, W. B. Human Malarial Parasites in Continuous Culture. Science. 1976, 193,
673-675.
Trang, D. T.; Huy, N. T.; Uyen, D. T.; Sasai, M.; Shiono, T.; Harada, S.; Kamei, K. Inhibition
assay of beta-hematin formation initiated by lecithin for screening new antimalarial
drugs. Anal. Biochem. 2006, 349, 292–296.
Tripathi, A. K.; Gupta, A.; Garg, S. K.; Tekwani, B. L. In vitro beta-hematin formation assays
with plasma of mice infected with Plasmodium yoelii and other parasite preparations:
comparative inhibition with quinoline and endoperoxide antimalarials. Life Sci. 2001, 69,
2725–2733.
Tripathi, A.K.; Garg, S.K.; Tekwani, B. L. A physiochemical mechanism of hemozoin (β-
hematin) synthesis by malaria parasite. Biochem. Biophys. Res. Commun.. 2002, 290,
595–601.

270
Tripathi, A. K.; Khan, S. I.; Walker, L. A.; Tekwani, B. L. Spectrophotometric determination of
de novo hemozoin/beta-hematin formation in an in vitro assay. Anal. Biochem. 2004,
325, 85–91.
Ursos, L. M.; DuBay, K. F.; Roepe, P. D. Antimalarial Drugs Influence the pH Dependent
Solubility of Heme via Apparent Nucleation Phenomena. Mol. Biochem. Parasitol. 2001,
112, 11-17.
van Helvoort, A.; Smith, A. J.; Sprong, H.; Fritzsche, I.; Schinkel, A. H.; Borst, P.; van Meer, G.
MDR1 P-glycoprotein is a lipid translocase of broad specificity, while MDR3 P-
glycoprotein specifically translocates phosphatidylcholine. Cell. 1996. 87, 507-517.
Vila, A.; Tallman, K. A.; Jacobs, A. T.; Liebler, D. C.; Porter, N. A.; Marnett, L. J. Identification
of Protein Targets of 4-Hydroxynonenal Using Click Chemistry for ex Vivo Biotinylation
of Azido and Alkynyl Derivatives. Chem. Res. Toxicol. 2008, 21, 432-444.
Wadkins, R. M.; Roepe, P. D. Biophysical aspects of P-glycoprotein-mediated multidrug
resistance. Int Rev Cytol. 1997. 171, 121-165.
Waller, K. L.; Muhle, R. A.; Ursos, L. M.; Horrocks, P.; Verdier-Pinard, D.; Sidhu, A. B. S.;
Fujioka, H.; Roepe, P. D.; Fidock, D. A. Chloroquine Resistance Modulated in Vitro by
Expression Levels of the Plasmodium falciparum Chloroquine Resistance Transporter.
The Journal of Biological Chemistry. 2003, 278, 33593-33601.
Wang, J.; Tan, X. T.; Nguyen, V. S.; Yang, P.; Zhou, J.; Gao, M.; Li, Z.; Lim, T. K.; Ong, C .S.;
Lay, Y.; Zhang, J.; Zhu, G.; Lai, S. L.; Ghosh, D.; Mok, Y. K.; Shen, H. M.; Lin, Q. A
Quantitative Chemical Proteomics Approach to Profile the Specific Cellular Targets of

271
Andrographolide, a Promising Anticancer Agent that Suppresses Tumor Metastasis. Mol.
Cell Proteomics. 2014, doi: 10.1074/mcp.M113.029793.
Warhurst, D. C.; Craig, J. C.; Adagu, I. S.; Meyer, D. J.; Lee, S. Y. The relationship of physico-
chemical properties and structure to the differential antiplasmodial activity of the
cinchona alkaloids. Malaria J. 2003, 2, 26-40.
Weisman, J. L.; Liou, A. P.; Shelat, A. A.; Cohen, F. E.; Guy, R. K.; DeRisi, J. L. Searching for
new antimalarial therapeutics amongst known drugs. Chem. Biol. Drug. Des.2006, 67,
409-416.
Wellems, T. E.; Panton, L. J.; Gluzman, I. Y.; do Rosario, V. E.; Gwadz, R. W.; Walker-Jonah,
A.; Krogstad, D. J. Chloroquine Resistance not linked to mdr-like genes in a Plasmodium
falciparum cross. Nature. 1990, 345, 253-255.
Wellems, T. E.; Walker-Jonah, A.; Panton, L. J. Gentic mapping of the chloroquine-resistance
locus on Plasmodium falciparum chromosome 7. Proc. Natl. Acad. Sci. USA. 1991, 88,
3382-3386.
Wellems, T. E.; Plowe, C. V. Chloroquine-Resistant Malaria. The Journal of Infectious Diseases.
2001, 184, 770-776.
Wells, T. N.; Alonso, P. L.; Gutteridge, W. E. New medicines to improve control and contribute
to the eradication of malaria. Nat. Rev. Drug Discov. 2009, 8, 879–891.
White, I. N.; Razvi, N.; Gibbs, A. H.; Davies, A. M.; Manno, M.; Zaccaro, C.; De Matteis, F.;
Pahler, A.; Dekant, W. Neoantigen formation and clastogenic action of HCFC-123 and
perchloroethylene in human MCL-5 cells. Toxicol Lett 2001. 124, 129-138.

272
White, N. J.; van Wugt, M.; Ezzet, F. Clinical Pharmacokinetics and Pharmacodynamics of
Artemether-Lumefantrine. Clin. Pharmacokinet. 1999, 37, 105-125.
Whitehead, S.; Peto, T. E. A. Stage-Dependent Effect of Deferoxamine on Growth of
Plasmodium falciparum In Vitro. Blood. 1990, 76, 1250-1255.
Wilkinson, S. R.; Kelly, J. M. Trypanocidal drugs: mechanisms, resistance and new targets.
Expert Rev Mol Med. 2009. 11, e31.
Wilson, C. M.; Serrano, A. E.; Wasley, A.; Bogenschutz, M. P.; Shankar, A. H.; Wirth, D. F.
Amplification of a gene related to mammalian mdr genes in drug-resistant Plasmodium
falciparum. Science. 1989. 244, 1184-1186.
Wong, R. P. M.; Salman, S.; Ilett, K. F.; Siba, P. M.; Mueller, I.; Davis, T. M. E. Desbutyl-
Lumefantrine Is a Metabolits of Lumefantrine with Potent In Vitro Antimalarial Activity
That May Influence Artemether-Lumefantrine Treatment Outcome. Antimicrobial Agents
and Chemotherapy. 2011, 55, 1194-1198.
World Health Organization. World Malaria Report 2010. World Health Organization, Geneva,
Switzerland.
http://www.who.int/malaria/publications/atoz/9789241564106/en/index.html.
Wright, A. T.; Cravatt, B. F. Chemical Proteomic Probes for Profiling Cytochrome P450
Activities and Drug Interactions In Vivo. Chemistry & Biology. 2007, 14, 1043-1051.
Wright, A. T.; Song, J. D.; Cravatt, B. F. A Suite of Activity-Based Probes for Human
Cytochrome P450 Enzymes. J. Am. Chem. Soc. 2009, 131, 10692-10700.
Yearick, K.; Ekoue-Kovi, K.; Iwaniuk, D. P.; Natarajan, J. K.; Alumasa, J.; de Dios, A. C.;
Roepe, P. D.; Wolf, C. Overcoming Drug Resistance to Heme-Targeted Antimalarials by
273
Systematic Side Chain Variation of 7-Chloro-4-aminoquinolines. J. Med. Chem. 2008,
51, 1995-1998.
Yerushalmi, H.; Lebendiker, M.; Schuldiner, S. EmrE, an Escherichia coli 12-kDa multidrug
transporter, exchanges toxic cations and H+ and is soluble in organic solvents. J Biol
Chem. 1995. 270, 6856-6863.
Yoshioka, T.; Krauser, J. A.; Guengerich, F. P. Tetrachloroethylene oxide: hydrolytic products
and reactions with phosphate and lysine. Chem Res Toxicol 2002. 15, 1096-1105.
Yoshida, T.; Migita, T. C. Mechanism of heme degradation by heme oxygenase. J. Inorg.
Biochem. 2000, 82, 33–41.
Yuan, J.; Johnson, R. L.; Huang, R.; Wichterman, J.; Jiang, H.; Hayton, K.; Fidock, D. A.;
Wellems, T. E.; Inglese, J.; Austin, C. P.; Su, X. Z. Genetic mapping of targets mediating
differential chemical phenotypes in Plasmodium falciparum. Nat Chem Biol. 2009, 5,
765-771.
Yuan, J.; Cheng, K. C. C.; Johnson, R. L.; Huang, R.; Pattaradilokrat, S.; Liu, A.; Guha, R.;
Fidock,, D. A.; Inglese, J.; Wellems, T. E.; Austin, C. P.; Su, X. Chemical Genomic
Profiling for Antimalarial Therapies, Response Signatures, and Molecular Targets.
Science. 2011, 333, 724-729.
Zhang, H.; Paguio, M.; Roepe, P. D. The Antimalarial Drug Resistance Protein Plasmodium
falciparum Chloroquine Resistance Transporter Binds Chloroquine. Biochemistry. 2004,
43, 8290-8296.