Orphan drug legislation: lessons for neglected tropical diseases
A Long Neglected World Malaria Map: Plasmodium vivaxEndemicity in 2010Peter W. Gething1*, Iqbal R. F. Elyazar2, Catherine L. Moyes1, David L. Smith3,4, Katherine E. Battle1,
Carlos A. Guerra1, Anand P. Patil1, Andrew J. Tatem4,5, Rosalind E. Howes1, Monica F. Myers1,
Dylan B. George4, Peter Horby6,7, Heiman F. L. Wertheim6,7, Ric N. Price7,8,9, Ivo Mueller10, J.
Kevin Baird2,7, Simon I. Hay1,4*
1 Spatial Ecology and Epidemiology Group, Department of Zoology, University of Oxford, Oxford, United Kingdom, 2 Eijkman-Oxford Clinical Research Unit, Jakarta,
Indonesia, 3 Johns Hopkins Malaria Research Institute, Johns Hopkins Bloomberg School of Public Health, Baltimore, Maryland, United States of America, 4 Fogarty
International Center, National Institutes of Health, Bethesda, Maryland, United States of America, 5 Department of Geography and Emerging Pathogens Institute,
University of Florida, Gainesville, Florida, United States of America, 6 Oxford University Clinical Research Unit - Wellcome Trust Major Overseas Programme, Ho Chi Minh
City, Vietnam, 7 Nuffield Department of Medicine, Centre for Tropical Medicine, University of Oxford, Oxford, United Kingdom, 8 Global Health Division, Menzies School of
Health Research, Charles Darwin University, Darwin, Northern Territory, Australia, 9 Division of Medicine, Royal Darwin Hospital, Darwin, Northern Territory, Australia,
10 Papua New Guinea Institute of Medical Research, Goroka, Papua New Guinea
Abstract
Background: Current understanding of the spatial epidemiology and geographical distribution of Plasmodium vivax is farless developed than that for P. falciparum, representing a barrier to rational strategies for control and elimination. Here wepresent the first systematic effort to map the global endemicity of this hitherto neglected parasite.
Methodology and Findings: We first updated to the year 2010 our earlier estimate of the geographical limits of P. vivaxtransmission. Within areas of stable transmission, an assembly of 9,970 geopositioned P. vivax parasite rate (PvPR) surveyscollected from 1985 to 2010 were used with a spatiotemporal Bayesian model-based geostatistical approach to estimateendemicity age-standardised to the 1–99 year age range (PvPR1–99) within every 565 km resolution grid square. The modelincorporated data on Duffy negative phenotype frequency to suppress endemicity predictions, particularly in Africa.Endemicity was predicted within a relatively narrow range throughout the endemic world, with the point estimate rarelyexceeding 7% PvPR1–99. The Americas contributed 22% of the global area at risk of P. vivax transmission, but high endemicareas were generally sparsely populated and the region contributed only 6% of the 2.5 billion people at risk (PAR) globally.In Africa, Duffy negativity meant stable transmission was constrained to Madagascar and parts of the Horn, contributing3.5% of global PAR. Central Asia was home to 82% of global PAR with important high endemic areas coinciding with densepopulations particularly in India and Myanmar. South East Asia contained areas of the highest endemicity in Indonesia andPapua New Guinea and contributed 9% of global PAR.
Conclusions and Significance: This detailed depiction of spatially varying endemicity is intended to contribute to a much-needed paradigm shift towards geographically stratified and evidence-based planning for P. vivax control and elimination.
Citation: Gething PW, Elyazar IRF, Moyes CL, Smith DL, Battle KE, et al. (2012) A Long Neglected World Malaria Map: Plasmodium vivax Endemicity in 2010. PLoSNegl Trop Dis 6(9): e1814. doi:10.1371/journal.pntd.0001814
Editor: Jane M. Carlton, New York University, United States of America
Received April 24, 2012; Accepted July 29, 2012; Published September 6, 2012
This is an open-access article, free of all copyright, and may be freely reproduced, distributed, transmitted, modified, built upon, or otherwise used by anyone forany lawful purpose. The work is made available under the Creative Commons CC0 public domain dedication.
Funding: SIH is funded by a Senior Research Fellowship from the Wellcome Trust (#095066), which also supports PWG, CAG, and KEB. CLM and APP are fundedby a Biomedical Resources Grant from the Wellcome Trust (#091835). REH is funded by a Biomedical Resources Grant from the Wellcome Trust (#085406). IRFE isfunded by grants from the University of Oxford—Li Ka Shing Foundation Global Health Program and the Oxford Tropical Network. DLS and AJT are supported bygrants from the Bill and Melinda Gates Foundation (#49446, #1032350) (http://www.gatesfoundation.org). PH is supported by Wellcome Trust grants 089276/Z/09/Z and the Li Ka Shing Foundation. RNP is a Wellcome Trust Senior Fellow in Clinical Science (#091625). JKB is supported by a Wellcome Trust grant(#B9RJIXO). PWG, APP, DLS, AJT, DBG, and SIH also acknowledge support from the RAPIDD program of the Science and Technology Directorate, Department ofHomeland Security, and the Fogarty International Center, National Institutes of Health (http://www.fic.nih.gov). This work forms part of the output of the MalariaAtlas Project (MAP, http://www.map.ox.ac.uk), principally funded by the Wellcome Trust, UK (http://www.wellcome.ac.uk). MAP also acknowledges the support ofthe Global Fund to Fight AIDS, Tuberculosis, and Malaria (http://www.theglobalfund.org). The funders had no role in study design, data collection and analysis,decision to publish, or preparation of the manuscript.
Competing Interests: The authors have declared that no competing interests exist.
* E-mail: [email protected] (PWG); [email protected] (SIH)
Introduction
The international agenda shaping malaria control financing,
research, and implementation is increasingly defined around the
goal of regional elimination [1–6]. This ambition ostensibly
extends to all human malarias, but whilst recent years have seen a
surge in research attention for Plasmodium falciparum, the knowl-
edge-base for the other major human malaria, Plasmodium vivax, is
far less developed in almost every aspect [7–11]. During 2006–
2009 just 3.1% of expenditures on malaria research and
development were committed to P. vivax [12]. The notion that
control approaches developed primarily for P. falciparum in
PLOS Neglected Tropical Diseases | www.plosntds.org 1 September 2012 | Volume 6 | Issue 9 | e1814

holoendemic Africa can be transferred successfully to P. vivax is,
however, increasingly acknowledged as inadequate [13–17].
Previous eradication campaigns have demonstrated that P. vivax
frequently remains entrenched long after P. falciparum has been
eliminated [18]. The prominence of P. vivax on the global health
agenda has risen further as evidence accumulates of its capacity in
some settings to cause severe disease and death [19–25], and of the
very large numbers of people living at risk [26].
Amongst the many information gaps preventing rational
strategies for P. vivax control and elimination, the absence of
robust geographical assessments of risk has been identified as
particularly conspicuous [9,27]. The endemic level of the disease
determines its burden on children, adults, and pregnant women;
the likely impact of different control measures; and the relative
difficulty of elimination goals. Despite the conspicuous impor-
tance of these issues, there has been no systematic global
assessment of endemicity. The Malaria Atlas Project was initiated
in 2005 with an initial focus on P. falciparum that has led to global
maps [28–30] for this parasite being integrated into policy
planning at regional to international levels [4,31–36]. Here we
present the outcome of an equivalent project to generate a
comprehensive evidence-base on P. vivax infections worldwide,
and to generate global risk maps for this hitherto neglected
disease. We build on earlier work [26] defining the global range
of the disease and broad classifications of populations at risk to
now assess the levels of endemicity under which these several
billion people live. This detailed depiction of geographically
varying risk is intended to contribute to a much-needed paradigm
shift towards geographically stratified and evidence-based plan-
ning for P. vivax control and elimination.
Numerous biological and epidemiological characteristics of P.
vivax present unique challenges to defining and mapping metrics of
risk. Unlike P. falciparum, infections include a dormant hypnozoite
liver stage that can cause clinical relapse episodes [37,38]. These
periodic events manifest as a blood-stage infection clinically
indistinguishable from a primary infection and constitute a
substantial, but geographically varying, proportion of total patent
infection prevalence and disease burden within different popula-
tions [37,39–41]. The parasitemia of P. vivax typically occurs at
much lower densities compared to those of falciparum malaria,
and successful detection by any given means of survey is much less
likely. Another major driver of the global P. vivax landscape is the
influence of the Duffy negativity phenotype [42]. This inherited
blood condition confers a high degree of protection against P. vivax
infection and is present at very high frequencies in the majority of
African populations, although is rare elsewhere [43]. These
factors, amongst others, mean that the methodological framework
for mapping P. vivax endemicity, and the interpretation of the
resulting maps, are distinct from those already established for P.
falciparum [28,29]. The effort described here strives to accommo-
date these important distinctions in developing a global distribu-
tion of endemic vivax malaria.
Methods
The modelling framework is displayed schematically in
Figure 1. In brief, this involved (i) updating of the geographical
limits of stable P. vivax transmission based on routine reporting
data and biological masks; (ii) assembly of all available P. vivax
parasite rate data globally; (iii) development of a Bayesian model-
based geostatistical model to map P. vivax endemicity within the
limits of stable transmission; and (iv) a model validation
procedure. Details on each of these stages are provided below
with more extensive descriptions included as Protocols S1, S2, S3,
and S4.
Updating Estimates of the Geographical Limits ofEndemic Plasmodium vivax in 2010
The first effort to systematically estimate the global extent of P.
vivax transmission and define populations at risk was completed in
2009 [26]. As a first step in the current study, we have updated this
work with a new round of data collection for the year 2010. The
updated data assemblies and methods are described in full in
Protocol S1. In brief, this work first involved the identification of
95 countries as endemic for P. vivax in 2010. From these, P. vivax
annual parasite incidence (PvAPI) routine case reports were
assembled from 17,893 administrative units [44]. These PvAPI
and other medical intelligence data were combined with remote
sensing surfaces and biological models [45] that identified areas
where extreme aridity or temperature regimes would limit or
preclude transmission (see Protocol S1). These components were
combined to classify the world into areas likely to experience zero,
unstable (PvAPI ,0.1% per annum), or stable (PvAPI $0.1% per
annum) P. vivax transmission. Despite the very high population
frequencies of Duffy negativity across much of Africa, the presence
of autochthonous transmission of P. vivax has been confirmed by a
systematic literature review for 42 African countries [26]. We
therefore treated Africa in the same way as elsewhere in this initial
stage: regions were deemed to have stable P. vivax transmission
unless the biological mask layers or PvAPI data suggested
otherwise.
Author Summary
Plasmodium vivax is one of five parasites causing malaria inhumans. Whilst it is found across a larger swathe of theglobe and potentially affects a larger number of peoplethan its more notorious cousin, Plasmodium falciparum, itreceives a tiny fraction of the research attention andfinancing: around 3%. This neglect, coupled with theinherently more complex nature of vivax biology, meansimportant knowledge gaps remain that limit our currentability to control the disease effectively. This patchyknowledge is becoming recognised as a cause for concern,in particular as the global community embraces thechallenge of malaria elimination which, by definition,includes P. vivax and the other less common Plasmodiumspecies as well as P. falciparum. Particularly conspicuous isthe absence of an evidence-based map describing theintensity of P. vivax endemicity in different parts of theworld. Such maps have proved important for otherinfectious diseases in supporting international policyformulation and regional disease control planning, imple-mentation, and monitoring. In this study we present thefirst systematic effort to map the global endemicity of P.vivax. We assembled nearly 10,000 surveys worldwide inwhich communities had been tested for the prevalence ofP. vivax infections. Using a spatial statistical model andadditional data on environmental characteristics and Duffynegativity, a blood disorder that protects against P. vivax,we estimated the level of infection prevalence in every565 km grid square across areas at risk. The resultingmaps provide new insight into the geographical patternsof the disease, highlighting areas of the highest endemic-ity in South East Asia and small pockets of Amazonia, withvery low endemic setting predominating in Africa. Thisnew level of detailed mapping can contribute to a widershift in our understanding of the spatial epidemiology ofthis important parasite.
Global Plasmodium vivax Endemicity in 2010
PLOS Neglected Tropical Diseases | www.plosntds.org 2 September 2012 | Volume 6 | Issue 9 | e1814

Creating a Database of Georeferenced PvPR DataAs with P. falciparum, the most globally ubiquitous and
consistently measured metric of P. vivax endemicity is the parasite
rate (PvPR), defined as the proportion of randomly sampled
individuals in a surveyed population with patent parasitemia in
their peripheral blood as detected via, generally, microscopy or
rapid diagnostic test (RDT). Whilst RDTs can provide lower
sensitivity and specificity than conventional blood smear micros-
copy, and neither technique provides accuracy comparable to
molecular diagnostics (such as polymerase chain reaction, PCR),
the inclusion of both microscopically and RDT confirmed parasite
rate data was considered important to maximise data availability
and coverage across the endemic world.
To map endemicity within the boundaries of stable transmis-
sion, we first carried out an exhaustive search and assembly of
georeferenced PvPR survey data from formal and informal
literature sources and direct communications with data generating
organisations [46]. Full details of the data search strategy,
abstraction and inclusion criteria, geopositioning and fidelity
checking procedure are included in Protocol S2. The final
database, completed on 25th November 2011, consisted of 9,970
quality-checked and spatiotemporally unique data points, span-
ning the period 1985–2010. Figure 2A maps the spatial
distribution of these data and further summaries by survey origin,
georeferencing source, time period, age group, sample size, and
type of diagnostic used are provided in Protocol S2.
Modelling Plasmodium vivax Endemicity within Regionsof Stable Transmission
We adopt model-based geostatistics (MBG) [47,48] as a robust
and flexible modelling framework for generating continuous
surfaces of malaria endemicity based on retrospectively assembled
parasite rate survey data [28,29,49]. MBG models are a special
class of generalised linear mixed models, with endemicity values at
each target pixel predicted as a function of a geographically-
varying mean and a weighted average of proximal data points.
The mean can be defined as a multivariate function of
environmental correlates of disease risk. A covariance function is
used to characterise the spatial or space-time heterogeneity in the
observed data, which in turn is used to define appropriate weights
assigned to each data point when predicting at each pixel. This
framework allows the uncertainty in predicted endemicity values
to vary between pixels, depending on the observed variation,
density and sample size of surveys in different locations and the
predictive utility of the covariate suite. Parts of the map where
survey data are dense, recent, and relatively homogenous will be
predicted with least uncertainty, whilst regions with sparse or
mainly old surveys, or where measured parasite rates are
extremely variable, will have greater uncertainty. When MBG
models are fitted using Bayesian inference and a Markov chain
Monte Carlo (MCMC) algorithm, uncertainty in the final
predictions as well as all model parameters can be represented
in the form of predictive posterior distributions [50].
Figure 1. Schematic overview of the mapping procedures and methods for Plasmodium vivax endemicity. Blue boxes describe inputdata. Orange boxes denote models and experimental procedures; green boxes indicate output data (dashed lines represent intermediate outputsand solid lines final outputs). U/R = urban/rural; UNPP = United Nations Population Prospects. Labels S1-4 denote supplementrary information inProtocols S1, S2, S3, and S4.doi:10.1371/journal.pntd.0001814.g001
Global Plasmodium vivax Endemicity in 2010
PLOS Neglected Tropical Diseases | www.plosntds.org 3 September 2012 | Volume 6 | Issue 9 | e1814

We developed for this study a modified version of the MBG
framework used previously to model P. falciparum endemicity
[28,29], with some core aspects of the model structure remaining
unchanged and others altered to capture unique aspects of P. vivax
biology and epidemiology. The model is presented in full in
Protocol S3. As in earlier work [28,29,49], we adopt a space-time
approach to allow surveys from a wide time period to inform
predictions of contemporary risk. This includes the use of a
spatiotemporal covariance function which is parameterised to
downweight older data appropriately. We also retain a seasonal
component in the covariance function, although we note that
seasonality in transmission is often only weakly represented in
PvPR in part because of the confounding effect of relapses
occurring outside peak transmission seasons [51]. A minimal set of
covariates were included to inform prediction of the mean
function, based on a priori expectations of the major environmental
factors modulating endemicity. These were (i) an indicator variable
defining areas as urban or rural based on the Global Rural Urban
Mapping Project (GRUMP) urban extent product [52,53]; (ii) a
long-term average vegetation index product as an indicator of
overall moisture availability for vector oviposition and survival
[54,55]; and (iii) a P. vivax specific index of temperature suitability
derived from the same model used to delineate suitable areas on
the basis of vector survival and sporogony [45].
Age StandardisationOur assembly of PvPR surveys was collected across a variety of
age ranges and, since P. vivax infection status can vary
systematically in different age groups within a defined community,
it was necessary to standardise for this source of variability to allow
all surveys to be used in the same model. We adopted the same
model form as has been described [56] and used previously for P.
falciparum [28,29], whereby population infection prevalence is
expected to rise rapidly in early infancy and plateau during
childhood before declining in early adolescence and adulthood.
The timing and relative magnitude of these age profile features are
Figure 2. The spatial distribution of Plasmodium vivax malaria endemicity in 2010. Panel A shows the 2010 spatial limits of P. vivax malariarisk defined by PvAPI with further medical intelligence, temperature and aridity masks. Areas were defined as stable (dark grey areas, where PvAPI$0.1 per 1,000 pa), unstable (medium grey areas, where PvAPI ,0.1 per 1,000 pa) or no risk (light grey, where PvAPI = 0 per 1,000 pa). Thecommunity surveys of P. vivax prevalence conducted between January 1985 and June 2010 are plotted. The survey data are presented as acontinuum of light green to red (see map legend), with zero-valued surveys shown in white. Panel B shows the MBG point estimates of the annualmean PvPR1–99 for 2010 within the spatial limits of stable P. vivax malaria transmission, displayed on the same colour scale. Areas within the stablelimits in (A) that were predicted with high certainty (.0.9) to have a PvPR1–99 less than 1% were classed as unstable. Areas in which Duffy negativitygene frequency is predicted to exceed 90% [43] are shown in hatching for additional context.doi:10.1371/journal.pntd.0001814.g002
Global Plasmodium vivax Endemicity in 2010
PLOS Neglected Tropical Diseases | www.plosntds.org 4 September 2012 | Volume 6 | Issue 9 | e1814

likely distinct between the two parasites in different endemic
settings [51,57], and so the model was parameterised using an
assembly of 67 finely age-stratified PvPR surveys (Protocol S2),
with estimation carried out in a Bayesian model using MCMC.
The parameterised model was then used to convert all observed
survey prevalences to a standardised age-independent value for use
in modelling, and then further allowed the output prevalence
predictions to be generated for any arbitrary age range. We chose
to generate maps of all-age infection prevalence, defined as
individuals of age one to 99 years (thus PvPR1–99). We excluded
infection in those less than one year of age from the standardisa-
tion because of the confounding effect of maternal antibodies, and
because parasite rate surveys very rarely sample young infants. We
deviated from the two-to-ten age range used for mapping P.
falciparum [28,29] because the relatively lower prevalences has
meant that surveys are far more commonly carried out across all
age ranges.
Incorporating Duffy NegativitySince Duffy negative individuals are largely refractory to P. vivax
infection [58], high population frequencies of this phenotype have
a dramatic suppressing effect on endemicity, even where
conditions are otherwise well suited for transmission [26]. The
predominance of Duffy negativity in Africa has led to a historical
perception that P. vivax is absent from much of the continent, and a
dearth of surveys or routine diagnoses testing for the parasite have
served to entrench this mantra [59]. However, evidence exists of
autochthonous P. vivax transmission across the continent [26], and
therefore we did not preclude any areas at risk a priori. Instead, we
used a recent map of estimated Duffy negativity phenotypic
frequency [43] and incorporated the potential influence of this
blood group directly in the MBG modelling framework. The
mapped Duffy-negative population fraction at each location was
excluded from the denominator in PvPR survey data, such that
any P. vivax positive individuals were considered to have arisen
from the Duffy positive population subset. Thus in a location with
90% Duffy negativity, five positive individuals in a survey of 100
would give an assumed prevalence of 50% amongst Duffy
positives. Correspondingly, prediction of PvPR was then restricted
to the Duffy positive proportion at each pixel, with the final
prevalence estimate re-converted to relate to the total population.
This approach has two key advantages. First, predicted PvPR at
each location could never exceed the Duffy positive proportion,
therefore ensuring biological consistency between the P. vivax and
Duffy negativity maps. Second, where PvPR survey data were
sparse across much of Africa, the predictions could effectively
borrow strength from the Duffy negativity map because predic-
tions of PvPR were restricted to a much narrower range of possible
values.
Model Implementation and Map GenerationThe P. vivax endemic world was divided into four contiguous
regions with broadly distinct biogeographical, entomological and
epidemiological characteristics: the Americas and Africa formed
separate regions, whilst Asia was subdivided into Central and
South East sub-regions with a boundary at the Thailand-Malaysia
border (see Protocol S2). This regionalisation was implemented in
part to retain computational feasibility given the large number of
data points, but also to allow model parameterisations to vary and
better capture regional endemicity characteristics. Within each
region, a separate MBG model was fitted using a bespoke MCMC
algorithm [60] to generate predictions of PvPR1–99 for every
565 km pixel within the limits of stable transmission. The
prediction year was set to 2010 and model outputs represent an
annualised average across the 12 months of that year. Model
output consisted of a predicted posterior distribution of PvPR1–99
for every pixel. A continuous endemicity map was generated using
the mean of each posterior distribution as a point estimate. The
uncertainty associated with predictions was summarised by maps
showing the ratio of the posterior distribution inter-quartile range
(IQR) to its mean. The IQR is a simple measure of the precision
with which each PvPR value was predicted, and standardisation by
the mean produced an uncertainty index less affected by
underlying prevalence levels and more illustrative of relative
model performance driven by data densities in different locations.
This index was then also weighted by the underlying population
density to produce a second map indicative of those areas where
uncertainty is likely to be most operationally important.
Refining Limits Definition and Population at RiskEstimates
In some regions within the estimated limits of stable transmis-
sion, PvPR1–99 was predicted to be extremely low, either because
of a dense abundance of survey data reporting zero infections or,
in Africa, because of very high coincident Duffy negativity
phenotype frequencies. Such areas are not appropriately described
as being at risk of stable transmission and so we defined a decision
rule whereby pixels predicted with high certainty (probability
.0.9) of being less than 1% PvPR1–99 were assigned to the
unstable class, thereby modifying the original transmission limits.
These augmented mapped limits were combined with a 2010
population surface derived from the GRUMP beta version [52,53]
to estimate the number of people living at unstable or stable risk
within each country and region. The fraction of the population
estimated to be Duffy negative [43] within each pixel was
considered at no risk and therefore excluded from these totals.
Model ValidationA model validation procedure was implemented whereby 10%
of the survey points in each model region were selected using a
spatially declustered random sampling procedure. These subsets
were held out and the model re-fitted in full using the remaining
90%. Model predictions were then compared to the hold-out data
points and a number of different aspects of model performance
were assessed using validation statistics described previously
[28,29]. The validation procedure is detailed in full in Protocol S4.
Results
Model ValidationFull validation results are presented in Protocol S4. In brief,
examination of the mean error in the generation of the P. vivax
malaria endemicity point-estimate surface revealed minimal
overall bias in predicted PvPR with a global mean error of
20.41 (Americas 21.38, Africa 0.03, Central Asia 20.43, South
East Asia 20.43), with values in units of PvPR on a percentage
scale (see Protocol S4). The global value thus represents an overall
tendency to underestimate prevalence by just under half of one
percent. The mean absolute error, which measures the average
magnitude of prediction errors, was 2.48 (Americas 5.05, Africa
0.53, Central Asia 1.52, South East Asia 3.37), again in units of
PvPR (see Protocol S4).
Global Plasmodium vivax Endemicity and Populations atRisk in 2010
The limits of stable and unstable P. vivax transmission, as defined
using PvAPI, biological exclusion masks and medical intelligence
Global Plasmodium vivax Endemicity in 2010
PLOS Neglected Tropical Diseases | www.plosntds.org 5 September 2012 | Volume 6 | Issue 9 | e1814

data are shown in Figure 2A. The continuous surface of P. vivax
endemicity predicted within those limits is shown in Figure 2B.
The uncertainty map (posterior IQR:mean ratio) is shown in
Figure 3A and the population-weighted version in Figure 3B.
We estimate that P. vivax was endemic across some 44 million
square kilometres, approximately a third of the Earth’s land
surface. Around half of this area was located in Africa (51%) and a
quarter each in the Americas (22%) and Asia (27%) (Table 1).
However, the uneven distribution of global populations, coupled
with the protective influence of Duffy negativity in Africa, meant
that the distribution of populations at risk was very different. An
estimated 2.48 billion people lived at any risk of P. vivax in 2010
(Table 1), of which a large majority lived in Central Asia (82%)
with much smaller fractions in South East Asia (9%), the Americas
(6%), and Africa (3%). Of these, 1.52 billion lived in areas of
unstable transmission where risk is very low and case incidence is
unlikely to exceed one per 10,000 per annum. The remaining 964
million people at risk lived in areas of stable transmission,
representing a wide diversity of endemic levels. The global
distribution of populations in each risk class was similar to the total
at risk, such that over 80% of people in both classes lived in
Central Asia (Table 1).
Plasmodium vivax Endemicity in the AmericasAreas endemic for P. vivax in the Americas extended to some 9.5
million square kilometres, of which the largest proportion was in
the Amazonian region of Brazil (Figure 2B). Interestingly, only a
relatively small fraction of these areas (15%) experienced unstable
rather than stable transmission, suggesting a polarisation between
areas at stable risk and those where the disease is absent altogether
(Table 1). The regions of highest endemicity were found in
Amazonia and in Central America – primarily Nicaragua and
Honduras – with predicted mean PvPR1–99 exceeding 7% in all
three locations. An important feature of P. vivax throughout the
Americas is that its distribution is approximately inverse to that of
the population. This is particularly true of the two most populous
endemic countries of the region, Brazil and Mexico, and it means
that, whilst the Americas contributed 53% of the land area
experiencing stable transmission worldwide, they housed only 5%
of the global population at that level of risk.
Figure 3. Uncertainty associated with predictions of Plasmodium vivax endemicity. Panel A shows the ratio of the posterior inter-quartilerange to the posterior mean prediction at each pixel. Large values indicate greater uncertainty: the model predicts a relatively wide range of PvPR1–99
as being equally plausible given the surrounding data. Conversely, smaller values indicate a tighter range of values have been predicted and, thus, ahigher degree of certainty in the prediction. Panel B shows the same index multiplied by the underlying population density and rescaled to 0–1 tocorrespond to Panel A. Higher values indicate areas with high uncertainty and large populations.doi:10.1371/journal.pntd.0001814.g003
Global Plasmodium vivax Endemicity in 2010
PLOS Neglected Tropical Diseases | www.plosntds.org 6 September 2012 | Volume 6 | Issue 9 | e1814

Uncertainty in predicted PvPR1–99 was relatively high through-
out much of the Americas (Figure 3B). This reflects the
heterogeneous landscape of endemicity coupled with the generally
scarce availability of parasite rate surveys in the region (see
Figure 2A). However, when this uncertainty is weighted by the
underlying population density (Figure 3B), its significance on a
global scale is placed in context: because most areas at stable risk
are sparsely populated, the population-weighted uncertainty was
very low compared to parts of Africa and much of Asia.
Plasmodium vivax Endemicity in Africa, Yemen and SaudiArabia (Africa+)
Our decision to assume stable transmission of P. vivax in Africa
unless robust PvAPI or biological mask data confirmed otherwise
meant that much of the continent south of the Sahara was initially
classified as being at stable risk (Figure 2A). However, by
implementing the MBG predictions of PvPR1–99 throughout this
range and reclassifying a posteriori those areas likely to fall below an
endemicity threshold of 1% PvPR1–99, the majority of stable risk
areas were downgraded to unstable (Figure 2B). Thus, in the final
maps, 92% of endemic Africa was at unstable risk, with the
majority of Madagascar and Ethiopia, and parts of South Sudan
and Somalia making up most of the remaining area at stable risk.
Even in these areas, endemicity was uniformly low, with predicted
endemicity values rarely exceeding a point estimate of 2% PvPR1–
99. We augmented the final map with an additional overlay mask
delineating areas where Duffy negativity phenotype prevalence has
been predicted to exceed 90% (Figure 2B). The influence of this
blood group on the estimated populations at risk is profound: of
the 840 million Africans living in areas within which transmission
is predicted to occur, only 86 million were considered at risk,
contributing just 3% to the global total (Table 1).
Uncertainty in predicted PvPR1–99 followed a similar pattern to
the magnitude of the predictions themselves (Figure 3B). Certainty
around the very low predicted endemicity values covering most of
the continent was extremely high – reflecting the increased precision
gained by incorporating the Duffy negativity information that
compensated for the paucity of P. vivax parasite rate surveys on the
continent. The pockets of higher endemicity in Madagascar and
northern East Africa were predicted with far less certainty. In the
population-weighted uncertainty map (Figure 3B), the lower
population densities of Madagascar reduced the index on that island
whereas the densely populated Ethiopian highlands remained high.
Plasmodium vivax Endemicity in Central and South EastAsia
Large swathes of high endemicity, very large population
densities and a negligible presence of Duffy negativity combine
to make the central and south-eastern regions of Asia by far the
most globally significant for P. vivax. We estimate that India alone
contributed nearly half (46%) of the global population at risk, and
two thirds (67%) of those at stable risk. China is another major
contributor with 19% of the global populations at risk, primarily in
unstable transmission regions, whilst Indonesia and Pakistan
together contributed a further 12%. Within regions of stable
transmission, endemicity is predicted to be extremely heteroge-
neous (Figure 2B). Areas where the point estimate of PvPR1–99
exceeded 7% were found in small pockets of India, Myanmar,
Indonesia, and the Solomon Islands, with the largest such region
located in Papua New Guinea.
The uncertainty map (Figure 3A) reveals how the most precise
predictions were associated with areas of uniformly low endemicity
and abundant surveys, such as Afghanistan and parts of Sumatra
and Kalimantan in Indonesia. Conversely, areas with higher or
more heterogeneous endemicity, such as throughout the island of
New Guinea, were the most uncertain. The population-weighted
uncertainty map (Figure 3B) differs substantively, indicating how
the populous areas of Indonesia, for example, were relatively
precisely predicted whereas India, China, and the Philippines had
the largest per-capita uncertainty.
Discussion
The status of P. vivax as a major public health threat affecting
the world’s most populous regions is becoming increasingly well
documented. The mantra of vivax malaria being a very rarely
threatening and relatively benign disease [7,10] has been
challenged with evidence suggesting that it can contribute a
significant proportion of severe malaria disease and death
attributable to malaria in some settings [61]. Some reports have
pointed especially to very young children being a major source of
morbidity [20,62] and some hospital-based studies have reported
comparable mortality rates between patients classified with severe
P. vivax and severe P. falciparum [21,24,63]. The recognition of a
lethal threat by this parasite comes with evidence of failing
chemotherapeutics against the acute attack [64] and overdue
acknowledgement of the practical inadequacy of the only available
therapy against relapse [65]. As the international community
defines increasingly ambitious targets to minimise malaria illness
and death [66–68], and to progressively eliminate the disease from
endemic areas [1–6], further sustained neglect of P. vivax becomes
increasingly untenable.
Here we have presented the first systematic attempt to map the
global distribution of P. vivax endemicity using a defined evidence
base, transparent methodologies, and with measured uncertainty.
These new maps aim to contribute to a more rational international
appraisal of the importance of P. vivax in the broad context of
Table 1. Area and populations at risk of Plasmodium vivax malaria in 2010.
Region Area (million km2) Population (millions)
Unstable Stable Any risk Unstable Stable Any risk
America 1.38 8.08 9.46 87.66 49.79 137.45
Africa+ 20.60 1.86 22.46 48.72 37.66 86.38
C Asia 5.60 3.63 9.24 1,236.92 812.55 2,049.47
SE Asia 0.96 1.78 2.74 150.17 64.90 215.07
World 28.55 15.35 43.90 1,523.47 964.90 2,488.37
Risk is stratified into unstable risk (PvAPI,0.1 per 1,000 people pa) and stable risk (PvAPI$0.1 per 1,000 people pa).doi:10.1371/journal.pntd.0001814.t001
Global Plasmodium vivax Endemicity in 2010
PLOS Neglected Tropical Diseases | www.plosntds.org 7 September 2012 | Volume 6 | Issue 9 | e1814

malaria control and elimination policies, as well as providing a
practical tool to support control planning at national and sub-
national levels.
Interpreting P. vivax Endemicity in 2010In 2010, areas endemic for P. vivax covered a huge geographical
range spanning three major continental zones and extending into
temperate climates. In the Americas, whilst important pockets of
high endemicity are present, the majority of areas of stable
transmission coincide with lower population densities, diminishing
the contribution of this continent to global populations at risk. In
Africa the protection conferred by Duffy negativity to most of the
population means the large swathes of the continent in which
transmission may occur contain only small populations at
biological risk. Thus it is primarily in Asia where very large
populations coincide with extensive high endemic regions, and as a
result nine out of every ten people at risk of P. vivax globally live on
that continent.
A number of important contrasts arise when comparing this
map with the equivalent 2010 iteration for P. falciparum [28].
Perhaps most obvious are the lower levels of observed endemicity
at which P. vivax tends to exist within populations experiencing
stable transmission. We used a cartographic scale between 0% and
7% to differentiate global variation in P. vivax endemicity, although
point estimates exceeded that upper threshold in localised areas.
For P. falciparum the equivalent scale spanned 0% to 70% [28],
suggesting an approximate order-of-magnitude difference in
prevalence of patent parasitemia. In part, this difference reflects
the decision to standardise our predictions across the 1–99 age
range, and values would have been higher if we had opted for the
peak 2–10 age range used for P. falciparum. This difference might
be accentuated by the likely more rapid acquisition of immunity to
P. vivax than P. falciparum in the most highly endemic areas [57]. A
number of other biological and epidemiological differences
between the two species also mean these lower apparent levels
of endemicity must be interpreted differently. One factor is the
lower sensitivities of microscopy and RDT diagnoses for a given
level of P. vivax infection prevalence, because infections tend to be
associated with much lower parasite densities which increase the
likelihood of false negative diagnoses [9]. A number of studies in
both high and low endemic settings have found microscopy to
underestimate prevalence by a factor of up to three when
compared with molecular diagnosis [57,69–72]. The decreasing
cost and time implications of molecular diagnosis may mean that
these gold standard diagnostic techniques become the standard for
parasite rate surveys in the future. A global map of PCR-positive
parasitemia rates would almost certainly reveal a larger underlying
reservoir of infections and, possibly, reveal systematic differences
in patterns of endemicity than we are able to resolve currently with
less sensitive diagnostic methods.
The lower parasite loads must be interpreted in the context of
implications for progression to clinical disease. For example,
Plasmodium vivax is known to induce fevers at comparatively lower
parasite densities than P. falciparum, a feature likely linked to overall
inflammatory responses of greater magnitude [16]. P. vivax is also
comparable to P. falciparum in its potential to cause anaemia
regardless of lower parasite densities, due to a combination of
dyserythropoesis and repeated bouts of haemolysis [22]. A recent
hospital-based study at a site in eastern Indonesia of hypo- to
meso-endemic transmission of both species showed far lower
frequencies of parasitemia .6,000/uL among inpatients classified
as having not serious, serious, and fatal illness with a diagnosis of P.
vivax compared to P. falciparum [24]. Further, the majority of case
reports describing severe and fatal illness with a diagnosis of vivax
malaria typically show parasitemia .5,000/uL. In contrast, the
World Health Organization threshold for severe illness attribut-
able to hyperparasitemia with P. falciparum is .200,000/uL [73].
In brief, the relationship between prevalence and risk of disease
and transmission for P. vivax is distinct from that for P. falciparum,
and it is weighted more heavily towards substantial risks at much
lower parasite densities and levels of prevalence of microscopically
patent parasitemia.
The capacity of P. vivax hypnozoites to induce relapsing
infections has a number of important implications. First, because
dormant liver stage infections are not detectable in routine parasite
rate surveys, our maps do not capture the potentially very large
reservoir of asymptomatic infections sequestered in each popula-
tion. Evidence is emerging that this hidden reservoir may be
substantially larger than previously thought, with long-latency P.
vivax phenotypes both prevalent and geographically widespread
[37]. Whilst not contributing to clinical disease until activated,
these dormant hypnozoites ultimately play a vital role in sustaining
transmission since they are refractory to blood-stage antimalarial
chemotherapy and interventions to reduce transmission. Hypno-
zoites also ensure an ability of P. vivax to survive in climatic
conditions that cannot sustain P. falciparum transmission. Second,
the P. vivax parasite rates observed in population surveys detect
both new and relapsing infections, although the two are almost
never distinguishable. This confounds the relationship between
observed infection prevalence and measures of transmission
intensity such as force of infection or the entomological inoculation
rate. This, in turn, has implications for the use of transmission
models seeking to evaluate or optimise control options for P. vivax
[2,9,27,74]. The current unavailability of any diagnostic method
for detecting hypnozoites [75] and our resulting ignorance about
the size and geographic distribution of this reservoir therefore
remain critical knowledge gaps limiting the feasibility of regional
elimination [9]. It is also worth noting that conventional parasite
rate data do not measure multiplicity of infection which is an
additional potential confounding effect between observed infection
prevalence and transmission intensity.
P. vivax in Africa and Duffy PolymorphismOur map of P. vivax endemicity and estimates of populations at
risk in Africa are heavily influenced by a single assumption: that
the fraction of the population estimated to be negative for the
Duffy antigen [43] is refractory to infection with P. vivax. A body of
empirical evidence is growing, however that P. vivax can infect and
cause disease in Duffy negative individuals, as reported in
Madagascar [76] and mainland sub-Saharan Africa [77–80] as
well as outside Africa [81,82]. Whether the invasion of erythro-
cytes via Duffy antigen-independent pathways is a newly evolved
mechanism, or whether this capacity has been overlooked by the
misdiagnosis of P. vivax in Africa as P. ovale remains unresolved
[9,42,59]. Whilst this accumulated evidence stands contrary to our
simplifying assumption of complete protection in Duffy negative
individuals, there is currently no evidence to suggest that such
infections are anything but rare and thus are unlikely to have any
substantive influence on the epidemiology or infection prevalence
of P. vivax at the population scale throughout most of Africa. We
also make no provision in our model for a protective effect in
Duffy-negative heterozygotes, although such protection has been
observed in some settings [83–86]. The movement and mixing
within Africa of human populations from diverse ethnographic
backgrounds complicates contemporary patterns of Duffy nega-
tivity and, in principle, could yield local populations with
substantially reduced protection from P. vivax infection in the
future. Indeed, the implications for our map of population
Global Plasmodium vivax Endemicity in 2010
PLOS Neglected Tropical Diseases | www.plosntds.org 8 September 2012 | Volume 6 | Issue 9 | e1814

movement go beyond the effect of Duffy negativity: the carriage of
parasites from high to low endemic regions, for example by
migratory workers, may play an important role in sustaining
transmission in some regions and further research is required to
investigate such processes.
Mapping to Guide ControlThere exists for P. falciparum a history of control strategies linked
explicitly to defined strata of endemicity, starting with the first
Global Malaria Eradication Programme [18,87,88] and undergo-
ing a series of refinements that now feature in contemporary
control and elimination efforts. Most recently, stratification has
been supported by insights gained from mathematical models
linking endemic levels to optimum intervention suites, control
options, and timelines for elimination planning [2,89–95]. In stark
contrast, control options for P. vivax are rarely differentiated by
endemicity, and there is little consensus around how this may be
done. In part, the absence of agreed control-oriented strata of P.
vivax endemicity stems from the biological complexities and
knowledge gaps that prevent direct interpretation of infection
prevalence as a metric for guiding control. It is also to some extent
inevitable that the dogma of unstratified control becomes self-
propagating: risk maps are not created because control is not
differentiated by endemicity, but that differentiation cannot
proceed without reliable maps.
As well as providing a basis for stratified control and treatment,
the endemicity maps presented here have a number of potential
applications in combination with other related maps. First, there is
an urgent need to better identify regions where high P. vivax
endemicity is coincident with significant population prevalence of
glucose-6-phosphate dehydrogenase deficiency (G6PDd). This
inherited blood disorder plays a key role in chemotherapy policy
for P. vivax because primaquine, the only registered drug active
against the hypnozoite liver stage is contra-indicated in G6PDd
individuals in whom it can cause severe and potentially fatal
haemolytic reactions [96,97]. A new global map of G6PDd
prevalence is now available (Howes et al, submitted) which can be
combined with the endemicity maps presented here to provide a
rational basis for estimating adverse outcomes and setting appro-
priate testing and treatment protocols. Moreover, in practice most
clinical infections are managed without differentiating the causative
parasite species: combining the endemicity maps for P. vivax and P.
falciparum may therefore inform unified strategies for malaria control
programs and policy [28]. It has been proposed, for example, that
artemesinin-based combination therapy (ACT) be adopted for all
presumptively diagnosed malaria in areas coendemic for both
species, as opposed to a separate ACT/chloroquine treatment
strategy [98]. Further, in some regions more than 50% of patients
diagnosed with falciparum malaria go on to experience an attack of
vivax malaria in the absence of risk of reinfection [99]. This high
prevalence of hypnozoites may also justify presumptive therapy with
primaquine against relapse with any diagnosis of malaria where the
two species occur at relatively high frequencies. Such geographically
specific cross-parasite treatment considerations hinge on robust risk
maps for both species.
Future Challenges in P. vivax CartographyNumerous research and operational challenges remain unad-
dressed that would provide vital insights into the geographical
distribution of P. vivax and its impacts on populations. Perhaps the
highest priority is to improve understanding of the link between
infection prevalence and clinical burden in both P. vivax mono-
endemic settings and where it is coendemic with P. falciparum.
Official estimates of national and regional disease burdens for P.
vivax remain reliant on routine case reporting of unknown fidelity
and are only crudely distinguished from P. falciparum [100]. It is
illuminating that only 53 of the 95 P. vivax endemic countries were
able to provide vivax-specific routine case reporting data, and
there is a clear mandate for strengthening the routine diagnosis
and reporting of P. vivax cases. Cartographic approaches to
estimating P. vivax burden can therefore play a crucial role in
triangulating with these estimates to provide insight into the
distribution of the disease independent of health system surveil-
lance and its attendant biases [27,101–105]. There is also a
particular need to define burden and clinical outcomes associated
with P. vivax in pregnancy [9,106] and other clinically vulnerable
groups, most notably young children. Linking infection prevalence
to clinical burden implies the need to better understand the
contribution of relapsing infections to disease. Whilst the
magnitude of this contribution is known to be highly heteroge-
neous, its geographical pattern is poorly measured and causal
factors only partially understood [39,41].
Further challenges lie in understanding how P. falciparum and P.
vivax interact within human hosts and how these interactions
manifest at population levels. Comparison of the maps for each
species reveals a complete spectrum from areas endemic for only
one parasite through to others where both species are present at
broadly equal levels. Whilst identifying these patterns of
coendemicity is an important first step, the implications in terms
of risks of coinfection and clinical outcomes, antagonistic
mechanisms leading to elevated severe disease risk, or cross-
protective mechanisms of acquired immunity remain disputed
[20,107–109].
ConclusionsTo meet international targets for reduced malaria illness and
death, and to progress the cause of regional elimination, the
malaria research and control communities can no longer afford to
neglect the impact of P. vivax. Its unique biology and global
ubiquity present challenges to its elimination that greatly surpass
those of its higher-profile cousin, P. falciparum. Making serious
gains against the disease will require substantive strengthening of
the evidence base on almost every aspect of its biology,
epidemiology, control and treatment. The maps presented here
are intended to contribute to this effort. They are all made freely
available from the MAP website [110] along with regional and
individual maps for every malaria-endemic country. Users can
access individual map images or download the global surfaces for
use in a geographical information system, allowing them to
integrate this work within their own analyses or produce bespoke
data overlays and displays. We will also make available, where
permissions have been obtained, all underlying P. vivax parasite
rate surveys used in this work.
Supporting Information
Protocol S1 Updating the global spatial limits ofPlasmodium vivax malaria transmission for 2010. S1.1
Overview. S1.2 Identifying Countries Considered P. vivax Malaria
Endemic. S1.3 Updating National Risk Extents with P. vivax
Annual Parasite Incidence Data. S1.4 Biological Masks of
Transmission Exclusion. S1.5 Risk Modulation Based on Medical
Intelligence. S1.6 Assembling the P. vivax Spatial Limits Map. S1.7
Refining Regions of Unstable Transmission after MBG Modelling.
S1.8 Predicting Populations at Risk of P. vivax in 2010.
(DOC)
Protocol S2 The Malaria Atlas Project Plasmodiumvivax parasite prevalence database. S2.1 Assembling the
Global Plasmodium vivax Endemicity in 2010
PLOS Neglected Tropical Diseases | www.plosntds.org 9 September 2012 | Volume 6 | Issue 9 | e1814

PvPR Data. S2.2 Database Fidelity Checks. S2.3 Data Exclusions.
S2.4 The PvPR Input Data Set. S2.5 Age-Standardisation. S2.6
Regionalisation.
(DOC)
Protocol S3 Bayesian model-based geostatistical frame-work for predicting PvPR1–99. S3.1 Bayesian Inference. S3.2
Model Overview. S3.3 Formal Presentation of Model.
(DOC)
Protocol S4 Model validation procedures and additionalresults. S4.1 Creation of Validation Sets. S4.2 Procedures for
Testing Model Performance. S4.3 Validation Results.
(DOC)
Acknowledgments
The large global assembly of parasite prevalence data was critically
dependent on the generous contributions of data made by a large number
of people in the malaria research and control communities and these
individuals are listed on the MAP website (http://www.map.ac.uk/
acknowledgements). We thank Professor David Rogers for providing the
Fourier-processed remote sensing data. We are grateful for the comments
of three anonymous referees that have helped strengthen the manuscript.
Author Contributions
Conceived and designed the experiments: PWG SIH. Performed the
experiments: PWG APP DLS. Analyzed the data: PWG APP DLS IRFE
CAG KEB. Contributed reagents/materials/analysis tools: IRFE CLM
CAG MFM KEB APP AJT REH DBG PH HFLW RNP IM JKB. Wrote
the paper: PWG.
References
1. MalERA (2011) Introduction: a research agenda to underpin malaria
eradication. PLoS Med 8: e1000406.
2. Chitnis N, Schapira A, Smith DL, Smith T, Hay SI, et al. (2010) Mathematicalmodeling to support malaria control and elimination. Roll Back Malaria
Progress and Impact Series, number 5. Geneva, Switzerland: Roll Back
Malaria. 48 p.
3. Tanner M, Hommel M (2010) Towards malaria elimination–a new thematicseries. Malaria J 9: 24.
4. Feachem RGA, Phillips AA, Targett GA, on behalf of the Malaria Elimination
Group, editors (2009) Shrinking the Malaria Map: a Prospectus on Malaria
Elimination. San Francisco, U.S.A.: The Global Health Group, University ofCalifornia - Santa Cruz Global Health Sciences. 187 p.
5. Moonen B, Cohen JM, Snow RW, Slutsker L, Drakeley C, et al. (2010)
Operational strategies to achieve and maintain malaria elimination. Lancet376: 1592–1603.
6. Tatem A, Smith D, Gething P, Kabaria C, Snow R, et al. (2010) Rankingelimination feasibility among malaria endemic countries. Lancet 376: 1579–1591.
7. Baird JK (2007) Neglect of Plasmodium vivax malaria. Trends Parasitol 23: 533–
539.
8. Mendis K, Sina BJ, Marchesini P, Carter R (2001) The neglected burden ofPlasmodium vivax malaria. Am J Trop Med Hyg 64: 97–106.
9. Mueller I, Galinski MR, Baird JK, Carlton JM, Kochar DK, et al. (2009) Keygaps in the knowledge of Plasmodium vivax, a neglected human malaria parasite.
Lancet Infect Dis 9: 555–566.
10. Price RN, Tjitra E, Guerra CA, Yeung S, White NJ, et al. (2007) Vivax malaria:neglected and not benign. Am J Trop Med Hyg 77: 79–87.
11. Carlton JM, Sina BJ, Adams JH (2011) Why Is Plasmodium vivax a neglectedtropical disease? PLoS Neglect Trop D 5: e1160.
12. PATH (2011) Staying the Course? Malaria Research and Development
in a Time of Economic Uncertainty. Seattle: PATH.
13. Bockarie MJ, Dagoro H (2006) Are insecticide-treated bednets more protectiveagainst Plasmodium falciparum than Plasmodium vivax-infected mosquitoes?
Malaria J 5: 15.
14. Luxemburger C, Perea WA, Delmas G, Pruja C, Pecoul B, et al. (1994)
Permethrin-impregnated bed nets for the prevention of malaria in schoolchil-dren on the Thai-Burmese border. T Roy Soc Trop Med H 88: 155–159.
15. Bousema T, Drakeley C (2011) Epidemiology and infectivity of Plasmodium
falciparum and Plasmodium vivax gametocytes in relation to malaria control and
elimination. Clin Microbiol Rev 24: 377–410.
16. Andrade B, Reis-Filho A, Souza-Neto S, Clarencio J, Camargo L, et al. (2010)Severe Plasmodium vivax malaria exhibits marked inflammatory imbalance.
Malaria J 9: 13.
17. Baird JK (2010) Eliminating malaria - all of them. Lancet 376: 1883–1885.
18. Yekutiel P (1980) III The Global Malaria Eradication Campaign. In: Klingberg
MA, editor. Eradication of infectious diseases: a critical study. Basel,Switzerland: Karger. pp. 34–88.
19. Barcus MJ, Basri H, Picarima H, Manyakori C, Sekartuti, et al. (2007)
Demographic risk factors for severe and fatal vivax and falciparum malariaamong hospital admissions in northeastern Indonesian Papua. Am J Trop Med
Hyg 77: 984–991.
20. Genton B, D’Acremont V, Rare L, Baea K, Reeder JC, et al. (2008) Plasmodium
vivax and mixed infections are associated with severe malaria in children: aprospective cohort study from Papua New Guinea. PLoS Med 5: e127.
21. Tjitra E, Anstey NM, Sugiarto P, Warikar N, Kenangalem E, et al. (2008)
Multidrug-resistant Plasmodium vivax associated with severe and fatal malaria: a
prospective study in Papua, Indonesia. PLoS Med 5: e128.
22. Anstey NM, Russell B, Yeo TW, Price RN (2009) The pathophysiology of vivax
malaria. Trends Parasitol 25: 220–227.
23. Kochar DK, Das A, Kochar SK, Saxena V, Sirohi P, et al. (2009) Severe
Plasmodium vivax malaria: a report on serial cases from Bikaner in northwestern
India. Am J Trop Med Hyg 80: 194–198.
24. Nurleila S, Syafruddin D, Elyazar IRF, Baird JK (2011) Morbidity and
mortality caused by falciparum and vivax malaria in hypo- to meso-endemic West
Sumba, Indonesia: a two year retrospective hospital-based study. Am J Trop
Med Hyg 85 (Suppl 451-A-516): 471.
25. Kochar DK, Saxena V, Singh N, Kochar SK, Kumar SV, et al. (2005)
Plasmodium vivax malaria. Emerg Infect Dis 11: 132–134.
26. Guerra CA, Howes RE, Patil AP, Gething PW, Van Boeckel TP, et al. (2010)
The international limits and population at risk of Plasmodium vivax transmission
in 2009. PLoS Neglect Trop D 4: e774.
27. MalERA (2011) A Research Agenda for Malaria Eradication: monitoring,
evaluation, and surveillance. PLoS Med 8: e1000400.
28. Gething P, Patil A, Smith D, Guerra C, Elyazar I, et al. (2011) A new world
malaria map: Plasmodium falciparum endemicity in 2010. Malaria J 10: 378.
29. Hay SI, Guerra CA, Gething PW, Patil AP, Tatem AJ, et al. (2009) A world
malaria map: Plasmodium falciparum endemicity in 2007. PLoS Med 6:
e1000048.
30. Hay SI, Snow RW (2006) The Malaria Atlas Project: developing global maps of
malaria risk. PLoS Med 3: e473.
31. Global Partnership to Roll Back Malaria, Johansson EW, Cibulskis RE,
Steketee RW (2010) Malaria funding and resource utilization: the first decade
of Roll Back Malaria. Geneva, Switzerland: World Health Organization on
behalf of the Roll Back Malaria Partnership Secretariat. 95 p.
32. McLaughlin C, Levy J, Noonan K, Rosqueta K (2009) Lifting the burden of
malaria: an investment guide for impact-driven philanthropy. Philadelphia:
The Center for High Impact Philanthropy. 1–79 p.
33. Zanzibar Malaria Control Program (2009) Malaria elimination in
Zanzibar: a feasibility assessment. Zanzibar, Tanzania: Zanzibar Ministry of
Health and Social Welfare.
34. Anonymous (2009) Kenya Malaria Monitoring and Evaluation Plan 2009–
2017. Nairobi, Kenya: Division of Malaria Control, Ministry of Public Health
and Sanitation, Government of Kenya.
35. World Bank (2009) World Development Report 2009: Reshaping Economic
Geography. Washington, DC. 383 p.
36. DFID (2010) Breaking the Cycle: Saving Lives and Protecting the Future. The
UK’s Framework for Results for Malaria in the Developing World. London,
UK. 65 p.
37. White NJ (2011) Determinants of relapse periodicity in Plasmodium vivax
malaria. Malaria J 10: 297.
38. Krotoski WA, Collins WE, Bray RS, Garnham PC, Cogswell FB, et al. (1982)
Demonstration of hypnozoites in sporozoite-transmitted Plasmodium vivax
infection. Am J Trop Med Hyg 31: 1291–1293.
39. Betuela I, Rosanas A, Kiniboro B, Stanisic D, Samol L, et al. (2011) Relapses
are contributing significantly to risk of P. vivax infection and disease in Papua
New Guinean children 1–5 years of age. Trop Med Int Health 16: 60–61.
40. Orjuela-Sanchez P, da Silva NS, da Silva-Nunes M, Ferreira MU (2009)
Recurrent parasitemias and population dynamics of Plasmodium vivax polymor-
phisms in rural Amazonia. Am J Trop Med Hyg 81: 961–968.
41. Battle KE, Van Boeckel T, Gething PW, Baird JK, Hay SI (2011) A review of
the geographical variations in Plasmodium vivax relapse rate. Am J Trop Med
Hyg 85 (Suppl 451-A-516): 470.
42. Mercereau-Puijalon O, Menard D (2010) Plasmodium vivax and the Duffy
antigen: a paradigm revisited. Transfus Clin Biol: 176–183.
43. Howes RE, Patil AP, Piel FB, Nyangiri OA, Kabaria CW, et al. (2011) The
global distribution of the Duffy blood group. Nat Commun 2: 266.
44. Guerra CA, Gikandi PW, Tatem AJ, Noor AM, Smith DL, et al. (2008) The
limits and intensity of Plasmodium falciparum transmission: implications for
malaria control and elimination worldwide. PLoS Med 5: e38.
45. Gething PW, Van Boeckel T, Smith DL, Guerra CA, Patil AP, et al. (2011)
Modelling the global constraints of temperature on transmission of Plasmodium
falciparum and P. vivax. Parasite Vector 4: 92.
Global Plasmodium vivax Endemicity in 2010
PLOS Neglected Tropical Diseases | www.plosntds.org 10 September 2012 | Volume 6 | Issue 9 | e1814

46. Guerra CA, Hay SI, Lucioparedes LS, Gikandi PW, Tatem AJ, et al. (2007)Assembling a global database of malaria parasite prevalence for the Malaria
Atlas Project. Malaria J 6: 17.
47. Diggle PJ, Tawn JA, Moyeed RA (1998) Model-based geostatistics. J Roy StatSoc C-App 47: 299–326.
48. Diggle PJ, Ribeiro PJ (2007) Model-based geostatistics; Bickel P, Diggle P,Fienberg S, Gather U, Olkin I et al., editors. New York: Springer. 228 p.
49. Gething PW, Patil AP, Hay SI (2010) Quantifying aggregated uncertainty in
Plasmodium falciparum malaria prevalence and populations at risk via efficientspace-time geostatistical joint simulation. PLoS Comput Biol 6: e1000724.
50. Patil AP, Gething PW, Piel FB, Hay SI (2011) Bayesian geostatistics in healthcartography: the perspective of malaria. Trends Parasitol 27: 245–252.
51. Lin E, Kiniboro B, Gray L, Dobbie S, Robinson L, et al. (2010) Differential
patterns of infection and disease with P. falciparum and P. vivax in young PapuaNew Guinean children. PLoS One 5: e9047.
52. Balk DL, Deichmann U, Yetman G, Pozzi F, Hay SI, et al. (2006) Determining
global population distribution: methods, applications and data. Adv Parasitol62: 119–156.
53. CIESIN/IFPRI/WB/CIAT (2007) Global Rural Urban Mapping Project(GRUMP) alpha: Gridded Population of the World, version 2, with urban
reallocation (GPW-UR). Available: http://sedac.ciesin.columbia.edu/gpw.
Palisades, New York, USA: Center for International Earth Science InformationNetwork, Columbia University/International Food Policy Research Institute/
The World Bank/and Centro Internacional de Agricultura Tropical.
54. Scharlemann JP, Benz D, Hay SI, Purse BV, Tatem AJ, et al. (2008) Global
data for ecology and epidemiology: a novel algorithm for temporal Fourier
processing. MODIS data. 3: e1408.
55. Hay SI, Tatem AJ, Graham AJ, Goetz SJ, Rogers DJ (2006) Global
environmental data for mapping infectious disease distribution. Adv Parasitol62: 37–77.
56. Smith DL, Guerra CA, Snow RW, Hay SI (2007) Standardizing estimates of
the Plasmodium falciparum parasite rate. Malaria J 6: 131.
57. Mueller I, Widmer S, Michel D, Maraga S, McNamara DT, et al. (2009) High
sensitivity detection of Plasmodium species reveals positive correlations betweeninfections of different species, shifts in age distribution and reduced local
variation in Papua New Guinea. Malar J 8: 41.
58. Miller LH, Mason SJ, Clyde DF, McGinniss MH (1976) Resistance factor toPlasmodium vivax in blacks Duffy-blood-group genotype, FyFy. New Engl J Med
295: 302–304.
59. Rosenberg R (2007) Plasmodium vivax in Africa: hidden in plain sight? TrendsParasitol 23: 193–196.
60. Patil A, Huard D, Fonnesbeck CJ (2010) PyMC: Bayesian stochastic modellingin Python. J Stat Softw 35: e1000301.
61. Price RN, Douglas NM, Anstey NM (2009) New developments in Plasmodium
vivax malaria: severe disease and the rise of chloroquine resistance. Curr OpinInfect Dis 22: 430–435.
62. Poespoprodjo JR, Fobia W, Kenangalem E, Lampah DA, Hasanuddin A, et al.(2009) Vivax malaria: a major cause of morbidity in early infancy. Clin Infect
Dis 48: 1704–1712.
63. Rogerson SJ, Carter R (2008) Severe vivax malaria: newly recognised orrediscovered. PLoS Med 5: e136.
64. Baird JK (2009) Resistance to therapies for infection by Plasmodium vivax. ClinMicrobiol Rev 22: 508–534.
65. Baird JK, Surjadjaja C (2011) Consideration of ethics in primaquine therapy
against malaria transmission. Trends Parasitol 27: 11–16.
66. Anonymous The Abuja Declaration and the Plan of Action: An extract from
The African Summit on Roll Back Malaria, Abuja, 25 April 2000 (WHO/
CDS/RBM/2000.17) Roll Back Malaria/World Health Organization. 1–11 p.
67. WHO (2005) Global strategic plan. Roll Back Malaria. 2005–2015. Geneva:
World Health Organization. 44 p.
68. RBMP (2008) The global malaria action plan for a malaria free world. Geneva,
Switzerland: Roll Back Malaria Partnership (R.B.M.P), World Health
Organization.
69. Harris I, Sharrock WW, Bain LM, Gray KA, Bobogare A, et al. (2010) A large
proportion of asymptomatic Plasmodium infections with low and sub-microscopic parasite densities in the low transmission setting of Temotu
Province, Solomon Islands: challenges for malaria diagnostics in an elimination
setting. 9: 254.
70. Katsuragawa TH, Soares Gil LH, Tada MS, de Almeida e Silva A, Neves
Costa JDA, et al. (2010) The dynamics of transmission and spatial distributionof malaria in riverside areas of Porto Velho, Rondonia, in the Amazon region
of Brazil. PLoS One 5.
71. da Silva NS, da Silva-Nunes M, Malafronte RS, Menezes MJ, D’Arcadia RR,et al. (2010) Epidemiology and control of frontier malaria in Brazil: lessons
from community-based studies in rural Amazonia. Trans Roy Soc Trop MedHyg 104: 343–350.
72. Steenkeste N, Rogers WO, Okell L, Jeanne I, Incardona S, et al. (2010) Sub-
microscopic malaria cases and mixed malaria infection in a remote area of highmalaria endemicity in Rattanakiri province, Cambodia: implication for malaria
elimination. 9: 108.
73. WHO (2010) Guidelines for the treatment of malaria. Second edition. Geneva,
Switzerland: World Health Organization. 194 p.
74. MalERA (2011) A Research Agenda for Malaria Eradication: modeling. PLoSMed 8: e1000403.
75. MalERA (2011) A Research Agenda for Malaria Eradication: diagnoses and
diagnostics. PLoS Med 8: 1–10.
76. Menard D, Barnadas C, Bouchier C, Henry-Halldin C, Gray LR, et al. (2010)
Plasmodium vivax clinical malaria is commonly observed in Duffy-negative
Malagasy people. P Natl Acad Sci USA 107: 5967–5971.
77. Mendes C, Dias F, Figueiredo J, Mora VG, Cano J, et al. (2011) Duffy negative
antigen is no longer a barrier to Plasmodium vivax – molecular evidences from the
African west coast (Angola and Equatorial Guinea). PLoS Neglect Trop D 5:
e1192.
78. Wurtz N, Lekweiry KM, Bogreau H, Pradines B, Rogier C, et al. (2011) Vivax
malaria in Mauritania includes infection of a Duffy-negative individual.
Malaria J 10: 336.
79. Ryan JR, Stoute JA, Amon J, Dunton RF, Mtalib R, et al. (2006) Evidence for
transmission of Plasmodium vivax among a Duffy antigen negative population in
western Kenya. Am J Trop Med Hyg 75: 575–581.
80. Koita OA, Sangare L, Sango HA, Dao S, Keita N, et al. (2012) Effect of
Seasonality and Ecological Factors on the Prevalence of the Four Malaria
Parasite Species in Northern Mali. J Trop Med 2012.
81. Pasvol G (2007) Eroding the resistance of Duffy negativity to invasion by
Plasmodium vivax? T Roy Soc Trop Med H 101: 953–954.
82. Cavasini CE, Mattos LCd, Couto AA, Bonini-Domingos CR, Valencia SH,
et al. (2007) Plasmodium vivax infection among Duffy antigen-negative
individuals from the Brazilian Amazon region: an exception? T Roy Soc
Trop Med H 101: 1042–1044.
83. Kasehagen LJ, Mueller I, Kiniboro B, Bockarie MJ, Reeder JC, et al. (2007)
Reduced Plasmodium vivax Erythrocyte Infection in PNG Duffy-Negative
Heterozygotes. PLoS One 2.
84. Sousa TN, Sanchez BAM, Ceravolo IP, Carvalho LH, Brito CFA (2007) Real-
time multiplex allele-specific polymerase chain reaction for genotyping of the
Duffy antigen, the Plasmodium vivax invasion receptor. Vox Sang 92: 373–380.
85. Cavasini CE, de Mattos LC, D’Almeida Couto AAR, D’Almeida Couto VSC,
Gollino Y, et al. (2007) Duffy blood group gene polymorphisms among malaria
vivax patients in four areas of the Brazilian Amazon region. Malaria J 6: 167.
86. Albuquerque SRL, Cavalcante FD, Sanguino EC, Tezza L, Chacon F, et al.
(2010) FY polymorphisms and vivax malaria in inhabitants of Amazonas State,
Brazil. Parasitol Res 106: 1049–1053.
87. Pampana E (1969) A textbook of malaria eradication. London: Oxford
University Press.
88. Macdonald G, Goeckel GW (1964) The malaria parasite rate and interruption
of transmission. Bull World Health Organ 31: 365–377.
89. Smith DL, Hay SI (2009) Endemicity response timelines for Plasmodium
falciparum elimination. Malaria J 8: 87.
90. Smith T, Maire N, Ross A, Penny M, Chitnis N, et al. (2008) Towards a
comprehensive simulation model of malaria epidemiology and control.
Parasitology 135: 1507–1516.
91. Chitnis N, Schapira A, Smith T, Steketee R (2010) Comparing the effectiveness
of malaria vector-control interventions through a mathematical model.
Am J Trop Med Hyg 83: 230–240.
92. Smith T, Killeen GF, Maire N, Ross A, Molineaux L, et al. (2006)
Mathematical modeling of the impact of malaria vaccines on the clinical
epidemiology and natural history of Plasmodium falciparum malaria: Overview.
Am J Trop Med Hyg 75: 1–10.
93. Ross A, Maire N, Sicuri E, Smith T, Conteh L (2011) Determinants of the cost-
effectiveness of intermittent preventive treatment for malaria in infants and
children. PLoS One 6: e18391.
94. Okell LC, Drakeley CJ, Bousema T, Whitty CJ, Ghani AC (2008) Modelling
the impact of artemisinin combination therapy and long-acting treatments on
malaria transmission intensity. PLoS Med 5: e226.
95. Griffin JT, Hollingsworth TD, Okell LC, Churcher TS, White M, et al. (2010)
Reducing Plasmodium falciparum malaria transmission in Africa: a model-based
evaluation of intervention strategies. PLoS Med 7: e1000324.
96. Ruwende C, Hill A (1998) Glucose-6-phosphate dehydrogenase deficiency and
malaria. J Mol Med 76: 581–588.
97. Cappellini MD, Fiorelli G (2008) Glucose-6-phosphate dehydrogenase
deficiency. Lancet 371: 64–74.
98. Douglas NM, Anstey NM, Angus BJ, Nosten F, Price RN (2010) Artemisinin
combination therapy for vivax malaria. Lancet Infect Dis 10: 405–416.
99. Douglas NM, Nosten F, Ashley EA, Phaiphun L, van Vugt M, et al. (2011)
Plasmodium vivax recurrence following falciparum and mixed species malaria:
risk factors and effect of antimalarial kinetics. Clin Infec Dis 52: 612–620.
100. WHO (2011) World malaria report 2011. Geneva: World Health Organiza-
tion. 246 p.
101. Rowe AK, Kachur SP, Yoon SS, Lynch M, Slutsker L, et al. (2009) Caution is
required when using health facility-based data to evaluate the health impact of
malaria control efforts in Africa. Malaria J 8: 209.
102. Gupta S, Gunter J, Novak R, Regens J (2009) Patterns of Plasmodium vivax and
Plasmodium falciparum malaria underscore importance of data collection from
private health care facilities in India. Malaria J 8: 227.
103. Hay SI, Gething PW, Snow RW (2010) India’s invisible malaria burden.
Lancet 376: 1716–1717.
104. Mueller I, Slutsker L, Tanner M (2011) Estimating the burden of malaria: The
need for improved surveillance. PLoS Med 8: e1001144.
Global Plasmodium vivax Endemicity in 2010
PLOS Neglected Tropical Diseases | www.plosntds.org 11 September 2012 | Volume 6 | Issue 9 | e1814

105. Hay SI, Okiro EA, Gething PW, Patil AP, Tatem AJ, et al. (2010) Estimating
the global clinical burden of Plasmodium falciparum malaria in 2007. PLoS Med
7: e1000290.
106. Nosten F, McGready R, Simpson JA, Thwai KL, Balkan S, et al. (1999) Effects
of Plasmodium vivax malaria in pregnancy. Lancet 354: 546–549.
107. Snounou G, White NJ (2004) The co-existence of Plasmodium: sidelights from
falciparum and vivax malaria in Thailand. Trends Parasitol 20: 333–339.
108. Maitland K, Williams TN, Bennett S, Newbold CI, Peto TEA, et al. (1996) The
interaction between Plasmodium falciparum and P. vivax in children on EspirituSanto island, Vanuatu. T Roy Soc Trop Med H 90: 614–620.
109. Maitland K, Williams TN, Newbold CI (1997) Plasmodium vivax and P.
falciparum: biological interactions and the possibility of cross-species immunity.Parasitol Today 13: 227–231.
110. The Malaria Atlas Project website (2012) Available: www.map.ox.ac.uk.Accessed 2012 Aug 12.
Global Plasmodium vivax Endemicity in 2010
PLOS Neglected Tropical Diseases | www.plosntds.org 12 September 2012 | Volume 6 | Issue 9 | e1814

1
Protocol S1 - Updating the global spatial limits of Plasmodium vivax malaria
transmission for 2010
S1.1 Overview
We have previously undertaken an exercise to define the geographical limits of P. vivax
transmission in the year 2009 [1], stratifying the world into areas considered risk-free or at-risk of
unstable (characterised by annual incidence less than 0.1‰) or stable (annual incidence
exceeding 0.1‰) transmission. The components used to generate these classifications are (i) an
initial identification of those countries housing autochthonous transmission within their borders
(the P. vivax malaria endemic countries, PvMECs); (ii) sub-nationally reported incidence records
from health management information systems (P. vivax annual parasite incidence data, PvAPI);
(iii) additional medical intelligence providing refined risk designations for specific regions such as
islands or cities; (iv) exclusion of risk in areas where the local annual temperature regime cannot
support transmission in an average year; and (v) further exclusion or downgrading of risk in
areas where extreme aridity is likely to limit transmission. For the present study we have
repeated this procedure in full to generate an updated version for 2010. In this supplementary
document we detail the data assembly procedures, how the various components are combined,
and the resulting limits definition.
S1.2 Identifying Countries Considered P. vivax Malaria Endemic
The first version of the P. vivax spatial limits map was developed upon a template consisting
of 95 PvMECs [1]. This list of countries was confirmed as up-to-date for the current 2010
iteration using the same approach and sources of international travel and health guidelines
described previously [1-4].
S1.3 Updating National Risk Extents with P. vivax Annual Parasite Incidence Data
PvAPI Data Processing
The PvAPI data by country were obtained from various sources (Table S1.1). The format in
which these data were made available varied considerably between countries. Ideally, all data
would have been available by administrative unit and by year, with each record representing the
estimated population for the administrative unit and the number of confirmed autochthonous
malaria cases by each human malaria parasite species, which would allow an estimation of
species-specific API. These requirements were sometimes not fulfilled completely and a number
of problems were encountered. First, population data by administrative unit were sometimes

2
unavailable, in which case these data were sourced separately (using the methods described in
S1.8) or extrapolated from preceding years to estimate PvAPI. Second, not all API data were
species-specific. In these cases, a parasite species ratio was inferred from alternative sources
and applied to provide an estimate of species-specific API. For example, such a ratio was often
available as a single national figure, in which case it was applied uniformly throughout the
country. Third, although a differentiation between microspcopy-confirmed and suspected cases
and between autochthonous and imported cases was often provided, in some cases it had to be
assumed that the data referred to confirmed, autochthonous cases.
PvAPI Data Summaries
Table S1.1 summarizes PvAPI data characteristics for all PvMECs for which these were
available. PvAPI data were not available for countries in the Africa+ region, with the exception of
Djibouti, Namibia, Saudi Arabia, South Africa, Swaziland and Yemen. For Botswana, risk was
constrained to northern districts based upon information from the travel and health guidelines
consulted [3,4]. For other countries in the Africa+ region, stable risk of P. vivax transmission was
assumed to be present throughout their territories. In total, PvAPI data were not available for 42
identified PvMECs, all in Africa+, with the exception of Uzbekistan.
The majority of the PvAPI data were obtained through personal communication with
individuals and institutions linked to national malaria control activities in each country. These are
cited in Table S1.1 and acknowledged on the MAP website
(http://www.map.ox.ac.uk/acknowledgements/). The specific aim was to collate data for the four
most recent years of reporting, ideally including 2010. For six countries the last year of reporting
available was 2010. For three countries, 2009 was the last year of reporting available, whilst
2008 and 2009 were the last years available for 24 and nine countries, respectively. For
Colombia, risk data could not be obtained after 2005. In terms of the length of the period of
reporting, one year of data was available for 14 countries, two years for nine countries, three
years for nine countries and four or more years for 22 countries (Table S1.1).
A total of 18 countries reported at ADMIN1 level and 29 at ADMIN2 level. For southern China,
Myanmar, Nepal and Peru, data were available at ADMIN3 level. In central and northern China
data were available at ADMIN1 level. Data for Namibia and Venezuela were a mixture of
ADMIN1 and ADMIN2 levels. In total, 17,893 administrative units in 53 countries were populated
with PvAPI data (Table S1.1).
Mapping PvAPI Data
In order to map PvAPI data consistently, they were reconciled to the 2009 version of the
Global Administrative Unit Layers (GAUL) data set, implemented by the Food and Agriculture
Organization of the United Nations (FAO) within the EC FAO Food Security for Action
Programme [5]. In some cases this reconciliation was not straightforward given differences in

3
national sub-divisions. In such cases, alternative sources and maps were used to guide
adequate matching of PvAPI data. For some countries, digital boundary files of the
administrative sub-divisions corresponding to PvAPI data were supplied. These countries were:
Afghanistan, Indonesia, Myanmar, Papua New Guinea, Peru, Solomon Islands, South Africa and
Vietnam. In these cases, coastlines remained the same as the supplied shape files whilst
borders between countries were made congruent with those in the GAUL dataset.
Classification of risk based on PvAPI data was done as described previously [1].
Classifications of extremely low, unstable transmission of P. vivax were assigned to
administrative units reporting PvAPI of less than 0.1 cases per 1,000 population per annum
(p.a.), and those reporting a PvAPI of ≥ 0.1 cases per 1,000 population p.a. were classified as
having stable transmission.
S1.4 Biological Masks of Transmission Exclusion
We adopt our earlier approach to excluding areas at risk based on environmental non-
suitability for P. vivax transmission [1]. For completeness, we describe in full here the rationale
and methods used.
Temperature Mask
In some regions, ambient temperature plays a key role in suppressing or precluding P. vivax
transmission via various effects on stages of the parasite and Anopheles vector life cycles - most
importantly by modulating the duration of the extrinsic incubation period of the parasite within the
vector and by affecting daily survival rates of the latter [6-10]. Here, we employ an existing
model [11] that evaluates temperature effects dynamically through time to generate for each
pixel an index of temperature suitability proportional to vectorial capacity, an established
biological metric of potential transmission intensity [12,13].
In brief, synoptic mean, maximum, and minimum monthly temperature records from 30-
arcsec (~1×1 km) spatial resolution climate surfaces [14] were converted to a continuous time
series using spline interpolation. This represented the mean temperature profile across an
average year. Diurnal variation [15] was incorporated by adding a sinusoidal component to the
time series with a wavelength of 24 hours and the amplitude driven by the difference between
the spline-smoothed monthly minimum and maximum values. Ambient temperature can limit or
preclude malaria transmission via a number of influences on components of the transmission
cycle. Although temperature effects have been described on the survival and emergence rates
of mosquito larvae [16,17], and vector feeding rates [18,19], the limiting effects of temperature
on transmission are most pronounced in the interaction between vector lifespan and the duration
of sporogony: the extrinsic incubation period during which the parasite matures into the
sporozoite life stage within the vector. For P. vivax transmission to be biologically feasible, a
cohort of anopheline vectors infected with the parasite must survive long enough for sporogony

4
to complete within their lifetime. We modelled daily vector survival rate as a continuous function
of local temperature regimes within each pixel using an established relationship drawn from a
series of observational and modelling studies [6-8]. Maximum vector lifespan was defined as 31
days since estimates of the longevity of the main dominant vectors [9] indicate that 99% of
anopheline vectors die in less than a month. The exceptions were areas that support the longer-
lived Anopheles sergentii and An. superpictus, where 62 days were more appropriate [20].
Sporogony is also strongly dependent on ambient temperature, so the time required for its
completion varies continuously as temperatures fluctuate across a year [10]. The dependence of
sporogony duration on temperature is classically expressed using a simple temperature-sum
model [21] in which sporogony occurs after a fixed number of degree-days over a minimum
temperature threshold for development.
The interaction between vector life span and sporogony duration was modelled for each pixel
based on an assumption of constant vector emergence and the continuous evaluation of the
expressions for daily vector survival and accumulation of degree days towards sporogony. A
system of difference equations was implemented that, in effect, simulated the emergence of
successive vector cohorts throughout the year, their declining population size as a function of
temperature, and whether any constituent vectors survived long enough to complete sporogony.
Those pixels in which no window existed across the year for the completion of sporogony were
classified as being at zero risk of transmission. The temperature mask resulting from this
process is shown in Figure S1.1.
Aridity Mask
A second driver of environmental suitability for P. vivax transmission is the availability of
moisture. We adopted our earlier approach [20] to mapping those areas where extreme aridity is
likely to prevent transmission by restricting vector survival and availability of oviposition sites
[22,23]. Such areas were identified using pixels defined as 'bare areas' by the GlobCover land-
cover classification product (ESA/ESA GlobCover Project, led by MEDIAS-France/POSTEL)
[24]. GlobCover products are derived from data provided by the Medium Resolution Imaging
Spectrometer (MERIS), on board the European Space Agency’s (ESA) ENVIronmental SATellite
(ENVISAT), for the period between December 2004 and June 2006, and are available at a
spatial resolution of 300 meters [24]. This layer was first resampled to a 1×1 km grid using a
majority filter, and all pixels classified as “bare areas” by GlobCover were overlaid onto the
PvAPI surface. The result is shown in Figure S1.2. The aridity mask was treated differently from
the temperature mask to allow for the possibility of the adaptation of human and vector
populations to arid environments [25,26]. A more conservative approach was taken whereby risk
was down-regulated by one class. In other words, GlobCover’s bare areas defined originally as
at stable risk by PvAPI were stepped down to unstable risk and those classified initially as
unstable were classed as malaria free.

5
S1.5 Risk Modulation Based on Medical Intelligence
We adopt the same data sources and assembly protocols for incorporation of medical
intelligence information as described previously [1]. For completeness, we detail these data and
methods again here.
Urban Transmission
Urban areas are less malarious than the surrounding rural environments due to the distinct
ecological conditions presented by man-made environments [27,28]. The extent to which
transmission is reduced will vary according to the local Anopheles species. Urbanisation has
been shown to reduce malaria transmission, measured by the entomological inoculation rate, by
an order of magnitude across Africa, due to reduced vector diversity and density, as well as
lower anopheline survival, biting and sporozoite rates in urban versus rural areas [29].
Anopheles darlingi, the main malaria vector in America, has shown itself to be similarly unsuited
to urban environments [30].
Urban malaria transmission is more entrenched in the Indian subcontinent because of the
presence of An. stephensi and, to a lesser extent, An. culicifacies, both recognised urban
malaria vectors [31]. No malaria vector is better adapted to urban environments than An.
stephensi, and this is due to its ability to breed in all types of artificial collections of water, such
as wells, pits, tanks and drains [32]. Anopheles culicifacies is less resilient to man-made
environments and is particularly affected by pollution of water sources [32,33]. Importantly, the
vector densities and sporozoite rates of both these species have been shown to decrease from
peri-urban to urban areas [32,34,35]. Despite this decrease, it is estimated that approximately
8% of reported malaria cases in India come from urban areas [36], with incidence often
surpassing the stable risk threshold. Reported annual parasite incidence (API) estimates
amongst 86 cities across India in 1993 ranged from 0 to 51.85 cases per 1,000 people per
annum (p.a.), with a median of 0.97 [37]. Seventy of these cities would have been classified as
supporting stable transmission according to the API threshold used in this paper (i.e. API ≥0.1
case per 1,000 people p.a.). In 2004, the API in an impoverished area located in the outskirts of
Kolkata was measured at 1.5 cases per 1,000 residents p.a., with the majority (97%) due to P.
vivax [38]. Since An. culicifacies seems to be more affected by the process of urbanisation, it
was assumed that urban malaria transmission is maintained mainly by An. stephensi (Figure
S1.4) as defined by the rules of risk modulation described below.
Risk Modulation in Specified Urban Areas
There are 59 cities cited as being malaria free in the two sets of international travel and health
guidelines consulted [39,40] (Table 1). In addition, urban areas in China, the Philippines and

6
Indonesia (specifically those located in Sumatra, Kalimantan, Nusa Tenggara Barat and
Sulawesi) are said to be malaria free. This is obviously not a comprehensive list of malaria free
cities but rather one restricted to main destinations of interest to travellers. Specific cities were
geo-positioned and their urban extents were identified using the Global Rural Urban Mapping
Project (GRUMP) urban extents layer [41]. In China, the Philippines and specified areas of
Indonesia all urban extents were identified and mapped. The resulting layer was overlaid on the
PvAPI layer and biological masks to identify the underlying risk of malaria. Those cities falling
within the range of An. stephensi [42] were also identified.
Of the 59 specified cities, 17 are in areas where P. vivax malaria transmission is absent as
defined by the PvAPI layer and the biological masks (e.g. highland areas). The urban extents of
the remaining 42 cities cover areas defined as unstable or stable transmission or both (Table
S1.2). Only eight of these cities fall within the range of An. stephensi: six in India (Bangalore,
Kolkata, Mumbai, Nagpur, Nashik and Pune) and two in Myanmar (Mandalay and Yangon;
Figure). In addition, cities in south-western Yunnan, China, also fall in areas inhabited by this
vector.
For all cities falling outside the range of An. stephensi, risk was classified as absent
throughout their urban extents. For those cities falling within the range of An. stephensi, risk was
assumed to be one level lower than the surrounding risk defined by PvAPI data and the
biological masks. This is to allow for the potential transmission of malaria by An. stephensi
combined with the transmission reducing effects of urban areas [32,34,35].
Risk Exclusion in Administrative Areas
Some sub-national administrative areas and territories are listed as being malaria free by the
international travel and health guidelines consulted [39,40]. These are shown in Table 2. Such
territories were mapped using the GAUL data set [43] and risk within them was assigned a
malaria free category, if not already classified as such by the PvAPI layer and the biological
masks. In addition to the territories listed in Table S1.3, the island of Socotra, in Yemen, has not
reported cases since 2005 after malaria elimination activities were initiated in 2000 [44]; this
island was assumed to be malaria free. Two further exclusions were those of the island of
Aneityum, in Vanuatu [45], and the Angkor Watt area, in Cambodia (corresponding to two
districts in Siem Reap province), which were classified as malaria free following personal
communication with malaria experts in these countries.

7
S1.6 Assembling the P. vivax Spatial Limits Map
Figure S1.3 summarises the different steps undertaken to assemble the P. vivax spatial limits
map. The various data sources described above were progressively applied on a geographical
information system with subsequent reductions in estimated area and population at risk. This
sequence is illustrated as different maps in Figure S1.5A-E
S1.7 Refining Regions of Unstable Transmission after MBG Modelling
In some regions within the estimated limits of stable transmission, the model-based
geostatistical predictions of PvPR1-99 were extremely low, either because of a dense abundance
of survey data reporting zero infections or, in Africa, because of very high coincident Duffy
negativity phenotype frequencies suppressing prevalence predictions. Such areas are not
appropriately described as at stable risk and so we defined a decision rule whereby pixels
predicted with high certainty (probability >0.9) of being less than 1% PvPR1-99 were identified and
assigned to the unstable class, thereby modifying the original transmission limits (Figure S1.5F).
These augmented mapped limits were combined with a 2010 population surface derived from
the Global Rural Urban Mapping Project (GRUMP) beta version [41,46] to estimate the number
of people living at no risk or at unstable or stable risk within each country and region.
S1.8 Predicting Populations at Risk of P. vivax in 2010
The Global Rural Urban Mapping Project (GRUMP) beta version provides gridded population
counts and population density estimates at 1×1 km spatial resolution for the years 1990, 1995
and 2000, both adjusted and unadjusted to the United Nations’ national population estimates
[41,46]. The adjusted population counts for the year 2000 were projected to 2010 by applying
the relevant urban and rural national growth rates by country [47] using methods described
previously [48]. The urban growth rates were applied to populations residing within the GRUMP-
defined urban extents [41], and the rural rates were applied elsewhere. National 2010 totals
were then adjusted to match those estimated by the United Nations [49].
The population grid was overlaid with the categorised limits map and the total population located
within each limits class was computed. An equivalent calculation was made of the land area
associated with each class, by replacing the population grid with one quantifying the surface
area of each pixel, taking into account the equirectangular map projection used. Additionally, the
population grid was combined with the uncertainty maps to provide a population-weighted index
of uncertainty (the product of the log of population density and the reciprocal of the probability of
correct class assignment).

8
Table S1.1. Summary of the P. vivax annual parasite incidence (PvAPI) data assembled for
each country. The data are grouped by the three global regions defined by Hay et al. [50]:
Africa+, America and Central and South East (CSE) Asia. ADMIN1, 2 or 3 refers to the
administrative division level (first, second or third level) at which data were available. The
number of risk units refers to how many administrative units, at the level specified, were
populated with actual data. Year start and Year end mark the start and end of the period for
which data were available.
Region Country Admin. level Risk units
Year start Year end Source
Africa+ Djibouti ADMIN1 5 2007 2009 [51]
Africa+ Namibia ADMIN1 & ADMIN2 30 2009 2009 [52]
Africa+ Saudi Arabia ADMIN1 13 2005 2006 [53]
Africa+ South Africa ADMIN2 257 2006 2009 [54]
Africa+ Swaziland ADMIN2 53 2007 2009 [55]
Africa+ Yemen ADMIN1 19 2002 2006 [53]
America Argentina ADMIN2 513 2008 2008 [56]
America Belize ADMIN1 6 2006 2006 [57]
America Bolivia ADMIN2 113 2008 2008 [58]
America Brazil ADMIN2 5510 2004 2008 [59]
America Colombia ADMIN2 1087 2005 2005 [60]
America Costa Rica ADMIN2 81 2006 2006 [61]
America Ecuador ADMIN2 220 2005 2008 [62]
America El Salvador ADMIN1 14 2006 2006 [57]
America French Guiana ADMIN2 21 2006 2006 [63]
America Guatemala ADMIN1 22 2006 2006 [64]
America Guyana ADMIN1 10 2004 2007 [65]
America Honduras ADMIN2 291 2005 2008 [66]
America Mexico ADMIN2 2454 2005 2008 [67]
America Nicaragua ADMIN1 17 2004 2007 [68]
America Panama ADMIN2 68 2006 2007 [69]
America Paraguay ADMIN2 219 2008 2008 [70]
America Peru ADMIN3 1828 2005 2008 [71]
America Suriname ADMIN1 10 2008 2008 [72]
America Venezuela ADMIN1 & ADMIN2 30 2004 2008 [73]
CSE Asia Afghanistan ADMIN2 398 2005 2008 [53]
CSE Asia Azerbaijan ADMIN1 73 2005 2008 [74]
CSE Asia Bangladesh ADMIN2 64 2007 2008 [75]
CSE Asia Bhutan ADMIN1 20 2004 2010 [76,77]
CSE Asia Cambodia ADMIN1 26 2005 2008 [78]
CSE Asia China ADMIN1 & ADMIN3 263 2003 2007 [79]
CSE Asia Georgia ADMIN2 79 2005 2010 [80,81]

9
Region Country Admin. level Risk units
Year start Year end Source
CSE Asia India ADMIN2 574 2004 2007 [82]
CSE Asia Indonesia ADMIN2 346 2005 2008 [83]
CSE Asia Iran ADMIN2 283 2007 2008 [53]
CSE Asia Iraq ADMIN2 11 2005 2008 [53]
CSE Asia Lao PDR ADMIN2 139 2006 2008 [84]
CSE Asia Kyrgyzstan ADMIN1 1 2008 2008 [3,4]
CSE Asia Malaysia ADMIN1 15 2003 2010 [85,86]
CSE Asia Myanmar ADMIN3 325 2006 2008 [87]
CSE Asia Nepal ADMIN3 75 2005 2010 [88,89]
CSE Asia Pakistan ADMIN2 119 2005 2008 [53]
CSE Asia Papua New Guinea ADMIN2 87 2005 2007 [90]
CSE Asia Philippines ADMIN2 82 2004 2007 [91]
CSE Asia Rep. of Korea ADMIN2 239 2005 2008 [92]
CSE Asia Solomon Islands ADMIN1 10 2003 2007 [93]
CSE Asia Sri Lanka ADMIN2 25 2006 2010 [94]
CSE Asia Tajikistan ADMIN2 56 2005 2008 [95]
CSE Asia Thailand ADMIN1 76 2006 2010 [96]
CSE Asia Timor-Leste ADMIN1 13 2008 2008 [97]
CSE Asia Turkey ADMIN2 926 2008 2008 [98]
CSE Asia Vanuatu ADMIN1 6 2003 2007 [99]
CSE Asia Viet Nam ADMIN2 671 2005 2008 [100]

10
Table S1.2 Cities cited as being malaria free by the sources consulted [39,40]. Defined risk
refers to the malaria risk categories defined by the PvAPI layer and biological masks; note that
urban extents often cover more than one category. Modified risk refers to the new malaria risk
categories assigned according to the rules described in the text. Cities where the defined risk
was “free” were not affected by these rules.
Country City Defined risk Modified risk
Azerbaijan Baku Free, unstable Free
Bangladesh Dhaka Free -
Belize Belize Unstable Free
Bolivia La Paz Free -
Botswana Gaborone Free -
Cambodia Phnom Penh Free, unstable Free
Colombia Bogota Free, unstable Free
Colombia Cartagena Free, unstable Free
Costa Rica Puerto Limon Unstable Free
Ecuador Guayaquil Unstable, stable Free
Ecuador Quito Free -
Eritrea Asmara Stable Free
Ethiopia Addis Ababa Stable, free Free
French Guiana Cayenne Free -
Georgia Tblisi Unstable, free Free
Guatemala Antigua Free -
Guatemala Guatemala Free -
Honduras San Pedro Sula Unstable Free
Honduras Tegucigalpa Unstable, free Free
India Bangalore Stable Unstable
India Kolkata Unstable, stable Free, unstable
India Mumbai Stable, unstable Unstable, free
India Nagpur Stable Unstable
India Nasik Unstable Free
India Pune Unstable Free
Indonesia Jakarta Free -
Iraq Baghdad Free -
Iraq Ramadi Free -
Iraq Tikrit Free -
Kenya Nairobi Stable Free
Kyrgyzstan Bishkek Free -
Laos Vientiane Free, unstable Free
Myanmar Mandalay Free, stable, unstable Free, unstable
Myanmar Yangon Unstable Free

11
Nepal Kathmandu Free -
Nicaragua Managua Unstable Free
Panama Panama Unstable Free
Peru Cuzco Free -
Saudi Arabia Jeddah Unstable Free
Saudi Arabia Mecca Unstable Free
Saudi Arabia Medina Unstable Free
Saudi Arabia Riyadh Free -
Saudi Arabia Ta'if Unstable Free
Suriname Paramaribo Free -
Thailand Bangkok Free, unstable Free
Thailand Chiang Mai Stable Free
Thailand Chiang Rai Unstable Free
Thailand Koh Phangan Stable Free
Thailand Koh Samui Stable Free
Thailand Pattaya Unstable Free
Viet Nam Can Tho Free, unstable Free
Viet Nam Da Nang Unstable Free
Viet Nam Haiphong Free -
Viet Nam Hanoi Free, unstable Free
Viet Nam Ho Chi Minh City Unstable Free
Viet Nam Hue Free, unstable Free
Viet Nam Nha Trang Free, unstable Free
Viet Nam Qui Nhon Unstable Free
Yemen Sana’a Unstable Free
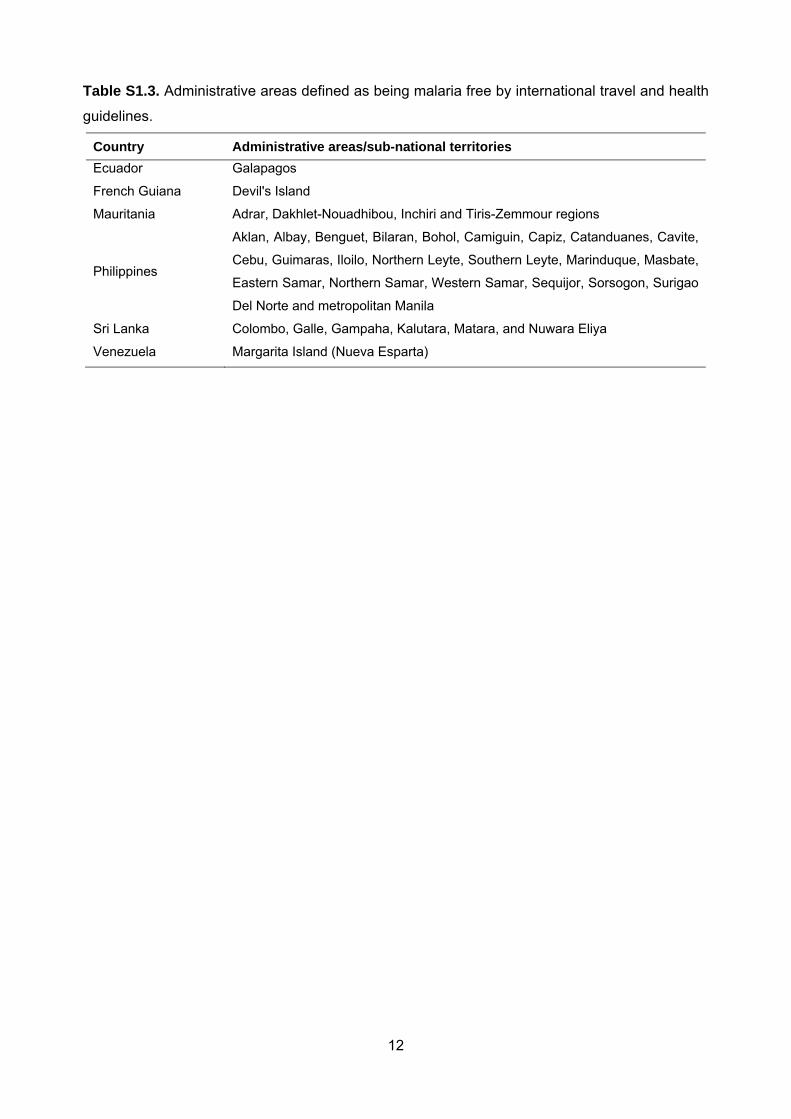
12
Table S1.3. Administrative areas defined as being malaria free by international travel and health
guidelines.
Country Administrative areas/sub-national territories
Ecuador Galapagos
French Guiana Devil's Island
Mauritania Adrar, Dakhlet-Nouadhibou, Inchiri and Tiris-Zemmour regions
Philippines
Aklan, Albay, Benguet, Bilaran, Bohol, Camiguin, Capiz, Catanduanes, Cavite,
Cebu, Guimaras, Iloilo, Northern Leyte, Southern Leyte, Marinduque, Masbate,
Eastern Samar, Northern Samar, Western Samar, Sequijor, Sorsogon, Surigao
Del Norte and metropolitan Manila
Sri Lanka Colombo, Galle, Gampaha, Kalutara, Matara, and Nuwara Eliya
Venezuela Margarita Island (Nueva Esparta)

13
Figure S1.1. Environmental suitability for transmission of P. vivax as defined by
temperature. Areas shaded green are those in which no windows exist across an average year
in which the annual temperature regime is likely to support the presence of infectious vectors.
The temperature suitability model is described in full elsewhere [11].

14
Figure S1.2. Environmental suitability for transmission of P. vivax as defined by extreme
aridity. Areas shaded grey are those classified as bare areas by the GlobCover land cover
product, interpreted as lacking sufficient moisture to support populations of Anopheles
necessary for transmission.

15
Figure S1.3. Flow chart of the various exclusion layers used to derive the final map. Area
(expressed in km2) and population at risk (PAR; expressed in millions) excluded are shown at
each step to illustrate how these were reduced progressively.

16
Figure S1.4. Distribution of An. stephensi [42] (hatched area) and location of the eight cities
falling within this range (light blue circles) overlaid on the PvAPI/biological masks-defined P.
vivax limits of transmission.

17

18
Figure S1.5. Map sequence illustrating the different exclusion layers applied. A = all
regions of the 95 P. vivax endemic countries; B = downgrading or exclusion of risk informed by
annual parasite incidence data (PvAPI); C = additional exclusion of risk informed by the
biological temperature mask; D = additional downgrading or exclusion of risk informed by the
aridity mask; E = additional downgrading or exclusion of risk informed by medical intelligence
and international travel and health guidelines; F = the final limits definition after additionally
downgrading risk in stable areas predicted to have very low prevalence by the MBG model.
Stable transmission is shown in red, unstable transmission in pink and P. vivax malaria free
areas in grey.

19
References
1. Guerra CA, Howes RE, Patil AP, Gething PW, Van Boeckel TP, et al. (2010) The international
limits and population at risk of Plasmodium vivax transmission in 2009. PLoS Neglect Trop
D 4: e774.
2. Gething P, Patil A, Smith D, Guerra C, Elyazar I, et al. (2011) A new world malaria map:
Plasmodium falciparum endemicity in 2010. Malaria J 10: 378.
3. C.D.C. (2009) CDC Health information for international travel 2010. Atlanta, United States of
America: Centers for Disease Control and Prevention, U.S. Department of Health and
Human Services.
4. W.H.O. (2010) International travel and health: situation as on 1 January 2010. Geneva,
Switzerland: World Health Organization.
5. F.A.O. (2009) The Global Administrative Unit Layers (GAUL): Technical Aspects. URL,
http://www.fao.org/geonetwork. Rome, Italy: EC-FAO Food Security Programme (ESTG),
Food and Agriculture Organization of the United Nations.
6. Boyd MF (1949) Epidemiology: factors related to the definitive host. In: Boyd MF, editor.
Malariology (Volume 1). London, U.K.: W.B. Saunders Company. pp. 608-697.
7. Horsfall WR (1955) Mosquitoes: their bionomics and relation to disease. New York, U.S.A.:
Hafner Publishing Company.
8. Clements AN, Paterson GD (1981) The analysis of mortality and survival rates in wild
populations of mosquitoes. J Appl Ecol 18: 373-399.
9. Kiszewski A, Mellinger A, Spielman A, Malaney P, Sachs SE, et al. (2004) A global index
representing the stability of malaria transmission. Am J Trop Med Hyg 70: 486-498.
10. Nikolaev BP (1935) [The influence of temperature on the development of the malaria
parasite in the mosquito]. Tr Paster Inst Epidem Bakt (Leningr) 2: 108.
11. Gething PW, Van Boeckel T, Smith DL, Guerra CA, Patil AP, et al. (2011) Modelling the
global constraints of temperature on transmission of Plasmodium falciparum and P. vivax.
Parasite Vector 4: 92.
12. Garrett-Jones C (1964) Prognosis for interruption of malaria transmission through
assessment of the mosquito's vectorial capacity. Nature 204: 1173-1175.
13. Smith DL, McKenzie FE (2004) Statics and dynamics of malaria infection in Anopheles
mosquitoes. Malaria J 3: 13.
14. Hijmans RJ, Cameron SE, Parra JL, Jones PG, Jarvis A (2005) Very high resolution
interpolated climate surfaces for global land areas. Int J Climatology 25: 1965-1978.
15. Paaijmans KP, Blanford S, Bell AS, Blanford JI, Read AF, et al. (2010) Influence of climate
on malaria transmission depends on daily temperature variation. P Natl Acad Sci USA 107:
15135-15139.
16. Ross R (1911) The prevention of malaria. London: John Murray.

20
17. Ahumada JA, Lapointe D, Samuel MD (2004) Modeling the population dynamics of Culex
quinquefasciatus (Diptera: Culicidae), along an elevational gradient in Hawaii. J Med
Entomol 41: 1157-1170.
18. Detinova TS (1962) Age-grouping methods in Diptera of medical importance, with special
reference to some vectors of malaria. Geneva: World Health Organization.
19. Mahmood F, Reisen WK (1981) Duration of the gonotrophic cycle of Anopheles culicifacies
Giles and Anopheles stephensi Liston, with observations on reproductive activity and
survivorship during winter in Punjab province, Pakistan. Mosq News 41: 41-50.
20. Guerra CA, Gikandi PW, Tatem AJ, Noor AM, Smith DL, et al. (2008) The limits and intensity
of Plasmodium falciparum transmission: implications for malaria control and elimination
worldwide. PLoS Med 5: e38.
21. Macdonald G (1957) The epidemiology and control of malaria. London: Oxford University
Press.
22. Shililu JI, Grueber WB, Mbogo CM, Githure JI, Riddiford LM, et al. (2004) Development and
survival of Anopheles gambiae eggs in drying soil: influence of the rate of drying, egg age,
and soil type. J Am Mosq Control Assoc 20: 243–247.
23. Gray EM, Bradley TJ (2005) Physiology of desiccation resistance in Anopheles gambiae and
Anopheles arabiensis. Am J Trop Med Hyg 73: 553-559.
24. Bicheron P, Defourny P, Brockmann C, Vancutsem C, Huc M, et al. (2008) GLOBCOVER:
Products description and validation report Toulouse, France MEDIAS-France.
25. Omer SM, Cloudsley-Thomson JL (1968) Dry season biology of Anopheles gambiae Giles in
Sudan. Nature 217: 879-880.
26. Omer SM, Cloudsley-Thompson JL (1970) Survival of female Anopheles gambiae Giles
through a 9-month dry season in Sudan. B World Health Organ 42: 319-330.
27. Hay SI, Guerra CA, Tatem AJ, Atkinson PM, Snow RW (2005) Urbanization, malaria
transmission and disease burden in Africa. Nat Rev Microbiol 3: 81-90.
28. Tatem A, Guerra C, Kabaria C, Noor A, Hay S (2008) Human population, urban settlement
patterns and their impact on Plasmodium falciparum malaria endemicity. Malaria J 7: 218.
29. Hay S, Guerra C, Tatem A, Atkinson P, Snow R (2005) Urbanization, malaria transmission
and disease burden in Africa. 3: 81 - 90.
30. de Castro MC, Monte-Mor RL, Sawyer DO, Singer BH (2006) Malaria risk on the Amazon
frontier. P Natl Acad Sci USA 103: 2452-2457.
31. Batra CP, Reuben R, Das PK (1979) Urban malaria vectors in Salem, Tamil Nadu: biting
rates on man and cattle. Indian J Med Res 70 Suppl: 103-113.
32. Sharma SN, Subbarao SK, Choudhury DS, Pandey KC (1993) Role of An. culicifacies and
An. stephensi in malaria transmission in urban Delhi. Indian Journal of Malariology 30:
155-168.

21
33. Batra CP, Adak T, Sharma VP, Mittal PK (2001) Impact of urbanization on bionomics of An.
culicifacies and An. stephensi in Delhi. Indian J Malariol 38: 61-75.
34. Sharma RS (1995) Urban malaria and its vectors Anopheles stephensi and Anopheles
culicifacies (Diptera : Culicidae) in Gurgaon, India. SE Asian J Trop Med 26: 172-176.
35. Nalin D, Mahood F, Rathor H, Muttalib A, Sakai R, et al. (1985) A point survey of periurban
and urban malaria in Karachi. J Trop Med Hyg 88: 7-15.
36. National Vector Borne Disease Control Programme (2009) Urban Malaria Scheme (UMS).
Delhi.
37. Akhtar R, Dutt AK, Wadhwa V (2009) Malaria Resurgence in Urban India: Lessons from
Health Planning Strategies. In: Akhtar R, Dutt AK, Wadhwa V, editors. Malaria In South
Asia: Eradication And Resurgence During The Second Half Of The Twentieth Century
(advances In Asian Human-environmental Research). London: Springer. pp. 141-155.
38. Sur D, von Seidlein L, Manna B, Dutta S, Deb AK, et al. (2006) The malaria and typhoid
fever burden in the slums of Kolkata, India: data from a prospective community-based
study. Trans Roy Soc Trop Med Hyg 100: 725-733.
39. Centers for Disease Control and Prevention (2009) CDC Health Information for International
Travel 2010. Atlanta: U.S. Department of Health and Human Services, Public Health
Service.
40. WHO (2009) International Travel and Health: Situation as on 1 January 2009. Geneva:
World Health Organization.
41. Balk DL, Deichmann U, Yetman G, Pozzi F, Hay SI, et al. (2006) Determining global
population distribution: methods, applications and data. Adv Parasitol 62: 119-156.
42. Hay SI, Sinka ME, Okara RM, Kabaria CW, Mbithi PM, et al. (2010) Developing maps of the
dominant Anopheles vectors of human malaria. PLoS Med 7: e1000209.
43. FAO (2008) The Global Administrative Unit Layers (GAUL): Technical Aspects. Rome: Food
and Agriculture Organization of the United Nations, EC-FAO Food Security Programme
(ESTG).
44. EMRO (2008) Technical discussion on malaria elimination in the Eastern Mediterranean
Region: vision, requirements and strategic outline. World Health Organization Regional
Office for the Eastern Mediterranean.
45. Kaneko A, Taleo G, Kalkoa M, Yamar S, Kobayakawa T, et al. (2000) Malaria eradication on
islands. Lancet 356: 1560-1564.
46. CIESIN/IFPRI/WB/CIAT (2007) Global Rural Urban Mapping Project (GRUMP) alpha:
Gridded Population of the World, version 2, with urban reallocation (GPW-UR). Available at
http://sedac.ciesin.columbia.edu/gpw. Palisades, New York, USA: Center for International
Earth Science Information Network, Columbia University / International Food Policy
Research Institute / The World Bank / and Centro Internacional de Agricultura Tropical.

22
47. U.N.P.D. (2007) World urbanization prospects: population database. http://esa.un.org/unup/.
New York: United Nations Population Division (U.N.D.P).
48. Hay SI, Noor AM, Nelson A, Tatem AJ (2005) The accuracy of human population maps for
public health application. Trop Med Int Health 10: 1073-1086.
49. U.N.P.D. (2008) World population prospects: the 2008 revision population database.
http://esa.un.org/unpp/. New York: United Nations Population Division (U.N.D.P).
50. Hay SI, Guerra CA, Gething PW, Patil AP, Tatem AJ, et al. (2009) A world malaria map:
Plasmodium falciparum endemicity in 2007. PLoS Med 6: e1000048.
51. M.d.l.S. (2010) Personal communication from Hawa H. Guessod, November 2010. Djibouti
Ville, Djibouti: Programme National de Lutte Contre le Paludisme, Ministère de la Sante.
52. Snow RW, Alegana VA, Makomva K, Reich A, Uusiku P, et al. (2010) Estimating the
distribution of malaria in Namibia in 2009: assembling the evidence and modeling risk.
Windhoek, Namibia: Ministry of Health and Social Services, Republic of Namibia and the
Malaria Atlas Project.
53. W.H.O. / E.M.R.O. (2009) Direct communication from World Health Organization Regional
Office for the Eastern Mediterranean, April 2009. Cairo, Egypt: World Health Organization /
Regional Office for the Eastern Mediterranean.
54. M.R.C. (2010) Personal communication from Rajendra Maharaj, February 2010. Durban,
South Africa: Malaria Research Program, Medical Research Council.
55. M.o.H. (2010) The Kingdom of Swaziland. Malaria Elimination Strategy 2008-2015. Manzini,
Swaziland: National Malaria Control Programme, Ministry of Health.
56. WHO (2010) Personal communication. January 2010.
57. PAHO (2009) Status of Malaria in the Americas, 1994-2007: A Series of Data Tables.
http://www.paho.org/english/hcp/hct/mal/malaria.htm. November 2009.
58. M.d.S.D. (2009) Personal communication from Juan Carlos Arraya, December 2009. La Paz,
Bolivia: Programa Nacional de Control y Vigilancia de la Malaria, Ministerio de Salud y
Deportes.
59. M.d.S. (2009) Personal communication from Cor Jesus Fontes, January 2009. Brasília,
Brazil: Coordenação Geral do Programa Nacional de Controle da Malária, Ministério da
Saúde.
60. M.d.l.P.S. (2007) Personal communication from María Victoria Valero, January 2007.
Bogotá, Colombia: Instituto Nacional de Salud, Ministerio de la Protección Social.
61. Ministerio de Salud de Costa Rica (2009) Vigilancia de la Salud.
http://www.ministeriodesalud.go.cr/index.php/inicio-estadisticas-vigilancia-salud-ms.
November 2009.
62. M.d.S.P. (2009) Personal communication from Luis Enrique Castro, April 2009. Guayaquil,
Ecuador: Programa Nacional de Control de la Malaria (SNEM), Ministerio de Salud
Pública.

23
63. W.H.O. / P.A.H.O. (2007) Personal communication from Rainier Escalada, August 2007.
Washington D.C., United States of America: World Health Organization / Pan American
Health Organization (Regional Office for the Americas).
64. W.H.O. / P.A.H.O. (2009) Status of malaria in the Americas, 1994-2007: a series of data
tables. URL, http://www.paho.org/English/AD/DPC/CD/mal-americas-2007.pdf. Accessed
November 2009. Washington D.C., United States of America: World Health Organization /
Pan American Health Organization (Regional Office for the Americas).
65. M.o.H. (2008) Statistical bulletins 2008, 2007 and 2006. URL,
http://www.health.gov.gy/info_publications.php. Accessed November 2009. Georgetown,
Guyana: Statistics Unit, Ministry of Health.
66. S.d.S. (2009) Personal communication from anonymous, October 2009. Tegucigalpa,
Honduras: Programa Nacional de Malaria, Secretaría de Salud.
67. Hernandez JE (2009) Personal communication. October 2009.
68. M.d.S. (2009) Boletines epidemiologicos. URL,
http://www.minsa.gob.ni/vigepi/html/boletin.html. Accessed November 2009. Managua,
Nicaragua: Dirección de Vigilancia Epidemiológica, Ministerio de Salud.
69. M.d.S. (2009) Personal communication from Jose E. Calzada, June 2009. Panama City,
Panama: Departamento de Control de Vectores, Ministerio de Salud.
70. Calzada J (2009) Personal communication. June 2009.
71. M.d.S. (2009) Personal communication from Angel Rosas, August 2009. Lima, Peru:
Dirección General de Salud de las Personas, Ministerio de Salud.
72. W.H.O. (2010) Information from the Global Malaria Program, World Health Organization,
January 2010. Geneva, Switzerland: World Health Organization.
73. M.d.P.P.p.l.S. (2008) Personal communication from Marcos de Donato, December 2008.
Caracas, Venezuela: Ministerio del Poder Popular para la Salud.
74. Gasimov E (2009) Personal communication. April 2009. Baku: WHO Regional Office for
Europe.
75. M.o.H.F.W. (2009) Personal communication from Nazrul Islam, September 2009. Dhaka,
Bangladesh: Malaria and Parasitic Disease Control Units - Directorate General of Health
Services, Ministry of Health and Family Welfare.
76. M.o.H. (2010) Personal communication from Karma Lhazeen, March 2010. Gelephu,
Bhutan: Vector-borne Disease Control Programme, Ministry of Health.
77. Yangzom T, Gyeltshen S (2011) Personal communication. Gelephu Vector-Borne Disease
Control Programme, Department of Public Health and Ministry of Health.
78. M.o.H. (2009) Personal communication from Doung Socheat, December 2009. Phnom Penh,
Cambodia: National Centre for Parasitology, Entomology and Malaria Control (CNM),
Ministry of Health.

24
79. W.H.O. / W.P.R.O. (2009) Malaria epidemiology, China. URL,
http://www.wpro.who.int/sites/mvp/epidemiology/malaria/. Accessed November 2009.
Manila, Philippines: World Health Organization / Regional Office for the Western Pacific.
80. Iosava M, Kalandadze I (2011) Personal communication. Tbilisi: Outbreak and Bioterrorism
Response Division, National Center for Disease Control and Public Health.
81. Kurtsikashvili G (2011) Personal communication. Tbilisi: World Health Organization Country
Office in Georgia.
82. I.C.M.R. (2009) Personal communication from Aditya P. Dash, January 2009. Delhi, India:
National Institute of Malaria Research, Indian Council of Medical Research.
83. M.o.H. (2009) Personal communication from Rita Kusriastuti, September 2009. Jakarta,
Indonesia: Directorate of Vector-borne Diseases, Ministry of Health.
84. M.o.H. (2009) Stratification of malaria zones in Lao PDR 2009. Vientiane, Lao People's
Democratic Republic: Center of Malariology, Parasitology and Entomology (CMPE),
Ministry of Health.
85. W.H.O. / W.P.R.O. (2009) Malaria epidemiology, Malaysia. URL,
http://www.wpro.who.int/sites/mvp/epidemiology/malaria/. Accessed November 2009.
Manila, Philippines: World Health Organization / Regional Office for the Western Pacific.
86. Rundi C (2011) Personal communication. Disease Control Division, Ministry of Health,
Malaysia.
87. W.H.O. / S.E.A.R.O. (2010) Personal communication from Rakesh M. Rastogi, January
2010. New Delhi, India: World Health Organization / Regional Office for South-East Asia.
88. M.o.H.P. (2009) Personal communication from Suman Thapa, August 2009. Kathmandu,
Nepal: Epidemiology and Disease Control Division, Department of Health Services,
Ministry of Health and Population.
89. Pokhrel N (2011) Personal communication. Kathmandu Department of Health Service
90. W.H.O. (2009) Information from the Global Malaria Program, World Health Organization,
February 2009. Geneva, Switzerland: World Health Organization.
91. D.o.H. (2009) Personal communication from Dorina G. Bustos and Cristina Galang, July
2009. Muntinlupa City, Philippines: Research Institute for Tropical Medicine and Malaria
Control Program, Department of Health.
92. Kim JY (2009) Personal communication. September 2009.
93. W.H.O. / W.P.R.O. (2009) Malaria epidemiology, Solomon Islands. URL,
http://www.wpro.who.int/sites/mvp/epidemiology/malaria/. Accessed November 2009.
Manila, Philippines: World Health Organization / Regional Office for the Western Pacific.
94. Galappaththy GN (2011) Personal communication. Colombo: National Malaria Control
Programme, Ministry of Health.
95. W.H.O. (2009) Personal communication from Nargis Saparova, October 2009. Dushanbe,
Tajikistan: World Health Organization / Country Office in Tajikistan.

25
96. Poungsombat S, Ketkaew J, Satimai W (2010) Personal communication. Nonthaburi,
Thailand: Bureau of Vector Borne Diseases, Department of Disease Control, Ministry of
Public Health.
97. M.o.H. (2009) Personal communication from Johanes Don Bosco, October 2009. Dili, Timor-
Leste Division of Communicable Diseases, Ministry of Health.
98. Topluoğlu S (2009) Personal communication. Ankara Malaria Control Department, Ministry
of Health.
99. W.H.O. / W.P.R.O. (2009) Malaria epidemiology, Vanuatu. URL,
http://www.wpro.who.int/sites/mvp/epidemiology/malaria/. Accessed November 2009.
Manila, Philippines: World Health Organization / Regional Office for the Western Pacific.
100. M.o.H. (2008) Personal communication from Nguyen Manh Hung, December 2008. Ha Noi
City, Vietnam: National Institute of Malariology, Parasitology and Entomology (NIMPE),
Ministry of Health.
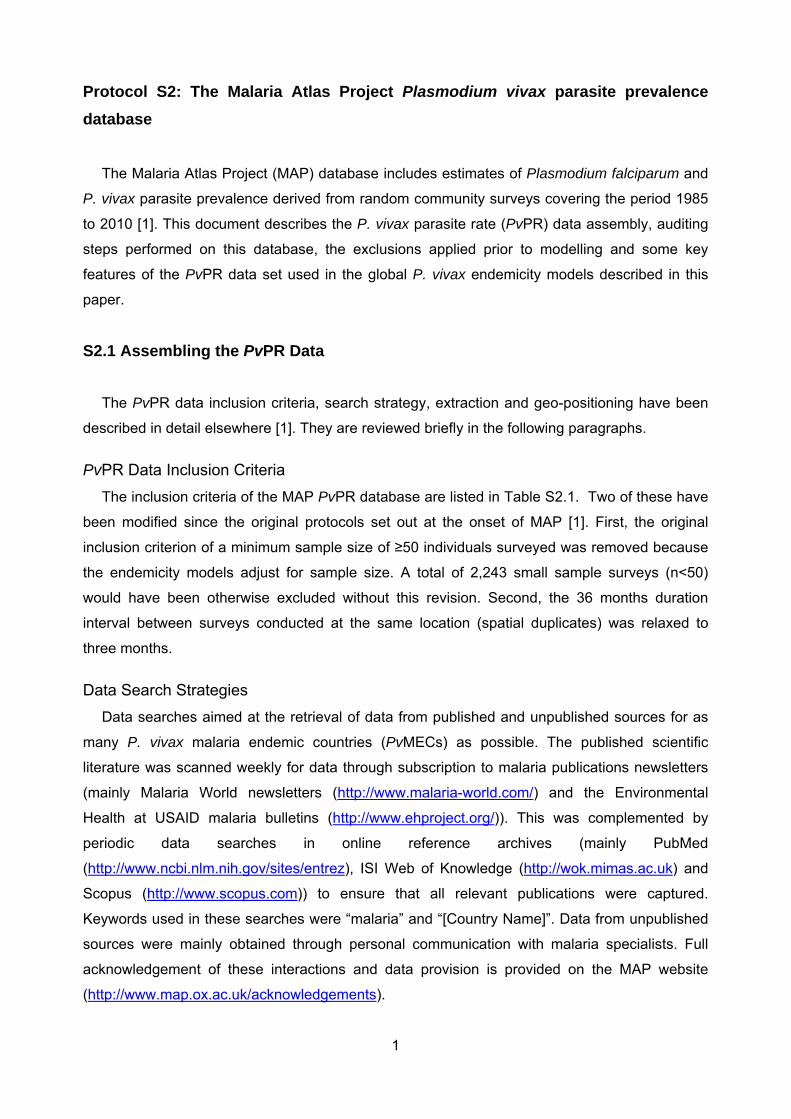
1
Protocol S2: The Malaria Atlas Project Plasmodium vivax parasite prevalence
database
The Malaria Atlas Project (MAP) database includes estimates of Plasmodium falciparum and
P. vivax parasite prevalence derived from random community surveys covering the period 1985
to 2010 [1]. This document describes the P. vivax parasite rate (PvPR) data assembly, auditing
steps performed on this database, the exclusions applied prior to modelling and some key
features of the PvPR data set used in the global P. vivax endemicity models described in this
paper.
S2.1 Assembling the PvPR Data
The PvPR data inclusion criteria, search strategy, extraction and geo-positioning have been
described in detail elsewhere [1]. They are reviewed briefly in the following paragraphs.
PvPR Data Inclusion Criteria
The inclusion criteria of the MAP PvPR database are listed in Table S2.1. Two of these have
been modified since the original protocols set out at the onset of MAP [1]. First, the original
inclusion criterion of a minimum sample size of ≥50 individuals surveyed was removed because
the endemicity models adjust for sample size. A total of 2,243 small sample surveys (n<50)
would have been otherwise excluded without this revision. Second, the 36 months duration
interval between surveys conducted at the same location (spatial duplicates) was relaxed to
three months.
Data Search Strategies
Data searches aimed at the retrieval of data from published and unpublished sources for as
many P. vivax malaria endemic countries (PvMECs) as possible. The published scientific
literature was scanned weekly for data through subscription to malaria publications newsletters
(mainly Malaria World newsletters (http://www.malaria-world.com/) and the Environmental
Health at USAID malaria bulletins (http://www.ehproject.org/)). This was complemented by
periodic data searches in online reference archives (mainly PubMed
(http://www.ncbi.nlm.nih.gov/sites/entrez), ISI Web of Knowledge (http://wok.mimas.ac.uk) and
Scopus (http://www.scopus.com)) to ensure that all relevant publications were captured.
Keywords used in these searches were “malaria” and “[Country Name]”. Data from unpublished
sources were mainly obtained through personal communication with malaria specialists. Full
acknowledgement of these interactions and data provision is provided on the MAP website
(http://www.map.ox.ac.uk/acknowledgements).

2
Data Abstraction and Entry
The minimum required data fields for each record were: description of the study area (name,
administrative divisions and geographical coordinates, if available), the dates of start and end of
the survey (month and year) and information about blood examination (number of individuals
tested, number positive for P. vivax and examination method). Authors were contacted to
request any missing information. Some survey results were reported as an aggregate in space
(e.g. a single PvPR for a group of villages) or time (e.g. a mean PvPR estimated from four
different surveys conducted in a period of time). In such cases, authors were contacted to
attempt to obtain disaggregated data (e.g. a PvPR estimate per village or per each of the cross-
sectional surveys conducted in a time period). Data were entered in a PostgreSQL 8.3 database
(PostgreSQL Global Development Group, 2009) running on a Unix platform.
Data Geo-Positioning
Data geo-positioning was a particularly demanding task during data entry. The same
guidelines described previously [1] were used here. According to their spatial representation,
data were classified as points (corresponding to an area ≤10 km2), wide-areas (>10 and ≤25
km2), small polygons (>25 and ≤100 km2) or large polygons (>100 km2). Authors were contacted
when reporting results as polygon data to try to disaggregate them into points or wide-areas.
Various digital resources were used to geo-position data, amongst which the most useful were
Microsoft Encarta Encyclopedia (Microsoft, 2004) and Google Earth (Google, 2009). Importantly,
the provision of GPS readings accompanying raw data obtained through personal
communication both decreased the burden of this task and improved the precision of data geo-
positioning.
S2.2 Database Fidelity Checks
The entire database was first checked with a series of simple range-check constraint queries
to identify potential errors that could have occurred during data entry. These queries assessed
all data fields relevant to modelling for missing or inconsistent information. The fields checked
included those describing the study area (area type, geographical coordinates, and urban or
rural author definitions) and those providing specific information about the survey (month and
year of start and end of the survey, age range of study population, number examined and
positive for P. vivax, and diagnostic method utilised).
The second objective was to check that survey sites were located precisely with respect to
the master raster grid templates in which the endemicity models were developed. The locations
therefore needed to be on grid squares identified as land and within the border of the country in
which the survey was conducted. All survey locations were intersected with the relevant grids

3
and erroneous locations were identified and corrected manually. Typically this occurred in areas
of complex coastlines with an average displacement of <1 km.
The final objective was to check for any duplicates introduced during the iterative data
assembly process. Pairs of survey sites found within 1 km were listed and further checks
identified whether they corresponded to the same location.
S2.3 Data Exclusions
The database was subjected to exclusions in order to attempt optimal spatial and temporal
resolution of the data prior to modelling. Large (n=43) and small polygon data (n=41) were
excluded because these records represented areas larger than the 5 × 5 km spatial resolution
grid output of the model. In total, 226 records were excluded for the reasons outlined. Table S2.2
and Figure S2.1 summarise these exclusions by region. Spatiotemporal duplicates (i.e. those
conducted at the same location with less than three months gap between surveys) were
excluded unless it could be shown that different communities were sampled by the different
surveys (e.g. separate but neighbouring schools).
S2.4 The PvPR Input Data Set
The data exclusions outlined above resulted in the PvPR input data set for the geo-statistical
models. Some summary figures describing this data set are presented in Table S2.3 and are
further discussed below.
On 25th November 2011, after all checks were performed, the database was considered
ready for the endemicity models. PvPR data were available for 52 countries (12 in America, 18
in Africa+ and 22 in CSE Asia) (Table S2.2). A total of 43 PvMECs, mostly in Africa+, were not
represented in the database. This explains the significantly lower number of PvPR data records
relative to the MAP PfPR database [2]. The PvMECs outside Africa+ not represented in the
database were Argentina, Azerbaijan, Belize, Bhutan, El Salvador, Georgia, Guyana, Iran, Korea
DPR, Kyrgyzstan, Panama, Paraguay, Republic of Korea and Uzbekistan. The five data richest
countries were Indonesia (n=4,457), Ethiopia (n=826), Viet Nam (n=657), Afghanistan (n=493)
and Bangladesh (n=365). The PvPR data were extracted from 432 different sources.
Total Number of Records
A total of 9,970 PvPR estimates between 1985 and 2010 were available for modelling (388 in
America, 1,640 in Africa+ and 7,942 in CSE Asia; Figures S2.1 and S2.2). There was a lack of
PvPR data from central, western and eastern Africa and 86% of the data from Africa+ derived
from large surveys in three countries: Ethiopia, Sudan and Zambia. In CSE Asia, 56% of the

4
data were from surveys done in one country, Indonesia. In the Americas, the majority of the data
(45%) were from Brazil.
Summary of Recorded PvPR Estimates
The recorded PvPR values were generally low. Globally, more than half (51%) of the PvPR
surveys reported zero prevalence. In Africa+, 79% of the data were absence records, compared
to 44% in America and 46% in CSE Asia. In Africa+, median and mean PvPR were zero and
0.01, respectively. The PvPR in America had a median of 0.01 and a mean of 0.03 and in CSE
Asia the median was 0.01 and the mean 0.04 (Table S2.3).
Data and Geographic Coordinate Sources
The great majority of the PvPR data (81%) were obtained from sources that had not been
peer-reviewed, including reports and theses, with only 10% contributed by the peer-reviewed
scientific literature. Over one-third (36%) of the geographical coordinates were obtained from
personal communication, mostly in the form of GPS readings. Geo-positioning was particularly
difficult in CSE Asia, where more than a third of the survey sites were geo-positioned using a
combination of methods to overcome these difficulties.
Year of Survey
Most of the data assembled derived from surveys conducted from the year 2000 onwards
(82%) and from 2005 (66%) (Figure S2.2). Nearly one third of the data (33%) was collected in
the years 2007 and 2008, the latter representing the data richest year. The majority of surveys in
Africa+ and CSE Asia were conducted in the period between 2005 and 2010 (76% and 66%,
respectively).
Age Range of Study Populations
In Table S2.3 the PvPR data are summarised into four groups according to the upper age
limit of the study population. The great majority of survey samples (88%) included adults (>20
years of age). This was particularly true for America and CSE Asia, where 97 and 91% of
surveys, respectively, sampled this age group. In Africa+ adults were sampled in 70% of
surveys.
Diagnostic Methods
Malaria prevalence surveys using only the two most common diagnostic methods,
microscopy and rapid diagnostic tests (RDTs), were incorporated into the PvPR database. All
surveys from America and Africa+ used microscopy as the examination method. In CSE Asia
2,314 surveys in 2007-2010 used RDTs despite the relative limitation of current tests for
diagnosing P. vivax infection [3]. Only 399 of those documented used an RDT that targets P.
vivax specifically (Table S2.4).

5
Survey Sample Sizes
Sample sizes ranged from one to more than 15,000 individuals per survey. Median sample
sizes were 92, 47 and 120 for America, Africa+ and CSE Asia, respectively. Globally, the
median sample size was 107 (IQR: 54-246). A total of 112 surveys did not report the number of
individuals tested. In these cases, and since the models required a sample size to be recorded,
the latter was inferred from additional information provided by the source or assumed to be 50 if
no such information was available.
S2.5 Age-Standardisation
The PvPR data were reported in a diversity of age ranges. Like P. falciparum, population
measures of P. vivax malaria prevalence are age-dependent [2]. It was therefore necessary to
standardise the PvPR survey estimates to a single, representative age group for comparison. All
surveys were standardised to the 1 to 99 year age group (PvPR1-99) using the same underlying
model form implemented previously for P. falciparum [2] based on catalytic conversion models
first adapted to malaria by Pull and Grab [4] and described in detail elsewhere [5].
Sixty-seven studies were used to develop the age-standardization module of the model,
which included 1,696 records of disaggregated age data from 67 unique sites. Sixty of the
studies [6-9] were conducted in Indonesia and seven in Papua New Guinea [10-21]. The number
of age strata varied among studies, but ranged from seven to 64 (mean = 25).
S2.6 Regionalisation
As in the most recent study to map P. falciparum globally [2], we adopt here a regional
modelling strategy whereby separate and independent models are fitted to regional subsets of
the global database. The rationale for stratifying the modelling geographically is two-fold. First,
the computational resources required to fit the model (i.e. to estimate parameter distributions via
Markov chain Monte Carlo (MCMC)) and use the fitted model to generate predictive maps are
heavily dependent on the number of data points being considered. The required computational
memory (RAM) and processing (CPU time) tend to scale cubically with the number of data.
There are also sound statistical reasons for geographic stratification because each regional
model is able to fit parameter distributions independently of those in other regions. This has the
practical advantage that systematic differences in the spatial heterogeneity of endemicity
between regions, or in the relationship between endemicity and environmental covariates can be
better represented with regionally bespoke models. In statistical parlance, this feature allows
parameter non-stationarity to be captured [22]. Weighed against these advantages is the issue
of data availability. Clearly, if a spatial data set is divided into too many spatial regions, or the

6
regions are inappropriately defined, it may mean that some regions have insufficient data with
which to fit robust models.
We subdivided the 95 PvMECs globally into four regions, as shown in Figure S2.3. The sizes
of the regions were chosen to strike a balance between too little data, which would yield
unacceptable levels of uncertainty, and too much data, which would yield unacceptable
computational cost. An immediate disadvantage with regional stratifications is the potential for
marked discontinuities in predictions along the boundaries when regions are re-joined to make a
final global map. Such discontinuities are biologically implausible, as well as being aesthetically
unwelcome in presented maps. To mitigate this effect, the stratified data sets were defined so
that each region drew information from data both within the region and within a buffer of one
decimal degree (approximately 111km at the equator) around the region’s boundary. This had
the practical effect of drawing the levels of predicted surfaces from neighbouring regions to
within similar ranges around border regions, reducing the potential for discontinuity.

7
References
1. Guerra CA, Hay SI, Lucioparedes LS, Gikandi PW, Tatem AJ, et al. (2007) Assembling a global database of malaria parasite prevalence for the Malaria Atlas Project. Malaria J 6: 17.
2. Gething P, Patil A, Smith D, Guerra C, Elyazar I, et al. (2011) A new world malaria map: Plasmodium falciparum endemicity in 2010. Malaria J 10: 378.
3. Mueller I, Galinski MR, Baird JK, Carlton JM, Kochar DK, et al. (2009) Key gaps in the knowledge of Plasmodium vivax, a neglected human malaria parasite. Lancet Infect Dis 9: 555-566.
4. Pull JH, Grab B (1974) Simple epidemiological model for evaluating malaria inoculation rate and risk of infection in infants. Bull World Health Organ 51: 507-516.
5. Smith DL, Guerra CA, Snow RW, Hay SI (2007) Standardizing estimates of the Plasmodium falciparum parasite rate. Malaria J 6: 131.
6. Elyazar I (2008) Personal communication.
7. Lopansri BK, Anstey NM, Stoddard GJ, Mwaikambo ED, Boutlis CS, et al. (2006) Elevated plasma phenylalanine in severe malaria and implications for pathophysiology of neurological complications. Infect Immun 74: 3355-3359.
8. Baird JK (2008) Personal communication.
9. Syafruddin D, Krisin, Asih P, Sekartuti, Dewi RM, et al. (2009) Seasonal prevalence of malaria in West Sumba district, Indonesia. Malaria J 8: 8.
10. Schultz L, Wapling J, Mueller I, Ntsuke PO, Senn N, et al. (2010) Multilocus haplotypes reveal variable levels of diversity and population structure of Plasmodium falciparum in Papua New Guinea, a region of intense perennial transmission. Malaria J 9: 336.
11. Maraga S, Plüss B, Schöpflin S, Sie A, Iga J, et al. (In Press) The epidemiology of malaria in the Papua New Guinea highlands: 7. Southern Highlands Province. PNG Med J.
12. Mueller I, Yala S, Ousari M, Kundi J, Ivivi R, et al. (2007) The epidemiology of malaria in the Papua New Guinea highlands: 6. Simbai and Bundi, Madang Province. PNG Med J 50: 123-133.
13. Mueller I, Ousari M, Yala S, Ivivi R, Sie A, et al. (2006) The epidemiology of malaria in the Papua New Guinea highlands: 4. Enga Province. PNG Med J 49: 115-125.
14. Mueller I, Kundi J, Bjorge S, Namuigi P, Saleu G, et al. (2004) The epidemiology of malaria in the Papua New Guinea highlands: 3. Simbu Province. PNG Med J 47: 159-173.
15. Mueller I, Bjorge S, Poigeno G, Kundi J, Tandrapah T, et al. (2003) The epidemiology of malaria in the Papua New Guinea highlands: 2. Eastern Highlands Province. PNG Med J 46: 166-179.
16. Mueller I, Taime J, Ivivi R, Yala S, Bjorge S, et al. (2003) The epidemiology of malaria in the Papua New Guinea highlands: 1. Western Highlands Province. PNG Med J 46: 16-31.
17. Mueller I, Sie A, Ousari M, Iga J, Yala S, et al. (2007) The epidemiology of malaria in the Papua New Guinea highlands: 5. Aseki, Menyamya and Wau-Bulolo, Morobe Province. PNG Med J 50: 111-122.

8
18. Mueller I (2008) Personal communication.
19. Mueller I, Widmer S, Michel D, Maraga S, McNamara DT, et al. (2009) High sensitivity detection of Plasmodium species reveals positive correlations between infections of different species, shifts in age distribution and reduced local variation in Papua New Guinea. Malaria J 8: 41.
20. Genton B, al-Yaman F, Beck HP, Hii J, Mellor S, et al. (1995) The epidemiology of malaria in the Wosera area, East Sepik Province, Papua New Guinea, in preparation for vaccine trials. I. Malariometric indices and immunity. Ann Trop Med Parasitol 89: 359-376.
21. Kasehagen LJ, Mueller I, McNamara DT, Bockarie MJ, Kiniboro B, et al. (2006) Changing patterns of Plasmodium blood-stage infections in the Wosera region of Papua New Guinea monitored by light microscopy and high throughput PCR diagnosis. Am J Trop Med Hyg 75: 588-596.
22. Diggle PJ, Ribeiro PJ (2007) Model-based geostatistics; Bickel P, Diggle P, Fienberg S, Gather U, Olkin I et al., editors. New York: Springer. 228 p.

9
Table S2.1. The inclusion criteria for the MAP PvPR database.
Inclusion criterion Original [1] Revised for PvPR database
Time of survey Post 1984 No change
Sample size 50 >0
Sampling method Random, community based No change
Intervention studies Pre-intervention only No change
Spatial duplicate time window >36 months >3 months
Numerator/denominator Required No change
Age groups sampled Children preferred (Africa) No change
Spatial coverage Points/wide-areas preferred No change
Examination method Microscopy preferred over RDT No change
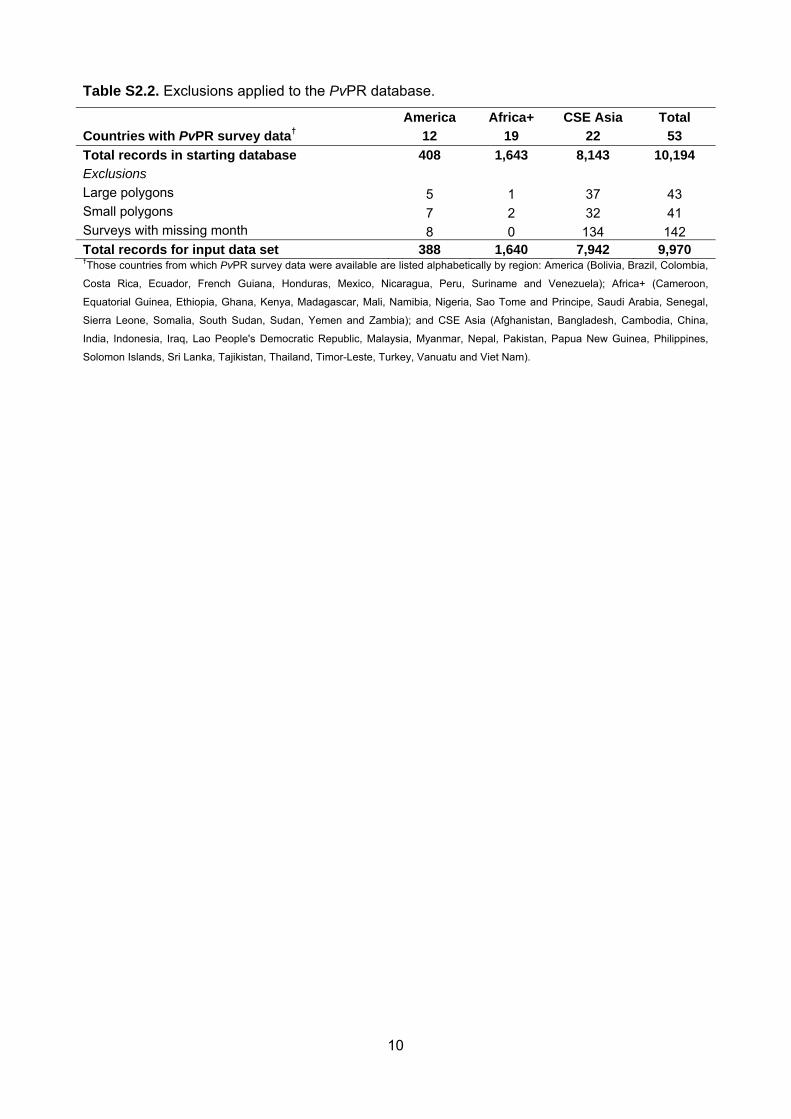
10
Table S2.2. Exclusions applied to the PvPR database.
America Africa+ CSE Asia Total
Countries with PvPR survey data† 12 19 22 53
Total records in starting database 408 1,643 8,143 10,194
Exclusions
Large polygons 5 1 37 43 Small polygons 7 2 32 41 Surveys with missing month 8 0 134 142 Total records for input data set 388 1,640 7,942 9,970 †Those countries from which PvPR survey data were available are listed alphabetically by region: America (Bolivia, Brazil, Colombia,
Costa Rica, Ecuador, French Guiana, Honduras, Mexico, Nicaragua, Peru, Suriname and Venezuela); Africa+ (Cameroon,
Equatorial Guinea, Ethiopia, Ghana, Kenya, Madagascar, Mali, Namibia, Nigeria, Sao Tome and Principe, Saudi Arabia, Senegal,
Sierra Leone, Somalia, South Sudan, Sudan, Yemen and Zambia); and CSE Asia (Afghanistan, Bangladesh, Cambodia, China,
India, Indonesia, Iraq, Lao People's Democratic Republic, Malaysia, Myanmar, Nepal, Pakistan, Papua New Guinea, Philippines,
Solomon Islands, Sri Lanka, Tajikistan, Thailand, Timor-Leste, Turkey, Vanuatu and Viet Nam).

11
Table S2.3. Summary of the most important aspects of the PvPR data by region.
America Africa+ CSE Asia Total
Total records of input data set 388 1,640 7,942 9,970 PvPR values
Number of zero records 171 1,288 3,631 5,090
Mean PvPR 3.43 0.60 3.55 3.06
Median PvPR 0.84 0.00 0.51 0.00
Inter-quartile range 4.01 0.00-0.00 0.00-3.70 0.00-2.97
Primary source of PvPR data
Peer reviewed sources 214 271 1,401 1,886 Unpublished work 56 386 5,760 6,202 Reports† 118 983 781 1,882 Source of spatial coordinates
GPS/Personal communication 175 1001 2,459 3,635 Encarta 75 103 873 1,051 GeoNames - - 125 125 Google Earth - 26 81 107 Combination 90 110 3,472 3,672 Other digital gazetteers 34 396 299 729 Paper source 13 1 9 23 Map 1 3 623 627 Not specified - - 1 1
Time period of surveys
1985-1989 55 86 219 360 1990-1994 51 57 479 587 1995-1999 120 80 662 862 2000-2004 121 164 1,291 1,576 2005-2010 41 1,253 5,291 6,585
Upper age sampled
<=10 2 376 209 587 >10 and <=15 7 81 164 252 >15 and <=20 - 27 294 321 >20 379 1,156 7,275 8,810
Diagnostic method
Microscopy 388 1,640 5,456 7,484 RDT - - 2,398 2,398 RDT – slide confirmed - - 88 88
Denominator
No denominator 6 38 68 112 1-49 125 870 1,248 2,243 50-100 77 292 1,985 2,354 101-500 149 300 3,466 3,915 >500 31 140 1,175 1,346 Median (IQR) 91.5 (40-198) 47 (34-108) 120 (54-281) 107 (54-246)
†Ministry of Health reports, theses and other unpublished sources.

12
Table S2.4. RDTs used as examination method by surveys in CSE Asia.
RDT name Number of records Target species*
CareStart Malaria 28 ‡
FalciVax 399 Pf, Pv
ICT Malaria Pf/Pv 36 Pf, Pan
Not specified 1,935 NA
*Pf = P. falciparum; Pv = P. vivax, Pan = Plasmodium species, NA = not applicable. ‡The specific type of CareStart Malaria test was
not provided.

13
Figure S2.1. Sequence of data exclusion rules for the formulation of a refined global PvPR
input data set for modelling. For each stage of exclusion the number of records excluded are
shown in parentheses.
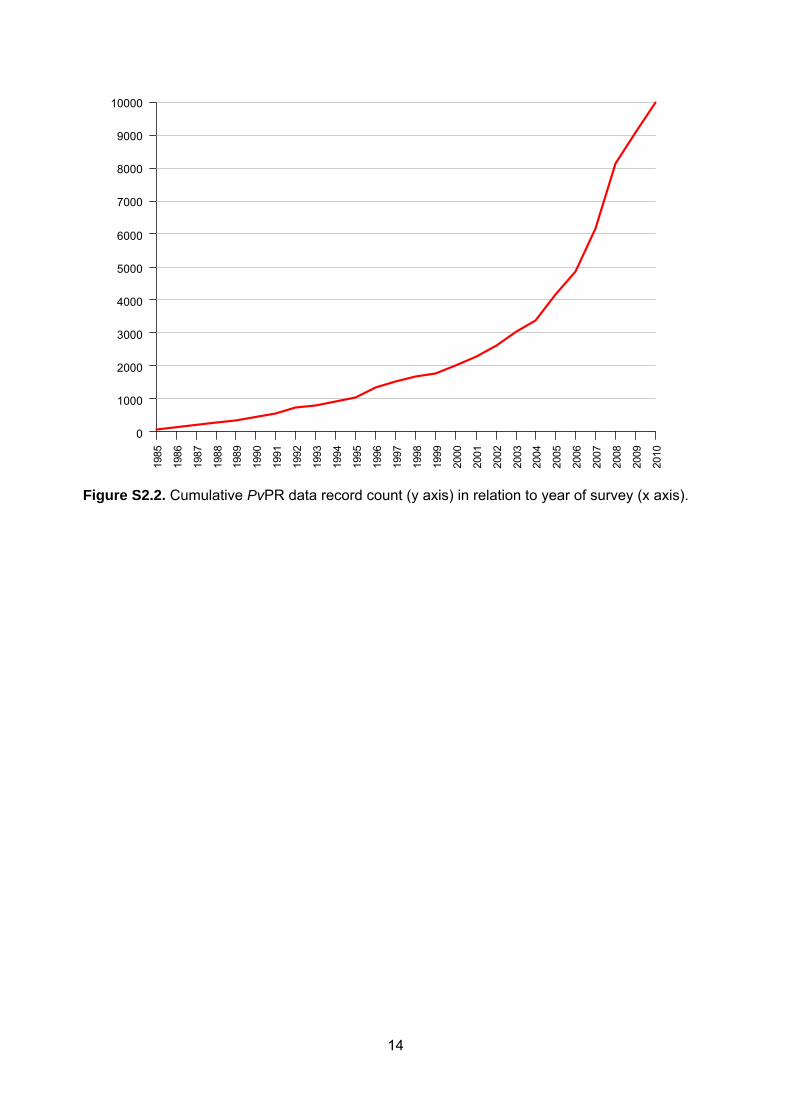
14
0
1000
2000
3000
4000
5000
6000
7000
8000
9000
10000
1985
1986
1987
1988
1989
1990
1991
1992
1993
1994
1995
1996
1997
1998
1999
2000
2001
2002
2003
2004
2005
2006
2007
2008
2009
2010
Figure S2.2. Cumulative PvPR data record count (y axis) in relation to year of survey (x axis).

15
Figure S2.3. Regional tiles used to stratify modelling. Pink = Americas; Blue = Africa +;
Green = Central Asia; Orange = South East Asia; Grey = Non endemic for P. vivax.
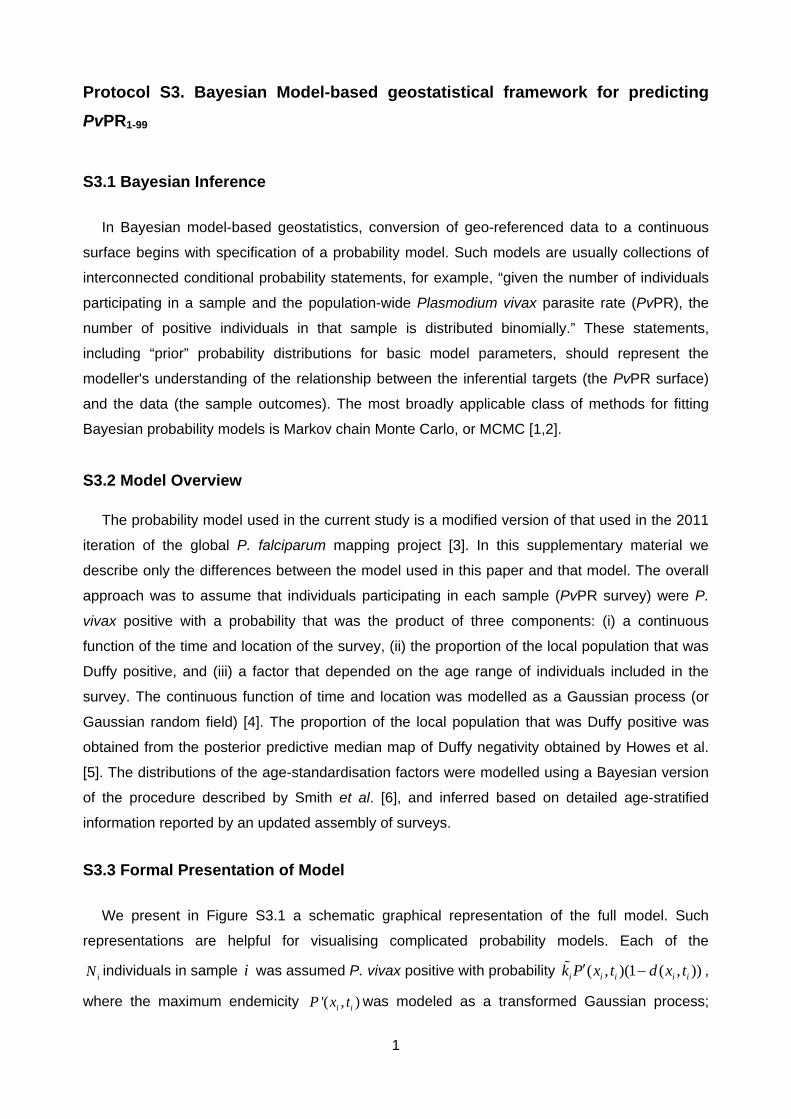
1
Protocol S3. Bayesian Model-based geostatistical framework for predicting
PvPR1-99
S3.1 Bayesian Inference
In Bayesian model-based geostatistics, conversion of geo-referenced data to a continuous
surface begins with specification of a probability model. Such models are usually collections of
interconnected conditional probability statements, for example, “given the number of individuals
participating in a sample and the population-wide Plasmodium vivax parasite rate (PvPR), the
number of positive individuals in that sample is distributed binomially.” These statements,
including “prior” probability distributions for basic model parameters, should represent the
modeller's understanding of the relationship between the inferential targets (the PvPR surface)
and the data (the sample outcomes). The most broadly applicable class of methods for fitting
Bayesian probability models is Markov chain Monte Carlo, or MCMC [1,2].
S3.2 Model Overview
The probability model used in the current study is a modified version of that used in the 2011
iteration of the global P. falciparum mapping project [3]. In this supplementary material we
describe only the differences between the model used in this paper and that model. The overall
approach was to assume that individuals participating in each sample (PvPR survey) were P.
vivax positive with a probability that was the product of three components: (i) a continuous
function of the time and location of the survey, (ii) the proportion of the local population that was
Duffy positive, and (iii) a factor that depended on the age range of individuals included in the
survey. The continuous function of time and location was modelled as a Gaussian process (or
Gaussian random field) [4]. The proportion of the local population that was Duffy positive was
obtained from the posterior predictive median map of Duffy negativity obtained by Howes et al.
[5]. The distributions of the age-standardisation factors were modelled using a Bayesian version
of the procedure described by Smith et al. [6], and inferred based on detailed age-stratified
information reported by an updated assembly of surveys.
S3.3 Formal Presentation of Model
We present in Figure S3.1 a schematic graphical representation of the full model. Such
representations are helpful for visualising complicated probability models. Each of the
iN individuals in sample i was assumed P. vivax positive with probability ( , )(1 ( , ))i i i i ik P x t d x t ,
where the maximum endemicity ,'( )i iP tx was modeled as a transformed Gaussian process;

2
)( ,i id x t is the proportion of the local population assumed Duffy negative; and the age
standardisation factor ik , 0 1ik , converted , )(1' ( , )( )i i i it d x tP x to the probability that
individuals within the age range reported for study i were P. vivax positive, and that the infection
was detected, thereby accounting for the influence of age on the probability of detection [6]. The
number positive iNwas distributed binomially:
ind
| , ( , ) ~ , ( , )(Bi ( 1 ( , ))ni i i i i i i i i iN P x t k P x t d xN N t (S3.1)
The Duffy negative proportion of the local population, )( ,i id x t was assumed equal to the
posterior median obtained by Howes et al. [5]. Each age standardisation factor ikwas assumed
drawn independently from a distribution k
Dwhose parameters were the lower and upper age
limits reported in study i , denoted ,L iA and ,U iA . The distribution k
Dwas obtained using the
method described by Gething et al. [3], applied to 67 age-stratified P. vivax parasite rate
surveys.
The mapped PvPR surface displays the P. vivax parasite rate for all age groups above one
year of age (notionally 1-99). Its value at an arbitrary location x and time t is the product of
,'( )i iP tx and another age standardization factor, 1 99k , which had a probability distribution
described by Gething et al. [3] and denoted Dk:
1 99
ind
1 99
( , ) ( , )(1 ( , )) ( , )
( , ) ~ (1,99)
PR
k
x t P x t d x t k x t
k x t D
Pv
(S3.2)
This composite value gives the probability that an individual selected at random from the
population, excluding individuals less than one year old, is P. vivax positive.
The coefficient '( , )P x t at arbitrary location x and time t was modeled as the inverse logit
function applied to a random field f evaluated at ( , )x t , plus an unstructured (random)
component ( , )x tò :
1 ('( , ) log ( , ) ( , )t )i f t tP x t x x ò (S3.3)

3
The components ( , )x tò were assumed independent and identically distributed for each location x
and time t, and a relatively diffuse but proper prior was assigned to their variance V:
iid
( , ) | ~ N(0, )
1/ ~ Gamma(3,12)
x t V V
V
ò (S3.4)
The random field f was modeled as a Gaussian process just as in Gething et al. [3]. Both the
age standardisation sub-model and the main spatial model were fitted as explained by Gething
et al. [3], using the open-source Bayesian analysis package PyMC [7].
References
1. Gelman A, Carlin JB, Stern HS (2003) Bayesian data analysis. Texts in Statistical Science.
Boca Raton, Florida, U.S.A.: Chapman & Hall / CRC Press LLC. 696 p.
2. Gilks WR, Spiegelhalter DJ (1999) Markov Chain Monte Carlo in practice. Interdisciplinary
Statistics. Boca Raton, Florida, U.S.A.: Chapman & Hall / CRC Press LLC.
3. Gething P, Patil A, Smith D, Guerra C, Elyazar I, et al. (2011) A new world malaria map:
Plasmodium falciparum endemicity in 2010. Malaria J 10: 378.
4. Banerjee S, Carlin BP, Gelfand AE (2004) Hierarchical modeling and analysis for spatial data.
Monographs on Statistics and Applied Probability 101. Boca Raton, Florida, U.S.A.: Chapman
& Hall / CRC Press LLC.
5. Howes RE, Patil AP, Piel FB, Nyangiri OA, Kabaria CW, et al. (2011) The global distribution of
the Duffy blood group. Nat Commun 2: 266.
6. Smith DL, Guerra CA, Snow RW, Hay SI (2007) Standardizing estimates of the Plasmodium
falciparum parasite rate. Malaria J 6: 131.
7. Patil A, Huard D, Fonnesbeck CJ (2010) PyMC: Bayesian stochastic modelling in Python. J
Stat Softw 35: e1000301.

4
Figure S3.1 A schematic of the probability model, expressed as a directed acyclic graph.
Ovals represent variables in the model. Grey ovals represent variables that have been observed.
Arrows indicate conditional distributions written down in the model. For example, the distribution
of the number positive in a parasite rate survey is specified based on the corresponding age-
standardisation factor, the underlying maximum PvPR surface P’ and the time and location of
the survey. It is possible to fit the age-standardisation sub-model separately with minimal
inconsistency. The maps presented in this study are summaries of the posterior of the upper
right-hand node, the PvPR surface.

1
Protocol S4: Model validation procedures and additional results
Assessing the plausibility of the model output is essential for reliable interpretation of the
mapped output. Many different measures of map uncertainty are available. Here, two different
aspects of the performance of the predictive model were assessed using a range of validation
statistics. This section describes in detail the procedures used to define a validation set, obtain
validation data, and compute a series of summary validation statistics and plots, as well as
presenting the results of these analyses in full. The procedures follow very closely those used
previously for P. falciparum [1,2], but for completeness are detailed here in full.
S4.1 Creation of Validation Sets
Validation statistics obtained via prediction of a validation set are representative of model
performance only if the validation set itself is a representative sample of the prediction space.
Visual examination of the PvPR point data used in this study revealed clear evidence of spatial
clustering (Figure 2A, main text). As such, a simple random sample drawn from this set would be
similarly clustered and not spatially representative of the predicted PvPR1-99 surface as a whole.
To generate a spatially representative validation set, the full set of 9,970 data locations was
stratified into the four global modelling sub-regions (see Protocol S2, section S2.6) and a
spatially declustered sampling procedure was implemented within each. Thiessen polygons
were defined around each data location within each region. A Thiessen polygon defines the
area closest to each data point in Euclidian space relative to surrounding points. Each datum
was then assigned a weight defined as where is the area of the Thiessen polygon
surrounding the data location, . A sample of size was drawn without replacement from the
regional set where each datum had a probability of selection proportional to its weight, . Those
surveys located outside the stable limits of transmission were excluded from selection.
Hold-out sets were thus defined for each modelling sub-region of size = 50, = 175, =
267 and = 530 for the America, Africa+, Central Asia and SE Asia regions, respectively. The
model was then re-run in full for each region independently using the corresponding thinned sets
of = 338, = 1,465, = 2,398 and = 4,747 data to predict PvPR at the validation locations.
In contrast to the main model run in which predictions were made for an annual mean for 2010,
the validation run predicted values for the time corresponding to the mid-point of each validation
survey to enable fairer comparisons of the observed and predicted PvPR values. We evaluated
here the ability of the model to predict PvPR within the age limits reported by each study, rather
than age-adjusted PvPR1-99. This was deemed a more thorough test of the overall predictive
fidelity of the model, because generating predictions for non-standardised age-ranges required

2
an additional age-correction step, and better represented the target quantities generated by the
model.
S4.2 Procedures for Testing Model Performance
Predictive performance of the model was tested using two different approaches: the ability of
the model to (i) predict point-values of PvPR at unsampled locations; and (ii) provide realistic
measure of uncertainty for each prediction.
Predicting Point Values of PvPR
The validation procedure generated = 1,022 point estimates of PvPR, where point
estimates were calculated using the mean of each predicted posterior distribution. This set of
point estimates (where the asterisk denotes a prediction) was then compared
to the corresponding set of observed PvPR values at the validation locations.
The ability of the model to predict point-values of PvPR at unsampled locations was quantified
using three simple summary statistics: the correlation coefficient between the predicted and
actual set, the mean prediction error (ME) defined as:
, (S4.1)
and the mean absolute prediction error (MAE) defined as:
(S4.2)
The correlation coefficient provides a straightforward measure of linear association between the
data and prediction sets, the ME provides a measure of the bias of the predictor (the overall
tendency to over or under predict PvPR values), and the MAE provides a measure of the mean
accuracy of individual predictions (the average magnitude of difference between each actual and
predicted value). ME and MAE values were presented as both absolute values and as a
proportion of the mean PvPR in each region as calculated from the validation set. A scatter plot
was also generated as a visualisation of the correspondence between point estimates of PvPR
and the corresponding known values.
A sample semi-variogram was calculated from standardised model residuals to assess the
presence of residual spatial autocorrelation unexplained by the model output. Standardised
Pearson [3] residuals were defined for each validation location as:

3
(S4.3)
where is the number of individuals surveyed in survey , is the age-standardised number
of P. vivax positive responses in that survey and is the corresponding point-prediction of
PvPR. This standardisation follows established procedures [4,5] and rescales the raw model
residuals to account for their variance characteristics as proportion values. Following the
procedure outlined by Diggle and Ribeiro [6], this sample semi-variogram was compared to a
Monte Carlo envelope computed from 99 random permutations of the same residual set. This
envelope represents the range of semi-variograms that could be expected by chance in the
absence of any spatial structure. Where the semi-variogram of interest lies entirely within this
envelope, it can be considered to display no significant spatial structure.
Providing Realistic Measures of Uncertainty for Each Prediction
Posterior distributions arising from Bayesian models provide an estimate of the relative
probability of a particular outcome and can be used to characterize uncertainty of prediction [7].
Our model generated a posterior distribution for each unsampled location and a procedure [8-10]
was implemented to test how well the validation set of 2,386 posterior distributions captured the
true uncertainty in our model output. A widely used summary measure extracted from predicted
posterior distributions is the credible interval (CI), which defines a range of candidate values
associated with a specified predicted probability of occurrence. The 95% CIs, for example, are
commonly reported around parameter estimates and define the range of possible values for that
parameter that has a 0.95 probability of containing the true value. Credible intervals can be
extracted from a posterior distribution for any specified level of probability, and can be tested in a
validation procedure against the actual proportion of true values falling within different intervals.
In a perfect model, for example, 95% of true values should fall within the 95% CI predicted at
each location, 50% within the 50% CI, and so on. In this study, we implemented [8,10] a
procedure using this rationale to test the extent to which predicted posterior distributions at each
location provided a suitable measure of uncertainty. Working through 100 progressively
narrower CIs, from the 99% CI to the 1% CI, each was tested by computing the actual proportion
of held-out prevalence observations that fell within the predicted CI. Plotting these actual
proportions against each predicted CI level allowed the overall fidelity of the posterior probability
distributions predicted at the held-out data locations to be assessed.

4
S4.3 Validation results
Examination of the mean error in the generation of the P. vivax malaria endemicity point-
estimate surface (Figure S4.1) revealed minimal overall bias in predicted PvPR with a global
mean error of -0.46 (Americas -1.38, Africa+ -0.03, Central Asia -0.43, South East Asia -0.43),
with values in units of PvPR on a percentage scale (Table S4.1). The global value thus
represents an overall tendency to underestimate prevalence by just under half of one percent.
The mean absolute error, which measures the average magnitude of prediction errors, was 2.48
(Americas 5.05, Africa+ 0.53, Central Asia 1.52, South East Asia 3.37), again in units of PvPR
(Table S4.1). These values give an indication of the consequences of taking values from the
point-estimate map as operational estimates of endemicity in each pixel. The estimate is nearly
unbiased (i.e. mean errors are small), but variance between predicted and observed
endemicities (i.e. mean absolute errors) can be substantial due to the short-range heterogeneity
observed in the data and the patchy distribution of the dataset. We have provided elsewhere [11]
a more in-depth discussion on approaches to utilising the point-estimate map and associated
posterior distribution estimates in downstream quantitative analyses. A semi-variogram of model
residuals (Figure S4.1B), defined as Pearson residuals divided by sample size, showed minimal
spatial structure. This indicates that the model explains nearly all spatially autocorrelated
variation in the observed data, with the unexplained variation being unstructured noise.
The probability-probability plot comparing predicted quantiles with observed coverage
fractions (Figure S4.1C) shows the fraction of the observations that were actually contained
within each predicted credible interval. This plot illustrates a high degree of fidelity in the
predicted quantiles or, put simply, that the predictive distribution is a good representation of the
uncertainty in our predictions.

5
References
1. Gething P, Patil A, Smith D, Guerra C, Elyazar I, et al. (2011) A new world malaria map:
Plasmodium falciparum endemicity in 2010. Malaria J 10: 378.
2. Hay SI, Guerra CA, Gething PW, Patil AP, Tatem AJ, et al. (2009) A world malaria map:
Plasmodium falciparum endemicity in 2007. PLoS Med 6: e1000048.
3. McCullagh P, Nelder JA (1989) Generalized Linear Models. Boca Raton, Florida: Chapman
and Hall / CRC Press. 540 p.
4. Clements ACA, Moyeed R, Brooker S (2006) Bayesian geostatistical prediction of the intensity
of infection with Schistosoma mansoni in East Africa. Parasitology 133: 711-719.
5. Diggle P, Moyeed R, Rowlingson B, Thomson M (2002) Childhood malaria in The Gambia: a
case-study in model-based geostatistics. J Roy Stat Soc C-App 51: 493-506.
6. Diggle PJ, Ribeiro PJ (2007) Model-based geostatistics; Bickel P, Diggle P, Fienberg S,
Gather U, Olkin I et al., editors. New York: Springer. 228 p.
7. Congdon P (2003) Applied Bayesian Modelling. Chichester: John Wiley and Sons Ltd. 457 p.
8. Gething PW, Noor AM, Gikandi PW, Hay SI, Nixon MS, et al. (2008) Developing geostatistical
space-time models to predict outpatient treatment burdens from incomplete national data.
Geogr Anal 40: 167-188.
9. Goovaerts P (2001) Geostatistical modelling of uncertainty in soil science. Geoderma 103: 3-
26.
10. Moyeed RA, Papritz A (2002) An empirical comparison of kriging methods for nonlinear
spatial point prediction. Math Geol 34: 365-386.
11. Patil AP, Gething PW, Piel FB, Hay SI (2011) Bayesian geostatistics in health cartography:
the perspective of malaria. Trends Parasitol 27: 245 - 252.

6
Table S4.1. Summary of the validation statistics for predicting continuous PvPR by region.
The mean of each predicted posterior distribution was used as the point estimate of PvPR for
comparison with observed values. See text for a full explanation on the derivation of these
statistics and interpretation of results. C Asia = Central Asia modelling region; SE Asia = South
East Asia modelling region.
Validation Measure Americas Africa+ C Asia SE Asia World
Mean error -1.38 0.03 -0.43 -0.43 -0.41
Mean absolute error 5.05 0.53 1.52 3.37 2.48
Correlation 0.37 0.67 0.49 0.58 0.56

7
Figure S4.1. Model Validation Plots. (A) Scatter plot of actual versus predicted point-values of
PvPR1-99. (B) Sample semi-variogram of standardised model Pearson residuals estimated at
discrete lags (circles) and compared to a Monte Carlo envelope (dashed lines) representing the
range of values expected by chance in the absence of spatial autocorrelation. (C) Probability-
probability plot comparing predicted credible intervals with the actual percentage of true values
lying in those intervals. In plots A, and D the 1:1 line is also shown (dashed line) for reference.
See text for full explanation of validation procedures and interpretation of results.
Copyright © 2022 FDOKUMEN