Neglected crises - ALNAP
258
-
Upload
khangminh22 -
Category
Documents
-
view
0 -
download
0
Transcript of Neglected crises - ALNAP

A global humanitarian organization
The International Federation of Red Cross and Red Crescent Societies is the world’s largesthumanitarian organization, providing assistance without discrimination as to nationality, race, reli-gious beliefs, class or political opinions. The International Federation’s mission is to improve thelives of vulnerable people by mobilizing the power of humanity.
Founded in 1919, the International Federation comprises 185 member Red Cross and Red Crescentsocieties – with an additional number in formation – a secretariat in Geneva and offices strategical-ly located to support activities around the world. The Red Crescent is used in place of the Red Crossin many Islamic countries.
The International Federation coordinates and directs international assistance to victims of naturaland technological disasters, to refugees and in health emergencies. It combines its relief activitieswith development work to strengthen the capacities of National Societies and through them thecapacity of individual people. The International Federation acts as the official representative of itsmember societies in the international field. It promotes cooperation between National Societies, andworks to strengthen their capacity to carry out effective disaster preparedness, health and social pro-grammes.
National Red Cross and Red Crescent Societies embody the work and principles of theInternational Red Cross and Red Crescent Movement. National Societies act as auxiliaries to the pub-lic authorities of their own countries in the humanitarian field and provide a range of services includ-ing disaster relief, health and social programmes. During wartime, National Societies assist the affect-ed civilian population and support the army medical services where appropriate.
The unique network of National Societies – which covers almost every country in the world – is theInternational Federation’s principal strength. Cooperation between National Societies gives theInternational Federation greater potential to develop capacities and assist those most in need. At alocal level, the network enables the International Federation to reach individual communities.Together, the National Societies comprise 97 million volunteers and 300,000 employees, who pro-vide assistance to some 233 million beneficiaries each year.
The International Committee of the Red Cross (ICRC) is an impartial, neutral and independentorganization whose exclusively humanitarian mission is to protect the lives and dignity of victims ofwar and internal violence and to provide them with assistance. It directs and coordinates the inter-national relief activities conducted by the Movement in situations of conflict. It also endeavours toprevent suffering by promoting and strengthening humanitarian law and universal humanitarianprinciples. Established in 1863, the ICRC is at the origin of the International Red Cross and RedCrescent Movement.
Together, all the components of the International Red Cross and Red Crescent Movement are guid-ed by the same seven Fundamental Principles: humanity, impartiality, neutrality, independence, vol-untary service, unity and universality. In the same manner, all Red Cross and Red Crescent activitieshave one central purpose: to help those who suffer without discrimination and thus contribute topeace in the world.
Cover photo: The specific ways in which women suffer – as well as contribute – during humanitar-ian crises is one of many neglected issues tackled by this year’s report. In traditional societies, dis-crimination against women can lead to higher death tolls and greater suffering during disaster.However, women’s invaluable role in networking for disaster response and recovery can also beoverlooked by male-dominated emergency management systems.
Olav A. Saltbones/Norwegian Red Cross

L i b y a n R e d C r e s c e n t
Swedish InternationalDevelopment CooperationAgency
The International Federation of Red Cross and Red Crescent Societies would like toexpress its gratitude to the following for committing to and supporting this publication:

Focus on neglected crises

2
Copyright © 2006 by the International Federation of Red Cross and Red Crescent Societies.
ISBN 92-9139-122-0
All rights reserved. Except for quotation in a review of the work, no part of thispublication may be reproduced, stored in a retrieval system, or transmitted, in any formor by any means, electronic, mechanical, photocopying, recording or otherwise, withoutthe prior permission of the International Federation of Red Cross and Red CrescentSocieties. This publication is copyright, but may be reproduced without fee for teachingpurposes but not for resale. Formal permission is required for all such uses. For copyingin any other circumstances, or for re-use in other publications, or for translation oradaptation, prior written permission must be obtained from the publisher.
The opinions expressed in this publication do not necessarily represent the official policyof the International Federation of Red Cross and Red Crescent Societies or of individualNational Red Cross or Red Crescent Societies. The designations used do not imply theexpression of any opinion on the part of the International Federation or National Societiesconcerning the legal status of a territory or of its authorities.
Editor: Jonathan Walter
Managing editor: Mohammed Mukhier
Design and production team: Gudrun Beger, Jean-Charles Chamois, Aradhna Duggal-Chadha, Nicholas Kouppari
We would like to thank all those who assisted contributors during travel and research forthis issue.
Baseline maps by Geoatlas® – ©GRAPHI-OGRE, Hendaye, France
Typesetting by Strategic Communications SA, Geneva, Switzerland
Printed by ATAR Roto Presse, Satigny/Vernier, Switzerland
Contact details:
International Federation of Red Cross and Red Crescent Societies17, chemin des Crêts, P.O. Box 372CH-1211 Geneva 19, SwitzerlandTel.: + 41 (0)22 730 4222. Fax: + 41 (0)22 733 0395E-mail: [email protected]; [email protected]: http://www.ifrc.org
To order the World Disasters Report, contact:
Kumarian Press Inc Eurospan1294 Blue Hills Ave 3 Henrietta Street, Covent GardenBloomfield CT 06002, USA London WC2E 8LU, UKTel.: +1 860 243 2098 Tel.: +44 (0)20 7240 0856Fax: +1 860 243 2867 Fax: +44 (0)20 7379 0609E-mail: [email protected] E-mail: [email protected]: http://www.kpbooks.com Web: http://www.eurospanonline.com

3World Disasters Report 2006 – Contents
Contents
International Federation of Red Cross and Red Crescent Societies inside front cover
Acknowledgements 2
Introduction 8
Focus on neglected crises
Chapter 1 Neglected crises: partial response perpetuates suffering 10
Box 1.1 Netherlands Red Cross: “Save a Child in the Congo” 15
Box 1.2 Journalists take initiative to highlight neglected crises 19
Box 1.3 DesInventar: measuring impacts from the bottom up 23
Box 1.4 Neglected: funds for risk reduction 36
Figure 1.1 Media coverage fuels Niger funding 16
Figure 1.2 Equitable aid? Humanitarian relief per beneficiary, 2005 20
Table 1.1 Neglected crises of 2005–2006 11
Table 1.2 Links between media and funding, 2005 – sorted by appeal coverage 17
Chapter 2 Hunger in Malawi: a neglected emergency 42
Box 2.1 Children pay hunger’s heaviest price 46
Box 2.2 How Malawians have survived recent food crises 53
Box 2.3 Subsidized seeds and fertilizer save lives and money 60
Map Malawi 45

4
Chapter 3 Hurricane Stan lifts the lid on Guatemala’s vulnerability 66
Box 3.1 Guatemala: vulnerability statistics 68
Box 3.2 Guatemala: windstorms and seismic hazards 70
Box 3.3 Red Cross boosts resilience through training and games 81
Box 3.4 Local risk reduction saves lives 82
Box 3.5 Panabaj: hope after so much suffering 84
Figure 3.1 Guatemala: comparison of disaster impacts, 1988–2000 71
Map Guatemala 67
Chapter 4 Unsafe motherhood: Nepal’s hidden crisis 92
Box 4.1 Delay nearly proves deadly 96
Box 4.2 Blood: a neglected priority 100
Box 4.3 Taking emergency measures 104
Box 4.4 Shaky data obscure plight of women and progress of response 106
Box 4.5 Safe abortion saves mothers’ lives 108
Box 4.6 Model hospital reaches out to community 111
Figure 4.1 Nepal fact file 94
Map Nepal – shaded by level of human development 93
Chapter 5 Death at sea: boat migrants desperate to reach Europe 116
Box 5.1 Lampedusa: an island in the spotlight 122
Box 5.2 From Africa to Spain: “strong men in flimsy boats” 128
Table 5.1 Irregular boat migration to Mediterranean islands surges 119
Map Irregular migration routes to southern Europe 118
Chapter 6 “Please don’t raise gender now – we’re in an emergency!” 140
Box 6.1 Women’s networking during Katrina saves lives 142
Box 6.2 Maasai women’s role in reducing vulnerability to drought neglected 145

5
Box 6.3 Training overcomes tradition in Pakistan quake 152
Box 6.4 Women organize for disaster response and risk reduction 158
Chapter 7 Adequate? Equitable? Timely? Humanitarian aid trends in 2005 164
Box 7.1 International Federation provides upfront funds for neglected emergencies 188
Figure 7.1 Total humanitarian aid from DAC government donors, 1970–2004 in real terms (2003 prices) 166
Figure 7.2 International funding for the Indian Ocean tsunami (US$ million and percentage) 168
Figure 7.3 Humanitarian aid from non-DAC governments, 2000–2005 (current prices US$ million) 169
Figure 7.4 Total requirements for UN consolidated and flash appeals, 1997–2005 (US$ million) 171
Figure 7.5 Total numbers of UN consolidated and flash appeals, 1996–2005 172
Figure 7.6 Percentage of needs covered for all UN consolidated and flash appeals, 1996–2005 174
Figure 7.7 Top and bottom five UN appeals by per cent coverage, 2000–2005 175
Figure 7.8 Per cent coverage of consolidated and flash appeals (inside the UN appeal) 2005 176
Figure 7.9 Total requirements and contributions per targeted beneficiary(inside UN appeal), 2005 (US$) 179
Figure 7.10 Total requirements and contributions per targeted beneficiary(inside and outside UN appeal), 2005 (US$) 181
Figure 7.11 Regional distribution of humanitarian aid, 1995–2004 (US$ million) 183
Figure 7.12 Percentage of donor commitments to all sectors,2000–2005 184
Figure 7.13 Average per cent coverage by sector, 2000–2005 185
World Disasters Report 2006 – Contents

6
Figure 7.14 Timing of contributions from all donors to UN consolidated appeals, 2005 186
Map 2005: the year of inequitable humanitarian aid? 166
AnnexAnnex Disaster data 193
Box 1 Data on mortality and malnutrition in conflicts: CE-DAT the Complex Emergency Database 196
Figure 1 ODA net disbursements (US$ million, 2004 prices): 1995–2004 202
Figure 2 ODA net disbursements in 2004 (US$ million, 2004 prices) 203
Figure 3 ODA: evolution of DAC contributions (US$ million, 2004 prices) 204
Figure 4 ODA as percentage of DAC donors’ GNI, 2004 205
Figure 5 Emergency/distress relief from DAC donors in 2004 (US$ million, 2004 prices) 206
Table 1 Total number of reported disasters, by continent and by year (1996 to 2005) 207
Table 2 Total number of people reported killed, by continent and by year (1996 to 2005) 208
Table 3 Total number of people reported affected, by continent and by year (1996 to 2005) in thousands 209
Table 4 Total amount of disaster estimated damage, by continent and by year (1996 to 2005) in millions of US dollars (2005 prices) 210
Table 5 Total number of reported disasters, by type of phenomenon and by year (1996 to 2005) 211
Table 6 Total number of people reported killed, by type of phenomenon and by year (1996 to 2005) 212
Table 7 Total number of people reported affected, by type of phenomenon and by year (1996 to 2005) in thousands 213
7World Disasters Report 2006 – Contents
Table 8 Total amount of disaster estimated damage, by type of phenomenon and by year (1996 to 2005) in millions of US dollars (2005 prices) 214
Table 9 Total number of reported disasters, by type of phenomenon and by continent (1996 to 2005) 215
Table 10 Total number of people reported killed, by type of phenomenon and by continent (1996 to 2005) 216
Table 11 Total number of people reported affected, by type of phenomenon and by continent (1996 to 2005) in thousands 217
Table 12 Total amount of disaster estimated damage, by type ofphenomenon and by continent (1996 to 2005) in millions of US dollars (2005 prices) 218
Table 13 Total number of people reported killed and affected by disastersby country (1986 to 1995; 1996 to 2005; and 2005) 219
Table 14 Refugees and asylum seekers by country/territory of origin (1999 to 2005) 226
Table 15 Refugees and asylum seekers by host country/territory (1999 to 2005) 230
Table 16 Significant populations of internally displaced people (1999 to 2005) 234
Index 236
Fundamental Principles inside back cover

8
Putting an end to deadly neglect
The past two years have seen unprecedented attention lavished on disasters by themedia, by the public and by aid organizations across the world. The record hurricaneseason in the Caribbean, the South Asia earthquake and the devastating Indian Oceantsunami combined to catapult so-called ‘natural’ disasters into the limelight.
The response has also been unprecedented. Last year, the resources committed tohumanitarian aid reached at least US$ 17 billion – outstripping any other year onrecord. Over US$ 5 billion of this was donated by private individuals to tsunami sur-vivors. So it may seem a strange time to speak of disasters and humanitarian crisesbeing ‘neglected’. Yet for every crisis that takes centre stage, there are a dozen morewaiting in the wings for a walk-on part.
Common sense would dictate that the larger the disaster, the greater the media atten-tion and the more generous the response. That was certainly the case with the tsuna-mi. But it is not, unfortunately, a universal rule. Research across a range of disastersreveals that there is no clear link between death tolls and media interest. Rather,Western self-interest gives journalists a stronger steer.
To take one example among many, Hurricanes Katrina and Stan – which hit America’sGulf Coast and Central America respectively last year – both led to the deaths ofaround 1,500 people. Yet Katrina generated 40 times more articles in newspapers acrossEurope, the US and Australia than Stan. The disparity in the financial response to eachdisaster was greater still.
Whether we like it or not, the media continue to exert a strong influence over whereresources flow for humanitarian crises – and not just for the tsunami or Katrina. TheSouth Asia earthquake attracted 86 minutes of TV coverage on US networks in 2005and raised over US$ 300 per targeted beneficiary. Meanwhile, Somalia and Côted’Ivoire attracted no TV coverage at all and raised respectively just US$ 53 and US$ 27 per beneficiary.
However, neglect is not just about headlines or appeal targets. The timing and appro-priateness of aid are also vital. Over recent years we have witnessed slow-motion foodshortages becoming full-blown humanitarian crises before our eyes. Niger, Malawi, theHorn of Africa. We have the early warning systems, we can assess when householdsshift from ‘reversible’ to ‘irreversible’ coping mechanisms, we have the expertise andexperience to invest in reducing risks before they become disasters. So why do we still

see last-minute, ultra-expensive airlifts of food aid in response to graphic TV images ofstarving children?
In Malawi last year, a state of emergency wasn’t declared until eight months after thefirst signs of crisis. When appeals were made, donors provided food aid but neglectedcalls for vital agricultural inputs – such as appropriate seeds and fertilizers – whichcould have helped reduce the risk of future food shortages. While food aid can play akey role in emergency response, there is an urgent need to commit more resourcestowards measures to secure people’s recovery, such as agricultural inputs, healthcare,livelihood interventions, water and sanitation.
This year’s report also looks at less likely candidates for the title of neglected crisis. InNepal, a country racked by civil war for a decade, an estimated 35,000 women and new-born babies die each year due to unsafe childbirth and neonatal practices. Mountains,conflict and lack of money conspire to prevent their access to adequate healthcare.Discrimination against women in the highly traditional villages of rural Nepal adds totheir burden. Yet this silent tragedy, which has claimed over 25 times more lives than theconflict, goes virtually unnoticed by the media and shows few signs of improving.
We devote a whole chapter to studying the gendered impacts of disasters, with a partic-ular focus on the women of northern Pakistan who survived the earthquake but strug-gled to access their fair share of aid. And we analyse the plight of Africa’s boat migrants,several thousand of whom are thought to die each year in desperate attempts to reachEurope by sea. Theirs is such a neglected crisis that no single organization is even col-lating data on casualties, let alone appealing for their aid.
Ideally, each situation would be judged according to priority humanitarian needs andfunds would be allocated accordingly. However, several factors still prevent that fromhappening: poor access and security in the some of the world’s more awkward countries,geopolitical preferences of donors, the effects of global media and the lack of commonhumanitarian criteria to compare needs objectively between continents.
The solutions to most of these neglected crises lie far beyond the mandate or capacity ofhumanitarian organizations. The best we can do is bear witness to what we see and alle-viate suffering where we can – however temporarily. The long-term answers lie in greaterpolitical, security, developmental and economic engagement. To that end, I commendyou to read this report and share it as widely as possible with your colleagues and friendsbeyond the humanitarian sphere.
Markku NiskalaSecretary General
9World Disasters Report 2006 – Introduction

10

Photo opposite page:A mother carries her malnourished infant in Maradi, southern Niger. Poverty and the worst drought in years left 3.6 millionpeople short of foodduring 2005. As G8 countries met inScotland to discussways to help Africa,Niger’s emaciatedchildren provided a case study of richworld inaction.
© REUTERS/Finbarr O’Reilly,courtesy www.alertnet.org
11World Disasters Report 2006 – Neglected crises
Neglected crises: partial response perpetuates sufferingGlobal interest in humanitarian response is riding high – after a string of sudden,large-scale disasters triggered by the Indian Ocean tsunami, the South Asia earthquakeand a record hurricane season along America’s Gulf Coast last year. But the brighterthe media spotlight shines on such high-visibility catastrophes, the deeper intoshadow fall more chronic – and often more deadly – humanitarian crises.
Lists of forgotten disasters have multiplied as commentators seek to portray peopleand places that have missed out (see Table 1.1). Aid organizations and donors havereiterated their commitment to impartial humanitarian aid – according to need alone.But has this growing interest in neglected crises and equitable aid had much impact?
Table 1.1 Neglected crises of 2005–2006
No. MSF, 20051 AlertNet, 20052 ECHO, 20063 UNDPI, 20064
1DemocraticRepublic of Congo
DemocraticRepublic of Congo
Algeria(Western Sahara)
Liberia
2 Chechnya Northern Uganda India (Kashmir)Asylum seekers and migrants
3 Haiti Sudan/Darfur Myanmar/BurmaDemocratic Republic of Congo
4AIDS drugs researchand development
AIDS Nepal Nepal’s children
5 North-eastern India West Africa Chechnya Somalia
6 Southern Sudan Colombia Refugees
7 Somalia ChechnyaSouth Asia earthquakereconstruction
8 Colombia Haiti Children behind bars
9 Northern Uganda Nepal Water wars/peace
10 Côte d'Ivoire Infectious diseases Côte d'Ivoire
1 Médecins Sans Frontières (MSF): ‘Top 10 most under-reported humanitarian stories’, based on monitoring by the Tyndall Report of the nightly newscasts of the US’s three major TV networks (CBS, NBC and ABC) in 2005.
2 Reuters AlertNet: ‘top 10 forgotten emergencies’, based on a poll of over 100 humanitarians, media, academics and activists published in March 2005.
3 European Commission’s Humanitarian Aid department (ECHO): most ‘forgotten crises’, based on ECHO’s nine-point methodology covering level of development, poverty, exposure to disasters, population movements, under-five health and donor contributions.
4 United Nations Department of Public Information (UNDPI): list of ‘10 stories the world should hear more about’.

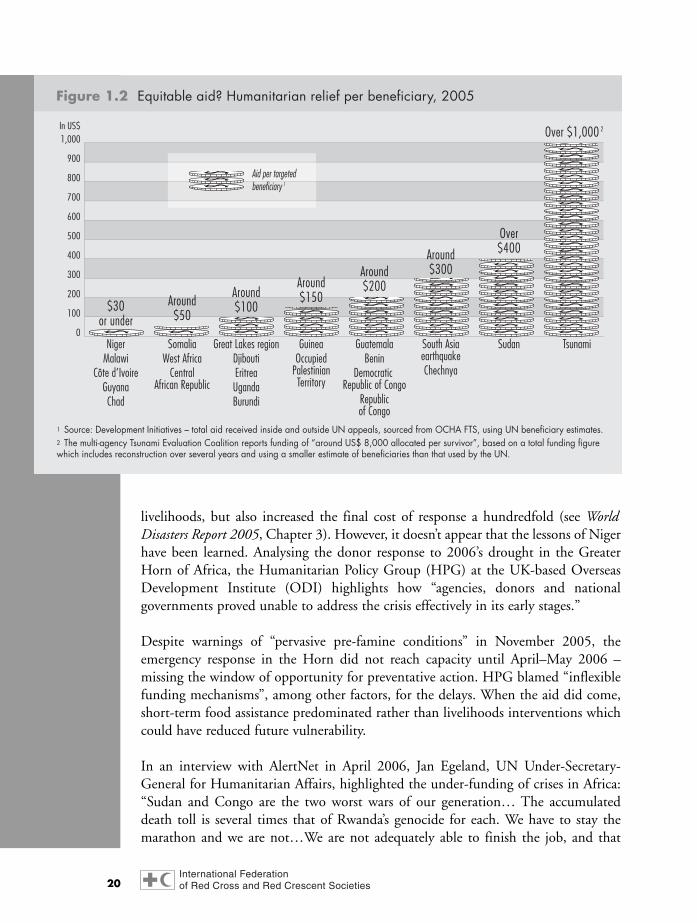
In 2005, the world responded more generously to people’s humanitarian needs thanat any time in recent history – yet millions still missed out on vital, potentially life-saving aid. The tsunami attracted billions of dollars – 50 times more per affectedperson than was donated for Chad, Guyana or Côte d’Ivoire. The gap between thebest- and worst-funded disasters remains unacceptably wide, as detailed in Chapter 7of this year’s report.
Why is humanitarian aid still unfairly distributed? Which communities languish inthe shadows of emergency response and prevention – neglected by the media, aidorganizations, donors, even by their own governments? Why do some crises rate newscoverage, donor money, a place in international disaster databases, while others don’t?What is the human impact of this neglect and what can be done about it?
This lead chapter seeks to provide some answers to these questions – focusing onhumanitarian crises and natural disasters, both chronic and acute. It starts by brieflyunpacking the meaning of neglect and then presents a typology which encompassesways in which neglect of humanitarian needs is manifested and the underlying reasonswhy. It concludes by arguing that, while the acute symptoms of human suffering areoften neglected, the critical need to address the underlying causes of that suffering ismore neglected still.
Neglect or select? Of what and by whom?Neglect signifies not being considered, incorporated or provided for. Neglect is wide-ranging in its causes and consequences and is therefore difficult to covercomprehensively in any short introduction to the topic. But distinguishing betweenneglect and select is one approach.
Neglect of humanitarian needs can arise from simple ignorance of a problem, due tolack of access to data or news. It may also be explained by forgetfulness ormisunderstanding. But many cases of neglect relate more to conscious prioritization,bias (often geographical or strategic) and self-interest. Neglect thus becomes select andselection is exercised by donors (public and private), aid organizations and the media.
Neglect is not only about the relative attention and resources given to differenthumanitarian crises. It’s also about the way the needs of different social groups areaddressed within crises. Humanitarian response and recovery are often flawed bydiscrimination (deliberate or not) against the poorer, the ethnically marginal, women,children, the aged and the politically weak.
Underpinning the neglect of people’s immediate needs is a wider neglect of rootcauses. The dominant assumption of aid organizations is that emergencies, disastersand crises are deviations from the ‘normal’ conditions of daily life. The alternative
12

view – that daily life for many people contains the seeds of crisis – is not oftenconsidered. So an unreal distinction arises between everyday life and crisis, when inreality vulnerable people are exposed to a wide spectrum of risk – as this year’schapters on Guatemala, Malawi and Nepal make clear.
Disaster and emergency managers are understandably reluctant or unable to tacklethe thorny issue of root causes. However, the 17 members of the GoodHumanitarian Donorship initiative agreed on a set of principles in 2003 which makeclear that the objectives of humanitarian action are not only to save lives and reducesuffering, but also to “strengthen the capacity of affected countries and localcommunities to prevent, prepare for, mitigate and respond to humanitarian crises”.They add that humanitarian action should “facilitate the return to normal lives andlivelihoods”.
Donor-led distinctions between humanitarian and development assistance, whileconvenient in terms of accounting, make it hard for organizations to meet the fullrange of people’s life-threatening needs. This is particularly the case in situations ofacute malnutrition found across sub-Saharan Africa, where the most appropriateresponse is urgent, large-scale support for livelihoods – an intervention which doesnot fit easily into either humanitarian or development boxes.
Typology of neglectThere are many types of neglect – and the same types can be both cause and effect.For example, lack of media coverage is a manifestation common to many neglecteddisasters, but the failure to report on such crises is equally a cause of their neglect. Oneway of grasping hold of this slippery issue and the challenges it presents is through thefollowing typology:
1. Unreported – or under-reported, by global media.2. Unfunded – or under-funded, by donors, aid organizations or host governments.3. Uncounted – not registered by disaster databases or not assessed by aid
organizations.4. Secondary – disasters triggered by a secondary event not prepared for by
governments, aid organizations or communities.5. Secret – concealed by host governments for political reasons or by communities
for cultural reasons.6. Awkward – not addressed by governments or aid organizations for political,
strategic, security or logistical reasons.7. Misunderstood – complex crises whose causes and solutions may not be
understood by experts or decision-makers.
The distinctions are somewhat artificial and some neglected crises will manifestseveral types of neglect at once. However, the advantage of this typology is that it
13World Disasters Report 2006 – Neglected crises
reveals the roles of different players – whether journalists, donors, database managers,aid organizations, analysts, governments or affected communities – and how theycould do more to highlight the plight of people whose needs are neglected. Andbehind these types of neglect there lies a common theme: neglecting the root causesof socially constructed vulnerability and chronic poverty.
1. Unreported
In 1998, the non-governmental organization (NGO) Médecins Sans Frontières(MSF) began publishing its ‘top 10’ most under-reported humanitarian stories of theyear. Since then, Colombia, the Democratic Republic of Congo (DRC), Chechnya,Somalia and the issue of access to life-saving medicines have all featured six times or more.
MSF’s source is the Tyndall Report, which monitors the amount of airtime devotedto disasters on the nightly newscasts of the three largest US television networks. Ofthe 14,000-plus minutes of news broadcast by these networks last year, HurricaneKatrina captured 1,153 minutes – making it the most covered news story of lastyear, after Iraq. The tsunami (250 minutes), Hurricanes Rita (136 minutes) andWilma (122 minutes), and the South Asia earthquake (86 minutes) also featured inthe top 20 news stories of 2005 – helping triple average annual coverage of naturaldisasters.
By contrast, DRC attracted just six minutes and Chechnya two minutes of coverage.The other eight stories highlighted by MSF were not covered at all. To help raisemoney for the people of DRC – and awareness of their plight – the Netherlands RedCross launched a six-day media campaign with the help of local radio DJs (see Box 1.1).
In January 2006, media consultancy CARMA International published the results of adetailed survey of the coverage of six disasters, based on an analysis of newspublications across Europe, the US and Australia. It concluded that: “Western self-interest is the pre-condition for significant coverage of a humanitarian crisis.”
In particular, while there appeared to be no link between the scale of a disaster andmedia interest in the story, there was a clear correlation between the quantity of mediacoverage and the perceived economic impact of a disaster on Western markets.
Of the six disasters analysed, Hurricane Katrina, which hit America’s Gulf Coast inAugust 2005, inflicted the fewest deaths (around 1,300) but generated the greatestnumber of articles (1,035) in the ten weeks following the disaster. This was 40 times more press coverage than the 25 articles generated by Hurricane Stanand the consequent rains and landslides that killed over 1,600 mainly Mayan people
14

15World Disasters Report 2006 – Neglected crises
Just before Christmas 2005, the NetherlandsRed Cross gave three well-known DJs the tas-tiest apple they had ever eaten. It was their firstfood after fasting for six days, shut in the GlassHouse in Utrecht from where they broadcast onthe radio 24 hours a day to raise money for theDemocratic Republic of Congo (DRC).
The public showed enormous interest. Theappeal, ‘Serious Request: Save a Child in the Congo’, raised over EUR 2.2 million (US $ 2.7 m). One million of that was donatedby the Dutch government.
In 1998, civil war broke out in DRC, duringwhich 3.9 million people died of disease,hunger or violence. Children die mainly frompreventable illnesses like diarrhoea.
A shortage of good food and safe watermakes children more prone to disease. In thechaos of war, they lose their families. Someare abducted to become child soldiers.
The International Committee of the RedCross (ICRC) is using the money raised toreunite children with their families and to trainvolunteers who search for families, as well asfor transport, temporary shelter, food andmedical assistance.
The Netherlands Red Cross has set up aspecial fund to provide aid in forgotten areassuch as the Congo.
In 2004, the organization coordinated an appeal with Radio 3FM, which raised EUR 915,995 (US$ 1.1 m) to build a hospitalin Darfur.
It’s not enough to issue a press release tohighlight forgotten disasters. A buzz has to becreated, like in December 2005:■ Well-known Dutch personalities visited the
Glass House. They gave performances or
donated autographed items for the Internetauction organized by eBay.
■ Listeners could request a record on pay-ment of a donation. A total of 25,271tracks were requested. One companydonated EUR 15,000 (US$ 18,500) forone song.
■ Students cycled alongside the house, cover-ing the distance from Utrecht to Kinshasaand back. Listeners sponsored the bike ride.
■ One couple even paid EUR 2,720 (US$ 3,300) to get married in the GlassHouse.
■ The marathon broadcast was also carriedon TV (90 hours live), cable and the Internet.
■ The campaign was supported by advertising,posters on roadside hoardings and 3.3 mil-lion debit card payments. People could alsomake a donation by text message.Subsequent research showed that 7.5 mil-
lion people in the Netherlands followed thecampaign, which reached 83 per cent ofDutch youth.
Eric Corton, a DJ with Radio 3FM, went toDRC to make radio and TV reports for the cam-paign. He met a four-year-old girl who was ina temporary shelter before being reunited withher family. “She was walking around in aragged skirt, but when she saw me with myheadphones and mike she ran away immedi-ately, only to return in a pink dress, fit for aprincess, that she had got from the people atthe shelter. That child had always been used asa worker. And then suddenly adults turn upwho are ‘simply’ kind to her. She was jumpingand dancing around, hanging on my arm.”
There are many more little girls like this whodeserve a Serious Request. ■
Box 1.1 Netherlands Red Cross: “Save a Child in the Congo”

in Guatemala in October 2005. Stan caused anestimated US$ 1 billion in damage – far less thanKatrina’s bill (estimated at US$ 80 billion) –although the storm damage to Guatemala wasabout three times greater as a percentage of GNPthan for the US.
According to CARMA: “The Hurricane Stanleyemergency stands out as the worst indictment ofthe selfish Western approach to humanitariandisasters: here there is no obvious significanteconomic or political interest. Consequently,there is virtually no coverage.” And thediscrepancy in media interest between Stan andKatrina was mirrored by enormous differences inaid allocations (see Chapter 3).
Even the high-profile tsunami, which killed over150 times more people than Katrina, attracted justhalf the media coverage. Meanwhile Darfur, withan estimated death toll of 180,000, generated only73 articles in the 18 months after the crisis emerged– according to CARMA’s survey.
Such deficiencies are all the more worryingbecause of the influence media appear to have onpolitical decision-makers. Dennis McNamara,UN Special Adviser on Internal Displacement,told the BBC in April 2006 that: “Media supportis critical… The influence on governments ismuch higher from the media than from theUN… There’s no question once, I’m afraid, thebabies are on screen.” McNamara is not alone inthinking this – the donor response to Niger’sneglected food crisis in 2005 was widely perceivedas media-driven (see Figure 1.1).
The public are as swayed as the politicians bymedia coverage. The intense reporting on thetsunami had a major impact on the amount ofmoney raised: 40 per cent of the US$ 14 billionpledged or committed to tsunami-affectedcountries was donated by private individuals. A
16
“The world wakes up when we see images on the TV and when we see children dying.” Jan Egeland, UN Under-Secretary-General for Humanitarian Affairs
“The only reason aid efforts increased at all was the mediaattention at the peak of the crisis.” Nicolas de Torrente, MSF’s executive director in the USA
“Media attentionhas triggered donors' interest.”Gian Carlo Cirri, WFP representative in Niger
Figure 1.1 Media coverage fuels Niger funding
Drought and locusts during 2004 led to harvest failure and the biggest shortfall of food for 20 years. By mid-2005, WFP reported 2.5m people on the brink of starvation, leading to what the UN described as one of the most extreme examples of a neglected emergency”.
16 May UN launches US$16m appeal – raised in July to US$ 30m
6 July BBC web story: “No food aid
as hungry flee Niger”
7 July UN appeal coverage: US$ 2.7m
7 July G8 conference starts at Gleneagles, UK – Africa high on agenda
14 July UN appeal coverage: US$ 3.6m
19 July BBC’s Hilary Andersson reports on TV and web: “Niger children starving to death”
21 July Niger’s president visits famine zone
27 July US$ 17m committed inside and outside UN appeal
Sources: BBC, IRIN, OCHA Financial Tracking Service, Reuters AlertNet, UN.

more thorough analysis of available data on media and aid coverage of disasters during2005 reveals a very close correlation between the two: from a selection of ten disasters,the coverage of UN appeals mirrors the extent of media coverage for all the crisesexcept Darfur/Sudan. Meanwhile, total humanitarian aid per beneficiary decreases inline with lower media coverage (see Table 1.2).
The media, however, can only absorb so much at a time. Pouring huge resources intocovering one disaster can cast other disasters into shadow. Overshadowing may alsoreflect the limited capacity of the global humanitarian system to respond, with theexperts that might be in touch with the press preoccupied in one part of the worldwhile another disaster occurs elsewhere.
17World Disasters Report 2006 – Neglected crises
Table 1.2 Links between media and funding, 2005– sorted by appeal coverage
Crisis
Aid appealcoverage %(within UNappeal)1
Aid appealcoverage %(inside and outside UN
appeal)
Aid perbeneficiary
US$2
Print mediacoverage –
press citations(AlertNet/Factiva)3
Print mediacoverage –number of
articles(CARMA)4
TV media coverage –
minutesof airtime(Tyndall)5
1 Tsunami 80 475 1,241 34,992 508 250
2 Uganda 76 105 86 5,209 n.a. 0
3 West Africa 69 125 50 4,804 n.a. n.a.
4 South Asia/earthquake 68 196 310 n.a. 102 86
5 Chechnya 67 104 281 2,886 n.a. 2
6 DemocraticRepublic of Congo
66 122 213 3,119 n.a. 6
7 Guatemala/Stan 65 91 224 n.a. 25 n.a.
8 Somalia 59 87 53 n.a. n.a. 0
9 Côte d'Ivoire 54 90 27 n.a. n.a. 0
10 Darfur/Sudan 53 73 431 7,661 312 n.a.
The table reveals close correlations between aid appeal coverage and media exposure (with the exception of Darfur/Sudan) and between aid per beneficiary andmedia coverage.n.a. denotes data not available.1 Source: UN Financial Tracking Service (OCHA FTS) for all aid appeal coverage – all appeals are for 2005.2 Source: Development Initiatives – total aid inside and outside UN appeals, sourced from OCHA FTS, using UN beneficiary estimates.3 Source: Reuters AlertNet – based on a Factiva survey of more than 200 global English-language newspapers, March 2004–February 2005.4 Source: CARMA International, January 2006 – based on survey of 1,967 print articles from 64 European, US and Australian newspapers published within
ten weeks of the disaster (150 weeks for Sudan's Darfur region only, February 2003–December 2005).5 Source: The Tyndall Report – minutes of airtime on the US's three leading TV networks, 2005.

The tsunami cast a very long shadow over many very deadly humanitarian crises inAfrica. Ruth Gidley of Reuters AlertNet commented that in 2005 the tsunami had“pushed hidden disasters off the map”. And just as the tsunami overshadowed Darfur,so Darfur cast a shadow of neglect on the situation in Chad.
During the 2005 hurricane season, such shadows lengthened. Hurricane Rita wascaught in the shadow of Katrina, despite packing winds of over 200 kilometres perhour and causing US$ 10 billion of damage. But Rita arrived in September 2005, latein the season, and was the tenth hurricane that year. After Rita came Wilma (affectingforeign tourists in Mexico), which in turn shadowed Stan.
Some of those affected by Rita believed the lack of media coverage translated into lessassistance. According to an article in The New York Times dated 20 April 2006:“Texans… say the nation never really took notice of the 77,000 homes madeuninhabitable by Hurricane Rita’s force, 40,000 of which were not insured, or the pilesof debris and garbage that still fester along the roads. ‘Personally I am sick of hearingabout Katrina,’ said Ronda Authement, standing outside her trailer in Sabine Pass,where she will live until she can get the money and the workers to put her three-bedroom house back on its foundation.”
However, despite clear reporting imbalances globally, there are some good mediapractices to report on (see Box 1.2).
2. Unfunded
While media coverage is certainly desirable in highlighting the plight of people inneglected crises, aid coverage is more important. Insufficient funding is a key cause –and symptom – of neglect.
Wealthy Western governments donated well over US$ 12 billion in humanitarianassistance last year – the highest figure since records began in 1970. In addition, privateindividuals gave at least US$ 5.5 billion in response to the tsunami – more than NGOsworldwide had ever collected in a whole year from all sources (see Chapter 7).
But how evenly were these considerable resources allocated? When the total amountof humanitarian funding per emergency is divided by the number of people targetedfor that aid, some revealing statistics emerge. Chechnya, prominent in MSF’s ‘top ten’lists, received US$ 281 per beneficiary in 2005. The South Asia earthquake attractedUS$ 310 and Sudan US$ 431 per head.
However, far and away the best-funded disaster was, not surprisingly, the tsunami,which raised at least US$ 1,241 per beneficiary in humanitarian aid alone – notincluding an extra US$ 8 billion for reconstruction. At the other end of the scale,
18

emergency appeals in 2005 for Chad, Guyana, Côte d’Ivoire, Malawi and Nigergarnered an average of less than US$ 27 per person in need (see Figure 1.2 andChapter 7, Figure 7.10).
To some extent, differences of funding between emergency appeals may reflectdiffering humanitarian needs and the costs of meeting those needs. But a comparisonof the extent to which priority needs – as defined by the UN’s Consolidated AppealsProcess (CAP) – are met by total humanitarian funding (both inside and outside theappeal process) reveals a similarly warped picture. While appeals for the Republic ofCongo, Djibouti and the Central African Republic were on average less than 40 percent funded, the tsunami appeal was 475 per cent funded and the South Asiaearthquake appeal was 196 per cent funded.
Timeliness of funding is vital during emergencies. Analysing UN appeals for 2005,nearly three-quarters of all contributions for flash appeals (for natural disasters)arrived within a month of the appeal launch. The comparable figure for consolidatedappeals (for complex emergencies) was just 7 per cent (see Chapter 7, Figure 7.14).
The slowness of governments to respond to the food crisis in Niger, triggered bylocusts and drought during 2003–2005, led not only to an avoidable loss of life and
19World Disasters Report 2006 – Neglected crises
■ The work of AlertNet, supported by theReuters news agency, is a good example ofcorporate responsibility. The Media Bridge isa promising initiative by AlertNet, supportedby the UK’s Department for InternationalDevelopment (DFID). The aim is to supportjournalists in order “to make it more difficultfor editors to say ‘no’” to in-depth storiesabout disasters. The idea comes in responseto a study by the Columbia School ofJournalism, which found that journalists strug-gle to cover stories with complex roots, espe-cially when they lack background informa-tion, where travel is expensive or dangerousand when it is hard to find people on theground to interview.
■ The Guardian, a British daily newspaper,provides in-depth coverage of disasters and
their root causes both in print and througha dedicated disasters web page.
■ BBC News Online provides stories andimportant web links to specialist aid organ-izations.
■ The US commercial TV network CBS hasdeveloped an encyclopaedic electronic ref-erence to natural hazards and disasters.
■ Some print media in the developing worldare increasingly penetrating in their disas-ter coverage, such as Tehelka, an Indianweekly newspaper, which carried critical,front-line reports in the aftermath of thetsunami, highlighting the plight of peopleon the Andaman and Nicobar Islands whomissed out on aid. ■
See references at end of chapter for web links.
Box 1.2 Journalists take initiative to highlight neglected crises
livelihoods, but also increased the final cost of response a hundredfold (see WorldDisasters Report 2005, Chapter 3). However, it doesn’t appear that the lessons of Nigerhave been learned. Analysing the donor response to 2006’s drought in the GreaterHorn of Africa, the Humanitarian Policy Group (HPG) at the UK-based OverseasDevelopment Institute (ODI) highlights how “agencies, donors and nationalgovernments proved unable to address the crisis effectively in its early stages.”
Despite warnings of “pervasive pre-famine conditions” in November 2005, theemergency response in the Horn did not reach capacity until April–May 2006 –missing the window of opportunity for preventative action. HPG blamed “inflexiblefunding mechanisms”, among other factors, for the delays. When the aid did come,short-term food assistance predominated rather than livelihoods interventions whichcould have reduced future vulnerability.
In an interview with AlertNet in April 2006, Jan Egeland, UN Under-Secretary-General for Humanitarian Affairs, highlighted the under-funding of crises in Africa:“Sudan and Congo are the two worst wars of our generation… The accumulateddeath toll is several times that of Rwanda’s genocide for each. We have to stay themarathon and we are not…We are not adequately able to finish the job, and that
20
0
100
200
300
400
500
600
700
800
900
1,000In US$
$30or under
Around$50
Around$100
Around$150
Around$200
Around$300
Over$400
Tsunami
Over $1,000 2
SudanSouth AsiaearthquakeChechnya
GuatemalaBenin
DemocraticRepublic of Congo
Republicof Congo
GuineaOccupied
PalestinianTerritory
SomaliaWest Africa
CentralAfrican Republic
NigerMalawi
Côte d’IvoireGuyanaChad
Great Lakes regionDjiboutiEritreaUgandaBurundi
Figure 1.2 Equitable aid? Humanitarian relief per beneficiary, 2005
1 Source: Development Initiatives – total aid received inside and outside UN appeals, sourced from OCHA FTS, using UN beneficiary estimates.2 The multi-agency Tsunami Evaluation Coalition reports funding of “around US$ 8,000 allocated per survivor”, based on a total funding figurewhich includes reconstruction over several years and using a smaller estimate of beneficiaries than that used by the UN.
Aid per targetedbeneficiary 1

means funding the return of refugees and displaced people and demobilizing andgiving jobs to the fighters.” He went on to note that donors had only come up withone-fifth of the funding needed to bring peace and stability to these two countries,despite appeals launched four months earlier.
In March 2006, the UN launched an expanded Central Emergency Response Fund(CERF) to provide rapid funds for humanitarian response within days of a disaster orappeal. A third of its funds will go to neglected crises – and in its first month, theCERF allocated US$ 13 million to agencies in the Horn of Africa. By June, the fundhad raised US$ 365 million towards its half-billion dollar target. The InternationalFederation of Red Cross and Red Crescent Societies initiated a similar Disaster ReliefEmergency Fund (DREF) 20 years ago, which dispersed over US$ 8.5 million ofrapid-response funding in 2005 – half of it for minor or forgotten emergencies (seeChapter 7, Box 7.1).
Other forms of financing, beyond Western governments and publics, should not beneglected. Non-Western donor governments are playing a larger part in humanitarianaid, especially since the tsunami. Meanwhile, global remittances back to thedeveloping world totalled around US$ 126 billion in 2004, according to the WorldBank – 50 per cent more than all humanitarian and development aid from the Westthat year. In Guatemala, remittances received during 2005 in the municipalitiesaffected by Hurricane Stan totalled US$ 413 million – 20 times more than the UNappeal had raised by early December (see Chapter 3).
3. Uncounted
Large, one-off, highly visible events that kill many people and cost a lot of money aregenerally less neglected than the many small, recurrent, cumulative and invisibleevents that happen every month. But are death and money the only losses that count?
There are two kinds of humanitarian crisis that are most commonly neglected:■ Small, recurrent, quick-onset (e.g., localized floods, landslides, fires).■ Large, recurrent or chronic, slow-onset (e.g., drought/food crisis, conflict,
disease).
However, it is vital that humanitarian organizations and governments don’t neglectsuch crises, for four reasons:
■ The accumulated death toll from recurrent or chronic crises may equal or exceedthat from big, quick-onset disasters.
■ The impact on household livelihoods and national economies may equal orexceed that of high-profile disasters.
■ Recurrent crises create a cumulative impact, ratcheting up vulnerability to largerhazards in the future.
21World Disasters Report 2006 – Neglected crises

■ Recurrent, small-scale crises provide an opportunity to intervene and mitigatethe impact of future, larger hazards.
One reason why these types of crisis are neglected is because of a reluctance to thinkin terms of continuums and accumulations of risk – yet losses range along spectrumsof kind and degree. Another reason is the lack of standardized methodologies formeasuring their human and financial impact – either through real-time assessmentsor in retrospective databases. The chapter will now briefly examine different ways inwhich the impact of crises are measured.
Counting from above/counting from below
Various databases exist to capture the impact of disasters at a global level. The mostwell-known and widely used are: EM-DAT, an international database of natural andtechnological disasters managed by the Centre for Research on the Epidemiology ofDisasters (CRED), based at the University of Louvain in Belgium; and the databasesmaintained by the reinsurance companies Munich Re and Swiss Re. These databasesrely mainly on information from governments and international humanitarianorganizations – counting from above.
Other systems, such as the DesInventar database, first developed in 1996 by theLatin American Network for the Social Study of Disaster Prevention (LA RED)count from the bottom up. Both types of database have their strengths andweaknesses, and finding ways in which they can complement each other is animportant challenge.
Unlike DesInventar, EM-DAT provides global coverage, while its disaster data goback to at least 1970, enabling trends to be analysed over a number of decades. Butwhile CRED plays a vital role in collecting much-used, impartial data on majordisasters, it only includes disasters if ten or more people are reported killed, or over100 people are reported affected, or if there is an emergency declaration or call forinternational assistance.
So, by definition, the smaller (or unreported) disasters don’t make it into EM-DAT.Yet in these small, everyday events, that erode the already meagre livelihoods ofmillions of people, lie the roots of future harm – as well as opportunities to reducevulnerability to tomorrow’s catastrophes.
DesInventar’s approach allows the registering of information on social and economicimpacts associated with any type of hazard event at the most local scale for whichinformation and cartography are available (usually district or municipal level). Datawere originally built up using local press coverage but are now increasingly derivedfrom official or aid agency sources.
22

Using DesInventar’s data, local effects and conditions can be analysed and therelative losses between large and small events can be approximated. In general, up to 40 per cent of DesInventar’s local registries of loss will correspond to theevents that appear in EM-DAT. The remaining 60 per cent are usually independent,small-scale, localized events with cumulative effects on local vulnerability (see Box 1.3).
The DesInventar methodology has expanded over the last five years from 18 LatinAmerican and Caribbean countries into various Asian countries and now exists inseveral language versions. Meanwhile, MANDISA, a similar kind of databasepioneered in South Africa, records urban disasters such as shack fires, small floods and
23World Disasters Report 2006 – Neglected crises
In Latin America, the DesInventar method hasbeen developed to register highly localizedimpacts of disruptive events, triggered by natural, technological or health-related hazards. Some examples illustrate the differ-ence between top-down and bottom-up count-ing, and how they depend on definitions ofwhat counts in the first place:Pergamino municipality, Buenos Aires province, Argentina.■ National level data sources for the period
1970–2002 revealed only 18 per cent ofall flooding incidents registered in a localdatabase for the same area, drawing onlocal publications and key informants.
■ This suggests that four-fifths of flooding in themunicipality is ‘invisible’ and hence neglect-ed, when viewed from the top down.
■ Although all larger-scale incidents appearin both databases, the great majority ofevents below the mean (in terms of impact)were not registered at the national level.
Peru earthquake, 23 June 2001.■ Analysis of the zone affected by the earth-
quake, using DesInventar data, reveals thatin the previous 30 years the number of per-
sons affected by small-scale events (associat-ed with a wide range of hazard types) wasdouble that assigned to the 2001 quake.
■ Compared to the quake, 30 years of small-er events had inflicted 20 per cent morehousing loss, affected 13 per cent morehouses, but affected 30 per cent less land.
■ These data reveal that the cumulativeimpacts of smaller events are not insignifi-cant, compared to one-off, large-scale dis-asters. Moreover, these small-scale eventsare likely to have increased the daily vul-nerability of local people which the subse-quent earthquake exposed.
Guatemala, 1988–2000.■ Analysing disaster data in Guatemala from
1988 to 2000, CRED’s EM-DAT databasereported 38 disasters which killed 1,617and affected 225,644 people.
■ Over the same period, DesInventar recorded2,949 ‘adverse local impact events’ whichkilled 1,848 and affected 557,820 people.
■ DesInventar included 529 local records inGuatemala for the impact of 1998’sHurricane Mitch, compared to EM-DAT’ssingle, global reference (see Chapter 3). ■
Box 1.3 DesInventar: measuring impacts from the bottom up

building collapses which do not appear in other databases. And since 2005, a newly-formed African Urban Risk Analysis Network (AURAN) has been developing abottom-up approach to quantifying urban risk across the continent.
Capturing the impact of slow-onset crises
Assessing the impact of recurrent or chronic slow-onset crises (e.g., drought/foodcrisis, disease/ill health, complex emergency) is fraught with methodologicaldifficulties. While individual aid organizations have conducted mortality surveys overvarying times, attributing a total death toll to a crisis is notoriously tricky. Figures forDarfur’s death toll, for example, have ranged from 60,000 to 380,000, according toan article in The Washington Post newspaper, dated April 2005. And Darfur is arguablyone of the more high-profile complex emergencies.
Surprisingly, no good global databases exist to track conflicts and collate their impacton civilians. CRED recently created CE-DAT – a database of mortality andmalnutrition surveys from complex emergencies – but methodological differencesprevent CRED from arriving at comparative death tolls per country or crisis (seeAnnex, Box 1).
While it is extremely difficult to measure the impact of complex emergencies in realtime, survey work can play catch-up. For example, the International RescueCommittee (IRC), a US-based NGO, has conducted mortality surveys in DRC whichestimate that 3.9 million people have died from conflict-related causes since 1998.Their surveys have played an important part in highlighting this most neglected of crises.
So-called natural, slow-onset disasters are not necessarily easier to quantify. Deathsarising in situations of chronic drought or acute malnutrition are oftenunderestimated or attributed to disease.
For example, at the time of the Malawi famine in 2001–2002, fatalities from thedisaster were widely estimated at around 1,000 (attributed mainly to a choleraoutbreak). However, Stephen Devereux, a fellow of the Institute of DevelopmentStudies (IDS) at the University of Sussex, UK, contributing to a book called The ‘NewFamines’ to be published in September 2006, presents four mortality estimates derivedfrom three separate surveys conducted shortly after the crisis which put the death tollat between 46,000 and 85,000 (see Chapter 2).
However, mortality surveys remain contentious, according to Hisham Khogali, asenior disaster management officer at the International Federation. “For organizationson the ground, knowing the cause of excess mortality is vital, otherwise just knowingpeople are dying doesn’t help you decide what to do. For example, a severely
24

malnourished child may be dying because of lack of food or lack of clean water. Byproviding the community with food and not the latter, you may do nothing toprevent future deaths.”
Comparative, participatory needs assessments remain elusiveFailure to measure the full impact of humanitarian crises not only occurs inretrospective databases, but in real-time needs assessments too. The capacity of thehumanitarian system to assess global needs in a transparent and comparative way isvital to ensure that crises can be correctly understood and that adequate aid arrives intime to assist those who most need it.
In 2003, the HPG published the results of a year-long study into how humanitarianneeds assessments influence allocations of aid – as part of a wider investigation intothe equity of aid. They concluded that aid organizations’ funding requests were oftenbased less on an objective assessment of needs than on what the donor ‘market’ couldbear for a given crisis (see World Disasters Report 2003, Box 1.3).
25World Disasters Report 2006 – Neglected crises
A woman sits with her child inside thehospital in the villageof El Wok, three milesfrom the Kenyanborder with Somalia.In this village thathasn’t seen significantrainfall in more thantwo years, this hospitalserves more than42,000 people, but has no doctor.
Daniel Cima/American Red Cross

Three years on, what’s changed? According to James Darcy, the publication’s lead author and now the head of HPG: “We’ve come some way since then.” TheGood Humanitarian Donorship (GHD) initiative has explicitly endorsed theprinciple that appeals should be based on sound needs assessments: “Donors are muchmore actively questioning the analysis that underlies UN flash and consolidatedappeals.”
However, argues Darcy, what’s still lacking is a “comparative measure of severitygauged against certain agreed indicators”. The CAP-related Needs AnalysisFramework has enjoyed only “mixed success”. National systems exist, such as theIntegrated Food Security Phase Classification of the Somalia-based Food SecurityAnalysis Unit (FSAU), which has the potential to be more widely adopted. But at aninternational level, “there is no consensus on how to measure the severity ofhumanitarian crises.” Darcy identifies three key problems:
■ Funding for needs assessments. “There is a gross underinvestment indiagnostics.” Donors are increasingly realizing that they must help fund not onlyinitial needs assessments, but continuous monitoring of humanitarian response.
■ Disconnect between needs assessments and decision-making. Without atransparent link here, the best needs assessment in the world will have noimpact.
■ Humanitarian storytelling. “We tend to misrepresent situations in our need toportray them as life-threatening and our role as life-saving.” Such a marketingapproach to selected appeals can grotesquely underplay the severity of othersituations, where response may be more difficult, as well as failing to highlightthe capacities of local response.
Darcy’s concerns reflect those of tsunami evaluators. The considerable resourcesavailable to aid organizations after the tsunami might have been expected to improvethe quality of needs assessments. But according to an evaluation released in 2006 bythe independent, multi-agency Tsunami Evaluation Coalition (TEC): “The slowmoving humanitarian needs assessment did not drive the initial humanitarianresponse. The availability of enormous amounts of funds in search of activities wasthe driving force… As a result the international response was a poor match for thereal aspirations of the people affected by the tsunami, who felt over-assessed but notconsulted.”
The TEC’s evaluation of around 200 assessment reports prepared in the first monthsafter the tsunami revealed several shortcomings: “the lack of a unique format forrapid assessments; the variable definition of who is affected and eligible forassistance; and the tendency of assessors to disregard local coping capacity”. Theneglect of aid organizations in failing to focus their response around the participationof affected people and their expressed priorities is a recurrent theme in theevaluation.
26

Margareta Wahlstrom, UN’s Deputy Emergency Relief Coordinator, suggests thatthe possibility (or not) of getting funding still plays a major part in guiding howmuch UN agencies appeal for: “You intuitively make an assessment of what you’ll beable to mobilize,” says Wahlstrom, adding: “We rarely have assessments that are theresult of a joint effort – that is, including donor agencies. Implicitly, if you do them[needs assessments] you also create a mutual commitment to finance them.” Factorsother than humanitarian needs also affect the amount of money appealed for, including: the “ambition and focus” given to places, the capability of in-country humanitarian teams, the attitude of the host government and securityconsiderations.
4. Secondary
Little attention is paid by media, researchers or donors to the secondary and tertiarydisasters that often accompany a primary event. Oil spills from refineries along theUS’s Gulf Coast were secondary to 2005’s record-breaking hurricane season, butcaused considerable economic and health impacts.
Other little-noticed but massively life-changing ‘secondary disasters’ include: sexual ordomestic violence and trafficking of women (see Chapter 6); problems withresettlement and land grabs (reported after the tsunami); and long-term disabilityfrom injuries (the South Asia earthquake resulted in several thousand amputationsand permanent disabilities).
During hurricanes in the Americas, the greatest cause of death is not wind or stormsurge but flooding and landslides. Yet these issues seldom receive direct analytical,programmatic or media attention. While they are secondary to the storm itself, theyare also secondary to other drivers, such as decades of land degradation anddeforestation.
When Hurricane Jeanne hit Haiti in 2004, floods and landslides down mountainslopes denuded of trees caused 2,000 deaths. But it was poverty and a lack oflivelihood options that forced generations of Haitians to cut down their forests tomake charcoal for sale. Where then is the disaster situated – in hurricanes, landslides,environmental degradation, poverty or poor governance?
Following the tsunami, the emergency response focused on coastal fishermen andtheir families but missed many communities living inland who suffered the secondary,‘invisible’ impacts of the disaster: people whose livelihoods depended on the fishingindustry – from boat-carpenters to idli sellers who provided rice cakes for returningfishermen (see World Disasters Report 2005, Chapter 5). Capturing such indirectly-affected people in needs assessments and disaster databases is an important first stepin meeting their humanitarian needs.
27World Disasters Report 2006 – Neglected crises

A different kind of secondary disaster can arise from uncontrolled or illegalpopulation movements. By the end of 2005, the world’s 12 million refugees weregreatly outnumbered by the 21 million people displaced within their owncountries, according to the US Committee for Refugees and Immigrants (seeAnnex, Tables 14–16).
In recent years, an estimated 2 to 3 million Colombians (half of them children)have been displaced by conflict over land and drugs in their country, promptingthe UN to describe it as the “worst humanitarian crisis in the western hemisphere”.A study conducted by the World Food Programme (WFP) between December2002 and April 2003 concluded that 80 per cent of Colombians displaced byviolence lived in extreme poverty and lacked access to sufficient food. Thesecondary impacts of displacement include exploitation, rape, violence, land lossand urban profiteering. The Colombian government gives displaced populationsjust three months’ emergency support (extendable in some cases), offering them few opportunities to stabilize their lives. And UNHCR’s expenditure per‘person of concern’ during 2003 was nine times lower in the Americas than in WestAfrica.
According to Gustavo Wilches-Chaux, a Latin American analyst, populationmovement in Colombia “generates new threats and vulnerabilities, because the influxof displaced people into the country’s towns and cities makes it necessary to ignore allthe town planning regulations… They occupy high-risk areas (or areas that becomehigh-risk when they are overburdened) and put a severe strain on the ability of thestate and society to provide public health and education services and to offeremployment and other income-generating opportunities.”
Meanwhile, hundreds of thousands of sub-Saharan African migrants attempt toreach Europe illegally each year. Most are fleeing destitution at home, caused byconflict, chronic crop failure or poverty. A minority attempt to enter Europe bysea, committing their lives to ruthless people-smugglers charging exorbitant pricesfor a passage in an overcrowded, often unseaworthy boat. At least 2,000 migrantslose their lives each year in the seas surrounding Europe – while the suffering ofthose crossing the Sahara en route to the smugglers’ ships goes unrecorded (seeChapter 5).
Innumerably more migrants put themselves at great risk trying to cross fromMexico into the US or by boat from China, Korea, and even Bangladesh to Japan.The long-term solutions are deeply complex and political, involving acombination of more legal employment opportunities in destination countries,coupled with better development in sending countries. But the immediate, short-term imperative to save lives lost in transit has received little serious attention.
28

5. Secret
Some life-threatening situations may be kept secret by governments for politicalreasons, or by communities for cultural reasons. The result can be hiddenhumanitarian crises, whose full, horrifying impacts are learned by the outside worldtoo late.
State secrecy can be a major factor. Emperor Haile Selassie hushed up the 1974famine in Ethiopia, argues Alex de Waal in his 1991 book Evil days: thirty years of warand famine in Ethiopia. In China, local officials did not alert the central authoritieswhen drought combined with a depletion of rural labour to produce the Great Leapfamine in the late 1950s.
While there is generally more openness in the 21st century, some nation states stillseek to limit investigations by the media or humanitarian organizations intodisastrous conditions. In April 2006, Jan Egeland, the UN’s humanitarian chief, wasrefused permission by the Sudanese government from visiting Darfur or from flyingover Darfur to visit Sudanese refugees in neighbouring Chad, according to Reutersnews agency.
In the same month, the government of Niger told a BBC team, which found evidenceof continuing hunger, that their permission to report on the humanitarian situationhad been withdrawn. Reporting on the ban, BBC Africa correspondent Orla Guerinsaid officials would not allow international or local media to report on the foodsituation as “they did not want that subject touched”.
Contemporary state secrecy is not limited to Africa. Severe hunger and healthproblems for millions of citizens in the Democratic People’s Republic of Korea(DPRK) were almost completely hidden for years, and humanitarian access is stilltightly controlled. In a detailed analysis of the DPRK famine of the mid- to late1990s, Andrew Natsios, the former administrator of the United States Agency forInternational Development (USAID), put the number of excess deaths at around 2.5 million, nearly ten times the government’s official figures. Human Rights Watch,in a report dated May 2006, says: “It is DPRK government policy to keep conditionsinside the country secret from the rest of the world, even when information wouldlead to desperately needed assistance.”
The plight of ethnic Karen people, displaced internally in Myanmar, is anotherexample of a humanitarian emergency a government would prefer to keep in the dark.Meanwhile, in June 2006, the Committee to Protect Journalists, a US-based NGO,expressed concern at a proposed Chinese law that would subject news outlets to finesfor reporting on natural disasters, riots and other emergencies without officialapproval. And when David Loyn, the BBC’s developing world correspondent,
29World Disasters Report 2006 – Neglected crises
approached Iranian officials about the possibility of returning to Bam to report onrecovery after December 2003’s earthquake, he was “advised not even to botherapplying for a visa”.
Apart from state secrecy there is cultural secrecy, which can particularly exaggerate theimpacts of humanitarian crises on women. After the South Asia earthquake ofOctober 2005, many women from remote, highly traditional mountain areas wereforbidden by their families from coming down to relief camps in the valleys, for fearof compromising their honour. As a result, women’s specific needs were not fully meteven six months after the disaster (see Chapter 6).
In the rural communities of Nepal, the plight of women in childbirth is exacerbatedby the social and religious discrimination they suffer. Women cannot discusspregnancy with anyone other than their husbands and mothers-in-law. They areconsidered polluted and impure for eleven days after giving birth. Male relatives,including husbands, are not permitted to go near them, so they often have to live inisolation with their newborn babies in a cowshed or hut.
Each year, it is estimated that between 5,000 and 6,000 Nepalese women die inchildbirth, while an estimated 30,000 newborn babies die within their first month oflife. Although this annual death toll is over 25 times higher than the number of deathsattributed to Nepal’s ten-year conflict, the issue of maternal and neonatal mortalityhas received virtually no media attention (see Chapter 4).
6. Awkward
Some humanitarian crises are neglected for years because Western donors find itpolitically awkward to engage fully and address them. The restrictions placed onmedia and aid workers alike by countries such as Myanmar, DPRK and Zimbabwemake humanitarian interventions extremely difficult. Political and logistical factorscan make deploying peacekeeping troops tricky.
In the case of Darfur, after three years of brutalization which has displaced 2 millionpeople and claimed several hundred thousand lives, Western attempts to broker apeace agreement in May 2006 failed to win over all factions. Nor could theinternational community persuade the Sudanese government to allow the UN todeploy a more robust peacekeeping force than the 7,000 troops under the commandof the African Union.
Without adequate security, aid organizations cannot operate effectively. Buthumanitarian crises of differing geostrategic significance attract widely varyingnumbers of peacekeepers. In Kosovo in 2001, NATO fielded 45,000 soldiers to keepthe peace in a territory of 2 million people. The following year, international
30

peacekeepers in Afghanistan, mandated by a UN Security Council resolution,numbered less than 5,000 among a population of around 25 million.
During 2006, the international peacekeeping force in DRC numbered 17,000 troops in a country of 62 million people, where, according to the IRC, 1,250 excess deaths still occurred every day. Over 70 per cent of these deaths were inthe insecure eastern provinces, where armed gangs roamed unchecked. Most victimsdied from easily preventable and treatable diseases. “Less than two per cent of thedeaths were directly due to violence,” points out IRC’s health director Rick Brennan.“However, if the effects of violence – such as the insecurity that limits access tohealthcare facilities – were removed, mortality rates would fall to almost normallevels.”
The HPG’s James Darcy argues that aid organizations should do more to highlightthe humanitarian imperative in such politically awkward situations. “For too long, thehumanitarian situation in Darfur took backstage to [Sudan’s] North–South peaceprocess,” he says, adding that humanitarians allowed the politically driven narrativeof the peace process in DRC to overshadow the acute humanitarian crisis in the eastof the country.
‘Never again’ risks becoming ‘again and again’. Following a trip to Darfur in January 2005, Paul Rusesabegina, the real-life manager of the fictional HotelRwanda, likened the situation to the Rwandan genocide of 1994 and lamented:“We see, we look and we never learn from the past.”
The UN’s Margareta Wahlstrom cautions that “the risk is always that you reduce apolitical crisis to a humanitarian one and therefore you apply the wrong mix ofinternationally available instruments.” In such cases, she adds: “We don’t solve anyproblems, we mitigate them for a while. But they will always rebound on us: just lookat Darfur over the past few years.” She advises humanitarians to be more robust inadvocating for the full range of actions needed to solve neglected crises – includingpolitical and security measures.
7. Misunderstood
In 1998, the analyst Mark Bradbury wrote an article entitled Normalising the crisis inAfrica, in which he criticized donors and humanitarian organizations for concoctingexit strategies from ongoing humanitarian operations, such as southern Sudan andSomalia, based on the twin myths of ‘relief dependency’ and the ‘transition todevelopment’. “In redefining them as opportunities for development,” wroteBradbury, “what we are seeing is a process of ‘normalisation’. This normalisation ischaracterized by a creeping acceptance of higher levels of vulnerability, malnutritionand morbidity.”
31World Disasters Report 2006 – Neglected crises

Revisiting those two countries in 2003, to research for an HPG report, Bradburyfound little change – with high levels of malnutrition or epidemic levels of diseasetreated as the ‘accepted’ norm. If anything, the thresholds for triggering humanitarianresponse were increasing: “For example, in Sudan and Somalia, global acutemalnutrition rates of 20 per cent or higher are commonplace and do notautomatically generate a response, even though this is 10 per cent above what isconsidered acceptable by international standards and would be consideredcatastrophic elsewhere.”
What exactly should trigger a humanitarian response, and when, remains a vexed andmisunderstood issue – especially when chronic food insecurity transmutes into acutefood crisis or famine. The International Federation’s Hisham Khogali points out that,for slow-onset disasters, one trigger or threshold could be the point at which copingstrategies become irreversible, rather than reversible. Once households start sellingvital assets, such as livestock or possessions, simply to buy food, the point of no returnmay already have passed.
The problem is that humanitarian aid often doesn’t arrive before coping strategiesbecome irreversible. We have seen how the donor response to the food crisis in Nigerwas triggered not by months of expert warnings about shrinking household assets ordistress migration, but by sensationalist media footage.
The risk is that, in simplifying and overdramatizing disaster, the nature of the crisisand how best to respond to it is misunderstood. The BBC’s David Loyn wroterecently: “It is difficult to fit the full story of a complex emergency into the simplenarrative demanded by TV news. There had been a drought, and harvests werereduced up to a point by locusts – the reasons usually given to explain the images ofsuffering – but the real reason for the emergency was high food prices caused bysuppliers defaulting on deliveries to Niger.”
Loyn added: “People were hungry because they were poor. Climate change and yearsof bad development policies were as much to blame as the locusts and short-termdrought, but both the international response and the language of most TV reportingwere framed as if a sudden disaster had hit Niger.”
The result was an expensive, last-minute intervention dominated by airlifts of foodaid, which saved lives but failed to reduce the risk of future crisis in a way that earlier,livelihoods-based interventions could have.
Malawi’s recent food crisis was anticipated by the government as far back as February 2005. But the UN didn’t launch a humanitarian appeal until late Augustand the government delayed declaring a state of emergency until October. Why? Thegovernment was desperate to regain credibility with the International Monetary Fund
32

(IMF) for prudent economic management, so as to complete the debt-relief process.Announcing an emergency earlier might have triggered panic buying and sent foodprices soaring. Pride was another factor: “Must we go begging?” asked one of Malawi’ssenior civil servants at the time (see Chapter 2).
However, by late 2005, maize prices had soared anyway, 5 million people (nearly halfthe country) faced a severe food crisis and innumerable women were forced intopotentially irreversible coping strategies by seeking sex in return for cash or food –putting themselves at risk of HIV/AIDS.
The UN’s Malawi appeal embraced a ‘smart’ two-pronged strategy, which includedfood aid and support for agricultural inputs, to enable the government todistribute improved seeds and fertilizers free to all smallholder farmers. Theseinputs – aimed at enhancing recovery and reducing the risk of another food crisisthe following season – were based on a similar government initiative which hadboosted crop yields to record levels from 1998 to 2000. But donors provided justone-fifth of the funds for this smart part of the appeal, while food aid requirementswere three-quarters covered.
Malawi’s experience is replicated globally. Some sectors – notably those holding outthe chance for recovery – are consistently more neglected than others. From 2000 to2005, appeals for food aid within the CAP were on average 79 per cent covered, whileeconomic recovery, shelter, protection, water and sanitation, health and agriculturewere all less than 40 per cent funded (see Chapter 7, Figure 7.13).
Livelihoods interventions, such as free agricultural inputs for smallholders orrestocking the animal herds of pastoralists in semi-arid zones, are vital measures tomitigate – or prevent – the impact of slow-onset disaster. Neglecting such measuresallows the resilience of marginal communities to erode, leaving them more vulnerableto recurrent hazards.
Do such funding patterns arise because the lessons of the past have been neglected ormisunderstood? The UN’s Margareta Wahlstrom suggests several reasons: “There’slots of money and power in food aid,” she says, adding: “The recurrent food securitycrises in Southern, East and West Africa have complex causes that require multi-institutional cooperation and a will to support institutions such as the Food andAgriculture Organization, which is not an emergency response agency but is oftenexpected to act like one.”
According to Wahlstrom: “It is clear that unless situations such as the one inMalawi are addressed with urgency, they will return with regularity asemergencies requiring humanitarian intervention. The donors’ reaction was tosome extent prejudiced by their opinion that flash appeals should only be for life-
33World Disasters Report 2006 – Neglected crises

saving aid. We, the international community, still do not have adequate andappropriate financing instruments for the number of situations today that needto be dealt with as something ‘between relief and development’. Our instrumentsstill force a choice of ‘either/or’. And we all know there are fewer and fewer suchsituations.”
Social vulnerability: anticipating crisesDisasters and humanitarian crises share common root causes. It is social vulnerabilitythat unites Mayan farmers who die on unstable slopes in Guatemala, destitutesmallholders in Malawi and pastoralists in Niger, families displaced by conflict inColombia, mothers who die in childbirth across the developing world, children whoare trafficked or forced to be soldiers, irregular migrants who wash up on the beachesof southern Europe. Yet tackling the social vulnerability that underpins all crises(forgotten or not) is itself a neglected issue.
A large and growing research literature shows clearly that development, risk reductionand humanitarian response are intimately bound. Social vulnerability predisposesgroups of people to the impact of a wide range of hazards. It also undermines theirability to cope and recover. Disasters are foreshadowed in the day-to-day vulnerabilityof people whose lives and livelihoods are blighted by failed development.
Neglect – no matter what type it falls under – betrays a failure, principally on thepart of governments, to adequately analyse or address the root causes of chronicsocial vulnerability. The phrase ‘forgotten crises’ misleadingly suggests the problemis one of temporary oversight – when in fact the crisis will recur until the underlyingfailure of development that constructs social vulnerability is understood andtackled.
Following the World Conference on Disaster Reduction (WCDR) in 2005 andagreement by 168 nations to the Hyogo Framework for Action, a multi-hazard,comprehensive approach to disaster risk reduction is slowly becoming the norm. It isbeing institutionalized in many countries under new laws for civil protection and riskmanagement. Official agencies, such as the UK’s DFID and Germany’s GTZ, arebeginning to build disaster risk reduction into their development programmes.DFID, the World Bank and others are also exploring social protection structureswhich address widespread vulnerability.
Of course, not all manifestations of poverty and marginalization should be treated asdisasters. But the commitment by the WCDR to bridge the gaps between disastermanagement, risk reduction and sustainable human development should beaccompanied by broadening the category of disaster to include a wider range ofhumanitarian crises.
34
A good example of social vulnerability is the silent, but avoidable death of 35,000 mothers and babies in Nepal each year. The reasons are rooted in the poverty,isolation, violence, poor governance and discrimination against women that preventaccess to adequate healthcare. The solution is more than a medical one. It involveschanging cultural attitudes, prioritizing health funding and improvinginfrastructure.
However, in Nepal as elsewhere, there aren’t any coherent efforts to capture the fullrange of risks – disaster, conflict, technological hazards, health risks, livelihoodinstability – that vulnerable people face. Everyone, from researchers to aidorganizations to donors, is compartmentalized along sectoral lines.
Any analysis of (or response to) neglected crises will be limited if it focuses solelyon losses rather than on risks and capacities. What does this mean forhumanitarian organizations, used to rapid, short-term interventions? The HPG’sJames Darcy is clear that humanitarian donors and agencies must “acknowledgerisk factors and how to reduce them”. Risk reduction is “hugely neglected”, hesays, yet it is “the language we must be talking to our development colleagues”.Meanwhile, spending on disaster risk reduction remains low and poorly monitored(see Box 1.4).
Darcy suggests that “not just diagnosis but prognosis” is needed – so the probableoutcomes of crises can be projected in time for preventative action. Such leadingindicators of risk – ranging from dirty water to roaming militias – are as importantfor humanitarians as lagging indictors of impact such as acute malnutrition. Bymeasuring and reducing such risk factors, humanitarians could reasonably argue theyhad also reduced unnecessary suffering. Measuring impact through a combination ofleading and lagging indicators would then provide a fuller picture of the success ofhumanitarian action.
There is increasing recognition that humanitarian response must embrace not justshort-term relief, but also vulnerability reduction, as made clear in 1994’s widely-adopted Code of Conduct for the International Red Cross and Red Crescent Movementand NGOs in Disaster Relief and, more recently, by the Good HumanitarianDonorship initiative.
Where humanitarian organizations lack expertise in this area, then options for closerintegration with other specialized agencies dealing with root causes need to beexplored. Humanitarian and development agencies need to cooperate in plugging thegap of risk reduction – social vulnerability is not something that ‘either side’ canaddress alone. The gap is not only one of joint analysis of needs and capacities, butalso one of financial and human resources, of adequate research into cost-effectiveinterventions, and of understanding risk from the viewpoint of the vulnerable.
35World Disasters Report 2006 – Neglected crises

36
Attempts to estimate how much is spent on dis-aster risk reduction (DRR) can quickly hit a brickwall. DRR is rarely a national priority of govern-ments or aid organizations and is not defined ormonitored as an economic sector. So it’s seldompossible to establish total DRR spending fromgovernment or donor expenditure reports.
Trawling through detailed lists of individualprojects and capital investments can also provefruitless, without in-depth information on everyitem, as DRR expenditure is not always obvious.Construction of a sea dyke may be explicitly list-ed as such. However, incremental expenditureon, for example, the construction of a new hos-pital or school to ensure it is earthquake-proof,or on the time spent by an agricultural exten-sion worker advising how to minimize droughtlosses, cannot be readily identified.
Aid organizations with separate DRR budgets can provide an exception to this rule.The European Commission’s Humanitarian Aiddepartment (ECHO) has a disaster preparednessprogramme (DIPECHO), which was launched in1996. DIPECHO’s share in the EC’s annualhumanitarian budget has gradually increased,from 0.9 per cent (EUR 7 million, US$ 7.5 mil-lion) in 1999 to 2.7 per cent (EUR 17.5 million, US$ 21.8 million) in 2005.
However, there is additional DRR spendingunder the EC’s development budget and indi-vidual Directorates-General, which is notreported as such. In fact, there is an implicitdanger in creating specific DRR budget linessolely under humanitarian departments, as itcan perpetuate the belief, held by some devel-opment practitioners, that DRR is the responsi-bility of emergency aid managers alone.
The UK’s Department for InternationalDevelopment (DFID) has deliberately sought toavoid such compartmentalization. Since 2004,DFID has formally linked DRR to its humanitarianaid programme, committing it to spend the equiv-
alent of 10 per cent of disaster response fundingto reduce the impact of related future disasters,where this can be done effectively. The moneycan come from the development or humanitarianbudgets – opening opportunities for develop-ment staff to take more interest in DRR.
From the perspective of involving develop-ment practitioners in DRR, difficulties obtainingdata on total DRR expenditure could be inter-preted positively. The vulnerability of develop-ment to disasters has been demonstrated manytimes. This has made governments and aidorganizations realize the need to ‘mainstream’disaster risk – routinely addressing risks fromnatural hazards while designing developmentprojects and strategies. These efforts towardsmainstreaming may partly explain the invisibili-ty of data on DRR spending, to the extent thatmainstreaming has actually occurred.
However, it is important to ensure thatexpenditure on DRR can be monitored.Progress towards DRR is not simply aboutensuring adequate funding. For instance,enforcing building codes and strengtheninginstitutional capacity for disaster risk manage-ment are also important. Nevertheless, dataon DRR expenditure are important in deter-mining whether the level and nature of expen-diture are commensurate with levels of risk.
One simple approach would be to tag allpublic projects that entail some element of dis-aster risk reduction as they are approved, atthe same time estimating expenditure to beundertaken specifically on DRR. This informa-tion could be maintained in a central govern-ment database, to which ministries wouldhave to report their data. It would be relative-ly straightforward and inexpensive to operate,generating comprehensive quantitative infor-mation for use in monitoring areas of progressin reducing risk and identifying critical remain-ing gaps that need to be addressed. ■
Box 1.4 Neglected: funds for risk reduction

Interestingly, the process of planning the UN’s first consolidated appeal for Nepalduring 2005 led to humanitarian and development organizations discussing for thefirst time how to deal with chronic risks in a conflict setting.
Of course, a balance between longer-term, strategic prevention and shorter-term,tactical treatment must be struck – it is not a situation of either/or. In the case ofHIV/AIDS, both are being pursued. For many years, care and treatment for peopleliving with HIV and AIDS (PLWHA) lost out to prevention campaigns. But recentefforts to get cheap, generic anti-retroviral drugs onto the market mean more peoplecan access drugs that greatly improve the length and quality of their lives.Furthermore, treatment is having a constructive effect on prevention. People whopreviously would not have admitted to being HIV-positive, or feared getting tested, are now coming forward to get the drugs. That should in turn slow theepidemic.
The same approach can be applied to disasters and humanitarian crises, generating adynamic relationship between prevention and response. For example, good responseand recovery can integrate risk reduction measures – such as stronger buildings,cleaner water supplies, diversified livelihoods, empowerment of socially vulnerablegroups – showcasing such approaches to new audiences.
ConclusionThe problem with analysing neglected disasters is that it can quickly become acatalogue of everything that’s wrong with the world – leading to an equally long andimpossible list of recommendations. Innumerable different countries, peoples,sectors, needs and capacities could be identified as neglected, in different ways and bydifferent people. In that sense, to describe a crisis as neglected conceals as much as itreveals.
This chapter has attempted to define seven types of neglect – along with theunderlying and all-encompassing neglect of social vulnerability. This typologyprovides a structure for certain recommendations about ways forward forhumanitarian organizations:1. Unreported
■ Develop closer dialogue with media on neglected crises and connections withroot causes.
■ Provide journalists with more objective data on crises and opportunities tocollaborate.
2. Unfunded■ Establish larger common, unearmarked emergency funds for neglected crises and
sectors.■ Commit at least 10 per cent of emergency funds to disaster risk reduction.
37World Disasters Report 2006 – Neglected crises

3. Uncounted■ Develop joint databases to capture the full spectrum of humanitarian risks and
impacts.■ Invest more resources in creating and implementing a globally comparative
measure of humanitarian needs, gauged against agreed indicators.4. Secondary
■ Improve analysis and mapping of secondary disasters, their impacts and rootcauses.
■ Ensure minimum standards of care apply to those forced to flee their homes,regardless of legal status.
5. Secret■ Work with international and domestic media to reveal the reality of
humanitarian needs in closed societies.■ Encourage governments to champion transparent analysis of humanitarian
suffering and its root causes.6. Awkward
■ Avoid reducing a political crisis to a humanitarian one.■ Advocate for sufficient global political and security attention to enable
humanitarian action to continue.7. Misunderstood
■ Improve analysis of appropriate responses to chronic, slow-onset crises –especially the nexus of drought/hunger/disease.
■ Agree with donors and host governments on appropriate trigger points foraction.
8. Social vulnerability■ Capture the perspectives, capacities and needs of vulnerable people.■ Explore options for integrated risk reduction with development organizations
and governments.
Principal contributors to this chapter and Box 1.2 were Ben Wisner, an independentresearcher affiliated with the Development Studies Institute at the London School ofEconomics, the Benfield Hazard Research Centre (University College London) and theUN University Institute for Environment and Human Security in Bonn; Allan Lavell,Coordinator, Programme for the Social Study of Risk and Disaster at the SecretariatGeneral's office of the Latin American Social Science Faculty, San Jose, Costa Rica andfounding member of the Latin American Network for the Social Study of DisasterPrevention-LA RED; and Jonathan Walter, editor of the World Disasters Report. Box1.1 was contributed by Marja Verbraak of The Netherlands Red Cross. Box 1.3 wascontributed by Allan Lavell. Box 1.4 was contributed by Charlotte Benson, an economistwith 15 years' experience of research on the economic aspects of natural disasters. Alltables and figures were contributed by Jonathan Walter.
38
Sources and further informationActionAid International and PDHRE. Tsunami Response: A Human Rights Assessment.
January 2006.
Becker, Jasper, Hungry Ghosts: China’s Secret Famine. London: John Murray, 1996.
Borger, J. ‘Katrina oil spills may be among the worst ever’, Guardian Online,16 September 2005.
Bradbury, M., Hofmann, C-A., Maxwell, S., Venekamp, D. and Montani, A.Measuring humanitarian needs: Needs assessment and resource allocation in SouthernSudan and Somalia. London: HPG, September 2003.
Bradbury, M. ‘Normalising the Crisis in Africa’ in The Journal of Humanitarian Assistance,London, February 1998. Available at http://www.jha.ac/articles/a043.htm
BBC. Why ‘Never Again’ is not Enough, BBC, 27 January 2005.
BBC. Chad refugee crisis ‘overlooked’, BBC News, 10 May 2005.
Canadian Broadcasting Corporation (CBC). Crisis Zone: Darfur, Sudan, CBCOnline, 5 May 2006.
CARMA International. The CARMA Report on Western media coverage ofHumanitarian Disasters. CARMA International, January 2006.
Chaiban, T. and Ramiro, S. Indifference is not an option in Darfur. US Fund forUNICEF, 27 April 2006.
De Ville de Goyet, C. and Morinière, L. The role of needs assessment in the tsunamiresponse. London: Tsunami Evaluation Coalition, 2006, forthcoming.
De Waal, A. Evil days: thirty years of war and famine in Ethiopia. New York: AfricaWatch, 1991.
Guerin, O. Niger halts BBC hunger coverage, BBC News Online, 3 April 2006.
Human Rights Watch. A Matter of Survival: The North Korean government’s control offood and the risk of hunger, ReliefWeb, 4 May 2006.
Humanitarian Policy Group (HPG). Saving lives through livelihoods: critical gaps in theresponse to the drought in the Greater Horn of Africa. Humanitarian Policy Groupbriefing note. London: Overseas Development Institute, May 2006.
Large, T. Fickle donors ignore Africa’s worst wars – UN, Reuters AlertNet,10 April 2006.
Loyn, D. ‘No easy answers’ in Developments. Department for InternationalDevelopment, London, June 2006.
Marcus, D. ‘Famine Crimes in International Law’ in American Journal of InternationalLaw, Vol. 97, pp. 245–281, 2003.
McDoom, O. Sudan risks aid loss over Egeland ban – UN official, Reuters AlertNet, 6 April 2006.
Médecins Sans Frontières (MSF). Top 10 most under-reported humanitarian stories of2005. MSF, January 2006.
39World Disasters Report 2006 – Neglected crises

Natsios, A. The Politics of Famine in North Korea. Special Report No. 51. UnitedStates Institute of Peace, 2 August 1999.
Steinhauer, J. ‘Storm Evacuees Strain Texas Hosts’, The New York Times, 20 April 2006.
Renzaho, A. Nutrition and Dietetics, Vol. 60, pp. 85–91, Australia, 2003.
Ross, S. Toward New Understandings: Journalists and Humanitarian Relief Coverage.New York: Fritz Institute, Columbia School of Journalism, 2004.
Sackur, S. IDPs: A world of misery, HARDtalk, BBC World, 5 April 2006. Availableat http://news.bbc.co.uk/1/hi/programmes/hardtalk/4879228.stm
UN Department of Public Information (UNDPI). 2006 list of ‘10 stories the worldshould hear more about’. New York: UNDPI, 2006. Available at http://www.un.org/events/tenstories
The Washington Post, ‘Darfur’s Real Death Toll’, 24 April 2005.
40

Web sitesActionAid International http://www.actionaid.orgBBC News http://news.bbc.co.uk/1/hi/worldCanadian Broadcasting Corporation http://www.cbc.ca/newsCARMA International http://www.carma.comCBS News Disaster Links
http://www.cbsnews.com/digitaldan/disaster/disasters.shtmlCenter for Research on the Epidemiology of Disasters, the international disasters
database http://www.em-dat.netDepartment for International Development http://www.dfid.gov.ukDesInventar http://www.desinventar.orgEuropean Commission’s Humanitarian Aid department http://ec.europa.eu/echoFood Security Analysis Unit – Somalia http://www.fsausomali.orgGood Humanitarian Donorship http://www.goodhumanitariandonorship.orgHumanitarian Policy Group http://www.odi.org.uk/HPGInternational Strategy for Disaster Reduction – Hyogo Framework for Action
http://www.unisdr.org/eng/hfa/hfa.htmMédecins Sans Frontières http://www.msf.orgReuters AlertNet http://www.alertnet.orgTehelka http://www.tehelka.comThe Guardian – special reports on natural disasters
http://www.guardian.co.uk/naturaldisastersThe New York Times http://www.nytimes.comThe Tyndall Report http://www.tyndallreport.comTsunami Evaluation Coalition http://www.tsunami-evaluation.org/homeUN High Commissioner for Refugees http://www.unhcr.orgUN Office for the Coordination of Humanitarian Affairs http://ochaonline.un.org
41World Disasters Report 2006 – Neglected crises

42

Photo opposite page:Providing smallholderfarmers withappropriate, improvedseeds and fertilizers isa far more cost-effective way ofaddressing recurrentfood crises thanappealing foremergency food aid.
Yoshi Shimizu/International Federation
43World Disasters Report 2006 – Hunger in Malawi
Hunger in Malawi: a neglected emergencyPoverty indeed turns a man into nothing. A poor man is never listened to. He has nowhereto go to complain for nobody will take action on his story. This is the case because the peoplein the system know each other and they protect each other too. It feels bad to have a heavyheart and to have nowhere to go to express your concerns.
Joseph Graciano, Bangwe township, Blantyre
Malawi, one of the poorest countries in the world, faced a severe food crisis during2005 and 2006, with 40 per cent of the population – nearly 5 million people – inneed of food aid. A combination of poor rains and insufficient access to food, seedsand fertilizers brought Malawi’s most vulnerable people to the brink of starvation.Underlying this crisis was a high prevalence of HIV/AIDS, poor health, very highmaternal mortality, chronic poverty, rising maize prices and malnutrition – turninglife for millions into a fight for survival.
As early as February 2005, the Ministry of Agriculture warned that the crisiscould be as bad as the 2002 famine. On 30 August 2005, the United Nations(UN) launched a flash appeal, adopting a two-pronged ‘smart’ strategy ofimmediate food aid plus support for agricultural inputs, to prevent another foodcrisis recurring. But two months later, the US$ 98 million appeal was just 29 per cent covered, with huge shortfalls in the health, agriculture and foodsectors. While the appeal eventually met three-quarters of its food requirements,donors provided just a fifth of the funds needed for agricultural inputs – thesmart second prong.
Meanwhile, on 18 October 2005, the International Federation of Red Cross and RedCrescent Societies launched an emergency appeal for US$ 30 million, covering sevensouthern African countries including Malawi. By early December, this appeal was just13 per cent covered.
This chapter considers the food crisis from the perspective of those directly affected.The first part presents the results of fieldwork conducted by the authors throughoutMalawi in February 2006. Chronic hunger is familiar to Malawians – one-third of thepopulation needed food aid in 2001–2002 and 2002–2003. Have people recoveredfrom those crises? Is the latest crisis even worse? The chapter reveals the reality ofpeople’s lives as they struggle to cope with hunger and chronic poverty. It examinesthe targeting of food aid and the dynamics that evolve in communities with limitedaccess to food. And it looks at the longer-term impacts on health, nutrition andvulnerable children.

The second part of the chapter takes an institutional perspective. Why were theredelays in declaring a state of emergency? Was the donor response commensurate withneed? What can be done to break the recurrent and devastating cycle of food criseswhich typifies Malawi today? The chapter concludes with constructiverecommendations for improving the agricultural production and diversification ofsmallholders, based on past experience.
Part 1: Fieldwork gives the vulnerable a voiceThe fieldwork consisted of detailed focus group discussions in 18 communities acrossthe country – mainly in the southern and central regions – using a structuredquestionnaire. Dominating the field evidence was the painfully slow recovery by poorhouseholds after the previous food crises in 2001–2002 and 2002–2003. Many hadsold all their assets and few had been able to rebuild their reserves. The pooresthouseholds had consumed most of their next harvest prematurely (as green maize),leaving them with inadequate stores to last until the next harvest. So families, alreadysuffering the after-effects of famine, fell desperately hungry the following season.Marriages broke up under the strain of severe food shortages. Early pregnancies andsexually transmitted infections (including HIV/AIDS) rose as the poor were driveninto sex work to survive. Children, especially orphans, proved particularly vulnerableto malnutrition, disease and exploitation (see Box 2.1).
Most Malawians need access to land to grow food, but after the 2001–2002 famine,some households were forced to sell or lease their land. “Many people had rented theirfields out for five years in exchange for food,” said Peter Madeya from Dedza district,“so they had no fields left to cultivate and had to rely on piece-work only.” Inequality inland ownership is resented. “There are big estates that are just standing idle when somepeople have no land to cultivate,” said Edward Kamanga from Mzimba district. “Landdistribution is a problem and it continues to contribute towards the ongoing hunger.”
Hunger pervades every aspect of life. Malawians are desperately frustrated at theirinability to break out of poverty. “There is no year in which we have rested fromhunger,” said Stephano Keyala from Chikwawa district. “Every year when we try torecover, the same problem comes back.” Rainfall is both a blessing and a curse. Somefarmers suffer from dry spells at critical periods, others nearby lose their houses andcrops to floods. The most unfortunate face both disasters in a single planting season.“This year we thought that we would be blessed with some decent harvest, but thefloods have swept away all our crops and we are left without much hope,” said JustinKankanyoza from Chikwawa. “After the floods, we had three weeks of scorching sunand this finished off the crops that had survived the floods.”
Households have tried to adapt. People in the centre and north of Malawi reported anoticeable increase in households growing and consuming alternative food crops, especially
44

45World Disasters Report 2006 – Hunger in Malawi

46
Food crises target the most vulnerable groupsin society, especially children, who arealready under threat from poverty and theHIV/AIDS pandemic.
During 2005, the country’s average glo-balacute malnutrition rate was 7 per cent – affect-ing 144,000 children under the age of five,according to the UN’s flash appeal forMalawi. Half the country’s children were stun-ted (low height for age), nearly one-third wereunderweight and 50,000 were severely mal-nourished, according to Mary Shawa, secre-tary for HIV/AIDS and nutrition in the office ofMalawi’s President.
Children who are severely underweight maybe up to eight times more likely to die of mal-nutrition than children of normal weight forheight, while being mildly underweight doublesthe risk. Malnutrition is implicated as a causalfactor in over 60 per cent of child deaths,according to expert Majid Ezzati, and con-tributes significantly to Malawi’s very high ratesof infant mortality (110 per 1,000 live births)and child mortality (175 per 1,000 live births).
Even before the 2005–2006 hunger crisis,Malawi had very high rates of protein malnu-trition, with 70 per cent of children admitted tonutritional rehabilitation units (NRUs) sufferingkwashiorkor due to protein deficiency. Datafrom the NGO Action Against Hunger, in col-laboration with UNICEF, showed that admis-sions to NRUs increased by 79 per cent in thecentral region and 48 per cent in the southernregion in the year to December 2005.
Unless they are HIV-positive, children dowell in NRUs. But the underlying drivers ofmalnutrition have not been addressed.“Children are taken into clinics and put underthe feeding programme. They do well,” saidSimon Mchewerewatha from Zomba district,
“but once they are discharged, they go backhome and there is no food. What happens?They go back to their former condition.”
The humanitarian response should haveensured that sufficient protein-rich pulses wereincluded as part of food aid. However, thiscomponent was underfunded. The impact onnutrition and recovery will inevitably be veryserious, according to Roger Mattisen, nutri-tionist for UNICEF Malawi.
Meanwhile, malnutrition reduces immunityto disease. Life expectancy in Malawi hasdeclined from an average of 41 years in1975 to 37.5 years today. There is a hugeburden of communicable diseases, the mostimportant of which is malaria, the majorcause of outpatient admissions and childdeaths. “In the villages this time round, malar-ial infection is very high,” said AntanasioManyenga from Dedza district. “Children thathave malnutrition are weak already and theyare dying when they are attacked.”
Malawi also has a devastating HIV/AIDSpandemic, with close to 15 per cent of theadult population (aged 15–49) infected withthe virus. The pandemic has fuelled a majorincrease in the incidence of tuberculosis. BothHIV/AIDS itself and antiretroviral (ARV) therapy increase the body’s overall nutrientdemand by around 30 per cent in adults,according to Shawa.
People recognize the clear links betweenfood crises and increased HIV transmission.“Due to famine, many women and girls go forcasual sex to get money for food. It’s a sur-vival mechanism,” said Edward Kamangafrom Mzimba district. “The HIV infection rateis already high in this country and they getinfected. The people who are positive move tofull-blown AIDS because of the hunger. Even
Box 2.1 Children pay hunger’s heaviest price

47World Disasters Report 2006 – Hunger in Malawi
those on ARVs are dying quickly because oflack of food.”
Father Nyantakanya from Ngabu districtvoiced the frustrations of many, when peopleare given good medical advice but lack themeans to follow it: “When famine is rampant,it does not sound sensible to send sick peoplehome when they are too weak to look afterthemselves. There is no food at home. Peopleare given medications, but they cannot takethem without food. The lack of nutritious foodis a major problem. People are dying whocould otherwise have been cured.”
And the more adults who die, the moreorphans are left behind – now numbering overa million in Malawi. This in turn puts morepressure on children to leave school early andearn whatever living they can: 1.2 million areinvolved in child labour.
Since the latest food crisis began in early2005, the number of children living on the streethas increased by 50–60 per cent in Malawi’stwo main cities, Lilongwe and Blantyre. Childrenleave their homes and come to town to work inmaize mills or simply to beg for food. They arevulnerable to sexual abuse and cases of childtrafficking have increased significantly, accord-ing to Linda Kabwila of UNICEF Malawi.
Girls are forced into early marriages, par-ticularly in northern Malawi where they com-mand a bride price. In early 2006, the mediareported that six girls in Karonga district wereexchanged for maize, cows, money, or usedas collateral for a loan.
Severe hunger and poverty in childhoodcan have a lifelong impact. Malnutritionreduces a child’s ability to learn, by reducinginteraction and exploration. For the hungry,learning is almost impossible. “Usually there isnothing in the homes. Children go to sleep onan empty stomach, but they cannot sleep,”said Mary Nangwale from Nsanje district.“The following day, they cannot even think of
going to school because they cannot concen-trate and feel dizzy.”
Those that do go to school may drop outearly. Over 81 per cent of Malawian childrenattend primary education, but less than 34 percent complete five years of school. A mere 20 per cent go on to secondary school, as manyparents simply can’t afford the fees. Even forpupils who attend school, learning is impededby a nationwide shortage of trained teachersand materials. “In some courses, there is onlyone book for five students. Our parents cannotafford to buy exercise books or pens. We goto school but have nowhere to write,” saidSusan Kachingwe from Mulanje district.
Hungry children may turn to theft.“Children would go and steal sugar cane orcassava from the fields,” said Stephen MaluzaMua from Dedza district. “Some of them wereseverely beaten and others harmed withpanga knives.” Children caught stealing foodhave lost their hands after having them put inboiling water.
The effects of malnutrition span genera-tions, as a malnourished girl becomes a mal-nourished mother. In Malawi, 78 per cent ofexpectant mothers are malnourished. Suchmothers give birth to babies with low birthweight, who are more at risk of dying in infan-cy. Malnutrition also increases the risk of moth-ers dying in childbirth. The latest publisheddata from UNICEF estimates maternal mortali-ty at 1,800 per 100,000 live births – one ofthe highest rates in the world.
The Malawi Red Cross Society, with itsinternational partners, has prioritized the pro-tection of Malawi’s most vulnerable citizens.Using emergency funds to supplement ongo-ing programmes, the Red Cross provides foodand nutritional support for orphans and vul-nerable children, as well as vital home-basedcare for those suffering from communicablediseases such as HIV/AIDS. ■

cassava and potatoes. Progress on diversification is, however, limited by the scarcity ofplanting materials (e.g., cassava cuttings and sweet potato vines). Irrigated vegetableproduction works where opportunities and markets exist (primarily near urban centres).Traditional dimba (wetland) gardens are used more intensively, both for staple foods andfor horticulture. But for the majority of smallholders, who don’t produce enough to feedthemselves most years, diversification is difficult, because they can’t generate enoughsurplus to invest in new assets, replenish livestock or diversify their income base.
Agricultural recovery is constrained by other major factors. Environmentaldegradation is spreading alarmingly, reducing the land’s productivity. Better inputs(appropriate seeds and fertilizers) are too expensive. Nearly half of Malawi’s 2.8 million smallholder households own less land than the bare minimum (0.5 hectares) needed to grow enough food to survive.
Investment in increasing agricultural productivity and reducing the vulnerability oflivelihoods is a vital part of the fight against hunger and poverty. But the interactionsof health, poverty and gender inequality must also be understood. UN special envoysStephen Lewis and James Morris clearly warned that the food crisis of 2001–2002would exacerbate poverty and the HIV/AIDS pandemic in southern Africa.
Malawi finds itself today in a recurring food crisis situation, where short-term survival– at household and national levels – is derailing investment in education, health andgovernance. The development policy community, both national and international,has been slow to act on these conclusions.
Chronic food crisis strikes twice in four years
Poor rains and insufficient access to agricultural inputs during the 2004–2005 seasonled to “the worst critical food crisis since 1994”, according to the UN appeal.Production of maize, Malawi’s most important staple crop, fell to just 55 per cent ofthe 2.1 million tonnes needed each year to sustain the nation. In August 2005, theUN estimated that at least 4.2 million people were at risk of serious food shortagesbetween June 2005 and March 2006 – with the southern part of the country worstaffected. The shortfall was calculated as equivalent to 269,000 tonnes of maize.
Towards the end of 2005, the estimated number of people in need of food aid rose tonearly 5 million. This compared with 3.2 million in need of food during the 2001–2002crisis. But communities were divided over which crisis was worse. Speaking of 2002,Hannock Phiri of Kasungu district said: “During that hunger, the whole village was soquiet – one could not even hear someone who is drunk make noise in the village.” Somenoted that more people died of hunger in 2001–2002. But deaths due to hunger tendto be under-reported in Malawi as elsewhere (partly because it is very difficult toseparate hunger from other causes of mortality, e.g., communicable diseases).
48

Others felt the situation was far worse in 2005–2006 because of the cumulativeimpact of the failure to recover from 2001–2002 and 2002–2003, plus the poorharvest in 2005–2006. “We had already sold our livestock, our bicycles, our radiosand even our wrist-watches”, said the headman of Chibothera village, Nkhotakotadistrict, “so this time we started with nothing.”
The main difference between the two crises has been the availability of maize on thecommercial market. In 2002, the Malawian government imported 250,000 tonnesof maize. It was sold at subsidized rates through the Agricultural Development andMarketing Corporation (ADMARC), the parastatal marketing network. Peoplewho had cash could access maize at affordable prices, since the presence of largequantities of subsidized maize pushed down prices in informal markets, thushelping the poor.
However, the importing and subsidizing of commercial maize proved very costly forthe government. Some of the maize remained unsold and was exported at a loss.Domestic debt swelled to unsustainable levels and the exchange rate sank, plungingthe country into a fiscal crisis.
To avoid this debt trap, the government imported a modest 70,000 tonnes of maizein 2005, utilizing futures options on the South African market. The effect on priceswas equally modest. In January 2006, the Famine Early Warning Systems Network(FEWS NET) reported: “Maize prices continue to increase at an unprecedented rate.Many ADMARC markets sold little or no maize in January due to the fact thatgovernment commercial stocks are exhausted. This comes at a time when maizedemand is at its peak… Maize prices this January are much higher than during the2001 food crisis or any other year in the past four seasons.”
The shortage of subsidized maize this year has had a major impact on the poor. SimonMcherewatha described the situation during early 2006 in his home district ofZomba: “When maize does arrive at the ADMARC depots, people line up for two tothree days before they are able to buy anything. Many things happen at ADMARCdepots. Some women have to sleep with the ADMARC staff so that they can have thepossibility of buying some food. The maize comes in very little amounts so peoplescramble on the line. They push each other and fight over positions. Sometimessecurity people beat up people in the name of bringing order, yet these are peopletrying to get food when they are weak and hungry.”
In an attempt to share limited supplies fairly, ADMARC initially restricted sales ofmaize to 20kg per person. In February 2006, they reduced this to 9kg per person(where maize was available at all). Those interviewed during the fieldwork wereconcerned about the transparency of maize sales behind closed doors. Some said thatADMARC staff overcharged or demanded a tip. “They tell us that uyikepo ya
49World Disasters Report 2006 – Hunger in Malawi

panwamba – literally meaning ‘put something on top’,” said MacCloud Banda fromKasungu. “As a result, we end up buying at double the normal ADMARC price.”
The UN’s September 2005 figure of 4.2 million people in need of food aid was basedon the assumption that maize would remain at between 19 and 23 Malawi kwacha(MWK) per kilogram – around 15 to 18 US cents. However, by February 2006,maize prices on the informal market had soared to around MWK 60 per kilogram inmuch of Malawi. In the south, a 50kg bag of maize (which would last an averagefamily a month) would sell for MWK 3,000–3,500.
By comparison, the average monthly minimum wage in Malawi is under MWK 2,000.People knew they were being ripped off, with reports of cut-down buckets being usedto measure out the maize. But for most, the main problem was that they couldn’taccess maize anywhere. “You cannot find maize now – not even a single grain,” saidLyness Yohane from Dowa district in January 2006.
Food aid and fertilizers fail to feed all
Efforts were made to target food aid on the basis of objective criteria through aparticipatory field-based process developed by the Vulnerability AssessmentCommittee (VAC), which comprises government, UN and non-governmentalorganization (NGO) players. The VAC made detailed recommendations in May 2005about how food aid should be phased by district – but not all recommendations werefollowed or effectively communicated.
The chair of the Parliamentary Committee on Agriculture, Dzoole Mwale,commented: “This time around I am completely in the dark. I don’t understand thebasis for targeting. The Vulnerability Assessment Committee has not briefedparliament on their report. I am not invited to meetings of the food security taskforce. There has been no communication with us. How can we inform ourconstituents when we don’t know anything?”
Outside the food security joint task force – dominated by government officials,donors and NGOs – very few people had access to, or an understanding of, the VACreport. Key players in parliament, civil society and the faith communities were notinformed about the VAC’s basis for food distribution. They had limited input into thepolicy, design or implementation of the humanitarian response. Parliamentarians feltsidelined from decision-making. Faith communities, with their detailed knowledge ofthe local situation, were not given the opportunity to participate.
This created a perception that all decisions were being made by the government inconsultation with donors, to the exclusion of civil society and parliament. “Donorshave their own policies and come and impose them on NGOs or partners, even
50

though the people on the ground understand the local situation,” said FatherNyantakanya from Ngabu district. “The beneficiaries may have some queries, butthey are afraid of losing out on the much-needed food. They simply accept everythingthat they are told.”
In areas targeted for food aid, people reported that things were better than during2001–2002. “Though the food is not enough, we are getting something. People arereceiving maize, cooking oil and beans. Many people would have died were it not forthe help we are getting,” said Peter Sofoliano from Nsanje district.
But in a desperately poor country like Malawi, for targeting to be accepted, therationale behind targeting needs to be clearly understood. Few outside seniorgovernment circles and donor agencies understand how beneficiaries are identified.Although the criteria are objective, the majority of those not targeted for food aidfailed to meet their basic nutritional requirements. In 2006, over 80 per cent ofMalawi’s population reduced their already unsatisfactory food intake due to hunger,but only 40 per cent were targeted for food aid under VAC guidelines.
During fieldwork for this chapter, some respondents were concerned at how thetargeting of food aid was affecting community relationships. “People are very bitterwith the chiefs who have been instrumental in determining aid,” said Enoch Phiri.“This has resulted in violence. There is chaos in the villages because some chiefs areseen as corrupt and unfair.”
There were problems when only the most vulnerable were targeted. While most ofthem shared the food with their relatives, as is customary in extended families, theyrisked discrimination if they didn’t share. “In some cases, those targeted are old peoplewho cannot help themselves,” said Peter Madeya from Dedza district. “If they do notshare, they are left on their own and life becomes hard for them. The communityspirit is threatened.”
There was also widespread criticism of the way fertilizer was subsidized. Thegovernment’s aim was to provide each smallholder with coupons to reduce the costof one 50kg bag of fertilizer from MWK 2,300 to MWK 950 (US$ 7.50). The UNhad appealed for donors to cover the remaining cost so smallholders could access the fertilizer completely free. But this part of the appeal failed to raise sufficientfunds.
“We were promised that we would get coupons for fertilizer and seed but very fewpeople received coupons. We don’t know how they decided who should get thecoupons,” said Grace Umali from Mangochi district. “Anyway, we cannot buyfertilizers – we don’t have the money. I have never seen MWK 950 at the sametime.”
51World Disasters Report 2006 – Hunger in Malawi

Martin Naluso of Blantyre district added: “The coupons were given out throughchiefs or village headmen. Most of the chiefs were selling them to people rather thangiving them free. In some places a coupon was going for MWK 300, in others MWK 500. Those who had the money, especially businessmen, bought these couponsand sold them back to poor people at a very high price.”
However, despite these problems, the fertilizer subsidy programme helpedincrease maize production and reduced the likelihood of another food crisis in2006. The government acknowledged problems with the distribution of fertilizervouchers and commissioned an evaluation to inform programme design infuture.
“Imagine having to become a thief because of hunger”
In areas not targeted for food aid, the situation could be desperate. In Ngabudistrict, Peter Nzonda said: “People are now eating the seeds of grass known asnkhoka. Birds feed on these seeds and now human beings and birds are competingfor them. Many have stomach problems and pain.” The same was happening inBalaka district.
There was despair where communities were excluded. “It is terribly bad not to betargeted for food relief when you don’t have food. It’s a matter of life and death.Denying you food is like killing you and whoever tries to kill you is not a friend,” saidGlades Fatchi in Chikwawa district. “The people involved in choosing face achallenge in presenting themselves as good to the whole suffering community.” Thissense of exclusion will persist after the crisis has passed and undermines scope forfuture collaboration in community development.
Households survived the way they did during the 2001–2002 food crisis (see Box 2.2). Those not getting food aid cut back their meals to one a day – in theevening. Their diet was limited to green vegetables and dried okra leaves, eaten withfresh leaves as a relish. Some households bought commercial maize seed as food as it’scheaper than maize grain in local markets.
Eating patterns changed. In Kasungu district, families used to eat from the same pot,which wasted food and made young children vulnerable. “With the present hunger,they eat once a day and food is measured out in individual portions,” said McCloudBanda. “This is to ensure that children get adequate food.”
However, hunger also led to widespread exploitation. “In some places you findunscrupulous people who employ others and take advantage of their being hungryand their desperation for food. They make them do hard labour and give them verylittle pay in return,” reported Vincent Morson from Mulanje district.
52
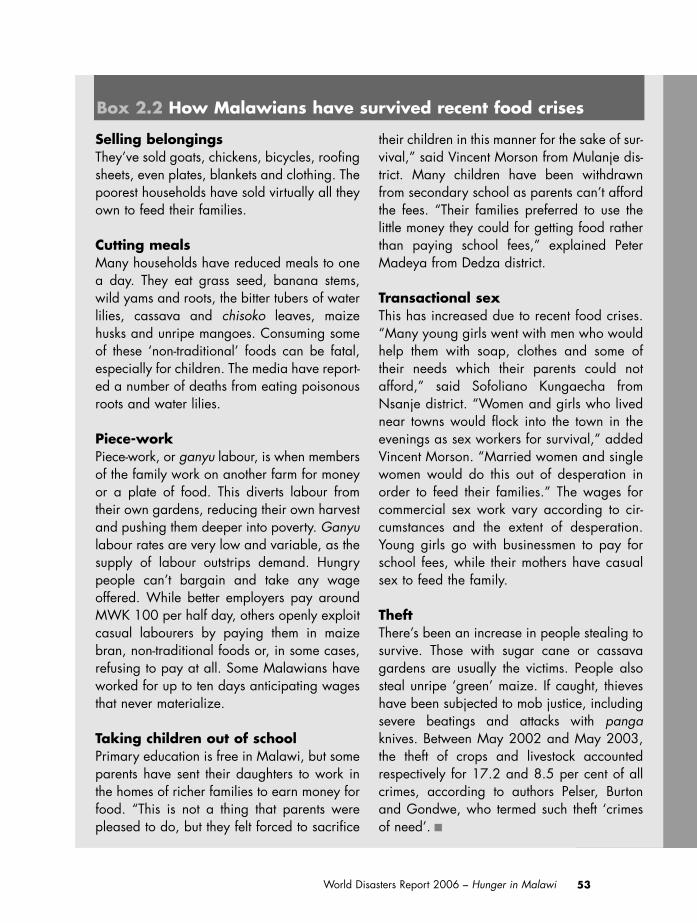
53World Disasters Report 2006 – Hunger in Malawi
Selling belongingsThey’ve sold goats, chickens, bicycles, roofingsheets, even plates, blankets and clothing. Thepoorest households have sold virtually all theyown to feed their families.
Cutting mealsMany households have reduced meals to onea day. They eat grass seed, banana stems,wild yams and roots, the bitter tubers of waterlilies, cassava and chisoko leaves, maizehusks and unripe mangoes. Consuming someof these ‘non-traditional’ foods can be fatal,especially for children. The media have report-ed a number of deaths from eating poisonousroots and water lilies.
Piece-workPiece-work, or ganyu labour, is when membersof the family work on another farm for moneyor a plate of food. This diverts labour fromtheir own gardens, reducing their own harvestand pushing them deeper into poverty. Ganyulabour rates are very low and variable, as thesupply of labour outstrips demand. Hungrypeople can’t bargain and take any wageoffered. While better employers pay aroundMWK 100 per half day, others openly exploitcasual labourers by paying them in maizebran, non-traditional foods or, in some cases,refusing to pay at all. Some Malawians haveworked for up to ten days anticipating wagesthat never materialize.
Taking children out of schoolPrimary education is free in Malawi, but someparents have sent their daughters to work inthe homes of richer families to earn money forfood. “This is not a thing that parents werepleased to do, but they felt forced to sacrifice
their children in this manner for the sake of sur-vival,” said Vincent Morson from Mulanje dis-trict. Many children have been withdrawnfrom secondary school as parents can’t affordthe fees. “Their families preferred to use the little money they could for getting food ratherthan paying school fees,” explained PeterMadeya from Dedza district.
Transactional sexThis has increased due to recent food crises.“Many young girls went with men who wouldhelp them with soap, clothes and some oftheir needs which their parents could notafford,” said Sofoliano Kungaecha fromNsanje district. “Women and girls who livednear towns would flock into the town in theevenings as sex workers for survival,” addedVincent Morson. “Married women and singlewomen would do this out of desperation inorder to feed their families.” The wages forcommercial sex work vary according to cir-cumstances and the extent of desperation.Young girls go with businessmen to pay forschool fees, while their mothers have casualsex to feed the family.
TheftThere’s been an increase in people stealing tosurvive. Those with sugar cane or cassavagardens are usually the victims. People alsosteal unripe ‘green’ maize. If caught, thieveshave been subjected to mob justice, includingsevere beatings and attacks with pangaknives. Between May 2002 and May 2003,the theft of crops and livestock accountedrespectively for 17.2 and 8.5 per cent of allcrimes, according to authors Pelser, Burtonand Gondwe, who termed such theft ‘crimesof need’. ■
Box 2.2 How Malawians have survived recent food crises

Most communities in the worst affected southern region confirmed an increase inhigh-risk sexual practices, including transactional sex, forcing young girls intoprostitution, forced early marriages, domestic violence and child abuse. “With thepresent hunger, women who have children and whose families cannot get any food goto the extent of selling their bodies to those who have food or money,” said JohnLockie in Nsanje district.
Families and marriages broke down. “The husbands know what is happening, butsince they have failed to provide the food themselves they just look on in pain,” saidPeter Sofoliano from Nsanje. Some communities in central and northern regions saidpeople had lost interest in sex, as their only priority was to survive. The spirit ofcommunity cooperation was strained, as people struggling to survive neglected thechronically sick and elderly.
Hunger has undermined human dignity and shattered self-esteem. RobertMchunju spoke for many when describing the situation in his home district ofNgabu: “Ordinary people have been reduced to beggars relying on hand-outs. It isreally degrading not to be able to feed your family. You feel a failure,” he said,adding: “The dignity of the family has been shaken due to all the quarrels thathave arisen between husband and wife. The dignity of women is gone because theyhave to go for men with money. They become the second or third wife of a manwho can provide food. They could not tolerate this if it were not for the hunger.The dignity of people is affected because now they have even turned to stealingfood from other people’s gardens. Imagine having to become a thief because ofhunger.”
People became angry. They lost hope in their future and faith in their god. Manycommunities believed the government had betrayed them. “It is difficult tounderstand our politicians,” said Robert Mchunju. “They promise a lot but dovery little.” Some, like Joseph Graciano from Blantyre district, pointed the fingerat the opposition: “Government has done its best – only that this year the famineis very bad. The politicians in the opposition have not helped. They did notsupport the government’s efforts. Instead, they wasted their time on im-peachment and gave little time to those issues that matter for the people of thecountry.”
At the root of many people’s anger was the sense that this crisis could have beenprevented. In the words of J. Banda from Blantyre: “This hunger was known longbefore and all of us knew that it was going to be very, very serious. But no propermechanisms were put in place to avert it. We blame our politicians for this. We aredisappointed in them. Even the president was very hesitant to declare a state ofdisaster for political reasons, which was very bad. When he did declare it, it wasrather late.”
54
Part 2: Analysing the responseWhen was it clear that the food shortages would become a humanitarian emergency?The parliament’s agriculture committee warned on 7 February 2005 that if thecurrent dry spell were to persist for the next two weeks, Malawi would be hit by adevastating food shortage. The next day, the Daily News newspaper reported thecommittee as saying: “The magnitude would be similar to the 2002 famine whichkilled several hundreds of people.” Their concerns were echoed by the government’sagriculture minister, Andrew Daudi, who told the Nation newspaper on 16 Februarythat he was concerned that the dry spell would adversely affect the maize harvest. Civilsociety groups also sounded warnings.
Almost immediately, others in government and the donor community sought to allaythese fears. A number of resident donors said that the scale of the crisis wasexaggerated and that the predicted national maize harvest of 1.3 million tonnes didnot represent a food crisis (even though the country needs 2.1 million tonnes a yearto feed itself ).
Two major donors, the UK’s Department for International Development (DFID) andthe European Commission, were the first to respond to the food crisis in March 2005,providing money to restock the country’s strategic grain reserve of 60,000 tonnes ofmaize. As the scale of the crisis became evident, donors increased their supportthrough regular programmed resources and in response to the UN’s flash appeal inSeptember. But, as the evidence from the markets has shown, this was insufficient tostop food prices escalating.
Financial and political fears delay declaration of emergency“A consensus has emerged that we have a serious food shortage affecting many peoplein Malawi and accordingly... I declare all districts in Malawi disaster areas with effectfrom today,” said President Mutharika in a statement issued on 15 October 2005,according to Reuters. Why did it take over eight months from the first signs of crisisfor the government to declare a state of emergency?
When Mutharika’s government was elected in May 2004, Malawi’s internationalfinancial reputation had been destroyed under the previous administration. Domesticdebt had exploded sixfold to MWK 60 billion since 2002, due to seriousmacroeconomic mismanagement and the cost of importing maize in response to thecrises of 2001–2002 and 2002–2003. Aid from the International Monetary Fund(IMF), balance of payments support from international donors (worth US$ 70m perannum), and the Heavily Indebted Poor Countries (HIPC) debt-relief process had allbeen suspended.
55World Disasters Report 2006 – Hunger in Malawi

Meanwhile, Malawi had to continue servicing its external debt of US$ 3.1 billion,costing over US$ 110 million in 2004 alone – around 15 per cent of total governmentexpenditure – according to data from the Reserve Bank of Malawi. As a result, debtrepayments crowded out spending on essential social services.
One of the major factors, therefore, lying behind the government’s decision to delaydeclaring a state of emergency was the need to re-establish its credibility for prudenteconomic management. This was vital to get back on track with the IMF andcomplete the debt-relief process. Other factors also contributed to the delay:
■ Fear of panic and hoarding. Declaring an emergency might trigger exactly therise in food prices the government was desperate to avoid, as those with cash rushto buy up whatever maize supplies remain. The government couldn’t afford tobuy sufficient reserves to influence market prices.
■ Political vulnerability. The new president was under threat of impeachment.Opposition parties could exploit a state of emergency as a failure of governmentpolicy and derail economic reforms.
■ National pride. One of Malawi’s senior civil servants reflected the views ofmany when he said: “Why should we declare a state of disaster? Do you want tohumiliate us? Must we go begging? Right from the beginning in February, thepresident called the donor community – he told them that there would be afood crisis. He asked for help. The donors live here; they are not blind. Theyknow that this will be a food crisis. They should increase aid for this crisis now.They should not ask us to declare a state of disaster as this will only cause moreproblems.”
It is not clear whether a declaration of a state of emergency is actually required fordonors to increase aid. Those with existing programmes can reallocate budgets torespond to an emergency. But to get significant additional humanitarian funds in theabsence of a state of emergency or UN appeal or significant press coverage is difficult,especially for a slow-onset disaster.
Response saved lives but failed to reduce vulnerability
In May 2005, Malawi’s Vulnerability Assessment Committee presented donors withtwo scenarios: the first assumed that maize prices would range between MWK 19and MWK 23 per kilogram. On this basis, an estimated 4.2 million people were atrisk and the missing food entitlement was 269,000 tonnes. The second scenario,based on maize prices of MWK 33–40 per kilogram, predicted that330,000–400,000 tonnes of maize equivalent would be needed as relief for thoseunable to access food in the market.
Donors planned their response around the first scenario, even though the governmentrevised the numbers at risk to 4.8 million – a missing food entitlement of
56

335,400 tonnes – in November 2005. Meanwhile, during early 2006, maize pricesthroughout Malawi continued to soar above scenario two levels.
The decision to plan around scenario one was unrealistic from the outset. It wasprobably driven by resource considerations and the recognition that congestion ontransport routes into landlocked Malawi would limit the amount of food aid thatcould be imported on time. As the situation deteriorated, the UN flash appealSeptember 2005–March 2006 called for US$ 51 million in humanitarian relief and US$ 36.5 million for agricultural inputs. The total appeal was later revised toUS$ 98 million. “Food aid must be prepositioned in many areas before the rains startin November,” said the appeal.
The aim of the agricultural inputs support was to help the government provide 2 million smallholder farming households with access to 50kg of free fertilizer and5kg of free maize seed – in time for the next growing season (January to March 2006).The expected impact was to improve agricultural production and reduce the “prospectof another food shortage and costly humanitarian operation in 2006–2007”. It made the appeal “forward-looking”, in the words of Jan Egeland, the UN’s human-itarian chief.
57World Disasters Report 2006 – Hunger in Malawi
Hospitals in Malawiare receiving a rising number ofmalnourished children.Mashina Haudi is one year and four months old. Her weight has beenimproving since shecame to the nutritionalrehabilitation unit atNkhotakota districthospital in Malawi.
Bo Mathisen/ International Federation

The timing of aid was clearly as important as the overall quantity delivered.However, by late October 2005, the UN appeal was less than one-third covered.Food had attracted US$ 18m of the US$ 49m needed, while just US$ 7.5m wasgiven for the vital agricultural inputs – covering 21 per cent of original requirements.In February 2006, emergency food relief had to be scaled back, at the height of thehunger crisis.
By late April 2006, the appeal had garnered US$ 56 million, just over half the US$ 98 million requested. Donations for food, health, water and sanitation had allincreased since October – but not for agriculture. According to the UN’s financialtracking system, a further US$ 61 million was contributed outside the UN appeal.This included programmes by NGOs and the International Federation, but the bulkof the money was a reallocation of US$ 37 million of World Bank funds to help thegovernment cover the cost of maize and fertilizer imports.
To put this response into perspective, for every dollar of aid Malawi received for itsfood crisis – whether inside or outside the UN appeal – it paid a dollar back in debtrepayments. Malawi is one of the world’s poorest countries – an estimated 65 per centof its people live below the poverty line. It is difficult to understand how its externaldebt could not have been reviewed at a time when the country was facing ahumanitarian emergency affecting 5 million people.
The failure to finance the true scale of the humanitarian crisis (the VAC’s secondscenario), combined with delays in the arrival of aid-bearing ships, overloadedtransport corridors and the poor performance of some suppliers, compromised thefood distribution pipeline. As a consequence, the UN World Food Programme(WFP) was forced to reduce planned food aid distributions.
However, while the humanitarian response prevented widespread hunger-relateddeaths, it was insufficient to ensure agricultural recovery, prevent escalatingmalnutrition among children or help households avoid destructive copingmechanisms that have forced them ever deeper into poverty.
Neglected solution: subsidies for agricultural recovery
The inclusion of support for agricultural inputs in the UN appeal was designed topromote recovery in a desperately poor agriculture-based economy where themajority of the population fails to meet basic nutritional requirements, even in non-crisis years.
To break the vicious cycle of poverty and food insecurity in which many smallholdersare trapped requires long-term, carefully implemented policies to transform theagricultural sector – plus effective programmes to alleviate the immediate impacts of
58

food insecurity. Both are essential if Malawi’s development is not to be continuallydisrupted by recurring food crises. Such an approach constitutes three main elements:
■ Ensuring effective, evidence-based subsidies for agricultural inputs which clearlybenefit the poor.
■ Enhancing market access for inputs and outputs – with explicit recognition ofthe cash constraints of the poor.
■ Strengthening the linkages between science and policy.
Direct subsidies on fertilizer prices are politically appealing, but exclude the poorestsmallholders who can’t afford to buy inputs even at subsidized rates. The costs canquickly spiral out of control, since the government doesn’t control the internationalprice of fertilizer, the exchange rate or fertilizer demand.
A better option is an ‘area-based subsidy’, similar to the universal ‘starter pack’programme designed and implemented by the Malawian government in 1998–2000to increase smallholder maize productivity. The starter pack provided all smallholderhouseholds with sufficient free seed and fertilizer for 0.1 hectares. It led to recordmaize production of around 2.5 million tonnes, averted recurrent food crises andbrought down the price of food for the poor. At around US$ 45 million per year in1998–1999, its cost compares favourably with the cost of emergency responses, whichtotalled US$ 117 million in 2005–2006 (see Box 2.3).
The starter pack planners used the ‘common sense’ criterion of providing sufficientinputs to put one extra bag of maize in every household’s granary – ensuring the inputswere big enough to make a difference, but small enough not to be diverted or sold.
The intention with area-based subsidies is to provide all farmers with the resourcesthey need to start the long haul out of poverty. In the first year, the focus would beon inputs to produce the staple food (e.g., maize). As farmers improve their foodsecurity, subsidized inputs could be varied to promote crop diversification. By year three, for example, the maize component could be reduced and inputs for otherimportant food or cash crops (e.g., groundnuts, beans, pigeonpea) might form thebulk of the pack. Inputs could be adjusted according to agro-ecological and marketconditions. Key principles include:
■ Sufficiently comprehensive to address rural and urban hunger without buildingdebt – benefiting all smallholder households.
■ Sustained for the medium term – 10 to15 years’ guaranteed funding.■ Incorporating ‘best-bet’ technologies – high-quality seed designed for local
conditions, early maturing varieties to reduce vulnerability to drought.■ Sound advice in: early planting, timely and efficient fertilizer application, correct
husbandry and weeding practices.■ Improving soil fertility and environmental sustainability through economically
viable biological technologies.
59World Disasters Report 2006 – Hunger in Malawi

60
Past experience shows that it is far more cost-effective to address recurrent food crises byproviding universal subsidies to support agri-cultural production rather than through emer-gency food imports and appeals for food aid.
Malawi has a chronic food deficit, with anational maize requirement of around 2.1 mil-lion tonnes and production levels averagingaround 1.6–1.7 million tonnes. So, in theabsence of a significant intervention by gov-ernment, Malawi has a maize productiondeficit of 500,000 tonnes.
But when the government, facing a food cri-sis, implemented its own programme to promotefood security, the results were remarkable. In the1998–1999 and 1999–2000 agricultural sea-sons, the government implemented a universal‘starter pack’ programme. Under this, all 2.8 million of Malawi’s smallholder householdswere given 2.5 kilograms of improved hybridmaize seed, 15 kilograms of fertilizer and 1 kilo-gram of legume seed. For two years, maize production increased by an average of125–150kg per household. Nationwide pro-duction reached around 2.5 million tonnes –half a million tonnes higher than before or since,and 67 per cent above the 21-year average.
The evaluation of the programme concludedthe universal starter packs were capable of pro-ducing between 280,000 and 420,000 ton-nes of maize, according to Sarah Levy, the editor of a recent book on the subject. The keyrequirements were that the programme promot-ed ‘best-bet’ technologies (seeds and fertilizerbest suited to local environmental and econom-ic circumstances) and that inputs were deliv-ered in advance of the planting rains. Whenthese requirements were met, the programmewas capable of closing the gap between pro-duction and consumption requirements.
The universal starter pack programme,which cost around US$ 45 million per annum,proved very cost-effective compared with thealternatives of subsidizing commercial maizeimports or appealing for emergency aid (in2005, the UN alone appealed for US$ 98 mil-lion for Malawi). In addition, compared tofood aid, starter packs encouraged develop-ment rather than dependence.
Following Malawi’s devastating food crisis in2005, the government implemented a fertilizersubsidy programme focused on increasingmaize productivity. The government subsidized147,000 tonnes of fertilizer at a cost of aroundUS$ 60 million. Donors contributed US$ 7.5 mil-lion, through the UN appeal, to support the dis-tribution of 4,000 tonnes of improved maizeseed, logistics and agricultural extension. Anexternal evaluation will calculate the total incre-mental production under the fertilizer subsidyprogramme, but initial indications were that pro-duction in 2006 would hit 2.4 million tonnes.
According to a report tracking soil health from1980 to 2004, published recently by theInternational Center for Soil Fertility andAgricultural Development, more than 80 per centof farmland in sub-Saharan Africa is plagued by severe degradation. Major factors include asoaring population, erosion by wind and waterand, crucially, farmers’ inability to afford fertiliz-er. Fertilizer use in Africa is the lowest in theworld – less than 10 per cent of the global aver-age – resulting in the world’s lowest crop yields.
The lesson for African governments strugglingwith recurrent food crises and chronic hunger isclear. It is better to subsidize agricultural pro-duction than be forced to deal with food criseswhich divert scarce foreign exchange for maizeimports, undermine growth, fuel inflation andlead to incalculable human misery. ■
Box 2.3 Subsidized seeds and fertilizer save lives and money

■ Promoting crop and livelihood diversification.■ Active collaboration with the private sector, local government and NGOs.
The advantage of area-based subsidies is that they reach and benefit all farmers,although the evidence suggests that the better-off will, unsurprisingly, make more ofthe opportunities provided. This is integral to the approach. Farming leaders must beactively involved in promoting and improving new technologies. There are clearrewards for good husbandry and the effective use of inputs, as well as a direct impacton poverty through improving food security and nutrition.
Such subsidies are a mechanism for driving the nation out of poverty and intoprofitable agriculture and other associated businesses. They can be adjusted tochanging national priorities by altering the mix of subsidized inputs. The costs areknown largely in advance. If the programme is properly planned and implemented, itcomplements commercial input supply and doesn’t disrupt trade.
The model could be varied according to the specific priorities of different farmers andregions of the country, with inputs adjusted from the start. One package could be freeand targeted at very poor farmers; another could comprise partially subsidized inputsfor more diverse crops – appropriate for better-off farmers. The explicit developmentof crop diversification was a major gap in the original starter pack initiative. A revisedprogramme should include the evaluation (with farmers’ full participation) of variousdiversification options. These are vital to recovery and should be introduced at theearliest opportunity, so that smallholders are no longer tied to their food crop as anincome source.
But careful attention needs to be paid to the market price of farm outputs. One of thebenefits of such a programme is its effect in keeping down food prices. This benefitsthe poor as well as schools and hospitals, which could buy up food at reasonable ratesto feed vulnerable groups.
To succeed, area-based subsidies need to be implemented with adequate lead time, plusa 10–15 year commitment. There is little international experience in executing thistype of programme. Importantly, it depends on the availability of reliable, high-yieldtechnologies suitable for the poor as well as for better-resourced farmers. Inputs mustbe provided on time – before the planting rains – and supported by public awarenessand advice through radio messages and focused extension efforts. To have a significantimpact on reducing vulnerability, the programme has to engage all smallholders.
For the majority of Malawi’s population – as in most of Africa – agriculture is themost important livelihood activity and agricultural constraints are immediate andcritical. Transforming agriculture must form a significant part of the solution toMalawi’s poverty and vulnerability.
61World Disasters Report 2006 – Hunger in Malawi

That transformation will come, as it has elsewhere, from the development andadoption of productive, profitable new technologies. A participatory ‘GreenEvolution’ in agricultural development is needed, which builds on an evolvingpartnership of scientists, farming communities and development agencies, andharnesses the best available skills in a collaborative, ‘learning-by-doing’ manner inwhich all feel ownership and pride.
Conclusion: listen to locals, invest in agricultureThis chapter has outlined the human impact of Malawi’s recent and recurrent foodcrises from the perspective of the people affected. Hunger has forced people to ‘cope’in the most destructive ways imaginable: selling precious possessions and vital assets,taking children out of school and forcing young girls and their mothers intoexploitative sexual relationships. It has led to the break-up of families and forcedchildren onto the street. It has exacerbated domestic tensions leading to grief, hurtand a sense of betrayal. It has eroded the spirit of community cooperation andaggravated relationships with traditional leaders.
The failure to ensure that a strong public awareness campaign accompanied thehumanitarian relief operation has left large swathes of the population, especially thosenot targeted for food or fertilizer, feeling betrayed, confused and angry. Trust innational governance has been badly damaged. Too few decision-makers within thegovernment and aid community have appreciated the true extent of poverty inMalawi. Too few have listened to people who live in vulnerable communities, eventhough it is a small country. None of this augurs well for Malawi’s long-termdevelopment.
Yet, in the face of chronic hunger and grinding poverty, the spirit of resilience andhope remains alive. People understand their situation and are articulate about theirpriorities. They want their most basic needs met: access to seeds and fertilizers sothey can grow sufficient food and not have to rely on food aid; access to qualityhealthcare, good education and clean water. They want stability in their familylives rather than being torn apart by poverty and premature death from disease andhunger. People want to be consulted about their needs – listened to, not talkeddown to. They would like to see their elected representatives outside of electioncampaigns. They want transparency, rather than watching the maize vanishthrough the back door when they’ve been waiting for days in line for their fairshare. They want equal access to subsidized fertilizer without being forced to paybribes.
Malawi is in a recurrent and devastating sequence of food crises – which need adevelopment as well as a relief component if the cycle is to be broken. But thehumanitarian response was underfunded from the outset and donors provided very
62

little support for the agricultural inputs envisaged by the UN appeal. The only way toavoid food crises in future is through increasing investment in agriculture, led bynational authorities and supported by international donors. Otherwise, this deadlycycle of crisis and short-term response will continue.
Some names have been changed to protect the identities of respondents. We would like toacknowledge the assistance of Mary Shawa in the Office of the Malawi President andCabinet, and Michael Keating, the United Nations resident representative, in preparingthis chapter.
This chapter was contributed by Anne Conroy, who has lived in Malawi for over 15 years,working on research, policy analysis and advocacy in the areas of agriculture, food security,health and HIV/AIDS; Malcolm Blackie, a Zimbabwean agricultural economist who hasworked in sub-Saharan Africa for four decades and is director of bT Associates, a smallnetwork of African development experts; Father Boniface Tamani, Chair of the Malawi-based Public Affairs Committee (PAC), an inter-faith advocacy and civic educationagency; and Austin Ngwira, an agriculture and rural development specialist, who hasworked extensively on rural food economies in Malawi and Zimbabwe.
Sources and further informationBationo, A., Kimetu, J., Ikerra, S., Kimani, S., Mugendi, D., Odendo, M., Silver, M.,
Swift, M.J. and Sanginga, N. The African Network for Soil Biology and Fertility:New Challenges and Opportunities. Scaling soil nutrient balances workshopproceedings. Nairobi, 2003.
Esser, K., Oygard, R., Chibwana, C. and Blackie, M. Opportunities for NorwegianSupport to Agricultural Development in Malawi. Noragric Report No. 27. Aas,Norway: Norwegian University of Life Sciences, 2005.
Ezzati, M., Lopez, A.D., Rodgers, A., Vander Hoorn, S., Murray, C.J.L. and theComparative Risk Assessment Collaborating Group. ‘Selected major risk factorsand global and regional burden of disease’ in The Lancet, Volume 360, Issue 9343,pp. 1–14, 2002.
Famine Early Warning System Network (FEWS NET). January Food Security Update,2006.
Gillespie, S. and Haddad, L. The Relationship between Nutrition and the MillenniumDevelopment Goals: a Strategic Review of the Scope for the Department forInternational Development’s Influencing Role. Washington DC: International FoodPolicy Research Institute, 2003.
Harrigan, J. Agricultural Diversification Options. Paper presented to the Malawi AfterGleneagles Conference, Scottish Parliament, Edinburgh, November 2005.
Levy, Sarah. ‘Production, Prices and Food Security’ in Sarah Levy (ed.), Starter Packs:A Strategy to Fight Hunger in Developing Countries? CABI Publishing, 2005.
63World Disasters Report 2006 – Hunger in Malawi

Malawi Government. Food Security Assessment Update. Paper presented to theVulnerability Assessment Committee of the National Food Crisis Task Force,November 2005.
Malawi Ministry of Health and UNICEF. Nutrition Survey. Paper presented to allstakeholders in the National Food Crisis Task Force, December 2005.
Pelser, E., Burton, P. and Gondwe, L. Crimes of Need: Results of the Malawi NationalCrime Victimisation Survey. Institute for Security Studies, 2004. Available athttp://www.iss.org.za/pubs/Books/CrimesOfNeed/Contents.htm
Reuters. Malawi leader declares disaster over food crisis. London, 15 October 2005.
Shawa, M., Secretary for HIV/AIDS and Nutrition, Office of the President andCabinet. National Overview Nutrition and HIV/AIDS. PowerPoint presentation toMalawi’s cabinet ministers, November 2005.
Thangata, P.H. and Nkedi-Kizza, P. Fertilizer Subsidy: the need for a pluralistic policyapproach to combating hunger and poverty in Malawi. Paper presented to thePresidential Parliamentary Committee on Agricultural Policies (MalawiGovernment), 1998.
United Nations (UN). Malawi 2005: Flash Appeal. UN Consolidated AppealsProcess, 30 August 2005.
UN Children’s Fund (UNICEF). Humanitarian Situation Update. Paper presented tothe National Food Crisis Task Force, Lilongwe, April 2006.
UN Development Programme (UNDP). Humanitarian Situation Reports. Paperspresented to the National Food Crisis Task Force, Lilongwe, January andFebruary 2006.
Zamba, C. Malawi’s Debt Situation. Paper presented to the Malawi After GleneaglesConference, Scottish Parliament, Edinburgh, November 2005.
64

Web sitesDemographic Health Survey 2004, Malawi
http://www.measuredhs.com/pubs/pdf/SR113/SR113.pdfNational Statistical Office of Malawi http://www.nso.malawi.netUN Children’s Fund (information on Malawi)
http://www.unicef.org/infobycountry/malawi_statistics.htmlUN Malawi 2005 Flash Appeal
http://ochaonline.un.org/cap2005/webpage.asp?Page=1249UN Population Fund (information on Malawi)
http://www.unfpa.org/profile/malawi.cfmWorld Bank Group in Malawi www.worldbank.org/mwWorld Food Programme (information on Malawi)
http://www.wfp.org/country_brief/indexcountry.asp?country=454
65World Disasters Report 2006 – Hunger in Malawi

66

PacificOcean
CaribbeanSea
Lago deAtitlán
Lago deAmatitlán
Lago de Ayarza
Lago de Izabal
San Marcos
Huehuetenango
Retalhuleu
EscuintlaAntigua
Jutiapia
Chiquimula
ZacapaEl Progreso
Cobán
Flores
Santa Cruzdel Quiché
Salama
Chimaltenango
Puerto Barrios
GUATEMALA
SAN SALVADOR
San José
Sta LuciaCotzulmalguapa
Pueblo NuevoTiquisate
Senahú
Sololá
PochutaPanabaj
Pastores
Alta Verapaz
BELIZE
HONDURAS
MEXICO
EL SALVADOR0 km 30 60 90 km
Guatemala
NORTH
Photo opposite page:Volunteers prepareto search for the victimsof a deadly mudslidenear the village ofPanabaj, Guatemala, 8 October 2005.Around 1,400 peopledied under themudslide, which wastriggered by torrentialrains from HurricaneStan.
© REUTERS/Daniel LeClair,courtesy www.alertnet.org
67World Disasters Report 2006 – Guatemalan vulnerability
Hurricane Stan lifts the lidon Guatemala’s vulnerabilityDoña Petronila doesn’t understand how rain – a divine gift for the harvest and the lifeit provides – can have become a punishment. Like her neighbours, Doña, aGuatemalan woman and a Maya Indian, survived the country’s long civil war from1960 to 1996, only to see her community devastated by Hurricane Stan in Octo-ber 2005. Homes, friends and family vanished – washed away by the mud and water.
The mountains that surround these communities were stripped by rain and erosion.Underground streams and floods brought terror to the small homes on the river’s edge.The inhabitants had settled here while on the run from the war, ten years ago, becauseno one else lived here. They rented land on the slopes of the mountains and cultivatedmaize. It was an uninhabitable wasteland when they arrived. Now it is again.
This scene, described by Costa Rican journalist María Suárez in A Personal Account ofa National Disaster, provides an insight into understanding the vulnerabilities ofpresent-day Guatemala: the long and bloody civil war, which displaced hundreds of
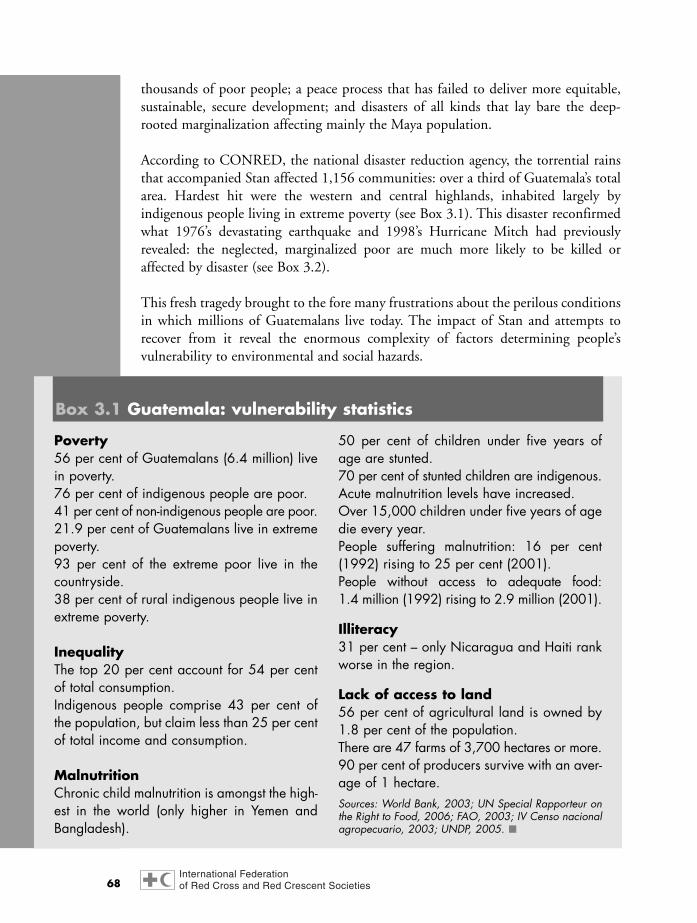
thousands of poor people; a peace process that has failed to deliver more equitable,sustainable, secure development; and disasters of all kinds that lay bare the deep-rooted marginalization affecting mainly the Maya population.
According to CONRED, the national disaster reduction agency, the torrential rainsthat accompanied Stan affected 1,156 communities: over a third of Guatemala’s totalarea. Hardest hit were the western and central highlands, inhabited largely byindigenous people living in extreme poverty (see Box 3.1). This disaster reconfirmedwhat 1976’s devastating earthquake and 1998’s Hurricane Mitch had previouslyrevealed: the neglected, marginalized poor are much more likely to be killed oraffected by disaster (see Box 3.2).
This fresh tragedy brought to the fore many frustrations about the perilous conditionsin which millions of Guatemalans live today. The impact of Stan and attempts torecover from it reveal the enormous complexity of factors determining people’svulnerability to environmental and social hazards.
68
Poverty56 per cent of Guatemalans (6.4 million) livein poverty.76 per cent of indigenous people are poor.41 per cent of non-indigenous people are poor.21.9 per cent of Guatemalans live in extremepoverty.93 per cent of the extreme poor live in thecountryside.38 per cent of rural indigenous people live inextreme poverty.
InequalityThe top 20 per cent account for 54 per centof total consumption.Indigenous people comprise 43 per cent ofthe population, but claim less than 25 per centof total income and consumption.
MalnutritionChronic child malnutrition is amongst the high-est in the world (only higher in Yemen andBangladesh).
50 per cent of children under five years ofage are stunted.70 per cent of stunted children are indigenous.Acute malnutrition levels have increased.Over 15,000 children under five years of agedie every year.People suffering malnutrition: 16 per cent(1992) rising to 25 per cent (2001).People without access to adequate food: 1.4 million (1992) rising to 2.9 million (2001).
Illiteracy31 per cent – only Nicaragua and Haiti rankworse in the region.
Lack of access to land56 per cent of agricultural land is owned by1.8 per cent of the population.There are 47 farms of 3,700 hectares or more.90 per cent of producers survive with an aver-age of 1 hectare.Sources: World Bank, 2003; UN Special Rapporteur onthe Right to Food, 2006; FAO, 2003; IV Censo nacionalagropecuario, 2003; UNDP, 2005. ■
Box 3.1 Guatemala: vulnerability statistics

The chapter does not intend to review progress made in risk reduction since Mitch,but provides an insight into the more neglected aspects of Guatemalan vulnerabilityexposed by Stan and reports on how the disaster has led to some surprising changes.The text is divided into four sections:
■ Stan – a disaster foretold. How small, recurrent disasters reflect and increaseeveryday vulnerability and prefigure larger disasters in the future.
■ Contexts determining disaster risk. This section examines some of the contextsand processes specific to Guatemala, which construct and maintain disaster risk.
■ Recovery boosts community cohesion. The response to and recovery from Stanhas led to greater bottom-up community organization, which could contributeto better governance with the right support from the top down.
■ Future risks demand sustained action. This section assesses the dangers ofaddressing disaster risk reduction as an occasional and intermittent problem,rather than as an urgent and permanent commitment.
Stan – a disaster foretoldStan was reported in the media as a disaster foretold – not just in the light ofHurricane Mitch in 1998, but also because in Guatemala, as in the rest of CentralAmerica, the number of small-scale disasters has been increasing in recent years,particularly those caused by torrential rains, mudslides and floods.
Stan was a repetition on a wider scale of what had been happening year after year inGuatemala – even in the months running up to the ‘big disaster’. For example, threemonths before Stan, a mudslide in Senahú village, Alta Verapaz (in the north-east),left 22 people dead and 57 homes destroyed. Five years earlier, a mudslide killed 13in the same place. There are similar stories of flooding on the south coast, where manycommunities are subjected to the same disaster year after year.
Although not as common as floods and mudslides, earthquakes are also regarded as adisaster waiting to happen. As more people move into weak buildings in high-riskareas, so vulnerability to seismic hazards is growing. In 1991, an earthquakemeasuring 5.3 on the Richter scale, triggered along a minor fault line beneath thetown of Pochuta, Chimaltenango, left 25 people dead and 2,300 homes in ruins.
Evidence of risk patterns and insights into potential disasters can be found in theDesInventar database for Guatemala (see Chapter 1). DesInventar does not definedisaster in quantitative terms, but records all the events that have an adverse effect onlives, property and infrastructure. The information, derived from secondary sourcesand disaggregated by community, provides a picture of the very varied daily riskscenarios existing at local level. It is a powerful tool for raising risk awareness at alllevels and provides useful guidelines for making risk management an integral part ofdevelopment.
69World Disasters Report 2006 – Guatemalan vulnerability

70
The historical memory of disasters in Guatemalarevolves around major earthquakes and dan-gerous volcanoes, which destroyed the capitalcity three times: in 1541, 1773 and 1917–1918. In 1902, the country was shaken by anearthquake measuring 8.2 on the Richter scaleand the dormant Santa Maria volcano awak-ened with one of the largest eruptions in history.
This year is the 30th anniversary of the great 1976 earthquake that shook a fifth ofGuatemala’s territory, leaving over 23,000 deadand 233,000 homes destroyed. Described byAmerican journalist Alan Riding as a ‘class-quake’, this disaster exposed the hardship andmisery enveloping the country and highlighted theextreme vulnerability of both the urban poor andrural Maya people living in the western highlands.
As Wisner et al have observed in their bookAt Risk: Natural Hazards, People’s Vulnerabilityand Disasters: “What makes Guatemala un-usual is the high degree of awareness of thesesocial weaknesses on the part of a large pro-portion of the population, so that post-disasterrelief and rehabilitation became a politicalbattleground.” However, the growing aware-ness and local organization that emerged asreconstruction got under way were among thefactors that led the state to unleash a wave ofrepression in 1978, marking the start of themost violent period of internal armed conflict.
Nowadays, the word disaster more oftenconjures up images of windstorms – epitomizedby Hurricanes Mitch (October 1998) and Stan(October 2005). However, neither of thesestorms struck Guatemala directly. It receivedfringe effects in the form of prolonged heavyrain coming at the end of rainy seasons thathad already recorded above-average rainfall.
Mitch, a category 5 hurricane at its peak,moved across the Caribbean and made landfall
on the Honduran coast, causing torrential rainsand the biggest disaster recorded in the regionin the 20th century, with thousands of floods andmudslides. By the time it passed throughGuatemala, Mitch had weakened to a tropicaldepression, although it caused considerableimpact, with continuous rains causing 529 localdisasters throughout the country, mainly in thenorth-east and central parts, including the metro-politan area, where the highest number ofdeaths was recorded in the slum areas. Overall,the disaster killed 268 people, affected a further110,758, destroyed 2,293 homes and caused direct and indirect damage totalling US$ 747.8 million, according to figures provid-ed by CONRED, the national disaster reductionagency, and ECLAC, the Economic Commissionfor Latin America and the Caribbean.
Stan developed mainly as a tropical storm,reaching category 1 hurricane status for a fewhours only. It passed over Mexico but did notcome near Guatemala. However, Stan’s outerbands of humid air gave rise to heavy rainsover the mountains of Guatemala’s westernhighlands, causing countless mudslides andriver flooding. In the lower part of the southerncoast, there was extensive flooding. Accordingto CONRED, the disaster affected 1,158 com-munities in 15 of the country’s 22 departments,leaving 669 people dead, 844 missing and9,136 homes destroyed. Estimates put the totalnumber of directly affected people at 474,928(4 per cent of Guatemala’s population) and thetotal number of people directly or indirectlyaffected at 3.5 million. ECLAC estimated thatlosses amounted to over US$ 920 million.
In addition, the years 2001–2002 will beremembered as a period of chronic food crisis– which caused numerous deaths as well asprompting solidarity in response. ■
Box 3.2 Guatemala: windstorms and seismic hazards

During the 13-year period from January 1988 to December 2000, DesInventarrecorded 2,949 adverse events in Guatemala (see Figure 3.1). The annual averagenumber of adverse events doubled from 130 in the period 1988–1995 to 275 in theperiod 1996–2000, excluding Mitch-related incidents.
Most of these events can be classified as low- or medium-impact incidents, which arenot included in official statistics. As a result, the people affected receive little, if any,assistance. In the period 1988–2000, the only disaster recorded by DesInventar witha major, regional impact was Hurricane Mitch (for which 529 adverse incidents wereregistered). The remaining 2,420 events were local disasters, although many of themcaused considerable damage and loss.
According to Xavier Castellanos, senior officer for disaster preparedness and responseat the International Federation of Red Cross and Red Crescent Societies, theseeveryday, recurring disasters are “common problems in the most vulnerable sectors ofthe population. They are considered one-off problems and therefore accorded littleimportance in the national context, even though hundreds, perhaps thousands, offamilies are affected by such disasters year after year. This tends to weaken theeconomic capacity of families and communities and results in a permanent increasein their levels of vulnerability.”
In Guatemala, the 2,949 events recorded by DesInventar correspond to 25 differenttypes of hazards (natural, technological and disease-related). Although some recur
71World Disasters Report 2006 – Guatemalan vulnerability
0
500
1,000
1,500
2,000
2,500
3,000
0
333
666
1,000
1,333
1,666
2,000
0
100,000
200,000
300,000
400,000
500,000
600,000
38
2,949
1,6171,848
225,644
557,8203
Figure 3.1 Guatemala: comparison of disaster impacts, 1988–2000
Total number of reported events
According to CRED’sEM-DAT1
Total number reported killed
Total number reported affected
Notes: 1 EM-DAT’s disaster criteria: 10 or more people reported killed, 100 or more reported affected, declaration of a state of emergency or call for international assistance – triggered by natural, technological or biological hazards.
2 DesInventar’s ‘disaster’ criteria: all events that have an ‘adverse effect’ on lives, property and infrastructure – triggered by natural, technological or biological hazards.
3 Refers to victims who have suffered direct material losses, e.g., destruction of homes, workplaces, livelihoods.
According to DesInventar2
more than others, they must all be taken into account when formulating risk-reduction policies. Six categories of hazard accounted for 87 per cent of all recordedevents: fires (822 events), heavy rains (524), mudslides (469), floods (440), forest fires(186) and epidemics (132).
Only 15 per cent of the events involved deaths, killing a total of 1,848 people. Thedeadliest hazard was epidemics (702 deaths, mainly cholera), followed by mudslides(336), heavy rains (204) and fires (144). The database recorded 557,820 directvictims (damnificados), most of whom were affected by floods (400,982 persons),heavy rains (85,471), epidemics (35,000), earthquakes (10,660), fires (9,384) andmudslides (4,433). It should be added that, in many cases, there are no accuratefigures for disaster victims, suggesting the real figures could be higher.
Many manifestations of risk – particularly those caused by man-made hazards – arenot considered disasters, so they receive little attention from state institutions. Yetthey have serious, sometimes deadly, consequences. The most common type ofadverse event in Guatemala is fires, particularly in urban areas. Fires often kill childrenand the elderly. They destroy dozens of homes in overcrowded shanty towns, fuelledby highly inflammable construction materials such as wood, cardboard and plastic.Fires in market-places are also very common.
The causes are always the same: candles or, where there is electricity, faultyinstallations that short-circuit; cooking on an open fire or, where gas is used, defectivecylinders. Guatemala’s rural and urban poor are caught in a risk trap – they face amultiplicity of hazards because they are poor and their vulnerability increases eachtime a hazard becomes a disaster.
The frequency of fires highlights another problem: the lack of rules and regulations,and where they do exist, the failure to enforce them. DesInventar reveals that 84 percent of loss and damage in the industrial sector can be attributed to fires and a further8 per cent to explosions and toxic gas leaks, as a result of unsafe installations ortechnology and negligence in handling materials and hazardous substances.
Contexts determining disaster riskWhile many aspects of vulnerability are common to all situations, each country, regionor community has its own specific dimensions of risk which must be identified. Fivecontexts or processes encompass any consideration of disaster risk in Guatemala:
■ The struggle for democracy and peace.■ Ongoing social violence.■ Social, ethnic and gender discrimination.■ Population dispersal to rural hamlets.■ Migration to the United States.
72

Democracy and peace: progress… but challenges remain
Democracy and peace are basic conditions which must be fulfilled if disaster riskreduction is to become a sustained policy rather than an intermittent concern in thewake of major disasters – as happened after Mitch in 1998 and now with Stan.
These conditions are only just beginning to be met in Guatemala. Furthermore, thereis a real risk that the incipient process of democratization and transformation maysuffer set-backs from growing political instability if post-Stan recovery does notaddress the survival crisis faced by the 1,000-plus storm-affected communities.
In 1986, after a long succession of military regimes, democratic elections were held inGuatemala and a civilian government was voted into power. Although progress hasbeen made towards democracy, interrupted in 1993 by a short-lived coup d’état, therisk of political instability remains high. Increasingly, new social actors – peasants, theyoung, women and indigenous people – are making themselves heard. But the processof building participatory citizenship is very fragile.
The country’s new institutions are very weak, suffer continuous changes and havefailed to achieve reforms contributing towards establishing the rule of law. Thehistorical mutual distrust between civil society and the state remains, while thebusiness sector continues to use its political clout to assert its private interests over thecommon good. Political and social conflicts, particularly at the local level, oftenculminate in violent acts, including lynching in extreme cases.
This year was declared National Peace Year, marking the tenth anniversary of thePeace Accords. According to a report issued in 1999 after years of research by theGuatemalan Comision de Esclarecimiento Historico (CEH, or ‘truth commission’),Guatemala’s civil war was one of the bloodiest in Latin America, resulting in over200,000 people killed or disappeared and another million displaced. A scorched earthpolicy led to the complete destruction of over 600 villages, often leaving noinhabitants alive. The investigation found that 93 per cent of the violence wasattributable to agents of the state (particularly the military) and that 53 per cent ofthe victims were Mayan, 11 per cent were Ladino and 30 per cent were of unregisteredethnicity.
The World Bank’s 2003 report on poverty in Guatemala suggested that “the PeaceAccords represented a turning point for Guatemala’s development path, paving theway for a transformation to a more prosperous and inclusive nation. Progress hasoccurred… but challenges remain. However, changing the course of history in such ashort time span is not easy in any country. The hierarchical relations, attitudes, andinstitutional forces that have pervaded for centuries do not disappear overnight.
73World Disasters Report 2006 – Guatemalan vulnerability

Furthermore, recent events (including Hurricane Mitch and political instability) havedelayed the implementation of the Peace Agenda.”
There is a long way to go in fulfilling the commitments made in the Peace Accords,particularly those requiring structural changes, such as agrarian reform, access to landas a means of livelihood and the rights of indigenous peoples. Social exclusion, racismand discrimination are still commonplace.
Social violence: problem number one
Today in Guatemala, the risk of losing one’s life or property is most people’s biggestworry. The risk of disaster pales in comparison, particularly since disaster affects poor,socially excluded sectors of the population. The issue of violence is a major priorityon the government’s agenda, but it is struggling to reduce it.
The 2006 report of the United Nations High Commissioner for Human Rights onthe situation in Guatemala concluded that: “Violence, arising from various causessuch as organized crime, common crime, gangs of youths and illegal, clandestinesecurity bodies and units, has become a national priority owing to its effects on publicsecurity and the creation of a state of public alarm. The phenomenon of gangs ofyouths (maras) is at the forefront of the social agenda, but the absence of any reliableanalysis makes it difficult to assess its real impact on the security situation.”
Homicides have soared. The Guatemalan human rights prosecutor, Sergio Morales,quoting the National Civilian Police (PNC), declared that 3,230 people were killedin 2001, rising to 5,338 in 2005. The number of violent deaths registered over thelast five years equals the death toll of the great earthquake of 1976. Guatemala’shomicide rate (44 per 100,000 inhabitants) is one of the highest in Latin America,itself one of the most violent regions in the world. In the capital, however, thehomicide rate rises to 109 and in some municipalities, such as Nueva Concepción(Escuintla) on the south coast, it is as high as 199, according to a report published inJune 2006 by the UN Development Programme (UNDP). According to the WorldHealth Organization (WHO), in 2000, the world’s average homicide rate was 8.8 per100,000 inhabitants.
Guatemala is also one of the countries with the highest number of violent deathsamong women: 1,729 were killed between 2001 and 2005, according to the PNC.Congresswoman Alba Maldonado, interviewed by the Inter Press Service in June 2005, said the methods used are reminiscent of those employed against theguerrillas and residents of rural indigenous villages during the civil war. A reportreleased at the same time by the London-based human rights group AmnestyInternational said the alarming increase in murders of women was compounded byimpunity, weak laws and a firmly entrenched machista or sexist mind-set.
74

Discrimination: root cause of vulnerability
Exclusion and racism drive much of Guatemala’s poverty and inequality and lie at theroot of people’s vulnerability to disaster. Such discrimination has deep-seated historiccauses in Guatemala, making it very difficult to overcome.
The World Bank’s poverty report said that :“Past policies greatly contributed to anexclusionary pattern of development in Guatemala, particularly for land, labour, andeducation. All of these spheres were intertwined with each other, and with thedevelopment of coffee, Guatemala’s primary export crop. Policies such as massive landexpropriations, forced labour, and exclusion from the education system (as part of abroader political strategy), all sought to promote economic growth, but to theexclusion and detriment of the indigenous population. Women were also excludedfrom these spheres.”
It is therefore indigenous women who are most seriously affected by discrimination,which perpetuates the invisibility of the many needs and risks affecting their day-to-dayexistence and their fight for survival. The UN High Commissioner for Human Rights,writing in 2006, expressed particular concern at the dual discrimination againstindigenous women, reflected in rejection of their costumes, their limited access toeducation, basic public services and land, and the lack of opportunities in the workplace.
Guatemala, with a population of 13 million, has the largest number of indigenouspeople in Central America. They speak 23 languages (21 Mayan languages, Xinca andGarifuna) and they account for 41 per cent of the total population, according to the2002 national census (other estimates put the figure at over 50 per cent).
The UN’s 2005 National Human Development Report maintained that : “Racism isstill very much alive and deeply rooted in the attitudes and practices of commonpeople and of institutions – public and private – as well. However, it is worthwhilenoting that most of the time, racism is not explicit. After the colonial times, therehave never been official ‘apartheid’ policies applied in Guatemala. One of the mainoutcomes of racism is discrimination in the access to human developmentopportunities for the indigenous – Maya – population. There is no sphere containedin the human development paradigm (economic, social, political or cultural) wherethe Maya people have equal conditions and opportunities when compared to the non-indigenous population. This situation also affects the Garifuna and Xinca people.”
Meeylyn Lorena Mejia Lopez, a researcher and writer with extensive experience inindigenous rights, says that history shows indigenous peoples themselves have notescaped the male chauvinist vision at the root of colonial and modern societies.Within indigenous communities there is a belief that the man is the “boss, the headof the family”, the one who takes decisions at household and community level.
75World Disasters Report 2006 – Guatemalan vulnerability

Exclusion and discrimination are also evident in the response to Hurricane Stan. TheEconomic Commission for Latin America and the Caribbean (ECLAC), in its 2005report on the impact of the disaster, highlighted the “evident lack of informationdisaggregated by gender and ethnicity. The latter is of crucial importance, because itis necessary to harness and mobilize the cultural values of the indigenous communitiesexpressed in organization, cooperation, solidarity, spiritual strength and socialcohesion, important in the care of orphaned children.” This lack of disaggregatedinformation is particularly significant, because those most seriously affected by thedisaster are indigenous communities, from which many of the men have emigrated tothe US, leaving a high proportion of households headed by women.
There is much evidence to show that the vulnerability of women has increaseddramatically since Stan, as has the incidence of domestic violence, already high beforethe disaster. As ECLAC pointed out: “Men are more likely to resort to violence whenthey are cut off from the familiar routines of daily life and lose their position as headof the household because they no longer have a job or source of income. Whenwomen lose their economic resources, their negotiating power within the householdis seriously weakened. In the case of women, disaster therefore increases poverty andsocial vulnerability.”
Population dispersal to rural hamlets
High population density, particularly in urban slums, is frequently cited as one of themost important factors determining disaster risk in Central America. But, accordingto Jacobo Dardón and Cecilia Morales of the Tzuk Kim-Pop Movement, the regionhardest hit by Hurricane Stan was the western highlands, where there are 5,000widely dispersed rural communities. Around 60 per cent of these communities arelocated on mountain slopes and at least 20 per cent are at high risk of disaster.
The dispersal of the rural population creates two types of vulnerability to disaster inGuatemala’s highland areas. Lacking other options, people increasingly inhabit placesthat are dangerous because of their rugged terrain and deforestation, as themountainsides are stripped to grow subsistence crops. The physical vulnerability ofthese communities to the growing threats of landslides and erosion is therefore high.
Secondly, for many communities, dispersal means ‘territorial exclusion’ or isolation.Geographic isolation – due to a complex topography and an inadequate road network– limits opportunities, constrains social networks and fosters vulnerability. Overall, 13 per cent of Guatemalan households lack any form of adequate motorized roadaccess, while the poorest quintiles and the indigenous are even more isolated.
The problems of isolation became glaringly apparent during Hurricane Stan. It wasextremely difficult to reach survivors in order to assist them, as the following
76

testimonies illustrate: “The list of names of the affected communities was endless.Most of them were communities, forgotten and excluded, about which very little isknown” (Father Helio, Comitancillo, San Marcos); “The living conditions of thepeople affected are appalling; many live in geographically dispersed communities andare very isolated” (Francisco Díaz, Médecins Sans Frontières).
This pattern of settlement has historical roots in Guatemala. It was used byindigenous people as a strategy during colonial times to escape the control of theSpanish and, later, to avoid forced labour on the coffee plantations. Since the 1950s,Guatemala has experienced an intense process of land colonization, in which ruralpeople have searched for land to farm in the absence of other livelihood options. Sothe agricultural frontier is being pushed back, mainly haphazardly, but also throughorganized projects.
The number of settlements in Guatemala increased from 13,375 in 1946 to 20,485in 1993 and still further to 23,340 in 1998, according to the National Institute forStatistics. That means in just five years, 2,855 new settlements were formed – oftenvery small villages in rural areas. There are now 12,200 localities with fewer than 500 inhabitants and around 500 localities with fewer than 50 inhabitants.
New rural settlements have also formed as a result of the displacement of people by theconflict, the creation of ‘development poles’ by the army and the resettlement of peoplereturning from Mexico after the signing of the Peace Accords. Indigenous women, whoresettled in Pochuta municipality on their return from Mexico, were so fearful of thisyear’s rainy season that they appealed to the media to be relocated somewhere safer.
Survivors of Stan staying in high-risk areas must now find a new place to live – 87 communities need relocating and the homes of over 8,000 families need rebuilding.But it’s extremely difficult for the government to find safe areas for relocation, as thebest land is privately owned and prices have soared in anticipation of post-disasterresettlement. Eight months after Stan, none of the relocation plans announced in thegovernment programme Nuevo Hábitat Comunitario was under way.
Migration to the US: a double-edged sword
“In Guatemala, migration to the United States has marked the economic, social,political and cultural dynamics of the country over the past two decades,” says Irene Palma, an expert on this subject. But what are the links between the dramaticincrease in migration to the US and disaster risk, specifically Hurricane Stan?
The impact of recent migratory trends is revealed in the value of remittances sent fromthe US back to Guatemala: US$ 11.3 million in 1987, soaring to US$ 563 million in2000 and US$ 2,993 million in 2005, according to the Banco de Guatemala. The
77World Disasters Report 2006 – Guatemalan vulnerability

International Organization for Migration (IOM) estimated that in 2004, almost amillion Guatemalan migrants were sending remittances to their families, helpingsupport 31 per cent of the country’s households. In 2005, remittances accounted foran estimated 9.5 per cent of gross domestic product (GDP), according to IOM.
It is significant that 58 per cent of Guatemalans in the US who send remittancesare from rural communities, while 22 per cent speak one of the Mayan languages.According to the UN’s National Human Development Report 2005, 15 per centof Maya Indians (around 712,000) have a family member working abroad. This isa strategy prompted by the total lack of opportunities in their own country andoften adopted as the only means of survival in times of crisis, as after Mitch andStan. In a survey of the plans of people affected by Hurricane Stan, conducted bythe UN’s Food and Agriculture Organization (FAO) in November 2005,emigration to the US was consistently mentioned as one of the few options opento them.
Remittances have helped avoid a greater deterioration in per capita income inGuatemala and reduced poverty among remittance-receiving families. According toVíctor Lozano, an IOM consultant, remittances helped 450,000 people to overcome
78
A man carries his sonafter he was injured
by a mudslide inSololá, Guatemala,
6 October 2005.
© REUTERS/Carlos Duarte,courtesy www.alertnet.org

poverty in the three years to 2005. Remittances also increase employment in ruralareas, through more house-building, more business and a greater demand for services,private health facilities and schools.
In rural communities with a high level of emigration, pressure on land and forestresources falls, as other sources of income become available. Migrants’ families enjoya higher standard of living and better access to healthcare and education, reducingtheir vulnerability. Many communities can implement basic services andimprovements with the help of their countrymen working in the US.
For many families affected by Stan with relatives in the US, the extra money sent tothem has contributed decisively to their swift recovery. Field research carried out inaffected areas by INCEDES, the Central American Institute for Social Studies andDevelopment, showed that, since Stan, remittances sent to Guatemala have increasedsignificantly. IOM, in a study presented in October 2005, revealed that remittancessent in 2005 to 43 municipalities affected by Stan totalled US$ 413 million,benefiting 107,379 families. This compared with US$ 21 million of international aidpledged through the UN’s emergency appeal, as at 7 December 2005.
However, migrants face serious risks, as immigration restrictions in the US andMexico force them to work without visas or permits and they receive no protectionfrom the Guatemalan government. Risks in transit include death, accidents, rape,theft, hunger, disease, abuse, deception and, last but not least, deportation.
Emigration also leads to new forms of vulnerability back home. Social structuresdisintegrate in rural communities, particularly indigenous ones. Among families,women are left without husbands and children without fathers. Among communities,the divide grows between more prosperous families of emigrants and the rest, while awhole generation of younger migrants may be lost. The result is a growingindividualization and lack of interest in preserving common resources, such ascommunal forests in the western highlands. It also leads to the emergence of newrisks, such as HIV/AIDS and the maras (highly dangerous youth gangs).
Jacobo Dardón observes that : “Women who are heads of household as a result ofinternal labour migration or emigration to the United States were the populationsector hardest hit by Hurricane Stan. In municipalities suffering severe damage, suchas San Martín Sacatepéquez, it is estimated that 40 per cent of men aged between 18and 35 are in the United States, many with wives and children living in Guatemala.Based on my own research, migrants need to work abroad for at least three years inorder to earn enough to build a basic house, and in some cases homes were lostwithout the migrant husband ever having seen them.” In such cases, the psychologicalprice paid in terms of separation, loneliness and pressure to rebuild the family homeand ensure economic survival is very high.
79World Disasters Report 2006 – Guatemalan vulnerability

For the government, the problem of female-headed households receives littleattention. But migrants’ families are now beginning to organize themselves to addresspressing issues, particularly the new migratory policies to be implemented by the USgovernment. In December 2005, they founded the Regional Council of Developmentand Migration Community Committees in the western highlands, with the supportof the Tzuk Kim-Pop Movement.
Recovery boosts community cohesionGuatemala faces serious governance problems in terms of the integration, cohesionand capacity of the political and institutional system and, most importantly, in termsof citizen participation, which is key to ensuring the viability of any political project,in this case, risk reduction.
The political and socio-economic system in Guatemala has been highly exclusionaryand bipolar since colonial times. The divisions are between the indigenous peoplesand the ladinos, between minifundios (small landholdings) and latifundios (largeagricultural estates), between urban and rural life, between the capital and the‘provinces’ and, at the municipal level, between the main town and surrounding ruralareas. The gap between rich and poor is one of the widest in Latin America. Followinga visit to Guatemala, Jeffrey Sachs, director of the US-based Earth Institute,announced to the newspaper El Periódico on 17 April 2006: “I see two Guatemalas,which are not united. A divided Guatemala leads to instability.”
However, one of the conclusions of the 2005 evaluation of the civil societyparticipation programme by UNDP is that: “Guatemala is undoubtedly witnessing asilent movement and the seeds of change are growing at the local level.”
This silent movement, which scarcely extends beyond community level, has beenconsolidated in the wake of Stan and during the recovery process. It is driven by twotrends: the increased presence of local actors and a growing capacity for communityorganization. This process only became possible in Guatemala after the Peace Accords.Even now, community leaders run serious risks if they stand up against local powergroups in conflicts over land, drug trafficking or illegal logging.
Experts agree that the most effective work in risk reduction is being achieved byorganizations with a strong local presence. These include not only humanitarianorganizations such as the Red Cross, but a wide variety of agencies involved indifferent development projects (see Box 3.3).
Meanwhile, those communities and regions that were already well organized andwhere non-governmental organizations (NGOs) were operating receivedhumanitarian aid faster. Trócaire, an international NGO, worked through local
80

organizations, acknowledging that those who live the reality of under-developmentand poverty are best placed to propose solutions to their problems. “Local expertisehelps the organization to identify the most needy members of the community, and aidrecipients trust them more because they know them already,” says Helga Gonzalez,Trócaire’s project leader in Sololá.
The link between local NGOs and disaster risk reduction stems from the post-Mitchperiod. Civil society associations have been formed, such as COCIGER (CitizenConvergence for Risk Mitigation) in September 2001, with 14 memberorganizations, which recently launched a process to build local capacities throughdepartmental and municipal task teams. One example is an integrated riskmanagement project implemented – before Stan hit – by ASDENA, a foundingmember of COCIGER, in Pastores municipality, near Antigua Guatemala. The stormdamaged or destroyed 150 homes but no one lost their lives, showing the value ofrisk-reduction training and community coordination (see Box 3.4).
The growing role of local NGOs has been accompanied by an increase in the capacityof communities to cope with the post-Stan crisis. Alfredo Puac, a consultant with
81World Disasters Report 2006 – Guatemalan vulnerability
Since 1993, the Guatemalan Red Cross hasadopted a community-based approach to dis-aster risk reduction. From three initial modules(community-based disaster preparedness,healthy home and community shelter manage-ment), the disaster risk-reduction programmehas expanded to more than 11 community-based training modules, each of them usingvulnerability and capacity assessments, whichoffer more possibilities for communities tounderstand their own strengths and how toreduce their vulnerabilities.
When Hurricane Stan hit, the NationalSociety mobilized over 200 flights of emer-gency supplies to affected areas within thefirst week. The society opened a donationcentre and deployed volunteers from the capital to support local volunteers during the emergency response. The InternationalFederation, through the Pan American
Disaster Response Unit (PADRU), assisted inthe response.
Compared to Mitch in 1998, there is evi-dence to suggest a higher level of resilienceamong communities which have benefited fromdisaster risk reduction and community develop-ment initiatives. Since Mitch, the governmenthas also increased its capacity to operate earlywarning systems, respond to emergency situa-tions and coordinate disaster response.
The Guatemalan Red Cross and theNetherlands Red Cross have implemented adisaster risk-reduction education project, adapt-ing expert knowledge for local languages.Meanwhile, the International Federation hashelped develop a board-game called Risklandand a community first-aid training module,which have both been translated and culturallyadapted for use among two different indige-nous ethnic groups in Guatemala. ■
Box 3.3 Red Cross boosts resilience through training and games

extensive experience in community work, confirms that communities at risk are at theforefront of dealing with disasters and usually provide the first emergency response.Meanwhile, the leading role in ensuring disasters are not ignored is taken by thecommunities themselves, argues Xavier Castellanos.
Community development councils flourish
Post-Stan recovery has seen the community development councils (COCODES)flourish, thanks to the involvement of affected communities. Salvador Casado, fromthe NGO CARE-Guatemala, observes that the formation of COCODES from 2002onwards created a very favourable context for the post-Mitch project CAMI (CentralAmerican Initiative for Disaster Mitigation) in Guatemala. They proved theireffectiveness once again in the response to Stan.
The COCODES are the most local units of the National System of Urban and RuralDevelopment Councils. Although the system was established by law in 1986, it hadremained virtually unused until 2002, when it was reformed and extended to the locallevel, as a participatory space open to all citizens in all the country’s communities.
82
Miguel Antonio López, mayor of Pastores,speaks about his experiences two weeks afterStan had struck the municipality.
“Although we were aware that living nearthe Guacalate river was a risk, we neverimagined that it could cause a disaster on thisscale. Fortunately, we had received risk and vul-nerability management training from ASDENA.I think that the training increased awarenessabout the issue and meant that the disastercaused no deaths in our municipality.
“A few days earlier, we had set up a disas-ter committee within the municipal council. Theidea was to begin with the municipal counciland then extend the same model to all thecommunity development councils. We alsodecided to create an emergency telephonedirectory and planned to set up an informationcentre to gather all the data necessary to pro-vide immediate solutions. We organized a dis-
aster relief brigade to work with municipal per-sonnel, which was also trained by ASDENA.
“An important aspect of the training waswhat we learned about land planning, whichis the basis of disaster prevention. We beganby identifying the places facing the greatestrisks. We are particularly concerned aboutthe people who live in the mountain areas,because the previous authorities gave themland in exchange for votes, but there was noplanning. These people live in settlementswith no proper roads, services or amenities,and we fear that there could be landslides...
“The training included a week inHonduras for a number of people to givethem an insight into the community preven-tion work being implemented in this countryin the wake of Mitch, mainly by communitycommittees, although the town councils arealso involved.” ■
Box 3.4 Local risk reduction saves lives

The Municipal Urban and Rural Development Councils (COMUDES), a higherlocal-level authority, were also reformed, so that they included representatives frompublic and private organizations and civil society. In addition to the DevelopmentCouncil Act, two relevant legal instruments (the new Municipal Code and theDecentralization Act, both passed in 2002) contribute to achieving this goal.
The World Bank’s 2003 report stressed that : “The recent passage of three laws ondecentralization and participation is an important step towards creating a legalframework for the empowerment of local communities. The implementation of theselaws should seek to reverse the traditional exclusion of women, the poor, anduneducated from community-level participation.”
Meeylyn Lorena Mejia Lopez, in her 2006 document Indigenous Women andGovernance in Guatemala, wrote that many Maya women leaders now chair thecommunity councils. The challenge of occupying these positions has allowed womento prove their capacities and commitment to community interests.
However, the blooming of the COCODES following Hurricane Stan is still a veryfragile process, bound up with all the conflict, vulnerability and exclusion thatcharacterize Guatemala’s mainly rural communities. Many council members areilliterate and some only speak a Mayan language. Even in less adverse conditions, theywould lack the expertise and experience necessary to draw up well-plannedcommunity development proposals; the work required involves much more than justsubmitting lists of projects to the COMUDES for financing. So the COCODESbadly need support with training.
The big advantage of the COCODES is that they are permanent and represent theentire community. They present an opportunity to break with the detrimentalpractice of creating ad hoc, grass-roots organizations associated with certain projects,which disappear once the financing ends, often causing conflict and rivalry amongdifferent organizations within the same community. Training for the COCODES is ameans of investing in the future and developing leadership skills (see Box 3.5).
Challenges and progress at national level
The government now faces the enormous challenge of responding to localmanagement, made all the more pressing after Stan. Since the days of the militaryregimes, Guatemala’s central government has implemented top-down systems, firstwith a view to maintaining territorial control and later to show its willingness to movetowards decentralization.
Such systems are traditionally based on the established administrative structure: fromthe central authority to department level and then municipal level. None of these
83World Disasters Report 2006 – Guatemalan vulnerability

84
Panabaj is a Tzutujil Mayan community on theshores of Lake Atitlán in western Guatemala.During the conflict of the 1980s, many Tzutujilmen were killed by the Guatemalan military,leaving a disjointed community of widowsand orphans. The community finally expelledthe army in 1990, six years before the PeaceAccords. The 5,000 people of Panabaj live inextreme poverty, struggling to survive throughagriculture and the sale of handicrafts.
In the early morning of 5 October 2005,strong rains caused by Hurricane Stan result-ed in tremendous flooding and landslidesfrom the nearby volcano. Over 150 houseswere completely buried under mud and rock.Others were swept away by the flood. Manymore were left seriously damaged.
The disaster was so sudden that many peo-ple could not escape and were either buriedby mud or swept away by it. Seven monthslater, the community had given formal burial to100 people, while 600 remained unaccount-ed for. The disaster was so overwhelming thatrecovery efforts were abandoned. For sur-vivors, the pain of lost loved ones is exacer-bated by the inability to give them a tradition-al Mayan burial. The disaster zone has beendeclared a cemetery, closed to public access.
Many families were destroyed: 25 childrenlost both parents, around 50 lost one parentand 77 women were widowed. All membersof the community suffered psychologically.More than 600 families were moved to tem-porary shelters or tents. The amount of landand crops lost had yet to be quantified, sevenmonths after the disaster.
The magnitude of the tragedy left the commu-nity scarred and fearful. But, as it did during thearmed conflict, the community transformed thepain of its loss into a united search for survival.
In the days following the tragedy, a group ofneighbours helping to rescue survivors and clearbodies formed an emergency committee toorganize the aid arriving for their community.They took a census of affected families, distrib-uted food and tried to answer the many ques-tions and concerns posed by the community.
The emergency committee soon realized thatonce the immediate emergency phase wasover, the community had to think of sustainablemedium- and long-term projects to contributetowards reconstruction and improving people’squality of life. In response to this need, theAssociation for Community Development inPanabaj (ADECCAP) was formed, with the sup-port of international volunteers. Based on mutu-al respect and the will to participate, ADEC-CAP is working for disaster relief and the devel-opment of Panabaj, through community partic-ipation, gender equality and the recognition ofhuman rights. The association has just foundeda community centre to promote psychosocialrehabilitation, economic revitalization, youtheducation and professional training for adults.
The most important short-term project in thereconstruction phase, however, is the discus-sion of community problems mediated throughthe community and municipal developmentcouncils, regarding the security of land forpermanent housing and the search for alter-native land for 300 or more families who donot want to live in the designated zone. In astudy conducted by CONRED, the nationaldisaster reduction agency, in April 2006, thewhole Panabaj area was declared a high-riskzone unsuitable for reconstruction. The tempo-rary shelters and the government project toconstruct permanent housing (already underway), are in this high-risk area. No solutionhas been found to this problem as yet. ■
Box 3.5 Panabaj: hope after so much suffering

systems has been effective so far, because of the lack of administrative capacity andfinancial support for departmental and local levels.
In the specific case of the CONRED (national disaster reduction agency) system, inwhich departmental, municipal and even local coordination offices are established bylaw, it was observed that the failure to work from the top down was not due to a lackof motivation, but to a lack of logistics and human resources.
The UN’s Disaster Assessment and Coordination (UNDAC) team report of October 2005 said that CONRED’s coordination and response were good at thenational level, but this was not always mirrored at the departmental, municipal andcommunity levels. Teresa Marroquín, from the Guatemalan Red Cross Society’snational disaster department, observed that the system did not work because it failedat the local level. On the rare occasions when local coordinators were in place, it didwork.
In its post-Stan report, ECLAC recommended that, as a priority medium-termmeasure, the budget allocated to CONRED in 2006 should be increased to strengthendecentralization, which would initially benefit the departmental authorities. However,this did not happen and additional funds were earmarked specifically for post-Stanrecovery efforts, for example to re-establish early warning systems. The amountbudgeted for 2005 was GTQ 20 million (US$ 2.6 million). Meanwhile, the nationalinstitute for seismology, volcanology, meteorology and hydrology (CONRED’sscientific and monitoring body) has an annual budget of scarcely US$ 1.5 million,which drastically limits its ability to evaluate risk scenarios for the whole country.
Since Stan, it has become clear that the two systems – the development councils andCONRED – must work in an integrated manner rather than in parallel. As a firststep, an agreement was signed on 17 March 2006 between CONRED and thePresident’s Office, specifically to integrate disaster risk reduction and promotesustainable local development. The aim is to strengthen inter-institutional relations,on the basis of the National Disaster Risk Reduction System and the National Systemof Urban and Rural Development Councils.
The system of development councils not only permits effective, sustained communityorganization and participation in local and regional planning, it also provides aframework for better coordination among the actors involved in disaster riskreduction – between NGOs and development agencies, between civil society andgovernment, and among government departments.
The Planning and Programming Secretariat of the President’s Office (SEGEPLAN)has proposed several new planning and investment instruments to increase theeffectiveness of development councils’ work in disaster risk management.
85World Disasters Report 2006 – Guatemalan vulnerability

SEGEPLAN’s Susana Palma is enthusiastic: “We are confident that if we begin at thetop of these systems, we will be able to work down to the implementing units,development councils and municipalities. For the first time in 2006, the regulationspublished by SNIP [National Public Investment System] include risk prevention andmitigation measures and a risk identification bulletin (developed in conjunction withCONRED), to be used in the process of analysing programmes and projects to assesshow they will reduce or increase vulnerability and danger. An internationalcooperation policy has also been formulated, including integral security conditions inthe guidelines for projects to be financed through international cooperation. Workhas also begun on making risk reduction more specific.”
In May 2006, seven months after Stan, Carmen Salguerro from UNDP Guatemalasummarizes the current situation in these words: “The opportunity to rebuild andtransform is there, but unless words are put into action in the next few months, timewill run out. Evidently, Hurricane Stan exposed a weak state, the reconstructionprocess is taking shape during the run-up to elections and, added to all this, there isan oppressive climate of violence and public insecurity. These factors make advancingtowards construction with transformation a complicated matter.”
Future risks demand sustained actionWhen a major disaster strikes a country like Guatemala, where a large proportion ofthe population is highly vulnerable and the institutional capacity to ensure rapidrecovery is very weak, development prospects can be seriously undermined. Thechances of fulfilling priority objectives, such as reducing poverty, increasing jobopportunities and improving health, education, housing, food security andenvironmental sustainability, are greatly reduced.
This is particularly true in the case of disasters that occur when risks constructed asthe result of unsustainable socio-environmental processes materialize and when thedetonating factor is a weather event that can recur every rainy or hurricane season.The impact of local disasters caused by Stan in Guatemala exacerbated vulnerabilityand environmental degradation in affected communities, increasing the risk of evennormal rainfall unleashing another disaster. The capacity of rivers to drain away waterhas been significantly reduced and the mountainsides of the western and centralhighlands are highly eroded and unstable.
Extreme poverty in Guatemala, which had fallen from 20 per cent in 1989 to 16 per cent in 2000, climbed back in 2004 to 21.9 per cent, owing partly to fallingcoffee prices and the drought, which mainly affected the eastern part of the countryin 2001. The general poverty rate, on the other hand, fell slightly to 56 per cent(about 6.4 million people) in 2000, thanks to remittances sent from abroad. In viewof Stan’s impact and the risk of future intense rainy seasons, poverty rates may
86

well increase further and the mortality rate, particularly infant mortality, is verylikely to rise.
With windstorms and rainstorms recurring each year, the Guatemalan government,aid agencies and community-based organizations are in a very difficult situation.While engaged in the slow process of recovering from one major disaster, they mustalso prepare at community and national levels for the possibility of more intensecyclone seasons in the near future. In this context, which could become a vicious circleof destruction and partial recovery, it may be difficult to achieve any real progress inwider risk reduction at a time when it is more necessary than ever.
Apply what we know, a little at a time
When Stan hit, Guatemala, like other Central American countries, had alreadyexperienced the impacts and lessons learned from Mitch, seven years earlier. Sincethen, new concepts, analytical and planning documents, commitments and proposalsfor disaster risk reduction in the region have been formulated and disseminated on anunprecedented scale.
As a result, a growing number of international cooperation organizations operating inGuatemala and national NGOs include risk management in their policies,programmes and projects, while various education and training initiatives have beenlaunched in this area. The current challenge is to generalize and strengthen theseinitiatives and ensure that they are institutionalized and adopted by the governmentin a way that cuts across its sector-specific agencies.
The first step on the path to solving complex problems, such as disaster riskreduction, is a clear-cut policy establishing strategies with specific, achievable tasks,starting with priority or basic concerns. For example, the most pressing needscurrently facing Guatemala in general terms are, among others:
■ Acknowledgement of disaster risk reduction as a day-to-day, cross-cutting issueand not just a problem for a specific government agency or NGOs specializingin this area.
■ Inclusion of risk reduction in school curricula at all levels.■ Incorporation of the disaster risk perspective in all development programmes and
projects. Risk reduction should be accorded the same priority as gender orenvironmental considerations.
■ Availability of information on risks at the local level and the capacity to producesuch information, transfer it to local actors and disseminate it among people atrisk.
■ Better land-use management at the municipal level, based on the situations facedby different communities, taking into account the areas and types of riskinvolved.
87World Disasters Report 2006 – Guatemalan vulnerability

■ Promotion of relevant, accessible technology for communities to monitorgrowing risk factors (e.g., waste, mountainside erosion, vulnerable housing).
■ Creation and application of legal frameworks, key to achieving risk reduction.
Principal contributor to this chapter and Boxes 3.1 and 3.2 was Gisela Gellert, a Guatemala-based geographer, independent researcher and member of the Latin American Network for theSocial Study of Disaster Prevention-LA RED. Box 3.3 was contributed by Xavier Castellanos,the International Federation’s senior officer for Disaster Preparedness and Response. Box 3.4is sourced from an interview by Eddie Fernández, dated 15 October 2005 and published onthe website of Inforpress Centroamericana, Guatemala: http://www.inforpressca.com. Box3.5 is sourced from the web site of La Semilla, a Panabaj community-based foundation:http://www.fundacionlasemilla.net. We would also like to acknowledge the invaluableassistance and advice of Ben Wisner, an independent researcher affiliated with theDevelopment Studies Institute at the London School of Economics, the Benfield HazardResearch Centre (University College London) and the UN University Institute forEnvironment and Human Security in Bonn, and Allan Lavell, Coordinator, Programme forthe Social Study of Risk and Disaster at the Secretariat General’s office of the Latin AmericanSocial Science Faculty, San Jose, Costa Rica and founding member of the Latin AmericanNetwork for the Social Study of Disaster Prevention-LA RED, in preparing this chapter.
Sources and further informationAmnesty International. Guatemala: No protection, no justice: Killings of women in
Guatemala. London: Amnesty International, June 2005.
Blaikie, P., Cannon, T., Davis, I. and Wisner, B. Vulnerabilidad: El entorno social,político y económico de los desastres. ITDG-LA RED, 1994.
Castellanos, Xavier. Desastres Olvidados – Información para desastres. FederaciónInternacional de Sociedades de la Cruz Roja y de la Media Luna Roja. Availableat http://www.cruzroja.org/desastres/redcamp/docs/materiales/DesastresOlvidados.pdf
CEH (Truth Commission). Guatemala, Memoria del Silencio. Conclusiones yRecomendaciones del Informe de la Comisión para el Esclarecimiento Histórico.Guatemala: CEH, 1999.
Comisión Económica para America Latina y el Caribe (CEPAL). El Desastre deOctubre de 2005 en Guatemala: Estimación preliminar de su Impacto Socio-Económico y Ambiental. Guatemala: November 2005.
CEPAL, Secretaría de Planificación y Programación de la Presidencia (SEGEPLAN).Efectos en Guatemala de las lluvias torrenciales y la tormenta tropical Stan, octubrede 2005. Guatemala: November 2005.
Coordinadora Nacional para la Reducción de Desastres (CONRED). Informe de laSecretaría Ejecutiva: Efectos de la Tormenta Tropical STAN en Guatemala y lasacciones realizadas durante y post emergencia. Guatemala: 3 December 2005.
88

Dardón, Jacobo and Morales, Cecilia (coord.). ¿Por qué tanta destrucción? Las amenazasnaturales y estructurales: sistematización de la vulnerabilidad, la negligencia y laexclusión regional del altiplano occidental en la tormenta asociada Stan. Guatemala:Editorial de Ciencias Sociales, 2006.
FAO. Evaluación de los efectos de la tormenta tropical Stan en los medios de vida de lafamilias vulnerables de Guatemala. Guatemala: December 2005.
Gellert, Gisela. De desastre en desastre… ¿cuánto hemos aprendido? Guatemala:FLACSO, Diálogo, año 5, No. 46, January 2006. Available at http://www.flacso.edu.gt/dialogo/46/46.htm#1
Gellert, Gisela and Gamarra, Luis. La trama y el drama de los riesgos a desastres: Dosestudios a diferente escala sobre la problemática en Guatemala. Guatemala:FLACSO, 2003.
Gobierno de Guatemala. Reconstrucción con transformación: Obras necesarias paraestabilizar las cuencas de mayor riesgo afectadas por la tormenta Stan. Parte I.República de Guatemala, March 2006.
Instituto Nacional De Sismologia, Vulcanología, Meteorología E Hidrologia(INSIVUMEH). Resumen del impacto asociado al huracán Stan en Guatemala.Guatemala: INSIVUMEH, October 2005.
Lavell, Allan. After Hurricane Mitch: Vulnerability and Risk Reduction in Central America.Latin American Social Science Faculty-FLACSO and the Latin American Networkfor the Social Study of Disaster Prevention-LA RED, August 2002.
Mejia Lopez, Meeylyn Lorena. Indigenous Women and Governance in Guatemala.FOCAL (Canadian Foundation for the Americas), March 2006. Available athttp://www.focal.ca
Programa de las Naciones Unidas para el Desarrollo (PNUD). Diversidad étnico-cultural y desarrollo humano: La ciudadanía en un Estado plural: Informe deDesarrollo Humano 2005. Guatemala: PNUD, 2006.
PNUD and Centro de Coordinación para la prevención de los Desastres Naturales enAmérica Central (CEPREDENAC). Memoria Foro Regional Mitch+5: ¿Dóndeestamos y para dónde vamos? Panama: PNUD, CEPREDENAC, 2004.
PNUD-Programa Participación de la Sociedad Civil. Civil Society ParticipationProgram. Closing report external evaluation. Guatemala: December 2005. Availableat http://www.pasoc.org.gt
Santa Cruz, Wendy. La tormenta Stan: Impacto, acciones sociales, estatales y de lacooperación internacional. Guatemala: FLACSO, Observatorio de MovimientosSociales, March 2006. Available at http://www.sociedadcivil.tk
SEGEPLAN. Plan de Reconstrucción, Tormenta Tropical Stan. Guatemala:SEGEPLAN, March 2006.
SEGEPLAN-Banco de Guatemala. Evaluación de los daños causados por el terremoto,su impacto sobre el desarrollo económico social y lineamientos para un programainmediato de reconstrucción. Guatemala: 1976.
89World Disasters Report 2006 – Guatemalan vulnerability

Suárez, María. Hurricane Stan: A Personal Account of a National Disaster.October 2005. Available at http://www.globalfundforwomen.org/work/programs/stan-personal-account.html
UN Disaster Assessment and Coordination (UNDAC). Informe de Misión:Inundación y deslizamientos ocasionados por la tormenta Stan. Guatemala: October 2005.
UN High Commissioner for Human Rights (UNHCHR). Report of the HighCommissioner for Human Rights on the situation of human rights in Guatemala.UNHCHR, February 2006. Available at http://www.ohchr.org/english/bodies/chr/sessions/62/listdocs.htm
Wiese, Anja Kristina and Wolpold-Bosien, Martin. The Human Right to Food inGuatemala. Heidelberg: ActionAid and Fian International, February 2005.Available at http://www.fian.org
World Bank. Guatemala: Poverty in Guatemala. Report of the Poverty Reduction andEconomic Management Unit, February 2003. Available at http://www.worldbank.org/guatemalapoverty
World Health Organization (WHO). Global Burden of Disease Project for 2000.Geneva: WHO, 2000.
Zapata Marti, Ricardo. CEPAL: Los efectos del huracán Stan en El Salvador yGuatemala. Revista EIRD, 12, 2006.
90

Web sitesCentro de Coordinación para la prevención de los Desastres Naturales en América
Central http://www.cepredenac.orgCoordinadora Nacional para la Reducción de Desastres http://www.conred.orgLa Semilla foundation http://www.fundacionlasemilla.netMédicos Sin Fronteras http://www.msf.esPrograma de las Naciones Unidas para el Desarrollo
http://www.pnudguatemala.org/stanPrograma de las Naciones Unidas para el Desarrollo Guatemala Informe de
Desarrollo Humano http://www.desarrollohumano.org.gtReliefWeb http://www.reliefweb.intSantiago Relief Fund http://www.santiagorelief.comSecretaría de Planificación y Programación de la Presidencia
http://www.segeplan.gob.gt/stan/index.htmTrócaire http://www.trocaire.org
91World Disasters Report 2006 – Guatemalan vulnerability

92
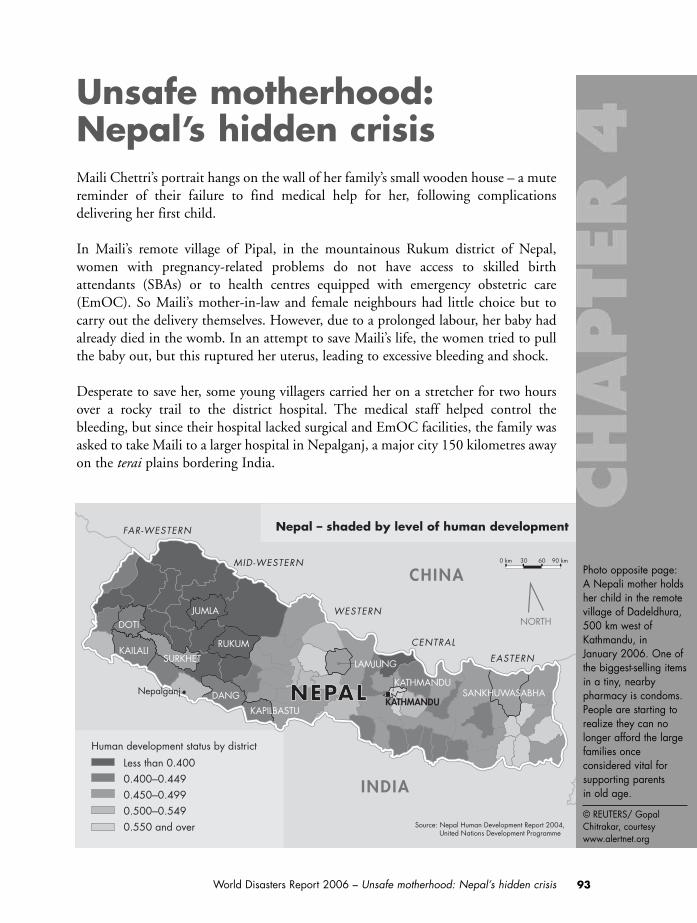
CHINA
NEPALNEPAL
MID-WESTERN
WESTERN
CENTRAL
EASTERN
FAR-WESTERN
INDIA
KAILALI
DOTI
SURKHET
JUMLA
Less than 0.4000.400–0.4490.450–0.4990.500–0.5490.550 and over
RUKUM
DANG
KAPILBASTU
LAMJUNG
KATHMANDUSANKHUWASABHA
Human development status by district
NepalganjKATHMANDU
Source: Nepal Human Development Report 2004,United Nations Development Programme
Nepal – shaded by level of human development
0 km 30 60 90 km
NORTH
Photo opposite page:A Nepali mother holdsher child in the remotevillage of Dadeldhura,500 km west ofKathmandu, in January 2006. One ofthe biggest-selling itemsin a tiny, nearbypharmacy is condoms.People are starting torealize they can nolonger afford the largefamilies onceconsidered vital forsupporting parents in old age.
© REUTERS/ GopalChitrakar, courtesywww.alertnet.org
93World Disasters Report 2006 – Unsafe motherhood: Nepal’s hidden crisis
Unsafe motherhood:Nepal’s hidden crisisMaili Chettri’s portrait hangs on the wall of her family’s small wooden house – a mutereminder of their failure to find medical help for her, following complicationsdelivering her first child.
In Maili’s remote village of Pipal, in the mountainous Rukum district of Nepal,women with pregnancy-related problems do not have access to skilled birthattendants (SBAs) or to health centres equipped with emergency obstetric care(EmOC). So Maili’s mother-in-law and female neighbours had little choice but tocarry out the delivery themselves. However, due to a prolonged labour, her baby hadalready died in the womb. In an attempt to save Maili’s life, the women tried to pullthe baby out, but this ruptured her uterus, leading to excessive bleeding and shock.
Desperate to save her, some young villagers carried her on a stretcher for two hoursover a rocky trail to the district hospital. The medical staff helped control thebleeding, but since their hospital lacked surgical and EmOC facilities, the family wasasked to take Maili to a larger hospital in Nepalganj, a major city 150 kilometres awayon the terai plains bordering India.
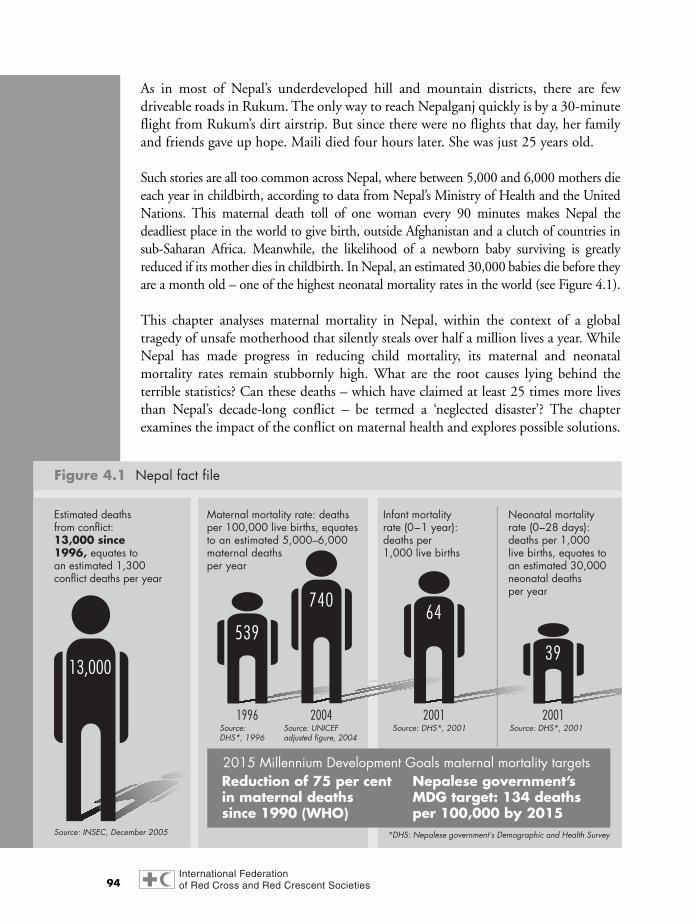
As in most of Nepal’s underdeveloped hill and mountain districts, there are fewdriveable roads in Rukum. The only way to reach Nepalganj quickly is by a 30-minuteflight from Rukum’s dirt airstrip. But since there were no flights that day, her familyand friends gave up hope. Maili died four hours later. She was just 25 years old.
Such stories are all too common across Nepal, where between 5,000 and 6,000 mothers dieeach year in childbirth, according to data from Nepal’s Ministry of Health and the UnitedNations. This maternal death toll of one woman every 90 minutes makes Nepal thedeadliest place in the world to give birth, outside Afghanistan and a clutch of countries insub-Saharan Africa. Meanwhile, the likelihood of a newborn baby surviving is greatlyreduced if its mother dies in childbirth. In Nepal, an estimated 30,000 babies die before theyare a month old – one of the highest neonatal mortality rates in the world (see Figure 4.1).
This chapter analyses maternal mortality in Nepal, within the context of a globaltragedy of unsafe motherhood that silently steals over half a million lives a year. WhileNepal has made progress in reducing child mortality, its maternal and neonatalmortality rates remain stubbornly high. What are the root causes lying behind theterrible statistics? Can these deaths – which have claimed at least 25 times more livesthan Nepal’s decade-long conflict – be termed a ‘neglected disaster’? The chapterexamines the impact of the conflict on maternal health and explores possible solutions.
94
Estimated deathsfrom conflict:13,000 since 1996, equates to an estimated 1,300 conflict deaths per year
Maternal mortality rate: deaths per 100,000 live births, equatesto an estimated 5,000–6,000 maternal deaths per year
Infant mortality rate (0–1 year):deaths per 1,000 live births
Neonatal mortality rate (0–28 days):deaths per 1,000 live births, equates to an estimated 30,000neonatal deathsper year
2015 Millennium Development Goals maternal mortality targets
Source: INSEC, December 2005
Source:DHS*, 1996
Source: UNICEFadjusted figure, 2004
Source: DHS*, 2001Source: DHS*, 2001
Nepalese government’sMDG target: 134 deaths per 100,000 by 2015
*DHS: Nepalese government’s Demographic and Health Survey
Reduction of 75 per cent in maternal deathssince 1990 (WHO)
1996 2004 2001
539
13,000
74064
2001
39
Figure 4.1 Nepal fact file

Why is childbirth so deadly?As in many countries with a high maternal mortality rate, most mothers who losetheir lives in childbirth in Nepal die from a lack of emergency obstetric care orassistance from a skilled birth attendant, following birth complications. According toAdik Wibowo, representative for the World Health Organization (WHO) in Nepal,71 per cent of the country’s maternal deaths are due to direct obstetric causes, mostof which could be effectively managed and prevented.
Of these causes, post-partum haemorrhage is the deadliest – accounting for 46 per cent ofall maternal deaths in Nepal. Put simply, each year nearly 3,000 women in Nepal bleed todeath – usually within two or three hours of giving birth. Heavy bleeding requires swiftemergency care. Delays can prove fatal. Over 20 years ago, international experts identifiedthree kinds of delay, known as the ‘3Ds’, which are particularly applicable in Nepal:
■ Delay in deciding to seek care.■ Delay in reaching a healthcare facility.■ Delay in accessing adequate treatment at the facility.
There are many reasons for these delays – cultural, topographical, financial or a simplelack of awareness (see Box 4.1). Ten years of conflict, between government securityforces and Maoist rebels, have made a bad situation worse.
Culture and superstition conspire against seeking careWomen living in traditional Nepalese societies suffer social and religiousdiscrimination. A woman is treated as ‘untouchable’ during her first menstruation.She is not allowed to see the sun, her husband or her brother due to a superstitionthat her male relatives would die. Women are not allowed to discuss pregnancy withanyone other than their husbands and mothers-in-law.
For the first 11 days after giving birth, a woman is regarded as polluted and impure.Male relatives, including the husband, cannot go near her, so she is forced to live inisolation – often in a cowshed or makeshift hut. She sleeps with her newborn on acold floor in unhygienic conditions, increasing her chances of septicaemia and riskingthe infant’s health. Male relatives don’t want to touch women who bleed after givingbirth, while private and public vehicles alike may refuse to transport them.
Traditionally, women must defer to their husbands for all important decisions. PeeyooshKumar Rajendra, director of the family health division at Nepal’s Ministry of Health,says: “It’s really a disturbing fact that in most villages women cannot seek medical helpon their own without sole permission of the husband and her in-laws. Despite awarenessamong women about taking help from trained health workers, they can’t do anything.”
95World Disasters Report 2006 – Unsafe motherhood: Nepal’s hidden crisis
In many districts, it’s been mandatory for every household to send a male member tojoin the Maoist ‘people’s liberation army’. Those who have remained in thecountryside have risked being arrested by the state security forces on suspicion ofbeing Maoist collaborators. Tens of thousands of Nepalese men have emigrated insearch of work – leaving grandparents, wives and children to cope alone. Accordingto a World Food Programme (WFP) survey of 1,676 households conducted inSeptember 2005 across 43 rural districts, nearly half the households reported that oneor more members had left – mostly men aged 18–30.
“There has been severe indirect impact on girls reaching the age of giving birth, because there is now work overload on them as men are migrating more.There is mental pressure and the priority is less among them to seek healthcare,”says Pinky Singh Rana, coordinator of the Safe Motherhood Network FederationNepal.
In the absence of her husband, it’s hard for a woman to seek healthcare, because ofthe travel expenses and hospital bills. In-laws are unlikely to give permission withoutdiscussing it with their son. Even when the wife has cash in hand, she may lack thecourage to spend it without her husband’s permission.
96
Sarada Lamichhane, 21, lives in Bhangsangwa,a village in Kapilbastu district in the westernterai plains. In early October 2005, she entru-sted the safe delivery of her first infant to herfamily. Despite being overdue, female relativessaid she just had to wait patiently. So she continued doing household chores until twohours before giving birth. After giving bed teato everyone in the house at 7am, she collapsed.
Her mother-in-law sought help from afemale neighbour. The room where Saradalay was dirty and unhygienic. After 90 min-utes, they managed to deliver the infant alive.Sarada gave her new baby a hot bath andstarted breastfeeding. The next day, aroundnoon, she began to bleed heavily and fainted.
Sarada’s husband Dhundiraj, a tractor driv-er, was not at home when she passed out,even though he had seen his wife in greatpain the previous night. “I was busy with work
and came back around late afternoon,” hesays. On his return, he called for an ambu-lance to take Sarada to the nearest major hos-pital, which fortunately was just an houraway. After receiving five pints of transfusedblood, she regained consciousness. Five dayslater she was discharged.
Shocked by the whole incident, her illiteratemother-in-law says they will never repeat theirmistake of delaying delivery or failing to calla health worker in time. “She is like my owndaughter,” she said with tears in her eyes.“Thank you God, for saving her life.”
But money also played its part in sav-ing Sarada. Her husband spent Rs 16,800 (US$ 227) in transport and hospital expenses– a fortune for a tractor driver. “I have yet topay for the cost of medicine and for the localhealth worker”, he says, “as I had no moneyat home to afford her treatment.” ■
Box 4.1 Delay nearly proves deadly

Furthermore, husbands and in-laws may not be aware of the risks involved inchildbirth. “Most families think pregnancy is not a special condition. They believe itcan be managed in a traditional way; but this is a dangerous notion, because deliveriesalways require special and skilled care,” explains Indira Basnett, from the nationwideSupport for Safe Motherhood Programme (SSMP), which is funded by the UK’sDepartment for International Development (DFID) and run collaboratively with thegovernment.
Health workers report that most rural families seek help too late. “Women and girlscan be saved if the family members call us on time,” says Mumkala Bhusal, agovernment nurse in Kapilbastu, 320 kilometres west of Kathmandu in the terai. Buther health workers in hill areas are informed only after four or five hours ofcomplications. The problem is worse among low-caste communities of the terai,where illiteracy can reach 90 per cent and discrimination against women is rife. “Theproblem is the level of ignorance and the attitude of the family towards women,” saysBhusal.
Conflict, poverty and topography prevent access to facilitiesEven if the poorest families decide to seek care, the barriers they face in getting thepatient to a well-equipped health facility are considerable. Mountains, money andMaoists may all get in the way.
Nepal has suffered a decade of violence since February 1996, when the CommunistParty of Nepal (Maoist) launched its ‘people’s war’. At least 13,000 Nepalese have losttheir lives due to the conflict, leaving behind thousands of orphans and widows.Hundreds of thousands have been forced to flee their homes.
While access to healthcare in Nepal has always been difficult, the conflict has made itworse. During 2005 and early 2006, the Maoists reportedly controlled around 80 percent of Nepal. Travelling from areas that Maoists control (rural and remote) to areasthe government controls (district capitals, where the medical facilities are) has oftenrequired written permission in advance.
A survey carried out in 2003 by the Nepal Safer Motherhood Project (NSMP – theforerunner of SSMP), found that “the reduced availability of transportation andcurfew [due to the conflict] have had most impact on the process of accessing servicesonce the decision had been made to seek care.” NSMP added that the conflict hasscared people from travelling beyond the village, especially at night. Curfews andsecurity checks have added around 20 per cent to journey times in moderately-affected areas and 40 per cent in the worst-affected areas, according to the report.
97World Disasters Report 2006 – Unsafe motherhood: Nepal’s hidden crisis

Meanwhile, despite the conflict, the poorest families can’t afford transport. For MailiChettri, it would have cost around US$ 250 to fly from Rukum to Nepalganj, catcha bus to the hospital and find accommodation – before considering the price ofsurgery and medicine. Such an expense is unthinkable to many Nepalese. In Maili’sregion, the average agricultural wage is 54 rupees (75 US cents) a day, according to the World Bank. Nationwide, over 80 per cent of Nepalese subsist on less than US$ 2 a day.
The conflict has made people poorer, as tourism has plummeted, jobs are scarcer andmarkets for farm produce have been fragmented by constant bandhs (strikes) andblockades. Neighbours are less inclined to lend money. With their men abroad, womenhave to earn for the family on top of doing household chores. Rather than seekingproper antenatal and postnatal care, many women work hard either side of giving birth– greatly increasing the risks of complications, bleeding and prolapse of the uterus.
The United Nations Human Development Report noted that Nepal’s human povertyindex fell five places globally to 74th in 2005. During the report’s launch inSeptember, the UN said that Nepal’s conflict had deepened poverty in affected areasand nationally, stunted development, increased internally displaced populations,reduced agricultural production and affected food security.
Another delay to accessing healthcare is the travel time involved. Most rural villagesare days’, sometimes weeks’, walk from the nearest roadhead, airstrip or major town.The journey may mean crossing mountain passes 2,000–3,000 metres high. Womenmay have to be carried for hours on a stretcher by local porters or relatives. WFP’sSeptember 2005 survey found that only 40 per cent of households were within 45 minutes’ walk of a driveable road.
“There is often hesitation among poor communities for a woman to visit healthcentres, as they know it would be useless travelling all the way and fear losing her lifeor the infant’s,” says Baburam Marasini from the Ministry of Health, which estimatesthat 11 per cent of maternal deaths occur on the way to health centres.
Most mothers who survive prolonged labour end up losing their newborns. “I couldnot get the bus on time as it was a long walk from my village to the bus stop,” saysPhulmati Kumari. By the time she reached Dang district hospital in western Nepal, itwas too late to save her infant. The baby of another young woman who arrived thesame day suffered a similar fate.
Lack of adequate facilities keeps death toll highEven if, against the odds, a woman suffering labour complications succeeds inreaching a health facility, there is no guarantee she will receive adequate care.
98

In principle, there are around 3,200 sub-health posts across the country – one forevery village development committee (comprising several villages). Each post is staffedby a nurse, serving 1,500–4,500 people. In practice, however, most have poorfacilities and comprise one or two rooms. A separate room for maternal care is out ofthe question and none of them has emergency obstetric facilities.
Most sub-health posts don’t function effectively, due to a shortage of medical supplies andtrained staff. Re-supplies from the government often never make it beyond the districtcapital, as the security forces have been unwilling to support health posts in Maoistterritory. “There is little financial support in the districts from the government budgetand many health centres cannot even afford to store medicines for the whole year,” saysBaburam Acharya, health assistant at the Hasutha village health post in the western terai.
Out of an estimated 900,000 pregnancies in Nepal each year, the UN estimates thataround 129,000 develop life-threatening complications and will require EmOCservices. To access these services, women must travel to the district centre. However,of Nepal’s 75 districts, only 25 have comprehensive EmOC facilities, while there arejust 17 basic EmOC facilities in other locations. Surgery and blood transfusionservices are limited (see Box 4.2). As a result, 95 per cent of women who develop birthcomplications receive no emergency care, according to the United Nations Children’sFund (UNICEF) in a report dated 2000.
Bishnu Jaiswal is public health director for Kapilbastu district hospital. Each month,25–85 women come here for pregnancy tests, of whom 20–30 give birth. But forthose with complications, “we have no choice but to refer the patients to a cityhospital with surgical facilities [four hours away by bus]. We have no provision ofblood bank, obstetricians and necessary equipments,” she says. The hospital evenlacks a separate room for maternal health services. Although UNICEF helpedconstruct a new hospital building, the post of medical doctor (general practitioner) –usually skilled in obstetrics and surgery, among other things – has yet to be filled bythe government.
The story is similar elsewhere. In Jumla, one of the poorest mountain districts inNepal’s far west, DFID helped build a maternity ward in the main hospital. But byspring 2006, the hospital still lacked resident doctors skilled in EmOC. As a result, thehospital’s maternity facilities remained underused – in a district where Johns HopkinsUniversity recorded a maternal mortality rate of 859 per 100,000 live births in 2000.
While recent government statistics suggest the public health system functionsreasonably well, not all experts are convinced. “The data are sourced from villagehealth posts, but are not verified by teams from the district health office, because ofthe conflict,” says SSMP’s Indira Basnett. Improving the quality of the health servicemonitoring system is an important priority.
99World Disasters Report 2006 – Unsafe motherhood: Nepal’s hidden crisis

Shortage of skilled health workers compounds risksAlthough neither party to the conflict has directly targeted health workers, the climate ofdanger and violence across much of the country has seriously affected the number of
100
Nearly half of Nepal’s maternal mortality isdue to post-partum haemorrhage – in simpleterms, that means almost 3,000 Nepalesewomen bleed to death after childbirth, everyyear. A rapid transfusion of blood is often theonly way to save them. But safe blood is inshort supply in Nepal.
The government has given the Nepal RedCross Society the mandate for blood servicesacross the country. But although there is a sys-tem in place for 100 per cent voluntary blooddonation, maintaining blood services is veryexpensive and requires a dedicated govern-ment budget. According to the Nepal RedCross Society’s health director, PitamberAryal, “there is a huge need to intensify sup-port from the government side.”
To ensure that blood is safe, it has to bescreened for HIV and other infections.Voluntary donors from low-risk populationsare usually the safest source of blood. But tobuild the public confidence needed to ensurea regular commitment from voluntary blooddonors requires a well-organized blood serv-ice with quality systems in all areas. This isvital for donor retention and for the safe andeffective use of blood – but it’s a major chal-lenge in Nepal, where trained health profes-sionals are in very short supply. Meanwhile,counselling for donors who discover they areHIV-positive has to be considered.
The Nepal Red Cross Society runs 56 bloodtransfusion centres in 41 of Nepal’s 75 dis-
tricts, but they aim to open two new centres ayear. Demand has risen due to both maternalhaemorrhage and an increase in civil unrest.The society also runs mobile blood donationcamps on fixed dates throughout the year in21 of its district branches. “In order to moti-vate people to give blood, Red Cross volun-teers visit schools, youth clubs, even other aidorganizations,” says Manita Rajkarnikar,director of the Nepal Red Cross Society’s cen-tral blood transfusion service.
Raising the profile of voluntary blood dona-tion is a vital task, but not the only challenge.“Nepal is doing well with 100 per cent volun-tary blood donation, but other areas of an inte-grated strategy for blood safety remain some-what neglected,” says Peter Carolan, SeniorOfficer, Health and Care (Blood), at theInternational Federation in Geneva. He adds:“There is now a real opportunity to implementchanges here and elsewhere. The WorldHealth Assembly recently recognized WorldBlood Donor Day, on 14 June, as an annualoccasion to remind all its member states of therole of voluntary blood donors in healthcareand the responsibilities of governments andtheir auxiliaries to build the infrastructure need-ed to implement an integrated strategy forblood safety.” Carolan also points out thatthree of the UN’s Millennium DevelopmentGoals (to reduce child mortality, improvematernal health and combat HIV/AIDS) aredependent on a safe blood supply. ■
Box 4.2 Blood: a neglected priority

qualified medical staff willing to work in rural areas. “Nepal always had a shortage of skilledmanpower and the conflict has made it worse – the rate of absenteeism has increased,” saysPitamber Aryal, health director for the Nepal Red Cross Society. “Doctors are not willingto go to conflict zones, so most health facilities lack trained professionals,” he adds.
The situation at village level is more complex. A large number of health workers are localand stay put, according to Susan Clapham, health adviser for DFID in Kathmandu. “Insome areas, health workers are performing better now as the Maoists supervise theirwork and hold them accountable,” she adds. The Maoists tax them too: “They pay anamount equal to 14 days of their salaries as levy every year,” says Daya Shanker LalKarna from the health centre in Sankhuwasabha, a Maoist-dominated district in fareastern Nepal. Meanwhile, health workers in remote villages have often beeninterrogated by security forces to reveal rebel locations. And since moving fromgovernment-controlled district centres to rural Maoist areas has often proved difficult,district health authorities have been unable to support or monitor village health posts.
Many of Nepal’s maternal deaths could be prevented with the help of more SBAs. Theycould be doctors, nurses or midwives – but they must be competent in internationally-recognized midwifery and obstetric skills. As part of the Millennium DevelopmentGoal (MDG) to reduce maternal mortality by three-quarters from 1990 levels, WHOhas set a target for 90 per cent of births to be attended by SBAs by 2015. For countrieswith a very high maternal mortality rate, the target is 60 per cent.
In Nepal, however, 91 per cent of deliveries take place at home, according to thegovernment’s Demographic and Health Survey (DHS) of 2001, the great majoritywithout any skilled help. At the outset of the conflict in 1996, the DHS found that10.1 per cent of all births – at home and in facilities – were attended by a trainedhealth worker. By 2004–2005, this figure had doubled to 20.2 per cent, according toanother survey by the government’s health management information system (HMIS).
However, says Basnett, “this is a misleading indicator”, as trained health workers includeanyone from a doctor to a village health assistant with no specific midwifery training.Basnett suggests that a more realistic estimate of birth attendance by SBAs in Nepaltoday would be around 10 per cent. A key priority is to establish accurate baseline dataon how many deliveries are conducted by SBAs. The government aims to introduce thisindicator in 2007. Even so, it’s clear Nepal is a long way off WHO’s 60 per cent target.
Unsafe motherhood threatens newbornsThe government has made progress cutting the under-five child mortality rate,particularly through nationwide immunizations which have helped save thousands ofyoung lives every year. “Our real challenge now is to address neonatal mortality,” saysDFID’s Susan Clapham.
101World Disasters Report 2006 – Unsafe motherhood: Nepal’s hidden crisis
Dangerous motherhood practices significantly contribute to Nepal’s high infantmortality rate (IMR) of 64 per 1,000 live births. According to the government’s 2001survey, around 50,000 children die each year before their first birthday. Of these, two-thirds die within 28 days, which equates to over 30,000 neonatal deaths annually –one every 20 minutes.
According to the United Nations Population Fund (UNFPA), an infant often diesfollowing the death of its mother during delivery. Motherless newborns are three toten times more likely to die than those with live mothers. Most neonatal deaths occuras a result of inadequate care during pregnancy, delivery or the first critical hours afterbirth. Over 16,000 babies born each year in Nepal do not survive for more than 24 hours.
Only half of Nepal’s pregnant women receive any antenatal care from a trained healthworker, according to the government. Three-quarters of mothers are anaemic, whichgreatly increases the risks of premature delivery, haemorrhage and underweight babies.Just one in four women reports receiving iron supplements, necessary to combatanaemia. Meanwhile, half of all pregnant women fail to receive a tetanus inoculation.
A WFP survey of 1,359 women across Nepal in 2005 found that 63 per cent of thosein the terai and 45 per cent of those in the hills and mountains weighed less than the45kg threshold. Poorly nourished mothers are not only more prone to bleeding andinfection, their babies are born smaller and are more vulnerable to potentially deadlydiarrhoea and pneumonia. A quarter of Nepal’s newborns are underweight, at lessthan 2.5kg.
Nepal’s safe motherhood programmes are focused more on antenatal and delivery carethan on postnatal care. According to Save the Children US, the majority of neonataldeaths occur at home. “Many mothers and newborns in Nepal do not make initialcontact with the formal health system until the newborn is brought to a healthprovider at six weeks for the newborn’s first immunizations,” says a report by theorganization.
These factors severely hamper the life chances of Nepal’s newest arrivals. “The mainreasons [for infant mortality] in Nepal are tetanus, infections and low weight. As theinfants are at high risk of infection due to low energy, they often die if proper care ismissing,” says Save the Children’s Nina Khadka.
Some experts argue that neonatal and maternal health should be more closelyintegrated. According to Clapham, two-thirds of neonatal deaths will be averted byinterventions that reduce maternal deaths. However, donors tend to be interested inbabies or mothers – not both, says Clapham, adding “although this is changing, weare yet to really integrate the services on a significant scale.”
102

But is this a neglected disaster?“Of course it is a disaster,” says the Nepal Red Cross Society’s Pitamber Aryal. TheUnited Nations would appear to agree. In launching its first ever emergencyconsolidated appeal for Nepal in September 2005, the UN included a budget line ofUS$ 1.29 million for ‘emergency reproductive health services for conflict-affectedpopulations’ (see Box 4.3).
Meanwhile, Indira Basnett recalls her experience as a district health officer in theremote hill district of Doti. “When a buffalo suffers birth complications, thecommunity runs to find a skilled attendant, because a buffalo has a high economicvalue – it carries luggage, it produces milk,” she says. “If a buffalo dies, they have topay a high cost to replace it, but if a woman dies, they can find another without cost.The attitude in rural areas is ‘deliver or die.’ Women are not perceived to haveeconomic value – for that reason, this is a neglected disaster.”
Not all experts agree. “The poor state of maternal health in Nepal can’t be defined asdisaster, since a disaster is a major deviation from normal,” says DFID’s SusanClapham, “yet we have been living with unacceptably high levels of maternalmortality for hundreds of years.” To call it a disaster, she adds, implies that somethingshould be done about it immediately. “But we can’t do anything in a relatively shorttime – the evidence shows that progress is only achieved through long-term action.”Clapham suggests that ‘silent tragedy’ would be a more accurate description.
Putting definitions aside, maternal and neonatal mortality are undoubtedly neglectedby the media. Since the Maoist insurgency began in 1996, around 13,000 people havebeen killed as a direct result of the conflict. Over the same decade, by extrapolatingcurrent mortality data, an estimated 350,000 mothers and month-old babies havedied of largely preventable causes. Yet international reporting of Nepal is dominatedby conflict and politics, while maternal and neonatal mortality barely get a mention.A search of the BBC News web site in May 2006 found 1,764 articles on Nepal sinceNovember 1997, of which just one focused on maternal mortality.
The same is largely true of the domestic media. Anecdotal evidence suggests a lack ofsensitivity to the issue. While a group of journalists from Kathmandu were observingan immunization programme in Dang district hospital during late 2005, two youngwomen were rushed into the emergency ward. They were in fits of pain due tochildbirth complications. “This happens all the time in the villages,” remarked onereporter. He added: “My editor won’t be interested in the story.”
For its part, the government of Nepal has been slow to address maternal mortality,although its policy at least has improved in recent years. The global initiative topromote safe motherhood began in the 1980s, but it wasn’t until 1993 that Nepal’s
103World Disasters Report 2006 – Unsafe motherhood: Nepal’s hidden crisis

government launched the national safe motherhood programme. In 2001, a globalassessment of 49 developing countries conducted by 750 reproductive health expertsconcluded that Nepal ranked 47th in all areas of maternal and neonatal health services.Published as part of the Maternal and Neonatal Program Effort Index (MNPI) by theUnited States Agency for International Development (USAID), the survey noted vastdisparities between urban and rural access to safe motherhood services.
104
In response to the conflict, aid organizations,including the UN and NGOs, have developeda framework of good practice known as theBasic Operating Guidelines (BOGs) whichemphasize that they have the right to suspendaid programmes in the absence of a safeworking environment. Nevertheless, both par-ties to the conflict have, at times, made it diffi-cult for aid operations to continue.
“The conflict has impacted on traditionalways of addressing maternal and child healthproblems,” says Paul Handley, humanitar-ian officer with the UN’s Office for theCoordination of Humanitarian Affairs (OCHA)in Kathmandu. “The basic health services ofthe state have been clearly affected, as havemany other more developmental approachesto delivering services by the international com-munity and local NGOs,” he adds.
Susan Clapham, health adviser for the UK’sDepartment for International Development(DFID) in Kathmandu, thinks this overstates thesituation. “The conflict does not change thecauses of deaths and therefore what we needto do to reduce deaths,” she says. “We adapthow we work – not what we do.”
Last year, the UN launched its first-everhumanitarian appeal for Nepal, asking fornearly US$ 65 million to cover the period fromOctober 2005 to December 2006. The appealmade waves among Kathmandu’s residentdevelopment agencies, who feared it woulddivert money from their work. Nick Russell, rep-
resentative for the International Federation inNepal, says the appeal process helped bringpeople together to address humanitarian anddevelopment issues in the context of the conflictand the pockets of vulnerability it creates. “Thesecurity situation is fluid, it keeps changing.”Russell points out: ”The aid agencies have tolearn to work in a different way.”
So, in a climate of violence and politicaluncertainty, are there any emergency meas-ures that could reduce the terrible toll of nearly100 mothers and babies dying from mainlypreventable causes each day in Nepal? TheNepal Red Cross Society operates a fleet of 90 ambulances in 56 of the country’s 75 dis-tricts – ready to rush women and children tohealth facilities when necessary. “Safe mother-hood should be integrated into the emergencyresponse of the country,” argues SafiehAndersen, deputy representative of the UNPopulation Fund (UNFPA) in Nepal. She addsthat an absence of emergency relief can fur-ther escalate the maternal health problem.
The UN appeal included over a million dol-lars for ‘emergency reproductive health ser-vices’. UNFPA started by organizing mobile reproductive health surgery camps in eightremote districts. Women with uterus prolapses flocked in to get free surgery, costing about US$ 30 per patient. Clapham, however, re-mains unconvinced: “Reducing maternal deathsis a long-term development challenge and can-not be fixed by an emergency approach.” ■
Box 4.3 Taking emergency measures

Meanwhile, accurate data on maternal deaths and safer motherhood indicators arehard to find (see Box 4.4). Basnett argues that “regular surveillance of each maternaldeath at district level is essential in order to design specific interventions for eachdistrict.”
Solutions for mother and child survivalWith such a range of complex root causes, the hidden crisis of Nepal’s lost mothersand newborns demands equally complex solutions. According to DFID’s SusanClapham, maternal mortality is the hardest health problem to crack. The death rateis roughly the same as that of children dying of measles each year. Yet while a recentnationwide measles elimination campaign, costing approximately one dollar a child,is having an immediate and dramatic impact on reducing measles deaths, saysClapham, “we have nothing like that in maternal health”.
The government’s policy, along with that of the Nepal Red Cross Society, is to addressmaternal mortality within a broader strategy of reproductive and child health. Thisencompasses sex education, family planning, safety from sexually transmittedinfections, safe motherhood and child survival. Reducing maternal mortality “is not
105World Disasters Report 2006 – Unsafe motherhood: Nepal’s hidden crisis
Giving birth in Nepalcan be a deadlyexperience. Between5,000 and 6,000Nepali women dieeach year duringchildbirth – a silenttragedy that goeslargely unreported.Over 90 per cent ofdeliveries take place athome, usually withoutthe skilled care that’svitally necessary toensure safemotherhood.
Liliane de Toledo/International Federation

106
Nepal’s routine health information systemslack the capacity to determine which districtshave the worst infant and maternal mortalityrates. Registration of births and deaths isweak and not all hospitals keep accuraterecords. This contrasts with, for example, SriLanka, whose health system reports all mater-nal deaths down to village level, making iteasy to calculate the maternal mortality rate.
One government medical recorder of amajor hospital in west Nepal admitted to theWorld Disasters Report that his staff do noteven keep records of maternal deaths. Heexplained, on condition of anonymity, that hedid not get enough pressure from the govern-ment, civil society or the media to do so. Headded that the death of one child fromencephalitis or HIV/AIDS received nationalmedia coverage, while women dying in child-birth received almost no media attention. Amedical recorder is a significant position inthe government’s health sector – responsiblefor disseminating information on various pub-lic health issues.
The alternative to nationwide registration ofall maternal and child deaths is to conductperiodic surveys. However, methodologiesvary so surveys cannot easily be compared.The government’s figure of 539 maternaldeaths per 100,000 live births dates from their1996 Demographic and Health Survey (DHS),which measures maternal mortality once adecade. The DHS of 2006 will provide the lat-est figures by the end of this year. However,the confidence interval for the DHS methodolo-gy is plus or minus 100 – so the 1996 figurecould be anywhere between 439 and 639.
The UN Development Programme (UNDP)highlighted in its Nepal Millennium Develop-ment Goals (MDGs) Progress Report 2005
that the data on maternal mortality in Nepalare highly problematic, under-reported andmisclassified, due to “such issues as variabili-ty of the sample, the small number of events, and differences in methodology”. In 2004,UNICEF reported a higher maternal mortalityrate of 740 per 100,000 live births. The gov-ernment defends its lower figure by arguingthat many deaths that occur in villages or onthe way to hospitals cannot be recorded.
The lack of reliable data makes it difficult todetermine Nepal’s progress towards its 2015MDG of reducing maternal mortality by three-quarters from 1990 levels. Agencies are noteven clear what the mortality rate was in1990, leading DFID’s Susan Clapham to say: “We don’t know if we’re on course or off course.” For its part, the Nepalese government is committed to an MDG target of134 deaths per 100,000 live births, based ona 75 per cent reduction from its 1996 figureof 539.
There are proxy indicators to measureannual progress towards safer motherhood.One is the percentage of births attended by askilled birth attendant (SBA) – but up to mid-2006, data are available only on attendanceby trained health workers who may or maynot be SBAs. This should change with theintroduction of SBA registration in July 2006.Another indicator is to measure the number ofwomen with birth complications who receiveemergency obstetric care (EmOC). Data onEmOC utilization have been gathered in 13 ofNepal’s 75 districts since a baseline year of1999–2000. But according to SSMP’s IndiraBasnett, “when the data was compared frombaseline to now, it was found that the pace isvery slow and there is a need of significantincrease in EmOC service.” ■
Box 4.4 Shaky data obscure plight of women and progress of response

just about how to have babies, it’s about how not to have babies”, says Manish Pant,senior health manager for the International Federation of Red Cross and RedCrescent Societies in South Asia.
After three or four births, women are more prone to anaemia, while their uterusbecomes less efficient at contracting, increasing the risks of post-partum haemorrhage.Teenagers are more vulnerable during childbirth as their bodies are less resilient andthey may be less aware of safe motherhood issues. In Nepal, says Pant, 13 per cent ofwomen give birth before they reach 20 years of age. Many pregnancies in Nepal maybe unwanted, leading to unsafe abortions by untrained villagers often armed withnothing more sophisticated than a sharp bamboo stick. Complications arising fromunsafe abortions in Nepal are estimated to account for 20 per cent of maternal deathsin health facilities alone, not counting the women who never make it to hospital (seeBox 4.5).
Red Cross volunteers are counselling adolescent girls in six districts of eastern Nepalin family planning and ways to avoid unwanted pregnancies. Meanwhile, at a nationallevel, the Nepal Red Cross Society has coordinated the annual Condom Day since1995 to promote birth spacing and disease prevention.
Examining the full range of reproductive and child health responses is beyond thescope of this chapter. However, one approach to safer motherhood is to examine waysof reducing the 3Ds mentioned earlier: delay in deciding to seek care, delay inreaching a healthcare facility and delay in accessing adequate treatment at the facility.The chapter will look briefly at these areas, reviewing what’s been achieved and goodpractices on which to build, before exploring options for home-based care andcommunity participation in making motherhood safer.
Boosting awareness through mass communicationSpeeding up the decision to seek care involves building greater awareness amongwomen and men of the benefits of expert help, especially if complications arise. It alsomeans tackling barriers of culture and gender discrimination. Options include raisingthe profile of safe motherhood through more critical media coverage and masscommunication among people at risk.
“If I only knew”, says Phulmati’s mother as she watches her daughter lying half-conscious in the hospital bed in Dang. She doesn’t have the courage to tell Phulmatithat she’s just given birth to a dead child. Like many Nepalese women, she bitterlyregrets not knowing what danger signs to watch out for.
Health awareness programmes are the best way to help people understand thesignificance of safe delivery, birth complications and health services. Sensitizing the
107World Disasters Report 2006 – Unsafe motherhood: Nepal’s hidden crisis
whole family is vital to prevent delays in seeking care. “Empowering only womenwon’t be effective,” says Deepa Pokhrel, equity and access adviser for SSMP.
In recent years, several organizations have launched ‘non-formal education’ on safermotherhood, forming community committees to raise awareness and funds. But theconflict has taken its toll on such projects. Agencies have reported difficulty gatheringlarge groups of villagers together in Maoist areas. The migration of educated peoplefrom rural communities has undermined information-sharing. And the sustainabilityof stand-alone projects is limited by short-term funding.
One way of conveying health messages is through existing mothers groups, nownumbering over 10,000 nationwide. Members, who include women from allbackgrounds, often discuss sensitive issues such as reproductive health. “These groups canhelp pregnant women not to be shy about discussing their problems,” explains Pokhrel.
Radio programmes could reach conflict-affected, remote or illiterate communities. In2002, NSMP launched a 15-minute weekly radio programme called Ama (literally:‘mother’), broadcast in three districts. Listeners’ clubs formed and some literatevillagers volunteered to explain the issues to less educated families. The programmeinvited doctors to respond to villagers’ queries.
108
Complications from unsafe abortions are amajor contributor to Nepal’s high maternalmortality and morbidity. Because of the sensi-tive nature of the subject, little hard data isavailable, but studies by the Ministry of Healthhave estimated that induced abortion compli-cations are responsible for 53.7 per cent ofgynaecological and obstetric hospital admis-sions and 20 per cent of maternal deaths inhealth facilities. This does not account for themany women who have died at home, eitherbecause they lived too far from a hospital, orcould not afford the expense, or were afraidto risk going to a public institution because ofthe illegal status of abortion, or feared theassociated stigma.
In 2002, the Nepalese government legalized abortion and, following implementa-
tion of the new law in December 2003, therehas been an intensive national programme totrain safe abortion service providers andestablish simple, safe and women-friendlyabortion facilities in public hospitals and pri-vate or NGO clinics.
In the two years since the programmebegan, 226 public and private doctors havereceived training, 117 safe abortion sites havebeen established (71 public and 46 private/NGO) and a total of 43,460 women havereceived services, with minimal complications.Although there is still far to go in buildingawareness about the legal availability of services and changing attitudes towards abortion, this represents a significant steptowards addressing a major cause of mater-nal death and suffering. ■
Box 4.5 Safe abortion saves mothers’ lives

An independent evaluation of Ama in Surkhet district found the project helpedchange attitudes, particularly among husbands and mothers-in-law, and increasedlocal demand for better health services. When NSMP was phased out in 2004 andreplaced by SSMP, Ama stopped production. Two years later, plans are afoot toresurrect it.
However, for national reach, the best option would be to harness the power ofmainstream journalism. “Journalists can play an important role in writing heart-rending case studies, investigating the shortcomings of the government andinternational development agencies, and informing rural communities about benefits,”says Pokhrel. But currently, journalists focus overwhelmingly on political coverage.When they do report on humanitarian issues, it’s mainly about infectious diseases.
However, there is experience on which to build. In the mid-1990s, the Nepal PressInstitute (NPI), a non-governmental organization (NGO) run by senior journalists,helped promote regular, national newspaper coverage of leprosy. NPI tied up withleprosy-focused NGOs, which sponsored field trips for journalists. Governmenthealth officials explained leprosy-related stigma to reporters. The initiative helpedchange attitudes towards people with leprosy. The same model could be applied tosafe motherhood.
Making it cheaper and quicker to reach helpReducing the delay in reaching a health facility is an issue of access, which in turndepends on ensuring freedom of movement with parties to the conflict, as well asovercoming topographical and financial barriers.
The sheer cost of travel and treatment puts off many of Nepal’s poorest families. In2005, over half of all households borrowed money to pay for hospital deliveries, whileone-third sold land and livestock to cover the bills, according to the Ministry ofHealth.
However, with funding from DFID, the government recently started a cost-sharingscheme in 27 districts. All women delivering a baby at a district hospital or primaryhealthcare centre receive cash to cover transport and other costs. Those travelling frommountain districts receive US$ 20, while those from hill and terai districts get US$ 15 and US$ 7 respectively.
In addition, women from districts with a low human development index (HDI, asdefined by the UN) receive free maternity and delivery services at public healthinstitutions. For poorer women from districts with a better HDI, there is anadditional travel allowance. Meanwhile, health workers such as SBAs receive US$ 5per delivery they attend.
109World Disasters Report 2006 – Unsafe motherhood: Nepal’s hidden crisis

Despite this innovative approach, the allowances won’t cover everything. Onaverage, it costs over US$ 70 for a normal hospital delivery and US$ 150 forsurgery. Add in transport and accommodation and the costs could soar. So poorerfamilies not living in districts with a low HDI may still be forced to sell assets ortake out high-interest loans to cover treatment. Added to which, women can onlyclaim the money on leaving the health facility, so the poorest will still need anadvance from somewhere.
“When we talk of birth preparedness, we need community-based emergency fundsavailable in the middle of the night,” says Suomi Sakai, UNICEF’s representative inNepal. One solution could be to approach mothers groups to advance emergencyfunds or low-cost loans to pregnant women in need. With hundreds of monthly feescoming in from members, many mothers groups serve as micro-banks.
In Jumla district, the local government is helping fund healthcare by taxing cigarettes,alcohol and air travel, levying an extra US$ 1.30 per passenger. Jumla plans to raiseUS$ 3,500 a year, which could go towards mothers’ travel expenses or even a residentSBA. In Dang district, UNICEF is working with the government to promote safemotherhood groups and easier access to facilities (see Box 4.6).
Engaging private practice is another option. In Lamjung district, the government ispiloting a safe motherhood project in which the private sector and local communityare free to decide the allowances of service providers, who receive a governmentincentive of US$ 5 per delivery. This scheme has helped increase coverage ofmaternity services among rural women.
Improving service delivery at health facilitiesRaising awareness of the need to deliver babies in health facilities and improvingaccess to those facilities will be of limited use if Nepal’s hospitals and health centreslack the equipment and staff necessary to ensure a safe delivery. Creating an effectivenationwide health service (which Nepal has arguably never had) is a vital part ofreducing unnecessary maternal and neonatal deaths. While a full analysis of this isbeyond the scope of this chapter, there are some key issues to consider, includingincreasing the numbers of SBAs and considering options for better home-based care.
At the current rate, Nepal will miss WHO’s 2015 target of 60 per cent of birthsattended by SBAs – and by a wide margin. Training more skilled birth attendants and,crucially, retaining them is a vital priority. At present there are 1,259 doctors and6,216 nurses working in the governmental health system, mostly in city and districthospitals. Not all of them are trained to the standards required of SBAs by theInternational Confederation of Midwives. There are no accurate data on the numbersof SBAs in Nepal – although nationwide registration was due to begin in July 2006.
110

The Ministry of Health plans to strengthen existing health centres sufficiently toprovide adequate birthing facilities and to train existing doctors and nurses in SBAskills. Far more SBAs are needed to cover remote areas. SSMP is proposing that inorder to hit the WHO target, one SBA is needed per 50 births in the mountains, oneper 100 births in the hills, and one per 150 births in the terai. This means over 4,000 SBAs are needed across the country.
While skilled birth attendants can manage minor complications, doctors are neededto operate EmOC facilities and manage major complications. According to GeetaRana, head of the safe motherhood programme for UNICEF in Nepal, “there is aneed to increase the numbers of general practitioners [medical doctors] so that thereis at least one in every district hospital and eventually two.” However, at present thereare only 45 Nepalese general practitioners, of which just 15 work for the government.
Most rural communities currently make do with traditional birth attendants (TBAs),who number approximately 15,000. Confusingly, however, TBAs – like maternal andchild health workers (MCHWs) – are not special birth attendants and cannot handlebirth complications. As many of them are poorly educated and trained, the best theycan do is refer patients on to SBAs. Since the late 1980s, the Nepalese government hasinvested in expanding the numbers of MCHWs and TBAs. However, evaluationssuggest that they have had little impact on improving safe motherhood practices, sogovernment policy is now focused on increasing the number of SBAs.
111World Disasters Report 2006 – Unsafe motherhood: Nepal’s hidden crisis
The district hospital of Dang, 400 kilometreswest of Kathmandu on the terai plains border-ing India, has become a model for safer motherhood. The government, with supportfrom UNICEF, now runs 24-hour maternityservices at the hospital. They have helped tostrengthen village health posts throughout thedistrict and their delivery services reach everylevel of society. Safe motherhood groups,comprising women from each community,keep watch on all expectant mothers andensure they go for regular antenatal check-ups. The groups help organize emergencyfunds so that any of their members with pregnancy-related complications can use the
money to travel to hospital. Last year alone,healthcare centres across the district treated344 life-threatening complications.
Most women still deliver babies at home inDang district, but local attitudes towardsmaternal and newborn health are changingfor the better. The hospital is helping to pro-mote the idea of deliveries in hospital or at the hands of skilled birth attendants (SBAs).These SBAs (often nurses) train locally at thedistrict hospital, where they learn to handlenormal births and complicated cases. The hos-pital has a fully functional and well-equipped15-bed maternity unit and a 24-hour bloodtransfusion service. ■
Box 4.6 Model hospital reaches out to community

Role for community-based care?One key issue is whether to invest more resources in improving health facilities or to sendmore SBAs into the homes of vulnerable women – especially given the enormous barrierswhich poorer women in remote locations face in reaching an adequate health facility.
In the late 1990s, donors like DFID concentrated on health facilities, but this ischanging. “There’s a lot more that can be done to prevent complications in thehome,” says DFID’s Susan Clapham. Reducing post-partum haemorrhage is critical.This can be done by managing labour correctly, including the use of essential drugs.But it requires skilled health workers such as SBAs, plus a drug supply system. So thekey priority is to ensure there are enough SBAs to provide care in the home as well asin community-based facilities in vulnerable, high-risk areas. Considering that 46 percent of maternal deaths in Nepal are caused by bleeding, which could largely bemanaged at home or in local facilities, Clapham believes such care by SBAs couldachieve “not far off a 50 per cent cut in maternal mortality”.
However, the barriers preventing women from accessing health facilities also apply toSBAs accessing communities. Persuading skilled health workers to operate in remote,dangerous locations will take sustained financial incentives and more support fromthe health system. This is primarily the state’s responsibility. “If the government isreally committed to the MDGs, it needs to invest more money in training andretaining SBAs,” says Indira Basnett.
In the meantime, should the roles of community health volunteers – including TBAs– be re-examined? They could be trained to register pregnancies and forward theinformation to the nearest SBAs, to facilitate antenatal visits. They could learn torecognize birth complications in time to refer women to expert care. They coulddistribute iron supplements to combat anaemia. And they could promote simplehealth messages before and after birth – such as the need for mothers to improve theirnutrition and take sufficient rest.
Proper postnatal care is vital, but often neglected by SBAs. One pilot project,conducted by Save the Children US with the government, has shown that TBAs canconduct effective home-based postnatal care. The project targeted 24 villages inKailali, one of the least developed districts in the far western terai, and trainedcommunity-based health workers and TBAs in how to conduct basic examinations ofnewborns in the home, recognize danger signs and refer to appropriate health centres.They had to make at least three visits to the home of each newborn, physicallyexamining babies and counselling mothers.
As a result, half the mothers and 44 per cent of newborns in the project area receivedpostnatal care. Unfortunately, the project staff had to pull out in 2004 for security
112
reasons, but the intervention showed that TBAs can be a valuable resource in the fightagainst neonatal mortality.
Conclusion: political champions, new partnersSolving the hidden crisis of maternal and neonatal mortality is a complicated, long-term process. Put simply, the solution involves two broad approaches which needconcurrent action:
■ Supply side: improving the healthcare system by equipping more health centreswith basic EmOC facilities, training and retaining more SBAs, improving safeabortion services, and enabling better access for the most vulnerable.
■ Demand side: building greater demand for reproductive health services bytackling socio-cultural barriers to a greater awareness of maternal and neonatalhealth among vulnerable communities.
To achieve this in the current political and security climate will require thecooperation not only of communities and government, but also the private sector, themedia and power-brokers across the country. Binding these disparate players togetherwill take a high level of advocacy and coordination among humanitarian anddevelopment organizations.
Find political champions: “Unsafe motherhood is not a quick fix. We need morepolitical champions to address this issue strongly,” says DFID’s Susan Clapham. Forexample, abortion was legalized after a high-profile campaign led by lawyers, civilsociety, politicians and the prime minister’s wife. Journalists were mobilized throughregular seminars and coverage of the court trials of women imprisoned for abortion.
Engage mainstream media: A similar campaign to that for abortion could beeffective for safer motherhood. Aid organizations could collaborate on concretecommunication strategies and build stronger ties with mainstream media – a majoruntapped resource with nationwide reach. Identifying a National Safe MotherhoodDay, as in India, would be a good start.
Partner with the private sector: Building effective partnerships with the privatesector could help supplement overstretched public health services. But districtgovernment officials need more autonomy for such schemes to succeed.
Advocate with rebels and security forces: Aid organizations and human rightsgroups could advocate more strongly with Maoists and security forces to ensureabsolute security, unhindered access and respect for health workers conducting life-saving missions across the country.
113World Disasters Report 2006 – Unsafe motherhood: Nepal’s hidden crisis

Principal contributors to this chapter and Boxes 4.1 – 4.4 and 4.6 were Naresh Newar,a reporter with the Nepali Times who also works as a freelancer for IRIN and BishnuSharma, who is a reporter for Rajdhani National Daily newspaper. Cherry Bird,consultant with the Technical Committee for the Implementation of ComprehensiveAbortion Care (TCIC) advising the Nepalese government, contributed Box 4.5. Wewould also like to acknowledge the invaluable assistance and advice of Dr Indira Basnett,consultant with Nepal’s Support for Safe Motherhood Programme (SSMP) and Dr SusanClapham, health adviser in Nepal for the UK’s Department for InternationalDevelopment (DFID).
Sources and further informationAdhikary, K. Qualitative Investigation of NSMP’s Radio Programme Launched in
Surkhet District. Kathmandu: NSMP, 2004.
Aitken, J-M. and Thomas, D. Synthesis of Final Evaluation Findings From the NepalSafer Motherhood Project. Kathmandu: Family Health Division, Department ofHealth Services, Ministry of Health, HMG Nepal, Options, DFID, 2004.
Beun, M. and Neupane, B.D. Impact of Conflict on Accessibility of EmOC HealthServices. Kathmandu: Family Health Division, Department of Health Services,Ministry of Health, HMG Nepal, Options, DFID, 2003.
Chhetry, S., Clapham, S. and Basnett, I. Community Based Maternal and Child HealthCare in Nepal: Self-Reported Performance of Maternal and Child Health Workers.Journal of Nepal Medical Association, 2005.
The Center for Reproductive Rights. Women of the World: Laws and Policies AffectingTheir Reproductive Lives – South Asia. New York: The Center for ReproductiveRights, 2005.
Consolidated Appeals Process. Nepal 2005. New York: United Nations, 2005.
Freedman, L.P., Waldman, R. J., de Pinho, H., Wirth, M.E., Mushtaque, A.,Chowdhury, R. and Rosenfield, A. Who’s got the power? Transforming health systemsfor women and children. London: Earthscan, 2005.
International Federation. Maternal and child health care. Geneva: InternationalFederation, 2005.
Ministry of Health, National Maternal Mortality and Morbidity Study 1998. Nepal:Ministry of Health and Population, HMG Nepal, 1998.
Ministry of Health. National Neonatal Health Strategy. Nepal: Family HealthDivision, Department of Health Services, Ministry of Health, HMG Nepal,2004.
Save the Children. State of the World’s Mothers 2006 – Saving the Lives of Mothers andNewborns. London: Save the Children, 2006.
Taylor, M.E. Analysis Of Systems: The Jumla Community Health Program. Maryland,USA: Unpublished doctoral thesis, January 2000.
114

Thomas, D., Messerschmidt, L. and Devkota, B. Increasing Access to Essential ObstetricCare: A review of progress and process. Kathmandu: Family Health Division,Department of Health Services, Ministry of Health, HMG Nepal, Options,DFID, 2004.
UN Children’s Fund. Needs assessment on the availability of emergency obstetric careservices. Kathmandu: UNICEF, 2000.
UN Population Fund. State of World Population 2005. New York: UNFPA, 2005.
World Food Programme. Household Food Security in Nepal. Nepal: WFP/VAM,December 2005.
World Health Organization. Beyond The Numbers: Reviewing Maternal Deaths AndComplications To Make Pregnancy Safer. Geneva: WHO, 2004.
World Health Organization. Improving Maternal, Newborn and Child Health in theSouth-East Asia Region, p. 70. New Delhi: WHO, 2000.
World Health Organization. Regional Health Forum WHO South-East Asia Region(Volume 6, Number 2). New Delhi: WHO, 2002.
World Health Organization, United Nations Children’s Fund, United NationsPopulation Fund. Maternal Mortality in 2000. Geneva: WHO, UNICEF,UNFPA, 2004.
World Health Organization. Skilled Attendant at birth 2005 Estimates. Available athttp://www.who.int/reproductive-health/global_monitoring/ skilled_attendant_at_birth2005_estimates.pdf
Web sitesUK’s Department for International Development (information on Nepal)
http://www.dfid.gov.uk/countries/asia/nepal.aspMaternal and Neonatal Program Effort Index
http://www.policyproject.com/pubs/MNPI/Nepal_MNPI.pdfNepal Red Cross Society http://www.nrcs.orgNepal Safer Motherhood Project http://www.nsmp.orgSave the Children US http://www.savethechildren.orgUN Population Fund Nepal http://www.unfpanepal.orgUN Children’s Fund (information on Nepal)
http://www.unicef.org/infobycountry/nepal_nepal_latest.htmlUN Integrated Regional Information Networks News http://www.irinnews.orgUN Millennium Project http://www.unmillenniumproject.orgWorld Health Organization Regional Office for South-East Asia
http://www.whosea.org
115World Disasters Report 2006 – Unsafe motherhood: Nepal’s hidden crisis

116
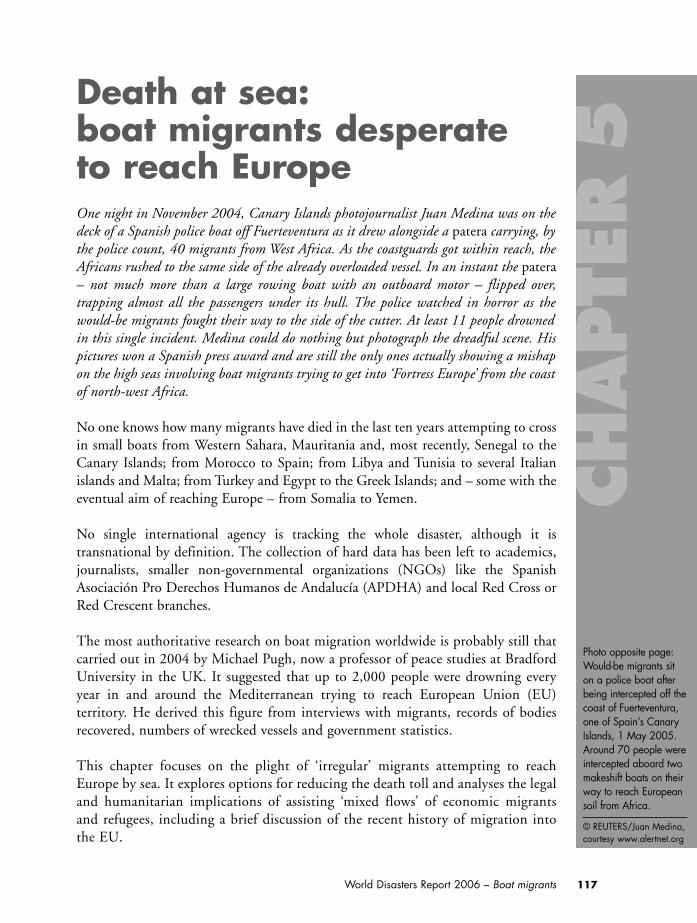
Photo opposite page:Would-be migrants siton a police boat afterbeing intercepted off thecoast of Fuerteventura,one of Spain’s CanaryIslands, 1 May 2005.Around 70 people wereintercepted aboard twomakeshift boats on theirway to reach Europeansoil from Africa.
© REUTERS/Juan Medina,courtesy www.alertnet.org
117World Disasters Report 2006 – Boat migrants
Death at sea: boat migrants desperate to reach EuropeOne night in November 2004, Canary Islands photojournalist Juan Medina was on thedeck of a Spanish police boat off Fuerteventura as it drew alongside a patera carrying, bythe police count, 40 migrants from West Africa. As the coastguards got within reach, theAfricans rushed to the same side of the already overloaded vessel. In an instant the patera– not much more than a large rowing boat with an outboard motor – flipped over,trapping almost all the passengers under its hull. The police watched in horror as thewould-be migrants fought their way to the side of the cutter. At least 11 people drownedin this single incident. Medina could do nothing but photograph the dreadful scene. Hispictures won a Spanish press award and are still the only ones actually showing a mishapon the high seas involving boat migrants trying to get into ‘Fortress Europe’ from the coastof north-west Africa.
No one knows how many migrants have died in the last ten years attempting to crossin small boats from Western Sahara, Mauritania and, most recently, Senegal to theCanary Islands; from Morocco to Spain; from Libya and Tunisia to several Italianislands and Malta; from Turkey and Egypt to the Greek Islands; and – some with theeventual aim of reaching Europe – from Somalia to Yemen.
No single international agency is tracking the whole disaster, although it istransnational by definition. The collection of hard data has been left to academics,journalists, smaller non-governmental organizations (NGOs) like the SpanishAsociación Pro Derechos Humanos de Andalucía (APDHA) and local Red Cross orRed Crescent branches.
The most authoritative research on boat migration worldwide is probably still thatcarried out in 2004 by Michael Pugh, now a professor of peace studies at BradfordUniversity in the UK. It suggested that up to 2,000 people were drowning everyyear in and around the Mediterranean trying to reach European Union (EU)territory. He derived this figure from interviews with migrants, records of bodiesrecovered, numbers of wrecked vessels and government statistics.
This chapter focuses on the plight of ‘irregular’ migrants attempting to reachEurope by sea. It explores options for reducing the death toll and analyses the legaland humanitarian implications of assisting ‘mixed flows’ of economic migrants and refugees, including a brief discussion of the recent history of migration intothe EU.

118
CorsicaFrance
SardiniaItaly
SicilyItaly
Crete
Balea
ric Islands
MadeiraPortugal
Canary IslandsSpain
15O 0O 15O 30O
0 km 300 600 900 km
Horn ofAfrica
SouthAsia,MiddleEast
West and Central Africa
1
2 3
ROYAUME-UNI
MOLDAVIE
BURKINA FASO
DEMOCRATICREPUBLIC
OF CONGO
FRANCE
REP.D'IRLANDE
PAYS DEGALLE
ALLEMAGNE
BELARUS
UKRAINE
CYPRUS
POLOGNE
HONGRIEROUMANIESLOVENIA
YOUGOSLAVIEALBANIA MACEDONIA
BOSNIE-HERZEG.
ITALY
MALTAGREECE
SPAIN
ALGERIA
LIBYA EGYPT
SUDAN
CENTRAL AFRICANREPUBLIC
UGANDA
LIECHTENSTEIN
PAYS-BAS
REP. TCHEQUE
AUTRICHESLOVAQUIE
TURKEY
CONGO
CAMEROON
CHAD
GH
AN
A
MALI
GUINEA
SENEGAL
MAURITANIA
COTED'IVOIRE
SIERRALEONE
GUINEA-BISSAU
GAMBIA
NIGERIA
NIGER
EQUATORIALGUINEASAO TOME
AND PRINCIPE
BELGIQUE
LUXEMBOURG
PORTUGAL
SUISSE
CROATIA
BULGARIA
TUNISIA
MOROCCO
LIBERIA TOG
OBE
NIN
Tamanrasset
Agadez
WesternSahara
La Manche
Strait of Gibraltar Me
di t e r r a
ne
an
S e a
Mer
AtlanticOcean
AtlanticOcean
AdriaticSea
Irregular migration routes to southern EuropeCanary Islands
Spain
0 km 100 200 300 400 km
AtlanticOcean
Dakar
Nouakchott
Saint-Louis
Nouadhibou
El Aaiun
Gran CanariaTenerife Fuerteventura
SENEGAL
MOROCCO
WesternSahara
MAURITANIA
1
Strait of GibraltarMediterranean Sea
Al Hoceima
Tangier
Fès
Oujda
MelillaSpain
CeutaSpain
GibraltarUnited Kingdom
MOROCCO
SPAIN Malaga Almeria
0 km 50 100 km
2
S i c i l eItalie
Mediterranean Sea
AgrigentoLicata
ITALY
LIBYA
TUNISIA
MALTA
Palermo
Bizerte
Monastir
Sfax
LampedusaItaly
PantelleriaItaly
Sicily
Tunis
Valetta
Tripoli0 km 50 100 km3
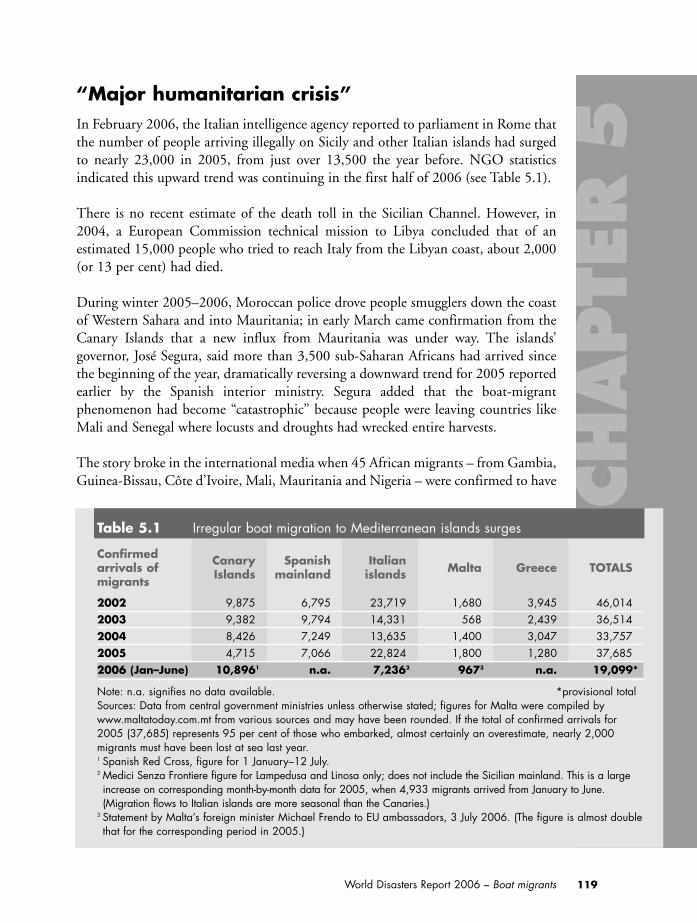
“Major humanitarian crisis”In February 2006, the Italian intelligence agency reported to parliament in Rome thatthe number of people arriving illegally on Sicily and other Italian islands had surgedto nearly 23,000 in 2005, from just over 13,500 the year before. NGO statisticsindicated this upward trend was continuing in the first half of 2006 (see Table 5.1).
There is no recent estimate of the death toll in the Sicilian Channel. However, in2004, a European Commission technical mission to Libya concluded that of anestimated 15,000 people who tried to reach Italy from the Libyan coast, about 2,000(or 13 per cent) had died.
During winter 2005–2006, Moroccan police drove people smugglers down the coastof Western Sahara and into Mauritania; in early March came confirmation from theCanary Islands that a new influx from Mauritania was under way. The islands’governor, José Segura, said more than 3,500 sub-Saharan Africans had arrived sincethe beginning of the year, dramatically reversing a downward trend for 2005 reportedearlier by the Spanish interior ministry. Segura added that the boat-migrantphenomenon had become “catastrophic” because people were leaving countries likeMali and Senegal where locusts and droughts had wrecked entire harvests.
The story broke in the international media when 45 African migrants – from Gambia,Guinea-Bissau, Côte d’Ivoire, Mali, Mauritania and Nigeria – were confirmed to have
119World Disasters Report 2006 – Boat migrants
Table 5.1 Irregular boat migration to Mediterranean islands surges
Confirmed Canary Spanish Italianarrivals of Islands mainland islands Malta Greece TOTALSmigrants
2002 9,875 6,795 23,719 1,680 3,945 46,0142003 9,382 9,794 14,331 568 2,439 36,5142004 8,426 7,249 13,635 1,400 3,047 33,7572005 4,715 7,066 22,824 1,800 1,280 37,6852006 (Jan–June) 10,8961 n.a. 7,2362 9673 n.a. 19,099*
Note: n.a. signifies no data available. *provisional totalSources: Data from central government ministries unless otherwise stated; figures for Malta were compiled bywww.maltatoday.com.mt from various sources and may have been rounded. If the total of confirmed arrivals for2005 (37,685) represents 95 per cent of those who embarked, almost certainly an overestimate, nearly 2,000migrants must have been lost at sea last year.1 Spanish Red Cross, figure for 1 January–12 July. 2 Medici Senza Frontiere figure for Lampedusa and Linosa only; does not include the Sicilian mainland. This is a largeincrease on corresponding month-by-month data for 2005, when 4,933 migrants arrived from January to June.(Migration flows to Italian islands are more seasonal than the Canaries.)
3 Statement by Malta’s foreign minister Michael Frendo to EU ambassadors, 3 July 2006. (The figure is almost doublethat for the corresponding period in 2005.)
drowned in two separate accidents off the Mauritanian coast on the same day inMarch 2006. Ahmedou Ould Haye, coordinator of the Mauritanian Red Crescent,told the Spanish Cadena Ser radio station: “They are prepared to commit suicide. It’sa game of Russian roulette: either I get there or I die.”
The Mauritanian Red Crescent estimated that more than 1,200 migrants had died atsea in the five months from November 2005. News reports in spring 2006 from theCanary Islands said that a third of the boats setting off from Mauritania were being lost.
In the case of West Africans, the sea voyage is often preceded by an equally hazardoustrek across the Sahara, and there are not even guesstimates of the number of peoplewho have died in the desert. For this is irregular, illegal migration and, in theMediterranean region (defined as including the Canary Islands) it is a highly lucrativebusiness which seems to be firmly in the hands of organized criminals.
In March 2006, just as the new seaborne exodus from Mauritania gathered pace,Spain’s El Pais newspaper carried a detailed report on a three-year-long investigationby the Spanish intelligence service into illegal migration to the Canary Islands. Itfound that the people-smuggling business was firmly in the hands of nearly 50Moroccan gangs, including some in Mauritania, who had lost interest in tobacco oncethey realized how profitable migrants are. They were said to have inveigled strugglingSenegalese and Mauritanian fishermen into acting as skippers with the promise of afree passage to Spain.
It’s possible that people-smuggling is even serving as a kind of unofficial redundancyscheme for the hard-pressed fishermen of Mauritania, whose bountiful waters –usually teeming with tuna, mackerel, snapper and sardinella – are in danger of beingfished out by, ironically, the EU fleet.
From one side of the African continent to the other, smugglers have used ruthlessmethods. Once land is sighted, they sometimes force migrants overboard at gunpointto avoid being arrested themselves. As many as 200 Somalis on a boat bound forYemen drowned in a single such incident in September 2005.
There is some reason to believe that in 2005–2006, as people-smuggling becamebetter organized in the eastern Mediterranean, losses at sea in the region might havefallen. But in the west, as boat migrants have been forced to attempt the longer routeto the Canaries from Mauritania and Senegal, they have almost certainly risen.
As defined by international conventions, people-smuggling, unlike human trafficking,is in theory not based on a deception of the person smuggled (across an internationalborder). But first-hand contact with smuggled – and often bewildered – people inSpain and Italy reveals that a significant degree of deception is involved. Some
120

migrants arriving on the tiny Italian island of Lampedusa, for example, believing theywere being taken to the mainland, ask where they can catch a train (see Box 5.1).
In November 2005, the Office of the United Nations High Commissioner forRefugees (UNHCR) described the situation in the Mediterranean region as a “majorhumanitarian crisis”. UNHCR also called on states to reaffirm their commitment toprotection and not engage in the summary repatriation of boat groups which mightinclude refugees.
The Red Cross Societies of the EU member states, together with Croatia, Serbia andMontenegro, Norway and Switzerland, issued a joint statement in January 2006expressing “grave concern” about the precarious humanitarian situation facingmigrants at the EU’s borders.
Most of these new migrants, especially young men from the Maghreb countries ofNorth Africa who are usually deported if identified, have destroyed their documentsand attempt to conceal their national origins. The police in countries like Spain andItaly use linguists and consular officials to try to identify them.
In the first decade of the new century, Europe seems to be facing the consequences offailed development in the global South, above all in sub-Saharan Africa. Drawn by theprospect of earning their fortunes and driven by desperation born of grinding poverty,unemployment, insecurity and hopelessness, many migrants view Europe as apromised land that they’re prepared to risk their lives to reach.
Get there or dieFuerteventura is closer to Africa than any of the other Canary Islands, lying just 100 kilometres or a day’s sail from Western Sahara and well known to northernEuropeans as a winter holiday destination. It was the first island in the chain whereAfrican boat migrants started landing, in the mid-1990s, using a route pioneered bySaharawi fishermen.
When the migrant flow to Fuerteventura spiked in 2004, both the authorities and thelocal branch of the Spanish Red Cross were nearly overwhelmed. According to ameticulous record kept by the Red Cross branch president, Gerardo Mesa Noda, aretired banker, nearly 1,000 boat people arrived on the island in October alone, thebusiest month. That year, the Red Cross on Fuerteventura assisted the Guardia Civil(police) with 65 bodies.
Mesa Noda’s data records the work of the branch’s emergency corps of 75 volunteers.His figures show a fall in arrivals from Western Sahara from the beginning of 2005onwards, probably due to tighter Moroccan and Algerian land-border controls. They
121World Disasters Report 2006 – Boat migrants
122
If Lampedusani have any objections to theisland’s ramshackle detention centre for boatmigrants, there’s no sign of them in its onlytown. No anti-immigrant graffiti; no hint in theelection posters that cover all the empty wallspace that immigration is even an issue at all;and Veronica Besengo, the Kenyan wife of thelocal Medici Senza Frontiere (MSF) doctorand one of the few black Africans actually res-ident on Lampedusa, says she has never hadany problems.
Mayor Bruno Siragusa is proud of the pres-idential medal awarded to Lampedusa – laroccia (the rock) – for humanitarian ser-vicesto migrants. Though some local traders dis-pute it, he says tourism actually increased by10 per cent in 2005 – the year after the tinyisland became the epicentre of an internation-al crisis over irregular migration that causedbitter divisions within the Italian body politicand threatened to tarnish Italy’s human rightsrecord. But Siragusa adds: “Everyone agreesthe time has come to replace the old detentioncentre with a better building.”
For a facility that has caused so much inter-national uproar, Lampedusa’s Centro diaccoglienza temporanea (temporary recep-tion centre) next to its airport, from which Italywas accused of carrying out several indis-criminate deportations of boat migrants in2004 and 2005, is quite unimposing. A littlecluster of former aviation buildings and ship-ping containers turned into sleeping-quarters,it’s sandwiched between the runway and theimmaculate rows of olives, figs, grapes andfico d’india (cactus) of an allotment field. Thetatty perimeter fence would not thwart a deter-mined escapee, but on Lampedusa – threekilometres wide and eleven long – there’s trulynowhere to go.
Tourists arriving at the airport, which ironi-cally can only handle domestic flights becausethere’s no customs base, would not know itwas even there unless they looked carefully.
The small size of the detention centre,intended to accommodate a maximum of190, however, is part of the problem. Onlytwo or three migrant boats need arrive and it’sforced to take several times more people thanit really should.
This year arrivals are up; way up.Among the best data on irregular boat
migration anywhere in the Mediterranean arestatistics for Lampedusa compiled by Dr StefanoValentini, Veronica’s husband, as a by-productof his work as MSF’s emergency physicianbased at the Guardia Costiera (coastguard)jetty. Valentini and his wife provide water, food,first aid – and do a head count. They’re calledevery time a migrant boat or a coastguard cut-ter carrying rescued migrants comes in.
In January 2006, a bad month to embark,a scarcely credible 767 migrants arrived byboat compared with a third that number inJanuary 2005. In February – again a badtime to sail – 181 arrived compared with 13 the previous February. In March, 1,626 migrants arrived compared with justover 1,100 in March 2005. In April, a monthof high winds, 84 migrants arrived comparedwith none at all in April last year.
In May, as the World Disasters Report wasgoing to print, a rusty fishing trawler withabout 500 people crammed aboard limpedinto Lampedusa’s tiny clover-shaped harbour –believed to be the largest number of migrantsever to arrive on a single vessel. The total fig-ure for May, the first month of the real migra-tion season, was 2,412 arrivals comparedwith 1,662 in May 2005.
Box 5.1 Lampedusa: an island in the spotlight

123World Disasters Report 2006 – Boat migrants
The consensus on Lampedusa is that theoverwhelming majority of migrants set offfrom Libya and that the people smugglers aremuch better organized than they were.
Luciana Mirto leads Sicily’s Italian RedCross (CRI) voluntary nurses, who do solo two-week stints at the Lampedusa detention centre.She says arriving migrants have very little ideawhat to expect or even exactly where they are.“Some ask where they can catch the train,”she says. “Some say they’re minors, so thepolice use X-rays of hands to try to age them.”Under Italian law, minors cannot be deported.
The nadir of the Lampedusa centre’s humanrights image probably came in October lastyear, when a journalist from L’espresso maga-zine, Fabrizio Gatti, went undercover as amigrant and wrote of a catalogue of abuse bycarabinieri. The article led to demands onLampedusa itself for the centre to be closed.But the chairman of the Italian parliament’simmigration committee, Alberto di Luca, a
member of the then-governing Forza Italiaparty, described the L’espresso article allega-tions as “unfounded and defamatory”.
As of March 2006, the United Nations HighCommissioner for Refugees (UNHCR), theInternational Organization for Migration (IOM)and the CRI have been sharing a small perma-nent office at the Lampedusa centre and finallyhave access to the detainees, if not the centralwired-in zone which is the preserve of localstaff of the Misericordia NGO. It hardly mat-ters: once inside the main gates there’s nothingbut flimsy chicken-netting between you and thedetainees. Migrants speak freely to visitors.
It’s difficult to imagine abuses of the kindalleged by L’espresso – or, for that matter, rushedand indiscriminate deportations of mixed groupsthat might contain refugees – going unnoticednow. Not from Lampedusa, at any rate. Newlyarrived migrants spend only a few days therenow before going on to other centres in Italy,such as Crotone, for processing. ■
Boats used by migrants wait to be broken up for scrap in Lampedusa.
© A
lex
Wyn
ter,
2006

also show that boat migrants reaching the Canaries are overwhelmingly sub-SaharanAfrican men: 6,584 out of a total for Fuerteventura in 2004 of 7,543. Fewer than 200women and children of any nationality made the crossing that year.
“Government statistics available to us do not provide a breakdown of the percentageof people in need of international protection,” says William Spindler, Senior PublicInformation Officer at UNHCR. Of those involved in irregular movements toEurope by land or by sea, “the majority are people looking for better economicprospects”, Spindler says, “but there is a significant minority of people fleeingpersecution, conflict or generalized violence.”
Fodé, a 41-year-old father of three from Guinea-Bissau staying in one of the twoSpanish Red Cross hostels on Fuerteventura, remembers his own voyage asuneventful: “We set off from the Moroccan coast at five in the morning and at seventhat evening we were in Spain.” He has mastered Spanish in his four years in theCanaries, but he’s suspended in a legal limbo, barred from seeking work, yet, underSpanish law, he cannot be returned to Guinea-Bissau as there is no bilateralrepatriation agreement. Fodé fled poverty and the diffuse, brutal conflict that acrossAfrica is often quite random in its impact. But he is not seeking refugee status or eventemporary humanitarian protection.
Whether they are actually refugees or not, many irregular boat migrants transitingthe Mediterranean at least behave as if they were fleeing for their lives, acceptingthe hazards often inherent in desperate flight. Juan Medina’s professional archive isa photo gallery of death at sea: African bodies floating in the tranquil waters ofwhat are ironically also known as the Fortunate Islands; or literally washed up atthe feet of tourists; or frozen where they huddled together in the bilges of theiropen boats.
This desperation originates in the tradition in some parts of Africa of “sending youngmen off to seek their fortunes abroad, sometimes with the financial backing of wholevillages,” according to Josephine Shields-Recass of the International Federation’sregional office for North Africa in Tunis. “That’s how they can afford to pay thesmugglers. And it is a big disgrace for them to go home empty-handed.”
The head of the Africa unit of the Spanish Red Cross, Jaime Bará Viñas, who was inMauritania in early 2006, agrees: “For them, there is no turning back. Many migrantsprefer to risk death rather than return to their communities with nothing.” He says:“It’s a question of pride mixed with poverty and misery.”
A Senegalese fisherman, Mamadou Ba, sitting in a Canary Islands police station inMarch waiting to be deported but vowing to try again, told a Reuters correspondent:“Die or succeed is the motto.”
124

Mesa Noda, a humane and thoughtful man, is dismayed at the idea of his youngvolunteers counting bodies on the shores of a beautiful island better known as atourist playground. For him, the human tragedy he observes week-in-week-out is,above all, a measure of crisis in Africa. “The world must know what’s happeninghere,” he insists. “People do not leave their homes and their countries for nothing.”
Morocco: EU border guardIt was actually a sequence of events on dry land last year that transformed ‘FortressEurope’ from metaphor to blunt fact and helped change the dynamics of the boat-migrant crisis throughout the north-west Africa region.
In late September 2005, hundreds of sub-Saharan African migrants stormed the razor-wire fences around the Spanish North African enclave of Ceuta in what was describedin news reports as a coordinated assault. Five died, two of them on the Spanish sideof the wire. Another incident in October at Melilla, the other Spanish enclave, left sixmigrants dead. Ceuta and Melilla are the EU’s only land border with Africa.
Exactly what happened is still not clear. Journalists and reported eyewitness accountssaid Spanish Guardia Civil officers protecting the border fired rubber bullets at themigrants on the Moroccan side, through and above the fence, while Moroccan policeused live ammunition. Morocco admitted its police shot four of the migrants who diedat Melilla; Spain has insisted the Guardia Civil did not fire the bullets that killed thetwo migrants who fell dead on Spanish soil at Ceuta, or use any live ammunition at all.
A day after the Melilla incident, Médicos Sin Fronteras, the Spanish branch ofMédecins Sans Frontières (MSF), disclosed it had found a group of more than 500 sub-Saharan African immigrants “left to their fate” in a remote desert area in the south ofMorocco. MSF said the migrants told how they had been transported into the desertby Moroccan police after being expelled by the Guardia Civil from Ceuta and Melilla.
Morocco initially denied it had dumped people in the desert, but responded tointernational pressure by retrieving more than 1,000 Africans and taking them to thetown of Oujda on the border with Algeria for repatriation.
Observers who have been tracking the Mediterranean migrant story agree that Morocco,in particular, has been successfully coaxed into policing Europe’s borders. “The EU haspersuaded Morocco to get tough,” says Mehdi Lahlou, a professor of economics at theNational Institute of Statistics and Applied Economics in Rabat. “Officially, Moroccodoes not want to be Europe’s border guard, but on the ground that’s what’s happening.”
And it is no secret. The police in Oujda themselves, for example, were quoted byAgence France-Presse (AFP) in late February as saying they’d deported to Algeria more
125World Disasters Report 2006 – Boat migrants

than 750 people “trying to make their way to Europe”. They included “sub-SaharanAfricans, Algerians, Indians, Pakistanis and Syrians”, arrested in various cities. Mostof the migrants that were camped out around the Spanish enclaves also left or weremoved on last winter.
In the immediate aftermath of the violence at Ceuta and Melilla, the NGO AmnestyInternational said its delegates had found “numerous irregularities in the treatment ofmigrants, including possible asylum seekers, during a ten-day mission to Spain andMorocco, including the towns of Ceuta, Melilla, Oujda, Nador and Tangier”.Amnesty interviewed people, mostly from Central and West Africa, “fleeing povertyand repression” who were trying to get into the Spanish enclaves.
Whatever a fair assessment of its human rights record might be, Morocco’s clamp-down on irregular ‘transit migrants’ seems, at the time of writing, to have succeededmainly in shifting the migrant issue elsewhere.
To Mauritania, for example. The Spanish NGO Médicos del Mundo, after watchingwould-be migrants arriving in the country’s northernmost port, Nouadhibou, in late2005, reported at one stage that up to 15,000 sub-Saharans were camped on the coastwaiting to sail in mafia cayucos – slightly larger and sturdier boats than the pateras thatare typical of the Saharawi route (see Box 5.2).
And to Libya, from where most migrants hope to reach Italy.
Smugglers “established” in LibyaOfficial Italian statistics for seaborne clandestini, as the media often call them, showannual arrivals falling from a peak of nearly 24,000 in 2002 to around 14,000 duringboth 2003 and 2004. For 2005, the numbers leapt back to nearly 23,000 and moreboat migrants than usual reached Sicily itself.
This is borne out by data for arrivals in the Sicilian port of Licata, collected by theItalian Red Cross (CRI) Agrigento branch, on the island’s southern coast. In 2004, asingle boat carrying 130 migrants arrived; but in 2005, between May and October,there were 12 boats, carrying no fewer than 1,433 people.
In 2005–2006, boat migrants arrived all along Sicily’s southern shores. Localnewspapers reported that there were hundreds of thousands of people waiting inLibya to “try their luck”. The true number in spring 2006 was more like 20,000,according to sources in North Africa familiar with the situation in Libya.
Generally, boat migrants arrive in Italy in good condition, “clean-shaven and in nicenew clothes”, according to one Italian aid worker with first-hand experience of
126

arrivals. Dehydration and the crippling stiffness typical of extended small-boatvoyages are rare. This has led to suspicions that people smugglers are using largerocean-going vessels to cover the bulk of the distance from North Africa andtransferring migrants to small boats for the final leg.
Members of the European Parliament (MEPs) visiting Libya in September 2005 weretold of “an increased emphasis on cooperation” between Libya and the EU overmigration, according to an official report from the parliament’s human rights unit.But much of the rest of what the MEPs heard – with its implication of large-scalehuman vulnerability – will have disturbed them.
The report detailed a briefing from the British ambassador in Tripoli: uncontrolledimmigration into Libya, a revolutionary country with a long tradition of welcomingAfrican citizens, was “putting a serious strain on society”. It was clear that “traffickershave established themselves”. Currently, around 7,000 people are repatriated fromLibya every month, most of them of sub-Saharan origin, the ambassador told MEPs.
For their part, Libyan government officials said they were interested in “humanitarianaid assistance, helicopters in order to rescue people in the desert, or even in theconstructions of roads in the south… to facilitate the control of entry into thecountry”.
In Tunisia, stepped-up law enforcement is said to have driven people smugglers acrossthe border into Libyan territory, while some sub-Saharan transit migrants, driven outof Morocco and into Algeria, are bypassing Tunisia altogether and travelling deep intothe Sahara to get to Libya.
Seaborne influx strains refugee conventionThe concept of asylum is “a central tenet of democracy”, UN High Commissioner forRefugees António Guterres said in a speech last year. Yet as seaborne mixed flows inEurope have grown, so have suspicions that exasperated governments are sometimesless than thorough in identifying genuine refugees within them.
Refugee specialists have argued that seaborne irregular migration has, to a greaterextent than perhaps any other migrant flow of the post-war era, led Western stateswith otherwise strong humanitarian traditions to bend the spirit – some say the letter– of the 1951 refugee convention.
In 2004 and 2005, Italy was explicitly accused of breaking the convention bydeporting boat migrants from Lampedusa, one of three small Italian islandsbetween Sicily and Tunisia, without properly ascertaining whether any of them wererefugees.
127World Disasters Report 2006 – Boat migrants

128
“They arrive soaked to the skin, vomiting andshitty,” Rubén Fernández of the Spanish RedCross (CRE) told Spanish newspaper El Paisone weekend in May 2006, when more than100 paramedics had helped nearly 400 sub-Saharan African boat migrants who’d justcome ashore in the Spanish Canary Island ofTenerife.
“The first thing is to give them a change ofclothes and a blanket.” Next, injuries. “Theyhave abrasions because of the saltiness of thewater. They’re seasick, dehydrated and some-times weak from hunger. But in just 15 minutes,they’re fine again. Of this 400, we only had tosend four or five to hospital with severe dehy-dration.”
“The sub-Saharan migrants are very strong,”added CRE coordinator Juan Antonio Corujo.But the cayucos they sail in from Mauritania andSenegal – a kind of flat-hulled African fishingcanoe, bigger than the pateras used on theWestern Sahara run – “are really very flimsy”.
“And they come in complete silence,”Corujo said. “They’re very reluctant to speakinitially, but we gradually win their trust andthey tell us how tough the sea crossing was,how they have tried before from Morocco,how they left home two years ago.
“Each cayuco has its own story. And not allthe migrants come from coastal African states.Many of them started their journey in CentralAfrica years ago.”
On 18 May 2006, the arrival in Tenerife ofnine open boats carrying between themalmost 650 people beat the previous single-day record for the Canaries by nearly 200.
In March, The Washington Post told thestory of Magat Jope, 34, “an electrician anda polite father of two” from Senegal, who borrowed US$ 1,100 from his mother and
travelled to Mauritania to get on a migrantboat to the Canary Islands.
After four days of seasickness and “constantbailing”, the leaky cayuco was intercepted bythe Moroccan coastguard and towed back toNouadhibou, Mauritania’s northernmost portabout 800 kilometres from the Canary Islands.Some of his fellow passengers swam ashoreand fled, to avoid being repatriated.
Jope later heard other friends had drownedwhen their boat carrying nearly 30 peoplesank at night. “Death on the water”, asWashington Post correspondent Kevin Sullivanput it, kept the gravediggers of Nouadhiboubusy early this year.
Throughout 2005, unreported and almostunnoticed by anyone but locally based agen-cies, sub-Saharan African migrants (later fol-lowed by the international media) streamed intothe port, by tradition an open and cosmopolitantown, boosting its population from around90,000 to 100,000. Exactly why the flow ofmigrants transiting Mauritania increased is notclear, but the tightening of borders by Moroccoand Algeria must have played a part.
Stories of tragedy on the high seas soonbegan to abound.
Mauritania’s only search and rescue patrolboat found a cayuco which had apparentlyset sail from Saint-Louis, Senegal, some 600kilometres even further to the south. It hadbeen at sea for two weeks. Of the more than40 people on board, half were dead.
Father Jerome Otitoyomi Dukiya remembersit was early last year when an excited youngman rushed into his office with the news that agroup had made it “all the way to Las Palmas”in a cayuco. The Nigerian missionary, who hasworked in Nouadhibou for four years, is wellplaced to evaluate the scale of the humanitari-
Box 5.2 From Africa to Spain: “strong men in flimsy boats”
According to Christopher Hein, Director of the Italian Refugee Council (IRC):“The Italians were engaging in mass expulsions from Lampedusa, sending peopleback to Libya irrespective of whether they are refugees or not.” A EuropeanParliament resolution on 14 April 2005 took the view that “collective expulsions”of migrants by Italy to Libya constituted a “violation of the [1951] principle ofnon-refoulement” and that the Italian authorities had “failed to meet theirinternational obligations” under the refugee convention. There were also seriousconcerns about the conditions in which migrants detained on Lampedusa werebeing held.
Italy denied these accusations, and exactly what happened on Lampedusa – in manyways the legal, political and diplomatic epicentre of the Mediterranean boat-migrantcrisis – was not independently verified. The Italian authorities consistently asserted that
129World Disasters Report 2006 – Boat migrants
an crisis surrounding irregular migration. Hesays no one can give precise figures, “but thereis always information”, he said.
“The first thing they do is try to contactsomeone to say they’ve arrived,” he says.“And then it becomes the talk of the town.[Likewise when they don’t arrive.] It’s verydangerous, very risky. Do you realize howmany people we’ve lost?”
The Mauritanian Red Crescent’s AhmedouOuld Haye, using information from a varietyof sources, including Spanish ones, estimatedthat more than 1,200 migrants had died atsea in the six months from November 2005.
But there’s no way of knowing exactly howmany African boat migrants to the Canarieshave been lost at sea. The condition of thosewho arrive, and the stories they tell, must lendcredence to reports that one boat in threedoesn’t make it. Father Jerome, frustrated thatby its very nature this disaster cannot be meas-ured properly, says the true numbers could bemuch worse. “I think it could be 30 per centwho do make it,” he says.
On land, the Spanish Red Cross and theNouadhibou branch of the Mauritanian RedCrescent established a humanitarian assis-tance programme for migrants detained by
the local authorities in a newly built centre.“Many of them have survived mishaps atsea,” said Jaime Bará Viñas, head of theAfrica unit of the Spanish Red Cross who wasin Mauritania early this year.
Three Spanish delegates and 15 RedCrescent volunteers provided water and hotfood, medical care, blankets, hygiene kits,clothes and free telephone calls. When askedif they risked creating a ‘pull factor’, BaráViñas replies: “These people are not delin-cuentes. Many of them are just young people,between 15 and 45, looking for a betterfuture. Some are selected by their own com-munity to make the dangerous voyage.”
“The origin of this migration is complex,”Bará argues, “but its origins must be addres-sed through a developmental approach, cre-ating job opportunities, providing training,education, basic services to people.”
The Spanish government announced inMay that it had agreed Plan África – a diplo-matic effort in at least six West African states,headquartered in Senegal, the latest jumping-off point for the Canaries, aimed at stemmingthe flow of irregular migrants through securitymeasures, repatriation agreements and aid.
It will be too late for many. ■

their actions did meet international obligations. Their defence appeared to be thatsome nationalities (such as Eritreans, Ethiopians, Somalis, Palestinians and Iraqis) wereallowed to claim asylum if they wanted to; others, mainly Egyptians, weren’t.
Since then, according to Amnesty International, Italy has been building threedetention centres in Libya which, it’s believed, will be used to conduct proceduresto determine the status of migrants in Libya and identify refugees. Such ‘offshoreprocessing’ has raised concerns among refugee and human rights organizations,while it is often pointed out that Libya is not a signatory to the 1951 refugeeconvention. Christopher Hein says the IRC might support the offshore asylum-processing of people in third countries but is “completely opposed to the deportationto such centres of people who have already arrived in a safe destination country.”
While UNHCR does not oppose governments’ rights to set migration policies, saysthe organization’s William Spindler, “what must always be ensured is that persons inneed of international protection have an effective opportunity to seek asylum andaccess to fair and efficient asylum procedures”. Spindler adds that offshore processing“raises many question marks, from a legal, practical and logistical point of view”. Anymeasures put in place should “not be aimed at preventing asylum seekers fromreaching Europe and offshore processing should not be used as a reason for refusingto process applications in Europe.”
What the Lampedusa episode seems to illustrate best is that it is unlikely thatrefugee organizations, human rights campaigners and EU governments facing aseaborne influx of mixed groups of migrants and refugees will ever interpret 1951in the same way. Perhaps the least controversial thing that can be said is that thewidely publicized repatriations of people who transited Lampedusa did nothing tostem the flow of boat migrants towards Italian territory. MSF’s figures for the firsthalf of 2006 for Lampedusa show, pro rata, the number of arrivals this year risingfar above even 2005.
In peril on the seaThe boat-migrant crisis brings two distinct humanitarian codes into play: sanctuaryon land and the maritime tradition of rescue at sea.
International maritime law, not to mention the time-honoured practice of marinerseverywhere, compels ships to go to the aid of anyone in distress on the high seas. Butthe law offers no guidance on a key issue, in the context of seaborne mixed or refugeeflows, of where people rescued at sea should be disembarked.
According to a senior official at the London-based International Maritime Organization(IMO), the mariner’s code is largely being observed in the Mediterranean region, despite
130

some well publicized (and, for shippers and insurers, expensive) wrangles over where todisembark rescued migrants. But there have also been allegations of people in distressbeing ignored by ships for fear of incurring delay and cost in rescuing them.
In July 2006, various amendments to both the Safety of Life at Sea (SOLAS) andSearch and Rescue (SAR) conventions were coming into force. They’re intended toensure that boat migrants are assisted regardless of nationality, legal status or thecircumstances in which they’re found, and that ships are able to disembark survivorsin a safe place. Above all, according to the IMO official, “for the first time, it will beprimarily states, not just ships’ masters, who have to find a safe disembarkation pointfor boat migrants found in their SAR areas.”
But some migration specialists like Martin Baldwin-Edwards, co-founder of theMediterranean Migration Observatory at Panteion University, Athens, believeEuropean governments are moving towards the model of interception at sea used bythe United States and Australia – an entirely different maritime concept from rescue.“In particular, Spain, with its Sistema Integrado de Vigilancia Exterior [a coastalnetwork of surface radar, sensors and cameras],” says Baldwin-Edwards, “but alsoItalian coastal patrols and collaboration with Libya and Egypt.”
There are no explicit allegations, however, that either the Spanish or Italiancoastguards are plucking people off migrant boats at sea and returning them directlyto countries of embarkation without transiting EU soil. This is a key humanitarianand political threshold which it appears has not yet been crossed by EU states.
Seaborne interception (or interdiction) of migrants, in the sense of swiftly returningboat people to the country from which they sailed, has been practised by the UScoastguard since 1980, mainly in the Caribbean. Australia, especially since 2001 andthe Tampa incident, has been a “trailblazer in policies on interception at sea,particularly in terms of… regional processing agreements and deterrence policies,”according to a January 2006 report by the Migration Policy Institute (MPI), aWashington DC-based independent think tank.
The inevitably cursory asylum procedures available on coastguard vessels makeinterception, especially in international waters, a highly controversial issue. Accordingto MPI, all migrants intercepted by the US coastguard in the Caribbean (exceptCubans and Chinese, who are subject to special rules), including the largest group,Haitians, are only given an on-board ‘credible-fear interview’ if they spontaneouslyshow they are afraid to return once the ship changes course. This has been dubbed the‘shout test’.
According to MPI, it is still too early to tell if interception at sea is leading to a“rejection of the concept of territorial asylum on which the international refugee
131World Disasters Report 2006 – Boat migrants

system is currently based [but] profound concerns about refoulement, deterrence anddiscrimination need close examination.”
In the short term, however, maritime options – such as increased coastal patrolling(whether of sending or receiving countries) – are not the solution to the problem ofboat migrants dying at sea. While the possibility of interception might deter somemigrants and assist states to control borders, it would be unlikely to reduce the deathtoll significantly, particularly in the Canary Islands region. The Spanish organizationAPDHA has produced figures for losses at sea in 2004 which show that some of themost dangerous moments in irregular voyages come shortly after casting off in shallowinshore waters and during interception on the high seas by coastguard cutters toolarge for the task.
EU migration policy to blame?APDHA blames the human tragedy of irregular boat migration on what it calls theEU’s política de cierre de fronteras (closed-border policy).
“We have to send a clear signal that there are other ways to reach Europe,” says theItalian Refugee Council’s Christopher Hein. “There also has to be the possibility ofremaining in a third country under humane conditions while you wait for the chanceto come to the EU as a migrant worker.”
132
An African would-beimmigrant holds on to
a makeshift boat hewas in which capsized
during a rescueoperation at sea off thecoast of Fuerteventura, 12 November 2004.
© REUTERS/Juan Medina,courtesy www.alertnet.org

In a speech in 2004, UN Secretary-General Kofi Annan said Europe’s populations aregetting smaller and older and argued that without immigration “your economieswould shrink and your societies could stagnate… I would therefore encourageEuropean states to open up greater avenues for legal migration – for skilled andunskilled workers, for family reunification and economic improvement, fortemporary and permanent immigrants.”
But Europe’s dilemma is that for immigration to offset the EU’s growing demographiccrisis (in countries like Germany, for example), it would have to rise beyond whatseems to be politically acceptable.
Even as things stand, during the period that the Mediterranean boat-migrant crisisreached its initial peak, from the late 1990s until 2004, the “net inflow of [legal]international migrants” to the EU rose from just under 0.5 million to nearly 2 milliona year, according to preliminary statistics for 2005 issued by Eurostat in January 2006.Spain, Italy, the UK and Germany – respectively the two countries most irregular boatmigrants arrive in and the two many say they want to go on to – were most receptiveto legal migrants (not necessarily sub-Saharan Africans), between them accounting for76 per cent of all inward migration into the EU in 2005.
In Spain, the estimated number of international migrants leapt from just over amillion in 1995 to nearly 4.8 million in 2005, or 11.1 per cent of the population,according to UN figures. Italy hosted nearly 1.5 million international migrants in1995 and more than 2.5 million in 2005. Just over 7 per cent of the Irish populationwere international migrants in 1995, rising to 14 per cent a decade later.
So while opening up legal channels for economic migration still further would self-evidently benefit successful applicants, it does not seem likely this would luremigrants away from smugglers. It is arguable that it’s precisely the recent hugeexpansion in primary immigration into, above all, Spain and Italy, that has increasedthe flow of irregular migrants.
Joanne van Selm, a migration specialist affiliated with the University of Amsterdamand a co-author of the 2006 MPI report, argues that those migrants not qualifyingeven for wider categories of legal entry would still continue to find their own way intoEurope illegally. She adds that: “It’s most unlikely that either governments oremployers will admit to needing unskilled workers who come from situations ofabject poverty and often widespread violence, famine and disease, and who areunlikely to return home without some sort of miracle in Africa.
“This is one of the most pertinent humanitarian issues in the story of irregularmigration to Europe. If people cannot survive in Africa but also cannot make it inEurope as workers, they are truly stuck.”
133World Disasters Report 2006 – Boat migrants

Helene Lackenbauer, the International Federation’s specialist on migration issues,argues that sub-Saharan Africans have not really benefited from increased migrationinto the EU. “Rich countries still hand-pick migrants,” says Lackenbauer, “consciouslyonly taking, say, IT professionals from India, medical personnel from Africa,tradesmen from EU accession states, rather than the unskilled irregular migrants whoactually prop up entire sectors like agriculture, building and catering in some countries– and for lower wages than they would get if their status was regularized.”
She would like to see more labour programmes targeting underemployed workersfrom the countries providing most of the Mediterranean’s boat migrants. “Then theycould apply for a work permit, rather than risk their lives crossing the Mediterraneanin unseaworthy boats. This would also guarantee that their basic rights inimmigration countries would be honoured.”
Action against smugglersBoat migration is dauntingly complex in its political and legal dimensions. Manyexperts argue that Africa is already losing far more skilled and professional people tothe North than it can afford to, and that emigration is actually damaging thecontinent’s chances of successful development; that is, it more than cancels out thecase for ‘development by remittance’.
But the issue’s humanitarian core is simple: if people set sail in vessels that are notseaworthy, a proportion of them will die. Can anything be done within existinghumanitarian norms to mitigate this neglected crisis?
One short-term answer to people-smuggling might be the same as the response tohuman trafficking, its more vicious criminal sibling: action against smugglers. Thisdoes not mean increased coastal security in receiving countries (the so-calledmilitarization of the EU’s outer borders) or interception (turning vessels back on thehigh seas). Patrol boats are not the answer. Still less should it rely on the indiscriminatemass deportation of migrants from or to transit countries like Morocco, Mauritaniaand Libya. This could jeopardize the vital principle of non-refoulement, which statessay they still want to honour.
Action against smugglers means exactly that: targeting smugglers not migrants. Thismeans better land-based policing of beaches and ports in sending countries and a purgeof corrupt officials. News reports in March said control of Mauritania’s beaches had tobe transferred from the police to the country’s gendarmerie after the former were foundcharging migrants nearly US$ 600 a head to turn a blind eye to small-boat departures.
Measures against the logistics of smuggling could be introduced or toughened: morerigorous checks on wholesale importers of outboard motors, for instance. Journalists
134

have noticed that confiscated outboards in the Canary Islands sometimes bearconsecutive serial numbers, suggesting bulk imports that would be difficult withoutthe connivance of corrupt officials. The Guardia Civil car park in the Fuerteventuracapital, Puerto del Rosario, has been turned into a graveyard for confiscated outboards– hundreds of them, in row upon identical row, together representing a multimillion-dollar turnover for the smugglers.
However, some legal experts have sounded a note of caution. They point out that itwould be a breach of the 1951 convention to prevent would-be refugees fromseeking sanctuary across an international border – even, provided certain conditionsare met, with the aid of smugglers. While the great majority of migrants waiting toboard boats to Europe are not seeking asylum, it would be important to ensure thatmeasures to tackle smuggling do not prevent people from fleeing a well-founded fearof persecution.
António Guterres, in a speech late last year, described the balance that needs to bestruck by states, which should “act forcefully to eliminate the smuggling and traffickingof human beings and severely punish the profiteers. But guarding borders must notprevent physical access to asylum procedures or fair refugee status determination forthose entitled to it by international law. A tough and uncompromising crackdown onabhorrent criminals must go hand-in-hand with a humanistic concern to protect theirneedy victims.”
Local heroes: sharing information, meeting needs
When Jean-Philippe Chauzy of the International Organization for Migration (IOM)travelled to Oujda, Morocco, late last year to visit stranded Malians, he found theyhad been unaware of the risks they would be taking. “In the desert, we wereabandoned by smugglers and robbed of all our belongings,” 38-year-old Bouramafrom Bamako told Chauzy. “We only survived thanks to the generosity of localshepherds who provided us with food and water.”
According to Barbara Harrell-Bond, professor of forced migration and refugee studiesat the American University in Cairo and founder of the Refugee Studies Centre inOxford: “One thing that does not happen now is any serious effort to communicatethrough the media in Africa about the loss of life at sea, in particular, including listsof nationalities or even names of the dead.
“In the African media, the only messages impoverished, desperate people get aboutthe West is through advertisements or false information sent back by migrants andrefugees who have made it there.”
135World Disasters Report 2006 – Boat migrants

One vital task is to gather information about the Mediterranean boat crisis andproduce a reasonably accurate regional death toll. Much of the work is already beingdone on local initiative – it just needs to be collated at international level,disseminated and publicized. Credible public information campaigns about the risksof illegal boat migration could then be undertaken in sub-Saharan source countries.This would most likely be a role for governments. Organized gangs of peoplesmugglers will not take kindly to having vulnerable and possibly gullible clientsseduced out of their clutches by well-meaning aid workers.
So what options are available for humanitarian organizations keen to reduce thesuffering of irregular migrants? Mario Musa, deputy head of the InternationalCommittee of the Red Cross’s regional delegation in Tunis, has this advice: “Giventhe involvement of organized crime in smuggling, the best time for NationalSocieties to address the needs of vulnerable migrants seems to be once their journeyhas failed and they are retained by the authorities in the process of beingrepatriated.”
Or once they’re dead. Musa points out that National Red Cross and Red CrescentSocieties could also help confirm the fate of the thousands of migrants who neverarrive.
Further afield, trained volunteers from the Canadian Red Cross Society regularlymonitor the situation of foreigners, especially Chinese boat people, detained underCanadian immigration laws. “This is part of our humanitarian mandate and has beenrecognized as such by the Canadian government,” said the society’s JohannaHökeberg in an interview in early 2006, adding: “We consider these detainees aparticularly vulnerable group in need of protection.”
The Australian Red Cross visits government detention centres to help detainedmigrants communicate with their families through Red Cross messages, as well as toorganize recreational activities and provide clothing, phonecards and foreignnewspapers.
In December 2005, the IOM launched a new programme to help stranded migrantsreturn home voluntarily, speaking of “a dramatic increase in demand for such helpacross the world, particularly during the last decade.”
Conclusion: migration out of choice, not necessityThe broad picture that emerges from a study of the recent history of boat migrationin the north-west Mediterranean region shows that, although it might not be theirdeclared policy, countries like Spain and Italy – in terms of refugee rights andprotection – regard the whole of the Maghreb as safe (including, most controversially,
136

Libya), as well as most West African source countries. But the region’s mixed flowsinclude people fleeing from more dangerous situations in the Horn of Africa, theMiddle East and South Asia.
While tougher action against criminal people smugglers would appear to be onerealistic short-term option to reduce the numbers of unnecessary deaths at sea, anyattempt to prevent the departure of irregular migrants on dangerous sea voyages fromtransit states immediately raises the issue of what should happen to the refugees whomight be among them.
There is a possible conflict here between the physical safety of migrants and the rightsof asylum seekers. It is a dilemma for humanitarians; one to which there isn’t even adifficult answer, let alone an easy one. Nevertheless, there remains an urgent need forhumanitarian organizations to ensure that migrants are treated legally and humanelywherever they find themselves detained by authorities.
The long-term answer to this grievous humanitarian problem, which surely has asmuch to do with globalization and the expectations it raises as anything else, is “here”,according to the secretary general of the Tunisian Red Crescent, Tahar Cheniti. “It’snot enough just to see this as a security issue for EU states,” he argues. “We have tofind a global approach.”
Unlike its sub-Saharan neighbours, Tunisia enjoys a surplus of highly educated peopleand the country would undoubtedly benefit from expanded EU managed-migrationprogrammes. But that wouldn’t help the poorly educated and often unemployedyoung men of which Tunisia also has a surplus and who often find themselves behindbarbed wire “on the other side”, as Cheniti puts it. “We must do much more forthem,” he insists, “and give them a reason to stay.”
In the words of the first “principle for action” of the 2005 Global Commission onInternational Migration: “Women, men and children should be able to realizetheir potential, meet their needs, exercise their human rights and fulfil theiraspirations in their country of origin, and hence migrate out of choice, rather thannecessity.”
Principal contributor to this chapter and Boxes is Alex Wynter, a UK-based journalist, whoedits The Bridge, the International Federation’s magazine for Europe. We would like toacknowledge the assistance and advice of Joanne van Selm, a migration specialist affiliatedwith the University of Amsterdam and the Migration Policy Institute, a Washington DC-based independent think tank, and Professor James C. Hathaway of the University ofMichigan Law School, Ann Arbor, USA.
137World Disasters Report 2006 – Boat migrants
Sources and further informationAmnesty International. Italy: Temporary Stay – Permanent Rights. London: June 2005.
Available at http://web.amnesty.org/library/index/engeur300042005
Amnesty International. Spain: the Southern Border. London: June 2005. Available athttp://web.amnesty.org/library/index/engeur410082005
Asociación Pro Derechos Humanos de Andalucía. Informe sobre la inmigraciónclandestina durante el año 2005. Seville: APDHA, January 2006.
Asociación Pro Derechos Humanos de Andalucía. Informe violaciones de los derechoshumanos en Marruecos. Seville: APDHA, October 2005.
Baldwin-Edwards, M. Between a Rock and a Hard Place: North Africa as a region ofemigration, immigration and transit migration. Athens: 2006.
Bowcott, O. ‘4,000 refugees believed drowned at sea every year’, The Guardian, 9October 2004. Available at http://www.guardian.co.uk/international/story/0,,1323294,00.html
Cooper, B. and van Selm, J. The New “Boat People”, Ensuring Safety and DeterminingStatus. Washington DC: Migration Policy Institute, January 2006.
Corsini, V. and Lanzieri, G. First demographic estimates for 2005. Luxembourg:Eurostat, January 2006.
Delicato, V. National Legislation and Good Practices in the Fight Against IllegalImmigration, the Italian Model. Rome: Interior Ministry, October 2004.
European Commission. Technical Mission to Libya on Illegal Immigration 27November–6 December 2004. Brussels: EC, 2004.
European Commission. Visit to Ceuta and Melilla – Mission Report. Technical missionto Morocco on illegal immigration 7 October–11 October 2005. Brussels: EC,October 2005.
European Parliament, Directorate General – External Policies Human Rights Unit.Report on the visit of an ad hoc delegation to Tripoli, Libya on 4 to 6 December 2005.
Global Commission on International Migration. Migration in an InterconnectedWorld. Geneva: GCIM, October 2005. Available at http://www.gcim.org/attachements/gcim-complete-report-2005.pdf
International Maritime Organization. Unsafe Practices Associated with the Traffickingor Transport of Migrants by Sea (First biannual report). London: IMO, 31 January2006.
International Organization for Migration. World Migration 2005. Geneva: IOM,2005.
Lutterbeck, D. Policing Migration in the Mediterranean. Mediterranean Politics, Vol.11, No. 1, pp. 59–82. Oxford: Routledge, March 2006.
138

Manuel Pardellas, J. ‘45 organizaciones mafiosas controlan el tráfico illegal depersonas desde 15 asentamientos’, El Pais, 8 March 2006.
Médicos Sin Fronteras (MSF). Violencia e inmigración, Informe sobre la inmigración deorigen subsahariano (ISS) en situación irregular en Marruecos. Barcelona: MSF,September 2005.
Organisation for Economic Co-operation and Development (OECD). Migration,Remittances and Development. Paris: OECD, 2005.
Pugh, M. ‘Drowning not Waving: Boat People and Humanitarianism at Sea’ inJournal of Refugee Studies, Vol. 17, No. 1. Oxford University Press, 2004.
Pugh, M. Europe’s boat people: maritime cooperation in the Mediterranean. Brussels:Institute for Security Studies of the Western European Union, July 2000.
Rennie, D. ‘Death stalks boat people of the Canaries’, The Daily Telegraph, 18 March2006. Available at http://www.telegraph.co.uk/news/main.jhtml?xml=/news/2006/03/18/wcanaries18.xml
Tattersall, N. European trawlers threaten Mauritania’s fishermen, The Associated Press,10 April 2006. Available at http://www.localnewsleader.com/elytimes/stories/index.php?action= fullnews&id=173348
Web sitesAmnesty International http://www.amnesty.orgAsociación Pro Derechos Humanos de Andalucía http://www.apdha.orgBBC News http://news.bbc.co.ukEuropean Commission http://europa.eu.int/comm/index_en.htmEurostat http://epp.eurostat.cec.eu.intForced Migration Review http://www.fmreview.orgInternational Maritime Organization http://www.imo.org/home.aspInternational Organization for Migration http://www.iom.intMédicos Sin Fronteras http://www.msf.esMigration Policy Institute http://www.migrationpolicy.orgSpanish Red Cross http://www.cruzroja.esUN High Commissioner for Refugees http://www.unhcr.org
139World Disasters Report 2006 – Boat migrants

140

Photo opposite page:Following October2005’s earthquake inPakistan, many womenfrom remote mountainareas were forbiddenby their families fromcoming down to reliefcamps in the valleys, in case their honourwas compromised.Most women couldonly access reliefsupplies through malerelatives.
Arne Hodalic/Slovenian Red Cross
141World Disasters Report 2006 – Gender issues in emergencies
“Please don’t raise gender now – we’re in an emergency!”Faced with a major disaster, some argue that attending to gender concerns is a luxurythat must wait until more important matters have been addressed. Yet evidence showsthat the failure to address gender-based inequalities immediately after disaster andthroughout the response can condemn women and girls to less aid, fewer lifeopportunities, ill health, violence and even death. This chapter challenges the ‘tyrannyof the urgent’, which leads to the neglect of gender before, during and after disaster –drawing on fieldwork from three continents.
Analysis of the impact of recent disasters reveals that women suffer disproportionately.However, this chapter also explores gender issues relating to men and boys in disasters,as well as the often neglected resilience of women in the face of crisis. Moving beyonda beneficiary model of disaster response, the chapter argues that, in order to reducefuture risks, aid organizations must adopt a rights-based approach to address thecauses of social vulnerability which are rooted in gender inequality.
Multiple identities of womenAll women and men have multiple identities and a simple categorization along one axisof perceived vulnerability or capacity (e.g., gender) can be misleading. Nevertheless,there is sufficient evidence to say that in disasters, as in everyday life, women and girlsacross the world experience greater discrimination than men and boys, and are morelikely to have their needs and contributions ignored or undervalued.
Gender inequality can be subtle or explicit. It can mean more women die in disastersthan men. Last year’s World Disasters Report related how 3,972 women died when theIndian Ocean tsunami hit Ampara, Sri Lanka, compared with 2,124 men. In theBangladesh cyclone of 1991, 71 women per 1,000 died compared with 15 men per 1,000 (aged 20–44). This has been blamed on male-to-male warning systems,women not getting men’s permission to evacuate and cyclone shelters not designed forwomen’s needs.
Women who survive disasters are often worse affected than men. According to Americanwriter Kathleen Bergin, Hurricane Katrina was “a highly racialised and gendered event”which hit African American women hardest. “More than half of the women in the city ofNew Orleans were single mothers, independently responsible for ensuring they and theirchildren survived the storm,” says Bergin. “These women lived in greater poverty than

men, owned fewer assets than men, had less formal education than men, and worked inless lucrative jobs than men. Women in New Orleans also comprised a majority of theelderly population, most of whom were destitute.”
Consequently, African American women formed the majority of those trapped in thecity or confined to mass evacuation centres as flood waters rose – exposing them to“unprecedented risk of rape and sexual assault”. However, it would be wrong tocharacterize women as victims of Katrina – there are many examples of women actingwith great ingenuity and courage (see Box 6.1).
142
On 29 August 2005, Hurricane Katrina madelandfall as a category 4 hurricane in Plaque-mines Parish, Louisiana, south of New Orleanson the Bird’s Foot Delta that extends into the Gulfof Mexico. A month later, Hurricane Rita – acategory 3 storm – lashed the same coastline.
Between them, the two storms turnedaround 76,000 acres of Louisiana’s wetlandsinto open water – almost half of which was inPlaquemines Parish. Katrina resulted in around1,300 deaths and major disruption to people’slives and livelihoods. It also had politicalramifications as the poor management of the disaster challenged those in governmentresponsible for emergency response.
Lower Plaquemines Parish, with a populationof African American, Cajun French, Vietnamese,Atakapa Indian and Euro-American citizens, wasswamped by a 28-foot storm surge of sea waterduring Hurricane Katrina and again during Rita.Communities inside and outside the levee systemof dykes were destroyed. Flood waters formed alake inside the levees for months following thestorms. Although the parish was more vulnerableand exposed to the storms than more protectedareas to the north, such as New Orleans, it hadfewer deaths. Women’s local knowledge andnetworking ability played a key part.
Six women in the sheriff’s office – alldispatchers (telephone operators who convey
information between the public and emergencyworkers) with no official authority – wereinstructed to stay at their positions during Katrina.Their supervisors (emergency operations officials)evacuated, leaving the six women on their own and unaware of any emergency plans.Concerned not to lose their jobs, these womenstayed and quickly devised a spontaneous rescueplan, which they communicated to a responsenetwork of friends and family before the stormknocked out phone lines and electricity.
The women contacted communities in the morevulnerable areas and made lists of who wouldstill be in the area during the hurricane, theirstrategy for survival and what resources they hadto offer – such as boats, fuel, able-bodiedcompanions and property on higher ground.
They then mapped where those stayingbehind would be located, along with theirneeds and resources. They linked possible boatdrivers with available boats, keys and fuel anddirected them to the neediest of the strandedpeople. They also instructed all boats to useradios to contact the coastguard, helpingrescue crews from outside the region to locatethem via their radio coordinates.
The women’s local knowledge of the area,its networks and resources, along with theirquick thinking and ingenuity, saved severalhundred lives. ■
Box 6.1 Women’s networking during Katrina saves lives

Gaps in measuring gender impactsDisaster impacts on women are not consistently quantified. For example, EM-DAT(the international disasters database compiled by the Centre for Research on theEpidemiology of Disasters (CRED)) does not disaggregate by gender, as such data arerarely available, especially for the more numerous small- to medium-sized disasters.
According to Debarati Guha-Sapir, CRED’s director: “Gender has not been seen asan issue in disaster prevention and preparedness, except as a blanket policy statement.Therefore, ground-level evidence on what the gender-related risks are remainsunknown and so cannot be translated into concrete action. For example, theCRED/ISDR [the United Nations International Strategy for Disaster Reduction]epidemiological study in Tamil Nadu on the victims of the tsunami show age andgender patterns that could have useful insights for disaster preparedness, but studieslike these are few and far between. So right now, we all agree that gender is asignificant issue in disaster, but we can say practically nothing quantitatively about itspatterns or magnitude.”
In order to protect people’s lives, livelihoods and dignity in emergencies, it isimportant to recognize their particular identities and cultural contexts. Gender-basedinequalities, combined with ethnicity, age and class, lead to great differences inwomen’s experiences in disasters. While humanitarian workers seem increasinglyaware of gender issues, research suggests many of them do not know concretely whatthis means.
The 2003 annual review of the Active Learning Network for Accountability andPerformance in Humanitarian Action (ALNAP) reports that, overall, the promotionof gender equality by humanitarian organizations is variable or poor. Analysing 127 evaluations of humanitarian action (2000–2003), ALNAP says the evaluation of gender equality was unsatisfactory in 73 per cent of cases. The review points tomajor gaps in training and gender mainstreaming that need to be addressed.
However, there have been some advances by international agencies (including UnitedNations Development Programme (UNDP), World Food Programme (WFP), Foodand Agriculture Organization (FAO), Inter-Agency Standing Committee (IASC) andthe International Red Cross and Red Crescent Movement), which have recentlydeveloped policies and tools for gender mainstreaming.
Women’s multiple rolesTypically, women are seen as being located mainly in the home. But researchers haveidentified at least three types of women’s activity :
■ Reproductive role: household, domestic, childbearing, family health.
143World Disasters Report 2006 – Gender issues in emergencies

■ Productive role : earning benefits in cash or in kind.■ Community role : contributing to community well-being – in this context,
focusing on women’s roles in disaster response.
Disasters and their aftermath impact on all three. This simple conceptualization givesstructure to the material which follows. However, referring to roles can make women’sand men’s lives seem static, when in reality they are dynamic and influenced bycomplex gender power relations.
Women’s reproductive roleDuring disasters, women predominantly carry out their normal, socially assignedroles. They hold their families together in the basic conditions offered by temporaryshelters, often managing with little support.
Women are at the biological and social centre of family life and, in many cultures,they embody the family honour. Some are chaperoned when going outside andprotected from outsiders even when inside the home. Inevitably, this can restrict theiraccess to disaster relief, so specific procedures must be in place to offset gaps indelivering aid.
In Pakistan, women from remote mountain areas were trapped in wrecked housesbecause they feared (or were forbidden from) coming down to relief camps in thevalleys. Dawn newspaper reported the views of two (male) survivors from Shangladistrict, in November 2005: “We are Pukhtun people,” said Abdul Hameed, who lefthis mother, wife and sister in the mountains. “For us, the woman’s honour mattersmore than life.”
Because they are often confined to the home, women and girls are particularly at riskfrom death and injury when buildings collapse. In the 1993 earthquake inMaharashtra, India, more women were crushed in their homes than men, whoworked or slept outside. This is one reason why women and their particular needsmust be included in the planning and reconstruction of damaged homes.
Despite being closely associated with the home, women often lack rights to land,tenancies and other property. When husbands died in the Pakistan earthquake, theirland went to the eldest son – even though the late owner’s wife had occupied andworked it. Meanwhile, in drought-stricken Kenya, Maasai women have to negotiatetheir right to cultivate family land, putting household food security at risk (see Box 6.2).
While looking after children is seen as a primary concern of women, the tsunami andKatrina left many children separated from their families (2,430 children after
144

145World Disasters Report 2006 – Gender issues in emergencies
Loitokitok is a sub-district in southern Kenyawhich lies near the foot of Mount Kilimanjaro.Populated by traditionally semi-nomadic Maasaipeople, the more arid parts of Loitokitok have,since the 1950s, experienced increasing temper-atures, droughts and rainfall variability. TheMaasai’s pastoralist livelihoods – based mainlyaround cattle – have also become increasinglyconstricted by the demarcation of grazing landsfor cultivation and wildlife conservation.
In response, the Maasai are reducing theirreliance on keeping livestock and embracingcrop farming and new herding strategies. Suchlivelihood diversification has important implica-tions for gender roles and relations.
Historically, crop farming among the Maasaihas been used to recover from drought, but fol-lowing the severe drought of 1984 it became amore permanent form of land use in Loitokitok.Crop farming is predominantly for cash and isbecoming dominated by men. As a result,women are now more involved in livestock pro-duction, which was once the preserve of men.
The new divisions of labour have an impact onthe role women play in managing householdfood security in this semi-arid zone. Womengrow food which is intercropped with men’s cashcrops on irrigated fields near their homesteads.But although women’s crops provide a critical (ifsmall) source of nourishment for the family duringdroughts, their share of irrigated land is extreme-ly low. This is because priority goes to men’s cashcrops and women only gain cultivation rights onfamily land through their husbands. The impor-tant role that women’s food crops play in droughtconditions is not widely recognized.
Meanwhile, Maasai women still have to main-tain the health of their families’ livestock andensure a sufficient milk supply for their children.During droughts and extended dry periods,
women have to work much harder to care for thelivestock. They must gather high-quality fodderfrom acacia trees for their sheep and goats, aswell as a variety of plants from the swamps andforests for their cattle. On the lower slopes ofMount Kilimanjaro and in Loitokitok’s swampyareas, many families feed high milk-yielding cat-tle in stalls. This means more work for the women,who must gather and deliver fodder and water tothe cattle stalls.
Across this area, women are working signifi-cantly harder than men in livestock production –but this hasn’t been recognized by practitionersin government and development organizationswho perpetuate the stereotype that Maasai pastoralism is a predominantly male activity.Recognizing and reinforcing the role played bypastoral women is critical to understanding howthe Maasai strengthen the resilience of their liveli-hoods in the face of greater climate variabilityand drought.
As livelihoods diversify, the dynamics of vulnerability also change. So organizationsintervening in arid and semi-arid areas mustensure that their activities are participatory,instead of being based on outdated assump-tions. Recognizing women’s roles will onlyprove productive if this is combined with anactive incorporation of women’s voices in inter-vention policies.
In the context of Loitokitok, this would requireseeking out women in their own spaces andmeeting with them at times convenient for them.However, meetings are mostly held at times ofday when only men can attend. Donors, non-governmental organizations (NGOs) and policy-makers should pay more attention to the impor-tant role that women’s crop and livestock production activities play in reducing vulnerabilityto drought in pastoral communities. ■
Box 6.2 Maasai women’s role in reducing vulnerability to drought neglected

Katrina). This has untold psychological effects on family members, while raisingserious protection issues.
Women can be at risk throughout their life: from sexual abuse, trafficking or loss ofeducation (when young); from forced marriages, nutritional deficits and birthcomplications (when childbearing); and from poverty, neglect or abandonment (whenelderly). At any time, they may be vulnerable to violence, honour killings orpunishment.
Mother/child health neglected during disastersIn November 2005, just a month after the earthquake, the United Nations PopulationFund (UNFPA) estimated 17,000 disaster-affected women in Pakistan would give birthin the next few months. Around 1,200 would face major complications and 400 wouldrequire surgery. Yet there was a critical lack of female doctors and health workers.Women from conservative areas sought professional care as a last resort, mainly becausemodesty and family honour prevented them from consulting male doctors.
From March 2006, temporary camps began to close, leaving many pregnant Pakistaniwomen with long, difficult journeys home. Basic reproductive health services are notavailable in most of the areas to which they have been returning. Lady health workers(LHWs) traditionally provide primary healthcare in remote mountain communities.They normally operate from their homes, but the earthquake destroyed their housesand threatened this vital service. Some agencies have provided support : the PakistanRed Crescent Society (PRCS) supplied LHWs with tents and supplies for 200 newhealth posts in affected areas. In some cases, this means people are getting betterhealthcare than before the quake.
After giving birth, breastfeeding women provide a vital, safe food supply for theiryoung children. Transferring to formula feeding during disaster greatly increases therisk of child morbidity and mortality, as the water which must be added to make upthe formula may be contaminated. Signatories to the 1990 Innocenti Declaration onthe Protection, Promotion and Support of Breastfeeding (including UN agencies andgovernments) have estimated that during emergencies, child illness and death ratescan increase 20 times due to increased exposure to infections and inadequate feedingand care.
Promoting breastfeeding before and after disaster, especially floods and earthquakes,is a fundamental part of disaster management, yet how often is it included inemergency plans? It is important to train aid workers to assist mothers inbreastfeeding, as their infants are at the greatest risk. This may also be the case in criseswhere transmission of HIV/AIDS is a risk. Current UN infant feeding guidelines say:“When replacement feeding is acceptable, feasible, affordable, sustainable and safe,
146

avoidance of all breastfeeding by HIV-positive mothers is recommended; otherwise,exclusive breastfeeding is recommended during the first months of life.”
Men’s psychological health neglectedThe stereotypical expectation of men to ‘be strong’ means that their specific healthneeds during disasters have not been widely recognised. Men’s psychosocial needs gountreated because of cultural norms, which inhibit men from expressing pain, fear ortheir own perceived inadequacy to fulfil their traditional role as family provider.Feminized care-giving systems disadvantage men, as they often don’t speak to womenabout their problems.
After the 1990 Towyn floods in Wales, UK, men seemed to cope initially and then,sometimes years later, sought help from doctors for stress-related symptoms associatedwith the flooding. Humanitarian workers can overestimate men’s emotional strength;men and boys may need gender-sensitive support to deal with trauma, loss and thechallenges of recovery.
In the absence of culturally acceptable support, men can resort to destructive forms of‘coping’, which are well documented by researchers, such as substance abuse and physicalaggression, and which put themselves and the women around them at risk of harm.
The tsunami aftermath amply demonstrated this. According to a report on thesituation in Sri Lanka, published in 2006 by Amnesty International: “Many mendisplaced by the conflict and tsunami are unemployed and traumatized, which isresulting in higher levels of alcohol abuse and violence.” This problem may haveinadvertently been fuelled by the generous aid response, whether in cash or in kind.“NGOs told Amnesty International that growing incidences of domestic violenceamong tsunami IDPs are partly due to the fact that the financial support is given tothe male household heads and can easily be spent on alcohol, as well as the fact thatmany relief items can be easily sold and the money spent on alcohol.” However, a UNOffice for the Coordination of Humanitarian Affairs (OCHA) situation report fromearly 2006 noted an increase in alcohol abuse among women and children in SriLanka – not just men.
Many men who have lost wives during disaster lack the domestic skills to cope andhave struggled to rebuild family life, says Sri Lankan gender and disaster specialistMadhavi Malalgoda Ariyabandu. In traditional societies, it is unusual – even sociallyunacceptable – for men to do household work or live in close proximity to theirdaughters. Some men widowed by the earthquake in Pakistan said they wanted toremarry soon to ensure they had a chaperone for their young children. They suggestedthat an organization could help them remarry women who had lost their husbandsand children in the earthquake.
147World Disasters Report 2006 – Gender issues in emergencies

Gender-based violenceHumanitarian crises can be a trigger or cover for violence towards women andchildren. In conflicts, women and girls are increasingly being trafficked, forced intoprostitution or sexual slavery, and used as weapons against the enemy.
Violence in the home can be attributed to the increased stress of disaster pushingpeople beyond what they can cope with – although disasters may simply revealunderlying power relations that existed before. Gender-based violence duringdisaster is under-researched, although the body of evidence is growing. Reportsof domestic violence have increased after major storms in the United States,Canada, Latin America, Australia and New Zealand – as well as after thetsunami.
Meanwhile, disturbing evidence of sexual abuse in UN peacekeeping missionsemerged after Sarah Martin, an expert on the subject at Refugees International,conducted investigations in Haiti and Liberia in 2005. “Since the bulk of personnelin peacekeeping missions are men, a hyper-masculine culture that encourages sexualexploitation and abuse and a tradition of silence have evolved within them,” she said.Who will protect people from the protectors?
In Pakistan after the earthquake, honour killings remain a threat. FaridaShaheed, coordinator of Pakistan’s Shirkat Gah women’s collective, reported thecase of one woman who was forced to provide sexual favours in return for aid;but nobody would discuss it openly because to do so could result in the woman’sdeath.
Women’s productive roleDamaged homes can mean damaged workspaces. For many women whose income isbased in the home, destroyed housing means a loss of workspace, as well a loss oftools, equipment, stock and markets. While working at home provides significanthousehold benefits, it is often not recorded in the same way as formal employment.So women may not be fully compensated after disasters.
Opportunities for employment outside the home vary around the world, but are oftenfewer for women than men. And competing demands in the wake of disaster may leadwomen to lose such jobs. In San Alfonso, a Salvadorean community hit by HurricaneStan in October 2005, one mother said: “Here we had women who lost their jobswashing and ironing for others because they had to stay at home and tend theirchildren. The employers didn’t understand. Three days of not showing up for work iscause for termination. Women said: ‘I don’t care about the job, I don’t want to losemy children’.”
148

In Pakistan, none of the women interviewed in a rapid assessment by theInternational Federation of Red Cross and Red Crescent Societies claimed to haveundertaken paid work before the earthquake. Nor had they been encouraged to takepart in cash for work promoted by some international non-governmentalorganizations (INGOs). Many said they’d be happy to help remove rubble, with orwithout men, if paid in cash. As plastering mud houses is traditionally women’s work,they were willing to help with reconstruction.
Some Pakistani women did find work. In tent villages in Balakot, the InternationalLabour Organization (ILO) employed women to be responsible for cleanliness. Thiswas a rare opportunity, regarded as acceptable because it replicated the type of workthey would normally do in the home. ILO also initiated a quilt-making enterprise,encouraging women to cut up piles of unsuitable donated clothes (which were beingburned to keep warm) and sew the pieces into quilts. This was so successful, thewomen started to receive orders.
In Muzaffarabad, Pakistan, after her daughter was killed and her house destroyed bythe earthquake, Shazia Noreen defied convention and built a small corrugated ironshop next to the tent where her family lived. “It is our family tradition to keep women
149World Disasters Report 2006 – Gender issues in emergencies
The specific impacts of disasters on womenand girls are notroutinely assessed,which can lead totheir needs andpriorities beingneglected. Nor arewomen always victimsof disaster – their rolesin networking andorganizing for disasterresponse are oftenoverlooked.
Marko Kokic/International Federation
in the house, but I’m going to change that tradition,” she told Reuters news agencyin January 2006. However, she did so with her husband’s permission. As one Islamicscholar in Muzaffarabad said, a woman was free to work – as long as her husband,brothers or father had no objections and she covered her face and body.
Just a few weeks after the 2001 earthquake in Gujarat, India, women began returningto work inside makeshift shelters, stitching together canvas bags and embroideringlinen. “If they don’t start again then what are they going to eat in future?” asked onewoman textile worker. But while Gujarati women worked, most men lost theirlivelihoods. “After the earthquake, the men of the family stopped working,” said onewoman. “The men are all in trauma.”
There are similar reports from Sri Lanka. Madhavi Malalgoda Ariyabandu, visiting acamp in Hambantota a year after the tsunami, found numerous women who hadstarted tailoring, trading vegetables or making food packets for sale, while still livingin temporary shelters. But the men sat passively in the camp common room, makingcomments such as: “So many agencies and teams of people come and go promisingto give various things, that we are waiting for their return,” or: “For labour work onehas to go very far, and we cannot do that.”
Disasters can destroy access to markets. A group of 25 women traders from inlandvillages were caught in the tsunami while attending the Sunday market inHambantota, which borders the coast. Subsequently, they were too traumatized toreturn to the market. When the market moved to a new location, these women losttheir places and nearby markets refused to accommodate them. Securing a place in aregular market is extremely competitive and often depends on who you know andwhat you can pay.
Since these women lived inland, they couldn’t access the massive amounts of reliefavailable to coast dwellers. They received government rations, but more than a yearafter the disaster, they were still struggling to recover their lost livelihoods.
Women’s community roleFollowing all disasters, formal teams are set up in camps, villages and at higheradministrative levels to manage disaster response. But these often lack gender equitybecause:
■ Socially constructed restrictions on mobility – especially regarding female safety –may prevent women from participating.
■ Approval is needed from a father/husband/brother for women to engage inactivities outside the immediate family.
■ Responsibility for multiple roles (e.g., domestic, childcare) leaves women littletime for activities outside the home or workplace.
150
■ Officials may lack gender awareness and see no need to engage women.■ Women themselves often lack confidence to play a public role – especially in
male-dominated disaster management.
These barriers hinder women’s participation in formal recovery – so specific measuresare necessary to include women.
Gender-aware NGOs and civil society groups have improved women’s engagement inrelief and recovery, but these efforts remain largely isolated and insufficient. Fieldworkin Pakistan suggested gender awareness was much more likely within NGOs, the RedCross and Red Crescent, and UN agencies as opposed to Pakistani governmentorganizations.
Women in Pakistan faced socially constructed barriers to receiving adequate reliefsupplies following the October 2005 earthquake. Farida Shaheed argues that disasterscannot be separated from the everyday. Women’s pre-existing physical, environmentaland social vulnerabilities – measured in terms of less education, less access toeconomic resources, fewer social assets and skills with no market value – underpinnedhow they fared during and after the earthquake.
Women were heavily dependent on men for access to relief after the Pakistan disaster,although there were exceptions (see Box 6.3). Few women received tents or rationsdirectly; most received them through male family members. The majority ofvolunteers were male, particularly in the early stages of relief, although many agenciesworked hard to recruit more females after this problem was recognized. However, itwas a challenge to find qualified women to work as volunteers. Women typically workin pairs if part of a male team and this meant there were often not enough womenavailable to meet rapid assessment timetables. This problem needs to be overcome infuture disasters.
A local government woman told the International Federation that when she went tothe Pakistani army’s distribution camp to request their support for a tented villagenearby, she was told: “Bring a man, we don’t talk to women.” According to femalerespondents to the International Federation’s needs assessment, some army campmanagers required all widows and female-headed families to enter under the name ofa male relative as head of their family.
However, this practice was not typical of all of Pakistan’s governmental responses.The IRIN news service reported in December 2005 on a camp in Hattian, Punjabprovince, which housed nearly 300 women and children who’d lost their male familymembers. The shelter was set up within a week of the disaster by the KhubabFoundation, a local NGO, and the Pakistani government’s Ministry of SocialWelfare.
151World Disasters Report 2006 – Gender issues in emergencies

152
The winding mountain road from Balakot toOld Sanghar village is still scarred by land-slides, six months after the earthquake thatdevastated northern Pakistan in October 2005.Boulders the size of buses hover above theroad, halfway down their headlong plummet,waiting for the next aftershock to shake themloose. Looking up at the snow-dusted ridge-lines three or four thousand metres high, it’shard to imagine the raw power of a tremorcapable of moving mountains.
“I was planting garlic in the field with mychildren when the earth shook,” says SaeedaBibi. “I looked back and saw my house hadcollapsed. My husband was inside. I thought:’Everything is finished’.”
Saeeda has lived in Old Sanghar village allher life. Now aged 25, she is married withtwo children. In September 2005, three weeksbefore the earthquake, she was one of sevenwomen and 18 men who attended a Pakistan
Red Crescent Society (PRCS) training sessionin community-based disaster preparedness.
For four days, Saeeda and her fellow par-ticipants learned about different types of dis-aster, how to prepare before the event, how toreact afterwards and where to go for help.
“There was an earthquake here in Balakotin 2004,” says Mufti Mansoor, the disastermanagement officer for the North WestFrontier Province (NWFP) branch of the PRCS.“A thousand houses were damaged then.Floods and landslides are even more com-mon. So it was clear to us that this is a disas-ter-prone district.” By early 2005, Mufti hadalready laid plans to establish a disaster man-agement cell and warehouse nearby, as wellas to conduct preparedness training in eightdistricts at risk across the province.
Mufti encountered considerable oppositionin recruiting women as well as men to histraining. The mountain regions of the NorthWest Frontier are deeply conservative. Themale village elders control what goes on, dis-cussing matters of importance by squatting ina circular jirga (council) from which womenare excluded.
Once in the mountain villages, we sawalmost no women outside their homes. Whenthey do work in the fields, they are forbiddenfrom speaking to men from neighbouring vil-lages. Female literacy in some districts ofNWFP is less than five per cent, according tothe UN’s IRIN news service.
“Before my training, people of the area crit-icized me for going to the town, alone as awoman, for training,” says Saeeda. The menin Chitrali caps clustered around Saeeda nodin agreement. “They called my husband andtold him to stop me,” she continues, “but hesaid I could go.”
Box 6.3 Training overcomes tradition in Pakistan quake
© Jo
nath
an W
alte
r, 20
06

153World Disasters Report 2006 – Gender issues in emergencies
Saeeda takes up her earthquake story again.Once she had found somewhere safe for herchildren, she saw her husband emergeunscathed from the ruins of their home. Dazedsurvivors began gathering on a nearby terracedfield. The mountainside to which Old Sangharclings is so sheer that the terraces are no morethan two or three metres wide. “I heard that myuncle, his wife Naseema Bibi and eight-month-old child were trapped under the ruins of theircollapsed home. We used farming tools and ourbare hands to dig them out. Aftershocks keptshaking the ground. After five hours, we res-cued them – they all survived.”
Not everyone in the village sharedNaseema’s luck. On top of the hill lies theruined rubble of the village school. Pages ofdiscarded exercise books still flap in the wind.A wooden class chair is buried to the arms by severed chunks of reinforced concrete.
Of the 11 people who died in Old Sangharwhen the earthquake struck, 10 were school-children, aged between 5 and 15 years.
How did Saeeda react in the face of disas-ter? Did her training help? “After the earth-quake in 2004, we didn’t know what to do,”she says. “But with the training I realized I hadto rescue people, mobilize people. I left myhome and organized other people to help.”
She provided water for survivors andcleaned mud from the bodies of victims. Shetold villagers to get blankets and assist theinjured. She helped rescue some school-children and pulled out dead bodies.
Together, Saeeda and those with her saved40–50 people from their collapsed homes.“We also learned the need for psychologicalsupport from our training,” she adds, “so Iasked people not to cry. I told them the disastercame from God, that it was not our fault.”
For a week or ten days, no aid arrived inOld Sanghar village. With temperatures
below freezing, the villagers were sleepingrough in the fields – too scared to ventureback inside their homes as dozens of after-shocks shook the region. Eventually, Saeedadecided to go in search of aid herself. “I knewI had to communicate to other people whathad happened,” she says.
She set off on foot to raise the alarm. Oncemore, the whole village objected to her goingto a strange town on her own. Undeterred, shetrekked for five hours across landslides andpast ruined houses, until she reached the RedCrescent office in Balakot. They responded bysending tarpaulin sheets, tents, blankets,kitchen sets and stoves back to her village.
We ask Saeeda how the disaster pre-paredness training could be improved – in thelight of her experience. She requests that thewomen of the village be taught first aid. Inmany parts of the world, this is included inRed Cross/Red Crescent community disastertraining. But before the earthquake struck, thePRCS simply lacked the resources: the annualcommunity disaster preparedness budget forthe whole province was just 30,000 rupees (US$ 500). Following the earthquake, that isset to change, with a month of intensive dis-aster management training planned for PRCS volunteers in this district alone.
Saeeda’s top priority, however, is for vil-lagers to be taught how to rebuild their homesin an earthquake-safe way, using local mate-rials. Most of the villagers continue to live intents, six months afterwards. “We still live infear of another earthquake,” she says, tomore nods. Like the experts, Saeeda knowsthat it is bad buildings, not earthquakes, thatkill people. And she knows that the only way she and countless thousands of other sur-vivors across the region will sleep without fearat night is if they can rebuild safer thanbefore. ■

In this camp, unlike many others, a school, hospital, playgrounds, community dininghall, general store and mosque were built. Some of the rooms had attachedbathrooms. Security was enforced by uniformed guards who allowed no unauthorizedmen inside. “Unlike other camp settlements, where families tend to huddle togetherin scared clusters, young girls and children run freely through the area, vying for aturn on one of the swings, and women sit outside in the sunshine mending clothes orknitting,” reported IRIN.
Other humanitarian organizations also made provisions for women. The internationalNGO ActionAid found that Pakistani women had faced harassment in camps due toa lack of private and public spaces for women. The agency constructed 20 women-friendly spaces, incorporating health services, psychosocial support, first aid and theinclusion of women in disaster preparedness. The Pakistan Red Crescent Societyimplemented a psychosocial support programme for women, men and children infour tent villages. Of the 31-person team, 16 were women. “We work with womenbecause men can’t,” said Tapassum Naz, one of the female team members. “Womenwant to be involved in recovery, but they complain that men are dominant in makingdecisions,” she said.
Absence of women in camp managementAfter the tsunami, Sri Lankan women were largely absent from the managementteams running the camps where nearly 250,000 survivors lived.
The women inhabitants among the 100 families housed in Dharma Kabeer mosque inHambantota lamented the lack of opportunities to express their concerns or contributeto daily management. When interviewed in May 2005, the women said they hadn’thad a single opportunity to discuss their concerns, nor had any women’s supportgroups visited them. The husband of one woman remarked: “It’s alright for women toengage in recovery planning activities, to go out and take part in the meetings, becauseit is a crisis situation. But in normal times, it’s a man’s job and it will remain so.”
This limited participation is mirrored at national level: the Sri Lankan ParliamentSelect Committee on Natural Disasters, mandated to examine disaster preparednessand mitigation, has just two women on its 22-member committee.
One major area of concern cutting across many recent disasters is the poormanagement of women’s and girl’s personal hygiene needs. A female governmentofficial from Kalutara, Sri Lanka, who was part of the district team responsible fordisaster relief, admitted that – even as a woman – it took her several days to ensuresanitary supplies were included in emergency distributions. In the male-dominatedworld of disaster management, it takes experience and gender training to considersuch issues from the start.
154
155World Disasters Report 2006 – Gender issues in emergencies
Meeting menstruation needs can be community, culture and class specific. Pakistaniwomen didn’t know how to use Western sanitary items. Poorer women often usewashable rags rather than sanitary towels. In most cultures, menstruation is anextremely private female issue. This posed difficulties for women queuing up publiclyto obtain sanitary items from mainly male relief teams. Organizations such asUNFPA, UN Children’s Fund (UNICEF) and the International Federation tookmeasures to provide appropriate female hygiene packs. But Pakistani women survivorstold Tapassum Naz that, even six months after the earthquake, their most personalneeds hadn’t been met because of a lack of female doctors or nurses.
Meanwhile, power relations exert a strong influence over food distribution. Awarenessof such family dynamics is vital if relief camps are to be managed effectively and justly.If food rations are distributed through a male householder, when traditionally womenbuy, grow or forage for food, it can change the power dynamics of the household,disempowering women. On the other hand, females accessing food in camps can beperceived as a threat to men’s authority. If men are no longer providing what they usedto provide for their family, they may fear losing the respect of others as well as theirown self-respect.
The security of displaced women and children in many relief camps remains aconcern. In Sri Lanka, women complained that their toilets were inadequately lit andlocated too close to men’s toilets – they would never normally visit the toilet in thepresence of unknown men.
In Pakistan, fieldwork in early 2006 by Khadim Hussain, from Islamabad’s RuralDevelopment Policy Institute, identified many tent villages with no proper securityarrangements. In Muzaffarabad, the manager of the Chattar Class camp was beatenup by locals after one of the girls in his camp was abused. Although this case was neverpublicized, camp residents knew of similar examples which fuelled their fears for thesecurity of women and girls.
Ismail, a tsunami survivor from Ampara, Sri Lanka, lost his wife and elder daughterin the disaster. He lived in a camp for six months with his unmarried youngerdaughter – but was anxious about her safety and emotional well-being when he wasaway queuing for relief or attending meetings. He used money provided by thegovernment for family funerals to buy two mobile phones, so that he and his daughtercould stay in contact and reassure each other.
Windows of opportunityIn Pakistan, argues Fareeha Ummar, from the Aga Khan Rural Support Project: “Theearthquake was the worst kind of catastrophe, but it brought out women and girls.There are opportunities, especially in the North West Frontier Province. In these areas,

women and girls had not been allowed to come out of their homes unaccompanied,even to see the sky. Since they have now lost their homes, they must come out.”
Disasters, although destructive in so many ways, can open windows of opportunityfor empowering women and enabling them to take an active role in buildingdisaster-resilient communities (see Box 6.4).
During the response to Hurricane Stan, which hit El Salvador in October 2005,women gained new strength and self-esteem by being active members of the manycommunity-based emergency preparedness committees set up by the NGO Plan El Salvador. Marisol Carmen Arevalo of La Laguna municipal civil protectioncommittee said: “Maybe we women are not used to share our experiences but I amgoing to dare to share. I have a problem: my husband is not keen on me attendingcommittee meetings and I have problems going out to assess damages, but I deliveredfood aid in Hurricane Stan. I was doing home visits to my neighbours despite mudgoing up to my knees but I realized we had to save them. Sometimes women don’tknow about our strength. It was us women who dared to go in the canyons, goingafter the victims. It was us women who took the elderly out of their houses.”
Importantly, even older women – a group often seen as most vulnerable and given theleast opportunities to be active – play a significant role in these committees. Christinadel Carmen from El Portillo said: “As soon as I joined this project I began learning. Iam an old woman but still able to learn!” During emergency and first-aid trainingdrills, these women discovered new strengths in themselves: “I had to carry a man! Ididn’t know I could do it,” said another female participant.
Plan adopted a rights-based approach, with a strong focus on gender and age equality,integrating risk reduction across disasters, health and environment. Over 1,200 wo-men, men, girls and boys joined community or school emergency committees andreceived training from the Salvadorean Red Cross Society in disaster mitigation andpreparedness. Training in gender equity and child rights produced much mutualrespect between committee members and encouraged them to challenge age- andgender-based norms of behaviour.
Following the tsunami in Sri Lanka, researchers have found that many NGOs are veryinterested in acquiring knowledge and skills to address gender issues in recovery. Toachieve this, large-scale, systematic skills development is needed by all agenciesengaged in disaster response and recovery.
More gender analysis neededIn disasters, as in everyday life, men’s lives tend to be understood as normal whilewomen are seen as a ‘special population’. However, women’s and men’s disaster
156

157World Disasters Report 2006 – Gender issues in emergencies
experiences and needs may simply differ. For example, in research conducted byShrader and Delaney for the World Bank in 2000, a Nicaraguan community wasasked : What was the worst thing about Hurricane Mitch? Women said : fear. Mensaid : decreased coffee production. How can both be better understood andaddressed?
A considerable body of evidence has now been amassed on the ‘gendered terrain ofdisaster’, although it is still small compared with what is known about other, moremainstream aspects of disasters.
While humanitarian organizations are increasingly practising a gender-disaggregatedapproach in needs assessments and other aspects of their work, there remain manyinstances where such a breakdown is not available. An analysis of the likely effect on gender equality of different kinds of distribution (e.g., preferencefor cash) is an area ALNAP regards as “ripe for investigation with primarystakeholders”.
Although a number of humanitarian organizations have initiated gender-relateddata collection, it remains largely ad hoc and has not been incorporated into theregular programmes of national statistics offices. This is a barrier to gender-sensitivedisaster project planning and evaluation.
If we are ever to know how disasters affect women and men differently, even at themost fundamental level of fatalities, then analysts must be trained to use a gender-sensitive lens. Until the quantification of gendered disaster impacts becomes acommonplace part of disaster datasets, aid organizations cannot fulfil their mandatesof saving lives, reducing avoidable suffering and increasing the resilience ofcommunities to disaster.
When gender is neglected in disaster response and risk reduction, impacts, needs andpriorities are also overlooked; poverty and inequity are exacerbated; vulnerability isintensified and new categories of ‘victims’ are created.
The issue is fundamentally a question of rights. A UN resolution from 2002 urgesgovernments and aid organizations to “ensure the full enjoyment by women and girlsof all human rights – civil, cultural, economic, political and social, including theright to development – including in disaster reduction, response and recovery; in thiscontext, special attention should be given to the prevention and prosecution ofgender-based violence.”
It is time to end the neglect of gender in disasters and ensure the rights ofwomen to be equal partners throughout all aspects of disaster risk reduction andresponse.

158
El Salvador. The women of San Alfonso knowthe value of community organization, after beinghit by Hurricane Mitch in 1998, two earthquakesin 2001 and Hurricane Stan in October 2005.Following Stan, Teresa Rivera, a member of thecommunity committee (formed with the help of theNGO Plan El Salvador) said: “When we facedHurricane Mitch, it destroyed our houses. So thisis the second time we’ve gone through this. That’swhy some people are struggling here. The rivertook their houses. They live in tin shacks near theriver. In Mitch we weren’t organized. We werelike crazy bees after the beehive is shaken. Wewere improvising. After Mitch we learned to getorganized. Now in Storm Stan we had that expe-rience and all houses were evacuated in time.”
While leading a discussion under a mangotree, Marta García, their leader said: “The river isa risk here. Right now it looks harmless, but theriver is a traitor. The latrines collapsed, houseswere damaged, we don’t have drinking waterand have chronic diseases.” Since Stan, theyhave constructed a risk map which combineshealth and environmental data. “After the storm,we worked on our map so now we know the riskareas. We are really motivated. We are monitor-ing the river and we know how to evacuate safe-ly,” said García, adding: “In spite of what we’vegone through, we are better organized. We worktogether in different sectors and we’ve alsoworked on organizing the youth. When we havean emergency we know we can count on eachother. We have various committees – support,sanitation, emergency – here in San Alfonso. Weknow what our goal is and our purpose.”
Tamil Nadu, India. Sasikala, Mari andJanaki are three women’s leaders who formedself-help groups after surviving the tsunami ofDecember 2004. A year later, when heavy rainsand floods afflicted Tamil Nadu state, they
found themselves wading for 15 kilometresthrough water a metre deep, holding hands toavoid falling into potholes, evading water snakesand creepers to provide emergency relief to thepeople of Poovalai, one of the worst affected vil-lages.
They went against the advice of men whowarned that nearby villages were marooned andreaching them by foot would be dangerous. Butthese tsunami survivors knew how to take controlof their lives in the wake of disaster. “When thetsunami struck, people from outside helped usrebuild our lives. We decided it was time to actquickly and help our neighbours in whatever waywe could,” they said. “If we found it so difficulteven to visit the villages, imagine the plight of thevillagers who live there!”
The women raised money to buy food and pre-pared 650 food packets. The youth team andlocal men helped them distribute the food byboat. It became a well-coordinated relief effortwhich lasted several days.
Gujarat, India. Following the earthquakethat shattered Kutch district, Gujarat, in 2001,Naviben Subhbhai Rajput studied low-cost earthquake-resistant technology. She rebuilt herhouse and convinced other villagers to follow herexample and become self-reliant.
“I knew the importance of living in a safehouse and was determined to know more aboutvarious training programmes. Post-earthquake,we have learnt a lot. Many people in my villagehave done retrofitting and several women haveattended mason-training programmes,” she said.“Our women’s group is now aware of the tech-niques involved and materials needed in makingour houses earthquake-resistant. Just as the post-earthquake reconstruction activities emphasizedthe need to adopt new and appropriate technol-ogy, the women’s groups have encouraged us to
Box 6.4 Women organize for disaster responseand risk reduction

159World Disasters Report 2006 – Gender issues in emergencies
be economically self-reliant. Today, I run a smallgrocery shop and plan to take a loan from thegroup to expand my shop.”
Meanwhile, Jamunaben Someswara, an enter-prising but uneducated woman from the same dis-trict, helped inspire the women of her village towork together for the benefit of the communityafter the earthquake. Previously, there was nopublic role for women and they seldom left theirhomes. But, following the example of women’sgroups in the aftermath of the earthquake inMaharashtra in 1991, Someswara formed fivewomen’s credit groups to encourage local enter-prise. “Earlier, we were not organized and werenever acknowledged for anything we did,” shesaid, “but we have started giving loans to womenmembers for various needs.” Out of 25 members, five of them now have businesses.
Working as a collective gave the women con-fidence to tackle other major problems that besetthe village, such as water shortages. Every day,women had to walk three kilometres to collectdrinking water. The women’s group approachedthe water supply office 25 kilometres away, metthe concerned officer and obtained written con-firmation that the village would receive a dailywater tanker. There are now three women on thevillage council and their next target is to improvethe village’s healthcare facilities.
Pakistan. In February 2006, the IRIN newsservice reported that the United Nations HighCommissioner for Refugees (UNHCR) had estab-lished a female committee in the earthquake-affected town of Muzaffarabad. Attended by upto 80 women from 60 camps across the district,their aim was to include women in camp man-agement and decision-making. The womenshared their concerns about issues such as food,debt, water and sanitation.
For most of the women, it was the first timethey’d voiced their problems in public. “Little bylittle these women are waking to a new reality,”
said Sumeera Mehboob Qureshi, the electedchairwoman. “As one woman said to me: ’Godcaused the earthquake and it has brought a lot ofdestruction, but it has shaken the roots of societyand has brought change into women’s lives andhas given us a voice’.”
Bangladesh. In response to recurrent windstorms and flooding, the Bangladesh RedCrescent Society (BDRCS) has made efforts toincrease the number of its female volunteers. Thesociety has been running a cyclone preparednessprogramme since the 1970s, but preparednessteams were male-dominated. In the 1990s,BDRCS began recruiting at least two female members per 12-person team. In the1998 floods,women were active in BDRCS’s response –alerting communities to rising flood waters,engaging in needs assessments, providing healtheducation and first aid to flooded communities.Subsequently, BDRCS developed a major disasterpreparedness programme in which volunteerteams recruited in disaster-prone areas shouldinclude at least eight women out of a total of 25 members.
Sri Lanka. In Batticaloa district, Oxfam andothers helped form a Women’s Coalition forDisaster Management, which found an innovativeway of communicating the need to respectwomen’s security and privacy. The coalition paint-ed colourful murals on the water tanks insidetsunami camps, with slogans such as: “My fatheris always shouting at my mother. Why? Violencedestroys the whole family.”
Disaster Watch. A new international net-work of women’s grass-roots organizations activein disasters, Disaster Watch brings women togeth-er across borders and other barriers. Throughfield studies and peer training, disaster-affectedwomen share what they have learned about cop-ing with cyclones in India or earthquakes inTurkey and Iran, and rebuilding structures in waysthat leave women stronger. ■

160
RecommendationsThe following recommendations call for an explicit commitment and clearlyarticulated strategy on gender issues from humanitarian organizations and the civilsociety groups (from grass-roots to national and international) with whom they(should) work. However, it is important not to conclude that disasters are divorcedfrom the daily, lived experiences of women and girls, men and boys, since theeveryday is where the root causes of disaster vulnerability are located and resilienceis generated.
In order to address gender inequalities, such organizations must take action in thefollowing areas:
Gender training■ Mandate and promote gender training. ■ Ensure staff and volunteer teams are gender-balanced.Protection■ Prioritize protection issues.■ Ensure identification of all at-risk populations, including women and girls at risk
of gender-based violence and trafficking.■ Include strategies for dealing with children.■ Provide for women’s physical safety post-disaster, including safe spaces and
facilities for women and girls.■ Ensure support for legal redress.Health■ Address the specific health needs of women and girls in disaster situations.■ Provide sufficient female health workers and doctors, prenatal and maternity
care.■ Provide suitable latrines and sanitary supplies.■ Address, in a gender-sensitive manner, the psychosocial needs of women and
girls, and men and boys, to cope with the loss of family and the ongoingchallenges of disaster.
Livelihoods■ Include strategies for creating long-term, income-generating projects for women,
especially those who have lost livelihoods and/or key providers.Education■ Ensure girls’ education is protected post-disaster.■ Rebuild/relocate schools quickly and safely.■ Train more women teachers.Gender analysis■ Ensure all data collected are, at the minimum, disaggregated by sex.■ Strive to include other axes of vulnerability, including race/ethnicity, age and
ability.

161World Disasters Report 2006 – Gender issues in emergencies
This chapter was contributed by Maureen Fordham, Programme Leader for the MSc inDisaster Management and Sustainable Development at Northumbria University, UK; Madhavi Malalgoda Ariyabandu, a Sri Lanka-based development researcherspecializing in the political economy of development and disasters; Prema Gopalan, theIndia-based global facilitator for the Women and Disaster Reduction Campaign of theHuairou Commission, a global grass-roots network; and Kristina J. Peterson, a communityactivist and doctoral student at the Center for Hazards Assessment, Response andTechnology (CHART), University of New Orleans, USA. Box 6.1 was contributed byKristina J. Peterson. Box 6.2 was contributed by Dr Elizabeth Edna Wangui, Departmentof Geography and Human Environmental Studies, San Francisco State University, USA.Box 6.3 was contributed by Jonathan Walter, editor of the World Disasters Report.Box 6.4 includes contributions from Maureen Fordham, Prema Gopalan, Kristina J.Peterson and Elaine Enarson, who teaches disaster sociology at Brandon University,Manitoba, Canada. We would also like to acknowledge the assistance of Elaine Enarsonin reviewing this chapter.
Sources and further informationActive Learning Network for Accountability and Performance in Humanitarian
Action (ALNAP). Annual Review of Humanitarian Action: Improving Monitoringto Enhance Accountability and Learning. London: ALNAP, 2003.
Ahmad Aftab, S. Earth Quake Response Relief Programmes Mansehra, Battagram andAbbottabad Districts. Pakistan: Sarhad Rural Support Programme, December 2005.
Amnesty International. Sri Lanka: Waiting to go home – the plight of the internallydisplaced. London: Amnesty International, 2006.
Ariyabandu, Madhavi Malalgoda and Wickramasinghe, Maithree. Gender Dimensionsin Disaster Management. New Delhi: Zubaan Books, 2005.
Asian Development Bank, World Bank. Pakistan 2005 Earthquake: PreliminaryDamage and Needs Assessment. Islamabad, Pakistan: 12 December 2005.
Chew, Lin and Ramdas, Kavita N. Caught in the Storm: The Impact of NaturalDisasters on Women. San Francisco: The Global Fund for Women, 2005.
Enarson, E. P. and Morrow, B. H. (eds.). The Gendered Terrain of Disaster. New York:Praeger, 1998.
Fordham, Maureen. ‘Gender, disaster and development: the necessity for integration’in Mark Pelling (ed.), Natural disasters and development in a globalizing world.London: Routledge, 2003.
Human Rights Commission, Sri Lanka. Report of the Women’s Division: Disaster ReliefMonitoring Unit. Sri Lanka: Human Rights Commission, August 2005.
International Federation. NWFP Early Recovery Needs Assessment – Gender andCommunity Participation Analysis Report. Unpublished draft, 2006.

162
International Federation. Training Pack on Gender Issues. Geneva: InternationalFederation, 2003.
International Federation. ‘Sharing information for tsunami recovery in South Asia’ inWorld Disasters Report 2005. Geneva: International Federation, 2005.
International Labour Organization (ILO). A Survey of the Demand for TemporaryEmployment in Cash for Work Projects, April–May 2005. Technical Paper 3, 24 June 2005, Sri Lanka.
International Strategy for Disaster Reduction (ISDR) and Centre for Research on theEpidemiology of Disasters (CRED). Understanding risks of death and injury:Evidence from the tsunami in Tamil Nadu. Press release, Bonn, 28 March 2006.
Martin, S. Must Boys Be Boys ? Ending Sexual Exploitation and Abuse in UNPeacekeeping Missions. Washington DC: Refugees International, 2005.
Moser, C. Gender Planning and Development : Theory, Practice and Training. London:Routledge, 1993.
Oxfam International. The tsunami’s impact on women. Oxfam briefing note. OxfamInternational, March 2005.
Shrader, E. and Delaney, P. Gender and Post-Disaster Reconstruction: The Case ofHurricane Mitch in Honduras and Nicaragua. World Bank, 2000.
Tercier Holst-Roness, F. Violence against girls in Africa during armed conflicts and crises.International Committee of the Red Cross, Second International PolicyConference on the African Child: Violence Against Girls in Africa. Addis Ababa,11–12 May 2006.
United Nations. The World’s Women 2005: Progress in Statistics. New York: UnitedNations, Department of Economic and Social Affairs, Statistics Division, 2006.
United Nations. Women 2000 and Beyond: Making Risky Environments Safer. NewYork: United Nations Division for the Advancement of Women, Department ofEconomic and Social Affairs, 2004.
United Nations. Agreed Conclusions on Environmental Management and the Mitigationof Natural Disasters, proposed by the United Nations Commission on the Statusof Women, forty-sixth session, 4–15 and 25 March 2002, and adopted asECOSOC resolution 2002/5.
UN Office for the Coordination of Humanitarian Affairs (OCHA) Situation Report,Sri Lanka, 27 January–2 February 2006.
World Health Organization (WHO). Gender and Health in Disasters. Geneva: WHO,2002.
World Health Organization. International Code of Marketing of Breast-milk Substitutes.Geneva: WHO, 1981.
Yonder, A., Akcar, S. and Gopalan, P. Women’s Participation in Disaster Relief andRecovery. New York: SEEDS, The Population Council, 2005.

163World Disasters Report 2006 – Gender issues in emergencies
Web sitesActive Learning Network for Accountability and Performance http://www.alnap.org
Bangladesh Red Crescent Society http://www.bdrcs.org
Centre for Research on the Epidemiology of Disasters, the international disastersdatabase http://www.em-dat.net
Disaster Watch http://www.disasterwatch.net
Gender and Disaster Network http://www.gdnonline.org
15th Anniversary of the Innocenti Declaration on the Protection, Promotion and Support of Breastfeeding http://www.innocenti15.net
Oxfam GB http://www.oxfam.org.uk
Population Council http://www.popcouncil.org
Refugees International http://www.refugeesinternational.org
Reuters AlertNet http://www.alertnet.org
UN Division for the Advancement of Womenhttp://www.un.org/womenwatch/daw
UN Integrated Regional Information Networkshttp://www.irinnews.org
UN Population Fund http://www.unfpa.org
Note: The title of this chapter is based on the reply of a (male) official to a (female) gender specialist’s request forgender issues to be considered during the response to the Pakistan earthquake in October 2005. This chapter refersto the South Asia earthquake of October 2005 as the ‘Pakistan earthquake’, since research on the earthquake for thischapter was conducted only in Pakistan.

164

Photo opposite page:Amounts ofhumanitarian aidcommitted to crises varyenormously from oneplace to another. Herein Chad, the UNappealed for US$ 32per beneficiary in2005, but received justUS$ 18 per head. Inneighbouring Sudan, it appealed for US$ 588 and receivedUS$ 310 per head.Does global inequity in emergency aid startwith the widelydivergent amounts ofmoney for whichagencies appeal?
Rosemarie North/International Federation
165World Disasters Report 2006 – Humanitarian financing
Adequate? Equitable?Timely? Humanitarian aid trends in 2005
How do we know which disasters or crises are neglected? Analysing flows ofhumanitarian aid against emergency appeals is one measure. This helps track whichcountries, types of disaster and sectors are underfunded – at least, within the scopeof crises for which humanitarian appeals are made.
This chapter tracks flows of humanitarian aid during 2005 and over the past fiveto ten years, analysing them by sector and amount per beneficiary – includingpublic and private donations – and comes up with some striking key findings (seeMap).
With the advent of the Good Humanitarian Donorship (GHD) initiative –launched by a group of key donors in 2003 to promote humanitarian aidaccording to need – interest has never been higher in how donors are respondingto disasters and humanitarian crises. Have wealthier countries met theircommitments to distribute humanitarian aid coherently and equitably across theworld? What are the trends among other donors? What priority areas need to beaddressed?
The chapter begins with an overview of the context of global humanitarian aid,exploring the key factors which have shaped trends in 2005 and their implicationsfor adequate, equitable and timely response. Part 2 compares aid for naturaldisasters and complex political emergencies. Part 3 analyses different ways ofmeasuring equitable and adequate humanitarian response. Part 4 looks at thelatest attempts to improve the equity of response and draws out somerecommendations.
Part 1: Overview of trendsHumanitarian aid from wealthy Western donor governments in 2005 is estimatedat over US$ 12 billion, according to preliminary figures released in April 2006 bythe Development Assistance Committee (DAC) of the Organisation for EconomicCo-operation and Development (OECD)1. This is an increase of over US$ 3billion in real terms (37 per cent) from 2004, and is particularly striking as thepreliminary figures don’t include all multilateral contributions to United Nations(UN) agencies.

166
Tsunami475%
Guyana285% South Asia
196%
Djibouti37%
Central AfricanRepublic
39%
Republicof Congo
42%
2005: the year of inequitable humanitarian aid?
Sources: OCHA Financial Tracking Service, 2006Development Initiatives, 2006
Total per cent coverage of priority needs, in 2005 (inside and outside UN appeals).
Note: The top three humanitarian appeals of the year were on average eight times better funded than the bottom three appeals.
0
1,000
2,000
3,000
4,000
5,000
6,000
7,000
8,000
9,000
10,000US$ million
19701971
19721973
19741975
19761977
19781979
19801981
19821983
19841985
19861987
19881989
19901991
19921993
19941995
19961997
19981999
20002001
20022003
2004
Figure 7.1Total humanitarian aid from DAC government donors, 1970–2004 in real terms (2003 prices)
Source: OECD DAC database
436
8,428

Looked at in real terms (2003 prices), humanitarian aid from OECD donors was lessthan US$ 1 billion in 1974. During the 1980s, it averaged around US$ 2 billion peryear. The 1990s saw humanitarian aid more than double in real terms, averaging overUS$ 5 billion a year. In 2004, it stood at US$ 8.4 billion (2003 prices) (see Figure 7.1).
As well as increasing in real terms, humanitarian aid has been rising as a percentage ofglobal aid, or official development assistance (ODA). The steepest rise took placeduring the first half of the 1990s – when ODA was falling, while post-cold warinstability in Europe and complex emergencies in Africa were receiving globalattention. A key question, now that ODA has started to rise (with substantial growthpredicted to 2010), is whether humanitarian aid will maintain its current share. Formore information on levels of ODA, see Annex.
Tsunami generates unprecedented attention and funds
Even before December 2004’s Indian Ocean tsunami focused global attention onhumanitarian needs with such tragic force, 2005 was expected to put bothdevelopment and humanitarian issues in the spotlight as never before.
Several factors ensured widespread public and political awareness last year: theMillennium Review Summit (assessing progress towards the UN MillenniumDevelopment Goals), the Make Poverty History campaign, the Global Call to ActionAgainst Poverty, LIVE 8 and the 20th anniversary of famine in Ethiopia and Somalia,the poverty and development orientation of the G8 Summit at Gleneagles, Scotland,plus the association of humanitarian needs with the global security agenda.
Public interest in humanitarian issues during early 2005 was strongly focused on theaftermath of the tsunami, which prompted unprecedented donations. The factorsspurring the generous response were clear soon after the disaster: its timing whilemany Westerners were enjoying seasonal holidays; the vast death toll involving somany nationalities; the vivid, immediate and extensive media coverage (includingamateur video footage of the moment of disaster); the perception that the tsunamiwas an act of nature and therefore nobody’s fault; and a strong identification with thevictims, through personal connections with affected countries.
International funds raised and pledged for the tsunami totalled over US$ 14 billion –substantially more than is pledged most years to all emergencies in developingcountries. This total included money from governments, aid organizations and privatedonors, some of it to be spent up till 2010 (see Figure 7.2).
Pledges from governments and international financial institutions (IFIs), includingthe World Bank, totalled US$ 8.5 billion – a very large amount in relation to ‘normal’
167World Disasters Report 2006 – Humanitarian financing

humanitarian aid, though not quite as large as official pledges in response to 1998’sHurricane Mitch, which amounted to approximately US$ 9 billion.
The most striking aspect of the response was the very high level of individual giving.At least US$ 5.5 billion was donated by the public, an amount greater than non-governmental organizations (NGOs) had ever before collected in a year from allsources of humanitarian aid. Private funds given through NGOs accounted for 23 percent of all tsunami donations, while 76 National Red Cross and Red Crescent Societiestogether contributed nearly US$ 1.8 billion – 13 per cent of total tsunami funding.
The enormous interest generated by the tsunami, plus the fact that some agenciesreceived more money than they had requested (or could spend, in some cases), threwthe issue of neglected disasters into sharp relief. Did the focus on a few high-profileemergencies during 2004–2005 come at the expense of other, unreported disasters orchronic humanitarian crises? Part 3 explores this question in more detail.
The emergence of non-DAC donors
Over the last 15 years, OECD-DAC donor countries have provided 95 per cent ofofficial development assistance. But during the 1970s and 1980s, non-DAC donors(including China, the former Soviet Union, several Middle Eastern and OPEC
168
Uncommitted pledges from DAC donors including action on debt, US$ 2,230m
Uncommitted pledges from non-DAC donors, US$ 274m
Loans and grants from development banks, US$ 2,091m
Firm commitments from DAC donors, US$ 3,658m
Firm commitments from non-DAC donors, US$ 319m
Private funds received by NGOs, US$ 3,214m
Private funds received by UN, US$ 494m
Private funds received by Red Cross/Red Crescent, US$ 1,782m
Figure 7.2International funding for the Indian Ocean tsunami (US$ million and percentage)
Source: Tsunami Evaluation Coalition (forthcoming) Overall Funding Flows in Response to the Tsunami, Development Initiatives, 2006
16%
23%
25%2%
4%
15%
13%
2%

countries, and countries such as Poland and the Czech Republic which are nowmembers of the European Union) provided significant amounts of aid. OPECcountries contributed 30 per cent of global aid in 1978.
In response to the tsunami, non-DAC governments pledged US$ 593 million, 9 percent of overall funding pledged by governments. Over the period 2000–2005, non-DAC donors provided 6 per cent of total humanitarian aid from governments,although in 2001 it was 13 per cent and since 2003 the share of the total from non-DAC donors has been growing each year (see Figure 7.3).
From 2000 to 2004, around 20 non-DAC donors a year provided humanitarian aidon average, but in 2005 the tsunami response boosted this to 64 countries. There areseveral reasons for assuming that, in future years, non-DAC donors will becomeincreasingly significant. Firstly, for countries without long-established patterns ofgiving, humanitarian crises provide obvious opportunities to channel resources.Secondly, several non-DAC countries, including South Korea, Turkey, Hungary andthe Slovak Republic, are committed to increasing their aid significantly. Lastly,emerging donors will want to spend money in a way that reinforces domestic supportfor a growing aid programme – and domestic constituencies are normally stronglysupportive of responding to clear humanitarian needs.
169World Disasters Report 2006 – Humanitarian financing
2000 2001 2002 2003 2004 20050
100
200
300
400
500
600
700
800
900
1,000US$ million
Figure 7.3Humanitarian aid from non-DAC governments, 2000–2005 (current prices US$ million)
Source: OCHA Financial Tracking Service
171
79
732
159
284
650

What will this increase in the number and range of donors do for neglectedemergencies? Historical trends suggest that while the effect may be modest overall, itwill be highly significant for some crisis-affected countries. The strength of the oilmarket increases the potential for countries such as Saudi Arabia to providesubstantial aid and, if the past is a guide to future action, OPEC and Middle Easterndonors are likely to concentrate on their neighbours in the Muslim world.
For example, between 2000 and 2005, Saudi Arabia provided over US$ 1 billion inhumanitarian aid to 47 countries – principally the Occupied Palestinian Territory(OPT) (US$ 671 million), Pakistan (US$ 144 million), Iraq (US$ 44 million),Afghanistan (US$ 23 million) and Niger (US$ 19 million).
In 2001, the OPT received US$ 645 million and North Korea (DPRK) US$ 68million – accounting for more than 97 per cent of all non-DAC humanitarian aid thatyear. From 2000 to 2004, just four beneficiaries (Afghanistan, Iraq, North Korea andthe OPT), received more than 80 per cent of non-DAC humanitarian aid. Of these,non-DAC donors accounted for 35 per cent of all humanitarian contributions to theDPRK and 20 per cent of such aid to the OPT, from 2002 to 2004 – according toUN OCHA’s Financial Tracking Service (FTS).
Humanitarian aid reported from non-DAC donors appears quite volatile – but theextent to which this is a result of variable reporting is not clear. Data from non-DACgovernments available on FTS are only reported voluntarily, which may account forthe very big year-on-year changes in the total figures.
One source of aid invisible in almost every analysis (because it is not easily monetizedand accounted for) is local response – both from governments and affected orneighbouring communities. This is often the earliest and most important response interms of saving lives. No institution appears to be measuring what host governmentsare spending on disaster response in their own countries and reporting itinternationally.
Part 2: Which types of disaster get most attention?Humanitarian aid tends to be categorized and accounted for, at least by the UN, intwo parts – natural disasters, for which ‘flash appeals’ are issued, and complexemergencies, for which ‘consolidated appeals’ are made. Somewhat confusingly, bothtypes of appeal form part of the UN’s Consolidated Appeals Process (CAP).
Since 1997, a total of US$ 29.4 billion has been requested under the CAP. Of this,by far the larger amount (almost US$ 27 billion) has been for complex emergencies.Just US$ 2.6 billion has been requested for natural disasters under flash appeals –most of this during 2005 (see Figure 7.4).
170

Over the last decade, there has been a fairly steady rise in the number of consolidatedand flash appeals, from 16 a decade ago to a peak of 31 in 2004, dropping slightly to25 last year. Much of this increase is due to a recent rise in flash appeals for naturaldisasters. Between 1996 and 2002, there were only three flash appeals, but since 2003there have been 21 (see Figure 7.5).
To some extent, this may be attributed to an upsurge in the impact of natural disasters.According to the latest data from the Centre for Research on the Epidemiology ofDisasters (CRED), the average number of natural disasters reported each year increasedby over 60 per cent during 2003–2005, compared with 1996–1998. The numbersreported killed and the estimated costs of damage increased by a similar margin.
It also appears that the increase in flash appeals has come about because the CAP isnow seen by donors as an increasingly important trigger for response and the flashappeal mechanism provides them with a reliable vehicle through which to contribute.Certainly, in 2005, the response to the two most prominent natural disasters – thetsunami and the South Asia earthquake – was well above historic response rates.
As there have been few flash appeals since 1997, it is difficult to give a morereliable explanation of trends. But the gathering momentum around the
171World Disasters Report 2006 – Humanitarian financing
1997 1998 1999 2000 2001 2002 2003 2004 20050
US$ million
1,000
2,000
3,000
4,000
5,000
6,000
Figure 7.4Total requirements for UN consolidated and flash appeals,1997–2005 (US$ million)
Source: OCHA Financial Tracking Service
1,922
2,382
1,522
2,15310 2,559
4,375
2,967
5,18931
3,798451
2
2,068
Flash appeals
Consolidated appeals

coordination of flash appeals under OCHA suggests that the increase of suchappeals in response to natural disasters will continue. Even without the tsunami,total requirements under flash appeals increased from US$ 451 million in 2004 toUS$ 762 million in 2005. With the tsunami appeal, requirements totalled morethan US$ 2 billion.
It is easier to assess trends in consolidated appeals because there have been 176 appealsover the decade. While there has been a decline in the number of consolidated appealsfrom 25 in 2003 to 15 in 2005, this is still in line with the average number of appealsfrom 1996 to 2001.
The recent reduction is as likely to be due to a consolidation in the way appeals aredeveloped as to a reduction in need related to fewer complex emergencies. In fact, theaverage amount requested per consolidated appeal in 2005 was US$ 253 million –well above the average since 1997 of US$ 164 million.
In volume terms over the decade, total requirements were at their highest in 2003(over US$ 5 billion), due to a US$ 2.2 billion request for Iraq. Between 1997 and2005, only three appeals had requirements over US$ 1 billion – Afghanistan in 2002,Iraq in 2003 and Sudan in 2005.
172
1996 1997 1998 1999 2000 2001 2002 2003 2004 20050
5
10
15
20
25
30
35
Figure 7.5Total numbers of UN consolidated and flash appeals, 1996–2005
Source: OCHA Financial Tracking Service
1513
15
11
1719
2422
25
15
21
9
210
Flash appeals
Consolidated appeals

Part 3: How adequate and equitable is humanitarian response?Concern about equitable response to emergencies has been on the internationalagenda for years, notably since 1994’s Code of Conduct for the International Red Crossand Red Crescent Movement and NGOs in Disaster Relief, which now has over 300 signatories and whose second principle states:
Within the entirety of our programmes, we will reflect considerations ofproportionality. Human suffering must be alleviated whenever it is found;life is as precious in one part of a country as another. Thus, our provision ofaid will reflect the degree of suffering it seeks to alleviate… Theimplementation of such a universal, impartial and independent policy canonly be effective if we and our partners have access to the necessary resourcesto provide for such equitable relief, and have equal access to all disastervictims.
The enormous response to the tsunami heightened awareness of the need to addressequitable responses between emergencies and coherent responses (which ensure thatpriority needs are met first) within emergencies. There are several ways of measuringequitable, coherent and adequate responses:
■ Tracking per cent coverage of appeals (measuring commitments againstrequirements).
■ Comparing funding by targeted beneficiary (both requirements andcommitments per head).
■ Analysing the regional distribution of global humanitarian aid.■ Measuring coverage by individual sectors to reveal whether responses are
coherent within crises. ■ Measuring the timeliness with which aid is committed – as the adequacy of
humanitarian response depends on speed as well as quantity.
The chapter will now examine each of these measures in turn, using data from boththe CAP and the DAC. It should, however, be noted that large numbers of people inneed of humanitarian aid are out of reach of aid agencies and so may not figure in aconsolidated or flash appeal. In addition, an analysis of CAP data cannot capture thefull nature of humanitarian aid flows, which include funding given directly togovernments and resources channelled through NGOs or the International Red Crossand Red Crescent Movement, which are not recorded as ‘inside the CAP’.
Tracking appeal coverage
The UN’s Consolidated Appeals Process has been operational since 1992. It is theinternational community’s primary method for ensuring that everyone affected by a
173World Disasters Report 2006 – Humanitarian financing

humanitarian crisis receives an adequate response. But over the last decade, there hasbeen no real improvement in the extent to which appeals are funded. At the sametime, the volume of requirements has increased substantially and, as a result, thevolume of funding through the CAP has also increased.
In the case of the tsunami, the flash appeal requested US$ 1.28 billion, but FTSrecorded over US$ 6 billion in humanitarian response alone during 2005 – most butnot all of which will have been available for spending in 2005. This means that thetsunami appeal was funded to the tune of 475 per cent. By contrast, most appeals areunderfunded by about one-third (see Figure 7.6).
Disaggregating the picture, it is clear that there is a huge range in the extent to whichappeals are funded. On average since 2000, the five best-funded appeals in each yearhave had well over four-fifths of their needs met. However, the five most poorlyfunded have received around a quarter to a third of their requirements. The widestgap came in 2003, when 96 per cent of needs were covered for the top fiveemergencies while only 27 per cent were met for the bottom five. The gap narrowedsomewhat in 2005, with the top five appeals 77 per cent covered and the bottom five36 per cent covered (see Figure 7.7).
174
1996 1997 1998 1999 2000 2001 2002 2003 2004 20050%
10%
20%
30%
40%
50%
60%
70%
80%
90%
100%
Figure 7.6Percentage of needs covered for all UN consolidated and flash appeals,1996–2005
Source: OCHA Financial Tracking Service
59%54%
69%64%
Average 64.6%72%
55%
67%64%
76%
66%

Looking at the impact of these variations on particular countries in 2005, the flashappeal for Guyana had the lowest coverage, at 30 per cent. When torrential raindeluged this small South American country in January 2005, two-fifths of the entirepopulation were affected in the country’s largest disaster for a century. Close onGuyana’s heels were the Djibouti flash appeal (34 per cent covered), Central AfricanRepublic (35 per cent), Republic of Congo (38 per cent) and the West Africa choleraflash appeal (45 per cent).
The appeals with the highest percentages of needs covered in 2005 were the Angolaflash appeal (72 per cent), Malawi flash appeal (76 per cent), Uganda (76 per cent),the Great Lakes (77 per cent) and, of course, the tsunami flash appeal (see Figure 7.8).However, according to FTS data, Malawi’s appeal was revised downwards after adisappointing donor response – just over half of the original appeal requirements weremet.
What are the reasons for these disparities? It is not to do with the volume of fundingneeded. Ironically, the most poorly funded appeals have had only modestrequirements. Guyana’s appeal was for less than US$ 3 million, while the complexemergencies in the Central African Republic and the Republic of Congo neededaround US$ 25 million each, but only received US$ 9 million.
175World Disasters Report 2006 – Humanitarian financing
2000 2001 2002 2003 2004 20050%
20%
40%
60%
80%
100%
Figure 7.7Top and bottom five UN appeals by per cent coverage, 2000–2005
Source: OCHA Financial Tracking Service
96%
89%
79%75%
35% 32%
24%27%
24%
36%
88%
77%

176
% 0 10 20 30 40 50 60 70 80 90 100
Guyana
Djibouti
Central African Republic
Republic of Congo
West and Central Africa
Sudan
Côte d'Ivoire
Chad
Burundi
Somalia
Palestinian Territory,Occupied
Guinea
Eritrea
Guatemala
Niger
South Asia
DemocraticRepublic of Congo
Benin
West Africa
Chechnya
Angola
Uganda
Malawi
Great Lakes region
Tsunami* 86%
77%
76%
76%
72%
69%
69%
66%
66%
66%
65%
64%
64%
63%
63%
58%
56%
55%
54%
53%
45%
38%
35%
34%
30%
Figure 7.8Per cent coverage of consolidated and flash appeals,(inside the UN appeal) 2005
Source: OCHA Financial Tracking Service
*Note on tsunami: for technical reasons, the tsunami was only 86% funded within the UN appeal, but 475% funded when all humanitarian response for 2005 is considered.

The data suggest that the reasons for neglect are rooted in the policy priorities givento different countries – possibly linked to the capacity to deliver. A country may bevery needy, but access may be difficult and other obstacles may prevent an effectiveresponse. However, this should be reflected in the appeal requirements, which are nota statement of needs alone, but a prioritized, costed set of programmes designed tomeet needs as far as possible.
The same countries appear continually at the top and bottom of the table for the shareof needs met. In the past ten years, the Great Lakes region of Africa has had an appealevery year. For eight of those years it was in the top five, in terms of per cent coverage.Angola appeared five times in the top five, while Sierra Leone, Tajikistan and theDPRK each appeared four times.
However, the Republic of Congo has had an appeal for five of the past ten years andeach of those has been in the bottom five and below 40 per cent coverage. Zimbabwehas appeared three times in the bottom five. Yet, while the Republic of Congo hasreceived very little media attention – which may help to explain its position as aneglected emergency – the same cannot be said of Zimbabwe. The difficult politicalcontext in Zimbabwe may inhibit the work of donors, but the country’s plight iscertainly not overlooked.
Analysing DAC data reveals a similar concentration of humanitarian aid in a fewcountries – far more so than for development assistance. In 2004, the latest year forwhich DAC data are available, the top five recipients shared 31 per cent of totalhumanitarian aid from DAC donors, while 137 other countries shared the remainingaid. These figures include all contributions to UN consolidated and flash appeals, butalso humanitarian aid to countries which are not the subject of an appeal.
Some of the 137 countries will have had very small, local crises and a small volume offunding cannot be interpreted as an inadequate response. However, the CAP issupposed to include all countries where the crisis is on a sufficient scale to require aconsolidated UN response. So the unevenness to which UN appeals are funded makesit clear that there is a big variation in international response, even between globallyprioritized emergencies.
Comparing funding per beneficiary
The other way of measuring neglect is by comparing responses between emergencies,looking at the data per targeted beneficiary.
The following analysis uses UN figures, where available, to work out humanitarianaid per beneficiary. OCHA’s 2005 Humanitarian Appeal provides numbers ofbeneficiaries targeted by all consolidated appeals for complex emergencies. Since this
177World Disasters Report 2006 – Humanitarian financing

information is less easily available for flash appeals, the analysis uses the best dataavailable from the appeal documents.
However, this does not always provide a like-for-like comparison. Some appeals, suchas the 2005 flash appeal to combat cholera in six countries across West and CentralAfrica, are principally for information-sharing rather than for meeting the needs ofaffected people.
In the case of the tsunami, estimates of the number of people affected ranged from 1 million to 5 million, so estimates of per capita spending will vary widely dependingon which estimate is taken. The UN tsunami appeal states that it aims to meet theneeds of 5 million people and this is the figure used for the analysis in this chapter.However, it is worth noting that the Tsunami Evaluation Coalition and the WorldBank put the number of people affected at 2 million.
A further complicating factor is the lack of humanitarian benchmarks which wouldset standards across all emergency situations for minimum adequate outcomes.Without these, the amounts requested (let alone donated) are determined to someextent by what can be delivered or by subjective criteria, rather than by the consistentapplication of a common denominator of need. Since appeals combine needsassessment with a call for resource mobilization, there is an ongoing risk that they willrequest funds based, at least in part, on what the donor market can bear.
Added to which, humanitarian appeals are not in principle intended to fund recoveryand reconstruction. But it’s not always easy to draw clear lines between these phasesand the emergency phase.
Analysing funding within the UN appeal process, it is striking that whilecontributions per targeted beneficiary were very diverse for different emergenciesduring 2005, this is at least in part because the funds requested were equally wide-ranging (see Figure 7.9).
Contributions inside the UN humanitarian appeal during 2005 ranged from US$ 3per targeted beneficiary in Guyana to US$ 310 per head in Sudan. Meanwhile, fundsrequested per beneficiary for Guyana and Sudan were US$ 9 and US$ 588respectively.
Taking the bottom five appeals of 2005 (West and Central Africa flash, Guyana flash,Malawi flash, Niger flash and Côte d’Ivoire), the average requested per beneficiary was US$ 16 and the average contributed inside the appeal was US$ 9. At the other end, the top five appeals (Djibouti flash, Chechnya, Benin flash, Republicof Congo and Sudan) averaged US$ 373 requested per beneficiary and US$ 190contributed.
178

179World Disasters Report 2006 – Humanitarian financing
US$0 100 200 300 400 500 600
West and Central Africa
Guyana
Malawi
Niger
Côte d'Ivoire
Chad
West Africa
Somalia
Central African Republic
Burundi
Uganda
Great Lakes region
Eritrea
Djibouti
Palestinian Territory,Occupied
South Asia
DemocraticRepublic of Congo
Guinea
Guatemala
Republic of Congo
Chechnya
Benin
Tsunami
Sudan $588
$451
$295
$271
$262
$261
$245
$208
$174
$160
$158
$111
$102
$88
$82
$61
$40
$32
$30
$23
$18
$9
$0.4
$126
$310
$170
$195
$186
$89
$225
$157
$131
$114
$102
$105
$39
$57
$68
$62
$36
$28
$18
$16
$15
$13
$3
$0.2
$81
Figure 7.9Total requirements and contributions per targeted beneficiary (inside UN appeal), 2005 (US$)
Source: OCHA Financial Tracking Service
Note: the Angola flash appeal is not counted because of uncertainty over numbers of targeted beneficiaries.
Total requirements per targeted beneficiary
Total contributions per targeted beneficiary

The difference between the top and bottom five appeals, in terms of both requests andcontributions per head, is greater than a factor of 20. But is it 20 times more expensiveto run an aid operation in Sudan, Congo or Benin than it is in Niger, Malawi orGuyana?
One reason for the huge difference in requirements per beneficiary may be due to thecontext, the nature of the appeal and what needs to be resourced. For instance, thereis a big difference between the appeals for Sudan (US$ 588 per head requested) andneighbouring Chad (US$ 32 per head requested). The 2005 appeal for Sudan was acountrywide work plan which aimed to restore peace in the country after years of war.It encompassed humanitarian, protection, recovery and development needs withrequirements totalling around US$ 1.4 billion. Meanwhile, the 2005 appeal for Chadwas launched principally to meet the needs of refugees entering eastern Chad fromSudan’s Darfur region and totalled US$ 182 million.
What is also striking from this analysis is that some well-covered appeals actuallydidn’t raise much money per targeted beneficiary. Malawi’s appeal, noted above as oneof the best covered at 76 per cent, only raised US$ 13 per person in need – the thirdlowest figure out of 25 appeals. Conversely, the Republic of Congo’s appeal, one ofthe worst covered at 38 per cent, raised US$ 170 per person in need – the secondhighest figure of the year.
However, many countries with UN humanitarian appeals also attract contributionsoutside those appeals – often channelled through NGOs or the International RedCross and Red Crescent Movement – and these figures are tracked by FTS (seeFigure 7.10).
Ten crises are revealed as receiving more humanitarian aid (inside and outside theirappeals) than was requested by the UN: Chechnya, Democratic Republic of Congo,Great Lakes region, Guyana flash appeal, Malawi flash appeal, Niger flash appeal,South Asia flash appeal, the tsunami flash appeal, Uganda and West Africa. But 14 appeals still fell short of the CAP’s stated requirements, even when counting totalhumanitarian donations. All funding provided for the Republic of Congo, Djiboutiand the Central African Republic, whether given inside or outside the appeal,amounted to less than half of what was requested in the CAP’s statement of priorityneeds.
In the case of the tsunami, private donations outside the appeal were particularlylarge, totalling more than US$ 3.8 billion – which meant four times more money wasdonated outside the appeal than inside. This boosted tsunami contributions in 2005for humanitarian aid alone to US$ 1,241 per targeted beneficiary (using the UN’sfigure of 5 million beneficiaries) or over US$ 3,000 per head, using the World Bank’sfigure of 2 million affected people.
180

181World Disasters Report 2006 – Humanitarian financing
US$ 0 100 200 300 400 500 600 700 800 900 1,000 1,100 1,200 1,300
West and Central Africa
Chad
Guyana
Côte d'Ivoire
Malawi
Niger
Central African Republic
West Africa
Somalia
Burundi
Uganda
Eritrea
Djibouti
Great Lakes region
Palestinian Territory,Occupied
Guinea
Republic of Congo
Democratic Republicof Congo
Benin
Guatemala
Chechnya
South Asia
Sudan
Tsunami$261
$588
$158
$271
$245
$295
$174
$451
$208
$160
$88
$126
$82
$102
$61
$40
$111
$23
$18
$30
$9
$32
$0.4
$262
$1,241
$431
$310
$281
$224
$218
$213
$190
$153
$129
$101
$95
$86
$82
$53
$50
$43
$30
$28
$27
$25
$23
$0.3
$96
Figure 7.10Total requirements and contributions per targeted beneficiary (inside and outside UN appeal), 2005 (US$)
Source: OCHA Financial Tracking Service
Notes: 1) The Angola flash appeal is not counted because of uncertainty over numbers of targeted beneficiaries. 2) The tsunami contributions figure is calculated as follows: total humanitarian assistance of US$ 6.2
billion for 2005, reported by FTS as inside and outside the UN appeal, divided by 5 million beneficiaries as stated by the UN appeal. Using the total tsunami aid of US$ 14 billion (including reconstruction funding,
pledges and loans as reported in Figure 7.2) would clearly result in an even higher per capita figure.
Total requirements per targeted beneficiary
Total contributions per targeted beneficiary

Another appeal to attract considerably more aid outside the UN appeal than insidewas the South Asia earthquake, boosting the per capita figure to US$ 310 – nearlydouble what was requested through the UN appeal.
At the other end of the spectrum, however, the same five countries appear nearthe bottom in terms of per capita aid, whether calculated inside or outside theappeal: Niger, Malawi, Côte d’Ivoire, Guyana and Chad. Taken together theseappeals attracted total humanitarian aid of less than US$ 27 per targetedbeneficiary.
It may be appropriate to treat the very large funding per person for the tsunami asexceptional, given the overwhelming public response. But, discounting the tsunami,it is clear that when total humanitarian aid is analysed, there are even widerdisparities between high-profile, well-funded emergencies and those where peopleare relatively neglected.
The regional distribution of humanitarian aid
Are some regions of the world more neglected than others when it comes tohumanitarian aid? According to the latest data from CRED, over 2.2 billionpeople in Asia have been killed, made homeless or otherwise affected by naturaldisasters over the past ten years, compared with 202 million in Africa over thesame period. But Asia (including Afghanistan) receives less than 30 per cent ofglobal humanitarian aid recorded by the DAC (see Figure 7.11).
The overall rise in funding for sub-Saharan Africa over the decade from 1995 to2004 was 182 per cent, while for North Africa the rise was 257 per cent, thanksmainly to increases in bilateral aid to Morocco and Algeria. This compares withrises of 138 per cent to the Middle East and 124 per cent to Asia.
Only two or three Asian countries are the subject of consolidated or flash appealseach year, compared with around 15 African countries, which raises the issue ofwhy Asia is comparatively neglected. Several factors are at play. Perhaps thestrongest is the tendency of wealthier donors to give humanitarian aid tocountries in their own region or with which they have strong economic, social orpolitical ties. This partly explains high levels of assistance to the Balkans fromEU member states throughout the 1990s. Most Japanese aid is focused on Asia;Latin America receives proportionately more aid from the US than from otherdonors.
Another factor is that complex emergencies are more prevalent in Africa than Asiaand have received more sustained political attention than natural disasters in Asiaover the decade to 2004 – and consequently more funding.
182
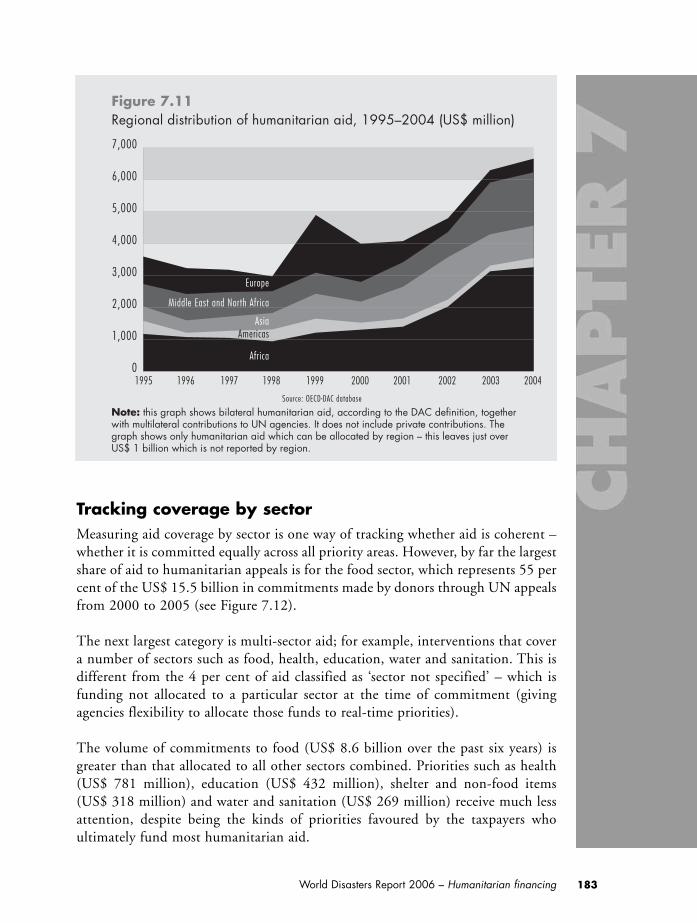
Tracking coverage by sectorMeasuring aid coverage by sector is one way of tracking whether aid is coherent –whether it is committed equally across all priority areas. However, by far the largestshare of aid to humanitarian appeals is for the food sector, which represents 55 percent of the US$ 15.5 billion in commitments made by donors through UN appealsfrom 2000 to 2005 (see Figure 7.12).
The next largest category is multi-sector aid; for example, interventions that covera number of sectors such as food, health, education, water and sanitation. This isdifferent from the 4 per cent of aid classified as ‘sector not specified’ – which isfunding not allocated to a particular sector at the time of commitment (givingagencies flexibility to allocate those funds to real-time priorities).
The volume of commitments to food (US$ 8.6 billion over the past six years) isgreater than that allocated to all other sectors combined. Priorities such as health(US$ 781 million), education (US$ 432 million), shelter and non-food items (US$ 318 million) and water and sanitation (US$ 269 million) receive much lessattention, despite being the kinds of priorities favoured by the taxpayers whoultimately fund most humanitarian aid.
183World Disasters Report 2006 – Humanitarian financing
19961995 1997 1998 1999 2000 2001 2002 2003 20040
1,000
2,000
3,000
4,000
5,000
6,000
7,000
Figure 7.11Regional distribution of humanitarian aid, 1995–2004 (US$ million)
Source: OECD-DAC database
Note: this graph shows bilateral humanitarian aid, according to the DAC definition, together with multilateral contributions to UN agencies. It does not include private contributions. The graph shows only humanitarian aid which can be allocated by region – this leaves just over US$ 1 billion which is not reported by region.
Europe
Middle East and North Africa
Asia
Africa
Americas

Food is not only by far the largest sector – it is also the sector which is best coveredin relation to requests (79 per cent covered from 2000 to 2005). By contrast, theneeds of vital sectors such as economic recovery, shelter, protection, water andsanitation, and health and agriculture were all on average less than 40 per cent coveredbetween 2000 and 2005 (see Figure 7.13).
Food aid to Iraq worth US$ 1.4 billion in 2003 helped boost spending on food thatyear to almost US$ 2.8 billion – after which the value of food aid has fallen back tounder US$ 1.5 billion. Food aid is subject to different driving forces compared withcash aid. For some large donors, food is given in kind – it cannot be converted intocash.
Other much smaller sectors showing an increase from 2000 to 2005 include waterand sanitation (up 17 times), economic recovery (up 33 times) and shelter (up153 times) – but all of these increases are from very low levels. Given the scale of foodaid, a small shift from food to other sectors could leave room for greatly increasedspending on other priorities. Health, for instance, went up from US$ 37 million in2000 to US$ 266 million in 2005 – but this still only represented 5 per cent ofspending last year.
184
Security 0%
Multi-sector 16%
Protection/human rights/rule of law 1%
Sector not specified 4%Food 56%
Education 3%
Health 5%
Economic recoveryand infrastructure 3%
Coordination and supportservices 5%
Agriculture 3%
Water and sanitation 2%
Shelter and non-food items 2%
Mine action 1%
Figure 7.12Percentage of donor commitments to all sectors, 2000–2005
Source: OCHA Financial Tracking Service
Note: percentages may not add up due to rounding

Making the global needs assessment and the UN’s Consolidated Appeals Process moreinclusive would improve the analysis of sectoral shortfalls. Up to now, NGOs and theInternational Red Cross and Red Crescent Movement have not been consistentlyinvolved in either the needs assessment or the CAP. If they have a particular focus onone sector, for example Oxfam on water and sanitation, their actions in that sectormay not be properly reported within the CAP data.
Timeliness: too late, as well as too little
A key issue on the adequacy and efficiency of humanitarian interventions is howquickly donors respond to need. If an emergency is neglected in its early stages theconsequences can be serious, not only for the people affected, but for the widerinternational community. Interventions that are life-saving cannot wait. Even lessextreme needs must be met in a timely way – there are often only very smallwindows of opportunity for an effective response.
As related in last year’s World Disasters Report, the delays in responding to Niger’slocust and food crisis from 2003 to 2005 proved costly in terms of lives, livelihoodsand aid. During a multi-donor meeting in Paris on 24 October 2004, there was
185World Disasters Report 2006 – Humanitarian financing
0% 10 20 30 40 50 60 70 80 90 100
Food
Multi-sector
Coordination and support services
Security
Mine action
Education
Agriculture
Health
Water and sanitation
Protection/human rights/rule of law
Shelter and non-food items
Economic recovery and infrastructure
Figure 7.13Average per cent coverage by sector, 2000–2005
Source: OCHA Financial Tracking Service
79%
73%
61%
44%
41%
40%
39%
37%
35%
33%
28%
24%

agreement that only US$ 1 million would have been needed to contain the locustthreat in July 2003, whereas the delayed response meant that, in the end, 100 timesthat figure was needed.
What is the record on timeliness for different kinds of UN appeal last year?
For 2005’s flash appeals (for natural disasters), 73 per cent of all contributions weremade either before or within the first month of an appeal launch – an improvementon 2004’s figure of 37 per cent. It is partly a result of the tsunami factor: thecatastrophe’s very high profile, the fact that budgets were available for the new yearand the media’s focus on the need to convert pledges into disbursements allprovided incentives for quick, reliable funding.
However, when analysing 2005’s consolidated appeals (for complex emergencies),just 7 per cent of contributions were made before or within the first month of theappeal launch. Within three months, just over one-third of contributions had beenmade, rising to just over two-thirds by the six-month stage (see Figure 7.14). Thiswas an improvement on 2004, when the majority of contributions (54 per cent)were made six months after the appeal start date.
186
Contributions before appeal launch
Contributions withinmonth 1
All other contributions after 6 months
Contributionswithin months 4–6
Contributionswithin months 2–3
Figure 7.14Timing of contributions from all donors to UN consolidated appeals, 2005
Source: OCHA Financial Tracking Service
36%
6%1%
28%
29%
Part 4: Improving the equity and timeliness of responseThere have been a number of attempts to improve the equity of humanitarianresponse. The Good Humanitarian Donorship initiative has made equitable responsea key priority. It was to report on its collective performance, using equity as a measure,in July 2006.
The European Commission’s humanitarian aid department, ECHO, has recognizedthe need for a donor of last resort for forgotten emergencies and has developed amethodology for identifying such crises (see Chapter 1). In 2002, 16 per cent ofECHO’s total budget of EUR 85 million (US$ 80 million) was dedicated to forgottenemergencies. In its 2006 aid strategy, ECHO classified Chechnya, Myanmar, theSaharawi refugees in Algeria, Nepal and the Kashmir crisis in India as forgottenemergencies.
Meanwhile, in March 2006, the UN launched the Central Emergency ResponseFund (CERF) as one step towards reform of the UN system. The fund, which has requested US$ 500 million in voluntary support from donors, will providerapid response funds within three to four days of a sudden-onset emergency.Furthermore, the CERF will target about one-third of its funds to forgotten crises.
Having funding available up front has several benefits. Crises that may have takenmonths to fund can now receive rapid start-up resources vital for mobilizing needsassessments and logistics pipelines. In addition, less high-profile disasters are now morelikely to receive funding. Until the expanded CERF was introduced in 2006, agencieshad to borrow to get immediate funding. Consequently, emergencies which wereexpected to be ‘unpopular’ lost out, since agencies would not borrow unless they werereasonably confident they would receive funding which would enable them to repaythe loan.
The grant-based CERF mechanism should make a major difference in accessingtimely funding for all emergency situations. However, as of June 2006, theCERF remained underfunded, with US$ 365 million in commitments and anadditional US$ 56 million in uncommitted pledges. One possible explanation isthat donors want to wait and see how the fund works before making financialcommitments.
The International Federation of Red Cross and Red Crescent Societies (InternationalFederation) has operated a similar kind of fund for over 20 years. Known as theDisaster Relief Emergency Fund (DREF), it provided over 10 million Swiss francs(US$ 8.5 million) of rapid response grants in 2005, half of which were for minor orforgotten emergencies (see Box 7.1).
187World Disasters Report 2006 – Humanitarian financing

188
The Disaster Relief Emergency Fund (DREF) was established in 1985 by the InternationalFederation to provide initial start-up funds andessential finance to National Red Cross andRed Crescent Societies, allowing rapid res-ponse in the case of emergencies.
As well as kick-starting rapid emergencyresponses, DREF has increasingly been used tomake funds available for responding to minoror neglected emergencies that would otherwisego unfunded. The fund also enables the Inter-national Federation to finance disaster pre-paredness and timely response and awareness-raising in the case of slow-onset disasters.
In 2005, DREF allocated 10.5 million Swissfrancs (US$ 8.5 million), of which nearly half went on minor emergencies. The fund isreplenished by donations to the InternationalFederation’s emergency appeals or by unear-marked funding from donors, which allows it torespond to minor emergencies.
Eighty per cent of disasters are managed atnational level where no international appeal islaunched to support them. Meanwhile, manyslow-onset disasters remain unattractive to donors,even after an emergency appeal is launched. Soin 2005, the International Federation decided touse DREF more ambitiously and proactively tosupport these minor and silent emergencies.
With the support of the Netherlands RedCross and the Netherlands government, theInternational Federation increased the amountallocated to minor emergencies from 1.56 mil-lion Swiss francs (US$ 1.25 million) in 2004to nearly 5 million Swiss francs (US$ 4 million)in 2005. Over the same period, the number ofminor emergencies funded more than doubledfrom 27 to 61. Requests for minor emergencyfunding continued to rise during 2006.
Africa benefited most from DREF funding in2005. The continent’s National Societies gen-erally have strong volunteer networks but lack
finance to respond to disasters. DREF provides them with the money to mobilize volunteers and procure relief items, or replacesupplies that have been distributed. Theknowledge that the operation will be financedallows the National Society to act quickly.
In the Sahel and East Africa, DREF providedconsiderable support for National Societies tobegin responding to food crises before majordonors showed an interest in supporting them.
In the case of infectious diseases, rapidresponse and awareness-raising at communitylevel are vital to prevent epidemics. In 2005,DREF made four minor emergency allocationsto support rapid response to cholera out-breaks in Mozambique and West Africa, plusa significant allocation to help counter the out-break of the Marburg virus in Angola.
In Asia, a minor emergencies grant enabledthe recently formed Timor-Leste Red Cross torespond swiftly to acute food shortages arisingfrom delayed rains and recurrent crop failure.In the Caribbean, DREF funding helped financeregional hurricane preparedness planning –which proved timely, as 2005 saw the worsthurricane season in recorded history.
In Lebanon, DREF resources helped ambu-lance services to continue operating whenstate support for the Lebanese Red Cross driedup during the political turmoil and bombattacks that the country has suffered sinceOctober 2004. According to Knut Kasperson,the International Federation’s head of delega-tion in Lebanon: “The Lebanese Red Cross hasbeen able to carry out 450 to 500 life-savingmissions per day. DREF ensured that the ambu-lances did not stop.”
A review of DREF is being carried out in2006. One question to be considered iswhether the fund should be increased to allowmore proactive support for countries andregions overlooked by donors. ■
Box 7.1 International Federation provides upfront funds for neglected emergencies

While upfront funding is a key part of improving the adequacy of humanitarianresponse, ensuring equity in response depends on the capacity to compare needs andnumbers of affected people across different crises.
In 2005 and early 2006, there were significant improvements in making needsassessments more comprehensive and the UN’s Consolidated Appeals Process morerigorously prioritized. The Needs Analysis Framework (NAF) has been developed as atool to help improve information on humanitarian needs in all emergencies. The NAFwas piloted in five countries in 2005 – the Occupied Palestinian Territory, DemocraticRepublic of Congo, Côte d’Ivoire, Uganda and Burundi – and it is being integratedinto all consolidated appeals in 2006. This should provide a more inclusive basis forthe prioritization of needs and should thus contribute to more equitable response.
The key point about the CAP is that it is intended to contribute to efficient andequitable response by establishing a definitive statement of priority needs in eachsituation. In principle, this means that the needs identified ‘inside the CAP’ shouldbe funded before other activities which are ‘outside the CAP'.
However, as we have seen, priority needs within the CAP have only been about two-thirds funded in recent years, while, for a variety of reasons, a great deal of fundingtakes place outside the CAP. For example, bilateral government-to-governmentfunding is not channelled through the CAP – nor is funding committed by a largenumber of NGOs. In addition, the often considerable resources available through theInternational Red Cross and Red Crescent Movement are recorded as outside the CAP.
Some donors and organizations bypass CAP processes for various reasons. Peter Rees,head of the International Federation’s Operations Support Department, says: “TheFederation is independent from the UN and does not appeal via a UN mechanism,such as the CAP. We do, however, regularly join the CHAP [Common HumanitarianAction Plan] process to ensure close coordination between UN, Red Cross/RedCrescent and NGO sectors.”
Neglect of protracted crises and chronic vulnerability
Peter Rees points out that the CAP excludes all UN development funding. This meansthat statements of humanitarian needs – such as those presented in the CAP – fail tocapture the full range of vulnerable people’s needs. “The bigger question”, says Rees,“is that humanitarian funding often comes as a result of a failed development approachor a failed political process.” He argues that the apparent lack of dialogue betweenhumanitarian and development sectors is “essentially non-strategic and inefficient”.
When analysing the CAP data presented in this chapter, it is striking how neglecteddevelopmental crises become neglected humanitarian crises. Last year’s slow-onset or
189World Disasters Report 2006 – Humanitarian financing

chronic ‘natural’ disasters (e.g., locust plagues, drought, poverty and hunger in Niger;drought, poverty, disease and hunger in Malawi) attracted much lower levels ofhumanitarian aid per beneficiary than the quick-onset natural disasters (e.g., thetsunami and the South Asia earthquake). Both Niger’s and Malawi’s food crises havebeen recurring for some years now.
The persistent and recurrent nature of many humanitarian crises is driven as much bychronic poverty and vulnerability as it is by natural hazards. This is especially so incountries such as Niger, where the 2005 food crisis threatening 2.5 million peoplewith starvation has been widely recognized as an acute manifestation of the chronicfood insecurity which left 40 per cent of children routinely malnourished even beforethe situation was brought to the attention of the global media and humanitarianagencies.
Not only are such chronic crises poorly funded in terms of aid per targetedbeneficiary, but the analysis of funding per sector reveals that programming to addressmore chronic issues, such as health, water and sanitation, agriculture and economicrecovery, is neglected compared to quick, emergency food aid. Meanwhile, data onthe timeliness of aid show that protracted, complex emergencies tend to attractfunding far slower than flash appeals for sudden-onset natural disasters.
The chronically poor, vulnerable people, who are neglected when it comes tohumanitarian response, are often the forgotten poor of development assistance –those who are hardest to reach and face the most obstacles to overcoming povertyand crisis.
Humanitarian interventions are focused on relieving humanitarian suffering ratherthan building long-term development. But looked at from the viewpoint of those inneed, there is an increasing case for a closer integration of humanitarian anddevelopment response and for an integrated perspective which ensures equity, notonly between humanitarian crises, but also between humanitarian crises andsituations of chronic poverty and vulnerability.
Conclusions and recommendations1. Aid must be adequate as well as equitable – to ensure there is enough money in
the system to meet all basic humanitarian needs, not just fairer slices of a cake thatis too small in the first place.
2. Assessments of priority needs are pivotal and work to improve their quality andcomparability must continue. The ability to prioritize within an emergency andbetween emergencies is essential if the most urgent needs are to be funded first.This not only requires institutional change, but also discipline among donors andagencies so that funding flows to those priority needs.
190

3. Needs assessments and the CAP must be more inclusive of all implementationagencies if they are to make the most of their capacity to ensure an adequate andequitable response to all emergencies.
4. Create a recognized minimum standard or benchmark of need – adenominator applicable to all emergencies. This would enable an objective,comparable judgement of the point when funding was adequate to meet basicneeds and, therefore, when any surplus resources could be transferred to neediersituations. Currently, there is not even a standard definition of the numbers ofpeople affected in different disasters.
5. Consider annual targets for humanitarian aid. The global response to disastersis financed by voluntary appeals. The humanitarian community could considerwhether its goal is that all people affected by disasters should be entitled to acertain minimum level of humanitarian aid and, if so, whether the current appeal-based system can deliver the predictable resources necessary to achieve that.
6. Ensure equity between humanitarian and development interventions – notjust equity between humanitarian crises – in order to address the needs of peoplesuffering chronic vulnerability and extreme poverty. Donor policy should bedriven by the perspective of affected individuals, not by the priorities of existingmanagerial departments.
This chapter was contributed by Development Initiatives (DI), drawing on the resourcesof the Global Humanitarian Assistance and Good Humanitarian Donorship project.DI welcomes corrections to any errors of fact or interpretation and additionalinformation. Please contact [email protected]. Further data can be found atwww.globalhumanitarianassistance.org. Box 7.1 was contributed by Elizabeth Soulié,the International Federation’s Communications and Reporting Officer for theOperations Support Department.
Sources and further information
Coopération Internationale pour le Développement et la Solidarité (CIDSE).Europe: A True Global Partner for Development? CIDSE Shadow Report onEuropean Progress towards Millennium Development Goal 8. CIDSE, April2005.
Development Initiatives. Global Humanitarian Assistance 2000. Report commissionedby the Inter-Agency Standing Committee (IASC) from Development Initiatives.Geneva: IASC, 2000. Available at http://www.globalhumanitarianassistance.org/2000.htm
Development Initiatives. Global Humanitarian Assistance 2003. Report commissionedby the Humanitarian Financing Work Programme (HFWP) from DevelopmentInitiatives. Geneva: HFWP, 2003. Available athttp://www.globalhumanitarianassistance.org/2003.htm
191World Disasters Report 2006 – Humanitarian financing

Development Initiatives. Global Humanitarian Assistance 2004–2005. Reportproduced by Development Initiatives as part of the Global HumanitarianAssistance and Good Humanitarian Donorship project. Available athttp://www.globalhumanitarianassistance.org
Development Initiatives. What type of funding models best support funding according toneed? Resource document for Ottawa meeting on good humanitarian donorship.2004. Available at http://www.reliefweb.int/ghd/GHD_Flexible_Funding_Models.pdf
Foy, C. and Helmich, H. (eds.). Public Support for International Development. Paris:OECD, 1996.
Fritz Institute. Lessons from the Tsunami: Top Line Findings. Fritz Institute, 2005.Available at http://www.fritzinstitute.org/PDFs/Programs/Findings_Sept2605.pdf
Organisation for Economic Co-operation and Development (OECD). TheDevelopment Effectiveness Of Food Aid: Does Tying Matter? OECD, 2006.
Oxfam International. Predictable funding for humanitarian emergencies: a challenge todonors. Oxfam briefing note. Oxfam International, October 2005.
United Nations Office for the Coordination of Humanitarian Affairs (OCHA).Humanitarian Response Review. Report commissioned by the United NationsEmergency Relief Coordinator and Under-Secretary-General for HumanitarianAffairs. OCHA, August 2005.
Web sitesCentre for Research on the Epidemiology of Disasters http://www.cred.beChronic Poverty Research Centre http://www.chronicpoverty.orgConsolidated Appeals Process, UN Office for the Coordination of Humanitarian
Affairs http://ochaonline.un.org/humanitarianappeal/Global Humanitarian Assistance http://www.globalhumanitarianassistance.orgGood Humanitarian Donorship http://www.goodhumanitariandonorship.orgOrganisation for Economic Co-operation and Development, Development
Co-operation Directorate http://www.oecd.org/dacOrganisation for Economic Co-operation and Development, Development
Assistance Committee online statistics databasehttp://www.oecd.org/dac/stats/idsonline
ReliefWeb Financial Tracking Service http://www.reliefweb.int/ftsTsunami Evaluation Coalition Online Forum http://www.tsunami-evaluation.org UN Office for the Coordination of Humanitarian Affairs Central Emergency
Response Fund http://ochaonline2.un.org/Default.aspx?tabid=7956
1 The DAC comprises the major group of donors who provide official development assistance (ODA): Australia,Austria, Belgium, Canada, Denmark, Finland, France, Germany, Greece, Ireland, Italy, Japan, Luxembourg,Netherlands, New Zealand, Norway, Portugal, Spain, Sweden, Switzerland, UK, USA and the European Commission.Humanitarian aid includes all funding from these governments to UN agencies, the International Red Cross and RedCrescent Movement, non-governmental organizations (NGOs) and direct expenditure classed as emergency anddistress relief (including spending on refugees in donor countries for the first year of their residence).
192

193World Disasters Report 2006
Annex

194

Disaster dataThe death toll from natural and technological disasters during 2005 was 99,425 – aboveaverage for the decade, according to the Centre for Research on the Epidemiology of Disasters (CRED). Natural disasters dominated, causing 88,835 deaths, of which 84 per cent were due to October’s South Asia earthquake.
The number of reported natural disasters was up 15 per cent from 2004, mainly dueto a 50 per cent increase in floods. The number of technological disasters dropped 10 per cent compared with 2004, but the death toll of 10,590 was in line with thedecade’s average.
Last year, 161 million people were affected by natural disasters – one-third less thanthe decade’s average of 250 million per year. During 2005, 27 disasters (10 floods, 9 windstorms, 7 droughts and the South Asia earthquake) affected more than 1 million people each. But none of these was on the scale of the floods which affectedover 100 million people in Bangladesh, India and China in 2004.
The cost of damage inflicted by natural disasters last year was estimated at nearly US$ 160 billion – more than double the average per year for the decade. HurricaneKatrina accounted for three-quarters of this total.
Official development assistance (ODA) from members of the DevelopmentAssistance Committee (DAC) of the Organisation for Economic Co-operation andDevelopment (OECD) grew to US$ 79.5 billion in 2004 (the latest year for whichcomplete data are available). Although this was an increase in real terms of nearly 6 per cent compared with 2003, it equated to an average of just 0.26 per cent of allDAC donors’ gross national income – well below the United Nations (UN) target of0.7 per cent. In 2004, emergency/distress relief (not including the relief providedthrough multilateral institutions and non-governmental organizations) grewsignificantly to US$ 7.3 billion (see Figures 1–5).
EM-DAT: a specialized disaster databaseTables 1–13 on natural and technological disasters and their human impact over thelast decade were drawn and documented from CRED’s EM-DAT. Established in1973 as a non-profit institution, CRED is based at the School of Public Health of theCatholic University of Louvain in Belgium and became a World Health Organization(WHO) collaborating centre in 1980. Although CRED’s main focus is on publichealth, the centre also studies the socio-economic and long-term effects of large-scaledisasters. In 2003, CRED initiated CE-DAT – a database for complex emergencies(see Box 1).
195World Disasters Report 2006 – Disaster data
Photo opposite page:From 1996 to 2005,disasters killed over934,000 people –nearly double thefigure for the previousdecade – while 2.5 billion people were affected acrossthe globe.
John Haskelo/International Federation

Since 1988, with the sponsorship of the United States Agency for InternationalDevelopment’s Office of Foreign Disaster Assistance (OFDA), CRED has maintainedEM-DAT, a worldwide database on disasters. It contains essential core data on theoccurrence and effects of more than 15,000 disasters in the world from 1900 to thepresent. The database is compiled from various sources, including UN agencies, non-governmental organizations, insurance companies, research institutes and press agencies.
Priority is given to data from UN agencies, followed by OFDA, governments andthe International Federation. This prioritization is not a reflection of the quality orvalue of the data but the recognition that most reporting sources do not cover alldisasters or may have political limitations that could affect the figures. The entries
196
Reliable data on conflict-affected populationsare notoriously difficult to obtain, but deci-sion-makers are increasingly demanding abetter evidence base for resource allocation.CE-DAT is an important initiative towardsaddressing this gap. Its approach is to com-pile and ana-lyse health and nutrition surveysundertaken in conflict and post-conflict situa-tions.
The main objectives of CE-DAT are to:■ Provide key nutritional, health
and mortality indicators for ration-al humanitarian aid decision-making;
■ Promote effectiveness of interna-tional policy on response and pre-vention through evidence-based trendanalysis and impact briefings; and
■ Support decision-making onhumanitarian aid and relief oper-ations though an Internet-accessible,multi-sourced database on complexemergencies and their impact on thehealth status of human populations.
The following indicators are collected inCE-DAT:
■ Mortality rates. Crude mortality,under-five mortality, infant mortality.
■ Malnutrition. Acute malnutrition, chronicmalnutrition, underweight, oedema andMUAC.
■ Vaccination coverage. Measles, polio,DTP and tuberculosis.
Beyond compiling health indicators, CE-DATalso:
■ Specifies the populations. The statusof populations – whether internally dis-placed, resident or refugee – is included.
■ Identifies the location. Data are brokendown to the smallest administrative levelboundary.
■ Provides methodologies. Informationis provided on how the data were collec-ted, including sampling methods andlengths of recall periods.
■ States the sources. All data are refer-enced to their original sources.
■ Collaborates with partners. CREDcollaborates actively with governmentaland non-governmental agencies active inthe field to improve the reliability of dataon conflict-affected populations and itsuse for decision-making.
For further information, please go tohttp://www.cred.be/cedat/index.htm ■
Box 1 Data on mortality and malnutrition in conflicts: CE-DAT – the Complex Emergency Database

are constantly reviewed for redundancies, inconsistencies and the completion ofmissing data. CRED consolidates and updates data on a daily basis. A further checkis made at monthly intervals. Revisions are made annually at the end of the calendar year.
The database’s main objectives are to assist humanitarian action at both national andinternational levels; to rationalize decision-making for disaster preparedness; and toprovide an objective basis for vulnerability assessment and priority setting.
Data definitions and methodology
CRED defines a disaster as “a situation or event, which overwhelms local capacity,necessitating a request to national or international level for external assistance(definition considered in EM-DAT); an unforeseen and often sudden event thatcauses great damage, destruction and human suffering”.
For a disaster to be entered into the database, at least one of the following criteriamust be fulfilled:
■ Ten or more people reported killed■ 100 people or more reported affected■ Declaration of a state of emergency■ Call for international assistance
The number of people killed includes persons confirmed as dead and personsmissing and presumed dead. People affected are those requiring immediate assistanceduring a period of emergency (i.e., requiring basic survival needs such as food, water,shelter, sanitation and immediate medical assistance). People reported injured orhomeless are aggregated with those reported affected to produce a ‘total number ofpeople affected’.
The economic impact of a disaster usually consists of direct consequences on the localeconomy (e.g., damage to infrastructure, crops, housing) and indirect consequences(e.g., loss of revenues, unemployment, market destabilization). In EM-DAT, theregistered figure corresponds to the damage value at the moment of the event andusually only to the direct damage, expressed in US dollars (2005 prices).
EM-DAT distinguishes two generic categories for disasters (natural and technological),divided into 15 main categories, themselves covering more than 50 sub-categories. Forthe production of the tables, natural disasters are split into two specific groups:
■ Hydrometeorological disasters: avalanches/landslides, droughts/famines,extreme temperatures, floods, forest/scrub fires, windstorms and other disasters,such as insect infestations and wave surges.
■ Geophysical disasters: earthquakes, tsunamis and volcanic eruptions.
197World Disasters Report 2006 – Disaster data

The technological disasters comprise three groups:■ Industrial accidents: chemical spills, collapse of industrial infrastructure,
explosions, fires, gas leaks, poisoning and radiation.■ Transport accidents: by air, rail, road or water means of transport.■ Miscellaneous accidents: collapse of domestic/non-industrial structures,
explosions and fires.
In Tables 1–13, ‘disasters’ refer to disasters with a natural and technological triggeronly, and do not include wars, conflict-related famines, diseases or epidemics.
The classification of countries as ‘high’, ‘medium’ or ‘low human development’ isbased on the 2005 Human Development Index (HDI) of the United NationsDevelopment Programme. For countries not appearing in the HDI, the World Bank’sclassification of economies by the countries’ level of income is used (‘high’, ‘middle’or ‘low’).
Caveats
Key problems with disaster data include the lack of standardized collectionmethodologies and definitions. The original information, collected from a variety ofpublic sources, is not specifically gathered for statistical purposes. So, even when thecompilation applies strict definitions for disaster events and parameters, the originalsuppliers of information may not. Moreover, data aren’t always complete for eachdisaster. The quality of completion may vary according to the type of disaster (forexample, the number of people affected by transport accidents is rarely reported) orits country of occurrence.
Data on deaths are usually available because they are an immediate proxy for theseverity of the disaster. However, the numbers put forward immediately after adisaster may sometimes need to be seriously revised several months later.
Data on the numbers of people affected by a disaster can provide some of the mostpotentially useful figures, for planning both disaster preparedness and response, butthey are sometimes poorly reported. Moreover, the definition of people affectedremains open to interpretation, political or otherwise. Even in the absence ofmanipulation, data may be extrapolated from old census information, withassumptions being made about percentages of an area’s population affected.
Data can also be skewed because of the rationale behind data gathering. Reinsurancecompanies, for instance, systematically gather data on disaster occurrence in order toassess insurance risk, but with a priority in areas of the world where disaster insuranceis widespread. Their data may therefore miss out poor, disaster-affected regions whereinsurance is unaffordable or unavailable.
198

For natural disasters over the last decade, data on deaths are missing for one-tenth ofreported disasters; data on people affected are missing for one-fifth of disasters; anddata on economic damages are missing for 84 per cent of disasters. The figures shouldtherefore be regarded as indicative. Relative changes and trends are more useful tolook at than absolute, isolated figures.
Dates can be a source of ambiguity. For example, a declared date for a famine is bothnecessary and meaningless – a famine does not occur on a single day. In such cases,the date the appropriate body declares an official emergency has been used. Changesin national boundaries cause ambiguities in the data and may make long-term trendanalysis more complicated.
Information systems have improved vastly in the last 25 years and statistical data arenow more easily available, intensified by an increasing sensitivity to disasteroccurrence and consequences. Nevertheless there are still discrepancies. An analysis ofthe quality and accuracy of disaster data, performed by CRED in 2002, showed thatoccasionally, for the same disaster, differences of more than 20 per cent may existbetween the quantitative data reported by the three major databases – EM-DAT(CRED), NatCat (Munich Re) and Sigma (Swiss Re).
Despite efforts to verify and review data, the quality of disaster databases can only beas good as the reporting system. This, combined with the different aims of three majordisaster databases (risk and economic risk analysis for the reinsurance companies anddevelopment agenda for CRED), may explain differences between data provided forthe same disasters. However, in spite of these differences, the overall trends indicatedby the three databases remain similar.
The lack of systematization and standardization of data collection is a major weaknesswhen it comes to long-term planning. Fortunately, due to increased pressure foraccountability from various sources, many donors and development agencies havestarted giving attention to data collection and its methodologies.
Part of the solution to this data problem lies in retrospective analysis. Data are mostoften publicly quoted and reported during a disaster event, but it is only long afterthe event, once the relief operation is over, that estimates of damage and death can beverified. Some data gatherers, like CRED, revisit the data; this accounts forretrospective annual disaster figures changing one, two and sometimes even threeyears after the event.
Improved data in EM-DAT
Last year, significant efforts were made to improve the EM-DAT informationavailable to the public. These changes, made according to a systematic and strict
199World Disasters Report 2006 – Disaster data

methodology, affect the results in some tables and may modify some trends. The mainareas of changes are:
■ Earthquakes. A systematic review of earthquake data for the last ten years led tothe introduction of 18 new disasters for the years 1996–1998. The inclusion ofthese events, plus the revision of already registered earthquakes, resulted in anincrease of 8.19 million in the number of people reported affected for the years1996–1999 and a decrease of 9.6 million in the number affected in 2001.
■ Floods. An ongoing review of all registered data led to an increase of almost 7.5 million in the number of people reported affected by floods for the years 1996–2004.
■ Droughts/famines. Improvements in this dataset (made in collaboration withthe International Research Institute for Climate Prediction) included a review ofover 800 historical drought disasters and 80 famines in EM-DAT, with dates andloss figures being reassigned as necessary. This led to an increase of 16 reporteddisasters and more than 47 million people affected for the years 2001–2004.
■ Economic loss/damage. Information gaps and the lack of a single, consistentmethodology led CRED to revise its dataset on economic data and consolidateits methodology on economic data entry. The revision led to an increase of morethan US$ 70 billion (at 2005 prices) in the total amount of loss/damage reportedfor the years 1996–2004.
United States Committee for Refugees and ImmigrantsThe United States Committee for Refugees and Immigrants (USCRI) is thesuccessor to the merged non-governmental organizations Immigration and RefugeeServices of America and United States Committee for Refugees. USCRI resettlesrefugees, reports on the situation of refugees and asylum seekers abroad andencourages the public, policy-makers and the international community to respondappropriately and effectively to the needs of uprooted populations. Its antecedentsgo back to 1910.
USCRI travels to the scene of refugee emergencies to gather testimony from uprootedpeople, to assess their needs and to gauge governmental and international response.The committee conducts public briefings to present its findings andrecommendations, testifies before the United States Congress, communicatesconcerns directly to governments and provides first-hand assessments to the media.USCRI publishes the annual (since 1961) World Refugee Survey, the monthly RefugeeReports and issue papers.
USCRI provided the data in Tables 14–16. The quality of the data in these tables isaffected by the less-than-ideal conditions often associated with flight. Unsettled
200
conditions, the biases of governments and opposition groups and the need to usepopulation estimates to plan for providing humanitarian assistance can eachcontribute to inaccurate estimates. The estimates reproduced in these tables areaccurate as at May 2006.
Table 14 lists refugees and asylum seekers by country of origin, while Table 15 liststhem by host country. Refugees are people who are outside their home country andare unable or unwilling to return to that country because they fear persecution orarmed conflict. But most refugees never receive a formal status determination.Asylum seekers are people who claim and, prima facie, appear to be refugees. Whilenot all asylum seekers are refugees, they are in need of international protection, atleast until they are determined not to be refugees. USCRI also includes personsgranted various subsidiary forms of protection if based on factors related to therefugee definition, as distinct from, for example, protection granted because ofnatural disaster.
Table 16 concerns internally displaced people (IDPs). Like refugees and asylumseekers, IDPs have fled their homes but remain in their home country. No universallyaccepted definition of IDPs exists. USCRI generally considers people who areuprooted within their country because of armed conflict or persecution – and thuswould be refugees if they were to cross an international border – to be internallydisplaced. Others employ broader definitions, however, sometimes including peopleuprooted by natural or human-made disasters or other causes not directly related tohuman rights. IDPs often live in war-torn areas and are neither registered nor countedin any systematic way. Estimates of the size of IDP populations are frequently proneto great margins of error.
Philippe Hoyois, Senior Research Fellow with CRED, Regina Below, Manager of CRED’sEM-DAT disaster database, and Debarati Guha-Sapir, Director of CRED, prepared thesections on natural and technological disasters, and official development assistance. Forfurther information, please contact Centre for Research on the Epidemiology of Disasters(CRED), School of Public Health, Catholic University of Louvain, 30.94 Clos Chapelle-aux-Champs, B-1200 Brussels, Belgium. Tel: +32 2 764 3327 Fax: +32 2 764 3441 E-mail: [email protected] Web: www.em-dat.net
The section on refugees, asylum seekers and IDPs was prepared by the US Committee for Refugees and Immigrants, 1717 Massachusetts Avenue NW, Suite 200, WashingtonDC 20036, USA (http://www.refugees.org). For questions regarding this section or data,please contact [email protected].
201World Disasters Report 2006 – Disaster data

1995 1996 1997 1998 1999 2000 2001 2002 2003 2004
Figure 1ODA net disbursements (US$ million, 2004 prices): 1995–2004
Source: OECD DAC: International Development Statistics, 2006
50,000
55,000
60,000
65,000
70,000
75,000
80,000
85,000US$ million
ODA from members of OECD’s DAC grew to US$ 79.5 billion in 2004 (the latest year for which complete data are available), a global increase of 5.9 per cent compared with 2003, when taking account of both inflation and exchange rate movements.
The figure shows that 9.2 per cent more aid was given in 2004 compared with 1995 and that, compared with 2001, the year with the lowest figure for the decade considered, ODA increased by 42.2 per cent.
Since 2001, the annual average increase in ODA is 12.5 per cent.
These figures do not take into account non-DAC donors’ development assistance of US$ 3.7 billion (2004 prices), of which 46.5 per cent was given by Saudi Arabia.
Also, voluntary contributions from the public via non-governmental organizations and private financial flows from migrants to their countries of origin are not considered.
202

Figure 2ODA net disbursements in 2004 (US$ million, 2004 prices)
Source: OECD DAC: International Development Statistics, 2006
The five biggest donors of ODA in 2004 were the United States (25 per cent of all ODA), Japan and France (both 11 per cent), the United Kingdom (10 per cent) and Germany (9 per cent). Their combined total of US$ 52 billion (2004 prices) represents two-thirds of all ODA.
If the contributions of the 15 countries forming the European Union (before its enlargement) are aggregated, their ODA amounts to US$ 43 billion (2004 prices), representing 54 per cent of all ODA.
212
236
465
607
655
678
1,031
1,460
1,463
1,545
2,037
2,199
2,437
2,462
2,599
2,722
4,204
7,534
7,883
8,473
8,906
19,705
0 2,000 4,000 6,000 8,000 10,000 12,000 14,000 16,000 18,000 20,000
New ZealandLuxembourg
GreeceIrelandFinlandAustria
PortugalAustraliaBelgium
SwitzerlandDenmarkNorway
SpainItaly
CanadaSweden
NetherlandsGermany
United KingdomFranceJapan
United States
203World Disasters Report 2006 – Disaster data

1995 1996 1997 1998 1999 2000 2001 2002 2003 2004
US$ million
0
5,000
10,000
15,000
20,000
25,000
USA
UK
Japan
Germany
France
USA
UK
Japan
Germany
France
Figure 3ODA: evolution of DAC contributions (US$ million, 2004 prices)
Source: OECD DAC: International Development Statistics, 2006
For the entire decade considered, the total contribution of the 15 countries forming the European Union (pre-enlargement) was US$ 339 billion (2004 prices), compared with US$ 118 billion for the United States and US$ 99 billion for Japan.
Compared with its lowest levels in 1997, the amount of United States’ development assistance, expressed in 2004 prices, increased by a factor of 2.5 in 2004, while the contribution of EU countries increased by a factor of 1.3 over the same period.
Compared with 2003, the biggest individual increases (measured in 2004 prices), came from the United States (up US$ 3 billion), Portugal and the United Kingdom (both up US$ 600 million), France and Canada (both up US$ 300 million), in real terms.
Between 2003 and 2004, taking account of both inflation and exchange rate movements, Portugal increased its ODA by 188 per cent, Austria by 20 per cent, the United States by 18 per cent, Canada by 15 per cent and Greece by 13 per cent.
Japan was the only one of the big five donors to cut ODA in 2004, continuing a downward trend which has seen its development assistance fall by half in real terms since 1995.
204

0.0 0.1 0.2 0.3 0.4 0.5 0.6 0.7 0.8 0.9Italy
United StatesJapan
GreeceAustria
New ZealandSpain
AustraliaCanada
GermanyFinland
United KingdomIreland
BelgiumSwitzerland
FrancePortugal
NetherlandsSweden
LuxembourgDenmark
Norway 0.87 0.85 0.83 0.78 0.73 0.63 0.41 0.41 0.41 0.39 0.36 0.35 0.28 0.27 0.25 0.24 0.23 0.23 0.23 0.19 0.17 0.15
1.0 %
UN target
Figure 4ODA as percentage of DAC donors’ GNI, 2004
Source: OECD DAC: International Development Statistics, 2006
Expressed as a percentage of donor countries’ gross national income (GNI), only five countries (Norway, Denmark, Luxembourg, Sweden and Netherlands) exceeded the UN’s 0.7 per cent target for ODA during 2004.
Compared with 2003, the proportion of aid as a percentage of GNI in 2004 increased for ten countries (Denmark, Luxembourg, Portugal, Switzerland, United Kingdom, Canada, Spain, Austria, Greece and the United States). This increase was particularly significant in Portugal, with its contribution growing from 0.22 per cent of GNI to 0.63 per cent.
Compared with 2003, the proportion of aid as a percentage of GNI in 2004 decreased for six countries (Norway, Sweden, Netherlands, Belgium, Japan and Italy). This decrease was particularly significant in Belgium, with its contribution falling from 0.60 per cent of GNI to 0.41 per cent.
For six countries, the proportion of aid as a percentage of GNI remained equal to 2003 (France, Ireland, Finland, Germany, Australia and New Zealand).
205World Disasters Report 2006 – Disaster data

0 500 1,000 1,500 2,000 2,500 3,000Greece
PortugalLuxembourg
New ZealandIrelandFinlandAustria
ItalyDenmark
SpainBelgiumAustraliaGermanyNorwayCanada
NetherlandsSwitzerland
SwedenUnited Kingdom
FranceJapan
United States 2,995 657 563 523 384 345 339 295 261 207 167 100 97 95 75 58 53 38 27 22 18 13
Figure 5Emergency/distress relief from DAC donors in 2004 (US$ million, 2004 prices)
Source: OECD DAC: International Development Statistics, 2006
In 2004, bilateral emergency/distress relief (not including the relief provided through multilateral institutions and non-governmental organizations) grew from US$ 6.2 billion to US$ 7.3 billion (2004 prices).
This relief includes support for disaster preparedness and the cost of transporting and sustaining refugees in donor countries during the first 12 months of their stay (OECD DAC Statistical Reporting Directives, p.16).
Japan’s bilateral emergency/distress relief of US$ 657 million in 2004 represented an increase of nearly 22 times its relief for 2003 (2004 prices). This significant increase is notably related to the Indian Ocean tsunami of December 2004. Portugal increased its relief 16 times over the same period. Meanwhile, the United States increased its relief by US$ 450 million (2004 prices) and accounted for 41 per cent of such relief in 2004.
206
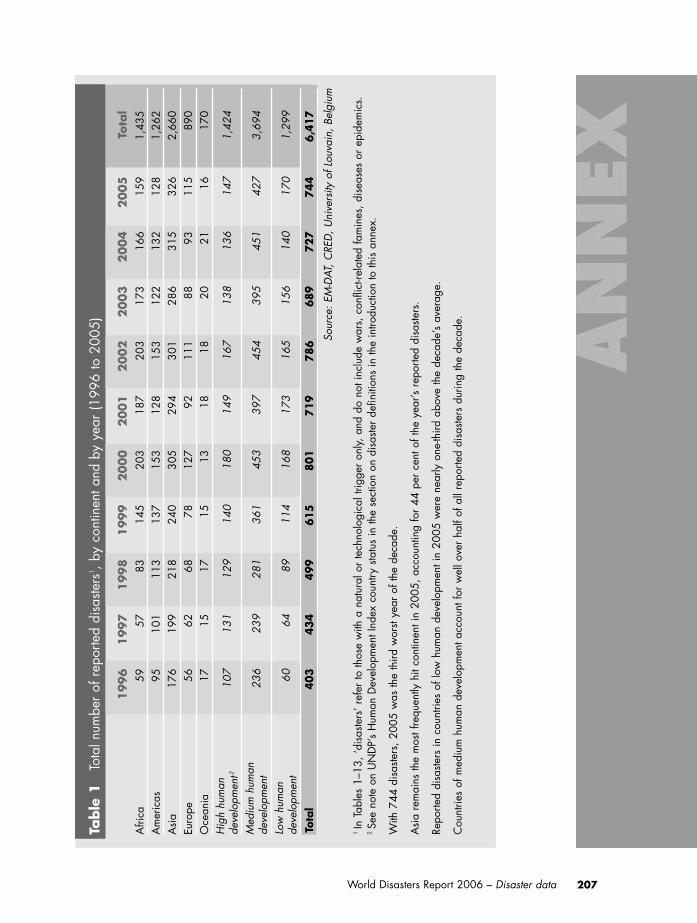
207World Disasters Report 2006 – Disaster data
Table
1To
tal n
umbe
r of
rep
orte
d di
saste
rs1 ,
by c
ontin
ent a
nd b
y ye
ar (1
996
to 2
005)
1996
1997
1998
1999
2000
2001
2002
2003
2004
2005
Tota
l A
frica
5957
8314
520
318
720
317
316
615
91,
435
Am
eric
as95
101
113
137
153
128
153
122
132
128
1,26
2A
sia
176
199
218
240
305
294
301
286
315
326
2,66
0Eu
rope
5662
6878
127
9211
188
9311
589
0O
cean
ia17
1517
1513
1818
2021
1617
0H
igh
hum
ande
velo
pmen
t210
713
112
914
018
014
916
713
813
614
71,
424
Med
ium
hum
ande
velo
pmen
t23
623
928
136
145
339
745
439
545
142
73,
694
Low
hum
ande
velo
pmen
t60
6489
114
168
173
165
156
140
170
1,29
9
Tota
l40
343
449
961
580
171
978
668
972
774
46,
417
Sour
ce: E
M-D
AT, C
RED
, Uni
vers
ity o
f Lou
vain
, Bel
gium
1In
Tab
les
1–13
, ‘di
saste
rs’ r
efer
to th
ose
with
a n
atur
al o
r te
chno
logi
cal t
rigge
r on
ly, a
nd d
o no
t inc
lude
war
s, c
onfli
ct-re
late
d fa
min
es, d
isea
ses
or e
pide
mic
s.2Se
e no
te o
n U
ND
P’s
Hum
an D
evel
opm
ent I
ndex
cou
ntry
sta
tus
in th
e se
ctio
n on
dis
aste
r de
finiti
ons
in th
e in
trodu
ctio
n to
this
ann
ex.
With
744
dis
aste
rs, 2
005
was
the
third
wor
st ye
ar o
f the
dec
ade.
Asi
a re
mai
ns th
e m
ost f
requ
ently
hit
cont
inen
t in
2005
, acc
ount
ing
for
44 p
er c
ent o
f the
yea
r’s r
epor
ted
disa
sters
.
Repo
rted
disa
sters
in c
ount
ries
of lo
w h
uman
dev
elop
men
t in
2005
wer
e ne
arly
one
-third
abo
ve th
e de
cade
’s av
erag
e.
Cou
ntrie
s of
med
ium
hum
an d
evel
opm
ent a
ccou
nt fo
r w
ell o
ver
half
of a
ll re
porte
d di
saste
rs d
urin
g th
e de
cade
.

208
Table
2To
tal n
umbe
r of
peo
ple
repo
rted
kille
d, b
y co
ntin
ent a
nd b
y ye
ar (1
996
to 2
005)
1996
1997
1998
1999
2000
2001
2002
2003
2004
2005
Tota
l A
frica
3,44
44,
079
6,93
12,
649
5,83
94,
437
7,52
06,
179
4,24
02,
913
48,2
31A
mer
icas
2,56
53,
073
21,8
5633
,985
2,05
53,
437
2,08
82,
151
8,26
94,
767
84,2
46A
sia
69,5
8471
,220
82,2
6275
,862
12,1
3729
,246
13,1
8038
,796
238,
042
90,7
4872
1,07
7Eu
rope
1,20
31,
177
1,43
419
,451
1,59
02,
195
1,70
146
,889
1,18
295
177
,773
Oce
ania
111
388
2,22
711
620
59
9164
3546
3,29
2H
igh
hum
ande
velo
pmen
t12,
171
2,53
03,
129
5,46
02,
261
2,14
51,
910
47,4
471,
311
2,75
471
,118
Med
ium
hum
ande
velo
pmen
t17
,020
18,2
7442
,380
70,1
0513
,927
33,3
0715
,015
42,8
1224
1,64
017
,550
512,
030
Low
hum
ande
velo
pmen
t57
,716
59,1
3369
,201
56,4
985,
638
3,87
27,
655
3,82
08,
817
79,1
2135
1,47
1
Tota
l 76,9
07
79,9
37
114,7
10
132,0
63
21,8
26
39,3
24
24,5
80
94,0
79
25
1,7
68
99,4
25
934,6
19
Sour
ce: E
M-D
AT, C
RED
, Uni
vers
ity o
f Lou
vain
, Bel
gium
1Se
e no
te o
n U
ND
P’s
Hum
an D
evel
opm
ent I
ndex
cou
ntry
sta
tus
in th
e se
ctio
n on
dis
aste
r de
finiti
ons
in th
e in
trodu
ctio
n to
this
ann
ex.
In 2
005,
91
per
cent
of p
eopl
e ki
lled
by d
isas
ters
live
d in
Asi
a, a
bove
the
deca
de’s
aver
age
of 7
7 pe
r ce
nt.
Cou
ntrie
s of
low
hum
an d
evel
opm
ent a
ccou
nted
for
80 p
er c
ent o
f rep
orte
d de
aths
in 2
005,
far
abov
e th
e de
cade
’s av
erag
e of
38
per
cent
.
Ove
r th
e pa
st de
cade
, rep
orte
d de
aths
from
glo
bal d
isas
ters
wer
e 84
per
cen
t hig
her
than
dea
ths
durin
g 19
86–1
995.
Num
bers
kill
ed tr
iple
d in
Oce
ania
and
mor
e th
an d
oubl
ed in
the
Am
eric
as o
ver
the
sam
e pe
riod.
The
deca
de s
aw a
num
ber
of m
ajor
dis
aste
rs: a
fam
ine
in th
e D
emoc
ratic
Peo
ple’
s Re
publ
ic o
f Kor
ea fr
om 1
995
to 1
999
(at l
east
270,
000
deat
hs);
the
Indi
anO
cean
tsun
ami i
n 20
04 (2
26,4
08 d
eath
s); t
he S
outh
Asi
a ea
rthqu
ake
in 2
005
(74,
647
deat
hs);
a he
atw
ave
in E
urop
e in
200
3 (4
5,74
0 de
aths
); flo
ods
inVe
nezu
ela
in 1
999
(30,
000
deat
hs);
thre
e ot
her
earth
quak
es –
one
in Ir
an in
200
3 (B
am: 2
6,79
6 de
aths
), on
e in
Indi
a in
200
1 (G
ujar
at: 2
0,00
5 de
aths
) and
one
in T
urke
y in
199
9 (Iz
mit:
17,
127
deat
hs);
and
a hu
rric
ane
in C
entra
l Am
eric
a in
199
8 (M
itch:
18,
791
deat
hs).

209World Disasters Report 2006 – Disaster data
Table
3To
tal n
umbe
r of
peo
ple
repo
rted
affe
cted
, by
cont
inen
t and
by
year
(199
6 to
200
5) in
thou
sand
s
1996
1997
1998
1999
2000
2001
2002
2003
2004
2005
Tota
l A
frica
4,27
77,
736
10,1
5014
,345
26,0
8818
,542
47,9
2125
,896
28,3
2318
,790
202,
068
Am
eric
as1,
868
2,70
016
,468
7,85
688
911
,375
1,90
23,
800
4,26
88,
025
59,1
52A
sia
211,
439
56,9
5331
6,19
119
1,62
122
5,03
413
1,49
058
5,29
023
2,16
713
6,59
513
3,87
32,
220,
652
Euro
pe27
454
93,
401
6,31
12,
911
787
1,44
31,
547
538
527
18,2
85O
cean
ia65
273
032
815
17
3141
3811
928
2,12
7H
igh
hum
ande
velo
pmen
t12,
113
1,83
42,
166
8,61
51,
089
7,35
21,
915
989
887
6,81
833
,778
Med
ium
hum
ande
velo
pmen
t20
7,63
558
,162
337,
453
199,
083
223,
474
133,
396
585,
465
236,
509
144,
348
125,
589
2,25
1,11
4
Low
hum
ande
velo
pmen
t8,
762
8,67
36,
919
12,5
8530
,367
21,4
7649
,218
25,9
4924
,608
28,8
3621
7,39
2
Tota
l218,5
10
68,6
68
346,5
38
220,2
83
25
4,9
29
162,2
25
636,5
98
263,4
47
169,8
42
161,2
43
2,5
02,2
84
Sour
ce: E
M-D
AT, C
RED
, Uni
vers
ity o
f Lou
vain
, Bel
gium
1Se
e no
te o
n U
ND
P’s
Hum
an D
evel
opm
ent I
ndex
cou
ntry
sta
tus
in th
e se
ctio
n on
dis
aste
r de
finiti
ons
in th
e in
trodu
ctio
n to
this
ann
ex.
Not
e: s
ome
tota
ls m
ay n
ot m
atch
due
to r
ound
ing.
On
the
basis
of a
vaila
ble
data
, an
aver
age
of 2
50 m
illio
n pe
ople
wer
e af
fect
ed a
nnua
lly b
y di
saste
rs fr
om 1
996
to 2
005
– al
mos
t 90
per
cent
of t
hem
in A
sia.
Ove
r th
e de
cade
, 90
per
cent
of t
hose
affe
cted
live
d in
cou
ntrie
s of
med
ium
hum
an d
evel
opm
ent,
whi
le 9
per
cen
t liv
ed in
cou
ntrie
s of
low
hum
an d
evel
opm
ent
and
just
1 pe
r ce
nt li
ved
in c
ount
ries
of h
igh
hum
an d
evel
opm
ent.
Dur
ing
the
deca
de, s
ix d
isas
ters
affe
cted
mor
e th
an 1
00 m
illio
n pe
ople
: a d
roug
ht in
Indi
a in
200
2; fo
ur fl
oods
in C
hina
in 1
996,
199
8, 1
999
and
2003
;an
d on
e w
inds
torm
in C
hina
in 2
002.
Ove
r th
e pa
st de
cade
, the
num
ber
of p
eopl
e re
porte
d af
fect
ed b
y di
saste
rs g
loba
lly in
crea
sed
by o
ne-th
ird, c
ompa
red
with
the
deca
de 1
986–
1995
. In
the
Am
eric
as, t
he n
umbe
r of
peo
ple
affe
cted
dou
bled
ove
r th
is p
erio
d.

210
Table
4To
tal a
mou
nt o
f dis
aste
r es
timat
ed d
amag
e, b
y co
ntin
ent a
nd b
y ye
ar (1
996
to 2
005)
in m
illio
ns o
f US
dolla
rs (2
005
pric
es)
1996
1997
1998
1999
2000
2001
2002
2003
2004
2005
Tota
l A
frica
147
4137
985
163
635
125
85,
877
1,53
18
10,0
79A
mer
icas
15,7
3912
,649
25,9
0222
,301
3,86
215
,690
4,14
014
,227
34,6
4313
6,59
628
5,74
8A
sia
37,6
8131
,931
47,6
8542
,131
26,9
5415
,870
8,63
818
,389
59,0
6218
,848
307,
190
Euro
pe2,
764
11,9
917,
271
39,3
559,
450
1,72
631
,537
15,3
182,
227
3,90
112
5,54
1O
cean
ia1,
165
301
406
1,05
060
839
842
463
857
819
95,
768
Hig
h hu
man
deve
lopm
ent1
19,7
0422
,705
22,6
6063
,360
21,6
0715
,488
34,9
5536
,467
77,7
7513
6,72
445
1,44
5
Med
ium
hum
ande
velo
pmen
t33
,943
34,1
8956
,859
42,3
1112
,522
17,9
879,
988
17,6
0819
,562
17,8
2826
2,79
6
Low
hum
ande
velo
pmen
t3,
849
202,
124
177,
382
561
5437
470
25,
001
20,0
85
Tota
l 5
7,4
96
56,9
14
81,6
43
105
,689
41,5
11
34,0
36
44,9
97
54,4
49
98,0
40
15
9,5
52
734,3
25
Sour
ce: E
M-D
AT, C
RED
, Uni
vers
ity o
f Lou
vain
, Bel
gium
1Se
e no
te o
n U
ND
P’s
Hum
an D
evel
opm
ent I
ndex
cou
ntry
sta
tus
in th
e se
ctio
n on
dis
aste
r de
finiti
ons
in th
e in
trodu
ctio
n to
this
ann
ex.
Not
e: s
ome
tota
ls m
ay n
ot m
atch
due
to r
ound
ing.
As
men
tione
d in
the
intro
duct
ion,
dam
age
asse
ssm
ent i
s fre
quen
tly u
nrel
iabl
e. E
ven
for
the
exis
ting
data
, the
met
hodo
logi
es a
re n
ot s
tand
ardi
zed
and
the
finan
-ci
al c
over
age
can
vary
sig
nific
antly
. Dep
endi
ng o
n w
here
the
disa
ster
occu
rs a
nd w
ho r
epor
ts it,
esti
mat
ions
var
y fro
m z
ero
to b
illio
ns o
f US
dolla
rs. D
amag
e is
repo
rted
for
1.8
per
cent
of t
echn
olog
ical
dis
aste
rs a
nd 2
7.5
per
cent
of n
atur
al d
isas
ters
.
2005
was
the
costl
iest
year
of t
he d
ecad
e, w
ith d
isas
ters
cos
ting
mor
e th
an d
oubl
e th
e de
cade
’s av
erag
e of
US$
73
billi
on p
er y
ear.
This
was
mai
nly
due
toH
urric
ane
Katri
na, w
hich
cau
sed
US$
125
bill
ion
of d
amag
e (7
8 pe
r ce
nt o
f the
tota
l for
200
5).
In 2
005,
nin
e ot
her
disa
sters
cau
sed
dam
age
estim
ated
at m
ore
than
US$
1 b
illio
n: a
typh
oon
in C
hina
; hur
rican
es in
the
USA
and
Cub
a; tw
o flo
ods
in C
hina
,tw
o in
Indi
a an
d on
e in
Sw
itzer
land
; and
the
Sout
h A
sia
earth
quak
e.
Ove
r th
e de
cade
, 120
dis
aste
rs c
ause
d U
S$ 1
bill
ion
or m
ore
of d
amag
e ea
ch. C
ount
ries
of h
igh
hum
an d
evel
opm
ent a
ccou
nted
for
61 p
er c
ent o
f the
deca
de’s
dam
age.
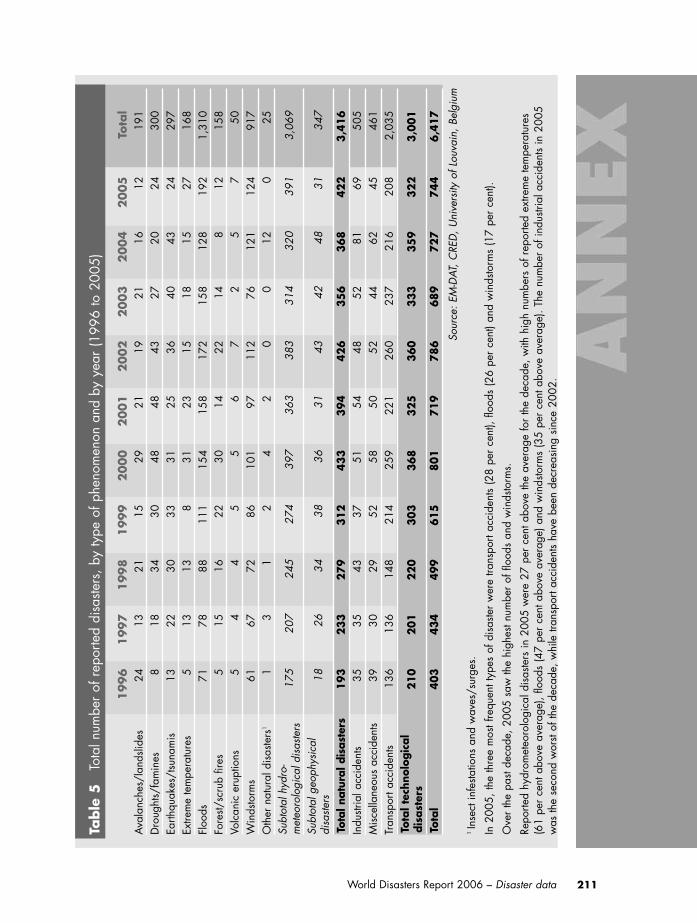
211World Disasters Report 2006 – Disaster data
Table
5To
tal n
umbe
r of
rep
orte
d di
saste
rs, b
y ty
pe o
f phe
nom
enon
and
by
year
(199
6 to
200
5)
1996
1997
1998
1999
2000
2001
2002
2003
2004
2005
Tota
l A
vala
nche
s/la
ndsli
des
2413
2115
2921
1921
1612
191
Dro
ught
s/fa
min
es8
1834
3048
4843
2720
2430
0Ea
rthqu
akes
/tsu
nam
is13
2230
3331
2536
4043
2429
7Ex
trem
e te
mpe
ratu
res
513
138
3123
1518
1527
168
Floo
ds71
7888
111
154
158
172
158
128
192
1,31
0Fo
rest/
scru
b fir
es5
1516
2230
1422
148
1215
8Vo
lcan
ic e
rupt
ions
54
45
56
72
57
50W
inds
torm
s61
6772
8610
197
112
7612
112
491
7O
ther
nat
ural
dis
aste
rs1
13
12
42
00
120
25Su
btot
al h
ydro
-m
eteo
rolo
gica
l dis
aste
rs17
520
724
527
439
736
338
331
432
039
13,
069
Subt
otal
geo
phys
ical
disa
sters
1826
3438
3631
4342
4831
347
Tota
l nat
ural
dis
aste
rs19
323
327
931
243
339
442
635
636
842
23,
416
Indu
stria
l acc
iden
ts35
3543
3751
5448
5281
6950
5M
isce
llane
ous
acci
dent
s39
3029
5258
5052
4462
4546
1Tr
ansp
ort a
ccid
ents
136
136
148
214
259
221
260
237
216
208
2,03
5To
tal t
echn
olog
ical
disa
ster
s21
020
122
030
336
832
536
033
335
932
23,
001
Tota
l40
343
449
961
580
171
978
668
972
774
46,
417
Sour
ce: E
M-D
AT, C
RED
, Uni
vers
ity o
f Lou
vain
, Bel
gium
1In
sect
infe
statio
ns a
nd w
aves
/sur
ges.
In 2
005,
the
thre
e m
ost f
requ
ent t
ypes
of d
isas
ter
wer
e tra
nspo
rt ac
cide
nts
(28
per
cent
), flo
ods
(26
per
cent
) and
win
dsto
rms
(17
per
cent
).
Ove
r th
e pa
st de
cade
, 200
5 sa
w th
e hi
ghes
t num
ber
of fl
oods
and
win
dsto
rms.
Repo
rted
hydr
omet
eoro
logi
cal d
isas
ters
in 2
005
wer
e 27
per
cen
t abo
ve th
e av
erag
e fo
r th
e de
cade
, with
hig
h nu
mbe
rs o
f rep
orte
d ex
trem
e te
mpe
ratu
res
(61
per
cent
abo
ve a
vera
ge),
flood
s (4
7 pe
r ce
nt a
bove
ave
rage
) and
win
dsto
rms
(35
per
cent
abo
ve a
vera
ge).
The
num
ber
of in
dustr
ial a
ccid
ents
in 2
005
was
the
seco
nd w
orst
of th
e de
cade
, whi
le tr
ansp
ort a
ccid
ents
have
bee
n de
crea
sing
sin
ce 2
002.

212
Table
6To
tal n
umbe
r of
peo
ple
repo
rted
kille
d, b
y ty
pe o
f phe
nom
enon
and
by
year
(199
6 to
200
5)
1996
1997
1998
1999
2000
2001
2002
2003
2004
2005
Tota
l A
vala
nche
s/la
ndsli
des
1,15
580
198
135
11,
023
692
1,14
970
635
764
97,
864
Dro
ught
s/fa
min
es54
,000
54,5
2057
,875
54,0
2937
019
953
321
1316
122
1,72
1Ea
rthqu
akes
/tsu
nam
is57
63,
219
9,57
321
,869
216
21,3
481,
634
29,6
1722
7,31
776
,241
391,
610
Extre
me
tem
pera
ture
s30
061
93,
225
771
922
1,65
33,
369
48,2
2823
992
360
,249
Floo
ds7,
187
6,97
19,
691
34,3
676,
429
4,66
24,
122
3,71
66,
957
6,13
590
,237
Fore
st/sc
rub
fires
4532
119
7047
336
4714
4746
0Vo
lcan
ic e
rupt
ions
453
n.a.
n.a.
n.a.
n.a.
200
n.a.
23
262
Win
dsto
rms
4,21
75,
330
24,6
5911
,900
1,14
41,
853
1,11
61,
002
6,51
34,
676
62,4
10O
ther
nat
ural
dis
aste
rs1
2040
0n.
a.3
1n.
a.nd
rnd
r27
ndr
451
Subt
otal
hyd
ro-
met
eoro
logi
cal d
isas
ters
66,9
2468
,673
96,5
5010
1,49
19,
936
9,09
210
,295
53,7
2014
,120
12,5
9144
3,39
2
Subt
otal
geo
phys
ical
disa
sters
580
3,27
29,
573
21,8
6921
621
,348
1,83
429
,617
227,
319
76,2
4439
1,87
2
Tota
l nat
ural
dis
aste
rs67
,504
71,9
4510
6,12
312
3,36
010
,15
230
,440
12,1
2983
,337
241,
439
88,8
3583
5,2
64In
dustr
ial a
ccid
ents
674
1,05
51,
942
740
1,77
01,
270
1,11
21,
444
1,79
72,
158
13,9
62M
isce
llane
ous
acci
dent
s1,
298
1,27
774
71,
323
1,33
61,
760
2,01
31,
430
2,11
52,
458
15,7
57Tr
ansp
ort a
ccid
ents
7,43
15,
660
5,89
86,
640
8,56
85,
854
9,32
67,
868
6,41
75,
974
69,6
36To
tal t
echn
olog
ical
disa
ster
s9,
403
7,99
28,
587
8,70
311
,674
8,88
412
,45
110
,742
10,3
2910
,590
99,3
55
Tota
l76
,907
79,9
3711
4,71
013
2,06
321
,826
39,3
2424
,580
94,0
7925
1,76
899
,425
934,
619
Sour
ce: E
M-D
AT, C
RED
, Uni
vers
ity o
f Lou
vain
, Bel
gium
1In
sect
infe
statio
ns a
nd w
aves
/sur
ges.
Not
e: n
.a. s
igni
fies
no d
ata
avai
labl
e; n
dr s
igni
fies
no d
isas
ter
repo
rted.
For
mor
e in
form
atio
n, s
ee s
ectio
n on
cav
eats
in in
trodu
ctor
y te
xt.
Earth
quak
es a
ccou
nted
for
77 p
er c
ent o
f the
tota
l dea
ths
repo
rted
for
2005
, in
a ye
ar w
hen
natu
ral d
isas
ters
cla
imed
nea
rly 8
9,00
0 liv
es.
The
dead
liest
repo
rted
disa
sters
of t
he d
ecad
e w
ere
earth
quak
es a
nd ts
unam
is (4
2 pe
r ce
nt),
drou
ghts/
fam
ines
(24
per
cent
) and
floo
ds (1
0 pe
r ce
nt).
Repo
rted
deat
hs fr
om h
ydro
met
eoro
logi
cal d
isas
ters
in 2
005
wer
e ov
er th
ree
times
low
er th
an th
e de
cade
’s av
erag
e of
44,
000
deat
hs a
yea
r.In
dustr
ial a
nd m
isce
llane
ous
acci
dent
s pe
aked
in 2
005,
with
rep
orte
d de
aths
ove
r 50
per
cen
t abo
ve th
e de
cade
’s av
erag
e. H
owev
er, t
he to
ll fro
m a
ll te
chno
-lo
gica
l dis
aste
rs h
as r
emai
ned
fairl
y ste
ady
thro
ugho
ut th
e de
cade
, ave
ragi
ng ju
st un
der
10,0
00 d
eath
s a
year
.
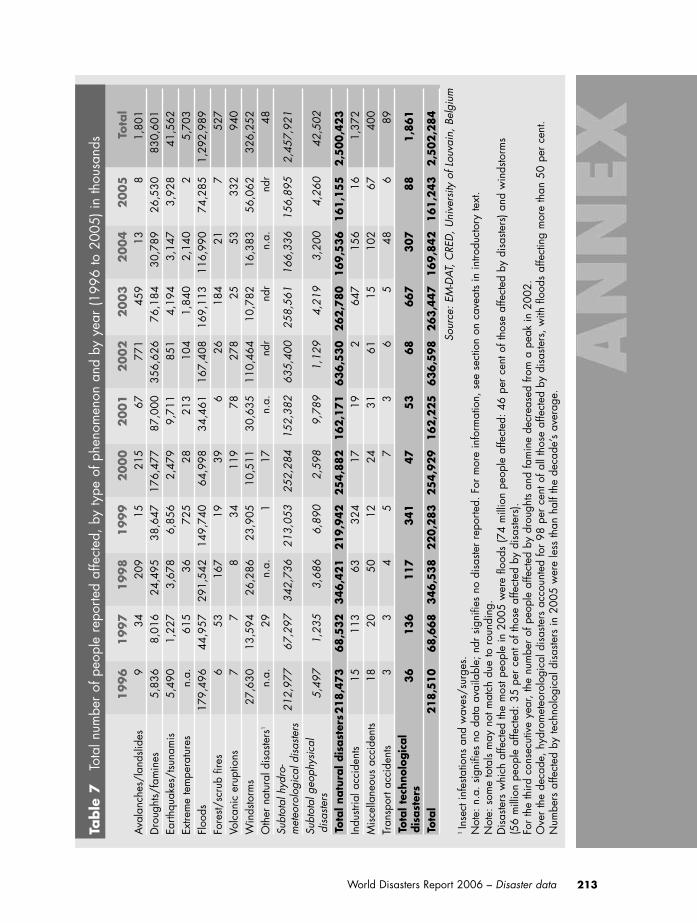
213World Disasters Report 2006 – Disaster data
Table
7To
tal n
umbe
r of
peo
ple
repo
rted
affe
cted
, by
type
of p
heno
men
on a
nd b
y ye
ar (1
996
to 2
005)
in th
ousa
nds
1996
1997
1998
1999
2000
2001
2002
2003
2004
2005
Tota
l A
vala
nche
s/la
ndsli
des
934
209
1521
567
771
459
138
1,80
1D
roug
hts/
fam
ines
5,83
68,
016
24,4
9538
,647
176,
477
87,0
0035
6,62
676
,184
30,7
8926
,530
830,
601
Earth
quak
es/t
suna
mis
5,49
01,
227
3,67
86,
856
2,47
99,
711
851
4,19
43,
147
3,92
841
,562
Extre
me
tem
pera
ture
sn.
a.61
536
725
2821
310
41,
840
2,14
02
5,70
3Fl
oods
179,
496
44,9
5729
1,54
214
9,74
064
,998
34,4
6116
7,40
816
9,11
311
6,99
074
,285
1,29
2,98
9Fo
rest/
scru
b fir
es6
5316
719
396
2618
421
752
7Vo
lcan
ic e
rupt
ions
77
834
119
7827
825
5333
294
0W
inds
torm
s27
,630
13,5
9426
,286
23,9
0510
,511
30,6
3511
0,46
410
,782
16,3
8356
,062
326,
252
Oth
er n
atur
al d
isas
ters
1n.
a.29
n.a.
117
n.a.
ndr
ndr
n.a.
ndr
48Su
btot
al h
ydro
-m
eteo
rolo
gica
l dis
aste
rs21
2,97
767
,297
342,
736
213,
053
252,
284
152,
382
635,
400
258,
561
166,
336
156,
895
2,45
7,92
1
Subt
otal
geo
phys
ical
disa
sters
5,49
71,
235
3,68
66,
890
2,59
89,
789
1,12
94,
219
3,20
04,
260
42,5
02
Tota
l nat
ural
dis
aste
rs21
8,47
368
,532
346,
421
219,
942
254,
882
162,
171
636,
530
262,
780
169,
536
161,
155
2,5
00,4
23In
dustr
ial a
ccid
ents
1511
363
324
1719
264
715
616
1,37
2M
isce
llane
ous
acci
dent
s18
2050
1224
3161
1510
267
400
Tran
spor
t acc
iden
ts3
34
57
36
548
689
Tota
l tec
hnol
ogic
aldi
sast
ers
3613
611
734
147
53
6866
730
788
1,86
1
Tota
l 21
8,5
1068
,668
346,
538
220,
283
254,
929
162,
225
636,
598
263,
447
169,
842
161,
243
2,5
02,2
84
Sour
ce: E
M-D
AT, C
RED
, Uni
vers
ity o
f Lou
vain
, Bel
gium
1In
sect
infe
statio
ns a
nd w
aves
/sur
ges.
Not
e: n
.a. s
igni
fies
no d
ata
avai
labl
e; n
dr s
igni
fies
no d
isas
ter
repo
rted.
For
mor
e in
form
atio
n, s
ee s
ectio
n on
cav
eats
in in
trodu
ctor
y te
xt.
Not
e: s
ome
tota
ls m
ay n
ot m
atch
due
to r
ound
ing.
Dis
aste
rs w
hich
affe
cted
the
mos
t peo
ple
in 2
005
wer
e flo
ods
(74
mill
ion
peop
le a
ffect
ed: 4
6 pe
r ce
nt o
f tho
se a
ffect
ed b
y di
saste
rs) a
nd w
inds
torm
s (5
6 m
illio
n pe
ople
affe
cted
: 35
per
cent
of t
hose
affe
cted
by
disa
sters
). Fo
r th
e th
ird c
onse
cutiv
e ye
ar, t
he n
umbe
r of
peo
ple
affe
cted
by
drou
ghts
and
fam
ine
decr
ease
d fro
m a
pea
k in
200
2.O
ver
the
deca
de, h
ydro
met
eoro
logi
cal d
isas
ters
acc
ount
ed fo
r 98
per
cen
t of a
ll th
ose
affe
cted
by
disa
sters
, with
floo
ds a
ffect
ing
mor
e th
an 5
0 pe
r ce
nt.
Num
bers
affe
cted
by
tech
nolo
gica
l dis
aste
rs in
200
5 w
ere
less
than
hal
f the
dec
ade’
s av
erag
e.

214
Table
8To
tal a
mou
nt o
f dis
aste
r es
timat
ed d
amag
e, b
y ty
pe o
f phe
nom
enon
and
by
year
(199
6 to
200
5)
in m
illio
ns o
f US
dolla
rs (2
005
pric
es)
1996
1997
1998
1999
2000
2001
2002
2003
2004
2005
Tota
l A
vala
nche
s/la
ndsli
des
n.a.
201,
066
n.a.
150
7814
55n.
a.n.
a.1,
382
Dro
ught
s/fa
min
es1,
494
498
646
8,97
07,
186
4,28
61,
804
2,13
81,
615
520
29,1
56Ea
rthqu
akes
/tsu
nam
is71
36,
032
3,26
741
,096
428
7,94
71,
702
9,29
237
,625
5,08
011
3,18
1Ex
trem
e te
mpe
ratu
res
n.a.
3,65
54,
431
1,17
214
122
10
6,42
30
155
16,1
97Fl
oods
35,7
5515
,936
47,7
3717
,097
21,2
183,
996
28,3
6215
,551
8,34
314
,439
208,
434
Fore
st/sc
rub
fires
2,14
420
,692
1,53
457
51,
201
9914
32,
755
340
29,1
86Vo
lcan
ic e
rupt
ions
2110
n.a.
n.a.
216
10n.
a.n.
a.n.
a.59
Win
dsto
rms
13,6
979,
560
22,7
4836
,540
10,5
5617
,382
2,08
018
,236
49,1
0113
9,30
931
9,20
8O
ther
nat
ural
dis
aste
rs1
n.a.
42
n.a.
136
n.a.
ndr
ndr
n.a.
ndr
142
Subt
otal
hyd
ro-
met
eoro
logi
cal d
isas
ters
53,0
9050
,365
78,1
6464
,354
40,5
8826
,062
32,4
0345
,157
59,0
6215
4,46
260
3,70
5
Subt
otal
geo
phys
ical
disa
sters
733
6,04
23,
267
41,0
9643
07,
963
1,71
29,
292
37,6
255,
080
113,
240
Tota
l nat
ural
dis
aste
rs5
3,82
45
6,40
681
,431
105
,45
041
,017
34,0
2534
,115
54,
449
96,6
8715
9,5
4271
6,94
6In
dustr
ial a
ccid
ents
1,50
146
415
44
n.a.
1110
,815
n.a.
931
n.a.
13,8
79M
isce
llane
ous
acci
dent
s1,
914
3122
349
3n.
a.67
n.a.
n.a.
102,
541
Tran
spor
t acc
iden
ts25
713
3523
3n.
a.n.
a.n.
a.n.
a.42
2n.
a.96
0To
tal t
echn
olog
ical
disa
ster
s3,
672
508
212
239
493
1110
,882
n.a.
1,35
310
17,3
80
Tota
l 5
7,49
65
6,91
481
,643
105
,689
41,5
1134
,036
44,9
975
4,44
998
,040
159,
55
273
4,32
5
Sour
ce: E
M-D
AT, C
RED
, Uni
vers
ity o
f Lou
vain
, Bel
gium
1In
sect
infe
statio
ns a
nd w
aves
/sur
ges.
Not
e: n
.a. s
igni
fies
no d
ata
avai
labl
e; n
dr s
igni
fies
no d
isas
ter
repo
rted.
For
mor
e in
form
atio
n, s
ee s
ectio
n on
cav
eats
in in
trodu
ctor
y te
xt.
Not
e: s
ome
tota
ls m
ay n
ot m
atch
due
to r
ound
ing.
Estim
ates
of d
isas
ter
dam
age
mus
t be
treat
ed w
ith c
autio
n, a
s th
e fin
anci
al v
alue
atta
ched
to in
frastr
uctu
re in
dev
elop
ed c
ount
ries
is m
uch
high
er th
an in
de
velo
ping
cou
ntrie
s.
Whi
le r
epor
ting
is b
ette
r fo
r la
rge
disa
sters
, the
low
rep
ortin
g ra
tes
of d
irect
dam
age
mak
e an
alys
is d
iffic
ult.
Th
e co
stlie
st di
saste
rs o
f the
dec
ade
wer
e w
inds
torm
s (4
3 pe
r ce
nt),
flood
s (2
8 pe
r ce
nt) a
nd e
arth
quak
es/t
suna
mis
(15
per
cent
).H
urric
ane
Katri
na, w
hich
cos
t US$
125
bill
ion,
acc
ount
ed fo
r al
mos
t 40
per
cent
of a
ll da
mag
e ca
used
by
win
dsto
rms
over
the
deca
de.

215World Disasters Report 2006 – Disaster data
Table
9To
tal n
umbe
r of
rep
orte
d di
saste
rs, b
y ty
pe o
f phe
nom
enon
and
by
cont
inen
t (19
96 to
200
5)A
fric
aA
mer
icas
Asi
aEu
rope
Oce
ani
aH
HD
2M
HD
2LH
D2
Tota
l A
vala
nche
s/la
ndsli
des
1142
112
188
2315
018
191
Dro
ught
s/fa
min
es14
051
8714
828
134
138
300
Earth
quak
es/t
suna
mis
2045
171
529
5021
433
297
Extre
me
tem
pera
ture
s7
3348
791
7680
1216
8Fl
oods
290
281
472
229
3832
068
530
51,
310
Fore
st/sc
rub
fires
1266
2347
1087
656
158
Volc
anic
eru
ptio
ns5
2313
27
1434
250
Win
dsto
rms
7432
134
011
072
433
413
7191
7O
ther
nat
ural
dis
aste
rs1
132
71
22
1310
25Su
btot
al h
ydro
-m
eteo
rolo
gica
l dis
aste
rs54
779
61,
089
498
139
969
1,54
056
03,
069
Subt
otal
geo
phys
ical
disa
sters
2568
184
5416
6424
835
347
Tota
l nat
ural
dis
aste
rs5
7286
41,
273
55
215
51,
033
1,78
85
953,
416
Indu
stria
l acc
iden
ts49
3936
156
056
395
5450
5M
isce
llane
ous
acci
dent
s94
7022
073
485
292
8446
1Tr
ansp
ort a
ccid
ents
720
289
806
209
1125
01,
219
566
2,03
5To
tal t
echn
olog
ical
disa
ster
s86
339
81,
387
338
1539
11,
906
704
3,00
1
Tota
l1,
435
1,26
22,
660
890
170
1,42
43,
694
1,29
96,
417
Sour
ce: E
M-D
AT, C
RED
, Uni
vers
ity o
f Lou
vain
, Bel
gium
1In
sect
infe
statio
ns a
nd w
aves
/sur
ges.
2H
HD
sta
nds
for
high
hum
an d
evel
opm
ent,
MH
D fo
r m
ediu
m h
uman
dev
elop
men
t and
LH
D fo
r lo
w h
uman
dev
elop
men
t. Se
e no
te o
n U
ND
P’s
Hum
anD
evel
opm
ent I
ndex
cou
ntry
sta
tus
in th
e se
ctio
n on
dis
aste
r de
finiti
ons
in th
e in
trodu
ctio
n to
this
ann
ex.
Floo
ds w
ere
the
mos
t com
mon
nat
ural
disa
ster t
o hi
t Afri
ca, A
sia a
nd E
urop
e; w
inds
torm
s w
ere
the
mos
t com
mon
disa
ster i
n th
e A
mer
icas
and
Oce
ania
. M
ore
than
hal
f the
dec
ade’
s ea
rthqu
akes
and
tsun
amis
occu
rred
in A
sia, w
hile
alm
ost h
alf t
he d
roug
hts/
fam
ines
occ
urre
d in
Afri
ca a
nd n
early
hal
f the
ext
rem
e te
mpe
ratu
re e
vent
s oc
curre
d in
Eur
ope.
D
roug
hts
wer
e m
ost f
requ
ent i
n co
untri
es o
f med
ium
and
low
hum
an d
evel
opm
ent.
Win
dsto
rms
and
extre
me
tem
pera
ture
s w
ere
mos
t com
mon
in c
ount
ries
of
med
ium
and
hig
h hu
man
dev
elop
men
t. Tr
ansp
ort a
ccid
ents
wer
e th
e m
ost f
requ
ent,
acco
untin
g fo
r nea
rly o
ne-th
ird o
f all
disa
sters
repo
rted
over
the
deca
de.

216
Table
10
Tota
l num
ber
of p
eopl
e re
porte
d ki
lled,
by
type
of p
heno
men
on a
nd b
y co
ntin
ent (
1996
to 2
005)
Afr
ica
Am
eric
as
Asi
aEu
rope
Oce
ani
aH
HD
2M
HD
2LH
D2
Tota
l A
vala
nche
s/la
ndsli
des
251
1,63
25,
464
389
128
365
6,95
354
67,
864
Dro
ught
s/fa
min
es4,
656
5421
6,92
30
880
842
220,
879
221,
721
Earth
quak
es/t
suna
mis
3,31
32,
861
364,
651
18,5
842,
201
2,62
530
6,84
582
,140
391,
610
Extre
me
tem
pera
ture
s16
81,
597
9,85
448
,630
048
,235
11,0
4197
360
,249
Floo
ds8,
183
38,0
2842
,570
1,42
234
3,47
173
,490
13,2
7690
,237
Fore
st/sc
rub
fires
114
8896
137
2519
725
94
460
Volc
anic
eru
ptio
ns20
154
3n.
a.4
5210
200
262
Win
dsto
rms
1,53
528
,110
31,9
0061
025
55,
813
51,4
115,
186
62,4
10O
ther
nat
ural
dis
aste
rs1
n.a.
344
8n.
a.n.
a.n.
a.45
1n.
a.45
1Su
btot
al h
ydro
-m
eteo
rolo
gica
l dis
aste
rs14
,907
69,5
1230
7,25
551
,188
530
58,0
8114
4,44
724
0,86
444
3,39
2
Subt
otal
geo
phys
ical
disa
sters
3,51
42,
915
364,
654
18,5
842,
205
2,67
730
6,85
582
,340
391,
872
Tota
l nat
ural
dis
aste
rs18
,421
72,4
2767
1,90
969
,772
2,73
560
,75
845
1,30
232
3,20
483
5,2
64In
dustr
ial a
ccid
ents
2,78
527
710
,056
844
ndr
360
10,6
312,
971
13,9
62M
isce
llane
ous
acci
dent
s2,
847
2,98
98,
401
1,47
446
2,02
79,
902
3,82
815
,757
Tran
spor
t acc
iden
ts24
,178
8,55
330
,711
5,68
351
17,
973
40,1
9521
,468
69,6
36To
tal t
echn
olog
ical
disa
ster
s29
,810
11,8
1949
,168
8,00
15
57
10,3
6060
,728
28,2
6799
,35
5
Tota
l48
,231
84,2
4672
1,07
777
,773
3,29
271
,118
512
,030
351,
471
934,
619
Sour
ce: E
M-D
AT, C
RED
, Uni
vers
ity o
f Lou
vain
, Bel
gium
1In
sect
infe
statio
ns a
nd w
aves
/sur
ges.
2H
HD
sta
nds
for
high
hum
an d
evel
opm
ent,
MH
D fo
r m
ediu
m h
uman
dev
elop
men
t and
LH
D fo
r lo
w h
uman
dev
elop
men
t. Se
e no
te o
n U
ND
P’s
Hum
anD
evel
opm
ent I
ndex
cou
ntry
sta
tus
in th
e se
ctio
n on
dis
aste
r de
finiti
ons
in th
e in
trodu
ctio
n to
this
ann
ex.
Not
e: n
.a. s
igni
fies
no d
ata
avai
labl
e; n
dr s
igni
fies
no d
isas
ter
repo
rted.
For
mor
e in
form
atio
n, s
ee s
ectio
n on
cav
eats
in in
trodu
ctor
y te
xt.
Ove
r th
e de
cade
, the
big
gest
kille
rs p
er c
ontin
ent (
not i
nclu
ding
con
flict
- and
dis
ease
-rela
ted
deat
hs) w
ere
trans
port
acci
dent
s in
Afri
ca (a
ccou
ntin
g fo
r ha
lf th
eco
ntin
ent’s
dea
ths
from
dis
aste
rs),
flood
s in
the
Am
eric
as (4
5 pe
r ce
nt),
earth
quak
es/t
suna
mis
in A
sia
(51
per
cent
), ex
trem
e te
mpe
ratu
res
in E
urop
e (6
3 pe
rce
nt) a
nd e
arth
quak
es/t
suna
mis
in O
cean
ia (6
7 pe
r ce
nt).
Ana
lysi
ng th
e fig
ures
by
leve
l of h
uman
dev
elop
men
t, H
HD
cou
ntrie
s lo
st m
ost l
ives
to e
xtre
me
tem
pera
ture
s (6
8 pe
r ce
nt),
MH
D c
ount
ries
toea
rthqu
akes
/tsu
nam
is (6
0 pe
r ce
nt) a
nd L
HD
cou
ntrie
s to
dro
ught
s/fa
min
es (6
3 pe
r ce
nt).
90 p
er c
ent o
f dea
ths
from
tech
nolo
gica
l dis
aste
rs w
ere
in M
HD
and
LH
D c
ount
ries.

217World Disasters Report 2006 – Disaster data
Table
11
Tota
l num
ber
of p
eopl
e re
porte
d af
fect
ed, b
y ty
pe o
f phe
nom
enon
and
by
cont
inen
t (19
96 to
200
5) in
thou
sand
sA
fric
aA
mer
icas
Asi
aEu
rope
Oce
ani
aH
HD
2M
HD
2LH
D2
Tota
l A
vala
nche
s/la
ndsli
des
320
31,
579
141
151,
780
71,
801
Dro
ught
s/fa
min
es17
3,97
915
,287
639,
190
1,06
31,
083
665
657,
066
172,
870
830,
601
Earth
quak
es/t
suna
mis
361
3,75
733
,392
4,01
636
833
36,3
014,
429
41,5
62Ex
trem
e te
mpe
ratu
res
04,
037
895
771
044
5,45
920
05,
703
Floo
ds23
,203
9,52
51,
255,
118
5,04
896
5,85
11,
253,
085
34,0
531,
292,
989
Fore
st/sc
rub
fires
918
457
260
1831
720
73
527
Volc
anic
eru
ptio
ns39
728
321
10
4968
762
110
940
Win
dsto
rms
3,90
225
,278
289,
215
7,02
583
225
,521
295,
276
5,45
632
6,25
2O
ther
nat
ural
dis
aste
rs1
n.a.
146
n.a.
n.a.
n.a.
1929
48Su
btot
al h
ydro
-m
eteo
rolo
gica
l dis
aste
rs20
1,09
754
,514
2,18
6,10
014
,180
2,03
032
,412
2,21
2,89
121
2,61
82,
457,
921
Subt
otal
geo
phys
ical
disa
sters
759
4,04
033
,603
4,01
685
901
37,0
624,
539
42,5
02
Tota
l nat
ural
dis
aste
rs20
1,85
65
8,5
54
2,21
9,70
318
,196
2,11
433
,313
2,24
9,95
321
7,15
72,
500
,423
Indu
stria
l acc
iden
ts10
576
716
71nd
r44
092
85
1,37
2M
isce
llane
ous
acci
dent
s18
912
172
1412
1420
817
840
0Tr
ansp
ort a
ccid
ents
139
624
n.a.
1125
5389
Tota
l tec
hnol
ogic
aldi
sast
ers
212
597
950
8912
464
1,16
123
51,
861
Tota
l20
2,06
85
9,15
22,
220,
652
18,2
852,
127
33,7
782,
251,
114
217,
393
2,5
02,2
84
Sour
ce: E
M-D
AT, C
RED
, Uni
vers
ity o
f Lou
vain
, Bel
gium
1In
sect
infe
statio
ns a
nd w
aves
/sur
ges.
2H
HD
sta
nds
for
high
hum
an d
evel
opm
ent,
MH
D fo
r m
ediu
m h
uman
dev
elop
men
t and
LH
D fo
r lo
w h
uman
dev
elop
men
t. Se
e no
te o
n U
ND
P’s
Hum
anD
evel
opm
ent I
ndex
cou
ntry
sta
tus
in th
e se
ctio
n on
dis
aste
r de
finiti
ons
in th
e in
trodu
ctio
n to
this
ann
ex.
Not
e: n
.a. s
igni
fies
no d
ata
avai
labl
e; n
dr s
igni
fies
no d
isas
ter
repo
rted.
For
mor
e in
form
atio
n, s
ee s
ectio
n on
cav
eats
in in
trodu
ctor
y te
xt.
Not
e: s
ome
tota
ls m
ay n
ot m
atch
due
to r
ound
ing.
Ove
r th
e de
cade
, the
dis
aste
rs w
hich
affe
cted
the
mos
t peo
ple
per
cont
inen
t wer
e: d
roug
hts/
fam
ines
in A
frica
(acc
ount
ing
for
86 p
er c
ent o
f all
disa
ster-
affe
cted
Afri
cans
) and
in O
cean
ia (5
1 pe
r ce
nt);
flood
s in
Asi
a (5
7 pe
r ce
nt);
and
win
dsto
rms
in th
e A
mer
icas
(43
per
cent
) and
Eur
ope
(38
per
cent
).W
inds
torm
s af
fect
ed th
e m
ost p
eopl
e in
HH
D c
ount
ries
(76
per
cent
), flo
ods
affe
cted
the
mos
t in
MH
D c
ount
ries
(56
per
cent
) and
dro
ught
s/fa
min
es a
ffect
edth
e m
ost i
n LH
D c
ount
ries
(80
per
cent
).M
HD
cou
ntrie
s ac
coun
ted
for
62 p
er c
ent o
f tho
se a
ffect
ed b
y te
chno
logi
cal d
isas
ters
.

218
Table
12
Tota
l am
ount
of d
isas
ter
estim
ated
dam
age,
by
type
of p
heno
men
on a
nd b
y co
ntin
ent (
1996
to 2
005)
in
mill
ions
of U
S do
llars
(200
5 pr
ices
)A
fric
aA
mer
icas
Asi
aEu
rope
Oce
ani
aH
HD
2M
HD
2LH
D2
Tota
l A
vala
nche
s/la
ndsli
des
n.a.
971,
265
20n.
a.20
1,36
2n.
a.1,
382
Dro
ught
s/fa
min
es33
44,
094
16,3
808,
019
329
10,7
1518
,147
293
29,1
56Ea
rthqu
akes
/tsu
nam
is5,
824
7,68
970
,060
29,6
09n.
a.62
,669
43,5
366,
976
113,
181
Extre
me
tem
pera
ture
s1
5,62
03,
650
6,70
622
112
,418
3,77
9n.
a.16
,197
Floo
ds1,
880
27,9
0312
9,05
547
,860
1,73
577
,568
125,
897
4,96
820
8,43
4Fo
rest/
scru
b fir
es11
2,66
323
,084
2,94
048
85,
847
23,3
39n.
a.29
,186
Volc
anic
eru
ptio
ns10
223
24n.
a.34
1510
59W
inds
torm
s1,
082
234,
680
62,4
4918
,138
2,85
926
6,94
045
,090
7,17
931
9,20
8O
ther
nat
ural
dis
aste
rs1
6n.
a.n.
a.n.
a.13
613
62
414
3Su
btot
al h
ydro
-m
eteo
rolo
gica
l dis
aste
rs3,
314
275,
057
235,
883
83,6
845,
768
373,
644
217,
617
12,4
4560
3,70
5
Subt
otal
geo
phys
ical
disa
sters
5,83
47,
711
70,0
6329
,633
n.a.
62,7
0343
,551
6,98
611
3,24
0
Tota
l nat
ural
dis
aste
rs9,
148
282,
768
305
,946
113,
316
5,7
6843
6,34
726
1,16
819
,430
716,
946
Indu
stria
l acc
iden
ts83
81,
245
696
11,1
00nd
r12
,345
1,31
621
813
,879
Mis
cella
neou
s ac
cide
nts
231,
609
3487
4n.
a.2,
429
107
52,
541
Tran
spor
t acc
iden
ts69
127
513
250
n.a.
324
204
432
960
Tota
l tec
hnol
ogic
aldi
sast
ers
931
2,98
11,
243
12,2
24n.
a.15
,097
1,62
765
517
,380
Tota
l10
,079
285
,748
307,
190
125
,541
5,7
6845
1,44
526
2,79
620
,085
734,
326
Sour
ce: E
M-D
AT, C
RED
, Uni
vers
ity o
f Lou
vain
, Bel
gium
1In
sect
infe
statio
ns a
nd w
aves
/sur
ges.
2H
HD
sta
nds
for
high
hum
an d
evel
opm
ent,
MH
D fo
r m
ediu
m h
uman
dev
elop
men
t and
LH
D fo
r lo
w h
uman
dev
elop
men
t. Se
e no
te o
n U
ND
P’s
Hum
anD
evel
opm
ent I
ndex
cou
ntry
sta
tus
in th
e se
ctio
n on
dis
aste
r de
finiti
ons
in th
e in
trodu
ctio
n to
this
ann
ex.
Not
e: n
.a. s
igni
fies
no d
ata
avai
labl
e; n
dr s
igni
fies
no d
isas
ter
repo
rted.
For
mor
e in
form
atio
n, s
ee s
ectio
n on
cav
eats
in in
trodu
ctor
y te
xt.
Not
e: s
ome
tota
ls m
ay n
ot m
atch
due
to r
ound
ing.
Am
ount
s of
esti
mat
ed d
amag
e m
ust b
e ap
proa
ched
with
cau
tion
due
to lo
w r
epor
ting
rate
s an
d m
etho
dolo
gica
l wea
knes
ses.
Ove
r th
e de
cade
, flo
ods
prov
ed c
ostli
est f
or A
sia
(acc
ount
ing
for
42 p
er c
ent o
f tot
al r
epor
ted
dam
age)
and
Eur
ope
(38
per
cent
); w
inds
torm
s pr
oved
cos
tlies
tfo
r th
e A
mer
icas
(82
per
cent
) and
Oce
ania
(50
per
cent
); an
d ea
rthqu
akes
/tsu
nam
is p
rove
d co
stlie
st fo
r A
frica
(58
per
cent
).In
HH
D c
ount
ries,
win
dsto
rms
caus
ed m
ost d
amag
e (5
9 pe
r ce
nt),
in M
HD
cou
ntrie
s flo
ods
caus
ed m
ost d
amag
e (4
8 pe
r ce
nt) a
nd in
LH
D c
ount
ries,
win
dsto
rms
and
earth
quak
es/t
suna
mis
each
cau
sed
arou
nd 3
5 pe
r ce
nt o
f all
dam
age.
LH
D c
ount
ries
acco
unte
d fo
r le
ss th
an 3
per
cen
t of t
he to
tal g
loba
l cos
t of d
isaste
rs.

219World Disasters Report 2006 – Disaster data
Table 13 Total number of people reported killed and affected by disasters by country(1986 to 1995; 1996 to 2005; and 2005)
Total Total Total Total Total Totalnumber number number number number number
of people of people of people of people of people of peoplereported reported reported reported reported reported
killed affected killed affected killed affected(1986–1995) (1986–1995) (1996–2005) (1996–2005) (2005) (2005)
Africa 31,161 138,388,197 48,231 202,068,099 2,913 18,790,330Algeria 486 73,748 3,892 307,569 43 1,894Angola 848 3,181,197 875 593,862 20 10,070Benin 23 241,000 245 678,305 ndr ndrBotswana 28 1,436,507 3 143,736 n.a. n.a.Burkina Faso 38 2,899,824 95 110,220 ndr ndrBurundi 112 3,600 390 1,266,453 168 89,118Cameroon 2,190 798,541 452 6,386 56 12Canary Islands (ES) ndr ndr 136 869 36 17Cape Verde n.a. 6,306 18 40,000 ndr ndrCentral African Republic 31 3,999 242 113,261 24 23,846
Chad 95 462,398 173 851,793 14 28Comoros 24 50,200 282 284,300 26 284,000Congo 663 16,500 119 118,663 19 3,500Congo, DR of 824 28,009 2,682 268,477 286 5,664Côte d’Ivoire 138 7,187 416 193 ndr ndrDjibouti 155 321,075 52 592,350 n.a. 47,000Egypt 2,325 258,886 1,991 6,390 136 95Equatorial Guinea 15 313 82 4,300 80 650Eritrea1 61 1,615,725 128 6,580,043 56 30Ethiopia1 956 37,361,788 1,118 78,324,181 242 242,460Gabon 102 10,000 50 11 ndr ndrGambia 100 n.a. 83 52,906 15 n.a.Ghana 331 707,309 470 471,000 18 n.a.Guinea 473 6,066 309 220,937 10 15Guinea-Bissau 15 10,050 218 102,508 12 8Kenya 1,456 3,900,294 1,454 16,372,805 141 2,536,308Lesotho 40 601,500 1 772,251 ndr ndrLiberia n.a. 1,002,000 70 5,000 ndr ndrLibyan AJ 290 121 200 79 ndr ndrMadagascar 663 2,274,434 1,074 4,883,115 109 78,910Malawi 507 21,108,710 788 8,735,861 61 4,544,514Mali 97 326,667 3,804 46,646 13 1,860Mauritania 2,350 482,414 141 816,491 43 3,000Mauritius 162 14,307 6 2,050 ndr ndrMorocco 1,009 38,203 1,520 375,669 46 36Mozambique 5,977 6,364,211 1,450 9,088,781 22 1,447,837
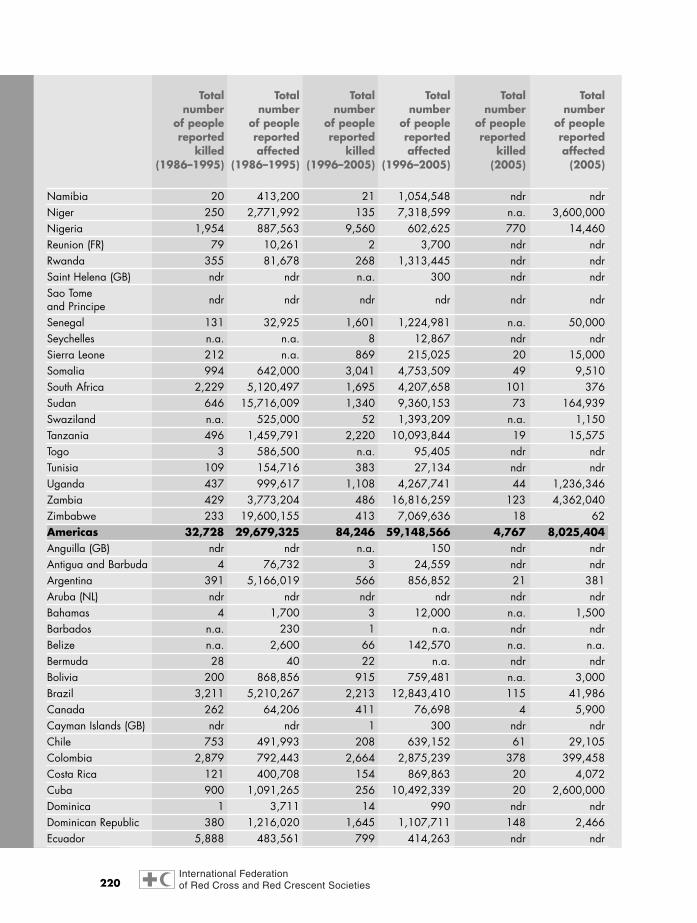
220
Total Total Total Total Total Totalnumber number number number number number
of people of people of people of people of people of peoplereported reported reported reported reported reported
killed affected killed affected killed affected(1986–1995) (1986–1995) (1996–2005) (1996–2005) (2005) (2005)
Namibia 20 413,200 21 1,054,548 ndr ndrNiger 250 2,771,992 135 7,318,599 n.a. 3,600,000Nigeria 1,954 887,563 9,560 602,625 770 14,460Reunion (FR) 79 10,261 2 3,700 ndr ndrRwanda 355 81,678 268 1,313,445 ndr ndrSaint Helena (GB) ndr ndr n.a. 300 ndr ndrSao Tome and Principe ndr ndr ndr ndr ndr ndr
Senegal 131 32,925 1,601 1,224,981 n.a. 50,000Seychelles n.a. n.a. 8 12,867 ndr ndrSierra Leone 212 n.a. 869 215,025 20 15,000Somalia 994 642,000 3,041 4,753,509 49 9,510South Africa 2,229 5,120,497 1,695 4,207,658 101 376Sudan 646 15,716,009 1,340 9,360,153 73 164,939Swaziland n.a. 525,000 52 1,393,209 n.a. 1,150Tanzania 496 1,459,791 2,220 10,093,844 19 15,575Togo 3 586,500 n.a. 95,405 ndr ndrTunisia 109 154,716 383 27,134 ndr ndrUganda 437 999,617 1,108 4,267,741 44 1,236,346Zambia 429 3,773,204 486 16,816,259 123 4,362,040Zimbabwe 233 19,600,155 413 7,069,636 18 62Americas 32,728 29,679,325 84,246 59,148,566 4,767 8,025,404Anguilla (GB) ndr ndr n.a. 150 ndr ndrAntigua and Barbuda 4 76,732 3 24,559 ndr ndrArgentina 391 5,166,019 566 856,852 21 381Aruba (NL) ndr ndr ndr ndr ndr ndrBahamas 4 1,700 3 12,000 n.a. 1,500Barbados n.a. 230 1 n.a. ndr ndrBelize n.a. 2,600 66 142,570 n.a. n.a.Bermuda 28 40 22 n.a. ndr ndrBolivia 200 868,856 915 759,481 n.a. 3,000Brazil 3,211 5,210,267 2,213 12,843,410 115 41,986Canada 262 64,206 411 76,698 4 5,900Cayman Islands (GB) ndr ndr 1 300 ndr ndrChile 753 491,993 208 639,152 61 29,105Colombia 2,879 792,443 2,664 2,875,239 378 399,458Costa Rica 121 400,708 154 869,863 20 4,072Cuba 900 1,091,265 256 10,492,339 20 2,600,000Dominica 1 3,711 14 990 ndr ndrDominican Republic 380 1,216,020 1,645 1,107,711 148 2,466Ecuador 5,888 483,561 799 414,263 ndr ndr
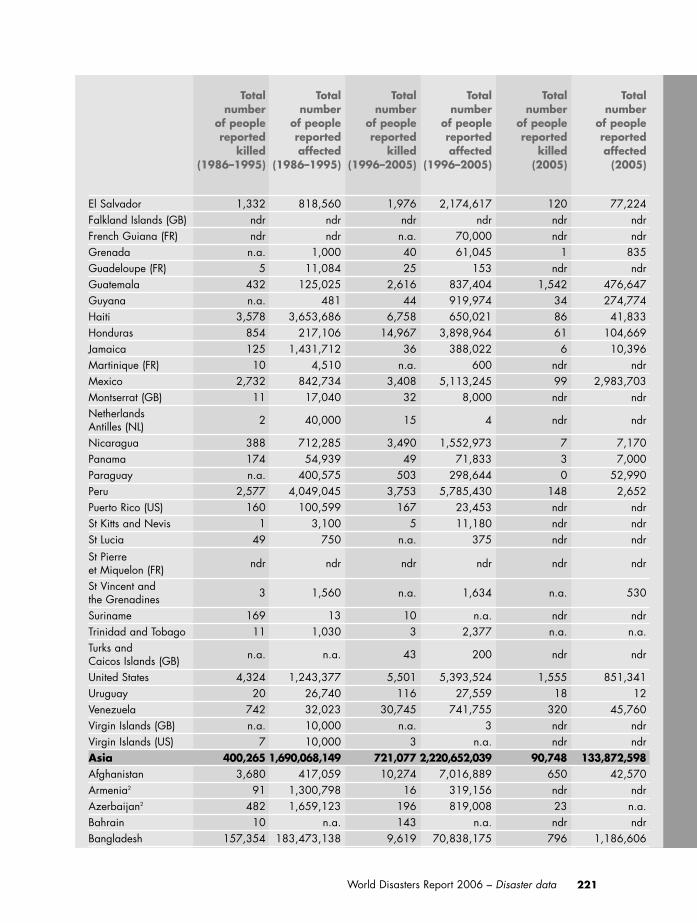
221World Disasters Report 2006 – Disaster data
Total Total Total Total Total Totalnumber number number number number number
of people of people of people of people of people of peoplereported reported reported reported reported reported
killed affected killed affected killed affected(1986–1995) (1986–1995) (1996–2005) (1996–2005) (2005) (2005)
El Salvador 1,332 818,560 1,976 2,174,617 120 77,224Falkland Islands (GB) ndr ndr ndr ndr ndr ndrFrench Guiana (FR) ndr ndr n.a. 70,000 ndr ndrGrenada n.a. 1,000 40 61,045 1 835Guadeloupe (FR) 5 11,084 25 153 ndr ndrGuatemala 432 125,025 2,616 837,404 1,542 476,647Guyana n.a. 481 44 919,974 34 274,774Haiti 3,578 3,653,686 6,758 650,021 86 41,833Honduras 854 217,106 14,967 3,898,964 61 104,669Jamaica 125 1,431,712 36 388,022 6 10,396Martinique (FR) 10 4,510 n.a. 600 ndr ndrMexico 2,732 842,734 3,408 5,113,245 99 2,983,703Montserrat (GB) 11 17,040 32 8,000 ndr ndrNetherlandsAntilles (NL) 2 40,000 15 4 ndr ndr
Nicaragua 388 712,285 3,490 1,552,973 7 7,170Panama 174 54,939 49 71,833 3 7,000Paraguay n.a. 400,575 503 298,644 0 52,990Peru 2,577 4,049,045 3,753 5,785,430 148 2,652Puerto Rico (US) 160 100,599 167 23,453 ndr ndrSt Kitts and Nevis 1 3,100 5 11,180 ndr ndrSt Lucia 49 750 n.a. 375 ndr ndrSt Pierre et Miquelon (FR) ndr ndr ndr ndr ndr ndr
St Vincent and the Grenadines 3 1,560 n.a. 1,634 n.a. 530
Suriname 169 13 10 n.a. ndr ndrTrinidad and Tobago 11 1,030 3 2,377 n.a. n.a.Turks and Caicos Islands (GB) n.a. n.a. 43 200 ndr ndr
United States 4,324 1,243,377 5,501 5,393,524 1,555 851,341Uruguay 20 26,740 116 27,559 18 12Venezuela 742 32,023 30,745 741,755 320 45,760Virgin Islands (GB) n.a. 10,000 n.a. 3 ndr ndrVirgin Islands (US) 7 10,000 3 n.a. ndr ndrAsia 400,265 1,690,068,149 721,077 2,220,652,039 90,748 133,872,598Afghanistan 3,680 417,059 10,274 7,016,889 650 42,570Armenia2 91 1,300,798 16 319,156 ndr ndrAzerbaijan2 482 1,659,123 196 819,008 23 n.a.Bahrain 10 n.a. 143 n.a. ndr ndrBangladesh 157,354 183,473,138 9,619 70,838,175 796 1,186,606

222
Total Total Total Total Total Totalnumber number number number number number
of people of people of people of people of people of peoplereported reported reported reported reported reported
killed affected killed affected killed affected(1986–1995) (1986–1995) (1996–2005) (1996–2005) (2005) (2005)
Bhutan 39 65,600 200 1,000 ndr ndrBrunei Darussalam ndr ndr ndr ndr ndr ndrCambodia 637 3,429,000 615 13,527,614 29 600,000China, PR of3 27,875 818,564,671 32,5741,247,077,832 3,555 91,171,439East Timor4 – – 4 3,558 ndr ndrGeorgia2 311 4,147 150 1,241,864 n.a. 2,500Hong Kong (CN)3 316 12,673 87 4,637 n.a. n.a.India 42,026 561,472,995 85,001 686,724,143 5,405 28,262,805Indonesia 7,641 5,139,970 174,738 4,626,139 1,697 152,848Iran, Islamic Rep. of 42,848 1,878,767 34,260 64,264,807 1,098 130,329Iraq 894 808,500 1,323 8,908 1,225 901Israel 68 343 109 1,857 7 200Japan 6,567 1,106,746 958 1,998,385 238 309,833Jordan 66 18,369 114 330,274 ndr ndrKazakhstan2 230 30,036 91 675,970 n.a. 25,000Korea, DPR of 54,842 6,222,967 216,773 6,519,768 207 16,298Korea, Rep. of 2,715 771,313 1,907 966,458 36 4,741Kuwait ndr ndr 2 200 ndr ndrKyrgyzstan2 232 195,306 203 13,536 3 2,050Lao, PDR 66 3,150,862 159 1,680,005 ndr ndrLebanon 70 105,575 48 17,555 ndr ndrMacau (CN) n.a. 3,986 ndr ndr ndr ndrMalaysia 598 116,979 637 173,300 13 30,600Maldives n.a. 24,149 143 27,314 ndr ndrMongolia 186 600,000 161 2,371,711 ndr ndrMyanmar 1,331 619,531 581 281,947 17 16Nepal 3,335 1,272,951 3,367 1,471,803 243 31,674Oman ndr ndr 104 104 ndr ndrPakistan 7,239 22,233,550 79,634 18,480,367 74,568 10,396,730Palestine(West Bank/Gaza)5 ndr ndr 14 20 ndr ndr
Philippines 24,141 42,991,053 6,006 17,196,335 116 213,066Qatar ndr ndr ndr ndr ndr ndrSaudi Arabia 2,034 n.a. 1,248 15,881 63 67Singapore 27 237 n.a. 1,200 ndr ndrSri Lanka 882 6,290,866 36,013 9,141,219 39 145,030Syrian Arab Republic 46 n.a. 366 668,676 62 88Taiwan (CN) 786 24,188 3,546 777,360 29 3,039Tajikistan2 1,718 146,792 244 3,732,966 45 7,072Thailand 3,973 11,735,586 9,737 25,280,191 103 255,226Turkmenistan2 n.a. 420 51 n.a. ndr ndr

223World Disasters Report 2006 – Disaster data
Total Total Total Total Total Totalnumber number number number number number
of people of people of people of people of people of peoplereported reported reported reported reported reported
killed affected killed affected killed affected(1986–1995) (1986–1995) (1996–2005) (1996–2005) (2005) (2005)
United Arab Emirates n.a. 100 183 41 ndr ndrUzbekistan2 10 50,400 168 1,125,488 n.a. 1,500Viet Nam 4,517 13,547,864 8,233 30,965,725 394 879,638Yemen6 319 91,539 1,077 262,653 87 732Yemen, Arab Rep.6 38 150,000Yemen, PDR6 25 340,000Europe 43,207 17,139,944 77,773 18,285,498 951 526,781Albania 75 3,239,190 29 605,009 5 400,500Andorra ndr ndr ndr ndr ndr ndrAustria 38 130 261 71,294 4 900Azores (PT) 172 n.a. 74 1,215 ndr ndrBelarus2 n.a. 40,000 92 23,499 ndr ndrBelgium 279 2,290 211 3,937 2 210Bosniaand Herzegovina7 ndr ndr 64 354,180 4 3,100
Bulgaria 71 8,179 49 13,940 32 12,200Channel Islands (GB) ndr ndr ndr ndr ndr ndrCroatia7 61 25 90 4,250 3 250Cyprus 2 1,865 88 1,240 31 8Czech Republic8 18 4 67 302,145 1 3Czechoslovakia8 41 n.a.Denmark 55 100 13 2,072 4 n.a.Estonia2 912 140 22 130 n.a. 100Faroe Islands (DK) ndr ndr ndr ndr ndr ndrFinland ndr ndr 35 448 n.a. 400France 636 12,822 15,692 3,593,495 65 4,080Germany9 143 132,195 5,616 447,621 4 617Germany, Dem. Rep.9 92 n.a.Germany, Fed. Rep. of9 155 3,993Gibraltar (GB) ndr ndr ndr ndr ndr ndrGreece 1,314 78,641 655 127,808 121 n.a.Greenland (DK) ndr ndr ndr ndr ndr ndrHoly See – – ndr ndr ndr ndrHungary 47 59 204 147,575 4 n.a.Iceland 34 363 n.a. 199 ndr ndrIreland 57 3,500 n.a. 1,000 n.a. n.a.Isle of Man (GB) ndr ndr ndr ndr ndr ndrItaly 599 32,242 20,922 111,010 59 103Latvia2 ndr ndr 36 n.a. n.a. n.a.Liechtenstein ndr ndr ndr ndr ndr ndr

224
Total Total Total Total Total Totalnumber number number number number number
of people of people of people of people of people of peoplereported reported reported reported reported reported
killed affected killed affected killed affected(1986–1995) (1986–1995) (1996–2005) (1996–2005) (2005) (2005)
Lithuania2 6 780,000 62 n.a. n.a. n.a.Luxembourg ndr ndr 20 n.a. ndr ndrMacedonia,FYR of7 198 11,515 43 108,409 1 2,003
Malta 12 n.a. 325 6 26 2Moldova2 50 50,580 10 2,610,957 n.a. 6,500Monaco ndr ndr ndr ndr ndr ndrNetherlands 135 262,063 1,317 5,303 11 16Norway 275 4,000 251 2,142 n.a. n.a.Poland 318 294 1,085 244,753 164 3,640Portugal 155 2,422 2,164 153,774 15 136Romania 443 32,156 500 322,446 115 57,223Russian Federation2 4,194 823,530 3,910 3,025,126 150 9,112San Marino ndr ndr ndr ndr ndr ndrSerbiaand Montenegro7 11 6,011 132 82,800 2 2,750
Slovakia8 11 200 77 58,393 1 n.a.Slovenia7 n.a. n.a. 1 1,305 ndr ndrSoviet Union2 28,076 2,404,616Spain 399 6,018,838 734 56,519 29 1Sweden 36 122 71 162 7 n.a.Switzerland 53 7,205 127 4,305 18 2,500Turkey 2,659 865,404 19,871 5,112,353 54 6,078Ukraine2 144 2,109,079 610 387,867 13 8,349United Kingdom 822 205,031 2,243 296,811 6 6,000Yugoslavia7 409 1,140Oceania 1,063 16,376,307 3,292 2,126,793 46 28,247American Samoa (US) n.a. n.a. 6 23,063 n.a. n.a.Australia 341 14,988,447 330 687,522 35 4,420Cook Islands (NZ) 6 2,000 19 2,252 n.a. 608Fiji 53 389,372 92 304,327 n.a. n.a.French Polynesia (FR) 10 n.a. 13 511 ndr ndrGuam (US) 1 6,115 233 22,064 ndr ndrKiribati ndr ndr n.a. 84,000 ndr ndrMarshall Islands n.a. 6,000 ndr ndr ndr ndrMicronesia,Fed. States of 5 203 48 37,431 ndr ndr
Nauru ndr ndr ndr ndr ndr ndrNew Caledonia (FR) 2 n.a. 2 1,100 ndr ndrNew Zealand 19 13,472 28 9,040 n.a. 500Niue (NZ) n.a. 200 1 702 ndr ndr

225World Disasters Report 2006 – Disaster data
Total Total Total Total Total Totalnumber number number number number number
of people of people of people of people of people of peoplereported reported reported reported reported reported
killed affected killed affected killed affected(1986–1995) (1986–1995) (1996–2005) (1996–2005) (2005) (2005)
Northern Mariana Islands (US) ndr ndr ndr ndr ndr ndr
Palau ndr ndr 1 12,004 ndr ndrPapua New Guinea 404 367,302 2,443 832,963 2 17,693Samoa 21 283,000 10 n.a. 9 n.a.Solomon Islands 139 239,024 n.a. 1,905 ndr ndrTokelau (NZ) n.a. 1,832 n.a. 26 n.a. 26Tonga 1 3,103 n.a. 23,071 ndr ndrTuvalu n.a. 850 18 n.a. ndr ndrVanuatu 55 70,867 48 84,812 n.a. 5,000Wallis and Futuna (FR) 6 4,520 ndr ndr ndr ndrTotal 508,424 1,891,651,922 934,619 2,502,280,995 99,425 161,243,360
Source: EM-DAT, CRED, University of Louvain, Belgium
1 Prior to 1993, Ethiopia was considered one country; after this date separate countries: Eritrea and Ethiopia.2 Prior to 1991, the Soviet Union was considered one country; after this date separate countries. The former western
republics of the USSR (Belarus, Estonia, Latvia, Lithuania, Moldova, Russian Federation, Ukraine) are included inEurope; the former southern republics (Armenia, Azerbaijan, Georgia, Kazakhstan, Kyrgyzstan, Tajikistan,Turkmenistan, Uzbekistan) are included in Asia.
3 Since July 1997, Hong Kong has been included in China.4 Since May 2002, East Timor has been an independent country.5 Since September 1993 and the Israel–PLO Declaration of Principles, the Gaza Strip and the West Bank have had a
Palestinian government. Direct negotiations to determine the permanent status of these territories began in September1999 but are far from a permanent agreement.
6 Prior to May 1990, Yemen was divided into Arab and People’s Democratic Republics; after this date it has been con-sidered one country.
7 Prior to 1992, Yugoslavia was considered one country; after this date separate countries: Bosnia and Herzegovina,Croatia, Serbia and Montenegro, Slovenia, FYR of Macedonia.
8 Prior to 1993, Czechoslovakia was considered one country; after this date separate countries: Czech Republic andSlovakia.
9 Prior to October 1990, Germany was divided into Federal and Democratic Republics; after this date it has been con-sidered one country.
Note: n.a. signifies no data available; ndr signifies no disaster reported. For more information, see section on caveats inintroductory text.
Note: some totals may not match due to rounding.
Over the last decade, the highest numbers of deaths per continent were reported in Nigeria (Africa), Venezuela(Americas), the Democratic People’s Republic of Korea (Asia), Italy (Europe) and Papua New Guinea (Oceania).
The highest numbers of disaster-affected people per continent were reported in Ethiopia (Africa), Brazil (Americas),China (Asia), Turkey (Europe) and Papua New Guinea (Oceania).
Compared with 1986–1995, the past decade has seen disaster deaths rise by 84 per cent and the numbers affected bydisasters rise by 32 per cent.

226
Table 14 Refugees and asylum seekers by country/territory of origin (1999 to 2005)
1999 2000 2001 2002 2003 2004 2005
Africa 3,072,800 3,254,300 2,923,000 2,907,700 3,102,100 3,209,300 3,196,900Algeria 5,000 – 10,000 – – – 900Angola 339,300 400,000 445,000 402,000 312,000 219,700 213,500Benin – – – – – – 100Burkina Faso – – – – – – 100Burundi 311,000 421,000 375,000 395,000 349,000 472,700 438,500Cameroon – – 2,000 – – 2,300 3,900CentralAfrican Republic – – 22,000 14,000 41,000 29,700 43,700Chad 13,000 53,000 35,000 – 3,000 53,000 49,900Comoros – – – – – – 500Congo, DR of 229,000 342,000 355,000 393,000 422,000 456,100 450,800Congo 25,000 22,000 30,000 15,000 14,000 22,700 24,300Côte d’Ivoire – – – 22,000 51,000 44,900 25,300Djibouti 1,000 1,000 – – – – 100Egypt – – – – – – 2,200Equatorial Guinea – – – – – – 200Eritrea 323,100 356,400 305,000 285,000 277,000 199,700 215,300Ethiopia 53,300 36,200 13,000 15,500 14,500 46,800 63,900Gambia – – – – – – 700Ghana 10,000 10,000 10,000 10,000 10,000 10,000 10,000Guinea – – 5,000 – – – 2,600Guinea-Bissau 5,300 1,500 – – – – 100Kenya 5,000 – – – – 10,100 11,400Liberia 249,000 196,000 215,000 255,300 381,800 323,100 219,800Madagascar – – – – – – 100Malawi – – – – – 2,900 3,800Mali 2,000 – – – – 4,000 3,300Mauritania 45,000 45,000 50,000 40,000 20,000 28,600 29,300Morocco – – – – – 124,000 117,400Mozambique – – – – – – 400Namibia 1,000 – – – – – 1,200Niger – – – – – – 100Nigeria – – 10,000 15,000 17,000 25,700 22,800Rwanda 27,000 52,000 60,000 36,000 40,000 45,900 102,500Senegal 10,000 10,000 10,000 11,000 13,000 11,600 9,600Sierra Leone 454,000 419,000 185,000 115,000 61,000 20,800 26,500Somalia 415,600 370,000 300,000 282,900 263,300 311,600 328,000South Africa – – – – – – 100Sudan 423,200 392,200 440,000 471,000 595,000 697,500 670,900Tanzania – – – – – 4,100 5,400Togo 3,000 2,000 – – 4,000 4,200 44,100Tunisia – – – – – – 100Uganda 15,000 20,000 20,000 25,000 28,000 29,100 35,100
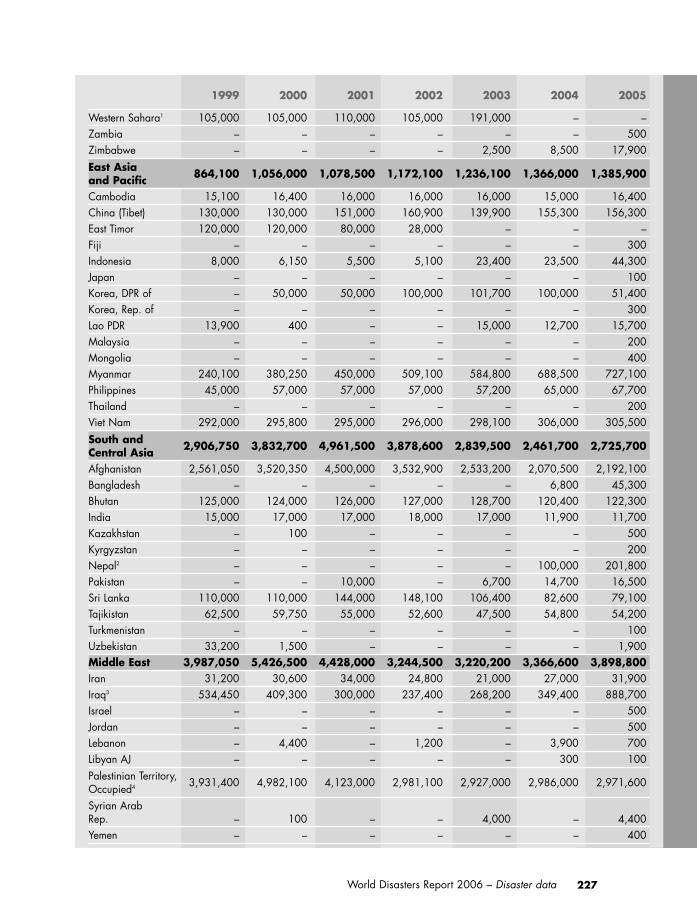
227World Disasters Report 2006 – Disaster data
1999 2000 2001 2002 2003 2004 2005
Western Sahara1 105,000 105,000 110,000 105,000 191,000 – –Zambia – – – – – – 500Zimbabwe – – – – 2,500 8,500 17,900East Asia and Pacific 864,100 1,056,000 1,078,500 1,172,100 1,236,100 1,366,000 1,385,900
Cambodia 15,100 16,400 16,000 16,000 16,000 15,000 16,400China (Tibet) 130,000 130,000 151,000 160,900 139,900 155,300 156,300East Timor 120,000 120,000 80,000 28,000 – – –Fiji – – – – – – 300Indonesia 8,000 6,150 5,500 5,100 23,400 23,500 44,300Japan – – – – – – 100Korea, DPR of – 50,000 50,000 100,000 101,700 100,000 51,400Korea, Rep. of – – – – – – 300Lao PDR 13,900 400 – – 15,000 12,700 15,700Malaysia – – – – – – 200Mongolia – – – – – – 400Myanmar 240,100 380,250 450,000 509,100 584,800 688,500 727,100Philippines 45,000 57,000 57,000 57,000 57,200 65,000 67,700Thailand – – – – – – 200Viet Nam 292,000 295,800 295,000 296,000 298,100 306,000 305,500South andCentral Asia 2,906,750 3,832,700 4,961,500 3,878,600 2,839,500 2,461,700 2,725,700
Afghanistan 2,561,050 3,520,350 4,500,000 3,532,900 2,533,200 2,070,500 2,192,100Bangladesh – – – – – 6,800 45,300Bhutan 125,000 124,000 126,000 127,000 128,700 120,400 122,300India 15,000 17,000 17,000 18,000 17,000 11,900 11,700Kazakhstan – 100 – – – – 500Kyrgyzstan – – – – – – 200Nepal2 – – – – – 100,000 201,800Pakistan – – 10,000 – 6,700 14,700 16,500Sri Lanka 110,000 110,000 144,000 148,100 106,400 82,600 79,100Tajikistan 62,500 59,750 55,000 52,600 47,500 54,800 54,200Turkmenistan – – – – – – 100Uzbekistan 33,200 1,500 – – – – 1,900Middle East 3,987,050 5,426,500 4,428,000 3,244,500 3,220,200 3,366,600 3,898,800Iran 31,200 30,600 34,000 24,800 21,000 27,000 31,900Iraq3 534,450 409,300 300,000 237,400 268,200 349,400 888,700Israel – – – – – – 500Jordan – – – – – – 500Lebanon – 4,400 – 1,200 – 3,900 700Libyan AJ – – – – – 300 100Palestinian Territory, Occupied4 3,931,400 4,982,100 4,123,000 2,981,100 2,927,000 2,986,000 2,971,600
Syrian Arab Rep. – 100 – – 4,000 – 4,400Yemen – – – – – – 400

228
1999 2000 2001 2002 2003 2004 2005
Europe 1,238,100 755,900 674,000 517,500 438,600 226,500 230,100Albania – – – – – 3,300 2,900Armenia 188,400 – 9,000 – – 2,500 4,200Azerbaijan 230,000 – – – – 11,000 13,000Belarus – – – – – – 1,300Bosniaand Herzegovina 250,000 234,600 210,000 156,100 121,200 30,300 29,700
Bulgaria – – – – – – 1,100Croatia 336,000 314,700 272,000 250,000 208,900 69,800 59,600Czech Republic – – – – – – 100Estonia – – – – – – 100Georgia 2,800 22,400 21,000 11,400 6,600 20,000 23,100Hungary – – – – – – 200Latvia – – – – – – 100Lithuania – – – – – – 200Macedonia,FYR of – – 23,000 3,000 – – 1,400
Moldova – – – – – – 1,500Poland – – – – – – 500Portugal – – – – – – 100Romania – – – – – – 900Russian Federation 12,350 22,700 18,000 27,900 25,600 39,400 34,000Serbia and Montenegro 376,400 148,900 60,000 52,200 52,800 19,300 24,700
Slovenia – 4,400 – – – – 100Turkey 11,800 12,600 43,000 16,900 17,600 26,600 25,700Ukraine – – 10,000 – 5,900 4,300 5,500United Kingdom – – – – – – 100Americas andCaribbean 393,800 366,750 428,000 454,200 319,000 339,800 324,000
Argentina – – – – – – 300Bolivia – – – – – – 100Brazil – – – – – – 600Colombia – 2,300 23,000 42,900 230,700 261,000 257,900Costa Rica – – – – – – 100Cuba 850 1,200 3,000 31,500 26,500 25,100 16,700Ecuador – – – – – – 200El Salvador5 253,000 235,500 217,000 203,000 4,500 4,500 5,000Grenada – – – – – – 100Guatemala5 146,000 102,600 129,000 129,000 10,200 12,600 5,900Guyana – – – – – – 500Haiti 23,000 20,600 25,000 30,800 23,800 19,900 17,200Honduras – – – – – – 1,300Jamaica – – – – – – 300Mexico – – 11,000 – 20,700 4,100 4,900Nicaragua5 18,000 3,800 13,000 15,800 2,600 8,200 5,600
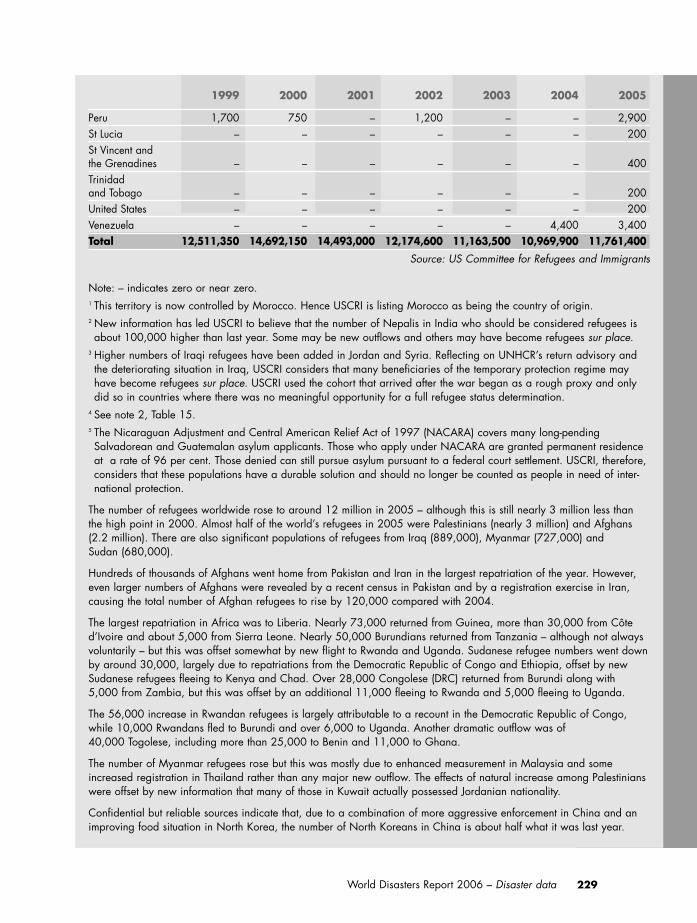
229World Disasters Report 2006 – Disaster data
1999 2000 2001 2002 2003 2004 2005
Peru 1,700 750 – 1,200 – – 2,900St Lucia – – – – – – 200St Vincent and the Grenadines – – – – – – 400Trinidad and Tobago – – – – – – 200United States – – – – – – 200Venezuela – – – – – 4,400 3,400Total 12,511,350 14,692,150 14,493,000 12,174,600 11,163,500 10,969,900 11,761,400
Source: US Committee for Refugees and Immigrants
Note: – indicates zero or near zero.1 This territory is now controlled by Morocco. Hence USCRI is listing Morocco as being the country of origin.2 New information has led USCRI to believe that the number of Nepalis in India who should be considered refugees isabout 100,000 higher than last year. Some may be new outflows and others may have become refugees sur place.
3 Higher numbers of Iraqi refugees have been added in Jordan and Syria. Reflecting on UNHCR’s return advisory andthe deteriorating situation in Iraq, USCRI considers that many beneficiaries of the temporary protection regime mayhave become refugees sur place. USCRI used the cohort that arrived after the war began as a rough proxy and onlydid so in countries where there was no meaningful opportunity for a full refugee status determination.
4 See note 2, Table 15.5 The Nicaraguan Adjustment and Central American Relief Act of 1997 (NACARA) covers many long-pendingSalvadorean and Guatemalan asylum applicants. Those who apply under NACARA are granted permanent residenceat a rate of 96 per cent. Those denied can still pursue asylum pursuant to a federal court settlement. USCRI, therefore,considers that these populations have a durable solution and should no longer be counted as people in need of inter-national protection.
The number of refugees worldwide rose to around 12 million in 2005 – although this is still nearly 3 million less than the high point in 2000. Almost half of the world’s refugees in 2005 were Palestinians (nearly 3 million) and Afghans(2.2 million). There are also significant populations of refugees from Iraq (889,000), Myanmar (727,000) and Sudan (680,000).
Hundreds of thousands of Afghans went home from Pakistan and Iran in the largest repatriation of the year. However,even larger numbers of Afghans were revealed by a recent census in Pakistan and by a registration exercise in Iran,causing the total number of Afghan refugees to rise by 120,000 compared with 2004.
The largest repatriation in Africa was to Liberia. Nearly 73,000 returned from Guinea, more than 30,000 from Côted’Ivoire and about 5,000 from Sierra Leone. Nearly 50,000 Burundians returned from Tanzania – although not alwaysvoluntarily – but this was offset somewhat by new flight to Rwanda and Uganda. Sudanese refugee numbers went downby around 30,000, largely due to repatriations from the Democratic Republic of Congo and Ethiopia, offset by newSudanese refugees fleeing to Kenya and Chad. Over 28,000 Congolese (DRC) returned from Burundi along with 5,000 from Zambia, but this was offset by an additional 11,000 fleeing to Rwanda and 5,000 fleeing to Uganda.
The 56,000 increase in Rwandan refugees is largely attributable to a recount in the Democratic Republic of Congo,while 10,000 Rwandans fled to Burundi and over 6,000 to Uganda. Another dramatic outflow was of 40,000 Togolese, including more than 25,000 to Benin and 11,000 to Ghana.
The number of Myanmar refugees rose but this was mostly due to enhanced measurement in Malaysia and someincreased registration in Thailand rather than any major new outflow. The effects of natural increase among Palestinianswere offset by new information that many of those in Kuwait actually possessed Jordanian nationality.
Confidential but reliable sources indicate that, due to a combination of more aggressive enforcement in China and animproving food situation in North Korea, the number of North Koreans in China is about half what it was last year.

230
Table 15 Refugees and asylum seekers by host country/territory (1999 to 2005)
1999 2000 2001 2002 2003 2004 2005
Africa 3,147,000 3,346,000 3,002,000 3,030,000 3,245,500 3,293,500 3,176,100Algeria 84,000 85,000 85,000 85,000 170,000 102,000 94,500Angola 15,000 12,000 12,000 12,000 13,000 14,900 14,900Benin 3,000 4,000 5,000 6,000 5,000 5,900 32,000Botswana 1,000 3,000 4,000 4,000 4,500 3,800 3,200Burkina Faso – – – – – – 1,300Burundi 2,000 6,000 28,000 41,000 42,000 60,700 40,600Cameroon 10,000 45,000 32,000 17,000 25,000 65,000 58,900CentralAfrican Rep. 55,000 54,000 49,000 50,000 51,000 30,600 26,500
Chad 20,000 20,000 15,000 16,000 156,000 260,000 275,500Congo, DR of 235,000 276,000 305,000 274,000 241,000 200,700 204,500 Congo 40,000 126,000 102,000 118,000 91,000 71,700 69,600Côte d’Ivoire 135,000 94,000 103,000 50,000 74,000 74,200 44,100Djibouti 23,000 22,000 22,000 23,000 36,000 18,000 10,500Egypt 47,000 57,000 75,000 78,000 69,000 85,800 86,700Eritrea 2,000 1,000 2,000 3,000 4,000 4,700 6,000Ethiopia 246,000 194,000 114,000 115,000 112,000 116,000 101,100Gabon 15,000 15,000 20,000 20,000 19,000 19,100 13,400Gambia 25,000 15,000 15,000 10,000 10,000 11,000 8,800Ghana 12,000 13,000 12,000 41,000 48,000 48,100 59,000Guinea 453,000 390,000 190,000 182,000 223,000 145,200 67,300Guinea-Bissau 5,000 6,000 7,000 7,000 10,000 7,700 7,800Kenya 254,000 233,000 243,000 221,000 219,000 269,300 314,600Liberia 90,000 70,000 60,000 65,000 60,000 38,600 16,100Libyan AJ 11,000 11,000 33,000 12,000 – 12,400 12,000Malawi – – 6,000 13,000 12,000 7,000 9,600Mali 7,000 7,000 9,000 4,000 7,000 12,300 13,100Mauritania 25,000 25,000 25,000 25,000 26,500 30,600 30,600Morocco – – – 2,000 – 2,300 2,300Mozambique 1,000 2,000 5,000 7,000 8,000 5,500 6,000Namibia 8,000 20,000 31,000 26,000 15,000 16,900 14,300Niger 2,000 1,000 1,000 – – – 300Nigeria 7,000 10,000 7,000 7,000 10,000 9,500 9,400Rwanda 36,000 29,000 35,000 32,000 37,000 36,100 49,500Senegal 42,000 41,000 43,000 45,000 23,000 23,200 23,400Sierra Leone 7,000 3,000 15,000 60,000 70,000 65,700 60,100Somalia – – – – – 3,000 2,900South Africa 40,000 30,000 22,000 65,000 104,000 142,900 169,800Sudan 363,000 385,000 307,000 287,000 280,000 225,900 231,700Swaziland – – 1,000 1,000 – – 1,000Tanzania 413,000 543,000 498,000 516,000 480,000 602,300 549,100Togo 10,000 11,000 11,000 11,000 12,000 11,700 9,700Tunisia – – – – – – 100

231World Disasters Report 2006 – Disaster data
1999 2000 2001 2002 2003 2004 2005
Uganda 197,000 230,000 174,000 221,000 231,500 252,300 254,400Zambia 205,000 255,000 270,000 247,000 239,000 174,000 155,900Zimbabwe 1,000 2,000 9,000 10,000 8,000 6,900 14,000East Asia and Pacific 657,300 791,700 815,700 874,700 953,400 1,013,200 1,029,400
Australia 17,000 16,700 21,800 25,000 22,800 14,600 14,800Cambodia 100 50 1,000 300 100 – 200China1 292,800 350,000 345,000 396,000 396,000 401,500 352,700Hong Kong1 n.a. n.a. n.a. – – – –Indonesia 120,000 120,800 81,300 28,700 300 – 100Japan 400 3,800 6,400 6,500 7,900 6,100 2,600Korea, Rep. of – 350 600 – 1,700 2,200 2,100Malaysia 45,400 57,400 57,500 59,000 75,700 101,200 152,700Nauru – – 800 100 200 – –New Zealand – 3,100 2,700 1,700 1,200 1,800 1,000PapuaNew Guinea 8,000 6,000 5,400 5,200 7,800 7,800 10,000Philippines 200 200 200 200 2,200 2,200 300Thailand 158,400 217,300 277,000 336,000 421,500 460,800 477,500Viet Nam 15,000 16,000 16,000 16,000 16,000 15,000 15,400South and Central Asia 1,689,000 2,655,600 2,702,800 2,188,600 1,872,900 1,724,600 1,953,600
Bangladesh 53,100 121,600 122,000 122,200 119,900 150,000 150,100India 292,000 290,000 345,800 332,300 316,900 393,300 515,100Kazakhstan 14,800 20,000 19,500 20,600 15,300 15,800 7,300Kyrgyzstan 10,900 11,000 9,700 8,300 8,200 4,200 3,100Nepal 130,000 129,000 131,000 132,000 134,600 130,600 130,600Pakistan 1,127,000 2,019,000 2,018,000 1,518,000 1,219,000 968,800 1,088,100Sri Lanka – – – – – – 200Tajikistan 4,700 12,400 4,600 3,500 3,200 3,700 2,600Turkmenistan 18,500 14,200 14,000 13,700 14,100 13,300 12,000Uzbekistan 38,000 38,400 38,000 38,000 41,700 44,900 44,500Middle East 5,849,000 6,035,300 6,830,200 5,290,300 4,353,100 4,288,100 4,855,400Gaza Strip 798,400 824,600 852,600 879,000 923,000 952,300 986,000Iran 1,835,000 1,895,000 2,558,000 2,208,500 1,335,000 1,046,100 994,000Iraq 129,400 127,700 128,100 134,700 131,500 96,600 63,400Israel 400 4,700 4,700 2,100 1,000 4,900 1,500Jordan2 1,518,000 1,580,000 1,643,900 155,000 163,700 168,300 609,500Kuwait 52,000 52,000 50,000 65,000 65,000 51,800 14,300Lebanon2 378,100 383,200 389,500 409,000 256,000 265,800 296,800Qatar – – – – – – 100Saudi Arabia 128,600 128,500 128,500 245,400 240,900 243,700 240,800Syrian Arab Rep.2 379,200 389,000 397,600 482,400 497,000 701,700 866,300United Arab Emirates – – – – – – 200
West Bank 569,700 583,000 607,800 627,500 665,000 682,700 699,800

232
1999 2000 2001 2002 2003 2004 2005
Yemen 60,000 67,600 69,500 81,700 75,000 74,200 82,700Europe 1,909,100 1,153,300 972,800 877,400 884,500 610,500 530,200Albania 5,000 500 400 100 100 – 100Armenia 240,000 – 11,000 11,000 11,000 11,200 11,300Austria 16,600 6,100 10,800 30,900 17,600 19,300 17,300Azerbaijan 222,000 3,600 7,000 11,400 10,300 9,800 3,300Belarus 2,900 3,200 3,100 3,600 3,400 3,400 2,700Belgium 42,000 46,400 41,000 30,300 33,000 24,500 14,100Bosnia and Herzegovina 60,000 38,200 33,200 34,200 22,500 22,700 10,800
Bulgaria 2,800 3,000 2,900 1,200 800 5,200 5,200Croatia 24,000 22,500 21,900 8,100 4,200 3,700 2,900Cyprus 300 300 1,300 1,800 5,300 10,600 14,300Czech Republic 1,800 4,800 10,600 6,300 3,900 2,700 1,300Denmark 8,500 10,300 12,200 5,200 2,800 2,000 2,000Finland 3,800 2,600 2,100 1,200 2,300 – 2,400France 30,000 26,200 12,400 27,600 34,900 22,900 25,500Georgia 5,200 7,600 7,900 4,200 3,900 2,600 2,500Germany 285,000 180,000 116,000 104,000 90,800 83,300 64,200Greece 7,500 800 6,500 1,800 5,200 10,200 11,300Hungary 6,000 4,200 2,900 1,200 1,500 8,000 8,800Iceland 100 50 – – – – 300Ireland 8,500 7,700 9,500 6,500 5,800 10,800 2,400Italy 24,900 13,700 9,600 5,200 5,600 5,800 5,800Liechtenstein – – – – – – 200Lithuania 100 150 300 200 100 – 600Macedonia,FYR of 17,400 9,000 3,600 2,700 2,300 2,200 2,200
Malta – – – – 200 – 2,400Moldova – – 300 300 100 – 200Netherlands 40,000 29,600 31,000 17,200 14,600 12,800 14,400Norway 9,500 8,600 13,200 5,900 11,000 8,900 4,300Poland 1,300 2,300 1,800 300 1,500 8,700 6,200Portugal 1,700 1,600 50 – – – 400Romania 900 2,100 200 100 200 2,400 2,300Russian Federation 104,300 36,200 28,200 17,400 161,300 150,000 149,200Serbia and Montenegro 476,000 484,200 400,000 353,000 291,100 76,500 78,600
Slovak Republic 400 400 3,100 4,500 4,700 3,300 3,100Slovenia 5,000 12,000 2,700 400 100 – 200Spain 4,500 1,100 1,000 200 200 – 1,600Sweden 20,200 18,500 18,500 24,900 25,600 19,400 19,400Switzerland 104,000 62,600 57,900 44,200 38,300 31,200 10,500Turkey 9,100 9,900 12,600 10,000 9,500 7,800 7,300Ukraine 5,800 5,500 6,000 3,600 3,100 6,400 4,000United Kingdom 112,000 87,800 69,800 79,200 55,700 22,200 14,600

233World Disasters Report 2006 – Disaster data
1999 2000 2001 2002 2003 2004 2005
Americas and the Caribbean 737,000 562,100 597,000 756,500 543,500 535,600 475,000
Argentina 3,300 1,000 3,100 2,700 2,300 3,900 3,900Bahamas 100 100 100 – – – –Belize 3,000 1,700 – 1,000 900 – 700Bolivia 400 – 400 400 500 – 500Brazil 2,300 2,700 4,050 3,700 3,900 3,800 3,700Canada 53,000 54,400 70,000 78,400 70,200 54,800 39,500Chile 300 300 550 400 500 – 900Colombia 250 250 200 200 200 – 200Costa Rica 22,900 7,300 10,600 12,800 13,600 10,600 12,200Cuba 1,000 1,000 1,000 1,000 800 – 700Dominican Republic 650 500 500 300 500 – 1,000Ecuador 350 1,600 4,300 9,100 16,500 45,100 47,400El Salvador – – – – 200 – –Guatemala 750 700 700 700 800 – 400Jamaica 50 50 – – – – –Mexico 8,500 6,500 6,200 4,000 2,900 4,500 3,400Nicaragua 500 300 – – 300 – 200Panama 600 1,300 1,500 1,700 2,000 – 2,200Paraguay – – 50 – – – –Peru 700 750 750 900 800 – 1,200United States3 638,000 481,500 492,500 638,000 244,200 232,800 176,700Uruguay 150 50 100 100 100 – 100Venezuela 200 100 400 1,100 182,300 180,100 180,100Total 13,988,000 14,543,700 14,921,000 12,337,500 11,852,900 11,465,500 12,019,700
Source: US Committee for Refugees and Immigrants
Note: – indicates zero or near zero; n.a. not available, or reported estimates unreliable.1 As of 1997, figures for Hong Kong are included in total for China.2 In the light of persistent protection gaps, USCR concluded in 2003 that the inclusion clause of Article 1D of the UNRefugee Convention brings Palestinian refugees under the Convention’s application. Accordingly, USCR changed itsstatistical approach in 2003 by applying the Convention’s definition of refugee status – including its cessation – to thispopulation rather than UNRWA’s registration criteria as before. The numbers in Lebanon were adjusted to reflect theacquisition of citizenship in Lebanon and other countries.
3 Includes asylum applications pending in the United States; USCRI estimates the number of individuals represented per case.
In 2005, Pakistan continued to host more refugees (over 1 million) than any other country in the world, while Iran hosted nearly 1 million refugees. The Middle East hosted 4.8 million refugees, while Africa hosted over 3 million. By contrast, Europe hosted 530,000 refugees and the Americas and Caribbean hosted 475,000.
USCRI adjusted the number of Burundians in Tanzania upwards to reflect new analysis of the durability of protection formore than 100,000 ‘long-stayers’ and made the same calculations for 40,000 Chadians in Cameroon. USCRI adjusted thenumber of Western Saharan refugees in Algeria downwards by 67,000 to reflect new data. A joint UNHCR–host govern-ment re-registration exercise reduced the count of former Yugoslav refugees in Serbia and Montenegro by more than200,000 as many had been found to have naturalized, returned or resettled, some earlier than 2004. USCRI also reducedthe count of Eritreans in Sudan, although the number is still believed to be substantially more than UNHCR’s figures.
Erratum: The figure of 20,600 refugees, recorded in WDR 2005 as hosted by New Zealand in 2004, was incorrect. Thefigure should have read 1,800 and has been corrected in this year’s tables.

234
Table 16 Significant populations of internally displaced people (1999 to 2005)
1999 2000 2001 2002 2003 2004 2005
Africa1 10,355,000 10,527,000 10,935,000 15,230,000 13,099,000 12,163,000 11,921,300Algeria 100,000 100,000 100,000 100,000 100,000 400,000 400,000Angola 1,500,000 2,000,000 2,000,000 2,000,000 1,000,000 60,000 61,700Burundi 800,000 600,000 600,000 400,000 400,000 145,000 117,000CentralAfrican Republic – – 5,000 10,000 200,000 200,000 200,000
Congo, DR 800,000 1,500,000 50,000 2,000,000 3,200,000 2,330,000 1,664,000Congo 500,000 30,000 2,000,000 100,000 60,000 48,000 48,000Côte d’Ivoire – 2,000 5,000 500,000 500,000 500,000 500,000Eritrea 250,000 310,000 90,000 75,000 75,000 59,000 50,500Ethiopia 300,000 250,000 100,000 90,000 90,000 132,000 150,000Guinea – 60,000 100,000 20,000 20,000 82,000 82,000Guinea-Bissau 50,000 – – – – – –Kenya 100,000 100,000 200,000 230,000 230,000 360,000 381,900Liberia 50,000 20,000 80,000 100,000 500,000 464,000 48,000Nigeria 5,000 – 50,000 50,000 57,000 200,000 200,000Rwanda 600,000 150,000 – – – – –Senegal – 5,000 5,000 5,000 17,000 – –Sierra Leone 500,000 700,000 600,000 – – 3,000 –Somalia 350,000 300,000 400,000 350,000 350,000 400,000 370,000Sudan 4,000,000 4,000,000 4,000,000 4,000,000 4,800,000 5,300,000 5,335,000Togo – – – – – – 3,000Uganda 450,000 400,000 500,000 600,000 1,400,000 1,330,000 1,740,500Zimbabwe – – 50,000 100,000 100,000 150,000 569,700East Asia and Pacific 1,577,000 1,670,000 2,266,000 1,349,000 1,400,000 1,160,000 992,000
East Timor 300,000 – – – – – –Indonesia 440,000 800,000 1,400,000 600,000 600,000 500,000 342,000Korea, DPR of – 100,000 100,000 100,000 50,000 50,000 50,000Myanmar 600,000 600,000 600,000 600,000 600,000 550,000 540,000PapuaNew Guinea 5,000 – 1,000 – – – –
Philippines 200,000 140,000 135,000 45,000 150,000 60,000 60,000Solomon Islands 32,000 30,000 30,000 4,000 – – –Europe 3,993,000 3,539,000 2,785,000 2,560,000 2,455,800 2,226,500 2,013,700Armenia – – 50,000 50,000 50,000 50,000 8,000Azerbaijan 568,000 575,000 572,000 576,000 571,000 528,000 558,400Bosniaand Herzegovina 830,000 518,000 439,000 368,000 327,200 309,200 183,400
Croatia 50,000 34,000 23,000 17,000 12,600 12,600 4,900Cyprus 265,000 265,000 265,000 265,000 265,000 150,000 150,000Georgia 280,000 272,000 264,000 262,000 260,000 260,000 240,000Macedonia, FYR of – – 21,000 9,000 – 2,700 800Russian Federation 800,000 800,000 474,000 371,000 368,000 339,000 265,000

235World Disasters Report 2006 – Disaster data
1999 2000 2001 2002 2003 2004 2005
Serbiaand Montenegro 600,000 475,000 277,000 262,000 252,000 225,000 247,400
Turkey1 600,000 600,000 400,000 380,000 350,000 350,000 355,800Americasand Caribbean 1,886,000 2,176,000 2,465,000 2,518,000 2,742,000 2,912,000 2,970,000
Colombia 1,800,000 2,100,000 2,450,000 2,500,000 2,730,000 2,900,000 2,900,000Haiti – – – 6,000 – – –Mexico 16,000 16,000 15,000 12,000 12,000 12,000 10,000Peru 70,000 60,000 – – – – 60,000Middle East1 1,917,000 1,700,000 1,670,000 2,646,000 2,346,000 1,648,000 1,792,000Palestinian Territory, Occupied 17,000 – 20,000 26,000 – – –
Iraq 900,000 700,000 700,000 1,100,000 800,000 1,000,000 1,300,000Israel 200,000 200,000 200,000 250,000 276,000 10,000 9,000Jordan – – – 800,000 800,000 168,000 160,000Lebanon 350,000 350,000 250,000 300,000 300,000 300,000 250,000Syrian Arab Rep. 450,000 450,000 500,000 170,000 170,000 170,000 73,000South and Central Asia 1,617,000 1,542,000 2,402,000 2,023,000 1,511,000 1,205,000 1,282,800
Afghanistan1 500,000 375,000 1,000,000 700,000 200,000 167,000 153,200Bangladesh 50,000 60,000 100,000 60,000 61,000 65,000 65,000India 507,000 507,000 500,000 600,000 650,000 500,000 600,000Nepal1 – – – 100,000 100,000 100,000 100,000Pakistan1 – – 2,000 – – 17,000 20,000Sri Lanka 560,000 600,000 800,000 563,000 500,000 353,000 341,200Uzbekistan – – – – – 3,000 3,400Total 21,345,000 21,154,000 22,523,000 26,326,000 23,553,800 21,314,500 20,971,800
Source: US Committee for Refugees and Immigrants
Note: – indicates zero or near zero; n.a. not available, or reported estimates unreliable.1 Estimates of the size of internally displaced populations are frequently subject to great margins of error and are oftenimprecise, particularly in these countries and regions.
According to USCRI, estimated numbers of global internally displaced people (IDPs) remained at around 21 million in2005, albeit less than the 26 million peak in 2002. Africa accounted for well over half of all IDPs, with 5.3 million inSudan, 1.7 million in Uganda and 1.6 million in the Democratic Republic of Congo (DRC). Other significant populationsof IDPs included Colombia (2.9 million) and Iraq (1.3 million).
In early 2006, the Internal Displacement Monitoring Centre (IDMC) of the Norwegian Refugee Council put the figure ofIDPs in December 2005 at 23.7 million, including 3.7 million in Colombia. IDMC reported that conflict newly uprootedover 2 million people during 2005, although nearly 4 million others were able to return home, especially in the DRC,Southern Sudan and Liberia. However, these returns were often not sustainable.
According to IDMC, continued violence in eastern provinces of the DRC displaced at least half a million people during2005, while in Zimbabwe the government evicted 570,000 people from their homes in urban slums. Ongoing fightingin Colombia displaced over 200,000 more people. In Iraq, military operations caused the often temporary displace-ment of an estimated 200,000 people. In Sudan’s Darfur region, brutal attacks on civilians led to the displacement oftens of thousands. Civil wars generated roughly half of all IDP situations, while at least 16 governments or occupationauthorities directly or indirectly displaced people in 2005, according to IDMC. The organization added that in a quar-ter of IDP situations, governments restricted international humanitarian access to affected people.

Indexabortion(s) 4, 107, 108, 113, 114
abuse 47, 54, 79, 123, 146-148, 162see also child abuse
accidents 79, 120, 198, 211-218
accommodation 98, 110
accountability 143, 161, 163, 199
Action Against Hunger 46
ActionAid International 39, 41
Active Learning Network for Accountabilityand Performance in Humanitarian Action(ALNAP) 143
affected people 26, 27, 70, 178, 180, 189,225, 235
see also victim(s)
Afghanistan 31, 94, 170, 172, 182, 221,227
Africa 4, 8, 9, 11, 13, 17, 18, 20, 21, 23,28, 29, 31, 33, 39, 48, 60, 61, 63, 94, 117,121, 124-129, 133-135, 137, 138, 162,167, 175, 177, 178, 180, 182, 188, 207-210, 215-220, 225, 226, 229, 230, 233,235
see also Maghreb
African American women 141, 142
African Union 30
African Urban Risk Analysis Network(AURAN) 24
aftershock(s) 152, 153
Aga Khan Rural Support Project 155
Agence France-Presse (AFP) 125
agrarian reform 74
agricultural wage 98
agriculture 33, 43, 50, 55, 58, 61-63, 78,84, 134, 143, 184, 190
aid 3, 5, 8, 9, 11-22, 24-26, 30-36, 39, 41,43, 46, 48, 50-52, 55-58, 60, 62, 79-81,84, 87, 100, 104, 113, 122, 126, 127, 129,130, 135, 136, 141, 144, 146-148, 153,154, 156, 157, 159, 165, 167-170, 173,177, 180, 182-185, 187, 190-192, 196
see also food aidsee also humanitarian aid
aid agency(ies)/organization(s) 8, 11-14, 19,22, 24-26, 30, 31, 35, 36, 100, 104, 113,141, 157, 167
aid coverage 17, 18, 183
aid worker(s) 30, 126, 136, 146
AIDS 11, 33, 37, 43, 44, 46-48, 63, 64,79, 100, 106, 146
see also HIV/AIDS
airlifts 9, 32
AlertNet 11, 17-20, 39, 41, 67, 78, 93,117, 132, 163
Algeria 11, 125, 127, 128, 182, 187, 219,226, 230, 233, 234
ambulances 104, 188
America 8, 11, 14, 23, 69, 70, 73-76, 80,88, 89, 148, 182, 200, 208
American University in Cairo 135
Americas 27, 28, 89, 207-210, 215-218,220, 225, 228, 233, 235
Amnesty International 74, 88, 126, 130,138, 139, 147, 161
Ampara 141, 155see also Sri Lanka
anaemia 102, 107, 112
Andaman and Nicobar Islands 19see also India
Angola 175, 177, 188, 219, 226, 230, 234
Annan, Kofi 133
236

antenatal care 102
area-based subsidy 59
Argentina 23, 220, 228, 233see also Buenos Aires
arid areas 145
Ariyabandu, Madhavi Malalgoda 161
Aryal, Pitamber 100, 101, 103
Asia 8, 11, 14, 17-19, 27, 30, 107, 114,115, 137, 162, 163, 171, 180, 182, 188,190, 195, 207-210, 215-218, 221, 225,227, 231, 234, 235
Asociación Pro Derechos Humanos deAndalucía (APDHA) 117
assessment(s) 22, 25-27, 39, 50, 56, 63, 64,81, 85, 90, 104, 115, 126, 149, 151, 157,159, 161, 178, 185, 187, 189-191, 197,200, 210
assistance 13, 15, 18, 20, 22, 26, 29, 39,63, 71, 88, 95, 114, 127, 129, 137, 161,165, 167, 168, 177, 182, 190-192, 195-197, 201
Associated Press 139
asylum seekers 7, 11, 126, 130, 137, 200,201, 226, 230
at-risk populations 160
Australia 8, 14, 40, 131, 148, 192, 224,231
Australian Red Cross 136
Balkans 182
Bam 30, 208see also Iran
Bamako 135see also Mali
Bangladesh 28, 68, 141, 159, 163, 195,221, 227, 231, 235
Bangladesh Red Crescent Society 159, 163
baseline data 101
Basic Operating Guidelines (BOGs) 104
Basnett, Indira 97, 99, 101, 103, 105, 106,112, 114
BBC 16, 19, 29, 32, 39-41, 103, 139
beneficiary(ies) 3, 5, 8, 17, 18, 20, 51,141, 165, 170, 173, 177-182, 190, 229
Benfield Hazard Research Centre 38, 88
Benin 178, 180, 219, 226, 229, 230
Bergin, Kathleen 141
birth complications 95, 99, 103, 106, 107,111, 112, 146
blankets 53, 129, 153
bleeding 93, 95, 98, 102, 112see also haemorrhage
blood bank 99
blood donation 100
blood transfusion 99, 100, 111
boat migrants 4, 9, 117, 120-122, 124,126, 127-134
Bradbury, Mark 31, 32, 39
Bradford University 117
breastfeeding 96, 146, 147, 163
bribes 62
broadcast 14, 15, 108
budget(s) 36, 56, 85, 99, 100, 103, 153,186, 187
Buenos Aires 23see also Argentina
Canada 148, 161, 192, 220, 233
Canadian Red Cross Society, The 136
Canary Islands 117, 119-121, 124, 128,132, 135, 219
see also Spain
237World Disasters Report 2006 – Index

capital 36, 70, 74, 80, 81, 99, 135
CARE-Guatemala 82
Caribbean 8, 23, 70, 76, 131, 188, 228,233, 235
see also Cayman Islandssee also Cubasee also Dominican Republicsee also Haiti
Carolan, Peter 100
cassava 47, 48, 53
Castellanos, Xavier 88
catastrophes 11, 22see also disaster(s)
cattle stalls 145
Cayman Islands 220
CBS 11, 19, 41
CE-DAT 6, 24, 195, 196
Central Africa 128, 178
Central African Republic 19, 175, 180
Central America 8, 69, 75, 76, 89, 208
Central American Initiative for DisasterMitigation (CAMI) 82
Central American Institute for SocialStudies (INCEDES) 79
Central Emergency Response Fund (CERF)21, 187
Centre for Research on the Epidemiology ofDisasters (CRED) 22, 41, 71, 143, 162,171, 182, 192, 195-197, 199-201, 207-218, 225
see also EM-DAT
Ceuta 125, 126, 138see also Spain
Chad 12, 18, 19, 29, 39, 165, 180, 182,219, 226, 229, 230
Chechnya 11, 14, 17, 18, 178, 180, 187
Cheniti, Tahar 137
child(ren) 3, 9, 11, 12, 15, 25, 28, 34, 43,44, 46, 47, 52-54, 57, 58, 62, 64, 65, 68,72, 76, 79, 84, 93, 94, 96, 99, 100-102,104-107, 111, 112, 114, 115, 124, 137,141, 144-148, 151-156, 160, 162, 190
child abuse 54
childbirth 9, 30, 34, 47, 94, 95, 97, 100,103, 105-107
see also giving birth
child labour 47
child survival 105
childbearing 143, 146
China 28, 29, 39, 168, 195, 209, 210, 222,225, 227, 229, 233
cholera 24, 72, 175, 178, 188
chronic diseases 158
civil society 50, 55, 73, 80, 81, 83, 85, 89,106, 113, 151, 160
civil war 9, 15, 67, 73, 74
Clapham, Susan 101-106, 112-114
civilian government 73
climate change 32
clothes 53, 126, 128, 129, 149, 154
coastguard 122, 128, 131, 132, 142
Code of Conduct for the International RedCross and Red Crescent Movement andNGOs in Disaster Relief 35, 173
coffee 75, 77, 86, 157
Colombia 11, 14, 28, 34, 220, 228, 233,235
Columbia School of Journalism 19, 40
Committee to Protect Journalists 29
communal forests 79
communication(s) 2, 50, 107, 113, 191
238
community(ies) 4, 12-14, 25, 27, 29, 30,33, 34, 43, 44, 48, 50-52, 54-56, 62, 67,68-73, 75-88, 97, 98, 103, 104, 107-114,124, 129, 142, 144-146, 148, 150, 152-159, 161, 170, 173, 185, 188, 191, 200
community-based disaster preparedness 81,152
community-based facilities 112
community-based organizations 87
community-level participation 83
complex crises/emergencies 13, 19, 24, 167,170, 172, 175, 177, 182, 186, 190, 195,196
conflict(s) 6, 9, 21, 24, 28, 30, 34, 35, 37,70, 73, 77, 80, 83, 84, 94, 95, 97, 98-101,103, 104, 108, 109, 114, 124, 137, 147,148, 162, 196, 198, 201, 207, 216, 235
conflict zones 101
Congo, Democratic Republic of (DRC) 11,14, 15, 17, 20, 24, 31, 180, 181, 189, 219,226, 229, 230, 234, 235
Congo, Republic of 19, 20, 175-180, 219,226, 230, 234
CONRED 68, 70, 84-86, 88, 91
Consolidated Appeals Process (CAP) 19
Côte d’Ivoire 8, 11, 12, 17, 19, 119, 178,182, 189, 219, 226, 229, 230, 234
countryside 68, 96
crime 64, 74, 136
Croatia 121, 225, 228, 232, 234
crop(s) 28, 33, 44, 48, 53, 59, 60, 61, 75,76, 84, 145, 188, 197
crop farming 145
Cuba 210, 220, 228, 233
cyclone(s) 87, 141, 159
cyclone seasons 87
cyclone shelters 141
Czech Republic 169, 225, 228, 232
danger 36, 86, 100, 107, 112, 120
Darcy, James 26, 31, 35
Darfur 11, 15-18, 24, 29-31, 39, 40, 180,235
see also Sudan
data 4, 6, 9, 12, 17, 22, 23, 36, 37, 46, 47,56, 82, 94, 99, 101, 103, 105, 106, 108,110, 117, 119, 121, 122, 126, 143, 157,158, 160, 170, 171, 173, 175, 177, 178,182, 185, 189-191, 195-201, 209, 210,212-214, 216-218, 225, 233
databases 12, 13, 22-25, 27, 38, 199see also CE-DATsee also DesInventarsee also EM-DAT
death(s) 8, 14, 24, 25, 27, 29-31, 46, 48,53, 58, 70, 72, 74, 82, 94, 95, 98, 101,102, 104-108, 110, 112, 115, 137, 142,195, 198, 199, 208, 212, 216, 225
debt-relief 33, 55, 56
debt trap 49
decentralization 83, 85
deforestation 27, 76
dehydration 127, 128
democracy 72, 73, 127
Demographic and Health Survey (DHS)94, 101, 106
demographic crisis 133
Department for International Development(DFID) 36, 55, 97, 104
deportation 79, 130, 134
DesInventar 3, 22, 23, 41, 69, 71, 72
development 4, 11, 13, 17, 19-21, 24, 28,29, 31, 32, 34-39, 41, 48, 49, 52, 55, 59-64, 68, 69, 73-75, 77-88, 97-101, 104,106, 109, 113-115, 121, 134, 139, 143,145, 155-157, 161, 162, 165, 167, 168,177, 180, 189-192, 195, 196, 198, 199,201, 207-210, 215-218
World Disasters Report 2006 – Index 239

development assistance 13, 165, 167, 168,177, 190, 192, 195, 201
Development Assistance Committee (DAC)165, 195
see also Organisation for Economic Co-operation and Development (OECD)
development poles 77
development projects 36, 80
Devereux, Stephen 24
de Waal, Alex 29, 39
diarrhoea 15, 102
diet 52
DIPECHO 36
disability 27
disaster(s) 2-9, 11-25, 27-39, 41, 43-45,47, 49, 51, 53-57, 59, 61, 63-65, 67-77,79, 81-91, 93-95, 97, 99, 101, 103, 105-107, 109, 111, 113, 115, 117, 119, 121-123, 125, 127, 129, 131, 133, 135, 137,139, 141-144, 146-157, 160-163, 165,167, 168, 170-173, 175, 182, 185-187,190-192, 195-201
see also hazardssee also natural disaster(s)see also technological disaster(s)
disaster affected 70
disaster data 6, 22, 23, 195, 198, 199
disaster management 24, 34, 146, 151-154,159, 161
disaster mitigation 82, 156
disaster preparedness 36, 71, 81, 88, 143,152-154, 159, 188, 197, 198
disaster relief 21, 35, 70, 82, 84, 144, 154,161, 162, 173, 187, 188
Disaster Relief Emergency Fund (DREF)21, 188
disaster response 4, 36, 81, 141, 144, 149,150, 156-158, 170
Disaster Watch 159, 163
discrimination 9, 12, 30, 35, 51, 72, 74,75, 76, 95, 97, 107, 132, 141
disease(s) 11, 15, 21, 24, 31, 32, 38, 44,46-48, 62, 63, 71, 79, 90, 107, 109, 133,158, 188, 190, 198, 207, 216
district health office 99
district hospital 57, 93, 98, 99, 103, 109,111
Djibouti 19, 175, 178, 180, 219, 226,230
domestic violence 27, 54, 76, 147, 148
Dominican Republic 220, 233
donor(s) 5, 6, 9, 11-14, 16, 20, 21, 25-27,30-33, 35, 36, 38, 39, 43, 44, 50, 51, 55,56, 60, 62, 63, 100, 102, 112, 145, 165,167-171, 175, 177, 178, 182-185, 187-192, 195, 199
donor market 178
drinking water 158, 159
drought(s) 4, 11, 19-21, 24, 29, 32, 36, 38,39, 59, 86, 119, 144, 145, 190, 195, 197,200, 209, 211-218
drug trafficking 80
drugs 11, 28, 37, 112
dry spell(s) 44, 55
early warning systems 8, 49, 81, 85
Earth Institute 80
earthquake(s) 8, 9, 11, 14, 17-19, 23, 27,30, 36, 68-70, 72, 74, 141, 144, 146-153,155, 158, 159, 161, 163, 171, 182, 190,195, 197, 200, 208, 210-218
earthquake-proof 36
earthquake-resistant 158
East Africa 188
economic growth 75
240

economic management 33, 56, 90
economic migrants 117
economic recovery 33, 184, 190
economic revitalization 84
education 28, 47, 48, 53, 62, 63, 75, 79,81, 84, 86, 87, 105, 108, 129, 142, 146,151, 159, 160, 183
Egeland, Jan 16, 20, 29, 57
Egypt 117, 131, 219, 226, 230
El Pais 120, 128, 139
El Salvador 90, 156, 158, 221, 233
electricity 72, 142
EM-DAT 22, 23, 41, 143, 163, 195-197,199-201, 207-218, 225
see also Centre for Research on the Epidemiology of Disasters (CRED)
emergency(ies) 3-6, 9, 11-13, 16, 18-22,24, 27-29, 32, 33, 36, 37, 43, 44, 47, 55,56, 58-60, 79, 81, 82, 84, 93, 95, 99, 103,104, 106, 110, 111, 115, 121, 122, 141-143, 145, 146, 154, 156, 158, 165, 167,168, 170, 172, 173, 177, 178, 182, 185-192, 195-197, 199, 200
emergency aid 36, 60, 165
emergency care 95, 99
emergency funds 37, 47, 110, 111
emergency obstetric care (EmOC) 93, 99,106, 111, 113, 114
emergency ward 103
employment 28, 79, 148, 162
environmental data 158
environmental degradation 27, 48, 86see also erosionsee also land degradation
environmental sustainability 59, 86
epidemic(s) 32, 37, 72, 188, 198, 207see also disease(s)
erosion 60, 67, 76, 88
Ethiopia 29, 39, 167, 225, 226, 229, 230,234
ethnicity 73, 76, 143, 160
Europe 4, 8, 9, 14, 28, 34, 117, 121, 124-127, 130, 132, 133, 135, 137, 139, 167,191, 207-210, 215-218, 223, 225, 228,232-234
European Commission’s Humanitarian Aiddepartment (ECHO) 36
European Union 117, 139, 169
exclusion 50, 52, 74-76, 83
external debt 56, 58
failed development 34, 121, 189
family health 95, 114, 115, 143
family planning 105, 107
famine(s) 20, 24, 29, 32, 39, 40, 43, 44,46, 47, 49, 54, 55, 63, 133, 167, 197-200,207, 208, 211-218
see also Great Leap faminesee also malnutrition
Famine Early Warning Systems Network(FEWS NET) 49
farming 57, 61, 62, 145, 153
fertilizer(s) 3, 9, 33, 43, 48, 50-52, 57-60,62, 64
fieldwork 43, 44, 49, 51, 141, 151, 155
fire(s) 21, 23, 72, 125, 197, 198, 211-218
fishermen 27, 120, 121, 139
fishing industry 27
flash appeals 5, 19, 33, 170, 171, 172, 177,178, 182, 186, 190
flood(s) 21, 23, 27, 44, 67, 69, 70, 72, 84,142, 146, 147, 152, 158, 159, 195, 197,200, 208-218
flood waters 142, 159
241World Disasters Report 2006 – Index

fodder 145
food aid 9, 32, 33, 43, 46, 48, 50-52, 57,58, 60, 62, 156, 184, 190, 192
see also aidsee also humanitarian aid
food crisis 16, 19, 21, 24, 32, 33, 43, 47-49, 52, 55, 56, 58, 60, 64, 70, 185, 190
food deficit 60
food distribution 50, 58, 155
food insecurity 32, 58, 59, 190
food rations 155
food sector 183
food shortages 8, 9, 44, 48, 55, 188
forced labour 75, 77
forest fires 72
forest resources 79
forgotten crises/disasters 11, 15, 21, 34,187
fuel 60, 142
Fuerteventura 117, 121, 124, 132, 135see also Spain
fund(s) 3, 5, 9, 15, 21, 26, 32, 33, 36, 37,39, 43, 47, 51, 55, 56, 58, 64, 65, 85, 91,99, 102, 104, 108, 110, 111, 115, 146,155, 161, 163, 167, 168, 178, 183, 187,188, 192
G8 Summit 167
Gambia 119, 219, 226, 230
gender 4, 48, 72, 76, 84, 87, 107, 141,143-145, 147, 148, 150, 151, 154, 156,157, 160-163
gender discrimination 72, 107
gender equality 84, 143, 157
gender-based violence 148, 157, 160
geographic isolation 76
Germany 34, 133, 192, 223, 225, 232
giving birth 30, 95, 96, 98, 105, 146see also childbirth
Global Call to Action Against Poverty 167
Good Humanitarian Donorship 13, 26, 35,41, 165, 187, 191, 192
government expenditure 56
grain reserve 55
granary 59
grass-roots organizations 83, 159
Great Lakes 175, 177, 180
Great Leap famine 29see also famine(s)
Greece 119, 192, 223, 232
Greek Islands 117
Green Evolution 62
groundnuts 59
Guardia Civil 121, 125, 135
Guardia Costiera 122
Guardian, The 19, 41, 138
Guatemala 4, 13, 16, 17, 21, 23, 34, 67,68-84, 86-91, 221, 233
see also Lake Atitlán
Guatemalan Red Cross 81, 85
Guha-Sapir, Debarati 143, 201
Guinea-Bissau 119, 124, 219, 226, 230,234
Gujarat 150, 158, 208see also India
Guterres, António 127, 135
Guyana 12, 19, 175, 178, 180, 182, 221,228
haemorrhage 95, 100, 102, 107, 112see also bleeding
Haiti 11, 27, 68, 148, 221, 228, 235
Harrell-Bond, Barabara 135
harvest 44, 49, 53, 55, 67
242

Haye, Ahmedou Ould 120, 129
hazard(s) 4, 19, 21-23, 33-36, 68-72, 124,161, 190
see also disaster(s)
health risks 35
health worker(s) 95-97, 100-102, 106, 109,111-114, 146, 160
healthcare 9, 31, 35, 62, 79, 95-98, 100,107, 109-111, 113, 146, 159
healthcare facility 95, 107
healthcare system 113
Heavily Indebted Poor Countries (HIPC)55
Hein, Christopher 129, 130, 132
high-risk zone 84
HIV/AIDS 33, 37, 43, 44, 46-48, 63, 64,79, 100, 106, 146
see also AIDS
Honduras 82, 162, 221, 228
Horn of Africa 8, 20, 21, 39, 137
horticulture 48
hospital(s) 4, 15, 25, 36, 57, 61, 93, 96,98, 99, 103, 106-111, 128, 154
household(s) 8, 21, 32, 44, 48, 52, 53, 57-60, 75, 76, 78-80, 96, 98, 109, 115, 143,144, 145, 147, 148, 155
human resources 35, 85
human rights groups 113
Human Rights Watch 29, 39
humanitarian(s) 3, 5, 8, 9, 11-14, 16-22,25-35, 37-41, 50, 55-58, 62, 64, 80, 109,113, 117, 119, 121, 124, 127, 130, 131,133, 134, 136, 137, 143, 147, 148, 154,157, 160-162, 165, 167-170, 173, 174,177, 178, 180, 182, 183, 185, 187, 189-192
see also aid worker(s)
humanitarian agency(ies)/organization(s) 9,21, 22, 29, 31, 35, 37, 80, 136, 137, 143,154, 157, 160
humanitarian aid 5, 8, 11, 12, 17, 18, 21,32, 36, 41, 80, 127, 165, 167-170, 173,177, 180, 182, 183, 187, 190-192, 196
see also aidsee also food aid
humanitarian appeal 32, 104, 177, 178
humanitarian crises 8, 11-13, 18, 25, 26, 29,30, 34, 37, 148, 165, 168, 169, 189-191
humanitarian emergency 29, 55, 58
humanitarian funds 56
Humanitarian Policy Group (HPG) 20
humanitarian response 11, 12, 21, 26, 32,34, 35, 46, 50, 58, 62, 165, 173, 174, 187,189, 190, 192
humanitarian system 17, 25
Hungary 169, 223, 228, 232
hunger 3, 15, 29, 38, 39, 43, 44, 46-48,51, 52, 54, 58-60, 62-64, 79, 128, 190
hurricane(s) 4, 8, 11, 14, 16, 18, 21, 23,27, 67-71, 74, 76-79, 81, 83, 84, 86, 89,90, 141, 142, 148, 156,-158, 162, 168,188, 195, 208, 210, 214
hygiene 129, 154, 155
Hyogo Framework for Action 34, 41
illiteracy 68, 97
immunization(s) 101-103
impunity 74
India 11, 93, 111, 113, 122, 134, 144,150, 158, 159, 161, 187, 195, 208-210,222, 227, 229, 231, 235
see also Andaman and Nicobar Islandssee also Gujaratsee also Maharashtrasee also Tamil Nadu
243World Disasters Report 2006 – Index
Indian Ocean 5, 8, 11, 141, 167, 208
infant(s) 11, 46, 87, 95, 96, 98, 102, 106,146, 196
infant mortality 46, 87, 102, 196
infection 46, 102
Institute of Development Studies (IDS) 24
institution(s) 33, 72, 73, 75, 108, 109,167, 170, 195
institutional system 80
Integrated Regional Information Networks(IRIN) 16, 114, 115, 151, 152, 154, 159,163
Inter Press Service 74
internally displaced people (IDPs) 7, 201,234, 235
see also refugee(s)
international agency(ies)/organization(s)117
international aid 79see also humanitarian aid
International Center for Soil Fertility andAgricultural Development 60
International Committee of the Red Cross(ICRC) 15
see also International Federation of Red Cross and Red Crescent Societiessee also International Red Cross and Red Crescent Movement
International Federation of Red Cross and Red Crescent Societies (InternationalFederation) 3, 5, 21, 24, 32, 43, 57, 58, 71,81, 88, 100, 104, 105, 107, 114, 124, 134,137, 149, 151, 155, 161, 162, 165, 187-189, 191, 195, 196
see also International Committee of theRed Crosssee also International Red Cross and Red Crescent Movement
International Labour Organization (ILO)149
international law 39, 135
international maritime law 130
International Monetary Fund (IMF) 32
International Maritime Organization(IMO)130, 131, 138, 139
International Organization for Migration(IOM) 78, 123, 135
International Red Cross and Red CrescentMovement 35, 143, 173, 180, 185, 189,192
see also International Committee ofthe Red Crosssee also International Federation of Red Cross and Red Crescent Societies
Iran 159, 208, 222, 227, 229, 231, 233see also Bam
Iraq 14, 170, 172, 184, 222, 229, 231, 235
Italian Islands 117, 119, 127see also Italy
Italian Red Cross 123, 126
Italy 119-123, 126, 127, 129, 130, 133,136, 138, 192, 223, 225, 232
see also Italian Islandssee also Lampedusasee also Romesee also Sicily
Japan 28, 192, 222, 227, 231
jirga 152
Johns Hopkins University 99
journalist(s) 3, 8, 14, 19, 29, 37, 40, 67,70, 103, 109, 113, 117, 123, 125, 134,137
Kathmandu 93, 97, 101, 103, 104, 111,114, 115
see also Nepal
244

Kenya 144, 145, 219, 226, 229, 230, 234
Khogali, Hisham 24, 32
Khubab Foundation 151
Korea, Democratic People’s Republic of(DPRK) 29, 30, 170, 177
Kosovo 30
labour 29, 47, 52, 53, 75, 77, 79, 93, 98,112, 134, 145, 149, 150, 162
Lahlou, Mehdi 125
Lake Atitlán 84see also Guatemala
Lampedusa 4, 119, 121-123, 127, 129, 130see also Italy
land degradation 27see also environmental degradation
landlocked 57
landslides 14, 21, 27, 76, 82, 84, 152, 153,197, 211-218
latifundios 80
Latin America 23, 70, 73, 74, 76, 80, 148,182
Latin American Network for the SocialStudy of Disaster Prevention (LA RED) 22
Lebanese Red Cross 188
Lebanon 188, 222, 227, 233, 235
Lewis, Stephen 48
Liberia 11, 148, 219, 226, 229, 230, 234,235
Libya 117, 119, 123, 126, 127, 129-131,134, 137, 138
LIVE 8 167
livelihood(s) 9, 13, 20-22, 27, 32-35, 37,39, 48, 61, 71, 74, 77, 142, 143, 145, 150,160, 185
livestock 32, 48, 49, 53, 109, 145
local capacity(ies) 81, 197
local community(ies) 13, 83, 110
local organization(s) 70, 80
locusts 19, 32, 119
logistics 60, 85, 134, 187
Maasai 4, 144, 145see also Kenya
macroeconomic mismanagement 55
Maghreb 121, 136see also Africa
Maharashtra 144, 159see also India
maize 33, 43, 44, 47-53, 55-62, 67
Malawi 3, 8, 9, 13, 19, 24, 32-34, 43, 44,46-48, 50, 51, 53, 55-65, 175, 178, 180,182, 190, 219, 226, 230
Malawi Red Cross Society 47
Mali 119, 219, 226, 230see also Bamako
malnutrition 6, 13, 24, 31, 32, 35, 43, 44,46, 47, 58, 68, 196
see also famine(s)
Malta 117, 119, 224, 232
Maoist rebels 95
Marburg virus 188
market 25, 37, 49, 50, 56, 59, 61, 72, 150,151, 170, 178, 197
maternal and child health workers(MCHWs) 111
Maternal and Neonatal Program EffortIndex (MNPI) 104
maternal health 94, 99, 100, 102-105
maternity ward 99
Mauritania 117, 119, 120, 124, 126, 128,129, 134, 139, 219, 226, 230
see also Nouadhibou
Mauritanian Red Crescent 120, 129
McNamara, Dennis 16
245World Disasters Report 2006 – Index

measles 105, 196
Médecins Sans Frontières (MSF) 14
media 3, 8, 9, 11-14, 16-19, 27, 29, 30,32, 37-39, 47, 53, 69, 77, 88, 103, 106,107, 113, 119, 126, 128, 135, 167, 177,186, 190, 200
Media Bridge 19
media coverage 3, 13, 14, 16-18, 39, 106,107, 167
Medina, Juan 117, 124, 132
medical care 129
medicine 96, 98
Mediterranean 4, 117, 119-122, 124, 125,129-131, 133, 134, 136, 138, 139
Mejia Lopez, Meeylyn Lorena 89
Melilla 125, 126, 138see also Spain
Mesa Noda, Gerardo 121, 125
meteorology 85
Mexico 18, 28, 70, 77, 79, 142, 221, 228,233, 235
Middle East 137, 182, 227, 231, 233
migrant(s) 4, 9, 11, 28, 34, 78, 79, 80,117, 119, 120-138
see also boat migrant(s)
migration 4, 32, 72, 77-80, 108, 117, 119,120, 122, 123, 127, 129, 130-139
Migration Policy Institute (MPI) 131, 133
migratory trends 77
Millennium Development Goal(s) 63, 94,100, 101, 106, 167, 191
Millennium Review Summit 167
minifundios 80
Montenegro 121, 225, 228, 232, 233, 235
Morocco 117, 125-128, 134, 135, 138,182, 219, 226, 229, 230
Morris, James 48
mortality 6, 24, 30, 31, 43, 46-48, 87, 94,95, 99-103, 105, 106, 108, 112-115, 146,196
motherhood 4, 93, 94, 96, 97, 101-115
Mozambique 188, 219, 226, 230
mudslides 69, 70, 72
Munich Re 22, 199
municipal level 22, 80, 83, 87
municipality 23, 77, 81, 82
Musa, Mario 136
Mutharika, Bingu 55
Muzaffarabad 149, 150, 155, 159see also Pakistan
Myanmar 11, 29, 30, 187, 222, 227, 229,234
National Disaster Risk Reduction System85
National Institute for Statistics 77
National Institute of Statistics and AppliedEconomics 125
National Safe Motherhood Day 113
national safe motherhood programme 104
National System of Urban and RuralDevelopment Councils 82, 85
Natsios, Andrew 29, 40
natural disaster(s) 12, 14, 19, 29, 38, 41,154, 161, 162, 165, 170-172, 182, 186,190, 195, 197, 199, 201, 210-218
see also disaster(s)see also technological disaster(s)
Needs Analysis Framework 26, 189see also needs assessments
246

needs assessments 25-27, 157, 159, 187,189, 191
see also Needs Analysis Framework
neglected crises 1, 3, 9, 11, 13, 18, 19, 21,31, 35, 37
Nepal 4, 9, 11, 13, 30, 35, 37, 93-112,114, 115, 187, 222, 231
see also Kathmandu
Nepal Press Institute (NPI) 109
Nepal Red Cross Society 100, 101, 103-105, 107, 115
Nepal Safer Motherhood Project (NSMP)97, 108, 109, 114, 115
Netherlands Red Cross, The 3, 14, 15, 38,81, 188
New Orleans 141, 142, 161
New York Times, The 18, 40, 41
New Zealand 148, 192, 224, 231, 233
Niger 3, 8, 11, 16, 19, 20, 29, 32, 34, 39,170, 178, 180, 182, 185, 190, 220, 226, 230
Nigeria 119, 220, 225, 226, 230, 234
non-governmental organizations (NGOs)80, 117, 168, 192
North Africa 121, 124, 126, 127, 138, 182
North West Frontier Province 152, 155see also Pakistan
Norway 63, 121, 192, 224, 232
Nouadhibou 126, 128, 129see also Mauritania
nurse 97, 99
nutrition 40, 43, 46, 61, 63, 64, 112, 196
obstetric care 93, 95, 106, 115
Occupied Palestinian Territory (OPT) 170
official development assistance (ODA) 6,167, 192, 195, 202-205
Organisation for Economic Co-operationand Development (OECD) 165, 167, 168,183, 192, 195, 202-206
see also Development Assistance Committee (DAC)
Organization of the Petroleum ExportingCountries (OPEC) 168-170
orphans 44, 47, 84, 97
Overseas Development Institute (ODI) 20
Oxfam 159, 162, 163, 185, 192
Pakistan 4, 9, 141, 144, 146-149, 151,152, 154, 155, 159, 161, 163, 170, 222,227, 229, 231, 233
see also Muzaffarabadsee also North West Frontier Province
Pakistan earthquake 144, 163
Pakistan Red Crescent Society 146, 152,154
Pan American Disaster Response Unit(PADRU) 81
pandemic 46, 48
Panteion University 131
peacekeeping 30, 31, 148, 162
peasants 73
people-smuggling(ers) 28, 120, 134
Peru 23, 221, 229, 233, 235
piece-work 44, 53
pigeonpea 59
Plan África 129
Planning and Programming Secretariat ofthe President’s Office (SEGEPLAN) 85
pneumonia 102
Pokhrel, Deepa 108, 109
Poland 169, 224, 228, 232
247World Disasters Report 2006 – Index

political instability 73, 74
population dispersal 72, 76
population movements 11, 28
post-earthquake 158
post-partum haemorrhage 95, 100, 107,112
postnatal care 98, 102, 112
poverty 11, 14, 27, 28, 34, 35, 43, 44, 46-48, 53, 58, 59, 61, 62, 64, 68, 73, 75, 76,78, 79, 81, 84, 86, 90, 97, 98, 121, 124,126, 133, 141, 146, 157, 167, 190-192
pregnancy 30, 93, 95, 97, 99, 102, 111, 115
premature delivery 102
press coverage 14, 22, 56
private donors 167
professional training 84
prostitution 54, 148
protection 33, 34, 47, 79, 88, 121, 124,130, 136, 146, 156, 160, 163, 180, 184,201, 229, 233
provinces 31, 80, 235
psychological support 153
psychosocial rehabilitation 84
Pugh, Michael 117, 139
Pukhtun 144
racism 74, 75
radio 14, 15, 61, 108, 114, 120, 142
rape 28, 79, 142
reconstruction 11, 18, 70, 84, 86, 144,149, 158, 162, 178
recovery 9, 12, 30, 33, 37, 44, 46, 48, 58,61, 69, 73, 79, 80, 82, 84, 85, 86, 87, 147,151, 154, 156, 157, 161, 162, 178, 180,184, 190
Rees, Peter 189
refugee(s) 7, 11, 21, 28, 29, 39, 41, 117,121, 123, 124, 127, 129-132, 135-139,148, 159, 162, 163, 180, 187, 192, 196,200, 201, 226, 229, 230, 233, 235
refugee convention 127, 129, 130, 233
Refugee Studies Centre 135
Refugees International 148, 162, 163
relief operations 196
relocation 77
repatriation 121, 124, 125, 129, 229
resettlement 27, 77
resources 8, 9, 12, 17, 18, 26, 35, 38, 55,59, 76, 79, 85, 112, 142, 151, 153, 169,173, 187-189, 191
Reuters 11, 17-19, 29, 39, 41, 55, 64, 67,78, 93, 117, 124, 132, 150, 163
Reuters AlertNet 11, 17, 18, 39, 41, 163
Richter scale 69, 70see also earthquake(s)
risk management 34, 36, 69, 81, 85, 87
risk patterns 69
risk reduction 3, 4, 34-38, 69, 73, 80-82,85-89, 156-158
Rome 119, 138see also Italy
Rural Development Policy Institute 155
Rwanda 20, 31, 220, 226, 229, 230, 234
Sachs, Jeffrey 80
Safe Motherhood Network FederationNepal 96
safer motherhood indicators 105
Sahel 188see also Africa
Salvadorean Red Cross 156
248

sanitation 9, 33, 58, 158, 159, 183-185,190, 197
Saudi Arabia 170, 222, 231
Save the Children 102, 112, 114, 115
Scotland 11, 167
seismology 85see also earthquakessee also Richter scale
Selassie, Haile 29
Senegal 117, 119, 120, 128, 129, 220, 226,230, 234
septicaemia 95
Serbia 121, 224, 225, 228, 232, 233, 235
settlements 77, 82, 154
sexually transmitted infections 44, 105see also HIV/AIDS
shanty towns 72
shelter 15, 33, 81, 151, 183, 184, 197
Shirkat Gah women’s collective 148see also women’s grass-roots organizations
Sicily 119, 123, 126, 127see also Italy
Sierra Leone 177, 220, 226, 229, 230, 234
skilled birth attendants (SBAs) 93
social exclusion 74
social violence 72, 74
social vulnerability 34, 35, 37, 38, 76, 141
Somalia 8, 11, 14, 17, 25, 26, 31, 32, 39,41, 117, 167, 220, 226, 230, 234
South Asia 8, 11, 14, 17-19, 27, 30, 107,114, 137, 162, 163, 171, 180, 182, 190,195, 208, 210
South Asia earthquake 8, 11, 14, 18, 19,27, 30, 163, 171, 182, 190, 195, 208,210
Southern Africa 48
Soviet Union 168, 225
Spain 4, 117, 120, 121, 124-126, 128, 131,133, 136, 138, 192, 224, 232
see also Canary Islandssee also Ceutasee also Fuerteventurasee also Melillasee also Tenerife
Spanish Red Cross 119, 121, 124, 128,129, 139
Spindler, William 124, 130
Sri Lanka 106, 141, 147, 150, 154, 155,156, 159, 161, 162, 222, 227, 231, 235
see also Ampara
stakeholders 64, 157
stress 147, 148
stunted 68, 98
Suárez, María 90
sub-Saharan Africa 13, 60, 63, 94, 121, 182
subsidy programme 52, 60see also area-based subsidy
Sudan 11, 17, 18, 20, 31, 32, 39, 165, 172,178, 180, 220, 226, 229, 230, 233, 234,235
see also Darfur
surgery 98, 99, 104, 110, 146
survivor 155
Swiss Re 22, 199
Switzerland 2, 121, 192, 210, 224, 232
Tajikistan 177, 225, 227, 231
Tamil Nadu 143, 158, 162see also India
technological disaster(s) 22, 195, 198, 201,210, 212, 213, 216, 217
see also disaster(s)see also natural disaster(s)
249World Disasters Report 2006 – Index

teenagers 107
Tenerife 128see also Spain
tetanus inoculation 102
The Tyndall Report 11, 14, 17, 41
theft 47, 53, 79
Timor-Leste Red Cross 188
topography 76, 97
tourism 98, 122
trafficking 27, 47, 80, 120, 134, 135, 138,146, 160
training 4, 81-84, 87, 101, 108, 110, 112,113, 129, 143, 152-154, 156, 158-160, 162
transactional sex 53, 54
trauma 147, 150
treatment 37, 95, 96, 107, 109, 110, 126
Trócaire 80, 81, 91
tropical storm 70
tsunami 5, 8, 11, 12, 14, 16-19, 21, 26, 27,39, 41, 141, 143, 144, 147, 148, 150, 154-156, 158, 159, 162, 167-169, 171-175,178, 180, 182, 186, 190, 192, 208
Tsunami Evalutation Coalition (TEC) 20,26, 39, 41, 168, 178, 192
tuberculosis 46, 196
Tunis 124, 136see also Tunisia
Tunisia 117, 127, 137, 220, 226, 230see also Tunis
Tunisian Red Crescent 137
Turkey 117, 159, 169, 208, 224, 225, 228,232
Uganda 11, 17, 175, 180, 189, 220, 226,229, 231, 234, 235
United Nations (UN) 43, 165, 195
UN appeals 5, 17, 19, 177, 183
UN Children’s Fund (UNICEF) 155
UN Consolidated Appeals Process (CAP)19, 26, 33, 170, 171, 173, 174, 177, 180,185, 189, 190
UN Development Programme (UNDP)106
UN Disaster Assessment and Coordination(UNDAC) 85, 90
UN flash appeal(s) 57
UN Food and Agriculture Organization(FAO) 68, 78, 89, 143
UN High Commissioner for Refugees(UNHCR) 28, 41, 121, 123, 124, 130,139, 159, 229, 233
UN International Strategy for DisasterReduction (ISDR) 41, 143
UN Office for the Coordination ofHumanitarian Assistance (OCHA) 16, 17,20, 104, 147, 162, 166, 169-172, 175-177,179, 181, 184-186
UN Population Fund (UNFPA) 104
UN Security Council resolution 31
UN tsunami appeal 178
United States Agency for InternationalDevelopment (USAID) 29, 104
University of Amsterdam 133, 137
University of Louvain 22, 195, 201, 207-218, 225
US Committee for Refugees andImmigrants (USCRI) 200, 201, 229, 233,235
van Selm, Joanne 133, 137, 138
vessel 117, 122
victims 31, 53, 67, 72, 73, 135, 142, 143,149, 153, 156, 157, 167, 173
see also affected people
250

village(s) 9, 25, 46, 48, 49, 51, 52, 67, 69,73, 74, 77, 93, 95-99, 101, 103, 106, 111,112, 124, 149-155, 158, 159
village development committee 99
village health assistant 101
village health post(s) 99, 101, 111
violent deaths 74
volcano 70, 84
volunteer(s) 15, 67, 81, 84, 100, 107, 112,121, 125, 129, 136, 151, 153, 159, 160,188
vulnerability 4, 14, 20-23, 31, 34-38, 48,50, 56, 59, 61, 64, 67-72, 75, 76, 79, 81,83, 86, 89, 104, 127, 141, 145, 157, 160,189, 190, 191, 197
Vulnerability Assessment Committee (VAC)50, 51, 58
vulnerability reduction 35
vulnerable housing 88
Wahlstrom, Margareta 27, 31, 33
Washington Post, The 24, 40, 128
water 9, 11, 15, 25, 33, 35, 37, 47, 53, 58,60, 62, 67, 86, 122, 128, 129, 135, 142,145, 146, 153, 158, 159, 183-185, 190,197, 198
water supply 159
West Africa 11, 17, 28, 33, 117, 125, 126,175, 180, 188
western donor(s) 21, 30, 165
Western Sahara 11, 117, 119, 121, 128
wetlands 142
widow(s) 84, 97, 151
windstorm(s) 4, 70, 87, 159, 195, 197,209, 211-218
women 4, 9, 12, 27, 30, 33, 35, 46, 49, 53,54, 73-77, 79, 83, 84, 88, 89, 93, 95, 97-100, 102-114, 124, 137, 141-151, 154-157, 160-163
Women’s Coalition for DisasterManagement 159
women’s grass-roots organizations 159
World Bank 21, 34, 58, 65, 68, 73, 75,83, 90, 98, 157, 161, 162, 167, 178, 180,198
World Blood Donor Day 100
World Conference on Disaster Reduction(WCDR) 34
World Disasters Report 2, 25, 27, 38, 106,122, 141, 161, 162, 185
World Food Programme (WFP) 28, 58,96
World Health Organization (WHO) 95,195
Yemen 68, 117, 120, 223, 225, 227, 232
youth education 84see also education
Zimbabwe 30, 63, 177, 220, 227, 231,234, 235
251World Disasters Report 2006 – Index


The Fundamental Principles of the International Red Cross and Red Crescent Movement
HumanityThe International Red Cross and Red Crescent Movement, born of a desire tobring assistance without discrimination to the wounded on the battlefield,endeavours, in its international and national capacity, to prevent and alleviatehuman suffering wherever it may be found. Its purpose is to protect life andhealth and to ensure respect for the human being. It promotes mutualunderstanding, friendship, cooperation and lasting peace among all peoples.
ImpartialityIt makes no discrimination as to nationality, race, religious beliefs, class orpolitical opinions. It endeavours to relieve the suffering of individuals, beingguided solely by their needs, and to give priority to the most urgent cases ofdistress.
NeutralityIn order to continue to enjoy the confidence of all, the Movement may not takesides in hostilities or engage at any time in controversies of a political, racial,religious or ideological nature.
IndependenceThe Movement is independent. The National Societies, while auxiliaries in thehumanitarian services of their governments and subject to the laws of theirrespective countries, must always maintain their autonomy so that they may beable at all times to act in accordance with the principles of the Movement.
Voluntary serviceIt is a voluntary relief movement not prompted in any manner by desire forgain.
UnityThere can be only one Red Cross or Red Crescent Society in any one country. Itmust be open to all. It must carry on its humanitarian work throughout itsterritory.
UniversalityThe International Red Cross and Red Crescent Movement, in which all societieshave equal status and share equal responsibilities and duties in helping eachother, is worldwide.

The International Federation ofRed Cross and Red CrescentSocieties promotes thehumanitarian activities ofNational Societies amongvulnerable people.
By coordinating international disaster relief and encouragingdevelopment support it seeksto prevent and alleviate humansuffering.
The International Federation, the National Societies and the International Committee of the Red Cross togetherconstitute the International Red Cross and Red CrescentMovement.
”
“Despite the rhetoric on good donorship and the mushrooming of the international aid reform industry, millions remain consigned to the shadows of unfashionable crises and disasters. For them, every day is a lottery to live or die. This report is a passionate critique of why this is still the case. It is essential reading for those impatient for faster change.
Mukesh Kapila, former Head of Conflict and Humanitarian Affairs, UK Department for International Development
World Disasters Report 2006 focus on neglected crises
Which people are missing out on humanitarian aid because no journalists report on them, no donors are interested in them,no agencies have assessed their needs, or because theirgovernments ignore them?
This year’s report ventures into the shadows lying behind thebrilliantly illuminated disasters of 2005–2006. It combines first-hand reporting from the field with critical analysis of aid flowsand donor preferences to highlight places and issues starved of attention. The report calls on aid organizations, journalists,governments and academics to work together to address thesymptoms – and causes – of neglected humanitarian crises.
The World Disasters Report 2006 features: ■ Neglected crises: partial response perpetuates suffering■ Hunger in Malawi: a neglected emergency■ Unsafe motherhood: Nepal’s hidden crisis■ Hurricane Stan lifts the lid on Guatemala’s vulnerability■ Death at sea: boat migrants desperate to reach Europe■ Adequate? Equitable? Timely? Humanitarian aid trends in 2005■ “Please don’t raise gender now – we’re in an emergency!”■ Disaster data: key databases, trends and statistics
Plus: photos, tables, maps, graphics, Red Cross Red Crescentcontacts and index.
Published annually since 1993, theWorld Disasters Report brings togetherthe latest trends, facts and analysis ofcontemporary crises – whether ‘natural’or human-made, quick-onset orchronic.