
Oneota Settlement Patterns Around Lake Koshkonong in Southeast Wisconsin: An Environmental Catchment...
180
1 ONEOTA SETTLEMENT PATTERNS AROUND LAKE KOSHKONONG IN SOUTHEAST WISCONSIN: AN ENVIRONMENTAL CATCHMENT ANALYSIS USING GIS MODELING By Richard Wynn Edwards IV A Thesis Submitted in Partial Fulfillment of the Requirements for the Degree of Master of Science in Anthropology at The University of Wisconsin-Milwaukee May 2010
Transcript of Oneota Settlement Patterns Around Lake Koshkonong in Southeast Wisconsin: An Environmental Catchment...
1
ONEOTA SETTLEMENT PATTERNS AROUND LAKE KOSHKONONG IN SOUTHEAST
WISCONSIN: AN ENVIRONMENTAL CATCHMENT ANALYSIS USING GIS MODELING
By
Richard Wynn Edwards IV
A Thesis Submitted in
Partial Fulfillment of the
Requirements for the Degree of
Master of Science
in Anthropology
at
The University of Wisconsin-Milwaukee
May 2010
2
ONEOTA SETTLEMENT PATTERNS AROUND LAKE KOSHKONONG IN SOUTHEAST
WISCONSIN: AN ENVIRONMENTAL CATCHMENT ANALYSIS USING GIS MODELING
By
Richard Wynn Edwards IV
A Thesis Submitted in
Partial Fulfillment of the
Requirements for the Degree of
Master of Science
in Anthropology
at
The University of Wisconsin-Milwaukee
May 2010
Major Professor Date
Graduate School Approval Date
ABSTRACT
3
ONEOTA SETTLEMENT PATTERNS AROUND LAKE KOSHKONONG IN SOUTHEAST
WISCONSIN: AN ENVIRONMENTAL CATCHMENT ANALYSIS USING GIS MODELING
by
Richard Wynn Edwards IV
The University of Wisconsin-Milwaukee, 2010
Under the Supervision of Robert J. Jeske PhD RPA
An environmental catchment analysis was conducted to determine the nature of Oneota
settlement patterns on the western shore of Lake Koshkonong in Jefferson County, Wisconsin.
Previous studies have used coarse-grained analyses which have led to an overgeneralization of
Oneota settlement patterns. This research uses a fine-grained analysis to elucidate the variation
of Oneota village placement within the study area. Prehistoric vegetation patterns were recreated
using the General Land Office Survey notes and soil data. Two kilometer catchments were
drawn around four sites; Crescent Bay Hunt Club (47JE904), Schmeling (47JE833), Twin Knolls
(47JE379), and the Carcajou Point (47JE002). Analysis of these catchments clarified the nature
of environmental variation in Oneota settlement patterns, increasing our understanding of their
overall lifeways.
Major Professor Date

4
© Copyright by Richard Wynn Edwards IV, 2010
All Rights Reserved

5
TABLE OF CONTENTS
List of Figures _________________________________________________________vii
List of Tables ___________________________________________________________x
Acknowledgements _____________________________________________________xii
Chapter One: Introduction _________________________________________________1
Research Problem _________________________________________________ 1
The Sites _________________________________________________________2
History of Oneota Research__________________________________________ 4
Identifying Oneota Archaeologically ___________________________________7
Wisconsin Oneota _________________________________________________8
Oneota Agriculture ________________________________________________14
Langford ________________________________________________________21
Settlement Patterns of Upper Mississippians ____________________________22
Chapter Two: Methodology and Methods ____________________________________35
Optimal Foraging Theory___________________________________________36
Ecotones________________________________________________________41
Catchment Analysis_______________________________________________42
Reconstructing the Prehistoric Vegetation_____________________________ 46
Vegetation Zones_________________________________________________54
Vegetation Zones as Discrete Resource Zones__________________________ 55
Geographic Information Science/ Systems_____________________________ 57
Resource Pull Analysis____________________________________________ 63
Analysis________________________________________________________ 64
Chapter Three: The Study Sites____________________________________________ 67
The Crescent Bay Hunt Club Site (47JE904) ___________________________ 67
The Schmeling Site (47JE833) ______________________________________ 80
The Twin Knolls Site (47JE379) _____________________________________90
The Carcajou Point Site (47JE002) __________________________________ 100
Chapter Four: Discussion________________________________________________ 111
Question #2: Were each of the sites situated in a similar environment? _____ 111
Question #3: Were the Oneota sites situated
to maximize agricultural production?_____________________118
Question #4: What was the nature of the Oneota settlement pattern
in the Koshkonong Locality? __________________________ 121
Question #5: How does this settlement pattern compare to previous
explanations of Upper Mississippian settlement patterns?_____142

6
Chapter Five: Conclusion_______________________________________________ 146
Summary______________________________________________________ 146
Future Research_________________________________________________ 147
References Cited_______________________________________________________149
Appendix_____________________________________________________________165

7
LIST OF FIGURES
Figure 1: Portion of “Original Vegetation Cover”______________________________27
Figure 2: Comparison of GLO Surveyor’s Map and
Finley’s (1976) “Original Vegetation Cover”____________________________50
Figure 3: Comparison of GLO and Soil Based
Vegetation Map___________________________________________________52
Figure 4: Vegetation Model of Study Area___________________________________53
Figure 5: Map of Case Sites within Study Area______________________________ 68
Figure 6: Location of the Crescent Bay Hunt Club site (47JE904)_________________ 69
Figure 7: Map of Archaeological Investigations at CBHC_______________________ 72
Figure 8: Map of Environmental Zones around Crescent Bay Hunt Club___________75
Figure 9: Map of Ecotones near Crescent Bay Hunt Club________________________76
Figure 10: Map of Agricultural potential near Crescent Bay Hunt Club_____________79
Figure 11: Map of the Schmeling Site’s Location______________________________81
Figure 12: Map of Archaeological Investigations at Schmeling___________________ 82
Figure 13: Map of Environmental Zones around Schmeling______________________85
Figure 14: Map of Ecotones near Schmeling__________________________________ 87
Figure 15: Map of Agricultural potential near Schmeling________________________ 89
Figure 16: Map of the Twin Knolls Site’s Location_____________________________91
Figure 17: Map of Archaeological Investigations at Twin Knolls_________________ 94
Figure 18: Map of Environmental Zones around Twin Knolls____________________ 95
Figure 19: Map of Ecotones near Twin Knolls_________________________________97
Figure 20: Map of Agricultural potential near Twin Knolls_______________________99

8
Figure 21: Map of the Carcajou Point Site’s Location_________________________102
Figure 22: Map of Environmental Zones around Carcajou Point_________________106
Figure 23: Map of Ecotones near Carcajou Point _____________________________108
Figure 24: Map of Agricultural potential near Carcajou Point____________________110
Figure 25: Comparison of Environmental Zones (1km) ________________________112
Figure 26: Comparison of Environmental Zones (2km) ________________________112
Figure 27: Biplot Results of wLRA for Environmental Zones___________________113
Figure 28: Ecotone proportions of 1 km Catchment___________________________115
Figure 29: Ecotone proportions of 2 km Catchment___________________________115
Figure 30: Biplot of Ecotonal Data 1km____________________________________117
Figure 31: Biplot of Ecotonal Data 2km_____________ _______________________117
Figure 32: Biplot of Agricultural Data______________________________________120
Figure 33: Agricultural Potential within 1 km of each site_______________________120
Figure 34: Agricultural Potential within 2 km of each site_______________________121
Figure 35: Topography of land near study sites_______________________________124
Figure 36: Resource Pull Analysis: Geographic Distribution of Scores_____________127
Figure 37: Distribution of Resource Pull Scores (1 km Catchment) _______________128
Figure 38: Distribution of Resource Pull Scores (2 km Catchment) _______________129
Figure 39: Physical Relationship among Study Sites and Garden Bed Sites_________132
Figure 40: Oneota Sites in Study Area______________________________________133
Figure 41: Map Results of Carcajou Point Catchment Analysis__________________138
Figure 42: Map Results of Crescent Bay Hunt Club Catchment Analysis___________139
Figure 43: Map Results of Schmeling Catchment Analysis______________________140

9
Figure 44: Map Results of Twin Knolls Catchment Analysis____________________141

10
LIST OF TABLES
Table 1: Oneota Site Types________________________________________________30
Table 2: Faunal Remains Recovered from Crescent Bay Hunt Club_______________ 73
Table 3: Environmental Zones within Crescent Bay Hunt Club Catchments_________ 74
Table 4: Ecotones within the Crescent Bay Hunt Club Catchments________________ 77
Table 5: Arable Land within the Crescent Bay Hunt Club Catchments______________78
Table 6: Faunal Remains Recovered from the Schmeling Site____________________83
Table 7: Environmental Zones within Schmeling Catchments_____________________84
Table 8: Ecotones within the Schmeling Catchments____________________________86
Table 9: Arable Land within the Schmeling Catchments_________________________88
Table 10: Environmental Zones within Twin Knolls Catchments__________________96
Table 11: Ecotones within the Twin Knolls Catchments_________________________98
Table 12: Arable Land within the Twin Knolls Catchments ______________________99
Table 13: Faunal Remains Recovered from the Carcajou Point Site_______________104
Table 14: Environmental Zones within Carcajou Point Catchments_______________ 105
Table 15: Ecotones within the Carcajou Point Catchments______________________107
Table 16: Arable Land within the Carcajou Point Catchments___________________109
Table 17: Elevation of Sites______________________________________________123
Table 18: Distance of Sites to Important Resources____________________________123
Table 19: Value Code description for Resource Pull Analysis ___________________126
Table 20: Resource Pull Analysis Distribution (1 km Catchment) ________________ 128
Table 21: Resource Pull Analysis Distribution (2 km Catchment) ________________129
Table 22: Resource Pull Analysis (Comparison of 1 km and 2km Catchments) ______130

11
Table 23: Oneota Sites within Study Area___________________________________134
Table 24: Drainage Classes for Soils: One and Two Kilometer Catchment Averages _145

12
ACKNOWLEDGEMENTS
I would like to give special thanks to my committee members, Dr. Robert Jeske, Dr. Robert
Sasso, and Brian Nicholls for their support, guidance, and additional insights into my research
and writing. I would also like to thank Jim Moss, Seth Schneider, and Kate Foley-Winkler for
their assistance with ideas, data, and references as well as the countless individuals that have
worked on the four sites over the past 50 years. I also need to thank everyone from Tuesday
nights for saving my sanity over the past few months. My family also deserves special thanks
for their love, support, and unwavering belief in me. I would also like to specifically thank my
father who, for as long as I can remember, encouraged me to further my education, find my
dreams, and follow them wherever they may lead.

13
CHAPTER ONE
INTRODUCTION
Research Problem
Past research of Wisconsin prehistory has focused on a variety of aspects of
Oneota culture including its origins, subsistence practices, and settlement patterns (e.g.,
Gibbon 1972; Hall 1962, 1986; Overstreet 1976, 1978, 1981, 1997; Rodell 1983). Of
particular interest has been the variation in environmental and geographic locations of
Oneota (and related) sites (e.g., Berres 2001, Jeske 1989, Richards and Jeske 2001, Sasso
1989). The focus of this thesis is the settlement strategy used by people who lived in the
Lake Koshkonong region of Jefferson County, Wisconsin during the late prehistoric
period (circa AD 1100-1400). Like past research on the topic, this thesis examines the
environmental contexts around known habitation sites. However, unlike past work on
this topic, this research utilizes catchment analyses which allows for the researcher to
quantify environmental variables; this particular study employs finer grained data than
what has typically been used ( i.e., Jeske 1990b:, Langford tradition in Illinios; Overstreet
1976, 1978; Rodell 1983:, Oneota eastern Wisconsin; Sasso 1989:, Oneota in western
Wisconsin).
The four sites used in this study are the Crescent Bay Hunt Club (47JE904), the
Schmeling (47JE833), the Twin Knolls (47JE379), and the Carcajou Point sites
(47JE002). It was possible to create a model of Oneota settlement within the study
region by examining several variables, such as the composition of environmental zones
around each site, nature of the ecotones near the habitations, the agricultural potential of
each village, and various other environmental contexts such as elevation and distance to
water. When compared to other models of Oneota and related Upper Mississippian
settlement patterns, the model generated by this study is more capable of explicitly
14
describing the variation present in the study region. Specifically the model will be used
to answer five main research questions: 1) what was the environmental context of each
site; 2) was each of the study sites placed in the same environmental context; 3) were the
sites placed to optimize agricultural production; 4) what is the nature of settlement
pattern of Oneota village sites near Lake Koshkonong; 5) How does the results of this
thesis compare to the results of the previous studies of Upper Mississippian settlement
patterns.
The Sites
The Crescent Bay Hunt Club site is an Oneota village site located on the shores of
Lake Koshkonong. The site was initially reported by Stout and Skavlem (1908) and was
first excavated in 1968 by David Baerreis of the University of Wisconsin-Madison. In
1998, the University of Wisconsin-Milwaukee (UWM) began a long-term excavation at
the site. AMS dates taken from food residue inside of ceramic vessels, as well as
diagnostic ceramic artifacts have securely dated the site to circa A.D. 1200-1400 (Jeske,
Foley Winkler et al. 2003).
The Schmeling site is just to the north of the Crescent Bay Hunt Club. Both
habitation sites are separated by a natural draw. The UWM field school began work at
the site in 2006 and returned in 2008 under the direct supervision of Kate Foley-Winkler
with Robert J. Jeske as principle investigator. The bulk of the material recovered dated to
the Developmental Oneota Horizon and is supported by a calibrated radiocarbon date of
A.D. 1220-1270 (Foley Winkler 2008).
15
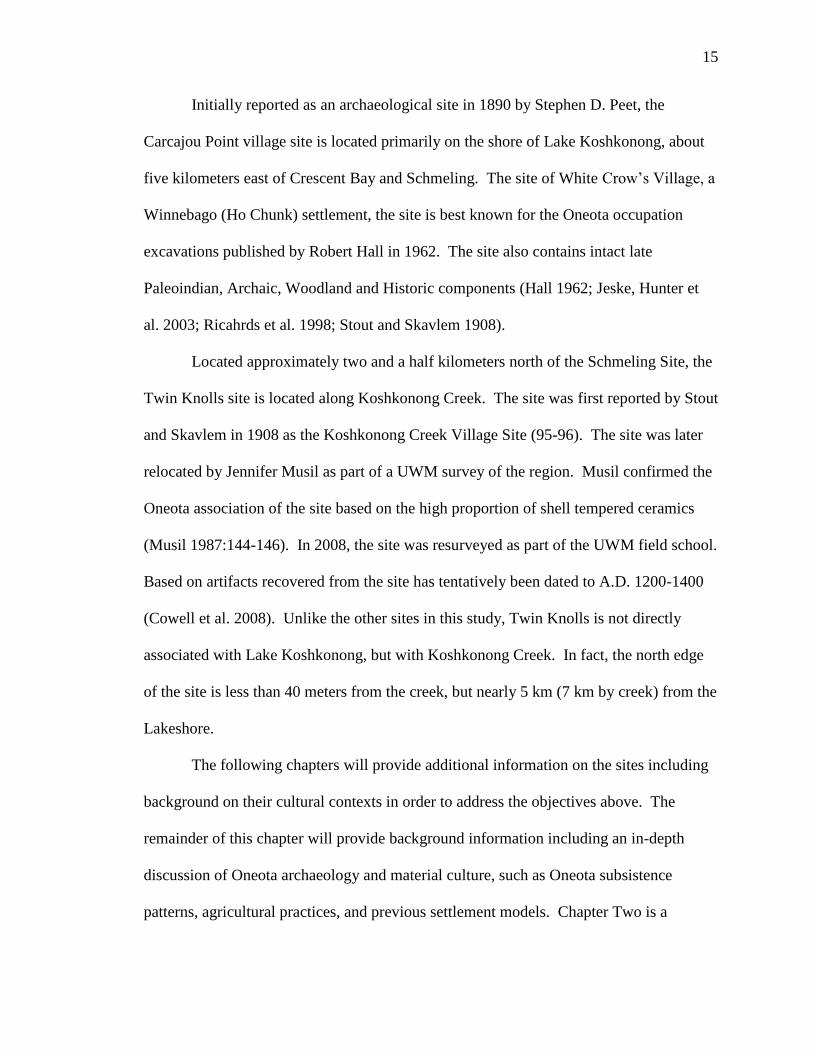
Initially reported as an archaeological site in 1890 by Stephen D. Peet, the
Carcajou Point village site is located primarily on the shore of Lake Koshkonong, about
five kilometers east of Crescent Bay and Schmeling. The site of White Crow’s Village, a
Winnebago (Ho Chunk) settlement, the site is best known for the Oneota occupation
excavations published by Robert Hall in 1962. The site also contains intact late
Paleoindian, Archaic, Woodland and Historic components (Hall 1962; Jeske, Hunter et
al. 2003; Ricahrds et al. 1998; Stout and Skavlem 1908).
Located approximately two and a half kilometers north of the Schmeling Site, the
Twin Knolls site is located along Koshkonong Creek. The site was first reported by Stout
and Skavlem in 1908 as the Koshkonong Creek Village Site (95-96). The site was later
relocated by Jennifer Musil as part of a UWM survey of the region. Musil confirmed the
Oneota association of the site based on the high proportion of shell tempered ceramics
(Musil 1987:144-146). In 2008, the site was resurveyed as part of the UWM field school.
Based on artifacts recovered from the site has tentatively been dated to A.D. 1200-1400
(Cowell et al. 2008). Unlike the other sites in this study, Twin Knolls is not directly
associated with Lake Koshkonong, but with Koshkonong Creek. In fact, the north edge
of the site is less than 40 meters from the creek, but nearly 5 km (7 km by creek) from the
Lakeshore.
The following chapters will provide additional information on the sites including
background on their cultural contexts in order to address the objectives above. The
remainder of this chapter will provide background information including an in-depth
discussion of Oneota archaeology and material culture, such as Oneota subsistence
patterns, agricultural practices, and previous settlement models. Chapter Two is a

16
discussion of the methods and methodology used for this study. Chapter Three supplies
an in-depth discussion of each of the study sites and provides the results of the analysis,
and Chapter Four is a discussion and interpretation of the results, the implications of the
study and Chapter Five discusses possible avenues for future research.
This rest of this chapter is intended to contextualize the research presented in this
thesis, both culturally and archaeologically. It describes the current state of research on
Oneota culture and defines the term Oneota (e.g., theories of their origins, how they are
identified archaeologically, and their subsistence patterns). This chapter also summarizes
the four settlement patterns, to which the results of this thesis will later be compared.
History of Oneota Research
Oneota is a well known cultural phenomenon found throughout much of central
North America, as far west as Nebraska, to the north as far as Ontario, Canada, and as far
east as Michigan (Hall 1962; Overstreet 1997:11; Rodell 1983; Staeck 1995). Oneota is
classified as an Upper Mississippian culture, a term that originally only referred to groups
that made a ceramic ware found in and near the upper Mississippi River Valley which
includes ceramic wares found in various areas of Wisconsin (McKern 1931:3-6). Upper
Mississippian was later expanded to include not only the Oneota culture but the Fort
Ancient and Fischer cultures as well (Hall 1962:5-6). The term Upper Mississippian
allows for the simultaneous contrasting of these typically northern groups from the
clearly distinct Middle Mississippian groups, such as the one found at Cahokia, while still
highlighting the similarities between the two cultures which implies that the two were not
entirely independent and interacted in a currently unknown manner (Hall 1986:365).

17
A major concern is the conflation of Oneota as an archaeological culture with the
dynamic human cultures that produced it. It is important to remember that Oneota, as
used in this thesis, refers to a constellation of material culture traits, not to a single ethnic
or culturally identifiable group. Brown describes Oneota as the “dominant stylistic
complex in the Prairie Peninsula at this period” (Brown 1965:122). The culture was
named by Keyes (1929, 1934), referring to archaeological sites probably associated with
a group known historically in Iowa. He differentiated the Oneota from other groups in
the region based upon their use of shell-tempered ceramics and triangular hafted bifaces.
Keyes also notes that Oneota sites were located in a restricted geographic range
compared to previous groups; Oneota village sites were found almost exclusively on high
ground overlooking rivers. In fact, the name Oneota comes from the original name for
the Upper Iowa River, which is near most of the known Oneota sites at the time Keys was
describing them.
Despite the Iowa origin of the term Oneota, some of the best evidence of early
Oneota comes from eastern Wisconsin, which spans roughly eight hundred years, though
this timeline is currently debated (Overstreet 1995; Theler and Boszhardt 2006). It is
currently unclear if Oneota developed in eastern Wisconsin or somewhere to the south or
potentially in multiple areas. The origins of Oneota are still debated but most arguments
fall into one of two groups, in situ development and migration (Gibbon 1982). One theory
is that during a warm phase in the region’s climate, prior to A.D. 1200, people from the
Middle Mississippian site of Cahokia spread outward and settled at sites such as Aztalan
in central Wisconsin (J. B. Griffin 1960). After A.D. 1200, the climate began to cool and
it made exclusively agricultural subsistence unsustainable, which in turn led to groups
18
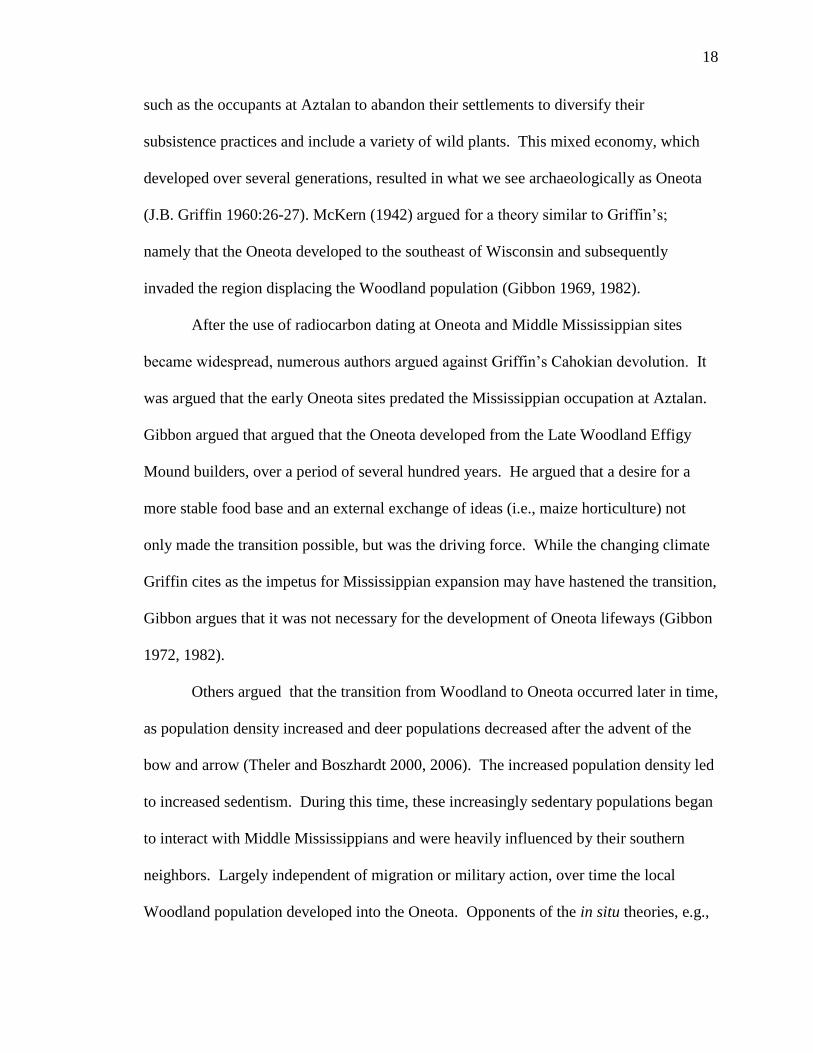
such as the occupants at Aztalan to abandon their settlements to diversify their
subsistence practices and include a variety of wild plants. This mixed economy, which
developed over several generations, resulted in what we see archaeologically as Oneota
(J.B. Griffin 1960:26-27). McKern (1942) argued for a theory similar to Griffin’s;
namely that the Oneota developed to the southeast of Wisconsin and subsequently
invaded the region displacing the Woodland population (Gibbon 1969, 1982).
After the use of radiocarbon dating at Oneota and Middle Mississippian sites
became widespread, numerous authors argued against Griffin’s Cahokian devolution. It
was argued that the early Oneota sites predated the Mississippian occupation at Aztalan.
Gibbon argued that argued that the Oneota developed from the Late Woodland Effigy
Mound builders, over a period of several hundred years. He argued that a desire for a
more stable food base and an external exchange of ideas (i.e., maize horticulture) not
only made the transition possible, but was the driving force. While the changing climate
Griffin cites as the impetus for Mississippian expansion may have hastened the transition,
Gibbon argues that it was not necessary for the development of Oneota lifeways (Gibbon
1972, 1982).
Others argued that the transition from Woodland to Oneota occurred later in time,
as population density increased and deer populations decreased after the advent of the
bow and arrow (Theler and Boszhardt 2000, 2006). The increased population density led
to increased sedentism. During this time, these increasingly sedentary populations began
to interact with Middle Mississippians and were heavily influenced by their southern
neighbors. Largely independent of migration or military action, over time the local
Woodland population developed into the Oneota. Opponents of the in situ theories, e.g.,
19
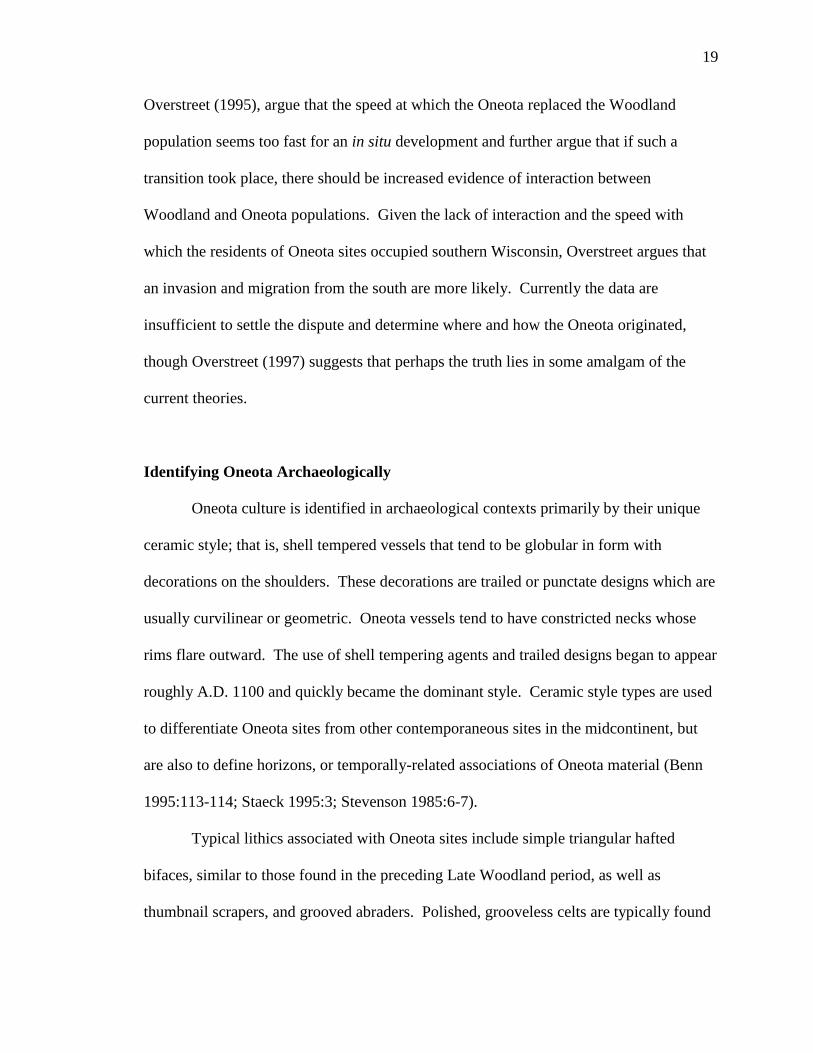
Overstreet (1995), argue that the speed at which the Oneota replaced the Woodland
population seems too fast for an in situ development and further argue that if such a
transition took place, there should be increased evidence of interaction between
Woodland and Oneota populations. Given the lack of interaction and the speed with
which the residents of Oneota sites occupied southern Wisconsin, Overstreet argues that
an invasion and migration from the south are more likely. Currently the data are
insufficient to settle the dispute and determine where and how the Oneota originated,
though Overstreet (1997) suggests that perhaps the truth lies in some amalgam of the
current theories.
Identifying Oneota Archaeologically
Oneota culture is identified in archaeological contexts primarily by their unique
ceramic style; that is, shell tempered vessels that tend to be globular in form with
decorations on the shoulders. These decorations are trailed or punctate designs which are
usually curvilinear or geometric. Oneota vessels tend to have constricted necks whose
rims flare outward. The use of shell tempering agents and trailed designs began to appear
roughly A.D. 1100 and quickly became the dominant style. Ceramic style types are used
to differentiate Oneota sites from other contemporaneous sites in the midcontinent, but
are also to define horizons, or temporally-related associations of Oneota material (Benn
1995:113-114; Staeck 1995:3; Stevenson 1985:6-7).
Typical lithics associated with Oneota sites include simple triangular hafted
bifaces, similar to those found in the preceding Late Woodland period, as well as
thumbnail scrapers, and grooved abraders. Polished, grooveless celts are typically found

20
in major habitation areas. It is difficult to use lithics to associate sites with the Oneota
because the majority of Oneota chipped stone repertoire is not unique to any cultural
group (Gibbon 1986:327-328; Stevenson 1985:8)
In addition to its use as a tempering agent, shell was also used to make pendants,
and tools that have been interpreted as fishing lures, hoes, spoons, and scrapers. The
scapulas of bison and elk were used as hoes for use in agricultural fields. Oneota copper
artifacts are found to a limited extent; however many of the copper artifacts found have
been non-utilitarian items such as pendants (Gibbon 1986:329-330; Overstreet 1997:251).
Wisconsin Oneota
A discussion of the entirety of Oneota in all of its geographical contexts is well
beyond the scope of this research. Therefore, the following sections will be limited to a
discussion to Wisconsin Oneota. Included in the subsequent paragraphs is a discussion of
the distribution and chronology of Oneota within the state. Before such topics can be
discussed, it is necessary to define several terms used in Oneota taxonomy.
The following terms will only be briefly defined, for a more complete discussion
see Henning (1998a, 1998b). Localities are geographic areas that are no larger than an
area inhabited by a single community. This area should also be culturally homogeneous
across space, though not necessarily across time. A region is a larger geographic area;
this term has several rules for its use. However, the one of the most importance for the
purpose of this thesis is that it is large enough for two or more phases to exist
simultaneously. A horizon refers to a specific time period across a superregional area
(e.g., Wisconsin) for an entire group (e.g., Oneota). A horizon is typically bounded by

21
the length of popularity of a particular type of artifact such as ceramic styles. A phase is
a discrete spatiotemporal cultural unit; a term that defines a single cultural group at a
specific place in time.
Wisconsin Oneota Localities/Regions Overstreet recognizes eight clusters of
Oneota habitation sites within the State of Wisconsin (1997). In the west, within the
Mississippi River Valley are the Lake Pepin Locality and the La Crosse Region. Lake
Pepin is located in southern Pierce, southwestern Pepin, and northwestern Buffalo
Counties. The majority of the La Crosse Region is found within La Crosse County;
however, it extends into extreme southern Trempealeau County and northern Vernon
County. In the east, there is the Door Peninsula Region, the Green Bay Locality, the
Middle Fox River Passageway, the Grand River Locality, and the Lake Koshkonong
Locality. The Middle Fox River Passageway includes the shores of Lake Winnebago as
well as the middle Fox River Valley and the Wolf River Valley. Sites in this locality are
found primarily in Winnebago, Calumet, and Fond du Lac Counties. The Door Peninsula
and Green Bay Localities are, as their name suggests in the Door Peninsula and near the
city of Green Bay (Door and Brown Counties respectively). The Grand River Locality
extends from central Marquette County to central Green Lake County. The Lake
Koshkonong Locality is primarily in southwest Jefferson County, along the shores of
Lake Koshkonong and the Rock River (Overstreet 1997:253 Figure 10.1).
Wisconsin Oneota Chronology Each of the Oneota localities has its own unique
cultural history (typically broken down into phases); however, in ideal contexts within
Wisconsin each Oneota component at a site can generally be placed into one of four
horizons. Hall (1962:106-109) developed the first three (Emergent Oneota,

22
Developmental Oneota, and Classic Oneota). The Historic Horizon was added by
Overstreet (1976, 1978). The use of the horizons allows for an easy understanding of the
various phases throughout the state independent of the geographic region in which the
site is found. Current research suggests that divisions between these horizons may have
little analytical utility (Jeske 2008; Moss 2010). It is interesting and potentially useful to
note that these categories have not been used extensively outside of Wisconsin (Benchley
et al. 1997:145).
The Emergent Oneota Horizon dates, as described by Overstreet (1997), from
A.D. 950-1150. Many have questioned the validity of the early results from radiocarbon
dating (e.g., Benchley et al. 1997; Boszhardt 1998; Theler and Boszhardt 2000, 2006;
Tiffany 1998). Jeske (2008) notes that, when calibrated, all but one reported Oneota date
in Wisconsin is at least as late as A.D. 1150 at one sigma. However Henning (1995:69),
referring to Iowa, Wisconsin, and Minnesota, notes that “[e]arly Oneota dates from all
three states are sufficiently numerous that they should not be ignored, averaged, or
written off.” The Emergent Horizon is represented in the Door Peninsula Region by the
early Mero Complex, in the Middle Fox River Passageway by the McKern Phase, in Lake
Koshkonong by the Early Koshkonong Phase, and in Lake Pepin by the Silvernale Phase.
Ceramics from this horizon are almost always undecorated (though this does not appear
to be the case in Pepin Locality), and handles are rare. Compared to later Oneota
horizons, the Emergent has very few end scrapers (Hall 1962:55-56; Overstreet
1997:255-266). Hall notes that during this time period, several ceramic styles were
present at the Carcajou Point, including Grand River Trailed, Grand River Plain, early
forms of Carcajou Curvilinear, and Diamond Bluff Trailed (Hall 1962:109).
23
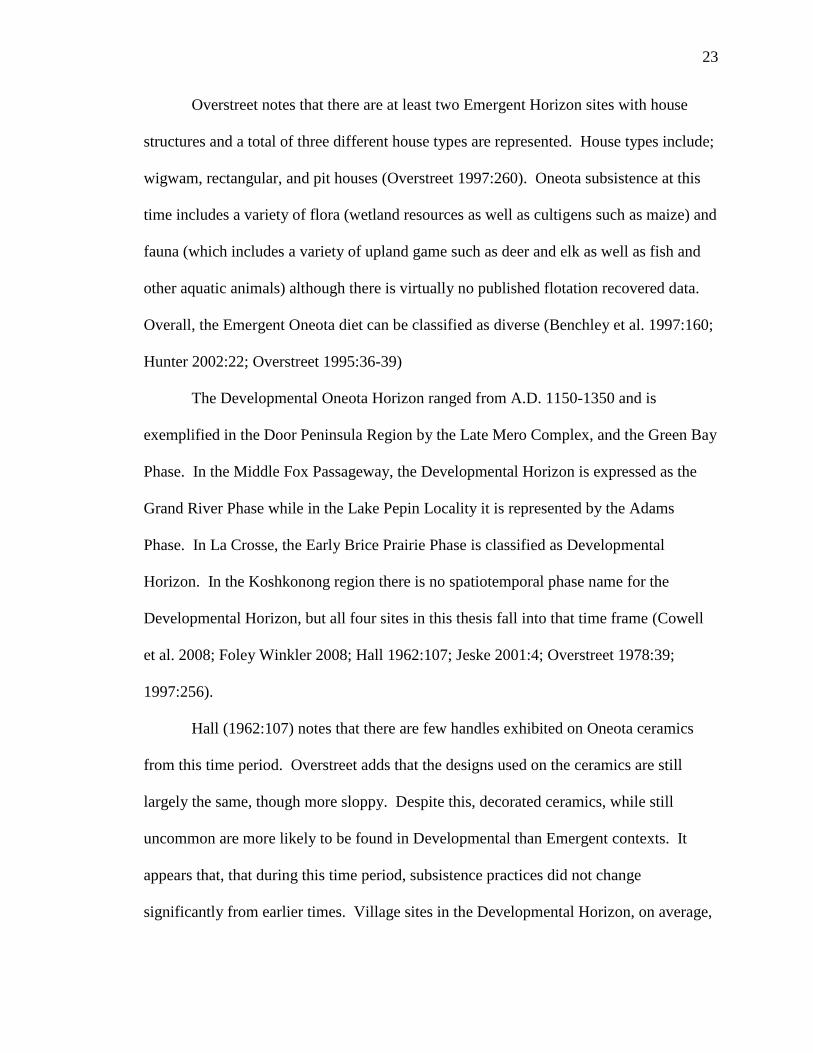
Overstreet notes that there are at least two Emergent Horizon sites with house
structures and a total of three different house types are represented. House types include;
wigwam, rectangular, and pit houses (Overstreet 1997:260). Oneota subsistence at this
time includes a variety of flora (wetland resources as well as cultigens such as maize) and
fauna (which includes a variety of upland game such as deer and elk as well as fish and
other aquatic animals) although there is virtually no published flotation recovered data.
Overall, the Emergent Oneota diet can be classified as diverse (Benchley et al. 1997:160;
Hunter 2002:22; Overstreet 1995:36-39)
The Developmental Oneota Horizon ranged from A.D. 1150-1350 and is
exemplified in the Door Peninsula Region by the Late Mero Complex, and the Green Bay
Phase. In the Middle Fox Passageway, the Developmental Horizon is expressed as the
Grand River Phase while in the Lake Pepin Locality it is represented by the Adams
Phase. In La Crosse, the Early Brice Prairie Phase is classified as Developmental
Horizon. In the Koshkonong region there is no spatiotemporal phase name for the
Developmental Horizon, but all four sites in this thesis fall into that time frame (Cowell
et al. 2008; Foley Winkler 2008; Hall 1962:107; Jeske 2001:4; Overstreet 1978:39;
1997:256).
Hall (1962:107) notes that there are few handles exhibited on Oneota ceramics
from this time period. Overstreet adds that the designs used on the ceramics are still
largely the same, though more sloppy. Despite this, decorated ceramics, while still
uncommon are more likely to be found in Developmental than Emergent contexts. It
appears that, that during this time period, subsistence practices did not change
significantly from earlier times. Village sites in the Developmental Horizon, on average,

24
are larger and occupied longer than their predecessors of the Emergent Horizon and a
number of these settlements are enclosed by palisades. Until recently it was thought that
Developmental Horizon house structures were thought to have been represented primarily
by mat-covered wigwams (Overstreet 1978:39-41; 1995:44,50). Recent work at the
Crescent Bay Hunt Club uncovered what initially appeared to be a palisade wall, but after
additional excavation and GIS analysis it is now interpreted as a longhouse structure
(Moss 2008, 2010).
The Classic Horizon dates from roughly A.D. 1350-1650 and is exemplified by
six distinct phases, three of which are in La Crosse region; the Late Brice Prairie Phase,
the Pammel Creek Phase, and the Valley View Phase. In the east, the late Lake
Winnebago Phase existed in the Middle Fox River Passageway and expanded into the
Door Peninsula where the Green Bay Phase is also represented. The Late Lake
Koshkonong Phase could be found along the shores of the Rock River and Lake
Koshkong. Scholars disagree as to whether there was a change in subsistence patterns
during this time period. Overstreet argues that there was little change, other than a
probable intensification of corn horticulture (Overstreet 1997:256, 274-287). According
to Gibbon (1986:333), at some point during the transition from the Developmental
Horizon to the Classic Horizon, there appears to have been a shift in subsistence practices
with an increase in bison hunting.
The Classic Horizon sees the appearance of several new ceramic types including,
Koshkonong Bold and Perrot Punctate. Perhaps the biggest change in ceramics is the
proportion of decorated vessels, which nears 90 percent. Settlement patterns seem to
change somewhat during this time as populations increase and become more concentrated

25
in even larger village sites. It also appears that there is a change in the lithic assemblage
as well, most significant of which is the change in proportion of end scrapers to triangular
hafted bifaces, with end scrapers being relatively more numerous in Classic horizon sites
(Overstreet 1995:50-53).
The extent of the Historic Oneota Horizon is a debated issue. According to
Benchley (1997), only material from the Orr phase, which originates in the west, can be
reliably dated to the historic period. There is a gap chronologically between the latest
dates for the Lake Winnebago Phase and historic sites belonging to the Winnebago (the
assumed descendents of the Oneota) (P. Richards 1993). Additionally there appears to
be stylistic gaps between these sites, as well, making it impossible at this date to
empirically link the Oneota with any historically known groups. Richards further
elaborates that the incomplete early historic record (which begins in 1634 with the arrival
of Jean Nicolet) has no firsthand accounts and very little information about the
Winnebago. It also contains a thirty-year gap (1634-1665) during the Iroquois Wars
which prevented direct French presence in the region. For a more complete discussion,
detailing the difficulties linking historically known groups to prehistoric ones, also see
Brown and Sasso (2001:212-213).
It has been argued that, with the exception of the Orr Phase ceramics, there does
not appear to be any clear continuity between any prehistoric Oneota ceramic styles and
those used by historically known groups that some traumatic event occurred between the
16th
and 17th
centuries. Green (1993) has argued that European disease arrived prior to
direct contact and caused a massive depopulation of the region. Oneota groups, who lived
26
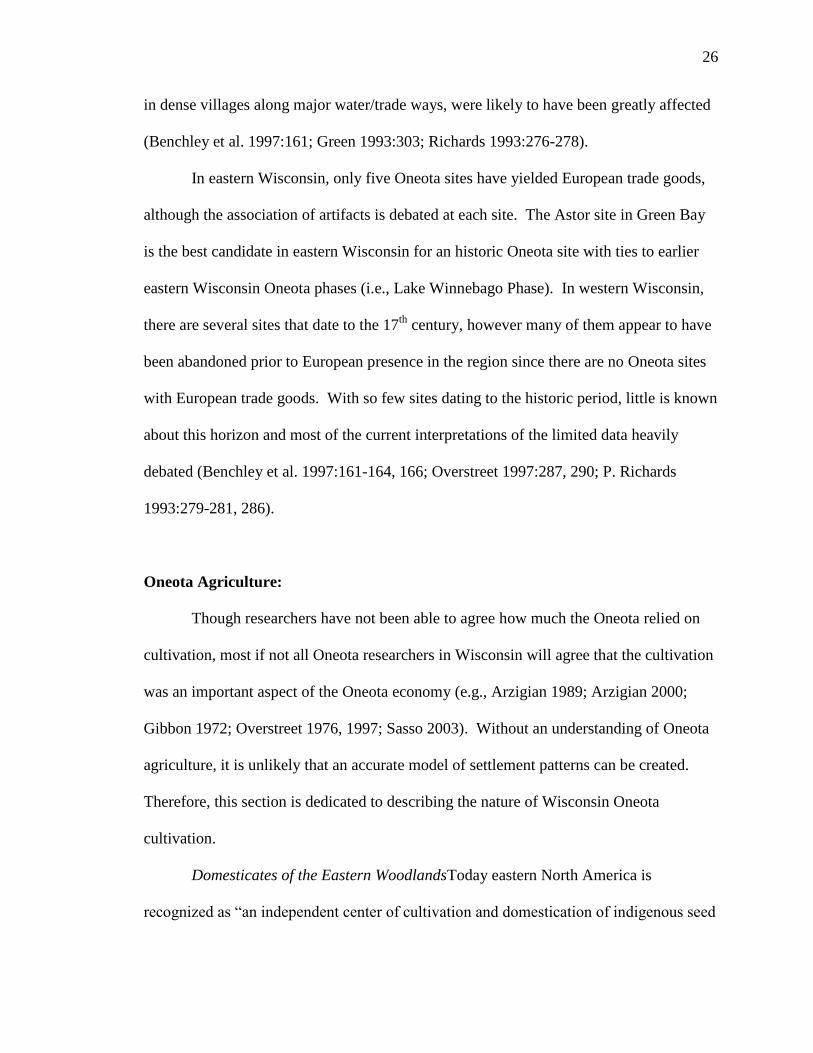
in dense villages along major water/trade ways, were likely to have been greatly affected
(Benchley et al. 1997:161; Green 1993:303; Richards 1993:276-278).
In eastern Wisconsin, only five Oneota sites have yielded European trade goods,
although the association of artifacts is debated at each site. The Astor site in Green Bay
is the best candidate in eastern Wisconsin for an historic Oneota site with ties to earlier
eastern Wisconsin Oneota phases (i.e., Lake Winnebago Phase). In western Wisconsin,
there are several sites that date to the 17th
century, however many of them appear to have
been abandoned prior to European presence in the region since there are no Oneota sites
with European trade goods. With so few sites dating to the historic period, little is known
about this horizon and most of the current interpretations of the limited data heavily
debated (Benchley et al. 1997:161-164, 166; Overstreet 1997:287, 290; P. Richards
1993:279-281, 286).
Oneota Agriculture:
Though researchers have not been able to agree how much the Oneota relied on
cultivation, most if not all Oneota researchers in Wisconsin will agree that the cultivation
was an important aspect of the Oneota economy (e.g., Arzigian 1989; Arzigian 2000;
Gibbon 1972; Overstreet 1976, 1997; Sasso 2003). Without an understanding of Oneota
agriculture, it is unlikely that an accurate model of settlement patterns can be created.
Therefore, this section is dedicated to describing the nature of Wisconsin Oneota
cultivation.
Domesticates of the Eastern WoodlandsToday eastern North America is
recognized as “an independent center of cultivation and domestication of indigenous seed
27
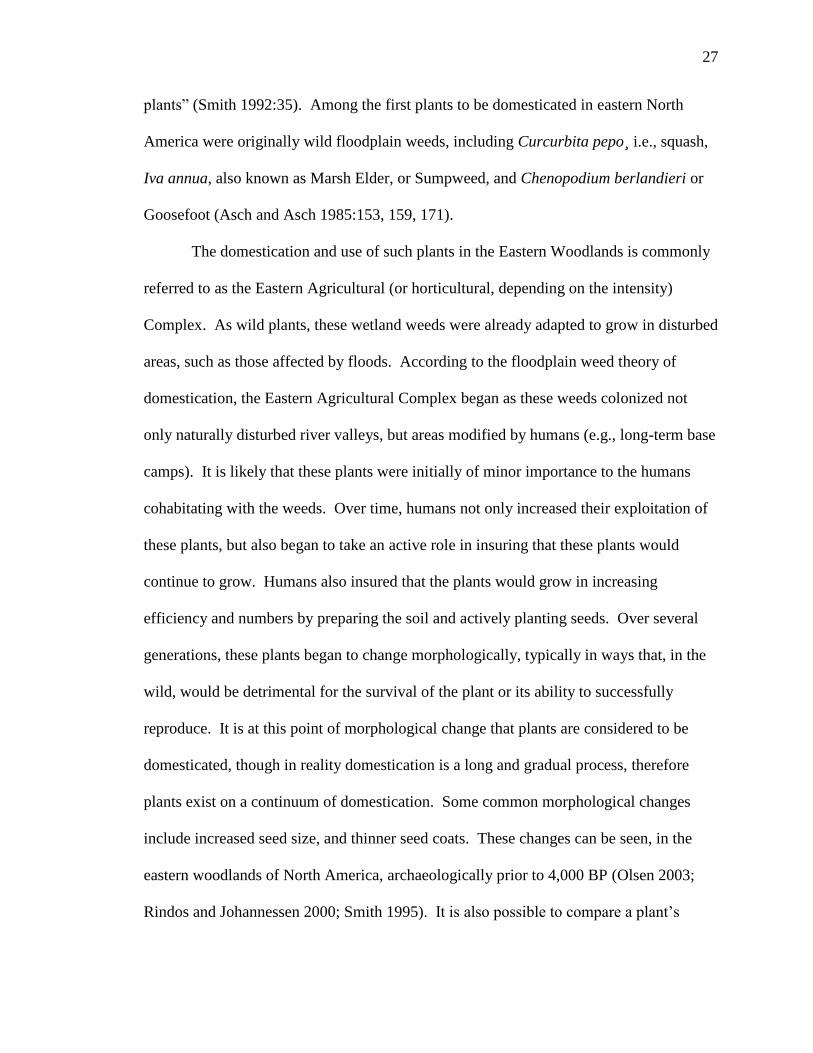
plants” (Smith 1992:35). Among the first plants to be domesticated in eastern North
America were originally wild floodplain weeds, including Curcurbita pepo¸ i.e., squash,
Iva annua, also known as Marsh Elder, or Sumpweed, and Chenopodium berlandieri or
Goosefoot (Asch and Asch 1985:153, 159, 171).
The domestication and use of such plants in the Eastern Woodlands is commonly
referred to as the Eastern Agricultural (or horticultural, depending on the intensity)
Complex. As wild plants, these wetland weeds were already adapted to grow in disturbed
areas, such as those affected by floods. According to the floodplain weed theory of
domestication, the Eastern Agricultural Complex began as these weeds colonized not
only naturally disturbed river valleys, but areas modified by humans (e.g., long-term base
camps). It is likely that these plants were initially of minor importance to the humans
cohabitating with the weeds. Over time, humans not only increased their exploitation of
these plants, but also began to take an active role in insuring that these plants would
continue to grow. Humans also insured that the plants would grow in increasing
efficiency and numbers by preparing the soil and actively planting seeds. Over several
generations, these plants began to change morphologically, typically in ways that, in the
wild, would be detrimental for the survival of the plant or its ability to successfully
reproduce. It is at this point of morphological change that plants are considered to be
domesticated, though in reality domestication is a long and gradual process, therefore
plants exist on a continuum of domestication. Some common morphological changes
include increased seed size, and thinner seed coats. These changes can be seen, in the
eastern woodlands of North America, archaeologically prior to 4,000 BP (Olsen 2003;
Rindos and Johannessen 2000; Smith 1995). It is also possible to compare a plant’s

28
natural geographic distribution to the archaeological contexts in which it is found. If they
are found archaeologically outside of their natural habitat, it can be used as an additional
line of evidence signifying domestication of plants, with the assumption that human
activity was the cause of its unnatural placement (Asch and Asch 1985:150).
Floral Utilization by the Oneota Brown argues that the Oneota likely exploited a
wide variety of resources that include large game hunting, wetland exploitation, and
maize agriculture (Brown 1982:111). Oneota may have practiced this diversified
subsistence strategy to minimize risk (Brown 1982; Clelland 1966; Hart 1990; Olsen
2003:120). In western Wisconsin, using the Pammel Creek (47LC61) site as an example,
Arzigian argues that maize, beans, squash, wild rice, little barley, and various nuts are the
floral resources often recovered in Oneota contexts. With the exception of corn, little
barley and wild rice appear to be among the plants most commonly utilized by the
western Wisconsin Oneota (Arzigian 1989, 2000). Floral studies at other sites in western
Wisconsin (e.g., the Sand Lake Site, 47LC44) have yielded similar results and also
include grassfoot, purslane, and carpetweed (Sasso et al. 1985:147-158). In eastern
Wisconsin, the Crescent Bay Hunt Club site has yielded maize, wild rice, little barley,
several species of chenopods (both wild and domesticated), amaranth, purslane and bottle
gourd (Olsen 2003:2, 135-134; Overstreet 1981:474-475; Yarnell 1966:199). Oneota
groups were clearly using plants of the Eastern Agricultural complex (Yarnell 1966).
Maize Agriculture There is an abundance of evidence for Oneota use of maize
(e.g., Arzigian 1989; Arzigian 2000; Hall 1962; Overstreet 1981; Yarnell 1966);
however, its level of significance as part of the Oneota diet is currently unclear. Based
upon the recovery of maize, beans, and squash, and the construction of ridged fields, it is

29
clear that a significant amount of energy was expended on agriculture but there is
currently no way to know how prominent a role agricultural foods played in the Oneota
diet (Hart 1990:570-571; Sasso et al. 1985:169-170). Overstreet (1997:283) indicates a
small sample of individuals associated with Lake Winnebago Trailed vessels yielded
carbon isotope data consistent with heavy consumption of maize, although he provides no
source nor names the site from where the data come.
In the state of Wisconsin, there are at least 459 known agricultural sites. Of those
459, there are 203 sites known to possess a feature commonly known as garden beds (or
functionally related features e.g., as corn hills, cornrows, ridged fields, etc.). Since the
mid-seventeenth century, garden beds have been reported regionally in Wisconsin and
Michigan. They have also been reported in many other parts of the country, though not
with the same frequency. Garden beds are found in a variety of settings, including both
eastern and western Wisconsin as well as uplands and lowlands (Gallagher et al. 1987;
Sasso 2003; Sasso and Brown 1987).
The physical traits of ridged fields and related agricultural features are variable.
Peske describes the garden beds of Lasley’s Point as, “linear, convoluted features”
(1966:190). Sasso and Brown (1987) describe garden beds as rows of earthen mounds
where crops could be planted. The height of these ridges seems to vary considerably; the
tallest of those excavated by Peske was three and a half inches (8.9 cm) higher than the
furrows between the ridges. However, Fowler (1969:374) describes some garden beds as
being two feet (0.6 m) higher than the furrows. Not all forms of cultivation mounds are
long ridges; smaller circular cultivation mounds are often called corn hills (Sasso and
Brown 1987:3). Fowler (1969) points out that some series of garden beds are extensive,

30
and cover an area up to 100 acres (40.5 hectares). Sasso (2003:262) notes that, near
Lasley’s Point, garden beds cover nearly 600 hectares of land. If they are all
contemporaneous, such a large area implies a significant investment into crop production.
The classification of these features as actual agricultural features is supported by
the excavation of refuse heaps near the Lasley’s Point fields. Bison scapula hoes, corn
cobs, corn kernels, and corn pollen were recovered from the refuse contexts in close
association with the garden beds (Peske 1966:190,192). Additionally, Riley and
Freimuth argue that with the number, size, and distribution of the ridges, agriculture is
the most likely use of the features (Riley and Freimuth 1979:271).
What purpose did these ridged fields serve, and why did the cultivators at Oneota
sites determine it necessary to build such features? Yarnell (1964:129-130) argues that
prehistorically, the risk of maize cultivation is too great in regions that average fewer
than 120 frost free days. While the growing season of maize is roughly 70 days, there is
still a high risk of a late killing frost in the spring or an early killing frost in the fall.
Within the state of Wisconsin, the majority of known prehistoric agricultural villages
have less than 160 average frost-free days. While greater than the 120 day minimum,
there is still a significant risk of frost damage (Yarnell 1964:134-135, 138-139).
Working with the hypothesis that the garden beds allowed for better drainage of
water off the top of the ridge and into the furrows, thereby reducing the risk of frost
damage, Riley and Freimuth created experimental garden beds near the University of
Illinois Urbana-Champaign campus. After taking careful weather and temperature
measurements, they concluded garden beds would reduce the chance of frost damage.
While this does not prove that ridged fields were used as protection against frost damage,
31
it verified the validity of the hypothesis’ underlying assumption (Riley and Freimuth
1979). Currently most scholars agree that frost prevention is the functional purpose of
ridged fields (e.g., Brown 1982; Sasso and Brown 1987). It has also been suggested that
their ability to drain water could also have been useful during the warmer periods (i.e.,
when frost is not a concern) in lowland locations that are more prone to flooding or heavy
rains. Additionally, ridged fields would also have been useful as a means of weed
control, and modifying the soil so that it is better suited for cultivation, i.e., aerating the
soil, loosening the soil to allow for denser plantings, enriching the soil, killing soil
dwelling insects, and erosion control (Gallagher et al. 1985, 1987; Gallagher and Sasso
1987:147-148).
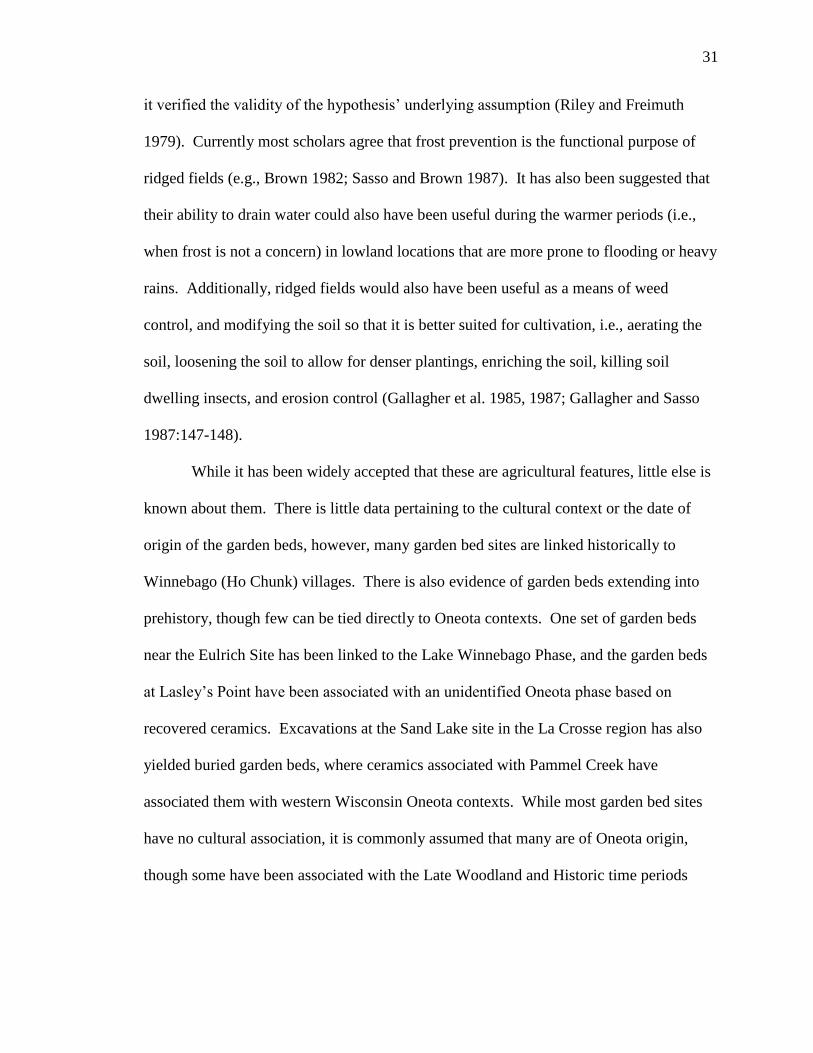
While it has been widely accepted that these are agricultural features, little else is
known about them. There is little data pertaining to the cultural context or the date of
origin of the garden beds, however, many garden bed sites are linked historically to
Winnebago (Ho Chunk) villages. There is also evidence of garden beds extending into
prehistory, though few can be tied directly to Oneota contexts. One set of garden beds
near the Eulrich Site has been linked to the Lake Winnebago Phase, and the garden beds
at Lasley’s Point have been associated with an unidentified Oneota phase based on
recovered ceramics. Excavations at the Sand Lake site in the La Crosse region has also
yielded buried garden beds, where ceramics associated with Pammel Creek have
associated them with western Wisconsin Oneota contexts. While most garden bed sites
have no cultural association, it is commonly assumed that many are of Oneota origin,
though some have been associated with the Late Woodland and Historic time periods
32
(Clauter 2010; Gallagher et al. 1985; Kaufmann 2005; Overstreet 1976:249-250; Peske
1966; 1971:65; Sasso 2003; Sasso et al. 1985).
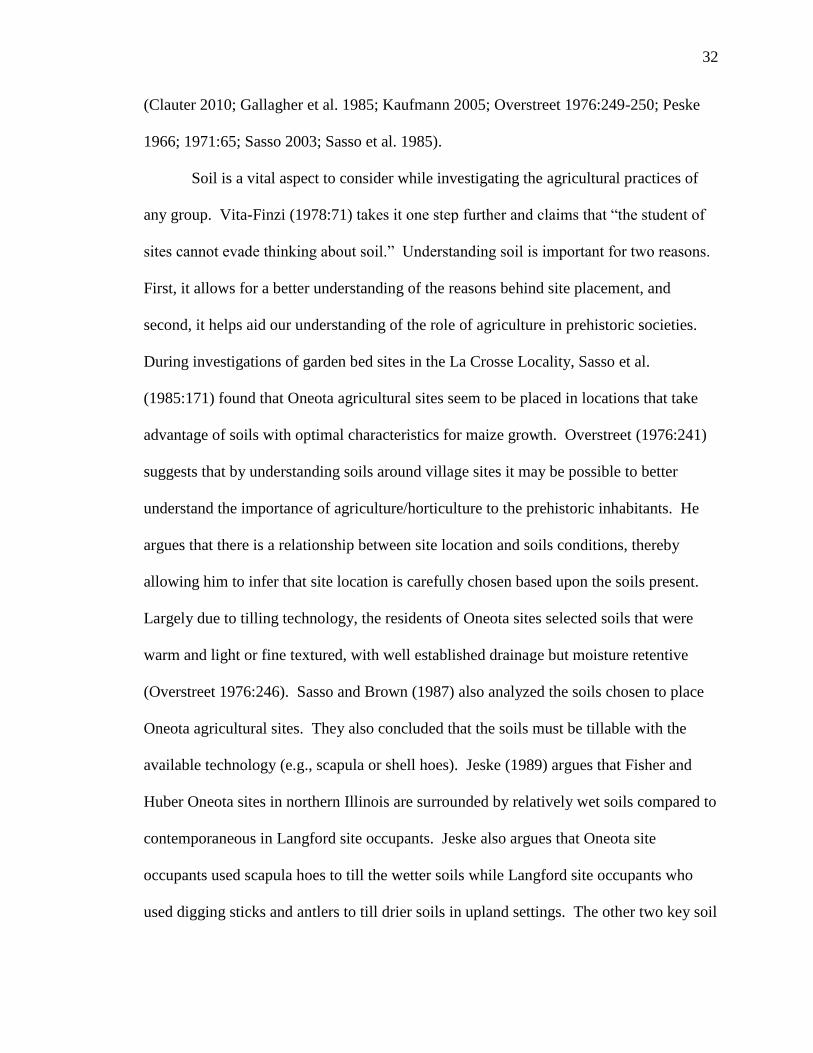
Soil is a vital aspect to consider while investigating the agricultural practices of
any group. Vita-Finzi (1978:71) takes it one step further and claims that “the student of
sites cannot evade thinking about soil.” Understanding soil is important for two reasons.
First, it allows for a better understanding of the reasons behind site placement, and
second, it helps aid our understanding of the role of agriculture in prehistoric societies.
During investigations of garden bed sites in the La Crosse Locality, Sasso et al.
(1985:171) found that Oneota agricultural sites seem to be placed in locations that take
advantage of soils with optimal characteristics for maize growth. Overstreet (1976:241)
suggests that by understanding soils around village sites it may be possible to better
understand the importance of agriculture/horticulture to the prehistoric inhabitants. He
argues that there is a relationship between site location and soils conditions, thereby
allowing him to infer that site location is carefully chosen based upon the soils present.
Largely due to tilling technology, the residents of Oneota sites selected soils that were
warm and light or fine textured, with well established drainage but moisture retentive
(Overstreet 1976:246). Sasso and Brown (1987) also analyzed the soils chosen to place
Oneota agricultural sites. They also concluded that the soils must be tillable with the
available technology (e.g., scapula or shell hoes). Jeske (1989) argues that Fisher and
Huber Oneota sites in northern Illinois are surrounded by relatively wet soils compared to
contemporaneous in Langford site occupants. Jeske also argues that Oneota site
occupants used scapula hoes to till the wetter soils while Langford site occupants who
used digging sticks and antlers to till drier soils in upland settings. The other two key soil

33
factors essential to maize agriculture are the fertility and productivity of the soil, and its
ability to provide moisture during critical growth periods of the plants.
Langford:
Oneota site occupants were not isolated from other Upper Mississippian groups
and interacted with their Langford neighbors in Northern Illinois (Jeske 1990b). The first
site excavated with a Langford tradition component was the Fisher Site in Will County,
Illinois. The site was excavated by George Langford (see Langford 1927) and contained
material that was clearly Upper Mississippian, but did not fit into Oneota or Fort Ancient
traditions (Hunter 2002). Langford sites in the Rock, Fox, and DesPlaines Rivers of
Illinois are among the closest contemporaneous neighbors (geographically) to the
Koshkonong Oneota complex. Like Oneota, Langford is an Upper Mississippian
tradition, however it can be differentiated by the absence of shell tempered ceramics,
differences in subsistence and settlement practices (Jeske 2003). Langford wares, with
few exceptions, are found exclusively in northern Illinois (Jeske 1990b:223). In
comparison to shell-tempered Fisher wares, John W. Griffin describes Langford wares as
having similar but less complicated designs. The vessels may be corded or smooth, and
decorations are typically some form of punctate or trailing. Griffin concluded that
Langford ceramics at the Fisher site are decorated less often than their Fisher
counterparts (Griffin 1946:17-18), and this dichotomy holds true at the Lawrence site in
the Rock River valley (Berres 2001; Jeske 2003). The Langford Tradition is roughly
contemporaneous with the Developmental Phase Oneota to the north in Wisconsin; it
dates from just prior to A.D. 1100 to A.D. 1450. Like Oneota, Langford sites yield data
34
that indicate a generalized economy focused largely on wetland resources and maize
agriculture (Jeske 1990b:223,225).
Settlement Patterns of Upper Mississippians:
The following is a summary of the three different models of Oneota settlement
patterns and one description of Langford settlement patterns. Two of the studies
encompass southeastern Wisconsin, one covers western Wisconsin, and the final study is
situated in northern Illinois. Each of these studies look at many of the same factors (e.g.,
soil types and vegetation zones) however they do not necessarily look at these factors the
same way. While not the only difference among these studies, the most notable
discrepancy is the scale of analysis. Overstreet and Rodell both use large scales of
analysis while Jeske and Sasso use a much finer scale of analysis; these distinctions
greatly affect the results of the studies.
Homogeneity Model Overstreet outlined his generalized Oneota settlement
pattern in his 1976 dissertation and further elaborated it in a chapter of the 1978
Mississippian Settlement Patterns edited by Bruce D. Smith. In both the dissertation and
book chapter, Overstreet looks at a wide temporal range that includes all four Oneota
Horizons. However, in his conclusions, he summarizes his findings, including settlement
patterns for each horizon separately.
Overstreet (1976, 1978) employed a regional approach to model Oneota
settlement patterns. Due to regional differences, he did not consider the Orr Phase in
western Wisconsin, and in the east, he discounted the Green Bay Phase since he felt, at
that time, the Green Bay Phase was not adequately understood (Overstreet 1976:4). He
determined the settlement patterns primarily by looking at four main factors. Those
35
factors included the Oneota economy, the location of the site in relation to major biotic
provinces and physiographic zones, the proximity of sites to major aquatic environmental
zones, and the distribution of soils near the sites.
Overstreet posits that Oneota sites in eastern Wisconsin were situated within
diverse environments with access to several different environmental zones. However,
when comparing the overall environmental characteristics each site is described as
situated in a relatively similar setting. Rather than providing an explicit discussion of the
environment around any site, Overstreet infers the general nature of the environment
from two sources. In order to determine the general topography and extent of prairies,
Overstreet looks to the nature of the Eastern Ridges and Lowlands, which is the
physiographic zone that encompasses the majority of eastern Wisconsin. Within this
region, Overstreet notes that almost all Oneota sites are situated within the sub region
known as the Green Bay-Lake Winnebago-Rock River lowlands. This sub region is
divided into three sections; the northern section is inundated by water beneath Green Bay.
The central plains region is characterized by very little relief. Overall, the vegetation is
forested and it has few, typically small, patches of prairie. This region contained all of
Overstreet’s study area with the exception of the Koshkonong sites, which were located
in the third region. To the south is a region with considerably more relief, and like the
plains region it comprises a mix of forest and prairie (Overstreet 1976:43-45).
The types of plants available were determined by the location of the sites in
reference to the tension zone between two or three major biotic provinces. The first is the
Canadian Biotic Province which extends into central Wisconsin and is characterized by
coniferous hardwood forests. The next is the Illinoisan to the south, which is composed
36
of a mixture of oak forests, savanna and prairie. The Carolinian Biotic Province, which
may extend into southern Wisconsin, is primarily composed of deciduous forests. The
interaction of the two or three biotic provinces in Overstreet’s study area creates a tension
zone, or a large ecotone, where a variety of plants from each biotic province is present.
Overstreet argues that based on the position of the sites within the physiographic region
and tension zone, that all of the eastern Oneota phases are within a mixed forest prairie
environment. Based upon the proximity of most Oneota sites to lakes and rivers,
Overstreet (1976:46-50, 55) indicates that, in addition to the forest/prairie mixture, there
is a variety of wetlands present at each site, and because each of these sites are situated
similarly within these macro physiographic/biotic settings they must have had similar
local environmental contexts.
In addition to the environmental features, Overstreet argues that Oneota
settlements were placed with specific reference to soil types, which is linked to the
importance of horticulture in Oneota economy. Overstreet (1976:241-247) found that
Oneota sites tend to be found on fine sandy loams and other soils that would be good for
agricultural potential. By placing villages on soils with high agricultural potential, it is
possible to grow maize and other cultigens nearby, thus minimizing travel time to garden
plots.
Overstreet’s pioneering model of Oneota settlement patterns is limited by three
main factors. The first limiting factor is the scale of his environmental analysis. Because
of the scale, he is unable to evaluate the variation within each region, thereby hampering
his ability to interpret accurately the nature of the human interaction with the
environment around each site. The second limiting factor is directly related to the first;
37
an inability to quantify the environmental zones within the study area. The lack of
quantification limits his ability to compare the distribution of sites in relation to
environmental zones accurately and may obscure regional variation in settlement
patterns. The third limiting factor pertains to the sites Overstreet used in his study.
Overstreet concentrated on village sites and did not account for the role of/interaction
with smaller sites, with the exception of garden bed or other agricultural sites. This
concentration is in part due to the nature of the archaeological research at the time, which
concentrated on the excavation of large sites at the expense of a smaller sites and regional
surveys.
Diversity Model In his 1983 master’s thesis, Rodell started where Overstreet left
off and took a “step toward understanding Oneota settlement and subsistence,” (Rodell
1983:1). Like Overstreet, Rodell takes a regional approach to determine the vegetation
patterns around southeastern Wisconsin Oneota sites; he uses biotic provinces and
physiographic regions to determine the environmental characteristics (Rodell 1983:5).
However, Rodell did not come to the same conclusions as Overstreet. Rodell argues that
the Oneota sites were not in a single ecozone, but a diverse one, which limited the extent
of Oneota adaptations. The variation in environment could be as seen two continuums of
change; from north to south, and from east to west (Rodell 1983:4-5, 83). Rodell then
went beyond the macro level environmental zones that Overstreet used and examined
what vegetation zone each site was within, based upon Finley’s (1976) 1:500,000 scale
map of the vegetation patterns produced from the General Land Office survey notes
(Rodell 1983:99). This map has since been digitized (Figure 1) and is currently available

38
for public download from the Wisconsin Department of Natural Resources (Wisconsin-
Madison 1990).
Rodell had more data to work with than Overstreet. Three systematic surveys
were conducted in Rodell’s study area. These surveys included the areas
surrounding the Rock/Crawfish River, conducted by the University of Wisconsin-
Milwaukee; the southern Fox River, conducted by the Great Lakes Archaeological
Research Center (GLARC); and the western shore of Lake Winnebago also conducted by
GLARC (1983:90-92). In total, Rodell examined 62 sites and the environment
surrounding them for his preliminary settlement model. Rodell notes that there is little
information about many of the sites since they were either identified by survey and were
not excavated, or they were small sites previously reported but never fully investigated
(1983:95). After plotting the study sites on soils maps, Rodell determined that Oneota
sites were placed on five different soil types. The first included well to poorly drained
soils over lacusterine and glacial materials. The second type was well-drained, highly
permeable sands, while the third soil type was characterized as somewhat poorly drained
to well-drained loams over sand and gravel. Oneota sites were also found on moderately
well drained to well-drained soils over loam subsoils and bedrock as well as organic soils
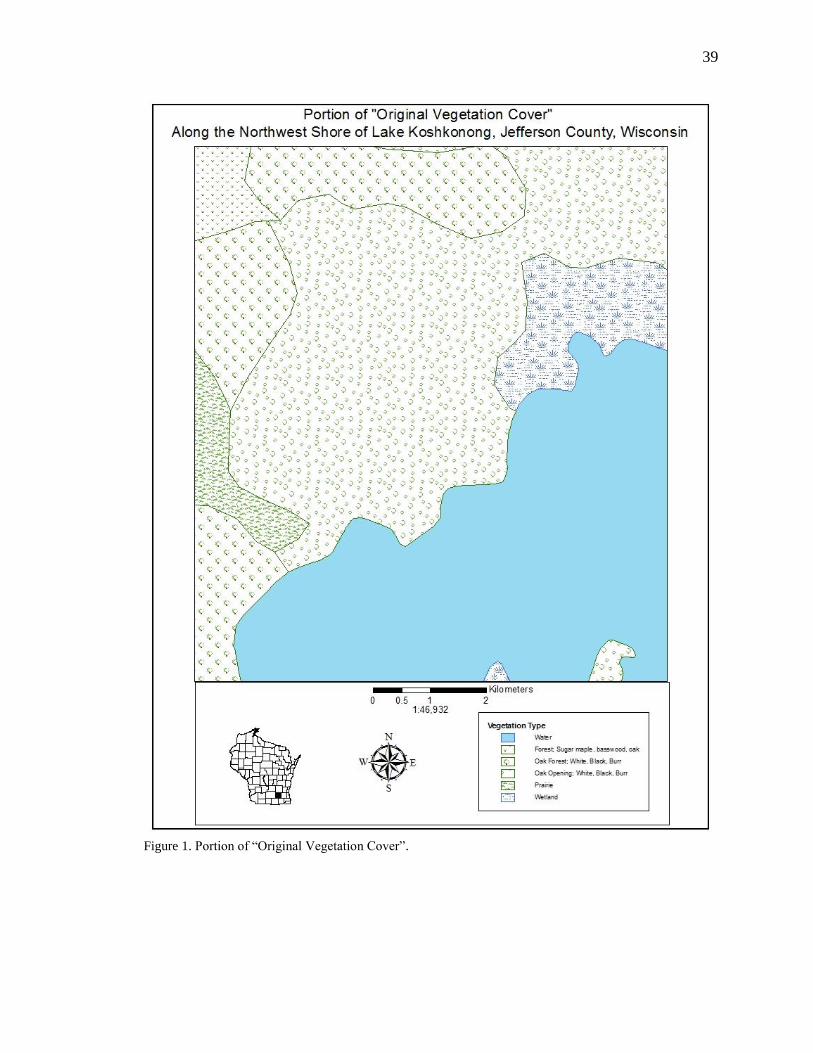
39
Figure 1. Portion of “Original Vegetation Cover”.

40
that were classified as poorly drained (1983:96). It is important to note that while these
results do not correspond with Overstreet (1976), Rodell’s sites include a variety of site
types as well as sites without a known function. Overstreet’s data were restricted to
known Oneota villages. Village sites are locations in which agriculture was believed to
play a significant role which could have limited the potential soil types of the sites.
Rodell concludes that Oneota sites, as Gibbon (1969, 1972) argued, are found in
an environmentally diverse region. However, Oneota site occupants only exploited a
portion of the available habitats. He characterized the exploited environmental zones as
“wetland-eutrophic lake settings occurring along portions of the Fox-Wolf and Rock
Rivers” where agriculturally viable soils and oak forest/savannas were present
(1983:107).
Rodell’s research was, like Overstreet’s, restricted by the scale of his analysis.
While Rodell’s use of the Finley (1976) map did allow him to quantify the environment
in a limited way, the fact that it was at a 1:500,000 scale limits its usefulness. Rodell did
attempt to account for all Oneota site types by incorporating recent data from regional
surveys that were not available to Overstreet. However, he did not account for differing
site types when comparing site location to the environment. Because of the nature of the
surveys, Rodell notes that much of that information had not been determined. The
inability to differentiate site types makes it difficult to make meaningful comparisons
between a site and its environmental context.
Function and Settlement Model for Western Wisconsin Sasso (1989) presented a
model of Oneota settlement patterns for western Wisconsin, based on a systematic survey
41
of the Coon Creek drainage near La Crosse. One of the most significant aspects of
Sasso’s research is that he makes an active attempt to recognize and take into account a
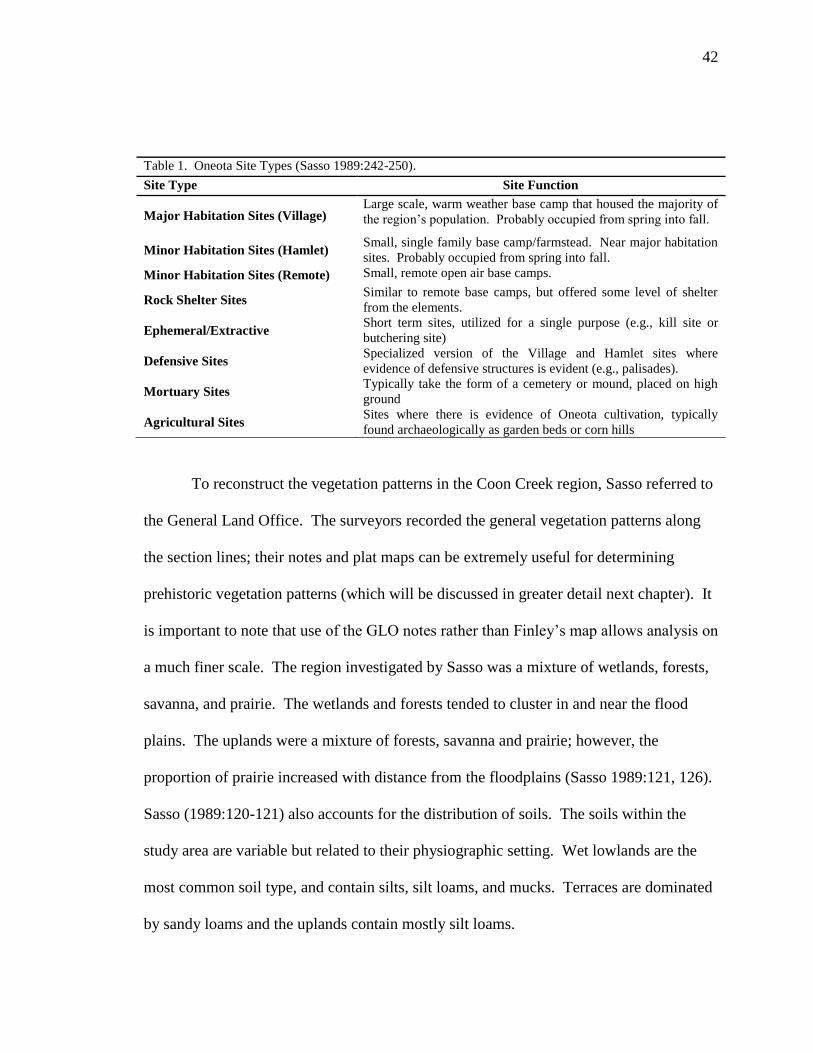
variety of site types. He differentiates among seven distinct Oneota site types in the
Western Wisconsin region (Table 1). This type of analysis allows for the consideration
of activities that took place outside of the villages, thereby illuminating various aspects of
the Oneota economy and the nature of relationships among different site types. The first
is major habitation sites which includes villages of various sizes. The next category is
defined as minor habitation sites and it includes small hamlets as well as minor remote
habitations. Hamlets are typically near known village sites and may represent
farmsteads. The remote minor habitations were most likely used as seasonal open air
base camps. They were situated significant distances away from any known villages.
Rockshelters are the third site type and are interpreted as being functionally similar to the
remote minor habitations. The next site type, ephemeral/extractive sites, likely
represented a multitude of subtypes, each with a different functional purpose. As the
name implies they were likely used on a very short basis. Defensive sites are defined as
habitation sites that include palisades or defensive features; several such sites have been
identified in the La Crosse Locality. Oneota mortuary sites are often placed on high
ground and usually take the form of a cemetery or a mound. The final site type consists
of garden beds and other agricultural sites (1989:242-250).
42
Table 1. Oneota Site Types (Sasso 1989:242-250).
Site Type Site Function
Major Habitation Sites (Village) Large scale, warm weather base camp that housed the majority of
the region’s population. Probably occupied from spring into fall.
Minor Habitation Sites (Hamlet) Small, single family base camp/farmstead. Near major habitation
sites. Probably occupied from spring into fall.
Minor Habitation Sites (Remote) Small, remote open air base camps.
Rock Shelter Sites Similar to remote base camps, but offered some level of shelter
from the elements.
Ephemeral/Extractive Short term sites, utilized for a single purpose (e.g., kill site or
butchering site)
Defensive Sites Specialized version of the Village and Hamlet sites where
evidence of defensive structures is evident (e.g., palisades).
Mortuary Sites Typically take the form of a cemetery or mound, placed on high
ground
Agricultural Sites Sites where there is evidence of Oneota cultivation, typically
found archaeologically as garden beds or corn hills
To reconstruct the vegetation patterns in the Coon Creek region, Sasso referred to
the General Land Office. The surveyors recorded the general vegetation patterns along
the section lines; their notes and plat maps can be extremely useful for determining
prehistoric vegetation patterns (which will be discussed in greater detail next chapter). It
is important to note that use of the GLO notes rather than Finley’s map allows analysis on
a much finer scale. The region investigated by Sasso was a mixture of wetlands, forests,
savanna, and prairie. The wetlands and forests tended to cluster in and near the flood
plains. The uplands were a mixture of forests, savanna and prairie; however, the
proportion of prairie increased with distance from the floodplains (Sasso 1989:121, 126).
Sasso (1989:120-121) also accounts for the distribution of soils. The soils within the
study area are variable but related to their physiographic setting. Wet lowlands are the
most common soil type, and contain silts, silt loams, and mucks. Terraces are dominated
by sandy loams and the uplands contain mostly silt loams.
43
Sasso (1989:254-255) argues that understanding subsistence strategies is the most
important factor in understanding Oneota settlement patterns. Like the previously
discussed studies, Sasso describes the Oneota subsistence as diverse; however, he argues
that within the La Crosse region there is a dichotomy of Oneota subsistence practices.
The residents of Oneota sites exploited both aggregated and dispersed resources
depending on seasonality. During the warm months, crops would be planted and the
aggregated resources available in the nearby wetlands were utilized. After harvest, the
sites’ occupants would concentrate on less concentrated resources such as upland game.
After accounting for soils, vegetation, site type, and seasonality, Sasso argues that
large Oneota villages were occupied in the summer and the residents dispersed into
smaller settlements after harvest. The villages themselves are placed on terraces near
streams and rivers, where flooding is not a threat and the inhabitants still have access to
the nearby wetland resources as well as productive soils for agriculture. In situations
where defenses are evident, the sites still tend to conform to this pattern; however, their
placement is often more restricted to locations that also offer natural defensive benefits.
Hamlet sites tend to be situated in locations similar to the villages (Sasso 1989:250-251).
Remote habitation sites are rarely found in upland settings, but rather are typically found
near the mouths of small valleys where they are optimally located to allow access to a
variety of habitats. These settlements likely represent winter habitations after the
aggregated resources no longer tied the residents to concentrate near the floodplains and
agricultural areas (1989:251, 253). Ephemeral sites are found near large habitation sites
as well as on the periphery of the Oneota territory. Sasso (1989:252) interprets these as
“special purpose excursions from major village settlements (i.e., during the summer) or

44
from remote seasonal base camps,” and “conceivably could have taken place during any
season of the year.” One limitation of this analysis is that it did not quantify the
environmental context of the sites, which eliminates the possibility of an inter-site
analysis that could explicitly measure environmental variation around sites with
presumed different functions
Function and Settlement Model for Northern Illinois Jeske’s settlement model of
the Langford tradition is based primarily on excavations at the Washington Irving
(11K52), Robinson Reserve (11CK2), Zimmerman (11LS13), and LaSalle County Home
(11LS14) sites. It is supplemented by survey and excavation data from other Langford
and Oneota (both Fisher and Huber) sites in northern Illinois (Jeske 1990b). Jeske (1989)
has argued that Langford settlement differs from contemporary and adjacent Oneota sites
(also c.f. Berres 2001; Jeske 2003b), noting that Fisher and Huber sites are restricted to
the Upper Illinois River Valley, the Middle Rock River Valley and the Calumet Lake
Plain and Dunes regions around the southern edge Lake Michigan. Unlike Langford
sites, there are no known Oneota sites in the smaller river valleys such as the DesPlaines,
Fox, Kishwaukee and DuPage, nor in the uplands among those valleys. Recent
comparisons of Langford to Oneota show that Langford groups relied less on wetland
resources than Oneota groups and instead exploits upland game more heavily (Hunter
2002). Despite this difference, Jeske (1990b, 2000b) points out that wetland resources
were still an important aspect of the Langford diet, so one could understandably expect
that Langford settlement patterns would reflect both the importance of upland and
wetland resources. The differences between Langford and Oneota settlement patterns
could then be expected to reflect the differential emphasis on upland resources.

45
Jeske’s settlement pattern provides a small-scale analysis and an account for
seasonality, unlike Overstreet’s or Rodell’s. Like Sasso, Jeske reconstructed the original
vegetation based on the notes from the GLO survey. After comparing environmental,
subsistence, and settlement data, Jeske’s conclusions were generally similar to Sasso’s.
Jeske argues that the Langford occupied large villages from spring through fall. These
habitations were situated along rivers where they could exploit good farmland and
wetland resources. During winter, the Langford would disperse into several small groups
which are exemplified by small ephemeral sites away from the villages in forest
environments (Jeske 1989:232-234). Like Sasso, Jeske does not quantify the
environmental contexts of the sites and therefore suffers from the same inability to
compare individual sites. However, Jeske (1989) does account for soils. After
examining Langford and Oneota sites in northern Illinois, Jeske concludes that there are
significant differences in the types of soils that each site type is found on. Langford sites
tend to be found on drier soils than Oneota sites. He argues that the difference in
preference may be due to differences in agricultural technology, where the Langford
residents were using digging sticks in flat agricultural fields and the Oneota were likely
using hoe technology with garden beds. Scapula and shell hoes are nonexistent at
Langford sites, but are common at Oneota sites (Jeske 1989).
The settlement analysis conducted for this thesis was designed to incorporate the
strengths of each of its above-mentioned predecessors. In order to ensure a fine-grained
analysis, this thesis incorporates GLO notes, maps, and soil data to construct a model of
the prehistoric environment within two kilometers of each of the four study sites. A fine-
grained data set is important because, as Tiffany (1982:4) argues, “if Oneota site

46
placement is to be understood, the more detailed the resource maps the better.” Soil data
are also used to model the agricultural potential of the land within the study area.
Catchment analysis and a geographic information systems (GIS) program will be
used to quantify a series of environmental variables such as proportion of environmental
zones, total area of ecotones, distance to water, and proportion of arable land. By
measuring each of these variables, this research can account for various economic aspects
of site placement including the importance of access to natural resources (e.g., water,
wild rice, deer, arable land). Finally, the system will be used to explore the placement of
other sites in the region. While there are not enough data to create a true settlement
system model, it will explore potential relationships among the sites of the region. The
results of the analysis will answer the following questions: 1) what was the
environmental context of each site; 2) was each of the study sites placed in the same
environmental context; 3) were the sites placed to optimize agricultural production; 4)
what is the nature of the Oneota settlement patterns in the Koshkonong Region.

47
CHAPTER TWO
METHODOLOGY AND METHODS
In order to determine the settlement patterns seen for Oneota sites in this region,
several different lines of evidence determined from several different methods were
utilized, including optimal foraging theory and catchment theory. This chapter describes
the various methods used, including the methodologies for each method, and how each
method applies to the current research.
It is assumed that settlements are not placed randomly across the landscape but
will be located in areas that are logically placed according to physical constraints and
culturally defined rules (c.f. Goldstein 1982; Hart and Jeske 1987; Roper 1979).
Nutritional requirements are one physical constraint; sites must be located in areas that
are capable of providing enough food, water, and other vital resources necessary for
human survival. Energy efficiency is another physical consideration that is linked
directly to nutritional requirements. The concept of energy efficiency states that humans
will attempt to expend the least amount of energy possible while maximizing energy
intake. Both of these factors are mitigated by culturally defined rules and preferences
which may limit or emphasize certain resources or locations over others. This concept is
integrally related to optimal foraging theory discussed in more depth below. It is also
necessary to assume that artifacts recovered from sites represent prehistoric activities and
behaviors that occurred at the site or related sites (c.f. Hart and Jeske 1987; Jeske
1990a:150; Roper 1979).

48
Optimal Foraging Theory:
Optimal foraging theory has its base in biological, economic, and ecological
theories, though they have been adapted for use in anthropological research. Optimal
foraging in anthropology developed as a means for cultural ecologists to empirically
measure variables such as energy costs (e.g., Lee 1969) and better understand how
environmental conditions can affect human behavior (Jochim 1983; Smith and
Winterhalder 1981). Optimal foraging theories rely on the parallels between animal and
human foraging strategies and biological needs. It requires that research questions (e.g.,
those pertaining to settlement patterns, resource exploitation, etc) are framed in a way
that they can be examined by a cost-benefit analysis where costs typically refer to time or
energy expenditures and benefits are calories or other chemicals (e.g., calcium) needed
for survival. A typical optimal foraging study will analyze all the potential food
resources available to a given group and will rank them in order of efficiency. The most
efficient resources are those that offer the highest reward relative to the cost of exploiting
that resource (Keene 1983; Winterhalder 1981b; Yesner 1981).
All optimal foraging models require a means to measure energy expended while
obtaining resources. The unit of cost is often time, which is affected by several factors.
Total time is composed of three components; time spent searching for the resource,
pursuit time (i.e., time from when the resource is spotted until it is killed and/or
collected), and consumption time, which is also includes the time necessary to make the
food edible (e.g., cooking meat). The mobility, population density, and level of
aggregation can affect the total time. Typically, resources that are highly mobile are

49
harder to find, therefore search time is often longer for animals than plants. Resources
with lower population density are also harder to find, thus increasing search time. Due to
their clustered nature, aggregated resources have shorter pursuit times (Keene 1981)
Traditional optimal foraging models require several key pieces of information in
order to function. First, it is necessary to know what resources were exploited by a
group. For archaeological research, this information can be collected by examining the
environment or by looking at faunal data from archaeological contexts. The former
requires the assumption that the inhabitants would have chosen to exploit all potential
resources; the latter is plagued by issues of preservation and data recovery techniques
(Yesner 1981).
In an oversimplified sense, most optimal foraging theories are based on one of
two assumptions about the environment. The resources are either uniformly distributed
in a homogeneous environment (fine-grained environment), or the resources are
differentially clustered into patches (coarse-grained environment), these patches represent
aggregated resources. It is also possible for a region to have fine-grained sections and
coarse-grained sections, or in some cases, an area may exhibit both but during different
seasons. Course-grained environments require the researcher to account for patch
selection, or how the forager(s) select which patch to exploit. Typically, each patch is
examined separately to determine its resource potential, and the costs of exploiting its
resources. The patch with the lowest cost will then be exploited first, and will be
exploited until its cost/benefit ratio drops from resource depletion below the level of
another patch. This second patch will then be exploited (O'Connell and Hawkes
1981:107-108; Winterhalder 1981a:68-69).

50
Optimal foraging theories applied to settlement patterns assume that there is a
relationship between natural resource distribution/availability and the location and size of
a group. For example, if resources are randomly and evenly dispersed throughout an area
(as in fine-grained environments), a central location for all individuals in the region is
inefficient in terms of distance traveled. Instead, several small settlements spread
throughout the region would maximize the chance of an encounter and minimize travel to
resources. However if resources are aggregated and their locations are predictable (as in
coarse-grained environments), a centralized settlement allows for more efficient
exploitation of the resources (Heffley 1981; Moore 1981; O'Connell and Hawkes 1981).
Additionally, the mobility of resources can also play a role in determining the location of
settlements. Sedentary resources are more likely to strongly affect settlement placement,
while highly mobile resources will have less effect. If a settlement is placed near an
immobile resource, the residents will consistently be near that resource. Since the highly
mobile resource will not be found in the same location for any significant length of time,
the time spent exploiting the resource will not be greatly affected by maintaining a base
camp or village near the sedentary resource (Jochim 1976:54-55).
Heffley (1981:140-142) discusses the settlement patterns of the Upper Tanna in
Alaska. Throughout much of the year, caribou are the most efficient food resources to
exploit, though early July marks the spawning runs of white fish, a seasonally important
resource. During the caribou migrations and the spawning runs, these animals are an
aggregated resource that can be exploited in predictable locations each year. While these
resources are clustered, the several families of Tanna would gather to exploit the
resources together. As the spawning runs and caribou migrations end, there is no access

51
to predictable or aggregated food resources. Once this occurs the large groups of Tanna
break apart into one and two family groups and disperse throughout the region to increase
their hunting efficiency.
After gathering as much data on the various costs, values, and availability of each
of resources, many optimal foraging theorists create what is called a linear programming
model. Keene (1981:14) defines a linear program as a “plan or schedule of activities”
that assumes variables are proportionally related to one another. The plan is designed to
optimizing the intake of key nutrients while minimizing effort and energy. A successful
program should be able to predict what time of year and to what extent the various
resources will be (or were in archaeological contexts) utilized. Some examples of linear
programming models include Keene (1981, 1983b) and Reidhead (1981).
While the present analysis will not incorporate a linear programming model to
explicate the Oneota settlement patterns, several of the basic assumptions about human
behavior used here are shared with Optimal Foraging Theory. Specifically economy and
efficiency (i.e., minimizing effort while maximizing productivity) are considered two of
the prime factors of settlement location. For the purposes of this thesis, it will be
assumed that Oneota diet was both economically feasible and relatively efficient within
cultural and local ecological constraints (c.f. Jochim 1976:6-7).
Based on Rodell’s (1983) research, the environment is interpreted as patchy,
though this will be discussed in greater detail below. The Lake Koshkonong environment
may be characterized as a series of patches ripening in both the wetlands and oak
savannas throughout various times of the year. Winterhalder (1981a:90-91) notes that
while deer are often present as a dispersed resource, in fact, they are often relatively

52
clustered--females maintain relatively small territories, while males move from territory
to territory. Deer often move along well-defined paths along lake and river shorelines,
forest edges, and the edge of agricultural fields. Hunters increase their chance of locating
deer using a priori knowledge of the animal’s behavior and tracking skills that would
allow the hunter to pursue the animal before seeing it. In fact, it is relatively easy to kill
deer by sitting still near areas where they are known to congregate, or to drive them
towards a central spot where hunters wait. In areas similar to the study area, it is possible
to sustainably kill 16 deer per square mile per year (Keene 1983:101-104). Both wild
rice and planted cultigens are interpreted as aggregated resources. Depending on the
season and the technology employed, fish can be either aggregated or dispersed
resources.
Within an optimal foraging context and given the nature of the resources
available, the Oneota settlements would need to be placed in locations that allowed them
to exploit the local resources in an efficient manner. That is, the settlements should be
placed where they can effectively exploit aggregated resources (i.e., near wetlands and
land with high agricultural potential) while still optimizing the chance of locally finding
dispersed prey (e.g., near forest edges).
While food resources are important, they are not the only part of the equation.
When using optimal foraging theory to analyze subsistence patterns, it is also necessary
to consider resources other than physical nourishment. Food resources, while important,
may not have been the only factor in deciding settlement locations. Other important
resources include water, fuel, and other raw materials (Jochim 1976).

53
Ecotones
Another important environmental aspect to consider is the distribution of
ecotones, “a transition between two or more diverse communities … a junction zone or
tension belt which may have considerable linear extent but is narrower than the adjoining
community areas” (Odum 1959:278). These areas are important because they typically
have characteristics of both zones, which may attract a wider variety of flora and fauna.
The interaction of two ecozones can also create a unique niche that supports species
diversity as well as species that exist only in border areas (Odum 1959:278-280). The
archaeological implications are clear from an optimal foraging perspective. Areas like
the forest edge or lakeshores will attract a wider variety of species, both flora and fauna,
than the center of a forest or the middle of a lake (Keene 1983; Winterhalder 1981a). In
these complicated environments (i.e., two or more environmental zones overlapping), it is
possible to exploit a wider variety of resources within a smaller area, minimizing effort
and maximizing productivity.
The archaeological importance of ecotones has been demonstrated. For example,
Jeske (1990a) showed that Langford site occupants on the current site of the Fermi
National Accelerator Laboratory between the DuPage and Fox River chose locations that
were within 500 meters of the forest/prairie boundary as depicted on GLO survey maps.
Hart and Jeske (1987) used a logit regression model to analyze the location of sites within
the Illinois-Michigan Canal and concluded that ecotones were of great importance to late
prehistoric groups when choosing site locations. Both studies showed a closer
association with ecotones for late prehistoric sites than for Archaic sites, which concurs
with OFT expectations for settling near areas of aggregated resources.

54
Catchment Analysis:
Catchment analysis was initially developed by Vita-Finzi and Higgs (1970) as a
means of relating the environment surrounding a site to the economic activities conducted
by the site’s inhabitants. As described by Tiffany (1982), site catchment analyses
requires the researcher to define an arbitrary border around the site in which economic
activities would have taken place. By examining the distribution of natural resources
within the arbitrary border, it is possible to infer site function and subsistence practices.
Catchment analyses draw upon several different theories, primarily ecological,
geographical, and anthropological (2). It also allows for a better understanding of how a
site’s inhabitants interacted with the local environment by examining the evidence of the
inhabitants’ activities and a detailed analysis of the local environment from which the
majority of resources would be gathered (Stevenson 1979:3).
The real value of catchment analyses is that they offer a consistent framework
when studying economic aspects of multiple sites that for comparisons to be made.
Though the connection is not always made explicit, catchment analyses are linked with
optimal foraging theories in that they both assume people will behave economically and
efficiently. For example, it is usually assumed that village and base camp sites are placed
in locations that will allow the easiest (lowest energy cost) exploitation of the most
resources (Gallagher and Stevenson 1982:20). Such an assessment fits well with Roper’s
(1979:131) findings of Woodland sites in Illinois. She concluded that base camps were
placed in locations that allowed easy access to the most important resources, while still
providing access to secondary resources and shelter from the environment. Michalik
(1982:40) also hypothesizes that by comparing sites within this consistent framework, it

55
is possible to determine seasonal variation in settlement patterns since each habitation site
should be placed nearest the resources that are available while the habitation site is
occupied. For example, a marsh may be extremely productive in the summer so a
summer habitation may be placed to efficiently exploit it. As the productivity of the
marsh declines due to seasonal nature of its resources, efficiency is no longer increased
by maintaining a nearby habitation so it may be temporarily abandoned in favor of a
location with readily available resources.
Because of the economic nature of catchment studies, it is assumed that the area
closest to the site is the most heavily utilized, and as distance from the site increases
exploitation decreases. The actual boundary of a catchment would be the point at which
food resources are not regularly gathered. Determining where such a boundary should be
drawn can be difficult. Vita-Finzi and Higgs’ catchment based studies have relied on
ethnographic data e.g., Lee (1969) !Kung study focusing on walking time (Gallagher and
Stevenson 1982; Roper 1979; Tiffany 1982). Vita-Finzi and Higgs (1970) created a series
of concentric rings around their study site. At each ring, the proportion of resources
utilized was reduced, so within the first catchment ring, resources were 100% utilized and
50% in the second. The largest ring had a radius of five kilometers and represented a
one-hour walk from the site. Therefore, the inner catchment ring was one kilometer
(within which resources are hypothetically fully utilized) and the radius of each
subsequent catchment was increased by one.
Oneota studies have utilized a variety of catchment sizes Michalik (1982) utilized
a one mile catchment for the Huber Phase Hoxie Farm site in Illinois. Hunter (2002) also
utilized a one mile catchment radius for the Crescent Bay Hunt Club and Washington

56
Irving sites. Tiffany (1982) utilized a two kilometer catchment for Iowa Oneota sites,
while Gallagher and Stevenson (1982) employed a series of five concentric catchment
rings ranging from two to ten kilometers around eight sites in the La Crosse Locality.
Interestingly enough, Gallagher and Stevenson did not utilize circular catchments;
instead, they used a method that accounted for the effects of terrain and non-walking
modes of transportation (e.g., canoe). By taking into account these additional factors, the
catchments more closely resemble the terrain in the region.
Several issues have been raised with catchment analyses, though most are
concerned with misuse of catchments rather than the underlying theory. For example,
Roper (1979:127) cautions that it is necessary to differentiate between a site’s territory
and its catchment. A catchment is the area that is habitually exploited, while the territory
should include all areas that may be exploited. Michalik (1982:40) notes, “the circular
catchment is basically an analytical device: it does not represent the actual catchment of a
site.” Therefore, it should not be taken as a literal representation of all economic
activities that took place at the site. Though not the first to raise some of these issues,
Brooks (1986) identifies several limitations of past catchments analyses, several of which
are applicable to research of the nature presented here. These include: a reliance on
modern data to reconstruct the prehistoric environment; natural resources are described in
generalities; failure to account for seasonality of a study site; permanence of a site; failure
to empirically validate the perceived substance patterns.
The analysis presented here takes into account these concerns, for example,
several lines of data are used to reconstruct the prehistoric vegetation, including textual
data and soils data that are supported by palynological data. To avoid generalities, the

57
GIS provides specific measurements of the distribution of vegetation zones. Data
pertaining to the seasonality, village permanence, and exploitation of natural resources
are examined on a site-by-site basis. While not eliminating all problems associated with
catchment analysis, by attempting to take into account as many known problems as
possible, it is hoped that the model developed serves as a reasonable approximation for
the past environment.
For this analysis, a double catchment of one and two kilometers will be utilized in
order to provide a finer resolution and to still maintain a reasonable catchment size.
Roper (1979:81) notes “that even though this seems to incorporate a high degree of
redundancy … it permitted a more accurate assessment of immediately available
resources, as well as those that were somewhat farther away. Based on Vita-Finzi and
Higgs’ estimations, this double catchment should allow a reasonable approximation of
the areas that were most likely exploited by the prehistoric occupants of the sites.
Additionally, two kilometers seems to coincide with relevant archaeological (e.g.,
Brown and Sasso 2001; Sasso 2003) and ethnohistoric (e.g., Denevan 1992; Jackson
1964; Kinietz 1965; Quimby 1960) research in this region. Tiffany (1982:2) argues that
based on ethnographic descriptions of agricultural settlements, a minimum of a one mile
catchment radius is necessary to adequately support a sedentary populace. Descriptions
of agricultural fields in the Great Lakes region were recorded as being “near” the
associated village. For example, referring to the Sauk, Fox and Miami, Quimby
(1960:133) argued, “subsistence was based upon a combination of farming and hunting.
In cleared fields near the villages the women planted and cultivated corn, beans, and
squash.” By examining the distribution of garden bed and Oneota habitation sites, Sasso

58
(2003:262-263) was able to provide some quantifiable distances. His analysis showed
that within Winnebago County, known garden bed sites were never more than 2.32
kilometers from a known Oneota village site. Many garden bed sites were well within
this range; the closest garden bed site to a known Oneota village was less than 0.1
kilometers, and on average garden beds were only 0.78 kilometers from villages. He
does caution that most of these garden beds have not been securely associated with
Oneota artifacts much less any particular Oneota habitation site but appear to fit known
patterns from northern Illinois. While the Oneota association of the agricultural sites may
be tentative, the results compare well with Vita-Finzi and Higgs’ estimations and should
provide an adequate proxy for estimating agricultural distance.
Even though non-circular catchments may provide a more realistic approximation
of the natural barriers, a circular catchment was chosen for this thesis. As Michalik
noted, a catchment is an analytical tool; it cannot do more than approximate the economic
area of importance to a site’s inhabitants. While a topographic based catchment may
provide a more accurate approximation, the additional information gained is not
significant to justify the additional calculations necessary to create the more complex
catchments or compensating for the variable area among site catchments. A circular
catchment, while not as sophisticated, will facilitate comparisons among sites and in
determining the vegetation distribution (c.f. Hunter 2002:60).
Reconstructing the Prehistoric Vegetation:
There are currently two available accepted methods that can be used to assess the
prehistoric vegetation patterns of Wisconsin. The first requires an examination of the

59
surveyors’ notes from the General Land Office Survey. The second requires an
examination of the soil distribution and determining the original vegetation based upon
the soil types (e.g. Jeske 1990a; Moran 1978, 1980; Sasso 1989; Staff n.d.).
The General Land Office (GLO) Survey was commissioned to be the first survey
of the Northwest Territory of the United States, which included land that is currently the
state of Wisconsin. Within the state, the survey was conducted between 1832 and 1866.
The purpose of the survey was to establish the Public Land Survey System’s (PLSS)
township and range grid across the state in order to sell the land to Euro-American
settlers. The surveyors were tasked with first plotting, marking, and then recording the
exterior boundary of each township. Once this was completed, the surveyors were
required to do the same thing for the interior section lines (Land 2005).
In addition to setting up the town/range grid, the surveyors were also required to
record the general vegetation patterns that were encountered. Since the surveyors did not
deviate from the section lines, there are no notes for the interior of the sections and many
small vegetation features were likely missed. Additionally, the surveyors were concerned
with recording economically important resources and long-lived trees. Potentially
profitable resources (e.g., hardwoods trees) are overrepresented and other species,
especially those within prairies and lightly wooded savannas are underrepresented.
Readers of the GLO field notes need to be aware that there was likely much more
diversity than the notes indicate (Moran 1978, 1980).
The study area near Lake Koshkonong was surveyed in 1833 and 1835 (Brink
1835; Miller 1833). Despite the roughly 600 year gap between the Oneota occupation of
the study sites and GLO survey, the field notes may still be used to accurately model the
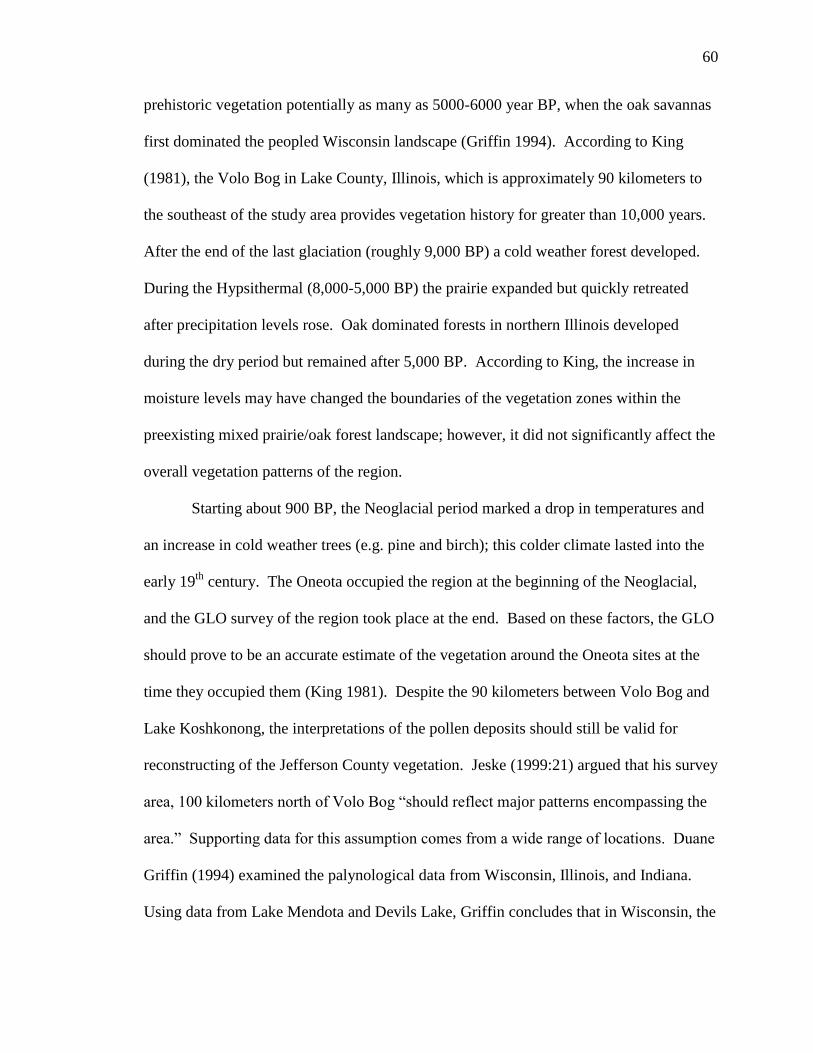
60
prehistoric vegetation potentially as many as 5000-6000 year BP, when the oak savannas
first dominated the peopled Wisconsin landscape (Griffin 1994). According to King
(1981), the Volo Bog in Lake County, Illinois, which is approximately 90 kilometers to
the southeast of the study area provides vegetation history for greater than 10,000 years.
After the end of the last glaciation (roughly 9,000 BP) a cold weather forest developed.
During the Hypsithermal (8,000-5,000 BP) the prairie expanded but quickly retreated
after precipitation levels rose. Oak dominated forests in northern Illinois developed
during the dry period but remained after 5,000 BP. According to King, the increase in
moisture levels may have changed the boundaries of the vegetation zones within the
preexisting mixed prairie/oak forest landscape; however, it did not significantly affect the
overall vegetation patterns of the region.
Starting about 900 BP, the Neoglacial period marked a drop in temperatures and
an increase in cold weather trees (e.g. pine and birch); this colder climate lasted into the
early 19th
century. The Oneota occupied the region at the beginning of the Neoglacial,
and the GLO survey of the region took place at the end. Based on these factors, the GLO
should prove to be an accurate estimate of the vegetation around the Oneota sites at the
time they occupied them (King 1981). Despite the 90 kilometers between Volo Bog and
Lake Koshkonong, the interpretations of the pollen deposits should still be valid for
reconstructing of the Jefferson County vegetation. Jeske (1999:21) argued that his survey
area, 100 kilometers north of Volo Bog “should reflect major patterns encompassing the
area.” Supporting data for this assumption comes from a wide range of locations. Duane
Griffin (1994) examined the palynological data from Wisconsin, Illinois, and Indiana.
Using data from Lake Mendota and Devils Lake, Griffin concludes that in Wisconsin, the
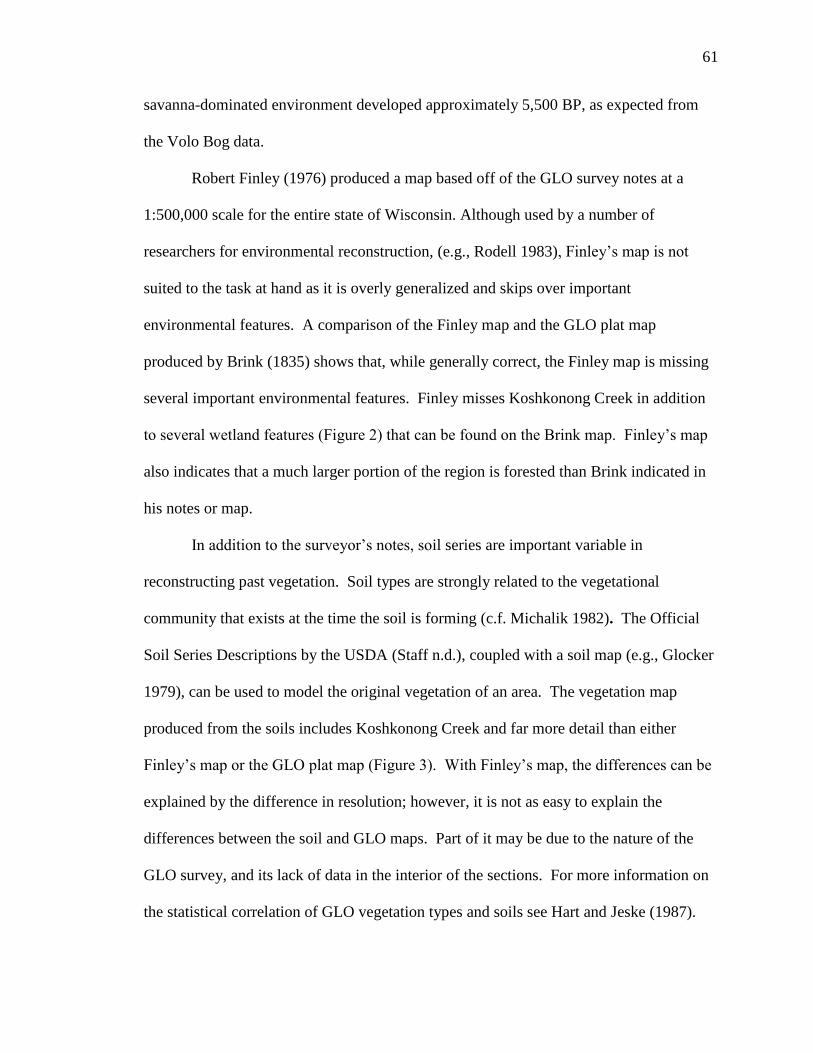
61
savanna-dominated environment developed approximately 5,500 BP, as expected from
the Volo Bog data.
Robert Finley (1976) produced a map based off of the GLO survey notes at a
1:500,000 scale for the entire state of Wisconsin. Although used by a number of
researchers for environmental reconstruction, (e.g., Rodell 1983), Finley’s map is not
suited to the task at hand as it is overly generalized and skips over important
environmental features. A comparison of the Finley map and the GLO plat map
produced by Brink (1835) shows that, while generally correct, the Finley map is missing
several important environmental features. Finley misses Koshkonong Creek in addition
to several wetland features (Figure 2) that can be found on the Brink map. Finley’s map
also indicates that a much larger portion of the region is forested than Brink indicated in
his notes or map.
In addition to the surveyor’s notes, soil series are important variable in
reconstructing past vegetation. Soil types are strongly related to the vegetational
community that exists at the time the soil is forming (c.f. Michalik 1982). The Official
Soil Series Descriptions by the USDA (Staff n.d.), coupled with a soil map (e.g., Glocker
1979), can be used to model the original vegetation of an area. The vegetation map
produced from the soils includes Koshkonong Creek and far more detail than either
Finley’s map or the GLO plat map (Figure 3). With Finley’s map, the differences can be
explained by the difference in resolution; however, it is not as easy to explain the
differences between the soil and GLO maps. Part of it may be due to the nature of the
GLO survey, and its lack of data in the interior of the sections. For more information on
the statistical correlation of GLO vegetation types and soils see Hart and Jeske (1987).
62
Figure 2:Comparison of GLO and Finley vegetation maps (adapted from Brink 1835; Wisconsin-Madison
1990)

63
There are also accuracy issues with some of the soil data. Figure 3 depicts the border (the
vertical line that separates sections 12 and 13 from sections 7 and 18) of Jefferson and
Dane Counties. These two areas were surveyed at separate times by separate crews. As a
result, the interpretations do not always correspond very well, as can be seen in by the
abrupt end of the prairie in section 13..
In addition to the surveyor’s notes, soil series are important variable in
reconstructing past vegetation. Soil types are strongly related to the vegetation since the
soil and GLO sources each provide different data for modeling the prehistoric vegetation,
both sources were used to supplement and complement the other. The GLO notes were
the primary reference when constructing the general vegetation patterns. The GLO plat
map and the soil data were both used to determine more accurately the extent and
boundaries of some vegetation zones. Since Koshkonong Creek does not neatly follow
the section lines, the surveyors would not have adequately mapped the contours of the
creek to accurately represent its winding nature. Therefore, when possible the creek was
mapped relying on the soil data rather than the GLO. The combination of these data
results in a more detailed representation of the environment than can be had from using
only one or the other of the data (Figure 4).
64
Figure 3. Comparison of GLO and Soil Based Vegetation Map.
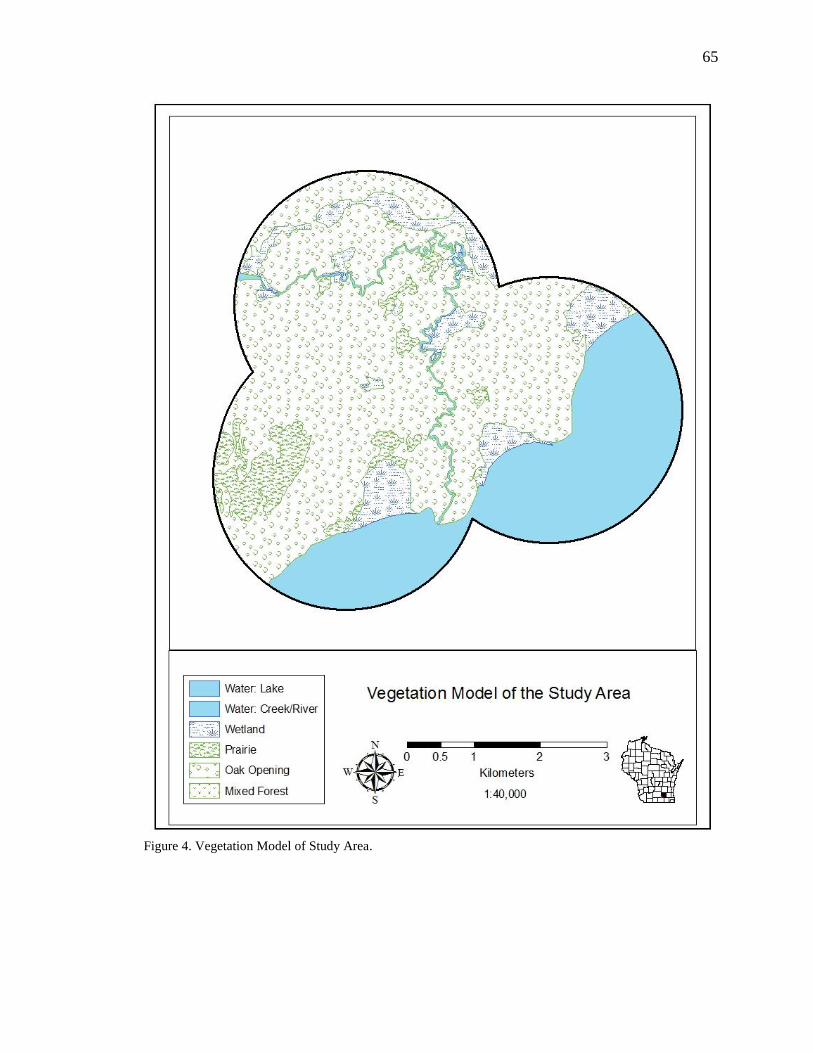
65
Figure 4. Vegetation Model of Study Area.

66
Vegetation Zones:
The general definitions of vegetation patterns used here are the same as used by
Jeske (c.f. 1999:31-34) and by ARG (1985). For this research, vegetation zones will be
broken into six separate vegetation categories. The first is forest, an area that has greater
than 50 percent tree coverage. GLO notes indicate that various types of oaks dominated
much of southeast Wisconsin; however, birch and maple, among others were present to a
lesser degree (c.f. Curtis 1959). Within the study area, it does not appear there were any
forested areas of significant size. Rather the area is dominated by savanna, primarily oak
savanna. Many scholars have speculated about the role of fire, both natural and cultural
in origin, in maintaining the prairie. It is possible that the lack of thickly wooded areas
near Lake Koshkonong is a product of natural fires in conjunction with periodic fires
started by the local human inhabitants (e.g., Goldstein and Kind 1995; Schorger
1937:117-118; Theler and Boszhardt 2006:442; Will-Wolf and Monague 1994).
In general terms, a savanna, also known as an oak opening or a barren, is a
mixture of forest and prairie with large amounts of both trees and grasses (White 1994).
More precisely, a savanna is an area with more than one tree per acre, but has less than 50
percent canopy coverage. A prairie is grassland with less than one tree per acre. The
category wetlands includes several distinct types of vegetation zones (e.g., marshes, wet
prairie, swamps). Jeske (1999:33) notes that it is usually not possible to determine what
wetland type was present based on GLO notes since all types are often referred to as
swamps or marshes. In the case of Brink (1835), wetlands are referred to as “wild
meadows,” with no further information concerning the type of wetland. The final two
categories are open water (i.e., lakes) and rivers. This diverges from Jeske’s system; he
67
includes lakes and rivers with wetlands arguing that the two are indistinguishable in the
GLO. However, the size of Koshkonong Lake and Creek are substantial enough that they
are easily differentiated in both the GLO notes and plat map, and therefore could be
differentiated in this analysis. Since lakes, rivers, and wetlands (e.g., marshes) all have
distinguishable characteristics, it is likely that the humans interacted with each
differently. For example, various fish can be found in Lake Koshkonong that are not
found in the wetlands, which do not have the same transportation potential (i.e., canoe
travel) as rivers or the lake.
Vegetation Zones as Discrete Resource Zones:
Each vegetation zone has a specific suite of plants that grows within its borders.
The suite of flora present in a vegetation zone affects the type, quantity, and density of
fauna that will regularly occupy that zone. Based on these two factors, it is possible to
predict the resource potential for the various vegetation zones (c.f. Goldstein and Kind
1995; Jeske 1988, 1999).
Forests provide a wide variety of resources from early spring through the
beginning of fall. In addition to firewood and raw materials, trees often provide nuts
(e.g., walnuts) and fruits (e.g., cherries). The underbrush often contains a variety of food
resources (e.g., blackberries, blueberries, and goosefoot). The forest is the habitat of a
variety of animals including deer, raccoon, fox, wolf, bear, and squirrel. On a scale
ranging from low, to good, to high, Goldstein and Kind rate the forest high on its food
potential (Goldstein and Kind 1995:19,27; Jeske 1999:35-36,38).

68
According to Goldstein and Kind (1995:19,29,34), the prairie provided few useful
resources to humans. In reference to flora, “the prairies offer nothing that cannot be
obtained with less effort elsewhere in Southeastern Wisconsin” (Goldstein and Kind
1995:29). They argue that the prairie fauna was similarly limited; that the only valuable
animal primarily restricted to the prairie was the bison. They rate the prairie as having
low food potential and argue that it is best to exploit the prairie in the winter. Jeske also
argues that the prairie has limited economic value, though it does provide a variety of
seeds and tubers (e.g., amaranth, chenopodium, and duck potato). In addition to bison,
the prairie could also provide elk, coyote, and rabbit (Jeske 1999:37-38).
Since savanna is essentially a combination of prairie and forest it offers a wide
range of exploitable flora and fauna from both environmental zones. Goldstein and Kind
(1995:26,28, 34) rate the barrens as good sources of food and argue that they are best
exploited during the winter and used for agriculture in the summer. Since the barren is
the primary environmental zone within the study area, and its floral resources would be
available from late spring into fall, Oneota site occupants may have exploited the barrens’
resources throughout the year.
Wetland resources are extremely diverse. Fauna found within the wetlands
include animals associated with upland habitats (e.g., deer), but also include aquatic and
semi-aquatic animals (e.g., turtles). Additionally wetlands often attract waterfowl such as
ducks and geese. Maygrass, sumpweed, strawberries, and wild rice are just a few of the
plants available from wetland environments (Jeske 1999:33,37).
Like wetlands, rivers and lakes provide access to a wide variety of plants and
animals. The water attracts upland animals, while providing shelter for aquatic mammals

69
(e.g., beaver and muskrat), waterfowl, and aquatic reptiles. The water is also home to a
variety of fish such as bass and pike. These environmental zones would have been
capable of providing a considerable amount of food (Jeske 1999:33). Wild rice was
likely an important resource; it was certainly one of many abundant resources. Lapham
notes in 1850 that the lake was a plentiful supply of food resources:
At the time of our visit (July, 1850), wild rice was growing abundantly over
almost the whole surface, giving it the appearance of a meadow than a lake. Fish
and mollusks also abound in its waters, finding plenty of food in the warm mud
beneath, and among the roots and stems of the grass and rushes [Lapham
1850:35].
Five of the six resource zones can be found within the study area. Clearly, there
was a wide diversity of resources available to inhabitants of the four study sites. The
questions that must then be asked; 1) what was the actual environmental composition of
within the study area; 2) how were the sites placed in relation to these environmental
zones; 3) what evidence do we have for Oneota utilization of resources from these zones.
Geographic Information Science/Systems:
GIS typically refers a computer program that combines database storage and
management with mapping capabilities. It allows for the spatial representation and
analysis of data. The value in the ability to calculate spatial analyses, explore data, or
create maps easily should be apparent to all archaeologists. Dillemuth (1999:96)
70
accurately claims that, “the results show that the use of GIS is a powerful and efficient
way to investigate a prehistoric landscape.” In the past, GIS has been used for settlement
analyses, Brandt et al. (1992) created a multi-layer map that rated the land surrounding
their sites based on several factors (e.g., distance to water and soil texture). They used
each of the variables to determine the quality or favorability of an area for archaeological
populations. In total, more than 75 sites from five different time periods in the
Netherlands were tested. They used the results of their catchment analysis to determine
the common traits found at various sites and compared the results to non-surveyed areas
to determine the potential of finding archaeological sites.
Hunt (1992) analyzed Late Woodland sites in New York state, suggesting that the
primary benefit of GIS is its capability to give the researcher, “the ability to overlay multiple
thematic coverages, generate new coverages as the result of mathematical computation between
two or more coverages, manage large multivariate data structures, compute basic statistics, and
satisfy cartographic standards” (Hunt 1992:285). Hunt continues that a GIS allows for more
complexity than many past catchment analyses allowing for analyses that are more meaningful.
Additionally its ability to convert coordinate systems and vary scales allows it to incorporate a
variety of sources that otherwise would be extremely difficult and tedious if not impossible.
For the research presented here, Environmental Systems Resources Institute’s
(ESRI) ArcGIS 9.3 and 9.3.1 software suites were utilized. ArcGIS is an extremely
versatile program which is capable of reading raster (data are cell based e.g., JPEG files)
and vector files (spatial information is stored as equations and linked to a separate file
containing the attribute data). It allows the user to manipulate either, or convert from one
to the other. It also offers a wide range of tools useful for exploring, summarizing, and
conducting spatial analyses on the data. For the research presented here, a vector dataset
will be used. Raster datasets were considered, but due to time constraints were not used
in the present analysis.
Careful planning is always the first step in creating a GIS. A Universal
Transverse Mercator (UTM) projected coordinate system was chosen for the project, so

71
the data would be displayed with reference to a universal datum rather than arbitrary site
data. All of the sites may then be displayed with reference to one another and to other
mapped objects from the real world or mapping phenomena (e.g., soil types or PLSS
townships or sections). Additionally, use of UTM coordinates uses the familiar and
easily interpreted meters as the base map units compared to other systems that use
latitude and longitude or the imperial measurement system. Geodatabases were created
so that relevant information (e.g., site name, site number, etc) would also be recorded and
stored in a systematic way with the proper spatial files.
The first items that needed to be mapped were the sites’ boundaries so that the
extent of the study area could be determined. While it was already determined that the
study area would contain the land within two kilometers from each of the sites, the
computer needs to be told exactly where the sites are so that it can create the study area.
The Schmeling site was digitized from a preexisting non-GIS site map (c.f. Foley
Winkler 2008) by georeferencing (modifying the file so that it has the appropriate UTM
coordinates and is properly scaled) the site map and then using ArcGIS to digitize the
map as vector files. The site boundaries were determined by the extent of the positive
shovel probes and the artifact scatter from the pedestrian survey. The boundaries were
then digitized as a polygon feature. Similar processes were conducted by James Moss,
Shannon Cowell, and Seth Schneider of the University of Wisconsin-Milwaukee for the
Crescent Bay Hunt Club and Twin Knolls sites (Cowell et al. 2008; Moss 2008) and
adopted for this project. Original site maps were not available for the Carcajou Point site
so a digital image was downloaded from the ASI files (Division of Historic Preservation
2003). The image was georeferenced and the outer boundaries of the four sites that make
72
up the Carcajou Point complex (47JE002, 47JE812, 47JE813, and 47JE814) were
digitized.
The next step was to turn the sites’ boundaries into points. It was decided that
using the center point of each site would be the optimal choice since it would allow for
the construction of circular catchments and provide a single point for measurements.
Such measurements would provide the mean value for each site. ArcGIS offers a tool
that can turn polygons into a point at its center. Using the buffer tool, a one and two
kilometer circular polygon (i.e., the catchment) was created around each of the sites. The
union tool was then used to create a separate polygon feature that shared the non-
overlapping boundaries of each of the two-kilometer catchments. This new polygon
represents the entire study area.
The GLO sketch maps for Town 5 north, Ranges 12 and 13 east were
georeferenced, and soil data were downloaded from the USDA (Staff n.d.). After the soil
data were symbolized to represent the vegetation, these two sources were used in
conjunction with the GLO survey notes to produce the model of prehistoric vegetation.
The clip tool was used to insure that no two environmental zones were
overlapping. The proportion of each ecozone within each catchment was calculated in
several steps. The vegetation model layer was copied into eight different files. The next
step involved selecting the associated catchment feature and using the clipping tool to
erase all areas of the vegetation model that were not within the catchment. This was done
twice for each site so that each site had two associated files, a two-kilometer catchment
and a one-kilometer catchment. Within the attribute table for each of these files is the
total area, in square meters, occupied by each ecozone.
73
To model the ecotones, the ecozone features were converted from polygons to
lines and then 250-meter polygon buffers were generated. This process had to be
conducted separately for each of the eight catchment files. Each overlapping polygon
was clipped so that no two ecotone features overlapped or extended beyond the
catchment. The attributes tables were updated so that each environmental zone that was
part of the ecotone (i.e., is within 250 meters of ecotone) was stored as part of the file.
Each combination of ecozones was stored as separate entries so it is possible to determine
how many square meters are classified as, for example, a wetland/prairie ecotone and
how many square meters are classified as wetland/prairie/savanna ecotone.
Distance to water was calculated by using the “Near” tool, which is designed to
find the shortest distance between the two specified points or features. The tool was used
three times total, first to determine the distance from each site point to open water (e.g.,
Lake Koshkonong), then to the nearest creek/river (e.g., Koshkonong Creek), and finally
to the nearest wetland. These distances, in meters, were stored within the attribute table
of the site-points file.
Based on previous work with Oneota agriculture (e.g., Overstreet 1976; Sasso and
Brown 1987) a series of soil characteristics were chosen (e.g., ability to be tilled by
prehistoric technology, water available at the roots, and drainage) were chosen to rate the
soil’s maize production potential as poor, fair, or good (Sasso, personal communication).
Soil qualities were determined from the soil survey books of Jefferson and Dane Counties
(Glocker 1979; Glocker and Patzer 1978). The first criterion examined was the soil’s
capacity to be tilled by Oneota technology (e.g., scapula or shell hoes). Because of the
extensive root systems of prairie soils, they were immediately discounted, as were all

74
soils that were primarily clay. Loams and silts were considered to be the best soil types
for tilling with Oneota technology. Loamy sands, silt loams, sandy loams, and silty sands
were also considered to be acceptable soils for Oneota agriculture. Silty clay loams were
considered to be marginal as they would have been more difficult to till.
The next criterion was drainage capability of the soils. Only soils classified as
well drained or moderately well drained were classified as good soils. Those that were
classified as somewhat poorly drained were considered fair. If the soils drain too quickly,
the plants are not likely to get enough water, and if it drains too slowly, they are likely to
be overly inundated. Either case will at the least stunt the growth/productivity of the
plants or kill them. For this reason, areas under standing water and mucks were
discounted. Related in some respects to the previous criterion, the availability of water at
the roots was the next criterion examined. Soils that had high to moderate water levels at
the roots were accepted as potential soils for Oneota agriculture. Like those with proper
drainage qualities, soils that provided moderate or high water levels would have given the
crops enough water without drowning them.
The final aspect examined was slope. Slope is important due to drainage and
erosion issues, as well as the practicality of tilling and harvesting (Sasso, personal
communication). In the study area, slope of soils is typically classified as zero to six
percent slope, six to twelve percent slope, and greater than twelve percent slope (Glocker
1979). Soils with less than a six percent slope were rated good. Soils of six to twelve
percent slope were considered fair. Soils with greater than a twelve percent slope were
considered to be too steep. The final list of soils within the study area that would have
been productive for Oneota technology is listed in the appendix.

75
ArcGIS allows a user to make complex selections. Soils with the proper attributes
were selected and exported as a separate file. The new files were copied then clipped
eight times so that each site had its own agricultural model at both catchment distances.
The total area classified as good and fair were recorded separately within the attribute
tables.
Resource Pull Analysis
Jochim (1976) advocated the idea that the more attractive resources (i.e., those
that can be exploited most economically) exhibit a pull on human populations. These
resources attract the inhabitants of the region to set up settlements close to them. If there
are multiple strong pulls in a region, the settlements will be placed to best exploit the
widest variety of high pull resources without sacrificing efficiency. If this is applied to
catchment analysis, then the smaller catchments would be expected to have a
disproportionate amount of the high pull resources. To apply such a test to the current
research, the entire study area was rated based on the economic potential of the resource
zone, the agricultural productivity, and the number of ecotones present. Wetlands and
savannas were rated as a four, lakes and creeks were rated two, and prairie was rated one.
Land with poor agricultural potential was rated zero, fair agricultural land was rated two,
and good agricultural land was rated four. Finally, the number of environments in an
ecotone determined the score of the ecotones. The most possible in this study was four,
and the least was zero. Each of the variable layers for each of the catchments was
subjected to the union overlay tool in the ArcToolbox. The result of using this tool was a
new shapefile that divided the map into homogenous zones (i.e., those that all shared the

76
same variable values), to which four new attribute fields (one for each of the variables
and one for the total value) were added. The field calculator was then used to determine
the total value. For this study area, the minimum score was one and a maximum score
was twelve. While this score is at best a crude measure of resource pull, it acts as a
heuristic device to elucidate patterns that may not otherwise be visible
.
Analysis
Once the total area of each ecozone, ecotone, and arable land are calculated for
each catchment, they, along with the faunal assemblages and distance to water types from
each site will be compared. To analyze the first research question, what was the
environmental context of each site; each of the above-mentioned variables will be
summarized and placed into an optimal foraging context with specific reference to known
Oneota subsistence patterns.
The second question, was each study site placed in the same environmental
context, will be answered by comparing the sites’ environmental contexts. The analysis
would not have been possible without the extensive assistance of Dr. J. Patrick Gray, and
was accomplished with the use of weighted log ratio analysis (wLRA). WLRA is a form
of composition analysis that is necessary due to the nature of the data. Composition
analysis is necessary when the variables (e.g., environmental zones or ecotones) are
considered relative or closed data; that is, the values are not fully independent.
Therefore, when the values of a variable for a particular catchment (e.g. environment),
are added together their total is equal to 100 percent of that catchment. In such cases, if
the values of one environment type changes, one or more of the other environment types

77
must change correspondingly (for a detailed explanation see Pawlowsky-Glahn and
Egozcue 2006).
The wLRA is related to correspondence analysis (CA) in that it is used to analyze
two-way tables, so long as the values of the tables are positive. Like CA, wLRA allows
the relationship between column and row values to be expressed with two factors or
dimensions. The advantage of the wLRA is that it is capable of taking into account the
relative proportions of values. Its main limitation is its inability to calculate zero values
(Greenacre and Lewi 2009). Since the data values for this thesis include zero, especially
the ecotone data, wLRA would not normally be appropriate. However, due to the large
population of the catchments (i.e., thousands of square meters) adding one to the zero
values will allow for wLRA but will not significantly skew the results (Gray, personal
communication).
The results of a wLRA are expressed in a biplot, which “is a graphical display of
the rows and columns of a rectangular n x p data matrix X, where the rows are often
individuals or other sample units and the columns are variables” (Aitchison and
Greenacre 2002:377). While there are several types of biplots, in general the biplot
displays variables (e.g., environment zone) as rays, and sample units (e.g., sites) as
points. The standard deviation of the variables can be calculated by measuring the length
of the ray, and by measuring the cosine of the angle of the ray, it is possible to determine
the intervariable correlations (Aitchison and Greenacre 2002). By using the wLRA and
its generated biplots, it is possible to determine if the sites were situated in similar
environments and, if not, how they were different.

78
The third question, were the sites placed to optimize agricultural production, will
be answered by analyzing the distribution of the arable soils and their distance to the
Oneota sites. The fourth question is: what is the nature of Oneota settlement pattern near
Lake Koshkonong? To answer this question, the variation is locations, especially in
reference to environmental zones and bodies of water will be determined. From this, the
overall pattern will be inferred and described in detail.
79
CHAPTER THREE
THE STUDY SITES
All four of the study sites are located in Town 5 north, Range 13 east in Jefferson
County, Wisconsin. These are not the only Oneota sites within the region; however, each
of the sites has been extensively surveyed, and three of the sites have subjected to
excavation. After assessing the Archaeological Site Inventory, it was determined that
these four sites were the only ones in the region that 1) had enough data collected to
allow for comparisons, and 2) were substantial enough to be considered village sites and
included in the survey. Crab Apple Point is the only other possibility; however, little is
known of the Oneota occupation, and not enough is known about the site to differentiate
its multiple components as would be necessary before including in the study (Division of
Historic Preservation 2003; Richards and Jeske 2002:43). The following is a brief
summary of the sites, their locations (Figure 5), histories, and interpretations.
The Crescent Bay Hunt Club Site (47JE904):
The Crescent Bay Hunt Club site is located in the southwest quarter of the
northeast quarter of Section 19, Town 5 north, Range 13 east (Figure 6). It is situated
atop a ridge that rises eight meters above wetlands located east of the site, and is roughly
180 meters west of the current shoreline of Lake Koshkonong. It is situated atop a ridge
that rises eight meters above wetlands located east of the site, and is roughly 180 meters
west of the current shoreline of Lake Koshkonong (Hanson 1996; Jeske, Hunter et al.
2003). It is possible that the site was first reported by Stout and Skavlem (1908), though
it is not clear if they are referring to the Crescent Bay site, Schmeling to the north, or
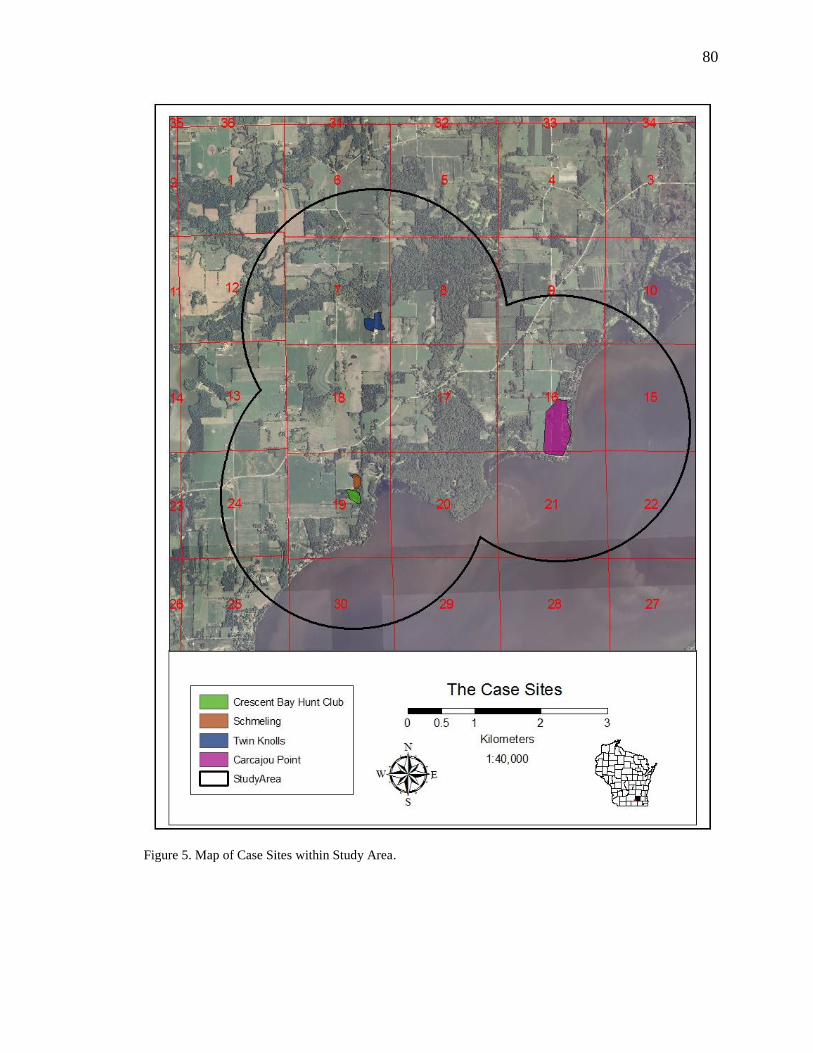
80
Figure 5. Map of Case Sites within Study Area.
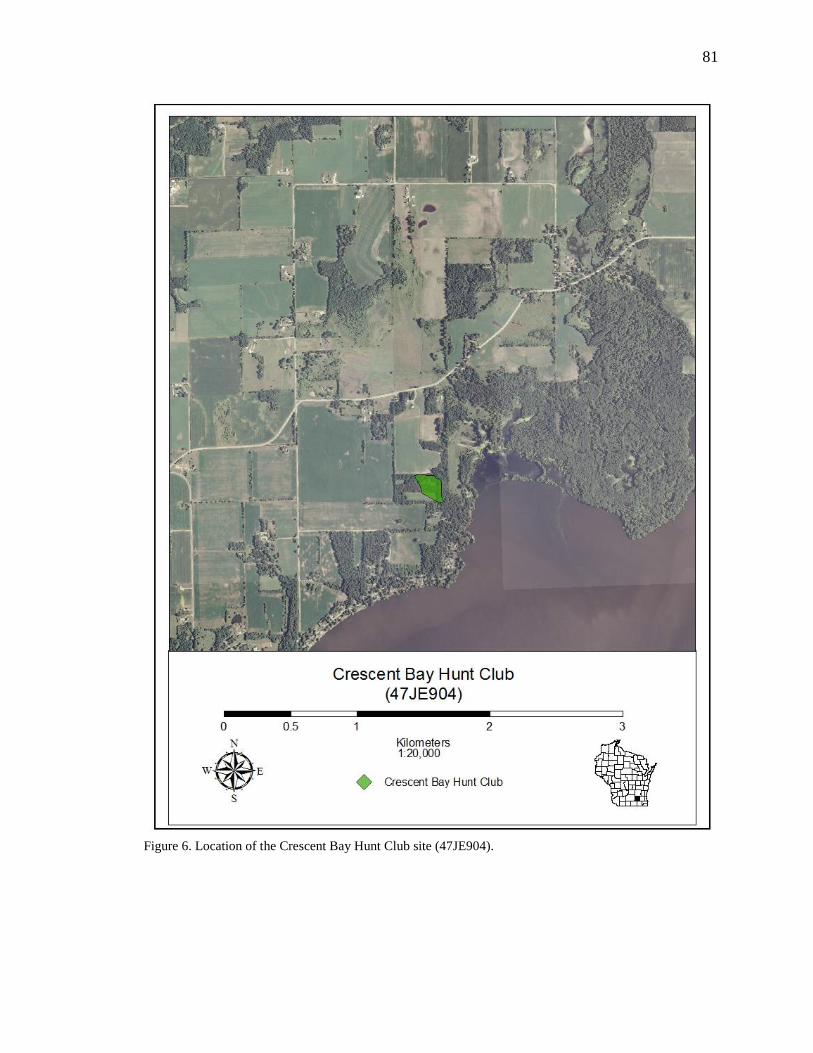
81
Figure 6. Location of the Crescent Bay Hunt Club site (47JE904).

82
material immediately south of site’s location (Jeske 2000a). The site was first excavated
in 1968 by the University of Wisconsin-Madison under the direction of David Baerris
(Gibbon n.d.). No additional work was done at the site for nearly thirty years, until 1995
when the Southeast Wisconsin Archaeological Project at the University of Wisconsin-
Milwaukee conducted a survey of the property (Hanson 1996). In 1998, UW-Milwaukee
returned to work at the site as the focus of its bi-annual field school under the direction of
Robert J. Jeske. The UW-Milwaukee field school has returned to the site every other
year since 1998 for a total of six field seasons to date (Hanson 1996; Jeske, Hunter et al.
2003).
The 1968 excavations uncovered ceramic sherds, including vessels that can be
described as Carcajou Curvilinear, Carcajou Plain, Grand River Trailed, or Grand River
plain. A variety of lithics including scrapers, ground stone tools, and triangular points
were recovered as well. In addition to the artifacts, many Oneota features were
uncovered including over 180 postholes of a wigwam style house (Gibbon n.d.). Since
1998, the University of Wisconsin has conducted an extensive subsurface investigation of
the site including numerous shovel probes and test pits. As a result, the students
uncovered dozens of features including an additional wigwam style house as well as what
is currently being interpreted as an Oneota longhouse (Hunter et al. 2003; Mollet and
Jeske 2001; Moss 2008, 2010). Ceramics recovered during the UW-Milwaukee
excavations are from the Emergent, Developmental, and Classic Horizons and also
include Fisher wares from Illinois which may suggest a southern connection (Jeske 2001,
2003a, n.d.). Human remains were recovered at Crescent Bay in a variety of contexts
including refuse pits. There does not appear to be a separate or formal cemetery at the

83
site. All burials found at Crescent Bay have been found within the habitation area (Foley
Winkler and Jeske 2003). Recent spatial analyses place several burials within the
boundaries of the longhouses and Moss (2010) argues that at least two burials were
placed under the floor of the structure.
Based on the recent excavations (Figure 7), the Crescent Bay Hunt Club site is
interpreted as an Oneota village site that dates primarily between A.D. 1200-1400 (Jeske
2008). It is clear that several of the houses were rebuilt at least once; evidenced by the
number of postholes around the wigwams and the overlapping wall trenches in the
longhouse. While it is not clear how long the site was occupied, given the number of
structures rebuilt it is likely that the site was occupied for several years, abandoned for
some time and then reoccupied. This pattern would likely have been occurred multiple
times during the site occupation (Moss 2010).
Although only a limited number of features have been examined for floral or
faunal analyses at this time, it appears that the subsistence pattern used at the Crescent
Bay Hunt Club is very similar to the general Oneota subsistence pattern discussed above.
After examining the floral remains, Olsen (2003:164) determined that the residents of the
site were exploiting more than 35 taxa of plants which included both “indigenous seeds
and exotic cultivars [Zea mays, Chenopodium].” According to Hunter (2002:84), over
half of the faunal remains recovered from Crescent Bay were fish (Table 2). Mammals
were the next most common remains, followed by bird, and then reptile. Both faunal and
floral data indicate a heavy emphasis on wetland resources, along with upland game (elk,
bison) and corn. The site was optimally placed to exploit the variety of resources
surrounding the site (Jeske, Foley Winkler et al. 2003).
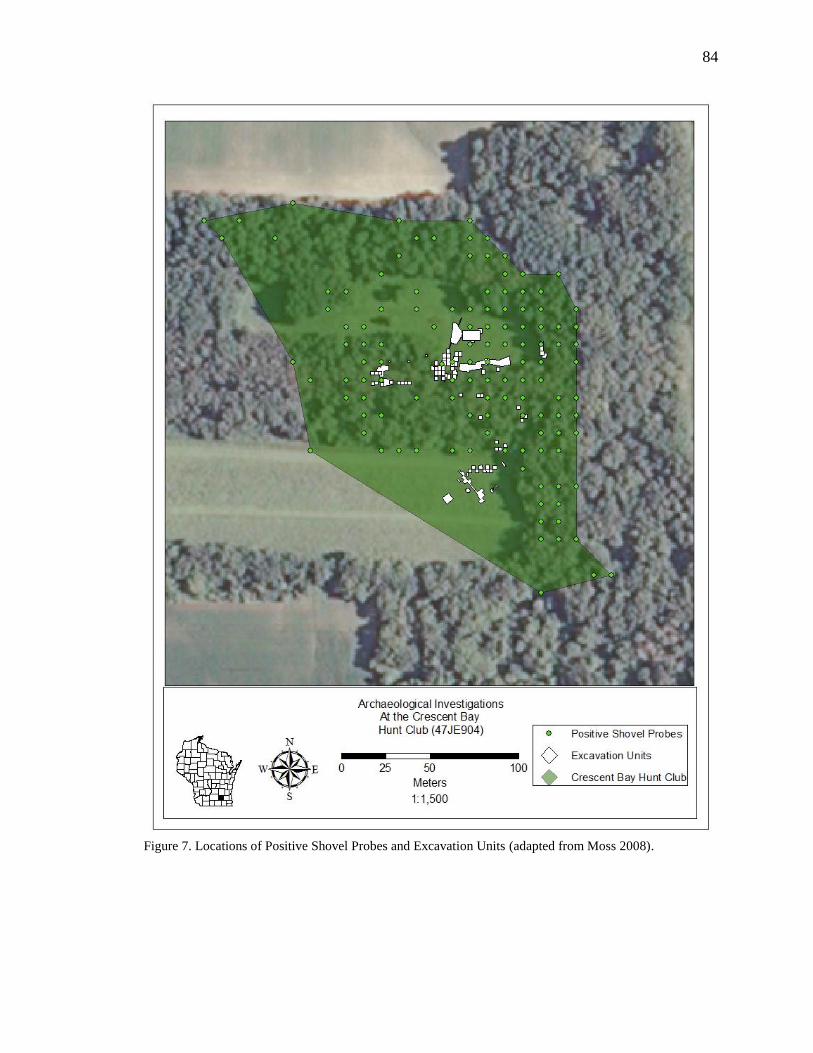
84
Figure 7. Locations of Positive Shovel Probes and Excavation Units (adapted from Moss 2008).
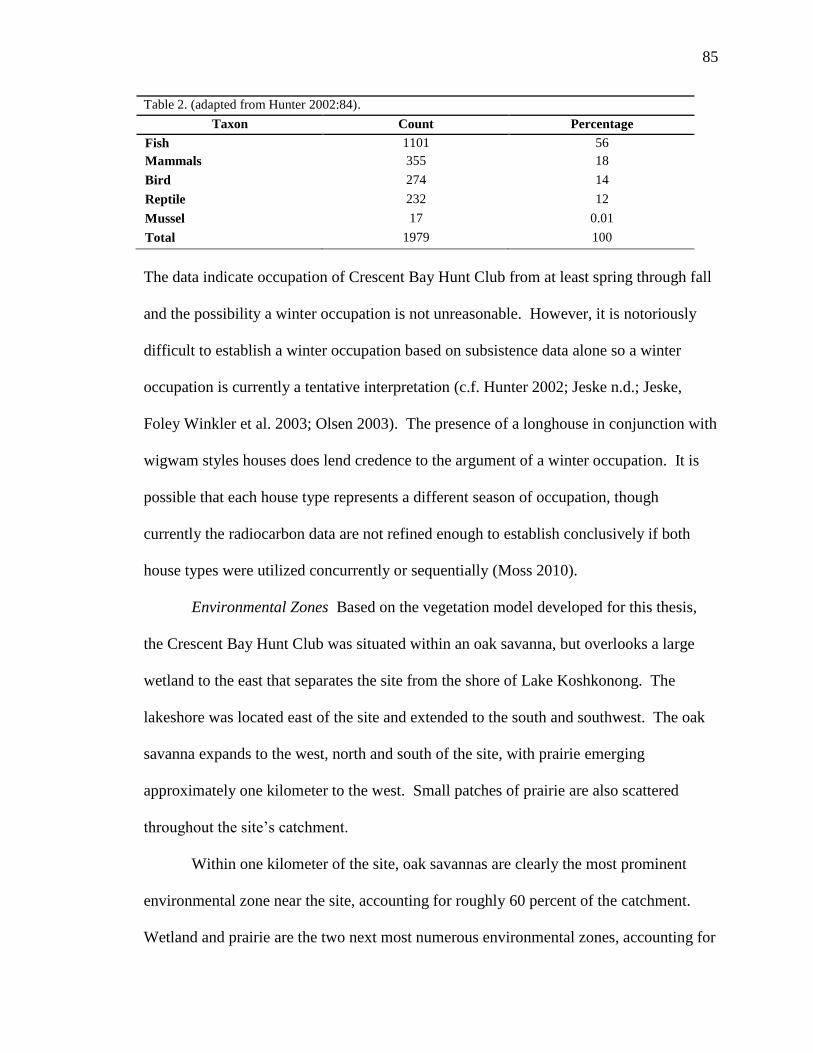
85
Table 2. (adapted from Hunter 2002:84).
Taxon Count Percentage
Fish 1101 56
Mammals 355 18
Bird 274 14
Reptile 232 12
Mussel 17 0.01
Total 1979 100
The data indicate occupation of Crescent Bay Hunt Club from at least spring through fall
and the possibility a winter occupation is not unreasonable. However, it is notoriously
difficult to establish a winter occupation based on subsistence data alone so a winter
occupation is currently a tentative interpretation (c.f. Hunter 2002; Jeske n.d.; Jeske,
Foley Winkler et al. 2003; Olsen 2003). The presence of a longhouse in conjunction with
wigwam styles houses does lend credence to the argument of a winter occupation. It is
possible that each house type represents a different season of occupation, though
currently the radiocarbon data are not refined enough to establish conclusively if both
house types were utilized concurrently or sequentially (Moss 2010).
Environmental Zones Based on the vegetation model developed for this thesis,
the Crescent Bay Hunt Club was situated within an oak savanna, but overlooks a large
wetland to the east that separates the site from the shore of Lake Koshkonong. The
lakeshore was located east of the site and extended to the south and southwest. The oak
savanna expands to the west, north and south of the site, with prairie emerging
approximately one kilometer to the west. Small patches of prairie are also scattered
throughout the site’s catchment.
Within one kilometer of the site, oak savannas are clearly the most prominent
environmental zone near the site, accounting for roughly 60 percent of the catchment.
Wetland and prairie are the two next most numerous environmental zones, accounting for
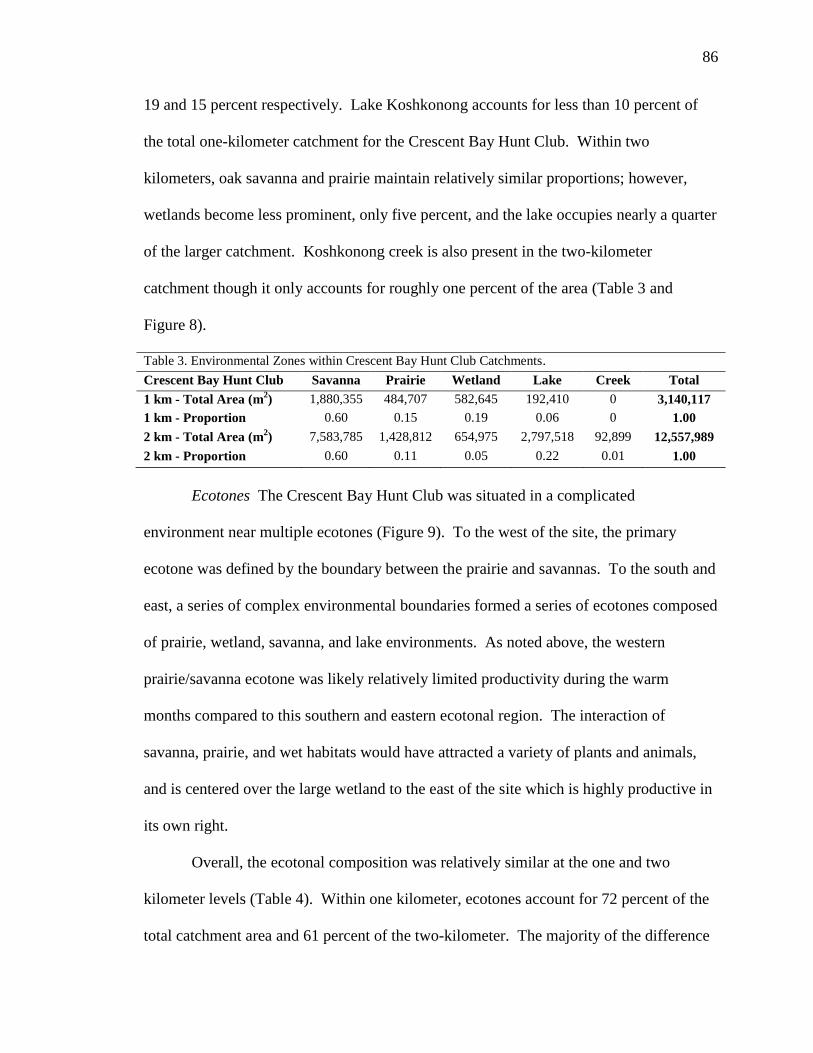
86
19 and 15 percent respectively. Lake Koshkonong accounts for less than 10 percent of
the total one-kilometer catchment for the Crescent Bay Hunt Club. Within two
kilometers, oak savanna and prairie maintain relatively similar proportions; however,
wetlands become less prominent, only five percent, and the lake occupies nearly a quarter
of the larger catchment. Koshkonong creek is also present in the two-kilometer
catchment though it only accounts for roughly one percent of the area (Table 3 and
Figure 8).
Table 3. Environmental Zones within Crescent Bay Hunt Club Catchments.
Crescent Bay Hunt Club Savanna Prairie Wetland Lake Creek Total
1 km - Total Area (m2) 1,880,355
484,707
582,645
192,410
0
3,140,117
1 km - Proportion 0.60
0.15
0.19
0.06
0 1.00
2 km - Total Area (m
2) 7,583,785
1,428,812
654,975
2,797,518
92,899
12,557,989
2 km - Proportion 0.60
0.11
0.05
0.22
0.01
1.00
Ecotones The Crescent Bay Hunt Club was situated in a complicated
environment near multiple ecotones (Figure 9). To the west of the site, the primary
ecotone was defined by the boundary between the prairie and savannas. To the south and
east, a series of complex environmental boundaries formed a series of ecotones composed
of prairie, wetland, savanna, and lake environments. As noted above, the western
prairie/savanna ecotone was likely relatively limited productivity during the warm
months compared to this southern and eastern ecotonal region. The interaction of
savanna, prairie, and wet habitats would have attracted a variety of plants and animals,
and is centered over the large wetland to the east of the site which is highly productive in
its own right.
Overall, the ecotonal composition was relatively similar at the one and two
kilometer levels (Table 4). Within one kilometer, ecotones account for 72 percent of the
total catchment area and 61 percent of the two-kilometer. The majority of the difference
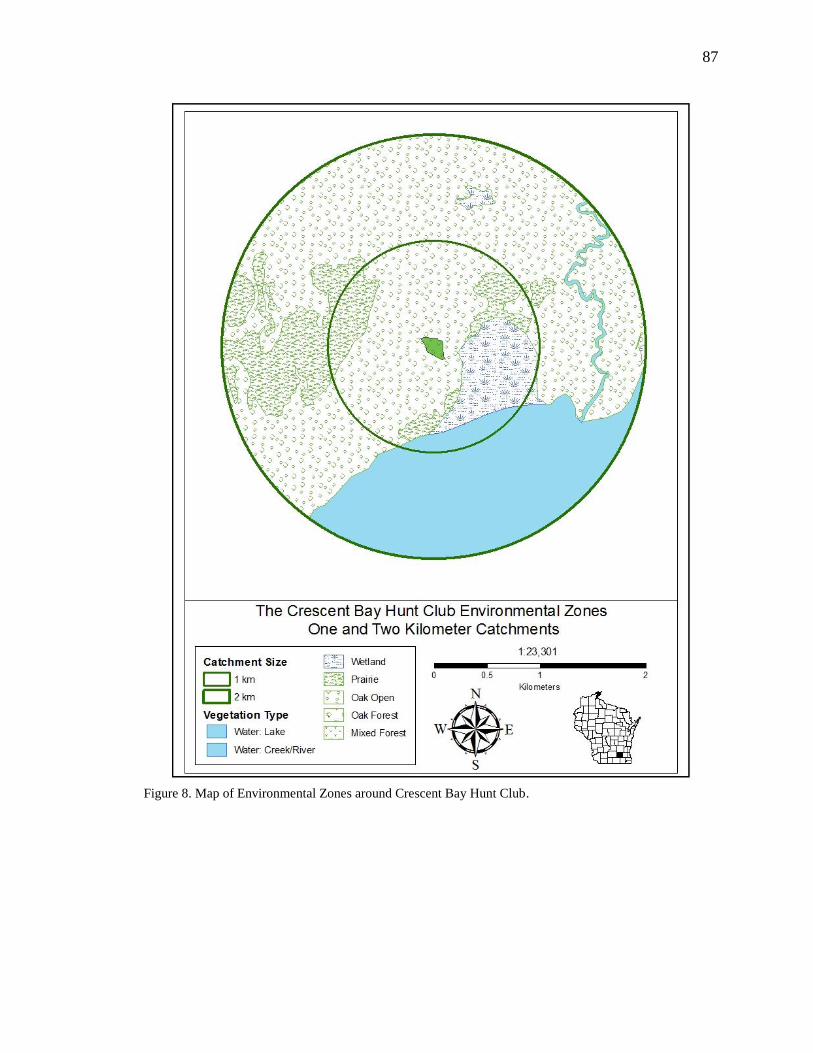
87
Figure 8. Map of Environmental Zones around Crescent Bay Hunt Club.
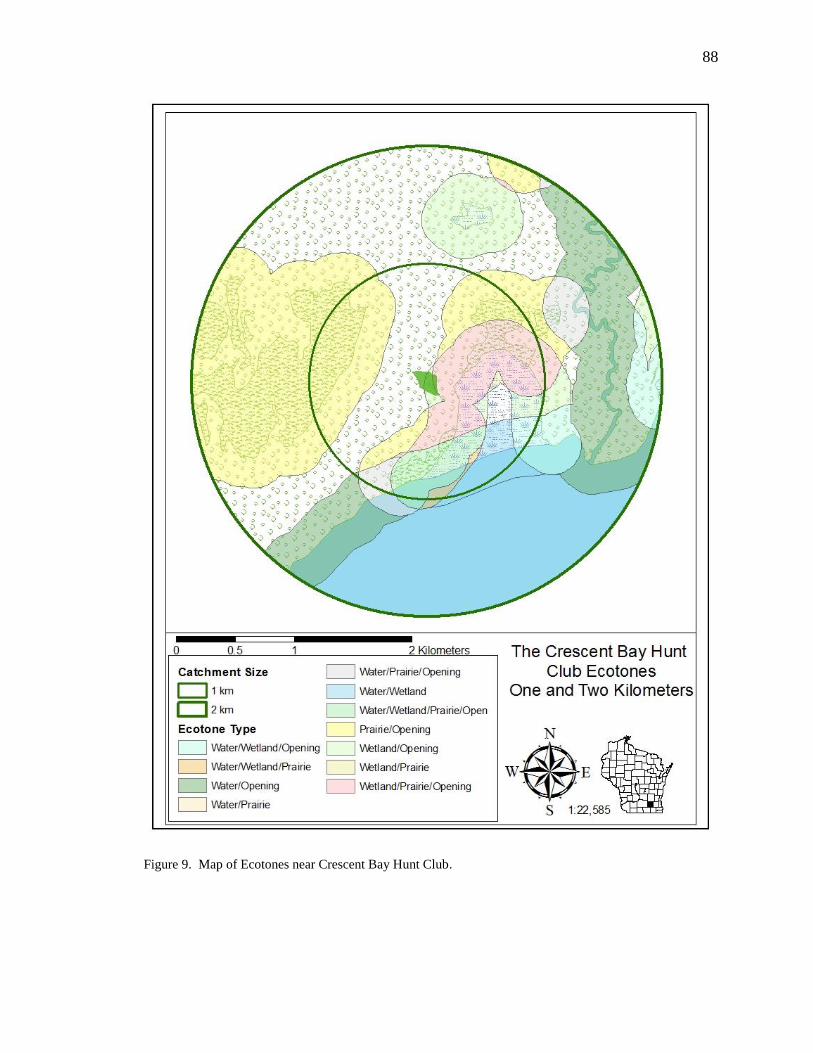
88
Figure 9. Map of Ecotones near Crescent Bay Hunt Club.
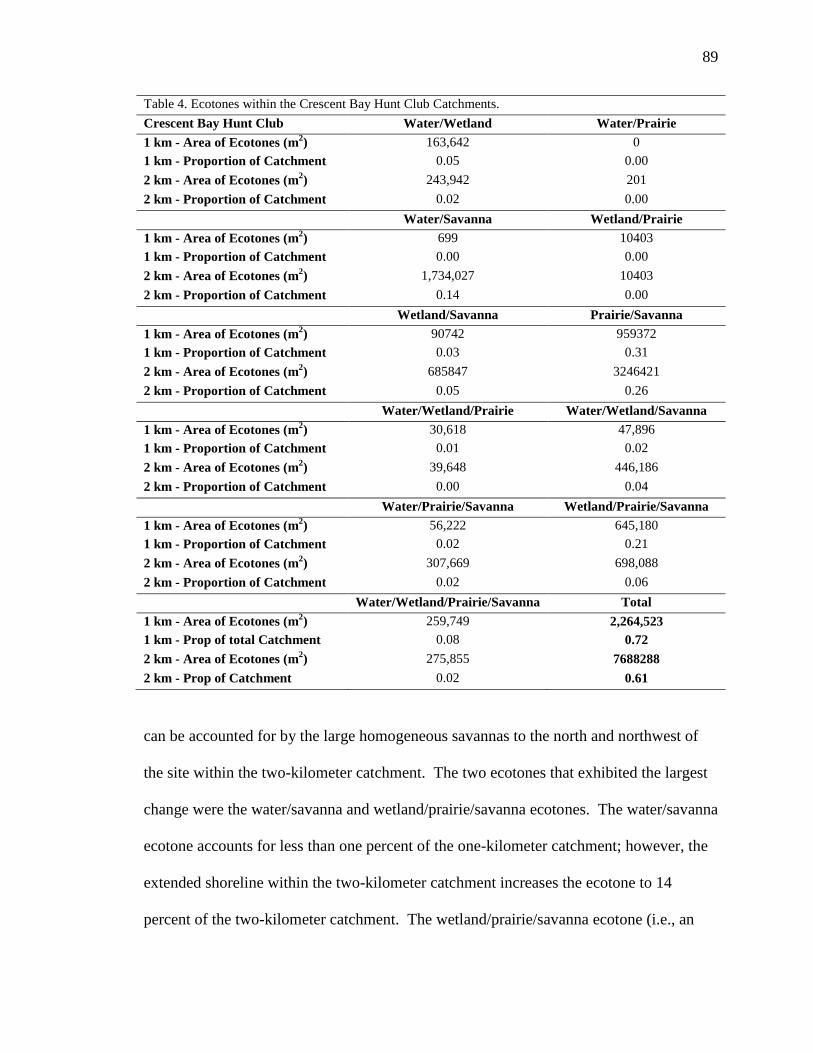
89
Table 4. Ecotones within the Crescent Bay Hunt Club Catchments.
Crescent Bay Hunt Club Water/Wetland Water/Prairie
1 km - Area of Ecotones (m2) 163,642 0
1 km - Proportion of Catchment 0.05 0.00
2 km - Area of Ecotones (m2) 243,942 201
2 km - Proportion of Catchment 0.02 0.00
Water/Savanna Wetland/Prairie
1 km - Area of Ecotones (m2) 699 10403
1 km - Proportion of Catchment 0.00 0.00
2 km - Area of Ecotones (m2) 1,734,027 10403
2 km - Proportion of Catchment 0.14 0.00
Wetland/Savanna Prairie/Savanna
1 km - Area of Ecotones (m2) 90742 959372
1 km - Proportion of Catchment 0.03 0.31
2 km - Area of Ecotones (m2) 685847 3246421
2 km - Proportion of Catchment 0.05 0.26
Water/Wetland/Prairie Water/Wetland/Savanna
1 km - Area of Ecotones (m2) 30,618 47,896
1 km - Proportion of Catchment 0.01 0.02
2 km - Area of Ecotones (m2) 39,648 446,186
2 km - Proportion of Catchment 0.00 0.04
Water/Prairie/Savanna Wetland/Prairie/Savanna
1 km - Area of Ecotones (m2) 56,222 645,180
1 km - Proportion of Catchment 0.02 0.21
2 km - Area of Ecotones (m2) 307,669 698,088
2 km - Proportion of Catchment 0.02 0.06
Water/Wetland/Prairie/Savanna Total
1 km - Area of Ecotones (m2) 259,749 2,264,523
1 km - Prop of total Catchment 0.08 0.72
2 km - Area of Ecotones (m2) 275,855 7688288
2 km - Prop of Catchment 0.02 0.61
can be accounted for by the large homogeneous savannas to the north and northwest of
the site within the two-kilometer catchment. The two ecotones that exhibited the largest
change were the water/savanna and wetland/prairie/savanna ecotones. The water/savanna
ecotone accounts for less than one percent of the one-kilometer catchment; however, the
extended shoreline within the two-kilometer catchment increases the ecotone to 14
percent of the two-kilometer catchment. The wetland/prairie/savanna ecotone (i.e., an

90
area that is near the boundary of each of the three environmental zones) composes more
than 20 percent of the one-kilometer catchment. Due to the localized nature of the
wetland, there is little increase in the total area occupied by this ecotone within the two-
kilometer catchment and therefore only accounts for six percent of the larger catchment.
Agricultural Potential The Crescent Bay Hunt Club site was situated near a
significant amount of arable land. Based on the environmental and soil data, the site was
situated on nearly 150 hectares of arable land, which accounts for almost half of the one-
kilometer catchment (Table 5 and Figure 10). Within two kilometers, that amount nearly
triples to more than 425 hectares and accounts for 34 percent of the catchment.
Table 5. Arable Land within the Crescent Bay Hunt Club Catchments.
Crescent Bay Hunt
Club
Good Fair Total Arable Poor
1 km - Total Area (m2) 730,512
731,919
1,462,431
1,677,687
1 km - Proportion 0.23
0.23
0.47
0.53
2 km - Total Area (m
2) 1,860,435
2,398,753
4,259,189 8,301,285
2 km - Proportion 0.15
0.19
0.34 0.66
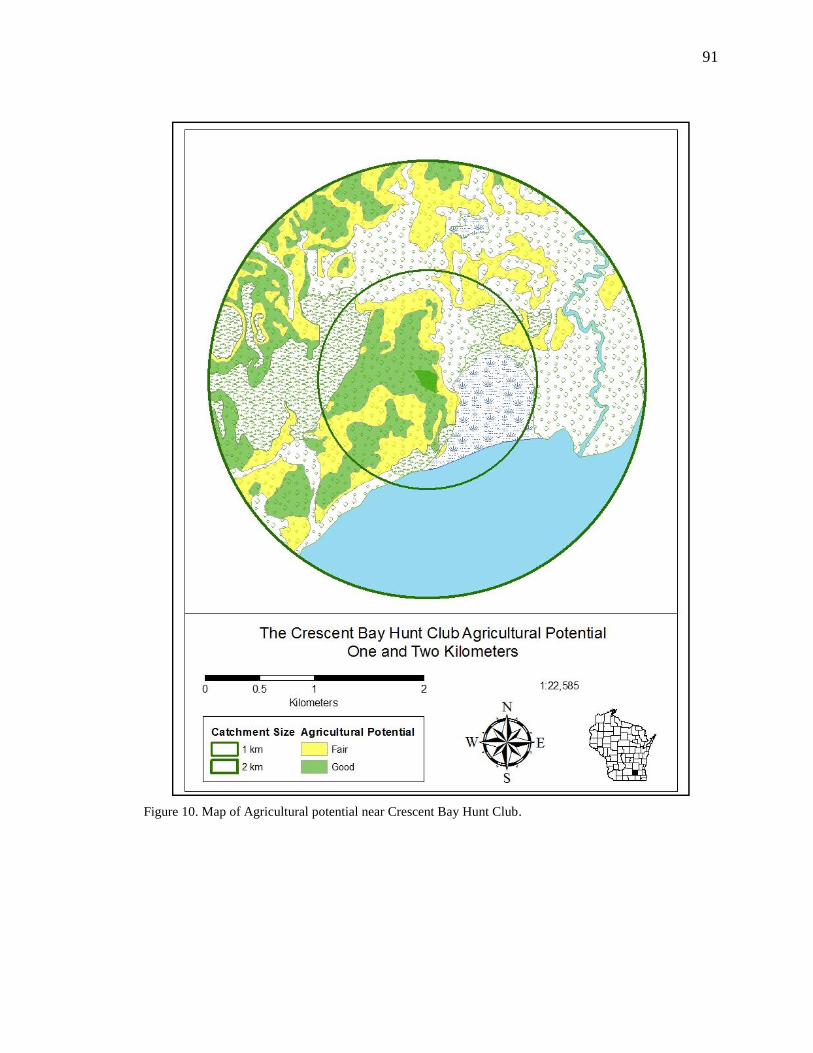
91
Figure 10. Map of Agricultural potential near Crescent Bay Hunt Club.

92
The Schmeling Site (47JE833):
The Schmeling site currently overlooks Lake Koshkonong and is located in the
southwest quarter of the northeast quarter of Section 19 Town 5 north Range 13 east
(Figure 11). Initially recorded by the University of Wisconsin-Milwaukee as part of a
regional survey in 1987, the Schmeling site is located north of the Crescent Bay Hunt
Club site on the same ridge. A draw, which runs from the northwest to the southeast,
separates the two sites. The original description of the site listed it as having a Late
Woodland and an Oneota occupation. In the summer of 2006 the UW Milwaukee field
school conducted an intensive pedestrian survey of the farm fields just west of the ridge.
The field school also conducted a shovel probe survey, at 10-meter intervals, of the
woods to the north, east, and south of the farm field. The pedestrian survey defined two
major scatter areas and two artifact concentrations (Figure 12). Over thirty of the shovel
probes yielded artifacts. Four two meter by two meter excavation units were placed near
the densest concentration of positive shovel probes. Four additional excavation units and
surface collection were conducted during the next field school in 2008 (Foley Winkler
2008).
Based on the artifacts collected, it is clear that Schmeling is a multi-component
site. The earliest occupants appear to be members of the Paleo-Indian tradition; while the
latest occupants were from the historic period. The Paleo-Indian occupation appears to
be concentrated in the southwest portion of the site, while the historic occupation was
located in the northeast (Foley Winkler 2008; Jeske and Winkler 2008). The majority of
artifacts however indicate that the most substantial component of the site is an Oneota
occupation. The conclusion is supported by the abundance of Grand River and Carcajou
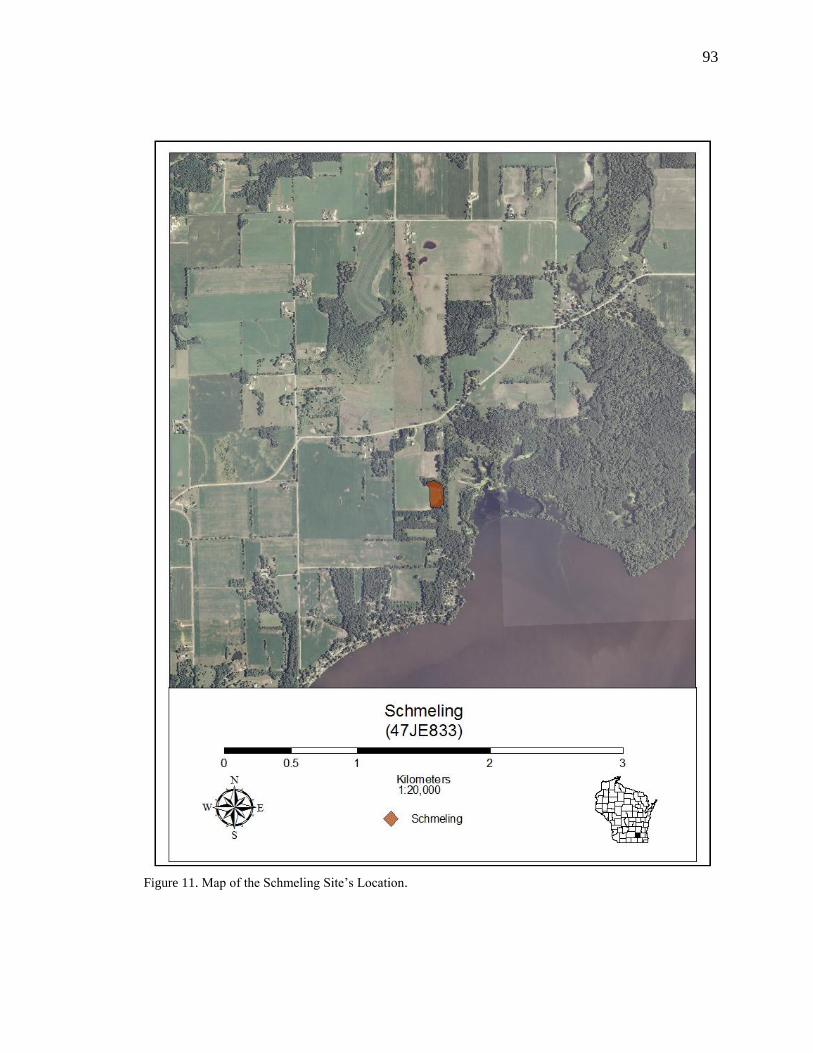
93
Figure 11. Map of the Schmeling Site’s Location.
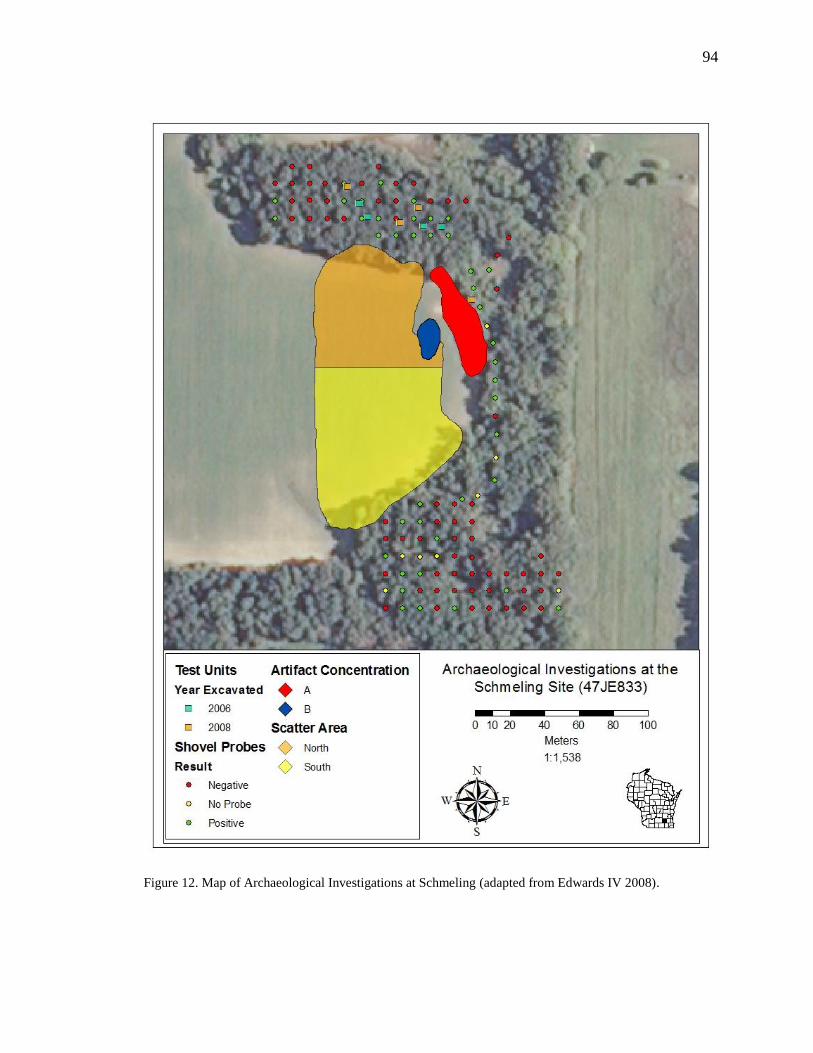
94
Figure 12. Map of Archaeological Investigations at Schmeling (adapted from Edwards IV 2008).
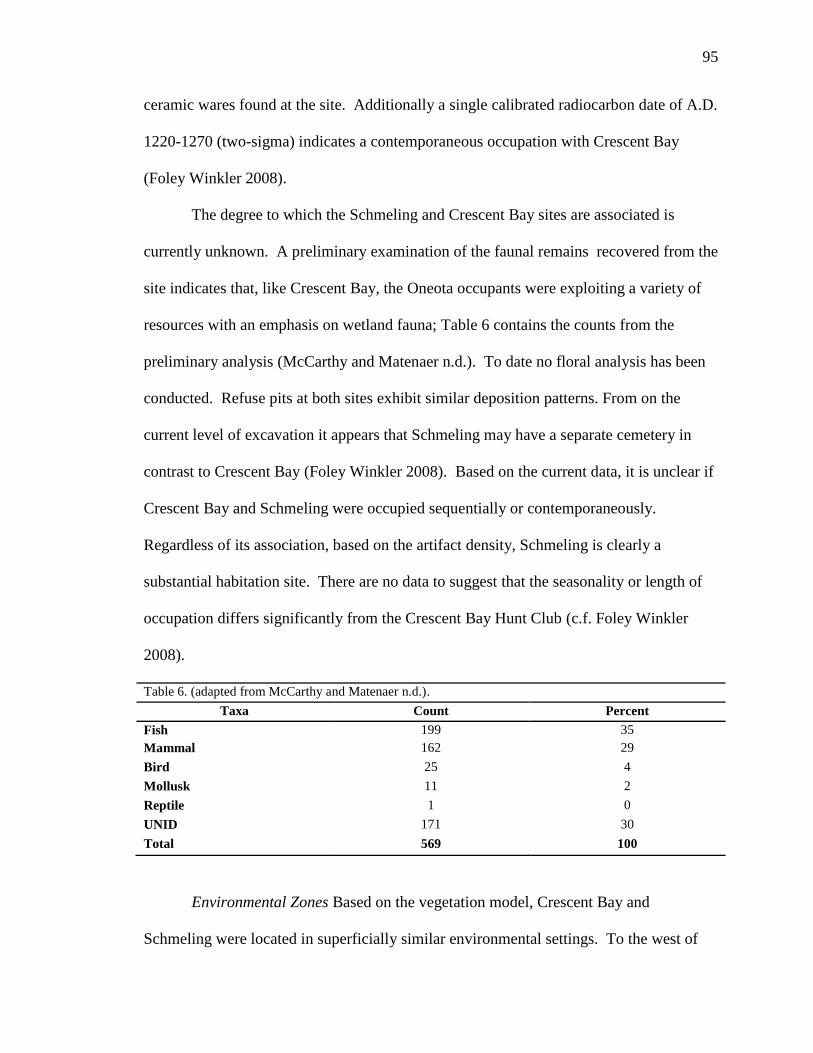
95
ceramic wares found at the site. Additionally a single calibrated radiocarbon date of A.D.
1220-1270 (two-sigma) indicates a contemporaneous occupation with Crescent Bay
(Foley Winkler 2008).
The degree to which the Schmeling and Crescent Bay sites are associated is
currently unknown. A preliminary examination of the faunal remains recovered from the
site indicates that, like Crescent Bay, the Oneota occupants were exploiting a variety of
resources with an emphasis on wetland fauna; Table 6 contains the counts from the
preliminary analysis (McCarthy and Matenaer n.d.). To date no floral analysis has been
conducted. Refuse pits at both sites exhibit similar deposition patterns. From on the
current level of excavation it appears that Schmeling may have a separate cemetery in
contrast to Crescent Bay (Foley Winkler 2008). Based on the current data, it is unclear if
Crescent Bay and Schmeling were occupied sequentially or contemporaneously.
Regardless of its association, based on the artifact density, Schmeling is clearly a
substantial habitation site. There are no data to suggest that the seasonality or length of
occupation differs significantly from the Crescent Bay Hunt Club (c.f. Foley Winkler
2008).
Table 6. (adapted from McCarthy and Matenaer n.d.).
Taxa Count Percent
Fish 199 35
Mammal 162 29
Bird 25 4
Mollusk 11 2
Reptile 1 0
UNID 171 30
Total 569 100
Environmental Zones Based on the vegetation model, Crescent Bay and
Schmeling were located in superficially similar environmental settings. To the west of
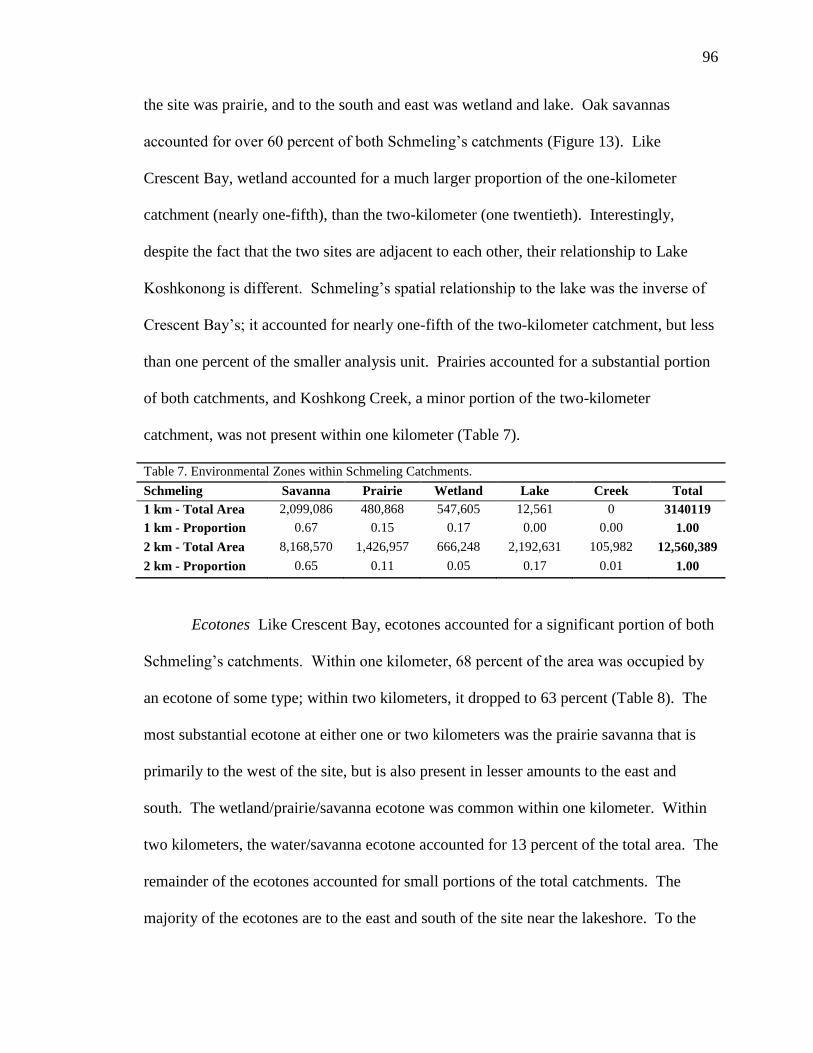
96
the site was prairie, and to the south and east was wetland and lake. Oak savannas
accounted for over 60 percent of both Schmeling’s catchments (Figure 13). Like
Crescent Bay, wetland accounted for a much larger proportion of the one-kilometer
catchment (nearly one-fifth), than the two-kilometer (one twentieth). Interestingly,
despite the fact that the two sites are adjacent to each other, their relationship to Lake
Koshkonong is different. Schmeling’s spatial relationship to the lake was the inverse of
Crescent Bay’s; it accounted for nearly one-fifth of the two-kilometer catchment, but less
than one percent of the smaller analysis unit. Prairies accounted for a substantial portion
of both catchments, and Koshkong Creek, a minor portion of the two-kilometer
catchment, was not present within one kilometer (Table 7).
Table 7. Environmental Zones within Schmeling Catchments.
Schmeling Savanna Prairie Wetland Lake Creek Total
1 km - Total Area
(m2)
2,099,086
480,868
547,605
12,561
0
3140119
1 km - Proportion 0.67
0.15
0.17
0.00
0.00
1.00
2 km - Total Area
(m2)
8,168,570
1,426,957
666,248
2,192,631
105,982
12,560,389
2 km - Proportion 0.65
0.11
0.05
0.17
0.01
1.00
Ecotones Like Crescent Bay, ecotones accounted for a significant portion of both
Schmeling’s catchments. Within one kilometer, 68 percent of the area was occupied by
an ecotone of some type; within two kilometers, it dropped to 63 percent (Table 8). The
most substantial ecotone at either one or two kilometers was the prairie savanna that is
primarily to the west of the site, but is also present in lesser amounts to the east and
south. The wetland/prairie/savanna ecotone was common within one kilometer. Within
two kilometers, the water/savanna ecotone accounted for 13 percent of the total area. The
remainder of the ecotones accounted for small portions of the total catchments. The
majority of the ecotones are to the east and south of the site near the lakeshore. To the
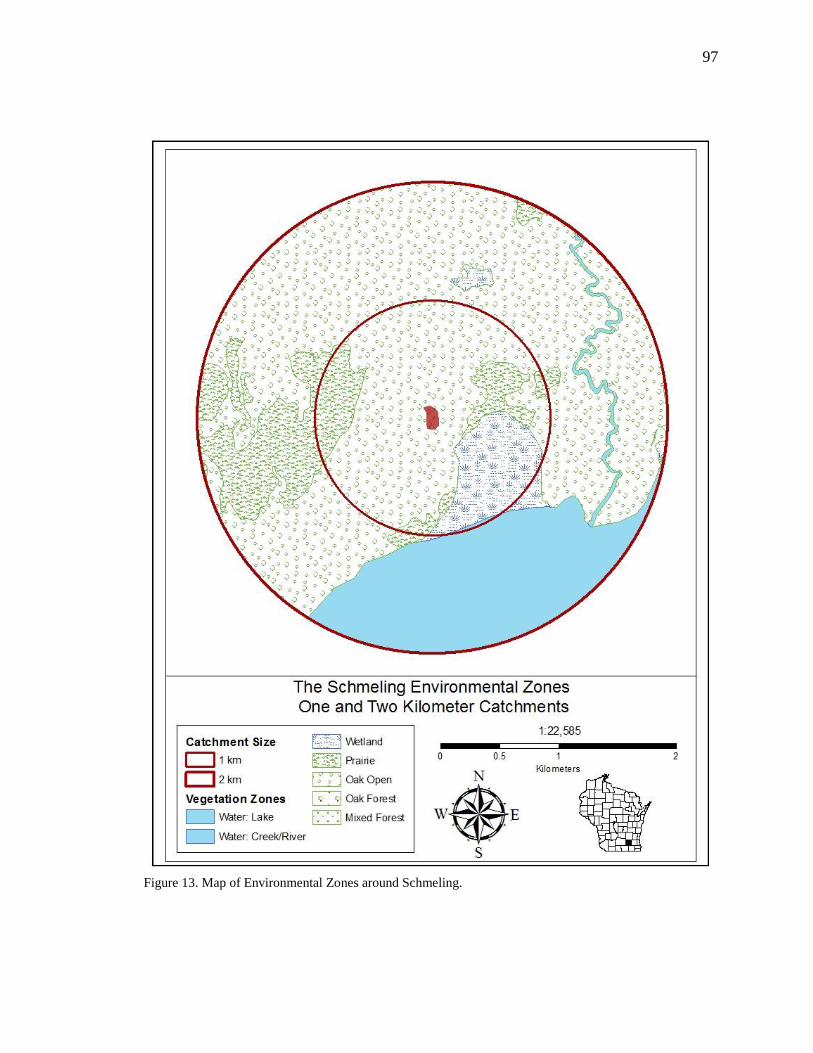
97
Figure 13. Map of Environmental Zones around Schmeling.
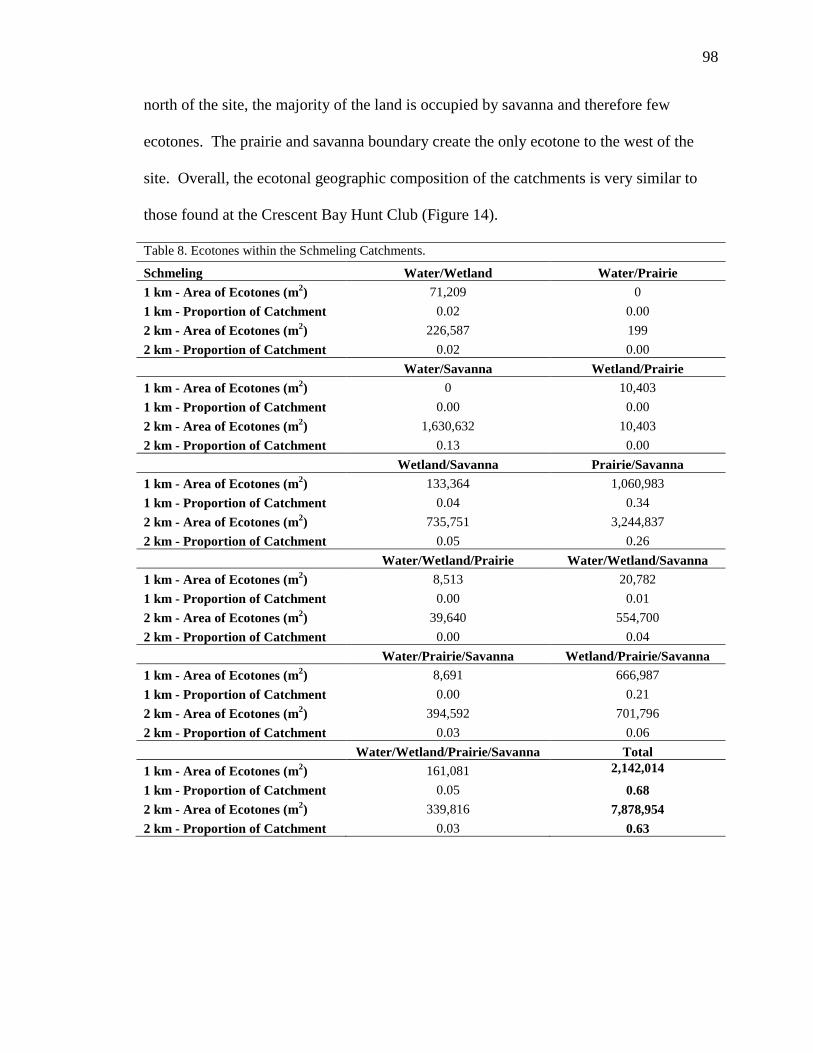
98
north of the site, the majority of the land is occupied by savanna and therefore few
ecotones. The prairie and savanna boundary create the only ecotone to the west of the
site. Overall, the ecotonal geographic composition of the catchments is very similar to
those found at the Crescent Bay Hunt Club (Figure 14).
Table 8. Ecotones within the Schmeling Catchments.
Schmeling Water/Wetland Water/Prairie
1 km - Area of Ecotones (m2) 71,209 0
1 km - Proportion of Catchment 0.02 0.00
2 km - Area of Ecotones (m2) 226,587 199
2 km - Proportion of Catchment 0.02 0.00
Water/Savanna Wetland/Prairie
1 km - Area of Ecotones (m2) 0 10,403
1 km - Proportion of Catchment 0.00 0.00
2 km - Area of Ecotones (m2) 1,630,632 10,403
2 km - Proportion of Catchment 0.13 0.00
Wetland/Savanna Prairie/Savanna
1 km - Area of Ecotones (m2) 133,364 1,060,983
1 km - Proportion of Catchment 0.04 0.34
2 km - Area of Ecotones (m2) 735,751 3,244,837
2 km - Proportion of Catchment 0.05 0.26
Water/Wetland/Prairie Water/Wetland/Savanna
1 km - Area of Ecotones (m2) 8,513 20,782
1 km - Proportion of Catchment 0.00 0.01
2 km - Area of Ecotones (m2) 39,640 554,700
2 km - Proportion of Catchment 0.00 0.04
Water/Prairie/Savanna Wetland/Prairie/Savanna
1 km - Area of Ecotones (m2) 8,691 666,987
1 km - Proportion of Catchment 0.00 0.21
2 km - Area of Ecotones (m2) 394,592 701,796
2 km - Proportion of Catchment 0.03 0.06
Water/Wetland/Prairie/Savanna Total
1 km - Area of Ecotones (m2) 161,081 2,142,014
1 km - Proportion of Catchment 0.05 0.68
2 km - Area of Ecotones (m2) 339,816 7,878,954
2 km - Proportion of Catchment 0.03 0.63
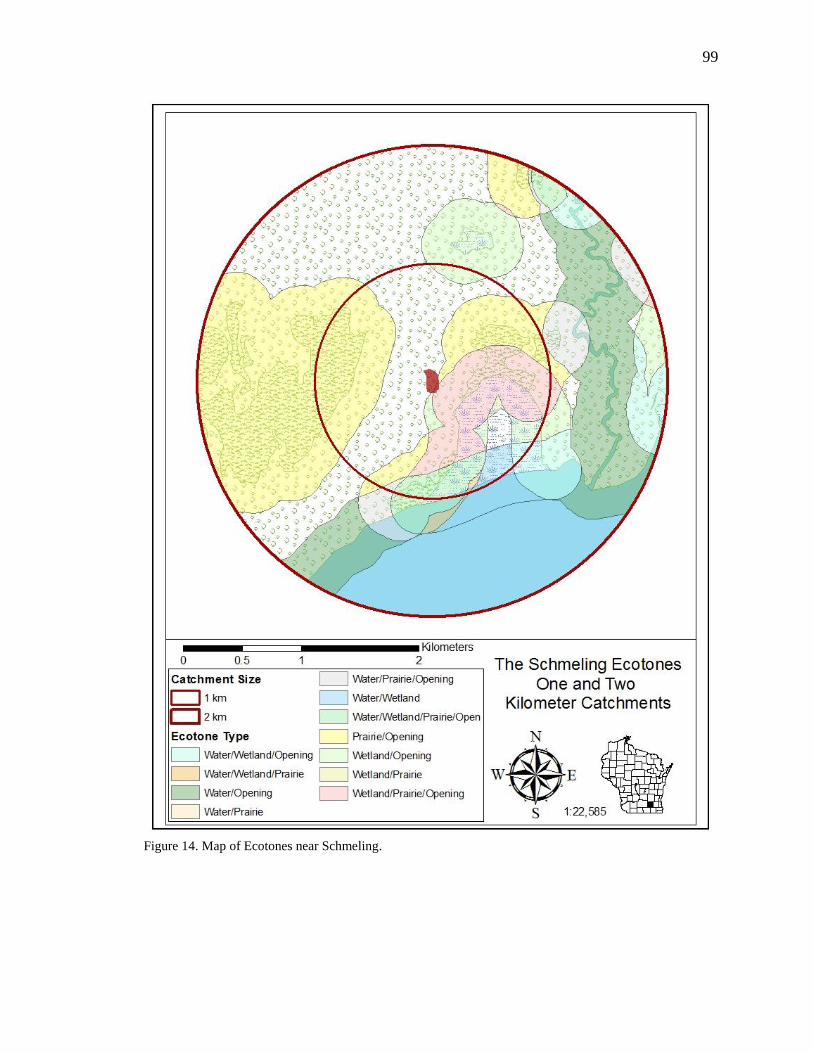
99
Figure 14. Map of Ecotones near Schmeling.

100
Agricultural Potential Arable land accounted for nearly half of the land within
one kilometer of the Schmeling site. Within two kilometers, the arable lands dropped to
roughly one-third of the catchment. In total, there was over 141 hectares of arable land
within one kilometer of the site and greater than 460 hectares within two kilometers
(Table 9). The majority of the arable land within one kilometer of the site was directly
west and southwest; however, within two kilometers it could be found to the north as well
(Figure 15).
Table 9. Arable Land within the Schmeling Catchments.
Schmeling Good Fair Total Arable Poor
1 km - Total Area (m2) 658,731
752,764
1,411,495
1,728,626
1 km - Proportion 0.21
0.24
0.45
0.55
2 km - Total Area (m
2) 2,118,656
2,552,143
4,670,798
7,889,683
2 km - Proportion 0.17
0.20
0.37
0.63
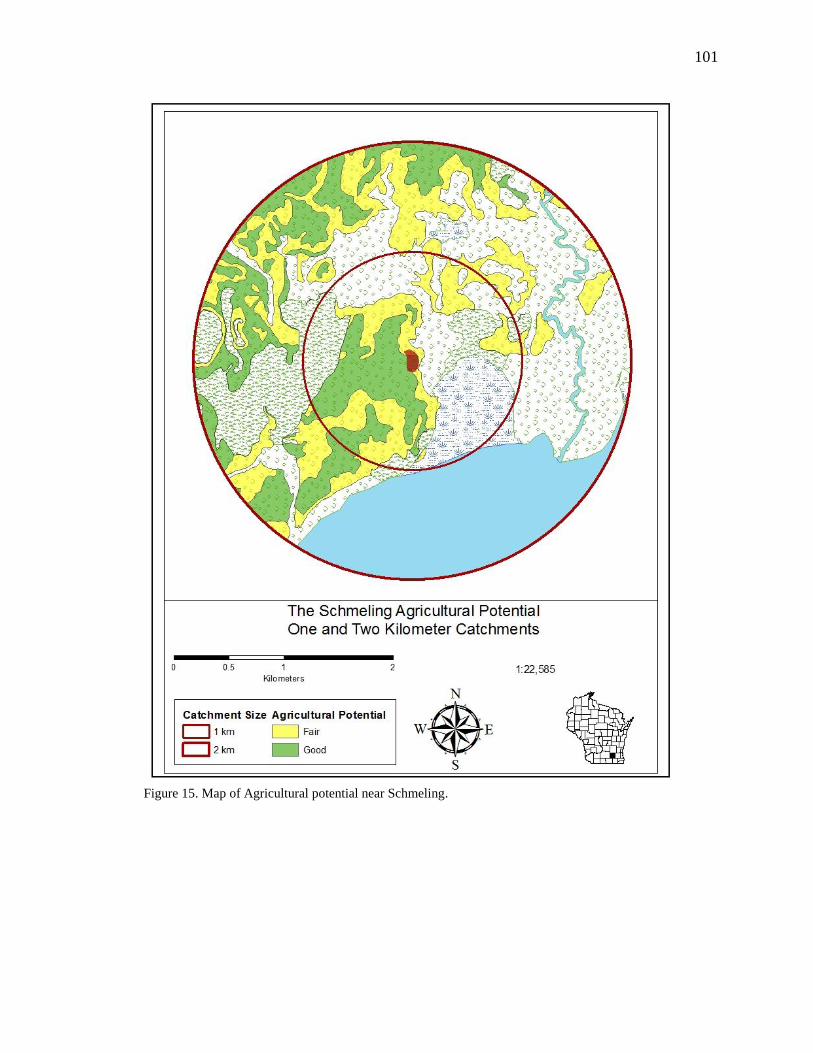
101
Figure 15. Map of Agricultural potential near Schmeling.
102
The Twin Knolls Site (47JE379)
The Twin Knolls site is located in the southeast quarter of Section 7 of Town 5
north, Range 13 east and is situated just south of (less than 40 meters) an oxbow in
Koshkonong Creek. The site is currently situated within a modern farm field on a knoll
that rises approximately 30 meters above the creek (Figure 16).
Twin Knolls was first recorded by Stout and Skavlem (1908:95-96) during their
survey of the Lake Koshkonong region. In the 1908 issue of the Wisconsin Archeologist,
the site was listed as the Koshkonong Creek Village Site. They encountered several
dense artifact scatters that they inferred were the remnants of refuse pits. Additionally
they encountered points, axes, and celts, in addition to the skeletal remains of two
individuals that had been brought to the surface by the plow.
The site was again surveyed as part of the Lake Koshkonong Survey which was
conducted by the University of Wisconsin-Milwaukee from 1983 until 1986 (Musil
1987:123). Based on the ratio of grit tempered to shell tempered ceramics, Musil
determined that the site was primarily of Oneota origin. A total of three artifact
concentrations were encountered. The first was located in the center of the site and
contained over 1,400 sherds of ceramics (nearly 70% of those recovered), as well as a
copper awl and greater than 70 percent of formal lithic tools. Concentration two is
located at the southern edge of the site; it was mainly composed of faunal remains within
a dense greasy black soil. Musil posited that this concentration could be evidence of a
house or a midden feature. The third concentration was located in the northeastern
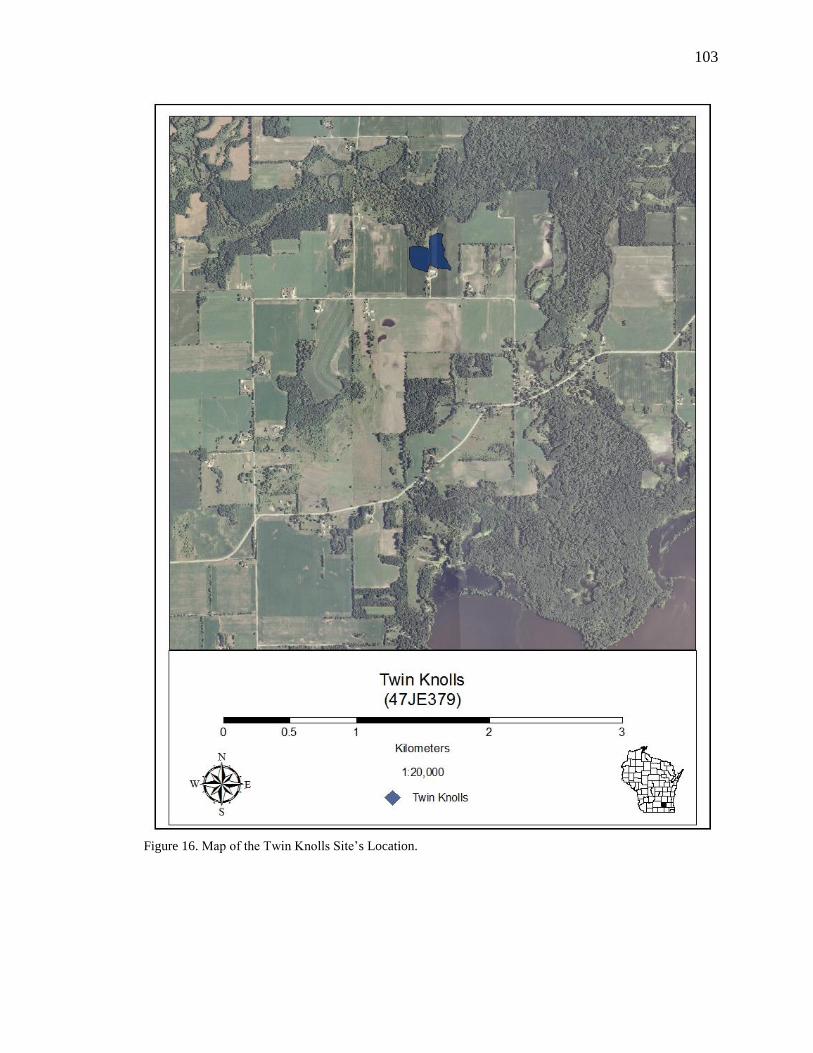
103
Figure 16. Map of the Twin Knolls Site’s Location.
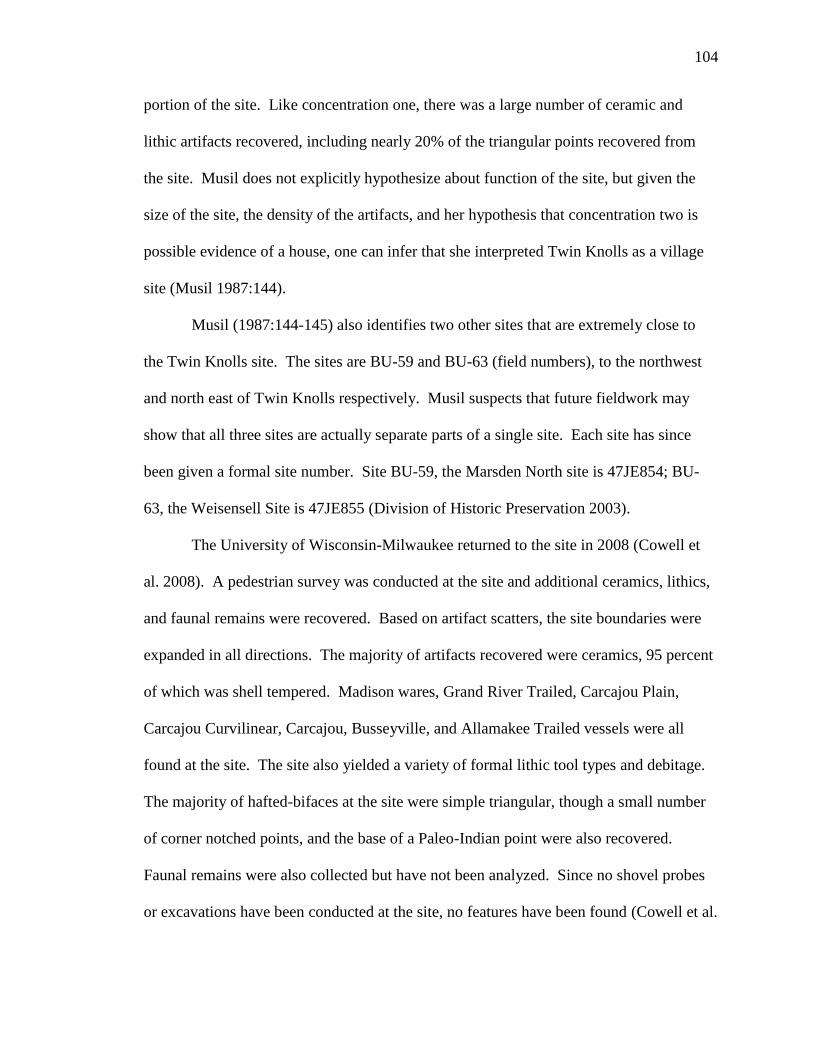
104
portion of the site. Like concentration one, there was a large number of ceramic and
lithic artifacts recovered, including nearly 20% of the triangular points recovered from
the site. Musil does not explicitly hypothesize about function of the site, but given the
size of the site, the density of the artifacts, and her hypothesis that concentration two is
possible evidence of a house, one can infer that she interpreted Twin Knolls as a village
site (Musil 1987:144).
Musil (1987:144-145) also identifies two other sites that are extremely close to
the Twin Knolls site. The sites are BU-59 and BU-63 (field numbers), to the northwest
and north east of Twin Knolls respectively. Musil suspects that future fieldwork may
show that all three sites are actually separate parts of a single site. Each site has since
been given a formal site number. Site BU-59, the Marsden North site is 47JE854; BU-
63, the Weisensell Site is 47JE855 (Division of Historic Preservation 2003).
The University of Wisconsin-Milwaukee returned to the site in 2008 (Cowell et
al. 2008). A pedestrian survey was conducted at the site and additional ceramics, lithics,
and faunal remains were recovered. Based on artifact scatters, the site boundaries were
expanded in all directions. The majority of artifacts recovered were ceramics, 95 percent
of which was shell tempered. Madison wares, Grand River Trailed, Carcajou Plain,
Carcajou Curvilinear, Carcajou, Busseyville, and Allamakee Trailed vessels were all
found at the site. The site also yielded a variety of formal lithic tool types and debitage.
The majority of hafted-bifaces at the site were simple triangular, though a small number
of corner notched points, and the base of a Paleo-Indian point were also recovered.
Faunal remains were also collected but have not been analyzed. Since no shovel probes
or excavations have been conducted at the site, no features have been found (Cowell et al.

105
2008). Despite this, the size and density of the artifact scatter are strong indicators that
this site was once a sizable habitation site, quite possibly a village (Figure 17).
Given the significant presence of Oneota artifacts, one might expect that the
inhabitants practiced similar subsistence patterns seen at nearby Oneota sites. However,
since Twin Knolls is located away from the lake and it is not clear exactly how its
location would have affected the subsistence patterns of the site’s inhabitants. There are
currently not enough data to determine the seasonality or length of occupation of the site.
Further work, most notably excavations, faunal, and floral analyses are necessary in order
to determine the actual nature of the site.
Environmental Zones Unlike the other sites, Twin Knolls was situated away from
the lake, near Koshkonong Creek. Lake Koshkonong does not appear in either the one or
two kilometer catchment boundaries. The site was most closely affiliated with savannas,
which composed the entirety of the site’s boundaries and accounted for greater than 80
percent of either catchment. The creek itself accounted for two percent of the catchments
while prairie and wetland account for the remainder. Sporadic wetlands could be found
within one kilometer of the site to the east and northwest. Likewise, patches of prairie
could be found dispersed throughout the one-kilometer catchment of the site. Within one
kilometer, neither prairie nor wetlands encompassed a significant portion of land;
however, within two kilometers, the wetlands accounted for over 12 percent of the
catchment. They were located along the creek shore as well as to the north and northeast
of the site (Figure 18 and Table 10).
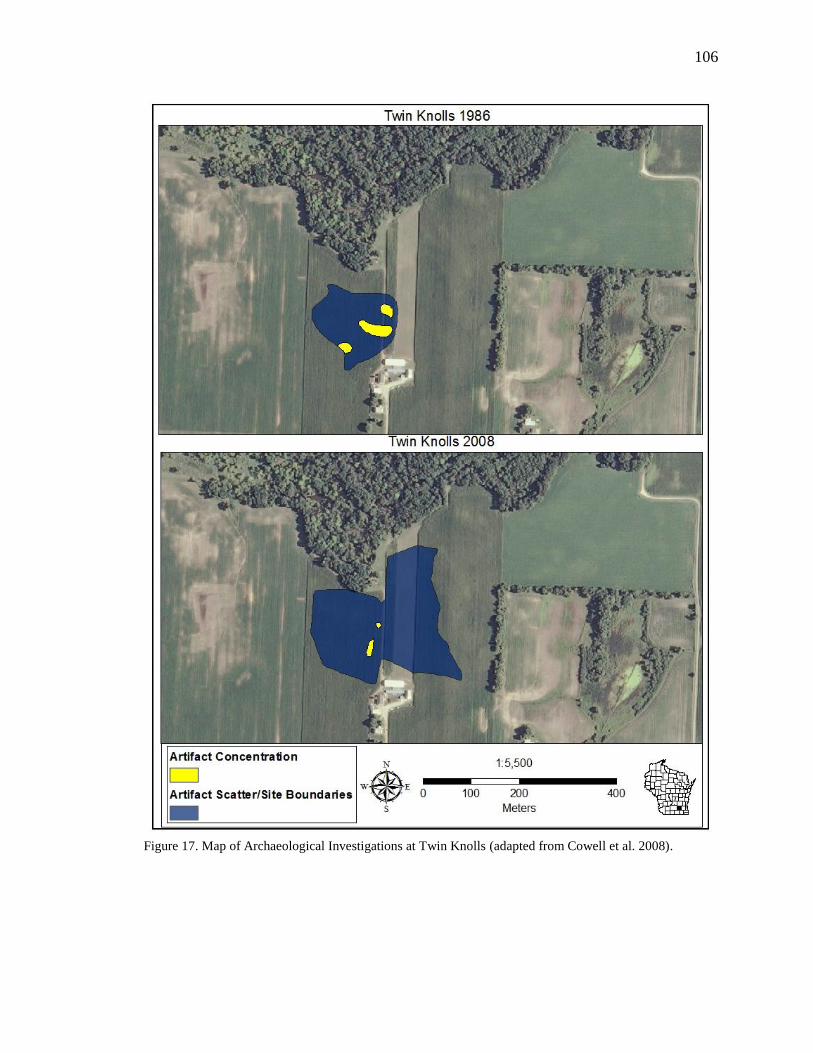
106
Figure 17. Map of Archaeological Investigations at Twin Knolls (adapted from Cowell et al. 2008).
107
Figure 18. Map of Environmental Zones around Twin Knolls.

108
Table 10. Environmental Zones within Twin Knolls Catchments.
Twin Knolls Savanna Prairie Wetland Lake Creek Total
1 km - Total Area
(m2)
2,747,716
199,414
118,405
0
74,598
3,140,132
1 km - Proportion 0.88
0.06
0.04
0.00
0.02
1.00
2 km - Total Area
(m2)
10,488,508
310,649
1,469,804
0
290,070
12,559,033
2 km - Proportion 0.84
0.02
0.12
0.00
0.02
1.00
Ecotones Twin Knolls was situated within an extremely diverse environment.
While savanna may have been nearly ubiquitous around the site, the creek and small
patches of wetland and prairie create an extremely complicated environment. The
winding nature of Koshkonong Creek (Figure 19) elongated the transitional boundaries
between environmental zones. The site itself was placed directly within four different
ecozones, and is surrounded on three sides by a variety of ecotones. Ecotones occupy 74
percent of the one-kilometer catchment, and 71 percent of the two-kilometer catchment.
The water/wetland/prairie/savanna, water/wetland/savanna, and wetland/savanna
ecotones are the largest within one kilometer of the site. However, within two
kilometers, the wetland/savanna and water/wetland/savanna ecotones become the largest,
accounting for 40 percent of the total catchment (Table 11).
Agricultural Potential The Twin Knolls site was placed near a large amount of
arable land. In the one-kilometer catchment, the majority extended to the south and west
of the site. Within two kilometers, it continued to the south and west, but was also
present in large quantities to the north, across Koshkonong Creek (Figure 20).
Approximately 213 hectares (circa 70%) of the land within one kilometer of the Twin
Knolls site was arable. Expanding the model to two kilometers more than doubles the
arable land, totaling over 733 hectares (60%) of the larger catchment (Table 12).
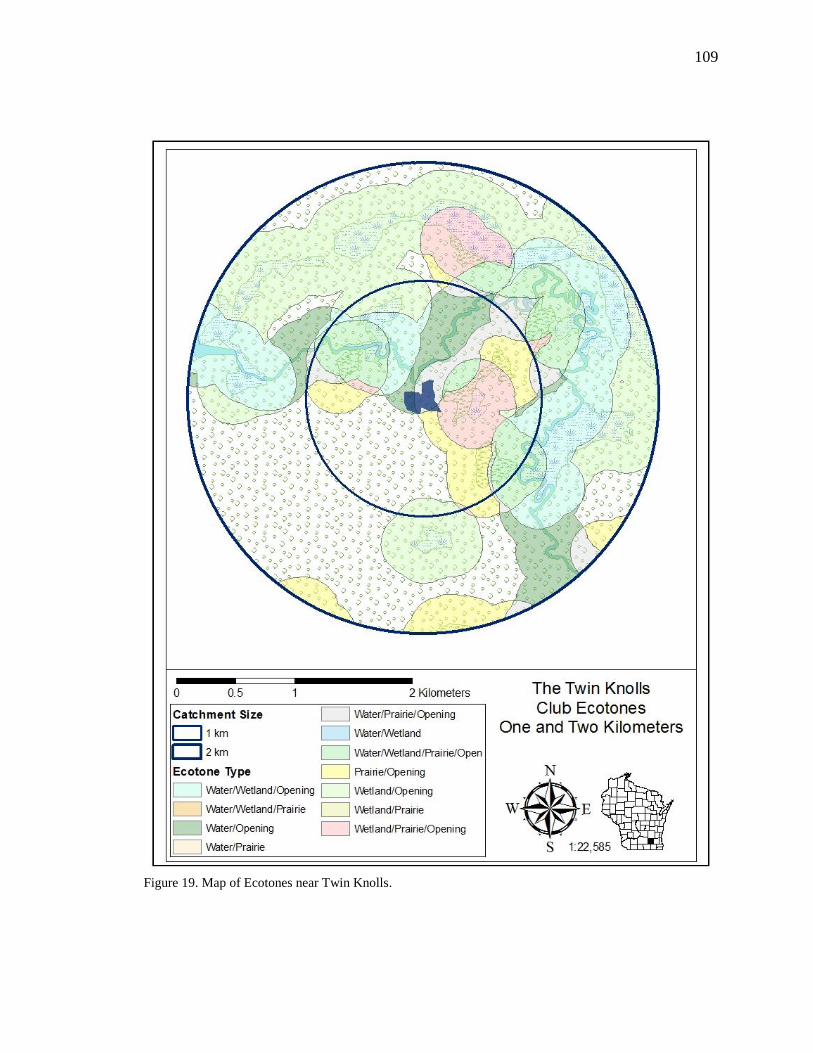
109
Figure 19. Map of Ecotones near Twin Knolls.
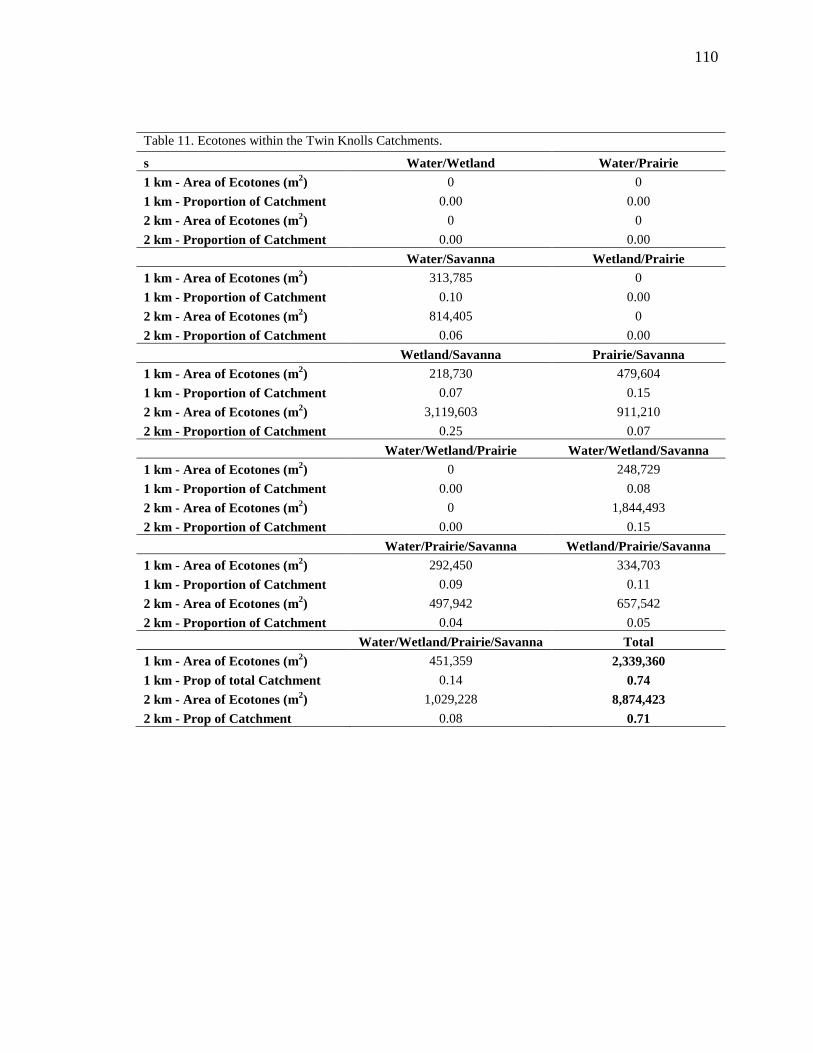
110
Table 11. Ecotones within the Twin Knolls Catchments.
s Water/Wetland Water/Prairie
1 km - Area of Ecotones (m2) 0 0
1 km - Proportion of Catchment 0.00 0.00
2 km - Area of Ecotones (m2) 0 0
2 km - Proportion of Catchment 0.00 0.00
Water/Savanna Wetland/Prairie
1 km - Area of Ecotones (m2) 313,785 0
1 km - Proportion of Catchment 0.10 0.00
2 km - Area of Ecotones (m2) 814,405 0
2 km - Proportion of Catchment 0.06 0.00
Wetland/Savanna Prairie/Savanna
1 km - Area of Ecotones (m2) 218,730 479,604
1 km - Proportion of Catchment 0.07 0.15
2 km - Area of Ecotones (m2) 3,119,603 911,210
2 km - Proportion of Catchment 0.25 0.07
Water/Wetland/Prairie Water/Wetland/Savanna
1 km - Area of Ecotones (m2) 0 248,729
1 km - Proportion of Catchment 0.00 0.08
2 km - Area of Ecotones (m2) 0 1,844,493
2 km - Proportion of Catchment 0.00 0.15
Water/Prairie/Savanna Wetland/Prairie/Savanna
1 km - Area of Ecotones (m2) 292,450 334,703
1 km - Proportion of Catchment 0.09 0.11
2 km - Area of Ecotones (m2) 497,942 657,542
2 km - Proportion of Catchment 0.04 0.05
Water/Wetland/Prairie/Savanna Total
1 km - Area of Ecotones (m2) 451,359 2,339,360
1 km - Prop of total Catchment 0.14 0.74
2 km - Area of Ecotones (m2) 1,029,228 8,874,423
2 km - Prop of Catchment 0.08 0.71
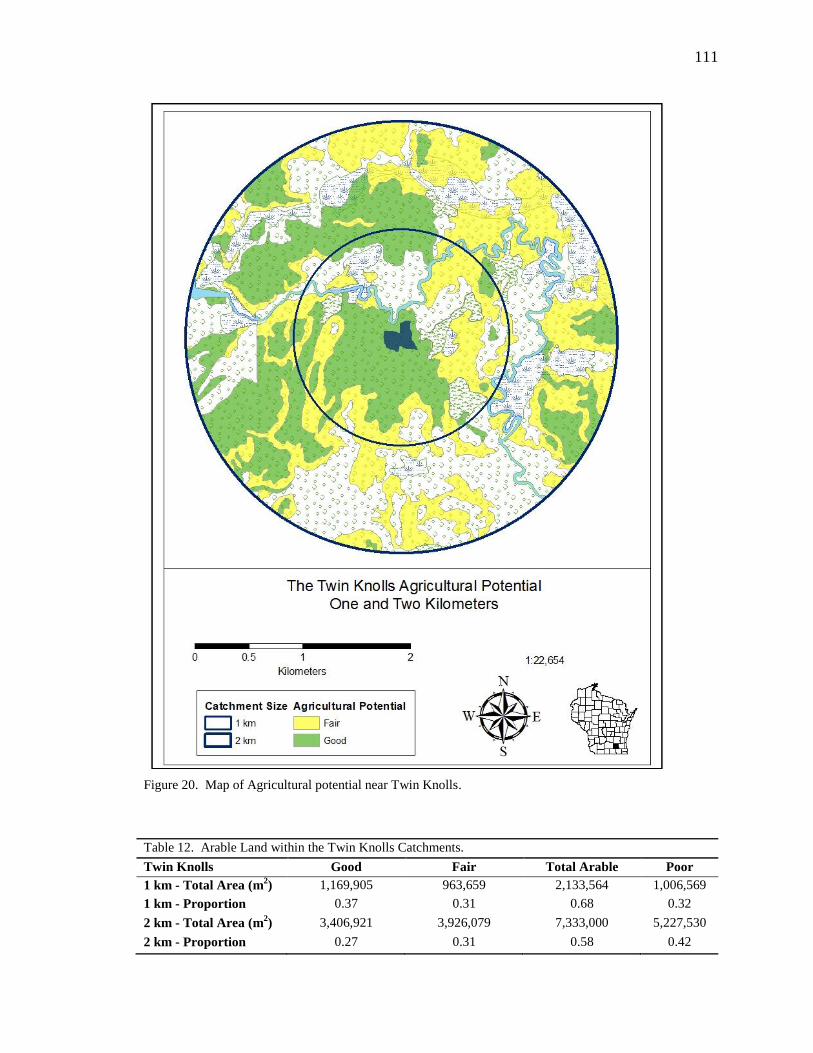
111
Figure 20. Map of Agricultural potential near Twin Knolls.
Table 12. Arable Land within the Twin Knolls Catchments.
Twin Knolls Good Fair Total Arable Poor
1 km - Total Area (m2) 1,169,905
963,659
2,133,564
1,006,569
1 km - Proportion 0.37
0.31
0.68
0.32
2 km - Total Area (m
2) 3,406,921
3,926,079
7,333,000
5,227,530
2 km - Proportion 0.27
0.31
0.58
0.42

112
The Carcajou Point Site (47JE002)
The Carcajou Point site has a long history of archaeological investigations; only a
summary of some of the major or important investigations are presented here. The first
mention of the site appears in the General Land Office Survey notes. It is listed as the
site of a historic Indian village between Sections 16 and 21 (Brink 1835). The historic
component of the village is known as White Crow’s Village. Stout and Skavlem (1908)
describe it as “one of the largest village sites of which we have present knowledge of in
southern Wisconsin.” They report that the site was situated on high, level ground and
extended a half mile west of the shore and was nearly a mile long, north to south. Stout
and Skavlem founds a large number of historic trade goods in addition to several small
mounds. After speaking to the people that had grown up on and farmed the property,
they found that the area had a large number of burials and was probably the site of a
cemetery. They also found several refuse pits which they excavated. The pits contained
a variety of faunal remains including deer, bird, fish, mussel, and turtle (Stout and
Skavlem 1908:89-93).
The Carcajou Point site is actually made up of four separate sites (Division of
Historic Preservation 2003). The original, 47JE002, was originally excavated by Robert
Hall from 1957-1959. During his first field-season, Hall was able to definitively
determine that the site had both historic and prehistoric components. Hall ceased
referring to the site as White Crow’s Village to reflect the prehistoric nature of the site,
and not just its Winnebago (now Ho Chunk) heritage (Hall 1962:7-11).
While excavating the site, Hall uncovered multiple burials, ceramic potsherds,
faunal remains, mussel shell, stone tools, chert debitage, and charcoal. Features

113
uncovered include wall trenches, what Hall describes as beaker and basin-shaped pits,
and postholes. Excavations uncovered evidence two to three types of house structures
including wigwams, semi-subterranean houses, and a rectangular house (Hall 1962).
Starting in 1983, the University of Wisconsin-Milwaukee expanded its survey of
the Crawfish and Rock River valleys to include a survey of the Carcajou Point site and
the surrounding region. In addition to the area excavated by Hall, the survey identified
three other areas that were later given the designation 47JE812, 47JE813, and 47JE814.
In total, the survey collected nearly 100 stone tools, greater than 1,000 pieces of debitage,
and more than 300 ceramic sherds. All four areas of the Carcajou Point site were
classified as Oneota based on an analysis of the artifacts recovered; however, there was
also evidence of a Woodland occupation. Based on artifact densities and distributions, it
appears that the bulk of the Oneota occupation occurred in the southern portion of the site
(c.f. Je2 and Bu6 in Figure 18, Rodell 1984:145) Figure 21 shows the boundaries of the
four Carcajou Point sites. While there were gaps between the sites in the survey, Rodell
argues that it is most likely due to disturbance, past collectors, and survey conditions.
Two other Oneota sites in Section 17, Town 5 north, Range 15 east were surveyed. The
sites were the Hearthstone (47JE089) and Purnell (47JE815) sites, of which little is
known (Musil 1987; Rodell 1984).
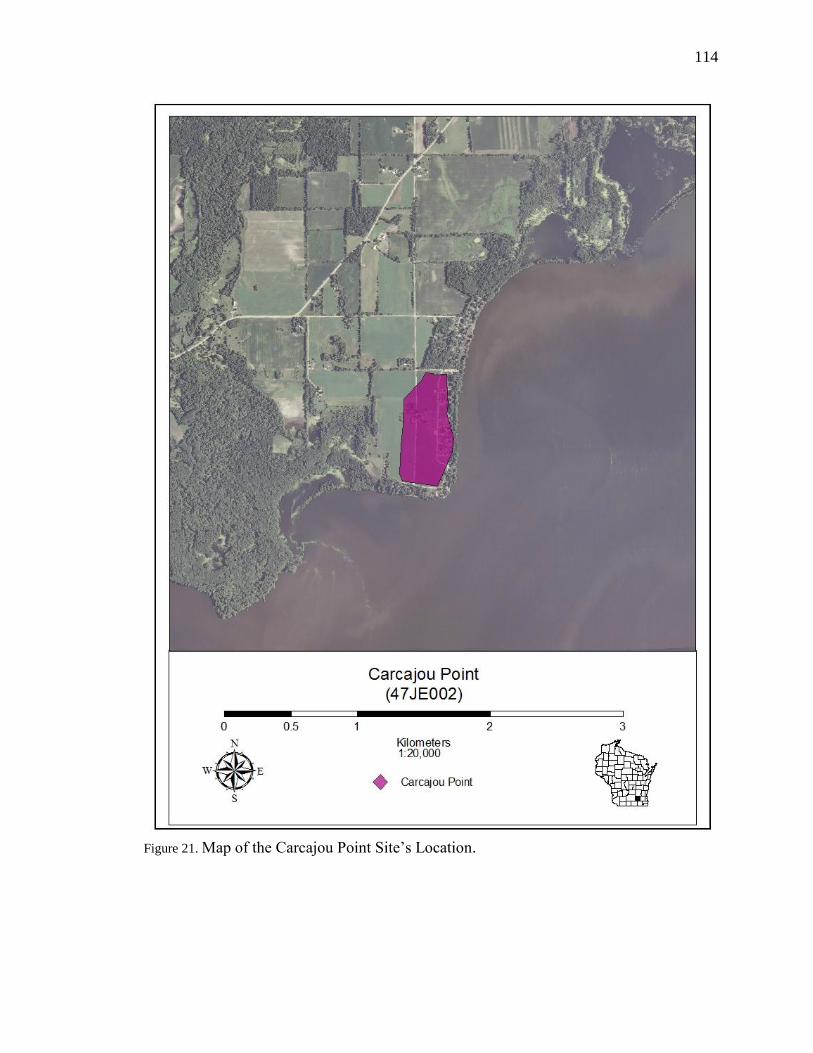
114
Figure 21. Map of the Carcajou Point Site’s Location.

115
In 1989 and 1990 UWM conducted archaeological investigations at the eastern
and extreme western edge of the site. In total 23 features were uncovered, many of which
contained shell-tempered ceramics. Far more shell-tempered ceramics were recovered
from the Figliuzzi property in the west, and the northern portion of the Kelly property in
east half of the site. While both study areas were multi-component, each had a
significant Oneota component, most likely part of a substantial habitation site (Brubaker
and Goldstein 1991).
In 1997, the State Historical Society of Wisconsin determined that Wisconsin
Electric and Power Company could place a natural gas pipeline and approximately 80
2x2 meter bell-holes across the site with no adverse affect. As Region 9 archaeologist for
the now-defunct Wisconsin State Regional Archaeology Program, Robert Jeske
monitored the placement of the pipeline and called a halt to excavation activities
immediately after human remains, lithics, ceramics, and other cultural materials were
pulled up by the pipeline excavations (Gaff 1998).
A cultural resource management firm, Historic Resource Management Services
(HRMS) returned to Carcajou Point as part of a contract with Wisconsin Energies to
monitor and mitigate adverse affects by the of bell holes, backhoe trenches, and slit
trenches necessary for the installation of new gas mains. Archaeological investigations
were limited to the southern portion of the site, similar to the area that Hall worked in
roughly 40 years prior (Richards et al. 1998). Over eighteen features were uncovered in
addition to thousands of artifacts. Nearly 2,000 formal stone tools, more than 3,000
ceramic sherds, and more than 1,100 fragments of faunal remains. Radiocarbon dates
place the site between A.D. 1015 and 1300. Ceramic and feature analyses identified the
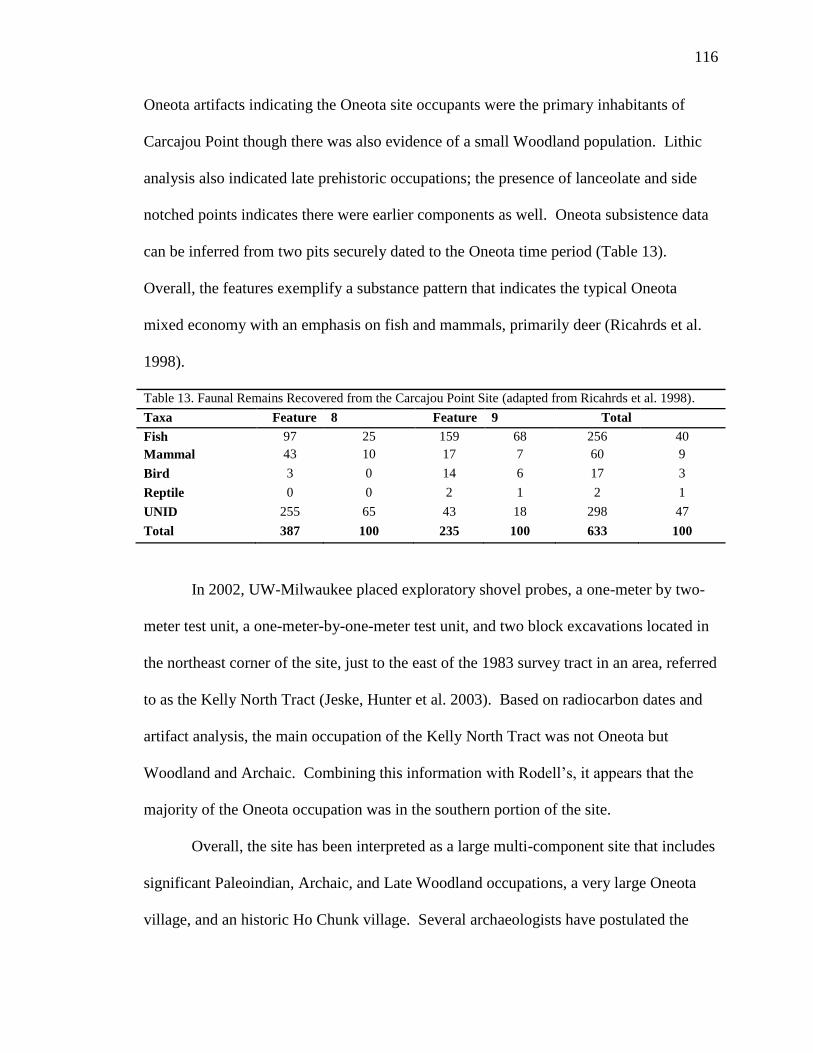
116
Oneota artifacts indicating the Oneota site occupants were the primary inhabitants of
Carcajou Point though there was also evidence of a small Woodland population. Lithic
analysis also indicated late prehistoric occupations; the presence of lanceolate and side
notched points indicates there were earlier components as well. Oneota subsistence data
can be inferred from two pits securely dated to the Oneota time period (Table 13).
Overall, the features exemplify a substance pattern that indicates the typical Oneota
mixed economy with an emphasis on fish and mammals, primarily deer (Ricahrds et al.
1998).
Table 13. Faunal Remains Recovered from the Carcajou Point Site (adapted from Ricahrds et al. 1998).
Taxa Feature
#
8
%
Feature
#
9
%
Total
#
% Fish 97 25 159 68 256 40
Mammal 43 10 17 7 60 9
Bird 3 0 14 6 17 3
Reptile 0 0 2 1 2 1
UNID 255 65 43 18 298 47
Total 387 100 235 100 633 100
In 2002, UW-Milwaukee placed exploratory shovel probes, a one-meter by two-
meter test unit, a one-meter-by-one-meter test unit, and two block excavations located in
the northeast corner of the site, just to the east of the 1983 survey tract in an area, referred
to as the Kelly North Tract (Jeske, Hunter et al. 2003). Based on radiocarbon dates and
artifact analysis, the main occupation of the Kelly North Tract was not Oneota but
Woodland and Archaic. Combining this information with Rodell’s, it appears that the
majority of the Oneota occupation was in the southern portion of the site.
Overall, the site has been interpreted as a large multi-component site that includes
significant Paleoindian, Archaic, and Late Woodland occupations, a very large Oneota
village, and an historic Ho Chunk village. Several archaeologists have postulated the
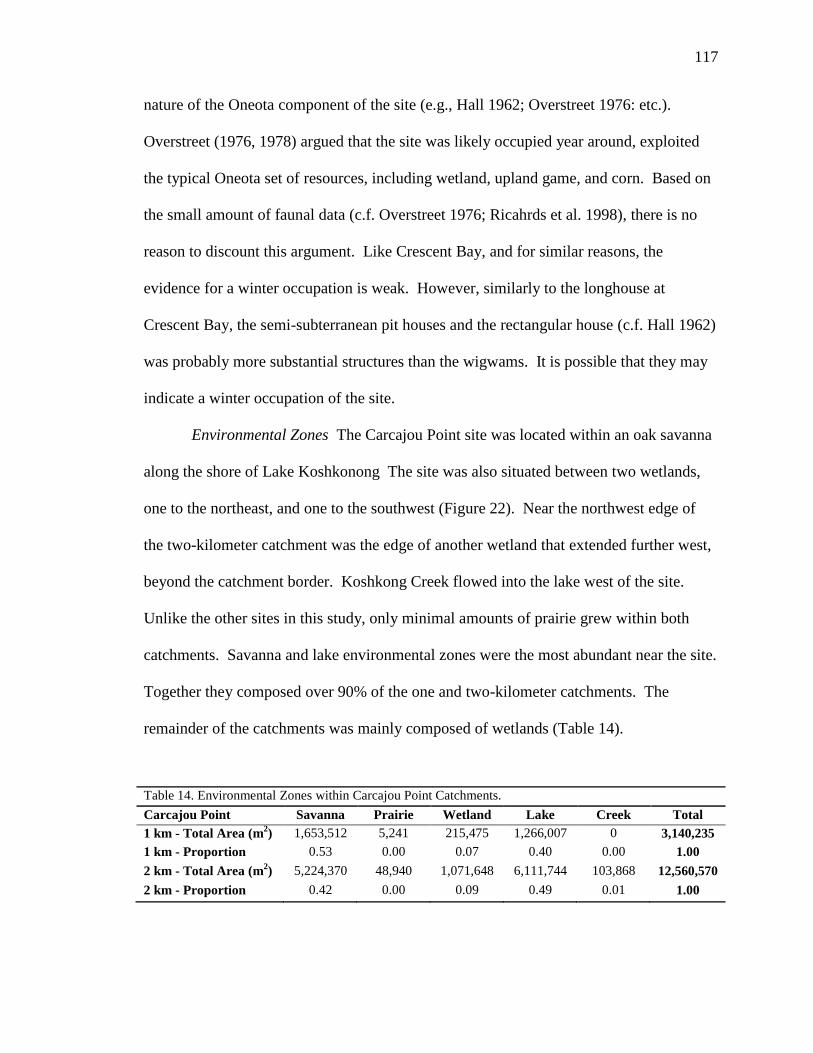
117
nature of the Oneota component of the site (e.g., Hall 1962; Overstreet 1976: etc.).
Overstreet (1976, 1978) argued that the site was likely occupied year around, exploited
the typical Oneota set of resources, including wetland, upland game, and corn. Based on
the small amount of faunal data (c.f. Overstreet 1976; Ricahrds et al. 1998), there is no
reason to discount this argument. Like Crescent Bay, and for similar reasons, the
evidence for a winter occupation is weak. However, similarly to the longhouse at
Crescent Bay, the semi-subterranean pit houses and the rectangular house (c.f. Hall 1962)
was probably more substantial structures than the wigwams. It is possible that they may
indicate a winter occupation of the site.
Environmental Zones The Carcajou Point site was located within an oak savanna
along the shore of Lake Koshkonong The site was also situated between two wetlands,
one to the northeast, and one to the southwest (Figure 22). Near the northwest edge of
the two-kilometer catchment was the edge of another wetland that extended further west,
beyond the catchment border. Koshkong Creek flowed into the lake west of the site.
Unlike the other sites in this study, only minimal amounts of prairie grew within both
catchments. Savanna and lake environmental zones were the most abundant near the site.
Together they composed over 90% of the one and two-kilometer catchments. The
remainder of the catchments was mainly composed of wetlands (Table 14).
Table 14. Environmental Zones within Carcajou Point Catchments.
Carcajou Point Savanna Prairie Wetland Lake Creek Total
1 km - Total Area (m2) 1,653,512
5,241
215,475
1,266,007
0
3,140,235
1 km - Proportion 0.53
0.00
0.07
0.40
0.00
1.00
2 km - Total Area (m
2) 5,224,370
48,940
1,071,648
6,111,744
103,868
12,560,570
2 km - Proportion 0.42
0.00
0.09
0.49
0.01
1.00
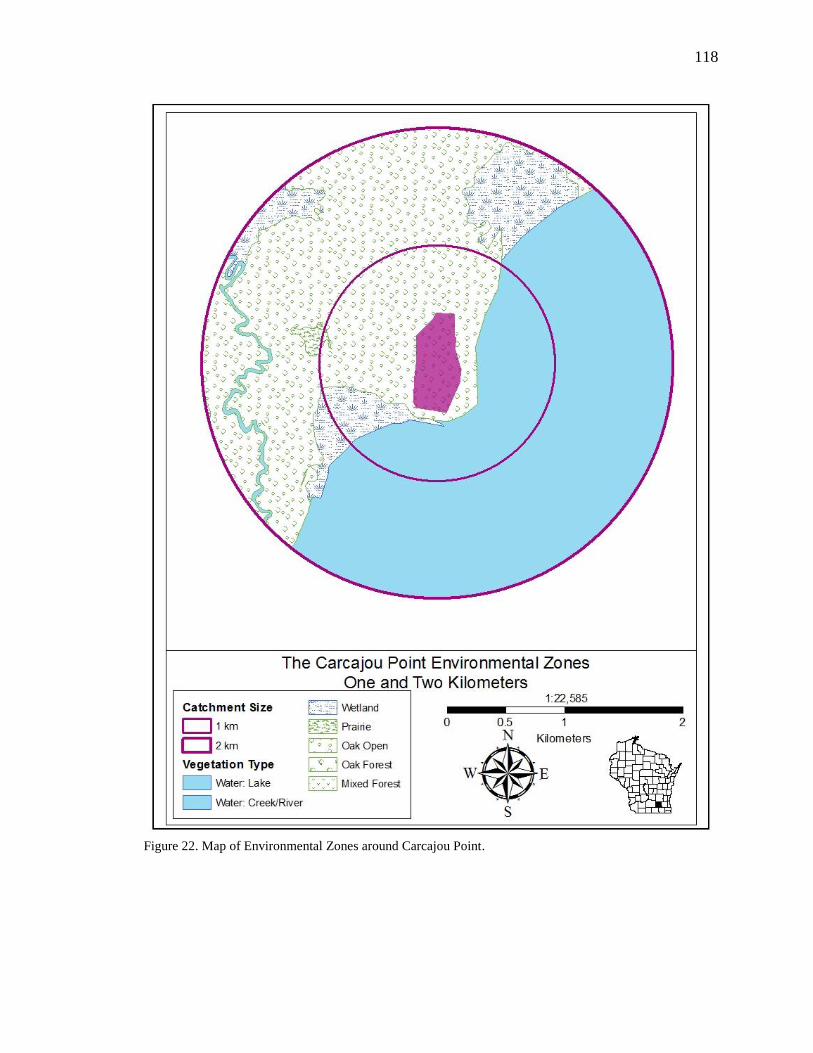
118
Figure 22. Map of Environmental Zones around Carcajou Point.
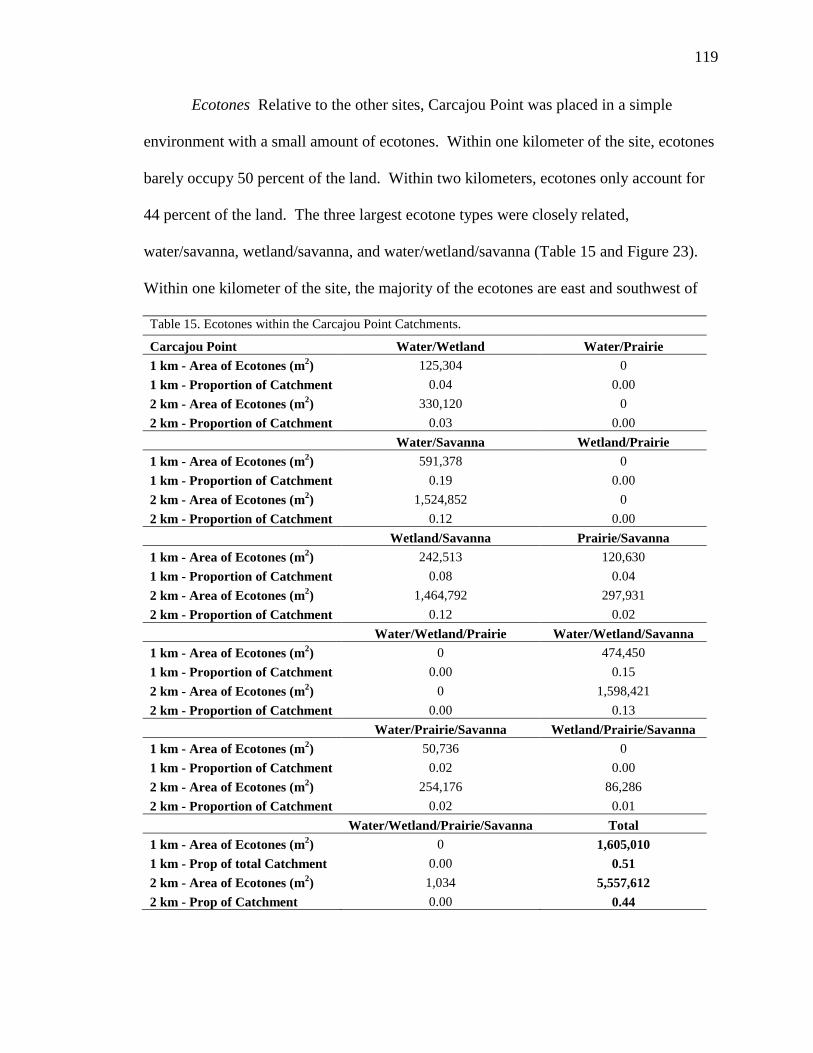
119
Ecotones Relative to the other sites, Carcajou Point was placed in a simple
environment with a small amount of ecotones. Within one kilometer of the site, ecotones
barely occupy 50 percent of the land. Within two kilometers, ecotones only account for
44 percent of the land. The three largest ecotone types were closely related,
water/savanna, wetland/savanna, and water/wetland/savanna (Table 15 and Figure 23).
Within one kilometer of the site, the majority of the ecotones are east and southwest of
Table 15. Ecotones within the Carcajou Point Catchments.
Carcajou Point Water/Wetland Water/Prairie
1 km - Area of Ecotones (m2) 125,304 0
1 km - Proportion of Catchment 0.04 0.00
2 km - Area of Ecotones (m2) 330,120 0
2 km - Proportion of Catchment 0.03 0.00
Water/Savanna Wetland/Prairie
1 km - Area of Ecotones (m2) 591,378 0
1 km - Proportion of Catchment 0.19 0.00
2 km - Area of Ecotones (m2) 1,524,852 0
2 km - Proportion of Catchment 0.12 0.00
Wetland/Savanna Prairie/Savanna
1 km - Area of Ecotones (m2) 242,513 120,630
1 km - Proportion of Catchment 0.08 0.04
2 km - Area of Ecotones (m2) 1,464,792 297,931
2 km - Proportion of Catchment 0.12 0.02
Water/Wetland/Prairie Water/Wetland/Savanna
1 km - Area of Ecotones (m2) 0 474,450
1 km - Proportion of Catchment 0.00 0.15
2 km - Area of Ecotones (m2) 0 1,598,421
2 km - Proportion of Catchment 0.00 0.13
Water/Prairie/Savanna Wetland/Prairie/Savanna
1 km - Area of Ecotones (m2) 50,736 0
1 km - Proportion of Catchment 0.02 0.00
2 km - Area of Ecotones (m2) 254,176 86,286
2 km - Proportion of Catchment 0.02 0.01
Water/Wetland/Prairie/Savanna Total
1 km - Area of Ecotones (m2) 0 1,605,010
1 km - Prop of total Catchment 0.00 0.51
2 km - Area of Ecotones (m2) 1,034 5,557,612
2 km - Prop of Catchment 0.00 0.44
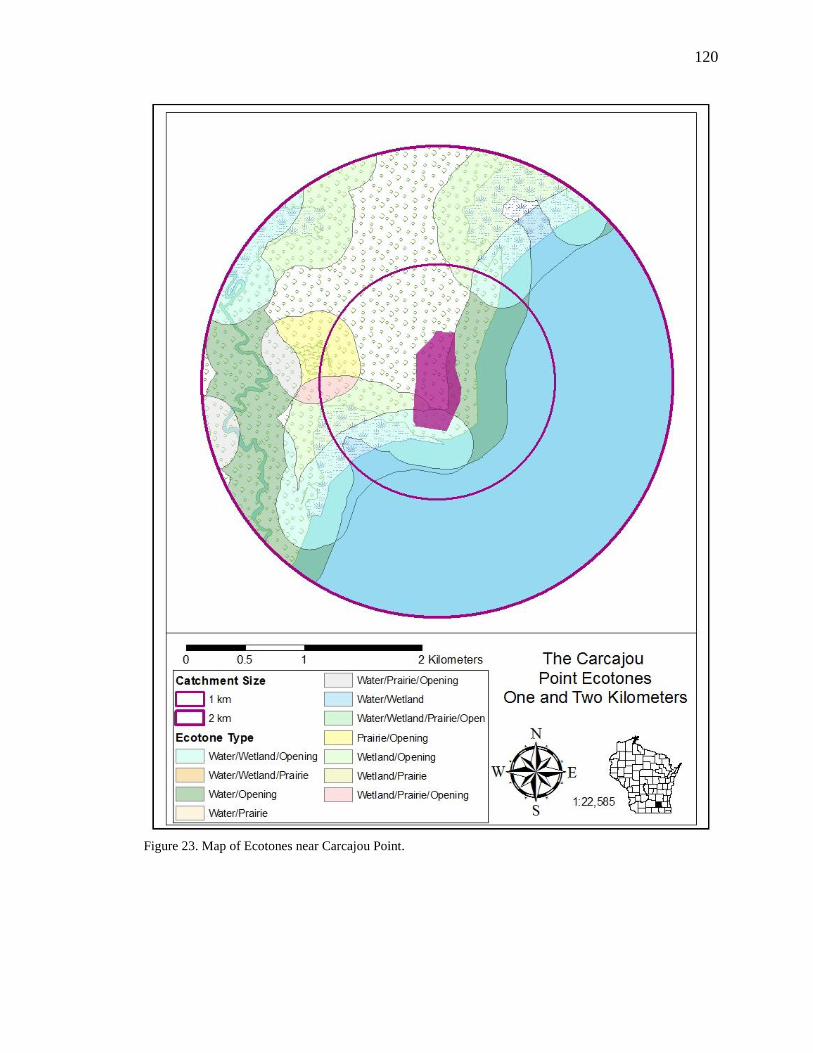
120
Figure 23. Map of Ecotones near Carcajou Point.
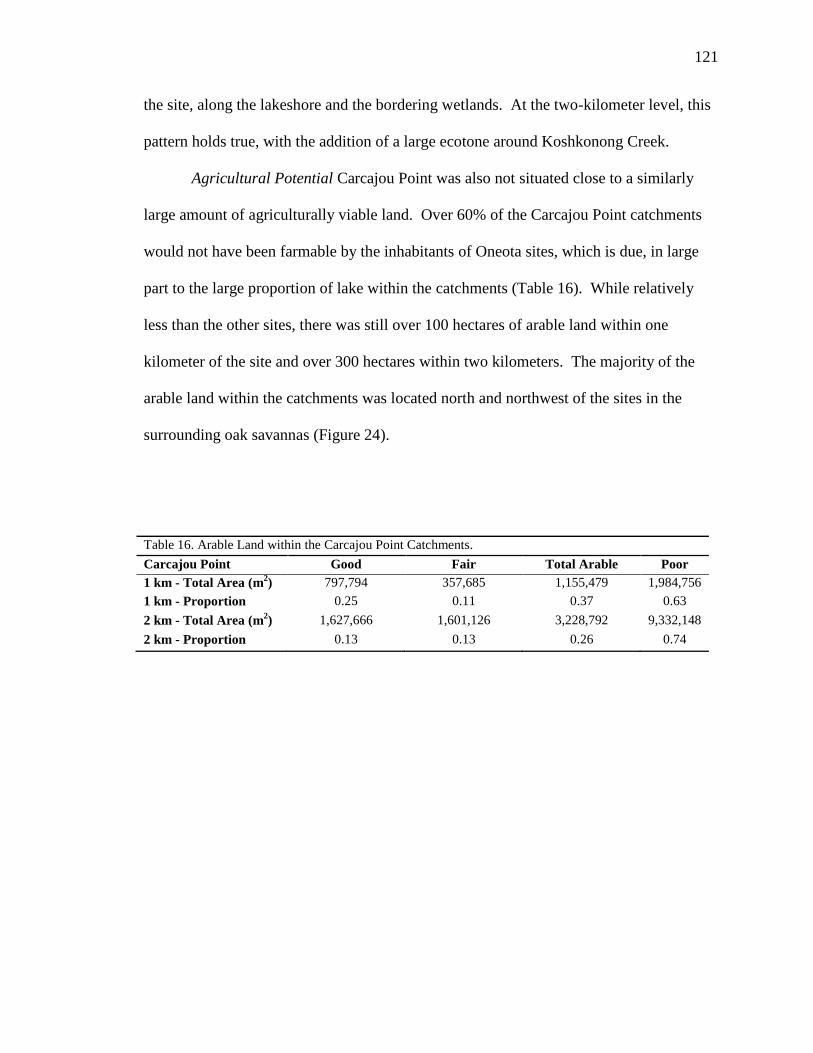
121
the site, along the lakeshore and the bordering wetlands. At the two-kilometer level, this
pattern holds true, with the addition of a large ecotone around Koshkonong Creek.
Agricultural Potential Carcajou Point was also not situated close to a similarly
large amount of agriculturally viable land. Over 60% of the Carcajou Point catchments
would not have been farmable by the inhabitants of Oneota sites, which is due, in large
part to the large proportion of lake within the catchments (Table 16). While relatively
less than the other sites, there was still over 100 hectares of arable land within one
kilometer of the site and over 300 hectares within two kilometers. The majority of the
arable land within the catchments was located north and northwest of the sites in the
surrounding oak savannas (Figure 24).
Table 16. Arable Land within the Carcajou Point Catchments.
Carcajou Point Good Fair Total Arable Poor
1 km - Total Area (m2) 797,794
357,685
1,155,479
1,984,756
1 km - Proportion 0.25
0.11
0.37
0.63
2 km - Total Area (m
2) 1,627,666
1,601,126
3,228,792
9,332,148
2 km - Proportion 0.13
0.13
0.26
0.74
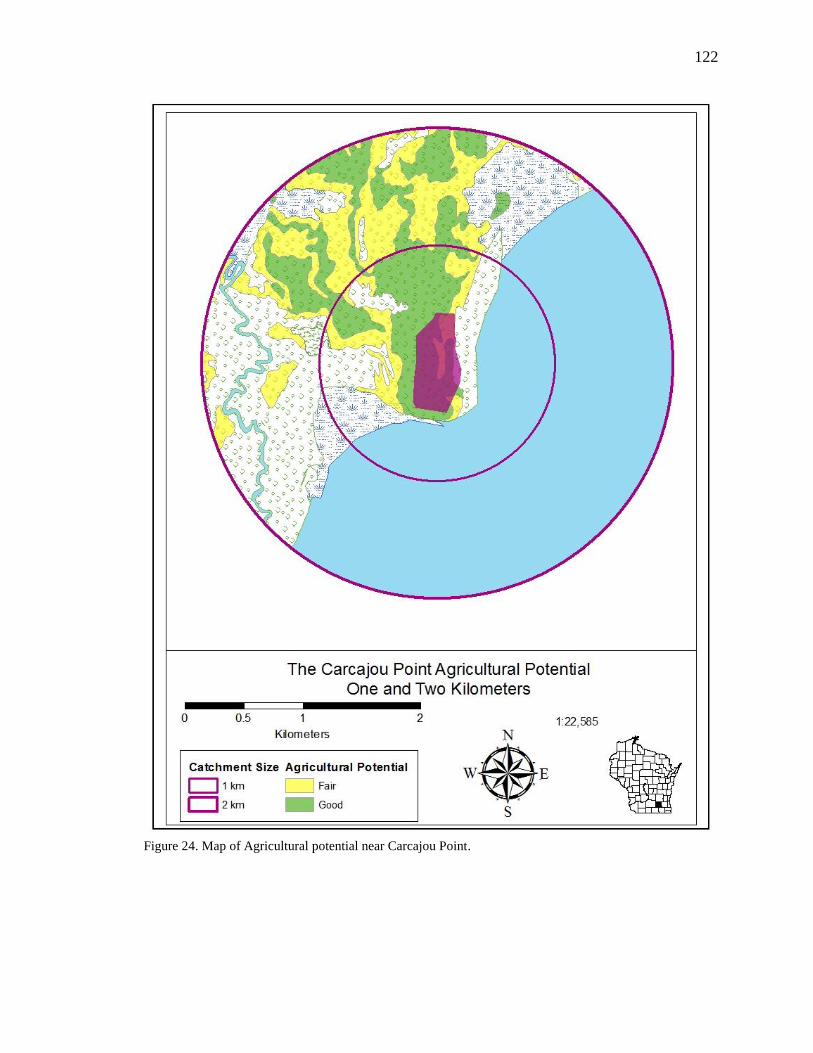
122
Figure 24. Map of Agricultural potential near Carcajou Point.

123
CHAPTER FOUR
DISCUSSION
When combined with the preexisting data for Oneota settlement patterns and
subsistence, the environmental data collected for this thesis pertaining to the known
Oneota village settlements in the Lake Koshkonong Locality allows for a more in-depth
examination and explanation of Oneota settlement patterns. This thesis was designed to
answer five main research questions about the Oneota occupation within the region. The
first question, what was the environmental setting of each known Oneota village, was
discussed in the previous chapter in detail. This chapter will examine the data to answer
the remaining research questions.
Question # 2: Were each of the sites situated in a similar environment?
To answer this question effectively, there are two aspects of the environment that
must be looked at. First, it is necessary to examine the similarity of the environments by
comparing the proportions of environmental zones within each of the sites’ catchments.
Second, to better understand the nature of the environment and its economic potential, an
examination of the ecotones within the study area needs to be conducted.
Environmental Zones From a cursory examination of the relative proportions of
the environmental zones at each of the four sites, it appears that there is a significant
degree of variation among them (Figures 25 and 26). Twin Knolls had far more savanna
than the other sites, and the lack of lake within both the one and two-kilometer
catchments further separate the site from the others. Carcajou Point stands out for the
dichotomous distribution of lake and savanna environments.
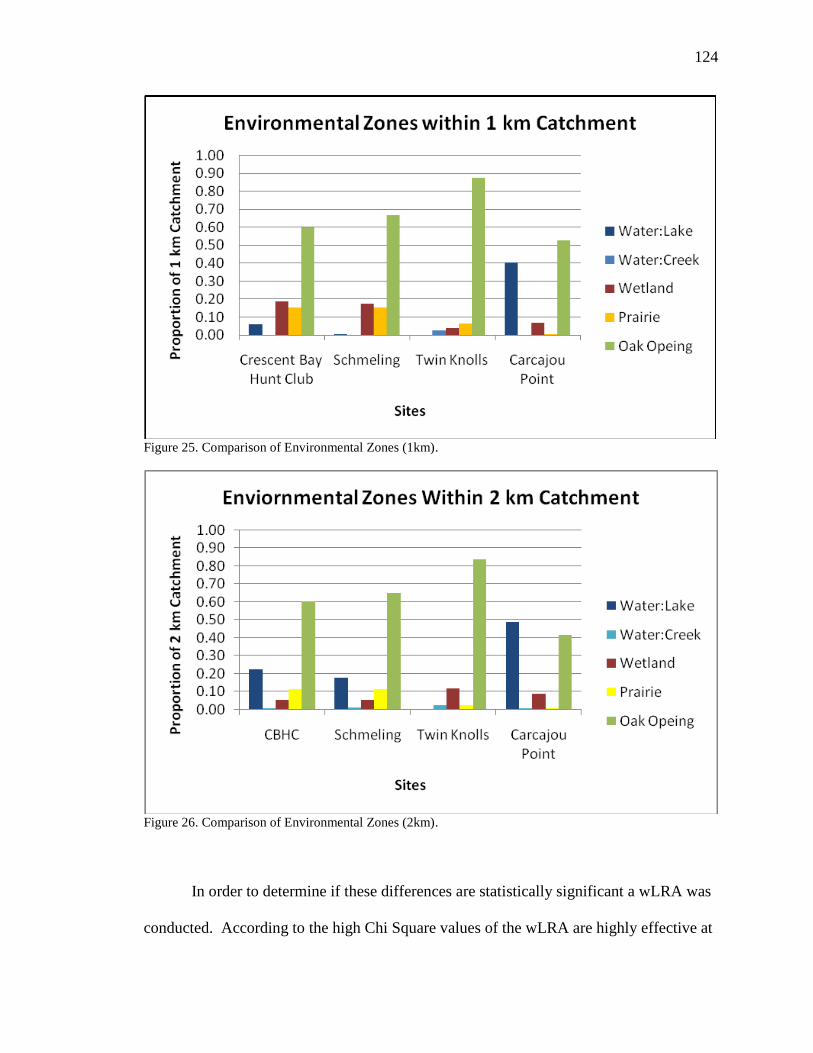
124
Figure 25. Comparison of Environmental Zones (1km).
Figure 26. Comparison of Environmental Zones (2km).
In order to determine if these differences are statistically significant a wLRA was
conducted. According to the high Chi Square values of the wLRA are highly effective at
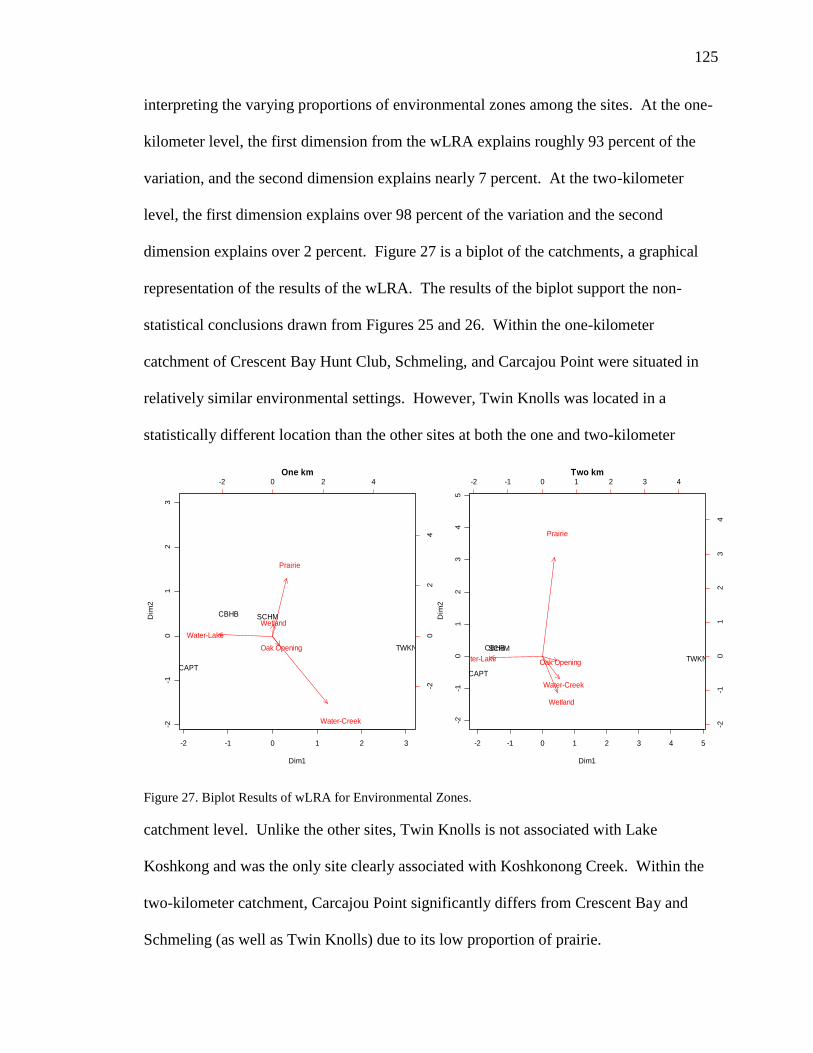
125
interpreting the varying proportions of environmental zones among the sites. At the one-
kilometer level, the first dimension from the wLRA explains roughly 93 percent of the
variation, and the second dimension explains nearly 7 percent. At the two-kilometer
level, the first dimension explains over 98 percent of the variation and the second
dimension explains over 2 percent. Figure 27 is a biplot of the catchments, a graphical
representation of the results of the wLRA. The results of the biplot support the non-
statistical conclusions drawn from Figures 25 and 26. Within the one-kilometer
catchment of Crescent Bay Hunt Club, Schmeling, and Carcajou Point were situated in
relatively similar environmental settings. However, Twin Knolls was located in a
statistically different location than the other sites at both the one and two-kilometer
-2 -1 0 1 2 3
-2-1
01
23
One km
Dim1
Dim
2
CBHB SCHM
TWKN
CAPT
-2 0 2 4
-20
24
Water-Lake
Water-Creek
Wetland
Prairie
Oak Opening
-2 -1 0 1 2 3 4 5
-2-1
01
23
45
Two km
Dim1
Dim
2
CBHBSCHM
TWKN
CAPT
-2 -1 0 1 2 3 4
-2-1
01
23
4
Water-Lake
Water-Creek
Wetland
Prairie
Oak Opening
Figure 27. Biplot Results of wLRA for Environmental Zones.
catchment level. Unlike the other sites, Twin Knolls is not associated with Lake
Koshkong and was the only site clearly associated with Koshkonong Creek. Within the
two-kilometer catchment, Carcajou Point significantly differs from Crescent Bay and
Schmeling (as well as Twin Knolls) due to its low proportion of prairie.

126
Based on the distribution of sites among various environmental zones, proportions
of various ecotones, and distances to important resources, it is clear that the sites were not
placed in the same environments. Due to their close proximity, Crescent Bay and
Schmeling were located in environments that were relatively similar to one another.
Despite its relative proximity (approximately three kilometers), it does not appear that
Twin Knolls was actually associated with Lake Koshkonong. Instead, the site was
located along the creek edge, where its residents could exploit a wide diversity of
resources that would be present due to the variety and amount of ecotones present near
the site. Conversely, Carcajou Point was located right on the shore of Lake Koshkonong
where its residents could exploit the rich resource base that the large body of water could
provide. Given the environmental differences, it is likely that a detailed faunal and floral
analysis of the sites would indicate subtle differences in the resources being exploited.
For example, Twin Knolls’ residents may have exploited a higher degree of upland and
riverine resources than the others, and Crescent Bay may have exploited a higher degree
of lacusterine resources.
Ecotones Based on the raw numbers, the sites appear to be placed in different
locations in reference to ecotones (Figures 28 and 29). Compared to the other sites,
ecotones within the Carcajou Point catchments accounted for the lowest proportion of
total area. The ecotones that were present were primarily water/savanna and
water/wetland/savanna. On the opposite end, Twin Knolls had the most total area
covered by ecotones. The site also appears to have had the most heterogeneity of
ecotones near the site. Schmeling and Crescent Bay appear to have a similar composition
of ecotones, which were primarily wetland/prairie and prairie/savanna ecotones.
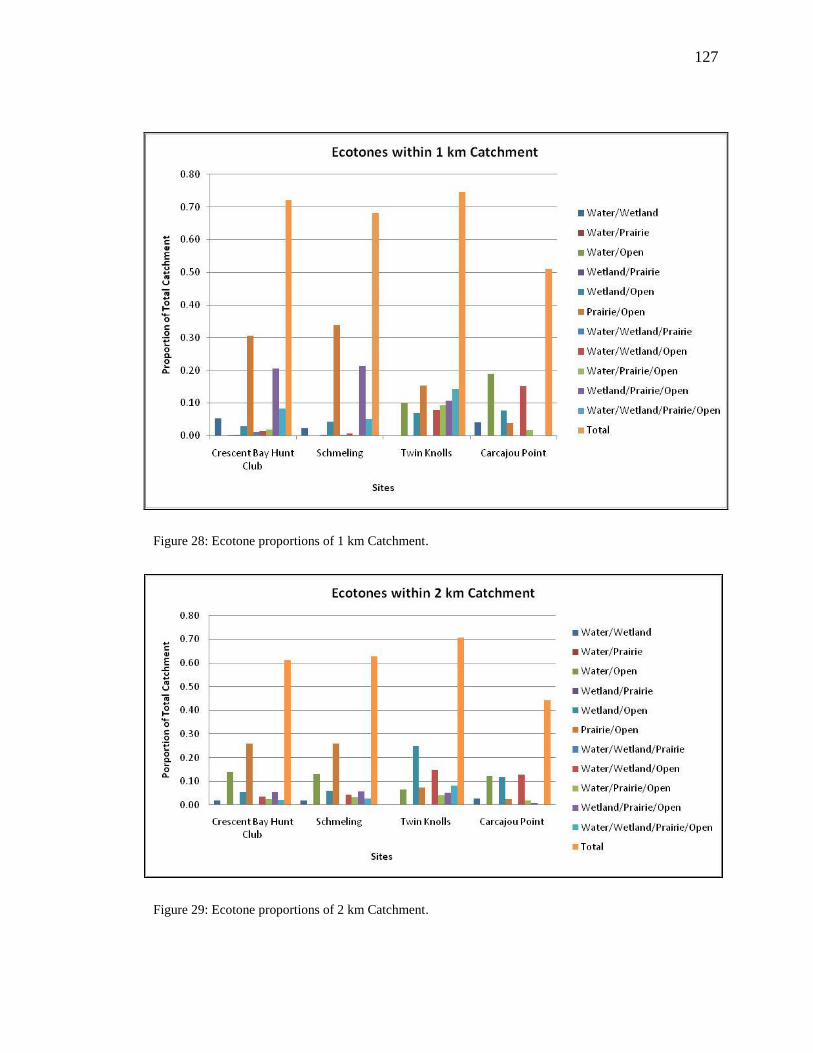
127
Figure 28: Ecotone proportions of 1 km Catchment.
Figure 29: Ecotone proportions of 2 km Catchment.

128
However, with eleven different ecotones, it is difficult to assess the similarity of the
ecotonal composition of the sites. At present, there is no way to determine if one ecotone
is more economically important than others.
At the two-kilometer level, the relative proportions appear to exhibit a similar
situation. Carcajou Point had the least amount of ecotones, evenly split between three
different ecotone types. Twin Knolls had the greatest amount, though the
wetland/savanna ecotone appears to have been one of the largest within the catchment.
These raw numbers also indicate that Schmeling and Crescent Bay had relatively similar
amounts of the same ecotones.
The results of the wLRA clarified the ecotonal relationships among the sites and
illuminated patterns that were otherwise not visible (Figures 30 and 31). At the one-
kilometer level, the first dimension of the wLRA explained 49.84 percent of the variation,
and the second explains 39.69 percent of the variation, totaling 89.53 percent of the
variation. For the two-kilometer catchment, the first dimension explains 57.71 percent,
and the second explains 31.37 percent, totaling 89.18 percent of the variation. The
statistical comparisons indicate that there is more site variability than was indicated by
the proportions or raw numbers. For example, despite the difference in raw counts, Twin
Knolls and Carcajou Point have relatively similar ecotonal compositions. However, there
are statistically significant differences among the sites; at one kilometer, Crescent Bay is
statistically different from the other sites and at two kilometers, Schmeling is different.
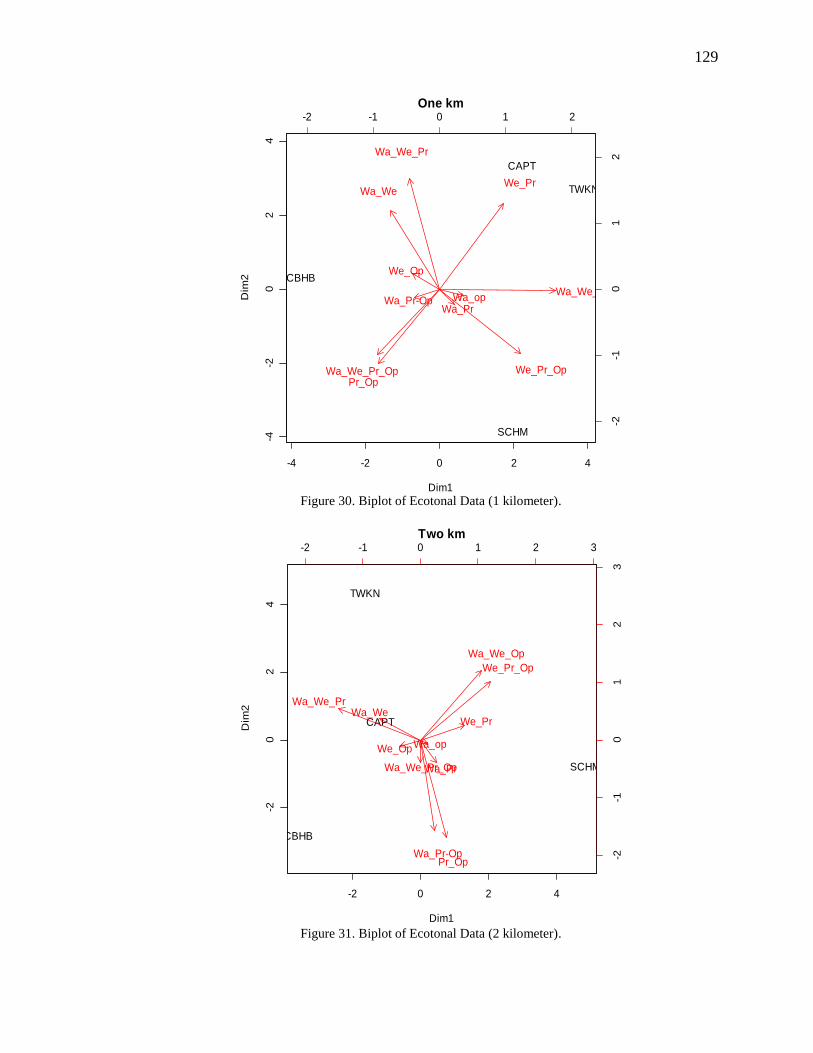
129
-4 -2 0 2 4
-4-2
02
4
One km
Dim1
Dim
2 CBHB
SCHM
TWKN
CAPT
-2 -1 0 1 2
-2-1
01
2
Wa_We
Wa_PrWa_op
We_Pr
We_Op
Pr_Op
Wa_We_Pr
Wa_We_OpWa_Pr-Op
We_Pr_OpWa_We_Pr_Op
Figure 30. Biplot of Ecotonal Data (1 kilometer).
-2 0 2 4
-20
24
Two km
Dim1
Dim
2
CBHB
SCHM
TWKN
CAPT
-2 -1 0 1 2 3
-2-1
01
23
Wa_We
Wa_Pr
Wa_op
We_Pr
We_Op
Pr_Op
Wa_We_Pr
Wa_We_Op
Wa_Pr-Op
We_Pr_Op
Wa_We_Pr_Op
Figure 31. Biplot of Ecotonal Data (2 kilometer).

130
Summary of Environmental Variability After accounting for the varying
composition of the ecotones and environmental zones within the catchments, it is clear
that the sites were not placed within the same environmental settings. This argument is
supported by the results of the weighted Log Ratio Analyses which indicate significant
differences among the sites at both catchment levels for ecotones and environmental
zones.
Question # 3: Were the Oneota sites situated to maximize agricultural potential?
A test of proportions shows that at both the 1km and 2 km catchment level Twin
Knolls has significantly more good arable land (in hectares) than the three other sites at
the 95% confidence interval. Crescent Bay, Carcajou Point and Schmeling are all similar
at 1km. At the 2km level, Schmeling has significantly more arable land than Crescent
Bay and Carcajou Point, although statistically less arable land than Twin Knolls.
Equally interesting is the difference in good arable land between 1km and 2km
catchments at each site. If one compares proportions of arable land by hectare, Crescent
Bay and Carcajou have significantly less arable land at the 95% confidence interval,
while the Twin Knolls 2km has significantly less at 90%. Schmeling retains the same
proportion below 80% confidence. If one uses acres, Crescent Bay, Carcajou Point and
Twin Knolls have significantly less arable land at the 99% confidence interval, while
Schmeling has the same proportions.
Looking at the entire spectrum of good, fair and poor arable soils gives a different
picture. Despite the large absolute differences of total arable land within the catchments,
the wLRA indicates that none of the sites differ significantly from the mean (Figure 32).

131
It appears that despite the variation in good soils, each site was placed within a similar
agricultural setting. Nonetheless, even the wLRA shows that Twin Knolls does have
significantly more arable land in both catchments than Carcajou Point. While typically
less than half of the catchment, each of the sites was placed near hundreds of hectares of
arable land (Figures, 33 and 34).
The much higher proportion of good quality soils in the 1km catchments indicates
that Oneota sites are specifically located near high quality arable soils. Despite the fact
that medium and poor quality soils result in a relatively homogeneous farm-friendly
environment, islands of high quality soils were actively sought out and settlements
established to take advantage of those patches.
The question then becomes, was this sufficient land to feed the Oneota
populations? Flannery (2009:92-93) examined the productivity of modern corn and
argued that a Mesoamerican village of 350 people could have been fed on a diet primarily
of corn with fewer than 80 hectares of arable land. While the corn grown by the Oneota
might not have been as productive as the modern maize used in Mexico, given the
diversity of the Oneota diet, the hundred plus hectares within one kilometer alone would
likely have proven more than enough land to grow the desired amount of maize. It is
likely that the sites were placed, in part, to allow the site’s inhabitants to effectively grow
maize, as well as take advantage of wild resources.
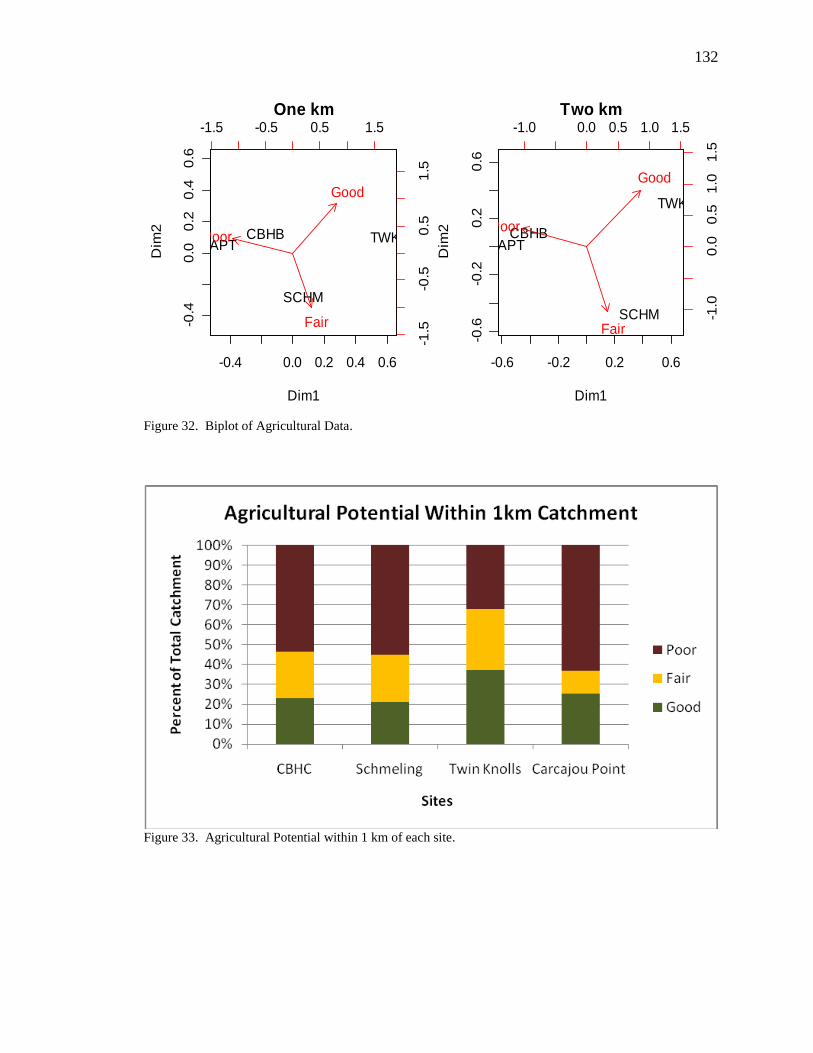
132
-0.4 0.0 0.2 0.4 0.6
-0.4
0.0
0.2
0.4
0.6
One km
Dim1
Dim
2 CBHB
SCHM
TWKNCAPT
-1.5 -0.5 0.5 1.5
-1.5
-0.5
0.5
1.5
Good
Fair
Poor
-0.6 -0.2 0.2 0.6
-0.6
-0.2
0.2
0.6
Two km
Dim1
Dim
2 CBHB
SCHM
TWKN
CAPT
-1.0 0.0 0.5 1.0 1.5
-1.0
0.0
0.5
1.0
1.5
Good
Fair
Poor
Figure 32. Biplot of Agricultural Data.
Figure 33. Agricultural Potential within 1 km of each site.
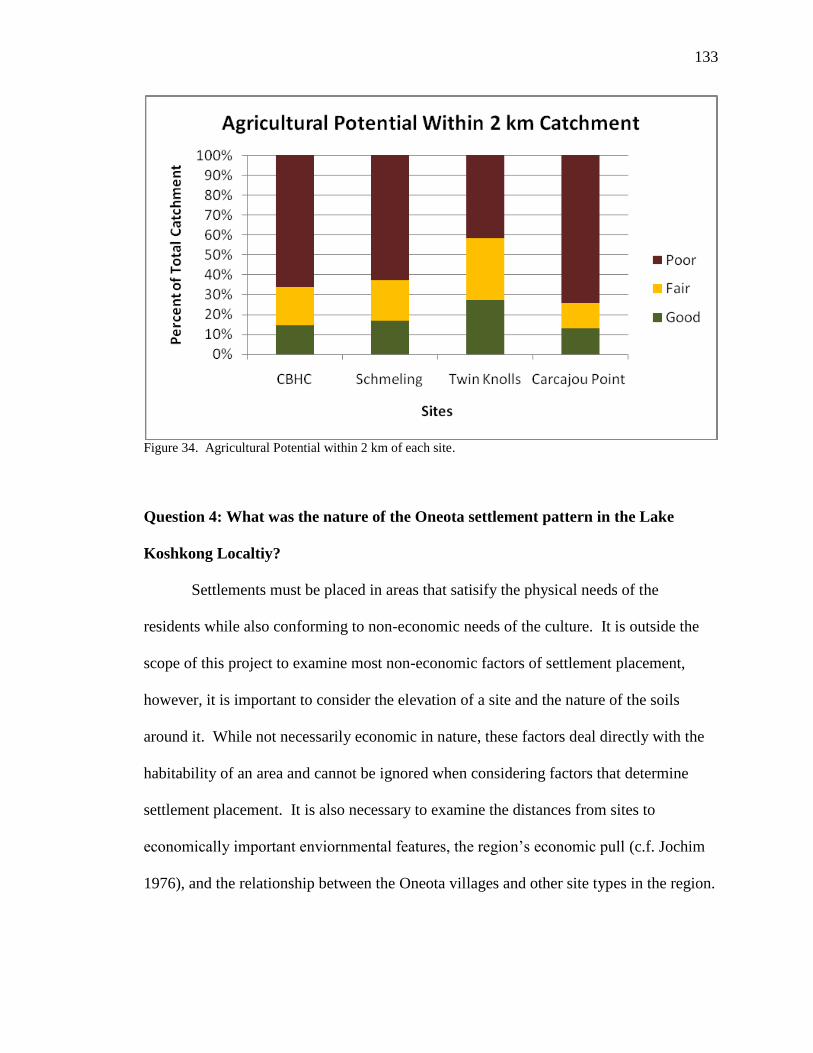
133
Figure 34. Agricultural Potential within 2 km of each site.
Question 4: What was the nature of the Oneota settlement pattern in the Lake
Koshkong Localtiy?
Settlements must be placed in areas that satisify the physical needs of the
residents while also conforming to non-economic needs of the culture. It is outside the
scope of this project to examine most non-economic factors of settlement placement,
however, it is important to consider the elevation of a site and the nature of the soils
around it. While not necessarily economic in nature, these factors deal directly with the
habitability of an area and cannot be ignored when considering factors that determine
settlement placement. It is also necessary to examine the distances from sites to
economically important enviornmental features, the region’s economic pull (c.f. Jochim
1976), and the relationship between the Oneota villages and other site types in the region.

134
Elevation Using the USGS Busseyville Quadrangle map, the elevations of each
of the sites were determined (Table 17). The first five columns of values in the table
refer to the elevation of the site as a polygon (i.e.,the two-dimensional boundaries of the
site). The average columns do not indicate spatial weighted averages but the mean of the
highest and lowest elevations. Using the polygon to determine the elevation of the sites
is useful in describing the variation within the sites; however, perhaps a better measure of
site elevation comes from the centroids of the sites. By measuring the elevation from the
center, modern erosion at the sites’ edges should have less effect on the readings, and
might better represent the elevation of the more heavily occupied and utilized portions of
the sites. Using this, Crescent Bay is the highest site at 253 meters above sea level, while
Twin Knolls and Carcajou Point are the lowest at 247 meters. Since the most heavy
concentration of Oneota artifacts at Carcajou Point came from the southern poriton of the
site, the centroid may not be the most accurate measure of elevation. The height of the
southern portion of the site is approximately 790 to 800 feet (241 to 244 meters) above
sea level. While the absolute elevations may vary from site to site, they were placed in
similar settings in relation to the surrounding topography (Figure 35).
All the sites were placed on high ground overlooking an aquatic environment, on
or near the edge of a hill or ridge which leads to the water below, affording the residents
of the sites some level of protection from flooding. For example, the northwest corner of
the wetlands east of Crescent Bay and Schmeling are at an elevation roughly of 237
meters (780 feet) above sea level, 13 meters below Schmeling and 16 below Crescent
Bay. Koshkonong Creek is roughly 10 meters below the centroid of Twin Knolls, and
the lake was approximately 10 to 15 meters below Carcajou Point. Elevation in relation

135
to the nearby water is not the only important factor to consider. To the west of Twin
Knolls, Schmeling, and Crescent Bay, there are hills that peak at over 260 meters above
sea level, which could have provided some measure of protection from strong winds from
the west.
Table 17. Elevation of sites.
Polygon Feet Avg. Meters Avg. Centroid
Lowest Highest Meters Lowest Highest Meters Feet Meters
Crescent Bay 820 840 830 250 256 253 830 253
Schmeling 800 830 815 244 253 248 820 250
Twin Knolls 800 820 810 244 250 247 810 247
Carcajou Point 770 820 795 234 250 242 810 247
Distance to Well-Drained Soils Soil drainage is an important criterion for
determining the habitability of land. For many of the same reasons, water drainage is
also important for the comfort and health of the humans living and sleeping on or near the
soils (Jochim 1976). Therefore, soil drainage present at a site is important for both
economic and other practical reasons as well. All four sites were similarly placed in
reference to well-drained soils (Table 18). Each site is located on soils that are either
well drained or moderately well drained. In conjunction with their relatively high
elevations, it is not likely that the sites would have remained wet for very long, even after
heavy rains since the soils well drained soils would topography of the land would pull the
water down hill and the nature of the soils would expedite that process.
Table 18. Distance of Sites to Important Resources.
CBHC Schmeling Twin Knolls Carcajou Point
Lake 787 967 3044 344
Creek 1387 1262 134 1394
Wetland 238 313 135 434
Ecotone 0 50 0 94
Well Drained Soil 0 0 0 0
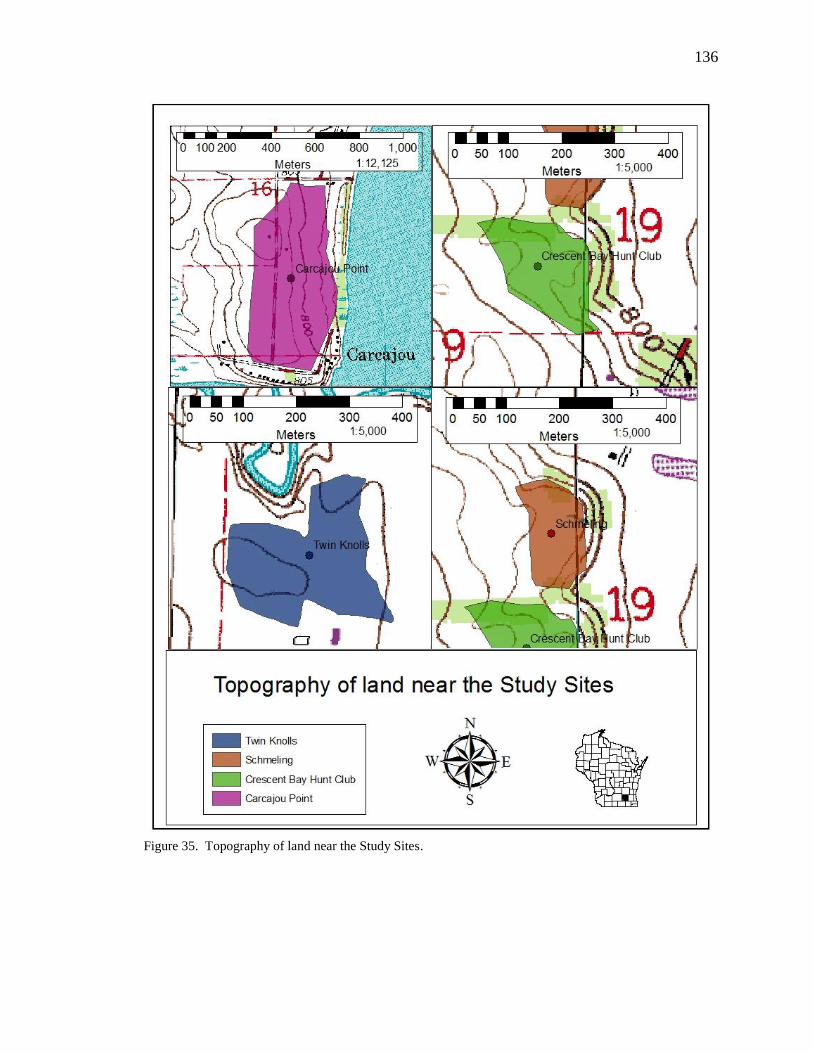
136
Figure 35. Topography of land near the Study Sites.
137
Distance to Water Sources There are three primary sources of water within the
study area; Lake Koshkonong, Koshkonong Creek, and the various wetlands. Since
water was not only an essential resource in and of itself, but vital for many other
activities (e.g., transportation), site distance to water is an important aspect to consider
(Table 18). Twin Knolls is more than three linear kilometers from Lake Koshkonong,
nearly 10 times farther than is Carcajou Point. However, Twin Knolls was the closest to
both creek and wetland sources of water. Carcajou Point was the furthest from these
other resources, though Crescent Bay and Schmeling were located more similarly to
Carcajou Point than Twin Knolls. In sum, there was considerable variation in settlement
locations with reference to distance from specific water types, though each site appears to
be placed near a specific wetland habitat. It appears that Carcajou Point was placed to
most effectively interface directly with the lake and its resources. Twin Knolls was
situated where its residents could best exploit the creek and nearby wetlands. Crescent
Bay and Schmeling were effectively placed with access to a variety of aquatic
environments, primarily a large wetland to the east of the sites. However, Crescent Bay
and Schmeling are significantly more distant from navigable, open water than either
Carcajou Point or Twin Knolls.
Distance to Ecotone Each of the sites was placed near multiple ecotones. The
centroid of Crescent Bay and Twin Knolls were actually within the boundary of ecotones.
The centroid of both Schmeling and Carcajou Point were less than 100 meters from the
edge of an ecotone. Residents of the sites were clearly well placed to effectively exploit
the additional benefits of these more diverse environments. The ecotones actually
extended into the boundary of the sites. Therefore, if the site boundaries, instead of

138
centroids, were used for this analysis then the minimum distance to ecotone would have
been zero for all of the sites. Ignoring the variation in ecotone types, the sites were
similarly placed near ecotones.
Resource Pull Analysis The resource pull analysis was designed to determine
which areas within the study area had the strongest economic pull. Scores were based on
the quality of the arable land, number of environmental zones within each ecotone, and
the productivity of the environmental zones present at any given location (Table 19,
Figure 36). Based on an economic approach one would expect that the high resource
zones i.e., those with the highest scores, would cluster within the one-kilometer
catchment, since this would indicate that the sites were placed near the most dense cluster
or clusters of valuable resource zones. An initial comparison of the proportions of high
value zones indicates that within one kilometer the proportions are relatively similar to
the proportions within the two-kilometer catchment (Figures 37, 38 and Tables 20, 21).
Therefore, the distribution of the high value resource zones does not initially appear to
cluster within the one-kilometer catchment zones. Due to the small amount of high value
resource zones in either catchment, however a different approach can elucidate some
interesting patterns otherwise not visible.
Table 19. Value Code description for Resource Pull Analysis Variables.
Productivity Score
Variables 0 1 2 3 4
Environmental
Zone
n/a Prairie Lake/Creek n/a Savanna/Wetland
Ecotones 0 Ecozones 1 Ecozone 2 Ecozones 3 Ecozones 4 Ecozones
Arable Land Non-Arable n/a Fair Potential n/a Good Potential
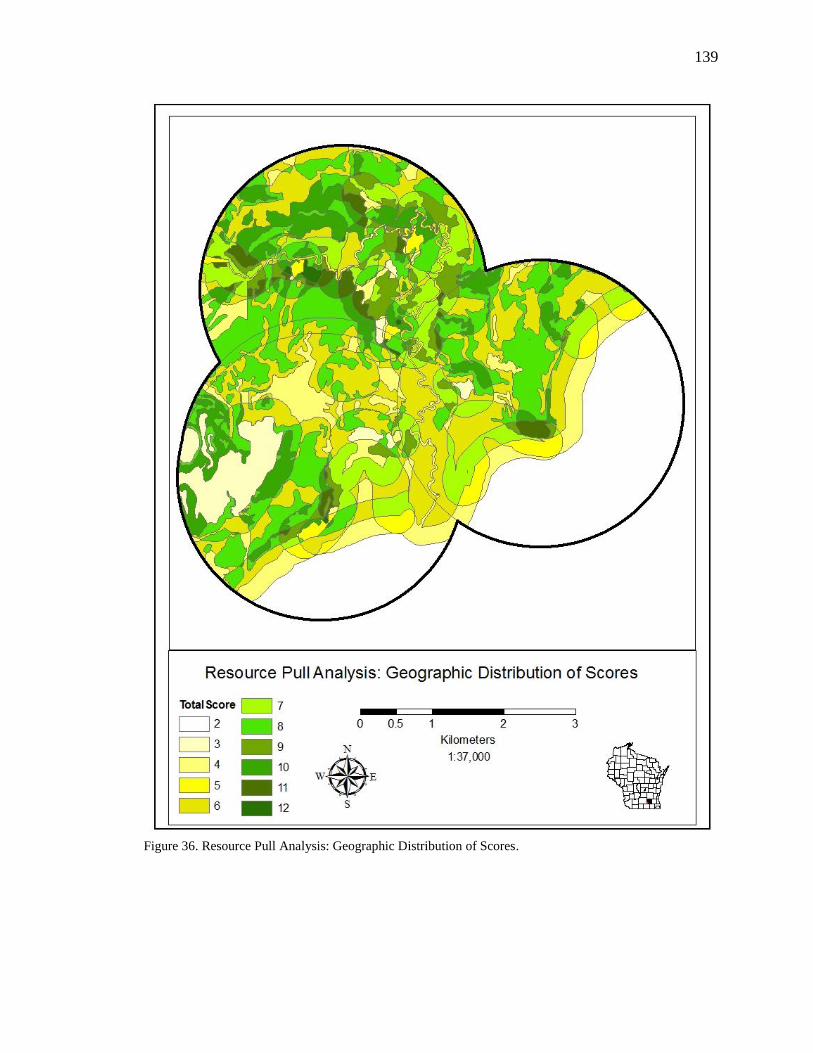
139
Figure 36. Resource Pull Analysis: Geographic Distribution of Scores.
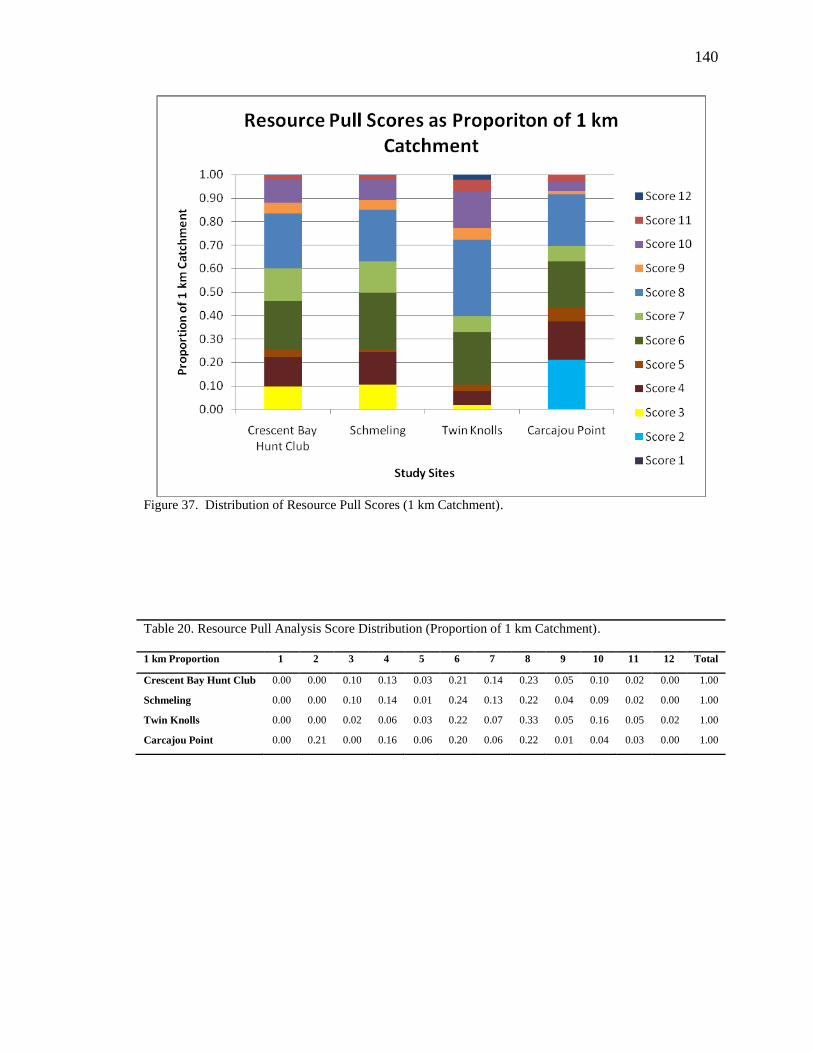
140
Figure 37. Distribution of Resource Pull Scores (1 km Catchment).
Table 20. Resource Pull Analysis Score Distribution (Proportion of 1 km Catchment).
1 km Proportion 1 2 3 4 5 6 7 8 9 10 11 12 Total
Crescent Bay Hunt Club 0.00 0.00 0.10 0.13 0.03 0.21 0.14 0.23 0.05 0.10 0.02 0.00 1.00
Schmeling 0.00 0.00 0.10 0.14 0.01 0.24 0.13 0.22 0.04 0.09 0.02 0.00 1.00
Twin Knolls 0.00 0.00 0.02 0.06 0.03 0.22 0.07 0.33 0.05 0.16 0.05 0.02 1.00
Carcajou Point 0.00 0.21 0.00 0.16 0.06 0.20 0.06 0.22 0.01 0.04 0.03 0.00 1.00
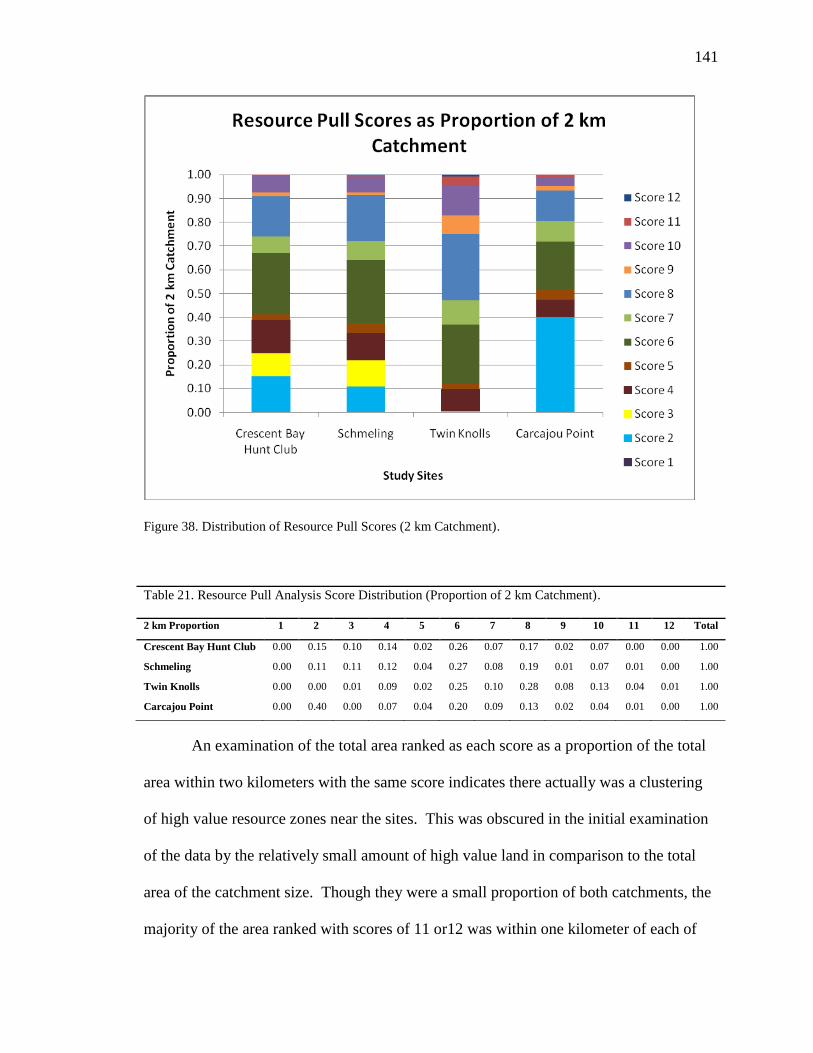
141
Figure 38. Distribution of Resource Pull Scores (2 km Catchment).
Table 21. Resource Pull Analysis Score Distribution (Proportion of 2 km Catchment).
2 km Proportion 1 2 3 4 5 6 7 8 9 10 11 12 Total
Crescent Bay Hunt Club 0.00 0.15 0.10 0.14 0.02 0.26 0.07 0.17 0.02 0.07 0.00 0.00 1.00
Schmeling 0.00 0.11 0.11 0.12 0.04 0.27 0.08 0.19 0.01 0.07 0.01 0.00 1.00
Twin Knolls 0.00 0.00 0.01 0.09 0.02 0.25 0.10 0.28 0.08 0.13 0.04 0.01 1.00
Carcajou Point 0.00 0.40 0.00 0.07 0.04 0.20 0.09 0.13 0.02 0.04 0.01 0.00 1.00
An examination of the total area ranked as each score as a proportion of the total
area within two kilometers with the same score indicates there actually was a clustering
of high value resource zones near the sites. This was obscured in the initial examination
of the data by the relatively small amount of high value land in comparison to the total
area of the catchment size. Though they were a small proportion of both catchments, the
majority of the area ranked with scores of 11 or12 was within one kilometer of each of
142
the sites (Table 22). While not quite as clear of a pattern as expected, it does support the
theory that sites were placed near high value resource zones. It is possible that the
arbitrary nature scale used, the relatively small amount of high value land, or the
heterogeneity of the environments is responsible for the obscured patterns.
Table 22. Resource Pull Analysis – Distribution of Resources, 1km values as proportion of 2km.
1 km Proportion of Whole 1 2 3 4 5 6 7 8 9 10 11 12
Crescent Bay n/a 0.00 0.25 0.23 0.34 0.20 0.50 0.34 0.68 0.36 0.97 1.00
Schmeling n/a 0.00 0.24 0.30 0.09 0.22 0.41 0.29 0.89 0.33 0.81 0.35
Twin Knolls 0.00 n/a 0.80 0.17 0.29 0.23 0.16 0.29 0.16 0.30 0.33 0.87
Carcajou Point n/a 0.13 0.11 0.55 0.36 0.24 0.19 0.43 0.19 0.25 0.80 n/a
Relationships to Other Oneota Sites The current data indicate that Crescent Bay,
Carcajou Point, and Schmeling were all practicing a subsistence pattern that generally
corresponds to the aquatic plant/animal, maize, and deer diet that is evident at Oneota
sites throughout the state. Returning to Sasso’s (2003:262) discussion of mean distance
from Oneota village sites to garden bed sites, if a similar pattern is assumed to have
existed in the Koshkonong Locality, there was clearly a substantial amount of arable land
throughout the entire range (0 to 2.32 km) Sasso reported for Winnebago County. There
are currently three known non-culturally affiliated garden bed sites within the study area.
The Loge Bay site, first reported by Stout and Skavlem (1908:94), is recorded in the ASI
files as both 47JE087 and 47JE089. The site is located in northwest quarter of the
northeast quarter of Section 16, Town 5 North, Range 13 East, and was described by
Stout and Skavlem as a series of garden beds and a small cornfield north of Carcajou
Place (roughly near the Carcajou Point site). The Messemer Garden Beds were first
identified by Stout and Skavlem, but were formally reported by Charles Brown
(1909:127) as garden beds that formerly existed in the southeast quarter of the southeast

143
quarter of Section 18, Town 5 North, Range 13 East. Stout and Skavlem (1908:79-80)
also identified corn hills on the east edge of the Crab Apple Point site.
Each of the garden bed sites are at least partially within the one-kilometer
catchment of one or more of the study sites and wholly within two kilometer catchments
(Figure 39). While these sites have no known cultural affiliation, given their close
proximity to the Oneota villages, it is not unreasonable to postulate that they may have
been Oneota garden beds. If these sites were of Oneota origin, they would clearly fit with
the postulated patterns elsewhere in the state (average minimum distance of the garden
bed site to study site is approximately 0.7 km), and would indicate that Oneota villages
and garden plots were placed in locations that did not require extensive travel.
While the garden beds may not be securely associated with Oneota material
culture, there are several other sites in the region that are. Most of the sites were located
and recorded during the 1980’s by the UWM and or Stout and Skavlem in 1908. Due to
the limited nature of the archaeological investigations, little is known about the size and
function of the sites. The majority of the sites were classified as campsite/villages in the
state’s codification files, two were listed as unknown, one was listed as a burial, and
several were listed as campsite/village and burial. Do to the paucity of data concerning
these sites, there is little one can do other than speculate as to their relationships with the
study sites, though additional work at these sites could provide a great deal of
information regarding the ways in which the occupants of the region utilized the
landscape (Figure 40). Based on the spatial locations of the sites, some were placed in a
similar fashion as the Oneota study sites, while others were placed in different
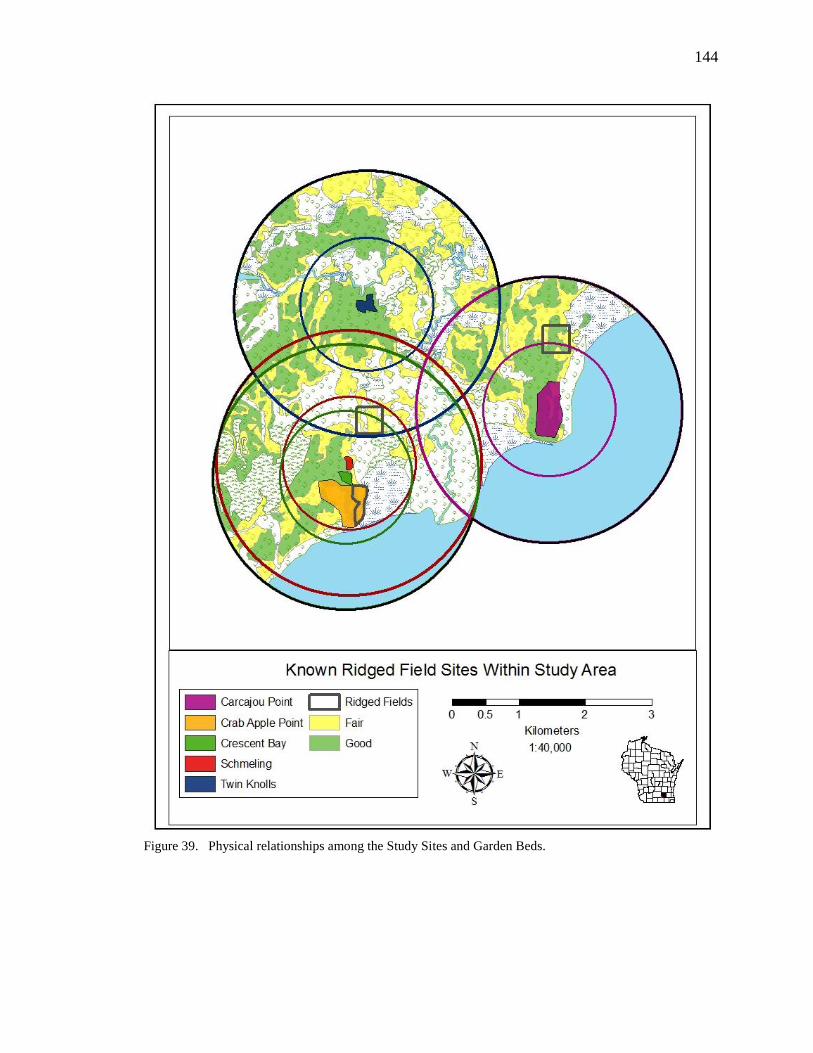
144
Figure 39. Physical relationships among the Study Sites and Garden Beds.
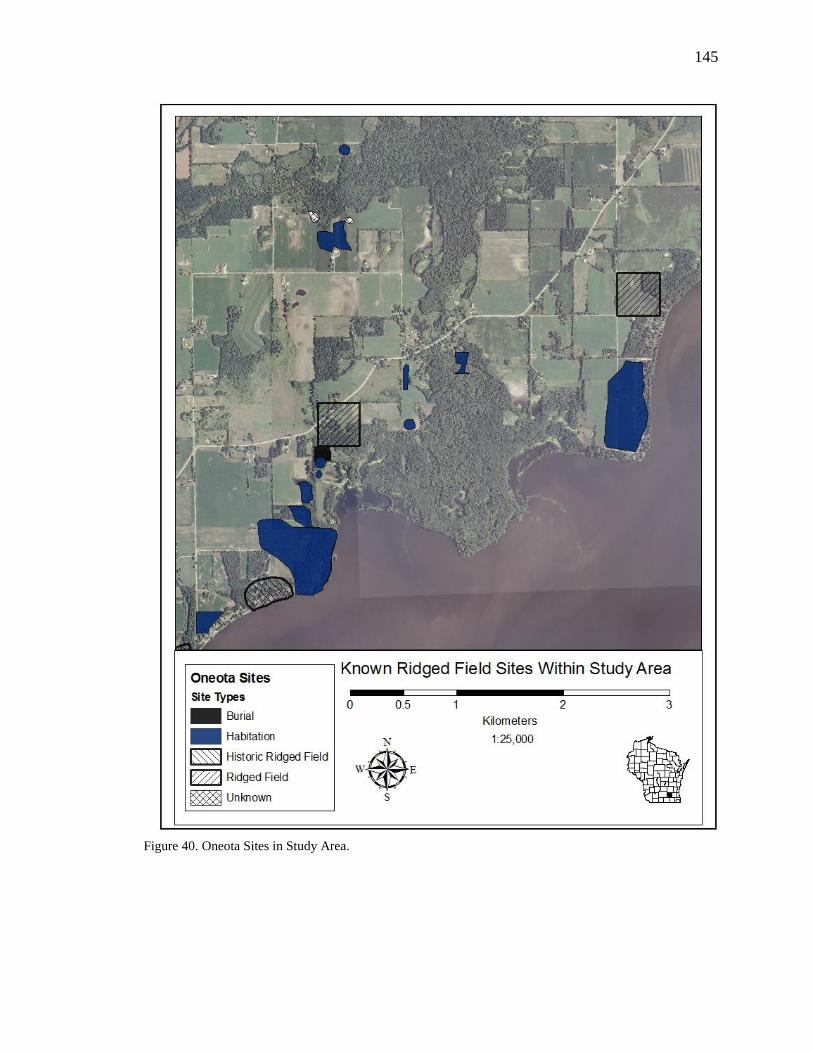
145
Figure 40. Oneota Sites in Study Area.
146
environmental/economic contexts. Future work may indicate that the regions inhabitants
utilized the landscape in a similar fashion as the Oneota site occupants in western
Wisconsin, as presented in Sasso (1989). Some of the other Oneota sites within the study
area may represent hamlets or extractive camps. With more data from these sites, it may
be possible to develop a settlement model rather than simply the settlement pattern
description presented here, thus allowing for a deeper understanding of culture and
lifeways practiced by the residents of Oneota sites. A list of the sites can be found in
Table 22.
Table 23. Oneota Sites within Study Area.
Site Name Site Number Site Type
Goldthrope Burials 47JE094 Burial
Purnell 47JE815 Campsite/Village
Carlson 47JE826 Campsite/Village
Marsden 47JE832 Campsite/Village
McKelvy Knoll 47JE849 Campsite/Village
Hearthstone 47JE089 Campsite/Village
Loge Bay 47JE087 Garden Beds
Messemer Garden Beds 47JE092 Garden Beds
Crab Apple Point 47JE093 Village/Burial/GardenBed/Cache
Bingham Corn Hills 47JE1158 Historic Garden Beds
Saunders Corn Hill 47DA1201 Historic Garden Beds
Marsden North 47JE854 Unknown
Weisensell 47JE855 Unknown
Blue Herron 47JE1001 Village
47JE1002 47JE1002 Village
Site Placement within an Optimization Context Despite the environmental
variation within the study area, it appears that economic factors played an important role
in determining site location. The results of this research suggest that additionally there
were three main economic factors that influenced site location: 1) distance to nearby
aquatic environments, 2) access to a complex ecotonal environment, 3) proximity to a
large amount of arable soils.

147
All of the sites were located overlooking some form of aquatic environment.
Given that the known Oneota diet consisted heavily of wetland, riverine and lacustrine
resources, the close proximity to such resources makes sense from an economic
perspective. As discussed in chapter two, many species of upland game are superficially
thought to be encountered by random chance can be effectively aggregated either
seasonally or by baiting favorable locations. Many aquatic resources, which are
primarily aggregated, found only within the boundaries of the aquatic resource zones can
be interpreted as patches. Because the Oneota occupants of the region knew exactly
where to go to exploit these aggregated resources, pursuit time was greatly reduced by
placing settlements in locations adjacent to the these highly productive wetlands. From
these locations near the water, hunters could travel into the nearby savannas to find the
upland game (e.g., deer), or they could wait near the water’s edge for their prey to arrive
since, like humans, they need water for survival.
While there may have been significant differences in composition of ecotones
among the sites, the extreme proximity of each of the sites to ecotones makes their
importance to the Oneota site occupants evident. The benefits of ecotones have been
discussed in-depth above, however it is important to reiterate that within an optimal
foraging context, ecotones represent areas that would have provided access to a wider
variety of resources. Since there were a greater variety of resources, it would have been
possible to exploit the more resource types with less time spent traveling to different
patches or regions. In optimal foraging terms, settlements placed near ecotones would
allow for shorter pursuit times. Additionally the richness of the ecotonal environment,
148
especially in aquatic ecotones, would have provided a large amount of food, at least
during the warm months, maximizing the time before the resources would be
overexploited. Therefore, by placing settlements near these highly productive resources
the sites’ residents were able to maximize their efficiency.
While there was some degree of variation of arable land among the sites, each site
was placed near a large amount of arable land. With substantial amounts of arable land
near the villages, it would have been possible to concentrate the majority of the cultivated
agricultural fields near the villages. There are multiple benefits of placing agricultural
fields near a site. For example, daily travel time during planting and harvesting to and
from the fields would be reduced. In autumn, harvested crops would not need to be
hauled far for processing, storage, or consumption, thereby saving time and energy for
other efforts. Cornfields also draw competitors/prey animals such as deer, raccoon, and
squirrel. As such they themselves provide excellent hunting grounds (Odum 1959).
As Sasso (2003) points out, keeping the agricultural fields close also provides a
measure of security for plants themselves as well as the people who would have been
tending the fields. It is not clear if security was an important factor in determining
Oneota settlement locations, however it is important to note that at current there is no
evidence of warfare at eastern Wisconsin Oneota sites (Foley Winkler 2010). With such
a small sample size, it is not possible to determine the minimum number of hectares that
were required before placing a settlement; however, based on Carcajou Point, the
minimum required was not any higher than 115 hectares.
Despite the fact that all of the sites are superficially in similar environments (i.e.,
savannas near a large lake), they are in several distinctly different microenvironmental

149
zones with differential access to a wide variety of resources. Nonetheless, each of the
sites was placed at the intersection of a variety of aquatic and upland ecotones, near large
islands of arable land. This central location allowed the Oneota site occupants to
maximize multiple resource zones effectively. Carcajou Point (Figure 41) is located just
north and west of a long lacusterine ecotone, with the most complex ecotones south of the
site. In the opposite direction, north and west of the site is a large mass of arable land. A
similar pattern can be seen for the other sites (Figures 42 to 44) as well, with ecotonal
regions concentrated to one direction from the site, and arable land to the other.
Summary of Oneota Settlement Patterns in the Koshkonong Locality While the
residents Oneota sites in the Koshkonong Locality may not have been choosing similar
environments in which to place each site, it appears that that there were several important
factors that determined Oneota site placement. As is true with most settlements (c.f. Hart
and Jeske 1987; Jochim 1976), the Oneota residents placed their village sites in areas that
were at a high enough elevation that they were not likely to flood. Rather than looking at
distance above absolute sea levels, it seems more appropriate to examine each site’s
elevation in reference to the topography surrounding it. The data suggest that the centers
of the sites were placed at least 10 meters above the adjacent aquatic environments with
the lowest portion of the sites roughly six meters above the wet environments. It is
important to note that with such a small sample that this argument is, at best, tentative.
Sites were also placed upon well-drained soils, at least in part to reduce flooding or
oversaturation of the ground. In order to maximize efficiency, the sites were placed
adjacent to aquatic environments on land that was on the border of ecotonal boundaries
and the edge of masses of arable land.
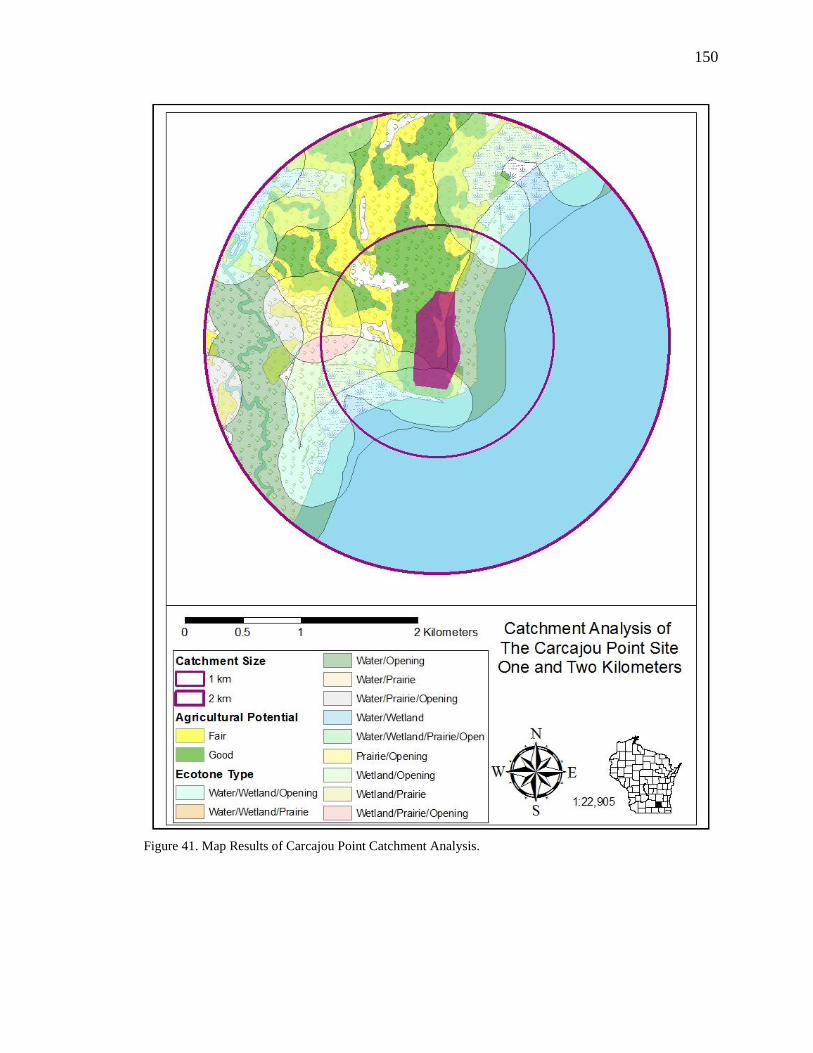
150
Figure 41. Map Results of Carcajou Point Catchment Analysis.
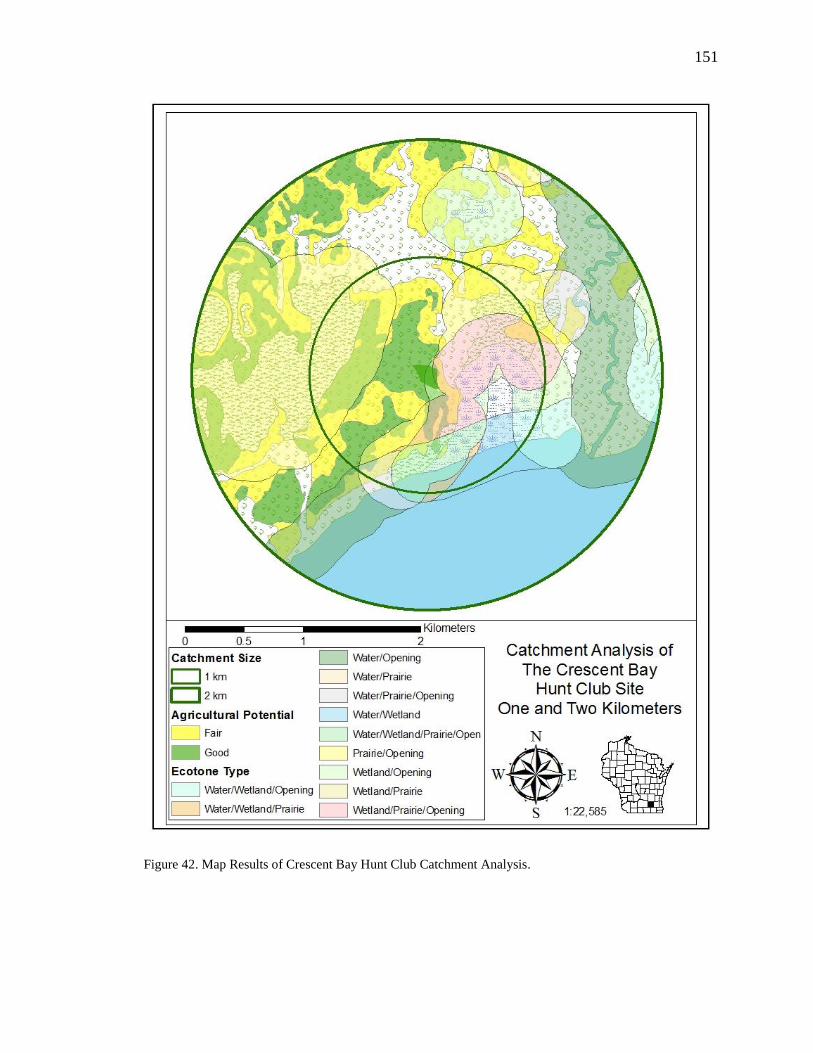
151
Figure 42. Map Results of Crescent Bay Hunt Club Catchment Analysis.
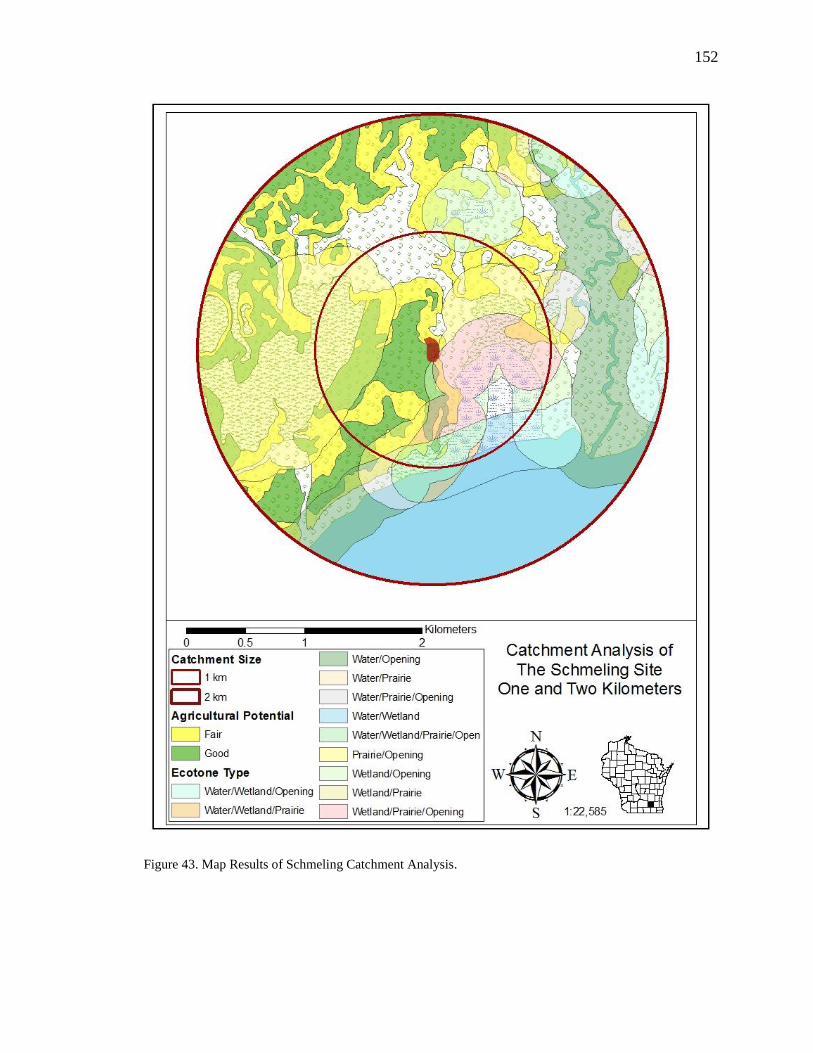
152
Figure 43. Map Results of Schmeling Catchment Analysis.
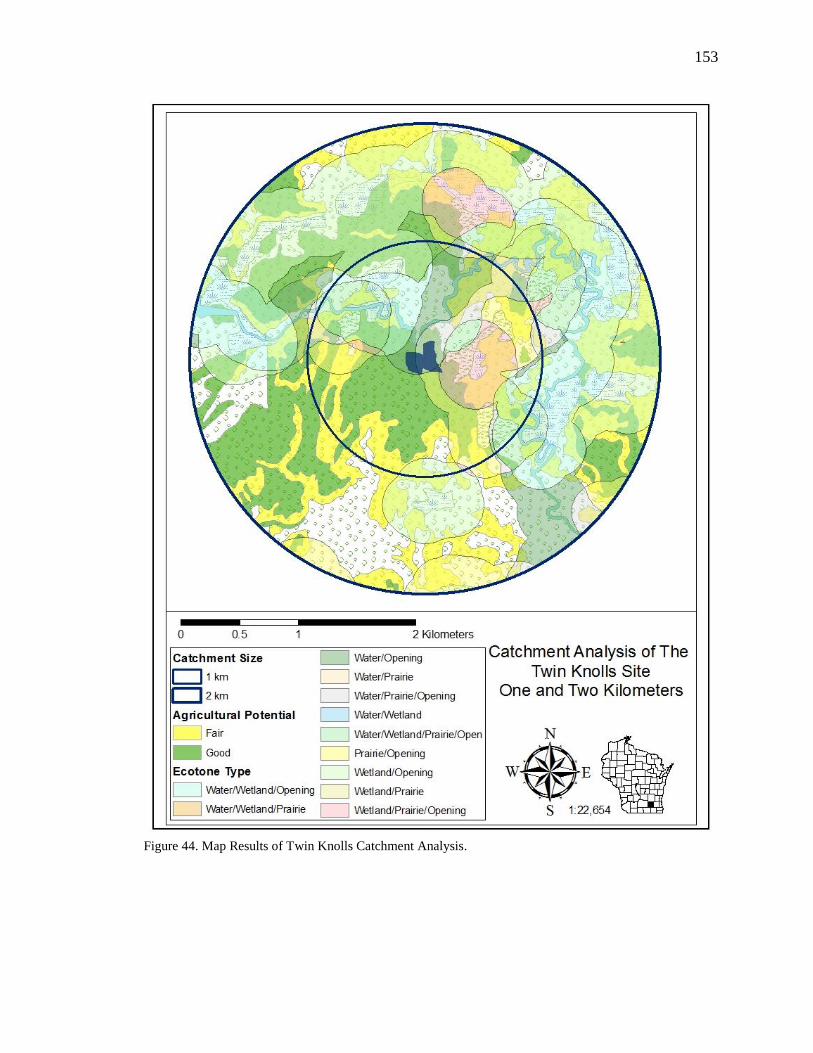
153
Figure 44. Map Results of Twin Knolls Catchment Analysis.

154
Question 5: How does this settlement pattern compare to previous explanations of
Upper Mississippian settlement patterns?
Past attempts at explaining the settlement patterns of Oneota typically used
coarse-grained data and described settlement placement in very broad terms. Over the
last two decades however, a great number of progress has been made, both
archaeologically and technologically that allow for a closer examination of the sites
environmental settings. Due to these advances, it is now possible to revisit, revaluate,
and build off of these previous studies; however, the differences in scale make
comparisons difficult.
Overstreet and Rodell offered conflicting descriptions of Oneota site locations in
eastern Wisconsin. Overstreet argued that Oneota sites were placed in a large-scale
ecotone that fostered a great deal of diversity which supported the wide spectrum
resource exploitation practiced by the occupants of Oneota sites, as evidenced by the
faunal and floral data recovered from the sites within his study (1976:235). Rodell
argued that the Eastern Ridges and Lowlands offered a very diverse environment, but the
Oneota sites were placed within relatively similar environments where they could exploit
wetland-eutrophic regions that supported savannas and forests (1983:107-108). Using
the settlement patterns within the Koshkonong Locality presented above as a test case, it
may be possible to assess the validity of each of their arguments.
Overstreet’s (1976:235) statement “that though they are marked by demonstrable
diversity, the environments of prehistoric [Oneota] components do not vary greatly” is
not well supported by the patterns present near Lake Koshkonong. Notably, there is more
variation of environmental composition within the study area than noted by Overstreet for
155
the region as a whole. The sites at Lake Koshkonong were placed in significantly
different environmental settings, with a high degree of variation in types of water
available, ecotone coverage and amonts of arable land.
Rodell’s assertion that the “region has a diverse environment that limited Oneota
adaptation to specific habitats” (1983:107) is partially supported by the data within the
Koshkonong Locality. As Rodell argues, the data for the Koshkonong Locality indicate
it was located within an extremely diverse environment. However, Rodell’s description
of how sites are placed within the diversity, i.e., areas along the Fox/Wolf and Rock
Rivers with wetland and oak resources does not accurately portray the diversity indicated
by the more fine-grained analysis. Twin Knolls for example is not located on the Rock
River, or where it widens to form Lake Koshkonong. It is found on a smaller tributary,
which is significantly smaller than both the other water bodies.
Sasso (1989) concluded that Oneota village sites in western Wisconsin were
placed adjacent to aggregated resources, i.e., wetlands and arable land and were occupied
at least late from late spring into early fall. As previously noted, a similar pattern can
also be seen in the Koshkonong locality. Sasso also discusses the seasonality of the
villages and the relationship among Oneota sites. He argues that during the warm months
villages were occupied by the majority of the region’s residents, though small farmsteads
were occupied regularly and extractive camps would have been occupied as needed.
Shortly after the fall harvest was complete, the village residents would begin to disperse
into smaller settlements over a larger area. While it is possible that there was a similar
pattern of site exploitation within the Koshkonong Locality, there is currently not enough
data pertaining to small Oneota sites in the region to determine the site utilization

156
patterns. As indicated above, the study sites may have been occupied year around. If this
is true, then it would indicate that the residents of the Koshkonong Locality sites adapted
to winters differently than their western neighbors. With additional data pertaining to
smaller sites, it may be possible to shed further light on the topic. If the Koshkonong
Locality residents did disperse into smaller groups in the winters, then the smaller sites
should provide an indication of this.
The Langford settlement patterns described by Jeske (1989, 1990b, 2000b, 2003b)
is quite different than the settlement patterns exhibited by the residents of the Oneota
sites in the Koshkonong Locality. While both Langford and Oneota sites were placed
near wetlands and arable land, the Langford sites were clearly placed in much drier
environments. Since the catchments for the Langford sites were measured in miles and
the Oneota sites in kilometers, it is difficult to make exact comparisons; however, the
averaging the values of the double catchment should allow for a relatively accurate
comparison. Approximately five percent of the one-mile (1.6 km) catchment of the
Keeshin Farm site was a wet environment. Wet environments accounted for six percent
of the one-kilometer catchment and 14 percent of the two-kilometer catchment of Twin
Knolls, the driest of the four study sites, which average to 10 percent, or twice that of
Keeshin Farms. The range of wet environments near all the sites is 10 to 53 percent (ca.
2-11 times higher than Keeshin Farm) and averages 27 percent (more than 5 times
Keeshin Farm) of total catchment (Jeske 2003b:172).
Jeske (1989) also argued that Langford sites were placed near soils that were drier
and better drained than Oneota sites. After examining the soils distribution with a one-
mile catchment of 15 Langford sites in the Chicago and Rock River regions, Jeske found
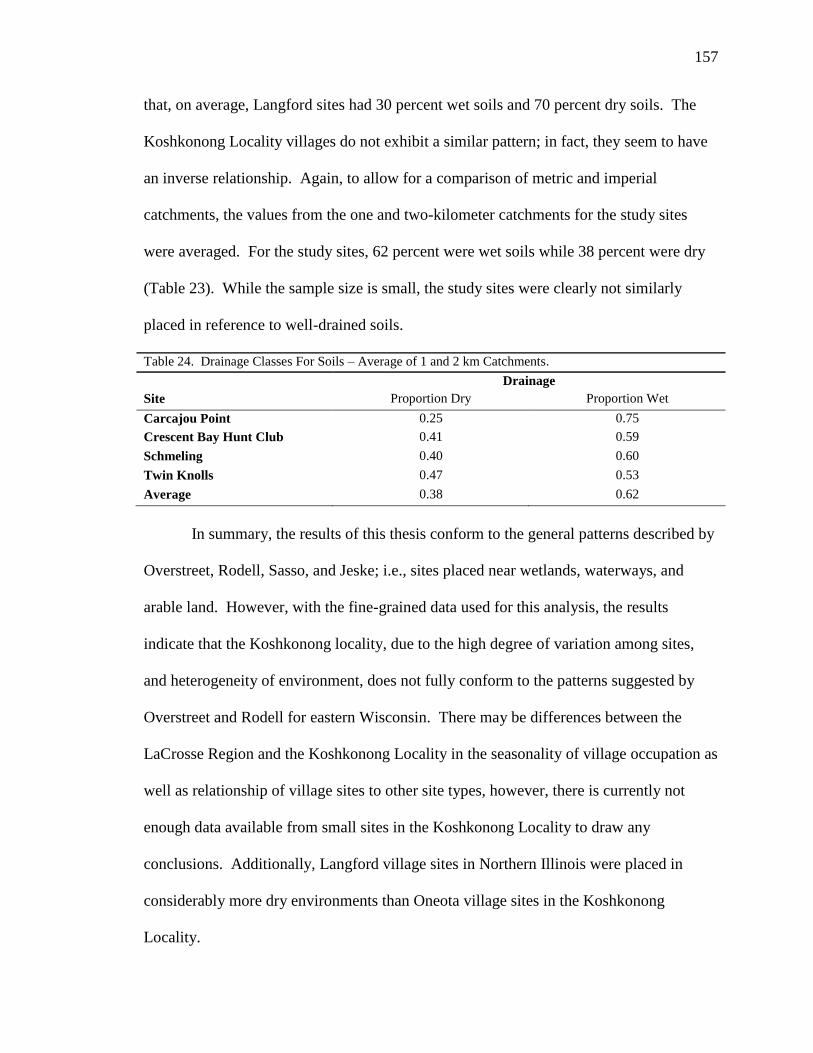
157
that, on average, Langford sites had 30 percent wet soils and 70 percent dry soils. The
Koshkonong Locality villages do not exhibit a similar pattern; in fact, they seem to have
an inverse relationship. Again, to allow for a comparison of metric and imperial
catchments, the values from the one and two-kilometer catchments for the study sites
were averaged. For the study sites, 62 percent were wet soils while 38 percent were dry
(Table 23). While the sample size is small, the study sites were clearly not similarly
placed in reference to well-drained soils.
Table 24. Drainage Classes For Soils – Average of 1 and 2 km Catchments.
Drainage
Site Proportion Dry Proportion Wet
Carcajou Point 0.25
0.75
Crescent Bay Hunt Club 0.41
0.59
0.59
Schmeling 0.40
0.60
Twin Knolls 0.47
0.53
Average 0.38
0.62
In summary, the results of this thesis conform to the general patterns described by
Overstreet, Rodell, Sasso, and Jeske; i.e., sites placed near wetlands, waterways, and
arable land. However, with the fine-grained data used for this analysis, the results
indicate that the Koshkonong locality, due to the high degree of variation among sites,
and heterogeneity of environment, does not fully conform to the patterns suggested by
Overstreet and Rodell for eastern Wisconsin. There may be differences between the
LaCrosse Region and the Koshkonong Locality in the seasonality of village occupation as
well as relationship of village sites to other site types, however, there is currently not
enough data available from small sites in the Koshkonong Locality to draw any
conclusions. Additionally, Langford village sites in Northern Illinois were placed in
considerably more dry environments than Oneota village sites in the Koshkonong
Locality.

158
CHAPTER FIVE
CONCLUSION
Summary
The research conducted for this thesis was centered on four Oneota sites,
Carcajou Point, Crescent Bay Hunt Club, Schmeling, and Twin Knolls, occupied from
circa A.D.1200-1400. This research was heavily influenced by the work of Overstreet
(1976, 1978), Rodell (1983), Sasso (1989), and Jeske (1989, 1990b, 2000b, 2003b). It
was the goal of this research to build upon the results of these previous research projects,
and to expand and produce more-refined results for one locality. The data generated
were used to evaluate the environmental contexts of the site to determine what, if any,
ecological factors were used to place sites. This goal was accomplished with the use of
catchment analysis and interpretations based on optimal foraging theories. Original
vegetation was modeled with the use of the General Land Office survey notes, sketch
maps, and modern soil data. Variables used included environmental zones, ecotones,
amount of arable land, and distance to important resources The results indicated that
Oneota village sites were placed in a diverse set of environments; however, the sites were
located to optimize three things: distance to an aquatic environment; distance to ecotones;
distance to large amounts of arable land. In order to optimize these three factors, the
occupants of the region built their sites on high ground at the edge of an aquatic
environment, between an area of ecotones and arable land.

159
Future Research
There is still a great deal of work that needs to be done on this topic in order to
refine and test the validity of the results of this study. Higher resolution data of the
subsistence practices of the sites’ occupants needs to be conducted. Much of this is
currently underway for the Schmeling and Crescent Bay sites, but was not available at
this time. Before such a study can be conducted of the Twin Knolls site, further
archaeological work must be conducted at the site, including subsurface excavations.
With such data, comparisons of the fauna and flora from each site could be conducted,
thereby allowing a means to determine the variation of resources exploited from each
site. Given the environmental differences of the sites, it would not be unreasonable to
assume that there would be some differences in resource exploitation. The occupants of
Twin Knolls, the driest of the sites, may have exploited more non-prairie upland game,
while the residents of Schmeling and Crescent Bay may have obtained a greater amount
of prairie resources such as bison than Carcajou Point. Research of this type could also
benefit from more data pertaining to the smaller Oneota sites in the region, especially
data that would allow for site type determinations. Until such data are obtained, it is not
possible to make interpretations as to the relationships among the various sites, or the
ways in which the creators of the sites utilized the landscape. Additionally, conducting
similar settlement pattern analyses in other Oneota localities could prove to be another
potentially fruitful avenue of research. This would allow for regional comparisons to be
made, and a better understanding of the nature of interactions among the residents of the
various regions of southeast Wisconsin. Additional raster-based GIS work on this topic
can utilize the vector-based data that was generated for this research. A raster-based

160
analysis may be able to more accurately model the sites’ residents’ access to resources
with the use of digital elevation models, least cost path analyses, and other cell by cell,
map algebra based computations.

161
REFERENCES CITED
Aitchison, John and Michael Greenacre
2002 Biplots of Compositional Data. Jounral of hte Royal Statistical Socety:
Series C (Applied Statistics) 51(4):375-392.
ARG (American Resource Group, Ltd.)
1985 An Inventory and Evaluation of Known Archaeological Resoures in the
Illinois and Michigan Canal National Herritage Corridor, Illinois. vol. I.
Cultural Resources Report, vol. 111. Carbondale.
Arzigian, Constance
1989 The Pammel Creek Site Floral Remains. Wisconsin Archeologist 70(1-
2):111-156.
2000 Middle Woodland and Oneota Contexts for Wild Rice Exploitation in
Southwestern Wisconsin. Midcontinental Journal of Archaeology 25(2):245-268.
Asch, David L. and Nancy B. Asch
1985 Prehistoric Plant Cultivation in West-Central Illinois. vol. Prehistoric
Food Production in North America, No. 75. Museum of Anthropology, University
of Michigan, Ann Arbor.
Benchley, Elizabeth D., Blane Nansel, Clark A. Dobbs, Susan M. Thurston Myster and
Barbara H. O'Connell
1997 Archaeology and Bioarchaeology of the Northern Woodlands. vol.
Arkansas Archeological Survey Research Series, No. 52. Arkansas Archeological
Survey, Fayetteville.
Benn, David W.
1995 Woodland People and the Roots of the Oneota. In Oneota Archaeology
Past, Present, and Future, edited by W. Green, pp. 91-140. Office of the State
Archaeologist, Iowa City.
Berres, Thomas E.
2001 Power and Gender in Oneota Culture: A Study of Late Prehistoric People.
vol. Northern Illinois University Press, De Kalb.
Boszhardt, Robert F.
1998 Oneota Horizons: A La Crosse Perspective. Wisconsin Archeologist
79:196-226.
Brandt, Roel , Bert J. Groenewoudt and Kenneth L. Kvamme
1992 An Experiment in Archaeological Site Location: Modeling in the
Netherlands using GIS Techniques. World Archaeology 24(2):268-282.

162
Brink, John
1835 General Land Office Survey Notes for the Interior Sections of Township 5
North, Range 13 East, 4th Meridian, 1835. Electronic Document,
http://digicoll.library.wisc.edu/cgi-bin/SurveyNotes/SurveyNotes-
idx?type=header&issueid=SurveyNotes.INT122E05&twp=T005NR013E,
accessed January, 2009.
Brooks, Robert Lee
1986 Catchment Analysis Revisited: A Critique and Application of a Test Case.
Unpublished Ph.D. Dissertation, Anthropology, University of Kentucky,
Lexington.
Brown, Charles E.
1909 Additions to the Record of Wisconsin Antiquities III. Wisconsin
Archeologist 8(4):113-138.
Brown, James A.
1965 The Prairie Penninsula: An Interaction Area in the Eastern United States.
Unpublished Ph.D. Dissertation, Anthropology, The University of Chicago,
Chicago.
1982 What kind of Economy did the Onetoa Have? In Oneota Studies, edited by
G. E. Gibbon, pp. 107-112. University of Minnesota Publications in
Anthropology Number 1. University of Minnesota, Minneapolis.
Brown, James A. and Robert F. Sasso
2001 Prelude to History on the Eastern Prairies. In Societies in Eclipse, edited
by D. S. Brose, C. W. Cowan and R. C. Mainfort Jr., pp. 205-228. Smithsonian
Institution Press, Washington.
Brubaker, Robert and Lynn Goldstein
1991 Jefferson County: Archaeological Investigations at Carcajou Point in the
Lake Koshkonong Region. In The Southeastern Wisconsin Archaeology Program,
edited by L. Goldstein, pp. 35-83. Report of Investigations, No. 107.
Archaeological Research Laboratory University of Wisconsin-Milwaukee,
Milwaukee.
Clauter, Jody
2010 Same Vessel, Different Mound: Ceramic Analysis from the Nitschke
Mound Group (47DO27) and Nitschke Garden Beds (47DO518). Paper presented
at the Annual Meeting of the Society for American Archaeology, St. Louis.
Clelland, C. E.
1966 The Prehistoric Animal Ecology of the Upper Great Lakes Region. vol.
Anthropological Papers, No. 29. Museum of Anthropology, University of
Michigan, Ann Arbor.

163
Cowell, Shannon H., Eric J. Scheutz and Seth A. Schneider
2008 The Oneota Component at the Twin Knolls Site (47JE379). Paper
presented at the 54th Annual Midwest Archaeological Conference, Milwaukee.
Curtis, J.T.
1959 The Vegetation of Wisconsin. vol. University of Wiscsonsin Press,
Madison.
Denevan, William M.
1992 The Pristine Myth: The Landscape of the Americas in 1492. Annals of the
Association of American Geographers 82(3):369-385.
Dillemuth, Julie A.
1999 A GIS Analysis of the Lake Koshkonong Effigy Mounds. In Southeastern
Wisconsin Archaeology Program: 1998-1999, edited by R. J. Jeske, pp. 95-143.
Report of Investigations, no. 141. University of Wisconsin-Milwaukee
Archaeology Research Laboratory, Milwaukee.
Division of Historic Preservation, Wisconsin Historical Society
2003 Archaeological Site Inventory. Electronic document,
http://www.wisahrd.org/index.cfm?d=show&t=welcome, accessed March, 2010.
Edwards IV, Richard W.
2008 A GIS Analysis of the Schmeling Site. Paper presented at the Midwest
Archaeological Conference, Milwaukee.
Finley, Robert W.
1976 Original Vegetation Cover of Wisconsin. U.S.D.A. Forest Service, North
Central Forest Experiment Station,St. Paul.
Flannery, Kent V. (editor)
2009 The Early Mesoamerican Village. Updated Edition ed. Left Coast Press
Inc., Walnut Creek.
Foley Winkler, Kathleen M.
2008 2008 Investigations at the Schmeling Site (47JE833). Paper presented at
the 54th Annual Midwest Archaeological Conference, Milwaukee.
2010 Oneota and Langford Morturary Practices from Eastern Wisconsin and
Northeastern Illinois. Paper presented at the 2010 Society for American
Archaeology Annual Conference, St. Louis.
Foley Winkler, Kathleen M. and Robert J. Jeske
2003 Analysis of Crescent Bay Hunt Club Burials. In Lake Koshkonong
2002/2003: Archaeological Investigations at Three Sites in Jefferson County,

164
Wisconsin, edited by R. J. Jeske, pp. 80-94. Report of Investigations, no 153.
University of Wisconsin-Milwaukee Archaeological Research Laboratory
Milwaukee.
Fowler, Melvin L.
1969 Middle Mississippian Agricultural Fields. American Antiquity 34(4):365-
375.
Gaff, D.G.
1998 Preliminary Investigations at the Crescent Bay Hunt Club, Jefferson
County. In The Southeastern Wisconsin Archaeology Program: 1997-1998, edited
by R. J. Jeske, pp. 34-75. Report of Investigations, No. 130. Archaeological
Research Laboratory, University of Wisconsin-Milwaukee, Milwaukee.
Gallagher, James P., Robert F. Boszhardt, Robert F. Sasso and Katherine Stevenson
1985 Oneota Ridged Field Agriculture in Southwestern Wisconsin. American
Antiquity 50(3):605-612.
1987 Floodplain Agriculture in the Driftless Area: A Reply to Overstreet.
American Antiquity 52(2):398-404.
Gallagher, James P. and Robert F. Sasso
1987 Investigations into Oneota Ridged Field Agriculture on the Northern
Margin of the Prairie Peninsula Plains Anthropologist 32(116):141-151.
Gallagher, James P. and Katherine Stevenson
1982 Oneota Subsistence and Settlemen in Southwestern Wisconsin. In Oneota
Studies, edited by G. E. Gibbons, pp. 15-28. University of Minnesota Publications
in Anthropology Number 1. University of Minnesota, Minneapolis.
Gibbon, Guy E.
1969 The Walker Hooper and Bornick Sites. Unpublished Ph.D. Dissertation,
Anthropology, University of Wisconsin-Madison, Madison.
1972 Cultural Dynamics and the Development of the Oneota Life-Way in
Wisconsin. American Antiquity 37(2):166-185.
1982 Oneota Origins Revisited. In Oneota Studies, edited by G. E. Gibbon, pp.
85-90. Univeristy of Minneosta Publications in Anthropology Number 1.
Univerity of Minneosta, Minneapolis.
1986 The Mississippian Tradition: Oneota Culture. Wisconsin Archeologist
67(2):314-338.
n.d. Je 244: The Crescent Bay Hunt Club Site. Unpublished Manuscript in
possession of the author.

165
Glocker, Carl L.
1979 Soil Survey of Jefferson County, Wisconsin. vol. U.S. Department of
Agriculture, Soil ConservationService.
Glocker, Carl L. and Robert A. Patzer
1978 Soil Survey of Dane County, Wisconsin. vol. U.S. Department of
Agriculture Soil Conservation Service.
Goldstein, Lynn (editor)
1982 Archaeology in the Southeastern Wisconsin Glaciated Region: Phase I.
University of Wisconsin-Milwaukee Archaeological Research Laboratory,
Milwaukee.
Goldstein, Lynn and Robert Kind
1995 The Physical Environment: The Early Vegetation of the Region. In
Southeastern Wisconsin Archaeology Project: 1986-87 & Project Summary,
edited by L. Goldstein, pp. 18-37. Report of Investigations, No. 88. University of
Wisconsin-Milwaukee Archaeological Research Laboratory, Milwaukee.
Green, William
1993 Examining Protohistoric Depopulation in the Upper Midwest. Wisconsin
Archeologist 74(1-4):290-323.
Greenacre, Michael and Paul Lewi
2009 Distributional Equivalence and Subcmpositional Coherence in the
Analysis of Compositional Data, Contigency Tables and Ratio-Scale
Measurements. Journal of Classification 26:29-54.
Griffin, Duane
1994 Pollen Analog Dates For Midwestern Oak Savannas. In Proceedings of the
North American Conference on Barrens and Savannas at Illinois State University
Normal, Illinois, October 15-16, 1994, edited by J. S. Fralish, R. C. Anderson, J.
E. Ebinger and R. Szafoni, pp. 91-94. The Environmental Protection Agency,
Great Lakes National Program Office, Normal.
Griffin, James B.
1960 Climatic Change: A Contributary Cause of the Growth and Decline of
Northern Hopewellian Culture. Wisconsin Archeologist 41(2):22-33.
Griffin, John Wallace
1946 The Upper Mississippian Occupations of the Fisher Site, Will County,
Illinois. Unpublished Master's Thesis, Anthropology, University of Chicago,
Chicago.

166
Hall, Robert L.
1962 The Archeology of Carcajou Point: With an interpretation of the
development of Oneota culture in Wisconsin. vol. 2 vols. The University of
Wisconsin Press, Madison.
1986 Upper Mississippi and Middle Mississippi Relations. Wisconsin
Archeologist 67(3-4):365-369.
Hanson, Paul
1996 Jefferson County: A Survey of the Crescent Bay Hunt Club Property. In
The Southeastern Wisconsin Archaeology Program: 1995-96, edited by L.
Goldstein, pp. 42-52. Report of Investigations, No. 128. Archaeological Research
Laboratory, University of Wisconsin-Milwaukee, Milwaukee.
Hart, John P.
1990 Modeling Oneota Agricultural Production: A Cross-Cultural Evaluation.
Current Anthropology 31(5):569-577.
Hart, John P. and Robert J. Jeske
1987 Report on a Systematic Archaeological Survey of Portions of the Illinois-
Michigan Canal National Heritage Corridor, in Cook, Will,Du Page, Grundy and
La Salle Counties, Illinois. vol. Contributions No. 5, Northwestern
Archaeological Center, Evanston.
Heffley, Sheri
1981 Northern Athapaskan Settlement and Resouce Distribution. In Hunter
Gatherer Foraging Strategies, edited by B. Winterhalder and E. A. Smith, pp.
126-147. University of Chicago Press, Chicago.
Henning, Dale R.
1995 Oneota Evolution and Interactions: A Perspective from teh Wever
Terrace, Southeast Iowa. In Oneota Archaeology Past, Present and Future, edited
by W. Green, pp. 65-90. Office of the State Archaeologist, Iowa City.
1998a Managing Oneota. Wisconsin Archeologist 79(1):122-130.
1998b Managing Oneota: A Reiteration and Testing of Contemporary
Archaeological Taxonomy. Wisconsin Archeologist 79(2):9-28.
Hunt, Eleazer D.
1992 Upgrading Site-Catchment Analyses with the Use of GIS: Investigating
the Settlement Patterns of Horticulturalists. World Archaeology 24(2):283-309.
Hunter, Chrisie L.
2002 A Comparative Study of Oneota. Unpublished Master's Thesis,
Anthropology, University of Wisconsin-Milwaukee, Milwaukee.

167
Hunter, Chrisie L., Anna Lampien and Christina Zervic
2003 Feature Analysis. In Lake Koshkonong 2002/2003: Archaeological
Investigations at three sites in Jefferson County, Wisconsin, edited by R. J. Jeske,
pp. 37-72. Report of Investigations, No. 153. University of Wisconsin-Milwaukee
Archaeological Research Laboratory, Milwaukee.
Jackson, Donald (editor)
1964 Black Hawk: An Autobiography. University of Illinois Press, Urbana.
Jeske, Robert J.
1988 The Archaeology of the Chain O'Lakes Region in Northeastern Illinois.
Illinois Historic Preservation Agency.
1989 Horticultural Technology and Social Interaction at the Edge of the Prairie
Peninsula. Illiniois Archaeology 1(2):103-120.
1990a Environmental Variation and Site Distribution at the Prairie Peninsula
Edge: The View From Fermi National Accelerator Laboratory, Batavia, Illinois.
The Wisconsin Archeologist 71(3-4):137-171.
1990b Langford Tradition Subsistence, Settlement, and Technology.
Midcontinental Journal of Archaeology 15(2):221-249.
1999 The Physical Setting. In Cedar Creek Valley: A Systematic
Archaeological Survey in Ozaukee and Washington Counties, Wisconsin, edited
by R. J. Jeske, pp. 19-40. Report of Investigations, no. 138. University of
Wisconsin-Milawaukee Arcaeological Research Laboratory, Milwaukee.
2000a Continuing Investigations at Crescent Bay Hunt Club Site (47-Je-904),
Jefferson County. In The Southeastern Wisconsin Archaeology Program:
1999-2000, edited by R. J. Jeske, pp. 4-43. Report of Investigations, 145.
Archaeological Research Laboratory, University of Wisconsin-Milwaukee,
Milwaukee.
2000b The Washington Irving Site: Langford Tradition Adaptations in Northern
Illinois. In Mounds, Modoc, and Mesoamerica, edited by S. R. Ahler, pp. 265-
294. Illinois State Museum Scientific Papers Series. vol. XXVIII. Illinois State
Museum, Springfield.
2001 Crescent Bay Hunt Club: Radiocarbon Dates and Research Summary. In
Program in Midwestern Archaeology (SOUTHEASTERN WISCONSIN
ARCHAEOLOGY PROGRAM): 2000-2001, edited by R. J. Jeske, pp. 4-12.
Report of Investigations, Number 148. Archaeological Research Laboratory,
University of Wisconsin-Milwaukee, Milwaukee.

168
2003a Ceramic Description. In Lake Koshkonong 2002/2003: Archaeological
Investigations at Three Sites in Jefferson County, Wisconsin, edited by R. J. Jeske,
pp. 77-79. Report of Investigations, no. 153. University of Wisconsin-Milwaukee
Archaeology Research Laboratory, Milwaukee.
2003b Langford and Fisher Ceramic Traditions: Moiety, Ethnicity or Power
Relations in the Upper Midwest? Wisconsin Archeologist 84(1&2):165-180.
2008 Space and Time at the Crescent Bay Hunt Club. Paper presented at the
Annual Meeting of the Midwest Archaeological Conference, Milwaukee.
n.d. Oneota Occupation of Lake Koshkonong: Dates, Diets, Technology and
Spatial Organization. Unpublished Manuscript in the posession of the author.
Jeske, Robert J., Kathleen M. Foley Winkler and Louise C. Lambert
2003 Continuing Investigations at the Crescent Bay Hunt Club Site (47Je904),
Jefferson County, Wisconsin. In Lake Koshkonong 2002/2003: Archaeological
Investigations at Three Sites in Jefferson County, Wisconsin, edited by R. J. Jeske,
pp. 6-94. Report of Investigations, no. 153. Archaeological Research Laboratory,
University of Wisconsin-Milwaukee, Milwaukee.
Jeske, Robert J., Chrisie L. Hunter, Daniel M. Winkler, Debra L. Miller and Leanne
Plencner
2003 Preliminary Investigations at Carcajou Point (47JE02) Kelly North Tract.
In Lake Koshkonong 2002/2003: Archaeological Investigations at Three Sites in
Jefferson County, Wisconsin, edited by R. J. Jeske, pp. 95-163. Report of
Investigations, no. 153. University of Wisconsin-Milwaukee Archaeological
Research Laboratory Milwaukee.
Jeske, Robert J. and Daniel M. Winkler
2008 The Clovis Occupation of the Schmeling Site (47JE833) in Jefferson
County, Wiscosin. Current Research in the Pleistocene 25:99-102.
Jochim, Michael
1976 Hunter-Gatherer Subsistence and Settlement: A Predictive Model. vol.
Academic Press, New York.
1983 7 Optimization Models in Context. In Archaeological Hammers and
Theories, edited by J. A. Moore and A. S. Keene, pp. 157-172. Academic Press,
New York.
Kaufmann, Kira
2005 Effigy Mound Sites as Cultural Landscapes : A Geophysical Spatial
Analysis of Two Late Woodland sites in southeastern Wisconsin. Unpublished
PhD Dissertation, Anthropology, University of Wisconsin-Milwaukee,
Milwaukee.

169
Keene, Arthur S.
1981 Prehistoric Foraging in a Temperate Forest: A Linear Programming
Model. vol. Academic Press, New York.
1983 Biology, Behavior, and Borrowing: A Critical Examination. In
Archaeological Hammers and Theories, edited by J. A. Moore and A. S. Keene,
pp. 137-156. Academic Press, New York.
Keyes, Charles Reuben
1929 Some Methods and Results of the Iowa Archaoelogical Survey. Wisconsin
Archeologist 8(4):135-143.
1934 Prehistoric Cultures. The Palimpsest 15(10):215-229.
King, J. E.
1981 Late Quaternary Vegetational History of Illinois. Late Quaternary
Vegetational History of Illinois 5(1):43-62.
Kinietz, W. Vernon
1965 The Indians of the Western Great Lakes: 1615-1760. vol. Ann Arbor
Paperbacks, The University of Michigan Press, Ann Arbor.
Land, Wisconsin Board of Commissioners of Public
2005 Wisconsin Public Land Survey Records: Original Field Notes and Plat
Maps. Electronic document,
http://digicoll.library.wisc.edu/SurveyNotes/SurveyInfo.html, accessed September
14th, 2007.
Langford, George
1927 The Fisher Mound Group, Successive Aboriginal Occupations near the
Mouth of the Illinois River. American Anthropologist 29(3):153-205.
Lapham, Increase A.
1855 Antiquities of Wisconsin. vol. The Smithsonian Institution Washington
D.C.
Lee, Ricahrd B.
1969!Kung Bushman Subsistence: AN Input-Output Analysis. In Environment
and Cultural Behavior, edited by A. P. Vayda, pp. 47-79. The Natural History
Press, Garden City.
McCarthy, Elizabeth and Alexander Matenaer
n.d. Faunal Analysis of the Schemeling Site (47-JE-833) in Jefferson County,
Wisconsin. Unpublished Manuscript in possession of the author.

170
McKern, William C.
1931 Wisconsin Pottery. American Anthropologist 33(3):383-390.
1942 The First Settlers of Wisconsin. Wisconsin Magazine of History
26(2):153-169.
Michalik, Laura K.
1982 An Ecological Perspective on the Huber Phase Subsistence-Settlement
System. In Oneota Studies, edited by G. E. Gibbon, pp. 29-54. University of
Minnesota Publications in Anthropology Number 1. University of Minnesota,
Minneapolis.
Miller, Lorin
1833 General Land Office Survey Notes for the Interior Sections of Township 5
North, Range 12 East, 4th Meridian, 1833. Electronic Document,
http://digicoll.library.wisc.edu/cgi-bin/SurveyNotes/SurveyNotes-
idx?type=header&issueid=SurveyNotes.INT113E01&isize=M&twp=T005NR012
E, accessed January, 2009.
Mollet, Janean and Robert J. Jeske
2001 Feature Analysis of the Crescent Bay Hunt Club Site. In Program in
Midwestern Archaeology (Southeastern Wisconsin Archaeological Program):
2000-2001, pp. 4-112. Report of Investigations, no. 148. University of Wisconsin-
Milwaukee Archaeological Research Laboratory, Milwaukee.
Moore, James A.
1981 The Effects of Information Networks in Hunter-Gatherer Societies. In
Hunter-Gatherer Foraging Strategies, edited by B. Winterhalder and E. A. Smith,
pp. 194-217. University of Chicago Press, Chicago.
Moran, Robbin Craig
1978 Presettlement Vegetation of Lake County Illinois. Paper presented at the
Paper presented at the 5th Midwest Prairie Conference, Ames.
1980 Presettlement (1830) Vegetation of De Kalb, Kane, and Du Page Counties,
Illinois. Unpublished Master's Thesis, Botany, Southern Illinois University,
Carbondale.
Moss, James
2008 Intrasite Feature Analysis of the Crescent Bay Hunt Club Site. Paper
presented at the Annual Midwest Archaeological Conference, Milwaukee.
2010 Intrasite Feature Analysis of the Crescent Bay Hunt Club (47JE904).
Unpublished Master's Thesis, Anthropology, University of Wisconsin-
Milwaukee, Milwaukee.

171
Musil, Jennifer L.
1987 Lake Koshkonong Region: Survey and Effigy Mound Research. In
Southeastern Wisconsin Archaeology Project: 1986-87 & Project Summary,
edited by L. Goldstein, pp. 121-181. Report of Investigations, no. 88. University
of Wisconsin-Milwaukee Archaeological Research Laboratory, Milwaukee.
O'Connell, James F. and Kristen Hawkes
1981 Alawara Plant Use and Optimal Foraging Theory. In Hunter-Gatherer
Foraging Strategies, edited by B. Winterhalder and E. A. Smith, pp. 99-125.
University of Chicago Press, Chicago.
Odum, Eugene P.
1959 Fundamentals of Ecology. Second ed. vol. W.B. Saunders Company,
Philadelphia.
Olsen, M. Lee
2003 Oneota Subsistence in Southern Wisconsin: Agriculture and Plant
Domestication at the Crescent Bay Hunt Club Site. Unpublished Master's Thesis,
Anthropology, University of Wisconsin-Milwaukee, Milwaukee.
Overstreet, David F.
1976 The Grand River, Lake Koshkonong, Green Bay, and Lake Winnebago
Phases: Eight Hundred Years of Oneota Prehistory in Eastern Wisconsin.
Unpublished Ph.D. Dissertation, Anthropology, University of Wisconsin-
Milwaukee, Milwaukee.
1978 Oneota Settlement Patterns in Easterin Wisconsin: Some Considerations
of Time and Space. In Mississippian Settlement Patterns, edited by B. D. Smith,
pp. 21-52. Academic Press, New York.
1981 Investigations at the Pipe Site (47Fd10) and some perspectives on Easter
Wisconsin Oneota Prehistory. Wisconsin Archeologist 62(4):365-525.
1995 The Eastern Wisconsin Oneota Regional Continuity. In Oneota
Archaeology: Past, Present, and Future, edited by W. Green, pp. 33-64. Report
20, Office of the State Archaeologist Iowa City.
1997 Oneota Prehistory and History. The Wisconsin Archeologist 78(1/2):251-
296.
Pawlowsky-Glahn, V. and J. J. Egozcue
2006 Compositional data and their Analysis: An Introduction. In Compositional
Data in the Geosciences: From Theory to Practice, edited by A. Buccianti, M.-F.
G. and V. Pawlowsky-Glahn, pp. 1-10. Geological Society Special Publication
264. The Geological Society of London, Wiltshire.

172
Peske, G. Ricahrd
1966 Oneota Settlement Patterns and Agricultural Patterns in Winnebago
County. Wisconsin Archeologist 47(4):190.
1971 Winnebago Cultural Adaptation to the Fox River Waterway. Wisconsin
Archeologist 52(2):52-70.
Quimby, George Irving
1960 Indian Life in the Upper Great Lakes: 11,000 B.C. to A.D. 1800. vol. The
University of Chicago Press, Chicago.
Reidhead, Van A.
1981 A Linear Programming Model of Prehidtoric Subsistence Optimization: A
Southeastern Indiana Example. vol. Indiana Historical Society, Indianapolis.
Ricahrds, John D., Patricia B. Richards and Brian D. Nicholls
1998 Archaeological Investigations in the Carcajou Point Locale, Sumner
Township, Jefferson County, Wisconsin. Historic Resource Managment Services.
Copies available from 129.
Richards, John D. and Robert J. Jeske
2002 Location, Location, Location: The Temporal and Cultural Context of Late
Prehistoric Settlement in Southeast Wisconsin. Wisconsin Archeologist 83(2):32-
54.
Richards, Patricia B.
1993 Winnebago Subsistence. Wisconsin Archeologist 74(1-4):272-289.
Riley, Thomas J. and Glen Freimuth
1979 Field Systems and Frost Drainage in the Prehistoric Agriculture of the
Upper Great Lakes. American Antiquity 44(2):271-285.
Rindos, David and Sissel Johannessen
2000 Human-Plant Interactiosn and Cultural Change in the American Bottom.
In Late Woodland Societies: Tradition and Transformation Across the
Midcontinent edited by T. E. Emerson, D. McElrath and A. C. Fortier, pp. 35-45.
University of Nebraska Press, Lincoln.
Rodell, Roland L.
1983 The Late Prehistory of Eastern Wisconsin: A Survey of the
Archaeological Research and Interpretations Pertaining to Oneota Settlement and
Subsistence. Unpublished Master's Thesis, Anthropology, University of
Wisconsin-Milwaukee, Milwaukee.

173
1984 A Survey of Oneota Sites in the Lake Koshkonong Area In Southeast
Wisconsin Archaeology Project: 1983-1984, edited by L. Goldstein, pp. 144-166.
Report of Investigations, no. 77. University of Wisconsin-Milwaukee
Archaeology Research Laboratory, Milwaukee.
Roper, Donna C.
1979 Archaeological Survey and Settlement Pattern Models in Central Illinois.
vol. 16. Midcontinental Journal of Archaeology Special Papers, No. 2, Illinois
State Museum.
Sasso, Robert F.
1989 Oneota Settlement Practices in the La Crosse Region: An Analysis of the
Coon Creek Drainage in the Driftless Area of Western Wisconsin Unpublished
Ph.D. Dissertation, Anthropology, Northwestern Evanston.
2003 Agricultural Places and the Oneota Lifeway in Wisconsin In Theory,
Method, and Practice in Modern Archaeology, edited by R. J. Jeske and D. K.
Charles, pp. 252-265. Praeger, Westport.
Sasso, Robert F., Robert F. Boszhardt, James C. Knox, James L. Theler, Katherine P.
Stevenson, James P. Gallagher and Cynthia Stiles-Hanson
1985 Prehistoric Ridged Field Agriculture in the Mississippi Valley. vol.
Reports of investigations, Number 38. Mississippi Valley Archaeology Center at
the University of Wisconsin-La Crosse, La Crosse.
Sasso, Robert F. and James A. Brown
1987 Land, Fields, and Maize: A Perspetive on Oneota Agriculture. Paper
presented at the Annual Meeting of the American Anthropological Association,
Chicago.
Schorger, A. W.
1937 The Range of Bison in Wisconsin. Electronic document,
http://digicoll.library.wisc.edu/cgi-bin/WI/WI-
idx?type=turn&entity=WI.WT1937.p0127&id=WI.WT1937&isize=M, accesed
February 24, 2010, 2010.
Smith, Bruce D. (editor)
1992 Rivers of Change: Essays on Early Agriculture in Eastern North America.
Smithsonian Institution Press, Washington.
1995 Seed Plant Domestication in Eastern Norht America. In Last Hunters First
Farmers, edited by T. D. Price and A. B. Gebauer, pp. 193-214. School of
American Research Press, Sante Fe.
Smith, Eric Alden and Bruce Winterhalder

174
1981 New Perspectives on Hunter-Gatherer Socioecology. In Hunter-Gatherer
Foraging Strategies,, edited by B. Winterhalder and E. A. Smith, pp. 1-12.
University of Chicago Press, Chicago.
Staeck, John P.
1995 Oneota Past, Present, and Future: In the Beginning, Again. In Oneota
Archaeology, Past, Present, and Future, edited by W. Green, pp. 3-8. Office of
the State Archaeologist, Iowa City.
Staff, Soil Survey
n.d. Official Soil Series Descriptions (OSD) with series extent mapping
capabilities Electronic document,
http://soils.usda.gov/technical/classification/osd/index.html, accesed February 15,
2009.
Stevenson, Katherine P.
1979 A Revised Method of Site Catchment Analysis Applied to Great Basin
Archaeology, Anthropology, University of Wisconsin-Madison, Madison.
1985 Oneota Subsistence-Related Behavior in the Driftless Area: A study of
the Valley View Site Near La Crosse, Wiscosin. Unpublished Ph.D. Dissertation,
Anthropology, University of Wisconsin-Madison, Madison.
Stout, A.B. and H.T. Skavlem
1908 The Archaeology of the Lake Koshkonong Region. The Wisconsin
Archeologist 7(2):1-102.
Theler, James L. and Robert F. Boszhardt
2000 The End of the Effigy Mound Culture: The Late Woodland to Oneota
Transition in Southwestern Wisconsin. Midcontinental Journal of Archaeology
25(2):289-312.
2006 Collapse of Crucial Resources and Culture Change: A Model for the
Woodland to Oneota Transformation in the Upper Midwest. American Antiquity
71(3):433-472.
Tiffany, Joseph A.
1998 Southeast Iowa Oneota: A Review. Wisconsin Archeologist 79:147-164.
Tiffany, Josepha A.
1982 Site Catchment Analysis of Southeast Iowa Oneota Sites. In Oneota
Studies, edited by G. E. Gibbons, pp. 1-14. University of Minnesota Publications
in Anthropology Number 1. University of Minnesota, Minneapolis.
Vita-Finzi, Claudio

175
1978 Archaeological Sites in their Settings. vol. Thames and Hudson Ltd,,
London.
Vita-Finzi, Claudio and E. Higgs
1970 Prehistoric Economy in the Mount Carmel area of Palestine: Site
Catchment Analysis. Prehisotric Society 36:1-337.
White, John
1994 How the Terms Savanna, Barrens, and Oak Openings were Used in Early
Illinois. In Proceedings of the North American Conference on Barrens and
Savannas at Illinois State University Normal, Illinois, October 15-16, 1994,
edited by J. S. Fralish, R. C. Anderson, J. E. Ebinger and R. Szafoni, pp. 25-64.
The Environmental Protection Agency, Great Lakes National Program Office,
Normal.
Will-Wolf, Susan and Timothy C. Monague
1994 Landscape and Enviornmental Constraints on the Distrubution of
Presettlement Savannas and Prairies in Southern Wisconsin. In Proceedings of the
North American Conference on Barrens and Savannas at Illinois State University
Normal, Illinois, October 15-16, 1994, edited by J. S. Fralish, R. C. Anderson, J.
E. Ebinger and R. Szafoni, pp. 97-111. The Environmental Protection Agency,
Great Lakes National Program Office, Normal.
Winterhalder, Bruce
1981a Foraging Strategies in the Boreal Forest. In Hunter Gatherer Foraging
Strategies, edited by B. Winterhalder and E. A. Smith, pp. 66-98. University of
Chicago Press, Chicago.
1981b Optimal Foraging Strategies and Hunter-Gatherer Research in
Anthropology. In Hunter-Gatherer Foraging Strategies, edited by B.
Winterhalder and E. A. Smith, pp. 13-35. University of Chicago Press, Chicago.
Wisconsin-Madison, University of
1990 Original Vegetation Cover of Wisconsin. Electronic document,
http://www.dnr.state.wi.us/maps/gis/geolibrary.html, accessed September 2008.
Yarnell, Richard A.
1964 Aboriginal Relationships Between Culture and Plant Life in the Upper
Great Lakes. vol. Anthropological Papers, No. 23. Museum of Anthropology,
University of Michigan Ann Arbor.
1966 Archaeological Plant Food Remains From Wisconsin. Wisconsin
Archeologist 47(4):196-202.
Yesner, David R.

176
1981 Archeological Applications of Optimal Foraging Theory: Harvest
Strategies of Aleut Hunter-Gatherers. In Hunter-Gatherer Foraging Strategies,
edited by B. Winterhalder and E. A. Smith, pp. 148-170. The University of
Chicago Press, Chicago.

177
APPENDIX
Agricultural Rating of Soils by Type
Soil Abbreviation Soil Name Soil Slope Erosion
Status
Agricultural
Rating
Ad Adrian Muck n/a Not Eroded Bad
Af Alluvial Land, wet n/a Not Eroded Bad
AzA Aztalan 0 to 2 Not Eroded Fair
BbB Batavia Silt Loam 2 to 6 Not Eroded Good
BbC2 Batavia Silt Loam 6 to 12 Eroded Fair
BoB Boyer Sandy Loam 2 to 6 Not Eroded Bad
BoC2 Boyer Sandy Loam 6 to 12 Not Eroded Bad
BoC2 Boyer Sandy Loam 6 to 12 Eroded Bad
BoD2 Boyer Sandy Loam 12 to 20 Eroded Bad
BpB Boyer Sandy Loam 1 to 6 Not Eroded Bad
CaC2 Casco Loam 6 to 12 Eroded Fair
CrD2 Casco Loam 12 to 20 Eroded Bad
CrE Casco-Rodman Complex 12 to 20 Not Eroded Bad
Cu Cut and Fill (disturbed) n/a n/a n/a
DcA Del Ray Silt Loam 0 to 3 Not Eroded Fair
DfA Del Ray Silt Loam 0 to 2 Not Eroded Fair
DrD2 Dresden Loam 12 to 20 Eroded Bad
DsB Dresden Silt Loam 2 to 6 Not Eroded Good
DsC2 Dresden Silt Loam 6 to 12 Eroded Fair
EgA Elburn Silt Loam 0 to 3 Not Eroded Fair
Fn Fluvaquents n/a Not Eroded Bad
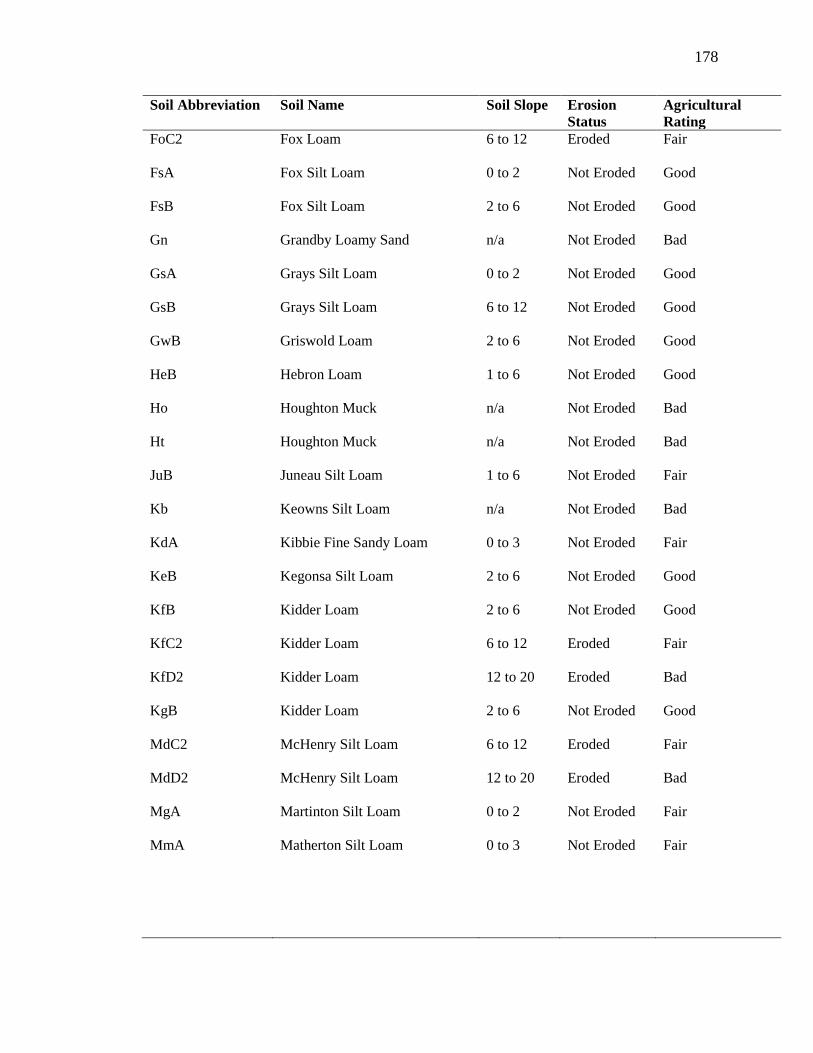
178
Soil Abbreviation Soil Name Soil Slope Erosion
Status
Agricultural
Rating
FoC2 Fox Loam 6 to 12 Eroded Fair
FsA Fox Silt Loam 0 to 2 Not Eroded Good
FsB Fox Silt Loam 2 to 6 Not Eroded Good
Gn Grandby Loamy Sand n/a Not Eroded Bad
GsA Grays Silt Loam 0 to 2 Not Eroded Good
GsB Grays Silt Loam 6 to 12 Not Eroded Good
GwB Griswold Loam 2 to 6 Not Eroded Good
HeB Hebron Loam 1 to 6 Not Eroded Good
Ho Houghton Muck n/a Not Eroded Bad
Ht Houghton Muck n/a Not Eroded Bad
JuB Juneau Silt Loam 1 to 6 Not Eroded Fair
Kb Keowns Silt Loam n/a Not Eroded Bad
KdA Kibbie Fine Sandy Loam 0 to 3 Not Eroded Fair
KeB Kegonsa Silt Loam 2 to 6 Not Eroded Good
KfB Kidder Loam 2 to 6 Not Eroded Good
KfC2 Kidder Loam 6 to 12 Eroded Fair
KfD2 Kidder Loam 12 to 20 Eroded Bad
KgB Kidder Loam 2 to 6 Not Eroded Good
MdC2 McHenry Silt Loam 6 to 12 Eroded Fair
MdD2 McHenry Silt Loam 12 to 20 Eroded Bad
MgA Martinton Silt Loam 0 to 2 Not Eroded Fair
MmA Matherton Silt Loam 0 to 3 Not Eroded Fair
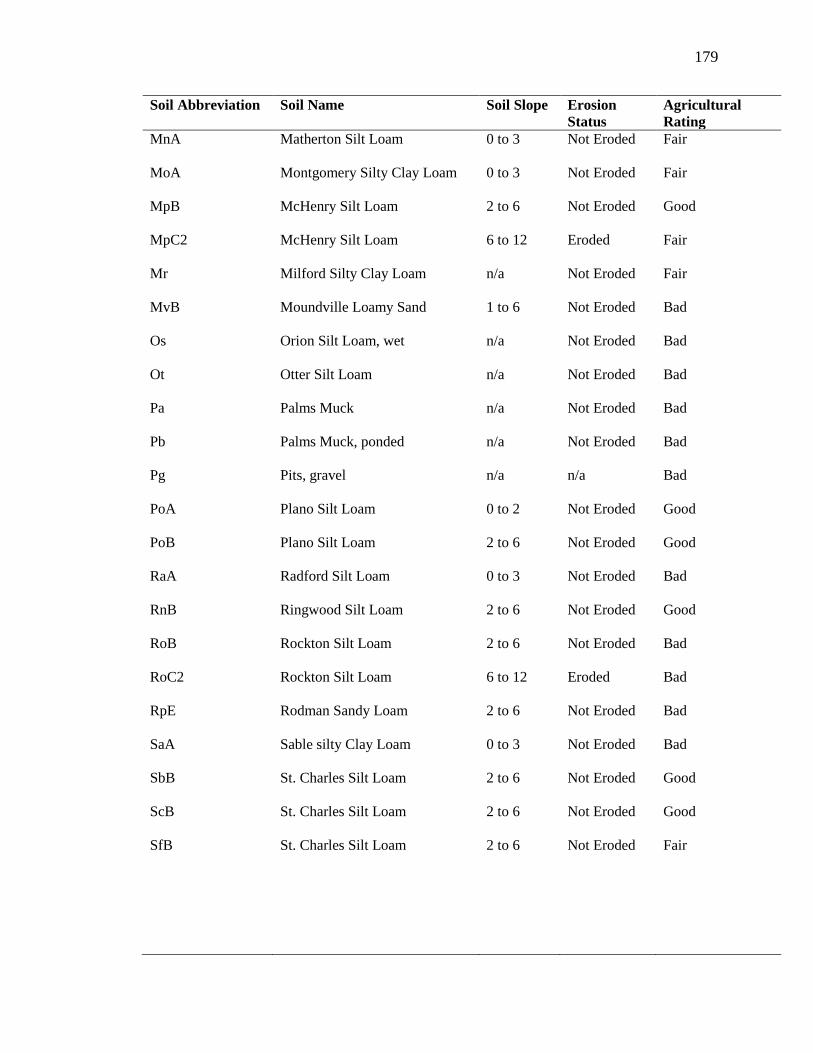
179
Soil Abbreviation Soil Name Soil Slope Erosion
Status
Agricultural
Rating
MnA Matherton Silt Loam 0 to 3 Not Eroded Fair
MoA Montgomery Silty Clay Loam 0 to 3 Not Eroded Fair
MpB McHenry Silt Loam 2 to 6 Not Eroded Good
MpC2 McHenry Silt Loam 6 to 12 Eroded Fair
Mr Milford Silty Clay Loam n/a Not Eroded Fair
MvB Moundville Loamy Sand 1 to 6 Not Eroded Bad
Os Orion Silt Loam, wet n/a Not Eroded Bad
Ot Otter Silt Loam n/a Not Eroded Bad
Pa Palms Muck n/a Not Eroded Bad
Pb Palms Muck, ponded n/a Not Eroded Bad
Pg Pits, gravel n/a n/a Bad
PoA Plano Silt Loam 0 to 2 Not Eroded Good
PoB Plano Silt Loam 2 to 6 Not Eroded Good
RaA Radford Silt Loam 0 to 3 Not Eroded Bad
RnB Ringwood Silt Loam 2 to 6 Not Eroded Good
RoB Rockton Silt Loam 2 to 6 Not Eroded Bad
RoC2 Rockton Silt Loam 6 to 12 Eroded Bad
RpE Rodman Sandy Loam 2 to 6 Not Eroded Bad
SaA Sable silty Clay Loam 0 to 3 Not Eroded Bad
SbB St. Charles Silt Loam 2 to 6 Not Eroded Good
ScB St. Charles Silt Loam 2 to 6 Not Eroded Good
SfB St. Charles Silt Loam 2 to 6 Not Eroded Fair

180
Soil Abbreviation Soil Name Soil Slope Erosion
Status
Agricultural
Rating
ShA Salter Sandy Loam, wet variant 0 to 3 Not Eroded Fair
SkB Saylesville Silt Loam 2 to 6 Not Eroded Good
Sm Sebewa Silt Loam n/a Not Eroded Bad
Sn Sebewa Silt Loam n/a Not Eroded Bad
SoB Sission Fine Sandy Loam 1 to 6 Not Eroded Good
SoC2 Sission Fine Sandy Loam 6 to 12 Eroded Fair
TrB Troxel Silt Loam 1 to 3 Not Eroded Bad
TuA Tuscola Silt Loam 0 to 2 Not Eroded Good
TuB Tuscola Silt Loam 2 to 6 Not Eroded Fair
VwA Virgil Silt Loam 0 to 3 Not Eroded Bad
W Water n/a n/a Bad
Wa Wacousta Silty Clay Loam n/a Not Eroded Bad
WmA Wasepi Sandy Loam 0 to 3 Not Eroded Fair
WrB Warsaw Silt Loam 2 to 6 Not Eroded Fair
WtA Watseka Variant Loamy Sand 0 to 3 Not Eroded Bad
WvA Wauconda Silt Loam 0 to 2 Not Eroded Fair
WxB Whalan Loam 2 to 6 Not Eroded Good
WxC2 Whalan Loam 6 to 12 Eroded Fair
WxD2 Whalan Silt Loam 12 to 20 Eroded Bad
YaA Yahara Fine Sandy Loam 0 to 3 Not Eroded Fair