Estimating required information size by quantifying diversity in random-effects model meta-analyses
12
BioMed Central Page 1 of 12 (page number not for citation purposes) BMC Medical Research Methodology Open Access Research article Estimating required information size by quantifying diversity in random-effects model meta-analyses Jørn Wetterslev*, Kristian Thorlund, Jesper Brok and Christian Gluud Address: Copenhagen Trial Unit, Centre for Clinical Intervention Research, Department 3344, Rigshospitalet, Copenhagen University Hospital, Blegdamsvej 9, DK-2100 Copenhagen Ø, Denmark Email: Jørn Wetterslev* - [email protected]; Kristian Thorlund - [email protected]; Jesper Brok - [email protected]; Christian Gluud - [email protected] * Corresponding author Abstract Background: There is increasing awareness that meta-analyses require a sufficiently large information size to detect or reject an anticipated intervention effect. The required information size in a meta-analysis may be calculated from an anticipated a priori intervention effect or from an intervention effect suggested by trials with low-risk of bias. Methods: Information size calculations need to consider the total model variance in a meta- analysis to control type I and type II errors. Here, we derive an adjusting factor for the required information size under any random-effects model meta-analysis. Results: We devise a measure of diversity (D 2 ) in a meta-analysis, which is the relative variance reduction when the meta-analysis model is changed from a random-effects into a fixed-effect model. D 2 is the percentage that the between-trial variability constitutes of the sum of the between- trial variability and a sampling error estimate considering the required information size. D 2 is different from the intuitively obvious adjusting factor based on the common quantification of heterogeneity, the inconsistency (I 2 ), which may underestimate the required information size. Thus, D 2 and I 2 are compared and interpreted using several simulations and clinical examples. In addition we show mathematically that diversity is equal to or greater than inconsistency, that is D 2 ≥ I 2 , for all meta-analyses. Conclusion: We conclude that D 2 seems a better alternative than I 2 to consider model variation in any random-effects meta-analysis despite the choice of the between trial variance estimator that constitutes the model. Furthermore, D 2 can readily adjust the required information size in any random-effects model meta-analysis. Background Outcome measures in a single randomised trial or a meta- analysis of several randomised trials are typically dichoto- mous, especially for important clinical outcomes such as death, acute myocardial infarction, etc. Although meta- analysts cannot directly influence the number of partici- pants in a meta-analysis like trialists conducting a single trial, the assessment of the meta-analytic result depends heavily on the amount of information provided. A limited number of events from a few small trials and the associ- ated random error may be under-recognised sources of spurious findings. If a meta-analysis is conducted before Published: 30 December 2009 BMC Medical Research Methodology 2009, 9:86 doi:10.1186/1471-2288-9-86 Received: 15 May 2009 Accepted: 30 December 2009 This article is available from: http://www.biomedcentral.com/1471-2288/9/86 © 2009 Wetterslev et al; licensee BioMed Central Ltd. This is an Open Access article distributed under the terms of the Creative Commons Attribution License (http://creativecommons.org/licenses/by/2.0 ), which permits unrestricted use, distribution, and reproduction in any medium, provided the original work is properly cited.
-
Upload
independent -
Category
Documents
-
view
3 -
download
0
Transcript of Estimating required information size by quantifying diversity in random-effects model meta-analyses

BioMed Central
BMC Medical Research Methodology
ss
Open AcceResearch articleEstimating required information size by quantifying diversity in random-effects model meta-analysesJørn Wetterslev*, Kristian Thorlund, Jesper Brok and Christian GluudAddress: Copenhagen Trial Unit, Centre for Clinical Intervention Research, Department 3344, Rigshospitalet, Copenhagen University Hospital, Blegdamsvej 9, DK-2100 Copenhagen Ø, Denmark
Email: Jørn Wetterslev* - [email protected]; Kristian Thorlund - [email protected]; Jesper Brok - [email protected]; Christian Gluud - [email protected]
* Corresponding author
AbstractBackground: There is increasing awareness that meta-analyses require a sufficiently largeinformation size to detect or reject an anticipated intervention effect. The required informationsize in a meta-analysis may be calculated from an anticipated a priori intervention effect or from anintervention effect suggested by trials with low-risk of bias.
Methods: Information size calculations need to consider the total model variance in a meta-analysis to control type I and type II errors. Here, we derive an adjusting factor for the requiredinformation size under any random-effects model meta-analysis.
Results: We devise a measure of diversity (D2) in a meta-analysis, which is the relative variancereduction when the meta-analysis model is changed from a random-effects into a fixed-effectmodel. D2 is the percentage that the between-trial variability constitutes of the sum of the between-trial variability and a sampling error estimate considering the required information size. D2 isdifferent from the intuitively obvious adjusting factor based on the common quantification ofheterogeneity, the inconsistency (I2), which may underestimate the required information size. Thus,D2 and I2 are compared and interpreted using several simulations and clinical examples. In additionwe show mathematically that diversity is equal to or greater than inconsistency, that is D2 ≥ I2, forall meta-analyses.
Conclusion: We conclude that D2 seems a better alternative than I2 to consider model variationin any random-effects meta-analysis despite the choice of the between trial variance estimator thatconstitutes the model. Furthermore, D2 can readily adjust the required information size in anyrandom-effects model meta-analysis.
BackgroundOutcome measures in a single randomised trial or a meta-analysis of several randomised trials are typically dichoto-mous, especially for important clinical outcomes such asdeath, acute myocardial infarction, etc. Although meta-analysts cannot directly influence the number of partici-
pants in a meta-analysis like trialists conducting a singletrial, the assessment of the meta-analytic result dependsheavily on the amount of information provided. A limitednumber of events from a few small trials and the associ-ated random error may be under-recognised sources ofspurious findings. If a meta-analysis is conducted before
Published: 30 December 2009
BMC Medical Research Methodology 2009, 9:86 doi:10.1186/1471-2288-9-86
Received: 15 May 2009Accepted: 30 December 2009
This article is available from: http://www.biomedcentral.com/1471-2288/9/86
© 2009 Wetterslev et al; licensee BioMed Central Ltd. This is an Open Access article distributed under the terms of the Creative Commons Attribution License (http://creativecommons.org/licenses/by/2.0), which permits unrestricted use, distribution, and reproduction in any medium, provided the original work is properly cited.
Page 1 of 12(page number not for citation purposes)

BMC Medical Research Methodology 2009, 9:86 http://www.biomedcentral.com/1471-2288/9/86
reaching a required information size (i.e., the requirednumber of participants in a meta-analysis) it should beevaluated according to the increased risk that the resultmay represent a chance finding. It has recently been sug-gested that sample size estimation in a single trial may beless important in the era of systematic review and meta-analysis [1]. Therefore, the reliability of a conclusiondrawn from a meta-analysis, despite standardly calculatedconfidence limits, may depend even more on the numberof events and the total number of participants includedthan hitherto perceived [2-8]. Both numbers determinethe amount of available information in a meta-analysis.The information size (IS) required for a reliable and con-clusive meta-analysis may be assumed to be at least aslarge as the sample size (SS) of a single well-powered ran-domised clinical trial to detect or reject an anticipatedintervention effect [2-4].
The estimation of a required information size for a meta-analysis in order to detect or reject an anticipated inter-vention effect on a binary outcome measure should beconsidered based on reasonable assumptions. Theseassumptions may be derived from two kinds of informa-tion. Firstly, by anticipating an a priori intervention effect,most appropriately decided at the time when the protocolfor a systematic review is prepared. An a priori interventioneffect may be estimated by consulting related interven-tions for the same disease or the same intervention forrelated diseases suggesting a clinically relevant effect to bedetected or ruled out [2-4]. This situation would bealmost analogous to the hypothesis testing in a single ran-domised trial. Secondly, an intervention effect estimatedby trials with low-risk of bias in the meta-analysis mayrepresent our best estimate, at a given time point, of a pos-sible intervention effect knowing the available data [5].This would be a kind of a post hoc analysis of the informa-tion needed to detect or reject an intervention effect sug-gested by data already available. When planning a newtrial it may be very important to estimate which IS isneeded for the updated meta-analysis to be conclusive. Inboth instances the estimated required information sizemay be applied to grade the evidence reported in a cumu-lative meta-analysis adjusting for the risk of random errordue to repetitive testing on accumulating data [5,6]. If thenumber of actually accrued participants falls short of therequired IS the meta-analysis may be inconclusive eventhough the confidence interval is suggestive of a clinicalrelevant effect or. Because if the confidence interval (or thep-value) is appropriately adjusted with sequential meth-ods, it may no longer show a statistically significant orclinically relevant effect. Conversely, if the actuallyaccrued number of participants supersedes the requiredinformation size without the meta-analysis becoming sta-tistically significant we may be able to rule out the antici-pated intervention effect size [5].
It is not realistic to assume that the population of theincluded trials in a meta-analysis is truly homogenous, asit may be in a single clinical trial. Meta-analysis, therefore,should not analyse included participants as if they arecoming from one trial [9]. Consequently the differencebetween obtaining the required IS and SS is rooted in theunderlying assumption of between trial variability, andthus, the chosen meta-analytical model.
If the between-trial variability of the outcome measureestimates in a meta-analysis is incorporated into themodel using the traditional one-way random-effectsmodel, the required IS will be affected [5]. In this vein, therequired IS is a monotonically increasing function of thetotal variability among the included trials. An estimate ofthe required IS can therefore be derived once the degree ofvariability is known or prespecified [5]. The test statisticfor heterogeneity in a meta-analysis, the inconsistency fac-tor (I2) based on Cochran's Q proposed by Higgins andThompson [10], may seem an obvious quantity to use forthis purpose as it allow us to estimate the degree of thevariation, which is not covered by assumption of homo-geneity [5]. However, I2 is derived using a set of generalassumptions that may be inappropriate in this context.
In this paper we derive a general expression for therequired IS in any random-effects model. We prove themonotone relationship between IS and the degree of totalvariability in a one-way random-effects meta-analysis. Weuse our results to define a quantification of diversity (D2)between included trials in a meta-analysis, which is therelative model variance reduction when the model ofpooling is changed from a random-effects model into afixed-effect model. We analyse and discuss the differencesbetween our definition of diversity, D2, and the com-monly used measure for heterogeneity, I2.
Methods2.1 Deriving the required meta-analysis information size and diversityIf the required IS needed to detect or reject an interventioneffect in a meta-analysis should be at least the sample sizeneeded to detect or reject a similar effect in a single trial,then the following scenario applies:
Let μF denote the weighted mean intervention effect to bedetected in a fixed-effect model meta-analysis and let μRdenote the weighted mean intervention effect to bedetected in a in a random-effects model meta-analysisusing generic inverse variance weighting. The informationsize (NF) needed to reject an intervention effect μF in thefixed-effect model (with a type I error less than α, a type IIerror less than β, and equal group sizes) becomes [11,12]:
Page 2 of 12(page number not for citation purposes)

BMC Medical Research Methodology 2009, 9:86 http://www.biomedcentral.com/1471-2288/9/86
and the information size (NR) needed to reject μR in therandom-effects model (with a type I error less than α, atype II error less than β, and equal group sizes) becomes[11,12]:
Where and are the variances in the
two models with wi and being the weights in the fixed-
and random-effects model respectively. The ratio of infor-mation sizes needed in the two models may be calculatedas:
under the assumption that μF = μR it follows that:
or
the relationship between the IS (NR) for a random-effectsmodel and the SS (NF) for a fixed-effect model is thereforemultiplicative by an adjustment factor ARF
Let τ2 denote the between-trial variance, k the number of
trials, and the 'typical' moment-based sampling error
within the trials according to Higgins and Thompson[10], then:
and combining 2.6 and 2.7:
This yields the intuitive interpretation that the required ISin a random-effects model is a monotone increasing func-tion of the degree of heterogeneity.
2.2 Limitations of a moment-based 'sampling error' in the definition of heterogeneity, I2
Higgins and Thompson [10] analysed candidate measuresof intertrial variability and decided on the inconsistencyfactor I2 under the assumption that all weights wi were
approximately equal, that is, for all k trials, that
is: ∀i ∈ {1,..., k} is . However, this assumption
may not be met in many meta-analyses. In the attempt togeneralise the use of I2 to the situation with trial weights
being unequal a 'typical' sampling error σ2 of the included
trials is assumed [10]. To use a 'typical' sampling error σ2
may not be appropriate in some meta-analyses as weightpercentages of the trials easily range from 0.5% to 50% orwider without a known distribution (Table 1 and Table2). The attempt to estimate the trials' 'typical' samplingerror as a moment-based sampling error
[10] may be misleading as it attributes
less emphasis to the trials with a very high number of par-
ticipants and events. I2 is interpreted as and
intends to measure the percentage of total meta-analysisvariability explained by between-trial variation. In thisvein,I2 has been interpreted as the between trial variancerelative to the sum of the between-trial variance and a 'typ-ical' moment-based sampling error or as it has beenphrased: "the between-trial variance rather than the sam-pling error"[10]. I2 achieves some of the desired propertiesto characterise between-trial variability. However, theconcept of a 'typical' sampling error is not relevant if itprovides a misleading estimate, seriously distorting the
I2calculation or interpretation. If overestimates the
sampling error then I2 will be underestimated and viceversa. In such instances it may in fact be wise to abandonthe concept of a 'typical' sampling error.
NZ Z F
FF = 4 ⋅ − + − ⋅( / )1 2 1
2
2a b n
m(2.1)
NZ Z R
RR = 4 ⋅ − + − ⋅( / )1 2 1
2
2a b n
m(2.2)
n Fwi
k=∑
1
1
n Rwi
k=∑
1
1
*
wi*
NRNF
F
R
RF
= ⋅m
m
nn
2
2(2.3)
NRNF
RF
= nn
(2.4)
N RF
NR F= ⋅nn
(2.5)
IS A SSRF= ⋅ (2.6)
s M2
A RF
Mk
Mk
M
M IRF = ≈
+
=+
=−
nn
t s
s
t s
s
22
2
2
2
21
1 2(2.7)
ISI
SS=−
⋅1
1 2
wi = 12s
wi = 12s
s M
wik
k
wik
wik
2 11
1
2 2
1
=∑ ⋅ −
∑ −∑
( )
( )
IM
2 2
2 2=+t
t s
s M2
Page 3 of 12(page number not for citation purposes)

BMC Medical Research Methodology 2009, 9:86 http://www.biomedcentral.com/1471-2288/9/86
Page 4 of 12(page number not for citation purposes)
Table 1: Meta-analyses examples
Meta-analysis Title Intervention Outcome measure Number of trials Number of participants
Afshari and others2007 [16]
Antithrombin III for critically ill patients
Antithrombin III Mortality 20 3,458
Al-Inany and others,2006 [17]
Cycle cancellations due to poor ovarian
response
Gonadotropin releasing hormone for assisted reproductive therapy
Number of cycle cancellations
13 2,543
Soll and others,1997 [18]
Prophylactic surfactant to prevent morbidity
and mortality in preterm infants.
Surfactant Mortality or pneumothorax
8 988
Wetterslev and Juhl,2006 [19]
Effect of perioperative β-blockade on non-fatal
perioperative AMI
Perioperative β-blockers for non-cardiac surgery
Perioperative myocardial infarction
within 30 days of operation
11 2,211
Bury and Tudehope,2000 [20]
Effect of antibiotics onnecrotizing enterocolitis
in newborn
Enteral antibiotics in newborn
Necrotizing enterocolitis
5 458
Li and others,2007 [21]
Intravenous magnesium for acute myocardial
infarction
Magnesium Mortality 23 72,472
Meyhoff and others,2008 [22]
Perioperative ventilation with 80% versus 30%
oxygen during intestinal surgery
Perioperative ventilation with 80%
oxygen
Wound infection within 15 days of surgery
4 989
Table 2: Derived data from meta-analyses examples
Meta-analysis
Range of weights wi (% weights) in the fixed-effect
model
Inconsistency(I2)%
Diversity(D2)%
(D2 - I2)% A priori relative risk reduction %
(RRR)
Unadjusted information
size(SS)
Heterogeneity-adjusted
information size(HIS)
Diversity-adjusted
information size
(DIS)
Afshari and others
2007 [16]
0.2-281(0.04-80%)
0.0 0.0 0.0 10 3,317 3,317 3,317
Al-Inany and others,
2006 [17]
0.2-3.9(1-18%)
7.2 13.9 6.7 25 3,516 3,789 4,083
Soll and others,1997 [18]
3.6-22.2(6.2-38.1%)
22.9 37.3 14.3 60 193 250 307
Wetterslev and Juhl,
2006 [19]
0.3-10.4(1-42%)
13.4 40.5 27.1 20 8,421 9,726 14,164
Bury and Tudehope,2000 [20]
1.5 - 9.6(7-38%)
40.2 57.7 17.5 45 440 736 1,039
Li and others,2007 [21]
0.24-565.1(0.02-42%)
61.9 89.9 28.0 10 31,094 81,466 306,276
Meyhoff and others,
2008 [22]
1.3-15.2(4-47%)
74.2 79.4 5.2 30 1,699 6,581 8,239

BMC Medical Research Methodology 2009, 9:86 http://www.biomedcentral.com/1471-2288/9/86
If the focus is shifted towards a sufficient IS estimation,then adjusting factors based on I2 calculated from amoment-based sampling error may be insufficient. Wetherefore suggest to consider an alternative adjusting fac-tor to obtain an adequate estimation of the required IS.
2.3 Defining and implementing a measure of diversityAssume we are interested in showing or rejecting a signif-icant intervention effect, μ, regardless of the choice ofmeta-analysis model (fixed or random). That is, assume μ= μF = μR. We then define diversity (D2) as the quantitycompelled to satisfy the following equation:
Solving the equation with respect to D2 we get the defini-tion of D2 explicitly:
As long as we do not know what the difference between I2
and D2 covers, knowing now from 2.9 that D2 reflects thetotal relative variance expansion changing from a fixed-effect into a random-effects model meta-analysis, we findit wise to denote D2 diversity instead of just another calcu-lation of heterogeneity. ARF will be an adjustment of NF to
NR taking into account the total variance expansion
changing from a fixed-effect into a random-effects model.Hereby, D2 expresses the relative variance reduction whenthe model of meta-analysis is changed from a random-effects model into a fixed-effect model. D2 is the percent-age of change in variance when the model is changed. D2
becomes exactly the proportion that the between-trial var-
iance component (τ2 = k·(VR - VF)) constitutes of the sum
of variances ( ) in the variance compo-
nent model if and only if (a sampling error originat-
ing from diversity or the required information size) isdefined as:
Diversity can then be expressed as:
This way, D2 in a meta-analysis may become a centralmeasure of the between-trial variability relative to the sumof the between-trial variability with an estimate of thesampling error basically originating from the requiredinformation size.
As such, D2 is able to quantify the relative model variancechange from a random-effects into a fixed-effect model.More importantly D2, in contrast to I2, is not based onunderlying assumptions of a 'typical' sampling error thatare violated in most meta-analyses. D2 is the percentage ofthe total variance (the sum of between trial variance andsampling error), in a random-effects model, contributedby the between trial variance.
2.4 Simulating meta-analysesIn our simulations, we considered meta-analyses with k =6 and k = 20 trials. For each k, we considered the four com-binations from two different average control event pro-portions, (PC) of 10% and 30%, and two true values ofthe overall effect in terms of odds ratios of 1 and 0.7. Theabove values were selected aiming to cover different plau-sible meta-analytic scenarios. In total, these values makeup for 8 simulation scenarios.
For each combination of the above mentioned variableswe generated data for k 2×2 tables. For all k trials, withingroup sample sizes were determined by sampling an inte-ger between 20 and 500 participants. Group sizes wereequal in each simulated trial. We drew the trial specificcontrol group event rate, PCi, from a uniform distribution,PCi~U(PC-0.15, PC+0.15). We drew the number ofobserved events in the control group from a binomial dis-tribution eiC ~bin(ni, PCi). For each meta-analysis scenariowe varied the degree of heterogeneity by sampling thebetween-rial standard deviation, τ (not the between-trialvariance τ2), from a uniform distribution, τ ~U(10-10,SQRT(0.60)). We simulated the underlying true trialintervention effects, as log odds ratio ln(ORi)~N(OR, τ 2),where OR is the true intervention effect expressed as anodds ratio. We drew the observed number of events in theintervention group from a binomial distributioneiE~bin(ni,PEi), where PEi = PCiexp(ln(ORi))/(1 - PCi +PCiexp(ln(ORi)))
For all meta-analysis scenarios we simulated 10,000 meta-analyses and for each of these we calculated the
and the . For each scenario we
A RF
wik
wik D
RF = =∑
∑=
−
nn
1
1
1
1 2*(2.8)
D FR
R FR
wik
wik
wik
wik
2 1 1 1
1
1
1 2 1
1
1
= − = − = −∑
∑= −
− + −∑
∑
nn
n nn
t* ( )
.
(2.9)
t s n2 2+ = ⋅D R k
s D2
s t nn nD
FR F
22
= ⋅−
. (2.10)
D R FR D
22
2 2= − =
+
n nn
t
t s(2.11)
I Q kQ
2 1= − −( ) D R FR
2 = −n nn
Page 5 of 12(page number not for citation purposes)

BMC Medical Research Methodology 2009, 9:86 http://www.biomedcentral.com/1471-2288/9/86
plotted D2 against I2 and incorporated the line of unity inthe scatter-plot.
2.5 Selection of meta-analyses examplesWe selected traditional random-effects meta-analyses tocover a range of inconsistency I2 from 0% to 100% and tocome from a wide range of medical research fields.
Results3.1 The relationship between diversity, D2, and heterogeneity, I2
We want to show that D2 ≥ I2 for all meta-analyses. This istrue if and only if:
According to a special case of the Chebyshev's inequality[13] we arrange the weights so w1 ≥ w2 ≥ ...... wk., for any k≥ 0 we then get that:
and hence:
and therefore
and subsequently:
We remember that Takouche et al. [14] proposed an esti-
mate of a 'typical' sampling error , which
yields the following relationship between and :
So it follows from (3.5) that for all meta-analy-
ses. Furthermore if we apply Chebyshev's inequality [13]
arranging the weights and at the
same time w1 ≥ w2 ≥ ...... wk then:
and as the random-effects weights are and
the fixed-effect weights are we get:
and hence:
which leads to:
and subsequently:
and since:
it follows that:
and therefore:
D
D M
I2 22
2 2
2
2 2=
+≥
+=t
t s
t
t s(3.1)
( ......... ) ( ......... ) ( ..... )w w w w k w w w wk k k k1 1 1 1+ + ⋅ + + ≤ ⋅ ⋅ + + ⋅
( )w k wi
i
k
i
i
k
= =∑ ∑≤ ⋅
1
2 2
1
(3.2)
k w w k wi i
i
k
i
k
i
i
k
⋅ − ≤ − ⋅== =∑∑ ∑(( ) ) ( ) ( )2 2
11
2
1
1
(3.3)
k
wii
k
k wii
k
wi wii
k
i
k
=∑
≤− ⋅
=∑
−=∑
=∑
1
11
2 2
11
( )
( )
(3.4)
s nT Fk2 = ⋅
s T2 s M
2
s sT Mk
wii
k
k wii
k
wi wii
k
i
k2 2
1
11
2 2
11
=
=∑
≤− ⋅
=∑
−=∑
=∑
=( )
( )
(3.5)
s sT M2 2≤
w w wk1 2* * *......≥ ≥ ≥
( ......... ) ( ......... ) ( .....* * * *w w w w k w w wk k k1 1 1 1+ + ⋅ + + ≤ ⋅ ⋅ + + ⋅ wwk)
wii
* =+1
2 2s t
wii
= 12s
( ... ) ( ... ) ( ...1
12 2
12 2
1
12
12
1
12
1
12 2s t s t s s s s t+
+ ++
⋅ + + ≤ ⋅ ⋅+
+ +k k
k112
12 2s s tk k
⋅+
)
11
12 2
12 2
1
12
12
11
12
1
12 2
( ... ) ( ... ) ( ..s t s t s s s s t+
+ ++
⋅ + +≥
⋅ ⋅+
+k k
k .. )+ ⋅+
12
12 2s s tk k
ts s t
s t s t s s
t2 12 2 21
1
12 2
12 2
1
12
12
⋅⋅ +
∑
++ +
+⋅ + +
≥i i
k
k k
( )
( ... ) ( ... )
22 12 2 21
1
12
1
12 2
12
12 2
⋅⋅ +
∑
⋅ ⋅+
+ + ⋅+
s s t
s s t s s t
i i
k
k
k k
( )
( ... )
k i i
k
k k
⋅
⋅⋅ +
∑
++ +
+⋅ + +
(( )
( ... ) ( ...
ts s t
s t s t s s
2 12 2 21
1
12 2
12 2
1
12
12
))
( ... )
( ...≥ ⋅
⋅ ⋅+
+ + ⋅+
⋅ ⋅+
+k k k
k
ts s t s s t
s s t
2 1
12
1
12 2
12
12 2
1
12
1
12 2
++ ⋅+
=12
12 2
2
s s t
t
k k
)
k i i
k
k k
⋅
⋅⋅ +
∑
++ +
+⋅ + +
ts s t
s t s t s s
2 12 2 21
1
12 2
12 2
1
12
12
( )
( ... ) ( ... )== ⋅
∑−
∑k
wik
wik
(*
)1
1
1
1
k
wik
wik
k R F⋅∑
−∑
= ⋅ − ≥(*
) ( )1
1
1
1
2n n t(3.6)
t nn n
n2 ⋅
−≤ ⋅F
R Fk F( )
Page 6 of 12(page number not for citation purposes)

BMC Medical Research Methodology 2009, 9:86 http://www.biomedcentral.com/1471-2288/9/86
Remembering the definitions of and lead to:
and it appears from (3.7) that for all meta-anal-
yses. As we have already shown in (3.5) that it
becomes clear that in all meta-analyses. As
and with it follows that:
and, finally, D2 ≥ T2 ≥ I2 in all meta-analyses.
3.2 Some useful properties of D2
Higgins and Thompson [10] specified three criteria thatshould be met by any quantification of variabilitybetween trials included in a meta-analysis: 1) the quantityshould be a monotonically increasing function of the
between-study variance, τ2; 2) the quantity should bescale invariant; and 3) the quantity should be independ-ent of the number of included trials. It is easily verifiedthat the D2 fulfils the first two of these criteria. The thirdcriterion may not be fulfilled, even by I2 (simulations byK Thorlund, personal communication). However, D2
becomes independent of the numbers of trials included in
the meta-analysis, to the same degree as , because D2
is a transformation of fulfilling the criterion accord-
ing to Higgins and Thompson [10]. Furthermore, it is easyto show that:
demonstrating that the percentage of increase in variancewhen the model of meta-analysis is changed from a fixed-effect model into a random-effects model can, of course,also be expressed in terms of diversity.
It is equally clear that D2 is always ≥ 0 as well as being < 1.D2 is a fraction between 0 and 100% because:
as (1 + wi·τ2) ≥ 1 for all i and for all estimators of τ2
including the DerSimonian-Laird estimator
[15] with being at least
greater than or equal to 0.
Furthermore, D2 = I2 when and only when all the weightswi in the fixed-effect model are equal. D2is approximatelyequal to I2 if:
Furthermore, D2 = 0 when and only when I2 = 0 because I2
= 0 when and only when τ2 = 0 the latter making = 1
and hence .
3.3 Simulations of meta-analysesWe performed 8 simulation scenarios showing that D2
always exceeds I2 despite any assumptions. Meta-analyseswith all weights being equal corresponding to D2 = I2 wererare. The pattern of data showed a greater degree of scatterin the scenarios where k = 6. The results of the simulationsof 10 000 meta-analyses according to the combinations ofOR = 0.70, OR = 1.00 and PC = 30% with 6 and 20 trials,respectively, are presented in figure 1 and figure 2. As seenD2 exceeds I2 for all the simulated meta-analyses inde-pendent of the chosen OR and number of trials in themeta-analyses.
3.4 Examples
We used the expression of D2 to calculate this quantity inseven traditional random-effects meta-analyses [16-22]listed in Table 1. These meta-analyses cover a range ofinconsistency, I2, from 0% to 74.2% and come from dif-ferent medical research fields: intensive care [16], assistedreproductive technology [17], perioperative medicine[19,22], neonatology [18,20], and cardiology [21]. Theresults of the calculations of I2,D2, inconsistency-adjusted
information size HIS ( ), and diversity-
s D2 s T
2
s t nn n
n sD F TF
R Fk2 2
2= ⋅
−≤ ⋅ = (3.7)
s sD T2 2≤
s sT M2 2≤
s sD M2 2≤
s s sD T M2 2 2≤ ≤ T
T
2 2
2 2=+
tt s
D
D T M
I2 22
2 2
2
2 2
2
2 2=
+≥
+≥
+=t
t s
t
t s
t
t s(3.8)
nn
RF
nn
RF
n nnR F
F
D
D
− =−
2
1 2(3.9)
w wwiwi
wi i i
kkkk* ( )= + =
+ ⋅≤− − ∑∑∑∑ 1 2 1
1111 1 2t
t
(3.10)
ˆ max{ , }( )
( )t 2 0
11
2 2
11
=− + ⋅∑
−∑∑
Q k wik
wi wikk t 2
s sD M
k wik
wi wikk
2 2
11
2 2
11
≈ =− ⋅∑
−∑∑
( )
( )
(3.11)
nn
FR
D FR
2 1 0= − =nn
D FR
wik
wik
wik
wik
wik
2 1 1 1
1
1 1
1
= − = −∑
∑=
∑ −∑
∑
nn
* *
(3.12)
HIS SS
I=
−1 2
Page 7 of 12(page number not for citation purposes)

BMC Medical Research Methodology 2009, 9:86 http://www.biomedcentral.com/1471-2288/9/86
adjusted information size DIS ( ) from these
meta-analyses are shown in Table 2. The range of the cal-culated unadjusted SS range from 440 to 31,094 partici-pants.
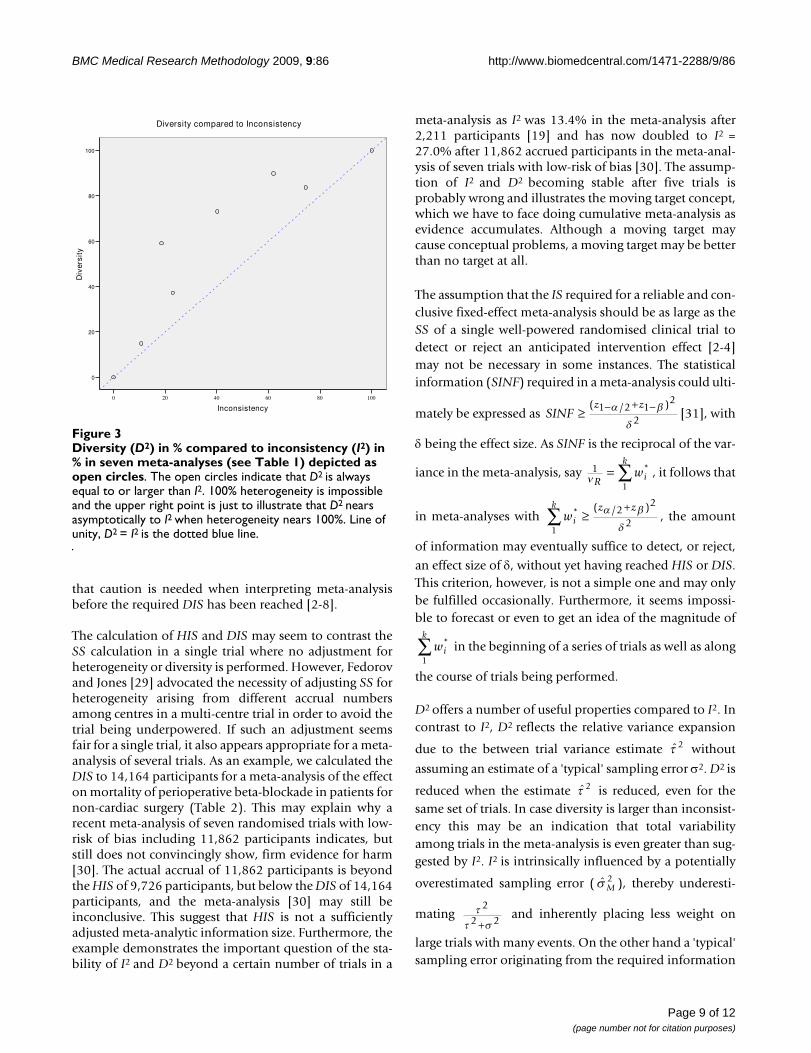
Figure 3 shows the relationship between D2, I2, and unity.All the meta-analyses examples are shown as open circlesabove the line of unity as D2 ≥ I2. The difference (D2 - I2)increases with heterogeneity until a certain point, afterwhich the difference again regresses to 0.
DiscussionUsing a mathematical derivation, meta-analyses simula-tions, and examples of meta-analyses we derive a conceptof diversity, D2. D2 may be used for adjustment of therequired information size in any random-effects modelmeta-analysis once the between trial variance is estimated.Focusing on the required information size estimation in arandom-effects meta-analysis, D2 seems less biased com-pared to I2. The D2 is directly constructed to fulfil therequirements of the information size calculation and issubsequently independent of any 'typical' a priori sam-pling error estimate, whereas the I2 is influenced by an apriori 'typical' sampling error estimate. We therefore findthat it is possible and appropriate taking D2 into consider-ation to calculate the required IS in meta-analyses as DIS.
DIS has several advantages. It measures the required ISneeded to preserve the anticipated risk of type I and typeII errors in a random-effects model meta-analysis. DISconsiders total variance change when the model shiftsfrom a fixed-effect into a random-effects model. DIS is amodel dependent and derived estimate of the required IS.The adjustment is dependent only on the anticipatedintervention effect and on the model used to incorporate
the between-trial variance estimate . D2 applies to ran-dom-effects models other than that proposed by DerSi-monian-Laird [16] as long as the between-trial estimator,
, is specified. The adjustment of IS does not depend onthe level of type I and II errors, as (Z1-α/2 + Z1-β)2 is levelled
out during the derivation of the adjustment factor ARF (see
equation 2.1, 2.2, and 2.5). The relationship D2 ≥ I2 in allthe simulations and in all the examples (shown as pointsabove the line of unity in figure 1, 2, and 3) are in accord-ance with the properties of D2 compared to I2 derived insection 3.1.
There are limitations of DIS. Like HIS the use of DIS can-not compensate for systematic bias such as selection bias,allocation bias, reporting bias, collateral interventionbias, and time lag bias [5,23-28]. Furthermore, DIS isalways greater than or equal to HIS, which may emphasise
DIS SS
D=
−1 2
t 2
t 2
Diversity (D2) compared to inconsistency (I2) in 10,000 simu-lations of meta-analyses with number of trials included k = 6Figure 1Diversity (D2) compared to inconsistency (I2) in 10,000 simulations of meta-analyses with number of trials included k = 6. Odds ratio = 1.00 and proportion of events in control group PC = 0.30. Meta-analyses depicted as open circles. D2 nears asymptotically to I2 when heterogene-ity nears 0% or 100%. Line of unity, D2 = I2 black line.
Diversity (D2) compared to inconsistency (I2) in 10,000 simu-lations of meta-analyses with number of trials included k = 20Figure 2Diversity (D2) compared to inconsistency (I2) in 10,000 simulations of meta-analyses with number of trials included k = 20. Odds ratio = 0.70 and proportion of events in control group PC = 0.30. Meta-analyses depicted as open circles. D2 nears asymptotically to I2 when heterogene-ity nears 0% or 100%. Line of unity, D2 = I2 black line.
Page 8 of 12(page number not for citation purposes)
BMC Medical Research Methodology 2009, 9:86 http://www.biomedcentral.com/1471-2288/9/86
that caution is needed when interpreting meta-analysisbefore the required DIS has been reached [2-8].
The calculation of HIS and DIS may seem to contrast theSS calculation in a single trial where no adjustment forheterogeneity or diversity is performed. However, Fedorovand Jones [29] advocated the necessity of adjusting SS forheterogeneity arising from different accrual numbersamong centres in a multi-centre trial in order to avoid thetrial being underpowered. If such an adjustment seemsfair for a single trial, it also appears appropriate for a meta-analysis of several trials. As an example, we calculated theDIS to 14,164 participants for a meta-analysis of the effecton mortality of perioperative beta-blockade in patients fornon-cardiac surgery (Table 2). This may explain why arecent meta-analysis of seven randomised trials with low-risk of bias including 11,862 participants indicates, butstill does not convincingly show, firm evidence for harm[30]. The actual accrual of 11,862 participants is beyondthe HIS of 9,726 participants, but below the DIS of 14,164participants, and the meta-analysis [30] may still beinconclusive. This suggest that HIS is not a sufficientlyadjusted meta-analytic information size. Furthermore, theexample demonstrates the important question of the sta-bility of I2 and D2 beyond a certain number of trials in a
meta-analysis as I2 was 13.4% in the meta-analysis after2,211 participants [19] and has now doubled to I2 =27.0% after 11,862 accrued participants in the meta-anal-ysis of seven trials with low-risk of bias [30]. The assump-tion of I2 and D2 becoming stable after five trials isprobably wrong and illustrates the moving target concept,which we have to face doing cumulative meta-analysis asevidence accumulates. Although a moving target maycause conceptual problems, a moving target may be betterthan no target at all.
The assumption that the IS required for a reliable and con-clusive fixed-effect meta-analysis should be as large as theSS of a single well-powered randomised clinical trial todetect or reject an anticipated intervention effect [2-4]may not be necessary in some instances. The statisticalinformation (SINF) required in a meta-analysis could ulti-
mately be expressed as [31], with
δ being the effect size. As SINF is the reciprocal of the var-
iance in the meta-analysis, say , it follows that
in meta-analyses with , the amount
of information may eventually suffice to detect, or reject,
an effect size of δ, without yet having reached HIS or DIS.This criterion, however, is not a simple one and may onlybe fulfilled occasionally. Furthermore, it seems impossi-ble to forecast or even to get an idea of the magnitude of
in the beginning of a series of trials as well as along
the course of trials being performed.
D2 offers a number of useful properties compared to I2. Incontrast to I2, D2 reflects the relative variance expansion
due to the between trial variance estimate without
assuming an estimate of a 'typical' sampling error σ2. D2 is
reduced when the estimate is reduced, even for thesame set of trials. In case diversity is larger than inconsist-ency this may be an indication that total variabilityamong trials in the meta-analysis is even greater than sug-gested by I2. I2 is intrinsically influenced by a potentially
overestimated sampling error ( ), thereby underesti-
mating and inherently placing less weight on
large trials with many events. On the other hand a 'typical'sampling error originating from the required information
SINFz z
≥ − + −( / )1 2 12
2a b
d
1
1n R
wi
k= ∑ *
wi
k z z* ( / )
1
22
2∑ ≥+a b
d
wi
k*
1∑
t 2
t 2
s M2
tt s
2
2 2+
Diversity (D2) in % compared to inconsistency (I2) in % in seven meta-analyses (see Table 1) depicted as open circlesFigure 3Diversity (D2) in % compared to inconsistency (I2) in % in seven meta-analyses (see Table 1) depicted as open circles. The open circles indicate that D2 is always equal to or larger than I2. 100% heterogeneity is impossible and the upper right point is just to illustrate that D2 nears asymptotically to I2 when heterogeneity nears 100%. Line of unity, D2 = I2 is the dotted blue line.
Inconsistency
100806040200
Div
ersi
ty
100
80
60
40
20
0
Diversity compared to Inconsistency
Page 9 of 12(page number not for citation purposes)

BMC Medical Research Methodology 2009, 9:86 http://www.biomedcentral.com/1471-2288/9/86
size, , could be deduced from the D2. We would, how-
ever, advise great cautiousness in such an attempt. The dif-ference (D2 - I2) reflects the difference of the moment-based and the information size-based 'typical' samplingerror estimate. The calculation of diversity and (D2 - I2)may serve as supplementary tools to the assessment of var-iability in a meta-analysis. D2 is a transformation of thevariance ratio of the variances from the random-effectsmodel and the fixed-effect model. This variance ratio wasa candidate for the quantification of heterogeneity [10].
D2 may vary within the same set of trials when different
between trial variance estimators are used in the corre-sponding random-effects model. On the contrary, I2 isintimately linked to the specific between trial varianceestimator in the DerSimonian-Laird random-effects
model as I2 by definition is [10] and Q is
used to estimate a moment-based between trial variance
[15]. The interpretation of heterogene-
ity is obviously dependent on the variance esti-
mator as well. An estimate of τ2 is a prerequisite forany random-effects model and the actual estimated value,
together with the way is incorporated into the model,actually constitutes the model [32]. Therefore, a quantifi-cation of the between-trial variability rather than sam-pling error which is independent of the specific random-effects model is impossible, as it is constituted by thebetween trial variance estimator [32]. D2 adapt automati-cally to different between trial variance estimators [32]while I2 is linked to the estimator from the DerSimonian-Laird random-effects model.
D2 may have some limitations too. The derivation of D2
depends on the assumption that the point estimate of theintervention effect in the fixed-effect model and the pointestimate of the intervention effect in the random-effectsmodel are approximately equal. Meta-analyses with con-siderable difference of the point estimate in the fixed-effect model and the point estimate in the random-effectsmodel represent specific problems. Probably more infor-
mation is needed when μF >> μR since the formula
yields higher values for NR under the
assumption of a constant variance ratio. On the other
hand less information may be needed when μF<<μR since
the formula then yields lower values
for NR under the assumption of a constant variance ratio.
However, examples with considerable differences of thepoint estimates in a fixed- and random-effects model pre-sumably represent meta-analyses of interventions withconsiderable between trial variance due to small trial bias.The meta-analysis of the effect of magnesium in patientswith myocardial infarction is such an example [21] whereone large trial totally dominate the result in the fixed-effect model but are unduly down-weighted in the ran-dom-effects model. Care should be taken to interpret therandom-effects model despite any calculated informationsize in such a situation. Further, to foresee a priori the size
of the difference between μF and μR seems impossible and
the calculation may then degenerate exclusively to a posthoc analysis.
Second, D2, though potentially unbiased with respect toinformation size calculations, could come with a greatervariance than I2 when both are calculated in the same setof meta-analyses. This latter situation presents a poten-tially unfavourable 'bias-variance-trade off' but an esti-mate of its magnitude will have to await simulationstudies addressing the issue.
It may seem an advantage that I2 is always reported inmeta-analysis and therefore readily available to adjust theexpected information size. On the other hand
is also calculable for meta-
analysis of ratio measures (e.g, RR or OR), widthF and
widthR refers to the widths of the confidence intervals for
the logarithmic transformed measures in the fixed-effectand the random-effects models, respectively.
Last but not least the decision to pool intervention effectestimates in meta-analysis should be the clinical relevanceof any inconsistency or diversity present. The betweentrial variance,τ2, rather than I2 or D2, may be the appropri-ate measure for this purpose [33-35].
The estimation of a required IS for a meta-analysis todetect or reject an anticipated intervention effect on abinary outcome measure should be considered based onreasonable assumptions. Accordingly, it may not be wiseto assume absence of heterogeneity in a meta-analysisunless the intervention effect is anticipated to be zero
s D2
t 2
I Q kQ
2 1= − −( )
ˆ ( )t DLQ k
wiwiwi
2 12= − −
∑ −∑∑
ˆ
ˆ ˆt
t s
2
2 + 2
t 2
t 2
N NR FRF
F
R
= ⋅ ⋅nn
m
m
2
2
N NR FRF
F
R
= ⋅ ⋅nn
m
m
2
2
D FR
FR
22
1 1= − = − ⎡⎣⎢
⎤⎦⎥
nn
widthwidth
Page 10 of 12(page number not for citation purposes)

BMC Medical Research Methodology 2009, 9:86 http://www.biomedcentral.com/1471-2288/9/86
[36,37]. On the contrary it may be wise to anticipate mod-erate to substantial heterogeneity (e.g., more than 50%)in an a priori adjustment of the required IS [37]. The con-cept of diversity points to the fact that an adjustmentbased on the experience with inconsistency would resultin underestimated heterogeneity and hence an underesti-mated required IS [37]. Alternatively for a future updatedmeta-analysis to become conclusive we may apply theactual estimated heterogeneity of the available trials in ameta-analysis as the best we have for the adjustment ofthe required IS. D2 seems more capable than I2 in obtain-ing such an adequate adjustment.
ConclusionA quantity to characterise the proportion of between trialvariation in any meta-analysis relative to the total modelvariance of the included trials is needed. Diversity, D2,may be such a quantity. D2 describes the relative modelvariance reduction changing from a random-effects modelinto a fixed-effect model. Diversity may be described asthe proportion of the total variance in a random-effectsmodel contributed by the between trial variation despitethe chosen between trial variance estimator. Furthermore,D2 can adequately adjust the required information size inany random-effects meta-analysis irrespective the meta-analytic model.
List of abbreviationsα: Risk of type 1 error; β: Risk of type 2 error; ARF: Adjust-
ment factor of information size changing from a fixed-
effect to a random-effects model; ∀: For any...; Q:Cochran's Q; D2: Diversity; DIS: Diversity adjusted infor-
mation size ( ); HIS: Heterogeneity adjusted
information size ( ); I2: Inconsistency factor;
K: Number of trials in a meta-analysis; NR: Required
number of participants in a random-effects meta-analysis;NF: Required number of participants in a fixed-effect
meta-analysis; IS: Required number of participants in a
meta-analysis; μF: Estimate of the intervention effect in a
fixed-effect meta-analysis; μR: Estimate of the intervention
effect in a random-effects meta-analysis; OR: Odds ratio;PC: Control event rate; RRR: Relative risk reduction; SS:
Sample size in a single randomised clinical trial; : Esti-
mate of a typical sampling error considering diversity;
: Estimate of a typical moment-based sampling error;
: Mean of estimates of sampling errors in a meta-anal-
ysis; τ2: Estimator of the variance of between trial inter-
vention effect estimates; : Estimate of the variance of
between trial intervention effect estimates; : DerSimo-
nian-Laird estimate of the variance of between trial inter-vention effect estimates; VF: The variance in a fixed-effect
meta-analysis; VR: The variance in a random-effects meta-
analysis; Z1-α/2: Fractile for 1-α/2; Z1-β: Fractile for 1-β.
Conflicts of interestsThe authors declare that they have no competing interests.
Authors' contributionsJW and KT conceived the idea of an information sizeadjustment factor and JW devised the concept of diversity,made the mathematical derivations and calculated theexamples. KT sat up the simulation program and KT andJW performed the simulations. JW, KT, and CG drafted thefirst manuscript. KT, JB and CG suggested revisions imple-mented by JW.
Authors informationJW is an anaesthesiologist and a trialist working withmeta-analysis and trial sequential analysis at the Copen-hagen Trial Unit having special interests in perioperativemedicine.
KT is a biostatistician working with meta-analysis and trialsequential analysis at the Copenhagen Trial Unit.
JB is an intern working in paediatrics with meta-analysisand trial sequential analysis.
CG is head of the Copenhagen Trial Unit, Editor-In-Chiefof the Cochrane Hepato-Biliary Group, a trialist, and anassociate professor at Copenhagen University.
AcknowledgementsWe are grateful to Jørgen Hilden, M.D., associate professor emeritus at the Department of Biostatistics, Copenhagen University, for having critically reviewed a former version of our manuscript. We thank the peer reviewers Rebecca Turner, MSc in statistics and Gerta Rücker, MSc in statistics for helpful suggestions for improvements of the manuscript.
References1. Guyatt GH, Mills EJ, Elbourne D: In the era of systematic reviews,
does the size of an individual trial still matter? PLoS Medicine2008, 5(1):e4. doi:10.1371/jounal.pmed.0050004.
2. Pogue J, Yusuf S: Cumulating evidence from randomized trials:utilizing sequential monitoring boundaries for cumulativemeta-analysis. Controlled Clinical Trials 1997, 18:580-93.
3. Pogue J, Yusuf S: Overcoming the limitations of current meta-analysis of randomised controlled trials. Lancet 1998,351(9095):47-52.
4. Devereaux PJ, Beattie WS, Choi PT, Badner NH, Guyatt GH, VillarJC: How strong is the evidence for the use of perioperativebeta-blockers in non-cardiac surgery? Systematic review andmeta-analysis of randomised controlled trials. BMJ 2005,331(7512):313-21.
5. Wetterslev J, Thorlund K, Brok J, Gluud C: Trial sequential analy-sis may establish when firm evidence is reached in a meta-analysis. Journal of Clinical Epidemiology 2008, 61(1):64-75.
DIS SS
D=
−1 2
HIS SS
I=
−1 2
s D2
s M2
s T2
t 2
t DL2
Page 11 of 12(page number not for citation purposes)
http://www.ncbi.nlm.nih.gov/entrez/query.fcgi?cmd=Retrieve&db=PubMed&dopt=Abstract&list_uids=9408720
http://www.ncbi.nlm.nih.gov/entrez/query.fcgi?cmd=Retrieve&db=PubMed&dopt=Abstract&list_uids=9408720
http://www.ncbi.nlm.nih.gov/entrez/query.fcgi?cmd=Retrieve&db=PubMed&dopt=Abstract&list_uids=9408720
http://www.ncbi.nlm.nih.gov/entrez/query.fcgi?cmd=Retrieve&db=PubMed&dopt=Abstract&list_uids=9433436

BMC Medical Research Methodology 2009, 9:86 http://www.biomedcentral.com/1471-2288/9/86
Publish with BioMed Central and every scientist can read your work free of charge
"BioMed Central will be the most significant development for disseminating the results of biomedical research in our lifetime."
Sir Paul Nurse, Cancer Research UK
Your research papers will be:
available free of charge to the entire biomedical community
peer reviewed and published immediately upon acceptance
cited in PubMed and archived on PubMed Central
yours — you keep the copyright
Submit your manuscript here:http://www.biomedcentral.com/info/publishing_adv.asp
BioMedcentral
6. Brok J, Thorlund K, Gluud C, Wetterslev J: Trial sequential analy-sis reveals insufficient information size and potentially falsepositive results in many meta-analyses. Journal of Clinical Epide-miology 2008, 61(8):763-9.
7. Thorlund K, Devereaux PJ, Wetterslev , Guyatt G, Ioannidis JPA,Thabane L, Gluud LL, Als-Nielsen B, Gluud C: Can trial sequentialmonitoring boundaries reduce spurious inferences frommeta-analyses? International Journal of Epidemiology 2008.Doi:10.1093/iej/dyn179.
8. Brok J, Thorlund K, Wetterslev J, Gluud C: Apparently conclusivemeta-analyses may be inconclusive-Trial sequential analysisadjustment of random error risk due to repetitive testing ofaccumulating data in apparently conclusive neonatal meta-analyses. International Journal of Epidemiology 2008. Doi:10.1093/iej/dyn188.
9. Altman DG, Deeks JJ: Meta-analysis, Simpson's paradox, andthe number needed to treat. BMC Medical Research Methodology2002, 2:3.
10. Higgins JP, Thompson SG: Quantifying heterogeneity in a meta-analysis. Statistics in Medicine 2002, 21:1539-1558.
11. Feinstein AR: Clinical Epidemiology: the Architecture of Clinical ResearchPhiladelphia: W.B. Saunders; 1985:166.
12. Chow S-C, Shao J, Wang H: Sample Size Calculation in Clinical ResearchVolume Chapter 8.8.1. Edited by: Shein-Chung Chow. CRC, Taylor &Francis Group; 2003:204-206.
13. Spiegel MR: Mathematical Handbook of Formulas and Tables 1971 [http://en.wikipedia.org/wiki/Chebyshev%27s_sum_inequality]. Schaum'soutline series, McGraw-Hill Book Company
14. Takouche B, Cadarso-Suaréz C, Spiegelman D: Evaluation of oldand new tests of heterogeneity in epidemiologic meta-anal-ysis. American Journal of Epidemiology 1999, 150:206-215.
15. DerSimonian R, Laird NM: Meta-analysis in clinical trials. Control-led Clinical Trials 1986, 7:177-188.
16. Afshari A, Wetterslev J, Brok J, Møller AM: Antithrombin III incritically ill patients. A systematic review with meta-analysisand trial sequential analysis. BMJ 2007, 335(7632):1219-20.
17. Al-Inany HG, Abou-Settea AM, Aboulghar M: Gonadotrophin-releasing hormone antagonists for assisted conception.Cochrane Database of Systematic Reviews 2006, 3:CD001750.
18. Soll RF: Prophylactic natural surfactant extract for prevent-ing morbidity and mortality in preterm infants. The CochraneDatabase of Systematic Reviews 1997, 4:CD000511.
19. Wetterslev J, Juul AB: Benefits and harms of perioperativebeta-blockade. Best Practice and Research of Clinical Anesthesiology2006, 20:285-302.
20. Bury RG, Tudehope D: Enteral antibiotics for preventing necro-tizing enterocolitis in low birthweight or preterm infants.The Cochrane Database of Systematic Reviews 2000, 2:CD000405. DOI:10.1002/14651858.CD000405.
21. Li J, Zhang M, Egger M: Intravenous magnesium for acute myo-cardial infarction. Cochrane Database of Systematic Reviews 2007,2:CD002755.
22. Meyhoff CS, Wetterslev J, Jorgensen LN, Henneberg SW, Simonsen I,Pulawska T, Walker LR, Skovgaard N, Heltø K, Gocht-Jensen P,Carlsson PS, Rask H, Karim S, Carlsen CG, Jensen FS, Rasmussen LS,the PROXI Trial Group: Perioperative oxygen fraction - effecton surgical site infection and pulmonary complications afterabdominal surgery: a randomized clinical trial. Rationale anddesign of the PROXI-Trial. Trials 2008, 9(1):58.
23. Gluud LL: Bias in clinical intervention research. American Journalof Epidemiology 2006, 163:493-501.
24. Chan AW, Hrobjartsson A, Haahr MT, Gøtzsche PC, Altman DG:Empirical evidence for selective reporting of outcomes inrandomized trials: comparison of protocols to publishedarticles. Journal of American Medical Association 2004,291(20):2457-2465.
25. Chan AW, Altman DG: Identifying outcome reporting bias inrandomised trials on PubMed: review of publications andsurvey of authors. BMJ 2005, 330(7494):753.
26. Wood L, Egger M, Gluud LL, Schulz KF, Jüni P, Altman DG, Gluud C,Martin RM, Wood AJ, Sterne JA: Empirical evidence of bias intreatment effect estimates in controlled trials with differentinterventions and outcomes: meta-epidemiological study.BMJ 2008, 336(7644):601-5.
27. Montori VM, Devereaux PJ, Adhikari NK, Burns KE, Eggert CH, BrielM, Guyatt G: Randomized trials stopped early for benefit: a
systematic review. Journal of American Medical Association 2005,294(17):2203-2209.
28. Flather MD, Farkouh ME, Pogue JM, Yusuf S: Strengths and limita-tions of meta-analysis: larger studies may be more reliable.Controlled Clinical Trials 1997, 18(6):568-579.
29. Fedorov V, Jones B: The design of multicentre trials. StatisticalMethods in Medical Research 2005, 14:205-248.
30. Bangalore S, Wetterslev J, Pranesh S, Sawhney S, Gluud C, MesserliFH: Perioperative beta blockers in patients having non-car-diac surgery: a meta-analysis. Lancet 2008, 372(9654):1962-76.
31. Jennison C, Turnbull BW: Group sequential methods with application toclinical trials Volume Chapter III. Chapman & Hall/CRC; 2000:49.
32. Sidik K, Jonkman JN: A comparison of heterogeneity varianceestimators in combining results of studies. Statistics in Medicine2007, 30;26(9):1964-81.
33. Rücker G, Schwarzer , Carpenter JR, Schumacher M: Undue reli-ance on I 2 in assessing heterogeneity may mislead. BMC Med-ical Research Methodology 2008, 8:79. doi:10.1186/1471-2288-8-79.
34. Higgins JP: Commentary: Heterogeneity in meta-analysisshould be expected and appropriately quantified. InternationalJournal of Epidemiology 2008, 37:1158-1160.
35. Rücker G, Schwarzer G, Carpenter JR, Schumacher M: Are largetrials less reliable than small trials? Letter to the editor. Jour-nal of Clinical Epidemiology 2009, 62:886-889.
36. Ioannidis JP, Trikalinos TA, Zintzaras E: Extreme between-studyhomoge-neity in meta-analyses could offer useful insights.Journal of Clinical Epidemiology 2006, 59(10):1023-32.
37. Ioannidis JP, Patsopoulos NA, Evangelou E: Uncertainty in hetero-geneity estimates in meta-analyses. BMJ 2007,335(7626):914-6.
Pre-publication historyThe pre-publication history for this paper can be accessedhere:
http://www.biomedcentral.com/1471-2288/9/86/prepub
Page 12 of 12(page number not for citation purposes)
http://www.ncbi.nlm.nih.gov/entrez/query.fcgi?cmd=Retrieve&db=PubMed&dopt=Abstract&list_uids=3802833
http://www.ncbi.nlm.nih.gov/entrez/query.fcgi?cmd=Retrieve&db=PubMed&dopt=Abstract&list_uids=9408719