Quantifying load imbalance on virtualized enterprise servers
8
Quantifying Load Imbalance on Virtualized Enterprise Servers Emmanuel Arzuaga Department of Electrical and Computer Engineering Northeastern University, Boston, MA [email protected] David R. Kaeli Department of Electrical and Computer Engineering Northeastern University, Boston, MA [email protected] ABSTRACT Virtualization has been shown to be an attractive path to increase overall system resource utilization. The use of live virtual machine (VM) migration has enabled more effective sharing of system resources across multiple physical servers, resulting in an increase in overall performance. Live VM migration can be used to load balance virtualized clusters. To drive live migration, we need to be able to measure the current load imbalance. Further, we also need to accurately predict the resulting load imbalance produced by any mi- gration. In this paper we present a new metric that captures the load of the physical servers and is a function of the resident VMs. This metric will be used to measure load imbalance and construct a load-balancing VM migration framework. The algorithm for balancing the load of virtualized enter- prise servers follows a greedy approach, inductively predict- ing which VM migration will yield the greatest improvement of the imbalance metric in a particular step. We compare our algorithm to the leading commercially available load bal- ancing solution - VMware’s Distributed Resource Scheduler (DRS). Our results show that when we are able to accu- rately measure system imbalance, we can also predict future system state. We find that we can outperform DRS and im- prove performance up to 5%. Our results show that our ap- proach does not impose additional performance impact and is comparable to the virtual machine monitor overhead. Categories and Subject Descriptors D.4 [Operating Systems]: Performance General Terms Experimentation,Measurement, Performance Keywords Virtualization, Dynamic Resource Allocation, VM Migra- tion Permission to make digital or hard copies of all or part of this work for personal or classroom use is granted without fee provided that copies are not made or distributed for profit or commercial advantage and that copies bear this notice and the full citation on the first page. To copy otherwise, to republish, to post on servers or to redistribute to lists, requires prior specific permission and/or a fee. WOSP/SIPEW’10, January 28–30, 2010, San Jose, California, USA. Copyright 2010 ACM 978-1-60558-563-5/10/01 ...$10.00. 1. INTRODUCTION Virtualization technologies have a rich history, dating back to the 1960s with IBM’s System/360 and 370 [5]. Current commercial solutions are dominated by VMware ESX Server [19], Microsoft Hyper-V [12] and Sun xVM [16]. Other popu- lar virtualization platforms include Citrix XenSource [2] and Xen – both of these provide open source solutions. There are open source versions of xVM as well. Server virtualization is currently used to consolidate loads [7], enhance the utilization of physical systems [1] and pro- vide a level of isolation and security for applications [23]. This has opened the door for the use of virtual machines in clusters of physical systems. However, in order to bet- ter utilize the resources in these systems, it is necessary to have the ability to dynamically allocate resources to the run- ning VMs. Figure 1 depicts such a scheme. VM2 is being migrated from Physical Server1 to Physical Server2 by the Virtualization Manager. The Virtualization Manager selects which VM to migrate based on an imbalance measurement. Notice that while the migration is taking place, the VM is completely functional, hence the term live migration. Dynamic migration of virtual machines maximizes the uti- lization of system resources by balancing server loads [4, 13]. In order to guarantee good system performance, it is very important to place VMs in physical hosts that are underuti- lized (rather than overloading part of the system). In this paper we study the effects of Dynamic Resource Allocation via live VM migration on virtualized enterprise servers. To evaluate our algorithms, we run online transaction process- ing (OLTP) workloads based on the TPC-C benchmark [17]. We present an imbalance metric based on the variation in load measured on the physical servers. This metric is the input to our VM migration algorithm. It is critical for the metric to accurately predict future system state. We have developed a greedy algorithm for VM migration, choosing the VM movement that obtains the greatest improvement in the imbalance metric at a particular step. The main con- tributions of our work are: 1. we present a metric that captures the load of a virtu- alized enterprise server based on its current resident VMs, 2. we demonstrate how the server load metric can drive a load balancing VM migration algorithm and can also be used to predict future server state, and 3. we provide an open source Dynamic Resource Allo- cation Framework for VMs that is an alternative to commercial products such as VMware’s DRS. 235
Transcript of Quantifying load imbalance on virtualized enterprise servers

Quantifying Load Imbalance on Virtualized EnterpriseServers
Emmanuel ArzuagaDepartment of Electrical and Computer
EngineeringNortheastern University, Boston, MA
David R. KaeliDepartment of Electrical and Computer
EngineeringNortheastern University, Boston, MA
ABSTRACTVirtualization has been shown to be an attractive path toincrease overall system resource utilization. The use of livevirtual machine (VM) migration has enabled more effectivesharing of system resources across multiple physical servers,resulting in an increase in overall performance. Live VMmigration can be used to load balance virtualized clusters.To drive live migration, we need to be able to measure thecurrent load imbalance. Further, we also need to accuratelypredict the resulting load imbalance produced by any mi-gration.
In this paper we present a new metric that captures theload of the physical servers and is a function of the residentVMs. This metric will be used to measure load imbalanceand construct a load-balancing VM migration framework.The algorithm for balancing the load of virtualized enter-prise servers follows a greedy approach, inductively predict-ing which VM migration will yield the greatest improvementof the imbalance metric in a particular step. We compareour algorithm to the leading commercially available load bal-ancing solution - VMware’s Distributed Resource Scheduler(DRS). Our results show that when we are able to accu-rately measure system imbalance, we can also predict futuresystem state. We find that we can outperform DRS and im-prove performance up to 5%. Our results show that our ap-proach does not impose additional performance impact andis comparable to the virtual machine monitor overhead.
Categories and Subject DescriptorsD.4 [Operating Systems]: Performance
General TermsExperimentation,Measurement, Performance
KeywordsVirtualization, Dynamic Resource Allocation, VM Migra-tion
Permission to make digital or hard copies of all or part of this work forpersonal or classroom use is granted without fee provided that copies arenot made or distributed for profit or commercial advantage and that copiesbear this notice and the full citation on the first page. To copy otherwise, torepublish, to post on servers or to redistribute to lists, requires prior specificpermission and/or a fee.WOSP/SIPEW’10, January 28–30, 2010, San Jose, California, USA.Copyright 2010 ACM 978-1-60558-563-5/10/01 ...$10.00.
1. INTRODUCTIONVirtualization technologies have a rich history, dating back
to the 1960s with IBM’s System/360 and 370 [5]. Currentcommercial solutions are dominated by VMware ESX Server[19], Microsoft Hyper-V [12] and Sun xVM [16]. Other popu-lar virtualization platforms include Citrix XenSource [2] andXen – both of these provide open source solutions. Thereare open source versions of xVM as well.
Server virtualization is currently used to consolidate loads[7], enhance the utilization of physical systems [1] and pro-vide a level of isolation and security for applications [23].This has opened the door for the use of virtual machinesin clusters of physical systems. However, in order to bet-ter utilize the resources in these systems, it is necessary tohave the ability to dynamically allocate resources to the run-ning VMs. Figure 1 depicts such a scheme. VM2 is beingmigrated from Physical Server1 to Physical Server2 by theVirtualization Manager. The Virtualization Manager selectswhich VM to migrate based on an imbalance measurement.Notice that while the migration is taking place, the VM iscompletely functional, hence the term live migration.
Dynamic migration of virtual machines maximizes the uti-lization of system resources by balancing server loads [4, 13].In order to guarantee good system performance, it is veryimportant to place VMs in physical hosts that are underuti-lized (rather than overloading part of the system). In thispaper we study the effects of Dynamic Resource Allocationvia live VM migration on virtualized enterprise servers. Toevaluate our algorithms, we run online transaction process-ing (OLTP) workloads based on the TPC-C benchmark [17].We present an imbalance metric based on the variation inload measured on the physical servers. This metric is theinput to our VM migration algorithm. It is critical for themetric to accurately predict future system state. We havedeveloped a greedy algorithm for VM migration, choosingthe VM movement that obtains the greatest improvementin the imbalance metric at a particular step. The main con-tributions of our work are:
1. we present a metric that captures the load of a virtu-alized enterprise server based on its current residentVMs,
2. we demonstrate how the server load metric can drive aload balancing VM migration algorithm and can alsobe used to predict future server state, and
3. we provide an open source Dynamic Resource Allo-cation Framework for VMs that is an alternative tocommercial products such as VMware’s DRS.
235

Figure 1: Live VM Migration Process.
VMware DRS [18] is the commercial application that per-forms dynamic resource allocation in VMware Virtual Cen-ter (VC). It monitors overall system behavior and migratesVMs to balance the load by issuing VMotion commands. Asit is a commercial product, there is limited information avail-able on DRS internals. However, available documentationshows that it uses some form of per-resource imbalance usingtheir concept of VM shares and entitlements and produces ametric based on the standard deviation of the per-resourceimbalance values of the system.
The rest of this paper is organized as follows. In Section 2we provide a definition of the Virtualized Server Load (VSL)in a physical server as a function of the VMs running onit. Section 3 presents our imbalance metric and the VSLInductive Balancing Method (VIBM). Section 4 discussesthe characteristics of the OLTP workload and the physicalsystem used. Results of our experiments are presented andanalyzed in Section 5. Section 6 discusses related work andSection 7 presents conclusions and areas for future work.
2. QUANTIFYING SERVER LOAD
2.1 Desirable Properties of a Virtualized ServerLoad Metric
A common approach for quantifying physical server load isto measure the utilization of its resources (e.g., CPU time,memory utilization, network and disk I/O traffic). Virtu-alization introduces another layer of abstraction on top ofa physical server – virtual machines only know about vir-tualized hardware resources, while the hypervisor managesboth virtual and physical hardware resources. As a result, itbecomes more challenging to balance performance in termsof per-VM utilization of system resources given this addedlayer of abstraction. Working at the hypervisor level allowsus to isolate each VMs’ virtual and physical resource con-sumption and enables us to isolate the resource consumptionof a particular VM when making predictions on the overallsystem balance.
Another desirable property of a virtualized server loadmetric is that it can be used on heterogeneous systems. Real-world cluster systems are rarely homogeneous, so in orderfor this metric to apply to a variety of system configurations,we need to quantify the load of a server in a manner thatdoes not depend on fixed resource units. A unitless metricallows the direct comparison of different servers in the sys-tem regardless of their internal components.
2.2 Virtualized Server LoadFor the purpose of defining such a metric, let S be the set
of physical servers and V MHost be the set of virtual ma-chines currently running on physical server Host, (Host ∈S). Then, the Virtualized Server Load (V SLHost) can beexpressed as:
V SLHost =X
resource
Wresource ×
P
v∈V MHost
vresourceusage
Hostresourcecapacity,
(1)where resource ∈ {CPU, memory, disk} and Wresource is aweight associated with each resource.
Note that this load measure has no units and starts at 0when the VMs resource usage is zero. The maximum valuedepends on the assigned weight values (Wresource) in thecase when the VMs consume all of the available resource.V SLHost varies dynamically, depending on the VMs runningon the physical system (Host). This fact makes it suitablefor a range of system characteristics such as a load balancingmetric.
3. MAINTAINING A BALANCED SYSTEM
3.1 Load Imbalance MetricLoad balancing has been one of the most important tech-
niques used to improve resource utilization and system per-formance in parallel and distributed systems. Although pre-vious work has focused on specific balancing algorithms [15,21, 22], it is difficult to directly apply them to virtualizedservers. Additionally, we need to take into consideration theimpact that the virtualization layer imposes on system re-sources. The virtualization layer can signficantly change theknown behavior of a workload running on a physical system.
A typical imbalance metric based on the resource utiliza-tion of physical servers is the standard deviation of the CPUutilization [21]. The reasoning behind this metric is that ifthe server loads are evenly distributed, the standard devia-tion will be small. The smaller this metric, the greater theload balance in the system. Although CPU utilization isgenerally a good predictor of system performance, the useof such a metric for load balancing does not take into con-sideration memory, network or disk I/O performance. In thecase of a more complex workload such as VMs running com-mercial workloads, relying only on CPU information maylead to undesireable results.
In the previous section, we defined a server load metricthat is a function of VM resource usage. This metric con-siders information specific to each VM when quantifying theload of a particular physical server. This metric takes intoconsideration the usage of multiple resources by the VMsresident on the system. Based on this definition, we cangenerate a load set L that contains the V SL values corre-sponding to all physical servers (∀ physical servers ∈ S).The desired system imbalance metric can then be defined interms of the coefficient of variation of L:
CL =σL
µL
(2)
As shown, CL is defined as the ratio of the standard devia-tion σL over the mean µL. The coefficient of variation CL isused in many areas of computer science including queueing
236

theory [8]. This metric captures the dispersion of the valuesassumed by a variable in a way that does not depend on themeasurement unit. The higher the CL, the greater the vari-ation in the measured values. Note that this metric will giveus a tighter bound than using only the standard deviation.For example, if we use CL to predict future system stateafter migrating a set of VMs, the metric accounts for themigration set that not only reduces σL, but that recognizeschanges in µL as well.
However, there are some problems that must be taken intoconsideration when using the CL as an imbalance metric.The most evident problem is in cases where µL is zero. Forthese cases, CL will be undefined. Similar problems mayoccur if the V SL returns non-positive values. This is notan issue for our V SL metric, as long as we use positivevalues in Wresource. Thus, the only part we need to worryabout is the case where µL becomes zero. The only time thiscould happen is when all servers are idle or when the virtualmachine monitor (VMM) is not consuming any resources.Although these cases are extremely rare, in order to avoidthis problem, we define our imbalance metric as:
IMetric :
(
0, if no VMs are active
CL, otherwise(3)
Figure 2 shows the behavior of this metric for differentthroughput values of a virtualized system running an onlinetransaction processing OLTP workload. As seen, this metriccaptures the variability of V SL across all hosts in S andreducing this metric produces a load-balanced set of serversthat provides a higher system throughput. In this work theweight values (Wresource) in Equation 1 are assumed to beequal. Following work will analyze the potential of tuningsuch values to improve or change the migration criteria.
Figure 2: CL as a function of throughput inTransactions-per-Minute (TpM). For lower CL val-ues there are higher TpM values.
3.2 Virtualized Server Load Inductive Balanc-ing Method
Based on IMetric, we can start to design a method forbalancing server load. The general problem of dynamicallyallocating VMs to physical servers has been shown to besimilar to bin-packing [7] or knapsack [14] problems, both
Algorithm 1: VIBM
IMetric ←− CL
while IMetric ≥ threshold dosrc←− host ∈ S : V SLhost = Max(L)for vcandidate ∈ V Msrc do
for (target ∈ S) 6= src dopredict benefit of migrating vcandidate totarget
compute Lcandidate
Lcandidate :
8
>
<
>
:
V SLtarget ←− V SLtarget + vcandidate
V SLsrc ←− V SLsrc − vcandidate
insert (vcandidate, src, target,Lcandidate) toCandidates
end
endselect candidate from Candidates :Min(CLcandidate
)
IMetricPREDICT ED←− CLcandidate
if IMetricPREDICT ED< IMetric then
promote candidate to migrateIMetric ←− IMetricPREDICT ED
elsedo not promote candidate
end
end
classic NP-Hard problems. We present a heuristic solutionthat follows a greedy approach by inductively selecting theVM migration that will yield the greatest improvement ofthe imbalance metric at its present state. This greedy lo-cal approach guarantees that we will seek migrations thatminimize the value of the IMetric over the current runninginterval of the system. We have named this approach theVSL Inductive Balancing Method (VIBM). The method ispresented in Algorithm 1.
The VIBM algorithm starts by determining that the sys-tem is unbalanced, that is, if IMetric is greater than somethreshold value. Whenever it is over threshold, VIBM looksfor migration candidates. The first step in this search isto select the physical system with the highest V SL as thesource host to select migration candidates from. VIBM thencomputes a prediction of the new IMetric by applying thecandidate migration to the corresponding target physicalsystem load (V SLtarget) and subtracts it from the load ofthe source server (V SLsrc). The vcandidate migration thatprovides the smallest CLcandidate
value will be selected forpromotion. If the IMetricPREDICT ED
is below the currentsystem IMetric, the candidate gets promoted, otherwise thesystem is unchanged. The VIBM migration handler is noti-fied of the promoted vcandidate and is in charge of performingthe corresponding migrations.
4. EXPERIMENTAL SETUP
4.1 Workload CharacteristicsOur experiments present results from running a simple
CPU-intensive microbenchmark and an OLTP workload. TheCPU-intensive workload issues simple integer operations sim-ilar to the Dhrystone benchmark [20]. It is used to show the
237

accuracy of VIBM to predict system state. The OLTP work-load is used for performance tests. It is implemented basedon the TPC-C specification [17], which models an onlinewholesale supplier managing orders. Order-entry providesa conceptual model for the benchmark, with the underly-ing components being typical of any OLTP system. Ta-ble 1 shows the five transaction types and their read/writecharacteristics. The transactions operate against a rela-tional database composed of 9 tables. Transactions generatereads, writes, and rollbacks. The application uses primaryand secondary key access. Our OLTP workload consists ofwarehouses, each containing 10 terminals, as outlined in theTPC-C specification. The terminal interface consists of aLinux terminal that displays information about the currenttransaction being performed.
Table 1: OLTP Transactions
Transaction Access PatternNew-order read/writePayment read/writeDelivery read/write
Order-status readStock-level read
4.2 Used SystemThe experimental setup for testing our imbalance met-
ric and VM migration algorithms is shown in Figure 3. Itconsists of three physical servers using VMware’s VirtualInfrastructure (VI) version 3. One of the ESX servers ser-vices storage I/O over an iSCSI shared SAN to the othertwo physical systems. The two ESX servers sharing theSAN constitute the system under test. The servers havetwo 2.33 GHz Intel Xeon EM64T dual-core processors witha 4GB memory configuration sharing a 700GB iSCSI SAN.The iSCSI SAN is supported by an EMC CLARiiON CX300storage array via fibre channel. The fibre channel connec-tion is made through a McData Sphereon 1440 fibre channelswitch. The server has a dedicated LUN of 1 TB, consistingof 7 HDDs with a RAID 5 configuration. The ESX servershave shared access to 700GB of this LUN. The VM files arestored on this storage system.
As Figure 3 shows, both ESX servers are administrated byVMware’s VC Server. The VIBM migration handler frame-work attaches to the VC server using the VMware VI SDKfor Perl. The VI SDK is an API that allows the extractionof performance information from a cluster of ESX serversadministered by VC. It also enables the scripting of systemadministration activities such as turning on/off VMs, col-lecting ESX server performance statistics, as well as invok-ing VMotion to migrate VMs. The VIBM migration han-dler connects to VC and calculates the Virtualized ServerLoads (V SLS) for each physical host. After generating theV SLS , it computes the actual IMetric for the system. Ifthe system is unbalanced, it triggers the VIBM algorithmand attempts to balance the system load accordingly, issu-ing VMotion calls with the selected migrations.
The main reason for choosing the VMware VI API for theimplementation of the VIBM migration handler prototypeis the presence of an available commercial product in VCthat could be used as a baseline to evaluate the effective-ness of our VIBM framework (DRS). Even though the cur-
Figure 3: Experimental System.
rent VIBM migration handler uses this API, there are otherVM Hypervisors that provide the capability of extractingthe same information. In particular, the Xen hypervisorprovides a set of profiling tools and an API that is robustenough to provide the same information to the VIBM migra-tion handler [3, 6, 11]. Thus, the VIBM migration handlercan be reconfigured to use those other hypervisors with mi-nor changes. This is a robustness that DRS lacks becauseof being an built in feature of VC.
Our experiments are designed to compare the effective-ness of our improved imbalance metric IMetric. We presentresults for three different migration policies: no migrations,VMware DRS and VIBM. VIBM results will be comparedto those of DRS when configured with an aggressive migra-tion setting. Running with this configuration, DRS makesrecommendations even if the suggested migration only pro-vides a slight improvement in the overall system balance.We want DRS to be as aggressive as possible to provide avery competitive baseline.
The VIBM migration handler will be in charge of monitor-ing the whole system and proposing load balancing solutions.Our implementation of the VIBM migration handler allowsthe selection of the type of migration scheme that will beperformed during the workload analysis. In this way, we cancompute the predicted IMetric associated with each migra-tion scheme to understand and evaluate its overall behavior.
Table 2: VM sizes and names
Large VM Small VMVM1 VM4 VM5VM2 VM6 VM7VM3 VM8
The evaluated system contains 8 VMs, using two differentsizes (in terms of virtual resources; CPUs and memory), asshown in Figure 3. The larger VM configuration consists oftwo virtual CPUs and 1GB of main memory. The smallerVM has one virtual CPU and 512MB of main memory. Both
238
VM configurations have 50GB virtual hard disks. Table 2shows the VM names and sizes. The following sections willexplain in more detail our experiments.
5. VIBM RESULTS
5.1 IMetric Analysis
5.1.1 Predicting System StateIn order to test the utility of VIBM to increase overall
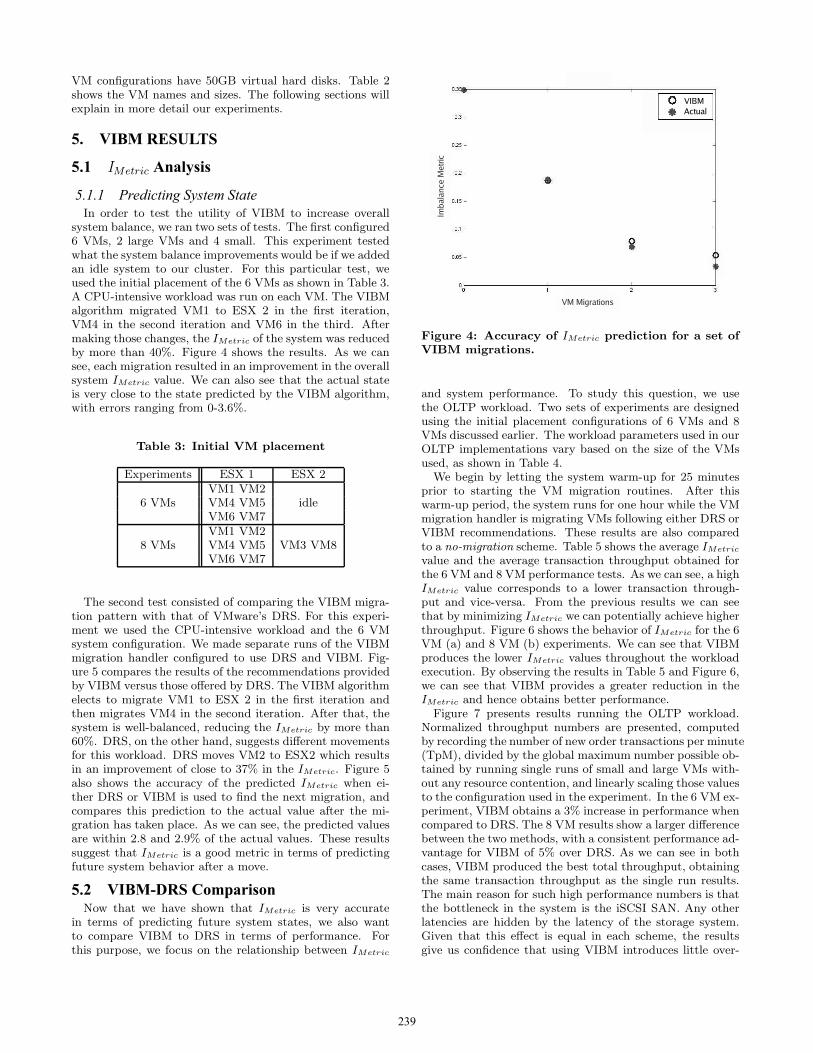
system balance, we ran two sets of tests. The first configured6 VMs, 2 large VMs and 4 small. This experiment testedwhat the system balance improvements would be if we addedan idle system to our cluster. For this particular test, weused the initial placement of the 6 VMs as shown in Table 3.A CPU-intensive workload was run on each VM. The VIBMalgorithm migrated VM1 to ESX 2 in the first iteration,VM4 in the second iteration and VM6 in the third. Aftermaking those changes, the IMetric of the system was reducedby more than 40%. Figure 4 shows the results. As we cansee, each migration resulted in an improvement in the overallsystem IMetric value. We can also see that the actual stateis very close to the state predicted by the VIBM algorithm,with errors ranging from 0-3.6%.
Table 3: Initial VM placement
Experiments ESX 1 ESX 2VM1 VM2
6 VMs VM4 VM5 idleVM6 VM7VM1 VM2
8 VMs VM4 VM5 VM3 VM8VM6 VM7
The second test consisted of comparing the VIBM migra-tion pattern with that of VMware’s DRS. For this experi-ment we used the CPU-intensive workload and the 6 VMsystem configuration. We made separate runs of the VIBMmigration handler configured to use DRS and VIBM. Fig-ure 5 compares the results of the recommendations providedby VIBM versus those offered by DRS. The VIBM algorithmelects to migrate VM1 to ESX 2 in the first iteration andthen migrates VM4 in the second iteration. After that, thesystem is well-balanced, reducing the IMetric by more than60%. DRS, on the other hand, suggests different movementsfor this workload. DRS moves VM2 to ESX2 which resultsin an improvement of close to 37% in the IMetric. Figure 5also shows the accuracy of the predicted IMetric when ei-ther DRS or VIBM is used to find the next migration, andcompares this prediction to the actual value after the mi-gration has taken place. As we can see, the predicted valuesare within 2.8 and 2.9% of the actual values. These resultssuggest that IMetric is a good metric in terms of predictingfuture system behavior after a move.
5.2 VIBM-DRS ComparisonNow that we have shown that IMetric is very accurate
in terms of predicting future system states, we also wantto compare VIBM to DRS in terms of performance. Forthis purpose, we focus on the relationship between IMetric
Figure 4: Accuracy of IMetric prediction for a set ofVIBM migrations.
and system performance. To study this question, we usethe OLTP workload. Two sets of experiments are designedusing the initial placement configurations of 6 VMs and 8VMs discussed earlier. The workload parameters used in ourOLTP implementations vary based on the size of the VMsused, as shown in Table 4.
We begin by letting the system warm-up for 25 minutesprior to starting the VM migration routines. After thiswarm-up period, the system runs for one hour while the VMmigration handler is migrating VMs following either DRS orVIBM recommendations. These results are also comparedto a no-migration scheme. Table 5 shows the average IMetric
value and the average transaction throughput obtained forthe 6 VM and 8 VM performance tests. As we can see, a highIMetric value corresponds to a lower transaction through-put and vice-versa. From the previous results we can seethat by minimizing IMetric we can potentially achieve higherthroughput. Figure 6 shows the behavior of IMetric for the 6VM (a) and 8 VM (b) experiments. We can see that VIBMproduces the lower IMetric values throughout the workloadexecution. By observing the results in Table 5 and Figure 6,we can see that VIBM provides a greater reduction in theIMetric and hence obtains better performance.
Figure 7 presents results running the OLTP workload.Normalized throughput numbers are presented, computedby recording the number of new order transactions per minute(TpM), divided by the global maximum number possible ob-tained by running single runs of small and large VMs with-out any resource contention, and linearly scaling those valuesto the configuration used in the experiment. In the 6 VM ex-periment, VIBM obtains a 3% increase in performance whencompared to DRS. The 8 VM results show a larger differencebetween the two methods, with a consistent performance ad-vantage for VIBM of 5% over DRS. As we can see in bothcases, VIBM produced the best total throughput, obtainingthe same transaction throughput as the single run results.The main reason for such high performance numbers is thatthe bottleneck in the system is the iSCSI SAN. Any otherlatencies are hidden by the latency of the storage system.Given that this effect is equal in each scheme, the resultsgive us confidence that using VIBM introduces little over-
239

0 1 20.1
0.2
0.3
0.4
0.5
0.6
0.7
0.8
VM Migrations
Imba
lanc
e M
etric
VIBMDRSActual
(a)
0 1 20.1
0.2
0.3
0.4
0.5
0.6
0.7
0.8
VM Migrations
Imba
lanc
e M
etric
VIBMDRSActual
(b)
Figure 5: Comparing the accuracy of IMetric prediction following different migration recommendations: DRS(a) and VIBM (b). Notice how VIBM selects the migrations that better reduce IMetric.
head and is comparable to the overhead that VirtualCenteralready introduces.
Table 4: VM OLTP workload description
Warehouse Number ofNumber Terminals
Large VM 5 50Small VM 2 20
Table 5: IMetric and Throughput Relation
Migration 6 VMs 8 VMsMethod IMetric TpM IMetric TpM
No Migrations 0.99 128.98 0.89 174.63DRS 0.81 133.96 0.71 193.20
VIBM 0.70 149.10 0.61 203.52
6. RELATED WORKOur work implements a VM migration framework based
on a new imbalance metric. We are interested in using thisframework to evaluate how well V SL increases workloadthroughput. The study of VM Migration through Virtu-alized Server Environments has gained popularity, as VMtechnology emerges as one of the most commonly deployedsolutions for server consolidation.
Most previous work on VM migration has focused on dy-namic resource management. However, these techniques areoriented towards managing individual system virtualized re-sources. Choi et al. [1] proposed an autonomous learningmethod for threshold-based VM migration. In their work,they focus on dynamically changing the migration thresh-olds. They base their approach on a migration history log
that keeps records of previous migrations and proposes newmigrations following the observed behavior of the system.They use User-Mode Linux (UML) VMs. Their approach issimilar to ours for developing an imbalance metric, but onlyconsiders the standard deviation of CPU resources. Theirresults show that their learning approach tends to obtainbetter results than a pure threshold-based scheme. How-ever, these results are heavily dependent on the imbalancemetric used. Since they chose to use the standard deviationof CPU utilization, they cannot characterize the true spreadof values captured by IMetric.
Park et al. [14] propose a self-managing solution that takesinto consideration application service level objectives (SLOs),and an optimization model based on linear programming(LP), specifically a Branch-and-Bound solution to the Bi-nary Multiple Knapsack Problem [10]. They propose an op-timal solution to their problem based on the implementedcost function applied to each VM. However, they mentionas a limitation the fact that their approach can producemigration cycles in which a heavily used server migrates aVM continuously because it unstabilizes the system on eachmigration. Our method avoids this problem by migrationthrottling if the predicted IMetric is greater than or equal tothe current value.
Kochut and Beaty [9] developed an analytical model ofvirtual machine migration that provides estimates of theexpected gain in response time due to the selected migra-tion. The model is based on queueing theory [8] and takesinto consideration the characteristics of a virtualized envi-ronment such as migration cost and overhead. They presentsimulations using data center CPU resource utilization traces.They assume that the physical servers follow an M/M/1queue behavior to derive the response time equations forthe system. The migrations are performed by selecting theone that minimizes the response time of the system.
The work most similar to ours is by Khanna et al. [7],which targets application performance management. Theirwork introduces the concept of server consolidation, where
240

1 2 3 4 5 6 7 8 9 100.5
0.6
0.7
0.8
0.9
1
1.1
1.2
1.3
TIME
Imba
lanc
e M
etric
VIBM DRS No Migrations
(a)
1 2 3 4 5 6 7 8 9 100.5
0.6
0.7
0.8
0.9
1
1.1
1.2
1.3
TIME
Imba
lanc
e M
etric
VIBM DRS No Migrations
(b)
Figure 6: A comparison of IMetric values over time per used method for: (a) 6 VM, and (b) 8 VM experiments.VIBM obtains the lowest average IMetric for both experiments.
��������
��������
����
No Migrations DRS VIBM
������������������������������������������������������������������������������
������������������������������������������������������������������������������
��������������������������������������������������������������������������������������������������������
��������������������������������������������������������������������������������������������������������
����������������������������������������������������������������������������������������������������������������
����������������������������������������������������������������������������������������������������������������
���������������������������������������������������������������������������������
���������������������������������������������������������������������������������
���������������������������������������������������������������������������������
���������������������������������������������������������������������������������
������������������������������������������������������������������������������������������������������������
������������������������������������������������������������������������������������������������������������
0.000
0.200
0.400
0.600
0.800
1.000
8−VM6−VM
Nor
mal
ized
Thr
ough
put (
TpM
)
Figure 7: OLTP Transaction Throughput (TpM)for: 6 VM, and 8 VM experiments. VIBM migra-tions produce a higher TpM in the two experiments.
the goal is to reduce the number of servers in a data centerby sharing one server between multiple applications. Theapplications are isolated from one another using one VMper application. The authors define the residual capacity asthe unused resources in a physical server that may be usedby a VM being migrated to it. The authors explain that aphysical host needs to have a high residual capacity in orderto accommodate incoming VMs, therefore their migrationmetric is based on maximizing the variance of the residualcapacities of the physical servers and also considers the costof the migration. In our case, we can see some similari-ties between minimizing CL and maximizing the variance ofresidual capacity. However, our method does not considermigration cost, and targets maximizing overall resource us-age instead of reducing local usage.
7. CONCLUSIONSIn this paper we introduced a new virtualized server load
metric that is based on the current resident VM resource us-age named V SL. We also described a new imbalance metricthat is based on the variation in load present on the physi-cal servers. Our new imbalance metric was shown to providepredictions of future system behavior with high fidelity (i.e.,with an error margin of less than 5%). This new imbalancemetric was used to drive our new load balancing method(VIBM) on a virtualized enterprise server.
VIBM implements a greedy approach, selecting the VMmigration that yields the most improvement of the imbal-ance metric at each time step. VIBM was implemented usingthe VMware VI SDK for Perl. The VIBM migration han-dler is an open source solution that interacts with VMware’sVirtualCenter Server to migrate VMs between the managedESX hosts. Our new algorithm was compared to VMwareDRS – VIBM produced a VM migration pattern that re-duced the overall imbalance metric. Our results showed thatby accurately predicting the imbalance metric to guide VMmigration can result in higher workload throughput, increas-ing performance by 2-5% over VMware’s DRS.
In future work we plan to enhance the VIBM algorithm byconsidering migration cost estimates. We will also study howtypical quality-of-service measures associated with commer-cial virtualization systems, such as shares and entitlements,affect overall resource utilization and migration patterns. Fi-nally, we would like to expand the utility of the V SL metricby applying it other important areas in virtualized enterpriseserver management such as power management. We are par-ticularly interested in the impact of the weights (Wresource)in Equation 1 to characterize the system behavior as it re-lates to power.
8. ACKNOWLEDGMENTSWe would like to acknowledge the support provided by
VMware’s VMAP program. This work was supported inpart by an NSF Major Research Instrumentation Grant (AwardNumber MRI-0619616), the Institute for Complex Scientific
241

Software, and from the Gordon-CenSSIS, the Bernard M.Gordon Center for Subsurface Sensing and Imaging Systems,under the Engineering Research Centers Program of the Na-tional Science Foundation (Award Number EEC-9986821).
9. REFERENCES[1] H. W. Choi, H. Kwak, A. Sohn, and K. Chung.
Autonomous learning for efficient resource utilizationof dynamic vm migration. In ICS ’08: Proceedings ofthe 22nd annual international conference onSupercomputing, pages 185–194, New York, NY, USA,2008. ACM.
[2] Citrix Systems Inc. Citrix XenSource.http://citrix.com/English/ps2/products/product.asp?
contentID=683148.
[3] Citrix Systems Inc. Xenserver SDK documentation.http://docs.xensource.com/XenServer/4.0.1/api/.
[4] C. Clark, K. Fraser, S. Hand, J. G. Hansen, E. Jul,C. Limpach, I. Pratt, and A. Warfield. Live migrationof virtual machines. In NSDI’05: Proceedings of the2nd Symposium on Networked Systems Design &Implementation, pages 273–286, Berkeley, CA, USA,2005. USENIX Association.
[5] R. P. Goldberg. Survey of virtual machine research.Computer, 7(6):34–45, June 1974.
[6] D. Gupta, R. Gardner, and L. Cherkasova. Xenmon:Qos monitoring and performance profiling tool.Technical Report HPL-2005-187, HP Labs, 2005.
[7] G. Khanna, K. Beaty, G. Kar, and A. Kochut.Application performance management in virtualizedserver environments. In Network Operations andManagement Symposium, 2006. NOMS 2006. 10thIEEE/IFIP, pages 373–381, April 2006.
[8] L. Kleinrock. Queueing Systems. Volume I: Theory.John Wiley and Sons, New York, 1975.
[9] A. Kochut and K. Beaty. On strategies for dynamicresource management in virtualized serverenvironments. In Modeling, Analysis, and Simulationof Computer and Telecommunication Systems, 2007.MASCOTS ’07. 15th International Symposium on,pages 193–200, Oct. 2007.
[10] S. Martello and P. Toth. Knapsack Problems:Algorithms and Computer Implementation. JohnWiley and Sons Ltd, Chichester, England, 1990.
[11] A. Menon, J. R. Santos, Y. Turner, G. J.Janakiraman, and W. Zwaenepoel. Diagnosingperformance overheads in the xen virtual machineenvironment. In VEE ’05: Proceedings of the 1stACM/USENIX international conference on Virtualexecution environments, pages 13–23, New York, NY,USA, 2005. ACM.
[12] Microsoft Corp. Microsoft Hyper-V.http://www.microsoft.com/windowsserver2008/en/us/
hyperv-main.aspx.
[13] M. Nelson, B.-H. Lim, and G. Hutchins. Fasttransparent migration for virtual machines. InUSENIX Annual Technical Conference, GeneralTrack, pages 391–394, 2005.
[14] J.-G. Park, J.-M. Kim, H. Choi, and Y.-C. Woo.Virtual machine migration in self-managingvirtualized server environments. In AdvancedCommunication Technology, 2009. ICACT 2009. 11thInternational Conference on, volume 03, pages2077–2083, Feb. 2009.
[15] L. D. Rose, B. Homer, and D. Johnson. Detectingapplication load imbalance on high end massivelyparallel systems. In Euro-Par, pages 150–159, 2007.
[16] Sun Mircrosystems Inc. Sun xVM. http://www.sun.com/software/products/xvmopscenter/index.jsp.
[17] Transaction Processing Council. The TPC-Cbenchmark. http://www.tpc.org.
[18] VMWare Inc. VMware Distributed ResourceScheduler.http://www.vmware.com/products/vi/vc/drs.html.
[19] VMWare Inc. VMware vSphere 4.https://www.vmware.com/products/vsphere/.
[20] R. P. Weicker. Dhrystone: a synthetic systemsprogramming benchmark. Commun. ACM,27(10):1013–1030, 1984.
[21] Z. Xu, R. Huang, and L. Bhuyan. Load balancing ofdns-based distributed web server systems with pagecaching. In Parallel and Distributed Systems, 2004.ICPADS 2004. Proceedings. Tenth InternationalConference on, pages 587–594, July 2004.
[22] X. Yang, H. Dai, Y. Tang, and X. Yi. A general metricof load balancing in delta-range. In APPT, pages311–321, 2003.
[23] M. Zhao and R. J. Figueiredo. Experimental study ofvirtual machine migration in support of reservation ofcluster resources. In VTDC ’07: Proceedings of the 3rdinternational workshop on Virtualization technology indistributed computing, pages 1–8, New York, NY,USA, 2007. ACM.
242