From virtualized resources to virtual computing grids: the In-VIGO system
Self-Adaptive Capacity Management forMulti-Tier Virtualized Environments
Ítalo Cunha, Jussara Almeida, Virgílio Almeida, Marcos SantosComputer Science Department
Federal University of Minas GeraisBelo Horizonte, Brazil, 30123-970
{cunha, jussara, virgilio, marcos}@dcc.ufmg.br
Abstract— This paper addresses the problem of hosting mul-tiple applications on a provider’s virtualized multi-tier infras-tructure. Building from a previous model, we design a new self-adaptive capacity management framework, which combines atwo-level SLA-driven pricing model, an optimization model andan analytical queuing-based performance model to maximize theprovider’s business objective. Our main contributions are themore accurate multi-queue performance model, which capturesapplication specific bottlenecks and the parallelism inherent tomulti-tier platforms, as well as the solution of the extendedand much more complex optimization model. Our approach isevaluated via simulation with synthetic as well as realistic work-loads, in various scenarios. The results show that our solutionis significantly more cost-effective, in terms of the provider’sachieved revenues, than the approach it is built upon, whichuses a single-resource performance model. It also significantlyoutperforms a multi-tier static allocation strategy for heavy andunbalanced workloads. Finally, preliminary experiments assessthe applicability of our framework to virtualized environmentssubjected to capacity variations caused by the processing ofmanagement and security-related tasks.
I. INTRODUCTION
Modern Internet and Web-based services commonly relyon computing-based outsourcing as a financially attractiveapproach to host their increasingly popular services [1]. In thisscenario, the service provider signs Service Level Agreement(SLA) contracts with an infrastructure provider. In order tobe profitable, the service provider demands that a significantfraction of their customer requests are served with a qualitythat meets specific requirements. On the other hand, the goal ofthe infrastructure provider, or simply the provider, is to devisethe most cost-effective strategy for managing their availableresources, shared among a number of hosted applications.
The capacity management of this shared infrastructure be-comes particularly challenging due to several reasons. CurrentWeb services demand for complex and heterogeneous multi-tier service platforms composed of HTTP servers, applicationservers and, possibly, a database server. Moreover, applicationheterogeneity and typically high workload daily fluctuations[2] can not be effectively accommodated with traditional staticcapacity management strategies. In such scenario, resourcevirtualization [3], [4], [5] can build a much more cost-effectiveenvironment. A virtualization mechanism creates isolated vir-tual machines (VMs) on top of the physical infrastructure,each one composed of a set of virtual instances of the physical
resources, and dedicated to serve a single application.The design of cost-effective capacity management strategies
for the hosting infrastructure is further challenged by newdemands from the service providers. There is a growinginterest in establishing service contracts where payment isproportional to the resources actually used [6]. Moreover,such contracts should provide guarantees not only on servicethroughput but also on the response time observed by eachrequest [7]. The latter implies a demand for guarantees on theresponse time tail distribution, as opposed to the traditionalrequirements on average response time. These requirementsimply the need for more complex SLA contracts, businessand pricing models, and, ultimately, for more sophisticatedcapacity management solutions.
Integrated management of such complex networked systemsdemands analytic models that combine different techniquesto represent important facets of the system. In [8], we haveproposed a self-adaptive capacity management solution thataddresses some of the aforementioned challenges. Our solu-tion combines a pricing model, built from a two-level SLAcontract model, a queuing-based performance model, andan optimization model to dynamically allocate the availablecapacity among the hosted applications, aiming at maximizingthe provider’s business objectives. As in other previous work[9], [10], [11], [12], our performance model represents thefraction of the physical resources assigned to each applicationas a single resource (i.e., a single queue). This is a simplifiedrepresentation of the system, especially for heterogeneousapplications running on multi-tier platforms. Thus, it maylead to significant inaccuracies, ultimately impacting the cost-effectiveness of the solution. Other common limitations ofpreviously proposed resource management frameworks includelack of business-oriented goals and use of average performanceguarantees [12], [13].
This paper builds on our previous work, and proposes asignificantly more cost-effective capacity management frame-work for multi-tier virtualized systems. The framework as-sumes the physical infrastructure of each tier is virtualized,assigning one local VM to each hosted application. In thiscase, the performance model represents each VM as a separatequeue, thus capturing the inherent parallelism of multi-tierplatforms missed by the single-resource models. In this multi-tier model, the computation of the probability of response time
SLA violations becomes significantly more challenging, whichultimately adds to the optimization model complexity. Twoalternative estimates of this probability are proposed, whichcombined with an extended optimization model yields twoself-adaptive multi-tier approaches.
We compare our two approaches against our previous self-adaptive single-resource model as well as a multi-tier staticallocation strategy. Simulation experiments with synthetic andrealistic workload profiles are used to assess the relative cost-effectiveness of the analyzed strategies in various interestingscenarios. One such scenario models dynamic changes in theavailable capacity as a consequence of local processing bymanagement and security-related tasks.
Our main conclusions are as follows. First, our multi-tierself-adaptive approaches scale reasonably well to practicalscenarios. Second, in case of heavy and unbalanced workloads,it yields significant revenue gains to the provider, if comparedwith the multi-tier static allocation. Third, the performanceinaccuracies introduced by the single-resource model leadto very conservative allocation decisions. As a consequence,the single-resource strategy is outperformed by the multi-tierself-adaptive and static approaches by orders of magnitude,even when the hosted applications are homogeneous and havebalanced service demands. Finally, our multi-tier self-adaptiveapproaches are also much more robust than the single-resourcemodel in face of capacity variations due to the local executionof management and security-related tasks.
This paper is organized as follows. Section II discussesrelated work. Our multi-tier virtualized environment and thepricing model upon which our approaches are built are de-scribed in Section III. Section IV presents our self-adaptiveframework. Simulation results are presented in Section V.Conclusions and future work are offered in Section VI.
II. RELATED WORK
A significant amount of effort has been dedicated to the de-sign of efficient methods for autonomic resource managementin modern computing systems. In particular, some previouswork focused on improving system performance by applyingadmission control and scheduling mechanisms [13] as wellas techniques for allocating shared capacity among hostedapplications [12]. However, these studies focus only on systemperformance and lack business-oriented goals. Other relatedtopics include the use of reward-driven request prioritization[14] and the management of grid systems [15].
A considerable amount of work applies analytic queuingmodels for autonomic capacity management, usually com-bining admission control and capacity allocation with theobjective of maximizing the provider’s business objective.Models using M/M/1 and M/G/1 queues with FIFO andprocessor sharing scheduling are considered in [10], [11],employing different approximations to the response time ofM/G/1 queues. The capacity manager proposed in [9] includesoperational costs (e.g., energy) into the optimization modelaiming at minimizing the revenue losses due to SLA viola-tions and management costs. In [8], we combine an SLA-
driven pricing model, a queuing-based performance model,and an optimization model to dynamically allocate availablecapacity among hosted applications aiming at maximizing theprovider’s revenues. Models with a single service center (eithera M/M/1 or a M/G/1 queue) are used to provide estimates ofthe response time tail distribution.
A number of previous work, including [16], [17], proposesqueuing-based performance models specifically for multi-tiersystems. More recent multi-tier models addresses issues suchas the caching of responses at tiers [18] and work conservation[19]. In common, these models focus on performance estima-tion only. They are not coupled to optimization models, andusually provide only average performance estimates.
Our approach improves on previous work, combining amore accurate multi-tier performance model and an opti-mization model, taking into account probabilistic performanceguarantees and being driven by the provider’s business objec-tive, expressed in a flexible two-level pricing model.
III. INFRASTRUCTURE MODEL
This section describes the target platform (Section III-A) ofour self-adaptive capacity management framework as well asthe pricing model (Section III-B) it is built upon.
A. Virtualized Hosting Platform
We consider a scenario where a provider hosts multiplethird-party Web services. Each such Web services may becomposed of different request types, characterized by differ-ent workloads, different service demands on resources, andexecuted by independent software components. We refer toeach such request type as an application class, and assume theinfrastructure hosts N independent classes from all services.
We consider the provider’s infrastructure is composed ofmultiple (K) tiers, as is the case for many Web services. Eachtier is responsible for a specific task in the process of servinga request (e.g., presentation, application and database tiers).Tiers operate in parallel and requests visit tiers in sequence.That is, a request from class i enters tier j, is served, and thenleaves the system with probability pi,j or proceeds to tier j+1with probability (1 − pi,j) (i = 1..N, j = 1..K, pi,K = 1).
Each tier is hosted on a separate hardware, which is sharedby all classes. Such an infrastructure must provide perfor-mance isolation between classes, among other desired features.Thus, we assume each tier runs a virtualization mechanism,such as Xen [3] and Denali [4], which provides service dif-ferentiation and performance isolation for hosted applicationclasses, simplifying load balancing and allowing the dynamicallocation of resources to each class. In fact, such technologies,are currently experiencing a renewed interest as a means forserver consolidation, improving system security, reliability andavailability, reducing costs and providing flexibility.
The considered hosting platform is shown in Fig. 1. Ontop of each tier physical infrastructure, a virtualization layercreates N isolated virtual machines (VMs), one for each class.Given K tiers, each request from a given application class isserved by K VMs, dedicated to that class. This hosting model

Fig. 1. Multi-Tier Virtualized Service Hosting Platform
isolates classes one from another, each using K VMs as ifthey were dedicated servers, working at a fraction of the total(physical) capacity.
The virtualization layers allow the provider to dynami-cally increase or decrease the amount of physical resourcesdedicated to a class on each tier, independently. Hence, wedefine the capacity allocation problem as the determination ofphysical capacity fractions for each class i at each tier j.
We assume that VMs employ admission control schemesto avoid unwanted situations like, service instability due tocapacity limitations, security attacks or to guarantee that therequirements of response time are met. In this work, we focuson the dynamic capacity allocation for hosted classes acrossall tiers, with the goal of maximizing the provider’s businessobjective, described next. By provisioning each tier separately,we can take specific application bottlenecks into consideration.
B. Pricing Model
In [8], we propose a pricing scheme that addresses thehigh variability of application workloads in online services.Many services which usually receive low to moderate load, aresuddenly inundated by an exceptional surge of requests. Thisphenomenon, known as “flash crowds” generates congestionat the service infrastructure, causing significant delays tocustomers. Due to the highly dynamic nature of Internet work-loads, we propose contracts with two levels of requirements,which correspond to two different operation modes, namely,normal and surge. In the following discussion, we refer to theservice provider as the customer, which establishes a contractwith the infrastructure provider to host its service.
In the normal operation mode, customers contract the ser-vice level which satisfies their needs for the majority of time,whereas in the surge operation mode, a higher service levellimit is established, up to which the provider has an incentiveto assign extra capacity so as to accommodate occasional loadpeaks. From the business standpoint, this approach can beadvantageous both to customers who pay for extra capacityonly when needed, and to providers who can offer moreattractive service plans by operating with more flexibility.
In this work, the SLA performance requirements quan-tify the capacity of the provider’s infrastructure to processtransactions, given that per-request response time probabilisticguarantees are satisfied. Moreover, the proposed SLA contractscontain performance targets for each operation mode.
Fig. 2. Self-Adaptive Capacity Management (from one tier’s perspective)
For the normal operation mode, the SLA defines a through-put XNSLA
i for each class i, which the provider is expectedto satisfy, given that the class arrival rate is high enough.In case of SLA violations, the provider agrees to refundpart of the service charged to its customers. This penalty isproportional to the difference between XNSLA
i and the actualvalid throughput (see below). For the surge operation mode,the SLA defines XSSLA
i ≥ XNSLAi , the throughput up to
which a customer is willing to pay a reward to the providerfor serving requests in excess of XNSLA
i . Rewards are alsoproportional to the extra valid throughput achieved. Penaltiesand rewards are calculated using SLA parameters ci and ri
per unit of throughput below or above XNSLAi , respectively.
The valid throughput is composed of all requests that wereserved with a response time that satisfies the specified SLA.We consider a tail distribution response time requirementstating that the response time of requests from class i mustnot exceed a given threshold RSLA
i for more than αi × 100%of the time. In other words, P (Ri > RSLA
i ) ≤ αi, where Ri
is the response time of a class i request.Note that the proposed approach can be extended to more
than two SLA levels, specifying multiple performance targetsso as to account for different levels of demands from applica-tions and customers. Given this pricing model, the provider’sbusiness objective is defined as the provision of capacity toVMs that execute the applications so as to maximize the netrevenues from penalties and rewards.
IV. CAPACITY MANAGEMENT FOR MULTI-TIER SERVICES
This section describes our self-adaptive capacity manage-ment model for multi-tier Web services. Section IV-A presentsthe self-adaptive framework, which is built from our previoussingle-resource model [8]. The most significant new contribu-tions lie on the more accurate performance model and on theextended optimization model designed to use it, presented inSections IV-B and IV-C, respectively.
A. Self-Adaptive Framework
Our self-adaptive framework proposes a system operationmodel based on feed-forward control, shown in Fig. 2. Its coreentity is the capacity manager, which is called periodically toallocate the capacity available on each tier among the hosted
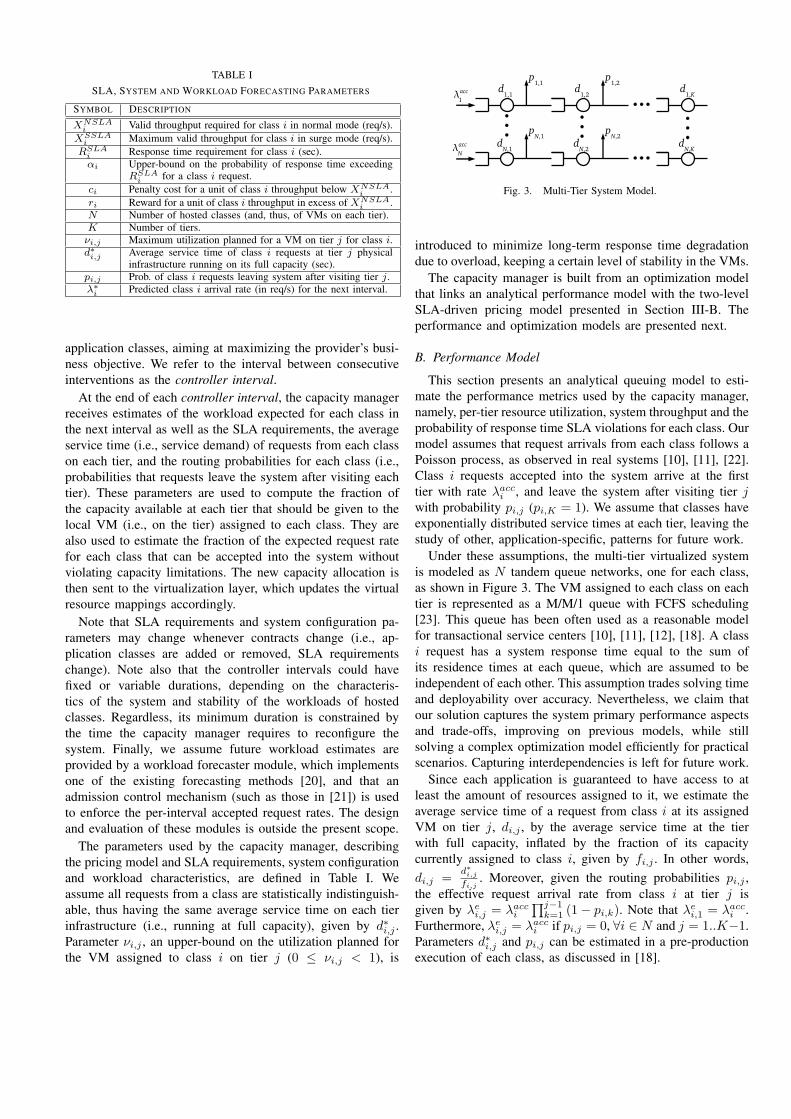
TABLE I
SLA, SYSTEM AND WORKLOAD FORECASTING PARAMETERS
SYMBOL DESCRIPTION
XNSLAi Valid throughput required for class i in normal mode (req/s).
XSSLAi Maximum valid throughput for class i in surge mode (req/s).
RSLAi Response time requirement for class i (sec).αi Upper-bound on the probability of response time exceeding
RSLAi for a class i request.
ci Penalty cost for a unit of class i throughput below XNSLAi .
ri Reward for a unit of class i throughput in excess of XNSLAi .
N Number of hosted classes (and, thus, of VMs on each tier).K Number of tiers.νi,j Maximum utilization planned for a VM on tier j for class i.d∗i,j Average service time of class i requests at tier j physical
infrastructure running on its full capacity (sec).pi,j Prob. of class i requests leaving system after visiting tier j.λ∗
i Predicted class i arrival rate (in req/s) for the next interval.
application classes, aiming at maximizing the provider’s busi-ness objective. We refer to the interval between consecutiveinterventions as the controller interval.
At the end of each controller interval, the capacity managerreceives estimates of the workload expected for each class inthe next interval as well as the SLA requirements, the averageservice time (i.e., service demand) of requests from each classon each tier, and the routing probabilities for each class (i.e.,probabilities that requests leave the system after visiting eachtier). These parameters are used to compute the fraction ofthe capacity available at each tier that should be given to thelocal VM (i.e., on the tier) assigned to each class. They arealso used to estimate the fraction of the expected request ratefor each class that can be accepted into the system withoutviolating capacity limitations. The new capacity allocation isthen sent to the virtualization layer, which updates the virtualresource mappings accordingly.
Note that SLA requirements and system configuration pa-rameters may change whenever contracts change (i.e., ap-plication classes are added or removed, SLA requirementschange). Note also that the controller intervals could havefixed or variable durations, depending on the characteris-tics of the system and stability of the workloads of hostedclasses. Regardless, its minimum duration is constrained bythe time the capacity manager requires to reconfigure thesystem. Finally, we assume future workload estimates areprovided by a workload forecaster module, which implementsone of the existing forecasting methods [20], and that anadmission control mechanism (such as those in [21]) is usedto enforce the per-interval accepted request rates. The designand evaluation of these modules is outside the present scope.
The parameters used by the capacity manager, describingthe pricing model and SLA requirements, system configurationand workload characteristics, are defined in Table I. Weassume all requests from a class are statistically indistinguish-able, thus having the same average service time on each tierinfrastructure (i.e., running at full capacity), given by d∗i,j .Parameter νi,j , an upper-bound on the utilization planned forthe VM assigned to class i on tier j (0 ≤ νi,j < 1), is
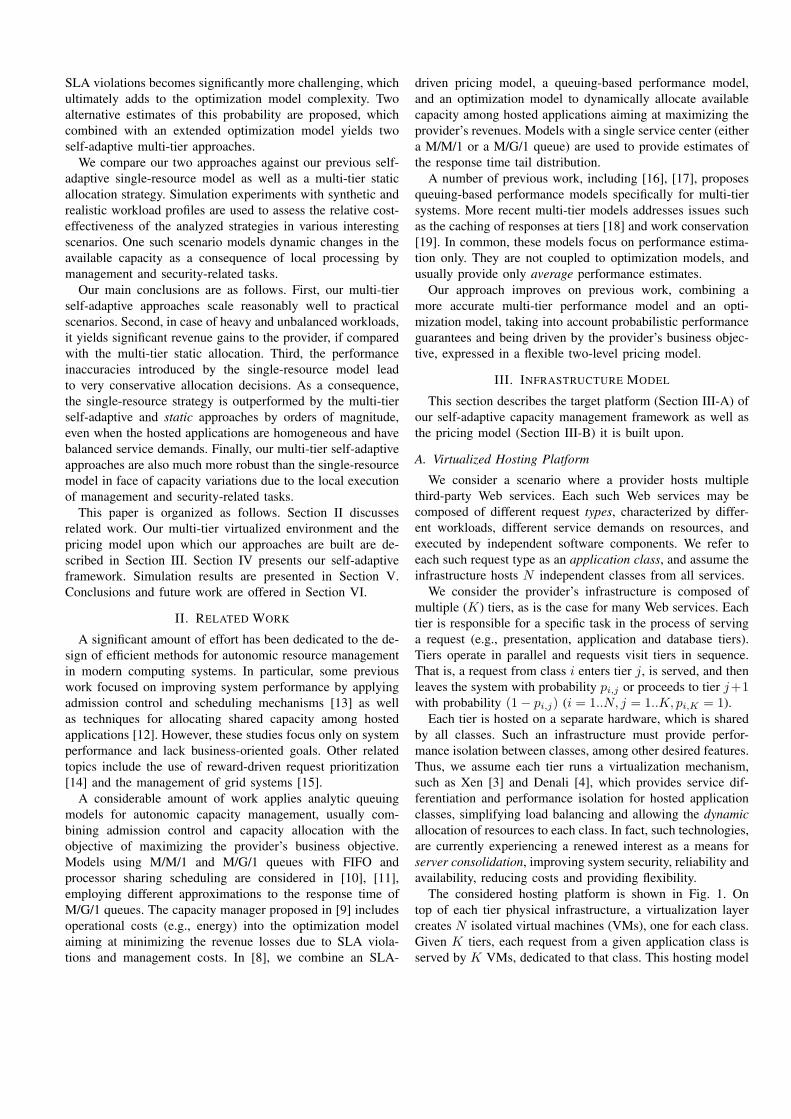
Fig. 3. Multi-Tier System Model.
introduced to minimize long-term response time degradationdue to overload, keeping a certain level of stability in the VMs.
The capacity manager is built from an optimization modelthat links an analytical performance model with the two-levelSLA-driven pricing model presented in Section III-B. Theperformance and optimization models are presented next.
B. Performance Model
This section presents an analytical queuing model to esti-mate the performance metrics used by the capacity manager,namely, per-tier resource utilization, system throughput and theprobability of response time SLA violations for each class. Ourmodel assumes that request arrivals from each class follows aPoisson process, as observed in real systems [10], [11], [22].Class i requests accepted into the system arrive at the firsttier with rate λacc
i , and leave the system after visiting tier jwith probability pi,j (pi,K = 1). We assume that classes haveexponentially distributed service times at each tier, leaving thestudy of other, application-specific, patterns for future work.
Under these assumptions, the multi-tier virtualized systemis modeled as N tandem queue networks, one for each class,as shown in Figure 3. The VM assigned to each class on eachtier is represented as a M/M/1 queue with FCFS scheduling[23]. This queue has been often used as a reasonable modelfor transactional service centers [10], [11], [12], [18]. A classi request has a system response time equal to the sum ofits residence times at each queue, which are assumed to beindependent of each other. This assumption trades solving timeand deployability over accuracy. Nevertheless, we claim thatour solution captures the system primary performance aspectsand trade-offs, improving on previous models, while stillsolving a complex optimization model efficiently for practicalscenarios. Capturing interdependencies is left for future work.
Since each application is guaranteed to have access to atleast the amount of resources assigned to it, we estimate theaverage service time of a request from class i at its assignedVM on tier j, di,j , by the average service time at the tierwith full capacity, inflated by the fraction of its capacitycurrently assigned to class i, given by fi,j . In other words,
di,j = d∗i,j
fi,j. Moreover, given the routing probabilities pi,j ,
the effective request arrival rate from class i at tier j isgiven by λe
i,j = λacci
∏j−1k=1 (1 − pi,k). Note that λe
i,1 = λacci .
Furthermore, λei,j = λacc
i if pi,j = 0, ∀i ∈ N and j = 1..K−1.Parameters d∗i,j and pi,j can be estimated in a pre-productionexecution of each class, as discussed in [18].
We are now ready to present our performance model. Notethat, given the job flow balance condition [23], which statesthat all accepted requests are actually processed by each VM,class i system throughput is given by the accepted request rateλacc
i . Moreover, the utilization of tier j by class i, ρi,j , can beestimated by the product of class i average service time at itsassigned VM on tier j by the rate at which its requests arriveat the tier [23]. That is, ρi,j = λe
i,jdi,j .The most challenging component of our performance model
is the estimate of the probability that a request from class iviolates its response time SLA. Given the residence time ofa class i request at tier j, Ri,j , and its system response timeRi =
∑Kj=1 Ri,j , our goal is to estimate P (Ri ≥ RSLA
i ).Note that Ri,j is the response time of a M/M/1 queue,
which is exponentially distributed with parameter γi,j = 1di,j
−λe
i,j [23]. Moreover, recall that the sum of K independentexponential variables with rates γi,j (j = 1..K) follows ahypoexponential distribution [24]. Thus, the probability of aresponse time SLA violation by a class i request is equal tothe complement of the cumulative distribution of the hypoex-ponential variable with parameters γi,j . In other words,
P (Ri ≥ RSLAi ) =
K∑j=1
K∏
k=1,k �=j
γi,k
γi,k − γi,j
e−γi,jRSLA
i
(1)Because our queuing-based performance model captures
the parallelism that can exist in a multi-tier environment,we expect Equation 1 to be more precise than applyingany of the approximations presented in [8] to our targetenvironment. Based on a single-resource model, the most cost-effective approximation is derived from the response time ofa single M/M/1 queue, which is exponentially distributed withparameter 1∑ K
j=1 di,j− λacc
i [8]. However, Equation 1 is also
more complex, which may compromise the model solutiontime. Thus, we also consider an approximation derived fromthe Chebyshev’s Inequality [23], which provides the followingupper-bound on the probability of a violation for class i:
P (Ri ≥ RSLAi ) ≤ V ar[Ri]
(RSLAi − E[Ri])2
(2)
E[Ri] and V ar[Ri] are the mean and variance of the systemresponse time for class i, and are equal to the sum of thecorresponding measures of each exponential component ofthe hypoexponential distribution. In other words, E[Ri] =∑K
i=11
γi,jand V ar[Ri] =
∑Ki=1 ( 1
γi,j)2.
We do not use the simpler Markov’s Inequality [23], whichdepends only on the mean response time, as this upper-boundis typically very loose, leading to more conservative and lesscost-effective allocation decisions [8].
C. Optimization Model
The core component of our capacity manager is the opti-mization model shown in Figure 4. Its main decision variableis vector fi,j , the fraction of tier j’s capacity assigned to
max
N∑i=1
gi(λacci )
s.t. 0 ≤ λacci ≤ min(λ∗
i ,XSSLAi ) ∀i ∈ N (a)
di,j =d∗i,jfi,j
∀i ∈ N, j ∈ K (b)
ρi,j = λei,jdi,j ≤ νi,j ∀i ∈ N, j ∈ K (c)
N∑i=1
fi,j ≤ 1 ∀j ∈ K (d)
fi,j ≥ 0 ∀i ∈ N, j ∈ K (e)
λei,j = λacc
i
j−1∏k=1
(1 − pi,k) ∀i ∈ N, j ∈ K (f)
P (Ri ≥ RSLAi ) ≤ αi ∀i ∈ N (g)
Fig. 4. Capacity Manager Optimization Model
the local VM responsible for class i. The objective functionexpresses the provider’s business objective, given by the sum,over all classes, of the net revenues from individual penaltiesand rewards. The penalty (or reward) for class i, gi, depends onits SLA requirements and accepted request rate λacc
i , which,in turn, is constrained by the values of fi,j . Before elaboratingon the formulation of gi, we describe the model constraints.
Constraint (a) states that the accepted request rate foreach class is limited by its predicted arrival rate and bythe maximum throughput the provider can capitalize uponwhen the class is on surge mode. Constraint (b) defines theaverage service time of class i at its assigned VM on tier j.Constraint (c) states that the utilization of tier j by class i, ρi,j ,which ultimately depends on λacc
i , is limited by the maximumplanned utilization for the corresponding VM. Constraints (d)and (e) impose obvious limits on vector fi,j . Constraint (f)defines the effective arrival rate at each tier.
Finally, constraint (g) expresses the SLA response timerequirement. Two variants of the model are created by usingthe expressions in Equations 1 and 2. Note that this constraintexpresses the trade-off between throughput and quality ofservice. A smaller value of αi assures that most class i requestsare served with short response times. However, fewer requestsare accepted into the system, and throughput is lower. Largervalues of αi allow more requests into the system and thushigher throughput. However, accepted requests observe longerresponse times more frequently.
We now turn to the formulation of gi, the provider’s revenuefrom class i. Recall that rewards are given to the providerwhenever the accepted request rate from class i exceeds itsthroughput SLA requirement for normal operation mode, i.e.,whenever λacc
i > XNSLAi . Constraint (a) guarantees the
upper-bound on such rewards based on XSSLAi . On the other
hand, penalties are incurred if λacci is lower than XNSLA
i , as
long as this is due to capacity limitations and not to lowerrequest arrival rates. In other words, a penalty is incurredwhenever λacc
i < min(λ∗i ,X
NSLAi ). Thus, the net revenue
obtained from class i, gi, is given by:
gi =
{−ci
(min(λ∗
i ,XNSLAi ) − λacc
i
)λacc
i ≤ XNSLAi
ri
(λacc
i − XNSLAi
)λacc
i > XNSLAi
(3)Note that gi, and thus the objective function, increases with
λacci . However, λacc
i is constrained by the workload and SLAcontract (constraint (a)), by limitations on resource utilization(constraint (c)), and, above all, by the response time SLArequirement (constraint (g)). The last two constraints indirectlylink the values of λacc
i to the decision variables fi,j .The optimization model shown in Figure 4 is an extension,
for multi-tier environments, of the one proposed in [8]. As in[8], the main challenge, from the optimality and solution timeperspectives, lies in the piecewise linear objective function andin the response time constraint (g). If the two-step piecewiselinear objective, computed from Equation 3, is concave (i.e.,ci ≥ ri, ∀i ∈ N ), it can be expressed as a set of linearconstraints which can be easily solved. Here, we have focusedon this scenario. Otherwise, a binary variable δi can be usedto combine penalties and rewards into a single expressionfor gi, as in [8]. Approximating the objective function by apolynomial is an alternative solution.
The probability of a response time SLA violation derivedfrom the Chebyshev’s inequality (Equation 2) as well as theapproximations proposed in [8], though convex and non-linearfunctions in the valid range of the decision variables, arereasonably simple. Thus, the optimization models can be easilysolved. This is true even for the most precise approximationproposed in [8], which is based on the exponential distributionof a M/M/1 queue response time [8].
The expression derived from the hypoexponential distribu-tion (Equation 1), on the other hand, is much more complex,yielding a much more challenging optimization model. Inparticular, the distribution is undefined whenever two of itsparameters γi,j have equal values, making the problem unsolv-able. Several strategies can be used to remedy this problem.First, the hypoexponential function can be approximated bya polynomial with a compromise in optimality. Second, onecan solve different instances of the model, covering comple-mentary regions of the solution space where the function isclearly defined, and then take the maximum solution fromall instances as the global optimum. We implemented thisstrategy and successfully tested it with a small number oftiers (2) and application classes (up to 4). However, it doesnot scale well for larger numbers of tiers and classes. Finally,one can approximate terms of the hypoexponential distribu-tion with equal parameter values by an Erlang distribution.This approximation is asymptotically exact, as the sum ofidentically distributed exponential variables has an Erlangdistribution [24]. We have selected this approach due to itsbetter scalability, discussed in Section V-A.
Our optimization model was implemented and tested inAMPL [25], a modeling language for mathematical program-ming. We ran a number of different solvers, and all of themconverged to the same solution for all tested inputs.
V. EXPERIMENTATION
In this section, we evaluate the cost-effectiveness of ourself-adaptive capacity management framework for multi-tierenvironments, comparing it with our previous self-adaptivestrategy based on a single-resource model [8] and with a staticcapacity allocation, in various scenarios. The main metricfor comparison is the provider’s net revenue obtained witheach strategy. In our experiments, we consider a two-tierenvironment (i.e., K = 2), applicable to a service platformwith a front-end server (e.g., an HTTP server) and a back-endresource (e.g., a storage area network or a database server).
We evaluate the two variants of our capacity manager thatestimate the probability of response time SLA violations usingthe hypoexponential distribution and Chebyshev’s inequality.In the single-resource model approach, this probability isestimated from the exponential distribution of response timeof a single M/M/1 queue [8], with per class average servicetime equal to the sum of the average service times at bothtiers. Finally, the static allocation assumes the best capacityallocation at each tier for the given workloads, assigninga fixed fraction of tier j’s total capacity to class i that isproportional to its average utilization over class i’s entireworkload. It also uses the system response time distributionfor the two M/M/1 queue network (Equation 1) to estimate themaximum request rate from each class that can be admittedinto the system while still meeting the response time SLAs.Thus, like our new approaches, it is based on a more accuraterepresentation of the system. These strategies are referred to,in this section, as the hypoexponential, Chebyshev, single-resource and static approaches.
We built an event-driven simulator that models the systemas a tandem queue with two centers, and is fed with work-load traces from N application classes. For the self-adaptivestrategies, the simulator is coupled to an optimization modelsolver, which is called at the end of each controller interval tocalculate the capacity allocation vector fi,j and the acceptedrequest rate λacc
i for each class i and tier j, for the nextinterval. During each interval, per-request response time aswell as per-class throughput and tier utilization are collectedand used to compute the provider’s revenue.
Our simulator employs a fair admission control mechanism,which accepts a class i request with probability λacc
i
λ∗i
. Thus,the assumption of Poisson arrivals holds for the acceptedrequests. This is a conservative approach compared to othermechanisms that aims at minimizing the inter-arrival timevariance [23]. Moreover, we assume every accepted requestvisits both tiers, and that the maximum planned utilizationfor all VMs is 95% (i.e., pi,1 = 0 and νi = 0.95, fori = 1..N ). Finally, since our current focus is on the cost-effectiveness of our new approaches, we compare them in abest-case scenario to understand trade-offs: we assume there

0
0.5
1
1.5
2
2.5
0 10 20 30 40 50 60
Ave
rage
Sol
ving
Tim
e (s
)
# Application Classes (N)
Linear fit
Fig. 5. Scalability of Self-Adaptive Multi-Tier Capacity Manager.
is no time limitation for adapting the system, and that an idealworkload forecasting, where future arrival rates are known apriori, is used. The selection and evaluation of a practicalworkload forecasting method, among several existing timeseries techniques [20] with varying degrees of accuracy, isleft for future work.
In Section V-A, we briefly discuss the scalability of ourcapacity manager. Simulation results for synthetic workloadsand for more realistic workload profiles are given in SectionsV-B and V-C. Finally, Section V-D discusses a scenario whereboth workload and available capacity dynamically change. Oursimulator was validated comparing the system response timemeasured with the analytical model (Equation 1) with errorsunder 1%. All results presented are averages of 5 runs (20 inSection V-A), with standard deviation under 2% of the means.
A. Capacity Manager Scalability
We evaluate the scalability of our multi-tier frameworkfor configurations with up to 60 classes. We focus on thehypoexponential approach, due to its higher complexity andlonger average solving times. Our experiments are conductedusing the SNOPT nonlinear solver [26], on a computer witha 2 GHz AMD Sempron 2400 CPU and 512 MB of RAM.
Figure 5 shows the average solving time as the number ofclasses increases. The linear fitting of the data indicates thataverage solving time, typically under 1 second, increases witha small factor of the number of classes. Thus, our new capacitymanager scales well to practical scenarios.
B. Synthetic Workloads
This section presents experimental results for syntheticworkloads and two application classes. Two scenarios illustratethe main trade-offs and benefits of our solution. The controllerinterval is set to 1000 seconds in both scenarios.
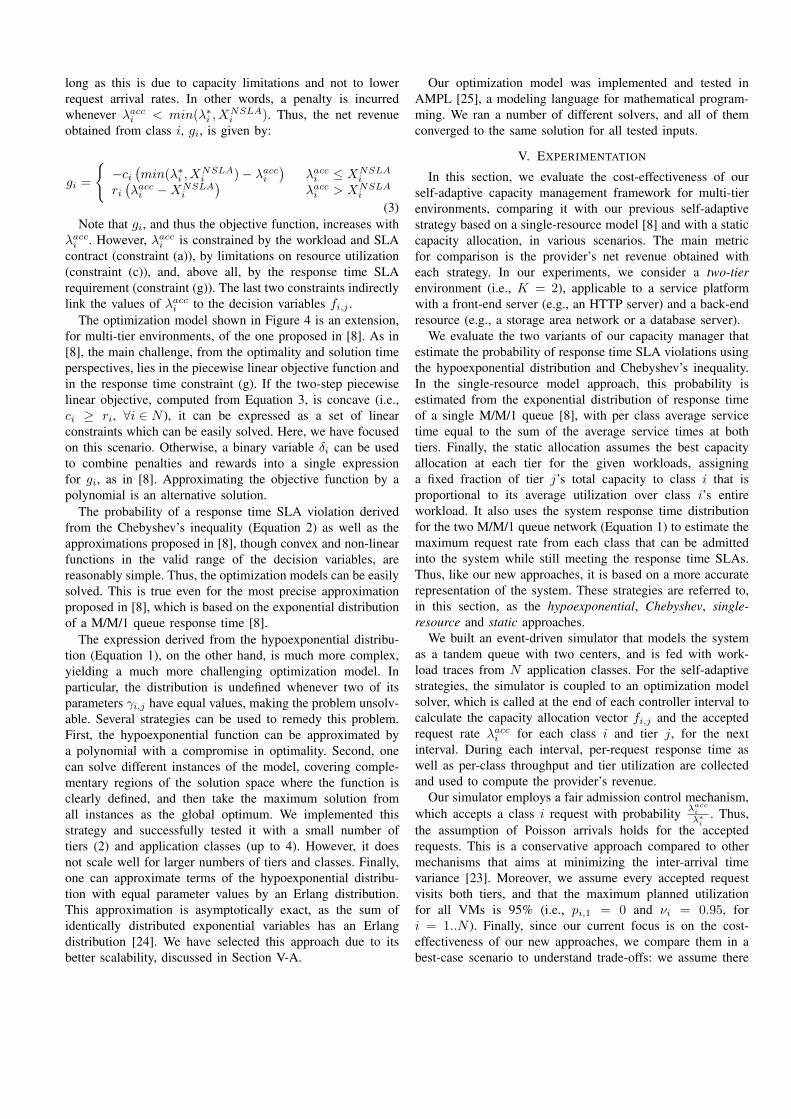
In scenario 1, requests from each class arrive accordingto the periodic step-like non-homogeneous Poisson processesshown in Figure 6-a). Arrival rates vary from 0 to 1000requests per second, with steps and periods of 1000 and10000 seconds, respectively. Both workloads have identicalprofiles with a shift in their periods. This is an interestingscenario for the self-adaptive approaches, which are ableto reassign the idle capacity from the underloaded VMs tothe overloaded ones to satisfy the SLA requirements. Theself-adaptive capacity manager is called at the end of each
TABLE II
PER-TIER AVERAGE SERVICE TIMES IN SCENARIOS 1 AND 2
Scenario 1 Scenario 2Class i d∗i,1(ms) d∗i,2(ms) d∗i,1(ms) d∗i,2(ms)
1 0.6 0.4 1 0.72 0.4 0.6 0.7 1
TABLE III
BUSINESS MODEL PARAMETER VALUES (i = 1..N )
Scenario RSLAi XNSLA
i XSSLAi ci ri αi
1 and 2 0.1 s 500 req/s 1200 req/s 1.0 0.5 0.13 210 s 0.08 req/s 10 req/s 3500 1750 0.14 105 s 0.08 req/s 10 req/s 1750 875 0.1
controller interval, which coincides with instants when per-class request rates change.
Average service times for each class at each tier as well asbusiness model parameter values are given in Tables II andIII, respectively. Note that classes 1 and 2 have bottlenecksat tiers 1 and 2, respectively. In this case, our self-adaptivemulti-tier approaches are able to dynamically assign, for eachapplication, more resources to the tier it needs the most. Never-theless, note that, for each class, the service time unbalance isnot very significant. Moreover, both classes have equal pricingmodel parameter values, as our interest is on the relative cost-effectiveness of the approaches analyzed.
Figure 6-b) shows the provider’s net revenue achievedby each approach throughout the simulation. The repeatingpattern of the curve is produced by the periodic behavior of theworkloads. The hypoexponential and Chebyshev approachesyield quantitatively similar revenues throughout the simula-tion. Interestingly, both approaches provide only marginalgains (11%) over the static approach when classes havecomplementary loads, even though this is the best scenario forself-adaptive approaches, as they can reassign idle capacityfrom the underloaded VMs to the overloaded ones. This isbecause the load imposed at each tier is very light throughoutsimulation. Thus, the ability of self-adapting does not playa significant role, and most requests are admitted into thesystem by all three strategies. Revenues are mostly dictatedby the opportunities for capitalizing from an application classrunning on surge mode, which are the same for all approaches.
On the other hand, with the single-resource approach, theper-class average service time is equal to 1 ms, making the in-frastructure slightly underprovisioned for the aggregate requestrates. The revenue gains provided by our self-adaptive multi-tier approaches over the single-resource approach varies from17% (during peaks) to 103% (during valleys). In fact, whenboth classes have similar load, the single-resource approach,based on a simplified system model, is significantly outper-formed even by the static approach. Figure 6-c) summarizesthese results, showing the revenue cumulative distributionsover all intervals. The self-adaptive multi-tier approaches yieldan overall revenue gain of 28% over the single-resourceapproach.
0
200
400
600
800
1000
1200
0 5000 10000 15000 20000 25000
Arr
ival
Rat
e (r
eqs/
s)
Time (s)
Class 1Class 2
(a) Workload Profiles
0
50
100
150
200
250
300
350
0 5000 10000 15000 20000 25000
Rev
enue
Time (s)
HypoexponentialChebyshev
StaticSingle−resource
(b) Provider’s Revenue over Time
0
0.2
0.4
0.6
0.8
1
0 50 100 150 200 250 300
P(r
even
ue <
r)
Revenue r
HypoexponentialChebyshev
StaticSingle−resource
(c) Provider’s Revenue Distribution
Fig. 6. Experimental Results for Synthetic Workloads: Scenario 1
200
300
400
500
600
700
800
900
1000
0 5000 10000 15000 20000 25000
Acc
epte
d R
eque
st R
ate
(req
s/s)
Time (s)
HypoexponentialStatic
Single−resource
(a) λacc1
0
200
400
600
800
1000
0 5000 10000 15000 20000 25000
Avg
. # S
ucce
sses
/Fai
lure
s pe
r S
econ
d
Time (s)
Hypo. HitsStatic Hits
0
200
400
600
800
1000
0 5000 10000 15000 20000 25000
Avg
. # S
ucce
sses
/Fai
lure
s pe
r S
econ
d
Time (s)
Hypo. MissesStatic Misses
Single−resource Hits
(b) Successes and Failures
0
0.2
0.4
0.6
0.8
1
0 0.05 0.1 0.15 0.2
P(r
espo
nse
< R
)
Response Time R (s)
Single−resourceChebyshev
StaticHypoexponential
(c) Response Time Distribution
Fig. 8. Application Class 1 Performance Metrics for Synthetic Workloads: Scenario 2
0
20
40
60
80
100
120
140
160
180
0 5000 10000 15000 20000 25000
Rev
enue
Time (s)
HypoexponentialChebyshev
0
20
40
60
80
100
120
140
160
180
0 5000 10000 15000 20000 25000
Rev
enue
Time (s)
Static
(a) Revenue over Time
0
0.2
0.4
0.6
0.8
1
−500 −400 −300 −200 −100 0 100 200
P(r
even
ue <
r)
Revenue r
HypoexponentialChebyshev
StaticSingle−resource
(b) Revenue Distribution
Fig. 7. Provider’s Revenue for Synthetic Workloads: Scenario 2.
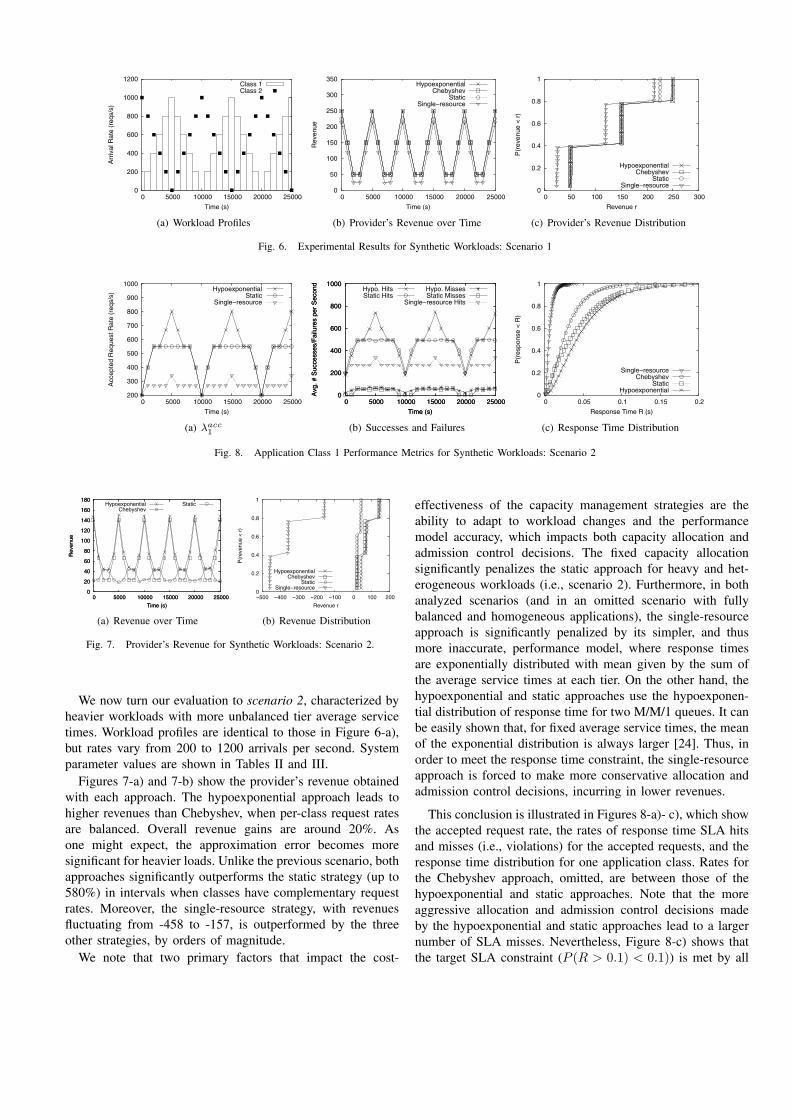
We now turn our evaluation to scenario 2, characterized byheavier workloads with more unbalanced tier average servicetimes. Workload profiles are identical to those in Figure 6-a),but rates vary from 200 to 1200 arrivals per second. Systemparameter values are shown in Tables II and III.
Figures 7-a) and 7-b) show the provider’s revenue obtainedwith each approach. The hypoexponential approach leads tohigher revenues than Chebyshev, when per-class request ratesare balanced. Overall revenue gains are around 20%. Asone might expect, the approximation error becomes moresignificant for heavier loads. Unlike the previous scenario, bothapproaches significantly outperforms the static strategy (up to580%) in intervals when classes have complementary requestrates. Moreover, the single-resource strategy, with revenuesfluctuating from -458 to -157, is outperformed by the threeother strategies, by orders of magnitude.
We note that two primary factors that impact the cost-
effectiveness of the capacity management strategies are theability to adapt to workload changes and the performancemodel accuracy, which impacts both capacity allocation andadmission control decisions. The fixed capacity allocationsignificantly penalizes the static approach for heavy and het-erogeneous workloads (i.e., scenario 2). Furthermore, in bothanalyzed scenarios (and in an omitted scenario with fullybalanced and homogeneous applications), the single-resourceapproach is significantly penalized by its simpler, and thusmore inaccurate, performance model, where response timesare exponentially distributed with mean given by the sum ofthe average service times at each tier. On the other hand, thehypoexponential and static approaches use the hypoexponen-tial distribution of response time for two M/M/1 queues. It canbe easily shown that, for fixed average service times, the meanof the exponential distribution is always larger [24]. Thus, inorder to meet the response time constraint, the single-resourceapproach is forced to make more conservative allocation andadmission control decisions, incurring in lower revenues.
This conclusion is illustrated in Figures 8-a)- c), which showthe accepted request rate, the rates of response time SLA hitsand misses (i.e., violations) for the accepted requests, and theresponse time distribution for one application class. Rates forthe Chebyshev approach, omitted, are between those of thehypoexponential and static approaches. Note that the moreaggressive allocation and admission control decisions madeby the hypoexponential and static approaches lead to a largernumber of SLA misses. Nevertheless, Figure 8-c) shows thatthe target SLA constraint (P (R > 0.1) < 0.1)) is met by all

0
0.2
0.4
0.6
0.8
1
0 14400 28800 43200 57600 72000 86400
Arr
ival
Rat
e (r
eqs/
s)
Time (s)
(a) Application 1
0
0.2
0.4
0.6
0.8
1
0 14400 28800 43200 57600 72000 86400
Arr
ival
Rat
e (r
eqs/
s)
Time (s)
(b) Application 3
Fig. 9. Request Traces from Two Real E-Business Applications.
TABLE IV
PER-TIER AVERAGE SERVICE TIMES IN SCENARIOS 3 AND 4.
Scenario / Avg Application Class iServ. Times (s) 1 2 3 4 5 6 7 83 d∗i,1 0.5 2.0 1.5 3.0 - - - -
d∗i,2 3.0 1.5 2.0 0.5 - - - -4 d∗i,1 0.25 1.25 0.75 0.9 0.85 1.0 0.5 1.5
d∗i,2 1.5 0.5 1.0 0.85 0.9 0.75 1.25 0.25
approaches. Note also that, even accepting a larger number ofrequests, the Chebyshev approach has a more skewed responsetime distribution than the static approach. The static allocationallied to more aggressive admission control decisions result inlonger queues at each tier, thus increasing response time.
Finally, to verify the impact of mispredicting the incom-ing workload, we ran simulations using different controllerintervals for scenario 2. We chose interval lengths that donot coincide with the instants when the workload changes.For interval lengths of 300 and 600 seconds, the overallloss in revenue compared to the results shown in Figure 7-a is only 5% (8%), and 11% (15%), respectively, for thehypoexponential (Chebyshev) model. Thus, our solution isreasonably robust to workload mispredictions.
C. Realistic Workload Profiles
In this section, we evaluate the capacity management ap-proaches for more realistic workload profiles. New workloadsare built from traces containing the request rate, at each 5-minute interval, to 4 different real e-business applications,over a period of 3 months (from 11/23/2004 to 2/23/2005).Confidentiality agreements prevent us from informing thesource of our workloads. All four traces have similar loadprofiles, with peaks around the same time. Request ratesvary widely, with a peak of 17 requests per second and anaverage of 0.078 requests per second. Figures 9-a) and 9-b) show the request rate variation for two applications, on atypical day. Realistic workloads are built by assuming requestarrivals follow non-homogeneous Poisson processes, with rateschanging at each 5 minute interval, and given by the traces.
Two new configuration scenarios are considered in ouranalysis. In scenario 3, we simulate 4 application classes withthe workloads built from our traces. Scenario 4 uses a largernumber (i.e., 8) of application classes, whose workloads arebuilt by duplicating each of the 4 baseline request traces,
0
0.2
0.4
0.6
0.8
1
−400 −300 −200 −100 0 100 200 300 400
P(r
even
ue <
r)
Revenue r
Single−res.Chebyshev
StaticHypo.
(a) Scenario 3
0
0.2
0.4
0.6
0.8
1
−400 −200 0 200 400 600 800
P(r
even
ue <
r)
Revenue r
Single−resourceStatic
ChebyshevHypoexponential
(b) Scenario 4
Fig. 10. Revenue Cumulative Distribution for Realistic Workloads.
−600
−400
−200
0
200
400
600
0 14400 28800 43200 57600 72000 86400
Rev
enue
Time (s)
−600
−400
−200
0
200
400
600
0 14400 28800 43200 57600 72000 86400
Rev
enue
Time (s)
HypoexponentialSingle−resource
Fig. 11. Provider’s Revenue Over Time for Dynamic Capacity (Scenario 5).
and shifting the requests in each replica by 6 hours to thefuture. Average service times at each tier are selected so asto make them underprovisioned for the aggregated workload.Moreover, the aggregated demand on each tier as well as thethroughput SLA requirements are fixed in both scenarios. Theparameter values are given in Tables III and IV. The controllerinterval is set to 5 minutes.
The revenue cumulative distributions for both scenarios areshown in Figures 10-a) and 10-b). The hypoexponential ap-proach yields the highest revenues in both cases. In scenario 3,the static strategy is as good as the hypoexponential approach.The very similar profiles of all four workloads leave littleroom for improvements from dynamic management. Note,however, its significant degradation in scenario 4, which hasmore opportunities for dynamic capacity allocation among the8 classes. In this case, the hypoexponential approach providesaverage per-day revenue gain of 429%.
As in scenario 2, the hypoexponential approach is morecost-effective than the Chebyshev approach, yielding averageper-day revenue gains of 20% and 26% in scenarios 3 and4, respectively. Again, the single-resource approach is outper-formed by orders of magnitude.
D. Varying the Available Capacity
In our last scenario, we evaluate the applicability of theself-adaptive strategies when the total capacity available atone of the tiers (i.e., tier 1) drops suddenly. This would bethe case, for instance, when the first tier (e.g., an HTTPserver) is target of a malicious attack (e.g., a Denial-of-Serviceattack) and has to dedicate some of its capacity for recoveryand other management tasks. During this period, the local

capacity available for serving legitimate requests from thehosted classes decreases. The other tier (e.g., an application ora database server) can still dedicate its full capacity to them.
We ran simulations with the same workload and systemparameters used in scenario 3. However, we limit the sim-ulation to the day shown in Figure 9. Tier 1 capacity isdynamically reduced by 25% during the highlighted 6-hourperiod. Average service times are scaled up accordingly. Figure11 shows the revenues for the hypoexponential and single-resource approaches. Clearly, the multi-tier hypoexponentialapproach is much more robust, yielding significantly higherrevenues even when tier 1 capacity is reduced.
Scenario 5 was devised to allow a preliminary evaluationof the applicability of our self-adaptive multi-tier frameworkfor virtualized environments under security attacks. Moresophisticated testing scenarios as well as workload and systemmodeling strategies are directions we intend to pursue next.
VI. CONCLUSIONS AND FUTURE WORK
In this paper, we presented a new self-adaptive capacitymanagement framework for multi-tier virtualized systems.Built from a previous single-resource model, our extendedframework shares with its origin the two-level SLA-drivenpricing model. However, it implements a much more accuratemulti-queue performance model, which captures applicationspecific bottlenecks and the parallelism inherent to multi-tier architectures, as well as an extended and much morechallenging optimization model.
We ran simulation experiments for five configuration sce-narios, which highlighted different trade-offs of our new solu-tions, compared to the single-resource model and a multi-tierstatic allocation strategy. Our main conclusions are threefold.First, our multi-tier self-adaptive solutions scale well and aresignificantly more cost-effective than the static allocation forheavy and unbalanced workloads. Second, the simplified andinaccurate single-resource performance model leads to veryconservative allocation decisions, which ultimately, compro-mise its cost-effectiveness, compared to the multi-tier self-adaptive approaches and, commonly, to the multi-tier staticapproach. This was true even for homogeneous and balancedworkloads. Finally, our multi-tier approaches are robust andcan be applied for capacity management of virtualized en-vironments subjected to capacity variations due to the localexecution of management and security-related tasks.
Possible directions for future work include: (a) extendingour models for alternative application traffic patterns and tocapture each tier specific resources individually; (b) includingoperational costs (e.g., energy) in our framework; (c) designingricher business models; (d) further evaluating the solution forenvironments under stress (i.e., attacks); and (e) prototypingthe capacity manager in a real system.
ACKNOWLEDGMENT
This work was developed in collaboration with HP BrazilR&D.
REFERENCES
[1] J. Ross and G. Westerman, “Preparing for Utility Computing: TheRole of IT Architecture and Relationship Management,” IBM SystemsJournal, vol. 43, no. 1, pp. 5–19, 2004.
[2] J. Chase, D. Anderson, P. Thakar, A. Vahdat, and R. Doyle, “ManagingEnergy and Server Resources in Hosting Centers,” in 18th ACM SOSP,Banff, Canada, 2001.
[3] P. Barham, B. Dragovic, K. Fraser, S. Hand, T. Harris, A. Ho, R. Neuge-bauer, I. Pratt, and A. Warfield, “Xen and the Art of Virtualization,” in19th ACM SOSP, Bolton Landing, NY, 2003.
[4] A. Whitaker, M. Shaw, and S. Gribble, “Scale and Performance in theDenali Isolation Kernel,” in 5th OSDI, Boston, MA, 2002.
[5] G. Banga, P. Druschel, and J. Mogul, “Resource Containers: a NewFacility for Resource Management in Server Systems,” in 3rd OSDI,New Orleans, LO, 1999.
[6] J. Wilkes, J. Mogul, and J. Suermondt, “Utilification,” in 11th ACMSIGOPS European Workshop: Beyond the PC, Leuven, Belgium, 2004.
[7] X. Liu, X. Zhu, S. Singhal, and M. Arlitt, “Adaptive Entitlement Controlto Resource Containers on Shared Servers,” in 9th IFIP/IEEE IM, Nice,France, 2005.
[8] B. Abrahao, V. Almeida, J. Almeida, A. Zhang, D. Beyer, and F. Safai,“Self-Adaptive SLA-Driven Capacity Management for Internet Ser-vices,” in 10th IEEE/IFIP NOMS, Vancouver, Canada, 2006.
[9] J. Almeida, V. Almeida, D. Ardagna, C. Francalanci, and M. Trubian,“Resource Management in the Autonomic Service-Oriented Architec-ture,” in 3rd IEEE ICAC, Dublin, Ireland, 2006.
[10] Z. Liu, M. S. Squillante, and J. L. Wolf, “On Maximizing Service-Level-Agreement Profits,” in 3rd ACM Conference on Electronic Commerce,Tampa, Florida, 2001.
[11] D. Villela, P. Pradhan, and D. Rubenstein, “Provisioning Servers in theApplication Tier for e-Commerce Systems,” in 12th IEEE InternationalWorkshop on Quality of Service, Passau, Germany, 2004.
[12] D. Menascé and M. Bennani, “Autonomic Virtualized Environments,” inIEEE International Conference on Autonomic and Autonomous Systems,Silicon Valley, CA, 2006.
[13] L. Cherkasova and P. Phaal, “Session-Based Admission Control: AMechanism for Peak Load Management of Commercial Web Sites,”IEEE Transactions on Computers, vol. 51, no. 6, pp. 669–685, 2002.
[14] D. Menascé, V. Almeida, R. Fonseca, and M. Mendes, “Business-Oriented Resource Management Policies for e-Commerce Servers,”Performance Evaluation, vol. 42, no. 2-3, pp. 223–239, 2000.
[15] J. Rolia, X. Zhu, M. Arlitt, and A. Andrzejak, “Statistical ServiceAssurances for Applications in Utility Grid Environments,” PerformanceEvaluation, vol. 58, no. 2+3, pp. 319–339, 2004.
[16] F. Baskett, M. Chandy, R. Muntz, and F. Palacios, “Open, Closed,and Mixed Networks of Queues with Different Classes of Customers,”Journal of the ACM, vol. 22, no. 2, pp. 248–260, 1975.
[17] J. Rolia and K. Sevcik, “The Method of Layers,” IEEE Transactions onSoftware Engineering, vol. 21, no. 8, pp. 689–700, 1995.
[18] B. Urgaonkar, G. Pacifici, P. Shenoy, M. Spreitzer, and A. Tantawi, “AnAnalytical Model for Multi-Tier Internet Services and its Applications,”in ACM SIGMETRICS, Banff, Canada, 2005.
[19] Y. Diao, J. Hellerstein, S. Parekh, H. Shaikh, M. Surendra, andA. Tantawi, “Modeling Differentiated Services of Multi-Tier Web Ap-plications,” in 14th IEEE MASCOTS, Washington, DC, 2006.
[20] B. Abraham and J. Ledolter, Statistical Methods for Forecasting. JohnWiley and Sons, 1983.
[21] H. Perros and K. Elsayed, “Call Admission Control Schemes: A Re-view,” IEEE Communications Magazine, vol. 34, no. 11, pp. 82–91,2003.
[22] V. Paxson and S. Floyd, “Wide Area Traffic: the Failure of PoissonModeling,” IEEE/ACM Transactions on Networking, vol. 3, no. 3, pp.226–244, 1995.
[23] L. Kleinrock, Queueing Systems. John Wiley and Sons, 1975.[24] K. Trivedi, Probability and Statistics with Reliability, Queuing and
Computer Science Applications. John Wiley and Sons, 2002.[25] R. Fourer, D. Gay, and B. Kernighan, AMPL: A Modeling Language for
Mathematical Programming. Boyd and Fraser, 1993.[26] P. Gill, W. Murray, and M. Saunders, “SNOPT: An SQP Algorithm for
Large-Scale Constrained Optimization,” SIAM Journal on Optimization,vol. 12, no. 4, pp. 979–1006, 2002.
Copyright © 2022 FDOKUMEN