Measuring the Immesurable: Corruption, Obliquity and Second-tier Indicators_Paris 13 December 2013
Upload
khangminh22Category
view
1download
0
Rev. 0
ABWR Design ContrDI DDcoment/Tier 2
19EA Direct Containment Heating
19EA.1 Summary Description
Direct Containment Heating (DCH) is the sudden heatup and pressurization of containment resulting from the fragmentation and dispersal of core material in the containment atmosphere. DCH is a concern for sequences in which the vessel fails at high pressure since the steam flow from the vessel provides the motive force for entrainment. In the event of a sufficiently large DCH event, the containment could fail at the time of vessel failure. Since this could lead to very high releases to the, environment, a study has been carried out to investigate the uncertainties in the challenge to containment due to aDCH event. In the past, this issue has been primarily addressed for Pressurized Water Reactors (Reference 19EA-l) since BWRs have very reliable vessel depressurization systems. Thus, the frequency of accidents with the vessel remaining at high pressure is extremely low.
Subsection 19D.6.2.5 provides an evaluation of the ADS System reliability including the nitrogen, control and instrumentation systems. Additional information about the SRVs and the ADS System may be found in Subsections 5.2.2, 7.3.1.1.1.2 and 19E.2.1.2.2.2.
Subsection 7.3.1.1.1.2(3) (h) indicates that the signal cables, solenoid valves, safety/relief valve operators and accumulators are located inside the drywell and are designed to operate in the most severe accident resulting from a DBA LOCA, including the radiation effects. The conditions in the containment during the early stages of a severe accident (before vessel failure) which require depressurization using the SRVs are less challenging than those specified by a DBA LOCA. Additional analyses of the ADS System capability were performed in support of station blackout performance analysis. This discussion is included in Subsection 19E.2.1.2.2.2. The conclusions of that analysis are that there is ample DC power for the operation of the SRVs for many days after the 8 hour capability required by the station blackout rule.
Subsection 5.2.2.4.1 indicates that the nitrogen accumulator capacity for each valve is designed to be sufficient to open for one actuation at drywell design pressure even if the . air supply to the accumulators is lost. The risk significant severe accidents in the ABWR PRA remain below the design pressure of the containment in the time period before vessel failure. Valve operability at high containment pressure conditions are also discussed in Subsection 19E.2.1.2.2.2(2) (b). Based on the presence of the containment overpressure protection system, the maximum drywell pressure is approximately 0.79 MPa (100 psig). Subsection 19E.2.1.2.2.2(2) (b) indicates the operator actions which could be taken to assure SRV operability under these conditions. The appropriate operator actions are specified in the ABWR EPGs. Since the containment pressurizes very slowly, over a period of about a day, there is ample time for the operators to take the appropriate actions.
Direct Containment Heating 19EA-1
ABWR Rev. 0
Design Control Document/Tier Z
Given the above discussions, one may conclude that the ADS System will not be compromised before vessel failure in the unlikely event of a severe accident, and the frequency of severe accident sequences in which the vessel fails at high pressure is extremely low. However, with the many sources oflow-pressure injection available to the ABWR to prevent core damage, the frequency of all core damage sequences is very low. Therefore, high-pressure core melts appear as contributors to the total core damage frequency, albeit with a very low probability.
A detailed study utilizing event trees was performed to assess the peak drywell pressure resulting from a DCH event. This attachment outlines the analysis and the results.
19EA.2 Description of Event Tree Analysis
19EA-2
The early containment failure event tree analysis consists of a main tree (Figures 19EA-l, 19EA-2, and 19EA-3) and three supplemental decomposition event trees (DETs) (Figures 19EA-4, 19EA-5, and 19EA-6).The first two events on the main event tree sort the sequence classes by Reactor Pressure Vessel (RPV) pressure and preexisting containment pressure at the time of vessel failure. These parameters are uniquely determined by the accident class attributes. The last event on the main event tree assesses the probability of drywell head failure following vessel failure. The probabilities for this event are evaluated in supplemental DETs. Three DETs were constructed to assist in the quantification for accident classes with high RPV pressure. (Low RPV pressure sequence classes are not expected to lead to containment pressures which would challenge the integrity of containment.) The three DETs assess the probability of containment failure for different pre-existing containment pressures at the time of RPV failure.
The DETs consider the major phenomena which contribute to early over pressurization of containment from high RPV pressure sequences including debris entrainment from the lower drywell, Direct Containment Heating (DCH), the pre-existing pressure in containment prior to RPV failure, and the pressure rise due to blowdown of the RPV. Each pathway through a DET represents a possible accident progression pathway given the uncertainties in the underlying phenomena. A peak containment pressure is associated with each pathway. These pressures have been estimated from a deterministic DCH model (described in Subsection 19EA.3) with input conditions which reproduce the parameter values and assumptions along each sequence pathway on the tree. These pressures were then compared with the containment fragility curve (developed in Attachment 19FA) to determine the probability of containment failure.
The probabilities for each sequence pathway with similar end states were summed and these results transferred as the branch probabilities for the last event on the main event tree.
Direct Containment Heating
ABWR Rev. 0
Design Control DocumentlTier 2
The spectrum of pressures and associated probabilities represented by the quantified DETs represents a discrete probability distribution of containment pressurization following vessel failure. This distribution is a representation of the uncertainties associated with the estimation of containment pressurization.due to the phenomena occurring at vessel failure.
19EA.2.1 Event Headings
The important parameters and assumptions which are considered as headings on the main event tree and the DETs and the reaSon for their use are discussed below.
19EA.2.1.1 Containment Pressure Prior to RPV Failure (CONTPRES)
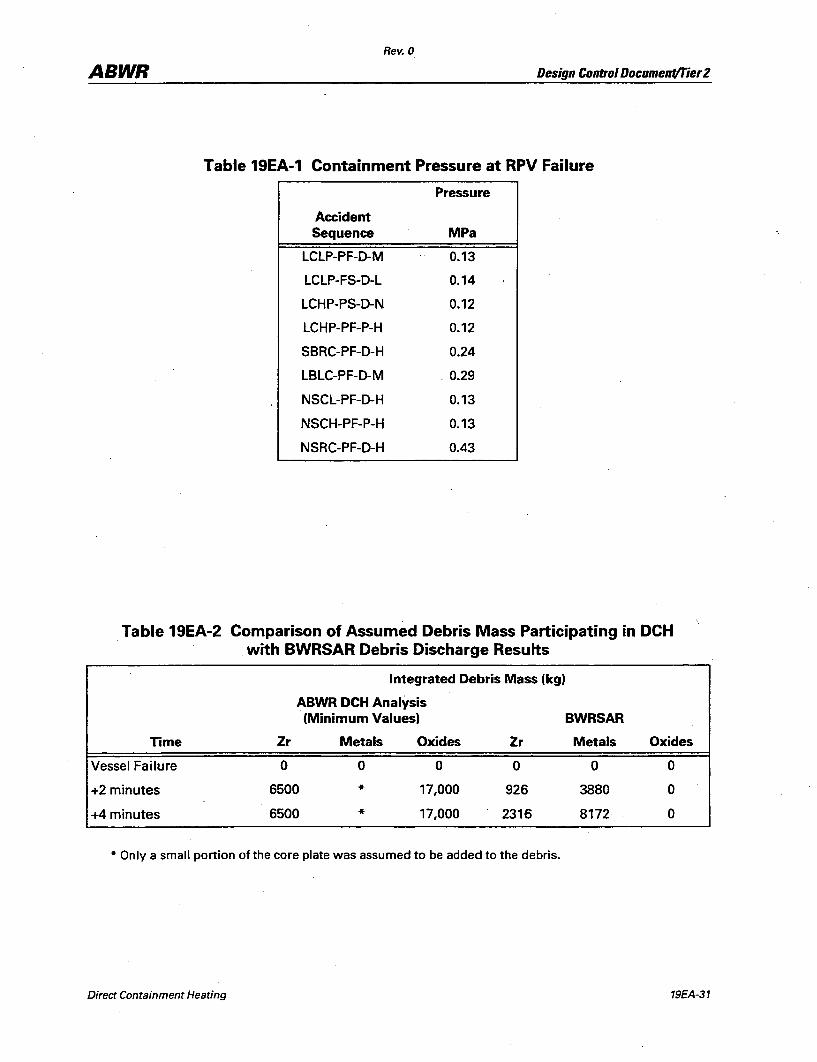
The pre-existing pressure of the containment is obviously important in the assessment of containment pressurization following vessel failure. Three pressure regimes have been selected to represen t the range of possible pre-RPV failure con tainmen t pressures. MAAP-ABWR calculations (described in Subsection 19E.2.2 and summarized on Table 19EA-l) indicate that ABWR accident sequences can be grouped into three classes. These pressure regimes are similar to those selected to represent pre-RPV failure containment pressures in NUREG/CR-4551 (Reference 19EA-2).
Class
Low
Inter
High
Pressure Range
0.134-0.264 MPa (Nominal = 1.5 atmosphere.)
0.264-0.310 MPa (Nominal = 2.5 atmosphere)
>0.310MPa (Nominal = 4 atmosphere)
Examples
. Non ATWS sequences with operable DHR or with rapid core damage (i.e., all invessel injection failed).
Large LOCAs with early failure ofDHR. SBO with . RCIC and failure ofDHR.
ATWS with RCIC.
This eveJ;lt is quantified based on the sequence accident class. This is a sorting type event. The probability of each branch is either 0 or 1 depending upon the attributes of the accident class.
19EA.2.1.2 RPV Pressure at RPV Failure (RVPRES)
The RPV pressure at the time of vessel failure is a major parameter impacting a number of processes which contribute to containment pressurization at RPV failure. Blowdown of the reactor vessel following failure at elevated pressure contributes directly to
Direct Containment Heating 19EA-3
ABWR Rev. 0
Design Control Document/Tier 2
containment pressurization. High RPV pressures promote entrainment of the debris from the lower drywell and debris fragmentation.
Subsection19~.3.1 describes the mechanism for entrainment and the potential for debris dispersal in the AB'WR..
Two pressure regimes are considered:
High> 1.37 MPa
Low::;; 1.37 MPa
For sequences with low RPV pressure at the time of vessel failure, the mechanisms which may lead to rapid containment pressurization are generally not operative. As discussed in Subsection 19EA.3.1, entrainment of the debris is an essential prerequisite for DCH. The entrainment of debris from the lower drywell occurs due to levitation by the steam expelled from the vessel after vessel failure. For sequences with the RPV at low pressure at the time of vessel failure, there is no driving force for the steam. Consequently, in the event tree for early containment failure due to DCH, the probability for early containment failure for low-pressure sequences is set to zero.
For high-pressure sequences, on the other hand, mechanisms such as DCH and RPV blowdown may challenge the integrity of the containment. The remaining events on the event tree assess those mechanisms which impact containment loading for highpressure sequences.
This event is quantified based on the sequence accident class. This is a sorting type event. The probability of each branch is either 0 or 1 depending upon the attributes of the accident class.
19EA.2.1.3 Mode of RPV Failure (MODRVFAIL)
19EA-4
Following slumping of the molten core debris into the lower RPV head, thermal attack on the lower head and lower head penetrations will eventually result in bottom head failure (unless the debris is cooled in-vessel). Several modes of vessel failure have been considered to be possible ranging from a limited area failure of one or more instrument tubes, drains or control rod drives to creep-rupture failure of the lower head resulting in a large diameter failure.
Direct Containment Heating
ABWR Rev. 0
Design Control Document/Tier2
This event is a split fraction, representing uncertainties in the phenomenology. Two size classes were defined for this study:
Small: Initial area equal to the area of one control rod drive penetration
« 0.1 m2)
Large: Nominal failure area of 2.0 m 2
For quantifying this event, the results from NUREGjCR-4551 were used as guidance. In this analysis, as in NUREGjCR-4551 , it was assumed that all breach sizes greater than 2.0 m2 could be treated identically. For all core damage sequences where core damage progression is not terminated in-vessel (and vessel failure is predicted) NUREGjCR-4551 indicated that the mean probability of small penetration failures was
0.75 and the probability of large lower-head failure modes was 0.25.
Analyses performed subsequent to NUREGjCR-4551 indicate that the probability of large creep-rupture lower-head failure modes may have been overestimated (References 19EA-3 and 19EA-4). Even though the best-estimate studies indicate a small penetration failure is expected, this analysis addresses hole sizes up to 2.0 m 2. The probability of a larger failure is judged to be quite low based on References 19EA-3 and 19EA-4. Therefore, the probability of large lower-head failure modes has been decreased in this analysis.
The probabilities are considered to be appropriate for both early and late core damage sequences. Vessel ablation is primarily controlled by the superheat in the core debris, and is less influenced by the time of core damage. Thus, the time of core damage will have little effect on the mode of vessel failure.
19EA.2.1.4 Fraction of Core Inventory Molten in Lower RPV Head (RVCORMASS)
This parameter largely defines the potential for large scale DCH events. It is generally considered that only the debris that is molten in the lower head at the time of vessel breach will have the potential for dispersal and fragmentation. Thus, only this material can significantly contribute to DCH.
Two regimes are considered:
Small 0-20% Core Debris Inventory (Nominal 10%)
Large 20-60% Core Debris Inventory (Nominal 40%)
These mass regimes are similar to those chosen in NUREGjCR-4551 to represent the Grand Gulf plant.
Direct Containment Heating 19EA-5
ABWR
79EA-6
Rev. 0
Design Control Document/Tier 2
NUREG/CR-4551 provides probabilities for three cases which also appear to be applicable to the ABWR The mean NUREG/CR-4551 probabilities are presented below:
(1) Case 1
For sequences with water injection into the reactor vessel prior to vessel breach by low-pressure or high-pressure injection systems:
P (Small) = 0.975
P (Large) = 0.025
(2) Cases 2 and 3
For high- and low-pressure sequences without in-vessel injection:
P (Small) = 0.9
P (Large) = 0.1
Since the maJority of ABWR core damage sequences do not involve late water addition to the core, it is conservatively assumed that the Case 2/3 results apply to all ABWR core damage sequences.
It can be shown that the core debris discharge rates used in the ABWR DCH analysis bound results typical ofa BWRSARcalculation (Reference 19EA-5). Table 19EA-2 com pares the approximate debris masses participating in DCH at selected in tervals after the vessel has failed. The ABWR DCH analysis column shows the values used for a small
mass of molten debris in the lower head at RPV failure. It should be noted that debris entrainment will occur only until the vessel has depressurized to about 1.379 MPa (200 psia). The BWRSAR results indicate that the RPV depressurizes in about four minutes. The analysis of this study has a much larger vessel failure area due to ablation, thus, the depressurization is more rapid. The pressurization of the containment is most rapid before the wetwell connecting vents clear. Vent clearing will occur within the first second of the blowdown. Therefore, the very early stages of the debris pour and entrainment are the most significant.
The total mass of debris and the zirconium mass used in this analysis are much larger than the masses calculated by BWRSAR. Indeed, the mass of the zirconium bounds the en.tire zirconium and metal mass calculated by BWRSAR for the critical, early stages of the blowdown. Since the heat of reaction for the oxidation of zirconium is much higher than that of other metals, the use of a high zirconium mass bounds the effects of the other metals. Even at the four minute mark, the distribution of the masses is
Direct Containment Heating
ABWR Rev. 0
Design Control Document/Tier 2
conservative due to the relative heats of reaction for zirconium and other metals. Thus, the table clearly shows that the assumed masses bound the BWRSAR results.
19EA.2.1.S High-Pressure Melt Ejection (HPME)
For sequences with high RPV pressure at vessel failure, the core debris is likely to be expelled from the vessel at high velocity. Furthermore, the velocity of the residual gases blowing down from the reactor vessel are likely to be sufficiently high to result in significant entrainment of the debris from the lower dryweU and to result in dispersal and fragmentation of the debris. This event is a split fraction indicating the uncertainty in phenomena. The question evaluates whether a substantial fraction of the core debris is expelled from the vessel at high velocity and followed by the blowdown of the vessel. Given these precursors, it is believed that material will be lifted from the lower drywell floor. A subsequent event heading (FRAG) will assess the extent of debris fragmentation, and dispersal into the upper drywell.
For all cases where reactor vessel failure occurred under high-pressure conditions, the probability of an HPME was assessed to be 0.8 for the Grand Gulf plant in the NUREG / CR-4550 study. Based on similariti~s in the design of the ABWR and BWR-6 vessel bottom heads, it is assumed that these results can also be applied to the ABWR. Additional discussion is provided in Subsection 19EA.3.1. The "No HPME" value of 0.2 represents the potential that the gas from the RPV will break through the core debris and the vessel will be depressurized prior to the release of the core debris and the potential that the initial vessel breach will be near the melt surface. BWRSAR results (Reference 19EA-5) indicate that the RPV depressurizes before any substantial amount of core material is expelled from the vessel.
For reasons similar to those discussed above for low-pressure sequences, if an HPME event does not occur, then the loads imposed on the containment structure at vessel failure will not result in a serious threat to containment integrity and the probability of early containment failure is assumed to be zero.
19EA.2.1.6 Fraction of Entrained Debris Fragmented and Transported to the Upper Drywell (FRAG)
This branch in the DETs is a split fraction event. For high-pressure sequences where an HPME has occurred, this event assesses the extent of dispersal and fragmentation of the entrained debris. In order for a serious overpressure challenge of the containment by direct containment heating (DCH) to occur, a significant fraction of the debris that was
molten in the lower RPV head at vessel failure must be transported from the lower drywell into the upper drywell and fragmented. The mechanisms which may limit the transport of the molten debris from the lower cavity to the upper cavity are discussed below. These include:
(1) Trapping of the debris in the lower drywell.
Direct Containment Heating 19EA-7
Rev. 0
ABWR Design Control DocumentlTier 2
19EA-8
(2) Impaction and removal of the debris in the gas transport pathway connecting the lower and upper drywell compartments.
(3) Partitioning of the gas (and entrained debris) flow exiting the lower drywell between the upper drywell and the wetwell.
(4) Debris dispersal by wave formation rather than by small particles.
The above mechanisms can impact the extent of debris dispersal to the upper drywell as small debris particles which is the critical parameter for determin,ing the potential threat from DCH.
The basic configuration of the ABWR lower drywell is shown in Figure 19EA-7. Additional details can be seen in the arrangement elevation drawing (Figures 1.2-2 and 1.2-2a), the lower drywell elevation (Figures 1.2-3b and 1.2-3c) and the arrangement plan (Figures 1.2-13e through 1.2-13h). The vessel skirt of the ABWR is solid, there are no openings in it which could connect the upper drywell to the lower drywell. This precludes water transport from the upper drywell into the lower drywell following a LOCA. Hence, the flow path for gases and debris expelled from the lower drywell will be through the downcomers. The upper drywell to wetwell downcomers are imbedded in the lower drywell wall. The down comers are also connected to the lower drywell gas space via horizontal pipes which penetrate the lower drywell wall at an elevation approximately two-thirds of the height between the lower drywell floor and the top of the lower drywell.
Because of the lower drywell configuration, it is expected that some fraction of the molten debris which is released at vessel failure will be trapped in the lower drywell. The region of the lower drywell above the downcomers does not have any open flow paths. Furthermore, the control rod drive mechanisms are located in this region. Therefore, the velocities in this region will be lower than that in the region below the down comers. Material which has been lifted off the floor could become trapped in these more stagnant regions of the lower drywell above the downcomer. Thus, one would not expect that all of the debris entrained in the gas flow would exit the lower drywell.
Once debris is assumed to leave the lower drywell and enter the downcomer, two mechanisms govern the final distribution of core material. These mechanisms are the impaction of core debris on structures and the transport to the suppression pool due to flow toward the wetwell in the downcomer. The gas transport pathway to the upper drywell is relatively convoluted. For the debris to enter the upper drywell, it must be en trained off the drywell floor, flowing vertically along the drywell wall. It then turns 90 degrees to enter the horizontal piping. After flowing a short distance through the horizontal piping, the flow will encounter a Tee type junction with the vertical downcomer. At this point the entrained debris must again turn 90 degrees. There is potential for impaction on the downcomer wall at each turn. This impacted debris is
Direct Containment Heating
ABWR Rev. 0
Design Control DocumentlTier 2
likely then to flow downward along the downcomer wall toward the wetwell vents. This effectively removes the material from participating in the DCB event.
In addition, if the horizontal wetwell vents have cleared then the entrained flow will split between that going upward toward the upper drywell and that going downward toward the wetwell vents. If_the vents have not (yet) cleared, then all the flow will go upward toward the upper drywell. The debris that partitions with the gas flow going downward toward the wetwell vents will not participate in DCH.
Finally, since DCH relies on the rapid heat transfer from the corium to the surrounding gas, any debris which is transported via a wave type motion will not participate in the DCH event. As discussed above and described in detail in Subsection 19EA.3, wave formation is not expected to be the dominant transport mechanism. Most of the debris transported to the upper drywell is expected to be in the fonn of particulate.
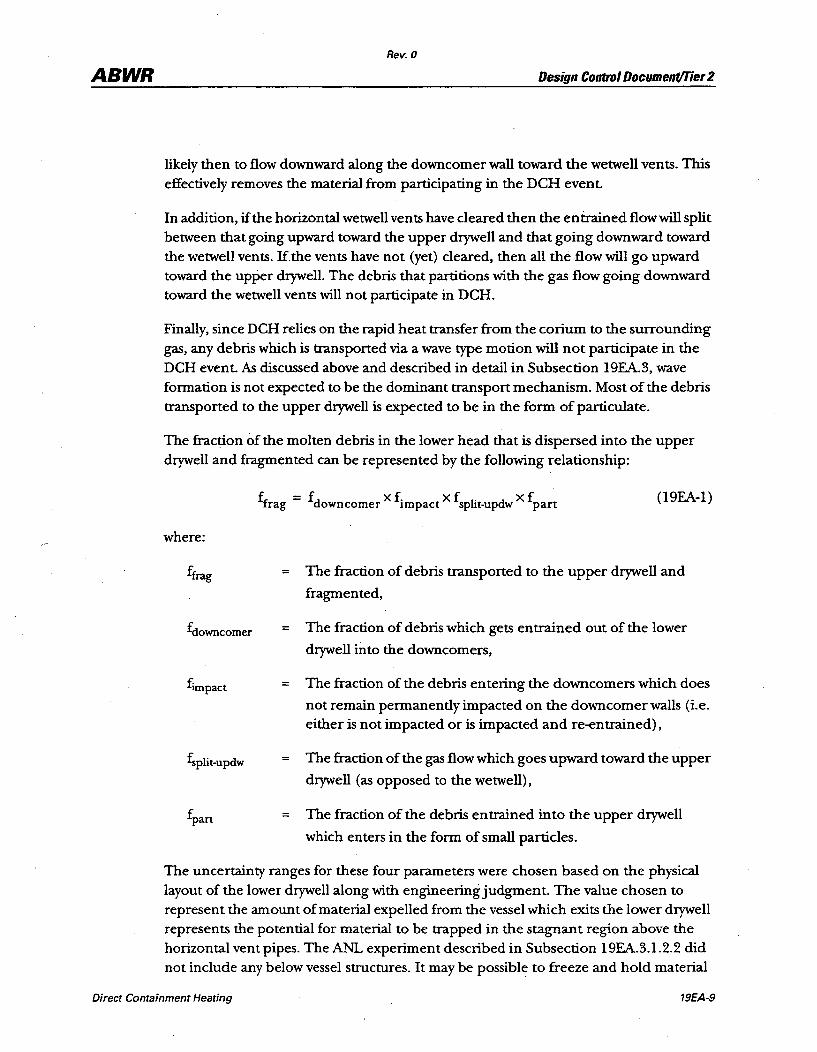
The fraction of the molten debris in the lower head that is dispersed into the upper drywell and fragmented can be represented by the following relationship:
where:
fdowncomer
fimpact
fsplit-updw
ff = fd x f. x f 1- pd x f rag own comer Impact sp It-u w part (19EA-l)
= The fraction of debris transported to the upper drywell and
fragmented,
= The fraction of debris which gets entrained out of the lower
drywell into the downcomers,
= The fraction of the debris entering the downcomers which does
not remain permanently impacted on the downcomer walls (i.e. either is not impacted or is impacted and re-entrained),
The fraction of the gas flow which goes upward toward the upper
drywell (as opposed to the wetwell),
= The fraction of the debris entrained into the upper drywell
which enters in the form of small particles.
The uncertainty ranges for these four parameters were chosen based on the physical layout of the lower drywell along with engineering judgment. The value chosen to represent the amount of material expelled from the vessel which exits the lower drywell represents the potential for material to be trapped in the stagnant region above the horizontal vent pipes. The ANL experiment described in Subsection 19EA.3.1.2.2 did not include any below vessel structures. It may be possible to freeze and hold material
Direct Containment Heating 19EA-9
ABWR Rev. 0
Design Control Documenf/Tier 2
on these massive st!Uctures. Furthermore, the openings from the ANL cavity are much wider than the openings in the ABWR. Since the debris will have to make a turn to enter the ABWR openings, the smaller area makes the debris less likely to entrain. Based on the above discussion, about half of the debris is assumed to reach the conn-ecting vents.
The debris leaving the lower drywell will then travel a short distance before entering a tee junction. It is expected that some of the debris will impact on the wall of the pipe at the junction and flow down into the wetwell. Based on the physical characteristics of the debris flow path, it was judged that most of the debris does not get removed due to impaction.
Prior to clearing of the horizontal vents, gas flow into the vent pipes will be directed up into the upper drywell. As the upper and lower drywells pressuri.ze, the water level within the vent pipes will be depressed, and venting into the wetwell will begin. The average vent clearing time is 0.5 seconds. Mter the vents have cleared, the gas would preferentially flow into the wetwell since the upper drywell would be increasing in pressure. If the wetwell and upper drywell pressures were conservatively assumed to be equal, then a 50/50 split would occur based on equal flow areas in both directions. As
described iIi Subsection 19EA.3, the entrainment dispersal time is estimated to be two seconds. If the debris is dispersed linearly, then the vents would clear after only 25% of the debris was released from the lower drywell. The debris leaving the lower drywell after vent clearing would then conservatively be split 50/50 between the wetwell and the upper drywell. Based on this discussion, it was conservatively assumed that most of the debris flows to the upper drywell.
The final phenomenon that could influence the amount of the debris that would participate in DCH is the wave formation. If the debris enters the upper drywell in the form of a coherent wave, it would not be expected to participate in mixing with the gas. Experiments performed at ANL for PWR cavity configurations have resulted in this wave type of sweepout. As discussed in Subsection 19EA.3, wave formation is not expected to be the dominant removal mechanism for the ABWR configuration. However, as debris flows through the wetwell/ drywell connecting vents to the upper drywell, it is possible that some of the debris forms wave-like sheets. Therefore, engineering judgment has been used to estimate that the median value for the fraction of debris that is dispersed as particulate debris is 0.875.
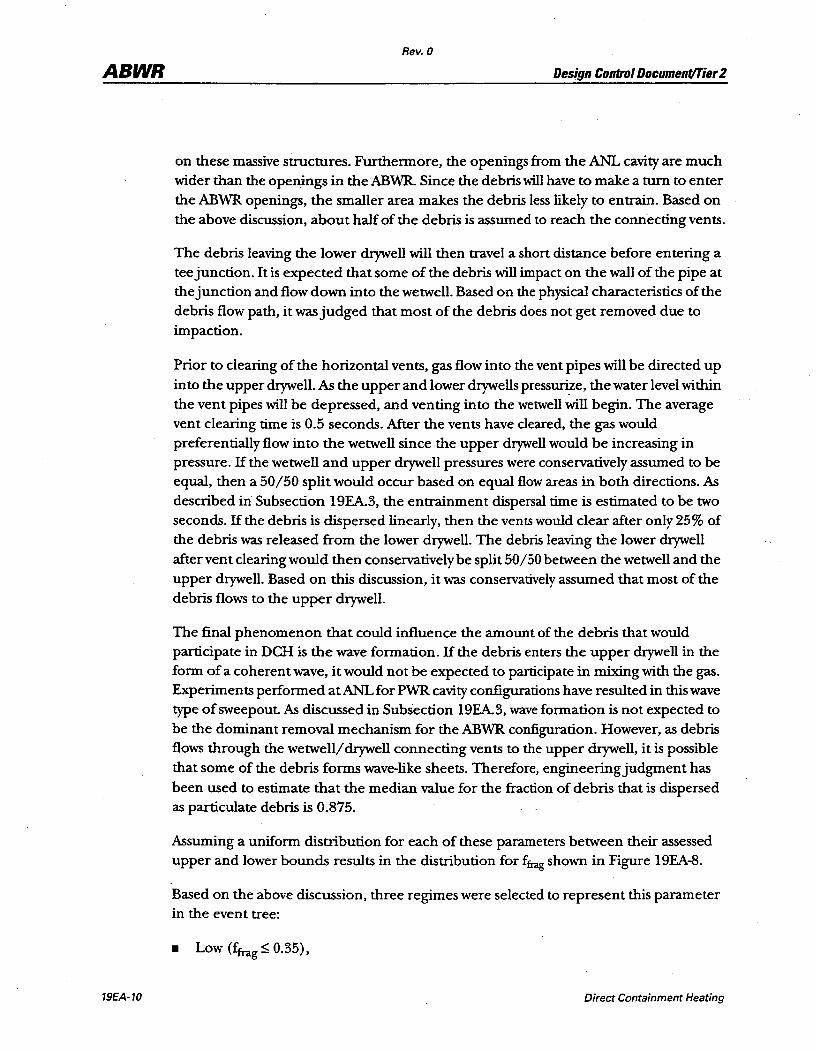
Assuming a uniform distribution for each of these parameters between their assessed upper and lower bounds results in the distribution for ffrag shown in Figure 19EA-8.
Based on the above discussion, three regimes were selected to represent this parameter in the event tree:
• Low (fCrag::; 0.35),
19EA-10 Direct Containment Heating
Rev. 0
ABWR Design Control Document/Tier 2
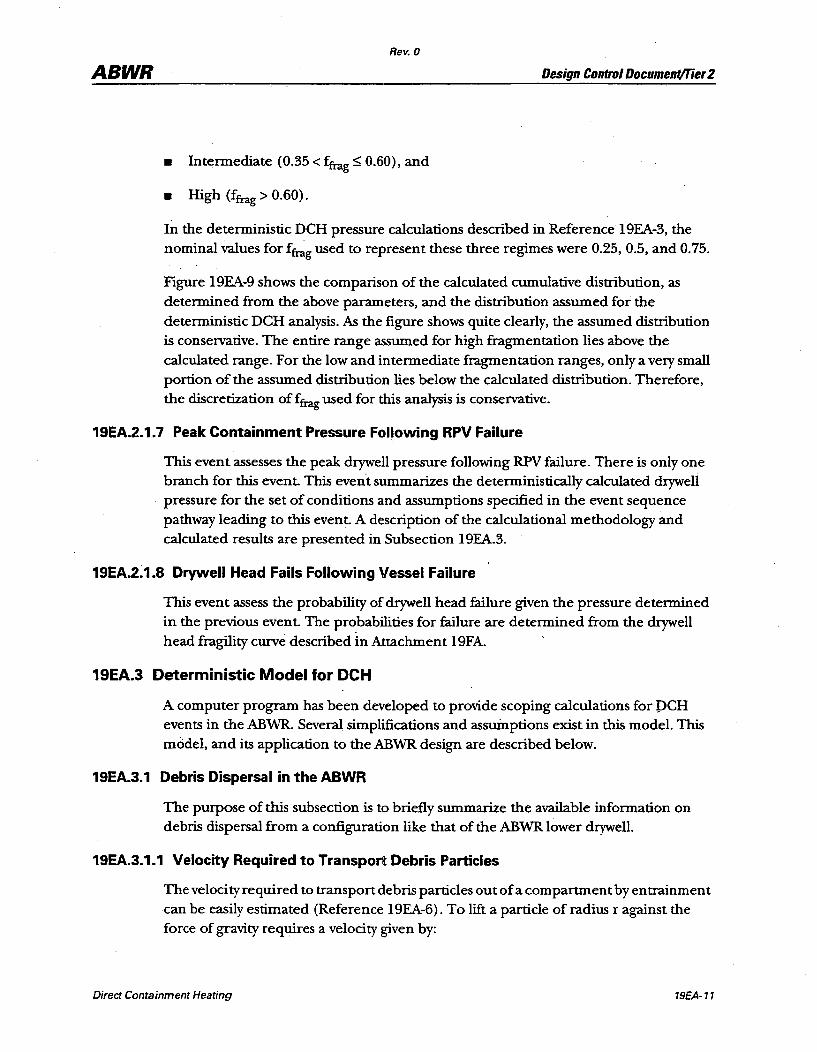
• Intermediate (0.35 < ffrag::;; 0.60), and
• High (ffrag > 0.60).
In the deterministic OCH pressure calculations described in Reference 19EA-3, the nominal values for ffrag used to represent these three regimes were 0.25, 0.5, and 0.75.
Figure 19EA-9 shows the comparison of the calculated cumulative distribution, as determined from the above parameters, and the distribution assumed for the deterministic nCR analysis. As the figure shows quite clearly, the assumed distribution is conseIVa.tive. The entire range assumed for high fragmentation lies above the calculated range. For the low and intermediate fragmentation ranges, only a very small portion of the assumed distribution lies below the calculated distribution. Therefore, the discretization of ffrag used for this analysis is conseIVa.tive.
19EA.2.1.7 Peak Containment Pressure Following RPV Failure
This event assesses the peak drywell pressure following RPV failure. There is only one branch for this event. This eveu"t summarizes the deterministically calculated dxywell pressure for the set of conditions and assumptions specified in the event sequence pathway leading to this event. A description of the calculational methodology and calculated results are presented in Subsection 19EA.3.
19EA.2.1.8 Drywell Head Fails Following Vessel Failure
This event assess the probability of drywell head failure given the pressure determined in the previous event. The probabilities for failure are determined from the drywell head fragility curve described in Attachment 19FA.
19EA.3 Deterministic Model for DCH
A computer program has been developed to provide scoping calculations for PCR events in the ABWR. Several simplifications and assuinptions exist in this model. This model, and its application to the ABWR design are described below.
19EA.3.1 Debris Dispersal in the ABWR
The purpose of this subsection is to briefly summarize the available information on debris dispersal from a configuration like that of the ABWR lower dxywell.
19EA.3.1.1 Velocity Required to Transport Debris Particles
The velocity required to transport debris particles out of a compartment by entrainment can be easily estimated (Reference 19EA-6). To lift a particle of radius r against the force of gravity requires a velocity given by:
Direct Containment Heating 19EA·11

ABWR
19EA-12
Rev. 0
Design Control Document/Tier 2
2 4 3 2PgU g
(Pr- Pg) 31tr g = cd1tr ~ (19EA-2)
where:
Pr = Fluid density
Pg = Gas density
r = Particle radius
g = Acceleration of gravity
cd = Drag coefficient
ug = Gas velocity
Ifwe ass~e complete hydrodynamic breakup, the maximum particle radius is given by equating the force imparted by the gas stream to the surface tension force holding the droplet together. This is usually cast in terms of a Weber number:
where:
2 2cd Pgug r
We=_---,::-_ 0'
SuIface tension
(19EA-3)
There is some ambiguity on the form of this equation and the choice of the Weber number, We. Most authors fold the drag coefficient into We. For reasons that will soon become clear, we follow Henry (Reference 19EA-7) and leave the coefficient explicitly in the expression. Typical values of Weber number are 6 to 12 when the drag coefficient is left out. Strictly speaking, these would specify the maximum particle size. The mass median diameter, for example, would be about half this value (Reference 19EA-8).
Ifwe substitute Equation 19EA-3 into 19EA-2 and neglect the gas density compared to the liquid density, we obtain:
(19EA-4)
Define the Kutateladze number by:
Direct Containment Heating
ABWR
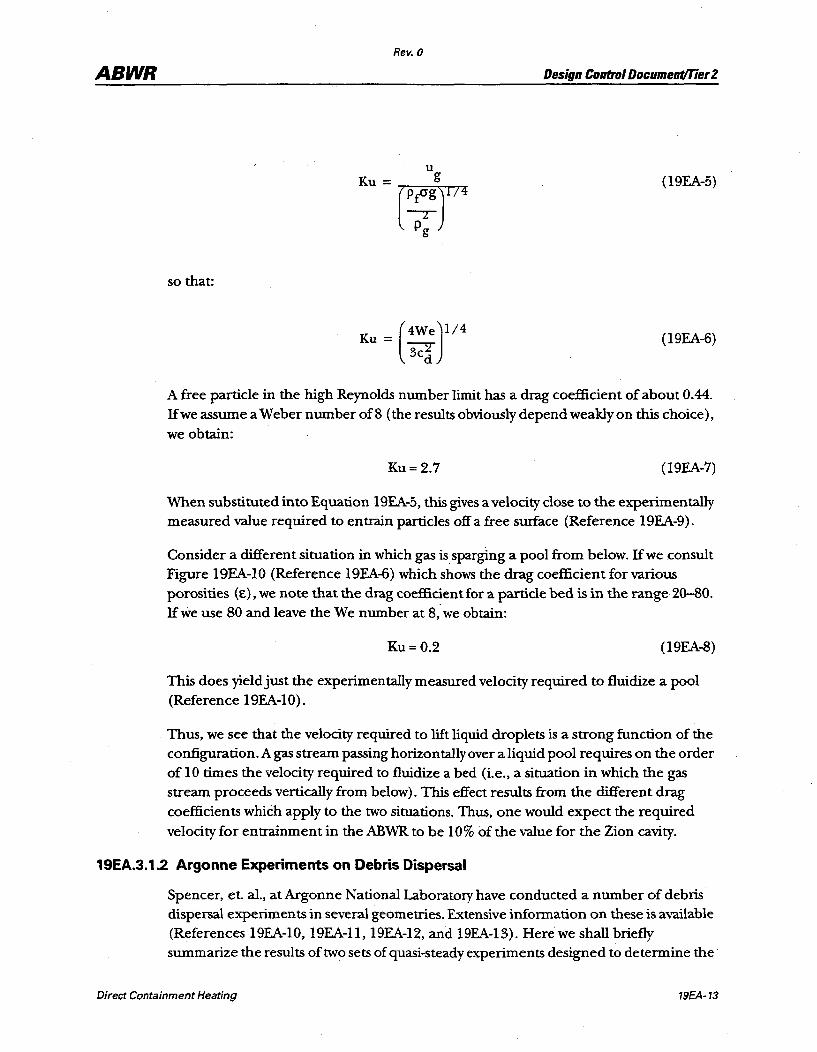
so that:
Rev. 0
u Ku = g
[p~gr4 Pg
(4weJl/4 Ku =
. ~ d
Design Control Document/Tier 2
(l9EA-5)
(19EA-6)
A free particle in the high Reynolds nwnber limit has a drag coefficient of about 0.44. If we assume a Weber number of 8 (the results obviously depend weakly on this choice), we obtain:
Ku= 2.7 (19EA-7)
When substituted into Equation 19EA-5, this gives a velocity close to the experimentally measured value required to en train particles off a free surface (Reference 19EA-9).
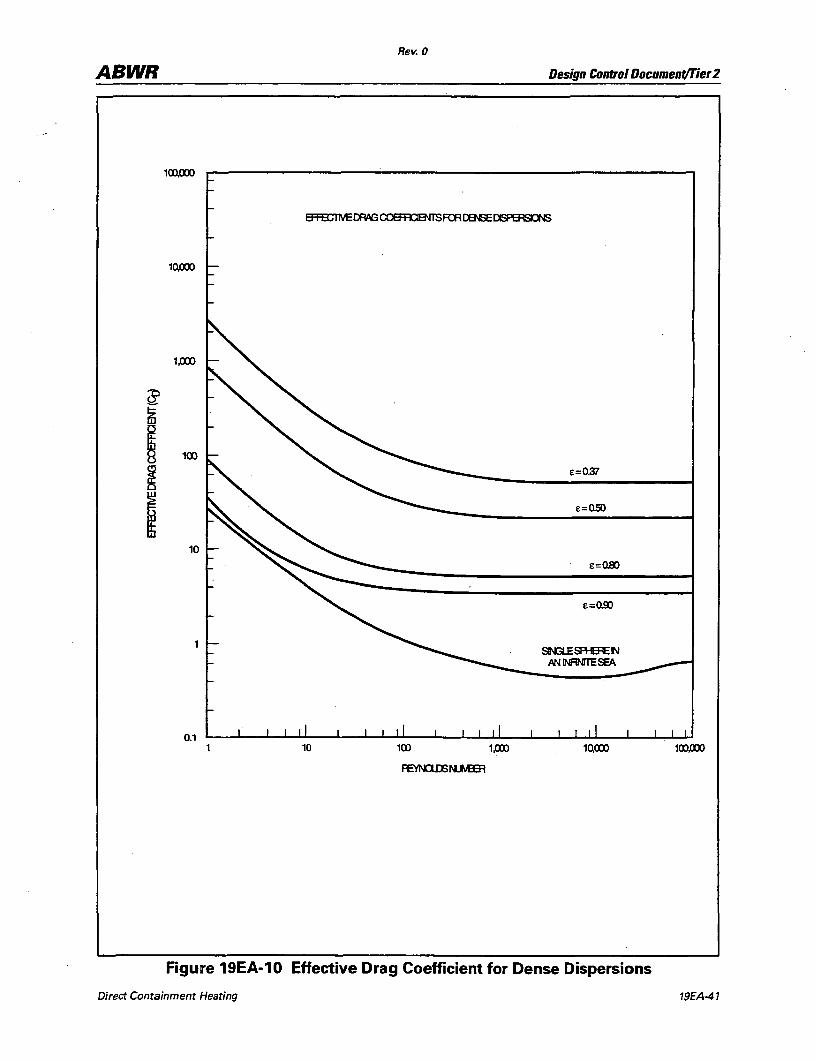
Consider a different situation in which gas is.sparging a pool from below. If we consult Figure 19EA-10 (Reference 19EA-6) which shows the drag coefficient for various porosities (e), we note that the drag coefficient for a particle bed is in the range 20-80. If we use 80 and leave the We nwnber at 8; we obtain:
Ku=0.2 (19EA-8)
This does yield just the experimentally measured velocity required to fluidize a pool (Reference 19EA-1O).
Thus, we see that the velocity required to lift liquid droplets is a strong function of the configuration. A gas stream passing horizontally over a liquid pool requires on the order oflO times the velocity required·to fluidize a bed (i.e., a situation in which the gas stream proceeds vertically from below). This effect results from the different drag coefficients which apply to the two situations. Thus, one would expect the required velocity for entrainment in the AB"WR to be 10% of the value for the Zion cavity.
19EA.3.1.2 Argonne Experiments on Debris Dispersal
Spencer, et. al., at Argonne National Laboratory have conducted a nwnber of debris dispersal experiments in several geometries. Extensive information on these is available (References 19EA-IO, 19EA-ll, 19EA-12, and 19EA-13). Here·we shall briefly summarize the results of two sets of quasi-steady experiments designed to determine the
Direct Containment Heating 19EA-13
ABWR -Rev. 0
Design Control Document/Tier 2
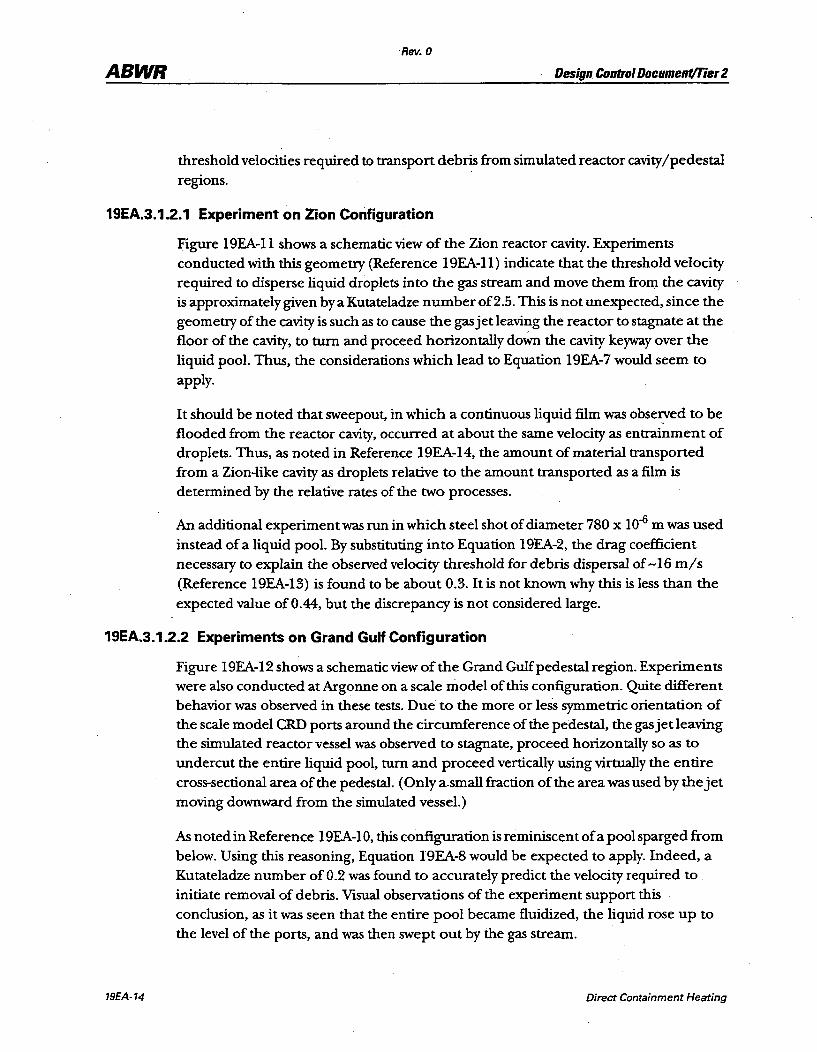
threshold velocities required to transport debris from simulated reactor cavity I pedestal regions.
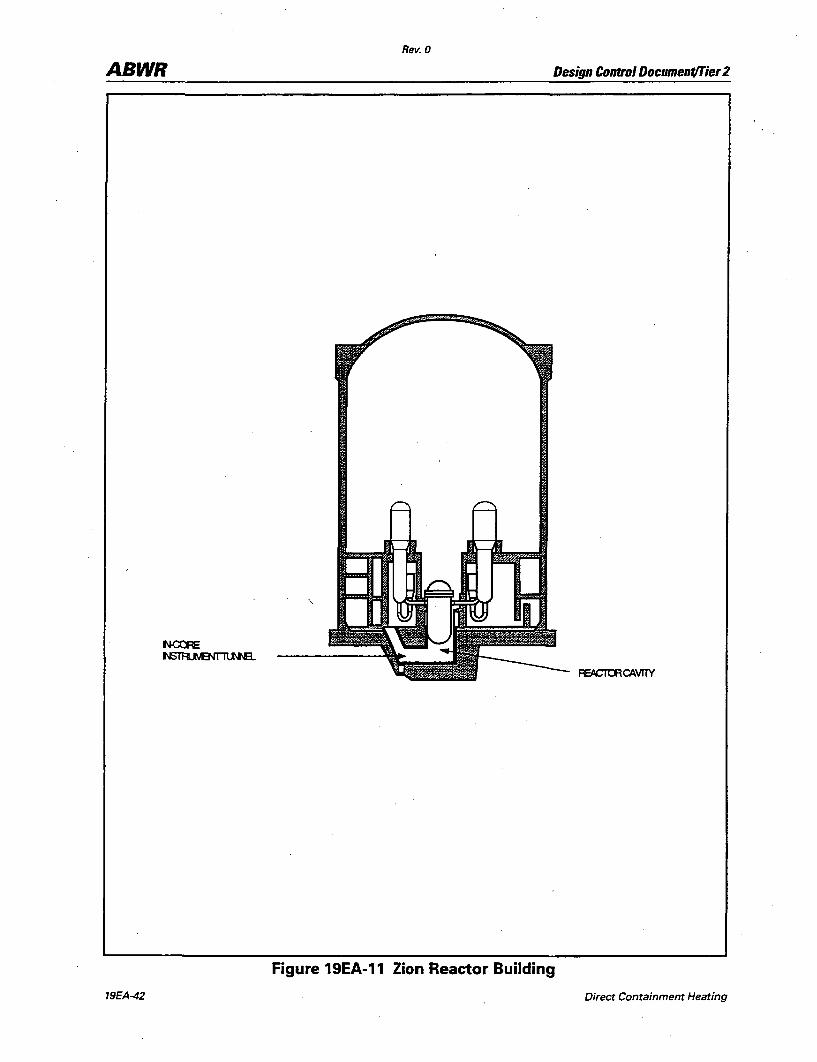
19EA.3.1.2.1 Experiment on Zion Configuration
Figure 19EA-ll shows a schematic view of the Zion reactor cavity. Experiments conducted with this geometry (Reference 19EA-ll) indicate that the threshold velocity required to disperse liquid droplets into the gas stream and move them from the cavity is approximately given by a Kutateladze number of2.5. This is not unexpected, since the geometry of the cavity is such as to cause the gas jet leaving the reactor to stagnate at the floor of the cavity, to turn and proceed horizontally doWn the cavity keyway over the liquid pool. Thus, the considerations which lead to Equation 19EA-7 would seem to apply.
It should be noted that sweepout, in which a continuous liquid film was obseryed to be flooded from the reactor cavity, occurred at about the same velocity as entrainment of droplets. Thus, as noted in Reference 19EA-14, the amount of material transported from a Zion-like cavity as droplets relative to the amount transported as a film is determined by the relative rates of the two processes.
An additional experiment was run in which steel shot of diameter 780 x 10-6 m was used instead of a liquid pool. By substituting into Equation 19EA-2, the drag coefficient necessary to explain the observed velocity threshold for debris dispersal of -16 mls (Reference 19EA-13) is found to be about 0.3. It is not known why this is less than the expected value of 0.44, but the discrepancy is not considered large.
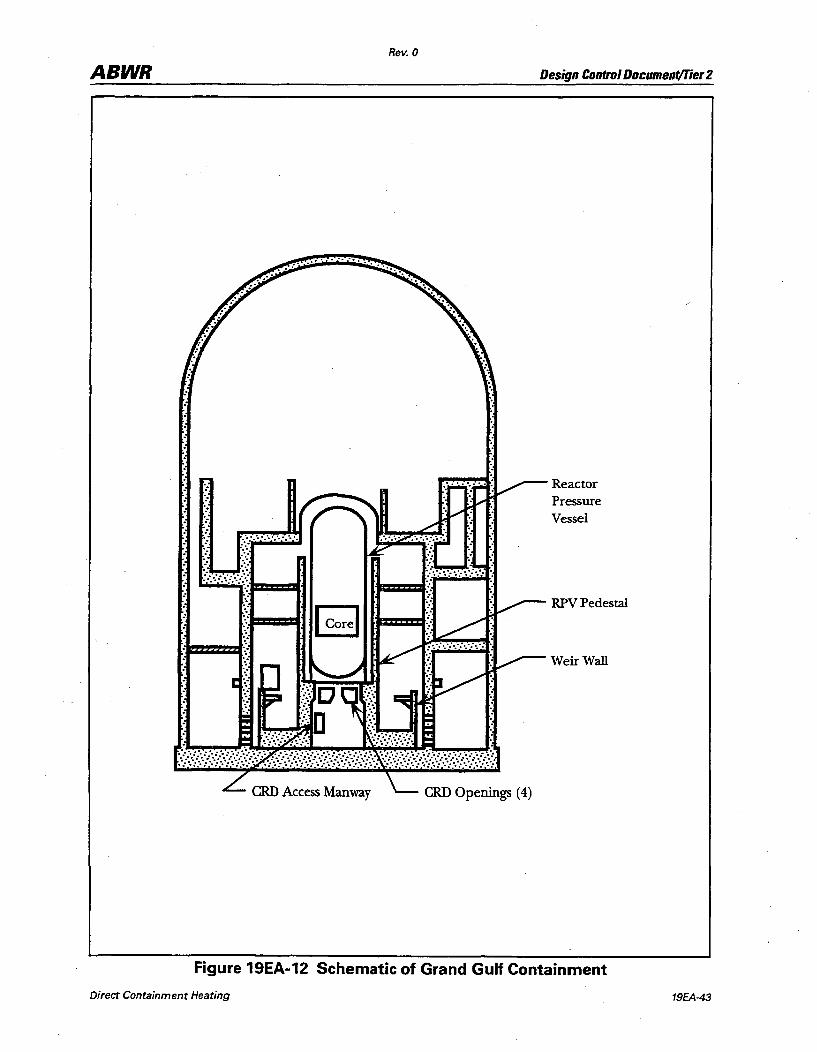
19EA.3.1.2.2 Experiments on Grand GuN Configuration
19EA-14
Figure 19EA-12 shows a schematic view of the Grand Gulf pedestal region. Experiments were also conducted at Argonne on a scale IIlodel of this configuration. Quite different behavior was observed in these tests. Due to the more or less symmetric orientation of the scale model CRD ports around the circumference of the pedestal, the gas jet leaving the simulated reactor vessel was observed to stagnate, proceed horizontally so as to undercut the entire liquid pool, tum and proceed vertically using virtually the entire cross-sectional area of the pedestal. (Only a.small fraction of the area was used by the jet moving downward from the simulated vessel.)
As noted in Reference 19EA-I0, this configuration is reminiscen t of a pool sparged from below. Using this reasoning, Equation 19EA-8 would be expected to apply. Indeed, a Kutateladze number of 0.2 was found to accurately predict the velocity required to initiate removal of debris. VIsual observations of the experiment support this conclusion, as it was seen that the entire pool became fluidized, the liquid rose up to the level of the ports, and was then swept out by the gas stream.
Direct Containment Heating

ABWR Rev. 0
Design Control DocumentlTier 2
An experiment was also conducted in this geometry with steel shot. A drag coefficient of about 7 is required to explain the measured velocity threshold for sweepout of -3.5 m/s. By consulting Figure 19EA-I0, we see that such a drag coefficient is appropriate for a bed of porosity about 0.8. This is, in fact, the porosity that would be obtained if the entire bed of shot was uniformly fluidized up to the elevation of the eRD ports. This suggests that the threshold velocity for sweepout in the Grand Gulf configuration might be a function of the ratio of the initial pool volume to the total volume which exists in the pedestal under the elevation of the gas flow paths. In other words, fluidization could begin at a low velocity (when the porosity is low and the drag coefficient is high), but as the pool tries to grow toward the exit flowpaths, the velocity required to continue to levitate droplets would increase. This conjecture cannot be confinned by the few tests run with liquid pools, however.
19EA.3.1.2.3 Application to GE ABWR Configuration
The ABWR configuration, Figure 19EA-7, is similar to that for Grand Gulf. Thus, we expect that a Kutateladze number on the order of 0.2 should be applied to calculate the dispersal threshold. With the exception of the ANL Grand Gulfwork, the documented experiments performed to date have focused on PWR type cavities such as Zion. As discussed above, these are not directly applicable to the ABWR configuration.
19EA.3.2 Pressurization Due to DCH
The pressurization of the drywell is affected by the blowdown of gases from the vessel and by the heat transfer from fragmented corium into the drywell. An explicit method is used to calculate the response of the system. The gas is assumed to be an ideal gas with the rate of change of pressure, P, calculated ,from:
M RTg MgRT P = g + g
MW V MW V (l9EA-9)
g g
where:
= Total mass of gas in containment (steam and non-condensable
gas)
R Gas constant (8314 Nem/kgemoleeK)
MWg = Average molecular weight of the gas mixture
v Drywell volume
Direct Containment Heating 19EA·15
ABWR Rev. 0
. Design Control Document/Tier 2
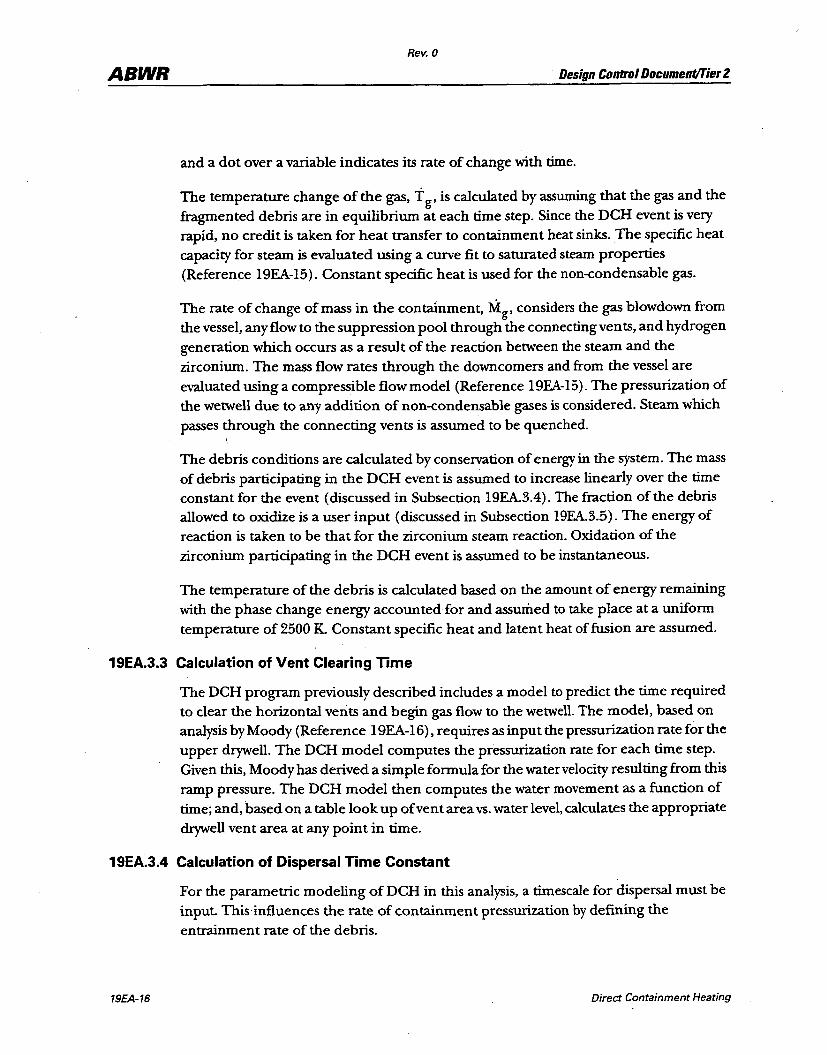
and a dot over a variable indicates its rate of change with time.
The temperature change of the gas, t g' is calculated by assuming that the gas and the fragmented debris are in equilibrium at each time step. Since the DCH event is very rapid, no credit is taken for heat transfer to containment heat sinks. The specific heat capacity for steam is evaluated using a curve fit to saturated steam properties (Reference 19EA-15). Constant specific heat is used for the non<ondensable gas.
The rate of change of mass in the containment, Mg, considers the gas blowdown from the vessel, any flow to the suppression pool through the connecting vents, and hydrogen generation which occurs as a result of the reaction between the steam and the zirconium. The mass flow rates through the downcomers and from the vessel are evaluated using a compressible flow model (Reference 19EA-15). The pressurization of the wetwell due to any addition of non<ondensable gases is considered. Steam which passes through the connecting vents is assumed to be quenched.
,
The debris conditions are calculated by conservation of energy in the system. The mass of debris participating in the DCH event is assumed to increase linearly over the time constant for the event (discussed in Subsection 19EA.3.4). The fraction of the debris allowed to oxidize is a user input (discussed in Subsection 19EA.3.5). The energy of reaction is taken to be that for the zirconium steam reaction. Oxidation of the zirconium participating in the DCH event is assumed to be instantaneous.
The temperature of the debris is calculated based on the amount of energy remaining with the phase change energy accounted for and assumed to take place at a uniform temperature of 2500 K. Constant specific heat and latent heat of fusion are assumed.
19EA.3.3 Calculation of Vent Clearing Time
The DCH program previously described includes a model to predict the time required to clear the horizontal vents and begin gas flow to the wetwell. The model, based on analysis by Moody (Reference 19EA-16), requires as input the pressurization rate for the upper drywell. The DCH model computes the pressurization rate for each time step. Given this, Moody has derived a simple formula for the water velocity resulting from this ramp pressure. The DCH model then computes the water movement as a function of time; and, based on a table look up of vent area vs. water level, calculates the appropriate drywell vent area at any point in time.
19EA.3.4 Calculation of Dispersal Time Constant
19EA-16
For the parametric modeling ofDCH in this analysis, a timescale for dispersal must be input. This·influences the rate of containment pressurization by defining the entrainment rate of the debris.
Direct Containment Heating

ABWR Rev. 0
Design Control Document/Tier 2
There is a dearth of good models for DCH. The only models which were identified are:
(1) The CONTAIN Model
This is a lumped parameter model in which the rate of entrainment is input by the user. It provides no insights for this study.
(2) Henry has developed a model for ARSAP (Reference 19EA-17) that explicitly compares the time-scale for dispersal due to the acceleration of the liquid film as a whole to the time required to entrain the debris as droplets.
This model is very attractive from the standpoint that it produces c1osed-fonn answers and illustrates that the competition between the two modes of debris removal from the cavity may be an important consideration for designing and interpr~ting experiments. However, there appear to be several problems with this model. First, it assumes a very schematic debris configuration, i.e. an initially static debris pool lying on the floor of the cavity. It seems more reasonable to assume that there is debris splashing throughout the cavity, as point out in Levy's WRSIM papers (Reference 19EA-18) and in Spencer's work atANL. Next, it is questionable that the entrainment rate fonnula that is used, the one developed by Ricou and Spalding for gas-gas entrainment, , applies to this situation. There is evidence (cited by Levy) that non-unifonn gas velocities in cavities may play an important role in enhancing entrainment rate. Finally, only very limited comparisons to data have been offered.
Taken at face value, Henry's model tends to predict very rapid removal of the debris from the cavity, mainly as a liquid film. Oddly enough, the time-scale for removal of the film depends only in a very weak way on the hole size in the vessel (Le. through the gas density in the cavity and even this matters only as the 0.25 power).
(3) BNL has written a one-dimensional model called DCHVlM. In a summary paper presented at the Pittsburgh Heat Transfer conference in 1987, the model is applied to the SNL DCH-1 experiment. For this calculation, however, the entrainment rate was taken directly from experimental data. In addition, the model was not applied to a full, reactor-scale scenario, only to DCH-l.
(4) Sienicki and Spencer at ANL have written a relatively sophisticated onedimensional hydrodynamics model called HARDCORE (Sienicki and Spencer, undated). Separate mass, momentum and energy equations are written for the liquid film, the droplets and the gas. The entrainment correlation is based on liquid jet breakup fonnulas developed by De Jarlais,
Direct Containment Heating 19EA-17
ABWR
19EA-18
Rev. 0
Design Control Document!Tier 2
Ishii, and Iinehan. Being one-dimensional, the model does not, of course, taken into account non-uniformities in velocity, though there is consideration given to entrainment from annular films on the cavity walls.
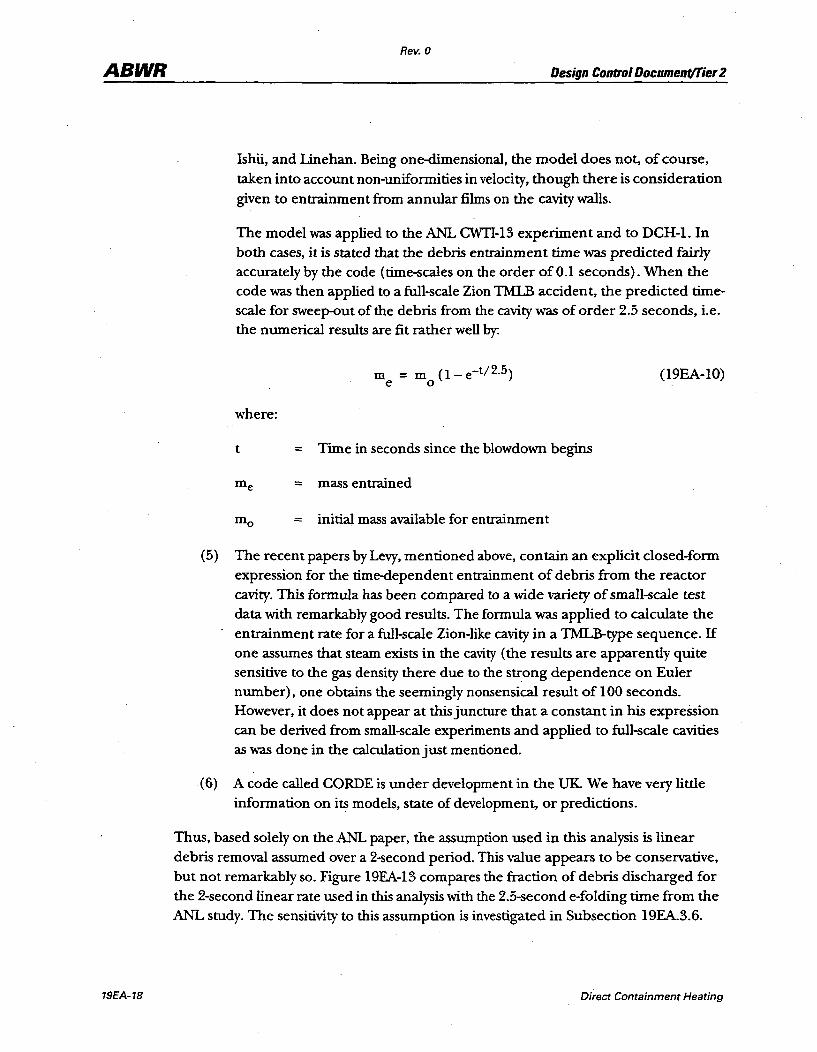
The model was applied to the ANL CWTI-13 experiment and to nCR-I. In both cases, it is stated that the debris entrainment time was predicted fairly accurately by the code (time-scales on the order of 0.1 seconds). When the code was then applied to a full-scale Zion TMLB accident, the predicted timescale for sweep-out of the debris from the cavity was of order 2.5 seconds, i.e. the numerical results are fit rather well by:
where:
m = m (I - e-t / 2.5) e 0
(19EA-1O)
t = Time in seconds since the blowdown begins
me = mass entrained
mo = initial mass available for entrainment
(5) The recent papers by Levy, mentioned above, contain an explicit closed-form expression for the time-dependent entrainment of debris from the reactor cavity. This formula has been compared to a wide variety of small-scale test data with remarkably good results. The formula was applied to calculate the entrainment rate for a full-scale Zion-like cavity in a TMLB-type sequence. If one assumes that steam exists in the cavity (the results are apparently quite sensitive to the gas density there due to the strong dependence on Euler number), one obtains the seemingly nonsensical result of 100 seconds. However, it does not appear at this juncture that a constant in his expression can be derived from small-scale experiments and applied to full-scale cavities as was done in the calculation just mentioned.
(6) A code called CORDE is under development in the UK. We have very little information on its models, state of development, or predictions.
Thus, based solely on the ANL paper, the assumption used in this analysis is linear debris removal assumed over a 2-second period. This value appears to be conservative, but not remarkably so. Figure 19EA-13 compares the fraction of debris discharged for the 2-second linear rate used in this analysis with the 2.5-second e-folding time from the ANL study. The sensitivity to this assumption is investigated in Subsection 19EA.3.6.
Direct Containment Heating
Rev. 0
ABWR Design Control Document/lier2
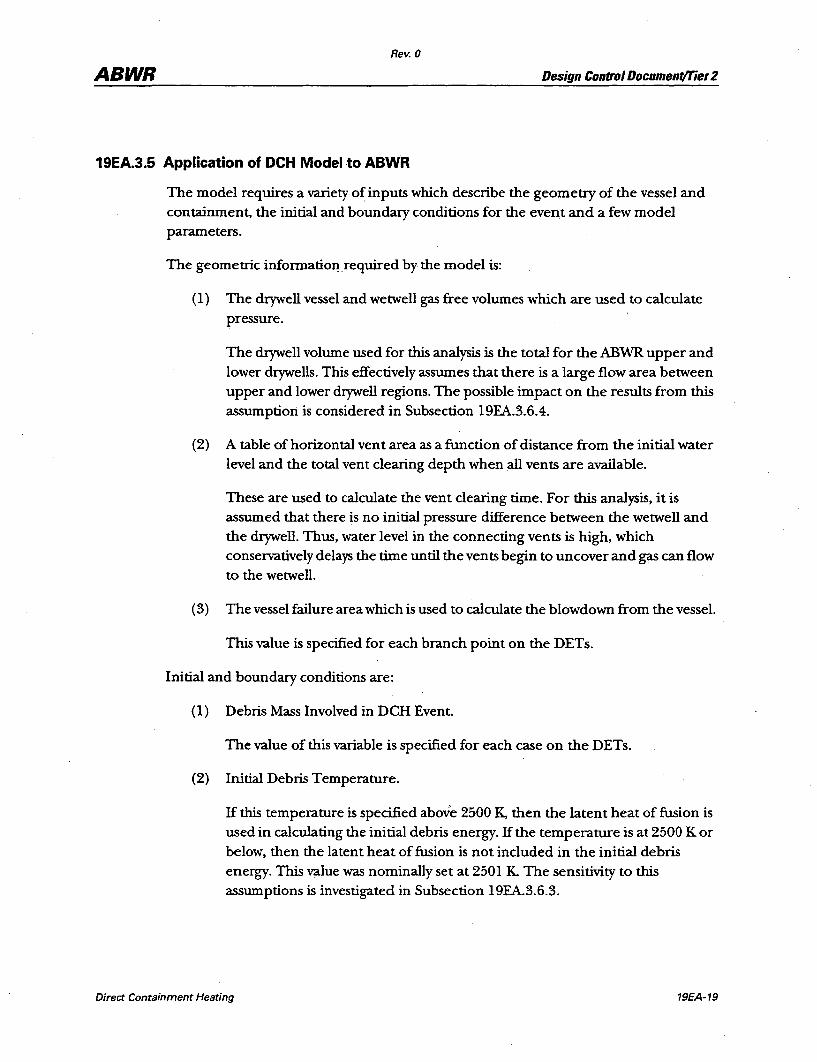
19EA.3.5 Application of DCH Model to ABWR
The model requires a variety o~ inputs which describe the geometry of the vessel and containment, the initial and boundary conditions for the event and a few model parameters.
The geometric information. required by the model is:
(1) The drywell vessel and wetwell gas free volumes which are used to calculate pressure.
The drywell volume used for this analysis is the total for the ABWR upper and lower drywells. This effectively assumes that there is a large flow area between upper and lower drywell regions. The possible impact on the results from this assumption is considered in Subsection 19EA.3.6.4.
(2) A table of horizontal vent area as a function of distance from the initial water level and the total vent clearing depth when all vents are available.
These are used to calculate the vent clearing time. For this analysis, it is assumed that there is no initial pressure difference between the wetwell and the drywell. Thus, water level in the connecting vents is high, which conservatively delays the time until the vents begin to uncover and gas can flow to the wetwell.
(3) The vessel failure area which is used to calculate the blowdown from the vessel.
This value is specified for each branch point on the DETs.
Initial and boundary conditions are:
(1) Debris Mass Involved in DCH Event.
The value of this variable is specified for each case on the DETs.
(2) Initial Debris Temperature.
If this temperature is specified above 2500 K, then the latent heat of fusion is used in calculating the initial debris energy. If the temperature is at 2500 K or below, then the latent heat of fusion is not included in the initial debris energy. This value was nominally set at 2501 K. The sensitivity to this assumptions is investigated in Subsection 19EA.3.6.3.
Direct Containment Heating 19EA-19
Rev. 0
ABWR Design Control Document/Tier2
19EA-20
(3) The initial containment temperature and pressure are assumed equal in the wetwell and drywell.
The steam mass fraction in the drywell is assumed to be 1.0. The sensitivity to this assumption is investigated in Subsection 19EA.3.6.6.
(4) The initial vessel pressure is used to calculate the source of steam from the vessel to the containment volume.
The pressure is assumed to be the nominal vessel pressure for normal operating conditions. Slight variations in this value (such as might result from a consideration of the SRV setpoints) do not have a significant impact on the results. No attempt is taken in this analysis to take credit for partially depressurized vessel conditions.
(5) Vessel gas temperature and vessel steam enthalpy.
Both values are conservatively taken to be constant. The values used are typical for MAAP analyses of high-pressure core melt scenarios.
Model parameters are:
(1) Fraction of Zr to be Oxidized in The DCH Event.
Of the debris mass that is being entrained at any instant, 20% is assumed to be Zr. This debris is assumed to oxidize immediately as it is entrained. Therefore, if one specifies 0.5 as the oxidation fraction, then half of that 20% mass will oxidize. For every mole ofZr, 2 moles of H 20 will be replaced by 2 moles of H2 in the drywell volume, and the chemical reaction energy will be added to the debris. The sensitivity to this parameter is discussed in Subsection 19EA.3.6.5.
(2) The time for debris entrainment determines the interval during which the specified mass of debris will be entrained.
Refer to Subsection 19EA.3.4 for a discussion of this parameter. The sensitivity to this parameter is investigated in Subsection 19EA.3.6.2 ..
(3) Time Constant for DCH.
If set to zero, the debris will be entrained linearly. If set to non-zero value, then the debris will entrain at a rate with an e-fold value equal to the time constant. This analysis assumes the debris is entrained linearly. Any sensitivity to this parameter is bounded by the time for debris entrainment sensitivity discussed in Subsection 19EA.3.6.2.
Direct Containment Heating
Rev. 0
ABWR Design Control Document/Tier 2
(4) The time stepfor the computer code calculations was selected to be one millisecond.
Since the time constant for the DCH event is on the order of a few seconds, there should be no sensitivity to reasonable variations in this parameter.
The DET methodology addresses the variation in debris mass, initial containment pressure, and vessel failure area. Subsection 19EA.3.6 provides a discussion of the
importance of the debris temperature, Zr fraction, dispersal rate, nodalization and
initial drywell steam fraction.
The code calculates the containment response to DCH events. The most important output of the calculation is the peak containment pressure. The results of the model analysis for each branch of the DETs are summarized in the penultimate column of Figures 19EA-4, 19EA-5, and 19EA-6.
19EA.3.6 Sensitivity to Various DCH Parameters
As indicated in Subsection 19EA.2, the DET methodology addresses the variation of several key DCH parameters. This subsection looks at the importance of the debris
temperature, amount of Zr oxidized ex-vessel, and the dispersal time constant to the
overall pressurization. These parameters were assumed to be constant in the scoping calculations and were judged not to have a significant impact on the results. The results
of the sensitivity studies confirm that these parameters have a second order effect on the peak containment pressure.
19EA.3.6.1 Base Case
For the purpose of comparison, the following case was analyzed using the DCH model:
(1) Fraction of core molten at vessel failure--40%.
(2) Fraction of material dispersed into the upper drywell-50%.
(3) Dispersal time-2 seconds.
(4) Initial containment pressure-l.5 atmosphere.
The result of the analysis indicates a peak drywell pressure of 0.903 MPa. Referring to the containment failure curve, this has a failure probability of about 0.17.
Direct Containment Heating 19EA-21
Rev. 0
ABWR Design Control DocumentlTier 2
19EA.3.6.2 Dispersal Time
19EA-22
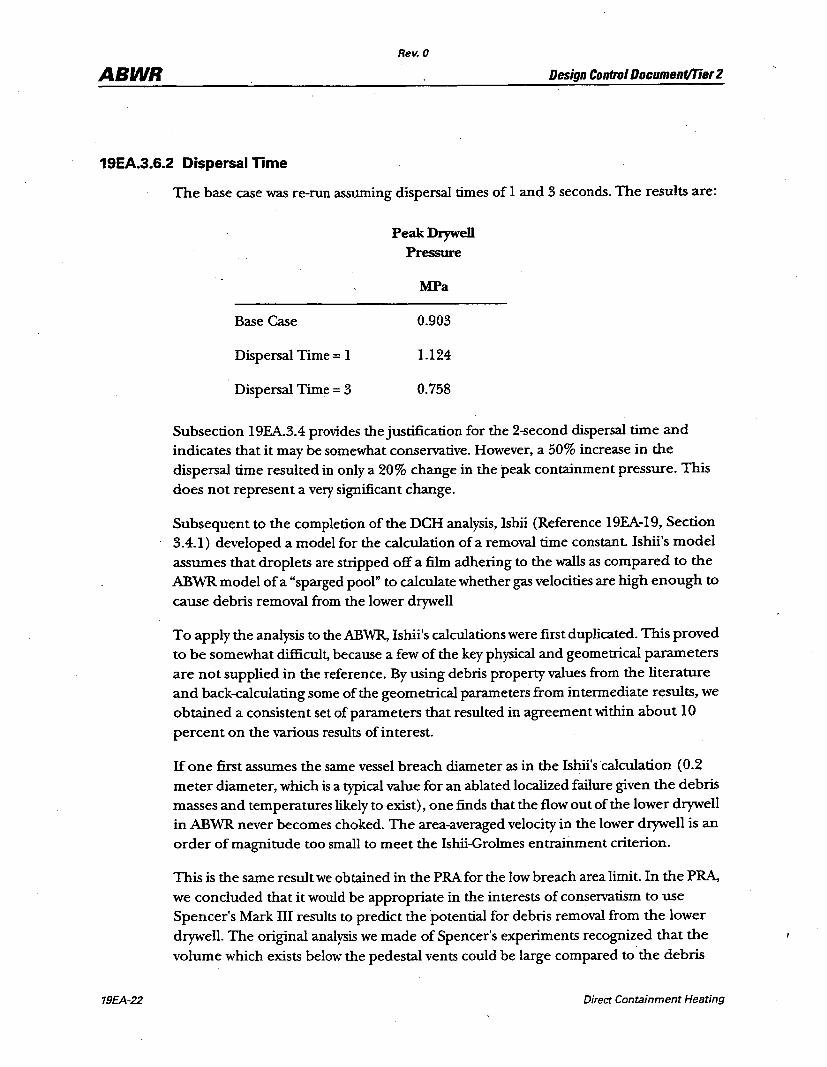
The base case was re-run assuming dispersal times of 1 and 3 seconds. The results are:
Base Case
Dispersal Time = 1
Dispersal Time = 3
Peak Drywell Pressure
MPa
0.903
1.124
0.758
Subsection 19EA.3.4 provides the justification for the 2-second dispersal time and indicates that it may be somewhat conservative. However, a 50% increase in the dispersal time resulted in only a 20% change in the peak containment pressure. This does not represent a very significant change.
Subsequent to the completion of the DCH analysis, Ishii (Reference 19EA-19, Section 3.4.1) developed a model for the calculation ofa removal time constant. Ishii's model assumes that droplets are stripped off a film adhering to the walls as compared to the ABWR model of a "sparged pool" to calculate whether gas velocities are high enough to cause debris removal from the lower drywell
To apply the analysis to the ABWR, Ishii's calculations were first duplicated. This proved to be somewhat difficult, because a few of the key physical and geometrical parameters are not supplied in the reference. By using debris property values from the literature and back-calculating some of the geometrical parameters from intermediate results, we obtained a consistent set of parameters that resulted in agreement within about 10 percent on the various results of interest.
If one first assumes the same vessel breach diameter as in the Ishii's calculation (0.2 meter diameter, which is a typical value for an ablated localized failure given the debris masses and temperatures likely to exist), one finds that the flow out of the lower drywell in ABWR never becomes choked. The area-averaged velocity in the lower drywell is an order of magnitude too small to meet the Ishii-Grolmes entrainment criterion.
This is the same result we obtained in the PRA for the low breach area limit. In the PRA, we concluded that it would be appropriate in the interests of conservatism to use Spencer's Mark III results to predict the -potential for debris removal from the lower drywell. The original analysis we made of Spencer's experiments recognized that the volume which exists below the pedestal vents could be large compared to the debris
Direct Containment Heating
ABWR Rev. 0
Design Control Document/Tier 2
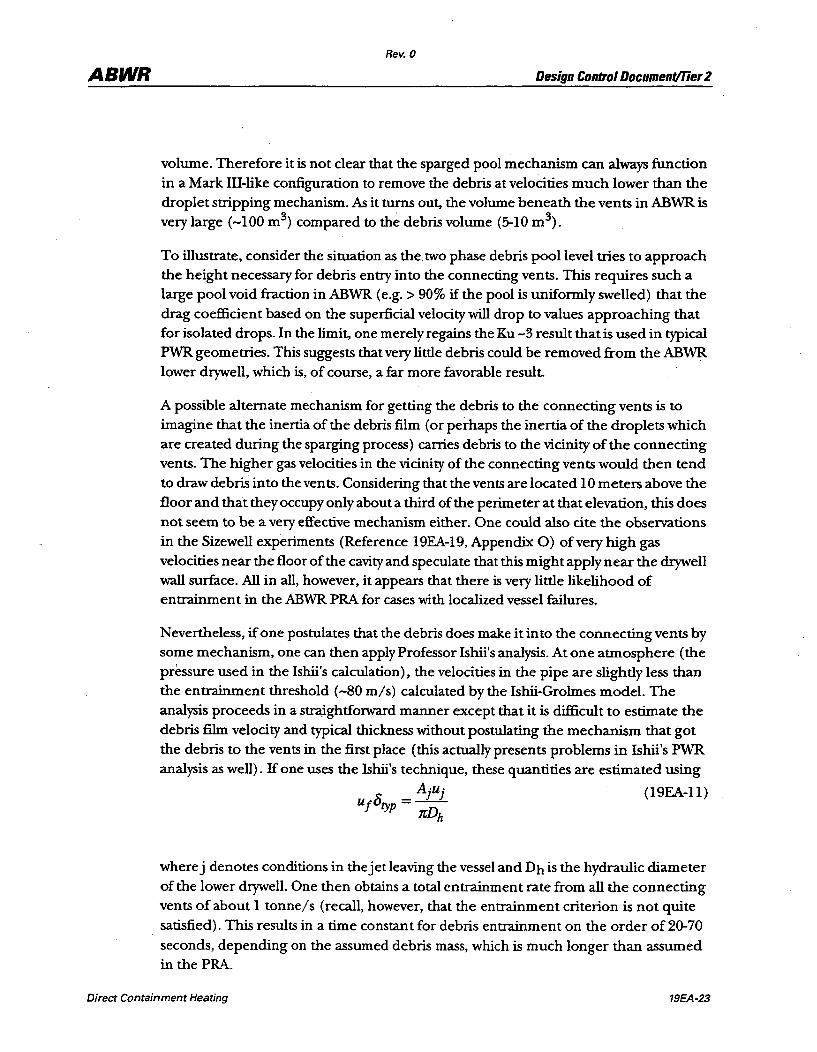
volume. Therefore it is not clear that the sparged pool mechanism can always function in a Mark III-like configuration to remove the debris at velocities much lower than the droplet stripping mechanism. As it turns out, the volume beneath the vents in AB'WR is very large (-100 m 3) compared to the debris volume (5-10 m 3).
To illustrate, consider the situation as the two phase debris pool level tries to approach the height necessary for debris entry into the connecting vents. This requires such a large pool void fraction in ABWR (e.g. > 90% if the pool is uniformly swelled) that the
drag coefficient based on the superficial velocity will drop to values approaching that for isolated drops. In the limit, one merely regains the Ku -3 result that is used in typical PWR geometries. This suggests that very little debris could be removed from the ABWR
lower drywell, which is, of course, a far more favorable result.
A possible alternate mechanism for getting the debris to the connecting vents is to imagine that the inertia of the debris film (or perhaps the inertia of the droplets.which are created during the sparging process) carries debris to the vicinity of the connecting vents. The higher gas velocities in the vicinity of the connecting vents would then tend to draw debris into the vents. Considering that the vents are located 10 meters above the
floor and that they occupy only about a third of the perimeter at that elevation, this does not seem to be a very effective mechanism either. One could also cite the observations
in the Sizewell experiments (Reference 19EA-19, Appendix 0) of very high gas velocities near the floor of the cavity and speculate that this might apply near the drywell wall surface. All in all, however, it appears that there is very little likelihood of entrainment in the ABWR PRA for cases with localized vessel failures.
Nevertheless, if one postulates that the debris does make it into the connecting vents by some mechanism, one can then apply Professor Ishii's analysis. At one atmosphere (the pressure used in the Ishii's calculation), the velocities in the pipe are slightly less than the entrainment threshold (-80 m/s) calculated by the Ishii-Grolmes model. The
analysis proceeds in a straightforward manner except that it is difficult to estimate the debris film velocity and typical thickness without postulating the mechanism that got the debris to the vents in the first place (this actually presents problems in Ishii's PWR
analysis as well). If one uses the Ishii's technique, these quantities are estimated using
5: _ Ajuj (19EA-ll) ufutyp ---
7rDh
where j denotes conditions in the jet leaving the vessel and Dh is the hydraulic diameter of the lower drywell. One then obtains a total entrainment rate from all the connecting vents of about 1 tonnels (recall, however, that the entrainment criterion is not quite
satisfied). This results in a time constant for debris entrainment on the order of 20-70 seconds, depending on the assumed debris mass, which is much longer than assumed in the PRA.
Direct Containment Heating 19EA-23
ABWR
19EA-24
Rev. 0
Design Control Document/Tier 2
We now turn our attention to the large end of the vessel breach area spectrum. This was
taken to be 2 m2 in the PRA and was assigned a conditional probability. In this case, flow from the cavity will be choked. In the Ishii's calculation, the cavity flow area is the same as the area connecting the cavity to the containment. To calculate the gas velocity, the initial cavity pressure and the vessel gas temperature (isothermal blowdown) were used which presumably maximizes the velocity. If one follows the same procedure here a velocity of230 m/s is obtained at an initial pressure of2.5 bar. This is much greater than the entrainment velocity of about 70 m/ s.
Gas velocities will be higher still in the connecting vents, which have about one tenth the flow area of the drywell. In the light of the previous discussion, it is assumed that the overall process of debris removal from the lower drywell is limited by the entrainment rate in the lower drywell, not the processes of de-entrainment and subsequent re-entrainment in the connecting vents.
The entrainment rate calculated in the lower drywell at 230 m/ s is very large, on the order of 1500 tonne/so It is doubtful that the correlations would be valid under such extreme conditions. Even if the equations do apply, the drywell pressure and gas density would rapidly increase due to the effect of the rapid transfer of momentum to the debris. This would invalidate the assumptions used in the calculation which maximized gas velocity.
These results supply useful insights. However, the overall impact of these considerations on the results of the PRA are relatively small. The small vessel breach area cases supplied half the conditional failure probability from DCH in the PRA. It appears that the likelihood of DCH-induced failures was overestimated for these cases since it is not at all clear that debris entrainment into the connecting vents can occur. In the large breach area cases, a more refined analysis which took into account the effect of the blowdownand debris entrainment on the thermal-hydraulic conditions in the lower drywell over the period when entrainment was occurring would be necessary to better quantify the likelihood of overpressurizing the lower drywell. For perspective, if all large vessel breach cases were assumed to result in containment failure, the conditional containment failure probability would be small. In any event, it is clear that the chance of significant DCH is determined largely by the assumptions used to characterize the upper extreme of the vessel breach spectrum.
In closing, it is noted that the implications of having a reduced chance of debris transport to the upper drywell in the majority of cases which have a small breach area may be more important for the upper drywell heat-up issue than for DCH. In particular the long term need for the initiation of the ACIW A system in spray mode may have been overestimated.
Direct Containment Heating

Rev. 0
ABWR Design Control Document/Tier 2
19EA.3.6.3 Debris Temperature
The core debris will interact with a variety of structures as it exits the reactor vessel. Thus, it is expected to experience substantial cooling by those structures on its way to the upper drywell. The ABWR DCH analysis conservatively assumed that the core debris entering the upper drywell was completely molten at a temperature of 2501 K. A sensitivity case was run assuming 2601 K for the debris temperature entering the upper drywell. The results indicate a peak containment pressure of 0.917 MPa vs. the base case value of 0.903 MPa.
19EA.3.6.4 Nodalization
The DCH analysis combines the lower and upper drywell compartments into a single control volume represented by node 1. The second node is set up to represent the wetwell with the suppression pool in the path connecting node 1 to node 2. A sensitivity case was run to investigate local pressurization in the lower drywell compartment. To do this, the volume included in Node 1 was reduced to that of the lower drywell with the vent area equal to the vent flow area from the lower to the upper drywell (11.3 m2).
Node 2 was used to represent the upper drywell. Since the junction between node 1 and node 2 does not require vent clearing as in the base case analysis, the vent path was assumed already cleared. All of the gas heating was done within the lower drywell compartment. In order to calculate the correct down-stream pressure, zero initial steam was assumed in the drywell compartment. This is necessary because the model assumes that all steam passing from the first node to the second node is condensed, setting the initial steam fraction to zero will correctly account for the increasing upper drywell pressure. A detailed examination of the results of this sequence indicates the zirconium oxidation reaction is essentially steam limited. Since the zirconium oxidation process consumes most of the steam exiting the vessel, only a small amount of steam will actually enter the second node.
The peak pressure computed for the lower drywell was 0.765 MPa. This indicates that the lower-to-upper drywell vent area is sufficient to preclude any substantial pressure buildup in the lower drywell region.
19EA.3.6.5 Zr Oxidation Ex-Vessel
The base case assumed that 20% of the core material that was discharged from the vessel was Zr metal. This is based on a unifonn distribution ofU02 and Zrwithin the lower plenum of the reactor vessel. Of this material 50% of the Zr that was involved in DCH was allowed to oxidize and contribute to the drywell heatup. This is a conservative value since, in the time frame of interest, only the Zr on the surface of the particles would oxidize.
As a sensitivity calculation, the amount of ex-vessel Zr oxidation was doubled. This
change in the amount of ex-vessel Zroxidation is equivalent to assuming that all of the
Direct Containment Heating 19EA·25

ABWR Rev. 0
Design Control Document/Tier 2
Zr metal in the debris is oxidized. Alternately, this assumption is equivalent to assuming the fraction of core debris exiting the vessel was 40% Zr instead of20% assumed in the base case. Thus, this sensitivity addresses both any possible non-unifonn core material distribution within the lower head and the potential for increased oxidation.
The peak drywell pressure was computed to be 1.034 MPa vs. the base case value of 0.903 MPa. This is a very small effect given a factor of two variation in the amount of Zr oxidized during the DCH event.
19EA.3.6.6 Initial Drywell Steam Fraction
Since steam passing through the connecting vents will condense, the amount ofwetwell pressurization during the DCH event is limited. The base analysis assumed a 100% steam environment in the drywell at the start of the event. To investigate the impact of this parameter on the peak pressure, a case was run assuming the drywell environment is initially 100% nitrogen. The wetwell pressure will be expected to increase faster for this case resulting in a higher drywell pressure. This result indicates that this is true, although the rise in the peak. pressure is small. The peak. pressure for this scenario is 0.979 MPa, as compared to a peak of 0.903 MPa for the base case. This variation due to initial drywell gas composition does not have a significant impact on the results of this study. ...
19EA.3.6.7 Hydrogen Combustion
Technical specifications allow the AB"WR to be operated with 4% oxygen inthe containment. During a DCH event, the drywell gas temperature may exceed the autoignition limit of approximately 811 K (lOOO°F). Burning of the hydrogen in the containment with this residual oxygen could result in an increase in energy of the gas. The appropriate reaction energywas added to the existing corium/ gas mixture in order to predict an increase in the peak. pressure due to hydrogen combustion. No credit was
taken for the reduction in moles which would occur as-a result of the burn.
The peak containment pressure increased by 0.103 MPa relative to the base case pressure of 0.903 MPa. The same analysis was perfonned assuming that the initial steam fraction was 0.0 (as compared to the base case assumption of 1.0). For this second case, the peak pressure increased by 0.228 :MPa. Since a 50% steam fraction in the containment more accurately represents the actual conditions, the expected increase in peak pressure resulting from the recombination is 0.172 MPa. This is only a 20% change in the peak containment pressure, and does not represent a very significant effect
19EA.3.6.8 Vent Clearing
19EA-26
Mter core debris discharge and before RPV blowdown, it is expected that the containment will begin to pressurize even before debris is dispersed into the upper drywell. A sensitivity study was run assuming that the vents had already cleared prior to
Direct Containment Heating
ABWR Rev. 0
Design Control DocumentlTier 2
debris dispersal. The results show that the peak containment pressure' is reduced by 0.221 MPa compared to 0.903 MPa for the base case. This represents a decrease in the peak pressure of about 20%. While this is not very significant, it does provide a measure of the consexvatism in the analysis.
19EA.4 Summary of Results
19EA.4.1 Quantmcation of Decomposition Event Trees
The quantified decomposition event trees are shown in Figures 19EA-1 through 19EA-6. The relationship between the peak drywell pressure and the cumulative probability distribution are shown in Figure 19EA-14. Note that the probability distribution functions (PDFs) are discrete since the discrete probabilities were assigned in developing the trees. The PDFs provide a measure of certainty that the pressure will not exceed a given value. They are not, however, uncertainty distributions in a statistical sense. Rather, they are based on knowledge ofDCH and engineeringjudgment which characterize the ability to accurately characterize the boundary conditions for the problem.
From a deterministic viewpoint, the best estimate for the peak containment pressure is given by the median value of the PDF. As can be seen by comparing Figures 19FA-1 and 19EA-14, this indicates that the containment would not be expected to fail for any of the initial containment pressures studied. A measure of the uncertainty in this study is found by using the weighted sum (mean) of the probability of drywell failure for each of the branches on the DETs. These weighted values are transferred to the containment event trees for use as the conditional probability of drywell failure for sequences in which the vessel fails at high pressure.
19EA.4.2 Impact on Containment Failure Probability
An inspection of the ABWR accident classes shows that the conditional probability of having high RPV pressure at vessel failure is moderate.
A calculated probability of early containment failure (from direct containment heating), conditional on core damage, is very small.
19EA.4.2.1 Sensitivity of Containment Failure Probability to Assumptions
In order to demonstrate the robustness of the containment failure probability to the peak pressures calculated in the deterministic DCH analysis, three additional sensitivity calculations were performed. First, the DET was requantified assuming that the peak containment pressure for each of the low initial containment pressure cases was increased by 0.207 MPa. This could represent the possibility of an initial steam fraction of 50% in combination with a hydrogen bum and no credit for partial clearing of the
Direct Containment Heating 19EA-27
ABWR Rev. 0
Design Control Document/Tier 2
wetwell connecting vents before the DCH event occurs. The resulting conditional containment failure probability for DCH increased slightly.
The second sensitivity case assumed that the containment would be at intermediate pressure for all cases. This represents potential uncertainties in the hydrogen production during the in-vessel portion of the accident. For this case, the containment failure probability due to DCH increases slightly. Although the conditional probability of failure by DCH is higher in this case than in the base analysis, DCH does not pose a
. significant threat to the CCFP goal of 0.10. .
The third sensitivity calculation assumed that the cont3.inment would be at the intennediate pressure for all cases and, in addition, that all peak pressures would be increased by 0.207 MPa. The results show that for this conservative case, the conditional containment failure probability for DCH would be increased. Even with these very conselVcitive assumptions, the DCH containment failure probability is far less than the 0.10 goal for CCFP. This demonstrates a large margin for the ABWR containment design to withstand containment challenges.
19EA.4.3 Impact on Offsite Dose
The final measure of the impact of uncertainties in severe accident phenomena is the effect on ofIsite dose. The CETs are quantified using the weighted sum of the containment failure probability as discussed above. The results of the CETs are then combined with deterministic accident sequence analysis and consequence analysis to detennine the dose associated with the spectrum of severe accidents. In order to indicate the possible variation in dose due to uncertainty in DCH phenomena, other values must be selected for the probability of containment failure due to DCH.
Since the probabilities used in developing the DETs are themselves the uncertainties in the phenomena, one cannot determine the classical 5-50-95 confidence limits. However, one can select pressures corresponding to various cumulative certainty of non-exceedance (shown in Figure 19EA-14) and compare these values to the con tainment fragility cwve (developed in Attachmen t 19F A) to estimate the probability of drywell failure with varying degrees of certainty. Selecting the 95% value from Figure 19EA-14 and noting that containment failure is not expected at the 50% certainty for peak pressure, one may draw the dose curves shown in Figure 19EA-15. This figure shows, that for the accident frequencies and certainty levels ofinterest, DCH has no detectable impact on the offsite dose.
19EA.5 Conclusions
19EA-28
The ABWR has a highly reliable depressurization system which results in a very low probability of a core damage event which leads to vessel failure at high pressure. Nonetheless, an evaluation of the potential risk of direct containment heating leading
Direct Containment Heating
ABWR Rev. 0
Design Control Document/Tier2
to containment failure in the ABWR has been performed. This study indicates that the design of the ABWR is highly resistant to damage as a result of a DCH event. This is due primarily to the general configuration of the ABWR lower drywell and connecting vent configuration and area. No modifications to the containment design are suggested as a result of this analysis.
19EA.6 References
19EA-l "Severe Accident Risks: An Assessment for Five U.S. Nuclear Power Plants", NUREG-1150, U.S. Nuclear Regulatory Commission,june 1989.
19EA-2 T.D. Brown, et. al., "Evaluation of Severe Accident Risks: Grand Gulf Unit 1", NUREG/CR-4551, Vol. 6 Rev. 1, Part 2, December 1990.
19EA-3 J. L. Rempe, "BWR Lower Head Failure Assessment for CSNI Comparison Exercise", EGG-EAST-9609, April 1991.
19EA-4 S.A. Hodge and LJ. Ott, "Failure Modes of BWR Reactor Vessel Bottom Head", ORNL/M-1019, Letter Report, May 10,1989 .
.19EA-5 S.R Greene, SA. Hodge, C.R Hyman, M.L. Tobias, "The Response ofBWR Mark II Containment to Station Blackout Severe Accident Sequences", NUREG/CR-5565, ORNL/TM-1l548, May 1991.
19EA-6 Fauske and Associates, "Key Phenomenological Models for Assessing NonExplosive Steam Generation Rates", IDCOR Technical Report 14.1B, June 1983.
19EA-7 RE. Henry, personal communication.
19EA-8 M. Pilch, et. al., "Acceleration Induced Fragmentation of Liquid Drops", NUREG/CR-2247, USNRC, August 1981 quoted inJ. Sienicki and B. Spencer, "A Multifluid and Multiphase Flow and Heat Transfer for the Prediction of Sweepout from a Reactor Cavity~, Proc. Fourth Miami Inter. Symposium on Multi-Phase Transport and Particulate Phenomena, Miami Beach, December 15-17,1986.
19EA-9 S. Kutateladze, "Elements of the Hydrodynamics of Gas-Liquid Systems"-,-Fluid Mechanics-Soviet Research, 1, 4, 1972.
19EA-I0 B. Spencer, S. Baronowsky, and D~ Kilsdonk, "Hydrodynamic Sweepout Thresholds in BWR Mark III Reactor Cavity Interactions", ANL/LWR/SAF-84-1, April 1984.
Direct Containment Heating 19EA-29
ABWR
19EA-30
Rev. 0
Design Control Document/Tier 2
19EA-ll B. Spencer, et al., "Sweepout Thresholds in Reactor Cavity Interactions", ANL/LWR/SAF 82-1, April 1982.
19EA-12 B. Spencer, D. Kilsdonk, andJ. Sienicki, "Hydrodynamics Aspects of Ex-Vessel Debris Dispersal in Zion-Type Containment Designs", ANL/LWR/SAF 83-1.
19EA-13 B. Spencer, D. Kilsdonk,J. Sienicki, and G.R Thomas, "Phenomenological Investigation of Cavity Interactions Following Postulated Vessel Meltthrough", Proc. Inter. Meeting on Thennal Nuclear Reactor Safety, NUREG/CP-0027, Volume 2, Session 16, pp. 923-937, Chicago, August 1982.
19EA-14 RE. Henry, "Fission Product Release During High-Pressure Melt Ejection", Task 3.4.6 Report, Advanced Reactor Severe Accident Program, November 1988.
19EA-15 "MAAP 3.0 B Computer Code Manual", EPR! NP-7071-CCML, Volume 2, November 1990.
19EA-16 Frederick Moody, "Introduction to Unsteady Thennofluid Mechanics", John Wiley and Sons, 1990.
19EA-17 RE. Henry, "Modifications for the Development of the MAAP-DOE Code", DOE/ID-I0216 Vol. IV, U.S. Department of Energy, November 1988.
19EA-18 S. Levy, "Debris Dispersal from Reactor Cavity During Lower Temperature Simulant Tests of Direct Containment Heating (DCH)", Paper presented at 18th Water Reactor Safety Information Meeting, Gaithersburg MD, NUREG/CP-01l4, Volume 2,1990, pp.157-206.
19EA-19 "An Integrated Structure and Scaling Methodology for Severe Accident Technical Issue Resolution", NUREG-CR 5809, Draft Report for Comment, November 1991.
Direct Containment Heating
Rev. 0
ABWR Design Control DocumentlTier Z
Table 19EA-1 Containment Pressure at RPV Failure
Pressure
Accident Sequence MPa
LCLP-PF-D-M 0.13
LCLP-FS-O-L 0.14
LCHP-PS-O-N 0.12
LCHP-PF-P-H 0.12
SBRC-PF-O-H 0.24
LBLC-PF-O-M .0.29
NSCL-PF-D-H 0.13
NSCH-PF-P-H 0.13
NSRC-PF-O-H 0.43
Table 19EA-2 Comparison of Assumed Debris Mass Participating in DCH with BWRSAR Debris Discharge Results
Integrated Debris Mass (kg)
ABWR DCH Analysis (Minimum Values) BWRSAR
Time Zr Metals Oxides Zr Metals Oxides
Vessel Failure 0 0 0 0 0 0
+2 minutes 6500 * 17,000 926 3880 0
+4 minutes 6500 * 17,000 2316 8172 0
* Only a small portion of the core plate was assumed to be added to the debris.
Direct Containment Heating 19EA-31

Rev. 0
ABWR Design Control Document/Tier 2
Figure 19EA-1 DCH Event Tree for Sequences with Low Containment Pressure Not Part ofDCD (Refer to SSAR)
19EA-32 Direct Containment Heating
Rev. 1
ABWR Design Control Document/Tier 2
Figure 19EA-2 DCH Event Tree for Sequences with Intermediate Containment Pressure, Not Pan ofDCD (Refer to SSAR)
Direct Containment Heating 19EA-33
I
Rev. 0
ABWR Design Control Document/Tier 2
Figure 19EA-3 DCH Event Tree for Sequences with High Containment Pressure Not Part of DeD (Refer to SSAR)
19EA-34 Direct Containment Heating

Rev. 0
ABWR Design Control Document/Tier 2
Figure 19EA-4 DET for Probability of Early Containment Failure-High RV Press and Low Cont Press Sequences
Not Part ofDeD (Refer to SSAR)
Direct Containment Heating 19EA-35
Rev. 0
ABWR Design Control Document/Tier Z
. Figure 19EA-5 DET for Probability of Early Containment Failure-High RV Press and Inter Cant Press Sequences
Not Part ofDCD (Refer to SSAR)
19EA-36 Direct Containment Heating
Rev. 0
ABWR Design Control Oocumenf/Tier 2
Figure 19EA-6 DET for Probability of Early Containment Failure-High RV Press and High Cont Press Sequences
Not Part ofDeD (Refer to SSAR)
Direct Containment Heating 19EA-37

ABWR
DRYWELL CONNECTING
VENT
o
SECONDARY CONTAINMENT BOUNDARY
Rev. 0
LOWER DRYWELL
Design Control Document/Tier 2
PRIMARY D CONTAINMENT VESSEL
CLEAN ZONE
BASE MAT
PRIMARY CONTAINMENT BOUNDARY
Figure 19EA-7 ABWR Containment Boundary Nomenclature
19EA-38 Direct Containment Heating
-.
Rev. 0
ABWR Design Control Document/Tier 2
Figure 19EA-8 Calculated Probability Distribution Function for DCH Parameter Ffragl Not Part of DeD (Refer to SSAR)
Direct Containment Heating 19EA-39
Rev. 0
ABWR Design Control Document/Tier 2
Figure 19EA-9 Comparison of Calculated and Assumed Ffrag Distributions Not Part of DCD (Refer to SSAR)
19EA-40 Direct Containment Heating
Rev. 0
ABWR Design Control Document/Tier2
1,(XX)
~ ~
~ 100
~ £=Q.37
I £=0,5)
10
£=08J
£=Q.9)
Sl\G.ESPHEFEN N.J INRNrTESEA
0.1 10 100 1,(XXl 1O,cm 100,(XXl
Figure 19EA-10 Effective Drag Coefficient for Dense Dispersions
Direct Containment Heating 19EA-41
Rev. 0
ABWR Design CDntrDI Document/Tier 2
Figure 19EA-11 Zion Reactor Building
19EA-42 Direct Containment Heating
Rev. 0
ABWR
::1===:41 .. fj====t ..
CRD Openings (4)
Design Control Document/Tier 2
Reactor Pressure Vessel
RPV Pedestal
Weir Wall
Figure 19EA-12 Schematic of Grand Gulf Containment
Direct Containment Heating 19EA-43

• ASSUMED
0.8
02
o~----------~----------~------------~----------~------------~----------~ o 0.5 1.5
TlME-s
2 2.5
Figure 19EA-13 Comparison of Assumed Debris Discharge to ANL Data Fit
3
Rev. 0
ABWR Design Control Document/Tier 2
Figure 19EA-14 Cumulative Distribution for Peak Pressure Due to DCH Not Part of OeD (Refer to SSAR)
Direct Containment Heating 19EA-45
Figure 19EA-15 Uncertainty in Whole Body Dose at 805 m (0.5 Mile) Due to DCH Not Part of DCD (Refer to SSAR)
Rev. 0
ABWR Design Control DDcoment/Tier 2
19EB Fuel Coolant Interactions
19EB.1 Introduction
Fuel coolant interactions were addressed in the early assessment for the ABWR response to a severe accident. Subsection 19E.2.3.1 examined the hydrodynamic limitations for steam explosions and concluded that there was no potential for a large scale steam explosion. The pressurization of the containment from non-explosive steam generation
, was calculated in the analyses for the accident scenarios. The following subsections examine the available experimental database for its relevance to the ABWR configuration, and provide a simple, scoping calculation to estimate the ability of the ABWR containment to withstand a large, energetic fuel coolant interaction.
Challenges of the containment during a severe accident may result from fuel coolant interactions. Both the impulse and static loads are considered here. Fuel Coolant Interactions (FeI) may occur either at the time of vessel failure when corium and water fall from the lower plenum of the vessel, or when the lower drywell flooder opens after vessel failure has occurred.
The critical time constants for a stearn explosion are considered in 19E.2.3.1. This analysis concludes that the critical rates for heat transfer and energy dispersal preclude a large scale steam explosion which could damage the containment. Nonetheless, this study was performed to examine the potential impact of a large steam explosion on the ABWR.
Several experiments which have provided insights to steam explosions are examined, and features of the ABWR are compared to previous plants to indicate the relative resistance of the ABWR to stearn explosions. A scoping calculation is also performed to estimate the size of stearn explosion the ABWR could withstand.
Four potential failure modes are considered. The transmission of a shock wave through water to the structure may damage the pedestal. Similarly, a shock wave through the airspace can cause an impulse load. However, since the gas is compressible, the shock wave transmitted through the gas will be much smaller than that which can be transmitted through the water. Therefore, this mechanism is not considered here. Third, loading is caused by slugs of water propelled into containment structures as a result of explosive stearn generation. Finally, the rapid steam generation may lead to overpressurization of the drywell.
19EB.1.1 Probability of a Pre-flooded Lower Drywell
The configuration of the ABWR containment, shown in Figure-19EB-6, limits the poten tial for water to be in the lower drywell at the time of vessel failure. The vessel skirt is solid and there are no active injection systems in the lower drywell. Therefore, the
Fuel Coolant Interactions 19E8-1
ABWR
19E8-2
Rev. 0
Design Control Document/Tier 2
only possible sources of water to the containment are the wetwell/ drywell connecting vents, the passive flooder and the vessel itself.
The wetwell/ drywell connecting vents connect the upper and lower drywell regions to the suppression pool. The connecting vent is a vertical .channel which has a horizontal branch leading to the lower drywell. Therefore, in order for water flow from the upper drywell to enter the lower drywell, it would have to fall almost nine meters down the connecting vents, then turn to enter the lower drywell. This is not viewed to be a credible scenario.
For the water level in the wetwell to' rise sufficiently to overflow into the connecting vents, approximately 7.2E5 kg (1.6E6Ibm) would have to be added to the containment. If the EPGs are followed, this would occur only if injection was being provided from an external source in the event that flow from the suppression pool was not available. This implies that the only available injection sources are the Firewater and RCIC Systems. The RCIC System may be the only system available in events initiated by station blackout. Examination of the cases in 19E.2.2.3 (SBRC sequences) and 19E.2.2.8 (NSRC sequences) indicates that enough water can be added by the RCIC System to lead to overflow from the suppression pool to the lower drywell. If the station blackout continues and the Firewater Addition System is not used to prevent core damage, vessel \
failure into a pre-flooded cavity can occur in these sequences. The results of the Level 2 analysis, depicted in Figure 19D.~3 indicate that SBRC sequences with failure of the vessel (no IV) are an extremely small percentage of all core damage sequences. The Class IV ATWS sequences were treat~d very conservatively in the containment event trees. All of these sequences were presumed to lead to core damage with high releases. However, as indicated by the analysis in Subsection 19E.2.2.8, Class IV sequences do not necessarily lead to core damage. Several hours are available for the operator to take appropriate actions to terminate the event. A conservative factor is applied to Class IV events to estimate the frequency of sequences with core damage and a pre-flooded lower drywell. These sequences are an extremely small percentage of all core damage sequences.
The passive flooder is designed to open when the temperature in the lower drywell airspace reaches 533 K (500°F). This temperature is slightly less than the temperature of the steam in the vessel under nonnal operating conditions. However, any potential break flow would cool by £lashing as it reaches the lower drywell. Therefore, the passive flooder will not open until after vessel failure.
ALOCA in the bottom head of the vessel is also a source of water which could be present in the lower drywell at the time of vessel failure. All of the penetrations in the lower head are small, and any loss of coolant accident through them is classified as a small break
LOCA. A conservative estimate of the core damage frequency for events initiated by LOCAs in the bottom head is the frequency of all small break LOCAs which lead to core
Fuel Coolant Interactions
ABWR Rev. 0
Design Control Document/Tier 2
damage for the ABWR. Examining Table 19D.4-1, the fraction of all core damage events
initiated by a small LOCA is extremely small.
The potential for a fuel coolant interaction which could threaten the containment may be bounded by summing the frequencies of the sequences with water in the lower
drywell at the time of vessel failure. Three sequences were identified above. The total frequency of these sequences is an extremely small percentage of all core damage sequences. Because this value is very small, it is judged that fuel coolant interactions will
not have a significant impact on risk.
19EB.2 Applicability of Experiments
A large number of experiments have been perfonned to better understand FC!. Most
of these experiments have been perfonned at bench scale with simulant materials. Freon-Water and Liquid NitrogenlWater Systems are often used. While these experiments are necessary to understand the underlying physics of FCI, they are not directly applicable to the reactor condition. However, there are also several experiments perfonned with metal and oxides which provide insight to the potential for energetic Fe! in a severe accident.
Other experiments, perfonned for different reasons, also yield some insights to FC!.
Some experiments perfonned for debris coolability and core concrete interaction studies added water to the debris. With one notable exception, these experiments did not result in an energetic Fe!. Finally, one experiment was perfonned to examine the impact of a water solid reactor cavity on direct containment heating. In the following
subsection each of these experiments is examined for the insights into FCI and applicability to the ABWR.
19EB.2.1 Fuel Coolant Interaction Tests
A wide variety of experiments have been perfonned to investigate steam explosions. This subsection discusses results from selected experiments. Most of the experiments are prototypic of the reactor condition wherein debris falls into a pre-existing pool of
water. The implications of these experiments on the potential for large, energetic FCI in the ABWR are also discussed.
Investigations into energetic fuel coolant interactions and steam explosions date back
to 1950. Early experimentS, including those by Long (References 19£B..l and 19EB-2) and Higgins (Reference 19EB-3), identified the requirements for considerable mixing of the molten debris and water. Higgins and Lemmon (Reference 19E84) noted that
the debris must be superheated and that the violence of the explosion increased with the melt temperature. Unfortunately, the triggers used in many of these experiments
were very large. Thus, infonnation about the pro~agation and energetics of these experiments is not applicable to reactor conditions.
Fuel Coolant Interactions 19£8-3
ABWR Rev. 0
Design Control Document/Tier 2
One of the important parameters in determining the potential challenge to the containment from a steam explosion is the duration of the pressure pulse. Buxton and Benedick (Reference 19EB-5) performed a large series·of experiments using ironalumina thermite. The pressure traces for these experiments indicate an explosive pressure pulse of about 5 milliseconds.
The final, intermediate scale test performed at Sandia (Reference 19EB-6) used a corium thermite mass to simulate the materials which might be typical of a severe accident. As in the Buxton and Benedick experiment, the duration of the pressure pulse in these experiments was about 5 milliseconds. Three shakedown tests were performed using iron-alumina thermite with water in a crucible. In all of the tests spontaneous, selftriggered explosions occurred. In contrast, all four of the corium tests were externally triggered which resulted in one run with a "weak explosion" and one with a "mild explosion". Two hypotheses were proposed to explain these results:
(1) The non-condensable gasses generated by oxidation stabilized the film boiling blanket, making it less susceptible to triggering;
(2) The U02 and zr02 superheat was only about 300 K. It is possible that the debris froze before the trigger was initiated. This would prevent fine fragmentation of the debris.
Both these hypotheses have important implications for application to the severe accidents. Presuming a BWRSAR-type melt progression, the early pour of debris from the vessel would be metallic. In this case stabilization of the gas film around the debris could prevent a large mass of molten material from participating in a steam explosion. On the other hand, the superheat associated with a large oxidic melt is typically less than a few hundred degrees. Therefore, it is likely that the surface of the debris droplets would freeze. This would slow the heat transfer to the coolant and a steam explosion would not occur.
19EB.2.2 Experiments With a Stratified System·
19EB-4
In some of the recent experiments performed to examine core concrete interaction, water has been added to the debris. As discussed in Subsection 19EB.l.l, the probability of a large amount of water in the lower di-ywell at the time of vessel failure is very small. Mter core debris is introduced to the lower drywell, it is flooded either by active systems or the Passive Lower Drywell Flooding System. Therefore, this is the most probable initial configuration for an FCI event in the ABWR.
Far fewer experiments have been performed in this stratified geometry than in the configuration of debris poured into water. Work by Bang and Corradini (Reference 19EB-7) used triggered Freon/Water and Liquid Nitrogen/Water Systems. In these studies the interaction zone for the vapor explosion is less than I cm thick.
Fuel Coolant Interactions
ABWR Rev. 0
Design Control Document/Tier 2
Assuming this depth is representative of reactor material, this would lead to the conclusion that less 3% of the ABWR core inventory could participate in an FCI event.
Prototypic materials have been used in a few·core-concrete interaction experiments in which water is added to molten debris. The MACE and WETCOR tests added water to a pre-existing pool of debris. These tests involved fairly large masses of molten simulant to which water was added. Thus, the initial condition is a stratified pool in which water lies over the core debris. The materials and masses of the experiments are summarized in Table 19EB-1. No energetic fuel coolant interactions were observed to occur in the stratified configuration. The experiments typically indicated an early heat transfer phase in which the heat fluxes were on the order of 1.5 to 2 MW / m 2. Later, presumably after the formation of a crust above the molten debris pool, the heat fluxes decreased. These heat fluxes are considered in Subsection 19EB.6.2 in bounding the non-explosive steam generation rates.
19EB.2.3 BETA V6.1
Recently, an energetic FC! occurred in the BETA facility. ExperimentV6.1 was intended to represent the Bibilus reactors. These reactors have an annular pool of water around the pedestal cavity. BETA V6.1 was designed to determine the impact of these water pools on corium concrete interaction. The configuration ofV6.1 is shown in Figure 19EB-I. The system consisted of a concrete crucible with an annular water pool which was vented back to the inner crucible via a small path. Molten iron alumina thermite was introduced into the cavity which was then allowed to ablate.
The debris eroded the concrete in the approximate shape shown in Figure 19EB-I. The superheat of the melt was very high since there was no water on the debris. Eventually, the sideward erosion caused the debris to reach the annular water pool at one local point. Instants later an explosion occurred. The bottom of the crucible was sheared off. There was severe damage to the facility. All of the instrumentation was destroyed and the melt injector was thrown several meters up, damaging the ceiling.
The energy required to do the damage has not yet been determined. However, the structure surrounding the test facility was fairly weak, unprotected sheet metal. Although the doors were blown open they were not damaged. Therefore, it is believed that the pressure spike may not have been very large.
The symmetry of the damage to the crucible indicates that the explosion was very symmetric. There was very little irregularity in the shearing of the bottom of the crucible. Thus, it is difficult to believe that the explosion began on one side of the crucible and propagated sideward. An alternate hypothesis has been proposed (Reference 19EB-8). When the debris penetrated to the annular pool, the steam generation rate increased. Since the annular compartment vents back to the center of the crucible via a small line, the pressure increased and water was forced back into the
Fuel Coolant Interactions 19E8-5
ABWR
19EB-6
Rev. 0
Design Control Document/Tier 2
debris. The debris was still highly superheated at this time. The confinement of the system allowed for intermixing of the debris and water and prevented the pressure from being relieved. Thus, the damage caused to the system was not a result of a shock wave, but rather due to simple pressurization of a confined region.
The steam explosion observed in the BETA facility is not applicable to the ABWR system. Although suppression pool and vent system of the ABWR is located in an annulus around the lower drywell, there is adequate vent area to relieve the pressure in the wetwell drywell connecting vents. In fact, the BETA configuration is also much more restrictive than the Bibilus reactor it was intended to represent. This restrictive condition resulted in ingression of water into the melt. Since the ABWR configuration has much more vent area, water ingression will not occur.
Additionally, there was no water on top of the debris before penetration into the annulus. Thus, the molten debris in V6.1 was highly superheated. This is contrasted to the situation in the ABWR. The ability to use active systems, such as the Firewater Addition System, and the presence of the passive lower drywell £looder virtually ensure that there will be water above the debris in the ABWR. The area of the ABWR lower drywell is also very large which enhances coolability. The uncertainty analysis of Attachment 19EC indicates there is a low probability that significant core concrete attack will occur. Therefore, the initial contact mode observed in V6.1 is unlikely.
Even if eCI occurs and the pedestal is eroded to the wetwell drywell connecting vents. The presence of water above the debris will cause a crust to form. The temperature on the lower surface of the crust will be at the melt point of the debris. Within any molten region, the debris temperature will be nearly equal to the melt temperature due to convection in the debris pool. Thus, the addition of any water to the molten pool will cause the debris to freeze and a steam explosion will not occur.
The conditions which led to the explosion at the BETA facility are not prototypic of the ABWR. Due to operation of the £looder there is a small likelihood that the debris will ablate the side wall and enter the wetwell drywell connecting vents. This is examined in Attachment 19EC. Even if the debris does penetrate the pedestal to the connecting vents, the vent area in the ABWR is sufficient to relieve the steam generation caused by the initial contact of water and debris. Thus, water would not be forced into the melt as occurred at BETA. Finally, the superheat of the melt at the BETA facility was very high, whereas the superheat of any debris which contacted water in the ABWR would be low. Thus, debris would be easily solidified, reducing the heat transfer to the water and preventing rapid steam generation. Thus, the explosion in V6.1 does not indicate that containment damage will occur in the ABWR as a result ofFCr.
Fuel Coolant Interactions
Rev. 0
ABWR Design Control Document/Tier 2
19EB.2.4 High-pressure Melt Ejection Experiments
Sandia performed a series of experiments to examine the influence of water pools on
the behavior of high-pressure melts in a Zion-like cavity (Reference I9EB-9). Two configurations were examined. In the SPIT-I5 test debris was i~ected into a closed acrylic box. This allowed for visualization of the phenomena. In the SPIT-I7 and InPS
. experiments ~ Zion-like cavity was constructed. The basic configuration of the SPIT-I7 and HIPS experiments is shown in Figure I9EB-2. The SPIT-l 7 cavity was made of
aluminum while the HIPS experiments used reinforced concrete cavities.
In all of the experiments water was present in the cavity at the time of melt ejection. The
inertia of the water prevented venting of the cavity. Thus, the steam generation in the cavity forced the region to pressurize and the structures were destroyed before gas flow from the end of the structure could relieve the pressure in the cavitY.
It is interesting to compare these experiments to BETA V6.1. In both instances it appears that large pressure spikes were created when the debris and water were tightly
confined. This early confinement keeps the water and debris in close contact, and seems to lead to the fragmentation of the hot molten material which is a necessary
precondition for steam explosions.
The results of this experiment are not applicable to the ABWR configuration. The lower drywell is not initially full of water and there is ample venting of the region. The extreme damage observed in these experiments appear to be consistent with that in BETA V6.1, both in the mode and magnitude of the damage to the facilities.
19EB.3 Explosive Steam Generation
This subsection presents a bounding analysis of the maximum steam generation rate which can occur for a given mass of corium interacting with water.
19EB.3.1 Phenomenology
Corium interactions with water can result in rapid steam generation. The rate of steam
generation can be limited by the amount of corium or water present. Maximum generation for a given amount of corium occurs when enough water is present to completely quench the corium. Corium mass, surface area, temperature and heat transfer coefficient dictate the maximum rate when ample water is available.
Two configurations are possible for quenching in the ABWR. First, corium can exit the
vessel when the lower drywell contains significant amounts of water. Corium exit from the vessel can be either by a slow pour (small vessel breach) or by a sudden drop (catastrophic failure oflower vessel head) . Second, corium can enter a dry lower drywell
and form a pool. Subsequently, the lower dryweU is flooded with water and the debris is
Fuel Coolant Interactions 19E8-7
ABWR Rev. 0
Design Control Document/Tier 2
quenched. This situation, commonly referred to as a stratified geometry steam explosion, is the expected configuration for any large FCI in the ABWR.
Molten core debris is expected to be discharged from the vessel close to its liquidus temperature, 2600 K. Therefore, the maximum temperature in either the pour or stratified geometries will be 2600 K. The actual temperature will be lower due to heat loss by the debris prior to interaction with water. In the pour case, corium will transfer heat to the air surrounding the vessel as it falls. Any residual water in the lower drywell, as well as concrete beneath and air above the debris pool will absorb heat in the stratified geometry.
For rapid steam generation to occur in either situation, the ejected corium must break up into small particles. The analysis presented in Subsection 19E.2.3.1.4 demonstrated
I
that corium breakup in the ABWR will be driven by Taylorinstabilities. The smallest particles fonned will be approximately 2.5 mm based on the Taylor critical wavelength. Debris breakup in the stratified geometry will also be governed by Taylor instabilities.
Crust formation will hinder debris breakup. Since corium is expected to exit the vessel near its liquidus temperature, any heat loss should contribute to crust fonnation. Furthermore, the outer debris surface will freeze rapidly after encountering water. Freezing will hinder further droplet division because more energy will be required to fracture the outer crust than it does to overcome the liquid surface tension. This, in part, explains why se1f.triggering can be observed with some highly superheated metals, but is much less likely with molten core debris.
19EB.3.2 Bounding Analysis
19EB-B
Moody, et al., (Reference 19EB-IO) detennined the maximum steam generation rate during Fe! based on a simplified thermal-hydraulic methodology. The steam formation rate from a single corium droplet assuming heat transfer to saturated water is:
(l9EB-l)
where:
mg, d == steam formation rate,
H == heat transfer coefficient,
surface area of a corium droplet,
== droplet surface temperature,
Fuel Coolant Interactions
ABWR Rev. 0
Design Control DocumentlTier 2
Teo = saturation temperature of water at the ambient pressure,
= latent heat of vaporization for water,
t = time from beginning of interaction,
'th = thermal response time.
Heat transfer from the droplet to the surrounding is dominated by convection and radiation. The heat transfer coefficient is:
where:
H = H +H C r
a (T4. _T4) = H + CI 00 E
C (I.-I) CI 00
= convective heat transfer coefficient,
= radiative heat transfer coefficient,
= Stefan-Boltzmann constant,
= emissivity of the droplet.
(19EB-2)
Due to the high temperature of corium, convective heat transfer from the surface of the particle will be in film boiling regime. The maximum convective heat transfer coefficient that can be expected is that of enhanced film boiling, which is 390 W /m2K The emissivity suggested for use in MAAP (Reference 19EB-l1) for corium is 0.85. This value will be used for this analysis.
If a mass of corium, Mc' interacts with water and breaks up into droplets of average radius, r, the number of droplets, N, will be given by:
(l9EB-3)
where:
Pc = density of corium.
Fuel Coolant Interactions 19£8-9
ABWR Rev. 0
Design Control Document/Tier 2
The total steam generation rate ofN corium droplets is:
(19EB-4)
where the maximum generation rate is:
(19EB-5)
This is the maximum steam generation rate that can occur for a given amount of corium broken up into small droplets in a large body of saturated water.
19EB.4 Impulse Loads
Rapid steam generation can produce a shock wave which imparts impulse loads to containment structures. Energetic FCIs, however unlikely, may occur in the lower drywell of the ABWR. Water in the lower drywell, which must be present for rapid steam generation, can transmit shock waves from the site of FC! to the walls of the pedestal. Shock waves which pass into the gas space above the water will be rapidly damped due to gas compressibility and ,will not represent any threat to containment integrity. If the impulse load is large enough, the pedestal will fail causing the vessel to tip. Tipping of the vessel would most likely lead to tearing of the containment penetrations. The scoping analysis presented in this subsection estimates the amount of corium which can
participate in a FC! without exceeding the impulse load capability of the pedestal.
19EB.4.1 Maximum Impulse Pressure
79E8-70
Moody, et. al., (Reference 19EB-1O) determined the maximum pressure increase at the site of an FC! based on the steam generation rate given in Equation 19EB-5. His analysis applied the Rayleigh bubble equation to a single steam bubble with an equivalent volume of the many bubbles fonned during interaction with N corium droplets of radius, r. Because the volume varies as r3, this results in overestimation of the rate of bubble expansion. The bubble expansion rate dictates the pressure rise. Therefore, this analysis bounds the pressure generated by the maximum steam generation during FCI.
The maximum pressure increase of a single submerged steam bubble above the ambient pressure during its fonnation at the generation rate given in Equation 19EB-5 is:
dP = 0.178 g 00 g, Max [
(R T n:i ) 2] 1/3 Max ,PI R4
o
(19EB-6)
Fuel Coolant Interactions
ABWR Rev. 0
Design Control Document/Tier 2
where:
= density of saturated water at the ambient pressure,
= gas constant for steam,
= starting radius for steam bubble growth.
The starting radius for bubble growth can be estimated by a spherical volume equal to the corium volume plus the total volume of water it vaporizes which in equation fonn is:
(19EB-7)
where:
Pc density of corium,
specific heat of corium.
The maximum pressure predicted by Equation 19EB-6 is shown in Figure 19EB-3 for participating corium masses from 0 to 30,000 Kg. The required corium properties were taken from Table 19E.2-17. The steam and water properties are saturated conditions at two atmospheres. Two atmospheres is a likely containment pressure at vessel failure for theABWR.
The peak pressure during impulse loading of the ABWR pedestal resulting from fuel coolant interactions should be bounded by the pressure shown in Figure 19EB-3. The pressure predicted by Equation 19EB-6 is conservative because of the assumptions which went into its creation. Furthennore, this is the pressure at the site of FCI. The pressure experienced by the pedestal wall will be reduced because the shock wave has to pass through some amount of water before it impinges on the wall. The pressure will decay as r-2 as it moves away from the source (Reference 19EB-12).
19EB.4.1.1 Impact of FMCRD Platform Grating (on Fen The FMCRD platform grating is located in the lower drywell at the elevation of the access tunnel. This rotating platfonn is circular and mounted on the rotating rail under the reactor vessel. There is an opening area at the center of the platform which is provided with a traveling rail for the CRD handling device. Gratings will be installed on both sides of the rail for maintenance personnel. Typically, the grating consists of 2.54 cm (I-inch) by 0.95 cm (3/B-inch) metal slats mounted edge-wise to form a grid with a grid size on the order of2.54 cm (1 inch) by 5.08 cm (2 inch).
Fuel Coolant Interactions 19£8-11
ABWR Rev. 0
Design Control Document/Tier 2
The presence of the grating could provide some increased fragmentation of the debris as the leading edge of the debris enters a pre-existing water pool. This will tend to increase the voiding of the pool. Because the structure of the grating is very open, there will be no significant limitations on the venting of steam generated below the grating. Increased voiding in the water pool will reduce the impulse loading from an FeI. This in turn will decrease the potential for early containment failure from FC!.
The grating will be ablated as the debris passes through it, in the same manner as the
ablation of the bottom head. Therefore, the grating will have no impact on the severe accident performance after the initial debris relocation. Any late debris relocation would be a slow drip-like relocation which would fall straight through the ablated region of the platform.
19EB.4.2 Impulse Duration
The main difference between energetic fuel coolant interactions (steam explosions) and non-energetic interactions is the time in which the energy stored in the corium is transferred to the coolant. Short transfer times, on the order of milliseconds, indicate explosive reactions. Longer times are indicative of non-energetic interactions. Several fuel coolant interaction experiments involving corium simulants were reviewed in Subsection 19EB.2.2. Pulse widths were observed to be of the order 5 milliseconds or less for Fa.
19EB.4.3 Pedestal Capability
Detailed calculations of the capability of the ABWR pedestal to withstand impulse loading have not been performed. However, a simple elastic-plastic calculation can provide a capability which can be used for scoping analysis. This estimate can be compared to the maximum pressure expected during a FCI for a given amount of participating corium and the impulse duration. The pedestal in Grand Gulf (MARK III containment) was ailalyzed in NUREG-1150 (Reference 19EB-13) with regards to its ability to withstand pressure spikes generated by steam explosions. Since the ABWR pedestal is expected to be at least as strong as that of a MARK Ill, the impulse capability
of the Grand Gulf pedestal "can also be used for comparison.
19EB.4.3.1 Elastic-Plastic Calculation
A failure limit estimate based on a simple elastic-plastic calculation has been performed by Corradini (Reference 19EB-12). The assumptions made in this analysis are:
(1) The pedestal wall is thin compared to its diameter,
(2) The pressure loading is uniform both spatially and temporally,
(3) Failure is based on a strain criteria of Jl (failure strain/yield strain) equal to 10,
19E8-12 Fuel Coolant Interactions
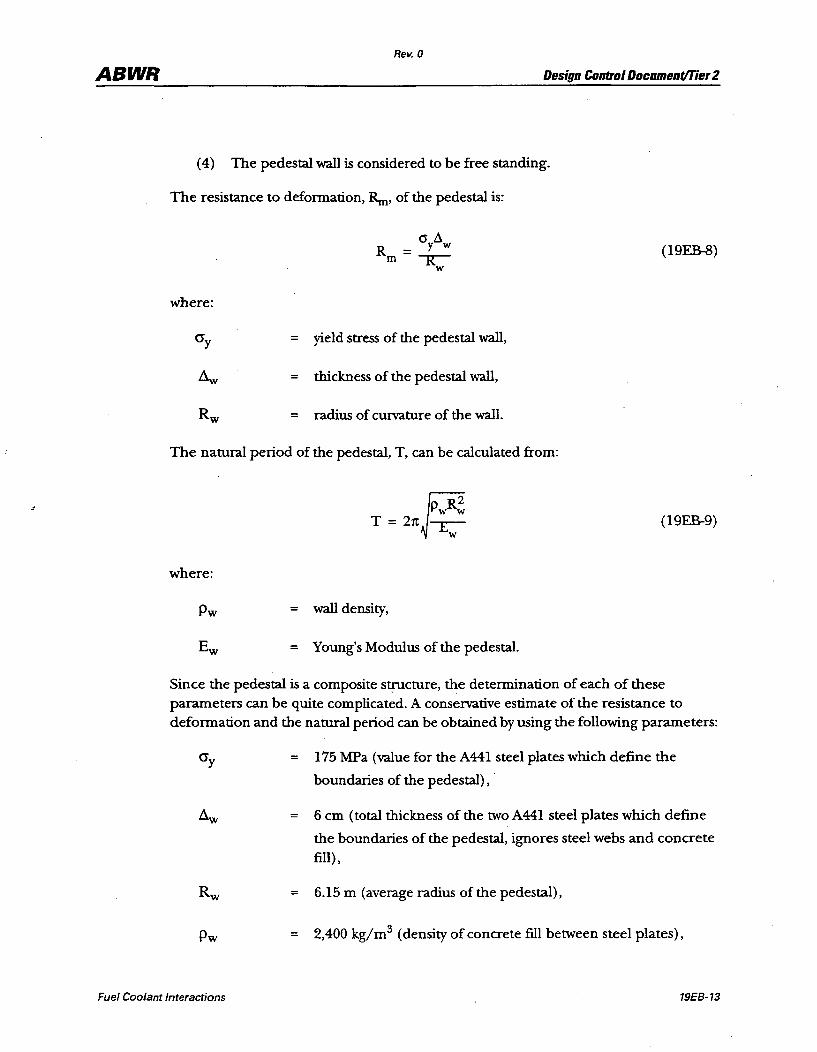
Rev. 0
ABWR Design Control Document/Tier2
(4) The pedestal wall is considered to be free standing.
The resistance to defonnation, Rm, of the pedestal is:
(19EB-8)
where:
= yield stress of the pedestal wall,
= thickness of the pedestal wall,
= radius of curvature of the wall.
The natural period of the pedestal, T, can be calculated from:
(19EB-9)
where:
Pw = wall density,
= Young's Modulus of the pedestal.
Since the pedestal is a composite structure, the detennination of each of these parameters can be quite complicated. A conservative estimate of the resistance to deformation and the natural period can be obtained by using the following parameters:
Pw
Fuel Coolant Interactions
175 MPa (value for the A441 steel plates which define the
boundaries of the pedestal) ,
6 cm (total thickness of the tWo A441 steel plates which define
the boundaries of the pedestal, ignores steel webs and concrete fill) ,
= 6.15 m (average radius of the pedestal),
= 2,400 kg/ m 3 (density of concrete fill between steel plates),
19E8-13
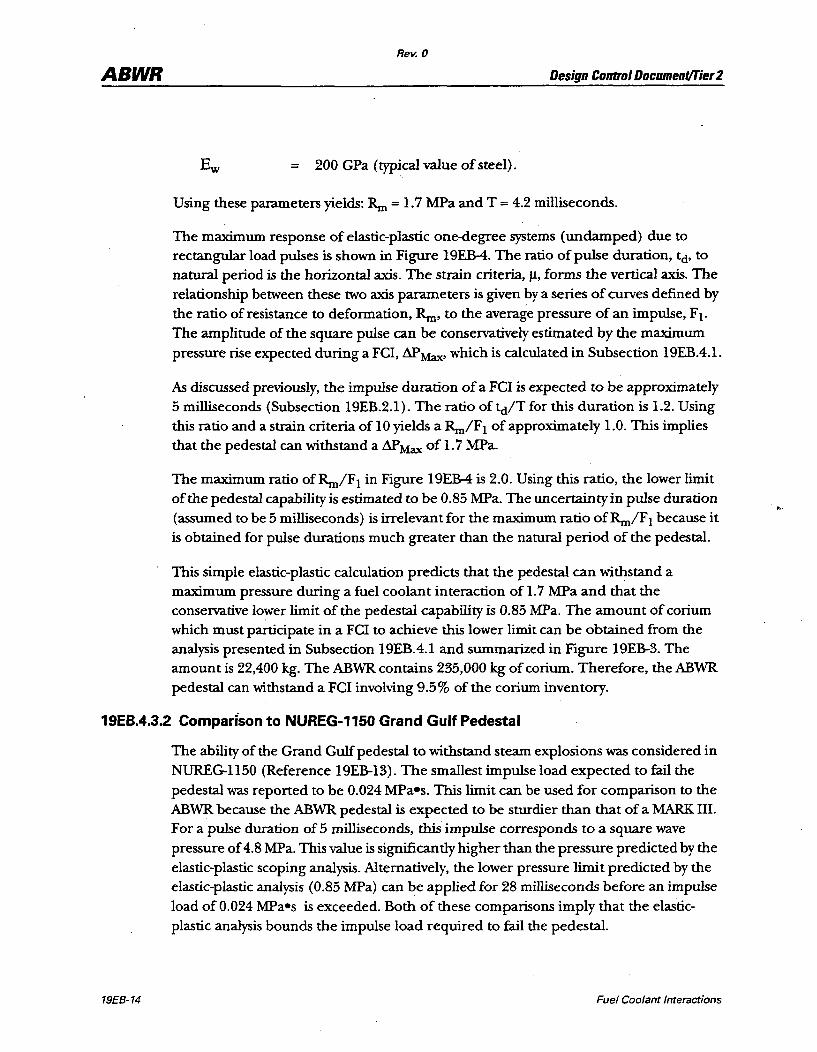
ABWR Rev. 0
Design Control Document/1ier 2
= 200 GPa (typical value of steel).
Using these parameters yields: Rut = 1.7 MPa and T ;: 4.2 milliseconds.
The maximum response of elastic-plastic one-degree systems (undamped) due to rectangular load pulses is shown in Figure 19EB-4. The ratio of pulse duration, td' to natural period is the horizontal axis. The strain criteria, ll, forms the vertical axis. The relationship between these two axis parameters is given by a series of curves defined by the ratio of resistance to deformation, Rut, to the average pressure of an impulse, Fl.
The amplitude of the square pulse can be conservatively estimated by the maximum
pressure rise expected during a FeI, &Max' which is calculated in Subsection 19EB.4.1.
As discussed previously, the impulse duration of a FeI is expected to be approximately 5 milliseconds (Subsection 19EB.2.1). The ratio oftd/T for this duration is 1.2. Using
this ratio and a strain criteria of 10 yields a Rut/F 1 of approximately 1.0. This implies that the pedestal can withstand a &Max of 1.7 MPa.
The maximum ratio ofRut/Fl in Figure 19EB-4 is 2.0. Using this ratio, the lower limit of the pedestal capability is estimated to be 0.85 MPa. The uncertain ty in pulse duration
(assumed to be 5 milliseconds) is irrelevant for the maximum ratio ofRut/F} because it is obtained for pulse durations much greater than the natural period of the pedestal.
This simple elastic-plastic calculation predicts that the pedestal can withstand a maximum pressure during a fuel coolant interaction of 1.7 MPa and that the conservative lower limit of the pedestal capability is 0.85 MPa. The amount of corium which must participate in a FCI to achieve this lower limit can be obtained from the analysis presented in Subsection 19EBA.l and summarized in Figure 19EB-3. The amount is 22,400 kg. The ABWR contains 235,000 kg of corium. Therefore, the ABWR pedestal can withstand a FeI involving 9.5% of the corium inventory.
19EB.4.3.2 Comparison to NUREG-1150 Grand Gulf Pedestal
19£8·14
The ability of the Grand Gulf pedestal to withstand steam explosions was considered in
NUREG-1150 (Reference 19EB-13). The smallest impulse load expected to fail the pedestal was reported to be 0.024 MPa-s. This limit can be used for comparison to the ABWR because the ABWR pedestal is expected to be sturdier than that of a MARK III. For a pulse duration of 5 milliseconds, this impulse corresponds to a square wave
pressure of 4.8 MPa. This value is significantly higher than the pressure predicted by the elastic-plastic scoping analysis. Alternatively, the lower pressure limit predicted by the elastic-plastic analysis (0.85 MPa) can be applied for 28 milliseconds before an impulse
load of 0.024 MPa-s is exceeded. Both of these comparisons imply that the elastic
plastic analysis bounds the impulse load required to fail the pedestal.
Fuel Coolant Interactions

Rev. 0
ABWR Design Control Document!Tier 2
19EB.4.4 Capability of the ABWR to Wrthstand Pressure Impulse
The ABWR pedestal has been shown in this scoping analysis to be capable of withstanding a peak pressure of at least 0.85 MPa during a steam explosion. The amount of corium required to produce this pressure impulse during a fuel coolant interaction was shown to be 22,400 kg. This represents 9.5% of the ABWR corium inventory. This is more than three times the maximum amount of debris which could participate in an FCI event based on the obse:rvations discussed in Subsection 19EB.2.2. Therefore, the ABWR pedestal is very resistant to the impulse loading which could occur in a severe accidenL This failure mechanism need not be considered further in the containment event trees or the uncertainty analysis.
19EB.5 Water Missiles
Submerged steam formation resulting from fuel coolant interactions can be rapid enough to propel an overlying liquid mass. Impact loads can be imparted to containment structures if the liquid mass (water missile) is ejected from the water pool with a great enough velocity. Although a prediction of impact by a water missile does not imply damage, additional analysis would be needed to assess the structural response. The maximum height to which a water missile can rise will be determined in this subsection for a given amount of participating corium. The rise height will be compared to the distance between the expected water. surface of a pre-flooded lower drywell and the bottom of the reactor vessel to determine if damage to the containment could occur. No other structures are considered because damage to them will not lead to containment failure.
19EB.S.1 Maximum Rise Height
Moody, eL al., (Reference 19EB-10) used the steam generation rate determined in Subsection 19EB.3.2 to predict the upward propulsion velocity and elevation characteristic of a water missile. The maximum velocity that a water missile can obtain is the maximum radial expansion rate of the steam bubble formed during FC!. This expansion rate is:
(1 9EB-1 0)
where:
= equilibrium steam bubble radius.
R,., is equal to:
Fuel Coolant Interactions 19EB-15
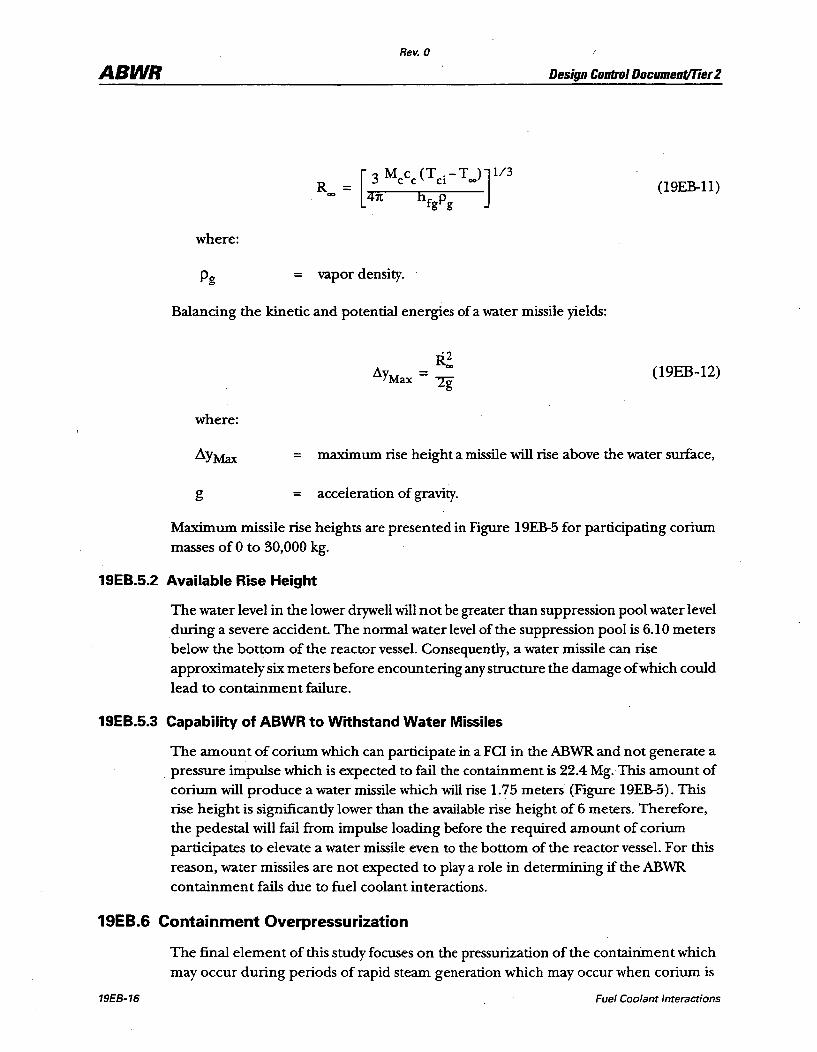
ABWR Rev. 0
Design Control Document/Tier 2
(l9EB-ll)
where:
= vapor density.
Balancing the kinetic and potential energies of a water missile yields:
(19EB-12)
where:
~YMax = maximum rise height a missile will rise above the water surface,
g = acceleration of gravity.
Maximum missile rise heights are presented in Figure 19EB-5 for participating corium masses of 0 to 30,000 kg.
19EB.S.2 Available Rise Height
The water level in the lower drywell will not be greater than suppression pool water level during a severe accident. The normal water level of the suppression pool is 6.10 meters below the bottom of the reactor vessel. Consequently, a water missile can rise approximately six meters before encountering any structure the damage of which could lead to containment failure.
19EB.S.3 Capability of ABWR to Withstand Water Missiles
The amount of corium which can participate in a FCI in the ABWR and not generate a . pressure impulse which is expected to fail the containment is 22.4 Mg. This amount of corium will produce a water missile which will rise 1.75 meters (Figure 19EB-5). This rise height is significantly lower than the available rise height of 6 meters. Therefore, the pedestal will fail from impulse loading before the required amount of corium participates to elevate a water missile even to the bottom of the reactor vessel. For this reason, water missiles are not expected to playa role in determining if the ABWR containment fails due to fuel coolant interactions.
19EB.6 Containment Overpressurization
19EB-16
The final element of this study focuses on the pressurization of the containment which may occur during periods of rapid steam generation which may occur when corium is
Fuel Coolant Interactions
ABWR Rev. 0
Design Control Document/Tier 2
being quenched. In the highly unlikely event of an ABWR core melt which leads to vessel failure, the corium will fall into the lower drywell. There are ten connecting vents
which join the lower drywell, the upper drywell and the wetwell, as shown in
Figure 19EB-6. The pressure suppression containment prevents large increases in containment pressure by sparging the steam through the connecting vents to the suppr~ssion pool which condenses the steam. However, if the pressure rise is extremely rapid, the vents may not be able to clear before the containment is damaged. At even higher steam generation rates, the area from the lower drywell to the upper drywell could be too small and a pressure difference between the drywell regions could occur, failing the lower drywell. This analysis determines the steam generation rates for different limits on FCI. The maximum rate is then compared to the containment pres~ure capability to assess the potential for containment damage as a result of
overpressure during an FCI event.
19EB.S.1 Methodology.
This calculation compares the pressurization due to rapid quenching of corium to the pressure capability of the containment. Two non-explosive steam generation limits are
considered. If there is a sufficien tly large water mass, then the quenching of corium will provide the steam generation limit. If the mass of water limits the steam spike then the steam generation will be less than, or equal to, the water flow in to the lower drywell. The impulse pressure limited mass, calculated in Subsection 19EB.3.1, is also considered.
If there is no water in the lower drywell at the time of vessel failure, then the maximum rate of steam generation at some later point in time is the rate at which water is introduced into the lower drywell. If there is still water in the lower plenum at the time of vessel failure, as predicted by MAAP-ABWR, then this source of water could react with
the corium in the lower dryweU. Water addition could also occur via the passive flooder, the use of the Firewater Addition System or by means ofECCS recovery. Each of these
possibilities will be examined to determine the maximum rate at which water could be
added to the lower drywell.
For most of the core melt sequences in the ABWR PRA there will not be water in the lower drywell at the time of vessel failure (Subsection 19EB.l.l). Nonetheless, an evaluation will be performed assuming that corium falls into a pre-existing pool of water and is quenched instantaneously. This will provide a limit on the peak containment
pressure which could result from quenching of debris as it falls into the lower drywell. For the ABWR, the majority of sequences with vessel failure occur at low pressure. Therefore, gravity is the driving force for the flow of corium from the lower head of the
vessel to the lower drywell. Both MELCOR and MAAP predict that the vessel fails at the penetrations for low pressure melts. Mter the initial hole is formed, the hole ablates due to the flow of hot corium. In order to determine the sensitivity of the ABWR containment to rapid steam generation 40% of the total U02 mass is assumed to be molten at the time of vessel failure. This value is consistent with the upper limit for
Fuel Coolant Interactions 19E8-17
ABWR Rev. O.
Design Control Documenf/Tier 2
molten debris used in the uncertainty analyses for direct containment heating (Subsection 19EA.2.1.4).
Two potential limits for pressurization due to steam generation are considered. First, the pressurization of the lower drywell is determined considering the limit of the ven t area from the lower drywell to the upper drywell. This determines any limits for the ,assumption that the upper and lower drywell regions have good communication and will respond similarly to the pressurization. Second, the response of the Pressure Suppression System is evaluated. Drywell pressurization rates are used to determine the vent clearing response which is in tum used to determine the peak containment pressure as a function of the pressurization rate.
19EB.6.2 Maximum Steam Generation Rates
The first step in determining the peak pressures that may result from fuel coolant interactions is to determine the maximum steam generation rates. The steam generation can be limited either by the available water or the available corium. Both of these possibilities will be considered separately.
19EB.S.2.1 Water Added to Debris
There are four potential sources of water addition to the lower drywell. First, in a MAAPtype core melt progression, there may be water in the lower plenum at the time of vessel failure. Mter the corium falls into the lower drywell, the water will follow through the ablated hole in the lower plenum. Second, the lower drywell passive flooder opens when its fusible material melts. Water from the wetwell is then driven by gravity into the lower drywell. Third, the Firewater System may be used to add water to either the vessel or the upper drywell. In either case, water will eventually flow into the lower drywell at the firewater injection rate. Finally, if the ECCS is recovered, these systems could be used to inject water into the vessel which again will flow into the lower drywell.
19EB.S.2.1.1 Water Inventory from Lower Plenum
19E8-18
If there is water in the lower plenum at the time of vessel failure, then it will fall into the lower drywell after the corium. Under these conditions, the flow will be driven by gravity through the ablated vessel failure. The expected failure mode for a BWR is penetration failure (Reference 19EB-14). A parametric study was performed to determine the final, ablated area resulting from different numbers of CRD penetrations. The study was
conducted by varying the number of vessel penetrations presumed to open at the time of vessel failure. Since this affects the initial area of the vessel failure, multiple penetration failures have higher initial debris pour rates. As seen in Figure 19EB-8, the final area varied from 0.06 m2 for 10 penetrations failed to 0.08 m 2 for one penetration. The final area is smaller for cases with multiple penetration openings because the duration of the debris pour is shorter. In order to bound the flow of water into the lower
Fuel Coolant Interactions
ABWR Rev. 0
Design Control Documenf/Tier 2
plenum, a value of 0.1 m2 is used which results in a maximum mass flow rate of
1020 kg/so
19EB.6.2.1.2 Passive Flooder Flow
The passive flooder is composed of ten pipes connecting the lower drywell to the suppression pool with fusible material at the lower drywell end which opens when it reaches a specified temperature. This is shown schematically in Figure 19EB-7.
The flow from the wetwell into the lower drywell is driven by the difference in the water height, h, between the connecting vents and the flooder. The flow rate is given by:
IIi = PAJ2gh (19EB-13)
where:
m = water mass flow in to the lower drywell (kg/ s) ,
P density of water (kg/m3),
A = total area of passive flooders (m3),
g acceleration of gravity (9.81 m/s2),
h driving head of water (m).
The maximum flow through the passive flooder would occur when the pressure difference between the wetwell and the drywell was sufficient to open the vacuum
breakers, and the suppression pool is cold. Assuming a suppression pool temperature of303.2 K (30°C), P = 996 kg/m3. The total area of the passive flooders isA = 0.081 m 2.
Assuming that the pool is at the high water level and the pressure difference between the wetwell and drywell is at the full open setpoint of the vacuum breakers, the height of water above the passive flooder is h = 4.75, which yields a maximum flow rate of ni = 780 kg/ S. The flow rate will typically be less than this maximum because the drywell pressure is greater than wetwell and the first row of vents will be clear.
19EB.6.2.1.3 ECCS and Firewater Flow
The ECCS and Firewater System are both capable of adding water to the vessel which would flow into the lower drywell. The Firewater System has a direct-drive diesel pump
which does not rely on AG power, so it is available even during a station blackout event. The EGGS is dependent on AC power; and, thus, will not be available during station blackout but could inject water during recovery late in a severe accident. The ECGS System has a flow rate far greater than the Firewater System. Therefore, no determination of the firewater flow is necessary. The maximum ECCS flow will be
Fuel Coolant Interactions 19E8-19
ABWR Rev. 0
Design ContrDI DDcument/Tier 2
bounded by the runout flow of the ECCS pumps. The actual flow will be somewhat smaller due to the flow losses at higher velocities when all of the pumps are operating simultaneously.
There are two HPCF Systems, each with a runout flow of 230 kg/s (3800 gpm), and three LPFL Systems with flow of 265 kg/s (4200 gpm). The RCIC System is not considered since the vessel will be depressurized. The total water addition rate to the lower drywell is 1250 kg/so
19EB.6.2.2 Steam Generation Rate for Pre-flooded Lower Orywell
19EB·20
For the ABWR. it is very unlikely that there is water in the lower drywell at the time of vessel failure. Thus, steam generation is usually limited by the availability of water. However, there may be sequences for which there is ample water, and the limitation on the steam generation rate is the energy of the quenching corium. Thus, it is prudent to determine the maximum steam generation from this limit if there were a large water supply available. A large mass of water is assumed to be present in the lower drywell for this portion of the analysis.
A wide number of analyses have been performed to determine the mode of vessel failure. While there are still some uncertainties in the details of the analysis, the work performed to date provides overwhelming indication that a BWR vessel fails at the penetrations (References 19EB-15 and 19EB-16). Once there is some flow through a penetration, the molten material will begin to ablate the hole. Neglecting the change in the driving force for the flow of molten material, the maximum flow rate Will occur when the hole size is maximized as the mass is exhausted.
In some MELCOR-type analyses, the corium quenches in the lower plenum of the vessel. It subsequently heats up and causes vessel failure. Therefore, there is little corium molten at the time of vessel failure. The flow rate of corium from the vessel is limited by the rate at which the corium melts in the vessel. Conversely, using a MAAP-type analysis, the corium does not quench in the lower plenum. Thus, there is a large molten mass at the time of vessel failure. Since this will result in larger flow rates than the MELCOR-type model, the MAAP results will be used to determine the corium flow rate for this analysis.
MAAP-ABWR (as well as MELCOR) uses the Pilch model for the ablation of the penetration (Reference 19EB-l1). The velocity of the corium through the vessel failure is approximately constant; therefore, the ablation rate of the failure is linear. A series of MAAP-ABWR runs were performed which examined the flow rate of molten debris and vessel failure area as a function of the number of failed penetrations. The results of these calculations are shown in Figures 19EB-8 and 19EB-9. The maximum rate of debris ejection from the vessel is about 6000 kg/ S. Assuming this material quenches as it is ejected, the steam generation rate is about 2800 kg/so
Fuel Coolant Interactions
ABWR Rev. 0
Design Control Document/Tier 2
The experimental heat flux obseIVed when molten core debris simulants are poured into water is on the order of 1.5 to 2.dMW /m2 based on the floor a~ea. Using the upper bound on the experimental obseIVations, the maximum steam generation rate for the ABWR is 80 kg/so This is far below the value detennined above for the instantaneous quenching of debris for a bounding debris pour rate.
19EB.6.2.3 Explosive Steam Gene.ration Rates
Based on the examination of the impulse loading calculation of Subsection 19EBA.3.1, the ABWR can withstand the shock wave which corresponds to 22.4£3 kg of core debris. The maximum steam generation rate associated with this amount of debris is 4100 kg/ s (Subsection 19EB.3.2).
19EB.6.2.4 Maximum Steam Generation
The maximum steam generation rates for each of the mechanisms described above are summarized in Table 19EB-2. Based on these results, the limiting scenario is the maximum steam explosion from the scoping study. Therefore, even though this event is far larger than the expected steam generation rate, the containment pressurization will be estimated using this value.
19EB.6.3 Containment Pressurization
The containment peak pressures may be calculated based on the flow rates detennined above. The results given below are for the most restrictive pressurization rate. Three limits are considered. The first condition is the flow rate of steam from the lower drywell to the upper drywell. Second, the time period before the suppression pool vents open must be considered. Finally, the quasi-steady condition of flow from the drywell to the wetwell through the suppression pool is considered.
19EB.6.3.1 Drywell Connecting Vent Flow
Consideration of the flow through the drywell/wetwell connecting vents is important to ensure that there is adequate vent area to allow the upper and lower drywells to communicate freely. If the flow is restricted a significant pressure difference could exist between the upper and lower drywell regions. This could potentially result in lower drywell region failure. Using the maximum steam generation rate and an effective area of about 11.25 m2 in the drywell/wetwell connecting vents, the pressure difference between the upper and lower drywell regions is less than 0.15 MPa.
19EB.6.3.2 Vent Clearing
If the drywell pressure is higher than the wetwell pressure at the time of the FCI,then steam flow to the wetwell can begin immediately. However, if the vents are not open, the pressure must accelerate the water in the vents to allow steam flow. During this interval the pressure in the drywell will rise quickly.
Fuel Coolant Interactions 19E8-21
ABWR Rev. 0
Design Control Document/Tier 2
Assuming that the initial drywell and wetwell are at equal pressures maximizes the time for vent clearing. The time to vent clearing is calculated based on analysis by Moody (Reference 19~ 17). This model requires the pressurization rate for the drywell. The pressurization rate is determined by assuming a steam generation rate and using the ideal gas relationship for steam. The pressure rise in the drywell due to steam generation is then calculated using the pressurization rate and the time to vent clearing. Using the maximum steam flow rate, a pressure rise of 0.17 MPa is calculated.
19EB.6.3.3 Horizontal Vent Flow
Mter the vents have cleared, steam will begin to flow from the drywell to the suppression pool. The drywell pressure during this time is equal to the wetwell pressure plus the flow and water heads. Using conservative assumptions and the maximum steam flow rate, the drywell wetwell pressure difference is found to be 0.16 MPa.
19EB.6.4 Summary of Overpressurization Limits
19EB-22
Based on the calculations presented above, the maximum pressure rise in the lower drywell due to fuel coolant interactions occurs just before the wetwell/ drywell connecting vents clear. At this time a pressure spike in the lower drywell of 0.17 MPa may occur. FCI events of the magnitude considered here occur when there is a large mass of unquenched debris which comes into sudden contact with water. In the ABWR this only occurs early in the course of a severe accident when the wetwell pressure is well below the COPS setpoint, typically at about 0.2 MPa. Even if the wetwell pressure were near the COPS setpoint of 0.72 MPa, the pressure difference between the drywell and wetwell would be equal to the design pressure of 0.27 MPa. There will be ample margin to the ultimate capability. Therefore, FCI leading to overpressurization failure of the lower drywell is not a credible event.
Concerning the upper drywell region, a conservative calculation based on the maximum steam generation rate given in Table 19EB-2 indicates that the maximum pressure in the upper drywell is the wetwell pressure plus 0.172 MPa. Again, considering that FCI events of the magnitude considered here occur when there is a large mass of unquenched debris which comes into sudden contact with water, the drywell will be well below even the service level C pressure of 0.72 MPa. Therefore, one would not expect upper drywell failure as a result of FCr.
The only FC! event one could hypothesize to occur late in the accident is the recovery of ECCS just before containment failure. However, in the ABWR design the passive flooder ensures that there is water above the debris. The addition ofECCS water will not cause increased heat transfer from the molten debris. Therefore, FCI leading to containment failure late in a severe accident has been ruled out by design.
The rapid steam generation rates which can occur due to bounding fuel coolant interactions do not lead to failure of the containment structure or opening of the
Fuel Coolant Interactions
ABWR Rev. 0
Design Control Document/Tier 2
rupture disk in the ABWR. Therefore, no further consideration of steam generation rates is required.
19EB.7 References
19EB-1 G. Long, "Explosions of Aluminum and Water", Aluminum Company of America, New Kensington, Pennsylvania, ALCOA Report 2-50-33, August 1950.
19EB-2 G. Long, "Explosions of Molten Aluminum and Water", Metal Progress, Volume 71, p. 107, May 1957.
19EB-3 H.M. Higgins, "The Reaction of Molten Uranium and Zirconium Alloys with Water", Aerojet Report 2914-2, Azusa, California, April 1955.
19EB-4 A.W. Lemmon, "Explosions of Molten Aluminum and Water", Light Metals, 1980, (C. Minn, Ed.), Proceedings of Technical Sessions Sponsored by TMS Light Metals Committee at the 190th AlME Annual Meeting, p.817.
19EB-5 L.D. Buxton and W.B. Benedick, "Steam Explosion Efficiency Studies", Sandia National Laboratory, SAND/79-1399, NUREG/CR-0947, November 1979.
19EB-6 L.D. Buxton, W.B. Benedick and M.L. Corradini, "Steam Explosion Efficiency Studies: Part II - Corium Experiments", NUREG/CR-1746, SAND/80-1324, Sandia National Laboratory, October 1980.
19EB-7 K.H. Bang and M.L. Corradini, "Vapor Explosions in a Stratified Geometry", Nuclear Science and Engineering, Volume 108, Number 1, May 1991.
19EB-8 M.L. Corradini, personal communication,June 24, 1992.
19EB-9 W.W. Tarbell, et. al., "Pressurized Melt Ejection into Water Pools", NUREG/CR-3916, SAND84-1531, Sandia National Laboratories, March 1991.
19EB-10 FJ. Moody, R Muralidharan, S.S. Dua, "Assessment of Ex-Vessel Steam Pressure Spikes in BWR MARK II Containments", 17th Water Reactor Safety Information Meeting, NUREG/CP-0104, October 1989.
19EB-ll "MAAP 3.0 B Computer Code Manual", EPR! NP-7071-CCML, Volume 2, November 1990.
19EB-12 M.L. Corradini, et. al" "Ex-Vessel Steam Explosions in the MARK II Containment", NUREG-1079, Appendix C, December 1985.
19EB-13 "Severe Accident Risks: An Assessment for Five U.S. Nuclear Power Plants", NUREG-1l50, Volume II, Appendix C, December 1990.
Fuel Coolant Interactions 19£8-23

ABWR
· 19E8-24
Rev. 0
Design Control Documenf/Tier 2
19EB-14 J. L. Rempe, "Light Water Reactor Lower Head Failure Analysis (Draft)", NUREG/CR-5642, Idaho National Engineering Laboratory, December 1990.
19EB-15 J. L. Rempe, "BWR Lower Head Failure Assessment for CSNI Comparison Exercise", EGG-EAST-9609, April 1991.
19EB-16 S. A Hodge and L.J. Ott, "Failure Modes of the BWRReactorVessel Bottom Head", ORNL/M-1019, May 1989.
19EB-17 Frederick Moody, "Introduction to Unsteady Thermofluid Mechanics",john Wiley and Sons, 1990.
19EB-18 J. M. Biggs, "Introduction to Structural Dynamics", McGraw-Hill Inc., 1964, p.72.
Fuel Coolant Interactions
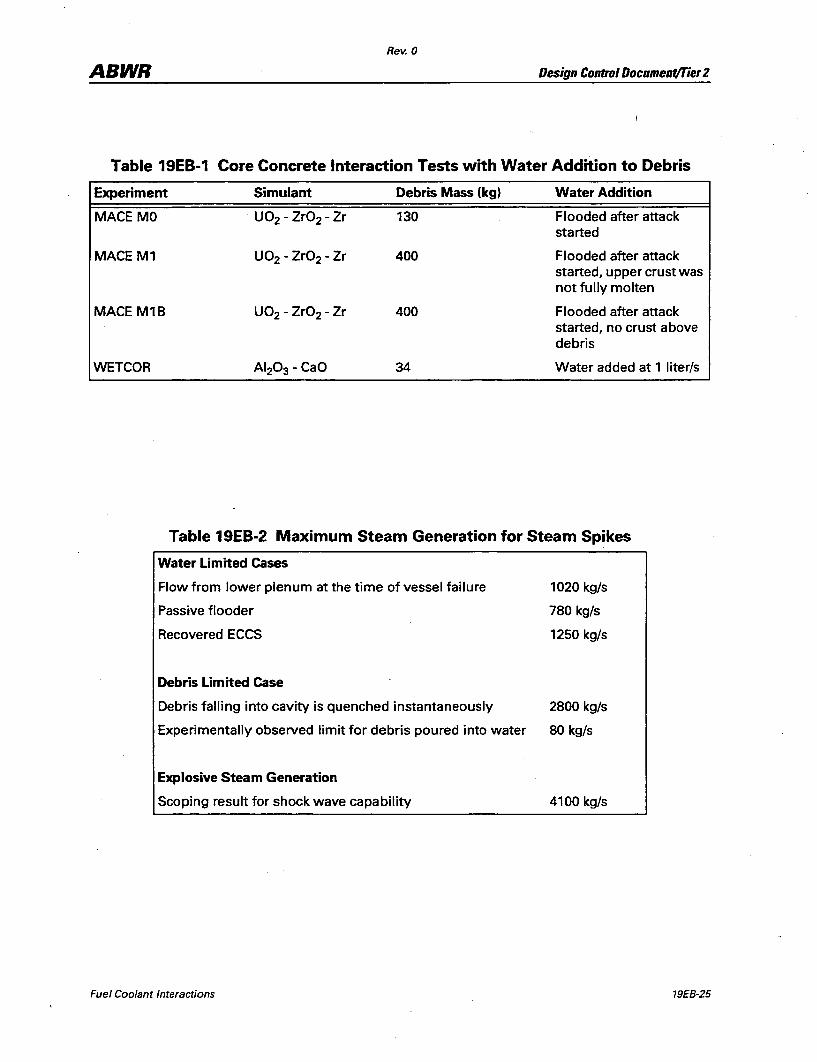
Rev. 0
ABWR Design Control DocumentlTier 2
Table 19EB-1 Core Concrete Interaction Tests with Water Addition to Debris
Experiment Simulant Debris Mass (kg) Water Addition
MACE MO U02 - Zr02 - Zr 130 Flooded after attack started
MACE M1 U02 - Zr02 - Zr 400 Flooded after attack started, upper crust was not fully molten
MACE M1B U02 - Zr02 - Zr 400 Flooded after attack
WETCOR
started, no crust above debris
AI20 3 - CaO 34 Water added at 1 liter/s
Table 19EB-2 Maximum Steam Generation for Steam Spikes
Water Limited Cases
Flow from lower plenum at the time of vessel failure
Passive flooder
Recovered ECCS
Debris Limited Case
1020 kg/s
780 kg/s
1250 kg/s
Debris falling into cavity is quenched instantaneously 2800 kg/s
Experimentally observed limit for debris poured into water 80 kg/s
Explosive Steam Generation
Scoping result for shock wave capability 4100 kg/s
Fuel Coolant Interactions 19£8-25
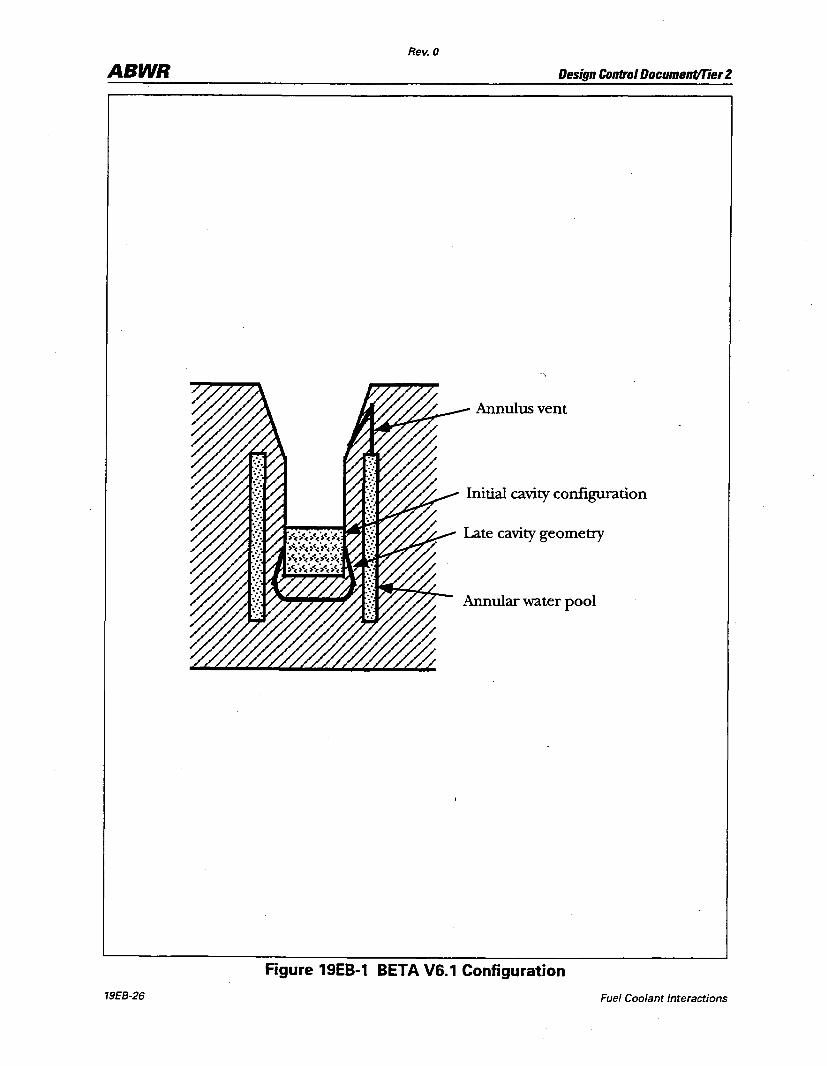
Rev. 0
ABWR Design Control Document/fier 2
Annulus vent
Initial cavity configuration
Annular water pool
Figure 19EB-1 BETA VS.1 Configuration
19E8-26 Fuel Coolant Interactions
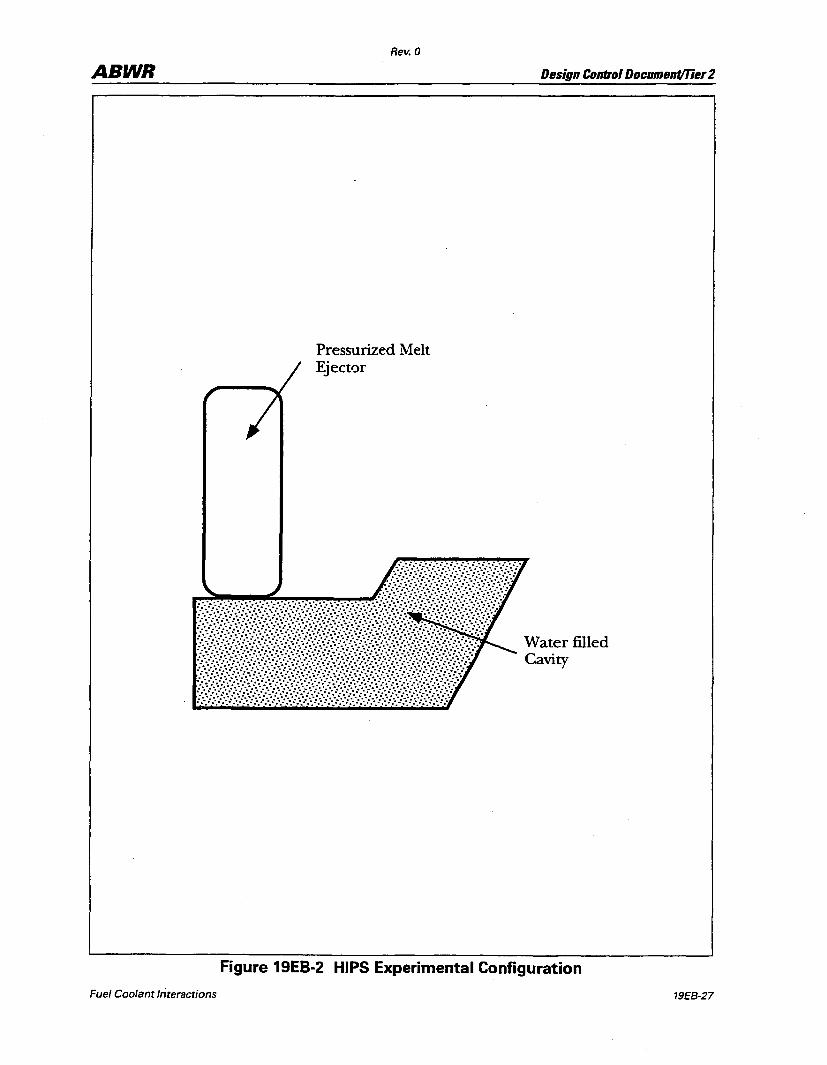
ABWR
Fuel Coolant Interactions
Rev. 0
Pressurized Melt Ejector
Design ContrDI DDcument!Tier 2
Figure 19EB-2 HIPS Experimental Configuration
19EB-27
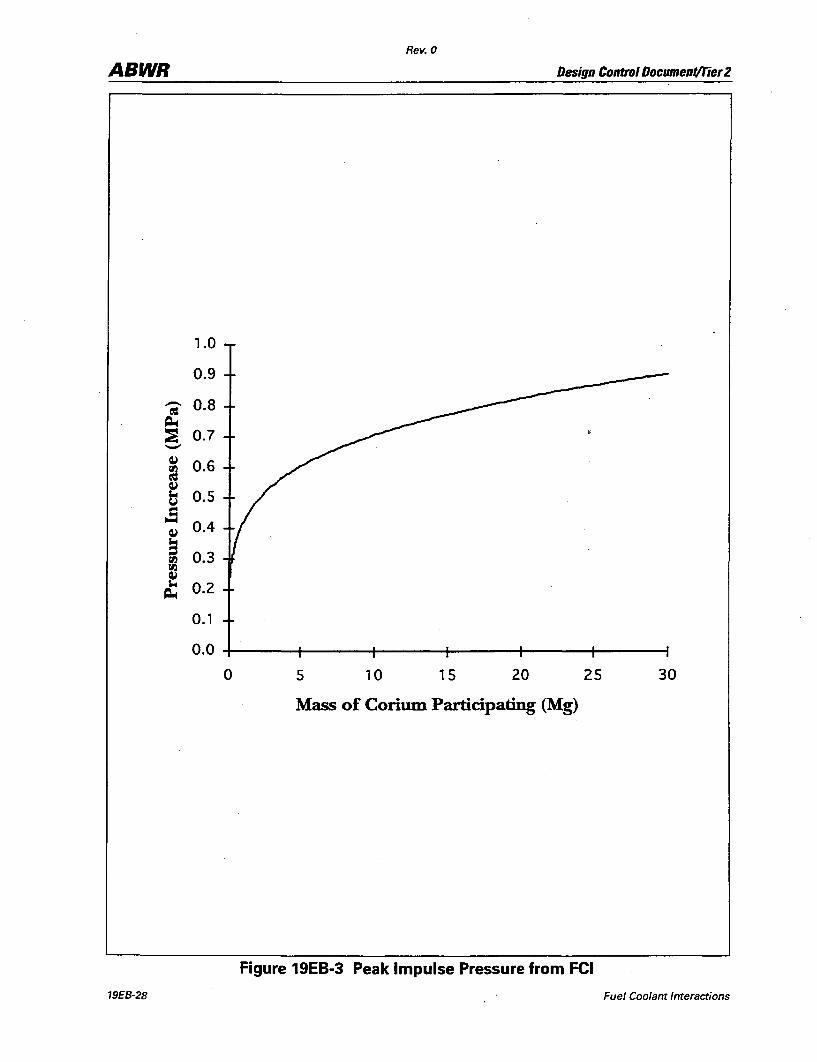
Rev. 0
ABWR Design Control Documentlfier 2
1.0
0.9
-- 0.8 = ~ ~ 0.7 -~ 0.6 ~ ~
C 0.5 ~ 0.4 ~
~ 0.3 rI.l rI.l ~ '- 0.2 ~
0.1
0.0
0 5 10 15 20 25 30
Mass of Corium. Participating (Mg)
Figure 19EB-3 Peak Impulse Pressure from FCI
19E8-28 Fuel Coolant Interactions
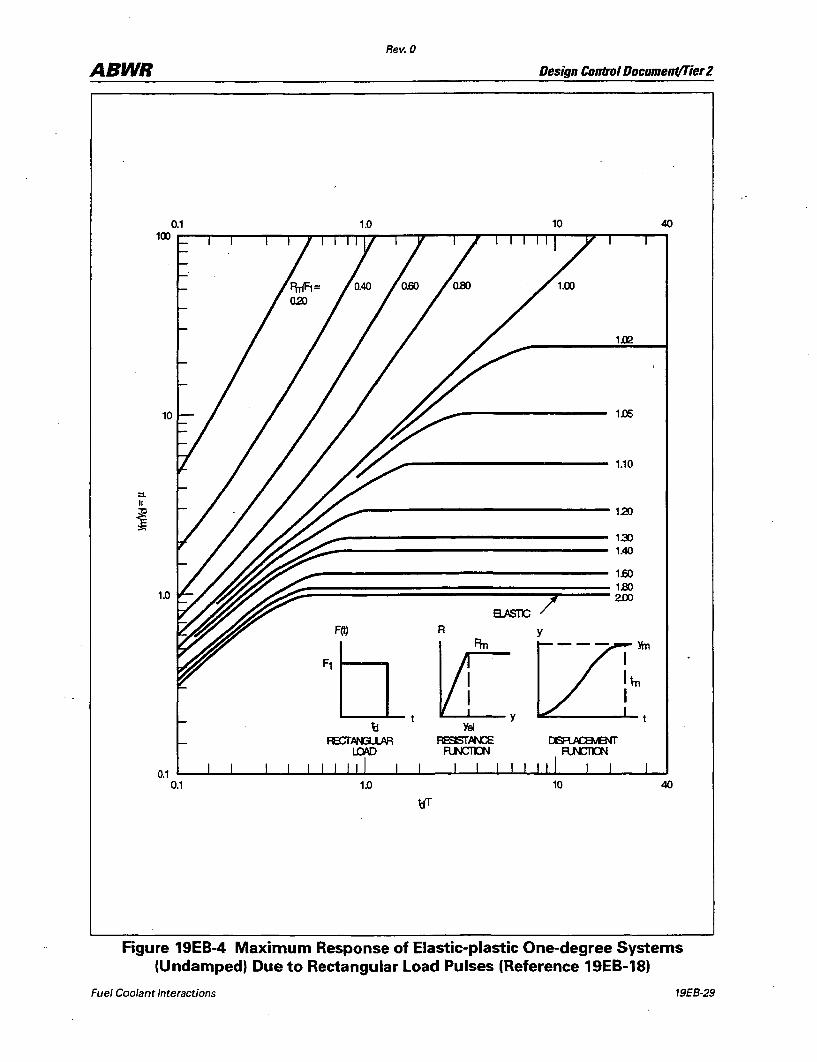
Rev. 0
ABWR Design Control Documentl11er 2
0.1 1.0 10 40 100~~--~--~~~~-r~~~~---r-'~~~TTT-~~~--~~
1.Q2
10 1.Cl5
1.10
::1. II
i 120
13:> 1.40
1.60 1..80
1.0 2.00 B..ASTX:;
F(t) R Y
~tl ~y )In
\j t YeI R:CrA/la.lAR RESlSTMCE llSFt.J!£Bvf:NT
l.QbD R..J\CTD\I R..f'.CTD'.l
0.1 0.1 1.0 10 40
Figure 19EB-4 Maximum Response of Elastic-plastic One-degree Systems (Undamped) Due to Rectangular Load Pulses (Reference 19EB-18)
Fuel Coolant Interactions 19E8-29
Rev. 0
ABWR Design Control Document/Tier 2
2.0
1.8
1.6
- 1.4 E -- 1.2 .c:: C>
·CD :c 1.0
CD 0.8 en a: 0.6
0.4
0.2
0.0
0 5 10 15 20 25 30
Mass of Corium Participating (Mg)
Figure 19EB-5 Rise Height of Water Missile
19£8-30 Fuel Coolant Interactions
Rev. 0
ABWR Design Control Document/Tier 2
1MSl31700
~I~~---------------~DA ----------------~~I IIOTES:
1. DIMENSIONSAAE IN MIllJMET'ER3
Figure 19EB-6 ABWR Containment Configuration
Fuel Coolant Interactions 19EB-31
ABWR
19E8-32
Lower Drywell
Rev. 0
Design Control Document/Tier 2
Wetwell
Figure 19EB-7 Pressure Head for Lower Drywell Flooder Flow
Fuel Coolant Interactions
Rev. 0
ABWR Design Control Document/Tier 2
Figure 19EB-8 Ablated Radius of Vessel Failure
Fuel Coolant Interactions 19EB-33
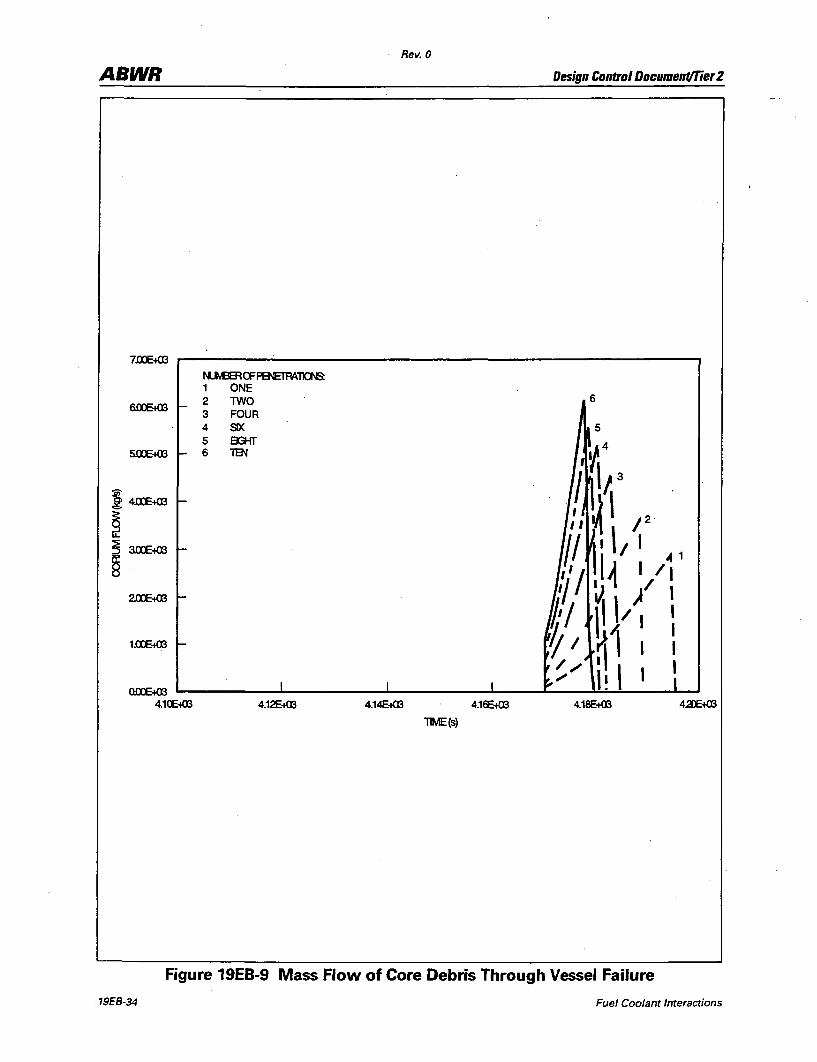
Rev. 0
ABWR Design Control Document/Tier 2
7~ ~--------~--------------------------------------------, ru.t3ERCFPENETRA"TlC:tS 1 ONE 2 TWO
6.CXJE.+m I- 3 FOUR 4 SIX 5 I3G{T
5!XEt<X3 I- 6 lBI/
1.<XE-+OO f-
I
4.12E-+OO
6
I I
4.14E-+OO 4.16E-+OO
lIME(s)
Figure 19EB-9 Mass Flow of Core Debris Through Vessel Failure
19E8-34 Fuel Coolant Interactions

Rev. 0
ABWR Design Control Document/Tier 2
19EC Debris Coolability and Core Concrete Interaction
Appendix 19E of the ABWRPRA discusses core concrete interaction. In particular, in Subsection 19E.2.1.3.6, it is stated that the core debris will be quenched preventing substantial concrete ablation due to operation of the passive flooder. Even if the flooder
was assumed to fail, water from the suppression pool would flood the lower drywell after 20.32 cm (8 inches) of radial ablation had occurred. This conclusion was based on available experimental information and the work performed in IDCOR Subtask 15.2 (Reference 19EC-l).
Since the original ABWR PRA was submitted there has been continued research in the
areas of debris coolability and core concrete interaction. Recent experiments performed at Argonne as part of the MACE program have indicated that, due to crust formation, debris cooling may be limited. This section will investigate the uncertainties associated with debris coolability in the lower drywell of the ABWR The investigation will begin with a look at applicable experimental data. Next, the issue of debris coolability will be decomposed into the controlling parameters and followed by the
development of a decomposition event tree (DET). After creation of the DET, deterministic evaluations will be made to quantify the end points of the tree. Finally, sensitivities to key assumptions will be investigated.
19EC.1 Applicability of Experiments to ABWR
Several experiments have been carried out to investigate the influence of an overlying water pool on debris coolability. The critical parameter that appears to dominate the behavior in several of the experiments is the formation of a stable crust. This crust is found to prevent substantial water ingression and, therefore, debris cooling. The major criticism of these experiments is that, due to their small scale, a stable crust is preferentially formed. This limitation makes it quite difficult to extrapolate the results
to a large reactor cavity. The MACE tests at Argonne have attempted to address this weakness by investigating larger cavity designs.
The following provides a brief summary of several debris coolability experiments.
(1) Theofanous and Saito - 1980 (Reference 19EC-2)
Experiments were performed with liquid nitrogen and water and liquid nitrogen and Freon 11. Crust formation was observed at low gas velocities but found to become unstable at high sparging rates. It was observed that as the gas velocity increased to a magnitude typical of core-concrete interaction, the
heat transfer rate increased by a factor of ten. The heat transfer rates were found to approach those associated with critical heat flux.
Debris Coolability and Core Concrete Interaction 19£C-1
Rev. 0
ABWR Design Control Document/Tier 2
(2) Greene -1988 (Reference 19EC-3)
Tests were run with liquid metals with water and Freon R11. Gases were injected in the melt. It was observed that the water/melt interactions were generally unstable and that the upward heat transfer increased with gas velocity. The typical upward heat transfer rates were found tobe 6 times greater than the classical Berenson correlation.
(3) FRAG (Reference 19EC-4)
This series of tests performed at Sandia National Laboratories (SNL) used 3 mm diameter steel spheres heated and placed in a 20 cm diameter concrete crucible. Tests were performed both with and without water addition. Both limestone and basaltic concrete types were investigated. The limestone tests showed that a stable crust made of concrete and steel formed that kept the water from penetrating the rest of the debris bed. The basaltic concrete allowed for some water penetration. The conclusion from these tests was that core-concrete attack continued even in the presence of water and that a substantial amount of steel oxidation took place.
(4) SWISS (Reference 19EC-5)
These testS, also performed at SNL, involved the interaction of molten steel on limestone concrete. The steel was heated at approximately five times the expected reactor decay heat levels. There appeared to be no violent meltwater interactions and the melt did not quench. There was a stable crust that was found to attach to the MgO sidewall. Typical upward heat flux was 800 kW /m2• There was also information from the experiment that the overlying water pool provided substantial aerosol scrubbing (DFs of 10-30).
(5) Mark I Shell Failure Experiments (Reference 19EC-6)
Several experiments were carried out Fauske and Associates, Inc. to investigate the influence of water on debris cooiability and specifically to observe drywell shell heatup. Iron-alumina thermite was discharged onto a concrete slab preflooded with water. The initial heat transfer was found to be quite high (20 times CHF) and leveled off at about 800 kW 1m2 later.
(6) MACE (Reference 19EC-7)
A series oflarge-scale experiments are being performed at Argonne National Laboratory investigating the coolability of molten-corium by water during its interaction with concrete. The MACE program has attempted to
(a) Employ prototypic corium melt materials
19EC-2 Debris Coolability and Core Concrete Interaction
Rev. 0
ABWR Design Control DocumentlTier 2
(b) Employ prototypic concrete types
(c) Obtain realistic melt temperatures
(d) Obtain realistic MCCI initial conditions
(e) Include prototypic chemical and internal heating, and by the increased size
(f) Ensure applicability to reactor cavities
In the scoping test, a high initial heat removal was observed. The crust that was formed was found to be supported by the electrodes. There were periodic melt eruptions through the crust that lead to substantial melt quenching. However, the melt did not completely cool and continued to erode concrete. One of the major difficulties with the test was that there were larger than prototypic heating rates.
The next test, MI, was performed on November 25,1991. The major difficulty with this test was that not all of the material melted initially and the sintered region on the top kept the water from penetrating the melt. Low melt-water heat transfer rates were observed. Concrete attack continued with the debris not cooled. This sintered crust configuration is not prototypical of the ABWR.
The most recent test, MIB, corrected the problems encountered with Ml. The melt temperature was observed to decrease steadily to near the concrete liquidus temperature after the water was introduced. Concrete ablation was found to continue but at a reduced rate (a few mm/h). The post-test examination showed that there were large holes in the top surface.
The experiments described above are insufficient to enable a full understanding of debris coolability in the lower drywell of the ABWR. Some insights can, however, be extracted. The following shows the observed upward heat flux for three of the tests ..
SWISS - 800 kW/m2
Mark I Shell Test - 800 kW/m2
MACE Scoping - 600 kW/m2
One of the major reasons why these tests are not prototypic is that, due to their small scale, they promote a stable crust formation. The larger scale MACE tests should generate some useful insights.
Debris Coolability and Core Concrete Interaction 19EC-3
Rev. 0
ABWR Design Control Document/Tier 2
19EC.2 Description of Event Tree Analysis
19EC.2.1 Debris Coolability
A decomposition event tree (DET) , shown in Figure 19EC-l, was developed to assess the likelihood of debris coolability. This subsection describes the branch points and the quantification of this DET.
19EC.2.1.1 Fraction of Debris in Lower Drywell Early (COR_DW_E)
This event assesses the initial debris mass which relocates to the lower drywell soon after vessel failure. The amount of debris which enters the lower drywell early is dependent on the amount of debris molten in the lower RPV head at the time ofRPV failure and on the amount of entrainment of the debris from the lower drywell. However, for simplicity, debris entrainment to the upper drywell was conservatively neglected in this analysis. For consistency with the DCH analysis, two regimes are considered for the fraction of the core inventory which is molten in the RPV at the time of RPV failure (Subsection 19EA.2.1.4). These regimes are:
Low 0 - 20% (nominal 1 0%) *
High 20 - 60% (nominal 40%)
*Probabilites not part ofDCD (Refer to SSAR).
19EC.2.1.2 Amount of Initial Debris Superheat (SUP_HEAT)
This event is used to represent the initial debris temperature when the debris first contacts the lower drywell floor. It is also used as a surrogate to represent the additional metal/water reaction heat production associated with a high metal to oxide ratio in the debris. Superheated debris or debris with a high metal content is expected to be more ~cult to quench initially and to experience faster initial concrete erosion. In the deterministic CCI analysis discussed in Subsection 19EC.3, the low superheat cases are represented by (molten) debris at the U-Zr-O eutectic melting temperature (approximately 2500 K). High superheat was taken to be temperatures in the range 300-500 Kabove the melting temperature. This was represented in the deterministic analysis by increasing the amount of steel added to the melt prior to vessel breach.
Two cases were considered in the DET analysis. The first case represents sequences with a small amount (10% of core inventory) of molten debris in the lower plenum at vessel rupture and the second case represents large amounts of debris (40%).
• Case l-Small Debris Mass in Lower Drywell Early
79EC-4 Debris Coolability and Core Concrete Interaction
ABWR Rev. 0
Design Control Document!Tier 2
For the case of a small debris mass in the lower RPV, it is likely that either
(1) Vessel failure occurred fairly quickly after core slump into the lower plenum (MAAP-type failure model), or that
(2) The debris in the lower plenum was initially quenched by residual water in the lower plenum and that RPV failure occurred later, after the water was boiled away and the debris started to reheat (BWRSAR-type failure model).
For these situations it is judged likely that the debris temperature will be at, or near, its melting point.
For the case of a large amount of molten debris it could be expected that this resulted from a delayed failure of the RPV allowing more debris to flow into the lower plenum (MAAP model) or for melting and heating of quenched debris already relocated to the lower plenum (BWRSAR model). For both situations the extended time to vessel failure could result in higher molten debris temperatures at RPV failure. It is unclear what the actual debris temperature would be for this case. Hence, equal probabilities are assigned to each branch to represent this large uncertainty ..
19EC.2.1.3 Debris Quenched Early (QUENCH_E)
The probability that long term debris cooling will be established is greatly increased if the initial debris pour is quenched soon after being expelled from the vessel. Initial quenching of the debris implies either that the debris has been fragmented to sizes which allow cooling, or if the debris is a continuous "pool" that it is sufficiently shallow to allow cooling by conduction through the layer of solid debris.
The ABWR design makes it extremely unlikely that water will be in the lower drywell prior to RPV failure. Most of the core damage frequency is the initiated by a transient. This type of sequence would not result in water in the lowerdrywell at the time of vessel failure. Only a LOCA in the RPV bottom drain line or an accident in which a large mass of water is added to the containment before core damage would result in water entering the drywell. All other LOCAs blow down into the upper drywell (which drains directly to the suppression pool). Hence, water which enters the lower drywell coincident with
the expelled debris must come from residual RPV inventory or from in-vessel injection systems which are operating at (or are initiated at) RPV failure. For a MAAP-type melt progression the lower plenum is nearly full of water at the time of vessel failure. Thus, 70,000 kg of water is available to quench the debris.
In addition, water may enter the lower drywell at the time of vessel failure via the passive flooder. Ifwater from the vessel does not enter the cavity, the debris will rapidly heat the
lower drywell, and the flooder will open quickly. Fora BWRSAR type melt progression model, there will not be water in the lower plenum at the time of vessel failure. In this
case, the lower drywell will heat up quickly and the passive flooder will open. A
Debris Coolability and Core Concrete Interaction 19EC-5
ABWR
19EC-6
Rev. 0
Design Control Document/fier 2
calculation was performed with a modified version ofMAAP-ABWR, which simulates the BWRSAR melt progression model, described in Subsection 19EC.6. Case LATE indicates that the flooder will open about 30 minutes after vessel failure for this case. Thus, it is very likely that water will be available to quench the initial debris expelled from the vessel.
The major parameters judged to impact the probability of initial debris quenching are
(1) The mass of debris in the lower drywell following RPV failure
(2) The availability of water in the lower drywell
(3) The initial temperature of the debris
The mass of debris retained in the lower drywell is determined in a preceding event. The initial debris temperature is also determined in a prior event. The source of water depends on the presumed core melt progression model as described above. In a MAAPtype melt progression, the initial availability of water is assured. For a BWRSAR model, the water comes either from injection systems which begin to inject at vessel failure or from the operation of the flooder which is considered in the next node. Since no credit will be taken for early quenching if a significant amount of debris enters the cavity before lower drywell flooding occurs, the order of this question and the late cavity flooding question (CAVWAT_L) question is not important for the BWRSAR case.
Four cases were defined in the DET. These cases are:
• Case 1-5mall Debris Mass and Low Superheat
For this case, approximately 24000 kg of molten debris are released from the RPV at vessel failure. Since the debris has a low superheat and the debris depth is very shallow « 5 em) it is highly likely that the debris would be initially quenched.
• Case 2-5mall Debris Mass and High Superheat
As for Case 1, approximately24000 kg of molten debris are released from the RPV at vessel failure. In this case, the debris has a high superheat and, although the debris depth is very shallow « 5 em), it is somewhat less likely that the debris would be initially quenched when the lower drywell is flooded for this case than for Case 1.
• Case 3-Large Debris Mass and Low Superheat
For this case, approximately 94000 kg of molten debris are released from the RPV at vessel failure. The debris depth in this case would be relatively shallow « 15 cm). Since the debris pool is relatively shallow and the debris superheat is low, it is judged that it is likely to be initially quenched when the lower drywell is flooded.
Debris Coo/ability and Core Concrete Interaction

Rev. 0
ABWR Design Control Document!Tier2
• Case 4-Large Debris Mass and Low Superheat
As for Case 3, approximately 94000 kg of molten debris are released from the RPV at vessel failure and the debris depth would be relatively shallow « 15 cm). However, the debris superheat is high and it is judged to be indeterminate whether or not the debris will be quenched by residual RPV coolant inventory.
19EC.2.1.4 Water Enters Cavity Late (CAVWAT_L)
This parameter is used to represent the longer term addition of water to the lower drywell. The lower drywell water addition system~ which are considered are the direct drive diesel firewater system, any vessel injection which is available late in the accident and the passive flooder. Initiation of the firewater addition system is the most likely means oflate water addition to the lower drywell. If the firewater system is not started, the passive flooder system will begin to inject water when the fusible material, located at the ends of the pipes near the drywell floor, melts. The fusible material on the passive flooder system is assumed to open when the lower drywell gas temperature reaches 533 K (500°F). Assuming a BWRSAR melt progression model, the fusible valves on the passive flooder system would open in approximately 30 minutes. For a MAAP-type melt progression model, the water in the lower drywell is first boiled off. The debris then begins to heat up. If the debris is quenched during the early boil-off phase the debris must reheat resulting in approximately 2 hours to flooder actuation. If the debris was not quenched early, the flooder opens about 30 minutes after the debris bed dries out. This event is a sorting type event, quantified (either 0 or 1) based on prior branch decisions in the CET.
19EC.2.1.5 Time Remaining Core Debris Falls Into Cavity (COREDROP)
This event assesses the timing of the entry of the remaining debris into the lower drywell relative to the timing of the addition of water (i.e., from the passive flooder or firewater system). If the majority of the debris is held up in the vessel until after water addition begins, then debris cooling is substantially more likely than if the bulk of the RPV debris enters the lower drywell prior to water addition. MAAP calculations indicate that the residual RPV debris will melt and fall into the lower drywell very slowly after vessel failure. This behavior is also typical of BWRSAR-type calculations (Reference 19EC-8).
Two cases are considered in the quantification of the event. The timing of residual RPV . debris entry into the lower drywell is considered to be sensitive to the extent of the acciden t progression in-vessel at the time of vessel failure. For the case of a small amount of molten debris in the lower RPV plenum at RPV failure (Event 1 in this DET), it is inferred that RPV failure has occurred relatively "early" in the in-vessel accident progression process. Conversely, for a large amount of molten debris in the lower RPV plenum at RPV failure, it is more likely that the in-vessel accident progression ~s further advanced at the time ofRPV failure. Consequently, it would be expected that for the
Debris Coolability and Core Concrete Interaction 19EC·7
ABWR Rev. 0
Design Control Document/Tier 2
case of small initial debris pours the timing between vessel failure and later debris pours would be delayed relative to the case of large initial debris pours. Based on insights from ABWR specific MAAP analyses and from a review of BWRSAR calculations for other BWR sequences branch probabilities were estimated.
19EC.2.1.6 Heat Transfer Rate to Overlying Water (HT_UPWARD)
79EC-B
This event assesses the longer term steady state heat transfer rate which characterizes upwards heat transfer from the debris. Three regimes are considered
(1) Heat transfer limited by hydrodynamics in an overlying water pool (CHF limit)
(2) Heat transfer limited by film boiling to an overlying water pool
(3) Heat transfer limited by conduction through a debris crust on the upper debris surface
Nominal values of the heat transfer rate used in the deterministic CCI model to characterize these three heat transfer regimes are 900, 300 and 100 kW /m2,
respectively.
The conduction limit represents conditions where a crust forms on the surface of the debris and water cannot penetrate into the debris bed. The use of a 100 kW /m2 heat flux is believed to be very conseIVative. Hthe debris is not quenched and core concrete interaction occurs, the upper crust will thin to a condition where the upward and downward heat fluxes are nearly equal. This will lead to a heat flux much higher than 100 kW /m2. Therefore, this value will lead to very aggressive core concrete interaction. Further discussion of the upward heat flux for the conduction limited configuration is given in Subsection 19EC.3.1.
The hydrodynamic limit represents Cases where water can penetrate into the debris bed allowing a much greater effective debris/coolant heat transfer area. Under these conditions the heat transfer rate is limited by the ability of the water to penetrate the debris bed. The use of 900 k W / m 2 is much lower than the typical heat fluxes observed in the experiments performed to date.
The film boiling regime is selected to represent an intermediate heat transfer rate where, for example, the crust is unstable allowing water to penetrate the debris bed in a limited fashion. The early phase of the experiments indicate a heat flux well in excess of 300 kW/m2 before the formation ofa crust
Four cases were identified for quantification. These cases are described below.
Debris Coolability and Core Concrete Interaction
ABWR Rev. 0
Design Control Document/T'ier 2
• ,Case I-Large Debris Mass in Lower Drywell Early, Debris Initially Quenched and Residual Core Debris Enters Lower Drywell Mter Flooding
This case is considered the most favorable set of conditions for establishment of a particu1ated debris bed which would be conducive to water ingression and coolability. The initial phase of the interaction is characterized by a large amount of debris which is initially quenched in the lower drywell. Prior to the entry of the residual RPV debris, the lower drywell is flooded resulting in the residual debris pouring into a pool of water which is likely to lead to fragmentation, quenching and the establishment of a particle bed. Consequently, a high probability is assigned under these conditions to an upwards heat flux characteristic of a particle bed with water ingression.
• Case 2-Small Debris Mass in Lower Drywell Early, Debris Initially Quenched and Residual Core Debris Enters Lower Drywell Mter Flooding
This case is considered to represent nearly as favorable a set of conditions for establishment of a particulated debris bed as was Case 1. In contrast to Case 1 however, the initial phase of the interaction is characterized by only a small amount of debris which is quenched in the lower drywell. Hence, a larger amount of debris enters the lower drywell after RPV failure than for Case 1. Prior to the entry of the residual RPV debris, the lower drywell is flooded resulting in the residual debris pouring into a pool of water which is likely to lead to fragmentation, quenching and the establishment of a particle bed. Consequently, as for Case 1, a relatively high probability is assigned under these conditions to an upwards heat flux characteristic of a particle bed with water ingression.
• Case 3-No Initial Debris Quench and Residual Core Debris Enters Lower Drywell MterFlooding
This case is considered less favorable for establishment of a particulated debris bed which would be conducive to water ingression and coolability. The initial phase of the interaction is characterized by failure to quench the debris soon after RPV failure. However, prior to the entry of the residual RPV debris, the lower drywell is flooded resulting in the residual debris pouring into a pool of water which is likely to lead to fragmentation of this debris. However, since the initial debris pour was
not quenched, long term establishment of a coolable particulated debris bed is somewhat uncertain. Consequently, a lower probability has been assigned for the most favorable debris bed configuration compared with Cases 1 and 2.
• Case 4-Residual Core Debris Enters Lower Drywell Prior to Flooding
This is considered the least favorable set of conditions for establishment of a particulated debris bed which would be conducive to water ingression and
Debris Coolability and Core Concrete Interaction 19£C-9
ABWR Rev. 0
Design Control Document/fier 2
coolability. For this case the bulk of the residual core debris enters the lower drywell prior to lower drywell flooding. This could lead to fonnation of a molten pool undergoing concrete attack. Later water addition, instead of particulating the debris may lead to crust fonnation, limiting the ability of water to penetrate into the debris.
19EC.2.1.7 Core Debris Concrete Attack (CCI)
This event characterizes the nature of the debris concrete attack. Three branches are considered. The No CCI branch represents cases where the little or no debris concrete attack would be expected. Wet CCI represents cases where CCI occurs in the presence of an overlying water pool and Dry CCI is for cases where the lower drywell was not flooded.
• Case I-Lower Drywell Not Flooded
The Dry eCI case occurs for all sequences where both active injection and the passive flooder fail to supply water to the lower drywell after vessel failure. Under these conditions Dry CCI is assured.
• Case 2-Lower Drywell Flooded, Upward Heat Transfer Limited by CHF
For cases where tIle lower drywell is flooded, MAAP analysis and supplemental hand calculations indicate that if the upward heat transfer is above about 300-400 kW 1m2
then the debris bed will be coolable.
• Case 3-Lower Drywell Flooded, Upward Heat Transfer Limited by Film Boiling
For cases where the lower drywell is flooded, MAAP analysis and supplemental hand . calculations indicate that if the upward heat transfer is in the range of about 300 kW 1m2 then the debris bed should be coolable. Since this case represents a range of upward heat transfer regimes (200-400 kW 1m2) and the lower part of this range may not in all cases be coolable and probabilities were assigned accordingly.
• Case 4--Lower Drywell Flooded, Upward Heat Transfer Limited by Conduction
For cases where the lower drywell is flooded, MAAP analysis and supplemental hand calculations indicate that if the upward heat transfer is below about 200 kW 1m2 then the debris bed will not be coolable.
19EC.2.2 Pedestal Resistance to CCI
This subsection describes the decomposition event tree (DET) analysis used to assess the probability of pedestal failure as a result of radial core concrete (eCI) attack in the lower drywell after reactor vessel failure. The DET is shown in Figure 19EC-2. Pedestal wall failure is considered to be sensitive to
(1) The nature of the CCI (Le. whether wet or dry)
19EC-10 Debris Coolability and Core Concrete Interaction
Rev. 0
ABWR Design Control Document/Tier 2
(2) Whether the debris spreads from lower drywell into the suppression pool following radial penetration through the pedestal wall to the wetwell/ drywell connecting vents
(3) The extent of radial erosion compared to downward erosion
The lower drywell will be flooded in most cases as a result of either active injection systems such as the firewater addition system or via passive injection through the lower drywell flooder.
19EC.2.2.1 Core Concrete Attack (CCI)
This event characterizes the nature of core concrete attack. Three branches are considered.
• NoCCI
• WetCCI
• DryCCI
The No CCI branch represents cases where there is little or no concrete attack. Wet CCI represents cases where CCI occurs in the presence of an overlying water pool. Dry CCI is for cases where the lower drywell was not flooded. The rate of CCI is higher for cases with dry CCI.
This event is a sorting type event which assigns a probability of 0 or 1 depending on the final branch taken in the CCI CET.
19EC.2.2.2 Suppression Pool Water Floods Lower Drywell after Downcomer Penetration (SP _INGRESS)
This event assesses if suppression pool water will flood into the lower drywell after the erosion front reaches the wetwell/ drywell connecting vents. The vents are imbedded in the pedestal. If 25 cm of the pedestal concrete is eroded, the ablation front will reach the inner surface of the connecting vents. It is considered quite likely that this will result in water ingression and flooding of the lower drywell.
This event is only significant for Dry CCI sequences where the lower drywell is not flooded by either active injection or the passive flooder. The probabilities are assigned based on judgement.
19EC.2.2.3 Debris Flows From Lower Orywell to Suppression Pool after Oowncomer Penetration (WW_DEB)
This event assesses whether a significant amount of the molten debris will flow from the lower drywell into the suppression pool following penetration of the wetwell/ drywell
Debris Coolability and Core Concrete Interaction 19EC-11
ABWR Rev. 0
Design Control Document/11er 2
. connecting vents. Mter 25 em of radial erosion the ablation front will reach the inner surface of the down comers. The floor of the lower drywell is above the bottom of the connecting vents, which, in tum, are above the floor of the wetwell. Thus, once the downcomers are breached, a flowpath exists from the lower drywell into the suppression pool. Flow of a significant portion of the molten debris into the suppression pool will increase the debris surface area in contact with water and decrease the debris depth in the lower drywell. Although there is a great deal of uncertainty in this behavior, it is considered fairly likely that the debris will flow into the suppression pool.
19EC.2.2.4 Ratio of Radial to Axial Erosion (RAD EROS)
Given that CCI is occurring, this event assesses the ratio of the radial concrete erosion to the downward erosion. Three branches are considered 1/5,1/3 and 1/1. CCI experiments have generally demonstrated significantly more downward concrete penetration than radial penetration. It is hypothesized that radial erosion is limited because the concrete decomposition gasses establish a gas film between the debris pool and the concrete walls. This gas film acts to insulate the concrete sidewalls, and to convect debris heat upwards: This limits the heat transfer to, and ablation of, the concrete sidewalls. Conversely, the gas film at the bottom surface of the pool would be unstable due to the heavier overlying debris pool. The density difference would cause the lower gas film to collapse, allowing contact of the debris with the concrete. This difference in gas film behavior would limit the sideward heat transfer compared to the downward heat transfer.
In the BETA series of debris concrete experiments conducted at the KfK research center in Germany, downward erosion rates exceeded sideward erosion rates by a factor from 3 to greater than 5. For example, in the high power CCI experiment BETA Vl.8, the downward erosion was measured to be approximately 40 cm and the sideward erosion was only about 2 cm (1/20 sideward to downward erosion ratio). For the low power experiment V6.1, the downward erosion was 35 cm and the sideward erosion was 10 cm (1/3.5 ratio).
Based on the CCI experiments, and the generally accepted model described above, it seems appropriate to assume that downward erosion is strongly favored over sideward erosion. Consequently, larger probabilities are assigned to the 1/5 and 1/3 branches than for the 1/1 branch. However, since some residual uncertainty remains as to the appropriate assumption for the extent of radial erosion for large reactor scale situations, a small probability ofis assigned to the 1/1 erosion branch.
19EC.2.2.5 Pedestal Failure (PED)
19EC-12
This branch assesses the probability of pedestal failure as a result of excessive radial concrete erosion of the lower drywell pedestal wall.
Debris Coolability and Core Concrete Interaction

ABWR Rev. 0
Design Control Document/Tier 2
Structural analysis of the pedestal indicates that the loads can be supported without yielding if only the outer shell and 15 cm of the steel webbing remains in tact. Thus, for a total wall thickness of 1.7 m, the lower limit for the amount of radial erosion which can be sustained without pedestal structural failure is 1.55 m. However, since the total depth of the pedestal is 1.7 m, erosion to the full 1.7 m depth will obviously result in pedestal failure. Additional discussion of the pedestal strength under radial concrete erosion is presented in Subsection 19EC.4.
Analyses were performed to estimate the extent of concrete erosion in the lower drywell under a variety of conditions. The results of these analyses are summarized in Subsection 19EC.5. Four cases were considered in the DET for quantification of pedestal wall failure. These cases are described below.
• Case I-Debris Flows into Suppression Pool after Downcomer Penetration
This case represents sequences where a substantial amount of the core debris relocates into the suppression pool after down comer penetration. This is represented by deterministic calculations FMXIOO, FMXCSP and NFlood. The calculations indicate that the increase in the pool surface area results in either a coolable debris configuration, or greatly reduced radial erosion rates. Consequently, the likelihood of sufficient radial penetration to fail the pedestal in this case is considered to be remote.
• _ Case 2-Wet CCI With No Debris Flow into The Suppression Pool after Downcomer Penetration
For sequences where CCI was predicted to occur in the presence ofm overlying water pool with no debris relocation to the suppression pool, the maximum amount of downward concrete erosion at 50 hours was 1.55 m (Case FMXIP). Using this value for the amount of axial erosion, the radial erosion depth is estimated for the three cases. Comparing this value to the pedestal capability of 1.55 m, estimates were made for the probability of pedestal failure.
• Case 3--Dry CCI With No Debris Flow into Suppression Pool and No Late Suppression Pool Water Ingression into The Lower Drywell
This case represents case DRY in the deterministic analysis. In this case the debris is assumed to remain dry for the entire duration of the accident. No flow of either water or debris through the wetwelll drywell connecting vents is presumed to occur when the ablation front reaches the vents. For this case the axial ablation depth at 50 hours was calculated to be 2.5 m. Using this value to estimate the radial erosion depth for the three radial to axial erosion ratios, split fractions are assigned based on the pedestal capability.
Debris Coolability and Core Concrete Interaction 19EC-13
ABWR Rev. 0
Design Control Document/Tier2
• Case 4-Dry eel With No Debris Flow into The Suppression Pool and Late Suppression Pool Water Ingression into The Lower Drywell
The case in which the debris is initially dry, but becomes flooded with water after the ablation front reaches the wetwell/drywell connecting vents is considered to be slightly better than ease 3. In this case the debris is assumed to remain in the lower
drywell throughout the period of eel.
19EC.3 Deterministic Model for Core Concrete Interaction
As described above, several key parameters influence the potential for concrete erosion in the presence of an overlying water pool. An analytical tool was selected to investigate the impact that these parameters have on eCI, containment pressurization, opening of the overpressure protection system, and possible fission product release. MAAP-ABWR was selected since, with a few minor code modifications, it was capable of investigating the key parameters identified in the DET. MAAP~ABWR allowed the impact of patametervariations to be carried out through containment pressurization and fission product release.
A few simple code modifications were made to allow the user to control the debris coolability and to simplify the specification of the severe accident scenario. These changes are summarized below.
(1) Subroutine PLS1M was modified to allow the user to specify the upward heat flux. Model parameter, FCHF, was redefined to be the upward heat flux in Watts/m2. All other debris-to-water heat transfer mechanisms were disabled in PLS1M.
(2) The following actions were added to the MAIN routine:
(a) Iflower drywell gas temperatur~ exceeds 533 K- open passive flooder
(b) If radial erosion exceeds 25 em - allow debris to spread to wetwell and allow water to flood the lower drywell
(c) If radial erosion exceeds 50 em (note that this limit is very conservative) - fail drywell with an area of ADWLEK (user input)
(d) If upper drywell wall surface temperatUre exceeds 533 K - begin to leak out of the upper drywell as specified in Subsection 19F.3.2.2
The major assumptions included in the MAAP analysis are described below:
(1) cel experiments have generally demonstrated significantly more downward concrete penetration than radial penetration. It is hypothesized that radial erosion is limited because the concrete decomposition gasses establish a gas film between the debris pool and the concrete walls. This gas film acts to
19EC-14 Debris Coolability and Core Concrete Interaction
ABWR Rev. 0
Design Control Document/Tier 2
insulate the concrete sidewalls, and to convect debris heat upwards. This limits the heat transfer to, and ablation of the concrete sidewalls. Conversely, the gas film at the bottom suIface of the pool would be unstable due to the heavier overlying debris pool. The density difference would cause the lower gas film to collapse, allowing contact of the debris with the concrete. This difference in gas film behavior would limit the sideward heat transfer compared to the downward heat transfer.
In the BETA series of debris concrete experiments ,conducted at the KfK research center in Gennany, downward erosion rates exceeded sideward erosion rates by a factor from 3 to greater than 5. For example, in the high power CCI experiment BETA VI.8, the downward erosion was measured to be approximately 40 cm and the sideward erosion was only about 2 cm (1/20 sideward to downward erosion ratio) . For the low power experiment V6.1, the downward erosion was 35 cm and the sideward erosion was 10 cm (1/3.5 ratio).
Based on the CCI experiments, and the generally accepted model described above, it seems appropriate to assume that the ratio of radial to axial attack is 1/5. However, this parameter is included as a parameter in the DET for pedestal erosion since the ratio is still uncertain. '.
Since MAAP assumed that radial and axial penetration were identical, the axial ablation numbers were multiplied by 1/5 to obtain an estimate on the radial attack depth.
(2) The heat transfer from the debris to the water was assumed to be equal to the user specified value throughout the transient.
Other than the changes described above, the standard MAAP-ABWR code was used to quantify the CCI decomposition event tree.
19EC.3.1 Minimum Heat Flux
The most critical element in determining the potential for core concrete interaction, and the containment response if it should occur is the minimum heat flux. The heat transfer between the water and the debris can be limited by:
(1) Conduction within the debris
(2) Critical heat flux
(3) Film boiling
Debris Coolability and Core Concrete Interaction 19EC-15
ABWR Rev. 0
Design Control Document/Tier 2
The last is of concern if the debris surface temperature remains so hot that the water cannot wet the surface, i.e. if an insulating blanket of steam fonns. Film boiling has been observed in well controlled laboratory environments using polished surfaces. However, it has also been observed that the smallest of surface imperfections or contaminants quickly results in a transition to nucleate boiling. It seems highly unlikely that the irregular surface of the debris would be able to maintain itself in film' boiling. Therefore, film boiling is not likely to limit upward heat transfer.
Critical heat flux is sufficiently high that it would not impose a practical limit on debris coolability. Therefore, a lower limit on the upward heat flux may be obtained by consideration of the conduction limit. The biggest unknown is whether the debris remains in an intact slab-like configuration, an intact configuration with irregularities which increase the heat transfer area and act as fins, or if,the debris develops cracks which allow water to ingress. The presence of cracks would increase the heat flux. Therefore, let us consider the worst situation (intact slab).
The temperature distribution in steady state, assuming one dimensional heat transfer and a homogeneous debris mixture, is given by:
2 kd -; ", 0 +q =
ax (19EC-1)
where:
k thennal conductivity (3.5 W /mKfor oxide debris)
q'" = volumetric heat generation
It is sufficient for our purposes to consider the case ofl % decay power. For a total debris mass of about 235,000 kg, this implies an average initial volumetric heat generation rate:
q'" = (1.5) ~ m
In a one-dimensional flat geomeny, integrating Equation 19EC-1 twice yields:
If we
III 2 T = -q x +C
1x+C
2 2k
(1) Assume nucleate boiling is maintained at the surface
(19EC-2)
19EC-16 Debris Coolability and Core Concrete Interaction
Rev. 0
ABWR Design Control Oocument/Tier 2
(2) Conservatively assume that the bottom of the debris in contact with concrete is adiabatic
(3) Impose the condition that the debris not ablate concrete and the temperature at the debris-concrete interface is 1550 K.
we obtain:
C2 == 1.550 K
T (Olim) == 450 K
where:
debris thickness
Substituting into Equation, we have for the limiting debris thickness for coolability:
o.im == 0.07 m
This means that if we are in nucleate boiling at the surface, we can just remove decay heat purely by conduction through the debris slab at a thickness of 7 cm. The surface heat flux is:
q" = q"'o.im = 100kW 1m2
The heat flux which would result from critical heat flux would be substantially higher than this value. Thus, one could view this as the lowest possible upward heat transfer given the boundary conditions. A higher temperature at the bottom of the crust or heat transfer into the slab would both increase the debris-to-water heat transfer.
This rather low heat transfer would be increased if the surface was of non-uniform thickness (fin effects) or especially if the surface cracked sufficiently to allow water to ingress.
19EC.4 Pedestal Strength
The configuration of the ABWR pedestal is shown in Figure 1.2-13e. The width of the pedestal is 1.7 m. The design consists of two concentric steel cylinders connected by steel web stiffeners. Ten wetwell-drywell connecting vents run through the annular region between the cylinders. The remainder of the space is filled with concrete. If significant core concrete attack occurs, the strength of the pedestal could be compromised as the pedestal is eroded. The strength of the pedest::i.I after it has
Debris Coolability and Core Concrete Interaction 19EC-17
ABWR Rev. 0
Design Control Document/Tier 2
undergone erosion is examined to detennine the maximum erosion depth allowable to ensure that the pedestal does not collapse.
The pedestal is designed based on the maximum stress obtained in the steel plates. The strength of the concrete is neglected. The allowable stress in the steel plates is 0.6 times the yield strength, neglecting temperature. The calculated stress without seismic loads in the ABWR pedestal is 0.4 times the yield strength.
For design analysis the largest single load is the accident temperature. If core concrete interaction were to take place as a result of a severe accident, the inner plate of the pedestal would melt. WIthout a continuous inner plate the moment induced by the differential temperature disappears. It is expected that any temperature induced moments acting along the stiffeners will be strain limited. Therefore, they will not reduce the capability of the outer plate.
In order to estimate the allowable ablation depth, the seismic and thermal loads are removed and the remaining loads are calculated. No attempt was made to take credit for the relocation of fuel from the vessel onto the floor of the drywelL The strength of the remaining concrete is neglected. The loads are compared to the yield strength of the remaining pedestal steeL Therefore, this calculation corresponds roughly to a service level C type of calculation.
The results of the calculation show that the outer shell of the pedestal plus 15 cm of the web stiffeners are required to maintain the pedestal loads below 90% of yield. This limit is used as a conservative estimate of the pedestal ultimate capability after erosion. The total pedestal width is 1.7 m. Therefore, pedestal integrity is ensured for ablation depths up to 1.55 m.
19EC.5 Application of eel Model to ABWR
The deterministic code used for investigating core-concrete interaction in the ABWR was described in Subsection 19EC.3. This subsection will describe the evaluations that were made to support the quantification of the CCI decomposition event tree.
19EC.S.1 Sequence Selection
The MAAP':'ABWR code, as modified for this application, allowed for a great amount of flexibility in analyzing the impact of key parameter variations on core-concrete attack. The following lists the key parameter variations that were investigated:
(1) Upward heat transfer to overlying water pool
(2) Mass of debris discharged from vessel
(3) Mode of fission product release from containment
19EC-18 Debris Coolability and Core Concrete Interaction

Rev. 0
ABWR Design Control Document/Tier 2
(4) Flooding of lower drywell resulting from radial penetration ofverticaI connecting vents
(5) Debris spreading related to radial penetration ofverticaI connecting vents
The base case sequence selected to investigate core concrete interaction was the low pressure loss of injection scenario. This event was initiated by a transient with the assumption that all injection was unavailable. The RPV was depressurized manually when the core level dropped below 2/3 core height. Without coolant injection, the core melts and slumps into the lower vessel head. Local penetration failure occurs and the debris is discharged into the lower drywell. A radial to axial ablation rate of 1/5 is assumed in all sequences. Table 19EC-l provides a chronology of the events up until the vessel is failed.
Table 19EC-2 defines each of the sequences analyzed and provides a summary of the results. The first column gives the case designation along with reference to specific notes. Columns two through four provide the relevant sequence definition infonnation. For purposes of demonstration, all cases were executed for the dominant sequence, a low pressure loss of injection sequence with a containment pressure at the time of vessel breach of approximately 1 atm. The upward heat flux was varied between 100, 300, and 900 kW 1m2• A value of 100 kW 1m2 was selected to approximate the heat transfer associated with a stable crust formation where the upward loss is controlled by conduction of heat through the crust. A value of 300 kW 1m2 was selected to represent limited water ingression into the debris bed with the upward heat transfer being controlled by film boiling. The largest value Used represents the critical heat flux limit for debris cooling; Further discussion of these values is included in Subsection 19EC.2.1.6
As run in its standard manner MAAP-ABWR calculates that 60% of the total core inventory was released from the vessel. The remaining 40% was calculated to be held up in the core with the decay heat being radiated to the vessel wall and convected into the upper drywell. The 40% remaining behind is typically the outer peripheral bundles which have low decay heat. To support the DET quantification, additional cases were run assuming that 100% of the core was discharged from the reactor vessel. This has two major influences on the containment behavior. Without the peripheral bundles in the core, the drywell heatup is reduced. Second, the added core mass on the lower drywell floor will influence the calculation of core-concrete attack, debris coolability and containment pressurization.
Debris Coo/ability and Core Concrete Interaction 19EC-19
Rev. 0
ABWR Design Control Document/Tier 2
19EC.5.2 Summary of Results
Table 19EC2 summarizes the results of the deterministic analyses for the ABWR. The following general conclusions are indicated by these results:
(1) For all sequences with successful operation of the £looder, radial concrete erosion was less than the structural limit described in Subsection 19ECA. Radial attack does not pose a significant challenge to containment.
(2) For sequences with operation of the containment overpressure protection system, due to suppression pool scrubbing, the fission product release is dominated by noble gas.
(3) Release times for cases with the passive £looder are on the order of 20 hours after the initiation of core damage (defined as onset of melting).
(4) The extended time period between vessel breach and rupture disk actuation (or containment failure) provides for a substantial reduction in the amount of fission product released from containment.
(5) Using experimentally-based values for the upward heat transfer (Subsection 19EC.1) would result in debris cooling in the ABWR and early termination of the core concrete attack. Therefore, the lower bound for upward heat transfer is conservatively assumed to be 100 kW 1m2• This is done in order to obtain substantial concrete erosion and demonstrate the robustness of the containment design if the debris is not quenched.
(6) For the dominant scenarios with successful operation of firewater to provide water to the debris, the time from onset of melting to fission product release is 24 hours from the beginning of the accident for all upward heat transfer rates.
A set of plots for case FMX100 case are included in Figures 19EC-3 through 19EC7. This case demonstrates long-term core-concrete interaction, but is otherwise typical of the conditions analyzed. The depletion of zirconium in this case occurs at about 20,000 seconds, coincident with the onset of CO production. The hydrogen gas generation is not equivalent to the amount which would be generated from a 100% metal water reaction because of a competing reaction between the zirconium and CO2•
19EC.5.3 Initial Concrete Attack due to Impinging Corium Jet
19EC-20
At vessel failure, core material is discharged from the RPV onto the floor of the lower drywell. At low RPV pressures, the discharge rate of the debris is controlled by gravity and the vessel breach area in the lower head. From analyses performed for FCI calculations, Subsection 19EB.6.2.2, it is assumed that ten penetrations failed. This
Debris Coolability and Core Concrete Interaction
ABWR Rev. 0
Design Control Documenf/Tier 2
results in a maximum corium discharge rate of 6000 kg/so The total failure area is 0.145 m 2• Assuming a density for corium of 8000 kg/m3, a discharge of 6000 kg/s corresponds to a corium velocity of 5 m/ s. The following calculation estimates the initial concrete attack depth resulting from this impinging corium jet
The model from the MAAP subroutine JET (Reference 19EC-9) was used to compute the concrete attack from an impingingjet of corium. The stagnation point heat transfer coefficient between the corium jet and the concrete is approximated by the expression,
or
where:
J.1cm
h
Pcm
Nu
Re
Nu = hD = 1.14JRe T
t aoU, h = 1.14kem J.1 D.
em Jet
Corium thermal conductivity
= Corium viscosity
= Velocity of the corium stream impinging on the floor
= Diameter of the jet
= Heat transfer coefficient
= Corium density
= Nusselt number
= Reynolds number
The corium velocity at the cavity floor is given by,
where:
= Velocity of the corium expelled from the reactor vessel
g = Acceleration of gravity
(19EC-3)
(19EC-4)
(19EC-5)
Debris Coolability and Core Concrete Interaction 19EC-21
ABWR Rev. 0
Design Control Document/Tier 2
and traIl is defined by
(19EC-6)
where:
= the elevation of the reactor vessel above the lower dryweU floor.
A crust of frozen corium forms on the concrete and the ablation process is the same as at the reactor vessel penetration. Thus, the concrete ablation velocity is given by
(19EC-7)
where:
Tan = Bulk. corium temperature
Pen = Concrete density
cpcn = Concrete specific heat
Yen = Concrete latent heat
Tcnp = Concrete melting temperature
To = Initial concrete temperature
Substituting the corium velocity and the ABWRspecific geometrical parameters into the above equations, results in an ablation rate of approximately 1 cm/ s. With the debris being discharged over 5 seconds, the resulting ablation depth is 5 cm. This would only occur in the central portion of the lower drywell, and would in no way threaten the integrity of the structures.
19EC.6 Sensitivity to Various Parameters
19EC-22
Also included in Table 19EC-2 are other analyses that address possible sensitivities to modeling assumptions. These results are described below .
• CaseDRY
This case was run assuming that the passive flooder did not open and that, even after radial penetration of the vertical vent pipes, water was not introduced into the lower
Debris Coo/ability and Core Concrete Interaction
ABWR Rev. 0
Design Control Document/Tier 2
drywell. The drywell began to leak as a result of high temperature at about 20 hours and resulted in a slow, low magnitude, release of fission products.
• Case DWF.AIL
This case is identical to case FMX300 except that the drywell was assumed to fail at the COPS set point. Due to the long time between vessel breach and containment failure, the fission products settle out very effectively and the result is a low magnitude release.
• Case FMX1P
This case was identical to case FMX100 except that the debris is assumed to not spread into the wetwell after penetrating the vertical connecting vents. The results indicate little sensitivity to this assumption. The radial attack at 50 hours is 31 cm for a ratio of radial to axial attack of one to five.
• Case NFLOOD
This case was identical to case ABWR100 except that the firewater addition system and passive flooder were not operational. Therefore, the debris was initially dry. Mter 25 em of radial erosion, the debris was assumed to spread into the wetwell and water from the suppression was introduced into the lower drywell. The results indicate more concrete erosion with the COPS actuating at 17.4 hours compared to 19.1 hours.
• Case FIRE
This sequence was identical to FMX100 except that the firewater system was used to add water to the debris. Due to the addition of cold water, the pressurization of containment due to steam was reduced and the COPS was not predicted to open until 24.6 hours as compared to 17.6 hours for the case with passive flooder operation.
• CaseLATE
This sequence was identical to case DRY except for a delayed vessel failure. The RPV was assumed to fail after all of the water in the lower plenum had boiled away and the debris heated up to the eutectic melting point (2501 K). Vessel failure occurred at 5.3 hours into the sequence as compared to 1.5 hours for the base case. Since there was no water discharged with the core debris at vessel failure, the gas temperature quickly increased to above the flooder actuation temperature. The £looder was assumed not to work for this case. The purpose of the run was to obtain an estimate of the time period between vessel failure and £looder actuation. The MAAP analysis conserva~vely assumes that the gas must reach 533 K before the
Debris Coo/ability and Core Concrete Interaction 19EC-23
ABWR Rev. 0
Design Control Documenttrier2
flooder can open. In this case it took about one hour before the gas reached 533 K Factoring in the difference between the wall surface and the gas temperature, the flooder would be expected to open within 30 minutes after discharge of the core debris. All other aspects of this run were similar to the DRY case.
The overall conclusions from the sensitivity analyses are that the ABWR containment design is quite insensitive to the uncertainties associated with core concre~e interaction. The concrete erosion rates are consistent with other published results (Reference 19EC-8) and do not pose a serious threat to containment integrity. Operation of the COPS provides for a scrubbed release of the fission products and greatly limits the risk to the public.
19EC.6.1 Impact of Pedestal Concrete Selection
19EC-24
The pedestal of the ABWR is defined as the sidewalls of the lower drywell. This structure supports the vessel and the wetwell/upper drywell diaphragm floor. The type of
. concrete to be used in the pedestal is not specified. Concrete with low gas generation
potential is required for the floor of the lower drywell.
Basaltic concrete was used for the lower drywell in determining the response of the containment to core concrete attack. This type of concrete is often used in the United States. The other type of concrete which is frequently used is limestone-common sand. Basaltic concrete is more rapidly eroded during core concrete interaction than is limestone<ommon sand concrete. Therefore, one would expect that if limestonecommon sand concrete were used in the ABWR pedestal (i.e. the side walls), the sideward erosion would be slower than that presented in Table 19EC-2. Therefore, the estimates in that analysis for the times at which pedestal integrity could be threatened are expected to be conservative if non-basaltic concrete is used in the pedestal.
The other key impact of the type of concrete is the production of non-condensable gas. Iimestone-common sand concrete produces more non-condensable gas than does basaltic concrete. However, this will not have a significant impact on this analysis because the surface area of the sidewall will be only 10-15 % of the floor area if core concrete attack should occur. Furthermore, the shape of the debris pool will be pancake-like. The gas generated at the side wall will not be able to reach into the debris pool and cause more rapid metal water reaction in the debris pool. Rather, it will bypass the debris. Therefore, there will be little impact of the gas generation on the rate of attack due to any enhanced metal water reaction.
In summary, the type of concrete to be used in the pedestal side wall is not specified. If non-basaltic concrete is used in the pedestal the rate of sideward ablation may be somewhat reduced as compared to the analysis presented here. The rate of noncondensable gas generation may be slightly higher. However, because of the relative
Debris Coolability and Core Concrete Interaction
ABWR Rev. 0
Design Control Document/Tier 2
areas of the sidewall and the floor the impact will be small. The conclusions of the uncertainty analysis will not be affected by a different choice of concrete.
19EC.6;2 Impact of FMCRD Platform Grating
The FMCRD platform grating is located in the lower drywell at the elevation of the access tunnel. This rotating platform is circular and mounted on the rotating rail under the reactor vessel. There is an opening area at the center of the platform which is provided with traveling rail for the CRD handling device. Gratings will be installed on both sides of the rail for maintenance personnel. Typically, the grating consists of 2.54 em (1 inch) by 0.95 cm (3/8 inch) metal slats mounted edge-wise to form a grid with a grid size on the order of 2.54 cm (1 inch) by 5.08 cm (2 inch).
However, it is expected that the grating will quickly ablate due to the flow of debris. This is much the same as the ablation of the vessel bottom head as the debris leaves the vesseL Any late debris relocation would be a slow, drip-like movement which would fall straight through the ablated region of the platform. Therefore, debris will not be retained above the platform and there will be no impact on containment performance.
19EC.7 Impact on Offsite Dose
The effect of the maximum core concrete interaction source term on a release with operation of the rupture disk is shown in Figure 19EC-8. The cases with rupture disk are the only risk significant release categories which would be impacted by core concrete interaction (The other sequences are cases with early containment failure due to DCB.) The figure shows the probability of dose exceedence assuming a release. Case 1 represents a sequence with no significant CCl, while Case 2 is a sequence with ongoing CCl. As the Figure 19EC7 clearly shows, CCl does not have significant impact on the offsite dose.
19EC.8 Conclusions
This attachment investigated the impact of core-concrete interaction on the ABWR containment response. First, detailed DETs were developed to address all of the key parameters that influence CCl. Then, several deterministic analyses were carried out to support quantification of the trees. The following summarizes the important conclusions of the CCl investigation:
(1) For the dominant core melt sequences that release core material into the containment, most result in no significant CCl. Virtually no sequences have dryCCl.
(2) Even for the low frequency cases with significant CCl, radial erosion remains below the structural limit.
Debris Coolability and Core Concrete Interaction 19EC-25
Rev. 0
ABWR Design Control Documenf/Tier 2
(3) The fission product releas~ mode for a sequence with CCI is dominated by operation of the containment overpressure protection system. The release, which occurs at about 24 hours, is not distinguishable from a case with no CCI.
(4) Experimental results indicate that sufficient upward heat transfer to an overlying water pool would exist in the ABWR lower drywell to cool the debris.
19EC.9 References
19EC·26
19EC-1 Final Report on Core Debris Coolability, IDCOR Task 15.2
19EC-2 "An Integrated Structure and Scaling Methodology for Severe Accident Technical Issue Resolution", to be published as NUREG/CR, Draft 1991.
19EC-3 G.A. Greene, C. Finfrock and S.B. Burson, "Phenomenological Studies on Molten Core-Concrete Interactions", Nuclear Engineering and Design, 108, 167-177,1988.
19EC-4 M.W. Tarbell, D.R Bradley, RE. Blose,j .W. Ross, and D.W. Gilbert, "Sustained . Concrete Attack by Low-Temperature Fragmented Core Debris",
NUREG/CR-3024, SAND82-2476 R3, R4,july 1987.
19EC-5 RE. BIose,j.E. Gronager, A.J. Suo-Antilla, andj.E. Brockman, "Sustained Heated Metallic/Melt Concrete Interactions with Overlaying Water Pools", NUREG/CR-4727, SAND85-1546 R3, R4, R7,july 1987.
19EC-6 R Henry, ''Experiments Relating to Drywell Shell- Core Debris Interaction", BWR Mark I Containment Workshop, Baltimore, MD, February 24-26, 1988. See also B. Malinovic, R Henry, and B. Sehgal, "Experiments Relating to BWR Mark I Drywell Shell- Core Debris Interactions", ASME/ AIChE National Heat Transfer Conference, Philadelphia, August 1989.
19EC-7 B.R Sehgal, "ACE Program Phase D: Melt Attack and Coolability Experiments (MACE) Program", presentation at C5ARP meeting, May 1992.
19EC-8 S.R Greene, SA Hodge, C.R Hyman, M.L. Tobias, "The Response of BWR Mark II Containment to Station Blackout Severe Accident Sequences", NUREG/CR-5565, ORNL/TM-1l548, May 1991.
19EC-9 "MAAP 3.0 B Computer Code Manual", EPRI NP-7071-CCML, Volume 2, November 1990.
Debris Coo/ability and Core Concrete Interaction

Rev. 0
ABWR Design Control DocumentlTier 2
Table 19EC-1 Summary of TIming for Core Concrete Interaction Base Case
Time (5) Event
0.0 Loss of all injection
4.2 Reactor scrammed
1097.0 Core uncovered
1138.0 Manual depressurization
3451.0 Onset of core melt
5364.0 Slump into lower head
5382.0 Vessel failure
Debris Coo/ability and Core Concrete Interaction 19£C·27
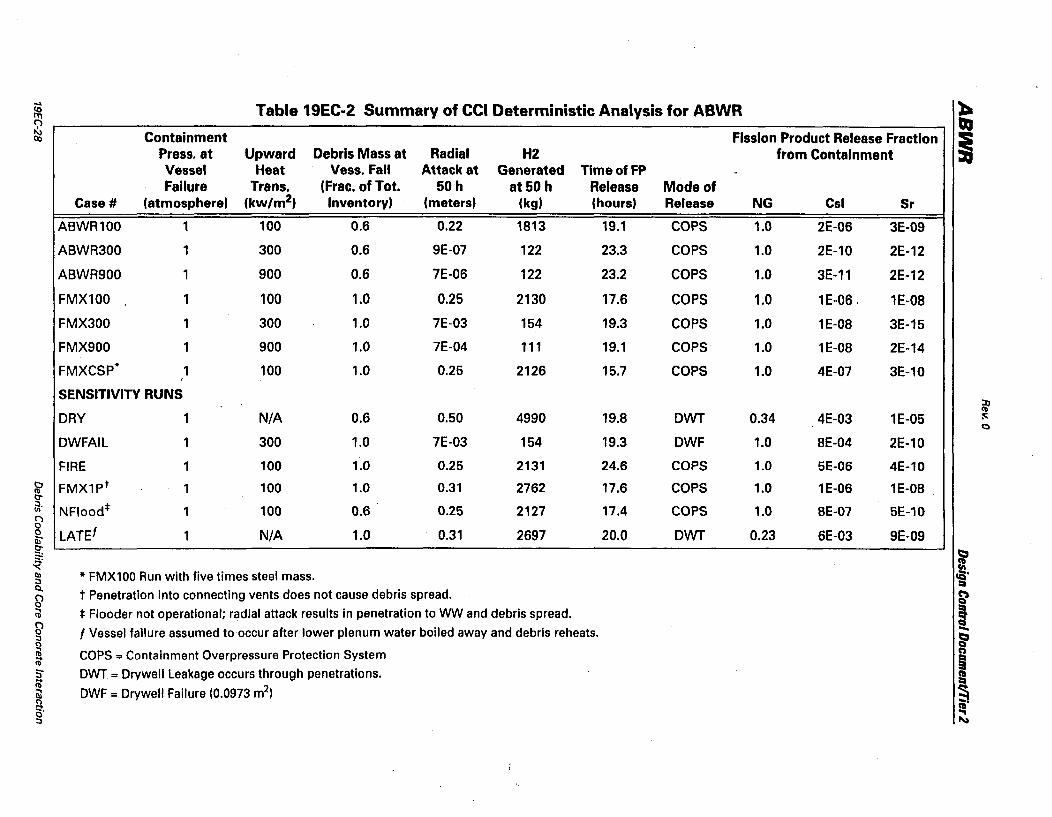
... Table 19EC-2 Summary of CCI Deterministic Analysis for ABWR ~ ~
<;"> QI ~ Containment Fission Product Release Fraction i Press. at Upward Debris Mass at Radial H2 from Containment
Vessel Heat Vess. Fall Attack at Generated TlmeofFP Failure Trans. (Frac. of Tot. 50h at 50 h Release Mode of
Case # (atmosphere) (kw/m2) Inventory) (meters) (kg) (hours) Release NG Csi Sr
ABWR100 1 100 0.6 0.22 1S13 19.1 COPS 1.0 2E-06 3E-09
ABWR300 1 300 0.6 9E-07 122 23.3 COPS 1.0 2E-10 2E-12
ABWR900 1 900 0.6 7E-06 122 23.2 COPS 1.0 3E-11 2E-12
FMX100 1 100 1.0 0.25 2130 17.6 COPS 1.0 1E-06, 1E-OB
FMX300 1 300 1.0 7E-03 154 19.3 COPS 1.0 1E-OS 3E-15
FMX900 1 900 1.0 7E-04 111 19.1 COPS' 1.0 1E-OS 2E-14
FMXCSP* 1 100 1.0 0.25 2126 15.7 COPS 1.0 4E-07 3E-10
SENSITIVITY RUNS ~
DRY 1 N/A 0.6 0.50 4990 19.5 DWT 0.34 4E-03 1E-05 !Ii: C)
DWFAIL 1 300 1.0 7E-03 154 19.3 DWF 1.0 BE-04 2E-10
FIRE 1 100 1.0 0.25 2131 24.S COPS 1.0 5E-OS 4E-10
l? FMX1pt 1 100 1.0 0.31 2762 17.S COPS 1.0 1E-OS 1E-OB 0-~. NFlood* 1 C')
100 0.6 0.25 2127 17.4 COPS 1.0 SE-07 5E-10 0
LATE! 0 1 N/A 1.0 0.31 2697 20.0 DWT 0.23 6E-03 9E-09 iii 0-
b ~ ~ III * FMX100 Run with five times steel mass. cQ' ;:] :::i CI. t Penetration into connecting vents does not cause debris spread. &' b> til :I: Flooder not operational; radial attack results in penetration to WW and debris spread. ! b> f Vessel failure assumed to occur after lower plenum water boiled away and debris reheats. -;:]
~ 0 til COPS = Containment Overpressure Protection System ib ~ S owr = Orywellleakage occurs through penetrations. g ib iil DWF = Drywell Failure (0.0973 m2) § 0 '11' g. .. ;:] '"
Rev. 0
ABWR Design Control Document!Tier 2
Figure 19EC-1 Core Debris Concrete Attack DET Not Part ofDeD (Refer to SSAR)
Debris Coolability and Core Concrete Interaction 19EC-29

Rev. 0
ABWR Design Control Document/Tier2
19EC-30
Figure 19EC-2 Containment Event Evaluation DET for Pedestal Failure Not Part of Den (Refer to SSAR)
Debris Coolability and Core Concrete Interaction
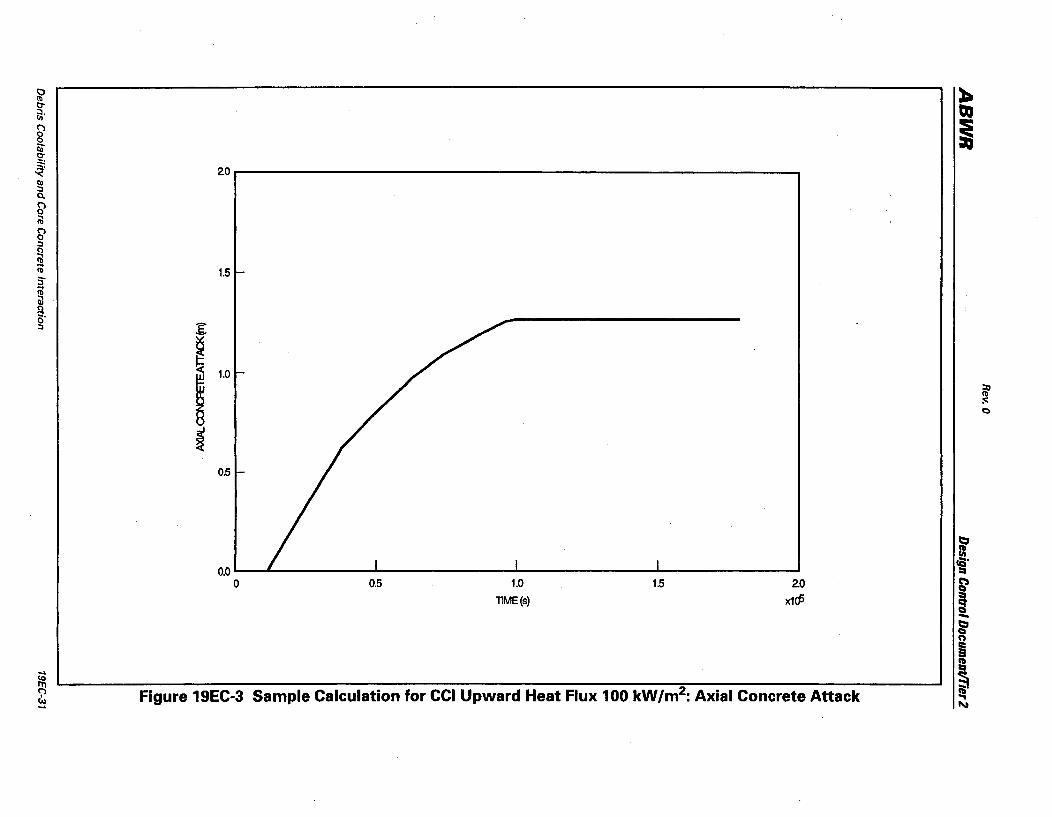
t:J (II tr ~.
~ 0 iii tr .::.: ~.
III :::J Q.
~ iil bl :::J C')
(iJ ... (II
:;-~ iil g. :::J S
~ <
! ~
2.0
1.5
1.0
0.5
0.01-......... '--------'--------....L....---------L..-------........ o 0.5 1.0
llME(s)
1.5 2.0 x1cP
Figure 19EC·3 Sample Calculation for CCI Upward Heat Flux 100 kW/m2: Axial Concrete Attack
:a:. ~
~
~ (II
:<: c
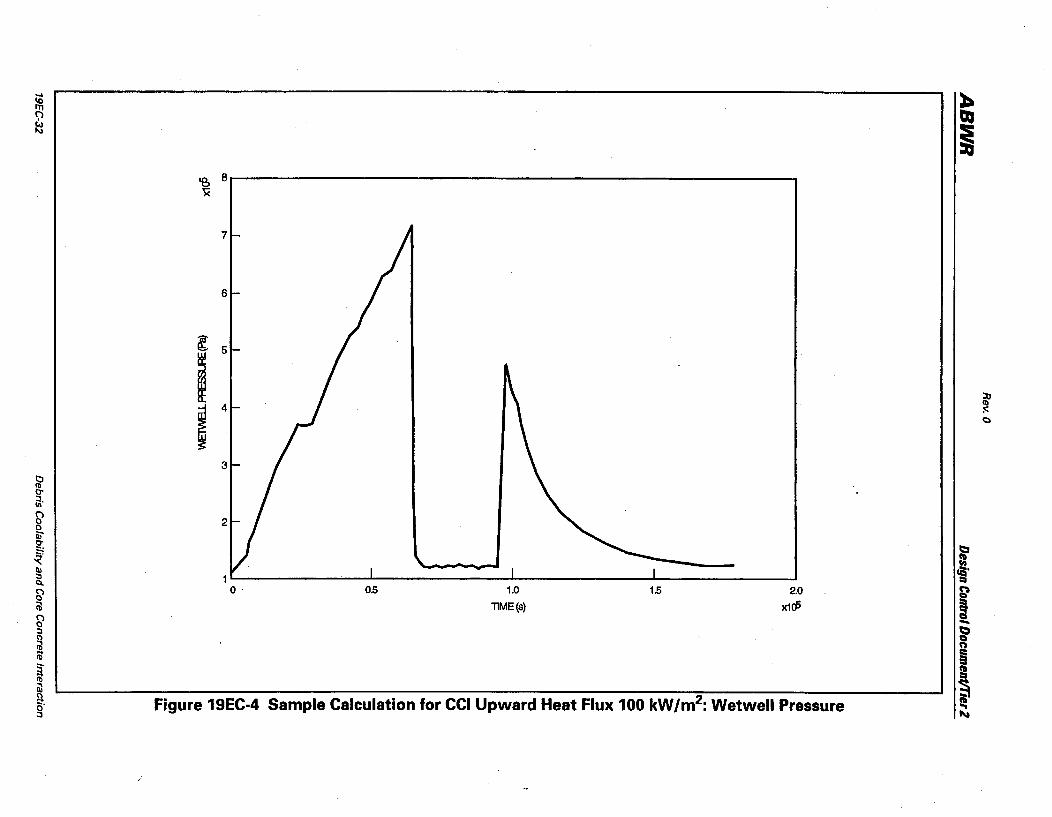
~ B~-------------------------------------------------------------, )(
7
6
3
2
1L-------------~--------------~--------------~--------------~ o 0.5 1.0 1.5 2.0
TIME (s) x1cP
Figure 19EC-4 Sample Calculation for CCI Upward Heat Flux 100 kW/m2: Wetwell Pressure
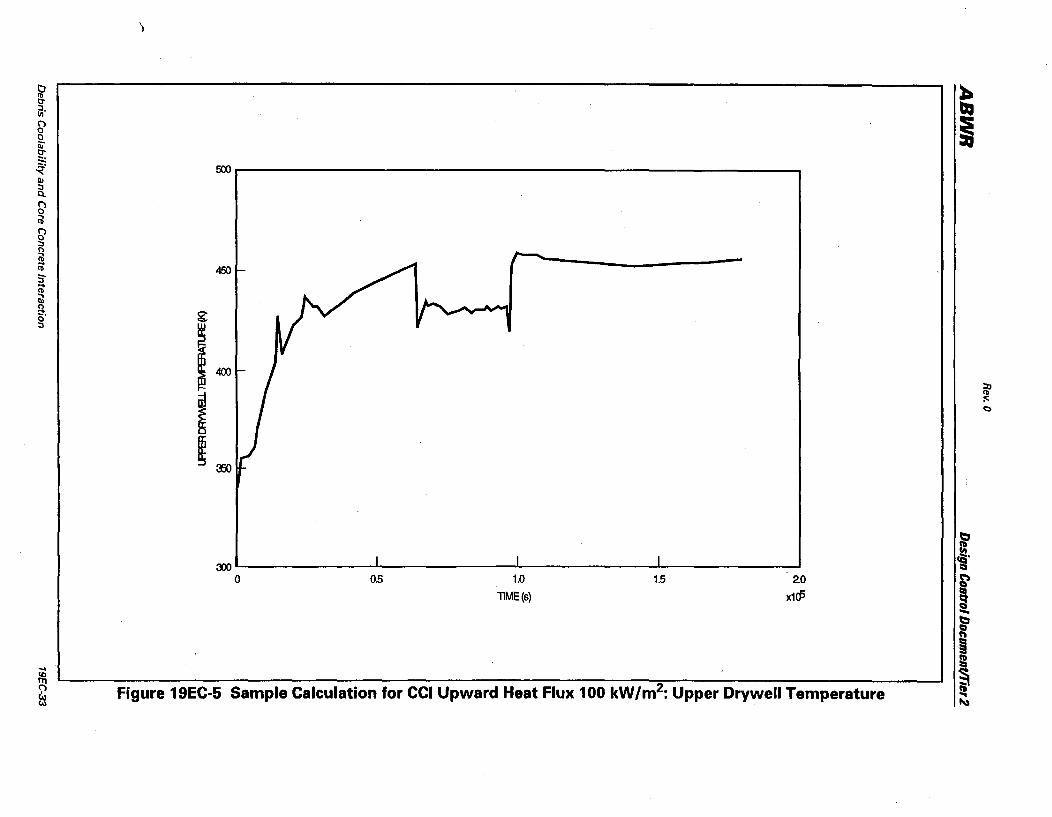
tI Cb 0-~. (') 0 0 iii 0-::;: ~.
III ::J Q.
b> ~
bl ::J
~ ;0 5" ... Cb ii1 !l O· ::J
g
i I ~
500
450
400
:JiO
xo~------------~--------------~--------------~--------------~ o 0.5 1.0
llME(s)
1.5 2.0
x1cP
Figure 19EC·5 Sample Calculation for CCI Upward Heat Flux 100 kW/m2: Upper Drywell Temperature
~ QI
i
:n Cb :<; 0
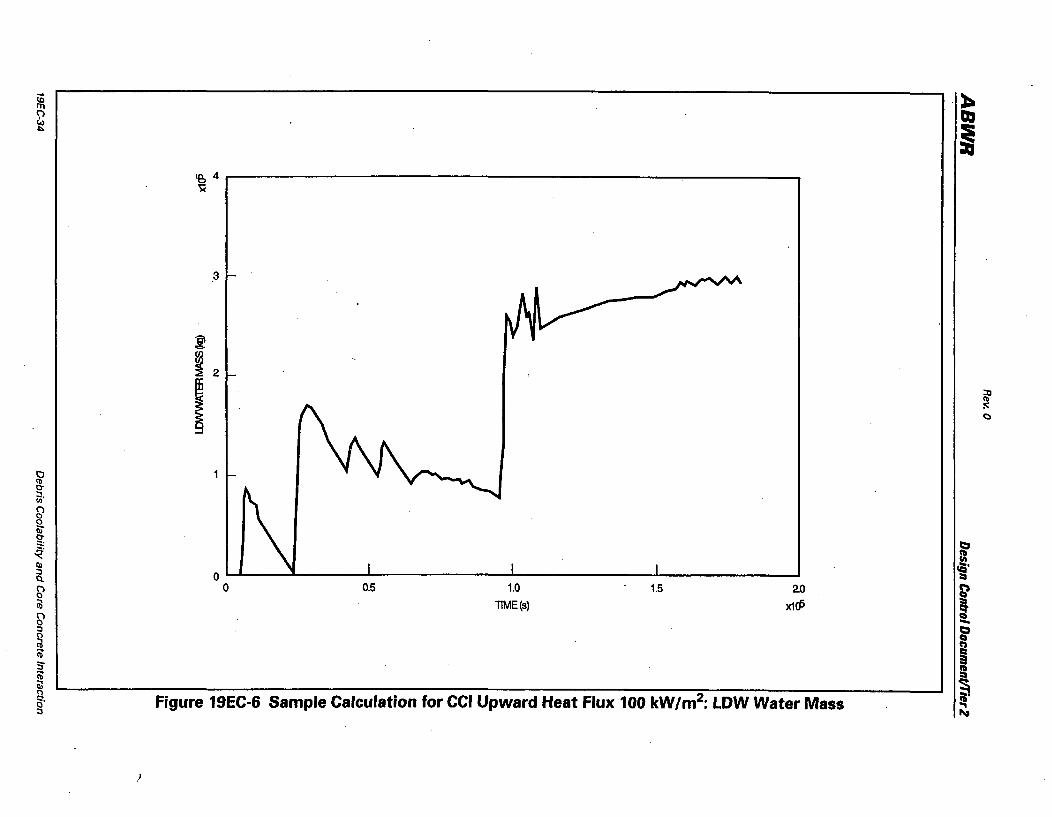
I
~ 4 r-------------------------------------------------~----------~ X
o~~--~--------~--------------~--------------~------------~ o 0.5 1.0
llME(s)
1.5 2.0
x1<P
Figure 19EC-6 Sample Calculation for CCI Upward Heat Flux 100 kW/m2: LDW Water Mass

2500 -
500- l
O~------------~I--------------.I--------------~I------------~ o 0.5 1.0 1.5
llME(s)
2.0
x1IP
Figure 19EC-7 Sample Calculation for CCI Upward Heat Flux 100 kW/m2: Average Corium Temperature
tl <1) 0-~. (') 0 0 Qj 0-:::: ~' III ::J Q,
b> ~
b> ::J C')
~ (it
5" (it iil C')
5' ::J
Figure 19EC·8 Whole Body Dose at 805 m (0.5 Mile) as a Probability of Exceedence Not Part of DCD (Refer to SSAR)
r tQ' :::I
l? :::. ~ -t:I Q CO)
~
~ ... '"
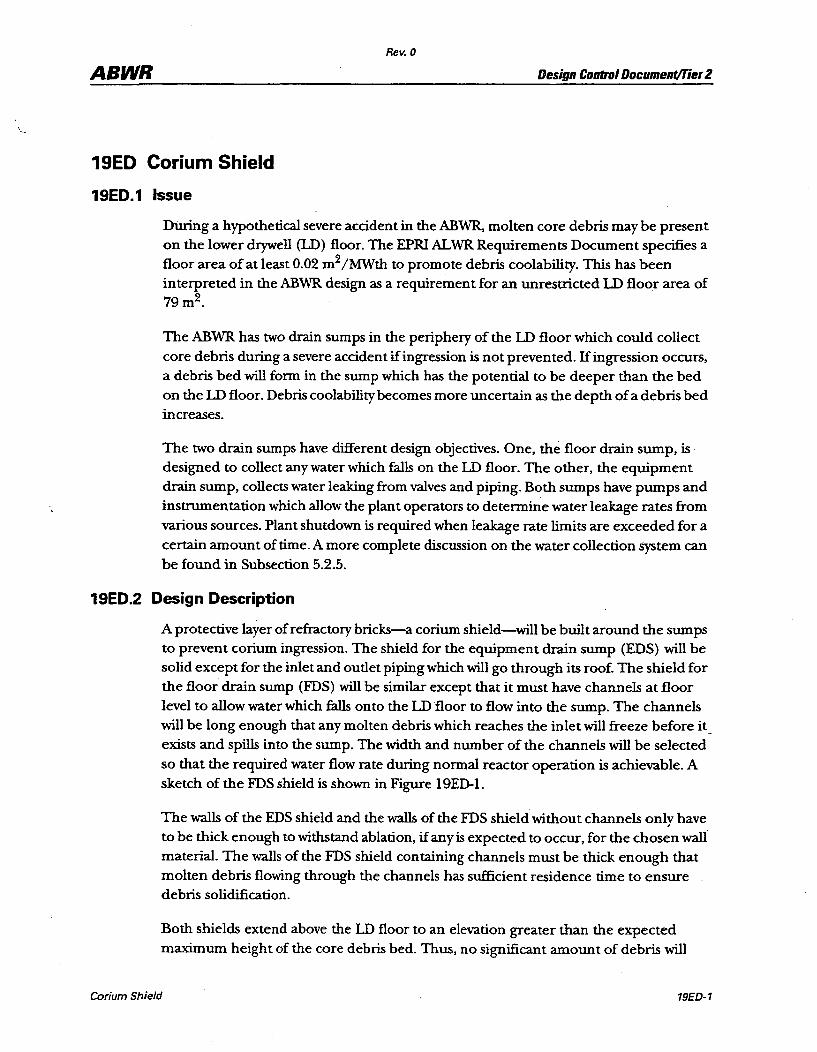
Rev. 0
ABWR Design Control Document/Tier 2
19ED Corium Shield
19ED.1 Issue
During a hypothetical severe accident in the AB"WR, molten core debris may be present on the lower drywell (LD) floor. The EPRI ALWR Requirements Document specifies a floor area of at least 0.02 m2/MWth to promote debris coolability. This has been interpreted in the ABWR design as a requirement for an unrestricted LD floor area of 79m2.
The ABWR has two drain sumps in the periphery of the LD floor which could collect core debris during a severe accident if ingression is not prevented. If ingression occurs, a debris bed will form in the sump which has the potential to be deeper than the bed on the LD floor. Debris coolability becomes more uncertain as the depth of a debris bed increases.
The two drain sumps have different design objectives. One, the floor drain sump, is designed to collect any water which falls on the LD floor. The other, the equipment drain sump, collects water leaking from valves and piping. Both sumps have pumps and instrumentation which allow the plant operators to determine water leakage rates from various sources. Plant shutdown is required when leakage rate limits are exceeded for a certain amount of time. A more complete discussion on the water collection system can be found in Subsection 5.2.5.
19ED.2 Design Description
A protective layer of refractory bricks-a corium shield-will be built around the sumps to prevent corium ingression. The shield for the equipment drain sump (EDS) will be solid except for the inlet and outlet piping which will go through its roof. The shield for the floor drain sump (FDS) will be similar except that it must have channels at floor level to allow water which falls onto the LD floor to flow into the sump. The channels will be long enough that any molten debris which reaches the inlet will freeze before it _ exists and spills into the sump. The width and number of the channels will be selected so that the required water flow rate during normal reactor operation is achievable. A sketch of the FDS shield is shown in Figure 19ED-l.
The walls of the EDS shield and the walls of the FDS shield without channels only have to be thick enough to withstand ablation, if any is expected to occur, for the chosen wall material. The walls of the FDS shield containing channels must be thick enough that molten debris flowing through the channels has sufficient residence time to ensure debris solidification.
Both shields extend above the LD floor to an elevation greater than the expected maximum height of the core debris bed. Thus, no significant amount of debris will
Corium Shield 19ED-1
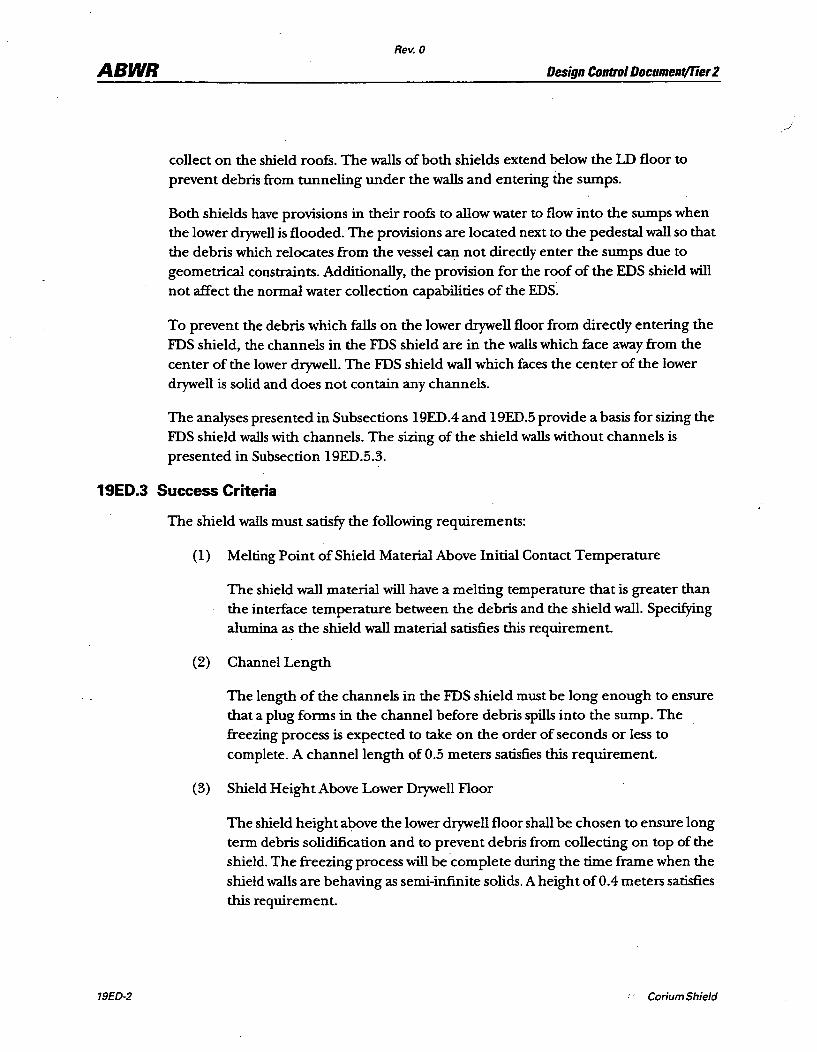
ABWR Rev. 0
Design Control DDcument/Tier 2
collect on the shield roofs. The walls of both shields extend below the ill floor to prevent debris from tunneling under the walls and entering the sumps.
Both shields have provisions in their roofs to allow water to flow into the sumps when the lower drywell is flooded. The provisions are located next to the pedestal wall so that the debris which relocates from the vessel can not directly enter the sumps due to geometrical constraints. Additionally, the provision for the roof of the EDS shield will
not affect the normal water collection capabilities of the EDS~
To prevent the debris which falls on the lower dryweU floor from directly entering the IDS shield, the channels in the IDS shield are in the walls which face away from the center of the lower drywell. The IDS shield wall which faces the center of the lower drywell is solid and does not contain any channels.
The analyses presented in Subsections 19EDA and 19ED.5 provide a basis for sizing the IDS shield walls with channels. The sizing of the shield walls without channels is presented in Subsection 19ED.5.3.
19ED.3 Success Criteria
19ED-2
The shield walls must satisfy the following requirements:
(1) Melting Point of Shield Material Above Initial Contact Temperature
The shield wall material will have a melting temperature that is greater than the interface temperature between the debris and the shield wall. Specifying alumina as the shield wall material satisfies this requirement.
(2) Channel Length
The length of the channels in the IDS shield must be long enough to ensure that a plug forms in the channel before debris spills into the sump. The freezing process is expected to take on the order of seconds or less to complete. A channel length of 0.5 meters satisfies this requirement.
(3) Shield Height Above Lower Drywell Floor
The shield height above the lower drywell floor shall be chosen to ensure long term debris solidification and to prevent debris from collecting on top of the shield. The freezing process will be complete during the time frame when the shield walls are behaving as semi-infini te solids. A height of 0.4 meters satisfies this requirement.
Corium Shield
Rev. 0
ABWR Design Control Document/Tier2
(4) Shield Depth Below Lower Drywell Floor
The walls of the FDS and EDS shields extend to the floors of the sumps to prevent tunneling of debris into the sumps.
(5) Channel Flow Area
The total flow area of the channels in the FDS shield shall be great enough to allow water flow rates stated in the Technical Specifications without causing excessive water pool fOmlation in the lower drywell.
(6) Chemical Resistance of Shield Walls
The· wall material chosen for the corium shields must have good chemical resistance to siliceous slags and reducing environments. Resistance can be detemlined to a first degr~e by comparing the Gibb's free energy of the oxides which make up the shield wall and the oxides present in core debris. Specifying alumina as the shield wall material satisfies this requirement.
(7) Seismic Adequacy
The seismic adequacy of the corium shields will be determined in the detailed design phase. Adequacy should be easily met because the shields are at the lowest point in the containmenCMissile generation is not an issue because the shields are not near any vital equipment.
(8) Channel Height
The channel height shall be small enough to ensure freezing. The current analysis is based on a channel height of 1 cm which satisfies this requirement.
19ED.4 Channel Length Analysis
Heat transfer and phase change analyses are presented in this subsection to determine the FDS channel length which prevents molten debris ingression into the sump. A freeze front analysis is performed for early times (on the order of seconds) after vessel failure to determine the time required to form a plug. The freeze front analysis is evaluated for three debris scenarios which envelope the expected debris parameters.
19ED.4.1 Assumptions
The major assumptions invoked in the analysis and their bases follow:
(1) Molten debris enters the channel with negligible superheat.
Corium Shield 19ED-3
ABWR
19ED-4
Rev. 0
Design Control Document/Tier2
Molten debris interacts with structural material (steel, concrete, etc.) and the lower drywell environment as it passes from the vessel, contacts the ill floor and spreads to the shield. This interaction depletes the molten debris of any superheat. To account for uncertainties, the impact of superheat will be considered in the sensitivity study contained in Subsection 19EDA.5.2.
(2) During the freezing process, the temperature profile of the solidified debris rapidly obtains its steady state value.
This assumption introduces little inaccuracy because:
(a) The thermal conductivity of the debris is larger than that of the shield material for most debris scenarios, see Subsection 19ED.4.4.
(b) The depth of the debris is only 1 cm; thus, the thermal time constant of the debris in the channel is small compared to the freezing times. This assumption can be checked by co~paring the freeze times calculated considering thermal gradients within the debris and the lumped mass analysis used in the superheat study.
(3) Heat transfer within the channel and shield is one-dimensional during plug formation.
The height of each channel is, much less than its length. The heat transfer in the shield material is low enough that any heat transferred from debris contacting the shield wall outside of the channel does not affect the temperature along the channel until long after a plug has formed. Any heat transfer to the shield material between adjacent channels enhances the debris freezing process.
(4) The shield wall acts as a semi-infinite slab with an initial temperature of 330 K during the initial freezing process.
The shield material has been selected such that it is a poor conductor of heat. The penetration depth during the short duration of the freezing process is on the order of ten millimeters. The small increases in LD temperature prior to the presence of core debris does not significantly alter the shield temperature from its value during normal plant operation.
(5) Core debris is not expected to enter the ill until about two hours after accident initiation at which time the decay heat level is approximately 1 % of rated power.
Core debris will not enter the lower drywell before about two hours for any credible severe accident (Subsection 19E.2.2).
Corium Shield

Rev. 0
ABWR Design Control Document!Tier 2
(6) The decay heat generation in the debris is negligible compared to the rate of latent heat generation during the freezing process.
This assumption was verified during the analysis.
(7) The thermal conductivity and thermal diffusivity of debris in solid and liquid phases are the same.
(8) The contact resistance between the bricks was assumed to be negligible. Contact resistance will be controlled in the detailed design by varying the thickness of the bricks or by using a high temperature binder between the bricks. Thicker bricks tend to minimize overall contact resistance by reducing the number of contact points. Some contact resistance may be acceptable in the final design if the composite thermal conductivity is high enough that the shields provide short- and long-term debris solidification.
(9) The corium shields were assumed to be structurally stable. Structural stability is only an issue during the initial onslaught of debris, into the lower drywell. Mter debris comes into contact with the shields, a crust will form and it will tend to grow in time. Crust formation eliminates buoyancy forces and will hold the individual bricks into place.
19ED.4.2 Initial Freezing of Molten Debris in Channel
If the floor drain sump shield fulfills its design objective, a debris plug will form in the channel before a significant amount of molten corium has a chance to traverse the channel and reach the sump. Molten debris enters the channel at a significantly elevated temperature (1800 K to 2500 K) compared to the shield wall (- 330 K). The walls absorb heat from the debris because of the large temperature difference. Since the debris contains negligible superheat, any heat loss by the debris results in freezing. Freeze fronts start at the channel walls and move toward the center of the channel. The freezing process is symmetric about the centerline of the channel because the same amount of heat is transferred through each wall while they are behaving as semi-infinite slabs. The channel walls behave as semi-infinite slabs during the freezing process because the heat conduction rate through the wall material is low compared to the release rate of latent heat. A sketch of the freezing process is shown in Figure 19ED-2.
Corium Shield
(1) Freezing Time
The temperature profile in the crust (Reference 1 QED-I), assuming it quickly reaches its steady state shape, is:
19ED-5
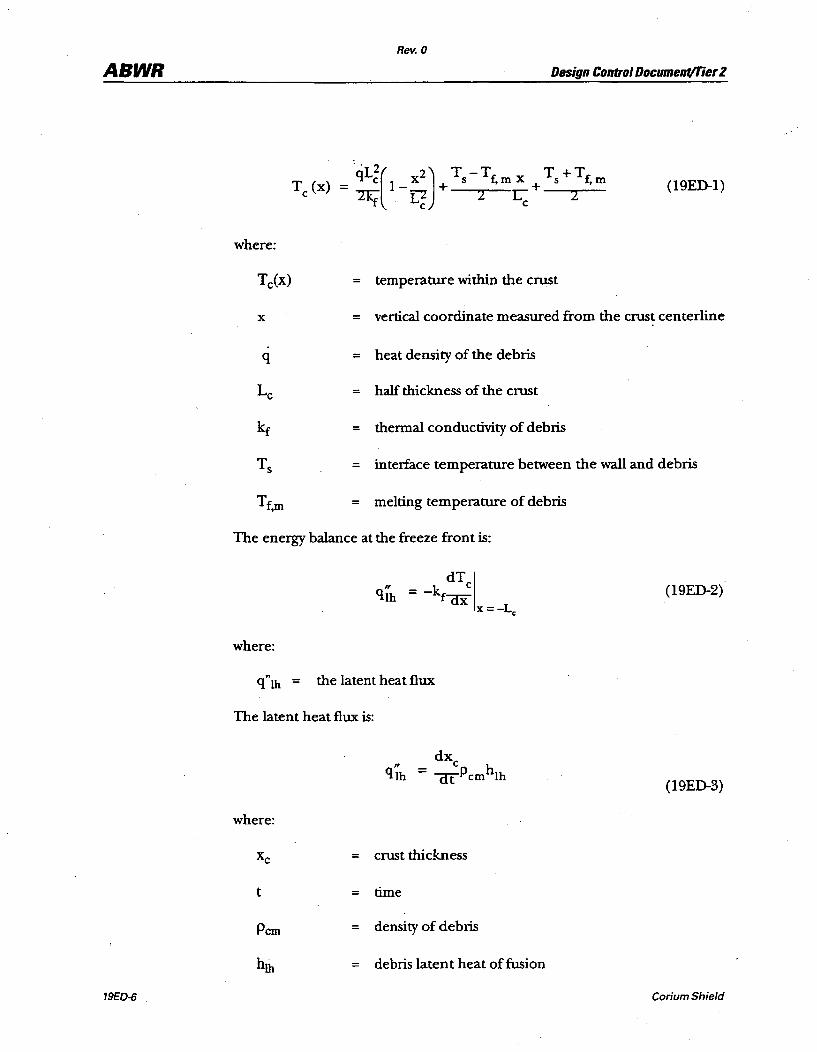
Rev. 0
ABWR Design Control DocumentlTier 2
Tc (x) (19ED-I)
where:
Tc(x) = temperature within the crust
x = vertical coordinate measured from the crust centerline
q = heat density of the debris
Lc = half thickness of the crust
kf = thermal conductivity of debris
Ts = interface temperature between the wall and debris
Tf,m = melting temperature of debris
The energy balance at the freeze front is:
(19ED-2)
where:
q"lh the latent heat flux
The latent heat flux is:
(l9ED-3)
where:
Xc = crust thickness
t = time
Pcm = density of debris
hili = debris latent heat of fusion
19ED-6 Corium Shield
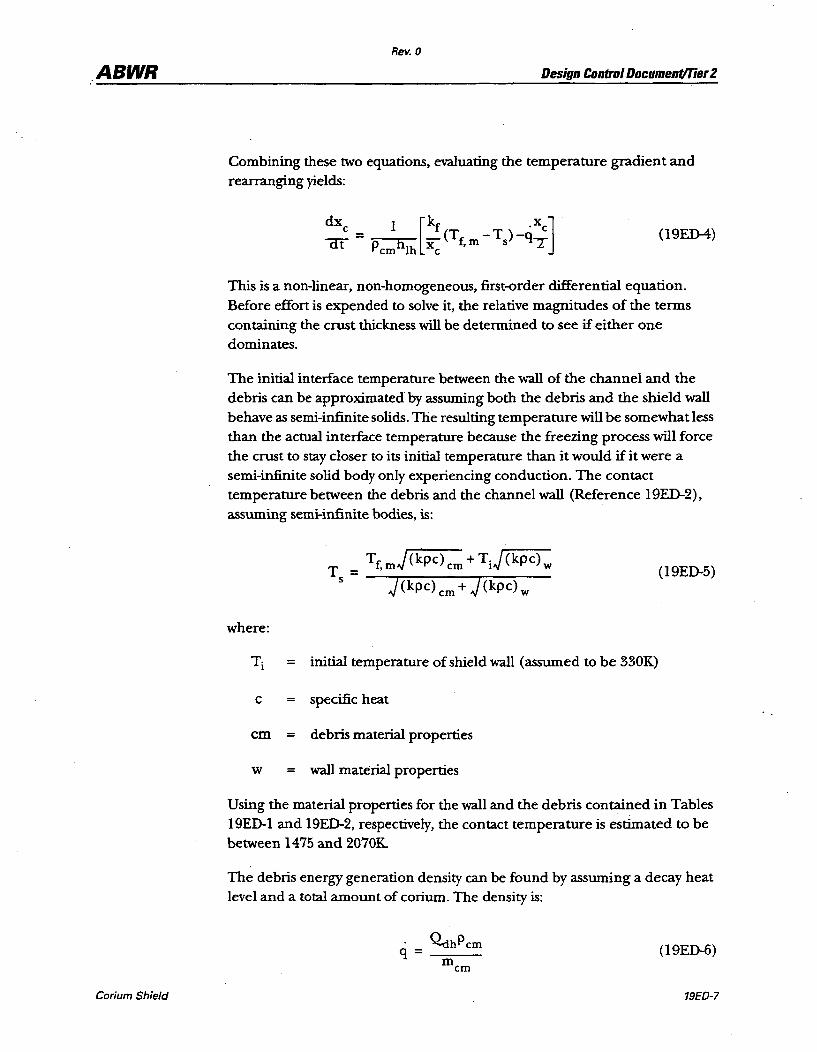
ABWR
Corium Shield
Rev. 0
Design Control Document/l"ier 2
Combining these two equations, evaluating the temperature gradient and rearranging yields:
(l9ED-4)
This is a non-linear, non-homogeneous, first-order differential equation. Before effort is expended to solve it, the relative magnitudes of the terms containing the crust thickness will be determined to see if either one dominates.
The initial interlace temperature between the wall of the channel and the debris can be approximated by assuming both the debris and the shield wall behave as semi-infinite solids. The resulting temperature will be somewhat less than the actual interlace temperature because the freezing process will force the crust to stay closer to its initial temperature than it would if it were a semi-infinite solid body only experiencing conduction. The contact temperature between the debris and the channel wall (Reference 19ED-2) , assuming semi-infinite bodies, is:
(19E0-5)
where:
Ti = initial temperature of shield wall (assumed to be 330K)
e specific heat
em = debris material properties
w = wall material properties
Using the material properties for the wall and the debris contained in Tables 19EO-l and 19E0-2, respectively, the contact temperature is estimated to be between 1475 and 2070K.
The debris energy generation density can be found by assuming a decay heat level and a total amount of corium. The density is:
(19ED-6)
19ED-7

ABWR Rev. 0
Design eolltrol Document/Tier 2
where:
~ decay heat level
IDem"= total mass of corium, 235 Mg.
Assuming the decay heat level is approximately 1 % of rated power yields:
q = 1.5 MW 1m3
The two terms inside the brackets in Equation 19ED-4 can now be evaluated, For a channel height of 1 cm (xc,Max = 0.5 cm) and melt Scenario I (the scenario with the limiting terms) these values are:
k ~(Tf -T) = 9.72 x 10
5 W 1m2 x ,m s
c
.xc 3 2 q-z- = 3.8 x 10 WI m
Therefore, the term containing the temperature difference across the crust is much larger than the one containing the heat generation rate. The temperature profile in the channel system ignoring energy generation in the debris is shown in Figure 19ED-2. Equation 19ED4 can be simplified to:
dxc kf =(T T) at P h x f,m- s em lh c
(19ED-7)
Solving this equation with the initial condition that xc(t = 0) = 0, reveals:
x = c Pcmhlh
(19ED-8)
This equation can be rearranged to determine the time required to freeze debris in a channel of height Ro' The freezing time is:
(19ED-9)
(2) Interface Temperature, Ts
19ED·8 Corium Shield
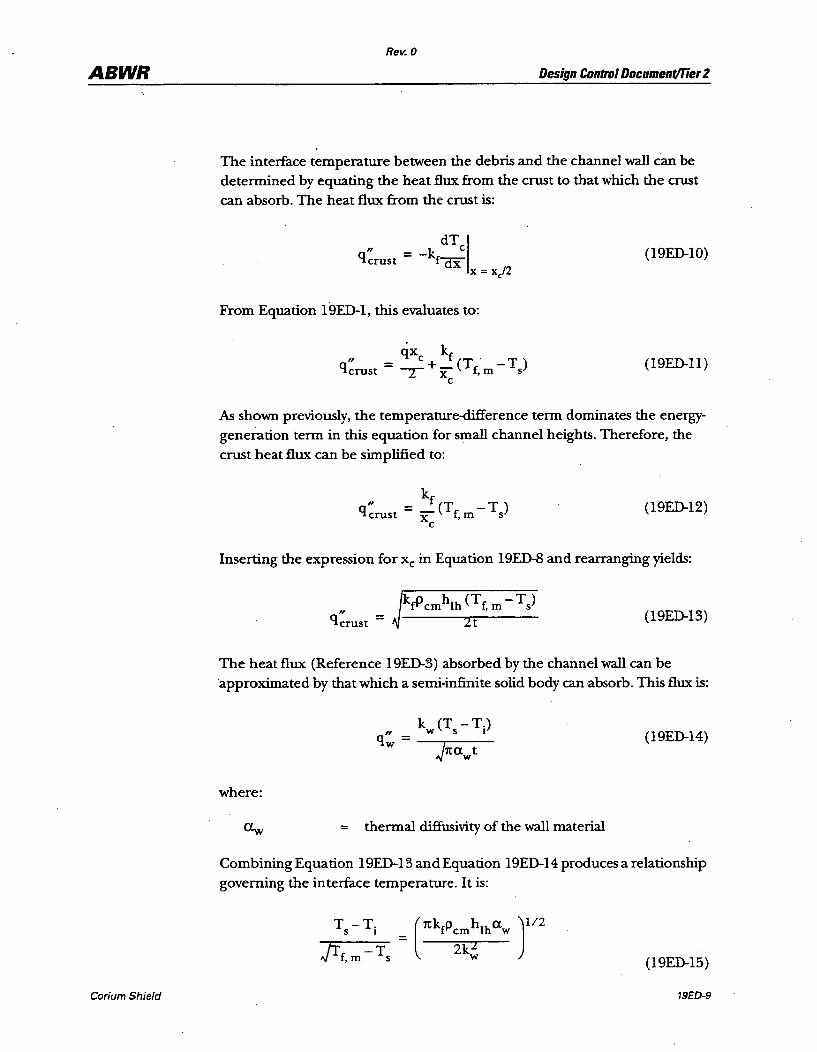
ABWR
Corium Shield
Rev. 0
Design Control Document/Tier 2
The interface temperature between the debris and the channel wall can be determined by equating the heat flux from the crust to that which the crust can absorb. The heat flux from the crust is:
dT I " _ k c qcrust - - fax
x= x/2
From Equation 19ED-l, this evaluates to:
qx k " _ c r (T . T )
qcrust - -Z-+X r,m- s c
(l9ED-I0)
(l9ED-ll)
As shown previously, the temperature-difference term dominates the energygeneration term in this equation for small channel heights. Therefore, the crust heat flux can be simplified to:
k " r (T T) qcrust = X r,m- s
c (l9ED-12)
Inserting the expression for Xc in Equation 19ED-8 and rearranging yields:
" qcrust = krPcmhlh (Tr, m - Ts)
2t (19ED-13)
The heat flux (Reference 19ED-3) absorbed by the channel wall can be approximated by that which a semi-infinite solid body can absorb. This flux is:
(19ED-14)
where:
= thermal diffusivity of the wall material
Combining Equation 19ED-13 and Equation 19ED-14 produces a relationship governing the interface temperature. It is:
(19ED-15)
19£0-9
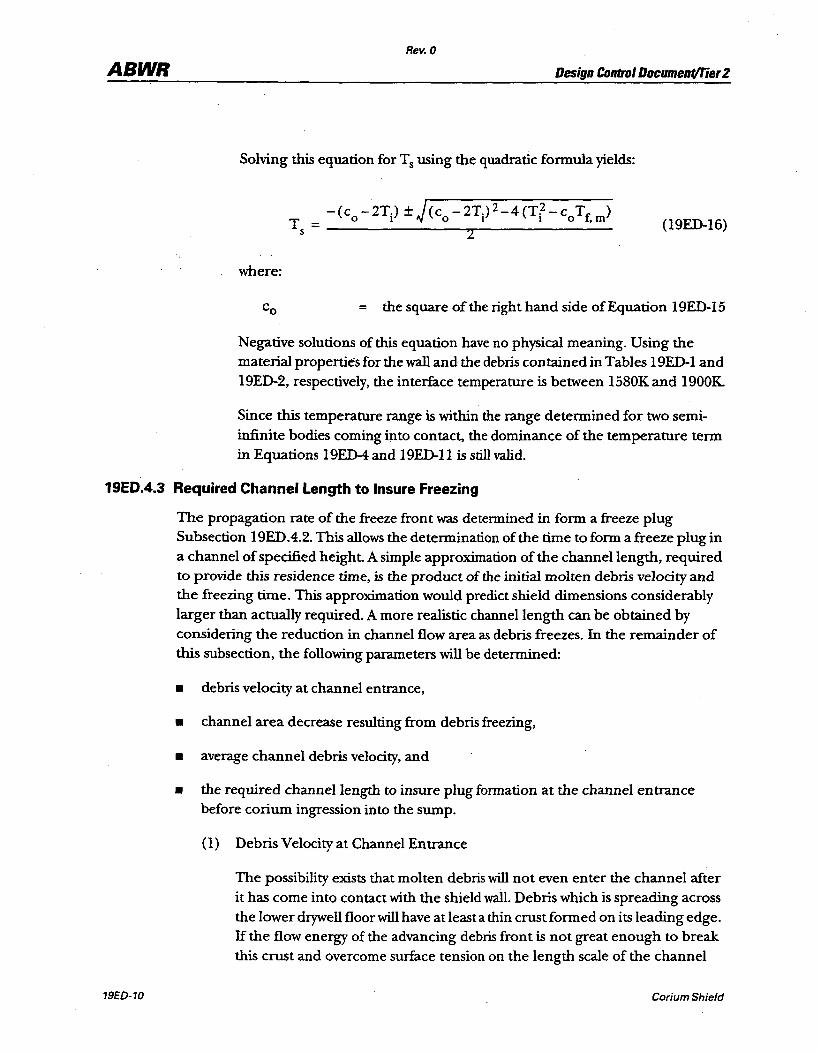
ABWR Rev. 0
Design Control Document/l"ier Z
Solving this equation for Ts using the quadratic fonnula yields:
-(co -2Ti ) ± J (co - 2Ti ) 2_4 (Tf -coTr, m)
Ts = -----------------2~--------------- (19ED-16)
where:
= the square of the right hand side of Equation 19ED-15
Negative solutions of this equation have no physical meaning. Using the material properties for the wall and the debris contained in Tables 19ED-l and 19E0-2, respectively, the interface temperature is between 1580Kand 1900K.
Since this temperature range is within the range detennined for two semiinfinite bodies coming into contact, the dominance of the temperature tenn in Equations 19ED-4 and 19ED-11 is still valid.
19ED.4.3 Required Channel length to Insure Freezing
19ED-10
The propagation rate of the freeze front was determined in fOIm a freeze plug Subsection 19ED. 4.2. This allows the deteImination of the time to fOIm a freeze plug in a channel of specified height. A simple approximation of the channel length, required to provide this residence time, is the product of the initial molten debris velocity and the freezing time. This apprOximation would predict shield dimensions considerably larger than actually required. A more realistic channel length can be obtained by considering the reduction in channel flow area as debris freezes. In the remainder of this subsection, the following parameters will be deteImined:
• debris velocity at channel entrance,
• channel area decrease resulting from debris freezing,
• average channel debris velocity, and
• the required channel length to insure plug formation at the channel entrance before corium ingression into the sump.
(1) Debris Velocity at Channel Entrance
The possibility exists that molten debris will not even enter the channel after it has come into contact with the shield wall. Debris which is spreading across the lower drywell floor will have at least a thin crust fOImed on its leading edge. If the flow energy of the advancing debris front is not great enough to break this crust and overcome surface tension on the length scale of the channel
Corium Shield
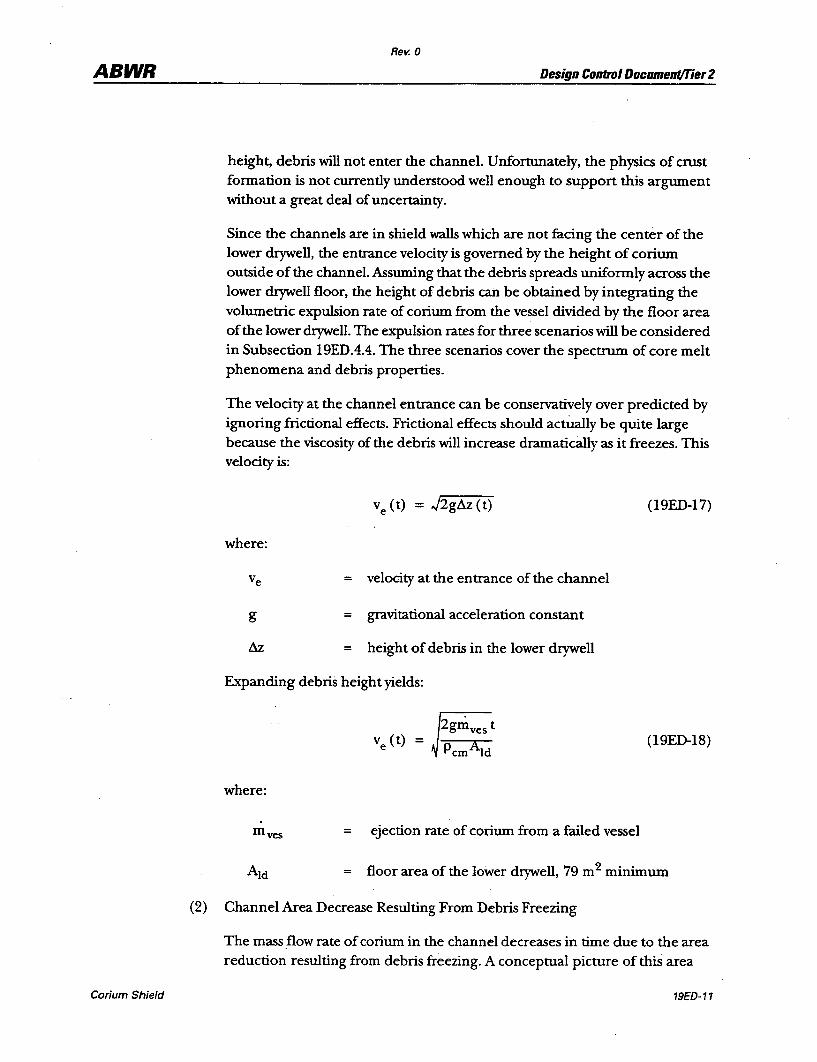
ABWR
Corium Shield
Rev. 0
Design Control Document/Tier 2
height, debris will not enter the channel. Unfortunately, the physics of crust fonnation is not currently understood well enough to support this argument without a great deal of uncertainty.
Since the channels are in shield walls which are not facing the center of the lower drywell, the entrance velocity is governed by the height of corium outside of the channel. Assuming that the debris spreads uniformly across the lower drywell floor, the height of debris can be obtained by integrating the volumetric expulsion rate of corium from the vessel divided by the floor area of the lower drywell. The expulsion rates for three scenarios will be considered in Subsection 19EDA.4. The three scenarios cover the spectrum of core melt phenomena and debris properties.
The velocity at the channel entrance can be conservatively over predicted by ignoring frictional effects. Frictional effects should actually be quite large because the viscosity of the debris will increase dramatically as it freezes. This velocity is:
ve (t) = J2gll.z (t) (19ED-17)
where:
= velocity at the entrance of the channel
g = gravitational acceleration constant
= height of debris in the lower drywell
Expanding debris height yields:
(19ED-18)
where:
m ves = ejection rate of corium from a failed vessel
floor area of the lower drywell, 79 m2 minimum
(2) Channel Area Decrease Resulting From Debris Freezing
The mass flow rate of corium in the channel decreases in time due to the area reduction resulting from debris freezing. A conceptual picture of this area
19ED-11

ABWR Rev. 0
Design Control Document/Tier 2
reduction process is shown in Figure 19ED-3. The mass flow rate at the entrance of the channel and at the location downstream where the debris front has just arrived is:
where:
m· 1
(l9ED-19)
= time varying mass flow rate per unit width at the
entrance of the channel
= time varying entrance flow height of the channel
= time varying velocity at the downstream location in the
channel where molten debris has just arrived
unobstnlcted height of the channel
mass freezing rate of debris per unit width in the
channel
This equation requires that
v (t) m = e H. (t) _ fr ~ 1 P H o em 0
(19ED-20)
The entrance flow height is:
(19ED-21)
Inserting the relationship for Xc found in Equation 19ED-8 into this expression yields:
H.(t) =H -1 0
(19ED-22)
The product of this equation and the width of the shield channel describes the reduction of channel inlet flow area with time.
(3) Average Channel Debris Velocity
19ED-12 Corium Shield
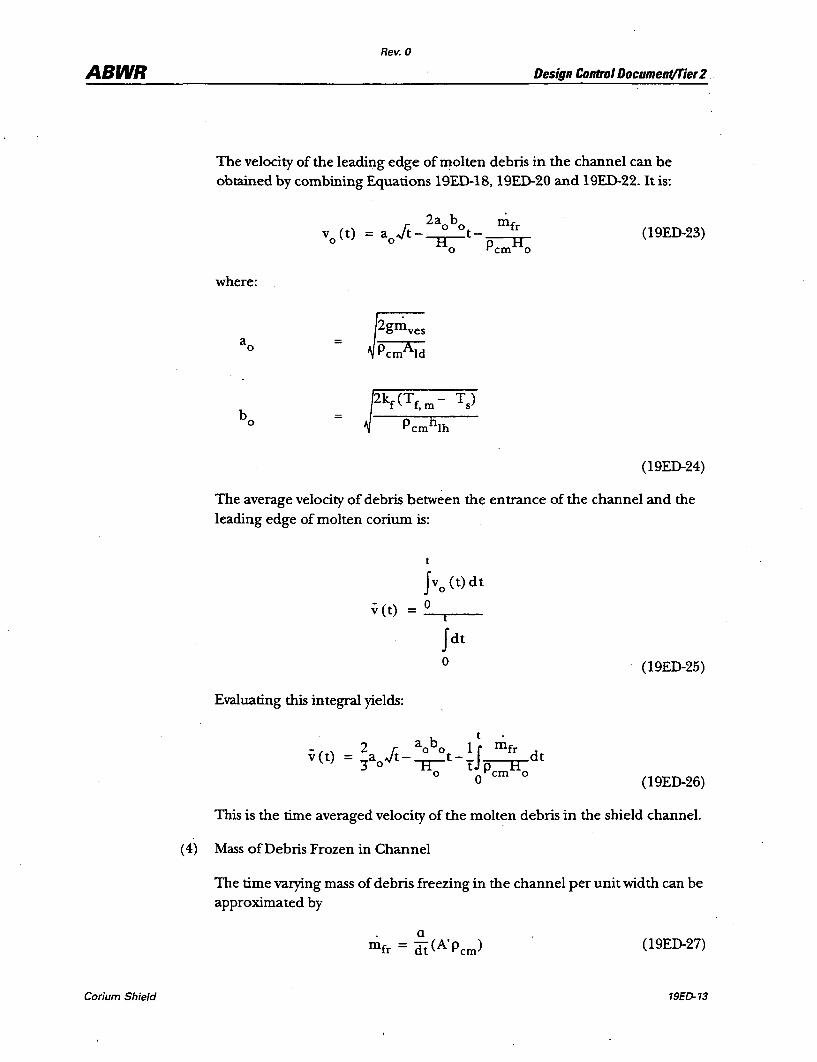
ABWR
Corium Shield
Rev. 0
Design Control Document/Tier 2 ..
The velocity of the leading edge of molten debris in the channel can be obtained by combining Equations 19ED-18, 19ED-20 and 19ED-22. It is:
where:
2a b ni vo(t) = a Jt- 0 0t_ fr
o -rr- p H
=
o em 0
2kf (Tf , m - Ts)
Pemhlh
(19ED-23)
(19ED-24)
The average velocity of debris between the entrance of the channel and the leading edge of molten corium is:
t
Jvo(t)dt
v (t) = _0-..-__
Evaluating this integral yields:
vet)
(19ED-25)
(19ED-26)
This is the time averaged velocity of the molten debris in the shield channel.
(4) Mass of Debris Frozen in Channel
The time varying mass of debris freezing in the channel per unit width can be approximated by
(19ED-27)
19E0-13
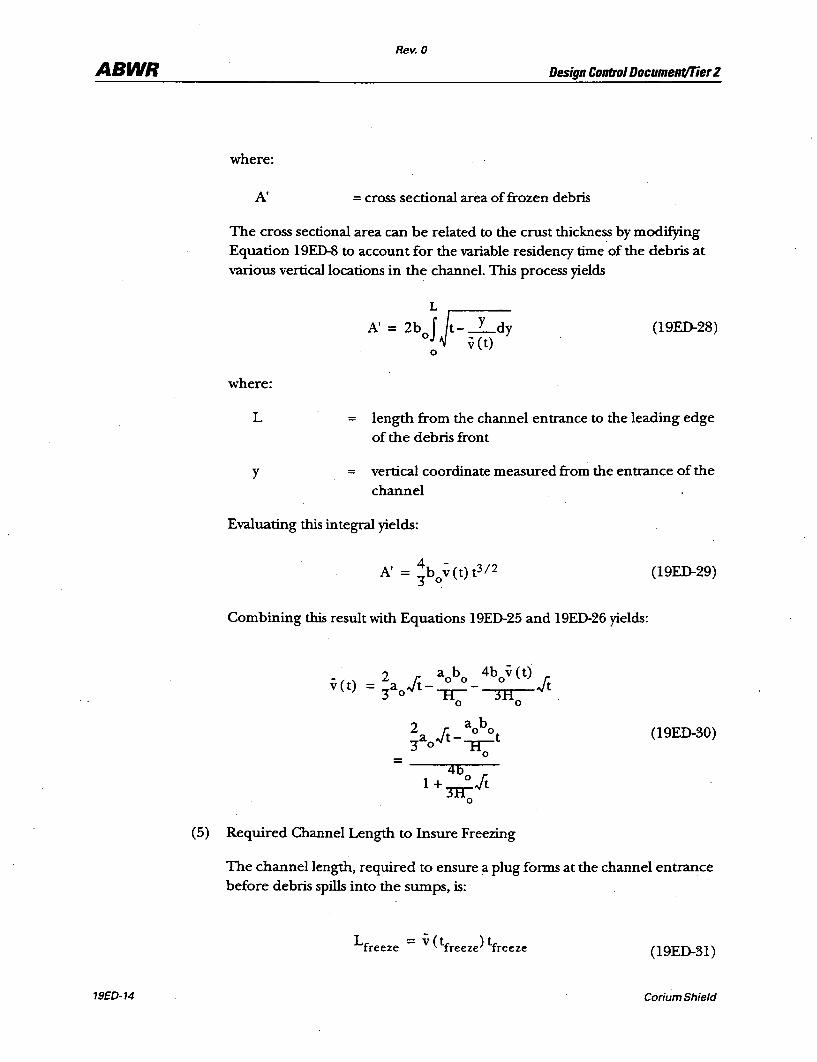
ABWR
19ED-14
Rev. 0
Design Control Document/Tier 2
where:
A' = cross sectional area of frozen debris
The cross sectional area can be related to the CIUSt thickness by modifying Equation 19ED-8 to account for the variable residency time of the debris at various vertica1locations in the channel. This process yields
where:
L
y
L
A' = 2b JJ- Y dy o v (t)
o
(19ED-28)
= length from the channel entrance to the leading edge of the debris front
= vertical coordinate measured from the entrance of the
channel
Evaluating this integral yields:
4 - 2 A' = b v(t) t 3 / '3 0
(19ED-29)
Combining this result with Equations 19E0-25 and 19£0-26 yields:
(19ED-30)
= ---:4'"b~--
1 +TIl-Jt o
(5) Required Channel Length to Insure Freezing
The channel length, required to ensure a plug forms at the channel entrance before debris spills into the sumps, is:
L =v(t )t freeze freeze freeze (19ED-31)
Corium Shield
\
Rev. 0
ABWR Design Control Documenf/Tier 2
where 'freeze is given by Equation 19ED-9.
19ED.4.4 Channel Lengths for Different Melt Scenarios
The analysis to detennine the channel length required to ensure that a plug forms in the channel prior to debris entering the sump is contained in Subsection 19EDA.3. The analysis will be executed in this subsection for three different melt scenarios which cover the range of expected core melt conditions. The scenarios differ in debris composition, debris material properties, initial temperature of the debris and the ejection rate of debris from the failed vessel. The impact of debris superheat will be considered in a sensitivity study contained in Subsection 19EDA.5.2.
Scenarios I and II were taken from NUREG/CR-5423 (Reference 19ED-7). These scenarios represent predominantly oxidic and metallic melts, respectively. The Peach Bottom Atomic Power Station was used for specifics in the NUREG/CR-5423 calculations. However, the similarities between Peach Bottom and the ABWR in core composition and vessel geometry allow the NUREG/CR-5423 core melt parameters to be applied in this analysis.
Scenario I is based on MAAP calculations which predict that there is a significant amount of molten debris available for relocation at the time of vessel failure. The debris release in this scenario is consistent with the core composition, corresponding to approximately 30% by weight of zirconium. Further, 20% of the available zirconium was assumed to be oxidized.
Scenario II is based on BWRSAR calculations which predict that debris which initially relocates to the lower plenum of the vessel is quenched. Subsequent water depletion results in the remelting of the debris and local failure of the vessel. Since the metallic constituents of the debris remelt before the oxidic constituents, the initial debris pour from the vessel is primarily metallic.
For both scenarios, only the initial molten material relocation is important in determining the required channel length because the channels will plug in a relatively short period of time (less than 10 seconds). Only the maximum initial debris relocation rates were utilized so that the calculated channel lengths would be conservatively overestimated. Subsequent molten material releases from the vessel will go into filling the lower drywell with debris and have no bearing on plug fonnation. Thus, the long-term debris relocation parameters discussed in NUREG/CR-5423 are of no consequence to this analysis.
The third scenario considered, Scenario M, represents the MAAP-ABWR analysis that was used to predict a bounding debris ejection rate from a failed oxidic vessel, see Subsection 19EB.6.2.2. MAAP-ABWR predicts that the mass flow rate from the vessel jumps to approximately 1000 kg/s at vessel failure and then increases to 6000 kg/s in
Corium Shield 19£D-15
ABWR Rev. 0
Design Control Document/Tier Z
eight seconds, see Figure 19EB-9. The debris release is essentially complete (flow rate 0 kg/s) in ten seconds. In order to avoid determining the debris entrance velocity into the channel for this complicated flow rate profile, the maximum debris relocation rate was assumed to prevail throughout the plug formation process. This assumption will lead to a conservative over-estimation of the required channel length.
. Another melt scenario commonly considered in calculations involving ex-vessel core debris is the formation of eutectics as a result of core-concrete interactions. However, consideration of eutectics is not required in the analysis of plug formation. In order for the debris properties to be changed significandy, core-concrete interactions must increase the debris mass by at least 10%. The time required for this to happen is longer than the time required for plug formation for a quickly spreading debris front. Alternatively, if the debris front is spreading slowly enough to allow a significant amount of core-concrete interaction, the leading edge of the debris will have a thick crust and have a height greater than the channel height. Thus, debris will not even enter the channel.
The parameters describing each of the three scenarios considered is contained in Table 19ED-2. The debris material properties for Scenarios I and II were determined using the i
constituent material properties contained in Table 19ED-3. Material properties for Scenario M were taken from MAAP-ABWR.
Inserting the scenario parameters contained in Table 19ED-2 into the analysis contained in Subsection 19EDA.3 results in the channel lengths contained in Table 19ED-4. All of the required channel lengths are less than 0.5 meters.
19ED.4.S Sensitivity to Melt Parameters
The three scenarios considered in Subsection 19ED. 4. 4 were chosen to represent a wide range of possible debris characteristics. The calculation of required channel length depends on the debris flow rate, the debris temperature, the channel height and several m.aterial properties of the debris and wall material. This subsection will evaluate the sensitivity of the calculation to these parameters. The final part of this subsection will evaluate the impact of debris superheat.
19ED.4.S.1 Material Properties
19ED-16
The channel length required to ensure freezing is dependent on both debris and channel wall material properties. The relevant debris material properties are density, latent heat offusion and thermal conductivity. For the channel wall, the relevant properties are thermal conductivity and thermal diffusivity. The sensitivity of the channel1ength calculation to these material properties will be determined in this subsection. Additionally, the sensitivity to debris temperature and debris flow rate from the vessel will also be determined. '
Corium Shield
ABWR Rev. 0
Design Control Document/T'ier 2
The sensitivity of the channel length calculation to these parameters will be estimated by varying each parameter, except debris temperature, by ± 20%. Debris temperature will be varied by ± 200K. The wide variations in material properties of the three base scenarios take into account deviations outside of this range and combinations of deviations.
The results of varying these parameters are contained in Table 19ED-5. The following discussion will describe the effect on channel length due to increasing each parameter. The reverse of the effect described holds true for decreasing the parameter.
Increasing debris density, latent heat of fusion or flow rate increases the amount of energy that must be transferred to the channel walls before a plug forms, and, as a result, increases the required channel length. Increasing the debris thermal conductivity increases the rate at which the debris can transfer its energy, and decreases the required channel length. Increasing the debris temperature increases the debris to channel wall temperature difference and, as a result, the rate of heat loss by the debris. Since this analysis assumes that the debris enters the channel with negligible superheat, increasing the debris temperature reduces the required channel length.
The impact on channel length due to variations in wall material properties is a direct result of the change in the interface temperature between the debris and the channel wall. Increasing the wall thermal conductivity decreases the interface temperature and results in a shorter channel length. Conversely, increasing the wall thermal diffusivity increases the interface temperature and results in a longer channel length.
Decreasing the interface temperature increases the temperature difference driving heat flow from the debris, and results in more rapid freezing. Alternatively, increasing the interface temperature decreases the interface temperature, and results in a longer freezing length. The interface temperature is decreased by increasing wall conductivity
and increased by increasing wall thermal diffusivity. Thus, increasing the wall thermal conductivity decreases the required channel length, while the opposite is true for increasing wall thennal diffusivity.
The three parameters which have the largest impact on channel length are debris density, debris latent heat of fusion and wall thennal conductivity. The impact of the debris properties are not surprising because they directly impact the amount of energy that must be removed from the debris in order for plug formation to occur. The impact of decreasing the thermal conductivity of alumina does not need to be considered because a lower bound of alumina thermal conductivity was used in the base analysis. Thus, a ten-percent decrease in the wall thermal conductivity is physically unrealistic.
As can be seen in Table 19ED-5, none of the parameter variations for Scenarios I and II resulted in required channel lengths greater than 0.5 meters. Only two of the variations for Scenario M resulted channel lengths greater than 0.5 meters, and these channel
Corium Shield 19ED-17
ABWR Rev. 0
Design CDntrol DDcument/Tier2
lengths were only slightly greater. If the channels are 0.5 meters long and two meters wide, the amount of debris which could enter the sump for a Scenario M melt with these two parameter variations is approximately 0.001 m3 (average depth 0.03 cm). This amount of debris entering the sump does not pose a threat to containment integrity Therefore, a channel length of 0.5 meters supplies enough margin to account for uncertainties in material properties.
19ED.4.S.2 Impact of Superheat
19ED-18
The channel length analysis contained in Subsection 19ED.4.3 assumes that the debris enters the channel with negligible superheat. The analysis contained in this subsection considers the effects of superheat on the corium freezing process. First, the credible amount of superheat for each melt scenario is discussed. Then, the change in energy due to including superheat will be calculated. Next, the impact on freezing time will be determined. The analysis will conclude with the determination of channel length when superheat is present.
According to NUREG/CR-5423 (Reference 19ED-7), the initial superheat of Scenario I is expected to be negligible "because of several concurrent reasons: (a) convective heat transfer to boundaries-typically less than 100°C can be sustained at decay heat levels, (b) continuous melting and incorporation of boundary material, and (c) heat losses to water and control rod guides during the relocation through the lower plenum. " The upper bound of reasonable superheat that the debris could obtain at the time of vessel failure was specified to be 125°C. The most probable superheat was limited to less than 50°C. Due to similarities in Scenario I and Scenario M (quick penetration failure after delayed core plate failure and mostly oxidic melt), the superheat of the two cases can be assumed to be the same.
Scenario II is expected in NUREG/CR-5423 to have more superheat than Scenario I because the molten mass does not have as much opportunity to lose heat to the lower head. The upper bound of reasonable superheat that the Scenario II debris could obtain at the time of vessel failure was specified to be 150°C. The most probable superheat was limited to less than 100 °C.
Mter the debris exits the vessel in any of the scenarios, the debris will lose some of its
heat before it reaches the corium shields. The heat loss will be by radiation and convection to the lower drywell environment and structures. Additionally the debris pool on the lower drywell floor will conduct heat to the lower drywell floor. These heat losses will remove some, if not all, of the debris superheat. This analysis consexvatively
assumes that the debris enters the shield wall channels with the same superheat it had when exiting the vessel.
Corium Shield
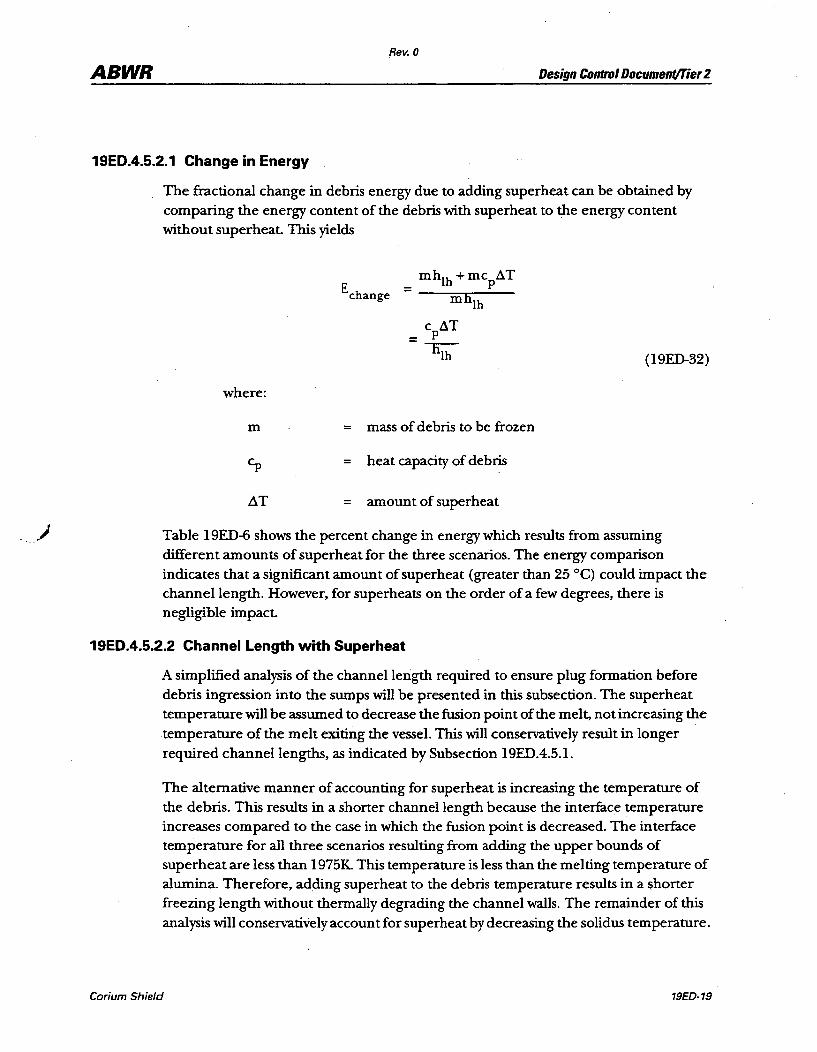
Rev. 0
ABWR Design Control DocumentlTier 2
19ED.4.S.2.1 Change in Energy
The fractional change in debris energy due to adding superheat can be obtained by comparing the energy content of the debris with superheat to the energy content without superheat. This yields
(19ED-32)
where:
m = mass of debris to be frozen
= heat capacity of debris
~T = amount of superheat
Table 19ED-6 shows the percent change in energy which results from assuming different amounts of superheat for the three scenarios. The energy comparison indicates that a significant amount of superheat (greater than 25°C) could impact the channel length. However, for superheats on the order of a few degrees, there is negligible impact.
19ED.4.S.2.2 Channel Length with Superheat
A simplified analysis of the channel length required to ensure plug formation before debris ingression into the sumps will be presented in this subsection. The superheat temperature will be assumed to decrease the fusion point of the melt, not increasing the temperature of the melt exiting the vessel. This will conservatively result in longer required channel lengths, as indicated by Subsection 19EDA.5.1.
The alternative manner of accounting for superheat is increasing the temperature of the debris. This results in a shorter channel length because the interface temperature increases compared to the case in which the fusion point is decreased. The interface temperature for all three scenarios resulting from adding the upper bounds of superheat are less than 1975K This temperature is less than the melting temperature of alumina. Therefore, adding superheat to the debris temperature results in a shorter freezing length without thermally degrading the channel walls. The remainder of this analysis will conservatively account for superheat by decreasing the solidus temperature.
Corium Shield 19£D·19
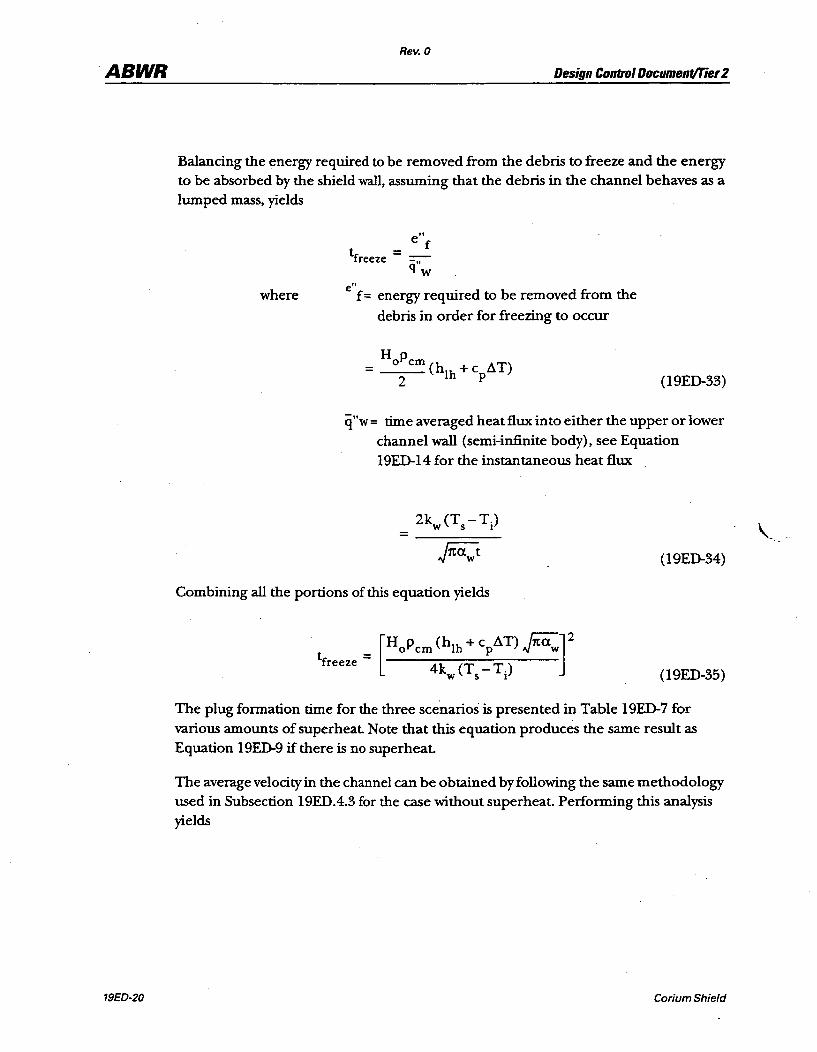
ABWR
19ED-20
Rev. 0
Design Control Document/Tier 2
Balancing the energy required to be removed from the debris to freeze and the energy to be absorbed by the shield wall, assuming that the debris in the channel behaves as a lumped mass, yields
where
e" t = f freeze ::;:-
qw e"
f= energy required to be removed from the
debris in order for freezing to occur
= H P
o em (h + c ~T) 2 Ih P (19ED-33)
q"w= time averaged heat flux into either the upper or lower
channel wall (semi-infinite body), see Equation
19ED-14 for the instantaneous heat flux
=-----(19E0-34)
Combining all the portions of this equation yields
t ..:. [HoP em (hIb + cp~ T) Fw] 2
freeze - 4k (T - T) W S 1 (19ED-35)
The plug formation time for the three scenarios is presented in Table 19ED-7 for
various amounts of superheat Note that this equation produces the same result as Equation 19ED-9 if there is no superheat
The average velocity in the channel can be obtained by following the same methodology used in Subsection 19EDA.3 for the case without superheat. Performing this analysis yields
Corium Shield
,-
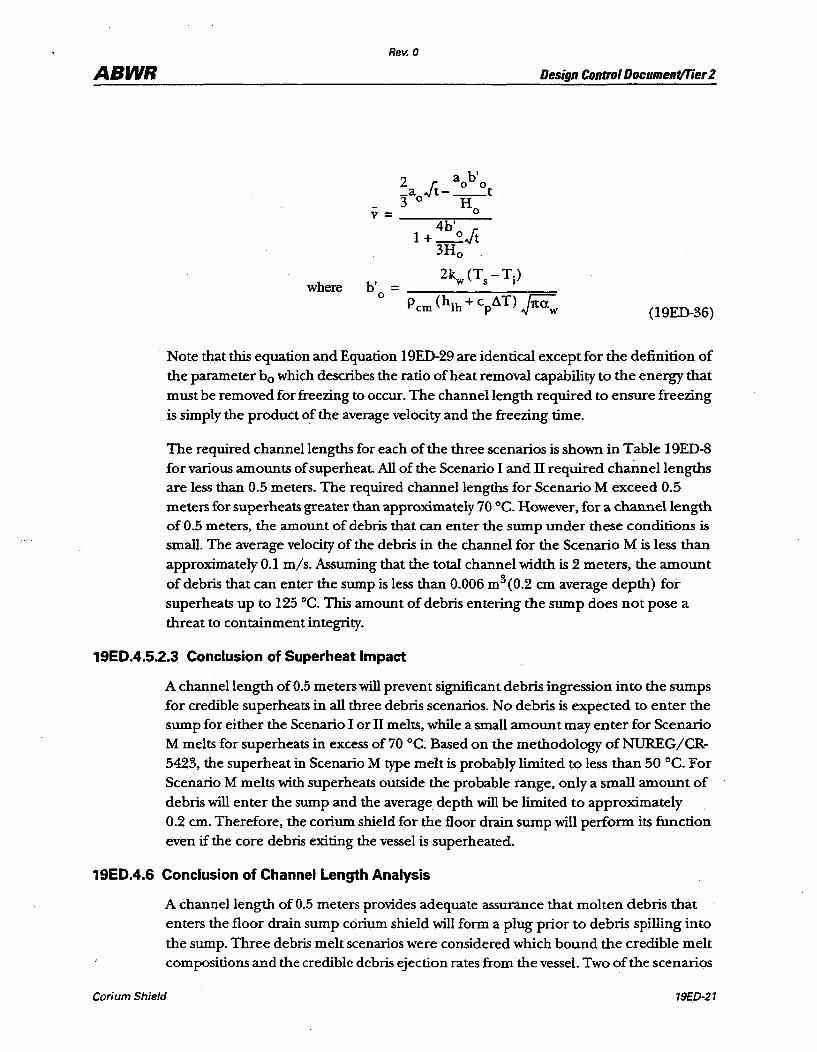
ABWR Rev. 0
Design Control Document/Tier 2
where
(19ED-36)
Note that this equation and Equation 19ED-29 are identical except for the definition of the parameter bo which describes the ratio of heat removal capability to the energy that must be removed for freezing to occur. The channel length required to ensure freezing is simply the product of the average velocity and the freezing time.
The required channel lengths for each of the three scenarios is shown in Table 19ED-8 for various amounts of superheat. All of the Scenario I and II required channel lengths are less than 0.5 meters. The required channel lengths for Scenario M exceed 0.5 meters for superheats greater than approximately 70°C. However, for a channel length of 0.5 meters, the amount of debris that can enter the sump under these conditions is small. The average velocity of the debris in the channel for the Scenario M is less than approximately 0.1 m/s. Assuming that the total channel width is 2 meters, the amount of debris that can enter the sump is less than 0.006 m3 (0.2 cm average depth) for superheats up to 125°C. This amount of debris entering the sump does not pose a threat to containment integrity.
19ED.4.S.2.3 Conclusion of Superheat Impact
A channel length of 0.5 meters will prevent significant debris ingression into the sumps for credible superheats in all three debris scenarios. No debris is expected to enter the sump for either the Scenario I or II melts, while a small amount may enter for Scenario M melts for superheats in excess of 70 0c; Based on the methodology ofNUREG/CR-5423, the superheat in Scenario M type melt is probably limited to less than 50 cC. For Scenario M melts with superheats outside the probable range, only a small amount of debris will enter the sump and the average depth will be limited to approximately 0.2 em. Therefore, the corium shield for the floor drain sump will perfonn its function even if the core debris exiting the vessel is superheated.
19ED.4.6 Conclusion of Channel Length Analysis
A channel length of 0.5 meters provides adequate assurance that molten debris that enters the floor drain sump corium shield will form a plug prior to debris spilling into the sump. Three debris melt scenarios were considered which bound the credible melt compositions and the credible debris ejection rates from the vessel. Two of the scenarios
Corium Shield 19ED-21
ABWR Rev. 0
Design Control Document/Tier 2
represented the oxidic and metallic melts used in the Mark I liner failure analysis, NUREG/CR-5423. The third scenario was developed with MAAP-ABWR to provide a gross over-estimation of the maximum debris ejection rate from a failed vessel. A sensitivity analysis demonstrated that a channel length of 0.5 meters provides enough margin to account for uncertainties in material properties. Additionally, the impact of superheat was shown to be minimal.
19ED.S Long-Term Capability of the Shield Waills
Initial debris solidification was considered in Subsection 19EDA. The requirements for keeping the debris in the channel frozen for an extended period of time (at least 24 hours) will be determined in this subsection. The height of the upper shield walls (above the lower drywell floor) with channels and depth of the lower shielc;l walls (below the lower drywell floor) with channels will be specified. Additionally, the thickness of the shield walls without channels will be specified.
19ED.S.1 Upper Shield Wall (Above Lower Drywell Floor) with Channels
19ED-22
To help assure the integrity of the roof of the corium shield, the upper shield wall should be tall enough to prevent the debris that is collecting on the lower drywell floor from flowing on top of the shield. Debris falling directly on the roof during relocation from the vessel does not pose a threat to roof integrity because the amount of debris that can fall on the roof is small. This is a result of the CRD and lower drywell configurations. The length and density of the CRDs in the lower drywell prevents the debris from exiting the CRD grid with any significant horizontal velocity component. The sumps are on the periphery of the lower dryweU floor. ThUs, debris which relocates
from the vessel will not fall directly on the sump roofs.
To prevent any debris from flowing on top of the shield roof, the shield should be taller than the maximum possible debris pool depth in the lower dryWell. This requirement is given by:
m H > em, tot uW-p A
em ld, min (19ED-37)
where:
IIlcm,tot = maximum amount of corium, 235 Mg
minimum floor area of the lower drywell, 79 m 2
Evaluating this expression yields:
Corium Shield
ABWR Rev. 0
Design Control Documenf/Tier 2
Huw~0.33 m (l9ED-38)
Mter debris relocation into the lower drywell, the lower drywell will almost always be flooded with water either by active systems (e.g., the firewater addition system) or by the passive flooder. The probability that the lower drywell will not be flooded after debris relocation is extremely small and is low enough that the case of a non-flooded lower drywell can be excluded from consideration.
The water in the lower drywell will provide long-term cooling to the debris on the floor, to any debris that is on the roof of the corium shield, and to the corium shield walls. Additionally, since the roof of the corium shield allows water flow into the sump when the lower drywell is flooded, the inner walls of the shield will be cooled. The heat transfer from the shield walls to the water is effective in preventing the debris frozen in the channels from remelting. Therefore, if the lower drywell is flooded, long-term solidification of the debris in the channels is assured and debris ingression into the sump is prevented.
To meet the requirements set forth in this subsection, the upper shield wall is specified to be 0.4 meters.
19ED.5.2 Lower Shield Wall (Below Lower Drywell Floor) with Channels
As stated in Subsection 19ED.5.1, long-term solidification of the debris in the channels is assured due to heat transfer from the shield walls to the water which has filled the lower drywell due to initiation of an active system or the passive flooder. Therefore, the only requirements for the lower shield wall are to absorb the initial energy released by the debris during the freezing process and to prevent tunneling of the debris beneath the shield when significant core-concrete interaction has not already occurred.
During the freezing process, the channel walls behave as semi-infinite bodies with a, temperature penetration depth less than a centimeter. Thus, the lower shield wall needs to have a depth of at least one centimeter to meet the requirement for initial debris freezing.
If core-concrete interaction is occurring, the potential exists that the lower drywell floor will be eroded to a depth below the lower shield wall. If this occurs, the debris could tunnel into the sump. This concern is eliminated by specifying that the shield wall extends down to the floor of the sump.
19ED.5.3 Shield Walls without Channels
The discussion in most of this attachment has focused on the shield walls with channels. This subsection will address the requirements for the shield walls without channels. The thickness, height and depth will be specified.
Corium Shield 19ED·23
ABWR
19£0-24
Rev. 0
Design Control Document/Tier 2
The corium shield walls without channels only need to be thick enough to provide a long-term, stable interface between the debris on the lower drywell floor and the interior of the sumps. As discussed in Subsection 19ED.5.1, only the long-term scenario with a flooded lower drywell needs to be considered.
The wall thickness needed to transfer a given heat flux under steady-state conditions is
kw(T -T.) I:1w = W,O W,l
q"d (19ED-39)
where:
= surface temperature of wall in contact with debris
= surface temperature of wall on inside of shield, and
= heat flux from the debris.
Assuming that the water in the sump is at three atmospheres, the inner shield wall will achieve a temperature of approximately 410 K to allow nucleate boiling. The MAAPABWR analysis contained in Subsection 19E2.2 demonstrate that the typical drywell pressure at the time of vessel failure is three atmospheres. To avoid ablation, the wall surface temperature in contact with debris must be less than the melting temperature of the shield wall material (approximately 2280 Kfor alumina).
The ~eat flux from the debris bed in the lower drywell can be apprOximated by assuming that the decay heat level is one-percent and that all the surfaces of the bed have the same heat flux. This approximation yields:
(19ED-40)
The actual heat flux to the wall may be significantly lower due to enhanced heat transfer from the debris bed to the overlying pool of water or separation of the bed from the wall.
Evaluating the wall thickness for these conditions yields
I:1x = 3 em·. (19ED-41)
This wall thickness provides a stable interface between the debris bed and a water filled sump. If the wall is thicker, it will ablate to this thickness and then establish a stable interface. To provide margin for any erosion due to initial debris contact with the wall, the thickness of the shield walls without channels is specified to be 10 cm.
Corium Shield
ABWR Rev. 0
Design Control DocumentlTier 2
The reasoning contained in Subsections 19ED.5.1 and 19ED.5.2 regarding the height and depth of the shield walls with channels also applies to the walls without channels. The height of the shield walls should be 0.4 meters which is greater than the maximum height of the debris bed in the lower drywelL The shield walls should extend to the floor of the sump to prevent debris tunneling.
19ED.6 Related Experimental and Analytical Work
The freezing of molten fuel in narrow channels and tubes has been studied previously in regards to core disruptive accidents in liquid metal fast breeder reactors (References 19E0-10, 19£0-11, 19ED-12 and 19ED-13) and in regards to ceramic core retention devices (Reference 19ED-13). This subsection will review these works for application to the channel freezing analysis contained in Subsection 19ED.4.
Cheung and Baker (Reference 19ED-10) analytically and experimentally studied the transient flow and freezing of molten core debris in coolant channels of a liquid-metal fast breeder reactor. Their data analysis determined the impact of several parameters on the penetration depth of the fuel into the channeL The derived variations are in general agreement with the trends shown in the sensitivity study contained in Subsection 19ED.4.5. This work cu1mi~ated in the determination of penetration depths for several coolant channel diameters. The material properties of Scenario M compare somewhat favorably to the material properties used by Cheung and Baker. However, they used a channel flow velocity of 100 cm/ s. Modifying their results to account for velocity differences yields penetration distances from 20 to 66 cm for channel diameters between 0.64 and 1.27 em and a debris temperature of 2770 °C. This result compares well to the results determined for Scenario M-a penetration depth of 30 cm for a 1 cm channeL
Fieg, et. aI., (Reference 19£0-12) performed channel plugging experiments at the Karlsruhe rnEFIS facility in Germany using alumina and alumina-iron melts as fuel simulants. The results indicated that the conduction-limited crust growth is an adequate hypothesis for modeling the penetration and freezing of molten fueL The basis of the this crust-growth model is that a stable crust forms at the channel boundary and then grows continually until it clogs the channeL This is also the basis of the model developed in Subsection 19ED.4. The experimental results presented by Fieg cannot readily be compared to the corium shield because the experimental velocities are so much higher (2.2 m/s to 4.4 m/s compared to 0.01 m/s to 0.1 m/s). However, Fieg's findings that increasing wall temperatures and/ or driving pressures increases penetration depth are consistent with the model developed in Subsection 19EDA.
Soussan, et. aI., (Reference 19ED-11) compared the results of experiments performed atAAE Winfrith and CEN Grenoble with the BUCOGEL code developed at Cadarache. The comparison revealed that penetration depths are over predicted using the conduction freezing model and under predicted using the bulk freezing modeL The
Corium Shield 19ED-25
ABWR Rev. 0
Design Control Document/Tier 2
freezing ofU02 was shown to be consistent with the conduction freezing mode. Alternatively, freezing of molybdenum was determined to undergo bulk freezing. This would tend to indicate that the analysis in Subsection 19ED. 4 over predicts the freezing of metallic melts such as Scenario II. However, the overall impact to the analysis is negligible because Scenario II is not limiting.
PLUGM (Reference 19ED-13) was developed to analyze freezing in a variety of geometries including the gaps between the ceramic bricks of a core retention device. The model in 19ED.4 is similar to the PLUGM model for "Thin Slit Geometry- No Crust with a Nonmelting, Infinitely-Thick Wall". The primary difference is that 19ED.4 is somewhat more simplified to allow a closed-form analytical solution, whereas PLUGM must be solved numerically. Unfortunately, the example contained in Reference 19ED-13 for a thin slit geometry does not lend itself to comparison with t?e corium shield analysis because the example models a vertical channel with a high entrance velocity.
The past investigations into the freezing of molten fuel in narrow channels tend to support the modeling and results of the channel length analysis contained in Subsection 19ED.4.
19ED.7 References
19ED-1 FrankP. Incropera and David P. DeWitt, "Fundamentals of Heat and Mass Transfer", 2nd Ed.,john Wiley and Sons, 1985,pp. 85-86.
19ED-2 Glen E. Myers, "Analytical Methods in Conduction Heat Transfer", Genium Publishing Corp., Schenectady, NY, 1987, p. 202.
19ED-3 FrankP. Incropera and David P. DeWitt, "Fundamentals of Heat and Mass Transfer", 2nd Ed., john Wiley and Sons, 1985, p.·203.
19ED-4 Frank P. Incropera and David P. DeWitt, "FundamenUIs of Heat and Mass Transfer", 2nd Ed., john Wiley and Sons, 1985, pp. 433-435.
19ED-5 H.S. Carslaw and J.c. jeager, "Conduction of Heat in Solids", 2nd Ed., Oxford University Press, 1959, pp. 112-113.
19ED-6 "Mark's Standard Handbook for Mechanical Engineers", 8th Ed., Theodore Baumeister, Editor-in-Chief, McGraw-Hill Book Company, 1978, pp. 6-171 to 6-177.
19ED-7 T.G. Theofanous, W.H. Amarasooriya, H. Yan, and U. Ratnam, "The Probability of Liner Failure in a Mark-I Containment", NUREG/CR-5423, August 1991.
19ED-26 Corium Shield
ABWR
Corium Shield
Rev. 0
Design Control Documenf/Tier 2
19ED-8 "MAAP-3.0B Computer Code Manual", EPRI NP-7071-CCML, November 1990.
19ED-9 "CRC Handbook of Chemistry and Physics", 62nd Ed. CRC Press, Boca Raton, Florida, 1981.
19ED-10 F.B. Chueng and L. Baker, "Transient Freezing of Liquids in Tube Flow, Nuclear Science and Engineering", 60, pp. 1-9,.1976.
19ED-11 P. Soussan, M. Schwartz, D. Maxon, and B. Berthet, "Propagation and Freezing of Molten Material Interpretation of Experimental Results", Proceedings of the 1990 International Fast Reactor Safety Meeting, Snowbird, Utah, August 12-16,1990.
19ED-12 G. Fieg, M. Maschke, I. Schub and H. Werle, "Penetration and Freezing Phenomena of Ceramic Melts Into Pin-Bundles", Proceeding of the 1990 International Fast Reactor Safety Meeting, Snowbird, Utah, August 12-16, 1990.
19ED-13 M. Pilch and P.K. Mast, "PLUGM: A Coupled Thermal-hydraulic Computer Model for Freezing Melt Flow in a Channel", NUREG/CR-3190, SAND82-1580, Sandia National Laboratories, Albuquerque, NM 1982.
19£D·27
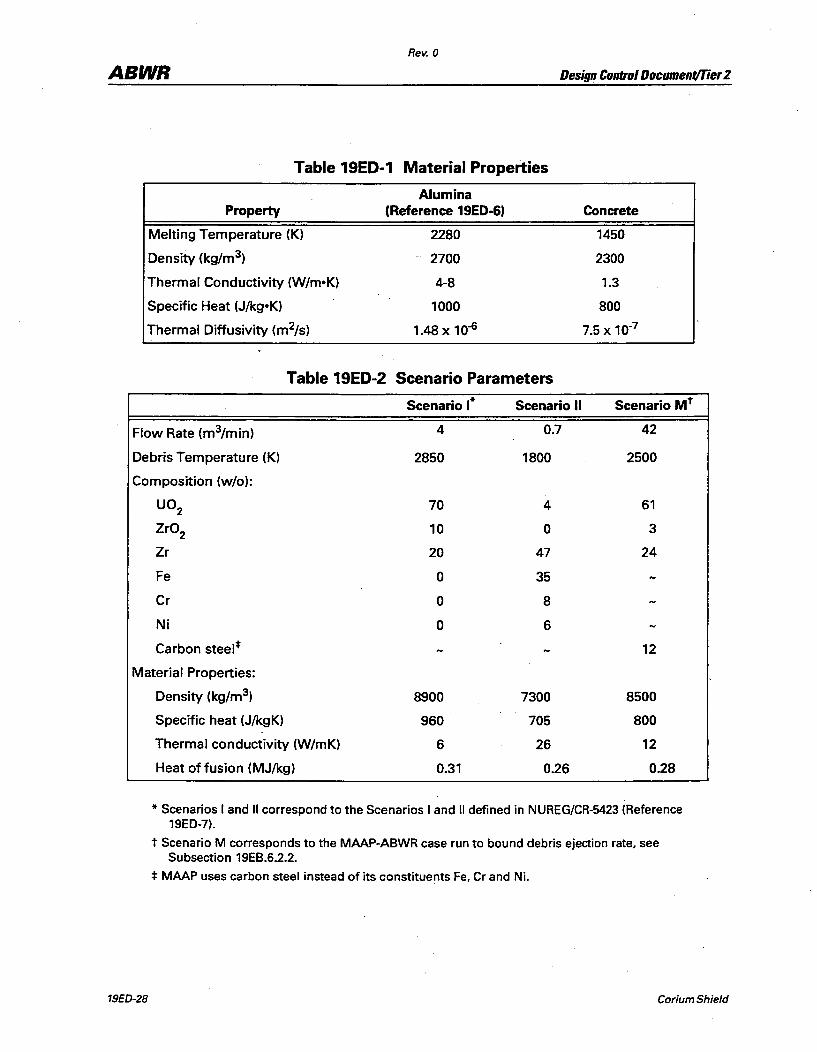
Rev. 0
ABWR Design Control Document/Tier 2
Table 19ED-1 Material Properties
Property
Melting Temperature (K)
Density (kg/m3)
Thermal Conductivity (W/m-K)
Specific Heat (J/kg-K)
Thermal Diffusivity (m2/s)
Alumina (Reference 19ED-6)
2280
- 2700
4-8
1000
1.48 x 10⁻⁶
Table 19ED-2 Scenario Parameters
Scenario 1" Scenario II
Flow Rate (m3/min) 4 0.7
Debris Temperature (K) 2850 1800
Composition (w/o):
U02 70 4
Zr02 10 0
Zr 20 47
Fe 0 35
Cr 0 8
Ni 0 6
Carbon steel*
Material Properties:
Density (kg/m3) 8900 7300
Specific heat (J/kgK) 960 705
Thermal conductivity (W/mK) 6 26
Heat of fusion (MJ/kg) 0.31 0.26
Concrete
1450
2300
1.3
800
7.S x 10-7
Scenario Mt
42
2500
61
3
24
12
8500
800
12
0.28
* Scenarios I and II correspond to the Scenarios I and II defined in NUREG/CR-5423 (Reference 19ED-7).
19ED-28
t Scenario M corresponds to the MAAP-ABWR case run to bound debris ejection rate, see Subsection 19EB.S.2.2.
:j: MAAP uses carbon steel instead of its constituents Fe, Cr and Ni.
Corium Shield
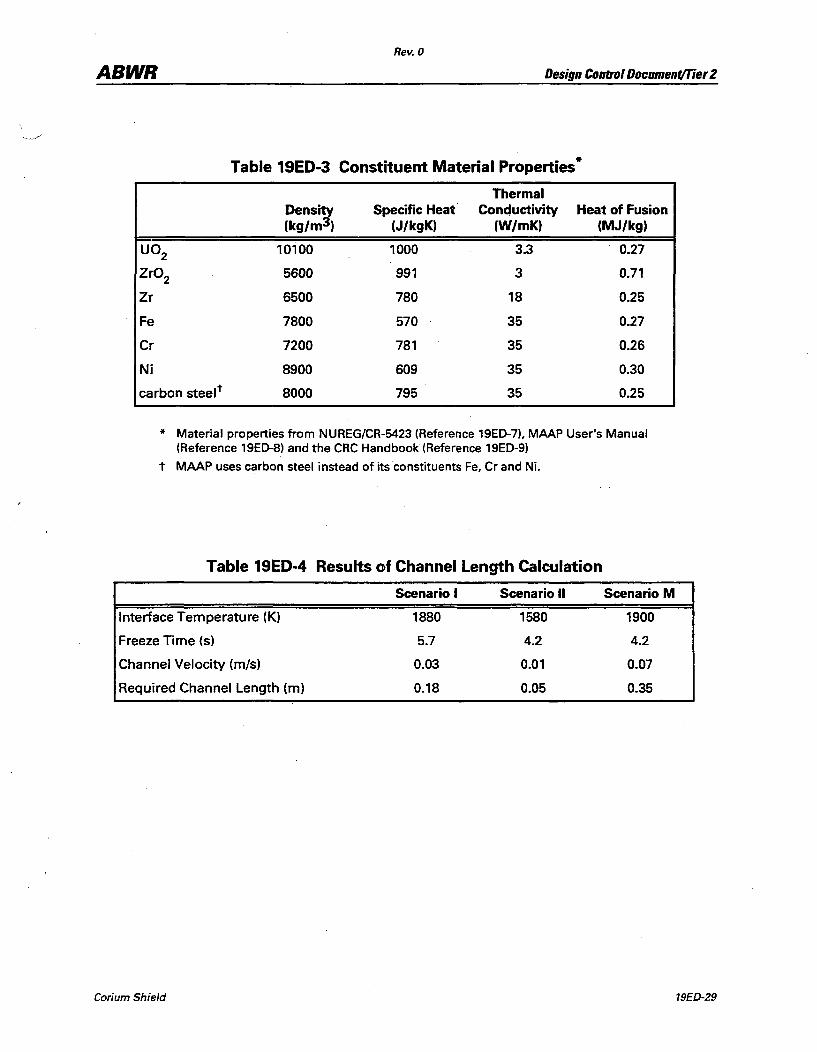
Rev. 0
ABWR Design Control Document/Tier 2
Table 19ED-3 Constituent Material Properties *
Thermal Dens~ Specific Heat Conductivity Heat of Fusion (kg/m ) (J/kgK) (W/mK) (MJ/kg)
U02 10100 1000 3.3 0.27
Zr02 5600 991 3 0.71
Zr 6500 780 18 0.25
Fe 7800 570 35 0.27
Cr 7200 781 35 0.26
Ni 8900 609 35 0.30
carbon steelt 8000 795 35 0.25
* Material properties from NUREG/CR-5423 (Reference 19ED-7), MAAP User's Manual (Reference 19ED-8) and the CRC Handbook (Reference 19ED-9)
t MAAP uses carbon steel instead of its constituents Fe, Cr and Ni.
Table 19ED-4 Results of Channel Length Calculation
Scenario I Scenario II Scenario M
Interface Temperature (K) 1880 1580 1900
Freeze Time (s) 5.7 4.2 4.2
Channel Velocity (m/s) 0.03 0.01 0.07
Required Channel Length (m) 0.18 0.05 0.35
Corium Shield 19ED-29
Rev. 0
ABWR Design Control Document/Tier 2
....... ~-
Table 19ED-5 Effect of Parameter Variations
Channel Length 1m)
Sen I Sen II SenM Average Effect
Base Case 0.18 0.05 0.35
Debris:
Density + 20% 0.26 0.07 0.50 +33%
Density - 20% 0.11 0.03 0.24 -63%
Latent heat of fusion + 20% 0.26 0.07 0.55 +35%
Latent heat of fusion - 20% 0.11 0.03 0.21 -69%
Flow rate + 20% 0.19 0.05 0.39 +9%
Flow rate - 20% 0.16 0.04 0.32 -12%
Thermal conductivity + 20% 0.15 0.04 0.32 -12%
Thermal conductivity - 20% 0.21 0.05 0.41 +13%
Temperature + 200K 0.15 0.03 0.29 -27%
Temperature - 200K 0.21 0.07 0.45 +23%
Wall:
Thermal conductivity + 20% 0.14 0.03 0.26 -36%
Thermal conductivity - 20% 0.25 0.08 0.53 +34%
Thermal diffusivity + 20% 0.20 0.06 0.42 +15%
Thermal diffusivity - 20% 0.15 0.04 0.30 -21%
19ED-30 Corium Shield
Rev. 0
ABWR Design Control Document/Tiel2
<--/
Table 19ED-6 Change in Energy due to Superheat
Change in Energy (%)
Superheat (OC) Scenario I Scenario II Scenario M
0 0 0 0
5 2 1 1
10 3 3 3
25 8 7 7
50 15 14 14
100 31 27 29
125 39 34 36
150 41
Table 19ED-7 Plug Formation Times with Superheat
Plug Formation Time (sec)
Superheat (OC) Scenario I Scenario II Scenario M
0 5.7 4.2 4.2
5 5.9 4.3 4.3
10 6.1 4.4 4.4
25 6.7 4.8 4.8
50 7.7 5.4 5.4
100 9.9 6.7 6.9
125 11.1 7.5 7.7
150 8;3
Corium Shield 19ED-31
Rev. 0
ABWR Design Control Document/Tier 2
'. . ""---'"
Table 19ED-8 Required Channel Lengths with Superheat
Required Channel Length (m)
Superheat (OC) Scenario I Scenario II Scenario M
0 0.18 0.05 0.35
5 0.19 0.05 0.37
10 0.19 0.05 0.39
25 0.22 0.06 0.44
50 0.27 0.07 0.53
100 0.40 0.09 0.75
125 0.47 0.11 0.89
150 0.13
19£D-32 Corium Shield

Rev. 0
ABWR Design Control Documenf/Tier 2
Corium Shield Lower Drywell
ContllnmentBoun~
Side View
Figure 19ED-1 Conceptual Design of Lower Orywell Floor Drain Sump Shield
Corium Shield 19£D-33
ABWR
Channel Centerline
19ED-34
Rev. 0
Molten Debris Crust
Design Control Document/Tier 2
Shield Wall (- semi-infinite Solid Body)
Figure 19ED-2 Temperature Profile in Channel Region
Corium Shield
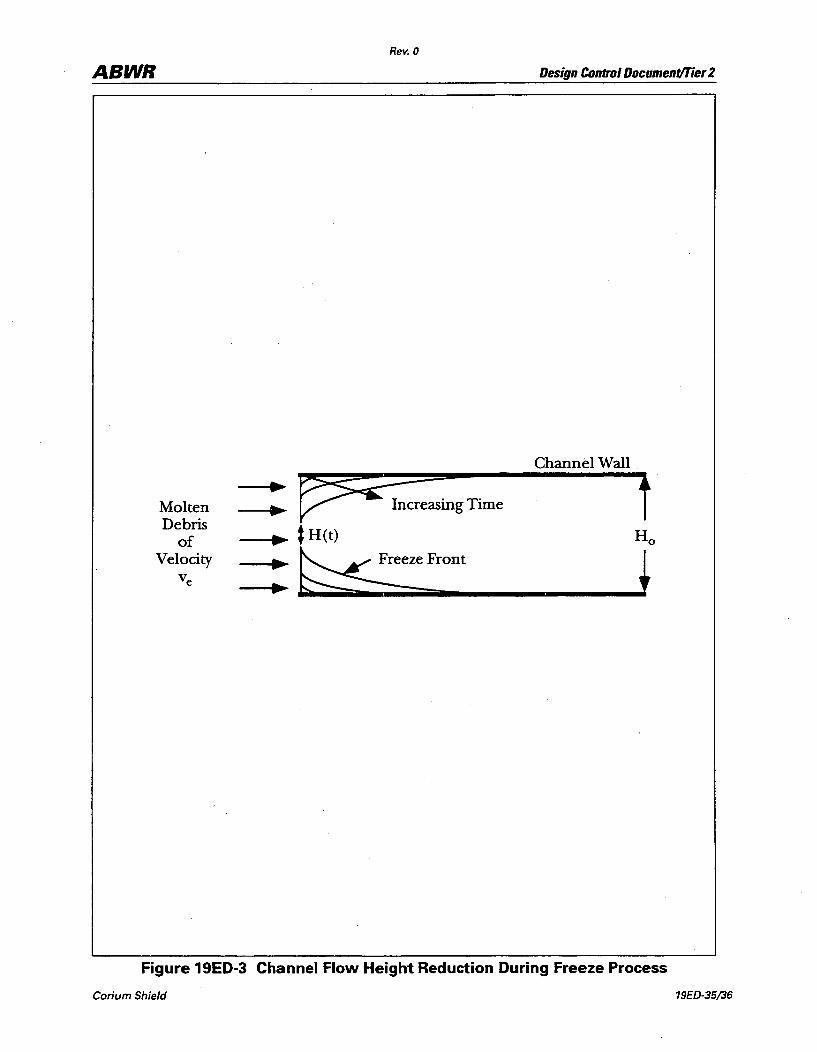
Rev. 0
ABWR Design Control Document/Tier 2
Channel Wall
• ~ Increasing Time t Molten • Debris of • * H(t) Ho
Velocity • ~ezeFront t ve •
Figure 19ED-3 Channel Flow Height Reduction During Freeze Process
Corium Shield 19£D-35136
Rev. 0
ABWR Design Control Document/Tier 2
19EE Suppression Pool Bypass
19EE.1 Suppression Pool Bypass
As shown in Subsection 19E.2.3.3.3 (4), the only mode of suppression pool bypass that presents any significant risk during a severe accident is vacuum breaker leakage. Vacuum breaker leakage is the passage of gas from the drywell into the wetwell air space. Vapor suppression and fission product scrubbing by the suppression pool are not available to the gas and vapor which pass through the vacuum breakers.
The ABWR contains eight vacuum breakers. ABWR vacuum breakers are swing check valves which begin to open passively when wetwell pressure exceeds drywell pressure by 0.0014 MPa and are fully open at 0.0035 MPa. When the pressure differential is less than this, or drywell pressure exceeds wetwell pressure, the vacuum breakers should be completely seated and no flow should be passing through them. A large drywell to wetwell pressure differential will produce a large force tending to close the vacuum breaker valves. A pressure differential of +0.048 MPa is typical in a severe accident after core damage occurs and the passive flooder opens. This pressure differential produces a closing force of981 0 N (2200 lbf) on the valves. For severe accident scenarios in which the firewater system is actuated, the pressure differential is about +0.096 MPa which produces a closing force of 19600 N (4400 lbf) on the valves. These large closing forces, as well as routine inspection, maintenance, and testing, ensure the probability of vacuum breaker leakage after the actuation of the passive £looder or the drywell spray system is extremely low.
Large amounts ofleakage can occur as a result of catastrophic failure of valve components or a valve sticking open. Lesser amounts ofleakage can result from nonnal wear and tear including degradation of the valve seating surfaces or retaining magnets. For sufficiently large amounts ofleakage during a severe accident, the time to rupture disk opening or containment failure can be reduced and the amount offission products released can be increased.
A study utilizing decomposition event trees and deterministic modeling was performed to assess the impact of vacuum breaker leakage on the performance of the ABWR during a severe accident. The event tree analysis is contained in Subsection 19EE.2. Subsection 19EE.3 contains the deterministic evaluation.
19EE.2 Description of Decomposition Event Tree Analysis
The suppression pool bypass decomposition event tree analysis consists of one decomposition event tree (DET) , Figure 19EE-1. The DET considers the major phenomena which influence accident consequences. The first two events on the DET sort out vacuum breaker leakage area. Plugging of vacuum breaker leakage pathways by aerosols is considered in the third event. Ifleakage exists but the pathway is not very
Suppression Pool Bypass 19EE-7
ABWR Rev. 0
Design Control Document/Tier2
large, aerosol plugging can significantly diminish the consequences of suppression pool bypass through the vacuum breakers. The last event assesses the amount of suppression pool bypass.
The probabilities for each sequence pathway with similar end states were summed and these results transferred as the branch probabilities of the main containment event tree ..
19EE.2.1 Vacuum Breaker Stuck Open (VB)
19EE-2
When a vacuum breaker sticks open or fails catastrophically, a large pathway is established between the drywell and wetwell. The deterministic analysis described in Subsection 19EE.3 demonstrates that pathway areas greater than 41 cm2 (opening widths greater than 0.9 cm) can significantly affect accident consequences.
The suppression pool bypass scoping analysis presented in Subsection 19E.2.3.3 aSsumed a failure probability for vacuum breaker full reverse flow based on pre-1970 U.S. BWR operating history of general check valves. This failure rate is highly conservative because:
(1) The ABWR vacuum breaker design is based on current knowledge which is substantially improved over earlier check valve designs.
(2) The ABWR vacuum breaker environment is significantly less severe than general check valves-the working fluid is gas rather than liquid and the ABWR vacuum breakers will not experience chugging loads.
The failure probability used in this analysis was based on BWR operating experience from April 1981 to March 1991 as contained in a database of Licensing Event Reports. The database was queried for abnormal wetwell-to-drywell vacuum breaker operation. Information about the valves connecting the containment and reactor building were not included because some of these valves are not swing, check valves. The database query provided a short narrative of each abnormal operation as well as the total component operating time.
The database query included BWR Mark I, II and III containments. The vacuum breakers in these containments are similar in design to the ABWR vacuum breakers (passive, flapper-type valves attached to horizontal piping). The ABWR vacuum breakers will be slightly different in size than some of those currently in operation, but this does not undermine the applicability of the data. Only flapper-type vacuum breakers were represented in the data. The motor-operated valves (MOVs) used in the vacuum relief systems of Mark III containments were not considered.
The failures were culled to exclude failures other than those that could lead to a vacuum breaker sticking open or catastrophically failing. Failures to open were excluded because mechanical binding was never the root cause. Most failures to open (10 out of
Suppression Pool Bypass
ABWR Rev. 0
Design Control Document/Tier 2
12) were attributed to either the setpoint drift or worn retaining magnets. Neither of these conditions would prevent the vacuum breaker from closing once it had opened, albeit at a differential pressure outside the normal range. The remaining failures were due to:
(1) a loose set screw on the flapper pivot pin, and
(2) excessive clearance between the valve shaft and disk.
Both of these conditions led to opening forces greater than technical specification limits and greater than the forces required to open the other vacuum breakers tested in the same sequence. In the ABWR design, only seven of the eight vacuum breakers are required to accommodate the most rapid drywell depressurization. Therefore, if either of the these two failure conditions existed during an accident, the affected valves would probably not open because the other vacuum breakers would open and relieve high differential wetwell pressure before the force required to open the affected valves was
achieved.
Failures to pass leak rate tests during refueling and maintenance outages when the vacuum breaker proximity switch indicated "closed" were also excluded because they represent small leakage paths. These failures were included in the probability for VB_LEAK as described in Subsection 19EE.2.2. A "closed" indication will be given only when the vacuum breaker disk is seated or very nearly so. Failures to close were included, as were cases in which excessive force was required to cycle a vacuum breaker during stroke capability testing.
The database query provided the following results:
Abnormal operation which could lead to failure to close 18 (Nclose)
Cumulative vacuum breaker operating time 2.66E7 hours (T close)
The ability of vacuum breakers to open and close in current plants is demonstrated monthly during stroke capability tests (Tstroke = 720 hours). Therefore, the probability that one of the eight ABWR vacuum breakers will fail to close on demand and a large leakage path will be established between the wetwell and drywell can be approximated.
This failure probability conservatively over-estimates the probability that one of the ABWR vacuum breakers will fail to close during accident conditions because the closure forces during an accident will be at least an order of magnitude greater than those present during testing and normal operation. Additional closure force will enhance sealing and overcome some, if not all of the closing resistance.
Suppression Pool Bypass 19EE-3
ABWR Rev. 0
Design Control Document!1ier 2
The vacuum breakers in the ABWR will not be stroke tested every month as are those in current operation. This is expected to improve vacuum breaker reliability because the monthly stroking increases wear, increases galling potential, imparts impact loads to the valve components, loads the valves in a non-uniform manner, and decreases the sealing ability of the soft seats. Reliabilitywill also be increased by improvements made possible by the operational experience of vacuum breakers currently in BWRs with Mark I, II and In containments. These improvements will include material selection, valve assembly techniques and maintenance procedures. Corrosion on ABWR vacuum breaker load bearing components will be negligible because of material selection and operating environment (nearly pure nitrogen). Since reliability is improved and corrosion will be negligible, the failure probability determined during monthly testing of current vacuum breakers provides a conservative over-estimation of ABWR vacuum breaker reliability.
19EE.2.2 Vacuum Breaker Leaks (VB_LEAK)
19EE-4
The consequences of small leakage paths between the drywell and wetwell are less severe than those for a vacuum breaker sticking open. The small leakage area cutoff was determined to be 41 cm2 in the sensitivity study contained in Subsection 19EE.3. The BWR operating history described in Subsection 19EE.2.1 was also used to determine the probability of small leakage.
BWRs with Mark I containments have a single passive, flapper-type valve attached to the end of each vacuum breaker line. Mark II containments have two passive, flapper-type valves in series in each vacuum breaker line. Mark III containments have a single, flapper-type valve in series with a motor operated valve (MOV) in each line. All of the valves are attached to horizontal piping in the wetwell air space. Since the ABWR has a single, flapper-type valve on the end of each line in the wetwell air space, the operating experience of BWRs with Mark I containments provides the best indication of ABWR
vacuum breaker leakage. Actual ABWR vacuum breakers will perform better than those in Mark I containments because:
(1) The ABWR vacuum breaker materials-especially those of the seating swfaces-will be improved because they will be based on the many years accumulated vacuum breaker experience of current BWRs.
(2) The ABWR vacuum breakers will not experience chugging loads.
(3) The ABWR vacuum breakers will not be cycled every m<?nth.
The ability of vacuum breakers to remain leak tight is demonstrated during wetwell-todrywellieakage tests performed as part of each refueling and maintenance outage. During these tests, the drywell is pressurized with respect to the wetwell and the pressure decay rate measured. If the pressure differential decreases too rapidly indicating
Suppression Pool Bypass
ABWR Rev. 0
Design Control Document/Tier 2
excessive leakage, the root cause is found and corrected. The instances when a vacuum breaker was found to be the leakage pathway are reported in Licensing Event Reports and included in the operating. experience database. The pressurization rate used in the leakage tests are generally slower than those experienced during accident conditions. Increased pressurization rates improve the sealing capability of soft seats and reduce leakage.
All failures reported in the selected operating history of wetwell-to-drywell vacuum breakers in Mark I containments, except failures to open and those used to determine vacuum breaker stuck open, were included in the determination of small leakage probability. The database query provided the following results:
Number of Mark I wetwell-to-drywell vacuum breaker 42 (N1eak)
abnormal operations which could lead to small leakage.
Cumulative Mark I vacuum breaker operating time 2.37E7 hours (T1eak)
The actual amount ofleakage was not reported in the database and is generally not available. However, the vacuum breaker leakage area can be roughly characterized. Currently, wetwell-to-drywell vacuum breakers are verified to be closed by indication lights in the control room every seven days. Position is determined by proximity switches which are generally accurate to within the 0.9 cm disk opening, corresponding to the 41 cm2 cutoff area. The proximity switches used in co~unction with the ABWR vacuum breakers will have even closer tolerances because of the increased importance placed on bypass leakage. None of the leakage failures included failure of "closed" indication. Therefore, leakage was occurring when the valve was open less than the cutoff amount.
During the operating period selected in the database query, refueling and maintenance outages were conducted every twelve to eighteen months. Thus, taking the test time to be eighteen months (Ttest = 13,140 hours) is conservative. The probability that one of the eight ABWR vacuum breakers develops a small leakage path can be approximated.
This probability is a conservative over-estimation since wetwell-to-drywellieakage test are conducted at differential pressures much lower than those expected during accident conditions. The additional differential pressures will greatly enhance sealing.
19EE.2.3 Aerosols Plug Leakage Path (LEAK_PLUG)
The consequences of leakage pathways between the drywell and wetwell can be greatly diminished if aerosols plug the path. The Vaughan aerosol plugging model -(Reference 19EE-l) was used with MAAP-ABWR to determine if and at what time plugging occurred. A full description of this methodology can be found in Subsection 19EE.3.1.
Suppression Pool Bypass 19EE-5

ABWR Rev. 0
Design CDntrol DDcument!Tier 2
The sensitivity study contained in Subsection 19EE.3.2 predicts that if plugging is allowed to occur in small leakage paths (opening widths ~ 0.9 cm), accident consequences are not effected by the presence ofleakage paths. Even though plugging may reduce the consequences oflarger opening widths, no credit was taken in the DET. The sensitivity study predicted plugging for opening widths up to 1.25 cm. Therefore, a high probability was given to plugging of opening widths up to 0.9 cm.
19EE2.4 Suppression Pool Bypass (POOL_BP)
This heading on the DET summarizes the amount of suppression pool bypass. "No Pool Bypass" indicates that either no leakage, an insignificant amount ofleakage, or a plugged leakage pathway exists. The consequences of a particular acciden t scenario will be unaffected by pool bypass for this condition. "Small Leak" indicates that a small amount of pool bypass is present. Small amounts of bypass will have marginal impact on accident consequences. Large amounts of pool bypass are indicated by "Large Leakage". Accident consequences will increase in severity when large amounts of pool bypass exist.
19EE.3 Deterministic Analysis
A sensitivity study was performed with MAAP-ABWR to access the impact of suppression pool bypass during severe accident conditions.'~·
19EE.3.1 Method
The dominant severe accident sequence [Loss of all core Cooling with vessel failure occurring at Low Pressure (LCLP)] was chosen to evaluate plant performance. MAAP-ABWR runs were made with effective vacuum breaker area, A/...JK, varying from o to 2030 cm2 (315 in2). The upper bound corresponds to one fully open vacuum breaker with no flow resistance. Five variations were analyzed. In each case the overpressure relief rupture disk opened when the wetwell pressure reached 0.72 MPa. The five scenarios were:
(l) Bypass leakage begins after passive flooder activation, aerosol plugging is neglected.
(2) Bypass leakage is present from the beginning of the accident, aerosol plugging is neglected.
(3) Bypass leakage begins after passive flooder activation, aerosol plugging of the vacuum breaker opening is considered.
(4) Bypass leakage is present from the beginning of the accident, aerosol plugging of the vacuum breaker opening is considered.
19EE-6 Suppression Pool Bypass
Rev. 0
ABWR Design Control Document/Tier 2
(5) Bypass leakage is present from the beginning of the accident and the operator initiates the firewater spray system.
MAAP-ABWR uses the MAAP 3.0B aerosol plugging model developed byE.V. Vaughan (Reference 19EE-l). The model predicts the mass of aerosol required to flow through the leak path in order to form a plug as a function of the size of the opening. MAAP conservatively assumes that the flow rate through the vacuum breaker opening is not affected by the growing aerosol plug until the aerosol mass required to plug the leak completely has passed through the opening. For a circular opening, the mass is proportional to the cube of the diameter; and, for a rectangular opening, the mass is proportional to the product of the length. and the square of its width. The proportionality constant has been experimentally detennined to range from 10,000 to 50,000 kg/ms (130 to 640 Ibm/ftS), and varies with aerosol size, aerosol mass flow rate, and leak path geometry. The MAAP-ABWR runs for scenarios 3 and 4 used a conservative proportionality constant of 50,000 kg/ms (640 Ibm/ftS).
Although the Vaughan aerosol plugging model does not suggest an upper bound on the size ofleak paths which can be plugged, there is some question about the applicability of the model for leak paths greater than I em (0.39 in) in diameter. In NRC/IDCOR Technical Issue 13A (Reference 19EE-2), the NRC asserted that the data cited by Morewitz (Reference 19EE-3) in support of the Vaughan plugging model for pathways greater than 1 em diameter does not adequately simulate severe accident conditions. The experiments cited with pathways greater than 1 em (0.39 in) in diameter involved straight ducts with lengths greater than 10 meters (32.8 ft). Therefore, due to the lack of appropriate experimental data, the NRC has accepted the Vaughan aerosol plugging model only for leak pathways smaller than 1 em (0.39 in). The NRC's position on this issue is stated in the resolution ofNRC/IDCOR Technical Issue 13A (Reference 19EE-2).
The applicability of the Vaughn Plugging Model to the conditions of the vacuum breakers was examined by consideration of various test data provided by Morewitz (Reference 19EE-3). The data surveyed includes a variety of experiments involving orifices as well as pipes. The data for orifice plugging indicates that the plugging coefficient is comparable to that for small piping.
Morewitz also discusses the impact of steam on the plugging of leakpaths. He indicates test data which indicated that "leak paths quickly plugged when steam was introduced in the containment atmosphere". He also notes that densification effects such as condensation of water on hygroscopic deposits could increase the rate of plug formation. In the ABWR, hygroscopic CsOH particles form a significant fraction of the aerosol. A large portion of the aerosol mass is expected to be made up of tin (Sn) which is released during the core degradation phase of the accident. Tin is insoluble in water (Reference 19EE-4) and therefore, any plug created with tin would not be expected to
Suppression Pool Bypass 19EE-7
ABWR Rev. 0
Design Control Documenf/Tier 2
be affected by the presence of steam. If continued core-concrete interaction is predicted, a major contributor to the aerosol mass would be Si02 which is also insoluble in water (Reference 19EE-4).
Most of the experimental evidence cited by Morowitz involves systems with very high pressure differences across the plug. For example, in the orifice test data noted above, the differential pressures ranged from 0.21 MPa to 6.9. MPa. Morowitz indicates that "either solid or porous plugs fonned" in these'experiments. Reference 19EE-3 also describes a test of a small, concrete, tilt-up-panel building at Atomics International in the early 1960's. The building was overpressurized and cracked so that it leaked badly. In order to plug the leaks, a sodium fire was lit inside the building and obseIVers were stationed around the outside. No smoke was seen issuing from the building. Upon pressure testing of the building, no gas leaks could be detected. Reference 19EE-3 describes several other situations with lower pressure differences in which tennination (or significant reduction) in gas flow rates was obseIVed. In the ABWR the maximum pressure difference across the plug will be limited to the head of water above the first row of horizontal vents [about 0.02 MPa assuming noxmal water level]. Therefore a complete blockage is expected. Any small gas leakage would have an insignificant affect on the wetwell pressurization.
In order to accurately simulate aerosol flow through open vacuum breaker valves in the ABWR, experiments should be conducted with ducts ofless than 2 cm (0.79 in) in length. However, the trends of the experimental data do not suggest that the Vaughan plugging model is invalid for openings only slightly larger than 1 cm. Unfortunately, no definitive conclusions can be reached regarding the applicability limit without additional experimental data. For this reason, studies were performed with and without
plugging for vacuum breaker bypass widths up to 1.6 cm (0.63 in) corresponding to an effective area of 75 cm2 (11.6 in2). This information is used to indicated the conservatisms which may exist in the analysis.
The opening of a stuck~pen vacuum breaker is neither circular nor rectangular. Rather it is a crescent shape fonned by two circular disks separating while remaining hinged at one point. The leak path width used for the Vaughan plugging model is conseIVatively assumed to be the maximum crack width. The length of opening is approximated as the effective area divided by the width. For vacuum breaker opening widths of up to 1 cm (0.39 in), corresponding to bypass effective areas of up to 46 cm2 (7.1 in2), Use of the plugging model provides the best estimate of containment response. As discussed above, additional calculations were run for widths up to 1.6 cm (0.63 in).
19EE.3.2 Results
19EE-8
A series of bypass flow areas was analyzed using MAAP-ABWR for each of the assumed scenarios. A summary of the time and magnitude of fission product releases for each scenario is presented in Table 19EE-1. It was not necessary to run all of the variations in
Suppression Pool Bypass
ABWR Rev. 0
Design Control Document/Tier 2
bypass area for each of the five scenarios for this analysis. Thus, Table 19EE-1 contains some blanks. The characteristics of each scenario is discussed below.
19EE.3.2.1 Late Suppression Pool Bypass with no Plugging
For the scenario 1 accident sequence, the passive flooder opens [based on the gas temperature in the lower drywell reaching 533 K (500°F)] at 5.5 hours. The pressure in the dryweU decreases as cold water floods into the suppression pool from the lower
drywell. Fifteen minutes later, the drywell starts to repressurize and the suppression pool bypass is presumed to begin. If there is no bypass leakage, the elapsed time before rupture disk opening and fission product release is about 20 hours. MAAP predicts that the time to rupture disk opening is not affected for effective vacuum breaker bypass areas of up to 5 cm2 (0.78 in2). As the effective area increases from 5 to 50 cm2 (0.775 to 7.75 in2), the time to rupture disk opening steadily decreases to about 10 hours. Above 50 cm2 (7.75 in2) , the time asymptotically approaches 9 hours and remains at 9 hours even for a fully open vacuum breaker valve.
As expected, fission product releases are much higher for cases with bypass leakage than for the case without bypass leakage. For non-bypass cases, the release fraction of CsI at 72 hours is less than 1E-7. The release fractions of CsI at 24 and 72 hours approach asymptotes as the effective bypass area increases. For cases with effective areas greater than 400 cm2, the 24 hour CsI release fractions are about 6% and the 72-hour release fractions are about 17%. Most of the releases occur late in the sequences as fission products revaporize from the vessel surfaces.
19EE.3.2.2 Pre-existing Suppression Pool Bypass with no Plugging
Bypass leakage was assumed to be present from the beginning of the accident sequence for the cases in scenario 2. As with the scenario 1 cases, the elapsed time before rupture disk opening is not affected by effective bypass areas smaller than 5 cm2 (0.775 in2).
Unlike the scenario 1 cases, however, the elapsed time did not reach a 9-hour asymptote. Instead, the elapsed time continued to decrease to a value of2.2 hours for a fully open vacuum breaker valve.
The 24- and 72-hour CsI release fractions asymptotically approached a maximum value for large effective areas. TheCsI release fractions for the scenario 2 cases are very similar to those for the cases of scenario 1. The variations in release are caused by changes in revaporization behavior due the slight differences in thermal hydraulic performance.
19EE.3.2.3 Late Suppression Pool Bypass with Plugging
For the scenario 3 cases, bypass leakage was assumed to begin after the actuation of the passive £looder. Plugging of the vacuum breaker opening before the wetwell pressure reached the rupture disk setpoint was predicted for all widths below 1.25 cm. After the leak plugs, all flow from the drywell is directed through the drywell connecting vents
Suppression Pool Bypass 19EE-9
ABWR Rev. 0
Design Control Document!Tier 2
into the suppression pool. There is then a period in which little steam is generated in the wetwell vapor space. The wetwell gas temperature decreases during this time due to condensation on the walls. This in turn causes the containment pressure to decrease for a short time. Steam generation in the drywell eventually causes the suppression pool to heat up and the containment pressure increases again. For cases with vacuum breaker opening widths up to 1 cm (0.39 in), the elapsed time to rupture disk actuation is about 20 hours, the same as for the case with no bypass leakage. MAAP-ABWR predicts CsI releases ofless than 1E-7 at 72 hours for all of the opening widths less than 1 em.
The maximum vacuum breaker opening width for which MMP predicts that the leak path will plug before the rupture disk opens was determined to be 1.25 cm (0.49 in). Even if the rupture disk opens before an aerosol plug forms, reductions in source term can be observed. Mter the rupture disk opens, aerosols will continue to flow through the vacuum breaker opening and can eventually form a plug. This essentially terminates fission product release. The CsI release fractions at 72 hours for cases with late bypass . and credit for aerosol plugging are significantly less than for the cases in which no plugging is assumed.
19EE.3.2.4 Pre-existing Suppression Pool Bypass with Plugging
The scenario 4 cases, in which suppression pool bypass flow was present from the beginning of the accident, show similar results to those of the scenario 3 cases. For cases with vacuum breaker opening widths up to 0.9 cm (0.35 in), the bypass leak plugged before the rupture disk opened and the elapsed time to fission product release was the same as the case with no bypass (about 20 hours). Also, the fission product release for these cases at 72 hours was less than 1E-7, as in the case with no bypass.
The case with an effective bypass area of 46 cm2 (7.1 in2), opening width of 1 cm (0.39 in), exhibited a different response. The mass of aerosol passing through the opening was not sufficient to plug the leak before the wetwell pressure reached 0.72 MPa and the rupture disk opened. However, the leak did plug about 30 minutes after the rupture disk opened which reduced the amount of fission products that was released to the environmenL MAAP predicts a CsI release fraction of 0.04% at 72 hours for this case, which is about two orders of magnitude less than the corresponding case in which no plugging is assumed. The same behavior was observed for the slightly larger 50 cm2 case.
19EE.3.2.5 Suppression Pool Bypass with Drywell Spray
19££-10
The last scenario examined the effects of the drywell spray on cases with bypass leakage present from the beginning of the accident. The firewater addition system was used for these cases since its flow rate is smaller than the drywell spray function of the RHR system. Assuming the operator initiates the firewater spray within 2 hours of the start of the accident, the elapsed time to rupture disk opening can be delayed to nearly 30
Suppression Pool Bypass
ABWR Rev. 0
Design Control Document/Tier 2
hours. This time is comparable to the base case, LCLP-F5-R-N, with no bypass leakage (Subsection 19E.2.2.1).
The fission product releases for all bypass areas analyzed are on the same order of magnitude as the releases for the cases of scenarios 1. and 2 (with no plugging or firewater addition), but the elapsed time to release is much longer. The long times to release allow for a great deal of fission product decay which leads to a substantial reduction in risk as compared to cases in which the drywell spray is not actuated.
19EE.3.3 Conclusions of Deterministic Analysis
Suppression pool bypass can lead to a significant increase in fission product release. Releases can be on the order of 10% for a fully stuck-open vacuum breaker. For sequences in which the firewater addition system is used in spray mode, the time to release is not significan tly affected by bypass. However, for sequences without sprays, the time from the beginning of the accident until the onset of the release can be significantly reduced. The use of the Morewitz blockage model results in a significant improvement in the calculated risk associated with suppression pool bypass. Nonetheless, there is a substantial increase in consequences associated with large bypass areas.
19EE.4 Summary of Results
19EE.4.1 Quantification of DET
The event tree is shown in Figure 19EE-1. The probabilities for different leakage areas are transferred to containment event trees.
19EE.4.2 Impact of Release Fractions.
MAAP-ABWR predicts the release fraction of CsI for the LCLP case without bypass leakage is less than lE-7. The effect ofleakage on the CsI release fraction (f) is shown below.
Amount of Leakage Release Fraction of CsI
None f < lE-7
Small 1% <f< 10%
Large f> 10%
19EE.4.3 Impact on TIme to Rupture Disk Opening
The sensitivity study contained in Subsection 19EE.3 focused on the Loss of all core Cooling with vessel failure occurring at Low Pressure (LCLP) accident sequence. This
Suppression Pool Bypass 19EE-11
ABWR
'~" '. . '
Rev. 0
Design Control Document!Tier 2
is the dominant sequence and its response to suppression pool bypass should be typical of the other accident sequences. .
Without suppression pool bypass, rupture disk opening is predicted to occur at approximately 20 hours into the accident for cases with passive flooder operation. The effect of leakage on time to rupture disk opening, t, is summarized below.
Amount of Leakage Time to Rupture Disk Opening
None -20 hours
Small 6 < t< 16 hours
large t< 6 hours
19EE.4.4 Impact on Aerosol Plugging on Integrated Offsite Risk
19EE-12
The quantification of the environmental source tenn presented in the decomposition event trees considers a substantial reduction in the frequency of byPass release due to plugging of the release path as described in Subsection 19EE.3.1. There is some uncertainty associated with the gas permeability of the plug under these conditions which may affect the source tenn timing and magnitude. In order to assess the effect of this uncertainty, a sensitivity study has been perfonned.
The impact of aerosol plugging on offsite risk can be assessed by eliminating the credit taken for plugging in the suppression pool bypass DET (Figure 19EE-1) and recalculating the source tenn category frequencies in Figure 19D.5-3. The change in
. source tenn category frequencies is propagated into the consequence analysis as described in Subsection 19E.3. The results of eliminating the credit taken for aerosol plugging in the suppression pool bypass DET are included.
The results of recalculating the frequencies for the affected STC#s are shown in Table 19EE-2. Events with extremely low frequencies do not significantly contribute to the offsite risk. Therefore, only STC#s 6, 8, 18, 19 and 30 are risk significant.
The significant STC#s are binned in Table 19D.5-7 into Case 1, Case 7 and Case 8 for the consequence analysis performed in Subsection 19E.3. The total frequencies of these two cases must be re-evaluated using the frequency changes in Table 19EE-2. The base case frequencies appear in Table 19E.3-6.
The impact of neglecting credit for aerosol plugging on offsite risk is presented in Figure 19EE-1. While aerosol plugging can significantly reduce the amount of fission products released from the containment given by bypass event, the phenomenological assumption has negligible impact.on offsite risk.
Suppression Pool Bypass
Rev. 0
ABWR Design Control Document!Tier 2
19EE.5 Conclusions
Suppression pool bypass (the passage of gas and vapor from the drywell directly into the wetwell air space) can lead to increased fission product releases. As shown in Subsection 19E.2.3.3.3( 4), the only mode of suppression pool bypass that has the possibility of significantly increasing risk is vacuum breaker leakage. This attachment determined the probabilities and consequences for vacuum breaker leakage areas from zero to that corresponding to one vacuum breaker stuck fully open.
Fission product release fractions were determined with MAAP-ABWR using the dominant accident sequence [Loss of all core Cooling with vessel failure occurring a Low Pressure (LCLP)] modified to include a path between the drywell and the wetwell air space. Plugging ofleakage paths by fission products was considered for small pathways. Leakage probabilities were determined by reviewing recent operating experience of wetwell to drywell vacuum breakers in BWRs with Mark I, II and III con tainmen ts.
Suppression pool bypass does not significan tly add to the risk associated with the ABWR because the bypass areas resulting in increased rei eases are offset by low probabilities of occurrence. No leakage and, correspondingly, no impact on plant risk is expected to occur for almost all of the accident demands. Small amounts of leakage have a small probability, and can result in medium volatile fission product releases (one to 10% of initial inventory). Volatile fission product releases on the order of 10-20% of initial inventory can result when large amounts of suppression pool bypass are present. However, the impact on plant risk is still negligible because the probability oflarge leakage is very small.
19EE.6 References
19EE-1 Vaughan, E.U., "Simple Model for Plugging of Ducts by Aerosol Deposits", Trans. Am. Nuclear. Soc., 28, 507,1978.
19EE-2 "Technical Support for Issue Resolution", IDCOR Technical Report 85.2,july 1985.
19EE-3 Morewitz, H.A, "Leakage of Aerosols from Containment Buildings", Health Physics, Vol. 42, No.2, 1982, pp. 195-207.
19EE-4 "Handbook of Chemistry and Physics", 53rd Edition, CRC Press, 1972-1973.
Suppression Pool Bypass 19EE-13
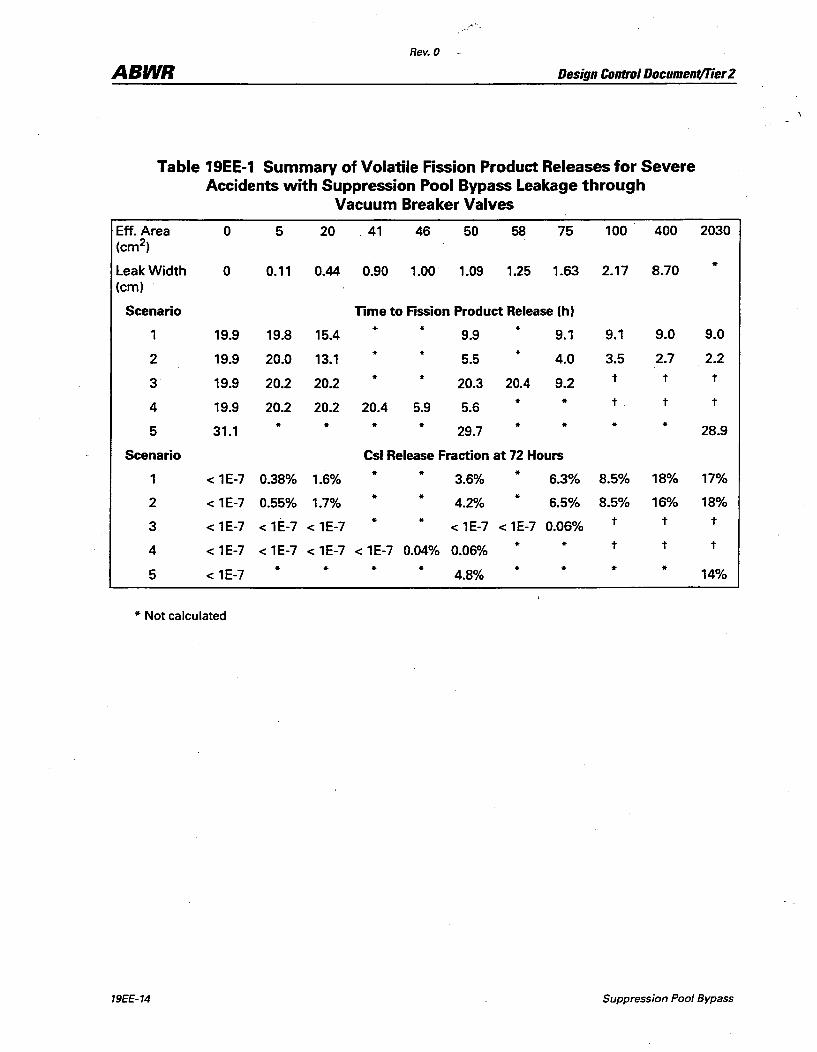
Rev. 0 -
ABWR Design Control DDcument/Tier Z
Table 19EE-1 Summary of Volatile Fission Product Releases for Severe Accidents with Suppression Pool Bypass Leakage through
Vacuum Breaker Valves
Eff. Area 0 5 20 41 46 50 58 75 100 400 2030 (em2)
Leak Width 0 0.11 0.44 0.90 1.00· 1.09 .1.25 1.63 2.17 8.70 ..
(em)
Scenario Time to Fission Product Release (h)
1 19.9 19.8 15.4 .. ..
9.9 it
9.1 9.1 9.0 9.0
2 19.9 20.0 13.1 .. it
5.5 it
4.0 3.5 2.7 2.2
3 19.9 20.2 20.2 it it
20.3 20.4 9.2 t t t
4 19.9 20.2 20.2 20.4 5.9 5.6 it .. t t t
5 31.1 .. .. .. ..
29.7 it .. .. ..
28.9
Scenario Csi Release Fraction at 72 Hours
1 < 1E-7 0.38% 1.6% .. ..
3.6% ..
6.3% 8.5% 18% 17%
2 < 1E-7 0.55% 1.7% .. ..
4.2% ..
6.5% 8.5% 16% 18%
3 < 1E-7 < 1E-7 < 1E-7 .. ..
< 1E-7 < 1E-7 0.06% t t t
4 < 1E-7 < 1E-7 < 1E-7 < 1E-7 0.04% 0.06% .. .. t t t
5 < 1E-7 .. .. .. ..
4.8% .. .. .. ..
14%
.. Not calculated
19EE-14 Suppression Pool Bypass

Rev. 0
ABWR Design Control Documenf/Tier 2
Table 19EE-2 Effect of Eliminating Aerosol Plugging Credit on Source Term Category Frequencies
6
7
8
18
19
20
30
31
32
42
43
44
Frequency (wi plugging credit)t
Frequency (w/o plugging credit)t
* See source term category grouping diagram, Figure 190.5-3
t Probabilities not part of DeD (Refer to SSAR).
Suppression Pool Bypass 19EE-15
Rev. 0
Design Control Document/Tier2
Figure 1SEE-1 Containment Event Evaluation DEl for Suppression Pool Bypass Not Part ofDCD (Refer to SSAR)
19EE-16 Suppression Pool Bypass
Figure 19EE-2 Impact of Aerosol Plugging Credit on Offsite Risk Measured by Whole Body Dose at 805 m (0.5 Mile) as Probability of Exceedence
Not Part of OeD (Refer toSSAR)
Rev. 0
ABWR Design Control Document/Tier2
19F Containment Ultimate Strength
19F.1 Introduction and Summary
This appendix describes analysis andjudgement used to estimate the containment internal pressure capability and associated failure mode and location. The ultimate pressure capability of the containment structure is limited by the drywell head whose failure mode is plastic yield of the torispherical dome. The pressure capability is 1.025 :MPa at 533 K (500°F) (typical temperature for most severe accident sequences), or 0.921 MPa at 644 K (700°F) [representative for those accidents in which the temperature exceeds 533 K (500°F)]. The containment is conservatively assumed to depressurize rapidly when the pressure capability is reached. No significant leakage through penetrations is anticipated before the capability pressure is reached. However, for the purpose of source term calculations, leakage in terms of leak. areas is
conservatively estimated for pressures below the capability pressure.
The primary function of the containment structure is to serve as the principal barrier to control potential fission product releases. The design basis event for this function is a postulated 10sH>f-coolan t acciden t (LOCA). Based on this functional requirement, the containment pressure vessel is designed to withstand the maxim1.lID pressure and temperature conditions which would occur during a postulated LOCA. The ABWR containment system employs pressure suppression which allows a design pressure of 0.411 :MPa and a design temperature of 444 K (340°F) for the primary containment pressure vessel. In addition the suppression pool retains fission products which could be released in the event of an accident. In this appendix the capability of the containment structural system of the ABWR standard plant to resist potentially higher internal pressures and temperatures associated with severe accidents is evaluated.
The primary containment vessel, also referred to as the RCCV for reinforced concrete containment vessel, is a right, cylindrical structure of the steel-lined, reinforced concrete design. The containment is integrated with the reactor building (RB) walls
from the basemat up to the elevation of the containment top slab. The top slab, together with pool girders and building walls, form the spent fuel and equipment storage pools. The elevation view of the reactor building/ containmen t structural system along 0°-180° direction is shown in Figure 19F-1. The containment is divided by the diaphragm floor and the reactor pressure vessel (RPV) pedestal into a drywell chamber and a suppression chamber. The drywell chamber above the diaphragm floor is called the upper drywell (U/D). The drywell chamber enclosed by the RPV support pedestal beneath the RPV is called the lower drywell (LID). The primary containment and internal structures are shown in Figure 19F-2. The major penetrations in the containment wall include:
(1) The upper drywell equipment and personnel hatches at azimuth 130° and 230°
Containment Ultimate Strength 19F-1

Rev. 0
ABWR Design Control DocumentlTier 2
19F-2
(2) The lower drywell equipment and personnel tunnels and hatches at azimuth 0° and 180°
(3) The suppression chamber airspace access hatch
(4) The main steam and feedwater pipe penetrations
Detailed descriptions of the containment design are included in Subsection 3.8.1.
The pressure boundary of the containment structure consists of the reinforced concrete containment vessel (RCCV) and the steel drywell head. The structural integrity of the RCCV is investigated for its global strength under internal pressure beyond the design basis using the FINEL computer program which is based on the nonlinear finite element method of analysis for axisymmetric reinforced concrete structures. The pressure capability of the steel drywell head is evaluated using approximate methods. During various severe accident conditions, the ABWR containment could also be challenged by high temperatures with a typical temperature of 533 K (500°F) for most accident sequences and a representative temperature of 644 K (700°F) for those accidents in which the temperature exceeds 533 K (500°F). At typical accident temperature of 533 K (500°F), the drywell head is found to have a ultimate pressure capability of 1.025 MPa and a service level C pressure capability of 0.77 MPa. For the RCCV the pressure capability at ambient temperature is governed by the top slab and its level C value (corresponding to ASME-III, Div. 2, CC-3420 and CC-3720 limits for factored load category) is 1.23 MPa. This is much higher than the ultimate pressure capability of the drywell head. On the basis of a recent Argone National Laboratory (ANL) study for the Sandia's l/&-scale containment model, it is expected that with thermal effects included the RCCV pressure capability will not be reduced below the drywell head capacity for the range of temperatures considered. The drywell head is the controlling component for the structural strength of the containment structure.
In order to evaluate liner response to over- pressurization, liner plates are included in the FINEL analysis. The analysis results show that the liner strains are much smaller than the code allowables when the internal pressure is as high as 1.34 MPa. A separate evaluation further demonstrates that at the governing containment failure pressure of 1.025 MPa at 533 K (500°F), the liner and anchor system will maintain its structural integrity and no liner tearing will occur.
The leakage potential through large operable penetrations such as the drywell head, equipment hatches, and personnel airlocks is evaluated. Assuming no sealing action
Containment Ultimate Strength
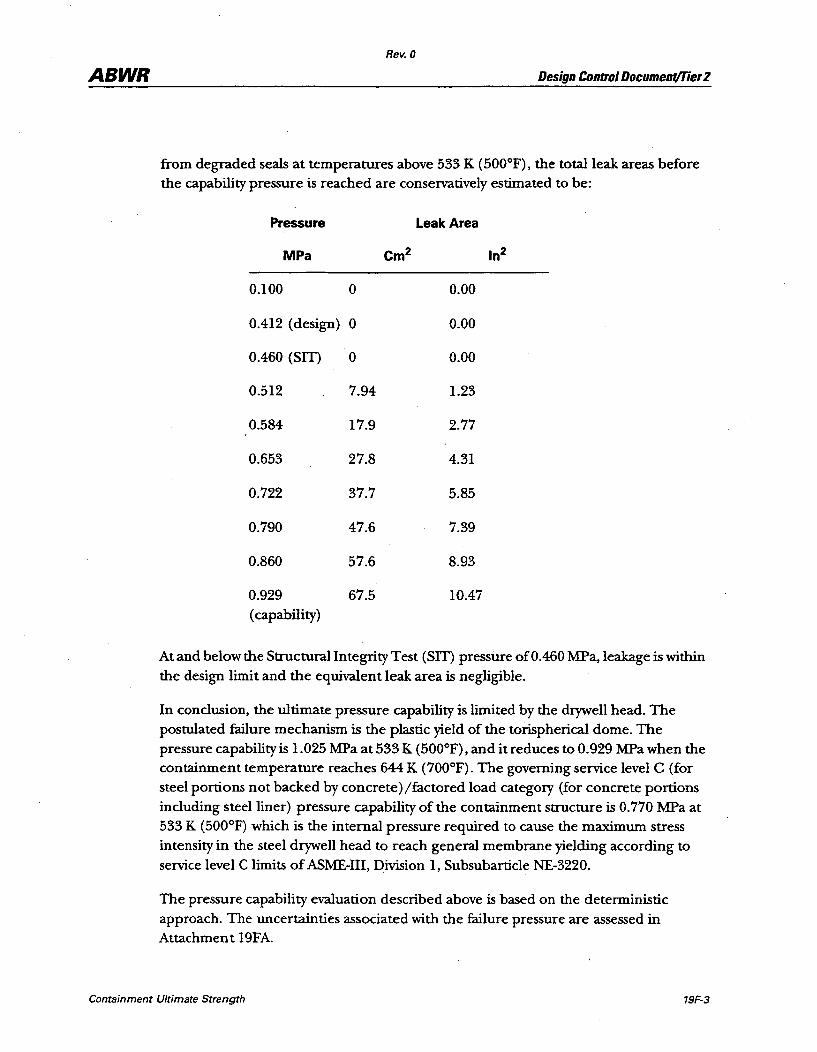
ABWR Rev. 0
Design Control Document/Tier 2
from degraded seals at temperatures above 533 K (500°F), the total leak areas before the capability pressure is reached are conservatively estimated to be:
Pressure Leak Area
MPa Cm2 In2
0.100 0 0.00
0.412 (design) 0 0.00
0.460 (SIT) 0 0.00
0.512 7.94 1.23
0.584 17.9 2.77
0.653 27.8 4.31
0.722 37.7 5.85
0.790 47.6 7.39
0.860 57.6 8.93
0.929 67.5 10.47 ( capability)
At and below the Structural Integrity Test (SIT) pressure of 0.460 MPa, leakage is within the design limit and the equivalent leak area is negligible.
In conclusion, the Ultimate pressure capability is limited by the drywell head. The postUlated failure mechanism is the plastic yield of the tolispherical dome. The pressure capability is 1.025 MPaat533 K (500°F), and it reduces to 0.929 MPa when the containment temperature reaches 644 K (700°F). The governing service level C (for steel portions not backed by concrete) /factored load category (for concrete portions including steel liner) pressure capability of the containment structure is 0.770 MPa at 533 K (500°F) which is the internal pressure required to cause the maximum stress intensity in the steel drywell head to reach general membrane yielding according to service level C limits of ASME-III, Division 1, Subsubarticle NE-3220.
The pressure capability evaluation described above is based on the deterministic approach. The uncertainties associated with the failure pressure are assessed in Attachmen t 19F A.
Containment Ultimate Strength 19F-3
Rev. 0
ABWR Design Control Document!17er 2
19F.2 RCCV Nonlinear Analysis
This subsection describes the non-linear analysis perfonned for the reinforced concrete containment vessel (RCCV) (excluding the drywell head) of the ABWR Standard Plant. Computer code "FINEL" was used for evaluation of the axisymmetrical components of the RCCV.
19F.2.1Finite Element (FE) Model Description
The containment and the containment internal snuctures are axisymmetric while the RCCV top slab together with the reinforced concrete girders even though not axisymmetric, are idealized and included in the axisymmetrical model. Solid elements are used to represent the girders at the top of the RCCV, approximating the stiffness of the actual snucture.
For simplicity, the reactor pressure vessel (RPV), the reactor building outside of the RCCV and supersnucture above the operating floor, are not modeled. To represent the restraining effects of the floors outside the containment, horizontal restraining elements are used with pseudo material properties. The model includes concrete elements, the reinforcing steel, the steel liner plate of the drywell, and the wetwell and the diaphragm floor snuctures, and the snuctural steel elements used for the pedestal.
The model consists of 868 nodal points and 1280 elements. There are 448 elements used with unidirectional stiffness representing rebar, whereas 832 elements are isotropic, representing steel, concrete, and soil. The soil below the foundation mat was
modeled to a depth of 50.0m and to a radius of 76.0m. See Figure 19F-3 for the model.
The FINEL computer program permits the specification ofbi-linear, brittle or ductile material properties. The concrete and soil elements are specified to have brittle properties such that they are strong in com pression and weak in tension. The steel plate elements and the rebar elements are specified to have ductile material properties with the same strength in tension and compression. The capability of the FINEL program to accommodate ductile and brittle material behaviors pennits both concrete cracking and yielding of steel and rebar. This allows the program to consider redistribution of forces throughout the snucture due to the non-linear behavior.
19F.2.2 Analysis
The FE model was run for three different load conditions shown in Table 19F-1.
(1) Structural Integrity Test 1 (SIT-I), with 0.46 MPa pressure in the drywell and wetwell (RCCV).
(2) Structural Integrity Test 2 (SIT-2), with 0.411 MPa pressure in the drywell and 0.18 MPa in the wetwell.
19F-4 Containment Ultimate Strength
Rev. 0
ABWR Design Control Document/Tier2
(3) Four times design pressure, with 1.34 MPa pressure in the RCCV.
Since FINEL performs non-linear analysis, it is necessary ~o apply simultaneously all loads of a loading combination. The program utilizes a stepwise linear iteration technique. The first cycle results are for elastic analysis. Based upon results of the first cycle, stiffness of all elements are adjusted by the program prior to the next iteration cycle.
19F.2.3 Results
Table 19F-l summarizes analytical results for various loading conditions. The results are shown in terms of maximum rebar stresses, concrete stresses, liner strains and structural deformations.
Based on the FINEL analysis, it can be concluded that the axisymmetric components of the RCCV, as designed based on ASME Section In Division 2 code requirements, can withstand an internal pressure of 1.34 MPa i.e, four times the design pressure, with stresses and strains in the rebar, liner plate and concrete within code allowable limits. The strength is governed bywetwell wall. The strength of the non-axisymmetric top slab region is evaluated by extrapolation of the elastic analysis results using a 3D finite element model as discussed in Subsection 19F.3.l.1.
19F.3 Prediction of Containment Ultimate Strength
19F.3.1 Structural Capability
19F.3.1.1 Concrete Shell
The structural integrity of the RCCV axisymmetric components has been demonstrated for an internal pressure of 1.34 MPa from the FINEL analysis. Based on extrapolation of analysis results, estimate of the level C pressure capability and the ultimate pressure capability is made and discussed in this subsection. The level C pressure capability is defined to be the pressure value at which the ASME-In, Div. 2, CC-3420 and CC-3720 limits for factored load category are reached. The ultimate pressure capability is assumed reached when rebars at both faces of a cross section reaching yield stress. The estin:i.ated pressure capabilities of the various components of the RCCV are shown in Table 19F-2. It should be noted that the extrapolation of results gives only approximate values beyond the analyzed values. The level C pressure value of 1.23 MPa for the top slab shown in Table 19F-2 is based on extrapolation of elastic 3D STRARDYNE analysis results and it is governed by the strength of the supporting pool girders. It should be recognized that this value could be somewhat different from inelastic analysis results. The ultimate pressure capability of the top slab is not made since its level C value is much higher than the drywell head ultimate pressure discussed in Subsection 19F.3.1.2.
Containment Ultimate Strength 19F-5

ABWR Rev. 0
Design CDntrDI Document/Tier 2
The analysis performed was static analysis. Dynamic effect on structural response becomes significant only when the rate of applied loading is within the range of natural periods of the structure. The fundamental natural period of the integrated RB and RCCV structures is less than one second. Therefore, containment loading resulting from severe accident conditions can be treated statically when the rate of loading buildup is longer than one second. For all accidents sequences considered in this PRA,
except hydrogen detonation, the pressure buildup rate within the containment is longer than one second. Thus, the results based on static analysis can be applied. Since the ABWR containment is inerted, hydrogen detonation is of no concern.
During various severe accident conditions, the ABWR containment could be challenged by high tempeIatures with a typical temperature about 533 K (500°F). The effect of elevated temperature on containment pressure capability has been investigated recently by Argonne National Laboratory (ANL) (Reference 19F-l). The ANL study concluded that for temperatures up to 644 K (700°F), the failure mode and location did not change from the case of internal pressure alone, and the failure pressure was reduced slightly (11 % maximum) from that predicted for the internal pressure alone case. On the basis of the ANL study it is expected that with thermal effects included the RCCV pressure capability will be not reduced below the drywell head capability for the range of temperatures considered.
19F.3.1.2 Orywell Head
19F-6
This subsection presents an evaluation of the structural capability of the drywell head under internal pressure and temperature loading. The leakage potential of the head closure is discussed in Subsection 19F.3.2.2.
The drywell head which covers the 10.29 m (33 ft-9 in.) in diameter opening in the upper drywell top slab is a steel torispherical dome assembly. Figure 19F-4 shows the major dimensions of the design. Under internal pressure loading, the most critical location of this type of configuration is the knuckle (or torus) region of the torispherical dome which may fail by plastic yield or buckling.
For torispherica1 pressure vessel heads, an approximate formula for the limit pressure at which significant plastic deformation occurs was developed by Shield and Drucker (Reference 19F-2) based on the upper and lower bound theorems oflimit analysis, and it is
. t ( t)2 Pc = Sy{(O.33+5.5r/D)r;+28(1-2.2r/D) r; -O.OOO6} (19F-l)
where:
= limit pressure
Containment Ultimate Strength
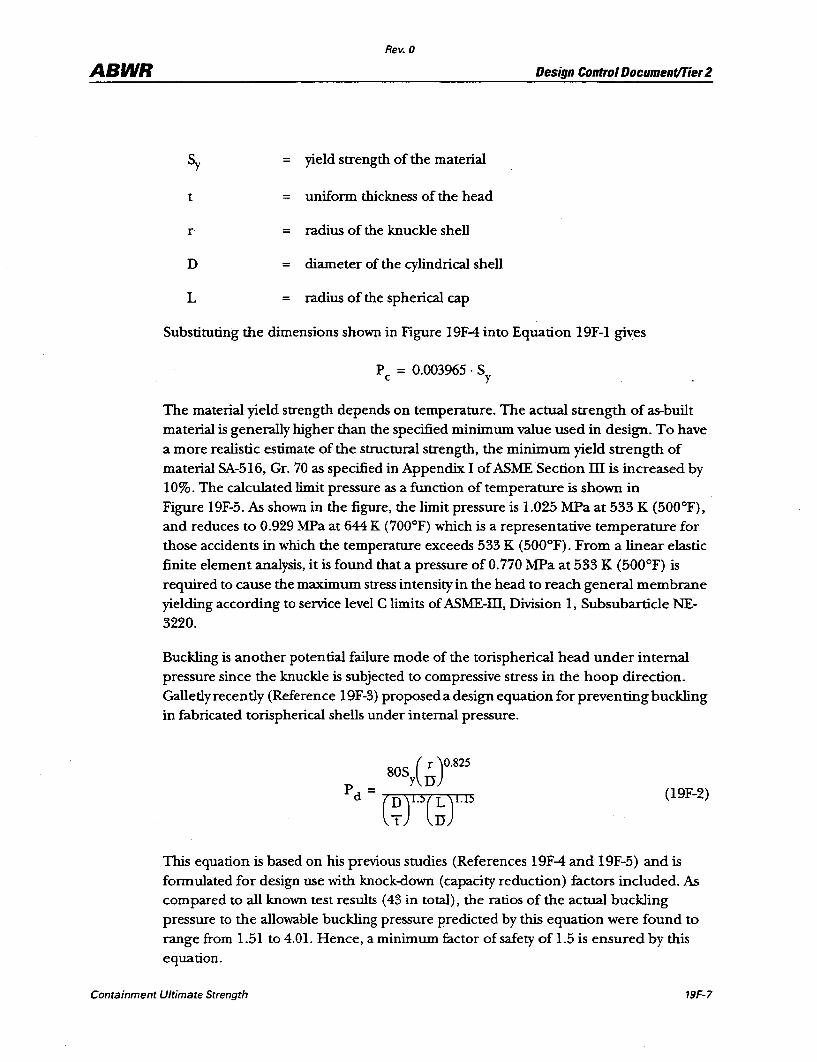
ABWR Rev. 0
Design Control Document!Tier 2
Sy = yield strength of the material
t = uniform thickness of the head
r radius of the knuckle shell
D = diameter of the cylindrical shell
L radius of the spherical cap
Substituting the dimensions shown in Figure 19F-4 into Equation 19F-l gives
Pc = 0.003965· Sy
The material yield strength depends on temperature. The actual strength of as-built material is generally higher than the specified minimum value used in design. To have a more realistic estimate of the structural strength, the minimum yield strength of material SA-516, Gr. 70 as specified in Appendix I of ASME Section III is increased by 10%. The calculated limit pressure as a function of temperature is shown in Figure 19F-5. As shown in the figure, the limit pressure is 1.025 MPa at 533 K (500°F), and reduces to 0.929 MPa at 644 K (700°F) which is a representative temperature for those accidents in which the temperature exceeds 533 K (500°F). From a linear elastic finite element analysis, it is found that a pressure of 0.770 MPa at 533 K (500°F) is required to cause the maximum stress intensity in the head to reach general membrane yielding according to service level C limits of ASME-III, Division 1, Subsubarticle NE-
3220.
Buckling is another potential failure mode of the torispherical head under internal pressure since the knuckle is subjected to compressive stress in the hoop direction. Galletly recently (Reference 19F-3) proposed a design equation for preventing buckling in fabricated torispherical shells under internal pressure.
80S ( r )0.825 P _ y U
d - (~)1.5(~)1.I5 (19F-2)
This equation is based on his previous studies (References 19F-4 and 19F-5) and is formulated for design use with knock-down (capacity reduction) factors included. As com pared to all known test results (43 in total), the ratios of the actual buckling pressure to the allowable buckling pressure predicted by this equation were found to range from 1.51 to 4.01. Hence, a minimum factor of safety of 1.5 is ensured by this equation.
Containment Ultimate Strength 19F-7

ABWR Rev. 0
Design Control Documenf/Tier 2
The test data presented in Refererice 19F-3 (excluding the test performed by Blenkin since no buckling was observed at the maximum test pressure) are summarized graphically in Figure 19F-6, showing the· relationship between the test and predicted pressures. The predicted pressures, as can be seen, are at least 1.5 times lower than the test results. In order to gain more insight about the data variability, statistical analyses are performed and the results are given in Figure 19F-7. The PDF (probability density function) of the data shown by solid lines is the histogram of 42 data points expressed in terms of the ratio of test to predicted pressure. It is observed that the data can be reasonably approximated by the lognormal distribution. The medium value of the test to predicted pressure ratios in the data set is 2.27 and the logarithmic standard deviation is 0.293. The resulting lognormal density and cumulative functions are shown in Figure 19F-7. The cumulative probability is 8% for the ratio up to 1.5. It means that the probability of the ratio of actual to predicted pressure being less than 1.5 is 8%. In other words, there is 92% confidence that the margin of safety against buckling is at least 1.5 when Equation 19F-2 is used. The 1.5 factor of safety corresponding to 92th percentile is deemed sufficient for the assurance of no buckling failure against severe accident loadings of very low probabilities of occurrence. Equation 19F-2 can be therefore used for the determination of level C buckling pressure of torispherical heads.
Substituting the dimensions shown in Figure 19F-4 and the material properties specified in Appendix I of ASME Section III for SA516, Gr. 70 into Equation 19F-2, the level C buckling pressure for the ABWR drywell head is calculated to be 0.860 MPa at
.533 K (500°F). It is higher than 0.770 MPa associated with general membrane yielding per level C stress intensity limits. Therefore, the governing level C pressure is 0.770 MPa.
As mentioned earlier, Equation 19F-2 has a factor of safety of 1.5 as compared to the lower bound of all known test results. From a statistical study of these test results, the medium buckling pressure is estimated to be 2.27 times the value predicted by Equation 19F-2. Subsequently, tIle critical buckling pressure of the ABWR drywell head are:
Lower bound = 1.5 x 0.860 MPa = 1.246 MPa,
Best estimate = 2.27 x 0.860 MPa = 1.839 MPa.
A comparison with the plastic yield limit pressure Pc calculated above indicates that plastic yield will occur before buckling and is the governing failure mode of the drywell head. The capability pressure is 1.025 MPa at 533 K (500°F), and reduces to 0.929 MPa when the containment temperature reaches 644 K (700°F).
19F.3.2 Leakage Potential
19F-B
The previous subsection has addressed the structural capability of the containment structures under severe accident conditions. However, the containment function can be
Containment Ultimate Strength
ABWR Rev. 0
Design Control Document/Tier 2
. compromised if excessive leakage occurs before the capability pressure is reached. Leakage above the design allowable could result from failure of the liner plate and penetrations at high pressures and temperatures. The leakage potential of the liner plate and penetrations is evaluated in the following subsections.
19F.3.2.1 Liner Plate
As discussed earlier, the containment liner plates were included in the flNEL model.
The maximum liner strains are found to be well within the code allowables when the internal pressure is as high as 1.34 MPa. Therefore, liner tearing is not expected to occur before the capability pressure of the drywell head is reached. This is confirmed by a separate evaluation as follows.
The ABWR containment liner plate system consists of 6.35-mm (1/4-in) thick plate made of ASME SA-516 Grade 70 steel. The liner plate is anchored into the concrete containment through WT 4 X 7.5 made of ASTM A-36 steel and welded to the liner plate. The following are the pertinent data of the ABWR containment liner plate system used for the evaluation.
• Concrete Containment
Inside Radius 14.5 m (571 in)
Thickness 2.0 m (78.7 in)
Hoop Rebar
Vertical Rebar
= 4.57 cm2/cm (1.8 in2/in) total on both faces
7.05 cm2/cm (1.666 in2/in) total on both faces
• Steel liner Plate:
6.35-mm (l/4-in) thickASME SA516 Grade 70
Yield stress at 294 K (70°F) = 262 MPa
Yield stress at 533 K (500°F) = 212 MPa
Ultimate Uniaxial Strain at Fracture = 21%
[Based on ASTM 516 Grade 70 minimum guaranteed elongation in 51 mm (2")]
• liner Anchor:
WT 4 X 7.5 spaced at 500 mm on center
Yield stress at 294 K (70°F) = 248 MPa (A36 steel)
Containment Ultimate Strength 19F-9

ABWR
79F-70
Rev. 0
Design Control Document!Tier 2
The following severe accident conditions are used for the evaluation of the ABWR containment liner plate.
• Containment Internal Pressure = 1.025 MPa .
• Steam Jet Temperature = 533 K (500°F)
• Ambient Temperature = 311 K (lOO°F)
• Rise in Temperature 477 K (400°F)
Due to the internal pressure, the liner plate has a tendency to elongate by virtue of hoop tension whereas it has a tendency to shorten due to compression on the inside face of the containment for elevated internal temperature. Thus, the combination of internal pressure and temperature loads on the liner plate has compensatory effects. The friction and the physical bond between the liner plate and concrete wall are conse.rvative1y neglected for the evaluation. The corresponding shrinkage strains, being small, are neglected, and the concrete is assumed to have zero tensile strength.
(1) Evaluation for Internal Pressure Loading
The hoop force due to the internal pressure of 1.025 MPa on an internal radius ofl4.5 m (571 in) is computed to be 13690 kg/em (76.5 kips per inch) height of the containment. Assuming that this hoop force is resisted by the total hoop steel ofll.6"cm2 (1.8 in2) and liner plate areaofl.61 cm2/cm (0.25 in2 per inch) height of the containment, the hoop stress is computed to be 257
" MPa which gives the value of hoop strain of 0.13%.
This compares very closely with the strain values obtained from the "FINEL " analysis for 1.025 MPa internal pressure which gave maximum strain of 0.126%. Assuming a very conservative estimate of strain concentration factor of 33 at the discontinuities on the Sandia Containment Test results based on internal pressure of 1.11 MPa (Reference 19F-6) , the maximum liner plate strain due to the internal pressure is estimated to be 0.13 X 33 = 4.3%. This strain is still far lower (by a factor of almost 5) than the ultimate fracture strain of21 % for the liner plate material. The internal pressure results in uniform tension in the liner but does not produce any load on the liner anchors. Thus, it can be inferred "that the liner plate will not tear for the severe accident pressure of 1.025 MPa.
(2) Evaluation for Thennal Loading/Jet Impingement
The internal temperature causes compressive forces on the liner resulting in potential buckling of the plate, as illustrated in Figure 19F-8. The then:nal strain resulting from a 477 K (400°F) temperature rise is 0.002744 cm/ cm
Containment Ultimate Strength

ABWR Rev. 0
Design ContrDI DDcument/Tier 2
(0.002744 in/in). The resulting hoop membrane force for the 6.3~mm (l/4-in) thick liner plate is 4625 kN/m (26.4 k/in). This is beyond the elastic limit and a plastic solution is sought using the procedure suggested in Bechtel Topic Report BC-TOP-l (Reference 19F-7). For the buckled configuration shown in Figure 19F-8, the following spring constants are found: .
= 890 kN/m/m (200 k/in/in) for the anchor
KsPL = 441 kN/m/m (99 k/in/in) for the bent plate
~L = 1522 kN/m/m (342 k/in/in) for plate relaxation
The resulting total force NT on the system is found to be 6244 kN/m (35.64 k/in) and the corresponding deflection 0 is 1.9 mm (0.0748 in). From the energy balance approach, the safety factor expressed in terms of the ratio of the total energy capacity of the anchor to the energy required for the equilibrium is calculated to be 1.9. The forces exerted on the liner plate and anchor are 897 kN/m (5.12 k/in) and 865 kN/m (4.94 k/in) which are within their respective yielding capaCity of 1356 kN/m (7.74 k/in) and 929 kN/m (5.3 k/in). Therefore, the anchor system is safe under applied loads.
(3) Conclusions
Based on the above discussions it is concluded that the ABWR containment liner plate and the liner anchorage will maintain its structural integrity even when subjected to severe accident pressure of 1.025 MPa at 533 K (500°F). In this evaluation, a very conservative strain concentration factor of 33, observed at the discontinuities in the Sandia containment tests, has been used. It is demonstrated that there are adequate margins over the maximum conceivable strains to the ultimate fracture strains available to preclude the type of tearing failures observed in the Sandia containment tests. It should also be noted that there are major differences between the liner plate system used in the Sandia tests and the ABWR containment. The significant difference is the use of intermittent stud type liner anchor in the Sandia tests as opposed to the welded wr 4 anchors for the ABWR containment. This should result in a more uniform distribution of the strain for the ABWR containment and in much lower-strain concentration factors compared to those observed in the Sandia test. This will further improve the margins of safety over the ones computed.
19F.3.2.2 Penetrations
An ANL study (Reference 19F-8) assigned high priority to the study oflarge operable penetrations such as the drywell head closure, equipment hatches, and personnel airlocks since they are expected to have high potential for leakage under severe
Containment Ultimate Strength 19F-11
ABWR
19F-12
Rev. 0
Design Control Document/Tier 2
accident conditions. Leakage from fiXed penetrations (both electrical and mechanical) appears to be less likely based on the results of experiments conducted to date by Sandia National Labratories (SNL) and its contractors (Reference 19F-8). In fact, according to the same reference, no leakage was detected from any of the three current electrical penetration assemblies (EPAs) during the severe accident testing (steam environments). Depending on the EPA type the highest temperature loading ranged from 456 K (361°F) to 644 K (700°F), and the highest pressure loading ranged from 0.517 MPa to 1.069 MPa. The EPAs used in the ABWR containment will be capable of maintaining leak tightness up to the containment pressure of 1.025 MPag and temperature of 644 K (700°F) (Subsection 8.3.3.7). The leakage estimate in this study therefore concentrates on large operable penetrations.
The leakage potential of operable penetrations depends on both the relative position of the sealing swfaces and the performance of the seal material. The position of the sealing surfaces depends on the initial conditions (metal-tcrmetal contact is maintained under design conditions for most penetrations) and on the deformations induced by accident pressure and temperature. The seal performance depends mainly on temperature as well as the effect of thermal and radiation aging. The recent SNL tests of seals for mechanical penetrations, Reference 19F-8, indicated that
(1) In a steam environment at a constant pressure of 1.069 MPa, the mean degradation temperature was 544 K (520°F) for silicon rubber and 606 K (630°F) for ethylene proplylene rubber (EPR) , and
(2) In a nitrogen environment at a constant pressure of 1.069 MPa, the mean degradation temperature was 528 K (490°F) for neoprene, and
(3) The degradation temperature was not significantly affected by thermal and radiation aging.
Neoprene is not used for operable penetrations in the ABWR containment and the seal degradation temperature is conservatively assumed to be 533 K (500°F). The SNL study also showed that even a degraded seal can prevent leakage if the separation of the sealing swfaces is small [less than 0.127 mm (0.005 in.)].
Sandia (Reference 19F-8) has proposed the following equations for "available gasket springback", Sp' for evaluating the leakage potential as a function of the compression set retention and the degradation temperature:
(19F-3)
Sp = 0.127mm (0.005 inch) for (T > T d) (19F-4)
where:
Containment Ultimate Strength
ABWR
=
h· I
Rev. 0
Design Control Document/Tier 2
__ the compression set retention (a dimensionless measure of the
permanent set in the gasket caused by aging),
the squeeze as illustrated in Figure 19F-9 (a dimensionless
measure of the gasket deformation under normal operation conditions) ,
the initial seal height, and
the degradation temperature of the gasket material.
Equation 19F-3 is based on the assumption that significant leakage can be prevented as long as positive compression of the gasket is maintained. Equation 19F-4 is empirical based on test results that even a degraded gasket can effectively prevent leakage if the separation of the sealing surfaces is equal to orless than 0.127 mm (0.005 in).
For the pressure-unseating drywell head closure and equipment hatches, the pressure required to separate the sealing surfaces is a function of the bolt preload, axial stiffness of the bolts and the compression flanges, and the differential thermal expansion between the bolts and the compression flanges. The separation pressure for operable penetrations typically ranges from 1.1 to 1.5 times design pressure (Reference 19F-8). In this study, the separation pressure is conservatively assumed to be 0.460 MPa which is the Structural In tegrity Test (SIT) pressure (1.15 times design pressure) . At and below this pressure, a metal-ta-metal contact is maintained and no leakage other than design allowable leak rate is anticipated, even if the seal degradation temperature of about 533 K (500°F) has reached. Additional pressure in excess of the separation pressure is carried entirely by the bolts. The separation displacement between the sealing surface after the separation pressure is reached is:
where:
r
Ps
1tr2 (p- ps) s = ---'K7""b-- (l9F-5)
= the inside radius of the equipment hatch sleeve or drywell head,
= the separation pressure, and
= the total bolt axial stiffness.
The above expression neglects the flexibility due to axial deflection of the compression flanges caused by the Poisson effect which contributes little to the total flexibility of the bolts. This approach for predicting leakage is based on the consideration of structural
Containment Ultimate Strength 19F-13

ABWR Rev. 0
Design Control DocumentlTier 2
deformations in terms of separation of connecting flanges of pressure unseating equipment hatches and drywell head. The adequacy of this approach has been recently confirmed by the Sandia hatch leakage tests (Reference 19F-9) in that the predicted leakage onset pressures were in favorable agreement with the test results. The drywell head anchorage to the top slab has a pressure capability higher than the drywell head shell and the leakage path of the drywell head assembly before the failure pressure is reached is through 'the flanges.
The drywell head is a 10.3-m diameter closure with double seal. One hundred twenty 68-mm diameter bolts hold the head in place. There are 3 equipment hatches in the containment wall. The largest of them has twenty 36-mm diameter bolts with double seal, and has a diameter of2.6 m. According to Equation 19F-5, the separation displacement at 0.929 MPa capability pressure is calculated to be about 0.0838 mm (0.0033 in) for the drywell head and 0.140 mm (0.0055 in) for the most flexible equipment hatch. The equipment hatch separation displacement is slightly larger than 0.127 mm (0.005 in). However, the resulting gap of 0.0127 mm (0.0005 in.) is small and no significant leakage is expected before the capability pressure is reached.
For equipment hatches, another potential leakage mechanism is ovalization of the sleeve which causes the sleeve to slide relative to the tensioning ring (or the cover flange). An initiation ofleakage due to sleeve ovalization, however, requires significant deformations of the containment shell around the equipment hatch. The average circumferential membrane strain in the shell that is needed to result in the initiation of leakage from ovalization for equipment hatches identified in the ANL survey (Reference 19F-8) was found to range from 2.5% to 7.3% by SNL (Reference 19F-8). For the equipment hatches under consideration, the ovalization leakage onset strain which is the ratio of the sleeve wall thickness at the sealing surface to the sleeve radius ranges from about 1.2% to 5.8%. At a pressure of 1.34 MPa, the maximum radial deflection of the wetwell wall was calculated to be 25.0 mm (0.983 in.) from the FINEL analysis (Table 19F-l). The corresponding hoop membrane strain is 0.15%. It is less than 1.2% and no leakage from sleeve ovalization of the equipment hatches will occur before the capability pressure is reached.
The leakage rate which should be small for the separation displacements of the drywell head and equipment hatches defined above cannot be quantified based on current capabilities. To facilitate source term calculations, leak areas as a function of pressure are conservatively taken to be the product of the separation displacements and the seal length for the drywell head and equipment hatches. It should be noted that this approach results in a very conservative leak area estimate since
(I) the seal is assumed lost at 533 K (500°F), and
(2) no credit is taken for the springback capability of 0.127 mm (0.005 in.) for degraded seals.
19F-14 Containment Ultimate Strength
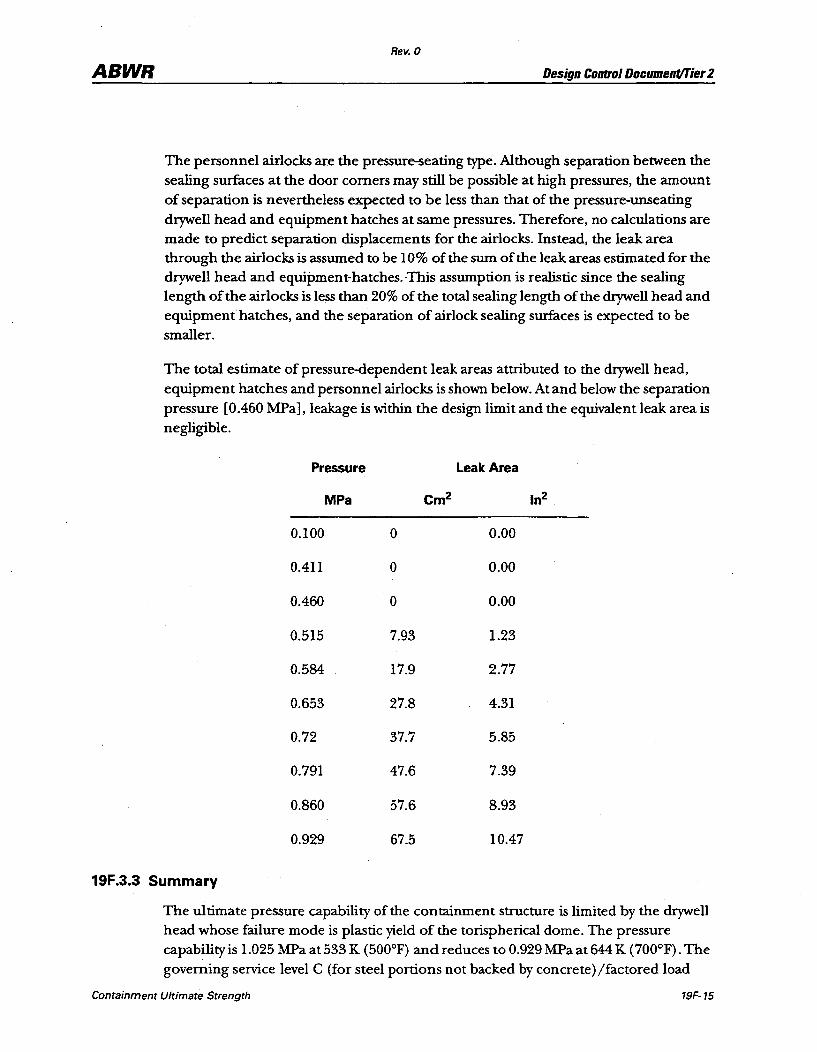
ABWR Rev. 0
Design Control Document/Tier 2
The personnel airlocks are the pressure-seating type. Although separation between the sealing surfaces at the door corners may still be possible at high pressures, the amount of separation is nevertheless expected to be less than that of the pressure-unseating drywell head and equipment hatches at same pressures. Therefore, no calculations are made to predict separation displacements for the airlocks. Instead, the leak area through the airlocks is assumed to be 10% of the sum of the leak areas estimated for the drywell head and equipment-hatches.-This assumption is realistic since the sealing length of the airlocks is less than 20% of the total sealing length of the drywell head and equipmen t hatches, and the separation of airlock sealing surfaces is expected to be smaller.
The total estimate of pressure-dependent leak areas attributed to the drywell head, equipmen t hatches and personnel airlocks is shown below. At and below the separation pressure [0.460 MPa], leakage is within the design limit and the equivalent leak area is negligible.
Pressure Leak Area
MPa Cm2 In2
0.100 0 0.00
0.411 0 0.00
0.460 0 0.00
0.515 7.93 1.23
0.584 17.9 2.77
0.653 27.8 4.31
0.72 37.7 5.85
0.791 47.6 7.39
0.860 57.6 8.93
0.929 67.5 10.47
19F.3.3 Summary
The ultimate pressure capability of the containment structure is limited by the drywell head whose failure mode is plastic yield of the torispherical dome. The pressure capability is 1.025 MPa at 533 K (500°F) and reduces to 0.929 MPa at 644 K (700°F). The governing service level C (for steel portions not backed by concrete)/factored load
Containment Ultimate Strength 19F-15
ABWR Rev. 0
Design Control Document/Tier 2
category (for concrete portions including steel liner) pressure capability of the containment structure is 0.770 MPa at 533 K (500°F) which is the internal pressure required to cause the maximum stress intensity in the steel drywell head to reach general membrane yielding according to seIVice level C limits of ASME-III, Division 1, Subsubarticle NE-3220.
No liner leakage will occur before the capability pressure is reached. Leakage through fixed (mechanical and electrical) penetrations is negligible compared to leakage through large operable penetrations such as the drywell head, equipment hatches, and personnel airlocks. The total pressure-dependent leak areas attributed to those operable penetrations are conservatively estimated in Subsection 19F.3.2.2, assuming no sealing action from degraded seals at temperatures above 533 K (500°F).
19F.4 References
19F·16
19F-l Pfeiffer, P. A, Kennedy,]. M., and Marchertas, A H., "Thennal Effects in Concrete Containment Analysis", Fourth Containment Integrity Workshop, June 15-17, 1988.
19F-2 Shield, R T., and Drucker, D. C., "Design of Thin-Walled Torispherical and Toriconical Pressure-Vessel Heads",Journal of Applied Mechanics, Transaction of ASME,June 1961.
19F-3 Galletly, G.D., "A Simple Design Equation for Preventing Buckling in Fabricated Torispherical Shells under Internal Pressure", ASMEJoumal of Pressure Vessel Technology, Vol. 108, November 1986.
19F-4 Galletly, G. D., and Radhamohan, S. K.., "Elastic-Plastic Buckling ofInternallyPressurized Thin Torispherical Shells",Joumal of Pressure Vessel Technology, ASME, Vol. 101, August 1979.
19F-5 Galletly, G.D., and Blachnut,j., "Torispherical Shells Under Internal Pressure - Failure Due to Asymmetric Plastic Buckling or Axisymmetric Yielding", Proc. ofInstitution of Mech. Engineers, Vol. 199, No. C3, 1985.
19F-6 Clauss, D.B., "Round Robin Analysis of the Behavior of a 1:6 scale reinforced concrete containment model pressurized to Failure: Post-test Evaluations", NUREG/CR-5341 SAND 89-0349, Sandia National Laboratories, October 1989.
19F-7
19F-8
"Containment Building Liner Plate Design Report", BCTOP-I, Rev. 1, Bechtel, December 1972.
Clauss, D. B., von Riesemann, W. A., and Parks, M. B., "Containment Penetrations", SAND88-0331 C.
Containment Ultimate Strength
ABWR
19F-9
Rev. 0
Design Control Document/Tier2
Parks, M.B., Walther, H.P., and Lambert, L.D., "Evaluation of the Leakage Behavior of Pressure-Unseating Equipment Hatches and Drywell Heads", SAND90-180C, 18th Water Reactor Safety Meeting, October 1990.
Containment Ultimate Strength 19F-17
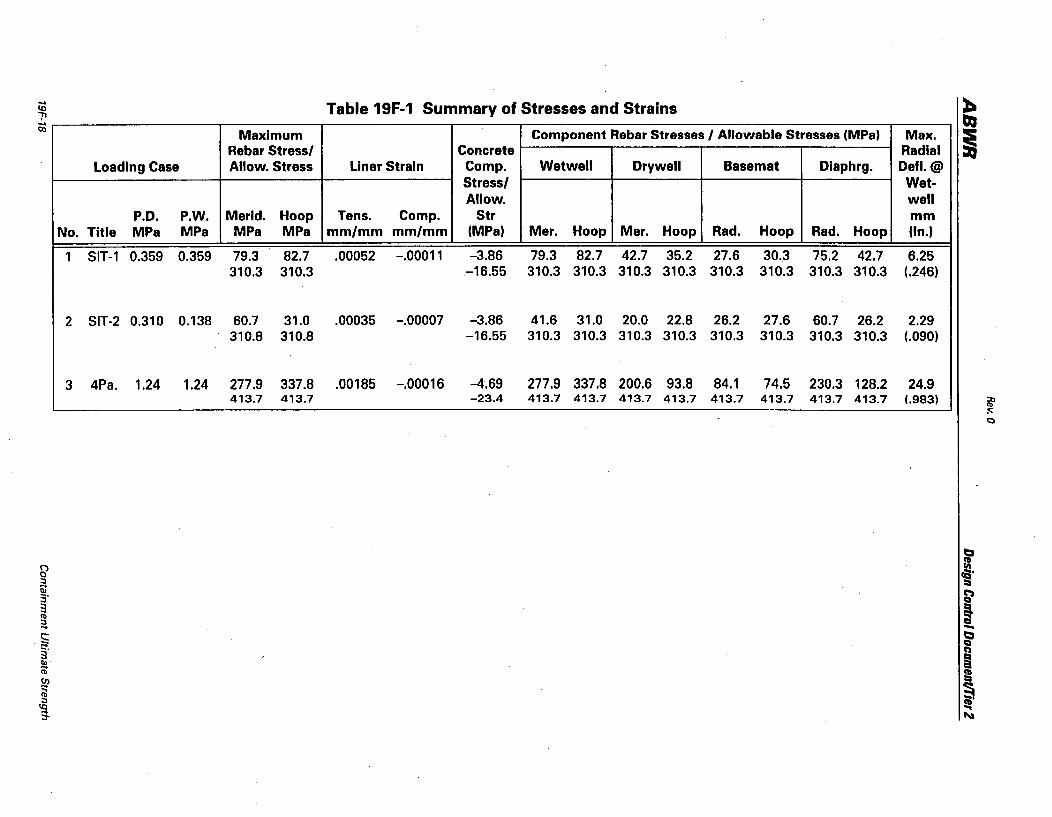
Table 19F-1 Summary of Stresses and Strains
Maximum Component Rebar Stresses / Allowable Stresses (MPa) Max. Rebar Stress/ Concrete Radial
loading Case Allow. Stress Liner Strain Compo Wetwell Drywell 8asemat Dlaphrg. Defl. @ Stress/ Wet-Allow. well
P.O. P.W. Merid. Hoop Tens. Compo Str mm No. Title MPa MPa MPa MPa mm/mm mm/mm (MPa) Mer. Hoop Mer. Hoop Rad. Hoop Rad. Hoop (In.)
1 SIT-1 0.359 0.359 79.3 82.7 .00052 -.00011 -3.86 79.3 82.7 42.7 35.2 27.6 30.3 75.2 42.7 6.25 310.3 310.3 -16.55 310.3 310.3 310.3 310.3 310.3 310.3 310.3 310.3 (.246)
2 SIT-2 0.310 0.138 60.7 31.0 .00035 -.00007 -3.86 41.6 31.0 20.0 22.8 26.2 27.6 60.7 26.2 2.29 310.8 310.8 -16.55 310.3 310.3 310.3 310.3 310.3 310.3 310.3 310.3 (.090)
3 4Pa. 1.24 1.24 277.9 337.8 .00185 -.00016 -4.69 277.9 337.8 200.6 93.8 84.1 74.5 230.3 128.2 24.9 413.7 413.7 -23.4 413.7 413.7 413.7 413.7 413.7 413.7 413.7 413.7 (.983)
,
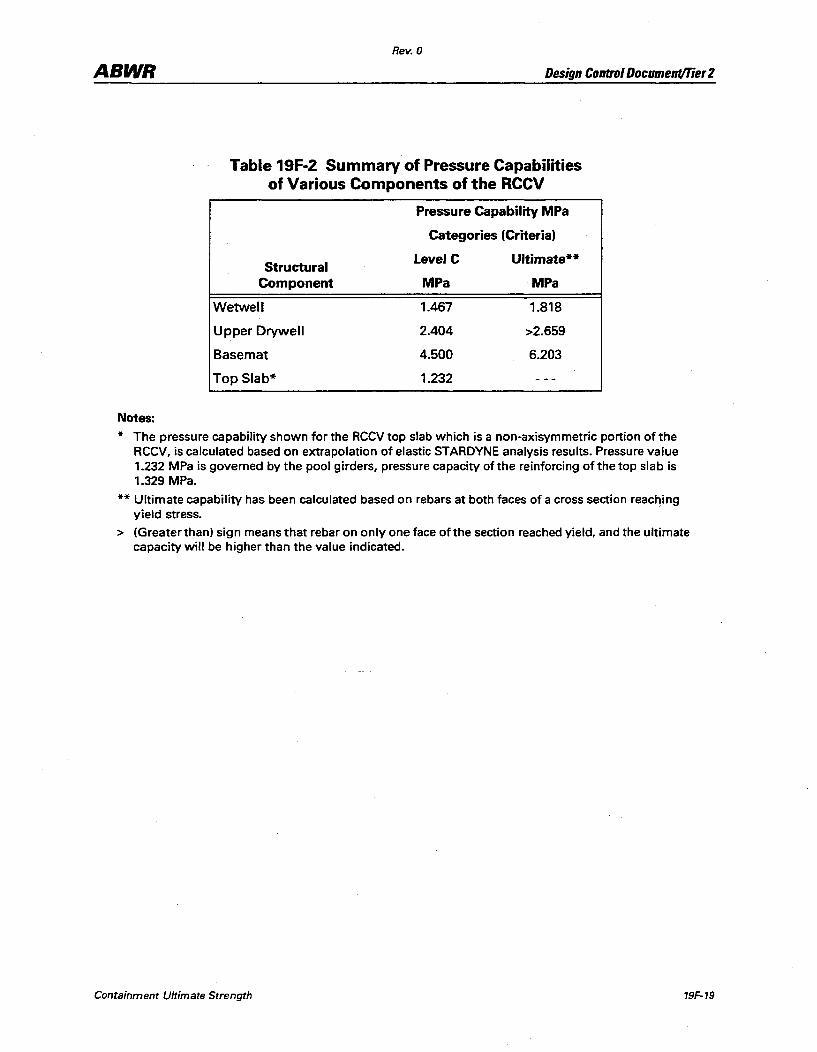
Rev. 0
ABWR Design Control Document!Tier 2
Notes:
Table 19F-2 Summary of Pressure Capabilities of Various Components of the RCCV
Pressure Capability MPa
Categories (Criteria)
Structural LevelC Ultimate**
Component MPa MPa
Wetwell 1.467 1.818
Upper Drywell 2.404 >2.659
Basemat 4.500 6.203
Top Slab* 1.232
* The pressure capability shown for the RCCV top slab which is a non-axisymmetric portion of the RCCV, is calculated based on extrapolation of elastic STARDYNE analysis results. Pressure value 1.232 MPa is governed by the pool girders, pressure capacity of the reinforcing of the top slab is 1.329 MPa.
** Ultimate capability has been calculated based on rebars at both faces of a cross section reaching yield stress.
> (Greater than) sign means that rebar on only one face of the section reached yield, and the ultimate capacity will be higher than the value indicated.
Containment Ultimate Strength 19F·19
Rev. 0
ABWR DesignConbVIDocumenViler2
Figure 19F-1 ABWR Reactor Buildingl Primary Containment (00 - 1800 Section
View)
(Refer to Figure 1.2-2)
Figure 19F-2 Primary Containment Configuration
(Refer to FiJJure 6.2-26)
19F-20 Containment Ultimate Strength
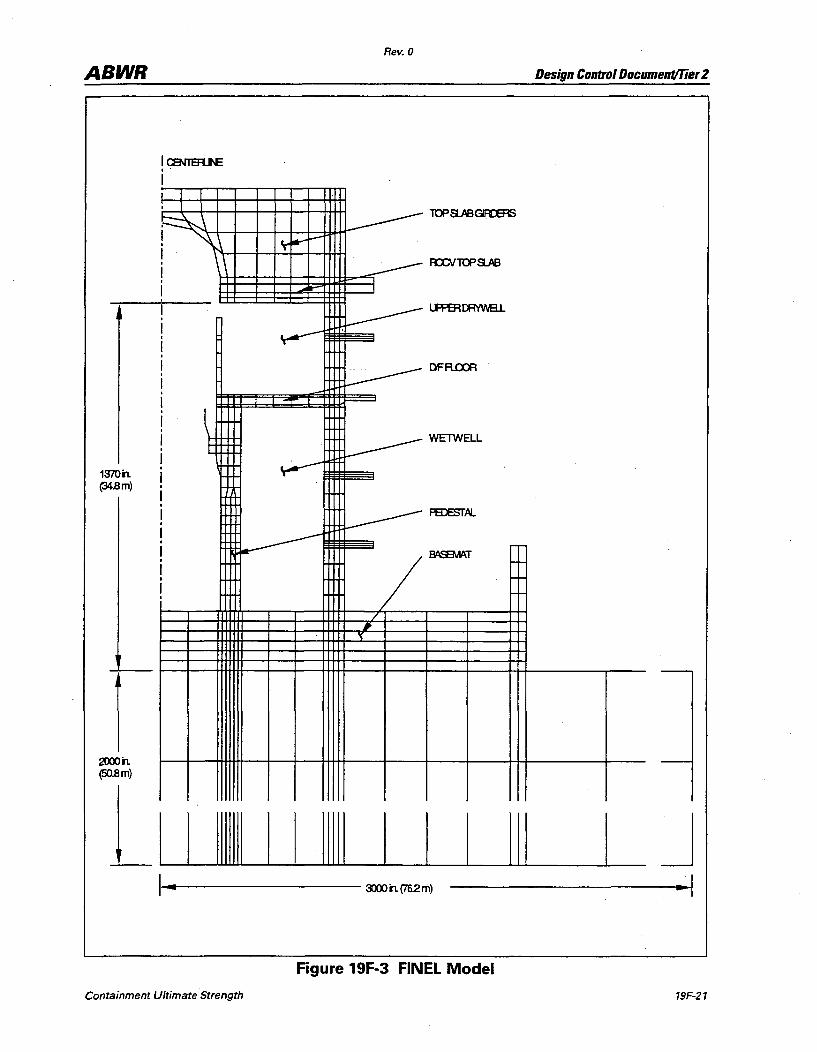
ABWR
1370h (34.Bm)
2000h (5O.Bm)
I I I , I I
! t
Rev. 0
1OPs.ABGRDERS
L-------" WETWELL
/
LIIIIIIIIIIIIIIIIIIIIII 11-... ------3XlOh(762m)
Figure 19F-3 FINEL Model
Containment Ultimate Strength
Design ControlOocument/Tier2
J ·1
19F-21

TOP SLAB
I
I I
I , I ----------1-
I
I I
I I
I I
I I
I
2.57 m (B' 5-1/4")
9.32 m (30' 6-5/B")
'==,..-------
-----~f--------------+-------------l1=:do------
3.1B em (1.25")
10.3 m (33'-9")
Figure 19F-4 Drywell Head
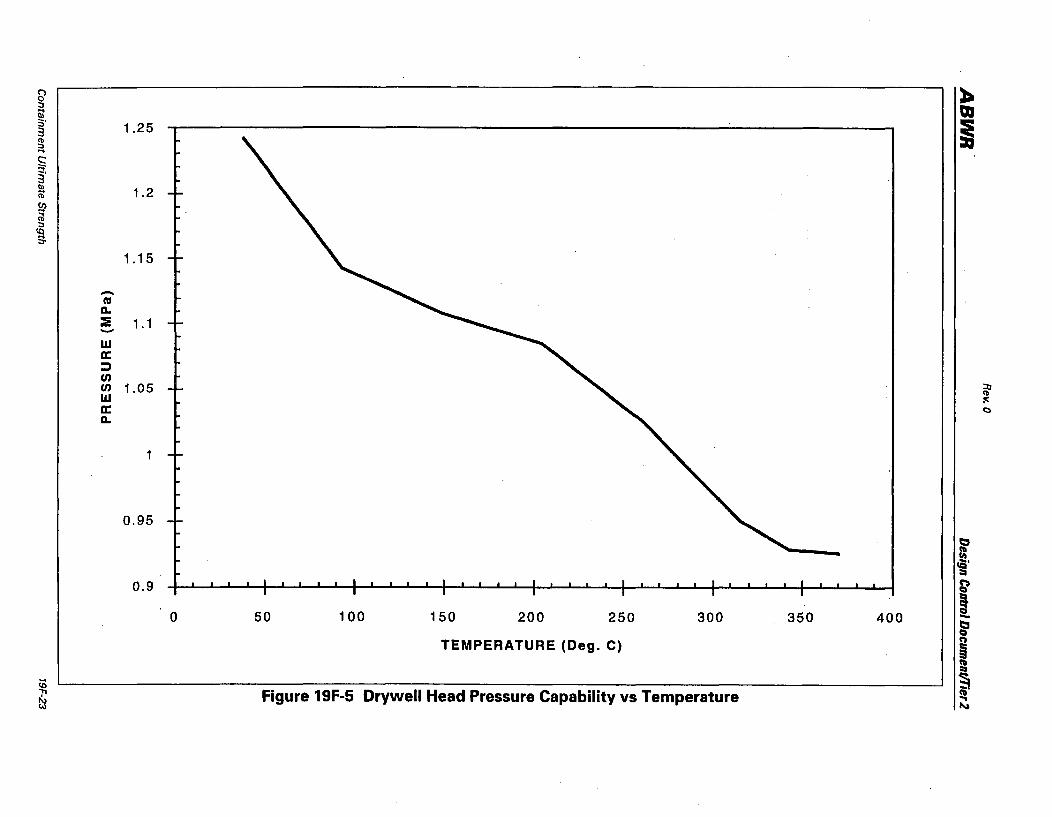
& :a:. ;:, ~ iit
:;' 1.25 I 3 <b ::. ...
~ III
1.2 ~ (J)
~ ::. co So
1.15
-tel Q.
:!! 1.1 -w a:: ;:) en en 1.05 ~ W :<: a:: c:)
Q.
1
0,95
0.9
o 50 100 150 200 250 300 350 400
TEMPERATURE (Deg.C)
Figure 19F-5 Drywell Head Pressure Capability vs Temperature

.... ). (l)
1" QI ~
i 7
+ + ++
6 +
5
+
~ 4 +
c +
I + ~ 3 + + 0: + + m +
2
+* +
++ +
o~~~--~~~~~~--~~~--~~--~~~--~~~~~~--~~~~~~--~~~--~-J
o 0.5 1.5 2 2.5 3
Figure 19F-6 Torispherical Head Buckling Test Data
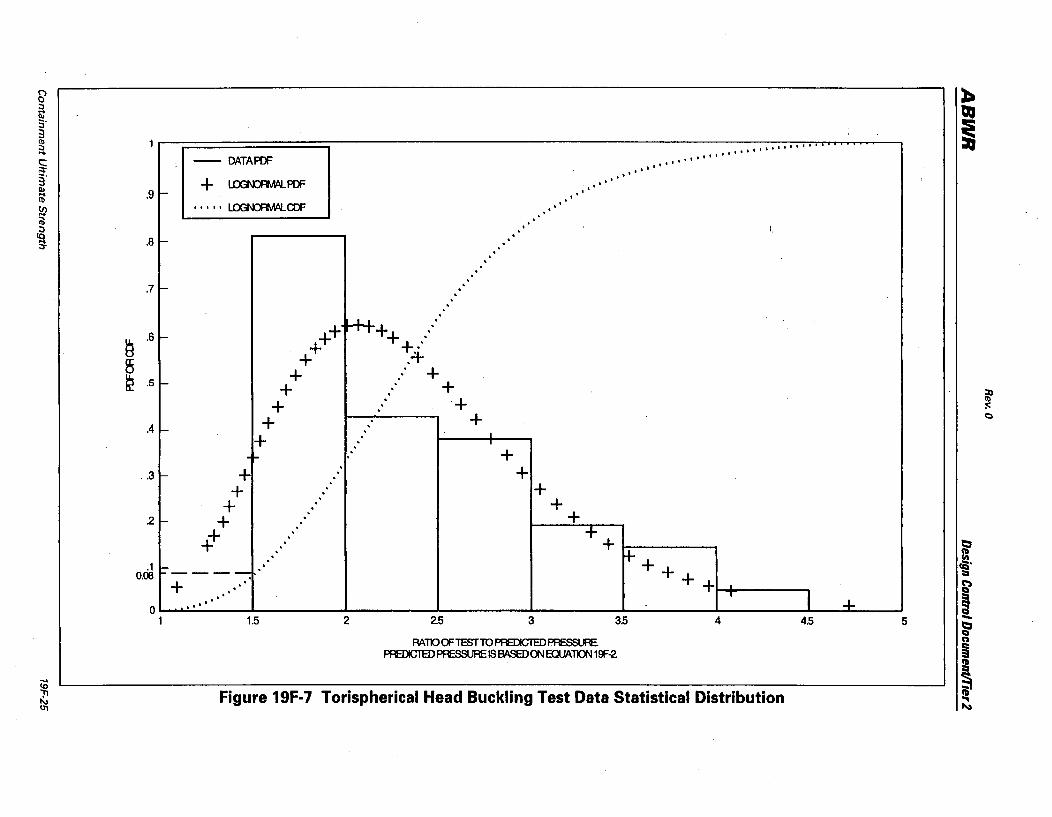
& ::J S 5' 3 Cb :J .... c: ;:;-§. III .9 .... !\)
-~ ::J
~ . 8 -
. 7 -
~ . 6 ,-
5 ~ .5 I-
. 4 l-
.3 I-
2 l-
. 1 0.08
l-
o 1
- DATA PDF
+ ~PDF •• I. I ~cn=
++ ++
+ +
+ +
+ + .
+ . + . . + . . .
++ . . . . . . .
----:-; + 0
. 000
000
1.5
000 .... "" I.···
000
.. , . 000
00
0 0
0
0
0 0
0 . . . . . . . . . . . .
1-++++ .-. . .
:+ . + . . + . .+ .
. + . . I . .
+ +
+ +
+ ++
r+-+ +
2 2.5 3 3S
RAID OF TEST 10 PfIHlIC1EDPRESSUFE PR:DIC1ED PPE.SSURE IS BASEDaoJ EQUA110N 19F-2.
+ + T
4
....... " ..
I.
I 4.5
Figure 19F-7 Torispherical Head Buckling Test Data Statistical Distribution
-I-5
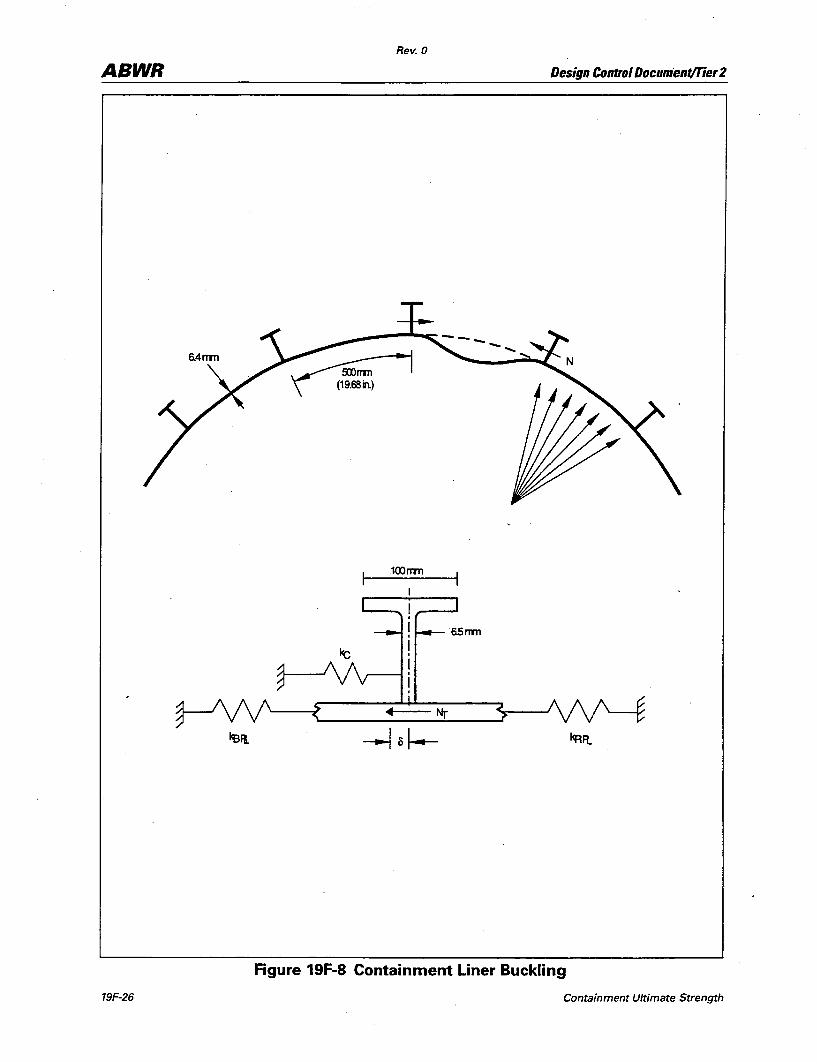
ABWR
19F-26
Rev. 0
,--~ "\ 69.68;;')
100nm
Design Control Document/Tier 2
65mn
Figure 19F-8 Containment Liner Buckling
Containment Ultimate Strength
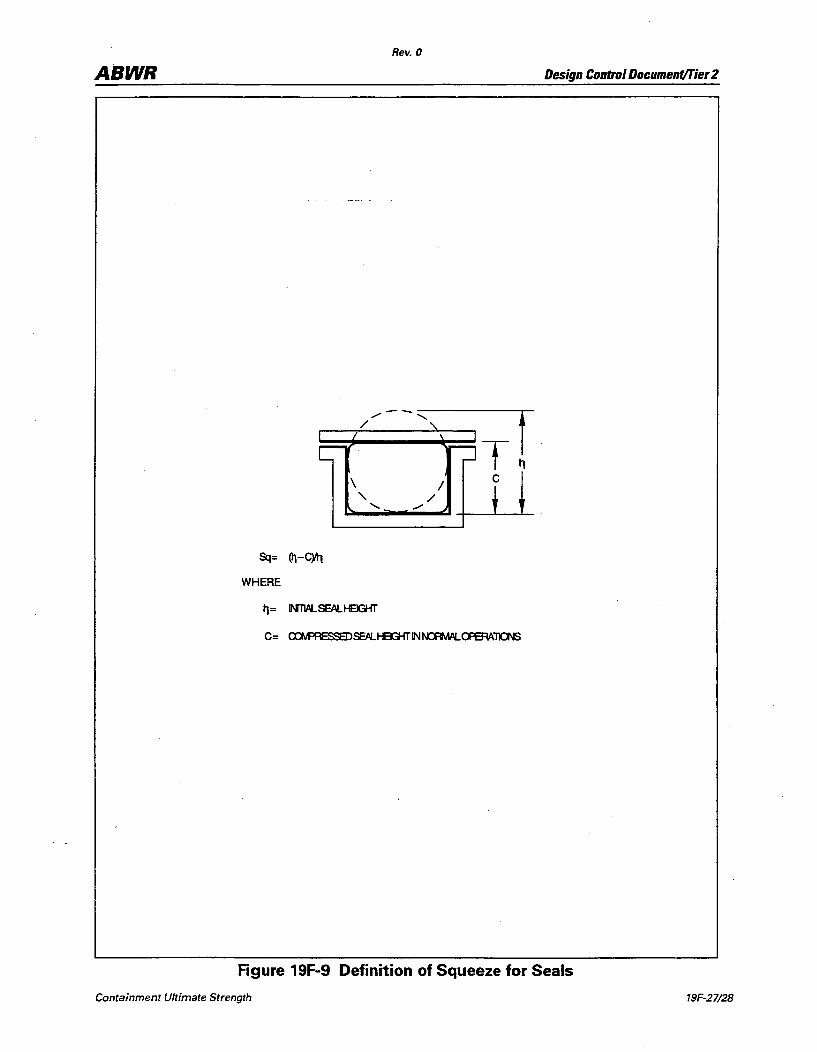
ABWR
\ '\.
"
Sq= ttl-c)t]
WHERE
I'J= NTlALSEALH3GHT
Rev. 0
/ /
./
Design Control DocumentlTier 2
Figure 19F-9 Definition of Squeeze for Seals
Containment Ultimate Strength 19F-27/2B
Rev. 0
ABWR Design Control Document!Tier 2
19FA Containment Ultimate Strength
This Attachment is not part of the DCD (Refer to SSAR)
Containment Ultimate Strength 19FA-1I2

Rev. 0
ABWR Design Control Document/Tier 2
19G Not Used
Not Used 19G-1/2
Rev. 0
ABWR Design Control Document/Tier 2
19H Seismic Capacity Analysis
19H.1 Introduction
This subsection presents seismic capacities for selected structures and components that have been identified as potentially important to the seismic risk analysis of the ABWR standard plant. The seismic capabilities in terms of seismic fragilities are first estimated, from which the high confidence low probability of failure (HCLPF) capacities are then derived. The HCLPF capacities serve as input to the system analysis following the seismic margins approach.
The peak ground acceleration of the design earthquakes is O.3g for the Safe Shutdown Earthquake (SSE). Extensive seismic soil-structure interaction analyses of the reactor building and control building complex were performed for a wide range of generic site conditions under a O.3g SSE. The analysis results in terms of site-envelope SSE loads are presented in Appendix 3A. The standard plant designed to these site-envelope seismic loads may result in significant design margins when it is situated at a specific site, particularly a soft soil site. Thus, the seismic capacities estimated from the site-envelope design requirements may be very conservative for certain sites.
For the seismic category I structures and components for which seismic design information is available, the seismi~ fragilities are evaluated using the factor of safety approach, which is called the Zion method in NUREG/CR-2300, PRA Procedures Guide (Reference 19H-l). This approach identifies various conservatisms and associated uncertainties introduced in the seismic design process and provides a probabilistic estimate of the earthquake level required to fail a structure or component in a postulated failure mode by linear extrapolation of the design information supplemented by judgement.
For certain safety-related components such as pumps, valves, and electrical equipment whose design details are not currently available, the generic seismic fragilities recommended in the EPRI ALWR Requirements Document, Appendix A PRA Key Assumptions and Groundrules (Reference 19H-2) or other data sources are used as appropriate. Those generic fragilities were chosen based on a review of prior PRAs and fragility data. They are considered achievable for the ABWRs with an evolutionary improvement in the seismic capacities of the components designed to a O.3g SSE.
19H.2 Fragility Formulation
Seismic fragility of a structure or component is defined herein to be the cumulative conditional probability of its failure as a function of the mean peak ground acceleration (i.e., the average of the peak of the two horizontal components).
The probability model adopted for fragility description is the lognormal distribution. Using the lognormal distribution assumption, an entire family offragility curves can be
Seismic Capacity Analysis 19H-1
ABWR
19H-2
Rev. 0
Design Control Document/Tier 2
fully described in terms of the median ground acceleration and two random variables as:
where:
(19H-l)
median peak ground acceleration corresponding to 50% failure probability.
= a lognormally distributed random variable accounting for inherent randomness about the median. It is characterized by unit median and logarithmic standard deviation ~Y.
= a lognormally distributed random variable accounting for uncertainty in the median value. It is characterized by unit median and logarithmic standard deviation ~I.I..
With ~own values of Am' ~Y' and ~!1' the failure probability P f at acceleration less than or equal to a given acceleration a can be computed using the following equation for any nonexceedance probability (NEP) level Q.
. [ 1 (a) ~I.I. -1 ] Pf(A~ alQ) = q, 1l.;ln X; + ll.;q, (Q) (19H-2)
where q, (.) is the standard Gaussian cumulative distribution function. Figure 19H-l shows a typical family of fragility curves for various NEP levels. The center solid curve represents the median fragility curve at 50% NEP level. The logarithmic standard deviation of the randomness component 13y determines the curve slope. The logarithmic standard deviation of the uncertainty component ~I.I. is a measure of the spread from the median curve. The 95th percentile and 5th percentile curves in Figure 19H-l are the upper and lower bounds of the failure probability for a given acceleration, corresponding to 95% and 5% NEP levels, respectively.
When only the point estimate is of interest, which is the case for this analysis, the total variability about the median value is taken to be the square root of the sum of the squares (SRSS) of the randomness and uncertainty components.
(19H-3)
The fragility curve corresponding to the median value Am with associated composite logarithmic standard deviation can be computed by the following equation:
Seismic Capacity Analysis
ABWR Rev. 0
Design Control Document/Tier2
(19H-4)
This composite fragility curve is also called the mean fragility curve and is shown as the dashed curve in Figure 19H-l for illustration. It represents the best estimate fragility description.
In estimating the median ground acceleration capacity and the associated variability, an intermediate variable defined as safety factor F is utilized. The safety factor is related to the median ground acceleration capacity by the following relationship.
(19H-5)
where Ad is the ground acceleration of the reference design earthquake to which the structure or component is designed. A key step in the seismic fragility estimate thus involves the evaluation of the factor of safety associated with the design for each important potential failure mode. The design margins inherent in the component capacity and the dynamic response to the specific acceleration are the two basic considerations. Each of the capacity and response margins involves several variables, and each variable has a median factor of safety and variability associated with it. The overall factor of safety F is the product of the factor of safety for each variable F i .
The overall composite logarithmic standard deviation is SRSS of the composite logarithmic standard deviations in the individual factors of safety.
~c = ft.~~i
(19H-6)
(19H-7)
Knowing the median peak ground acceleration (Am) and associated logarithmic standard deviation (~c), the HCLPF capacity is obtained using the equation below.
(l9H-7a)
19H.3 Structural Fragility
19H.3.1 General
The plan t sUUctures are divided in to two categories according to their function and the degree of integrity required to protect the public during a seismic event. These categories are seismic category I and non-category 1. Seismic category I includes those
Seismic Capacity Analysis 19H-3
ABWR Rev. 0
Design Control Document/Tier 2
structures whose failure might cause or increase the severity of an accident which would endanger the public health and safety. The reactor building and control building structures are in this category. The non-category I structures are those structures which are important to reactor operation, but are not essential for preventing an accident which would endanger the public health and safety, and are not essential for the mitigation of the consequences of these accidents. One example is the turbine building structure.
For the purpose of this study, structures are considered to fail functionally when inelastic deformations of the structure under seismic load increase to the extent that the operability of the safety-related components attached to the structure cannot be assured. The ductility limits chosen for structures are estimated as corresponding to the onset of significant structural damage. For many potential modes offailure, this is believed to represent a conservative bound on the level of inelastic structural deformation which might interfere with the function of the system housed within the structure.
The potential of seismic-induced soil failure such as liquefaction, differential settlement, or slope' instability is highly site dependent and cannot be assessed for generic site conditions. It is assumed in this analysis that there is no soil failure potential in the range of ground motions considered~
Building-to-building impact due to differential building displacements under strong earthquakes is deemed incredible since adjacent buildings are separated by more than 182 cm (6 feet). Differential building displacements of sufficient magnitude could, however, potentially result in damage to interconnecting piping, depending on system configuration and sliding resistance of building foundation. Detailed evaluation of seismic capacities of interconnecting systems against differential building displacement cannot be made due to lack of design details and specific site conditions. It is assumed that the mode offailure due to differential building displacement has a capacity no less than the generic piping fragility.
19H.3.2 Reactor Building Complex Structures
19H-4
Detailed fragility evaluations were made for the following structures in the reactor building complex:
• Reactor building shear walls
• Containment
• Reactor pressure vessel pedestal
Those structures were evaluated according to the approach outlined previously and using various safety factors as presented below.
Seismic Capacity Analysis
ABWR Rev. 0
Design Control Document/Tier 2
The factor of safety for a structure against a specific failure mode is the product of the capacity factor Fe and strUctural response factor Frs;
F=FF c rs (19H-8)
The individual factors in the capacity and response factors are presented in the following subsections.
19H.3.2.1 Capacity Factor (Fe)
The capacity factor represents the capability of a structure to withstand seismic excitation in excess of the design earthquake. This factor is composed of two parts:
where:
(19H-9)
= the ultimate structural strength margin above the design SSE
load, and
= the inelastic energy absorption factor accounting for additional
capacity of the structure to undergo inelastic deformations beyond yield.
The capacity estimated by this approach is the elastic capacity equivalent to the actual nonlinear behavior under strong motion earthquakes.
(1) Strength Factor (Fs)
The strength factor associated with seismic load can be calculated using the following equation.
where:
Seismic Capacity Analysis
(19H-IO)
= the actual ultimate strength,
the nonnal operating and operation transient (i.e., SRV)
loads, and
19H-5
ABWR
19H-6
Rev. 0
Design Control Document/Tier 2
= the design SSE load.
The earthquake-resistant structural elements of the reactor building are reinforced concrete shear walls which are integrated with the reinforced concrete cylindrical containment through concrete floor slabs. The reactor pressure vessel pedestal is of a composite steel-concrete construction consisting of two concentric steel shells filled with concrete in the annulus. In addition, stiffeners are welded to the steel shells. The specified compressive strength of concrete is 27.5 MPa. The specified yfeld strength of reinforcing steel of ASTM A615, Grade 60 is 414 MPa. The structural steel material for the pedestal shells and stiffeners is A572, Gr. 50, for which the specified yield strength is 345 MPa. These are design values; the actual material strengths are higher.
Concrete compressive strength used for design is normally specified as a value at a specific time after mixing (28 or 90 days). This value is verified by laboratory testing of mix samples. The strength must meet specified values, allowing a finite number of failures per number of trials. There are two major factors which affect the actual strength:
(a) To meet the design specifications, the contractor attempts to create a mix that has an "average" strength somewhat above the design strength, and
(b) As concrete ages, it increases in strength.
Taking those two elements into consideration, the actual compressive strength of aged concrete is commonly 1.3 times the design strength (Reference 19H-3). The total logarithmic standard deviation about the median strength is about 0.13.
According to the same reference, the ratio of the median yield strength to the specified strength of reinforcing steel is taken to be 1.2 with logarithmic standard deviation of 0.12.
The median yield strength of steel plates is typically 1.25 times the code specified strength with logarithmic standard deviation of 0.14 (References 19H-3 and 19H-4).
The reactor building shear wall is chosen as an example for the discussion of the strength factor evaluation. For reinforced concrete shear walls the ultimate shear strength can be computed using the following equation (Reference 19H-5).
Seismic Capacity Analysis
ABWR Rev. 0
Design Control DocumentlTier 2
= 8.3 If - 3.4 If(~ -!) + !:. + P f "'''c "' .. c w... ,+wt se Y (19H-ll)
where:
Vc = shear strength provided by concrete
Vs shear strength provided by reinforcing steel
fc = concrete compressive strength
h = wall height
w wall length
N = bearing load
f yield strength of reinforcing steel y
t = wall thickness
Pse = APv+BPh
Ph = horizontal steel reinforcement ratio
Pv vertical steel reinforcement ratio
A&B constants depending on h/w:
A B
h/w<0.5 1 o
0.5 < h/w < 1.0 2 (1 - h/w) 2h/w-1
1.0 <h/w 0 1
In computing ultimate shear strength with this equation, the median material strengths of the concrete and reinforcing steel defined above are used and the wall bearing load is conservatively neglected.
Seismic Capacity Analysis 19H-7
ABWR
19H-B
Rev. 0
Design Control Document/Tier 2
The strength factor F s is then calculated using Equation 19H-10 for each of the levels of the reactor building shear walls. The operating loads do not result in lateral shear force and horizontal loads induced by SRVactuations are found to be negligible compared to the SSE-induced horizontal loads. Therefore, the strength factor is the ratio of the median shear strength to the design SSE shear. The least strength factor is found to be 3.32. The associated logarithmic standard deviation is calculated to be 0.09 using the second moment approximation (Reference 19H-5) accounting for both concrete and reinforcing steel material strength variabilities. There is also an uncertainty associated with Equation 19H-ll since it is an approximate model fit to data. The modeling uncertainty is 0.15 expressed in terms oflogarithmic standard deviation (Reference 19H-5). The total composite logarithmic standard deviation in the median strength factor is 0.17, which is the SRSS value of 0.09 for the material strength uncertainty and 0.15 for the equation uncertainty.
(2) I~elastic Energy Absorption Factor (Fu)
The inelastic energy absorption factor (Fu) accounts for the fact that an earthquake represents a limited energy source and many structures are capable of absorbing substantial amounts of energy beyond yield without loss of function. The parameter commonly used to measure the energy absorption capacity in the inelastic range is the ductility ratio, ~. It is defined as the ratio of the maximum displacement to the displacement at yield. Newmark, Reference 19H-6, has shown that in the amplified acceleration range (approximately 2 to 8 Hz) the inelastic energy absorption factor Fu can be estimated by
F = EJ2~-1 u (19H-12)
where E is an error variable to account for the uncertainty associated with the use of this equation. This error variable is assumed to be lognormally distributed with a median of unity and a logarithmic standard deviation ranging from 0.02 to 0.1 (Reference 19H-7). For rigid structures (fundamental frequency above 20 Hz), the following equation given by Reference 19H-7 maybe used.
F 0.13
u = E~ (19H-13)
Again, E is an error variable of unit median and logarithmic standard deviation ranging from 0.02 to 0.1. For intermediate frequencies, the F u factor can be interpolated from Eqs. 19H-12 and 19H-13.
Seismic Capacity Analysis
ABWR Rev. 0
Design Control Document/Tier 2
According to Reference 19H-3, the system ductility ratio for reinforced concrete shear walls failing in shear is 2.5. The integrated building/ containment system responds in multiple modes with predominant modes up to 10Hz. The corresponding inelastic energy absorption factor is thus about 2.0 according to Equation 19H-12. The associated logarithmic standard deviation is 0.25 (Reference 19H-3). Flexural failures tend tobe more ductile than shear failures. A ductility ratio of 4.0 is estimated and the corresponding F is 2.65 with logarithmic standard deviation of 0.25. u .
Steel structures are typically more ductile than concrete structures. When local buckling is prevented, the allowable ductility ratio is 5 (Reference 19H-8) for which the corresponding F u is 3. The F u factor is taken as unity when the failure mode is of a brittle type such as buckling or failure of high strength anchor bolts.
19H.3.2.2 Structural Response Factor (Frs)
The structural response factor (F ) consists of a number of factorS or parameters rs. introduced in the calculation of structural response in the seismic dynamic analysis. Response calculations performed in the design analysis utilized conservative deterministic parameters. The actual response may differ significantly from the calculated response for a given peak ground acceleration level since many of these parameters are random. The structural response factor is evaluated as the product of the following factors that are considered to have the most influence on the structural response.
where:
F . SS!
Seismic Capacity Analysis
F = F FdF .F F F rs sa SS! m me eee (19H-14)
= spectral shape factor accounting for the margin of the design ground response spectra with respect to the median centered spectra,
damping factor accounting for the variability in response due to difference in expected damping at failure and damping used in the analysis,
soil-structure interaction factor accounting for the variability associated with SSI effects on structural response,
= structural modeling factor accounting for the variability in response due to modeling assumptions,
19H-9
Rev. 0
ABWR Design Control Document/Tier 2
19H-10
Fmc = -- modal response combination factor accounting for the variability in response due to the method used in combining modal responses,
F ecc earthquake component combination factor accounting for the variability in response due to the method used in combining the earthquake components.
(1) Spectral Shape Factor (Fsa)
The ground response spectrum considered in the seismic design is the siteindependent spectrum from Regulatory Guide (RG) 1.60, normalized to the design ground acceleration. To facilitate dynamic analysis using the time history method, artificial acceleration time histories of three directional components were generated so that the resulting spectra envelop the design spectra for the damping ratios of interest.
For the purpose of seismic risk assessment, the median ground spectrum given in NUREG/CR-0098 (Reference 19H-9) is considered to be the realistic input ground motion definition. The differences between the design spectra and median spectra are the margins in the ground motion input.
The spectral shape factor (Fsa) is defined to be the ratio of the amplification factor of the design spectrum to that of the median spectrum at the same frequency and damping level.
(19H-15)
In constructing the median spectrum, the competent soil condition is conservatively assumed since it results in higher maximum ground velocity and displacement amplitudes than the rock condition for a same maximum ground acceleration. The design spectnlm and median spectrum are compared at the 5% damping level for the maximum ground acceleration of 19. The average spectral shape factors in representative frequency ranges are approximately
Frequency Range (Hz) Average Fsa
2 to 10 1.34
10 to 20 1.20
Seismic Capacity Analysis
ABWR Rev. 0
Design Control Document/Tier 2
Frequency Range (Hz) Average Fsa
20 to 33 1.07
above 33 1.00
The logarithmic standard deviation in the spectral shape factor is the variability in the median spectra which is 0.2 according to Reference 19H-2. No variability exists for frequencies above 33 Hz.
(2) Damping Factor (F d)
The SSE loads were calculated using the SSE damping ratios specified in RG 1.61. The RG 1.61 damping values are considered to be quite consexvative,
particularly at response levels near failure. More realistic damping values are specified in Reference 19H-9.
For reinforced concrete structures the damping ratio considered in the SSE analysis is 7%. The realistic values at or near yield range from 7 to 10% (Reference 19H-9). The upper bound value is considered to be median and the lower bound corresponds to the 84th percentile level.
The RG 1.60 design ground spectra are used to evaluate the margin in response due to difference in actual damping at failure and design damping. The damping factor F d can be calculated to be the ratio of the amplification factor at design damping (AF dd) to the amplification factor at median damping (AF md) at the same frequency.
Fd = AFdd/AFmd (19H-16)
The associated logarithmic standard deviation can be calculated to be the
natural log of the ratio of the amplification factor at 84th percentile damping (AFbd ) to the amplification factor at median damping (Amd ) at the same frequency.
(l9H-17)
Seismic Capacity Analysis 19H·11

ABWR
19H-12
(3)
Rev. 0
Design Control Document/Tier2
For reinforced concrete structures the average damping factors and associated logarithmic standard deviations in representative frequency ranges are approximately
Frequency Range (Hz) Average Fd Average ~c
2 to 10 1.19 0.18
10 to 20 1.12 0.11
20 to 33 1:02 0.02
above 33 1.00 0.0
Soil-Structure Interaction Factor (F ssi)
Seismic soil-structure interaction (SSI) analyses for the SSE were perfonned for the reactor building complex situated in a wide range of generic site conditions as described in Appendix 3A. The design seismic loads were established to be the site-envelope loads calculated by the SSI analyses. The site-envelope loads may have margins for a given site. The margin may be substantial if the specific site is a soft soil site. Since the ABWR standard plant is designed for generic site conditions, no credit is taken for site margins.
Thus; the Fssi factor is taken as 1.0. The associated logarithmic standard deviation is estimated to be 0.1.
(4) Modeling Factor (F m)
The reactor building complex structural model considered in 'the seismic design analysis is a multi-degree-of-freedom system constructed according to common modeling techniques and the Standard Review Plan (SRP) requirements in terms of number of degrees of freedom and subsystem decoupling. The model is thus considered to be the best estimate and the resulting dynamic characteristics are median centered. The modeling factor is thus unity. A relatively large logarithmic standard deviation of 0.15 is estimated to account for the complexity of the integrated reactor building and the containment design.
(5) Modal Combination Factor (Fmc)
The analysis method used in the seismic response analysis is the time history method solved in the frequency domain. The phasing between individual modal responses are known and the total response is the algebraic sum of all
Seismic Capacity Analysis
ABWR Rev. 0
Design Control DocumentlTier 2
modes of interest. The maximum response is thus precise and the modal combination factor (F me) is unity. The associated uncertainties should be less than the uncertainties associated with the response spectnun method, in which the maximum modal responses are combined by the SRSS method. Therefore, a relatively small logarithmic standard deviation of 0.05 is estimated.
(6) Earthquake Component Combination Factor (F eee)
The effects of multi-directional earthquake excitation on structural response depend on the geometry, dynamic response characteristics, and relative magnitudes of the two horizontal and the vertical earthquake components. The design method is SRSS, according to RG 1.92, which is considered to result in median-centered response. The earthquake component combination factor is 1.0.
The reactor building walls are designed to resist in-plane loads. The torsional effects were found to be small and the walls mainly respond to the horizontal motion parallel to the walls. The vertical loads on the walls due to the vertical excitation are typically less significant in contributing to the total stresses and there is an equal probability of acting upward or downward. The earthquake component combination effect on the wall design is thus not significant and a small logarithmic standard deviation of 0.05 is estimated. I
Other major structures inside the reactor building such as the containment and the pedestal are cylindrical structures. The responses to the three orthogonal excitation components are essentially uncoupled. The logarithmic standard deviation is estimated to be 0.05.
19H.3.2.3 Reactor Building Complex Summary
The median values of individual factors and associated logarithmic standard deviations are summarized in Tables 19H-2 through 19H-4 for the critical failure modes of the reactor building walls, the containment, and the reactor pressure vessel pedestal. The overall factor is the product of all individual factors. The total logarithmic standard deviation is the SRSS value of individual logarithmic standard deviations. The seismic fragility in terms of median ground acceleration is the product of the overall factor and the SSE design ground acceleration of 0.3 g.
19H.3.3 Other Seismic Category I Structures
Seismic category I structures other than the reactor building structures in the ABWR standard plant include the control building, and the radwaste building substructures.
Seismic Capacity Analysis 19H-13
ABWR Rev. 0
Design Control Document/Tier Z
The con trol building fragility is evaluated using the same procedure described above for the reactor building. The controlling mode of failure is shear of shear walls. Table 19H-5 shows the margin in each of the strength and response factors.
The radwaste building does not contain safety-related equipment and its failure will not lead to core damage. Consequently, an estimate of the radwaste building fragility is not required.
19H.4 Component Fragility
19H.4.1 General
Seismic fragilities of safety-related components were assessed for the following two categories of components:
(1) ABWR specific components whose fragility evaluation is made according to existing design information.
(2) Generic components whose fragilities are based on the data recommended in
Reference 19H-2 or other data sources as appropriate.
19H.4.2 ABWR Specific Components
19H-14
Detailed seismic fragility evaluations are performed for the following ABWR specific components:
• Reactor pressure vessel (RPV)
• Shroud support
• Control rod drive (CRD) guide tubes
• CRD housings
• Fuel assemblies
The design seismic loads for these components were calculated directly using a coupled building structures and RPV /internals model. Consequently, no subsystem dynamic analyses using input motions at support points were required. Therefore, the fragility -" evaluation procedures used for the reactor building structures as presented previously are also applicable to these specific components.
Reactor Pressure Vessel (RPV) The failure of the RPV due to an earthquake results in a sequence similar to a large break loss-of-coolant accident, with the exception that there may be no means to
provide makeup (i.e., injection or cooling) to the core. The ABWR RPV is supported by a conical skirt which is anchored to the pedestal with 120-68 mm minimum diameter
Seismic Capacity Analysis
ABWR Rev. 0
Design Control Document/Tier 2
high-strength anchor bolts. Atan upper elevation, the RPV is laterally restrained by stabilizers which are connected to the reactor shield wall.
Failure of the RPV support system would result in excessive RPV deflection which could induce failure of the connecting pipes. The ultimate capacity of the support system is provided by both the skirt and the stabilizers. In this analysis, the resistance capacity of the support system is conservatively limited to the yielding capacity of the stabilizers or the skirt, whichever is smaller.
The critical failure mode is found to be stabilizer yielding.
RPV Internal Components The internal components examined for seismic fragilities include the shroud support, CRD guide tubes, CRD housings, and fuel assemblies. Failure of those components could potentially result in inability to insert the control rods to shut down the reactor.
Tables 19H-7 through 19H-I0 show the failure modes and associated median ground acceleration capacities of those components. The contributing factors are also shown in these tables.
As noted, the fuel assemblies are found to have the lowest seismic capacity among the RPV internal components. The failure mode is excessive deflection of the fuel channel. The maximum deflection that the channel can undergo without collapse is limited by the amount that would inhibit the control rod from insertion to achieve reactor scram. The scram limited deflection is laiger than the channel deflection at yield. To assess the seismic capacity of the channel, the moment-deflection resistance function is conservatively assumed to be of perfect elasto-plastic. The strength margin is taken to be the ratio of the yielding moment to the SSE induced moment. The additional capacity due to inelastic deformation is accounted for with a ductility ratio equal to the scram-limited deflection divided by the yielding deflection.
19H.4.3 Generic Components
Detailed fragility evaluations for safety·related components other than those specific components presented above cannot be made at this stage of certification due to lack of design details.
The ABWR generic components of interest for this seismic risk analysis are the following:
• Cable trays
• Large flat-bottom storage tanks
• Air-operated valves
Seismic Capacity Analysis 19H·15
Rev. 0
ABWR Design Control Document/Tier2
• Heat exchangers
• Off-site Power (transfonners and ceramic insulators)
• Batteries and battery racks
• Electric equipment (chatter failure mode) .
• Switchgear/Motor control centers
• Transfonners (480V)
• Diesel generators and support systems
• Turbine-driven pumps
• Motor-driven pumps
• Diesel-driven pumps
• Small tanks (e.g., standby liquid control tank)
• Motor-operated valves
• Safety relief, manual, and check valves
• Hydraulic control units
• .Heating, ventilation, and air conditioning ducting
• Air handling units/room air conditioners
• Piping
• Service water pump house
Their seismic fragilities and corresponding HCLPF values are summarized in Table 19H-1. These generic seismic capacities are selected from a review of ALWR recommendation (Reference 19H-2) and other PRA studies (References 19H-IO and 19H-ll).
19H.5 COL License Information
19H.S.1 Seismic Capacity
19H-16
The COL applicant shall detennine the HCLPFvalues for the plant-specific/asdesigned components corresponding to those generic components defined in Subsection 19HA.3. The values should be compared to their assumed HCLPF values
Seismic Capacity Analysis
ABWR Rev. 0
Design Control Document/Tier 2
given in Table 19H-l (or TabIe-19I-1 on system basis). It should be noted that only the capacities ofimportant contributors (Section 19.8) need to be detennined and compared. These important contributions are hereafter referred to as SMA SSCS for systems, structures, and components needed for consideration in the seismic margins assessment.
An explicit evaluation of HCLPF values of only the important contributors (Section 19.8) need to be performed. However, prior to the HCLPF evaluation it is essential to verify that the quality of construction of structures and installation of equipment and systems are in conformance with the commitments in the SSAR and that the as-built structures systems and components meet all the applicable ITACC requirements .. These important components are hereafter referred to as SMA SSCS for systems, structures, and components needed for consideration in seismic margins assessment.
The HCLPF calculations can be made using fragility analysis or the conservative deterministic failure margin (CDFM) approach. The location effects should be taken into account in determining the limiting capacity of the same component on different locations.
For structures, equipment and systems other than the important items metioned above, it is only necessary to verify that the site-dependent conditions are within the site envelope parameters in accordance with the procedure described in Subsection 2.3.1.2 or that site-specific SSE n;sponses are bounded by those considered in the standard design, provided that the as-biult structures, systems and components are verified to be designed, constructed, installed and tested in accordance with Tier 2 and Tier 1 commitments. Otherwise, site-specific HCPLF capacities for these structures and components need to be established.
It is not necessary that in each case the HCLPF equal or exceed the value assumed in the margins analysis of the standardized design, especially since the NRC has judged that HCLPF=O.5 is acceptable. However, depending on the degree of difference and the significance of the component in accident sequences, an evaluation of the site-specific plant level HCLPF capacity may be needed. The level of acceptable seismic margin for the plant should be established in a manner consistent with that used in existing nuclear power plants.
The site should also be investigated for the potential of seismic-induced soil failure (liquefaction, differential settlement, or slope stability) at 1.67 times the site-specific SSE. .
In order to increase confidence that the as-designed seismic capacities of the SMA SSCS are realized in the final constructed plant, a seismic walkdown shall be performed by the COL applicant according to the process as follows:
• Step I-Preparation for Plant Walkdown
• Step 2-Plant Seismic Logic Model Walkdown
• Step 3-Assessment of As-Built SMA SSC HCLPF Values
Seismic Capacity Analysis 19H-17
Rev. 0
ABWR Design Control Document/Tier 2
79H-78
• Step 4-Seismic Plant Walkdown
• Step 5-Plant Damage State and Plant Level HCLPF Calculations
These steps are discussed in detail in the remainder of this subsection.
Step 1-Preparation for Plant Walkdown
The SMA presented in Appendix 191 contains seismic logic models for the plant. These models include the seismic-induced failures that were considered necessary to be evaluated as part of the SMA. These failures, and the associated HCLPF values of the SMA SSCS shall be reviewed. In preparing for the plant walkdown, all appropriate information regarding these failures should be gathered. These include, but are not necessarily limited to:
• Piping and instrumentation drawings,
• Electrical one-line diagrams,
• Plant arrangement drawings,
• Detailed design drawings,
• Procurement specifications,
• Construction drawings (especially those concentrating on seismic detailing and load paths),
• Quality assurance records,
• Seismic analysis used for defining floor response spectra,
• Floor spectra used as required response spectra by vendors,
• Engineering analyses of seismic performance (especially for representative seismic anchorages), and
• Equipment qualification data/material test data.
Step 2-Plant Seismic Logic Model Walkdown
The walkdown will concentrate on the identification of potential systems interactions that could impact the performance of the front-line and support SSCs included in the models. The original SMA model considered in Appendix 191 included the most significan t systems interactions (e.g., collapse of major buildings). However, it is necessary to assure that no other interactions exist in the as-built plant that were not included in the SMA model. The walkdown should include a thorough examination of the SSCs included in the SMA, including piping runs, cable trays, etc. During the walkdown process, the team should identify the presence of any SSCs whose failure could impact the performance of the SMA SSCs. Based on a review of the seismic event trees (Figures 191-1,-2 and -3) it was considered appropriate to add the following systems
Seismic Capacity Analysis
ABWR Rev. 0
Design Control Document/Tier2
to SMA SSCs for this step; RCIC one HPCF train, one LPFl... train, and SLC.These could include such.things as:
• Non-load bearing walls adjacent to SMA SSCs
• Non-safety components above or adjacent to SMA SSCS
• Hard swfaces within deflection range of SMA SSCS
• Flooding! deluge sources in the vicinity of SMA SSCS.
All such potential interactions should be identified, along with the failure mode that could impact the performance of the SMA SSCs. These are new failure modes based on as-built plant conditions. This must be done for 100 percen t of the SSCS included in the event and fault tree models. These new failure modes should be added as basic events on the SMA fault! event trees as appropriate and be added to the list of SMA SSCs. In addition, the design information specified in Step 1 should be assembled for these new failures. Note that all future reference to SMA SSCs is intended to refer to the expanded list, including the newly added system interactions.
Step 37 Assessment of As-Built SMA SSC HCLPF Values For each SMA SSC, a compilation of the design characteristics that control the HCLPF value should be prepared. These design characteristics can be one of two things: either they directly contribute to the dominant failure mode(s) or to failure modes that are close to being dominant. The dominant failure modes(s) is defined as the failure modes (s), from the list of all potential failure modes that will cause the SSC to be unable to perlonn its safety function, whose H CLPF value is the lowest (or equal to the lowest). Thus, the reduction of the HCLPF value of this failure mode would result in a corresponding reduction in the HCLPF of the SSC. This being the case, the design characteristics that would be compiled would include all of the specific design conditions that directly contribute to the dominant SSC failure mode(s). Another way to express this is that any change in anyone of these design conditions that results in a reduction in seismic capacity will directly cause a reduction in the SSC HCLPF value. In addition, they would also include all such conditions that directly contribute to SSC failure mode (s), if any, that could become the dominant failure mode if it were to have a "somewhat" lower HCLPFvalue. For the purpose of this review, "somewhat" is defined as about a 10 percent to 20 percent HCLPF reduction. Thus, these failure modes are those whose calculated HCLPF value is only on the order of 10 percent to 20 percent higher than the dominant failure mode.
The characteristics that would be identified could include such things as:
• Size, type and number of anchor bolts,
• Size, type and orientation of support members,
Seismic Capacity Analysis 19H-19
Rev. 0
ABWR Design Control Document/Tier2
• Distance between rigid pipe supports (allowance for differential motion),
• Distance between components.
The specification of these characteristics should be quite definitive (i.e., numerical where possible).
Step 4-Seismic Plant Walkdown Final detennination of the as-built plant design characteristics affecting HCLPF values is required. This should take the fonn of a final plant walkdown of the SMA SSCs, and RCIC, one HPCF train, one LPFL train and SLC as noted in step 2. As a product of Step 3, a compilation of key design characteristics (those that control or could control the HCLPF value of the SMA SSCs) was prepared. The plant walkdown is intended to detennine the extent to which these design characteristics exist in the plant. Each SSC should be inspected and the as-build condition compared with the key design characteristics.
It is not required to perform a detailed walkdown inspection of 100 percent of the SMA SSCs. A 100 percent "walk by" is sufficient. The "walk by" is intend~d to assure that there is a reasonable basis for the assumption that the HCLPF of broad classes of SSC are essentially the same (i.e., that the SSCS are of similar design and manufacture and are similarly anchored). For each group of SSCs for which this condition of similarity can reasonably be established by the "walk by", It will then be necessary to select one representative SSC from each group to be subjected to a more rigorous inspection. This inspection will be conducted in such a manner as to determine if the representative SSC is in agreement with the assumed design characteristics compiled in Step 3.
It is understood that it will not always be possible to visually detennine the existence of all the key characteristics, since some of them may be embedded within walls or in other inaccessible places. In such cases, it will be acceptable to use the construction QA records as adequate demonstration that the as-build SSC has the design characteristics required. In all cases, the result of the seismic plant walkdown should be fully documented.
Step S-Plant Damage State and Plant Level HCLPF Calculations The final step in the process is to detennine HCLPF values for each event sequence, each plant damage state and for the overall plant. This should be done using both the min-max and convolution approaches and reported in the same form as in the SMA in Appendix 191.
19H.6 References
19H-l "PRAProcedures Guide", NUREG/CR-2300,january 1983.
19H-20 Seismic Capacity Analysis
ABWR Rev .. 0
Design Control Document!11er 2
19H-2 c-" AL WR Utility Requirements Document, Volume II, Chapter 1, Appendix A PRA Key Assumptions and Groundrules", EPRI, October 1988.
19H-3 "Report on Quantification of Uncertainties, Report of Seismic Analysis Main Committee", ASCE, March 15 1983.
19H-4. "Severe Accident Risk Assessment-limerick Generating Station", NUS Report, April 1983.
19H-5 "Handbook of Nucl~ar Power Plant Seismic Fragilities, Seismic Safety Margins Research Program", NUREG/CR-3558,June 1985.
19H-6 Newmark, N. M., "InelaStic Design of Nuclear Reactor Structures and Its Implication on Design of Critical Equipment", SMIRT Paper K4/1, 1977 SMIRT Conference, San Francisco, 1978.
19H-7 Kennedy, R P., and Ravindra, M. K., "Seismic Fragilities for Nuclear Power Plant Risk Studies, Nuclear Engineering and Design", PP47-68, (79) 1984.
19H-8 "Structural Analysis and Design of Nuclear Plant Facilities, Manual and Reports on Engineering Practice", No. 58, ASCE, 1980.
19H-9 "Development of Criteria for Seismic Review of Selected Nuclear Power Plants", NUREG/CR-0098, May 1978.
19H-I0 _ Harrison, S. W., Esfandiari, S., Pandya, D., and Ahmed, R, "Seismic Fragility Curves for Evaluation of Generic Electrical Conduit Supports, to be presented in the ASME PVP Annual Meetings", Honolulu, Hawaii,July 22-24, 1989.
19H-ll Campbell, RD., Ravindra, M. K., and Bhatia, A., "Compilation of Fragility Information from Available Probabilistic Risk Assessments", LLNL, September 1985.
Seismic Capacity Analysis 19H-21
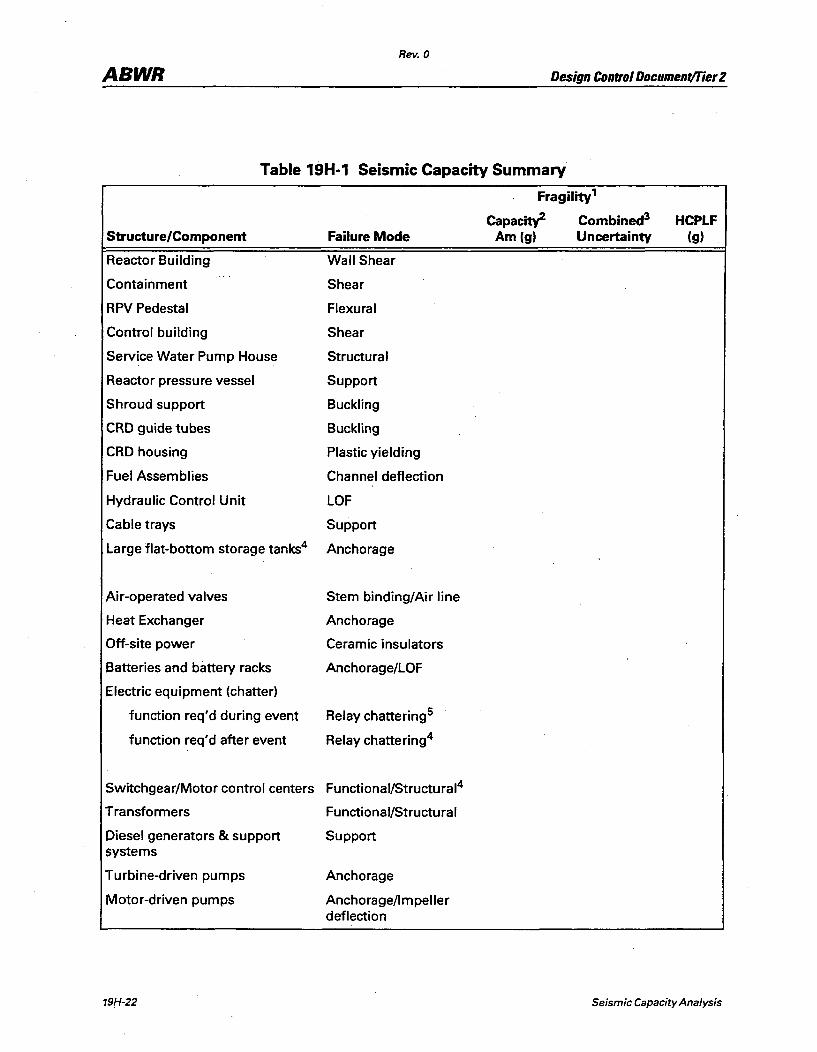
Rev. 0
ABWR Design Control Document!Tier 2
Table 19H-1 Seismic Capacity Summary
Structure/Component
Reactor Building
Containment
RPV Pedestal
Control building
Service Water Pump House
Reactor pressure vessel
Shroud support
CRD guide tubes
CRD housing
Fuel Assemblies
Hydraulic Control Unit
Cable trays
Large flat-bottom storagetanks4
Air-operated valves
Heat Exchanger
Off-site power
Batteries and battery racks
Electric equipment (chatter)
function req'd during event
function req'd after event
Failure Mode
Wall Shear
Shear
Flexural
Shear
Structural
Support
Buckling
Buckling
Plastic yielding
Channel deflection
LOF
Support
Anchorage
Stem binding/Air line
Anchorage
Ceramic insulators
Anchorage/LOF
Relay chattering5
Relay chattering4
Switchgear/Motor control centers Functional/Structural4
Transformers
Diesel generators & support systems
Turbine-driven pumps
Motor-driven pumps
19H-22
Functional/Structural
Support
Anchorage
Anchorage/lmpeller deflection
Fragility'
Capac~ Combined3
Am (g) Uncertainty HCPLF
(g)
Seismic Capacity Analysis
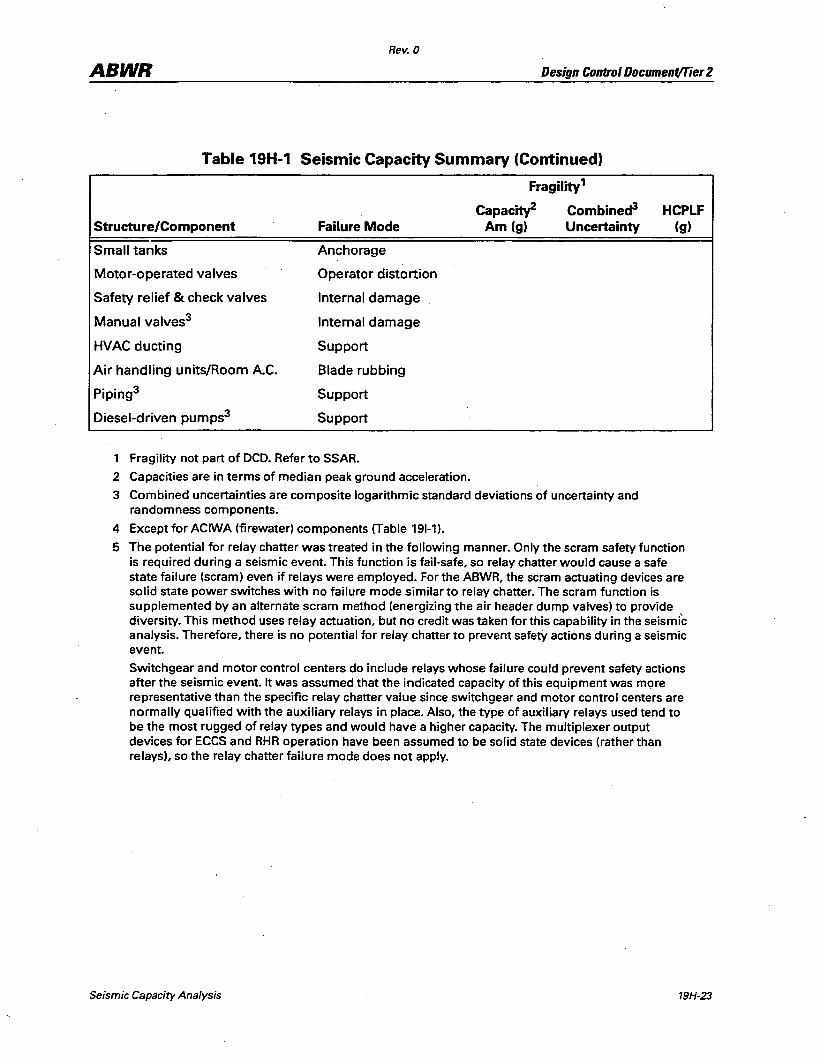
Rev. 0
ABWR Design ContrDI DDcument/Tier 2
Table 19H-1 Seismic Capacity Summary (Continued)
Structure/Component
Small tanks
Motor-operated valves
Safety relief & check valves
Manual valves3
HVAC ducting
Air handling units!Room A.C.
Piping3
Diesel-driven pumps3
Failure Mode
Anchorage
Operator distortion
Internal damage
Internal damage
Support
Blade rubbing
Support
Support
1 Fragility not part of OCD. Refer to SSAR.
2 Capacities are in terms of median peak ground acceleration.
Fragility'
Capacjty2 Combined3
Am (g) Uncertainty
3 Combined uncertainties are composite logarithmic standard deviations of uncertainty and randomness components.
4 Except for ACIWA (firewater) components (Table 191-1).
HCPLF (g)
5 The potential for relay chatter was treated in the following manner. Only the scram safety function is required during a seismic event. This function is fail-safe, so relay chatter would cause a safe state failure (scram) even if relays were employed. For the ABWR, the scram actuating devices are solid state power switches with no failure mode similar to relay chatter. The scram function is supplemented by an alternate scram method (energizing the air header dump valves) to provide diversity. This method uses relay actuation, but no credit was taken for this capability in the seismic analysis. Therefore, there is no potential for relay chatter to prevent safety actions during a seismic event.
Switchgear and motor control centers do include relays whose failure could prevent safety actions after the seismic event. It was assumed that the indicated capacity of this equipment was more representative than the specific relay chatter value since switchgear and motor control centers are normally qualified with the auxiliary relays in place. Also, the type of auxiliary relays used tend to be the most rugged of relay types and would have a higher capacity. The multiplexer output devices for ECCS and RHR operation have been assumed to be solid state devices (rather than relays), so the relay chatter failure mode does not apply.
Seismic Capacity Analysis 19H-23
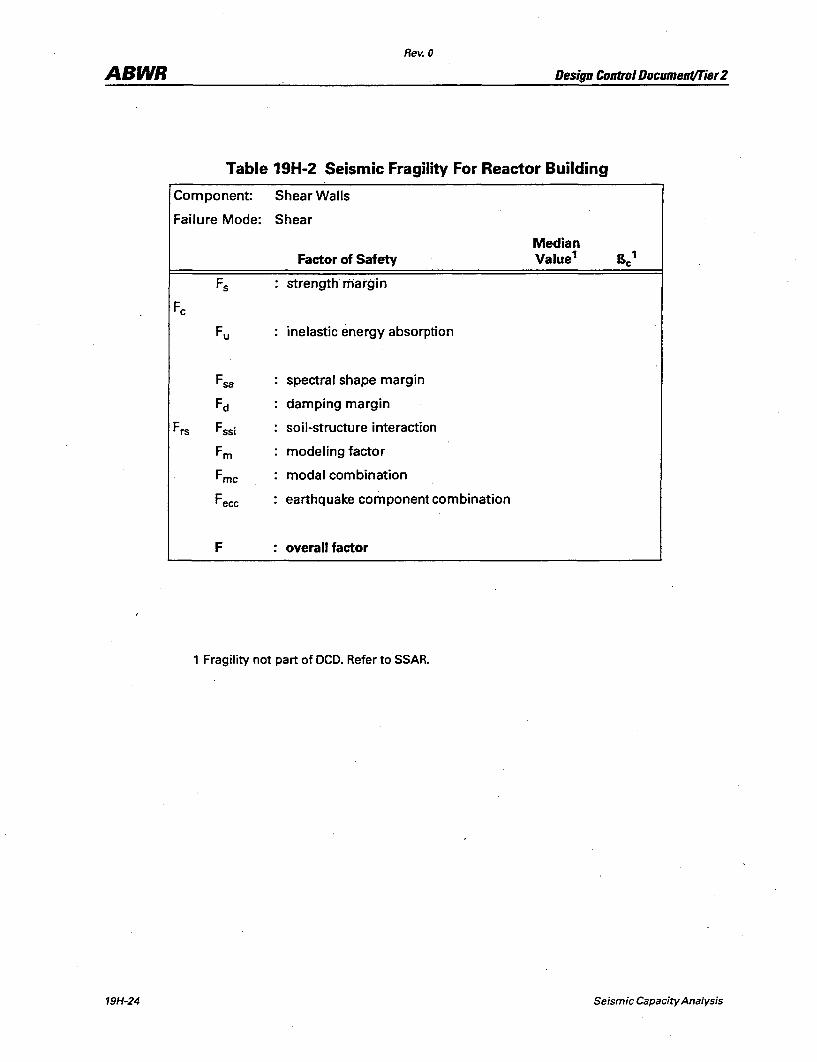
Rev. 0
ABWR Design Control Document/Tier 2
Table 19H-2 Seismic Fragility For Reactor Building
Component: Shear Walls
Failure Mode: Shear
Median Factor of Safety Value' B ' c
Fs strength margin
Fe
Fu inelastic energy absorption
Fsa spectral shape margin
Fd damping margin
Frs Fssi soil-structure interaction
Fm modeling factor
Fmc modal combination
Feee earthquake component combination
F overall factor
1 Fragility not part of OeD. Refer to SSAR.
19H-24 Seismic Capacity Analysis
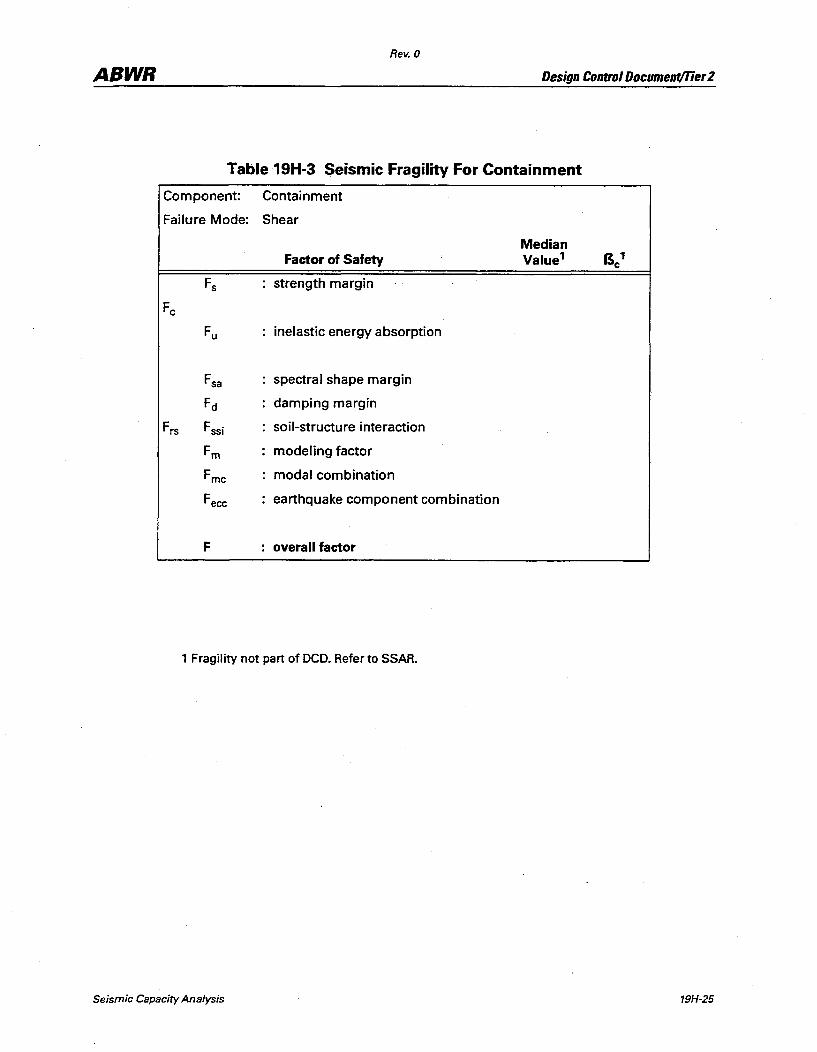
Rev. 0
ABWR Design Control Document/Tier 2
Table 19H-3 Seismic Fragility For Containment
Component: Containment
Failure Mode: Shear
Median Factor of Safety Value' 8' c
Fs strength margin
Fe
Fu inelastic energy absorption
Fsa spectral shape margin
Fd damping margin
Frs Fssi soil-structure interaction
Fm modeling factor
Fmc modal combination
Fecc earthquake component combination
F overall factor
, Fragility not part of OeD. Refer to SSAR.
Seismic Capacity Analysis 19H-25
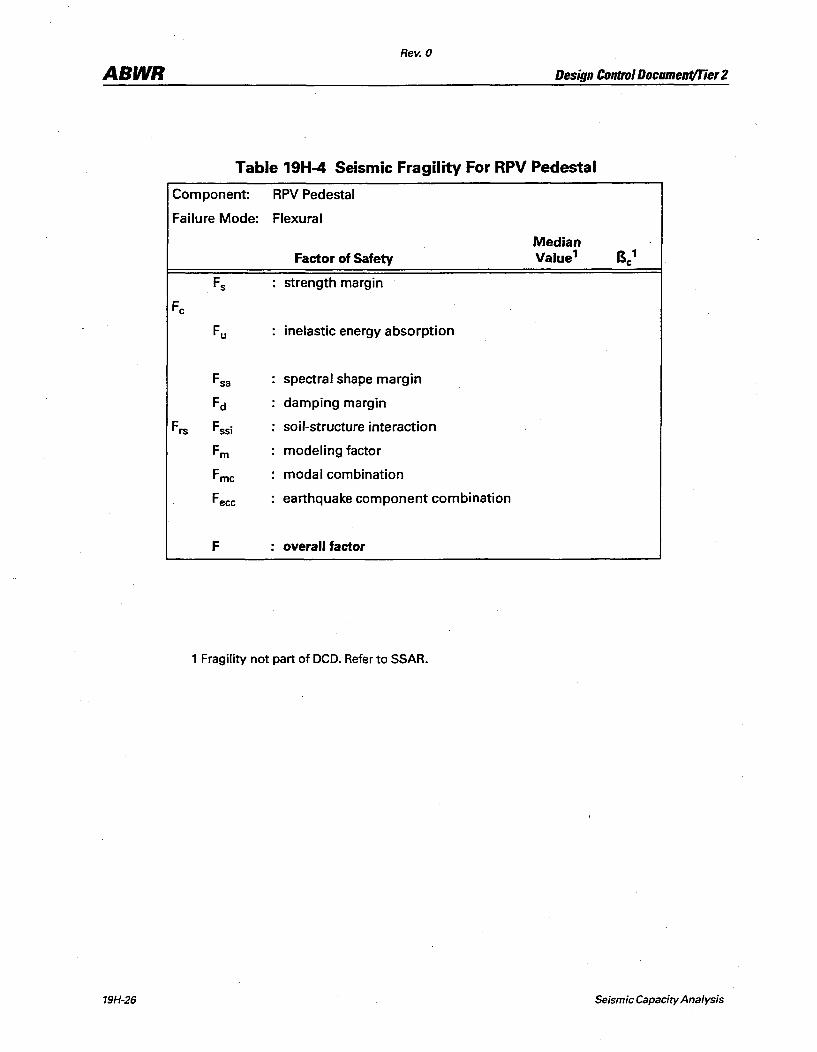
Rev. 0
ABWR Design Control DocumentlTier 2
Table 19H-4 Seismic Fragility For RPV Pedestal
Component: RPV Pedestal
Failure Mode: Flexural
Median Factor of Safety Value' 8' c
Fs strength margin
Fe
Fu inelastic energy absorption
Fsa spectral shape margin
Fd damping margin
Frs Fssi soil-structure interaction
Fm modeling factor
Fmc modal combination
Fecc earthquake component combination
F overall factor
1 Fragility not part of OeD. Refer to SSAR.
19H-26 Seismic Capacity Analysis
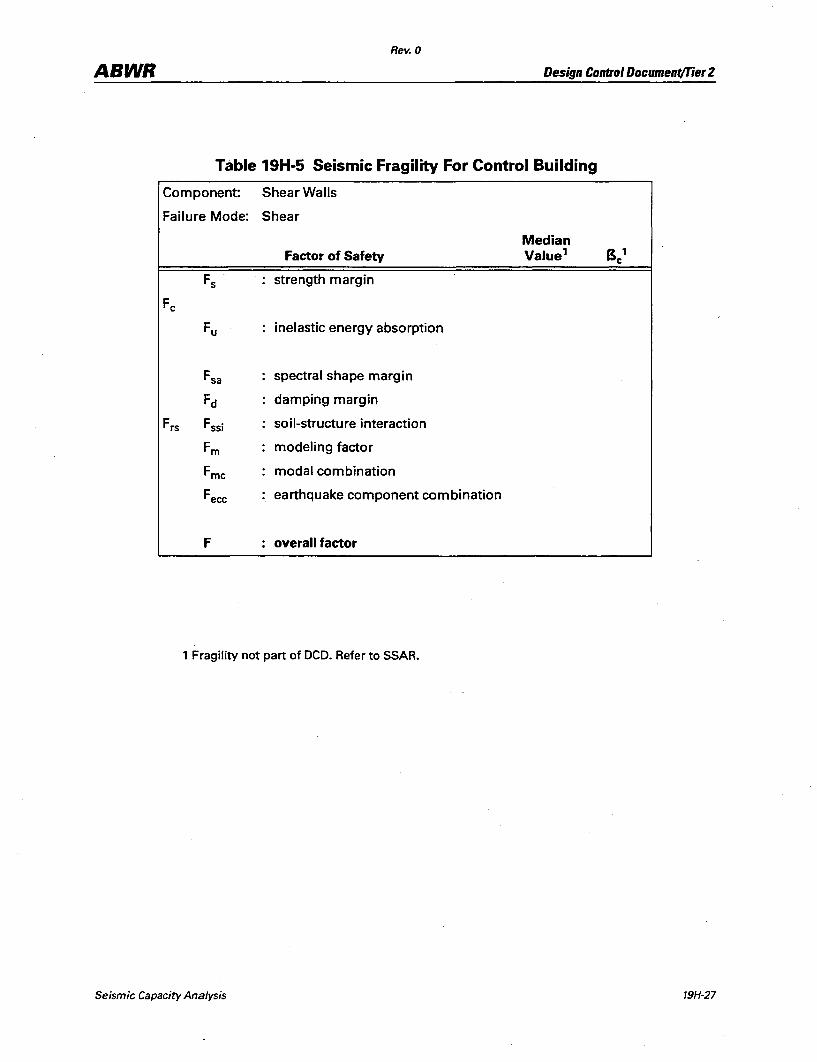
Rev. 0
ABWR Design Control Document/Tier 2
Table 19H-5 Seismic Fragility For Control Building
Component: Shear Walls
Failure Mode: Shear
Median Factor of Safety Value' (1' c
Fs . strength margin . Fe
Fu inelastic energy absorption
Fsa spectral shape margin
Fd damping margin
Frs Fssi soil-structure interaction
Fm modeling factor
Fmc modal combination
Fecc earthquake component combination
F overall factor
1 Fragility not part of OeD. Refer to SSAR.
Seismic Capacity Analysis 19H-27
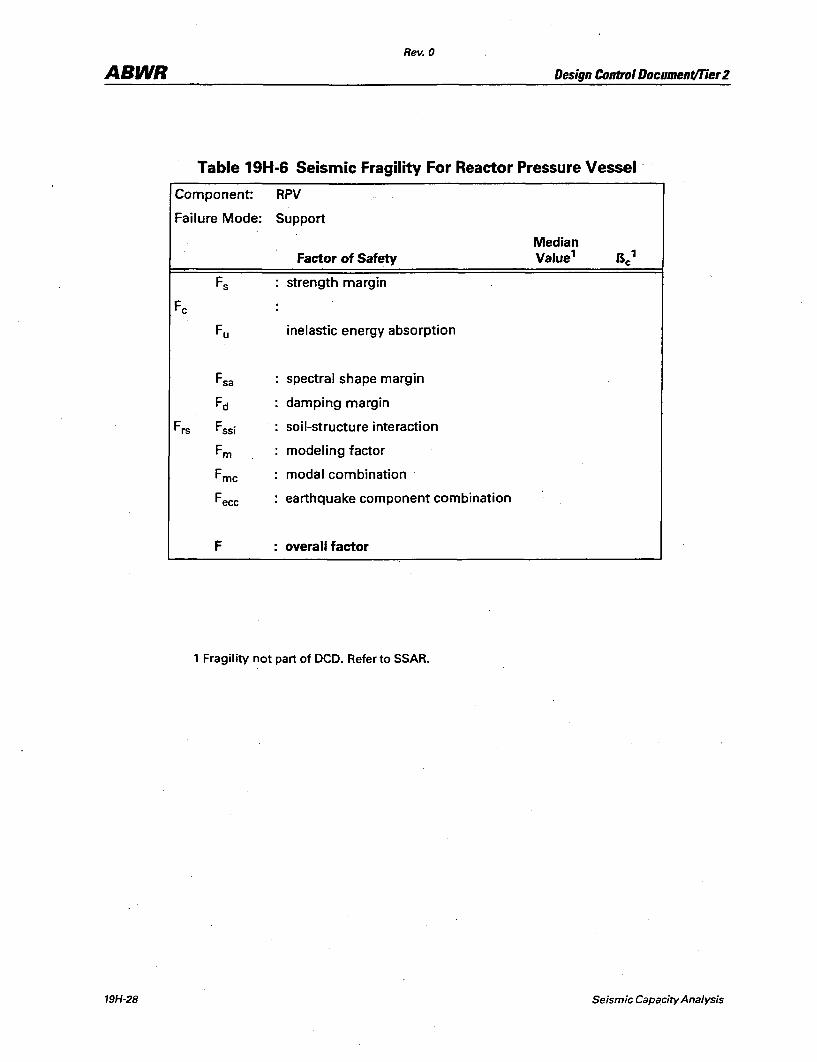
Rev. 0
ABWR Design Control DocumentlTier 2
Table 19H-6 Seismic Fragility For Reactor Pressure Vessel· .
Component: RPV
Failure Mode: Support
Median Factor of Safety Value' 6 1
c
Fs strength margin
Fe
Fu inelastic energy absorption
Fsa spectral shape margin
Fd damping margin
Frs Fssi soil-structure interaction
Fm modeling factor
Fmc modal combination
Fecc earthquake component combination
F overall factor
, Fragility not part of OeD. Refer to SSAR.
19H-28 Seismic Capacity Analysis
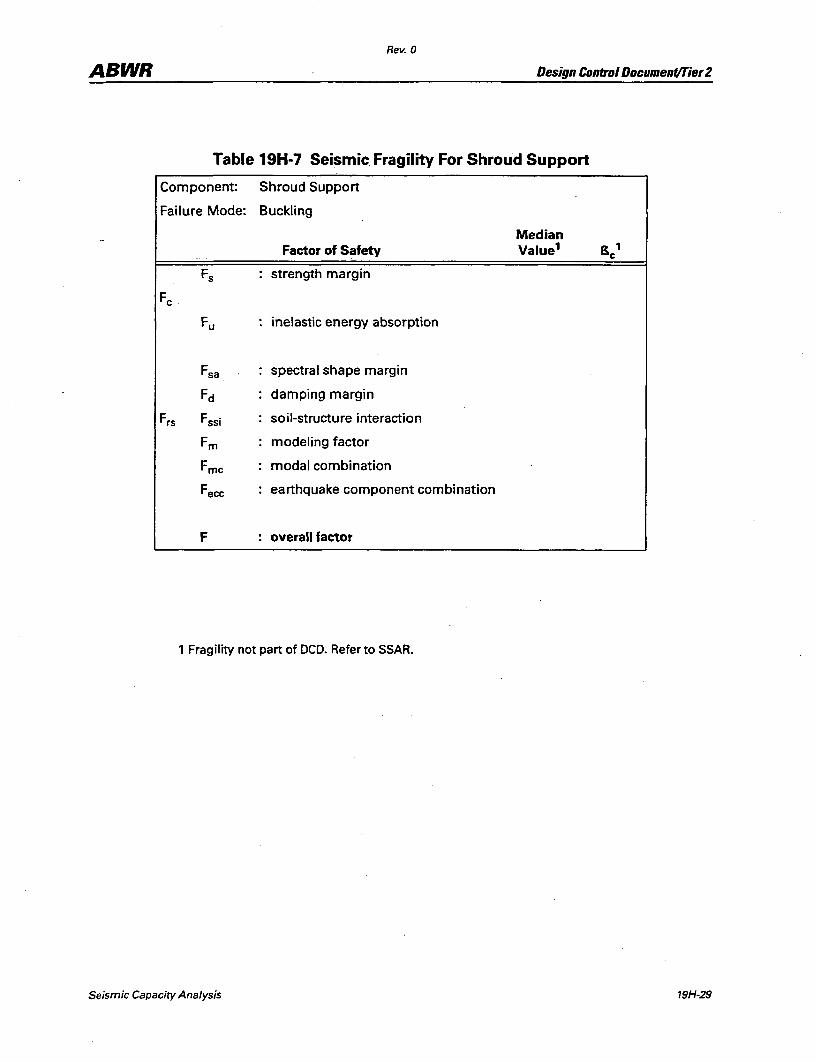
Rev. 0
ABWR Design Control Document/Tier 2
Table 19H·7 Seismic Fragility For Shroud Support
Component: Shroud Support
Failure Mode: Buckling
Median Factor of Safety Value' S ' c
Fs strength margin
Fe
Fu inelastic energy absorption
Fsa spectral shape margin
Fd damping margin
Frs Fssi soil-structure interaction
Fm modeling factor
Fmc modal combination
Feee earthquake component combination
F overall factor
, Fragility not part of OeD. Refer to SSAR.
Seismic Capacity Analysis 19H-29
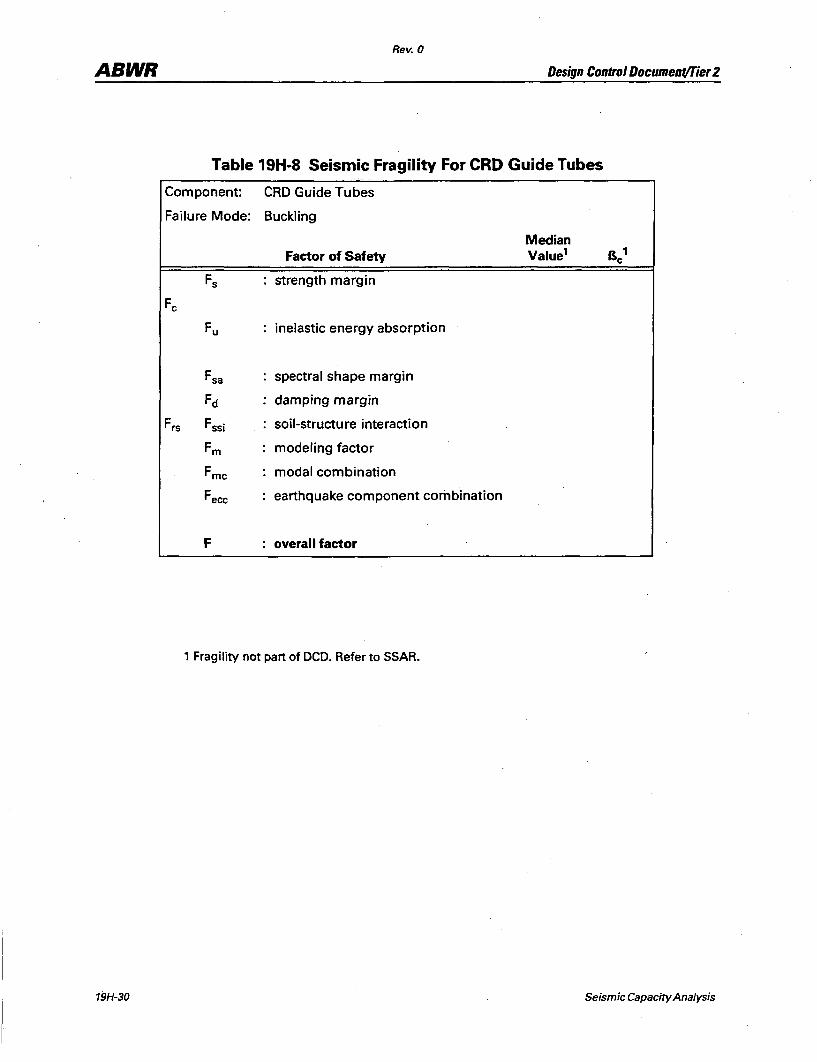
Rev. 0
ABWR Design Control Document/Tier 2
Table 19H-8 Seismic Fragility For CRD Guide Tubes
Component: CRD Guide Tubes
Failure Mode: Buckling
Median Factor of Safety Value' 6 1 c
Fs strength margin
Fe
Fu inelastic energy absorption
Fsa spectral shape margin
Fd damping margin
Frs Fssi soil-structure interaction
Fm modeling factor
Fmc modal combination
Fecc earthquake component combination
F overall factor
1 Fragility not part of OeD. Refer to SSAR.
19H-30 Seismic Capacity Analysis
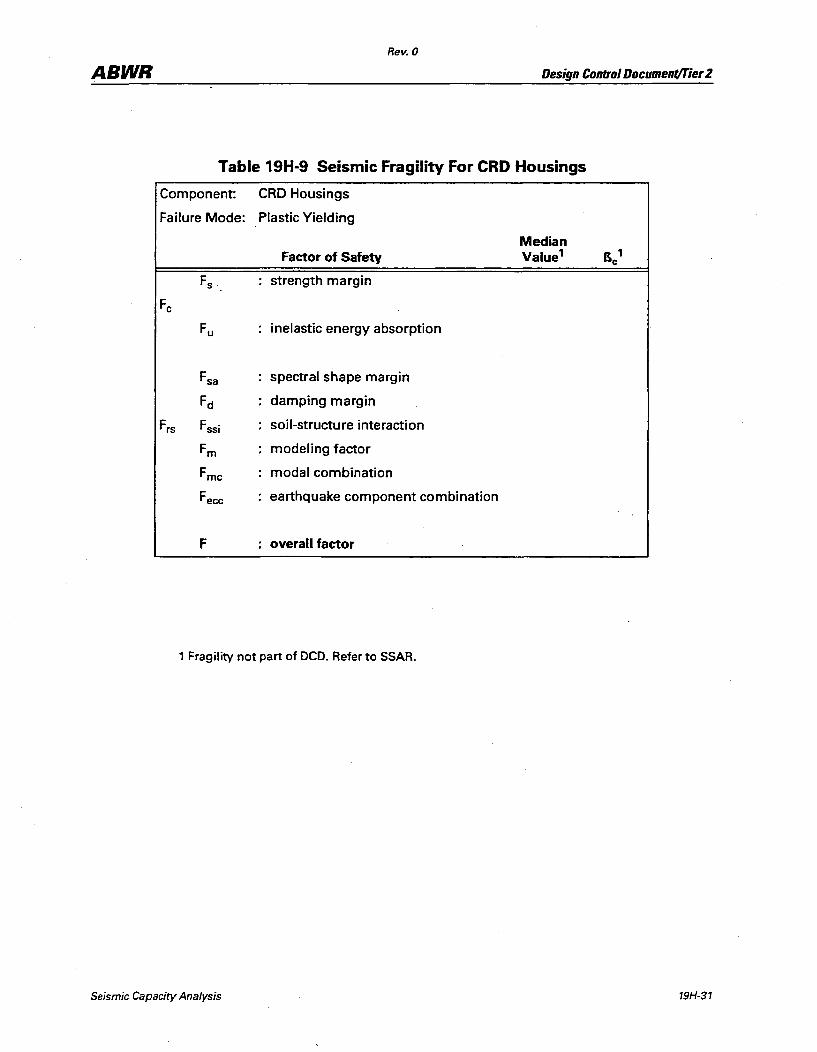
Rev. 0
ABWR Design Control DocumentlTier 2
Table 19H-9 Seismic Fragility For CRD Housings
Component: CRD Housings
Failure Mode: Plastic Yielding
Median Factor of Safety Value' B ' c
Fs strength margin
Fe
Fu inelastic energy absorption
Fsa spectral shape margin
Fd damping margin
Frs Fssi soil-structure interaction
Fm modeling factor
Fmc modal combination
Fecc earthquake component combination
F overall factor
, Fragility not part of OeD. Refer to SSAR.
Seismic Capacity Analysis 19H-31
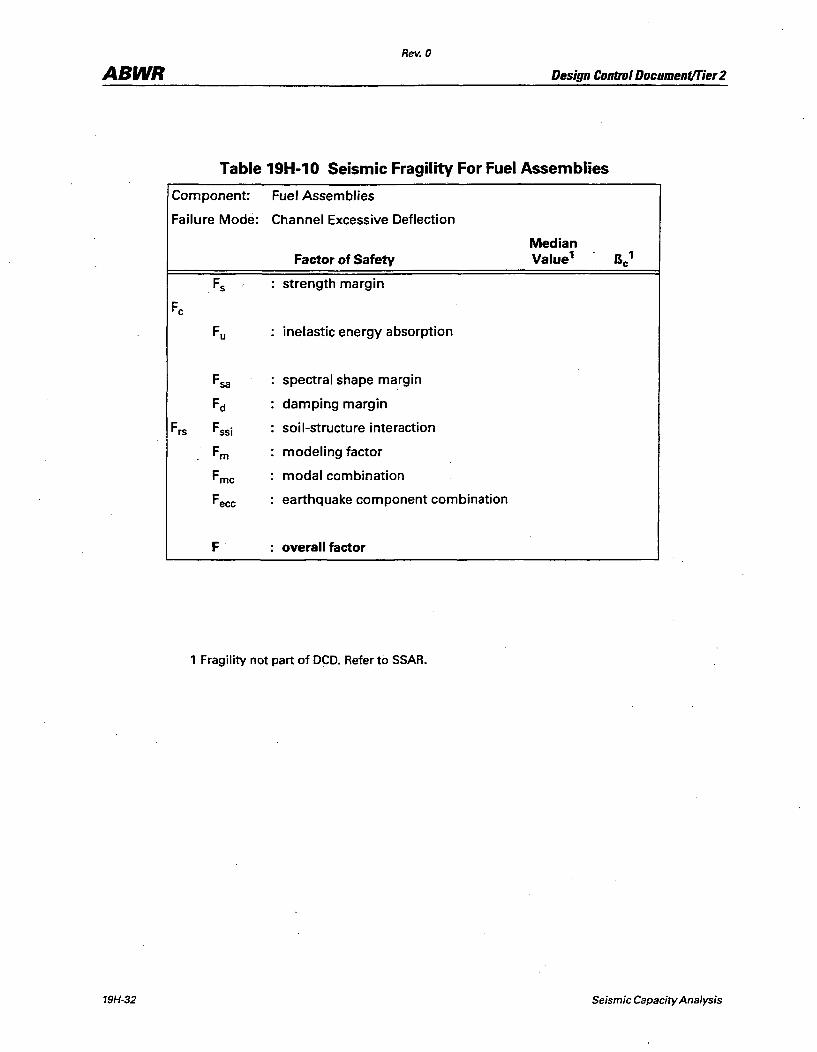
Rev. 0
ABWR Design Control Document!Tier2
Table 19H-10 Seismic Fragility For Fuel Assemblies
Component: Fuel Assemblies
Failure Mode: Channel Excessive Deflection
Median Factor of Safety Value' B 1 c
Fs strength margin
Fe
Fu inelastic energy absorption
Fsa spectral shape margin
Fd damping margin
Frs Fssi soil-structure interaction
Fm modeling factor
Fmc modal combination
Fecc earthquake component combination
F overall factor
1 Fragility not part of OeD_ Refer to SSAR_
19H-32 Seismic Capacity Analysis
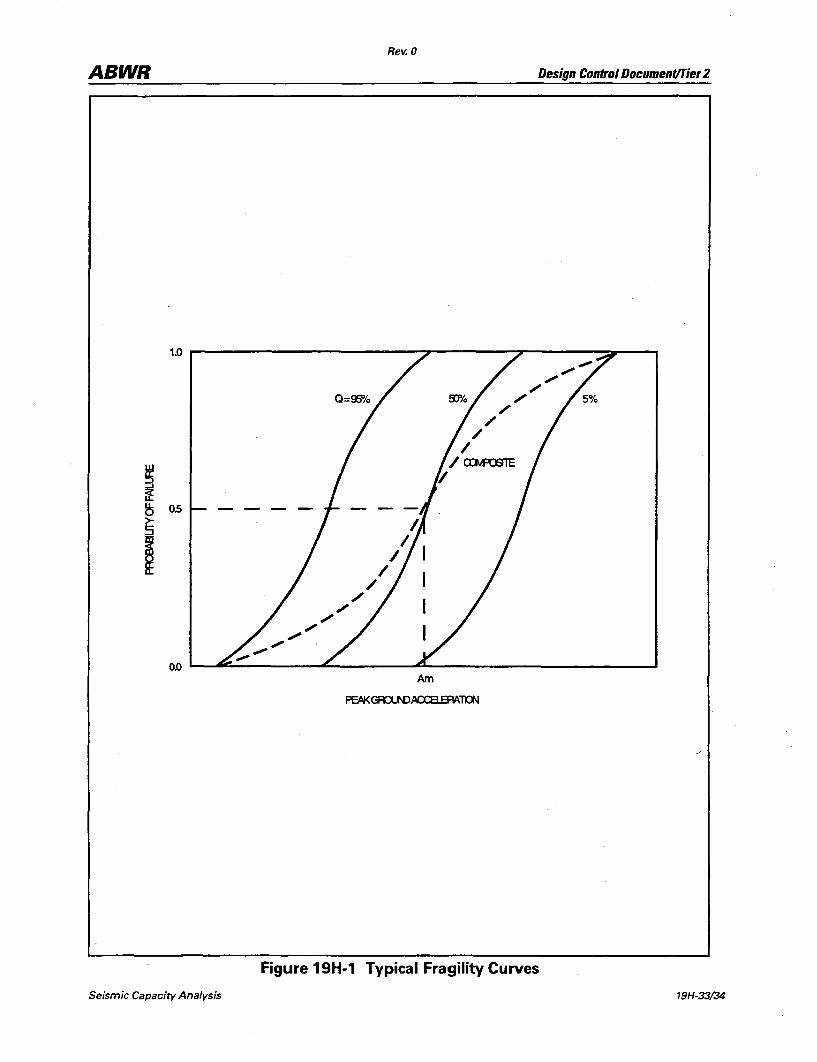
Rev. 0
ABWR Design Control Document/Tier 2
1.0 ~-------------,-----~----~----,
~ u.: ~ 0.5
i OD ~--~----~-----~~-----------~
Am
Figure 19H-1 Typical Fragility Curves
Seismic Capacity Analysis 19H-33/34
Rev. 0
ABWR Design Control Document/Tier 2
191 Seismic Margins Analysis
191.1 Introduction
A seismic margins analysis (SMA) has been conducted for the ABWR using a modification of the Fragility Analysis method of Reference 191-1 to calculate high confidence low probability of failure (HCLPF) accelerations for important accident sequences and accident classes. HCLPF values were calculated for components and structures using the relationship
where:
I3c
HCLPF = Am *exp (-2.326*l3c)
= the median peak ground acceleration corresponding to 50%
failure probability,
= the logarithmic standard deviation of the component or
structure fragility.
The resulting HCLPF acceleration corresponds essentially to the 95th percent confidence level that at that acceleration the failure probability of a particular structure or component is less than 0.05 (5%). HCLPFs for accident sequences were evaluated through use of event trees, and seismic system analysis was performed with fault trees to determine HCLPFs of systems.
The seismic margins analysis evaluates the capability of the plant and equipment to withstand a large earthquake of 2 times the safe shutdown earthquake (2*SSE). In this analysis, two alternative methods were used to evaluate the seismic accident sequences-a "convolution" method and a "min-max" method.
In the convolution method, accident sequences are evaluated by combining input fragility CUIVes according to the Boolean expression for each sequence. Seismic and random/human failure probabilities are calculated and combined (convolved) for discrete intervals of ground acceleration, and then integrated over the range of interest
In the min-max method, input fragilities are combined by using the lowest (minimum) HCLPF value of a group of inputs operating in an OR logic, and by using the highest (maximum) HCLPF value of a group of inputs operating in an AND logic. Random/human failure probabilities are reported in combination with HCLPFs for each accident sequence.
Analysis of the effects beyond core damage (Level 2 PRA analysis) was not a part of this seismic margins analysis. However, event trees were constructed to examine the
Seismic Margins Analysis 191-1
ABWR Rev. 0
Design Control Document/Tier 2
possibility of loss of containment isolation resulting in a large release given the earthquake and a resulting core damaging accidenL
Because of the inclusion of a rupture disk in the ABWR design as an ultimate means of containment heat removal, and because an earthquake would not prevent rupture of the disk, f.Ulure of containment heat removal is not modeled in the seismic margins analysis. (There are no Class II sequences in the analysis.) There are two valves in line with the rupture disk; however, these valves are left in an open position, and the earthquake would not cause these valves to close.
There are several operator actions included in the seismic margins analysis. These operator actions are discussed in Subsection 190.7.4.
191.2 Component and Structure Fragility - ~, Be
Component and structure fragility values have been established for selected structures and components that have been identified as potentially important to the seismic margins analysis. The fragility values used in the analysis are shown in Table 191-1, together with the calculated component/structure HCLPFs. For more information regarding the development of these fragilities and capacities, refer to Appendix 19H.
191.3 Event Tree Analysis
The event trees used in the ABWR Levell seismic margins analysis are shown on Figures 191-1 through 191-3. The individual paths through the event trees represent the accident sequences which are input to the HCLPF analysis. There is essentially only one seismic event tree, but it is presented on three figures representing transfers from Figure 191-1 to Figures 191-2 and 191-3.
The event trees show large random failure probabilities and min-max HCLPFs for each top evenL Human error probabilities are included in the random failure probabilities.
191.3.1 Support State Event Tree
191-2
The seismic event tree of Figure 191-1 starts with the spectrum of seismic events, considers whether or not there is a structural failure (node SI), whether or not offsite power is lost (node LOP) and continues from there. Because of the ground rules of the analysis and the relative values of seismic fragilities, loss of structural integrity results in core damage, and survival of off site power results in successful event termination. Thus, all remaining accident sequences on Figure 191-1 are for cases of no structural failure, but always with loss of ofIsite power.
The success or failure of emergency OC power (station batteries) (node OP), and the emergency AC power and/or service water (node APW) are taken into consideration in Figure 191-1 to account for support system dependencies. Failure of all DC power results
Seismic Margins Analysis
ABWR Rev. 3
Design Control DocumentlTier 2
in a high-pressure core melt since all control is lost, the high-pressure systems fail, and
the reactor cannot be depressurized. The condition of successful emergency DC and AC power and successful scram is indicated by the ET transfer and is described in detail in Figure 191-2. The condition of successful emergency DC and AC power, but with failure to scram is indicated by the ATWS transfer, and is described in Figure 191-3.
The condition of successful emergency DC and failure of emergency AC continues on
Figure 191-1. The next question is whether or not there is a failure to scram (node C). Failure to scram is considered as a Class IV core melL With successful scram, RCIC (node UR) and firewater (node FA) are the only available means of water injection into the RPV since all AC power is lost. Since station batteries will eventually discharge resulting in loss of RClC, or ifRCIC fails, the reactor must then be depressurized (node
X) to allow firewater injection. The loss of emergency DC power (station batteries) results in a high-pressure core melt as shown in Figure 191-1.
The firewater system has a diesel driven pump and all needed valves can be accessed and operated manually. No support systems are required for firewater operation. See
Subsection 19.9.21 for COL license information pertaining to housing of ACIWA
equipmenL The random failure probability of firewater is dominated by operator failure to initiate the system. For the upper branch, where RCIC is successful, the
operator has 8 hours before the station batteries expire and RCIC trips. The human error probability (HEP) for this case is very small. For the lower branch, where RCIC fails, the operator has only 30 minutes in which to depressurize the reactor and initiate firewater injection. For this case, the HEP is moderate. In the event that the firewater
diesel fails to start, the operator could make use of a fire truck, but this was not modeled.
If the RHR heat exchanger fails (node HX) due to the earthquake, it is presumed that
the failure could include a pipe break that could partially drain the suppression pool
into the RHR pump room. These core damage sequences are identified with a "P" (e.g., IB2-P). Fission product scrubbing would still be effective in preventing a large release.
The effects of possible flooding on equipmen t operation beyond the RHR room were considered and found to be relatively insignificant because of the relatively high HCLPF of the heat exchangers, the ability of the operator to isolate the break, and the presence of the independent ACrw A (firewater) system.
191.3.2 LOOP with Emergency Power and Scram Event Tree
In the event tree of Figure 191-2 (ET transfer), there are two similar divisions depending on whether or not there is a stuck-open relief valve (node PC). If there is a stuck-open
valve, the reactor will eventually depressurize causing loss of RCIC steam supply. The
probability of having a stuck-open valve is based on operating experience. If both highpressure injection systems fail, the reactor must be depressurized rapidly for lowpressure system use (LPFL -VI).
Seismic Margins Analysis 191·3
I
Rev. 3
ABWR Design Control DocumentlTier 2
191.3.3 AlWS Event Tree
Figure 191-3 (ATWS transfer) represents failure to scram, and requires standby liquid control (automatic) and operator action to control reactor water level with the injection system(s) that are available. The HEP for this action is small. In this AlWS analysis, if high-pressure systems fail, core damage results. No credit is given to low-pressure injection. For an AlWS, the probability of a stuck-open SRV was conservatively increased on the basis of increased SRV activity.
191.4 System Analysis
191-4
The fault trees used in the seismic system analysis are shown on Figures 191-4 through 191-15. The seismic system analysis calculates the probability of seismic failure and corresponding system HCLPFs of each of the important systems throughout the seismic ground acceleration spectrum. The system HCLPFs are then input to the event trees and combined with random system f<lilure probabilities and ~uman errors. The seismic fault trees contain only those components that might be subject to seismic failure. Random system failure probabilities are taken from the internal events analysis and include all other components. One of the important ground rules of the seismic margins analysis is that all like components in a system always fail together.
The reactor protection system, control rod drive system, and alternate rod insertion system were not modeled since the failure of control rods to insert is dominated by the relatively low seismic fragility of the fuel assemblies, control rod guide tubes, and housings. A seismic fault tree for reactivity control is shown on Figure 191-13. The fuel assemblies are the most fragile component.
A seismic fault tree for the standby liquid control system is shown on Figure 191-14. Failure of the standby liquid control system is dominated by failure of two components: the pump and boron supply tank.
Since the most fragile essential component in the plant is the ceramic insulator in the switchyard, the loss of offsite power dominates the analysis and the availability of emergency power becomes very important. The loss-of-power fault tree (Figure 191-10) is for emergency AC power. In the loss of emergency AC power fault tree, the more fragile components are the diesel generator, transformers, motor control centers, inverter and circuit breaker. The DC power fault tree (Figure 191-11) has two elements: batteries and cable tray.
Systems and equipment which require offsite power, such as the feedwater system and condensate injection system, are not modeled since offsite power is presumed to be not available for the core damage sequences.
Seismic Margins Analysis
ABWR Rev. 3
Design Control Document/Tier 2
Essential service water is as important as emergency power, and its loss would have much th~ same effect as the loss of emergency AC power. The loss-of-service-water fault tree is shown on Figure 191-12. The more fragile components in this system are the service water pump, heat exchanger, and room air conditioning unit. The service water pump house is also included in this fault tree.
Structure failures that could contribute to seismic core damage are shown on Figure 191-9. In this analysis, anyone or more of these structural failures are conservatively presumed to result in core damage. The structures having the lowest seismic capacity are the reactor building and control building.
The remainder of the fault trees are for core cooling (Figures 191-4 through 191-8). The more fragile components in these systems are the pumps, heat exchangers, and the firewater supply tank. The condensate storage tank (CST) is not modeled since the ECCS systems that take suction from the CST have automatic switchover to the suppression pool if CST level is low. Valves for the switchover are included in the fault trees.
The ACIW A (firewater) system (Figure 191-8) is designed to inject water into the reactor if the ECCS systems are not available. It is also the only means of water injection in case of a station blackout beyond 8 hours. Although firewater is not a Class IE safety system, because of the safety function described above, the firewater diesel-driven pump, the firewater tank, valves, and related piping will have seismic margin above the SSE.
Because of the importance of RCIC in station blackout sequences, differences between the seismic RCIC fault tree and the internal events fault tree are explained below:
(1) The internal events fault tree contains basic events that would not be affected by an earthquake, e.g., test and maintenance unavailability. These events contribute to the random failure probability during the seismic event and are included in the random failure part of the seismic analysis. They are deleted from the RCIC seismic fault tree.
(2) The internal events fault tree contains common-cause failure events. These are deleted from the RCIC seismic fault tree since a basic rule of the seismic analysis is that all like components within a system fail together.
(3) The internal events RCIC fault tree contains separate events for the turbine and for the pump. The seismic fault tree uses a combined event, "turbinedriven pump", since that is the assembly for which there is a seismic capacity.
Seismic Margins Analysis 191-5

Rev. 0
ABWR Design Control DocumentlTier 2
191.5 Accident Sequence HCLPF Analysis
Seismic fragility of a structure or component is defined as the conditional probability of its failure as a function of peak ground acceleration. The probability model adopted for each component fragility is the log-normal distribution. The density function for the component fragility, f(g) , can be written
[ [In(:-)] 2J f (g) = 1 exp -21
m . forg> 0 J2x*~c*g Pc
where:
median capacity of the component,
~c = logarithmic standard deviation of the fragility function,
g peak ground acceleration.
The cumulative distribution of the component fragility, F(g), will then be
{ [ ( gl J]2} g. In r
F (g) = f *1 * exp -~ 13 m dg l oJ2IT ~c gl C
191.5.1 Convolution Analysis
191·6
If a system, S, (o.r sequence) contains two components (A, B) operating in OR logic, the
failure of either component will fail the system (S =A + B), and the cumulative fragility distribution of the system is one minus the product of their complementary cumulative fragility distributions:
On the other hand, if two elements operate in AND logic, only the failure of both components will fail the system (S = A * B), and the cumulative fragility distribution of
the system is the product of their cumulative fragility distributions:
Seismic Margins Analysis
ABWR Rev. 0
Design Control Document!Tier 2
Using the two principles above, the distribution function of each system fragility is obtained by combining its comp0Q-ent fragility functions based on its Boolean expression derived from the system fault tree.
Then the OR logic methodology is used to convolve the seismic and random/human failure probability of the systems. The combined cumulative fragility distribution of a system, Fc(g), is the OR logic combination of the cumulative seismic fragility distribution, Fs (g), and the cumulative random/human failure distribution, F r' as follows:
Similai-Iy, the distribution for each accident sequence is derived from the combined system fragility functions by using the Boolean expression obtained from the seismic accident sequence event trees. The fifth and fiftieth percentiles of the combined cumulative distribution of each accident sequence are used to obtain the Am and ~c for the corresponding sequence. Then, the HCLPF of each accident sequence is obtained by using the formula presented in Subsection 191.1 as follows:
HCLPF = Am *exp (-2.326*~c)
where the parameters Am and ~c are the median capacity and logarithmic standard deviation of the lognormal distribution of the accident sequence.
191.5.2 Min-Max Analysis
If a system, S, (or sequence) contains two components (A,B) operating in OR logic, the failure of any component will fail the system (S = A + B), and the ctimulative fragility distribution of the system is governed by the fragility distribution of the weakest component. This principle is applied to the system fault trees, which generally are made up of OR gates.
If two elements operate in AND logic, only the failure of both components will fail the system (S = A * B), and the cumulative fragility distribution of the system is governed by the fragility distribution of the strongest component. This principle is applied to accident sequences, which are composed of ANDed elements.
Significant random/human failure probabilities are combined with HCLPFs for elements in an accident sequence as follows:
(HCLPFI + RHPl) * (HCLPF2 + RHP2) =
HCLPFI *HCLPF2,
-Seismic Margins Analysis 191-7
Rev. 3
ABWR DesignContro/ Document/Tier 2
H CLPF 1 *RHP2,
HCLPF2*RHPI,
RHPI*RHP2,
where:
HCLPFI the HCLPF of one event,
RHPI the random/human failure probability of that event,
HCLPF2 = the HCLPF of a second event, and
RHP2 = the random/human failure probability of the second event.
The resulting combinations are reduced according to min-max rules.
191.6 Results of the Analyses
The results of the convolution analysis are shown on the event trees and in Table 191-2 in terms of HCLPF values for the accident sequences, with and without the inclusion of random failures. The results of the convolution analysis in terms of accident classes are shown in Table 191-3. The combination of HCLPF and random failure probabilities of accident sequences are described in Table 191-4.
191.7 Containment Isolation and Bypass Analysis
In the seismic margins analysis there were no cutsets leading to core damage with low HCLPFvalues. A supplemental analysis was conducted to evaluate the HCLPF values for containment isolation for events that could cause containment bypass as a result of an earthquake, with potential for large releases to the environment.
Based on the results of the bypass analysis discussed in Subsection 19E.2.3.3 and shown on Figure 191-16 through 191-25, the events selected for evaluation in this analysis are:
(1) Main steam lines (Figure 19E.2-19a)
(2) Feedwater or SLC injection lines (Figure 19E.2-19b)
(3) Reactor instrument, CUW instrument, LDS instrument/sample or containment atmosphere monitoring lines (Figures 19E.2-19d, 19E.2-1ge, and 19E.2-19f, respectively)
(4) RCIC steam supply or CUW suction lines (Figure 19E.2-1ge)
(5) Post accident sampling lines (Figure 19E.2-19j)
19/-8 Seismic Margins Analysis
I
I
Rev. 3
ABWR Design Control DocumentlTier 2
(6) Drywell sump drain line (Figure 19E.2-19j)
(7) SRV discharge lines (Figure 19E.2-19k)
(8) ECCS lines (Figure 19E.2-19c)
(9) Drywell inerting/purge lines (Figure 19E.2-19i)
(l0) Wetwell/ drywell vacuum breaker lines (Figure 19E.2-19g)
The bypass paths for atmospheric control system crosstie lines (Figure 19E.2-19h) require inadvertent opening of two normally closed motor operated valves. Since the seismic analysis does not consider a fail-open mode for normally closed valves, these bypass paths are not included in the analysis.
In the bypass analysis of Subsection 19E.2.3.3, several potential bypass pathways were excluded from detailed analysis on the basis of various reasons. The reasons are discussed in Subsection 19E.2.3.3.2 and Table 19E.2-1. These reasons were reviewed to
. determine whether they remain valid in regard to seismic events. All but one of the
reasons are based on configuration details that would not be affected by an earthquake. RHR wetwell and drywell spray lines were excluded on the basis that the pipes are designed for higher internal pressures than will be seen in actual operation and would thus have a very low probability of breaking. In this case, the seismic event could increase the probability of a break in these lines. However, these pipes have very high seismic capacity with very low probability of breaking due to a seismic event.
An even t tree was constructed for each of the above even ts. These even t trees are shown on Figures 191-16 through 191-25. All event trees start with the earthquake as the initiating event followed by a core-damaging accident. If there is no core damage there is no large release. The HCLPF and random failure probability are shown for each branch point, and the sequence HCLPFs using convolution and min-max methods are also shown on the figures.
Figure 191-16 is for suppression pool bypass via main steam lines. Following the earthquake and acciden t, the question is asked whether or not there is a break in a main steam line outside containment. If there is a break, the question is asked whether or not at least one MSIV in each steam line closes to isolate the break. For the case where there is no break, there could still be a bypass release to the main condenser if a turbine bypass valve is open-unless the MSIVs are closed to isolate the break.
Figure 191-17 is an event tree for bypass via feedwater or standby liquid control lines. These lines inject into the RPV and are protected from reverse flow by redundant check valves. These check valves provide isolation of upstream breaks provided that one of the valves doses in the line with the break.
Seismic Margins Analysis 191-9
ABWR Rev. 3
Design Control DocumentlTier 2
Figure 191-18 is for bypass via reactor instrument, CUW instrument, LDS instrument, LDS sample or containment aunosphere monitoring lines. These lines are also protected by check valves, a single valve in each line.
Figure 191-19 is for bypass via either the RCIC steam supply line or the CUW suction line. Both of these lines are protected by motor operated isolation valves which require power. Since offsite power is lost due to the earthquake, emergency power is required.
Figure 191-20 is for bypass via the post accident sampling lines. These lines are also isolated by motor operated valves.
Figure 191-21 is for bypass via the drywell sump drain line. This line is protected by a motor operated isolation valve and a check valve.
Figure 191-22 is for bypass via the SRV discharge lines. If there is a break in an SRV discharge line during a core-damaging accident, and that SRV is open, a bypass pathway will exist. In this analysis, it is assumed that the SRV will be open during the accident.
Figure 191-23 is for bypass via any of the ECCS lines. The lines of concern are the HPCF and LPFL warm-up and discharge lines. These lines are protected by motor operated isolation valves and check valves.
Figure 191-24 is for bypass via drywell inerting/ purge lines. These lines are protected by air operated valves.
Figure 191-25 is for bypass via wetwell/ drywell vacuum breaker lines. It requires an inadvertent opening ofa vacuum breaker (check valve) to initiate a bypass during a severe accident.
191.8 References
191-1
191-10
R.P. Kennedy, et aI., "Assessment of Seismic Margin Calculation Methods", NUREG/CR-5270, Lawrence Livermore National Laboratory, March 1989.
Seismic Margins Analysis
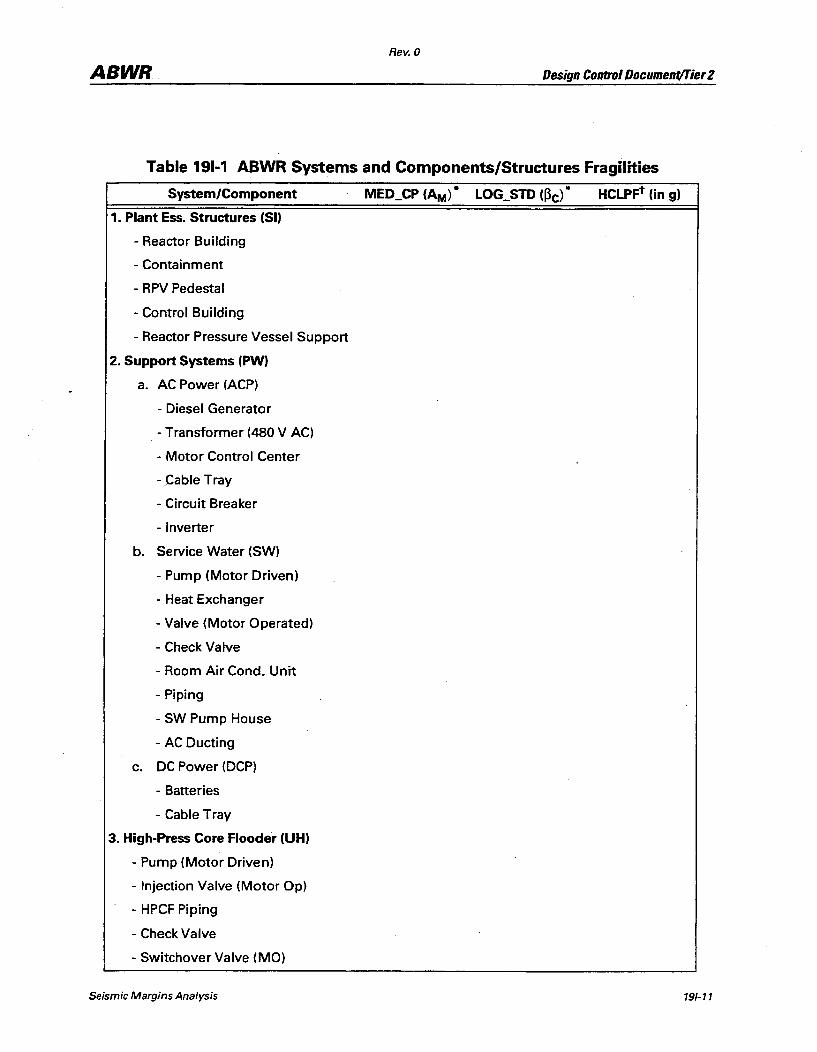
Rev. 0
ABWR Design Control Document/Tier 2
Table 191-1 ABWR Systems and Components/Structures Fragilities
1. Plant Ess. Structures (51)
- Reactor Building
- Containment
- RPV Pedestal
- Control Building
- Reactor Pressure Vessel Support
2. Support Systems (PW)
a. AC Power (ACP)
- Diesel Generator
- Transformer (480 V AC)
- Motor Control Center
- _Cable Tray
- Circuit Breaker
- Inverter
b. Service Water (SW)
- Pump (Motor Driven)
- Heat Exchanger
- Valve (Motor Operated)
- Check Valve
- Room Air Condo Unit
- Piping
- SW Pump House
- AC Dueting
c. DC Power (DCP)
- Batteries
- Cable Tray
3. High-Press Core Flooder (UH)
- Pump (Motor Driven)
- Injection Valve (Motor Op)
- HPCF Piping
- Cheek Valve
- Switchover Valve (MO)
Seismic Margins Analysis 191-11

Rev. 0
ABWR Design Control Documenf/Tier 2
Table 191-1 ABWR Systems and Components/Structures Fragilities (Continued)
SystemlComponent MED_CP (~).. LOG_STD (~c) * HCLPFt (in g)
4. Reactor Core Is. Cooling (UR)
- Pump (Turbine Driven)
- Steam Sup. Valve (MO)
- Discharge Valve (MO)
- Min Flow Valve (MO)
- Check Valve
- RCIC Piping
- Switchover Valve (MO)
5. Low-Press Core Flooder (V1)
- Pump (Motor Driven)
- Check Valve
- Injection Valve (MO)
- Discharge Valve (MO)
- LPCF Piping
6. RHR Heat Exchanger (HX)
-Heat Exchanger
7. Reactivity Control Sys. (C)
- Fuel Assemblies
- CRD Guide Tube
- CRD Housing
- Shroud Support
- Hydraulic Control Unit
8. SRVs Close (PC, PC1)
- Safety Relief Valve
9. Depressurization (X)
- Safety Relief Valve
10. Level & Press. Control (LPL)
- Safety Relief Valve
11. Inhibit ADS (PA)
- Safety Relief Valve
191-12 Seismic MarginsAnalysis
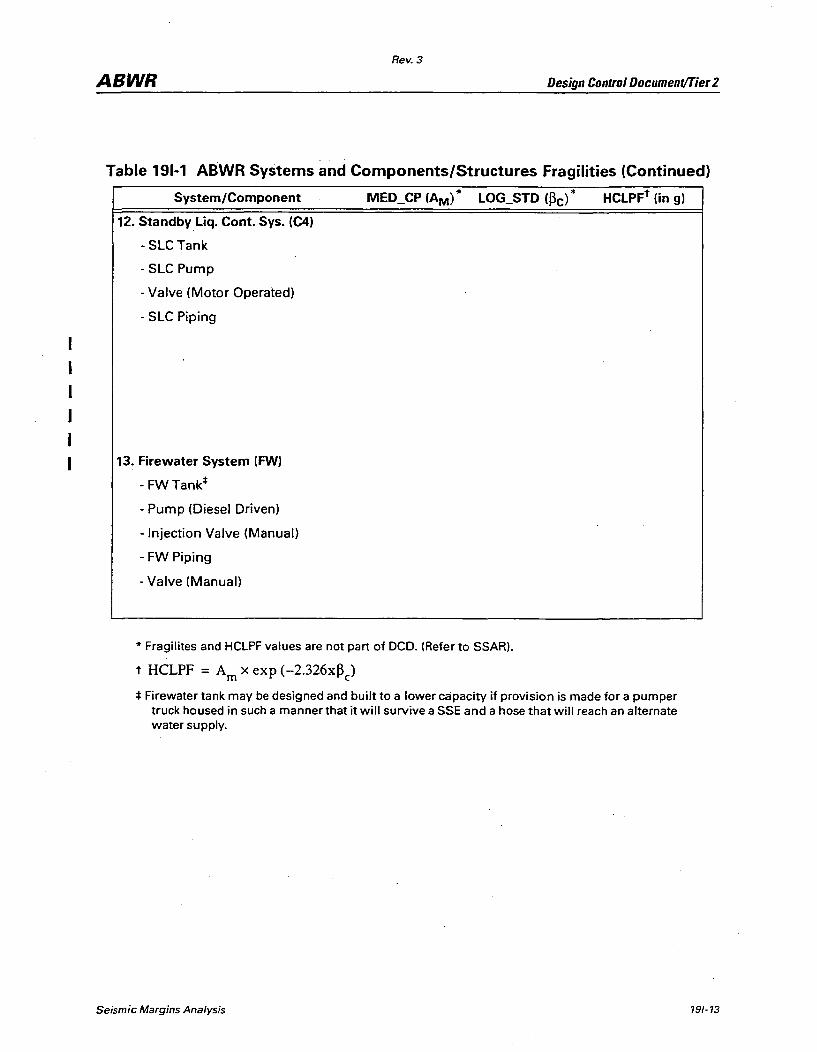
Rev. 3
ABWR Design Control DocumentlTier 2
Table 191-1 ABWR Systems and Components/Structures Fragilities (Continued)
System/Component MED_CP (AM)· LOG_STD (~c) * HCLPFt (in g)
12. Standby Liq. Cont. Sys. (C4)
- SLC Tank
- SLC Pump
- Valve (Motor Operated)
- SLC Piping
13. Firewater System (FW)
- FWTank*
- Pump (Diesel Driven)
- Injection Valve (Manual)
- FW Piping
- Valve (Manual)
* Fragilites and HCLPF values are not part of DCD. (Refer to SSAR).
t HCLPF = Am X exp (-2.326x~c)
* Firewater tank may be designed and built to a lower capacity if provision is made for a pumper truck housed in such a manner that it will survive a SSE and a hose that will reach an alternate water supply.
Seismic Margins Analysis 191-13
Rev. 0
ABWR Design Control Document/Tier 2
Table 191-2 Seismic Margins for ABWR Accident Sequences (Convolution Method) (Not part of DCD Refer to SSAR).
191-14 Seismic Margins Analysis
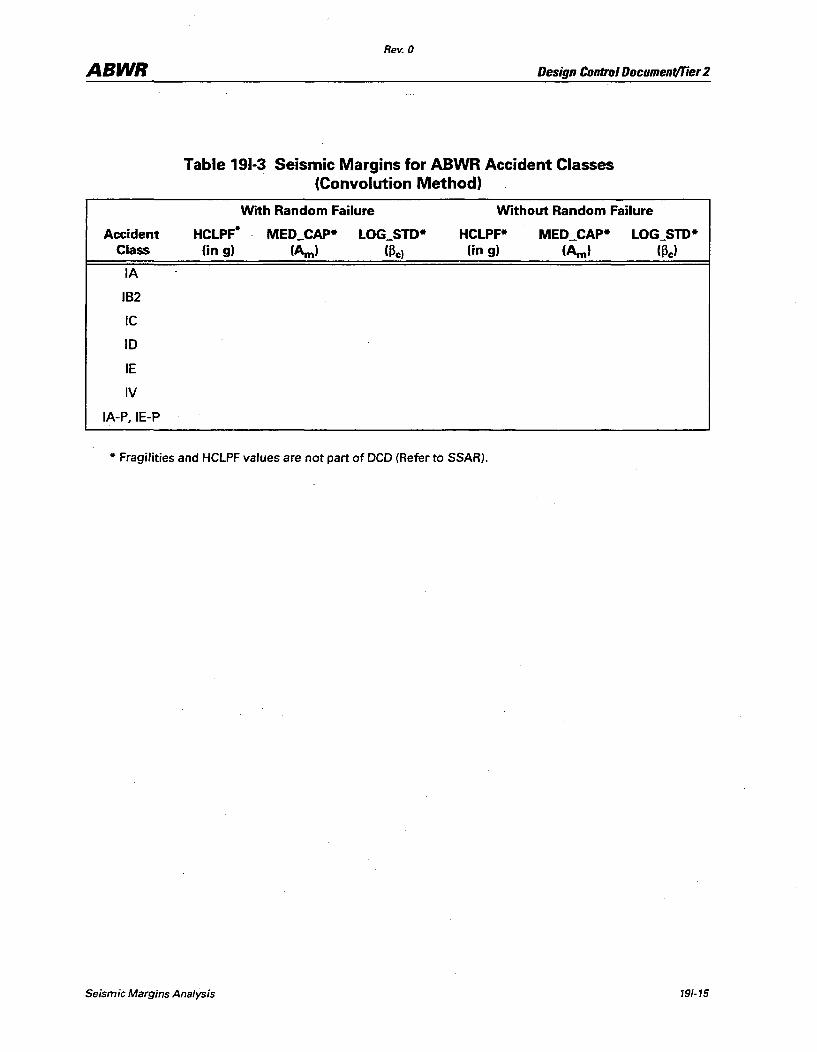
Rev. 0
ABWR Design Control Oocument/Tier 2
Accident Class
IA
IB2
Ie
10
IE
IV
IA-P,IE-P
Table 191·3 Seismic Margins for ABWR Accident Classes (Convolution Method)
_ HCLPF" (in g)
With Random Failure Without Random Failure
HCLPF* (in g)
" Fragilities and HCLPF values are not part of DCD (Refer to SSAR).
Seismic Margins Analysis 191-15
Rev. 0
ABWR Design Control Document/Tier 2
Table 191-4 HCLPF Derivation for the ABWR Accident Sequences (MIN-MAX Method) is not part of OCD (Refer to SSAR)
191-16 Seismic Margins Analysis

Rev. 0
ABWR Design Control Document/Tier 2
Figures 191-1 through 191-25 are not part of OeD (Refer to SSAR).
\
Seismic Margins Analysis 191-17/18

Rev. 0
ABWR Design Control Document/Tier 2
19J Not Used
Not Used 19J-1/2
Rev. 0
ABWR Design Coatro/ Document!1ier 2
19K PRA-Based Reliability and Maintenance
19K.1 Introduction
In this appendix, the results of the PRA are reviewed to determine the appropriate reliability and maintenance actions that should be considered throughout the life of an ABWR plant so that the PRA remains an adequate basis for quantifying plant safety. These actions comprise a part of the plant'S reliability assurance program (RAP).
Paragraph S.S, "Maintenance and Surveillance", of the ABWR Licensing Review Bases (Reference 19K-1), reads in part, "GE is to provide in the SSAR the reliability and maintenance criteria that a future applicant must satisfy to ensure that the safety of the as-built facility will continue to be accurately described by the certified design." This appendix provides the PRA based reliability and maintenance actions which should be considered for incorporation into the future applicant's (i.e., the applicant referencing the ABWR design) operating and maintenance procedures required by Standard Review Plan (SRP) Subsection 13.5.2. As indicated in Table 1.8-19, SRP 13.5.2 is an interface requirement to be provided by the utility applicant referencing the ABWR design.
19K.2 General Approach
To determine the appropriate reliability and maintenance-related activities that should be considered to assure that plant safety is maintained as operation proceeds, results of PRA and other analyses were reviewed. The objective of the review was to determine the relative importance of prevention and mitigation features of the ABWR in satisfying the key PRA goals related to core damage frequency (CDF) and frequency of offsite release. Also considered were the initiating events that had significant impact on CDF. From this review (Subsection 19K..3), the most important plant features were identified.
The PRA was further reviewed (Subsections 19K..4through 19K..I0) for other important features, the failure of which was not addressed directly in Subsection 19K..3, to supplement the above list. Finally (Subsection 19K.ll), the individual features iden tified in Subsections 19K..3 through -19K..1 0 were reviewed to determine appropriate maintenance and surveillance actions.
19K.3 Determination of Ulmportant Structures, Systems and ComponentsD for Level 1 Analysis
To determine which plant structures, systems and components (SSCs) are the most important with respect to CDF, the Levell analysis results were analyzed. The SSCs were listed in order of Fussell-Vesely (FV) importance, or the percent of cutsets that contribute to the CDF, as calculated by the CAFTA code. A second criterion for selecting SSCs was to consider those SSCs with high "risk achievement worth", or the increase in CDF if that SSC always fails. The 21 SSCS of greatest importance, in that they
PRA·Based Reliability and Maintenance 19K-1
ABWR
19K-2
Rev. 0
Design Control Document!Tier 2
had modest FV importance are shown in Table 19K-I. Five additional SSCS with modest values of risk achievement worth were considered. Not shown in Table 19K-l are several human error contributions. Significant human errors are addressed in Subsection 19D.7.
The 26 SSCS in Table 19K-l were further evaluated to eliminate those with a combination oflowvalues for both FV importance and risk achievement worth. The five SSCs meeting this criterion are so indicated. However, one of those five is retained because of its designation as a "critical task" in the human factors evaluation of Subsection 18E.2. The other four are not considered further in this subsection.
The remaining 22 designated SSCs of Table 19K-l should be included with important SSCs being considered for periodic testing and/or preventive maintenance (PM) as part of the Reliability Assurance Program (RAP) of the plant owner/operator. The reliability and maintenance actions suggested for the listed SSCs are identified in Subsection 19K.ll.
A second table, Table 19K-2, was prepared to show those SSCs with small to moderate values of risk achievement worth. These SSCs all have very low Fussell-Vesely importance, indicating a low probability of failure. However, if they fail, the impact on CDF is not negligible. Most of these SSCS have the same risk achievement worth because their failure would result in failure of the RCIC system to perform its function.
Initiating events that are significant contributors to CDF in the Levell analysis are listed in Table 19K-3. There are five such events which are shown. The three most significant events, accounting for more than one-half of the CDF, are all station blackout events. The next two events, contributing small fractions of CDF are isolation/loss of feedwater and manual reactor shutdown. All other initiating events contribute small amounts to
CDF ..
The components within the control of the COL applicant that are of most significance to limiting· the frequency of station blackout are the diesel generators and the combustion turbine. The COL applicant should assure that maintenance and test activities for these components are appropriate to assure high reliability.
Systems that are most important to limiting the frequency of isolation/loss of feedwater are the Feedwater and Feedwater Control (FWC) Systems. The FWC System is triply redundant, having digital logic with self-checking. The automatic checking of the FWC
System assures that its reliability remains high throughout operation. The COL applicant should assure that maintenance and test activities for risk-significant components in the FW System, the FW pumps and motors, are appropriate to assure high reliability.
PRA-Based Reliability and Maintenance
ABWR Rev. 0
Design Control Document/Tier 2
Unplanned manual reactor shutdowns occur with a relatively short time for preparation, in contrast with a planned shutdown. To assure that the unplanned shutdowns will not cause undue risk to the plant, the training procedures should include adequate training, including simulator exercises, for such events so the operating crews can respond to plant conditions during such shutdowns on short notice.
The RAP activities for important SSCS identified by consideration of initiating events are included in Table I9K-4.
The relative importance of some ABWR features is not established by the Level 1 analysis described above because some important SSCS are not treated in the Level 1 calculation. To identify other important SSCs, the Level 2, seismic, fire, flood and shutdown analyses results were carefully reviewed by knowledgeable engineers who identified additional SSCs for the RAP. The important SSCs identified in these other studies are given in Subsections I9K.4 through I9K.IO, and RAP activities are in Subsection I9KII.
19K.4 Determination of Ulmportant Structures, Systems and ComponentsR for Level 2 Analysis
The Level 2 analysis evaluates the offsite release of fission products following core damage. Those analyses related to the consequences of core damage were reviewed, including source term sensitivity studies, ~eterministic analysis of plant performance, and containment event trees. Those systems which would be important with regard to mitigating a core damage event were considered as potential risk-significant SSCs. The following features were identified:
(1) The Automatic Depressurization System (ADS)
The ADS depressurizes the RPV so that the low pressure systems can inject water. Even if no water injection is available, the depressurization via one safety/relief valve (SRV) eliminates the potential for direct containment heating in event ofRPV failure. The SRVs are important SSCS for the ADS since they are the components that function to release steam to reduce RPV pressure.
(2) The AC-independent Water Addition (ACIWA) System
The ACIWA System has two major benefits. First, it can inject water into the RPV to prevent core damage or facilitate in-v~ssel recovery. Second, it helps protect the containment by flooding the lower drywell (diverse from LDF) to cool corium in event of core melt and vessel failure. The ACIWA System can also be used to reduce high drywell temperature when operated in the drywell spray mode.
PRA-Based Reliability and Maintenance 19K-3
ABWR
19K-4
Rev. 0
Design Control Document/Tier 2
Also, for sequences with loss of containment heat removal, the ACIWA System adds thermal mass to the containment, significantly delaying the time of rupture disk opening. The important SSCS for the ACIWA System are the valves, the diesel-driven pump, and the onsite fire truck as they provide for the addition of water to the core and/or drywell.
(3) The Lower Dlywell Flooder (LDF)
The LDF System was selected because it is important in providing cooling for corium released from the reactor vessel and in scrubbing fission products released from the corium in the event all the automatic and manual systems fail to inject water. The LDF fusible plug valves are important SSCs for the LDF System since they provide for flooding of the lower drywell.
(4) The Containment Overpressure Protection System (COPS)
The COPS is important since it prevents containment failure and assures a fission product release path through the suppression pool. This serves to limit the potential offsite dose after a core damage event. Sequences which result in slow pressurization will lead to a COPS operation, as opposed to the drywell failure. Since the suppression pool scrubs fission products before they enter the wetwell air space, this results in a much lower source term than does the case of a drywell head failure.
The COPS will also reduce the potential for a Class II sequence to lead to core damage. The predominant mechanism for core damage in Class II sequences is failure of containment or reactor building structures causing damage to long term heat removal equipment. Operation of the COPS directs the gas flow to the stack, preventing damage to the equipment. The COPS SSCS identified by the analysis are the rupture disks, which prevent containment failure and limit offsite doses after core damage, the isolation valves, and the flow lines.
(5) . TheRHRSystem
The RHR System is a primary source of decay heat removal. Decay heat removal is necessary to prevent fission product release from the containment in the unlikely event of a severe accident. Also, the drywell spray function of the RHR is an important feature in limiting the consequences of the Level 2 analysis. The technical specifications and valve and pump inservice testing (Table 3.9.:.8) requirements for the RHR System were reviewed and it was
concluded that except for a maintenance requirement on the RHR Non-safety Related Valve, no additional reliability and maintenance actions are needed in the RAP for the RHR System.
PRA-Based Reliability and Maintenance
ABWR Rev. 0
Design Control Document/Tier 2
The RAP activities for important SSCs identified by this Level 2 analysis are given in Table 19K-4.
19K.5 Determination of Ulmportant Structures, Systems and Components" for Seismic Analysis
The seismic analysis considers the potential for core damage from plant damage resulting from a seismic event. The results of the seismic analysis identified key features by consideration of those SSCs important to reactor shutdown or to decay heat removal which could potentially be damaged by seismic action.
The seismic margins analysis calculated high confidence, low probability of failure (HCLPF) accelerations for important accident sequences and classes of accidents. The analysis showed that all SSCS in the analysis have HCLPF significantly greater than that of the safe shutdown earthquake (SSE). Because an important failure mode for beyond design bases earthquakes is the failure of the RHR heat exchanger in such a manner as to drain the suppression pool, the RHR heat exchanger was assigned a reasonably high HCLPF in the ABWR PRA-based seismic margins analysis.
The two methods that were used to identify important SSCs from the standpoint of seismic analysis are the following:
(1) Identification of the SSCS whose failure would provide the shortest path to core melt in terms of the number offailures required, and comparison of the seismic capacities of those SSCS.
(2) Identification of the most sensitive SSCS in terms of their effect on accident sequence and accident class HCLPFs resulting from variation of component seismic capacities.
The primary containment and the Reactor Building are the Category I structures in the design certification scope with the lowest values ofHCLPF, but since both have high values of HCLPF no special RAP activities are deemed necessary for these structures. Other SSCS identified by the seismic analysis as being important are as follows:
• The diesel generators, 480 VAC transformers, motor control centers and circuit breakers of the emergency AC Power System
• The batteries and cable trays of the DC Power System
• The heat exchangers of the Residual Heat Removal System
• The pumps, pump house and air conditioners of the Service Water System
• The SLC tank, valves, and piping and the motor driven pumps of the Standby Liquid Control System
PRA-Based Reliability and Maintenance 19K-5
ABWR Rev. 0
Design Control Document/Tier 2
.' The valves, piping, and diesel-driven pump of the Fire Water System
• The discharge lines of the SRVs of the Nuclear Boiler System
The RAP activities for important SSCS identified by this seismic analysis are given in Table 19K-4.
19K.6 Determination of Ulmportant Structures, Systems and ComponentsR for Fire Analysis
The fire analysis considers the potential for core damage from plant damage resulting from a fire. The important SSCS identified by this analysis are the room fire barriers, which prevent the fire from spreading to other rooms, the Smoke Removal System, which maintains pressure differentials to exhaust smoke rather than allow it to reach other areas, and the remote shutdown panel and control which are needed following a fire in the control room or HVAC failure in the control room.
The RAP activities for important SSCs identified by this fire analysis are given in Table 19K-4.
19K.7 Determination of Ulmportant Structures, Systems and ComponentsR for Flood Analysis
The flood analysis considers the potential for core damage from plant damage resulting from a flood. The important SSCS identified by this analysis are the ECCS room, RCW rooms and control and reactor building external water tight doors, which prevent water from flowing into rooms other than the one with the leak; isolation valves on the Reactor Service Water System and anti-siphon capability, which limit the amount of water spilled into the control building; circuit breakers that will trip RSW pumps, which also limits the amount of water spilled into the control building; isolation valves in the
. Circulating Water System (CWS); circuit breakers that will trip CWS pumps; level switches in the turbine building condenser pit and control building RCW rooms; sump pump operation; overfill lines in reactor building sumps on floor BIF; and room drain lines.
The RAP activities for important SSCS identified by this flood analysis are given in Table 19K-4.
19K.8 Determination of Ulmportant Structures, Systems and ComponentsR for Shutdown Analysis
19K-6
The shutdown analysis considers the potential for core damage during shutdown. Potential core damage during shutdown arises when the RHR System is lost. The important SSCs identified by this analysis are the ADS System, the RHR System for shutdown cooling and in the low pressure flooder (LPFL) mode, the High Pressure Core Flooder (HPCF) System, the AC-independent Water Addition (ACIWA) System,
PRA-Based Reliability and Maintenance
ABWR Rev. 0
Design Control Document/Tier 2
and the Control Rod Drive (CRD) System. Also impprtant are the support systems, AC power an<i DC power. The important components are SRVs of the ADS System, valves and pumps of the RHR System and of ' the HPCF, ACIWA and CRD Systems.
The RAP activities for important SSCs identified by this shutdown analysis are given in Table 19K-4.
19K.9 Identification of Important Systems. with Redundant Trains
Several plant systems have multiple trains of which only one is required to operate to perlormthe system safety function, the other trains providing redundancy. Because of this redundancy, components of the systems may not show up in a listing of high importance components. However, it is possible that operation or maintenance activities related to these systems could introduce some common cause failures which could affect all similar trains of a given system and, thereby, render all trains of such systems incapable of perlorming their safety functions. Engineeringjudgment was used to identify the multiple train systems having important safety functions that should be checked in addition to any identified component tests or maintenance. The systems selected are the RHR System in the shutdown cooling and the low pressure flooder (LPFL) mode, the High Pressure Core Flooder (HPCF) System, the Reactor Water Cleanup (CUW) System, the Reactor Service Water (RSW) System, and the AC Electrical System.
A single train of each of these systems should be designated for RAP by the COL applicant and the train should be given a walkdown inspection every refueling outage. The inspection should verify that system equipment is being operated and maintained properly so that there is no reason to suspect that other trains of the same system have problems that would preclude the system from perlorming its safety functions. The RAP activities for trains of systems identified by this analysis are given in Table 19K-4.
19K.10 Identification of Important Capabilities Outside the Control Room
Most safety-related actions by plant operators are conducted from inside the control room. However, in some sequences it is necessary for the operators to take appropriate action from stations outside the control room. Engineeringjudgment was used to identify activities that the operators should be capable of perlorming outside the control room, during internal flood, during reactor shutdown, or when the control room is inaccessible, such as in event of a fire.
The identified activities outside the control room are:
(1) Execution of the emergency operation procedures for operating the remote shutdown panels
(2) Manual operation of the RCIC System from outside the control room
PRA-Based Reliability and Maintenance 79K-7
ABWR Rev. 0
Design Control Document/Tier 2
(3) . Qosing water tight doors that are open (if there is flooding in the intact ECCS division) before opening doors to attempt corrective action
(4) Manual lineup of the combustion turbine generator and emergency diesel generators to non-safety-related buses
(5) Manual alignment of the ACindependent Water Addition System
(6) Manual bypass of the regenerative heat exchanger in the Reactor Water Cleanup System
(7) Connection of the diesel fire truck to the ACindependent Water Addition System after a seismic event
The RAP activities identified by these considerations are given in Table 19K-4.
19K.11 Reliability and Maintenance Actions
The individual SSCS identified as being "important" in Subsections 19K.3 through 19K.10 were reviewed to determine the appropriate reliability and maintenance actions. These actions are defined in this subsection.
The important SSCs are tabulated in Table 19K-4, showing the failure mode or cause, the recommended maintenance, the test or maintenance intervals and the basis for intervals, and the unavailabilityorfailurerate. Where several components in one system are identified, such as for the RCIC, the ACIWA, and COPS, only the system unavailability is given. If the owner/operator cannot demonstrate each component meeting its unavailability assumption, the PRA assumptions will still be valid if the system unavailability assumption is met.
19K.11.1 Component Inspections and Maintenance
19K-8
The two component types with the highest FV importances in the Levell analysis are the combustion turbine generator and the emergency diesel generators. Maintenance activities to assure high reliability of these components are discussed in 19K.1!.10 and 19K.l!.l!.
The system of greatest FV importance is the RCIC System, which has been assigned a small value of unavailability for test and maintenance. The amount of time the RCIC System is unavailable because of test and maintenance should be monitored to assure that it remains within the specified assumption annually. Sensitivity studies of increased SSC unavailabiIities showed that an increase in RCIC unavailability would cause the greatest increase in estimated core damage frequency of any SSe. The RCIC System was
also found to be the most sensitive system to increased outage time assumptions. The
PRA-Based Reliability and Maintenance

ABWR Rev. 0
Design Control Documentffier 2
highest contributor to uncertainties in the CDF as well as the CDF estimate was RCIC test and maintenance.
Multiplexers which provide multiple signals to several systems are identified by the Levell analysis as high importance components. Safety system multiplexers have a builtin self test that checks circuits frequently. In addition, one of four multiplexers can be bypassed and tested during plant operation without loss of system function. Such tests provide a complete simulation of the multiplexer signals, more than included in the self-test. During plant outages more detailed multiplexer tests are possible, including a complete system test and identification of signal errors. These tests will include verification that the remote multiplexing units function properly. Multiplexer tests that are suggested as part of the RAP are given in Table 19K-4.
The turbine of the RCIC System is an important component, as identified in Table 19K-I. Periodic startup and operation of the RCIC turbine is one way to monitor this turbine, and less frequent turbine inspection and refurbishment are also recommended. The RCIC pump is tested at the same time by measurement of speed, flow rate, differential pressure, and vibration. The turbine lube oil pump operation and many of the RCIC valves are also tested when the turbine testing is done. These RAP activities are included in Table 19K-4.
Trip logic units (TLUs) for the Reactor Protection System (RPS) represent another high importance component. Functional tests of these TLUs are perfonned at frequent intervals by the online, self-test feature of ABWR solid-state logic. Additional omine, semi-automatic, end-to-end (sensor input to trip actuator) testing ofTLUs, which exercises the safety system logic and control logic processes, is important because it allows the detection of failures not sensed by the online system. The TLU tests that are suggested as part of the RAP are given in Table 19K-4.
Station batteries receive periodic checks in accordance with plant technical specifications. These checks will be adequate to assure that the batteries will have the reliability assumed in safety analyses.
For the nonnally closed, fail closed (NCFC) injection valves, the steam supply valves and
the bypass valves of the RCIC System, which nonnally are not required to operate during plant operation, a quarterly full stroke test is judged to be appropriate for the RAP. Such tests are in compliance with ASME Code requirements for valves in nuclear plants. Detailed disassembly, inspection and refurbishment of valves would be done less frequently. The normally open, fail open (NOFO) bypass valves should be considered for similar tests. Suggested RAP activities and frequencies, and the basis for each suggested activity, are shown in Table 19K-4 for identified failure modes.
The HPCF maintenance valve is normally locked open, and its failure mode is being left closed following maintenance. To prevent this human error from occurring,
PRA-Based Reliability and Maintenance 19K-9
ABWR
19K-10
Rev. 0
Design Control DocumentlTier 2
administrative controls should require independent verification of the valve position following maintenance, positive control of the key to the valve lock, and control room verification of the valve position prior to startup. The RAP activities are in Table 19K-4.
The RCIC isolation signal logic should have a logic functional test every three months to assure it is functioning properly as shown in Table 19K-4.
Reliability of offsite power sources cannot be completely controlled by the plant. However, to assure that plant equipment does not contribute to pow~r losses, inspection of switchyard equipment should be performed with a frequency of at least once every six months in accordance with site administrative procedures. Such inspections should include confirmation of secure structural mounting of equipment, physical condition of insulators and other supporting apparatus, and visual inspection of transformers and other oil filled equipment for oil leaks. Infrared thermography should be used to detect hot spots on electrical equipment and connections. All supports and supporting structures should be examined for structural integrity. In addition, suggested RAP activities given in Table 19K-4 for protective relay testing and for control power source components are recommended.
Common-cause miscalibration of RHR flow meters, and of Level 8 sensors, and common-cause failure (CCF) of digital trip modules (DTMs) , and of Level 2 sensors, will have acceptable probabilities if adequate administrative controls are exercised. Calibration procedures for RHR flow meters and for Level 8 sensors should include notes about the safety importance of these instruments. Historical trend analysis should be performed for Level 2 sensors at each calibration. The procedure for testing DTMs should include a warning about their importance to safety. Suggested RAP activities are given in Table 19K-4.
The CCF of safety relief valves (SRVs) can be kept to an acceptably low probability if the SRVs receive the appropriate inservice inspection, if identified problems receive root cause analysis and correction, and if the configuration and qualified life of the valves at the site (or elsewhere) is maintained correctly, including consideration for aging and wear of parts. The SRV control panel can also be tested, separate from valve operation, to assure that it works properly. An inservice check to detect for valve leakage that can lead to setpoint drift is the temperature alarm on the tail pipe. The inservice inspection ofSRVs is included in Table 19K-4 for RAP.
Isolation check valves of the NBS are leak tested -at refueling outages, and that -test
demonstrates that the valves move from open to closed. Subsequent plant operation of the feedwater system opens the valves, giving assurance that they have ability to open. The NBS manual isolation valve has a stroke test at each refueling outage to assure that it can function. Testable check valves of the RCIC System can also be checked at each refueling to assure that they would function properly if conditions required a change in position. These valve tests are included in Table 19K-4.
PRA-Based Reliability and Maintenance
Rev. 0
ABWR Design Control Document/Tier 2
19K.11.2 RCIC System Testing
The Levell analysis identified the Reactor Core Isolation Cooling (RCIC) System as one whose failures contribute substantially to CDF. Failure ofRCIC to start or failure to continue operation after start are failure modes that are identified as significant. To provide assurance that the RCIC operation will be reliable, it is suggested that the system be started and operated long enough to demonstrate stable operation at least once every three months. The flow rate of RCIC should be measured to verify that it meets design requirements for injection into the RPV. Quarterly tests are with flow to the suppression pool. The RCIC System test will accomplish many of the RCIC turbine, pump and valve tests and will demonstrate that the Division 1 distribution panel is functioning. Components of RCIC that have been identified as significant, including many valves and instruments, are included in Table 19K-4 with identified failure modes and suggested RAP activities.
19K.11.3 Depressurization
The ADS technical specifications were reviewed, and it was concluded that no additional reliability and maintenance actions are needed. Testing of ADS System SRVs is included in Table 19K-4 with the other RAP activities.
19K.11.4 Lower Drywell Flooder (LDF)
In order to assure a dry cavity at the time of vessel failure, it is im portan t that there be negligible probability of premature or spurious actuation of the passive .£looder valves at temperatures less than 533 K (500°F) or under differential pressures associated with reactor blowdown and pool hydrodynamic loads.
Activities suggested for RAP are given in Table 19K-4 and discussed below.
(1) The ten fusible plug valve flanges and outlets should be inspected every refueling outage to assure there is no leakage ..
(2) Two of ten fusible plug valves should be removed, inspected and their temperature setpoiilts tested every two refueling outages. (See testing and inspection requirements, Subsection 9.5.12.4.)
19K.11.5 AC-Independent Water Addition (Firewater) System
Inspection and testing of this system should be included in RAP. However, because of the importance of manual alignment, lining up the firewater should be specifically included in the training programs to assure that the system benefits are obtained. Specific procedures are required to be developed by the COL applicant to align the ACIWA System for vessel injection or drywell spray. See Subsection 19.9.7.
PRA-Based Reliability and Maintenance 19K-11

ABWR Rev. 0
Design Control Document/Tier 2
The strategy discussed below is recommended to test key components to assure that pumps and valves are operable and that there is no significant flow blockage in the flow paths from the Fire Water System to the reactor pressure vessel and to the drywell spray. Component testing is included in Table 19K-4.
(1) Onsite fire truck (pumper) maintenance should be conducted in accordance with the utility'S normal fire protection maintenance procedures. A site service test of fire truck performance should he penormed annually or after any major repairs in conformance With Chapter II ofNFPA 1901, "Standard on Automotive Fire Apparatus". These tests should demonstrate that the pumper/engine combination is capable of meeting the penormance requirements of the original certification or acceptance tests. Fire truck reliability for supporting the water injection function is assumed to be high. A satisfactory service test should consist of pumping water to the ground or back to the suction source as follows:
(a) Twenty minutes of pumping 100% rated capacity, preferably at draft, at 1.034 MPa net pump pressure
(b) Ten minutes of pumping 70% rated capacity at 1.379 MPa net pump
pressure
(c) Ten minutes of pumping 50% rated capacity at 1.724 MPa net pump
pressure
Engine speed should be recorded for each condition. A "spurt" test need not be conducted, but if care is taken to ensure that the pump does not cavitate, running the pumper with wide open throttle at 1.138 MPa net pump pressure may give a good indication of engine condition.
(2) As a part of the normal testing required by the utility'S fire protection procedures, the following tests should be considered:
(a) . Once every two refueling outages or every four years (which ever is most convenient) the fire truck should be used to pressurize the fire protection system and test the flow capacity. Suction shoul~ be from both fire protection tanks and the ultimate heat sink water supply.
(b) Once every two refueling outages or every four years the flow capacity of both the AC-driven and the direct diesel-driven fire pumps should be tested. This flow test call be alternated with the fire truck flow test (2a above). The diesel-driven fire water pump is assumed to have high reliability for supporting the water injection function.
19K-12 PRA-Based Reliability and Maintenance
Rev. 0
ABWR Design Control Document!Tier 2
(3) Once every two years the RHR non-safety-related valve (Ell-Fl03C of Figure 5.4-10, Sheet 7) which must operate to provide flow to the vessel, or to the drywell spray or wetwell spray, should be manually opened and closed. Safety-related valves Ell-FIOIC and Ell-FI02C are exercised every three months as part of the valve inservice testing program.
(4) Once every four years the ACindependent Water Addition (ACIW A) System flow and flow monitoring instrumentation from the fire protection system (FPS) to the RHR main loop should be tested. This can be accomplished during a reactor shutdown by initially isolating and closing off the branch lines of the RHR main loop C (however, the heat exchanger throttle valve EIlF004C remains open) and stopping both pumps, COOIC and C002C. After ACIWA valves Ell-FIOIC and Ell-FI02C are opened to apply the FPS pressure to the RHR main loop, the shutoff head pressure should be verified. With the RHR main loop closed off, no flow should occur. Then for a short time period, the flushing drain to the radwaste using valves EII-F029C and Ell-F030C, Figure 5.4-10, Sheet 6, can be opened. The resulting flow can be measured with flow meter Ell-FEOI2B, Figure 5.4-10, Sheet. 4.
Throttling valve EII-F030C can be used to turn the flow on and off and limit the flow to the desired rate and duration. The flow duration should be minimized to reduce the load to radwaste. The test should be repeated first with valve Ell-FIOIC closed, then with the fire truck hose connection and valves EII-FIOIC and Ell-FI03C opened, Figure 5.4-10, Sheet 7.
(5) Once every five years all fire protection and RHR piping which forms the AC Independent Water Addition System should be tested to ensure that it is structurally intact and properly supported.
(6) Seismic-related inspections listed in Subsection 19K.I1.7 should be done.
19K.11.6 Containment Overpressure Protection System (COPS)
The COPS is identified in Subsection 19K.4 as important to limiting fission product release. Suggested system component testing as part of RAP is identified in Table 19K-4. Also, system flow testing and special operator training should be considered for inclusion in the RAP.
(1) Air-operated valves (AOVs) in series with rupture disks should be maintained in the same manner as containment isolation valves. It is suggested that, during preoperational testing and during each RIM outage, each valve be exercised and proper open and closed local and control room indications be checked. Any position other than full open should alarm in the control room.
PRA-Based Reliability and Maintenance 19K-13
ABWR Rev. 0
Design Control Document/Tier 2
Mter valves are returned to the open position, indication should be verified locally and in the main control room. These tests are included in Table 19K-4.
(2) Rupture disks should be maintained as required by the ASME code. The rupture disk manufacturer should perform the necessary tests to certify that the rupture disks will open at a pressure within 5% of the rated value. Every five years, the disks should be tested and replaced. These tests are included in Table 19K-4.
(3) A flow test should be conducted every five years to assure that there are no obstructions in the pressure relief path.
(4) Special training on operator actions following rupture disk opening should be included in the plant training program.
19K.11.7 Seismic-Related Inspections
The seismic capability of the following equipment is identified (Subsection 19K.5) as risk-significant: emergency diesel generators, 480 VAC transformers, motor control centers and circuit breakers of the AC Power System; batteries and cable trays of the DC Power System; the SLCS tank, valves and piping and motor driven pumps of the Standby
Liquid Control System; the Service Water System pumps, pump house and air conditioner; the heat exchanger of the RHR System; the valves, piping and diesel-driven pump of the Fire Water System, and the discharge lines of the SRVs. For this equipment, the seismic related inspections detailed in Subsection 19H.5 should be conducted once every 10 years or after any earthquake equal to or greater than that corresponding to the cumulative absolute velocity (CAV) shutdown threshold.
19K.11.8 Plant Structures
19K-14
No maintenance activities other than those already associated with the inservice surveillance of the seismic instrumentS defined in Subsection 3.7.4.5 are needed for seismic events. The seismic instrumentation program (Subsection 3.7.4) is designed to provide information on the input ground motion and resultant responses of representative Category I structures and equipment in the event an earthquake occurs sufficient to activate the seismic instrumentation. If the earthquake exceeds that corresponding to the CAV shutdown threshold, the plant is shut down, manually if necessary, and a detailed post-earthquake evaluation is undertaken. When it is determined that plant structures and equipment were not damaged, the plant can be safely re-started on the basis of seismic considerations.
PRA-Based Reliability and Maintenance
Rev. 0
ABWR Design Control Document!Tier 2
19K.11.9 Hydraulic C.9ntrol Units and Control Rod Drives
The technical specifications associated with the hydraulic control units and control rod drives were reviewed. It was concluded that no additional reliability and maintenance actions are needed beyond those in technical specifications.
19K.11.10 Emergency Diesel Generators.
Maintenance for the emergency diesel generators is expected to be performed in accordance with site procedures and the manufacturer's recommendations. Surveillance testing is required in accordance with Regulatory Guide 1.9, "Design, Qualification and Testing of Diesel Generators", and with the surveillance requirements described in th~ Technical Specifications (Subsection 16.11.1) beginning with SR 3.8.1.4. Seismic-related inspections noted in Subsection 19K.11.7 should be done.
Maintaining emergency diesel generator reliability is a basic part of the station blackout rule (10CFR50.63). A reliability assurance program is required which maintains a target reliability. In view of the existing requirements noted above, it is judged that additional reliability and maintenance activities are not needed.
19K.11.11 Combustion Turbine Generator
Maintenance for the combustion turbine generator (CTG) is expected to be performed in accordance with site procedures and the manufacturer's recommendations. Suggested surveillance testing includes quarterly operation at rated speed and rated load until temperatures reach steady state values, approximately one hour. Also quarterly there should be a check of oil levels and assurance that there are no oil or fuel leaks. Quarterly the oil should be sampled and analyzed for acceptable quality. At each refueling/maintenance outage CTG fuel oil and lube oil should be inspected for deterioration; and replaced as necessary. Also, the fuel, lube oil and air filters should be replaced. There should be a thorough inspection of the entire assembly to assure that the inlet and outlet plenums are not blocked or deteriorating. Also, a complete visual inspection of the power unit should be made to assure that support bolts are secured and that there are no cracks and no blown gasket or engine hot spots. These tests and preventive maintenance activities are included in Table 19K-4.
19K.11.12 Fire Protection
The room fire barriers, the Smoke Removal System, and the remote shutdown panel and control were determined to be relatively important (Subsection 19K(6). Fire barriers, including penetrations, should be inspected periodically to assure that they retain their integrity with respect to confining a fire. The Smoke Removal System should be operated annually to demonstrate that it will be able to maintain a negative pressure in a room with a fire so that probability of propagation of fire and/or smoke to other rooms is low.
PRA-Based Reliability and Maintenance 19K-15
ABWR Rev. 0
Design Control Document/Tier 2
Smoke Removal System testing will be performed on each smoke removal zone in the reactor building, the service building and the radwaste building. Smoke Removal System testing will be patterned after damper alignment intended for smoke removal operation of the system. This consists of reducing normal exhaust from adjoining zones, to increase their pressure, and bypassing exhaust filters or small exhaust fans in the zone being tested to increase its exhaust flow rate. This will establish a pressure differential between zones to reduce the possibility that smoke will get into zones not directly atIected by a fire.
Personnel entry to an area experiencing a fire is gained from an adjacent fire area which, by design, is at a positive pressure with respect to the area containing the fire. The pressure differential is sufficient to provide adequate velocity through the open door to push the combustion products back into the zone of the fire. The flow through the open door into the area of the fire and out of the area through the fire's exhaust duct system is enhanced by the positive pressure of the non-fire area. The HVAC Systems with recirculated air are manually switched over to a once-through system during a fire or test, so there is no direct mixing of smoke from one room to another.
The differential pressure between zones will be greater if all doors are closed, but each zone is relatively large, so one or two open doors between zones will not have a significant impact on the tests or on Smoke Removal System operation during a fire. Personnel should be advised that it is permissible to open doors during a test (or during -a fire), but that doors should normally be closed at those times. This will allow personnel access to all related areas, and will not unduly restrict fire fighting personnel in event of a fire.
The remote shutdown panel should be tested periodically to show that it can perform its functions that will lead to-safe shutdown. These RAP activities related to fire protection are included in Table 19K-4.
19K.11.13 Flood Protection
19K-16 -
The important SSCS for flood protection are the water tight doors on external entrances to the control and reactor buildings and in ECCS and RCW rooms, the RSW and CWS isolation valves, anti-siphon capability, the circuit breakers that trip RSW and CWS pumps and water level sensors in the turbine building condenser pit and control building RCW rooms; sump pump operation; overfill lines on reactor building sumps on floor BIF; and room drain lines (Subsection 19K. 7). Periodically room water barriers should be inspected to assure that they will prevent the spread of flooding, room drain lines should be checked to ensure no biockage exists, RSW isolation valves (MOVs) should be stroke tested (normally accomplished by switching from one pump to the
standby pump in a given loop), CWS isolation valves should be stroke tested, the ability of RSW and CWS pump circuit breakers to trip upon receipt of a trip signal should be
PRA-Based Reliability and Maintenance
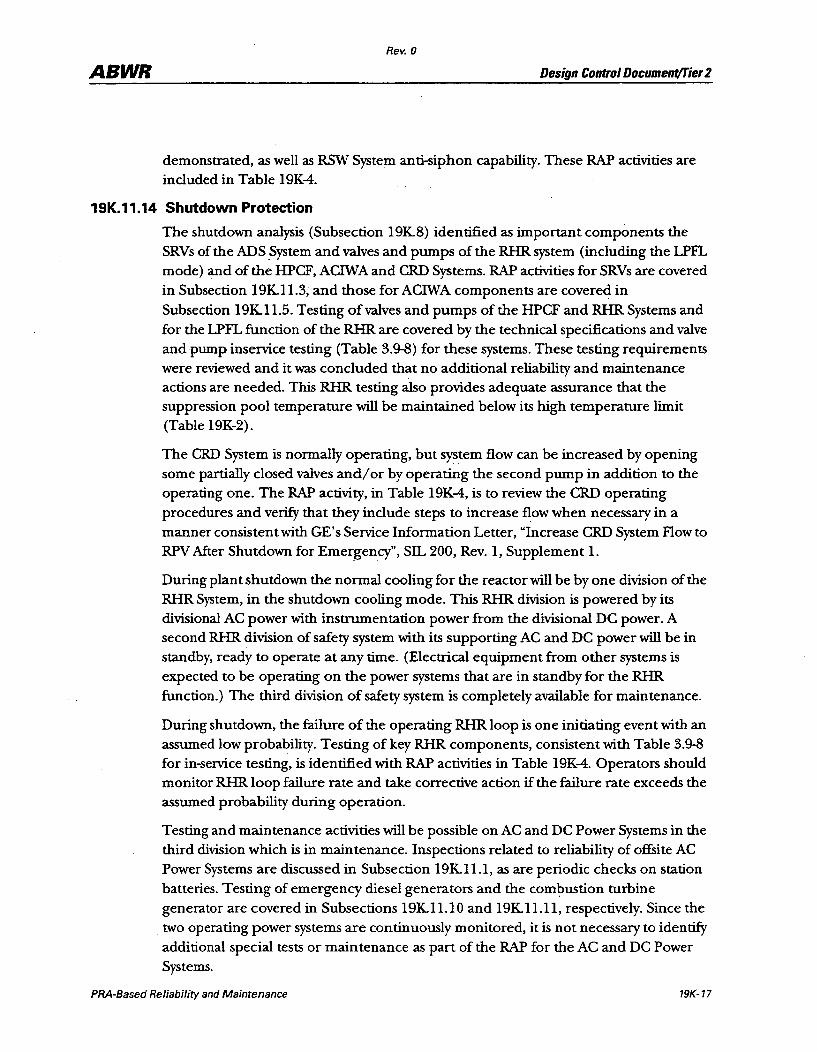
ABWR Rev. 0
Design Control Document/Tier 2
demonstrated, as well as RSW System anti-siphon capability. These RAP activities are included in Table 19K-4.
19K.11.14 Shutdown Protection
The shutdown analysis (Subsection 19K-8) identified as important components the SRVs of the ADS System and valves and pumps of the RHR system (including the LPFL mode) and of the HPCF, ACIWAand CRD Systems. RAP activities for SRVs are covered in Subsection 19K-I 1.3, and those for ACIW A components are covered in Subsection 19K-Il.5. Testing of valves and pumps of the HPCF and RHR Systems and for the LPFL function of the RHR are covered by the technical specifications and valve and pump inservice testing (Table 3.9-8) for these systems. These testing requirements were reviewed and it was concluded that no additional reliability and maintenance actions are needed. This RHR testing also provides adequate assurance that the suppression pool temperature will be maintained below its high temperature limit (Table 19K-2).
The CRD System is normally operating, but system flow can be increased by opening some partially closed valves and! or by operating the second pump in addition to the operating one. The RAP activity, in Table 19K-4, is to review the CRD operating procedures and verify that they include steps to increase flow when necessary in a manner consistent with GE's Service Information Letter, "Increase CRD System Flow to RPV After Shutdown for Emergency", SIL 200, Rev. 1, Supplement 1.
During plant shutdown the nonnal cooling for the reactor will be by one division of the RHR System, in the shutdown cooling mode. This RHR division is powered by its divisional AC power with instrumentation power from the divisional DC power. A second RHR division of safety system with its supporting AC and DC power will be in standby, ready to operate at any time. (Electrical equipment from other systems is expected to be operating on the power systems that are in standby for the RHR function.) The third division of safety system is completely available for maintenance.
During shutdown, the failure of the operating RHR loop is one initiating event with an assumed low probability. Testing of key RHR components, consistent with Table 3.9-8 for in-service testing, is identified with RAP activities in Table 19K-4. Operators should monitor RHR loop failure rate and take corrective action if the failure rate exceeds the assumed probability during operation.
Testing and maintenance activities will be possible on AC and DC Power Systems in the third division which is in maintenance. Inspections related to reliability of offsite AC Power Systems are discussed in Subsection 19K-Il.I, as are periodic checks on station batteries. Testing of emergency diesel generators and the com~ustion turbine generator are covered in Subsections 19K-Il.IO and 19K 11.11, respectively. Since the two operating power systems are continuously monitored, it is not necessary to identify additional special tests or maintenance as part of the RAP for the AC and DC Power Systems.
PRA-Based Reliability and Maintenance 19K-17

Rev. 0
ABWR Design Control Document!Tier 2
19K.11.15 Prevention of Intersystem LOCA
The Reactor Water Cleanup (CUW) System provides a negligible benefit in the ABWR PRA by removing decay heat at high pressure. It would only be used in this mode if the containment cooling mode of the RHR system was disabled. During all operating modes, an unisolated CUW break could cause serious consequences, therefore these CUW isolation valves must be capable of automatically isolating against a differential pressure equal to the operating pressure of the reactor coolant system in the event of a LOCA in the CUW. If the automatic isolation valves fail to close, the operator can close the remote manual shutoff valve from the control room to tenninate the LOCA. The RAP activities to assure reliability of these isolation valves are listed in Table 19K-4.
19K.11.16 Determination of IIlmportant Structures, Systems and Componentsn for Suppression Pool Bypass Analysis
The suppression pool is an important containment feature for severe accident progression and fission product removal, since releases from the reactor vessel are either directly routed to the pool (e.g., transients with actuation of ADS) or pass through the pool via the drywell-wetwell connecting vents.
If an event leads to pressurization of the wetwell to the extent that the containment rupture disks open, the vacuum breakers would open to equalize pressures in the wetwell and drywell. The breakers would then close, thereby isolating the drywell from the wetwell. Failure of a DW-WW vacuum breaker to close following the assumed event would provide a significant bypass from the drywell into the wetwell airspace. If the rupture disk is open and one of the vacuum breakers has not closed there would be a direct pathway from the drywell to the wetwell and to the environment.
The following are critical to assuring a low risk from wetwell/ drywell vacuum breaker bypass:
(1)
(2)
(3)
A low probability of vacuum breaker leakage (
A low probability that the vacuum breakers fail to close
A high availability of drywell or wetwell sprays (and ACIWA as a backup) to condense steam which bypasses the suppression pool.
Recommendations for testing of DW-WW vacuum breakers and ACIWA System RAP activities are included in Table 19K-4.
19K.12 References
19K-1 "GE ABWR Licensing Review Bases", August 1987.
19K-18 PRA-Based Reliability and Maintenance
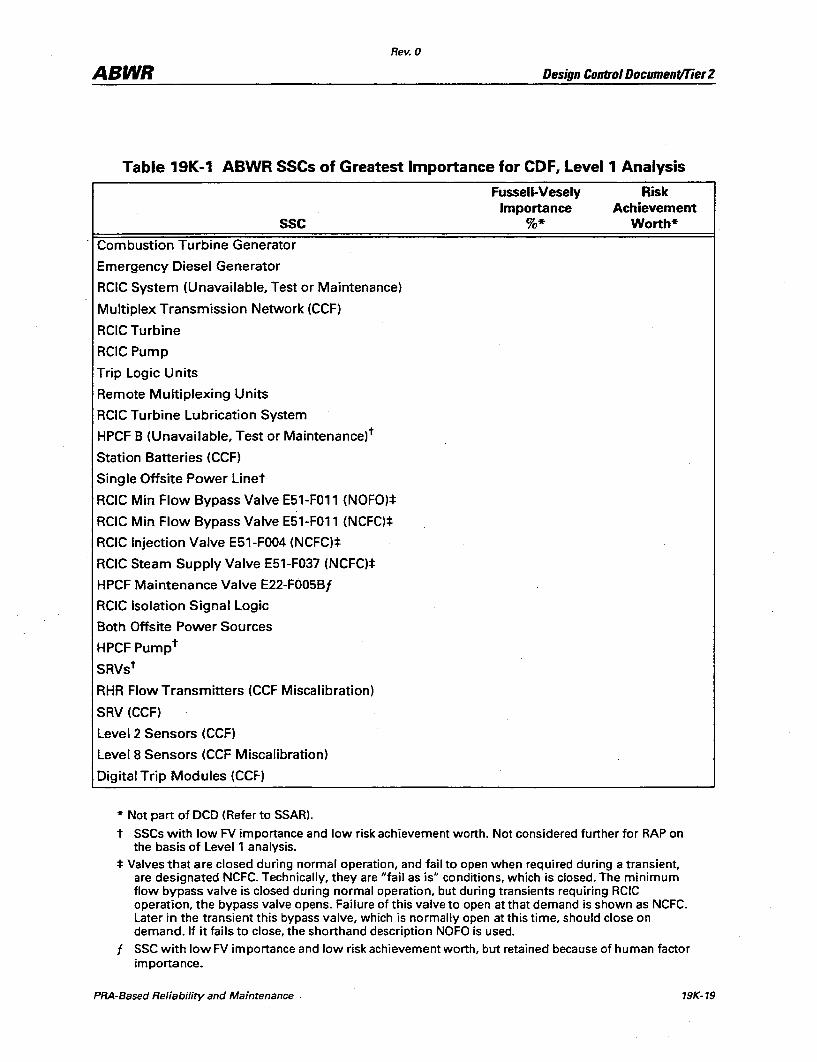
Rev. 0
ABWR Design Control Document/Tier2
Table 19K-1 ABWR SSCs of Greatest Importance for CDF, Level 1 Analysis
sse Combustion Turbine Generator
Emergency Diesel Generator
RCIC System (Unavailable, Test or Maintenance)
Multiplex Transmission Network (CCF)
RCIC Turbine
RCIC Pump
Trip Logic Units
Remote Multiplexing Units
RCIC Turbine Lubrication System
HPCF B (Unavailable, Test or Maintenance)t
Station Batteries (CCF)
Single Offsite Power Linet
RCIC Min Flow Bypass Valve E51-F011 (NOFO):f:
RCIC Min Flow Bypass Valve E51-F011 (NCFC):f:
RCIC Injection Valve E51-F004 (NCFC):f:
RCIC Steam Supply Valve E51-F037 (NCFC):f:
HPCF Maintenance Valve E22-F005Bf
RCIC Isolation Signal Logic
Both Offsite Power Sources
HPCF Pumpt
SRVst
RHR Flow Transmitters (CCF Miscalibration)
SRV (CCF)
Level 2 Sensors (CCF)
Level 8 Sensors (CCF Miscalibration)
Digital Trip Modules (CCF)
* Not part of OCD (Refer to SSAR).
Fussell-Vesely Importance
%*
Risk Achievement
Worth*
t SSCs with low FV importance and low risk achievement worth. Not considered further for RAP on the basis of Level 1 analysis.
* Valves that are closed during normal operation, and fail to open when required during a transient, are designated NCFC. Technically, they are ufail as isn conditions, which is closed. The minimum flow bypass valve is closed during normal operation, but during transients requiring RCIC operation, the bypass valve opens. Failure of this valve to open at that demand is shown as NCFC. Later in the transient this bypass valve, which is normally open at this time, should close on demand. If it fails to close, the shorthand description NOFO is used.
f SSC with low FV importance and low risk achievement worth, but retained because of human factor importance.
PRA·Based Reliability and Maintenance 19K· 19
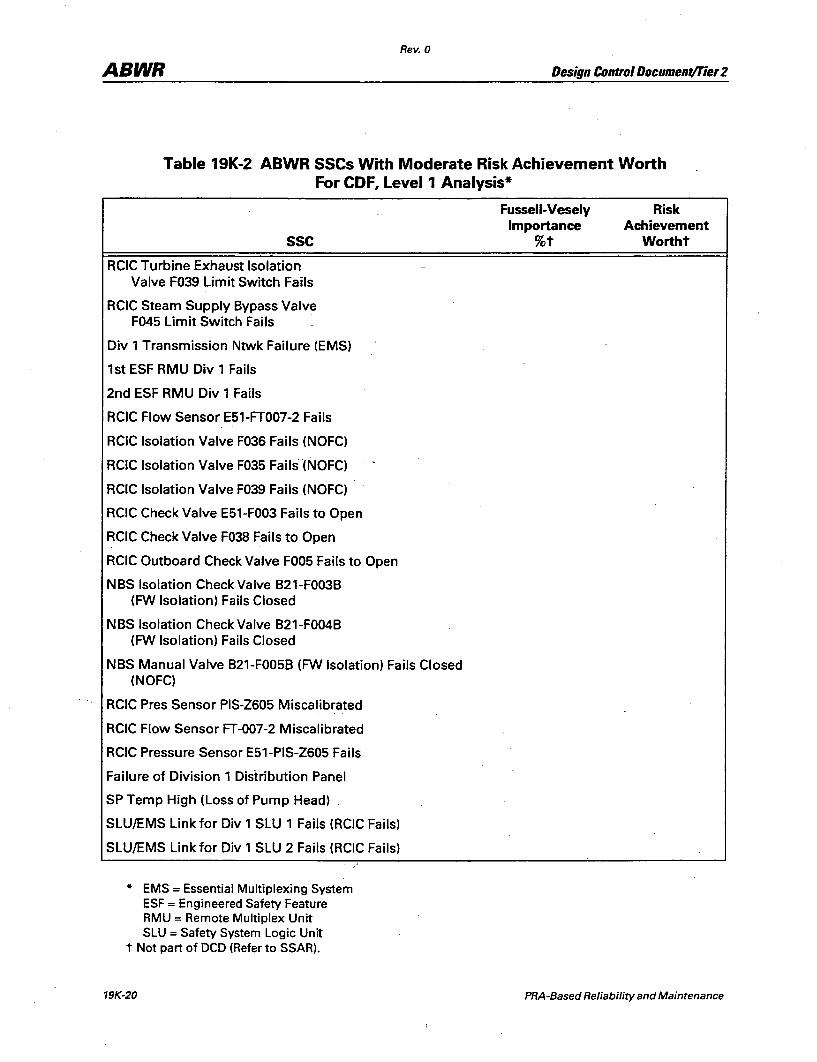
Rev. 0
ABWR Design ContrDI DocumentlTier 2
Table 19K-2 ABWR SSCs With Moderate Risk Achievement Worth For CDF, Level 1 Analysis*
sse RCIC Turbine Exhaust Isolation
Valve F039 Limit Switch Fails
RCIC Steam Supply Bypass Valve F045 Limit Switch Fails
Div 1 Transmission Ntwk Failure (EMS)
1st ESF RMU Div 1 Fails
2nd ESF RMU Div 1 Fails
RCIC Flow Sensor E51-FT007-2 Fails
RCIC Isolation Valve F036 Fails (NOFC)
RCIC Isolation Valve F035 Fails (NOFC)
RCIC Isolation Valve F039 Fails (NOFC)
RCIC Check Valve E51-F003 Fails to Open
RCIC Check Valve F038 Fails to Open
RCIC Outboard Check Valve F005 Fails to Open
NBS Isolation Check Valve B21-F003B (FW Isolation) Fails Closed
NBS Isolation Check Valve B21-F004B (FW Isolation) Fails Closed
NBS Manual Valve B21-F005B (FW Isolation) Fails Closed (NOFC)
RCIC Pres Sensor PIS-Z605 Miscalibrated
RCIC Flow Sensor FT-007-2 Miscalibrated
RCIC Pressure Sensor E51-PIS-Z605 Fails
Failure of Division 1 Distribution Panel
SP Temp High (Loss of Pump Head)
SLU/EMS Link for Div 1 SLU 1 Fails (RCIC Fails)
SLU/EMS Link for Div 1 SLU 2 Fails (RCIC Fails)
* EMS = Essential Multiplexing System ESF = Engineered Safety Feature RMU = Remote Multiplex Unit SLU = Safety System Logic Unit
t Not part of DeD (Refer to SSAR).
19K-20
/
Fussell-Vesely Importance
%t
Risk Achievement
Wortht
PRA-Based Reliability and Maintenance
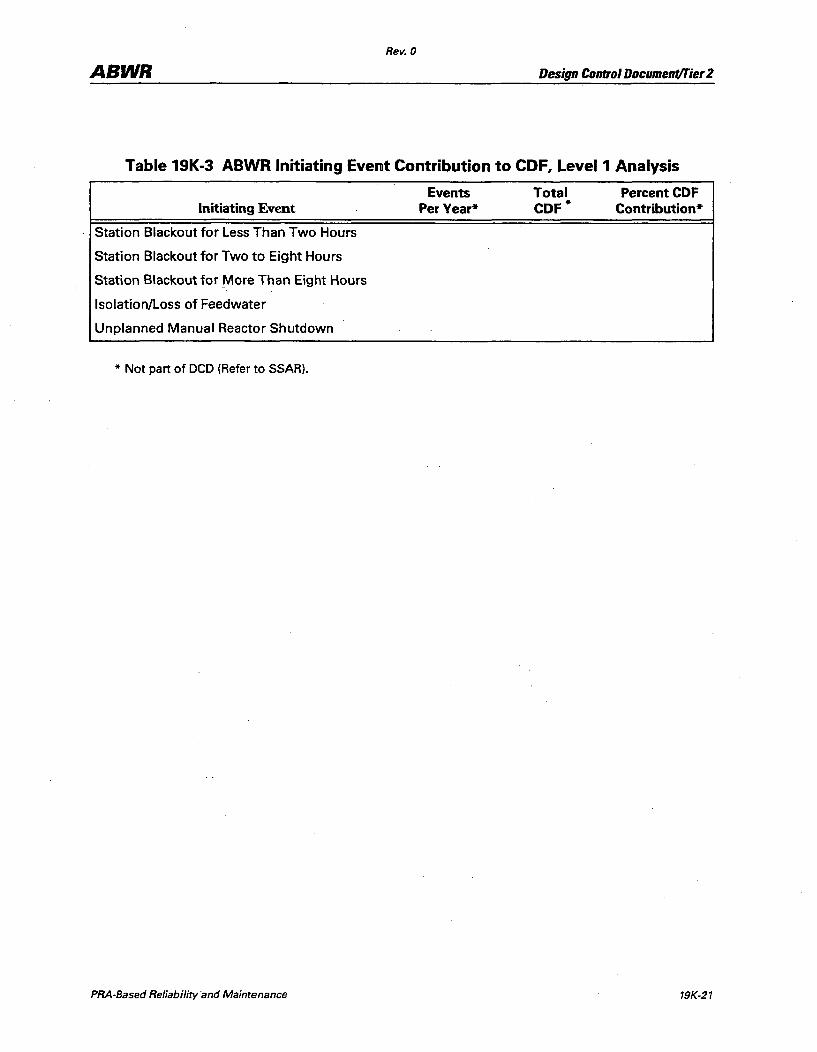
Rev. 0
ABWR Design Control Document/Tier 2
Table 19K-3 ABWR Initiating Event Contribution to CDF, Level 1 Analysis
Initiating Event
Station Blackout for Less Than Two Hours
Station Blackout for Two to Eight Hours
Station Blackout forlVlore Than Eight Hours
Isolation/Loss of Feedwater
Unplanned Manual Reactor Shutdown
* Not part of DeD (Refer to SSAR).
PRA-Based Reliability and Maintenance
Events PerYear*
Total CDF*
Percent CDF Contribution*
19K-21
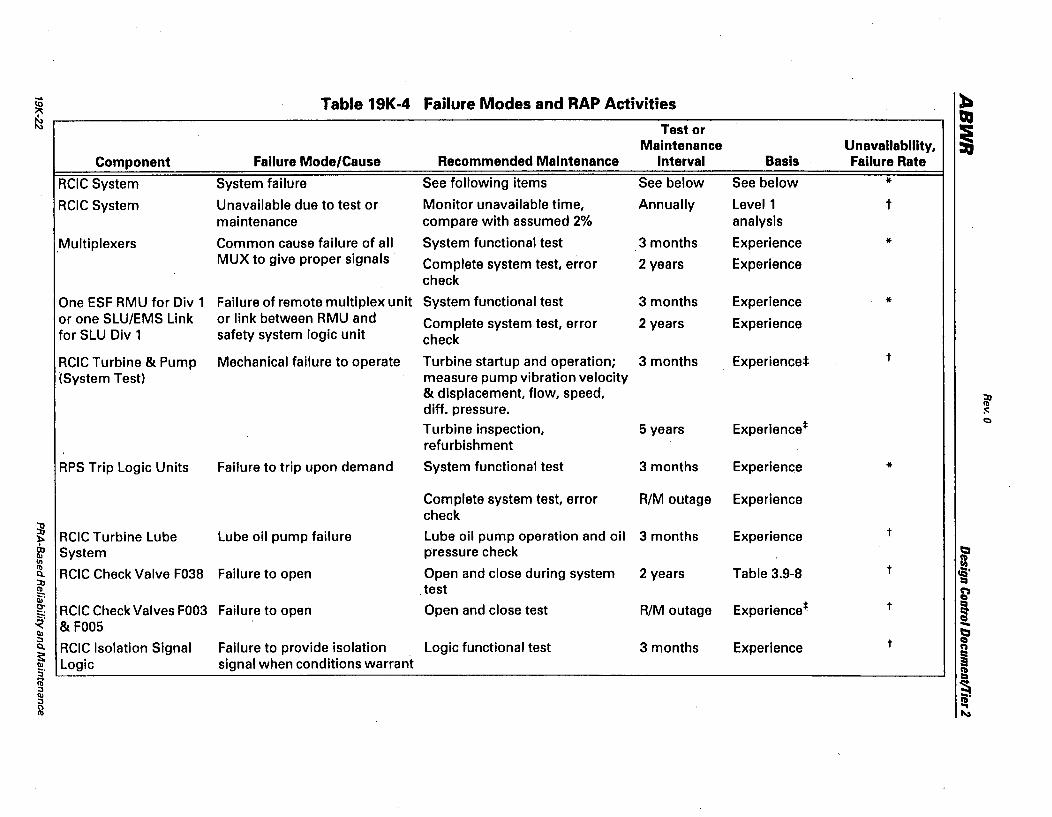
... Table 19K·4 Failure Modes and RAP Activities :b 10
~ QI ~ I\) Test or
~ Maintenance Unavailability, Component Failure Mode/Cause Recommended Maintenance Interval Basis Failure Rate
RCIC System System failure See following items See below See below * RCIC System Unavailable due to test or Monitor unavailable time, Annually Level 1 t
maintenance compare with assumed 2% analysis
Multiplexers Common cause failure of all System functional test 3 months Experience * MUX to give proper signals Complete system test, error 2 years Experience
check
One ESF RMU for Div 1 Failure of remote multiplex unit System functional test 3 months Experience· * or one SLU/EMS Link or link between RMU and Complete system test, error 2 years Experience for SLU Div 1 safety system logic unit check
RCIC Turbine & Pump Mechanical failure to operate Turbine startup and operation; 3 months Experience:!: t
(System Test) measure pump vibration velocity & displacement, flow, speed, ::n diff. pressure. III :::
Experlence* Q
Turbine inspection, 5 years refurbishment
RPS Trip Logic Units Failure to trip upon demand System functional test 3 months Experience *
Complete system test, error RIM outage Experience check
:B RCIC Turbine Lube Lube oil pump failure Lube oil pump operation and oil 3 months Experience t :b a:, System pressure check ~ II) a (I) III
RCIC Check Valve F038 Failure to open Open and close during system 2 years Table 3.9-8 t cQ' e.. ::n ::. III . test ~ ~ 0- RCIC Check Valves FOO3 Failure to open Open and close test RIM outage Experience* t ~ ~
~' & F005 -II) ~ ::l Failure to provide isolation Logic functional test 3 months Experience t e.. RCIC Isolation Signal co»
~ Logic signal when conditions warrant ~ S'
= ib ~ ::;, II) ::l III' 0 ~ III fI.a
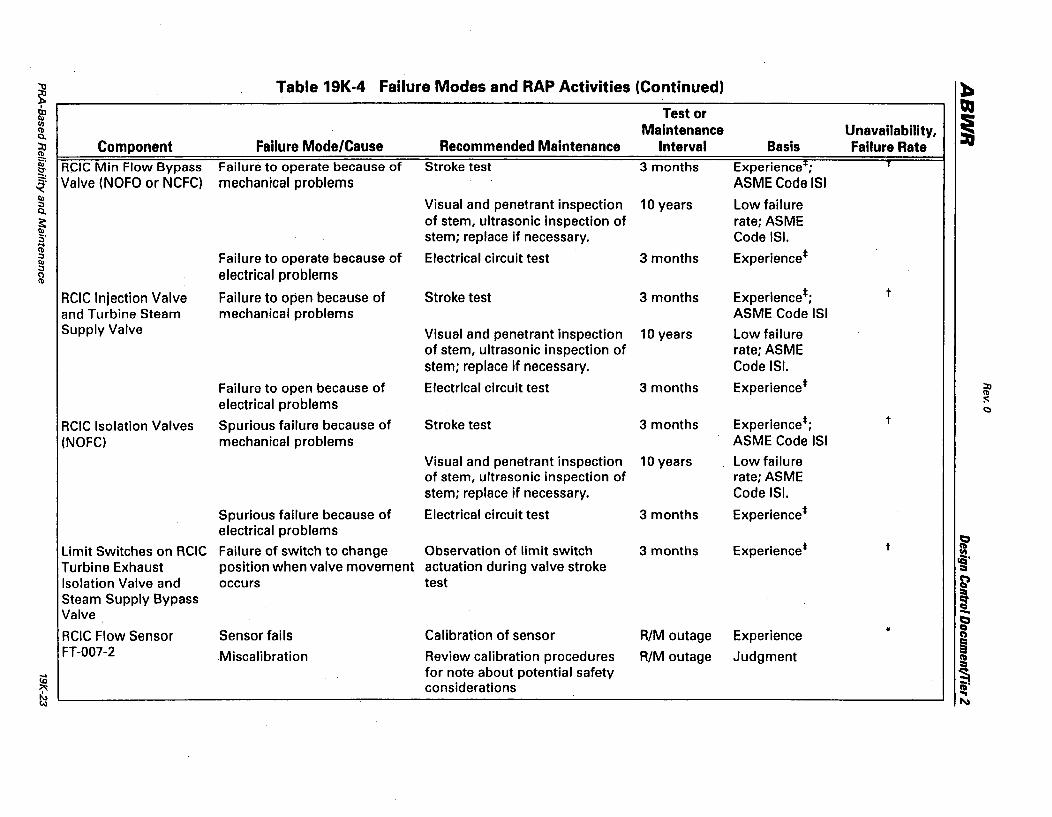
~ Table 19K-4 Failure Modes and RAP Activities (Continued) :t-o
Test or QJ til ~ ~ Cb Maintenance Unavailability, Cl. :0 Component Failure Mode/Cause Recommended Maintenance Interval Basis Failure Rate !t iii' RCIC Min Flow Bypass Failure to operate because of Stroke test 3 months Experience"'; T t:r
~ Valve (NOFO or NCFC) mechanical problems ASME Code lSI CIl
Visual and penetrant inspection 10 years Low failure ;:, Cl.
s:: of stem, ultrasonic inspection of rate; ASME CIl
stem; replace if necessary. Code lSI. 5' ilt
Experience* ;:, Failure to operate because of Electrical circuit test 3 months CIl ;:,
electrical problems ~
RCIC Injection Valve Failure to open because of Stroke test 3 months Experience*; t
and Turbine Steam mechanical problems ASME Code lSI Supply Valve Visual and penetrant inspection 10 years Low failure
of stem, ultrasonic inspection of rate; ASME stem; replace if necessary. Code lSI.
Failure to open because of Electrical circuit test 3 months Experience* :n Cb
electrical problems ::: 0
RCIC Isolation Valves Spurious failure because of Stroke test 3 months Experlence*; t
(NOFC) mechanical problems ASME Code lSI
Visual and penetrant inspection 10 years Low failure of stem, ultrasonic inspection of rate; ASME stem; replace if necessary. Code lSI.
Spurious failure because of Electrical circuit test 3 months Experience* electrical problems
t:I Limit Switches on RCIC Failure of switch to change Observation of limit switch 3 months Experience* t ~ Turbine Exhaust position when valve movement actuation during valve stroke rQ'
::i
Isolation Valve and occurs test P Steam Supply Bypass ~ Valve -t:I RCIC Flow Sensor Sensor fails Calibration of sensor RIM outage Experience * c
CO)
FT-007-2 Miscalibration Review calibration procedures RIM outage Judgment ~ !:
CD for note about potential safety ~ ~ considerations ...
~ II.a
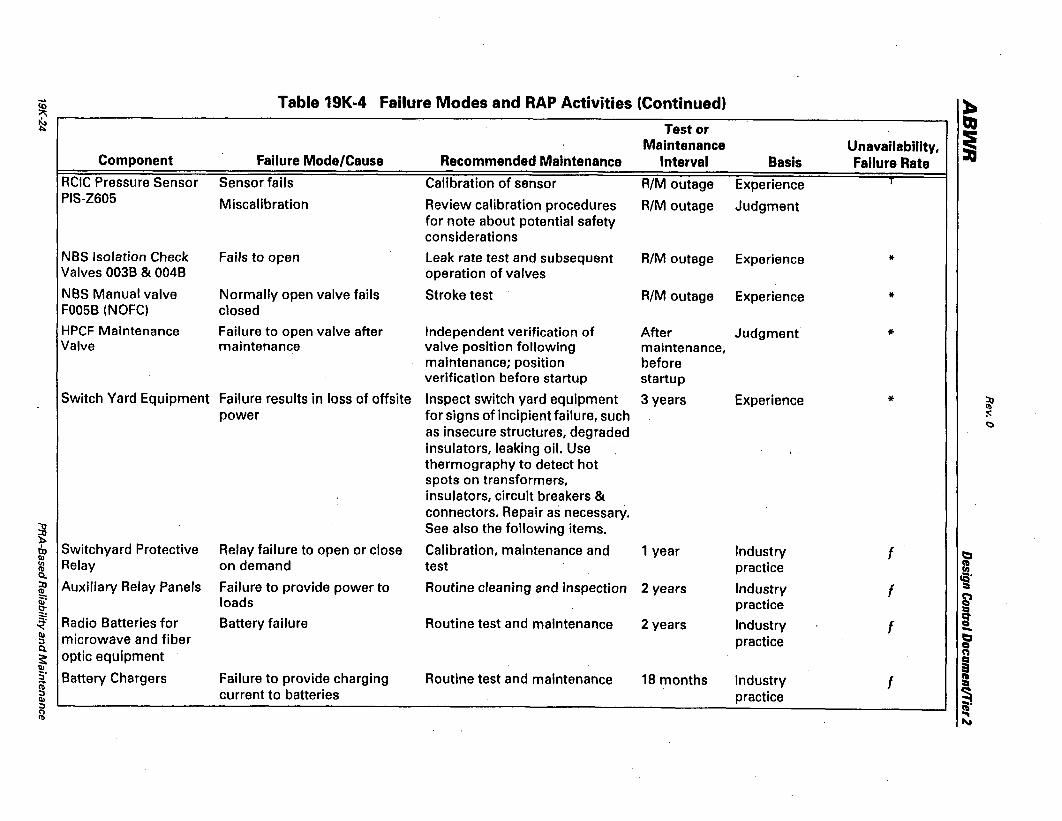
... Table 19K-4 Failure Modes and RAP Activities (Continued) ~ co ~ tI:I ~ Test or
~ Maintenance Unavailability, Component Failure Mode/Cause Recommended Maintenance Interval Basis Failure Rate
RCIC Pressure Sensor Sensor fails Calibration of sensor RIM outage Experience T
Pls-zeos Miscalibration Review calibration procedures RIM outage Judgment for note about potential safety considerations
NBS Isolation Check Fails to open leak rate test and subsequent RIM outage Experience * Valves 003B & 004B operation of valves
NBS Manual valve Normally open valve fails Stroke test RIM outage Experience * F005B (NOFC) closed
HPCF Maintenance Failure to open valve after Independent verification of After Judgment * Valve maintenance valve position following maintenance,
maintenance; position before verification before startup startup
Switch Yard Equipment Failure results in loss of offsite Inspect switch yard equipment 3 years Experience * ~ power for signs of incipient failure, such :-::
c::! as insecure structures, degraded insulators, leaking oil. Use thermography to detect hot spots on transformers, insulators, circuit breakers & connectors. Repair as necessary.
;g See also the following items. ~
Switchyard Protective Relay failure to open or close Calibration, maintenance and 1 year Industry to f t:I II>
Relay on demand test practice I: en !b ciS' ~ ;x, Auxiliary Relay Panels Failure to provide power to Routine cleaning and inspection 2 years Industry f :::i !b
~ ~ loads practice 0- i ~ Radio Batteries for Battery failure Routine test and maintenance 2 years Industry f -II> microwave and fiber practice t:I :J Q Q.
optic equipment CO)
3: ~ II> S' Battery Chargers Failure to provide charging Routine test and maintenance 18 months Industry f ~ iti :J current to batteries practice II> :J 0 ... !b N
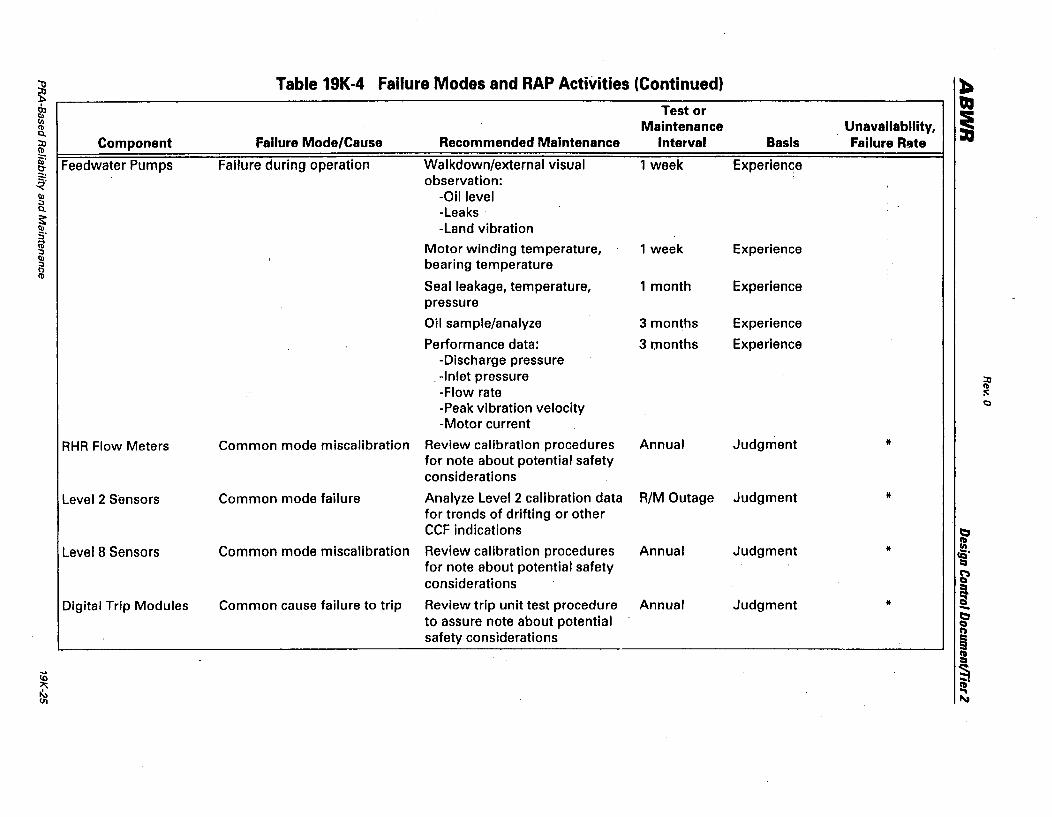
~ Table 19K-4 Failure Modes and RAP Activities (Continued) ~ 0:. Test or
QJ Il> I (I)
Maintenance Unavailability, <II 0.. ::u Component Failure Mode/Cause Recommended Maintenance Interval Basis Failure Rgte (1)
~ Feedwater Pumps Failure during operation Walkdown/external visual 1 week Experienc;e 0-
~ observation: III -Oil level ::J 0.. -Leaks ~ -Land vibration :i" ~ Motor winding temperature, 1 week Experience :J III ::J bearing temperature 0 (1)
Seal leakage, temperature, 1 month Experience pressure
Oil sample/analyze 3 months Experience
Performance data: 3 months Experience -Discharge pressure
. -Inlet pressure ~
-Flow rate :0::
-Peak vibration velocity C)
-Motor current
RHR Flow Meters Common mode miscalibration Review calibration procedures Annual Judgment * for note about potential safety considerations
Level 2 Sensors Common mode failure Analyze Level 2 calibration data R/M Outage Judgment * for trends of drifting or other CCF indications b
Level 8 Sensors Common mode miscalibration Review calibration procedures Annual Judgment * Il cQ'
for note about potential safety l:i
considerations ~
Digital Trip Modules Common cause failure to trip Review trip unit test procedure Annual Judgment * ~ -to assure note about potential i' safety considerations
C')
~ ~
iD § ;:.; ,,' ~ ... U1 PI.a
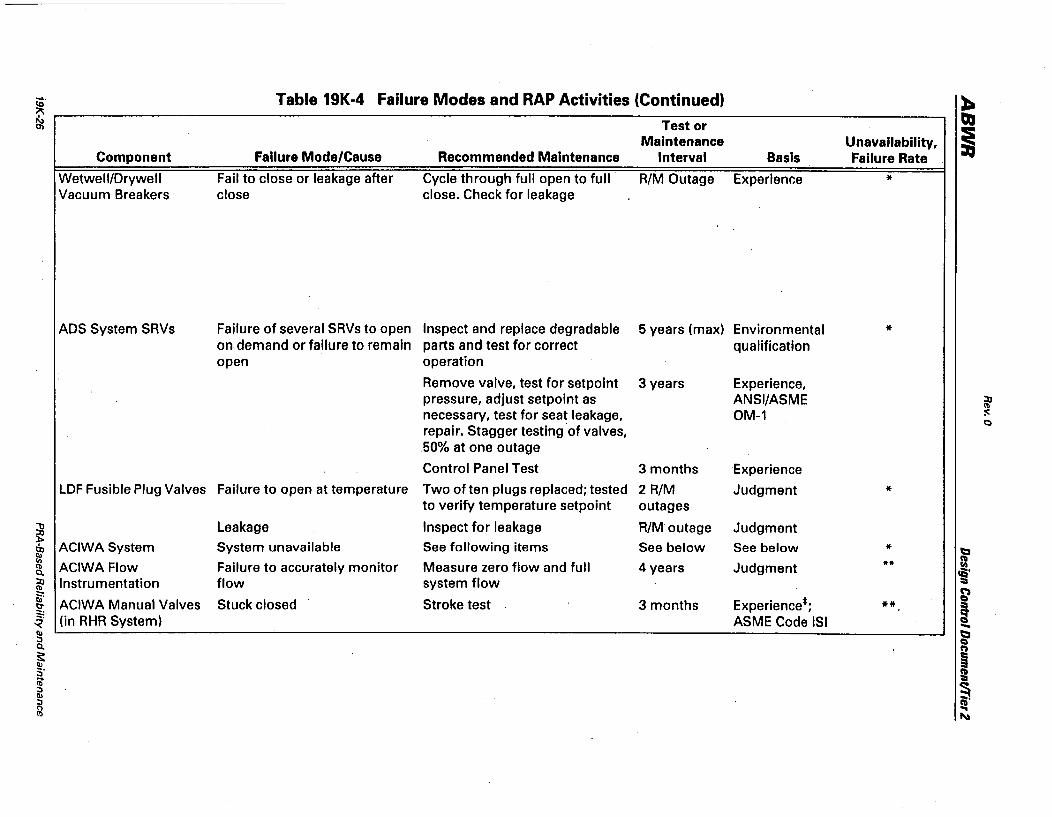
;g l>o a, III I/) <b Q. ~ <b
~ 0-
~ III ::, Q.
s: III 5' ~ ::J III ::, 0 <b
Component
Wetwell/Drywell Vacuum Breakers
ADS System SRVs
LDF Fusible Plug Valves
ACIWA System
ACIWAFlow Instrumentation
ACIWA Manual Valves (in RHR System)
Table 19K·4 Failure Modes and RAP Activities (Continued)
Failure Mode/Cause
Fail to close or leakage after close
Failure of several SRVs to open on demand or failure to remain open
Failure to open at temperature
Leakage
System unavailable
Failure to accurately monitor flow
Stuck closed
Recommended Maintenance
Cycle through full open to full close. Check for leakage
Inspect and replace degradable parts and test for correct operation
Remove valve, test for setpoint pressure, adjust setpoint as necessary, test for seat leakage, repair. Stagger testing of valves, 50% at one outage
Control Panel Test
Two of ten plugs replaced; tested to verify temperature setpoint
Inspect for leakage
See following items
Measure zero flow and full system flow
Stroke test
Test or Maintenance
Interval
R/M Outage
5 years (max)
3 years
3 months
2 RIM outages
R/Moutage
See below
4 years
3 months
Basis
Experience
Environmental qualification
Experience, ANSI/ASME OM-1
Experience
Judgment
Judgment
See below
Judgment
Experience*; ASME Code lSI
Unavailability, Failure Rate
*
*
*
* **
**
~ :0:: c:)
t:J ~
cQ' :::i
~
! -i' " ~ ~ § 111' ... ~
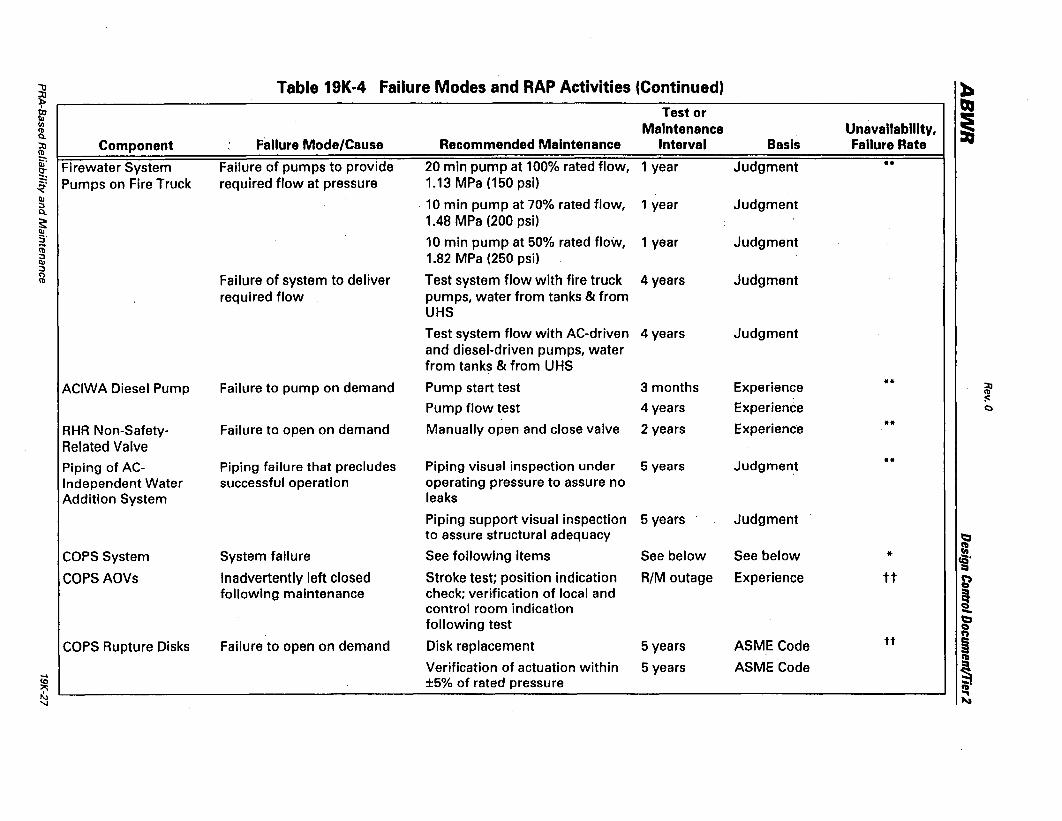
~ Table 19K·4 Failure Modes and RAP Activities (Continued) :a:. g, Test or ~ C/)
Maintenance Unavailability, i <b Cl. :n Component Failure Mode/Cause Recommended Maintenance Interval Basis Failure Rate <II
~ Firewater System Failure of pumps to provide 20 min pump at 100% rated flow, 1 year Judgment ** ~
~ Pumps on Fire Truck required flow at pressure 1.13 MPa (150 psi) III
10 min pump at 70% rated flow, 1 year Judgment ::3 Cl.
~ 1.48 MPa (200 psi) s' 10 min pump at 50% rated flow, 1 year Judgment .... <II ::3 1.82 MPa (250 psi) III :::J (')
Failure of system to deliver Test system flow with fire truck 4 years Judgment <II
required flow pumps, water from tanks & from UHS
Test system flow with AC-driven 4 years Judgment and diesel-driven pumps, water from tanks & from UHS
ACIWA Diesel Pump Failure to pump on demand Pump start test 3 months Experience ** ::0 <b
Pump flow test Experience :<:
4 years 0
RHR Non-Safety- Failure to open on demand Manually open and close valve 2 years Experience **
Related Valve
Piping of AC- Piping failure that precludes Piping visual inspection under 5 years Judgment ** Independent Water successful operation operating pressure to assure no Addition System leaks
Piping support visual inspection 5 years Judgment to assure structural adequacy ~
COPS System System failure See following items See below See below * D: «S. Inadvertently left closed Stroke test; position indication
:::i COPS AOVs RIM outage Experience tt ~
following maintenance check; verification of local and ! control room indication -following test ~ Q
tt CO)
COPS Rupture Disks Failure to open on demand Disk replacement 5 years ASME Code ~ Verification of actuation within 5 years ASME Code !:I
.... § <0 ±5% of rated pressure "" CII· ~ ... 'I ~
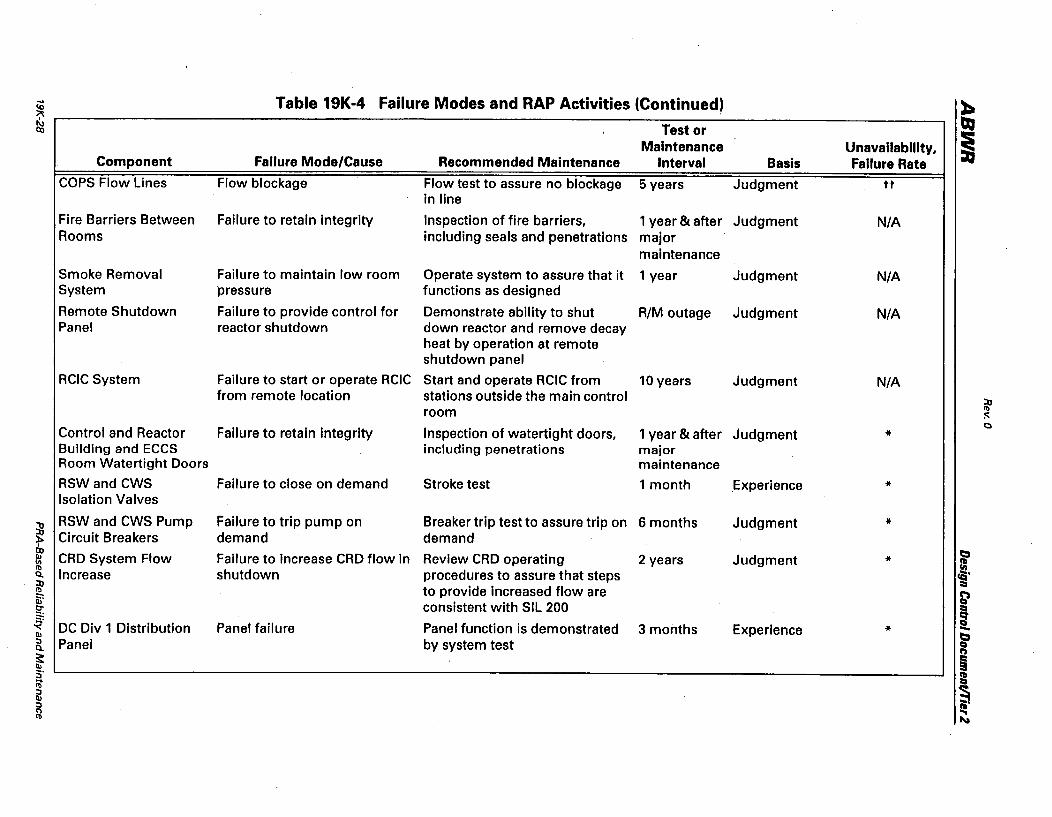
.... Table 19K-4 Failure Modes and RAP Activities (Continued) ). ~ t\, Test or DJ 00
i Maintenance Unavailability, Component Failure Mode/Cause Recommended Maintenance Interval Basis Failure Rate
COPS Flow Lines Flow blockage Flow test to assure no blockage 5 years Judgment tt in line
Fire Barriers Between Failure to retain integrity Inspection of fire barriers, 1 year & after Judgment N/A Rooms including seals and penetrations major
maintenance
Smoke Removal Failure to maintain low room Operate system to assure that it 1 year Judgment N/A System pressure functions as designed
Remote Shutdown Failure to provide control for Demonstrate ability to shut RIM outage Judgment N/A Panel reactor shutdown down reactor and remove decay
heat by operation at remote shutdown panel
RCIC System Failure to start or operate RCIC Start and operate RCIC from 10 years Judgment N/A from remote location stations outside the main control :n
"' room :0: C)
Control and Reactor Failure to retain integrity Inspection of watertight doors, 1 year & after Judgment * Building and ECCS including penetrations major Room Watertight Doors maintenance
RSWand CWS Failure to close on demand Stroke test 1 month ,Experience * Isolation Valves
~ RSW and CWS Pump Failure to trip pump on Breaker trip test to assure trip on 6 months Judgment *
:to Circuit Breakers demand demand to
CRD System Flow Failure to increase CRD flow in Review CRD operating 2 years Judgment ~ ~ *
= "' Q., Increase shutdown procedures to assure that steps ~' :n to provide increased flow are
:::. ~ ~ iii' consistent with SIL 200 0- ! ~ DC Div 1 Distribution Panel failure Panel function is demonstrated 3 months Experience * -III ~ :J Panel by system test Q Q., n
~ ~ 5' II ib § :J III :J \11' (') .. "' "*
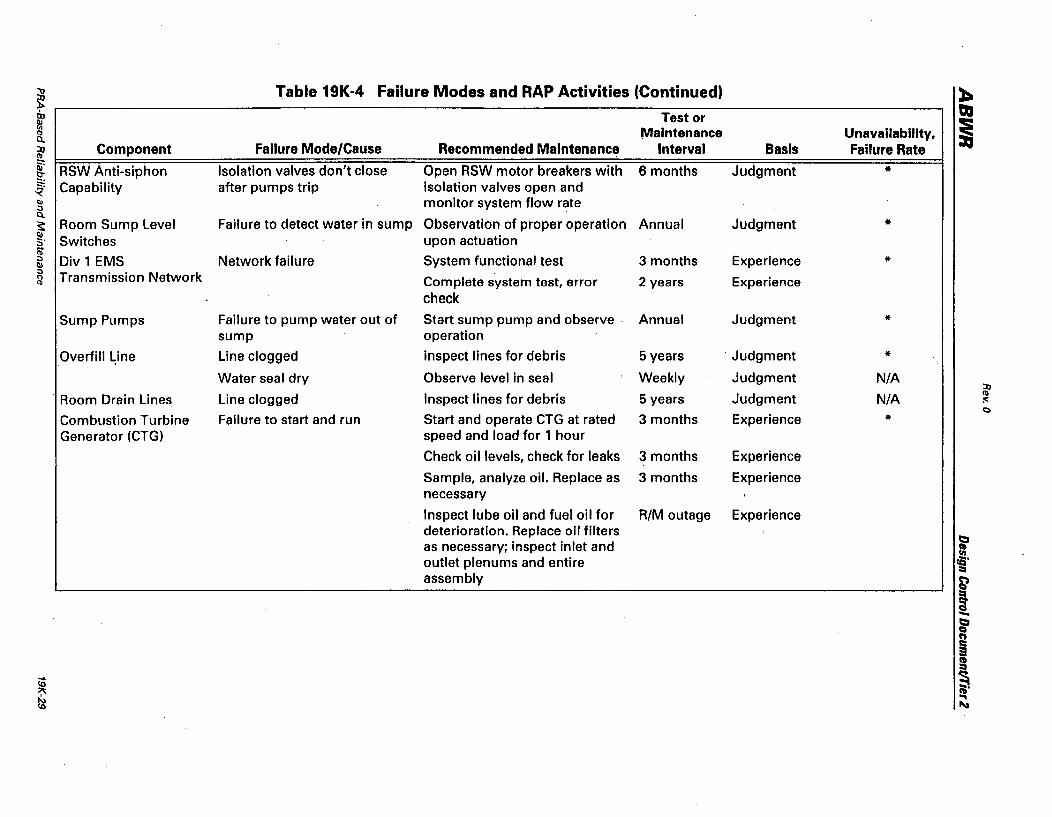
~ Table 19K-4 Failure Modes and RAP Activities (Continued) :b 0:, Test or QI I\)
I III Maintenance Unavailability, <b Q. ::Q Component Failure Mode/Cause Recommended Maintenance Interval Basis Failure Rate <b
~ RSW Anti-siphon Isolation valves don't close Open RSW motor breakers with 6 months Judgment * tT
~ Capability after pumps trip isolation valves open and I\) monitor system flow rate :J Q.
~ Room Sump Level Failure to detect water in sump Observation of proper operation Annual Judgment * Q)
Switches upon actuation 5' ~ :J Div 1 EMS Network failure System functional test 3 months Experience * Q) :J Transmission Network ... Complete system test, error 2 years Experience <b
check Sump Pumps Failure to pump water out of Start sump pump and observe . Annual Judgment *
sump operation
Overfill ~ine Line clogged inspect lines for debris 5 years . Judgment * Water seal dry Observe level in seal Weekly Judgment N/A
::Q
Room Drain lines line clogged Inspect lines for debris 5 years Judgment N/A Ib :0: <:)
Combustion Turbine Failure to start and run Start and operate CTG at rated 3 months Experience * Generator (CTG) speed and load for 1 hour
Check oil levels, check for leaks 3 months Experience
Sample, analyze oil. Replace as 3 months Experience necessary
Inspect lube oil and fuel oil for RIM outage Experience deterioration. Replace oil filters
~ as necessary; inspect inlet and :: outlet plenums and entire cQ'
:::i assembly ~
~ -~ CI n ~ m
<0 § :>I; III' ~ ~
CD ~
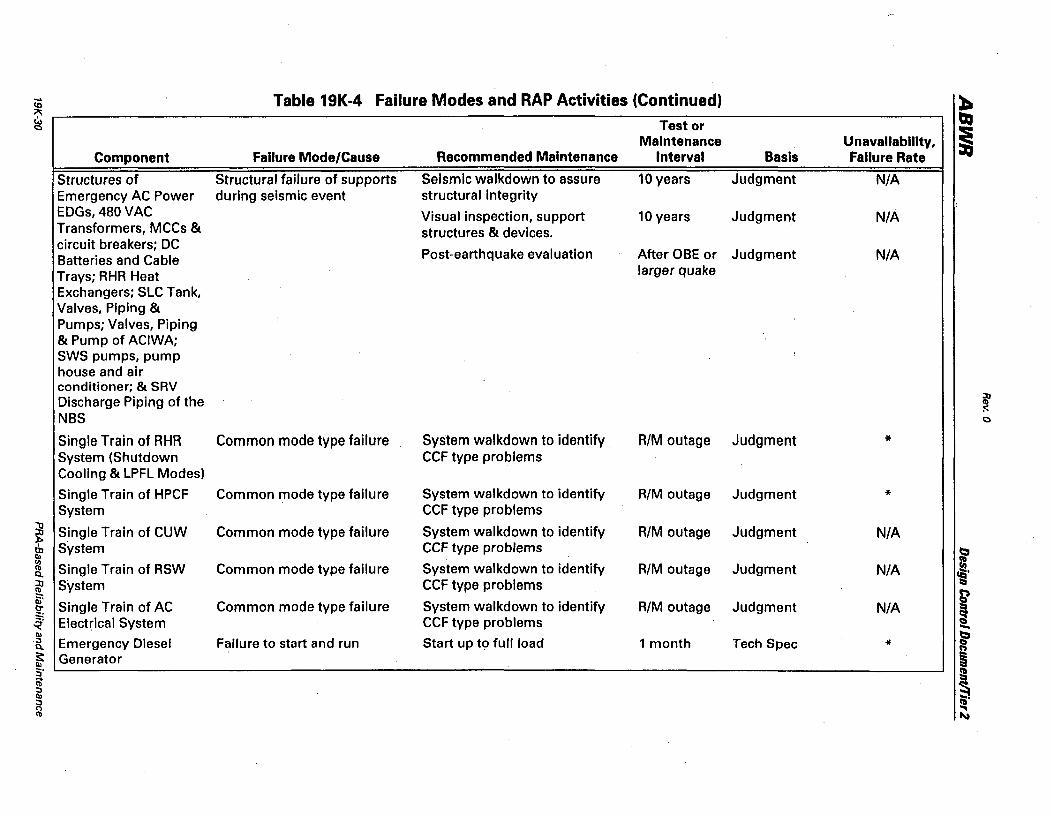
.... Table 19K-4 Failure Modes and RAP Activities (Continued) :b ~ CAl Test or ~ C)
i Maintenance Unavailability, Component Failure Mode/Cause Recommended Maintenance Interval Basis Failure Rate
Structures of Structural failure of supports Seismic walkdown to assure 10 years Judgment N/A Emergency AC Power during seismic event structural integrity EDGs, 480 VAC Visual inspection, support 10 years Judgment N/A Transformers, MCCs & structures & devices. circuit breakers; DC
Post-earthquake evaluation After aBE or Judgment N/A Batteries and Cable Trays; RHR Heat larger quake
Exchangers; SLC Tank, Valves, Piping & Pumps; Valves, Piping & Pump of ACIWA; SWS pumps, pump house and air conditioner; & SRV Discharge Piping of the ~
:c: NBS C)
Single Train of RHR Common mode type failure System walkdown to identify RIM outage Judgment * System (Shutdown CCF type problems Cooling & LPFL Modes)
Single Train of HPCF Common mode type failure System walkdown to identify RIM outage Judgment * System CCF type problems
:E Single Train of CUW Common mode type failure System walkdown to identify RIM outage Judgment N/A ~ tb System CCF type problems t::I Ql a II)
Single Train of RSW Common mode type failure System walkdown to identify RIM outage Judgment N/A Cb Q., cQ' :x, System CCF type problems ~ Cb
~ ~ Single Train of AC Common mode type failure System walkdown to identify RIM outage Judgment N/A c:r ~ ~ Electrical System CCF type problems .... II> t::I :3 Emergency Diesel Failure to start and run Start up to full load 1 month Tech Spec * a Q., II')
~ Generator ~ Ql S' ! Cb ::J Ql ~. ::J 0 ... Cb '"

~ Table 19K-'4 Failure Modes and RAP Activities (Continued) ~ ~ Test or QJ
'" Maintenance Unavailability, I Cb Q. 21 Component Failure Mode/Cause Recommended Maintenance Interval Basis Failure Rate Cb
~ CUW Isolation Valves Failure to operate because of Stroke test 3 months Experience*lI; * 0-
~ (NO, FAil mechanical problems ASME Code lSI III :::.
Visual and penetrant inspection of 10 years Low fa i1'ure rate; Q.
~ stem, ultrasonic inspection of ASME Code lSI s' stem; replace if necessary ~ Experience* :::. III
Failure to operate because of Electrical circuit test 3 months :::. C"l Cb electrical problems
CUW Remote Manual Failure to operate because of Stroke test Refueling out- Judgement * Shutoff Valve mechanical problems. age (non-safety-(NO, FA!) related) .
Failure to operate because of Electrical circuit test Refueling out- Judgement electrical problems. age (non-safety-
related) :J:J Operating RHR Shut- Failure to Operate because of See following items See below See below * Ib
:0:: down Cooling Loop mechanical or electrical prob- e:::.
lems
RHR Pumps Failure to provide adequate flow Discharge pressure test 3 months Table 3.9-8 ** at desired pressure Inlet pressure test
Flow test Vibration test
RHR Injection Failure to operate Stroke test Cold Table 3.9-8 ** Valves, FOOS shutdown
RHR Isolation Failure to operate Stroke test Cold Table 3.9-8 ** ~
Valves, F010, F011 shutdown ~ ta'
RHR Admission Failure to operate Stroke test 3 months Table 3.9-8 ** ::a
Valves, F012 ~
~ -* Not part of DeD (refer to SSAR). ~ CI C'I
t RCIC component failure rates are included within the system unavailability. ~ :j: These types of valves and turbines have been used in operating BWRs, so there is much experience to guide owners/operators in care of the equipment. m
.... f Switchyard component failure rates are included within the switchyard equipment failure rate. ~ ~ ** ACIWA component failure rates are included within the system unavailability. t.l ... S ~
tt COPS component failure rates are included within the system unavailability. (Failure of the rupture disks to actuate upon demand before structural failure of the ~ containment dominates failure of COPS.)
** RHR component failure rates are included within the system unavailability.
Rev. 0
ABWR Design Control Document/Tier 2
19L ABWR Shutdown Risk Evaluation
19L.1 Purpose
The purpose of this study is to review the potential risk associated with ABWR operation while the plant is shut down. Events that have a potential to lead to accidents when the ABWR plant is shut down for maintenance or refueling are identified and reviewed against ABWR plant features which prevent and mitigate these accidents.
Additional information on ABWR shutdown risk is contained in Appendix 19Q.
19L.2 Conclusions
It is concluded that the ABWR plant is adequately protected against accidents during shutdown conditions. It is judged that the probability of core damage during shutdown periods is negligible and therefore it is concluded that no modifications to the ABWR plant design are required. It is also concluded that a detailed probabilistic risk assessment (PRA) for the ABWR shutdown conditions is not required.
19L.3 Introduction
General Electric completed a PRA for the ABWR plant as part of Tier 2. The internal event PRA (Section 19.3) provided an extensive analysis of transients and accidents that initiate during power operation. The seismic PRA (Section 19.4) also consisted of events that initiate during power operation. In both PRAs, it was judged that the risks during shutdown conditions would be low with respect to those during power operations for several reasons:
(I) Most of the transients that disturb power operations do not apply to the shut down plant
(2) Low system pressure reduces the already small frequency ofloss of coolant events due to pipe break
(3) Low decay heat means long time periods are available to restore cooling capability should residual heat removal system cooling be interrupted
However, the NRC has requested (Reference 19L-I) that GE review the risks associated with shutdown in more detail to support the conclusion that such risks are low.
Shutdown risks have not been studied in detail in the past. In the Reactor Safety Study (Reference 19L-2) the shutdown risks were estimated to be negligible. EPR! conducted a somewhat detailed review of the shutdown risks for the Zion plant, a pressurized water reactor (PWR) (Reference 19L-3), and concluded that the mean core damage frequency (CDF) for the shutdown conditions is about a factor of four lower than the corresponding value for power operation. In a subsequent study (Reference 19L-4) for
ABWR Shutdown Risk Evaluation 19L-1
ABWR Rev. 0
Design Control Document/Tier 2
the Seabrook plant, anotherP~ the shutdown risk waS calculated to be about a factor of 5 lower than that for power operation. A recen t French study (Reference 19L-5) has concluded that shutdown risks for the Paluel PWR plant constitute about 60% of the total plant risk. Recently, the NRC has launched studies to estimate the risk associated with shutdown conditions for two plants: Surrey (PWR plant, analyzed by Brookhaven) and Grand Gulf (BWR plant, analyzed by Sandia National Laboratories). The results of
these studies are expected in 1993.
Appendix 19Q contains additional information on ABWR shutdown risk including a risk assessment of the loss of an operating RHR system during shutdown. This risk assessment evaluates the conditional core damage probability given a loss of one RHR train. Minimum sets of systems are identified that, if administratively controlled to not be in maintenance, will ensure an acceptably low conditional core damage probability. Other items discussed in 19Q are:
• ABWR features to minimize shutdown risk
• Procedures for completion of outage plans
• Use of freeze seals
• Evaluation of potential vulnerabilities due to new ABWRfeatures
• How ABWR features could mitigate past events at operating BWRs
19L.4 Scope of the Study
19L.4.1 Mode of Reactor Operation
The various modes of AB'WR reactor operation as noted in the plant technical specifications are shown in Table 19L-1.
The ABWRPRA (Section 19.3) covers periods of power operation (Mode 1) and start up periods (Mode 2), whereas this shutdown study covers periods of cold shutdown (Mode 4) and refueling (Mode 5). Periods of hot shutdown (Mode 3) are not included in either study. Hot shutdown periods are expected to be relatively small compared to those previously analyzed (Modes 1 and 2) and considered in this study (Modes 4 & 5). Also, hot shutdown can be seen as an extension of the shutdown process started during Mode 1 and the incremental increase in risk during this mode of operation is judged to be small since the safety systems available for achieving hot shutdown continue to be available during hot shutdown. Loss ofRHR in Mode 3 is discussed in Subsection 19Q. 7.
The types of events during Modes 4 and 5 considered in this study are as follows:
• Reactivity Excursion Events
19L-2 ABWR Shutdown Risk Evaluation
Rev. 0
ABWR Design Control Document/Tier 2
• Reactor Pressure Vessel Draining Events
• Loss of Cooling Events
• Loss of Decay Heat Removal Events
19L.4.2 Noncore-Related Events
Events which occur inside the containment that are not related to the fuel in the reactor core, but have a potential to release radioactivity to the environment were not included in the PRA, but are addressed in this study. Events outside the containment, such as the rupture of the liquid radwaste tank, are not reviewed in this study since they are judged to be negligible contributors to ABWR Plant risk.
19L.4.3 Summary of Types of Events Considered
The types of events considered in this shutdown risk study are summarized as follows:
(1) Reactivity Excursion Events (Subsection 19L.5)
(2) Reactor Pressure Vessel Draining Events (Subsection 19L.6)
(3) Loss of Core Cooling (Subsection 19L.7)
(4) Loss of Decay Heat Removal Events (Subsection 19L.8)
(5) Non-Core-Related Events (Subsection 19L.9)
19L.5 Reactivity Excursion Events
Reactivity events which have a potential to occur during power operations are examined for their likelihood to' occur during shutdown conditions. In addition, events which have a potential to occur only during shutdown conditions are also reviewed.
19L.S.1 Control Rod Drop Accident
The ABWR fine motion control rod drive (FMCRD) is equipped with several new and unique features to prevent a control rod drop accident compared with locking piston control rod drives (LPCRD) used in the boiling water reactors (BWR) currently in operation. Three modes of failure that could lead to a control rod drop accident have been identified and a summary of the event causes and preventive and mitigative features included in the FMCRD design is provided in Table 19L-2.
Subsection 15.4.9 provides a detailed review of the control rod drop accident during power operation and describes the ABWR features that prevent and mitigate the accident. The following discussion extends the review to shutdown conditions (operating Modes 4 & 5).
ABWR Shutdown Risk Evaluation 19L-3
ABWR Rev. 0
Design Control Document/Tier2
For the rod drop accident to occur during power operation, the control rod must stick initially and then physically separate from the drive on a control rod withdrawal command. Later the same control rod becomes unstuck and drops freely resulting in a rod drop accident. For the rod drop accident to occur during operating Modes 4 & 5, in addition to the above failures, the reactor must also be critical. Since the reactor is subcritical in these modes, even with the above sequence of failures, it is impossible for a rod drop accident to occur. The only time when the above sequence of events could potentially result in a rod drop accident is when it occurs in conjunction with the withdrawal of an adjacent control rod for reasons such as testing. As will be shown by the following consideration and analysis, the probability of a control rod accident during operating Modes 4 & 5 is negligible.
The ABWR features that help prevent control rod accidents are as follows:
(1) Each FMCRD is equipped with dual Class IE separation detection devices that will detect the separation of the control rod from the CRD if the control rod and hollow piston stick and separate from the ballnut of the CRD. The separation switches can also detect if the blade separates from the hollow piston, even with the hollow piston still resting on the ball nut. The separation detection device is in operation at all times. When the separation has been detected, the interlocks will prevent further rod withdrawal (i.e., will initiate a rod block). Also, an alarm signal will be initiated in the control room to warn the operator.
(2) The hollow piston part of the FMCRD is equipped with a latch mechanism. If the hollow piston is separated from the ballnut and the rest of the drive due to a stuck rod, the latch will limit any subsequent rod drop to a distance of 20.32 cm (8 inches). (More detailed descriptions of the FMCRD system are presented in Subsection 4.6.1.)
(3) There is a unique, highly reliable bayonet-type coupling between the control rod blade and the control rod drive. The coupling spud at the top end of the hollow piston engages and locks into a mating socket at the base of the control rod. The coupling requires a 45-degree rotation for engaging or disengaging. Once locked, the drive and rod form an integral unit that must be manually unlocked by specific procedures before the components can be separated. This feature practically assures that the rod and the drive are never accidentally separated, and offers protection against the rod drop failure Mode 2 (Table 19L-2).
(4) Procedural coupling checks are enforced to assure proper coupling.
(5) Interlocks have been provided to assure that inadvertent criticality does not occur because a control rod is withdrawn adjacent to another control rod.
19L-4 ABWR Shutdown Risk Evaluation
ABWR Rev. 0
Design Control Document/Tier 2
The Class IE separation detection device and the control rod withdrawal interlock help prevent each of the three control rod drop failure modes listed in Table 191..-2. The other features that help prevent specific failure modes are discussed below.
Control rod drop failure requires the following events/failures: I
For Failure Mode 1:
(1) Operator withdraws two control rods for testing,
(2) A third adjacent control rod sticks and unsticks at specific times,
(3) Qass IE separation detection of the third control rod or rod block fails,
(4) Operator tries to withdraw the third control rod and the interlock fails,
(5) Operator ignores alarm and continues withdrawal of the third rod, and
(6) Hollow piston latch of the third rod fails.
For Failure Mode 2:
(1) Operator withdraws two control rods for testing,
(2) A third adjacent control rod sticks and unsticks at specific times,
(3) Positive bayonet coupling of the third control rod experiences structural failure,
(4) Class IE separation detection of third control rod or rod block fails,
(5) Operator tries to withdraw the third control rod and the interlock fails, and
(6) Operator ignores alarm and continues withdrawal of the third rod.
For Failure Mode 3:
(1) Operator withdraws two control rods for testing;
(2) Operator installs a third adjacent control rod drive without coupling, and fails to detect the error during procedural coupling checks;
(3) The third control rod sticks and unsticks at specific times;
(4) Class IE separation detection of the third rod or rod block fails; and
(5) Operator ignores alarm and continues withdrawal of the third rod.
ABWR Shutdown Risk Evaluation 19L-5
ABWR Rev. 0
Design ContrDI Document/Tier 2
It is clear from the above discussion that multiple hardware failures and human errors have to occur to cause a rod drop accident. Even without a detailed analysis, it can be seen that the rod drop aCciqent frequency is negligible. It is therefore concluded that the rod drop accident is unlikely to occur during Modes 4 & 5 and is therefore not a safety concern for the ABWR
19L.5.2 Control Rod Ejection Accident
19L-6
The control rod ejection accident during the ABWR power operation starts with a major break in the FMCRD housing weld between the housing and the RPV, or a major break in the drive mounting bolts or a drive spool piece. The accident can also be started with a break in the drive insert line. Following the break, the reactor pressure exerted on the CRD coupling pushes down the hollow piston and the ballnut with a large force. The shaft screw and the motor are forced to unwind, resulting in the rod being ejected. For the control rod ejection accident to occur during operating Modes 4 & 5, in addition to the above failures, the reactor must also be critical. Since the reactor is subcritical in these modes, even with the above sequences of failures, it is impossible for a con trol rod ejection accident to occur. Similarly, the low pressures associated with these operating modes makes the break in the FMCRD housing or drive insert line extremely unlikely. The only time when the above sequence of events (i.e. those that cause control rod ejection accident during power operation) could potentially result in a control rod ejection accident during operating Modes 4 & 5 is when it occurs in conjunction with a reactor hydro-test and withdrawal of an adjacent control rod withdrawn for reasons such as scram time testing. A summary of the causes of the rod ejection accident and the ABWR preventive and mitigative features is provided in Table 19L-3. As will be shown by following consideration and analysis, the probability of control rod ejection accident during operating Modes 4 & 5 is negligible.
The ABWR features that prevent and mitigate control rod ejection accidents are:
(1) A break in the FMCRD housing (or weld between housing and vessel or drive mounting bolts or drive spool piece) is mitigated by integral internal blowout supports ("shootout restraints") (Subsection 4.6.1.2.2.9) which physically prevent the control rod from being ejected.
(2) A break in the drive insert line is mitigated by the following:
(a) Ball check valve in the CRD insert port.
(b) Electromechanical brake
The FMCRD design incorporates an electromechanical brake keyed to the motor shaft. The brake is normally engaged by a passive spring force. It is disengaged when the spring load is overcome by the energized magnetic force. The braking torque between the motor shaft and the
ABWR Shutdown Risk Evaluation
ABWR Rev. 0
Design Control Document/Tier 2
CRD spool piece is sufficient to prevent control rod ejection in the event of a failure in the pressure retaining parts of the drive mechanism. The brake is designed so that its failure will not preven t the control rod from rapid insertion (scram). Additional details on the electromechanical brake are provided in Subsection 4.6.1.
(c) Holding torque provided by the permanent magnet in the step motor prevents rod from being ejected during operating Modes 4 & 5 when the reactor is not under pressure.
Control rod ejection can occur only under the following conditions:
(1) Failure ofFMCRD housing, etc., coupled with failure ofintegral internal blowout support of one FMCRD when an adjacent drive has been withdrawn for testing and reactor is undergoing hydro-test (i.e. reactor is at pressure).
(2) Break in anyone of the FMCRD insert pipes coupled with the failure of the corresponding ball check valve in the insert port and failure of the corresponding FMCRD electromechanical brake when an adjacent drive has been withdrawn for testing and reactor is undergoing hydro-test.
During operating Modes 4 & 5, the time duration that the reactor is at pressure due to hydro-test is very small. Also, because of multiple independent failures required, the probability of a control rod ejection accident through above sequences is judged to be negligibly low. It is therefore concluded that the control rod ejection accident is unlikely to occur during operating Modes 4 & 5 and is therefore not a safety concern for the ABWR.
19L.5.3 Refueling Error
Refueling errors resulting in the loading of fuel bundles in two adjacent uncontrolled cells could result in a reactivity accident. Uncontrolled cells are fuel cells in which control blades have been withdrawn. An accident can result from inserting a fuel bundle into a fueled region of the core which has withdrawn control blades.
Preventive and mitigative features in the ABWR plant are summarized in Table 19L-4 and discussed below:
(1) In the ABWR plant there is very little incentive for unloading the entire core. Generally, utilities resort to unloading the whole core when there is a need to maintain a large number of control rod drives during a refueling outage. In the case of ABWR, very few FMCRD need to be removed for maintenance and therefore there is very little incentive for unloading the whole core.
ABWR Shutdown Risk Evaluation 19L-7
Rev. 0
ABWR Design Control Document/Tier 2
(2) During refueling, only one rod can be withdrawn. This is because Technical
Specifications require that the gang/single selector switch in the Rod Control and Information System (RC and IS) be placed in the single position during
refueling. Any attempt to withdraw a second rod results in a rod block initiated by the RC and IS.
(3) With mode switch in the REFUEL position, if anyone control blade has been removed, then the refueling interlocks prevent hoisting another fuel assembly over the vessel (Subsection 9.1.4.2.7.1).
Therefore, for this accident to take place, the following events must occur.
(1) Utility decides to unload the whole core or perform control blade shuffling in parallel with refueling.
(2) One control blade is removed and its CRD is valved out of service.
(3) The rod block fails and the operators remove the adjacent control blade, and its CRD is valved out of service.
(4) Operator starts loading the fuel bundles. All fuel cells adjacent to withdrawn blades have been loaded except for the last fuel bundle.
(5) The last bundle is lowered into the empty uncontrolled fuel cell.
(6) The control room operator fails to observe SRNM multiplication.
(7) The reactor goes critical and high flux initiates a scram signal but valved out drives cannot scram.
As a consequence of this accident, local fuel failures can be expected. GE has studied this problem and has issued a service information letter (SIL-372) (Reference 19L-7) ,
to assist the operating plants. In that study, GE has found that for the BWR plants
following GE's guidelines, the probability of this accident is negligible. The probability of this accident is also expected to be negligible for the ABWR plants.
19l.5.4 Rod Withdrawal Error
During shutdown, there is a potential for the reactor to become critical if two adjacent control rods are withdrawn inadvertently. The ABWRfeatures that prevent and mitigate this event are as follows:
(1) During refueling, Technical Specifications only allow one rod to be withdrawn
at a time. Any attempt to withdraw a second rod results in a rod block by the rod withdrawal interlock.
19L-8 ABWR Shutdown Risk Evaluation
Rev. 0
ABWR Design Control Document/Tiel2
(2) If the rod block fails and the rod is withdrawn, the reactor will scram on a high flux signal. The scram system is in operation at all times during shutdown.
Therefore, for this event to take place, the following events must occur:
(1) Operator withdraws one control rod for testing.
(2) Operator decides to test a second control rod without inserting the first control rod (i.e., operator does not follow procedures).
(3) The second control rod is adjacent to the first control rod which was withdrawn for testing.
(4) The interlock designed to prevent the withdrawal of the second rod fails.
(5) Rod fails to scram as designed.
The refueling interlock and the scram systems are highly reliable. The combined probability of operator error and failure of the above systems resulting in a rod withdrawal error is judged to be negligible.
19L.5.5 Fuel Loading Error
During refueling, there is a potential for the reactor to become critical if a fuel loading error is followed by withdrawal of a potentially high worth control rod. The ABWR features that prevent and mitigate this event are as follows:
(1) Operators follow specific core loading procedures.
(2) During core loading, interlocks prevent withdrawal of more than one control rod.
(3) Following the full core loading, an as-loaded core verification process is completed.
(4) If the reactor does become critical on a control rod withdrawal, it will be followed by a scram immediately, since the neutron monitoring system is in operation during refueling.
Therefore, for this event to take place, the following events must take place:
(1) Operators fail to follow fuel loading procedures and commit specific loading errors.
(2) Core verification fails to reveal the fuel loading error.
(3) Operator withdraws a control rod for testing.
ABWR Shutdown Risk Evaluation 19L-9
Rev. 0
ABWR Design Control Documellt/Tier 2
(4) Reactor fails to scram.
It should be noted that not all fuel loading errors can initiate this accident. For fuel loading error to be a concern, the high worth fuel bundles must be loaded at the wrong location. The combined probability of this error plus the others listed above is judged to be negligible. Therefore, it is concluded that a fuel loading error during refueling is not a concern for the ABWR plant.
19L.5.6 Conclusion
It is concluded that, during operation Modes 4 and 5, reactivity excursion events have a negligible probability of occurrence and are therefore not a safety concern for the ABWRplant.
19L.6 Reactor Pressure Vessel Draining Events
There is a potential for draining the reactor vessel during operating Modes 4 and 5, either as a result of hardware failures or operator errors or a combination of both. There is a potential for draining the vessel during maintenance activities such as the CRD or reactor internal pump removal and replacement. There is also a potential for draining the vessel when systems feeding to and bleeding from the RPV are in continuous operation. The control room operator routinely monitors the water level and takes corrective actions such as isolating the appropriate valve when the water level drops for unexplained reasons. Certain other corrective actions initiate automatically. A discussion of these drain paths and the preventive and mitigative features of the ABWR design are discussed below.
19L.6.1 FMCRD Replacement
19L-10
FMCRD replacement can take place only during operating Mode 5. The replacement is done in two steps. First the control blade is withdrawn until the blade back-seats on the guide tube to provide a metal to metal contact. This provides the seal for preventing the reactor water from draining.Then the CRD spool piece is removed at which time the spindle adaptor seats on the splined spindle adaptor back seat to prevent any leakage of water from the RPV. The drive can then be removed and replaced. This arrangement of preventing vessel draining through back-seating of the control blade is the same as the one used in the operating BWR plants. There is still a potential for the operator to
remove the blade inadvertently. The probability of this error is minimized through administrative controls. Occasionally a small amount of water leakage is experienced due to imperfect sealing of the control blade. However, based on hundreds of reactoryears of operating experience, it is judged that the probability of draining the vessel during FMCRD replacement is negligible.
ABWR Shutdown Risk Evaluation
Rev. 0
ABWR Design Control Document/Tier 2
19L.6.2 Reactor Internal Pump
There is a potential for draining the RPV while the reactor internal pumps (RIP) are undergoing maintenance or replacement. Two such maintenance activities, replacement of the RIP motor and replacement of the RIP impeller are discussed below and summarized in Table 19L-5.
19L.6.2.1 RIP Motor Replacement
This activity is carried out only during operating Mode 5. Mter the bolts are loosened at the bottom, the whole pump moves down by about 6 mm until the impeller backseats to prevent leakage of reactor water when the motor cover is removed. A secondary seal is then provided inflated with the help ofa portable pump. At this point, the RIP motor can be removed and replaced.
19L.6.2.2 RIP Impeller Replacement
Impeller replacement can be carried out only after the RIP motor is removed as described above. Following the removal of the motor, a temporary cover plate is bolted at the bottom. The impeller is then removed from the top. The seal is provided by the bolted cover plate at the bottom. Mter the impeller is removed, a cap is installed on the RPVbottom head at the impeller shaft opening to provide additional protection against draining the RPV.
19L.6.2.3 Potential for Draining
Nuclear plants with RIPs have been in operation for over 10 years. Over 500 RIPs and motors have been removed and reinstalled in the European BWR plants without any problem. This has demonstrated that the replacement activities can be carried out without draining the vessel. For draining to occur, as a minimum, the impeller backseat and the inflatable seal have to fail when the motor is being replaced. Administrative procedures assure that impeller removal does not start until the RIP motor is removed and the temporary motor cover plate is bolted. In the most likely failure scenario, it is possible that the sealing between the impeller shaft backseat and the sealing provided by the inflatable seal may not be perfect. However, such failures are detectable, and result only in a small leakage [6.3xlO-5 m3/s (less than one gallon per minute)]. Under these conditions, the operator can always bolt the temporary bottom plate if needed. During impeller replacement, for drainage to occur, the impeller shaft nozzle cap must fail (or be dislodged), finally the bottom plate must also fail. During maintenance on the inflatable seals, a plug is placed over the impeller diffuser inside the RPV to prevent draining. Subsection 19Q.4.2 contains additional information on RIP maintenance.
19L.6.3 Control Rod Drive Hydraulic System
During operating Modes 4 & 5, the control rod drive hydraulic system (CRDHS) continues operating with one pump running to provide purge water to the FMCRDs.
ABWR Shutdown Risk Evaluation 19L-11
ABWR Rev. 0
Design Control Document/Tier 2
With one pump in operation, the head of the pumping water can easily overcome the pressurized head of the RPV; hence, there is no possibility of draining the RPV. In the event that neither pump is in operation, there is a potential for draining the RPV through the CRDRS as discussed below, summarized in Table 19L-6, and shown in Figure 19L-I. As will be shown by the following considerations and analysis, the probability of draining the RPV through the CRD hydraulic system is negligible.
19L.6.3.1 Path 1
When neither pump is in operation, the scram valves will open due to low hydraulic control unit (RCV) charging header pressure, and will stay open if
(1) The reactor protection system (RPS) scram logic is not reset, or
(2) There is no instrument air available to the scram valve, or
(3) The scram pilot solenoid valves are disconnected from the RPS scram circuits.
This, combined with the failures of the CRD ball check valve and check valve (FIl5), and the mechanical failure of the RCV maintenance isolation valves (FIOI, Fl40) and RCV drain valve (FII3) to isolate when closed by the operator or the operator error to leave them open, will lead to drainage of the RPV into the CRD hydraulic system.
Multiple failures are necessary for path 1 to occur. Should they occur in one RCV, only 2 CRD's will be affected. In addition, the size of the piping connection between the RPV and CRDRS, being only 32A allows for a discharge rate which will provide enough time to remedy the situation. Therefore, the probability of draining the RPV through this path is judged to be negligible.
19L.6.3.2 Path 2
79L-72
In the event where neither pump is in operation and the scram valves fail to open, there is still another potential path for draining the RPV through the CRDRS. Similar to the failures that resulted in path 1, (Subsection 19L.6.3.I) the CRD ball check valve must fail, and the RCV maintenance isolation valves (FIOI and FI40) must be open by operator error or mechanical failure. In addition, the scram valve must fail to open, the test port valve (FI4I) must be open by operator error or by mechanical failure, and testing equipment (or lack of) must fail. A drainage of the RPV through this path would lead to contamination of the plant environment.
Again, multiple failures are necessary for path 2 to occur; and, should a failure occur, only 2 CRDs will be affected and the slow discharge rate will provide time to correct the situation. Therefore, the probability of draining the RPV through this path is judged to be negligible.
ABWR Shutdown Risk Evaluation
Rev. 0
ABWR Design Control Document!Tiel2
19L.6.3.3 Path 3·
Path 3 is similar to path 2 with the exception that the test port valve (F141) remains closed, the check valve (F138) must fail and HCU isolation valve (FI04) must fail open or be left open by the operator. Such an event could cause drainage of the RPV water into the CRDH System . .As with all other paths in this system, multiple combinations are needed for an event to occur and the drainage rate will be slow. Therefore, 1Jle probability of draining the RPV through this path is judged to be negligible.
19L.6.3.4 Conclusion
In conclusion, because of the multiple failures required in each HCU, it isjudged that the probability of draining the vessel through the CRDHS during shutdown is negligibly low. Also, because of the small drain line size, adequate time is available to remedy the situation should vessel drain start. It is therefore concluded that during operating Modes 4 & 5, draining ofRPV through failures in CRDHS is not a safety concern for the ABWRplant.
19L.6.4 Reactor Water Cleanup System
During the operating Modes 4 & 5, the reactor water cleanup (CUW) system is used in conjunction with the fuel pool cooling and cleanup system (FPC) to provide continuous cleaning of the reactor water. During these modes, both pumps operate to provide 100% capacity. Reactor water flows from the RPV via both the RPV bottom head line and a shared nozzle with the RHR suction line. There is a potential for draining the RPV through the CUW System during shutdown mode as discussed below, summarized in Table 19L-7 and shown in Figure 19L-2 . .As will be shown by the following considerations and analysis, the probability of draining the RPV through the CUW system is negligible.
19L.6.4.1 Path 1
During Modes 4 and 5, one potential path for RPV drainage occurs when valves F500 and F501 are open (failed open or inadvertently opened by operator). Reactor water will drain to the low conductivity waste (LCW) sump in the drywell through a 50A diameter vessel nozzle. This path is unlikely to occur because valves F500 and F501 are in series, F500 is locked closed, and both valves are under administrative control. However, should this drain path be established, when the LCW drywell floor sump water level reaches high level, a persistent alarm is annunciated in the main control room to alert the operator for proper action. Also, drainage will be slow because of the small (50A diameter) size of the vessel drain nozzle, thereby allowing adequate time to correct the situation. Because of the above features, the probability of draining the RPV by this path is judged to be negligible.
ABWR Shutdown Risk Evaluation 19L-13
Rev. 0
ABWR Design Control Document/Tier 2
19L.6.4.2 Paths 2 & 3
Paths 2 and 3 are dependent on the normally closed valves F055A and F055B. Both are used for chemical flushing and decontamination before maintenance. Should either of these two valves be left open during operating Modes 4 or 5 (either by equipment failure or by operator error), reactor water will drain into the reactor building. Floor drain sumps are provided in the reactor building to collect waste from the equipment drains. If the water level in the drain sumps reaches a high level, an alarm is annunciated in the main control room to alert the operator. Should paths 2 or 3 occur, the drain path, a 50A diameter pipe, will allow sufficient time to correct the situation. Should no corrective action be taken manually, on reaching reactor water level 2, valves F002 & F003 will be isolated automatically, terminating the evenL Also, the operator monitors the reactor water level in the control room and takes mitigative actions. Because of all these preventive and mitigative features, the probability of draining the RPV by this path is judged to be negligible.
19L.6.4.3 Path 4
Valves F022, F024 and F025 are normally closed. During the plant startup mode, excess water generated by reactor water level swell is dumped in a controlled manner to the main condenser. Flow control valve F022 regulates the blowdown flow. Should all three be inadvertently left open or fail open at the same time during operating Modes 4 or 5, RPV water will drain to the suppression pool. There are a number of preventive and mitigative features in the ABWR design. The valves are redundant and the valve status (open, closed) is indicated in the control room for all three valves. In the unlikely event that reactor water is drained through this path, high flow will be detected by flow element IT -017 and signals will be sent to the leak detection system to isolate the CUW system. Furthermore, if this drain path is established, it will terminate on reactor level 2 isolation of valves F002 & F003. Also, the operator monitors the reactor water level in the control room and takes mitigative actions. BecaUse of all these preventive and mitigative features, the probability of draining the RPV by this path is judged to be negligible.
19L.6.4.4 Path 5
19L-14
Path 5 is dependent on valves F022 and F023. Both .are normally closed during operating Modes 4 and 5. During startup, excess water generated by reactor water level swell is dumped in a controlled manner to the LCW collector tank. Flow control valve F022 modulates the blowdown flow. If both valves are left open (by operator error or equipment failure), RPVwaterwill drain to the LCW collector tank. There are a number of preventive and mitigative features in the ABWR design. The valves are redundant and the valve status (open, closed) is indicated in the control room for all three valves. In the unlikely event that RPV water drains through these valves, high flow will be detected by flow element IT-017 which will send a signal to the leak detection
ABWR Shutdown Risk Evaluation

ABWR Rev. 0
Design Control Document/Tier 2
system to isolate the CUW System. If established, the drain. path will terminate on reactor level 2 isolation as before. Also, the operator monitors the reactor water level in the control room and takes mitigative actions. Because of all these preventive and mitigative features, the probability of draining the RPV by this path is judged to be negligible.
19L.6.4.5 Path 6
Valve F056, which is used for chemical washing and decontamination before maintenance, is normally closed during operating Modes 4 & 5. If it fails open or is inadvertently left open by the opera'tor when the CUW pump is in operation, reactor water will drain into the reactor building. Similar to path 2, floor drain sumps are provided in the reactor building to collect waste from the equipment drains and high water levels in these sunips will activate an alarm to alert the operator. Since this is a small diameter pipe, the slow drainage rate will allow sufficient time to correct the situation before level 2 is reached at which point the path will terminate on reactor level 2 isolation signal. Also, the operator monitors the reactor water level in the con trol room and takes mitigative actions. Because of all these preventive and mitigative features, the probability of draining the RPV by this path isjudged to be negligible.
19L.6.4.6 Path 7
Path 7 is similar to path 4. If valves F022 and F025 are inadverten tly left open or fail open at the same time, RPV water will drain to the main condenser. The two valves in series and the valve status indicator help lower the possibility of this path occurring. In the unlikely event this path were to occur, flow element IT -017 will detect the high flow and signal the leak detection system to isolate the CUW system. If unmitigated, the drain path will be terminated on reactor water level 2. As in the case for path 4, the probability of draining the RPV through this path is judged to be negligible.
19L.6.4.7 Conclusion
Because of the multiple failures or operator errors required for each of the above paths to occur, and the leak detection instrumentation in the drywell and reactor building that will alert the operator, it is judged that the probability of draining the RPV during shutdown mode through the reactor water cleanup system is negligibly low. Furthermore, as a mitigative measure, at reactor water level 2, CUW system valves F002 and F003 isolate the reactor from the CUW system. In practically all cases, even if all the above features should fail, the RPV drain will stop automatically when the RPV outlet nozzle is uncovered. At that point, there is still 1.6 meters of water over the top of the active core. It is therefore concluded that draining of the RPV through CUW system failures is not a safety concern for the ABWR plant.
ABWR Shutdown Risk Evaluation 19L-15
Rev. 0
ABWR Design Control DocumentlTier 2
19L.6.5 Residual Heat Removal System
The AB'WR residual heat removal (RHR) system is a closed system consisting of three independent pump loops (A, B, and G-where B and C are similar) which inject water into the vessel and/or remove heat from the reactor core or containment. Loop A differs from B and C in that its return line goes to the RPV through the feedwater line
.. whereas loop B & C return lines go directly to the RPV. In addition, loop A does not have connections to the drywell or wetwell sprays or a return to the fuel pool cooling system. However, for purposes of this analysis, the differences are minor and the three loops can be considered identical. The RHR system has many modes of operation, each mode making use of common RHR system components. These components are actuated by the operator; hence, the operation is subject to operator error which could potentially lead to drainage of the RPV. Potential paths for draining the RPV through the RHR system during operating Modes 4 and 5 are discussed below, summarized in Table 19L-8, and depicted in Figure 19L-3. Of the various modes ofRHR operation it was judged that the potential for RfV draining was the greatest during the shutdown cooling mode. Therefore, the poteiItial RPV draining paths start with the RHR in the shutdown cooling mode of operation . .As will be shown by the following consideration and analysis, the probability of draining the RPV through the RHR system is negligibly low. Even if all the preventive and mitigative features fail, RPV draining will stop when the RHR shutdown cooling nozzle is uncovered at which point there is still 1.6 meters of water over the top of the active fuel.
19L.6.5.1 Path 1 (Loop Band Conly)
During the shutdown cooling mode of operation, pump COOl is in operation and valves FOIO, FOIl, FOI2, F004, FOOS and F007 are normally open. One potential path will occur if valve F026 is open (by mechanical failure or operator error). This will lead to drainage ofRPVwater to HCW (high conductivitywater). The preventive and mitigative features are as follows: valves FOIO and FOIl will isolate the reactor from the RHR system at reactor water level 3; the operator monitors reactor waterlevel in the control room and correctly responds to control room indicators and alarms; and the drain path is only a 40A diameter line allowing sufficient time for corrective action. Because of all these preventive and mitigative measures, the probability of draining the RPV by this path is judged to be negligible.
19L.6.5.2 Path 2
19L-16
With the pump running during the shutdown cooling mode of operation, path 2 will be established if the liquid waste flush valves (F029 and F030) are open by mechanical failure or operator error. Through this route, RPV water will drain to radwaste via a 150A diameter pipe. To prevent this from occurring, valves F029 and F030 are required to be closed during shutdown cooling mode, and if open, their open status will be indicated in the control room. Also at reactor water level 3, valves FOIO and FOIl will
ABWR Shutdown Risk Evaluation
ABWR Rev. 0
Design Control Document/Tier2
isolate the system. I"inally, the operator monitors the reactor water level in the control room and takes corrective actions. Because of all these preventive and mitigative measures, the probability of draining the RPV-by this path is judged to be negligible.
19L.6.5.3 Path 3
During the shutdown cooling mode of operation, if the suppression pool return valve . (F008) is open (by mechanical failure or operator error), potential draining path 3 will be established. This path will drain reactor water to the suppression pool. The preventive and mitigative features are as follows: an interlock prevents opening of valve F008 if FO 12 is open and vice versa and indicators in the control room will show the status of F008 and the reactor water level which will prompt the operator to correctly respond to these control room indicators and alarms. In addition, valves FOIO and FOIl will isolate the RHR system at reactor level 3. Because of all these preventive and mitigative measures, the probability of draining the RPV by this path is judged to be negligible.
19L.6.5.4 Path 4
The fuel pool isolation valves (FOI4 and FOI5) are normally closed during shutdown cooling mode. Potential path 4 is established when the fuel pool isolation valves are open (by mechanical failure or operator error). By this path, reactor water will drain into the fuel pool through a 300A diameter pipe. The preventive and mitigative features are as follows: valve FOl4 is equipped with a key lock; and valves FOIO and FOIl will isolate the system at reactor water level 3. Also the operator should correctly respond when alerted by control room alarms and indicators. Because of all these preventive and mitigative measures the probability of draining the RPV by this path is judged to be'
negligible.
19L.6.5.5 Path 5
Potential draining path 5 will occur if the drywell spray isolation valves (FOI7, FOI8) are opened inadvertently or fail to close during the shutdown cooling mode of operation. If this path is established, RPV water will be sprayed in the drywell through a 250A diameter pipe. The preventive and mitigative features are as follows: during shutdown cooling, with the drywell pressure low, valves FOl7 and F018 cannot be opened at the same time because they are interlocked such that both can be opened simultaneously only if the drywell pressure is high. The status of valves FO 17 and FO 18 is indicated in the control room. Futhermore, the isolation valves FOIO and FOIl will isolate on reactor level 3 and the operator monitoring the water level in the control room will take corrective actions to further mitigate this drain path. Because of these preventive and mitigative measures, the probability for draining the RPV by this path is judged to be
negligible.
ABWR Shutdown Risk Evaluation 19L-17

Rev. 0
ABWR Design Control Document/Tier 2
19L.6.5.6 Path 6
During shutdown cooling m<;>de operation, the wetwell spray isolation valve, F019 is norinally closed. If FO 19 is open (by operator error or mechanical failure), RPV water will be sprayed in the wetwell through a 100A diameter pipe. This event is unlikely to occur since it requires F019 to be open, the operator to incorrectly respond to control room alarms and indicators, and the failure of valves FOlO and FOIl to isolate the reactor from the RHR system at level 3. Because of these preventive and mitigative measures, the probability of draining the RPV by this path is negligibly low.
19L.6.5.7 Path 7
During shutdown cooling mode operation, opening of normally locked closed valves FO 16 (by mechanical failure or operator error) establishes drain path 7 between the . RPVand the fuel pool. However, since the fuel pool is at a higher elevation than the RPV, water cannot drain from the RPV to the fuel pool when the RHR pumps are not operating, and therefore this path is not a concern for the ABWR plant.
19L.6.5.8 Path 8
Potential path 8 will occur during shutdown cooling mode of operation if the nonnally closed valve FOO 1 is open (inadvertently or by mechanical failure) . Path 8 will drain RPV water to the suppression pool through an 450A diameter pipe. The preventive and mitigative features in the design are as follows: both FOIO and FOIl are interlocked to be opened only when the RPVis depressurized, FOl2 is interlocked such that it cannot be opened unless FOOl is closed, and similarly, valve FOOl cannot be opened unless valve FO 12 is closed. If the RPV drain path is established, draining will stop on reactor level 3 isolation of valves FOIO & FOIL Also, the operator monitors the reactor level in the control room and takes corrective actions. Because of all these preventive and mitigative measures, the probability of draining the RPV through this path is judged to be negligible.
19L.6.5.9 Path 9
19L-18
Path 9 has the potential to drain reactor water to the suppression pool. The minimum flow valve, F021, will automatically open when pump COOl is running and the flow through the main loop (downstream of F004 and FO 13) is below the low flow setpoin t. The valve will automatically close when the low setpoint is reached indicating sufficient flow. Inadvertent opening of this valve will divert the flow to the suppression pool. The preventive and mitigative features in the design are as follows: valve F021 closes on receipt of nonnal flow signal in the main loop, the isolation valves FOIO and FOIl will isolate on reactor level 3 and the operator monitors the reactor water level in the control room and will take corrective actions to mitigate the event. Because of all these preventive and mitigative measures, the probability of draining the RPV by this path is negligibly low.
ABWR Shutdown Risk Evaluation
Rev. 0
ABWR Design Control Document/Tier2
19L.6.5.10 Conclusion
Because of the multiple failures or operator errors required for each of the above paths to occur, and the numerous keylocks, valve interlocks and control room indicators to prevent such paths, it is judged that the probability of draining the vessel during shutdown, through the RHR system is negligibly low. Furthermore, as a mitigative measure, in all Cases, at reactor water level 3, valves FOIO and FOIl isolate the reactor from the RHR system. Even if all these safety features fail, the RPV draining will stop automatically when the RHR shutdown cooling nozzle is uncovered at which point there is still 1.7 meters of water over the top of the active fuel. It is therefore concluded that draining ofRPV through failures in RHR System is not a safety concern for the ABWRplant.
19L.6.6 Summary of Reactor Pressure Vessel Draining Events
Based on a review of maintenance activities which have the potential to drain the RPV and based on a review of the operation of water systems which are connected to the RPV, it is concluded that during operating Modes 4 and 5, draining of the RPV is not a safety concern for the ABWR plant.
19L.7 Loss of Core Cooling
19L.7.1 Introduction
During operating Modes 4 & 5, with the RHR system in operation in the shutdown cooling mode, no steam is being produced in the reactor and therefore there is no need for making up reactor coolant inventory using core cooling systems. Thus loss of core cooling capability in itself is not a concern unless either the RHR system becomes unavailable causing loss of coolant inventory through evaporation or the RPV is drained. As discussed in Subsection 19L.6 the 'probability of draining the RPV is
negligible. The remaining sequences where loss of core cooling becomes a potential concern are discussed below.
Subsection 19Q.7 contains additional information on the risk associated with loss of core cooling during shutdown.
19L.7.2 Success Criteria
Many systems continue to be available for cooling the core during operating Mode 4.
A list of core cooling systems that satisfy the core cooling success criteria are as follows:
• CRDHS, or
• HPCFBorC, or
• LPFLA, B or C, or
ABWR Shutdown Risk Evaluation 19L-19
Rev. 0
ABWR Design Control Document/Tier 2
• 1 feedwater pump + 1 condensate pump + 1 condensate transfer pump, or
• AC-independent Water Addition System
Note that no credit is taken for the RCIC because oflack of steam in the reactor. If none of these systems are available initially, the reactor will heat up and be repressurized. If one of the high pressure make up systems is recovered, then immediate coolant makeup is possible. However, should one of the failed low pressure core cooling systems be recovered, the reactor will have to be depressurized prior to coolant injection.
The systems that satisfy the core cooling success criteria for operating Mode 5 are essentially same as those for operating Mode 4. One difference is that if none of these systems are available during operating Mode 5, the reactor will not be preSSurized since the pressure vessel head has been removed. An additional difference is that if none of these sources of water is available, a flexible hose connected to the AC independent water addition system from any outside source of water can be used to cool the core since the decay heat rate diminishes substantially by the time operating Mode 5 is reached. It is thus concluded that loss of core cooling is more limiting for operating Mode 4 than for operating Mode 5. Therefore, the remainder of this review focuses on operating Mode 4.
19L.7.3 Review of Accident Sequence
The sequence of concern starts with a loss of RHR event. It is assumed that the low pressure core flooder LPFL (A, B & C) are unavailable and for core damage to occur the loss of RHR must be followed by failure of all remaining core cooling systems that meet the success criteria. Based on results of the internal event PRA, it is clear that the combined probability of failure of all systems is dominated by support system failures, especially offsite and onsite power failures. Table 19L-9 shows the dependency of the core cooling systems on power support systems. The ABWR plant technical specifications require that during operating Mode 4, at least one offsite AC power source and two diesel generators be available. In addition, the combustion turbine generator is expected to be available.
It is judged that the time window during which operating Mode 4 is most vulnerable to accidents is the first week of operation in that mode. Following that period, decay heat levels are low enough that there is a high probability of recovering a failed system. During the first week, the most dominant cut-set for core damage is expected to consist
of the following basic events:
(a) Loss of offsite power during the first one week period of operating in Mode 4 with no recovery, and
(b) Failure of diesel generators, and
19L-20 ABWR Shutdown Risk Evaluation

Rev. 0
ABWR Design Control Document/Tier 2
(c) Combustion turbine generator failure to start, and
(d) Failure of operator to initiate the AGindependent Water Addition System, and
(e) Failure of operator to recover anyone of the failed systems.
The combined failure probability of all these systems is negligible, even when excluding operator failure to recover.
It is recognized that there are other cutsets that could contribute to core damage. Also, at certain times, some of the systems may be unavailable due to maintenance. (The plant technical specifications control the number of safety systems that can unavailable at any given time.) On the other hand, the above calculation takes no credit for power or equipment recovery, even though sufficient time is available. Therefore, it is judged that even after the above considerations are factored in, the combined failure probability would be negligible.
19L.7.4 Conclusion
It is concluded that loss of core cooling capability during operating Modes 4 & 5 is a negligible contributor to ABWR plant risk.
19L.8 Loss of Decay Heat Removal Events
19L.8.1 Introduction
In the ABWR internal event PRA, (Section 19.3) accident sequences were analyzed to a point where the reactor is in a condition of hot stable shutdown with the reactor mode switch in shutdown, the reactor subcritical, pressures and temperatures stabilized and within limits, containment and suppression pool cooling being maintained and vessel water level controlled. The heat removal systems were evaluated for the first 20 hours of operation. Therefore, the shutdown risk evaluation for operating Mode 4 begins at 20 hours after shutdown. Twenty hours of shutdown cooling resUlts in a reactor coolant temperature of 294.85 K (51.7°C) or less. It takes about 2 to 3 days to reach operating Mode 5. Therefore, evaluation for operating Mode 5 starts at about 48 hours after reactor shutdown.
Subsection 19Q.7 contains additional information on the risk associated with loss of decay heat removal during shutdown conditions.
19L.8.2 Accident Initiators
The core cooling and heat removal systems are either available or in operation at the onset of operating Modes 4 and 5. (Scenarios involving failure of these systems prior to shutdown are analyzed in the internal event PRA.) This means, prior to operating Mode 4, at least 20 hours of core and containment cooling has been successfully in
ABWR Shutdown Risk Evaluation 19L-21
ABWR Rev. 0
Design Control Document/Tier 2
· operation. At this point, accidents involving loss of the intended RHR heat removal function can be initiated only as follows:
• Internal failures in the RHR System, or
• Failures in the RHR support systems such as off site and onsite power, or service water, or
• Improper operation of the RHR system (flow diversion by operator).
19L.8.3 Success Criteria
19L-22
The ABVVR plant features many redundant means of removing decay heat. In the internal event PRA, depending upon the sequence, credit has been taken for the following:
• Main condenser (normal heat removal path)
• RHR (3 redundant loops)
• Reactor water cleanup heat exchanger
An overpressure relief rupture disk (containment vent) has been added to the ABWR design and this can. also be used to remove the containment heat under certain conditions.
The success criteria for operating Mode 4 are given in Table 19L-IO. It should be noted that even though the reactor is at low pressure, main condenser and CUW heat exchangers can still be used to remove decay heat following failure of the RHR system. The overpressure relief rupture disk comes into play when the containment is pressurized following the loss of all heat removal systems.
During operating Mode 5 both the RPV and drywell heads are open and the containment is thus "vented" already. Complete failure of heat removal functions would result in initially heating the pool of water and eventually, in the worst case, boiling the water. For all practical purposes this is similar to removing the containment heat through the overpressure relief rupture disk (vent) following which the suppression pool begins to boil. In both cases water makeup to the respective pools is necessary. In other words, operating the reactor in Mode 5 can be seen as operating with a vented containment, and if heat removal functions are lost during this mode, the only action needed is to make up the water inventory lost by evaporation.
There is sufficient time available to provide the makeup water and therefore loss ofRHR during operating Mode 5 is not judged to be a safety concern. Therefore, the rest of this review focuses on operating Mode 4.
ABWR Shutdown Risk Evaluation

Rev. 0
ABWR Design Control DocumentlTier 2
19L.8.4 Review of Accident Sequence
At the start of the event, the core cooling as well as the heat removal functions are in operation. Initially, the heat is removed by the main condenser and after the reactor pressure is reduced, if the reactor is not isolated, the RHR system is engaged in the shutdown cooling mode. If the reactor is isolated, core cooling is provided by the high pressure system and the heat rejected to the suppression pool through the SRVs is removed by the R.HR system in the suppression pool cooling mode. At about 20 hours into the event, with the reactor temperature at approximately 294.85 K (5L7°C), the RHR system fails as a result of internal failures, or support system failures. Loss of RHR function is the initiator. Success criteria are listed in Table 19L-1O.
The probability that all these systems will fail due to unrelated problems is judged to be negligible. It is more likely that these systems will fail as a result of failures in the support systems. Table 19L-ll shows the power related support systems for the systems listed in the·success criteria. The AB"WR plant technical specifications require that during operating Mode 4, at least one offsite AC power source and two diesel generators be available. In addition, the combustion turbine generator is expected to be available. The most likely accident initiator is the loss of off site power. If power is not recovered in time (say 24 hours), and the diesel generators and the combustion turbine generator fail to start, then the only heat removal system available is the overpressure relief rupture disk.
The combined failure probability of this event sequence is negligible. It is recognized that this analysis does not include all the failure paths and does not account for equipment that are unavailable due to maintenance. On the other hand, it should also be noted that failure of heat removal function does not automatically lead to core damage as has been assumed above. Only a fraction of these sequences lead to core damage as would be evident if detailed containment event trees were developed. On balance, it is concluded that the probability of core damage, resulting from a loss of containment heat removal function during operating Mode 4 is negligible. It has also been identified that no problems are anticipated during operating Mode 5 as long as the water evaporated by boiling is periodically made up. Thus, in summary, it is concluded that loss of containment cooling function during operating Modes 4 and 5 pose a negligible threat to the ABWR plant safety.
19L.9 Noncore-Related Accidents
19L.9.1 Introduction
Many noncore-related accidents can be postulated during operating Modes 4 & 5. However, it is judged that the consequences of any accident that does not involve fuel bundles is negligible. Thus for instance, drainage of the radwaste tank is not considered
ABWR Shutdown Risk Evaluation 19L-23
ABWR Rev. 0
Design Control Document/Tier 2
in this study. Accidents considered here are the fuel bundle drop accident, spent fuel cask drop accident, loss of fuel pool cooling, and drainage of fuel pool.
19L.9.2 Fuel Drop Accident
19L-24
The fuel handling accident can only be assumed to occur as a sequence of failures in the fuel assembly lifting mechanisms which will result in the dropping of a fuel bundle and the subsequent release of radioactive materials from damaged rods. A detailed probabilistic analysis of such an accident was not performed based upon the following considerations.
(1) The probability for the failure of mechanisms involved in fuel handling either through mechanical failure or human action is assumed very small based upon the small number of cases seen to date throughout the nuclear industry in the handling of literally thousands of fuel bundles. Therefore, initially the probability of a fuel bundle being dropped is very small.
(2) Given the occurrence of a fuel bundle being dropped, the radiological consequences depend upon the distance of fall, the angle of impact, and the surface onto which the bundle would fall. For the exposure time during which any fuel bundle is being moved from point A to point B, the potential consequences are a function of probability involving distance of fall, type of bundle being dropped (exposed or fresh), and surface on to which the bundle can fall (steel, concrete, other bundles and their exposure history).
(3) Based upon the reasoning in paragraph 2 above and upon current operating experience, the more probable fuel drop events result in damage to no to a few rods (less than 10). Considering the factor of radioactive decay prior to
. handling exposed fuel, the use of safety systems (the failure of which would reduce the potential accident probability), volatility and migrability of the fission products through water pools and potential in plant transport analysis, maximal whole body and thyroid doses less than a few tenths of a milliRem at extremely low probabilities could be expected at the site boundary.
(4) Given releases for larger events at lower probabilities and the factors above, doses up to one millirem at even lower probabilities are estimated.
It is therefore concluded that this accident is a negligible contributor to AB'WR plant risk.
ABWR Shutdown Risk Evaluation
Rev. 0
ABWR Design Control Document/Tier 2
19L.9.3 Spent Fuel Cask Drop Accident
The spent fuel cask drop accident is discounted as a credible accident based upon the following logic.
(1) The probability of dropping aspen t fuel cask during handling is extremely low due to the mechanical interlocks and safety systems used. During handling the cask is moved via a type 1 crane with redundant rigging with both procedural and mechanical interlocks to prevent movement of the cask over areas such as the spent fuel pool.
(2) During handling from the cask loading pit to the cleaning pit the cask lid is in place and the height of lift is limited such that a fall would not result in any significant damage to the cask and no damage to the cask contents. The cask is sealed in the cleaning pit and given that a drop occurs over the hatch in transient to the loading dock, the maximum fall would not be expected to result in sufficient impact to damage the cask based upon cask design requirements from DOE.
(3) Even assuming potential releases from a cask, the minimum time for fuel movement is generally one year after removal from the core which results in the decay of all volatile isotopes except Kr-85. Owing to Kr-85's low gamma energy, such a release would result in doses which are less than 0.1E-06 Svor accidents of probability on the order of or less than 1.0E-06 at the site boundary.
It is therefore concluded that this accident is a negligible contributor to ABWR plant risk.
19L.9.4 Loss of Fuel Pool Cooling
In the ABWR plant, the fuel pool cooling and cleanup FPC system is backed up by the RHR system (2 of the 3 loops) . Therefore, fuel pool cooling function is lost only if both ,the FPC and two loops ofRHR system become unavailable. Even if these systems become unavailable, adequate time will be available for repairs to be made to restore the failed systems before' fuel damage occurs. Providing makeup water alone will mitigate the accident and many sources of water exist including fire or potable water. The combined probability of loss of FPC and RHR and failure to repair the failed system or provide makeup water isjudged to be negligible and therefore it is concluded that this event is a negligible contributor to ABWR plant risk.
19L.9.5 Drainage of Fuel Pool
FPC system is designed with no piping penetrations or drain paths which can drain the fuel pool. Further, there are no potential paths for siphoning water from the pool. Thus
ABWR Shutdown Risk Evaluation 19L·25
ABWR Rev. 0
Des~nCo~oIDocumen~eT2
it is impossible to drain the pool inadvertently. For fuel pool drainage to occur, the pool liners must fail causing leakage of water from the pool. A postulated means of damaging the liners is dropping of a heavy load, such as the fuel transfer cask in the fuel pool. In WASH-1400 (Reference 19L-2) the probability of draining the pool by this postulated accident was estimated to be negligible. The WASH-1400 analysis isjudged to be applicable for ABWR. also, and it is therefore concluded that this event is a negligible contributor to ABWR plant risk.
19L.10 References
19L-1 Dino C. Scaletti, "Summary of Meetings with GE on ABWR-item 4", USNRC, june 8, 1990.
19L-2 "Reactor Safety Study-An Assessment of Accident Risks in U. S. Commercial Nuclear Power Plants", WASH-l400 (NUREG-75/014), USNRC, October 1975.
19L-3 "Zion Nuclear Power Plant Residual Heat Removal PRA", NSAC/84, NSAC/EPRI,july 1985.
19L-4 "Seabrook Station Probabilistic Safety Study-Shutdown (Modes 4,5 and 6)", New Hampshire Yankee, May 1988.
19L-5 A. Vl1lemeur, et al. (Electricite de France), "Living Probabilistic Safety Assessment of a French 1300 MWe PWR Nuclear Power Plant Unit: Methodology, Results and Teachings", Published at TIN-Workshop on Living PSA Application, Hamburg, FRG, May 7-8, 1990.
19L-6 "Advanced Light Water Reactor Utility Requirements Document, Volume II, Chapter 1, Appendix A: PRA Key Assumptions and Ground Rules", Draft, EPRI, August 1988.
19L-7 "Recommended Technical Specifications for Fuel Loading", service infonnation letter No. 372, General Electric, june 1982.
19L-26 ABWR Shutdown Risk Evaluation
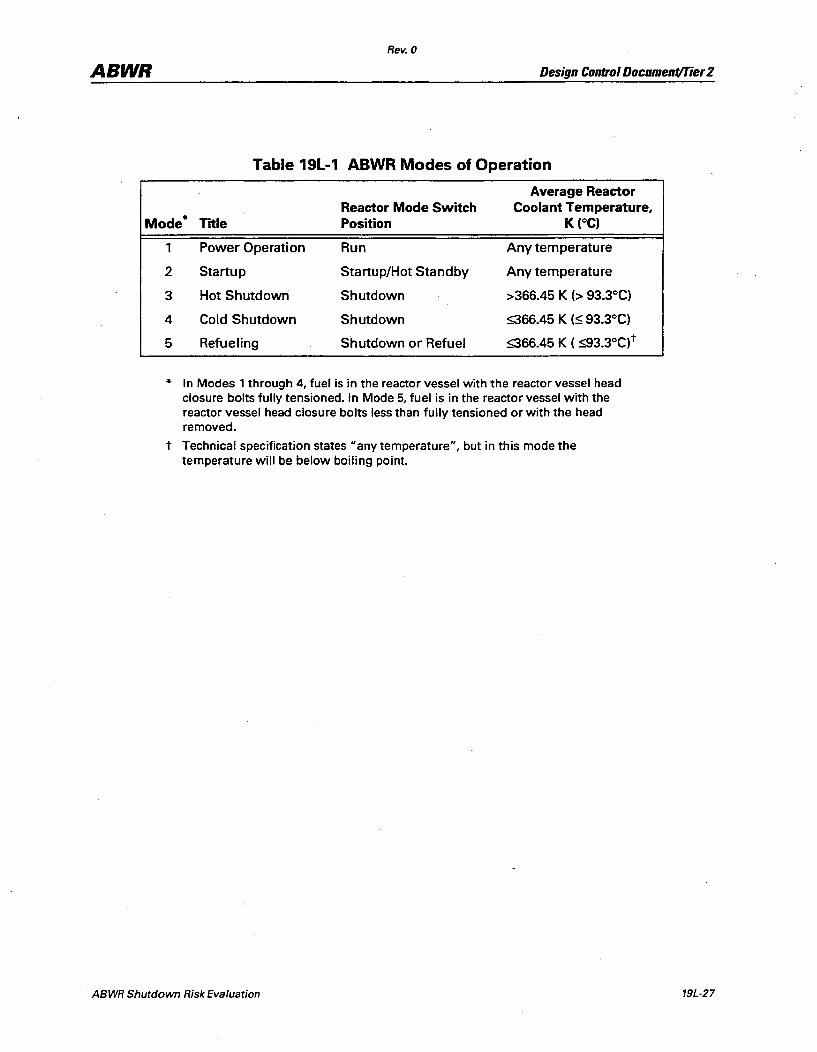
Rev. 0
ABWR Design Control Document/Tier 2
Table 19L-1 ABWR Modes of Operation
Average Reactor Reactor Mode Switch Coolant Temperature,
Mode* Trtle Position K (OC)
1 Power Operation Run Any temperature
2 Startup Startup/Hot Standby Any temperature
3 Hot Shutdown Shutdown >366.45 K (> 93.3°C)
4 Cold Shutdown Shutdown :;366.45 K (~ 93.3°C)
5 Refueling Shutdown or Refuel ~66.45 K ( ~3.3°C) t
* In Modes 1 through 4, fuel is in the reactor vessel with the reactor vessel head closure bolts fully tensioned. In Mode 5, fuel is in the reactor vessel with the reactor vessel head closure bolts less than fully tensioned or with the head removed.
t Technical specification states u any temperature", but in this mode the temperature will be below boiling point.
ABWR Shutdown Risk Evaluation 19L-27
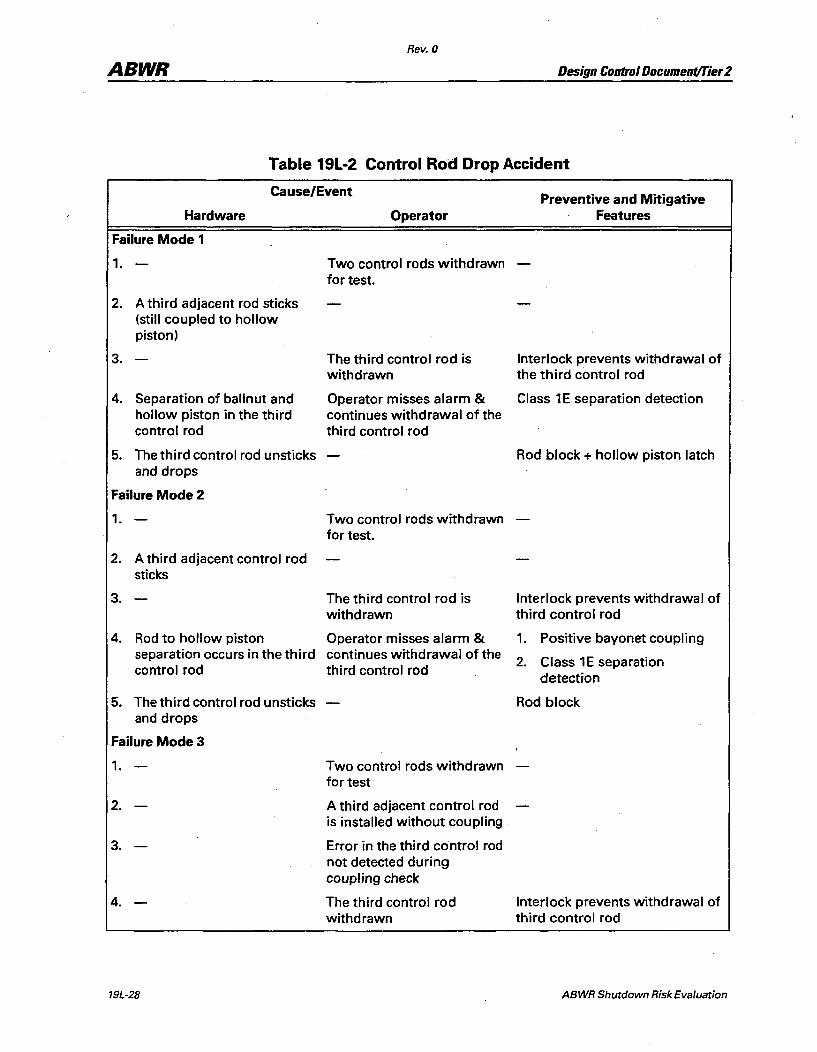
Rev. 0
ABWR Design Control Document/Tier 2
Table 19L-2 Control Rod Drop Accident
Cause/Event
Hardware
Failure Mode 1
1.
2. A third adjacent rod sticks (still coupled to hollow piston)
3.
4. Separation of ballnut and hollow piston in the third control rod
5. The third control rod unsticks and drops
Failure Mode 2
1.
2. A third adjacent control rod sticks
3.
Operator
Two control rods withdrawn for test.
The third control rod is withdrawn
Operator misses alarm & continues withdrawal of the third control rod
Two control rods withdrawn for test.
The third control rod is withdrawn
4. Rod to hollow piston Operator misses alarm & separation occurs in the third continues withdrawal of the control rod third control rod
5. The third control rod unsticks and drops
Failure Mode 3
1.
2.
3.
4. -
19L-28
Two control rods withdrawn for test
A third adjacent control rod is installed without coupling
Error in the third control rod not detected during coupling check
The third control rod withdrawn
Preventive and Mitigative Features
Interlock prevents withdrawal of the third control rod
Class 1 E separation detection
Rod block + hollow piston latch
Interlock prevents withdrawal of third control rod
1. Positive bayonet coupling
2. Class 1E separation detection
Rod block
Interlock prevents withdrawal of third control rod
ABWR Shutdown Risk Evaluation
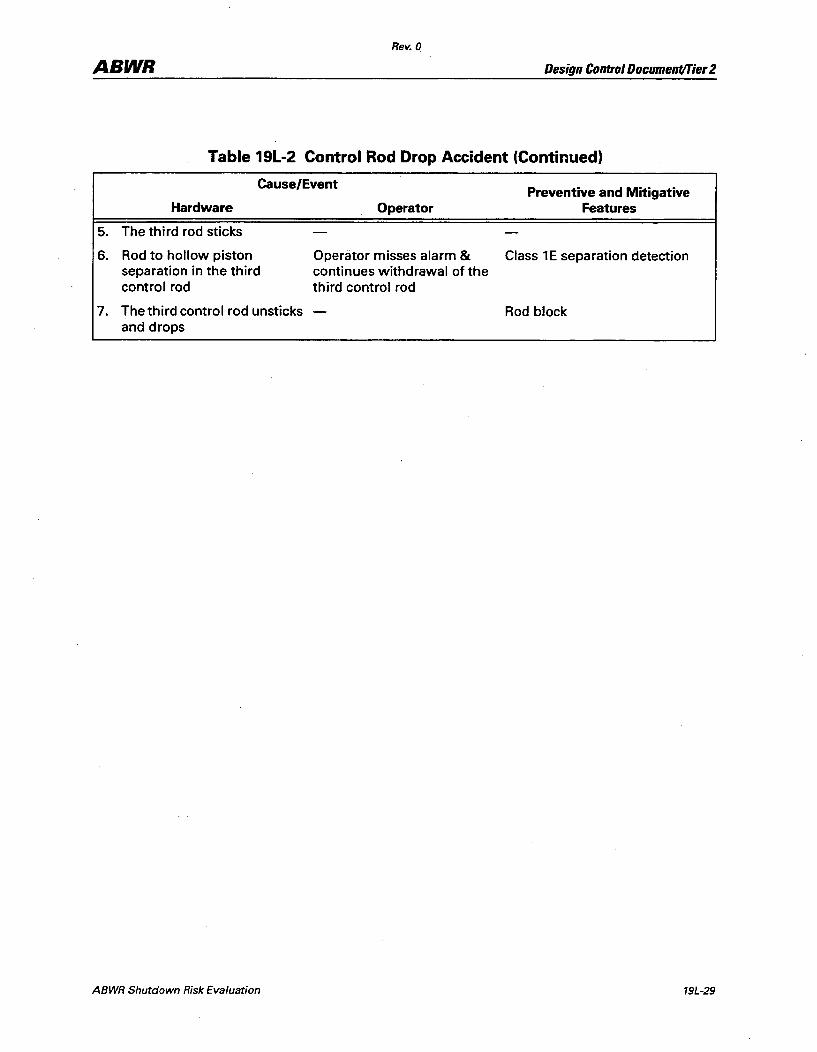
Rev. 0.
ABWR Design Control Document!Tier 2
Table 19L-2 Control Rod Drop Accident (Continued)
Cause/Event Preventive and Mitigative
Features Hardware
5. The third rod sticks
6. Rod to hollow piston separation in the third control rod
7. The third control rod unsticks and drops
ABWR Shutdown Risk Evaluation
Operator
Operator misses alarm & Class 1E separation detection continues withdrawal of the third control rod
Rod block
19L-29

Rev. 0
ABWR Design Control Document/Tier 2
Table 19L-3 Control Rod Ejection Accident
Cause/Event
Hardware
Failure Mode 1
1. Reactor under hydro test
2.
Operator
Two control rods withdrawn for testing
3. Break in the adjacent FMCRD None housing
or weld between housing and vessel
or CRD mounting bolts
or CRD spool piece
Failure Mode 2
1. Reactor under hydro test
2.
3. Break of insert pipe in the adjacent CRD
19L-30
Two control rods withdrawn for testing
None
Preventive and Mitigative Features
This occurs during a small fraction of time during shutdown
Integral internal blowout support ("shootout restraints")
This occurs during a small fraction of time during shutdown
1. Ball check valve in insert port
2. FMCRD electro-mechanical brake
ABWR Shutdown Risk Evaluation
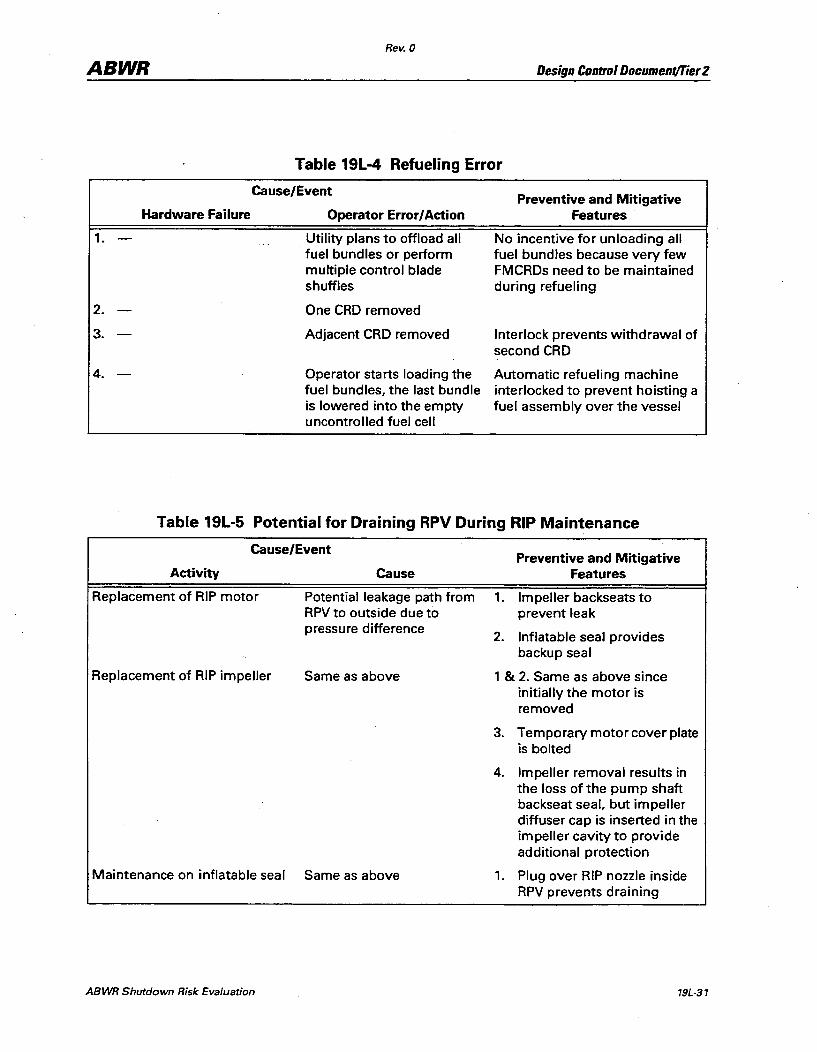
Rev. 0
ABWR Design Control Document!Tier 2
Table 19L-4 Refueling Error
Cause/Event
Hardware Failure Operator Error/Action
1. - Utility plans to offload all fuel bundles or perform multiple control blade shuffles
2.
3.
4. -
One CRD removed
Adjacent CRD removed
Operator starts loading the fuel bundles, the last bundle is lowered into the empty uncontrolled fuel cell
Preventive and Mitigative Features
No incentive for unloading all fuel bundles because very few FMCRDs need to be maintained during refueling
Interlock prevents withdrawal of second CRD
Automatic refueling machine interlocked to prevent hoisting a fuel assembly over the vessel
Table 19L-5 Potential for Draining RPV During RIP Maintenance
Cause/Event
Activity
Replacement of RIP motor
Replacement of RIP impeller
Cause
Potential leakage path from RPV to outside due to pressure difference
Same as above
Maintenance on inflatable seal Same as above
ABWR Shutdown Risk Evaluation
Preventive and Mitigative Features
1. Impeller backseats to prevent leak
2. Inflatable seal provides backup seal
1 & 2. Same as above since initially the motor is removed
3. Temporary motor cover plate is bolted
4. Impeller removal results in the loss of the pump shaft backseat seal, but impeller diffuser cap is inserted in the impeller cavity to provide additional protection
1. Plug over RIP nozzle inside RPV prevents draining
19L·31
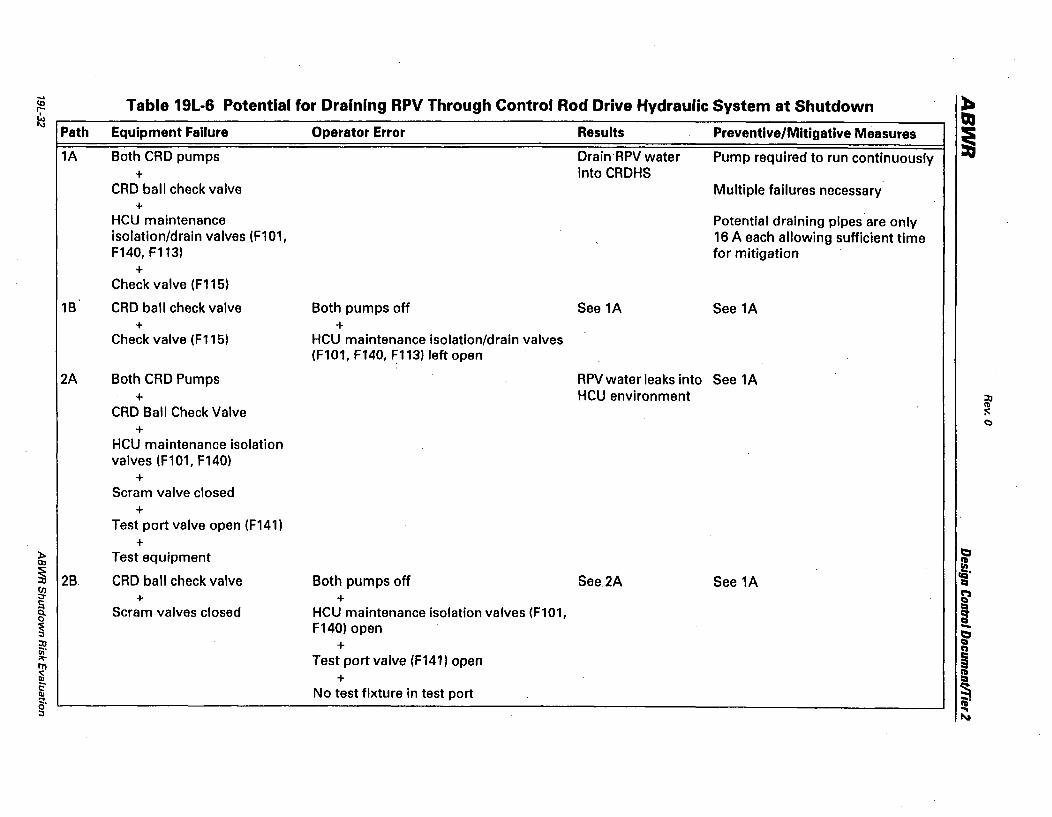
.... Table 19L-6 Potential for Draining RPV Through Control Rod Drive Hydraulic System at Shutdown ~ II)
r-~ QJ
Path Equipment Failure Operator Error Results Preventive/Mitigative Measures I 1A Both CRD pumps DrainRPV water Pump required to run continuously + into CRDHS
CRD ball check valve Multiple failures necessary +
HCU maintenance Potential draining pipes are only isolation/drain valves (F1 01, 16 A each allowing sufficient time F140, F113) for mitigation
+ Check valve (F115)
1B CRD ball check valve Both pumps off See 1A See 1A + +
Check valve (F115) HCU maintenance isolation/drain valves (F101, F140, F113) left open
2A Both CRD Pumps RPV water leaks into See 1A
+ HCU environment ~ III
CRD Ball Check Valve :0: C)
+ HCU maintenance isolation valves (F101, F140)
+ Scram valve closed
+ Test port valve open (F141)
+ ~ Test equipment t:I ttl :: ~ 28 CRD ball check valve Both pumps off See2A See 1A
cQ' l:I
C/) ~ :J" + + c::
! a Scram valves closed HCU maintenance isolation valves (Fl01, 0
~ F140) open -~ ~ + en' C')
~ Test port valve (F141) open ~ n, Ili + ~ c: No test fixture in test port III g. CD' .. :J '"
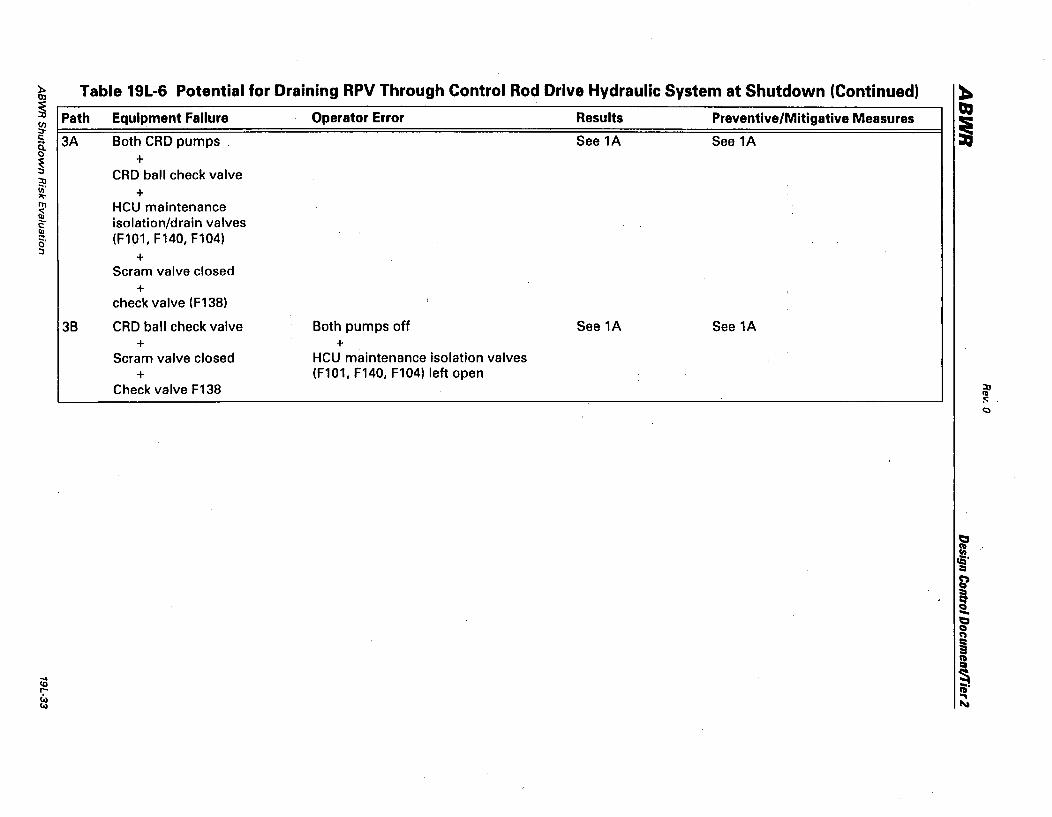
:k> Table 19L-6 Potential for Draining RPV Through Control Rod Drive Hydraulic System at Shutdown (Continued) :b OJ
~ Path Equipment Failure Operator Error Results Preventive/Mitigative Measures ~
C/) i ::J-a 3A Both CRD pumps . See 1A See 1A 0 + ~ CRD ball check valve ::n ~ + III HCU maintenance ~ ~ isolation/drain valves III
(F101, F140, F104) g. ::J +
Scram valve closed +
check valve (F138)
3B CRD ball check valve Both pumps off See 1A See 1A + +
Scram valve closed HCU maintenance isolation valves + (F101, F140, F104) left open
Check valve F138 ::n III :<:. t:)
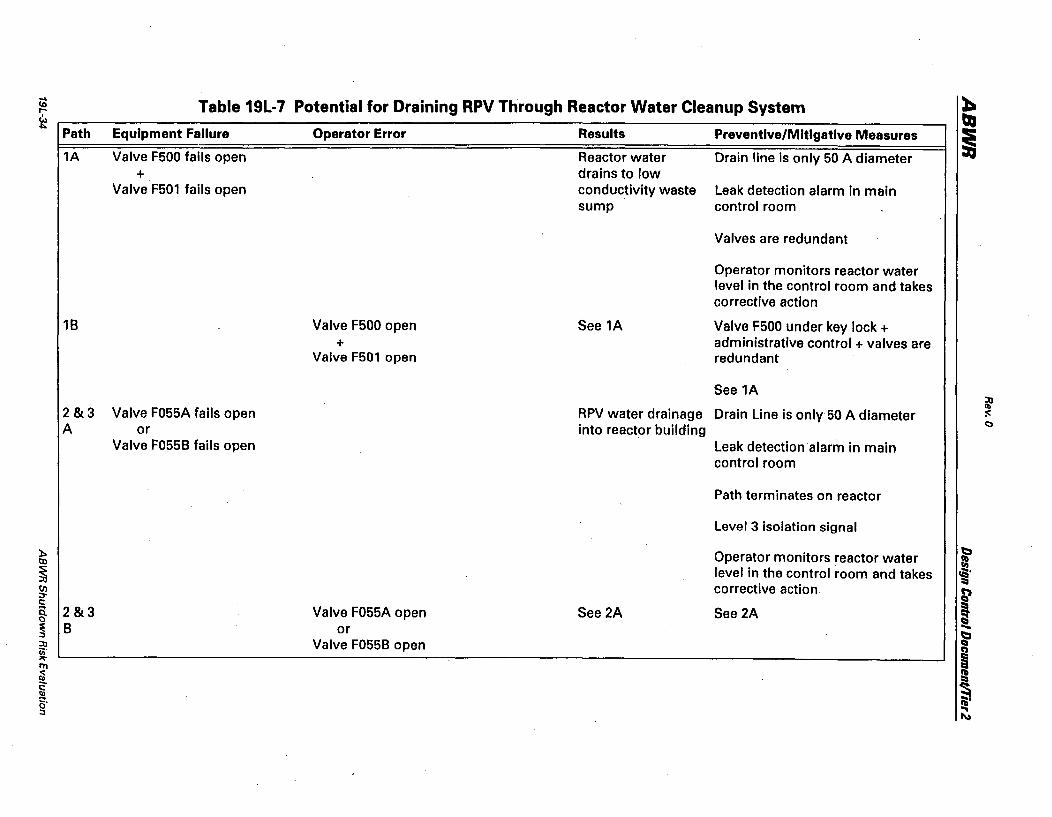
... Table 19L-7 Potential for Draining RPV Through Reactor Water Cleanup System ~ co
r-
* ~ Path Equipment Failure Operator Error Results Preventive/Mitigative Measures
~ 1A Valve F500 fails open Reactor water Drain line is only 50 A diameter + drains to low
Valve F501 fails open conductivity waste Leak detection alarm in main sump control room
Valves are redundant
Operator monitors reactor water level in the control room and takes corrective action
18 Valve F500 open See 1A Valve F500 under key lock + + administrative control + valves are
Valve F501 open redundant
See 1A
Valve F055A fails open RPV water drainage Drain Line is only 50 A diameter ~
2&3 :c: A into reactor building
C)
or Valve F055B fails open Leak detection alarm in main
control room
Path terminates on reactor
Level 3 isolation signal
~ Operator monitors reactor water b OJ ;: ~ level in the control room and takes ~'
corrective action :::::i
C/) P ::r-c: ! a 2&3 Valve F055A open See2A See 2A 0
~ B or -:0 Valve F055B open ~ ~. 2 ~ 51 111 ~ ~ 1: III g. iii' ... :J I'I.a
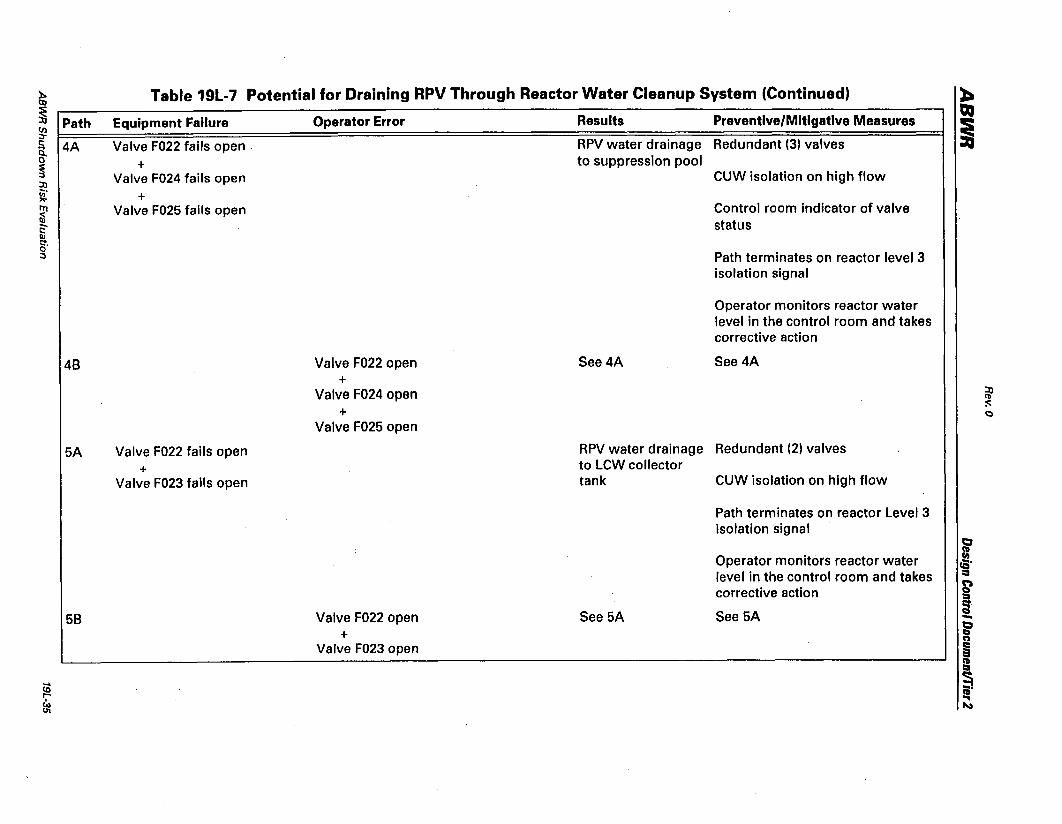
~ Table 19L-7 Potential for Draining RPV Through Reactor Water Cleanup System (Continued) :t. OJ
~ Path Equipment Failure Operator Error Results Preventive/Mitigative Measures ~ CI) i ~
~ 4A Valve F022 fails open. RPV water drainage Redundant (3) valves
~ + to suppression pool
~ Valve F024 fails open CUW isolation on high flow
<ii' + ~
III Valve F025 fails open Control room indicator of valve Qi - status c: Q)
g. :J Path terminates on reactor level 3
isolation signal
Operator monitors reactor water level in the control room and takes corrective action
48 Valve F022 open See4A See 4A +
Valve F024 open ~ :c:
+ Q
Valve F025 open
5A Valve F022 fails open RPV water drainage Redundant (2) valves
+ to LCW collector Valve F023 fails open tank CUW isolation on high flow
Path terminates on reactor Level 3 isolation signal
0
Operator monitors reactor water a cQ'
level in the control room and takes ;:,
corrective action ~
58 Valve F022 open See 5A See 5A ~. -0
+ Q
" Valve F023 open I II ... ~ co
r- !.t ~ ~

-.. Table 19L-7 Potential for Draining RPV Through Reactor Water Cleanup System (Continued) :t. 10 r-
~ ~ Path Equipment Failure Operator Error Results Preventive/Mitigative Measures
~ 6A Valve F056 fails open See 2A See 2a
68 Valve F05S open See2A See 2A
7A Valve F022 fails open See4A See4A +
Valve F025 fails open
78 Valve F022 open See4A See4A +
Valve F025 open
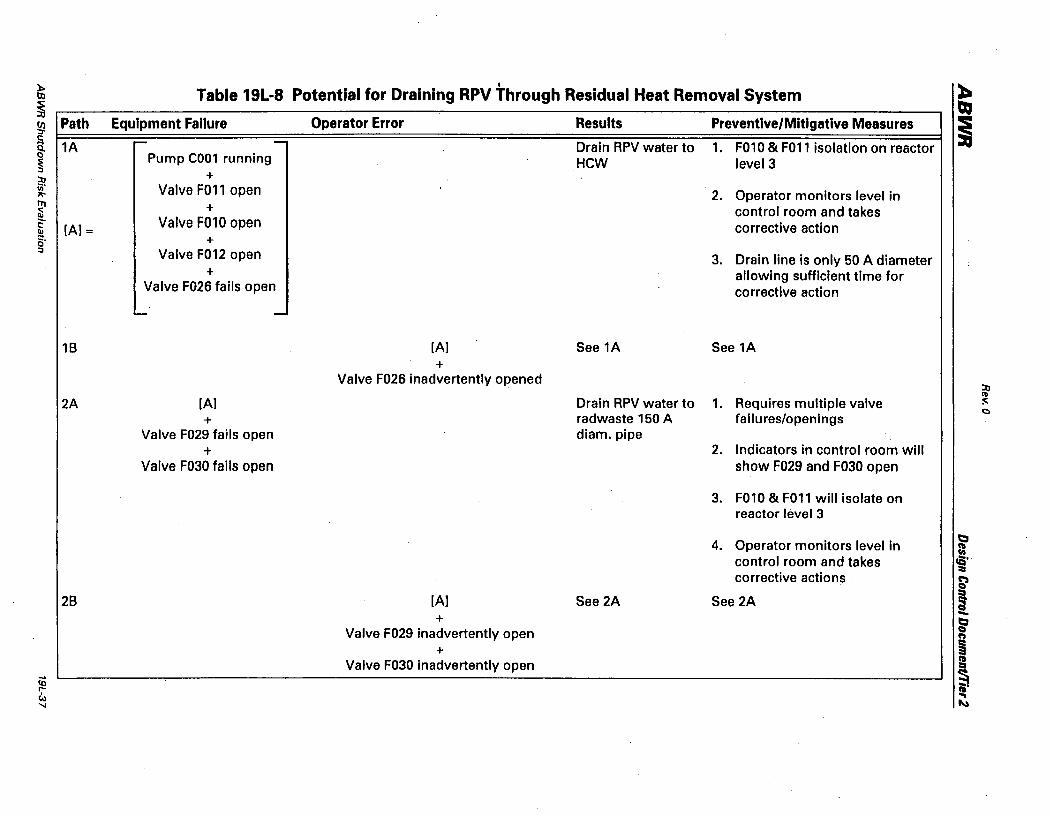
t
Table 19L-8 Potential for Draining RPV Through Residual Heat Removal System
Path Equipment Failure Operator Error Results Preventive/Mitigative Measures
1A r-- - Drain RPV water to 1. F010 & F011 isolation on reactor Pump C001 running HeW level 3
+ Valve F011 open 2. Operator monitors level in
+ control room and takes [AI=
Valve F010 open corrective action +
Valve F012 open 3. Drain line is only 50 A diameter + allowing sufficient time for
Valve F026 fails open corrective action L-. -
18 [AI See 1A See 1A +
Valve F026 inadvertently opened
2A [AI Drain RPV water to 1. Requires multiple valve + radwaste 150 A failures/openings
Valve F029 fails open diam. pipe + 2. Indicators in control room will
Valve F030 fails open show F029 and F030 open
3. F010 & F011 will isolate on reactor level 3
4. Operator monitors level in control room and takes corrective actions
28 [AI See 2A See 2A +
Valve F029 inadvertently open +
Valve F030 inadvertently open
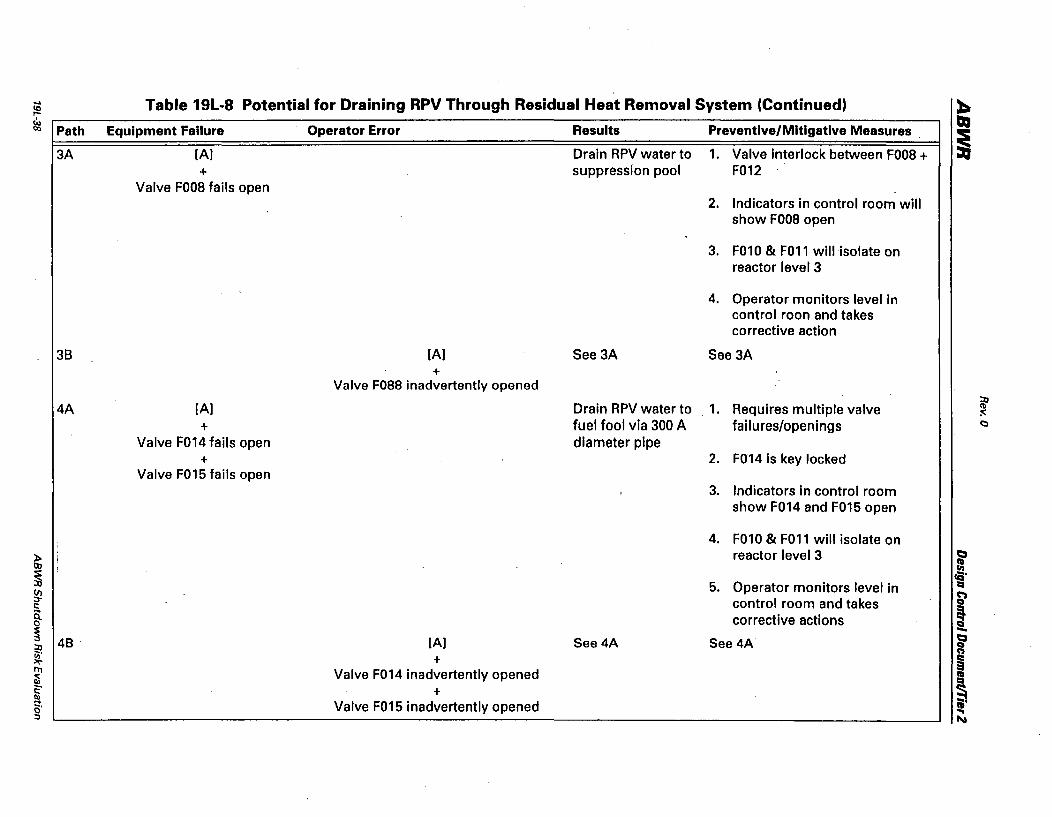
--~ ~ Path
3A
38
4A
Table 19L·8 Potential for Draining RPV Through Residual Heat Removal System (Continued)
Equipment Failure
[AJ +
Valve FOOS fails open
[AJ +
Valve F014 fails open +
Valve F015 fails open
Operator Error
[AJ +
Valve F088 inadvertently opened
[AI +
Valve F014 inadvertently opened +
Valve F015 inadvertently opened
Results
Drain RPV water to suppression pool
See3A
Drain RPV water to fuel fool via 300 A diameter pipe
See4A
Preventive/Mitigative Measures
1. Valve interlock between FOOS + F012
2. Indicators in control room will show FOOS open
3. F010 & F011 will isolate on reactor level 3
4. Operator monitors level in control roan and takes corrective action
See 3A
1. Requires multiple valve failures/openings
2. F014 is key locked
3. Indicators in control room show F014 and F015 open
4. F010 & F011 will isolate on reactor level 3
5. Operator monitors level in control room and takes corrective actions
See 4A·
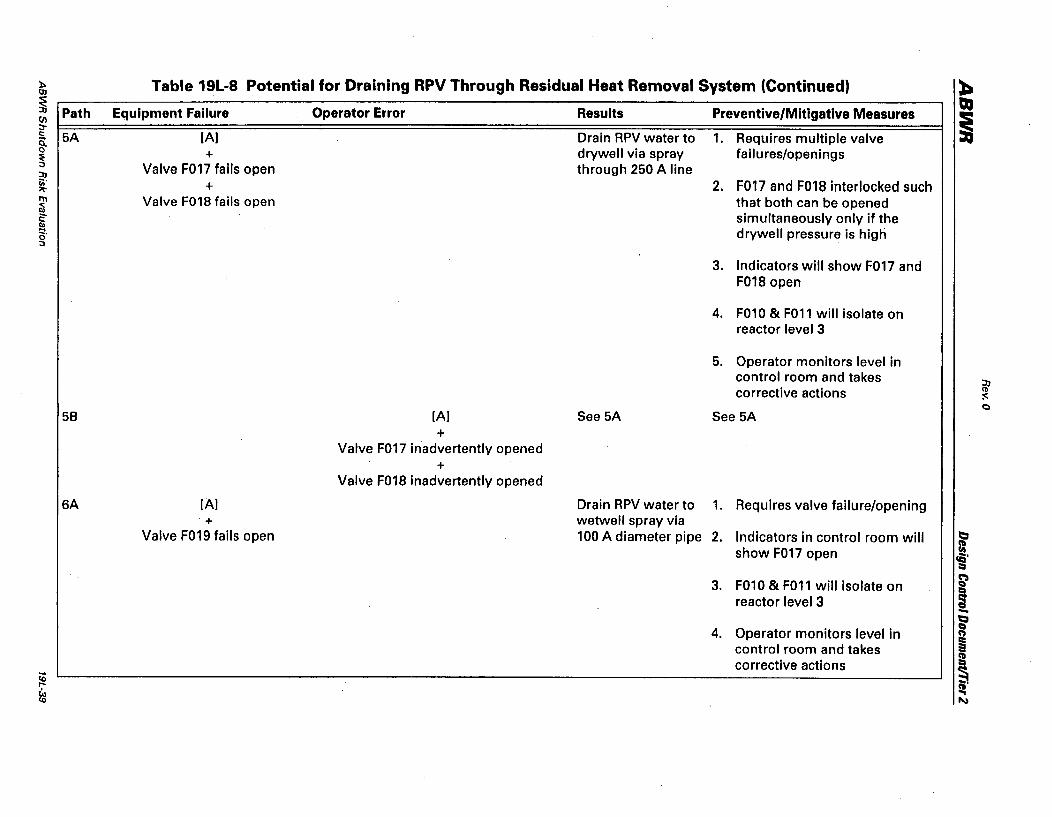
:t. Table 19L-8 Potential for Draining RPV Through Residual Heat Removal System (Continued) ~ OJ
~ Path Equipment Failure Operator Error Results Preventive/Mitigative Measures QI
C/) i ::r
~ 5A [AI Drain RPV water to 1. Requires multiple valve
~ + drywell via spray failures/openings
::Q Valve F017 fails open through 250 A line iii' + 2. F017 and F018 interlocked such ~ ITo Valve F018 fails open that both can be opened Q1 ~ simultaneously only if the Qj ~, drywell pressure is high 0 ::J
3. Indicators will show F017 and F018 open
4. F010 & F011 will isolate on reactor level 3
5. Operator monitors level in control room and takes ::Q corrective actions (1)
:<.: C)
58 [AI See 5A See 5A +
Valve F017 inadvertently opened +
Valve F018 inadvertently opened
6A [AI Drain RPV water to 1. Requires valve failure/opening + wetwell spray via
Valve F019 fails open 100 A diameter pipe 2. Indicators in control room will t::I
show F017 open ~ IQ' :::I
3. F010 & FOll will isolate on i reactor level 3 -4. Operator monitors level in
i' CO)
control room and takes ~ corrective actions !:l ... ~ Il)
r-
~ ... ~
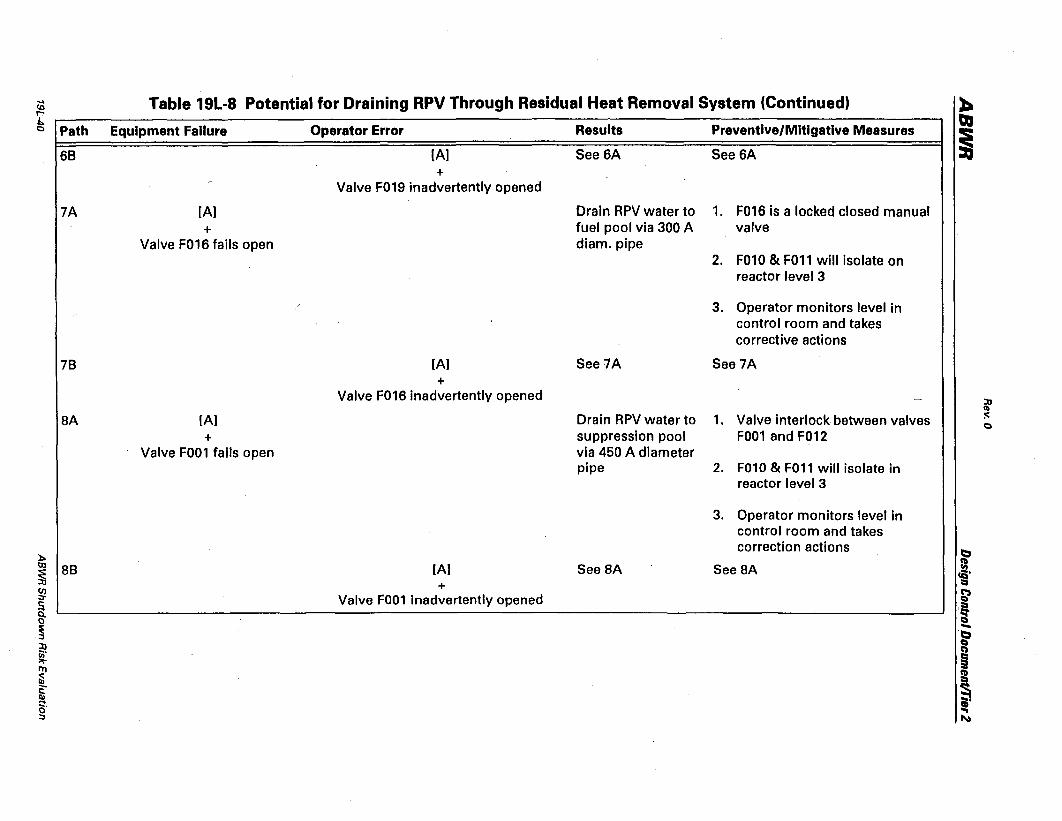
.... Table 19L-8 Potential for Draining RPV Through Residual Heat Removal System (Continued) ~ ID r-
QJ J.. Path Equipment Failure Operator Error Results Preventive/Mitigative Measures 0
i 68 [A] See6A See 6A +
Valve F019 inadvertently opened
7A [AI Drain RPV water to 1. F016 is a locked closed manual + fuel pool via 300 A valve
Valve F016 fails open diam. pipe 2. F010 & F011 will isolate on
reactor level 3
3. Operator monitors level in control room and takes corrective actions
78 [A] See7A See7A +
Valve F016 inadvertently opened :n (II
SA [A] Drain RPV water to 1. Valve interlock between valves :0:: 0
+ suppression pool F001 and F012 Valve F001 fails open via 450 A diameter
pipe 2. F010 & F011 will isolate in reactor level 3
3. Operator monitors level in control room and takes correction actions
~ ):. OJ S8 [AJ See SA See SA ~ ~ IQ'
+ :::I g! Valve F001 inadvertently opened ~ a ,~ 0 Ci
~ -.~ :n 0
C'I ~ ~ 111 ~ m [ ~ g. ... :;, "»
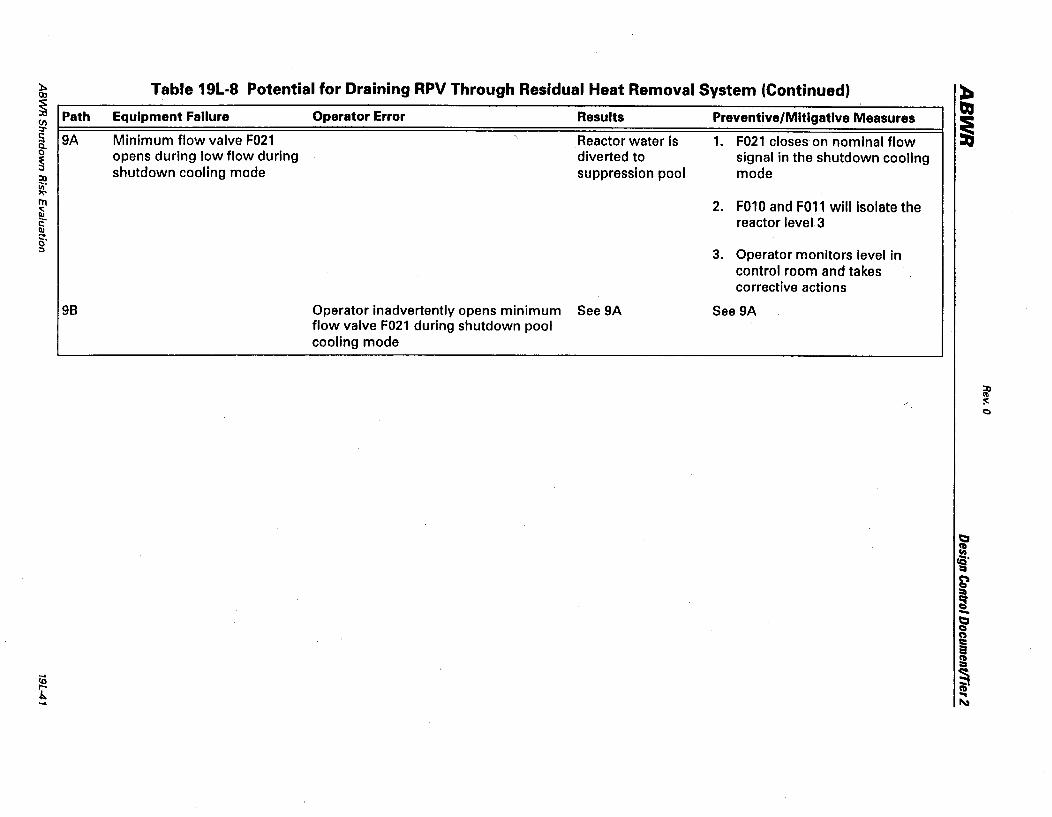
~ til
~ Path (f) :,-
~ 9A 0
~ :n iii' ~
fl1 ~ ~ III g. ::l
98
Table 19L-8 Potential for Draining RPV Through Residual Heat Removal System (Continued)
Equipment Failure Operator Error Results
Minimum flow valve F021 opens during low flow during shutdown cooling mode
Reactor water is diverted to suppression pool
Operator inadvertently opens minimum See 9A flow valve F021 during shutdown pool cooling mode
Preventive/Mitigative Measures
1. F021 closes on nominal flow signal in the shutdown cooling mode
2. F010 and F011 will isolate the reactor levelr3
3. Operator monitors level in control room and takes corrective actions
See 9A
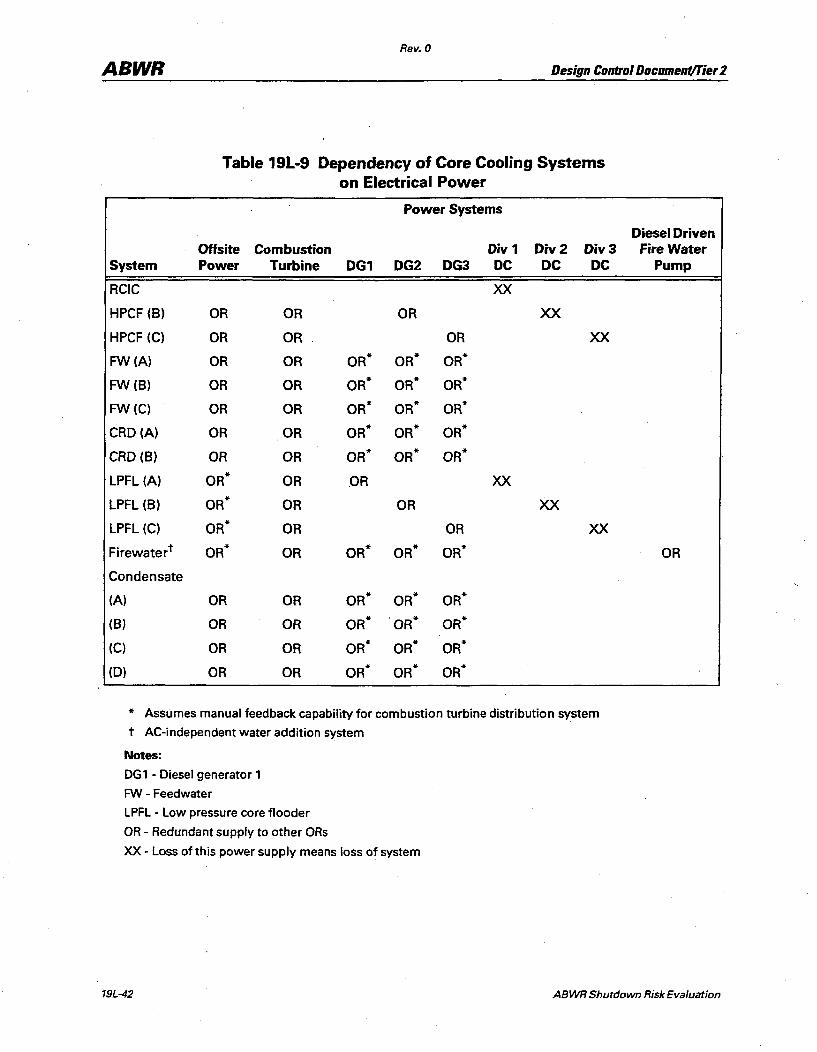
Rev. 0
ABWR Design ContrDI DDcument/Tier 2
Table 19L-9 Dependency of Core Cooling Systems on Electrical Power
Power Systems
Diesel Driven Offsite Combustion Div 1 Div2 Diva Fire Water
System Power Turbine DG1 DG2 DG3 DC DC DC Pump
RCIC XX
HPCF (B) OR OR OR XX
HPCF (C) OR OR OR XX
FW(A) OR OR OR* OR* OR*
FW (B) OR OR OR* OR* OR*
FW(C) OR OR OR* OR* OR*
CRO (A) OR OR OR* OR* OR*
CRD (B) OR OR OR* OR* OR*
LPFL (A) OR* OR .OR XX
LPFL (B) OR* OR OR XX
LPFL (C) OR* OR OR XX
Firewatert OR* OR OR* OR* OR* OR
Condensate
(A) OR OR OR* OR* OR*
(B) OR OR OR* OR* OR*
(C) OR OR OR* OR* OR*
(0) OR OR OR* OR* OR*
* Assumes manual feedback capability for combustion turbine distribution system
t AC-independent water addition system
Notes:
DG1 - Diesel generator 1
FW - Feedwater
LPFL - Low pressure core flooder
OR - Redundant supply to other ORs
XX - Loss of this power supply means loss of system
19L-42 ABWR Shutdown Risk Evaluation

Rev. 0
ABWR Design Control DocumentITier 2
Table 19L-10 -Success Criteria for Long-Term Heat Removal for Operating Mode 4
Function
Containment heat removal during operating Mode 4
Success Criteria
RHR-A or B or C" or
Normal heat removal using main condensert
or Reactor water cleanup*
or Overpressure relief rupture discI
" RHR can be operated in either the suppression pool cooling or the shutdown cooling mode. Shutdown cooling requires the reactor to be at low pressure.
t Reactor will have to be pressurized and MSIVs opened for establishing this path.
:I: Reactor may have to be pressurized to use the CUW system efficiently to remove decay heat or reactor water could be drained to the main condenser hotwell through the CUW system and reactor water makeup obtained from HPCF, feedwater, CRD hyrdraulic system, or the AC independent water addition system.
f Reactor will have to be pressurized and heat transferred to the suppression pool through safety/relief valves. Long-term suppression pool makeup will be required to compensate for water lost through evaporation and reactor water makeup must be obtained from any of the methods indicated in Note :I: above.
Table 19L-11 Dependency of Heat Removal Systems on Electrical Power
Offsite Combustion Div1 Div2 Div3 System Power Turbine DG1 DG2 DG3 DC DC DC
RHR (A) OR OR OR XX
RHR (B) OR OR OR XX
RHR (C) OR OR OR XX
CUW (A or B) OR OR OR" OR"
Overpressure Relieft
Main Condenser XX
" Assumes feedback capability for combustion turbine distribution system.
t Does not need power source for operation. Also, the function provided by the overpressure relief can be provided by operator opening one ofthe containment doors.
Notes:
DG1 - Diesel generators
OR - Redundant supply to other ORs
XX - Loss of this power supply means loss of system
ABWR Shutdown Risk Evaluation 19L-43
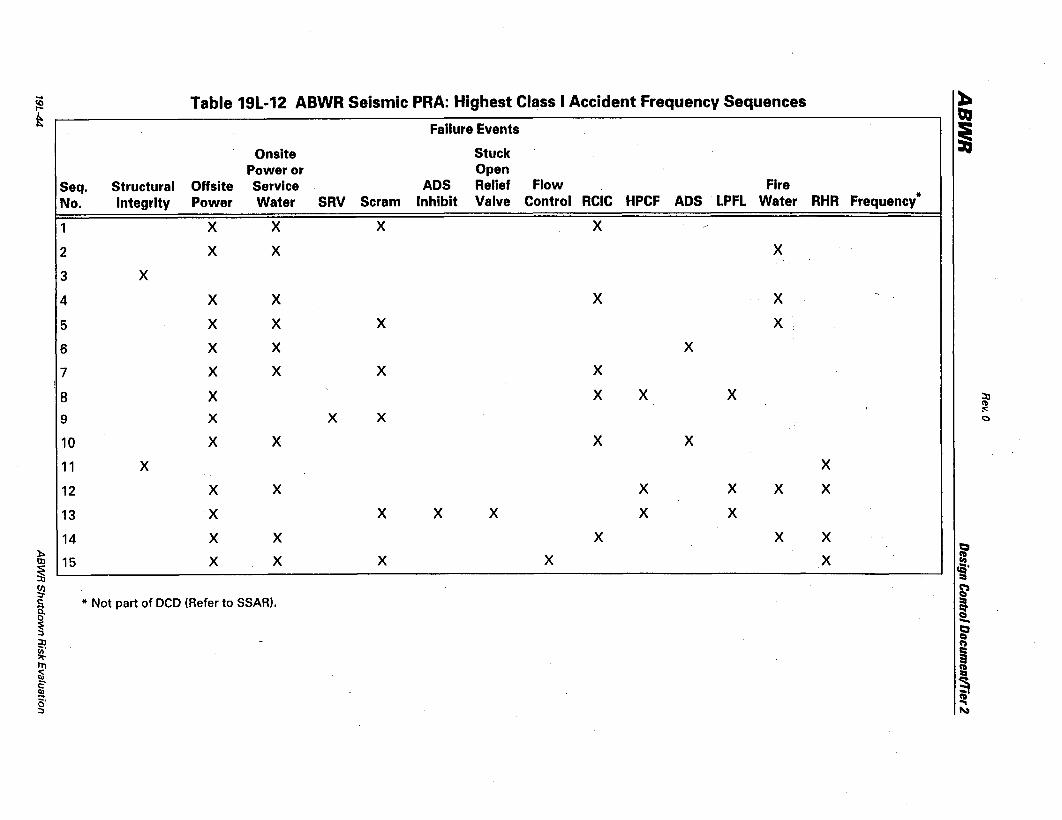
iO Table 19L-12 ABWR Seismic PRA: Highest Class I Accident Frequency Sequences ~ r-QI k Failure Events i Onsite Stuck
Power or Open Seq. Structural Offsite Service ADS Relief Flow Fire No. Integrity Power Water SRV Scram Inhibit Valve Control RCIC HPCF ADS LPFL Water RHR Frequency *
1 X X X X
2 X X X
3 X
4 X X X X
5 X X X X
6 X X X
7 X X X X
8 X X X X ~ X X X
::: 9 0
10 X X X X
11 X X
12 X X X X X X
13 X X X X X X
14 X X X X X ~
t;, OJ 15 X X X X X ~ ~ Iii'
::::I (J) ~ ::r c: * Not part of DeD (Refer to SSAR). ! a 0
~ -t;, ::0 C
CO) iii' ; ,... III CD ~ § ~ III g, CD' .. ;:] ~
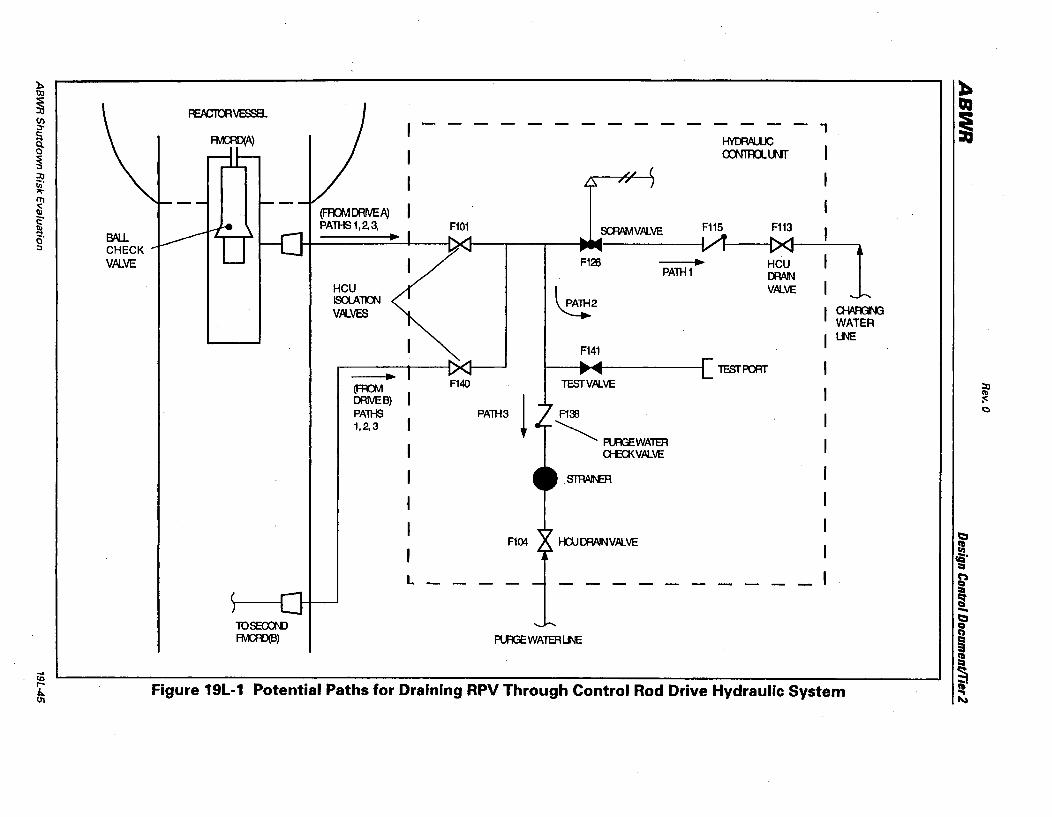
EW.L CHECK VPlVE
HCU 1Sa..A11Q\I VPlVES
(FFO.1 DANES) PAlHS 1,2.3
F101
F140
PA1H3 1
Fie»
L ___ _
Fi26
~2 F141
lESTVPLVE
F131
~ F\R?CWATER O£a<VPLVE
f-OJ DR.AJNVPLVE
Fii5 Fii3
lEST PORT
a-w:a-G WATER LNE
Figure 19L-1 Potential Paths for Draining RPV Through Control Rod Drive Hydraulic System
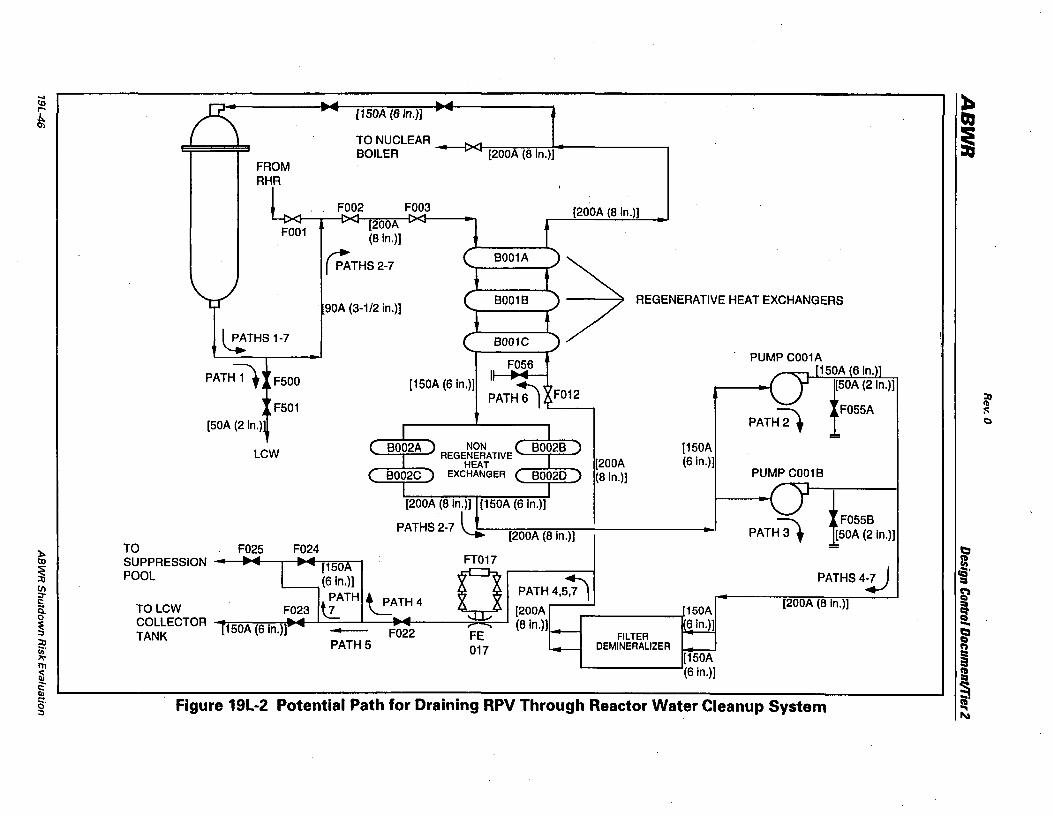
FROM RHR
F001
[15OA (6In.)1
TO NUCLEAR _---D<l-=:-:-:,-:-:--:-!-ol-----------, BOILER [20OA (8 In.)]
F002
[20OA (8 In.)]
~THS2-7
F003 [20OA (8 In.)]
90A (3-1/2 in.)] REGENERATIVE HEAT EXCHANGERS
l:THS 1-7
PATH~ F500
F501
[50A (2 In.)
LCW
TO F025 F024 SUPPRESSION -----.'4--.._. ..... rr;::;=:T"""1
POOL
F056
[15OA (6In.)1 ~ATH~ F012
[20OA (8 in.)]
FT017
PATH4,5~
[200A (8 In.)]
[150A (6 In.)]
O.--------lr-----f
TO LCW F023 [20OA 150A COLLECTOR -1-=50,...."A......,(6..,.....,.....ln..,..,.)]~---'--=-1---I ..... ------:~,.--J (8 In.)] 6 In.)] TANK --- F022 FE FILTER
PATH 5 017 DEMINERALIZER [15OA
'-------'(6 in.)]
PATH~
PUMP C001B
PATH~ lF055B
150A (2 in.)]
PATHS4~ [200A (8 In.)]
Figure 19L-2 Potential Path for Draining RPV Through Reactor Water Cleanup System
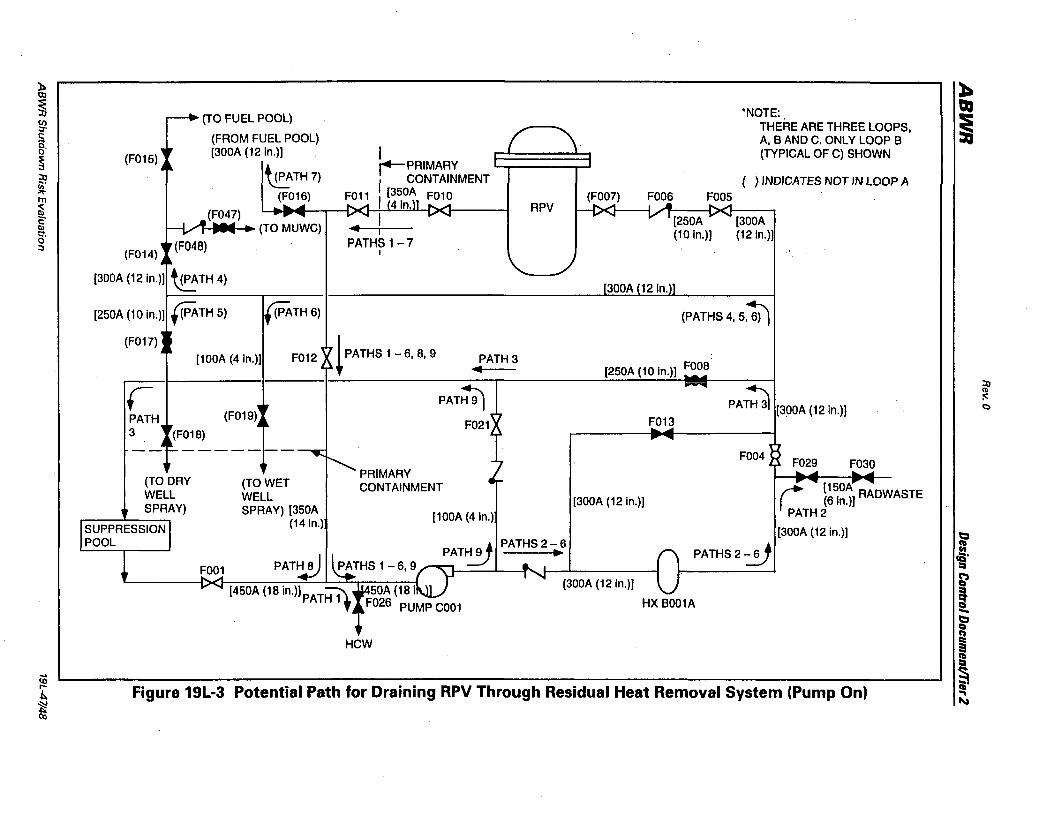
(F015)
(TO FUEL POOL)
(FROM FUEL POOL) [30OA (12 In.)]
~TH7) (F016)
/l-__ ~~ (TO MUWC)
(F048)
I rPRIMARY ! CONTAINMENT
(35OA F010 I 4 In.
4 I I
PATHS 1-7
(F017)
[10OA (4 In.)] F012 l PATHS 1 - 6,8,9 PATH 3 ~
~--------·I------.-PATH 3
(TO DRY WELL SPRAY)
(F019)
(TO WET WELL SPRAY) [350A
(14 In.)
PAT~ F021
PRIMARY CONTAINMENT
(10OA (4 In.)
HCW
RPV
'NOTE: . THERE ARE THREE LOOPS, A, BAND C. ONLY LOOP B (TYPICAL OF C) SHOWN
} INDICATES NOT IN lOOP A
[30OA (12 In.)]
(PATHS4,5~
(25OA (10 In.)] FOOS
F013 PA~ [30OA (12 in.))
F004
(30OA (12 In.)] ,. [15OA RADWASTE I~ .. (6 In.)]
PATH 2
[300A (12 in.)]
PATHS2~
[30OA (12 in.))
HX 8001A
Figure 19L-3 Potential Path for Draining RPV Through Residual Heat Removal System (Pump On)
Rev. 1
ABWR Desigo Cootro/ Document!Tier 2
19M Fire Protection Probabilistic Risk Assessment
19M.1 Introduction
As part of the Advanced Boiling Water Reactor (ABWR) design certification process, the USNRC requested that General Electric expand upon earlier considerations of the subject of fire risk. Through discussions with the NRC it was mutually agreed that a fire screening analysis approach was appropriate. It was further agreed that the Fire Vulnerability Evaluation (FIVE) Methodology Plant Screening Guide (Reference 19M-I) being developed by the Electric Power Research Institute (EPRI) provided an appropriate vehicle for performing this analysis.
The FIVE methodology provides procedures for identifying fire compartments for evaluation purposes, defining fire ignition frequencies, and performing quantitative screening analyses of fire risk. The criterion for screening acceptability is that the risk of core damage from any postulated fire be less than an acceptably small criterion. Any fire scenarios not meeting this criterion require more detailed consideration.
Five bounding fire scenarios and corresponding ignition frequencies were developed on the basis of the FIVE methodology. The first three of these consider the impact of fires which incapacitate each of the three divisions of emergency power, and thus the ECCS equipment which is dependent on each for successful performance. The fourth scenario considers the impact of a fire in the control room with the assumption that the only ECCS functions available are those that can be controlled and operated from the remote shutdown panel, and the RCIC, which can be manually operated outside of the control room. The fifth and final scenario examines the consequences of a fire in the turbine building based upon the assumption that resulting loss of off-site power bounds the possible outcomes of this initiator.
19M.2 Basis of the Analysis
This analysis is prepared with Figures 5.1 and 6.0 and related text sections from the FIVE Methodology Draft Report as the basis. In performing this analysis the ABWR was broken into three major groupings as follows:
(1) A safety-related building grouping consisting of the reactor building except primary containment, control building except the control room complex, and the intake structure. This grouping contains all of the equipment required for safe shutdown except that within primary containment and the control room complex. The buildings are subdivided by three hour rated fire barriers into fire areas corresponding to the safety divisions. Each division is considered as a unit, although each division encompasses several fire areas in three buildings. For these groupings, it is conservatively assumed that a fire at any location in a divisional fire area results in the immediate loss of function of the
Fire Protection ProbabjJistic Risk Assessment 19M-1

ABWR Rev. a
Design Control DocumentRier Z
division. This precludes having to calculate the rate of spread and possible magnitude of a fire within a fire area. The requirement that the fire containment system be capable of confining any fire within the fire area of origin is documented in Subsection 9.5.1.
(2) Control room complex-The control room complex contains safety-related equipment from all four divisions in a single fire area and therefore must be uniquely analyzed. The redundant system to the control room is the remote shutdown paneL For the purposes of this analysis, remote manual operation of the RCIC system is also included as a method of mitigation.
(3) Turbine building-As documented in Subsection 9A.5.5.1, fire induced failure of the small amount of safety-related sensors located in this building cannot prevent safe shutdown of the plant. The turbine building is included in the analysis because a turbine building fire could result in a plant shutdown
concurrent with a loss of off site power.
19M.3 Summary of Results
19M-2
All three major groupings were determined to be "Significant Fire Areas" by the screening procedures outlined in FIVE Methodology Figure 5.1, which is included as Figure 19M-I. They were then screened out by the Step 2 path of the procedures outlined in FIVE Figure 6.0, which is included as Figure 19M-2, on the basis that
(1) The product of the Fire Ignition Frequency and the probability that the redundant or alternate systems would not be available was less than the acceptance criteria.
(2) The redundant or alternate systems for which credit was taken are in fire areas other than the one experiencing the fire and therefore the fire cannot affect the redundant or alternate systems. Fire areas are separated by three hour fire rated barriers.
A summary of the results of the analysis is given in Table 19M-I. Note that the core damage frequencies per year are less than the acceptance criteria for all cases. Originally, the remote shutdown panel included controls for just three safety-relief valves. For this configuration, the core damage frequency for a fire in the control room was greater than the acceptance criteria, even though credit was taken for local manual operation of the RCIC (See Subsection 19M.7 for COL license information). A control switch for a fourth SRV was added to the remote shutdown paneL This dropped the probability of core damage for a control room fire to less than the acceptance criteria. This is considered a very conservative estimate because of the conservative assumptions
that a fire in one area disables all potentially affected equipment. Taking credit for the distance between fire sources and targets would reduce the core damage probability to
Fire Protection Probabilistic Risk Assessment
ABWR Rev. 0
Design Control DocumentlTier 2
a fraction of the calculated low probability. For this reason, it wasjudged not appropriate to add these results to other core damage frequencies estimated elsewhere in Chapter 19.
The analyses required to calculate the fire ignition frequencies and combine them with the PRA models are included in Subsections 19M.4 through 19M.6.
19M.4 Phase I Scenario and Phase II Fire Frequency Analysis
This analysis is prepared with Figures 5.1 and 6.0 from the FIVE Methodology Draft Report as the basis. Subsections of the analysis bear the titles of the applicable FIVE Methodology sections or the applicable blocks from the F1VE Methodology figures, flagged with "(F1VE)" for identification. The subsections detail the method of compliance or source of information requested by the block.
19M.4.1 Phase I Qualitative Analysis (FIVE)
19M.4.1.1 Identify Plant Fire Areas (FIVE, Use Table 1 Matrix)
For the purpose of this analysis the ABWR has been broken into three major groupings as follows:
(1) A safety-related building grouping consisting of the reactor building except primary containment, control building except the control room complex, and the intake structure. This grouping contains all of the equipment required for safe shutdown except that within primary containment and the control room complex. The buildings are subdivided by rated fire barriers into fire areas corresponding to the safety divisions. Each division is considered as a unit, although each division encompasses several fire areas in three buildings. For these groupings, it is assumed that a fire at any location in a divisional fire area results in the immediate loss of function of the division.
The assumption of the immediate loss of function for the division is a conservative adaptation of the FIVE methodology and makes it unnecessary to calculate the rate of fire growth and spread within a fire area, provided the results of the analysis confirm that the probability of the redundant/alternate systems being unavailable is less than the acceptance criteria.
(2) Turbine building-As documented in Subsection 9A.5.5.1, fire induced failure of the small amount of safety-related sensors located in this building cannot prevent safe shutdown of the plant. The turbine building is included in the analysis because a turbine building fire could result in a loss of off site power and/ or a plant shutdown.
Fire Protection Probabilistic Risk Assessment 19M·3
Rev. 0
ABWR Design Control Docament/Tier 2
19M-4
(3) Control room complex-The control room complex contains safety-related equipment from all four divisions in a single fire area and therefore must be uniquely analyzed. The redundant system to the control room is the remote shutdown panel. For the purposes of this analysis, remote manual operation of the RCIC system is also included as a method of mitigation.
Primary containment was determined to not be a significant fire area because:
(1) It is inerted during plant operation.
(2) A fire in containment cannot prevent safe shut- down of the plant. (Subsection 9.5.1.0.2.)
(3) The containment spray system could serve as a fire suppression system if the need did arise.
(4) The F1VE Analysis excluded the containment.
The equipment in primary containment was included in the probabilistic failure models as required to support safe shutdown, however.
Fire in non safety-related buildings other than those listed above was not considered as the buildings are separated from the equipment required for safe shutdown by three hour rated fire barriers. Therefore, fire in the non safety-related buildings cannot prevent safe shutdown.
A table offire areas for the safety related buildings (reactor and control) is provided as Table 9A.6-1. The fire areas listed on the table are as shown on the fire area separation drawings, Figures 9A-1 through 9A-18. Except as described above for the control complex and primary containment, fire areas are assigned to specific safety divisions.
As stated above, screening of the fire areas is on a grouped basis. A fire in anyone of the grouped fire areas is assumed to result in the immediate loss of function for the equipment of the division of the grouped area, and screening is on that basis. For example, all of the Division 1 fire areas are screened as a group because it is possible for a fire to occur at any location in the Division 1 fire area and the fire is assumed to result in immediate failure of Division 1 for purposes of evaluating the effects on safe shutdown.
The relative location of the fire areas has been specified such that there should be no reason for the detail designer to route piping or cable trays of non-conforming divisions though divisional fire areas. It is an interface requirement (Subsection 9.5.13.12) that
the utility confirm that the routing of piping and cable trays during the detailed design phase conforms with the fire area divisional assignment documented in the fire hazard analysis.
Fire Protection Probabilistic Risk Assessment
Rev. 0
ABWR Design Control Document/Tier 2
19M.4.1.2 List Safe Shutdown Systems (FIVE, Use Table 1 Matrix)
In this conservative analysis, credit is taken for only safety-related systems for accomplishing safe shutdown. Not all safety-related systems are safe shutdown systems. A differentiation is not made, however, as a fire involving a safety-related system not required for safe shutdown could result in the loss of a divisional power supply common to the safety-related system required for safe shutdown. Rather than analyzing all possible interactions between systems within a division, the worst case is assumed.
Therefore, damage to any safety-related system is considered to have the possibility of
affecting a system required for safe shutdown during a fire situation. Safety-related equipment is identified by aI, 2, 3, or 4 in the "Electrical Division" column of Table 9A6-1. The system identification is included in the master parts list number shown on the table.
The acceptability of possible spurious operation (e.g. motors randomly starting or stopping, valves randomly opening and closing, etc.) was also addressed and found acceptable as a result of the analysis for uncontrolled acts by an inside saboteur. The results of the study is provided in Appendix 19C.
19M.4.1.3 Identify Safe Shutdown Systems in Each Fire Area (FIVE, Use Table 1 Matrix)
The devices are sorted by system for each room on Table 9A.6-2. The safety division and room number are also shown on the table. This allows cross comparison of the table and the fire separation drawings to determine what systems are in each fire area. A column listing the fire area for each device will be added to the table so that cross reference to the fire protection drawings is not required to determine the fire area for each piece of equipment.
19M.4.1.4 Shutdown Equipment In Fire All'ea (FIVE)
If there is safety-related equipment in any fire area, it is assumed that either the equipment is required for safe shutdown or its loss by fire could affect equipment required for safe shutdown. The answer for this block is assumed to be "yes" if there is safety-related equipment in the area.
19M.4.1.S Fire Causes Demand For Safe Shutdown Equipment (FIVE)
It is assumed that accomplishment of safe shutdown must be possible with a fire at any location in the plant. This block is always "yes".
19M.4.1.6 Significant Fire Areas (FIVE)
The above screens confirm that the reactor building except primary containment, the control building except the control room complex, the intake structure, the turbine
building and the control room complex should be tenned to be "significant fire areas".
Fire Protection Probabilistic Risk Assessment 19M-5
ABWR Rev. 0
Design Control Document/Tier 2
They must be subjected to the screening depicted by Figure 6.0 of the FIVE Methodology.
19M.4.2 Phase II Quantitative Analysis (FIVE)
19M.4.2.1 Identify Fire Compartments For Evaluation Purposes (FIVE)
The fire areas established in the ABWR design meet the requirements for fire areas as defined in section 2.2 of the FIVE Methodology Draft Report. The AB~ fire protection design is on the basis of separation being on a fire area basis. Conservatively, credit is not taken for the lesser separation allowed by the fire compartment definition of section 2.4 of the FIVE Methodology Draft Document. Most ABWR fire areas encompass more than one room. The separation between rooms within a fire area is similar to that required for fire compartments in the FIVE methodology. Separation within a fire area by room does tend to limit the consequences of a fire within a fire area,
. but no credit is taken for this in the ABWR analysis.
To summarize, screening of the fire areas is by a grouping of the intake structure, reactor building and control building except primary containment and the control room complex; the turbine building; and the control room complex. The fire areas of each safety division external to the control room complex and primary containment are considered as a group. A fire in anyone of these grouped areas is assumed to result in immediate loss of function for the equipment in the grouped area and screening is on that basis.
19M.42.2 Evaluate Fire Vulnerability Frequency (FI) For Fire Compartment (FIVE)
This evaluation is done by the FIVE methodology on the basis of grouped fire areas and not fire compartments.
19M.4.2.3 Determine Fire Ignition Frequency (FI) (FIVE) [Figure 6.3.1.2]
Figure 6.3.1.2 of the FIVE report is used and the results are entered in the appropriate locations on Table 1. See Subsection 19M.5.2 for the calculations for the fire ignition frequency. There are no significant fire areas with a fire ignition frequency less than
1E-6 per year.
19M.42.4 Choose (FIVE)
19M-6
The choice is always for Step 2. The ability of the plant to accommodate the complete burnout of any fire area without recovery is a design requirement and is always assumed. Step 3, separation of redundant safety-related systems by less than a rated fire barrier, is not available for a new plant design.
Fire Protection Probabilistic Risk Assessment
Rev. 0
ABWR Design Control Document/Tier 2
19M.42.S Probability For Redundant/Alternate System Unavailable (FIVE)
The Level 1 PRA models are used to deterinine the probability of failure of the redundant systems external to the grouped fire area. The PRA models were combined with the fire ignition frequency for the calculation. The results of the analysis are entered in the appropriate locations on Table 19M-I.
All significant fire areas have a fire induced core damage frequencies of less than the acceptance criteria.
19M.4.2.6 Can Fire Affect Redundant/Alternate Path (FIVE)
It is concluded that a fire cannot affect the redundant/alternate paths in other divisional fire areas since only physical separation by rated fire barriers (as described in Subsection 9.5.1 and confirmed in the fire hazard analysis, Appendix 9A) is relied upon. All fire areas screen out.
19M.5 Calculation of the Fire Ignition frequency
19M.S.1 General Comments On Completion Of FIVE Table 3
• Fire Compartment Boundaries: (FIVE)
All boundaries are three hour rated structures such as walls, ceilings, floors and doors. All penetrations are closed by penetrations with a fire rating equal to the rating of the structure penetrated.
• Inside Fire Area: (FIVE)
No general comments.
Fire Ignition Frequency
• Step 1.1 (FIVE)
Selected Fire Location (FIVE, Table 1.1)
No general comments.
• Step 1.2 (FIVE)
Location Weighting Factor (WFd (FIVE, Table 1.2)
The location weighting factors for the ABWR are summarized on Table 19M-2. The first two columns of the table were copied from Table 1.1 of the FIVE methodology. The third and fourth columns apply specifically to the ABWR. The rationale for determining each factor is stated on the table.
Fire Protection Probabilistic Risk Assessment 19M-7
ABWR
79M-B
Rev. 0
Design Control Document/Tier 2
Division 4 is not included in the table because a very small fraction of the plant fire areas are Division 4 areas. Division 4 only provides additional instrumentation and control logic in support of the other three divisions which contain all of the safety-related depressurization, core cooling and containment heat removal capacity. Loss of Division 4 can therefore only have an impact which is a fraction of the loss of anyone of the other 3 safety-related divisions.
Some equipment which was in the reactor building in operating plants is located in the lower portion of the control building for the ABWR. Separation from the control room complex by three hour rated fire barriers is provided for this equipment and it is considered in conjunction with the reactor building for purposes of the analysis. A fire in a single divisional area in either building is assumed to cause loss of that division without recovery. Considering the two locations as one provides an ABWR basis similar to the basis for the fire frequency data for the FIVE methodology.
• Step 1.3 (FIVE)
Ignition Source Weighting Factor (FIVE)
Potential Fixed Ignition Sources-It appears that the list of potential ignition sources in Table 1.2 of the FIVE methodology report represents all types of significant ignition sources that have resulted in fires in the existing plants and are therefore all inclusive. Potential ignition sources which are in existing plants but which have not ignited a fire may experience a fire in the future. Since they have not yet served as an ignition source, the frequency would be less than any data given on the FIVE tables. Any new potential fire sources unique to the ABWR have been considered. The new potential sources are the fine motion control rod drive (FMCRD) power supplies and the reactor internal pump (RIP) adjustable speed drives. These two new sources are included in the reactor building analysis.
In the FIVE methodology, the ignition source weighting factors are fractional numbers calculated on the basis of the number of ignition sources in the fire compartment (fire area) being considered divided by the total number of similar ignition sources for the plant. For example, if there are 30 electrical cabinets in the reactor building and 10 of them are in a fire compartment (fire area) being analyzed, the ignition source weighting factor would be 10/30 or 0.33 for the fire compartment. Counted quantities are used to calculate
fractions.
The specific rationale for derivation of the weighting factor for each potential ignition source is given below for each Ignition Source Data Sheet (ISDS), Table 3 (FIVE).
Fire Protection Probabilistic Risk Assessment
Rev. 0
ABWR Design Control DocumentlTier 2
19M.5.2 Completed Ignition Source Data Sheets and Notes
The fire compartment fire frequency was determined for the applicable building areas by completing Ignition Source Data Sheets, Tables 19M-3 through 19M-I0 and their associated notes, for the applicable areas. A summary of the results follows:
Building Area
Reactor/Control Building/Intake Structure
Division 1 Fire Areas
Division 2 Fire Areas
Division 3 Fire Areas
Turbine Building
Control Room Complex
FIre Compartment ·Frre FrequencY-
, Not a part of OeD (Refer to SSAR).
These fire compartment fire frequency values were used as input to the probability risk assessment models.
19M.5.3 Completed Ignition Source Data Sheets and Notes
Completed ignition source data sheets and the associated explanatory notes for each sheet are included as Tables 19M-3 through 19M-I0.
19M.6 Calculation of Core Damage Frequencies
19M.S.1 Methodology
The calculations were based upon original ABWR functional fault trees for the reactor water injection and heat removal functions, which included a gas turbi:ne generator as a diverse source of emergency power. The fault trees and input data are described in detail in Chapter 19. Fault tree analyses were performed using the CAFTA computer program.
Functional fault trees were developed to reflect the reduced injection and heat removal capabilities defined by each of the five bounding fire scenarios. Estimates of expected core damage frequency were developed for each scenario by applying results of these functional fault tree analyses to accident sequence event tree structures developed for
Fire Protection probabilistic Risk Assessment 19M-9

ABWR Rev. 0
Design Control Document/Tier 2
the ABWR internal events PRA, and described in Chapter 19. The isolation/loss of feedwater event tree, Figure I9D.4-2, was selected for evaluation as a conservative representation of the sequence of events for fires which lead to divisional power loss and for control room fires.
The consequences of a turbine building fire were determined to be bounded by a loss of off-site power event, and therefore the loss of off-site power event trees, Figures 19D.4-3 through I9D.4-9, were used as the basis for its assessment.
Conservative estimates of fire initiating event frequencies and assumed consequences were developed in a preceding task using the EPRI FIVE methodology. The initiating event frequencies obtained and used in this analysis are as follows:
Annual Initiating Event and Assumed Consequences Frequency'-
Fire disabling electrical Division 1
Fire disabling electrical Division 2
Fire disabling electrical Division 3
Control room fire limiting ECCS control to remote shutdown panel
Turbine building fire resulting in loss of off-site power
1 Not a part of DeD (Refer to SSAR).
19M.6.2 Results
19M-10
Calculated core damage frequencies for each of the initiating events are summarized in Table 19M-II. Breakdowns of core damage frequency by acciden t class for each initiator are provided in Tables 19M-12 and 19M-I3. It should be noted that the core damage frequencies for Class II events are reduced very significantly prior to summation in the "TOT. CDF" columns and rows of the latter two tables. This accounts for recovery actions for Level 1 PRA Class II events identified in the Level 2 containment event tree analyses in Subsection I9D.5.
Fire Protection Probabilistic Risk Assessment
ABWR Rev. 0
Design Control Document!Tier 2
Event trees used for the ABWR fire risk screening analysis fqr divisional and control room fires are illustrated in Figures 19M-3 through 19M-6. Those for the turbine building fire event are given in Figures 19M-7 through 19M-13. As indicated in Tables 19M-12 and 19M-13, only event sequences categorized as accident Class I are found to contribute significantly to core damage frequency. It can also be seen from the tables that all postulated fire events pass the screening criteria.
The event tree figures and summary tables show the main contributor to core damage frequency for each initiator leading to a divisional power loss to be that sequence in which both high and low pressure injection systems fail, following successful scram and SRV performance and loss of feedwater. In the case of the control room fire event, assumed inability to recover feedwater or inject condensate at low pressure increases the values of both high and low pressure Class I sequences. The probability of failure to manually depressurize also has greater impact in this latter event, since only four SRVs can be controlled from the remote control location in the modified scenario, and opening of three is required for success. For the divisional fire sequences, failure to depressurize is essentially determined by human error. Turbine building fire core damage frequency is dominated by station blackout event sequences.
The core damage frequency initially calculated for control room fires (initiating event CR.) was greater than that predicted for a divisional electrical fire, and did not pass the FIVE Methodology screen. This was due to the provision of capability at the remote shutdown location to control a single loop for high pressure injection (HPCF) as well as only three safety relief valves for depressurization. With respect to the latter, successful operation of all three"valves would be necessary to prevent core damage in the event of a need to depressurize. Therefore, a more detailed analysis was required for this initiator, as well as consideration of possible system control capability modifications to the remote shutdown control system.
Potential courses of action to reduce control room fire risk which were identified and evaluated included the following:
• Providing control capability for a fourth SRV at the remote shutdown control panel, and
• Taking credit for operating the RCIC system from outside the control room if determined to be practical, i. e., from the motor control center and locally at the RCIC.
Examination of the latter possibility led to the conclusion that successful operation of the RCIC system from outside the control room would be practical, and it is an interface requirement that the applicant provide an emergency operating procedure for manual operation of the RCIC.
Fire Protection Probabilistic Risk Assessment 19M-ll
ABWR Rev. 0
Design Control Document/Tier 2
Results of these evaluations are documented in Table 19M-14. It can be seen that neither of the above actions by itself satisfies the screening criterion. In combination, however, the criterion is met, and with incorporation of the above two actions no further analyses are required to demonstrate acceptably low fire risk for the ABWR.
19M.7 COL License Information
19M.7.1 Manual Control of RCIC
Subsection 19M.3 requires local manual control of RCIC as one means of mitigation in case of a control room fire. It is a requirement that a procedure for local operation of the RCIC be provided by the COL applicant.
19M.8 References
19M-1 "Fire Vulnerability Evaluation Methodology, FIVE, Plant Screening Guide", Electric Power Research Institute, Preliminary Draft.
19M-12 Fire Protection Probabilistic Risk Assessment
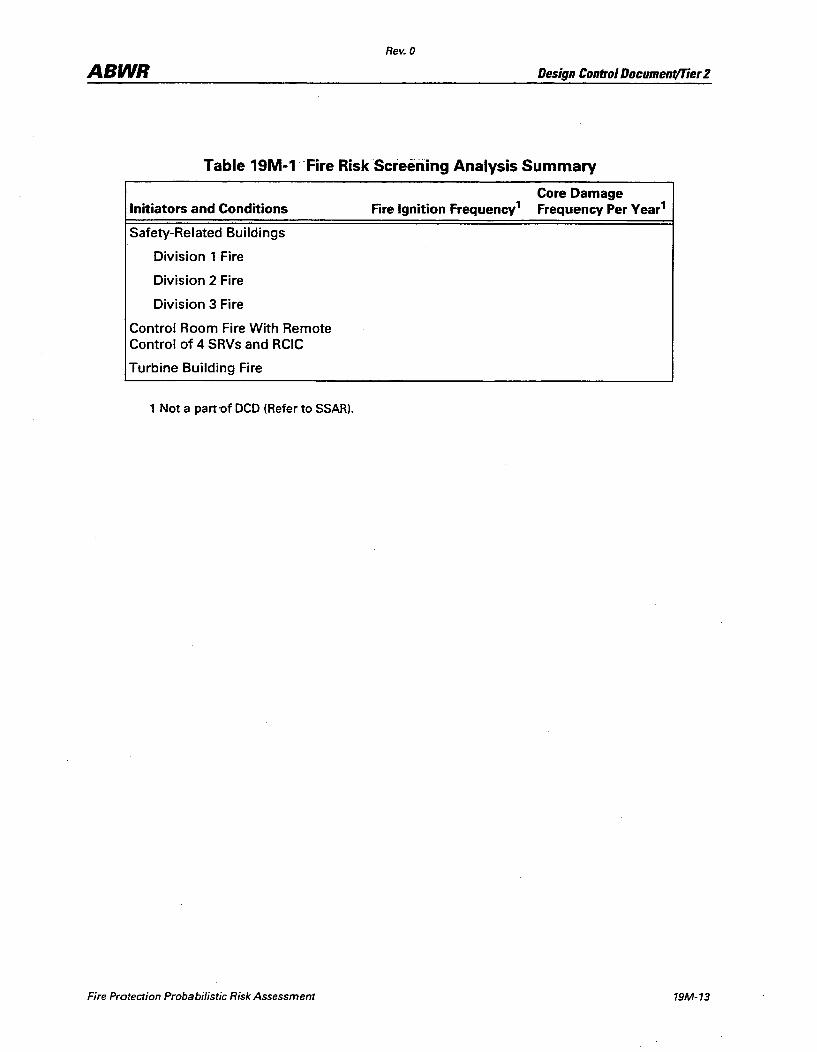
Rev. 0
ABWR Design Control DocumentlTier 2
Table 19M-1· Fire Risk -Screening Analysis Summary
Initiators and Conditions
Safety-Related Buildings
Division 1 Fire
Division 2 Fire
Division 3 Fire
Control Room Fire With Remote Control of 4 SRVs and RCIC
Turbine Building Fire
1 Not a part-of OeD (Refer to SSAR).
Fire Protection Probabilistic Risk Assessment
Core Damage Fire Ignition Frequency 1 Frequency Per Year 1
19M-13
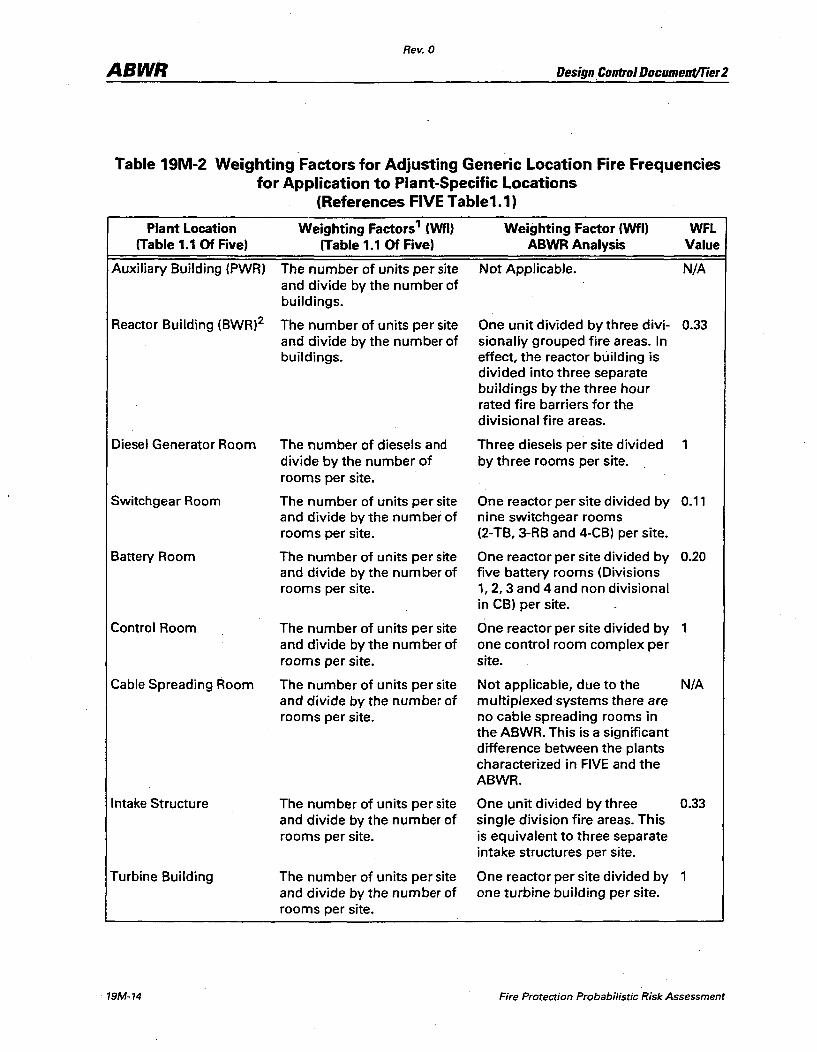
Rev. 0
ABWR Design . Control Document/Tier 2
Table 19M-2 Weighting Factors for Adjusting Generic Location Fire Frequencies for Application to Plant-Specific Locations
(References FIVE Table1.1)
Plant Location Weighting Factors 1 (Wf!) Weighting Factor (Wf!) WFL (Table 1.1 Of Five) (Table 1.1 Of Five) ABWR Analysis Value
Auxiliary Building (PWRl The number of units per site Not Applicable. N/A and divide by the number of buildings.
Reactor Building (BWR)2 The number of units per site One unit divided by three divi- 0.33 and divide by the number of sionally grouped fire areas. In buildings. effect, the reactor building is
divided into three separate buildings by the three hour rated fire barriers for the divisional fire areas.
Diesel Generator Room The number of diesels and Three diesels per site divided 1 divide by the number of by three rooms per site. rooms per site.
Switchgear Room The number of units per site One reactor per site divided by 0.11 and divide by the number of nine switchgear rooms rooms per site. (2-TB, 3-RB and 4-CB) per site.
Battery Room The number of units per site One reactor per site divided by 0.20 and divide by the number of five battery rooms (Divisions rooms per site. 1,2,3 and 4 and non divisional
in CBl per site.
Control Room The number of units per site One reactor per site divided by 1 and divide by the number of one control room complex per rooms per site. site.
Cable Spreading Room The number of units per site Not applicable, due to the N/A and divide by the number of multiplexed systems there are rooms per site. no cable spreading rooms in
the ABWR. This is a significant difference between the plants characterized in FIVE and the ABWR.
Intake Structure The number of units per site One unit divided by three 0.33 and divide by the number of single division fire areas. This rooms per site. is equivalent to three separate
intake structures per site.
Turbine Building The number of units per site One reactor per site divided by 1 and divide by the number of one turbine building per site. rooms per site.
19M-14 Fire Protection Probabilistic Risk Assessment
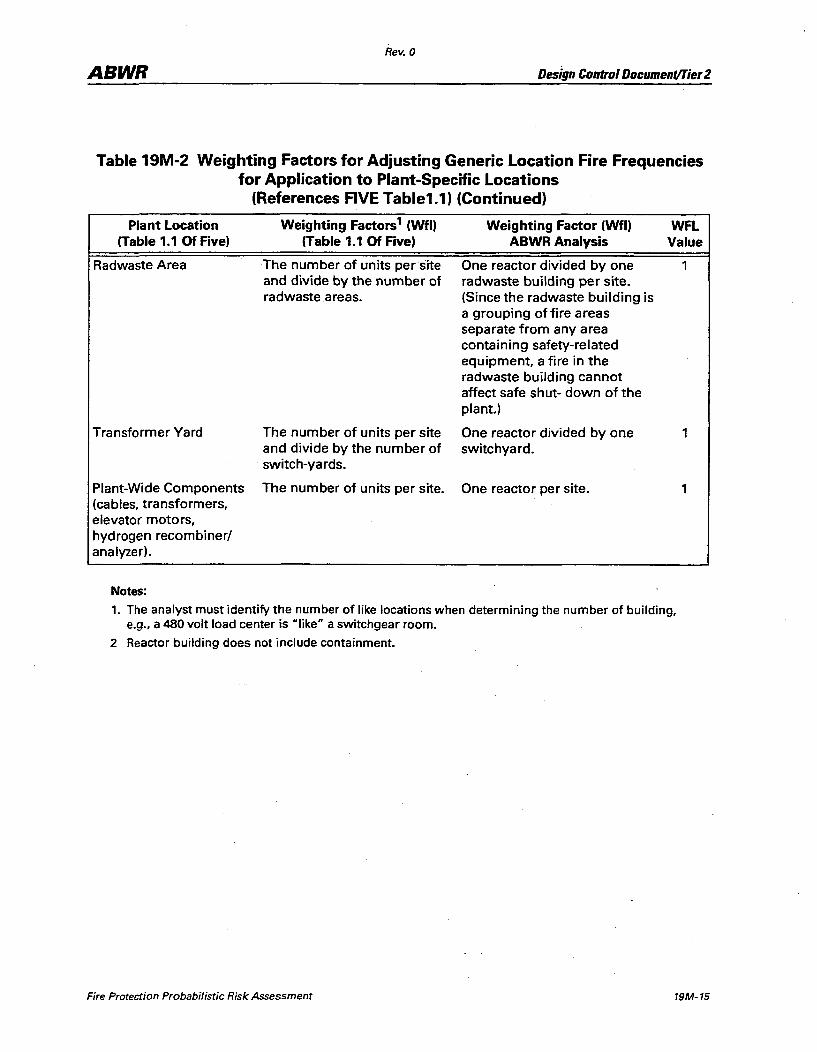
Rev. 0
ABWR Design Control Documenf/Tier 2
Table 19M-2 Weighting Factors for Adjusting Generic Location Fire Frequencies for Application to Plant-Specific Locations
(References FIVE Table1.1) (Continued)
Plant Location (Table 1.1 Of Five)
Radwaste Area
Transformer Yard
Plant-Wide Components (cables, transformers, elevator motors, hydrogen recombiner/ analyzer).
Notes:
Weighting Factors 1 (Wfl) (Table 1.1 Of Five)
The number of units per site and divide by the number of radwasteareas.
The number of units per site and divide by the number of switch-yards.
The number of units per site.
Weighting Factor (Wfl) WFL ABWR Analysis Value
One reactor divided by one 1 radwaste building per site. (Since the radwaste building is a grouping of fire areas separate from any area containing safety-related equipment, a fire in the radwaste building cannot affect safe shut- down of the plant.)
One reactor divided by one 1 switchyard.
One reactor per site. 1
1. The analyst must identify the number of like locations when determining the number of building, e.g., a 480 volt load center is "like" a switchgear room.
2 Reactor building does not include containment.
Fire Protection Probabilistic Risk Assessment 19M-15

Table 19M-3 Fire Compartment-Division 1 Ignition Source Data Sheet (lSDS) (Taken from Draft FIVE,Methodology)
Not part of DCD (Refer to SSAR)

Table 19M-3 Fire Compartment-Division 1 Ignition Source Data Sheet (lSDS) (Taken from Draft FIVE Methodology) (Continued)
Not part of DCD (Refer to SSAR)
Table 19M-4 Fire Compartment - Division 2 Ignition Source Data Sheet (lSDS) , (Taken from Draft FIVE Methodology)
Not part of DCD (Refer to SSAR)
Table 19M-4 Fire Compartment - Division 2 Ignition Source Data Sheet (lSDS) (Taken from Draft FIVE Methodology) (Continued)
Not part of DCD (Refer to SSAR)

Table 19M-5 Fire Compartment - DivisIon 3'gnition Source Data Sheet (lSDS) (Taken from Draft FIVE Methodology)
Not part of DeD (Refer to SSAR)
Table 19M-5 Fire Compartment - Division 3 Ignition Source Data Sheet (lSDS) (Taken from Draft FIVE Methodology) (Continued)
Not part ofDeD (Refer to SSAR)
ABWR
19M-22
Rev. 0
Design Control Document/Tier 2
Table 19M-6 Reactor and Control Building Fire Areas Explanatory Notes (for Tables 19M-3,4 & 5)
(FIVE, Table 3) Not part of Den (Refer to SSAR)
Fire Protection Probabilistic Risk Assessment

Rev. 0
ABWR Design Control DocumentlTier 2
Table 19M-6 Reactor and Control Building Fire Areas Explanatory Notes (for Tables 19M-3,4 & 5)
(FIVE, Table 3) (Continued) Not part ofDeD (Refer to SSAR)
Fire Protection Probabilistic Risk Assessment 19M-23

ABWR
19M-24
Rev. 0
Design Control Document/Tier2
Table 19M-6 Reactor and Control Building Fire Areas Explanatory Notes (for Tables 19M-3,4 & 5)
(FIVE, Table 3) (Continued) Not part of DeD (Refer to SSAR)
Fire Protection Probabilistic Risk Assessment
Rev. 0
ABWR Design Control Document/Tier 2
Table 19M-6 Reactor and Control Building Fire Areas Explanatory Notes (for Tables 19M-3,4 & 5)
(FIVE, Table 3) (Continued) Not part of DeD (Refer to SSAR)
Fire Protection Probabilistic Risk Assessment 19M-25
Table 19M-7 Fire Compartment - Turbine Building Ignition Source Data Sheet (lSDS) (Taken from Draft FIVE Methodology)
Not part of DCD (Refer to SSAR)
*legend for Teble 19M-7 Not part of DeD (Refer to SSAR)

ABWR
19M-28
Rev. 0
Design Control Document/Tier 2
Table 19M-8 Turbine Building Explanatory Notes (For Table 19M-7)(FIVE, Table 3) Not part of DeD (Refer to SSAR)
Fire Protection Probabilistic Risk Assessment
ABWR Rev. 0
Design Control Document/Tier 2
. Table 19M-8 Turbine Building Explanatory Notes (For Table 19M-7)(FIVE, Table 3) (Continued)
Not part of DeD (Refer to SSAR)
Fire Protection Probabilistic Risk Assessment 19M-29

ABWR
19M-30
Rev. 0
Design Control DocumentlTier 2
Table 19M-8 Turbine Building Explanatory Notes (For Table 19M-7)(FIVE, Table 3) (Continued)
Not part ofDCD (Refer to SSAR)
)
Fire Protection Probabilistic Risk Assessment
Table 19M-9 Fire Compartment - Control Room Complex Ignition Source Data Sheet(lSDS)* (Taken from Draft FIVE Methodology)
Not part of DeD (Refer to SSAR)
ABWR
19M-32
Rev. 0
Design Control Document!Tier 2
Table 19M-10 Control Room Complex Explanatory Notes (For Table 19M-g) (FIVE, Table 3) Not part of DCD (Refer to SSAR)
Fire Protection Probabilistic Risk Assessment
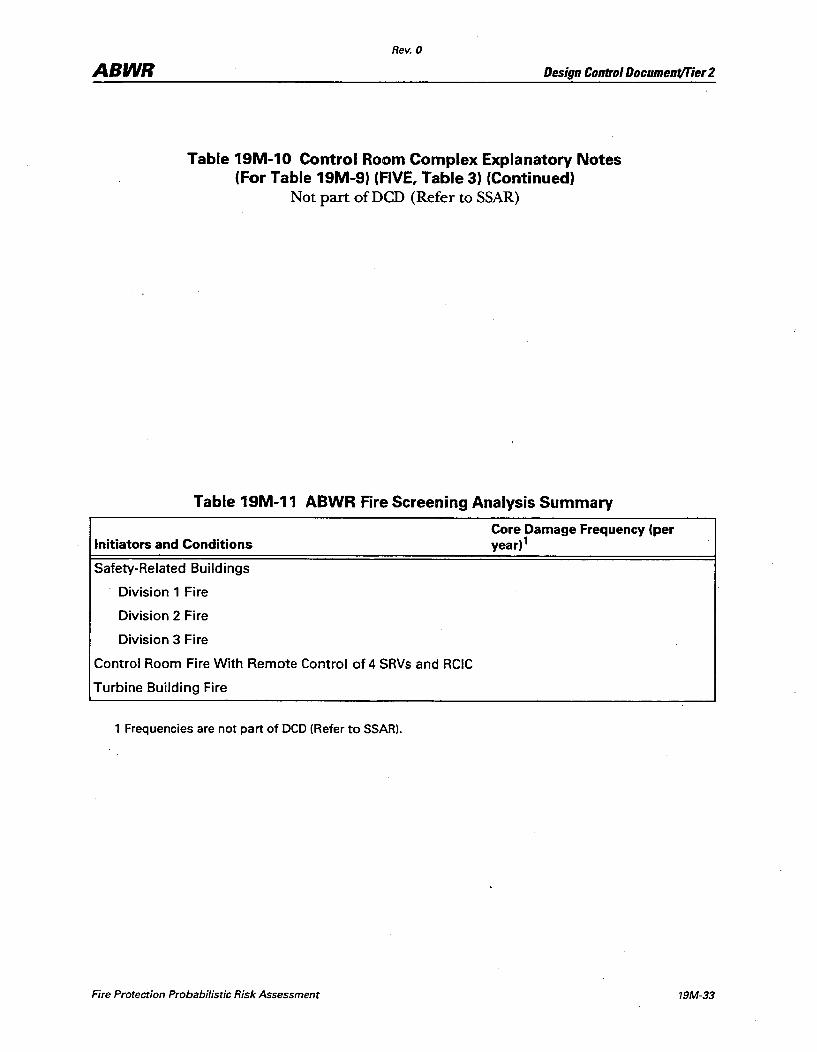
Rev. 0
ABWR Design Control DocumentlTier 2
Table 19M-10 Control Room Complex Explanatory Notes (For Table 19M-9) (FIVE, Table 3) (Continued)
Not part ofDeD (Refer to SSAR)
Table 19M-11 ABWR Fire Screening Analysis Summary
Initiators and Conditions
Safety-Related Buildings
Division 1 Fire
Division 2 Fire
Division 3 Fire
Control Room Fire With Remote Control of 4 SRVs and RCIC
Turbine Building Fire
1 Frequencies are not part of DeD (Refer to SSAR).
Fire Protection Probabilistic Risk Assessment
Core Damage Frequency (per year)'
19M-33
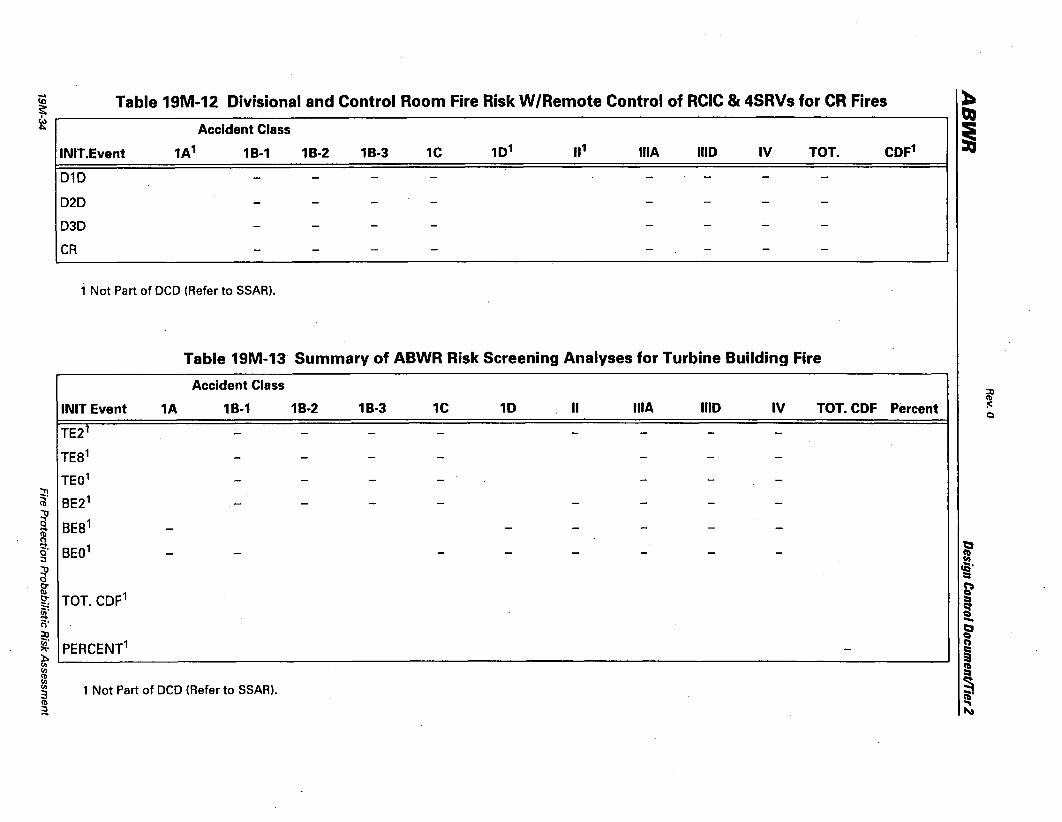
iO Table 19M-12 Divisional and Control Room Fire RiskW/Remote Control of RCIC & 4SRVs for CR Fires ~ r-----------------------------------------------------------------------------------------------, ~ Accident Class
INIT.Event
010
020
D3D
CR
1A 1 18-1 18-2
1 Not Part of DCD (Refer to SSAR).
18-3 1C iliA 1110 IV TOT.
Table 19M-13 Summary of ABWR Risk Screening Analyses for Turbine Building Fire
INIT Event
TE21
TES1
TE01 ~ (I) BE21 ~ o BEa' a g' BE01 ~ o 0-
g TOT. CDF1 ~.
0' :n ~ PERCENT1
Accident Class
1A 18-1 18-2 18-3 1C 10 " iliA 1110 IV TOT. COF Percent
~ ~--------------------------------------------------------------------------------------------~ ~ 3 1 Not Part of DCD (Refer to SSAR), ~ ...
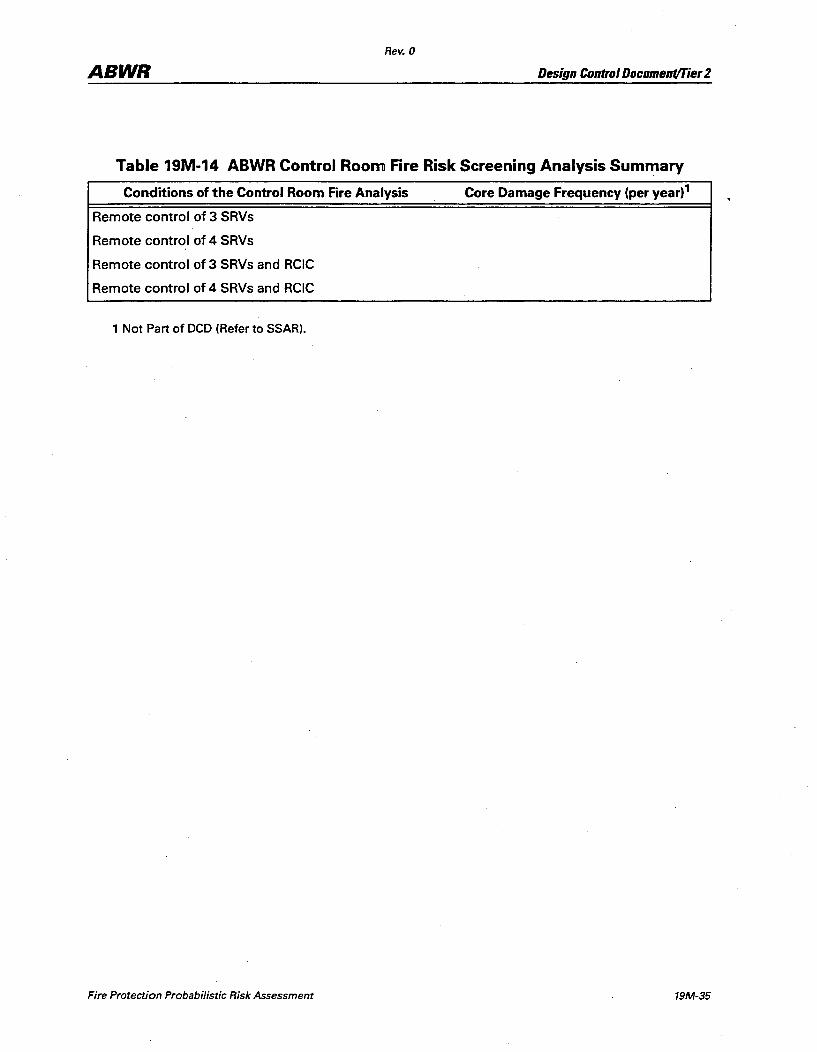
Rev. 0
ABWR Design Control Document/Tier 2
Table 19M-14 ABWR Control Room Fire Risk Screening Analysis Summary
Conditions of the Control Room Fire Analysis
Remote control of 3 SRVs
Remote control of 4 SRVs
Remote control of 3 SRVs and RCIC
Remote control of 4 SRVs and RCIC
1 Not Part of OeD (Refer to SSAR).
Fire Protection Probabilistic Risk Assessment
Core Damage Frequency (per year) 1
19M-35
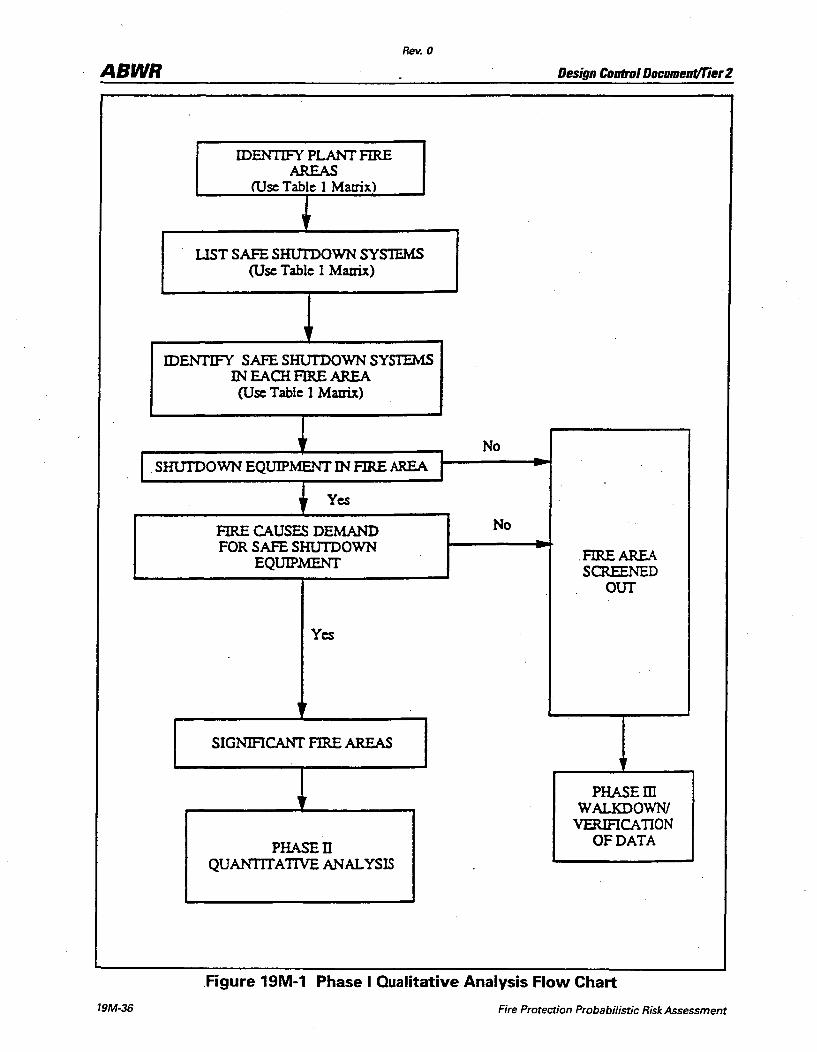
ABWR
IDENTIFY PLANT FIRE AREAS
(Use Table 1 Matrix) I ,
Rev. 0
~TSMtSmnDOWNSY~ (Use Table 1 Mattix)
IDENTIFY SAFE SHUrDOWN SYSTEMS IN EAOi FIRE AREA (Use Table 1 Mattix)
,Ir
I . SHUTDOWN EQUIPMENT IN FIRE AREA
Yes
FIRE CAUSES DEMAND FOR SAFE SHUTDOWN
EQUIPMENT
Yes
,
SIGNIFlCANT F1RE AREAS
,
PHASEn QUANTITATIVE ANALYSIS
No
No
Design Control Document/Tier2
. FIRE AREA SCREENED
OUT
PHASEID WALKDOWN/
VERIFICA nON OF DATA
Figure 19M-1 Phase I Qualitative Analysis Flow Chart
19M-36 Fire Protection Probabilistic Risk Assessment
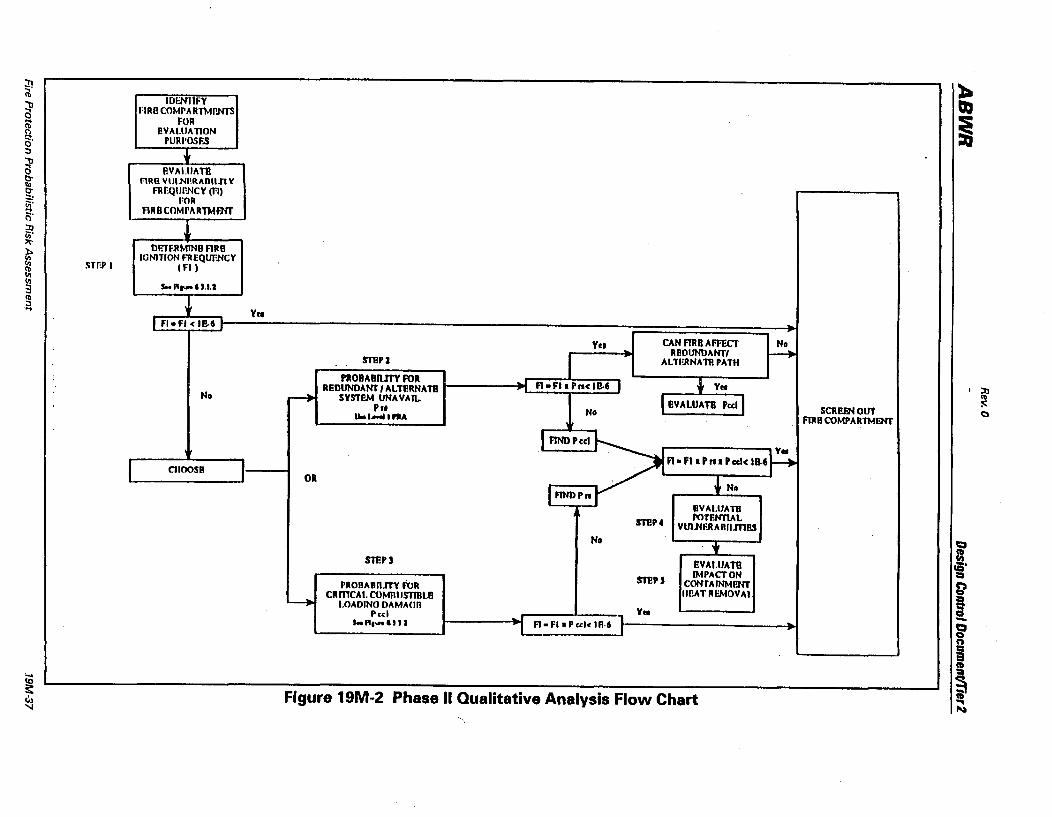
1DEN11FY nRB COMPARTh1PNTS
FOR eVALUATION
I'URPOSF3
-+ eVAI.IIATB
nRIl VlJI.Nl!RAOnnV FRf:Qllr!NCY (fIl
rOR ARBCOMPARTMOO
~ DF.TERMlNB ARB
SUP I IGNITION FREQur!NCY
( Fil
,"R_U.U
~ Ytt I F.-F. < II!-' ...
Vee CAN flR B AFFECT No RBOUNDANT' f-+ ST1!P2 AI..Tl'JlNAm PATH
nOBABIUTY FOR fl-FhPnclB-6 I .~. Ya REDUNDANT/ALT£RNATB
No ~ SYn'F.M UNAVAIl.. I EVALUATB Pcd I I'll No sa ruiN OllT Uoo t-oIl PM ARB COMPARTMENT
L FIND'ccl
i~ fl- Fla Pna Pcdc 18-6 ClIOOSR I
I OR ~ No L FTNDh IiVAI.UATB
ST1!P. roTEHTIAL VtIIllFJIARllmBS
1'10 ·t ST1lP' EVAI.UATB
IMPACT ON PRODABnlTY foR
STEPS CONfAINMENT CRmeAI. COMIJUSTlBlB \I!!AT REMovAl
~ LOAOINO OAMAUIl Ya Pul '"1'1._&1, I I fl - FI • P ul< 111-6 I
Figure 19M-2 Phase II Qualitative Analysis Flow Chart
Figure 19M·3 Division 1 Electrical Fire Not part ofDeD (Refer to SSAR)
Figure 19M-4 Division 2 Electrical Fire Not part ofDeD (Refer to SSAR)
Figure 19M·5 Division 3 Electrical Fire Not part of DeD (Refer to SSAR)

Figure 19M-6 Control Room Fire Not part of DeD (Refer to SSAR)
Figure 19M-7 Turbine Building Fire (Loss of Offsite Power and Station Blackout Event Tree) Not part of DeD (Refer to SSAR)
Figure 19M·8 Loss of Offsite Power Event Tree (Recovery time: 30 min< t < 2 h) Not part of DCD (Refer to SSAR)
Figure 19M-9 Loss of Offsite Power Event Tree (Recovery time: 2 hrs< t < 8 h) Not part of DCD (Refer to SSAR)
Figure 19M-10 Loss of Offsite Power Event Tree (Recovery time: t > 8 h) Not part of DCD (Refer to SSAR)
Figure 19M-11 Station Blackout Event Tree (Recovery time: 30 min < t < 2 h) Not part of DCD (Refer to SSAR)
Figure 19M·12 Station Blackout Event Tree (Recovery time: 2 hrs< t <8 h) Not part of DCD (Refer to SSAR)

Figure 19M-13 Station Blackout Event Tree (Recovery time: t > 8 h) Not part of DCD (Refer to SSAR)
Rev. 0
ABWR Design Control Documenf/fier2
19N Analysis of Common-Cause Failure of Multiplex Equipment
19N.1 Introduction
The effect of common-cause failures of the ABWR multiplexing equipment (EMUX) on each safety function is included in the PRA analysis of each of the transient and LOCA initiating events (Appendix 19D). The fault tree designators for EMUX CCF are CCFMUX, CCFILU, and ILCClli. The probability values used in the PRA analysis are based on random probabilities of failure and common-cause beta-factor. The effect on total core damage frequency (CDF) , as evaluated, is found to be significant.
Because of the importance of the multiplexing equipment to ABWR instrumentation and control, a supplemental study ofEMUX CCF has been perfonned to further investigate the effects of the use of colIlmon instruments, multiplexers, ",:nd transmission networks for reactivity control (scram), ECCS (core cooling and decay heat removal), and lDIS (isolation).
The safety system logic and control (SSLC)· has four independent divisions of instrumentation having separate sensors, actuators and multiplexing equipment. The only restriction regarding assignment of sensors and actuators to remote multiplexing units within a division is that reactor pressure vessel (RPV) wide-range and narrowrange water-level sensors are always assigned to different RMUs.
The primary effect considered in this analysis is that due to common-cause failure of automatic initiation of the ECCS and RPS functions. The study also examines the effects ofEMUX common-cause failure on containment isolation.
19N.2 Results and Conclusions
The effects of EMUX CCF on total core damage frequency are found to be significant for transient and LOCA initiating events as analyzed in the PRA (Subsections 19N.5.1-19N.5.3). Additional "special" initiating events have been analyzed and found to not be affected by EMUX CCF (Subsection 19N.5.4) Common-cause failure of the multiplexing equipment during noxmal plant operation at power has also been examined as a potential accident initiator, and found to be a negligible CDF contributor (Subsection 19N.5.5).
The PRA analysis contains several conservatisms in regard to the evaluation of the effect ofEMUX CCFs on CDF.
(1) As a simplification, the CCF probabilities were derived using the beta-factor method. Use of the "multiple-Greek" method of analysis, as described in Reference 19N-l, would provide smaller CCF probabilities where more than two failures are involved.
Analysis of Common-Cause Failure of Multiplex Equipment 19N-1
Rev. 0
ABWR Design Control Document/Tier 2
(2) The mean time between failures (M1BFs) used in the analysis to represent the component reliabilities treated all failures as functional failures; whereas a substantial fraction of the failures would be minor and would not fail the function.
(3) Multiple equipment failures generally do not occur simultaneously. Usually there will be a noticeable time period between the first and any subsequent failures, thus, providing advance information on a potentially developing problem. If the first failure is detected and its cause determined before subsequent failures occur, loss of system functions can be avoided and corrective action can be taken.
The potential causes of common failure of multiple divisions ofEMUX have been identified as the following:
• Earthquake
• Loss of DC Power
• Loss of Cooling
• Sensor Miscalibration
• RMU Miscalibration
• Set Point Drift
• Maintenance/Test Error
• Manufacturing Error
• Electromagnetic Interference
• Fire
• Software Fault
These eleven potential common causes have been examined (Subsection 19NA) and only three of them appear to be credible: '
(1) RMU miscalibration,
(2) maintenance/test error, and
(3) software fault.
19N-2 Analysis of Common-Cause Failure of Multiplex Equipment
ABWR Rev. 0
Design Control Document/Tier 2
All three of these potential causes could exist across division boundaries in spite of physical separation and electrical independence. Because of the existence of these three potential causes of common-cause EMUX failure, several precautions are being taken regarding defense against them:
(1) To eliminate the RMU miscalibration as a credible source ofEMUX commoncause failure, administrative procedures will be established to perform crosschannel checking ofRMU outputs at the main control room SSLC instrumentation, as a final checkpoint of RMU calibration work.
(2) To eliminate maintenance/test error as a credible source ofEMUX commoncause failure, a thorough post-maintenance test (Subsection 7.1.2.1.6 (4), (5), (6), Protection System InseIvice Testability) will be conducted using the surveillance test controller (STC) that is provided in each instrumentation division as part of the EMUX and SSLC designs. The STC contains preprogrammed test sequences for each sensor type and each safety-related system supported by EMUX and SSLC. The tests cannot be changed by the maintenance technician; the technician only selects which system is to be simulated. The STC then injects appropriate simulated sensor signals (traceable to and automatically checked against known standards) i~to the RMUs of the EMUX. Failure of the calibration standards is alarmed. Testing is dynamic; i.e., the STC injects ramp-type analog signals over the full range (including abnormal upscale and downscale) of the simulated transmitters and also injects pulse, contact closure or frequency-modulated signals as required by the system under test. In this way, the full transmission capability of EMUX and the functional control and interlock logic in SSLC are tested. Test results are monitored either at the EMUX outputs in the control room or local area, or at the SSLC outputs, depending upon where test or maintenance was performed. The STC logs the test results, which can also be sent to the process computer or printed out. The STCs are normally off, have continuous self-test, and are operated one at a time, so they are not subject to CCFs of their own. Since the logged test results can verified independently by control room persollnel, a single technician can safely maintain multiple divisions of EMUX.
The test features described above check the electronic circuitry from the signal conditioning and A/D converter inputs through the digital processing electronics. Transmitter calibration and other sensor calibration activities will require two technicians for the four safety divisions. Each will calibrate his division to the inputs of the RMUs and then check the other's work. This will then be repeated for the remaining two divisions.
Analysis of Common-Cause Failure of Multiplex Equipment 19N-3
Rev. 0
ABWR Design Control DocumentlTier 2
(3) To prevent any unidentified EMUX faults/failure modes (e.g., an undetected software fault) from propagating to other EMUX divisions, so that such unidentified faults are effectively eliminated as a credible source ofEMUX common-cause failure:
(a) Chapter 16, "Plant Operating Technical Specifications" will incorporate requirements on the "Limiting Conditions of Operation" and "Required Action" that must be followed in the even t of a failure of a single division of EMUX and i~ the event of a failure of multiple divisions of EMUX.
(b) The plant operating procedures will include the appropriate detailed procedures necessary to assure that the ABWR plant operations are maintained within compliance with the governing "Plant Operating Technical Specifications" during the periods of divisional EMUX failure. These will also include the appropriate symptom-based procedures to assure that adequate core cooling is maintained in the hypothetical event of an entire EMUX syste~ failure.
19N.3 Basis for the Analysis
19N-4
The design features of the EMUX that are of most importance to and form the basis for this analysis are the following:
(1) There is complete separation ofRMUs, DTMs, SLUs, nus, sensors and ECCS actuators, etc., between the four safety divisions of control and instrumentation.
(2) Within a given division, the only restriction regarding assignments of sensors and actuators to RMUs is that wide-range and narrow-range reactor water level sensors cannot be input to and processed by the same RMU.
(3) There is separation ofDTM and lLU modules within a division along the lines of "deenergize to operate" and "energize to operate" functions, i.e., RPS, and MSIV signals are processed by different DTM and TLU modules than the DTM and SLU modules used for ECCS control and PCV isolation (PCV isolation is also deenergize-to-operate).
(4) The RMUs are connected by a separate mUltiplexing system (EMUX), in each division, which is a redundant or reconfigurable control data network of high reliability (MTBF=100,OOO hours).
(5) All data communications to and from other divisions of control and instrumentation, and all data communications to nondivisional systems are electrically isolated.
Analysis of Common-Cause Failure of Multiplex Equipment
Rev. 0
ABWR Design Control Document/Tier 2
(6) Comparison of a sensed input to a setpoint for generating a trip is done by a DIM. Coincident 2/4 trip logic processing for generating a divisional output trip is done by a TIU or SLU.
(7) Loss of data communications in any division to the RPS (and deenergize-tooperate isolation functions) will result in a trip (and isolation, respectively) in the failed division due to the fail-safe design.
(8) Manual scram is implemented by hard wire to the scram pilot valve solenoids and does not depend on the correct operation of the DIM or TIU.
(9) A bypass of the RPS output logic unit is a manual division out-of-service bypass, which allows repair of the DTM or TIU of that division without a half scram condition or halfMSIV isolation condition. Only one division can be bypassed at a time.
(10) To reduce the probability of spurious initiation ofECCS, two SLUs are used in parallel within a division, with 2/2 voting at the final channel output to initiate equipment actuation. If one ECCS SLU is in a failed condition, it is automatically bypassed, the control room is alerted, and the remaining SLU operates with 1/1 logic until the failed SLU is restored.
(11) RMUs and EMUXs are self-tested every 15 minutes and repaired/replaced in an average time of 4 hours.
(12) Control room indications, annunications, and alarms associated with EMUXtransmitted control signals are dependent on correct operation of EMUXs.
(13) Vital plant parameters are hard-wired to the remote shutdown panel independent of EMUX.
In addition to the design features listed above, the following assumptions and ground rules also supply the basis for this analysis:
(1) Common-cause failure of all RMUs or all EMUX networks cannot be ruled-out as impossible or incredible. The reason for this is that several potential common causes can be postulated. (Subsection I9N.2.)
(2) The probability of common-cause failure of interdivisional RMUs or EMUXs is extremely low. The reasons for this are the common-cause defenses built into the design-physical separation, electrical separation, asynchronous operation, optical isolation, natural convection cooling ability, and the selftesting feature-in addition to the special defenses discussed in Subsection I9N.2.
Analysis of Common-Cause Failure of Multiplex Equipment 19N-5
Rev. 0
ABWR Design Control Document/Tier 2
(3) RMUs may be postulated to have comnion-cause failures of the energize-tcr trip mode or the deenergize-tcrtrip mode, but not of both modes simultaneously.
(4) EMUX transmission may be postulated to have common·cause failures of the energize-tcrtrip mode only. Failure of the deenergize-tcrtrip mode is considered to not be possible.
(5) Simultaneous failure of all RMUs or EMUXs in the energize-tcrtrip mode would result in an automatic scram and MSN and PCV isolation valve closure, and loss of automatic ECCS initiation capability. Some ECCS could be initiated manually from the remote shutdown panel.
(6) In addition to complete failure of energize-tcrtrip or deenergize-tcrtrip functions, the RMUs may have common-cause calibration errors.
19N.4 Potential Causes of and Defenses Against EMUX CCF
Because of the high degree of independence between divisions in the ABWR design, the probability of simultaneous failures in multiple divisions is very low. If there were no identifiable common failure cause, the random probability of failure of n divisions would be the nth power of the probability of a single division. In the presence of potential common failure causes, the probability of multiple failures may increase. The identified potential common failure causes are listed in Subsection 19N.2. A discussion of the nature and credibility of each of these potential common failure causes and the defenses against them follows in Subsections 19N.l through 19NA.12.
19N.4.1 Earthquake
.The multiplex equipment consists of solid-state electrcroptical modules, which are vibration and shock resistant by nature. In addition, the equipment is designed and tested to very high acceleration levels (7-l0g). Earthquakes of magnitudes above 2g have never been experienced, are not expected to occur, and if they did occur would have much more serious consequences than loss ofEMUX equipment. Even allowing for magnification above ground level, earthquake does not appear to be a credible cause of concern.
19N.4.2 loss of D.C. Power
19N-6
Common-cause loss of DC power has been examined intensively in an EPRI analysis (Reference 19N-l). Most of the identified potential common causes were found to either reSult in gradual degradation and/or be self-announcing. The consequences of actual loss of all DC power would be far more serious than the loss ofEMUX equipment since most control instrumentation in the plant's safety equipment depends on DC power. (Loss of DC power is evaluated as part of the station blackout analysis of
Analysis of Common-Cause Failure of Multiplex Equipment
ABWR Rev. 0
Design Control Document/Tier 2
Appendix 190.) Loss of DC power does not constitute a significant cause of commoncause EMUX failure.
19N.4.3 Loss of Cooling
It is a design requirement that the ABWR. EMUX equipment must be capable of continuous operation at 323.15 K (50°C), and must be capable of continuous operation in its installed condition without fans. This is not a problem for present-day low-power solid-state electronic equipment, and the maximum anticipated ambient temperature 'is 313.15 K (40°C). Loss of cooling is not a credible common cause.
19N.4.4 Sensor Miscalibration
Sensor miscalibration does not represent a common-cause failure ofEMUX equipment per se, but is identified here because of the fact that there is a reduction in the number of sensors in the ABWR multiplexed instrumentation configuration relative to earlier designs, and the sensors are shared between safety functions.
A reduction in the number of sensors does not necessarily degrade reliability or availability. In fact, simpler systems are usually more reliable than more complex
systems. When additional components are used redundantly in a system to improve reliability, a point ma~ be reached where the system reliability is dominated by commoncause failure, and additional redundancies add little, if any, improvement in system reliability.
Sharing of sensors raises the possibility of common-cause sensor miscalibration error between safety functions. For the limiting-risk case, where low RPV water level is the sole sensed initiation condition, reactor trip and ECCS initiation have different sets and types of sensors. ECCS is initiated by two sets of wide-range water level sensors and reactor trip is initiated by a separate set of narrow-range sensors. WIth proper maintenance procedures and special precautions, the possibility of common-cause miscalibration resulting in loss of automatic initiation of both safety functions is very remote.
In summary, a reduction in sensors from earlier designs has little effect on core damage frequency or risk due to the separation of functions, diversity of sensor types, different modes of operation, and use of multiple trip units for different trip set points. Sensor miscalibration is not a credible cause of common-cause failure in the ABWR
multiplexed instnimentation.
19N.4.5 RMU Miscalibration
. Only the analog-to-digital converters of the RMUs require calibration. The calibration is automatic and computer-controlled. Calibration is accomplished by comparison to voltage, resistance and time references that are verified against extemallaboratory
Analysis of Common·Cause Failure of Multiplex Equipment 19N·7
ABWR Rev. 0
Design-Control Document/Tier 2
standards. The EMUX transmission equipment is self-calibrating. The technician only initiates calibration by pushing a button. In addition, the self-test feature of the equipment detects certain types of calibration faults.
The above factors minimize the likelihood of miscalibration, but do not eliminate miscalibration as a possible (credible) common cause. Administrative controls will be used during cross-channel checking to assure that miscalibration is not propagated by transmission of bad signals from one division to another.
19N.4.6 Setpoint Drift
Setpoints are digital and programmed into non-volatile memory locations; therefore, . there is no setpoint drift. Setpoint drift is not a credible cause. (Setpoints could be incorrectly set initially, as discussed in Subsection 19NA.7.)
19N.4.7 Maintenance/Test Error
The EMUX equipment has a built-in provision to prevent bypassing multiple divisions simultaneously. This feature would not prevent common maintenance or test errors that were done consecutively and were latent by nature, such as set points being erroneously set. Periodic surveillance, as required by the technical specifications, includes verification of setpoints. The self-test feature of the equipment will also identify some types of maintenances/test errors.
Although the features discussed above will minimize the likelihood of common-cause maintenance/test errors, they do not eliminate maintenance/test errors as a credible common cause. Administrative controls will be used to further reduce the likelihood of most of these types of errors by not allowing the same technician to work on multiple divisions. (See the discussion in Subsection 19N.2.)
19N.4.8 Manufacturing Error
Solid-state electronic manufacture is a largely automated process subjected to multiple tests at successive levels of assembly (component, circuit, board and instrument level). Safety-related equipment is further qualified by extensive burn-in to uncover premature failures. The equipment is also subjected to very thorough check-out and test during installation. It is difficult to conceive of a type of manufacturing error that could escape all inspections and tests and cause concurrent failure in multiple channels at a later time. Manufacturing error does not appear to be a credible cause.
19N.4.9 Electromagnetic Interference (EMI)
19N-B
EMI is a potential cause of failure of solid-state electronic equipment. EM! can enter a circuit through any of several paths-power supplies, adjacent equipment, adjacent cabling, or input signals. In the case of the EMUX equipment, none of these paths would affect multiple divisions since the divisions are widely separated physically and
Analysis of Common-Cause Failure of Multiplex Equipment

ABWR Rev. 0
Design Control Document/Tier 2
are electrically independent. In addition, the nature of electro-optics reduces the susceptibility to EM!. Fiber-optic transmission lines are not subject to EMI and will not propagate transients between lines. EM! is not a credible common cause.
19N.4.10 Fire
The four divisions of remote EMUX equipment are located in separate rooms of the reactor building and are separated by barriers. The fiber optic transmission cables have fire-resistant protective covering. A localized fire would affect only one division. A more wide-spread fire might affect two divisions, but a fire large enough to affect three or four divisions would have more far-reaching effects than the loss of EMUX transmission. Because of the physical separation, common-cause faih.~.re of remote EMUX equipment due to fire does not appear to be a credible concern.
A fire in the main control room could affect multiple divisions to the same extent that it would affect habitability of the room and other control functions. In such even tuality, the remote shutdown panel would be used for controL
19N.4.11 Software
The EMUX equipment is programmed to perfonn the multiplex function, self-test, and calibration. The software that provides the programming is subject to extensive "debugging" procedures and strict quality control and test requirements (verification and validation). Nevertheless, it is not impossible that an undetected "bug" could remain. If such were the case, it would most likely affect all divisions. It would not necessarily cause all divisions to fail simultaneously. Common<ause software fault is a credible, although unlikely, possibility. To provide additional defense against software CCF, technical specification requirements and administrative procedures will be established, as discussed in Subsection 19N .2, to assure taking of appropriate action in the event of failure of individual multiplex divisions.
19N.4.12 Summary
Of the eleven potential common causes examined, only three appear to be credible:
(1) RMU miscalibration
(2) Maintenance/test error
(3) Software fault
All of these potential causes could exist across division boundaries in spite of physical separation and electrical independence. In all cases, administrative controls will be applied to minimize the probability of common-cause failure.
Analysis of Common-Cause Failure of Multiplex Equipment 19N-9
ABWR Rev. 0
Design Control Documenf/Tier 2
The failure that would result in a significant contribution to core damage frequency would be complete failure during plant operation of three or four divisions of EMUX that transmit signals from wid~range water level sensors. This condition could resultin fail1lle to automatically initiate ECCS. Since failure ofEMUX equipment is annunciated, the operator would be aware of the need for manual initiation of ECCS. Appropriate instrumentation and control-is available at the remote shutdown panel, if needed.
19N.5 Discussion of the Effect on Core Damage Frequency
The three primary safety functions that are necessary to prevent core damage are reactivity control, core cooling, and decay heat removal. The effects ofEMUX CCF are included in the quantification of core damage frequency in the internal events analysis of Appendix 19D. Additional discussion is given herein to provide further information and insight into the nature ofEMUX CCF contribution to core damage frequency. The isolation function does not contribute directly to core damage frequency and is evaluated separately in Subsection 19N.6.
The most demanding condition requiring safety action is the condition of decreasing water level in the reactor pressure vessel (RPV) during power operation. This condition requires immediate reactivity control (scram) to slow the rate of inventory loss, increased water injection into the vessel to maintain or increase the water level (ECCS), and eventually a means of removing decay heat from the containment (main condenser or RHR). The limiting condition regarding automatic initiation and control of the three safety functions is a situation where the only sensed abnormal condition is the decreasing water level. This could occur with a feedwater trip or malfunction, a turbine trip, or closure of the main steam isolation valves (MSIVs). These three plant responses could result from a large variety of causes, including generator trip, loss of ofIsite power, loss of condenser vacuum, load rejection, recirculation pump trip, and others. For purposes of this analysis, all of these events resulting in decreasing water level are grouped and designated as "plant transients".
19N.S.1 General Plant Transient Events
19N-10
In the ABWR, automatic response of the safety functions to a plant transient producing decreasing water level is initiated by signals transmitted through the EMUX. Initiation of ECCS and closure of some isolation valves is by the presence of an energizing signal. Initiation ofRPS (scram) and MSIV and PCV closure is by a deenergizing signal or absence/loss of energization.
There are four independent divisions of sensors and EMUX equipment. Simultaneous loss of transmission capability on any two of the four divisions would result in a scram on loss of energization. Loss of transmission capability on any three divisions simultaneously would result in loss of automatic initiation of ECCS and loss of low-
Analysis of Common-Cause Faiiure of Multiplex Equipment
ABWR Rev. 0
Design Control Document/Tier 2
pressure permissive signals for reactor shutdown cooling. When a single division is lost, the control room is alerted and that division is bypassed by the operator. Bypassing of a division results in that division becominginoperative; ie, that division cannot contribute to scram, isolation, or ECCS initiation. Technical specification requirements govern actions to be taken under those conditions.
Because of the high degree of independence between divisions in the ABWR design, the probability of simultaneous failures in multiple divisions is very low. IT there were no common failure cause, the random probability of failure of n divisions would be the nth power of the probability of failure of a single division. I~ the presence of potential common failure causes, the probability of multiple failures could increase. Potential multiple failure causes are listed in Subsection 19N.2. Defenses against these commoncause failures are discussed in Subsections 19N.2 and 19NA. These defenses provide a high degree of independence between instrumentation channels and divisions in the EMUX control data network.
The relationship of the safety function initiation and the EMUX is depicted in a simplified event tree, shown on Figure 19N-3. This event tree is for a plant transient initiating event and loss of transmission capability from three or four divisions ofEMUX transmission of wide-range RPV water level signals. Loss of transmission of narrow-range water level sensor RMUs due to common-cause failure would not affect the results since scram would be automatically initiated by loss of energization. The purpose of this event tree is to provide a means for examining the effect of common-cause failures of safety function initiating signals. Random failures of instrumentation and failures of mechanical execution of the safety function are evaluated in Appendix 19D.
The first safety response to a plant transient is a reactor trip and scram. Because of the deenergize-to-trip feature, a scram would be initiated, even with a common-cause failure of all EMUX transmission. (A loss of transmission through the EMUX would result in a plant scram at any time, even without a plant transient. That event is evaluated in a latf:':r subsection-Subsection 19N.5.5.) Common-cause failure of transmission would also result in closure of the MSIVs.
Given a successful scram, the next essential safety function is to maintain water level in the reactor pressure vessel. The limiting case for common-cause failure of the EMUX is common-cause failure of three or four of the individual remote multiplexing units processing wide-range RPV water level signals. Since ABWR has motor-driven feedwater pumps, closure of the MSIVs would not cause loss of feedwater unless the feedwater pumps tripped because of the transient. If the feedwater pumps did not trip, RPV waterlevel could be maintained as long as there was water in the condenser hotwell. In ABWR, the condenser hotwell inventory is automatically replenished from the condensate storage tank. If the feedwater pumps were tripped, they could be started manually from the control room, since the feedwater control system is independent of the EMUX. If
Analysis of Common-Cause Failure of Multiplex Equipment 19N-11

ABWR
19N-12
Rev. 0
Design Control Document!1ier 2 '
necessary, sufficient ECCS pumps could be started manually from the remote shutdown panel to provide water to the RPV. Automatic initiation of ECCS would not occur because of the common-cause failure ofEMUX to transmit wide-range RPV water level signals.
In the event that the motor-driven feedwater pumps were tripped and could not be restarted, the operator would need to manually start ECCS pumps in a relatively short time (approximately 30 minutes). The operator can extend the time available by starting the second CRD pump as instructed by the emergency operating procedures (EOPs). This extension of available time is not included in the internal events analysis of Appendix 19D.
To manually start some ECCS pumps, the operator may have to use the remote shutdown panel, since manual start signals from the control room are normally transmitt~d through the EMUX and may not be operable. The operator would have correct indication of RPV water level in the control room since water level is hard wired in addition to being transmitted through the EMUX. He also would be aware of the reactor scram. If control is not possible from the control room, the EOPs will tell the operator to proceed to or send someone to the remote shutdown panel where true indications and means of control are supplied through independent channels. In this simplified bounding analysis, failure of the operator to manually start ECCS pumps would result in uncovering of the reactor core and eventual core damage.
In the event that the operator successfully recovered feedwater or started ECCS pumps, the RPV water level would be maintained above the top of the fuel and no direct core damage would ensue. Eventually (within 20-24 hours-or longer if the main condenser were available) decay heat removal would be required to prevent excessive heatup of the suppression pool and containment. Initiation of decay heat removal would be accomplished by the operator through manual start and valve lineup of RHR in the suppression pool cooling mode. Later in the shutdown procedure, the operator would realign RHR in the shutdown cooling mode. In this analysis, proper action by the operator to provide pump initiation and valve lineup is all that is considered. Mechanical failure of pumps, valves, or other equipment is evaluated in Appendix 19D.
In this simplified analysis, if the operator fails to initiate decay heat removal, it is assumed that the containment will eventually fail and ECCS equipment will also fail due to harsh environmental conditions. This is a conservative simplification, since the ABWR has a containment overpressure protection system.
The effect of common-cause EMUX failure on CDF is included in the quantification of the event trees in Appendix 19D for transient-initiated and LOCA events. The random unavailability of the RMUs and nus is derived from an expected mean time between failures (MTBF) and a mean time to detect and repair a failure (MTTR). The random unavailability of the EMS is derived from an expected MTBF and an MTfR. The MTBF
Analysis of Common-Cause Failure of Multiplex Equipment
ABWR Rev. 0
Design Control DocumentlTier 2
values are 'estimated,based on infonnation from the supplier. The MITR value is based on the use of a self-test feature which detects a failure within 15 minutes on the average, and the existence of spare replacement units on hand at the plant. The self-test feature detects most of the failures. The remainingVailures are detected by surveillance testing conducted quarterly.
The beta-factor model used to estimate the common<ause failure probability is based on the premise that the common<ause failure probability is a function of the random unavailability of the individual units, as well as the existence of potential common causes. The beta-factor is simply the ratio of the common<ause failure probability to the total failure probability. Stated another way, the beta-factor represents the proportion of total failures that are multiple failures due to a common cause.
If there were sufficient experience data for multiple failures of solid-state multiplexing equipment, the experience data would be used directly and there would be no need for use of the beta-factor model. However, there is a dearth of multiple-failure data pertaining to solid-state multiplexer equipment, particularly equipment with a self-test feature. The alternative is to evaluate or estimate the relative susceptibility of the EMUX to multi-divisional failures through use of the beta-factor.
A recent report by the Electric Power Research Institute (EPRI) (Reference 19N-l) discusses the beta-factor model and lists representative values for beta. The values listed generally range from 0.1 down to about 0.01, but there is no value given specifically for solid-state multiplexing equipment. Considering the defenses in the ABWR design, particularly the self-test feature, a lower value for beta is justified. The self-test feature of the EMUX equipment provides detection offailures in 15 minutes, and on-hand spare modules provides restoration of operability within 4 hours. This feature limits the available time for propagation of multiple failures to 4.25 hours, and essentially eliminates several of the more likely causes of multiple failures.
A data summary of Licensing Event Reports (Reference 19N-2) pertaining to commoncause failure of instrumentation equipment derives beta-factors for several types of instrumentation equipment. Although there is no summary specifically for solid-state multiplexer units, there is a summary for "signal conditioning equipment." Direct applicability and use of these data for the Appendix 19D analysis is not warranted, and the data are not used directly. All of the data have very large bands of uncertainty. The derived median values for beta provide some indication that the beta-factor used in the Appendix 19D analysis may be conservative.
The ABWR PRA indicates that the total core damage frequency for the ABWR design will be very low. The PRA analysis also indicates that potential EMUX CCFs during plant transient events are significant contributors to the low total CDF. EMUX CCFs appear in many of the top cutsets. An importance analysis indicates that all three EMUX CCFs have relatively high "risk achievement worth", i.e., increases in the CCF probabilities
Analysis of Common-Cause Failure of Multiplex Equipment 19N-13
ABWR Rev. 0
Design Control Document/Tier 2
would result in significant increases in total CDF. The defenses against EMUX CCFs in the plant design (Subsection 19NA) and the administrative procedures prescribed in Subsection 19N.2 should prevent increases in EMUX CCF probabilities above the values used in the PRA analysis. Conservatisms in this part of the PRA tend to somewhat overestimate the importance of EMUX CCFs.
19N.5.2 Loss of Feedwater Event
The previous analysis considered the effect of loss of transmission capability of the EMUX, that is, an instance where the EMUX failed to transmit an energization signal. The reverse failure mode would be failure to lose the energization signal for RPS due to common-cause failure of the narrow-range water level sensor RMUs to properly sense a Level 3 condition. For many plant transients, automatic scram would occur due to increased neutron flux or other direct-input signals to the RPS logic. For purposes of this analysis, an initiating event is used that would require response of the narrow-range RMUs that sense a Level'3 water-level condition. A feedwater pump nip can be used to represent such an event.
The probability of common-cause failure in this mode is much lower than for the lossof-transmission mode since most of the identifiable common causes would not cause a failure in this mode. The EMUX failure in this mode could result in failures of automatic scram. There is a very high probability that the operator would provide manual scram based on independent indications of the feedwater pump trip. Since the MSIVs would not close, the power conversion system would remain in operation. Based on past operating experience, there is a high probability that the operator would recover feedwater in addition to initiating manual scram. If feedwater were not recovered before low water level (Level 2) was reached, ECCS would be initiated automatically by means· of transmission through the wide-range water-level sensor RMUs.
Initiation of decay heat removal would not be affected by the EMUX failure in the deenergize-to-trip mode.
Failure of the deenergize-to-trip mode of the narrow-range water level sensors does not contribute to core damage frequency for the ABWR.
19N.5.3 Loss of Coolant Accidents
19N-14
Because of the low frequency of occurrence, LOCA events are very small contributors to ABWR core damage frequency. The probability of a coincidental common-cause EMUX failure together with a LOCA is an extremely low probability event. The possibility of a common-cause EMUX failure occurring as a result of a LOCA, where the LOCA would provide the common cause, is highly unlikely because of the locations and physical separation of the EMUX divisions.
Analysis of Common·Cause Failure of Multiplex Equipment
Rev. 0
ABWR Design Control Document/Tier 2
19N.S.4 Other Initiating Events
Other initiating events that have been considered on past PRAs include the following:
(1) Loss of offsite power
(2) Loss of DC power
(3) Inadvertent open relief valve
(4) Loss of service water
(5) Loss of instrument air
19N.S.4.1 Loss of Offsite Power
Loss of all offsite power would have no direct effect on EMUX operability since EMUX equipment operates completely on divisional DC power. A loss of offsite power would cause a small increase in the conditional probability ofloss of DC power since DC power is supplied by batteries or an AC converter-charger. The probability ofloss of DC power is very low as discussed below in Subsection 19N.5.4.2.
19N.S.4.2 Loss of DC Power
Each division of the EMUX is powered by a division of DC power. Loss of all divisions of DC power would result in loss ofEMUX transmission capability. The annual prob~bility ofloss of DC power on one essential bus is extremely small. The complete loss of DC power to all four divisions of essential power is considered to be essentially zero since the four divisions are independent, loss of DC power on anyone division is alarmed, and the station batteries are routinely tested. Very few credible causes of common-cause failure of multiple DC buses have been identified (Reference 19N-l).
19N.S.4.3 Inadvertent Open Relief Valve .
An inadvertent open relief valve (IORV) as an initiating event is treated in this analysis as just another plant transient. Although the plant response is somewhat different for an IORV, there is no peculiar impact on EMUX operation or response, and commoncause failure ofEMUX would have the same effect on plant response as it would in any other plant transient event.
19N.S.4.4 Loss of Service Water
Loss of essential service water has been hypothesized and studied as an initiating event since loss of service water could disable some ECCS equipmen t. Service water is not used directly by any EMUX equipment and is not used for room cooling. The effects ofloss of service water on essential safety equipment is evaluated in the system fault trees of Appendix 19D.
Analysis of Common·Cause Failure of Multiplex Equipment 19N·15
Rev. 0
·ABWR Design Control Document/Tier 2
19N.S.4.S Loss of Instrument Air
Instrument air is not used by EMUX equipment. As with essential service water, loss of
instrument air would not affect EMUX. equipment or this analysis.
19N.5.5 CCF of EMUX During Normal Plant Operation
. 19N-16
Results of the above analyses indicate that common-cause failure of EMUX equipment in response to a demand from a plant transient or other off-normal event is a very small contributor to core damage frequency. This subsection examines the effect of a common-cause EMUX failure at a random time during normal plant operation (EMUX
failure as an initiating event).
The limiting failure in this case would be common-cause failure of the three or four
divisions of remote multiplexing units transmitting the signals from the narrow-range and wide-range water level sensors. If only the narrow-range transmission channels
failed, the plant would scram on loss of energization, and ECCS would be initiated automatically through the wide-range RMUs. If only the wide-range water level sensor
RMUs failed, the plant would not scram from that failure alone and there would be no demand on ECCS unless a plant transient occurred. Thus, both wide-range and narrow
range RMUs must fail in multiple divisions to cause a condition of concern and a potential accident initiator. In that event, the plant would scram and ECCS would not be automatically initiated.
Using the beta-factor method of CCF evaluation, the expected frequency of commoncause failure of all RMUs in three or four divisions would be equal to the product of the expected frequency of random failure of a single RMU and a beta-factor. In this case,
the beta-factor should be lower than for the transient-initiated event since twice as many RMUs must fail; however, the assignment of a specific value to beta in this case is
extremely uncertain.
Because of the great degree of uncertainty in any quantitative analysis that could be performed at this level, it appears preferable (and sufficient) to make a qualitative judgement. Since two or three EMUX divisions must fail in two distinct modes involving separate equipment, and they must fail in a nearly simultaneous manner, i.e., in a
sufficiently short interval to not allow mitigating action to be taken, the expected frequency of occurrence must be extremely low.
Even if the initiating event should occur, there are still means of providing water injection to the core in time to prevent core damage, and to provide decay heat removal
The contribution to CDF for this initiating event is certainly extremely smalL
. Further defenses against this event are discussed at the end of Subsection 19N.7 .
Analysis of Common-Cause Failure of Multiplex Equipment
Rev. 0
ABWR Design Control Document/Tier 2
19N.6 Discussion of the Effect on Isolation Capability
Failure of the Leak Detection and Isolation System (LDIS) does not have a direct effect on core damage frequency. The primary purpose of the LDIS function is to isolate the reactor and associated primary equipment and certain fission products in the event of a loss-Of-coolant accidenL A simplified event tree for a LOCA with common-cause loss of transmission capability of all RMUs is shown on Figure 19N-4. For this condition, MSIVs and PCV isolation valves would close on loss-of-signal.
The largest expected initiation frequency for a LOCA is for a small LOCA and is very small. The conditional probability of common-cause unavailability ofRMUs is extremely small. There is no identifiable mechanism by which the LOCA could increase the probability of common-cause RMU failure.
With the MSIVs closed and the reactor shut down, the operator would have sufficient indications that an event had occurred and that the water level indication was erratic. Following operating procedures, the operator would send someone to the remote shutdown panel to monitor plant conditions and initiate necessary safety functions. There is a very high probability that isolation valves would then be closed manually within a reasonable time. The location of the remote shutdown panel is such that it cannot be made inaccessible by a LOCA.With any reasonable judgmental value assigned to failure of the operator to provide .manual isolation, the total expected frequency of failing to isolate in response to a LOCA is negligible.
One additional isolation failure event should be considered-the effect of failing to isolate in a severe accident situation with a severely damaged core. In accident sequences resulting in core damage because the operator failed to maintain water inventory to the reactor (given an EMUX CCF), it is possible that he would also fail to close isolation valves.
The consequences of failure to isolate in the presence of a damaged core are not necessarily severe. If the MSIVs are closed, as they would be in this event, then the primary effect offailing to isolate is contamination of piping and equipment exiting the reactor vessel. Since all return lines to the RPV have check valves, check valve failures would have to occur to contaminate return lines and upstream equipment.
Contamination of the lines and equipment exiting the RPV would be mostly by steam or other aerosols rather than liquid, since the RPV water level would be very low. To provide a pathway into the reactor building or a release to the environment, there would also have to be a break or leak in the piping or piping components, since all systems are closed. In a severe accident scenario, there are larger and more likely potential bypass paths than isolation failure, and the consequences of failing to isolate would be very mild in comparison.
Analysis of Common-Cause Failure of Multiplex Equipment 19N-17
Rev. 0
ABWR Design Control Documellf/Tier Z
19N.7 Summary
79N-78
This analysis has focused on the use of common multiplexing equipment in the EMUX. Because it is possible to identify feasible causes of multiple failures, the possibility of common-cause failure of identical multiplexing units has been studied. In view of the number and types of defenses built in to the EMUX design, the probability of commoncause failure should be very low. Because of the lack of multiple-failure experience data on equipment of this type, it has been necessary to predict the common-cause failure probability by use of an analytical model. The model used is a simple model-the betafactor model-that hypothesizes that common-cause failure probability is proportional to the random failure probability of a single unit. The proportionality factor is beta. The hypothesis may not be true in all cases, and there is a great deal of uncertainty in assigning a value to beta.
Beta represents the fraction of total failures that would involve multiple identical units. The expected value of beta is dependent on the nature of the possible causes, how and how fast failures would propagate between units, and what defenses exist to the causes. There is no established method for quantifying these factors. In the absence of good and sufficient data,_ assignment ofa value to beta isa matter of judgement. Values that have been used for beta range from 0.1 down to 0.001 and lower. Values of beta between 0.1 and 0.01 are common for mechanical equipment. Values below 0.01 are more common for instrumentation. The value used in the analysis of Appendix 19D may be conservative, considering the defenses in the ABWR EMUX design.
Using a conservative value for EMUX beta, the results of the Appendix 19D analysis show that use of the ABWR multiplexed shared-sensor configuration results in very little contribution to core damage frequency in response to demands from plant transients or off-normal events. This is because of the high availability on demand of the limiting equipment, the RMU. The high availability of the RMU is due to the self-test capability and the resulting short mean time to detect and recover from a failure. This same selftest feature is the best protection against common-cause failures, since multiple failures must all occur within an average time interval of 4.25 hours. This study tends to confirm the conclusions of the Appendix 19D analysis in regard to the effect on CDF of EMUX CCF in response to transient and LOCA initiated events.
Also of potential concern is common-cause failure ofEMUX as an initiating event. The EMUX must be available at all times when the plant is operating because of the "failsafe" (deenergize-to-trip) design for scram and MSIV closure. A simultaneous commoncause failure of two EMUX divisions at any time during plant operation would result in a plant trip, even though all plant parameters were normal. In a sense, this is a "false alarm" that results in a scram, which is a potential accident initiating event. If the third and/ or fourth division ofEMUX equipment also failed simultaneously, there could be a loss of automatic initiation ofECCS.
Analysis of Common-Cause Failure of Multiplex Equipment

ABWR Rev. 0
Design Control Document/Tier2
The expected frequency of occurrence of common-cause EMUX failure during nonnal operation is a function of the EMUX reliability, including D.C. power reliability. Fast recovery time due to the EMUX self-test feature does not help if two divisions fail simultaneously, since a plant trip is immediate. (The self-test feature is a major defense if the CCFs do not occur simultaneously.) The probability and expected frequency of occurrence of such an event is extremely low. Administrative controls will be imposed to minimize the probability of progressive common-cause failures. With the present design, the frequency of occurrence can be further reduced only by increasing the reliability of the remote multiplexing unit.
One type of administrative action that will effectively eliminate several common causes including software faults is establishment of required action to be taken in the event of functional failure of a single EMUX channel during plant operation. The action to be taken in the event of functional failure of an EMUX channel during plant operation is to re-establish operability and detennine the cause of the failure as soon as possible. During the period of repair/replacement and diagnosis, the remaining channels are monitored closely. In the event of a second channel failing before the first channel is restored, the safest available action is immediately taken as prescribed by technical specifications and/or emergency operating procedures.
The sensitivity of core damage frequency to EMUX MTBF and beta can be seen from the event tree of Figure 19N-3. The RMU CCF probability or frequency is a direct function of both of these reliability elements. In turn, the core damage frequency is directly proportional to the RMU CCF probability and the initiating event frequency. If the RMU MTBF was twice as high, the core damage frequency would be reduced by half. In like manner, uncertainty in the initiating frequency propagates directly into uncertainty in CDF.
19N.8 References
19N-1 "Procedures for Treating Common Cause Failures in Safety and Reliability Studies", EPRI NP-5613, February 1988.
19N-2 Meachum, T.R, and Atwood, C.L., "Common-Cause Fault Rates for Instrumentation and Control Assemblies", EG and G Idaho, Inc., May 1983.
Analysis of Common-Cause Failure of Multiplex Equipment 19N-19
ABWR
Figure 19N-1 Not Used
Figure 19N-2 Not Used
19N-20
Rev. 0
Design Control Document/Tier 2
Analysis of Common-Cause Failure of Multiplex Equipment
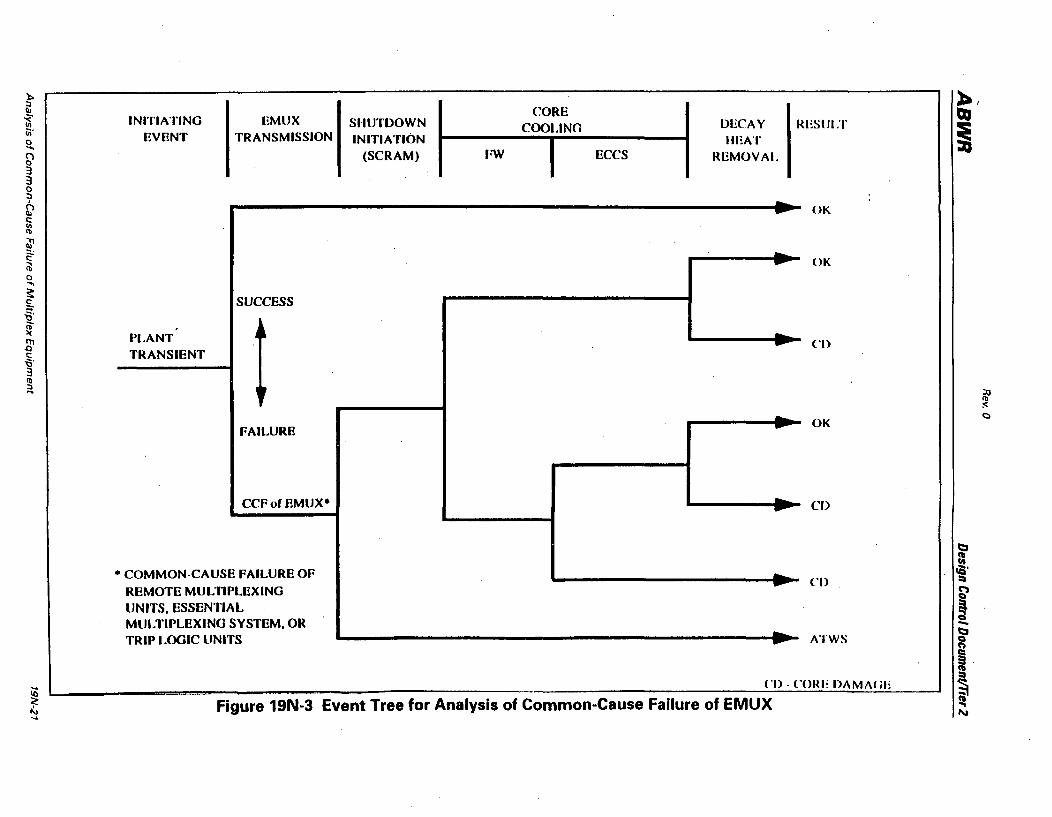
):. :J a. ~ iii' 0 .... ~ 3 3 0 :J
~ c: (I) <b
~ ~ ~ 0 .... ~ ~ '[ <b >c III .Q c: '0' 3 <b :J ...
INITIATING EMLJX EVENT TRANSMISSION
SUCCESS
PLANT l
TRANSIENT
r
FAILURE
CCFof EMUX·
• COMMON-CAUSE FAILURE OF REMOTE MULTIPLEXING UNITS, BSSENTIAL MULTIPLEXING SYSTEM, OR TRIP LOGIC UNITS
CORE SIIlJTDOWN COOLING INITIATION
(SCRAM) FW Eces
DECAY RESllI ;r IIEAT
REMOVAL
-- OK
-- OK
... - ('I)
- OK -
- CD -('D --
- ATWS -('I) - CORE nAMA(;!!
Figure 19N-3 Event Tree for Analysis of Common-Cause Failure of EMUX
):., QI
i
::Q <b ~
<::I
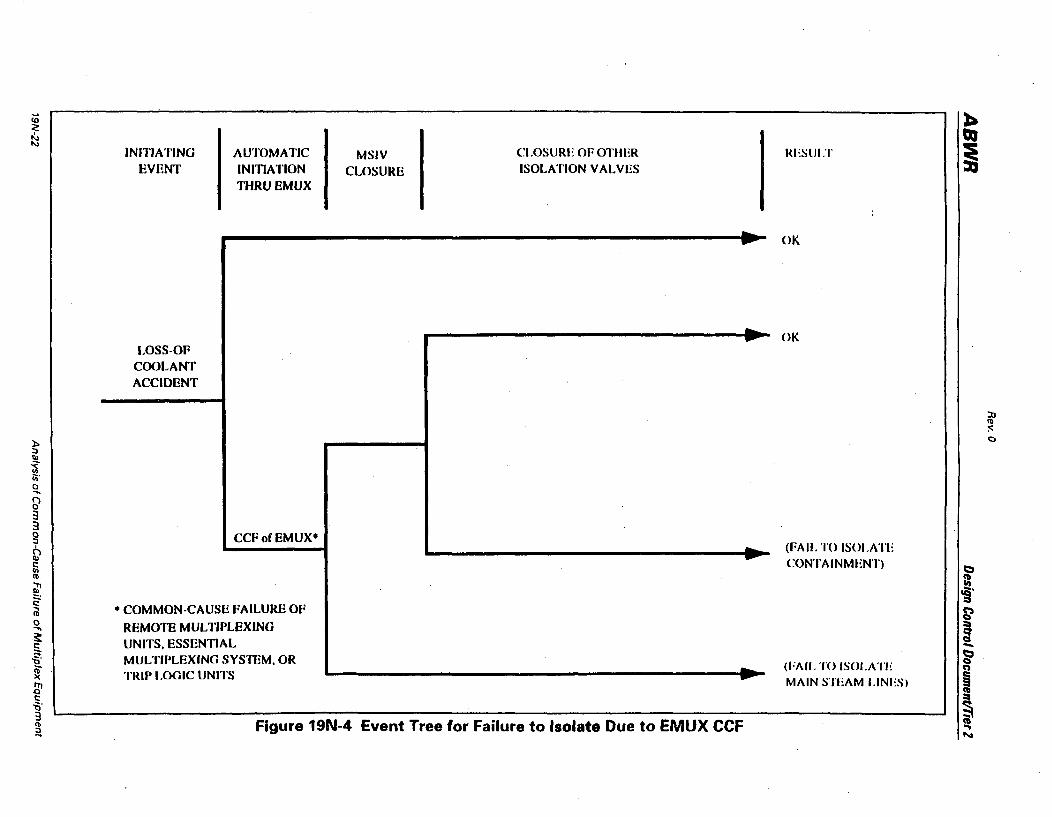
INITIATING EVENT
LOSS-OF COOLANT ACCIDENT
AUTOMATIC INITIATION TIfRUEMUX
CCFofEMUX·
• COMMON-CAUSE FAILURE OF
REMOTE MUL l1PLEXING UNITS. ESSEN'nAL MULTIPLEXING SYSTEM. OR TRIP LOGIC UNITS
MSIV CLOSURE
CLOSURE OF OHlER ISOLATION VALVES
----
--
.. -Figure 19N-4 Event Tree for Failure to Isolate Due to EMUX CCF
RESULT
OK
OK
(rAil, TO ISOI.ATE CONTAINMENT)
(I·AII. TO ISOI.ATE MAIN STEAM I.INIiS)

Rev. 0
ABWR Design Control Document/Tier 2
190 Not Used
Not Used 190-1/2
I
I
Rev. 3
ABWR Design Control Document/Tier 2
19P Evaluation of Potential Modifications to the ABWR Design
This Section is not pan of the DCD (Refer to Attlchrnent A of the "Technical Support Document for the ABWR *"). Attachment A of the Technical Support Document for the ABWR is not incorporated by reference in the DCD.
* Revision 1 - December 1994. See letter from J .F. Quirk, GE, to R W. Borchardt, NRC, dated December 21,1994.
Evaluation of Potential Modifications to the ABWR Design 19P-1/2
ABWR Rev. 0
Appendix 19Q Table of Contents
Design Control Documenf/Tier 2
list of Tables .................................................................................................................... 19Q-iii
list of Figures ..................................................................................................................... 19Q-v
19Q ABWR Shutdown Risk Assessment ................................................................................... 19Q-l 19Q.l 19Q.2 19Q.3 19Q.4
19Q.5 19Q.6 19Q.7
19Q.8 19Q.9 19Q.I0 19Q.11
19Q.12
Introduction ...................................................................................................... 19Q-l Evaluation Scope ............................................................................................... 19Q-l Summary of Results ........................................................................................... 19Q-2 Features to Minimize Shutdown Risk ............................................................... 19Q4 19Q.4.1 Decay Heat Removal ....................................................................... 19Q-5 19Q.4.2 Inventory Control ........................................................................... 19Q-6 19Q.4.3 Containment Integrity .................................................................. 19Q-l1 19Q.4.4 E;J.ectrica1 Power ............................................................................ 19Q-12 19Q.4.5 Reactivity Control ......................................................................... 19Q-13 19Q.4.6 Summary of Shutdown Risk Category Analysis ........................... 19Q-15 Instrumentation ............................................................................................... 19Q-16 Flooding and Fire Protection ......................................................................... 19Q-17 Decay Heat Removal Reliability Study ........................................................... 19Q-22 19Q.7.1 Introduction .................................................................................. 19Q-22 19Q.7.2 Purpose ......................................................................................... 19Q-23 19Q. 7.3 Summary ....................................................................................... 19Q-23 19Q.7.4 Methodology ................................................................................. 19Q-24 19Q. 7.5 Core Damage Probability Goal and RPV Boiling ....................... 19Q-25 19Q.7.6 Success Criteria ..................................................................... " ....... 19Q-27 19Q. 7. 7 Accident Progression and Event Trees ....................................... 19Q-28 19Q. 7.8 System Fault Trees ........................................................................ 19Q-30 19Q.7.9 Results and Condusions ............................................................... 19Q-31 Use of Freeze Seals in ABWR .......................................................................... 19Q-34 Shutdown Vulnerability Resulting from New Features ................................. 19Q-35 Procedures ....................................................................................................... 19Q-35 Summary of Review of Significant Shutdown Events: Electrical Power and Decay Heat Removal ................................................................................ 19Q-39 Results and Interface Requirements .............................................................. 19Q42 19Q.12.1 Insights Gained from the Analysis ............................................... 19Q42 19Q.12.2 Important Design Features .......................................................... 19Q43 19Q.12.3 Operator Actions .......................................................................... 19Q-43 19Q.12.4 Reliability Goals (Input to RAP} .................................................. 19Q-45 19Q.12.5 Conclusions ................................................................................... 19Q-45
19QA Fault Trees ....................................................................................................................... 19QA-l
19QB DHR Reliability Study ..................................................................................................... 19QB-l 19QB.l Offsite Dose and Operator Recovery Calculations ........................................ 19QB-l
19QB.l.l Offsite Doses ................................................................................. 19QB-l 19QB.2 Time to Reach Boiling .................................................................................... 19QB-2 19QB.3 Time for RPV Water Level to Reach Top of Active Fuel... ............................ 19QB-2 19QBA Human Reliability Analysis (HRA} ................................................................. 19QB-2
19QB.4.1 Purpose ......................................................................................... 19QB-2
Table of Contents 190-;
Rev. 0
ABWR Design Control Document/Tier 2
Table of Contents (Continued)
19QB.4.2 Summary ....................................................................................... 19QB-3 19QB.4.3 Methodology ...... : .......................................................................... 19QB-3 19QBA.4 Results and Conclusions ............................................................... 19QB-4
19QB.5 Decay Heat Removal Capability of CUW and FPC ........................................ 19QB-4 19QB.6 References ........................................................................................................ 19QB-4
,
19QC Review of Significant Shutdown Events: Electrical Power and Decay Heat Removal.19QC-l 19QC.l Review .of Significant Shutdown Events ......................................................... 19QC-l
19QC.l.l Summary ofDHR Events .............................................................. 19QC-l 19QC.l.2 Summary ....................................................................................... 19QC-l
190·;; Table of Contents
ABWR Rev. 0
Appendix 19Q List of Tables
Design Control Document!Tier 2
Table 19Q-1 ABWRFeatures That Minimize Shutdown Risk ............................................ 19Q46
Table 19Q-2 Success Criteria for Prevention of Core Damage .......................................... 19Q-51
Table 19Q-3 Minimum Sets of Systems for Modes 3 and 4 ................................................ 19Q-51
Table 19Q-4 Minimum Sets of Systems for Mode 5 (Unflooded) ..................................... 19Q-52
Table 19Q-5 Minimum Sets of Systems for Mode 5 (Flooded) .......................................... 19Q-5 2
Table 19Q-6 Shutdown Vulnerability Evaluation of new ABWR Features ........................ 19Q-53
Table 19QB-1 Time to Boiling for the RPV and RPV Plus SFP ............................................ 19QB-5
Table 19QB-2 Time for RPV Water Level to Reach TAF ...................................................... 19QB-5
Table 19QB-3 Probability of Failure to Diagnose .................................................................. 19QB-5
Table 19QB-4 Probability of Failure to Start a Specified "Minimum-Set" System ............... 19QB-6
Table 19QB-5 Control Room Alarms and Indications Aiding Diagnosis of "One RIIR Lost" .............................................................................................. 19QB-6
Table 19QB-6 Times Available (in Hours) ............................................................................ 19QB-6
Table 19QG 1 Loss of Offsite Power Precursors .................................................................... 19QC3
Table 19QG2 Decay Heat Removal Precursors ................................................................... 19QC 15
List of Tables 19Q-jji/iv
ABWR Rev. 0
Appendix 190 List of Figures
Design Control Document/Tier 2
Figures 19Q-l through 19Q-19 are not part of the DeD (Refer to SSAR Section 19Q)
Figures 19QA-19A through 19QA-20ck are not part of the DCD (Refer to SSAR Section 19QA)
List of Figures 19Q-v
Rev. 0
ABWR Design Control DocumentlTier 2
19Q ABWR Shutdown Risk Assessment
190.1 Introduction
Due to events at operating plants in the past several years such as the loss of offsite power at Vogtle on March 20, 1990 and the loss of decay heat removal (DHR) at Diablo Canyon on April 10, 1987, the shutdown risk associated with nuclear power plants has become more ofa concern to the industry. OnJanuary 17,1992 the NRC issued Draft NUREG-I449, "NRC Staff Evaluation of Shutdown and Low Power Operation." In NUREG-I449 the NRC staff identified some safety issues that may result in new regulatory requirements.
As part of the certification process for the advanced boiling water reactor (ABWR) , an evaluation of the shutdown risk associated with the ABWR was completed. This Appendix discusses the design and procedural features of the ABWR that contribute to the conclusion that the ABWR shutdown risks are negligible.
190.2 Evaluation Scope
The ABWR shutdown risk evaluation covers the important aspects ofNUREG-I449 as well as specific items requested by the NRC.
The evaluation encompasses plant operation in Modes 3 (hot shutdown), 4 (cold shutdown), and 5 (refueling). The ABWRfull power PRA covered operation in Modes 1 (power operation) and 2 (startup/hot standby). This evaluation addresses conditions for which there is fuel in the reactor pressure vessel (RPV). It includes all aspects of the Nuclear Steam Supply System (NSSS), the containment, and all systems that support operation of the NSSS and containment. It does not address events involving fuel handling outside the primary containment or fuel storage in the spent fuel pool.
The evaluation was broken down into several topics covering design, procedures, and ABWRfeatures that have the potential to prevent/mitigate past operating events that are considered precursors to loss of decay heat removal capability and fuel damage. The
. design issues included: decay heat removal, inventory control, containment integrity, electrical power, reactivity control, and instrumentation. Guidelines for generation of ABWR procedures are covered in a separate section, as well as the risk implications of using freeze seals during ABWR maintenance.
In NUREG-I449 it was pointed out that due to the increased level of maintenance activity while shutdown, the potential for fires and flooding in operating nuclear plants is considered higher during shutdown. These topics are covered separately to highlight the ABWR features designed to minimize the shutdown risks from fires and flooding.
In order to evaluate the ABWR features that are capable of preventing or mitigating safety significant events that have occurred at operating plants in the past, a study was
ABWR Shutdown Risk Assessment 190-1
ABWR Rev. 0
Design Control Documenttrier 2
completed of specific past events that resulted either in a loss of offsite power or a challenge to DHR. Loss of power events as described in NVREG-141 0, "Loss of Vital AC Power and the Residual Heat Removal System During Mid-Loop Operation at Vogtle Unit 1 on March 20, 1990," were evaluated and ABWR features which could have prevented/mitigated the event were described. A total of 74 loss of power events were evaluated. In a like manner, events described in NSAC-88, "Residual Heat Removal
. Experience Review and Safety Analysis-Boiling Water Reactors," were reviewed along with certain loss ofDHR events from INPO Significant Evaluation Reports (SERs) and Significant Operating Experience Reports (SOERs) and NRC Information Notices. Over 100 precursor events to loss ofDHR were reviewed.
To ensure that new features (Le., different than current operating BWRs) of the ABWR do not introduce any additional vulnerabilities to operation of the plant, a failure Modes and Effects Analysis (FMEA) was completed on these new features. The FMEA focused on the potential safety impact of identified failure modes and why these do not contribute to increased risk of ABWR shutdown operation.
Lasdy, a detailed reliability study was completed of theABWR DHR function. Probabilistic Risk Assessment (PRA) models including Fault and Event Trees were completed for all DHR and makeup systems. Based on PRA results, minimum sets of systems were identified that, if available, would result in acceptable shutdown risk.
Based on this shutdown risk evaluation, input has been provided to other parts of Tier 2. Systems and components important to safety were identified for inclusion in the reliability assurance program. COL action items such as a need for shutdown procedures and important operator actions were specified. Plant features important to risk reduction were identified and made part of Tier 1.
19Q.3 Summary of Results
190-2
The ABWR design has been evaluated for risks associated with shutdown conditions (Le., Modes 3, 4, and 5). The evaluation included the following shutdown risk categories discussed in NUREG-1449:
• Decay heat removal
• Inventory control
• Containment integrity
• Loss of electrical power
• Reactivity control
ABWR Shutdown Risk Assessment
ABWR Rev. 0
Design Control Document/Tier 2
The evaluation also included shutdown risk reduction features of the ABWR design due to instrumentation, flooding and fire protection, use of freeze seals, and procedure guidelines. ABWR. features that are not part of current domestic BWR. designs were evaluated to detennine if any new shutdown risk vulnerabilities would be introduced. Finally, minimum sets of plant systems that if available would meet a goal of an acceptably low conditional core melt probability were identified.
The results of this shutdown risk evaluation demonstrate that the ABWR incorporates design features which make the plant risk during shutdown negligible. This conclusion is based on the following principal ABWR features which are capable of mitigating shutdown risks:
Shutdown Risk Concern Principal ABWR Feature
Decay Heat Removal Three physically and electrically independent RHR and
support systems
Inventory Control Multiple makeup systems and sources
Loss of Electrical Power Two offsite and four onsite power sources
Reactivity Control RPS, ARI, and standby liquid control systems and interlocks
to prevent accidental reactivity excursions
The ABWR is adequately protected from internal flooding by floor drains, sump pumps, watertight doors, water level alarms, automatic isolation of flow sources, equipment mounted 20.32 em (8 inches) off the floor, and the ability to fully contain potential flood sources (where appropriate).
Adequate protection from fire is provided by means of fire barriers and physical separation of the three independent safety divisions. Use of fire detectors, alarms, automatic fire suppression, manual fire water system, and a trained crew of fire fighters keep the risk related to fire at a negligible level.
To assure the flood and fire related risks are kept low during shutdown, the shutdown procedures that the COL applicant is required to develop have been identified.
Based on an FMEA of the new features incorporated into the ABWR that are different from operating domestic BWR plants, it is concluded that none of the new features will introduce additional shutdown vulnerabilities.
Instrumentation was identified that is available during shutdown to adequately monitor the status of the plant and operation of systems which will result in low levels of shutdown risk.
ABWR Shutdown Risk Assessment 190-3

ABWR Rev. 0
Design Control Document/Tier 2
Guidance was presented on how freeze seals could be used during maintenance on . unisolatable valves to minimize the risk associated with loss of the freeze seal.
Recommendations on outage planning procedures were presented to ensure that actiVities scheduled during outages take into account plant status and potentially high risk periods or configurations during shutdown. It was pointed out that the single most important eiement of reducing shutdown fisk is proper outage scheduling of maintenance on systems and support systems capable of removing decay heat or supplying inventory makeup.
An analysis of 70 loss of power and over 100 loss of DHR precursor events at operating BWRs confirmed that the ABWR design features would prevent or mitigate the most safety significant of these events.
The PRA model for analyzing the loss of DHR accident initiation identified about 12 systems that can be used to prevent core damage. The resultant core damage frequency was negligible but the focus of the study was to identify minimum combinations of systems that, if available, would result in a conditional core melt of an acceptably low probability given a loss of RHR event. It was found that generally about four of the 12 systems are sufficient to meet the goal.
In all cases, the minimum type and number of systems required by technical specifications (e.g., RHR) plus systems normally operating during shutdown (e.g., CRD and fire water) are sufficient to maintain adequate shutdown safety margins.
Many such combinations are possible, but certain specific combinations of minimum sets of systems have been identified to provide guidance to the COL applicant. Additional minimum sets of systems can be identified by the COL applicant, if needed, by using the PRA model. These combinations of systems identified will allow COL owners much flexibility in preparing outage plans to ensure that shutdown safety margins are adequate at all times.
19Q.4 Features to Minimize Shutdown Risk
As part of the process for certifying the ABWR design, the NRC requested that General Electric provide a specific discussion of ABWR features that minimize shutdown risk.
The list of ABWR shutdown risk features is presented in Table 19Q-1. The features are grouped by risk categories as discussed in NUREG-1449, "NRC Staff Evaluation of Shutdown and Low Power Operation." Fire protection was not discussed in NUREG-1449 but was added to the list based on discussions with the NRC. The risk categories are:
• Decay Heat Removal
• Inventory Control
19Q-4 ABWR Shutdown Risk Assessment
ABWR Rev. 0
Design Control Document/Tier 2
• Containment Integrity
• Electrical Power
• Flooding Control
• Reactivity Control
• Fire Protection
NUREG-1449 also discussed'reactor coolant system pressurization but this was not included in the list because it is mainly a PWR issue. BWR shutdown pressure control concerns are ultimately inventory (Le., LOCA) concerns and are addressed under Inventory Control.
The ABWR has been designed with the minimization of risk being a high priority. PRA methods have been very influential in the design of the ABWR. The ABWR features described in Table 19Q-l along with appropriate Technical Specifications and utility operating and maintenance procedures (which contain insights gained from risk based evaluations) all result in the conclusion that during shutdown conditions the ABWR is adequately protected against accidents and the estimated core damage frequency is negligible.
The following subsections describe the shutdown risk concern, past experience at operating BWRs for each risk concern, and the ABWR features that contribute towards minimizing shutdown risk for each concern.
19Q.4.1 Decay Heat Removal
Shutdown Risk Loss of decay heat removal (DHR) while shutdown can lead to fuel uncovery and damage. It can be initiated by loss of the operating RHR System or by loss of an intermediate or ultimate heat sink. If loss ofDHR occurs shortly after shutdown, bulk boiling of reactor coolant and fuel uncovery can happen quickly (i.e., less than one half hour for bulk boiling and approximately five hours to core uncovery if no protective action is taken).
Past Experience There has never been a loss of DHR in a BWR which resulted in actual core uncovery but several precursors to such an event have occurred in the past. Subsection 19Q.ll discusses many of these precursor events and describes ABWR features that could have prevented or mitigated each event.
For BWRs, the most common precursor events involved temporary loss ofRHR due to various reasons including inability to open Shutdown Cooling (SDC) valves inside
ABWR Shutdown Risk Assessment 190-5

ABWR Rev. 0
Design Control DDcument/Tier 2
con tainment and isolation of SDC due to low water level in the RPV or loss of power to the Reactor Protection System (RPS). In all of these cases, redundant loops of RHR or alternate DHR methods were available.
ABWR Features The ABWR contains many features to minimize the loss ofDHR. The ABWR contains three divisions ofRHR and associated support systems that are electrically and physically separated. This is the first line of defense in maintaining DHR. One RHR loop could be in maintenance and if a single failure were to occur to the operating loop, the third loop could be placed into service. It is also possible, if conditions warrant, to run RHR loops in parallel. In this case, failure of one loop would not result in even a temporary loss of DHR.
In the unlikely event that all RHR loops were unavailable, several alternate methods of DHR from the RPV could be used. Steam from the RPV could be directed to the main condenser (if available). Makeup to the RPV could be supplied by many sources as discussed in Subsection 19QA.2. Other potential heat sinks include the suppression pool (via the safety relief valves) , or under certain conditions the Reactor Water Cleanup System, or the Fuel Pool Cooling and Cleanup System (if the reactor water level is raised to the refueling level). As a final method, if the RPV head was removed, bulk boiling of reactor coolant in the RPV with adequate makeup would prevent fuel damage.
From the above it can be seen that there are multiple methods to maintain DHR in the ABWR such that the shutdown risk associated with loss of DHR is negligible.
19Q.4.2 Inventory Control
Shutdown Risk
190-6
Loss of inventory control can lead to uncovering the fuel and damage by overheating. Reduction of reactor coolant inventory is more likely when the plant is shut down because additional paths for diversion of coolant (e.g., RHR System) are operable. In addition, there are shutdown activities such as test and maintenance that require seldom used valve line-ups and plant configurations which increase the probability of operator errors associated with inventory control.
Past Experience As discussed in Subsection 19Q.ll , events at operating plants have resulted in reduction of reactor coolant inventory. For BWRs this typically involved diversion of reactor coolant from the RPV to the suppression pool due to improper valve line-ups (e.g., opening suppression pool suction valve before SDC suction was fully closed) or valve leakage (e.g., RHR pump mini-recirculation valve). Other inventory losses were due to leaking RHR heat exchanger tubes, placing a partially drained RHR loop online following maintenance, and buckling of an RHR heat exchanger due to marine growth.
ABWR Shutdown Risk Assessment
ABWR Rev. 0
Design Control DocumentlTier 2
In all cases, the loss of inventory was either recovered due to operator action or automatically stopped by isolation of SDC on low RPV level.
ABWR Features The ABWR contains several design features to minimize the potential for inventory loss. Indication ofRPV level is displayed to the operator in the control room continuously during all modes of plant operation (including refueling). To ensure that an adequate level is maintained in the RPV, multiple sources of makeup exist including:
• Suppression pool
• Condensate storage tank
• Main condenser hotwell
• AC-independent Water Addition System
To minimize the potential for pipe breaks, RHR system valves are interlocked with reactor system pressure to ensure that low pressure RHR piping is not exposed to full system pressure. In the event that the interlocks fail or are bypassed, the RHR piping is capable of withstanding full reactor pressure without rupture.
During shutdown there are many maintenance tasks and evolutions that could lead to potential draining of the RPV. These include: CRD and Reactor Internal Pump (RIP) removal and replacement, and failures or operator errors associated with operation of the Reactor Water Cleanup System and the RHR System. These potential drainage paths are discussed below.
CRD Replacement CRD replacement for the ABWR will use the same procedure followed for current operating BWRs. The CRD is withdrawn to the point where the CRD blade back seats onto the CRD guide tube. This provides a metal to metal seal that prevents RPV ·drainage when the CRD is removed. The many years ofBWR experience with CRD removal gives a high degree of assurance that the risk from this operation will be negligible for the ABWR.
See Subsections 4.6.1.2.1 and 4.6.2.3.4 for additional information on CRDreplacement and maintenance.
RIP Motor and Impeller Replacement Nuclear plants with RIPs have been in operation for over 15 years. Over 500 RIPs and motors have been successfully removed and reinstalled in European BWR plants. This has demonstrated that replacement activities can be carried out without draining the vessel.
ABWR Shutdown Risk Assessment 190-7
ABWR
19Q-8
Rev. 0
Design Control Document/Tier 2
Replacement of RIP motor and impeller involves the following steps. The RIP lower bolts are loosened and the pump allowed to move downward approximately 6.25 mm (l/4-inch) to the point where the impeller becomes backseated. An integral inflatable seal is then actuated as a backup sealing device to assure no RPV leakage occurs. The RIP motor can then be removed. Following motor removal, a temporary cover plate is bolted to the bottom. The impeller is then removed from the top. The bolted cover plate prevents leakage of coolant from the RPV. Mter the impeller is removed, a plug is installed on the RPV bottom head at the impeller nozzle to provide additional protection against draining the RPV.
During maintenance activities on the RIP, there are two periods when the potential for leakage is greatest: when removing the motor and when completing maintenance on the secondary seals. In both these cases, the temporary bottom cover plate is removed. During motor removal, the primary and secondary seals prevent leakage but they could fail. In this case, only small leakage could occur because of the tight clearances between the RIP housing and the impeller shaft. If the seals were to leak, the bottom cover could be bolted in place to prevent further leakage. Maintenance on the secondary seals requires removal of the motor, impeller and shaft, and the temporary bottom cover. A temporary plug is installed in the RIP diffuser before removing the bottom cover plate. This temporary RIP diffuser plug is designed so that it can not be removed unless the RIP motor housing bottom cover is in place. Due to the multiple operator errors required to cause a maJor leak during RIP maintenance, the risk from RIP maintenance is considered negligible.
See Subsection 5.4.1.5 for additional information on RIP motor and impeller maintenance.
Control Rod Drive Hydraulic System During operating Modes 4 and 5, the Control Rod DriveBydraulic System (CRDHS) continues operating with one pump running to provide purge water to the FMCRDs. With one pump in operation, the head of the pumping water can easily overcome the head of water in the RPV; hence, draining the RPV is unlikely. In the event that neither pump is in operation, there are several potential paths for draining the RPV through the CRDHS.
With neither CRD pump operating, the scram valves will open due to low Hydraulic Control Unit (HCU) charging header pressure. The scram valves may remain open due to operator error in not resetting the RPS logic or other system failures such as loss of instrument air to the scram valve. This combined with multiple mechanical failures to check valves and operator errors in CRD hydraulic system valve lineups could result in RPV drainage through the CRD hydraulic system. Multiple failures are required for RPV leakage to occur and even if a leak were to develop, only two CRDs would be affected and the leak would be small since it would occur in a 32A (1-1/4-inch) line. Therefore,
ABWR Shutdown Risk Assessment

ABWR Rev. 0
Design ContrDI Document/Tier 2
the probability of draining the RPV through the eRD hydraulic system is considered
negligible.
Reactor Water Cleanup System (CUW) During shutdown, the euw provides continuous cleaning of the reactor coolant. Water is removed from the RPV through the RHR shutdown cooling suction nozzle and a line attached to the RPV bottom head and after passing through a series of heat exchangers and a filter demineralizer is returned to the RPV either via an attachment to the upper head or through the feedwater lines and spargers.
Potential drainage paths exist due to several maintenance flush and drain valves and euw discharge paths to the low conductivity water (LCW) sump and the main condenser. The latter two paths are used during reactor startup to control excess reactor water due to heat up and thermal expansion.
For any of the potential flow paths described above to result in RPV drainage, multiple failures of equipment and operator errors must occur. In addition, if the RPV were to start draining all but one of the potential flow paths (LCW sump) would be automatically isolated on low RPV level. The flow path to the LCW sump is controlled by two valves in series one of which is locked closed and both are under administrative control. If drainage were to occur, LCW sump well level alarms would annunciate in the control room. Also, the line is only 50A (2 inches) in diameter and so the flow rate would be slow enough to allow ample operator time to mitigate the leak.
Because of the multiple failures and operator errors that must occur to cause RPV drainage through the CUW and the automatic RPV isolation logic to stop most potential flow paths, the risk of RPV drainage though the euw is considered negligible.
Residual Heat Removal System The ABWR Residual Heat Removal (RHR) System is a closed system consisting of three independent pump loops (A, B, and C-where Band e are similar) which inject water. into the vessel and/or remove heat from the reactor core or containment. Loop A differs from B and C in that its return line goes to the reactor pressure vessel (RPV) through the feedwater line whereas loop B and e return lines go directly to the RPV. In addition, loop A does not have connections to the drywell or wetwell sprays or a return to the fuel,pool cooling system. However, for purposes of this analysis, the differences are minor and the three loops can be considered identical. The RHR System has many modes of operation, each mode making use of common RHR System components.
Protective interlocks are provided to prevent the most likely interactions of mode combinations.
The operator has five mode selection switches available that will automatically perform the required valve alignment for the mode selected. This feature reduces the chance of operator error by only requiring one action, selection of the mode switch, to realign
ABWR Shutdown Risk Assessment .190-9
ABWR
190-10
Rev. 0
Design Control Document/Tier Z
several valves. Only one mode at a time can be operational, thus precluding potential undesirable multiple mode interactions. The five modes are:
(1) RHR initiation
(2) RHR suppression pool cooling
(3) RHR shutdown cooling
(4) RHR standby
(5) RHR drywell spray
There are two basic ways that the ABWR RPV water level can potentially be decreased through the RHR System during shutdown cooling. The first way is through operator error in opening manual isolation valves that are used for RHR System maintenance. These paths are to the High Conductivity Water sump and the Liquid Radwaste Flush System. These valves are normally closed during the shutdown cooling mode of plant operation. These are 50A (2-inch) and 150A (6-inch) lines respectively. Inadvertent opening of these valves would result in a relatively slow RPV level decrease which would be alarmed to the operator in the control room such that there would be adequate time to respond. If the operator failed to notice the decreased RPV level, an alarm would annunciate in the control room and the RPV isolation valves would automatically close on low RPV level. The fuel would remain covere'd with water and no fuel damage would occur.
The second way that RPV level could decrease would be for one of the motor operated valves (MOVs) in the RHR System to open inadvertently or by operator error. Most of the MOVs in the RHR System are interlocked to prevent inadvertent diversion ofRPV water (e.g., the shutdown cooling (SDC) suction line is interlocked so that the suppression pool suction and return valves and wetwell spray valve must be closed before the SDC valve can be opened, the shutdown cooling suction valve must be fully closed before the suppression pool suction or return valve can be opened, the two series dry well spray valves cannot be opened at the same time unless the drywell pressure is high) . Thus loss ofRPV level through these paths is not likely. Loss ofRPV level through the wetwell spray valve requires a mechanical failure or an operator error to open the valve when not required. The only other potential path is via the RHR pump mini-flow valve. This valve is designed to open to allow water flow back to the suppression pool if the RHR pump is running at shutoff head. This is a pump protection feature. The valve opens and closes automatically depending on measured RHR flow.
Whether the potential flow path is caused by mechanical failure or operator error, two features exist to mitigate the loss of RPV level. On a low RPV level signal, both RPV isolation valves close to stop all flow out of the RPV. The RPV low level setpoint is 3.81
ABWR Shutdown Risk Assessment
ABWR Rev. 0
Design Control Document/Tier2
meters above the top of the fuel. Even if the low RPV level isolation feature were to fail (after a previous valve mechanical failure or operator error), flow out of the RPV would automatically stop when the RHR shutdown cooling nozzle is uncovered. At this point, 1. 7 meters of water would still be above the top of the active fuel. Therefore, the draining of the RPVvia the RHRSystem to the point of uncovering the fuel and causing fuel damage is not considered credible for the ABWR.
Another potential for loss of inventory control is through the use offreeze seals on piping attached to the RPV. Subsection 19Q.8 discusses how freeze seals will be used on the ABWR and why the risks associated with freeze seals will be small.
In summary, the ABWR contains many redundant and diverse features such that, along with the use of experience proven administrative controls, loss of inventory control is not a significant safety concern.
19Q.4.3 Containment Integrity
Shutdown Risk A breach of containment integrity is not by itself an issue of high safety significance but, in conjunction with other initiating events, could increase the severity of the initiating event. A breach of containment integrity followed by breach of another radiological barrier or boiling of the reactor coolant could lead to a direct release to the atmosphere. Attachment 19QB discusses potential offsite releases following boiling in the RPV with the head removed and shows that releases would be a small fraction of normal operating limits. In addition, the PRA results in Subsection 19Q.7 indicate that the risk of RPV boiling is low.
During refueling of the BWR, the primary containment is open and cannot be readily closed since the drywell head is removed. Nonetheless, loss of containment integrity has not been an issue for BWRs in the past.
The probability of core melt during shutdown is low, but if a core melt were to occur when the primary containment was open, the suppression pool may be bypassed resulting in high offsite doses.
ABWR Features During shutdown with the drywell head removed, the ABWR has the secondary containment which can be automatically isohiied on high radiation from a radiological boundary breach or fuel handling accident.
The Standby Gas Treatment System (SGTS) filters air from the secondary containment to reduce potential contamination to the atmosphere.
The ABWR secondary containment and use of the SGTS results in a negligible risk concern for loss of containment integrity.
ABWR Shutdown Risk Assessment 190-11
Rev. 0
ABWR Design Control Document!1ier 2
19Q.4.4 Electrical Power
Shutdown Risk
190-12
A loss of all off site power cha).lenges the onsite sources to power safety-related equipment to maintain safe shutdown. Loss of individual buses (AC or DC) affects divisional train capability and results in loss of redundancy to complete required safety functions.
Past Experience As discussed in Subsection 19Q.ll, loss of power events have occurred at many nuclear power plants. There have been several cases of a total loss of offsite power which, in some instances; led to loss of shutdown cooling and increases in coolant temperatures of as much as 333 K (140°F).
The majority of total loss of offsite power events were due either to severe weather or operator errors. Several losses of onsite power events were due to objects falling on transformers while operators were performing maintenance activities in the switchyard. In other cases, switching errors resulted in temporary loss of power to vital buses or offsite power.
ABWR Features The ABWR electrical system has the following features to prevent or mitigate potential loss of power events:
• Three physically and electrically independent Class IE emergency diesel generators
• Two independent sources of off site power
• Three unit auxiliary transformers powering three Class 1 E and non-IE power buses
• Combustion turbine generator (CTG) that can be used to power any of the Class IE or non-IE buses
The ABWR electrical power system contains redundancy and diversity of electric power sources. This allows sources to be in maintenance during shutdown and still have adequate power sources to meet potential equipment failures. Even in the case of a loss of offsite power, the CTG has the ability to start a feedwater or other pump for DHR or inventory makeup if required. This means that the ABWR can use alternate sources of DHR with only onsite power sources.
In the event that one phase of the main transformer were to fail, an installed spare is available to return the preferred source of off site power to service without the need to procure and deliver a new transformer.
ABWR Shutdown Risk Assessment
ABWR Rev. 0
Design Control Document/Tier 2
As discussed more fully in Subsection 19Q.ll, the ABWR electrical power distribution system has features that are capable of mitigating potential loss of power events that have occurred at operating plants in the pasL The design features described above in conjunction with appropriate Technical Specifications and other administrative controls resUlt in an electrical distribution system that is able to maintain an adequate level of redundancy and capacity even with equipment out for maintenance or testing. This ensures that safety margins can be maintained at all times during shutdown and normal plant operation. -
19Q.4.5 Reactivity Control
Shutdown Risk Reactivity control during shutdown may be a concern because local cnticality can be achieved through movement of control rods or errors in fuel handling that may not be adequately detected by installed neutron detectors. Also at lower temperatures, the inherent negative reactivity feedback available at normal operating temperature and pressure is less able to mitigate potential power excursions.
While overall core shutd.own margins are adequate to protect the fuel as long as procedures are followed, inadvertent withdrawal of two adjacent CRDs or fuel handling errors can lead to fuel damage.
Past Experience A few isolated cases of BWR shutdown reactivity control concerns have been identified in the past and were attributed to operator errors (e.g., withdrawing the wrong control rod).
Reactivity excursion events could occur due to anyone of the following:
• Control Rod Drop
• Control Rod Ejection
• Refueling Error
• Rod Withdrawal Error
• Fuel Loading Error
Control Rod Drop While shutdown, the only time a control rod drop could occur is during control rod testing. If two control rods associated with one Hydraulic Control Unit (HCU) are fully withdrawn, a rod block signal prevents withdrawal of a third control rod. If the rod block signal were to fail and the operator were to incorrectly select an adjacent control rod for withdrawal, a latch mechanism exists such that if the rod were to become stuck and
ABWR Shutdown Risk Assessment 190·13
ABWR
190-14
Rev. 0
Design CoDtro/ Document/Tier 2
decouple from its drive it could only drop a maximum of 20.32 cm(8 inches). In addition, a Class IE separation detection system would sense a separated control rod drive and initiate a rod block signal.
Due to the combination of events required to cause a control rod drop including . operator error coincident with multiple mechanical failures, the ABWR rod drop accident risk is considered negligible.
Control Rod Ejection For 'a control rod ejection accident to occur while shutdown, RPV pressure would have to be increased (e.g:, during a hydrostatic test). The series of events that would have to occur are:
(I) During RPV hydrostatic testing one or two control rods associated with an HCU are withdrawn for testing and,
(2) A break occurs:
(a) In the CRD housing of an adjacent rod which also results in failure of the internal control rod anti-ejection supports ("shootout restraints")
or
(b) In the CRD insert pipes coupled with failure of both its ball check valve and electr<rmechanical brake.
Due to the short amount of time that the RPV undergoes hydrostatic testing and the multiple failures required for a control rod ejection to occur, the risk from this event is considered negligible.
Refueling Error During refueling, inserting a fuel bundle into a fueled region of the core which has a withdrawn control rod blade could result in a reactivity accident.
The ABWR features that prevent or mitigate refueling errors are:
(I) An interl~ck with the mode switch in the REFUEL position which prevents hoisting another fuel assembly over the vessel if a control blade has been removed.
(2) While shutdown, only two control rods can be withdrawn at a time. Any attempt to withdraw a third control rod would result in a rod block signal
being initiated by the rod control and instrumentation system. During refueling, technical specifications allow only one rod to be withdrawn at a time.
ABWR Shutdown Risk Assessment
Rev. 0
ABWR Design Control Document/Tier 2
~ (3) The operator would be alerted to a refueling error by the source range neutron monitoring system;
Due to the. combination of operator errors, interlock failures, and core configuration required for this event to occur, refueling accident risks are considered negligible.
Rod Withdrawal Error If two adjacent control rods are withdrawn at the same time, the reactor may become critical. To prevent this, the ABWR has an interlock which prevents adjacent control rods being withdrawn at the same time. Two control rods associated with an HCU can be withdrawn at the same time but these rods are separated by at least two cells. An interlock prevents withdrawal of a third rod. If the interlock fails and the rod is withdrawn, the rods would scram on a high flux signal.
The coincident failures of the rod withdrawal interlock and Reactor Protection System in cOrUunction with operator error, which are required to cause a rod withdrawal error are considered improbable and the risk negligible.
Fuel Loading Error This event is similar to a refueling error. In this case the refueling procedure is not followed and a higher than design core reactivity configuration is formed. If not identified by the core verification process, subsequent control rod testing may result in inadvertent criticality and power excursion. A high flux scram would terminate the excursion.
The risk from a fuel loading error is considered negligible because of the combination of events required for the accident to occur.
Summary of Reactivity Control The ABWR refueling interlocks, control rod design, Reactor Protection System operability during shutdown, and strict administrative controls all combine to support the conclusion that shutdown Reactivity Control is a negligible risk concern for the ABWR design.
19Q.4.6 Summary of Shutdown Risk Category Analysis
The ABWR design was evaluated against shutdown risk categories from NUREG-1449. The analysis took into account past experience at operating BWRs. The conclusion from this analysis is that the ABWR design contains multiple features to minimize potential risk during shutdown for the major shutdown risk categories.
ABWR Shutdown Risk Assessment 190-15
Rev. 0
ABWR Design Control DDcument/Tier 2
19Q.S Instrumentation
The ABWR instrumentation system contains many features that help reduce shutdown risk. These features are contained in the basic design of the instrument systems and in the type and number of parameters monitored.
During shutdown, the mainconcem from a risk perspective· is removal of decay heat from the fuel in the RPV. The large volume of water in the spent fuel pool and low probability of draining makes the risk associated with fuel pool operation relatively low. The smaller reactor pressure vessel (RPV) volume and relatively high decay heat load of the fuel increases the cooling requirements and decreases the available time to recover from loss of decay heat removal (DHR). Thus, to minimize shutdown risk, the instrumentation system must monitor RPV level and water temperature, status of makeup sources and heat sinks, and display these to the plant operators in a reliable and easy to understand manner.
Design Features The ABWR utilizes redundant channels of safety-related instruments for initiating safety actions and monitoring plant status. This is accomplished by a four division correlated and separated protection logic complex called the safety system logic and control (SSLC). The SSLC receives signals from the redundant channels of instrumentation, displays information to the operator, and makes decisions on safety actions.
The safety system setpoints are determined by analysis and experience, factoring in instrument errors, drift, repeatability, safety margins, and the need to minimize spurious actuations. The system provides continuous automatic online testing of the logic and offline semi-automatic end-to-end (sensor input to trip actuator) testing. This combination meets all current regulatory requirements.
Specific instrumentation features important to shutdown operations include:
• Automatic initiation of ECCS to ensure adequate RPV makeup.
• Four channels of instrumentation to allow for bypass during maintenance and testing while still retaining redundancy. (The two-out-of-four logic reverts to twoout-of-three during maintenance bypass).
• Continuous monitoring for detection of fires or flooding in safety-related and other areas.
• Operability of the Reactor Protection System (RPS) during shutdown to mitigate potential reactivity excursions.
• Interlocked refueling bridge operation to prevent reactivity excursion.
190-16 ABWR Shutdown Risk Assessment
Rev. 0
ABWR Design Control DocumentlTier 2
• Automatic isolation of shutdown cooling (SDC) on low level in the reactor pressure vessel (RPV) to ensure against fuel uncovery.
• Interlocked residual heat removal (RHR) valves (SDC and suppression pool) to reduce the potential for diversion of coolant from the RPV to the suppression pool.
• Ability to control shutdown plant status from the remote shutdown panel in the event that the control room becomes uninhabitable.
• Ability to monitor radiation levels throughout the plant to detect breaches in radiological barriers.
Parameters Monitored The key shutdown parameters monitored by the ABWR instrumentation system include:
• RPV level, water temperature, and pressure
• Neutron flux
• Drywell and wetwell pressure and temperature
• Suppression pool temperature and level
• Reactor, turbine and control building flooding level
• RHR flow rate, temperature, pump motor trip, and loop logic power failure
• CUW outlet temperature
• Fire detection in various buildings
• . Electric power distribution system parameters (e.g., power, voltage, current, frequency)
• Operation of fire water system
19Q.6 Flooding and Fire Protection
The ABWR has been designed to minimize the risks associated with fires and flooding through the basic layout of the plant and the choice of systems to enhance the plants tolerance to fires and flooding.
Plant Layout The plant layout is such that points of possible common cause failure between safetyrelated and non-safety-related systems have been minimized. As an example, the control room is situated between the reactor building and the turbine building. Thus safety-
ABWR Shutdown Risk Assessment 190-17
ABWR
190-18
Rev. 0
Design Control DocumentlTier 2
related equipment and controls that are used to shutdown and maintain long term cold shutdown of the plant cannot be impacted by failures of non-safety-related systems in the turbine building. Likewise, non-safety-related systems/equipment in the turbine building that could be used to reach and maintain cold shutdown (e.g., condensate, main condenser) are not affected by failures of safety-related equipment, therefore, interactions between reactor and turbine building systems are minimized.
Normal and alternate preferred power is supplied through the turbine building to the reactor building for safety-related loads. These non-safety-related power sources are backed.-up by safety-related diesel generators located in the reactor building. The diesel generators are thus not affected by events in the turbine building.
The buildings are laid out internally so that fire areas of the same division are grouped together in block form as much as possible. This grouping is coordinated from building to building so that the divisional fire areas lineup adjacent to each other at the interface between the reactor and control building. An arrangement of this fashion naturally groups piping, HV AC ducts, and cable trays together in divisional arrangements and does not require routing of services of one division across space allotted to another division.
A major difference between the ABWR and current reactor designs is that due to the multiplexing of plant systems, there is no need for a cable spreading room. This removes a significant source of potential fires that could lead to core -damage both during normal plant operation and shutdown conditions.
Systems The ABWR has three independent safety-related divisions, anyone of which is capable of maintaining the reactor in a safe cold shutdown condition. With this arrangement, a single division may be out for maintenance and a single random failure could occur
which disabled another division, but the third division could be available to ensure continued DHR.. In addition, there are non-safety-related systems such as condensate that can be used to maintain cold shutdown.
In general, systems are located and grouped together by safety division so that; with the exceptions of the primary containment, the control room, and the remote shutdown room (when operating from the remote shutdown panels); there is only one division of safe shutdown equipment in a fire area. Complete burnout of any fire area without recovery will not prevent continued decay heat removal (DHR) , therefore, complete burnout of a fire area is acceptable from a public risk perspective.
ABWR Shutdown Risk Assessment
ABWR Rev. 0
Design Control Document/Tier 2
The separation exception in the primary containment is made because it is not practical to divide the primary containment into three fire areas. The design is deemed acceptable because:
(1) Sprinkler coverage is provided by the containment spray system.
(2) Only check valves and ADS/SRV valves (if the RPV head is on) are required to operate within containment to provide DHR A fire could not prevent the operation of a check valve nor would it prevent a safety valve from being lifted on its spring by pressure. The high pressure pumps are capable of providing water to the core up to the set point of the SRVs. Thus, a fire could not prevent injection of water to and relief of steam from the reactor vessel.
(3) In addition, maximum separation is maintained between the divisional equipment within primary containment.
All divisions are present in the control room and this cannot be avoided. The remote shutdown panel provides redundant control of the DHR and ECCS functions from outside of the control room. The controls on the remote shutdown panel are hard wired to the field devices and power supplies. The signals between the remote shutdown panel and the control room are multiplexed over fiber optic cables so that there are no power supply interactions between the control room and the remote shutdown panel.
There are some areas where there is equipment from more than one safety division in a fire area. Each of these cases is examined on an individual basis to determine that the encroachment is required and that failure in the worst conceivable fashion is acceptable. These are documented in Subsection 9A5.5 unde~ "Special Cases-Fire Separation for Divisional Electrical Systems."
Divisions I and II 1~5 VDC and 120 VAC power supplies, reactor building cooling water pumps and heat exchangers, emergency chillers and emergency HV AC Systems are located in the control building. Since these systems are required for DHRifthe function of the control room is lost, they are separated from the control room complex and its HV AC System by rated fire barriers. A fire resulting in the loss of function of the control room will not affect the operation of the remote shutdown or remote shutdown support systems.
'When the plant is shutdown and, if due to normal maintenance or other work, fire barriers must be breached between two safety divisions, the third division must be operable and its barriers checked to ensure they are intact.
ABWR Shutdown Risk Assessment 190·19
ABWR Rev. 0
Design Control Document/Tier 2
Fire Containment The fire containment system is a combination of structures and barriers that work together to confine the direct effects of a fire to the fire area in which the fire originates. The fire containment system is comprised of the following elements:
(1) Concrete fire barrier floors, ceilings and walls which must be at least 15.24 cm (6 inches) thick if made from carbonate and silicious aggregates. Other aggregates and thicknesses are acceptable if the type of construction has been tested and bears a UL (or equal) label for a three hour rating.
(2) Fire doors, which are required to have a UL (or equal) label certifying that they have been.tested for a three hour rating per ASTM E119, including a hose stream test.
(3) Electrical penetrations which are required to have been type tested to ASTM E119, including a hose stream test.
(4) Piping penetrations which are required to have been type tested to ASTM E119, including a hose stream test.
(5) Fire dampers for any HVAC duct penetrating a fire barrier and which must have a rating of three hours. The only fire dampers separating divisions are in the HV AC duct for secondary containment (six total). The plant arrangement minimizes fire dampers.
(6) Fire rated columns and support beams, which are required to be of reinforced concrete construction or, if of steel construction, enclosed or coated to provide a three hour rating.
(7) Backup of the fire barrier penetration seals by the HV AC Systems operating in the smoke removal mode. This backup feature is accomplished in the reactor and control buildings by maintaining a positive static pressure for the redundant divisional fire areas with respect to the fire area with the fire. Leakage is into the fire impacted area under sufficient static pressure to confine smoke and heat to the fire area experiencing the fire, even if there is
a major mechanical failure of the penetration seal.
Other aspects of the ABW'R design that minimize the risk due to fires while shutdown are: J
• HV AC Systems dedicated to the divisional areas which they serve.
• A smoke control system to remove smoke and heat from the affected area, to control the pressure in a room due to a fire, assure that any fire barrier leakage is into the fire area experiencing the fire, and supply a clean air path for fire suppression
190-20 ABWR Shutdown Risk Assessment
ABWR Rev. 0
Design Control DocumentlTier 2
personnel. The HV AC System has been designed for the dual purposes of HV AC and smoke control.
• Fire alarm systems.
• Fire suppression system to automatically initiate, where appropriate, and extinguish fires.
• Manual fire suppression equipment such as hand held CO2 or chemical fire extinguishers, and water hoses.
• Administrative controls to ensure that at least one safety division is available with intact barriers at all times.
Fires During Maintenance When the plant is shutdown, maintenance activities may require breaching the fire barriers for one or more activities. The recommended outage philosophy regarding fire barrier integrity is that through administrative controls, one division of safety equipment will be available (i.e., not in maintenance) and its physical barriers will be intact. This division will be in standby and one other division will be operating to remove decay heat and complete other required functions (e.g., fuel pool cooling, CRD purging, reactor water cleanup). The third division could then be fully in maintenance. In this configuration, a fire in anyone division would not result in loss of decay heat removal capability. Hthe fire were to occur in the intact division, the fire barriers would restrict the fire to that division only and the operating division could continue to remove decay heat. For fires in either of the other two divisions, even if the barriers between the two divisions were breached, the intact division would be available to remove decay heat. See Subsection 19.9.24 for COL license information requirements.
As discussed more fully in 19Q. 7, the COL applicant must identify a minimum set of systems that will not be in maintenance such that the conditional probability of core damage due to certain initiating events is maintained acceptably low. The minimum set selected should take into account fires in various locations of the plant. H the above outage philosophy is followed, the risk from fires during shutdown conditions will be low.
Flooding Many of the features that are designed to mitigate fires also serve to protect the plant from damage due to flooding. Physical separation of safety divisions not only prevents
. propagation of fires but also restricts or prevents flooding of safety-related equipment. The fire barriers will also prevent potential water from entering a divisional area due to flooding from non-divisional sources or contain water in the fire area for divisional water sources.
ABWR Shutdown Risk Assessment 19Q-21
ABWR Rev. 0
Design Control DDcument/Tier 2
Other aspects of the ABWR design that minimize the risk from flooding are the practice of not routing unlimited sources of water (e.g., seIVice water) through ECCS room areas and ensuring that other large water sources (e.g., suppression pool) can be contained without damaging equipment in more than one safety division if a flood were to occur.
A review has been completed of all ABWR internal flood sources and the results show that during shutdown conditions at least one safety division would be unaffected by water damage for any postulated flood. Features, beside separation, that contribute to this low level of risk are: Adequately sized room floor drains, water level alarms and automatic isolation of flood sources for potentially affected rooms, mounting motors and other electrical equipment at least 20.32 cm above floor level, and using watertight doors. As was discussed under fire protection, administrative controls will be ' implemented to assure that at least one safety division with intact barriers is available at all times during plant shutdown. The seals on the doors seat with water pressure from floods outside the room but only small leakage past the seals is expected from flooding in the ECCS room. Therefore, during shutdown if maintenance tasks require breaching the barriers of two divisions, flooding in the intact division will not cause damage to equipment in all three divisions. Additional details on the ABWR flood mitigation
capability is contained in Appendix 19R
Summary of Fire and Flood Features The ABWR has been designed to minimize the risk due to fires or flooding during shutdown conditions by plant configuration and system design. Divisional separation, both physically and electrically, as well as fire/flooding mitigation systems exist to reduce plaI].t risks from these potentiai accidents. Along with these design features, administrative controls are implemented to ensure that at least one safety division is not in maintenance and its physical barriers are intact.
19Q.7 Decay Heat Removal Reliability Study
19Q.7.1 Introduction
190-22
As part of the ABWR shutdown risk evaluation, a reliability assessment of the decay heat removal (DHR) capability was completed. Decay heat removal reliability has received increasing attention due to events such as those at Vogtle and Diablo Canyon where decay heat removal systems were made inoperable due to loss of electric power and other causes.
Attachment 19QC summarizes approximately 200 events at operating plants which were either loss of decay heat removal events or precursors to such events. The relatively large number of events underscores the potential for loss of decay heat removal events and the potential for associated core damage.
ABWR Shutdown Risk Assessment
Rev. 0
ABWR Design ContrDI DDcument/Tier 2
190.7.2 Purpose
The purpose of this study is to detennine the minimum number of systems that might be available during shutdown to ensure that the risks associated with loss of decay heat
removal events are acceptable. That is, given a loss of the operating RHR System for any reason, the subsequent conditional probability of core damage remains acceptably low using only those systems that are potentially available (Le., system not in maintenance but which could experience random failures).
The results of this study provide guidance regarding various combinations of systems, that if kept available during a plant outage, will ensure that the risk associated with loss ofDHR Systems will be acceptable. A utility may choose to keep more systems available but as long as a minimum set is made available, shutdown risk will be considered acceptable. This minimum set of systems will give a utility flexibility in scheduling maintenance activities for DHR Systems. The minimum sets described in this study are
representative of acceptable combinations. There may be additional sets of equipment that were not included in this study which would also result in acceptable risk levels.
The minimum sets of systems take into account plant conditions (i.e., modes) and the fuel decay heat generation rate as a function of time. Both safety and non-safety (e.g., power conversion) systems are included in the minimum sets.
190.7.3 Summary
Using probabilistic risk assessment (PRA) techniques, an acceptable level of shutdown risk was demonstrated for various minimum sets of equipment and systems that were assumed to be available (i.e., not in maintenance).
These minimum sets were detennined for an initiating event involving loss of an operating RHR System. The three primary causes of a loss of the RHR System were
identified to be the following:
(1) Mechanical or electrical failures in the operating RHR System
(2) Loss of the operating service water pump associated with the operating RHR System
(3) Loss of offsite power
Loss of operating service water pump and offsite power were evaluated separately as the
cause for loss of the operating RHR because of their impact on other DHR Systems.
Each potential cause for loss of the RHR System was considered an initiating event.
Success criteria were detennined for each initiating event, taking into account decay heat load and plant operating mode. Minimum complements of systems that will
ABWR Shutdown Risk Assessment 190-23
ABWR Rev. 0
Design Control Document/Tier 2
prevent core damage given the initiating event and the dIDe dependent core decay heat
generation rate were then identified.
Event trees were generated based on the assumed initiating event and applicable success criteria. System failure probabilities were detennined with the help of fault tree analysis.
The results from the study are summarized in Tables 19Q-3, 19Q4, and 19Q-5. The tables show that significant flexibility exists for completion of system maintenance during outages while still maintaining adequate safety margins. These minimum sets of systems can be used by utilities for initial outage planning and for evaluating changes to outage schedules to ensure adequate safety margins are maintained at all times during the outage. The risk goal can, in general, be met by just those systems required to be operable (and therefore available) by the ABWR Technical Specifications plus normally
operating systems (e.g., CRD, fire water, CUW, FPC).
19Q.7.4 Methodology
190-24
The methodology used in this study was the same utilized in full power PRAs (i.e., event trees and fault trees). The plant is assumed to be shutdown with decay heat being removed by the RHR System in the shutdown cooling (SDC) mode. Loss of the operating RHR System is then assumed. The loss could occur due to mechaniCal or electriCal component failures of the RHR System, loss of service (i.e., cooling) water pump in the same division as the operating RHR System, or loss of offsite electriCal power. The three types of failures are assumed to be initiating events.
For each initiating event, the success criteria were determined. The success criteria are the minimum complement of systems that are capable of preventing core damage. As
the decay heat load is dependent on the time following shutdown, the minimum systems required to remove the decay heat will also be time dependent. Therefore, the success criteria have been determined as a function of time. Subsection 19Q.7.6 discusses the success criteria in more detail.
With the help of the success criteria, event trees for each initiating event were developed for each period. Subsection 19Q.7.7 discusses the event trees.
The branch points on the event trees model the probability of success and failure for each system included in the success criteria. The failure probability for each system was
evaluated by a fault tree analysis. The fault trees model potential system failures due to mechanical failure of components, loss of electric power to pumps or valves, or operator errors associated with manual actions (e.g., valve line ups or remote control of pumps and valves). Unavailability due to maintenance was modeled as follows. For a system included in a minimum set~ the maintenance unavailability was taken to be 0 (i.e., the system is assumed to not be in maintenance). For a system not in a minimum set, the
ABWR Shutdown Risk Assessment
ABWR Rev. 0
Design Control DocumentlTier 2
maintenance unavailability was taken to be 1. In other words, the system was assumed to be completely unavailable. This is a very conservative assumption because it is unlikely that all systems allowed to be in maintenance would all be in maintenance at the same time. In addition, some systems in maintenance might be returned to service in time. The fault trees used in this study are contained in Attachment 19QA. A mission time of 24 hours was used for this study. The loss ofRHR event is assumed to terminate successfully if the mitigating systems start and ru.n for a period of24 hours. It is assumed that provisions for long term maintenance of decay heat removal will be made within 24 hours. This assumption is consistent with other full power PRAs.
A number of deterministic analyses were performed and documented in Attachment 19QB. These include the estimation of time available for operator action and human reliability analysis to estimate the probability of operator error under various conditions.
The event trees were quantified with an initiating event frequency of 1.0. Thus the core damage probability that is obtained by this evaluation yields the conditional probability of core damage given a loss of decay heat removal event. The event trees were quantified assuming various complements of systems to be available. The various minimum complements of systems that met the goal were selected for inclusion in Tables 19Q3 through 19Q-5.
Maintenance of the suppression pool was not modeled in this study. If the suppression pool level must be lowered for any reason, several options exist, such as: off loading all fuel in the RPV to the spent fuel pool or making systems available which do not rely on the suppression pool as a source of water (e.g., condensate, fire water, HPCF). From a risk perspective, the suppression pool should only be drained during periods when it is not relied upon for a source of water or heat sink in performance of an ECCS function. If the above recommendations are followed,.the suppression pool unavailability will have a negligible impact on core damage frequency during shutdown;
19Q.7.5 Core Damage Probability Goal and RPV Boiling
The conditional core damage probability goal was selected for this study for the following reasons. The initiating event frequency for loss of an RHR System is not included in this probability goal, but can be conservatively assumed. In the analysis, it is conservatively assumed that all systems not explicitly required to be kept out of maintenance are totally unavailable (i.e., all in maintenance).
The ABWR meets the NRC goal of an overall core damage frequency of 1.0E-04 and a large release goal of 1.0E-06 per reactor-year. In reality, loss ofRHR events occur less than assumed and more importantly, not all systems allowed to be in maintenance will all be in maintenance at the same time. Typically, the results show that more than six to ten systems are allowed to be under maintenance and there is a very low probability that
ABWR Shutdown Risk Assessment 190-25
ABWR
190-26
. Rev. 0
Design ~ontrol Document/Tier 2
all the systems will be simultaneously under maintenance. An analysis using more realistic maintenance unavailability assumptions results in lower core damage frequency estimates. The simplifying assumption of 0 or 1 for maintenance unavailability allows for the calculation of core damage probabilities without having to model maintenance unavailability for each system. This avoids discussion of overlapping maintenance periods for systems during outages. These conservative assumptions allow for a straightfonvard determination of minimum system availabilities that also meet the NRC risk goals.
In Mode 5 with the RPV head removed, it is assumed that successful DHR can be achieved by allowing water in the RPV to boil and making up lost water by various water sources. Boiling under these conditions is an effective means ofDHR but it is not desirable because the resultant pressure buildup in secondary containment could cause loss of containment integrity (Le., steam release to the atmosphere). Calculations presented in Attachment 19QB show that the boiling release rates, assuming no core damage, are well below allowable limits for normal plant operations.
Equipment in the reactor building would be exposed to the steam environment including: CRD, CUW, RHR, HPCF, and FPC. No other areas in the plant would be exposed to the steam environment that operators would need to enter to assure continued decay heat removal capability.
The RHR and HPCF Systems are qualified for a harsh environment and their operation would not be affected by the steam. The impact of the steam on operation of CUW or FPC is a moot point because either the systems had previously failed or the decay heat load exceeded their capacity or boiling would not have occurred.
The CRD System is not qualified for a steam environment but due to its hardy construction it would be expected to operate for some period of time. Depending on the decay heat load, the time to boiling could vary between 4 - 26 hours. Mter 4.5 days, the time to boiling is approximately 15 hours and after 14 days is 26 hours. Therefore, for most of the outage, the CRD System could be relied upon for makeup for a significant period of time following loss of normal decay heat removal before being damaged by the steam environment
There would also be non-safety-related equipment in other buildings that would not experience the steam environment which could be relied upon for makeup (e.g., condensate). The fire water system can also be used for makeup at low pressure.
The fire water system ties into the RHR System through a connection on the outside of the reactor building. Three RHR valves inside the reactor building must be manually opened to inject firewater into the RPV. Adequate time would be available to open these valves following loss of RHR before boiling occurred so that the operator would
ABWR Shutdown Risk Assessment

ABWR Rev. 0
Design CDntrol DDcument/Tier 2
'not be affected by the steam environment. All other operator actions to mitigate loss of RHR can be perfonned outside the reactor building.
19Q.7.6 Success Criteria
In order to prevent core damage given an initiat:ing event, sufficient systems must be available to ensure that the core decay heat is removed and the fuel remains covered by water. No fuel damage will occur as long as the fuel remains covered by water. There are
three ways to achieve success:
(1) Remove decay heat directly from the coolant in the RPV
(2) Remove decay heat indirectly by condensing the steam produced, and provide makeup water to the RPV
(3) Allow the coolant to boil in the RPV and provide makeup water to the RPV to keep the core covered
These three ways to achieve success are discussed in detail below:
(1) Direct Decay Heat Removal from RPV
Recovery of the failed RHR System, use of one of the other two RHR Systems
(SDC) or the Reactor Water Oeanup (CUW) System (under certain plant conditions) is sufficient for success. The CUW System capacity is temperature dependent and requires both pumps and nonregenerative heat exchangers (the regenerative heat exchangers must be bypassed). In Mode 5, the Fuel Pool Cooling and Oeanup (FPC) System can be used after the reactor cavity is flooded. FPC alone after 10 days is sufficient to remove all the decay heat. Both FPC pumps and heat exchangers and the supporting systems are required. CUW can remove the entire decay heat 8 days after shutdown.
(2) Decay Heat Removal and RPV Water Makeup
Under certain plant conditions the main condenser, if available, can be used
to remove decay heat by condensing steam. The MSIVs must be opened and a condensate return path to the RPV is required. If the condenser is unavailable, steam can be released through the SRVs into the suppression pool and RPV makeup can be supplied by several sources. The availability of the SRVs is not explicitly modeled. At least one SRV is expected to be operable in the safety
mode (i.e., spring pressure) even if power is not available.
High pressure makeup can be accomplished by the HPCF, CRD, or feedwater and condensate systems. Low pressure makeup is available from the
condensate, LPFL or ACindependent Water Addition Systems. Low pressure
ABWR Shutdown Risk Assessment 190-27
ABWR Rev. 0
Design Control Document/Tier 2
makeup may require depressurization of the RPV by actuation of ADS or individual SRVs.
(3) In Mode 5 with the RPV head removed, boiling of water in the RPV with adequate makeup from low or high pressure sources is considered success for the purposes of this study.
Mitigation of loss of offsite power requires recovery of offsite power or use of the emergency diesel generators or combustion turbine generator. The AC-independent Water Addition System can be used for make up in the event of a loss of all AC power.
The success criteria and event trees do not explicitly model maintenance ofRPVwater level for availability of the Reactor Water Cleanup System or RHR. RPV level is assumed to be maintained by automatic activation of ECCS (i.e., LPFL or HPCF) in Modes 3 - 4 and Mode 5 (reactor cavity unflooded). In Mode 5 with the reactor cavity flooded, RPV level control is assured since the water level will be 7.01 m (23 feet) above the RPV flange.
Table 19Q-2 summarizes the loss of RHR success criteria.
190.7.7 Accident Progression and Event Trees
Loss ofRHR may initiate from a failure in the operating RHR System, loss of operating Service Water pump, or loss of offsite power. The accident progression for each of the above initiators is discussed below.
190.7.7.1 Loss of RHR Due to Failure in the Operating RHR System
190-28
Following reactor shutdown, the plant is cooled down by rejecting steam to the main condenser and making up water loss in the RPV by the feedwater system. The RHR System in the SDC mode can be initiated at about 1.034 MPa which corresponds to approximately 456 K (360°F). The RHR System is then used to cool down to either Mode 4 [less than 367 K (200°F)] or Mode 5 (refueling). Loss of the operating RHR loop is assumed to occur sometime after it has been initiated.
Loss of RHR in Mode 3 or 4 Figures 19Q-l and 19Q2 are the event trees for loss ofRHR in Mode 3 or 4, respectively. The following discussion applies to both event trees. Following loss of the operating RHR loop (event tree node RHR), the operator has to recognize the event and start following the correct procedure (OP). The sequence of events following the successful. outcome at this node is described first. The operator can identify the failed system and request the maintenance crew to restore it to operation. An analysis showed that for the decay heat load at this time, water in the RPV would begin to boil in 1.3 hours. Using a typical mean time to repair for the RHR System, and 1.3 hours as the time for recovery, the system recovery probability was determined (REC).
ABWR Shutdown Risk Assessment
ABWR Rev. 0
Design Control Document/Tier 2
If the failed RHR System cannot be recovered, the operator could initiate one of the other two RHR Systems, if available, in the shutdown cooling mode (R). If all RHR Systems fail, the RPV would pressurize and the main condenser could be made available (V2) by opening the MSIVs, drawing a vacuum in the condenser, and operating the feedwater and condensate pumps for makeup.
If the main condenser fails or is unavailable, the operator can use the CUW System to remove the decay heat (W2) if the RPV temperature is above 386 K (234°F).
If all DHR means are unavailable, the only path to success is to keep the core covered by either high pressure or low pressure sources. The high pressure sources are feedwater and condensate' (Q), HPCF (UH), or a CRD pump (C). The HPCF initiates automatically whereas the other two systems require operator action. If all these fail, the operator must depressurize the RPV by actuation of individual SRVs or ADS will initiate automatically (X) on low water level in the RPV. Successful depressurization would make the LPFL (VI), condensate (CDS), orAC-independentWater Addition (FW)
Systems available.
Failure to depressurize the reactor or failure ofFW leads to core damage.
If at node OP, the operator fails to follow the correct procedure, the reactor coolant temperature and pressure in the RPVwill rise,the SRVs will open and discharge steam to the suppression pool and eventually the HPCF will initiate (UH) on low RPV water level. If HPCF fails, ADS will actuate on low water level (X). Failure to depressurize will lead to core damage. Following successful reactor depressurization, LPFL will inject on low water level (VI) . Failure to inject with LPFL leads to core damage.
Loss of RHR in Mode 5 Figure 19Q3 shows the event tree for loss ofRHR in Mode 5 less than 3 days after shutdown. This sequence is the same as the previous one except that since the RPV head is removed, the main condenser and feedwater pumps are unavailable and ADS is not required as theRPV cannot become pressurized. Also, at this low temperature, CUWby itself is not capable of remOving all the decay heat generated within three days of shutdown.
Figure 19Q4 shows the event tree for loss ofRHR in Mode 5 for 3 - 8 days after shutdown. Figure 19Q-5 shows the event tree for loss ofRHR in Mode 5 for the period 8 -10 days and Figure 19Q-6 shows the event tree for greater than 10 days. The differences in these event trees are that for the period 8 -10 days CUW alone is success (W2) and beyond 10 days FPC alone (FPC) is success.
19Q.7.7.2 Loss of RHR Due to Loss of Sell'Vice Water
Figures 19Q-7 through 19Q16 show the event trees for loss of the Division A or C operating service water pump. The scenarios are basically the same as for a loss of RHR
ABWR Shutdown Risk Assessment 190-29
ABWR Rev. 0
Design ControlDocument/Tier 2
except that loss of the operating service water pump may impact other DHR or makeup systems in addition to the operating RHR pump. Loss of both service water pumps in Division A or B (operating and standby pum ps) also results in loss of CUW and FPC. For Division B, the HPCF(B) is also lost (Division A contains RCIC which is not available during shutdown). Likewise, loss of both service water pumps in Division C causes loss ofHPCF(C) in addition to the Division C RHR pump. Loss of Division B service water is identical to loss of Division A service water, therefore no event trees were developed specifically for Division B.
190.7.7.3 Loss of RHR Due to Loss of Offsite Power
Figures 19Q-17, 19Q-18 and 19Q-19 show the event trees for loss of off site power in
Modes 3, 4,and 5, respectively. The success criteria are the same but longer time is available for recovery in Mode 5. Following a loss of offsite power, it is possible to recover power in time to prevent core damage. If power is not recovered, the available DG will start automatically, and if the DG fails, CTG can be manually initiated. Following loss of all AC power, the AC-independent Water Addition System can be used for make up if the RPV can be depressurized by opening SRVs.
190.7.8 System Fault Trees
190-30·
The unavailability of a system to perform its safety function on demand given a loss of RHR was eValuated by fault tree analysis. Eleven fault trees were used in this analysis. The fault trees are contained in Attachment 19QA.
Five of the fault trees: HPCF, RHR (SDC) , RHR (LPFL) , Reactor Building Service Water, and ADS, were taken from the full power PRA with modifications (e.g., maintenance unavailability and operator actions) to reflect shutdown conditions. The other six fault trees were developed specifically for the shutdown PRA and include:
• Reactor Water Cleanup,
• Fuel Pool Cooling,
• Main Condenser,
• CRD,
• Condensate, and
• Feedwater.
The fault trees model system unavailability due to mechanical failures, loss of power, and operator errors. As previously mentioned, maintenance unavailability is either assumed to be 1 or 0 (Le., system is in or out of\naintenance).
ABWR Shutdown R;sk Assessment
ABWR Rev. 0
Design Control Document/Tier 2
The unavailability of the AGindependent Water Addition System was estimated based on the assumed operator error in manually initiating the system.
19Q.7.9 Results and Conclusions
19Q.7.9.1 Introduction
The event trees described in the previous subsection were evaluated and the core damage probability calcu1ated with certain systems assumed unavailable due to maintenance. In general, the minimum set of equipment assumed to be available was initially taken as that required by the Technical Specifications for the given operating mode. Combinations of systems were made available until a set resu1ted in a conditional probability of less than the selected threshold. Each of these sequences that met the acceptance criteria is considered a minimum set for assuring acceptable shutdown risk.
Minimum setS were obtained for each of the three loss of RHR initiators:
• Loss of Operating RHR System
• Loss of Operating RSW Pump
• Loss of Offsite Power
Tables 19Q-3 through 19Q-5 list certain minimum sets of systems that meet the acceptance criteria for loss of the operating RHR System initiator for the three major configurations during shutdown. The configurations are: Modes 3 or 4, Mode 5 prior to flooding the reactor cavity, and Mode 5 after the reactor cavity has been flooded. The effect of changes in decay heat, as a function of time, will be discussed for each of the three plant conditions.
With about 12 systems available, and about four needed to meet the goal, many minimum setS can be identified. In order to simplify the selection of minimum set systems, the following maintenance philosophy was assumed: all of division C in maintenance; division B, ADS, and combustion turbine generator (CTG) are available. Although the CTG is not covered by Technical Specifications, its availability is assumed to be controlled by Administrative Procedures. Other maintenance philosophies can be adopted and the model used to identify appropriate minimum systems. Additional details of the plant configuration based on selected maintenance philosophy is as follows. The plant is being cooled through use ofRHR "A" and itS support systems (i.e., service water "A", RCW "A", electric power division "A"). Other division "A" systems, including EDG "A" may be in maintenance unless specifically included as a support system in one of the minimum sets. All division "B" systems are assumed to be not in maintenance, although they may become unavailable due to random failures or operator errors. All division "C" systems are assumed to be in maintenance. For the above assumed configuration, one of the isolation valves for RHRB is powered by
ABWR Shutdown Risk Assessment 190-31
ABWR Rev. 0
Design Control DocumenVTier 2
division "C" (due to single failure concerns with containment isolation}.IfRHRB is required, division "C" power can be made available momentarily. This configuration was selected because it is one that meets minimum technical specification requirements (i.e., 2 ECCS and 2 RHR Systems available). Other configurations could have been selected but this one is typical and the resulting minimum sets identified will demonstrate the low risk associated with loss of decay heat removal for the ABWR and the flexibility afforded utilities for outage maintenance scheduling while still maintaining low risk levels. If one of the assumed power sources becomes unavailable, the utility should make another power source (e.g., a second EDG) available to ensure the safety criterion will be met. Normal sUlVeillance testing should be used to assure the availability of these systems.
19Q.7.9.2 Loss of RHR Initiator
190-32
The minimum set for loss ofRHR is discussed first. Table 19Q-3lists some minimum sets of systems that if available during Mode 3 or 4 meet the core damage criterion. As can be seen, if the 2 ECCS Systems are assumed to be RHR, then only a CRD pump plus AC-independent Water Addition or CUWpius AC-independent Water Addition need be made available. This is not restrictive since one pump from CRD and firewater are usually available for other reasons (e.g., CRD to purge the FMCRDs and AC independent water addition for fire protection) and CUW is usually operable during this period. The table shows five different minimum sets. This is indicative of the flexibility for performing ABWR shutdown maintenance while still maintaining risk margins.
Table 19Q4 lists some minimum sets of systems for Mode 5 during 2 - 3 days after shutdown. In this configuration the RPV head bolts have been detensioned and the
. head is off but the reactor cavity has not been flooded. For this Mode 5 configuration, fewer systems are available than during Mode 3 or 4 or after flooding the reactor cavity but enough systems are available to ensure adequate risk margins. Also, this is a relatively short duration of the outage. The main condenser is not available since the RPV cannot be pressurized. Fuel pool cooling cannot be used because the RPV and fuel pool have not been connected together and CUW capacity is not sufficient to remove all the decay heat due to the low RPV temperature and high decay heat load. The table shows three minimum sets of systems which meet the risk criteria. As was noted for Modes 3 and 4, the CRD pump which is normally available in addition to fire water and RHRB meet the core damage criterion. Another minimum set might be RHRB (SPC) condensate, and fire water.
Table 19Q-5 lists nine minimum sets for Mode 5 following 3 days after shutdown when the reactor cavity is flooded. RHR plus condensate and fire water meet the criterion. Mter 8 days, CUW and firewater along with either CRD or condensate meet the criterion, and after 10 days, FPC, CRD, and condensate could be a minimum set. As time
ABWR Shutdown Risk Assessment
ABWR Rev. 0
Design Control Document/Tier2
following shutdown increases, more systems become able to remove decay heat and
greater time is available for operator actions prior to boiling or core damage.
As Tables 19Q-3 through 19Q-5 illustrate, many combinations of systems can be made available to ensure adequate shutdown risk while still allowing for maintenance to be performed on systems. As previously mentioned, these minimum sets are only a few of the possible combinations that will ensure adequate shutdown risk margins. Other minimUIIi sets can be identified for different assumed plant conditions. An important point that is illustrated by the minimum sets identified in this study is that under all
shutdown plant conditions, minimum technical specification requirements plus systems that are nonnally operating or available during shutdown (e.g., CUW, FPC, CRD, and fire water) are enough to ensure adequate shutdown risk margins.
19Q.7.9.3 Loss of Service Water (SW) Initiator
Ifloss of the operating SW pump is assumed to be the initiating event, all the minimum sets in Tables 19Q-3 through 19Q-5 would be applicable. This is because there is only one RHR pump per division, while one standby pump supports the operating pump in each division of service water. Therefore, RHR (A) is not lost due to the failure of the operating RSW pump. With RHR (A) available, the minimum sets previously identified
withoutRHR (A) must still be able to meet the acceptance criteria. Loss of the operating RHR pump is the limiting condition for this analysiS.
19Q.7.9.4 Loss of Offsite Power Initiator
For a loss of offsite power initiator, calculations have shown that the probability of failing both the EDG and the CTG along with not recovering offsite power within 80 minutes is extremely small. For core damage to occur, loss of AC independent water addition or ADS must also occur. This scenario is less than the acceptance criteria and
thus meets the criterion. Since the above maintenance philosophy assumes only EDGB and the CTG are available, no additions to the minimum sets already identified are
required for the loss of offsite power initiator.
19Q.7.9.5 Adequacy of Technical Specifications
From the above results, the following can be stated regarding adequacy of the ABWR Technical Specifications. In Mode 5, the onset of boiling is most dependent on water level (or total inventory), and thus the most vulnerable condition is at low water level prior to flooding up of the reactor cavity. In this condition, not only is the time to boiling relatively insensitive to decay heat level, but RHR in shutdown cooling (SDC) is the only source of decay heat removal. This is the basis for the Technical Specifications
requiring that two loops of RHR SDC be available in this condition; one normally operating and one in standby. Results of the analysis show that given the loss of the operating RHR pump, with one RHR loop in standby there is a small probability of the
onset of boiling. This is acceptable given the short time duration the plant is expected
ABWR Shutdown Risk Assessment 190·33
ABWR Rev. 0
Design Control Oocument/Tier 2
to be in this unique condition and the benign consequences that are calculated to result so long as core damage is avoided. Clearly, a utility could further reduce the likelihood of boiling by assuring that the third division ofRHR SDC provided in the ABWR design is available during these conditions. Thus, during the early stages of the transition from Mode 4 to Mode 5 (prior to flood-up), the availability of the third loop of RHR SDC , further reduces shutdown risk. However, given the other compensatory measures available to delay the onset of boiling and prevent core damage (e.g., condensate, AC independent water addition, CRD), the two loops ofRHR SDC required by ABWR Technical Specifications are more than adequate during these plant conditions.
19Q.7.9.6 Contribution of Human Errors to CDF
The ABWR design is relatively insensitive to human error contributions to CDF during shutdown for the following reasons. Although several potential human errors have been identified (e.g., failure to recognize the loss of operating RHR loop and failure to manually actuate systems such as condensate, fire water, Reactor Water Cleanup, and Fuel Pool Cooling), multiple systems and paths for decay heat removal and makeup are available during shutdown to mitigate these errors. Also, automatic actuation of makeup from LPCF and HPCF and multiple alarms to alert the operator to potential unsafe conditions during shutdown (e.g., high RHR temp~rature, sump pump alarms, fire detection, low RPV level, high area radiation, and high neutron flux) all contribute to the conclusion that the ABWR is tolerant of human errors.
The methodology used in this study does not allow for a quantitative estimate of the impact of human errors to CDF, but based on the above discussion it is considered to be low.
19Q.8 Use of Freeze Seals in ABWR
190-34
Freeze seals are used for repairing and replacing such components as valves, pipe fittings, pipe stops, and pipe connections when it is impossible to isolate the area of repair any other way. Freeze seals have successfully been used in pipes as large as 700A (28 inches) in diameter.
The ABWR design has eliminated a significant amount of piping associated with the Reactor Coolant System (RCS) (e.g., no recirculation loops). This by itself will reduce the necessity for freeze seals in ABWRs over other plant designs.
In addition to reduced RCS piping, the ABWR design has most piping connected to the reactor pressure vessel (RPV) enter at a level significantly higher [152.4 cm (5 feet)] than the top of active fuel. Inadvertent draining from these lines will automatically stop without exposing the fuel. The only piping connection below the top of active fuel (Reactor Water Cleanup System) is small in size [<50A « 2 inches)]. Ifafreeze seal were
ABWR Shutdown Risk Assessment
ABWR Rev. 0
Design Control Documenf/Tier2
required on this line and it were to fail, several sources of makeup are available to refill the RPV to prevent core uncovery.
-Whenever freeze seals or other tempo,rary boundaries are used in the ABWR, administrative procedures will be necessary to ensure integrity of the temporary boundary. Also, mitigative measures will be identified in advance and appropriate backup systems made available to ensure ~o loss of coolant inventory occurs.
An option that a utility could choose is to off-load all the fuel in the RPVto the spent fuel pool when repair or maintenance of an unisolatable valve must be completed.
The selected method for working on unisolatable valves must take into account adequate safety margins, personnel experience with freeze seals, availability of backup systems, and the potential impact on other outage activities.
See Subsection 19.9.23 for COL license information requirements.
190.9 Shutdown Vulnerability Resulting from New Features
The ABWR has incorporated many new design features that do not exist in current operating domestic BWRs. These features have been added based on past operating experience, advances in technology since earlier designs were finalized, and the results of detailed probabilistic risk assessments (PRAs).
In order to evaluate the potential shutdown risk associated with these new features, a Failure Modes and Effects Analysis (FMEA) was completed for each new feature. The feature is identified followed by potential failure mode(s). The possible method for detecting each failure mode is then presented followed by the-potential impact on safe shutdown and any preventive or mitigating feature that may exist. Finally, the overall shutdown vulnerability evaluation is described.
The FMEA is contained in Table 19Q-6. As the r~sults presented in Table 19Q-6 show, there are no identified vulnerabilities resulting from implementation of new design features in the ABWR that affect shutdown risk.
190.10 Procedures
The ABWR has been designed to minimize risk associated with plant operations both at normal power and shutdown conditions. As previously mentioned, PRA techniques have been employed to identify potential accident scenarios and, where appropriate, design modifications have been included to reduce estimated risks. In addition to the physical plant design and configuration, the ABWR will incorporate operating procedures that are based on rigorous engineering evaluations including safety analyses. These procedures will be prepared consistent with NUMARC Guidelines presented in NUMARC 91-06, "Guidelines to Enhance Safety During Shutdown."
ABWR Shutdown Risk Assessment 190-35
ABWRr Rev. 0
Design Control Document!fier 2
Each utility must generate plant specific operating procedures based on individual site characteristics and training program requirements. A procedures guideline will be completed for the ABWR to address shutdown conditions. The guideline will provide insight into two general areas:
(1) Effective outage plamiing and control
(2) Maintenance of key shutdown safety functions:
(a) Decay heat removal capability,
(b) Inventory control,
(c) Electrical power availability,
(d) Reactivity control, and
(e) Containment integrity (primary and secondary).
Outage Planning and Control Although design features help, shutdown risk can best be minimized through appropriate outage planning and control procedures. Planning is important because of the large number and diversity of tasks that must be completed during the outage. Safety and support systems must be taken out of service for maintenance. This reduces redundancy of safety systems. If alternate means are not utilized to backup the lost safety system, a reduction in safety margin may occur. The ABWR contains multiple normal and alternate systems to complete all required shutdown safety functions. Availability of normal and alternate systems must be made known to all personnel involved in planning and execution of the outage. This is an ever-changing situation during outages and proper planning and tracking of activities is required to ensure safety margins are maintained.
The plant specific procedures for outage planning and control should ensure that the appropriate focus is maintained on the following activities:
(1) Documentation of outage philosophy including organizations responsible for outage scheduling. This should address not just the initial outage plan but all safety significant changes to the schedule.
(2) Ensuring that all activities, particularly higher risk evolutions, receive . adequate resources. The plan should consider scope growth and unanticipated changes.
190-36 ABWR Shutdown Risk Assessment
Rev. 0
ABWR Design Control Documenr/Tier 2
(3)· Ensuring that the "defense in depth" concept that is central to power operation be maintained during shutdown to ensure that safety margins are not reduced. Safety systems must be taken out of service for maintenance but
alternate or backup systems can be made available if proper planning is completed .
. (4) Ensuring that all personnel involved in outage planning and execution receive adequate training. This should include operator simulator training to
the extent practicable. Other plant personnel, including temporary personnel, should receive training commensurate with the outage tasks they will be performing.
(5) Mter completion of outage planning, but prior to final approval, a review of the schedule should be completed by an independent safety review team. The main objective of this review is to assure that the defense in depth principal will not be violated at any time during the outage.
See Subsection 19.9.25 for COL license information requirements.
Shutdown Safety Issues Procedures for outage planning and control address general aspects of risk reduction
during shutdown. Specific shutdown procedures are required to maintain key safety functions during shutdown (See Subsection 19.9.25 for COL license information requirements). The following guidelines should be used for each key shutdown safety function.
(1) Decay Heat Removal Capability
The normal method of Decay Heat Removal (DHR) is through use of the Residual Heat Removal System (RHR) in the shutdown cooling mode. As discussed in Subsections 19Q.7 and 19Q.ll, there have been.many events at operating plants that have resulted in partial or total loss ofDHR. A recovery strategy should be established to address loss of normal RHR This should include identification of alternate DHR Systems as well as personnel responsible for execution of the recovery plan. In addition to recovery plans, outage planning should emphasize availability of DHR by postponing maintenance on RHR Systems to later in the outage when decay heat loads have been reduced or to when the core has been off-loaded to the spent fuel pool. In the case of core off-load, procedures should be prepared to ensure
maintenance of spent fuel pool cooling.
(2) Inventory Control
ABWR Shutdown Risk Assessment 190-37
ABWR
19Q-38
Rev. 0
Design Control Document!Tier 2
IfDHR were to be lost, the time to reactor coolant boiling and core uncovery will be detennined by the initial coolant inventory and makeup capability.
Procedures should be prepared to ensure that adequate coolant inventory is m~ntained at all times during shutdown. Also, plant activities or configurations where a single failure can result in loss of inventory should be identified and compensatory measures established. Specific activities for the ABWRthat should be reviewed for the potential of inven tory deduction are: Use of freeze seals (see Subsection 19Q.8 for a more complete discussion);
removal of control rods, control rod drives, and reactor internal pumps; RHR
valve actuations or leakage leading to diversion ofRPV coolant to the
suppression pool (e.g., RHR pump mini-flow valve failure/leakage, switching shutdown cooling from one division to another); and inadvertent actuation of
safety relief valves.
(3) Electrical Power Availability
As discussed in Subsections 19Q. 4. 4 and 19Q.ll, loss of electrical power
during shutdown has resulted in loss ofDHR in the past. The ABWR has two
sources of offsite (preferred) and four sources of onsite electrical power. Procedures should be utilized to ensure that defense in depth for electrical power sources is maintained; Maintenance of power sources should reflect the
current plant conditions. Availability of normal and alternate power sources should be ensured especially during periods of higher risk evolutions (e.g., unbolting the RPV head prior to flooding the reactor cavity). Many of the loss
of power events discussed in Subsection 19Q.ll were caused by operator errors (e.g., switching errors, inadeqUate maintenance/testing procedures) and grounding of transformers in switchyards due to movement of equipment by cranes and trucks. All maintenance and switchyard activities should be
reviewed to identify single failures or procedural errors that could result in loss of power to vital buses during shutdown. Procedures should be developed
for implementation of alternate sources of power including applicable breakers and bus locations, required tools, and sequence of steps to be
performed.
(4) Reactivity Control
Shutdown reactivity control for the ABWR is maintained by core design analysis and interlocks that restrict fuel and control rod drive movements. Procedures are required to ensure that the core is loaded per design requirements and that unauthorized fuel movement does not occur simultaneous with CRD mechanism maintenance. If the refueling sequence
must be altered, new shutdown margin analyses should be performed. All fuel movements should be verified by knowledgeable trained personnel.
ABWR Shutdown Risk Assessment
Rev. 0
ABWR Design Control Document/Tier 2
(5) Containment Integrity
The ABWR primary containment will not be available during most of the
refueling outage but procedures should be developed to ensure its availability during Mode 3 and during Mode 4 (if appropriate). During all modes, procedures should be available to ensure that secondary containment can be
maintained functional as required, especially during higher risk evolutions.
Procedure Reviews An important part of procedures implementation is a review of the adequacy of all operating procedures. All shutdown operating procedures should be reviewed periodically to ensure that the defense in depth concept is being maintained given the actual events occurring at each site. This review should include not only procedure adequacy but dissemination of the outage philosophy to all personnel involved in scheduling and executing the outage plan and training of personnel including temporary personnel. This review should be documented and retained as a permanent plant record.
19Q.11 Summary of Review of Significant Shutdown Events: Electrical Power and Decay Heat Removal
As part of the certification process for the ABWR design, the NRC has requested that General Electric complete a review of significant shutdown events in operating plants and discuss ABWR features which could prevent or mitigate such events.
To complete this evaluation, a review was made of operating events involving loss of
offsite power (LOOP) and loss of Decay Heat Removal (DHR). These two areas appear to have the greatest potential for causing core damage during shutdown based on past
experience. The sources utilized for information on past shutdown events were:
• "Residual Heat Removal Experience Review and Safety Analysis", NSAC88, March 1986
• "Loss of Vital AC Power and the Residual Heat Removal System during Mid-Loop Operations at Vogtle Unit Ion March 20,1990", NUREG-1410,June 1990
• "NRC Staff Evaluation of Shutdown and Low Power Operation", NUREG-1449, March 1992
• Selected INPO SE~ Reports and NRC Information Notices
The results of this evaluation are contained in Attachment 19QC, Tables 19QC-1 and 19QC-2 for LOOP and loss ofDHR respectively. The following is a discussion of the results for each event type.
ABWR Shutdown Risk Assessment 190-39
ABWR
19Q-40
Rev. 0
Design Control Document/Tier 2
LOOP NUREG-I4IO contains a discussion of 70 LOOP events at operating plants both PWR and BWR. Although the response to LOOP events will differ for PWRs and BWRs, the initiating events are similar in that off site and onsite power configurations are similar, for both reactor types. The events evaluated in NUREG-I4IO occurred between 1965 and 1989. Two additional recent LOOP events were added to this list and are included in Table I9QC-1.
The LOOP events can be grouped into the following categories:
• Loss of all offsite power sources due to various reasons including weather, operator errors or grid upset
• Loss of one or more offsite sources with at least one off site source remaining
• Isolation of offsite power due to onsite electrical faults
• Degraded offsite or onsite power sources resulting from errors in maintenance activities
As discussed in Table I9QC-I, the ABWR electrical distribution system has several features which would prevent or mitigate every precursor event evaluated in this study. Prevent or mitigate in this case means that at least one Class IE power supply would be available to energize equipment to maintain plant cold shutdown.
The main features of the electrical system are:
• Two independent" sources of off site power
• Three physically and electrically independent Class IE emergency diesel generators
• Three unit auxiliary transfonners powering three Class IE and three non-IE power buses
• Combustion Turbine Generator (CTG) that can be used to power any of the Class IE or non-IE power buses
The above features of the ABWR electrical distribution system, along with appropriate Technical Specifications and other administrative controls, assures that adequate power sources would be available to mitigate potential electrical events such as those described in Table I9QC-1.
Loss of DHR NSAC-88 contains a discussion of gO loss or degradation ofDHR events during the seven year period 1977 through the end of 1983. The source for these events were Licensee
ABWR Shutdown Risk Assessment
ABWR Rev. 0
Design Control DocumentlTier 2
Event Reports (LERs). Other events described in INPO SEO reports and NRC infonnation notices were also reviewed and included in the study.
Summary of DHR Events The results of this evaluation are contained in Table 19QC-2. Not all of the· events discussed in NSAC-88 are contained in Table 19QC-2. Those events that were due to random failures of single components and did not result in loss of DHR or other significant plant effects were not evaluated further. If the single failure resulted in loss of coolant, overpressurization, flooding, or loss of Shutdown Cooling (SDC) function, the event was included and the applicable ABWR feature to prevent or mitigate the event was discussed.
For the purposes of this study, prevention or mitigation means that, given the DHR challenge event, the ABWR design would either not be susceptible to the postulated failure or it has design features that could be relied upon to ensure that the fuel in the RPV remained covered with water at all times.
Of the events described in Table 19QC-2, some were single failures ofRHR System components that resulted in either delayed achievement of shutdown cooling (SDC) , reduction in reactor pressure vessel (RPV) water level, or a temporary loss ofSDC. In all of these events, the fuel remained covered with water and alternate means of DHR remained available (e.g., Reactor Water Cleanup System, main condenser, and ECCS Systems). In the cases of delayed or temporary loss of SDC, RPV water temperature increases ranged from 261 K - 333 K (10° - 140°F). In all cases, SDC was restored and alternate means of DHR were not used although available. Operator errors associated with improper valve lineups or incorrect maintenance were identified. In these cases, delays in implementing SDC or temporary loss of SDC occurred while the error was corrected. In a few cases, marine growth caused failure of one or more RHR heat exchangers which resulted in temporary loss ofSDC while other RHR loops or alternate cooling paths were implemented. In one case, a freeze seal failure in the RHRSW caused 56.8 m3 (15,000 gallons) of water to damage ECCS power supplies resulting in temporary isolation of SDC.
None of the events described above and in Table 19QC-2 resulted in fuel being uncovered. The flexibility of the RHR System and the several alternate means ofDHR that were available seIVed to mitigate the component failures or operator errors.
Summary Significant shutdown events in operating plants have been reviewed to detennine
ABWR features which could prevent or mitigate the events. Loss of offsite power and loss or degradation events from published nuclear industry reports were the database for this review. The results of this review demonstrate thatABWR design includes many features that prevent or mitigate unacceptable consequences of typical past events.
ABWR Shutdown Risk Assessment 19Q-41
ABWR Rev. 0
Design Control Document/Tier 2
The main features of the ABWR that will prevent or mitigate shutdown events are:
• Three divisions of ECCS and support systems that are physically and electrically independent
• Two inciependent offsite power sources
• Four onsite power sources (three emergency diesel generators and one combustion turbine generator) -
• Plant configuration and structural integrity to minimize common mode failures due to fire and floods
• Appropriate Technical Specifications and other administrative controls to ensure availability of systems during periods of potentially high risk operations
• Several alternate means of DHR if normal systems were to fail or be out of service for maintenance
• Instrumentation availability during shutdown to monitor plant safety status and initiate safety systems when needed
19Q.12 Results and Interface Requirements.
19Q.12.1 Insights Gained from the Analysis
Completion of the ABWR shutdown risk analysis has resulted in the following insights:
(1) The most important element in control of shutdown risk is adequate planning of maintenance on systems and support systems that can be used to remove
decay heat or supply inventory makeup to the RPV.
(2) The ABWR design has incorporated a significant number of new design features relative to operating BWRs. Past events that have led to loss of decay heat removal capability or loss of offsite power can,. in general, be ~itigated by ABWR design features.
(3) The ABWR design has a very low risk associated with loss of decay heat removal. Adequate shutdown safety margins exist if only systems required by Technical Specifications and those that are already in operation (e.g., CRD, FPC, firewater) are relied upon. Minimum combinations of systems have been identified that, if available, will ensure adequate shutdown safety margins. Combinations other than those identified in this study may exist which also result in adequate shutdown risk margins. By taking advantage of these available decay heat removal and makeup systems, utilities can exercise much flexibility in outage maintenance scheduling while ensuring that adequate safety margins are maintained at all times during shutdown conditions.
19Q-42 ABWR Shutdown Risk Assessment
Rev. 0
ABWR Design Control Documenf/Tier 2
(4) The above safety margins were calculated using very conservative estimates for human error probabilities. For all events analyzed during shutdown, sufficient time is available to prevent core damage that no extraordinary operator actions are required. ABWR safety is designed into the plant.
(5) Fire and floods during shutdown can be mitigated by ensuring, through administrative procedures that at least one safety division is not in maintenance and its physical boundaries remain intact. If it is decided to breach the boundaries of two safety divisions to complete maintenance tasks, an evaluation must be completed to ensure that a minimum set of systems capable of meeting the shutdown safety criterion will remain available if a fire or flood were to occur. This applies to flooding/fire in the intact division as well as the breached divisions.
(6) The minimum technical specification requirements plus systems normally operating during shutdown (e.g., CRD, fire water, CUW) are adequate to ensure that safety margins can be maintained during shutdown due to a loss of an operating RHR train. Also, no technical specification changes are required to mitigate fires or floods during shutdown. Administrative controls are recommended on maintenance activities during shutdown to ensure the availability of systems to mitigate loss of RHR, fires, and floods.
19Q.12.2 Important Design Features
The ABWR features identified as important contributors to the low level of risk associated with shutdown are discussed in Subsection 19.8.6.
19Q.12.3 Operator Actions
The following operator actions have been identified that are important to minimization of shutdown risk and have been included as COL action items:
• Ability to recognize failure of an operating RHR System.
• Rapid implementation of standby RHR Systems following the loss of the operating RHRSystem.
• Use of alternate means of decay heat removal using non-safety grade equipment such as CUW, FPC, or main condenser.
• Use of alternate means ofinventory makeup using non-safety grade equipment such as AC independent water addition, CRD pump, feedwater, or condensate.
• How to utilize boiling for decay heat removal in Mode 5 with the RPV head removed including available makeup sources.
ABWR Shutdown Risk Assessment 19Q-43
Rev. 0
ABWR Design Control Document/Tier 2
19Q..44
• Implementation of fire/flood watches during periods of degraded safety division physical integrity.
• Fire fighting during shutdown.
• Use of remote shutdown panel during shutdown.
• Instrumentation must be made available during shutdown to support the following functions:
Isolation of RPV
ADS
HPCF
LPFL
RPV water level, pressure, and temperature
RHR System alarms
EDG
Refueling interlocks
Flood detection and associated valve isolation and pump trips
• Procedures should be prepared to address the following tasks during shutdown:
Fire fighting with part of the fire protection system in maintenance
Outage planning to minimize risk using guidance from NUMARC 91-06
Use offreeze seals
Replacement of RIPs and CRD blades
Loss of offsite power
Increasing CRD pump flow when using it for inventory control
Maintenance of suppression pool as it relates to maintaining SaIety margins for decay heat removal
Ensure that one safety division is always available with intact fire/flood barriers.
ABWR Shutdown Risk Assessment
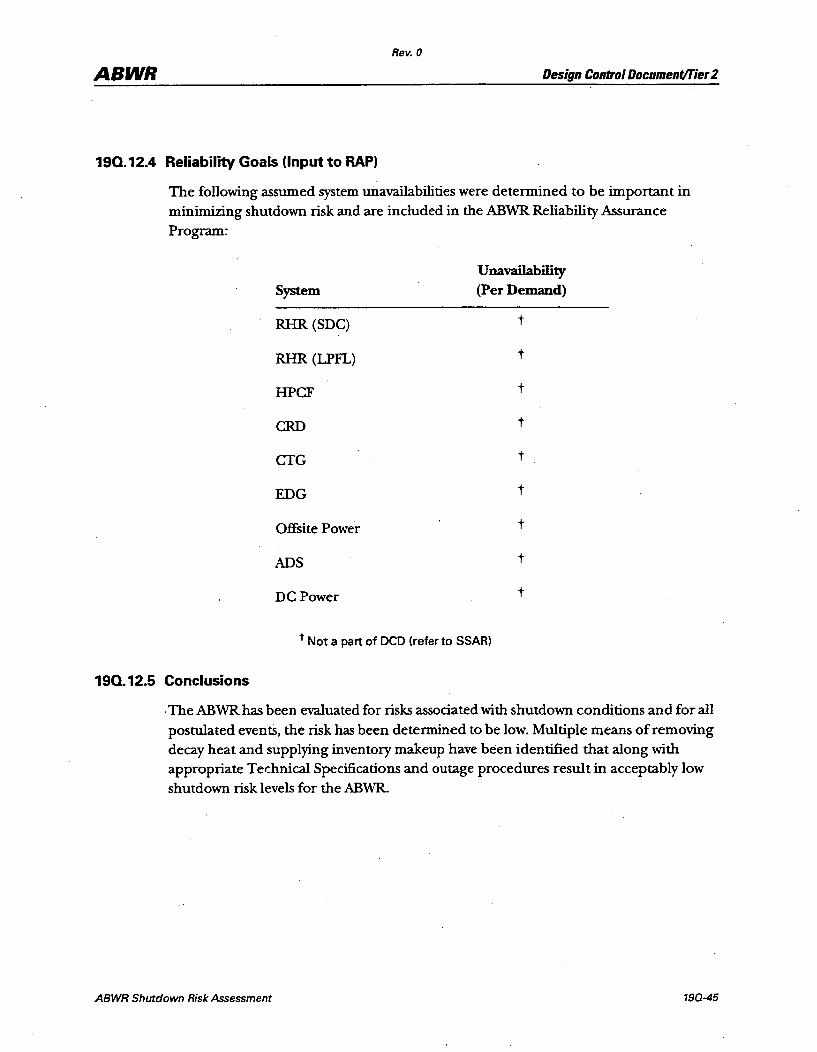
Rev. 0
ABWR Design Control DocumentlTier 2
190.12.4 Reliability Goals (Input to RAP)
The following assumed system unavailabilities were detennined to be important in minimizing shutdown risk and are included in the ABWR Reliability Assurance Program:
Unavailability System (Per Demand)
RHR (SDC) t
RHR (LPFL) t
HPCF t
CRD t
CTC t
EDG t
Off site Power t
ADS t
DC Power t
t Not a part of OeD (refer to SSAR)
190.12.5 Conclusions
. The ABWR has been evaluated for risks associated with shutdown conditions and for all
postulated events, the risk has been determined to be low. Multiple means of removing decay heat and supplying inventory makeup have been identified that along with appropriate Technical Specifications and outage procedures result in acceptably low shutdown risk levels for the ABWR.
ABWR Shutdown Risk Assessment 19Q-45
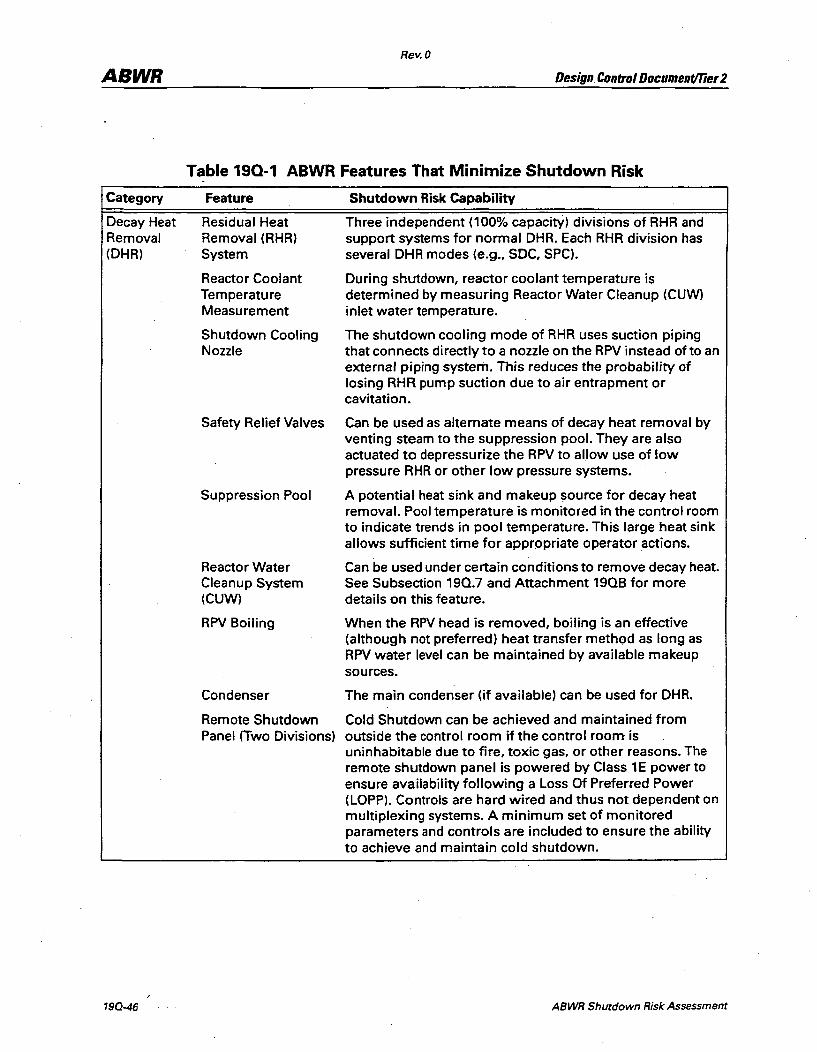
ABWR
Category
Decay Heat Removal (DHR)
19Q-46
Rev. 0
Design Control Document/Tier 2
Table 190-1 ABWR Features That Minimize Shutdown Risk
Feature
Residual Heat Removal (RHR) System
Reactor Coolant Temperature Measurement
Shutdown Cooling Nozzle
Safety Relief Valves
Suppression Pool
Reactor Water Cleanup System (CUW)
RPV BOiling
Condenser
Remote Shutdown Panel (Two Divisions)
Shutdown Risk Capability
Three independent (100% capacity) divisions of RHR and support systems for normal DHR. Each RHR division has several DHR modes (e.g., SOC, SPC).
During shutdown, reactor coolant temperature is determined by measuring Reactor Water Cleanup (CUW) inlet water temperature.
The shutdown cooling mode of RHR uses suction piping that connects directly to a nozzle on the RPV instead of to an external piping system. This reduces the probability of losing RHR pump suction due to air entrapment or cavitation.
Can be used as alternate means of decay heat removal by venting steam to the suppression pool. They are also actuated to depressurize the RPV to allow use of low pressure RHR or other low pressure systems.
A potential heat sink and makeup source for decay heat removal. Pool temperature is monitored in the control room to indicate trends in pool temperature. This large heat sink allows sufficient time for appropriate operator actions.
Can be used under certain conditions to remove decay heat. See Subsection 19Q.7 and Attachment 19QB for more details on this feature.
When the RPV head is removed, boiling is an effective (although not preferred) heat transfer method as long as RPV water level can be maintained by available makeup sources.
The main condenser (if available). can be used for DHR.
Cold Shutdown can be achieved and maintained from outside the control room if the control room is uninhabitable due to fire, toxic gas, or other reasons. The remote shutdown panel is powered by Class 1E power to ensure availability following a Loss Of Preferred Power (LOPP). Controls are hard wired and thus not dependent on multiplexing systems. A minimum set of monitored parameters and controls are included to ensure the ability to achieve and maintain cold shutdown.
ABWR Shutdown Risk Assessment

Rev. 0
ABWR . Design Control Document/Tier 2
Table 190-1 ABWR Features That Minimize Shutdown Risk (Continued)
Category
Reactor Inventory
Feature
Instrumentation
Fuel Pool Cooling System
High Strength Low Pressure Piping
Interlocked RHR Valves (Mode Switch)
RPV Isolation Valves
Makeup Control
ABWR Shutdown Risk Assessment
Shutdown Risk Capability
Adequate instrumentation is available to operators both inside and outside of the control room for monitoring shutdown conditions throughout the plant. Some of the safety significant parameters monitored during shutdown include: RPV water level, reactor coolant temperature, neutron flux, drywell pressure, RHR flow, reactor pressure, and suppression pool temperature and level. In addition to monitoring, signals are also available to actuate ECCS functions on low RPV water level, scram control rods on high flux, and close isolation valves on appropriate signals. Four divisions of instrumentation allow one division of monitoring sensors to be in maintenance without disabling the function, thus assuring availability of instrumentation during shutdown.
Tl1e Fuel Pool Cooling System (FPC) can be used for DHR under certain conditions during Mode 5 (refueling). See Subsection 19Q.7 and Attachment 19Q8 for more detail. The pool does not contain drains and includes antisiphon devices to prevent inadvertent drainage. The RHRS can be interconnected to the F~C to aid cooling of fuel in the pool if required.
Low pressure piping connected to high pressure piping has been redesigned to a higher pressure rating up to the most remote closed valve and is therefore expected to withstand full reactor pressure on a rupture criteria basis. This minimizes the potential for loss of inventory.
The RPV shutdown cooling suction valve must be fully closed before the suppression pool return or suction valves can be opened. Shutdown cooling suction valve cannot be opened until suppression pool suction and return valves are fully closed. This prevents inadvertent draining of the RPV to the suppression pool. Interlocks are part of mode switch design.
All large diameter [>50A (>2 inches)] isolation valves in the RHR and CUW Systems that connect to the RPV (except injection lines) automatically close on a low RPV water level signal. This reduces potential for the core being uncovered due to an inadvertent RPV drain down event.
If RPV level decreases, High Pressure Core Flooder (HPCF), Automatic Depressurization System (ADS), and Low Pressure Flooder (LPFL) Systems initiate automatically. If HPCF and LPFl Systems are in the test mode and a RPV low level signal is received, the systems automatically switch to the vessel injection mode.
19Q-47

Rev. 0
ABWR Design Control Document/Tier 2
Table 190-1 ABWR Features That Minimize Shutdown Risk (Continued)
Category Feature
Feedwater and Condensate Pumps
High Pressure/Low Pressure Interlocks
Makeup Sources
No Recirculation Piping
RPV Level Indication
Containment Containment Integrity
Electrical Power
190-48
Standby Gas Treatment System
Reactor Building Isolation Control
3 Diesel Generators
Combustion Turbine Generator
2 Sources of Offsite Power
Electrical Cable Penetrations
4 Divisions of DC Power
Shutdown Risk Capability
Three electric driven pumps that can be used during shutdown for makeup.
Controls position of RHR valves to ensure that the RHR is not exposed to pressures in excess of its design pressure.
Multiple sources of RPV makeup are potentially available while the plant is shutdown (e.g., main condenser hotwell, condensate storage tank, suppression pool, control rod drive system, AC-independent Water Addition System).
Elimination of Recirculation piping external to RPV reduces . probability of LOCA both during normal operations and
while shutdown.
Permanently installed RPV water level indication for all modes of shutdown. Redundant sensors use a two-out-offour logic configuration to ensure high reliability.
Reinforced concrete structure surrounds RPV to withstand LOCA loads and contain radioactive products from potential accidents during hot shutdown. Secondary containment permits isolation and monitoring all potential radioactive leakage from the primary containment.
Removes and treats contaminated air from the secondary containment following potential accidents.
Automatically closes isolation dampers on detection of high radiation. These dampers are potential leakage paths for radioactive materials to the environs following breach of nuclear system barriers or a fuel handling accident.
One diesel for each safety division. Independent, both electrically and physically, of each other to minimize common mode failure. Allows for diesel maintenance while still maintaining redundancy.
Redundant and diverse means of supplying power to safety and non-safety buses in event of loss of offsite power and diesel generator failures.
Reduces risk of LOPP due to equipment failure or operator error.
Will prevent propagation of fire damage and water from postulated flooding sources.
Electrically and physically independent. Includes batteries and chargers. Diverse means of electrical power for control circuits and emergency lighting.
ABWR Shutdown Risk Assessment
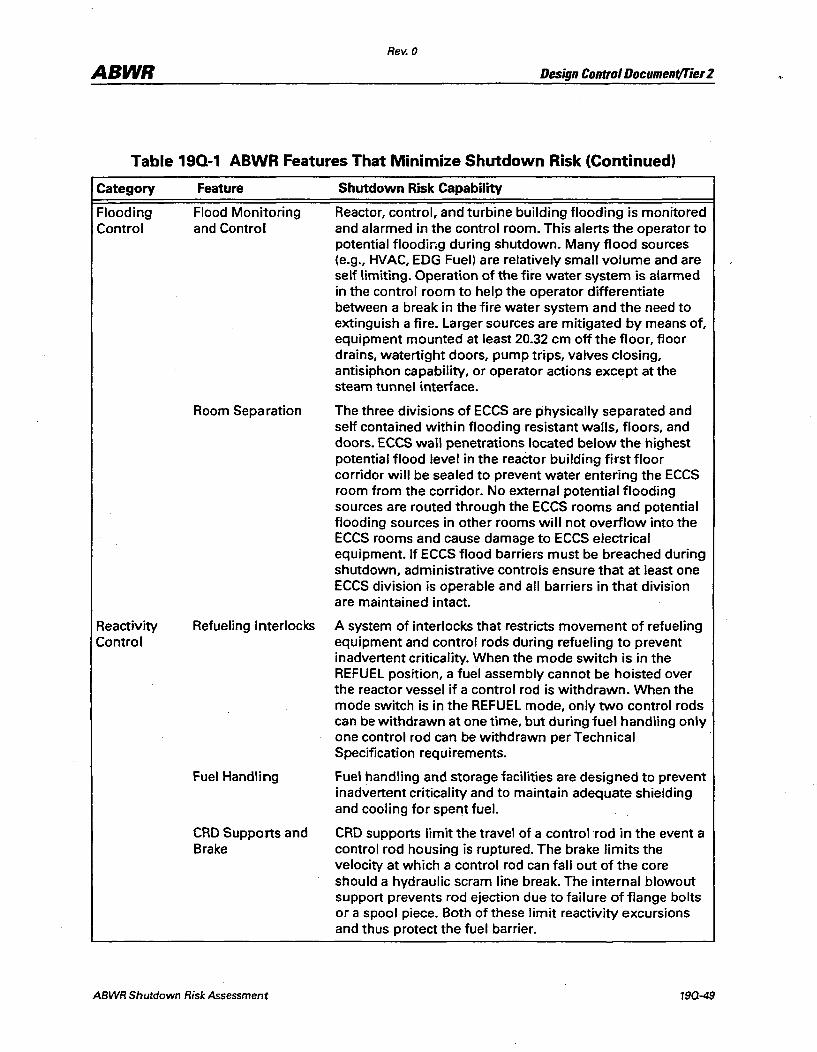
Rev. 0
ABWR Design Control Document/TieT 2
Table 190-1 ABWR Features That Minimize Shutdown Risk (Continued)
Category
Flooding Control
Reactivity Control
Feature
Flood Monitoring and Control
Room Separation
Shutdown Risk Capability
Reactor, control, and turbine building flooding is monitored and alarmed in the control room. This alerts the operator to potential floodir.g during shutdown. Many flood sources (e.g., HVAC, EDG Fuel) are relatively small volume and are self limiting. Operation of the fire water system is alarmed in the control room to help the operator differentiate between a break in the fire water system and the need to extinguish a fire. Larger sources are mitigated by means of, equipment mounted at least 20.32 cm off the floor, floor drains, watertight doors, pump trips, valves closing, antisiphon capability, or operator actions except at the steam tunnel interface.
The three divisions of ECCS are physically separated and self contained within flooding resistant walls, floors, and doors. ECCS wall penetrations located below the highest potential flood level in the reactor building first floor corridor will be sealed to prevent water entering the ECCS room from the corridor. No external potential flooding sources are routed through the ECCS rooms and potential flooding sources in other rooms will not overflow into the ECCS rooms and cause damage to ECCS electrical equipment. If ECCS flood barriers must be breached during shutdown, administrative controls ensure that at least one ECCS division is operable and all barriers in that division are maintained intact.
Refueling Interlocks A system of interlocks that restricts movement of refueling equipment and control rods during refueling to prevent inadvertent criticality. When the mode switch is in the REFUEL position, a fuel assembly cannot be hoisted over the reactor vessel if a control rod is withdrawn. When the mode switch is in the REFUEL mode, only two control rods can be withdrawn at one time, but during fuel handling only one control rod can be withdrawn per Technical Specification requirements.
Fuel Handling Fuel handling and storage facilities are designed to prevent inadvertent criticality and to maintain adequate shielding and cooling for spent fuel.
CRD Supports and Brake
CRD supports limit the travel of a control rod in the event a control rod housing is ruptured. The brake limits the velocity at which a control rod can fall out of the core should a hydraulic scram line break. The internal blowout support prevents rod ejection due to failure of flange bolts or a spool piece. Both of these limit reactivity excursions and thus protect the fuel barrier.
ABWR Shutdown Risk Assessment 190-49
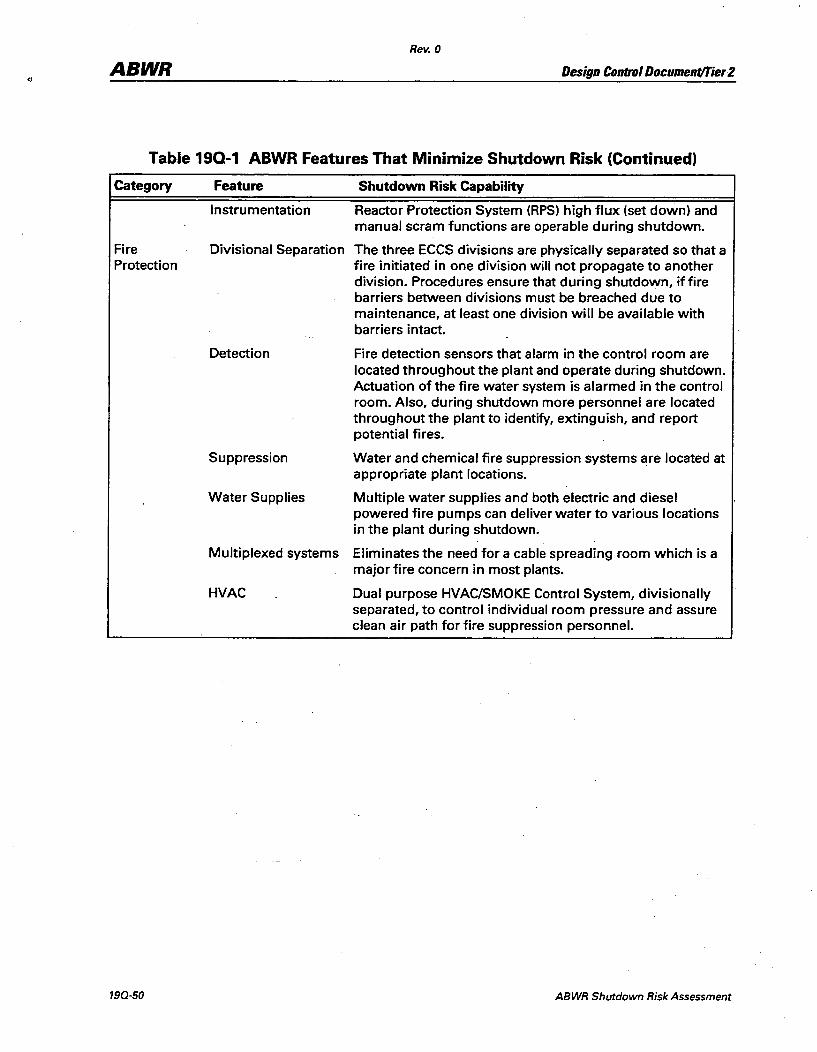
Rev. 0
ABWR Design Control Document/Tier2
Table 190-1 ABWR Features That Minimize Shutdown Risk (Continued)
Category
Fire Protection
190-50
Feature Shutdown Risk Capability
Instrumentation Reactor Protection System (RPS) high flux (set down) and manual scram functions are operable during shutdown.
Divisional Separation The three ECCS divisions are physically separated so that a fire initiated in one division will not propagate to another division. Procedures ensure that during shutdown, if fire barriers between divisions must be breached due to maintenance, at least one division will be available with barriers intact.
Detection
Suppression
Water Supplies
Fire detection sensors that alarm in the control room are located throughout the plant and operate during shutdown. Actuation of the fire water system is alarmed in the control room. Also, during shutdown more personnel are located throughout the plant to identify, extinguish, and report potential fires.
Water and chemical fire suppression systems are located at appropriate plant locations.
Multiple water supplies and both electric and diesel powered fire pumps can deliver water to various locations in the plant during shutdown.
Multiplexed systems Eliminates the need for a cable spreading room which is a major fire concern in most plants.
HVAC Dual purpose HVAC/SMOKE Control System, divisionally separated, to control individual room pressure and assure clean air path for fire suppression personnel.
ABWR Shutdown Risk Assessment
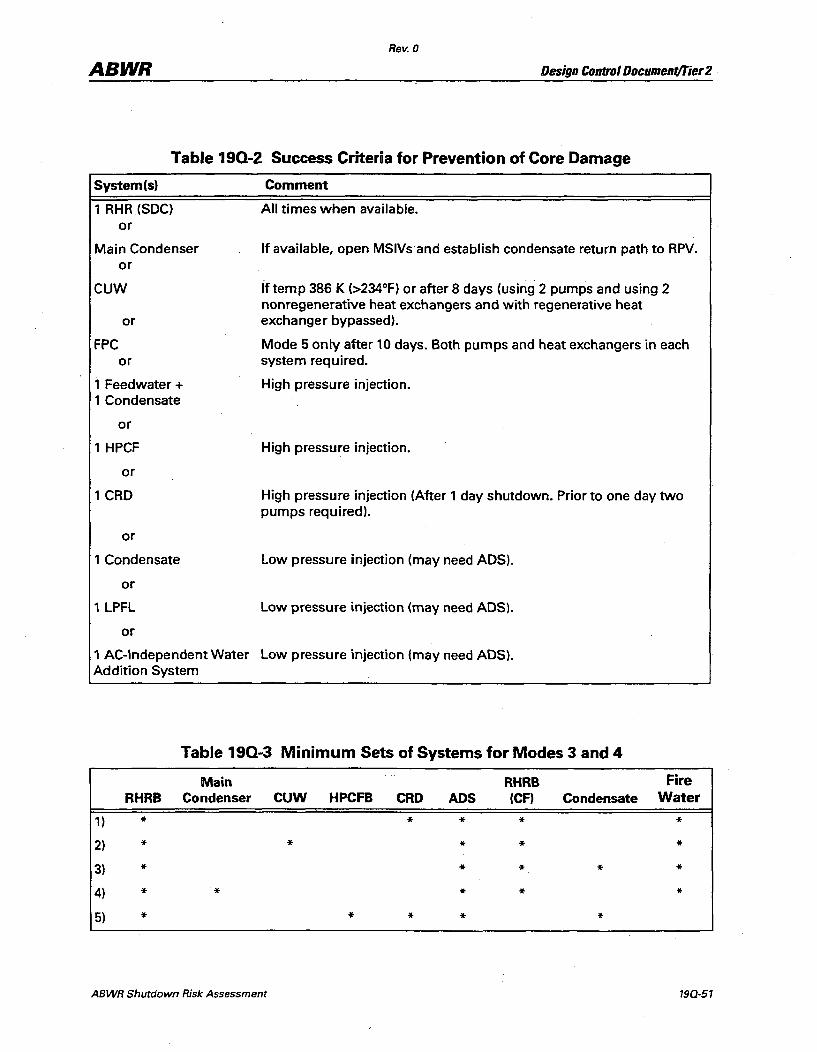
Rev. 0
ABWR Design Control Docomenf/Tier 2
Table 190-2 Success Criteria for Prevention of Core Damage
System(s)
1 RHR (SDC) or
Main Condenser or
CUW
or
FPC or
1 Feedwater + 1 Condensate
or
1 HPCF
or
1 CRD
or
1 Condensate
or
1 LPFL
or
Comment
All times when available.
If available, open MSIVsand establish condensate return path to RPV.
If temp 386 K (>234°F) or after 8 days (using 2 pumps and using 2 nonregenerative heat exchangers and with regenerative heat exchanger bypassed).
Mode 5 only after 10 days. Both pumps and heat exchangers in each system required.
High pressure injection.
High pressure injection.
High pressure injection (After 1 day shutdown. Prior to one day two pumps required).
Low pressure injection (may need ADS).
Low pressure injection (may need ADS).
1 AC-Independent Water Low pressure injection (may need ADS). Addition System
Table 190-3 Minimum Sets of Systems for Modes 3 and 4
Main RHRB Fire RHRB Condenser CUW HPCFB CRD ADS (CF) Condensate Water
1) * * * * * 2) * * * * * 3) * * * * * 4) * '* * * * 5) * * * * *
ABWR Shutdown Risk Assessment 190-51
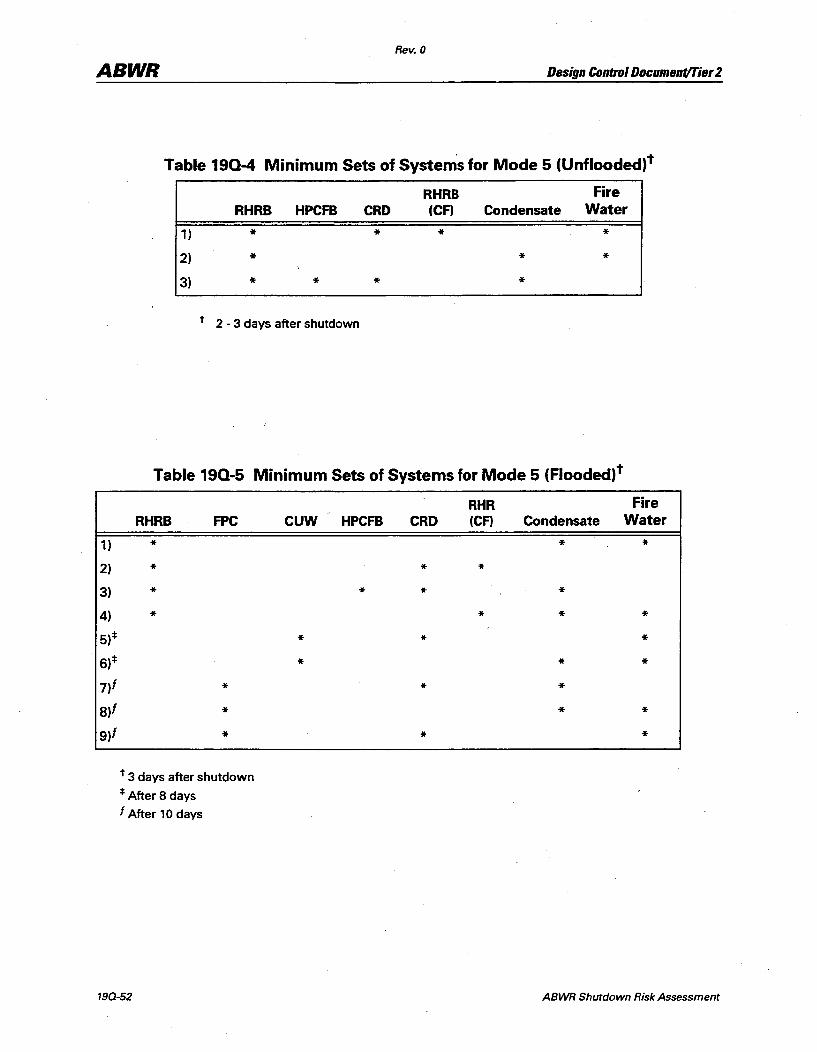
Rev. 0
ABWR Design Control Document/Tier 2
Table 190-4 Minimum Sets of Systems for Mode 5 (Unflooded)t
RHRB Fire RHRB HPCFB CRD (eA Condensate Water
1) * * * * 2) * * * 3) * * * *
t 2 - 3 days after shutdown
Table 190-5 Minimum Sets of Systems for Mode 5 (Flooded)t
RHR Fire RHRB FPC CUW HPCFB CRD (CF) Condensate Water
1) * * * 2) * * * 3) * * * * 4) * * * * 5)* * * * 6)* * * * 7)1 * * * 8)1 * * * 9)1 * * *
t 3 days after shutdown
* After 8 days f After 10 days
190-52 ABWR Shutdown Risk Assessment
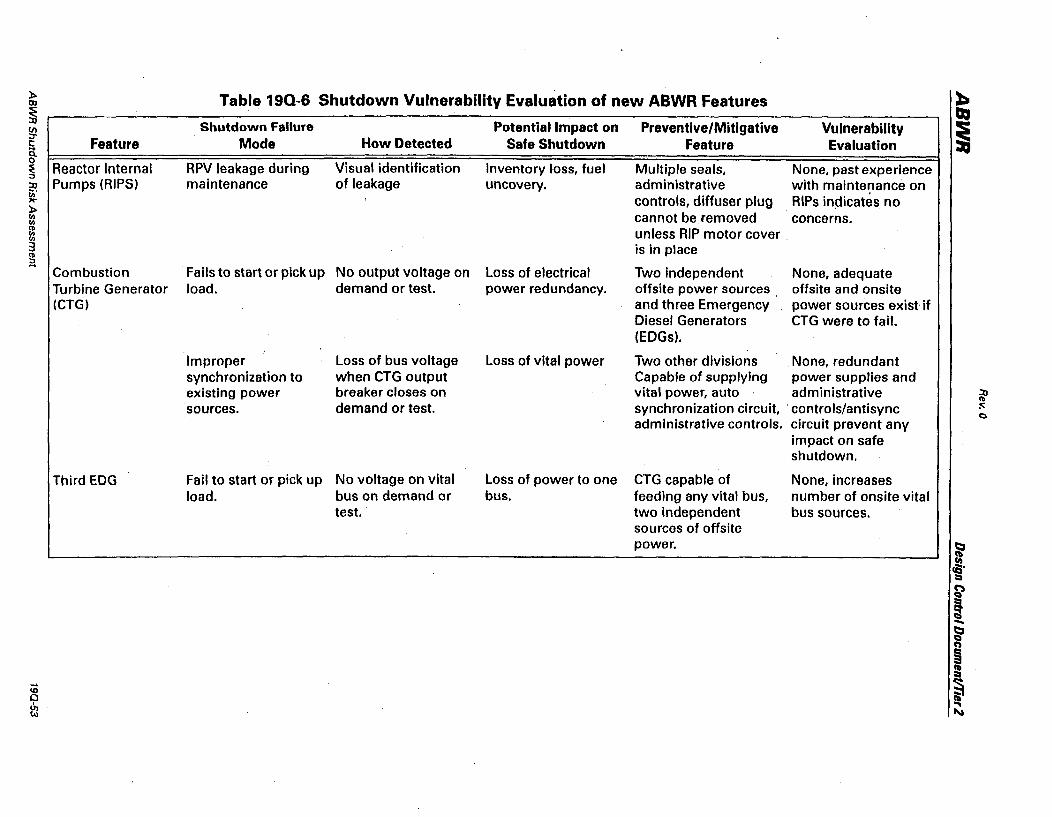
l> Table 19Q-6 Shutdown Vulnerability Evaluation of new ABWR Features )) til
~ ~ (J) Shutdown Failure Potential Impact on Preventive/Mitigative Vulnerability i :J"
Feature Mode How Detected Safe Shutdown Feature Evaluation c: ... Q. 0
Reactor Internal RPV leakage during Visual identification Inventory loss, fuel Multiple seals, None, past experience ~ :ll Pumps (RIPS) maintenance of leakage uncovery. administrative with maintenance on iii' controls, diffuser plug RIPs in.dicates no ,... l> (/I cannot be removed concerns. C/O <1> unless RIP motor cover C/O C/O
3 is in place <1> a
Combustion • Fails to start or pick up No output voltage on Loss of electrical Two independent None, adequate Turbine Generator load. demand or test. power redundancy. offsite power sources, offsite and onsite (CTG) and three Emergency •• power sources exist if
Diesel Generators CTG were to fail. (EDGs).
Improper Loss of bus voltage Loss of vital power Two other divisions . None, redundant synchronization to when CTG output Capable of supplying power supplies and existing power breaker closes on vital power, auto administrative ~ sources. demand or test. synchronization circuit, 'controls/antisync :<:
C)
administrative controls. circuit prevent any impact on safe shutdown.
Third EOG Fail to start or pick up No voltage on vital Loss of power to one CTG capable of None, increases load. bus on demand or bus. feeding any vital bus, number of onsite vital
test. two independent bus sources. sources of offsite power. t:I
= ca· :::i
~
! .... ~ CO)
~
= c:o ~ 0
!!l .. ~
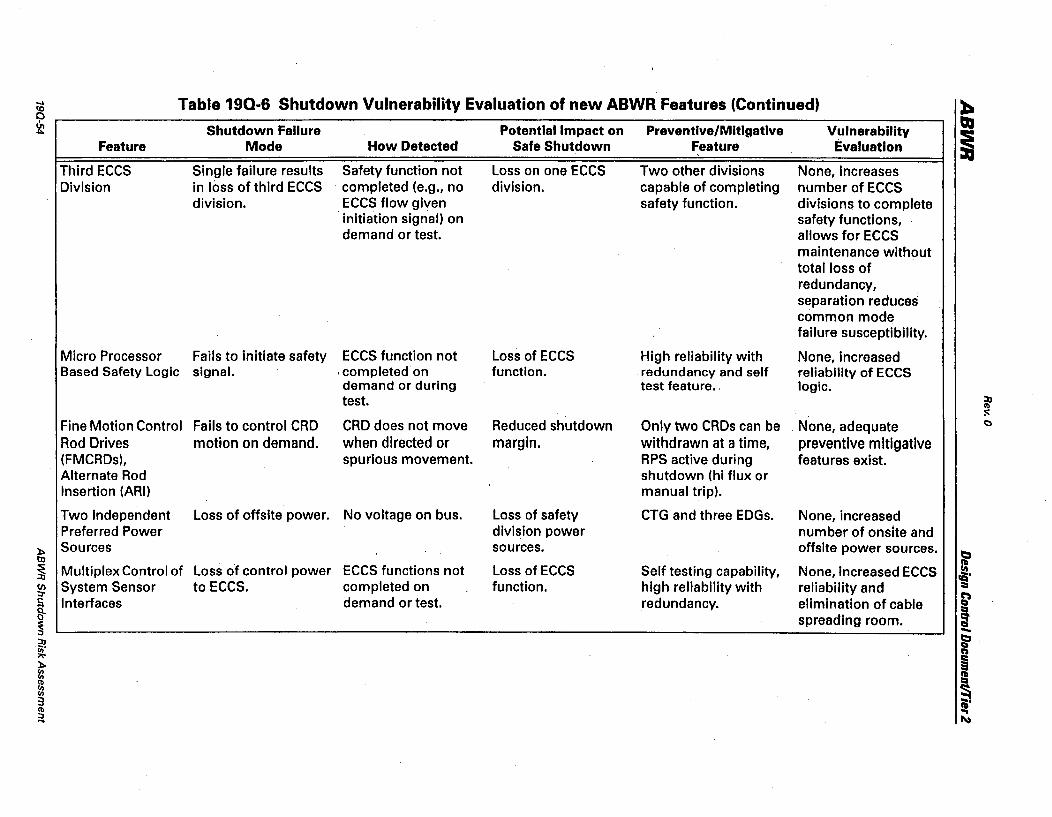
... Table 190·& Shutdown Vulnerability Evaluation of new ABWR Features (Continued) ~ ~
~ Shutdown Failure Potential Impact on Preventive/Mitigative Vulnerability QI
Feature Mode How Detected Safe Shutdown Feature Evaluation I Third ECCS Single failure results Safety function not Loss on one ECCS Two other divisions None, increases Division in loss of third ECCS completed (e.g., no division. capable of completing number of ECCS
division. ECCS flow given safety function. divisions to complete initiation signal) on safety functions, demand or test. allows for ECCS
maintenance without total loss of redundancy, separation reduces common mode failure susceptibility.
Micro Processor Fails to initiate safety ECCS function not Loss of ECCS High reliability with None, increased Based Safety Logic signal. ' completed on function. redundancy and self reliability of ECCS
demand or during test feature. logic. test. ~
CRD does not move :<::
Fine Motion Control Fails to control CRD Reduced shutdown Only two CRDs can be None, adequate C)
Rod Drives motion on demand. when directed or margin. withdrawn at a time, preventive mitigative (FMCRDs), spurious movement. RPS active during features exist. Alternate Rod shutdown (hi flux or Insertion (ARt) manual trip).
Two Independent Loss of offsite power. No voltage on bus. Loss of safety CTG and three EDGs. None, increased Preferred Power division power number of onsite and
~ Sources sources. offsite power sources. e::, t1J
~ ~ Multiplex Control of Loss of control power ECCS functions not Loss of ECCS Self testing capability, None, increased ECCS IQ' til System Sensor to ECCS. completed on function. high reliability with reliability and :II :r
~ ~ Interfaces demand or test. redundancy. elimination of cable
spreading room. i ~ .... ~
b Q n
>I-
~ ~ !:l m Cb
!:l § 3 CII' Cb ... ::J ~ ...
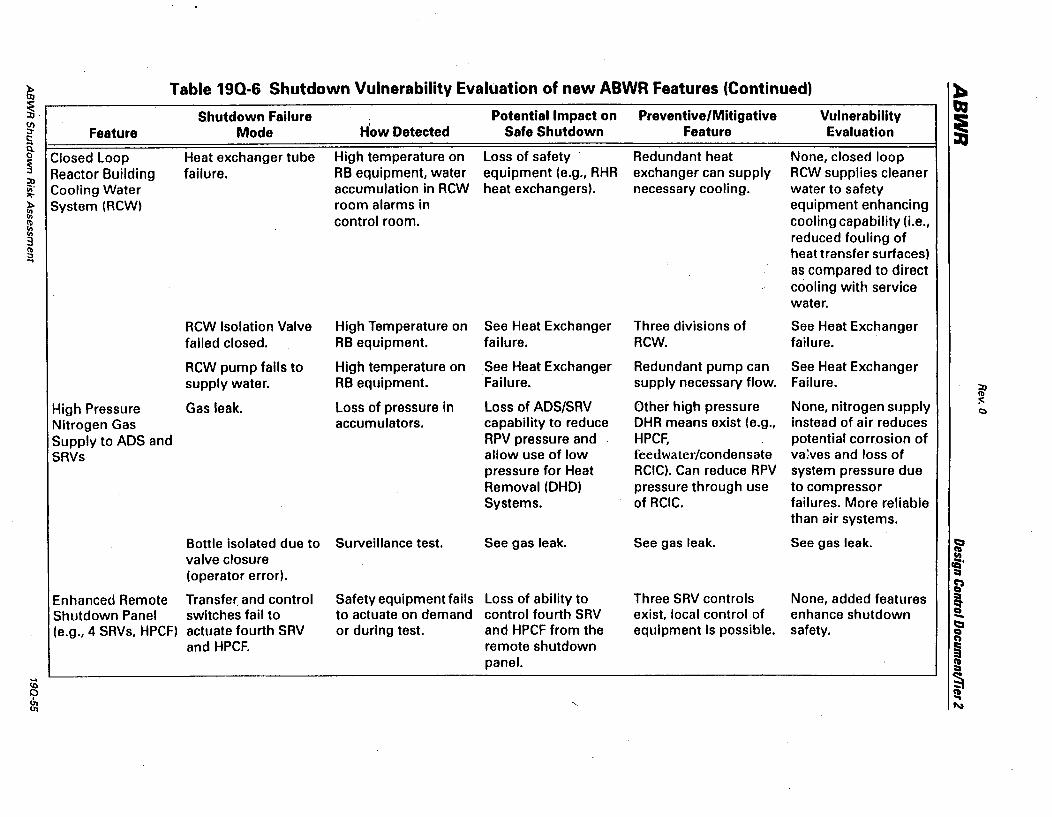
p Table 190-6 Shutdown Vulnerability Evaluation of new ABWR Features (Continued) ~ III
~. Shutdown Failure Potential Impact on Preventive/Mitigative Vulnerability QI
(J')
H'ow Detected i :J- Feature Mode Safe Shutdown Feature Evaluation c: a 0 Closed Loop Heat exchanger tube High temperature on Loss of safety Redundant heat None, closed loop ~ Reactor Building failure. RB equipment, water equipment (e.g., RHR exchanger can supply RCW supplies cleaner ~ Cooling Water accumulation in RCW heat exchangers). necessary cooling. water to safety ~ p System (RCW) room alarms in equipment enhancing !:l III control room. cooling capability (Le., ~ 3 reduced fouling of (1)
heat transfer surfaces) :;, ... as compared to direct cooling with service water.
RCW Isolation Valve High Temperature on See Heat Exchanger Three divisions of See Heat Exchanger failed closed. RB equipment. failure. RCW. failure.
RCW pump fails to High temperature on See Heat Exchanger Redundant pump can See Heat Exchanger supply water. RB equipment. Failure. supply necessary flow. Failure. :r"
(1)
High Pressure Gas leak. Loss of pressure in Loss of ADS/SRV Other high pressure None, nitrogen supply :0:: Q
Nitrogen Gas accumulators. capability to reduce DHR means exist (e.g., instead of air reduces Supply to ADS and RPV pressure and HPCF, potential corrosion of SRVs allow use of low feedwater/condensate va:ves and loss of
pressure for Heat RCIC). Can reduce RPV system pressure due Removal (DHD) pressure through use to compressor Systems. of RCIC. failures. More reliable
than air systems.
Bottle isolated due to Surveillance test. See gas leak. See gas leak. See gas leak. ~
valve closure a cQ'
(operator error). ::a ~
Enhanced Remote Transfer and control Safety equipment fails Loss of ability to Three SRV controls None, added features ! Shutdown Panel switches fail to to actuate on demand control fourth SRV exist, local control of enhance shutdown -(e.g .• 4 SRVs, HPCF) actuate fourth SRV or during test. and HPCF from the equipment is possible. safety. ~ CI
and HPCF. remote shutdown co,
~ panel. III ::a
iO § 0 III
8: ... ~
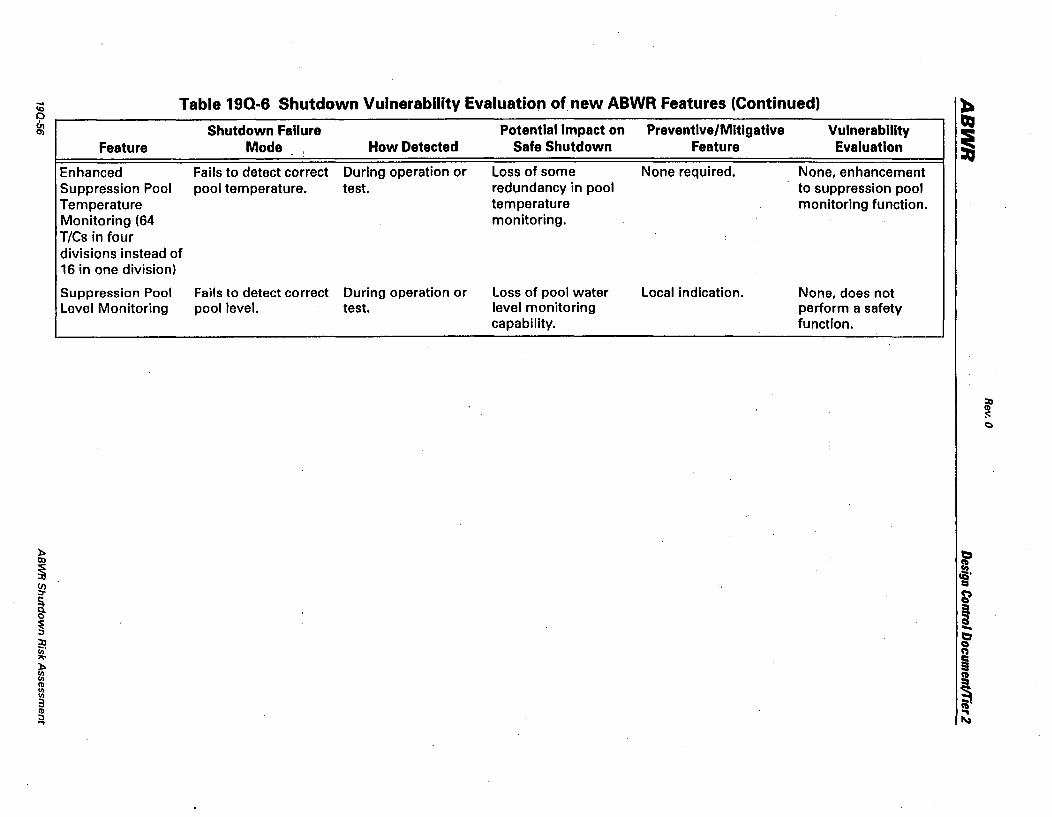
... Table 190·6 Shutdown Vulnerability Evaluation of new ABWR Features (Continued) ~ (Q
~ Shutdown Failure Potential Impact on Preventive/Mitigative Vulnerability ~
i Feature Mode How Detected Safe Shutdown Feature Evaluation
Enhanced Fails to detect correct During operation or Loss of some None required. None, enhancement Suppression Pool pool temperature. test. redundancy in pool to suppression pool Temperature temperature monitoring function. Monitoring (64 monitoring. TICs in four divisions instead of 16 in one division)
Suppression Pool Fails to detect correct During operation or Loss of pool water Local indication. None, does not Level Monitoring pool level. test. level monitoring perform a safety
capability. function.
Rev. 0
ABWR Design Control Document/Tier 2
Figures 190-1 through 190-19 are not part of the DeD (Refer to SSAR)
ABWR Shutdown Risk Assessment 190-57/58
ABWR
Fault Trees
Rev. 0
Design Control Documenf/Tier 2
. Figures 19QA-1a through 19QA-20ck are not part of DeD (Refer to SSAR Figures 19QA-1a through 19QA-20ck).
19QA-1!2
Rev. 0
ABWR Design Control Document/Tier 2
19Q8 DHR Reliability Study
19Q8.1 Offsite Dose and Operator Recovery Calculations
This attachment covers five different calculations that were completed for various aspects of the ABWR Decay Heat Removal Reliability Study. The calculations are:
(1) Offsite doses following RPV boiling in Mode 5
(2) Time to reach RPV boiling for specific plant conditions and decay heat loads
(3) Time for RPV water level to reach top of active fuel (TAF)
(4) Human Reliability Analysis
(5) Decay heat removal capability of CUW and FPC
19Q8.1.1 Offsite Doses
For the ABWR Decay Heat Removal Reliability Study, the success criteria for Mode 5 allows boiling of Water in the RPV or spent fuel pool. The following calculation of offsite doses assuming boiling in the RPV and spent fuel pool substantiates why boiling is a viable success criteria in Mode 5.
The equation for calculating offsite doses is:
Dose = RR * DF* BR * DCF
Dose = Off site dose for 24 hour period (Sv)
RR = Release rate for 24 hours
=
Decay Heat Load Goulelh)* 5.92 (B / 1-131) * 2039 Joule/kg Water q g
0.015 (1-1 31 carryover) *24
DF = Dispersion factor = 1.2x10⁻³ s/m3
BR Breathing rate = 3.47xl04 m3 Is
DCF = Thyroid dose concentration factor = 2.92 x 10⁻⁷ Sv/Bq
The values in the above equation such as 1-131 canyover, 1-131 concentration, and dispersion factor are conservative estimates based on ABWR Tier 2 analysis and regulatory guidance.
Offsite Dose and Operator Recovery Calculations 19Q8-1
ABWR Rev. 0
Design Control Document!Tier 2
The decay heat loads at 3 and 14 days following shutdown are 17.29 x 10⁶ w (5.9 x 10⁷ Btu/h) and 9.378 x 10⁶ w (3.2 x 10⁷ Btu/h), respectively. Using the above equation, the doses for 24 hours at 3 and 14 days are 7.5 x 10⁻⁶ and 4.04 x 10⁻⁶ Sv, respectively. This is significantly below the FEMA limit of 0.05 Sv per 24 hours for normal plant operations. Thus boiling in Mode 5 will not exceed any offsite dose limits and is a viable success criteria.
1908.2 Time to Reach 80iling
The time for an operator to recover a failed RHR system in the ABWR Decay Heat Reliability Study is conservatively based on the time to boiling in the RPV or the spent fuel pool. The following discussion addresses the calculation of time to boiling for the RPV and RPV plus spent fuel pool at various times after shutdown.
It is assumed that the initial -temperature of the RPV or spent fuel pool is 333.15 K (140°F). This is typical for normal Mode 4 or 5 operation.
The equation for time to boiling is:
t = [.~T Iheat up rate (OKlh) ]
t = 373.15°K-333.15°K (Decay Heat Rate/Mass of Water)
Table 19QB-l shows the results for time to boiling for the RPV alone at 2 and 3 days following shutdown and for the RPV plus spent fuel pool (i.e., reactor cavity flooded and fuel pool gates opened) at 3 and 14 days. As can be seen, the time for operator action varies from a little over an hour for the RPV alone to approximately one day for the RPV plus spent fuel pool 14 days after shutdown.
1908.3 Time for RPV Water Level to Reach Top of Active Fuel
This subsection summarizes the calculations for the time to reach top of active fuel in Modes 3, 4, and 5. The results show it will take 6.4 hours in Mode 3, 13 hours in Mode 5, 15 hours in the early part of Mode 5 before flooding of the cavity, and more than a week after cavity flooding in Mode 5. Assuming that it takes 9.76x 10⁵ joules (925 BTU) to vaporize 0.4536 kg (1 lb) of water, the decay heat ata specific time is divided by 9.76 x 10⁵ joules to find the rate of vaporization. Division of water mass by this vaporization rate results in the time for RPV water level to reach TAF. Table 19QB-2 shows the results.
1908.4 Human Reliability Analysis (HRA)
19Q8.4.1 Purpose
19Q8-2
The purpose of this HRA is to calculate the human error probabilities (HEPs) for the decay heat removal reliability study.
Time to Reach 80iling
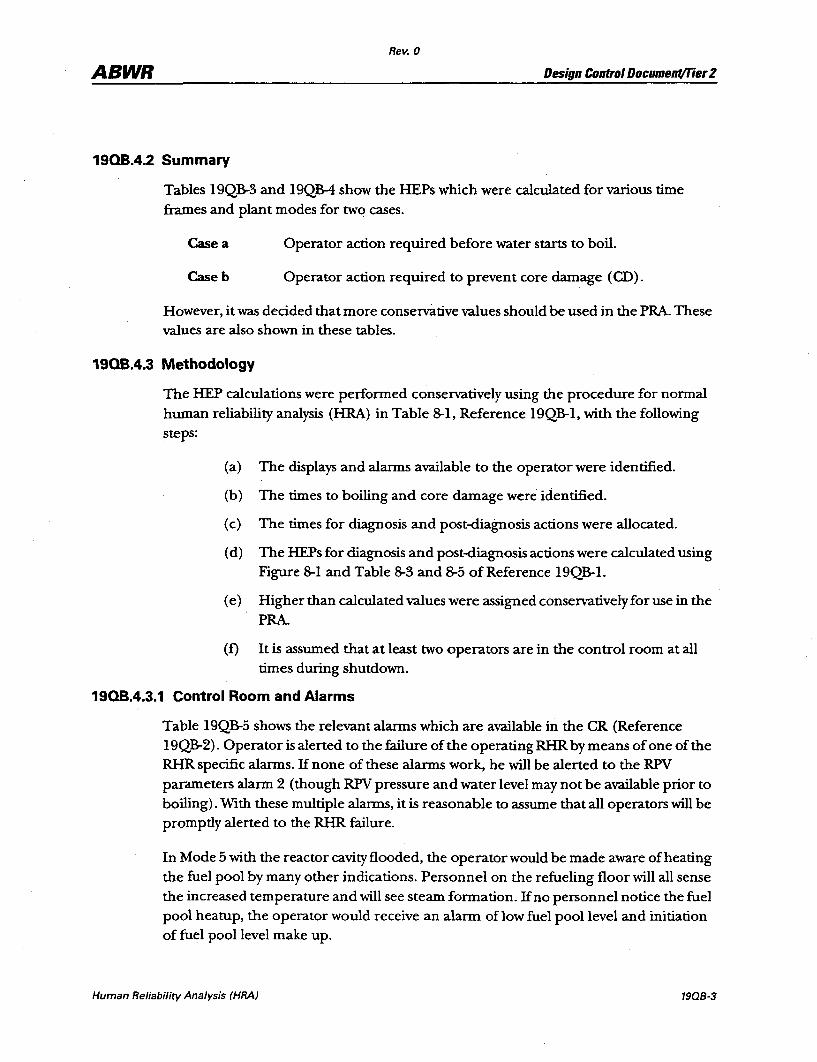
Rev. 0
ABWR Design Control Document/Tier 2
19Q8.4.2 Summary
Tables 19QB-3 and 19QB-4 show the HEPs which were calculated for various time frames and plant modes for two cases.
Case a Operator action required before water starts to boil.
Caseb Operator action required to prevent core damage (CD).
However, it was decided that more conservative values should be used in the PRA. These values are also shown in these tables.
1908.4.3 Methodology
The HEP calculations were performed conservatively using the procedure for normal human reliability analysis (HRA) in Table 8-1, Reference 19QB-1, with the following steps:
(a)
(b)
(c)
(d)
(e)
(f)
The displays and alarms available to the operator were identified.
The times to boiling and core damage were identified.
The times for diagnosis and post-diagnosis actions were allocated.
The HEPs for diagnosis and post-diagnosis actions were calculated using Figure 8-1 and Table 8-3 and 8-5 of Reference 19QB-1.
Higher than calculated values were assigned conservatively for use in the PRA.
It is assumed that at least two operators are in the control room at all times during shutdown.
1908.4.3.1 Control Room and Alarms
Table 19QB-5 shows the relevant alarms which are available in the CR (Reference 19QB-2). Operator is alerted to the failure of the operating RHR by means of one of the RHR specific alarms. If none of these alarms work, he will be alerted to the RPV parameters alarm 2 (though RPV pressure and water level may not be available prior to boiling) . 'With these multiple alarms, it is reasonable to assume that all operators will be promptly alerted to the RHR failure.
In Mode 5 with the reactor cavity flooded, the operator would be made aware of heating the fuel pool by many other indications. Personnel on the refueling floor will all sense the increased temperature and will see steam formation. If no personnel notice the fuel pool heatup, the operator would receive an alarm of low fuel pool level and initiation of fuel pool level make up.
Human Reliability Analysis (HRA) 1908-3

Rev. 0
ABWR Design Control Documentllier 2
1908.4.3.2 Allocation of Times to Diagnosis and Post-Diagnosis Actions
The time available to the operators was allocated between time for diagnosis and time for post-diagnosis action. Table 19QB-6 shows the various times which were to calculate the HEPs. Column three gives the calculated times before boiling (case a), and core damage (case b), or the total time available for allocation. Columns 4 and 5 show the results of the allocation. Enough time is allocated to post-diagnostic actions, so that there is sufficient time for recovery of human errors, even if the required action must take place outside the control room.
19Q8.4.4 Results and Conclusions
The results of this lIRA study are documented in Tables 19QB-3 and 19QB-4. It is concluded that the operator has adequate instrumentation and alarms to diagnose the event. Adequate procedures and operator training will assure proper response to the loss ofRHR event.
1908.5 Decay Heat Removal Capability of CUW and FPC
The purpose of the following heat removal calculations is to determine heat removal capabilities of FPC and CUW after flooding the cavity as a function of time following shutdown. In Modes 3 and 4, FPC cannot be used but CUW is able to remove the decay heat because of increased capacity at higher temperatures. The results show that the CUW System alone is capable of removing the decay heat 8 days after shutdown because it keeps the RPV temperature below 373 K (212°F) within 24 h. The FPC System can be used 10 days after shutdown to keep the temperature below 339 K (150°F), which is the design limit for the FPC pumps. To perform these calculations, initial RPV temperatures of 333 K (140°F) and 325 K (125°F) were assumed for the CUW and the FPC, respectively an initial temperature of 333 K (l40°F) and 325 K (l25°F) was assumed for the CUW to account for the time that it takes to initiate the CUW System manually, because one FPC pump is working all the time, it takes a negligible amount of time to initiate the second pump.
1908.6 References
19Q8-4
19QB-1 Swain, A.D., "Accident Sequence Evaluation Program Human Reliability Analysis Procedure", Sandia National Laboratories, NUREG /CR-4772, u.S. Nuclear Regulatory Commission, Washington, D.C., February 1987.
19QB-2 Interlock Block Diagram,IBD, 137C8326, Sh. 18, Rev. 2.
Decay Heat Removal Capability of CUW and FPC
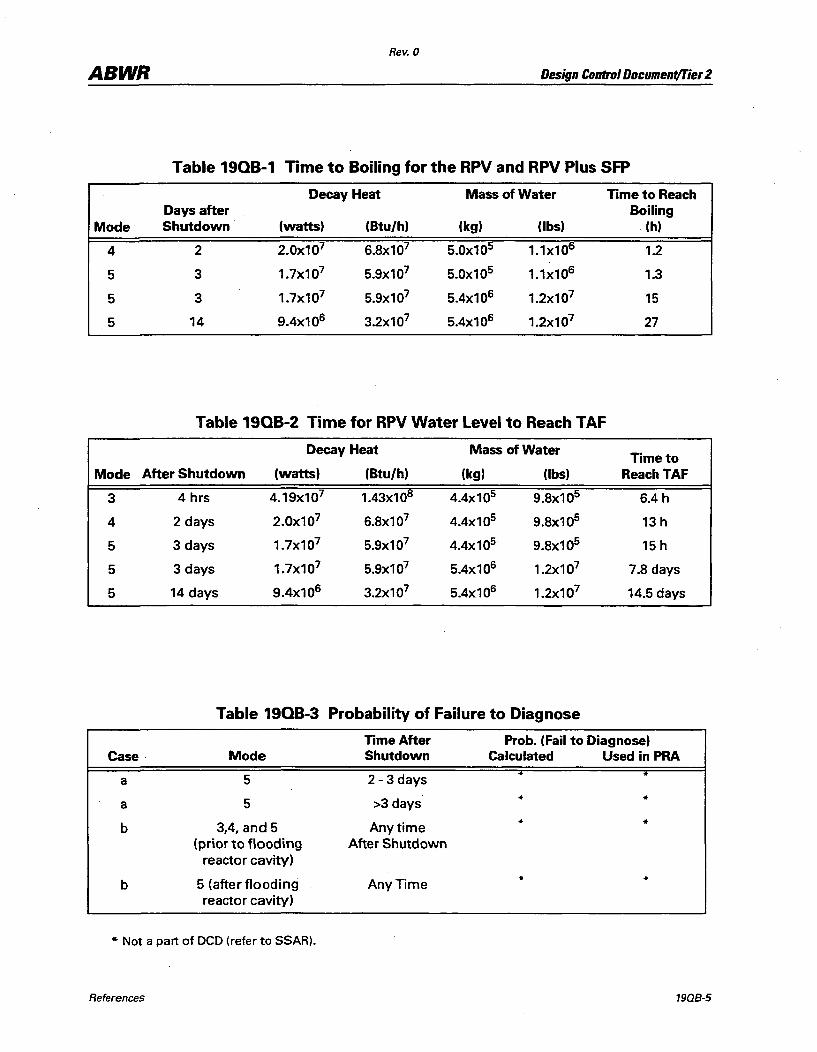
Rev. 0
ABWR Design Control Document/Tier2
Table 19Q8-1 Time to 80iling for the RPV and RPV Plus SFP
Decay Heat Mass of Water Time to Reach Days after Boiling
Mode· Shutdown (watts) (Btu/h) (kg) (lbs) . (h)
4 2 2.0x10⁷ 6.8x10⁷ 5.0x10⁵ 1.1x10⁶ 1.2
5 3 1.7x10⁷ 5.9x10⁷ 5.0x10⁵ 1.1x10⁶ 1.3
5 3 1.7x10⁷ 5.9x10⁷ 5.4x10⁶ 1.2x10⁷ 15
5 14 9.4x10⁶ 3.2x10⁷ 5.4x10⁶ 1.2x10⁷ 27
Table 19Q8-2 Time for RPV Water Level to Reach TAF
Decay Heat Mass of Water Time to
Mode After Shutdown (watts) (Btu/h) (kg) nbs) Reach TAF
3 4 hrs 4.19x10⁷ 1.43x10⁸ 4.4x10⁵ 9.8x10⁵ 6.4 h
4 2 days 2.0x10⁷ 6.8x10⁷ 4.4x10⁵ 9.8x10⁵ 13 h
5 3 days 1.7x10⁷ 5.9x10⁷ 4.4x10⁵ 9.8x10⁵ 15 h
5 3 days 1.7x10⁷ 5.9x10⁷ 5.4x10⁶ 1.2x10⁷ 7.8 days
5 14 days 9.4x10⁶ 3.2x10⁷ 5.4x10⁶ 1.2x10⁷ 14.5 days
Table 19Q8-3 ProbabOlity of Failure to Diagnose
Case·
a
a
b
b
Mode
5
5
3,4, and 5 (prior to flooding
reactor cavity)
5 (after flooding reactor cavity)
* Not a part of DeD (refer to SSAR).
References
Time After Shutdown
2 - 3 days
>3 days
Anytime After Shutdown
AnyTime
Prob. (Fail to Diagnose) Calculated Used in PRA
*
* *
* *
* *
19Q8-5
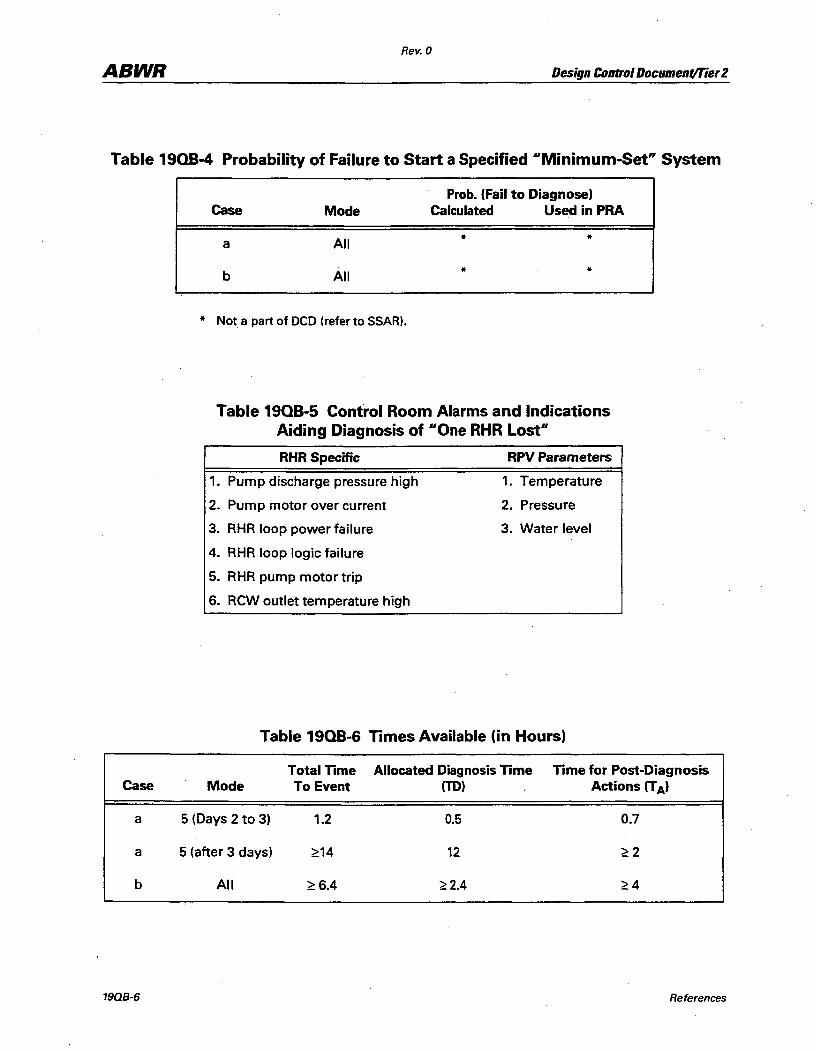
Rev. 0
ABWR Design Control Document/Tier 2
Table 1908-4 Probability of Failure to Start a Specified uMinimum-Set" System
Case
a
a
b
19Q8-6
Prob. (Fail to Diagnose) Case Mode Calculated Used in PRA
a All * *
b All * *
* Not a part of OeD (refer to SSAR).
Table 1908-5 Control Room Alarms and Indications Aiding Diagnosis of uOne RHR LostU
RHR Specific RPV Parameters
1. Pump discharge pressure high 1. Temperature
2. Pump motor over current 2. Pressure
3. RHR loop power failure 3. Water level
4. RHR loop logic failure
5. RHR pump motor trip
6. RCW outlet temperature high
Table 19Q8-6 Times Available (in Hours)
Total Time Allocated Diagnosis Time Time for Post-Diagnosis Mode To Event (TO) Actions (T A)
5 (Days 2 to 3) 1.2 0.5 O~7
5 (after 3 days) ~14 12 ~2
All ~ 6.4 ~2.4 ~4
References
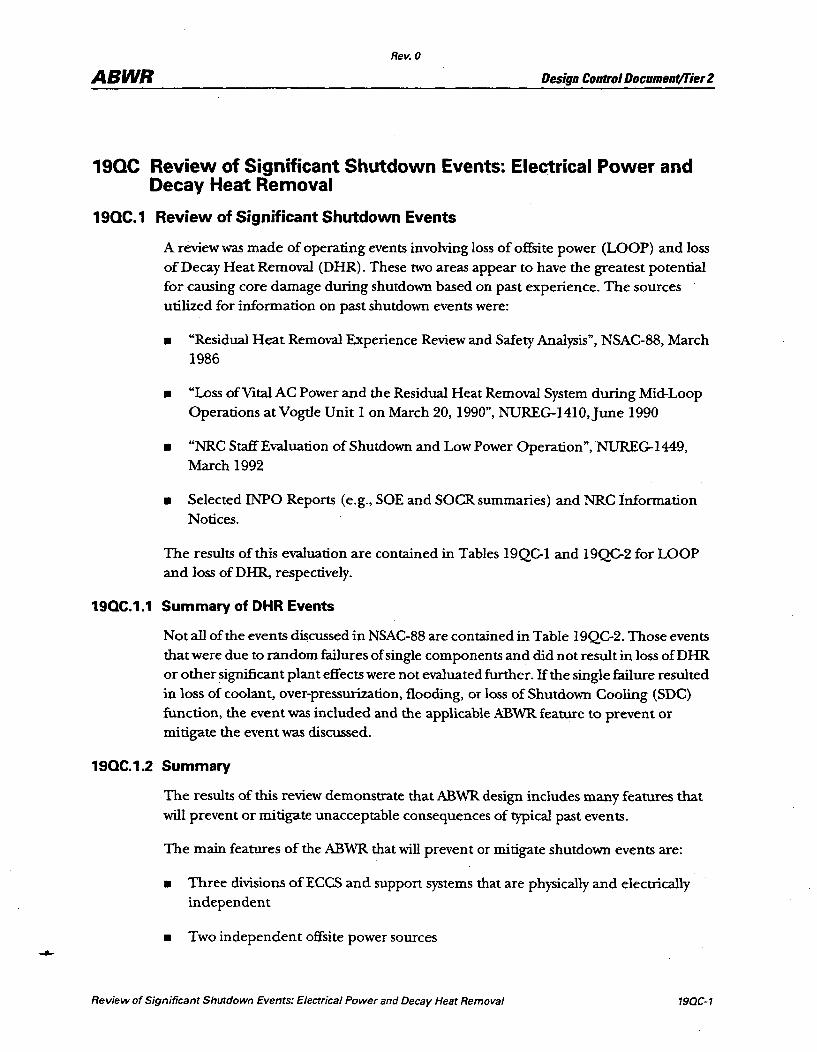
Rev. 0
ABWR Design Control Document/Tier Z
19QC Review of Significant Shutdown Events: Electrical Power and Decay Heat Removal
19QC.1 Review of Significant Shutdown Events
A review was made of operating events involving loss of offsite power (LOOP) and loss of Decay Heat Removal (DHR). These two areas appear to have the greatest potential for causing core damage during shutdown based on past experience. The sources utilized for information on past shutdown events were:
• "Residual Heat Removal Experience Review and Safety Analysis", NSAC-88, March 1986
• "Loss of Vital AC Power and the Residual Heat Removal System during Mid-Loop Operations atVogtle Unit Ion March 20,1990", NUREG-1410,june 1990
• "NRC Staff Evaluation of Shutdown and Low Power Operation", NUREG-I449, March 1992
• Selected INPO Reports (e.g., SOE and SOCRsummaries) and NRC information Notices.
The results of this evaluation are contained in Tables 19QC-I and 19QC2 for LOOP and loss of DHR, respectively.
19QC.1.1 Summary of DHR Events
Not all of the events discussed in NSAC-88 are contained in Table 19QC-2. Those events that were due to random failures of single components and did not result in loss ofDHR or other significant plant effects were not evaluated further. If the single failure resulted in loss of coolant, over-pressurization, flooding, or loss of Shutdown Cooling (SDC) function, the event was included and the applicable ABWR feature to prevent or mitigate the event was discussed.
19QC.1.2 Summary
The results of this review demonstrate that ABWR design includes many features that will prevent or mitigate unacceptable consequences of typical past events.
The main features of the ABWR that will prevent or mitigate shutdown events are:
• Three divisions of ECCS and support systems that are physically and electrically independent
• Two independent offsite power sources
Review of Significant Shutdown Events: Electrical Power and Decay Heat Removal 19QC-1
Rev. 0
ABWROesign Control Oocument/Tier 2
• Four onsite power sources (three emergency diesel generators and one combustion turbine generator)
• Plant configuration to minimize common mode failures due to fire and floods
• Appropriate Technical Specifications and administrative controls to ensure availability of systems during periods of potentially high risk operations
• Several alternate means of DHR if normal systems were to fail or be out of seIVice for maintenance
• Instrumentation availability during shutdown to monitor plant safety status and initiate safety systems when needed
19QC-2 Review of Significant Shutdown Events: Electrical Power and Decay Heat Removal
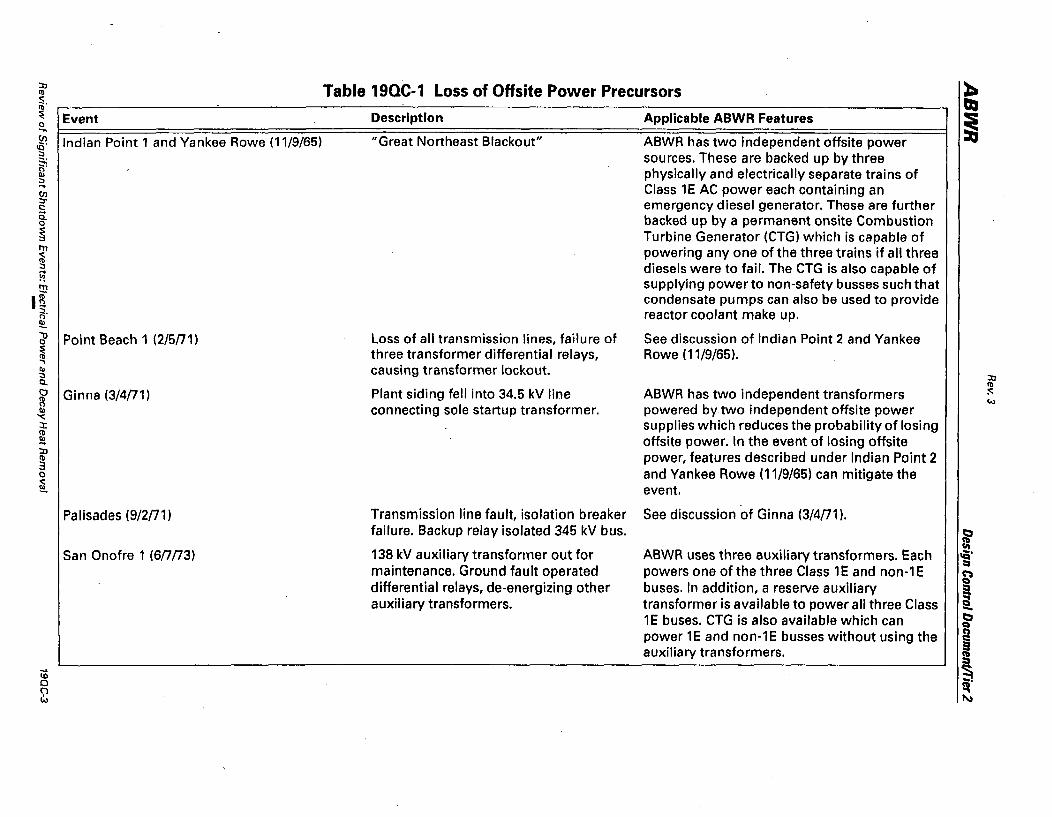
::0 Table 19QC·1 Loss of Offsite Power Precursors ~ en S, ~ en ~ Event Description Applicable ABWR Features I 0 .... (f) Indian Point 1 and Yankee Rowe (11/9/65) "Great Northeast Blackout" ABWR has two independent offsite power <ii' ~ sources. These are backed up by three ~ Il> physically and electrically separate trains of :a Class 1E AC power each containing an (f) ::l" emergency diesel generator. These are further c:: Q. backed up by a permanent onsite Combustion 0
~ Turbine Generator (CTG) which is capable of rn powering anyone of the three trains if all three '<: en ~ diesels were to fail. The CTG is also capable of ~ !!! supplying power to non-safety busses such that
I~ condensate pumps can also be used to provide ~. reactor coolant make up. !!!. 1] Point Beach 1 (2/5nn Loss of all transmission lines, failure of See discussion of Indian Point 2 and Yankee 0
~ three transformer differential relays, Rowe (11/9/65) . .., Il> causing transformer lockout. ~ ::0 Q. en 0 Ginna (3/4/71) Plant siding fell into 34.5 kV line ABWR has two independent transformers :=: en
"" 0 connecting sole startup transformer. powered by two independent offsite power Il>
'<: :J: supplies which reduces the probability of losing en ~ offsite power. In the event of lOSing offsite ::0
power, features described under Indian Point 2 en 3 0 and Yankee Rowe (11/9/65) can mitigate the ~ event.
Palisades (9/2{71) Transmission line fault, isolation breaker See discussion of Ginna (3/4{71). failure. Backup relay isolated 345 kV bus.
~ San Onofre 1 (6/7/73) 138 kV auxiliary transformer out for ABWR uses three auxiliary transformers. Each IQ'
maintenance. Ground fault operated powers one of the three Class 1 E and non-1 E = ~
differential relays, de-energizing other buses. In addition, a reserve auxiliary ~ auxiliary transformers. transformer is available to power all three Class 5!.
1E buses. CTG is also available which can t:I Q
power 1E and non-1E busses without using the n ~ auxiliary transformers.
~ iD 0 ~ 2 ~
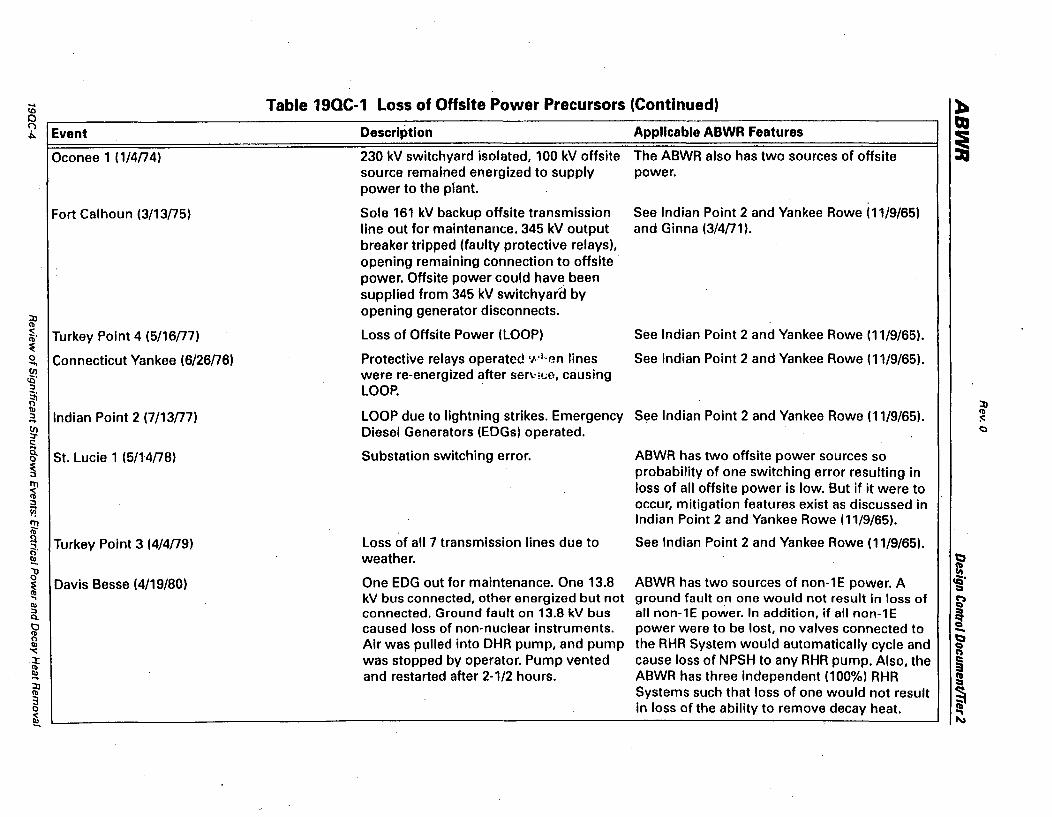
... Table 19QC-1 Loss of Offsite Power Precursors (Continued) ):. co 0 QI C')
Event Description Applicable ABWR Features i,.
I Oconee 1 (1/4/74) 230 kV switchyard isolated, 100 kV offsite The ABWR also has two sources of offsite source remained energized to supply power. power to the plant.
Fort Calhoun (3/13/75) Sale 161 kV backup offsite transmission See Indian Point 2 and Yankee Rowe (11/9/65) line out for maintenance. 345 kV output and Ginna (3/4/71). breaker tripped (faulty protective relays), opening remaining connection to offsite power. Offsite power could have been supplied from 345 kV switchyarCt by
::n opening generator disconnects. <II < Turkey Point 4 (5/16/77) Loss of Offsite Power (LOOP) See Indian Point 2 and Yankee Rowe (11/9/65). ib' ~ 0 Connecticut Yankee (6/26/76) Protective relays operated ,~·i.r!n lines See Indian Point 2 and Yankee Rowe (11/9/65). .... C/) were re-energized after serv;(;o, causing cQ' :) LOOP. ~ 0 ::0 II) :) Indian Point 2 (7/13/77) LOOP due to lightning strikes. Emergency See Indian Point 2 and Yankee Rowe (11/9/65). (1) ... :0:: C/) Diesel Generators (EDGs) operated. (:) :T c:: ... Q, St. Lucie 1 (5/14/78) Substation switching error. ABWR has two offsite power sources so 0
~ probability of one switching error resulting in ITt loss of all offsite power is low. But if it were to ;§ :) occur, mitigation features exist as discussed in Y! ~
Indian Point 2 and Yankee Rowe (11/9/65).
~, Turkey Point 3 (4/4/79) Loss of all 7 transmission lines due to See Indian Point 2 and Yankee Rowe (11/9/65). ~ weather. t:J a' a ~ Davis Besse (4/19/80) One EDG out for maintenance. One 13.8 ABWR has two sources of non-1E power. A cQ'
:::I .... kV bus connected, other energized but not ground fault on one would not result in loss of ~ III :) connected. Ground fault on 13.8 kV bus all non-1E power. In addition, if all non-1E ~ Q,
\;) caused loss of non-nuclear instruments. power were to be lost, no valves connected to <II -~ Air was pulled into DHR pump, and pump the RHR System would automatically cycle and t:t Q
'< n ~ was stopped by operator. Pump vented cause loss of NPSH to any RHR pump. Also, the ~ <II
~ and restarted after 2-1/2 hours. ABWR has three independent (100%) RHR CD ::n :::a <II Systems such that loss of one would not result ~ 3 0 in loss of the ability to remove decay heat. ~
... ~
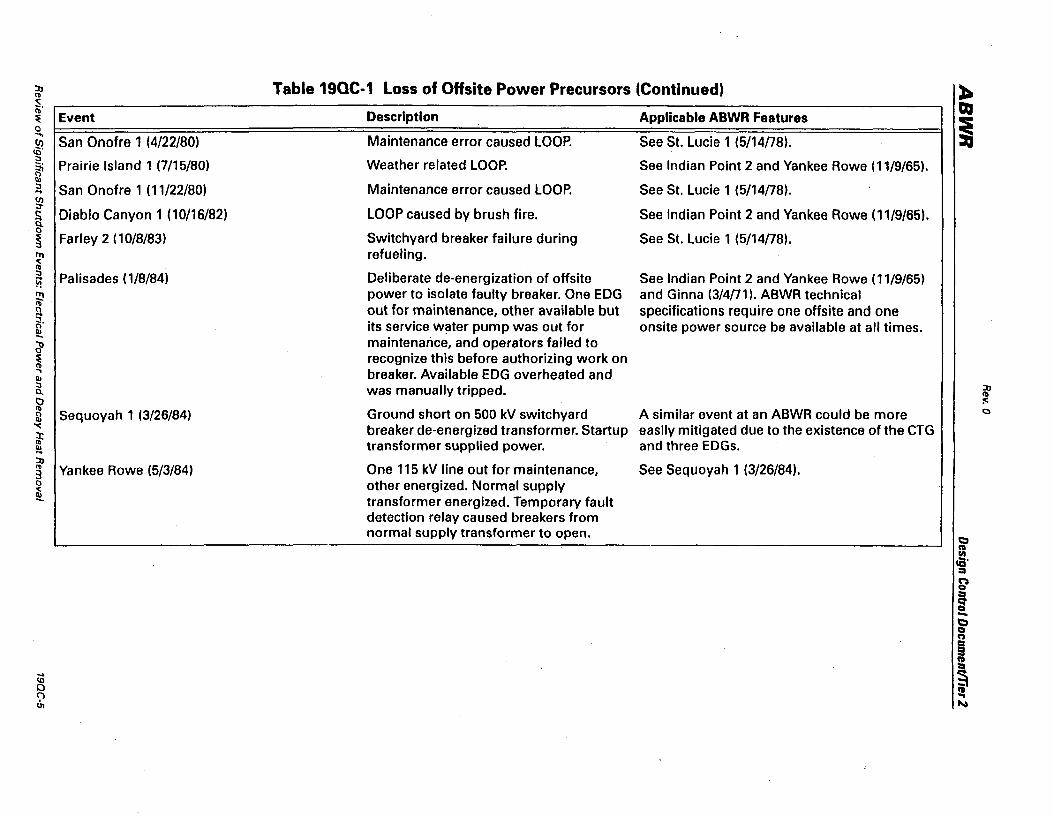
::n 11> '<: (b'
Event ~ 0 .....
San Onofre 1 (4/22/80) (f) cQ' ::J
Prairie Island 1 (7/15/80) ~ \I) :::J San Onofre 1 (11/22/80) ... U) ::r
Diablo Canyon 1 (10/16/82) ~ CI. 0
~ Farley 2 (10/8/83) ",
~ :::J Palisades (1/8/84) ~
~ ~ ~, ~
d' ~ ., III :::J CI. I;) 11>
Sequoyah 1 (3/26/84) &l '<: :r:: 11>
'" ... ::n 11> Yankee Rowe (5/3/84) 3 0
!
Table 19QC-1 loss of Offsite Power Precursors (Continued)
Description
Maintenance error caused LOOP.
Weather related LOOP.
Maintenance error caused LOOP.
LOOP caused by brush fire.
Switchyard breaker failure during refueling.
Deliberate de-energization of offsite power to isolate faulty breaker. One EDG out for maintenance, other available but its service water pump was out for maintenance, and operators failed to recognize this before authorizing work on breaker. AvailableEDG overheated and was manually tripped.
Applicable ABWR Features
See St. Lucie 1 (5/14n8).
See Indian Point 2 and Yankee Rowe (11/9/65).
See St. Lucie 1 (5/14/78) .
See Indian Point 2 and Yankee Rowe (11{9{65).
See St. Lucie 1 (5/14/78).
See Indian Point 2 and Yankee Rowe (11/9/65) and Ginna (3/4/71). ABWR technical specifications require one offsite and one onsite power source be available at all times.
Ground short on 500 kV switchyard A similar event at an ABWR could be more breaker de-energized transformer. Startup easily mitigated due to the existence of the eTG transformer supplied power. and three EOGs.
One 115 kV line out for maintenance, other energized. Normal supply transformer energized. Temporary fault detection relay caused breakers from normal supply transformer to open.
See Sequoyah 1 (3/26/84).
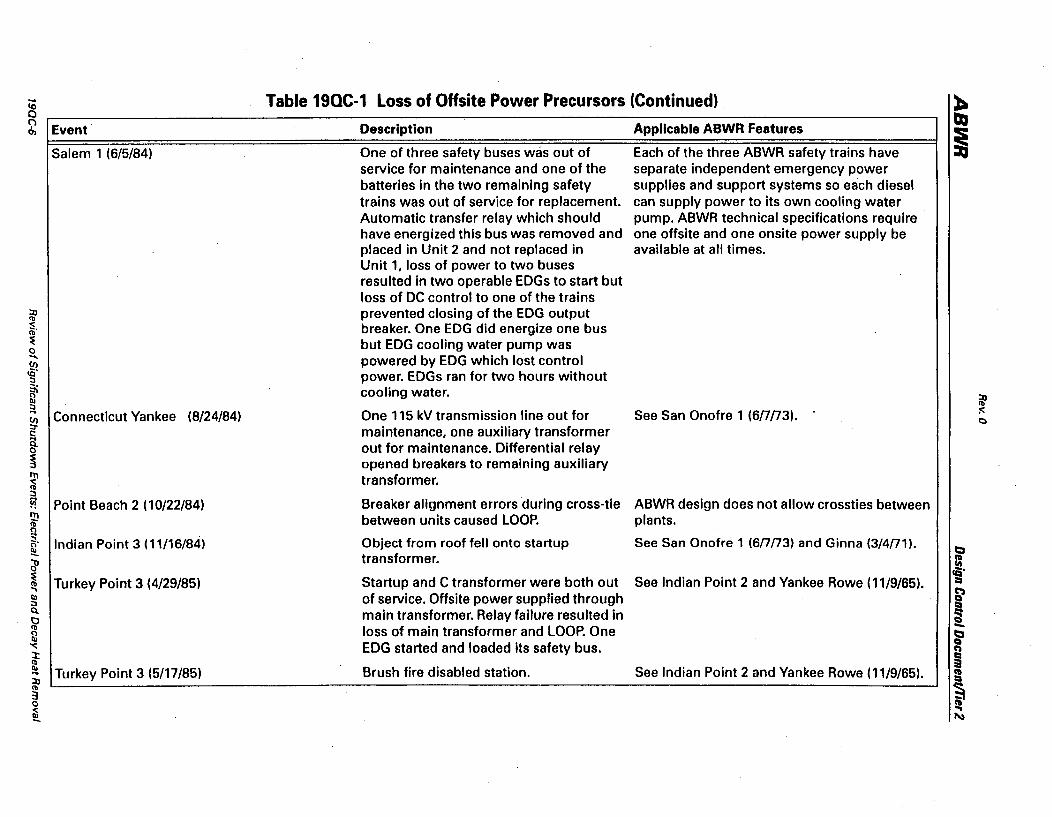
... Table 19QC-1 Loss of Offsite Power Precursors (Continued) :b ~ 0
~ \l Event Description Applicable ABWR Features Ol
~ Salem 1 (6/5/84) One of three safety buses was out of Each of the three ABWR safety trains have service for maintenance and one of the separate independent emergency power batteries in the two remaining safety supplies and support systems so each diesel trains was out of service for replacement. can supply power to its own cooling water Automatic transfer relay which should pump. ABWR technical specifications require have energized this bus was removed and one offsite and one onsite power supply be placed in Unit 2 and not replaced in available at all times. Unit 1, loss of power to two buses resulted in two operable EDGs to start but loss of DC control to one of the trains
::0 prevented closing of the EDG output <b
~, breaker. One EDG did energize one bus ~ but EDG cooling water pump was 0 .... powered by EDG which lost control fJ) !E' power. EDGs ran for two hours without :;,
~ cooling water. ::0 cu <b :;, :c: ... Connecticut Yankee (8/24/84) One 115 kV transmission line out for See San Onofre 1 (6nn3) . fJ) C) ::r maintenance, one auxiliary transformer c: a out for maintenance. Differential relay 0
~ opened breakers to remaining auxiliary 11'1 transformer. ~ :;,
!11 Point Beach 2 (10/22/84) Breaker alignment errors during cross-tie ABWR design does not allow crossties between ~ between units caused LOOP. plants. 0
[ Indian Point 3 (11/16/84) Object from roof fell onto startup See San Onofre 1 (6nn3) and Ginna (3I4n1). ~
clJ transformer. = ~ Startup and C transformer were both out See Indian Point 2 and Yankee Rowe (11/9/65).
IQ' Turkey Point 3 (4/29/85) l:I .,
~ cu of service. Offsite power supplied through :;,
~ Q. main transformer. Relay failure resulted in tJ <b loss of main transformer and LOOP. One -0 i' cu
'or:: EDG started and loaded its safety bus. e') :x: ~ <b cu Turkey Point 3 (5/17/85) Brush fire disabled station. See Indian Point 2 and Yankee Rowe (11/9/65). ... CD
::0 l:I <b
~ 3 0
~ ~
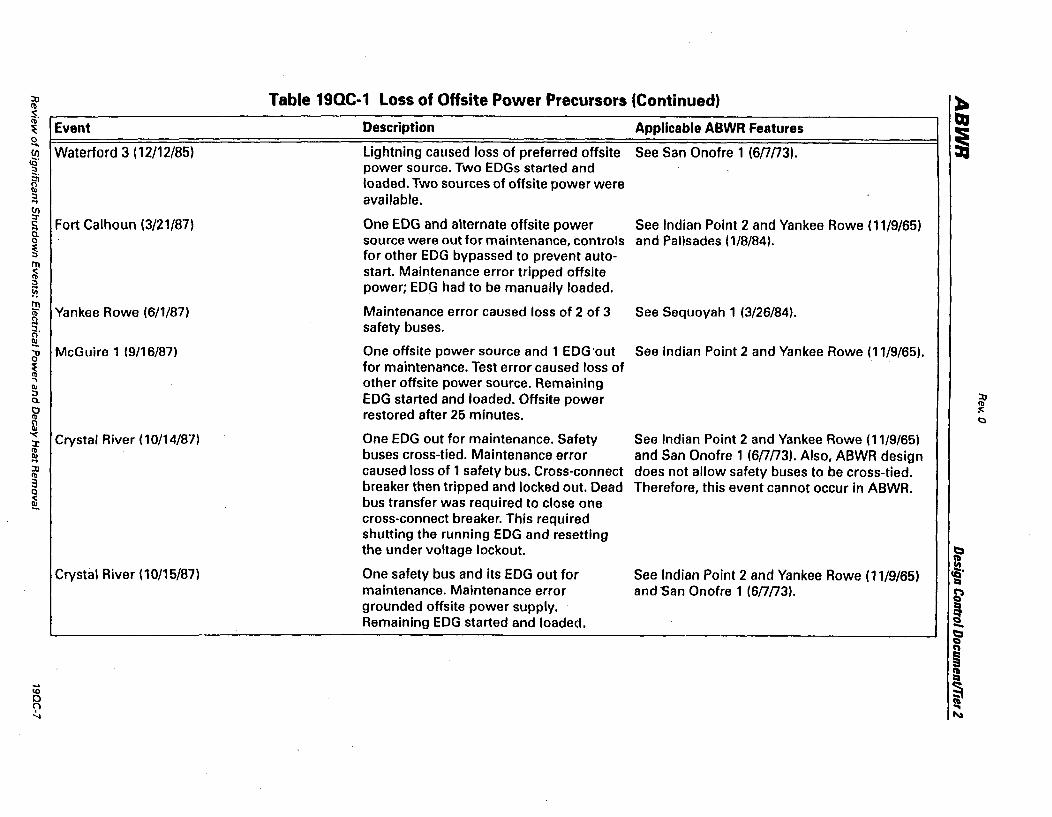
:0 Table 19QC-1 Loss of Offsite Power Precursors (Continued) l:. !b S, QI II>
Event Description Applicable ABWR Features ~ i 0 ..... Waterford 3 (12/12/85) Lightning caused loss of preferred offsite See San Onofre 1 (6(1(13). (J)
to' power source. Two EDGs started and :;,
5i loaded. Two sources of offsite power were <> I\) :;, available. ... fJ) :T
Fort Calhoun (3/21/87) One EDG and alternate offsite power See Indian Point 2 and Yankee Rowe (11/9/65) !; 0.. source were out for maintenance, controls and Palisades (1/8/84). 0
~ for other EDG bypassed to prevent auto-r" < start. Maintenance error tripped offsite 'I> :;, power; EDG had to be manually loaded. ~ !!! Yankee Rowe (6/1/87) Maintenance error caused loss of 2 of 3 See Sequoyah 1 (3/26/84). 'I> II safety buses. ~. ~
McGuire 1 (9/16/87) One offsite power source and 1 EDG'out See Indian Point 2 and Yankee Rowe (11/9/65). ci' ~ for maintenance. Test error caused loss of ., other offsite power source. Remaining '" :J EDG started and loaded. Offsite power ~ 0..
~ restored after 25 minutes. :<:.
~ C)
"< Crystal River (10/14/87) One EDG out for maintenance. Safety See Indian Point 2 and Yankee Rowe (11/9/65) :J: 'I> buses cross-tied. Maintenance error and San Onofre 1 (6(1(13). Also, ABWR design '" ... :0 caused loss of 1 safety bus. Cross-connect does not allow safety buses to be cross-tied. (\)
:3 breaker then tripped and locked out. Dead Therefore, this event cannot occur in ABWR. 0
~ bus transfer was required to close one cross-connect breaker. This required shutting the running EDG and resetting the under voltage lockout. t::t a
Crystal River (10/15/87) One safety bus and its EDG out for See Indian Point 2 and Yankee Rowe (11/9/65) cS· :::a
maintenance. Maintenance error and San Onofre 1 (6/7/73). ~ grounded offsite power supply. ~ Remaining EDG started and loaded. -t::t
CI f\ ; = iO ~ 0
~ .. '..j ~

.... Table 19QC-1 Loss of Offsite Power Precursors (Continued) ~ <0 0 QI \)
Event Description Applicable ABWR Features CIO i ,Wolf Creek (10/16/87) One safety bus and 1 EDG out for Anti-pump circuitry has been redesigned in the maintenance. Error de-energized other ABWR to allow closure following breaker trip bus. EDG output breaker opened and when required. would not close due to anti-pump circuit preventing reclosure once it had been opened after EDG started on under-voltage. DHR lost for 17 minutes.
Oconee 3 (9/11/88) All offsite power going through 1 breaker. See Indian Point 2 and Yankee Rowe (11/9/65). Maintenance error caused this breaker to ABWR RPV water level instruments are
::n open, and it could not be reclosed. No powered by batteries and at least two divisions <1) instruments to determine actual level and are required to be operable during shutdown to ~, ~ temperature of water in reactor core support ECCS automatic initiation functions. 0 region (incore thermocouples not yet ..... fJ) reconnected, and no power to RPV level cQ' ::J transmitters). ~ III ::n ::J Surry 1 and 2 (4/6/89) Electrical fault and transformer lockout. See Indian Point 2 and Yankee Rowe (11/9/65) <1) ... :r:: fJ) This de-energized one safety bus in each and Point Beach 2 (10/22/84). Q ::r ~ unit. Unit 2 EDG started and loaded. Q. I:)
Unit 1 EDG control in manual. ~ ~ Diablo Canyon 1 (317191) Maintenance error caused power arc and See Indian Point 2 and Yankee Rowe (11/9/65). ;, LOOP. EDGs started and loaded. ii! !!! Nine Mile Point (11/17173) One transmission line out for See Indian Point 2 and Yankee Rowe (11/9/65). <1) I'l
maintenance. Maintenance error caused ~
[ loss of other line. t:)
d' ~ ~ Pilgrim (4/15174) Lightning caused loss of all 245 kV lines. See Indian Point 2 and Yankee Rowe (11/9/65). cQ'
:::a ., 23 kV line remain energized . ~ III ;,
! Q. Pilgrim (5/26/74) All 345 kV lines de-energized (cause See Indian Point 2 and Yankee Rowe (11/9/65). I::l
<1) unknown). 23 kV line remained energized. -I'l ~ III
'< :t: Brunswick 2 (3/26/75) One train of 230 kV buses for each unit out See Indian Point 2 and Yankee Rowe (11/9/65).
e')
<1) ~ III for maintenance. Relay error cause_d ... = ::n <1) breakers on all five lines supplying
~ :3 0 remaining buses to open. ~ 1\1

:n Table 19QC-1 loss of Qnsite Power Precursors (Continued) ~ ~
< QI ~' Event Description Applicable ABWR Features ~ i a .... Quad Cities 2 (2/13n8) Reduced voltage on grid caused under- See Indian Point 2 and Yankee Rowe (11/9/65). (J)
cO' voltage relays to trip breakers on both ABWR has an alarm at 95% of rated voltage ::I
~ safety buses. System dispatcher (degraded voltage). This gives operator 5 Ql ::I increased grid voltage. minutes to restore full voltage before offsite ... (J)
breakers would open. ::r c: ... Q.
FitzPatrick (3/27{79) Maintenance error caused LOOP. See Indian Point 2 and Yankee Rowe (11/9/65). a ~
Browns Ferry 1 and 2 (3/1/80) Ice storm caused loss of both offsite lines. See Indian Point 2 and Yankee Rowe (11/9/65). ~ ::l Power supplied by Unit 3. ft! ;p Monticello (4/27/81) 4.16 kV breaker was racked out under See San Onofre 1 (6nn3). !l load. Breaker then shorted, causing loss ... 0' of both safety buses. ~
dJ Quad Cities 1 (6/22/82) Not really an event: Unit 1 supplied Unit 2 See Browns Ferry 1 and 2 (3/1/80). ~
when Unit 2 scrammed. ~ ... Ql ::l
Pilgrim (10/12/82) Storms failed 345 kV lines. 23 kV See Indian Point 2 and Yankee Rowe (11/9/65). :n Q. (1)
0 remained energized .. :c: (1) c:. 0
'" "'" Brunswick 1 (4/26/83) One offsite power source out for test. See Indian Point 2 and Yankee Rowe (11/9/65). if a Maintenance error caused loss of second :n source resulting in LOOP. ~
3 a Fort St. Vrain (5/17/83) One EDG out for maintenance. 2nd EDG in For the ABWR, the CTG could be used to power ~ parallel with offsite power. Storm caused one of the safety buses if offsite power was not
LOOp, and 2nd EDG tripped on secure. In event of LOOP from any sources, overcurrent due to faulty load sequencer features described under Indian Point 2 and
~ and operating non-essential loads. Yankee Rowe (11/9/65) would mitigate the ~
1/1
event. IQ' l:I
Pilgrim (8/2/83) Lightning caused loss of all 345 kV. See Indian Point 2 and Yankee Rowe (11/9/65). ~ §
Oyster Creek (11/14/83) Fire caused loss of power to 1 startup See Ginna (3/4n1) and Sequoyah 1 (3/26/84). -transformer. Switchyard de-energized to t:) Q
permit cleanup. Main generator n ~
disconnect links were removed, which ~ :::I .... allowed for use of unit transformer if ~ CD
0 necessary (wasn't used). ~
... N
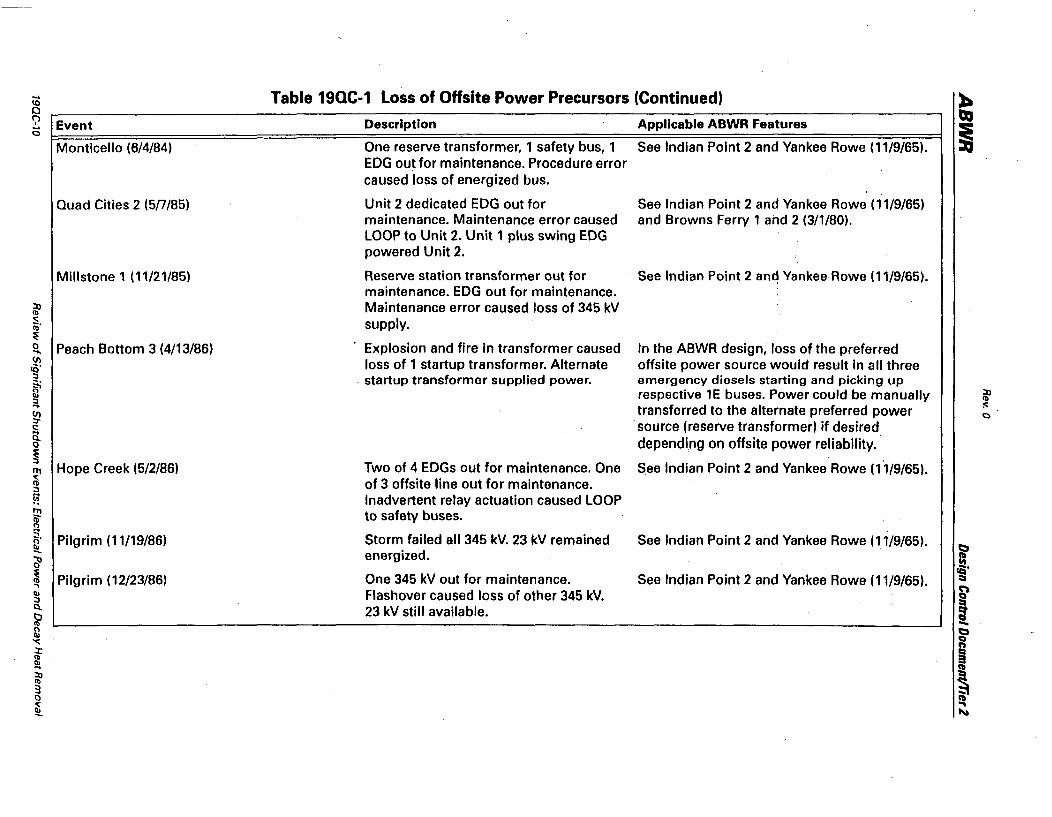
iO Table 19QC-1 Loss of Offsite Power Precursors (Continued) ~ 0 QI t;) Event Description Applicable ABWR Features 0 i Monticello (6/4/84) One reserve transformer, 1 safety bus, 1 See Indian Point 2 and Yankee Rowe (11/9/65).
EDG out for maintenance. Procedure error caused loss of energized bus.
Quad Cities 2 (5n/85) Unit 2 dedicated EDG out for See Indian Point 2 and Yankee Rowe (11/9/65) maintenance. Maintenance error caused and Browns Ferry 1 and 2 (3/1/80). lOOP to Unit 2. Unit 1 plus swing EDG powered Unit 2.
Millstone 1 (11/21/85) Reserve station transformer out for See Indian Point 2 anc~ Yankee Rowe (11/9/65). maintenance. EDG out for maintenance.
:n Maintenance error caused loss of 345 kV Cl> ..;: iQ' supply. ~ 0 Peach Bottom 3 (4/13/86) Explosion and fire in transformer caused In the ABWR design, loss of the preferred ... (J) loss of 1 startup transformer. Alternate offsite power source would result in all three cO' :3 . startup transformer supplied power. emergency diesels starting and picking up ~ Q) respective 1E buses. Power could be manually ~ :3 .... transferred to the alternate preferred power :0:: (J) C) ::r source (reserve transformer) if desired c:: a depending on offsite power reliability. 0
~ Hope Creek (5/2/86) Two of 4 EDGs out for maintenance. One See Indian Point 2 and Yankee Rowe (11/9/65). III
~ of 3 offsite line out for maintenance. :3
~ Inadvertent relay actuation caused lOOP ~ ... to safety buses .
~ Pilgrim (11/19/86) Storm failed all 345 kV. 23 kV remained See Indian Point 2 and Yankee Rowe (11/9/65).
~ ti' energized.
~ One 345 kV out for maintenance. See Indian Point 2 and Yankee Rowe (11/9/65). fi3.
Pilgrim (12/23/86) :::i ., &a Q) Flashover caused loss of other 345 kV. :::J
! Q. 23 kV still available. lr -... t:J III '( a n ::r ~ Cl> Q) .... ~ :n Cl> § 3 0 ~ ~ ~
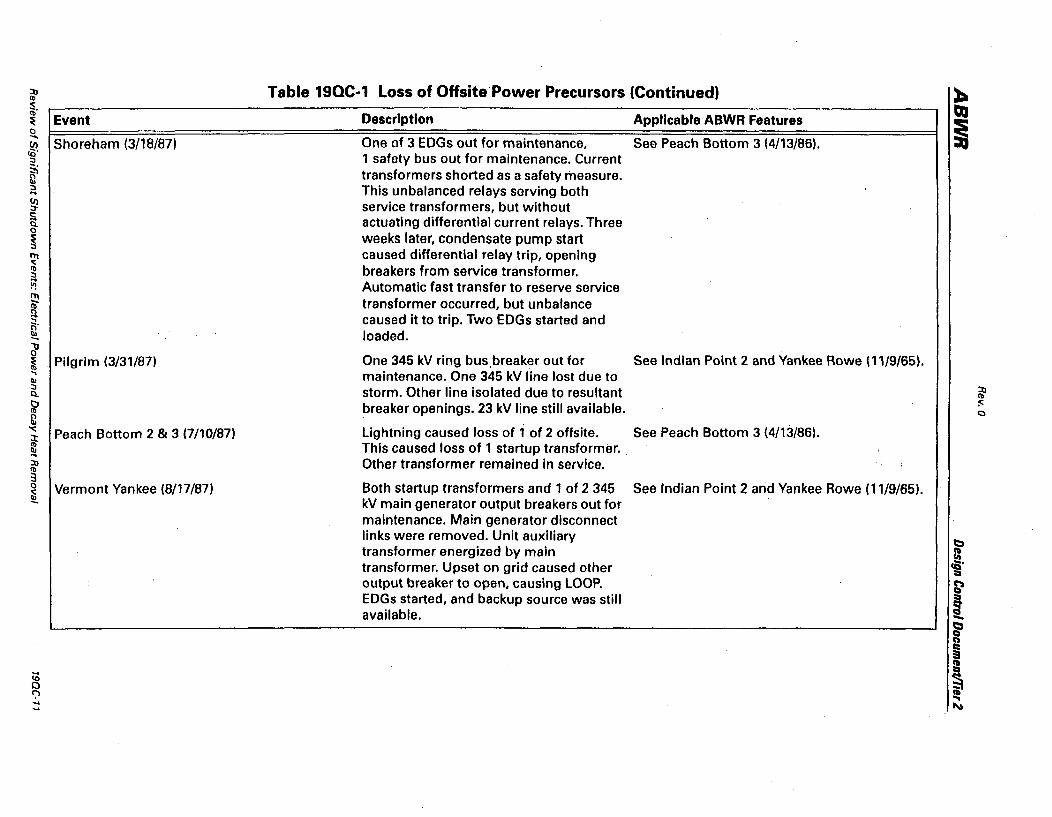
~ ~, ~ Event o i Shoreham (3/18/87)
5i l;l ::I ... ~
~ ~ ~ ::I
~
~ ~ [ dJ ~ "' Q)
::I Q
~ tl '<
~ ... :n <b
3
Pilgrim (3/31/87)
Peach Bottom 2 & 3 (7/10/87)
~ Vermont Yankee (8/17/87)
Table 19QC-1 Loss of Offsite Power Precursors (Continued)
Description
One of 3 EDGs out for maintenance, 1 safety bus out for maintenance. Current transformers shorted as a safety measure. This unbalanced relays serving both service transformers, but without actuating differential current relays. Three weeks later, condensate pump start caused differential relay trip, opening breakers from service transformer. Automatic fast transfer to reserve service transformer occurred, but unbalance caused it to trip. Two EDGs started and loaded.
Applicable ABWR Features
See Peach Bottom 3 (4/13/86). I
One 345 kV ring bus,breaker out for See Indian Point 2 and Yankee Rowe (11/9/65). maintenance. One 345 kV line lost due to storm. Other line isolated due to resultant breaker openings. 23 kV line still available.
Lightning caused loss of 1 of 2 offsite. See Peach Bottom 3 (4{13{86). This caused loss of 1 startup transformer . Other transformer remained in service.
Both startup transformers and 1 of 2345 See Indian Point 2 and Yankee Rowe (11/9/65). kV main generator output breakers out for maintenance. Main generator disconnect links were removed. Unit auxiliary transformer energized by main transformer. Upset on grid caused other output breaker to open, causing lOOP. EDGs started, and backup source was still available.
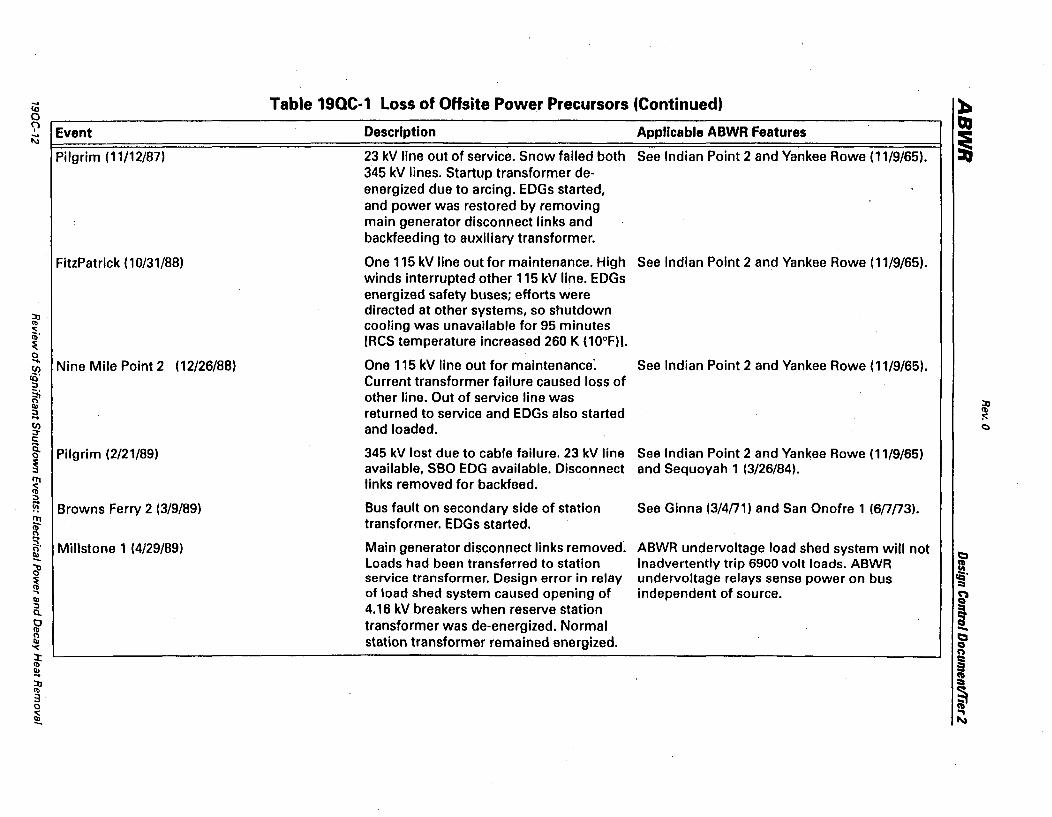
iii Table 19QC-1 loss of OHsite Power Precursors (Continued) ~ 0 tQ ~ Event Description Applicable ABWR Features ...
~ I\)
Pilgrim (11/12/87) 23 kV line out of service. Snow failed both See Indian Point 2 and Yankee Rowe (11/9/65). 345 kV lines. Startup transformer de-energized due to arcing. EDGs started, and power was restored by removing main generator disconnect links and backfeeding to auxiliary transformer.
FitzPatrick (10/31/88) One 115 kV line out for maintenance. High See Indian Point 2 and Yankee Rowe (11/9/65). winds interrupted other 115 kV line. EDGs energized safety buses; efforts were
::n directed at other systems, so shutdown
'" cooling was unavailable for 95 minutes " ib' (RCS temperature increased 260 K (10°F)). ~ 0 ....
Nine Mile Point 2 (12/26/88) One 115 kV line out for maintenance: See Indian Point 2 and Yankee Rowe (11/9/65). ~ :J Current transformer failure caused loss of ~ other line. Out of service line was
~ III returned to service and EDGs also started :J ... :(
g! and loaded. C)
c: g. Pilgrim (2/21/89) 345 kV lost due to cable failure. 23 kV line See Indian Point 2 and Yankee Rowe (11/9/65) ~ available, SBO EDG available. Disconnect and Sequoyah 1 (3/26/84). III links removed for backfeed. ~ :J
~ Browns Ferry 2 (3/9/89) Bus fault on secondary side of station See Ginna (3/4nl) and San Onofre 1 (6nn3). !!! transformer. EDGs started. III .... ... ~, Millstone 1 (4/29/89) Main generator disconnect links removed~ ABWR undervoltage load shed system will not
t:J ~ Loads had been transferred to station inadvertently trip 6900 volt loads. ABWR ~ cl' service transformer. Design error in relay undervoltage relays sense power on bus cq. ~ =:. ... of load shed system caused opening of independent of source . ~ III :J 4.16 kV breakers when reserve station ! Q,
~ transformer was de-energized. Normal -.... station transformer remained energized. t:J III
-.;: C ~
l:: ~ III
~ III ::n =:. III
~ 3 0
~ I\a
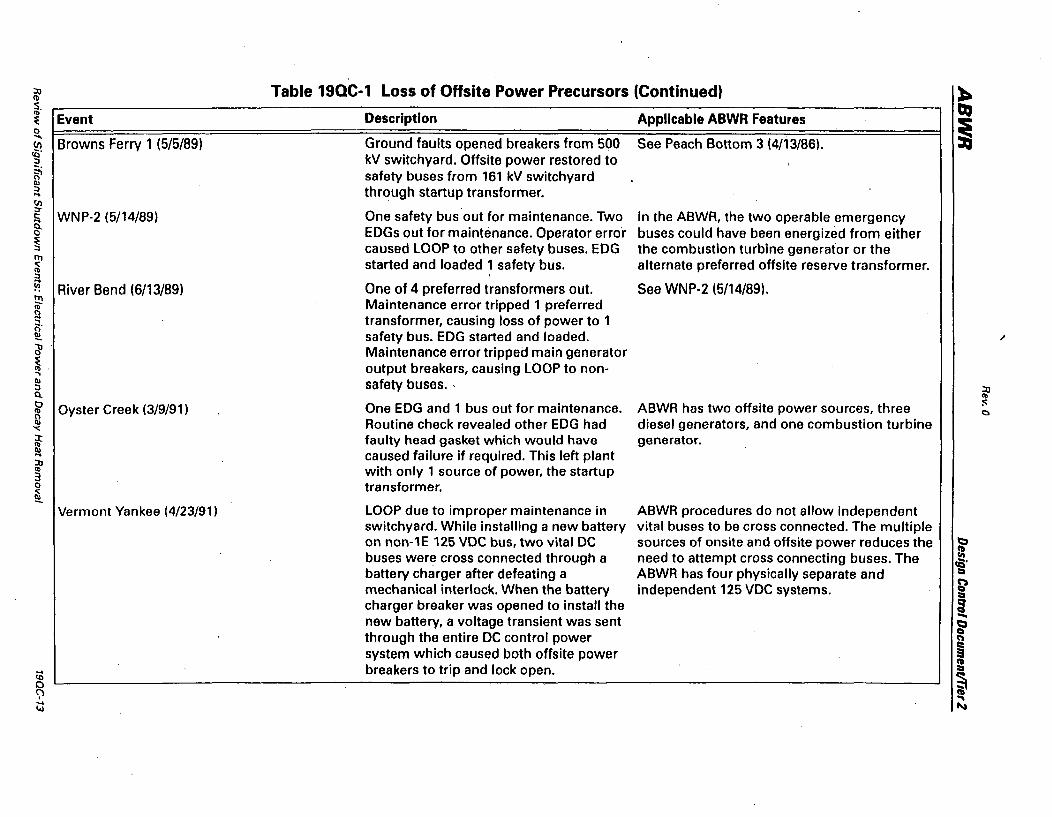
:JJ Table 19QC-1 Loss of Offsite Power Precursors (Continued) :b III S. QI "' Event Description Applicable ABWR Features :E
~ 0 .... Browns Ferry 1 (5/5/89) Ground faults opened breakers from 500 See Peach Bottom 3 (4113/86). (J)
<Q' kV switchyard. Offsite power restored to ::J
~ safety buses from 161 kV switchyard Q) ::J through startup transformer . .... (f) ~
WNP-2 (5114/89) One safety bus 'out for maintenance. Two In the ABWR, the two operable emergency ~ Cl EDGs out for maintenance. Operator error buses could have been energized from either 0
~ caused lOOP to other safety buses. EDG the combustion turbine generator or the III ~ started and loaded 1 safety bus. alternate preferred offsite reserve transformer. ::J
~ River Bend (6/13/89) One of 4 preferred transformers out. See WNP-2 (5/14/89). !!) Maintenance error tripped 1 preferred "' ! transformer, causing loss of power to 1
safety bus. EDG started and loaded. ~ Maintenance error tripped main generator ~ "', output breakers, causing lOOP to non-., Q) safety buses. ' ::J :n Cl "' ~ Oyster Creek (3/9/91) One EDG and 1 bus out for maintenance. ABWR has two offsite power sources, three ~
<:)
~ Routine check revealed other EDG had diesel generators, and one combustion turbine '<:
~ faulty head gasket which would have generator. ~ caused failure if required. This left plant :JJ "' with only 1 source of power, the startup 3 0 transformer. ~
Vermont Yankee (4/23/91) LOOP due to improper maintenance in ABWR procedures do not allow independent switchyard. While installing a new battery vital buses to be cross connected. The multiple on non-1E 125 VDC bus, two vital DC sources of on site and offsite power reduces the ~
buses were cross connected through a need to attempt cross connecting buses. The = ca' battery charger after defeating a ABWR has four physically separate and :::i
mechanical interlock. When the battery independent 125 VDC systems. ~ charger breaker was opened to install the ! new battery, a voltage transient was sent
.... 1::1
through the entire DC control power a C\
system which caused both offsite power ~ .... breakers to trip and lock open . !:l 10
~ 0 c,1 ... ....
~ w
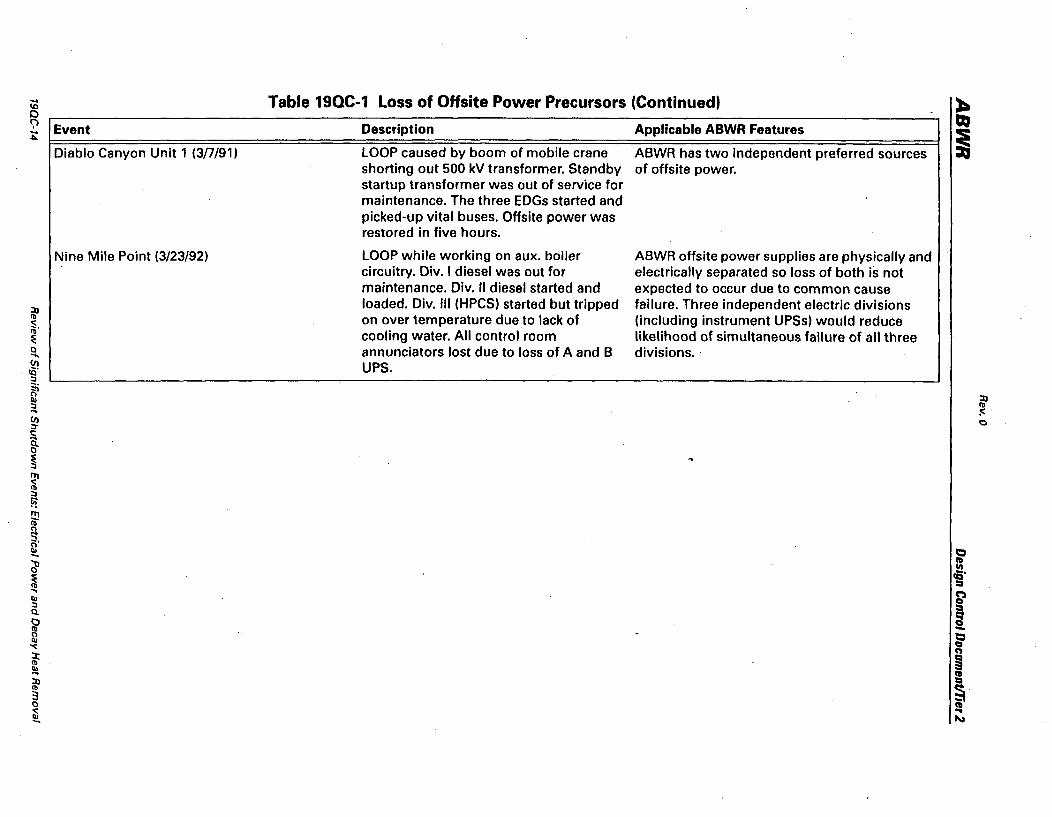
... <0 o ~ Event i:
Diablo Canyon Unit 1 (3/7/91)
Nine Mile Point (3/23/92)
Table 19QC-1 Loss of Offsite Power Precursors (Continued)
Description
lOOP caused by boom of mobile crane shorting out 500 kV transformer. Standby startup transformer was out of service for maintenance. The three EDGs started and picked-up vital buses. Offsite power was restored in five hours.
lOOP while working on aux. boiler circuitry. Div. I diesel was out for maintenance. Div. II diesel started and loaded. Div. III (HPCS) started but tripped on over temperature due to lack of cooling water. All control room annunciators lost due to loss of A and B UPS.
Applicable ABWR Features
ABWR has two Independent preferred sources of offsite power.
ABWR offsite power supplies are physically and electrically separated so loss of both is not expected to occur due to common cause failure. Three independent electric divisions (including instrument UPSs) would reduce likelihood of simultaneous failure of all three divisions. '
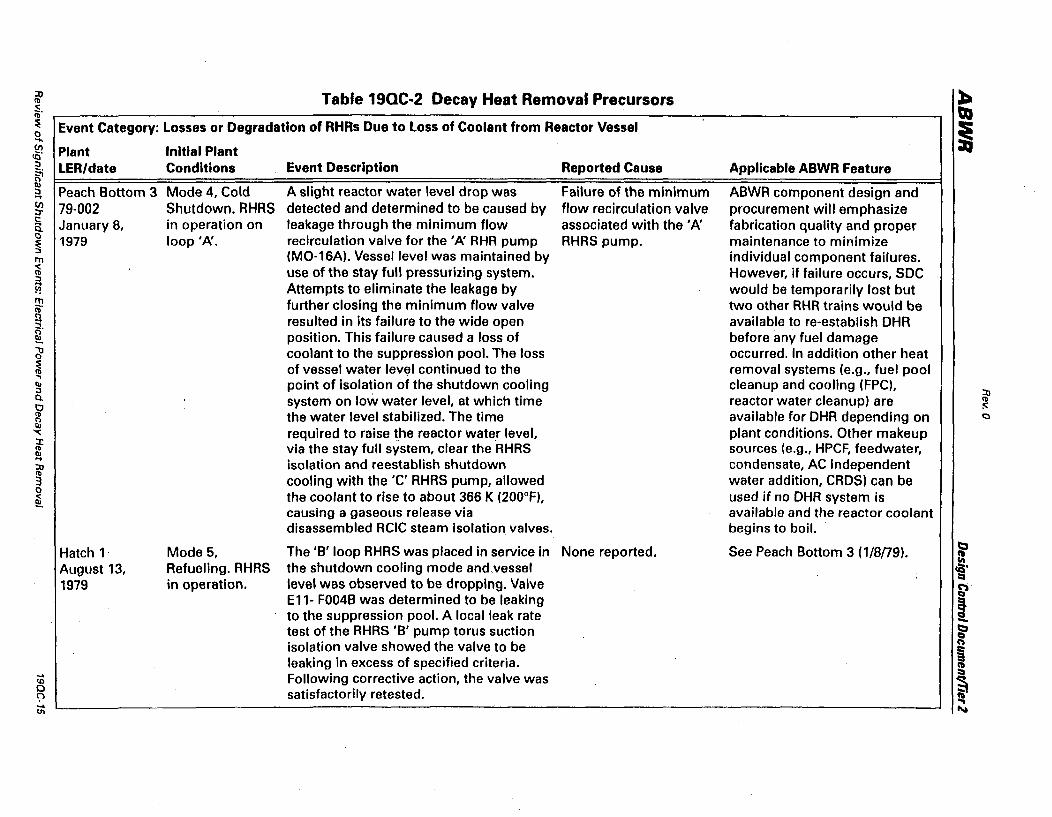
J:) Table 19QC·2 Decay Heat Removal Precursors ). <II
~. QI ~ Event Category: Losses or Degradation of RHRs Due to Loss of Coolant from Reactor Vessel i 0 ..., (J) Plant Initial Plant cQ' :J LER/date Conditions Event Description Reported Cause Applicable. ABWR Feature ~ ~ Peach Bottom 3 Mode 4, Cold A slight reactor water level drop was Failure of the minimum ABWR component design and (J) 79-002 Shutdown. RHRS detected and determined to be caused by flow recirculation valve procurement will emphasize ::r a January 8, in operation on leakage through the minimum flow associated with the'''' fabrication quality and proper 0 1979 loop ''''. recirculation valve for the 'N RHR pump RHRS pump. maintenance to minimize ~ IT! (MO-16A). Vessel level was maintained by individual component failures. ~ use of the stay full pressurizing system. However, if failure occurs, SOC :J
Y! Attempts to eliminate the leakage by would be temporarily lost but t!! further closing the minimum flow valve two other RHR trains would be <II
~ resulted in its failure to the wide open available to re-establish DHR position. This failure caused a loss of before any fuel damage
dJ coolant to the suppression pool. The loss occurred. In addition other heat ~ of vessel water level continued to the removal systems (e.g., fuel pool .., Ib point of isolation of the shutdown cooling cleanup and cooling (FPC), :J :n 0. system on low water level, at which time reactor water cleanup) are <II 1:1 :0: <II the water level stabilized. The time available for DHR depending on 0 ... III
required to raise the reactor water level, plant conditions. Other makeup -..:: :x: <II via the stay full system, clear the RHRS sources (e.g., HPCF, feedwater, Ib ...
isolation and reestablish shutdown condensate, AC Independent :J] <II
cooling with the 'c' RHRS pump, allowed water addition, CRDS) can be :3 0
the coolant to rise to about 366 K (200°F), used if no DHR system is ~ causing a gaseous release via available and the reactor coolant disassembled RelC steam isolation valves. begins to boil.
Hatch 1 Mode 5, The 'B' loop RHRS was placed in service in None reported. See Peach Bottom 3 (1/8/79). ~ August 13, Refueling. RHRS the shutdown cooling mode and vessel CS·
=-1979 in operation. level was observed to be dropping. Valve ~ E11- F0048 was determined to be leaking ! to the suppression pool. A local leak rate -test of the RHRS 'B' pump torus suction ~
isolation valve showed the valve to be n ~ leaking in excess of specified criteria. III ... Following corrective action, the valve was ::a
CD
~ 0 satisfactorily retested. <;"l ... ... I\a U1
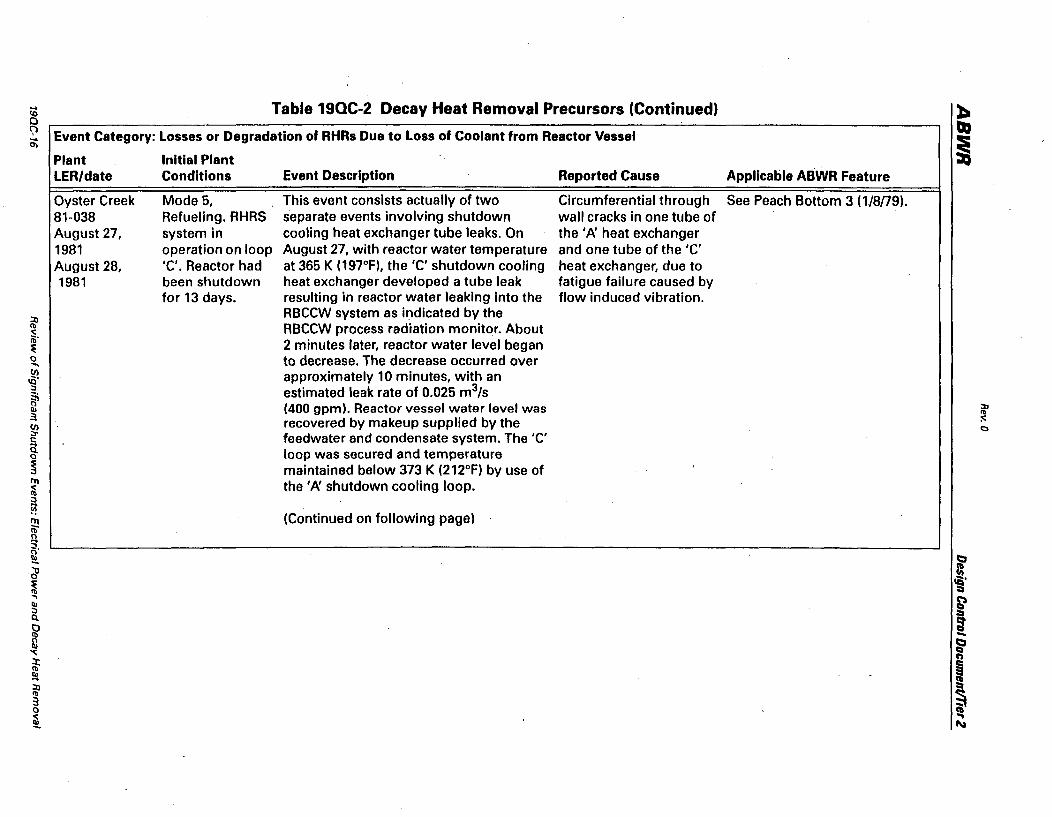
~ Table 19QC-2 Decay Heat Removal Precursors (Continued)
~ Event Category: Losses or Degradation of RHRs Due to Loss of Coolant from Reactor Vessel 0)
Plant Initial Plant LER/date Conditions Event Description Reported Cause
Oyster Creek 81-038 August 27, 1981 August 28, 1981
Mode 5, Refueling. RHRS system in operation on loop 'C'. Reactor had been shutdown for 13 days.
This event consists actually of two separate events involving shutdown cooling heat exchanger tube leaks. On August 27, with reactor water temperature at 365 K (197°F), the 'c' shutdown cooling heat exchanger developed a tube leak resulting in reactor water leaking into the RBCCW system as indicated by the RBCCW process radiation monitor. About 2 minutes later, reactor water level began to decrease. The decrease occurred over approximately 10 minutes, with an estimated leak rate of 0.025 m3/s (400 gpm). Reactor vessel water level was recovered by makeup supplied by the feedwater and condensate system. The 'c' loop was secured and temperature maintained below 373 K (212°F) by use of the '~ shutdown cooling loop.
(Continued on following page)
Circumferential through wall cracks in one tube of the I ~ heat exchanger and one tube of the 'c' heat exchanger, due to fatigue failure caused by flow induced vibration.
Applicable ABWR Feature
See Peach Bottom 3 (t/8/79).
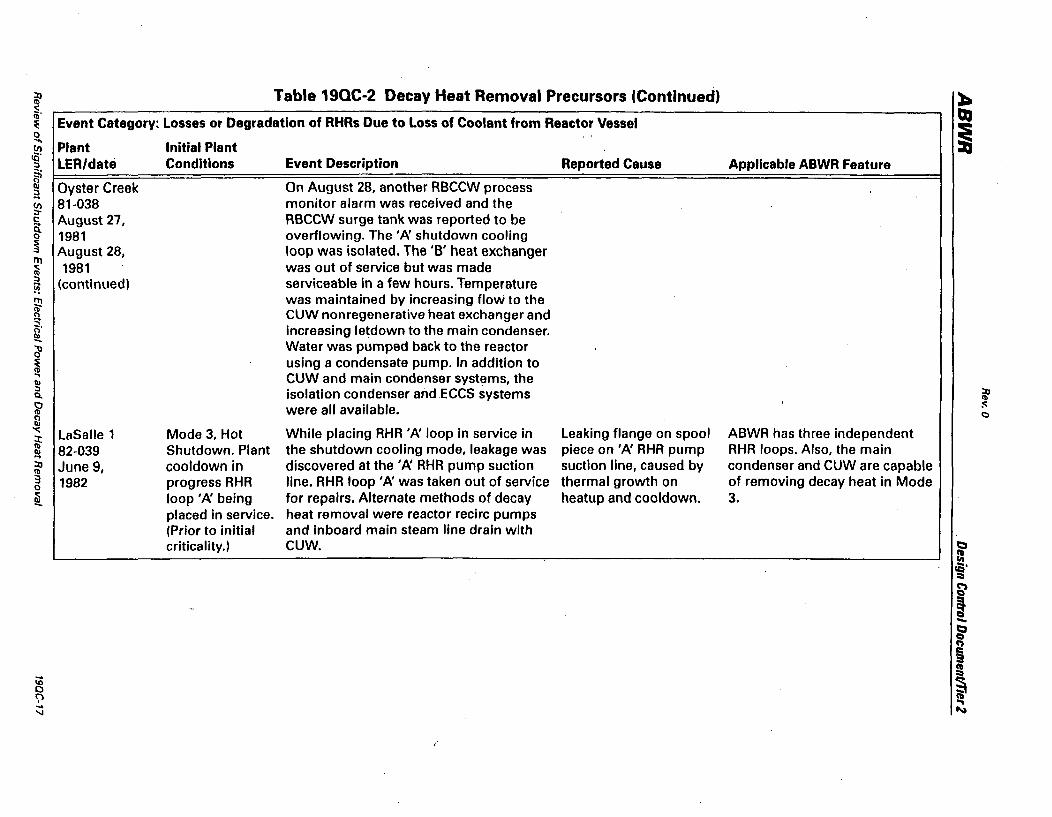
Table 19QC-2 Decay Heat Removal Precursors (Continued) ~ ~. ~ Event Category: Losses or Degradation of RHRs Due to Loss of Coolant from Reactor Vessel o ;; Plant Initial Plant eg' lER/date Conditions
~ :, ... ~
~ ~
i Y1
~ ~
[ ~ ~ "' a. ::J Q.
~ ~
Oyster Creek 81-038 August 27, 1981 August 28, 1981
(continued)
-.:: LaSalle 1 ~ 82-039 ::Q III 3 o ~
June 9, 1982
Mode 3, Hot Shutdown. Plant cooldown in progress RHR loop '/\ being placed in service. (Prior to initial criticality.)
Event Description
On August 28, another RBCCW process monitor alarm was received and the RBCCW surge tank was reported to be overflowing. The' /\ shutdown cooling loop was isolated. The 'B' heat exchanger was out of service but was made serviceable in a few hours. Temperature was maintained by increasing flow to the CUW non regenerative heat exchanger and increasing letdown to the main condenser. Water was pumped back to the reactor using a condensate pump. In addition to CUW and main condenser systems, the isolation condenser and .ECCS systems were all available.
While placing RHR '/\ loop in service in the shutdown cooling mode, leakage was discovered at the' N RHR pump suction line. RHR loop 'N was taken out of service for repairs. Alternate methods of decay heat removal were reactor recirc pumps and inboard main steam line drain with CUW.
Reported Cause
Leaking flange on spool piece on '/\ RHR pump suction line, caused by thermal growth on heatup and cooldown.
Applicable ABWR Feature
ABWR has three independent RHR loops. Also, the main condenser and CUW are capable of removing decay heat in Mode 3.

..... <0 o
Table 19QC-2 Decay Heat Removal Precursors (Continued)
~ Event Category: Losses or Degradation of RHRs Due to Loss of Coolant from Reactor Vessel eX)
Plant Initial Plant LER/date Conditions
LaSalle 1 82-042 June 11, 1982
Mode 4, Cold Shutdown (Prior to initial criticality).
Event Description
The unit was in cold shutdown following performance of reactor internals vibration testing. 'B' AHA system was operating in the shutdown cooling mode with all flow bypassing the 'B' RHR heat exchanger to maintain reactor temperature between 333 K (140°F) and 366 K (200°F). The 'A' RHR system was lined up for standby shutdown cooling. The '/\ and 'B' AHR suppression pool suction valves were out of service electrically for repair and the valves were manually closed. No backup means of decay heat removal was available due to the reactor building closed cooling water system being out of service. (No actual decay heat existed.)
(Continued on following page)
Reported Cause
Personnel did not recognize the potential vessel drain path that existed upon returning the system to a normal lineup from standby operation. The test procedure failed to recognize the current operating status of the AHR system in shutdown cooling. The level instruments tap off the downcomer region where shutdown cooling receives its suction. The Tech Specs were interpreted such that both shutdown cooling loops were required operable with one in operation, and that the idle pump could be out of service for only 2 hours. This was a conservative interpretation but it aggravated the event by imposing an arbitrary time restraint on the test.
Applicable ABWR Feature
ABWA procedures will clearly describe proper operational steps and the technical specifications will be based on minimizing plant risks during normal full power operation and shutdown conditions. The ABWR has three independent RHR systems and SOC is isolated on low RPV level.
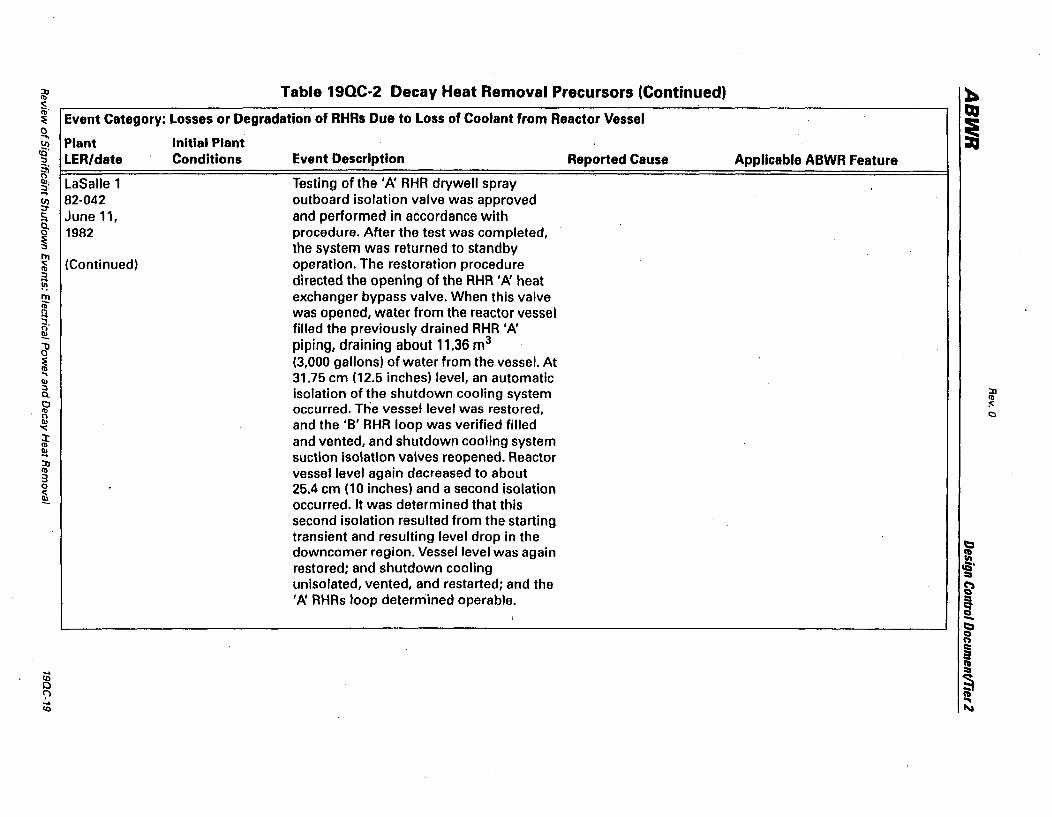
Table 19QC-2 Decay Heat Removal Precursors (Continued) ~ ~. ~ Event Category: Losses or Degradation of RHRs Due to Loss of Coolant from Reactor Vessel o ....
~ ~ ~; .. g!
~ ~
~ :J
~
I ti' ~ '" II> :J Q.
)? 2
'"<
~ ~
~ 3 o ~
Plant LER/date
LaSalle 1 82-042 June 11, 1982
(Continued)
Initial Plant Conditions Event Description
Testing of the '/1\ RHR drywell spray outboard isolation valve was approved and performed in accordance with procedure. After the test was completed, the system was returned to standby operation. The restoration procedure directed the opening of the RHR '/1: heat exchanger bypass valve. When this valve was opened, water from the reactor vessel filled the previously drained RHR '/1\ piping, draining about 11.36 m3
(3,000 gallons) of water from the vessel. At 31.75 em (12.5 inches) level, an automatic isolation of the shutdown cooling system occurred. The vessel level was restored, and the 'B' RHR loop was verified filled and vented, and shutdown cooling system suction isolation valves reopened. Reactor vessel level again decreased to about 25.4 cm (10 inches) and a second isolation occurred. It was determined that this second isolation resulted from the starting transient and resulting level drop in the downcomer region. Vessel level was again restored; and shutdown cooling unisolated, vented, and restarted; and the '/1: RHRs loop determined operable.
Reported Cause Applicable ABWR Feature

.... 10 o
Table 19QC-2 Decay Heat Removal Precursors (Continued)
~ Event Category: Losses or Degradation of RHRs Due to loss of Coolant from Reactor Vessel
Plant Initial Plant LER/date Conditions
Grand Gulf N/A April 3, 1983
Mode 4, Cold Shutdown, after initial criticality. RHRS Loop 'B' in Shutdown Cooling.
Event Description
Loop' f\ of the RHRS was lined up in the LPCI mode, and loop 'B' was lined up in the shutdown cooling mode for a surveillance test. After completion of the test, the operator returned 'B' loop to the LPCI mode, which required shutting the loop 'B' SOC suction valve (FOOS) and opening the loop 'B' suppression pool suction valve (F004). Since a light bulb was burned out on the open indicator for FOOS, the operator assumed that FOOS was already shut, and opened F004. This opened a flow path from the reactor vessel via the 'B' RHR-Ioop to the sUfpression pool. Approximately 37.85 m (10,000 gallons) of water drained from the reactor vessel prior to automatic isolation of the RHRS on low water level. The operator attempted to res hut F004 upon receiving a low level alarm, but the valve's MOV breaker tripped.
Reported Cause
Operator error; misinterpretation of valve position indication. FOOS "fu"y open" indicator light was not burning, but neither was the "fu"y shut" indicator. Valve was probably in a partially open position. Reason for F004 MOV breaker trip not explained.
Applicable ABWR Feature
The potential for this operator error has been eliminated in the ABWR design by providing valve interlocks. When RHR system is in the shutdown cooling mode (i.e .• taking suction from the RPV); the discharge valves to the suppression pool are interlocked in the closed position to prevent inadvertent draining of the RPV. To realign to the Low Pressure Flooder (LPFL) mode, the suppression pool suction valve cannot be opened until the SOC suction valve is fully closed.
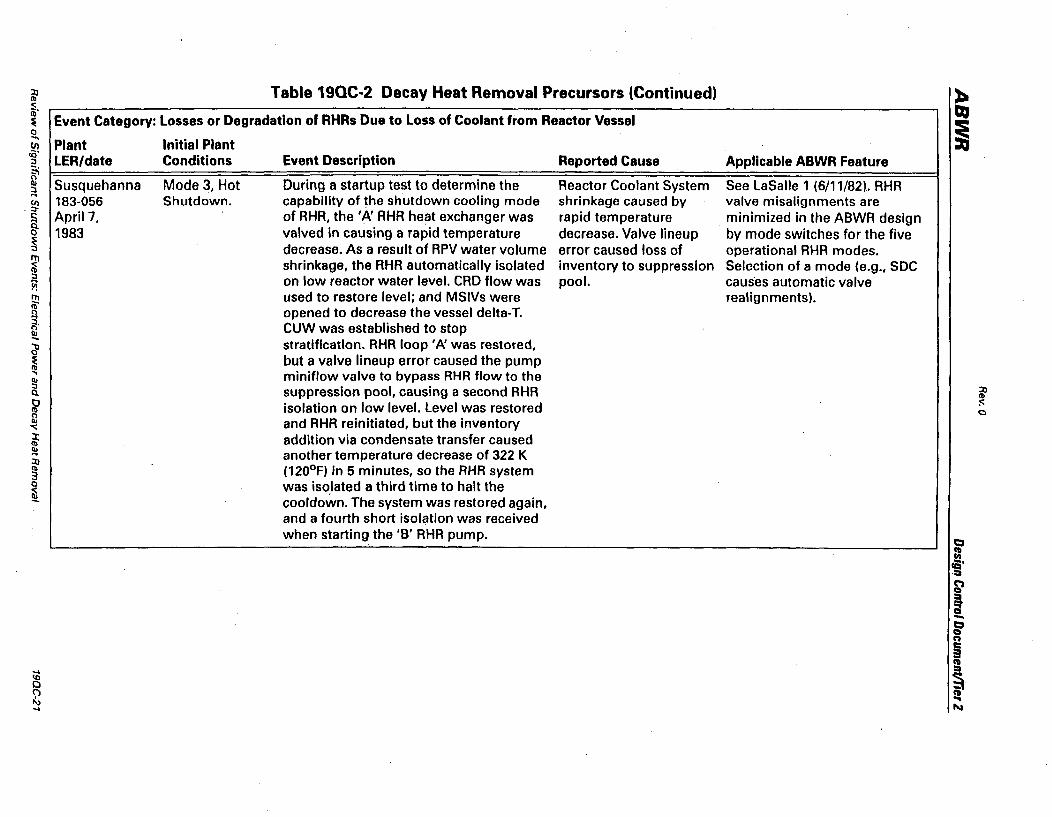
Table 19QC-2 Decay Heat Removal Precursors (Continued) ~ ~, ~ Event Category: losses or Degradation of RHRs Due to loss of Coolant from Reactor Vessel o C;; Plant Initial Plant '§' LER/date Conditions
~ :l Susquehanna ~ 183~056
. ::.-
O~ April 7, 1983
~ ~ H w
~ d' ~ .., ~ Q.
~ ~
.....
~ :n ~ o ~
... 10 o 2 ...
Mode 3, Hot Shutdown .
Event Description
During a startup test to determine the capability of the shutdown cooling mode of RHR, the 'A' RHR heat exchanger was valved in causing a rapid temperature decrease. As a result of RPV water volume shrinkage, the RHR automatically isolated on low reactor water level. CRD flow was used to restore level; and MSIVs were opened to decrease the vessel delta-T. CUW was established to stop stratification. RHR loop' /l: was restored, but a valve lineup error caused the pump miniflow valve to bypass AHA flow to the suppression pool, causing a second RHR isolation on low level. Level was restored and RHR relnltlated, but the inventory addition via condensate transfer caused another temperature decrease of 322 K (120°F) in 5 minutes, so the RHR system was isoJated a third time to halt the cooldown. The system was restored again, and a fourth short isolation was received when starting the 'B' RHR pump .
Reported Cause
Reactor Coolant System shrinkage caused by rapid temperature decrease. Valve lineup error caused loss of inventory to suppression pool.
Applicable ABWR Feature
See LaSalle 1 (6/11/82).. RHR valve misalignments are minimized in the ABWR design by mode switches for the five operational RHR modes. Selection of a mode (e.g., SOC causes automatic valve realignments).
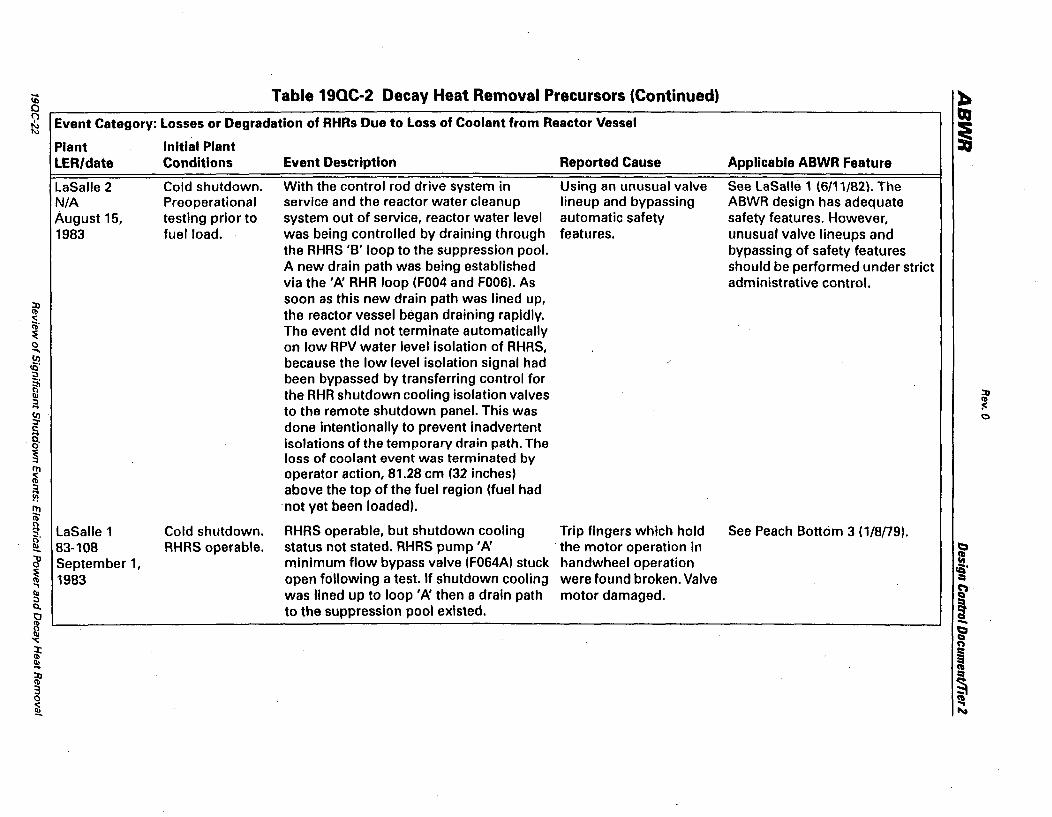
in Table 19QC-2 Decay Heat Removal Precursors (Continued) l:. 0 QI ~ Event Category: Losses or Degradation of RHRs Due to Loss of Coolant from Reactor Vessel ~ ~ Plant Initial Plant LER/date Conditions Event Description Reported Cause Applicable ABWR Feature
LaSalle 2 Cold shutdown. With the control rod drive system in Using an unusual valve See LaSalle 1 (6/11/82). The N/A Preoperational service and the reactor water cleanup lineup and bypassing ABWA design has adequate August 15, testing prior to system out of service, reactor water level automatic safety safety features. However, 1983 fuel load. was being controlled by draining through features. unusual valve lineups and
the AHAS 'B' loop to the suppression pool. bypassing of safety features A new drain path was being established should be performed under strict via the 'fJ: AHA loop (F004 and F006). As administrative control.
:0 soon as this new drain path was lined up,
Ib the reactor vessel began draining rapidly. -: tb' The event did not terminate automatically ~ 0 on low APV water level isolation of AHAS, .... tI) because the low level isolation signal had 10' ::J been bypassed by transferring control for ~ the AHR shutdown cooling isolation valves :n ::J III ... to the remote shutdown panel. This was :c: tI) 0 :r done intentionally to prevent inadvertent c: ~ isolations of the temporary drain path. The ~ loss of coolant event was terminated by III operator action, 81.28 em (32 inches) ~ ::J above the top of the fuel region (fuel had it! ~
not yet been loaded).
n LaSalle 1 Cold shutdown. AHRS operable, but shutdown cooling Trip fingers which hold See Peach Bottom 3 (1/8n9). ~, 2!. 83-108 RHRS operable. status not stated. RHRS pump I fJ: the motor operation in ~ ~ September 1, minimum flow bypass valve (F064A) stuck handwheel operation iQ. ~ 1983 open following a test. If shutdown cooliniJ were found broken. Valve :::a ... n III was lined up to loop 'fJ: then a drain path motor damaged. 0 ::J
! Q" to the suppression pool existed. tl Ib -&1 b '<: 0
" l: ~ Ib
III ... CIa :0 :::a Ib
~ :3 0
~ "a
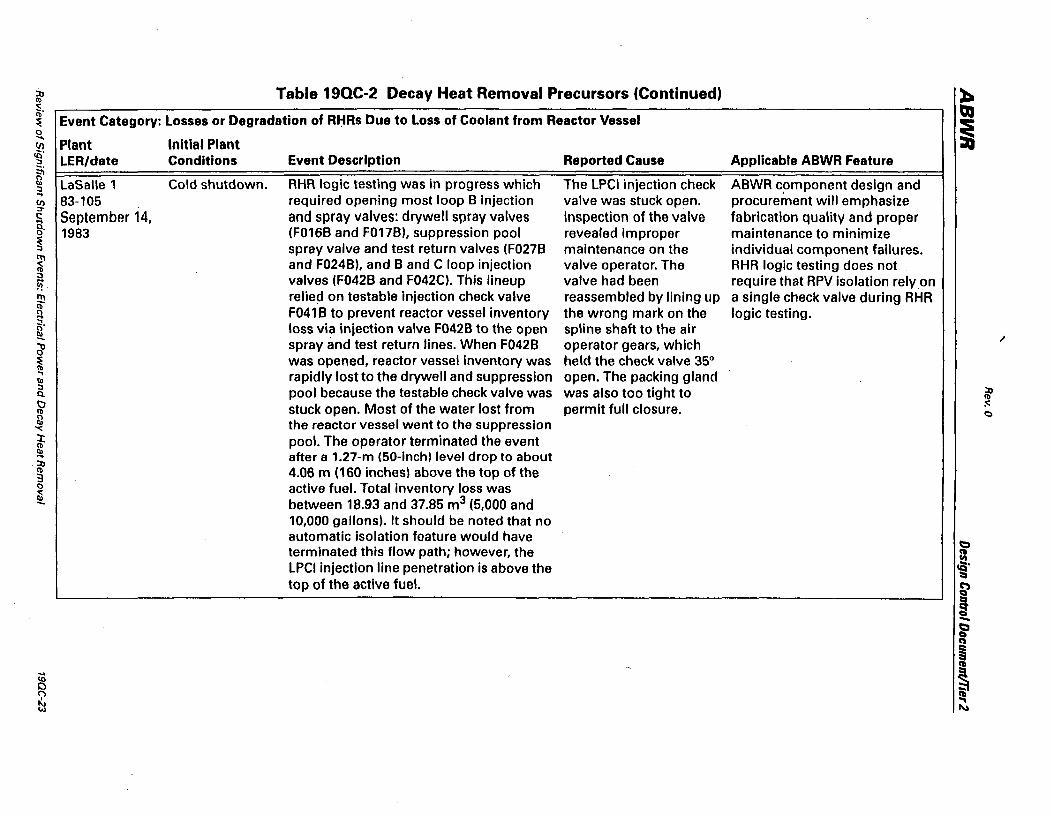
~ Table 19QC-2 Decay Heat Removal Precursors (Continued) ~. ~ Event Category: losses or Degradation of RJ:lRs Due to loss of Coolant from Reactor Vessel
LaSalle 1 . 83-105 ,
September 14, 1983
Initial Plant Conditions
Cold shutdown.
Event Desc;ription
RHR logic testing was in progress which required opening most loop 8 injection and spray valves: drywell spray valves (F0168 and F0178), suppression pool spray valve and test return valves (F027B and F024B), and Band C loop injection valves (F042B and F042C). This lineup relied on testable injection check valve
. F041 B to prevent reactor vessel inventory loss via injection valve F042B to the open spray and test return lines. When F042B was opened, reactor vessel inventory was rapidly lost to the drywell and suppression pool because the testable check valve was stuck open. Most of the water lost from the reactor vessel went to the suppression pool. The operator terminated the event after a 1.27-m (50-inch) level drop to about 4.06 m (160 inches) above the top of the active fuel. Total inventory loss was between 18.93 and 37.85 m3 (5,000 and 10,000 gallons). It should be noted that no automatic Isolation feature would have terminated this flow path; however, the LPCI injection line penetration is above the top of the active fuel.
Reported Cause
The LPCI injection check valve was stuck open. Inspection of the valve revealed improper maintenance on the valve operator. The valve had been reassembled by lining up the wrong mark on the spline shaft to the air operator gears, which held the check valve 35° open. The packing gland was also too tight to permit full closure.
Applicable ABWR Feature
ABWR component design and procurement will emphasize fabrication quality and proper maintenance to minimize individual component failures. RHR logic testing does not require that RPV isolation relyon a single check valve during RHR logic testing .
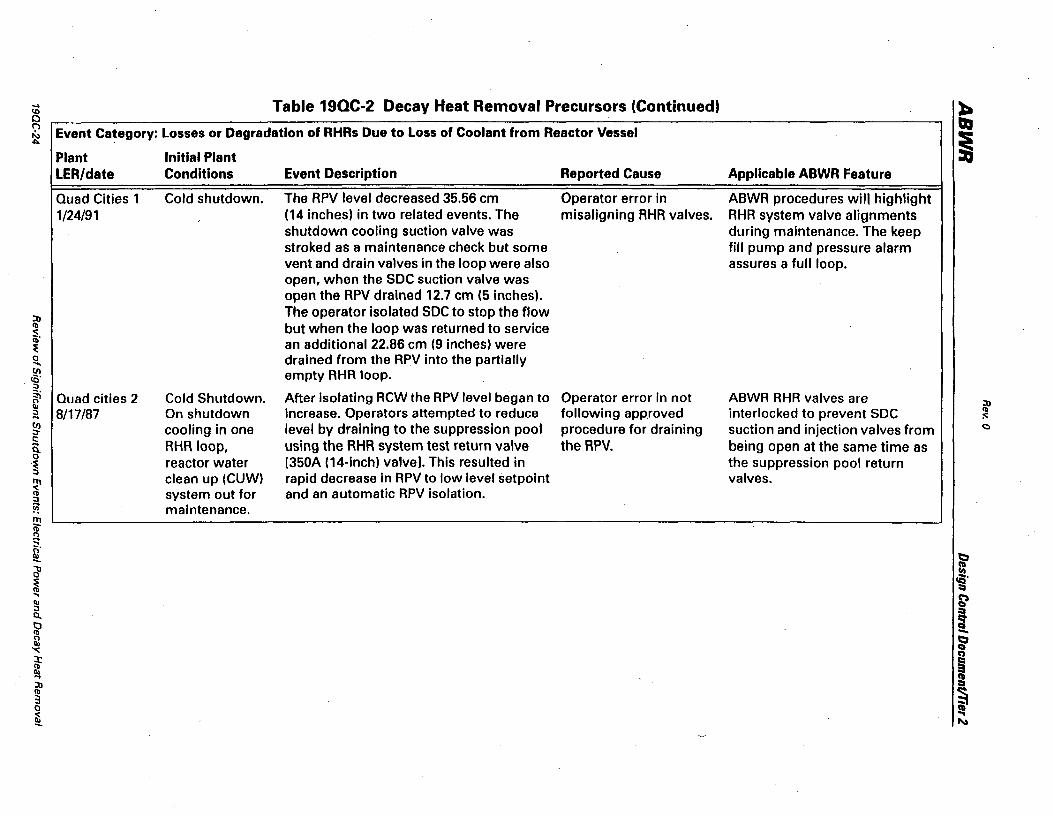
Table 19QC-2 Decay Heat Removal Precursors (Continued) ... (Q
o ~ Event Category: Losses or Degradation of RHRs Due to Loss of Coolant from Reactor Vessel
~ <: lb' ~ o .... U)
~'
Plant LER/date
Quad Cities 1 1/24/91
Si Quad cities 2 !i1 ~ 8/17/87 U) :l' a o .~
~ :J fjt
~ o q
[ ~
~ ~ Q.
lr !i1 '<
~ ... ::n 3 o ~
Initial Plant Conditions
Cold shutdown.
Cold Shutdown. . On shutdown
cooling in one RHR loop, reactor water clean up (CUW) system out for maintenance.
Event Description
The RPV level decreased 35.56 cm (14 inches) in two related events. The shutdown cooling suction valve was stroked as a maintenance check but some vent and drain valves in the loop were also open, when the SOC suction valve was open the RPV drained 12.7 cm (5 inches). The operator isolated SOC to stop the flow but when the loop was returned to service an additional 22.86 em (9 inches) were drained from the RPV into the partially empty RHR loop.
After isolating RCW the RPV level began to increase. Operators attempted to reduce level by draining to the suppression pool using the RHR system test return valve [350A (14-inch) valvel. This resulted in rapid decrease in RPV to low level setpoint and an automatic RPV isolation.
Reported Cause
Operator error in misaligning AHA valves.
Operator error in not following approved procedure for draining the APV.
Applicable ABWR Feature
ABWA procedures will highlight AHA system valve alignments during maintenance. The keep fill pump and pressure alarm assures a full loop.
ABWR RHR valves are interlocked to prevent SOC suction and injection valves from being open at the same time as the suppression pool return valves.

~ Table 19QC-2 Decay Heat Removal Precursors (Continued) :t. <b
~. Event Category: losses or Degradation of RHRs Due to Loss of Coolant from Reactor Vessel Dol
~ i 0 ..... Plant Initial Plant ~
;:, LER/date Conditions Event Description Reported Cause Applicable ABWR Feature ~.
~ Fermi 2 Hot Shutdown SOC loop was being put in service but Operator error in placing ABWR RHR system keep fill ;:, .. 3/17/87 following loop normal loop heatup alignment could not SOC loop in service using alarm would alert operator to a C/)
~
~ test, one RHR be used because one valve would not unappro'ved procedure. partially drained loop condition. loop inoperable. open [600A (24-inch) testable check valve).
~ A smaller [25A (1-inch)) valve was used to ~ fill the loop but the normal100A (4-inch) ;:, drain line caused drainage faster than the ~ ITt 25A (1-inch) line could fill the loop. This ib" ~ drained the loop but the operator could ~. not tell. When proper SOC loop !!!. ti' temperature was reached the operator
~ opened the SOC suction valve to the RPV -. and RPV level decreased to the low level II> ;:,
setpoint and RPV isolation occurred. ~ Q. I:l :0: <b
Fermi 2 Cold Shutdown. During the process of shifting SOC from Operator error in not ABWR RHR suppression pool C)
~ "'< 8/2/87 SOC on Division .Division II to Division I, a RPV low level following proper suction and SOC suction valves ~ II> II. signal occurred because valves were procedure placing SOC in are interlocked to prevent .. ::0 misaligned resulting in an open flow path' service. inadvertent RPV drainage. <b
3 to the suppression pool from the RPV. 0
[ WNP-2 Cold Shutdown While returning from SOC to standby low Operator error in not Suppression pool suction valve· 5/7/85 in SOC. pressure injection mode of RHR, the knowing that stroke time cannot be opened until SOC
operator opened the suppression pool for each valve is 90-100 suction valve is fully closed. b
suction valve before the SOC suction valve seconds. ~ was fully closed. This opened a drain path cQ'
::a from the RPV to the suppression pool ~ resulting in a low RPV and SOC isolation. !
Shoreham Cold Shutdown While returning one RHR loop to standby, See WNP-2 See WNP-2 -b 7/26/85 both RHR loops operator opened suppression pool suction 5/7/85. 5/7/85.
Q n
in SDC mode. valve while SOC suction valve was i .... partially open (see WNP-2 5/7/85) . II IQ
~ 0 C')
~ ... ~
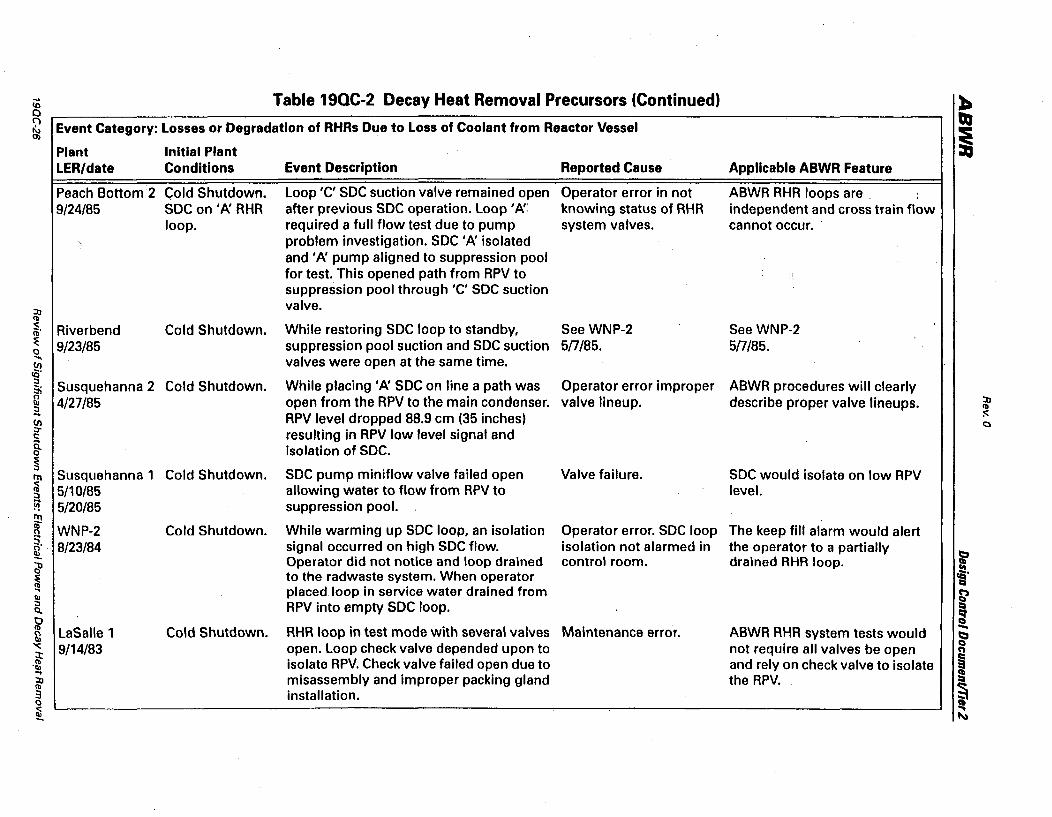
-- Table 19QC-2 Decay Heat Removal Precursors (Continued) ~ 10 0 QI 2 Event Category: Losses or Degradation of RHRs Due to Loss of Coolant from Reactor Vessel 0) i Plant Initial Plant
LER/date Conditions Event Description Reported Cause Applicable ABWR Feature
Peach Bottom 2 Cold Shutdown. Loop 'C' SOC suction valve remained open Operator error in not ABWR RHR loops are , 9/24/85 SOC on 'p\ RHR after previous SOC operation. Loop' P\ knowing status of RHR independent and cross train flow
loop. required a full flow test due to pump system valves. cannot occur. . problem investigation. SOC 'P\ isolated and' P\ pump aligned to suppression pool for test. This opened path from RPV to : ~
suppression pool through 'C' SOC suction
::u valve. III < Riverbend Cold Shutdown. While restoring SOC loop to standby, See WNP-2 See WNP-2 lb' ~ 9/23/85 suppression pool suction and SOC suction 5n/85. 5n/85. 0 .... valves were open at the same time. (J')
<Q' :J Susquehanna 2 Cold Shutdown. While placing 'P\ SOC on line a path was Operator error improper ABWR procedures will clearly ~ !;l 4/27/85 open from the RPV to the main condenser. valve lineup. describe proper valve lineups. ::u :J III .. RPV level dropped 88.9 cm (35 inches) :<: (J') 0 :r resulting in RPV low level signal and c: .. Q. isolation of SOC. 0
~ Susquehanna 1 Cold Shutdown. SOC pump miniflow valve failed open Valve failure. SOC would isolate on low RPV III
~ 5/10/85 allowing water to flow from RPV to level. :J
!iT 5/20/85 suppression pool. ~ WNP-2 Cold Shutdown. While warming up SOC loop, an isolation Operator error. SOC loop The keep fill alarm would alert 0 ~
[ 8/23/84 signal occurred on high SOC flow. isolation not alarmed in the operator to a partially ~
d' Operator did not notice and loop drained control room. drained RHR loop. = ~ to the radwaste system. When operator .a' ::::Ii ., placed loop in service water drained from ~ Qj :J RPV into empty SOC loop. ::::Ii Q.
~ ~ LaSalle 1 Cold Shutdown. RHR loop in test mode with several valves Maintenance error. ABWR RHR system tests would -!;l ~ "< 9/14/83 open. Loop check valve depended upon to not require all valves be open Q
n :t ~ III isolate RPV. Check valve failed open due to and rely on check valve to isolate "Qj .. misassembly and improper packing gland the RPV. ~ ::u
III
~ 3 installation. 0
~ ~

~ Table 19QC-2 Decay Heat Removal Precursors (Continued) ~, ~ Event Category: Losses or Degradation of RHRs Due to Loss of Coolant from Reactor Vessel o ..... ~ Plant :J LER/date
~ :J ... til :J'
~ ~ ~ :J
it!
[ ~, ~
~ ~ ... Q) :J Q.
~ £ "<:
[ ... :0 Ib
3 o ~
Brunswick 2 S/24/84
Pilgrim 81-064 December 21, 1981
Initial Plant Conditions
Cold Shutdown.
Mode 5, Refueling RHRS in operation. Coolant temperature at 294 K (70°F).
Event Description
Operator attempted to lower s.uppression pool level to radwaste but loop was in SOC mode and resulted in water diversion from RPV to radwaste.
While performing maintenance on a feeder transformer, a live transfer of power was attempted. Mal-operation of a power breaker de-energized a vital instrument panel, causing two shutdown cooling valves (MO-47 and MO-48) to close on receipt of a reactor high pressure isolation signal. The 'c' RHRS pump should have tripped Immediately when its suction valves shut, but failed to do so. After about 5 hours, when the process computer was returned to service, abnormal heat exchanger temperatures alerted operatorS to a problem. At this time, the 'c' RHRS pump was observed to be running with both suction valves shut. The 'c' pump was tripped, the valves opened, and the '/I: pump started to restore shutdown cooling.
Reported Cause
Operator error.
Electrical contacts in the pump trip logic were corroded to the extent that they seized in the open position. 'c' RHRS pump; therefore did not trip when the suction valves left their full open position. Inadequacies in the implementation of administrative controls for shift turnover, valve lineup checks, and board checks aggravated the situation. Extensive maintenance activities distracted operators.
Applicable ABWR Feature'
RHR system drain to the radwaste system contains two valves in series that automatically close on low RPV level.
See Peach Bottom 3 (1/8nS) and LaSalle 1 (6/11/82).

.... Table 19QC-2 Decay Heat Removal Precursors (Continued) ~ CD 0 QJ (")
Event Category: losses or Degradation of RHRs Due to loss of Coolant from Reactor Vessel ~
~ Cl6
Plant Initial Plant lER/date Conditions Event Description Reported Cause Applicable ABWR Feature
Susquehanna 1 Mode 4, Cold The AHAS was operating in the shutdown The Aeactor Protection Loss of power does nO,t cause 83-030 Shutdown. AHAS cooling mode. A Division I isolation signal System (RPS) was isolation of SOC in the ABWR February 16, in operation on to the inboard isolation valve to the RHRS operating on alternate design. The multiplexed safety 1983 100p'l\. caused a loss of shutdown cooling. The power supplies while the system logic will only cause
system was reestablished by resetting the APS MG set was isolation if a valid isolation signals. A second occurrence was ' undergoing condition existed. experienced within an hour. maintenance. Spurious
::n trips of the RPS alternate Ib power supply breakers <: (b' caused isolation signals. :lE 0 " .... Susquehanna 1 Mode 4, Cold An RPS actuation caused AHA loop 'B' RPS actuation caused by See Susquehanna 1 (2/16/83) . ~ ::. 83-060 Shutdown. RHR operating in the shutdown cooling mode an inadvertent breaker ~ 'April 11, in operation on to isolate. RHR pump '0' tripped twice on trip (bumped by a ::n II> ;a 1983 loop 'B'. attempts to restart. RHA cooling was construction worker). Ib
~ (J) established again on loop 'B' using pump The restart trips are I:) ::r c::
'B'. believed to be due to a a 0 faulty shutdown cooling ~ 111 flow switch. ~
Following electrical maintenance during The power supply fuses ::. Grand Gulf Mode 4, Cold ABWR solid state logic !iT ~
83-069 Shutdown. which some shutdown cooling motor- to the isolation logic had minimizes use of fuses and logic
~ May 23, (During initial operated valves were blocked open, not been replaced testing is easier such that these ~, 1983 plant startup power was restored, and the valves were following completion of types of operator errors will be
t:I !!!.. phase). unblocked. The valves isolated as a result a design change. reduced. = cl'
~ of a previously existing isolation signal cQ' ::t
'" from the valve isolation logic, causing a ~ II> ;:, loss of both shutdown cooling loops. ! Q. 0 Ib -0 t:I II> Q "<: n l:: ~ Ib II> .... ~ ::n Ib
~ 3 0
~ ~
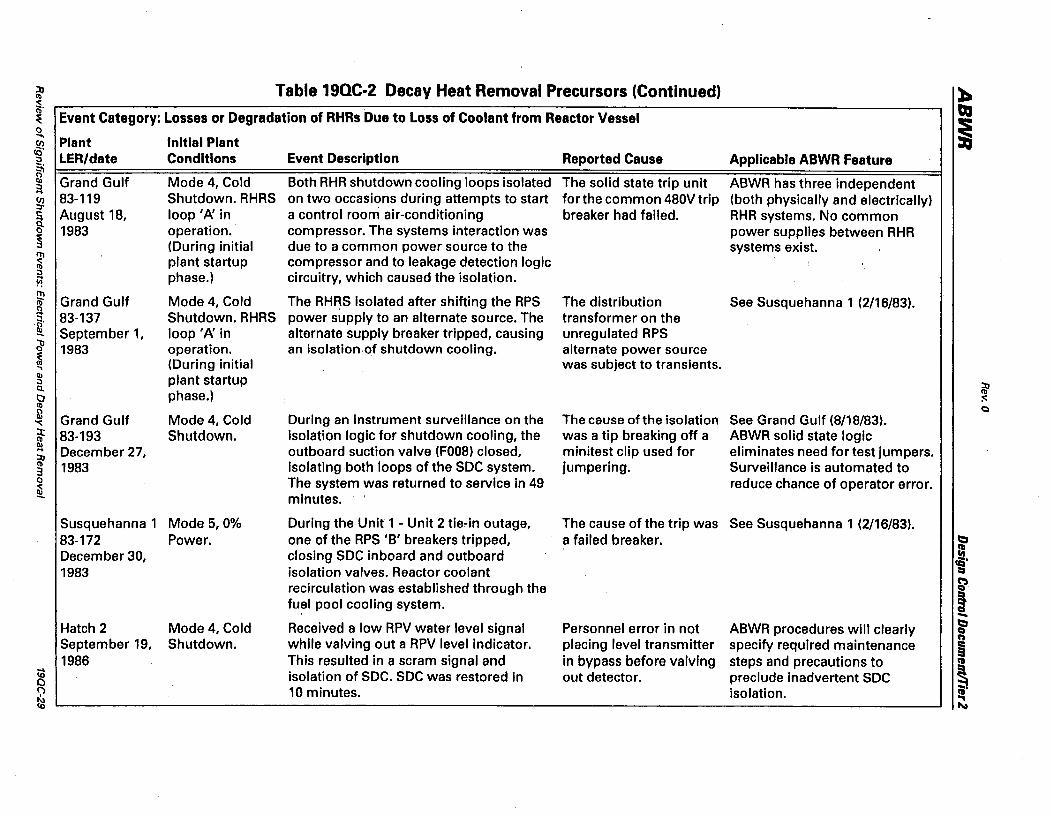
~ Table 19QC-2 Decay Heat Removal Precursors (Continued) :b ~.
Event Category: Losses or Degradation of RHRsDue to Loss of Coolant from Reactor Vessel QI
~ i 0 .... Plant Initial Plant (J)
eg' LER/date Conditions Event Description Reported Cause Applicable ABWR Feature
~ Grand Gulf Mode 4, Cold Both RHR shutdown cooling loops isolated The solid state trip unit ABWR hasthree independent ::J ... 83-119 Shutdown. RHRS on two occasions during attempts to start for the common 480V trip (both physically and electrically) (J)
::J' August 18, loop' />\ in a control room air-conditioning breaker had failed. RHR systems. No common
~ 1983 operation. compressor. The systems interaction was power supplies between RHR ~ (During initial due to a common power source to the systems exist. I'T1 ~ plant startup compressor and to leakage detection logic ::J phase.) circuitry, which caused the isolation. ~
~ Grand Gulf Mode 4, Cold The RHRS Isolated after shifting the RPS The distribution See Susquehanna 1 (2/16/83). 14 83-137 Shutdown. RHRS power supply to an alternate source. The transformer on the .~. ~ September 1, loop '/>\ in alternate supply breaker tripped, causing unregulated RPS cl' 1983 operation. an isolation ·of shutdown cooling. alternate power source ~ (During initial was subject to transients. '"' III plant startup ::J
~ Cl. phase.) 0 :0;
(1) <:)
tl Grand Gulf Mode 4, Cold During an instrument surveillance on the The cause of the isolation See Grand Gulf (8/18/83). '<: ::x: 83-193 Shutdown. isolation logic for shutdown cooling, the was a tip breaking off a ABWR solid state logic (1) III
December 27, outboard suction valve (F008) closed, minitest clip used for eliminates need for test jumpers. ... ::0 (1) 1983 isolating both loops of the SOC system. jumpering. Surveillance is automated to 3 0 The system was returned to service in 49 reduce chance of operator error. ~ minutes.
Susquehanna 1 Mode 5,0% During the Unit 1 - Unit 2 tie"in outage, The cause of the trip was See Susquehanna 1 (2/16/83). 83-172 Power. one of the RPS 'B' breakers tripped, a failed breaker. t:I
December 30, closing SOC inboard and outboard = IQ' 1983 isolation valves. Reactor coolant =a
recirculation was established through the ~.
fuel pool cooling system. ~ -Hatch 2 Mode 4, Cold Received a low RPV water level signal Personnel error in not ABWR procedures will clearly t:I Q fa
September 19, Shutdown. while valving out a RPV level indicator. placing level transmitter specify required maintenance ~ 1986 This resulted in a scram signal and in bypass before valving steps and precautions to ! - isolation of SOC. SOC was restored in out detector. preclude inadvertent SOC CD
0 <;1 10 minutes. isolation. ii' ... ~ I\J
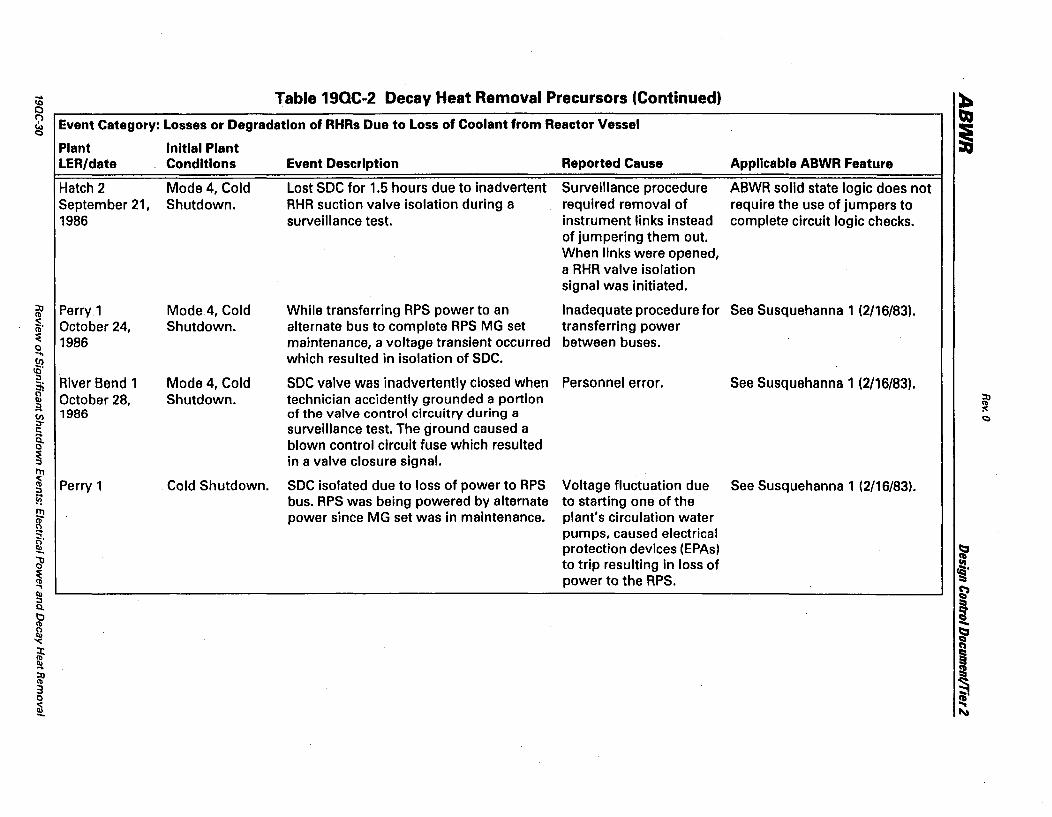
... Table 19QC-2 Decay Heat Removal Precursors (Continued) :b 10 0
~ <;'> Event Category: Losses or Degradation of RHRs Due to Loss of Coolant from Reactor Vessel ~ i Plant Initial Plant LER/date Conditions Event Description Reported Cause Applicable ABWR Feature
Hatch 2 Mode 4, Cold Lost SOC for 1.5 hours due to inadvertent Surveillance procedure ABWR solid state logic does not September 21, Shutdown. RHR suction valve isolation during a required removal of require the use of jumpers to 1986 surveillance test. instrument links instead complete circuit logic checks.
of jumpering them out. When links were opened, a RHR valve isolation signal was initiated.
~ Perry 1 Mode 4, Cold While transferring RPS power to an Inadequate procedure for See Susquehanna 1 (2/16/83). Cb <: October 24, Shutdown. alternate bus to complete RPS MG set transferring power (b'
~ 1986 maintenance, a voltage transient occurred between buses. 0 .... which resulted in isolation of SOC. (/)
to' :::. River Bend 1 Mode 4, Cold SOC valve was inadvertently closed when Personnel error. See Susquehanna 1 (2/16/83). ~ g October 28, Shutdown. technician accidently grounded a portion ~ ~ 1986 of the valve control circuitry during a :0: C/) <:) ::T surveillance test. The ground caused a t:: ... 0.. blown control circuit fuse which resulted 0
~ rn
in a valve closure signal.
~ Perry 1 . Cold Shutdown. SOC isolated due to loss of power to RPS Voltage fluctuation due See Susquehanna 1 (2/16/83). :::. ~ bus. RPS was being powered by alternate to starting one of the rn power since MG set was in maintenance. plant's circulation water ib ~ pumps, caused electrical [ protection devices (EPAs) b d' to trip reSUlting in loss of ~ ~ cii'
power to the RPS. :::i .., ~ III
:::.
~ 0.. tJ Cb
~ ~ '< l: a '" !i ~ !I ::Q Cb
~ 3 0
~ .. I\l
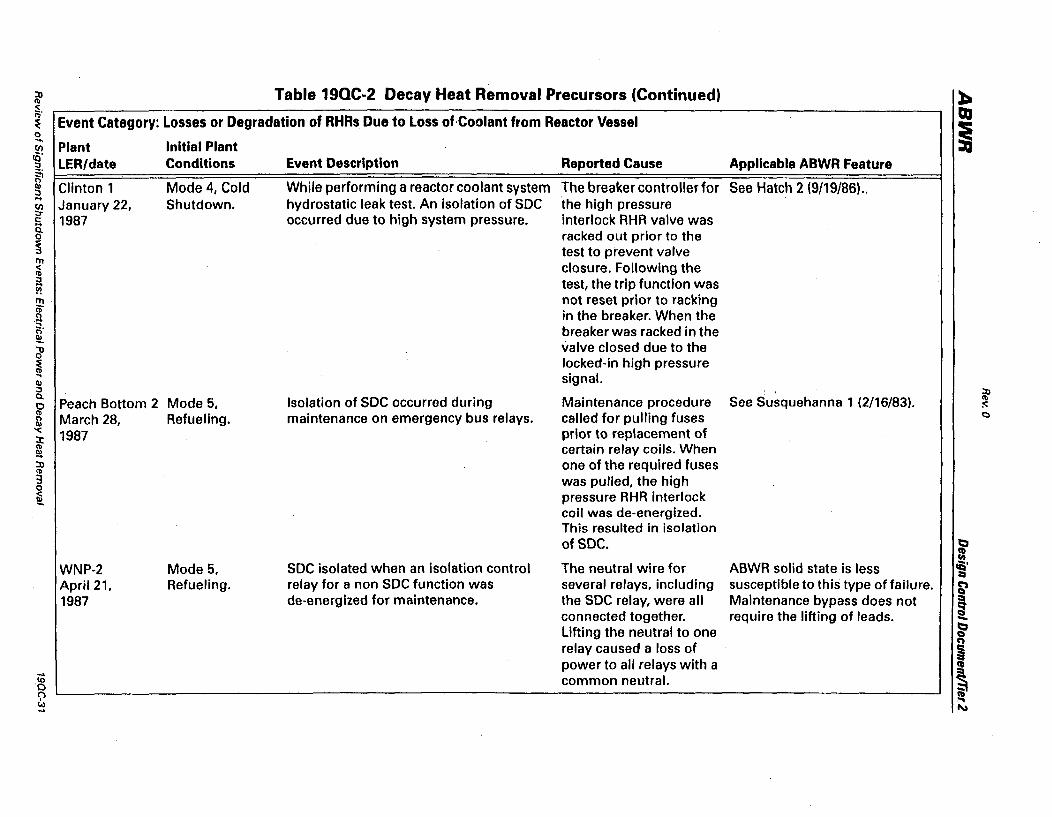
:n Table 19QC-2 Decay Heat Removal Precursors (Continued) ). <b S. CO <b
Event Category: Losses or Degradation of RHRs Due to Loss of·Coolant from Reactor Vessel ~ i 0 ~
Plant Initial Plant f./)
cO' LER/date Conditions Event Description Reported Cause Applicable ABWR Feature :J
~ Clinton 1 Mode 4, Cold While performing a reactor coolant system The breaker controller for See Hatch 2 (9/19/86) .. Q)
:;, ... January 22, Shutdown. hydrostatic leak test. An isolation of SOC the high pressure f./)
:r 1987 occurred due to high system pressure. interlock RHR valve was ~
0.. racked out prior to the 0
~ test to prevent valve ITt < closure. Following the <b :J test, the trip function was ... !'!
~ not reset prior to racking .!l in the breaker. When the 5' breaker was racked inthe ~
valve closed due to the a' ~ locked-in high pressure <b ... signal. Q) ::I
~ 0.. Peach Bottom 2 Mode 5, Isolation of SOC occurred during Maintenance procedure See Susquehanna 1 (2/16/83). I:) :c;
<b March 28, Refueling. maintenance on emergency bus relays. called for pulling fuses c
~ Q)
'< 1987 prior to replacement of J: <b certain relay coils. When ~ :n one of the required fuses <b
3 was pulled, the high 0
~ pressure RHR interlock coil was de-energized. This resulted in isolation of SDC. t::J ::
WNP-2 Mode 5, SOC isolated when an isolation control The neutral wire for ABWR solid state is less cQ' :::a
April 21, Refueling. relay for a non SOC function was several relays, including susceptible to this type of failure. ~ 1987 de-energized for maintenance. the SOC relay, were all Maintenance bypass does not §
connected together. require the lifting of leads. -lifting the neutral to one t::J CI
relay caused a loss of CO)
~ power to all relays with a ..
:::a ... common neutral. ~
CD '0 t;'l ~ w ~ ...
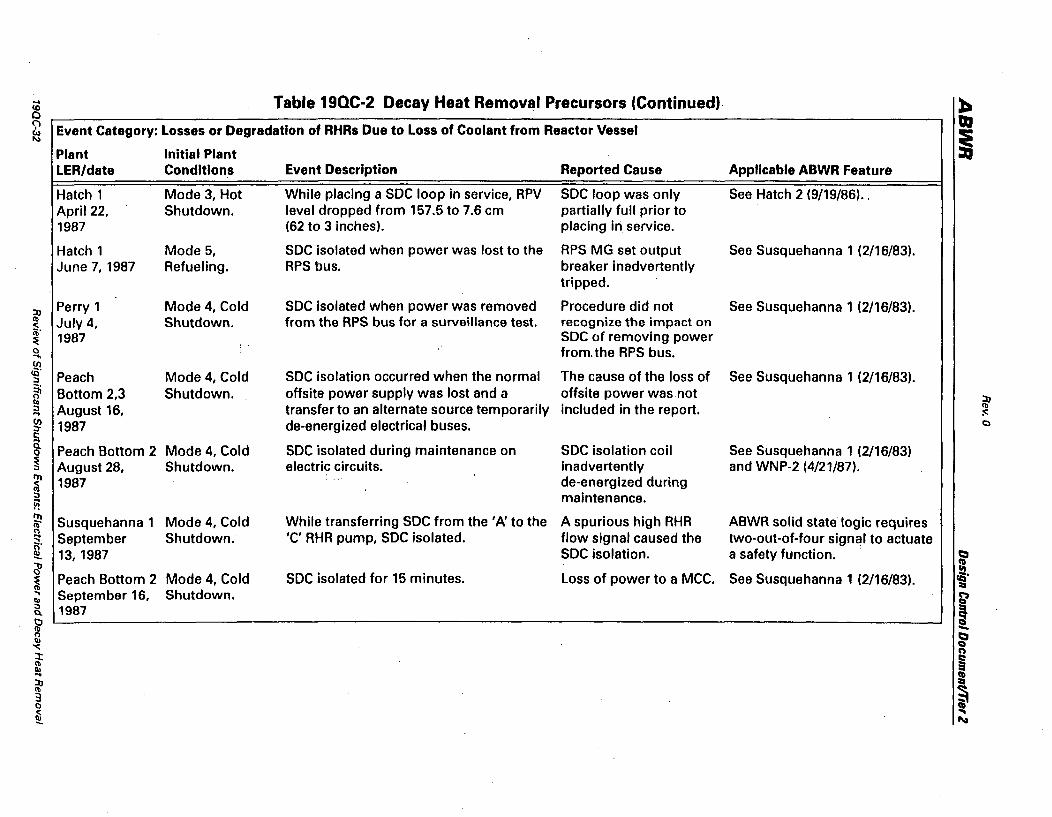
- Table 19QC-2 Decay Heat Removal Precursors (Continued) l=-eo 0 QI <;') Event Category: Losses or Degradation of RHRs Due to Loss of Coolant from Reactor Vessel ~ i Plant Initial Plant
LER/date Conditions Event Description Reported Cause Applicable ABWR Feature
Hatch 1 Mode 3, Hot While placing a SOC loop in service, RPV SOC loop was only See Hatch 2 (9119/86). , April 22, Shutdown. level dropped from 157.5 to 7.6 cm partially full prior to 1987 (62 to 3 inches). placing in service.
Hatch 1 Mode 5, SOC isolated when power was lost to the RPS MG set output See Susquehanna 1 (2/16/83). June 7, 1987 Refueling. RPS bus. breaker inadvertently
tripped.
::Q Perry 1 Mode 4, Cold SOC isolated when power was removed Procedure did not See Susquehanna 1 (2/16/83). <II July 4, Shutdown. from the RPS bus for a surveillance test. recognize the impact on < (b'
1987 SOC of removing power ~ 0 from. the RPS bus. .... ~ Peach Mode 4, Cold SOC isolation occurred when the normal The cause of the loss of See Susquehanna 1 (2/16/83). ::J
~ Bottom 2,3 Shutdown. offsite power supply was lost and a offsite power was not ::Q Ql ::J August 16, transfer to an alternate source temporarily included in the report. Ib ... ~
~ 1987 de-energized electrical buses. 0
~ Peach Bottom 2 Mode 4, Cold SOC isolated during maintenance on SOC isolation coil See Susquehanna 1 (2116/83) 0
~ August 28, Shutdown. electric circuits. inadvertently and WNP-2 (4/21/87). III 1987 de-energized during ~ ::J maintenance. !i! ~ Susquehanna 1 Mode 4, Cold While transferring SOC from the' Pi to the A spurious high RHR ABWR solid state logic requires ~ September Shutdown. 'c' RHR pump, SOC isolated. flow signal caused the two-out-of-four signal to actuate [ 13, 1987 SOC isolation. a safety function. c:::. ~ a ~ Peach Bottom 2 Mode 4, Cold SOC isolated for 15 minutes. Loss of power to a MCC. See Susquehanna 1 (2116/83). ca' ::I ., September 16, Shutdown. ~ II> ::J 1987 ~ Q..
\;) Ib -Q c:::. -c: Q
n J:
~ Ib Ql ... III ::Q :::. Ib
~ 3 0
~ ~
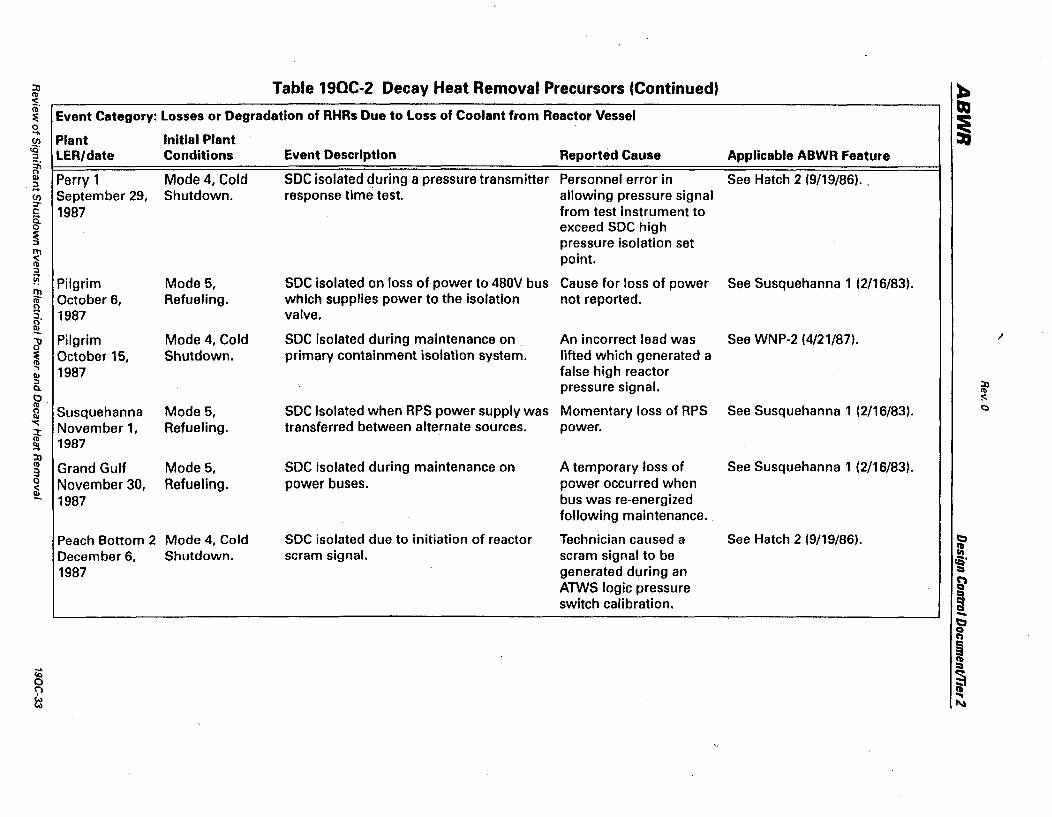
::n Table 190C-2 Decay Heat Removal Precursors (Continued) :b ~ <: QJ ib'
Event Category: Losses or Degradation of RHRs Due to Loss of Coolant from Reactor Vessel :E i 0 .."
Plant Initial Plant Ul cO'
LER/date Conditions Event Description Reported Cause Applicable ABWR Feature ::J
~ Mode 4, Cold SOC isolated during a pressure transmitter Personnel error in See Hatch 2 (9119/86). , III Perry 1 .~
September 29, Shutdown. response time test. allowing pressure signal Ul ::T
1987 from test instrument to c: 8. 0 exceed SOC high :E
.::J pressure isolation set ITt ;§ point. ::J
~ Pilgrim Mode 5, SOC isolated on loss of power to 480V bus Cause for loss of power See Susquehanna 1 (2/16/83). ~ October 6, Refueling. which supplies power to the Isolation not reported. 0 t:: 1987 valve. 0' ~
Pilgrim Mode 4, Cold SOC isolated during maintenance on An incorrect lead was See WNP-2 (4/21/87). " d' ~ October 15, Shutdown. primary containment isolation system. lifted which generated a ... 1987 false high reactor QI ::J pressure signal. :n Q. ~
~. :::
2 Susquehanna Mode 5, SOC isolated when RPS power supply was Momentary loss of RPS See Susquehanna 1 (2/16/83). <::)
'<: November 1, Refueling. transferred between alternate sources. power. ::t ~ 1987 QI ... ::n (b Grand Gulf Mode 5, SOC isolated during maintenance on A temporary loss of See Susquehanna 1 (2116/83). 3 0 November 30, Refueling. power buses. power occurred when ~ 1987 bus was re-energized
following maintenance.
Peach Bottom 2 Mode 4, Cold SOC isolated due to initiation of reactor Technician caused a See Hatch 2 (9/19/86). t;,
December 6, Shutdown. scram signal. scram signal to be ~ cQ'
1987 generated during an :::a
ATWS logic pressure ~ switch calibration. ~ -t;,
0 C')
~ III
<;; l::I
0 ~ <;"l ~
f:l ~
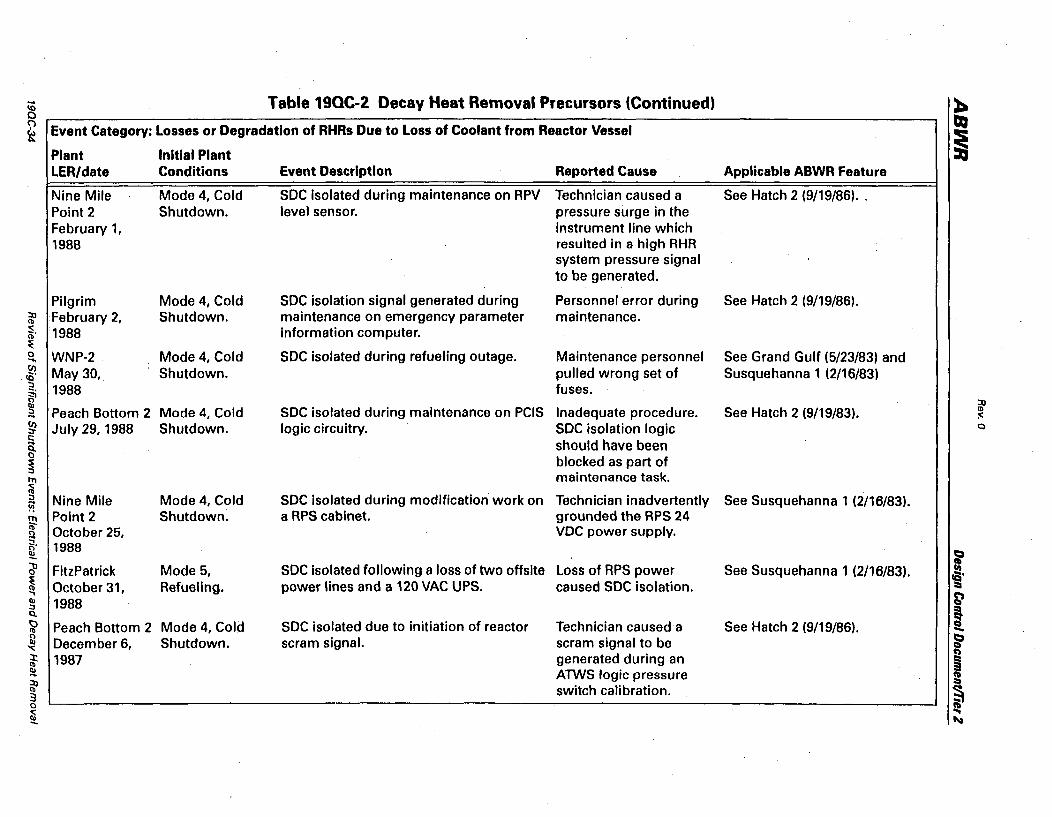
.... Table 19QC-2 Decay Heat Removal Precursors (Continued) ~ 10 0 IX» <;"l Event Category: Losses or Degradation of RHRs Due to Loss of Coolant from Reactor Vessel ~ ~ Plant Initial Plant
LER/date Conditions Event Description Reported Cause Applicable ABWR Feature
Nine Mile Mode 4, Cold SOC isolated during maintenance on RPV Technician caused a See Hatch 2 (9/19/86). , Point 2 Shutdown. level sensor. pressure surge in the February 1, instrument line which 1988 resulted in a high RHR
system pressure signal to be generated.
Pilgrim Mode 4, Cold SOC isolation signal generated during Personnel error during See Hatch 2 (9/19/86). :n February 2, Shutdown. maintenance on emergency parameter maintenance. <1> c:: (b' 1988 information computer. ~ 0 WNP-2 Mode 4, Cold SOC isolated during refueling outage. Maintenance personnel See Grand Gulf (5/23/83) and .... (J)
May 30,. Shutdown. pulled wrong set of Susquehanna 1 (2{16{83) lQ' ~ 1988 fuses. ~ :n ;:) Peach Bottom 2 Mode 4, Cold SOC isolated during maintenance on PCIS Inadequate procedure. See Hatch 2 (9/19{83). <1> ... :c (J) July 29, 1988 Shutdown. logic circuitry. SOC isolation logic C) :r c:
should have been a 0
blocked as part of ~ III maintenance task. ~
SOC isolated during modification work on ;:) Nine Mile Mode 4, Cold Technician inadvertently See Susquehanna 1 (2/16{83). !i! III Point 2 Shutdown. a RPS cabinet. grounded the RPS 24 ib October 25, VDC power supply. I') ... ~. 1988 1::1 ~
~ FitzPatrick Mode 5, SOC isolated following a loss of two offsite Loss of RPS power See Susquehanna 1 (2/16/83). ~ rQ'
~ October 31, Refueling. power lines and a 120 VAC UPS. caused SOC isolation. l::i ., ~ III 1988 ;:)
! Q.
~ Peach Bottom 2 Mode 4, Cold SOC isolated due to initiation of reactor Technician caused a See Hatch 2 (9/19/86). -£ December 6, Shutdown. scram signal. scram signal to be 1::1
'" Q n
l: 1987 generated during an ~ <1> III ATWS logic pressure ...
~ :n <1> switch calibration. 3 0
~ .. ~
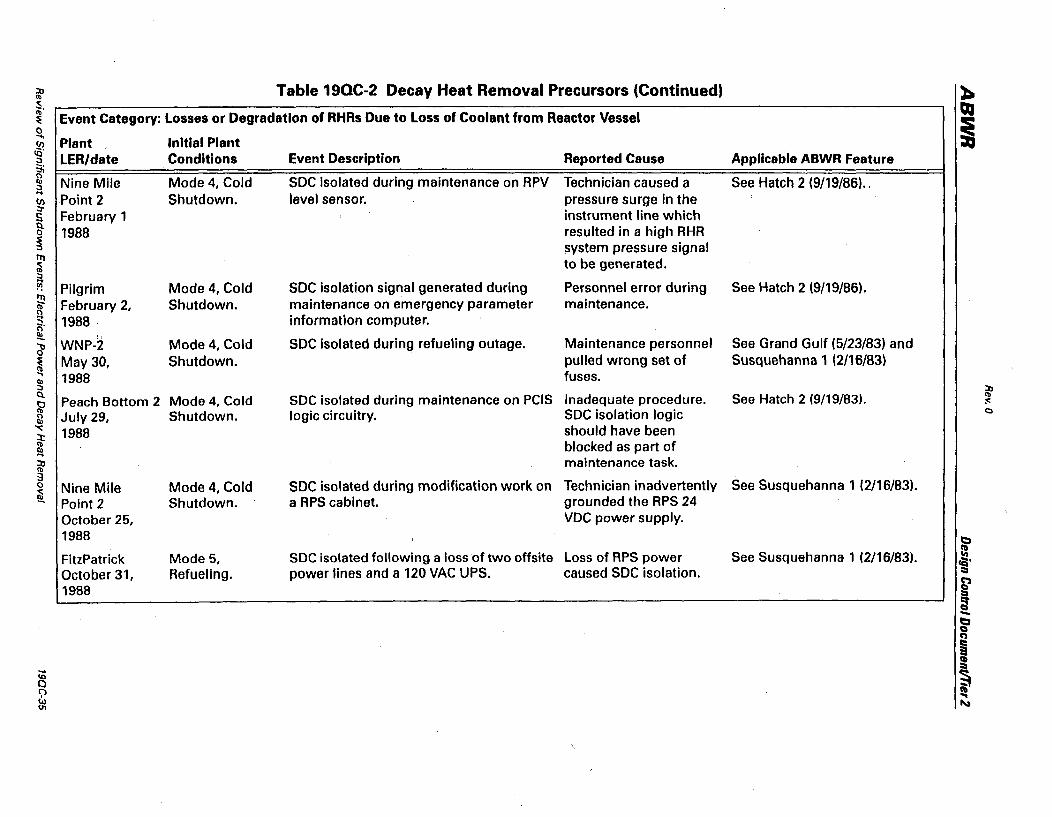
:n Table 19QC-2 Decay Heat Removal Precursors (Continued) ~ <II
~. Event Category: Losses or Degradation of RHRs Due to loss of Coolant from Reactor Vessel
QJ ~ i (:) .....
Plant Initial Plant ~ ::J lER/date Conditions Event Description Reported Cause Applicable ABWR Feature
~ Nine Mile Mode 4, Cold SOC isolated during maintenance on RPV Technician caused a See Hatch 2 (9/19/86) .. ::J ... Point 2 Shutdown. level sensor. pressure surge in the !/)
::Jo February 1 instrument line which a
0 1988 resulted in a high RHR ~ system pressure signal III '<: to be generated. <II :::J
fir Pilgrim Mode 4, Cold SOC isolation signal generated during Personnel error during See Hatch 2 (9/19/86). !!! February 2, Shutdown. maintenance on emergency parameter maintenance. <II C') ... 1988 . information computer . ~. ~
WNP-2 Mode 4, Cold SOC isolated during refueling outage. Maintenance personnel See Grand Gulf (5/23/83) and ~ ~ May 30, Shutdown. pulled wrong set of Susquehanna 1 (2/16/83) ..,
1988 fuses . Cb :::J ~ Cl.
Peach Bottom 2 Mode 4, Cold SOC isolated during maintenance on PCIS Inadequate procedure. See Hatch 2 (9/19/83). 0 :<: <II
July 29, Shutdown. logic circuitry. SOC isolation logic c Q '< 1988 should have been l: <II blocked as part of ~ :n <II
maintenance task. 3
SOC isolated during modification work on Technician inadvertently See Susquehanna 1 (2/16/83). 0 Nine Mile Mode 4, Cold ~ Point 2 Shutdown. a RPS cabinet. grounded the RPS 24
October 25, VOC power supply. 1988
~ FitzPatrick Mode 5, SOC isolated following a loss of two offsite Loss of RPS power See Susquehanna 1 (2/16/83). Iii' October 31, Refueling. power lines and a 120 VAC UPS. caused SOC isolation. =:.
1988 ~
! -b Q n ~ ~ ....
<.0
~ Q ';)
~ ~

- Table 190C-2 Decay Heat Removal Precursors (Continued) ~ CQ 0
~ c;1 Event Category: Losses or Degradation of RHRs Due to Loss of Coolant from Reactor Vessel w i Ol
Plant Initial Plant LER/date Conditions Event Description Reported Cause Applicable ABWR Feature
FitzPatrick Mode 5, SOC pump stopped when SOC isolation Momentary loss of See Susquehanna 1 (2/16/83). November 9, Refueling. valve left its open position. power to RPS caused 1988 SOC valve to start
closing. Interlock of SOC isolation valve and pump caused control breaker to open.
:\) Fermi 2 Mode 4, Cold SOC isolated when Oiv. 1 ESF power was Loss of power cause not See Susquehanna 1 (2/16/83). Ib
~. January 10, Shutdown. lost. reported. :Ii 1989 0 .... (J)
Clinton Mode 5, SOC isolated during testing of RCIC logic. While attempting to See Grand Gulf (5/23/83) and 1Cj' :J January 10, Refueling. jumper out the SOC Susquehanna 1 (2116/83). ~ III 1989 " isolation signal, a ~ :J ... technician inadvertently :0: CI) a ;:,- grounded the RPV low c: a level circuit. This caused 0
~ a fuse to blow and SOC fT1 to isolate. ~ :J
P! Nine Mile Point Mode 4, Cold SOC isolated during a surveillance test of Test procedure specified See Hatch 2 (9/19/86). W January 22, Shutdown. the reactor building high temperature the wrong isolation ~ 1989 isolation signal. signal be actuated. [
Mode 4, Cold During performance of a surveillance test, Procedural error. leads See Hatch 2 (9/19/86) and t::I
d' Hope Creek a ~ March 1, Shutdown. the SOC injection valve closed resulting in were lifted to allow Hatch 2 (9/21/86). ca· ::a ., 1989 a loss of SOC. completion of RHR logic ~ III :J test without valve ! Q. I:) actuations. The lead for Ib -0
the RHR injection valve t::I III Q '<: ~ :::t: was inadvertently left off ~ Ib ~ the list of leads to be
= :\) Ib lifted. § 3 0 ~ ~ ~
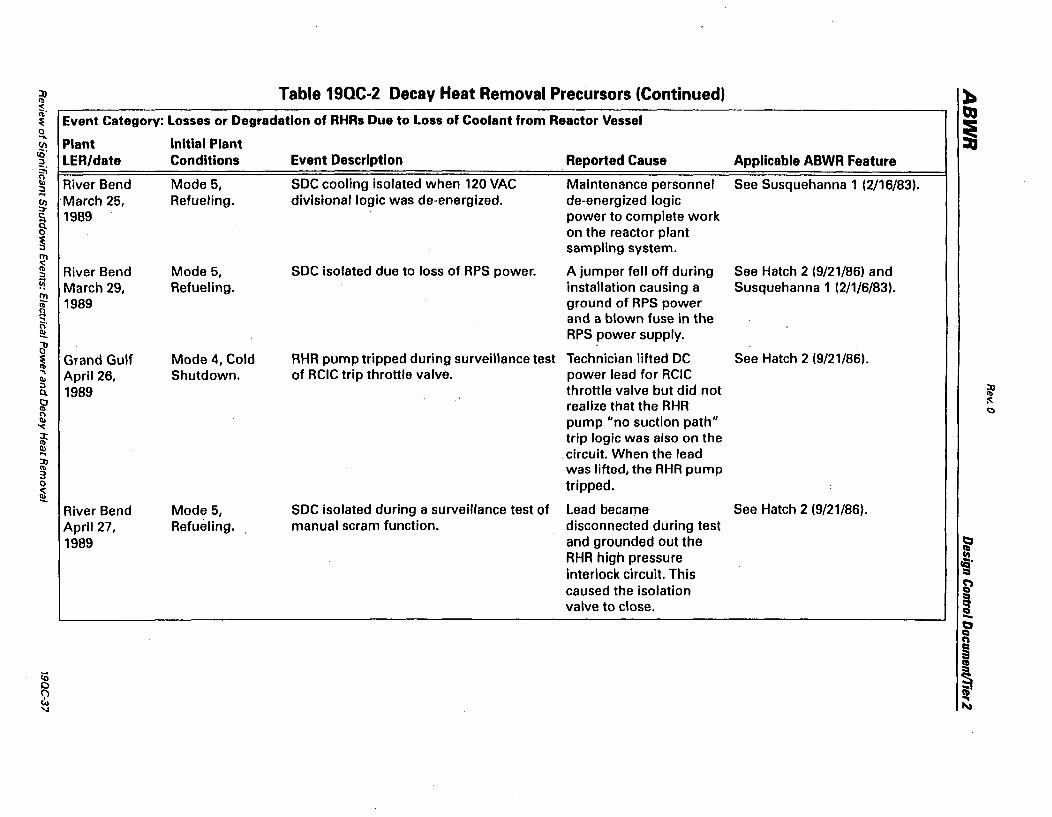
:0 Table 19QC-2 Decay Heat Removal Precursors (Continued) :b Cb
~" Event Category: Losses or Degradation of RHRs Due to Loss of Coolant from Reactor Vessel QI
~ i 0 .... Plant Initial Plant (J)
10" LER/date Conditions Event Description Reported Cause Applicable ABWR Feature :3 .:;; !;l River Bend Mode 5, SOC cooling isolated when 120 VAC Maintenance personnel See Susquehanna 1 (2/16/83). :J ...
March 25, Refueling. divisional logic was de-energized. de-energized logic g!
a 1989 power to complete work 0 on the reactor plant ~ sampling system. ~ River Bend Mode 5, SOC isolated due to loss of RPS power. A jumper fell off during See Hatch 2 (9/21/86) and :3
Y! March 29, Refueling. installation causing a Susquehanna 1 (2/1/6/83). !!! 1989 ground of RPS power Cb
~" and a blown fuse in the ~ RPS power supply. dJ ~ Grand Gulf Mode 4, Cold RHR pump tripped during surveillance test Technician lifted OC See Hatch 2 (9/21/86). .,
April 26, Shutdown . of RCIC trip throttle valve. power lead for RCIC III :3
1989 throttle valve but did not ::0 Q. Cb
0 realize that the RHR :<: Ib C) 0 III pump "no suction path" '< :J: trip logic was also on the Cb III circuit. When the lead ... ::0 Cb was lifted, the RHR pump :3 0 tripped. ~
River Bend Mode 5, SOC isolated during a surveillance test of Lead became See Hatch 2 (9/21/86). April 27, Refueling. manual scram function. disconnected during test 1989 and grounded out the t:I
RHR high pressure ~ cQ'
interlock circuit. This :::a
caused the isolation ~ valve to close. ~ -t:I
Q C'l
~ ttl
~ :::a
0 ~ 2 'J 1\11
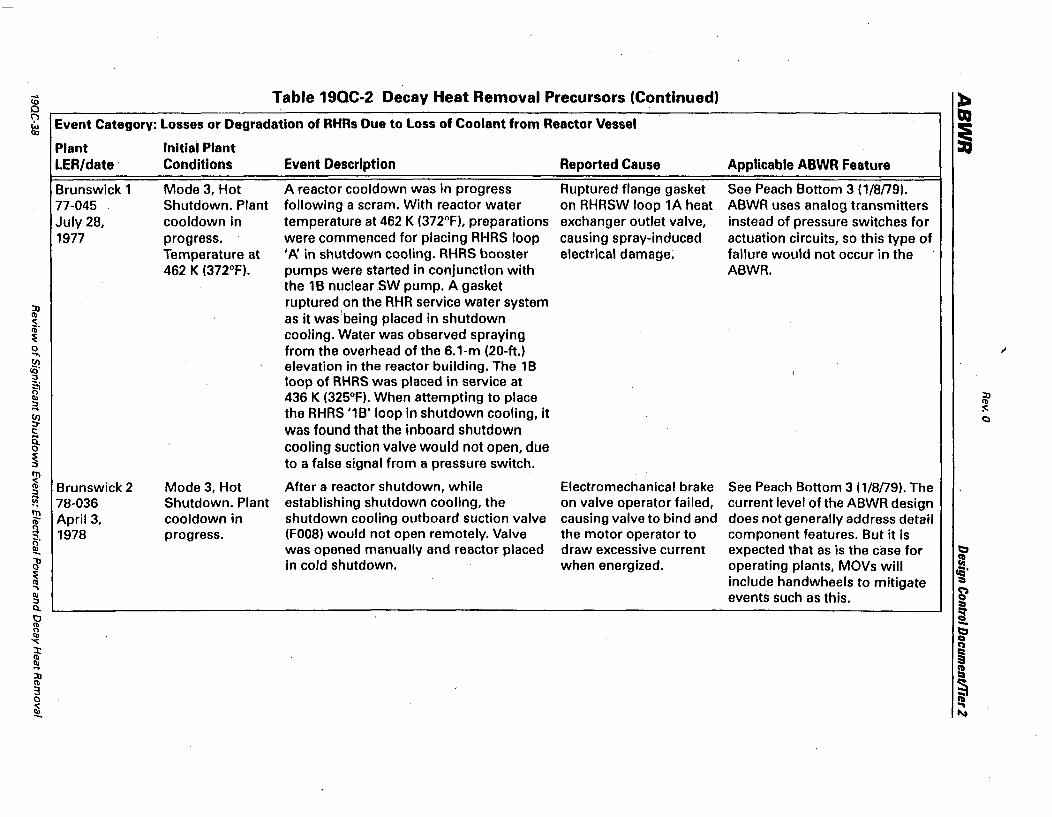
-- Table 19QC-2 Decay Heat Removal Precursors (Continued) ~ 10 0 tal .~ Event Category: Losses or Degradation of RHRs Due to Loss of Coolant from Reactor Vessel ~ i Plant Initial Plant
LER/date Conditions Event Description Reported Cause Applicable ABWR Feature
Brunswick 1 Mode 3, Hot A reactor cooldown was in progress Ruptured flange gasket See Peach Bottom 3 (1/an9). 77-045 Shutdown. Plant following a scram. With reactor water on RHRSW loop 1A heat ABWR uses analog transmitters July 2a, cooldown in temperature at 462 K (372°F), preparations exchanger outlet valve, instead of pressure switches for 1977 progress. were commenced for placing RHRS loop causing spray-induced actuation circuits, so this type of
Temperature at '/J\ in shutdown cooling. RHRS booster electrical damage~ failure would not occur in the 462 K (372°F). pumps were started in conjunction with ABWR.
the 1 B nuclearSW pump. A gasket
:n ruptured on the RHR service water system Cb as it was~being placed in shutdown ~, ~ cooling. Water was observed spraying 0 from the overhead of the 6.1-m (20-ft.) .., ~ elevation in the reactor building. The 1 B :J loop of RHRS was placed in service at ~ 436 K (325°F). When attempting to place :n :J Cb .... the RHRS '1B' loop in shutdown cooling, it :c: tI) C) ;:,.
was found that the inboard shutdown c:
~ cooling suction valve would not open, due ~ to a false signal from a pressure switch. III ~ Brunswick 2 Mode 3, Hot After a reactor shutdown, while Electromechanical brake See Peach Bottom 3 (1/8n9). The :J
~ 78-036 Shutdown. Plant establishing shutdown cooling, the on valve operator failed, current level of the ABWR design III April 3, cooldown in shutdown cooling outboard suction valve causing valve to bind and does not generally address detail ib' ~ 1978 progress. (FOOS) would not open remotely. Valve the motor operator to component features. But it is 1)' ~ was opened manually and reactor placed draw excessive current expected that as is the case for ~
ti' in cold shutdown. when energized. operating plants, MOVs will ~ cQ'
~ include handwheels to mitigate ::I ., F Qj events such as this. :J
Q"
~ I:) Cb -0 ~ Qj CI -.;
CO) :x: ~ Cb
~
= :n Cb
~ 3 0
~ "" 1\1
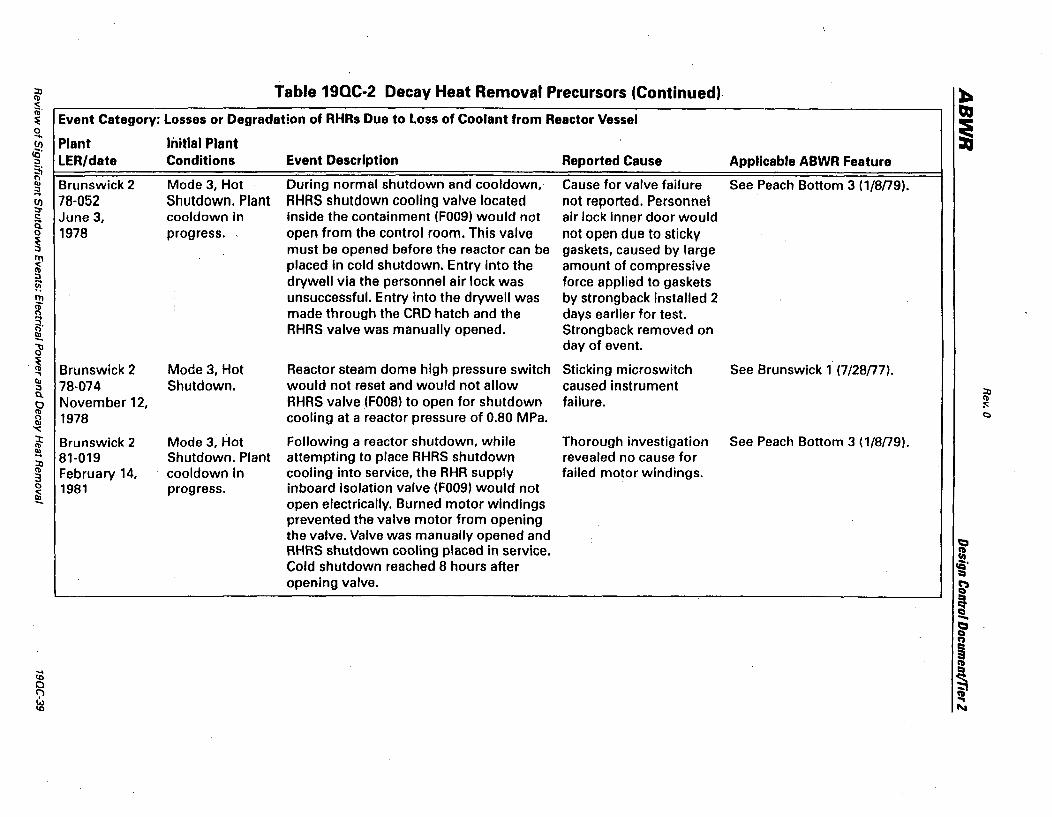
::0 Table 19QC-2 Decay Heat Removal Precursors (Continued) ~ Cb
~, Event Category: Losses or Degradation of RHRs Due to Loss of Coolant from Reactor Vessel
QI ~
i 0 ... Plant Initial Plant (I)
!(i' LER/date Conditions Event Description Reported Cause Applicable ABWR Feature :J
5i I")
Brunswick 2 Mode 3, Hot During normal shutdown and cooldown, Cause for valve failure See Peach Bottom 3 (1/8n9). '" :a (I) 78-052 Shutdown. Plant RHRS shutdown cooling valve located not reported. Personnel :,.
June 3, cooldown in inside the containment (F009) would not air lock inner door would ~ Q.
1978 open from the control room. This valve not open due to sticky 0 progress. ~ must be opened before the reactor can be gaskets, caused by large III '<: placed in cold shutdown. Entry into the amount of compressive Cb :J drywell via the personnel air lock was force applied to gaskets Y1
~ unsuccessful. Entry into the drywell was by strong back installed 2 I") made through the CRD hatch and the days earlier for test. [ RHRS valve was manually opened. Strong back removed on
~ day of event. ,~ Brunswick 2 Mode 3, Hot Reactor steam dome high pressure switch Sticking microswitch See Brunswick 1 (7/28n7) . ... '" 78-074 Shutdown. would not reset and would not allow caused instrument :J ::0 Q.
November 12, RHRS valve (F008) to open for shutdown failure. Cb 0 ~ Cb
1978 cooling at a reactor pressure of 0.80 MPa. <::> !;l '< l: Brunswick 2 Mode 3, Hot Following a reactor shutdown, while Thorough investigation See Peach Bottom 3 (1/8(79). Cb !!; 81-019 Shutdown. Plant attempting to place RHRS shutdown revealed no cause for ::0 Cb February 14, cooldown in cooling into service, the RHR supply failed motor windings. 3 0 1981 progress. inboard isolation valve (F009) would not [ open electrically. Burned motor windings
prevented the valve motor from opening the valve. Valve was manually opened and
'=' RHRS shutdown cooling placed in service. a Cold shutdown reached 8 hours after !Cj'
l:I opening valve. ~
! -''=' CI n ~ III
iO l:I
0 ~ ~ ~
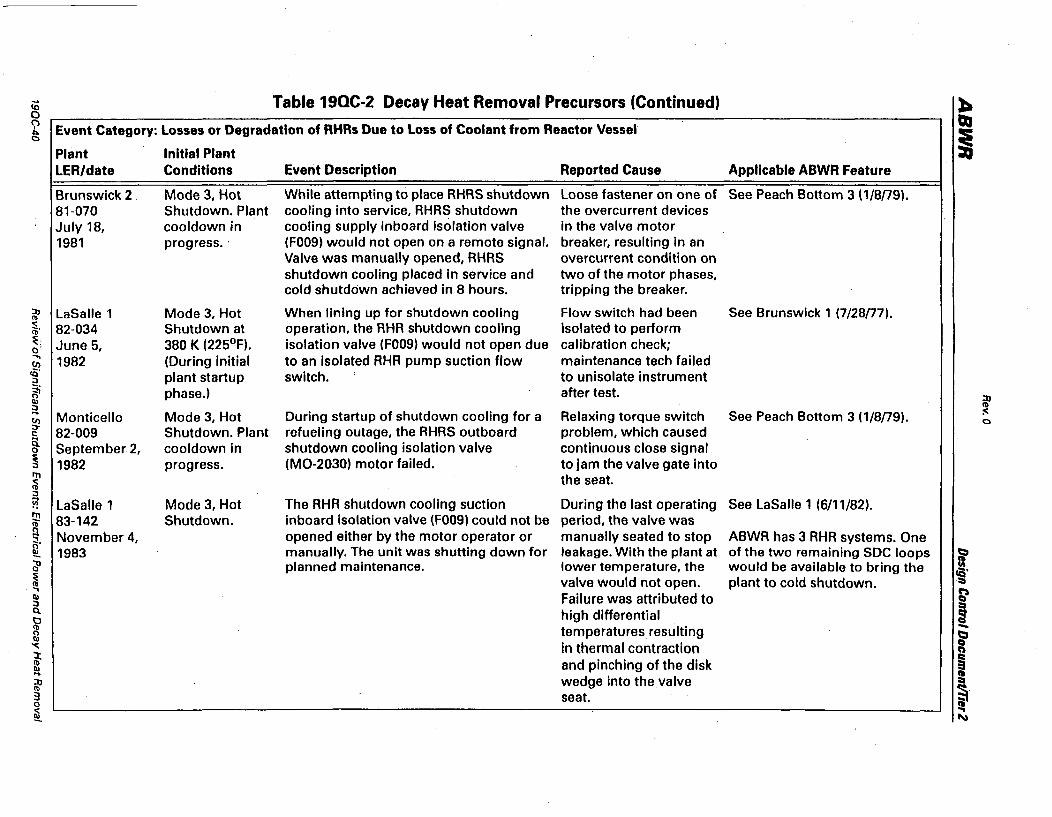
iii Table 19QC-2 Decay Heat Removal Precursors (Continued) ~ 0 QI ~ Event Category: Losses or Degradation of RHRs Due to Loss of Coolant from Reactor Vessel C) i Plant Initial Plant
LER/date Conditions Event Description Reported Cause Applicable ABWR Feature
Brunswick 2 Mode 3, Hot While attempting to place RHRS shutdown Loose fastener on one of See Peach Bottom 3 (1/8f79). 81-070 Shutdown. Plant cooling into service, RHRS shutdown the overcurrent devices July 18, cooldown in cooling supply inboard isolation valve in the valve motor 1981 progress. ' (F009) would not open on a remote signal. breaker, resulting in an
Valve was manually opened, RHRS overcurrent condition on shutdown cooling placed in service and two of the motor phases, cold shutdown achieved in 8 hours. tripping the breaker.
:n LaSalle 1 Mode 3, Hot When lining up for shutdown cooling Flow switch had been See Brunswick 1 (7/28{77). Cb <: ib' 82-034 Shutdown at operation, the RHR shutdown cooling isolated to perform ~. June 5, 380 K (2250 F). isolation valve (F009) would not open due calibration check; 0' .... 1982 (During initial to an isolated RHA pump suction flow maintenance tech failed CJ) rQ' plant startup switch. to unisolate instrument :J
~ phase.) after test. :n Cb ;:a Cb
Monticello Mode 3, Hot During startup of shutdown cooling for a Relaxing torque switch See Peach Bottom 3 (1/8{79). ~
~ C)
c:: 82-009 Shutdown. Plant refueling outage, the RHRS outboard problem, which caused ... Cl. September 2, cooldown in shutdown cooling isolation valve continuous close signal 0
~ 1982 progress. (MO-2030) motor failed. to jam the valve gate into rn the seat. ~ :J
!iT LaSalle 1 Mode 3, Hot The RHR shutdown cooling suction During the last operating See LaSalle 1 (6/11/82). m 83-142 Shutdown. inboard isolation valve (F009) could not be period, the valve was Cb
~ November 4, opened either by the motor operator or manually seated to stop ABWR has 3 RHR systems. One [ 1983 manually. The unit was shutting down for leakage. With the plant at of the two remaining SOC loops I:::»
00 planned maintenance. lower temperature, the would be available to bring the :: tQ'
~ valve would not open. plant to cold shutdown. :::i ., ~ III Failure was attributed to :J :::i
Cl. high differential ~ 0 Cb temperatures resulting -t1 t;:, "< in thermal contraction
Q C\
l: and pinching of the disk ~ Cb
Cb ... wedge into the valve
CD :n :::i Cb § 3 seat. 0 ~ ~ ~
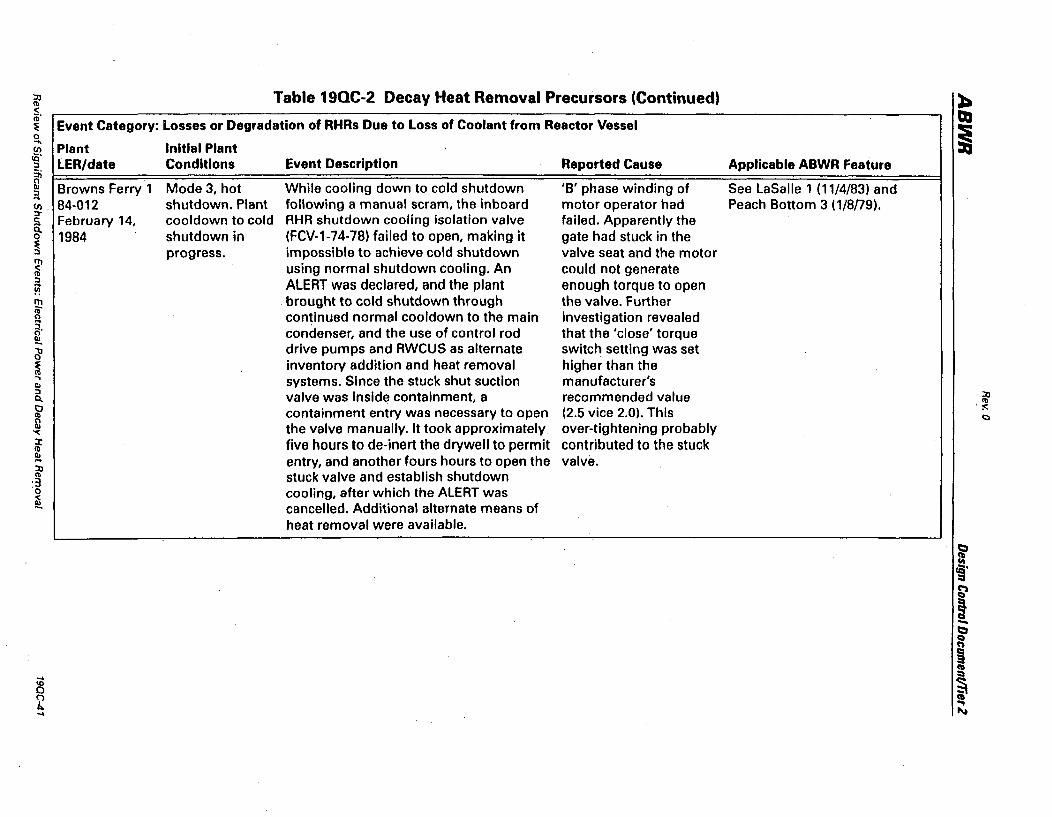
~ Table 19QC·2 Decay Heat Removal Precursors (Continued) < iD' ~ Event Category: Losses or Degradation of RHRs Due to Loss of Coolant from Reactor Vessel o C;; Plant Initial Plant <E' ::J LER/date Conditions
~ :J Browns Ferry 1 Mode 3, hot ~. 84-012 shutdown. Plant S February 14, cooldown to cold g. 1984 shutdown in ~ III ~ :J
~ ~ A ~, ~
~ ~ .., Q) :J Q.
~ 2 "<
re ... ~ '3 ·0
~
progress.
Event Description
While cooling down to cold shutdown following a manual scram, the inboard RHR shutdown cooling isolation valve (FCV-1-74-78) failed to open, making it impossible to achieve cold shutdown using normal shutdown cooling. An ALERT was declared, and the plant brought to cold shutdown through continued normal cooldown to the main condenser, and the use of control rod drive pumps and RWCUS as alternate inventory addition and heat removal systems. Since the stuck shut suction valve was inside containment, a containment entry was necessary to open the valve manually. It took approximately five hours to de-inert the drywell to permit entry, and another fours hours to open the stuck valve and establish shutdown cooling, after which the ALERT was cancelled. Additional alternate means of heat removal were available.
Reported Cause
'B' phase winding of motor operator had failed. Apparently the gate had stuck in the valve seat and the motor could not generate enough torque to open the valve. Further investigation revealed that the 'close' torque switch setting was set higher than the manufacturer's recommended value (2.5 vice 2.0). This over-tightening probably contributed to the stuck valve .
Applicable ABWR Feature
See LaSalle 1 (11/4/83) and Peach Bottom 3 (1/8n9).
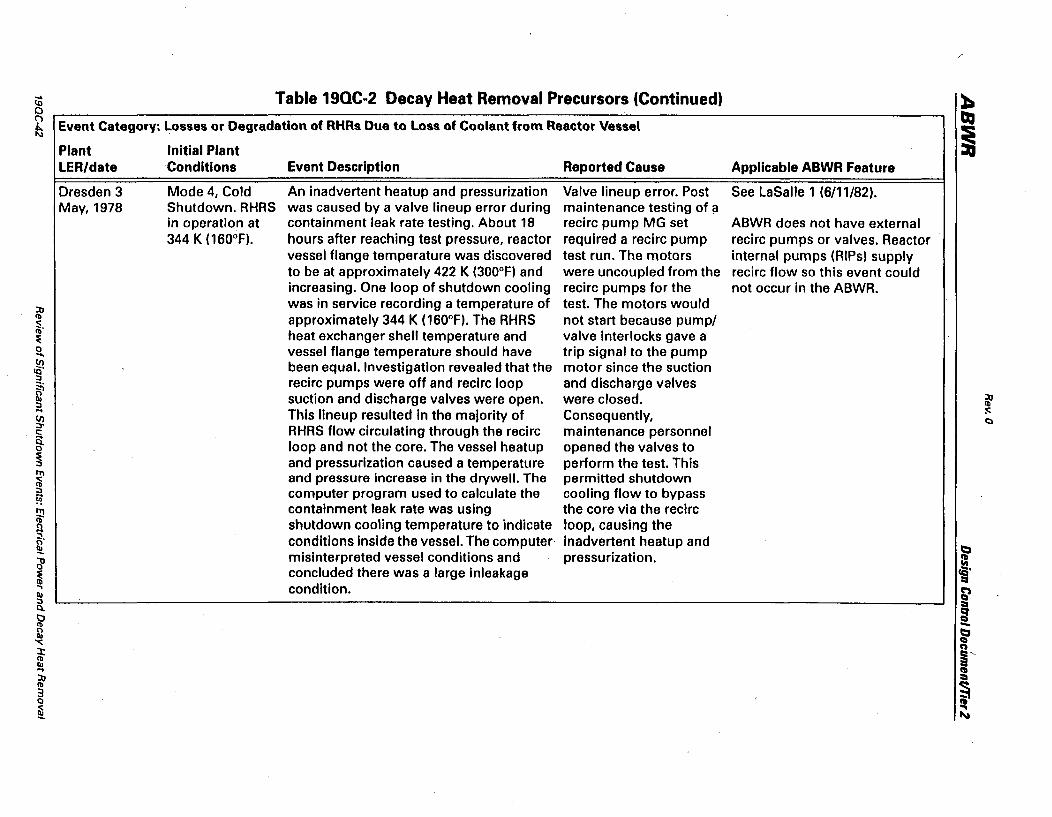
... CD o
Table 19QC-2 Decay Heat Removal Precursors (Continued)
~ Event Category: Losses or Degradation of RHRs Due to Loss of Coolant from Reactor Vessel I\)
Plant LER/date
Dresden 3 May, 1978
Initial Plant Conditions
Mode 4, Cold Shutdown. RHRS in operation at 344 K (160°F).
Event Description
An inadvertent heatup and pressurization was caused by a valve lineup error during containment leak rate testing. About 18 hours after reaching test pressure, reactor vessel flange temperature was discovered to be at approximately 422 K (300°F) and increasing. One loop of shutdown cooling was in service recording a temperature of approximately 344 K (160°F). The RHRS heat exchanger shell temperature and vessel flange temperature should have been equal. Investigation revealed that the recirc pumps were off and recirc loop suction and discharge valves were open. This lineup resulted in the majority of RHRS flow circulating through the recirc loop and not the core. The vessel heatup and pressurization caused a temperature and pressure increase in the drywell. The computer program used to calculate the containment leak rate was using shutdown cooling temperature to indicate conditions inside the vessel. The computer misinterpreted vessel conditions and concluded there was a large inleakage condition.
Reported Cause
Valve lineup error. Post maintenance testing of a recirc pump MG set required a recirc pump test run. The motors were uncoupled from the recirc pumps for the test. The motors would not start because pump! valve interlocks gave a trip signal to the pump motor since the suction and discharge valves were closed. Consequently, maintenance personnel opened the valves to perform the test. This permitted shutdown cooling flow to bypass the core via the recirc loop, causing the inadvertent heatup and pressurization.
Applicable ABWR Feature
See LaSalle 1 (6/11/82).
ABWR does not have external recirc pumps or valves. Reactor internal pumps (RIPs) supply recirc flow so this event could not occur in the ABWR.
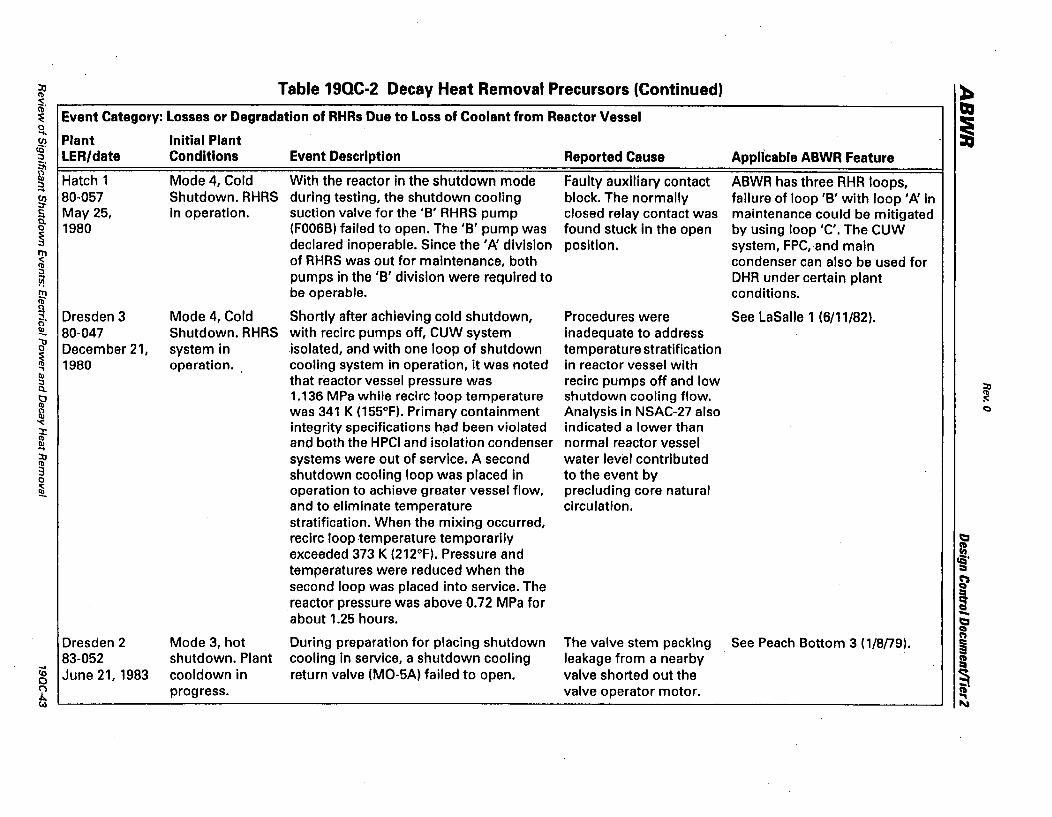
:XJ Table 19QC-2 Decay Heat Removal Precursors (Continued) ~ <b
~, Event Category: losses or Degradation of RHRs Due to loss of Coolant from Reactor Vessel
QJ ~ i 0 ....
Plant Initial Plant U) "S'
LER/date Conditions Event Description Reported Cause Appll'cable ABWR Feature :;, 5i 0
Hatch 1 Mode 4, Cold With the reactor in the shutdown mode Faulty auxiliary contact ABWA has three AHA loops, Q) :;, ...
80-057 Shutdown. AHAS during testing, the shutdown cooling block. The normally failure of loop 'B' with loop '/:\ in g! a May 25, in operation. suction valve for the 'B' RHRS pump closed relay contact was maintenance could be mitigated 0 1980 (F006B) failed to open. The 'B' pump was found stuck in the open by using loop 'C'. The CUW ~ declared inoperable. Since the '/:\ division position. system, FPC, and main III '<:: of RHRS was out for maintenance, both condenser can also be used for <b ::J pumps in the 'B' division were required to DHA under certain plant Y! ~ be operable. conditions. ~
Dresden 3 Mode 4, Cold Shortly after achieving cold shutdown, Procedures were See LaSalle 1 (6/11/82). ~, ~ 80-047 Shutdown. RHRS with recirc pumps off, CUW system inadequate to address d' December 21, system in isolated, and with one loop of shutdown temperature stratification ~ 1980 operation. , cooling system in operation, it was noted in reactor vessel with ., Q) that reactor vessel pressure was recirc pumps off and low ::J
~ Cl 1.136 MPa while recirc loop temperature shutdown cooling flow. fr ~
fil was 341 K (155°F). Primary containment Analysis In NSAC-27 also <:)
'<: integrity specifications had been violated indicated a lower than ::t <b and both the HPCI and isolation condenser normal reactor vessel Q) ... :x;, systems were out of service. A second water level contributed <b 3 shutdown cooling loop was placed in to the event by 0
~ operation to achieve greater vessel flow, precluding core natural and to eliminate temperature circulation. stratification. When the mixing occurred, recirc loop temperature temporarily ~
exceeded 373 K (212°F). Pressure and ~ cQ'
temperatures were reduced when the :::I
second loop was placed into service. The ~ reactor pressure was above 0.72 MPa for 3 about 1.25 hours. -~
Mode 3, hot During preparation for placing shutdown The valve stem packing See Peach Bottom 3 (1/8n9). n
Dresden 2 ~ 83-052 shutdown. Plant cooling in service, a shutdown cooling leakage from a nearby
= iQ June 21, 1983 cooldown in return valve (MO-5A) failed to open. valve shorted out the ~ 0
~ progress. valve operator motor. ~
t..l I\t
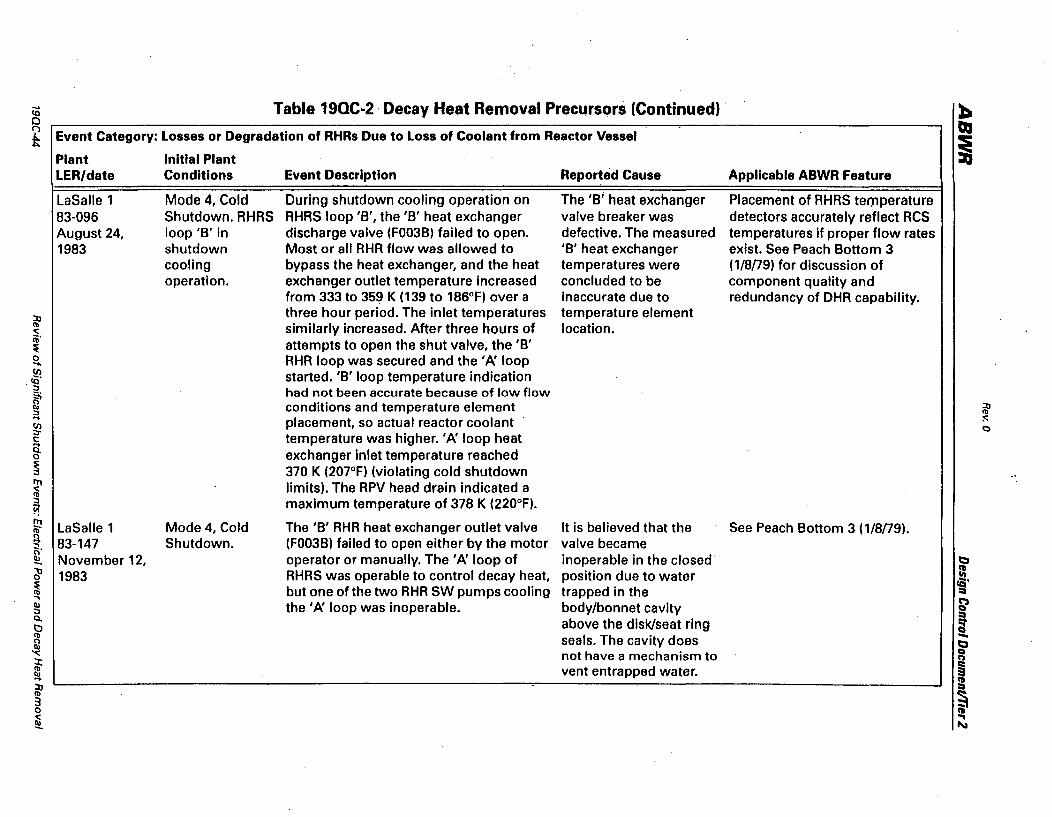
-- Table 19QC·2· Decay Heat Removal Precursors (Continued) :b (Q
0 ~ k Event Category: Losses or Degradation of RHRs Due to Loss of Coolant from Reactor Vessel
~ Plant Initial Plant LER/date Conditions Event Description Reported Cause Applicable ABWR Feature
LaSalle 1 Mode 4, Cold During shutdown cooling operation on The'B'heatexchanger Placement of RHRS temperature 83-096 Shutdown. RHRS RHRS loop 'B', the 'B' heat exchanger valve breaker was detectors accurately reflect RCS August 24, loop 'B' in discharge valve (F003B) failed to open. defective. The measured temperatures if proper flow rates 1983 shutdown Most or all RHR flow was allowed to 'B' heat exchanger exist. See Peach Bottom 3
cooling bypass the heat exchanger, and the heat temperatures were (1/8n9) for discussion of operation. exchanger outlet temperature increased concluded to be component quality and
from 333 to 359 K (139 to 186°F) over a inaccurate due to redundancy of DHR capability.
:lJ three hour period. The inlet temperatures temperature element <b similarly increased. After three hours of location. <: Ib' attempts to open the shut valve, the 'B' ~ 0 RHR loop was secured and the' Pi loop .... (f) started. 'B' loop temperature indication . .g' ~
had not been accurate because of low flow conditions and temperature element ~ ::l .. placement, so actual reactor coolant :<:
(f) 0 ~ temperature was higher. 'Pi loop heat t: .g. exchanger inlet temperature reached ~ 370 K (207°F) (violating cold shutdown III limits). The RPV head drain indicated a ~ :;:, maximum temperature of 378 K (220°F). Y! ~ LaSalle 1 Mode 4, Cold The 'B' RHR heat exchanger outlet valve It is believed that the See Peach Bottom 3 (1/8n9). ~ 83-147 Shutdown. (F003B) failed to open either by the motor valve became 0' ~ November 12, operator or manually. The 'Pi loop of inoperable in the closed' t:t JI 1983 RHRS was operable to control decay heat, position due to water ~
IQ' ~ but one of the two RHR SW pumps cooling trapped in the ::I ., ~ Cb the 'Pi loop was inoperable. body/bonnet cavity :;:, l:l Q.
above the disk/seat ring :l I:) <b seals. The cavity does -0 t:t Cb '<: not have a mechanism to c if
COl
vent entrapped water. ~ ~ ~ :lJ
<b
~ 3 0
~ 1\1
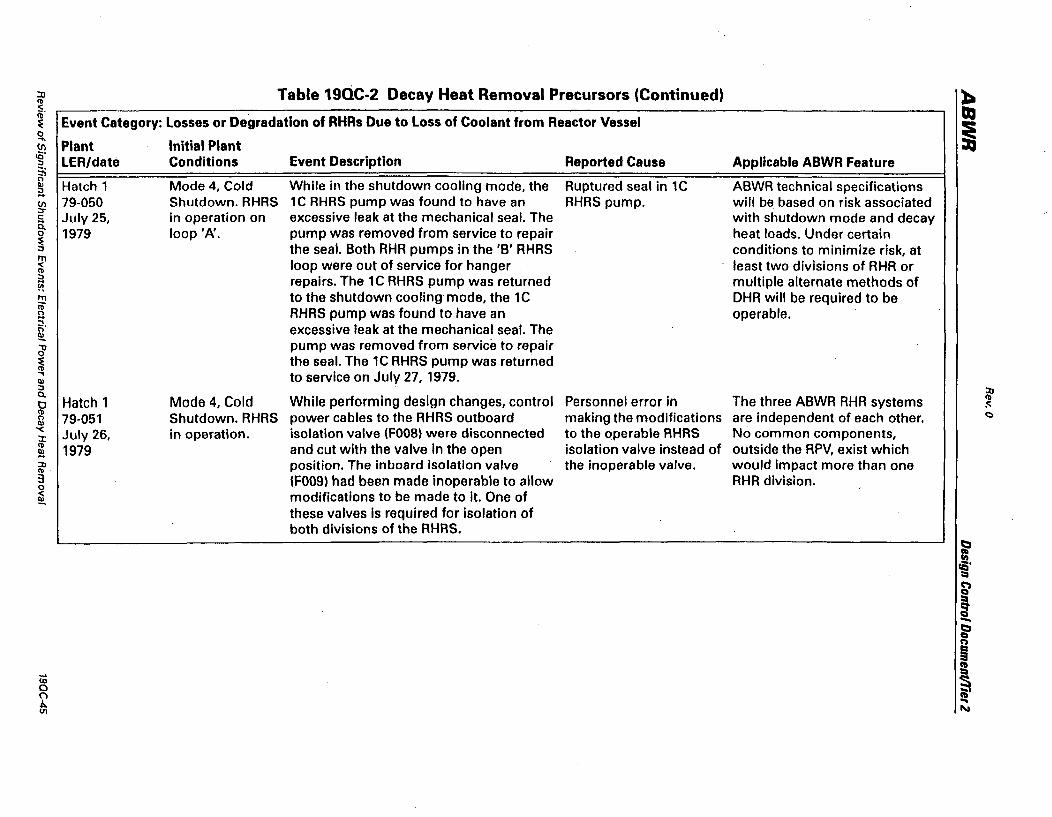
::0 <1>
Table 19QC-2 Decay Heat Removal Precursors (Continued) ~, ~ Event Category: losses or Degradation of RHRs Due to loss of Coolant from Reactor Vessel 2-(/) Plant Initial Plant .g' LER/date Conditions
i .... (J) ::r S 0. o
~ tTl ~
~ tTl CD
[ f III ::J
Hatch 1 79-050 July 25, 1979
0. ~ Hatch 1 £ 79-051 ~ July 26, ~ 1979 ::0 <1>'
3
~
Mode 4, Cold Shutdown. RHRS in operation on loop 'A'.
Mode 4, Cold Shutdown. RHRS in operation.
Event Description
While in the shutdown cooling mode, the lC RHRS pump was found to have an excessive leak at the mechanical seal. The pump was removed from service to repair the seal. Both RHR pumps in the 'B' RHRS loop were out of service for hanger repairs. The 1 C RHRS pump was returned to the shutdown cooling mode, the lC RHRS pump was found to have an excessive leak at the mechanical seal. The pump was removed from service to repair the seal. The 1 C RHRS pump was returned to service on July 27, 1979.
While performing design changes, control power cables to the RHRS outboard isolation valve (F008) were disconnected and cut with the valve in the open position. The inboard isolation valve (F009) had been made inoperable to allow modifications to be made to it. One of these valves is required for isolation of both divisions of the RHRS.
Reported Cause
Ruptured seal in 1 C RHRS pump.
Personnel error in making the modifications to the operable RHRS isolation valve instead of the inoperable valve.
Applicable ABWR Feature
ABWR technical specifications will be based on risk associated with shutdown mode and decay heat loads. Under certain conditions to minimize risk, at least two divisions of RHR or multiple alternate methods of DHR will be required to be operable.
The three ABWR RHR systems are independent of each other. No common components, outside the RPV, exist which would impact more than one RHR division.
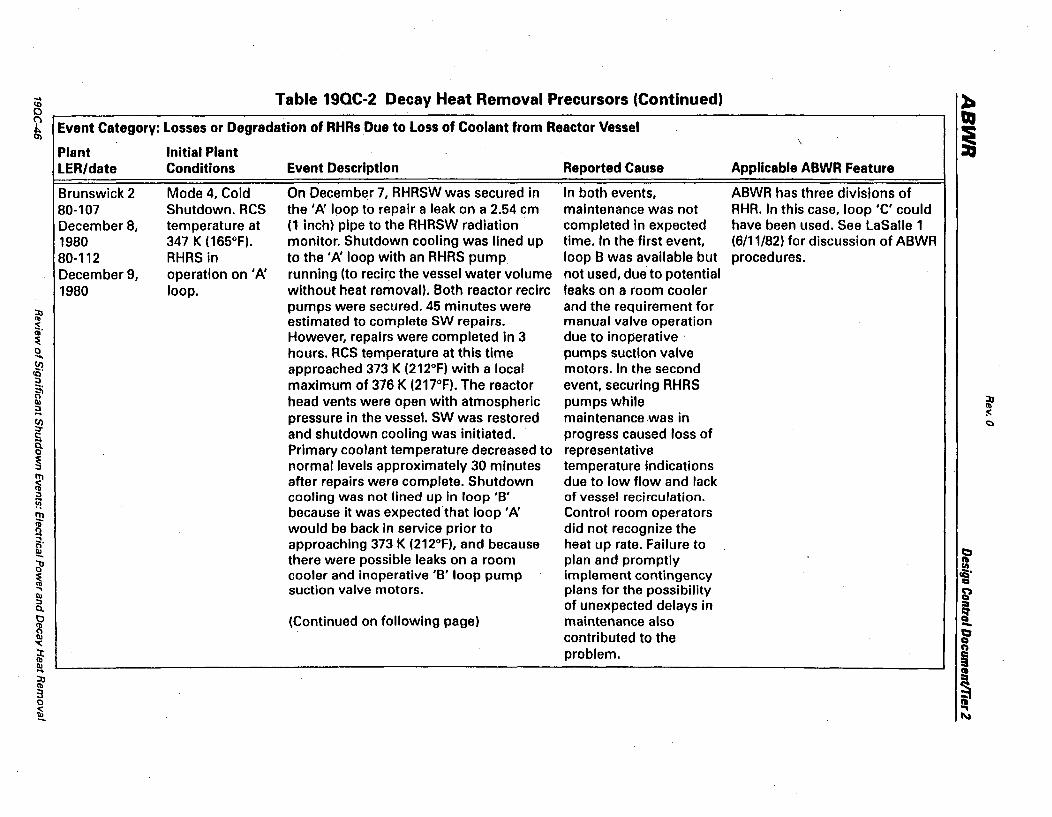
Table 19QC-2 Decay Heat Removal Precursors (Continued) -10 o ~ Event Category: Losses or Degradation of RHRs Due to Loss of Coolant from Reactor Vessel
Plant lER/date
Brunswick 2 80-107 December 8, 1980 80-112 December 9, 1980
Initial Plant Conditions
Mode 4, Cold Shutdown. RCS temperature at 347 K (165°F). RHRS in operation on 'A: loop.
Event Description
On December 7, RHRSW was secured in the 'fJi loop to repair a leak on a 2.54 cm (1 inch) pipe to the RHRSW radiation monitor. Shutdown cooling was lined up to the'fJi loop with an RHRS pump running (to recirc the vessel water volume without heat removal). Both reactor recirc pumps were secured. 45 minutes were estimated to complete SW repairs. However, repairs were completed in 3 hours. RCS temperature at this time approached 373 K (212°F) with a local maximum of 376 K (217°F). The reactor head vents were open with atmospheric pressure in the vessel. SW was restored and shutdown cooling was initiated. Primary coolant temperature decreased to normal levels approximately 30 minutes after repairs were complete. Shutdown cooling was not lined up in loop 'B' because it was expected that loop' fJi would be back in service prior to approaching 373 K (212°F), and because there were possible leaks on a room cooler and inoperative 'B' loop pump suction valve motors.
(Continued on following page)
Reported Cause
In both events, maintenance was not completed in expected time. In the first event, loop B was available but not used, due to potential leaks on a room cooler and the requirement for manual valve operation due to inoperative . pumps suction valve motors. In the second event, securing RHRS pumps while maintenance was in progress caused loss of representative temperature indications due to low flow and lack of vessel recirculation. Control room operators did not recognize the heat up rate. Failure to plan and promptly implement contingency plans for the possibility of unexpected delays in maintenance also contributed to the problem.
Applicable ABWR Feature
ABWR has three divisions of RHA. In this case, loop 'c' could have been used. See LaSalle 1 (6/11/82) for discussion of ABWR procedures.
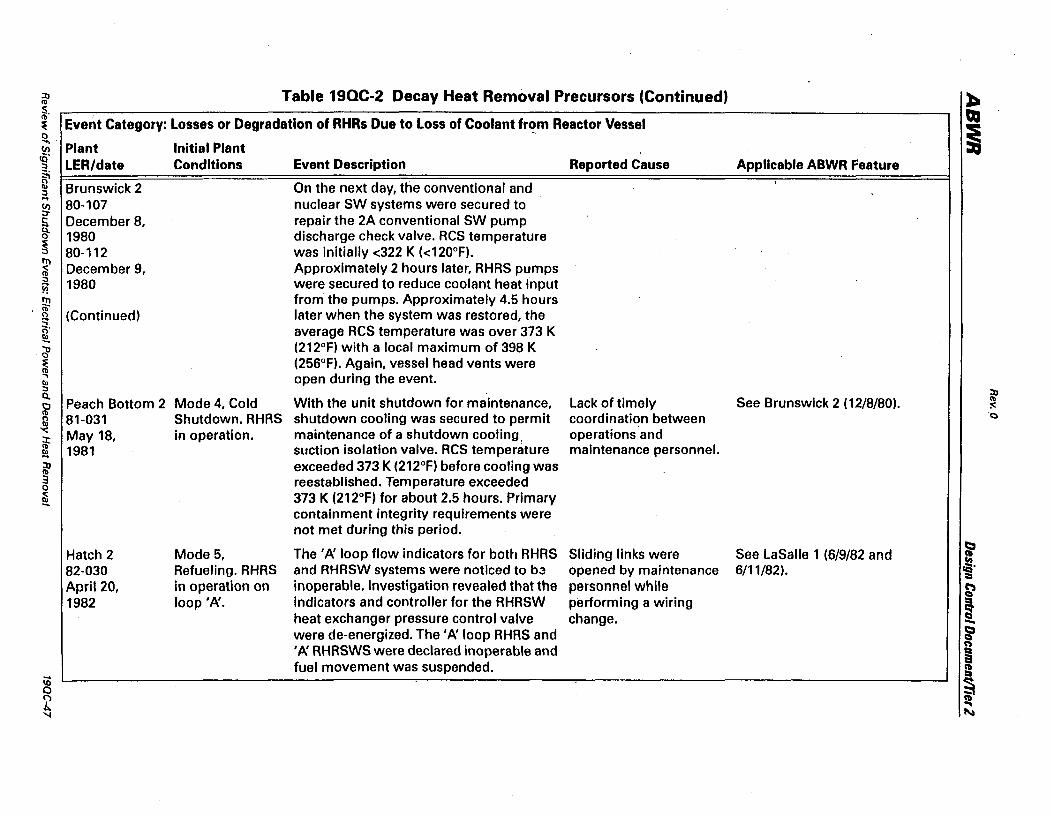
'::Q Table 19QC-2 Decay Heat Removal Precursors (Continued) ~ <b
~, Event Category: Losses or Degradation of RHRs Due to Loss of Coolant fr~m Reactor Vessel OJ
~
i 0 .... Plant Initial Plant (J)
15' LER/date Conditions Event Description Reported Cause Applicable ABWR Feature :3 g; Brunswick 2 On the next day, the conventional and II>
:3 "+
80-107 nuclear SW systems were secured to (J) ;:,-
December 8. repair the 2A conventional SW pump ~ 1980 discharge check valve. RCS temperature ~ 80-112 was initially <322 K (<120°F). III
December 9. Approximately 2 hours later. RHRS pumps <: <b :3 1980 were secured to reduce coolant heat input Y! ~ from the pumps. Approximately 4.5 hours
~ (Continued) later when the system was restored, the
[ average RCS temperature was over 373 K
cl' (212°F) with a local maximum of 398 K
~ (256°F). Again, vessel head vents were ., open during the event . II> :3 ::Q Q,
Peach Bottom 2 Mode 4. Cold With the unit shutdown for maintenance. Lack of timely See Brunswick 2 (12/8/80). <b
~ ;or:
~ 81-031 Shutdown. RHRS shutdown cooling was secured to permit coordination between 'Q
'( May 18, in operation. maintenance of a shutdown cooling, operations and ::t:
<b 1981 suction isolation valve. RCS temperature maintenance personnel. II> ... lJ exceeded 373 K (212°F) before cooling was <b 3 reestablished. Temperature exceeded 0
~ 373 K (212°F) for about 2.5 hours. Primary containment integrity requirements were not met during this period.
Hatch 2 Mode 5, The'~ loop flow indicators for both RHRS Sliding links were See LaSalle 1 (6/9/82 and t::I a
82-030 Refueling. RHRS and RHRSW systems were noticed to b3 opened by maintenance 6/11/82). ca' ::i April 20, in operation on inoperable. Investigation revealed that the personnel while ~ 1982 loop'~. indicators and controller for the RHRSW performing a wiring ! heat exchanger pressure control valve change. -were de-energized. The'l\ loop RHRS and ~
'1\ RHRSWS were declared inoperable and co»
~ fuel movement was suspended. ~
iO ~ 0
~ ~
'I tI..l
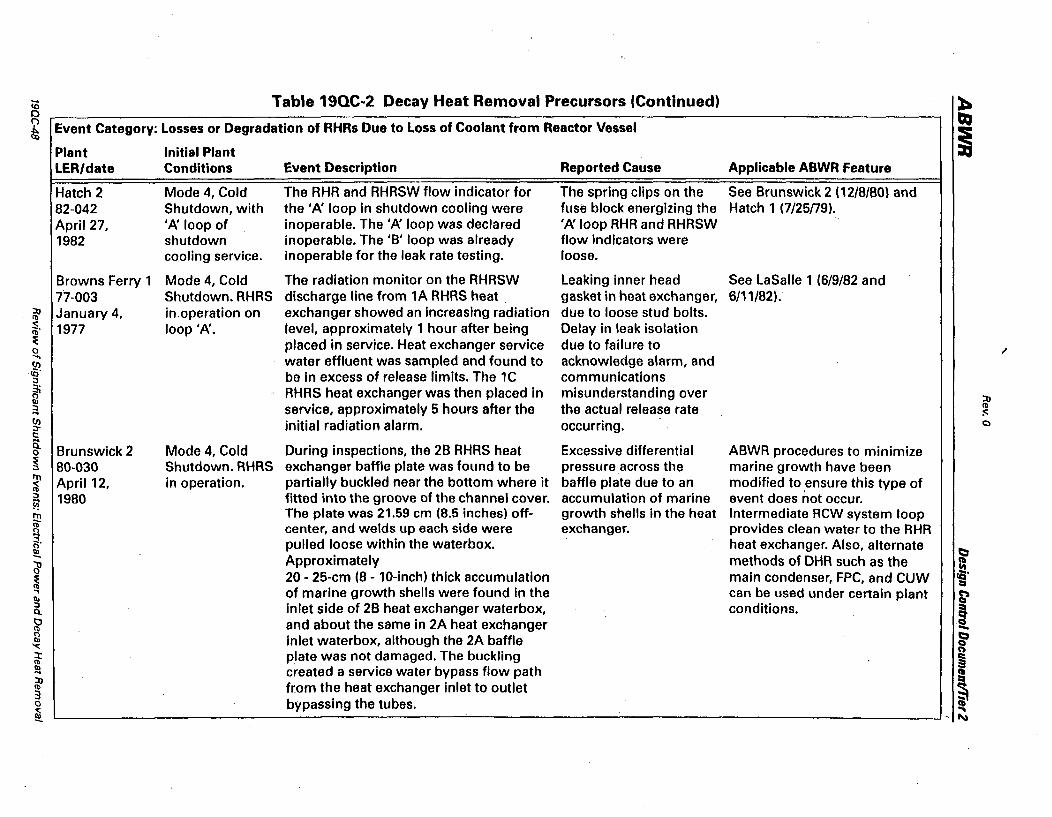
.... Table 19QC-2 Decay Heat Removal Precursors (Continued) ~ co 0 QJ ~ Event Category: Losses or Degradation of RHRs Due to Loss of Coolant from Reactor Vessel
~ Plant Initial Plant LER/date Conditions Event Description Reported Cause Applicable ABWR Feature
Hatch 2 Mode 4, Cold The AHA and AHRSW flow indicator for The spring clips on the See Brunswick 2 (12/8/80) and 82-042 Shutdown, with the' A: loop in shutdown cooling were fuse block energizing the Hatch 1 (7/2Sn9). April 27, 'A: loop of inoperable. The 'A: loop was declared 'A: loop RHR and RHRSW 1982 shutdown inoperable. The 'B' loop was already flow indicators were
cooling service. inoperable for the leak rate testing. loose.
Browns Ferry 1 Mode 4, Cold The radiation monitor on the RHRSW Leaking inner head See LaSalle 1 (6/9/82 and 77-003 Shutdown. AHAS discharge line from 1A AHRS heat gasket in heat exchanger, 6/11/82).
:J:J January 4, in. operation on exchanger showed an increasing radiation due to loose stud bolts. <b
~. 1977 loop 'A:. level, approximately 1 hour after being Delay in leak isolation :l! placed in service. Heat exchanger service due to failure to 0 " ...,
water effluent was sampled and found to acknowledge alarm, and ~ :;, be in excess of release limits. The lC communications ~ ~ RHRS heat exchanger was then placed in misunderstanding over :J:J III :;, service, approximately 5 hours after the the actual release rate CD ... :c: (I) initial radiation alarm. occurring. 0 ::t t: a Brunswick 2 Mode 4, Cold During inspections, the 2B RHRS heat Excessive differential ABWR procedures to minimize 0
~ 80-030 Shutdown. RHRS exchanger baffle plate was found to be pressure across the marine growth have been III April 12, in operation. partially buckled near the bottom where it baffle plate due to an modified to .ensure this type of ;§ :;, 1980 fitted into the groove of the channel cover. accumulation of marine event does not occur. Y! III The plate was 21.59 cm (8.5 inches) off- growth shells in the heat Intermediate RCW system loop iD center, and welds up each side were exchanger. provides clean water to the RHR (')
~. pulled loose within the waterbox. heat exchanger. Also, alternate b !!!. Approximately methods of DHR such as the ~ =
~ 20 - 25-cm (8 - 10-inch) thick accumulation main condenser, FPC, and CUW ca' ::i ., of marine growth shells were found in the can be used under certain plant ~ III :;, inlet side of 2B heat exchanger waterbox, conditions. ! Q.
~ and about the same in 2A heat exchanger -tl inlet waterbox, although the 2A baffle ~ '< CO) :t plate was not damaged. The buckling ; <b
~ created a service water bypass flow path CIa :J:J l:I <b from the heat exchanger inlet to outlet ~ 3 0 bypassing the tubes. ~
... ~
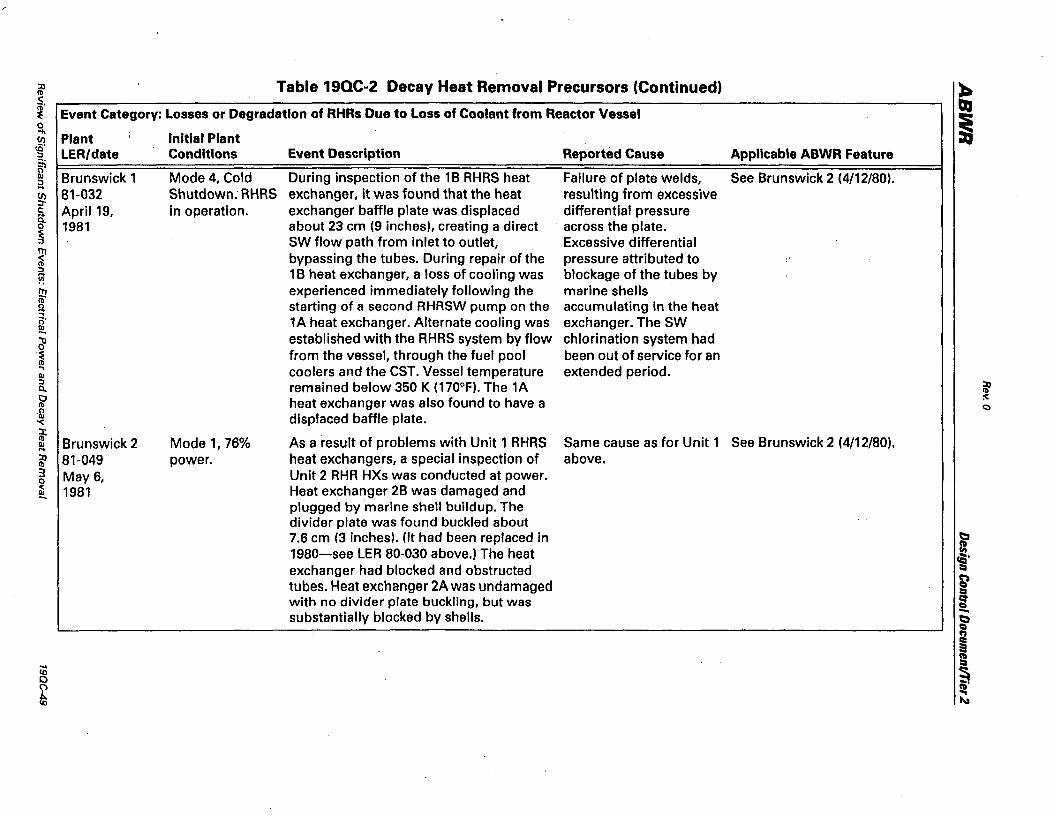
:0 Table 19QC-2 Decay Heat Removal Precursors (Continued) ~ <b <: QJ iii'
Event Category: Losses or Degradation of RHRs Due to Loss of Coolant from Reactor Vessel :E
~ 0 .... Plant Initial Plant (J)
ta' LER/date Conditions Event Description Reported Cause Applicable ABWR Feature :l
~ Brunswick 1 Mode 4, Cold During inspection of the 1 B RHRS heat Failure of plate welds, See Brunswick 2 (4/12/80). Q)
:l ... 81-032 Shutdown. RHRS exchanger, It was found that the heat resulting from excessive (J)
::r-April 19, in operation. exchanger baffle plate was displaced differential pressure ~
0 1981 about 23 cm (9 inches), creating a direct across the plate. ~ SW flow path from inlet to outlet, Excessive differential ~ bypassing the tubes. During repair of the pressure attributed to :l 1 B heat exchanger, a loss of cooling was blockage of the tubes by ~ IT'! experienced immediately following the marine shells iii" n starting of a second RHRSW pump on the accumulating in the heat .., [ 1A heat exchanger. Alternate cooling was exchanger. The SW
~ established with the RHRS system by flow chlorination system had .~ from the vessel, through the fuel pool been out of service for an
<b .., coolers and the CST. Vessel temperature extended period . Q)
:l remained below 350 K (170°F). The 1A :n Q. <b I:) heat exchanger was also found to have a :0:: <b <:)
2 displaced baffle plate. '<:
if Brunswick 2 Mode 1,76% As a result of problems with Unit 1 RHRS Same cause as for Unit 1 See Brunswick 2 (4/12/80). Q) ... :0 81-049 power. heat exchangers, a special inspection of above. Ib 3 May 6, Unit 2 RHR HXs was conducted at power. 0
~ 1981 Heat exchanger 2B was damaged and plugged by marine shell buildup. The divider plate was found buckled about 7.6 cm (3 inches). (It had been replaced in ~ 1980-see LER 80-030 above.) The heat ca' exchanger had blocked and obstructed ::::i
tubes. Heat exchanger 2A was undamaged ~ ::::i
with no divider plate buckling, but was ~ substantially blocked by shells. -t)
Q CO)
~ ... 11 en ~ 0
~ ... en I\l
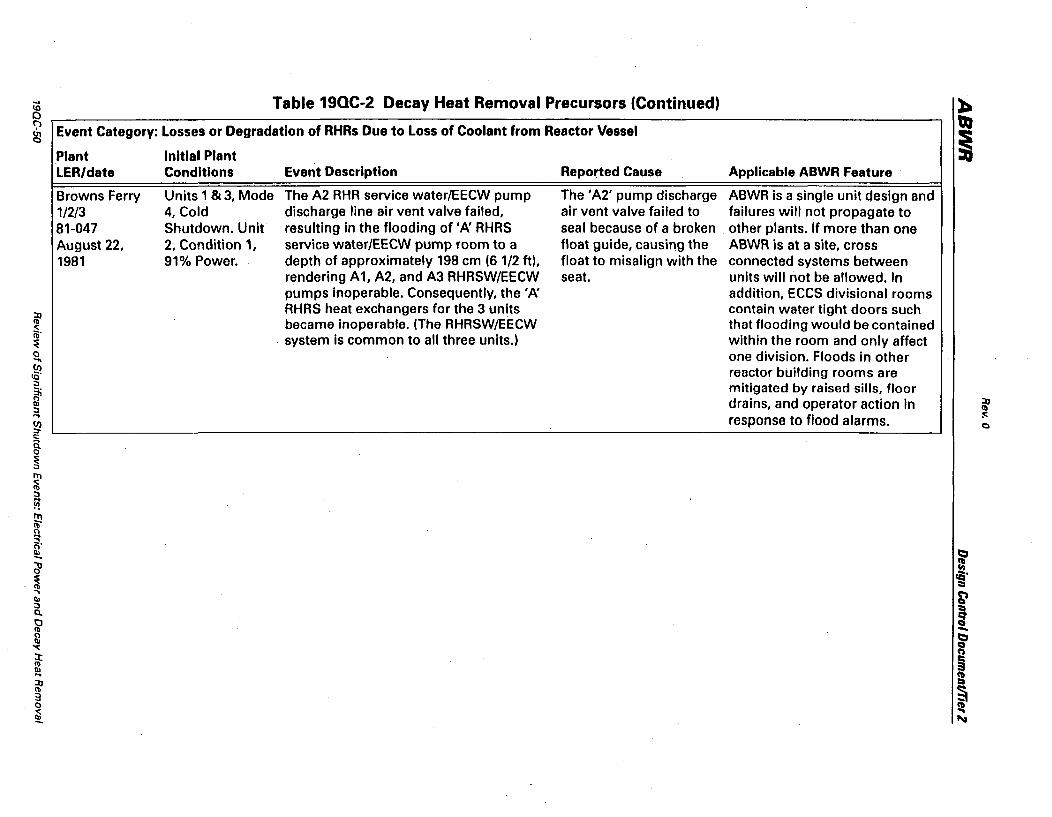
..... 10 o
Table 19QC-2 Decay Heat Removal Precursors (Continued)
~ Event Category: losses or Degradation of RHRs Due to loss of Coolant from Reactor Vessel
Plant LER/date
Browns Ferry 1/2/3 81-047 August 22, 1981
Initial Plant Conditions
Units 1 & 3, Mode 4, Cold Shutdown. Unit 2, Condition 1, 91% Power.
Event Description
The A2 RHR service water/EECW pump discharge line air vent valve failed, resulting in the flooding of'/J: RHRS service water/EECW pump room to a depth of approximately 198 cm (6 1/2 tt), rendering A1, A2, and A3 RHRSW/EECW pumps inoperable. Consequently, the '/J: RHRS heat exchangers for the 3 units became inoperable. (The RHRSW/EECW system is common to all three units.)
Reported Cause
The 'A2' pump discharge air vent valve failed to seal because of a broken float guide, causing the float to misalign with the seat.
Applicable ABWR Feature
ABWR is a single unit design and failures will not propagate to other plants. If more than one ABWR is at a site, cross connected systems between units will not be allowed. In addition, ECCS divisional rooms contain water tight doors such that flooding would be contained within the room and only affect one division. Floods in other reactor building rooms are mitigated by raised sills, floor drains, and operator action in response to flood alarms.

:n CII Table 19QC-2 Decay Heat Removal Precursors (Continued) ~. ::E Event Category: Losses or Degradation of RHRs Due to Loss of Coolant from Reactor Vessel o U; Plant Initial Plant
Conditions ~. LEA/date
~ Browns Ferry 3 Mode 4, Cold ~ 83-004 Shutdown RHRS
O~ January 16, in operation on
~ ~ ~
~
~ [ ~ ~ . ., II> ~ Q.
~ '<:
if ~ :n CII 3 o [
1983 loop 'B'.
Event Description
RHR heat exchanger 3D leaked reactor coolant into the RHRS service water in excess of Technical Specification limits. The '0' heat exchanger and pump were removed from service and the 'B' heat exchanger and pump placed in service. Approximately 8 hours later an alarm was received on the SW effluent monitor. The 'B' heat exchanger and pump were removed from service. (The' P\ and 'c' heat exchanger and pumps were inoperable due to a bentstem on their common injection valve.) Thus there was a complete loss of RHR shutdown cooling capability. The RCS temperature increased from 360 to 373 K (188 to 211°F) in approximately 45 minutes. Reactor heat removal was provided by steaming to the main condenser, and by coolant makeup from theCRD and CUW systems.
Reported Cause
Twelve dented tubes were found in the '0' heat exchanger. One of the dented tubes was leaking. The 'B' heat exchanger did not actually leak, but had to be isolated until. it could be confirmed to not be leaking. The 3B and 3D heat exchangers share a common radiation monitor .
Applicable ABWR Feature
ABWR has three independent RHR loops. The probability of losing all three loops due to component failures is very low. Even if loss of all RHR were to occur, DHR could be completed using the main condenser, CUW, FPC, CRD, HPCF, condensate, or fire protection water systems depending on plant conditions.
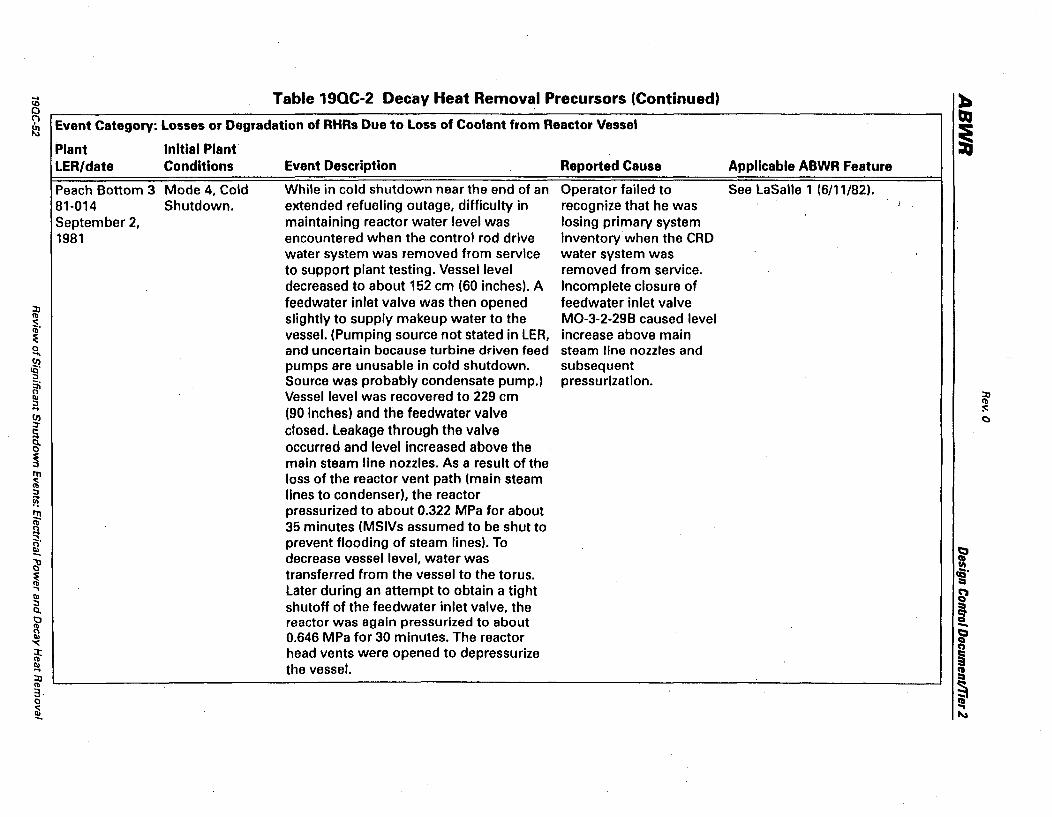
... <0 o
Table 19QC-2 Decay Heat Removal Precursors (Continued) .
g Event Category: Losses or Degradation of RHRs Due to Loss of Coolant from Reactor Vessel
Plant LER/date
Initial Plant Conditions
Peach Bottom 3 Mode 4. Cold 81-014 Shutdown. September 2. 1981
Event Description
While in cold shutdown near the end of an extended refueling outage. difficulty in maintaining reactor water level was encountered when the control rod drive water system was removed from service to support plant testing. Vessel level decreased to about 152 em (60 inches). A feedwater inlet valve was then opened slightly to supply makeup water to the vessel. (Pumping source not stated in LER, and uncertain because turbine driven feed pumps are unusable in cold shutdown. Source was probably condensate pump.) Vessel level was recovered to 229 em (90 inches) and the feedwater valve closed. Leakage through the valve occurred and level increased above the main steam line nozzles. As a result of the loss of the reactor vent path (main steam lines to condenser), the reactor pressurized to about 0.322 MPa for about 35 minutes (MSIVs assumed to be shut to prevent flooding of steam lines). To decrease vessel level, water was transferred from the vessel to the torus. Later during an attempt to obtain a tight shutoff of the feedwater inlet valve. the reactor was again pressurized to about 0.646 MPa for 30 minutes. The reactor head vents were opened to depressurize the vessel.
Reported Cause
Operator failed to recognize that he was losing primary system inventory when the CRD water system was removed from service. Incomplete closure of feedwater inlet valve MO-3-2-298 caused level increase above main steam line nozzles and subsequent pressurization.
Applicable ABWR Feature
See LaSalle 1 (6/11/82).
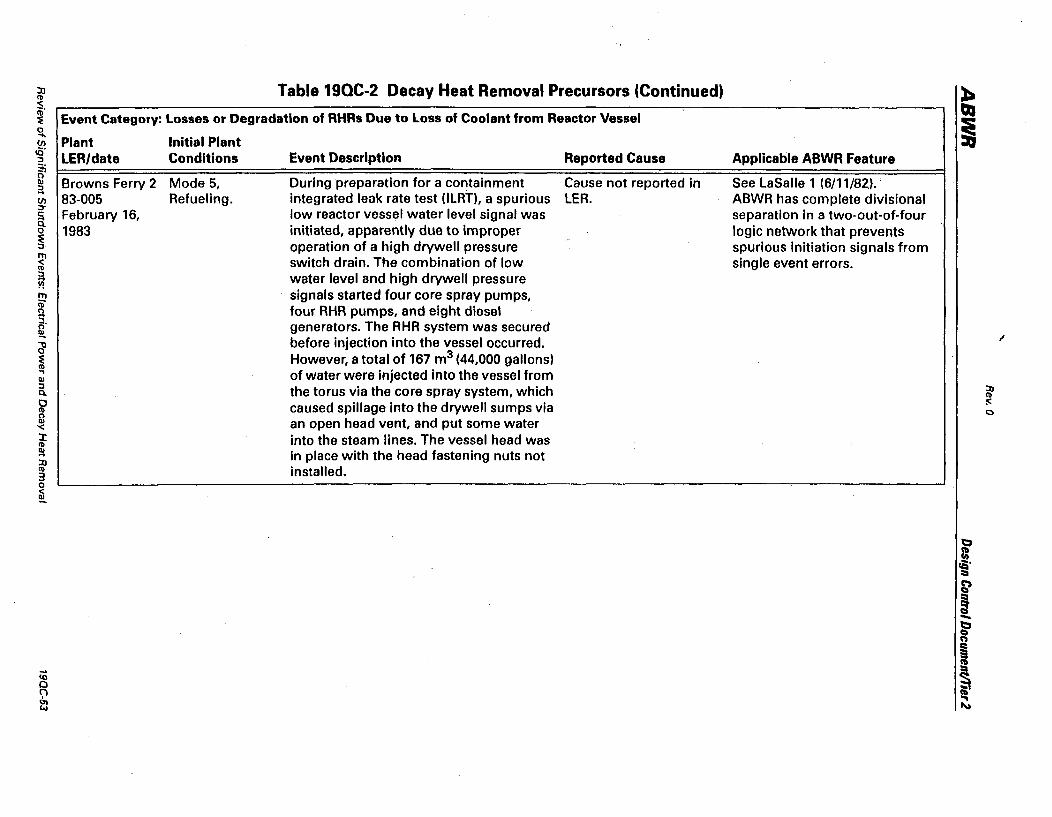
~ Table 19QC-2 Decay Heat Removal Precursors (Continued) s, ~ Event Category: Losses or Degradation of RHRs Due to Loss of Coolant from Reactor Vessel o ..., ~ Plant ::I LER/date :;; ~ Browns Ferry 2 til 83-005 ::I" a February 16, o 1983 ~ ~ <II
~
I til ~ ., III :J Q,
o <II
&l '<
~ !!! ~ <II 3 o ~
Initial Plant Conditions
Mode 5, Refueling.
Event Description
During preparation for a containment integrated leak rate test (lLRn, a spurious low reactor vessel water level signal was initiated, apparently due to improper operation of a high drywell pressure switch drain. The combination of low water level and high drywell pressure signals started four core spray pumps, four RHR pumps, and eight diesel generators. The RHR system was secured before injection into the vessel occurred. However, a total of 167 m3 (44,000 gallons) of water were injected into the vessel from the torus via the core spray system, which caused spillage into the drywell sumps via an open head vent, and put some water into the steam lines. The vessel head was in place with the head fastening nuts not installed.
Reported Cause
Cause not reported in LER.
Applicable ABWR Feature
See LaSalle 1 (6/11/82.).' ABWR has complete divisional separation in a two-out-of-four logic network that prevents spurious initiation signals from single event errors.
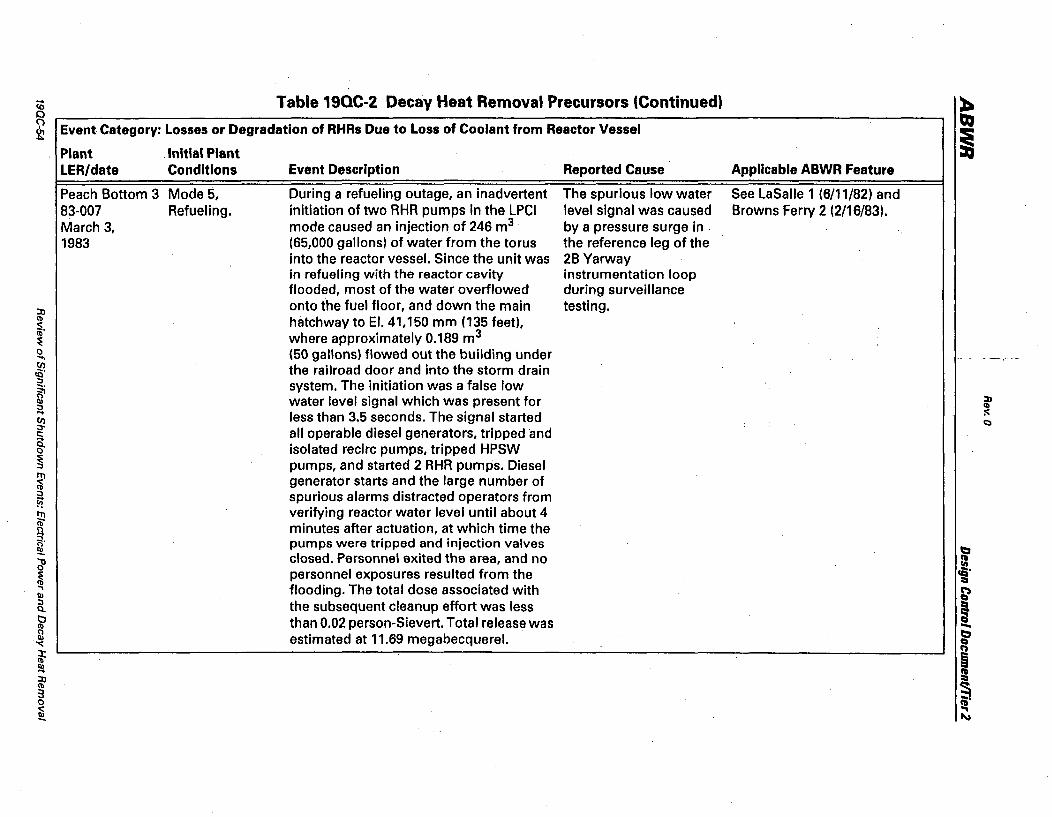
co o Table 19QC-2 Decay Heat Removal Precursors (Continued)
~ Event Category: Losses or Degradation of RHRs Due to Loss of Coolant from Reactor Vessel
Plant LER/date
Initial Plant Conditions
Peach Bottom 3 Mode 5, 83-007 Refueling. March 3, 1983
Event Description
During a refueling outage, an inadvertent initiation of two RHR pumps in the LPCI mode caused an injection of 246 m3
(65,000 gallons) of water from the torus into the reactor vessel. Since the unit was in refueling with the reactor cavity flooded, most of the water overflowed onto the fuel floor, and down the main hatchway to EI. 41,150 mm (135 feet), where approximately 0.189 m3
(50 gallons) flowed out the building under the railroad door and into the storm drain system. The initiation was a false low water level signal which was present for less than 3.5 seconds. The signal started all operable diesel generators, tripped and isolated recirc pumps, tripped HPSW pumps, and started 2 RHR pumps. Diesel generator starts and the large number of spurious alarms distracted operators from verifying reactor water level until about 4 minutes after actuation, at which time the pumps were tripped and injection valves closed. Personnel exited the area, and no personnel exposures resulted from the flooding. The total dose associated with the subsequent cleanup effort was less than 0.02 person-Sievert. Total release was estimated at 11.69 megabecquerel.
Reported Cause
The spurious low water level signal was caused by a pressure surge in . the reference leg of the 2B Yarway instrumentation loop during surveillance testing.
Applicable ABWR Feature
See LaSalle 1 (6/11/82) and Browns Ferry 2 (2/16/83).
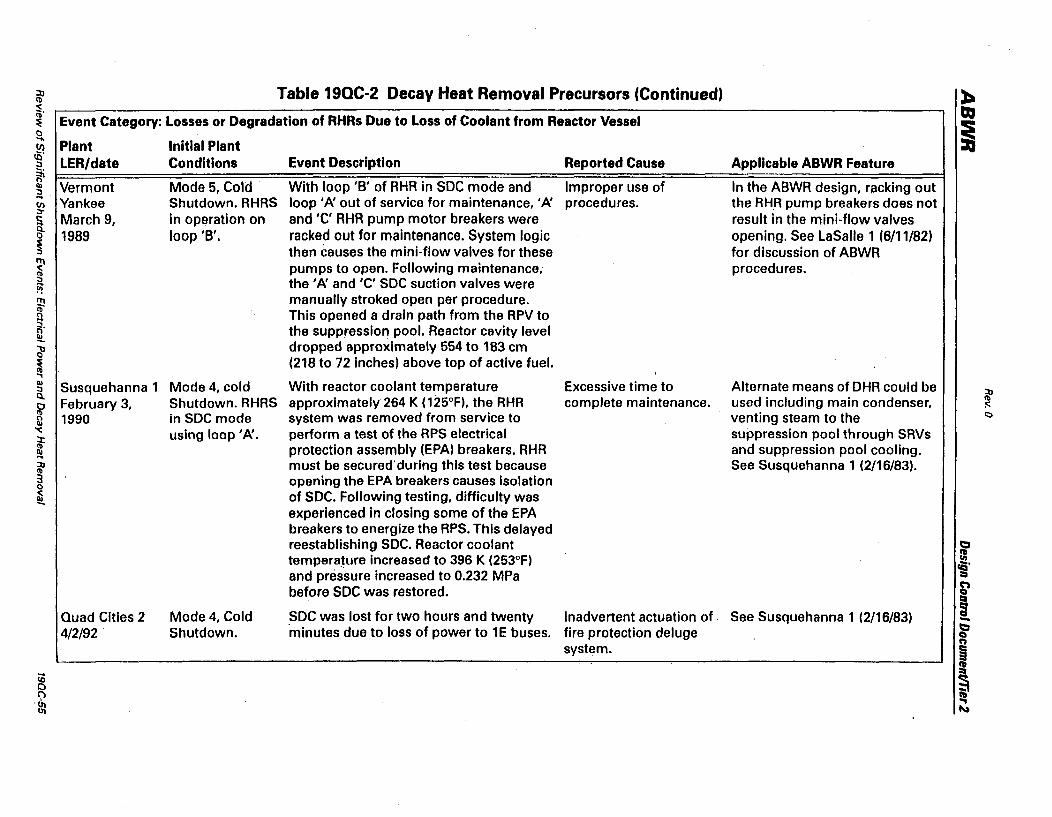
~ Table 19QC-2 Decay Heat Removal Precursors (Continued) ~ <II
~. Event Category: Losses or Degradation of RHRs Due to Loss of Coolant from Reactor Vessel ~
~
i 0 .... Plant Initial Plant !J)
~.
LER/date Conditions Event Description Reported Cause Applicable ABWR Feature :J
~ Vermont Mode 5, Cold With loop 'B' of RHR in SOC mode and Improper use of In the ABWR design, racking out III ;a
en Yankee Shutdown. RHRS loop 'N out of service for maintenance, 'N procedures. the RHR pump breakers does not ::r
March 9, in operation on and 'C' RHA pump motor breakers were result in the mini-flow valves ~ 0 1989 loop 'B'. racked out for maintenance. System logic opening. See LaSalle 1 (6/11/82) ~ then causes the mini-flow valves for these for discussion of ABWR III
pumps to open. Following maintenance; procedures. ~ ::. the 'N and 'c' SOC suction valves were ~ !!! manually stroked open per procedure. <I> This opened a drain path from the RPV to ~ ~. the suppression pool. Reactor cavity level ~
ti' dropped approximately 554 to 183 cm
~ (218 to 72 inches) above top of active fuel. ., III Susquehanna 1 Mode 4, cold With reactor coolant temperature Excessive time to Alternate means of OHR could be ::.
~ ~ February 3, Shutdown. RHRS approximately 264 K (125°F), theRHR complete maintenance. used including main condenser, l? :<:
tl 1990 in SOC mode system was removed from service to venting steam to the <:)
'< using loop' N. perform a test of the RPS electrical suppression pool through SRVs if ~ protection assembly (EPA) breakers. RHR and suppression pool cooling. ::n must be secured'during this test because See Susquehanna 1 (2/16/83). <I> 3 opening the EPA breakers causes isolation 0
~ of SOC. Following testing, difficulty was experienced in closing some of the EPA breakers to energize the RPS. This delayed reestablishing SOC. Reactor coolant t:I
temperature increased to 396 K (253°F) ~ cQ'
and pressure increased to 0.232 MPa :::. before SOC was restored. ~
Quad Cities 2 Mode 4, Cold SOC was lost for two hours and twenty Inadvertent actuation of . See Susquehanna 1 (2/16/83) 3 -4/2/92 Shutdown. minutes due to loss of power to 1 E buses. fire protection deluge i' n
system. ~ - ~ 10 0 C) g: ..
N
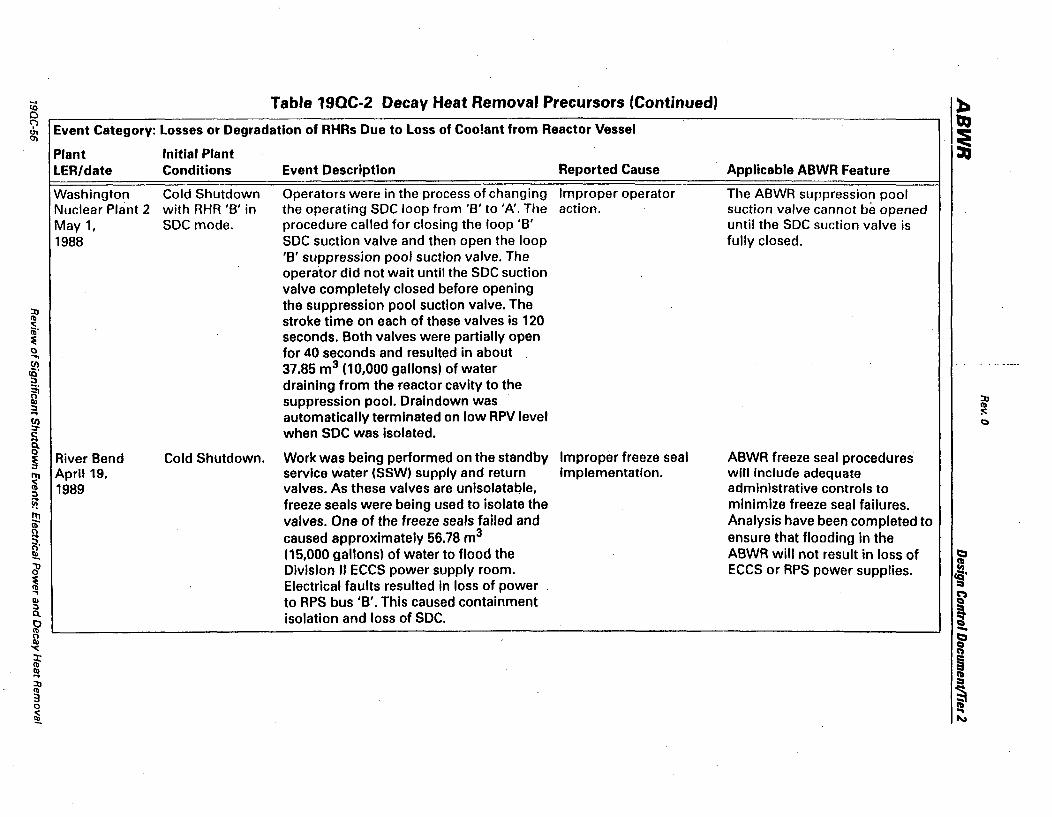
to Table 19QC-2 Decay Heat Removal Precursors (Continued) ~ 0 QJ <;1 Event Category: Losses or Degradation of RHRs Due to Loss of Coolant from Reactor Vessel g: ~ Plant Initial Plant
LER/date Conditions Event Description Reported Cause Applicable ABWR Feature
Washington Cold Shutdown Operators were in the process of changing Improper operator The ABWR suppression pool Nuclear Plant 2 with RHR 'B' in the operating SOC loop from 'B' to 'A'. The action. suction valve cannot be opened May 1, SOC mode. procedure called for closing the loop 'B' until the SOC suction valve is 1988 SOC suction valve and then open the loop fully closed.
'B' suppression pool suction valve. The operator did not wait until the SOC suction valve completely closed before opening
:n the suppression pool suction valve. The
"' stroke time on each of these valves is 120 '<: ib' seconds. Both valves were partially open ~ 0 for 40 seconds and resulted in about .... CI) rEo 37.85 m3 (10,000 gallons) of water ::J draining from the reactor cavity to the ~ Ib suppression pool. Draindown was ~ ::J ... automatically terminated on low RPV level :<: CI) C) ::J" when SOC was isolated. c:: it 0
River Bend Cold Shutdown. Work was being performed on the standby Improper freeze seal ABWR freeze seal procedures ~ I'T1 April 19, service water (SSW) supply and return Implementation. will include adequate ~ 1989 valves. As these valves are unisolatable, administrative controls to :l
~ freeze seals were being used to isolate the minimize freeze seal failures. ~ valves. One of the freeze seals failed and Analysis have been completed to !l caused approximately 56.78 m3 ensure that flooding in the ~. ~ (15,000 gallons) of water to flood the ABWR will not result in loss of ~
d' Division" ECCS power supply room. ECCS or RPS power supplies. 51 fQ'
~ Electrical faults resulted in loss of power =a ., ~ Ib to RPS bus 'B'. This caused containment ::J ! CI.. isolation and loss of SOC. 0
"' -~ ~ Q
'< ~ :x: ~ <b III ... ~ :n <b
~ 3 0
~ "..
Rev. 0
ABWR Design Control Documentffier 2
19R Probabilistic Flooding Analysis
19R.1 Introduction and Summary
The ABWR has been designed to withstand the effects of postulated flooding internal to the plant. This appendix discusses the capabilities of the ABWR to withstand internal flooding (e.g., service water, suppression pool line breaks).
Results of the ABWR probabilistic flood analysis show:
(1) The only buildings where potential flooding could damage safety-related equipment or cause plant transients are the turbine, control, service and reactor buildings. The radwaste building does not contain safety-related equipment and flooding cannot affect safety-related equipment in other buildings. Failure of seals in the radwaste tunnels between buildings was detennined to result in several orders of magnitude lower core damage frequency than direct flooding due to pipe breaks in each building and was not included in the f1~oding event trees.
(2) The flood concern for the turbine building is water filling up the condenser pit and flowing into the service building tunnel which il; the access path to the reactor and control buildings. The reactor and control buildings contain safe shutdown equipment. The turbine building has the potential to be flooded by two unlimited sources: circulating water and turbine service water. The condenser pit contains redundant water level sensors (in a two-out-of-four logic) which send an alann to alert the operator to potential flooding and automatically trip the circulating water system (CWS) pumps and close CWS isolation valves. In the unlikely event this automatic protection fails and the operator fails to take any action, potential flood waters would still be prevented from reaching the service building. Potential fl<?od waters would be expected to exit the turbine building through the non-watertight truck entrance door. Also, there is a normally closed and alarmed door separating the turbine and service building access tunnel. H this door were to open due to water pressure from the flood, watertight doors at the entrances to the reactor and control buildings from the service building should prevent damage to safety-related equipment. Turbine service water (TSW) breaks must be manually mitigated by either tripping the pumps, or closing valves, or opening the truck entrance door. Sufficient time is available to complete these actions (greater than several hours) due to the relatively low TSW flow and the large size of the turbine building. CWS breaks dominate the CDF so no TSW event trees were completed. Thus, no impact on plant safety is expected from potential turbine building flooding. The estimated core damage frequency from turbine building flooding is extremely small for a plant with a low power cycle heat sink (PCBS) and is slightly higher for a high PCHS.
Probabilistic Flooding Analysis 19R-1

ABWR
" I. I Rev. 0
Design Control Document/Tier 2
(3) The control building could potentially be flooded by the reactor building seIVice water (RSW) system which is an unlimited source or by breaks in the Fire Water System. The control building has six floors but floor drains and stairwells would direct all potential flood waters to the bottom floor where the safety-related reactor building cooling water (RCW) system components are located. There are three divisions of RCW /RSW in physically separate rooms with watertight doors. The RCW /RSW rooms in the control building lower level contain two sets of water level sensors in each division in a two-out-of-four logic. The first set of sensors send an alarm signal to the operator at 0.4 meter. The second set of sensors are actuated at 1.5 meters and send an alarm signal to the operator and trip the RSW pumps and close RSW system isolation valves in the affected division. Water remaining in the lines between the control building and the ultimate heat sink could be siphoned or drained into the control building. The water pumped into the control building prior to isolation of the RSW system and the water drained in from the RSW line outside is limited to affecting only one RCW division. The two other safety divisions (or alternate means) would remain undamaged and able to be used to achieve safe shutdown if necessary. The estimated core damage frequency from RSW flooding is extremely small.
Fire Water System breaks could cause flooding in all three safety divisions on a given floor since doors separating the divisions do not have sills. Floor drains and other floor openings in all three divisions ensure that postulated fire water breaks, if unisolated, will be directed to the first floor. The CDF for fire water flooding in the Control Building is extremely small.
The total control building flooding CDF is extremely small.
The reactor building is adequately protected from flooding concerns by the , following:
(a) Inside secondary containment, extensive flooding sources in ECCS divisional rooms at the lowest elevation are limited to impacting no more than one safety division by watertight doors. Extensive flooding in nondivisional rooms (i.e., corridors) is prevented from entering divisional rooms by watertight doors. In addition, the corridor volume is large enough to contain the largest flood source (Suppression pool). At higher elevations, potential flooding in systems such as Fire Water is directed to the first (bottom) level by floor drains and stairwells. The CDF for flooding inside secondary containment is extremely small.
(b) Outside secondary containment, floor drains direct all flood sources to the sumps on floor B1F. If the sump pumps fail or flood rates exceed sump pump capacity, a sump overfill line directs water to the corridor of floor B3F inside secondary containment where it can be contained as discussed above. Emergency diesel generator lube or fuel oil leaks are contained within the individual rooms until a portable pump can be brought in to remove the oil. The estimated core damage frequency for
19R-2 Probabilistic Flooding Analysis

ABWR Rev. 0
Design Control Document!Tier 2
reactor building flooding outside secondary containment is extremely small.
(c) The total reactor building flooding CDF is extremely small.
(4) The estimated total core damage frequency from internal flooding is very small for a low PCHS and slightly higher for a high PCHS. This low risk level is attributable to the relatively low probability oflarge internal floods and the physical separation of certain safety equipment in the ABWR design. It is highly unlikely that a single flood can result in loss of more than one safety division. Where there is a potential for large flood sources to affect equipment in more than one division, instrumentation for detecting the flood and isolating the flood source is provided. The two remaining safety divisions and alternate core cooling and decay heat removal features (e.g., AC independent water addition, power conversion system) give high assurance of achieving safe shut down.
19R.2 Scope of Analysis
The ABWR flooding analysis covers all phases of plan t operation. It addresses all potential flooding sources and their impact on safe shutdown of the plant. The effect on safety systems that are required to achieve and maintain safe shutdown is covered.
The analysis is completed in three steps. First, a listing is completed of all internal water sources and the buildings that they serve. This list is then screened to determine the sources and buildings that have a potential to prevent safe shutdown.
Following the screening analysis, the ability of the plant to achieve safe shutdown is analyzed both deterministically and probabilistically. The deterministic analysis describ~s plant features that are designed to either prevent or mitigate potential flooding concerns. This analysis focuses on plant features such as physical separation of buildings and rooms within buildings, isolation mechanisms to limit flooding, and the ability of the plant to contain potential flood waters due to room size and sump pumps. The intent of the deterministic analysis is to show that, for all postulated water sources, the ABWR design features can, with realistic operator actions, successfully achieve safe shutdown.
The probabilistic flooding analysis involves the use of event trees to evaluate the frequency of core damage for pipe breaks in various systems and buildings. Pipe breaks for each building of concern are evaluated and shown to have a negligible contribution to core damage frequency.
The results of the analysis are presented in terms of insights gained from the study and interface requirements that came out of the study which will be used as· input for the inspections, tests, analysis and acceptance criteria (ITAAC) , reliability assurance
Probabilistic Flooding Analysis 19R·3
ABWR Rev. 0
Design Control Documenf/Tier 2
program (RAP), and emergency procedure guideline programs. Lastly, the main conclusions from the flooding analysis are presented which support the ABWR's capability to withstand postulated internal floods.
19R.3 Screening Analysis (Water Sources and Buildings)
In order to focus the flooding analysis on buildings and water sources that have the potential to cause flooding concerns, a screening analysis waS completed to eliminate sources and buildings that, for various reasons, do not require further analysis.
The screening analysis was carried out for each of the buildings. From a safe shutdown perspective, the radwaste building does not contain any equipment that is required for safe shutdown and because of physical separation, flooding cannot affect safe shutdown equipment in other buildings. Therefore, the radwaste building was not evaluated further for flooding concerns. Failure of seals in the radwaste tunnels between buildings was determined to result.in several orders of magnitude lower core damage frequency than direct flooding due to pipe breaks in the buildings and was not included in the flooding event trees. Adequacy of these seals should be confirmed by the COL applicant. The turbine building does not contain any safe shutdown equipment but a flood could cause a turbine trip which is an accident initiator. Also, the turbine building is next to the service building which is the access to the reactor and control buildings and so flooding between the two buildings must be considered. The reactor and the control buildings contain safe shutdown equipment (e.g., RHR, RCIC, HPCF, RSW, Class IE batteries). The flooding analysis will thus focus on the turbine, control, service and reactor buildings, all of which either contain safety-related equipment or where flood damage could result in plant transients.
The sources of water in the ABWR are shown in Table 19R-1. As will be shown later, some of the smaller water sources (e.g., HV AC) can be eliminated due to insufficient volume to cause flooding concerns (Le., damage safety-related equipment) .
Potential flooding in the main steam tunnel and inside the drywell are adequately addressed in the LOCA discussion included in the full power PRA (Appendix 19D) and will not be further discussed in this appendix. In addition, the spent fuel pool is a seismic Category I structure that is fully lined and does not contain any drain lines. Therefore, flooding due to leaks in the spent fuel pool was also not considered in the study.
19R.4 Deterministic Flood Analysis
19R-4
This subsection summarizes the physical design features of the AB"WR that are capable of mitigating the effects of potential floods. A more detailed discussion of ABWR flooding features is contained in Tier 2 Subsection 3.4. The analysis will focus on the turbine, control, and reactor buildings.
Probabilistic Flooding Analysis
Rev. 0
ABWR Design Control Document/Tier 2
19R.4.1 Analysis Assumptions
The following general assumptions apply to all buildings in this deterministic flooding
analysis:
(1) In moderate energy piping larger than nominal one inch diameter, leakage cracks are postulated to occur in accordance with ANSI! ANS 56.11, "Design Criteria for Protection Against the Effects of Compartment Flooding in Light Water Reactor Plants."
(2) No credit is taken for operation of the drain sump pumps although they are
expected to operate during some of the postulated flooding events.
(3) When flooding can be identified and terminated by operator action from the
control room, a 10-minute response time is assumed. If flooding is identified only visually and subsequent local or control room action is required to mitigate the flood, a 30-minute response time is assumed.
(4) A single active failure of flood mitigating systems is assumed following the flood.
19R.4.2 General Design Features
In each ABWR building with a potential flooding concern, there are common design features that are capable of mitigating potential floods. These features include:
• Wall and floor penetrations for cables and pipes
• Automatic pump trips on high water level or high system flow rate in a room
• Room barriers that are capable of containing water within a room or preventing water from entering another room
• Alarmed watertight room doors to ensure integrity
• Floor drains
• Pipes within or between rooms contained in pipe chases
These features are described in more detail below.
19R.4.2.1 Penetrations
Whenever an electrical cable, pipe, or HV AC duct must pass through a wall or a floor separating areas of different safety-related divisions, a penetration seal is provided to ensure the integrity of the room.
Probabilistic Flooding Analysis 19R-5
ABWR Rev. 0
Design Control Document/Tier 2
Cable tray penetrations are furnace tested to 1089 K (1900°F) and subjected to a hose stream test [38.1-cm (l.5-inch) hose operating at 0.618 MPa]. This ensures that flooding by hot sources such as reactor water cleanup (CUW) will not cause failure of the penetration.
Piping penetrations have been minimized throughout the plant to reduce the potential for loss of barrier integrity. No high pressure or high temperature piping lines penetrate walls or floors separating two different safety divisions. Piping penetrations are qualified to the same differential pressure requirements as the walls or floors they penetrate.
HVAC ducts have also been minimized throughout the plant. In areas where isolation is essential (e.g., secondary containment), motor operated positive shutoff valves are provided in the HV AC duct.
19R.4.2.2 Automatic Pump Trips
Some rooms contain level sensors to detect the presence of water in the room. In general, one set oflevel sensors alerts the operator of a potential flooding condition and a second (higher level) set of sensors actuate to trip pumps that could be causing the water level to increase in the room. These sensors are safety or non-safety grade (depending on the application), diverse, and typically arranged in a two-out·of-four lOgic.
Some systems (e.g., fire water) have high flow rate sensors to detect leaks in the system. In this case, the operator would be warned of a high flow rate instead of high room water level. Appropriate action would then be taken to isolate the leak.
19R.4.2.3 Room Barriers
Except in primary containment and the control room complex, divisional areas are separated from each other by 3-hour rated fire barrier walls and floors.
These walls are made of concrete and are at least 15.24 cm (6 inches) thick. They are designed to ensure that fires are not propagated between safety-related divisions and thus act as effective flood barriers. As with penetration seals, the fire barriers are flame and hydrostatically tested to ensure their high temperature performance and thus will not fail due to flooding by hot water sources.
19R.4.2.4 Watertight Doors
19R-6
ECCS equipment rooms on the first floor of the reactor and control buildings have watertight doors. Also, external entrances to the control and reactor buildings below grade level have watertight doors. The entrance to other divisional rooms have fire rated doors. These doors are normally closed and are included in the security
Probabilistic Flooding Analysis
ABWR Rev. 0
Design Control DocumentlTier 2
surveillance system. These doors can be opened only with a card key and if left open security personnel will be alerted immediately. This system gives high assurance that the divisional separation will not be breached due to a door being inadvertently left open. The alarm system can detect if a watertight door is closed but not if it is dogged. A once per shift walkdown will ensure that watertight doors remain dogged when not in use.
In cases where a fire door must be opened due to maintenance or surveillance activities, administrative controls are implemented to require that a watch be posted near the door until the activity is completed and the door returned to its normally closed position. In the event of a flood in an ECCS room when the other two ECCS rooms are opened, plant procedures should direct operators to ensure that at least one of the two unflooded room doors be closed before opening the door to the flooded ECCS room.
19R.4.2.S Floor Drains
The reactor and control buildings contain floor drains to direct potential flood waters to rooms where sumps and sump pumps are located. The drain system is sized to withstand breaks in the fire water system which is the most probable flood source for these two buildings. Sizing of the drain system will include provisions for plugging of some drains by debris.
The drain system will be designed so that floor drains in ECCS rooms will be connected to the corresponding divisional sump in the ECCS rooms on the first floor. Nondivisional rooms will drain to the non-divisional sumps on appropriate floors.
Floor BIF of the reactor building has overfill lines on the non-divisional sumps outside secondary containment. If the sump pumps fail or the flow rate exceeds the sump pump capacity, the lines will direct water to the non-divisional corridor of the first floor (B3F) inside secondary containment. A water seal is provided to maintain secondary containment integrity.
19R.4.2.6 Pipe Chases
When pipes are run between certain buildings ( e.g., main steam feedwater lines between the reactor building and the turbine building) they are encased in sections called "chases." The chases are capable of retaining the water or steam that may be deposited due to a pipe break or leak. In essence, the pipe chase acts as a divisional barrier similar to a fire wall or floor.
19R.4.2.7 Equipment Mounting
All electrical equipment is mounted 20.32 em (8 inches) off the floor to help protect against damage from potential flood sources.
Probabilistic Flooding Analysis 19R-7
Rev. 0
ABWR Design Control Document/fier 2
19R.4.2.S Electrical Equipment Design
Electric motors are all of drip proof design and motor control centers have NEMA Type 4 enclosures. Both· of these features protect electrical equipment from water spray and dripping water from above.
The above general design features all contribute to limiting the risk due to potential internal flooding in the ABWR. The following discussion addresses specific features of the turbine, control, and reactor buildings that prevent or mitigate postulated ABWR internal floods.
19R.4.2.9 Shutdown Considerations
During shutdown, increased maintenance activities introduce the potential for flooding to impact more than one safety division. As discussed in SSAR Subsection 19Q. 7, it is recommended that maintenance during shutdown be completed on one division at a time. The recommended shutdown configuration is: one RHR division and support systems operating, one safety division administratively controlled to not be in maintenance and its barriers intact, and the third division undergoing maintenance.
In this configuration, flooding in any division will still result in at least one division being available for decay heat removal. If flooding occurred in the intact division, the water would be contained in that division and the operating division would continue to supply decay heat removal capability. The watertight doors are designed to stop water from entering the room (i.e., the door seals seat with water pressure from flooding external to the room) but only small leakage is expected past the seals from flooding in the ECCS room. If flooding occurred in either of the two other divisions, even ifbarriers in both divisions were breached for main tenance, the in tact division would be available.
Due to maintenance activities there is also greater potential for debris clogging floor drains and preventing proper drainage of flood waters. The ABWR contains an adequate number of floor drains that if some were to become plugged the remaining drains would be available to direct water to the sump tanks. Some backup of water may occur but equipment mounted at least 20.32 em off the floor would ensure that no equipment was damaged. Also, normal housekeeping tasks required by NRC regulations would keep debris to a minimum.
19R.4.3 Turbine Building
19R-B
There is no safety-related equipment located in the turbine building. It is included as part of the detailed flood analysis because it contains non-safety-related equipment (e.g., condenser, condensate pumps) that could be used to achieve safe shutdown if required, a turbine building flood could result in a turbine trip which is a transient initiator, and because it is connected to the control and reactor buildings through the
Probabilistic Flooding Analysis
ABWR Rev. 0
Design Control Document/Tier2
service building access tunnel. Since the control and reactor buildings contain safetyrelated equipment, interbuilding flooding must be addressed.
The water sources contained in the Turbine Building are shown in Table 19R-1. These are:
• Circulating water
• Turbine service water
• Turbine cooling water
• HV AC normal cooling water
• Fire water
• Make up water (condensate)
• Reactor feedwater
The flood concern in the turbine building is filling up the condenser pit until it overflows, at which point water has the potential to enter the service building. Of all the turbine building water sources, only the circulating water or turbine service water (both unlimited sources) are capable of flooding the turbine building and causing a flood concern.
If either the circulating or turbine service water systems were to develop a leak and flood the turbine building, several features exist to mitigate the consequences of the flood. There are three circulating water pumps and two turbine service water pumps supplying water to the turbine building. Each pump has an associated motor operated isolation valve. The condenser pit has redundant water level sensors arranged in a two-out-of-four logic. Iffloodingwere to occur, the level sensors would alert the control room operator, trip the CWS pumps and close CWS valves. For breaks in the TSW system, adequate time (greater than several hours) is available for operator action to trip pumps, or close isolation valves, or open the truck entrance door.
If, for some reason, failure of one or more pumps or valves allowed the water level to rise up to the top of the condenser pit and start flooding the grade level, the following additional flood protection features can mitigate the flood. At one end of the turbine building there is a non-watertight truck entrance door. Water would be expected to flow under and around this door and exit on the ground outside the turbine building. In addition, between the turbine building and service building is a normally closed and alarmed door. It is opened for passage and immediately closed. If the door is not closed immediately, the operator in the control room and plant security would be notified and a security guard sent to investigate. This door has an 20.32-cm (8-inch) step up from the turbine building to divert Water away from the service building.
Probabilistic Flooding Analysis 19R-9
ABWR Rev. 0
Design Control DocumentlTier 2
From the above, it can be concluded that the ABWR contains adequate mitigating features such'thatfloodingin the turbine building would not prevent safe shutdown of
the plant.
19R.4.4 Control Building
19R-10
The control building contains safety-related equipment that could be used to achieve safe shutdown. Potential flooding of the control building could thus negatively impact the plants ability to reach and maintain safe shutdown.
Of the five sources of water in the control building listed in Table 19R-l, three of them
(RCW, HNCW, and HECW) are relatively small and available room volumes and floor drains are adequate to mitigate flooding from these sources. Fire water is located on all floors (typically in the corridors not in equipment rooms). The fire water system flowrate is low and the system contains a flow alarm to alert the operator to a potential flooding condition. Adequate time would be available to locate and isolate fire water system leaks before any safety-related equipment would be damaged.
The main flooding concern in the control building are potential leaks in the reactor service water (RSW) system which is an unlimited source. Leaks in the RSW system could cause flooding damage to the reactor building cooling water (RCW) pump motors which are located on the bottom floor (i.e., -13150 mm level). The three divisions ofRCW are physically separated in rooms with watertight doors and each RCW /RSW room is equipped with a sump pump.
All floors above the bottom floor contain divisionally separated floor drains. These floor drains direct any water in the rooms to the bottom floor where sump pumps are located. Safety-related equipment located in upper floor rooms (e.g., electrical control panels, emergency HV AC, divisional batteries) will be protected from flooding damage by equipment installed 20.32 cm (8 inches) from the floor and floor drains which will divert accumulated water to the bottom floor. Figure 19R-l shows an elevation view of the control building.
The RCW /RSW rooms contain two sets of diverse safety grade level sensors in a two out offour logic. The first set is located at 0.4 meters from the floor and is intended to alert
the control room operator to investigate for the presence of water in the RCW /RSW rooms. The second set of sensors are located at 1.5 meters and informs the control room operators that a serious condition exists that needs immediate attention. In addition, the upper level sensors trip the RSW pumps and close motor operated isolation valves in the RSW system of the affected division.
Anti-siphon capability (e.g., vacuum breakers, air breaks) is included to prevent continued flooding in the event that the RSW pump is tripped but the isolation valves do not close. Figure 19R-2 depicts the RSW system. Given that the pumps have ,tripped,
Probabifistic Flooding Analysis
ABWR Rev. 0
Design ContrDI DDcument/Tier 2
actuation of the anti-siphon capabilitywill tenninate the flood. The ABWR UHS cannot gravity drain into the control building.
From the above, it is concluded that the only flooding concern in the control building is a leak in the RSW system that threatens the RCW system motors in the RCW /RSW rooms. If the upper level sensor alarms, it is a clear indication of a m~or RSW system leak in the RCW /RSW room.
The following assumptions are used in this "worst case" control building flood:
(1) The ultimate heat sink (UHS) is at an elevation higher than the control building RCW /RSW rooms such that siphoning of UHS water through the RSW system to the RC\V/RSW rooms is possible.
(2) There is a maximum of 4000 meters of pipe (2000 each for supply and return) between the UHS and the RCW /RSW room which can be discharged to the
. RCW /RSW room following RSW pump trip.
(3) The size of the RSW crack is about 103 cm2 (16 in2) per ANSI! ANS-58.2 and BTP MEB 3-1.
(4) The leak occurs in the RCW /RSW room.
(5) No operator action was assumed.
The results of this "worst case" control building flood are:
(1) A leak occurs in the RCW /RSW room with the RSW pump running and the lower level sensor alarms at 0.4 meters.
(2) The water level continues to rise and reaches the high level sensor. The RSW pumps in the leaking division are tripped at 1.5 meters.
(3) Water flows into the RCW /RSW room from the 4000 meters ofRSW pipe outside the control building.
( 4) No water leaves the flooded room and only one division of RCW is affected.
From the above, it is concluded that there are no flooding concerns in the control building because most sources of water are either not large enough or leak at small enough rates that no equipment damage could reasonably occur. The only potential water source of concern is the RSW system but automatic isolation of a potential leak would occur and only one division of RCW would be affected. The reactor could be brought to safe shutdown using equipment from the other two divisions.
Probabilistic Flooding Analysis 79R-17
Rev. 0
ABWR Design Control Document/Tier 2
19R.4.5 Reactor Building
19R-12
The reactor building flooding analysis will be presented in two parts: flooding inside and outside secondary containment. For both cases flooding concerns on each floor will be discussed as appropriate.
From Table 19R-l it can be seen that there are several sources of water in the reactor building. Of these sources, fire water is the main concern (i.e., capable of damaging electrical equipment) on all floors outside secondary containment and on floors BIF and above inside secondary containment. Inside secondary containment on floors B3F and B2F potential flooding from breaks in the suppression pool and condensate make up lines are the major flood concerns. The other water sources are smaller and thus are oflesser concern. The following flooding discussion will thus focus on potential flooding damage from suppression pool and fire water breaks. Potential breaks in the emergency diesel generators fuel and lube oil systems will be treated separately. Table 19R-2 summarizes the reactor building flood sources and safety-related equipment for each floor.
Inside Secondary Containment FloorB3F
This is the lowest floor in the reactor building and is entirely within secondary containment. The equipment that could be damaged by potential flooding are ECCS equipment (e.g., HPCF, RCIC, RHR), the CRD hydraulic control units, and the CRD pumps. (Figure 19R-3).
Flooding on this floor could occur from breaks in lines attached to the suppression pool or condensate storage tank (CST) and result in water accumulation in one of the three ECCS divisional rooms or within the divisional corridors. The ECCS rooms each contain watertight doors and have individual sump pumps. Flooding inside these rooms would result in loss of the ECCS function for that division. Suppression pool flooding in an ECCS room will reach an equilibrium level below the ceiling of each ECCS room. The watertight doors open into the corridor so that some water in the ECCS room may leak past the door seal into the corridor.
In the divisional corridor, maximum flooding could occur from line leaks associated with the suppression pool cleanup system. In addition, breaks in fire water standpipes on B3F or other floors inside secondary containment would accumulate in the B3F corridor. This is because all inside secondary containment floor drain lines are routed to the B3F corridor. The corridor volume is large enough to contain all of the water from the suppression pool or CST that could enter the corridor. The ECCS watertight doors would prevent any damage to ECCS equipment. The corridor sump pump alarms would alert the operator to flooding in these areas.
Probabilistic Flooding Analysis
ABWR Rev. 0
Design Control Documenf/Tier 2
Flooding could also occur in the HPCF and RCIC rooms due to a leak. in the line to the CST. The CST volume is less than the suppression pool but since it is located at a higher elevation, more water could potentially enter the reactor building (i.e., flood volume not limited by water level equilibrium conditions). The operator could close the CST isolation valve from the control room based on ECCS room sump pump operation and indication of a decreasing water level in the CST. It is expected that the operator would close the CST isolation valve before the low CST level was reached. If not, the ECCS system is designed to automatically shift HPCF or RCIC suction to the suppression pool. In this case, the normally closed suppression pool suction valve would be under water and not expected to open. Even if the suction valve were to open, suppression pool water would fill the ECCS room and flow on to the floor of B2F where it would return to the B3F corridor of the same division via floor drains. The volume of the ECCS Room and the divisional corridor are sufficient to contain the flood water from both the CST and suppression pool.
FloorB2F
Inside secondary containment potential flo~ding on this floor could occur from the same sources as on B3F (i.e., suppression pool and fire water). A leak in the ECCS chase in each of the divisional valve rooms would cause water to flow down floor drains to the ECCS divisional room on B3F and be processed as previously discussed. Flooding in other areas would be routed through floor drains to the divisional corridor in B3F (Figure 19R-4).
Floors BIF-4F
All inside secondary containment flooding sources on floors BIF-4F would be routed through floor drains to the corridor of B3F and mitigated as discussed above for flooding on B3F.
CUW line Breaks
The effects of an unisolated reactor water cleanup (CUW) break were analyzed to determine the potential impact on ECCS equipment. The specific effects considered were the possibility of a CUWbreak rupturing an ECCS wall due to pressure, and the possibility of a CUW break flooding an ECCS room.
The analysis was based on the ABWR secondary subcompartment pressurization analysis (SSPA) model, which postulates a break in each subcompartment through which a CUW high energy line passes. For each postulated break, pressure and temperature tiansients for each subcompartment were determined using the same methodology as used for compartment pressurization analyses reported in SSAR Subsection 6.2.3.
Probabilistic Flooding Analysis 19R-13
ABWR
79R-74
Rev. 0
Design Control Document/Tiel2
Since there are no common walls between ECCS and CUW quadrants, the pressure in the El (-) 8200 mm corridor is the only CUW break source that could rupture an ECCS wall. The worst-case CUW break was determined from the SSP A to be a 200 mm doubleended break in the El (-) 8200 mm pump rooms. The worst-case break in this analysis was defined as the break which will result in the highest pressure in the El (-) 8200 mm Division B corridor. The entire corridor at elevation (-)8200 mm is modeled as one volume, assuming that divisional s,eparation doors (at this elevation) are open and remain open during the high energy line break events (Figure 19R-3).
Break flow is comprised of flow from the reactor side (upstream of break) and from the balance-of-system (BOS) side (downstream of break to check valve). Reactor side break flow is modeled in two distinct phases: a period of unsteady flow called the inventory depletion period followed by steady, critical flow choked at flow venturi FE-OOI (Figure 5.4-12, Sheet 1 of 4) inside the primary containment. BOS break flow consists of inventory depletion period flow only since check valves isolate this side of the break from feedwater, the downstream pressure source. The analysis conservatively assumes the complete BOS volume of water, including heat exchangers and filterdemineralizers, will flow out of the break. Steady critical flow is calculated using the Moody Homogenous Equilibrium Critical Flow model.
Analysis results showed that the maximum pressure and temperature values for the EL(-)8200 mm corridor during the worst-case CUW break are 0.028 MPaG and 381 K (107.9°C) respectively. These values are below the design pressure and temperature conditions (Tables 6.2-3 and 31.3-15).
The volume of water released from the worst-case CUW break was detexmined to be 439 cubic meters, based on the density of water at 381 K (107.9°C). This calculation also assumed that the operator depressurizes the reactor 30 minutes after the break texminating the flood. Assuming conservatively that the Division B corridor contained all the released water. This volume of water will fill the corridor to a level of approximately 1.4 m. The ECCS watertight doors will ensure that no water enters any of the ECCS rooms. If the break were to occur during shutdown, administrative procedures ensure that at least one ECCS division will be available.
In view of the above, a CUW line break is not expected to cause failure of any ECCS walls. Also, the flood volume will be contained within the corridor.
Outside Secondary Containment
Flooding sources outside secondary containment are dominated by fire water leaks. Areas outside secondary containment start at level BIF (Le_, B3F and B2F are entirely within secondary containment.) BIF contains two sump pumps, one each in the Division Band C areas. Floors IF-4F contain floor drains which all tenninate on floor BIF.
Probabilistic Flooding Analysis
ABWR Rev. 0
Design Control Document/Tier 2
The following discussion_addresses specific flooding concerns on each floor outside secondary containment.
BIF
BIF contains the three emergency electric rooms. Flood damage in these rooms would affect power supplies to safety-related equipment. The major flooding source is fire water contained in standpipes in Division Band C areas outside the electrical rooms and in the clean access path near the entrance to all three divisional areas (Figure 19R-5). There is no water source in the Division A area or in the emergency electrical rooms of Division B or C.
Fire water breaks in Division B or C would be mitigated by the sump pumps in each area in conjunction with operation of sump overfill lines if necessary. The sump overfill lines are installed to mitigate the result of sump pump failures or flood rates in excess of sump pump capability [i.e. 0.009lm3 / s (150 GPM)]. The sump overfill feature is a drain line through the BIF floor to the corndor of floor B3F inside secondary containment. The line contains a water filled loop seal which acts as the secondary containment boundary. If the water level were to rise above the sump, it would enter the overfill line and be directed to the B3F corridor. The flood would then be mitigated as previously discussed.
For a fire water break in the clean access area (i.e., outside entrance to all three divisional areas), the water could flow under the Division B and C fire doors and enter the sumps in those areas or, if necessary, the sump overfill lines as discussed above. The Division A room does not contain a sump but all equipment is mounted 20.32 cm (8 inches) off the floor and flood levels will not damage the equipment.
IF (Grade)
Fire Water flooding on this floor would be routed by floor drains to BIF and mitigated as discussed above. The emergency diesel generator (EDG) rooms could be flooded by fuel or lubricating oil. In order to preclude the possibility of oil plugging the other floor drains, the EDG rooms can contain any potential oil spills until a portable pump can be used to remove the oil. Figure 19R-6 is a schematic of floor if showing equipment that could be damaged by floods.
2F-4F
Flooding on these floors would be routed by floor drains either to BIF or the EDG rooms (for fuel oil or lubricating oil leaks) and mitigated as discussed above.
Probabilistic Flooding Analysis 19R-15
ABWR Rev. 0
Design Control Document/lier 2
Summary of Reactor Building Deterministic Flooding Analysis Flooding in the reactor building can be mitigated for all postulated flood sources by the following features:
(1) Inside secondary containment-floor drains in all floors above the first floor direct potential flood water to either the non-divisional corridor or, for ECCS line breaks, into the ECCS room on the first (B3F) floor. For flooding outside the ECCS rooms in the non-divisional corridor, watertight doors on each ECCS room prevents water from damaging electrical equipment. The corridor volume is large enough to contain any postulated water source. Flooding inside an ECCS room would only damage electrical equipment in the affected division. For large flooding sources leaking into an ECCS room, the water would eventually leak out int<? the corridor either:
(a) Past the watertight door seals (since the doors open into the corridor)
(b) Continue flooding up to the valve room on floor B2F and then flow under the fire door and down the floor drain to the B3F corridor.
(2) Outside secondary containment-floor drains in all floors above BIF route potential flood sources either to the sumps on BIF or, in the case ofEDG oil leaks, to the EDG room. The sump pumps would deliver the water to the plant draining system. If the sump pumps fail or if flooding exceeds sump pump capacity [0.0091 m3;s (150 GPM) per pump], sump overfill lines route the water to the B3F corridor inside secondary containment. The corridor can safely contain the flood waters. EDG oil flooding is contained within the EDG room for later removal with a portable pump. _
From the above, it is concluded that all postulated internal flooding can be mitigated by the ~WR design. No more than one safety division of electrical equipment would be affected and the plan t would be able to achieve safe shutdown using either of the two remaining safety divisions or other features (e.g., feedwater, condensate, AC independent water addition system).
19R.5 Probabilistic Flood Assessment
19R.S.1 Introduction
19R-16
The objective of the ABWR internal probabilistic flood analysis is to identify and provide a quantitative assessment of the core damage frequency due to internal flood events. In ternal floods may be caused from large leaks due to rupture or cracking of pipes, piping components, or water containers such as storage tanks. Other possible flooding causes are the operation of fire protection equipment and human errors during maintenance. The spraying or dripping of water from high energy pipe breaks or fire
protection equipment onto safety equipment are also considered in the analysis.
P~obabilistic Flooding Analysis
ABWR Rev. 0
Design Control DocumentlTier 2
The internal flooding event may contribute to core damage frequency by:
(1) Initiating an accident sequence which in combination with the probability of random failure events could lead to core damage, and/or
(2) Disabling safety equipmen~ required to achieve plant safe shutdown.
Therefore, both types of contributions are identified in the evaluation of internal
flooding.
19R.S.2 Methodology
Event tree analysis is used to estimate core damage frequency due to internal flooding. The information developed in the deterministic phase of internal flooding analysis is used to construct event trees. Each node in an event tree diagram is dependent on the occurrence of previous events. Therefore, the event tree approach allows the dependence among the flooding initiating event and the success or failure of flooding
detection, mitigation, and safe shutdown operation events to be combined properly. Thus, the probability of a specific flooding sequence will be the product of all system failure probabilities in the sequence.
In the ABWR probabilistic flooding analysis, one or more event trees are constructed for each building of flooding concern which is identified in the deterministic flood
analysis (i.e., turbine, control, and reactor buildings). Floods in the remaining buildings were eliminated from the study based on a screening analysis. Each node in the event tree represents a different stage in the flooding progression. The first stage depicts the flooding initiating event. The existing nuclear power plant operating data and the data in the Hatch internal flood analysis are used to assess the ABWR flooding initiation frequency (Table 19R-3) for each building of concern. The subsequent nodes represent the success or failure offloodingdetection and mitigation features. The data in Table 19R-4 is used to evaluate these events. The final node represents the plant safe shutdown operation. Success or failure at this point may lead either to a safe shutdown or to a core damage event. The probability of failure of this event is dependent upon the availability of systems (which survive internal flooding events). The conditional core damage given failure of the specific mitigating systems is obtained from the ABWR full power PRA. Table 19R-5 lists the conditional probabilities for failure to safely shut down
the plant given the loss of various ECCS and BOP systems. The table also explains the basis for each conditional probability.
Since the internal flooding contribution to the ABWR core damage frequency is expected to be very small, a bounding analysis approach is adapted in this study to
Probabi~istic Flooding Analysis 19R-17
ABWR Rev. 0
Design Control Docament/Tier 2
simplify the computation. The following assumptions are used to constIuct and quantify the event trees:
(1) Any flooding event in a given building is assumed to be the worst case flood possible (i.e., a double ended shear of the largest pipe). This is a very
, consexvative assumption because, in general, most floods result in leaks, not double ended breaks.
(2) When a flooding event progresses to fail equipment in a safety division, the complete division is assumed to have failed.
(3) Given the failure of a safety division, there'is a conditional probability that plant shutdown using the other two divisions may result in core damage. This conditional probability of core damage has been evaluated using the ABWR full power PRA model. It has been determined from that PRA that the probability of core damage following loss of division 2 or 3 is equal and also greater than that for the loss of division 1. Conservatively, the division 2 (or 3) core damage probability was used in the study irrespective of which division was damaged by the postulated flood. Other conditional core damage probabilities (e.g., turbine trip without bypass) were also taken from the full powerPRA.
(4) When the plant is shutdown, at least one division of equipment will be administratively controlled to ensure that all systems are available (i.e., not in maintenance). This is in addition to the operating division. (See Subsection 19Q.7 for a discussion of the ABWR shutdown maintenance recommendations). Flooding in the intact division will be contained and will not affect the operating division and flooding in other divisions will not affect the intact division due to the presence of watertight doors and other flood barriers.
19R.5.3 Turbine Building
19R-18
The turbine building does not contain any safety-related equipment. But the flooding of the turbine building can initiate a reactor trip and may impact the safe shutdown of the plant if the water reaches the control building through the service building access tunnel. There are several water sources listed in Table 19R-1 that may leak into the turbine building. Only the two unlimited water sources (circulating water and turbine service water) are capable of flooding the turbine building and threatening safety equipment in the control building.
The circulating water system (CWS) has three pumps and each pump has an associated motor operated isolation (shutoff) valve. The turbine service water (TSW) system has three pumps and three motor operated isolation valves. For a high power cycle heat sink plant design (i.e., the heat sink is at an elevation higher than grade level of the turbine
Probabilistic Flooding Analysis
ABWR Rev. 0
Design Control Document!Tier 2
building), an additional isolation valve is installed in each line. All of these are classified as non-safety grade equipment. If a large pipe break develops either in the CWS or TSW piping and initiates flooding in the turbine building, it is necessary either to trip all of the pumps (for a low heat sink) or to close all of the valves of the associated system to terminate the flood. Four redundant safety grade water level sensors (operating in a two-out-of-four logic) in the condenser pit of the turbine building will generate a signal to alert the control room operator and trip all pumps and close all isolation valves in the CWS. TSW breaks must be manually mitigated but, due to the lower flow rate (Compared to CWS), sufficient time is available to trip the pumps or close isolation valves from the control room. A turbine trip and reactor shutdown will be initiated as a consequence of turbine building flooding.
If one or more pumps fail to trip or its associated valve fails to close, the water level may rise up to the top of the condenser pit and reach grade level. If the operator received an alann from the level sensors, even though the automatic protective features failed, the operator could open the truck entrance door (roll up type door) to allow the flood water to exit the building. If the operator does not receive an alarm, it is assumed that insufficient time will be available for the operator to open the truck door for a CWS break before the water level would effectively cause binding of the door and prevent opening. For TSW breaks, greater than 2 hours is available to open the door.
Even if the door could not be opened, leakage past the door could be sufficient to keep the flood level below the bottom of the door entering into the service building. There is a 20.32<m (8-inch) step up from the turbine building to the service building door. If the flood level were to increase above 20.32 cm (8 inches), the service building door is a normally closed alanned door that will offer resistance to flooding. If the door remains closed (it opens into the service building), the flood rate into the service building would be low enough that personnel in the service building would discover the flooding. There would be sufficient time to mitigate the flood before any damage to safety-related equipment could occur because the service building must flood before water could start to enter either the reactor or control buildings.
If the service building door fails open, the flood rate into the service building could be high enough to flood the service building to a significant level. Since the service building is the main entrance to the plant, personnel would hear or see the flood water and alert operators in the control room. Operator action could then be taken to manually trip the CWS or TSW pumps or close CWS or TSW valves. This is assuming that the level sensors failed but control circuitry for pump trip/valve isolation was still available.
If these actions failed, the flood waters would fill up the service building and could potentially enter the control or reactor buildings through several external normally closed watertight doors. On the first floor of the service building there is a watertight door which allows entrance to the reactor building cooling water (RCW) heat . exchanger rooms. Failure of this door could allow the flood waters to damage
Probabilistic Flooding Analysis 19R-19
ABWR Rev. 0
Design Control DocumentlTier 2
equipment in all three safety divisions and potentially the battery room on the next level. If the watertight door to the RCW rooms does not fail, the water level would rise up in the service building to the next level where there are two watertight doors, one to the battery rooms of the control building and another to the reactor building clean access area. Failure of the watertight door to the battery rooms is assumed to result in core damage as loss of all DC (batteries and battery chargers) will occur. DC power is required for control of safe shutdown -systems or t~ depressurize and use non-safety-related makeup sources such as condensate or AC independent water addition systems. Failure of the watertight door to the reactor building clean access area could result in damage to all three electrical divisions. If none of these watertight doors fail, flooding could continue to the next level where a normally open watertight door allows access to the control room area. Given the extensive flooding which had occurred to this point; the operators would have sufficient time and warning to close this watertight door. If the door failed or the operators failed to close it; no core damage should occur because automatic initiation of safety systems such as the high pressure core flooder would ensure that the core remained covered with water. Continued flooding would then reach grade level where the water could exit the service building through the main entrance. It is assumed that failure of any of the external watertight doors (except the control room door) results in core damage.
Figures 19R-7 and 19R-8 are event trees which describe the turbine building flooding -for low and high Power Cycle Heat Sink (PCHS) configurations, respectively. The accident progression due to a large pipe break in the CWS (the worst case flooding) is described in the event tree. As the CWS break is bounding, no TSW flooding event trees were developed. The success or failure of each flood mitigating feature in the event tree diagram may have a significant impact on the result of accident progression. The event trees in Figures 19R-7 and 19R-8 are described as follows:
(1) A large CWS pipe break occurs in the turbine building (flooding initiator).
(2) Four redundant safety grade water level sensors (operating in two-out-of-fourlogic) in the condenser pit of the turbine building detect and alert control room operators about flooding (detection).
(3) The bus breaker and/ or pump breakers of CWS pumps open and trip all three pumps (flooding prevention for low PCHS). Although siphoning could occur if the PCHS was higher than the bottom of the condenser pit, the siphon could not cause flooding to grade leveL Therefore, the flood would be contained within the turbine building. In case of high PCHS, the success probability of this feature is assumed to be zero.
(4) CWS isolation valves close (flooding prevention for high or low PCHS) .
(5) If the water level sensors alerted the operator to the flooding condition but the automatic flood protection features failed (CWS pump trip and valve isolation), time may be available for an operator to open the roll up truck
19R-20 Probabilistic Flooding Analysis
ABWR Rev. 0
Design Control Document/Tier 2
entrance door to ensure that flood waters would exit the turbine building to the ground outside. IT the water level sensors failed, it is assumed that by the
time the operator becomes aware of the flooding condition that the water level will have reached the truck door and the water pressure against the door will not allow it to be opened.
(6) The roll up truck entrance door is not watertight and it is expected that it will leak if flooding occurs. The door may not fail open but it will buckle and could
leak at a rate high enough to keep the flooding level below the level of the service building door [20.32 cm (8 inches)].
(7) The service building door is a normally closed and alarmed security door. It is not watertight but it should give significant resistance to flooding. If the door remains closed, the flood rate into the service building will be low.
(8) The control room operator can prevent flood damage to safety-related equipment by manually tripping the CWS pumps or closing the valves. It is assumed that if automatic features failed (given that the sensors did not fail) that control room actuations would also fail. If the sensors failed though, it may be possible to manually close the valves or trip the pumps from the control room once the operator is aware of the flooding condition. The
probability of success is higher if the sensors did not fail because the operator would receive two indications of flooding: early in the scenario from the _ sensors in the turbine building and later from personnel in the service building if the flood were to propagate to that point. In either case, the watertight doors in the control and reactor buildings can prevent damage to
safety-related equipment.
(9) Once the flood is terminated, the plant is manually shutdown using equipment not damaged by the flood. Failure to terminate the flood and any external watertight door failure is assumed to result in core damage.
The description of flooding for a high PCHS is the same as for a low PCHS except that the pump tripping feature is not credited.
The core damage frequency for turbine building flooding is extremely small for a low PCHS and slightly higher for a high PCHS.
19R.S.4 Control Building
The control building contains safety-related equipment and the potential flooding of the control building could impact the ability of the reactor to shutdown. The major flooding source in the control building is reactor service water (RSW) which is used to remove the heat from the RCWheat exchangers. The control building could potentially be flooded by the RSW system which is an unlimited water source. Unisolated breaks in,
Probabilistic Flooding Analysis 19R-21
ABWR Rev. 0
Design Control Document/Tier 2
the fire water system could cause inter-divisional flooding since doors separating safety divisions do not have sills. The control building· has six floors (Figure 19R-l) but floor drains and stairwells would direct all potential flood waters which could potentially impact safe shutdown equipment to the bottom floor (-8,200 mm level).
19R.S.4.1 RSW Line Breaks
19R-22
The RSW system is the only unlimited water source that could cause substantial flooding in the control building (Table 19R-1). It is highly unlikely that RSW flooding could damage more than one safety division. But the occurrence of several unlikely random failures and operator errors could result in flooding damage to equipment in all three RCW divisions.
The safety-related RCW motors are located on the -8,200 mm elevation (the lowest level of the con trol building) in three RSW /RCW rooms which are physically separated from each other by concrete walls and watertight doors. Each RSW /RCW room is also equipped with a sump pump.
Each of the three RSW divisions has two safety grade pumps, safety grade motoroperated isolation (shutoff) valves, and anti-siphon capability (e.g., vacuum breaker) (Figure 19R-2). During normal operation, one pump in each division is operating and the other pump is in standby. If a large leak or a pipe break develops in anyone of the RSW /RCW rooms, tripping the pump and closing the associated valves in the affected division will stop the flooding. If the RSW pump trips but isolation valves fail to close, then the anti~siphon capability prevent continued flooding. Four redundant safety grade water level sensors (operating in a two-out-of-four logic) at the lower level (0.4 meter) of the control building will generate a signal to alert the control room operator. If the control room operator fails to take appropriate action to stop the water flow, the second set of level sensors will actuate when the water reaches the 1.5 meter level of the room. At this level, the sensors (operating in two-out-of-fourlogic) not only send an alarm signal to the operator but also trip the affected RSW pump and close all the isolation valves. The upper level sensors are diverse from the lower level sensors.
It is assumed that only one division ofRCW is lost if the affected RSW pump trips or the isolation valves close. In case the level sensors fail to detect the flood, the water will rise to the second floor level and may start flowing into the other two remaining divisional RCW /RSW rooms. The level sensors in these two divisional rooms will generate a signal to alert the operator about the flood. If the sensors in the first division failed, the sensors in the other divisions are assumed to fail with a high probability to account for common cause failures (CCF). Only one division is assumed lost if the operator is successful in isolating the flood, otherwise the loss of all three safety divisions is possible.
Flooding in the RSW pump house was not addressed because the ultimate heat sink
including the RSW pump house is outside the scope of GE supply. The COL applicant
Probabilistic Flooding Analysis
ABWR Rev. 0
Design Control Document/Tier 2
must complete a plant specific probabilistic analysis of flooding in the RSW pump house.
The event tree in Figure 19R-9 describes the accident progression for a control building RSW flood. A large pipe break in the RSW !n the RSW /RCW heat exchanger room is considered to be the worst case flooding in the control building. The description of events shown in Figure 19R-9 follows:
(1) A large RSW pipe break occurs in the RCW /RSW room in the control building (flooding initiator).
(2) Four redundant safety grade water level sensors located at the 0.4 m level detect and alert the control room operator about flooding (detection).
(3) The operator investigates the presence of water and isolates the flooding by tripping the affected pump and/or closing the isolation valve (flooding prevention) .
(4) If the first level of detection fails or the operator fails to isolate the flowing water, then water continues rising in the room and the second set of diverse sensors located at 1.5 meters detects the water and trips the affected pump and closes all motor operated valves in the RSW system. Meanwhile the signal alerts the control room operator of the flooding condition (flooding prevention).
(5) If the operator is successful in isolating the flooding, one safety division is assumed lost, otherwise the loss of all three safety divisions may occur (flooding mitigation).
(6) The pump breaker of the affected RSWpump opens to trip the pump and/or the isolation valves close automatically (flooding isolation).
(7) In the unlikely event that the flood is not mitigated by automatic means or operator action, the water rises to the second floor level and starts flowing into the other two remaining RCW /RSW rooms. The first set of level sensors in these two divisional rooms detects the water and alerts the operator the third time (flooding detection). This operator action is considered separately from the previous high water alarm action because the alarm would occur approximately 45 minutes later and be annunciated as occurring from a different division.
(8) Reactor safe shutdown using available equipment (reactor shutdown).
The core damage probability for an 'RSW flood is estimated to be extremely small.
Probabilistic Flooding Analysis 19R-23
Rev. 0
ABWR Design Control Document/Tier 2
19R.S.4.2 Fire Water System Breaks
19R-24
The ABWR fire water system is a moderate energy system that is designed to withstand a 0.3g seismic event. The system is very rugged and large breaks of the eight inch header piping are not expected. The most probable failure mechanism for the fire water piping would be a crack which would not propagate to a large break because of the low pressure of the system (approximately 0.69 MPa). In keeping with the bounding analysis methodology used in other parts of the flooding PRA, a large break (0.086 m 3/s) will be assumed. The frequency of this bounding case large break of the fire water piping is small. This value was obtained from a revi~w of the Limerick Generating Station flooding PRA for a fire suppression system pipe double ended shear.
Figure 19R-IO is the event tree for fire water system flooding in the Control Building. The system unavailabilities are taken from the ABWR full power PRA and the operator failure probabiliti"es are based on methods used in Chapter 10 of Swain and Guttman given the many sources of information available indicating a fire water system break and the simple action of stopping the fire water pumps.
Fire water standpipes are located on all floors of the Control Building. A large break on any upper floor will result in a 0.086 m 3 / s flood which will be directed by the floor drain system to the RCW rooms on the first floor.
The ABWR does not contain sills on doors between safety divisions and fire doors can have up to a 1.9 cm gap at the bottom per National Fire Protection Association (NFPA 80) requirements. The floor drain system, although not finalized yet, will be designed so that this break flow can be accommodated taking into account all the drain lines in the three safety divisions. In addition, water may flow under the fire doors and down stairwells and elevator shafts. Due to the available drainage sources, the water level on any upper floor will not exceed 20.32 cm which is the minimum height that all water sensitive equipment must be mounted from the floor (ABWR Tier 2 Section 3.4). Therefore, no damage to equipment on any of the upper floors will occur due to emersion in the flood water. Spray onto safety-related equipment is not a concern because all fire water system flow will be directed to the three RCW rooms on the first floor.
Following a break in the fire water piping, the operator will receive indication that the fire water system pump(s) have started due to low system header pressure. WIthin a few minutes, he will also receive indication of excessive sump pump operation in the Control Building. As no fire alarm will accompany the fire water system actuation, the operator would send someone to confirm the nonexistence of a fire in the Control Building. Water flowing past hose stations causes actuation of audible alarms in each hose station. These alarms will alert personnel to actuation of the fire suppression system and help direct them to the break location. Once it has been deteITIlined that no fire exists, an operator can trip the fire pumps locally and close manual valves, if
Probabilistic Flooding Analysis
ABWR Rev. 0
Design Control Document!Tier 2
necessary, to terminate the flood. It is estimated that it will take a minimum of 30 ·minutes to isolate the flood (i.e., no credit for operator action within 30 minutes).
Based on the size of the three RCW rooms and the maximum fire water flow rate, it will take over one hour to flood the three RCW rooms up to the bottom of the RCW motors (minimum of 400 mm from the floor). If the flood is not terminated in approximately one hour, all three divisions ofRCW are assumed lost. This assumes a double ended shear of the fire water piping. If a design basis crack (ANSI! ANS 56.11) were to occur (the more probable occurrence) it would take approximately 10 hours for water to accumulate to a level of 400 mm.
Given that three divisions ofECCS are lost due to the loss ofRCW, the plant must then be manually shutdown per Technical Specifications using feedwater/condensate and the main condenser. Mter isolation of the fire water system flood, fire water would also be available for make up if required. RCIC does not require direct cooling by RCW, so it would be available for make up during this event.
The CDF for fire water flooding in the control Building is extremely small.
19R.S.5 Reactor Building
The reactor building contains safety-related equipment and the potential fl09ding of the reactor building could impact the safe shutdown of the plant. From the flooding stand point, the reactor building is divided into two parts:
(1) Inside secondary containment
(2) Outside secondary containment
19R.S.5.1 Flooding Inside Secondary Containment
The major flooding sources inside of the secondary containment are the suppression pool, condensate makeup and fire water. The rest of the potential flooding sources are listed in Table 19R-l. The lowest floor of the reactor building (B3F) is entirely within the secondary containment. The safety-related equipment that can be damaged by potential flooding are in the three divisional ECes rooms. Each of these rooms have watertight doors and individual sump pumps. The flooding inside these rooms would result in loss of ECCS equipment (e.g., HPCF, RCIC, RHR).
Flooding on this floor (B3F) could occur due to a pipe break attached to the suppression pool and result in water accumulation in one of the three ECCS divisional rooms or within the non-divisional corridor. The ECCS rooms are large enough to contain the water that could enter from a suppression line break (described in Subsection 19R.4.5). The watertight door of the affected ECCS room opens into the corridor and the corridor sump pump alarms alert the operator to the flooding in this
Probabilistic Flooding Analysis 19R-25
ABWR
19R-26
Rev. 0
Design Control Document/Tier 2
area. The watertight door of the unaffected ECCS room prevents the water in the. corridor from entering the other ECCS rooms. Therefore, flooding on this floor can not impact more than one division due to:
(1) The corridor volume is large enough to contain the largest flood source (suppression pool)
(2) The watertight doors prevent the water from entering the unaffected ECCS rooms. Common cause failure of the watertight doors is addressed.
At higher elevations, the potential flooding due to the largest water source (fire water) is directed to the B3F corridor (the lowest level) by floor drains and stailWells. The
corridor volume is large enough to contain anyone of the upper level water sources.
The flooding sources outside secondary containment are dominated by fire water leaks. Areas outside secondary containment start at level BIF. This level contains two sump pumps, one each in the Division B and C areas. Floors IF through 4F contain floor drains which all terminate on floor BIF. Floor drains in all floors above BIF route potential flood sources to the sumps on BIF. The sump pumps would deliver the flooding water to the plant drainage system. If the sump pumps fail or if flooding exceeds sump pump capacity, sump over-fill lines route the water to the B3F corridor inside secondary containmenL The corridor can safely contain the flood waters. In the case of emergency diesel generator (EDG) oil leaks, the EDG room can contain the spill until portable pumps can be brought in to remove the oil. As described in detail in Subsection I9R4.5, the flooding outside secondary containment can not impact more than one safety division.
The worst case reactor building flooding could potentially occur in the HPCF or RCIC rooms (inside secondary containment) due to a leak. in the line to the condensate storage tank (CST). If the operator fails to close the CST isolation valve (in spite of sump pump alarm and the indication of CST water level decreasing), the suction line of the affected ECCS system automatically realigns to the suppression pool on low CST level.
In this case, the normally closed suppression pool suction valve would be under water and not expected to open. Even if the suction valve were to open, the suppression pool water would fill the ECCS room and flow to the floor of B2F where it would return to the B3F corridor via floor drains. The volume of the ECCS room and the divisional corridor are sufficient to contain the flood water from the CST or the suppression pool.
If a leak. were to occur during shutdown, some of the ECCS rooms may be open for maintenance. ABWR procedures specify that one safety division will be maintained intact at all times during shutdown. If a leak were to occur in the intact division, the operator would be directed to close the ECCS door to an unaffected division before attempting to mitigate the flood in the protected division. The ABWR Technical Specifications require at least two ECCS divisions be operable during shutdown except
Probabilistic Flooding Analysis

ABWR Rev. 0
Design Control DocumentlTier 2
under certain conditions in mode 5 (reactor cavity flooded). Thus, in general, one other safety division would be available to maintain decay heat removal. Also, non-safety grade equipment (e.g., condensate, AC independent water addition system) can be used if necessary for decay heat removal. Appendix 19Q discusses the ABWR decay heat removal reliability during shutdown.
Figures 19R-ll, 19R-12, and 19R-13 are the event trees for flooding in the reactor building. The figures describe flooding on floor B3F inside an ECCS room, flooding on B3F in the divisional corridor, and fire water flooding outside secondary containment, respectively. These are the three worst case reactor building floods.
Flooding inside an ECCS room due to a leak in the suppression pool suction line upstream of the isolation valve results in an unisolable suppression pool leak (Figure 19R-ll). The first indication of a flood will be actuation of the ECCS sump pump. No operator action to stop the flooding is possible, but the ECCS room volume is large enough to contain the amount of water that will enter the ECCS room before the water levels in the ECCS room and suppression pool reach equilibrium. Equipment in the affected ECCS room would be damaged but the watertight doors would prevent water from damaging the other two safety divisions. Failure of the watertight doors results in loss of all three ECCS rooms and only the AC independent water addjtion is available for shutting down the plant. The core damage probability for this event is extremely small. As mentioned in Subsection 19R4.5, a break in a CST line could potentially allow more water to enter the rooms than a suppression pool line break, but the leak could be isolated and the results are the same (i.e., loss of only one ECCS division). Therefore, the core damage probability will be lower than for an unisolable suppression pool line break. and no event tree was completed for a CST line break.
Flooding in the non-<iivisional corridor from a break. in the suppression pool line is described in Figure 19R-12. The sumps highwater alann would alert the operators to the presence of a flood. In this case, the flooding can be stopped by appropriate operator action. If the operator fails to stop the flooding, the corridor volume is large enough to contain the amount of water that could enter from the suppression pool. The watertight doors on the ECCS rooms will prevent any damage to safety equipment and the plant can be safely shutdown using the three divisions of safety equipment. The core damage probability for this event is extremely small.
In the Reactor Building, fire water flooding inside secondary containment is bounded by flooding due to postulated breaks in lines from the suppression pool or condensate storage tank (CST). The maximum water level inside secondary containment is approximately the same for breaks in the fire water system, CST, or lines from the suppression pool since they each are capable of supplying the same volume of water but it would take over seven hours to drain the fire water system. By contrast, a break in a line from the suppression pool would result in an equilibrium level in the corridor in
Probabilistic Flooding Analysis 19R-27
ABWR Rev. 0
Design Control Document/Tier2
approximately one hour and it would take over five hours for the CST to drain. Even if the fire water flood was not isolated within 7 hours, the watertight doors on the ECCS rooms would prevent damage to any safety-related equipment. Therefore, fire water system flooding inside secondary containment will have a very low CDF and since is dominated by breaks in lines from the suppression pool, a separate event tree was not
completed.
19R.S.S.2 Flooding Outside Secondary Containment
Flooding outside secondary containment could affect the emergency electric motor control rooms and other equipment for all three safety divisions. The flooding concern is a break in a fire water standpipe. For breaks in the fire water system outside secondary containment, the situation is similar to flooding in the Control Building, Figure I9R-13 is the event tree for a fire water system flood outside secondary containment. Floor BIF is the lowest floor outside secondary containment and floods on all floors above this are directed to BIF via floor drains. Floor BIF contains two sumps outside secondary . containment. The overfill lines direct water in excess of the sump pump capacity to the corridor of the first floor (B3F) inside secondary containment. As the sump pump capacity will not handle a full header break, some water will enter the overfill lines and flow into the B3F corridor. The overlilllines may not be able to pass full fire water system flow either, so water will flow under fire doors and may enter the three Class IE electrical equipment rooms. Equipment in these rooms is raised at 20.32 cm off the floor and it is estimated that will take over one hour for the flood to damage equipment in these rooms. Water could also flow down the stairwells to the first floor but this was
conservatively excluded.
The initiating events frequency will be very low and similar to the Control Building since the same pipe and configuration are used and the length of piping is similar. The time for operator action is approximately the same as for the Control Building (one hour) and the effect of not isolating the flood is loss of the three ECCS divisions due to loss of power. RCIC will not be affected by the power loss and thus is assumed to be available for this scenario. As in the case of the Control Building, feedwater/condensate, the main condenser, and fire water (after isolation of the break) will be available. The CDF for fire water system flooding outside secondary containment is extremely small.
19R.6 Results and Interface Requirements
19R-28
This subsection summarizes the results of the ABWR probabilistic flooding analysis including insights gained from the analysis, important flooding design features,
operator actions to prevent/mitigate potential flooding, system reliability goals to ensure validation of probabilistic core damage estimates, and the conclusions reached on the ability of the ABWR to withstand postulated internal flooding.
Probabilistic Flooding Analysis
Rev. 0
ABWR Design Control Document!Tier 2
19R.6~ 1 Results
The results from the ABWR probabilistic risk analysis are shown in Table 19R-6 for the turbine, control and reactor buildings. This consen'ative bounding analysis shows that the CDF for internal flooding is very small and is less than the total plant CDF .
19R.6.2 . Insights Gained from Analysis
Completion of the ABWR probabilistic flooding analysis has led to the following insights on the flooding mitigation capability of the ABWR:
(1) The ABWR due to its basic layout and safety design features is inherently capable of mitigating potential internal flooding. Safety system redundancy and physical separation for flooding by large water sources along with c
alternate safe shutdown features in buildings separated from flooding of safety systems give the ABWR significant flooding mitigation capability. Also, fire protection features such as floor and wall penetrations and fire barriers help to contain potential flood sources.
(2) Due to the inherent ABWR flooding capability discussed above, only a small number of flooding specific design features must be reiied on to mitigate all potential flood sources. The flood specific features are: watertight doors on control and reactor building entrances, ECCS rooms, and RCW rooms; floor drains in reactor and control building; RSW pump trip, isolation valve closure and actuation of anti-siphon capability on high water level in the RCW rooms; CWS pump trip and valve closure on high water level in the condenser pit; and sump overfill lines on floor B1F of the reactor building.
(3) All postulated floods can be mitigated without taking credit for operation of sump pumps.
(4) While timely operator action can limit potential flood damage, all postulated floods can be adequately mitigated (from a risk perspective) without operator action.
19R.6.3 Important Design Features
Table 19R-7 lists the features of the ABWR design that contribute to its ability to withstand postulated flooding. The list includes general features as well as specific features in each building for identified potential flood sources. Also included is the rationale for how each feature could prevent/mitigate flood damage. The table also identifies the new features that were added as a result of the flooding PRA.
The features that are considered important to mitigate flooding in the ABWR are discussed in Subsection 19.8.5.
Probabilistic Flooding Analysis 19R-29
Rev. 0
ABWR Design Control Document/lier 2
19R.6.4 Operator Actions
From a flooding perspective there are several operator actions that, i! taken in a timely manner, could mitigate the effects of potential internal flooding. These are:
(1) Isolation of flood sources following detection by sump pump operation and alarms or floor water level detectors. Potential flood sources as listed in Table 19R-1 can, in general, all be isolated by appropriate operatorac,tions.
(2) A leak in the suppression pool line upstream of the HPCF /RCIC suction valve cannot be isolated but operator action to ensure other divisional watertight doors are closed could prevent damage to equipment in more than one safety division.
(3) Open doors or hatches to divert water from safety-related equipment following postulated floods.
(4) Close watertight door at entrance to the control room area if floods in the turbine building result in service building flooding.
(5) Open the truck entrance door in the turbine building to prevent a CWS or TSW break from entering the service building. This will prevent external flooding of the control and reactor buildings from a CWS or TSW line break.
In the PRA, operator action of responding to a flood alarm has been modeled. Floods in the turbine, control and reactor buildings result in alarms in the control room. It is assumed that flood procedures exist and operators are well trained to respond to flooding events. The operator failure probability depends upon the time available for taking action and are conservative values based on engineeringjudgment. The operator actions are not important in the sense that automatic actions will prevent core damage. However, timely operator action could limit the consequences of flood events.
19R.6.5 Reliability Goals (Input to RAP)
19R-30
The results of the probabilistic flooding analysis indicate that the following equipment is important to reducing the risk due to internal floods and should be included in the ABWR reliability assurance program:
Probabilistic Flooding Analysis
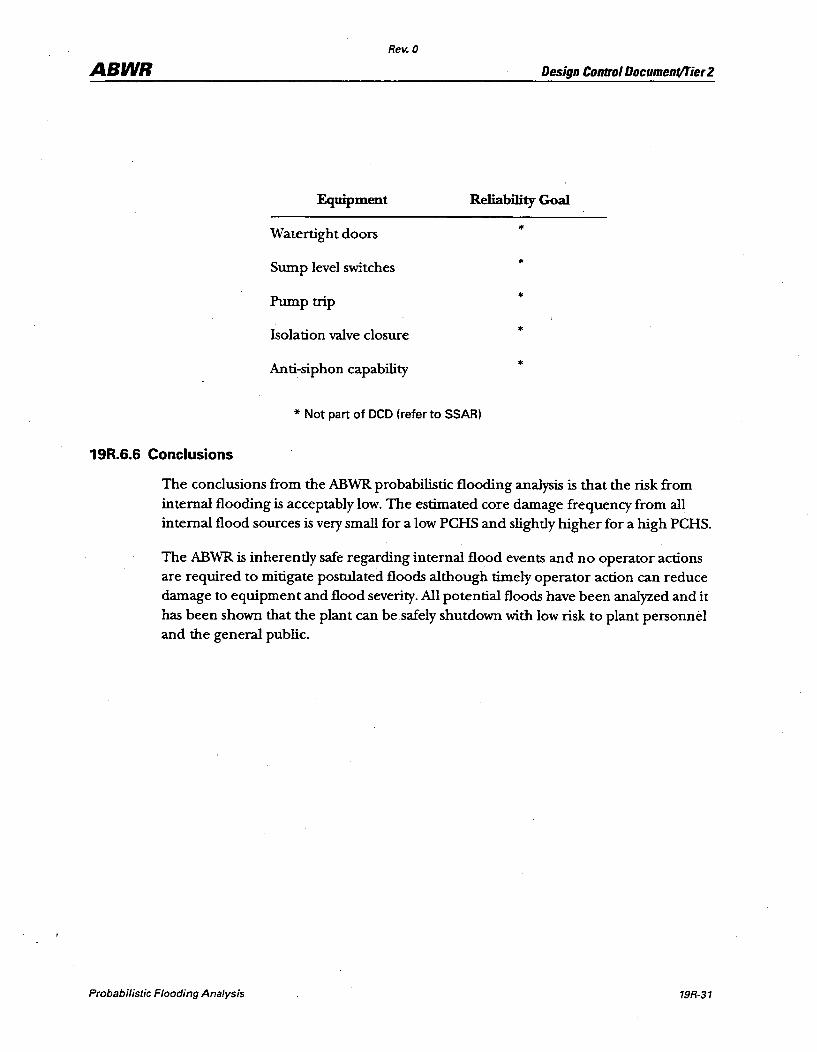
Rev. 0
ABWR Design Control Document/Tier 2
Equipment Reliability Goal
Watertight doors *
Sump level switches *
Pump trip *
Isolation valve closure *
Anti-siphon capability *
* Not part of OeD (refer to SSAR)
19R.6.6 Conclusions
The conclusions from the ABWR probabilistic flooding analysis is that the risk from internal flooding is acceptably low. The estimated core damage frequency from all internal flood sources is very small for a low PCHS and slightly higher for a high PCHS.
The ABWR is inherently safe regarding internal flood events and no operator actions are required to mitigate postulated floods although timely operator action can reduce damage to equipment and flood severity. All potential floods have been analyzed and it has been shown that the plant can be safely shutdown with low risk to plant personnel and the general public.
Probabilistic Flooding Analysis
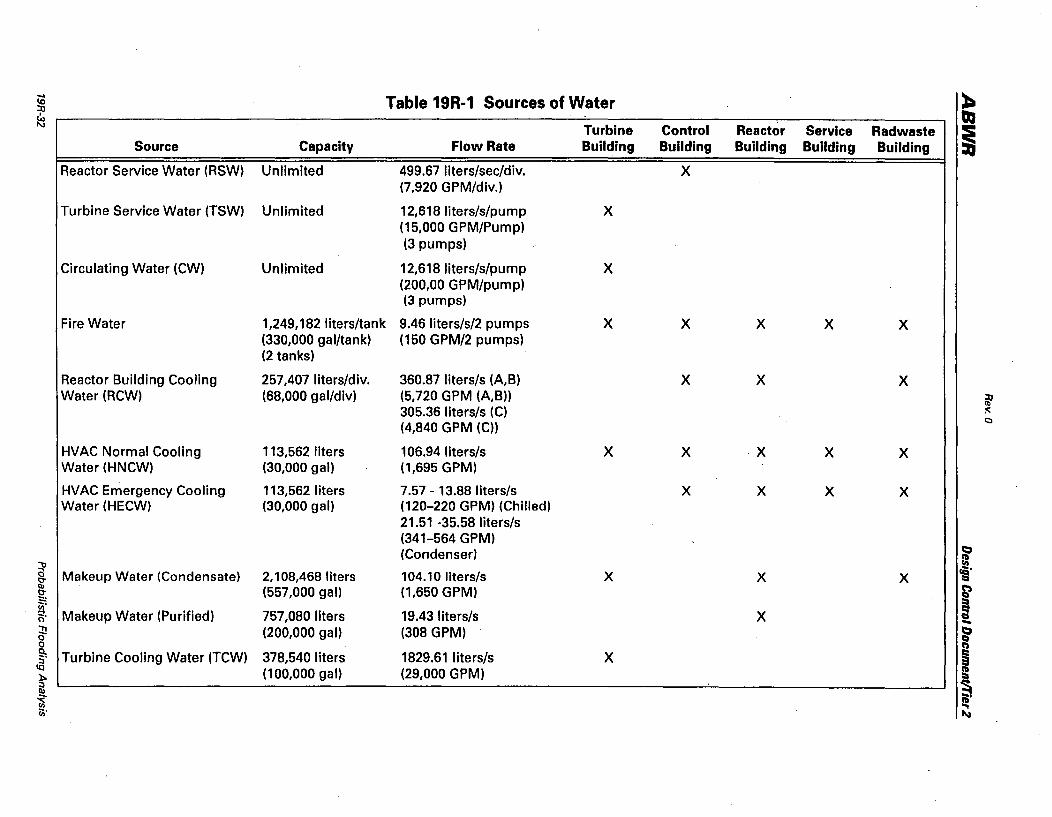
... Table 19R-1 Sources of Water ~ <0
:l)
~ ~ Turbine Control Reactor Service Radwaste I Source Capacity Flow Rate Building Building Building Building Building
Reactor Service Water (RSW) Unlimited 499.67 liters/sec/div. X (7,920 GPM/div.)
Turbine Service Water (T5W) Unlimited 12,618 liters/s/pump X (15,000 GPM/Pump) (3 pumps)
Circulating Water (CW) Unlimited 12,618Iiters/s/pump X (200,00 GPM/pump) (3 pumps)
Fire Water 1,249,182 liters/tank 9.46 Iiters/s/2 pumps X X X X X (330,000 gal/tank) (150 GPM/2 pumps) (2 tanks)
Reactor Building Cooling 257,407 liters/div. 360.87 liters/s (A,B) X X X Water (RCW) (68,000 gal/div) (5,720 GPM (A,B)) ~
305.36 liters/s (C) :0:
(4,840 GPM (C)) Q
HVAC Normal Cooling 113,562 liters 106.94 IIters/s X X X X X Water (HNCW) (30,000 gal) (1,695 GPM)
HVAC Emergency Cooling 113,562 liters 7.57 - 13.88 liters/s X X X X Water (HECW) (30,000 gal) (120-220 GPM) (Chilled)
21.51 -35.58 liters/s (341-564 GPM) (Condenser) I:)
Il ~ Makeup Water (Condensate) 2,108,468 liters cQ' 0 104.10 Iiters/s X X X c:r :::i
II> (557,000 gal) (1,650 GPM) ~ c:r :::.:
~ iii' g. Makeup Water (Purified) 757,080 liters 19.43 liters/s X .... :n (200,000 gal) (308 GPM) ~ 0 0 CO) Q.
Turbine Cooling Water (TCW) 378,540 liters 1829.61 liters/s X ~ 5' eQ
(100,000 gal) (29,000 GPM) CD ).
~ :J II>
~ iii' '"
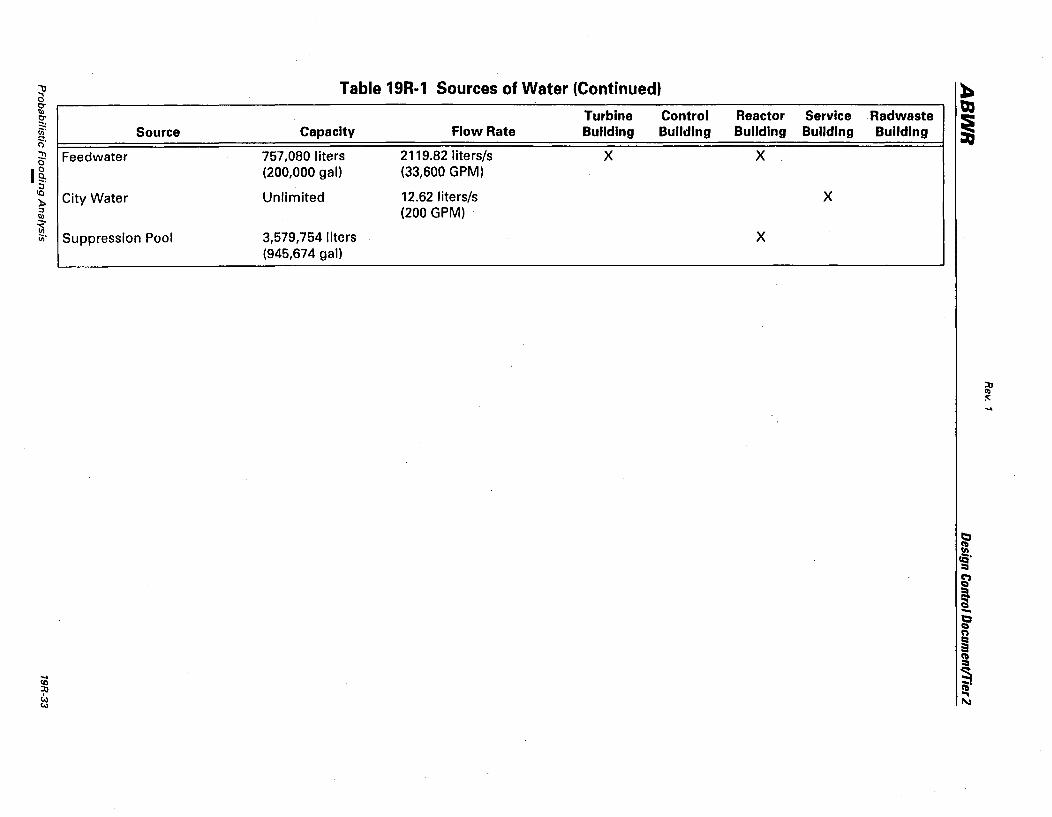
~ o g-tr
~ Source
~ Feedwater
Ii :b City Water :J III
~ <n' Suppression Pool
Table 19R·1 Sources of Water (Continued)
Turbine Control Capacity Flow Rate Building Building
757,080 liters 2119.82Iiters/s X (200,000 gal) (33,600 GPM)
Unlimited 12.62Iiters/s (200 GPM)
3,579,754 liters (945,674 gal)
Reactor Service Radwaste Building Building Building
X
X
X
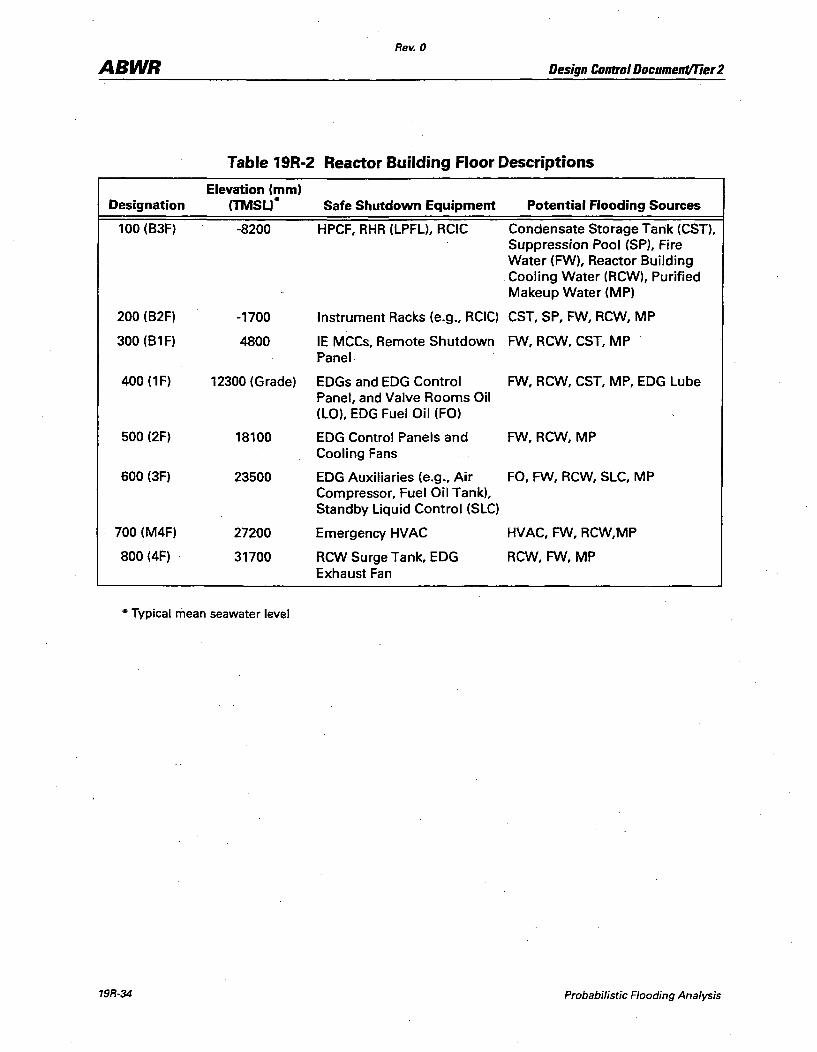
Rev. 0
ABWR Design Control Document/Tier2
Table 19R-2 Reactor Building Floor Descriptions
Elevation (mm) Designation (TMSL) * Safe Shutdown Equipment Potential Flooding Sources
100 (B3F) -8200 HPCF, RHR (LPFL), RCIC Condensate Storage Tank (CST), Suppression Pool (SP), Fire Water (FW), Reactor Building Cooling Water (RCW), Purified Makeup Water (MP)
200 (B2F) -1700 Instrument Racks (e.g., RCIC) CST, SP, FW, RCW, MP
300 (B1F) 4800 IE MCCs, Remote Shutdown FW, RCW, CST, MP Panel
400 (1F) 12300 (Grade) EDGs and EDG Control FW, RCW, CST, MP, EDG Lube Panel, and Valve Rooms Oil (La), EDG Fuel Oil (Fa)
500 (2F) 18100 EDG Control Panels and FW, RCW, MP Cooling Fans
600 (3F) 23500 EDG Auxiliaries (e.g., Air Fa, FW, RCW, SLC, MP Compressor, Fuel Oil Tank), Standby Liquid Control (SlC)
700 (M4F) 27200 Emergency HVAC HVAC, FW, RCW,MP
800 (4F) . 31700 RCW Surge Tank, EDG RCW, FW, MP Exhaust Fan
* Typical mean seawater level
19R-34 Probabilistic Flooding Analysis
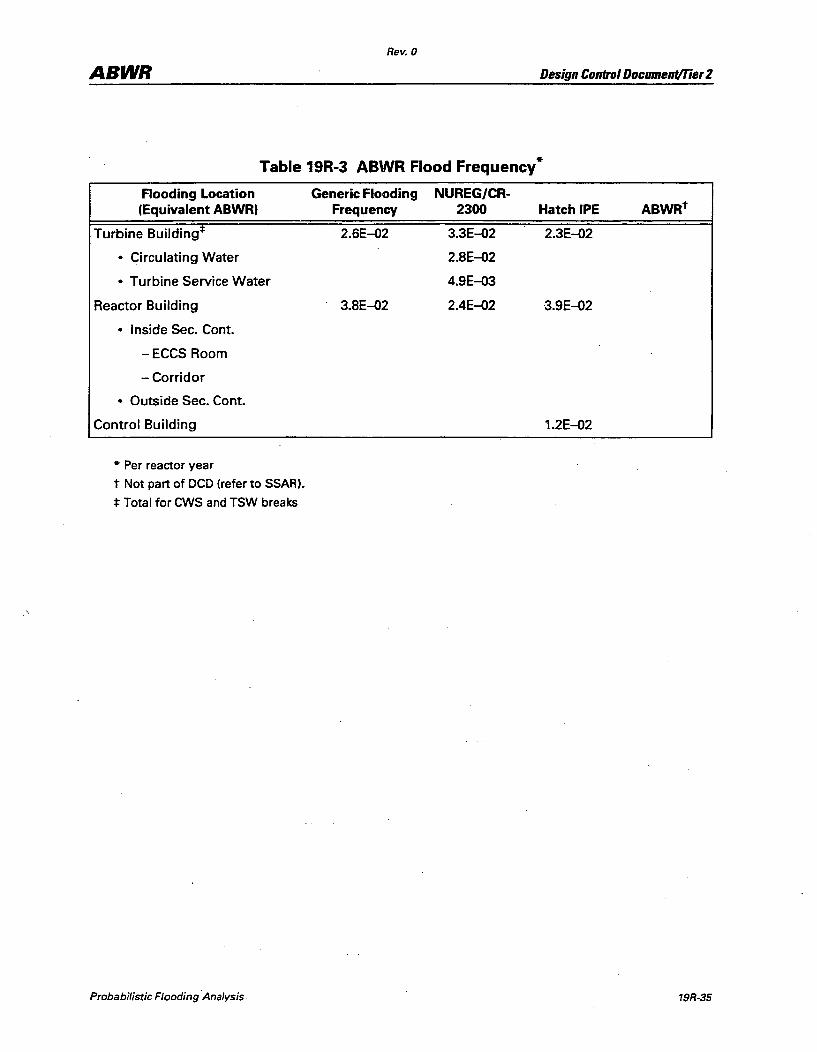
Rev. 0
ABWR Design Control Document/Tier 2
Table 19R-3 ABWR Flood Frequency·
Flooding Location (Equivalent ABWR)
Turbine Building'"
• Circulating Water
• Turbine Service Water
Reactor Building
• Inside Sec. Cont.
-ECCS Room
-Corridor
• Outside Sec. Cont.
Control Building
* Per reactor year
t Not part of DeD (refer to SSAR).
:1= Total for CWS and TSW breaks
Probabilistic Flooding Analysis·
Generic Flooding Frequency
2.6E-02
3.8E-02
NUREG/CR-2300
3.3E-02
2.8E-02
4.9E-03
2.4E-02
Hatch IPE
2.3E-02
3.9E-02
1.2E-02
19R-35
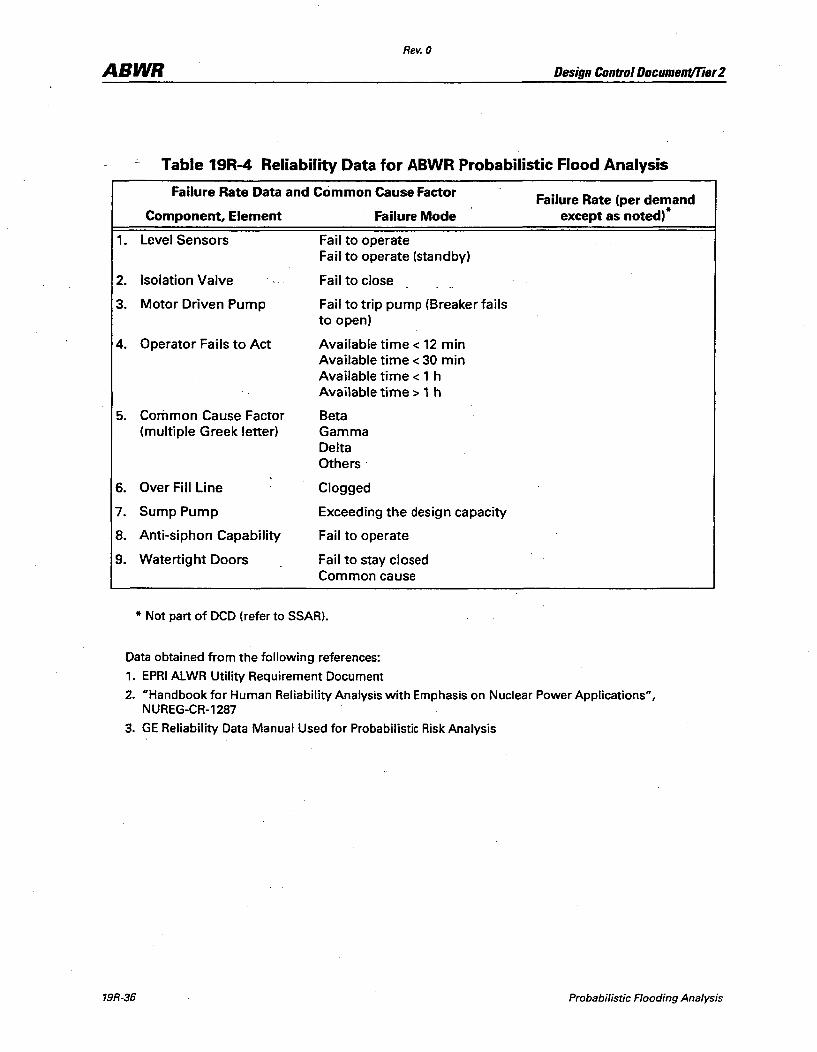
Rev. 0
ABWR Design Control Documentllier 2
Table 19R-4 Reliability Data for ABWR Probabilistic Flood Analysis
Failure Rate Data and Common Cause Factor
Component, Element
1. Level Sensors
2. Isolation Valve
3. Motor Driven Pump
4. Operator Fails to Act
5. Common Cause Factor (multiple Greek letter)
6. Over Fill Line
7. Sump Pump
8. Anti-siphon Capability
9. Watertight Doors
Failure Mode
Fail to operate Fail to operate (standby)
Fail to close
Fail to trip pump (Breaker fails to open)
Available time < 12 min Available time < 30 min Available time < 1 h Available time> 1 h
Beta Gamma Delta Others·
Clogged
Exceeding the design capacity
Fail to operate
Fail to stay closed Common cause
- Not part of DCD (refer to SSAR).
Data obtained from the following references:
1. EPRI ALWR Utility Requirement Document
Failure Rate (per demand except as noted)-
2. "Handbook for Human Reliability Analysis with Emphasis on Nuclear Power Applications", NUREG-CR-1287
3. GE Reliability Data Manual Used for Probabilistic Risk Analysis
19R-36 Probabilistic Flooding Analysis
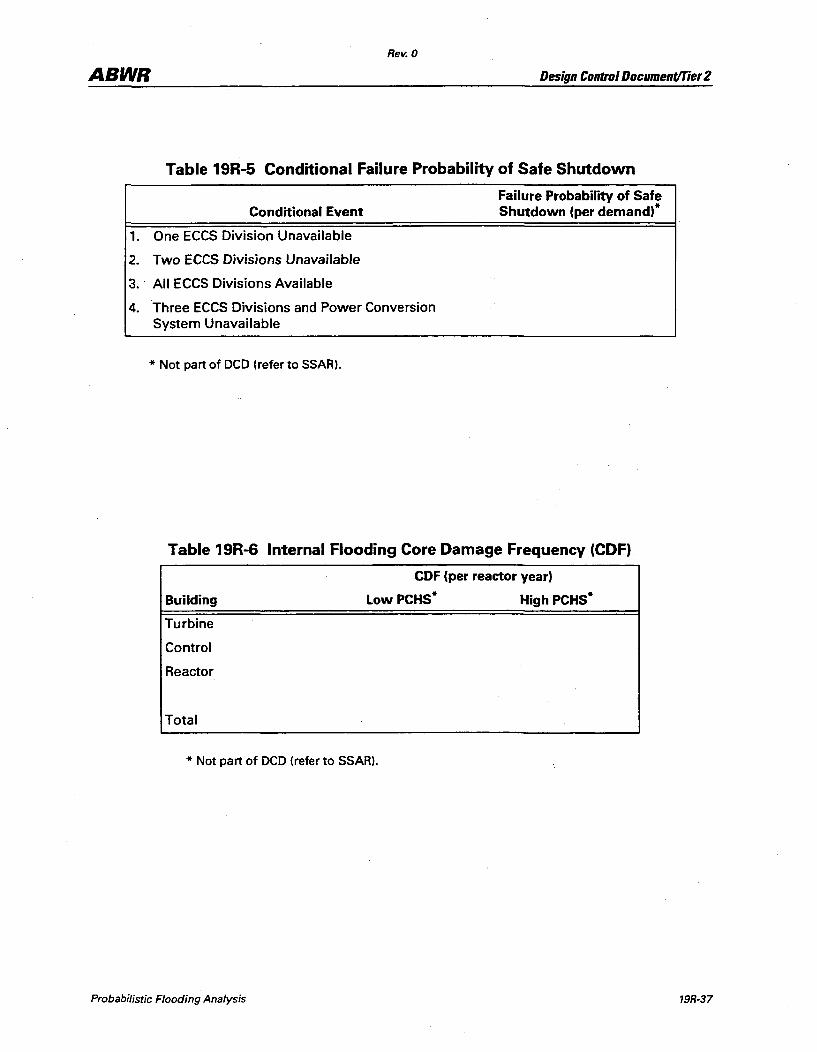
Rev. 0
ABWR Design Control Document/Tier2
Table 19R-5 Conditional Failure Probability of Safe Shutdown
Conditional Event
1. One ECCS Division Unavailable
2. Two ECCS Divisions Unavailable
3. All ECCS Divisions Available
4. Three EeCS Divisions and Power Conversion System Unavailable
* Not part of DCD (refer to SSAR).
Failure Probability of Safe Shutdown (per demand)·
Table 19R-6 Internal Flooding Core Damage Frequency (CD F)
CDF (per reactor year)
Building
Turbine
Control
Reactor
Total
Low PCHS· High PCHS·
* Not part of DCD (refer to SSAR).
Probabilistic Flooding Analysis 19R-37

Rev. 0
ABWR . Design Colltro/ DocumentlTier 2
Table 19R-7 ABWR Features to Prevent/Mitigate Flooding
Feature
General Features
Floor/wall penetrations are sealed.
Alarmed doors.
Pipe chases.
Benefit
Restricts water flow from entering or leaving divisional rooms.
Alert operator to loss of room integrity.
Contains potential flooding of high pressure systems (e.g., feedwater and main steam in tunnel between reactor and control buildings).
High pressure or high temperature lines not routed Reduces potential for high energy pipe break through floors or walls separating two different to affect more than one safety division. safety divisions.
Room sump pumps and alarms.
Floor drains.
Remove water from rooms to protect equipment and to alert operators to potential flooding conditions.
Directs water from room to lower floors for removal by sump pumps or other means.
Room water level alarms, pump trips, and isolation - Alert operator to potential flooding and valve closures. isolate flooding source(s).
Fire water flow initiation alarmed in the control room.
"Motor control centers have NEMA Type 4 enclosures.
Drip proof motors.
Turbine Building.
*Four water level sensors in condenser pit in twoout-of-four logic. When actuated they alarm and trip circulating water pumps and close isolation valves. They will also alert the operator to other floods such as TSW.
Non-watertight truck entrance door.
Normally closed and alarmed fire door between turbine building and service building tunnel (access to control and reactor buildings).
19R-38
Alerts operator to initiation of fire water flow and possible flood concern.
Protects MCCs from damage due to water from pipe break or fire hose.
Protects motors from falling liquids.
Isolates flooding source and alerts operator to potential flooding.
Expected to allow any internal flood water to leak out of turbine building to the outside and thereby not allow water to reach control or reactor bUildings.
Restricts potential flood water in turbine building from entering control or reactor buildings via the service building.
Probabilistic Flooding Analysis
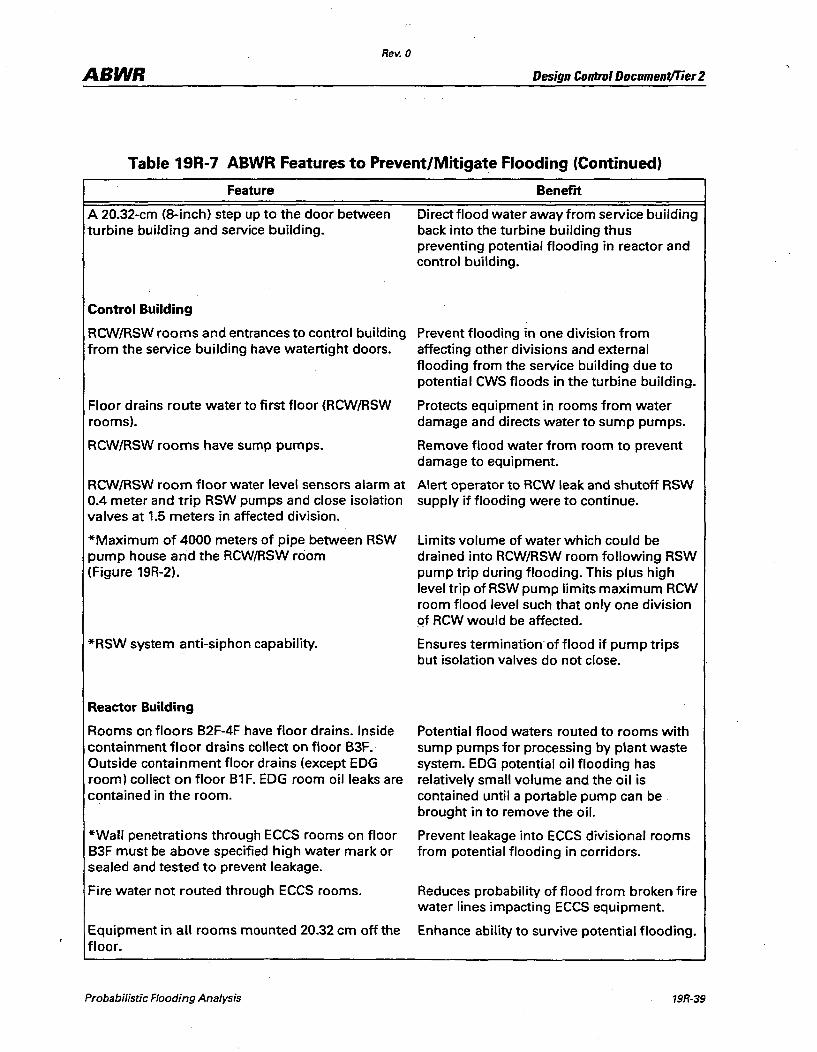
Rev. 0
ABWR Design Control Document/Tier 2
Table 19R-7 ABWR Features to Prevent/Mitigate Flooding (Continued)
Feature
A 20.32-cm (8-inch) step up to the door between turbine building and service building.
Control Building
RCW/RSW rooms and entrances to control building from the service building have watertight doors.
Floor drains route water to first floor (RCW/RSW rooms).
RCW/RSW rooms have sump pumps.
RCW/RSW room floor water level sensors alarm at 0.4 meter and trip RSW pumps and close isolation valves at 1.5 meters in affected division.
*Maximum of 4000 meters of pipe between RSW pump house and the RCW/RSW room (Figure 19R-2).
*RSW system anti-siphon capability.
Reactor Building
Rooms on floors B2F-4F have floor drains. Inside containment floor drains collect on floor B3F. Outside containment floor drains (except EDG room) collect on floor B1F. EDG room oil leaks are contained in the room.
*Wall penetrations through ECCS rooms on floor 83F must be above specified high water mark or sealed and tested to prevent leakage.
Fire water not routed through ECCS rooms.
Equipment in all rooms mounted 20.32 em off the floor.
Probabilistic Flooding Analysis
Benefit
Direct flood water away from service building back into the turbine building thus preventing potential flooding in reactor and control building.
Prevent flooding in one division from affecting other divisions and external flooding from the service building due to potential CWS floods in the turbine bUilding.
Protects equipment in rooms from water damage and directs water to sump pumps.
Remove flood water from room to prevent damage to equipment.
Alert operator to RCW leak and shutoff RSW supply if flooding were to continue.
Limits volume of water which could be drained into RCW/RSW room following RSW pump trip during flooding. This plus high level trip of RSW pump limits maximum RCW room flood level such that only one division Qf RCW would be affected.
Ensures termination of flood if pump trips but isolation valves do not close.
Potential flood waters routed to rooms with sump pumps for processing by plant waste system. EDG potential oil flooding has relatively small volume and the oil is contained until a portable pump can be brought in to remove the oil.
Prevent leakage into ECCS divisional rooms from potential flooding in corridors.
Reduces probability of flood from broken fire water lines impacting ECCS equipment.
Enhance ability to survive potential flooding.
19R-39

Rev. 0
ABWR Design Control Document/Tier 2
Table 19R-7 ABWR Features to Prevent/Mitigate Flooding (Continued)
Feature
High level alarms in room sumps.
Steamline tunnel pipe chase.
ECCS rooms (Floor B3F) have watertight doors. Doors open into corridor.
Benef'1t
Alert operator to potential flooding.
Contains potential flooding from high pressure main steam and feedwater.
Prevent flooding in corridor from entering ECCS Rooms. Contains leaks in ECCS room to limit damage to one safety division (small leakage past door seals may occur).
Entrances to the reactor building control room and Prevents flooding of these areas due to clean access areas from the service building have turbine building CWS leaks that propagate to watertight doors. the service building.
Floor B3F corridor volume adequate to contain single largest flood source (suppression pool).
*CRD rooms have non-watertight doors. Doors open into corridor.
*Sumps on floor B1F outside secondary containment have overfill lines to B3F corridor.
* New Feature
19R-40
Largest flood mitigated without need to rely on active components (sump pumps).
Restricts water in corridor from entering room. Flooding in CRD room will leak out into corridor.
Ensure adequate mitigation for outside containment flooding if sump pumps fail or flood rate exceeds sump pump capacity.
Probabilistic Flooding Analysis

[Page Redacted - Official Use Only - Security Related Information]
[Page Redacted - Official Use Only - Security Related Information]
[Page Redacted - Official Use Only - Security Related Information]
Rev. 0
ABWR Design Control Document/Tier 2
Probabilistic Flooding Analysis 19R-43

[Page Redacted - Official Use Only - Security Related Information]
Rev. 0
ABWR Design Control DDcumentITier 2
19R-44 Probabilistic Flooding Analysis

[Page Redacted - Official Use Only - Security Related Information]
Rev. 0
ABWR Design Control Document/Tier2
Probabilistic Flooding Analysis 19R-45

[Page Redacted - Official Use Only - Security Related Information]
Rev. 0
ABWR Design Control Document/Tier 2
19R-48 Probabilistic Flooding Analysis

Figure 19R·7 Turbine Building Flooding (Low PCHS) Not Part of DeD (Refer to SSAR)

Figure 19R·8 Turbine Building Flooding (High PCHS) Not Part of DeD (Refer to SSAR)
Figure 19R-9 RSW Control Building Flood
Not Part of DCD (Refer to SSAR)
Figure 19R-10 Fire Water Flood in the Control Building Not Part of DCD (Refer to SSAR)
Figure 19R-11 Reactor Building Flooding in ECCS Room Not Part of DeD (Refer to SSAR)

Figure 19R-12 Reactor Building Flooding in Corridor Not Part of DeD (Refer to SSAR)
Figure 19R·13 Fire Water Flood in the Reactor Building Outside Secondary Containment Not Part of DeD (Refer to SSAR)
Copyright © 2022 FDOKUMEN