

Investor Presentation BPCE Inaugural RAC Tier 2
65
Investor Presentation BPCE Inaugural RAC Tier 2 September 2021
-
Upload
khangminh22 -
Category
Documents
-
view
1 -
download
0
Transcript of Investor Presentation BPCE Inaugural RAC Tier 2

Investor PresentationBPCE Inaugural RAC Tier 2
September 2021
2 INVESTOR PRESENTATION
Disclaimer
This presentation has been prepared exclusively by the management of BPCE (the “Company”).
This presentation does not contain, constitute or form part of, and should not be construed as, an offer, solicitation or invitation to subscribe for, underwrite or otherwise acquire, or an inducement to invest in, any securities of the Company or any member of its group nor
should it or any part of it form the basis of, or be relied on in connection with, any contract to purchase or subscribe for any securities of the Company or any member of its group, nor shall it or any part of it form the basis of or be relied on in connection with any contract or
commitment whatsoever.
This presentation is an advertisement and is not a prospectus for the purposes of Regulation (EU) 2017/1129, as amended (the “Prospectus Regulation”). the Company has prepared a preliminary prospectus dated 28 September 28 (the “Preliminary Prospectus”), to which
reference is made. This presentation is qualified in its entirety by reference to the Preliminary Prospectus. Before you invest, you should read the Preliminary Prospectus for more information concerning the Notes and the Company. The information in the Preliminary
Prospectus supersedes the information therein to the extent that there are any inconsistencies. You may obtain a copy of the Preliminary Prospectus from Natixis.
Investors should not subscribe for or purchase any notes or other securities referred to in this presentation on the basis of this presentation, and except on the basis of the prospectus which is intended to be approved by the Autorité des Marchés Financier (the “AMF”) which
is the French competent authority for the purpose of the Prospectus Regulation. The AMF only approves the prospectus as meeting the standards of completeness, comprehensibility and consistency imposed by the Prospectus Regulation. By approving the prospectus, the
AMF does not engage in respect of the economic or financial opportunity of the operation under the prospectus or the quality and solvency of the Company. Such approval should not be considered as an endorsement of the Company that is subject of the prospectus or of
the quality of the notes that are the subject of the prospectus. The prospectus will be published by the Company in due course in connection with the expected admission of the notes on the regulated market of Euronext Paris. The final prospectus, when published, will be
available on the website of the Issuer (www.groupebpce.com) and of the AMF (http://www.amf-france.org).
This presentation includes only summary information and does not purport to be comprehensive. The information included in this presentation has been provided to you solely for your information and background and is subject to updating, completion, revision and
amendment and such information may change materially. No person is under any obligation to update or keep current the information contained in this presentation and any opinions expressed in relation thereto are subject to change without notice. No reliance should be
placed on, and no representation or warranty, express or implied, is made as to, the fairness, accuracy, reasonableness or completeness of the information contained herein. The Company, its advisors, or any of its affiliates, directors, officers and employees accept any
liability (in negligence or otherwise) for any loss howsoever arising, directly or indirectly, from this presentation or its contents.
Preparation of the financial information requires to make estimates and assumptions in certain areas with regard to uncertain future events. These estimates are based on the judgment of the individuals preparing this financial information and the information available at the
balance sheet date. Actual future results may differ from these estimates.
This presentation contains statistics, data and other information relating to markets, market sizes, market shares, market positions and other industry data pertaining to the Company’s business, markets and competitive positioning. Unless otherwise indicated, such
information is based on the Company’s analysis of multiple sources, and may include market studies commissioned by the Company. Such information has been accurately reproduced and, as far as the Company is aware and able to ascertain, no facts have been omitted
which would render the reproduced information provided inaccurate or misleading. The Company and its respective affiliates, directors, officers, advisors and employees have not independently verified the accuracy of any such statistical data and third party projections and
make no representations or warranties in relation thereto. Such data and projections are included herein for information purposes only. This presentation and the information contained therein is provided as at the date of this presentation.
This presentation contains certain statements that are forward-looking. These statements include statements about the Company’s business strategies, expansion and growth of operations, and statements regarding future events, trends or objectives and expectations. Such
statements are subject to risks and contingencies, and actual results may differ materially from those included in such statements as a result of (without limitation) regulatory changes, business changes or changes with respect to market conditions. The Company and its
respective affiliates, officers directors, advisors, employees and representatives expressly disclaim any liability whatsoever for such forward-looking statements and shall not have any duty to update or revise such statements or this presentation.
This document and any materials distributed in connection with this document are not directed to, or intended for distribution to or use by, any person or entity that is a citizen or resident or located in any locality, state, country or other jurisdiction where such distribution,
publication, availability or use would be contrary to law or regulation or which would require any registration or licensing within such jurisdiction. The distribution of this document in certain jurisdictions may be restricted by law and persons into whose possession this
document comes should inform themselves about, and observe any such restrictions.
Any offer of securities of the Company may only be made in France pursuant to a prospectus having received the approval of the AMF or, outside of France, pursuant to an offering document prepared for such purpose. Furthermore, any offering of securities of the Company
in a member state of the European Economic Area (other than France) will only be made to “qualified investors” the meaning of Article 2(e) of the Regulation (EU) 2017/1129 (the “Prospectus Regulation”). Any offering of securities of the Company in the United Kingdom will
only be made to persons who are qualified investors within the meaning of Article 2(e) of the Prospectus Regulation as it forms part of UK domestic law by virtue of the European Union (Withdrawal) Act 2018 who (i) have professional experience in matters relating to
investments falling within Article 19(5) of the Financial Services and Markets Act 2000 (Financial Promotion) Order 2005, as amended (the “Order”) or (ii) are persons falling within Article 49(2)(a) to (d) (“high net worth companies, unincorporated associations, etc.”) of the
Order or (iii) are persons to whom it may otherwise lawfully be made.
This presentation is not an offer for sale of securities in the United States or any other jurisdiction. The Company’s securities have not been and will not be registered under the US Securities Act of 1933 (the “Securities Act”) and may not be offered or sold in the United
States absent registration under the Securities Act or exemption from the registration requirement thereof.
This presentation may not be reproduced, redistributed or published, directly or indirectly, in whole or in part, to any other person. Neither this presentation nor any copy of it may be taken, transmitted into or distributed in the United States of America, Canada, Australia or
Japan. Non-compliance with these restrictions may result in violation of legal restrictions of the United States of America or of other jurisdictions.
3 INVESTOR PRESENTATION
A cooperative bank with a diversified business model, leading positions, and strong commitments to society
Delivering solid performance based on synergies and moderate risk appetite
Operating with robust capital ratios, strong loss-absorbing capacity and high credit ratings
Global and innovative issuer, committed to society
02
03
04
05
Focus on the RAC Tier 2 Offering 01
4 INVESTOR PRESENTATION
Transaction rationale & investment thesis
Transaction
rationale
Investment thesis
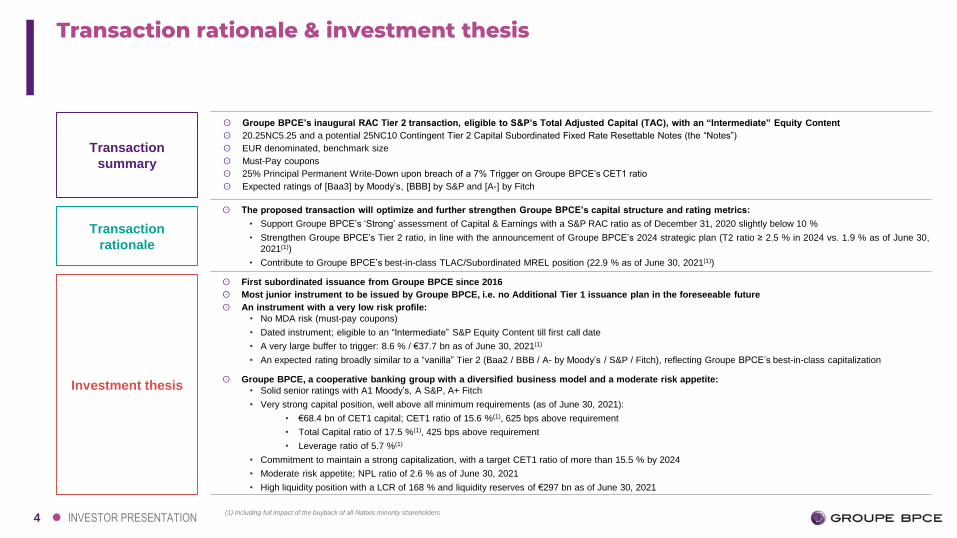
ʘ Groupe BPCE’s inaugural RAC Tier 2 transaction, eligible to S&P’s Total Adjusted Capital (TAC), with an “Intermediate” Equity Content
ʘ 20.25NC5.25 and a potential 25NC10 Contingent Tier 2 Capital Subordinated Fixed Rate Resettable Notes (the “Notes”)
ʘ EUR denominated, benchmark size
ʘ Must-Pay coupons
ʘ 25% Principal Permanent Write-Down upon breach of a 7% Trigger on Groupe BPCE’s CET1 ratio
ʘ Expected ratings of [Baa3] by Moody’s, [BBB] by S&P and [A-] by Fitch
Transaction
summary
ʘ The proposed transaction will optimize and further strengthen Groupe BPCE’s capital structure and rating metrics:
• Support Groupe BPCE’s ‘Strong’ assessment of Capital & Earnings with a S&P RAC ratio as of December 31, 2020 slightly below 10 %
• Strengthen Groupe BPCE’s Tier 2 ratio, in line with the announcement of Groupe BPCE’s 2024 strategic plan (T2 ratio ≥ 2.5 % in 2024 vs. 1.9 % as of June 30,
2021(1))
• Contribute to Groupe BPCE’s best-in-class TLAC/Subordinated MREL position (22.9 % as of June 30, 2021(1))
ʘ First subordinated issuance from Groupe BPCE since 2016
ʘ Most junior instrument to be issued by Groupe BPCE, i.e. no Additional Tier 1 issuance plan in the foreseeable future
ʘ An instrument with a very low risk profile:
• No MDA risk (must-pay coupons)
• Dated instrument; eligible to an “Intermediate” S&P Equity Content till first call date
• A very large buffer to trigger: 8.6 % / €37.7 bn as of June 30, 2021(1)
• An expected rating broadly similar to a “vanilla” Tier 2 (Baa2 / BBB / A- by Moody’s / S&P / Fitch), reflecting Groupe BPCE’s best-in-class capitalization
ʘ Groupe BPCE, a cooperative banking group with a diversified business model and a moderate risk appetite:
• Solid senior ratings with A1 Moody’s, A S&P, A+ Fitch
• Very strong capital position, well above all minimum requirements (as of June 30, 2021):
• €68.4 bn of CET1 capital; CET1 ratio of 15.6 %(1), 625 bps above requirement
• Total Capital ratio of 17.5 %(1), 425 bps above requirement
• Leverage ratio of 5.7 %(1)
• Commitment to maintain a strong capitalization, with a target CET1 ratio of more than 15.5 % by 2024
• Moderate risk appetite; NPL ratio of 2.6 % as of June 30, 2021
• High liquidity position with a LCR of 168 % and liquidity reserves of €297 bn as of June 30, 2021
(1) Including full impact of the buyback of all Natixis minority shareholders
5
01Focus on the RAC Tier 2 Offering
6 INVESTOR PRESENTATION
Ensuring a very low
risk profile for the RAC
Tier 2
Operating with robust
capital ratios, strong
loss-absorbing
capacity and high
credit ratings
A large cooperative
banking group with a
diversified business
model, leading market
positions and
moderate risk
appetite
Groupe BPCE’s RAC Tier 2 - Investment thesis
15,6 %
7,0 %
8,6 %
Jun-21 CET1 Buffer RAC Tier 2trigger
BPCE SA Moody’s S&P Fitch
Senior LT A1 A A+
Outlook Stable Stable Negative
SNP Baa1 BBB+ A
Tier 2 Baa2 BBB A-
RAC Tier 2 [Baa3] [BBB] [A-]
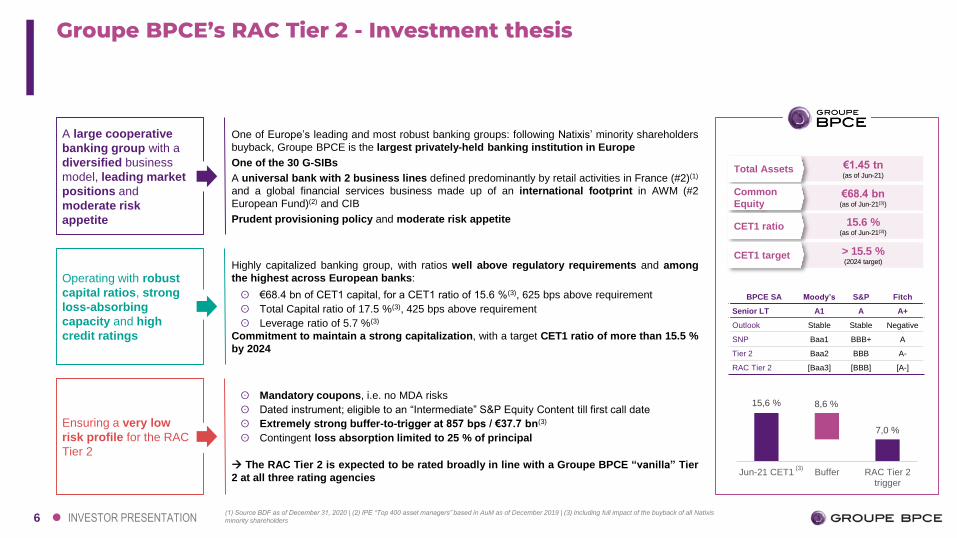
Total Assets €1.45 tn(as of Jun-21)
Common
Equity€68.4 bn(as of Jun-21(3))
CET1 ratio 15.6 %(as of Jun-21(3))
CET1 target > 15.5 %(2024 target)
One of Europe’s leading and most robust banking groups: following Natixis’ minority shareholders
buyback, Groupe BPCE is the largest privately-held banking institution in Europe
One of the 30 G-SIBs
A universal bank with 2 business lines defined predominantly by retail activities in France (#2)(1)
and a global financial services business made up of an international footprint in AWM (#2
European Fund)(2) and CIB
Prudent provisioning policy and moderate risk appetite
Highly capitalized banking group, with ratios well above regulatory requirements and among
the highest across European banks:
ʘ €68.4 bn of CET1 capital, for a CET1 ratio of 15.6 %(3), 625 bps above requirement
ʘ Total Capital ratio of 17.5 %(3), 425 bps above requirement
ʘ Leverage ratio of 5.7 %(3)
Commitment to maintain a strong capitalization, with a target CET1 ratio of more than 15.5 %
by 2024
ʘ Mandatory coupons, i.e. no MDA risks
ʘ Dated instrument; eligible to an “Intermediate” S&P Equity Content till first call date
ʘ Extremely strong buffer-to-trigger at 857 bps / €37.7 bn(3)
ʘ Contingent loss absorption limited to 25 % of principal
The RAC Tier 2 is expected to be rated broadly in line with a Groupe BPCE “vanilla” Tier
2 at all three rating agencies
(1) Source BDF as of December 31, 2020 | (2) IPE “Top 400 asset managers” based in AuM as of December 2019 | (3) Including full impact of the buyback of all Natixis
minority shareholders
(3)

7 INVESTOR PRESENTATION
15,6 %
10,8 %7,3 % 7,0 %
Buffer: 475bps Buffer:
826bpsBuffer: 857bps
CET1 as of Jun-21 Total CET1requirement
(incl. AT1 shortfall)
Minimum CET1requirement
(incl. AT1 shortfall)
RAC Tier 2 trigger
Groupe BPCE’s RAC Tier 2 - Investment thesis
Solid buffer to RAC Tier 2 trigger Strong capital position to be comforted by 2024 targets
eq. to €37.7 bn
Consistent track record of maintaining high capital standards Not a single annual loss since the creation of Groupe BPCE
-
1 000
2 000
3 000
4 000
5 000
2009 2010 2011 2012 2013 2014 2015 2016 2017 2018 2019 2020
Net Income - Group share (in €m)
15,3 % 15,8 % 15,7 % 16,0 % 15,6 %
3,8 % 3,7 % 3,2 % 2,1 % 1,9 %
19,2 % 19,6 % 18,8 % 18,1 % 17,5 %
Dec-17 Dec-18 Dec-19 Dec-20 Jun-21
Tier 2
AT1
CET1
CET1 ratio 15.6 %(Jun-21(1))
10.8 %(Total CET1 requirement, incl.
AT1 shortfall)
> 15.5 %
Tier 2 ratio 1.9 %(Jun-21(1))
2.4 %(proforma of CRD art. 104a)
≥ 2.5 %
TLAC /
Sub. MREL22.9 %(Jun-21(1))
21.5 %(planned SRB req. as of 2022)
> 23.5 %
Current position Requirement 2024 target
(1)
(2)
(1) Including full impact of the buyback of all Natixis minority shareholders | (2) Pillar 1 + Pillar 2 Requirement (i.e. excluding Combined Buffer Requirement)
386 393 422 431 440RWA (€bn)

8 INVESTOR PRESENTATION
Series no.: 2021-20[42] Series no.: 2021-20[46]
Issuer BPCE SA
Issue Date [●] [October] 2021
Issue Rating (M/S/F) [Baa3 / BBB / A-] (expected)
Size EUR [●]m (benchmark) EUR [●]m (benchmark)
Coupon[●], payable annually from the Issue Date to the First Reset Date ([●] [January] 20[27]). [●]%(1) step-down
upon the occurrence of a Rating Event. Non-discretionary, non-deferrable
[●], payable annually from the Issue Date to the First Reset Date ([●] [October] 20[31]). [●]%(1) step-down
upon the occurrence of a Rating Event. Non-discretionary, non-deferrable
Maturity [●] [January] 20[42] [●] [October] 20[46]
Issuer CallAt Prevailing Principal Amount, any day falling in the period commencing on (and including) [●] [October]
20[26], ending on and including the First Reset Date and every Interest Payment Date thereafter
At Prevailing Principal Amount, any day falling in the period commencing on (and including) [●] [July]
20[31], ending on and including the First Reset Date and every Interest Payment Date thereafter
Coupon Reset
Interest Rate reset on the First Reset Date and every 5 years thereafter to the prevailing 5-year Mid-Swap
+ [●]. Margin shall be reduced by [●]bps(1) upon the occurrence of a Rating Methodology Event prior to
the First Reset Date
Interest Rate reset on the First Reset Date and every 5 years thereafter to the prevailing 5-year Mid-Swap
+ [●]. Margin shall be reduced by [●]bps(1) upon the occurrence of a Rating Methodology Event prior to
the First Reset Date
Write DownIn the case of a Trigger Event, 25 per cent. of the Prevailing Principal Amount of the Notes will be permanently written down, unless the CET1 generated through Higher Trigger Loss Absorbing Instruments is
sufficient to remedy the Trigger Event. The Notes may only be subject to Write-Down once
Trigger EventA Trigger Event will be deemed to have occurred if the CET1 Capital Ratio of Groupe BPCE falls below 7.00 per cent, unless a Rating Methodology Event has occurred and has been notified by the Issuer to the
Noteholders prior to the First Reset Date in which case there shall be no Trigger Event
Replacement Capital
For so long as the Issuer solicits an issuer rating (or such similar nomenclature used by S&P from time to time) from S&P, the Issuer intends (without thereby assuming a legal obligation) that it will only redeem the
Notes pursuant to Optional Redemption or following purchase of the Notes to the extent that the aggregate principal amount of the Notes to be redeemed does not exceed such part of the net proceeds, received by
the Issuer and/or any member of the Banques Populaires or the Caisses d’Epargne during the 360-day period prior to the date of redemption of the Notes, from the sale or issuance by the Issuer and/or any member
of the Banques Populaires or the Caisses d’Epargne to third party purchasers (other than members of the Groupe BPCE), of securities that are assigned by S&P, following the time of sale or issuance of such
securities, a level of “equity content” (or such similar nomenclature used by S&P from time to time) that is equal to or greater than the “equity content” assigned to the Notes to be redeemed at the date of issue of the
Notes (but taking into account any changes in bank capital methodology or another relevant methodology or the interpretation thereof since the date of issue of the Notes). This limitation will no longer apply if a
Rating Methodology Event occurs
Rating Methodology
Event
A change in methodology of S&P Global Ratings Europe Limited (“S&P”) (or in the interpretation of such methodology) that was not reasonably foreseeable by the Issuer at the Issue Date as a result of which the
equity content assigned by S&P to the Notes is, in the reasonable opinion of the Issuer, materially reduced when compared to the equity content assigned by S&P to the Notes on the Issue Date or, if later, on the date
on which such equity content was first assigned to the Notes
Early Redemption EventSubject to the prior permission of the Relevant Regulator and/or Relevant Resolution Authority, the Issuer has the option to redeem all (but not some only) of the Notes at their Prevailing Nominal Amount upon the
occurrence of a Capital Event (full exclusion from Tier 2 Capital), a MREL/TLAC Disqualification Event (full or partial exclusion from MREL /TLAC) or a Tax Event (Withholding, Gross-Up or Tax Deduction)
Governing Law / Listing French Law / Euronext Paris
(1) Expected to be 25 basis points
Groupe BPCE’s RAC Tier 2 - Summary terms

9 INVESTOR PRESENTATION
Issue Date [●] [October] 2021 July 15th, 2021 June 3rd, 2014 September 19th, 2013
Issue Rating (M/S/F)(1) [Baa3 / BBB / A-] (expected) - / B+ / - - / BBB- / BBB - / BBB- / BBB-
Size EUR [●]m (benchmark) EUR 100m EUR 600m USD 1,000m
Coupon [●], payable annualy 5.25 %, payable annualy 4.00 %, payable annualy 8.125 %, payable semi-annualy
Maturity [●] October 15th, 2041 June 3rd, 2026 September 19th, 2033
Issuer CallAnytime from and including [●], ending on (and
including) [●] and every IPD thereafter
Anytime from and including July 15th, 2026, ending
on (and including) October 15th, 2026, and every
IPD thereafter
June 3rd, 2021, and every IPD thereafter September 19th, 2018, and every IPD thereafter
Coupon ResetOn First Reset Date and every 5 years thereafter
at 5yr MS+[●] bps
On First Reset Date and every 5 years thereafter
at 5yr MS+554.5 bps
On First Reset Date and every 5 years thereafter
at 5yr MS+285 bps
On First Reset Date and every 5 years thereafter
at 5yr MS+478.3 bps
Loss Absorption Permanent and Partial Write-down (25 %) Permanent and Partial Write-down (50 %) Permanent and Full Write-down Permanent and Full Write-down
Trigger Event Group CET1 < 7.00 % Group CET1 < 7.00 %Group CET1 < 7.00 % and/or
Issuer CET1 <7.00 %Group CET1 < 7.00 %
Replacement Capital
Not part of the T&Cs
The Issuer intends that it will only redeem the
Notes to the extent that the aggregate principal
amount to be redeemed does not exceed the net
proceeds received during the prior 360 days from
the sale of securities with an equal or greater
Equity Content
Not applicable if the Issuer is no longer rated by
S&P or following a Rating Event
Not part of the T&Cs
The Issuer intends that it will only redeem the
Notes to the extent that the aggregate principal
amount to be redeemed does not exceed the net
proceeds received prior to the redemption from the
sale of securities with an equal or greater Equity
Content
Not applicable if the Issuer is no longer rated by
S&P or following a Rating Event
The Issuer will only redeem the Notes to the
extent that the aggregate principal amount to be
redeemed does not exceed the net proceeds
received during the prior 360 days from the sale of
securities with an equal or greater Equity Content
Not applicable if Group Going Concern Capital
Ratio is above 11.9 % or following a Rating Event
Rating Methodology
Event
If material reduction of the S&P Equity Content
before the First Reset Date
Trigger Event is not applicable and [●]bps(2) step-
down
If material reduction of the S&P Equity Content
before the First Reset Date
Trigger Event is not applicable and 50 bps step-
down
If reduction in full of the S&P Equity Content
If material reduction of the S&P Equity Content
Trigger Event is not applicable and 150 bps step-
down
Early Redemption EventTax Event, Capital Event and MREL/TLAC
Disqualification EventTax Event and Capital Event Tax Event and Capital Event Tax Event, Capital Event and Rating Event
Governing Law / Listing French Law / Euronext Paris French Law / Euronext Paris English Law / Euronext Dublin French Law / Euronext Paris
Groupe BPCE’s RAC Tier 2 - Comparison of structures
Sources: Offering circulars and prospectuses
(1) At time of issuance | (2) Expected to be 25 basis points

10 INVESTOR PRESENTATION
Issue Date [●] [October] 2021 April 22nd, 2016 November 30th, 2015
Issue Rating (M/S/F)(1) [Baa3 / BBB / A-] (expected) Baa3 / BBB / A- Baa3 / BBB / A-
Size EUR [●]m (benchmark) EUR 700m EUR 750m
Coupon[●], payable annualy
Non-discretionary, non-deferrable
2.875 %, payable annualy
Non-discretionary, non-deferrable
2.75 %, payable annualy
Non-discretionary, non-deferrable
Maturity [●] April 22nd, 2026 November 30th, 2027
Issuer CallAnytime from and including [●], ending on (and including) [●] and
every IPD thereafterNot applicable November 30th, 2022
Coupon Reset On First Reset Date and every 5 years thereafter at 5yr MS+[●] bps Not applicable On First Reset Date at 5yr MS+237 bps
Loss Absorption Permanent and Partial Write-down (25 %) Not applicable Not applicable
Trigger Event Group CET1 < 7.00 % Not applicable Not applicable
Replacement Capital
Not part of the T&Cs
The Issuer intends that it will only redeem the Notes to the extent
that the aggregate principal amount to be redeemed does not
exceed the net proceeds received during the prior 360 days from the
sale of securities with an equal or greater Equity Content
Not applicable if the Issuer is no longer rated by S&P or following a
Rating Event
Not applicable Not applicable
Rating Methodology
Event
If material reduction of the S&P Equity Content before the First
Reset Date
Trigger Event is not applicable and [●]bps(2) step-down
Not applicable Not applicable
Early Redemption Event Tax Event, Capital Event and MREL/TLAC Disqualification Event Tax Event and Capital Event Tax Event and Capital Event
Governing Law / Listing French Law / Euronext Paris French Law / Euronext Paris French Law / Euronext Paris
Sources: Offering circulars and prospectuses
(1) At time of issuance | (2) Expected to be 25 basis points
2021 Callable
RAC Tier 2
2016 EUR 750m
Bullet Tier 2
2015 EUR 750m
Callable Tier 2
Groupe BPCE’s RAC Tier 2 - Side-by-side with “vanilla” Tier 2
11
02A cooperative bank with a diversifiedbusiness model, leading positions, and strong commitments to society

12 INVESTOR PRESENTATION
BPCE SA,THE GROUP’S
CENTRAL INSTITUTION
• BPCE SA is responsible forStrategy
• Control and coordination
• Group’s MLT funding
• Internal solidarity mechanism
2 CORE BUSINESSES
• Retail Banking & Insurance
• Global Financial Services
A structure and governance ensuring a strong
commitment to the development of regional and
international expertise on a long-term basis and an
alignment of interests for all the Group’s stakeholders
A large cooperative banking group with a diversified business model,leading market position and clear business lines (1/2)

13 INVESTOR PRESENTATION
25%
75%
#2 banking group in France(2)
21.5% of market sharefor customer loans(2)
22% for depositsand savings(2)
#15 player worldwide
and
#2 player Euro zone(4)
(1) Excluding corporate center and exceptional items(2) Banque de France Q3-2020, Market shares: 22% in customer savings and 21.5% in customer credit (all non-financial customer categories).(3) Banque de France Q3-2020, 21.5% market shares on total non-financial customer loan outstandings (4) # : ranking in France, except when specified otherwise
#1 European player
in real estate
#4 worldwide in
renewable energies(4)
RETAIL BANKING & INSURANCE
Contribution to the H1-21Gross Operating Income(1)
GLOBAL FINANCIAL SERVICES
Regional banks
Business lines serving retail
banking activities
Insurance Payments
Financial Services
& Expertise
Asset & Wealth
Management
Corporate &
Investment Banking
A large cooperative banking group with a diversified business model,leading market position and clear business lines (2/2)One of the 30 Global Systemically Important Banks (G-SIBs)
14 INVESTOR PRESENTATION
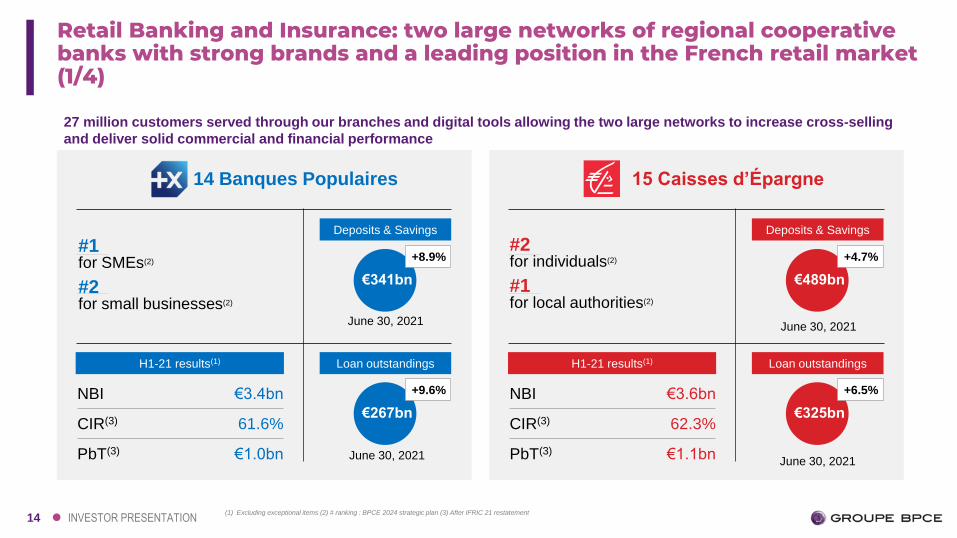
14 Banques Populaires
#1 for SMEs(2)
#2 for small businesses(2)
H1-21 results(1)
Deposits & Savings
NBI €3.4bn
CIR(3) 61.6%
PbT(3) €1.0bn
June 30, 2021
Loan outstandings
€341bn
+8.9%
€267bn
+9.6%
15 Caisses d’Épargne
#2 for individuals(2)
#1 for local authorities(2)
H1-21 results(1)
Deposits & Savings
NBI €3.6bn
CIR(3) 62.3%
PbT(3) €1.1bn
Loan outstandings
€489bn
+4.7%
€325bn
+6.5%
June 30, 2021
June 30, 2021
June 30, 2021
Retail Banking and Insurance: two large networks of regional cooperative banks with strong brands and a leading position in the French retail market (1/4)
(1) Excluding exceptional items (2) # ranking : BPCE 2024 strategic plan (3) After IFRIC 21 restatement
27 million customers served through our branches and digital tools allowing the two large networks to increase cross-selling
and deliver solid commercial and financial performance

15 INVESTOR PRESENTATION
6.6 million active Sécur-Pass customers carrying out day-to-day operations in a totally secure environment:
+2.6m since the beginning of the year
+90m credit transfers via mobile phone since the beginning of the year: +32% vs. H1-20
+5.2m beneficiaries added: +47% vs. H1-20
+36% card transactions blocked, confirmed online vs. H1-20
H1-21 key figures
12 million customers active on mobile apps or
websites at end-June 2021
including 8.2m active on mobile devices
(+14% vs. Dec. 20)
≈ 80% of principal active customers using digital
channels
Net Promoter Score
+41
Digital NPS
4.7/5
App Store
DATA – AUTOMATION OF THE COLLECTION AND VERIFICATION OF CUSTOMER DOCUMENTS
+385K support documents transmitted online since the beginning of the year vs. 400K in 2020
+122K tax assessment notices automatically checked in H1-21 vs. 100K in full-year 2020
DIGITAL – DEVELOPMENT OF VIDEOCONFERENCING SOLUTIONS WITH CUSTOMERS
37,000 advisers equipped to hold meeting with customers via videoconference: +8,000 vs. Dec. 20
Data resources and digital services serving the needs of our customer advisers
4.3/5
Google Play
'Self-care’: fluid and secure operations largely adopted for our customers
Digital subscription pathways increasingly used by our customers
The addition of new functionalities and expansion to reach new customer segments generated more traffic on these pathways
For example, consumer loans initiated via digital pathways in 2021 now represent 12% of new loan production for the BP and 21% for the CE
#1 among universal banks
Launch of Oney+: a solution including an app, an account and a Visa card that makes split payment universal and gives consumers the power to manage their spending
Retail Banking and Insurance: Increased use of data resources and digital services to serve the needs of our customers and their advisers (2/4)
16 INVESTOR PRESENTATION
H1-20 H1-21
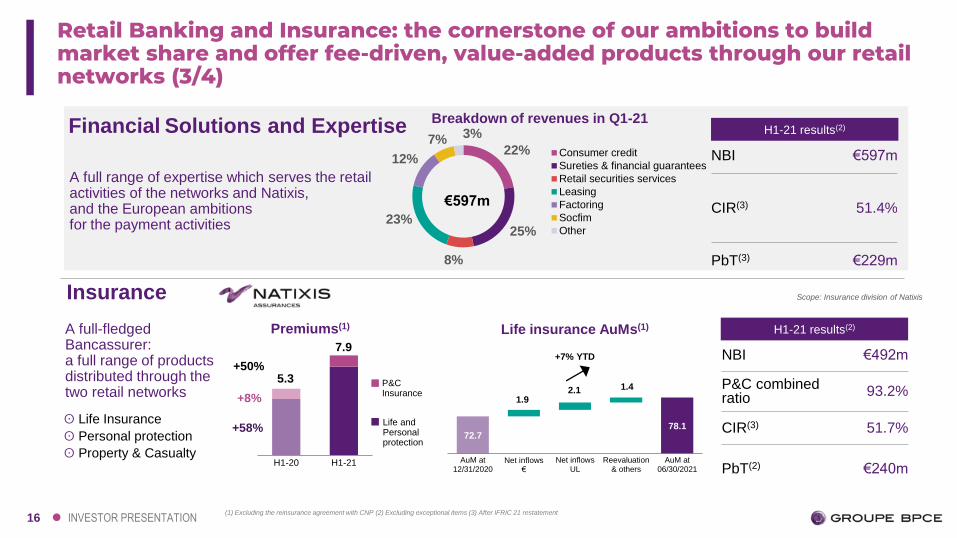
Financial Solutions and Expertise
A full range of expertise which serves the retail activities of the networks and Natixis, and the European ambitions for the payment activities
A full-fledged Bancassurer: a full range of products distributed through the two retail networks
H1-21 results(2)
NBI €492m
P&C combined ratio
93.2%
CIR(3) 51.7%
PbT(2) €240m
ʘ Life Insurance
ʘ Personal protection
ʘ Property & Casualty
Insurance
H1-21 results(2)
NBI €597m
CIR(3) 51.4%
PbT(3) €229m
Breakdown of revenues in Q1-21
€597m
Premiums(1)
+8%
+50%5.3
7.9
P&C Insurance
Life andPersonal protection
Scope: Insurance division of Natixis
+58%
22%
25%
8%
23%
12%
7% 3%
Consumer credit
Sureties & financial guarantees
Retail securities services
Leasing
Factoring
Socfim
Other
72.776,6 78.1
1.92.1 1.4
AuM at12/31/2020
Net inflows €
Net inflowsUL
Reevaluation& others
AuM at06/30/2021
+7% YTD
Life insurance AuMs(1)
Retail Banking and Insurance: the cornerstone of our ambitions to build market share and offer fee-driven, value-added products through our retail networks (3/4)
(1) Excluding the reinsurance agreement with CNP (2) Excluding exceptional items (3) After IFRIC 21 restatement
17 INVESTOR PRESENTATION
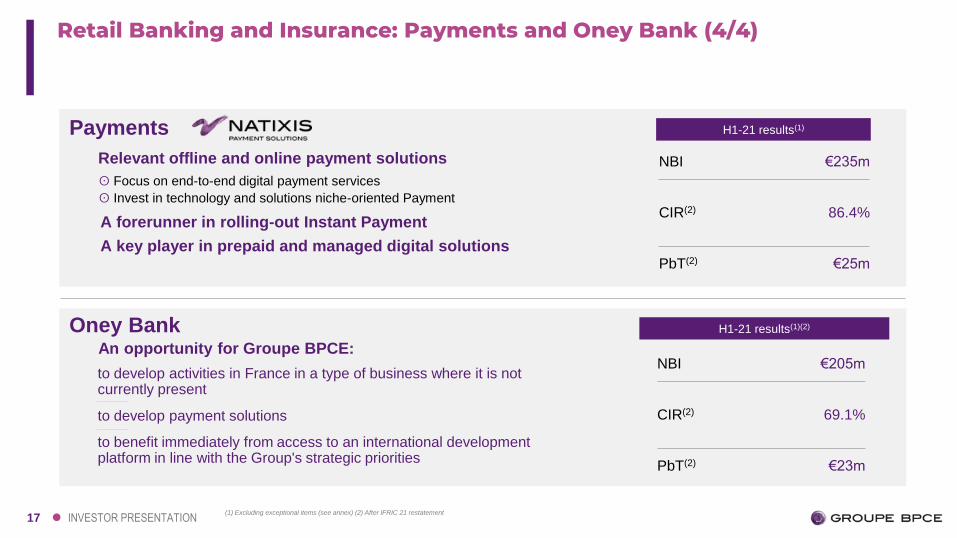
to develop activities in France in a type of business where it is not currently present
to develop payment solutions
to benefit immediately from access to an international development platform in line with the Group's strategic priorities
An opportunity for Groupe BPCE:
Relevant offline and online payment solutions
ʘ Focus on end-to-end digital payment services
ʘ Invest in technology and solutions niche-oriented Payment
A forerunner in rolling-out Instant Payment
A key player in prepaid and managed digital solutions
Payments
Oney Bank
H1-21 results(1)
NBI €235m
CIR(2) 86.4%
PbT(2) €25m
H1-21 results(1)(2)
NBI €205m
CIR(2) 69.1%
PbT(2) €23m
Retail Banking and Insurance: Payments and Oney Bank (4/4)
(1) Excluding exceptional items (see annex) (2) After IFRIC 21 restatement

18 INVESTOR PRESENTATION
(3)
More than 20 specialized investment managers globally committed to a highly active, conviction-led investment style (ESG, multi-asset, innovative alternatives, etc..)
Q2-21 Fees(4)
24 bps+1.2bps YoY
Assets under management(1) (in €bn)
Affiliates plugged into the international distribution platform
with a footprint in over 20 countries
Americas Europe and APAC
EUROPE
H1-21 results(2)
NBI(3) €1,625m
CIR(3) 74.6%
PbT(3) €410m
1,153
1,183
Americas Europe and APAC
EUROPE
Global Financial Services/ Asset and Wealth Management: global ambitions for our multi-affiliate model focused on active asset management and insurance Funds
(1) Europe including Dynamic Solutions and Vega IM, excluding H20 AM (€17bn AuM as at 06/30/2021); US including WCM IM (2) Excluding exceptional items (see annex)
(3) After IFRIC 21 restatement
19 INVESTOR PRESENTATION
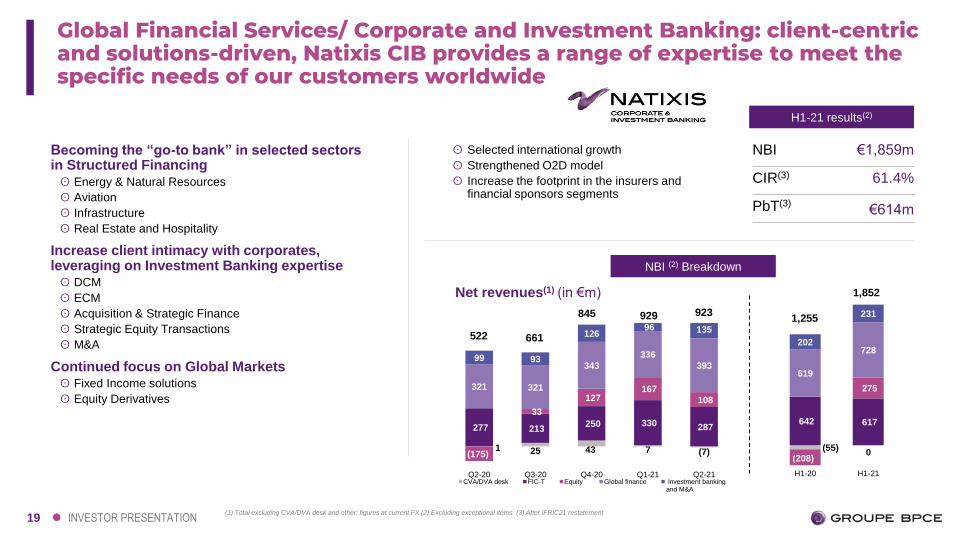
H1-21 results(2)
NBI €1,859m
CIR(3) 61.4%
PbT(3)€614m
ʘ Selected international growth
ʘ Strengthened O2D model
ʘ Increase the footprint in the insurers and financial sponsors segments
Becoming the “go-to bank” in selected sectorsin Structured Financingʘ Energy & Natural Resources
ʘ Aviation
ʘ Infrastructure
ʘ Real Estate and Hospitality
Increase client intimacy with corporates, leveraging on Investment Banking expertiseʘ DCM
ʘ ECM
ʘ Acquisition & Strategic Finance
ʘ Strategic Equity Transactions
ʘ M&A
Continued focus on Global Marketsʘ Fixed Income solutions
ʘ Equity Derivatives
NBI (2) Breakdown
Net revenues(1) (in €m)
1 25 43 7 (7)
277 213250 330 287
(175)
33
127167
108
321 321
343
336
39399 93
12696 135
Q2-20 Q3-20 Q4-20 Q1-21 Q2-21CVA/DVA desk FIC-T Equity Global finance Investment banking
and M&A
(55)0
642 617
(208)
275
619
728202
231
H1-20 H1-21
522 661
845 929 9231,255
1,852
Global Financial Services/ Corporate and Investment Banking: client-centric and solutions-driven, Natixis CIB provides a range of expertise to meet the specific needs of our customers worldwide
(1) Total excluding CVA/DVA desk and other; figures at current FX (2) Excluding exceptional items (3) After IFRIC21 restatement

20 INVESTOR PRESENTATION
Alignment on a "Net Zero" trajectory: the Group has joined the "Net Zero Banking Alliance" coordinated by the United Nations Environment Programme Finance Initiative (UNEP FI)
Mobilization against climate change: the Group has joined the Ambition 4 Climate platform that presents 114 projects, all sharing the same goal of climate neutrality
Fight against climate change confirmed as a key priority for all business lines in new strategic plan BPCE 2024; the Group just joined the Net Zero Banking Alliance
Groupe BPCE's commitments to society
Strong commitments
Actions to promote our customers' energy transition
Improvement in the Sustainalytics rating
Financing of renewable energy projects
Launch by the Caisses d’Epargne, in collaboration with Natixis and BPCE Energéco, of the 1st debt fund dedicated to financing renewable energy projects, with €1.5bn in resources
9 new projects representing 1,262 MW of installed capacity and €606 million in financing arranged by Natixis in Q2-21
Supporting the energy renovation
Partnership with Cozynergy (acquired by a group of regional banks of Groupe BPCE), a start-up specializing in energy renovation, which decided to team up with the Group in order to speed up the rollout of its digital platform and services
Promoting new transition solutions
Signature of a partnership with Energy Observer aimed at developing technical solutions around hydrogen to enable industrial decarbonization and the development of renewable energies by offering storage solutions
Falling from 22.3 (medium risk) to 17.9 (low risk) thanks to better management of the ESG risks by the Group

21
03Delivering solid performance based on synergies and moderate risk appetite

22 INVESTOR PRESENTATION
RevenuesGroup revenues: €12.5bn, +16.0% vs. H1-20 and +6.4% vs. H1-19
Retail Banking & Insurance: revenues +7.6% YoY; strong activity in retail banking, Insurance and FSE
Global Financial Services: revenues up 36.7%(1) YoY
Operating
expenses
Operating expenses: +5.0%(2) YoY, in line with dynamic activity
Strong positive jaws effect; cost/income ratio(3) down 7.0pp to 67.0% in H1-21
Cost of riskDown 44.6% in H1-21 YoY at €822m (22 bps), with stable S1/S2 provisions in Q2-21 illustrating the continued prudent provisioning
Underlying net income up to €2.25bn in H1-21, x2.6 vs. H1-20(4)
Reported net income at €1.9bn in H1-21, x5.9 vs. H1-20Net income
Capital CET1 ratio: 15.6%(5), including full impact of the buyback of all Natixis minority shareholders
Well above requirements, +425 bps over MDA trigger threshold
Strategic
developmentsSuccessful public tender offer on Natixis shares; squeeze-out on July 21st, 2021
Groupe BPCE released its new strategic plan BPCE 2024 on July 8th, 2021
RatingsRecent rating decisions: Moody’s has affirmed the A1 long term senior preferred rating with a stable outlook; R&I has affirmed the A+ long term senior preferred rating with a stable outlook
Groupe BPCE: strong recovery in H1-21 driven by commercial momentum and significant decrease in cost of risk
Underlying figures, unless otherwise indicated
(1) At constant Fx (2) Excluding exceptional items and Single Resolution Fund (3) After IFRIC 21 restatement (4) Net income Group share excluding Coface net contribution
and after IFRIC 21 restatement (5) Estimated ratio at June 30,2021

23 INVESTOR PRESENTATION
Groupe BPCE has engaged a major step in its transformation and the development of its businesses
Strategic development
All conditions are fulfilled for Groupe BPCE to catch opportunities, have a positive
impact on major societal issues and engage a new expansion of its footprint
ʘOn February 9th, 2021, Groupe BPCE announced the public tender offer on the 29% Natixis shares the Group didn’t already own, to engage the simplification of its organization
ʘThis simplified organisation will increase the strategic flexibility of the businesses and allow acceleration in their development for the benefit of their customers and their performance
ʘAnd also improve capital flows within the Group, in an increasingly challenging regulatory environment
ʘThe tender offer was successful, and the squeeze-out took place on July 21st, 2021
ʘOn July 8th, 2021, Groupe BPCE released its new strategic plan BPCE 2024, notably based on simplification, unification and development
ʘNext step: finalization of the study(1) on the acquisition by BPCE of the Insurance and Payments activities of Natixis to better serve our retail banking networks and their customers
(1) Any project stemming from this study will be submitted, if need be, to the consultation of the relevant works councils
24 INVESTOR PRESENTATION
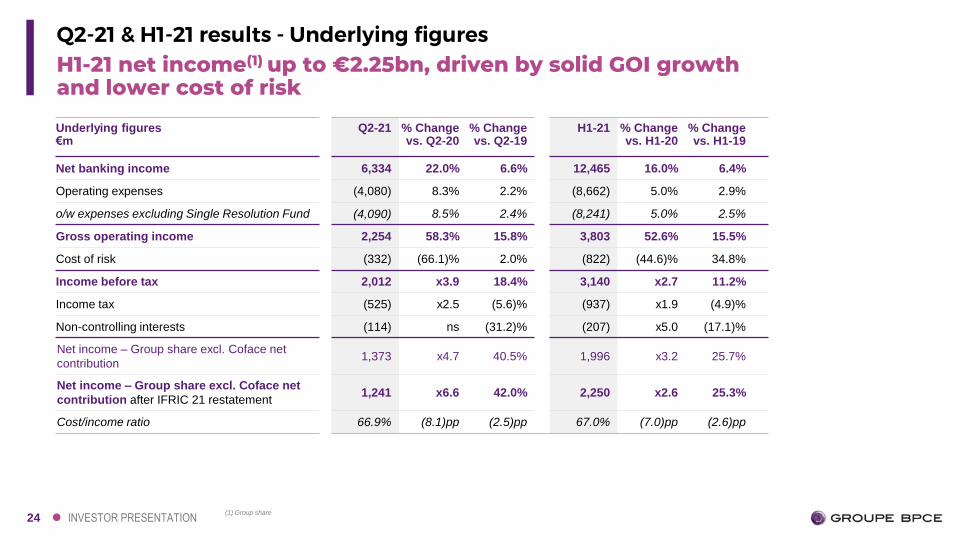
H1-21 net income(1) up to €2.25bn, driven by solid GOI growth and lower cost of risk
Q2-21 & H1-21 results - Underlying figures
Underlying figures€m
Q2-21 % Change vs. Q2-20
% Change vs. Q2-19
H1-21 % Change vs. H1-20
% Change vs. H1-19
Net banking income 6,334 22.0% 6.6% 12,465 16.0% 6.4%
Operating expenses (4,080) 8.3% 2.2% (8,662) 5.0% 2.9%
o/w expenses excluding Single Resolution Fund (4,090) 8.5% 2.4% (8,241) 5.0% 2.5%
Gross operating income 2,254 58.3% 15.8% 3,803 52.6% 15.5%
Cost of risk (332) (66.1)% 2.0% (822) (44.6)% 34.8%
Income before tax 2,012 x3.9 18.4% 3,140 x2.7 11.2%
Income tax (525) x2.5 (5.6)% (937) x1.9 (4.9)%
Non-controlling interests (114) ns (31.2)% (207) x5.0 (17.1)%
Net income – Group share excl. Coface net
contribution1,373 x4.7 40.5% 1,996 x3.2 25.7%
Net income – Group share excl. Coface net
contribution after IFRIC 21 restatement1,241 x6.6 42.0% 2,250 x2.6 25.3%
Cost/income ratio 66.9% (8.1)pp (2.5)pp 67.0% (7.0)pp (2.6)pp
(1) Group share

25 INVESTOR PRESENTATION(1) Cost of risk expressed in annualized basis points on gross customer outstandings at the beginning of the period or in € amounts – Excluding exceptional items (2) In Q1-
20, excluding the methodological effect, the cost of risk would have been 29 bps for RB&I (positive impact of €115m) and 35 bps for Groupe BPCE (positive impact of €120m)
1139
930
6 925
8
112
124
112 65
478
118
27
5
2613
36
5 -115
2
17
20
10
13
2019
18
19
84455
229591
92 -14
53878
420
526
356
332
398345
946
743
Q1-20 Q2-20 Q3-20 Q4-20 Q1-21 Q2-21 H1-20 H1-21
Continued prudent provisioning: cost of risk at €822m in H1-21
Cost of risk(1)
H1-21 results - Cost of risk/Asset quality (1/2)
Groupe BPCE
Groupe BPCE
CIB
(in bps)
(in €m)
Cost of risk
€822m-44.6% vs. H1-20
NPL ratio
2.6%+0.1 pp vs. Dec. 20
981
585923
5
2512 31
5-1
152
24
29
19
18
2118
27
19
17
55
32
49
144163
18
45
23
49
S3S1/S2
25
12195
53
26
490332
1,484
822
42
22
1735
3421
504
29
123
21
RB&I(2)
26 INVESTOR PRESENTATION
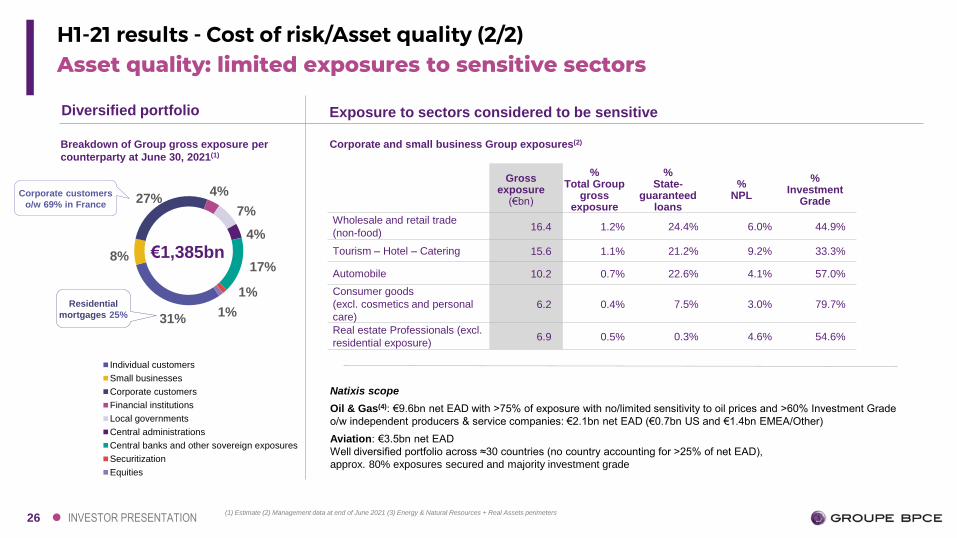
31%
8%
27%4%
7%
4%
17%
1%
1%
Individual customers
Small businesses
Corporate customers
Financial institutions
Local governments
Central administrations
Central banks and other sovereign exposures
Securitization
Equities
Breakdown of Group gross exposure per
counterparty at June 30, 2021(1)
Diversified portfolio
Corporate customers
o/w 69% in France
Residential
mortgages 25%
Exposure to sectors considered to be sensitive
Corporate and small business Group exposures(2)
Gross exposure
(€bn)
% Total Group
gross exposure
% State-
guaranteed loans
% NPL
% Investment
Grade
Wholesale and retail trade
(non-food) 16.4 1.2% 24.4% 6.0% 44.9%
Tourism – Hotel – Catering 15.6 1.1% 21.2% 9.2% 33.3%
Automobile 10.2 0.7% 22.6% 4.1% 57.0%
Consumer goods
(excl. cosmetics and personal
care)6.2 0.4% 7.5% 3.0% 79.7%
Real estate Professionals (excl.
residential exposure)6.9 0.5% 0.3% 4.6% 54.6%
Natixis scope
Oil & Gas(4): €9.6bn net EAD with >75% of exposure with no/limited sensitivity to oil prices and >60% Investment Grade
o/w independent producers & service companies: €2.1bn net EAD (€0.7bn US and €1.4bn EMEA/Other)
Aviation: €3.5bn net EAD
Well diversified portfolio across ≈30 countries (no country accounting for >25% of net EAD),
approx. 80% exposures secured and majority investment grade
€1,385bn
H1-21 results - Cost of risk/Asset quality (2/2)Asset quality: limited exposures to sensitive sectors
(1) Estimate (2) Management data at end of June 2021 (3) Energy & Natural Resources + Real Assets perimeters

27
04Operating with robust capital ratios, strong loss-absorbing capacityand high credit ratings

28 INVESTOR PRESENTATION
Requirements
June 30, 2021
Actual levelsas at
June 30, 2021(1)
CET1 ratio 9.32%(2)
(ECB)
15.6%
Total capital ratio 13.26%(2)
(ECB)
17.5%
TLAC ratio 19.51%(FSB)
22.9%(3)
Subordinated
MREL ratio19.5%
(SRB)
22.9%(3)
Total MREL ratio 25.0%(SRB)
29.5%CET1 capital equal to €68.4bn(1) as of June 30, 2021
Total loss-absorbing capacity stood at €100.8bn(1) as of June 30, 2021
Leverage ratio equal to 5.7%(1,4) as of June 30, 2021
CET1 ratio as of June 30 , 2021 including full impact of the buyback of all Natixis minority shareholders, above 2021 year-end guidance
+32bps +4bps
+5bps(19)bps
(70)bps
CET1 ratioat March 31, 2021
Retainedearnings
Change inrisk-weighted
assets
Issuanceand distributionof cooperative
shares
Full impactof buyback
of all Natixisminority
shareholders
Otherchanges
CET1 ratioat June 30,
2021
16.1%
15.6%
Organic capital creation = 13bps
Capital and Loss-absorbing Capacity
Capital adequacy, Total loss-absorbing capacity – see note on methodology (1) Estimate at June 30, 2021 (2) Excluding “Pillar 2 Guidance” (3) As part of its annual
resolvability assessment, Groupe BPCE has chosen to waive the possibility offered by Article 72b(3) of the Capital Requirements Regulation to use senior preferred debt for
compliance with its TLAC/subordinated MREL requirements in 2021 (4) The adjusted leverage ratio requirement is set at 3.2%
Change in the CET1 Ratio (bps)
29 INVESTOR PRESENTATION
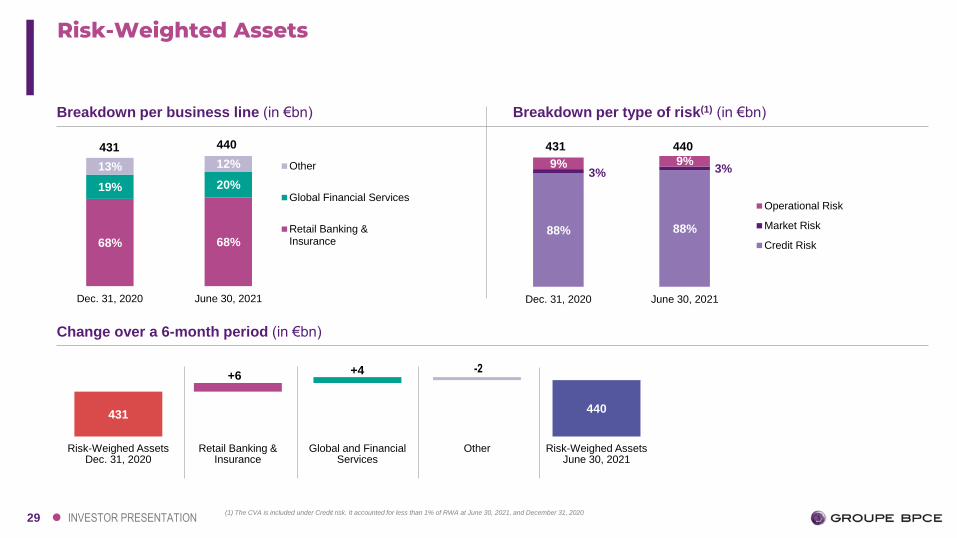
Change over a 6-month period (in €bn)
68% 68%
19% 20%
13% 12%
Dec. 31, 2020 June 30, 2021
Other
Global Financial Services
Retail Banking &Insurance
440431
88% 88%
3% 3%9% 9%
Dec. 31, 2020 June 30, 2021
Operational Risk
Market Risk
Credit Risk
431 440
431440
+6 +4 -2
Risk-Weighed AssetsDec. 31, 2020
Retail Banking & Insurance
Global and Financial Services
Other Risk-Weighed Assets June 30, 2021
Breakdown per business line (in €bn) Breakdown per type of risk(1) (in €bn)
Risk-Weighted Assets
(1) The CVA is included under Credit risk. It accounted for less than 1% of RWA at June 30, 2021, and December 31, 2020

30 INVESTOR PRESENTATION
Reconciliation of shareholders’ equity to total capital
In billions of euros June 30, 2021 Dec. 31, 2020
Equity attribuable to equity holders of the parent 76.3 72.7
Cancelation of hybrid securities(1) in equity
attribuable to equity holders of the parent- -
Non-controlling interests(2) 0.2 4.4
Goodwill and intangibles (4.9) (4.8)
EL/Prov. Difference (0.3) (0.4)
Deduction of irrevocable payment commitments - -
Other regulatory adjustments (2.9) (2.9)
Common Equity Tier-1 capital 68.4 69.0
Additional Tier-1 capital - -
Tier-1 capital 68.4 69.0
Tier-2 capital 10.1 10.8
T2 regulatory adjustments (1.5) (1.6)
Total capital 77.0 78.2
16.0 15.6
2.1 1.9
Dec. 31, 2020 June 30, 2021
T2 Contribution
CET1 ratio
42.1 40.9
26.9 27.5
9.3 8.6
Dec. 31, 2020 June 30, 2021
Tier-2 capital
cooperative shares
Reserves
Regulatory capital (in €bn)
Total capital ratios (as a %)
78.2 77.0
18.1% 17.5%
CET169.0
CET168.4
(3)
Own funds
(1) As at 12/31/2020, BPCE deeply subordinated notes booked to equity attributable to equity holders of the parent (3) Non-controlling interests (prudential definition); as at
06/30/2021 account is only taken of the part from Oney after regulatory clipping and as at 12/31/2020 account is only taken of the part from Natixis, excluding super-
subordinated notes and Oney, after regulatory clipping (4) Reserves net of prudential restatements
31 INVESTOR PRESENTATION
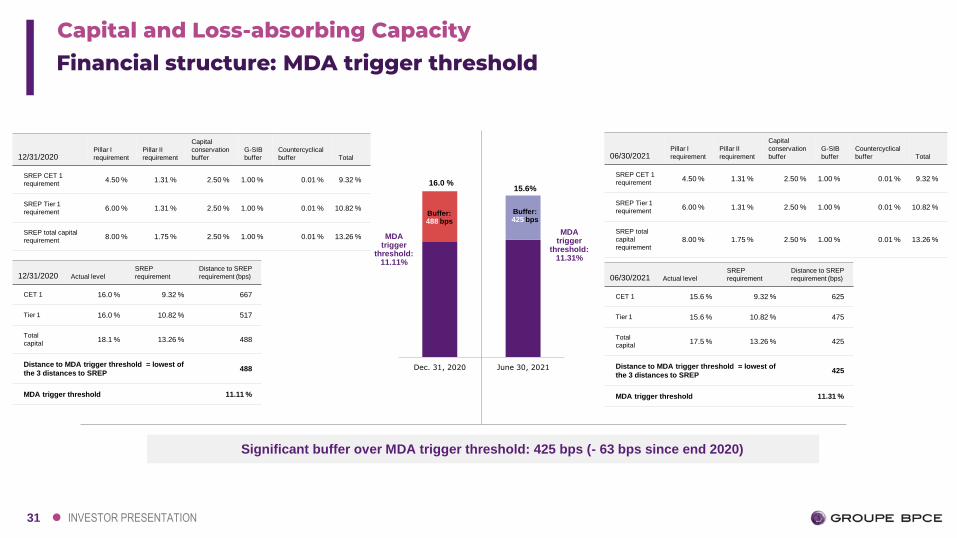
Financial structure: MDA trigger threshold
Significant buffer over MDA trigger threshold: 425 bps (- 63 bps since end 2020)
12/31/2020Pillar I
requirement
Pillar II
requirement
Capital
conservation
buffer
G-SIB
buffer
Countercyclical
buffer Total
SREP CET 1
requirement4.50 % 1.31 % 2.50 % 1.00 % 0.01 % 9.32 %
SREP Tier 1
requirement6.00 % 1.31 % 2.50 % 1.00 % 0.01 % 10.82 %
SREP total capital
requirement8.00 % 1.75 % 2.50 % 1.00 % 0.01 % 13.26 %
12/31/2020 Actual level
SREP
requirement
Distance to SREP
requirement (bps)
CET 1 16.0 % 9.32 % 667
Tier 1 16.0 % 10.82 % 517
Total
capital18.1 % 13.26 % 488
Distance to MDA trigger threshold = lowest of
the 3 distances to SREP488
MDA trigger threshold 11.11 %
06/30/2021 Actual level
SREP
requirement
Distance to SREP
requirement (bps)
CET 1 15.6 % 9.32 % 625
Tier 1 15.6 % 10.82 % 475
Total
capital17.5 % 13.26 % 425
Distance to MDA trigger threshold = lowest of
the 3 distances to SREP425
MDA trigger threshold 11.31 %
Dec. 31, 2020 June 30, 2021
Buffer: 488 bps
Buffer: 425 bps
16.0 %
MDA trigger
threshold:11.11%
15.6%
MDA trigger
threshold:11.31%
06/30/2021Pillar I
requirement
Pillar II
requirement
Capital
conservation
buffer
G-SIB
buffer
Countercyclical
buffer Total
SREP CET 1
requirement4.50 % 1.31 % 2.50 % 1.00 % 0.01 % 9.32 %
SREP Tier 1
requirement6.00 % 1.31 % 2.50 % 1.00 % 0.01 % 10.82 %
SREP total
capital
requirement8.00 % 1.75 % 2.50 % 1.00 % 0.01 % 13.26 %
Capital and Loss-absorbing Capacity
32 INVESTOR PRESENTATION
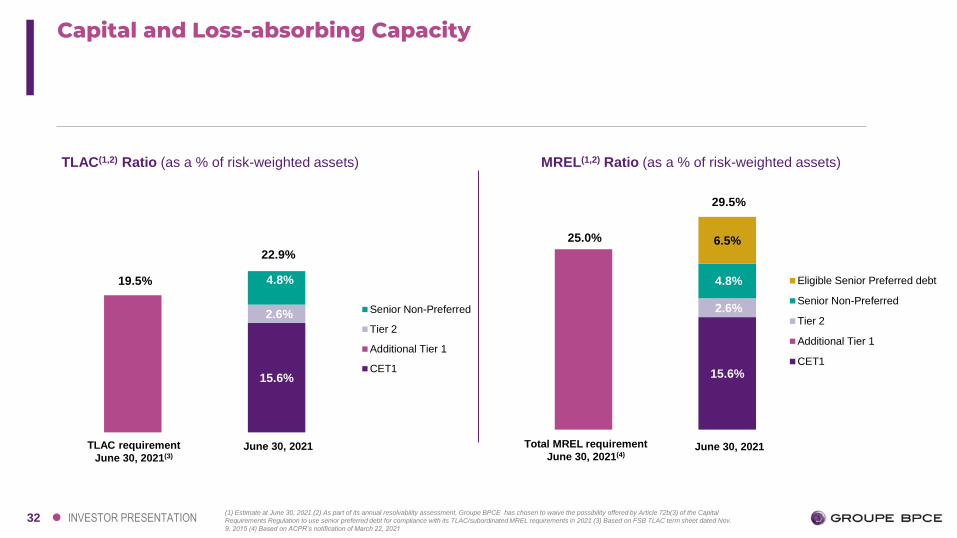
15.6%
4.8%
2.6% Senior Non-Preferred
Tier 2
Additional Tier 1
CET1 15.6%
4.8%
2.6%
6.5%
Eligible Senior Preferred debt
Senior Non-Preferred
Tier 2
Additional Tier 1
CET1
TLAC(1,2) Ratio (as a % of risk-weighted assets)
June 30, 2021
MREL(1,2) Ratio (as a % of risk-weighted assets)
June 30, 2021
19.5%
22.9%
25.0%
29.5%
TLAC requirement
June 30, 2021(3)
Total MREL requirement
June 30, 2021(4)
Capital and Loss-absorbing Capacity
(1) Estimate at June 30, 2021 (2) As part of its annual resolvability assessment, Groupe BPCE has chosen to waive the possibility offered by Article 72b(3) of the Capital
Requirements Regulation to use senior preferred debt for compliance with its TLAC/subordinated MREL requirements in 2021 (3) Based on FSB TLAC term sheet dated Nov.
9, 2015 (4) Based on ACPR’s notification of March 22, 2021

33 INVESTOR PRESENTATION
As of June 24, 2021
Senior preferred long-term debt A1 A A+ A+
Outlook Stable Stable Negative Stable
Senior non-preferred Baa1 BBB+ A A
Tier 2 Baa2 BBB A-
Senior short-term debt P-1 A-1 F1
Groupe BPCE’s ratings are among the best in the global banking industry, based on a robust capital position, well-diversified business model and efficient strategy execution

34
05Global and innovative issuer, committed to society

35 INVESTOR PRESENTATION
High liquidity levelsʘ Average monthly LCRs in Q2-21: 160%
ʘ Liquidity reserves: €297bn at end-June 2021
ʘ Coverage ratio of short-term debt obligations: 241% at end-June 2021
43%
55%
3%
Unsecured bondissues
Covered bond issues
ABS
30%
5%4%
1%
61%
USD
GBP
AUD
JPY
Others
EUR
Foreigncurrencies39%
Structure of MLT wholesale funding(3)
raised in 2021 YTD(2)
Diversification of the investor base/unsecured MLT wholesale funding raised in 2021 YTD(2)TLTRO III
ʘ TLTRO III outstanding amount: €97.2bn at end-June 2021
ʘ Repayment at maturity fully integrated in our MLT funding plans
MLT wholesale funding: revised 2021 plan and execution YTD(2)
ʘ Target: €22bn(1) / Raised YTD(1,2): €14.9bn or ≈68% Tier 2 and/or Senior Non-Preferred
Target: €5.5bn / Raised YTD(2): €2.1bn of SNP Senior Preferred
Target: €6bn / Raised YTD(1,2): €4.4bn Covered Bonds
Target: €10.5bn / Raised YTD(2): €8.4bn
ʘ Asset-Backed SecuritiesTarget: €1.5bn / Raised YTD(2): €0.4bn
Groupe BPCE is a global issuer, operating in EMEA, the US and the Asia-Pacific region in several currencies and types of debt instruments≈68% of the 2021 MLT wholesale funding plan(1) raised(2)
(1) Excluding structured private placements and asset-backed securities and instead of an initial plan of €22bn to €25bn (2) As at 9 July 2021 (3) Excluding structured private
placements

36 INVESTOR PRESENTATION
20152019
2020
GREEN BONDS:
€300m
GREEN COVERED
BONDS: €1.25bn Methodology Note:
Green BuildingsGREEN BONDS:
€500m Methodology Note:
Renewable Energies
July 2020
Best green/ISR
deal of the year
September11,2020
Euro Bond
of the year
TRANSITION BONDS:
€100m
2021
GREEN COVERED
BONDS: €1.5bn Methodology Note:
Green Buildings
20172018 -2019
2020
SOCIAL BONDS:
€512m equiv.Human Development
SOCIAL BONDS:
€1.02bn equiv. Human Development
SOCIAL BONDS:
€1.68bn equiv
. Methodology Note:Local Economic Development
September 7, 2017
Deal of the Yearfor Healthcare
Bonds
Best
Sustainability
Bond in
2017
March 25, 2018
Most innovative
Investment Bank
for climate change
& sustainability
SOCIAL BONDS: €250m equiv. Methodology Note:
Local Economic Development/
Covid 19
GREEN €3.7bn AuM
Renewable Energies
Green Buildings
SOCIAL3.5G€ AuM
Human Development: Education, Healthcare and Social Services
Local Economic Development
Green and Transition Bond Issues Social Bond issues
Renewable Energies
Innovation is at the heart of Groupe BPCE’s funding policy
≈€7.1bn BPCE SRI outstanding as of end-June 2021

37 INVESTOR PRESENTATION
Total liquidity reserves of Groupe BPCE(1) (in €bn) Short-term funding and MLT debt maturing in the short term (in €bn)
246% 234% 241%
Coverage ratio of short-term funding + MLT debtmaturing in the short-term by liquidity reserves
106 113102
1923
21
Dec. 31,2020
March 31,2021
June 30,2021
MLT
ST105 91 95
5651 57
146 176 145
Cash placed withcentral banks
LCR securities
Assets eligible forcentral bankfunding
318
June 30,
2021
(2)
Dec.31,
2020
March 31,
2021
307 297
Liquidity reserves and short-term funding
(1) Excluding MMF US Natixis deposits (2) Coverage ratio = Total liquidity reserves of Groupe BPCE / [Short-term funding +MLT debt maturing in the short term]

38
ADDITIONAL INFORMATION
39 INVESTOR PRESENTATION
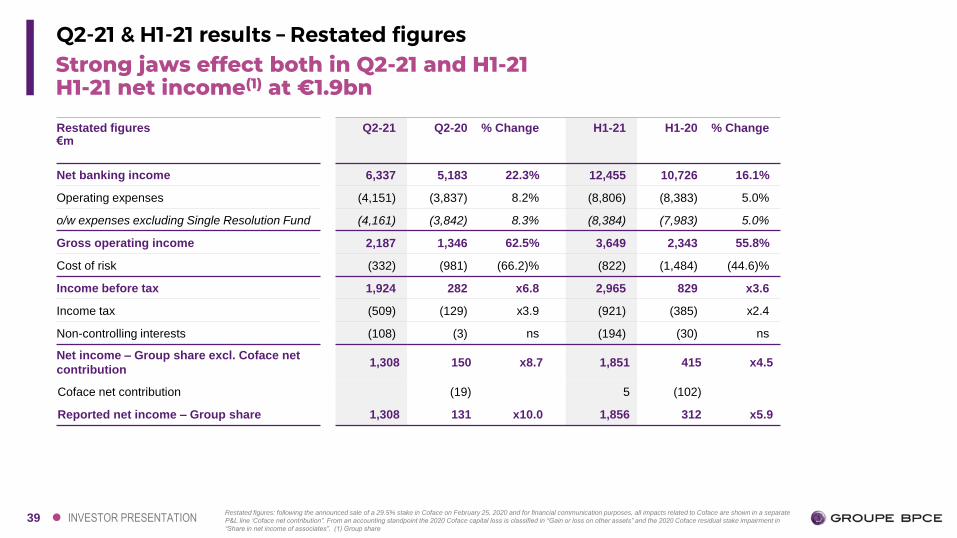
Strong jaws effect both in Q2-21 and H1-21H1-21 net income(1) at €1.9bn
Q2-21 & H1-21 results – Restated figures
Restated figures€m
Q2-21 Q2-20 % Change H1-21 H1-20 % Change
Net banking income 6,337 5,183 22.3% 12,455 10,726 16.1%
Operating expenses (4,151) (3,837) 8.2% (8,806) (8,383) 5.0%
o/w expenses excluding Single Resolution Fund (4,161) (3,842) 8.3% (8,384) (7,983) 5.0%
Gross operating income 2,187 1,346 62.5% 3,649 2,343 55.8%
Cost of risk (332) (981) (66.2)% (822) (1,484) (44.6)%
Income before tax 1,924 282 x6.8 2,965 829 x3.6
Income tax (509) (129) x3.9 (921) (385) x2.4
Non-controlling interests (108) (3) ns (194) (30) ns
Net income – Group share excl. Coface net
contribution1,308 150 x8.7 1,851 415 x4.5
Coface net contribution (19) 5 (102)
Reported net income – Group share 1,308 131 x10.0 1,856 312 x5.9
Restated figures: following the announced sale of a 29.5% stake in Coface on February 25, 2020 and for financial communication purposes, all impacts related to Coface are shown in a separate
P&L line ‘Coface net contribution”. From an accounting standpoint the 2020 Coface capital loss is classified in “Gain or loss on other assets” and the 2020 Coface residual stake impairment in
“Share in net income of associates”. (1) Group share

40 INVESTOR PRESENTATION
GROUPE BPCE
GROUPE BPCE
In millions of euros H1-21
Reported
Coface H1-21
Restated
H1-20
reported
Coface H1-20
restated
Net banking income 12,455 12,455 10,726 10,726
Operating expenses (8,806) (8,806) (8,383) (8,383)
Gross operating income 3,649 3,649 2,343 2,343
Cost of risk (822) (822) (1,484) (1,484)
Share in net income of associates 156 (7) 149 68 33 101
Gains or losses on other assets (11) (11) (242) 112 (130)
Income before tax 2,972 (7) 2,965 685 145 829
Income tax (921) (921) (385) (385)
Non-controlling interests (196) 2 (194) 13 (43) (30)
Net income – excl. Coface net contribution 1,856 (5) 1,851 312 102 415
Coface – Net contribution 5 (102)
Net income – Group share 1,856 1,856 312 312
Reconciliation of restated data to reported data

41 INVESTOR PRESENTATION
In millions of euros
Net
banking
income
Operating
expenses
Income
before tax
Net
income
- Group
share
excluding
Coface
Restated H1-21 results 12,455 (8,806) 2,965 1,851
Revaluation of assets associated with deeply subordinated notes
denominated in foreign currenciesCorporate center (2) (2) (8)
Transformation and reorganization costsBusiness lines/
Corporate center11 (143) (154) (128)
Legal provision (19) (19) (10)
H1-21 results
excluding exceptional items & Coface net contribution12,465 8,662 3,140 1,996
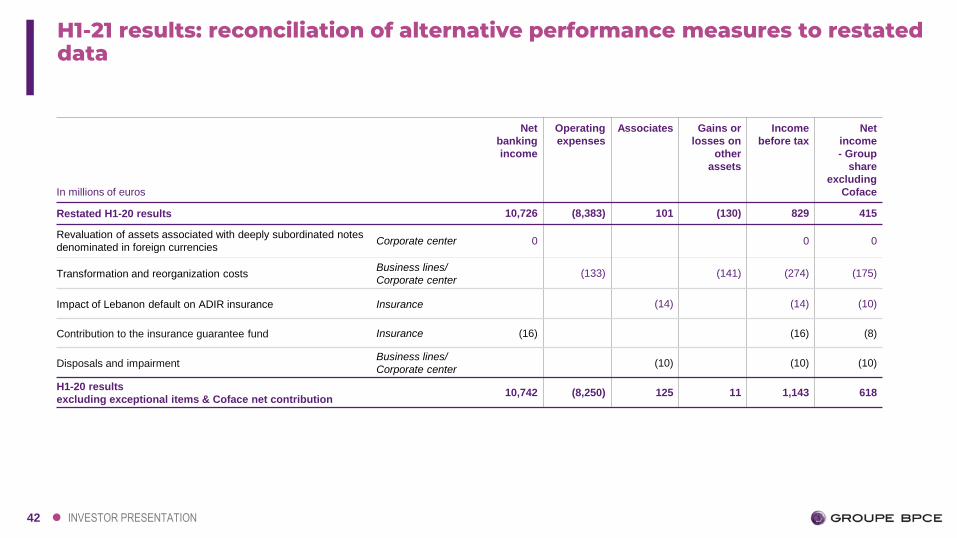
H1-21 results: reconciliation of alternative performance measures to restated data
42 INVESTOR PRESENTATION
In millions of euros
Net
banking
income
Operating
expenses
Associates Gains or
losses on
other
assets
Income
before tax
Net
income
- Group
share
excluding
Coface
Restated H1-20 results 10,726 (8,383) 101 (130) 829 415
Revaluation of assets associated with deeply subordinated notes
denominated in foreign currenciesCorporate center 0 0 0
Transformation and reorganization costsBusiness lines/
Corporate center(133) (141) (274) (175)
Impact of Lebanon default on ADIR insurance Insurance (14) (14) (10)
Contribution to the insurance guarantee fund Insurance (16) (16) (8)
Disposals and impairmentBusiness lines/
Corporate center(10) (10) (10)
H1-20 results
excluding exceptional items & Coface net contribution10,742 (8,250) 125 11 1,143 618
H1-21 results: reconciliation of alternative performance measures to restated data

43 INVESTOR PRESENTATION
Retail banking and Insurance
Q1-20 Q2-20 Q3-20 Q4-20
In millions of eurosNet
banking
income
Operating
expenses
Income
before taxNet income
Net
banking
income
Operating
expenses
Income
before taxNet income
Net
banking
income
Operating
expenses
Income
before taxNet income
Net
banking
income
Operating
expenses
Income
before taxNet income
Reported figures 4,140 (2,803) 1,032 685 4,074 (2,585) 844 537 4,162 (2,629) 1,211 818 4,081 (2,796) 527 289
Analytical adjustments 1 2 2 1 1 1 2 1 1 1 2 1 1 1 2 1
Central institution’s expenses (65) 7 (58) (39) (65) 7 (58) (39) (65) 7 (58) (39) 194 (21) 173 118
Pro forma figures 4,076 (2,794) 977 646 4,010 (2,577) 789 499 4,098 (2,620) 1,156 780 4,276 (2,816) 702 407
Global financial services
Q1-20 Q2-20 Q3-20 Q4-20
In millions of eurosNet
banking
income
Operating
expenses
Income
before taxNet income
Net
banking
income
Operating
expenses
Income
before taxNet income
Net
banking
income
Operating
expenses
Income
before taxNet income
Net
banking
income
Operating
expenses
Income
before taxNet income
Restated figures 1,462 (1,136) 134 41 1,223 (1,014) (71) (46) 1,447 (1,085) 135 54 1,896 (1,251) 465 225
Analytical adjustments (8) (3) (11) (6) (8) (3) (11) (6) (8) (3) (11) (6) (8) (3) (11) (6)
Pro forma figures 1,454 (1,140) 124 36 1,215 (1,017) (82) (51) 1,439 (1,088) 124 49 1,888 (1,254) (454) 219
Reconciliation of 2020 data to pro forma data (1/2)

44 INVESTOR PRESENTATION
Corporate center Q1-20 Q2-20 Q3-20 Q4-20
In millions of eurosNet
banking
income
Operating
expenses
Income
before taxNet income
Net
banking
income
Operating
expenses
Income
before taxNet income
Net
banking
income
Operating
expenses
Income
before taxNet income
Net
banking
income
Operating
expenses
Income
before taxNet income
Restated figures (58) (606) (619) (461) (115) (238) (491) (341) (98) (191) (263) (169) 326 (309) 77 114
Analytical adjustments 7 2 9 4 7 1 9 5 7 1 9 5 7 1 9 4
Central institution’s expenses 65 (7) 58 39 65 (7) 58 39 65 (7) 58 39 (194) 21 (173) (118)
Pro forma figures –
excl. Coface net contribution13 (612) (553) (418) (42) (244) (425) (297) (26) (197) (197) (125) 139 (286) (88) 1
Reconciliation of 2020 data to pro forma data (2/2)

45 INVESTOR PRESENTATION
H1-21
In millions of euros
RETAIL BANKING
& INSURANCE
GLOBAL
FINANCIAL
SERVICES
CORPORATE
CENTER
GROUPE BPCE
Impact of exceptional items
(excl. Coface)(33) (43) (99) (175)
Impact of IFRIC 21 (58) (19) (231) (308)
Total impact on Income before
tax(91) (62) (330) (483)
In millions of euros
BANQUE
POPULAIRE
NETWORK
CAISSE
D'EPARGNE
NETWORK
SEF INSURANCE PAYMENTS OTHER
NETWORKS
RETAIL BANKING
& INSURANCE
Impact of exceptional items (15) (13) (4) 0 (1) 0 (33)
Impact of IFRIC 21 (21) (25) (3) (8) 0 (1) (58)
Total impact on Income before
tax(36) (38) (7) (8) (1) (1) (91)
In millions of euros
AWM CIB GLOBAL
FINANCIAL
SERVICE
Impact of exceptional items
(excl. Coface)(17) (26) (43)
Impact of IFRIC 21 (3) (17) (19)
Total impact on Income before
tax(20) (43) (62)
Exceptional items and IFRIC 21 effects per business line
46 INVESTOR PRESENTATION
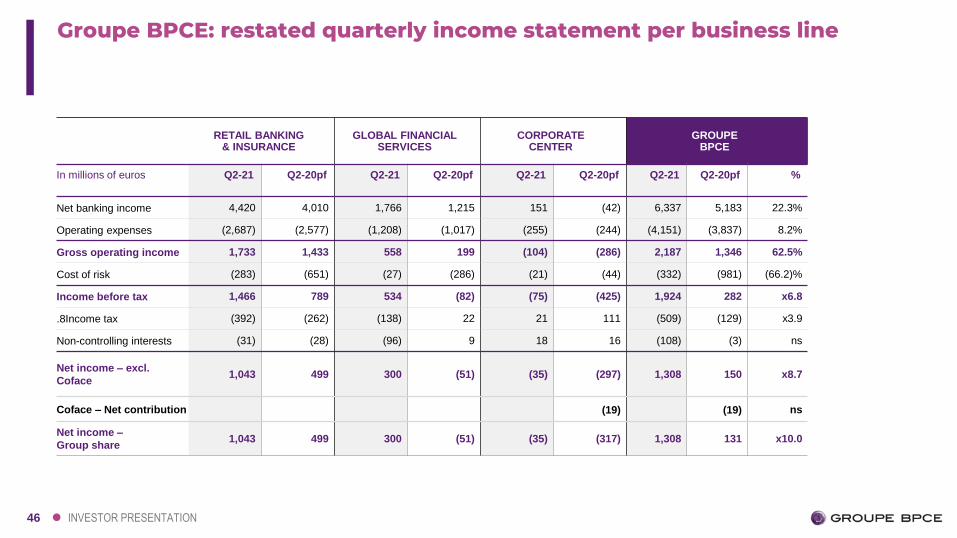
RETAIL BANKING & INSURANCE
GLOBAL FINANCIAL SERVICES
CORPORATE CENTER
GROUPE BPCE
In millions of euros Q2-21 Q2-20pf Q2-21 Q2-20pf Q2-21 Q2-20pf Q2-21 Q2-20pf %
Net banking income 4,420 4,010 1,766 1,215 151 (42) 6,337 5,183 22.3%
Operating expenses (2,687) (2,577) (1,208) (1,017) (255) (244) (4,151) (3,837) 8.2%
Gross operating income 1,733 1,433 558 199 (104) (286) 2,187 1,346 62.5%
Cost of risk (283) (651) (27) (286) (21) (44) (332) (981) (66.2)%
Income before tax 1,466 789 534 (82) (75) (425) 1,924 282 x6.8
.8Income tax (392) (262) (138) 22 21 111 (509) (129) x3.9
Non-controlling interests (31) (28) (96) 9 18 16 (108) (3) ns
Net income – excl.
Coface1,043 499 300 (51) (35) (297) 1,308 150 x8.7
Coface – Net contribution (19) (19) ns
Net income –
Group share1,043 499 300 (51) (35) (317) 1,308 131 x10.0
Groupe BPCE: restated quarterly income statement per business line
47 INVESTOR PRESENTATION
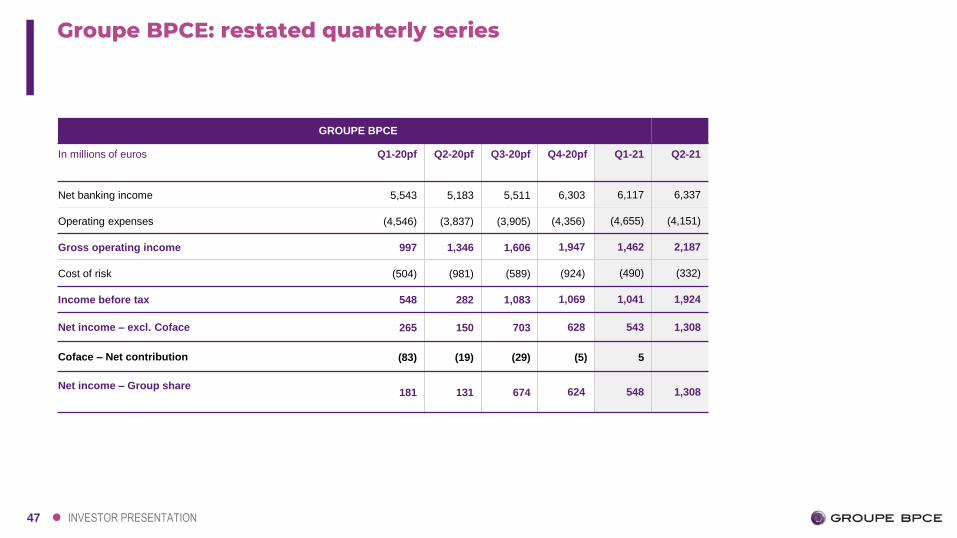
GROUPE BPCE
In millions of euros Q1-20pf Q2-20pf Q3-20pf Q4-20pf Q1-21 Q2-21
Net banking income 5,543 5,183 5,511 6,303 6,117 6,337
Operating expenses (4,546) (3,837) (3,905) (4,356) (4,655) (4,151)
Gross operating income 997 1,346 1,606 1,947 1,462 2,187
Cost of risk (504) (981) (589) (924) (490) (332)
Income before tax 548 282 1,083 1,069 1,041 1,924
Net income – excl. Coface 265 150 703 628 543 1,308
Coface – Net contribution (83) (19) (29) (5) 5
Net income – Group share181 131 674 624 548 1,308
Groupe BPCE: restated quarterly series
48 INVESTOR PRESENTATION
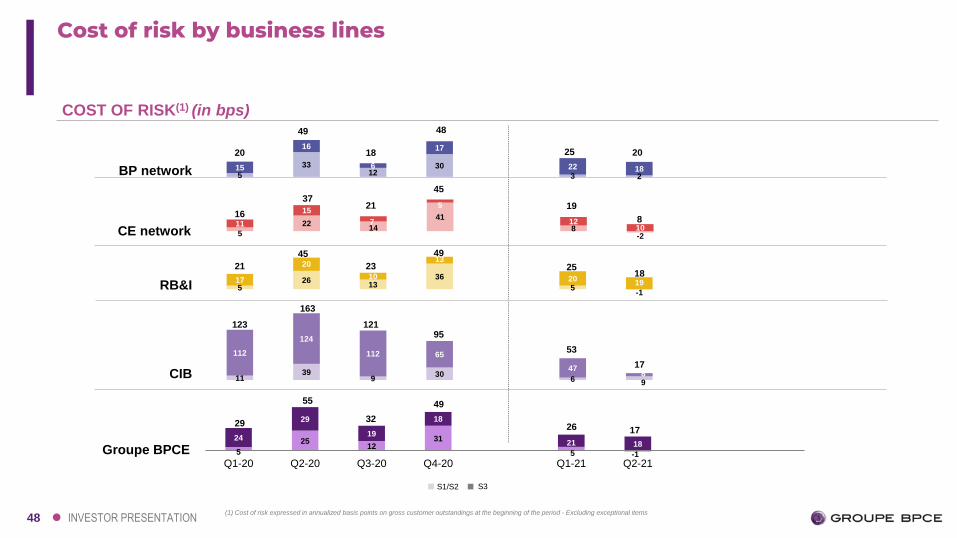
COST OF RISK(1) (in bps)
BP network
CIB
Groupe BPCE
CE network
5
3312
30
3 215
16
6
17
22 18
5
2214
41
8-2
11
15
7
5
1210
1139
930
6 9
112
124
112 65
478
5
2512
31
5 -1
24
29
19
18
21 18
Q1-20 Q2-20 Q3-20 Q4-20 Q1-21 Q2-21
RB&I 526
1336
5-1
17
20
10
13
2019
55
29
123
163
21
45
16
37
20
49
32
23
21
18
49
49
45
48
25
19
25
12195
53
26
S3S1/S2
17
17
18
8
20
Cost of risk by business lines
(1) Cost of risk expressed in annualized basis points on gross customer outstandings at the beginning of the period - Excluding exceptional items
49 INVESTOR PRESENTATION
6,530 7,050
BP + CE networks
H1-20 H1-21
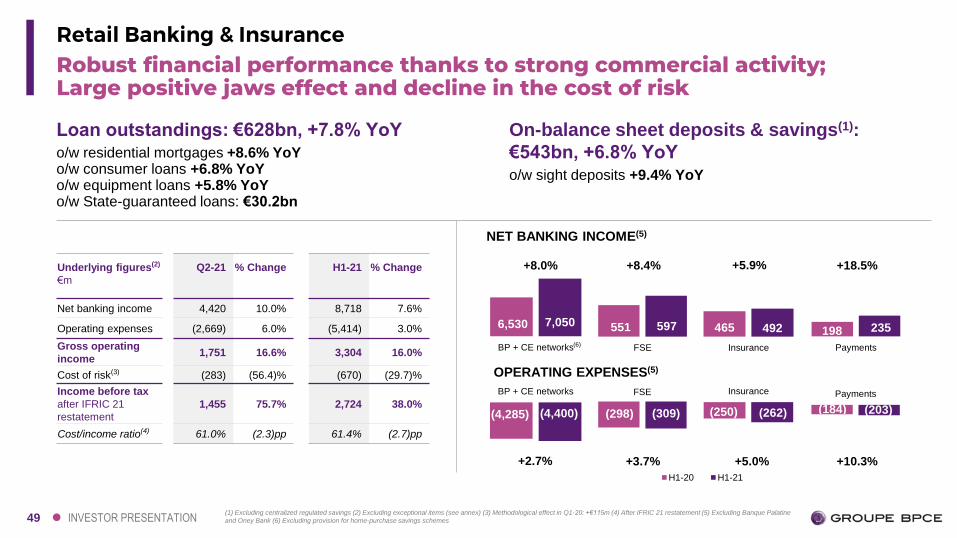
Robust financial performance thanks to strong commercial activity;Large positive jaws effect and decline in the cost of risk
Retail Banking & Insurance
+2.7% +3.7% +5.0% +10.3%
Loan outstandings: €628bn, +7.8% YoYo/w residential mortgages +8.6% YoYo/w consumer loans +6.8% YoYo/w equipment loans +5.8% YoYo/w State-guaranteed loans: €30.2bn
On-balance sheet deposits & savings(1):
€543bn, +6.8% YoYo/w sight deposits +9.4% YoY
Underlying figures(2)
€m
Q2-21 % Change H1-21 % Change
Net banking income 4,420 10.0% 8,718 7.6%
Operating expenses (2,669) 6.0% (5,414) 3.0%
Gross operating
income1,751 16.6% 3,304 16.0%
Cost of risk(3) (283) (56.4)% (670) (29.7)%
Income before tax
after IFRIC 21
restatement
1,455 75.7% 2,724 38.0%
Cost/income ratio(4) 61.0% (2.3)pp 61.4% (2.7)pp
465 492
Insurance
551 597
FSE
OPERATING EXPENSES(5)
(4,285) (4,400)
BP + CE networks
(250) (262)
Insurance
(298) (309)
+8.0% +8.4% +5.9% +18.5%
NET BANKING INCOME(5)
(184) (203)
PaymentsFSE
(6)
198 235
Payments
(1) Excluding centralized regulated savings (2) Excluding exceptional items (see annex) (3) Methodological effect in Q1-20: +€115m (4) After IFRIC 21 restatement (5) Excluding Banque Palatine
and Oney Bank (6) Excluding provision for home-purchase savings schemes
50 INVESTOR PRESENTATION
36,8%38,3%
1,744
2,068
Net interest income
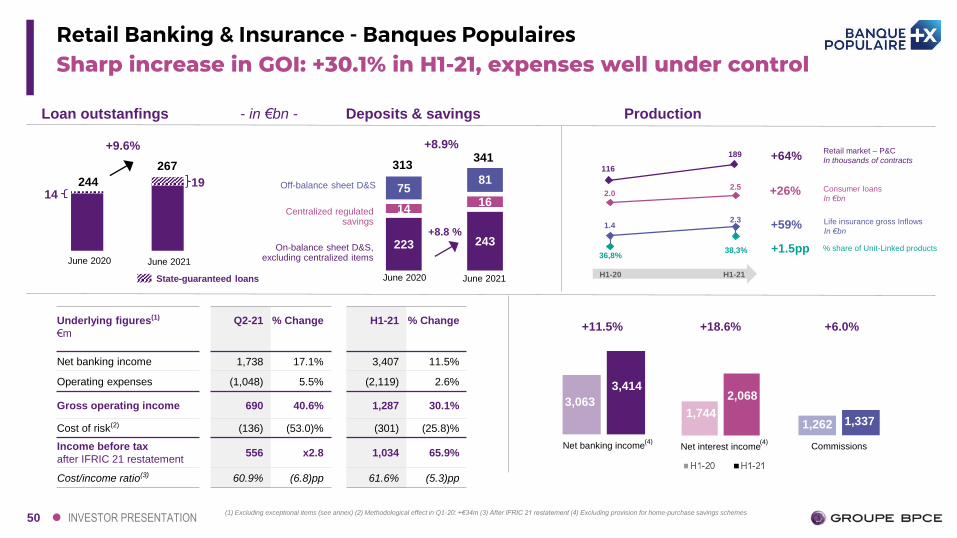
Sharp increase in GOI: +30.1% in H1-21, expenses well under controlRetail Banking & Insurance - Banques Populaires
Loan outstanfings
+9.6%
244
267
3,063
3,414
Net banking income
1,262 1,337
Commissions
+18.6% +6.0%
(4)
+11.5%
(4)
223 243
1416
7581
June 2020 June 2021
+8.8 %
Off-balance sheet D&S
Centralized regulated savings
On-balance sheet D&S, excluding centralized items
+8.9%
313341
Deposits & savings- in €bn -
116
189 Retail market – P&C
In thousands of contracts
Consumer loans
In €bn
+64%
2.02.5 +26%
H1-20 H1-21
June 2020 June 2021
State-guaranteed loans
19
Underlying figures(1)
€m
Q2-21 % Change H1-21 % Change
Net banking income 1,738 17.1% 3,407 11.5%
Operating expenses (1,048) 5.5% (2,119) 2.6%
Gross operating income 690 40.6% 1,287 30.1%
Cost of risk(2) (136) (53.0)% (301) (25.8)%
Income before tax
after IFRIC 21 restatement556 x2.8 1,034 65.9%
Cost/income ratio(3) 60.9% (6.8)pp 61.6% (5.3)pp
14
Life insurance gross Inflows
In €bn
% share of Unit-Linked products
1.42.3
+59%
+1.5pp
(1) Excluding exceptional items (see annex) (2) Methodological effect in Q1-20: +€34m (3) After IFRIC 21 restatement (4) Excluding provision for home-purchase savings schemes
Production

51 INVESTOR PRESENTATION
4.37.7
34,4%
35,8%
Strong increase in GOI: +9.2% in H1-21 Retail Banking & Insurance - Caisses d’Epargne
305325
+6.5%
1,8672,043
Net interest income
1,576 1,655
Commissions
+9.5% +5.0%
3,4673,636
Net banking income
+4.9%
(4) (4)
273 288
59 61
134 140
+5.0%
+4.7%467 489
June 2020 June 2021
Off-balance sheet D&S
Centralized regulated savings
On-balance sheet D&S, excluding centralized itemsJune 2020 June 2021
State-guaranteed loans
10
Underlying figures(1)
€m
Q2-21 % Change H1-21 % Change
Net banking income 1,825 3.6% 3,620 5.1%
Operating expenses (1,128) 6.2% (2,281) 2.8%
Gross operating income 696 (0.3)% 1,339 9.2%
Cost of risk(2) (66) (76.0)% (219) (44.8)%
Income before tax
after IFRIC 21 restatement620 51.1% 1,147 34.4%
Cost/income ratio(3) 62.5% 1.5pp 62.3% (1.4)pp
7
255 338 Retail market – P&C
In thousands of contracts
Consumer loans
In €bn
+33%
3.85.1
+33%
H1-20 H1-21
Life insurance gross Inflows
In €bn
% share of Unit-Linked products
+80%
+1.4pp
(1) Excluding exceptional items (see annex) (2) Methodological effect in Q1-20: +€75m (3) After IFRIC 21 restatement (4) Excluding provision for home-purchase savings schemes
Loan outstanfings Deposits & savings- in €bn - Production
52 INVESTOR PRESENTATION
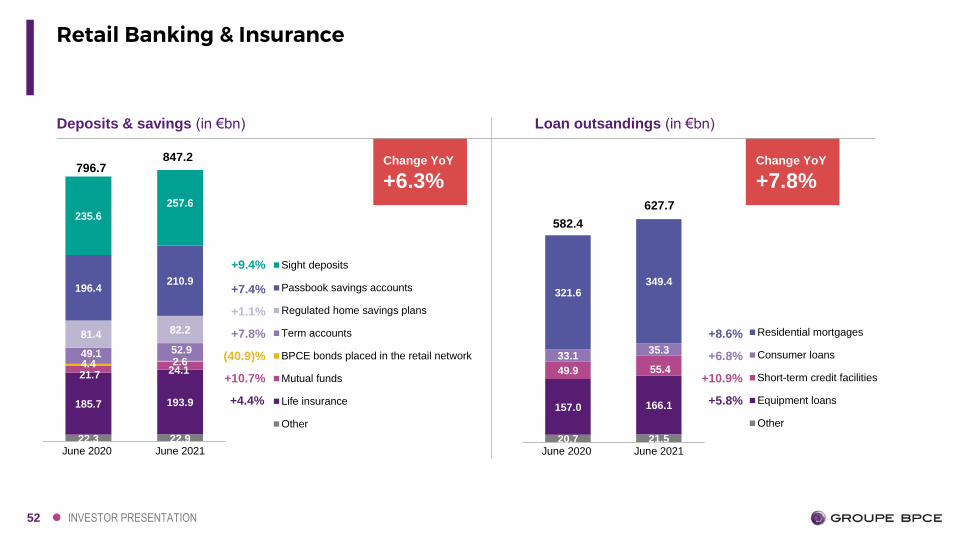
Retail Banking & Insurance
22.3 22.9
185.7 193.9
21.7 24.14.4 2.649.1 52.9
81.4 82.2
196.4210.9
235.6
257.6
June 2020 June 2021
Sight deposits
Passbook savings accounts
Regulated home savings plans
Term accounts
BPCE bonds placed in the retail network
Mutual funds
Life insurance
Other
20.7 21.5
157.0 166.1
49.9 55.4
33.135.3
321.6349.4
June 2020 June 2021
Residential mortgages
Consumer loans
Short-term credit facilities
Equipment loans
Other
+9.4%
+7.4%
+1.1%
+7.8%
(40.9)%
+10.7%
+4.4%
+8.6%
+6.8%
+10.9%
+5.8%
Deposits & savings (in €bn) Loan outsandings (in €bn)
Change YoY
+7.8%Change YoY
+6.3%796.7
847.2
582.4
627.7
53 INVESTOR PRESENTATION
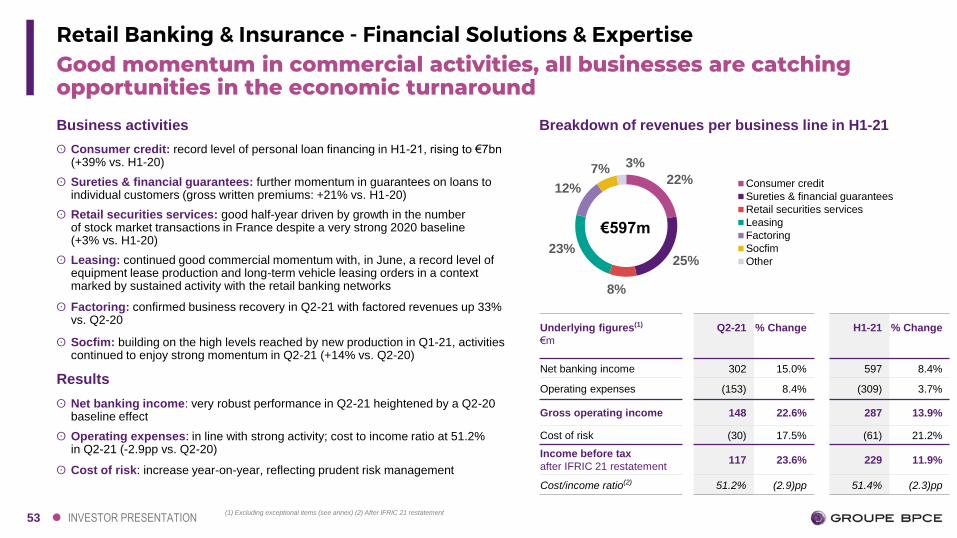
Retail Banking & Insurance - Financial Solutions & Expertise
22%
25%
8%
23%
12%
7% 3%
Consumer credit
Sureties & financial guarantees
Retail securities services
Leasing
Factoring
Socfim
Other
Results
ʘ Net banking income: very robust performance in Q2-21 heightened by a Q2-20 baseline effect
ʘ Operating expenses: in line with strong activity; cost to income ratio at 51.2% in Q2-21 (-2.9pp vs. Q2-20)
ʘ Cost of risk: increase year-on-year, reflecting prudent risk management
Breakdown of revenues per business line in H1-21
€597m
Business activities
ʘ Consumer credit: record level of personal loan financing in H1-21, rising to €7bn (+39% vs. H1-20)
ʘ Sureties & financial guarantees: further momentum in guarantees on loans to individual customers (gross written premiums: +21% vs. H1-20)
ʘ Retail securities services: good half-year driven by growth in the number of stock market transactions in France despite a very strong 2020 baseline (+3% vs. H1-20)
ʘ Leasing: continued good commercial momentum with, in June, a record level of equipment lease production and long-term vehicle leasing orders in a context marked by sustained activity with the retail banking networks
ʘ Factoring: confirmed business recovery in Q2-21 with factored revenues up 33%vs. Q2-20
ʘ Socfim: building on the high levels reached by new production in Q1-21, activities continued to enjoy strong momentum in Q2-21 (+14% vs. Q2-20)
Underlying figures(1)
€m
Q2-21 % Change H1-21 % Change
Net banking income 302 15.0% 597 8.4%
Operating expenses (153) 8.4% (309) 3.7%
Gross operating income 148 22.6% 287 13.9%
Cost of risk (30) 17.5% (61) 21.2%
Income before tax
after IFRIC 21 restatement117 23.6% 229 11.9%
Cost/income ratio(2) 51.2% (2.9)pp 51.4% (2.3)pp
Good momentum in commercial activities, all businesses are catching opportunities in the economic turnaround
(1) Excluding exceptional items (see annex) (2) After IFRIC 21 restatement

54 INVESTOR PRESENTATION
Solid commercial activity and financialsRetail Banking & Insurance - Insurance
Life insurance AuMs(1)- in €bn -
Scope: Insurance division of Natixis
Q2-20 Q2-21
Premiums(1)
+95%
+12%
+79%
2.1
3.7
Underlying figures(2)
€m
Q2-21 % Change H1-21 % Change
Net banking income 252 6.7% 492 5.9%
Operating expenses (124) 6.6% (262) 5.0%
Gross operating income 128 6.7% 230 7.0%
Income before tax
after IFRIC 21 restatement125 10.1% 240 6.2%
Cost/income ratio(3) 50.8% (0.6)pp 51.7% (0.1)pp
72.776,6 78.1
1.92.1 1.4
AuM at12/31/2020
Net inflows €
Net inflowsUL
Reevaluation& others
AuM at06/30/2021
+7% YTD
Key indicators(1)
ʘ €2.9bn gross inflows and €1.7bn net inflows for Life insurance in Q2-21 (€6.4bn and €3.9bn respectively for H1-21), strongly up vs. prior year period
ʘ P&C Insurance premium growth +12% vs. Q2-20
ʘ P&C and Personal Protection equipment rate at 29.3% (+0.6pp QoQ) for the Banques Populaires and at 32.5% for the Caisses d’Epargne (+0.4pp QoQ)
ʘ P&C combined ratio at 93.5% in Q2-21 (+0.7pp YoY), 93.2% in H1-21(+1.6pp YoY)
€4.0bn
Gross inflows
YoY share of UL
€56bn
AuM
UL
€
€78.1bn
€22bn 28%
€6.4bn
38%€2.4bn
Share of UL products – H1-21
+2pp+3pp
H1-20 H1-21
+58%
+8%
+50%
P&C Insurance Life and Personal protection
5.3
7.9
(1) Excluding the reinsurance agreement with CNP (2) Excluding exceptional items (see annex) (3) After IFRIC 21 restatement
55 INVESTOR PRESENTATION
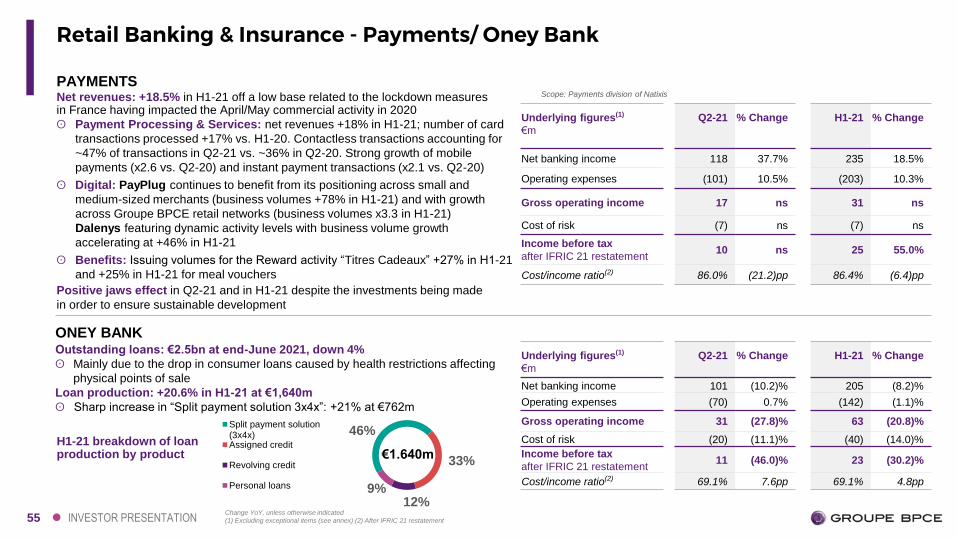
Retail Banking & Insurance - Payments/ Oney Bank
ONEY BANK
9%12%
33%
46%Split payment solution(3x4x)Assigned credit
Revolving credit
Personal loans
H1-21 breakdown of loan production by product €1.640m
Scope: Payments division of NatixisNet revenues: +18.5% in H1-21 off a low base related to the lockdown measures in France having impacted the April/May commercial activity in 2020
ʘ Payment Processing & Services: net revenues +18% in H1-21; number of card
transactions processed +17% vs. H1-20. Contactless transactions accounting for
~47% of transactions in Q2-21 vs. ~36% in Q2-20. Strong growth of mobile
payments (x2.6 vs. Q2-20) and instant payment transactions (x2.1 vs. Q2-20)
ʘ Digital: PayPlug continues to benefit from its positioning across small and
medium-sized merchants (business volumes +78% in H1-21) and with growth
across Groupe BPCE retail networks (business volumes x3.3 in H1-21)
Dalenys featuring dynamic activity levels with business volume growth
accelerating at +46% in H1-21
ʘ Benefits: Issuing volumes for the Reward activity “Titres Cadeaux” +27% in H1-21
and +25% in H1-21 for meal vouchers
Positive jaws effect in Q2-21 and in H1-21 despite the investments being made
in order to ensure sustainable development
PAYMENTS
Outstanding loans: €2.5bn at end-June 2021, down 4%
ʘ Mainly due to the drop in consumer loans caused by health restrictions affecting
physical points of sale
Loan production: +20.6% in H1-21 at €1,640m
ʘ Sharp increase in “Split payment solution 3x4x”: +21% at €762m
Underlying figures(1)
€m
Q2-21 % Change H1-21 % Change
Net banking income 101 (10.2)% 205 (8.2)%
Operating expenses (70) 0.7% (142) (1.1)%
Gross operating income 31 (27.8)% 63 (20.8)%
Cost of risk (20) (11.1)% (40) (14.0)%
Income before tax
after IFRIC 21 restatement11 (46.0)% 23 (30.2)%
Cost/income ratio(2) 69.1% 7.6pp 69.1% 4.8pp
Underlying figures(1)
€m
Q2-21 % Change H1-21 % Change
Net banking income 118 37.7% 235 18.5%
Operating expenses (101) 10.5% (203) 10.3%
Gross operating income 17 ns 31 ns
Cost of risk (7) ns (7) ns
Income before tax
after IFRIC 21 restatement10 ns 25 55.0%
Cost/income ratio(2) 86.0% (21.2)pp 86.4% (6.4)pp
Change YoY, unless otherwise indicated
(1) Excluding exceptional items (see annex) (2) After IFRIC 21 restatement
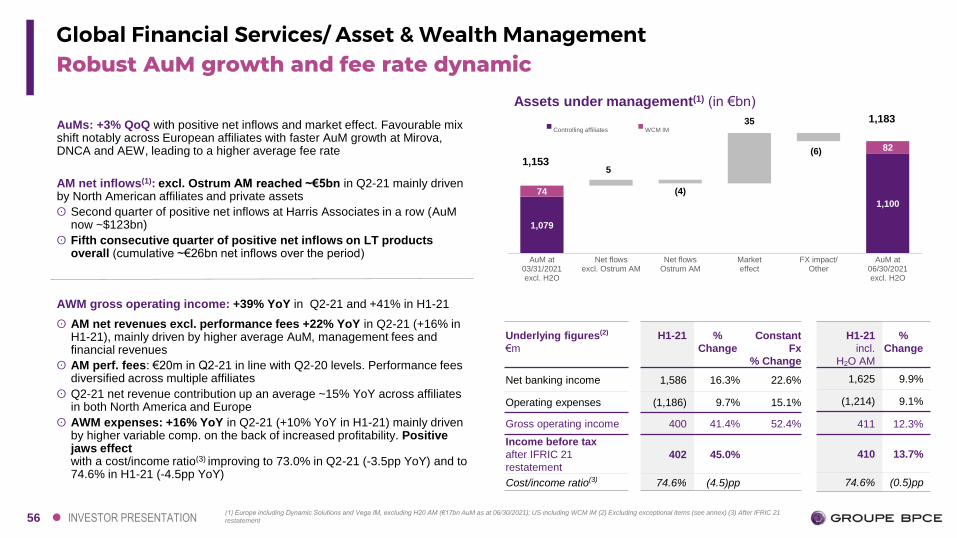
56 INVESTOR PRESENTATION
1,079
1,100
74
5
(4)
35
(6) 82
AuM at03/31/2021excl. H2O
Net flowsexcl. Ostrum AM
Net flowsOstrum AM
Marketeffect
FX impact/Other
AuM at06/30/2021excl. H2O
Controlling affiliates WCM IMAuMs: +3% QoQ with positive net inflows and market effect. Favourable mix shift notably across European affiliates with faster AuM growth at Mirova, DNCA and AEW, leading to a higher average fee rate
AM net inflows(1): excl. Ostrum AM reached ~€5bn in Q2-21 mainly driven by North American affiliates and private assets
ʘ Second quarter of positive net inflows at Harris Associates in a row (AuMnow ~$123bn)
ʘ Fifth consecutive quarter of positive net inflows on LT products overall (cumulative ~€26bn net inflows over the period)
AWM gross operating income: +39% YoY in Q2-21 and +41% in H1-21
ʘ AM net revenues excl. performance fees +22% YoY in Q2-21 (+16% in H1-21), mainly driven by higher average AuM, management fees and financial revenues
ʘ AM perf. fees: €20m in Q2-21 in line with Q2-20 levels. Performance fees diversified across multiple affiliates
ʘ Q2-21 net revenue contribution up an average ~15% YoY across affiliates in both North America and Europe
ʘ AWM expenses: +16% YoY in Q2-21 (+10% YoY in H1-21) mainly driven by higher variable comp. on the back of increased profitability. Positive jaws effect with a cost/income ratio(3) improving to 73.0% in Q2-21 (-3.5pp YoY) and to 74.6% in H1-21 (-4.5pp YoY)
Assets under management(1) (in €bn)
Underlying figures(2)
€m
H1-21 %
Change
Constant
Fx
% Change
Net banking income 1,586 16.3% 22.6%
Operating expenses (1,186) 9.7% 15.1%
Gross operating income 400 41.4% 52.4%
Income before tax
after IFRIC 21
restatement
402 45.0%
Cost/income ratio(3) 74.6% (4.5)pp
833
1,153
1,183
H1-21
incl.
H2O AM
%
Change
1,625 9.9%
(1,214) 9.1%
411 12.3%
410 13.7%
74.6% (0.5)pp
Global Financial Services/ Asset & Wealth ManagementRobust AuM growth and fee rate dynamic
(1) Europe including Dynamic Solutions and Vega IM, excluding H20 AM (€17bn AuM as at 06/30/2021); US including WCM IM (2) Excluding exceptional items (see annex) (3) After IFRIC 21
restatement

57 INVESTOR PRESENTATION
1 25 43 7 (7)
277 213250 330
287
(175)
33
127167
108
321 321
343
336
39399 93
12696 135
Q2-20 Q3-20 Q4-20 Q1-21 Q2-21
CVA/DVA desk FIC-T Equity Global finance Investment bankingand M&A
Net revenues continue to exhibit solid momentum on the back of a strong commercial activity and off a low base due to the H1-20 market conditions (mainly spreads widening and dividend mark-downs on equity products)
Global markets:
ʘ FIC-T revenues up YoY at €287m in Q2-21 (€617m in H1-21) with a higher contribution from Credit, Rates and Treasury more than offsetting a lower contribution from FX
ʘ Equity revenues at €108m in Q2-21 (€275m in H1-21) driving by favorable market conditions and a strong commercial successes, notably with the Groupe BPCE networks
Global finance:
ʘ Net revenues +22% YoY at €393m in Q2-21 (+18% in H1-21), driven by higher contribution from the portfolio, notably with corporates, as well as on Real assets (mainly Infrastructure) and Trade finance
Investment banking/M&A:
ʘ Investment banking revenues slightly down YoY in Q2-21 on the back of a lower contribution from DCM although +10% in H1-21
ʘ M&A revenues more than doubled YoY in Q2-21 (+20% in H1-21) off a low base and with strong contributions from Natixis Partners and Solomon Partners
Positive jaw effect with a cost/income ratio(3) improving to 64.3% in Q2-21 (-31.0pp YoY) and 61.4% in H1-21 (-24.0pp YoY)
Cost of risk improving and benefiting from benign Stage 3 net provisioning in Q2-21
Net revenues(1) (in €m)845
Underlying figures(2)
€mQ2-21
%
Change H1-21
%
Change
Constant
Fx %
Change
Net banking income 919 79.8% 1,859 56.1% 63.0%
Operating expenses (583) 21.9% (1,159) 11.8% 14.9%
Gross operating income 336 x10.2 700 x4.5
Cost of risk (28) (90.0)% (109) (76.8)%
Income before tax
after IFRIC 21
restatement
303 ns 614 ns
Cost/income ratio(3) 64.3% (31.0)pp 61.4% (24.0)pp
929 923
522 661
(55)0
642 617
(208)
275
619
728202
231
H1-20 H1-21
1,255
1,852
Global Financial Services/ Corporate and Investment Banking Strong commercial activity and improved cost of risk
(1) Total excluding CVA/DVA desk and other; figures at current FX (2) Excluding exceptional items (see annex) (3) After IFRIC 21 restatement

58 INVESTOR PRESENTATION
DESCRIPTION
Internal solidarity and guarantee system defined by law between all affiliated French Regulated Credit Institutions (FRCI) within the group
BPCE SA has the legal obligation to take all necessary measures to guarantee the liquidity and the solvency of its FRCI affiliates
AMOUNT
The aggregate Tier 1 capital of the 2 networks ultimately protects the Bondholders
The French Monetary and Financial Code creates a joint solidarity fund (at BPCE SA level) immediately available (€1.283bn as of June 30, 2021)
In addition, mobilization of the total regulatory capital of the 2 networks if needed (€56.9bn of Tier 1 capital as of June 30, 2021 )
CONSEQUENCESFinancial failings of any affiliated FRCI (including BPCE SA) within the group would be covered by the aggregate Tier 1 capital of the 2 networks
Only 1 credit risk and 1 senior debt rating for all affiliated FRCI within the group (excl. CFF with S&P)
PREVENTION
BPCE SA, as the central institution, has taken measures to safeguard liquidity and solvency of its affiliated FRCI
Examples: Natixis: guarantee mechanism on GAPC credit portfolio
Crédit Foncier de France: €1.5bn capital increase in late 2011
Group internal solidarity & guarantee system call

59 INVESTOR PRESENTATION
ASSETS (in millions of euros)
June 30, 2021 Dec. 31, 2020
Cash and amounts due from central banks 151,361 153,403
Financial assets at fair value through profit or loss 186,044 196,260
Hedging derivatives 7,662 9,608
Financial assets at fair value through shareholders' equity 50,043 49,630
Financial assets at amortized cost 27,218 26,732
Loans and receivables due from credit institutions
and similar at amortized cost99,064 90,018
Loans and receivables due from customers at amortized cost 757,573 746,809
Revaluation difference on interest rate risk-hedged portfolios 6,833 8,941
Insurance activity investments 129,175 124,566
Current tax assets 642 747
Deferred tax assets 3,476 3,667
Accrued income and other assets 14,282 16,367
Non-current assets held for sale 2,434 2,599
Investments in associates 4,383 4,586
Investment property 774 770
Property, plant and equipment 6,089 6,222
Intangible assets 1,037 1,038
Goodwill 4,354 4,307
TOTAL ASSETS 1,452,445 1,446,269
LIABILITIES (in millions of euros)
June 30, 2021 Dec. 31, 2020
Amounts due to central banks
Financial liabilities at fair value through profit or loss 162,369 191,371
Hedging derivatives 13,523 15,262
Debt securities 229,051 228,201
Amounts due to credit institutions 153,187 138,416
Amounts due to customers 648,664 630,837
Revaluation difference on interest rate risk-hedged
portfolios198 243
Current tax liabilities 1,014 485
Deferred tax liabilities 1,140 1,239
Accrued expenses and other liabilities 21,476 22,662
Liabilities associated with non-current assets held for sale 2,173 1,945
Insurance-related liabilities 121,014 114,608
Provisions 5,451 6,213
Subordinated debt 16,262 16,375
Shareholders' equity 76,923 78,412
Equity attributable to equity holders of the parent 76,266 72,683
Non-controlling interests 657 5,728
TOTAL LIABILITIES 1,452,445 1,446,269
Consolidated balance sheet
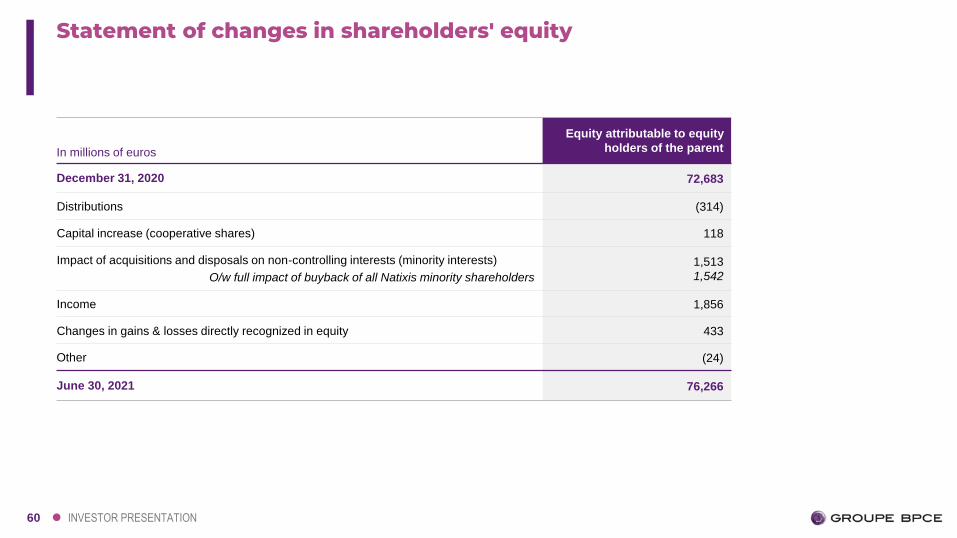
60 INVESTOR PRESENTATION
Statement of changes in shareholders' equity
In millions of euros
Equity attributable to equity
holders of the parent
December 31, 2020 72,683
Distributions (314)
Capital increase (cooperative shares) 118
Impact of acquisitions and disposals on non-controlling interests (minority interests)
O/w full impact of buyback of all Natixis minority shareholders
1,513
1,542
Income 1,856
Changes in gains & losses directly recognized in equity 433
Other (24)
June 30, 2021 76,266

61 INVESTOR PRESENTATION
In billions of eurosJune.30, 2021 Dec.31, 2020
Gross outstanding loans to customers and credit institutions 870.3 850.4
O/w S1/S2 outstandings 847.9 828.9
O/w S3 outstandings 22.4 21.5
Non-performing loans/gross outstanding loans 2.6% 2.5%
S1/S2 impairments recognized 4.2 4.2
S3 impairments recognized 9.4 9.4
Impairments recognized/non-performing loans 42.1% 43.7%
Coverage ratio
(including guarantees related to impaired outstandings)62.6% 66.2%
Non-performing loans and impairments

62 INVESTOR PRESENTATION
7%
24%
55%
8%
4% 2%
France Centralization of regulated savings
Europe excluding France North & South America
Asia/Oceania Africa & the Middle East
Financial institutions/local governments Central administrations/Central banks and other sovereign exposures
Corporate customers
71%
18%
7%4%1%
Breakdown per geographical region
69%
15%
9%
4% 2%
Breakdown of gross exposure as of June 30, 2021(1)
(1) Estimate

63 INVESTOR PRESENTATION
Issuer Operator
Short-term
All instruments, all markets including CDs, ECP, USCP & interbank deposits BPCE / Natixis Natixis
Medium & long-term
Covered Bonds
BPCE SFH BPCE
CoFF (SCF)
Natixis Pfandbriefbank
CFF
Natixis
Senior Preferred (Unsecured)
Public issues BPCE BPCE
Plain vanilla private placements BPCE Natixis
Structured private placements Natixis Natixis
Senior Non-Preferred (Unsecured) BPCE BPCE
Subordinated debt BPCE BPCE
In the money market, Banque Populaire and Caisse d’Epargne networks & other subsidiaries can issue in the domestic market (CDs & interbank deposits)
BPCE and Natixis fully benefit from the Group internal solidarity and guarantee system
Main issuers in the market

64 INVESTOR PRESENTATION
BPCE
Roland CharbonnelHead of Group Funding & Investor Relations
+33 1 58 40 69 30
Jean-Philippe BerthautHead of Group Funding
+33 1 58 40 69 15
François CourtoisHead of Investor Relations
+33 1 58 40 46 69
France de SuryDeputy Head of Investor Relations
+33 1 58 40 39 95
Anne SadournyInvestor Relations
+33 1 58 40 76 59
Cindy AmarInvestor Relations APAC
+ 852 3915 1314
Marianne MedoraInvestor Relations Americas
+1 212 891 5782
Damien PommierInvestor Relations Americas
+1 212 632 2856
Contact list