Erratum: Single base–resolution methylome of the silkworm reveals a sparse epigenomic map
7
© 2010 Nature America, Inc. All rights reserved. NATURE BIOTECHNOLOGY ADVANCE ONLINE PUBLICATION LETTERS Epigenetic regulation in insects may have effects on diverse biological processes. Here we survey the methylome of a model insect, the silkworm Bombyx mori, at single-base resolution using Illumina high-throughput bisulfite sequencing (MethylC-Seq). We conservatively estimate that 0.11% of genomic cytosines are methylcytosines, all of which probably occur in CG dinucleotides. CG methylation is substantially enriched in gene bodies and is positively correlated with gene expression levels, suggesting it has a positive role in gene transcription. We find that transposable elements, promoters and ribosomal DNAs are hypomethylated, but in contrast, genomic loci matching small RNAs in gene bodies are densely methylated. This work contributes to our understanding of epigenetics in insects, and in contrast to previous studies of the highly methylated genomes of Arabidopsis 1 and human 2 , demonstrates a strategy for sequencing the epigenomes of organisms such as insects that have low levels of methylation. The recently developed MethylC-Seq 1 technology couples bisulfite- based detection of methylated cytosines to high-throughput whole- genome sequencing. Application of this technology to Arabidopsis 1 and humans 2 has revealed that these species are highly methylated (about 5% genomic cytosines), and the high resolution of these studies identified new elaborate patterns and functional effects of DNA methylation. Insects, however, seem to have lower levels of methylation 3 , with ~0.15–0.19% of DNA being methylated in the silk gland of the silkworm (Bombyx mori) 4 , as assayed by high-performance liquid chromatography, and even lower levels observed in flies, mosquitoes and honeybees 3,4 . The feasibility of performing MethylC-Seq on organ- isms with such low methylation levels has not yet been evaluated. Recent interest in DNA methylation in insects has been sparked by evidence for the existence both of active methyltransferase enzymes, which attach methyl groups to DNA, and of methylated genes in Drosophila, the aphid Myzus persicae and particularly the honeybee Apis mellifica 5–7 . The absence of comprehensive genome-wide profiling and functional analysis of DNA methylation in insects, however, has hindered our understanding of epigenetic regulation in these organisms. The silkworm, which has been subjected to domestication for 5,000 years 8 , is an economically important model insect of Lepidoptera, an order that includes many crop pests, such as the cotton bollworm. As an alternative mechanism to mutations in germline DNA, epigenetic changes via DNA methylation called epimutations have been reported to influence ecologically favorable traits, and thus species evolution, in both plants and mammals 9,10 . Therefore, the silkworm could be a valuable model, not only for studying functional effects of DNA methylation in insects but also for exploring the effects of epigenetics during domestication. The number of DNA methyltransferase enzymes encoded in the genomes of different insect species varies greatly 11 . In the silkworm (B. mori), previous studies 11,12 identified two DNA methyltransferase genes (dnmt1 and dnmt2) and experimentally characterized the methyl DNA–binding protein MBD2/3, providing intriguing evidence for the presence of DNA methylation in this insect species. We conducted extensive searches in the silkworm genome and confirmed that there are only dnmt1 and dnmt2 DNA methyltransferase genes (Bmdnmt1 and Bmdnmt2). Our PCR experiments with reverse transcription (RT-PCR) show that the two silkworm methyltransferase genes are expressed in a development- and tissue-regulated pattern (Supplementary Fig. 1a). Nuclear protein extracts from early embryos (8-h eggs) and silk glands further demonstrate the presence of catalytic activity of DNA methylation in silkworms (Supplementary Fig. 1b). Single base–resolution methylome of the silkworm reveals a sparse epigenomic map Hui Xiang 1,2,10 , Jingde Zhu 3,4,10 , Quan Chen 2,10 , Fangyin Dai 5,10 , Xin Li 1,10 , Muwang Li 6 , Hongyu Zhang 3 , Guojie Zhang 2 , Dong Li 5 , Yang Dong 1 , Li Zhao 1 , Ying Lin 5 , Daojun Cheng 5 , Jian Yu 3 , Jinfeng Sun 3 , Xiaoyu Zhou 3 , Kelong Ma 3 , Yinghua He 3 , Yangxing Zhao 3 , Shicheng Guo 3 , Mingzhi Ye 2 , Guangwu Guo 2 , Yingrui Li 2 , Ruiqiang Li 2 , Xiuqing Zhang 2 , Lijia Ma 2 , Karsten Kristiansen 7 , Qiuhong Guo 8 , Jianhao Jiang 8 , Stephan Beck 9 , Qingyou Xia 5 , Wen Wang 1 & Jun Wang 2,7 1 CAS-Max Planck Junior Research Group, State Key Laboratory of Genetic Resources and Evolution, Kunming Institute of Zoology, The Chinese Academy of Sciences, Kunming, China. 2 BGI-Shenzhen, Shenzhen, China. 3 Cancer Epigenetics and Gene Therapy Program, The State-key Laboratory for Oncogenes and Related Genes, Shanghai Cancer Institute, Shanghai Jiaotong University, Shanghai, China. 4 Cancer Epigenetics Laboratory, Obstetrics and Gynecology Hospital, Fudan University, Shanghai, China. 5 The Key Sericultural Laboratory of Agricultural Ministry, College of Biotechnology, Institute of Sericulture and Systems Biology, Southwest University, Chongqing, China. 6 Sericultural Research Institute, Chinese Academy of Agricultural Sciences, Zhenjiang, China. 7 Department of Biology, University of Copenhagen, Denmark. 8 Shanghai Institute of Plant Physiology and Ecology, Shanghai Institutes for Biological Sciences, The Chinese Academy of Sciences, Shanghai, China. 9 UCL Cancer Institute, University College London, London, UK. 10 These authors contributed equally to this work. Correspondence should be addressed to J.W. ([email protected]) or W.W. ([email protected]) or Q.Y.X. ([email protected]). Received 8 February; accepted 23 March; published online 2 May 2010; doi:10.1038/nbt.1626
Transcript of Erratum: Single base–resolution methylome of the silkworm reveals a sparse epigenomic map

©20
10 N
atu
re A
mer
ica,
Inc.
All
rig
hts
res
erve
d.
nature biotechnology advance online publication �
l e t t e r s
Epigenetic regulation in insects may have effects on diverse biological processes. Here we survey the methylome of a model insect, the silkworm Bombyx mori, at single-base resolution using Illumina high-throughput bisulfite sequencing (MethylC-Seq). We conservatively estimate that 0.11% of genomic cytosines are methylcytosines, all of which probably occur in CG dinucleotides. CG methylation is substantially enriched in gene bodies and is positively correlated with gene expression levels, suggesting it has a positive role in gene transcription. We find that transposable elements, promoters and ribosomal DNAs are hypomethylated, but in contrast, genomic loci matching small RNAs in gene bodies are densely methylated. This work contributes to our understanding of epigenetics in insects, and in contrast to previous studies of the highly methylated genomes of Arabidopsis1 and human2, demonstrates a strategy for sequencing the epigenomes of organisms such as insects that have low levels of methylation.
The recently developed MethylC-Seq1 technology couples bisulfite-based detection of methylated cytosines to high-throughput whole-genome sequencing. Application of this technology to Arabidopsis1 and humans2 has revealed that these species are highly methylated (about 5% genomic cytosines), and the high resolution of these studies identified new elaborate patterns and functional effects of DNA methylation.
Insects, however, seem to have lower levels of methylation3, with ~0.15–0.19% of DNA being methylated in the silk gland of the silkworm (Bombyx mori)4, as assayed by high-performance liquid chromatography, and even lower levels observed in flies, mosquitoes and honeybees3,4. The feasibility of performing MethylC-Seq on organ-isms with such low methylation levels has not yet been evaluated. Recent
interest in DNA methylation in insects has been sparked by evidence for the existence both of active methyltransferase enzymes, which attach methyl groups to DNA, and of methylated genes in Drosophila, the aphid Myzus persicae and particularly the honeybee Apis mellifica5–7. The absence of comprehensive genome-wide profiling and functional analysis of DNA methylation in insects, however, has hindered our understanding of epigenetic regulation in these organisms.
The silkworm, which has been subjected to domestication for 5,000 years8, is an economically important model insect of Lepidoptera, an order that includes many crop pests, such as the cotton bollworm. As an alternative mechanism to mutations in germline DNA, epigenetic changes via DNA methylation called epimutations have been reported to influence ecologically favorable traits, and thus species evolution, in both plants and mammals9,10. Therefore, the silkworm could be a valuable model, not only for studying functional effects of DNA methylation in insects but also for exploring the effects of epigenetics during domestication.
The number of DNA methyltransferase enzymes encoded in the genomes of different insect species varies greatly11. In the silkworm (B. mori), previous studies11,12 identified two DNA methyltransferase genes (dnmt1 and dnmt2) and experimentally characterized the methyl DNA–binding protein MBD2/3, providing intriguing evidence for the presence of DNA methylation in this insect species. We conducted extensive searches in the silkworm genome and confirmed that there are only dnmt1 and dnmt2 DNA methyltransferase genes (Bmdnmt1 and Bmdnmt2). Our PCR experiments with reverse transcription (RT-PCR) show that the two silkworm methyltransferase genes are expressed in a development- and tissue-regulated pattern (Supplementary Fig. 1a). Nuclear protein extracts from early embryos (8-h eggs) and silk glands further demonstrate the presence of catalytic activity of DNA methylation in silkworms (Supplementary Fig. 1b).
single base–resolution methylome of the silkworm reveals a sparse epigenomic mapHui Xiang1,2,10, Jingde Zhu3,4,10, Quan Chen2,10, Fangyin Dai5,10, Xin Li1,10, Muwang Li6, Hongyu Zhang3, Guojie Zhang2, Dong Li5, Yang Dong1, Li Zhao1, Ying Lin5, Daojun Cheng5, Jian Yu3, Jinfeng Sun3, Xiaoyu Zhou3, Kelong Ma3, Yinghua He3, Yangxing Zhao3, Shicheng Guo3, Mingzhi Ye2, Guangwu Guo2, Yingrui Li2, Ruiqiang Li2, Xiuqing Zhang2, Lijia Ma2, Karsten Kristiansen7, Qiuhong Guo8, Jianhao Jiang8, Stephan Beck9, Qingyou Xia5, Wen Wang1 & Jun Wang2,7
1CAS-Max Planck Junior Research Group, State Key Laboratory of Genetic Resources and Evolution, Kunming Institute of Zoology, The Chinese Academy of Sciences, Kunming, China. 2BGI-Shenzhen, Shenzhen, China. 3Cancer Epigenetics and Gene Therapy Program, The State-key Laboratory for Oncogenes and Related Genes, Shanghai Cancer Institute, Shanghai Jiaotong University, Shanghai, China. 4Cancer Epigenetics Laboratory, Obstetrics and Gynecology Hospital, Fudan University, Shanghai, China. 5The Key Sericultural Laboratory of Agricultural Ministry, College of Biotechnology, Institute of Sericulture and Systems Biology, Southwest University, Chongqing, China. 6Sericultural Research Institute, Chinese Academy of Agricultural Sciences, Zhenjiang, China. 7Department of Biology, University of Copenhagen, Denmark. 8Shanghai Institute of Plant Physiology and Ecology, Shanghai Institutes for Biological Sciences, The Chinese Academy of Sciences, Shanghai, China. 9UCL Cancer Institute, University College London, London, UK. 10These authors contributed equally to this work. Correspondence should be addressed to J.W. ([email protected]) or W.W. ([email protected]) or Q.Y.X. ([email protected]).
Received 8 February; accepted 23 March; published online 2 May 2010; doi:10.1038/nbt.1626
©20
10 N
atu
re A
mer
ica,
Inc.
All
rig
hts
res
erve
d.
� advance online publication nature biotechnology
l e t t e r s
The above results led us to apply MethylC-Seq to reveal the genome-wide DNA methylation pattern in the silkworm. First, we sequenced bisulfite-treated total DNA, extracted from the silk gland of an individual of the Dazao strain, whose genome has already been sequenced13. In total, 272,312,422 raw reads were produced (Supplementary Table 1). After removing low-quality and clonal reads, we obtained 133,765,113 effective reads, and the sequence yield for final analysis was 5.9 gigabase pairs (Gb), covering 92% of all cytosines in the genome with an average depth 7.4 × per strand (Supplementary Table 1). Initially we observed overall genome-wide methylation levels of 0.67% at CG, 0.21% at CHG and 0.24% at CHH sites (H = A, C or T), indicating higher CG methylation than non-CG methylation.
Because non-CG methylation is reported to be either very rare or nonexistent in honeybees6, we selected a series of genomic regions to validate our initial results. Based on the MethylC-Seq results, we picked five genomic regions that contain 26 mCGs, as well as three regions that contain 98 clustered mCHHs and one mCHG. In these regions, we performed traditional bisulfite-PCR and sequencing validation (BS-PCR). Notably, although 92.3% of the methylated cytosines (mCs) at CG sites were validated, none of the non-CG mCs were validated by the BS-PCR (Supplementary Table 2).
To further confirm this result, we validated a larger batch of regions with methylation sites (692 CGs, 29 CHGs and 63 CHHs, respec-tively) using BS-PCR followed by 454 sequencing (454 Life Sciences). Similarly, a high percentage of CG methylations were validated (82.9%) but none of the non-CG mCs (Supplementary Table 2). These results suggest that non-CG mCs are either nonexistent or very rare in the silkworm, as was found in the honeybee6. To account for this fact, we used the non-CG mC rate as the background control2 to calculate the false-positive rate (non-conversion and thymidine-to-cytosine sequencing errors), the value of which is estimated to be 0.23%. After corrections based on this value, we identified 600,422 mCs, accounting for 0.40% of all genomic cytosines. Unfortunately,
about 45% of these mCs were at non-CG sites, indicating that false mCs were still prevalent even after this correction.
To remove as many of the remaining false positives as possible, we decided to adopt a biological replicate strategy and thus conducted MethylC-Seq on silk gland DNA from a second individual from the same Dazao strain. The sequence yield for final analysis is 9.9 Gb, covering 92% of all cytosines in the genome with an average depth of 9.0 × per strand (Supplementary Table 1). After the same proc-ess of mC identification as used for the first individual, we observed 983,395 mCs, 58.3% Cs of which were at non-CG sites. Comparison of the mCs identified independently in the two individuals revealed a high concordance for mCG sites but overall discordance for mCs at non-CG sites (Supplementary Fig. 2). This again indicates that in the silkworm, non-CG mCs are all, or nearly all, false positives, whereas mCGs are frequently genuine.
Although different individuals probably have variable levels of methylation owing to subtle physiological differences, overlap of mCs in two individuals gives a very conservative estimation of real mCs in the Dazao silkworm genome. More specifically, 11.3% (65 of 574) of the real mCGs validated by BS-PCR for the first individual were excluded in the final mC map, whereas 99.5% (190 of 191) of false- positive non-CG mCs were excluded (Supplementary Table 2).
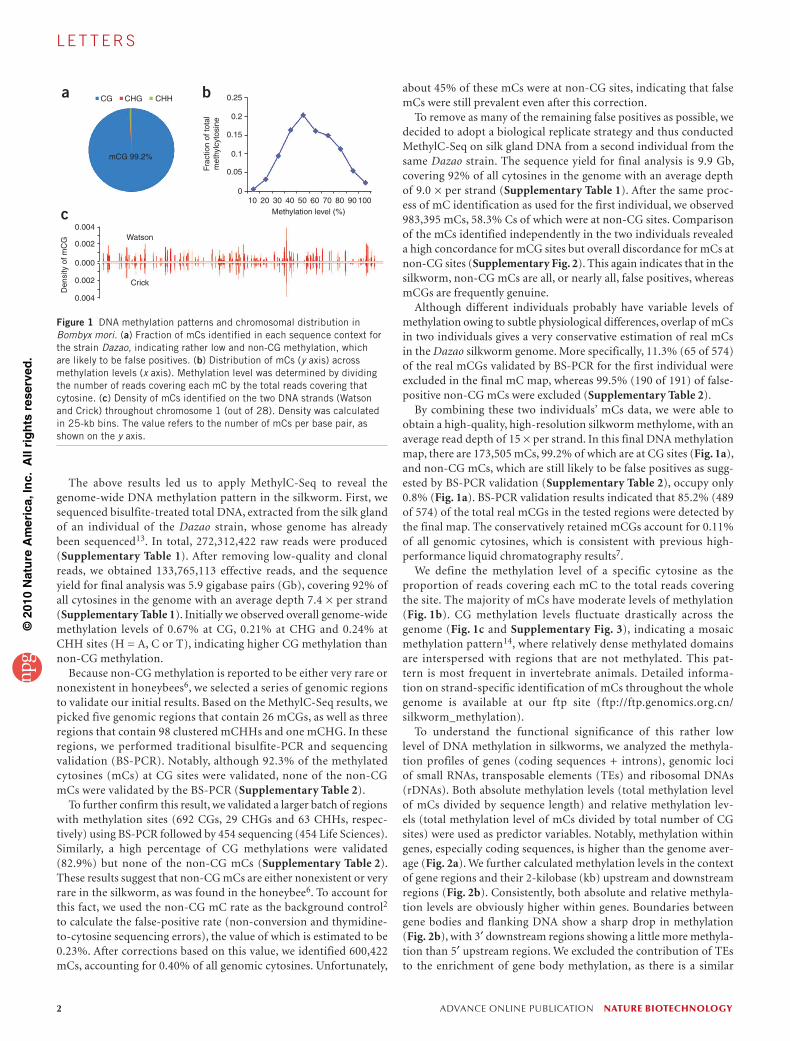
By combining these two individuals’ mCs data, we were able to obtain a high-quality, high-resolution silkworm methylome, with an average read depth of 15 × per strand. In this final DNA methylation map, there are 173,505 mCs, 99.2% of which are at CG sites (Fig. 1a), and non-CG mCs, which are still likely to be false positives as sugg-ested by BS-PCR validation (Supplementary Table 2), occupy only 0.8% (Fig. 1a). BS-PCR validation results indicated that 85.2% (489 of 574) of the total real mCGs in the tested regions were detected by the final map. The conservatively retained mCGs account for 0.11% of all genomic cytosines, which is consistent with previous high- performance liquid chromatography results7.
We define the methylation level of a specific cytosine as the proportion of reads covering each mC to the total reads covering the site. The majority of mCs have moderate levels of methylation (Fig. 1b). CG methylation levels fluctuate drastically across the genome (Fig. 1c and Supplementary Fig. 3), indicating a mosaic methylation pattern14, where relatively dense methylated domains are interspersed with regions that are not methylated. This pat-tern is most frequent in invertebrate animals. Detailed informa-tion on strand-specific identification of mCs throughout the whole genome is available at our ftp site (ftp://ftp.genomics.org.cn/ silkworm_methylation).
To understand the functional significance of this rather low level of DNA methylation in silkworms, we analyzed the methyla-tion profiles of genes (coding sequences + introns), genomic loci of small RNAs, transposable elements (TEs) and ribosomal DNAs (rDNAs). Both absolute methylation levels (total methylation level of mCs divided by sequence length) and relative methylation lev-els (total methylation level of mCs divided by total number of CG sites) were used as predictor variables. Notably, methylation within genes, especially coding sequences, is higher than the genome aver-age (Fig. 2a). We further calculated methylation levels in the context of gene regions and their 2-kilobase (kb) upstream and downstream regions (Fig. 2b). Consistently, both absolute and relative methyla-tion levels are obviously higher within genes. Boundaries between gene bodies and flanking DNA show a sharp drop in methylation (Fig. 2b), with 3′ downstream regions showing a little more methyla-tion than 5′ upstream regions. We excluded the contribution of TEs to the enrichment of gene body methylation, as there is a similar
0.25
0.004
0.004
0.002
Den
sity
of m
CG
0.002
0.000
CG CHGa
c
bCHH
mCG 99.2%
Watson
Crick
Frac
tion
of to
tal
met
hylc
ytos
ine
0.15
0.05
10 20 1009080706050Methylation level (%)
40300
0.1
0.2
Figure 1 DNA methylation patterns and chromosomal distribution in Bombyx mori. (a) Fraction of mCs identified in each sequence context for the strain Dazao, indicating rather low and non-CG methylation, which are likely to be false positives. (b) Distribution of mCs (y axis) across methylation levels (x axis). Methylation level was determined by dividing the number of reads covering each mC by the total reads covering that cytosine. (c) Density of mCs identified on the two DNA strands (Watson and Crick) throughout chromosome 1 (out of 28). Density was calculated in 25-kb bins. The value refers to the number of mCs per base pair, as shown on the y axis.

©20
10 N
atu
re A
mer
ica,
Inc.
All
rig
hts
res
erve
d.
nature biotechnology advance online publication �
l e t t e r s
abundance of TEs within and outside gene regions, and methylation is more prominent in coding sequences than it is in introns (Fig. 2a,c). In other insects, such as the aphid and the honeybee, body methyla-tion has also been observed in some genes5,6,15, and therefore this pattern may be a common feature in insects.
Methylation at genomic sequences that are complementary to small RNAs (smRNAs) is also higher than the genome average for the silkworm (Fig. 2a). Notably, these genomic loci matching smRNAs tend to be found in gene bodies but not in TEs (Fig. 2c,d). Our analysis showed a significant excess of methylated genomic loci matching smRNA within genes (86.9% of all methylated smRNAs within genes) compared with the genomic background (57.3% of all CG-containing smRNAs within genes) (P < 0.001, χ2 test). In contrast, methylated genomic loci matching smRNA were signifi-cantly depleted within TEs (0.5% of all methylated smRNAs in TEs versus 2.9% of all CG-containing smRNAs in TEs, P < 0.01, χ2 test). This pattern contrasts with observations in plants, where highly methylated genomic loci matching smRNAs were barely found in gene bodies but are prevalent in TEs and other repeats (ref. 16 and our unpublished data on rice). In plants, smRNA-directed methyla-tion that targets homologous DNA plays an important role in TE silencing17, which explains why smRNAs in TEs are highly methy-lated. smRNAs were also observed to target methylated genes in Arabidopsis18, although this was relatively rare. In silkworms, the prevalence of genomic loci of smRNA in gene bodies and their dense CG methylation imply that smRNAs could be involved in gene body CG methylation.
Methylation in TEs seems to be low compared with the genome average (Fig. 2a). Only about 1.2% (5521 of 431,743) of TEs have at least one mCGs, and of these, the majority have low levels of methylation (Supplementary Fig. 4), indicating that TEs are usu-ally unmethylated in the Bombyx silk gland. In contrast to a recent study4 on Drosophila early embryos that suggested methylation plays a role in transposon silencing, our genome-wide pattern of TE methylation in the silkworm silk gland does not support a general
role for methylation on TEs. We did not observe any mCs in rDNAs, which have been proposed to act as a switch controlling ribosomal gene transcription in plants and mammals19, implying that, in insects, as suggested by other case studies20, the regulation of rDNA transcription via methylation has probably not developed.
We found that CG methylation level is not correlated with GC con-tent but with CpG dinucleotide density and CpG observed/expected (O/E) ratio (Fig. 2e). CpG O/E ratio is a widely used parameter to predict DNA methylation level based on C→T transition mechanisms resulting from deamination of mCs over the course of evolution21,22. Consistent with previous predictions and observations22,23, genes with higher methylation level tend to have lower CpG dinucleotide and density CpG O/E ratios (Fig. 2e).
To reveal the functional consequences of gene body methylation, we generated expression profiles for the two individuals’ silk glands using digital gene expression (DGE) tag profiling technology, which uses Illumina high-throughput sequencing as a readout for a classical SAGE (Serial Analysis of Gene Expression) assay. For the two bio-logical replicates, 7,991,117 and 4,620,989 raw reads were generated, and 4,811,597 (60.2%) and 2,435,608 (52.7%), respectively, uniquely mapped to annotated genes. We detected 7,445 and 6,780 annotated genes by at least one unique read (Supplementary Table 3). We were also able to detect expression of Bmdnmt1 and Bmdnmt2 genes in the DGE data, which is consistent with the results shown by RT-PCR (Supplementary Fig. 1a).
We divided genes into five groups based on expression levels, from the bottom 20% to the top 20%. Notably, we observed that methyla-tion level is positively correlated with expression level in both indi-viduals (Fig. 3a and Supplementary Fig. 5a). A similar pattern was observed when grouping genes by their methylation levels (Fig. 3b and Supplementary Fig. 5b). The observed correlations are supported by Spearman correlation analyses (Fig. 3c and Supplementary Fig. 5c). This result suggests that gene body methylation may be an ancient system, because the same pattern has been reported in plants and chordates18,23. However, no correlation between expression level and
0.0016
a b c
d e
Absolute methylation levelRelative methylation level
Absolute methylation levelRelative methylation level
0.020
0.07
0.06
0.05
0.04
0.03
0.02
0.01
0.00
0.015
0.010
0.005
2 21 10 50 100
0.5 0.50.25
Upstream (kb)TE (%)
smRNA
Downstream (kb)
Upstream (kb)Gene (%) Downstream
(kb)
0.250 50 100
0
0.05
0.04
0.03
0.02
0.00
0.01
Abs
olut
e m
ethy
latio
n le
vel
(mC
G/le
ngth
)
TE
den
sity
GC
con
tent
or
CpG
(O/E
)
smR
NA
den
sity
smR
NA
densityC
pG density
Abs
olut
e m
ethy
latio
n le
vel
(mC
G/le
ngth
)
Relative m
ethylation level(m
CG
/CG
)
Relative m
ethylation level(m
CG
/CG
)
0.0012
0.0008
0.0004 0.0002
0.0004
0.0006
0.0008
Upstream (kb)Downstream
(kb) Gene (%)
Genome Gene cds Intron
smRNATE
smRNA TE rRNA0 0
0.025
0.020
0.015
0.010
0.005
GC contentCpG(O/E)CpG density
GC contentCpG(O/E)CpG density
0.000
0.20
0.15
0.10
0.05
0.00
1.2 0.06
0.05
0.04
0.03
0.02
0.01
0
0.8
0.6
0.4
0.2
0
1
2 0 50 1 21001
0 2 3Rank of methylation level
4 5 8 9 106 71
into 20 intervals (5% per interval). Plots show methylation level (b) or percentage of TEs and smRNAs (c) in each interval. A schematic representation of a gene is shown as a thick horizontal bar (scaled to 10 kb, the average length of Bombyx mori gene coding regions). (d) Abundance of genomic loci of smRNAs was plotted for TEs, as in c, except that the upstream and downstream lengths are 0.5 kb, considering that the average length of TEs is 200 bp. (e) Relationship between methylation level and GC content, CpG dinucleotide density and CpG(O/E)
22. Genes were ranked based on absolute
methylation level ( , , ) or relative methylation level ( , , ). 0, unmethylated genes. 1–10, the lowest to the highest methylated genes. Genes were divided into deciles based on methylation levels, from the bottom 10% to the top 10%. 0, unmethylated genes. 1–10, the lowest to the highest deciles of methylated genes.
Figure 2 Methylation of different functional regions of Bombyx mori (Dazao). Absolute methylation level was calculated as total methylation level of mCs divided by length of the corresponding region. Relative methylation level was calculated as total methylation level of mCs divided by total number of CGs in the corresponding regions. (a) Methylation level at different functional regions. (b,c) Analysis of coding genes. Two-kilobase regions upstream and downstream of each gene were divided into 100–base pair (bp) intervals. Each gene was divided

©20
10 N
atu
re A
mer
ica,
Inc.
All
rig
hts
res
erve
d.
� advance online publication nature biotechnology
l e t t e r s
methylation level in the promoter regions was detected (Fig. 3d and Supplementary Fig. 5d), which suggests that the well-known gene regulatory function of promoter methylation in plants and mam-mals17,24,25 may not operate in insects.
We further used the BGI WEGO (Web Gene Ontology Annotation Plotting)26 to functionally categorize the methylated and unmethylated
genes and observed significant differences (Fig. 4a). Methylated genes tend to be enriched in binding activities, including translation regu-lators. As for biological processes, they are enriched in functions associated with cellular metabolic and biosynthetic processes as well as cellular response to stimulus. In contrast, unmethylated genes are enriched in transcription regulators, such as transcription factors, and
a
c d
bAbsolute methylation level
0
–0.30 1 0 50 100 1 2
–0.2
–0.1
0
0.1
0.2
0.3
–0.32 1 0 50 100 1 2
–0.2
–0.1
0
0.1
0.2
0.3
2
Upstream(kb)
Gene (%) Downstream(kb)
Upstream(kb)
Gene (%) Downstream(kb)
Upstream(kb)
Gene (%) Downstream(kb)
Upstream(kb)
Gene (%) Downstream(kb)
1 0 50 100 1 20
2
Relative methylation level
1st quintile
1st quintile2nd quintile3rd quintile4th quintile5th quintile
2nd quintile3rd quintile4th quintile5th quintile
1 0 50 100 1 2
0
0
Expression (LgTag_number)
2 4 6 8 10 12
0
0
Expression (LgTag_number)
All methylated genes
Relative methylation levelAbsolute methylation level
Gene without methylation
2 4 6 8 10 12
0.1
0.2
0.3
0.4
0.1
0.2
0.3
0.4
0.05
0.10
0.15
Abs
olut
e m
ethy
latio
n le
vel
(mC
G/le
ngth
)S
pear
man
ran
k co
rrel
atio
n
Rel
ativ
e m
ethy
latio
n le
vel (
mC
G/C
G)
Fre
quen
cy
0.001
0.002
0.003
0.004
1st quintile2nd quintile3rd quintile4th quintile5th quintile
All methylated genesGene without methylation
Expression (LgTag_number)
0
0
0
Expression (LgTag_number)
2 4 6 8 10 12
0.1
0.2
0.3
0.4
2 4 6 8 10 12
0
0.1
0.2
0.3
0.4
Fre
quen
cyFigure 3 Relationship between DNA methylation and expression levels of genes in Bombyx mori (Dazao). (a) Methylation level within gene bodies divided by expression level. Genes were classified into quintiles based on expression: 1st quintile is lowest and 5th is highest. Two-kilobase regions upstream and downstream of each gene were divided into 100-bp intervals. Each gene was divided into 20 intervals (5% per interval). Plots show the methylation level of each interval. (b) Expression of methylated compared with unmethylated genes. Genes were rank-ordered based on gene body methylation level and divided into quintiles. For the methylated genes, 1st quintile is the lowest and 5th is the highest. (c) Spearman correlation index between methylation level and gene expression level. Two-kilobase regions upstream and downstream of each gene were divided into 100-bp intervals. Each gene was divided into 20 intervals (5% each interval). Plots show the Spearman correlation index of each interval. (d) The same as b, except for promoter methylation. Absolute and relative methylation levels were calculated as described for Figure 2.
All genes
0
5
59
597
5971
0
2
23
233
2333
Per
cent
of g
enes
(Lg
)
Per
cent
of g
enes
(Lg
)
0.01
0.1
1
10
100
0.01
0.1
1
10
100Methylated genes All genesUnmethylated genes
WEGO output WEGO output
Num
ber of genes
a b
Antiox
idant
Mole
cular
tran
sduc
er
Trans
lation
regu
lator
Biosyn
thet
ic pr
oces
s
Cellula
r mac
rom
olecu
lar co
mple
x sub
unit o
rgan
izatio
n
Mac
rom
olecu
lar co
mple
x sub
unit o
rgan
izatio
n
Primar
y met
aboli
c pro
cess
Binding
Mole
cular
tran
sduc
er
Cellula
r com
pone
nt b
iogen
esis
Regula
tion
of ce
llular
pro
cess
Regula
tion
of b
iolog
ical p
roce
ss
Pigmen
tatio
n
Met
aboli
c pro
cess
Cellula
r pro
cess
Cellula
r com
pone
nt o
rgan
izatio
n
Cell a
dhes
ion
Biolog
ical r
egula
tion
Biolog
ical a
dhes
ion
Anato
mica
l stru
cture
form
ation
Trans
porte
r
Trans
lation
regu
lator
Trans
cript
ion re
gulat
or
Trans
cript
ion fa
ctor
Signal
trans
duce
r
Organ
elle
orga
nizat
ion
Mult
icellu
lar o
rgan
ismal
proc
ess
Met
aboli
c pro
cess
Mac
rom
olecu
le m
etab
olic p
roce
ss
Cellula
r loc
aliza
tion
Develo
pmen
tal p
roce
ss
Cellula
r res
pons
e to
stim
ulus
Cellula
r pro
cess
Cellula
r met
aboli
c pro
cess
Cellula
r com
pone
nt o
rgan
izatio
n
Cellula
r com
pone
nt b
iogen
esis
Cellula
r com
pone
nt a
ssem
bly
Cell co
mm
unica
tion
Cell a
dhes
ion
Catab
olic p
roce
ss
Biolog
ical r
egula
tion
Biolog
ical a
dhes
ion
Alcoho
l met
aboli
c pro
cess
Trans
porte
r
Trans
cript
ion re
gulat
or
Binding
0
5
59
597
5971
0
3
33
331
3314
Num
ber of genes
Biological processMolecular function
Biological processMolecular function
TissueSpecificity (T)
Unmethylated genesMethylated genes
00>1010987654321>1010987654321
0.050.050.10
0.10 0.150.15 0.20
0.20 0.25
0.250.30
0.30
0.350.40
0.60.350.1
Fra
ctio
n
Fra
ctio
n
0
0.05
0.10
0.15
0.20
0.25
0.30
Fra
ctio
n
HighLowExpression (Ln intensity)Expression (Ln intensity)
dc e
genes showed significant enrichment difference (P < 0.05, χ2 test) compared with total analyzed genes. Annotations are grouped by molecular function or biological process based on the silkworm Bombyx mori GO annotation information (ftp://silkdb.org/pub/current/otherdata/Gene_ontology/silkworm_glean_gene.go). Gene numbers and percentages (on log scale) are listed for each category. (c,d) Expression in the anterior-mid silk gland (c) and posterior silk gland (d) of methylated and unmethylated genes examined by microarray analysis. (e) Tissue expression specificity of methylated and unmethylated genes measured by τ value27.
Figure 4 Annotation and microarray analysis of methylated and unmethylated genes. (a,b) Annotation of methylated (a) and unmethylated genes (b) with WEGO26. Of the 5,971 genes that have GO annotations, 2,333 methylated and 3,314 unmethylated

©20
10 N
atu
re A
mer
ica,
Inc.
All
rig
hts
res
erve
d.
nature biotechnology advance online publication �
l e t t e r s
transducers and transporters. Unmethylated genes are also enriched in functions associated with regulation and adhesion processes. We confirmed that methylated genes tend to be more highly expressed than unmethylated genes in the silk gland (Fig. 4b,c) by analyzing the relationship between gene body methylation and tissue expression specificity using the available microarray data from B. mori tissues on day three of the fifth-instar larvae (BmMDB: http://silkworm.swu.edu.cn/microarray/). We suspect that methylation may contribute to maintaining the relatively high expression of genes that are essential for biosynthetic processes in the silk gland. Furthermore, methyl-ated genes showed lower tissue specificity (Fig. 4d), which was also observed in Arabidopsis24.
In conclusion, we have generated the first, to our knowledge, single base–resolution methylome for an insect species. We found that MethylC-Seq has a considerable false-positive rate in detecting mCs in species with low methylation level. Thus, effective removal of these false positives is very important before any functional analysis. In this study, we used non-CG mCs as the background control in conjunction with a biological replicate strategy. Together, these controls identi-fied methylated CG sites that could be validated by low-throughput assays. This high-quality single-base DNA methylome map supports the functional significance of the rather low methylation in the silk-worm and indicates that the well-established functions of methylation on TEs, rDNAs and promoters in plants and mammals may not be well developed in insects. This DNA methylome map will be useful for further studies on epigenetic gene regulation in silkworm and other insects. Moreover, the active epigenetic system existing in the silkworm lays a foundation for exploring the contributions of epige-netics to silkworm domestication.
METHoDSMethods and any associated references are available in the online version of the paper at http://www.nature.com/naturebiotechnology/.
Accession codes. Sequence data is available under the GEO accession GSE18315 and the SRA accession SRP001159.
Note: Supplementary information is available on the Nature Biotechnology website.
ACKnoWLeDGMentSWe thank J. Ridley for English editing on the manuscript. This work was supported by a 973 Program grant (no. 2007CB815700), a key project of the National Natural Science Foundation of China (no. 90919056), the 100 Talents Program of Chinese Academy of Sciences, two Provincial Key Grants of the Department of Sciences and Technology of Yunnan Province (no. 2008CC017 and no. 2008GA002) and a Chinese Academy of Sciences–Max Planck Society Fellowship to W.W.; a National Natural Science Foundation of China grant (no. 30870296) and a China Postdoctoral Science Foundation grant to H.X.; the National Natural Science Foundation of China (no. 30725008), a Chinese 863 Program grant (no. 2006AA10A121), the Danish Platform for Integrative Biology, the Ole Rømer grant from the Danish Natural Science Research Council, and a Solexa Project grant (no. 272-07-0196) to J.W.; a 973 Program grant (no. 2005CB121000) to Q.X.; a Shanghai Science Foundation grant (no. 07DJ14074), two National Science Foundation grants (no. 90919024 and no. 30872963), two 973 Program grants (no. 2009CB825606 and no. 2009CB825607) and a European 6th program grant (no. LSHB-CT-2005-019067) to J.Z.
AUtHoR ContRIBUtIonSJ.W., W.W., J.Z. and Q.X. designed the study. H.X., W.W. and X.L. wrote the manuscript. X.L., G.Z., Q.C., Y.L. and R.L. developed the method for mapping and processing BS reads. D.L. and D.C., performed microarray analysis. F.D. and M.L. provided the domestic silkworm samples and detailed background information on silkworm domestication and breeding. H.X. and X.L. analyzed the 454 data. H.X.
did RT-PCR. Y.D. performed the methyltransferase assay. H.X., Y.L., Q.G. and J.J. extracted DNAs and RNAs. J.Z., H.Z., J.Y., J.S., X.Z., K.M., L.Z., Y.H., S.G. and Y.Z. constructed the BS-seq libraries and conducted the BS validation. G.G., X.Z., L.M., M.Y. and K.K. performed the Solexa sequencing. S.B. contributed to the interpretation of the results. All authors have read and contributed to the manuscript.
CoMPetInG FInAnCIAL InteReStSThe authors declare no competing financial interests.
Published online at http://www.nature.com/naturebiotechnology/. reprints and permissions information is available online at http://npg.nature.com/reprintsandpermissions/.
1. Lister, R. et al. Highly integrated single-base resolution maps of the epigenome in Arabidopsis. Cell 133, 523–536 (2008).
2. Lister, R. et al. Human DNA methylomes at base resolution show widespread epigenomic differences. Nature 462, 315–322 (2009).
3. Regev, A., Lamb, J.M. & Jablonka, E. The role of DNA methylation in invertebrates: developmental regulation or genome defense? Mol. Biol. Evol. 15, 880–891 (1998).
4. Phalke, S. et al. Retrotransposon silencing and telomere integrity in somatic cells of Drosophila depends on the cytosine-5 methyltransferase DNMT2. Nat. Genet. 41, 696–702 (2009).
5. Field, L.M. Methylation and expression of amplified esterase genes in the aphid Myzus persicae (Sulzer). Biochem. J. 349, 863–868 (2000).
6. Wang, Y. et al. Functional CpG methylation system in a social insect. Science 314, 645–647 (2006).
7. Patel, C.V. & Gopinathan, K.P. Determination of trace amounts of 5-methylcytosine in DNA by reverse-phase high-performance liquid chromatography. Anal. Biochem. 164, 164–169 (1987).
8. Xiang, Z. Genetics and Breeding of the Silkworm (Chinese Agriculture Press, Beijing, P.R. China, 1995).
9. Kalisz, S. & Purugganan, M.D. Epialleles via DNA methylation: consequences for plant evolution. Trends Ecol. Evol. 19, 309–314 (2004).
10. Farcas, R. et al. Differences in DNA methylation patterns and expression of the CCRK gene in human and nonhuman primate cortices. Mol. Biol. Evol. 26, 1379–1389 (2009).
11. Schaefer, M. & Lyko, F. DNA methylation with a sting: an active DNA methylation system in the honeybee. Bioessays 29, 208–211 (2007).
12. Uno, T. et al. Expression, purification and characterization of methyl DNA binding protein from Bombyx mori. J. Insect Sci. 5, 8 (2005).
13. Xia, Q. et al. A draft sequence for the genome of the domesticated silkworm (Bombyx mori). Science 306, 1937–1940 (2004).
14. Suzuki, M.M. & Bird, A. DNA methylation landscapes: provocative insights from epigenomics. Nat. Rev. Genet. 9, 465–476 (2008).
15. Mandrioli, M. & Borsatti, F. DNA methylation of fly genes and transposons. Cell. Mol. Life Sci. 63, 1933–1936 (2006).
16. Cokus, S.J. et al. Shotgun bisulphite sequencing of the Arabidopsis genome reveals DNA methylation patterning. Nature 452, 215–219 (2008).
17. Zhang, X. The epigenetic landscape of plants. Science 320, 489–492 (2008).18. Zilberman, D., Gehring, M., Tran, R.K., Ballinger, T. & Henikoff, S. Genome-wide
analysis of Arabidopsis thaliana DNA methylation uncovers an interdependence between methylation and transcription. Nat. Genet. 39, 61–69 (2007).
19. Lawrence, R.J. & Pikaard, C.S. Chromatin turn ons and turn offs of ribosomal RNA genes. Cell Cycle 3, 880–883 (2004).
20. Mandrioli, M. & Borsatti, F. Analysis of heterochromatic epigenetic markers in the holocentric chromosomes of the aphid Acyrthosiphon pisum. Chromosome Res. 15, 1015–1022 (2007).
21. Elango, N., Kim, S.H., Vigoda, E. & Yi, S.V. Mutations of different molecular origins exhibit contrasting patterns of regional substitution rate variation. PLOS Comput. Biol. 4, e1000015 (2008).
22. Elango, N., Hunt, B.G., Goodisman, M.A. & Yi, S.V. DNA methylation is widespread and associated with differential gene expression in castes of the honeybee, Apis mellifera. Proc. Natl. Acad. Sci. USA 106, 11206–11211 (2009).
23. Suzuki, M.M., Kerr, A.R., De Sousa, D. & Bird, A. CpG methylation is targeted to transcription units in an invertebrate genome. Genome Res. 17, 625–631 (2007).
24. Zhang, X. et al. Genome-wide high-resolution mapping and functional analysis of DNA methylation in Arabidopsis. Cell 126, 1189–1201 (2006).
25. Weber, M. et al. Distribution, silencing potential and evolutionary impact of promoter DNA methylation in the human genome. Nat. Genet. 39, 457–466 (2007).
26. Ye, J. et al. WEGO: a web tool for plotting GO annotations. Nucleic Acids Res. 34, W293–297 (2006).
27. Liao, B.Y. & Zhang, J. Low rates of expression profile divergence in highly expressed genes and tissue-specific genes during mammalian evolution. Mol. Biol. Evol. 23, 1119–1128 (2006).

©20
10 N
atu
re A
mer
ica,
Inc.
All
rig
hts
res
erve
d.
nature biotechnology doi:10.1038/nbt.1626
oNLINE METHoDSExpression of Dnmt1 and Dnmt2 genes evaluated by RT-PCR. Total RNAs were extracted from different developmental stages (8-h-old, 3-day-old, 7-day-old and 10-day-old eggs; 1st- to 4th-instar larvae; young and old pupae; adults of the silkworms), as well as from different tissues including heads, cuticle, silk glands, guts, ovaries, and testis from the 5th-instar larvae of silkworms, using Trizol (Invitrogen). Total RNA was digested with DNase I (Takara) to remove remaining DNA. Complementary DNA (cDNA) was synthesized using the RevertAid First Strand cDNA Synthesis Kits (Fermentas). Expression of Dnmt1 and Dnmt2 genes was evaluated by RT-PCR using primers listed in Supplementary Table 4 with 30 cycles (30 min at 94 °C, 30 min at 54 °C and 30 min at 72 °C) for cDNA templates derived from materials of different devel-opmental stages, and 34 cycles (30 min at 94 °C, 30 min at 54 °C and 30 min at 72 °C) for cDNA templates derived from different tissues, respectively.
Nuclear protein extraction and assay of DNA methyltransferase activity. About 150 mg of silkworm eggs or one silk gland from one silkworm indi-vidual were ground into powder in liquid nitrogen and homogenized in 150 µl tissue homogenization buffer (10 mmol HEPES-KOH (pH 7.6), 25 mmol KCl, 0.15 mmol spermine, 0.5 mmol spermidine, 2 mol sucrose, 10% (v/v) glycerol,1 mmol EDTA). Homogenate was held on ice for 30 min and then centrifuged at 3000g for 15 min at 4 °C to obtain the protein precipi-tate. The protein precipitate was resuspended in 650 µl resuspension buffer (5 mmol HEPES-KOH (pH 7.9), 0.5 mmol phenylmethylsulfonyl fluoride, 26% (v/v) glycerol, 0.5 mmol dithiothreitol, 1.5 mmol MgCl2) and then centrifuged at 14,000g for 45 min at 4 °C to obtain soluble proteins. Protein concentration was determined by the Bio-Rad Protein Assay kit (Bio-Rad). Three independ-ent replicate protein samples were prepared for each material.
About 15 µg nuclear protein extracts from either eggs or silk gland and equal amount of the negative control (bovine serum albumin) were respec-tively analyzed for DNA methyltransferase activity using the EpiQuik DNA Methyltransferase Activity/Inhibition Assay Kit (Epigentek) following the manufacturer’s instructions. Pure mouse DNMT1 in the kit was used as the positive control. Methyltransferases activity is indicated by the average absorb-ance at 450 nm (OD450).
Sample preparation for MethylC-Seq and digital gene expression analy-ses. Each silk gland of 5th-instar larvae of two individuals (called biological replicate 1 and 2, respectively) of the silkworm (B. mori) strain Dazao was ground into powder in liquid nitrogen. Half of the powder from each silk gland was used to extract total DNAs using DNeasy Blood and Tissue Kit (Qiagen), and the other half was used to extract total RNAs using RNeasy Mini Kit (Qiagen).
MethylC-Seq library construction and sequencing. DNA was fragmented by sonication with a Sonicator (Sonics & Materials) to a mean size of approxi-mately 250 bp, followed by blunt ending, 3′-end addition of dA, and adapter ligation, in which Illumina methylated adapters were used according to the manufacturer’s instructions (Illumina). The bisulfite conversion of silkworm DNA was carried out using a modified NH4SO4-based protocol28 and ampli-fied by 12 cycles of PCR. Ultra-high-throughput pair-end sequencing was car-ried out using the Illumina Genetic Analyzer (GA2) according to manufacturer instructions. Raw GA sequencing data were processed by Illumina base-calling pipeline (SolexaPipeline-1.0).
Digital gene expression (DGE) tag libraries and sequencing. DGE tag librar-ies were constructed using the silk gland RNAs and the DGE-Tag Profiling NlaIII Sample Prep Kit (Illumina). Libraries were sequenced using the Illumina Genetic Analyzer (GA2) according to the manufacturer’s instruc-tion. Raw GA sequencing data were processed by Illumina base-calling pipeline (SolexaPipeline-1.0).
Mapping and initial processing of MethylC-Seq reads. Short reads with 44-nucleotide (nt) reads or 75-nt reads from each end generated by Illumina sequencing were aligned to the Dazao reference genome. B. mori (Dazao) reference genome sequences were downloaded from the SilkDB (ftp://silkdb.org/pub/current/Genome/silkworm_genome_v2.0.fa.tar.gz).
Because DNA methylation has strand specificity, the plus strand and the minus strand of the Dazao genome should be separated and formed align-ment target sequences. That is, each cytosine in genome sequences was converted to thymine, termed T-genome, which represents the plus strand. Meanwhile, each guanine in genome sequences was converted to adeno-sine, termed A-genome, which represents the minus strand. In addition, the original reads were also computationally transformed to the alignment forms with the following steps: (i) observed cytosines on the forward read of each read pair were in silico replaced by thymines; (ii) observed guanines on the reverse read of each read pair were in silico replaced by adenosines.
We used the software named SOAPaligner29, allowing up to two mismatches for mapping both 44-nt pair-end reads (for the biological replicate 1) and up to four mismatches for 75-nt pair-end reads (for the biological replicate 2) to map the computationally transformed reads to the alignment target sequences. Multiple reads mapped to the same start position were regarded as clonal duplication, which might be generated during PCR process, and only one of them was kept. For mC detection, we transformed each aligned read and the two strands of the Dazao genome back to their original forms to build an alignment between the original forms. Cytosines in the MethylC-seq reads that are also matched to the corresponding cytosines in the plus (Watson) strand, or otherwise guanines in the MethylC-seq reads that are also matched to the corresponding guanines in the minus (Crick) strand will be regarded as potential mCs. Q score, which is used in base-calling pipeline (SolexaPipeline-1.0) (Illumina) to detect sequences from the raw fluorescent images, is calculated as:
Q = 10 log [ (X) / (1- (X)]10 p p
where p(X) is the probability that a read is correctly called. We then carried out a filtering process to filter out all potential mCs with Q scores smaller than 20, guaranteeing that a base is correctly called at more than 99% probability, highly conservative for calling reliable bases.
Bisulfite-PCR validation for target regions using either Sanger sequencing or 454 sequencing. One microgram of genomic DNA from the silk gland of biological replicate 1 was bisulfite-converted following the same protocol for constructing the MethylC-Seq library. Primers were designed to amplify a batch of target regions of the bisulfite-converted DNA for validation of the MethylC-Seq results. Initially, we validated five target regions contain-ing 26 mCGs detected by MethylC-Seq and three target regions containing one mCHG and 98 clustered mCHHs detected by MethylC-Seq by Sanger sequencing multiple independent TA clones for each PCR product. Then we further used 454 sequencing technique (454 Life Sciences) to confirm 107 PCR products in total (692 mCGs, 29 mCHGs and 63 mCHHs). We pooled PCR products of these fragments, and the 454 sequencing library was constructed according to the manufacturer’s instruction (454 Life Sciences). Eventually we obtained sequencing data on 6,698,205 bp. BLAST searches (e-value <1e10–3) against the original target sequence database were performed to map the raw reads. Matched sequences with length ≥30 bp were used for further calculation of methylation level at each single cytosine site. All the primers were listed in Supplementary Table 4.
mC identification and removal of background noises. All of the tested mCHGs and mCHHs initially detected by MethylC-Seq are proved to be false positive by bisulfite-PCR validation, indicating that non-CG mCs are either very rare or all false positive (Supplementary Table 2). Therefore, we first checked the mCs detected by initial MethylC-Seq of each biological replicate. If the next base of mC at a non-CG site in the read is actually G, it should be a false-positive non-CG methylation but a possible CG methylation due to polymorphism in different individuals. However, to be conservative we uniformly exclude these potential single-nucleotide polymorphism-caused mCs. We then used the methylation rate at non-CG sites of the whole genome as the background noise control, which provides a measure for the false-positive rate (sum of the nonconversion rate and thymidine-to-cytosine sequencing errors):
False-positiverate = ( + ) / 100%mCHG mCHH depthn n n ×

©20
10 N
atu
re A
mer
ica,
Inc.
All
rig
hts
res
erve
d.
nature biotechnologydoi:10.1038/nbt.1626
Where nmCHG and nmCHH refer to the total number of sequenced Cs in the CHG and CHH contexts in the reference genome, respectively. ndepth refers to the total sequenced depth at cytosine positions in CHG and CHH contexts in the reference genome. Using this value as a measure of the false mC discovery rate, following the correction algorithm of Lister et al.2, we set a significance threshold (99% confidence) to identify the presence of an mC determined at each base position based on the binomial probability distribution, read depth and the calculated false-positive rate. mCs that are below the minimum threshold at a site were rejected.
Despite these filtrations, the non-CG methylation noises still occupied a considerable proportion, because a proportion of non-CG mCs appeared in high methylation levels in the original MethylC-Seq data. Because our bisulfite-PCR validation showed that even high-methylation-level mCs are false positive, to effectively remove these noises we decided to use a strategy of biological replicates and thus compared the mCs independently identified in both replicates and found that a large proportion of the mCGs are consist-ently detected in both replicates, whereas mCs in non-CG contexts are nearly replicate-specific (Supplementary Fig. 1), further confirming that non-CG mCs are either all false positive or very rare, whereas mCGs are largely real in the silkworm. In this way we effectively removed background noises and finally generated a methylome map with high reliability and high resolution (on average each cytosine in the genome is covered by 15 reads).
Mapping and processing DGE tags. Sequence information of the Bombyx mori genes was downloaded from the SilkDB (ftp://silkdb.org/pub/current/Gene/Glean_genes/silkworm_glean_cds.fa.tar.gz). Gene annotation infor-mation was downloaded from the SilkDB (ftp://silkdb.org/pub/current/Gff/ silkworm_glean.gff.tar.gz). Because annotated genes were mainly predicted using prediction software, only open reading frame positions were available. We created putative full-length cDNA sequences for each gene by adding 1-kb downstream sequences of open reading frame to coding sequences. Then all possible CATG + 17 nt tag sequences were created from putative full-length cDNAs and used as a reference tag database. Unique tag sequences and their numbers were extracted from our raw DGE tags, and these tags were aligned against the reference tag database using SOAP30. Only perfect matches were kept for further analysis, and no mismatches were allowed. Expression level of one gene was represented by the total number of tags that uniquely aligned to this gene.
Analyses on abundance of TEs and genomic loci of smRNAs. Annotation of known TEs was downloaded from the SilkDB (ftp://silkdb.org/pub/ current/Gff/Public_ReAS_TEs/silkworm_Publicknow_TE.gff.tar.gz). The smRNA sequences were downloaded from the GenBank (http://www.ncbi.nlm.nih.gov/geo/query/acc.cgi?acc=GSE17965). Sequences of smRNAs were mapped to the reference genome using SOAP30 without mismatch, and uniquely mapped smRNAs were used for further analysis. TE and smRNA densities were defined as the ratios of number of bases that belong to TEs or smRNAs divided by the total length of the calculated regions.
Gene ontology (GO) annotation. GO annotations of silkworm genes were downloaded from the SilkDB (ftp://silkdb.org/pub/current/otherdata/Gene_ontology/silkworm_glean_gene.go). GO comparative analyses between inter-ested gene groups were performed using BGI WEGO (http://wego.genomics.org.cn/cgi-bin/wego/index.pl)26.
Microarray analysis. The microarray data of the analyzed genes were obtained from the B. mori microarray database (BmMDB: http://silkworm.swu.edu.cn/microarray/). Tissue specificity index τ27 is used to measure the tissue specificity of a silkworm gene, which is defined as:
τHj
nHH
H
H
S i j
S i
n=
−
−=∑ (
log ( , )
log ( ,max))1
1
1
2
2
where nH is the number of female silkworm tissues examined and SH (i, max) is the highest expression signal of gene i across the nH tissues. To minimize the influence of noise from low intensity, we arbitrarily let SH (i, j) be 100 if it is lower than 100. The τ value ranges from 0 to 1, with higher values indicating higher tissue specificity. Genes with the highest expression signal of a certain tissue were considered as expressionally upregulated in this tissue.
28. Hayatsu, H., Tsuji, K. & Negishi, K. Does urea promote the bisulfite-mediated deamination of cytosine in DNA? Investigation aiming at speeding-up the procedure for DNA methylation analysis. Nucleic Acids Symp. Ser. 50, 69–70 (2006).
29. Li, R. et al. SOAP2: an improved ultrafast tool for short read alignment. Bioinformatics 25, 1966–1967 (2009).
30. Li, R., Li, Y., Kristiansen, K. & Wang, J. SOAP: short oligonucleotide alignment program. Bioinformatics 24, 713–714 (2008).