ERRATUM.: "ArcGIS-SWAT: A Geodata Model and GIS Interface for SWAP
Upload
independentCategory
view
1download
0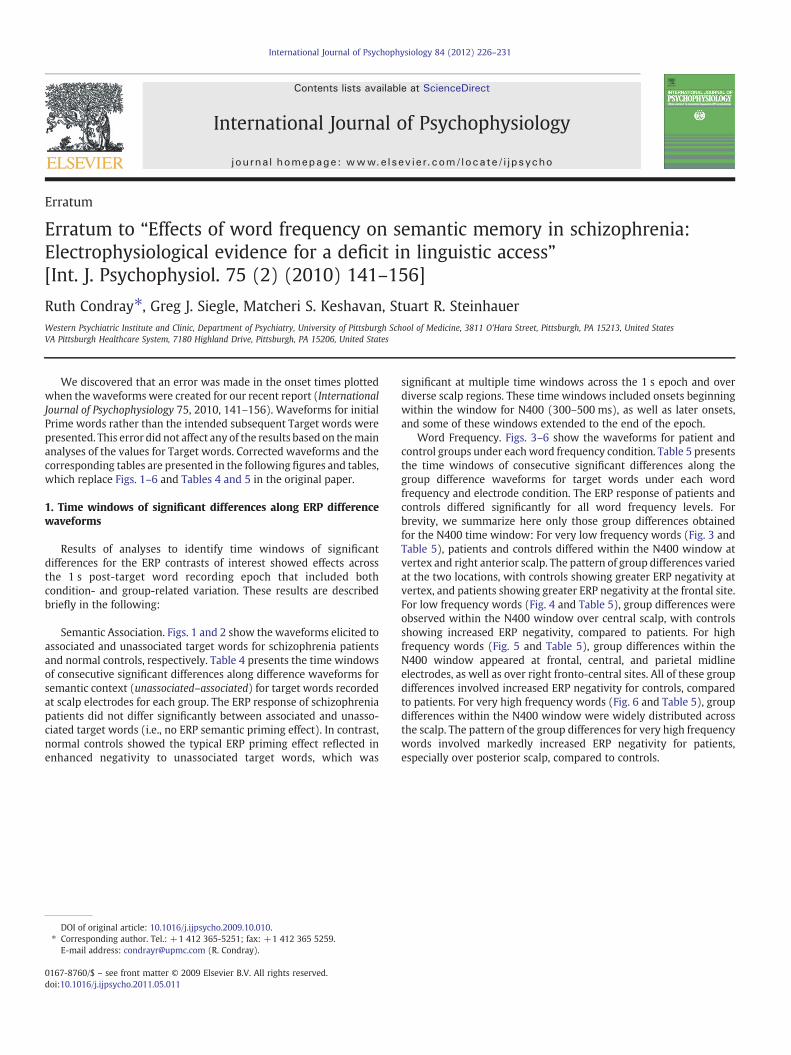
International Journal of Psychophysiology 84 (2012) 226–231
Contents lists available at ScienceDirect
International Journal of Psychophysiology
j ourna l homepage: www.e lsev ie r.com/ locate / i jpsycho
Erratum
Erratum to “Effects of word frequency on semantic memory in schizophrenia:Electrophysiological evidence for a deficit in linguistic access”[Int. J. Psychophysiol. 75 (2) (2010) 141–156]
Ruth Condray⁎, Greg J. Siegle, Matcheri S. Keshavan, Stuart R. SteinhauerWestern Psychiatric Institute and Clinic, Department of Psychiatry, University of Pittsburgh School of Medicine, 3811 O'Hara Street, Pittsburgh, PA 15213, United StatesVA Pittsburgh Healthcare System, 7180 Highland Drive, Pittsburgh, PA 15206, United States
We discovered that an error was made in the onset times plotted significant at multiple time windows across the 1 s epoch and over
when the waveformswere created for our recent report (InternationalJournal of Psychophysiology 75, 2010, 141–156). Waveforms for initialPrime words rather than the intended subsequent Target words werepresented. This error did not affect any of the results based on themainanalyses of the values for Target words. Corrected waveforms and thecorresponding tables are presented in the following figures and tables,which replace Figs. 1–6 and Tables 4 and 5 in the original paper.1. Time windows of significant differences along ERP differencewaveforms
Results of analyses to identify time windows of significantdifferences for the ERP contrasts of interest showed effects acrossthe 1 s post-target word recording epoch that included bothcondition- and group-related variation. These results are describedbriefly in the following:
Semantic Association. Figs. 1 and 2 show the waveforms elicited toassociated and unassociated target words for schizophrenia patientsand normal controls, respectively. Table 4 presents the time windowsof consecutive significant differences along difference waveforms forsemantic context (unassociated–associated) for target words recordedat scalp electrodes for each group. The ERP response of schizophreniapatients did not differ significantly between associated and unasso-ciated target words (i.e., no ERP semantic priming effect). In contrast,normal controls showed the typical ERP priming effect reflected inenhanced negativity to unassociated target words, which was
DOI of original article: 10.1016/j.ijpsycho.2009.10.010.⁎ Corresponding author. Tel.: +1 412 365-5251; fax: +1 412 365 5259.
E-mail address: [email protected] (R. Condray).
0167-8760/$ – see front matter © 2009 Elsevier B.V. All rights reserved.doi:10.1016/j.ijpsycho.2011.05.011
diverse scalp regions. These time windows included onsets beginningwithin the window for N400 (300–500 ms), as well as later onsets,and some of these windows extended to the end of the epoch.
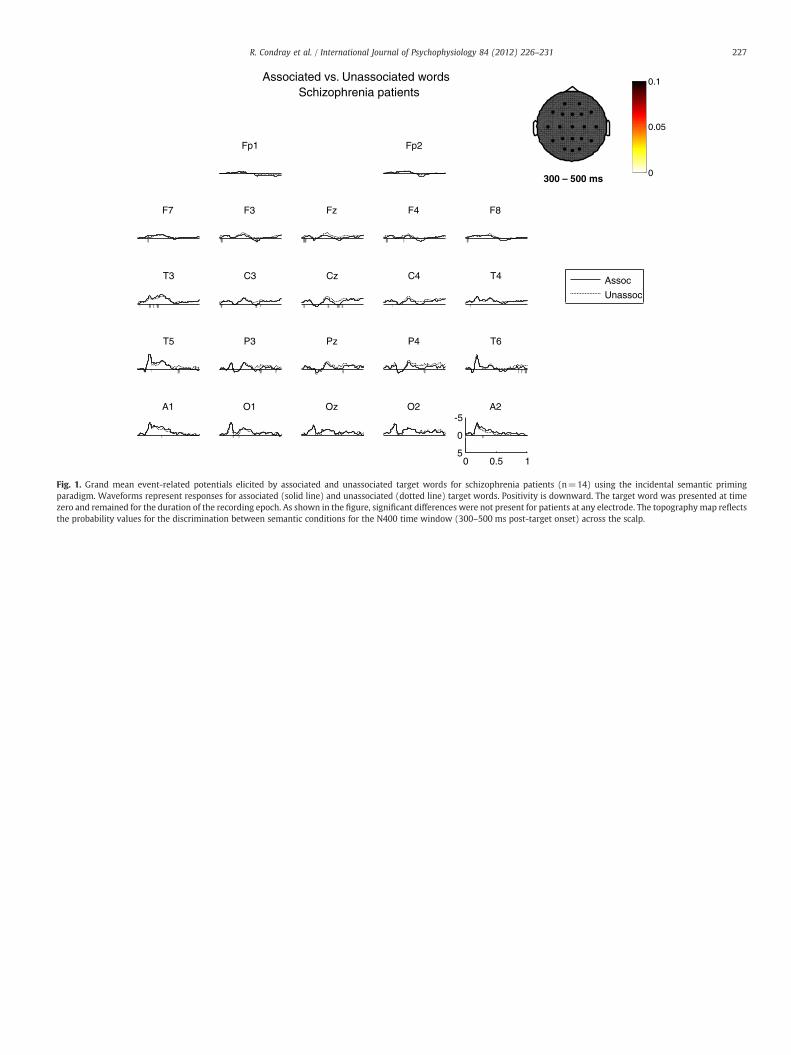
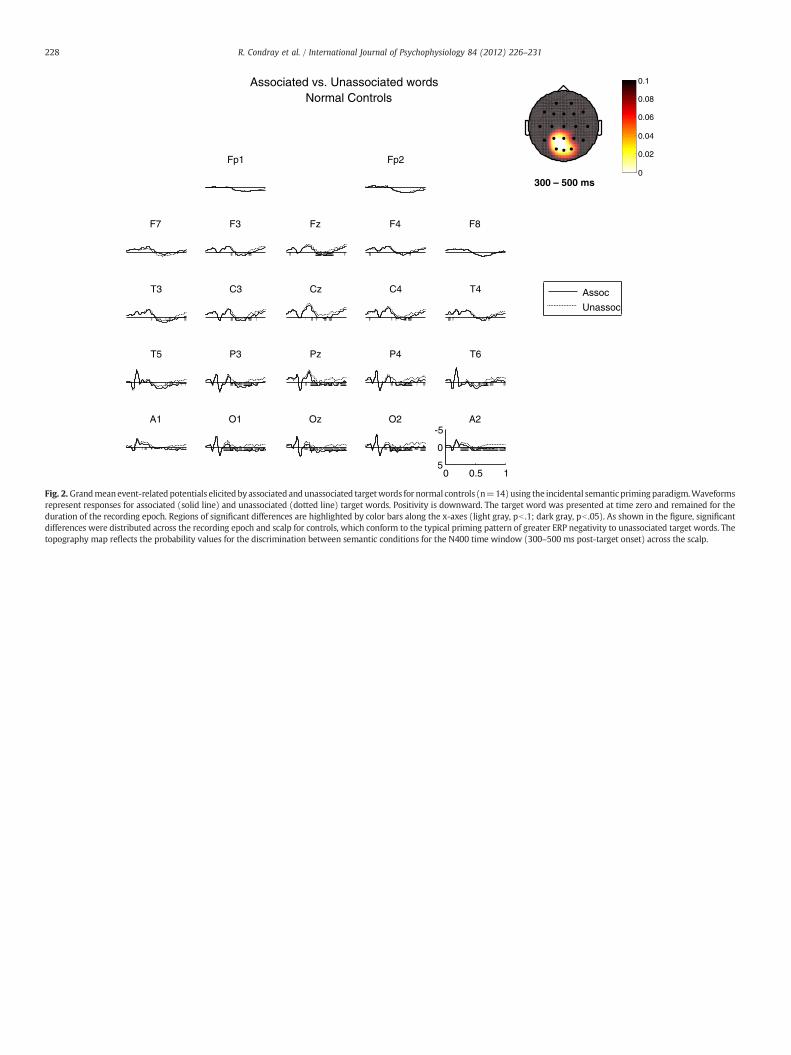
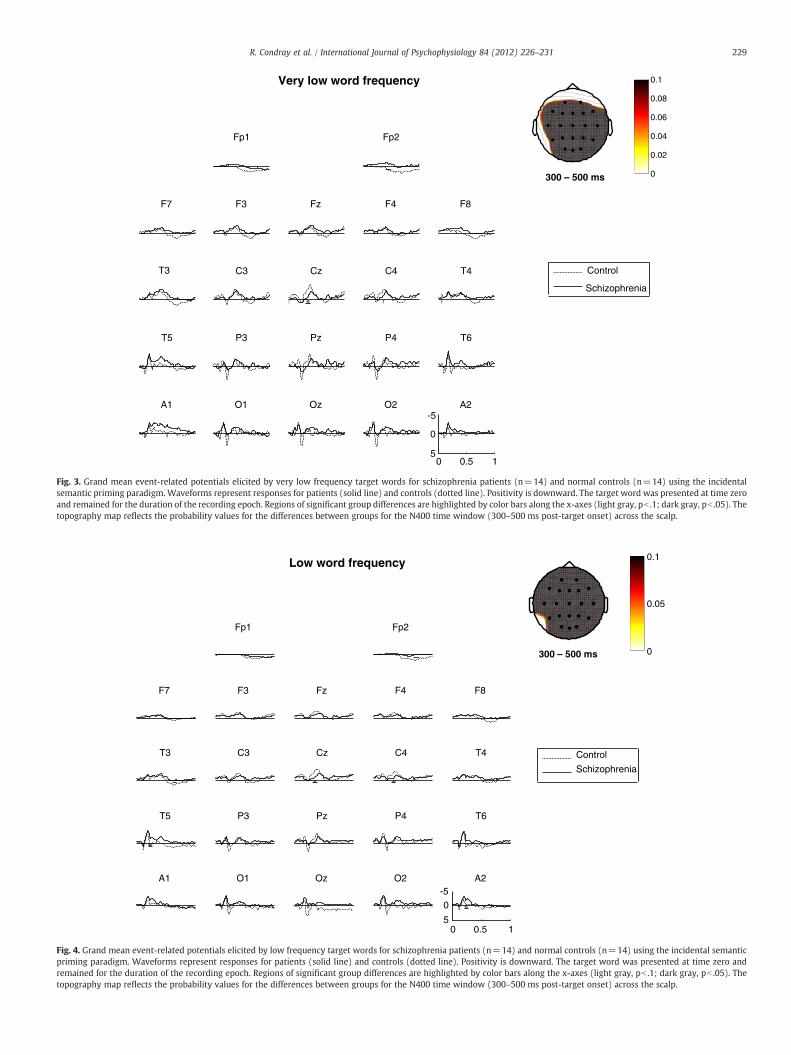
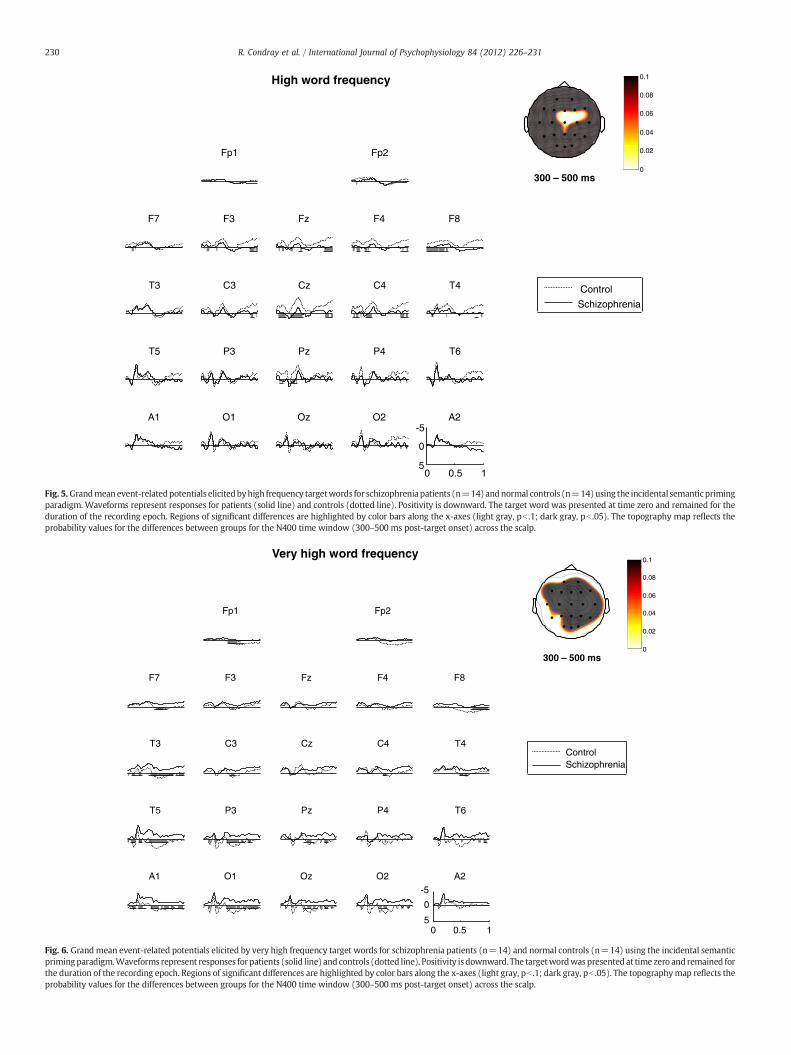
Word Frequency. Figs. 3–6 show the waveforms for patient andcontrol groups under eachword frequency condition. Table 5 presentsthe time windows of consecutive significant differences along thegroup difference waveforms for target words under each wordfrequency and electrode condition. The ERP response of patients andcontrols differed significantly for all word frequency levels. Forbrevity, we summarize here only those group differences obtainedfor the N400 time window: For very low frequency words (Fig. 3 andTable 5), patients and controls differed within the N400 window atvertex and right anterior scalp. The pattern of group differences variedat the two locations, with controls showing greater ERP negativity atvertex, and patients showing greater ERP negativity at the frontal site.For low frequency words (Fig. 4 and Table 5), group differences wereobserved within the N400 window over central scalp, with controlsshowing increased ERP negativity, compared to patients. For highfrequency words (Fig. 5 and Table 5), group differences within theN400 window appeared at frontal, central, and parietal midlineelectrodes, as well as over right fronto-central sites. All of these groupdifferences involved increased ERP negativity for controls, comparedto patients. For very high frequency words (Fig. 6 and Table 5), groupdifferences within the N400 window were widely distributed acrossthe scalp. The pattern of the group differences for very high frequencywords involved markedly increased ERP negativity for patients,especially over posterior scalp, compared to controls.
Associated vs. Unassociated words Schizophrenia patients
0
0.05
0.1
Fz
Cz
Pz
Oz
Fp1
F3F7
C3
P3
T3
T5
O1
Fp2
F4 F8
C4
P4
T4
T6
O2A1
0 0.5 1
-5
0
5
A2
Assoc
Unassoc
300 – 500 ms
Fig. 1. Grand mean event-related potentials elicited by associated and unassociated target words for schizophrenia patients (n=14) using the incidental semantic primingparadigm. Waveforms represent responses for associated (solid line) and unassociated (dotted line) target words. Positivity is downward. The target word was presented at timezero and remained for the duration of the recording epoch. As shown in the figure, significant differences were not present for patients at any electrode. The topography map reflectsthe probability values for the discrimination between semantic conditions for the N400 time window (300–500 ms post-target onset) across the scalp.
227R. Condray et al. / International Journal of Psychophysiology 84 (2012) 226–231
Associated vs. Unassociated words Normal Controls
0
0.02
0.04
0.06
0.08
0.1
Fz
Cz
Pz
Oz
Fp1
F3F7
C3
P3
T3
T5
O1
Fp2
F4 F8
C4
P4
T4
T6
O2A1
0 0.5 1
-5
0
5
A2
Assoc
Unassoc
300 – 500 ms
Fig. 2. Grandmeanevent-related potentials elicitedby associated andunassociated targetwords for normal controls (n=14)using the incidental semantic priming paradigm.Waveformsrepresent responses for associated (solid line) and unassociated (dotted line) target words. Positivity is downward. The target word was presented at time zero and remained for theduration of the recording epoch. Regions of significant differences are highlighted by color bars along the x-axes (light gray, pb .1; dark gray, pb .05). As shown in the figure, significantdifferences were distributed across the recording epoch and scalp for controls, which conform to the typical priming pattern of greater ERP negativity to unassociated target words. Thetopography map reflects the probability values for the discrimination between semantic conditions for the N400 time window (300–500 ms post-target onset) across the scalp.
228 R. Condray et al. / International Journal of Psychophysiology 84 (2012) 226–231
Low word frequency
0
0.05
0.1
Fz
Cz
Pz
Oz
Fp1
F3F7
C3
P3
T3
T5
O1
Fp2
F4 F8
C4
P4
T4
T6
O2A1
0 0.5 1
-5
0
5
A2
Control
Schizophrenia
300 – 500 ms
Fig. 4. Grand mean event-related potentials elicited by low frequency target words for schizophrenia patients (n=14) and normal controls (n=14) using the incidental semanticpriming paradigm. Waveforms represent responses for patients (solid line) and controls (dotted line). Positivity is downward. The target word was presented at time zero andremained for the duration of the recording epoch. Regions of significant group differences are highlighted by color bars along the x-axes (light gray, pb .1; dark gray, pb .05). Thetopography map reflects the probability values for the differences between groups for the N400 time window (300–500 ms post-target onset) across the scalp.
Very low word frequency
0
0.02
0.04
0.06
0.08
0.1
Fz
Cz
Pz
Oz
Fp1
F3F7
C3
P3
T3
T5
O1
Fp2
F4 F8
C4
P4
T4
T6
O2A1
0 0.5 1
-5
0
5
A2
Control
Schizophrenia
300 – 500 ms
Fig. 3. Grand mean event-related potentials elicited by very low frequency target words for schizophrenia patients (n=14) and normal controls (n=14) using the incidentalsemantic priming paradigm. Waveforms represent responses for patients (solid line) and controls (dotted line). Positivity is downward. The target word was presented at time zeroand remained for the duration of the recording epoch. Regions of significant group differences are highlighted by color bars along the x-axes (light gray, pb .1; dark gray, pb .05). Thetopography map reflects the probability values for the differences between groups for the N400 time window (300–500 ms post-target onset) across the scalp.
229R. Condray et al. / International Journal of Psychophysiology 84 (2012) 226–231
0
0.02
0.04
0.06
0.08
0.1High word frequency
300 – 500 ms
Fz
Cz
Pz
Oz
Fp1
F3F7
C3
P3
T3
T5
O1
Fp2
F4 F8
C4
P4
T4
T6
O2A1
0 0.5 1
-5
0
5
A2
Control
Schizophrenia
Fig. 5.Grandmeanevent-relatedpotentials elicitedbyhigh frequency targetwords for schizophreniapatients (n=14) andnormal controls (n=14)using the incidental semanticprimingparadigm. Waveforms represent responses for patients (solid line) and controls (dotted line). Positivity is downward. The target word was presented at time zero and remained for theduration of the recording epoch. Regions of significant differences are highlighted by color bars along the x-axes (light gray, pb .1; dark gray, pb .05). The topography map reflects theprobability values for the differences between groups for the N400 time window (300–500 ms post-target onset) across the scalp.
Very high word frequency
0
0.02
0.04
0.06
0.08
0.1
300 – 500 ms
Fz
Cz
Pz
Oz
Fp1
F3F7
C3
P3
T3
T5
O1
Fp2
F4 F8
C4
P4
T4
T6
O2A1
0 0.5 1
-5
0
5
A2
ControlSchizophrenia
Fig. 6. Grand mean event-related potentials elicited by very high frequency target words for schizophrenia patients (n=14) and normal controls (n=14) using the incidental semanticprimingparadigm.Waveforms represent responses forpatients (solid line) and controls (dotted line). Positivity is downward. The targetwordwaspresented at time zero and remained forthe duration of the recording epoch. Regions of significant differences are highlighted by color bars along the x-axes (light gray, pb .1; dark gray, pb .05). The topographymap reflects theprobability values for the differences between groups for the N400 time window (300–500 ms post-target onset) across the scalp.
230 R. Condray et al. / International Journal of Psychophysiology 84 (2012) 226–231
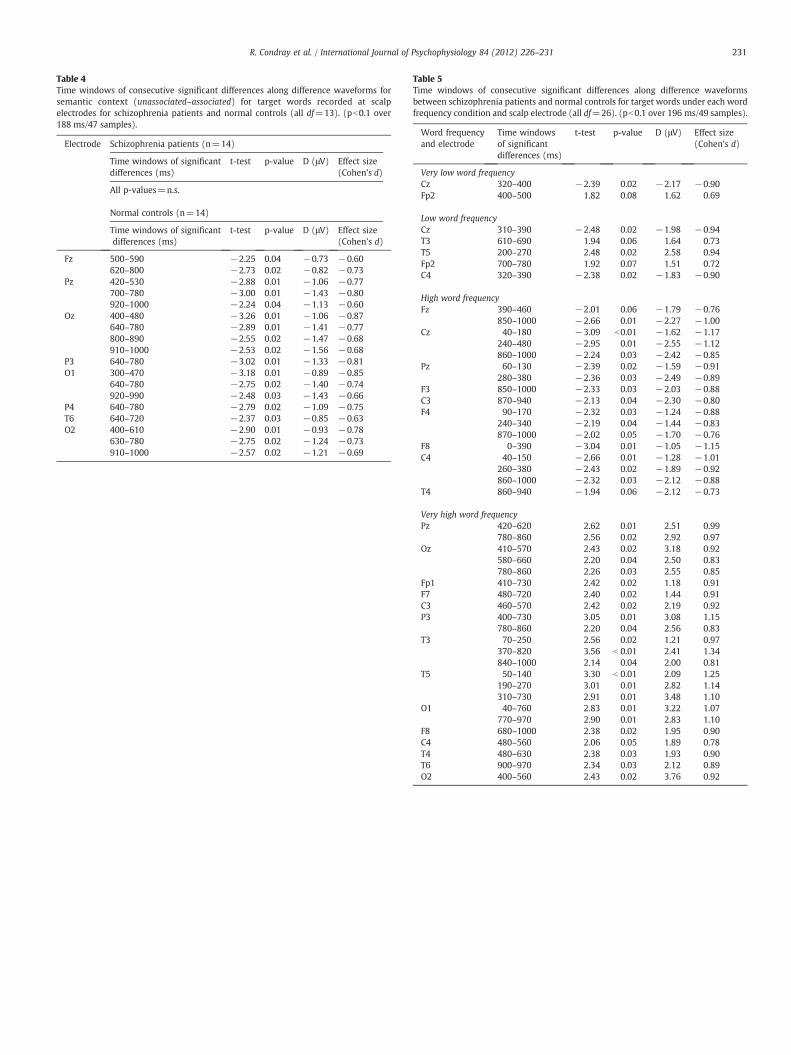
Table 4Time windows of consecutive significant differences along difference waveforms forsemantic context (unassociated–associated) for target words recorded at scalpelectrodes for schizophrenia patients and normal controls (all df=13). (pb0.1 over188 ms/47 samples).
Electrode Schizophrenia patients (n=14)
Time windows of significantdifferences (ms)
t-test p-value D (μV) Effect size(Cohen's d)
All p-values=n.s.
Normal controls (n=14)
Time windows of significantdifferences (ms)
t-test p-value D (μV) Effect size(Cohen's d)
Fz 500–590 −2.25 0.04 −0.73 −0.60620–800 −2.73 0.02 −0.82 −0.73
Pz 420–530 −2.88 0.01 −1.06 −0.77700–780 −3.00 0.01 −1.43 −0.80920–1000 −2.24 0.04 −1.13 −0.60
Oz 400–480 −3.26 0.01 −1.06 −0.87640–780 −2.89 0.01 −1.41 −0.77800–890 −2.55 0.02 −1.47 −0.68910–1000 −2.53 0.02 −1.56 −0.68
P3 640–780 −3.02 0.01 −1.33 −0.81O1 300–470 −3.18 0.01 −0.89 −0.85
640–780 −2.75 0.02 −1.40 −0.74920–990 −2.48 0.03 −1.43 −0.66
P4 640–780 −2.79 0.02 −1.09 −0.75T6 640–720 −2.37 0.03 −0.85 −0.63O2 400–610 −2.90 0.01 −0.93 −0.78
630–780 −2.75 0.02 −1.24 −0.73910–1000 −2.57 0.02 −1.21 −0.69
Table 5Time windows of consecutive significant differences along difference waveformsbetween schizophrenia patients and normal controls for target words under each wordfrequency condition and scalp electrode (all df=26). (pb0.1 over 196 ms/49 samples).
Word frequencyand electrode
Time windowsof significantdifferences (ms)
t-test p-value D (μV) Effect size(Cohen's d)
Very low word frequencyCz 320–400 −2.39 0.02 −2.17 −0.90Fp2 400–500 1.82 0.08 1.62 0.69
Low word frequencyCz 310–390 −2.48 0.02 −1.98 −0.94T3 610–690 1.94 0.06 1.64 0.73T5 200–270 2.48 0.02 2.58 0.94Fp2 700–780 1.92 0.07 1.51 0.72C4 320–390 −2.38 0.02 −1.83 −0.90
High word frequencyFz 390–460 −2.01 0.06 −1.79 −0.76
850–1000 −2.66 0.01 −2.27 −1.00Cz 40–180 −3.09 b0.01 −1.62 −1.17
240–480 −2.95 0.01 −2.55 −1.12860–1000 −2.24 0.03 −2.42 −0.85
Pz 60–130 −2.39 0.02 −1.59 −0.91280–380 −2.36 0.03 −2.49 −0.89
F3 850–1000 −2.33 0.03 −2.03 −0.88C3 870–940 −2.13 0.04 −2.30 −0.80F4 90–170 −2.32 0.03 −1.24 −0.88
240–340 −2.19 0.04 −1.44 −0.83870–1000 −2.02 0.05 −1.70 −0.76
F8 0–390 −3.04 0.01 −1.05 −1.15C4 40–150 −2.66 0.01 −1.28 −1.01
260–380 −2.43 0.02 −1.89 −0.92860–1000 −2.32 0.03 −2.12 −0.88
T4 860–940 −1.94 0.06 −2.12 −0.73
Very high word frequencyPz 420–620 2.62 0.01 2.51 0.99
780–860 2.56 0.02 2.92 0.97Oz 410–570 2.43 0.02 3.18 0.92
580–660 2.20 0.04 2.50 0.83780–860 2.26 0.03 2.55 0.85
Fp1 410–730 2.42 0.02 1.18 0.91F7 480–720 2.40 0.02 1.44 0.91C3 460–570 2.42 0.02 2.19 0.92P3 400–730 3.05 0.01 3.08 1.15
780–860 2.20 0.04 2.56 0.83T3 70–250 2.56 0.02 1.21 0.97
370–820 3.56 b 0.01 2.41 1.34840–1000 2.14 0.04 2.00 0.81
T5 50–140 3.30 b 0.01 2.09 1.25190–270 3.01 0.01 2.82 1.14310–730 2.91 0.01 3.48 1.10
O1 40–760 2.83 0.01 3.22 1.07770–970 2.90 0.01 2.83 1.10
F8 680–1000 2.38 0.02 1.95 0.90C4 480–560 2.06 0.05 1.89 0.78T4 480–630 2.38 0.03 1.93 0.90T6 900–970 2.34 0.03 2.12 0.89O2 400–560 2.43 0.02 3.76 0.92
231R. Condray et al. / International Journal of Psychophysiology 84 (2012) 226–231
Copyright © 2022 FDOKUMEN