Comparative Study of Surface Irrigation and Drip Irrigation for ...
Upload
khangminh22Category
view
0download
0
Italian Journal of Agrometeorology (2): 29-42, 2021
Firenze University Press www.fupress.com/ijam
ISSN 2038-5625 (print) | DOI: 10.36253/ijam-1261
Italian Journal of AgrometeorologyRivista Italiana di Agrometeorologia
Citation: B. Douh, A. Mguidiche, M. Jar Allah al-Marri, M. Moussa, H. Rjeb (2021) Assessment of deficit irrigation impact on agronomic parameters and water use efficiency of six chickpea (Cicer Arietinum L.) cultivars under Mediterranean semi-arid climate. Italian Journal of Agrometeorology (2): 29-42. doi: 10.36253/ijam-1261
Received: March 25, 2021
Accepted: October 10, 2021
Published: December 27, 2021
Copyright: © 2021 B. Douh, A. Mguidiche, M. Jar Allah al-Marri, M. Moussa, H. Rjeb. This is an open access, peer-reviewed article published by Firenze University Press (http://www.fupress.com/ijam) and distributed under the terms of the Creative Commons Attri-bution License, which permits unre-stricted use, distribution, and reproduc-tion in any medium, provided the origi-nal author and source are credited.
Data Availability Statement: All rel-evant data are within the paper and its Supporting Information files.
Competing Interests: The Author(s) declare(s) no conflict of interest.
Assessment of deficit irrigation impact on agronomic parameters and water use efficiency of six chickpea (Cicer Arietinum L.) cultivars under Mediterranean semi-arid climate
Boutheina Douh1,*, Amel Mguidiche2,*, Massoud Jar Allah al-Marri3, Mohamed Moussa4, Hichem Rjeb5
1 Department of Engineering of Horticultural Systems and Natural Environments, Higher Institute of Agronomy of chott Meriem, University of Sousse, BP 47, 4042 Sousse, Tunisia, [email protected] The Olive tree Institute, Ibn Khaldoun 14, Sousse 4061, Tunisia; University of Sfax, Tunisia, [email protected] 3 Food Security Department, Ministry of Municipality and Environment, Qatar, [email protected] 4 Laboratory of Eremology and Desertification Control, Institute for Arid Regions of Medenin, Tunisia, [email protected] 5 Department of Horticulture and Landscape, Higher Institute of Agronomy of chott Meri-em, University of Sousse, BP 47, 4042 Sousse, Tunisia, [email protected] *Corresponding authors: [email protected]; [email protected]; the first and the second author contributed equally to this research
Abstract. Six kabuli chickpea genotypes (Cicer Arietinum L.) were evaluated under three water levelss at the open field during February -June 2018. This study was con-ducted to evaluate the chickpea water stress, on soil water dynamic, agromorphologi-cal traits, and water use efficiency to estimate variability levels between varieties and to identify the varieties of chickpea adaptable on semi-arid bioclimatic stage. For this purpose, a trial was conducted at the Higher Agronomic Institute of Chott Mari-em (Tunisia). There is no effect of the treatment on the height, biological yield, and branching number. The seeds weigh, PCG, seed yield, harvest index, and water use efficiency relative to seed have the highest value in T1 (100% of ETc) when water use efficiency relative to biological yield, number of pods and of seeds recorded the high-est values in T3 (50% of ETc). Univariate analysis showed highly significant differences between genotypes for many traits. Principal Component Analysis was performed for all traits and allowed to define two axes. The first one explains 49.30% of the variability of the total trait and was formed by genotypes ‘Beja’, ‘Nayer’ and’ ‘Rebha’. Genotypes forming this axe are closely related to each other according to their common morpho-logical characters like height (r=0.88), biological yield (r=0.93), bringing the number (r=0.53), seed yield (r=0.81), WUE relative to seed (r=0.75), harvest index (r=0.65) and WUE relative to biological yield (r=0.94). The second clustered genotypes ‘Bochra’ and ‘Nour’. This second axe (27.99%) is represented by pods number (r=0.87), seed number (r=0.87) and PCG (r=0.78).
Keywords: Soil Water Content, evapotranspiration, chickpea, harvest index, Seed yield, Mediterranean region.

30 Douh Boutheina et al.
INTRODUCTION
The sustainability of agricultural production depends on conservation and appropriate use and man-agement of water resources. Water scarcity exacerbated by climate change is expected to define food production in the coming decades. Recently, water crisis has become one of the most significant problems in the world espe-cially in the Mediterranean region where irrigation is required for improving productivity (Douh et Boujel-ben, 2011; Rabi et al., 2012). The amount of water avail-able for agriculture in the Mediterranean is decreasing due to pressure from the growing population and an increased frequency of drought. The pressure of using water in agriculture sector is increasing, to create ways to improve water use efficiency and taking a full advan-tage of available water (Stewar, 2001).
Fabaceae are quality foods given their richness in proteins which can correct the deficit in animal pro-teins. Besides, they are rich in essential minerals and lysine, so they are complementary to the nutritional profiles of cereals (Bacha et Ounane, 2003). In Tuni-sia, chickpea (Cicer arietinum L.), particularly Kabuli genotypes, is the second pulse crop after fababean. It is grown, in spring rainfed conditions (Wery, 1990), in humid and sub-humid regions, mainly at Bizerte, Mateur, Beja, Jendouba, and Nabeul areas (Ben Mbarek and al., 2011). It is cultivated on an average annual area of 19 650 ha, which represents 1.1% of the areas sown to field crops. Annual production is of the order of 13 520 tonnes with an average yield of 670 kg ha-1. To meet the needs of the concept, the Tunisian gov-ernment uses imports on the order of 19 000 t year-1, which represents 141% of national production. The chickpea suffers from many difficulties, apart from the environmental conditions and the lack of mastery of cultivation techniques which are not insignificant causes of the weakness of production; it seems that the major problem remains that of an abiotic factor such as the deficiency in phosphorus, salinity, and drought. The latter is a major factor, which in the event of low availability, constrains the production of legume crops. Two types of droughts affect the chickpea crop in Tuni-sia, a spring caused by the breakdown of rainfall and a terminal one occurs at the end of the crop’s growth cycle due to a lack of rainfall and drying out of water reserves in soil (Wery et al., 1994).
Most of the chickpea crop in the world is produced on residual moisture but supplemental irrigation can enhance production. Especially irrigation during the pre-flowering period and at early pod fill resulted in increased yield at several locations in India (Saxena,
1980). Many studies have been conducted to assess the yield potential of chickpea under different irriga-tion levels (Ali (2017), Kadam et al. (2014)). Ali (2017) proved that the variety had a significant effect on yield attributes and seed yield. Besides, the highest water use efficiency of 263.01 kg ha-1 cm-1 was also found in the treatment which received no irrigation. From the results of his study, it is revealed that under the pre-vailing climatic and soil condition, the chickpea cul-tivars do not need any irrigation at Magura, rather it reduces yield. Ilhe et al. (2009), conducted field experi-ment at Ahmednagar, India, to evaluate water produc-tion function for chickpea under sprinkler irrigation. They concluded that growing of chickpea resulted in the more seed yield 25.90 q ha-1 and maximum benefit in terms of cost ratio 2.57 as compared to the surface irrigation method.
The main objectives of this study were assessing the best chickpea genotypes which adapt to the central of Tunisia climatic conditions by identifying agronomic attributes whose selection would lead to improvement in chickpea seed yield. Added to that this research help producer to manage their inputs to maximize efficiency of the available water resources. Certainly, the evalua-tion of varieties from the national chickpea improve-ment program is of particular interest to ensure food security and help smallholders cope with climate change.
MATERIAL AND METHODS
1. Experimental sites
The test was carried out in spring cultivation on a plot of the experimental domain of the Higher Agro-nomic Institute of Chott Mariem located in the Center East of Tunisia which is part of the semi-arid biocli-matic stage below a latitude of 35°91’ North and a lon-gitude of 10°55’ East, Altitude 19 m above sea level. The climate is semi-arid superior to temperate winter and hot summer. Climatic data during the study period was provided by a meteorological station located 100 m from the experimental site. The monitoring of climat-ic data was used for irrigation management. Thus, the minimum and maximum temperatures have the respec-tive average values of 10 and 23°C. The relative humid-ity and the wind speed are 70% and 2.3 m s-1, respec-tively. This area is characterized by an average annual rainfall and evaporation of 270 mm/year and 1243 mm/year, respectively, and a drought that extends for five months out of twelve (May – September). It is defined by reduced and scarce precipitation, evaporation, and high maximum temperatures.

31Assessment of deficit irrigation impact on agronomic parameters and water use efficiency of six chickpea cultivars
Figure 1 shows the daily values of reference evapo-transpiration (ET0), which increased with climatic con-ditions from about 2 mm/day in early March to a maxi-mum of about 6 mm/day at the end of May. Daily rain-fall values and Full irrigation levels are also presented.
In this research, we chose six varieties of chickpea of the Kabuli type registered in Tunisia as support to deter-mine the behaviour of its varieties to water stress and its adaptation to the climate. The six varieties are Beja, Rabha, Nayer, Nour, Amdoun and Bouchra. The spring chickpea thrives, mainly, on the water supply in the soil. The latter is gradually exhausted with the development of culture. From the end of the vegetative development phase until maturity, the crop has undergone water stress which affects many parameters by morphologi-cal, physiological, and metabolic changes that occur in all the organs of the plant and result in a reduction yield (Cochard et al., 2002).
2. Experimental design
The trial was carried out on a plot of the experi-mental domain of the Higher Agronomic Institute Chott Mariem. Sowing was carried out in February with a density of 12.5 plants/m2 with a spacing of 0.2 m between rows and 0.4 m on the row. Each elementary plot was made up of nine lines five meters in length. The experimental setup adopted was in randomized blocks with three replications. The test plots were divided into blocks spaced 1.5 m apart. The previous crop was a worked fallow. Sowing took place on February 26 and harvest took place on June 18.
3. Soil characterization
The method used is the particle size analysis method by sedimentation (the ROBINSON pipette). The pipette apparatus conforms to NEN5357 and ISO/DIS 11,277. The method is based on the difference in sedimentation rates between light particles and larger ones.
3.1. Electrical conductivity
By determining the electrical conductivity (EC) of the soil, we can deduce the salinity of the soil extract. The laboratory preparation with the soil saturation phase after air-drying is considered. The principle of this method is to take a sample of soil (200 g) with distilled water until saturation is reached and to extract the fil-trate by vacuum filtration. The EC of this extract is thus measured by a conductometer.
S = 0.64 EC (1)
With: – S: Salinity of the measured sample (g/l).EC: Electrical conductivity (mS/cm).
Three replications are considered for each depth 20, 40, and 60 cm.
3.2. Hydrodynamic properties of the soil
Soil Water content (SWC)The measurements of the water content by weight
are made before and after each irrigation by layer [0–20 cm], [20–40 cm], and [40–60 cm]. The samples are excreted from the soil by the auger and brought to the laboratory for weighing in a fresh state and placed in an oven for 24 hours to then determine the dry mass of each sample. The water content by weight in each sample corresponds to the ratio of its mass of water to its mass in the fresh state. This water content is multiplied by the bulk density to determine the volume of water content.
Water content at field capacity (θfc)The water content at field capacity represents the
maximum amount of water that the soil can hold. It is determined in the laboratory with a pressure cooker. The determination of the water content at the field capacity was made with a pressure cooker.
Water content at permanent wilting point (θpwp)The moisture content at the permanent wilting point
is the moisture in the soil from which the plant can no longer draw water, and wilts then die if this moisture
Figure 1. Daily values of precipitation, Full irrigation and reference evapotranspiration during the study period.
32 Douh Boutheina et al.
level continues. The determination of the wilting point was made with a pressure cooker (15atm).
4. Irrigation and crop water requirement
Three irrigation levels were applied to the crop to study the behavior of the six varieties to water stress. The irrigation system used is the drip irrigation system with integrated drippers delivering a flow rate of 4l h-1. The spacing between the drippers is 40 cm while that between the ramps is 20 cm.
Field data from the Regional Research center on Horticulture and Organic Agriculture of Chott Meriem weather station were used to estimate reference evapotran-spiration and to calculate crop water requirements using CROPWAT 8.0 model. The reference evapotranspiration was used to simulate optimal irrigation schedule. Irriga-tion water supplies are made based on the crop’s potential evapotranspiration (ETc). The crop coefficient (Kc) and the duration of the physiological phases of chickpea adopted are those used by the FAO 56. In addition, the reported information on climate, soil and crop constituted the input data. At the field studies, various irrigation treatments were applied to chickpea crops, full irrigation T1 corre-sponds to 100% of ETC and deficit irrigation T2 and T3 respectively 75 and 50% of ETC (Table 1).
CROPWAT Model input parameters are: - Climate: temperature, rainfall, wind speed, relative
air humidity, solar radiation- Crop: Kc, Maximum rooting depth, area covered by
plant, - Soil: Initial soil moisture, Daily Soil Moisture, Defi-
cit soil condition
5. Agronomic parameters related to vegetative development
5.1. Plant height
The height growth of continuously driven plants was measured using a graduated ruler at each vegetative stage on six plants of each variety and each treatment.
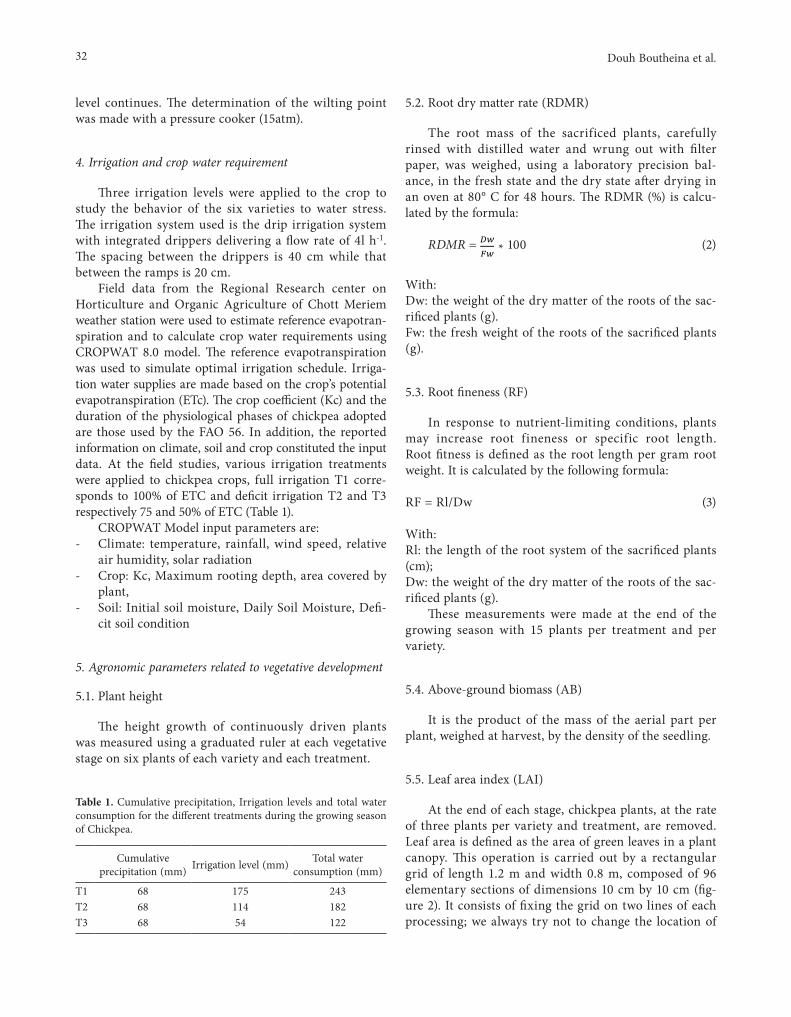
5.2. Root dry matter rate (RDMR)
The root mass of the sacrificed plants, carefully rinsed with distilled water and wrung out with filter paper, was weighed, using a laboratory precision bal-ance, in the fresh state and the dry state after drying in an oven at 80° C for 48 hours. The RDMR (%) is calcu-lated by the formula:
RDMR = * 100 (2)
With:Dw: the weight of the dry matter of the roots of the sac-rificed plants (g).Fw: the fresh weight of the roots of the sacrificed plants (g).
5.3. Root fineness (RF)
In response to nutrient-limiting conditions, plants may increase root fineness or specific root length. Root fitness is defined as the root length per gram root weight. It is calculated by the following formula:
RF = Rl/Dw (3)
With:Rl: the length of the root system of the sacrificed plants (cm);Dw: the weight of the dry matter of the roots of the sac-rificed plants (g).
These measurements were made at the end of the growing season with 15 plants per treatment and per variety.
5.4. Above-ground biomass (AB)
It is the product of the mass of the aerial part per plant, weighed at harvest, by the density of the seedling.
5.5. Leaf area index (LAI)
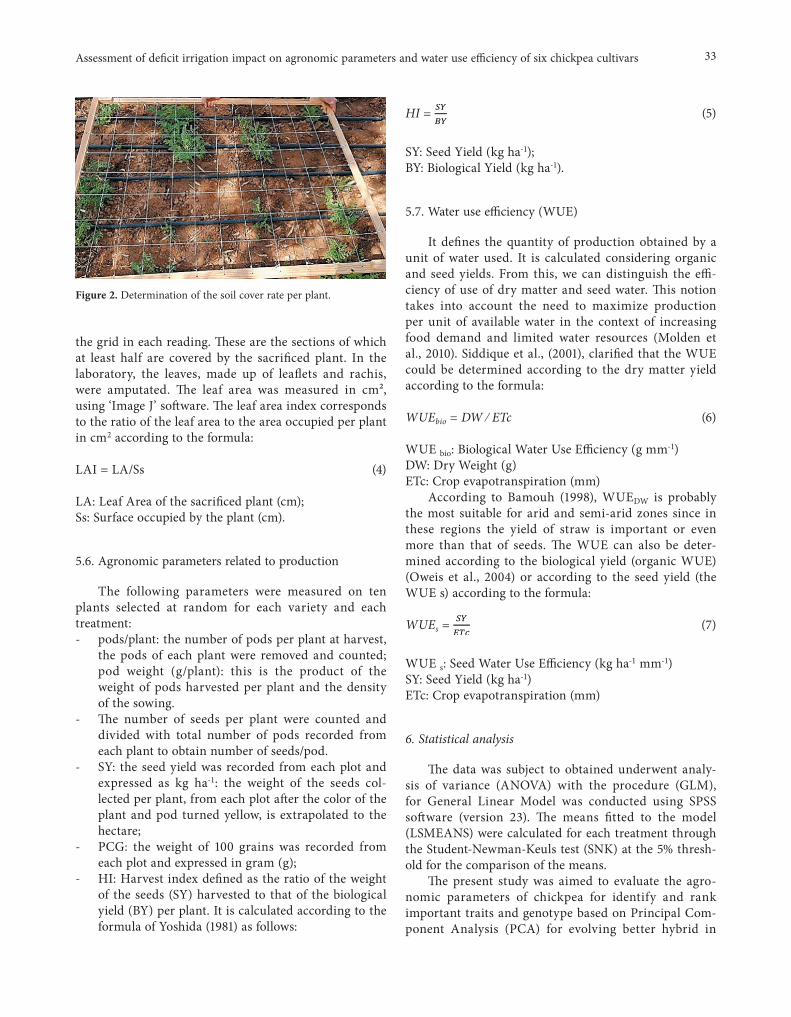
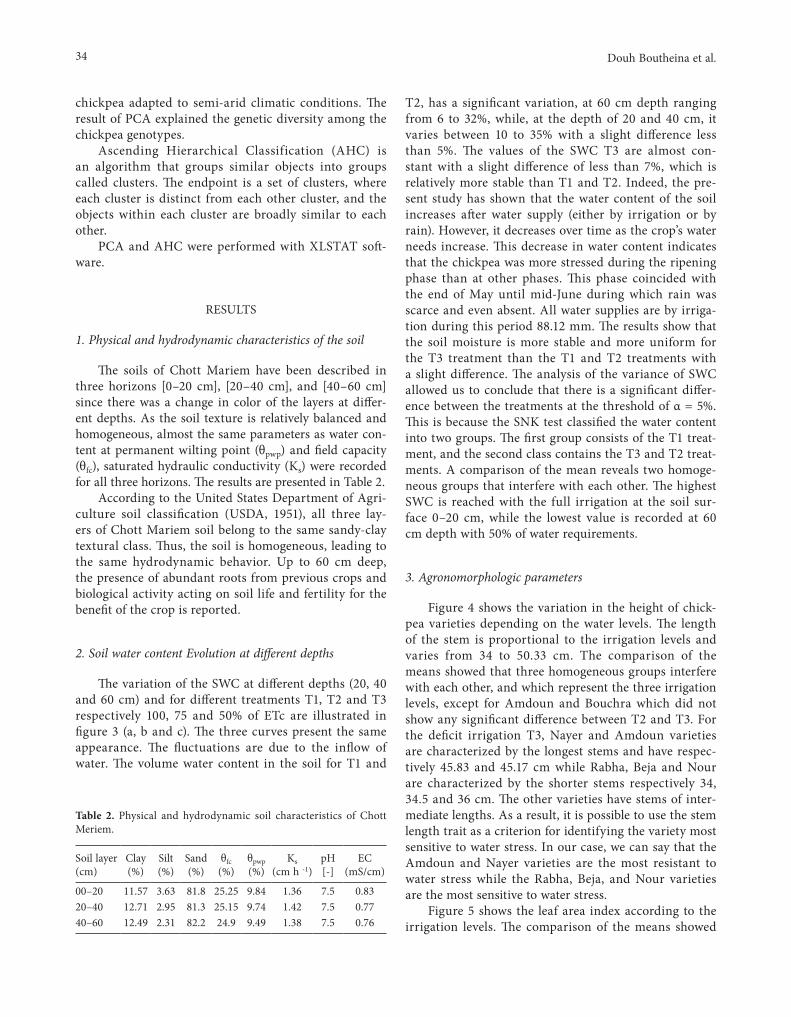
At the end of each stage, chickpea plants, at the rate of three plants per variety and treatment, are removed. Leaf area is defined as the area of green leaves in a plant canopy. This operation is carried out by a rectangular grid of length 1.2 m and width 0.8 m, composed of 96 elementary sections of dimensions 10 cm by 10 cm (fig-ure 2). It consists of fixing the grid on two lines of each processing; we always try not to change the location of
Table 1. Cumulative precipitation, Irrigation levels and total water consumption for the different treatments during the growing season of Chickpea.
Cumulative precipitation (mm) Irrigation level (mm) Total water
consumption (mm)
T1 68 175 243T2 68 114 182T3 68 54 122
33Assessment of deficit irrigation impact on agronomic parameters and water use efficiency of six chickpea cultivars
the grid in each reading. These are the sections of which at least half are covered by the sacrificed plant. In the laboratory, the leaves, made up of leaflets and rachis, were amputated. The leaf area was measured in cm², using ‘Image J’ software. The leaf area index corresponds to the ratio of the leaf area to the area occupied per plant in cm2 according to the formula:
LAI = LA/Ss (4)
LA: Leaf Area of the sacrificed plant (cm);Ss: Surface occupied by the plant (cm).
5.6. Agronomic parameters related to production
The following parameters were measured on ten plants selected at random for each variety and each treatment:- pods/plant: the number of pods per plant at harvest,
the pods of each plant were removed and counted; pod weight (g/plant): this is the product of the weight of pods harvested per plant and the density of the sowing.
- The number of seeds per plant were counted and divided with total number of pods recorded from each plant to obtain number of seeds/pod.
- SY: the seed yield was recorded from each plot and expressed as kg ha-1: the weight of the seeds col-lected per plant, from each plot after the color of the plant and pod turned yellow, is extrapolated to the hectare;
- PCG: the weight of 100 grains was recorded from each plot and expressed in gram (g);
- HI: Harvest index defined as the ratio of the weight of the seeds (SY) harvested to that of the biological yield (BY) per plant. It is calculated according to the formula of Yoshida (1981) as follows:
HI = (5)
SY: Seed Yield (kg ha-1);BY: Biological Yield (kg ha-1).
5.7. Water use efficiency (WUE)
It defines the quantity of production obtained by a unit of water used. It is calculated considering organic and seed yields. From this, we can distinguish the effi-ciency of use of dry matter and seed water. This notion takes into account the need to maximize production per unit of available water in the context of increasing food demand and limited water resources (Molden et al., 2010). Siddique et al., (2001), clarified that the WUE could be determined according to the dry matter yield according to the formula:
WUEbio = DW ⁄ ETc (6)
WUE bio: Biological Water Use Efficiency (g mm-1)DW: Dry Weight (g)ETc: Crop evapotranspiration (mm)
According to Bamouh (1998), WUEDW is probably the most suitable for arid and semi-arid zones since in these regions the yield of straw is important or even more than that of seeds. The WUE can also be deter-mined according to the biological yield (organic WUE) (Oweis et al., 2004) or according to the seed yield (the WUE s) according to the formula:
WUEs = (7)
WUE s: Seed Water Use Efficiency (kg ha-1 mm-1)SY: Seed Yield (kg ha-1)ETc: Crop evapotranspiration (mm)
6. Statistical analysis
The data was subject to obtained underwent analy-sis of variance (ANOVA) with the procedure (GLM), for General Linear Model was conducted using SPSS software (version 23). The means fitted to the model (LSMEANS) were calculated for each treatment through the Student-Newman-Keuls test (SNK) at the 5% thresh-old for the comparison of the means.
The present study was aimed to evaluate the agro-nomic parameters of chickpea for identify and rank important traits and genotype based on Principal Com-ponent Analysis (PCA) for evolving better hybrid in
Figure 2. Determination of the soil cover rate per plant.
34 Douh Boutheina et al.
chickpea adapted to semi-arid climatic conditions. The result of PCA explained the genetic diversity among the chickpea genotypes.
Ascending Hierarchical Classification (AHC) is an algorithm that groups similar objects into groups called clusters. The endpoint is a set of clusters, where each cluster is distinct from each other cluster, and the objects within each cluster are broadly similar to each other.
PCA and AHC were performed with XLSTAT soft-ware.
RESULTS
1. Physical and hydrodynamic characteristics of the soil
The soils of Chott Mariem have been described in three horizons [0–20 cm], [20–40 cm], and [40–60 cm] since there was a change in color of the layers at differ-ent depths. As the soil texture is relatively balanced and homogeneous, almost the same parameters as water con-tent at permanent wilting point (θpwp) and field capacity (θfc), saturated hydraulic conductivity (Ks) were recorded for all three horizons. The results are presented in Table 2.
According to the United States Department of Agri-culture soil classification (USDA, 1951), all three lay-ers of Chott Mariem soil belong to the same sandy-clay textural class. Thus, the soil is homogeneous, leading to the same hydrodynamic behavior. Up to 60 cm deep, the presence of abundant roots from previous crops and biological activity acting on soil life and fertility for the benefit of the crop is reported.
2. Soil water content Evolution at different depths
The variation of the SWC at different depths (20, 40 and 60 cm) and for different treatments T1, T2 and T3 respectively 100, 75 and 50% of ETc are illustrated in figure 3 (a, b and c). The three curves present the same appearance. The fluctuations are due to the inflow of water. The volume water content in the soil for T1 and
T2, has a significant variation, at 60 cm depth ranging from 6 to 32%, while, at the depth of 20 and 40 cm, it varies between 10 to 35% with a slight difference less than 5%. The values of the SWC T3 are almost con-stant with a slight difference of less than 7%, which is relatively more stable than T1 and T2. Indeed, the pre-sent study has shown that the water content of the soil increases after water supply (either by irrigation or by rain). However, it decreases over time as the crop’s water needs increase. This decrease in water content indicates that the chickpea was more stressed during the ripening phase than at other phases. This phase coincided with the end of May until mid-June during which rain was scarce and even absent. All water supplies are by irriga-tion during this period 88.12 mm. The results show that the soil moisture is more stable and more uniform for the T3 treatment than the T1 and T2 treatments with a slight difference. The analysis of the variance of SWC allowed us to conclude that there is a significant differ-ence between the treatments at the threshold of α = 5%. This is because the SNK test classified the water content into two groups. The first group consists of the T1 treat-ment, and the second class contains the T3 and T2 treat-ments. A comparison of the mean reveals two homoge-neous groups that interfere with each other. The highest SWC is reached with the full irrigation at the soil sur-face 0–20 cm, while the lowest value is recorded at 60 cm depth with 50% of water requirements.
3. Agronomorphologic parameters
Figure 4 shows the variation in the height of chick-pea varieties depending on the water levels. The length of the stem is proportional to the irrigation levels and varies from 34 to 50.33 cm. The comparison of the means showed that three homogeneous groups interfere with each other, and which represent the three irrigation levels, except for Amdoun and Bouchra which did not show any significant difference between T2 and T3. For the deficit irrigation T3, Nayer and Amdoun varieties are characterized by the longest stems and have respec-tively 45.83 and 45.17 cm while Rabha, Beja and Nour are characterized by the shorter stems respectively 34, 34.5 and 36 cm. The other varieties have stems of inter-mediate lengths. As a result, it is possible to use the stem length trait as a criterion for identifying the variety most sensitive to water stress. In our case, we can say that the Amdoun and Nayer varieties are the most resistant to water stress while the Rabha, Beja, and Nour varieties are the most sensitive to water stress.
Figure 5 shows the leaf area index according to the irrigation levels. The comparison of the means showed
Table 2. Physical and hydrodynamic soil characteristics of Chott Meriem.
Soil layer (cm)
Clay (%)
Silt (%)
Sand (%)
θfc (%)
θpwp (%)
Ks(cm h -1)
pH[-]
EC(mS/cm)
00–20 11.57 3.63 81.8 25.25 9.84 1.36 7.5 0.8320–40 12.71 2.95 81.3 25.15 9.74 1.42 7.5 0.7740–60 12.49 2.31 82.2 24.9 9.49 1.38 7.5 0.76

35Assessment of deficit irrigation impact on agronomic parameters and water use efficiency of six chickpea cultivars
that two homogeneous groups represent the three irri-gation levels (A and B). The comparison of the means showed that the highest leaf area index is 3.39 and recorded with the full irrigation (T1 treatment); while the lowest index is 1.83 and recorded at processing level T3. The leaf area index of chickpea varieties ranges from 2.32 to 3.63. The comparison of the means showed that there is a single homogeneous group that represents the six varieties. Similar values indicate that there is no vari-etal variability for this parameter. At the interaction lev-el (Varieties × Irrigation levels), the leaf area index varies from 1.23 to 4.32. It is highest with T1 in Rabha and the lowest with the 50% level of ETc in Bouchra. The com-
parison of the leaf area index of the chickpea varieties under the different irrigation levels showed two homo-geneous groups (A and B). The first group, characterized by high LAI, consists of Rabha, Nayer, Nour, Amdoun and plugged with the irrigation level 100% of ETc; Beja, Nayer, Nour, Amdoun and Bouchra with the irrigation level 75% of ETc and Nayer with the lowest level of ETc 50%. The second group, characterized by low LAI, is made up of Beja with the 100% level of ETc, Rabha with
Figure 3. SWC for different treatments T1, T2 and T3, at different depths 20, 40 and 60 cm respectively (a), (b) and (c).
A B and C: present the height classification groups according to the irrigation level.a, b and c: presents the height classification groups according to the variety.Means followed by the same letters have no significant difference based on the LSD test at 5% error probability.
Fig. 4. Mean values of the stem height as a function of the interac-tion’s varieties × Irrigation level.
A B and C: present the height classification groups according to the irrigation level.a, b and c: presents the height classification groups according to the variety.Means followed by the same letters have no significant difference based on the LSD test at 5% error probability.
Fig. 5. Mean values of LAI as a function of the interaction’s varie-ties × Irrigation level.

36 Douh Boutheina et al.
the 75% level of ETc and Beja, Rabha, Nour, Amdoun and Bouchra with the level. 50% of ETc. We can see that the Nayer variety develops even in conditions of water deficit.
Figure 6 shows the variation in the length of the root system as a function of interactions (varieties × irrigation levels). The interaction (varieties × irriga-tion levels) has no significant effect on the length of the root system. But comparing the means has shown that two homogeneous groups interfere with each other. The longest root system is produced by the Nayer vari-ety with the 100% rate of ETc (18 cm); while the short-est root system is produced by the Nour variety with the 50% level of ETc.
Figure 7 presents a comparison of the variations in root fineness values as a function of interactions (Varie-ties × Irrigation levels). The fineness of the root or spe-cific length of the roots is proportional to the irrigation levels. The comparison of means showed that there is only one homogeneous group. With all three irrigation levels, the RF values are considered similar. But a slight increase is noted with the lower level (50% of ETc). RF plays an important role in the drought resistance of plants. The comparison of the average RF values showed that it is proportional to the variety and reveals three homogeneous groups that interfere with each other. For the full irrigation, the highest value of RF is produced by the Bouchra variety with 67.8 cm g-1, the lowest val-ue is produced by Beja 20.5 cm g-1. While for the deficit irrigation 50% of the crop evapotranspiration the high-est value of RF is produced by Amdoun, Rebha and Beja
wich recorded an average of 40.1 cm g-1and the lowest are for Nayer 11.4 cm g-1.
The variation in the dry matter content in the roots is shown in Figure 8. The RDMR values vary between 14.6 and 32.2% for T1, 28.0 and 42.7% for T2 and 24.6 and 33.6% for T3. Indeed, the more the plant is subjected to water stress, the more the plant devel-
A B and C: present the height classification groups according to the irrigation level.a, b and c: presents the height classification groups according to the variety.Means followed by the same letters have no significant difference based on the LSD test at 5% error probability.
Fig. 6. Mean values of the root system length as a function of the interaction’s varieties × Irrigation level.
A B and C: present the height classification groups according to the irrigation level.a, b and c: presents the height classification groups according to the variety.Means followed by the same letters have no significant difference based on the LSD test at 5% error probability.
Fig. 7. Mean values of root fineness as a function of the interac-tion’s varieties × Irrigation level.
A B and C: present the height classification groups according to the irrigation level.a, b and c: presents the height classification groups according to the variety.Means followed by the same letters have no significant difference based on the LSD test at 5% error probability.
Fig. 8. Mean values of dry matter rate in the roots as a function of the interaction’s varieties × Irrigation level.

37Assessment of deficit irrigation impact on agronomic parameters and water use efficiency of six chickpea cultivars
ops its root system to extract water from the soil. The RDMR varies are depending on the variety of chick-pea. The comparison of means revealed two homo-geneous groups that interfere with each other. For T1, the root system of the Nayer variety is the richest (32.2%), while Rabha is the poorest in the dry matter (14.6%). Statistical analysis using the SNK test allowed us to detect a highly significant difference between the different irrigation treatments for each variety except for the Bouchra where the RDMR is not affected by the irrigation levels.
4. Agronomic parameters related to production
The number of seeds per plant varies with the irri-gation tratment. The comparison of the mean revealed two homogeneous groups. The first one consists of T1 and T2 (100% and 75% of ETc) while the lowest level (50%) is presented by the second group. Under the dif-ferent irrigation levels, the weight of 100 seeds varies from 14.479 ± 4.75 to 36.259 ± 10.22 g. The compari-son of averages revealed three groups that interfere with each other. The highest PCG was recorded for full irri-gation. These results indicate that the 50% irrigation level of ETc caused intense water stress which greatly reduced pod filling and resulted in the formation of empty pods and stunted seeds. Under the effect Irriga-tion level, the highest seed yield values were recorded for the full irrigation, and it varies from 220.229 ± 51.13 kg ha-1 (T1) to 490.667 ± 16.61 kg ha-1 (T3). The water use efficiency relative to biological yield is inversely proportional to the irrigation level. The comparison of means revealed three homogeneous groups. The first
group contains the highest values of 0.125 ± 0.029 g/mm found with the lowest level (50% of the ETc), the second group contains the intermediate values (0.090 ± 0.01 g/mm) recorded by the irrigation level 75% of the ETc while the last group includes the values of 0.067 ± 0.02g/mm recorded by the full irrigation.
Table 3 showed that, statistically, there is no effect of the treatment on the plant height, biological yield, and branching number. The PCG (weight of 100 seeds (g/100 seeds)), seed yield per hectare (SY), harvest index, and water use efficiency relative to seed have the highest val-ue in T1 (100% of ETc) when water use efficiency relative to biological yield, number of pods and seeds recorded the highest values in T3 (50% of ETc).
The more the plant is subject to water stress, the higher the number of pods per plant and the higher the number of seeds, while seed weights are low and con-sequently seed yield and harvest index are negatively affected by water stress.
Principal Component Analysis and individual variations
Data were considered in each component with Eigen value > 1 which determined at least 10% of the variation. The higher Eigen values were considered as best repre-sentative of system attributes in principal components. Eigen values of five component axes and percentage of variation accounting for them obtained from the prin-cipal component analysis are presented in Table 4. The results of the PCA showed that the variables represented 77.29% of the total inertia on the first two axes, which constitutes a strong plan in the discrimination of the variables.
Table 3. Mean quality Agronomic parameters related to production.
Variable T1 T2 T3
Plant height (cm) 36.767 ± 2.32 (a) 38.567 ± 2.93(a) 36.233 ± 3.45(a)
Biological yield (g) 21.794 ± 5.30(a) 22.199 ± 3.19(a) 20.413 ± 4.67(a)
Branching number 5.283 ± 0.71(a) 4.633 ± 0.64(a) 5.017 ± 0.51(a)
Pods/plant 20.333 ± 5.28 (ab) 19.767 ± 3.09(b) 23.800 ± 3.48(a)
Number of seeds 12.183 ± 2.86(b) 12.467 ± 0.83(b) 14.533 ± 2.16(a)
Seeds weight (g) 3.925 ± 0.13(a) 3.317 ± 0.32(b) 1.762 ± 0.41(c)
PCG (g/100 seeds) 36.259 ± 10.22(a) 27.777 ± 2.39(a) 14.479 ± 4.75(b)
SY (kg/ha) 490.667 ± 16.61(a) 414.667 ± 40.34(b) 220.229±51.13(c)
Harvest Index 0.199 ± 0.05(a) 0.164 ± 0.05 (ab) 0.096 ± 0.03(b)
WUEs (kg/ha/mm) 1,499 ± 0.05(a) 1,689 ± 0.16(a) 1,346 ± 0.31(b)
WUE bio (g/mm) 0.067 ± 0.02(c) 0.090 ± 0.01(b) 0.125 ± 0.029(a)
a,b and c: present the height classification groups according to the irrigation level.Means followed by the same letters have no significant difference based on the LSD test at 5% error probability.

38 Douh Boutheina et al.
The higher Eigen values were considered as best representative of system attributes in principal com-ponents. Only three components showed more than 1 Eigen value and exhibited about 97.83% cumula-tive variability, therefore these two PCs were given due important for the further explanation. Analysis of the parameters studied shows that the two axes have respectively 49.30 and 27.99% of the total inertia (Fig-ure 9). Axis 1 (49.30%) is represented by the measure-ments of height (r = 0.88), biological yield (r = 0.93), bringing the number (r = 0.53), seed yield (r = 0.81), WUE relative to seed (r = 0.75), harvest index (r = 0.65) and WUE relative to biological yield (r = 0.94). For varieties, axis 1 influenced Beja (r = 0.40), Nayer (r = 0.79) and Rebha (r = 0.75). This axis is positively cor-related with most of the parameters studied and espe-cially with production. However, Axis 2 (27.99%) is represented by pod number (r = 0.87), seed number (r = 0.87) and PCG (r = 0.78). For varieties, axis 2 influ-enced Bochra (r = 0.60) and Nour (r = 0.78). This axis represents vegetative development.
Ascending Hierarchical Classification (AHC)
Based on the various measurements carried out, the ascending hierarchical classification made it possible to distinguish three classes (figure 10).
– Classes 1 Nayer and Beja: They are made up of highly developed individuals, with strong vegetative development and production, having the highest average values for height (40.23 cm), PCG (30.83), SY (387.42), WUEs (1.59), WUE bio (0.11). These two varieties can be adapted to any region and are more tolerant of water stress.
– Classes 2 Bochra and Nour: They are composed of plants with an average potential, but which have a slight superiority for the parameters Number of seeds per plant (14.43) and Number of Pods (23.33).
– Class 3 Amdoun and Rebha: this class is made up of fragile individuals, poorly developed relative to plants of other classes with low productive power. These vari-eties are very sensitive to water stress and can only be grown in areas that have a humid climate.
DISCUSSION
From the literature, it is revealed that the response of irrigation to chickpea seed yield depends on the initial soil moisture reserve, atmospheric water demand, and the cultivar. The main objective of the present study was to evaluate the yield potential of new cultivars of chick-pea under different soil moisture regimes (Ali, 2017).
Table 4. Eigen value, contribution of variability and Eigen vectors for the principal component axes in chickpea.
F1 F2 F3 F4 F5
Eigenvalue 5.423 3.079 2.260 0.197 0.042Variability (%) 49.300 27.987 20.542 1.791 0.379Cumulative % 49.300 77.288 97.830 99.621 100.000
Fig. 9. Biplot graphical display for WUE of the tested Chickpea genotypes for different levels irrigation.
Fig. 10. Ascending Hierarchical Classification of the six studied genotypes of chickpea.
39Assessment of deficit irrigation impact on agronomic parameters and water use efficiency of six chickpea cultivars
Mguidiche et al. (2018) study the effect of deficit irriga-tion on Wheat Yield and Water Use Efficiency in the North of Tunisia and proved that due to the severe climatic con-ditions and increased crop water requirements root extrac-tion increased, SWC decreases to 14% in all soil profiles at the end of the growing season. Krouma et al. (2015), prove that drought-induced loss in crop yield probably exceeds losses from all other causes, since both the severity and duration of the stress are critical. Added to that Water potential measured in leaves shows a clear decrease of this potential when plants are subjected to drought.
Levit (1980) observed that too much water could adversely affect the growth of aboveground biomass in chickpea, while a water deficit inhibits the growth of stems and leaves. Osmotic regulation can enable the maintenance of cell turgor for survival or assist plant growth under severe drought conditions in pearl mil-let (Berninger et al., 2000). Aspinal (1986), indicated that the water deficit results in a reduction in the height and diameter of the stem, a shortening of the internodes, and a decrease in the leaf area. The results found are con-firmed with those of Slim et al. (2006), who was able to classify chickpea varieties into two groups, notably, tall ones such as Amdoun and short ones such as Beja and Bochra. Ben Naceur et al. (2014), noted that stem height and leaf area of durum wheat were negatively affected by water deficit. Aspinal (1986), indicated that the water def-icit results in a reduction in the height and diameter of the stem, a shortening of the internodes, and a decrease in the leaf area. According to Ben Mbarek et al. (2011), the leaf area index of chickpea ranges from 0.5 to 3.5. Daaloul et al. (2007), have shown that root flexibility is reflected in the improvement of the growth of its root system under conditions of water deficit by the alloca-tion of dry matter. This proves the results of the varia-tion in dry matter content in the roots as a function of the irrigation level. LAI results are confirmed with Singh et al. (1995), who reported that at 128 days after sowing, the leaf area index is estimated at 1.1 in the early irri-gated treatments and 2.8 in the fully irrigated treatment. Likewise, Sheldrake and Saxena (1979) found a differ-ence between the leaf area indices of a variety of chickpea grown in different areas and attributed this difference to climatic conditions and more specifically to rainfall.
These results indicate that the root fineness is dependent on the variety (genetic dependence) which is confirmed by Daaloul et al. (2007) who indicated the pre-dominance of genetic control over root fineness. Albouchi et al., (2003), indicated that, under conditions of water stress, the growth of the aerial parts of stressed plants is more affected than that of the roots. Under such condi-tions, the response of a plant results in a preferential sup-
ply of biomass to the roots. Pacucci et al., (2006) indicat-ed that additional irrigation of chickpeas, applied at the flowering and pod filling stages, increased the number of seeds by 14 to 27%. Gan et al., (2004) noticed that chick-pea of the kabuli type produces a high number of empty pods. Early in pod formation, water stress increases the abortion rate and reduces chickpea pod production. The filling of chickpea pods strongly depends on climatic con-ditions and varies from 9 to 57% (Pundir et al., 1992). Lawlor and Cornic (2002) indicate that determination of water status and relations in plants demonstrated that drought decreased water potential, relative water content and osmotic adjustment. The utilization of leaf root water content as an indicator of the plant water status is usually.
According to Tiznado et al. (2012), the weight of 100 field-grown Kabuli-type chickpea seeds is highly variable and ranges from 28 to 70g. With the different levels of irrigation, the weights of 100 seeds are differ-ent. It is highest with the 100% ETc irrigation level and lowest with the 50% ETc level. Moinuddin and Khanna-Chopra, (2004) noted that the weight of 100 seeds is sig-nificantly affected by water stress.
Belhassen et al. (1995) found that the processes involved in developing the seed yield of a crop are influ-enced by two types of factors: genetic factors, intrinsic to the plant, and environmental factors. The environmen-tal, abiotic stresses that affect a crop can cause consider-able yield losses. Ben Mbarek (1990) pointed out that gene expression of potential yield depends on climatic condi-tions. Singh et al. (1995) noticed that delayed sowing of a chickpea (Cicer arietinum L.) crop, carried out in dry or irrigated conditions, allows its potential yield to be deter-mined. With delayed sowing, water stress-tolerant geno-types produce 40–50% of their potential yields (Sabaghpour et al., 2006) ; while susceptible genotypes only produce 10%. Thus, the low seed yields obtained may be due to the effects of high temperature during the cycle. Also, Kamel (1990) stated that thermal and water stress, quite frequent at the end of the crop cycle, limit the yield from 42 to 75%. Gan et al., (2010) reported that the water use efficiency of Kabuli-type chickpeas is 5.3 kg ha-1 mm-1 or 20% less than the average WUE 6.6 kg ha-1 mm-1. However, exposing a chickpea crop to a terminal drought shortens its crop cycle and reduces its water use efficiency (Brown et al., 1989).
Condon et al. (2004), indicate that water use efficien-cy is an important strategy for drought tolerance in crop plants, including chickpea. Pang et al. (2017), showed that a significant amount of genetic variability has been recorded on stressed conditions.
Bingru and Hongwen (2000) have stated that water use efficiency is an important factor in determining resistance to water stress.

40 Douh Boutheina et al.
CONCLUSION
To increase the production of chickpeas and miti-gate the national limited water resources, it would be necessary to resort to a second alternative, which con-sists of extending the cultivation of this species to areas of semi-arid Tunisia. It is in this context that the present work is based on six varieties of chickpeas most culti-vated in Tunisia. From the results found, it is clear that the efficiency of seed water use and biological yield varies with the irrigation level, as well as with the variety. It is important to tell farmers the most adaptable varieties for each bioclimatic region and each irrigation level. Indeed, in the region of Chott Mariem which belongs to the low-er semi-arid bioclimatic stage, with an amount of 100% ETc the WUE in seeds is almost the same for all six vari-eties with a slight difference for Nour, Beja, and Nayer. The difference begins to be remarkable with the irriga-tion amount of 75% of ETc, of which it has been observed that the varieties Amdoun, Nayer and Beja perform well with a WUE which varies from 1.6; 1.58 and 1.53 kg ha-1 mm-1 respectively for the three varieties, which recorded a WUE of seeds with extreme values compared to Rab-ha, Nour, and Bochra varying respectively from 1.5, 1.48 and 1, 46 53 kg ha-1 mm-1 with an irrigation level of 50% of the ETc. Varieties that have shown tolerance to water stress should be grown on a large scale, in spring culti-vation, in different Tunisian bioclimatic stages. Other aspects of this type of crop merit investigation, including the Rhizobium-genotype relationship tolerant to water stress and under conditions of low nitrogen content and the presence of sufficient rhizobia in the soil.
ACKNOWLEDGMENTS
This project was supported by the research unit, ‘UR 13 AGR06 Horticulture, Landscape, Environment’. Also, we wish to present our special thanks to the Regional Center for Field Crop Research in Beja (CRRGCB), IRESA Tunisia for kindly supplying seeds of chickpea.
REFERENCES
Albouchi A, Béjaoui Z. et El Aouani M.H. (2003). Influ-ence d’un stress hydrique modéré ou sévère sur la croissance de jeunes plants de Casuarina (Casuarina glauca Sieb.). Sécheresse Vol.14; 3, 37-142.
Ali M.H. (2017). Response of Chickpea Varieties to Dif-ferent Irrigation Regimes, Asian Journal of Advances in Agricultural Research 2(4): 1-7.
Aspinal D. (1986). Metabolic effects of water and salinity stress in relation to the expression of the leaf surface. Aust. J. Plant Physiol. 13: 59–73.
Bacha F. et Ounane S. M. (2003). Etude de l’effet du stress hydrique sur les Activités des enzymes nitrate réductase et nitrogénase de la culture du pois chiche (Cicer arietinum L.). Institut National de la Recherche agronomique d’Algérie 13: 1111-1992.
Bamouh A. (1998), Gestion de la contrainte pluviomét-rique pour l’amélioration de la production végétale et de l’efficience d’utilisation de l’eau. Bulletin de liaison du Programme National de Transfert de Technologie en Agriculture (PNTTA); Instituts, Rabat, Maroc; 10 p.
Belhassen E., This D. et Monneveux P. (1995). L’adaptation génétique face aux contraintes de sécher-esse. Cahiers Agriculture 4: 251-261.
Ben Mbarek K., Douh B. and Boujelben A. (2011). Effects of Irrigation on the Flowering and Maturity of Chickpea Genotypes, Chapter in book irrigation-systems-and-practices-in-challenging-environments, Intech edition, pp 1-18.
Ben Naceur M., Khamassi K., Chaabane R., Khoufi S. et Kharrat M. (2014). Evaluation Agro-morphologique de Quelques Génotypes Locaux de Pois Chiche d’Hiver (Cicer arietinum L.) en Tunisie. New Sciences. Vol 5(2), 19p.
Berninger C. Li, F. , Koskela J. , Sonninen E. (2000). Drought responses of Eucalyptus microtheca F. Muell. Provenances depend on seasonality of rainfall in their place of origin. Aust. J. Plant Physiol. 27: 21-238.
Bingru H. and Hongwen G. (2000). Root physiological characteristics associated with drought resistance in tall fescue cultivars. Crop Sci. 40: 196-2003.
Brown S.C., Gregory P.J., Cooper P.J.M., et Keating J.D. (1989). Root and shoot growthand water use of chickpea (Cicer arietinum L.) grown in dryland con-ditions effects of sowing date and genotype. J. Agric. Sci. 113: 41–50.
Cochard H., Coll L., Roux X.L. et Amyglio T. (2002). Unraveling the Effects of Plant Hydraulics on Sto-mata1 Closure during Water Stress in Walnut. Plant Physiology 128: 282-290.
Condon, A. G., Richards, R. A., Rebetzke, G. J., Farquhar, G. D. (2004). Breeding for high water-use efficiency. J. Exp. Bot. 55: 2447-2460.
Daaloul A., Bchini H., et Sayar R. (2007). Variabilité génétique de quelques paramètres du système raci-naire du blé dur (Triticum durum Desf.) sous deux régimes hydriques. Bioversity International - FAO. 129: 25-31.
Douh, B. and Boujelben, A. 2011. Improving water use efciency for a sustainable productivity of agricultur-

41Assessment of deficit irrigation impact on agronomic parameters and water use efficiency of six chickpea cultivars
al systems with using subsurface drip irrigation for maize (Zea mays L.). J. Agric. Sci. Technol. B 1: 881-888.
Ilhe SS, Patil HM, Macharekar RJ. (2009). Water produc-tion function for chickpea under sprinkler method of irrigation. International Journal of Agricultural Sci-ences 5(1): 221-225.
Gan Y. T., Warkentin D.T., Bing D.J.,.Stevenson F.C., McDonald C.L. (2010). Chickpea water use efficiency in relation to cropping system, cultivar, soil nitrogen and Rhizobial inoculation in semiarid environments, Agricultural Water Management 97(9): 1375-1381
Gan, Y., Wang J., Angadi S.V. et Mc Donald C.L. (2004). Response of chickpea to short periods of high tem-perature and water stress at different developmental stages. New directions for a diverse planet: Proceed-ings of the 4th International Crop Science Congress. Brisbane, Australia, 26 Sep.-1 Oct.
Kadam CS, Thanki JD, Gudadhe NN. (2014). Response of chickpea to irrigation methods, fertilisers and biofer-tiliser under south Gujarat condition. Indian J. Fert. 10(4): 20-24.
Kamel M. (1990). Winter chickpea: Status and prospects. Option Méditerranéenne Séries, Séminaires 9: 145-150.
Krouma Abdelmajid, Fujimura T., Abdelly C., 2015. Growth, photosynthetic activity and water relations in three Tunisian chickpea genotypes (cicer arietinum l.) subjected to a progressive water deficit stress, Agri-cultural Science Research Journal 5(12): 206-214.
Mguidiche Belhaj A., Douh B., Gazouani H., Harbaoui K., Sahbi F. (2018) Wheat Yield and Water Use Effi-ciency in the North of Tunisia Under Supplemen-tal Irrigation. In: Kallel A., Ksibi M., Ben Dhia H., Khélifi N. (eds) Recent Advances in Environmental Sci-ence from the Euro-Mediterranean and Surrounding Regions. EMCEI 2017. Advances in Science, Technol-ogy & Innovation (IEREK Interdisciplinary Series for Sustainable Development). Springer, Cham.
Moinuddin A. S. and Khanna-Chopra R. (2004). Osmotic adjustment in chickpea in relation to seed yield and yield parameters, Crop Science 44(2): 449-455.
Molden D., Theib O., Pasquale S., Prem B., Munir A H. et Jacob K. (2010). Improving agricultural water productivity: between optimism and caution. Agric. Water Manage. 97: 528-535.
Rabi A., Martín I. and Rodriguez-Clemente R., 2012. Conceptual Frame on Technological Perspective for Water Resources Management in the Mediter-ranean Region. In: Choukr-Allah R., Ragab R., Rod-riguezClemente R. (eds) Integrated Water Resources Management in the Mediterranean Region. Springer Netherlands, pp 57-65.
Lawlor DW, Cornic G (2002). Photosynthetic carbon assimilation and associated metabolism in relation to water deficits in higher plants. Plant Cell Environ. 25: 275-294.
Oweis T., Hachum A. et Pala M. (2004). Water use effi-ciency of winter-sown chickpea under supplemental irrigation in à Mediterranean environment. Agricul-tural Water Management 66: 163-179.
Pacucci G., Troccoli C. et Leoni B. (2006). Supplementary Irrigation on Yield of Chickpea Genotypes in a Med-iterranen Climate. Agricultural Engineering Interna-tional: The CIGR Ejournal. Manuscript LW 04 005. Vol. VIII. May 2006.
Pundir R.P.S., Reddy K.N. et Mengesha (1992). Pod vol-ume and pod filling as useful traits of chickpea. Inter-national Chickpea Newsletter 17: 18-20.
Sabaghpour, S. H., Mahmodi, A. A., Saeed, A., Kamel, M., Malhotra, R. S. (2006). Study on chickpea drought tolerance lines under dryland condition of Iran. Indian J. Crop Sci. 1: 70-73.
Saxena MC. (1980). Recent advances in chickpea agron-omy. In: Proc. Int. Workshop on Chickpea Improve-ment, 28 Feb–2 Mar 1979, Hyderabad, India, 89–105.
Sheldrake R. and Saxena N.P., 1979. Comparisons of Ear-lier- and Later-formed Pods of Chickpeas (Cicer ari-etinum L.), Annals of Botany 43(4): 467-473.
Siddique K.H.M., Regan K.L., Tennant D., et Thomson B.D. (2001). Water use and water use efficiency of cool season grain legumes in low rainfall Mediterra-nean-type environments. European Journal of Agron-omy 15(4): 267-280.
Singh K.B., Malhotra R.S., Saxena M.C., et Bejiga G. (1995). Analysis of a decade of winter/spring chick-pea. In: Germplasm program legumes; Annu-al report; International Center for Agricultural Research in the Dry Areas (ICARDA); P.O. Box 5466. Aleppo, Syria, 210 p.
Slim N., Sifi B. et Triki S. (2006). Criblage de variétés de pois chiche (Cicer arietinum L.) pour la résistance au stress hydrique. In: Gestion des Ressources et Appli-cations Biotechnologiques en Aridoculture et Cul-tures Sahariennes : Perspectives pour la valorisation des potentialités du Sahara. Séminaire International; Djerba, du 25 au 28 Décembre 2006.
Stewar W.M., 2001, Balanced Fertilization Increases Water Use Efficiency, regional newsletter, the Potash and Phosphate Institute (PPI) and the Potash and Phosphate Institute of Canada (PPIC).
Tiznado J. Garzón, Ochoa-Lugo M., Heiras-Palazuelos M., Domínguez-Arispuro D., Rodríguez E., Gutiérrez-Dorado R., Milán-Carrillo J. and Reyes-Moreno C., (2012). Acceptability Properties and Antioxidant Pon-

42 Douh Boutheina et al.
tential of Desi Chickpea (Cicer arietinum L.) Culti-vars, Food and Nutrition Sciences 3(9): 1281-1289.
USDA (1951). Soil Survey Manual. U.S.Department of Agriculture, Edition Washington D.C. 503 pp.
Wery, J. (1990). Adaptation to frost and drought stress in chickpea and implications in plant breeding. In: Sax-ena M.C; Cubero J.I. and Wery (Eds), Present status and future prospects of chickpea crop production and improvement in the Mediterranean countries, Options Méditerranéennes, Série Séminaires n° 9, CIHEAM, Paris. pp 77-85.
Copyright © 2022 FDOKUMEN