Visibility and Logistic Control Tower - the Accenture case -
Upload
independentCategory
view
1download
0
Erratum to: Beyond Acclamations
and Excuses: Environmental Performance,
Voluntary Environmental Disclosure
and the Role of VisibilityCedric E. Dawkins
John W. Fraas
ABSTRACT. Some researchers have argued that firms
with favorable environmental performance are more likely
to provide voluntary environmental disclosure, while
others have argued that firms with poor environmental
performance are most likely to disclose. The authors pro-
pose a curvilinear relation between environmental per-
formance and environmental disclosure that is moderated
by visibility. Data were obtained from S&P 500 firms
queried by Ceres’ Climate Disclosure Project. Results
show a U-shaped environmental performance–environ-
mental disclosure relation and a main effect for visibility but
no moderating effect for visibility on the U-shaped envi-
ronmental performance–environmental disclosure rela-
tion. The authors discussed the implications of these results
for future research and practice.
KEY WORDS: corporate social responsibility, disclo-
sure, environmental disclosure, corporate social respon-
sibility disclosure, voluntary environmental disclosure
Environmental disclosure is growing in importance
due to the increased demand for environmental
performance information and the prospect that such
information will improve financial performance
(Al-Tuwaijri et al., 2004; Porter and van der Linde,
1995). There are wide variations in environmental
disclosure across companies (Kolk, 2003; Patten,
2002; Russo and Fouts, 1997) and differing views on
why companies voluntarily provide environmental
disclosure. Voluntary disclosure includes informa-
tion that is not required by law or code of practice
(e.g., annual reports and proxy statements) or goes
beyond what is required, and is useful for stake-
holder decision-making. Essentially, there are two
linear explanations for voluntary disclosure that are
termed as legitimacy theory and voluntary disclosure
theory.
Voluntary disclosure theory (Dye, 2001; Verrec-
chia, 1983) is a strategy-based approach that predicts a
positive association between environmental perfor-
mance and the level of voluntary environmental dis-
closure. According to voluntary disclosure theory,
superior environmental performers will attempt to
distinguish themselves by disclosing information
acclaiming their favorable performance relative to
their peers. Firms with inferior environmental records
will disclose less in an attempt to avoid negative
exposure. Conversely, the legitimacy theory approach
(e.g., Patten, 2002) posits that voluntary disclosure is a
function of pressure by institutional and public
stakeholders. Because disclosure is essentially a reac-
tion to this pressure, firms with less favorable envi-
ronmental performance records use disclosure to
explain their performance. Essentially, the voluntary
disclosure approach focuses on acclamations of good
The online version of the original article can be found under
doi:10.1007/s10551-009-0149-2.
The Editor-in-Chief and Springer wish to inform readers of
this journal that the retraction of the paper by Cedric Daw-
kins and John W. Fraas entitled ‘‘Beyond acclamations and
excuses: Environmental performance, voluntary environmen-
tal disclosure and the role of visibility’’ published in Online
First under the DOI number 10.1007/s10551-009-0149-
2 has been replaced by a correction. The Dawkins/Fraas
paper is largely the work of Dawkins and Fraas, but includes
some sentences and ideas that previously appeared in an
unpublished paper and/or Power Point presentation with the
same title only with Cedric Dawkins and Cynthia Clark
Williams listed as authors. The earlier collaborative work with
Professor Williams should have been acknowledged.
Journal of Business Ethics (2011) 99:383–397 � Springer 2010DOI 10.1007/s10551-010-0659-y
performance, while the legitimacy approach is direc-
ted toward excusing poor performance.
In order to move research on environmental dis-
closure beyond acclamations and excuses, we propose
a curvilinear relationship between environmental
performance and environmental disclosure that is
moderated by visibility. If such a curvilinear rela-
tionship exists, it provides a means with which to
reconcile the two primary explanations for corporate
disclosure. In what follows we will review and assess
the current research on environmental performance
and disclosure, develop hypotheses about the pro-
posed relationships, and present and discuss the results
of hypothesis testing.
Environmental performance and voluntary
environmental disclosure
Although there has been an increase in the number
of firms providing environmental information (Kolk,
2003), previous research on the environmental
performance–environmental disclosure relation has
yielded mixed results. Several recent studies have
concluded that heightened attention to environ-
mental performance results in more pressure on poor
performing firms to increase disclosure. Patten
(2002) opined that previous studies of voluntary
disclosure were inconclusive because of methodo-
logical shortcomings such as small sample sizes,
narrow environmental performance measures, and
lack of adequate control measures for firm size and
industry. He addressed those shortcomings using
Toxic Release Index1 (TRI) data to measure envi-
ronmental performance, a widely dispersed sample of
131 US firms, and the Wiseman (1982) Index, which
focuses on the financial consequences of environ-
mental activities, for content analysis, and found a
negative relationship between environmental per-
formance and environmental disclosure.
Hughes et al. (2001) examined the relationship
between environmental disclosures and environ-
mental performance using annual report statements
as a proxy for disclosure, a version of the Wiseman
Index (1982) to measure environmental disclosures
and environmental performance ratings derived from
the Council of Economic Priorities (CEP). They
found no significant difference in environmental
disclosures between companies rated ‘‘good’’ and
companies rated ‘‘average’’ in environmental per-
formance, but firms receiving poor environmental
performance ratings provided more environmental
disclosure. Cho et al. (2006) focused on the content
of disclosure among firms with different levels of
environmental performance by differentiating be-
tween monetary and non-monetary environmental
disclosure. Given that quantitative data are more
precise, they assumed that worse environmental
performers would make more non-monetary envi-
ronmental disclosures than their better performing
competitors. Worse environmental performers did, in
fact, make higher levels of non-monetary environ-
mental disclosures than their better performing
counterparts. Thus, in each of the preceding studies,
there was a negative relationship between environ-
mental performance and disclosure, which is consis-
tent with the legitimacy-based approach to disclosure.
Leading environmental performers have a favor-
able story to tell and their behavior can be more fully
explained by a strategy-based approach like volun-
tary disclosure theory. Al-Tuwaijri et al. (2004)
examined environmental disclosure based on con-
tent analysis of SEC filings and 10 K forms, and
environmental performance based on TRI estimates
of total recycled waste. They determined that strong
environmental performance was significantly asso-
ciated with environmental disclosures and economic
performance. Finally, Clarkson et al. (2008) assessed
the relationship between environmental perfor-
mance and environmental disclosure using content
analysis of sustainability reports of 191 firms in five
high-polluting industries in the U.S. The relation-
ship between TRI and sales and the percentage of
recycled waste were used as proxies for environ-
mental performance. They found a positive rela-
tionship between environmental performance and
the level of voluntary disclosures. Consequently,
they discounted the impact of legitimacy theory in
predicting the level of disclosure.
In sum, the mixed results are attributable to
methodological issues that will be addressed later and
the seemingly incompatible theoretical foci of the
studies. Nevertheless, the legitimacy-based and vol-
untary disclosure approaches are fundamentally
similar in that they seek to favorable manage dis-
closure, but do so from different operational con-
ditions – one focused on maintaining legitimacy and
the other on strategic position. It may be that the
384 Cedric E. Dawkins and John W. Fraas
legitimacy and strategy-based approaches to environ-
mental disclosure need not be mutually exclusive.
Clarkson et al. (2008) allude to this by concluding that
legitimacy theory is useful in predicting what is
disclosed, but inaccurate in predicting how much is
disclosed. Thus, the theoretical divide between legiti-
macy-based and voluntary disclosure-based approaches
to environmental disclosure may be over ought.
Hypothesis
Environmental performance and voluntary disclosure
Legitimacy theory best explains the level of disclo-
sure provided by firms that utilize communication
strategies to protect legitimacy in the face of socio-
political challenges. There are a number of reasons
why poor environmental performers comply with
requests for voluntary disclosure. First, disclosure of
environmental activity is a potential source of
legitimacy (Hooghiemstra, 2000) and because legit-
imacy substantially enhances firm performance
(Oliver, 1991), it is likely that poor performing firms
will attempt to capitalize on that benefit. When
firms meet environmental expectations they are
perceived to be higher in legitimacy (Bansal and
Clelland, 2004). On the other hand, firms failing to
meet environmental expectations are perceived to be
of lower environmental legitimacy but can mitigate
the negative effects by disclosing information and
expressing commitment to the environment (Brown
and Deegan, 1998). For example, Deegan et al.
(2000) determined that the extent of corporate envi-
ronmental disclosure was positively associated with
environmental lobby groups’ concerns about envi-
ronmental performance, and following environmen-
tal catastrophes, companies operating in the affected
industries increased their annual report disclosure.
Second, the marginal utility of enhanced legiti-
macy may be even greater for poor performing firms
than for firms with better environmental records.
Poor performers can do nothing, which would tend
to increase attention and the likelihood of external
regulation (Dutton and Ashford, 1993; Mahon and
Waddock, 1992; Wartick and Cochran, 1985), im-
prove their performance, or influence the way their
performance is perceived by stakeholders. Ignoring
performance may exacerbate the problem and
improving performance may take considerable time.
Gray et al. (1995) and Lindblom (1994) argue that
companies whose social legitimacy is threatened have
incentives to increase environmental disclosures to:
(a) educate and inform relevant publics about changes
in their performance, (b) change perceptions about
their performance, (c) deflect attention from the issue
of concern by highlighting other accomplishments,
and (d) seek to change public expectations of their
performance. Clearly, the most egregious performers
will encounter problems by denying requests for
disclosure. Ceres, an organization of environmentally
conscious investors, accompanied the release of its
2006 Climate Risk Disclosure Project report with the
following headline on its blog, S&P 500 Companies
Faulted for Poor Climate Disclosure (Ceres, 2007a). One
month later Ceres released a list of climate watch firms
from several industries2 and investors filed shareholder
resolutions with those firms (Ceres, 2007b). Provid-
ing disclosure in these circumstances can decrease the
length of the issue’s life cycle. Thus, influencing
stakeholder perception through disclosure is a suitable
way to manage poor environmental performance.
Conversely, the voluntary disclosure literature
(Verrecchia, 1983) posits that good environmental
performers have a number of reasons to inform
stakeholders of their environmental activities. First,
companies may want to call greater attention to
improvements made to environmental programs and
capture the implicit endorsement of key stakeholders
in the process. Responsiveness to CSR issues, such
as environmental impact, can lead to competitive
advantage if a company is able to focus stakeholders’
attention on that resource (Mackey et al., 2007).
Because environmental performance can help a firm
build its brand and reputation (Fombrun, 1996;
McWilliams and Siegel, 2001; Waddock and Graves,
1997) and lead to above-average industry profits
(Russo and Fouts, 1997), it is important to adopt a
pattern of disclosure that capitalizes on this asset.
Another benefit of this approach is that stake-
holders are able to receive ‘‘bad news’’ from the
company along with good news. Godfrey (2005)
proposes that, because stakeholders have become
more wary about the motives of various aspects of
CSR, it is important for companies to avoid the
appearance of ingratiation or symbolic legitimacy (e.g.,
Adams, 2004; Bansal and Kistruck, 2006; Hughes
et al., 2001). It may be that companies that have
385Beyond Acclamations and Excuses
adopted a full disclosure posture with respect to
disclosure have done so because they fundamentally
believe that their strengths outweigh their weak-
nesses and are committed to environmental disclo-
sure as a matter of values. Also, these companies may
want to call greater attention to the program and
policy improvements they have made to their
environmental programs and capture the implicit
endorsement of key stakeholders like Ceres or KLD.
Being perceived as legitimate improves access to
needed resources (Pfeffer and Salancik, 1978). Vol-
untary disclosure theory predicts a positive associa-
tion between environmental performance and the
level of voluntary environmental disclosure.
Thus, poor environmental performance can lead
to an expectations gap, which is a difference be-
tween the way a firm performs and how key external
stakeholders believe it should perform (Wartick and
Mahon, 1994). Firms with unfavorable environ-
mental performance provide disclosure to manage
this expectations gap. On the other hand, firms that
are exceeding stakeholder expectation provide dis-
closure to highlight their favorable performance, but
not so much disclosure as to invite additional media
scrutiny. If both, voluntary disclosure and legitimacy
theory, rationales for disclosure are accurate then as
performance increases or decreases disclosure should
also increase. Firms with average environmental
performance have little to gain by highlighting this
fact and are less likely to raise the ire of stakeholders
by withholding disclosure because they are meeting
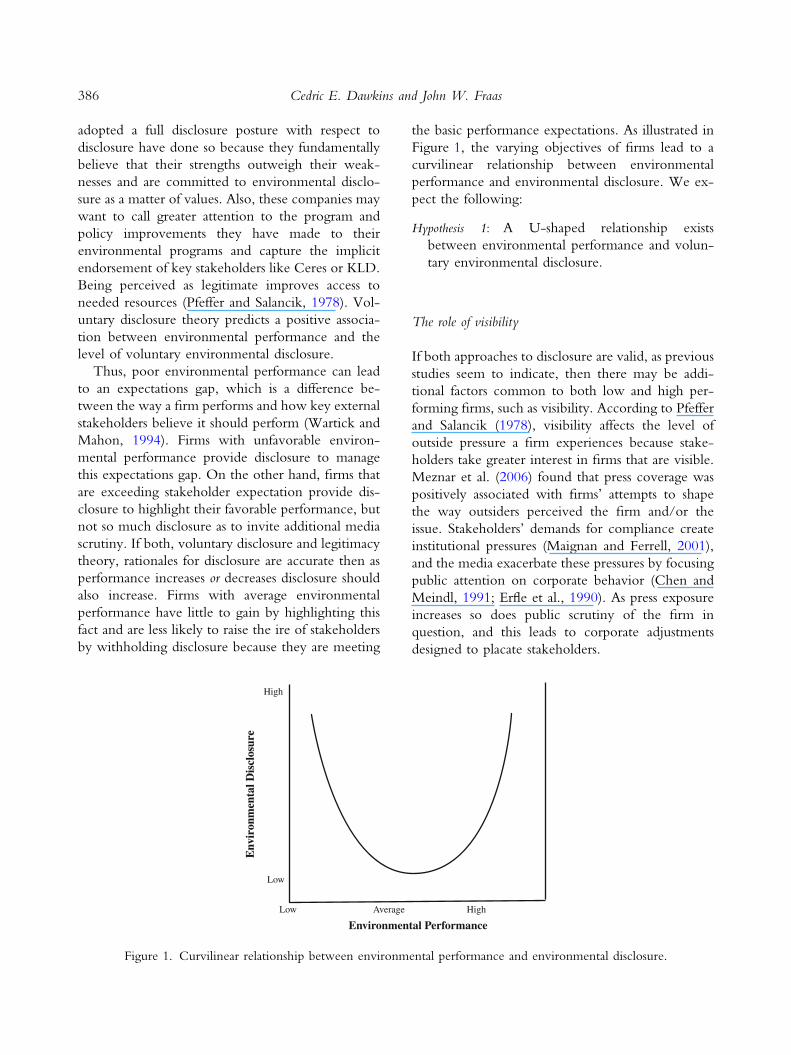
the basic performance expectations. As illustrated in
Figure 1, the varying objectives of firms lead to a
curvilinear relationship between environmental
performance and environmental disclosure. We ex-
pect the following:
Hypothesis 1: A U-shaped relationship exists
between environmental performance and volun-
tary environmental disclosure.
The role of visibility
If both approaches to disclosure are valid, as previous
studies seem to indicate, then there may be addi-
tional factors common to both low and high per-
forming firms, such as visibility. According to Pfeffer
and Salancik (1978), visibility affects the level of
outside pressure a firm experiences because stake-
holders take greater interest in firms that are visible.
Meznar et al. (2006) found that press coverage was
positively associated with firms’ attempts to shape
the way outsiders perceived the firm and/or the
issue. Stakeholders’ demands for compliance create
institutional pressures (Maignan and Ferrell, 2001),
and the media exacerbate these pressures by focusing
public attention on corporate behavior (Chen and
Meindl, 1991; Erfle et al., 1990). As press exposure
increases so does public scrutiny of the firm in
question, and this leads to corporate adjustments
designed to placate stakeholders.
E En n
v vi ir ro o
n nm m
e en nt ta a
l l D Di is s
c cl lo os s
u ur re e
Low
High
Low Average High
Environmental Performance
Figure 1. Curvilinear relationship between environmental performance and environmental disclosure.
386 Cedric E. Dawkins and John W. Fraas
Arguably, increased visibility through press cov-
erage is most likely in the case of inadequate per-
formance than of favorable performance (Gans,
1979). Even so, the expectation gap is likely to be
demonstrated more dramatically by comparing poor
performers with their peer institutions to illustrate
how an issue should be addressed. Bansal and Roth
(2000) have even suggested that some environ-
mentally legitimate firms are reluctant to tout their
environmentally responsible activities and stop dis-
closure after they achieve legitimacy to avoid the
additional visibility and the attending scrutiny. Low
performing firms are not meeting stakeholder
expectations, which bring increased scrutiny on their
shortcomings (Klein, 2000). For example, reporting
on environmental mishaps increased environmental
disclosures in the affected industries (Deegan and
Gordon, 1996; Deegan et al., 2000).
It is important to note that visibility need not be
directly related to environmental issues. Highly visible
firms that do well or poorly with respect to envi-
ronmental issues would tend to receive more media
scrutiny for environmental performance because of
their visibility. Following this line of reasoning, firms
with neither low nor high levels of environmental
performance are less visible and thereby better posi-
tioned strategically to withhold disclosure than either
their lower or higher performing peers. It appears that
as environmental performance decreases or increases,
firms are more vulnerable to the effects of visibility
and thereby more likely provide disclosure. That is,
the effects of environmental performance [ep] on
environmental disclosure [ed] depend on the degree
of visibility on the firm in question [v], such that firm’s
visibility will generally increase disclosure over what
would be expected if there was no visibility (e.g.,
ed = ep * v).
Hypothesis 2: Visibility moderates the U-shaped
relationship between environmental performance
and voluntary environmental disclosure.
Methods
Sample
The firms in this study were members of the S&P
500, a stock market index containing the stocks of
500 large capitalization corporations from the
United States. We have also employed the 2005
Kinder, Lydenberg and Domini (KLD) ratings of
environmental performance and the 2006 Ceres
Carbon Disclosure Project survey of S&P 500 firms
(Ceres, 2007a). KLD is a ratings firm specializing in
corporate social performance (CSP) analysis and
rankings. The advantages of the KLD ratings are that
they (a) utilize an objective set of evaluative criteria
(b) are consistently applied across companies by a
specialized, independent staff, (c) employ a wide
variety of company, government, NGO, and media
sources, and (d) have been widely used in CSP re-
search (e.g., Dawkins, 2002; Johnson and Greening,
1999; Johnston, 1994; Waddock, 2003). Ceres is a
network of investors, environmental groups, and
public interest groups that encourages firms to
incorporate environmental and social challenges into
their daily decision-making and has launched pro-
grams such as the Global Reporting Initiative, the
Sustainable Governance Forum on Climate Risk, and
the Investor Network on Climate Risk.
Firms were included in the study sample if they
were (a) included in the S&P 500 in 2005 and 2006,
(b) evaluated for environmental performance in the
2005 KLD performance ratings; and (c) received a
request from Ceres to participate in the Ceres 2006
Climate Disclosure Project survey. Our hypotheses
imply a temporal relationship between variables in
that environmental performance and visibility would
influence later disclosure. Thus, we have staggered
the years of data collection to allow the KLD envi-
ronmental performance ratings and visibility to
influence later levels of environmental disclosure.
This procedure yielded 363 firms that ranged in total
assets3 from $259.0 to $1,051,450 million. The
mean number of employees for the sample firms was
43,400 and the mean return on assets was 8.28%.
Measures
As noted earlier, the mixed results in studies of
environmental performance and disclosure are partly
attributable to continuing methodological difficulties
that result in limited industry coverage and small
sample sizes, and failure to adequately reconcile
the legitimacy theory and voluntary disclosure
approaches. Because the Wiseman scale (e.g.,
387Beyond Acclamations and Excuses
Clarkson et al., 2008; Patten, 2002) focuses on the
financial consequences of corporate environmental
activities, poor environmental performers disclose
more because they have greater exposure and must
detail the financial ramifications of those exposures in
their regulatory filings. A number of the studies con-
tinue to use the CEP ratings that monitor a limited
number of firms and industries resulting in restricted
sample size and breadth. In addition, the CEP evaluates
environmental performance in different industries
with different criteria, which limits generalizability.
Also, a number of studies used the TRI measure
for environmental performance that focuses on
negative outcome measures (e.g., Al-Tuwaijri et al.,
2004; Patten, 2002) to the virtual exclusion of input
measures such as equipment maintenance, the use of
recyclables in production, and ISO 14,000 envi-
ronmental certification. As will be detailed later, we
address these shortcomings using (a) an environ-
mental performance measure that includes both in-
put and outcome measures, (b) the S&P 500 sample
to improve sample size and industry representation,
and (c) the Ceres disclosure ratings to assess disclo-
sure rather than the Wiseman scale.
Consequently, the key research design challenge
in the study of environmental performance and
disclosure was to develop reliable proxies for the
variables. Besides increasing the number and variety
of firms in the sample, we have addressed this
challenge in two ways. First, we employed a measure
of environmental performance that included positive
input activities as well as the more commonly em-
ployed negative outcome metrics, which enabled us
to compare the disclosure practices of good per-
formers and poor performers concurrently. Second,
we used an environmental disclosure measure
developed by Ceres that avoided the negative bias of
the Wiseman scale and the use of different industry
performance measures that called into question the
validity of cross-industry comparisons.
Dependent variable
Voluntary environmental disclosure comprised the
firms’ responses to an environmental disclosure
survey request made by Ceres. In response to the
survey, Ceres categorized firm responses into four
areas: (a) ignored or refused the request, (b) provided
alternative information, (c) provided information
but required that it not be made public,4 or (d)
complied with the request. Because ignoring the re-
quest and refusing the request have the same out-
come, we placed these four responses into three basic
areas: (a) no disclosure, firms that ignored or refused
the request; (b) partial disclosure, firms provided
different5 or incomplete information; or (c) full dis-
closure, complied with the request by providing
complete information. In this way, the dependent
variable voluntary environmental disclosure was devel-
oped as an ordinal variable with three levels: no dis-
closure (n = 139), partial disclosure (n = 89), and full
disclosure (n = 127).
Independent variables
The independent variable environmental performance
was determined on the basis of KLD environmental
performance ratings. To evaluate environmental
performance, KLD evaluated a number of activities
that were indicators of environmental strengths or
environmental concerns. Those questions are listed in
the Appendix. The KLD environmental performance
strength assessment considered proactive measures of
performance such as pollution prevention programs,
use of recycled materials in manufacturing, mainte-
nance of equipment, and ISO certifications. Con-
versely, the environmental weakness assessment
accounted for negative outcomes such as recently paid
fines for waste management violations, high toxic
emissions, and regulatory fines or controversies. A
strength or weakness on an assessment item was
indicated numerically with a rating of 1. If the firm did
not exhibit the strength nor weakness item in ques-
tion, this was indicated with a rating of 0 (KLD
Analytics, 2007b). Environmental performance was
developed as a continuous variable by subtracting the
pro-rata concern score from the pro-rata strength
score for each firm.6
A second independent variable was formed from
the values in the environmental performance variable.
Each of the environmental performance values was
squared to construct the variable required to reflect
the second-degree component of the U-shaped
relationship between environmental performance
and voluntary environmental disclosure stipulated in
Hypothesis 1. This independent variable was labeled
environmental performance2.
The third independent variable was visibility. As
with other measures of visibility (e.g., Dawkins,
2005; Meznar and Nigh, 1995), we used the number
388 Cedric E. Dawkins and John W. Fraas
and timing of articles published in the popular press
to measure visibility. The newspapers selected had
national reputations and were from different regions
of the U.S. to assure broad coverage. The number of
times a firm was mentioned in the New York
Times, Washington Post, Wall Street Journal, USA
Today, or Los Angeles Times during the calendar
year of 1996 were identified by a Lexis-Nexis search
for the sample firms and summed to yield a visibility
score.7 Altogether, the firms in our sample were
mentioned in 11,258 articles during 1996 with
scores ranging from 0 to 678. The visibility variable
had very positively skewed distributions, and thus
we used logarithmic transformation to permit valid
statistical analyses.
Two additional independent variables were gen-
erated to determine whether the U-shaped rela-
tionship between environmental performance and
voluntary environmental was modified by visibility.
The first of these variables, which was labeled
enperXvis, was formed by multiplying the environ-
mental performance variable by the visibility vari-
able. The second variable, which was labeled
enperXvis2, was constructed by multiplying the
square of each environmental performance value by
the company’s visibility value.
Control variables
Previous research has indicated that performance,
size, and industry can affect disclosure practices and
CSP ratings (Bushman et al., 2004; Graves and
Waddock, 1994; Patten, 2002; Roberts, 1992).
Hence, we formed additional independent variables
as control variables. Financial performance was measured
as the return on assets, and size was measured as the
logarithm of total assets.8 Industry was employed as a
control variable because pollution propensity and
outside monitoring varied from industry to industry.
Our sample included firms from the 10 industry
sectors used in the Ceres Risk Disclosure Survey
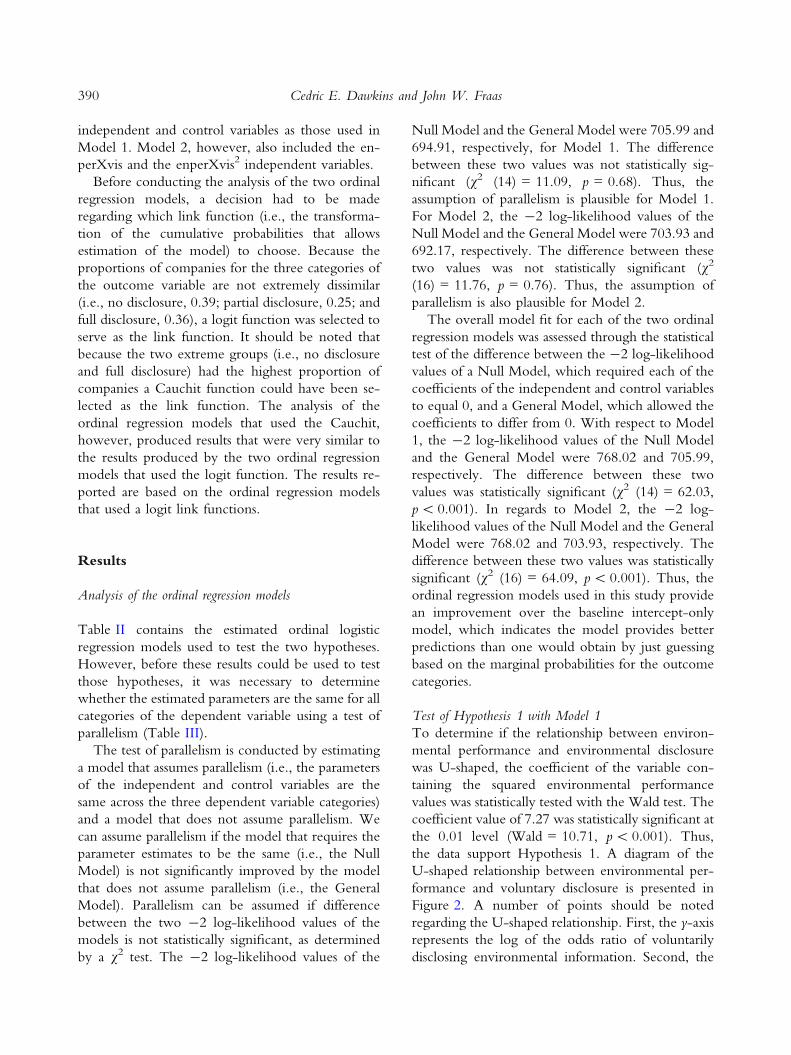
(Ceres, 2007c). The highest concentrations of firms
were in consumer discretionary (68) and finance (60)
industries, while telecommunications industry sectors
had the lowest concentration of firms (7). Each of the
industry classifications was well represented as a per-
centage of total sample size except telecommunica-
tions, which comprised 1.9% of the sample. Summary
data on the industry and disclosure variables from the
sample firms are provided in Table I.
Data analysis
Construction of the ordinal regression model
The dependent variable, voluntary disclosure, con-
sisted of three categories: (a) no disclosure, firms that
ignored or refused the request; (b) partial disclosure,
firms provided different9 or incomplete information;
or (c) full disclosure, complied with the request by
providing complete information. In the analysis
conducted for this study, these three categories of
the voluntary disclosure dependent variable were
treated as ordinal under the assumption that the
categories have a natural ordering (none, partial, and
full), but the distances between adjacent levels are
unknown. Due to this assumption, the data were
subjected to ordinal regression analyses to statistically
test the two hypotheses previously presented. The
first ordinal regression model, labeled Model 1,
which was used to test the Hypothesis 1, included
the continuous independent variables of environ-
mental performance, environmental performance2,
and visibility. In addition, Model 1 included the
continuous control variables of size and financial
performance, and 9 of the 10 dichotomous variables
representing the 10 industries. The second ordinal
regression model, labeled Model 2, which was
used to test the Hypothesis 2, included the same
TABLE I
Disclosure and industry frequencies
N Percentage
Ceres
No disclosure 139 39.4
Partial disclosure 89 24.8
Full disclosure 127 35.8
Industry
Consumer discretionary 66 18.6
Consumer staples 30 8.5
Energy 23 6.5
Finance 60 16.9
Healthcare 36 10.1
Industrial 42 11.8
Information technology 51 14.4
Materials 19 5.4
Telecommunications 7 2.0
Utilities 21 5.9
389Beyond Acclamations and Excuses
independent and control variables as those used in
Model 1. Model 2, however, also included the en-
perXvis and the enperXvis2 independent variables.
Before conducting the analysis of the two ordinal
regression models, a decision had to be made
regarding which link function (i.e., the transforma-
tion of the cumulative probabilities that allows
estimation of the model) to choose. Because the
proportions of companies for the three categories of
the outcome variable are not extremely dissimilar
(i.e., no disclosure, 0.39; partial disclosure, 0.25; and
full disclosure, 0.36), a logit function was selected to
serve as the link function. It should be noted that
because the two extreme groups (i.e., no disclosure
and full disclosure) had the highest proportion of
companies a Cauchit function could have been se-
lected as the link function. The analysis of the
ordinal regression models that used the Cauchit,
however, produced results that were very similar to
the results produced by the two ordinal regression
models that used the logit function. The results re-
ported are based on the ordinal regression models
that used a logit link functions.
Results
Analysis of the ordinal regression models
Table II contains the estimated ordinal logistic
regression models used to test the two hypotheses.
However, before these results could be used to test
those hypotheses, it was necessary to determine
whether the estimated parameters are the same for all
categories of the dependent variable using a test of
parallelism (Table III).
The test of parallelism is conducted by estimating
a model that assumes parallelism (i.e., the parameters
of the independent and control variables are the
same across the three dependent variable categories)
and a model that does not assume parallelism. We
can assume parallelism if the model that requires the
parameter estimates to be the same (i.e., the Null
Model) is not significantly improved by the model
that does not assume parallelism (i.e., the General
Model). Parallelism can be assumed if difference
between the two -2 log-likelihood values of the
models is not statistically significant, as determined
by a v2 test. The -2 log-likelihood values of the
Null Model and the General Model were 705.99 and
694.91, respectively, for Model 1. The difference
between these two values was not statistically sig-
nificant (v2 (14) = 11.09, p = 0.68). Thus, the
assumption of parallelism is plausible for Model 1.
For Model 2, the -2 log-likelihood values of the
Null Model and the General Model were 703.93 and
692.17, respectively. The difference between these
two values was not statistically significant (v2
(16) = 11.76, p = 0.76). Thus, the assumption of
parallelism is also plausible for Model 2.
The overall model fit for each of the two ordinal
regression models was assessed through the statistical
test of the difference between the -2 log-likelihood
values of a Null Model, which required each of the
coefficients of the independent and control variables
to equal 0, and a General Model, which allowed the
coefficients to differ from 0. With respect to Model
1, the -2 log-likelihood values of the Null Model
and the General Model were 768.02 and 705.99,
respectively. The difference between these two
values was statistically significant (v2 (14) = 62.03,
p < 0.001). In regards to Model 2, the -2 log-
likelihood values of the Null Model and the General
Model were 768.02 and 703.93, respectively. The
difference between these two values was statistically
significant (v2 (16) = 64.09, p < 0.001). Thus, the
ordinal regression models used in this study provide
an improvement over the baseline intercept-only
model, which indicates the model provides better
predictions than one would obtain by just guessing
based on the marginal probabilities for the outcome
categories.
Test of Hypothesis 1 with Model 1
To determine if the relationship between environ-
mental performance and environmental disclosure
was U-shaped, the coefficient of the variable con-
taining the squared environmental performance
values was statistically tested with the Wald test. The
coefficient value of 7.27 was statistically significant at
the 0.01 level (Wald = 10.71, p < 0.001). Thus,
the data support Hypothesis 1. A diagram of the
U-shaped relationship between environmental per-
formance and voluntary disclosure is presented in
Figure 2. A number of points should be noted
regarding the U-shaped relationship. First, the y-axis
represents the log of the odds ratio of voluntarily
disclosing environmental information. Second, the
390 Cedric E. Dawkins and John W. Fraas
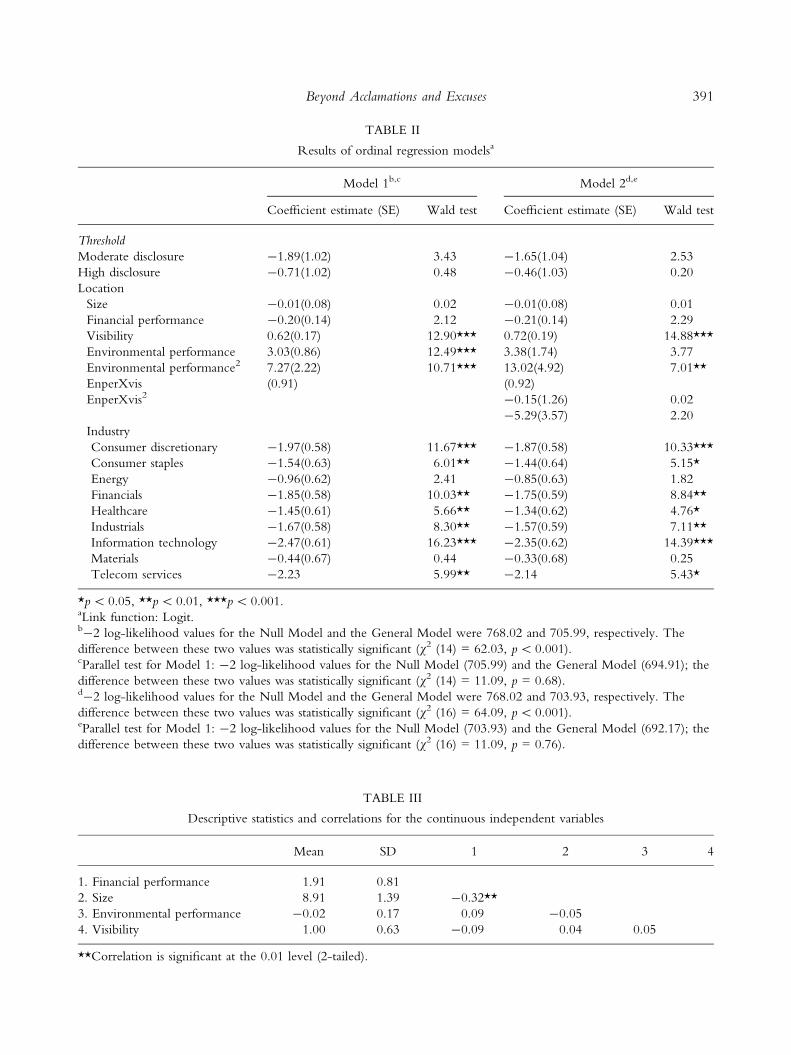
TABLE III
Descriptive statistics and correlations for the continuous independent variables
Mean SD 1 2 3 4
1. Financial performance 1.91 0.81
2. Size 8.91 1.39 -0.32**
3. Environmental performance -0.02 0.17 0.09 -0.05
4. Visibility 1.00 0.63 -0.09 0.04 0.05
**Correlation is significant at the 0.01 level (2-tailed).
TABLE II
Results of ordinal regression modelsa
Model 1b,c Model 2d,e
Coefficient estimate (SE) Wald test Coefficient estimate (SE) Wald test
Threshold
Moderate disclosure -1.89(1.02) 3.43 -1.65(1.04) 2.53
High disclosure -0.71(1.02) 0.48 -0.46(1.03) 0.20
Location
Size -0.01(0.08) 0.02 -0.01(0.08) 0.01
Financial performance -0.20(0.14) 2.12 -0.21(0.14) 2.29
Visibility 0.62(0.17) 12.90*** 0.72(0.19) 14.88***
Environmental performance 3.03(0.86) 12.49*** 3.38(1.74) 3.77
Environmental performance2 7.27(2.22) 10.71*** 13.02(4.92) 7.01**
EnperXvis (0.91) (0.92)
EnperXvis2 -0.15(1.26) 0.02
-5.29(3.57) 2.20
Industry
Consumer discretionary -1.97(0.58) 11.67*** -1.87(0.58) 10.33***
Consumer staples -1.54(0.63) 6.01** -1.44(0.64) 5.15*
Energy -0.96(0.62) 2.41 -0.85(0.63) 1.82
Financials -1.85(0.58) 10.03** -1.75(0.59) 8.84**
Healthcare -1.45(0.61) 5.66** -1.34(0.62) 4.76*
Industrials -1.67(0.58) 8.30** -1.57(0.59) 7.11**
Information technology -2.47(0.61) 16.23*** -2.35(0.62) 14.39***
Materials -0.44(0.67) 0.44 -0.33(0.68) 0.25
Telecom services -2.23 5.99** -2.14 5.43*
*p < 0.05, **p < 0.01, ***p < 0.001.aLink function: Logit.b-2 log-likelihood values for the Null Model and the General Model were 768.02 and 705.99, respectively. The
difference between these two values was statistically significant (v2 (14) = 62.03, p < 0.001).cParallel test for Model 1: -2 log-likelihood values for the Null Model (705.99) and the General Model (694.91); the
difference between these two values was statistically significant (v2 (14) = 11.09, p = 0.68).d-2 log-likelihood values for the Null Model and the General Model were 768.02 and 703.93, respectively. The
difference between these two values was statistically significant (v2 (16) = 64.09, p < 0.001).eParallel test for Model 1: -2 log-likelihood values for the Null Model (703.93) and the General Model (692.17); the
difference between these two values was statistically significant (v2 (16) = 11.09, p = 0.76).
391Beyond Acclamations and Excuses
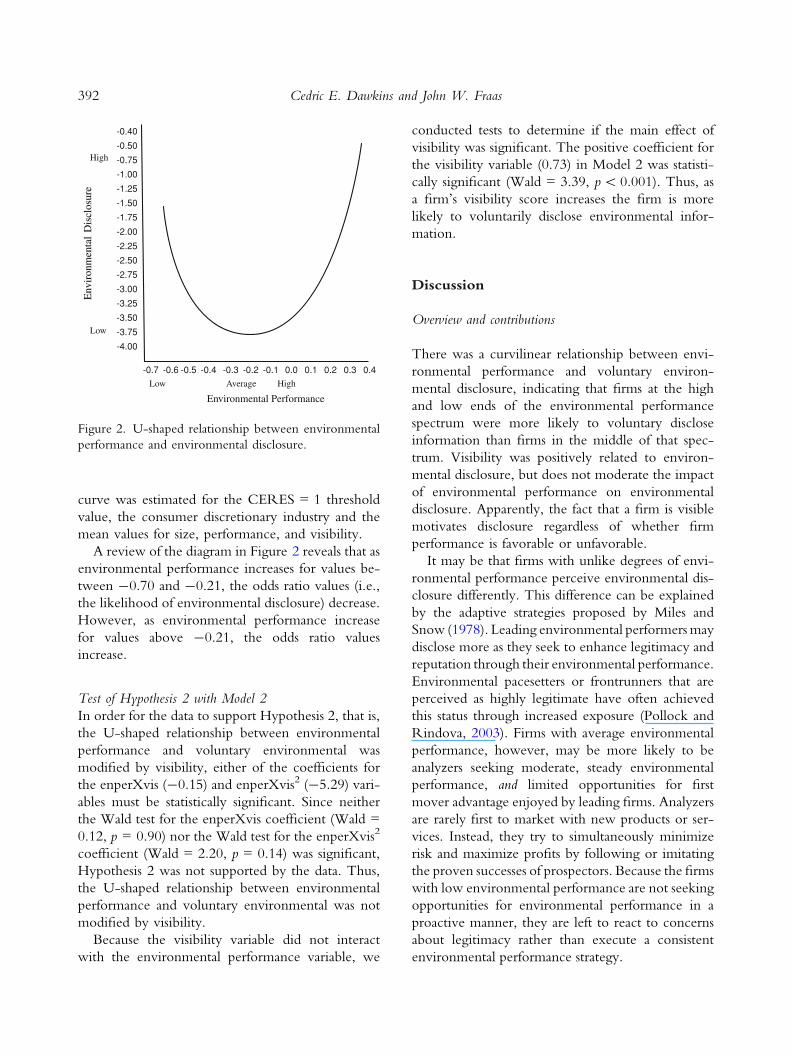
curve was estimated for the CERES = 1 threshold
value, the consumer discretionary industry and the
mean values for size, performance, and visibility.
A review of the diagram in Figure 2 reveals that as
environmental performance increases for values be-
tween -0.70 and -0.21, the odds ratio values (i.e.,
the likelihood of environmental disclosure) decrease.
However, as environmental performance increase
for values above -0.21, the odds ratio values
increase.
Test of Hypothesis 2 with Model 2
In order for the data to support Hypothesis 2, that is,
the U-shaped relationship between environmental
performance and voluntary environmental was
modified by visibility, either of the coefficients for
the enperXvis (-0.15) and enperXvis2 (-5.29) vari-
ables must be statistically significant. Since neither
the Wald test for the enperXvis coefficient (Wald =
0.12, p = 0.90) nor the Wald test for the enperXvis2
coefficient (Wald = 2.20, p = 0.14) was significant,
Hypothesis 2 was not supported by the data. Thus,
the U-shaped relationship between environmental
performance and voluntary environmental was not
modified by visibility.
Because the visibility variable did not interact
with the environmental performance variable, we
conducted tests to determine if the main effect of
visibility was significant. The positive coefficient for
the visibility variable (0.73) in Model 2 was statisti-
cally significant (Wald = 3.39, p < 0.001). Thus, as
a firm’s visibility score increases the firm is more
likely to voluntarily disclose environmental infor-
mation.
Discussion
Overview and contributions
There was a curvilinear relationship between envi-
ronmental performance and voluntary environ-
mental disclosure, indicating that firms at the high
and low ends of the environmental performance
spectrum were more likely to voluntary disclose
information than firms in the middle of that spec-
trum. Visibility was positively related to environ-
mental disclosure, but does not moderate the impact
of environmental performance on environmental
disclosure. Apparently, the fact that a firm is visible
motivates disclosure regardless of whether firm
performance is favorable or unfavorable.
It may be that firms with unlike degrees of envi-
ronmental performance perceive environmental dis-
closure differently. This difference can be explained
by the adaptive strategies proposed by Miles and
Snow (1978). Leading environmental performers may
disclose more as they seek to enhance legitimacy and
reputation through their environmental performance.
Environmental pacesetters or frontrunners that are
perceived as highly legitimate have often achieved
this status through increased exposure (Pollock and
Rindova, 2003). Firms with average environmental
performance, however, may be more likely to be
analyzers seeking moderate, steady environmental
performance, and limited opportunities for first
mover advantage enjoyed by leading firms. Analyzers
are rarely first to market with new products or ser-
vices. Instead, they try to simultaneously minimize
risk and maximize profits by following or imitating
the proven successes of prospectors. Because the firms
with low environmental performance are not seeking
opportunities for environmental performance in a
proactive manner, they are left to react to concerns
about legitimacy rather than execute a consistent
environmental performance strategy.
E En nv v
i ir ro on n
m me en n
t ta al l
D Di is s
c cl lo os s
u ur re e
Low
High
Low Average High
Environmental Performance
-0.40
-0.50
-0.75
-1.00
-1.25
-1.50
-1.75
-2.00
-2.25
-2.50
-2.75
-3.00
-3.25
-3.50
-3.75
-4.00
-0.7 -0.6 -0.5 -0.4 -0.3 -0.2 -0.1 0.0 0.1 0.2 0.3 0.4
Figure 2. U-shaped relationship between environmental
performance and environmental disclosure.
392 Cedric E. Dawkins and John W. Fraas
Fombrun et al. (2000) characterize different ap-
proaches to CSP in terms of opportunity platforms
and safety nets. Firms that were rated highly for
environmental strengths utilized environmental dis-
closure as an opportunity platform, while those that
exhibited more environmental weaknesses used
disclosure as a safety net against threats to legitimacy.
As firms’ environmental performance deteriorates, it
becomes more necessary to provide reasons for the
poor performance and assurance of commitment to
the environment (Bansal and Clelland, 2004), and as
performance improves it becomes more valuable as a
strategic asset. There is an emerging stream of re-
search examining how companies use CSR report-
ing to highlight their commitment to corporate
social responsibility (e.g., Brammer and Pavelin,
2004; Hooghiemstra, 2000). Institutional pressure
and increased visibility appear to be key reasons for
attempts to alter public perception about the legiti-
macy of the firms through voluntary disclosure.
Firms with neither low nor high environmental
performance were less likely to perceive the need to
act for reasons of strategic opportunity or safety.
By focusing on reconciling the legitimacy and
voluntary disclosure approaches to environmental
disclosure, our analysis opens up new avenues for
research. First, it contributes toward clarification of
the different outcomes proposed by legitimacy the-
ory and voluntary disclosure explanations for envi-
ronmental performance–environmental disclosure
relation. Second, it highlights the role of visibility in
the amount of disclosure firms are willing to make.
Third, the study provides some new methodological
approaches. Using the KLD and Ceres databases
enabled a very broad and representative sample,
which has been lacking in a number of previous
studies due to the limitations of acquiring environ-
mental data. The measure of environmental perfor-
mance included proactive types of planning and
reporting in addition to outcome measures that have
tended to result in a negative relationship between
performance and disclosure.
Implications for research and practice
Although the study sheds light on a variety of issues
surrounding environmental performance and envi-
ronmental disclosure and raises the issue of visibility
(at least in large, American, publicly held firms), it
raises other issues about the role of visibility and the
behavior of average performing firms versus those at
the ends of the performance spectrum. As Clarkson
et al. (2008) have alluded, future research should
examine poor and strong performers’ use of more
strategic disclosure techniques (e.g., partial or full
disclosure) to capture a greater variation of type and
form of environmental responses. Neither the
legitimacy nor voluntary disclosure approaches focus
on firms with average environmental performance
ratings. Given that most firms are likely to exhibit
average environmental performance, future research
might focus on firms with moderate levels of envi-
ronmental performance as well.
It would also be beneficial to test for nonlinear
relationships among different industries with respect
to environmental performance and environmental
disclosure. As our results show, there are consider-
able disclosure differences among industries that
have a high impact on the environment and those
that have a low impact on the environment. While
this finding is consistent with previous research
(Kolk, 2003), future research could focus on firms
within a single high-impact industry to tease out
within-sector differences. Likewise, a low-impact
industry, such as banking, could be examined to see
why some firms within that industry are proactive in
terms of environmental disclosures while others are
not. More research is needed to address these
important questions.
In view of our findings, managers of firms with
inconspicuous environmental performance may in-
deed have more discretion in their activities than their
more conspicuous peers. For stakeholder groups, the
implication is very clear; managers respond to sunlight
and exposure similar to the Ceres environmental
‘‘watch’’ list is likely to be effective. According to
signaling theory (Spence, 1973), corporations with
superior information transparency signal better cor-
porate governance. Hence, even those who do not
choose to provide disclosure are, by default, giving an
indication of how their firms view disclosure.
Study limitations and conclusion
The limitations of this study provide avenues for
further research. First, the results of the study might
393Beyond Acclamations and Excuses
be enriched by a finer grained analysis of visibility. In
this study, we made no distinction between articles
that report on environment or sustainability and those
that may be touting a new product launch. While
visibility need not be directly related to environ-
mental issues, a careful analysis that provides the tenor
of visibility and press coverage, though a daunting and
time consuming task, might lead to a better under-
standing of the role of visibility coverage associated
with firms’ patterns of disclosure. Second, because we
have no absolute measure of environmental perfor-
mance, it is possible that we have a sample or sample
year in which most firms performed well or poorly.
Finally, a longitudinal approach to assess environ-
mental performance might be helpful in addressing
this shortcoming. By shedding a bit more light on the
nature of the interface between environmental per-
formance and environmental disclosure, we hope to
assist the efforts of firms in providing disclosure in a
financially and socially responsible manner, and
stakeholders in efforts to receive the information they
need to protect their interests.
Notes
1 The TRI is a publicly available Environmental Pro-
tection Agency database that contains information on
toxic chemical releases and waste management activities
reported annually by certain industries as well as federal
facilities.2 Banking & Financial – Wells Fargo; Electric Power
– TXU, Dominion Resources, and Allegheny Energy;
Coal – Massey Energy and Consol. Energy Insurance –
ACE; Oil & Gas – ExxonMobil and ConocoPhillips;
and Retail – Bed Bath & Beyond.3 As of December 31, 2005.4 Ceres makes the firm responses available to its mem-
bers and, with the firm’s permission, publishes its report
on its web site for general access.5 For example, the company attached its corporate
sustainability report.6 The number of items used to rate strengths and
weaknesses differed, which precluded simply subtracting
total weakness scores from total strength scores to ob-
tain a composite score.7 In order to be counted as a ‘‘mention’’ the firm had
to be included in the article title and first paragraph.8 Log of total assets was used because the distribution
was skewed by a few very large observations.
Appendix: KLD environmental performance
rating criteria
Strengths
1. Beneficial products and services. The company
derives substantial revenues from innovative
remediation products, environmental ser-
vices, or products that promote the effi-
cient use of energy, or it has developed
innovative products with environmental
benefits.
2. Pollution prevention. The company has notably
strong pollution prevention programs includ-
ing both emissions reductions and toxic-use
reduction programs.
3. Recycling. The company either is a substantial
user of recycled materials as raw materials in
its manufacturing processes or a major factor
in the recycling industry.
4. Clean energy. The company has taken signifi-
cant measures to reduce its impact on climate
change and air pollution through use of
renewable energy and clean fuels or through
energy efficiency. The company has demon-
strated a commitment to promoting climate-
friendly policies and practices outside its own
operations.
5. Communications. The company is a signatory
to the Ceres Principles, publishes a notably
substantive environmental report, or has
notably effective internal communications
systems in place for environmental best prac-
tices.
6. Property, plant, and equipment. The company
maintains its property, plant, and equipment
with above-average environmental perfor-
mance for its industry. KLD has not assigned
strengths for this issue since 1995.
7. Management systems. The company has demon-
strated a superior commitment to management
systems through ISO 14001 certification and
other voluntary programs. This strength was
first awarded in 2006.
8. Other strength. The company has demon-
strated a superior commitment to manage-
ment systems, voluntary programs, or other
environmentally proactive activities.
394 Cedric E. Dawkins and John W. Fraas
Concerns
1. Hazardous waste. The company’s liabilities for
hazardous waste sites exceed $50 million, or
the company has recently paid substantial
fines or civil penalties for waste management
violations.
2. Regulatory problems. The company has re-
cently paid substantial fines or civil penalties
for violations of air, water, or other environ-
mental regulations, or it has a pattern of reg-
ulatory controversies under the Clean Air
Act, Clean Water Act, or other major envi-
ronmental regulations.
3. Ozone depleting chemicals. The company
is among the top manufacturers of ozone
depleting chemicals such as HCFCs, methyl
chloroform, methylene chloride, or bromines.
4. Substantial emissions. The company’s legal
emissions of toxic chemicals (as defined by
and reported to the EPA) from individual
plants into the air and water are among the
highest of the companies followed by KLD.
5. Agricultural chemicals. The company is a sub-
stantial producer of agricultural chemicals,
i.e., pesticides or chemical fertilizers.
6. Climate change. The company derives substan-
tial revenues from the sale of coal or oil and its
derivative fuel products, or the company de-
rives substantial revenues indirectly from the
combustion of coal or oil and its derivative
fuel products. Such companies include electric
utilities, transportation companies with fleets
of vehicles, auto and truck manufacturers, and
other transportation equipment companies.
7. Other concern. The company has been in-
volved in an environmental controversy that
is not covered by other KLD ratings.
References
Adams, C. A.: 2004, ‘The Ethical, Social and Environmental
Reporting-Performance Portrayal Gap’, Accounting,
Auditing & Accountability Journal 17(5), 731–757.
Al-Tuwaijri, S. A., T. E. Christensen and K. E. Hughes:
2004, ‘The Relations Among Environmental Dis-
closure, Environmental Performance, and Economic
Performance: A Simultaneous Equations Approach’,
Accounting, Organizations & Society 29(5/6), 447–465.
Bansal, P. and I. Clelland: 2004, ‘Talking Trash: Legiti-
macy, Impression Management, and Unsystematic
Risk in the Context of the Natural Environment’,
Academy of Management Journal 47(1), 93–103.
Bansal, P. and G. Kistruck: 2006, ‘Seeing is (not)
Believing: Managing the Impressions of the Firm‘ and
Commitment to the Natural Environment’, Journal of
Business Ethics 67(2), 165–180.
Bansal, P. and K. Roth: 2000, ‘Why Companies Go
Green: A Model of Ecological Responsiveness’,
Academy of Management Journal 43(4), 717–736.
Brammer, S. and S. Pavelin: 2004, ‘Voluntary Social
Disclosures by Large UK Companies’, Business Ethics:
A European Review 13(2/3), 86–99.
Brown, N. and C. Deegan: 1998, ‘The Public Disclosure
of Environmental Performance Information – A Dual
Test of Media Agenda Setting Theory and Legitimacy
Theory’, Accounting & Business Research 29(1), 21–41.
Bushman, R. M., J. D. Piotroski and A. J. Smith: 2004,
‘What Determines Corporate Transparency?’, Journal
of Accounting Research 42(2), 207–252.
Ceres: 2007a, January 31, S&P 500 Companies Faulted For
Poor Climate Disclosure. Downloaded from the World
Wide Web on February 26, 2007, http://www.ceres.
org/news/news_item.php?nid=264.
Ceres: 2007b, TXU, Exxon Mobil Among 10 ‘Climate
Watch’ Companies Targeted by Investors. Retrieved
May 22, 2008, from http://news-ceres.blogspot.com/
2007/02/txu-exxon-mobil-among-10-climate-watch.
html.
Ceres: 2007c, Climate Risk Disclosure and the S&P 500.
Ceres. Downloaded from the World Wide Web on
February 26, 2007, http://www.ceres.org/Document.
Doc?id=473. Retrieved June 15, 2009.
Chen, C. C. and J. R. Meindl: 1991, ‘The Construction
of Leadership Images in the Popular Press: The Case of
Donald Burr and People Express’, Administrative Science
Quarterly 36(4), 21–55.
Cho, C., D. Patten and R. Roberts: 2006, ‘Corporate
Political Strategy: An Examination of the Relation
between Political Expenditures, Environmental Per-
formance, and Environmental Disclosure’, Journal of
Business Ethics 67(2), 139–154.
Clarkson, P. M., Y. Li, G. D. Richardson and F. P.
Vasvari: 2008, ‘Revisiting the Relation Between
Environmental Performance and Environmental
Disclosure: An Empirical Analysis’, Accounting, Orga-
nizations & Society 33(4/5), 303–327.
Dawkins, C. E.: 2002, ‘Corporate Welfare, Corporate
Citizenship, and the Question of Accountability’,
Business & Society 41(3), 269.
395Beyond Acclamations and Excuses
Dawkins, C. E.: 2005, ‘First to Market: Issue Management
Pacesetters and the Pharmaceutical Industry Response
to AIDS in Africa’, Business & Society 44(3), 244–282.
Deegan, C. and B. Gordon: 1996, ‘A Study of the
Environmental Disclosure Practices of Australian
Corporations’, Accounting & Business Research 26(3),
187–199.
Deegan, C., M. Rankin and P. Voght: 2000, ‘Firms’
Disclosure Reactions to Major Social Incidents: Aus-
tralian Evidence’, Accounting Forum 24(1), 101–130.
Dutton, J. E. and S. J. Ashford: 1993, ‘Selling Issues to
Top Management’, Academy of Management Review
18(3), 397–428.
Dye, R. A.: 2001, ‘An Evaluation of ‘Essays on Dis-
closure’ and the Disclosure Literature in Accounting’,
Journal of Accounting and Economics 32, 181–235.
Erfle, S., H. McMillan and B. Grofman: 1990, ‘Regula-
tion via Threats: Politics, Media Coverage, and Oil
Pricing Decisions’, Public Opinion Quarterly 54(1),
48–49.
Fombrun, C. J.: 1996, Reputation: Realizing Value from the
Corporate Image (Harvard Business School Press, Bos-
ton).
Fombrun, C., N. Gardberg and M. L. Barnet: 2000,
‘Opportunity Platforms and Safety Nets: Corporate
Citizenship and Reputational Risk’, Business and Soci-
ety Review 105, 85–106.
Gans, H. J.: 1979, Deciding What’s News (Pantheon
Books).
Godfrey, P. C.: 2005, ‘The Relationship Between Cor-
porate Philanthropy and Shareholder Wealth: A Risk
Management Perspective’, Academy of Management
Review 30, 777–798.
Graves, S. B. and S. A. Waddock: 1994, ‘Institutional
Owners and Corporate Social Performance’, Academy
of Management Journal 37(4), 1034.
Gray, R., R. Kouhy and S. Lavers: 1995, ‘Corporate
Social and Environmental Reporting: A Review of
the Literature and a Longitudinal Study of UK
Disclosure’, Accounting, Auditing & Accountability Journal
8(2), 47–77.
Hooghiemstra, R.: 2000, ‘Corporate Communication
and Impression Management – New Perspectives Why
Companies Engage in Corporate Social Reporting’,
Journal of Business Ethics 27(1/2), 55–68.
Hughes, S. B., A. Anderson and S. Golden: 2001,
‘Corporate Environmental Disclosures: Are They
Useful in Determining Environmental Performance?’,
Journal of Accounting & Public Policy 20(3), 217–240.
Johnson, R. A. and D. W. Greening: 1999, ‘The Effects
of Corporate Governance and Institutional Ownership
Types of Corporate Social Performance’, Academy of
Management Journal 42(5), 564–576.
Johnston, P.: 1994, Success While Others Fail: Social Union
Movementism and the Public Workplace (ILR Press, Ith-
aca, NY).
KLD Analytics (2007). Research Methodology. http://
www.kld.com/research/methodology.html; July 29.
Klein, N.: 2000, No Logo: Taking Aim at the Brand Bullies
(Picador, New York).
Kolk, A.: 2003, ‘Trends in Sustainability Reporting by
the Fortune Global 250’, Business Strategy and the
Environment 12(5), 279–291.
Lindblom, C. K.: 1994, The Implications of Organiza-
tional Legitimacy for Corporate Social Performance
and Disclosure. Critical Perspectives on Accounting
Conference, New York.
Mackey, A., T. B. Mackey and J. B. Barney: 2007,
‘Corporate Social Responsibility and Firm Perfor-
mance: Investor Preferences and Corporate Strategies’,
Academy of Management Review 32(3), 817–835.
Mahon, F. A. and S. A. Waddock: 1992, ‘Strategic Issues
Management: An Integration of Issue Life Cycle Per-
spectives’, Business and Society 31(1), 19–32.
Maignan, I. and O. C. Ferrell: 2001, ‘Antecedents and
Benefits of Corporate Citizenship: An Investigation of
French Businesses’, Journal of Business Research 51(1), 37–
51.
McWilliams, A. and D. Siegel: 2001, ‘Corporate Social
Responsibility: A Theory of the Firm Perspective’,
Academy of Management Review 26(1), 117–127.
Meznar, M. B., J. H. Johnson Jr. and P. J. Mizzi: 2006,
‘No News is Good News? Press Coverage and Cor-
porate Public Affairs Management’, Journal of Public
Affairs (14723891) 6(1), 58–68.
Meznar, M. B. and D. Nigh: 1995, ‘Buffer or Bridge?
Environmental and Organizational Determinants of
Public Affairs Activities in American Firms’, Academy
of Management Journal 38(4), 975–996.
Miles, R. E. and C. C. Snow: 1978, Organizational Strat-
egy, Structure, and Process (McGraw-Hill, New York).
Oliver, C.: 1991, ‘Strategic Responses to Institutional Pro-
cesses’, Academy of Management Review 16(1), 145–179.
Patten, D. M.: 2002, ‘The Relation Between Environ-
mental Performance and Environmental Disclosure: A
Research Note’, Accounting, Organizations & Society
27(8), 763–773.
Pfeffer, J. and G. R. Salancik: 1978, The External Control
of Organizations: A Resource Dependency Perspective
(Harper & row, New York).
Pollock, T. G. and V. P. Rindova: 2003, ‘Media Legit-
imation Effects in the Market for Initial Public
Offerings’, Academy of Management Journal 46(5), 631–
642.
Porter, M. E. and C. van der Linde: 1995, ‘Toward a
New Conception of the Environment–Competitive-
396 Cedric E. Dawkins and John W. Fraas
ness Relationship’, Journal of Economic Perspectives 9(4),
97–118.
Roberts, R. W.: 1992, ‘Determinants of Corporate Social
Responsibility Disclosure: An Application of Stake-
holder Theory’, Accounting, Organizations & Society
17(6), 595–612.
Russo, M. V. and P. A. Fouts: 1997, ‘A Resource-Based
Perspective on Corporate Environmental Performance
and Profitability’, Academy of Management Journal 40(3),
534–559.
Spence, M.: 1973, ‘Job Market Signaling’, Quarterly
Journal of Economics 87(3), 355–374.
Verrecchia, R. E.: 1983, ‘Discretionary Disclosure’,
Journal of Accounting & Economics 5(3), 179–194.
Waddock, S.: 2003, ‘Myths and Realities of Social
Investing’, Organization & Environment 16(3), 369.
Waddock, S. A. and S. B. Graves: 1997, ‘The Corporate
Social Performance–Financial Performance Link’,
Strategic Management Journal 18(4), 303–319.
Wartick, S. L. and P. L. Cochran: 1985, ‘The Evolution
of the Corporate Social Performance Model’, Academy
of Management Review 4, 758–769.
Wartick, S. L. and J. F. Mahon: 1994, ‘Toward a Sub-
stantive Definition of the Corporate Issue Construct’,
Business & Society 33(30), 293–312.
Wiseman, J.: 1982, ‘An Evaluation of Environmental
Disclosures made in Corporate Annual Reports’,
Accounting, Organizations & Society 7(1), 53–63.
Cedric E. Dawkins
Management and Human Resources,
California State Polytechnic University – Pomona,
Pomona, CA, U.S.A.
E-mail: [email protected]
John W. Fraas
Business Administration,
Ashland University,
Ashland, CA, U.S.A.
E-mail: [email protected]
397Beyond Acclamations and Excuses
Copyright © 2022 FDOKUMEN