
ERA40-aided assessment of the atmospheric influence on satellite retrieval of Adriatic Sea surface...
15
ORIGINAL PAPER ERA-40-aided assessment of the atmospheric influence on satellite retrieval of Adriatic Sea surface temperature Igor Tomaz ˇic ´ Milivoj Kuzmic ´ Received: 27 April 2006 / Accepted: 16 October 2008 / Published online: 6 November 2008 Ó Springer-Verlag 2008 Abstract The aim of this work is assessment of regional atmospheric influence on satellite derivation of Adriatic Sea surface temperature (SST). To this end the European Centre for Medium-Range Weather Forecast (ECMWF) ERA-40 reanalysis dataset has been employed to provide the temperature and humidity profiles and surface data, while the RTTOV 8.7 radiative transfer model was used to calculate the top-of-atmosphere brightness temperatures for the advanced very high-resolution radiometer (AVHRR) channels. Ten ERA-40 grid points over the Adriatic Sea were used in the analysis, providing 29,590, 00 UTC and 12 UTC, clear-sky profiles. Climatological analysis of the ERA-40 profiles demonstrated distinct seasonal variability over the Adriatic Sea. Seasonality noted in the temperature and specific humidity profiles also evinced in the atmo- spheric transmittance, thermal channels temperature deficit, and derived c and q parameters. A multivariate analysis was applied to relate the simulated top-of-atmo- sphere brightness temperatures to the Adriatic SSTs in order to generate exploratory sets of SST retrieval coeffi- cients. All derived coefficient sets exhibited smaller noise amplification factor than the global counterpart. A test comparison of satellite-derived SST with an 11-month in situ SST series showed than locally derived coefficients provide smaller scatter (improved precision), and skin- centred bias that requires additional adjustment. Almost identical SST residual and error metric was obtained with seasonally adjusted classical split-window coefficients and with coefficients explicitly accommodating water-vapor dependence. Comparison with data reinforces the notion that the atmosphere over the Adriatic may exhibit vari- ability that cannot be fully accommodated by globally adjusted correction. 1 Introduction Sea surface temperature (SST) is an important variable in climate monitoring and weather forecasting as well as in many other atmospheric or oceanographic empirical and modeling studies. Satellite SST data have been collected globally for almost three decades, enjoying in the process all the advantages, but also suffering the drawbacks, of remote sensing. An important problem is atmospheric interference with surface thermal radiation. When a surface thermal signal passes through the atmosphere, a fraction of it is absorbed by atmospheric constituents (e.g., water vapor, aerosols, or ozone) and re-emitted at different wavelengths. Thus information about atmospheric along- path concentrations of aerosols, ozone, and water vapor in particular is very important (Minnett 1990; Tanre et al. 1992). The net atmospheric effect is to reduce the thermal radiation reaching the sensor, and consequently lower the brightness temperature registered. If one is to derive satellite SST properly, correction of measured radiance is needed to account for these effects. The fact that these influences are wavelength dependent and spatially and temporally variable further aggravates the problem. The atmosphere exhibits spectral windows where the sea surface thermal radiation peaks, atmospheric attenuation is reduced, and reflected solar radiation is low. The radiative transfer of the surface signal through the atmosphere can be defined as I. Tomaz ˇic ´ M. Kuzmic ´(&) Center for Marine and Environmental Research, Rud¯er Bos ˇkovic ´ Institute, Bijenic ˇka cesta 54, HR-10002 Zagreb, Croatia e-mail: [email protected] 123 Meteorol Atmos Phys (2009) 104:37–51 DOI 10.1007/s00703-008-0015-2
Transcript of ERA40-aided assessment of the atmospheric influence on satellite retrieval of Adriatic Sea surface...
ORIGINAL PAPER
ERA-40-aided assessment of the atmospheric influenceon satellite retrieval of Adriatic Sea surface temperature
Igor Tomazic Æ Milivoj Kuzmic
Received: 27 April 2006 / Accepted: 16 October 2008 / Published online: 6 November 2008
� Springer-Verlag 2008
Abstract The aim of this work is assessment of regional
atmospheric influence on satellite derivation of Adriatic
Sea surface temperature (SST). To this end the European
Centre for Medium-Range Weather Forecast (ECMWF)
ERA-40 reanalysis dataset has been employed to provide
the temperature and humidity profiles and surface data,
while the RTTOV 8.7 radiative transfer model was used to
calculate the top-of-atmosphere brightness temperatures for
the advanced very high-resolution radiometer (AVHRR)
channels. Ten ERA-40 grid points over the Adriatic Sea
were used in the analysis, providing 29,590, 00 UTC and
12 UTC, clear-sky profiles. Climatological analysis of the
ERA-40 profiles demonstrated distinct seasonal variability
over the Adriatic Sea. Seasonality noted in the temperature
and specific humidity profiles also evinced in the atmo-
spheric transmittance, thermal channels temperature
deficit, and derived c and q parameters. A multivariate
analysis was applied to relate the simulated top-of-atmo-
sphere brightness temperatures to the Adriatic SSTs in
order to generate exploratory sets of SST retrieval coeffi-
cients. All derived coefficient sets exhibited smaller noise
amplification factor than the global counterpart. A test
comparison of satellite-derived SST with an 11-month in
situ SST series showed than locally derived coefficients
provide smaller scatter (improved precision), and skin-
centred bias that requires additional adjustment. Almost
identical SST residual and error metric was obtained with
seasonally adjusted classical split-window coefficients and
with coefficients explicitly accommodating water-vapor
dependence. Comparison with data reinforces the notion
that the atmosphere over the Adriatic may exhibit vari-
ability that cannot be fully accommodated by globally
adjusted correction.
1 Introduction
Sea surface temperature (SST) is an important variable in
climate monitoring and weather forecasting as well as in
many other atmospheric or oceanographic empirical and
modeling studies. Satellite SST data have been collected
globally for almost three decades, enjoying in the process
all the advantages, but also suffering the drawbacks, of
remote sensing. An important problem is atmospheric
interference with surface thermal radiation. When a surface
thermal signal passes through the atmosphere, a fraction of
it is absorbed by atmospheric constituents (e.g., water
vapor, aerosols, or ozone) and re-emitted at different
wavelengths. Thus information about atmospheric along-
path concentrations of aerosols, ozone, and water vapor in
particular is very important (Minnett 1990; Tanre et al.
1992). The net atmospheric effect is to reduce the thermal
radiation reaching the sensor, and consequently lower the
brightness temperature registered. If one is to derive
satellite SST properly, correction of measured radiance is
needed to account for these effects. The fact that these
influences are wavelength dependent and spatially and
temporally variable further aggravates the problem.
The atmosphere exhibits spectral windows where the sea
surface thermal radiation peaks, atmospheric attenuation is
reduced, and reflected solar radiation is low. The radiative
transfer of the surface signal through the atmosphere can be
defined as
I. Tomazic � M. Kuzmic (&)
Center for Marine and Environmental Research, Ruder Boskovic
Institute, Bijenicka cesta 54, HR-10002 Zagreb, Croatia
e-mail: [email protected]
123
Meteorol Atmos Phys (2009) 104:37–51
DOI 10.1007/s00703-008-0015-2
Ltoa m; hð Þ ¼ es m; hð ÞBðTsÞss m; hð Þ þ Lua m; hð Þ þ Lrda m; hð Þþ Lrs m; hð Þ;
ð1Þ
where Ltoa is the radiance emerging at the top of the
atmosphere (TOA), m is frequency, h is the satellite zenith
angle, and es, Ts, and ss are surface emissivity, temperature,
and transmittance, respectively. The second, third, and
fourth term stand for the upwelling atmospheric thermal
radiation, reflected downwelling atmospheric radiation, and
surface-reflected solar radiance, respectively; B is the
Planck function. If the atmospheric effects could be spec-
ified and the surface effects could be well characterized,
the Eq. 1 would render the surface temperature. However,
direct inversion of the radiative transfer equation is a tall
order, so approximations are necessary if one is to obtain
solutions, particularly operational ones.
Various simplified approaches have been proposed to
account for atmospheric attenuation of the infrared radi-
ance leaving the surface, usually ignoring the effect of
nonunity surface emissivity. Since the work of Anding and
Kauth (1970) the difference between measurements in two
separate infrared channels (differential absorption) is
commonly used to estimate the amount of atmospheric
correction required. In such a framework it is necessary to
assume equal average atmospheric temperature in two
spectral windows/channels and to have independent mea-
surement of the brightness temperature in each of them
(McMillin 1975). This approach then leads to algorithms of
the form:
Ts ¼ A0 es; wv; Lrda; hð Þ þ A1 es; wv; Lrda; hð Þ � T1
þ A2 es; wv; Lrda; hð Þ � T2 ð2Þ
often cast in somewhat modified form as:
Ts ¼ a0 þ a1 � T1 þ a2 � T1 � T2½ �; ð3Þ
where T1 and T2 are the sensor’s channel brightness
temperatures (BTs), and ai are empirical coefficients,
assumed to be constant; wv stands for water vapor.
Water vapor is the most important absorber in the 10–
13 lm window (see, e.g., Anding and Kauth 1970).
Absorption by water vapor yields a temperature deficit
which, if not corrected for, creates an error in the SST
estimates, which becomes larger for off-nadir satellite
viewing angles. The coefficients in a SST algorithm can
be derived either by regression of satellite, or radiative
transfer model (RTM)-derived, BTs against in situ tem-
perature data. The former approach has been practised in
numerous studies using the advanced very high-resolution
radiometer (AVHRR) retrievals (see, e.g., Strong and
McClain 1984), whereas the latter characterizes the pro-
cessing of along-track scanning radiometer (ATSR) data
(see, e.g., Zavody et al. 1995).
Although the AVHRR-related algorithms have under-
gone numerous changes, their consistent performance over
a global range of atmospheric conditions still remains a
challenge. A major cause of poor validation statistics
appears to be (over)simplifications of Eq. 1 in operational
algorithms and misrepresentation of regional atmospheric
spatial and temporal variability. An approach that appears
to partly ameliorate the problem, producing consistent
results on the global scale (accuracy of 0.02 ± 0.5�C), is
estimation of the algorithm coefficients on a monthly basis
(Kilpatrick et al. 2001), distinguishing two (wet and dry)
atmospheric regimes. Acknowledging temporal variability
still leaves open the question of the regional suitability of
global solutions. Regional and/or time-limited applications
need not take into account the full range of atmospheric
variability, but should include regional and/or seasonal
dependence (Minnett 1990). Exploring the errors associ-
ated with SST retrievals from the Indian Ocean Shenoi
(1999) obtained considerably improved validation statistics
with regionally optimized SST algorithm coefficients. Eu-
genio et al. (2005) used a subset of the Pathfinder matchup
database to derive SST algorithm coefficients optimized for
the Canary Islands—Azores—Gibraltar region. Requesting
spatial and temporal coincidence of ±10 km and ±30 min,
respectively, the authors devised a new algorithm with
considerably improved statistics (mean error of 0.0748�C,
RMS error of 0.58�C). Focusing on just the Canary Island
zone, Arbelo et al. (2000) demonstrated inadequate per-
formance of the global SST algorithm (derived for six
standard atmospheres). Compared with their regional
algorithm (derived for the local atmosphere characterized
with 30 radiosonde temperature and humidity profiles) the
global algorithm generated mean error difference of
?0.3 K, and about twice as large RMS difference. How-
ever, a recent study (Merchant et al. 2006) warns that,
although suboptimal choice of retrieval coefficients
degrades an estimate, some errors are an intrinsic conse-
quence of the form of the retrieval equation, a simplified
example of which is given in Eq. 1.
In this paper we study the atmospheric influence on the
SST derivation from satellite data over the Adriatic Sea. In
addressing this problem our goal is not to derive a new
operational algorithm, but rather to assess the extent of the
local atmospheric influence on such a product. More spe-
cifically, we firstly address the seasonal temperature and
humidity variability of the atmosphere over the Adriatic
Sea, followed by deriving test SST retrieval coefficients
reflecting that variability, and than gauging their impact on
the Adriatic SST estimates. Atmospheric variability over
the Adriatic Sea was explored using the clear-sky tem-
perature and humidity profiles from the European Centre
for Medium-Range Weather Forecast (ECMWF) ERA-40
reanalysis (Uppala et al. 2005). An accurate fast radiative
38 I. Tomazic, M. Kuzmic
123
transfer model (RTTOV 8.7; Saunders and Brunel 2005)
was then used to simulate brightness temperature in AV-
HRR channels (4 and 5) using atmospheric profiles and
SST values obtained from ERA-40.
The rest of the paper is organized as follows. The data
obtained from the ERA-40 reanalysis are discussed in the
second section. In the third section we briefly present the
RTTOV model and in the fourth section discuss results of
the analysis. Conclusions are given in the last section.
2 Data
The dataset employed in this study is an Adriatic Sea
subset of the ECMWF ERA-40 reanalysis data (Uppala
et al. 2005). The ERA-40 reanalysis covers the period from
September 1957 to August 2002. The reanalysis was done
with T159 spherical-harmonic representation of upper-air
fields, and on a reduced Gaussian grid N80 providing data
on the corresponding regular latitude/longitude resolution
of 1.125� 9 1.125� at 60 vertical model-pressure levels
between the surface and the 0.1 hPa level. ERA-40 data are
available at 00:00, 06:00, 12:00, and 18:00 UTC over a 45-
year period. The climatological analysis and the RT model
simulations were done using the ERA-40 temperature,
specific humidity as well as integrated (total column water
vapor) and surface data (2-m air temperature, sea-level
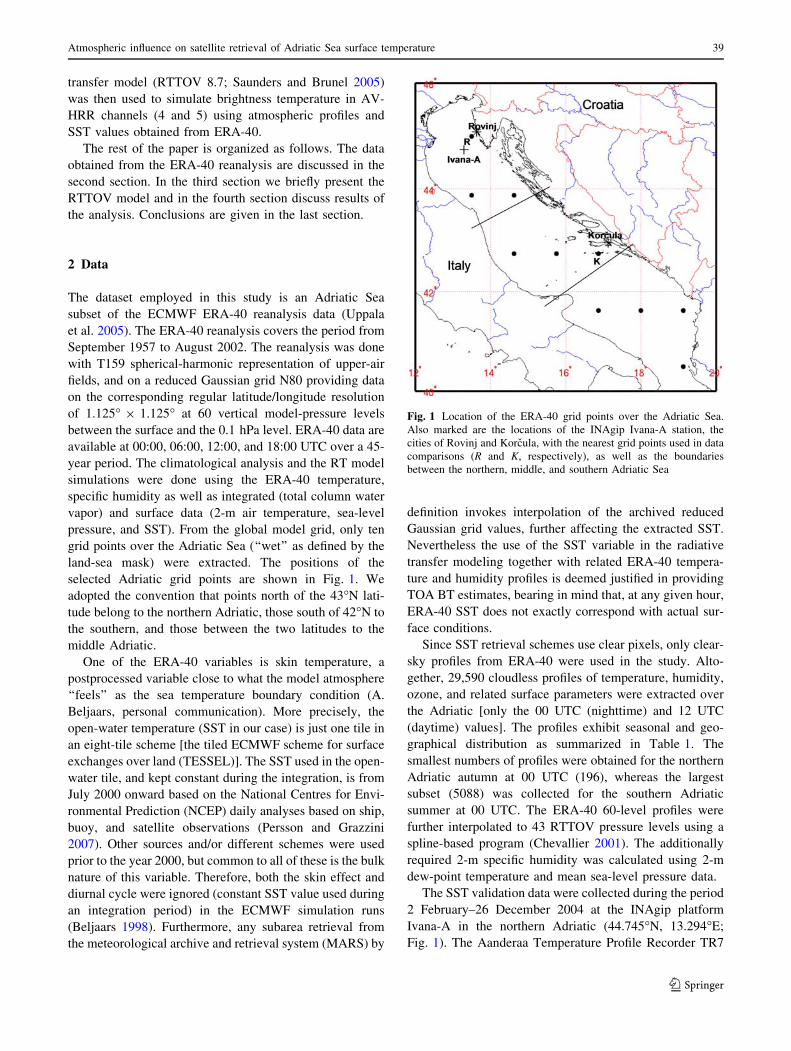
pressure, and SST). From the global model grid, only ten
grid points over the Adriatic Sea (‘‘wet’’ as defined by the
land-sea mask) were extracted. The positions of the
selected Adriatic grid points are shown in Fig. 1. We
adopted the convention that points north of the 43�N lati-
tude belong to the northern Adriatic, those south of 42�N to
the southern, and those between the two latitudes to the
middle Adriatic.
One of the ERA-40 variables is skin temperature, a
postprocessed variable close to what the model atmosphere
‘‘feels’’ as the sea temperature boundary condition (A.
Beljaars, personal communication). More precisely, the
open-water temperature (SST in our case) is just one tile in
an eight-tile scheme [the tiled ECMWF scheme for surface
exchanges over land (TESSEL)]. The SST used in the open-
water tile, and kept constant during the integration, is from
July 2000 onward based on the National Centres for Envi-
ronmental Prediction (NCEP) daily analyses based on ship,
buoy, and satellite observations (Persson and Grazzini
2007). Other sources and/or different schemes were used
prior to the year 2000, but common to all of these is the bulk
nature of this variable. Therefore, both the skin effect and
diurnal cycle were ignored (constant SST value used during
an integration period) in the ECMWF simulation runs
(Beljaars 1998). Furthermore, any subarea retrieval from
the meteorological archive and retrieval system (MARS) by
definition invokes interpolation of the archived reduced
Gaussian grid values, further affecting the extracted SST.
Nevertheless the use of the SST variable in the radiative
transfer modeling together with related ERA-40 tempera-
ture and humidity profiles is deemed justified in providing
TOA BT estimates, bearing in mind that, at any given hour,
ERA-40 SST does not exactly correspond with actual sur-
face conditions.
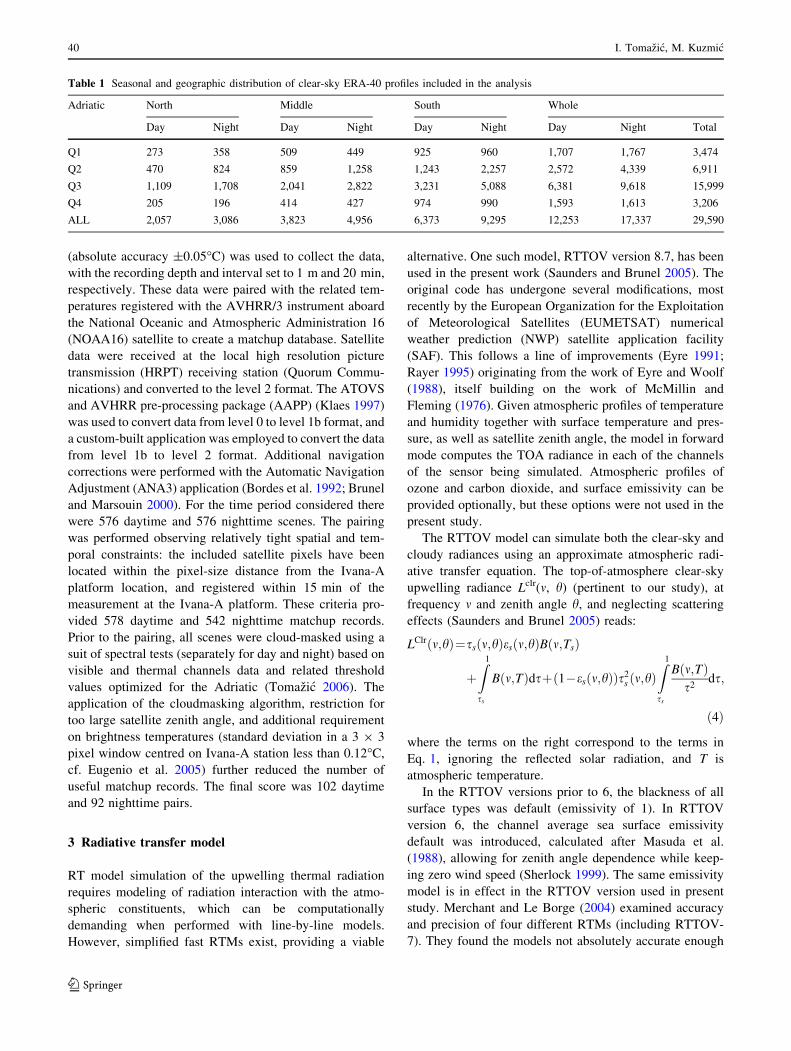
Since SST retrieval schemes use clear pixels, only clear-
sky profiles from ERA-40 were used in the study. Alto-
gether, 29,590 cloudless profiles of temperature, humidity,
ozone, and related surface parameters were extracted over
the Adriatic [only the 00 UTC (nighttime) and 12 UTC
(daytime) values]. The profiles exhibit seasonal and geo-
graphical distribution as summarized in Table 1. The
smallest numbers of profiles were obtained for the northern
Adriatic autumn at 00 UTC (196), whereas the largest
subset (5088) was collected for the southern Adriatic
summer at 00 UTC. The ERA-40 60-level profiles were
further interpolated to 43 RTTOV pressure levels using a
spline-based program (Chevallier 2001). The additionally
required 2-m specific humidity was calculated using 2-m
dew-point temperature and mean sea-level pressure data.
The SST validation data were collected during the period
2 February–26 December 2004 at the INAgip platform
Ivana-A in the northern Adriatic (44.745�N, 13.294�E;
Fig. 1). The Aanderaa Temperature Profile Recorder TR7
Fig. 1 Location of the ERA-40 grid points over the Adriatic Sea.
Also marked are the locations of the INAgip Ivana-A station, the
cities of Rovinj and Korcula, with the nearest grid points used in data
comparisons (R and K, respectively), as well as the boundaries
between the northern, middle, and southern Adriatic Sea
Atmospheric influence on satellite retrieval of Adriatic Sea surface temperature 39
123
(absolute accuracy ±0.05�C) was used to collect the data,
with the recording depth and interval set to 1 m and 20 min,
respectively. These data were paired with the related tem-
peratures registered with the AVHRR/3 instrument aboard
the National Oceanic and Atmospheric Administration 16
(NOAA16) satellite to create a matchup database. Satellite
data were received at the local high resolution picture
transmission (HRPT) receiving station (Quorum Commu-
nications) and converted to the level 2 format. The ATOVS
and AVHRR pre-processing package (AAPP) (Klaes 1997)
was used to convert data from level 0 to level 1b format, and
a custom-built application was employed to convert the data
from level 1b to level 2 format. Additional navigation
corrections were performed with the Automatic Navigation
Adjustment (ANA3) application (Bordes et al. 1992; Brunel
and Marsouin 2000). For the time period considered there
were 576 daytime and 576 nighttime scenes. The pairing
was performed observing relatively tight spatial and tem-
poral constraints: the included satellite pixels have been
located within the pixel-size distance from the Ivana-A
platform location, and registered within 15 min of the
measurement at the Ivana-A platform. These criteria pro-
vided 578 daytime and 542 nighttime matchup records.
Prior to the pairing, all scenes were cloud-masked using a
suit of spectral tests (separately for day and night) based on
visible and thermal channels data and related threshold
values optimized for the Adriatic (Tomazic 2006). The
application of the cloudmasking algorithm, restriction for
too large satellite zenith angle, and additional requirement
on brightness temperatures (standard deviation in a 3 9 3
pixel window centred on Ivana-A station less than 0.12�C,
cf. Eugenio et al. 2005) further reduced the number of
useful matchup records. The final score was 102 daytime
and 92 nighttime pairs.
3 Radiative transfer model
RT model simulation of the upwelling thermal radiation
requires modeling of radiation interaction with the atmo-
spheric constituents, which can be computationally
demanding when performed with line-by-line models.
However, simplified fast RTMs exist, providing a viable
alternative. One such model, RTTOV version 8.7, has been
used in the present work (Saunders and Brunel 2005). The
original code has undergone several modifications, most
recently by the European Organization for the Exploitation
of Meteorological Satellites (EUMETSAT) numerical
weather prediction (NWP) satellite application facility
(SAF). This follows a line of improvements (Eyre 1991;
Rayer 1995) originating from the work of Eyre and Woolf
(1988), itself building on the work of McMillin and
Fleming (1976). Given atmospheric profiles of temperature
and humidity together with surface temperature and pres-
sure, as well as satellite zenith angle, the model in forward
mode computes the TOA radiance in each of the channels
of the sensor being simulated. Atmospheric profiles of
ozone and carbon dioxide, and surface emissivity can be
provided optionally, but these options were not used in the
present study.
The RTTOV model can simulate both the clear-sky and
cloudy radiances using an approximate atmospheric radi-
ative transfer equation. The top-of-atmosphere clear-sky
upwelling radiance Lclr(m, h) (pertinent to our study), at
frequency m and zenith angle h, and neglecting scattering
effects (Saunders and Brunel 2005) reads:
LClr m;hð Þ¼ss m;hð Þes m;hð ÞB m;Tsð Þ
þZ1
ss
B m;Tð Þdsþ 1�es m;hð Þð Þs2s m;hð Þ
Z1
ss
B m;Tð Þs2
ds;
ð4Þ
where the terms on the right correspond to the terms in
Eq. 1, ignoring the reflected solar radiation, and T is
atmospheric temperature.
In the RTTOV versions prior to 6, the blackness of all
surface types was default (emissivity of 1). In RTTOV
version 6, the channel average sea surface emissivity
default was introduced, calculated after Masuda et al.
(1988), allowing for zenith angle dependence while keep-
ing zero wind speed (Sherlock 1999). The same emissivity
model is in effect in the RTTOV version used in present
study. Merchant and Le Borge (2004) examined accuracy
and precision of four different RTMs (including RTTOV-
7). They found the models not absolutely accurate enough
Table 1 Seasonal and geographic distribution of clear-sky ERA-40 profiles included in the analysis
Adriatic North Middle South Whole
Day Night Day Night Day Night Day Night Total
Q1 273 358 509 449 925 960 1,707 1,767 3,474
Q2 470 824 859 1,258 1,243 2,257 2,572 4,339 6,911
Q3 1,109 1,708 2,041 2,822 3,231 5,088 6,381 9,618 15,999
Q4 205 196 414 427 974 990 1,593 1,613 3,206
ALL 2,057 3,086 3,823 4,956 6,373 9,295 12,253 17,337 29,590
40 I. Tomazic, M. Kuzmic
123

to specify the offset coefficient to the desired accuracy of
0.1 K. Within the scope of performed validation studies the
RTTOV-8 has shown performance similar to that of
RTTOV-7 (Saunders et al. 2005).
4 Results and discussion
Addressing the local atmospheric influence on satellite-
derived Adriatic SST we will first analyze in this section
the temperature and humidity variability over the Adriatic
Sea as derived from ERA-40 data, and then assess the
influence of that variability on the SST retrieval coeffi-
cients. Changeable features of the atmospheric humidity
exert great influence on Earth-emitted long-wave radiation,
but specific quantitative studies of vertical distribution of
humidity in the Mediterranean area in general, and over the
Adriatic Sea in particular, appear to be nonexistent. We
have therefore taken as the reference situations the average
conditions embodied in the mid-latitude profiles.
4.1 Seasonal atmospheric variability
In order to examine the extent of local atmospheric vari-
ability, separate analyses of the ERA-40 temperature and
humidity profiles were performed for different seasons.
Preliminary analysis of intra-Adriatic geographic variability
did not produce enough variability to warrant further con-
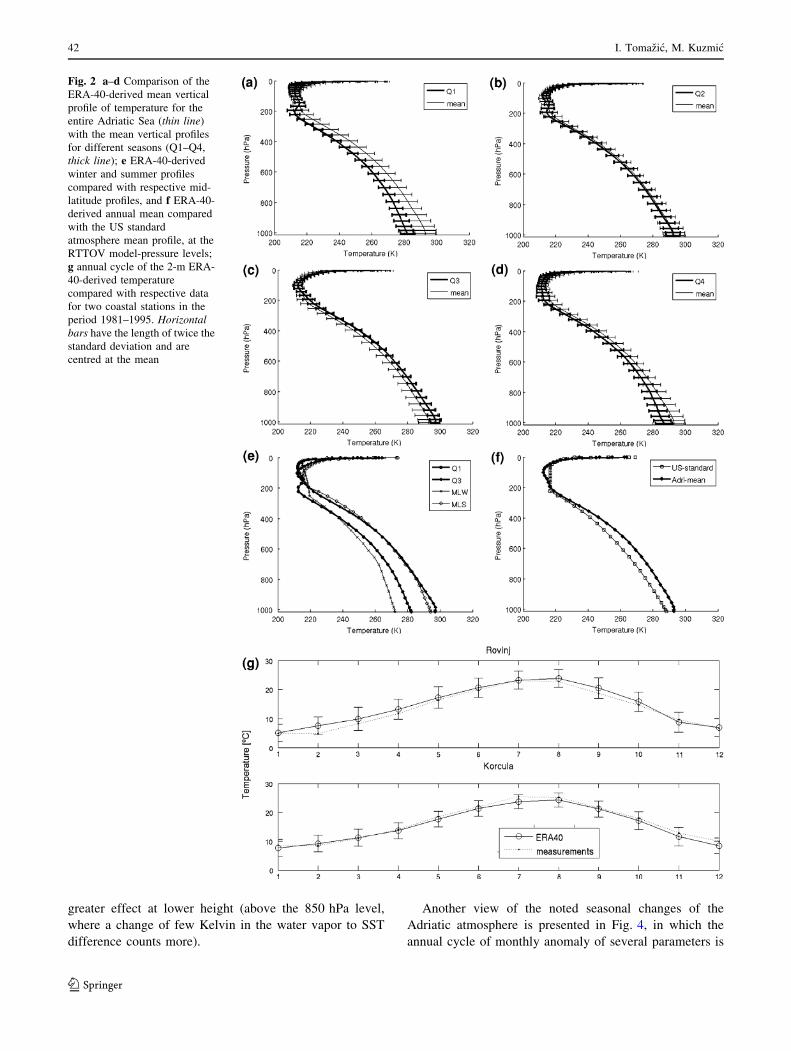
sideration. The result for temperature is presented in Fig. 2.
The comparison of ERA-40-derived seasonal temperature
profiles with respective mean profile for the Adriatic
exhibits marked variability (Fig. 2a–d). Seasonal tempera-
ture variations to the pressure levels in the higher
troposphere and lower stratosphere (to the pressure level of
194 hPa) can be seen, and are most significant at the lowest
pressure levels. More significant difference in mean and
standard deviation (horizontal bars) can be seen in the winter
(Q1) and summer (Q3) periods. We further compared the
ERA-40 Adriatic seasonal average winter and summer
profiles with the respective mid-latitude data (Fig. 2e).
Comparison suggests that the ERA-40-derived winter lower
troposphere is warmer than the mid-latitude average by as
much as 10 K. The summer profile is more similar to its mid-
latitude counterpart, diverging from it toward higher values
in the lower troposphere. The Adriatic ERA-40-derived
multi-annual average turns out to be somewhat warmer than
the US standard atmosphere, throughout the troposphere,
and in its middle part in particular (Fig. 2f).
Monthly averaged Adriatic 2-m air temperatures calcu-
lated from the ERA-40 dataset exhibit a clear seasonal
cycle. In Fig. 2g those values for two model points (R and
K in Fig. 1) are compared to related in situ climatology
from the two nearest coastal stations (Rovinj and Korcula;
Fig. 1). The field data (http://www.hhi.hr/archipelago/
naslov/e_temp.htm) were available only for the period
1981–1995 so the ERA-40 series was shortened accord-
ingly. One notes a close correspondence between the
measured and modeled data, with the ERA-40 values being
persistently somewhat higher than the measured tempera-
tures at the northern (Rovinj) station; the opposite appears
to hold at the southern (Korcula) station. In this comparison
one has to bear in mind the nature of the ERA-40 SST
series elaborated in the data section.
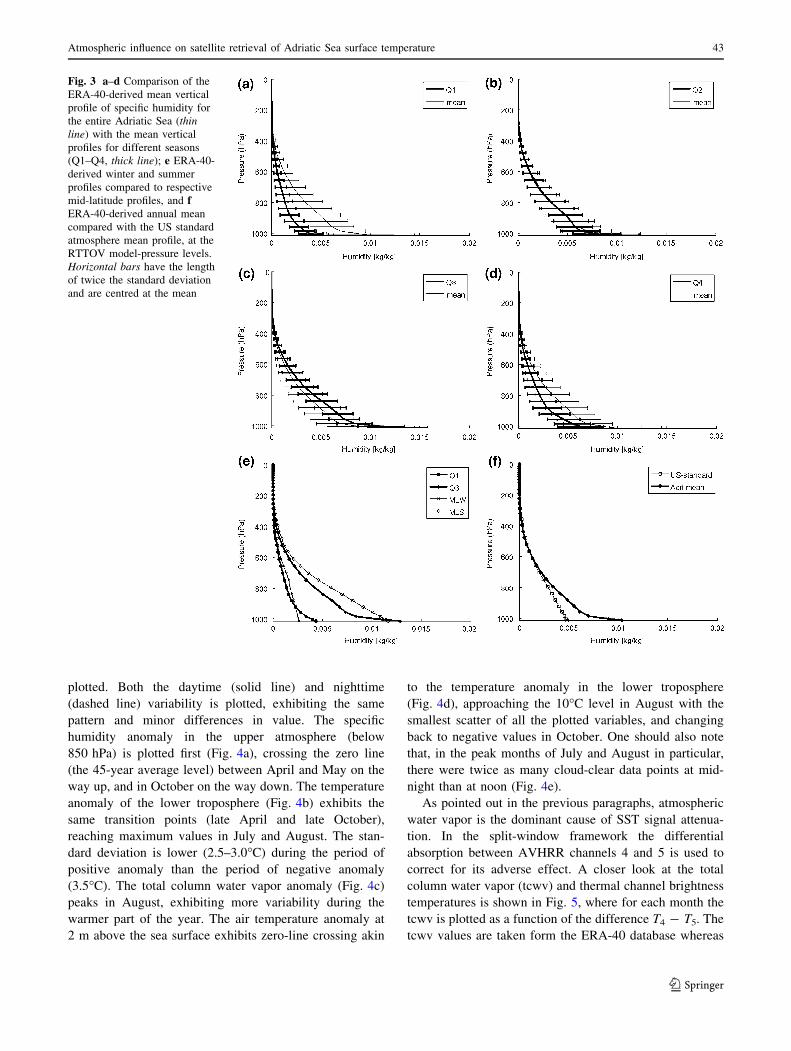
The results of the specific humidity analysis are pre-
sented in Fig. 3. Specific humidity seasonal variations go
up to 300 hPa pressure level. Significant differences in the
mean and standard deviation (horizontal bars) can be
observed in all seasons. The only exception is the spring
profile, which remains very similar to the annual mean.
Again the most distinct seasonal differences in the mean
are observed in winter, and the least significant in spring
(Fig. 3a, c). It is worth noting that the winter mean profile
in particular is much dryer than the annual mean. The
seasonal difference may be further appreciated by
inspecting Fig. 3e. One may see that the ERA-40-derived
winter specific humidity follows relatively closely the mid-
latitude average except in the lowermost layers where the
Adriatic profile is higher. Similar difference is observed
between the average Adriatic and US standard atmosphere
(Fig. 3f), only the point of disagreement starts higher, close
to the 700 hPa level.
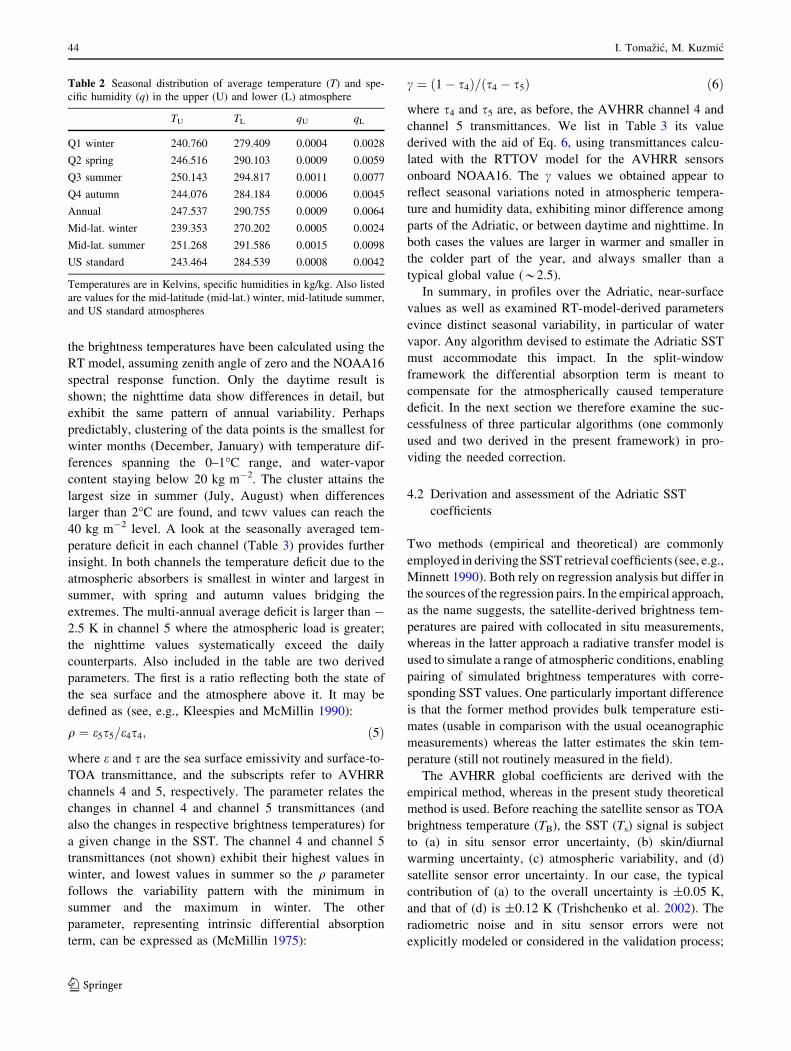
The noted variability is also seen in Table 2, in which
numerical values of seasonal and layer averages of tem-
perature and specific humidity are listed. The first two
columns list the average values of the atmospheric tem-
perature TL below (P [ 850 hPa) and TU above
(P \ 850 hPa) the reference level. The chosen pressure
level conveniently divides the mean vertical distribution of
the specific humidity (Minnett 1986); in the text that fol-
lows we will refer to these parts as the upper and lower
atmosphere. The next two columns in the table list the
respective specific humidity values.
Seasonally, the winter TL is about 11 K lower, and the
summer TL some 4 K higher, than the annual average.
Similarly, the winter qU is about 0.5 g kg-1 below, and the
summer qU about 0.2 g kg-1 above, the annual average.
The lower and upper temperature and humidity annual
averages are somewhat larger than the respective US
standard atmosphere values. In a study based on a 100
marine radiosonde profiles over the northeastern Atlantic
Ocean in July, Minnett (1986) simulated effects of anom-
alous atmospheric conditions by independently adjusting
humidity and temperature profiles. He found that conse-
quences of humidity anomalies are greater when occurring
at greater height (below the 850 hPa level, where the water
vapor is colder), whereas temperature anomalies exhibit
Atmospheric influence on satellite retrieval of Adriatic Sea surface temperature 41
123
greater effect at lower height (above the 850 hPa level,
where a change of few Kelvin in the water vapor to SST
difference counts more).
Another view of the noted seasonal changes of the
Adriatic atmosphere is presented in Fig. 4, in which the
annual cycle of monthly anomaly of several parameters is
Fig. 2 a–d Comparison of the
ERA-40-derived mean vertical
profile of temperature for the
entire Adriatic Sea (thin line)
with the mean vertical profiles
for different seasons (Q1–Q4,
thick line); e ERA-40-derived
winter and summer profiles
compared with respective mid-
latitude profiles, and f ERA-40-
derived annual mean compared
with the US standard
atmosphere mean profile, at the
RTTOV model-pressure levels;
g annual cycle of the 2-m ERA-
40-derived temperature
compared with respective data
for two coastal stations in the
period 1981–1995. Horizontalbars have the length of twice the
standard deviation and are
centred at the mean
42 I. Tomazic, M. Kuzmic
123
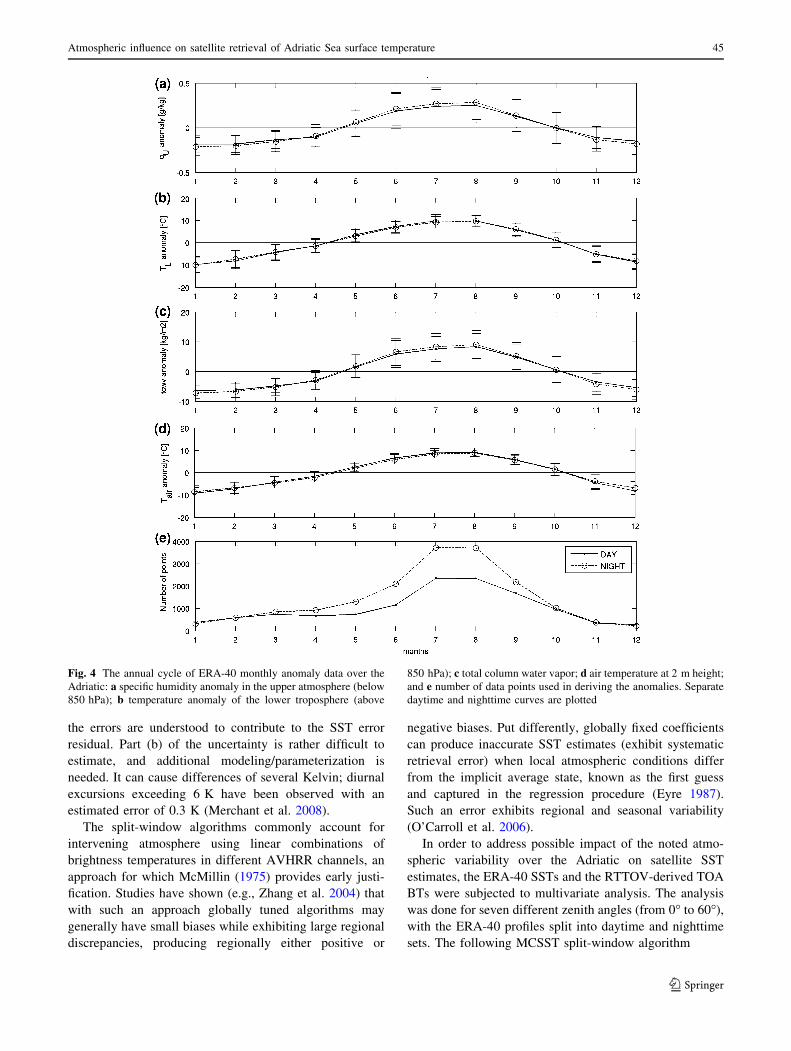
plotted. Both the daytime (solid line) and nighttime
(dashed line) variability is plotted, exhibiting the same
pattern and minor differences in value. The specific
humidity anomaly in the upper atmosphere (below
850 hPa) is plotted first (Fig. 4a), crossing the zero line
(the 45-year average level) between April and May on the
way up, and in October on the way down. The temperature
anomaly of the lower troposphere (Fig. 4b) exhibits the
same transition points (late April and late October),
reaching maximum values in July and August. The stan-
dard deviation is lower (2.5–3.0�C) during the period of
positive anomaly than the period of negative anomaly
(3.5�C). The total column water vapor anomaly (Fig. 4c)
peaks in August, exhibiting more variability during the
warmer part of the year. The air temperature anomaly at
2 m above the sea surface exhibits zero-line crossing akin
to the temperature anomaly in the lower troposphere
(Fig. 4d), approaching the 10�C level in August with the
smallest scatter of all the plotted variables, and changing
back to negative values in October. One should also note
that, in the peak months of July and August in particular,
there were twice as many cloud-clear data points at mid-
night than at noon (Fig. 4e).
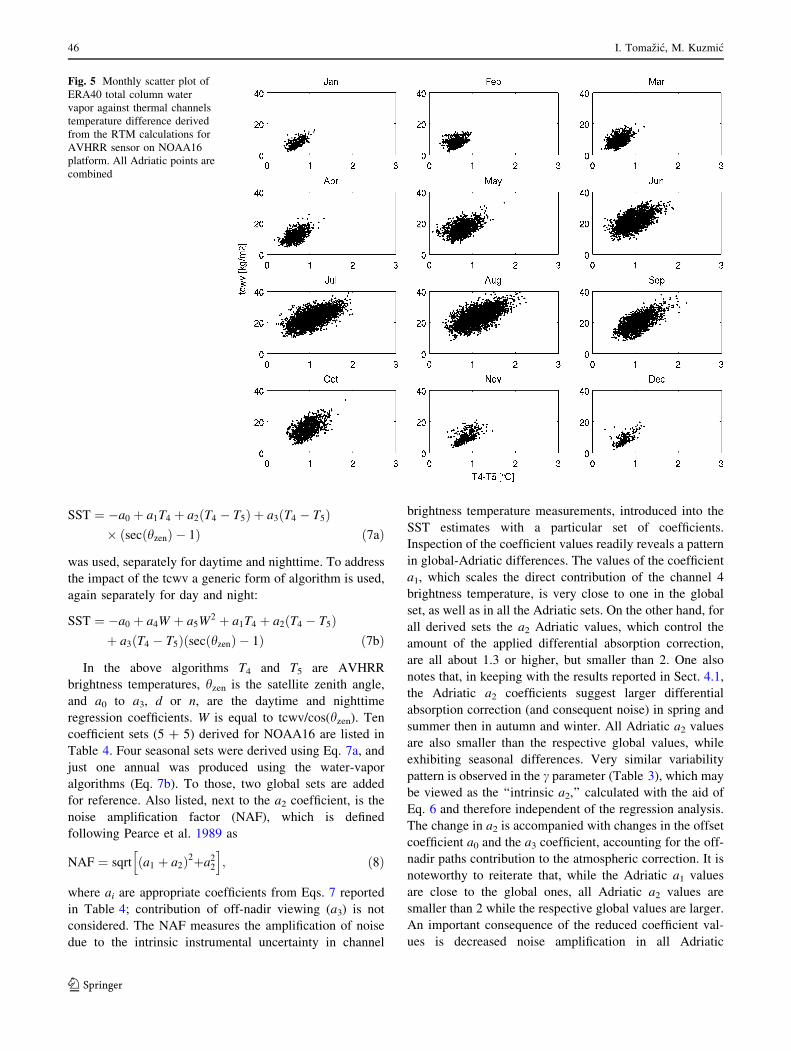
As pointed out in the previous paragraphs, atmospheric
water vapor is the dominant cause of SST signal attenua-
tion. In the split-window framework the differential
absorption between AVHRR channels 4 and 5 is used to
correct for its adverse effect. A closer look at the total
column water vapor (tcwv) and thermal channel brightness
temperatures is shown in Fig. 5, where for each month the
tcwv is plotted as a function of the difference T4 - T5. The
tcwv values are taken form the ERA-40 database whereas
Fig. 3 a–d Comparison of the
ERA-40-derived mean vertical
profile of specific humidity for
the entire Adriatic Sea (thinline) with the mean vertical
profiles for different seasons
(Q1–Q4, thick line); e ERA-40-
derived winter and summer
profiles compared to respective
mid-latitude profiles, and fERA-40-derived annual mean
compared with the US standard
atmosphere mean profile, at the
RTTOV model-pressure levels.
Horizontal bars have the length
of twice the standard deviation
and are centred at the mean
Atmospheric influence on satellite retrieval of Adriatic Sea surface temperature 43
123
the brightness temperatures have been calculated using the
RT model, assuming zenith angle of zero and the NOAA16
spectral response function. Only the daytime result is
shown; the nighttime data show differences in detail, but
exhibit the same pattern of annual variability. Perhaps
predictably, clustering of the data points is the smallest for
winter months (December, January) with temperature dif-
ferences spanning the 0–1�C range, and water-vapor
content staying below 20 kg m-2. The cluster attains the
largest size in summer (July, August) when differences
larger than 2�C are found, and tcwv values can reach the
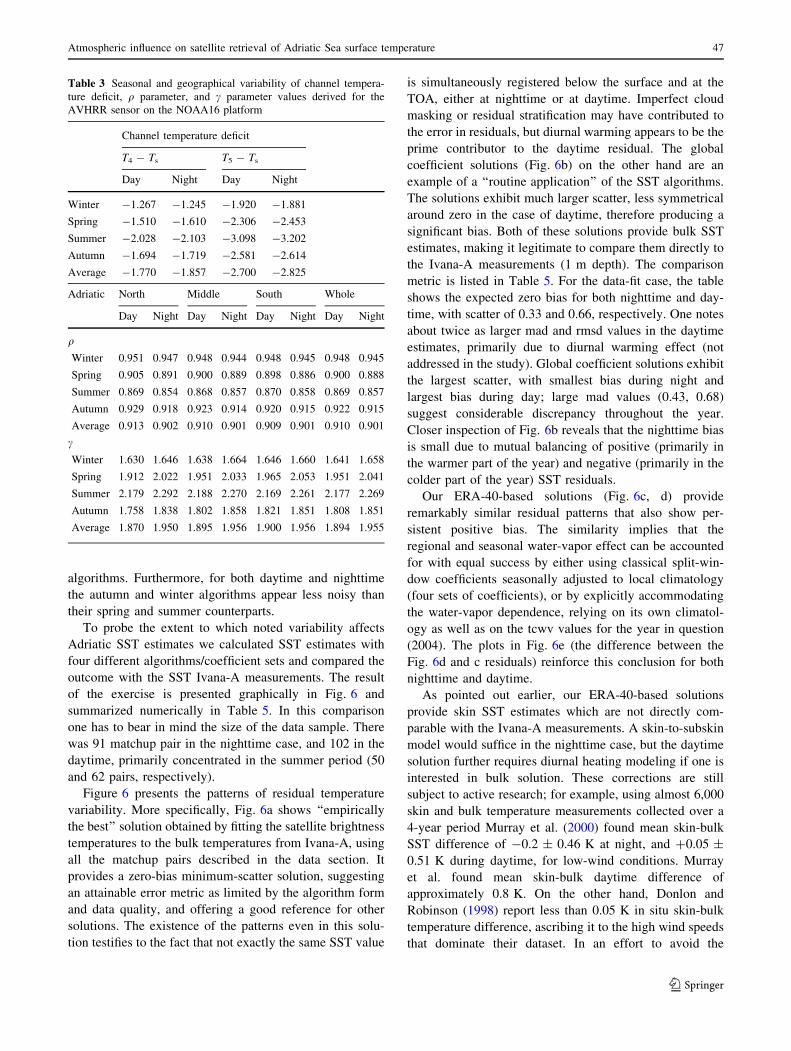
40 kg m-2 level. A look at the seasonally averaged tem-
perature deficit in each channel (Table 3) provides further
insight. In both channels the temperature deficit due to the
atmospheric absorbers is smallest in winter and largest in
summer, with spring and autumn values bridging the
extremes. The multi-annual average deficit is larger than -
2.5 K in channel 5 where the atmospheric load is greater;
the nighttime values systematically exceed the daily
counterparts. Also included in the table are two derived
parameters. The first is a ratio reflecting both the state of
the sea surface and the atmosphere above it. It may be
defined as (see, e.g., Kleespies and McMillin 1990):
q ¼ e5s5=e4s4; ð5Þ
where e and s are the sea surface emissivity and surface-to-
TOA transmittance, and the subscripts refer to AVHRR
channels 4 and 5, respectively. The parameter relates the
changes in channel 4 and channel 5 transmittances (and
also the changes in respective brightness temperatures) for
a given change in the SST. The channel 4 and channel 5
transmittances (not shown) exhibit their highest values in
winter, and lowest values in summer so the q parameter
follows the variability pattern with the minimum in
summer and the maximum in winter. The other
parameter, representing intrinsic differential absorption
term, can be expressed as (McMillin 1975):
c ¼ 1� s4ð Þ= s4 � s5ð Þ ð6Þ
where s4 and s5 are, as before, the AVHRR channel 4 and
channel 5 transmittances. We list in Table 3 its value
derived with the aid of Eq. 6, using transmittances calcu-
lated with the RTTOV model for the AVHRR sensors
onboard NOAA16. The c values we obtained appear to
reflect seasonal variations noted in atmospheric tempera-
ture and humidity data, exhibiting minor difference among
parts of the Adriatic, or between daytime and nighttime. In
both cases the values are larger in warmer and smaller in
the colder part of the year, and always smaller than a
typical global value (*2.5).
In summary, in profiles over the Adriatic, near-surface
values as well as examined RT-model-derived parameters
evince distinct seasonal variability, in particular of water
vapor. Any algorithm devised to estimate the Adriatic SST
must accommodate this impact. In the split-window
framework the differential absorption term is meant to
compensate for the atmospherically caused temperature
deficit. In the next section we therefore examine the suc-
cessfulness of three particular algorithms (one commonly
used and two derived in the present framework) in pro-
viding the needed correction.
4.2 Derivation and assessment of the Adriatic SST
coefficients
Two methods (empirical and theoretical) are commonly
employed in deriving the SST retrieval coefficients (see, e.g.,
Minnett 1990). Both rely on regression analysis but differ in
the sources of the regression pairs. In the empirical approach,
as the name suggests, the satellite-derived brightness tem-
peratures are paired with collocated in situ measurements,
whereas in the latter approach a radiative transfer model is
used to simulate a range of atmospheric conditions, enabling
pairing of simulated brightness temperatures with corre-
sponding SST values. One particularly important difference
is that the former method provides bulk temperature esti-
mates (usable in comparison with the usual oceanographic
measurements) whereas the latter estimates the skin tem-
perature (still not routinely measured in the field).
The AVHRR global coefficients are derived with the
empirical method, whereas in the present study theoretical
method is used. Before reaching the satellite sensor as TOA
brightness temperature (TB), the SST (Ts) signal is subject
to (a) in situ sensor error uncertainty, (b) skin/diurnal
warming uncertainty, (c) atmospheric variability, and (d)
satellite sensor error uncertainty. In our case, the typical
contribution of (a) to the overall uncertainty is ±0.05 K,
and that of (d) is ±0.12 K (Trishchenko et al. 2002). The
radiometric noise and in situ sensor errors were not
explicitly modeled or considered in the validation process;
Table 2 Seasonal distribution of average temperature (T) and spe-
cific humidity (q) in the upper (U) and lower (L) atmosphere
TU TL qU qL
Q1 winter 240.760 279.409 0.0004 0.0028
Q2 spring 246.516 290.103 0.0009 0.0059
Q3 summer 250.143 294.817 0.0011 0.0077
Q4 autumn 244.076 284.184 0.0006 0.0045
Annual 247.537 290.755 0.0009 0.0064
Mid-lat. winter 239.353 270.202 0.0005 0.0024
Mid-lat. summer 251.268 291.586 0.0015 0.0098
US standard 243.464 284.539 0.0008 0.0042
Temperatures are in Kelvins, specific humidities in kg/kg. Also listed
are values for the mid-latitude (mid-lat.) winter, mid-latitude summer,
and US standard atmospheres
44 I. Tomazic, M. Kuzmic
123
the errors are understood to contribute to the SST error
residual. Part (b) of the uncertainty is rather difficult to
estimate, and additional modeling/parameterization is
needed. It can cause differences of several Kelvin; diurnal
excursions exceeding 6 K have been observed with an
estimated error of 0.3 K (Merchant et al. 2008).
The split-window algorithms commonly account for
intervening atmosphere using linear combinations of
brightness temperatures in different AVHRR channels, an
approach for which McMillin (1975) provides early justi-
fication. Studies have shown (e.g., Zhang et al. 2004) that
with such an approach globally tuned algorithms may
generally have small biases while exhibiting large regional
discrepancies, producing regionally either positive or
negative biases. Put differently, globally fixed coefficients
can produce inaccurate SST estimates (exhibit systematic
retrieval error) when local atmospheric conditions differ
from the implicit average state, known as the first guess
and captured in the regression procedure (Eyre 1987).
Such an error exhibits regional and seasonal variability
(O’Carroll et al. 2006).
In order to address possible impact of the noted atmo-
spheric variability over the Adriatic on satellite SST
estimates, the ERA-40 SSTs and the RTTOV-derived TOA
BTs were subjected to multivariate analysis. The analysis
was done for seven different zenith angles (from 0� to 60�),
with the ERA-40 profiles split into daytime and nighttime
sets. The following MCSST split-window algorithm
Fig. 4 The annual cycle of ERA-40 monthly anomaly data over the
Adriatic: a specific humidity anomaly in the upper atmosphere (below
850 hPa); b temperature anomaly of the lower troposphere (above
850 hPa); c total column water vapor; d air temperature at 2 m height;
and e number of data points used in deriving the anomalies. Separate
daytime and nighttime curves are plotted
Atmospheric influence on satellite retrieval of Adriatic Sea surface temperature 45
123
SST ¼ �a0 þ a1T4 þ a2ðT4 � T5Þ þ a3ðT4 � T5Þ� ðsecðhzenÞ � 1Þ ð7aÞ
was used, separately for daytime and nighttime. To address
the impact of the tcwv a generic form of algorithm is used,
again separately for day and night:
SST ¼ �a0 þ a4W þ a5W2 þ a1T4 þ a2ðT4 � T5Þþ a3ðT4 � T5ÞðsecðhzenÞ � 1Þ ð7bÞ
In the above algorithms T4 and T5 are AVHRR
brightness temperatures, hzen is the satellite zenith angle,
and a0 to a3, d or n, are the daytime and nighttime
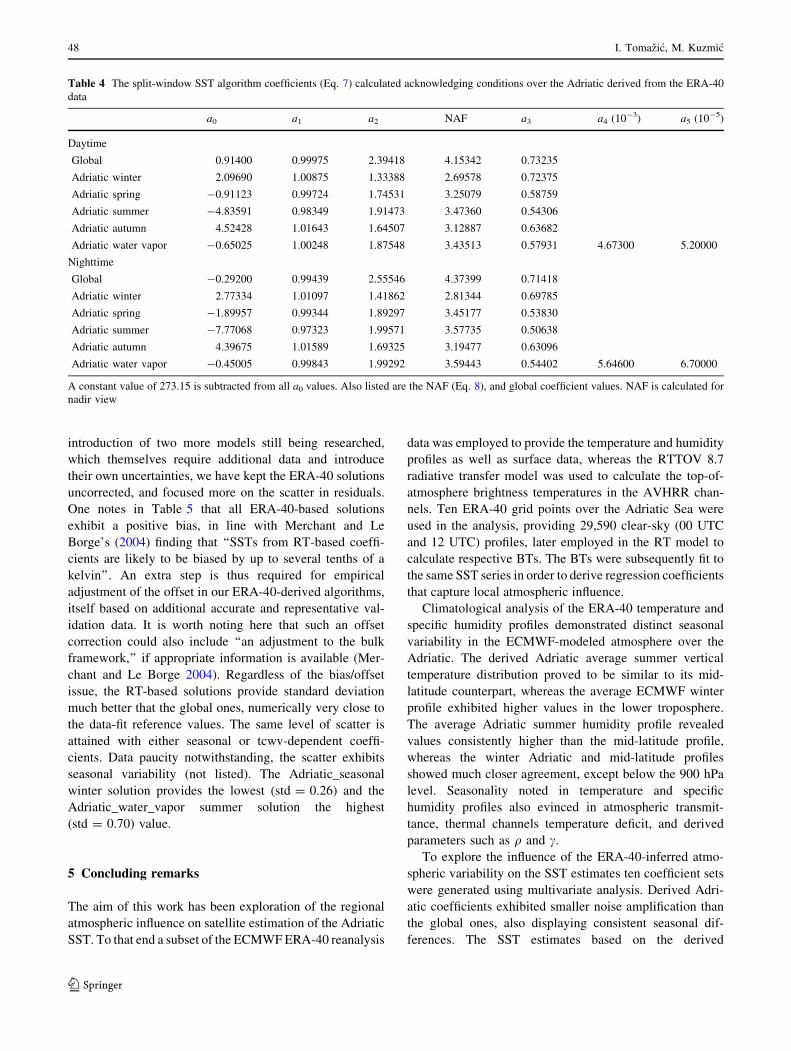
regression coefficients. W is equal to tcwv/cos(hzen). Ten
coefficient sets (5 ? 5) derived for NOAA16 are listed in
Table 4. Four seasonal sets were derived using Eq. 7a, and
just one annual was produced using the water-vapor
algorithms (Eq. 7b). To those, two global sets are added
for reference. Also listed, next to the a2 coefficient, is the
noise amplification factor (NAF), which is defined
following Pearce et al. 1989 as
NAF ¼ sqrt a1 þ a2ð Þ2þa22
h i; ð8Þ
where ai are appropriate coefficients from Eqs. 7 reported
in Table 4; contribution of off-nadir viewing (a3) is not
considered. The NAF measures the amplification of noise
due to the intrinsic instrumental uncertainty in channel
brightness temperature measurements, introduced into the
SST estimates with a particular set of coefficients.
Inspection of the coefficient values readily reveals a pattern
in global-Adriatic differences. The values of the coefficient
a1, which scales the direct contribution of the channel 4
brightness temperature, is very close to one in the global
set, as well as in all the Adriatic sets. On the other hand, for
all derived sets the a2 Adriatic values, which control the
amount of the applied differential absorption correction,
are all about 1.3 or higher, but smaller than 2. One also
notes that, in keeping with the results reported in Sect. 4.1,
the Adriatic a2 coefficients suggest larger differential
absorption correction (and consequent noise) in spring and
summer then in autumn and winter. All Adriatic a2 values
are also smaller than the respective global values, while
exhibiting seasonal differences. Very similar variability
pattern is observed in the c parameter (Table 3), which may
be viewed as the ‘‘intrinsic a2,’’ calculated with the aid of
Eq. 6 and therefore independent of the regression analysis.
The change in a2 is accompanied with changes in the offset
coefficient a0 and the a3 coefficient, accounting for the off-
nadir paths contribution to the atmospheric correction. It is
noteworthy to reiterate that, while the Adriatic a1 values
are close to the global ones, all Adriatic a2 values are
smaller than 2 while the respective global values are larger.
An important consequence of the reduced coefficient val-
ues is decreased noise amplification in all Adriatic
Fig. 5 Monthly scatter plot of
ERA40 total column water
vapor against thermal channels
temperature difference derived
from the RTM calculations for
AVHRR sensor on NOAA16
platform. All Adriatic points are
combined
46 I. Tomazic, M. Kuzmic
123
algorithms. Furthermore, for both daytime and nighttime
the autumn and winter algorithms appear less noisy than
their spring and summer counterparts.
To probe the extent to which noted variability affects
Adriatic SST estimates we calculated SST estimates with
four different algorithms/coefficient sets and compared the
outcome with the SST Ivana-A measurements. The result
of the exercise is presented graphically in Fig. 6 and
summarized numerically in Table 5. In this comparison
one has to bear in mind the size of the data sample. There
was 91 matchup pair in the nighttime case, and 102 in the
daytime, primarily concentrated in the summer period (50
and 62 pairs, respectively).
Figure 6 presents the patterns of residual temperature
variability. More specifically, Fig. 6a shows ‘‘empirically
the best’’ solution obtained by fitting the satellite brightness
temperatures to the bulk temperatures from Ivana-A, using
all the matchup pairs described in the data section. It
provides a zero-bias minimum-scatter solution, suggesting
an attainable error metric as limited by the algorithm form
and data quality, and offering a good reference for other
solutions. The existence of the patterns even in this solu-
tion testifies to the fact that not exactly the same SST value
is simultaneously registered below the surface and at the
TOA, either at nighttime or at daytime. Imperfect cloud
masking or residual stratification may have contributed to
the error in residuals, but diurnal warming appears to be the
prime contributor to the daytime residual. The global
coefficient solutions (Fig. 6b) on the other hand are an
example of a ‘‘routine application’’ of the SST algorithms.
The solutions exhibit much larger scatter, less symmetrical
around zero in the case of daytime, therefore producing a
significant bias. Both of these solutions provide bulk SST
estimates, making it legitimate to compare them directly to
the Ivana-A measurements (1 m depth). The comparison
metric is listed in Table 5. For the data-fit case, the table
shows the expected zero bias for both nighttime and day-
time, with scatter of 0.33 and 0.66, respectively. One notes
about twice as larger mad and rmsd values in the daytime
estimates, primarily due to diurnal warming effect (not
addressed in the study). Global coefficient solutions exhibit
the largest scatter, with smallest bias during night and
largest bias during day; large mad values (0.43, 0.68)
suggest considerable discrepancy throughout the year.
Closer inspection of Fig. 6b reveals that the nighttime bias
is small due to mutual balancing of positive (primarily in
the warmer part of the year) and negative (primarily in the
colder part of the year) SST residuals.
Our ERA-40-based solutions (Fig. 6c, d) provide
remarkably similar residual patterns that also show per-
sistent positive bias. The similarity implies that the
regional and seasonal water-vapor effect can be accounted
for with equal success by either using classical split-win-
dow coefficients seasonally adjusted to local climatology
(four sets of coefficients), or by explicitly accommodating
the water-vapor dependence, relying on its own climatol-
ogy as well as on the tcwv values for the year in question
(2004). The plots in Fig. 6e (the difference between the
Fig. 6d and c residuals) reinforce this conclusion for both
nighttime and daytime.
As pointed out earlier, our ERA-40-based solutions
provide skin SST estimates which are not directly com-
parable with the Ivana-A measurements. A skin-to-subskin
model would suffice in the nighttime case, but the daytime
solution further requires diurnal heating modeling if one is
interested in bulk solution. These corrections are still
subject to active research; for example, using almost 6,000
skin and bulk temperature measurements collected over a
4-year period Murray et al. (2000) found mean skin-bulk
SST difference of -0.2 ± 0.46 K at night, and ?0.05 ±
0.51 K during daytime, for low-wind conditions. Murray
et al. found mean skin-bulk daytime difference of
approximately 0.8 K. On the other hand, Donlon and
Robinson (1998) report less than 0.05 K in situ skin-bulk
temperature difference, ascribing it to the high wind speeds
that dominate their dataset. In an effort to avoid the
Table 3 Seasonal and geographical variability of channel tempera-
ture deficit, q parameter, and c parameter values derived for the
AVHRR sensor on the NOAA16 platform
Channel temperature deficit
T4 - Ts T5 - Ts
Day Night Day Night
Winter -1.267 -1.245 -1.920 -1.881
Spring -1.510 -1.610 -2.306 -2.453
Summer -2.028 -2.103 -3.098 -3.202
Autumn -1.694 -1.719 -2.581 -2.614
Average -1.770 -1.857 -2.700 -2.825
Adriatic North Middle South Whole
Day Night Day Night Day Night Day Night
q
Winter 0.951 0.947 0.948 0.944 0.948 0.945 0.948 0.945
Spring 0.905 0.891 0.900 0.889 0.898 0.886 0.900 0.888
Summer 0.869 0.854 0.868 0.857 0.870 0.858 0.869 0.857
Autumn 0.929 0.918 0.923 0.914 0.920 0.915 0.922 0.915
Average 0.913 0.902 0.910 0.901 0.909 0.901 0.910 0.901
c
Winter 1.630 1.646 1.638 1.664 1.646 1.660 1.641 1.658
Spring 1.912 2.022 1.951 2.033 1.965 2.053 1.951 2.041
Summer 2.179 2.292 2.188 2.270 2.169 2.261 2.177 2.269
Autumn 1.758 1.838 1.802 1.858 1.821 1.851 1.808 1.851
Average 1.870 1.950 1.895 1.956 1.900 1.956 1.894 1.955
Atmospheric influence on satellite retrieval of Adriatic Sea surface temperature 47
123
introduction of two more models still being researched,
which themselves require additional data and introduce
their own uncertainties, we have kept the ERA-40 solutions
uncorrected, and focused more on the scatter in residuals.
One notes in Table 5 that all ERA-40-based solutions
exhibit a positive bias, in line with Merchant and Le
Borge’s (2004) finding that ‘‘SSTs from RT-based coeffi-
cients are likely to be biased by up to several tenths of a
kelvin’’. An extra step is thus required for empirical
adjustment of the offset in our ERA-40-derived algorithms,
itself based on additional accurate and representative val-
idation data. It is worth noting here that such an offset
correction could also include ‘‘an adjustment to the bulk
framework,’’ if appropriate information is available (Mer-
chant and Le Borge 2004). Regardless of the bias/offset
issue, the RT-based solutions provide standard deviation
much better that the global ones, numerically very close to
the data-fit reference values. The same level of scatter is
attained with either seasonal or tcwv-dependent coeffi-
cients. Data paucity notwithstanding, the scatter exhibits
seasonal variability (not listed). The Adriatic_seasonal
winter solution provides the lowest (std = 0.26) and the
Adriatic_water_vapor summer solution the highest
(std = 0.70) value.
5 Concluding remarks
The aim of this work has been exploration of the regional
atmospheric influence on satellite estimation of the Adriatic
SST. To that end a subset of the ECMWF ERA-40 reanalysis
data was employed to provide the temperature and humidity
profiles as well as surface data, whereas the RTTOV 8.7
radiative transfer model was used to calculate the top-of-
atmosphere brightness temperatures in the AVHRR chan-
nels. Ten ERA-40 grid points over the Adriatic Sea were
used in the analysis, providing 29,590 clear-sky (00 UTC
and 12 UTC) profiles, later employed in the RT model to
calculate respective BTs. The BTs were subsequently fit to
the same SST series in order to derive regression coefficients
that capture local atmospheric influence.
Climatological analysis of the ERA-40 temperature and
specific humidity profiles demonstrated distinct seasonal
variability in the ECMWF-modeled atmosphere over the
Adriatic. The derived Adriatic average summer vertical
temperature distribution proved to be similar to its mid-
latitude counterpart, whereas the average ECMWF winter
profile exhibited higher values in the lower troposphere.
The average Adriatic summer humidity profile revealed
values consistently higher than the mid-latitude profile,
whereas the winter Adriatic and mid-latitude profiles
showed much closer agreement, except below the 900 hPa
level. Seasonality noted in temperature and specific
humidity profiles also evinced in atmospheric transmit-
tance, thermal channels temperature deficit, and derived
parameters such as q and c.
To explore the influence of the ERA-40-inferred atmo-
spheric variability on the SST estimates ten coefficient sets
were generated using multivariate analysis. Derived Adri-
atic coefficients exhibited smaller noise amplification than
the global ones, also displaying consistent seasonal dif-
ferences. The SST estimates based on the derived
Table 4 The split-window SST algorithm coefficients (Eq. 7) calculated acknowledging conditions over the Adriatic derived from the ERA-40
data
a0 a1 a2 NAF a3 a4 (10-3) a5 (10-5)
Daytime
Global 0.91400 0.99975 2.39418 4.15342 0.73235
Adriatic winter 2.09690 1.00875 1.33388 2.69578 0.72375
Adriatic spring -0.91123 0.99724 1.74531 3.25079 0.58759
Adriatic summer -4.83591 0.98349 1.91473 3.47360 0.54306
Adriatic autumn 4.52428 1.01643 1.64507 3.12887 0.63682
Adriatic water vapor -0.65025 1.00248 1.87548 3.43513 0.57931 4.67300 5.20000
Nighttime
Global -0.29200 0.99439 2.55546 4.37399 0.71418
Adriatic winter 2.77334 1.01097 1.41862 2.81344 0.69785
Adriatic spring -1.89957 0.99344 1.89297 3.45177 0.53830
Adriatic summer -7.77068 0.97323 1.99571 3.57735 0.50638
Adriatic autumn 4.39675 1.01589 1.69325 3.19477 0.63096
Adriatic water vapor -0.45005 0.99843 1.99292 3.59443 0.54402 5.64600 6.70000
A constant value of 273.15 is subtracted from all a0 values. Also listed are the NAF (Eq. 8), and global coefficient values. NAF is calculated for
nadir view
48 I. Tomazic, M. Kuzmic
123
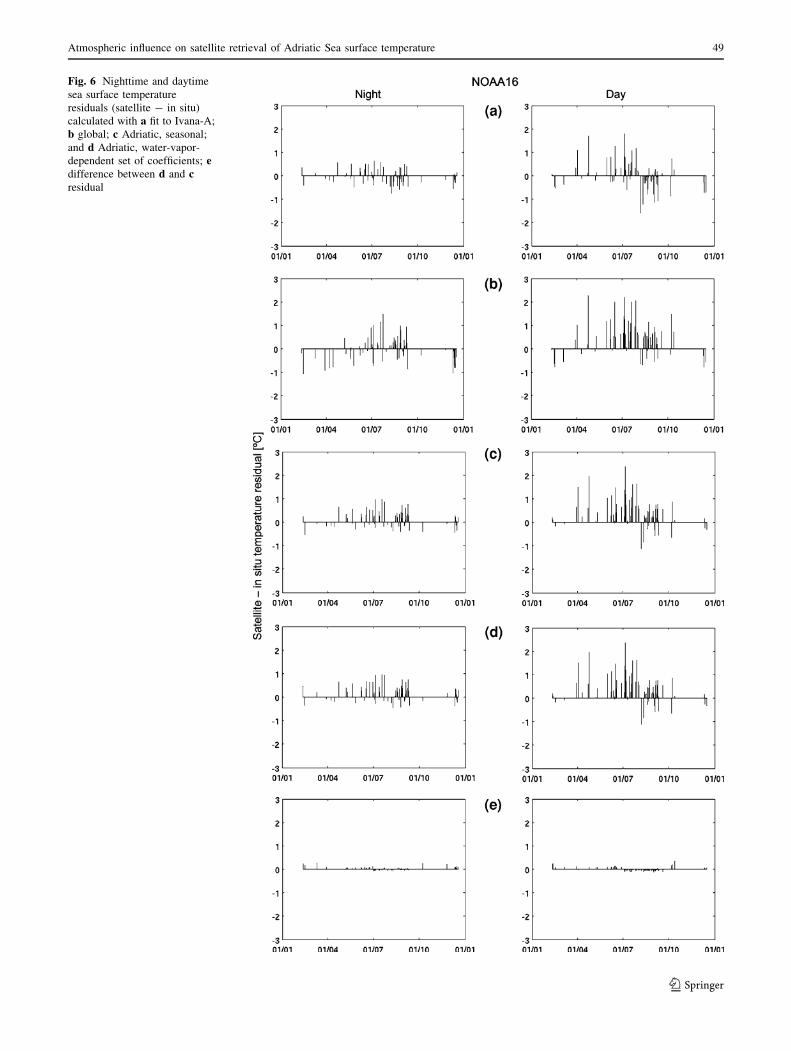
Fig. 6 Nighttime and daytime
sea surface temperature
residuals (satellite - in situ)
calculated with a fit to Ivana-A;
b global; c Adriatic, seasonal;
and d Adriatic, water-vapor-
dependent set of coefficients; edifference between d and cresidual
Atmospheric influence on satellite retrieval of Adriatic Sea surface temperature 49
123
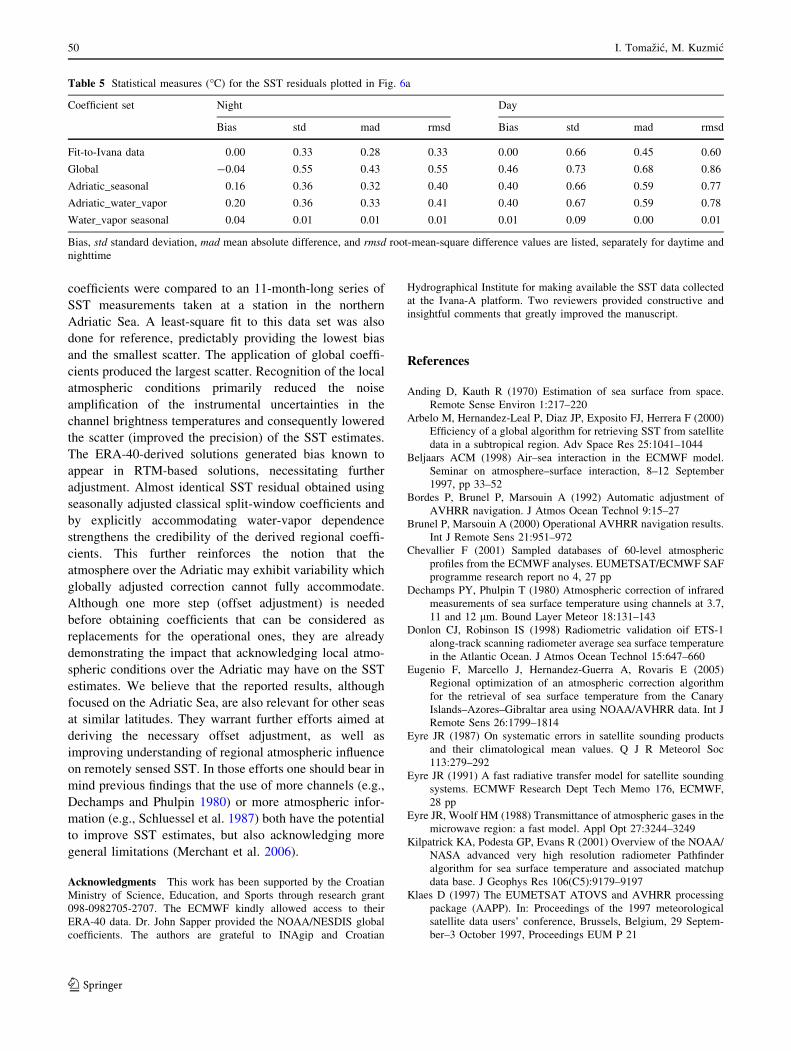
coefficients were compared to an 11-month-long series of
SST measurements taken at a station in the northern
Adriatic Sea. A least-square fit to this data set was also
done for reference, predictably providing the lowest bias
and the smallest scatter. The application of global coeffi-
cients produced the largest scatter. Recognition of the local
atmospheric conditions primarily reduced the noise
amplification of the instrumental uncertainties in the
channel brightness temperatures and consequently lowered
the scatter (improved the precision) of the SST estimates.
The ERA-40-derived solutions generated bias known to
appear in RTM-based solutions, necessitating further
adjustment. Almost identical SST residual obtained using
seasonally adjusted classical split-window coefficients and
by explicitly accommodating water-vapor dependence
strengthens the credibility of the derived regional coeffi-
cients. This further reinforces the notion that the
atmosphere over the Adriatic may exhibit variability which
globally adjusted correction cannot fully accommodate.
Although one more step (offset adjustment) is needed
before obtaining coefficients that can be considered as
replacements for the operational ones, they are already
demonstrating the impact that acknowledging local atmo-
spheric conditions over the Adriatic may have on the SST
estimates. We believe that the reported results, although
focused on the Adriatic Sea, are also relevant for other seas
at similar latitudes. They warrant further efforts aimed at
deriving the necessary offset adjustment, as well as
improving understanding of regional atmospheric influence
on remotely sensed SST. In those efforts one should bear in
mind previous findings that the use of more channels (e.g.,
Dechamps and Phulpin 1980) or more atmospheric infor-
mation (e.g., Schluessel et al. 1987) both have the potential
to improve SST estimates, but also acknowledging more
general limitations (Merchant et al. 2006).
Acknowledgments This work has been supported by the Croatian
Ministry of Science, Education, and Sports through research grant
098-0982705-2707. The ECMWF kindly allowed access to their
ERA-40 data. Dr. John Sapper provided the NOAA/NESDIS global
coefficients. The authors are grateful to INAgip and Croatian
Hydrographical Institute for making available the SST data collected
at the Ivana-A platform. Two reviewers provided constructive and
insightful comments that greatly improved the manuscript.
References
Anding D, Kauth R (1970) Estimation of sea surface from space.
Remote Sense Environ 1:217–220
Arbelo M, Hernandez-Leal P, Diaz JP, Exposito FJ, Herrera F (2000)
Efficiency of a global algorithm for retrieving SST from satellite
data in a subtropical region. Adv Space Res 25:1041–1044
Beljaars ACM (1998) Air–sea interaction in the ECMWF model.
Seminar on atmosphere–surface interaction, 8–12 September
1997, pp 33–52
Bordes P, Brunel P, Marsouin A (1992) Automatic adjustment of
AVHRR navigation. J Atmos Ocean Technol 9:15–27
Brunel P, Marsouin A (2000) Operational AVHRR navigation results.
Int J Remote Sens 21:951–972
Chevallier F (2001) Sampled databases of 60-level atmospheric
profiles from the ECMWF analyses. EUMETSAT/ECMWF SAF
programme research report no 4, 27 pp
Dechamps PY, Phulpin T (1980) Atmospheric correction of infrared
measurements of sea surface temperature using channels at 3.7,
11 and 12 lm. Bound Layer Meteor 18:131–143
Donlon CJ, Robinson IS (1998) Radiometric validation oif ETS-1
along-track scanning radiometer average sea surface temperature
in the Atlantic Ocean. J Atmos Ocean Technol 15:647–660
Eugenio F, Marcello J, Hernandez-Guerra A, Rovaris E (2005)
Regional optimization of an atmospheric correction algorithm
for the retrieval of sea surface temperature from the Canary
Islands–Azores–Gibraltar area using NOAA/AVHRR data. Int J
Remote Sens 26:1799–1814
Eyre JR (1987) On systematic errors in satellite sounding products
and their climatological mean values. Q J R Meteorol Soc
113:279–292
Eyre JR (1991) A fast radiative transfer model for satellite sounding
systems. ECMWF Research Dept Tech Memo 176, ECMWF,
28 pp
Eyre JR, Woolf HM (1988) Transmittance of atmospheric gases in the
microwave region: a fast model. Appl Opt 27:3244–3249
Kilpatrick KA, Podesta GP, Evans R (2001) Overview of the NOAA/
NASA advanced very high resolution radiometer Pathfinder
algorithm for sea surface temperature and associated matchup
data base. J Geophys Res 106(C5):9179–9197
Klaes D (1997) The EUMETSAT ATOVS and AVHRR processing
package (AAPP). In: Proceedings of the 1997 meteorological
satellite data users’ conference, Brussels, Belgium, 29 Septem-
ber–3 October 1997, Proceedings EUM P 21
Table 5 Statistical measures (�C) for the SST residuals plotted in Fig. 6a
Coefficient set Night Day
Bias std mad rmsd Bias std mad rmsd
Fit-to-Ivana data 0.00 0.33 0.28 0.33 0.00 0.66 0.45 0.60
Global -0.04 0.55 0.43 0.55 0.46 0.73 0.68 0.86
Adriatic_seasonal 0.16 0.36 0.32 0.40 0.40 0.66 0.59 0.77
Adriatic_water_vapor 0.20 0.36 0.33 0.41 0.40 0.67 0.59 0.78
Water_vapor seasonal 0.04 0.01 0.01 0.01 0.01 0.09 0.00 0.01
Bias, std standard deviation, mad mean absolute difference, and rmsd root-mean-square difference values are listed, separately for daytime and
nighttime
50 I. Tomazic, M. Kuzmic
123

Kleespies TJ, McMillin LM (1990) Retrieval of precipitable water
from observations in the split window over varying surface
temperatures. J Appl Metorol 29:851–862
Masuda K, Takashima T, Takayama Y (1988) Emissivity of pure and
sea waters for the model sea surface in the infrared window
region. Remote Sense Environ 24:313–329
McMillin LM (1975) Estimation of sea surface temperatures from two
infrared window measurements with different absorption.
J Geophys Res 80:5113–5117
McMillin LM, Fleming HE (1976) Atmospheric transmittance of an
absorbing gas: a computationally fast and accurate transmittance
model for absorbing gases with constant mixing ratios in
inhomogeneous atmospheres. Appl Opt 15:358–363
Merchant CJ, Filipiak MJ, LeBorgne P, Roquet H, Autret E, Piolle
J-F, Lavender S (2008) Diurnal warm-layer events in the western
Mediterranean and European shelf seas. Geophys Res Lett 35.
doi:10.1029/2007GL033071
Merchant CJ, Le Borge P (2004) Retrieval of sea surface temperature
from space, based on modelling of infrared radiative transfer:
capabilities and limitations. J Atmos Oceanic Tech 21:1734–1746
Merchant CJ, Horrocks LA, Eyre JR, O’Caroll AG (2006) Retrievals
of sea surface temperature from infrared imagery: origin and
form of systematic errors. Q J R Meteorol Soc 132:1205–1223
Minnett PJ (1986) A numerical study of the effects of anomalous
North Atlantic atmospheric conditions on the infrared measure-
ments of sea surface temperature from space. J Geophys Res
91:8509–8521
Minnett PJ (1990) The regional optimization of infrared measure-
ments of sea surface temperature. J Geophys Res 95:13,497–
13,510
Murray MJ, Allen MR, Merchant CJ, Harris AR, Donlon CJ (2000)
Direct observations of skin-bulk variability. Geophys Res Lett
27:1171–1174
O’Carroll AG, Watts JG, Horrocks LA, Saunders RW, Rayner NA
(2006) Validation of the AATSR meteo product sea surface
temperature. J Atmos Oceanic Tech 23:711–726
Pearce AF, Prata AJ, Manning CR (1989) Comparison of NOAA/
AVHRR-2 sea surface temperature with surface measurements
in coastal waters. Int J Remote Sens 10:37–52
Persson A, Grazzini (2007) User Guide to ECMWF forecast products.
Meteorological Bulletin M3.2, ECMWF, 161 pp
Rayer PJ (1995) Fast transmittance model for satellite sounding. Appl
Opt 34:7387–7394
Saunders R and Brunel P (2005) RTTOV_8_7 users guide. EUMET-
SAT NWP SAF, NWPSAF-MO-UD-008, 45 pp
Saunders R with Contributors (2005) RTTOV-8 science and valida-
tion report. NWPSAF-MO-TV-007, 46 pp
Schluessel P, Shin H-Y, Emery WJ, Grassl H (1987) Comparison of
satellite-derived sea surface temperatures with in situ skin
measurements. J Geophys Res 92:2859–2874
Shenoi SC (1999) On the suitability of global algorithms for the
retrieval of SST from the north Indian Ocean using NOAA/
AVHRR data. Int J Remote Sens 20:11–29
Sherlock V (1999) ISEM-6: Infrared surface emissivity model for
RTTOV-6. NWP SAF report, 16 pp
Strong AE, McClain EP (1984) Improved ocean temperatures from
space—comparison with drifting buoys. Bull Am Meteorol Soc
65:138–142
Tanre D, Holben BN, Kaufman Y (1992) Atmospheric correction
algorithm for NOAA-AVHRR products: theory and application.
IEEE Trans Geosci Remote Sens 30:231–248
Trishchenko AP, Fedosejeva G, Li Z, and Cihlar J (2002) Trends and
uncertainties in thermal calibration onboard NOAA-9 to NOAA-
16. J Geophys Res 107D. doi:10.1029/2002JD002353
Tomazic I (2006) Validation of remotely sensed Adriatic Sea surface
temperature. MSc thesis, University of Zagreb, 170 pp
Uppala SM, 45 Co-authors (2005) The ERA-40 re-analysis. Q J R
Meteorol Soc 131:2961–3012
Zavody AM, Mutlow CT, Llewellyn-Jones DT (1995) A radiative
transfer model for sea surface temperature retrieval for the
along-track scanning radiometer. J Geophys Res 100:937–952
Zhang H-M, Reynolds RW, Smith TM (2004) Bias characteristics in
the AVHRR sea surface temperature. Geophys Res Lett
31:L01307. doi:10.1029/2003GL018804
Atmospheric influence on satellite retrieval of Adriatic Sea surface temperature 51
123