Environmental & Social Baseline of Thar Coalfield Block -1
78
SOCIAL & ENVIRONMENTAL BASELINE OF THAR COAL FIELD SINHAR-VIKIAN-VARVAI BLOCK-I Prepared by Dr. Mirza Arshad Ali Beg [email protected] 136 C Rafahe Aaam Housing SocietyKarachi 75210
-
Upload
independent -
Category
Documents
-
view
0 -
download
0
Transcript of Environmental & Social Baseline of Thar Coalfield Block -1
SOCIAL & ENVIRONMENTAL BASELINE OFTHAR COAL FIELD SINHAR-VIKIAN-VARVAI BLOCK-I
Prepared by
Dr. Mirza Arshad Ali Beg
136 C Rafahe Aaam Housing SocietyKarachi 75210
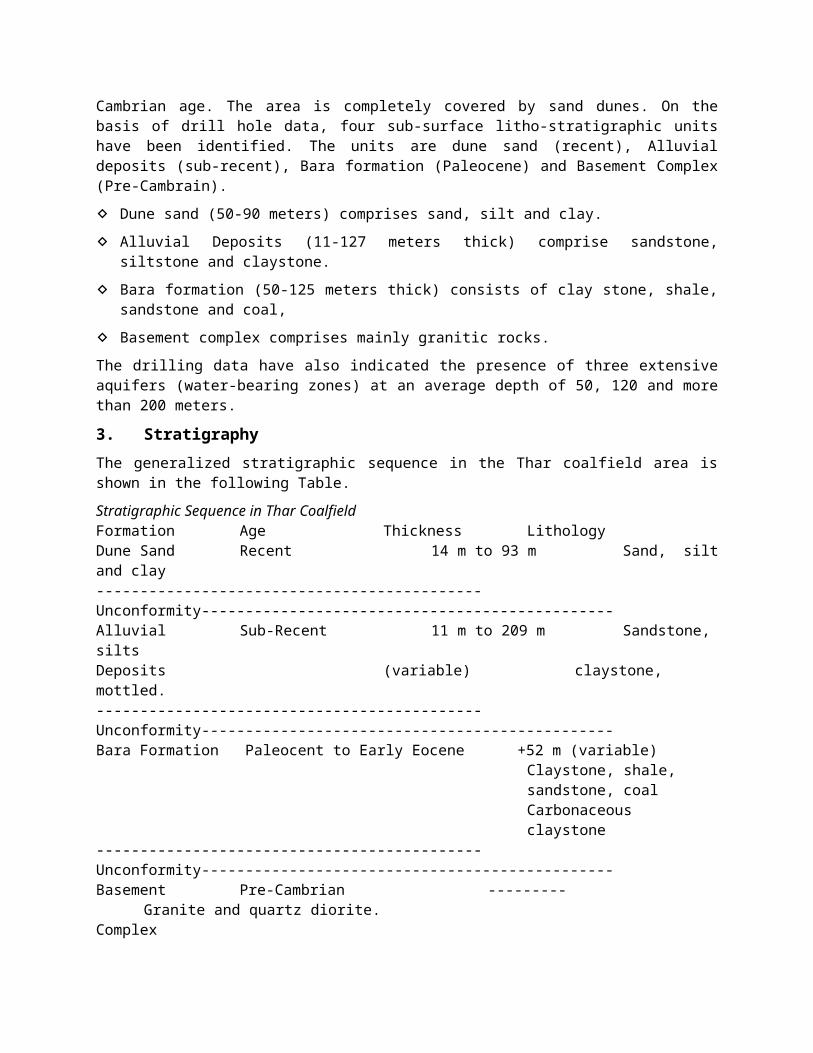
ENVIRONMENTAL BASELINE OF THAR COAL FIELD SINHAR-VIKIAN-VARVAI BLOCK-I
1. GeneralThe microenvironment of Sinhar Vikian Varvai Thar Coalfield Block 1(TCB-1) is located approximately between Latitudes 24°15’N and 25°45’Nand Longitudes 69°45’E and 70° 45’E in the southern part of SindhProvince in the Survey of Pakistan topo-sheet Nos. 40 L/2,5 and 6.Based on available infrastructure and geology, the Geological Surveyof Pakistan had identified four blocks some 5 km beyond Islamkot forexploration and assessment of coal resources. The four blocks withnames, area and coordinates as provided earlier on were as given inthe following Table (4.16):S.No. Name/Blocks Area
(km2)Coordinates
Latitude Longitude
1 Sinhar Vikian Varvai,Block-I
122.00
24° 35’N to 24°44’N
70° 12’E to 70°18’E
2 Singharo Bhitro,Block-II 55.00 24° 44’N to 24°
51’N70° 15’E to 70°25’E
3 Saleh Jo Tar, Block –III 99.50 24° 49’N to 24°
58’N70° 12’E to 70°18’E
4 Sonalba, Block – IV 82.50 24° 41’N to 24°48’N
70° 12’E to 70°20’E
The TCB-1 area is accessible by a 410 kilometers metalled road formKarachi up to Islamkot via Hyderabad-Mirpur Khas-Naukot and Thatta-Badin-Mithi-Islamkot routes. A road network connecting all the majortowns with Thar Coalfield has been developed. The rail link fromHyderabad is up to Naukot, which is about 100 kilometers fromIslamkot.The ecosystem of the TCB-1 that would be leased to SSRL-GMC forestablishment of Coal Mining Project comprises barren undulating sanddunes. Thar Coal field: Sinhar Vikian Varvai, Block-1 is spread over122 km2 area. The terrain is sandy and rough with sand dunes formingthe topography. 2. General GeologyThe studies conducted so far, show that the Thar coalfield restsdirectly on relatively shallow, rifted basement rocks of late Pre-
Cambrian age. The area is completely covered by sand dunes. On thebasis of drill hole data, four sub-surface litho-stratigraphic unitshave been identified. The units are dune sand (recent), Alluvialdeposits (sub-recent), Bara formation (Paleocene) and Basement Complex(Pre-Cambrain). Dune sand (50-90 meters) comprises sand, silt and clay. Alluvial Deposits (11-127 meters thick) comprise sandstone,
siltstone and claystone. Bara formation (50-125 meters thick) consists of clay stone, shale,
sandstone and coal, Basement complex comprises mainly granitic rocks. The drilling data have also indicated the presence of three extensiveaquifers (water-bearing zones) at an average depth of 50, 120 and morethan 200 meters.3. StratigraphyThe generalized stratigraphic sequence in the Thar coalfield area isshown in the following Table. Stratigraphic Sequence in Thar CoalfieldFormation Age Thickness LithologyDune Sand Recent 14 m to 93 m Sand, siltand clay--------------------------------------------Unconformity-----------------------------------------------Alluvial Sub-Recent 11 m to 209 m Sandstone,silts Deposits (variable) claystone,mottled.--------------------------------------------Unconformity-----------------------------------------------Bara Formation Paleocent to Early Eocene +52 m (variable)
Claystone, shale, sandstone, coalCarbonaceousclaystone
--------------------------------------------Unconformity-----------------------------------------------Basement Pre-Cambrian ---------
Granite and quartz diorite.Complex
An unconformity rests at the base of underlying sedimentary sequenceeastward to the point where the Paleocene/ Eocene rocks are positioneddirectly on the basement granite. The geological information suggeststhat coal-bearing strata of Paleocene-Eocene sediments uncomfortablyoverlie the pre-Cambrian basement igneous rocks exposed at NagarParkar (Fasset & Durrani, 1994).The generalized straitigraphic sequence in the Tharparkar Districtcomprises a) the recent deposit including the sand dunes, b) alluvialdeposits, c) coal-bearing Bara Formation, and d) basement complex. Thedescription of each straitigraphic unit is as follows:a) Recent Deposits: Recent deposits consist of dune sand varying in
thickness from 14 to 93 m. The unit dominantly consists of fine sandand also contains few meters thick bands of silt and clay. Sand ispale yellowish brown, yellowish brown, yellowish gray, grayishorange and pinkish gray. Sand consists mostly of quartz and grainsof ferromagnesian minerals. At places a few calcareous grains arealso noticed. Quartz is dominantly fine to medium grains are mostlysub-angular to sub-rounded and moderate to well sorted. Scatteredminute mica flakes are also present.Strata covering the surface are fine sand layers of quaternarysystem which is more than 60 meters in thickness, mottled sandstoneand clay rock layer of tertiary system, raw coal and carbargilitelayer and igneous rock of Precambrian system respectively from topto bottom. The quaternary system manily consists of Aeolian finesand and it is loose and weak in strength, it is not suitable forproviding a supporting layer as the natural foundation and needs tohave foundation treatment.
b) Alluvial Deposits (11-127 meters thick) comprise sandstone,siltstone and clay stone.
c) The Bara formation (50-125 meters thick) consists of clay stone,shale, sandstone and coal. The coal-bearing horizon of thePaleocene-Eocene sediments above the basement complex is designatedas the Bara Formation. It is correlated on the basis of agedetermined by palanological studies, comparable lithology andassociated lignite coal beds with Bara Formation of the adjoiningareas of Lakhra, Sonda, Thatta and Khorwah. Ahmed and Ghani (1976)proposed the name Bara Formation for the lower part of the RanikotFormation of Vredenburg (1906) and the lower non-fossiliferous partof the Ranikot series of Blenford (1879). The name Bara Formation is
derived from the section at Baran Nai (river) near Amri, Dadudistrict, where the rocks are best exposed. The Formation is exposed predominantly of sandstone and subordinateclaystone or shale, siltstone and coal. The thickness of BaraFormation varies from place to place. It is 705 m thick in BOC well(Lakhra No: 1) and 890 m thick at Lakra (Hunt well No: 2). Its uppercontact with the Lakhra Formation is conformable. Plano-assemblageindicates an age from Early Eocene to Paleocene (HDIP, 1995). In theexplored Thar area the Bara Formation has an uncomfortable contactwith the underlying basement complex and the overlying unit variesbetween 54 complex and the overlying Sub-Recent deposits. Thecontact with the overlying unit varies between 54 and 230 m depth.The Formation comprises claystone, carbonaceous claystone,sandstone; siltstone and kaolin with inter-laminated coal beds. Thepercentage of sand increases at depth in the drill holes below thelast coal beds. The quartzose sandstone bodies are saturated withbrackish water under semi-artesian conditions.
d) Basement Complex: The basement complex comprises mainly graniticrocks. In the investigated area the basement complex was penetratedat varying depths between 110 and 127 m. The basement rocks arepenetrated by granite and granodiorite. The granite is white,pinkish grey to light gray in color, coarse grained has feldsparsaltered to kaolin. It outcrops in the form of small scatteredhillocks in Nagarparkar area in the Thar desert and has beenclassified into: (i) metabasites (oldest), (ii) acidic dykes in themetabasites, (iii) grey granite, (iv) pink granite and (v) dykes(youngest).The metabasites are medium to coarse grained volcanic and palutonicrocks. These are commonly metamorphosed to epidote amphibolitescontaining acidic dykes of rhyolites to quartz trachyte composition.The grey granite forms maximum exposures including the metabasitesand itself being intruded by pink granite. It is medium to coarsegrained, equigranular to porphyretic and is essentially composed ofperthite, albite and quartz. Riebeckite and oxides of iron andtitanium oxides occur commonly followed by aegerine and minorbiotite in several samples. Other minor constituents include zircon,apatite, allanite, titanite along with local epidote.
The three aquifers (water-bearing zones) are inter-bedded in the coalzone at an average depth of 50, 120 and more than 200 meters. Theexistence of pressurized aquifers above and below the lignite mass hasbeen described in the Hydrology Section where the capacity, hydraulic
head, recharge potential (including if they consist of recent fossilwater), and composition are mentioned in detail.4. Geological ConditionThe strata of Thar Coalfield are described respectively down-to-up asexposed in the series of drill holes:
Precambrian of Proterozoic era The era of the base which constitutes the coal strata is uncertain. Itconsists mainly of granite, rhyolite, diorite and other intrusionrocks as well as chorismite, such as granulitite. The top of graniteis strongly weathered into kaolin that belongs to bedded kaolin layer,with the thickness of 0-13.50m, which is the boundary sign for theoverburden coal bearing strata. Kainozoic (1) Palaeocene-eocene series of paleogene system (E1-E2) is the coalbearing strata of this area, which is distributed over the entirearea. It can be divided into three sections according to the nature ofcoal: Lower section is composed mainly of gray and off-white medium and
coarse sandstone. It is unstable thin mudstone on the top, which isthe direct floor of coal seam. The sandstone is mainly composed ofquartz and little ferromagnesian mineral, which is poor in sortingand presents edge angle and subround shape. It is generally looseargillaceous cement, with poor cementation. It is direct floor ofcoal seam in local places. There are few rosin particles in thecoal, and the woody structure is rarely found.
Middle section is the main coal containing section, mostly comprisingcoal seam, mudstone and carbonaceous mudstone. There are 4 coalseams. The coal seam is brown black or grey black, in blocks, withlight quality. Woody structure is occasionally found, along withplenty of yellowish-brown rosin particles and blocks and few pyritesand siderites nodules. The coal seam occasionally contains thinlayers of mudstone and carbonaceous mudstone. Mudstone is foundmainly between coal seams.
Upper section is mainly composed of mouse color and grey blackmudstones containing thin coal seams. Off-white fine sandstone isfound occasionally. The mudstone is soft and found in blocks,containing few carbonized plant debris. Resin particles are rarelyfound.
(2) Pliocene series of Neocene system (N2) is the alluvial formation,which is distributed in the whole area. It is found distributed intothree sections:
Lower section: mainly composed of off-white sand that is mainly quartzcontained in coarse sandstone layers, containing few kaolin andferromagnesian mineral. It is poor in sorting and rounding and issubangular. It is generally loose argillaceous cement, with poorcementation.
Middle section: mainly composed of off-white and bluish grey finesandstone, clayey fine sandstone, fine sandy clay rock, in theinterbedded form. Some fraction is brownish red and orange yellowinoculated by iron oxide. The main component is clayey quartz inblocks. The cementation is poor, and the quality is soft.
Upper section: mainly composed of yellow and pink fine sandstone,with the main component of quartz, containing few darkferromagnesian minerals and dolomite fragments. Some fine quartzgravels are contained in local places. Off-white calcareous blocksare rarely found in the sandstone. Irregular limonite nodules arealways found at the bottom, in argillaceous cement (semi-cemented)and blocks.
(3) Holocene series of kainozoic quaternary system (Q4) is distributedin the whole area, and mainly comprises fine sand, which is aeoliansediment, with the main component of quartz, containing fewferromagnesian minerals; the upper part mainly consists of yellow graysand, containing lots of calcareous concretions. The thickness isuneven. The strength is low under natural conditions, and the strengthbecomes greater after drying. The middle part mainly consists ofyellow gray and orange gray sand, containing few calcareous particlesor blocks and thin clay layer occasionally; the upper part mainlyconsists of yellow white and yellow gray fine sand. It is loose,containing small calcareous particles.
5. OverburdenThar Desert occupies approximately 75,000 km2 area in SE Pakistan. Muchof the desert is covered by sand dunes. Kazmi (1984) distinguishedthree varieties of dunes, which included longitudinal, transverse, andBarchan type. Much of the southern part of the desert comprises stablelongitudinal dunes, while the other varieties occur to the north inthe transitional zones between the Thar, Thal and Cholistan deserts.The longitudinal dunes in much of the southern Thar desert are
consistently trending NE-SW and some are as long as 10 km. Echelongeometry results in overlapping longitudinal dunes resulting incomplex dunes, some as long as 32 km (Kazmi and Jan, 1997). In termsof width, the longitudinal dunes are 200 to 250 meters wide withtopographic relief of up to 100 meter (Passet, 1994).
Small, narrow elongated depressions intervene the dunes and arecovered by thin veneer of loamy soil. ln the vicinity of the GreatRann of Kuchchh, such inter-dunal depressions are filled with playatype sediments and salt deposits. In this area these depressionscommonly define saline lakes and marshes.
Valleys at the Thar Coalfields are moist enough to admit cultivationand when not cultivated they yield luxuriant crops of rank grass. Butthe extraordinary salinity of sub-soil and consequent shortage ofpotable water renders many tracts quite uninhabitable. In many of thevalleys the sub-soil water collects and forms large picturesque saltlakes, which rarely dry up. The present geological setting indicates aregional high erosion of Palaeozoic rocks and exposure of basementgranite during Mesozoic times. During unconformity over Paleocenetimes an early Eocene environment was suitable for formation of coaldeposits in Thar. Traversed by Indus River system which deposited thesub-recent alluvial sediments, the dunes were formed 20,000 years ago.
Overburden at Block – 1: The overburden of the Coalfield at SinharVikian Varvai, Block-1 consists of dune sand, alluvium and sedimentarysequence. The total overburden has thickness ranging from 150 to 230meters. The roof and the floor rocks are claystone and loose sandstonebeds. Cultivation is carried out wherever alluvial soil exists andnear or along the numerous depressions where rain water is absorbed bythe soil and stored. Cattle grazing and wood cutting are the mainoccupation.
The overburden over the mineable reserve of coal deposit in the TCB-1comprises all the three geological strata of the coalfields viz. dunesand, alluvium and sedimentary rocks of the Bara formation above thefirst coal bed. Thickness of the overburden as found in the drillholes varies from 137 to 189 meters in the area. The thickness of thedune sand through the area (at inter dune drill sites) ranges between51 and 90 meters and averages around 68 meters; alluvium thicknessranges between 58 and 100 meters and averages around 76 meters. Thethickness of the bedrock above the first coal seam is normally quite
low and is generally less than 15 meters beneath the alluvium bedrockcontact.
In a few drill holes alluvium is found directly on the first coalseam. The average thickness of the dune sand beneath imaginary planeconnecting the surface elevations of all the drill sites is about 50meters. The alluvial layer averages 80 meters throughout thecoalfield; 50 meters of sand dune below the low points where the testholes are located plus an average of 30 meters more represented by thepresent dune topography.
The total overburden isopach map of Block-I shows that two areas ofless overburden with 135 to 145 m thickness exist around the boreholes VV-1.4,14,15 and 16 and another in the southwest corner aroundthe bore holes SV-9, NC-12, NC-13, NC-14, and STP-11. The area in themiddle part around bore holes VV-11, NC-15, NC-4, NC-7, SV-5, SV-6,SV-11 and SV-13 bounded by the area of lesser overburden haveoverburden thickness of more than 180 meters. The overburden inanother area in the north around drill hole VV-2 is also more than 180meters thick.
6. Sub-Surface Geology The subsurface geology of the Thar Desert has only recently come to beknown in detail. In an area of around 500 km2 at the southeasternextremity of the desert, in the vicinity of the Nagar Parkar Town, thebasement rock is exposed as a suite of Late Proteozoic A-type granìtesin the form of sporadic hills, intruded in a Proteozoìc basementcomprising amphibolites. This part of Thar Desert represents a majoruplift in the region, resulting in the absence of rocks younger thanLate Proteozoic, probably due to erosion following the uplift. Aburied fault with uplift of ~ 150 meters of this area relative to NWcoal-bearing area marks the boundary of this uplifted area to the NW(Kazmi, 1984). Being part of the western Indian shield, the NagarParkar granites and their host basement amphibolites belong to thepost-Delhi tectonic/anorogenic magmatic event dated around 850-750 Main the Aravali Craton (Roy, 1988). The Nagar Parkar Igneous Complex(Jan et al., 1997) resembles closely with granites from Siwana andJalore in western Rajasthan, which yield Rb-Sr ages of 698 and 728 Ma.
Depth to the basement relative to the surface increases Westward inthe Thar desert. The basement is exposed at the surface in thevicinity of Nagar Parkar village but it gradually deepens to depths of
1500 m short of Mithi. The depth to basement increases further westtowards the current location of the Indus River, where it approaches adepth of 3.5 km. A cross section across the Indus platform from theborder area in the Thar Desert to the Indus river depicts a westfacingpre-Paleocene half graben structure, with basement high underlying theThar desert. A sedimentary wedge comprising sediments from Permian toRecent fills this graben structure, with base of the Palaeocene UpperGuru Formation defining a post-rift angular unconformity. The thickquaternary deposit is cause for liquefaction hazards in lower IndusBasin. It is noticeable that quaternary deposits in southern Sindhprovince are on average 200 meters thick with maximum thicknessreaching 800 meters. With high water table in the Indus basin, and thepresence of large aquifers interbed in the coal seams, these recentsediments are highly vulnerable to land subsidence and liquefactíon inthe wake of an earthquake of intensity of VIII or high. It may bereminded that land subsidence has already taken toll of the coastalarea and considerable land area has submerged and that includes thecoastal area from the Rann of Kuchchh to Shah Bunder – Keti Bunder –Mirpur Sakro – Gharo.
Geology of Thar Coal Deposit: Thar coal deposits are reported to haveoccurred in alluvial environments in Bara Formation of Paleocene age(Coal Facies, Depositional Environments And Basin Basin Modeling Of Thar Coal Field, Abrar Ahmad, Thesis, University of the Punjab, 2004).This, the largest coal field of Pakistan, has reserves estimated at175,506 million tonnes. The coal field was initially distributed intofour blocks. 217 boreholes had been drilled until the year 2002 toestablish the reserve.
Classification of Thar Coal as matrix coal facies, with Xylite coalfacies observed at a few places was carried by application of detailedorganic petrography along with Rock-Eval pyrolysis and geochemicaltechniques for the core samples from five boreholes from Block-l. Itwas observed that a number of pale and light layers in Thar coals werepresent in the core samples. This has led to the conclusion that thematrix coals and pale and light layers represent reed marshenvironments, and that the peats were formed in treeless, low-lyingswamps, perhaps of the Indus-Ghaggar/Saraswati delta.
Quantitative petrographic analysis shows that the coals are huminiterich (91.0%, on mineral matter free basis) on the average, with lowconcentration of liptinite and inertinite (6.7 % and 2.7 %, mmfbasis). Thar coal core samples were found rich in humodetrinite, withits content varying from 43% to 56%. A one-meter thick sapropelic coal
facies which may grade into an oil shale facies was found in oneborehole.
Application of all available techniques e.g. Tissue Preservation Indexand Gelification Index of Diesel, (1992), Ground Water Index andVegetation index of Calder, (1991 ), Facies-critical MaceralAssociations and Mineral Matter Contents, ABC ternary diagram ofKalkreuth (1991) and TFD ternary model of Marchioni and Kalkreuth(1991) for the interpretation of the environments of depositionsuggests herbaceous vegetation, limnic and limno-telmatic environmentsfor most of the coal seams, especially the main coal seam. Three tofour samples from three small coal seams however, suggest wet forestenvironments.
The sulphur content of the main seam was found to range from 0.45 to1.66% on as received basis and the ash content between 3.24 and 8.46%,with positive correlation between the sulphur and pyrite contents. Thelow ash and low sulphur content of the main seam has been taken asevidence that the marsh was not frequently flooded and there was nomarine influence on the hydrology of the peat.
The palynomorphs have been taken to suggest the prevalence of dicots,monocots and pteridophytes at the time of deposition of theinvestigated strata. Similarly the gymnosperms and the conifers werefound totally absent. Occurrence of high percentage of dicots,herbaceous monocots and complete absence of gymnospermic pollen inalmost all samples, at all depths, indicate dominance of cool tropicalto subtropical environment with low humidity.
Coal petrographic, Rock Eval pyrolysis and gross calorific value basedon moist and ash free data, classify these coals as Lignite B, LigniteA and Bituminous C. The geochemical, Rock- Eval pyrolysis and organicpetrographic analyses on the coal and associated sediments indicategood to excellent potential for gas as well as for liquidhydrocarbons.
The burial and thermal histories established using 1-0 basin modellingprogramme suggest that these coals were deeply buried (>500m) for ashort period during late Oligocene and Early Miocene time. The Tmax andvitrinite reflectance data show that these coals are not mature forhydrocarbon generation. However the presence of oil droplets in twoboreholes point toward hydrocarbon generation. The oil droplets may be
generated from resinite which can generate liquid hydrocarbons at lowmaturity.
7. Seismology The Bhuj Earthquake of January 26, 2001 had devastating effect inIndia in terms of loss of life and property. The epicenter beingwithin 150 km from the SE border of Pakistan, shocks were felt over awide region in Pakistan, resulting in damage to buildings at far offdistances and loss of around 15 people in the southeastern Sindhprovince of Pakistan(Bhuj earthquae of January 26, 2001: Effects in the Thar-Nagar Parkar Region of Sindh,
SE Pakistan, M. Asif Khan, Iftikhar Abbasi, Shamsul Hadi, Amanullah Laghari & Roger Bilham, Geological Bulletin Univ.
Peshawar Vol. 35, pp. 9-26, 2002).
It was noted that a 170 km long belt of about 15km width at thesouthern fringes of the Thar desert adjacent to the Great Rann ofKuchchh suffered widespread liquefactíon, that resulted in damage tomud houses and cane huts in several villages, including the Tobovillage (southeast of Díplo) where 25- 30 such houses collapsedcompletely or partially. No liquefaction was noticed at Nagar Parkartown (with bedrock as foundation) as well as in the northern parts ofthe Thar desert (probably due to low water table), and all the damageto buildings in this region was in response to ground shaking.
Based on reported damage three ísoseismal intensity zone have beenidentified 1) region encompassing parts of the Thar desert including towns/villages ofNagar Parkar, Islamakot, Díplo, Tobo, and Mithi is assigned anintensity of VIII on MMI scale based on extensive damage to masonrybuildings and intensive liquefaction in parts of the region, 2)northern Thar desert, districts of Mirpur Khas, Badin and Hyderabadhave been assigned intensity of VII, based on development of cracksand partial collapse to poorly constructed masonry buildings, and 3)region where buildings escaped damage but experienced swaying inresponse to ground shaking was assigned intensity VL including thecities of Karachi and Sukkur.
Tectonic setting of the Thar desert and lower lndus basin underlain byCretaceous normal faults and close proximity to two seismic zones,Kuchchh seismic zone in the southeast and Chaman seismic zone in thewest-northwest, suggests that the region is vulnerable to earthquakehazards. Furthermore, the region is underlain by a thick cover of
recent loose sediments, vulnerable to liquefaction and with a capacityto amplify the ground shaking.
Seismotectonic Stability: The central and southeastern coastal regionof Pakistan between Karachi and Nagar Parkar is generally believed tobe tectonically stable. Yet, one of the greatest earthquakes in Indiansubcontinent took place in the Rann of Kuchchh (immediately south ofPakistan border at Ali Bander) on Iune 16, 1819. After 182 years, thesame region was struck with another major earthquake on January 26,2001, with epicenter near the town of Bhachau, District Gujarat,India. This has reconfirmed that the region is vulnerable to seismichazards in response to active tectonics. (Geological control on natural hazards: earthquakes
and mass movement. Khan, M.A., Abbasi, LA., Khattak, G.A. (Efls.). Geological Bulletin, University of Peshawar, (Special
Issue), Vol. 35, pp. 9-26, 2002)
Regional Geological Setting: The Thar region on the SE Sindh marks thenorthern margin of the East-West oriented Great Rann of Kuchchh.Incidentally the geomorphic boundary between Thar Desert in the northand the Rann of Kuchchh in the south also marks the political borderbetween Pakistan and India. The Kuchchh region is underlain by rift-like structures, which have been mapped offshore beneath thecontinental shelf with a general east-west trend (Biswas, 1987). Onbroader regional scale, the Kuchchh Graben is part of the Cambay rift-system controlling the tectonic framework of Sindh-Gujarat regionbetween Bombay in the SE and Karachi in the NW. Besides the KuchchhGraben, this region hosts rift-structures of Cambay Graben, BombayGraben and Narmada Graben.
The India-Asia collision has been ongoing since the Eocene, and has inthe meantime initiated a compressional stress regime in anorthwesterly direction, which is very different from that at the timeof rifting, and the normal faults associated with rifting are subjectto inversion tectonics attaining reverse sense of displacement(Khattari, 1992; Chung and Gao, 1995).
The Thar-Kuchchh region is divisible into major geomorphic zones(Malik et al., 2000), which include from north to south:
1) Thar Desert and the Nagar Parkar Uplift 2) the Great Rann of Kuchchh, connected at its eastern end by the NE
-SW oriented little Rann, both comprising saline wastelands, 3) Banni Plains, marked by raised mud flats, 4) Kuchchh mainland comprising rocky uplands,
5) Coastal zone, marking the southern fringes of Kuchchh mainlandregion against the Gulf of Kuchchh further to the south.
The boundaries between these geomorphic zones are marked by faults ofregional extent.
The regional faults in the region include from north to south, NagarParkar Fault, Allah Band Fault and Kuchchh Mainland Fault (Malik etal., 2000; Bilham, 1998).
Nagar Parkar Fault: The Nagar Parkar fault runs parallel for some 10-20 km north of the eastwest geomorphic boundary between the TharDesert and the Great Rann of Kuchchh. ln the vicinity of the NagarParkar town, the fault takes a northeastern turn and passes north ofthe Nagar Parkar Uplift comprising Karunjhar Hill and other hillocksexposing granites of the Precambrian Nagar Parkar lgneous Complex.
Allah Band Fault: A regional fault is considered to be running alongthe axis of the Great Rann of Kuchchh in an east - west direction,some 10-20 km south of the India-Pakistan boundary (Malik, 2000). Amajor earthquake of magnitude 7.7 is associated with this faultepicentred at some 10 km north of the Fort Sindri (~10 km south of thecurrent PakistanIndia border). The uplift associated with this 1819earthquake created 90 km long natural dam (later termed Allah Band)across the Kori creek-Puran distributary of the Indus River. Theextension of Allah Band fault to the west and east is not so welldefined. Malik (2000) considers it to run eastward along the axis ofthe Great Rann of Kuchchh, while Bilahm (1999) following the accountof Oldham (1926) proposes a northeasterly turn for the Allah Bandfault some 50 km east of Fort Sindry to follow the geomorphic boundarybetween Thar desert and the Great Rann of Kuchchh. If so, it ispossible that Allah Band and Nagar Parkar may join up north of theNagar Parkar town, but there is no clear evidence for this.
Kuchchh Mainland and Associated Faults: The Great Rann of Kuchchh-Banni Plain, at their southern margin, abut against a series of lowhills defining the Kuchchh rocky mainland, and the sharp contact,marked by an elevation contrast of about 120 meters between the two isdefined by a regional fault termed Kuchchh Mainland Fault (Malik2000). This fault is vertical to steeply inclined normal fault, thatchanges upwards into a high-angle reverse fault (Biswas, 1987). Thesouthern wall of the fault defines a series of NW-SE to E-W orienteddomes and antíforms which characterize the Kuchchh rocky mainland.
Another regional fault termed Katrol Hill Fault passes through thecentral part of the rocky mainland which is associated with numerousfolded hills similar to those along the Kachchh mainland fault (KMF).Up to 400 meter high Hill Ranges associated with these two regionalfaults traversing the rocky mainland are intervened by Bhuj lowland(average altitude of 80-1000 m). The central and eastern parts of KMFhave ruptured during the Bhuj Earthquake 2001 (Rastogi et al., 2001).
Geology & Structure of Thar DesertThar Desert and the lower Indus Basin, to its west, are covered bythick sand dunes that conceal the structure. The existing informationregarding the structure of the region mainly comes from gravity,seismic reflection profiles and borehole data mainly related withpetroleum and coal related exploration.
The lower Indus basin together with Thar Desert in the east andKuchchh region to the southeast is governed by faults associated witha Cretaceous phase of extensìonal tectonics in this region reflectedin the KuchchhCambay-Bombay rift systems. Whereas the Kuchchh regionis marked by structures related with east-west oriented Kuchchhgraben, the Thar and Lower Indus basin are controlled by NW-SEoriented extensional faults defining a series of grabens and horsts.It may be noted that the Thar region together with the GujaratDistrict of India in the south is considered intra-cratonic intectonic setting. In the context of ongoing Himalayan orogeny, theinherited extensional faults have potential to be reactivated. Therehave been suggestions that the western boundary of the Indian platemay be involved in collisional tectonics as east of the Bela-MuslimBagh suture as Bhuj region of India (Stein et al., 2002).
Rann of Kutch Fault: This E-W trending fault has producedearthquake of the order of M ~ 7.6 on Richter scale. In 1819 and1956, this fault was responsible for severe earthquakes in Gujrat,Tharparkar and Indus delta. This fault system also known as AllahBund Fault passes in the proximity of the Steel Mills and KarachiNuclear Power plant. It is 225 km in length and is responsible for theproduction of earthquake of considerably high magnitude of up to 7.6 Mon Richter scale and of IX to X intensity on the Modified Mercali, MMscale on June 16, 1819.
Additionally a complex series of faults generally oriented easterlyand slightly concave to the north have been identified through aerial
photographs. They are roughly parallel to the inferred zone of rupturefor the 1819 earthquake event.
Over the last sixty years, earthquakes of intensity lower than 5 onRichter Scale, including those in 1945 and 1985, have struck theregion comprising the macroenvironment and thus far they have been ofminor significance. This is mainly because the earthquakes here arenot "Inter-Plate" or "Plate Boundary" earthquakes which occur commonlyalong narrow zones that follow the edges of tectonic plates.
The tectonic fault that produced the 2001-Bhuj earthquake, whichregistered a massive 7.7 on the Richter scale, was part of a complexsystem of geologic faults that run northwest in Gujrat through themarshy Rann of Kutch, where it produced a magnitude 7.6 quake in 1819,and also ran into Pakistan. While concealed under the loose sand ofthe Rajasthan and Thar deserts and sediments of the Indus delta, thissystem of faults appears to continue to the west, passing throughKarachi and while extending into the Arabian Sea, it intersectsanother system of faults associated with a major tectonic boundarythat has produced devastating earthquakes as far north as Quetta inthe past. Together these fault systems have produced historicallylarge earthquakes in the Pab Range, Tharparkar taluka, and Jhimpirareas.
Kutch is virtually an island, as it is surrounded by the Arabian Seain the west; the Gulf of Kuchchh in south and southeast and Rann ofKuchchh in north and northeast. The border with Pakistan lies alongthe northern edge of the Rann of Kutch, of the disputed Kori Creek.The Kutch peninsula is an example of active fold and thrust tectonism.In Central Kuchch there are four major east-west hill rangescharacterized by fault propagation folds with steeply dipping northernlimbs and gently dipping southern limbs. From the gradual increasingdimension of the linear chain of hillocks towards the west along theKuchchh mainland fault and the epicentre of the earthquake of 2001lying at the eastern extreme of Kuchchh mainland fault, it issuggested that the eastern part of the Kutch mainland fault isprogressively emerging upward. It can be suggested from the absence ofdistinct surface rupture both during the 1956 Anjar earthquake and2001 Bhuj earthquake, that movements have taken place along a blindthrust. Villages situated on the blind thrust in the eastern part ofthe Kuchchh mainland hill range (viz. Jawaharnagar, Khirsara, Devisar,Amarsar and Bandhdi) were completely erased during the 2001earthquake.
Age data of liquefaction features suggest that a previous event ofcomparable size must have occurred 800–1000 years ago. Seismicactivity appears to be related to the reactivation of an ancient riftin a stress regime that is dominated by nearly north–southcompression.
Intra-plate type of earthquakes (Mid-Plate Earthquakes) occurs faraway from plate boundaries. The latter type earthquakes are lessfrequent but are capable of releasing just as much energy in a singleevent as one of similar intensity along a plate boundary. These arisedue to localized systems of forces in the crust sometimes associatedwith ancient geological structures such as in the Rann ofKuchchh. Thus while the October 8, 2005 megathrust earthquake was thedirect result of the interaction between Indian Plate and the Eurasianplate, the earthquakes of July, August and October 11 in themacroenvironment are intra-plate or Mid-Plate events.
It is interesting to note that no earthquake, including the 1945Makran and 2001 Bhuj events, as well as the occasional shaking from M4-5 earthquakes on faults in the Deh Kohistan, has ever produceddocumented damage anywhere. Although the 1819 earthquake wasapparently similar or larger in magnitude than the 2001 Bhuj event,little damage occurred in Tharparkar and Hyderabad in 1819 compared to2001 even though the former event was closer to thesetowns/cities.4.134.13
The 1819 earthquake is well recorded and survey of Sindh Coast byCarless in 1817 and again in 1837 showed lot of changes in the variousbranches of the Indus. Besides these Sindhri a coastal town on theeastern branch of the Indus called Puran leading to Lakhpat on KoreeCreek, submerged about 6 meters below the water in the Rann of Kutchand probably Rann of Kutch got disconnected with sea due to rise ofits western edge close to and turned into inland lake. During thisearthquake a mound 16 kms wide 80 kms long and 6 meters high, roseacross the Puran blocking water supply to Lakhpat for some nine years,when the bund breached due to water pressure again in 1828 AD andchannel leading to Basta and Lakhpat and Koree creek was restored.This bund was locally called Allah bund (God’s embankment).4.134.13 Seismic Hazard in Karachi, Pakistan: Uncertain Past, Uncertain Future, RogerBilham, Sarosh Lodi, Susan Hough, Saria Bukhary, Abid Murtaza Khan, and S. F. A.Rafeeqi, Seismological Research Letters; November 2007; v. 78; no. 6; p. 601-613; DOI:10.1785/gssrl.78.6.601
Mud geysers were recorded south of Jati in 19th century, showingvolcanic activity down below. The Sindh and Baluchistan coaststherefore need to be under surveillance against seismic activity.
1819 AD, Earthquake in Rann of Kutch bordering SindhIt occurred on June 16, 1819, an eye witness account by the Britishofficers, informing that 7,000 buildings were demolished, 1,150 personwere buried alive in the ruins. A shallow stream about 7,000 feet(2133 metres) wide was formed and Rann which was previouslydisconnected with sea was filled with sea water spreading to largearea. Sindri fort 15 feet high above water level, and a Talpur bordercheckpost (now in India), was submerged nearly totally and customofficers on the fort wall were rescued by a British ship. Totaldisplacement of Allah Bund was 30 feet uplift and 10 feet depressiondue to vertical slipping at the fault plains. The earthquake isreported to have disbursed normal drainage pattern of Rann of Kutchand river Indus and the Indus River branches to the sea changed theircourse as can be seen from coastal maps of 1817 and 1830 AD.
Due to 1819 earthquake Shah Bunder port was abandoned and two newcreeks namely Kukaiwari and Kadewari came into existence between 1819and 1837.
1901 AD EarthquakeThe 1901 earthquake caused fissure in alluvium in Badin and JatiTalukas. Warm water and mud gayer erupted for about 12 hours. Thegeyser holes were 15-20 feet wide and 8-10 feet deep. Records aboutdamage done to houses, roads etc. are not present in Sindh Governmentrecords now. Search for them can give useful information for future.
1956 AD EarthquakeAnother earthquake in Rann of Kuchchh took place on July 21, 1956 at aplace called Anjar 80 miles south east of Allah Band and caused greatdamage to life and property.
Earlier Earthquake of 1668 ADIn 1668, a severe earth quake caused major topographical changes inthe Rann of Kuchchh and loss of life and property and possibly somedamage in coastal Sindh.
Indus lineament and effect of earthquakesIndus lineament is suggested to be responsible for change in theoriginal course of the Indus in 1758 AD. This earthquake is thought to
have caused shift in the course of river to the one at present. Thesehydrological changes were already taking place since 1755 AD andKalhoras changed their capitals a number of times during a span of fewyears.
Hurricanes or TornadoesCoastal area is within hurricane zone, which strikes Sindh coast,Kutch, Kathiawar and some parts of Gujarat periodically. There is lackof record of such hurricanes in the past, but May 1999 AD hurricanestruck not only coastal areas of Thatta district, but sufficientlyinside. The waves were considered much more than 18 feet high andsubmerging all areas upto 18 feet contours but suddenly with littlenotice and no warning was issued and there was loss of human lives anddomesticated animals. The land once submerged into sea water, neededfresh water for washing salts out and vast area of Kotri barragecontaining sea salts which in time have been converted in to sodiumbicarbonates and carbonates, needs costly reclamation. It is stillawaiting reclamation.
History has recorded such a hurricane in days of Shah Jehan when vastareas of present Thatta and Badin districts were submerged and Emperorhad to send special funds for help of people. Many such cases arereported periodically in the past 23 years, when warnings have beenissued, but luckily the hurricane got diverted towards Rann of Kutchor Kathiawar, the hilly shores of which reduced impact and damage inthose areas. It is proposed to study exact area which was submerged in1999 and work suggests:(a) Land reclamation procedures.(b) Future warning and evacuation system.
The following Table shows the earthquake occurrences over the lastforty years. The Table does not include the numerous events ofmagnitude less than 4.0 on Richter scale. Earthquakes of recentoccurrence were recorded on July 16, 2005, followed by one on August6, another on August 13, yet another on October 9 and then again onOctober 11, 2005. They were all of magnitude between 4 and 5.1 onRichter scale. The epicenter of these earthquakes was away from thoselisted in table. The epicenter of the most recent tremor of January 2,2009 was 100 kilometers in the coastal region of Tharparkar district.It had a shallow depth of 10 kilometers and magnitude of 2.2 M onRichter scale.
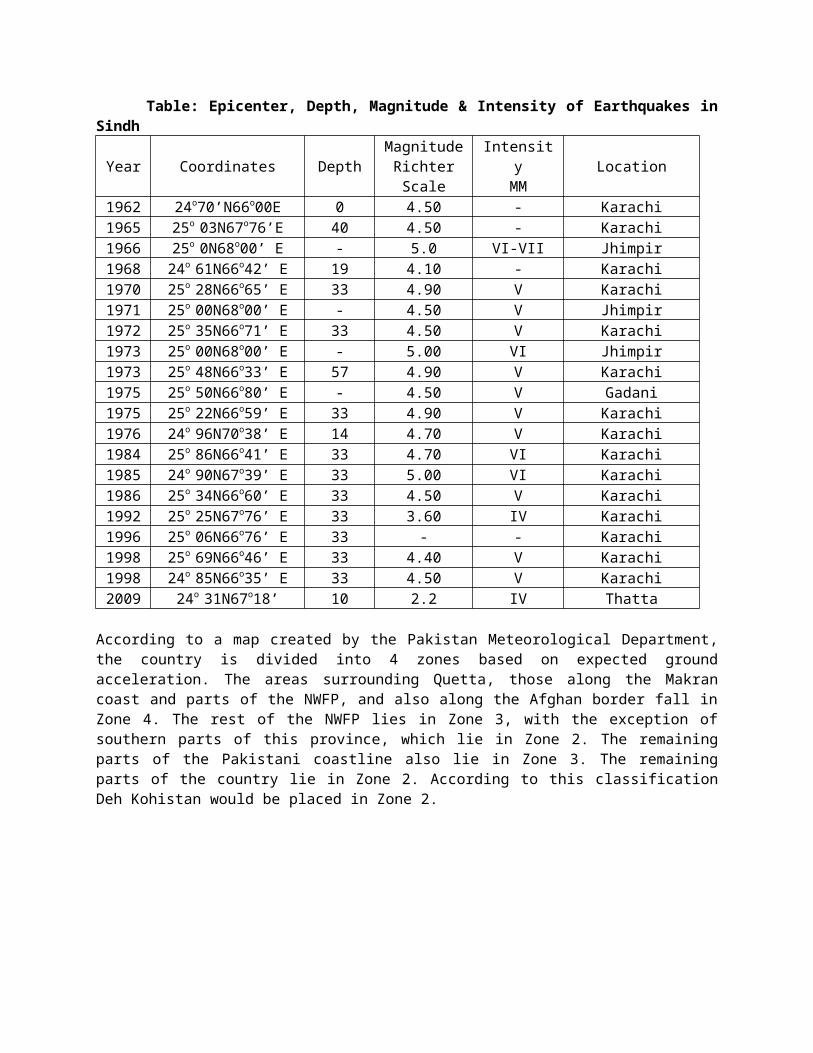
Table: Epicenter, Depth, Magnitude & Intensity of Earthquakes inSindh
Year Coordinates DepthMagnitudeRichterScale
IntensityMM
Location
1962 24o70’N66o00E 0 4.50 - Karachi1965 25o 03N67o76’E 40 4.50 - Karachi1966 25o 0N68o00’ E - 5.0 VI-VII Jhimpir1968 24o 61N66o42’ E 19 4.10 - Karachi1970 25o 28N66o65’ E 33 4.90 V Karachi1971 25o 00N68o00’ E - 4.50 V Jhimpir1972 25o 35N66o71’ E 33 4.50 V Karachi1973 25o 00N68o00’ E - 5.00 VI Jhimpir1973 25o 48N66o33’ E 57 4.90 V Karachi1975 25o 50N66o80’ E - 4.50 V Gadani1975 25o 22N66o59’ E 33 4.90 V Karachi1976 24o 96N70o38’ E 14 4.70 V Karachi1984 25o 86N66o41’ E 33 4.70 VI Karachi1985 24o 90N67o39’ E 33 5.00 VI Karachi1986 25o 34N66o60’ E 33 4.50 V Karachi1992 25o 25N67o76’ E 33 3.60 IV Karachi1996 25o 06N66o76’ E 33 - - Karachi1998 25o 69N66o46’ E 33 4.40 V Karachi1998 24o 85N66o35’ E 33 4.50 V Karachi2009 24o 31N67o18’ 10 2.2 IV Thatta
According to a map created by the Pakistan Meteorological Department,the country is divided into 4 zones based on expected groundacceleration. The areas surrounding Quetta, those along the Makrancoast and parts of the NWFP, and also along the Afghan border fall inZone 4. The rest of the NWFP lies in Zone 3, with the exception ofsouthern parts of this province, which lie in Zone 2. The remainingparts of the Pakistani coastline also lie in Zone 3. The remainingparts of the country lie in Zone 2. According to this classificationDeh Kohistan would be placed in Zone 2.
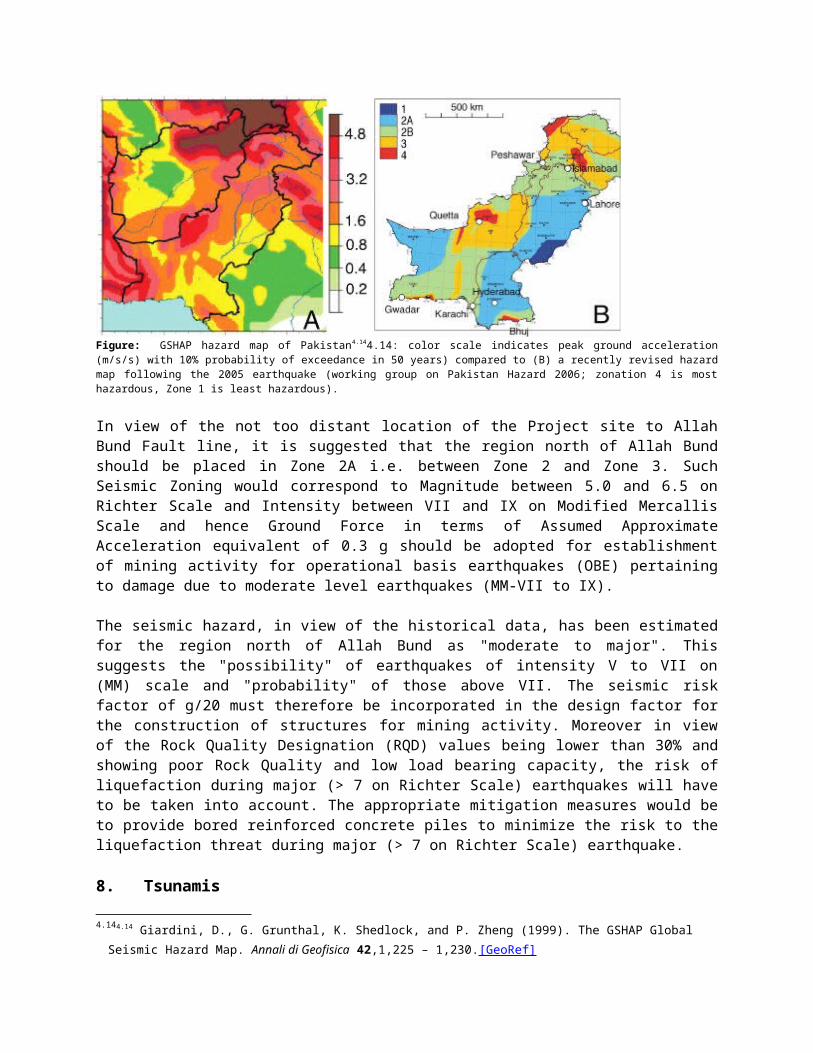
Figure: GSHAP hazard map of Pakistan4.144.14: color scale indicates peak ground acceleration(m/s/s) with 10% probability of exceedance in 50 years) compared to (B) a recently revised hazardmap following the 2005 earthquake (working group on Pakistan Hazard 2006; zonation 4 is mosthazardous, Zone 1 is least hazardous).
In view of the not too distant location of the Project site to AllahBund Fault line, it is suggested that the region north of Allah Bundshould be placed in Zone 2A i.e. between Zone 2 and Zone 3. SuchSeismic Zoning would correspond to Magnitude between 5.0 and 6.5 onRichter Scale and Intensity between VII and IX on Modified MercallisScale and hence Ground Force in terms of Assumed ApproximateAcceleration equivalent of 0.3 g should be adopted for establishmentof mining activity for operational basis earthquakes (OBE) pertainingto damage due to moderate level earthquakes (MM-VII to IX).
The seismic hazard, in view of the historical data, has been estimatedfor the region north of Allah Bund as "moderate to major". Thissuggests the "possibility" of earthquakes of intensity V to VII on(MM) scale and "probability" of those above VII. The seismic riskfactor of g/20 must therefore be incorporated in the design factor forthe construction of structures for mining activity. Moreover in viewof the Rock Quality Designation (RQD) values being lower than 30% andshowing poor Rock Quality and low load bearing capacity, the risk ofliquefaction during major (> 7 on Richter Scale) earthquakes will haveto be taken into account. The appropriate mitigation measures would beto provide bored reinforced concrete piles to minimize the risk to theliquefaction threat during major (> 7 on Richter Scale) earthquake.
8. Tsunamis
4.144.14 Giardini, D., G. Grunthal, K. Shedlock, and P. Zheng (1999). The GSHAP Global Seismic Hazard Map. Annali di Geofisica 42,1,225 – 1,230.[GeoRef]
Major damages done by Tsunamis, the impulsively generated seawaterwaves that are a result of underwater earthquakes, have not beenrecorded for the coastal area south of District Tharparkar. There are,however, evidences of a 1.2 m tsunami generated by an offshoreearthquake of intensity 8 M in 1945, which caused only minor damagesin Port Qasim area. This event was followed by another Tidal wave thatwas recorded in 1953. The Tsunami of December 26, 2004 had no impacton the macroenvironment of the SSRL-GMC Project site.
Tsunami hazards exist on the contiguous coastline. The > 1-hour delaybetween the main shock and the arrival of the damaging tsunamiassociated with the 1945 earthquake was very probably caused bysubmarine slumping offshore rather than direct uplift of the coast. Ifthis were indeed the case, even a modest earthquake in the Rann ofCutch region would be sufficient to trigger a submarine slide thatwould endanger the shoreline of District Thatta, which however is morethan 70 km from the Project site. There is therefore no likelihood ofTsunami threat to the site.
9. HydrologyThar coalfield is positioned in the synclinorium that encloses theIndus – Saraswati delta. The synclinorium is a saucer-shaped shallowbasin, surrounded in the north, east and south by buried basementridges of low relief. It is filled up by a 300 to 400 m thick sequenceof sedimentary rocks.
Surface Water: Surface water availability in the entire synclinoriumis limited to scant precipitation which barely makes the soil moist.There are no perennial surface water sources e.g. rivers, streams,canals, or lakes located in the microenvironment of Thar CoalfieldBlock - 1. However, in Nagarparkar, which is outside the TCB-1, thereare two perennial springs named Anchleshwar and Sardharo as well astemporary streams called Bhetiani River and Gordharo River whereadequate water flow is noted after the rains.
In normal dry weather conditions the water bodies like the ponds rundry while the water level of the dug wells reaches the rock bottom aswas observed in the study area of Varvai, Tilvai and Khario GhulamShah. The average annual rainfall of the area is 225mm. This amount ofrainfall is generally received during a few days between July andAugust each year and it does not cause any harm or create any floodsituation. The sand dunes with sand accumulations of up to 50 to 90
meters are studded with depressions. Flooding does not occur as thesand absorbs the normal precipitation. In case of cloud burst howeverthere is excessive rainfall in a short period of time. There isflooding under the circumstances as was the case in July and August2011. At each such event the sharecroppers do not get adequate returnfrom the agricultural fields.
The mining area of TCB-1 is short of surface water and the surfaceaccumulations in large and small ponds are not useable. Some suchdepressions have been so manipulated by the villagers as to divert theflow of rain water into ponds. These depressions are generally linedwith silty clay and surface-eroded material so that the accumulatedwater is restrained from seepage. There are also rain-harvestingstructures in place in Varvai, Tilvai and Khario Ghulam Shah whererain water is collected in organized manner.
The depressions near the Rann of Kuchchh receive much of the seepagesand have during the course of time turned into saline lakes calleddhand. One such dhand is only 20 km from TCB-1; in fact it is within themine boundary.
Groundwater: The main source of water in the area is groundwater. Theregion faces acute shortage of potable water and village women have tofetch water from many kms away to meet domestic requirements. In manyplaces the groundwater is brackish or saline. Efforts were made byWAPDA to study known groundwater resources and explore potential onesin the region. In groundwater management, particularly in arid regionslike western Rajasthan, it is important to know the presence of modernrecharge and to estimate the recharge rate to avoid overexploitationof the groundwater resource. Isotope study has been carried out toidentify current recharge and to estimate recharge rate to theaquifer. Surface water resources being limited for the mining complex as wellas the towns and villages, alternative sources that have been examinedinclude:
a) Left Bank Outfall Drainage (LBOD) Canal: This is located 120 kmwest of the study area and having a discharge of 4000 m3/s ofwater into the sea. The government is evaluating the option ofsupply of water from LBOD to Thar Coalfield. This water can beused in power plants after treatment.
b) Diversion of the surface water from the Nara Canal System, whichtakes off from Sukkur Barrage in the north of the desert, and
runs along the Western boundary of the Thar Desert area until itdrains into sea through Left Bank Outfall Drain (LBOD) and KPOD.The Nara main canal branches out into distributaries in thevicinity of coalfields in Tharparkar district. The nearest branchcanal to TCB-1 is Mithrao Branch canal. Water supply to Mithi,the district head quarter of Tharparkar District, and few othervillages and towns of the district is through a 12 inch pipelinefrom one of the Naukot distributary of the Mithrao Branch andmultiple booster pumping stations. Being at the tail-end of thedistribution system, water supply is inadequate and is unable tomeet the demand of growing population that is now converging onMithi and Islamkot. The water supply will therefore not be enoughfor the future requirement of the coalfields nor for thepopulation that may be resettled. In November 2009 the Governmentof Sindh had directed the Sindh Irrigation and Drainage Authority(SIDA) to complete a project for supply of 300 cusecs of freshwater from Nabisar Shakh to the Thar Coal fields within shortestpossible time. That project is still under process. In view of anoverall short supply of water in irrigation canals, it isdoubtful if this could be accepted as a dependable perennialsource.
c) Rann of Kuchchh: The marshy land of Kuchchh is about 45 km south-southeast of TCB-1 area. This is the marshy land of Arabian Sea.Between the TCB – 1 and the sea there are several dhands wherethe saline water is used for havesting common salt on acommercial scale.
d) During the rainy season the local population collects sweet waterfrom rainfall accumulations in the depressions and lagoons. Thiswater is however available for only a short period of time andthe local population has to rely on the brackish water from thewells whose water level is invariably below 35 meters.
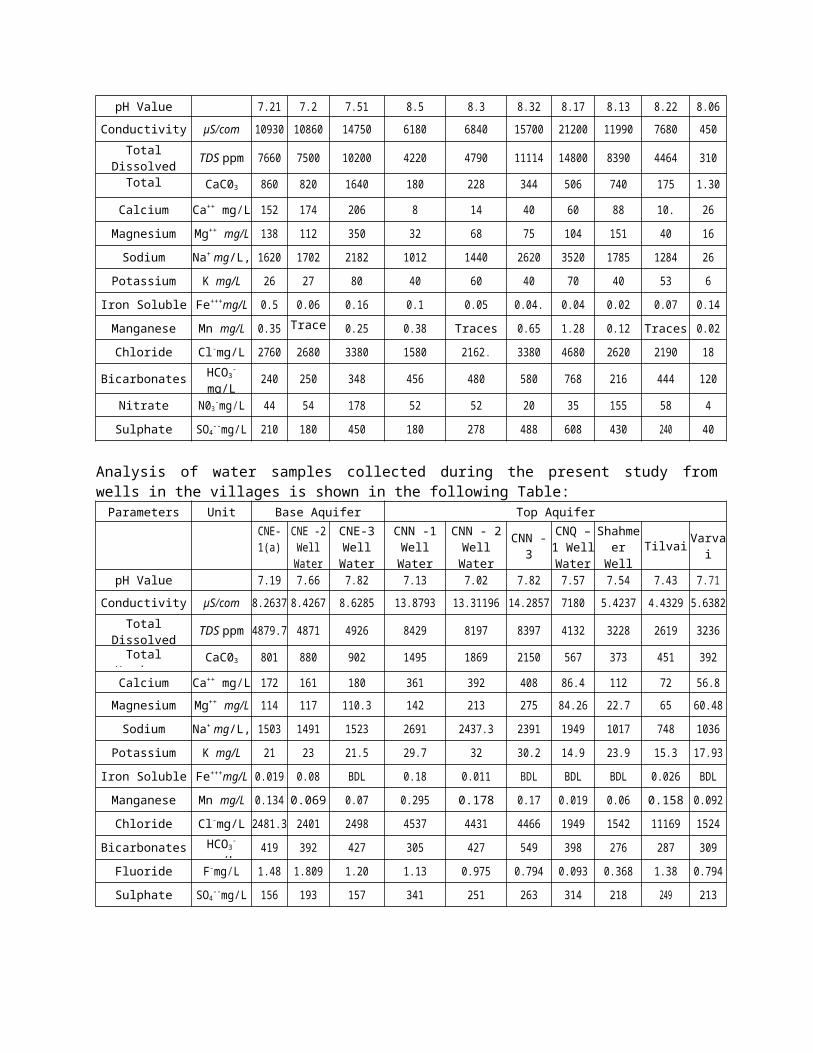
Analysis of surface water samples in an earlier study by otherconsultant is recorded in the following Table which indicates the pHof all Base aquifer samples range between 7.27 and 7.5, while that ofthe well water samples, which represent the top aquifer, range between8.1 and 8.5. TDS in the base aquifer samples is above 7,000 mg/litrewhile in the top aquifer it is above 4000 mg/litre. In both cases thechloride of sodium is the dominant component. Parameters Unit Base Aquifer Top
AquiferRE51
RE 52Well
KharioWell
Varvai-1
Varvai- 2
Tilvai -1
Tilvai - 2
Khario - 1
Khario -2
Indus at
pH Value 7.21 7.2 7.51 8.5 8.3 8.32 8.17 8.13 8.22 8.06Conductivity µS/com 10930 10860 14750 6180 6840 15700 21200 11990 7680 450
TotalDissolved TDS ppm 7660 7500 10200 4220 4790 11114 14800 8390 4464 310
TotalHardness
CaC03 860 820 1640 180 228 344 506 740 175 1.30,Calcium Ca++ mg/L 152 174 206 8 14 40 60 88 10. 26
Magnesium Mg++ mg/L 138 112 350 32 68 75 104 151 40 16Sodium Na+ mg/L, 1620 1702 2182 1012 1440 2620 3520 1785 1284 26
Potassium K mg/L 26 27 80 40 60 40 70 40 53 6Iron Soluble Fe+++mg/L 0.5 0.06 0.16 0.1 0.05 0.04. 0.04 0.02 0.07 0.14Manganese Mn mg/L 0.35 Trace
s0.25 0.38 Traces 0.65 1.28 0.12 Traces 0.02
Chloride Cl-mg/L 2760 2680 3380 1580 2162. 3380 4680 2620 2190 18
Bicarbonates HCO3-
mg/L240 250 348 456 480 580 768 216 444 120
Nitrate N03-mg/L 44 54 178 52 52 20 35 155 58 4
Sulphate SO4--mg/L 210 180 450 180 278 488 608 430 240 40
Analysis of water samples collected during the present study fromwells in the villages is shown in the following Table:Parameters Unit Base Aquifer Top Aquifer
CNE-1(a)
CNE -2WellWater
CNE-3WellWater
CNN -1WellWater
CNN - 2WellWater
CNN -3
CNQ –1 WellWater
ShahmeerWell
Tilvai Varvai
pH Value 7.19 7.66 7.82 7.13 7.02 7.82 7.57 7.54 7.43 7.71Conductivity µS/com 8.2637 8.4267 8.6285 13.8793 13.31196 14.2857 7180 5.4237 4.4329 5.6382
TotalDissolved TDS ppm 4879.7 4871 4926 8429 8197 8397 4132 3228 2619 3236Total
HardnessCaC03 801 880 902 1495 1869 2150 567 373 451 392
,Calcium Ca++ mg/L 172 161 180 361 392 408 86.4 112 72 56.8Magnesium Mg++ mg/L 114 117 110.3 142 213 275 84.26 22.7 65 60.48Sodium Na+ mg/L, 1503 1491 1523 2691 2437.3 2391 1949 1017 748 1036
Potassium K mg/L 21 23 21.5 29.7 32 30.2 14.9 23.9 15.3 17.93Iron Soluble Fe+++mg/L 0.019 0.08 BDL 0.18 0.011 BDL BDL BDL 0.026 BDLManganese Mn mg/L 0.134 0.069 0.07 0.295 0.178 0.17 0.019 0.06 0.158 0.092Chloride Cl-mg/L 2481.3 2401 2498 4537 4431 4466 1949 1542 11169 1524
Bicarbonates HCO3-
mg/L419 392 427 305 427 549 398 276 287 309
Fluoride F-mg/L 1.48 1.809 1.20 1.13 0.975 0.794 0.093 0.368 1.38 0.794Sulphate SO4
--mg/L 156 193 157 341 251 263 314 218 249 213
The above Table shows the highly saline nature of the top aquifer ofwhich sodium chloride is the major component. Furthermore the fluorideion is present in concentration above acceptable limits. Groundwater: Apart from the four strata that include the overburdenand the coal beds, the Thar Coalfield at Block 1 has at least threeaquifers, which contain one upper, two-middle and one lower aquifer atan average depth of 50 m, 120 m and more than 200 meters repectively:
(1) Aquifer above the coal zone: There are a number of aquifers between 52.70and 93.27 meters depth above the coal zone that rest between depths of41.38 meters above mean sea level to 40 meters below mean sea level.The water bearing horizons are within medium to coarse sand horizonsvarying in thickness from 3.35 to 41.27 meters. The first perchedaquifer is somewhat persistent throughout the Thar coalfield at adepth of 50 to 90 meters from the surface at the contact of dune sandwith the Sub-Recent deposits.
The Dune Sand Formation that constitutes the top aquifer has a watercolumn of few meters only at the formation base on top of theSubrecent. Permeability here is in the range of 10-5 m/s. Recharge ofthis aquifer is direct through rainfall infiltration. The wateravailable in the several dug wells in the villages of TCB - 1 are fromthis aquifer. The quality of this upper aquifer is, according to theanalyses presented above, the poorest. It is however being used fordomestic purpose and cattle use.
2) Aquifer within the coal zone: The middle aquifer of TCB-1 with the coalzone at 120 meters depth and varying thickness of up to 68.74 metershas 2 to 3 aquifers consisting of sand horizons, which vary inthickness from 2.24 to 68.78 meters between 43 to 150 meters below themean sea level. The middle and lower aquifers are plentiful and arealready providing a discharge of 100 to 900 liters per minute to anumber of tubewells.
All aquifers in the coal-bearing formation are under pressure. Thesand horizons consist of quartzitic sand that is medium to coarsegrained and gritty. One of the middle aquifers extends over ~4000 km2
in the eastern part of Thar. The lower aquifer is artesian andpreliminary tests at TCB-1 indicate that it is capable of fairly highwater storage(S), transmissivity (T) and water yield.
The middle aquifer is composed of a variety of mainly disconnectedsand lenses and channels with medium to high silt content and lowpermeability within the lignite bearing Bara Formation and theSubrecent Formation. Recharge to these aquifers is likely to be poor.Quality of groundwater at Thar coalfield is brackish to saline. Thewater largely contains 2000 to 10,000 ppm total dissolved solids (TDS)content. Groundwater occurs in well defined salinity zones which havebeen mapped. Desalinization of groundwater will thus be an essentialcomponent of water development projects in this region.
3) Aquifer below the coal zone: An earlier study has shown that the lowermostaquifer has varying thickness of up to 47 meters at a depth between 94and 175 meters below the mean sea level. The base aquifer with pumptested transmissivities of 7.9x10⁻³ and 1.8x10⁻³ m²/s extends throughoutthe exploration area with a thickness of about 60 meters. Recharge ispossibly from the Northeast across the Indian border.
The base aquifer mainly consists of coarse, gritty quartziticsand/sandstone. The relevant test for quality and quantity at RanjhoNoon tube well site shows that the water is saline having electricconductivity in the range of 4600 to 5500 m.mho/cm. with a productionof 8000 to 9000 gallons per hour. This aquifer is the source of waterfor most of the tube wells installed in TCB – 1.
The present study has generated the following data on the waterpotential of the base aquifers:
Summarized Results of Pump Out TestingStatic Water Level: = 39.62 mDischarge: = 16.66 L/ SecDynamic Water Level: = 44.97 mMaximum Drawdown: = 4.96 mSpecific Yield = 3.36 L/m ddTransmissibility “T” = 2.072 m2/SecStorage Coefficient “S” = 0.007809
Aquifer Analysis of CNN-1 & CNN-1-1 (About 3 km southwest of “Varvai”village)
Predominantly sandstone/Siltstone interbedded with claystone atdifferent depths.
Sandstone beds below water table conditions are low to medium yieldaquifers of the area.
Brackish to saline quality of groundwater is interpreted within theprospective aquifers zone.
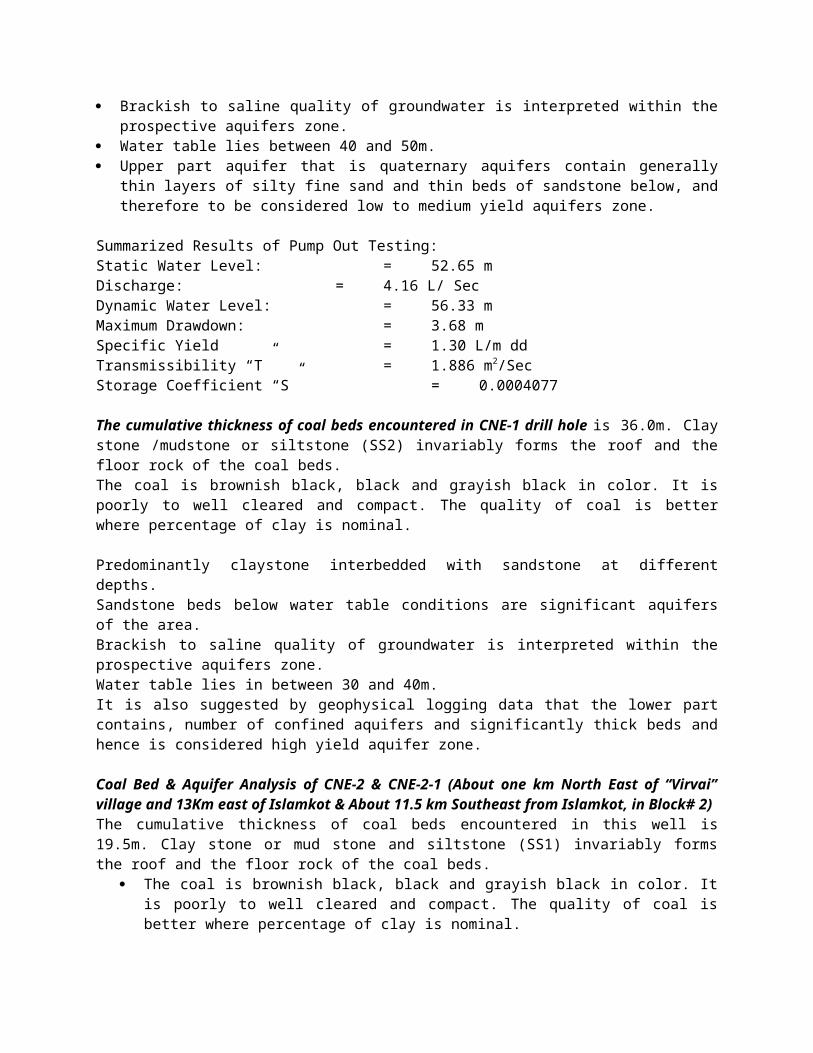
Water table lies between 40 and 50m. Upper part aquifer that is quaternary aquifers contain generally
thin layers of silty fine sand and thin beds of sandstone below, andtherefore to be considered low to medium yield aquifers zone.
Summarized Results of Pump Out Testing:Static Water Level: = 52.65 mDischarge: = 4.16 L/ SecDynamic Water Level: = 56.33 mMaximum Drawdown: = 3.68 mSpecific Yield = 1.30 L/m ddTransmissibility “T” = 1.886 m2/SecStorage Coefficient “S” = 0.0004077
The cumulative thickness of coal beds encountered in CNE-1 drill hole is 36.0m. Claystone /mudstone or siltstone (SS2) invariably forms the roof and thefloor rock of the coal beds.The coal is brownish black, black and grayish black in color. It ispoorly to well cleared and compact. The quality of coal is betterwhere percentage of clay is nominal.
Predominantly claystone interbedded with sandstone at differentdepths. Sandstone beds below water table conditions are significant aquifersof the area. Brackish to saline quality of groundwater is interpreted within theprospective aquifers zone.Water table lies in between 30 and 40m. It is also suggested by geophysical logging data that the lower partcontains, number of confined aquifers and significantly thick beds andhence is considered high yield aquifer zone.
Coal Bed & Aquifer Analysis of CNE-2 & CNE-2-1 (About one km North East of “Virvai”village and 13Km east of Islamkot & About 11.5 km Southeast from Islamkot, in Block# 2)The cumulative thickness of coal beds encountered in this well is19.5m. Clay stone or mud stone and siltstone (SS1) invariably formsthe roof and the floor rock of the coal beds.
The coal is brownish black, black and grayish black in color. Itis poorly to well cleared and compact. The quality of coal isbetter where percentage of clay is nominal.
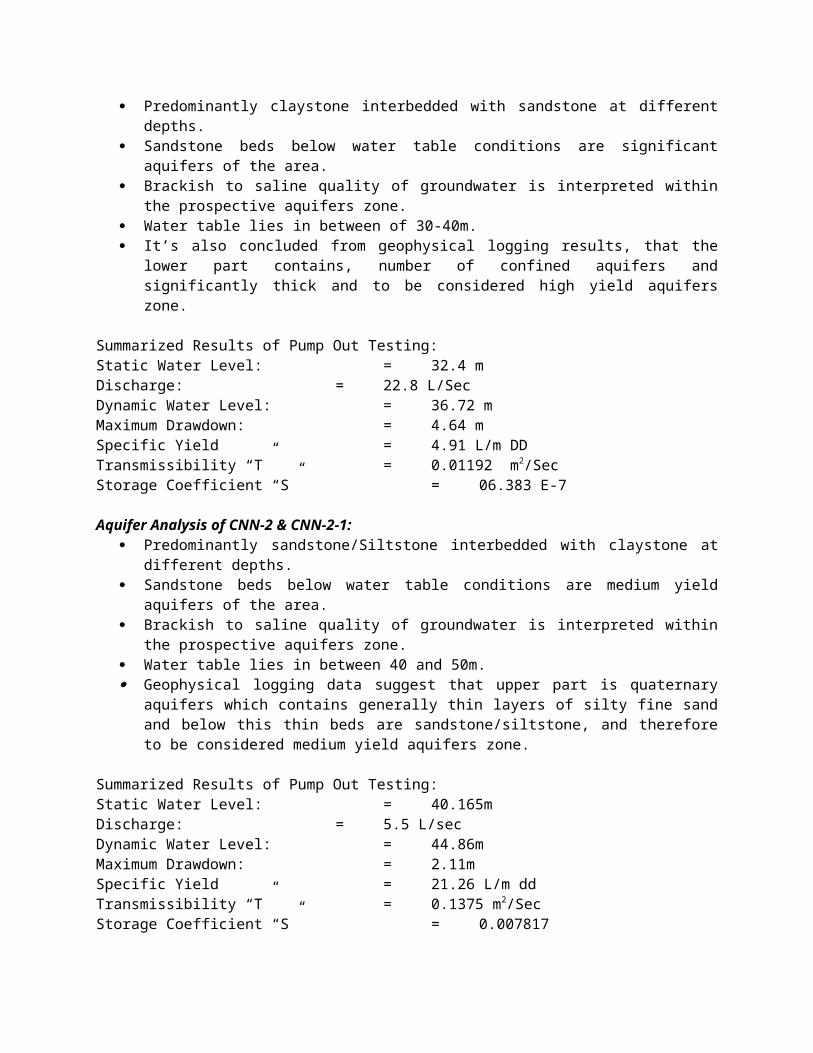
Predominantly claystone interbedded with sandstone at differentdepths.
Sandstone beds below water table conditions are significantaquifers of the area.
Brackish to saline quality of groundwater is interpreted withinthe prospective aquifers zone.
Water table lies in between of 30-40m. It’s also concluded from geophysical logging results, that the
lower part contains, number of confined aquifers andsignificantly thick and to be considered high yield aquiferszone.
Summarized Results of Pump Out Testing:Static Water Level: = 32.4 mDischarge: = 22.8 L/Sec Dynamic Water Level: = 36.72 mMaximum Drawdown: = 4.64 m Specific Yield = 4.91 L/m DD Transmissibility “T” = 0.01192 m2/SecStorage Coefficient “S” = 06.383 E-7
Aquifer Analysis of CNN-2 & CNN-2-1: Predominantly sandstone/Siltstone interbedded with claystone at
different depths. Sandstone beds below water table conditions are medium yield
aquifers of the area. Brackish to saline quality of groundwater is interpreted within
the prospective aquifers zone. Water table lies in between 40 and 50m. Geophysical logging data suggest that upper part is quaternary
aquifers which contains generally thin layers of silty fine sandand below this thin beds are sandstone/siltstone, and thereforeto be considered medium yield aquifers zone.
Summarized Results of Pump Out Testing:Static Water Level: = 40.165mDischarge: = 5.5 L/sec Dynamic Water Level: = 44.86mMaximum Drawdown: = 2.11mSpecific Yield = 21.26 L/m ddTransmissibility “T” = 0.1375 m2/SecStorage Coefficient “S” = 0.007817
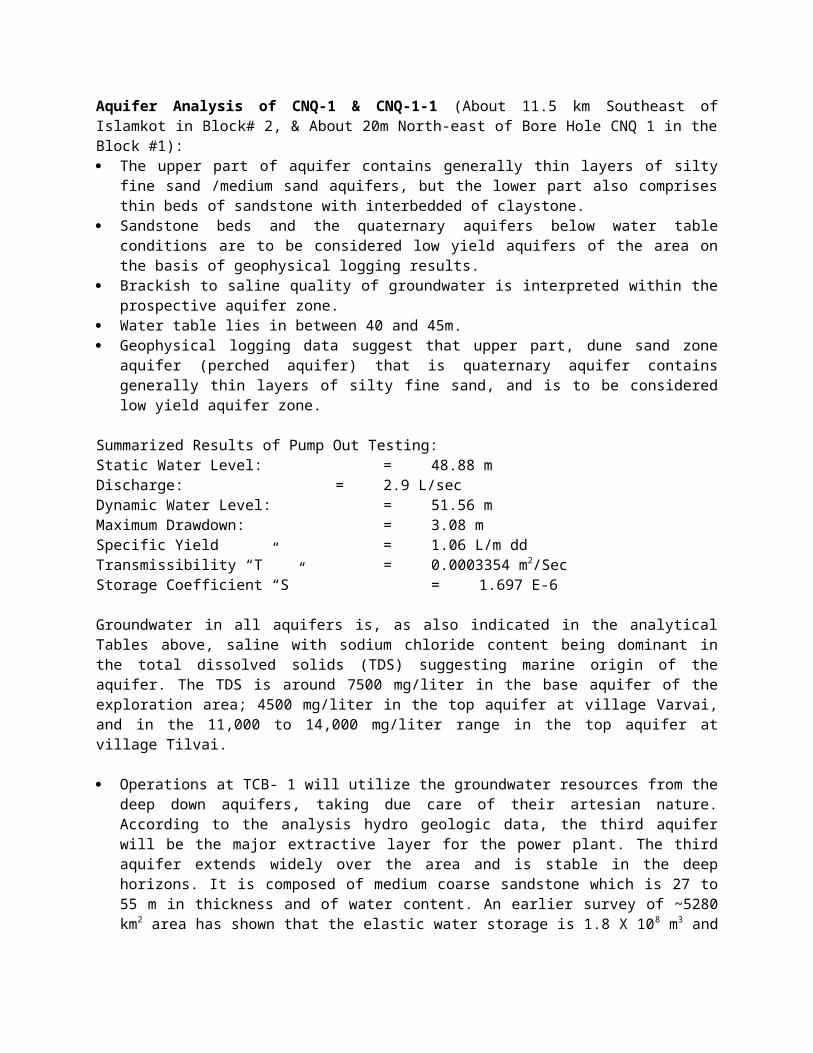
Aquifer Analysis of CNQ-1 & CNQ-1-1 (About 11.5 km Southeast ofIslamkot in Block# 2, & About 20m North-east of Bore Hole CNQ 1 in theBlock #1): The upper part of aquifer contains generally thin layers of silty
fine sand /medium sand aquifers, but the lower part also comprisesthin beds of sandstone with interbedded of claystone.
Sandstone beds and the quaternary aquifers below water tableconditions are to be considered low yield aquifers of the area onthe basis of geophysical logging results.
Brackish to saline quality of groundwater is interpreted within theprospective aquifer zone.
Water table lies in between 40 and 45m. Geophysical logging data suggest that upper part, dune sand zone
aquifer (perched aquifer) that is quaternary aquifer containsgenerally thin layers of silty fine sand, and is to be consideredlow yield aquifer zone.
Summarized Results of Pump Out Testing:Static Water Level: = 48.88 mDischarge: = 2.9 L/sec Dynamic Water Level: = 51.56 mMaximum Drawdown: = 3.08 mSpecific Yield = 1.06 L/m ddTransmissibility “T” = 0.0003354 m2/SecStorage Coefficient “S” = 1.697 E-6
Groundwater in all aquifers is, as also indicated in the analyticalTables above, saline with sodium chloride content being dominant inthe total dissolved solids (TDS) suggesting marine origin of theaquifer. The TDS is around 7500 mg/liter in the base aquifer of theexploration area; 4500 mg/liter in the top aquifer at village Varvai,and in the 11,000 to 14,000 mg/liter range in the top aquifer atvillage Tilvai.
Operations at TCB- 1 will utilize the groundwater resources from thedeep down aquifers, taking due care of their artesian nature.According to the analysis hydro geologic data, the third aquiferwill be the major extractive layer for the power plant. The thirdaquifer extends widely over the area and is stable in the deephorizons. It is composed of medium coarse sandstone which is 27 to55 m in thickness and of water content. An earlier survey of ~5280km2 area has shown that the elastic water storage is 1.8 X 10⁸ m3 and
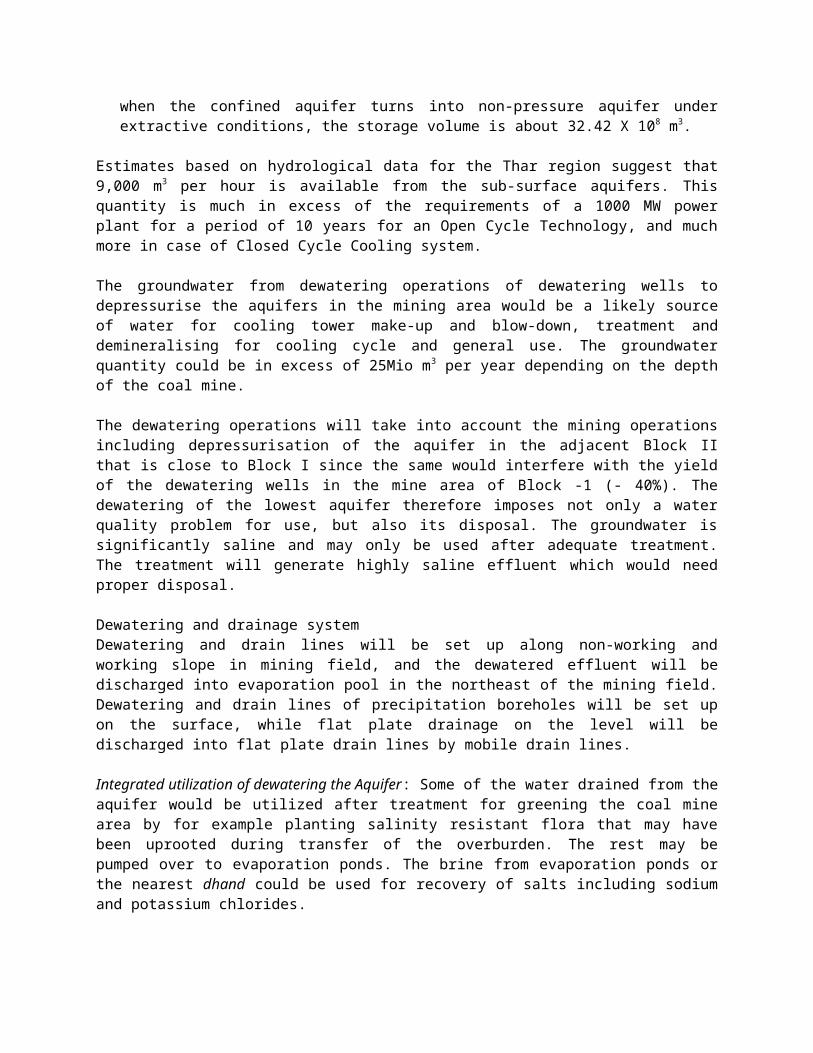
when the confined aquifer turns into non-pressure aquifer underextractive conditions, the storage volume is about 32.42 X 10⁸ m3.
Estimates based on hydrological data for the Thar region suggest that9,000 m3 per hour is available from the sub-surface aquifers. Thisquantity is much in excess of the requirements of a 1000 MW powerplant for a period of 10 years for an Open Cycle Technology, and muchmore in case of Closed Cycle Cooling system.
The groundwater from dewatering operations of dewatering wells todepressurise the aquifers in the mining area would be a likely sourceof water for cooling tower make-up and blow-down, treatment anddemineralising for cooling cycle and general use. The groundwaterquantity could be in excess of 25Mio m3 per year depending on the depthof the coal mine.
The dewatering operations will take into account the mining operationsincluding depressurisation of the aquifer in the adjacent Block IIthat is close to Block I since the same would interfere with the yieldof the dewatering wells in the mine area of Block -1 (- 40%). Thedewatering of the lowest aquifer therefore imposes not only a waterquality problem for use, but also its disposal. The groundwater issignificantly saline and may only be used after adequate treatment.The treatment will generate highly saline effluent which would needproper disposal.
Dewatering and drainage system Dewatering and drain lines will be set up along non-working andworking slope in mining field, and the dewatered effluent will bedischarged into evaporation pool in the northeast of the mining field.Dewatering and drain lines of precipitation boreholes will be set upon the surface, while flat plate drainage on the level will bedischarged into flat plate drain lines by mobile drain lines.
Integrated utilization of dewatering the Aquifer: Some of the water drained from theaquifer would be utilized after treatment for greening the coal minearea by for example planting salinity resistant flora that may havebeen uprooted during transfer of the overburden. The rest may bepumped over to evaporation ponds. The brine from evaporation ponds orthe nearest dhand could be used for recovery of salts including sodiumand potassium chlorides.
The drainage water could alternatively be drained into a combinedeffluent treatment centre that may be set up for the upcomingcoalfields. Drainage pipelines would be laid all over the open-pitmine and the drainage effluent will be collected in a sump and finallypumped to a common facility for production of potable water by theflash evaporation process or production of power by the co-generationsystem.
An alternative suggested by the present study for disposal andutilization of Mining drainage effluent comprises the discharge of thecombined effluent into the Left Bank Outfall Drain (LBOD) which runsjust across the Tharparkar-Badin District Boundary and has much lowerTDS (~3000), high BOD and low SAR (Sodium Absorption Ratio). Acombination of the two effluents may provide an ideal mix forsecondary treatment of both effluents and may provide an opportunityto produce a few million acre feet of good quality water from what isbeing considered a waste. The secondary treatment facility will makenearly freshwater to rejuvenate the virtually dead Narrhi and Jabholagoons
Flood protection and drainage on surface: Mining activity by SSRL will startfrom the eastern part of open pit field, towards which the land formslopes gently. This will require levees to be built in order toprevent surface runoff from entering into the mining field. (A leveeis trapezoidal earth embankment, with the total length of about2.23km, with the height of 5m, with the top width of 5m; the amount ofearth filling will be 167000 m3).
The northeast of non-working slope has the earth removal area; it cancome in handy to intercept surface runoff at that point. The surfacewater will not easily flow into mining field since the terrain of thewestern part of mining field is low. The levees will therefore beconstructed outside surface realm at the eastern slope end. The modeof disposal of surface water is natural evaporation and infiltration,the flood water would be diverted towards the nearest depression inthe earlier stage of the mining project. The level of earth removalarea will be made with anti-slope form to prevent converging water ofslope surface from flowing into the mining field. With progressivestripping of land in the mining process the temporary flood controldykes will be built to intercept converging water of surface per yearby using open pit soil and rock stripped outside the realm of miningfield.
Another source of water of good quality would be available from thelignite drying plants. The lignite with 47.5 percent moisture contentwould be dried to 12 percent. The water vapour would be condensed andput to good use in the boilers and cooling towers. It is estimatedthat about 1.7 to 1.8 Mio m3/a of good quality water could be producedfrom about 6 Mio t/a raw lignite from the drying process that would besufficient to run the power plant with closed cycle coolers and otheruses related to the mine.
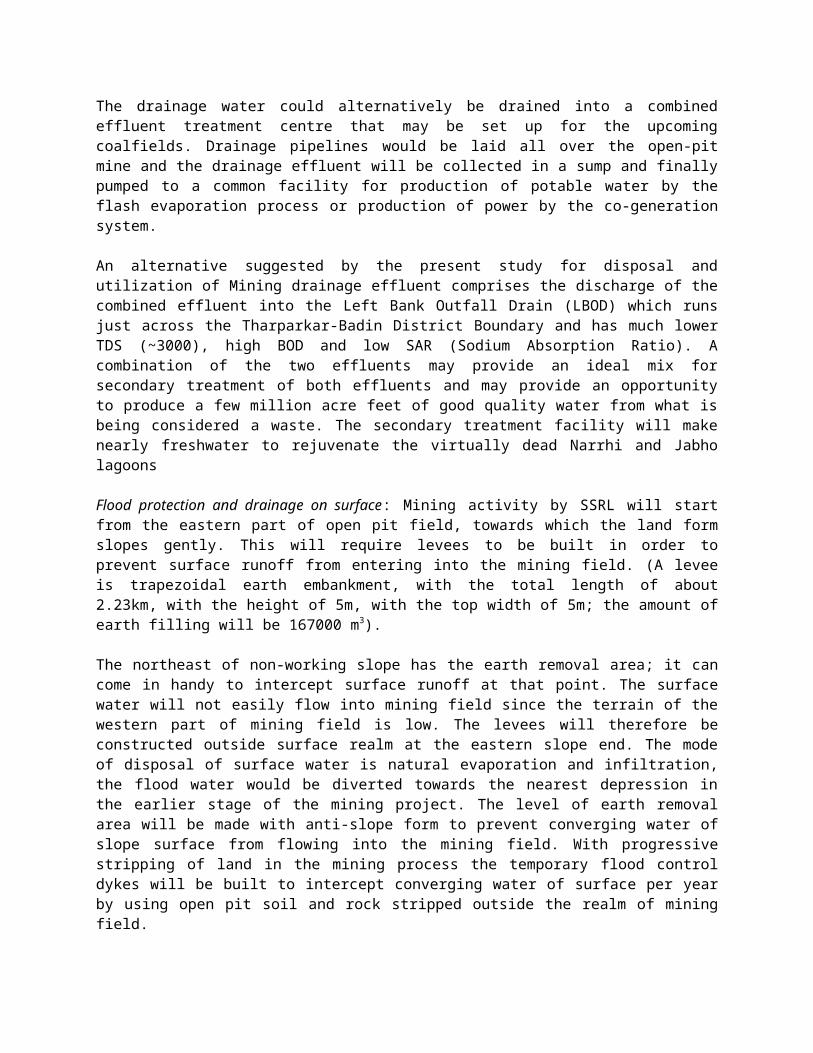
10. Coal DepositsA number of studies on Thar coalfields have identified the presence ofcoal beds of variable thickness ranging from 0.2 to 22.81 meters inthe extensive area under the sand dunes of Thar Desert. The maximumnumber of coal seams found in some of the drill holes is 20. Thecumulative thickness of the coal beds range from 0.2 to 36 meters.Claystone invariably forms the roof and the floor rock of the coalbeds. The coal is brownish black, black and grayish black in colour.It is poorly to well cleared and compact. The quality of coal isbetter where percentage of clay is nominal.
Coal RservesAs a result of extensive drilling over an area of 9000 km2, a total of175 billion tons of coal resource potential has been assessed.Detailed evaluation on four blocks has provided following results:
The
overburden consists of three kinds of material; dune sand, alluviumand sedimentary sequence. The total overburden is around 150 to 230meters thick. The roof and floor rocks are claystone and loosesandstone beds.
Chemical Composition
SNo
Name/Blocks Area(Sq.km)
Reserves (MT)Measured
Indicated
Inferred
Total
1 Sinhar Vikian Varvai, Block-I
122.00
620 1918 1028 3566
2 Singharo Bhitro, Block-II
55.00
640 944 - 1584
3 Saleh Jo Tar, Block –III
99.50
413 1337 258 2008
4 Sonalba, Block IV 82.50 684 1711 76 2471
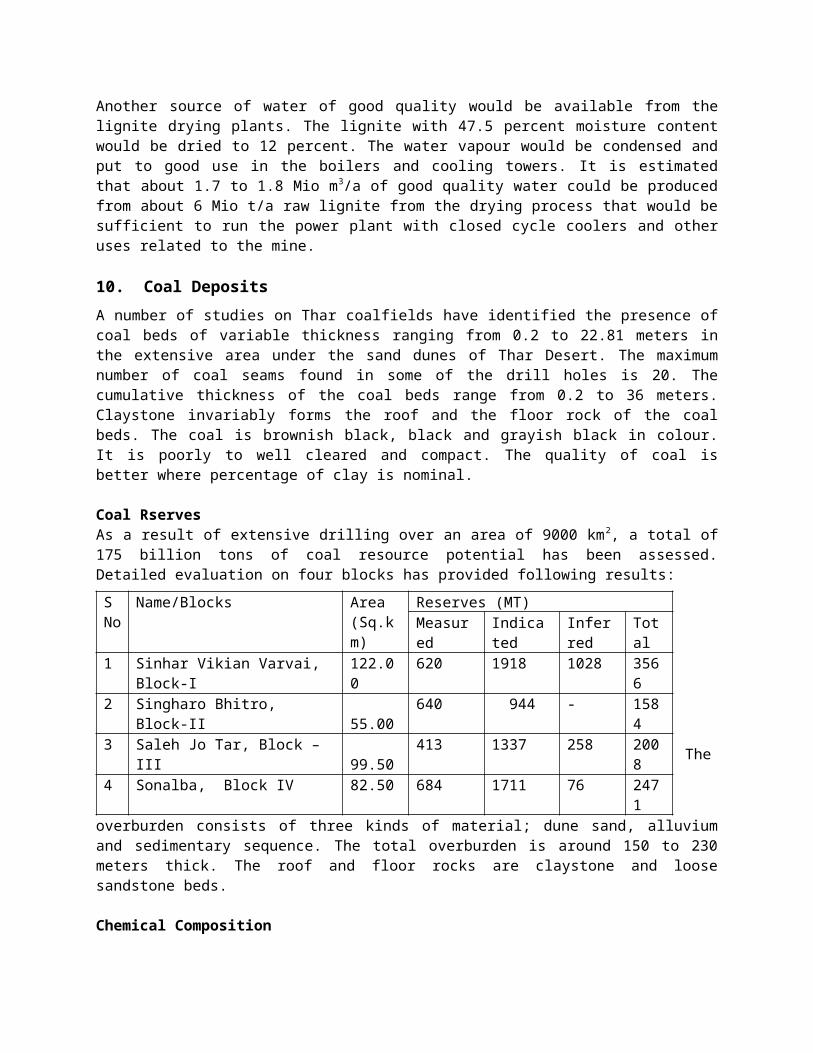
The weighted average chemical analysis of the coal samples of the fourblocks show variation and are as given below:
Chemical CompositionParameter Range %Moisture 43.24 to 49.01Ash 5.18 to 6.56VolatileMatter
26.50 to 33.04
Fixed Carbon 19.35 to 22.00Sulphur 0.92 to 1.34
Moisture (%) 43.24 to 49.01Ash (%) 5.18 to 6.56Volatile Matter (%) 26.50 to 33.04Fixed Carbon (%) 19.35 to 22.00Sulphur (%) 0.92 to 1.34
Heating value (Btu/lb)As Received 5780 to 6398Dry 10723 to 11353DAF 11605 to 12613MMM Free 6101 to 6841
Heating value (Btu/lb)As Received 5780 to 6398Dry 10723 to 11353DAF 11605 to 12613MMM Free 6101 to 6841
Resource estimation for TCB - 1A part of the boreholes provided by RWE is located out of TCB -1. Theboundary of the resource estimation is the Block 1 and the areaextended 400m from the location of boreholes out of Block -1 providedby RWE.
Through established the geological model, the calculating results ofthe whole Block 1 and its external resource are seen in Table:
Table 4.18 Block Ⅰand Its External Exploration ResourceCoal Seam A B C DGeological Resource(MT) 309.29 791.65 2267.78 30.07
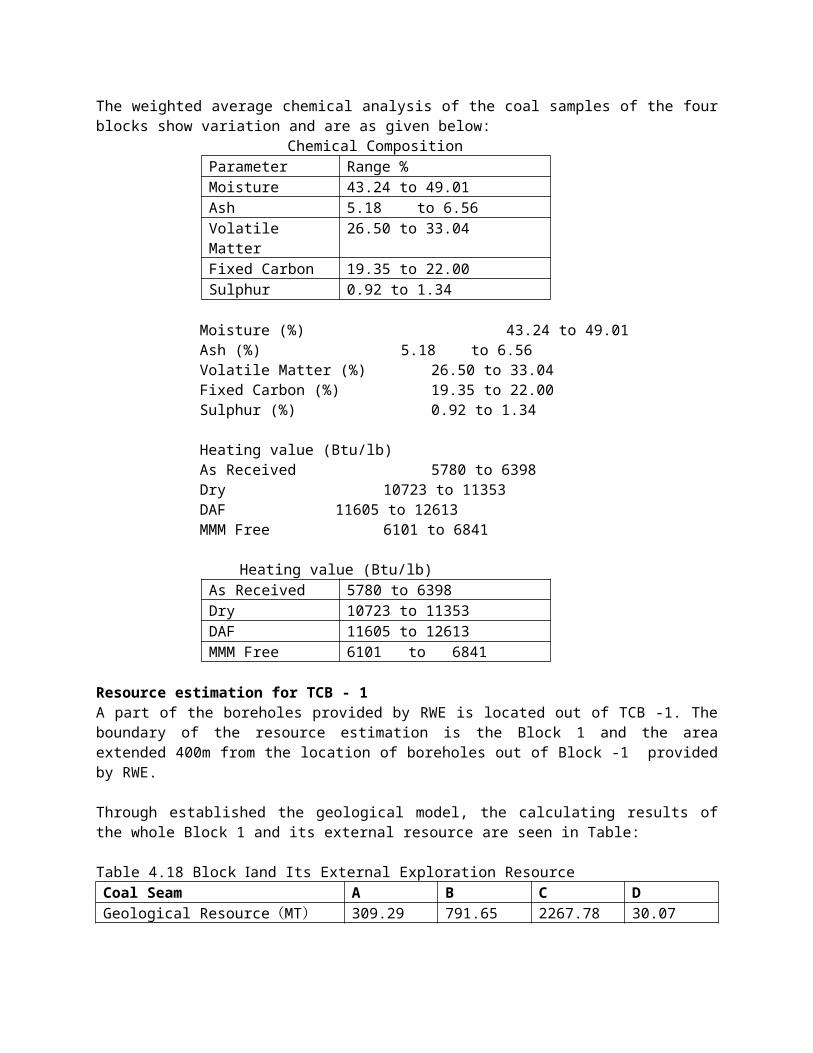
The distance between the boreholes from GSP is far; the distancebetween the boreholes from RWE is close but distributed in local part.According to the JORC standard, the distance of boreholes from RWE isclose; the exploration degree is high; the Stripping Ratio is quitesmall; as a result, this area will be as the first development area ofthe open-pit mine and others are as spare mining area of the open-pitmine.
Resource/Reserve Calculation Principle: The coal seams used for reserve calculation are A seam, B seam and C
seam in open-pit mine field. The minimum minable thickness of coal seam is 1.00m; the minimum
thickness for reject separation is 1.00m; the appearance density ofthe coal from A seam is 1.22t/m3; the appearance density of the coalfrom B seam is 1.24t/m3; the appearance density of the coal from Cseam is 1.19t/m3; the appearance density of the reject is 1.85t/m3.
Rate of Recovery: The loss thickness of coal seam roof is 0.2m; theloss thickness of coal seam floor is 0.2m; Reject roof dilutionthickness is 0.2m; floor dilution thickness is 0.2m; Other miningloss is 1%.
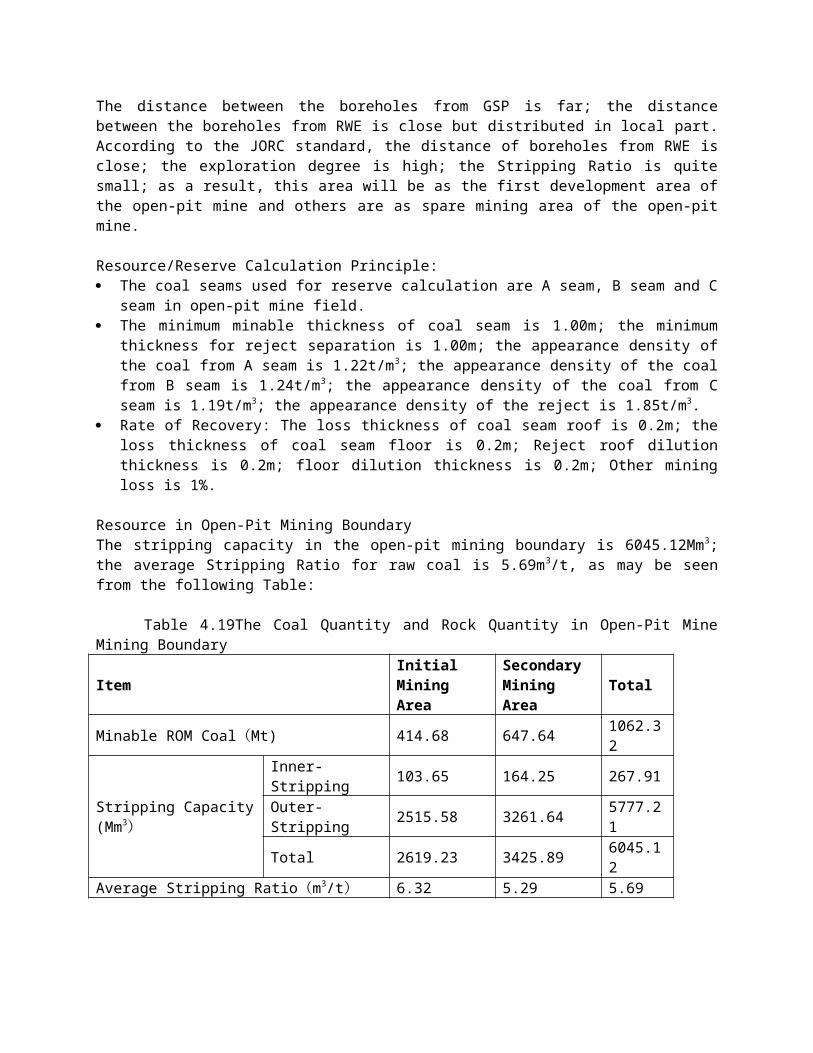
Resource in Open-Pit Mining BoundaryThe stripping capacity in the open-pit mining boundary is 6045.12Mm3;the average Stripping Ratio for raw coal is 5.69m3/t, as may be seenfrom the following Table:
Table 4.19The Coal Quantity and Rock Quantity in Open-Pit MineMining Boundary
ItemInitial MiningArea
Secondary MiningArea
Total
Minable ROM Coal(Mt) 414.68 647.64 1062.32
Stripping Capacity(Mm3)
Inner-Stripping 103.65 164.25 267.91
Outer-Stripping 2515.58 3261.64 5777.2
1
Total 2619.23 3425.89 6045.12
Average Stripping Ratio(m3/t) 6.32 5.29 5.69
Note: If the secondary stripping impact is taken account into theStripping Ratio, the average Stripping Ratio of the secondary miningarea will be at 6.35m3/t.
Designed Production CapacityOpen-pit mine construction scale is 10.00MT/A.
Demand construction scaleAccording to actual condition of coal seams buried depth is high, withhigh capital investment for construction period. To reduce coaltonnage expenditure and improve operational economic benefit, theEntrepreneur demands the construction scale of open-pit mine be10.00MT/A of raw coal.
Construction scale as basis of mining technology condition: The mining objects ofopen-pit mine are A seam, B seam and C seam. The average minable coalseam thickness is appropriate 23m. The working line length in fullproduction is 2200m. The working line will be advanced less than 250mannual. According to domestic and international mines’ experiences, itis feasible that Shovel/Truck and Belt conveyer that are advanced atspeed less than 250m/a.
Rationale for reasonable economical efficiency: It needs large numbersof stripping equipments because of large scale stripping quantity ofthe open-pit mine so that the investment for equipments andconstruction is high. Following this, it should expand coal mine scaleto decrease investment per tonne of coal and unit operating cost.While the designed production capacity is more than 4.00MT/A and lessthan 10.00MT/A, the designed service life of open-pit mine is no lessthan 30 years. The minable raw coal resource of the mine is 1062.32MT.While the designed production capacity is 10.00MT/A or more than10.00MT/A, the designed service life of open-pit mine is no less than35 years. When raw coal production capacity is 10.00MT/A, the designedservice life of open-pit mine is 96.5 years depending on 1.1 reservefactor of mine reserves. As a result, the economical efficiency isreasonable.
Open-pit mine working system: According to pre-determined constructionscale and working system, the production capacities by day and shiftare as follows:Average raw coal production capacity per day: 30.303X10³t;Average raw coal production per shift: 10.101X10³t.
Open-pit mine service lifeThe minable raw coal resource of the open-pit mine is 1062.32MT. Whenraw coal production capacity is 10.00MT/A, the designed service lifeof open-pit mine is 96.5 years depending on 1.1 reserve factor of minereserves.
11. Soil QualityThar Desert area is covered by an approximately 70 meter thick dunesand layer. This dune sand consists mainly of quartz sand with somefeldspar and only some clay/silt content. There is no thick top soilwith appreciable organic components available. The almost barren sandis only locally enriched with higher clay/silt in some areasespecially in inter-dune valleys, where flood waters accumulate thesilt. There the soil is favorable for crop production relative to dunesand both because of some enrichment in potassium and calcium withinthese silty materials and the increased water bearing capacity ofthese strata.
In general the soil is poor in organic matter and also in fertility.The initial stages of open pit mining will be keenly monitored withrespect to removal of overburden and mixing with interburden. There isa strong likelihood of improvement of water bearing capacity of thefuture top soil, and enrichment of the dune sand with plant nutrientssuch as magnesium and potassium on mixing of the barren dune sand withsilty clayey strata from the over- and inter-burden materials in thereclamation areas on the outside and inside dumps.
Earlier on it was indicated that survey of ~5280 km2 area has shownthat the elastic water storage is 1.8 X 10⁸ m3 and when the confinedaquifer turns into non-pressure aquifer under extractive conditions,the storage volume would be about 32.42 X 10⁸ m3. Removal of overburdenwill be accompanied/followed by dewatering of the under pressureaquifers, which in turn will entail the subsidence of 3 billion m3
equivalent of the soil if not larger volume.
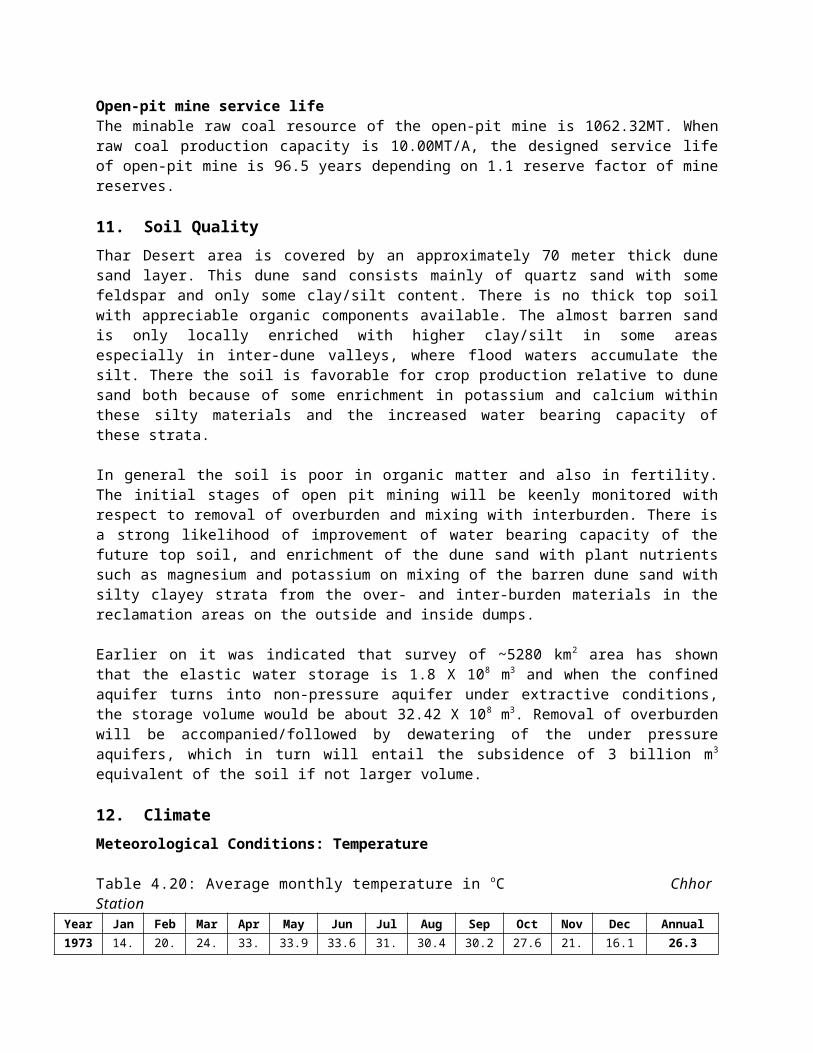
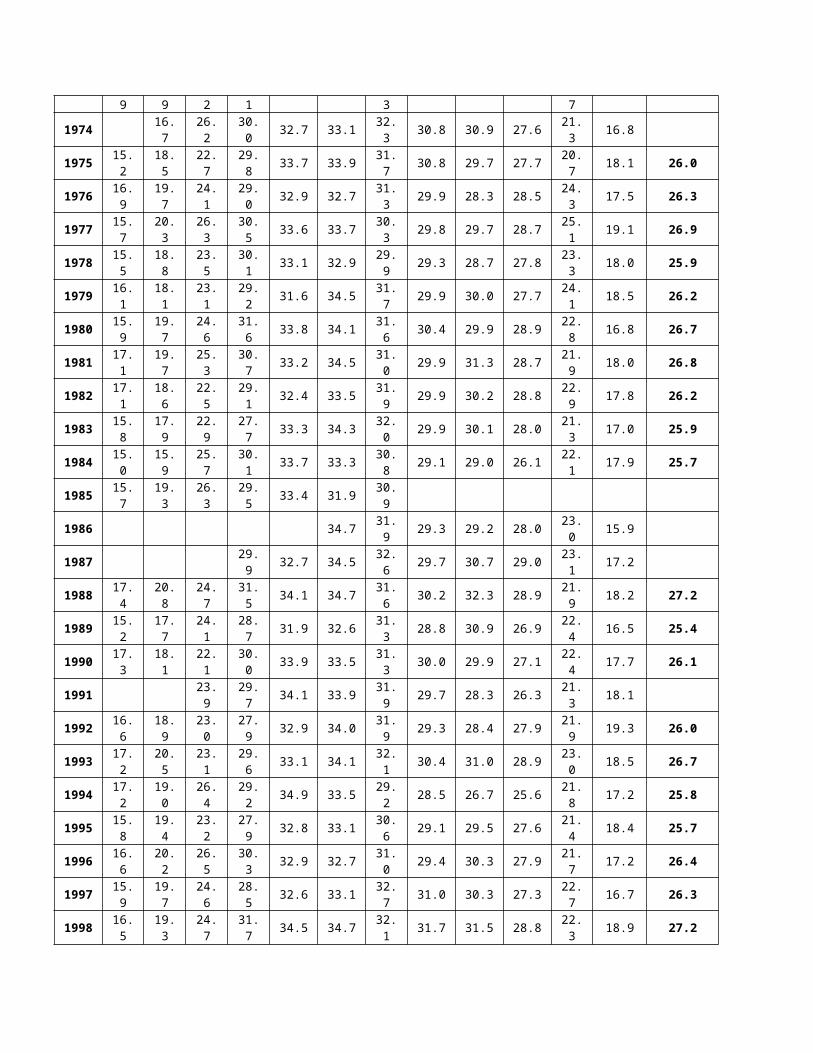
12. ClimateMeteorological Conditions: Temperature
Table 4.20: Average monthly temperature in oC ChhorStation
Year Jan Feb Mar Apr May Jun Jul Aug Sep Oct Nov Dec Annual1973 14. 20. 24. 33. 33.9 33.6 31. 30.4 30.2 27.6 21. 16.1 26.3
9 9 2 1 3 7
1974 16.7
26.2
30.0 32.7 33.1 32.
3 30.8 30.9 27.6 21.3 16.8
1975 15.2
18.5
22.7
29.8 33.7 33.9 31.
7 30.8 29.7 27.7 20.7 18.1 26.0
1976 16.9
19.7
24.1
29.0 32.9 32.7 31.
3 29.9 28.3 28.5 24.3 17.5 26.3
1977 15.7
20.3
26.3
30.5 33.6 33.7 30.
3 29.8 29.7 28.7 25.1 19.1 26.9
1978 15.5
18.8
23.5
30.1 33.1 32.9 29.
9 29.3 28.7 27.8 23.3 18.0 25.9
1979 16.1
18.1
23.1
29.2 31.6 34.5 31.
7 29.9 30.0 27.7 24.1 18.5 26.2
1980 15.9
19.7
24.6
31.6 33.8 34.1 31.
6 30.4 29.9 28.9 22.8 16.8 26.7
1981 17.1
19.7
25.3
30.7 33.2 34.5 31.
0 29.9 31.3 28.7 21.9 18.0 26.8
1982 17.1
18.6
22.5
29.1 32.4 33.5 31.
9 29.9 30.2 28.8 22.9 17.8 26.2
1983 15.8
17.9
22.9
27.7 33.3 34.3 32.
0 29.9 30.1 28.0 21.3 17.0 25.9
1984 15.0
15.9
25.7
30.1 33.7 33.3 30.
8 29.1 29.0 26.1 22.1 17.9 25.7
1985 15.7
19.3
26.3
29.5 33.4 31.9 30.
9
1986 34.7 31.9 29.3 29.2 28.0 23.
0 15.9
1987 29.9 32.7 34.5 32.
6 29.7 30.7 29.0 23.1 17.2
1988 17.4
20.8
24.7
31.5 34.1 34.7 31.
6 30.2 32.3 28.9 21.9 18.2 27.2
1989 15.2
17.7
24.1
28.7 31.9 32.6 31.
3 28.8 30.9 26.9 22.4 16.5 25.4
1990 17.3
18.1
22.1
30.0 33.9 33.5 31.
3 30.0 29.9 27.1 22.4 17.7 26.1
1991 23.9
29.7 34.1 33.9 31.
9 29.7 28.3 26.3 21.3 18.1
1992 16.6
18.9
23.0
27.9 32.9 34.0 31.
9 29.3 28.4 27.9 21.9 19.3 26.0
1993 17.2
20.5
23.1
29.6 33.1 34.1 32.
1 30.4 31.0 28.9 23.0 18.5 26.7
1994 17.2
19.0
26.4
29.2 34.9 33.5 29.
2 28.5 26.7 25.6 21.8 17.2 25.8
1995 15.8
19.4
23.2
27.9 32.8 33.1 30.
6 29.1 29.5 27.6 21.4 18.4 25.7
1996 16.6
20.2
26.5
30.3 32.9 32.7 31.
0 29.4 30.3 27.9 21.7 17.2 26.4
1997 15.9
19.7
24.6
28.5 32.6 33.1 32.
7 31.0 30.3 27.3 22.7 16.7 26.3
1998 16.5
19.3
24.7
31.7 34.5 34.7 32.
1 31.7 31.5 28.8 22.3 18.9 27.2
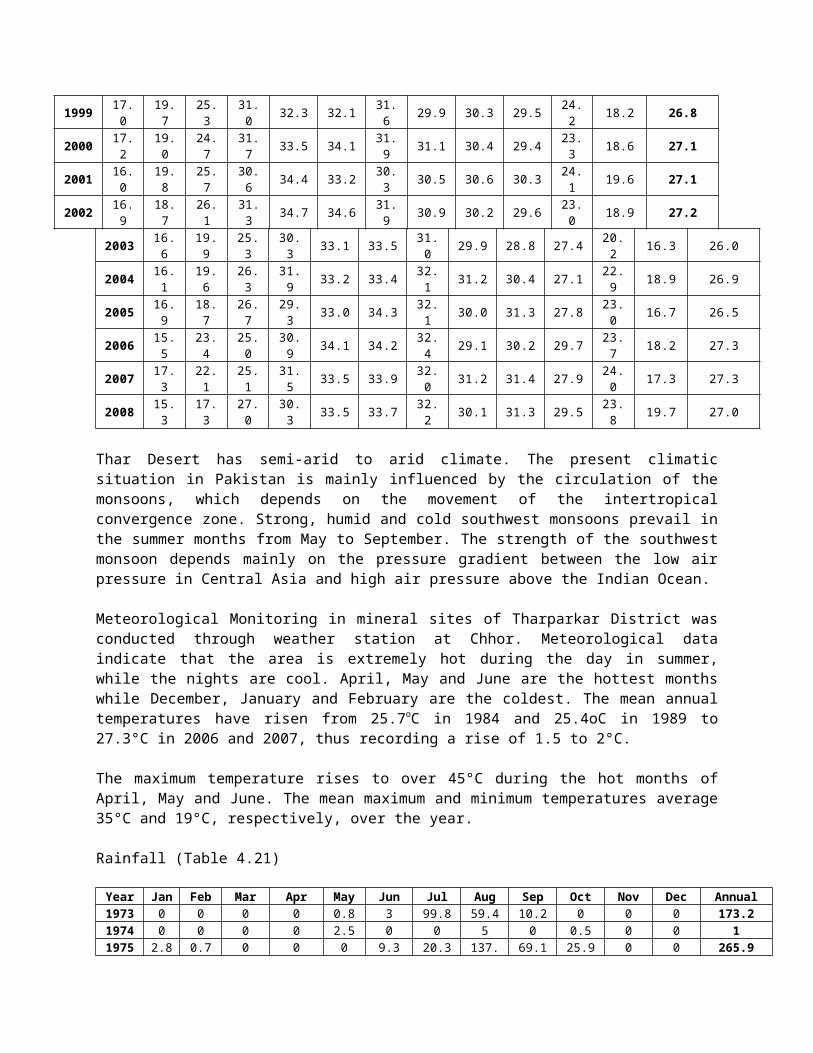
1999 17.0
19.7
25.3
31.0 32.3 32.1 31.
6 29.9 30.3 29.5 24.2 18.2 26.8
2000 17.2
19.0
24.7
31.7 33.5 34.1 31.
9 31.1 30.4 29.4 23.3 18.6 27.1
2001 16.0
19.8
25.7
30.6 34.4 33.2 30.
3 30.5 30.6 30.3 24.1 19.6 27.1
2002 16.9
18.7
26.1
31.3 34.7 34.6 31.
9 30.9 30.2 29.6 23.0 18.9 27.2
2003 16.6
19.9
25.3
30.3 33.1 33.5 31.
0 29.9 28.8 27.4 20.2 16.3 26.0
2004 16.1
19.6
26.3
31.9 33.2 33.4 32.
1 31.2 30.4 27.1 22.9 18.9 26.9
2005 16.9
18.7
26.7
29.3 33.0 34.3 32.
1 30.0 31.3 27.8 23.0 16.7 26.5
2006 15.5
23.4
25.0
30.9 34.1 34.2 32.
4 29.1 30.2 29.7 23.7 18.2 27.3
2007 17.3
22.1
25.1
31.5 33.5 33.9 32.
0 31.2 31.4 27.9 24.0 17.3 27.3
2008 15.3
17.3
27.0
30.3 33.5 33.7 32.
2 30.1 31.3 29.5 23.8 19.7 27.0
Thar Desert has semi-arid to arid climate. The present climaticsituation in Pakistan is mainly influenced by the circulation of themonsoons, which depends on the movement of the intertropicalconvergence zone. Strong, humid and cold southwest monsoons prevail inthe summer months from May to September. The strength of the southwestmonsoon depends mainly on the pressure gradient between the low airpressure in Central Asia and high air pressure above the Indian Ocean.
Meteorological Monitoring in mineral sites of Tharparkar District wasconducted through weather station at Chhor. Meteorological dataindicate that the area is extremely hot during the day in summer,while the nights are cool. April, May and June are the hottest monthswhile December, January and February are the coldest. The mean annualtemperatures have risen from 25.7oC in 1984 and 25.4oC in 1989 to27.3°C in 2006 and 2007, thus recording a rise of 1.5 to 2°C.
The maximum temperature rises to over 45°C during the hot months ofApril, May and June. The mean maximum and minimum temperatures average35°C and 19°C, respectively, over the year.
Rainfall (Table 4.21)
Year Jan Feb Mar Apr May Jun Jul Aug Sep Oct Nov Dec Annual1973 0 0 0 0 0.8 3 99.8 59.4 10.2 0 0 0 173.21974 0 0 0 0 2.5 0 0 5 0 0.5 0 0 11975 2.8 0.7 0 0 0 9.3 20.3 137. 69.1 25.9 0 0 265.9
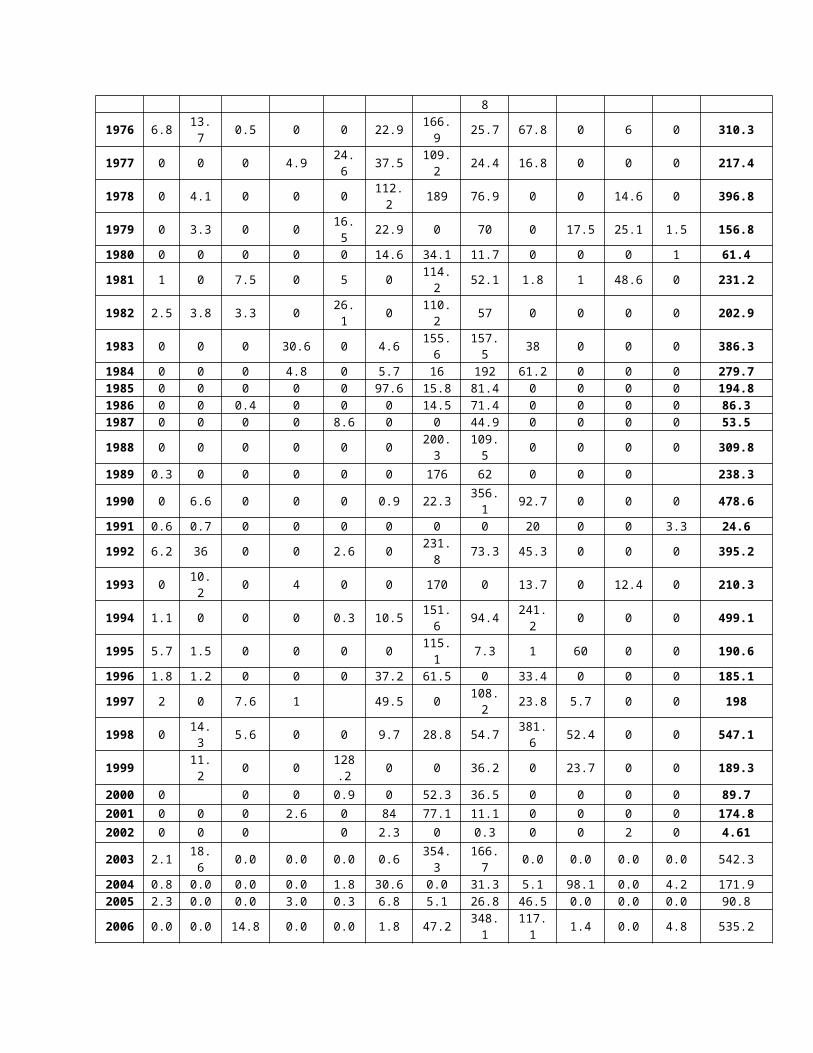
8
1976 6.8 13.7 0.5 0 0 22.9 166.
9 25.7 67.8 0 6 0 310.3
1977 0 0 0 4.9 24.6 37.5 109.
2 24.4 16.8 0 0 0 217.4
1978 0 4.1 0 0 0 112.2 189 76.9 0 0 14.6 0 396.8
1979 0 3.3 0 0 16.5 22.9 0 70 0 17.5 25.1 1.5 156.8
1980 0 0 0 0 0 14.6 34.1 11.7 0 0 0 1 61.4
1981 1 0 7.5 0 5 0 114.2 52.1 1.8 1 48.6 0 231.2
1982 2.5 3.8 3.3 0 26.1 0 110.
2 57 0 0 0 0 202.9
1983 0 0 0 30.6 0 4.6 155.6
157.5 38 0 0 0 386.3
1984 0 0 0 4.8 0 5.7 16 192 61.2 0 0 0 279.71985 0 0 0 0 0 97.6 15.8 81.4 0 0 0 0 194.81986 0 0 0.4 0 0 0 14.5 71.4 0 0 0 0 86.31987 0 0 0 0 8.6 0 0 44.9 0 0 0 0 53.5
1988 0 0 0 0 0 0 200.3
109.5 0 0 0 0 309.8
1989 0.3 0 0 0 0 0 176 62 0 0 0 238.3
1990 0 6.6 0 0 0 0.9 22.3 356.1 92.7 0 0 0 478.6
1991 0.6 0.7 0 0 0 0 0 0 20 0 0 3.3 24.6
1992 6.2 36 0 0 2.6 0 231.8 73.3 45.3 0 0 0 395.2
1993 0 10.2 0 4 0 0 170 0 13.7 0 12.4 0 210.3
1994 1.1 0 0 0 0.3 10.5 151.6 94.4 241.
2 0 0 0 499.1
1995 5.7 1.5 0 0 0 0 115.1 7.3 1 60 0 0 190.6
1996 1.8 1.2 0 0 0 37.2 61.5 0 33.4 0 0 0 185.1
1997 2 0 7.6 1 49.5 0 108.2 23.8 5.7 0 0 198
1998 0 14.3 5.6 0 0 9.7 28.8 54.7 381.
6 52.4 0 0 547.1
1999 11.2 0 0 128
.2 0 0 36.2 0 23.7 0 0 189.3
2000 0 0 0 0.9 0 52.3 36.5 0 0 0 0 89.72001 0 0 0 2.6 0 84 77.1 11.1 0 0 0 0 174.82002 0 0 0 0 2.3 0 0.3 0 0 2 0 4.61
2003 2.1 18.6 0.0 0.0 0.0 0.6 354.
3166.7 0.0 0.0 0.0 0.0 542.3
2004 0.8 0.0 0.0 0.0 1.8 30.6 0.0 31.3 5.1 98.1 0.0 4.2 171.92005 2.3 0.0 0.0 3.0 0.3 6.8 5.1 26.8 46.5 0.0 0.0 0.0 90.8
2006 0.0 0.0 14.8 0.0 0.0 1.8 47.2 348.1
117.1 1.4 0.0 4.8 535.2
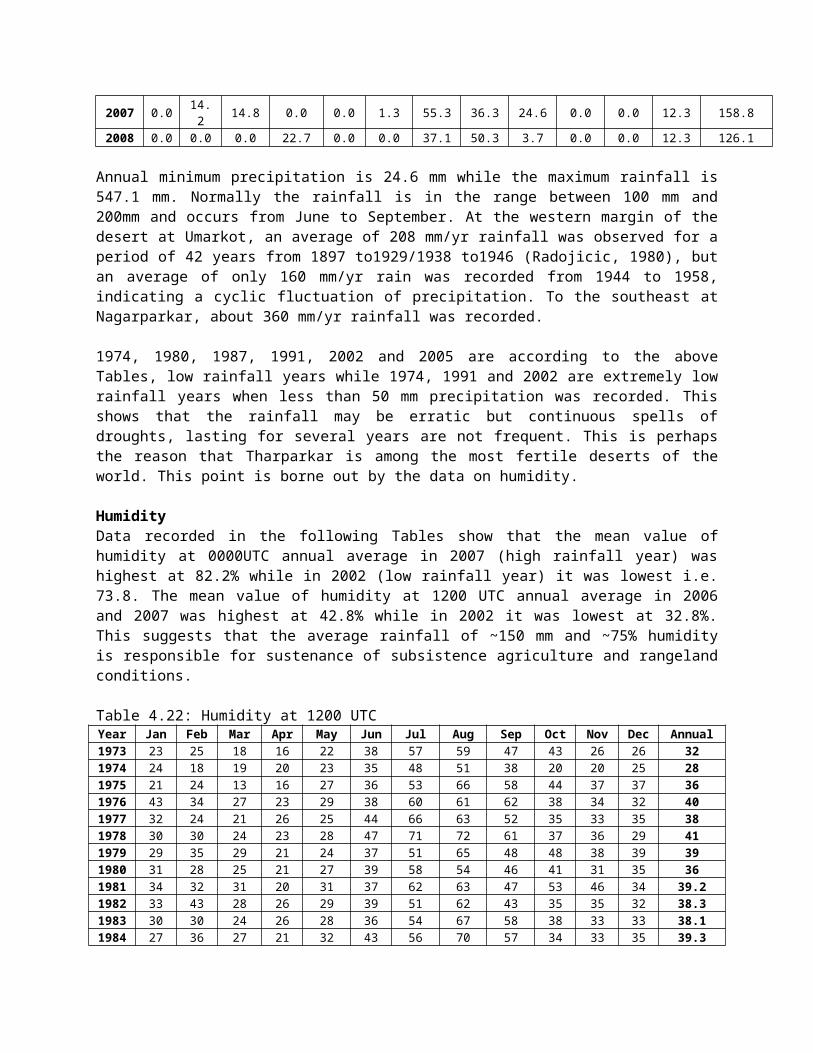
2007 0.0 14.2 14.8 0.0 0.0 1.3 55.3 36.3 24.6 0.0 0.0 12.3 158.8
2008 0.0 0.0 0.0 22.7 0.0 0.0 37.1 50.3 3.7 0.0 0.0 12.3 126.1
Annual minimum precipitation is 24.6 mm while the maximum rainfall is547.1 mm. Normally the rainfall is in the range between 100 mm and200mm and occurs from June to September. At the western margin of thedesert at Umarkot, an average of 208 mm/yr rainfall was observed for aperiod of 42 years from 1897 to1929/1938 to1946 (Radojicic, 1980), butan average of only 160 mm/yr rain was recorded from 1944 to 1958,indicating a cyclic fluctuation of precipitation. To the southeast atNagarparkar, about 360 mm/yr rainfall was recorded.
1974, 1980, 1987, 1991, 2002 and 2005 are according to the aboveTables, low rainfall years while 1974, 1991 and 2002 are extremely lowrainfall years when less than 50 mm precipitation was recorded. Thisshows that the rainfall may be erratic but continuous spells ofdroughts, lasting for several years are not frequent. This is perhapsthe reason that Tharparkar is among the most fertile deserts of theworld. This point is borne out by the data on humidity.
HumidityData recorded in the following Tables show that the mean value ofhumidity at 0000UTC annual average in 2007 (high rainfall year) washighest at 82.2% while in 2002 (low rainfall year) it was lowest i.e.73.8. The mean value of humidity at 1200 UTC annual average in 2006and 2007 was highest at 42.8% while in 2002 it was lowest at 32.8%.This suggests that the average rainfall of ~150 mm and ~75% humidityis responsible for sustenance of subsistence agriculture and rangelandconditions.
Table 4.22: Humidity at 1200 UTCYear Jan Feb Mar Apr May Jun Jul Aug Sep Oct Nov Dec Annual1973 23 25 18 16 22 38 57 59 47 43 26 26 321974 24 18 19 20 23 35 48 51 38 20 20 25 281975 21 24 13 16 27 36 53 66 58 44 37 37 361976 43 34 27 23 29 38 60 61 62 38 34 32 401977 32 24 21 26 25 44 66 63 52 35 33 35 381978 30 30 24 23 28 47 71 72 61 37 36 29 411979 29 35 29 21 24 37 51 65 48 48 38 39 391980 31 28 25 21 27 39 58 54 46 41 31 35 361981 34 32 31 20 31 37 62 63 47 53 46 34 39.21982 33 43 28 26 29 39 51 62 43 35 35 32 38.31983 30 30 24 26 28 36 54 67 58 38 33 33 38.11984 27 36 27 21 32 43 56 70 57 34 33 35 39.3
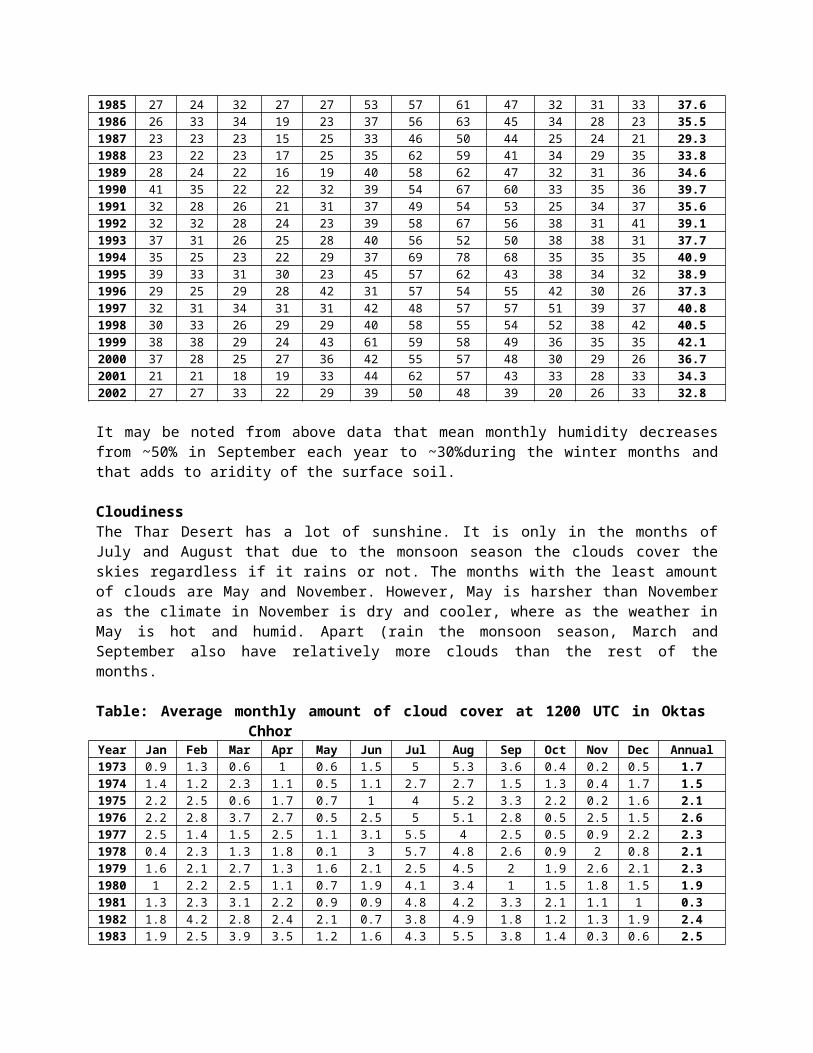
1985 27 24 32 27 27 53 57 61 47 32 31 33 37.61986 26 33 34 19 23 37 56 63 45 34 28 23 35.51987 23 23 23 15 25 33 46 50 44 25 24 21 29.31988 23 22 23 17 25 35 62 59 41 34 29 35 33.81989 28 24 22 16 19 40 58 62 47 32 31 36 34.61990 41 35 22 22 32 39 54 67 60 33 35 36 39.71991 32 28 26 21 31 37 49 54 53 25 34 37 35.61992 32 32 28 24 23 39 58 67 56 38 31 41 39.11993 37 31 26 25 28 40 56 52 50 38 38 31 37.71994 35 25 23 22 29 37 69 78 68 35 35 35 40.91995 39 33 31 30 23 45 57 62 43 38 34 32 38.91996 29 25 29 28 42 31 57 54 55 42 30 26 37.31997 32 31 34 31 31 42 48 57 57 51 39 37 40.81998 30 33 26 29 29 40 58 55 54 52 38 42 40.51999 38 38 29 24 43 61 59 58 49 36 35 35 42.12000 37 28 25 27 36 42 55 57 48 30 29 26 36.72001 21 21 18 19 33 44 62 57 43 33 28 33 34.32002 27 27 33 22 29 39 50 48 39 20 26 33 32.8
It may be noted from above data that mean monthly humidity decreasesfrom ~50% in September each year to ~30%during the winter months andthat adds to aridity of the surface soil.
CloudinessThe Thar Desert has a lot of sunshine. It is only in the months ofJuly and August that due to the monsoon season the clouds cover theskies regardless if it rains or not. The months with the least amountof clouds are May and November. However, May is harsher than Novemberas the climate in November is dry and cooler, where as the weather inMay is hot and humid. Apart (rain the monsoon season, March andSeptember also have relatively more clouds than the rest of themonths.
Table: Average monthly amount of cloud cover at 1200 UTC in Oktas Chhor
Year Jan Feb Mar Apr May Jun Jul Aug Sep Oct Nov Dec Annual1973 0.9 1.3 0.6 1 0.6 1.5 5 5.3 3.6 0.4 0.2 0.5 1.71974 1.4 1.2 2.3 1.1 0.5 1.1 2.7 2.7 1.5 1.3 0.4 1.7 1.51975 2.2 2.5 0.6 1.7 0.7 1 4 5.2 3.3 2.2 0.2 1.6 2.11976 2.2 2.8 3.7 2.7 0.5 2.5 5 5.1 2.8 0.5 2.5 1.5 2.61977 2.5 1.4 1.5 2.5 1.1 3.1 5.5 4 2.5 0.5 0.9 2.2 2.31978 0.4 2.3 1.3 1.8 0.1 3 5.7 4.8 2.6 0.9 2 0.8 2.11979 1.6 2.1 2.7 1.3 1.6 2.1 2.5 4.5 2 1.9 2.6 2.1 2.31980 1 2.2 2.5 1.1 0.7 1.9 4.1 3.4 1 1.5 1.8 1.5 1.91981 1.3 2.3 3.1 2.2 0.9 0.9 4.8 4.2 3.3 2.1 1.1 1 0.31982 1.8 4.2 2.8 2.4 2.1 0.7 3.8 4.9 1.8 1.2 1.3 1.9 2.41983 1.9 2.5 3.9 3.5 1.2 1.6 4.3 5.5 3.8 1.4 0.3 0.6 2.5
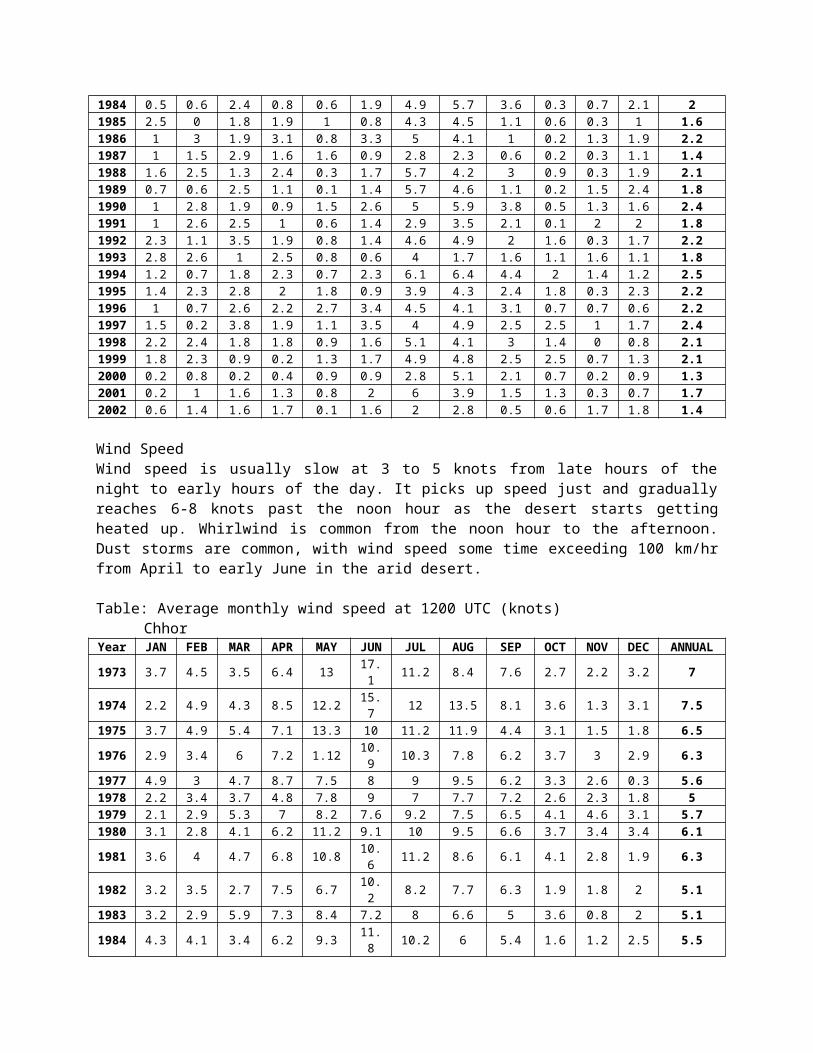
1984 0.5 0.6 2.4 0.8 0.6 1.9 4.9 5.7 3.6 0.3 0.7 2.1 21985 2.5 0 1.8 1.9 1 0.8 4.3 4.5 1.1 0.6 0.3 1 1.61986 1 3 1.9 3.1 0.8 3.3 5 4.1 1 0.2 1.3 1.9 2.21987 1 1.5 2.9 1.6 1.6 0.9 2.8 2.3 0.6 0.2 0.3 1.1 1.41988 1.6 2.5 1.3 2.4 0.3 1.7 5.7 4.2 3 0.9 0.3 1.9 2.11989 0.7 0.6 2.5 1.1 0.1 1.4 5.7 4.6 1.1 0.2 1.5 2.4 1.81990 1 2.8 1.9 0.9 1.5 2.6 5 5.9 3.8 0.5 1.3 1.6 2.41991 1 2.6 2.5 1 0.6 1.4 2.9 3.5 2.1 0.1 2 2 1.81992 2.3 1.1 3.5 1.9 0.8 1.4 4.6 4.9 2 1.6 0.3 1.7 2.21993 2.8 2.6 1 2.5 0.8 0.6 4 1.7 1.6 1.1 1.6 1.1 1.81994 1.2 0.7 1.8 2.3 0.7 2.3 6.1 6.4 4.4 2 1.4 1.2 2.51995 1.4 2.3 2.8 2 1.8 0.9 3.9 4.3 2.4 1.8 0.3 2.3 2.21996 1 0.7 2.6 2.2 2.7 3.4 4.5 4.1 3.1 0.7 0.7 0.6 2.21997 1.5 0.2 3.8 1.9 1.1 3.5 4 4.9 2.5 2.5 1 1.7 2.41998 2.2 2.4 1.8 1.8 0.9 1.6 5.1 4.1 3 1.4 0 0.8 2.11999 1.8 2.3 0.9 0.2 1.3 1.7 4.9 4.8 2.5 2.5 0.7 1.3 2.12000 0.2 0.8 0.2 0.4 0.9 0.9 2.8 5.1 2.1 0.7 0.2 0.9 1.32001 0.2 1 1.6 1.3 0.8 2 6 3.9 1.5 1.3 0.3 0.7 1.72002 0.6 1.4 1.6 1.7 0.1 1.6 2 2.8 0.5 0.6 1.7 1.8 1.4
Wind SpeedWind speed is usually slow at 3 to 5 knots from late hours of thenight to early hours of the day. It picks up speed just and graduallyreaches 6-8 knots past the noon hour as the desert starts gettingheated up. Whirlwind is common from the noon hour to the afternoon.Dust storms are common, with wind speed some time exceeding 100 km/hrfrom April to early June in the arid desert.
Table: Average monthly wind speed at 1200 UTC (knots) Chhor
Year JAN FEB MAR APR MAY JUN JUL AUG SEP OCT NOV DEC ANNUAL
1973 3.7 4.5 3.5 6.4 13 17.1 11.2 8.4 7.6 2.7 2.2 3.2 7
1974 2.2 4.9 4.3 8.5 12.2 15.7 12 13.5 8.1 3.6 1.3 3.1 7.5
1975 3.7 4.9 5.4 7.1 13.3 10 11.2 11.9 4.4 3.1 1.5 1.8 6.5
1976 2.9 3.4 6 7.2 1.12 10.9 10.3 7.8 6.2 3.7 3 2.9 6.3
1977 4.9 3 4.7 8.7 7.5 8 9 9.5 6.2 3.3 2.6 0.3 5.61978 2.2 3.4 3.7 4.8 7.8 9 7 7.7 7.2 2.6 2.3 1.8 51979 2.1 2.9 5.3 7 8.2 7.6 9.2 7.5 6.5 4.1 4.6 3.1 5.71980 3.1 2.8 4.1 6.2 11.2 9.1 10 9.5 6.6 3.7 3.4 3.4 6.1
1981 3.6 4 4.7 6.8 10.8 10.6 11.2 8.6 6.1 4.1 2.8 1.9 6.3
1982 3.2 3.5 2.7 7.5 6.7 10.2 8.2 7.7 6.3 1.9 1.8 2 5.1
1983 3.2 2.9 5.9 7.3 8.4 7.2 8 6.6 5 3.6 0.8 2 5.1
1984 4.3 4.1 3.4 6.2 9.3 11.8 10.2 6 5.4 1.6 1.2 2.5 5.5
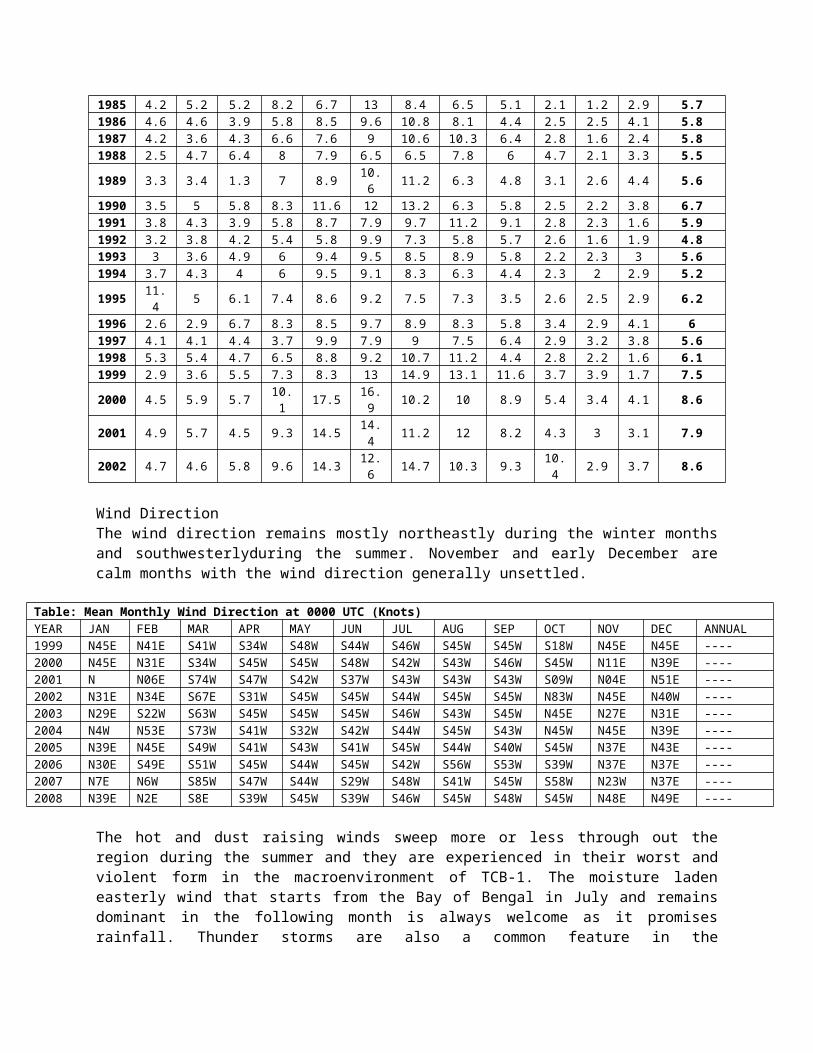
1985 4.2 5.2 5.2 8.2 6.7 13 8.4 6.5 5.1 2.1 1.2 2.9 5.71986 4.6 4.6 3.9 5.8 8.5 9.6 10.8 8.1 4.4 2.5 2.5 4.1 5.81987 4.2 3.6 4.3 6.6 7.6 9 10.6 10.3 6.4 2.8 1.6 2.4 5.81988 2.5 4.7 6.4 8 7.9 6.5 6.5 7.8 6 4.7 2.1 3.3 5.5
1989 3.3 3.4 1.3 7 8.9 10.6 11.2 6.3 4.8 3.1 2.6 4.4 5.6
1990 3.5 5 5.8 8.3 11.6 12 13.2 6.3 5.8 2.5 2.2 3.8 6.71991 3.8 4.3 3.9 5.8 8.7 7.9 9.7 11.2 9.1 2.8 2.3 1.6 5.91992 3.2 3.8 4.2 5.4 5.8 9.9 7.3 5.8 5.7 2.6 1.6 1.9 4.81993 3 3.6 4.9 6 9.4 9.5 8.5 8.9 5.8 2.2 2.3 3 5.61994 3.7 4.3 4 6 9.5 9.1 8.3 6.3 4.4 2.3 2 2.9 5.2
1995 11.4 5 6.1 7.4 8.6 9.2 7.5 7.3 3.5 2.6 2.5 2.9 6.2
1996 2.6 2.9 6.7 8.3 8.5 9.7 8.9 8.3 5.8 3.4 2.9 4.1 61997 4.1 4.1 4.4 3.7 9.9 7.9 9 7.5 6.4 2.9 3.2 3.8 5.61998 5.3 5.4 4.7 6.5 8.8 9.2 10.7 11.2 4.4 2.8 2.2 1.6 6.11999 2.9 3.6 5.5 7.3 8.3 13 14.9 13.1 11.6 3.7 3.9 1.7 7.5
2000 4.5 5.9 5.7 10.1 17.5 16.
9 10.2 10 8.9 5.4 3.4 4.1 8.6
2001 4.9 5.7 4.5 9.3 14.5 14.4 11.2 12 8.2 4.3 3 3.1 7.9
2002 4.7 4.6 5.8 9.6 14.3 12.6 14.7 10.3 9.3 10.
4 2.9 3.7 8.6
Wind DirectionThe wind direction remains mostly northeastly during the winter monthsand southwesterlyduring the summer. November and early December arecalm months with the wind direction generally unsettled.
Table: Mean Monthly Wind Direction at 0000 UTC (Knots)YEAR JAN FEB MAR APR MAY JUN JUL AUG SEP OCT NOV DEC ANNUAL1999 N45E N41E S41W S34W S48W S44W S46W S45W S45W S18W N45E N45E ----2000 N45E N31E S34W S45W S45W S48W S42W S43W S46W S45W N11E N39E ----2001 N N06E S74W S47W S42W S37W S43W S43W S43W S09W N04E N51E ----2002 N31E N34E S67E S31W S45W S45W S44W S45W S45W N83W N45E N40W ----2003 N29E S22W S63W S45W S45W S45W S46W S43W S45W N45E N27E N31E ----2004 N4W N53E S73W S41W S32W S42W S44W S45W S43W N45W N45E N39E ----2005 N39E N45E S49W S41W S43W S41W S45W S44W S40W S45W N37E N43E ----2006 N30E S49E S51W S45W S44W S45W S42W S56W S53W S39W N37E N37E ----2007 N7E N6W S85W S47W S44W S29W S48W S41W S45W S58W N23W N37E ----2008 N39E N2E S8E S39W S45W S39W S46W S45W S48W S45W N48E N49E ----
The hot and dust raising winds sweep more or less through out theregion during the summer and they are experienced in their worst andviolent form in the macroenvironment of TCB-1. The moisture ladeneasterly wind that starts from the Bay of Bengal in July and remainsdominant in the following month is always welcome as it promisesrainfall. Thunder storms are also a common feature in the
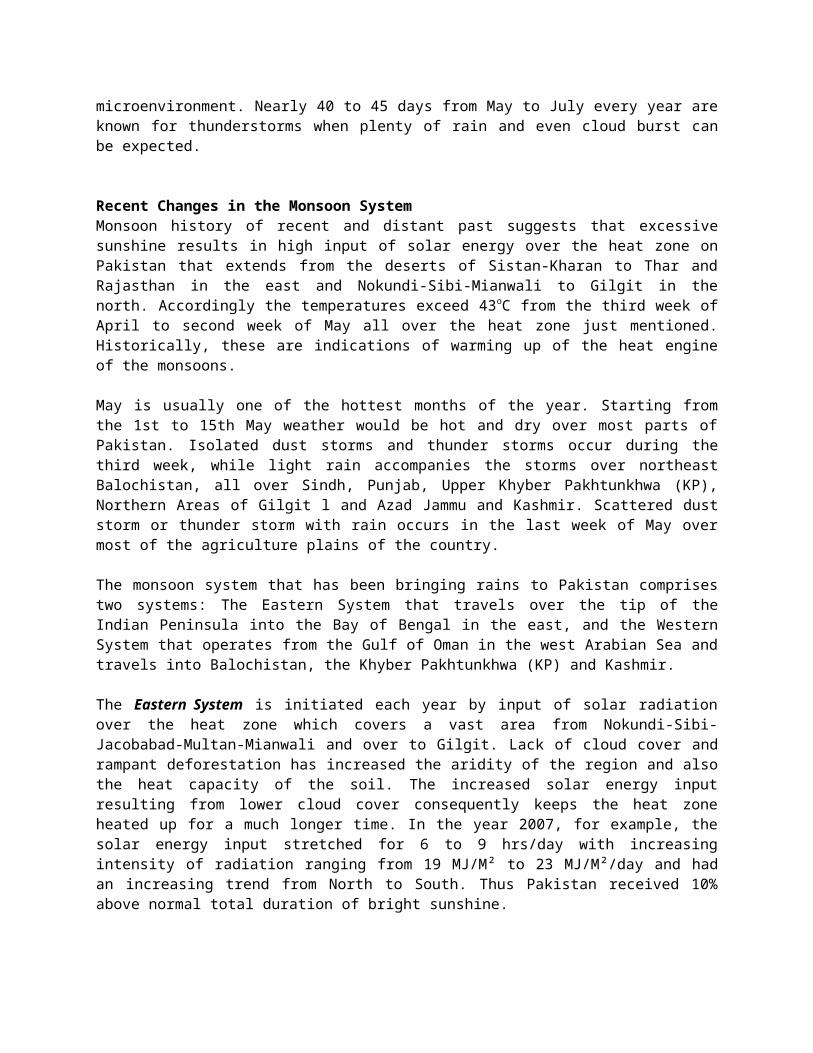
microenvironment. Nearly 40 to 45 days from May to July every year areknown for thunderstorms when plenty of rain and even cloud burst canbe expected.
Recent Changes in the Monsoon SystemMonsoon history of recent and distant past suggests that excessivesunshine results in high input of solar energy over the heat zone onPakistan that extends from the deserts of Sistan-Kharan to Thar andRajasthan in the east and Nokundi-Sibi-Mianwali to Gilgit in thenorth. Accordingly the temperatures exceed 43oC from the third week ofApril to second week of May all over the heat zone just mentioned.Historically, these are indications of warming up of the heat engineof the monsoons.
May is usually one of the hottest months of the year. Starting fromthe 1st to 15th May weather would be hot and dry over most parts ofPakistan. Isolated dust storms and thunder storms occur during thethird week, while light rain accompanies the storms over northeastBalochistan, all over Sindh, Punjab, Upper Khyber Pakhtunkhwa (KP),Northern Areas of Gilgit l and Azad Jammu and Kashmir. Scattered duststorm or thunder storm with rain occurs in the last week of May overmost of the agriculture plains of the country.
The monsoon system that has been bringing rains to Pakistan comprisestwo systems: The Eastern System that travels over the tip of theIndian Peninsula into the Bay of Bengal in the east, and the WesternSystem that operates from the Gulf of Oman in the west Arabian Sea andtravels into Balochistan, the Khyber Pakhtunkhwa (KP) and Kashmir.
The Eastern System is initiated each year by input of solar radiationover the heat zone which covers a vast area from Nokundi-Sibi-Jacobabad-Multan-Mianwali and over to Gilgit. Lack of cloud cover andrampant deforestation has increased the aridity of the region and alsothe heat capacity of the soil. The increased solar energy inputresulting from lower cloud cover consequently keeps the heat zoneheated up for a much longer time. In the year 2007, for example, thesolar energy input stretched for 6 to 9 hrs/day with increasingintensity of radiation ranging from 19 MJ/M² to 23 MJ/M²/day and hadan increasing trend from North to South. Thus Pakistan received 10%above normal total duration of bright sunshine.
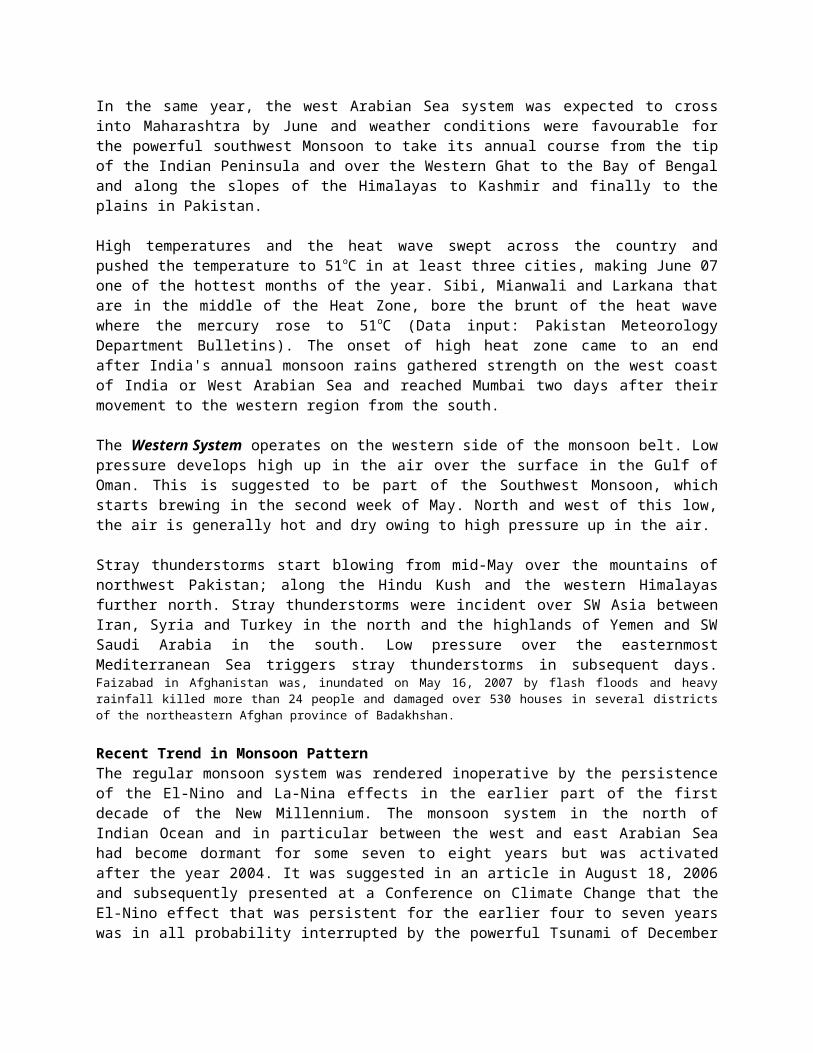
In the same year, the west Arabian Sea system was expected to crossinto Maharashtra by June and weather conditions were favourable forthe powerful southwest Monsoon to take its annual course from the tipof the Indian Peninsula and over the Western Ghat to the Bay of Bengaland along the slopes of the Himalayas to Kashmir and finally to theplains in Pakistan.
High temperatures and the heat wave swept across the country andpushed the temperature to 51oC in at least three cities, making June 07one of the hottest months of the year. Sibi, Mianwali and Larkana thatare in the middle of the Heat Zone, bore the brunt of the heat wavewhere the mercury rose to 51oC (Data input: Pakistan MeteorologyDepartment Bulletins). The onset of high heat zone came to an endafter India's annual monsoon rains gathered strength on the west coastof India or West Arabian Sea and reached Mumbai two days after theirmovement to the western region from the south.
The Western System operates on the western side of the monsoon belt. Lowpressure develops high up in the air over the surface in the Gulf ofOman. This is suggested to be part of the Southwest Monsoon, whichstarts brewing in the second week of May. North and west of this low,the air is generally hot and dry owing to high pressure up in the air.
Stray thunderstorms start blowing from mid-May over the mountains ofnorthwest Pakistan; along the Hindu Kush and the western Himalayasfurther north. Stray thunderstorms were incident over SW Asia betweenIran, Syria and Turkey in the north and the highlands of Yemen and SWSaudi Arabia in the south. Low pressure over the easternmostMediterranean Sea triggers stray thunderstorms in subsequent days.Faizabad in Afghanistan was, inundated on May 16, 2007 by flash floods and heavyrainfall killed more than 24 people and damaged over 530 houses in several districtsof the northeastern Afghan province of Badakhshan.
Recent Trend in Monsoon PatternThe regular monsoon system was rendered inoperative by the persistenceof the El-Nino and La-Nina effects in the earlier part of the firstdecade of the New Millennium. The monsoon system in the north ofIndian Ocean and in particular between the west and east Arabian Seahad become dormant for some seven to eight years but was activatedafter the year 2004. It was suggested in an article in August 18, 2006and subsequently presented at a Conference on Climate Change that theEl-Nino effect that was persistent for the earlier four to seven yearswas in all probability interrupted by the powerful Tsunami of December
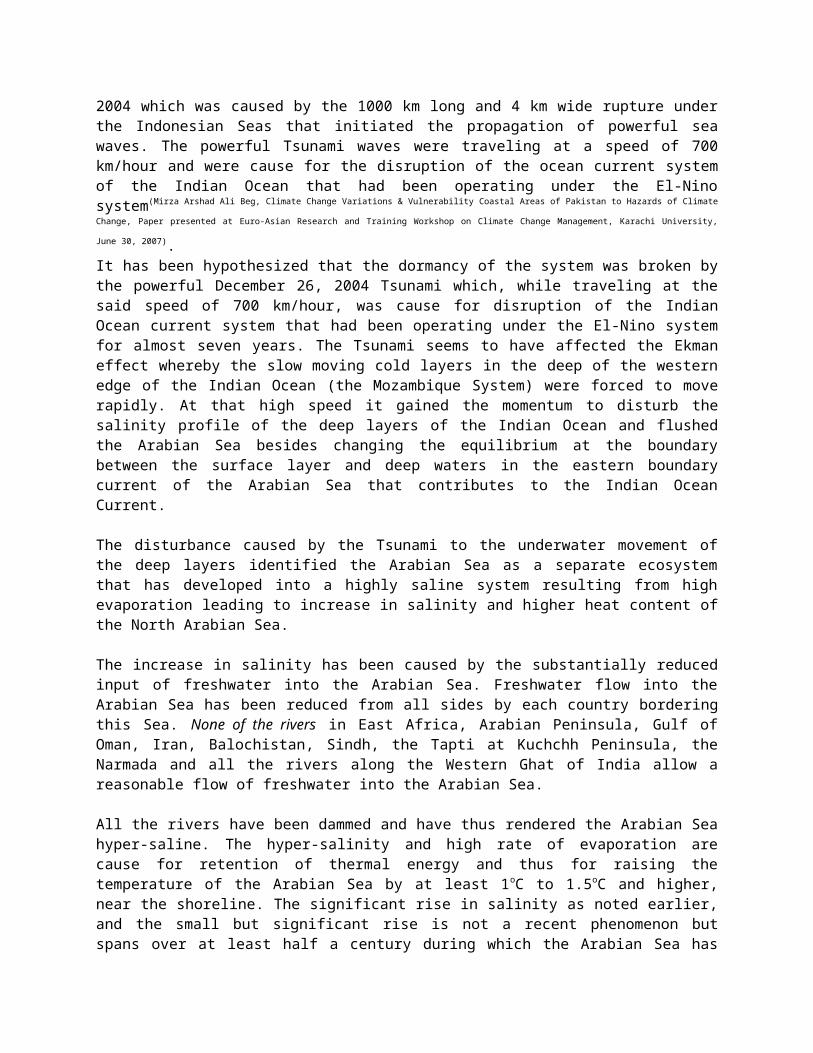
2004 which was caused by the 1000 km long and 4 km wide rupture underthe Indonesian Seas that initiated the propagation of powerful seawaves. The powerful Tsunami waves were traveling at a speed of 700km/hour and were cause for the disruption of the ocean current systemof the Indian Ocean that had been operating under the El-Ninosystem(Mirza Arshad Ali Beg, Climate Change Variations & Vulnerability Coastal Areas of Pakistan to Hazards of Climate
Change, Paper presented at Euro-Asian Research and Training Workshop on Climate Change Management, Karachi University,
June 30, 2007).It has been hypothesized that the dormancy of the system was broken bythe powerful December 26, 2004 Tsunami which, while traveling at thesaid speed of 700 km/hour, was cause for disruption of the IndianOcean current system that had been operating under the El-Nino systemfor almost seven years. The Tsunami seems to have affected the Ekmaneffect whereby the slow moving cold layers in the deep of the westernedge of the Indian Ocean (the Mozambique System) were forced to moverapidly. At that high speed it gained the momentum to disturb thesalinity profile of the deep layers of the Indian Ocean and flushedthe Arabian Sea besides changing the equilibrium at the boundarybetween the surface layer and deep waters in the eastern boundarycurrent of the Arabian Sea that contributes to the Indian OceanCurrent.
The disturbance caused by the Tsunami to the underwater movement ofthe deep layers identified the Arabian Sea as a separate ecosystemthat has developed into a highly saline system resulting from highevaporation leading to increase in salinity and higher heat content ofthe North Arabian Sea.
The increase in salinity has been caused by the substantially reducedinput of freshwater into the Arabian Sea. Freshwater flow into theArabian Sea has been reduced from all sides by each country borderingthis Sea. None of the rivers in East Africa, Arabian Peninsula, Gulf ofOman, Iran, Balochistan, Sindh, the Tapti at Kuchchh Peninsula, theNarmada and all the rivers along the Western Ghat of India allow areasonable flow of freshwater into the Arabian Sea.
All the rivers have been dammed and have thus rendered the Arabian Seahyper-saline. The hyper-salinity and high rate of evaporation arecause for retention of thermal energy and thus for raising thetemperature of the Arabian Sea by at least 1oC to 1.5oC and higher,near the shoreline. The significant rise in salinity as noted earlier,and the small but significant rise is not a recent phenomenon butspans over at least half a century during which the Arabian Sea has
been under serious stress while all the rivers failed to deliverfreshwater into their delta and the sea.
It has been hypothesized that the Tsunami of 2004 reduced the stresswith its shearing action to restrain the outflow of the Arabian Seacurrent and to contain the stress into the ecosystem just north of thetip of the Indian Peninsula. Time has shown that the Tsunami has hadlong range impact on the Indian Ocean by identifying the Arabian Seaas a separate ecosystem under high stress of salinity.
It seems that the disturbance caused by the Tsunami of December 2004system was instrumental in bringing an end to the El-Nino and settingin the La Nina effect so as to bring in rains, though still belowaverage, in Sindh in the year 2005. The disruption of the oceaniccurrent system has firmed up in subsequent years starting from theyear 2006, suggesting revival of the past system when there would beheavy rains after periods of drought.
The revival of the system seems to be continuing during subsequentyears. This is authenticated by the Long Range Forecast for 2007Southwest Monsoon Season Rainfall, by which the Indian MeteorologicalDepartment reported that moderate El Nino conditions developed overthe equatorial Pacific Ocean during the end of August 2006, but theevent was very short lived. The warm sea surface temperature (SST)anomalies over the east equatorial Pacific disappeared during February2007. By the end of February, SSTs were near average in the vicinityof the date line, and below average over the eastern equatorialPacific. The equatorial upper-ocean heat content (average temperaturedepartures in the upper 300 m of the ocean) also decreased rapidly.These trends in surface and subsurface ocean temperatures indicatethat the warm (El Niño) episode had ended and that conditions werebecoming favorable for La Niña to develop.
The disturbance caused by the December 2004 Tsunami system also seemsto be instrumental in setting off the 3-year temperature cycle on thecoastal area of Sindh and also initiated above average rainfall eventsall over Sindh. This caused serious disturbances in the currentpattern in the Arabian Sea leading to major cyclonic eventsthereafter. The disruption of the oceanic current system firmed uphereafter and thus there was revival of the past system when therewould be heavy rains after periods of drought.
The Cyclones
Increase in sunshine period, high temperatures over the extensive heatzone, windstorms and low rainfall all appear to fit into the generalmonsoon pattern. These are also the ideal conditions for TropicalCyclones, which occur primarily during summer in the NorthernHemisphere and during autumn in the Southern Hemisphere. The necessaryconditions for development of cyclones are warm ocean waters withtemperatures of at least 26°C, a tropical atmosphere that can quiteeasily kick off convection causing thunderstorms, low vertical shearin the troposphere, and a substantial amount of large-scale spinavailable, either through the monsoon trough or easterly waves.
In the North Arabian Sea the ocean reaches its warmest temperatures inthe month of May and thus the conditions for peaking of the cyclonesare obtained much earlier than late June which is the time for maximumsolar radiation in the tropical Northern Hemisphere. The atmosphericcirculation in the tropics is also favorable for tropical cyclones.
One of the indicators of intensity of monsoon activity is upwellingthat comes along with the Mozambique current. In the year 2007 therewas reason for upwelling to intensify because i) input of sunshineover the land area of Pakistan had increased, and ii) salinitygradient was created at the mid-tropical region of the Arabian Seawhere the cool hyposaline layers of seawater from the Antarctica werecreating deep gradients with the hypersaline layers from the heated upcoastline along the Arabian Sea.
The thunderstorm that struck the Northern Areas and Azad Kashmir fromthe start of second week of May in 2007 and also in 2010 was part ofthe monsoon system and its incidence was not unusual. Its intensityand the damage done were severe in each case.
On 2 June, 2007 Tropical Cyclone 03A, Gonu, was forecast to continueon a slow northwest path. It was at that time centered on 15o north and68o west, or about 700 km southeast of Mumbai, India. The stormstrengthened and within hours it changed its category from a tropicalstorm to category 4 (speed 200 to 250 km/hr) and on June 4 it pickedup speed of over 260 km/hr which is category 5.
The paths of tropical cyclone over the northern Arabian Sea, duringthe last 22 years 1985-2005, did not lead to the Gulf of Oman and fewstorms ever approached the Arabian Peninsula. Most paths actuallyturned northeastwards to India; one such cyclone 02A hit Badin on May1, 1999, while other storms broke up at sea. The onset of Gonu, the
Arabian Sea cyclone not only disturbed the monsoon system on theeastern Arabian Sea, but time has shown that it has set a beginningfor catastrophes ahead.
Study of the Pattern of Change in Climatic norms in Pakistan,particularly the coastal areas of Sindh and Balochistan whosevulnerability has been demonstrated by the series of events startingfrom Tropical Cyclone 02A in May 1999 to Gonu that landed on thewestern coast of Balochistan on June 10, 2007, and to Yemym that alsolanded on the west coast of Balochistan on June 26.
Following the 3-year cyclic pattern, just noted, the tropical cyclonicevent Phet was incident on June 6, 2010, when history repeated itselfto support the above hypothesis. The low cloud cover and increasedsunshine resulted in rise in temperature of landmass in the hinterlandof the Arabian Sea. High temperatures such as 55oC recorded at MoenjoDaro on May 25 setting the fourth world record, have (i) since turnedlarge territory of Pakistan into an extensive heat zone, and (ii)raised the temperature of the North Arabian Sea by 1oC to 1.5oC. Theheat zone serving as the main heat engine for the monsoon system,while the significant rise in temperature of the Arabian Sea has ledto high evaporation rates over the sea surface. This has led to highersalinity and hence to higher heat content of the Arabian Sea. Theseare sufficient conditions to create salinity steep gradient inaddition to thermal gradients and trigger cyclones in the high seas,and the Arabian Sea was no exception.
Rise in temperature indicates onset and persistence of low-pressurezone on land and temperatures higher than 26oC at sea. This temperatureis critical in that it may induce steep salinity gradient on the sea.The former parameter i.e. heat zone can attract rain bearing winds incase they are around, while the latter can nucleate cyclones/storms.Such attraction of moisture laden winds did cause severe storms, thelatest on June 6, 2010; and earlier on June 5, 2007; on August 21,2007; and on August 17, 2006 and brought sudden heavy rains of as muchas 50 to 100 mm in two to three hours. Such an event did bring earlieron 150 mm rainfall in 3 hours in 1967 and caused accumulation of 8 ftwater in Shershah in Karachi. In the 1977 monsoon season also theincessant pouring brought 200 mm rains in five hours.
The cyclonic event that was incident on June 6, 2010 brought 100 mmrainfall in two hours. On August 10 and 11 of 2007 it broughtunusually high rainfall of 107mm in 24 hours as compared with the
normal of about 60 mm for August. The wettest August ever experiencedby the city of Karachi was in 1979, when over 262 mm rainfall wasrecorded. The record for maximum rainfall within 24 hours was 166 mmof rain on August 7, 1979. The heavy rainfall was thus not unusualparticularly because it was caused by the system that travelled fromacross Rajasthan and lay over Sindh. The monsoon weather system didnot move towards Baluchistan but the penetration of moist currentsfrom Sindh brought scattered to heavy rain in southern Baluchistan,particularly along its coastal regions.
One of the indicators of intense activity of the monsoon is theupwelling that is part of the system of oceanic current that moves inwhen the sun moves from over the Tropic of Capricorn to the Tropic ofCancer. Up welling had intensified ever after the incidence of theTsunami event in the year 2004, and its intensity seems to be on anincrease with increasing input of sunshine over the land area andincreasing salinity and heat content of the Arabian Sea. Because ofthe increased input of sunshine over the land area of Pakistan duringthe year 2007 there was serious disturbance in the current pattern inthe Arabian Sea which led to the major cyclonic events during the year2007, and 2010.
Cyclones and Storms SurgesThe Arabian Sea is known to be frequented by general cyclonic stormsand some of these had been among the worst cyclonic storms of theworld in terms of severity, resulting in huge losses to life andproperty in the coastal areas. A significant number of the cyclonicstorms produced in the Arabian Sea move towards north and northeastand some of them land in Pakistan. However most of these cycloneswhich tend to move towards southern part of the Pakistan coast veryoften reciprocate towards eastern coast of India.
The east of Indus Basin in the North Arabian Sea is more vulnerable tostorm surges, associated with the severe cyclonic storm, than thatgenerated in the Makran coast on the west of the Arabian Sea. Tropicalcyclones generally develop over Arabian Sea in low latitude i.e.between 5 oN and 20oN and dissipate after they move over land. Themaximum frequency of tropical cyclone formation occurs in April, Mayand early June, and in the October-November period. The later half ofJune receives least tropical cyclones in the region. About 76% oftropical cyclones in Karachi approach from the south through the east.
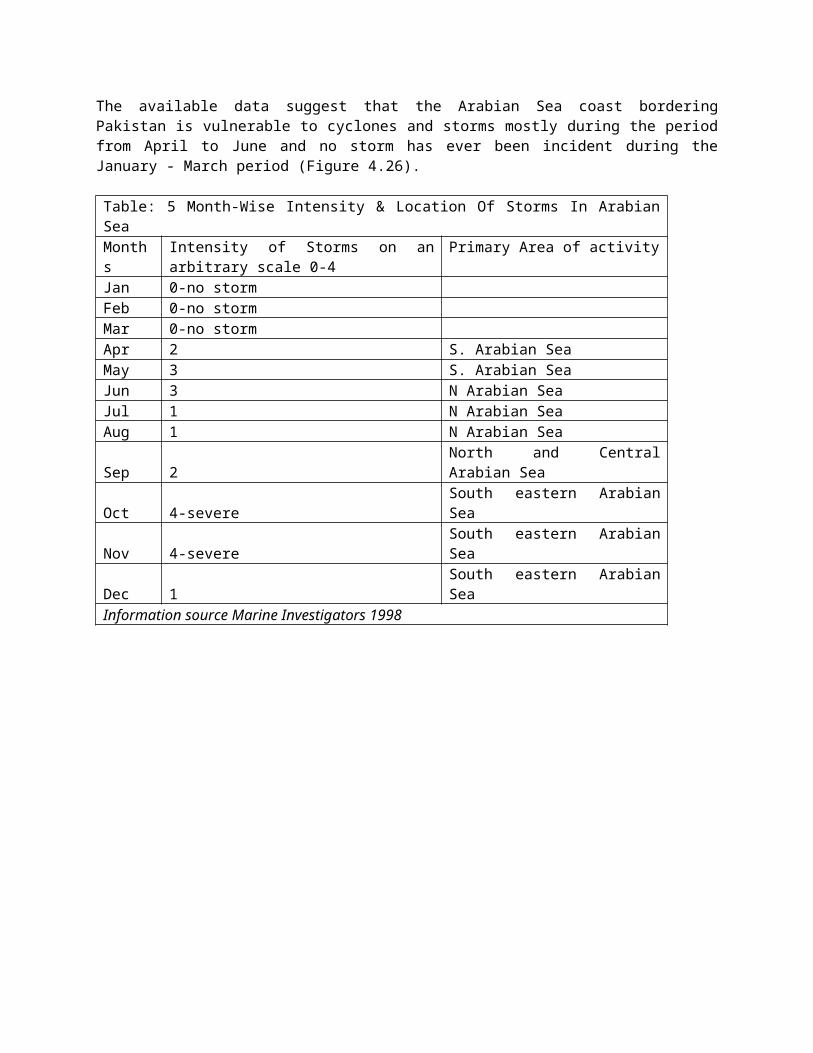
The available data suggest that the Arabian Sea coast borderingPakistan is vulnerable to cyclones and storms mostly during the periodfrom April to June and no storm has ever been incident during theJanuary - March period (Figure 4.26).
Table: 5 Month-Wise Intensity & Location Of Storms In ArabianSeaMonths
Intensity of Storms on anarbitrary scale 0-4
Primary Area of activity
Jan 0-no storm Feb 0-no storm Mar 0-no storm Apr 2 S. Arabian SeaMay 3 S. Arabian SeaJun 3 N Arabian SeaJul 1 N Arabian SeaAug 1 N Arabian Sea
Sep 2North and CentralArabian Sea
Oct 4-severeSouth eastern ArabianSea
Nov 4-severeSouth eastern ArabianSea
Dec 1South eastern ArabianSea
Information source Marine Investigators 1998
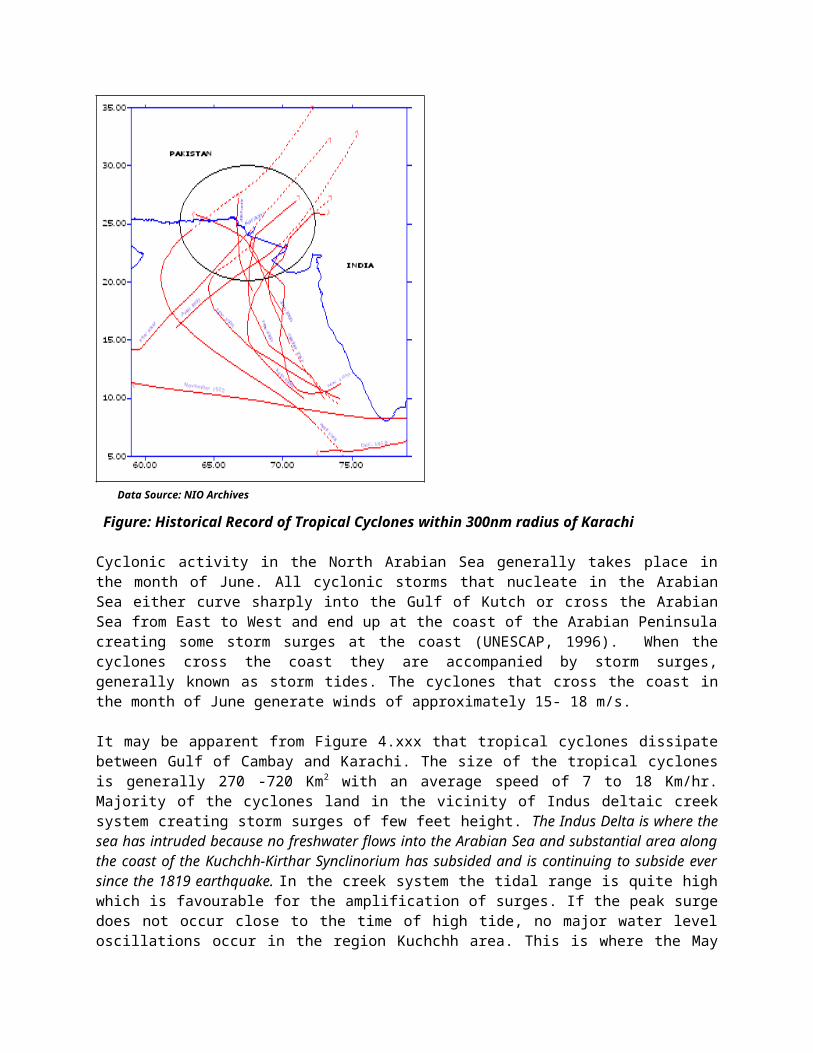
Data Source: NIO Archives
Figure: Historical Record of Tropical Cyclones within 300nm radius of Karachi
Cyclonic activity in the North Arabian Sea generally takes place inthe month of June. All cyclonic storms that nucleate in the ArabianSea either curve sharply into the Gulf of Kutch or cross the ArabianSea from East to West and end up at the coast of the Arabian Peninsulacreating some storm surges at the coast (UNESCAP, 1996). When thecyclones cross the coast they are accompanied by storm surges,generally known as storm tides. The cyclones that cross the coast inthe month of June generate winds of approximately 15- 18 m/s.
It may be apparent from Figure 4.xxx that tropical cyclones dissipatebetween Gulf of Cambay and Karachi. The size of the tropical cyclonesis generally 270 -720 Km2 with an average speed of 7 to 18 Km/hr.Majority of the cyclones land in the vicinity of Indus deltaic creeksystem creating storm surges of few feet height. The Indus Delta is where thesea has intruded because no freshwater flows into the Arabian Sea and substantial area alongthe coast of the Kuchchh-Kirthar Synclinorium has subsided and is continuing to subside eversince the 1819 earthquake. In the creek system the tidal range is quite highwhich is favourable for the amplification of surges. If the peak surgedoes not occur close to the time of high tide, no major water leveloscillations occur in the region Kuchchh area. This is where the May
1999 cyclone 2A made a land fall and caused colossal damage to theLBOD system including the Spinal Drain.
SW monsoon winds in June also add about 0.3 m of surge to the currenttides. Thus tidal level of over 4.0 m prevailing in the GharoCreek/Port Qasim region inundates the banks and erodes the coastalareas. Such high tides were experienced in 1986, 1990, 1993, 1999,2007 and 2010 when heavy damage was recorded in the low lying coastalareas of Badin and Thatta districts and also part of TharparkarDistrict.
It may be mentioned here that movement of cyclones in the Arabian Seaalong Pakistan coast is generally in the west- northwest WNW directionbut they sometimes change direction and hit the Pakistan coastline, anexample being the Cyclone 2A of May 1999, which formed in the ArabianSea but changed direction during the course of movement and hit thecoastal area of Badin and caused heavy losses of property and lives.Karachi was in the peripheral area and only showers of moderateintensity were recorded.
The June 6, 2010 cyclone 03A, nicknamed Phet had landed on the coastof Oman and had lost its intensity. Moving in clockwise direction itpoured heavy rains on Gwadar and Pasni. The rain bearing winds movedalong the coastline towards Karachi. Cyclone 03A touched Karachi onlytangentially and brought 100 mm rainfall two days before it landedsouth of Thatta District and reached the coastline of Badin andTharparkar.
Cyclones generally constitute the strong winds having the speed ofover 60 Knots and the central pressure as low as 980 mb. The wind andlow pressure creates the storm surges which when combined with hightides, become a destructive force in the coastal area. Coastal erosionand inundation are commonly associated with storm surges. Beside thecyclones, several depression with less severe intensity frequentlyoccur in the northern Arabian sea, which are also related with surges.These surges, which are about 0.5 m in height, when combined with HHWbecome the potential source of erosion; they create high waves in theopen sandy coast and increase tide water level favouring tidalinundation.
According to the studies so far available the Sindh coast falls in abelt where the frequency of storm striking the coast is low (for overa 75 year period only four storms struck the coast at latitude 18oN and
only three struck between 19 oN and 20 oN). The low lying marshy Rann ofKutch is located between Dwarka in India, and the Indus Delta. Thetracks in this region are not favourable for major surge development.The tidal range is quite high and hence unless peak surge occurs closeto the time of high tide, no major water level oscillation can occurhere. The frequency of storm would accordingly be low.
Rainstorm of July 2003: The coastal area of Tharparkar and Badindistricts was hit by devastations of high magnitude during therainstorm of 2003. The flood conditions were precipitated not by therainfall of 350 to 450 mm in 5 days, but by the combined action ofrun-off from the prolonged and high intensity rainfall and highvelocity canal flows through the breaches in Sani Guni Canal, PhullelyCanal, Nasir Canal and other distributaries. The high flows in thecanals were caused by restricted use or no use of irrigation water bythe farmers. This water had to end up at the canal escapes mentionedabove. A huge surge of saline water that came from the cuts andbreaches made by the people to drain surface water into the LBODsystem, was face to face with a massive flow of seawater that camefrom the opposite direction and stopped the floodwater and the escapewater from going into the sea.
Carrying capacity of the LBO drainage system had been renderedinadequate as a result of its having remained idle during thecontinuous drought for the previous five years. The channels weresilted up to a great extent and were unable to accept the massiveinflow of floodwater. This led to accumulation of floodwater andseawater in thickly populated Talukas of Badin and SF Rahu for daystogether. The other Talukas viz. Tando Bagho, Matli and Talhar werealso badly affected and all of them had to face destruction of crops,livestock and property.
The rainstorm and floods affected the entire coastline primarily dueto the damaged Tidal Link embankments in the south of Badin District.Absence of an effective drainage system and the high water table,which did not allow the rainwater from a rainfall of 350 to 450 mm in5 days to percolate rapidly, were in the same way responsible for thedevastations. A number of fertile agricultural fields turned intosaline water ponds, while the massive seawater intrusion causedirreparable damage to the entire coastal belt. This event has clearlydemonstrated the need to take note of land subsidence and submergenceand the consequent intrusion of the sea. One way to mitigate thesituation would be to restrain further destabilization of the
coastline and not to build any structure that may yield to the strongforces of the tidal waves.
It is worth making a note that the land slope in Badin and Tharparkardistricts is generally 1 ft to a mile or 1 in about 5000 and less thanthat in the nearshore region of the Rann of Kuchchh. The channel bedof Tidal Link on the Badin-Tharparkar border has a slope of 1 in14,000. The adequacy of the slope is difficult to justify inconsideration of the tidal forces and oceanic currents that are highlyenergetic during the monsoon season. At least half of the volume thatis drained by the Tidal Link during low tide is pushed upstream duringhigh tides. This aspect of drainage when considered in the light ofneed to have the Cholri weir suggests that the Tidal Link as well asthe dhands upstream are potentially vulnerable to residual pressurethat may persist at peak water levels under extreme tidal conditions.
According to the above stated conditions it is likely for the TidalLink even in its dilapidated form not to accept drainage water fromthe tail-end of Karo, Gunjro and Guni outfall drains, whenever thereis a rise in the water level in the dhands that are interconnectedwith Cholri dhandh. Such situations that have occurred during therainstorm of 2003, would always result in building up the salinitylevel at the coastline and also lead to seawater intrusion. Wetness ofthe soil along the coastline ahead of and much past the Tidal Link aswell as along the Rann of Kuchchh found during the visit to the areaindicates that this phenomenon is already operating in the southernareas of Badin and Tharparkar districts and along the Rann of Kuchchh.
13. Air QualityAir quality issues in the microenvironment of the Thar coalfield Block1 mostly relate to dust fall in the open field and air emissions fromthe small number of vehicles operating in the urban clusters. Thesmall industrial units in the microenvironment generally processagriculture products e.g. threshing, grinding, or workshops which arenot major pollution units. These units also do not cause emission ofparticulate matter.
Indoor pollution at the small smithies and workshops besides thehouseholds is a major cause of concern mainly due to burning of firewood, and kerosene oil which are responsible for smoke and carbonmonoxide emissions. However, the extent of these emissions is limitedto the wokplace.
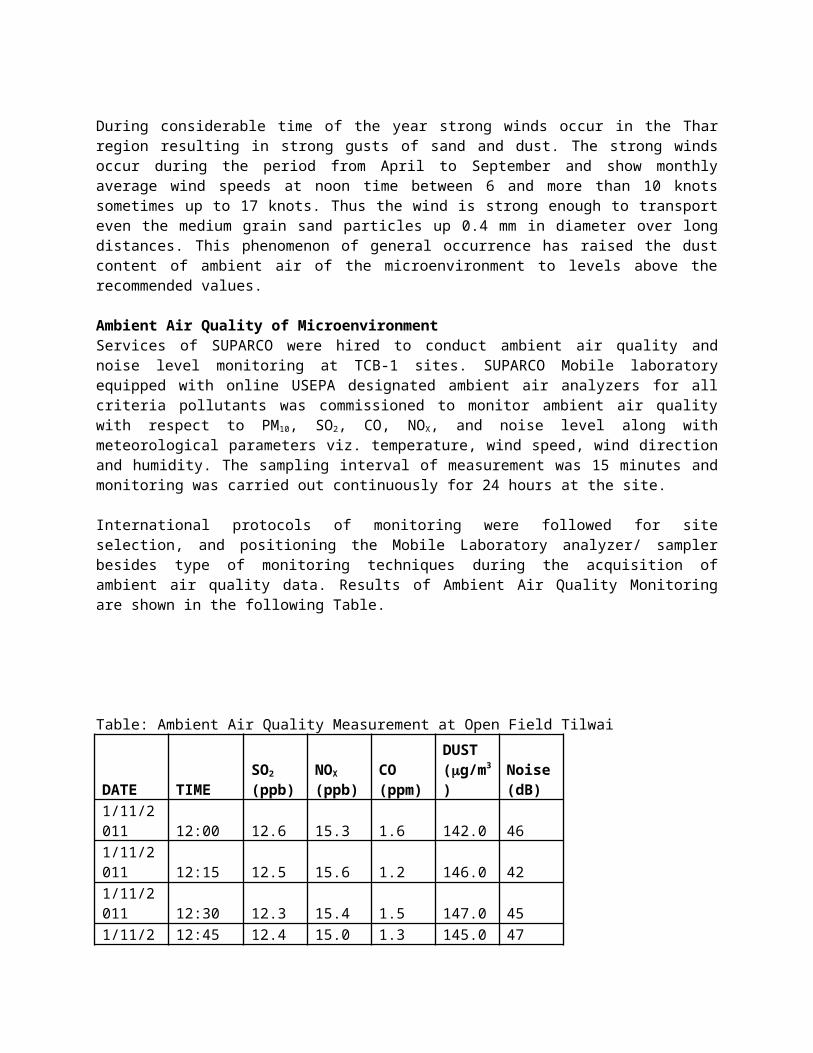
During considerable time of the year strong winds occur in the Tharregion resulting in strong gusts of sand and dust. The strong windsoccur during the period from April to September and show monthlyaverage wind speeds at noon time between 6 and more than 10 knotssometimes up to 17 knots. Thus the wind is strong enough to transporteven the medium grain sand particles up 0.4 mm in diameter over longdistances. This phenomenon of general occurrence has raised the dustcontent of ambient air of the microenvironment to levels above therecommended values.
Ambient Air Quality of MicroenvironmentServices of SUPARCO were hired to conduct ambient air quality andnoise level monitoring at TCB-1 sites. SUPARCO Mobile laboratoryequipped with online USEPA designated ambient air analyzers for allcriteria pollutants was commissioned to monitor ambient air qualitywith respect to PM10, SO2, CO, NOX, and noise level along withmeteorological parameters viz. temperature, wind speed, wind directionand humidity. The sampling interval of measurement was 15 minutes andmonitoring was carried out continuously for 24 hours at the site.
International protocols of monitoring were followed for siteselection, and positioning the Mobile Laboratory analyzer/ samplerbesides type of monitoring techniques during the acquisition ofambient air quality data. Results of Ambient Air Quality Monitoringare shown in the following Table.
Table: Ambient Air Quality Measurement at Open Field Tilwai
DATE TIMESO2
(ppb)NOX
(ppb)CO(ppm)
DUST(g/m3
)Noise(dB)
1/11/2011 12:00 12.6 15.3 1.6 142.0 461/11/2011 12:15 12.5 15.6 1.2 146.0 421/11/2011 12:30 12.3 15.4 1.5 147.0 451/11/2 12:45 12.4 15.0 1.3 145.0 47
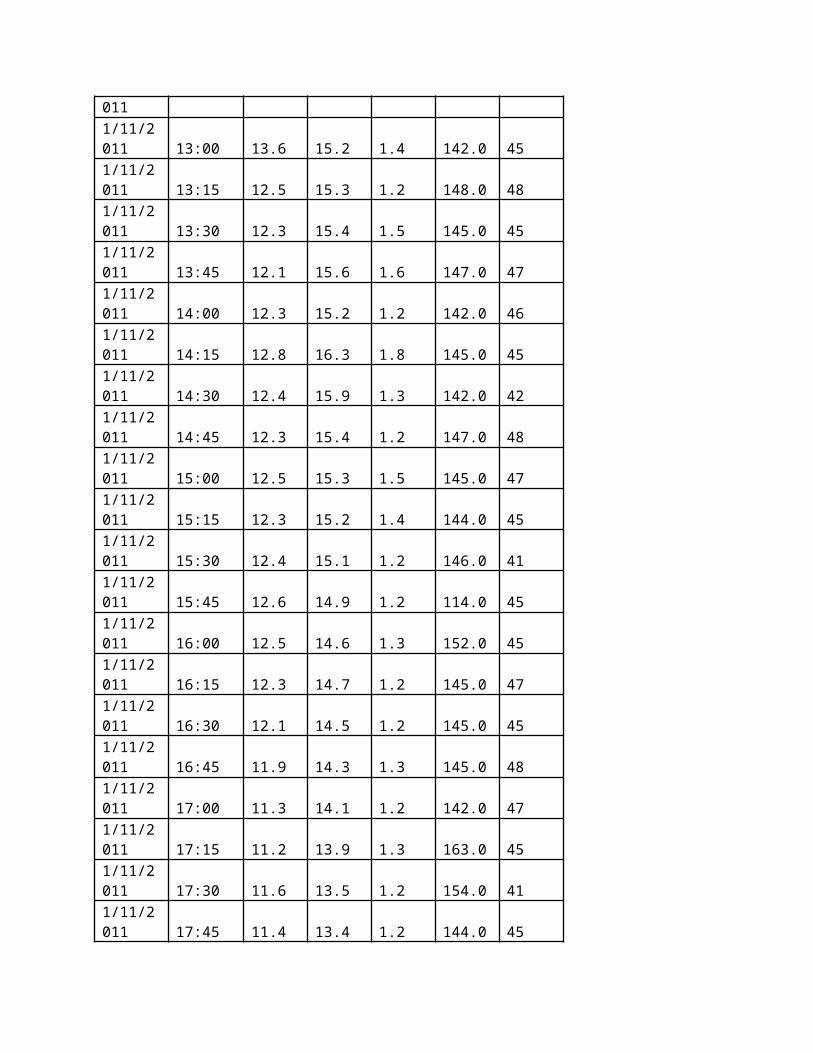
0111/11/2011 13:00 13.6 15.2 1.4 142.0 451/11/2011 13:15 12.5 15.3 1.2 148.0 481/11/2011 13:30 12.3 15.4 1.5 145.0 451/11/2011 13:45 12.1 15.6 1.6 147.0 471/11/2011 14:00 12.3 15.2 1.2 142.0 461/11/2011 14:15 12.8 16.3 1.8 145.0 451/11/2011 14:30 12.4 15.9 1.3 142.0 421/11/2011 14:45 12.3 15.4 1.2 147.0 481/11/2011 15:00 12.5 15.3 1.5 145.0 471/11/2011 15:15 12.3 15.2 1.4 144.0 451/11/2011 15:30 12.4 15.1 1.2 146.0 411/11/2011 15:45 12.6 14.9 1.2 114.0 451/11/2011 16:00 12.5 14.6 1.3 152.0 451/11/2011 16:15 12.3 14.7 1.2 145.0 471/11/2011 16:30 12.1 14.5 1.2 145.0 451/11/2011 16:45 11.9 14.3 1.3 145.0 481/11/2011 17:00 11.3 14.1 1.2 142.0 471/11/2011 17:15 11.2 13.9 1.3 163.0 451/11/2011 17:30 11.6 13.5 1.2 154.0 411/11/2011 17:45 11.4 13.4 1.2 144.0 45
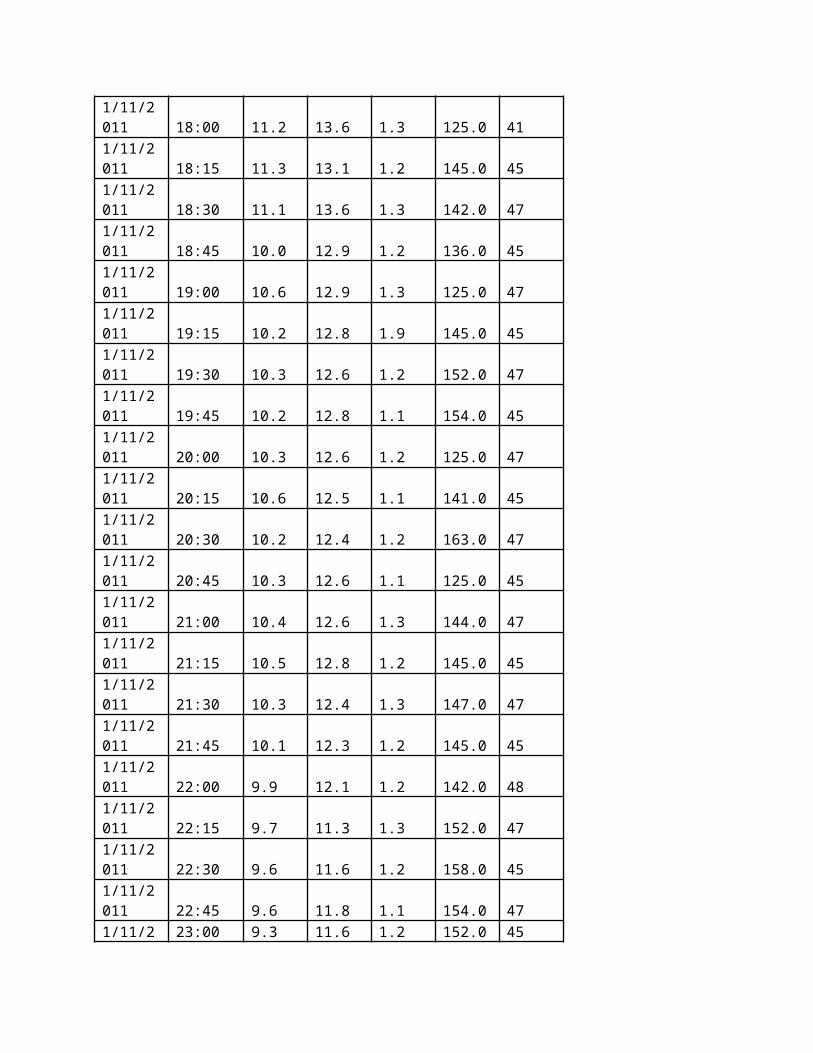
1/11/2011 18:00 11.2 13.6 1.3 125.0 411/11/2011 18:15 11.3 13.1 1.2 145.0 451/11/2011 18:30 11.1 13.6 1.3 142.0 471/11/2011 18:45 10.0 12.9 1.2 136.0 451/11/2011 19:00 10.6 12.9 1.3 125.0 471/11/2011 19:15 10.2 12.8 1.9 145.0 451/11/2011 19:30 10.3 12.6 1.2 152.0 471/11/2011 19:45 10.2 12.8 1.1 154.0 451/11/2011 20:00 10.3 12.6 1.2 125.0 471/11/2011 20:15 10.6 12.5 1.1 141.0 451/11/2011 20:30 10.2 12.4 1.2 163.0 471/11/2011 20:45 10.3 12.6 1.1 125.0 451/11/2011 21:00 10.4 12.6 1.3 144.0 471/11/2011 21:15 10.5 12.8 1.2 145.0 451/11/2011 21:30 10.3 12.4 1.3 147.0 471/11/2011 21:45 10.1 12.3 1.2 145.0 451/11/2011 22:00 9.9 12.1 1.2 142.0 481/11/2011 22:15 9.7 11.3 1.3 152.0 471/11/2011 22:30 9.6 11.6 1.2 158.0 451/11/2011 22:45 9.6 11.8 1.1 154.0 471/11/2 23:00 9.3 11.6 1.2 152.0 45
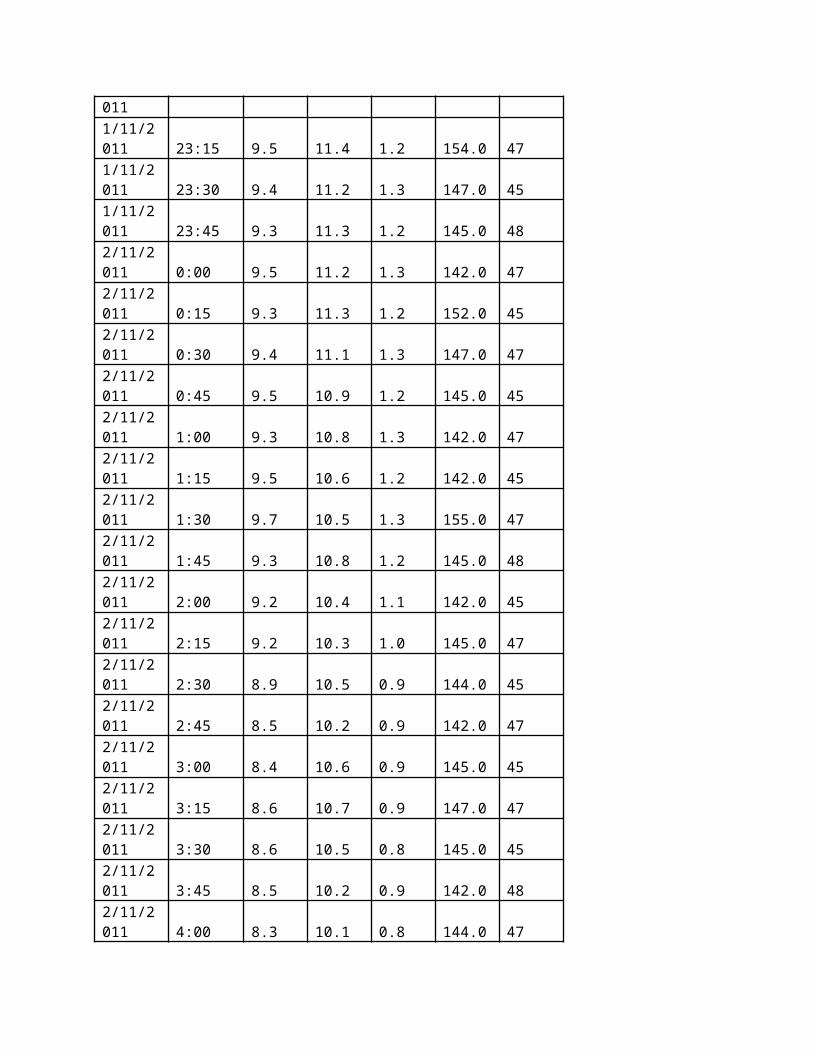
0111/11/2011 23:15 9.5 11.4 1.2 154.0 471/11/2011 23:30 9.4 11.2 1.3 147.0 451/11/2011 23:45 9.3 11.3 1.2 145.0 482/11/2011 0:00 9.5 11.2 1.3 142.0 472/11/2011 0:15 9.3 11.3 1.2 152.0 452/11/2011 0:30 9.4 11.1 1.3 147.0 472/11/2011 0:45 9.5 10.9 1.2 145.0 452/11/2011 1:00 9.3 10.8 1.3 142.0 472/11/2011 1:15 9.5 10.6 1.2 142.0 452/11/2011 1:30 9.7 10.5 1.3 155.0 472/11/2011 1:45 9.3 10.8 1.2 145.0 482/11/2011 2:00 9.2 10.4 1.1 142.0 452/11/2011 2:15 9.2 10.3 1.0 145.0 472/11/2011 2:30 8.9 10.5 0.9 144.0 452/11/2011 2:45 8.5 10.2 0.9 142.0 472/11/2011 3:00 8.4 10.6 0.9 145.0 452/11/2011 3:15 8.6 10.7 0.9 147.0 472/11/2011 3:30 8.6 10.5 0.8 145.0 452/11/2011 3:45 8.5 10.2 0.9 142.0 482/11/2011 4:00 8.3 10.1 0.8 144.0 47
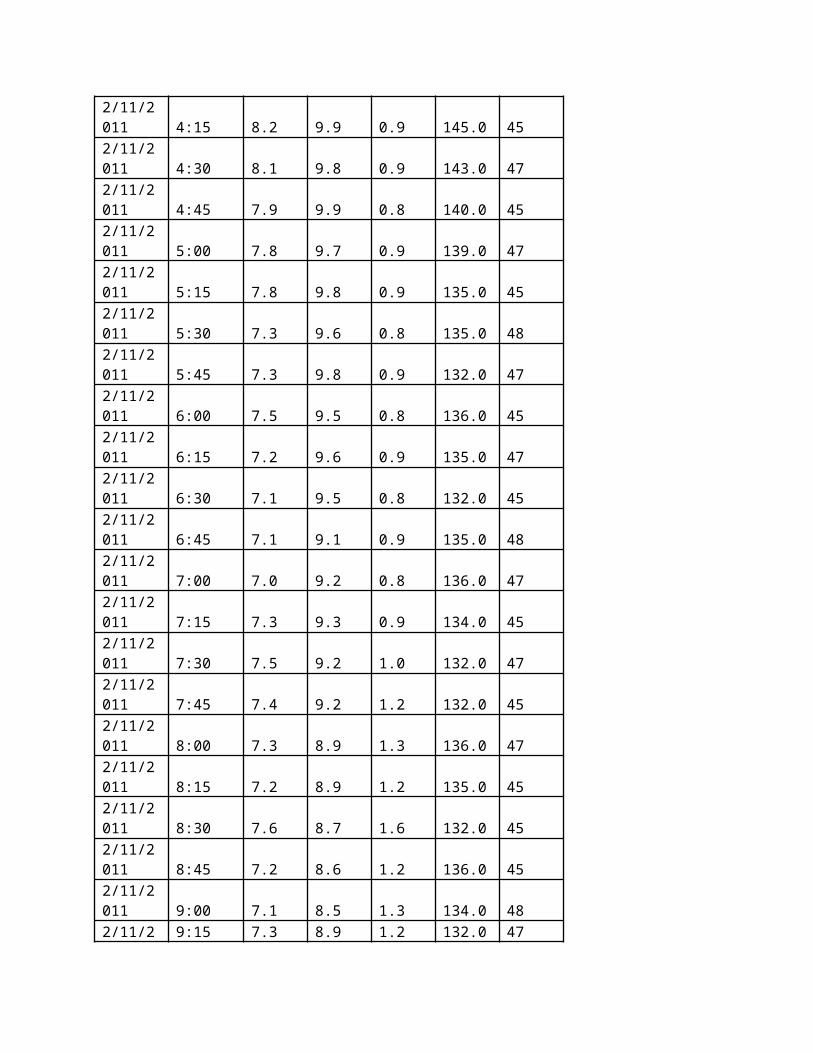
2/11/2011 4:15 8.2 9.9 0.9 145.0 452/11/2011 4:30 8.1 9.8 0.9 143.0 472/11/2011 4:45 7.9 9.9 0.8 140.0 452/11/2011 5:00 7.8 9.7 0.9 139.0 472/11/2011 5:15 7.8 9.8 0.9 135.0 452/11/2011 5:30 7.3 9.6 0.8 135.0 482/11/2011 5:45 7.3 9.8 0.9 132.0 472/11/2011 6:00 7.5 9.5 0.8 136.0 452/11/2011 6:15 7.2 9.6 0.9 135.0 472/11/2011 6:30 7.1 9.5 0.8 132.0 452/11/2011 6:45 7.1 9.1 0.9 135.0 482/11/2011 7:00 7.0 9.2 0.8 136.0 472/11/2011 7:15 7.3 9.3 0.9 134.0 452/11/2011 7:30 7.5 9.2 1.0 132.0 472/11/2011 7:45 7.4 9.2 1.2 132.0 452/11/2011 8:00 7.3 8.9 1.3 136.0 472/11/2011 8:15 7.2 8.9 1.2 135.0 452/11/2011 8:30 7.6 8.7 1.6 132.0 452/11/2011 8:45 7.2 8.6 1.2 136.0 452/11/2011 9:00 7.1 8.5 1.3 134.0 482/11/2 9:15 7.3 8.9 1.2 132.0 47
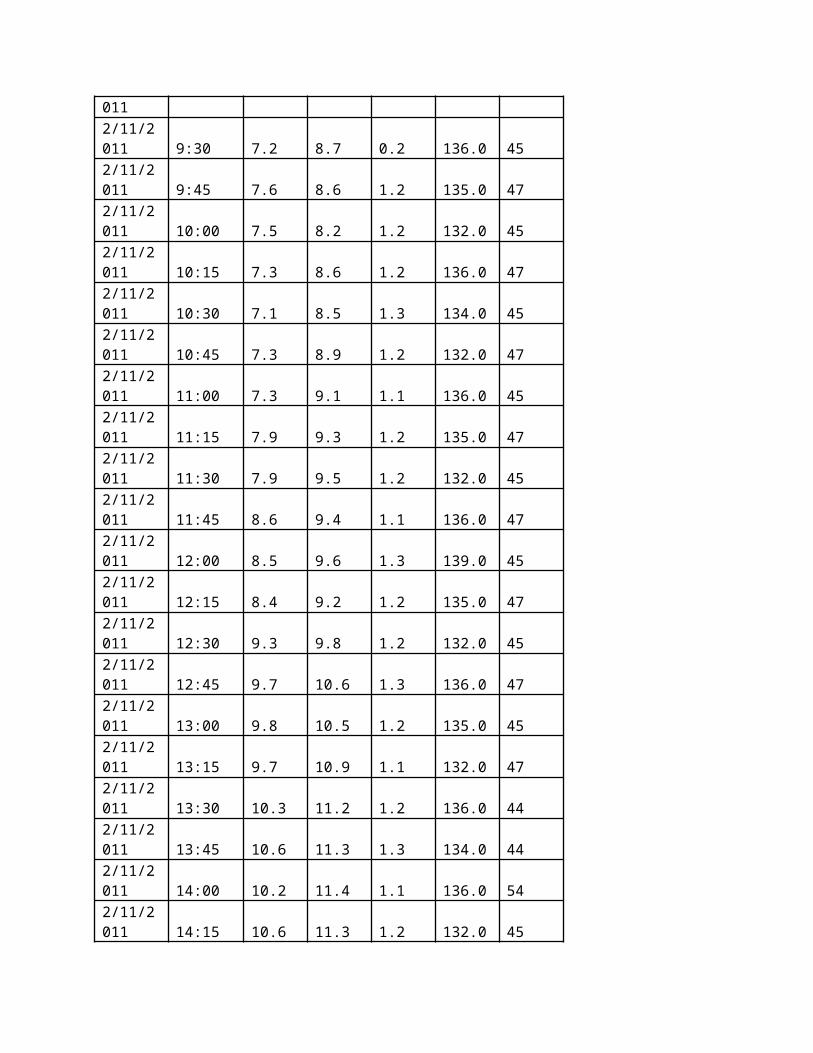
0112/11/2011 9:30 7.2 8.7 0.2 136.0 452/11/2011 9:45 7.6 8.6 1.2 135.0 472/11/2011 10:00 7.5 8.2 1.2 132.0 452/11/2011 10:15 7.3 8.6 1.2 136.0 472/11/2011 10:30 7.1 8.5 1.3 134.0 452/11/2011 10:45 7.3 8.9 1.2 132.0 472/11/2011 11:00 7.3 9.1 1.1 136.0 452/11/2011 11:15 7.9 9.3 1.2 135.0 472/11/2011 11:30 7.9 9.5 1.2 132.0 452/11/2011 11:45 8.6 9.4 1.1 136.0 472/11/2011 12:00 8.5 9.6 1.3 139.0 452/11/2011 12:15 8.4 9.2 1.2 135.0 472/11/2011 12:30 9.3 9.8 1.2 132.0 452/11/2011 12:45 9.7 10.6 1.3 136.0 472/11/2011 13:00 9.8 10.5 1.2 135.0 452/11/2011 13:15 9.7 10.9 1.1 132.0 472/11/2011 13:30 10.3 11.2 1.2 136.0 442/11/2011 13:45 10.6 11.3 1.3 134.0 442/11/2011 14:00 10.2 11.4 1.1 136.0 542/11/2011 14:15 10.6 11.3 1.2 132.0 45
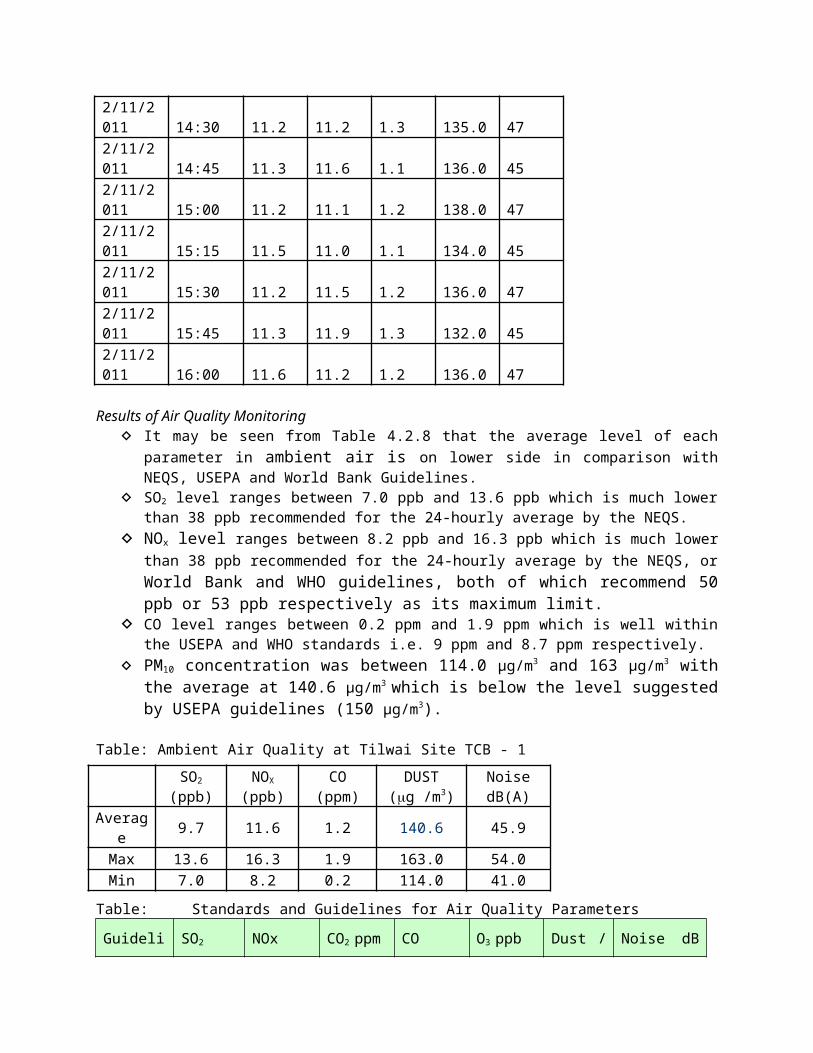
2/11/2011 14:30 11.2 11.2 1.3 135.0 472/11/2011 14:45 11.3 11.6 1.1 136.0 452/11/2011 15:00 11.2 11.1 1.2 138.0 472/11/2011 15:15 11.5 11.0 1.1 134.0 452/11/2011 15:30 11.2 11.5 1.2 136.0 472/11/2011 15:45 11.3 11.9 1.3 132.0 452/11/2011 16:00 11.6 11.2 1.2 136.0 47
Results of Air Quality Monitoring It may be seen from Table 4.2.8 that the average level of each
parameter in ambient air is on lower side in comparison withNEQS, USEPA and World Bank Guidelines.
SO2 level ranges between 7.0 ppb and 13.6 ppb which is much lowerthan 38 ppb recommended for the 24-hourly average by the NEQS.
NOx level ranges between 8.2 ppb and 16.3 ppb which is much lowerthan 38 ppb recommended for the 24-hourly average by the NEQS, orWorld Bank and WHO guidelines, both of which recommend 50ppb or 53 ppb respectively as its maximum limit.
CO level ranges between 0.2 ppm and 1.9 ppm which is well withinthe USEPA and WHO standards i.e. 9 ppm and 8.7 ppm respectively.
PM10 concentration was between 114.0 µg/m3 and 163 µg/m3 withthe average at 140.6 µg/m3 which is below the level suggestedby USEPA guidelines (150 µg/m3).
Table: Ambient Air Quality at Tilwai Site TCB - 1
Table: Standards and Guidelines for Air Quality ParametersGuideli SO2 NOx CO2 ppm CO O3 ppb Dust / Noise dB
SO2
(ppb)NOX
(ppb)CO
(ppm)DUST
(g /m3)NoisedB(A)
Average 9.7 11.6 1.2 140.6 45.9
Max 13.6 16.3 1.9 163.0 54.0Min 7.0 8.2 0.2 114.0 41.0
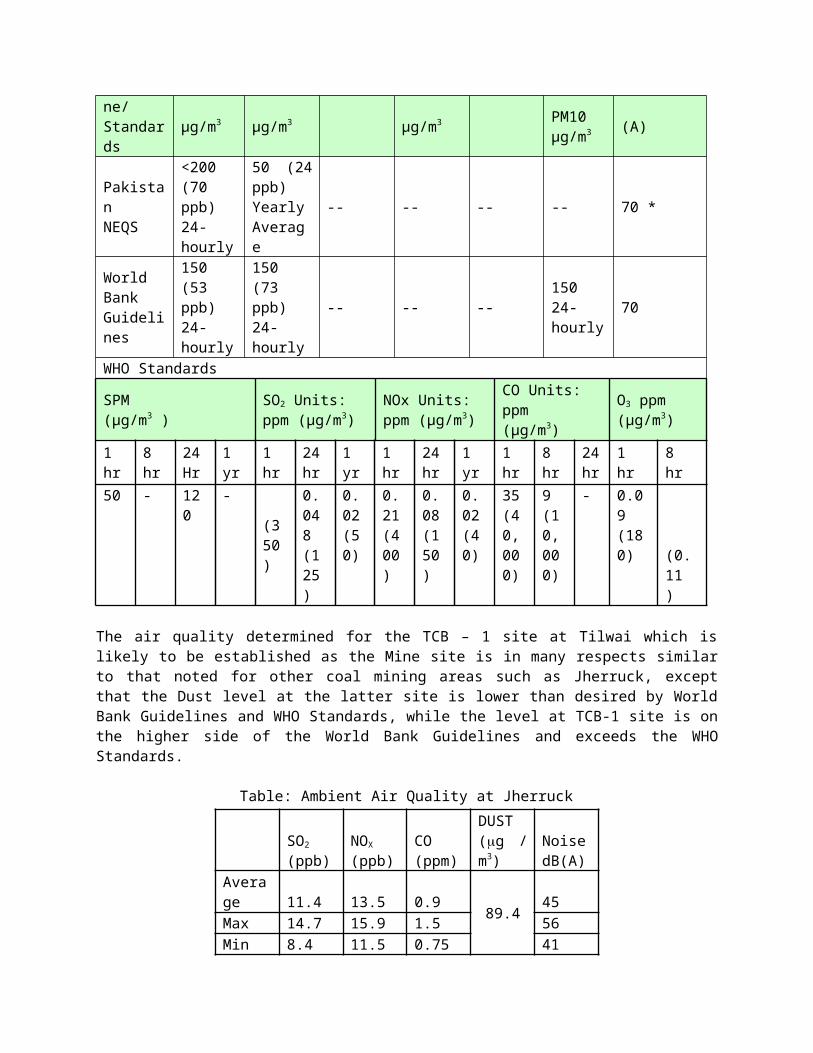
ne/Standards
µg/m3 µg/m3 µg/m3 PM10µg/m3 (A)
Pakistan NEQS
<200(70ppb)24-hourly
50 (24ppb)YearlyAverage
-- -- -- -- 70 *
WorldBankGuidelines
150(53ppb) 24-hourly
150(73ppb)24-hourly
-- -- --150 24-hourly
70
WHO Standards
SPM (µg/m3 )
SO2 Units: ppm (µg/m3)
NOx Units: ppm (µg/m3)
CO Units: ppm(µg/m3)
O3 ppm(µg/m3)
1 hr
8hr
24Hr
1yr
1hr
24hr
1yr
1hr
24hr
1yr
1hr
8hr
24hr
1hr
8hr
50 - 120
-
(350)
0.048(125)
0.02(50)
0.21(400)
0.08(150)
0.02(40)
35(40,000)
9(10,000)
- 0.09(180) (0.
11 )
The air quality determined for the TCB – 1 site at Tilwai which islikely to be established as the Mine site is in many respects similarto that noted for other coal mining areas such as Jherruck, exceptthat the Dust level at the latter site is lower than desired by WorldBank Guidelines and WHO Standards, while the level at TCB-1 site is onthe higher side of the World Bank Guidelines and exceeds the WHOStandards.
Table: Ambient Air Quality at Jherruck
SO2
(ppb)NOX
(ppb)CO(ppm)
DUST(g /m3)
NoisedB(A)
Average 11.4 13.5 0.9 89.4 45Max 14.7 15.9 1.5 56Min 8.4 11.5 0.75 41
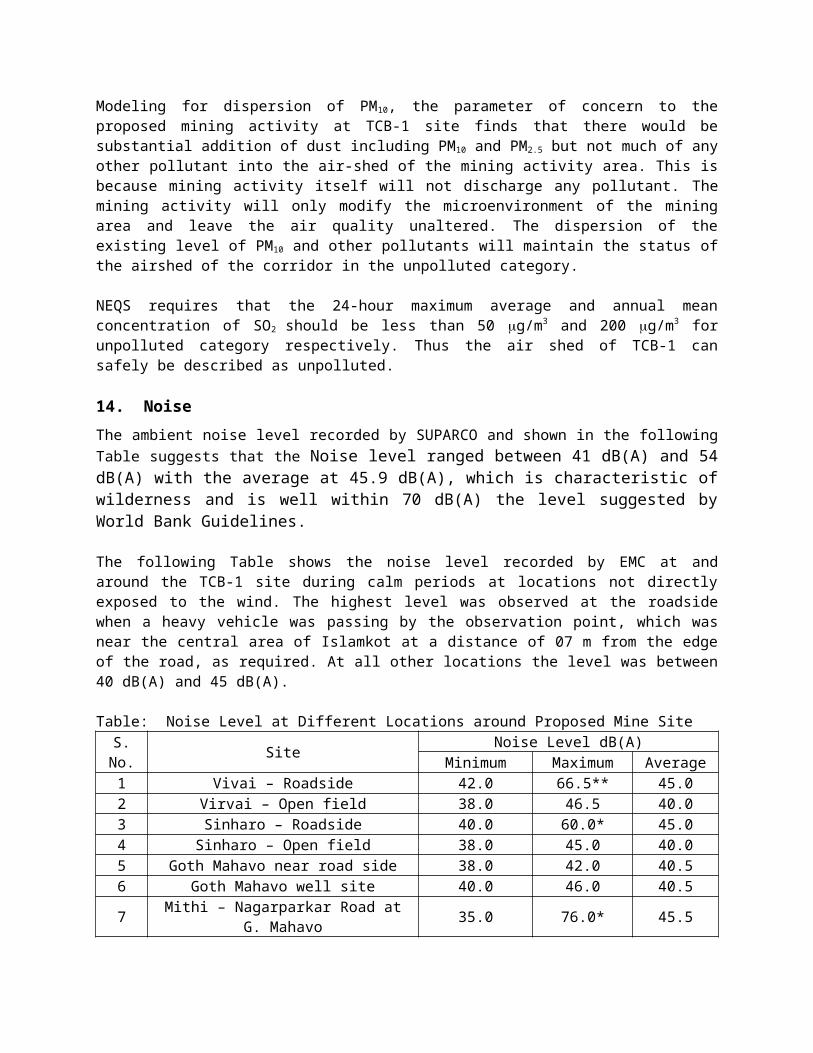
Modeling for dispersion of PM10, the parameter of concern to theproposed mining activity at TCB-1 site finds that there would besubstantial addition of dust including PM10 and PM2.5 but not much of anyother pollutant into the air-shed of the mining activity area. This isbecause mining activity itself will not discharge any pollutant. Themining activity will only modify the microenvironment of the miningarea and leave the air quality unaltered. The dispersion of theexisting level of PM10 and other pollutants will maintain the status ofthe airshed of the corridor in the unpolluted category.
NEQS requires that the 24-hour maximum average and annual meanconcentration of SO2 should be less than 50 g/m3 and 200 g/m3 forunpolluted category respectively. Thus the air shed of TCB-1 cansafely be described as unpolluted.
14. NoiseThe ambient noise level recorded by SUPARCO and shown in the followingTable suggests that the Noise level ranged between 41 dB(A) and 54dB(A) with the average at 45.9 dB(A), which is characteristic ofwilderness and is well within 70 dB(A) the level suggested byWorld Bank Guidelines.
The following Table shows the noise level recorded by EMC at andaround the TCB-1 site during calm periods at locations not directlyexposed to the wind. The highest level was observed at the roadsidewhen a heavy vehicle was passing by the observation point, which wasnear the central area of Islamkot at a distance of 07 m from the edgeof the road, as required. At all other locations the level was between40 dB(A) and 45 dB(A).
Table: Noise Level at Different Locations around Proposed Mine SiteS.No. Site Noise Level dB(A)
Minimum Maximum Average1 Vivai – Roadside 42.0 66.5** 45.02 Virvai – Open field 38.0 46.5 40.03 Sinharo – Roadside 40.0 60.0* 45.04 Sinharo – Open field 38.0 45.0 40.05 Goth Mahavo near road side 38.0 42.0 40.56 Goth Mahavo well site 40.0 46.0 40.5
7 Mithi – Nagarparkar Road atG. Mahavo 35.0 76.0* 45.5
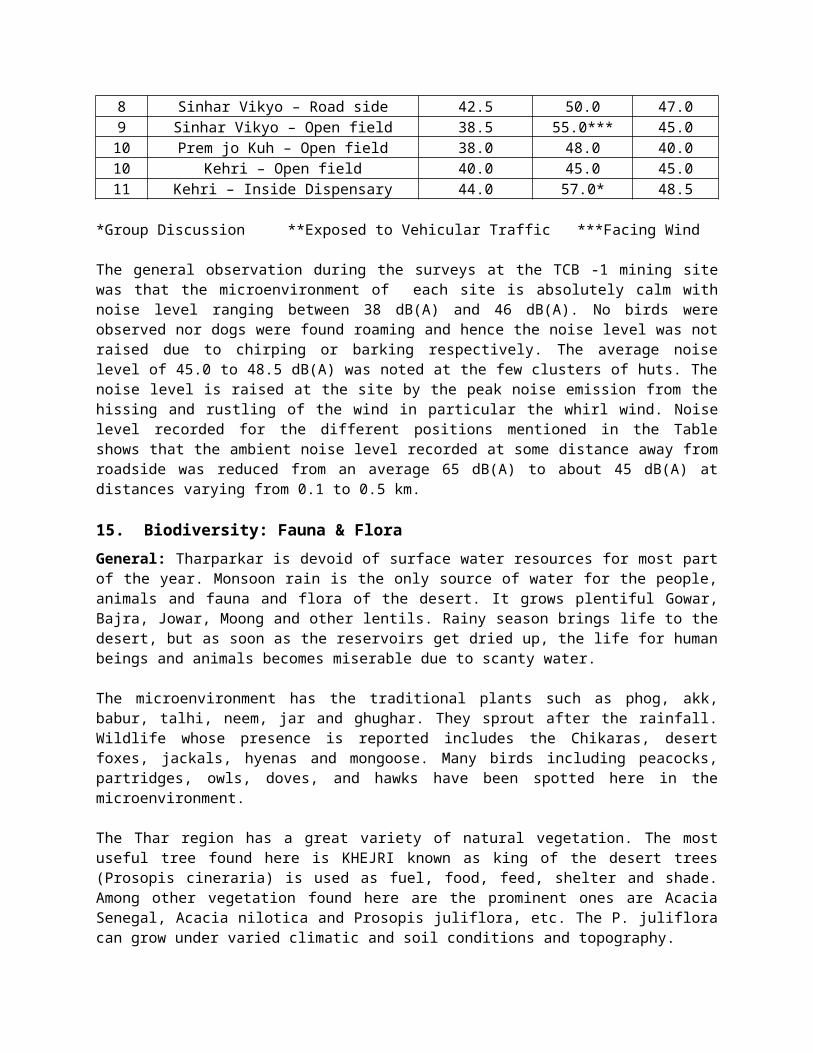
8 Sinhar Vikyo – Road side 42.5 50.0 47.09 Sinhar Vikyo – Open field 38.5 55.0*** 45.010 Prem jo Kuh – Open field 38.0 48.0 40.010 Kehri – Open field 40.0 45.0 45.011 Kehri – Inside Dispensary 44.0 57.0* 48.5
*Group Discussion **Exposed to Vehicular Traffic ***Facing Wind
The general observation during the surveys at the TCB -1 mining sitewas that the microenvironment of each site is absolutely calm withnoise level ranging between 38 dB(A) and 46 dB(A). No birds wereobserved nor dogs were found roaming and hence the noise level was notraised due to chirping or barking respectively. The average noiselevel of 45.0 to 48.5 dB(A) was noted at the few clusters of huts. Thenoise level is raised at the site by the peak noise emission from thehissing and rustling of the wind in particular the whirl wind. Noiselevel recorded for the different positions mentioned in the Tableshows that the ambient noise level recorded at some distance away fromroadside was reduced from an average 65 dB(A) to about 45 dB(A) atdistances varying from 0.1 to 0.5 km.
15. Biodiversity: Fauna & FloraGeneral: Tharparkar is devoid of surface water resources for most partof the year. Monsoon rain is the only source of water for the people,animals and fauna and flora of the desert. It grows plentiful Gowar,Bajra, Jowar, Moong and other lentils. Rainy season brings life to thedesert, but as soon as the reservoirs get dried up, the life for humanbeings and animals becomes miserable due to scanty water.
The microenvironment has the traditional plants such as phog, akk,babur, talhi, neem, jar and ghughar. They sprout after the rainfall.Wildlife whose presence is reported includes the Chikaras, desertfoxes, jackals, hyenas and mongoose. Many birds including peacocks,partridges, owls, doves, and hawks have been spotted here in themicroenvironment.
The Thar region has a great variety of natural vegetation. The mostuseful tree found here is KHEJRI known as king of the desert trees(Prosopis cineraria) is used as fuel, food, feed, shelter and shade.Among other vegetation found here are the prominent ones are AcaciaSenegal, Acacia nilotica and Prosopis juliflora, etc. The P. julifloracan grow under varied climatic and soil conditions and topography.
Say about 100 years back the fauna (Wild Life) in Thar was mostexciting and plentiful but due to the increased human population,excessive hunting, utilization of forest land for agriculture, etc.,most of the wild species have either become extinct (Panther/Leopard,tiger, Lion etc.) or are on the verge of extinction. The great Indianbustard which is also the State bird needs to be conserved properly.the most common mammals (Wild Animals) among the region are blackbuck,Chinkara, Nilgai, Wild boar, Hanuman Langur, etc. Among birds, Sandgrouse, Quails, Peacock, etc., are prominent.
Macro-Site Selection ConsiderationsFor selecting the macro-site and taking a start of the miningactivity, the Wildlife Act of 1975 makes it necessary to examine thepotential of the impact of mining operation on the resident andmigratory birds and their flyways. Mining areas sited outside theseflyways are expected to have the least impact on wildlife. However,even if they are sited peripheral to major flyways, they could havedemonstrable impacts on local populations, and threatened andendangered species.
Micro-Site EvaluationTCB-1 site does not fall within major or minor migration route, andbecause sufficient work has been done in this region previously1, EMCdid not undertake site evaluation studies or multiple seasons andmulti year baseline data collection. Data collection for siteevaluation generally includes the following methodologies to measurepotential wildlife mortality, displacement and disturbance:
Mobile Radar: This technique uses mobile radar and is perhaps themost powerful tool for conducting a risk assessment as itprovides data on the abundance, spatial distribution andelevation of birds. This technology is, however very costly. However, it has not been used in Pakistan.
Sound Recordings: This low cost technology uses microphones in anarray that can provide information on species composition,abundance and altitude.
Aerial Surveys: This method is chiefly employed in determiningspecies composition, abundance, behavior and movement patterns inan offshore environment. Aerial surveys can be used tosupplement visual observations.
1 Mohammad Sharif Khan, Annotated Checklist of Amphibians and Reptiles of Pakistan, Asiatic Herpetological Research, 2004, Vol. 10, pp. 191-201
Visual Observations: Qualified observers conduct surveys thatprovide data on abundance and behavior of birds on and aroundproposed sites.
Visual observation technique was employed for identifying the fauna aswell as flora. Local population assisted EMC experts in a 24-hourwatch on the movement and intensity of the wildlife includingquadrupeds, reptiles and high flying as well as nesting birds, inaddition to locating habitats, if any besides identifying the speciesin and around the mining area.
The visual observation technique included the following:
Point Count SurveysIn this method, observation points were established along the roads,tracks, or at higher places or any other suitable location forlocating or sighting the animals. At each vantage point, all sightingsof the animals at the site were recorded and the index of theabundance of each species was calculated as number of animals seen perhour of observation.
Roadside or Rough Track CountThis method was applied to locate the animals and to have theirpopulation estimates animals and to have their population estimateswhere it was difficult to enter in to the habitat of the specieswhich were shy or wary.
Line TransectStrip Census method was also applied which involved recording theanimals seen traversing a predetermined transect line.
Track and Sign CountsTracks and signs are indication of the presence of animals in thearea. Signs such as footprints, burrows, holes and presence of faecalmaterial were taken into account to record the occurrence of theanimals in the area.
Searching the micro habitatsOne effective way to record the presence of small mammals is toactively search their preferred habitats along sandy plain areas,bushy areas, agriculture fields and near human habitations etc.For surveying the birds, both transect count and point count methodswere applied. Both are based on recording birds along a predefined
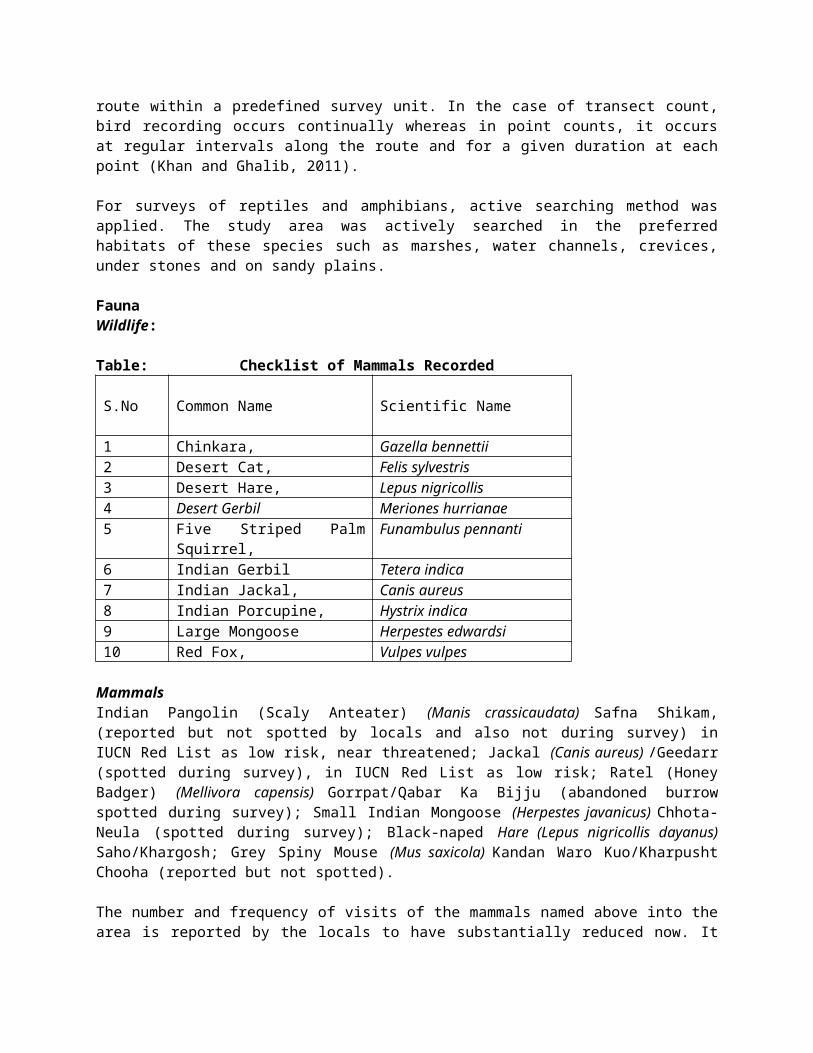
route within a predefined survey unit. In the case of transect count,bird recording occurs continually whereas in point counts, it occursat regular intervals along the route and for a given duration at eachpoint (Khan and Ghalib, 2011).
For surveys of reptiles and amphibians, active searching method wasapplied. The study area was actively searched in the preferredhabitats of these species such as marshes, water channels, crevices,under stones and on sandy plains.
FaunaWildlife:
Table: Checklist of Mammals Recorded
S.No Common Name Scientific Name
1 Chinkara, Gazella bennettii2 Desert Cat, Felis sylvestris3 Desert Hare, Lepus nigricollis4 Desert Gerbil Meriones hurrianae5 Five Striped Palm
Squirrel, Funambulus pennanti
6 Indian Gerbil Tetera indica7 Indian Jackal, Canis aureus8 Indian Porcupine, Hystrix indica9 Large Mongoose Herpestes edwardsi10 Red Fox, Vulpes vulpes
MammalsIndian Pangolin (Scaly Anteater) (Manis crassicaudata) Safna Shikam,(reported but not spotted by locals and also not during survey) inIUCN Red List as low risk, near threatened; Jackal (Canis aureus) /Geedarr(spotted during survey), in IUCN Red List as low risk; Ratel (HoneyBadger) (Mellivora capensis) Gorrpat/Qabar Ka Bijju (abandoned burrowspotted during survey); Small Indian Mongoose (Herpestes javanicus) Chhota-Neula (spotted during survey); Black-naped Hare (Lepus nigricollis dayanus)Saho/Khargosh; Grey Spiny Mouse (Mus saxicola) Kandan Waro Kuo/KharpushtChooha (reported but not spotted).
The number and frequency of visits of the mammals named above into thearea is reported by the locals to have substantially reduced now. It
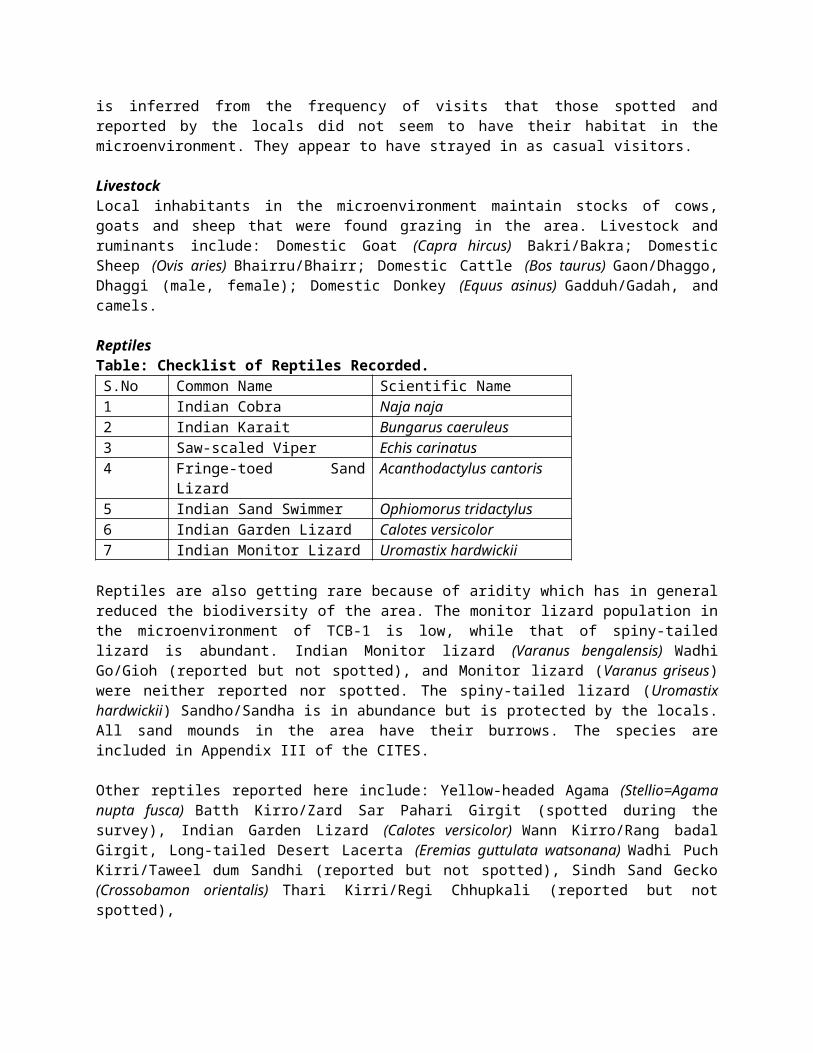
is inferred from the frequency of visits that those spotted andreported by the locals did not seem to have their habitat in themicroenvironment. They appear to have strayed in as casual visitors.
Livestock Local inhabitants in the microenvironment maintain stocks of cows,goats and sheep that were found grazing in the area. Livestock andruminants include: Domestic Goat (Capra hircus) Bakri/Bakra; DomesticSheep (Ovis aries) Bhairru/Bhairr; Domestic Cattle (Bos taurus) Gaon/Dhaggo,Dhaggi (male, female); Domestic Donkey (Equus asinus) Gadduh/Gadah, andcamels.
Reptiles Table: Checklist of Reptiles Recorded.S.No Common Name Scientific Name1 Indian Cobra Naja naja2 Indian Karait Bungarus caeruleus3 Saw-scaled Viper Echis carinatus4 Fringe-toed Sand
LizardAcanthodactylus cantoris
5 Indian Sand Swimmer Ophiomorus tridactylus6 Indian Garden Lizard Calotes versicolor7 Indian Monitor Lizard Uromastix hardwickii
Reptiles are also getting rare because of aridity which has in generalreduced the biodiversity of the area. The monitor lizard population inthe microenvironment of TCB-1 is low, while that of spiny-tailedlizard is abundant. Indian Monitor lizard (Varanus bengalensis) WadhiGo/Gioh (reported but not spotted), and Monitor lizard (Varanus griseus)were neither reported nor spotted. The spiny-tailed lizard (Uromastixhardwickii) Sandho/Sandha is in abundance but is protected by the locals.All sand mounds in the area have their burrows. The species areincluded in Appendix III of the CITES.
Other reptiles reported here include: Yellow-headed Agama (Stellio=Agamanupta fusca) Batth Kirro/Zard Sar Pahari Girgit (spotted during thesurvey), Indian Garden Lizard (Calotes versicolor) Wann Kirro/Rang badalGirgit, Long-tailed Desert Lacerta (Eremias guttulata watsonana) Wadhi PuchKirri/Taweel dum Sandhi (reported but not spotted), Sindh Sand Gecko(Crossobamon orientalis) Thari Kirri/Regi Chhupkali (reported but notspotted),
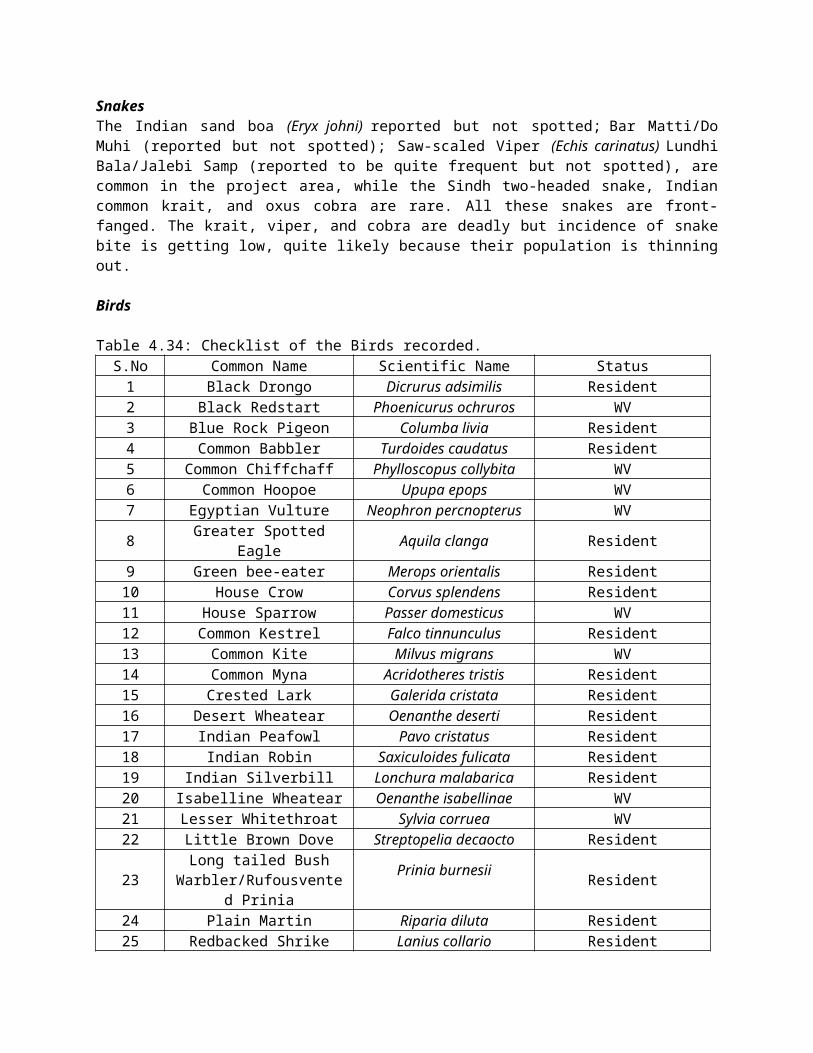
SnakesThe Indian sand boa (Eryx johni) reported but not spotted; Bar Matti/DoMuhi (reported but not spotted); Saw-scaled Viper (Echis carinatus) LundhiBala/Jalebi Samp (reported to be quite frequent but not spotted), arecommon in the project area, while the Sindh two-headed snake, Indiancommon krait, and oxus cobra are rare. All these snakes are front-fanged. The krait, viper, and cobra are deadly but incidence of snakebite is getting low, quite likely because their population is thinningout.
Birds
Table 4.34: Checklist of the Birds recorded.S.No Common Name Scientific Name Status1 Black Drongo Dicrurus adsimilis Resident2 Black Redstart Phoenicurus ochruros WV3 Blue Rock Pigeon Columba livia Resident4 Common Babbler Turdoides caudatus Resident5 Common Chiffchaff Phylloscopus collybita WV6 Common Hoopoe Upupa epops WV7 Egyptian Vulture Neophron percnopterus WV
8 Greater SpottedEagle Aquila clanga Resident
9 Green bee-eater Merops orientalis Resident10 House Crow Corvus splendens Resident11 House Sparrow Passer domesticus WV12 Common Kestrel Falco tinnunculus Resident13 Common Kite Milvus migrans WV14 Common Myna Acridotheres tristis Resident15 Crested Lark Galerida cristata Resident16 Desert Wheatear Oenanthe deserti Resident17 Indian Peafowl Pavo cristatus Resident18 Indian Robin Saxiculoides fulicata Resident19 Indian Silverbill Lonchura malabarica Resident20 Isabelline Wheatear Oenanthe isabellinae WV21 Lesser Whitethroat Sylvia corruea WV22 Little Brown Dove Streptopelia decaocto Resident
23Long tailed Bush
Warbler/Rufousvented Prinia
Prinia burnesii Resident
24 Plain Martin Riparia diluta Resident25 Redbacked Shrike Lanius collario Resident
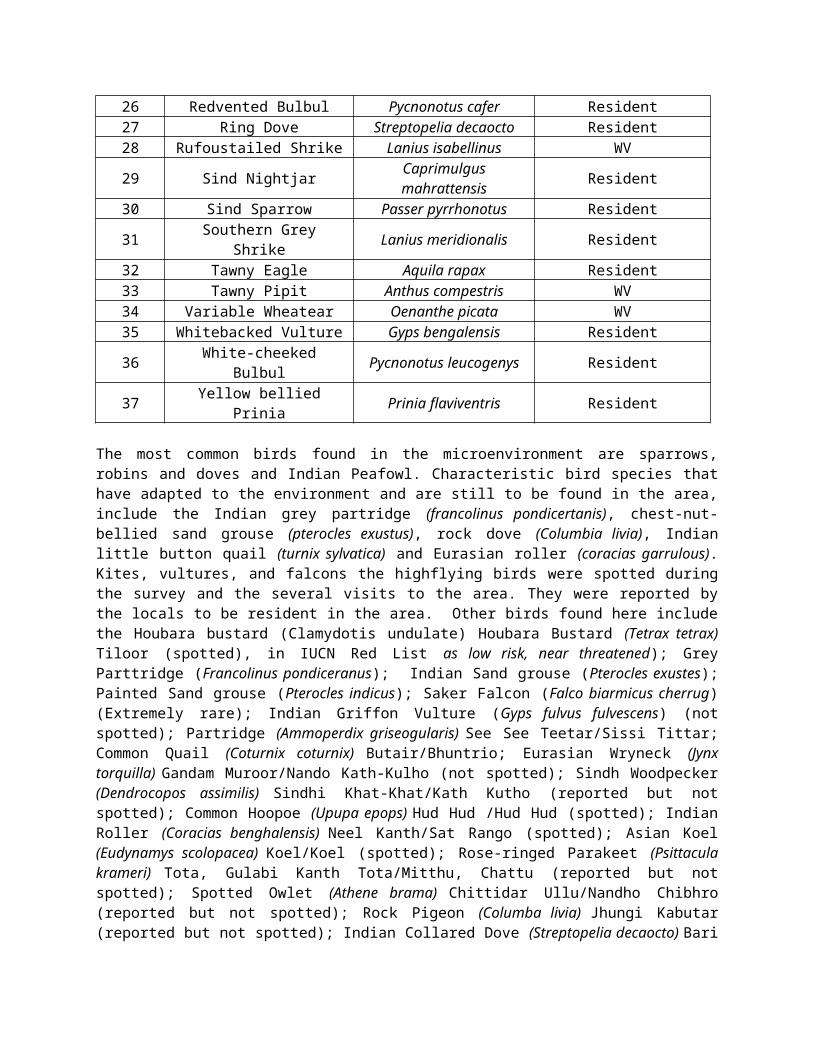
26 Redvented Bulbul Pycnonotus cafer Resident27 Ring Dove Streptopelia decaocto Resident28 Rufoustailed Shrike Lanius isabellinus WV
29 Sind Nightjar Caprimulgusmahrattensis Resident
30 Sind Sparrow Passer pyrrhonotus Resident
31 Southern GreyShrike Lanius meridionalis Resident
32 Tawny Eagle Aquila rapax Resident33 Tawny Pipit Anthus compestris WV34 Variable Wheatear Oenanthe picata WV35 Whitebacked Vulture Gyps bengalensis Resident
36 White-cheekedBulbul Pycnonotus leucogenys Resident
37 Yellow belliedPrinia Prinia flaviventris Resident
The most common birds found in the microenvironment are sparrows,robins and doves and Indian Peafowl. Characteristic bird species thathave adapted to the environment and are still to be found in the area,include the Indian grey partridge (francolinus pondicertanis), chest-nut-bellied sand grouse (pterocles exustus), rock dove (Columbia livia), Indianlittle button quail (turnix sylvatica) and Eurasian roller (coracias garrulous).Kites, vultures, and falcons the highflying birds were spotted duringthe survey and the several visits to the area. They were reported bythe locals to be resident in the area. Other birds found here includethe Houbara bustard (Clamydotis undulate) Houbara Bustard (Tetrax tetrax)Tiloor (spotted), in IUCN Red List as low risk, near threatened); GreyParttridge (Francolinus pondiceranus); Indian Sand grouse (Pterocles exustes);Painted Sand grouse (Pterocles indicus); Saker Falcon (Falco biarmicus cherrug)(Extremely rare); Indian Griffon Vulture (Gyps fulvus fulvescens) (notspotted); Partridge (Ammoperdix griseogularis) See See Teetar/Sissi Tittar;Common Quail (Coturnix coturnix) Butair/Bhuntrio; Eurasian Wryneck (Jynxtorquilla) Gandam Muroor/Nando Kath-Kulho (not spotted); Sindh Woodpecker(Dendrocopos assimilis) Sindhi Khat-Khat/Kath Kutho (reported but notspotted); Common Hoopoe (Upupa epops) Hud Hud /Hud Hud (spotted); IndianRoller (Coracias benghalensis) Neel Kanth/Sat Rango (spotted); Asian Koel(Eudynamys scolopacea) Koel/Koel (spotted); Rose-ringed Parakeet (Psittaculakrameri) Tota, Gulabi Kanth Tota/Mitthu, Chattu (reported but notspotted); Spotted Owlet (Athene brama) Chittidar Ullu/Nandho Chibhro(reported but not spotted); Rock Pigeon (Columba livia) Jhungi Kabutar(reported but not spotted); Indian Collared Dove (Streptopelia decaocto) Bari
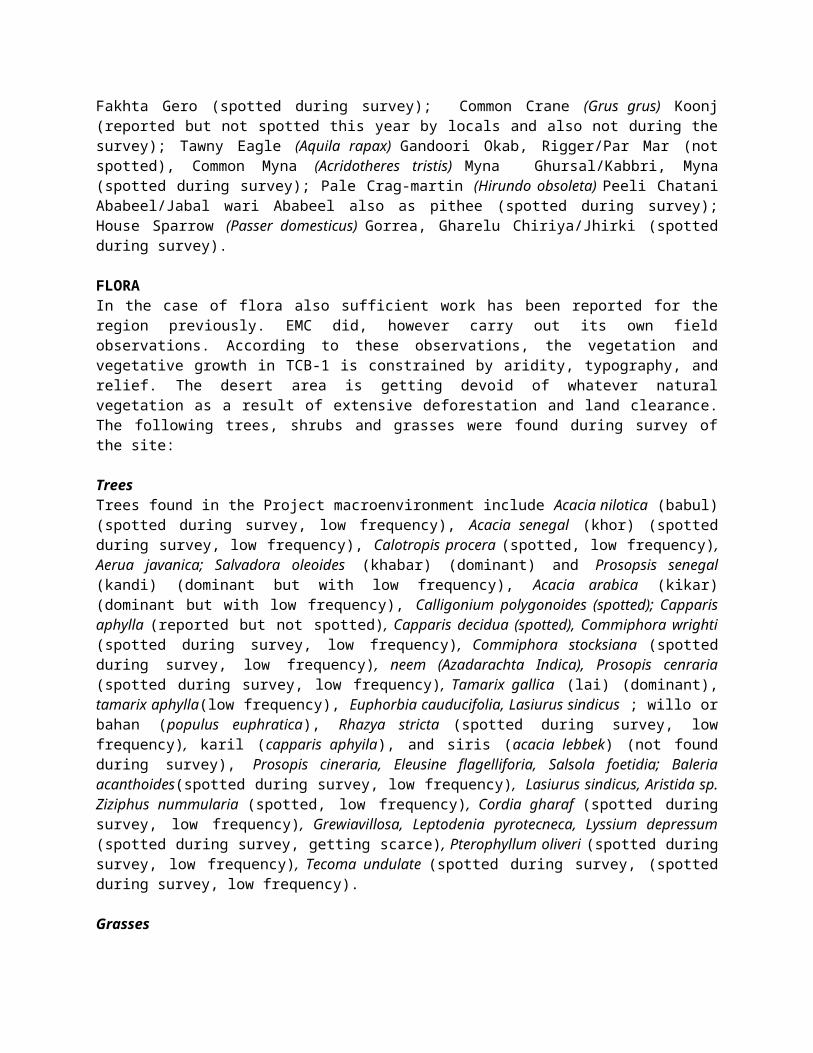
Fakhta Gero (spotted during survey); Common Crane (Grus grus) Koonj(reported but not spotted this year by locals and also not during thesurvey); Tawny Eagle (Aquila rapax) Gandoori Okab, Rigger/Par Mar (notspotted), Common Myna (Acridotheres tristis) Myna Ghursal/Kabbri, Myna(spotted during survey); Pale Crag-martin (Hirundo obsoleta) Peeli ChataniAbabeel/Jabal wari Ababeel also as pithee (spotted during survey);House Sparrow (Passer domesticus) Gorrea, Gharelu Chiriya/Jhirki (spottedduring survey).
FLORAIn the case of flora also sufficient work has been reported for theregion previously. EMC did, however carry out its own fieldobservations. According to these observations, the vegetation andvegetative growth in TCB-1 is constrained by aridity, typography, andrelief. The desert area is getting devoid of whatever naturalvegetation as a result of extensive deforestation and land clearance.The following trees, shrubs and grasses were found during survey ofthe site:
Trees Trees found in the Project macroenvironment include Acacia nilotica (babul)(spotted during survey, low frequency), Acacia senegal (khor) (spottedduring survey, low frequency), Calotropis procera (spotted, low frequency),Aerua javanica; Salvadora oleoides (khabar) (dominant) and Prosopsis senegal(kandi) (dominant but with low frequency), Acacia arabica (kikar)(dominant but with low frequency), Calligonium polygonoides (spotted); Capparisaphylla (reported but not spotted), Capparis decidua (spotted), Commiphora wrighti(spotted during survey, low frequency), Commiphora stocksiana (spottedduring survey, low frequency), neem (Azadarachta Indica), Prosopis cenraria(spotted during survey, low frequency), Tamarix gallica (lai) (dominant),tamarix aphylla(low frequency), Euphorbia cauducifolia, Lasiurus sindicus ; willo orbahan (populus euphratica), Rhazya stricta (spotted during survey, lowfrequency), karil (capparis aphyila), and siris (acacia lebbek) (not foundduring survey), Prosopis cineraria, Eleusine flagelliforia, Salsola foetidia; Baleriaacanthoides(spotted during survey, low frequency), Lasiurus sindicus, Aristida sp.Ziziphus nummularia (spotted, low frequency), Cordia gharaf (spotted duringsurvey, low frequency), Grewiavillosa, Leptodenia pyrotecneca, Lyssium depressum(spotted during survey, getting scarce), Pterophyllum oliveri (spotted duringsurvey, low frequency), Tecoma undulate (spotted during survey, (spottedduring survey, low frequency).
Grasses
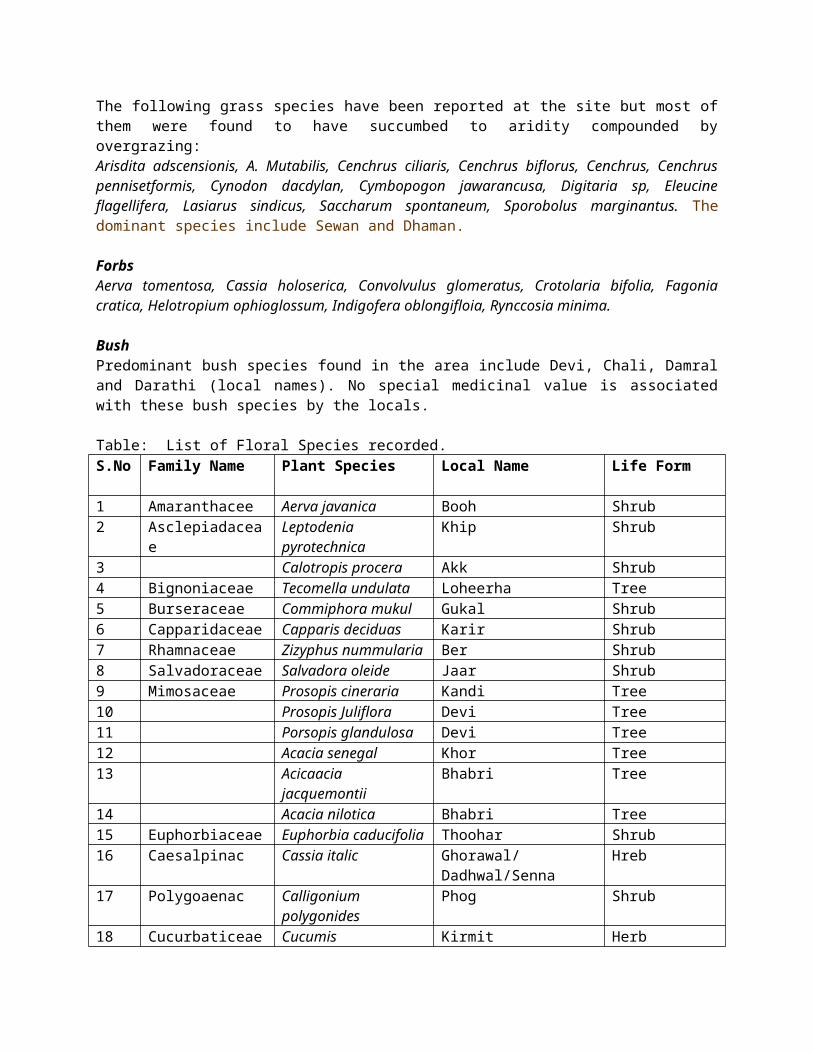
The following grass species have been reported at the site but most ofthem were found to have succumbed to aridity compounded byovergrazing: Arisdita adscensionis, A. Mutabilis, Cenchrus ciliaris, Cenchrus biflorus, Cenchrus, Cenchruspennisetformis, Cynodon dacdylan, Cymbopogon jawarancusa, Digitaria sp, Eleucineflagellifera, Lasiarus sindicus, Saccharum spontaneum, Sporobolus marginantus. Thedominant species include Sewan and Dhaman.
ForbsAerva tomentosa, Cassia holoserica, Convolvulus glomeratus, Crotolaria bifolia, Fagoniacratica, Helotropium ophioglossum, Indigofera oblongifloia, Rynccosia minima.
Bush Predominant bush species found in the area include Devi, Chali, Damraland Darathi (local names). No special medicinal value is associatedwith these bush species by the locals.
Table: List of Floral Species recorded.S.No Family Name Plant Species Local Name Life Form
1 Amaranthacee Aerva javanica Booh Shrub2 Asclepiadacea
eLeptodeniapyrotechnica
Khip Shrub
3 Calotropis procera Akk Shrub4 Bignoniaceae Tecomella undulata Loheerha Tree5 Burseraceae Commiphora mukul Gukal Shrub6 Capparidaceae Capparis deciduas Karir Shrub7 Rhamnaceae Zizyphus nummularia Ber Shrub8 Salvadoraceae Salvadora oleide Jaar Shrub9 Mimosaceae Prosopis cineraria Kandi Tree10 Prosopis Juliflora Devi Tree11 Porsopis glandulosa Devi Tree12 Acacia senegal Khor Tree13 Acicaacia
jacquemontiiBhabri Tree
14 Acacia nilotica Bhabri Tree15 Euphorbiaceae Euphorbia caducifolia Thoohar Shrub16 Caesalpinac Cassia italic Ghorawal/
Dadhwal/SennaHreb
17 Polygoaenac Calligoniumpolygonides
Phog Shrub
18 Cucurbaticeae Cucumis Kirmit Herb
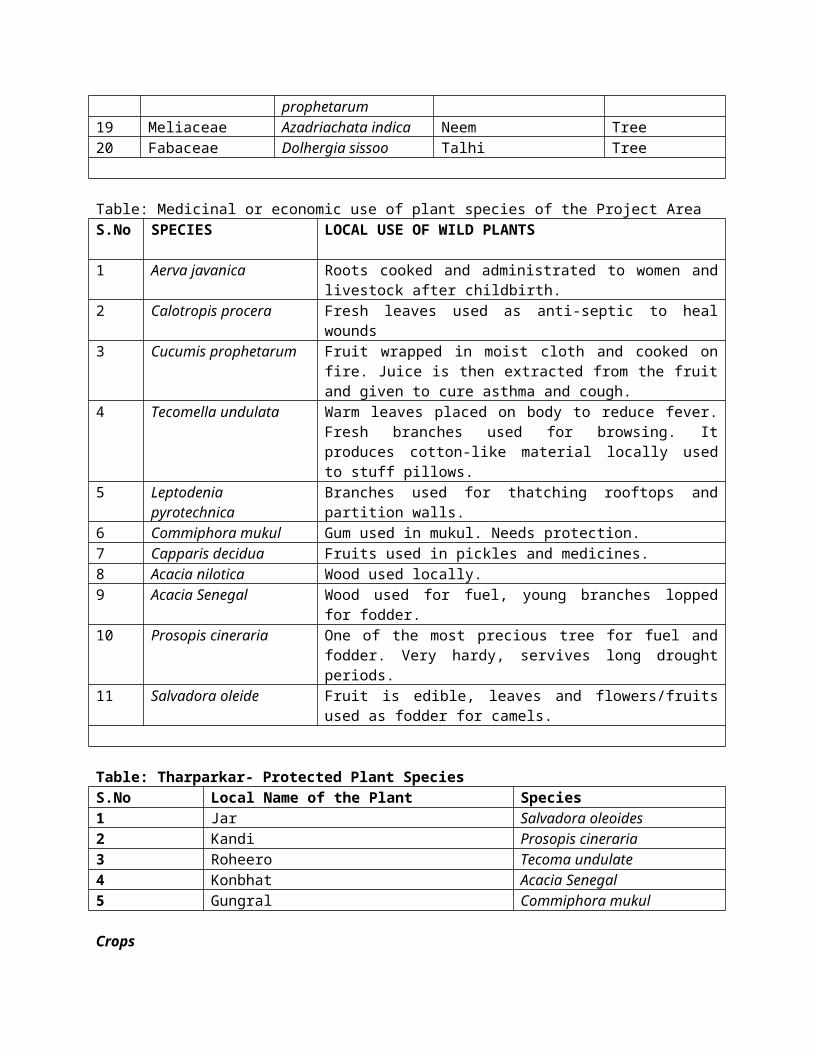
prophetarum19 Meliaceae Azadriachata indica Neem Tree20 Fabaceae Dolhergia sissoo Talhi Tree
Table: Medicinal or economic use of plant species of the Project AreaS.No SPECIES LOCAL USE OF WILD PLANTS
1 Aerva javanica Roots cooked and administrated to women andlivestock after childbirth.
2 Calotropis procera Fresh leaves used as anti-septic to healwounds
3 Cucumis prophetarum Fruit wrapped in moist cloth and cooked onfire. Juice is then extracted from the fruitand given to cure asthma and cough.
4 Tecomella undulata Warm leaves placed on body to reduce fever.Fresh branches used for browsing. Itproduces cotton-like material locally usedto stuff pillows.
5 Leptodeniapyrotechnica
Branches used for thatching rooftops andpartition walls.
6 Commiphora mukul Gum used in mukul. Needs protection.7 Capparis decidua Fruits used in pickles and medicines.8 Acacia nilotica Wood used locally.9 Acacia Senegal Wood used for fuel, young branches lopped
for fodder.10 Prosopis cineraria One of the most precious tree for fuel and
fodder. Very hardy, servives long droughtperiods.
11 Salvadora oleide Fruit is edible, leaves and flowers/fruitsused as fodder for camels.
Table: Tharparkar- Protected Plant SpeciesS.No Local Name of the Plant Species1 Jar Salvadora oleoides2 Kandi Prosopis cineraria3 Roheero Tecoma undulate4 Konbhat Acacia Senegal5 Gungral Commiphora mukul
Crops
Agricultural activities are constrained by rainfall which has beenerratic though plentiful in the microenvironment. Major crops grown onthe few fields outside the villages include Indian corn. No cropproduction was possible during the current season because there wasexcessive untimely rainfall.
Wildlife Reserves & Endangered SpeciesThere is no Wildlife Reserve in close vicinity of Project site. Rann of Kuchchh Wildlife Sanctuary: Part of the Rann is included in TharparkarDistrict but it is at least 25 km outside of the TCB -1microenvironment. Rann of Kuchchh includes permanent saline marshes,coastal brakish lagoons, tidal mudflats, and esturine habitats. Itsupports many locally and globally threatened species, including theGreat Indian Bustard (Choriots nigriceps); Houbara Bustard (Chlamydotisundulate); Sauras Crane ( Grus antigone) and Hyaena (Hyaena hyaena) andsupports more than 1 % of the biogeographical population of Greater—Flamingo (Phoenicopterus roseus) and Lesser Flamingo ( Phoenicopterus minor).Some 50,000 agro- pastoralitis live in 330 village /hamlets in thearea, and rich archaeological remains include three giant templesdating from 1375- 1449. Scarcity of water remains the potential threatto the ecosystem (Ramsar Site No. 1285).
The area is very important due to its unique wildlife, in particularthe Indian Wild Ass, Blue Bull, Indian Pangolin, Honey Badger,Chinkara, Caracal, Wolf, Hyaena, Whitebacked Vulture, LongbilledVulture, Sauras Crane, Pale Craig Martin, Indian Krait and IndianChamaeleon.
Very large concentration of migratory waterbirds has been recorded inthe marshy Rann of Kutch area. The other important wetlands includeNaryasar, Bhansar, Bodesar and Ranpur Dam. It is a Ramsar Site,Important Area and is included among the Global 200 ecoregions.
Houbara bustard, although a migratory bird, is one of the endangeredspecies found in the area. Falcons are rarely spotted in the area andwere also not spotted during the present study surveys. The above list of birds and mammals might give an impression that thearea is rich in biodiversity. This is not correct. It has been notedin parenthesis that the animals have been reported by the locals butthey were not spotted during the surveys. As such it needs to bestressed that the land has lost or is fast losing its wildlife
resources. Despite being a wildlife sanctuary, poaching of peacocksand partridges is very common. In the winter season hunters arrivefrom the Middle Eastern Gulf countries, with special permits to huntHoubara Bustard. Camps of falcon trappers are common in Nagarparkar,who are given permits by Sindh Wildlife Department.
The spiny-tailed lizard (Uromastix hardwickii) Sandho/Sandha is inabundance in the microenvironment but it is protected by the locals.All sand mounds in the area have the Sandha burrows. The two species:Uromastix and monitor lizard are included in Appendix III of theCITES.
16. Places of Archeological, Historical & Religious Significancein District TharparkarMonuments in Tharparkar are reminders of the distant past. Naukot isthe gateway of Tharparkar desert. Gorhi jo Mandir (a Hindu Temple)fourteen miles to the north west of Virawah; it was famous for thewealth and gold in it.
Mithi, the headquarter of Tharparkar is famous for its silverjewelry , applicants, bed sheets, wall hangings ,embroidered shirts ,shawls, babies hats, , horse and camel trapping, and carved, woodenfurniture. Hindus and Muslims live in a harmony with each other inthis area. Diplo is an ancient town and Taluka Headquarter; 40 km from Mithi theDistrict Headquarter. It is home to the Kutchi Memon Community whichis settled here for long. Diplo is also famous for its carpets andhandicrafts.
Bhalwa is the land of “Marvi” the symbol of patriotism and sacrifice.
Parinagar is an ancient Port city that was on the trade route tosettlements of the Indus Valley Civilization; it was abandoned whenthe ancient Ghaggra River was silted up by the 1819 earthquake. Anchlesar is a spring 3 km from Nagarparkar; the Hindus attach greatsanctity to its water. Nagarparkar is 150 km from Mithi; it is famous for the Hindu templesthere.
Places of Worship forHindu CommunityShri Ram Temple, Islam KotMata Temple, Lohar Paro, Islam Kot

Shiv Temple, DanodandalKolhi Paro Temple, Islam KotMata Temple, Meghwar Paro, Islam KotMata Temple, Kolhi Paro Mataro Sand , UC Islam KotHindu Graveyard, Islam KotSaint Nenu Ram Ashram, Islam KotMeghwar Para Temple, Islam KotShri Ram Chandar Temple, Islam KotHanuman Mandir, Islam Kot