Environmental Exposures Methodologies Doc
25
Environmental Exposures Methodology Introduction 3 File Structure 4 Fields In Environmental Exposures Files 4 Examples 4 Asset Types 5 Factory Facilities 5 Retail Locations 6 Weather Data 7 Anomalies 8 Overview 8 Weather Variables 8 Aggregation Methodology 9 Feed Information 9 Climatology 10 Overview 10 Weather Variables 10 Aggregation Methodology 10 Feed Information 11 Cyclones (02:00 and 14:00 UTC) 12 Overview 12 Weather Variables 12 Aggregation Methodology 12 Feed Information 13 Droughts (1 Month and 3 Month) 14 Overview 14 Weather Variables 14 Aggregation Methodology 14 Feed Information 15 Earthquakes 16 Overview 16 Weather Variables 16 Aggregation Methodology 16 Feed Information 17 1
-
Upload
khangminh22 -
Category
Documents
-
view
0 -
download
0
Transcript of Environmental Exposures Methodologies Doc

Environmental Exposures MethodologyIntroduction 3
File Structure 4Fields In Environmental Exposures Files 4Examples 4
Asset Types 5Factory Facilities 5Retail Locations 6
Weather Data 7
Anomalies 8Overview 8Weather Variables 8Aggregation Methodology 9Feed Information 9
Climatology 10Overview 10Weather Variables 10Aggregation Methodology 10Feed Information 11
Cyclones (02:00 and 14:00 UTC) 12Overview 12Weather Variables 12Aggregation Methodology 12Feed Information 13
Droughts (1 Month and 3 Month) 14Overview 14Weather Variables 14Aggregation Methodology 14Feed Information 15
Earthquakes 16Overview 16Weather Variables 16Aggregation Methodology 16Feed Information 17
1

Floods 2 Day 18Overview 18Weather Variables 18Aggregation Methodology 18Feed Information 19
Forecast Observed Weather 20Overview 20Weather Variables 20Aggregation Methodology 20Feed Information 21Incomplete Historical Files 22
Observed Weather 23Overview 23Weather Variables 23Aggregation Methodology 23Feed Information 24
Appendix 25
2

IntroductionThe Bloomberg Environmental Exposures product (also referred to as the “Entity Weather”product) provides insight into understanding environmental hazards to a company's assets. Thisproduct is the first to meaningfully quantify weather and other environmental impacts at thecompany level. Our new dataset covers more than 10,000 public manufacturing and retailcompanies globally. We use location data and geospatial techniques to generate statistics thatwe aggregate and summarize by each company daily. This dataset shows you which companieshave the most — or least — exposure to environmental events like snowfall, extremetemperatures, cyclones, floods, earthquakes, seasonal weather trends, and more.
Understanding the risk from environmental occurrences is a critical factor to many investmentsand poses unique problems across asset classes, industry sectors, and geographies.Environmental impacts are often simple to observe but complex to quantify. Bloomberg nowoffers clients the ability to quantify environmental exposures to investments by providingweather and extreme event data based on company asset locations. All of the datasets listed inthis document are available for download via the Bloomberg Enterprise Access Point (BEAP)website as well as via the BEAP API.
This document provides a detailed description and methodology for each EnvironmentalExposure dataset, to allow you to understand and use the data effectively. Keep in mind,“Environmental Exposures” and “Entity Weather” are both terms used to describe this productoffering. “Entity Weather” is referenced in multiple places on each BEAP dataset page alongsidethe term “Environmental Exposures”, and should be used synonymously. Similarly, the terms“company” and “entity” are used interchangeably to refer to any singular financial institution, andthe terms “weather” and “environment” are used to refer to any naturally occurring phenomenon.
3
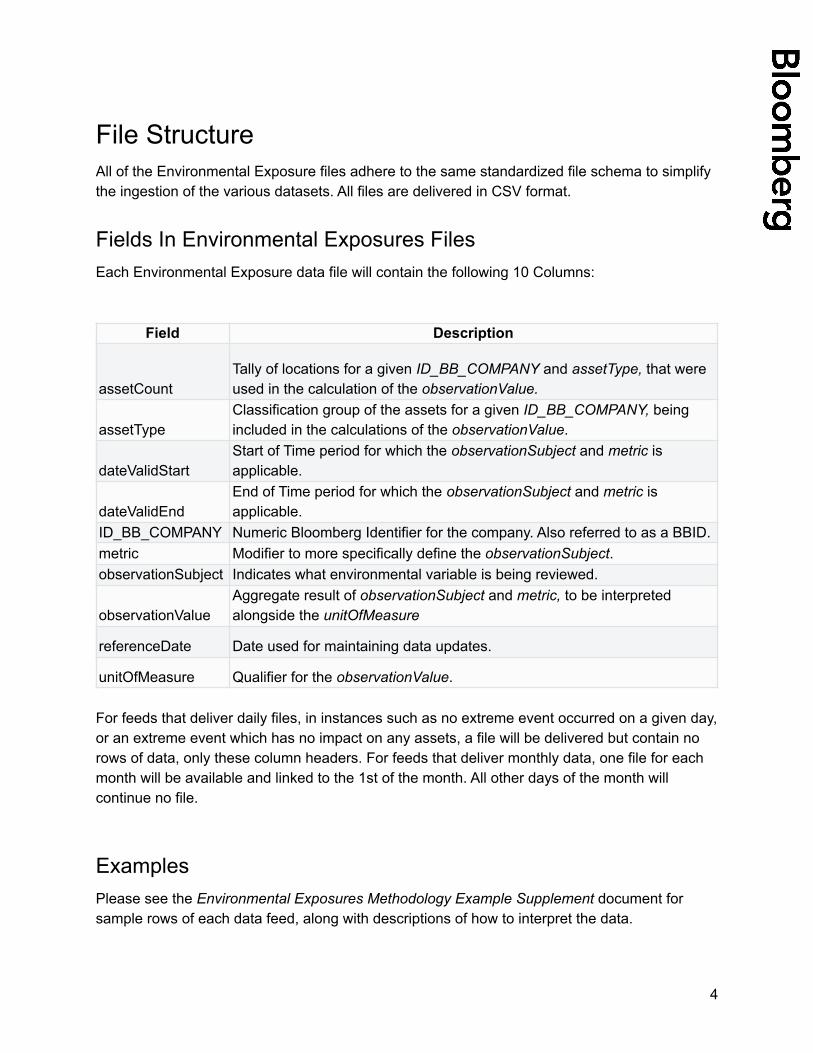
File StructureAll of the Environmental Exposure files adhere to the same standardized file schema to simplifythe ingestion of the various datasets. All files are delivered in CSV format.
Fields In Environmental Exposures FilesEach Environmental Exposure data file will contain the following 10 Columns:
Field Description
assetCountTally of locations for a given ID_BB_COMPANY and assetType, that wereused in the calculation of the observationValue.
assetTypeClassification group of the assets for a given ID_BB_COMPANY, beingincluded in the calculations of the observationValue.
dateValidStartStart of Time period for which the observationSubject and metric isapplicable.
dateValidEndEnd of Time period for which the observationSubject and metric isapplicable.
ID_BB_COMPANY Numeric Bloomberg Identifier for the company. Also referred to as a BBID.metric Modifier to more specifically define the observationSubject.observationSubject Indicates what environmental variable is being reviewed.
observationValueAggregate result of observationSubject and metric, to be interpretedalongside the unitOfMeasure
referenceDate Date used for maintaining data updates.
unitOfMeasure Qualifier for the observationValue.
For feeds that deliver daily files, in instances such as no extreme event occurred on a given day,or an extreme event which has no impact on any assets, a file will be delivered but contain norows of data, only these column headers. For feeds that deliver monthly data, one file for eachmonth will be available and linked to the 1st of the month. All other days of the month willcontinue no file.
ExamplesPlease see the Environmental Exposures Methodology Example Supplement document forsample rows of each data feed, along with descriptions of how to interpret the data.
4

Asset TypesThe Environmental Exposures product provides data for entity assets of two types: factoryfacilities and retail locations.
Factory FacilitiesThe Factory Facilities data is derived from a Bloomberg proprietary dataset of around 200,000worldwide factory facility locations. These individual facilities are linked to more than 10,000public companies, and are compiled from analysis of company reports, news stories, pressreleases, and other public sources of information. These facilities are updated continuouslythroughout the year, and are categorized into one or more of the following four types:
● Administration, Operations, Sales, Headquarters, Marketing, Management, Support● Distribution, Logistics, Warehousing, Shipping● Manufacturing, Assembly, Production, Plant, Engineering● R&D, Research, Design, Testing, Product Development, Technical Center, Laboratory
Bloomberg assigns these designations based on available descriptive information about thefacility. All facilities will be in at least one of these categories, but can be classified into all 4 ofthese types if applicable. In the Factory Facility Environmental Exposure files, all of the weatheraggregations are done by classification group and by company. We also provide an aggregationon the unique number of factory facilities per company, due to the potential overlap of a singularlocation being multi-classified. This is shown on rows where the “assetType” is set to “All”.
The public companies in this dataset cover a range of Bloomberg Industry Classifications (BICS)sectors. Below is a sample of the percent of public companies in a given BICs Sector within theFactory Facilities dataset:
BICS Level 1 Sector Name Percent of ID_BB_COMPANYs in FileIndustrials 24%Materials 23%Technology 18%Consumer Discretionary 15%Consumer Staples 11%Health Care 7%Other 2%
5

Retail LocationsThe Retail Locations data is derived from a third-party dataset that covers over 330,000 retailstore locations in the USA and Canada. These individual locations are linked to over 300 publiccompanies. The retail locations have been updated monthly since 2017 and were updatedquarterly back to 2014. Each retail store is classified into one of the following fifteen types:
● Apparel Stores● Banks● Category Killers● Chain Drug Stores● Chain Restaurants● Chain Supermarkets● Convenience Stores● Department Stores● Discount Stores● General Merchandise Stores● HBC/Cosmetic Stores● Health Clubs/Gyms● Home Centers & Hardware Chains● Home Furnishings● Liquor Stores
Below is a sample of the percent of public companies in a given location type within the RetailLocations dataset:
Location Type Percent of ID_BB_COMPANYs in FileChain Restaurants 19%Apparel Stores 18%Category Killers 13%Convenience Stores 10%Chain Supermarkets 8%Banks 7%Home Furnishings 5%Chain Drug Stores 4%HBC/Cosmetic Stores 4%Home Centers & Hardware Chains 4%Department Stores 3%Discount Stores 3%General Merchandise Stores 2%Health Clubs/Gyms 1%Liquor Stores 1%
6
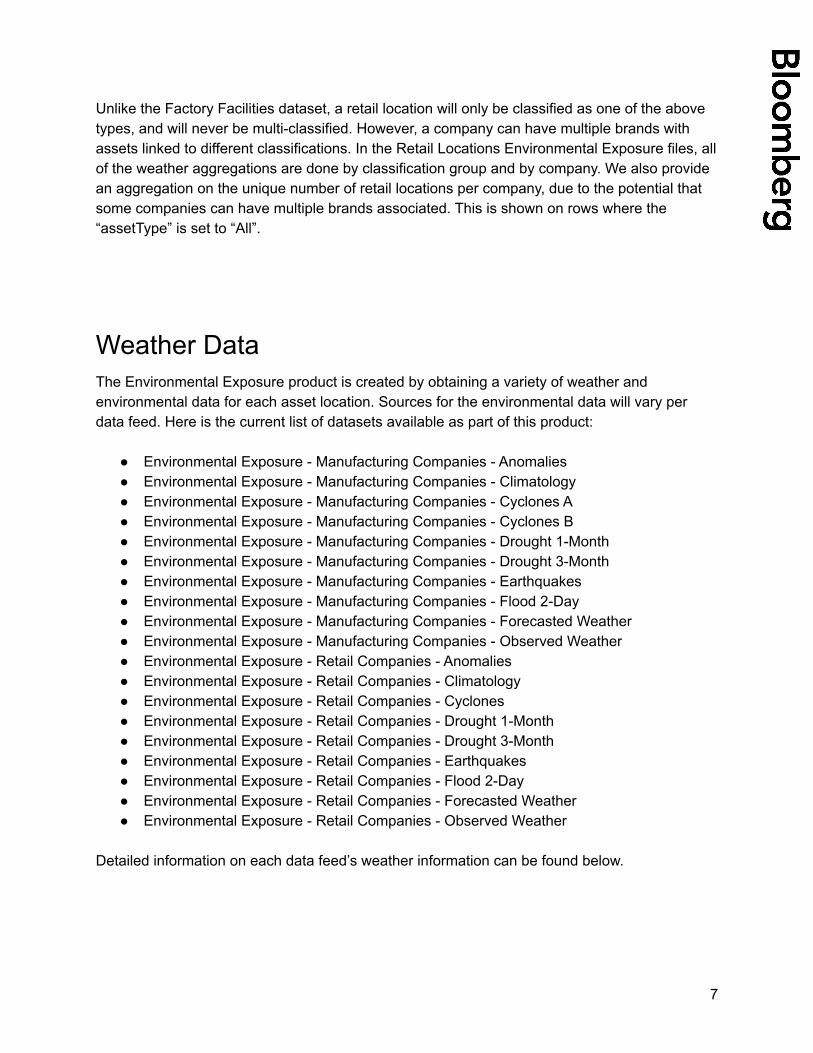
Unlike the Factory Facilities dataset, a retail location will only be classified as one of the abovetypes, and will never be multi-classified. However, a company can have multiple brands withassets linked to different classifications. In the Retail Locations Environmental Exposure files, allof the weather aggregations are done by classification group and by company. We also providean aggregation on the unique number of retail locations per company, due to the potential thatsome companies can have multiple brands associated. This is shown on rows where the“assetType” is set to “All”.
Weather DataThe Environmental Exposure product is created by obtaining a variety of weather andenvironmental data for each asset location. Sources for the environmental data will vary perdata feed. Here is the current list of datasets available as part of this product:
● Environmental Exposure - Manufacturing Companies - Anomalies● Environmental Exposure - Manufacturing Companies - Climatology● Environmental Exposure - Manufacturing Companies - Cyclones A● Environmental Exposure - Manufacturing Companies - Cyclones B● Environmental Exposure - Manufacturing Companies - Drought 1-Month● Environmental Exposure - Manufacturing Companies - Drought 3-Month● Environmental Exposure - Manufacturing Companies - Earthquakes● Environmental Exposure - Manufacturing Companies - Flood 2-Day● Environmental Exposure - Manufacturing Companies - Forecasted Weather● Environmental Exposure - Manufacturing Companies - Observed Weather● Environmental Exposure - Retail Companies - Anomalies● Environmental Exposure - Retail Companies - Climatology● Environmental Exposure - Retail Companies - Cyclones● Environmental Exposure - Retail Companies - Drought 1-Month● Environmental Exposure - Retail Companies - Drought 3-Month● Environmental Exposure - Retail Companies - Earthquakes● Environmental Exposure - Retail Companies - Flood 2-Day● Environmental Exposure - Retail Companies - Forecasted Weather● Environmental Exposure - Retail Companies - Observed Weather
Detailed information on each data feed’s weather information can be found below.
7
Anomalies
OverviewThe Anomalous Weather dataset provides daily anomalous weather measurements derivedfrom the comparison of the daily observed value and the expected climatological value.Historical data is available, starting from January 1st, 2014.
Weather VariablesThis feed is derived directly from a comparison of the Observed Weather and the ClimatologicalWeather datasets. This dataset provides the counts and percentages of assets owned by anentity that lie outside of the 10 year climatological range of normal values for those specificlocations.
The Observed weather values at each specific location is computed from a normalized weathercoverage, which comes from weather station observations. Standard weather variables arecollected from over 13,000 weather stations across the globe. Interpolation through inversedistance weighting is used to create a continuous grid of data which allows values to beassigned to any location. The density of weather stations allow the resolution of the grid to be5km in North America and 22km for the rest of the globe. The increased resolution is attributedto better quality input data from government and station sources. The weather at each point is aweighted average of several nearby points within that resolution on the map. The weathervariables are measured from 00:00 to 23:59 local time for each asset. The numerical weatherdata is presented at 1 decimal point precision.
The Climatological weather values for each specific location is based on ten years of history foreach weather variable. This data is the uniformly weighted average of the historical value foreach day of the year plus the values for the 7 days before and after. The result is a total of 15data points used to create a single day’s climatological value for one year. A single asset’sclimatological value is derived from 10 years of these values, which create 150 data points touse. The 10 year range for which the climatological values were generated from, are“2007-01-01” to “2016-12-31” inclusive.
8
Aggregation MethodologyWe use two methods to report anomalies:
● Bucketed Anomalies○ Per each company, the sum of assets outside of the normal range of the daily
climatological average of each weather variable. The normal range is -1 to 1standard deviations. We present the data for all applicable weather variables in 4standard deviation buckets:
■ 2-2.9 Positive Standard Deviations■ 3 Positive Standard Deviation and Greater■ 2-2.9 Negative Standard Deviations■ 3 Negative Standard Deviations and Less
● Average Diurnal Variation○ Per each company, the percent difference of the observed value from the daily
climatological average, for all of its assets. This is applicable for any weathervariables that have a daily minimum and a daily maximum value.
Feed InformationWe currently offer Anomalous Weather data feeds on the Bloomberg Enterprise Access Point(BEAP) for the following 2 datasets:
● Dataset Name○ entityWeatherAnomalousFactoryFacilities
■ Dataset URL● https://eap.bloomberg.com/catalogs/bbg/datasets/entityWeatherA
nomalousFactoryFacilities/■ Update Frequency
● For all public companies with factory assets, a daily file isavailable on BEAP by 20:00 UTC. The file contains the previousday’s weather data.
○ entityWeatherAnomalousRetailLocations■ Dataset URL
● https://eap.bloomberg.com/catalogs/bbg/datasets/entityWeatherAnomalousRetailLocations/
■ Update Frequency● For all public companies with retail assets, a daily file is available
on BEAP by 20:00 UTC. The file contains the previous day’sweather data.
9

Climatology
OverviewThe Climatology Weather dataset provides the daily average of observed weather values for ahistorical 10 year period across a company’s asset locations. Historical data is available, startingfrom January 1st, 2014.
Weather VariablesThe climatology weather data for each specific location is based on ten years of history for eachweather variable. This data is the uniformly weighted average of the historical value for eachday of the year plus the values for the 7 days before and after. The result is a total of 15 datapoints used to create a single day’s climatological value for one year. A single asset’sclimatological value is derived from 10 years of these values, which create 150 data points touse. The 10 year range for which the climatological values were generated from are“2007-01-01” to “2016-12-31” inclusive. The 58 weather variables and their definitions are listedin the Data Dictionary. Examples of these variables include Average Climatological MaximumAir Temperature and Average Climatological Total Snowfall.
Aggregation MethodologyFor each asset location, we receive the climatological value for each weather variable. We takethose individual asset level data points and aggregate them to present the average conditionsfor each variable across the company and asset type. If we have issues processing any assetfor a company, we will exclude that company from the daily BEAP file until we have confirmedthe accuracy of the weather data.
10
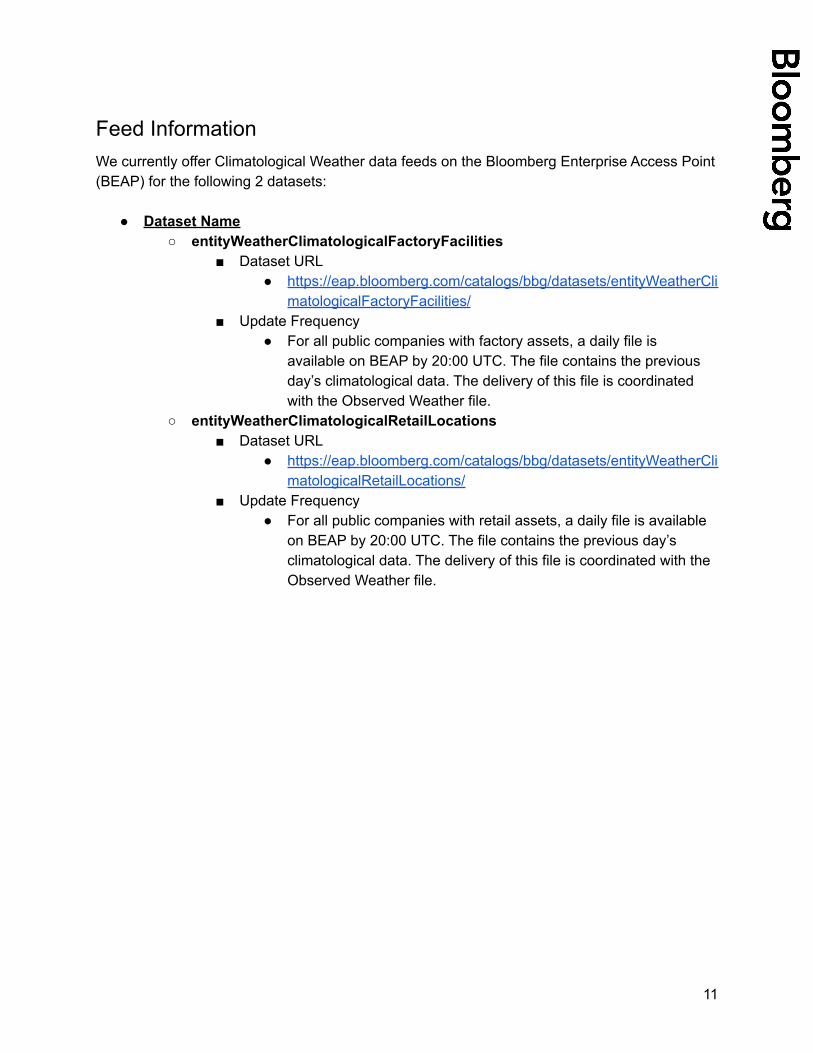
Feed InformationWe currently offer Climatological Weather data feeds on the Bloomberg Enterprise Access Point(BEAP) for the following 2 datasets:
● Dataset Name○ entityWeatherClimatologicalFactoryFacilities
■ Dataset URL● https://eap.bloomberg.com/catalogs/bbg/datasets/entityWeatherCli
matologicalFactoryFacilities/■ Update Frequency
● For all public companies with factory assets, a daily file isavailable on BEAP by 20:00 UTC. The file contains the previousday’s climatological data. The delivery of this file is coordinatedwith the Observed Weather file.
○ entityWeatherClimatologicalRetailLocations■ Dataset URL
● https://eap.bloomberg.com/catalogs/bbg/datasets/entityWeatherClimatologicalRetailLocations/
■ Update Frequency● For all public companies with retail assets, a daily file is available
on BEAP by 20:00 UTC. The file contains the previous day’sclimatological data. The delivery of this file is coordinated with theObserved Weather file.
11
Cyclones (02:00 and 14:00 UTC)
OverviewThe Cyclones datasets provide a daily tally of a company’s assets affected by cyclones in theprevious 24 hours, or assets that are forecasted to be affected by cyclones within the next 120hours. Historical data is available, starting from January 1st, 2014.
Weather VariablesThe cyclone dataset includes both forecasted affect and observed impact of global cyclones oncompany assets. The cyclone forecast data uses two prediction models: OFCL and AEMN.OFCL provides data for North American cyclones, and AEMN provides data for global cyclones.Both forecast models can provide up to 120 hours of forecasted impact for a given storm,though depending on the strength and location of the storm, not all will have 120 hour forecasts.The observed cyclone data is derived from the Best Track archive, which provides globalhistorical impact data. For both forecasted data and observed data, the impact is displayed aswind speed. Impact conditions are classified into 3 wind swath buckets: 35-49 knots, 50-63knots, and greater than 63 knots. This feed only provides insight to the effect wind has onassets and does not account for other cyclone related variables such as precipitation orflooding.
Aggregation MethodologyFor a given day, all assets are identified that fall within forecasted or observed cyclone windswaths. The resulting file is a count of assets in each of the three possible wind swath bands.There are two methods for which affected assets are reported:
● Newly Affected Assets○ Count of assets that either:
■ Are experiencing a cyclone event on a given day and did not experienceany cyclone events on the previous day, or
■ Are experiencing a cyclone event on a given day with a greater windspeed than what was experienced on the previous day
● All Affected Assets○ Count of assets that are experiencing a cyclone event on a given day, regardless
of any previous events
The number of assets that are experiencing cyclonic wind conditions for multiple days iscalculated from the difference between the “Newly Affected” asset count and the “All Affected”asset count. In both cases, the dateValidStart and dateValidEnd will report what day the affectedevents occurred or are forecasted to occur. The referenceDate reports the date that the file was
12

generated. The referenceDate of files can be compared to the datetime in the dateValidStartand dateValidEnd to determine how far in the future the forecast for a given model waspredicting, at its runtime. Realized cyclone impact rows only report the actual affected assets for1 day previous from the file generation.
Feed InformationWe currently offer Cyclone data feeds on the Bloomberg Enterprise Access Point (BEAP) for thefollowing 3 datasets:
● Dataset Name○ entityWeatherCyclonesFactoryFacilities0200
■ Dataset URL● https://eap.bloomberg.com/catalogs/bbg/datasets/entityWeatherC
yclonesFactoryFacilities0200/■ Update Frequency
● For all public companies with factory assets, a daily file isavailable on BEAP by 02:00 UTC. This dataset is designed for theAPAC market, and offers insights from the cyclone models that runat 18:00 UTC the previous day.
○ entityWeatherCyclonesFactoryFacilities1400■ Dataset URL
● https://eap.bloomberg.com/catalogs/bbg/datasets/entityWeatherCyclonesFactoryFacilities1400/
■ Update Frequency● For all public companies with factory assets, a daily file is
available on BEAP by 14:00 UTC. This dataset is designed for theAMER market, and offers insights from the cyclone models thatrun at 06:00 UTC on the day.
○ entityWeatherCyclonesRetailLocations1400■ Dataset URL
● https://eap.bloomberg.com/catalogs/bbg/datasets/entityWeatherCyclonesRetailLocations1400/
■ Update Frequency● For all public companies with retail assets, a daily file is available
on BEAP by 14:00 UTC. The 14:00 file offers insights from thecyclone models that run at 06:00 UTC on the day. There is no02:00 file for retail assets since we currently only have retail datafor primarily the United States and Canada.
If no factories or retail assets are affected by a cyclone, the file in BEAP will be blank, with justthe column headers.
13
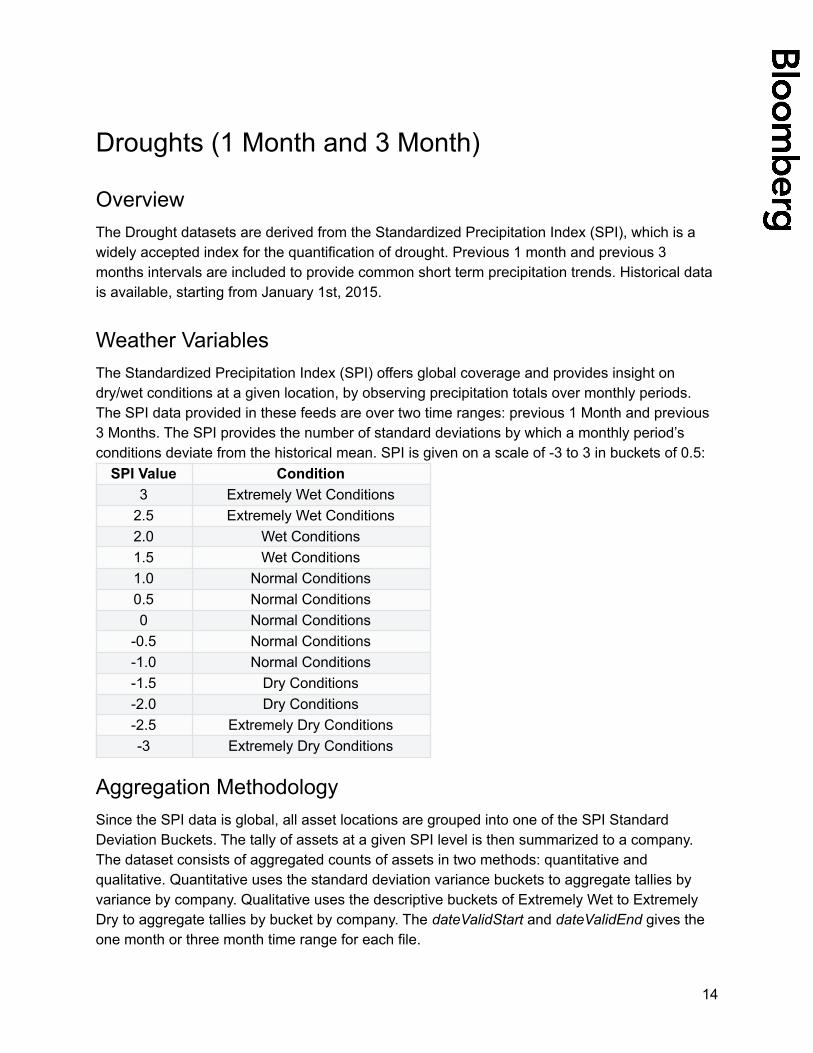
Droughts (1 Month and 3 Month)
OverviewThe Drought datasets are derived from the Standardized Precipitation Index (SPI), which is awidely accepted index for the quantification of drought. Previous 1 month and previous 3months intervals are included to provide common short term precipitation trends. Historical datais available, starting from January 1st, 2015.
Weather VariablesThe Standardized Precipitation Index (SPI) offers global coverage and provides insight ondry/wet conditions at a given location, by observing precipitation totals over monthly periods.The SPI data provided in these feeds are over two time ranges: previous 1 Month and previous3 Months. The SPI provides the number of standard deviations by which a monthly period’sconditions deviate from the historical mean. SPI is given on a scale of -3 to 3 in buckets of 0.5:
SPI Value Condition3 Extremely Wet Conditions
2.5 Extremely Wet Conditions2.0 Wet Conditions1.5 Wet Conditions1.0 Normal Conditions0.5 Normal Conditions0 Normal Conditions
-0.5 Normal Conditions-1.0 Normal Conditions-1.5 Dry Conditions-2.0 Dry Conditions-2.5 Extremely Dry Conditions-3 Extremely Dry Conditions
Aggregation MethodologySince the SPI data is global, all asset locations are grouped into one of the SPI StandardDeviation Buckets. The tally of assets at a given SPI level is then summarized to a company.The dataset consists of aggregated counts of assets in two methods: quantitative andqualitative. Quantitative uses the standard deviation variance buckets to aggregate tallies byvariance by company. Qualitative uses the descriptive buckets of Extremely Wet to ExtremelyDry to aggregate tallies by bucket by company. The dateValidStart and dateValidEnd gives theone month or three month time range for each file.
14

Feed InformationWe currently offer Drought data feeds on the Bloomberg Enterprise Access Point (BEAP) for thefollowing 4 datasets:
● Dataset Name○ entityWeatherFactoriesDroughtPrecipIndexOneMonth
■ Dataset URL● https://eap.bloomberg.com/catalogs/bbg/datasets/entityWeatherFa
ctoriesDroughtPrecipIndexOneMonth/■ Update Frequency
● For all public companies with factory assets, a monthly file isavailable on BEAP by the 10th of each month. The file is markedwith the first date of the previous month, and contains data for theprevious month.
○ entityWeatherFactoriesDroughtPrecipIndexThreeMth■ Dataset URL
● https://eap.bloomberg.com/catalogs/bbg/datasets/entityWeatherFactoriesDroughtPrecipIndexThreeMth/
■ Update Frequency● For all public companies with factory assets, a monthly file is
available on BEAP by the 10th of each month. The file is markedwith the first date of the previous month, and contains data for theprevious three months.
○ entityWeatherRetailDroughtPrecipIndexOneMonth■ Dataset URL
● https://eap.bloomberg.com/catalogs/bbg/datasets/entityWeatherRetailDroughtPrecipIndexOneMonth/
■ Update Frequency● For all public companies with retail assets, a monthly file is
available on BEAP by the 10th of each month. The file is markedwith the first date of the previous month, and contains data for theprevious month.
○ entityWeatherRetailDroughtPrecipIndexThreeMth■ Dataset URL
● https://eap.bloomberg.com/catalogs/bbg/datasets/entityWeatherRetailDroughtPrecipIndexThreeMth/
■ Update Frequency● For all public companies with retail assets, a monthly file is
available on BEAP by the 10th of each month. The file is markedwith the first date of the previous month, and contains data for theprevious three months.
15
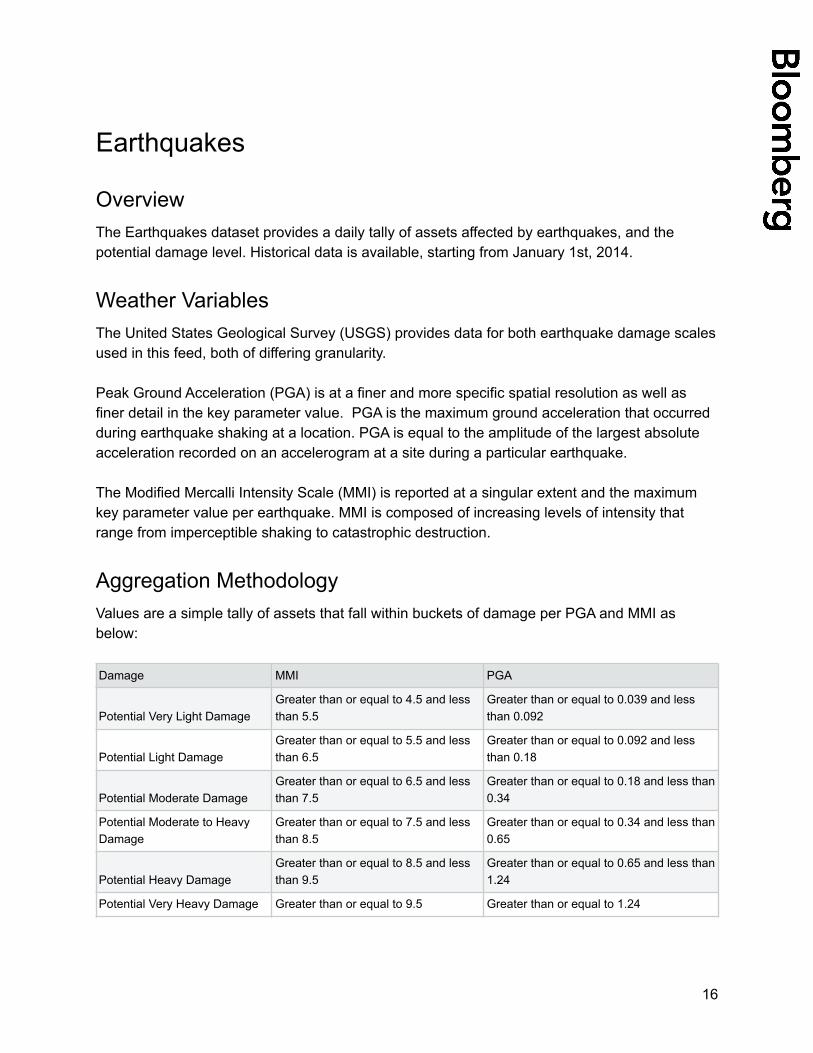
Earthquakes
OverviewThe Earthquakes dataset provides a daily tally of assets affected by earthquakes, and thepotential damage level. Historical data is available, starting from January 1st, 2014.
Weather VariablesThe United States Geological Survey (USGS) provides data for both earthquake damage scalesused in this feed, both of differing granularity.
Peak Ground Acceleration (PGA) is at a finer and more specific spatial resolution as well asfiner detail in the key parameter value. PGA is the maximum ground acceleration that occurredduring earthquake shaking at a location. PGA is equal to the amplitude of the largest absoluteacceleration recorded on an accelerogram at a site during a particular earthquake.
The Modified Mercalli Intensity Scale (MMI) is reported at a singular extent and the maximumkey parameter value per earthquake. MMI is composed of increasing levels of intensity thatrange from imperceptible shaking to catastrophic destruction.
Aggregation MethodologyValues are a simple tally of assets that fall within buckets of damage per PGA and MMI asbelow:
Damage MMI PGA
Potential Very Light DamageGreater than or equal to 4.5 and lessthan 5.5
Greater than or equal to 0.039 and lessthan 0.092
Potential Light DamageGreater than or equal to 5.5 and lessthan 6.5
Greater than or equal to 0.092 and lessthan 0.18
Potential Moderate DamageGreater than or equal to 6.5 and lessthan 7.5
Greater than or equal to 0.18 and less than0.34
Potential Moderate to HeavyDamage
Greater than or equal to 7.5 and lessthan 8.5
Greater than or equal to 0.34 and less than0.65
Potential Heavy DamageGreater than or equal to 8.5 and lessthan 9.5
Greater than or equal to 0.65 and less than1.24
Potential Very Heavy Damage Greater than or equal to 9.5 Greater than or equal to 1.24
16
Feed InformationWe currently offer Earthquake data feeds on the Bloomberg Enterprise Access Point (BEAP) forthe following 2 datasets:
● Dataset Name○ entityWeatherEarthquakesFactoryFacilities
■ Dataset URL● https://eap.bloomberg.com/catalogs/bbg/datasets/entityWeatherE
arthquakesFactoryFacilities/■ Update Frequency
● For all public companies with factory assets, a daily file isavailable on BEAP by 04:00 UTC. This file contains the previousday’s data.
○ entityWeatherEarthquakesRetailLocations■ Dataset URL
● https://eap.bloomberg.com/catalogs/bbg/datasets/entityWeatherEarthquakesRetailLocations/
■ Update Frequency● For all public companies with retail assets, a daily file is available
on BEAP by 04:00 UTC. This file contains the previous day’s data.
If no factories or retail assets were affected by an earthquake, the file in BEAP will be blank,with just the column headers.
17

Floods 2 Day
OverviewThe Floods datasets provide a tally of assets that may be experiencing flooding conditions in thepast 2 days. Historical data is available, starting from January 1st, 2015.
Weather VariablesThe National Aeronautics and Space Administration's (NASA) MODIS satellite gives globalreadings of abnormal surface water over land. The 2 day product is used for generalidentification of assets that may be experiencing flooding. This product is based on satellitedetections, so it does not provide any ground truth confirmation. This dataset provides insight onassets that received 2 positive flood readings within the previous 2 days. The goal of requiring 2positive readings is to mitigate against singular false positive cases from the satellite.
Please note: NASA introduced a new flood model with various processing and accuracyimprovements, that will affect files with referenceDates of 2021-07-08 and beyond. The oldmodel, used in files with referenceDates prior to 2021-07-08, has been discontinued and will nolonger be used going forward. Given the differences in the models, note that results may not becomparable between the two.
Aggregation MethodologySatellite observations create a binary output for each asset location that experienced 2 positiveflood readings within the past 2 days. The number of assets experiencing a positive reading aretallied and aggregated as the number of affected assets per company.
The dateValidStart and dateValidEnd give the 2 day range for each file. The referenceDatereports the date that the file was generated.
18

Feed InformationWe currently offer Flood data feeds on the Bloomberg Enterprise Access Point (BEAP) for thefollowing 4 datasets:
● Dataset Name○ entityWeatherFloodTwoDayFactoryFacilities
■ Dataset URL● https://eap.bloomberg.com/catalogs/bbg/datasets/entityWeatherFl
oodTwoDayFactoryFacilities/■ Update Frequency
● For all public companies with factory assets, a daily file isavailable on BEAP by 04:00 UTC. This file contains data for theprevious two days.
○ entityWeatherFloodTwoDayRetailLocations■ Dataset URL
● https://eap.bloomberg.com/catalogs/bbg/datasets/entityWeatherFloodTwoDayRetailLocations/
■ Update Frequency● For all public companies with retail assets, a daily file is available
on BEAP by 04:00 UTC. This file contains data for the previoustwo days.
If no factories or retail assets were affected by a flooding event, the file in BEAP will be blank,with just the column headers.
19

Forecast Observed Weather
OverviewThe Forecast Observed Weather dataset provides +1 to +8 days of forecasted daily averageweather measurements across a company’s asset locations. The value at each location isderived from the arithmetic mean of 24 discrete forecasted hourly values per day, based on localtime of the individual asset. Historical data is available, starting from January 15th, 2015.
Weather VariablesThe weather values are derived from model prediction at each specific location for all of thestandard weather variables. Standard weather variables are collected from over 13,000 weatherstations across the globe. Interpolation through inverse distance weighting is used to create acontinuous grid of data which allows values to be assigned to any location. The density ofweather stations allows the resolution of the grid to be 5km in North America and 22km for therest of the globe. The increased resolution is attributed to better quality input data fromgovernment and station sources. The weather at each point is a weighted average of severalnearby points within that resolution on the map. The 56 weather variables we include as part ofthis feed and their definitions are listed in the Data Dictionary. Examples of these variablesinclude Forecast Average Maximum Air Temperature and Forecast Average SnowfallProbability. The numerical weather data is presented at 1 decimal point precision. Data fromthese weather stations are used in the predictions of daily expected value for up to 8 days in thefuture from the date the file is generated.
Aggregation MethodologyFor each asset location, we receive the forecasted value for all weather variables on a givenday in the future. Those individual asset level data points are then aggregated to present theforecasted average conditions for each variable across the company and asset type. If we haveissues processing any assets for a company, we will exclude that company from the daily BEAPfile, until we have confirmed the accuracy of the weather data.
The dateValidStart and dateValidEnd will report what day values are forecasted to occur. ThereferenceDate reports the date that the file was generated.
20

Feed InformationWe currently offer Forecasted Weather data feeds on the Bloomberg Enterprise Access Point(BEAP) for the following 2 datasets:
● Dataset Name○ entityWeatherFactoriesForecastObserved
■ Dataset URL● https://eap.bloomberg.com/catalogs/bbg/datasets/entityWeatherFa
ctoriesForecastObserved/■ Update Frequency
● For all public companies with factory assets, a daily file isavailable on BEAP by 14:00 UTC. This file contains up to 8 daysof forecasted weather data.
○ entityWeatherRetailForecastObserved■ Dataset URL
● https://eap.bloomberg.com/catalogs/bbg/datasets/entityWeatherRetailForecastObserved/
■ Update Frequency● For all public companies with retail assets, a daily file is available
on BEAP by 14:00 UTC. This file contains up to 8 days offorecasted weather data.
21

Incomplete Historical FilesThere are a few historical files for both the Factories Forecast Feed and the Retail ForecastFeed where we do not have complete Forecast data. We do not want to present incompletedata, so any companies where we do not have full forecast data were omitted from these files.Thus, the number of rows and the number of companies included for the below list of dates arelower than expected:
Incomplete Factories Forecast Dates Incomplete Retail Forecast Dates
2015-04-01 2015-04-01
2015-06-12 2015-06-12
2015-09-06 2015-09-06
2015-10-04 2015-10-04
2015-11-19 2015-11-19
2016-01-13 2016-01-13
2016-02-09 2016-01-20
2016-02-20 2016-02-09
2016-03-09 2016-02-20
2016-03-20 2016-02-22
2016-04-10 2016-03-09
2016-05-14 2016-03-20
2016-07-07 2016-04-10
2016-07-10 2016-07-07
2016-09-09 2016-07-10
2016-09-24 2016-09-09
2016-09-26 2016-09-24
2016-10-20 2016-09-26
2016-10-26 2016-10-02
2017-09-30 2016-10-20
2016-10-26
2017-09-30
22

Observed Weather
OverviewThe Observed Weather dataset provides a daily average or sum of weather measurementsacross a company’s asset locations. The value at each location is derived from the arithmeticmean of 24 discrete hourly values per day, based on local time of the individual asset. Historicaldata is available, starting from January 1st, 2014.
Weather VariablesThe weather values at each specific location are computed from a normalized weathercoverage, which comes from weather station observations. Standard weather variables arecollected from over 13,000 weather stations across the globe. Interpolation through inversedistance weighting is used to create a continuous grid of data which allows values to beassigned to any location. The density of weather stations allow the resolution of the grid to be5km in North America and 22km for the rest of the globe. The increased resolution is attributedto better quality input data from government and station sources. The weather at each point is aweighted average of several nearby points within that resolution on the map. The weathervariables are measured from 00:00 to 23:59 local time for each asset. In cases where the assetdataset is global, it is necessary for all time zones to complete their 24 hour day before the startof processing the data. The 56 weather variables we include as part of this feed and theirdefinitions are listed in the Data Dictionary. Examples of these variables include AverageMaximum Air Temperature and Average Total Snowfall. The numerical weather data ispresented at 1 decimal point precision.
Aggregation MethodologyFor each asset location, we receive the aggregated value for the 24 hour period for a givendate. For example, at a single asset location we receive 1 value for Average Air Temperaturederived from the averages of 24 hourly air temperature readings for a given date. Thoseindividual asset level data points are then aggregated to provide the average conditions for eachvariable across the company and asset type. If issues arise during the processing of any assetsfor a company, that company will be excluded from the daily BEAP file, until the accuracy of theweather data has been confirmed.
23

Feed InformationWe currently offer Observed Weather data feeds on the Bloomberg Enterprise Access Point(BEAP) for the following 2 datasets:
● Dataset Name○ entityWeatherObservedFactoryFacilities
■ Dataset URL● https://eap.bloomberg.com/catalogs/bbg/datasets/entityWeatherO
bservedFactoryFacilities/■ Update Frequency
● For all public companies with factory assets, a daily file isavailable on BEAP by 20:00 UTC. The file contains the previousday’s weather data.
○ entityWeatherObservedRetailLocations■ Dataset URL
● https://eap.bloomberg.com/catalogs/bbg/datasets/entityWeatherObservedRetailLocations/
■ Update Frequency● For all public companies with retail assets, a daily file is available
on BEAP by 20:00 UTC. The file contains the previous day’sweather data.
24

Appendix
For more information on the Cyclones Feeds, please go to:● https://web.uwm.edu/hurricane-models/models/models.html
For more information on the Drought Feeds, please go to:● https://climatedataguide.ucar.edu/climate-data/standardized-precipitation-index-spi● http://www.ncl.ucar.edu/Applications/spi.shtml● https://wrcc.dri.edu/spi/explanation.html
For more information on the Earthquake Feed, please go to:● https://earthquake.usgs.gov/data/shakemap/
For more information on the Flood Feeds, please go to:● https://earthdata.nasa.gov/earth-observation-data/near-real-time/mcdwd-nrt
Disclaimer
The BLOOMBERG TERMINAL service and Bloomberg data products (the “Services”) are owned and distributed by Bloomberg Finance L.P. (“BFLP”)except that Bloomberg L.P. and its subsidiaries (“BLP”) distribute these products in Argentina, Australia and certain jurisdictions in the Pacific islands,Bermuda, China, India, Japan, Korea and New Zealand. BLP provides BFLP with global marketing and operational support. The following aretrademarks and service marks of BFLP, a Delaware limited partnership, or its subsidiaries: BLOOMBERG, BLOOMBERG ANYWHERE, BLOOMBERGMARKETS, BLOOMBERG NEWS, BLOOMBERG PROFESSIONAL, BLOOMBERG TERMINAL and BLOOMBERG.COM. Absence of any trademarkor service mark from this list does not waive Bloomberg's intellectual property rights in that name, mark or logo. All rights reserved.
25