Examination Validation Methodologies for Personnel ...
32
Examination Validation Methodologies for Personnel Certification Schemes Osman Vural 1 , Ioannis Anastasopoulos 2 , David S. Nelson 3 1 Director International Personnel Certification Association, 2 University of California at Berkeley, Dpt. Of Mathematics, 3 Chairman, Quality Psychometric Services [email protected] 1 , [email protected] 2 , [email protected] 3 Abstract. The validation of the examinations provided by the Conformity Assessment Bodies for Personnel Certification Purposes is a requirement of the international standard ISO/IEC 17024 “Conformity assessment — General requirements for bodies operating certification of persons”. A foundamental requirement for each examination developer is to achieve a reliable and fair examination process. The validity of a test paper depends on the quality of the sections that are constituting the examination. Considering that the examination must measure the competencies derived by the relevant job/task analysis, there is a direct connection between the job/task analysis outputs and the respective examination. There are prescribed steps in linking the relatedness of the examination to the knowledge and skills required for a job. These steps lead to an examination that has been "validated" in that its content accurately measures the necessary knowledge and skill required for the job. This paper describes the steps the examination (personnel evaluation) system should be designed, as well as some of the statistical techniques that can be used in the analysis of items that are necessary for the establishment of question banks. The scope of this paper is limited to the “job analysis” component of certification schemes and does not extend to requirements for administration of examinations, including performance-based assessments, oral examinations, and remote assessments. Keywords. examination, validation, psychometrics, personnel certification, job analysis, competence Definitions 1. Fairness (ISO/IEC 17024:2012, Clause 3.16) Equal opportunity for success provided to each candidate (3.14) in the certification process (3.1) 2. Validity (ISO/IEC 17024:2012, Clause 3.17) Evidence that the assessment (3.8) measures what it is intended to measure, as defined by the certification scheme (3.2) NOTE In this international Standard, validity is also used in its adjective form "valid". 19 Eximia Journal Vol. 1, 19-50, April, 2021 ISSN: 2784-0735 www.eximiajournal.com
-
Upload
khangminh22 -
Category
Documents
-
view
3 -
download
0
Transcript of Examination Validation Methodologies for Personnel ...
Examination Validation Methodologies for Personnel
Certification Schemes
Osman Vural1, Ioannis Anastasopoulos2, David S. Nelson3
1Director International Personnel Certification Association, 2University of California
at Berkeley, Dpt. Of Mathematics, 3Chairman, Quality Psychometric Services
[email protected], [email protected], [email protected]
Abstract. The validation of the examinations provided by the Conformity Assessment Bodies
for Personnel Certification Purposes is a requirement of the international standard ISO/IEC
17024 “Conformity assessment — General requirements for bodies operating certification of
persons”. A foundamental requirement for each examination developer is to achieve a reliable
and fair examination process. The validity of a test paper depends on the quality of the sections
that are constituting the examination. Considering that the examination must measure the
competencies derived by the relevant job/task analysis, there is a direct connection between the
job/task analysis outputs and the respective examination. There are prescribed steps in linking
the relatedness of the examination to the knowledge and skills required for a job. These steps
lead to an examination that has been "validated" in that its content accurately measures the
necessary knowledge and skill required for the job. This paper describes the steps the
examination (personnel evaluation) system should be designed, as well as some of the statistical
techniques that can be used in the analysis of items that are necessary for the establishment of
question banks. The scope of this paper is limited to the “job analysis” component of certification
schemes and does not extend to requirements for administration of examinations, including
performance-based assessments, oral examinations, and remote assessments.
Keywords. examination, validation, psychometrics, personnel certification, job analysis,
competence
Definitions
1. Fairness
(ISO/IEC 17024:2012, Clause 3.16)
Equal opportunity for success provided to each candidate (3.14) in the certification
process (3.1)
2. Validity
(ISO/IEC 17024:2012, Clause 3.17)
Evidence that the assessment (3.8) measures what it is intended to measure, as defined
by the certification scheme (3.2)
NOTE In this international Standard, validity is also used in its adjective form "valid".
19
Eximia JournalVol. 1, 19-50, April, 2021
ISSN: 2784-0735www.eximiajournal.com

3. Reliability
(ISO/IEC 17024:2012, Clause 3.18)
Indicator of the extent to which examination (3.9) scores are consistent across different
examination times and locations, different examination forms and different examiners (3.10)
4. Standard deviation
Index of variability in a set of numbers. Computationally, this is the square root of the
sum of deviations of each score and the mean, divided by the number of data points in the set.
5. Mean
The average score for a set of numbers.
6. Standard error of measurement (SEM)
This is the estimate of the variance of a person’s scores if the person took many tests of
a similar size. It is computed with the reliability coefficient of a test and the standard deviation
of the set of obtained scores.
7. Item
The smallest measurable component of a test that can be scored is called an item.
8. Item analysis
Several characteristics of (usually) multiple-choice items that indicate the quality of the
item and of the whole test.
Examination Process Requirements in the ISO/IEC 17024: 2012 standard
The examination process requirements are described in clause 9.3.1 of ISO/IEC
17024:2012: “Examinations shall be designed to assess competence based on, and consistent
with, the scheme, by written, oral, practical, observational or other reliable and objective means.
The design of examination requirements shall ensure the comparability of results of each single
examination, both in content and difficulty, including the validity of fail/pass decisions.”
Additional information is also provided in clause 9.3.5 of ISO/IEC 17024:2012:
“Appropriate methodology and procedures (e.g. collecting and maintaining statistical data)
shall be documented and implemented in order to reaffirm, at justified defined intervals, the
fairness, validity, reliability and general performance of each examination, and that all
identified deficiencies are corrected”.
What is exam (assessment) in personnel certification process?
A test or examination (informally, exam or evaluation) is an assessment intended to
measure a test-taker's knowledge, skill, aptitude, or classification in many topics. The goal of
the exam is to determine if an individual has sufficient knowledge, skills, and abilities (KSAs)
to be professionally competent at an entry-level in the specified field. An exam may be
administered verbally, on paper, on a computer, or in a predetermined area that requires a test
taker to demonstrate or perform a set of skills.
20
Eximia JournalVol. 1, 19-50, April, 2021
ISSN: 2784-0735www.eximiajournal.com

There is no general consensus or invariable standard for test formats and difficulty.
Often, the format and difficulty of the test is dependent upon the requirements of accreditation
or industrial association. Standardized tests are usually used by the personnel certification
bodies to determine if a test taker is allowed to practice a profession, to use a specific job title,
or to claim competency in a specific set of skills. It is a direct method of assessment of
knowledge, skills, ability and personal behaviors. The assessment types that can be used in
personnel certification programs are as follows.
Criterion-referenced tests are designed to measure candidate’s performance against a
fixed set of criteria or industry standards or certification schemes, based on a construct of
“minimal acceptable competency “It is possible for all test takers to pass, just like it is possible
for all test takers to fail. A criterion-referenced test will use questions which will be correctly
answered by candidates who are competent in the specific subject.
Standardized test is a test that is administered and scored in a consistent, or "standard",
manner. Standardized tests are designed in such a way that the questions, conditions for
administering, scoring procedures, and interpretations are consistent and are administered and
scored in a predetermined, standard manner. Any test in which the same test is given in the
same manner to all test takers, and graded in the same manner for everyone, is a standardized
test. A standardized test may be any type of test: a written test, an oral test, or a practical skills
performance test. The questions can be simple or complex. Standardized tests are designed to
permit reliable comparison of outcomes across all test takers, because everyone is taking a test
which is designed to assess the same competencies. Criterion-referenced scoring is used
because criterion-referenced score is concerned solely with whether or not this particular
candidate's answer is correct and complete.
Performance-based assessment is the evaluation process of objective data collecting
from the actual or simulated application site on the knowledge, skill, attitudes.
A personnel certification exam has to design as criterion-referenced standardized test or
in combination with the criterion-referenced performance-based assessment.
Fairness
The fairness of an exam refers to its freedom from any kind of bias. The exam should
be appropriate for all qualified examinees, without regard for factors which are irrelevant to
professional competency, such as race, religion, gender, or age. The test should not
disadvantage any examinee, or group of examinees, on any basis other than the examinee's lack
of the knowledge and skills the test is intended to measure. Item writers should address the goal
of fairness as they undertake the task of writing items. In addition, the items should also be
reviewed for potential fairness problems during the item review phase. Any items that are
identified as displaying potential bias or lack of fairness should then be revised or dropped from
further consideration.
21
Eximia JournalVol. 1, 19-50, April, 2021
ISSN: 2784-0735www.eximiajournal.com

Validating an exam
Exam Validation Process Flow Chart
Basic steps in exam validation process
1. Job Analysis: Conducting a job analysis is an essential first step in
establishing the content validity of certification exams. Job analysis is the foundation for
defining the “certification scheme” (ISO/IEC 17024 sec. 8). A job analysis will define the
important elements of professional competency through a series of discrete “job tasks” and the
associated knowledge, skills and abilities (KSAs) required to perform these tasks. Metrics used
for ranking the importance of job tasks should consider their “relevance” (to professional
competency), “frequency” (how often these are done), and “criticality” (significance to
professional success and to the protection of public health, safety, and welfare). In this process,
job tasks should be eliminated from consideration in an examination when the KSA is
adequately assessed by governmental licensing agencies (such as driving skills), and when no
valid means of assessing competency in the task is identified. The rationale for eliminating
tasks from consideration must be documented. Job analysis information may be gathered by
direct observation of people currently in the job, interviews with experienced supervisors and
job incumbents, questionnaires, personnel and equipment records, and work manuals.
Workshops are held to identify specific job tasks and capabilities required for successful job
performance. During these workshops, subject matter experts verify that the task statements
developed are technically correct, unambiguous, and accurately reflect the job. identification of
capabilities must be done on a task-by-task basis, so that a link is established between each task
statement and requisite capability. Job analysis information is central in deciding what to test
for and which tests to use.
Job Analysis
Exam
Specification
Validate Existing
Questions
Write New
Questions
Validate New
Questions
Pilot Test
Questions
Develop
Certification Exam
Determine
Passing Score Statistical
Review
Review Job
Analysis
22
Eximia JournalVol. 1, 19-50, April, 2021
ISSN: 2784-0735www.eximiajournal.com
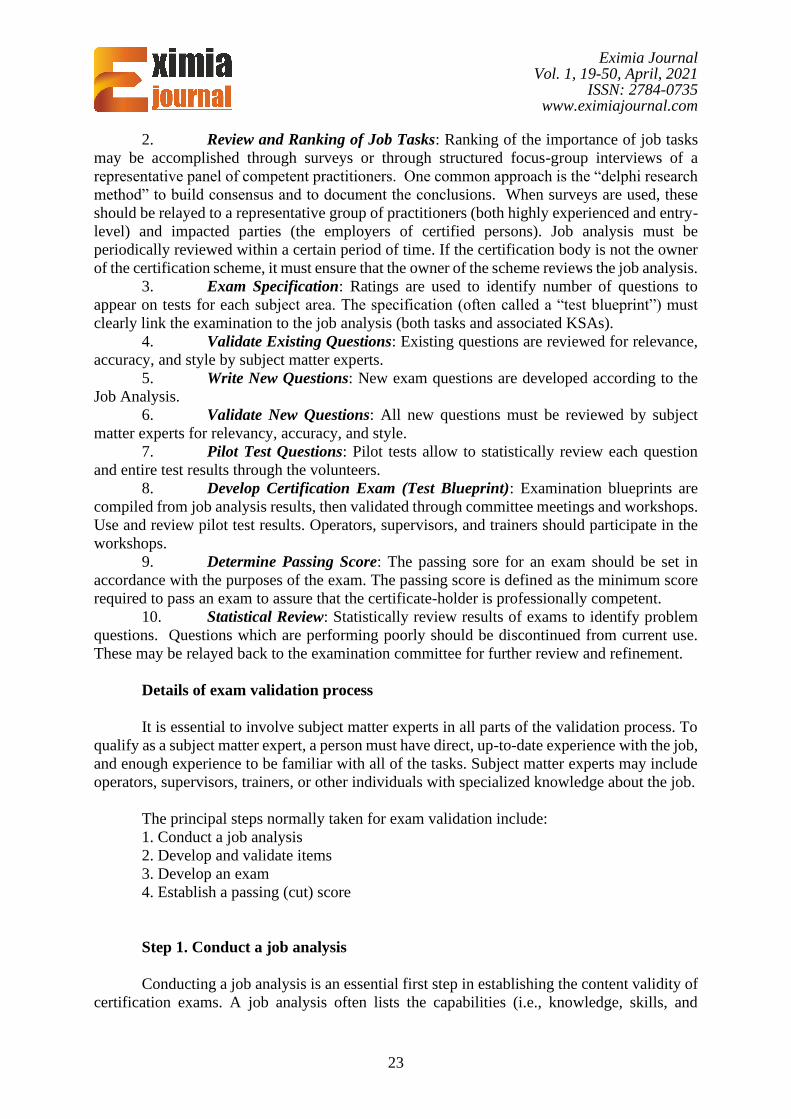
2. Review and Ranking of Job Tasks: Ranking of the importance of job tasks
may be accomplished through surveys or through structured focus-group interviews of a
representative panel of competent practitioners. One common approach is the “delphi research
method” to build consensus and to document the conclusions. When surveys are used, these
should be relayed to a representative group of practitioners (both highly experienced and entry-
level) and impacted parties (the employers of certified persons). Job analysis must be
periodically reviewed within a certain period of time. If the certification body is not the owner
of the certification scheme, it must ensure that the owner of the scheme reviews the job analysis.
3. Exam Specification: Ratings are used to identify number of questions to
appear on tests for each subject area. The specification (often called a “test blueprint”) must
clearly link the examination to the job analysis (both tasks and associated KSAs).
4. Validate Existing Questions: Existing questions are reviewed for relevance,
accuracy, and style by subject matter experts.
5. Write New Questions: New exam questions are developed according to the
Job Analysis.
6. Validate New Questions: All new questions must be reviewed by subject
matter experts for relevancy, accuracy, and style.
7. Pilot Test Questions: Pilot tests allow to statistically review each question
and entire test results through the volunteers.
8. Develop Certification Exam (Test Blueprint): Examination blueprints are
compiled from job analysis results, then validated through committee meetings and workshops.
Use and review pilot test results. Operators, supervisors, and trainers should participate in the
workshops.
9. Determine Passing Score: The passing sore for an exam should be set in
accordance with the purposes of the exam. The passing score is defined as the minimum score
required to pass an exam to assure that the certificate-holder is professionally competent.
10. Statistical Review: Statistically review results of exams to identify problem
questions. Questions which are performing poorly should be discontinued from current use.
These may be relayed back to the examination committee for further review and refinement.
Details of exam validation process
It is essential to involve subject matter experts in all parts of the validation process. To
qualify as a subject matter expert, a person must have direct, up-to-date experience with the job,
and enough experience to be familiar with all of the tasks. Subject matter experts may include
operators, supervisors, trainers, or other individuals with specialized knowledge about the job.
The principal steps normally taken for exam validation include:
1. Conduct a job analysis
2. Develop and validate items
3. Develop an exam
4. Establish a passing (cut) score
Step 1. Conduct a job analysis
Conducting a job analysis is an essential first step in establishing the content validity of
certification exams. A job analysis often lists the capabilities (i.e., knowledge, skills, and
23
Eximia JournalVol. 1, 19-50, April, 2021
ISSN: 2784-0735www.eximiajournal.com

abilities) required to perform work tasks. Job analysis information may be gathered by direct
observation of people currently in the job, interviews with experienced supervisors and job
incumbents, questionnaires, personnel and equipment records, and work manuals.
Workshops are held to identify specific job tasks and capabilities required for successful
job performance. During these workshops, subject matter experts verify that the task statements
developed are technically correct, unambiguous, and accurately reflect the job. identification of
capabilities must be done on a task-by-task basis, so that a link is established between each task
statement and requisite capability.
Job analysis information is central in deciding what to test for and which tests to use.
Step 2. Develop and validate items
Exam items are developed from the results of the job analysis so that exams are
representative of job tasks. Once the new items are written, they must go through a validation
process, which includes:
1. Linking new questions to the results of the job analysis. The purpose of this is to
ensure that all questions on the certification exam measure at least one important aspect of an
operator’s job. During this process, subject matter experts are asked to rate the extent to which
the questions reflect specific tasks in the job.
2. Analyzing questions for technical accuracy, style, readability, and possible bias to
sub- groups. Determine that the correct answer is the best answer that the distractors (incorrect
answers) are wrong, and that the question is free from bias with respect to race, gender, and
culture.
3. Reviewing items for job importance. Importance ratings should reflect how well the
question distinguishes between effective and ineffective job performance and if the knowledge
tested in the question is necessary for competent job performance. The continued relevance of
questions that have been validated must be ensured through periodic reviews of the items by
subject matter experts. Evaluation of questions should also be conducted through statistical
analysis. Of particular importance are the difficulty index (the ratio of examinees that answer
each question correctly) and the discrimination index (how well the question distinguishes
between the more knowledgeable and less knowledgeable examinees).
Conduct the item analysis
In this phase statistical methods are used to identify any test items that are not working
well. If an item is too easy, too difficult, failing to show a difference between skilled and
unskilled examinees, or even scored incorrectly, an item analysis will reveal it. The two most
common statistics reported in an item analysis are the item difficulty, which is a measure of the
proportion of examinees who responded to an item correctly, and the item discrimination, which
is a measure of how well the item discriminates between examinees who are knowledgeable in
the content area and those who are not.
24
Eximia JournalVol. 1, 19-50, April, 2021
ISSN: 2784-0735www.eximiajournal.com

Item Difficulty index (pJ) is the level of question difficulty affects test validity. If the
exam is merely composed of difficult or easy questions, the distinction among the applicants
cannot be determined clearly. The exam is expected to have an intermediate level of difficulty
and this level helps determine the distinction among the applicants. Also, it is used for internal
consistency formula.
It is denoted as;
𝑝j = 𝑛(𝐷)
𝑁
𝑛(𝐷) : The number of participants that true answered item
𝑁 : The number of all participants that take exam
Evaluation of Item Difficulty Index
Item Difficulty Index Item Difficulty Level
Close to 1.00 easy
About 0.50 medium
Close to 0.00 difficult
For example, consider an exam with 20 participants that contains multiple choice
questions. If a question had 9/20 test takers answer it correctly, this would then result in an Item
Difficulty Index (pj) of 0.45, which would then classify this question as Medium Difficulty. If
a question, on the other hand, had 19/20 test takers answer it correctly, this would result in a pj
of 0.9, which would classify it as an Easy Difficulty question.
Item Discrimination Index (r) is the efficiency of test questions in determining the
distinction among the applicants. It expresses the relationship between the overall score and
single question scores. It is a measure of how well an item is able to distinguish between
examinees who are knowledgeable and those who are not, or between masters and non-masters.
Item discrimination efficiency is to be high for test reliability. When an item is discriminating
negatively, overall, the most knowledgeable examinees are getting the item wrong and the least
knowledgeable examinees are getting the item right. A negative discrimination index may
indicate that the item is measuring something other than what the rest of the test is measuring.
More often, it is a sign that the item has been mis keyed.
When interpreting the value of a discrimination it is important to be aware that there is
a relationship between an item's difficulty index and its discrimination index. If an item has a
very high (or very low) p-value, the potential value of the discrimination index will be much
less than if the item has a mid-range p-value. In other words, if an item is either very easy or
very hard, it is not likely to be very discriminating.
There are over twenty discrimination indices used as indicators of the item’s
discrimination effectiveness such as the index of discrimination ( D ), Henryson discrimination
index (rjx), the point-biserial correlation coefficient ( rpbis ), biserial correlation coefficient ( rbis
), etc..
25
Eximia JournalVol. 1, 19-50, April, 2021
ISSN: 2784-0735www.eximiajournal.com
Evaluation of Item Discrimination Index
Item Discrimination Index Item Discrimination Level
0.4 and above very well
0,30 - 0,39 reasonable
0,20 - 0,29 should be corrected
0,19 and below very poor, remove from test
Some of the statistical formulas are given below.
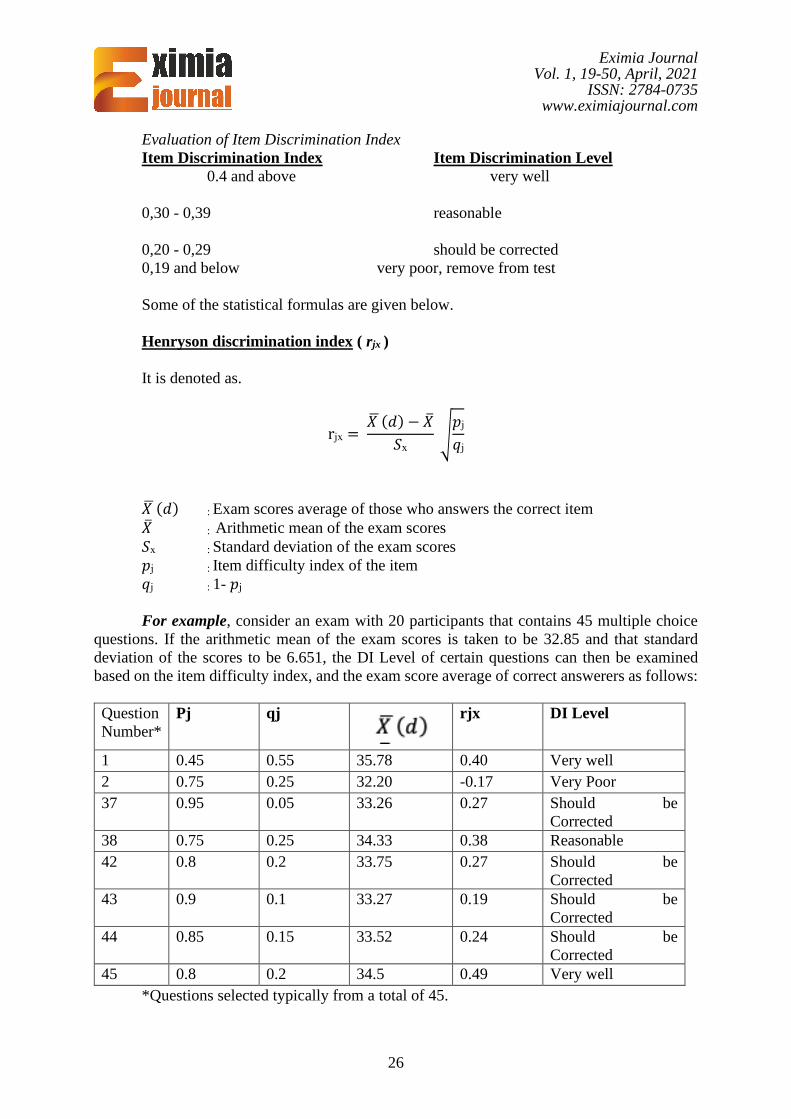
Henryson discrimination index ( rjx )
It is denoted as.
rjx = 𝑋 (𝑑) − ��
𝑆x √
𝑝j
𝑞j
𝑋 (𝑑) : Exam scores average of those who answers the correct item
�� : Arithmetic mean of the exam scores
𝑆x : Standard deviation of the exam scores
𝑝j : Item difficulty index of the item
𝑞j : 1- 𝑝j
For example, consider an exam with 20 participants that contains 45 multiple choice
questions. If the arithmetic mean of the exam scores is taken to be 32.85 and that standard
deviation of the scores to be 6.651, the DI Level of certain questions can then be examined
based on the item difficulty index, and the exam score average of correct answerers as follows:
Question
Number*
Pj qj
rjx DI Level
1 0.45 0.55 35.78 0.40 Very well
2 0.75 0.25 32.20 -0.17 Very Poor
37 0.95 0.05 33.26 0.27 Should be
Corrected
38 0.75 0.25 34.33 0.38 Reasonable
42 0.8 0.2 33.75 0.27 Should be
Corrected
43 0.9 0.1 33.27 0.19 Should be
Corrected
44 0.85 0.15 33.52 0.24 Should be
Corrected
45 0.8 0.2 34.5 0.49 Very well
*Questions selected typically from a total of 45.
26
Eximia JournalVol. 1, 19-50, April, 2021
ISSN: 2784-0735www.eximiajournal.com

Index of discrimination ( D )
While calculating the discrimination index according to the Simple Method, the
respondents are divided into two groups as lower and upper groups according to the method. In
this method, first, the total scores are calculated according to the results obtained from the
measurement tool and ranked from the highest to the lowest. The 27% group with the highest
success is taken as the upper group and the 27% group with the lowest success is taken as the
subgroup. The remaining 46% group is excluded from the calculation.
It is denoted as.
𝐷 = 𝑃𝑢 − 𝑃𝑙
𝑃𝑢 : the proportion in the upper group who get the item right
𝑃𝑙 : the proportion in the lower group who get the item right
For example, consider an exam with 20 participants that contains multiple choice
questions. If a question had 67% of the upper group getting it correct (Pu = 0.67) and 33% of
the lower group getting it correct (Pl = 0.33) the Item Discrimination Index would be 0.33 which
would classify the discrimination as reasonable. Meanwhile if both the upper and lower groups
all got the question correct (Pu = Pl = 1) this would result in an Item Discrimination Index of 0
and imply that said item discriminates very poorly.
Point-biserial Correlation Coefficient ( 𝒓𝒑𝒃𝒊𝒔 )
Point biserial in the context of an exam is a way of measuring the consistency of the
relationship between a candidate’s overall exam mark (a continuous variable – i.e. anywhere
from 0-100%) and a candidate’s item mark (a dichotomous variable i.e. with only two possible
outcomes). It gives an indication of how strong or weak this correlation is compared to the other
items in that exam. In other words, does the way candidates answer that item help to indicate
whether they are strong or weak candidates?
It is denoted as;
𝑟𝑝𝑏𝑖𝑠 = 𝑀1 − 𝑀0
𝑆𝑛 √𝑝𝑞
𝑀1 : mean (for the entire test) of the group that received
the positive binary variable (i.e. the “1”).
𝑀0 : mean (for the entire test) of the group that received
the negative binary variable (i.e. the “0”).
𝑆𝑛 : standard deviation for the entire test.
𝑝 : item difficulty index
𝑞 : (1 – 𝑝 )
27
Eximia JournalVol. 1, 19-50, April, 2021
ISSN: 2784-0735www.eximiajournal.com

For example, consider an exam with 20 participants that contains 45 multiple choice
questions. If the arithmetic mean of the exam scores is taken to be 32.85 and that standard
deviation of the scores to be 6.651, the DI Level of certain questions can then be examined
based on the item difficulty index, the mean of the group of test takers that answered correctly,
and the mean of test takers that answered incorrectly, as follows:
Question
Number*
Pj qj
rpbis DI Level
1 0.45 0.55 35.78 30.45 0.40 Very well
2 0.75 0.25 32.20 34.80 -0.17 Very Poor
3 0.45 0.55 35.78 30.45 0.40 Very well
25 0.75 0.25 34.33 28.4 0.38 Reasonable
26 0.85 0.15 33.23 30.66 0.136 Very Poor
27 0.65 0.35 34.76 29.28 0.39 Very well
37 0.95 0.05 33.26 25 0.27 Should be
Corrected
38 0.75 0.25 34.33 28.4 0.38 Reasonable
*Questions selected typically from a total of 45.
Biserial Correlation Coefficient ( 𝒓𝒃𝒊𝒔 )
It is almost the same as point biserial correlation, but one of the variables is dichotomous
ordinal data and has an underlying continuity.
It is denoted as.
𝑟𝑏𝑖𝑠 =(𝑀1 − 𝑀0)(
𝑝𝑞
𝑌)
𝑆𝑛
𝑀1 : mean (for the entire test) of the group that received
the positive binary variable (i.e. the “1”).
𝑀0 : mean (for the entire test) of the group that received
the negative binary variable (i.e. the “0”).
𝑆𝑛 : standard deviation for the entire test.
𝑝 : item difficulty index
𝑞 : (1 – 𝑝 )
Y : Y ordinate of the normal distribution corresponding to the p value.
Using item analysis on essay types questions
Personnel certification bodies may want to evaluate their candidates by various types of
questions like essay type, modified essay type, short answer type and multiple-choice questions.
Among these questions Multiple Choice Questions (MCQ) are very common and preferred type
questions used in exams due to the efficiency and reliability of scoring and simplicity of
analysis.
28
Eximia JournalVol. 1, 19-50, April, 2021
ISSN: 2784-0735www.eximiajournal.com
One of the most common tools used for assessment of knowledge is the essay questions.
Their evaluations depend upon test and item analysis which is consisting of analysis of
individual questions and analysis of the whole test. Although this activity is more precisely
could be done in objective type questions also it can apply to essay type, structured essay type,
and short answer questions.
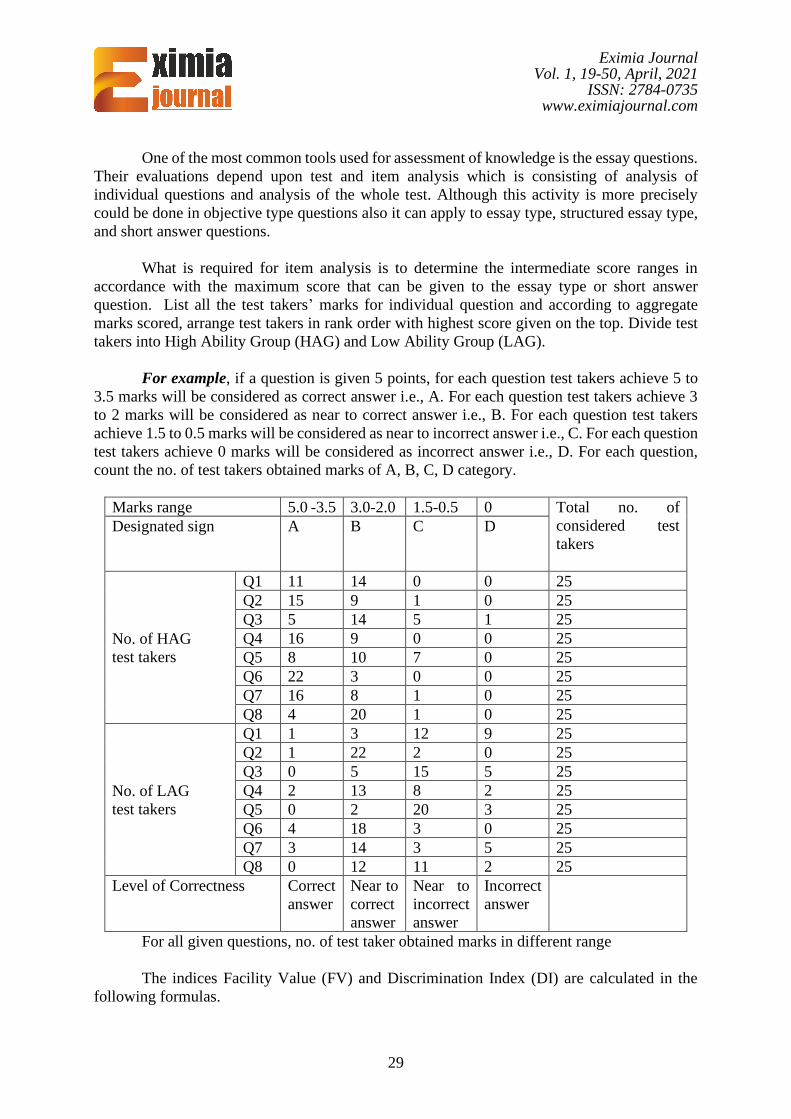
What is required for item analysis is to determine the intermediate score ranges in
accordance with the maximum score that can be given to the essay type or short answer
question. List all the test takers’ marks for individual question and according to aggregate
marks scored, arrange test takers in rank order with highest score given on the top. Divide test
takers into High Ability Group (HAG) and Low Ability Group (LAG).
For example, if a question is given 5 points, for each question test takers achieve 5 to
3.5 marks will be considered as correct answer i.e., A. For each question test takers achieve 3
to 2 marks will be considered as near to correct answer i.e., B. For each question test takers
achieve 1.5 to 0.5 marks will be considered as near to incorrect answer i.e., C. For each question
test takers achieve 0 marks will be considered as incorrect answer i.e., D. For each question,
count the no. of test takers obtained marks of A, B, C, D category.
Marks range 5.0 -3.5 3.0-2.0 1.5-0.5 0 Total no. of
considered test
takers
Designated sign A B C D
No. of HAG
test takers
Q1 11 14 0 0 25
Q2 15 9 1 0 25
Q3 5 14 5 1 25
Q4 16 9 0 0 25
Q5 8 10 7 0 25
Q6 22 3 0 0 25
Q7 16 8 1 0 25
Q8 4 20 1 0 25
No. of LAG
test takers
Q1 1 3 12 9 25
Q2 1 22 2 0 25
Q3 0 5 15 5 25
Q4 2 13 8 2 25
Q5 0 2 20 3 25
Q6 4 18 3 0 25
Q7 3 14 3 5 25
Q8 0 12 11 2 25
Level of Correctness Correct
answer
Near to
correct
answer
Near to
incorrect
answer
Incorrect
answer
For all given questions, no. of test taker obtained marks in different range
The indices Facility Value (FV) and Discrimination Index (DI) are calculated in the
following formulas.
29
Eximia JournalVol. 1, 19-50, April, 2021
ISSN: 2784-0735www.eximiajournal.com

Facility Value (FV): It is number in the group answering a question right. Facility value
is a measure of how easy or how difficult a question which is given to test takers, so it is also
called as Difficulty Index. Higher the FV, easier is the question.
It is denoted as.
𝐹𝑉 = 𝐻𝐴𝐺 + 𝐿𝐴𝐺
𝑁 × 100
𝐻𝐴𝐺 : Higher ability group
𝐿𝐴𝐺 : Lower ability group
𝑁 : Total no. of considered test takers
FV value is expressed in percentage. Its range is 0-100. Its recommended value is 45-
60 and its acceptable value is 25-75.
Discrimination Index (DI): This index indicates the ability of a question to discriminate
between a higher and a lower ability student.
It is denoted as;
𝐷𝐼 = 2 × (𝐻𝐴𝐺 − 𝐿𝐴𝐺)
𝑁
DI value is expressed in as a fraction. Its range is 0-1.0.
Its maximum value is 1.0, which indicates an ideal question with perfect discrimination
between HAG and LAG. Its value could extend from -1.00 to + 1.00. This minus value is called
as negative discrimination which means that more test takers in the lower group are answering
that item correctly than test takers in the higher group.
Recommended value is > 0.25
Acceptable with revision is 0.15 - 0.25
Discard the question < 0.15
These item analysis helps in detecting specific technical flaws in the questions and
provide information for improvement. It also increases the skill of examiners in item writing.
No clear-cut guidelines in formulating item analysis. However, regular exercise over this
analysis would contribute to personnel certification body in formulation of appropriate
questions.
Step 3. Develop the exam
After the job analysis survey is evaluated, the results are used to develop valid
certification exams. Specifications for certification exams are based on the results of the job
analysis and reflect how often a task, knowledge, skill, or ability is needed in practice and how
much impact it has on effective job performance.
30
Eximia JournalVol. 1, 19-50, April, 2021
ISSN: 2784-0735www.eximiajournal.com
Step 4. Establish the passing (cut) score
The cut score is defined as the minimum score required to pass an exam. Defining the
cut score required for certification is one of the most important but difficult aspects of the
validation process.
Setting the passing (cut) score of an exam
Standard setting is the process used to select a passing score for an exam. Of all the steps
in the test development process, the standard setting phase may be the one most like art, rather
than science; while statistical methods are often used in conducting a standard setting, the
process is also greatly impacted by judgment and policy.
The passing score (also known as the passing point, the cutoff score, or the cut-score) is
used to classify examinees as either masters or non-masters. An examinee's score must be equal
to or greater than the passing point, in order for that examinee to be classified as a master, or to
pass the test. If an examinee is misclassified, that is referred to as a classification error.
Typically, the passing score is set at a score point on the exam that the judges determine
reflects the minimum level of competency to protect the public from harm or to provide minimal
competency at the occupational level being assessed. For the standard setting to be conducted
successfully, the panel of judges should be carefully selected and then thoroughly prepared and
trained to their task.
There are a number of approaches to standard setting, including: informed judgment,
conjectural, and contrasting groups methods. All of these methods require the insight of a
representative panel of competent practitioners, representing appropriate demographics and
experience, ranging from those who have recently entered the profession to those who have
competently practiced for many years.
Methods for standard setting
Types of Classification Error: The passing score for a test should be set in accordance
with the purposes of the exam and considering relative risks to the public from incompetent
practice. It should not be set arbitrarily, but rather should be carefully determined by a panel of
judges who are familiar with the content of the exam as well as the characteristics of the
occupation concerned.
Two types of classification error can occur when the passing score is applied.
One type of misclassification is termed a false-positive (i.e., an error of acceptance). An
example of a false-positive error would be an examinee who was not minimally competent, but
who passed the test.
The second type of misclassification is termed a false-negative (i.e., an error of
rejection). In this type of misclassification, an examinee who actually has the level of
competence fails the test.
31
Eximia JournalVol. 1, 19-50, April, 2021
ISSN: 2784-0735www.eximiajournal.com

Depending upon the nature of the exam program, one of these types of errors may be
far more problematic than the other. Awareness of these potential consequences may be used
to influence the determination of the final passing score, after the panel of judges has made their
recommendation. Policy makers at the exam program may adjust that recommended passing
point based on other factors, possibly including operational test score data when it becomes
available.
Informed Judgment Method: The informed judgment method is a test-based approach.
A panel of judges, or stakeholders, reviews the overall test and its content. Based on their
holistic reviews, the judges then each suggest a percentage of items on the test that he or she
believes ought to be correctly answered by a minimally competent examinee. This percent-
correct score on the total test can be viewed as the individual judges' recommended passing
score. Once you have these recommended passing scores from the panel you can use them,
perhaps along with additional information, to set the final passing score. The informed judgment
method might be difficult to rationally defend when it is used in isolation. However, it may be
a very appropriate method for use in combination with other methods, particularly the
contrasting groups method.
Conjectural (Modified Angoff) Method: The modified Angoff method is the most
commonly used of the conjectural methods, all of which are item-based approaches to standard
setting. A panel of judges is assembled and is asked to review the test, one item at a time. For
each item, each judge gives an estimate of the probability that a minimally competent examinee
would be likely to respond correctly. (Alternatively, the judges may be asked to imagine a
hypothetical group of minimally competent examinees and then to indicate the percentage of
that group who would be likely to respond to the given item correctly.) When judges are not in
agreement regarding the pass/fail standard, those with disparate ratings are given the
opportunity to explain their rankings, with the voting process repeated, building consensus.
Typically, one or more additional rounds of review are undertaken. These passing scores are
then averaged across the individual judges to arrive at the full panel's recommended final
passing score.
Contrasting Groups Method: The contrasting groups method is an examinee-based
approach to standard setting. This method in particular requires that the panel of judges be
highly familiar with the target test population. The panel of judges identifies a set of examinees
who are clearly non-masters and another set of examinees who are clearly masters; borderline
examinees are not included. It is especially important that the non-masters be carefully selected.
While these non-master examinees would not yet be considered minimally competent in the
occupational area, they should nevertheless be members of the target test population. If, instead,
the examinees who are identified as non-masters are completely unknowledgeable in the exam's
content area, the passing score may be set at an artificially low point. After the two groups of
examinees have been identified, they are then administered the test. The two resulting test score
frequency distributions are plotted on the same continuum. The passing score can be set at the
intersection point of the two distributions; or, alternatively, the final passing score can be
adjusted somewhat, based on the relative cost of false-positive and false-negative classification
errors. While the contrasting groups method can be used independently, it may also be used as
a complement to the informed judgment or other standard setting method.
32
Eximia JournalVol. 1, 19-50, April, 2021
ISSN: 2784-0735www.eximiajournal.com

For example, consider an exam with 20 participants that contains 45 multiple choice
questions. A list can be created, including the descending order of scores of experienced test
takers (pictured in blue, below) and the ascending order of scores of other test takers (pictured
in orange below).
Notice that the lists intersect at a score of 31, which can then be used as a cut off score.
Test reliability
Test Reliability is an index of the consistency of scores produced by the test, with a
higher value being desirable. A value of 1.0 indicates a perfectly reliable test. A value of 0.0
indicates the test essentially produces random scores
The test measures what it claims to measure consistently or reliably. This means that if
a person were to take the test again, the person would get a similar test score.
Reliability refers to how dependably or consistently a test measures a characteristic. If
a person takes the test again, will he or she get a similar test score, or a much different score?
A test that yields similar scores for a person who repeats the test is said to measure a
characteristic reliably.
How do we account for an individual who does not get exactly the same test score every
time he or she takes the test? Some possible reasons are the following:
▪ Test taker’s temporary psychological or physical state. Test performance can be
influenced by a person’s psychological or physical state at the time of testing. For example,
differing levels of anxiety, fatigue, or motivation may affect the applicant’s test results.
▪ Environmental factors. Differences in the testing environment, such as room
temperature, lighting, noise, or even the test administrator, can influence an individual’s test
performance.
▪ Test form. When tests are administered on multiple dates, for security reasons
additional forms of the test may be necessary. It is expected that test forms will be revised at
least annually. Test forms must be assembled to the same “test blueprint.” Different forms of
44 43 42 43
38
33 3331 30 29
20
24 25
2830 31 31 31
33
38
1 2 3 4 5 6 7 8 9 10
Test
Tak
er
Sco
re
33
Eximia JournalVol. 1, 19-50, April, 2021
ISSN: 2784-0735www.eximiajournal.com
a test are known as parallel forms or alternate forms. These forms are designed to have similar
measurement characteristics, but they contain different items. Because the forms are not exactly
the same, a test taker might do better on one form than on another.
▪ Multiple raters. In certain tests, scoring is determined by a rater’s judgments of the
test taker’s performance or responses. Differences in training, experience, and frame of
reference among raters can produce different test scores for the test taker.
These factors are sources of chance or random measurement error in the assessment
process. If there were no random errors of measurement, the individual would get the same test
score. The degree to which test scores are unaffected by measurement errors is an indication of
the reliability of the test.
Types of reliability estimates
There are several types of reliability estimates, each influenced by different sources of
measurement error. The acceptable level of reliability will differ depending on the type of test
and the reliability estimate used.
1. Test-retest reliability indicates the repeatability of test scores with the passage of
time. This estimate also reflects the stability of the characteristic or construct being measured
by the test. For constructs that are expected to vary over time, an acceptable test-retest reliability
coefficient may be lower than is suggested in table.1
2. Alternate or parallel form reliability indicates how consistent test scores are likely
to be if a person takes two or more forms of a test. A high parallel form reliability coefficient
indicates that the different forms of the test are very similar which means that it makes virtually
no difference which version of the test a person takes. On the other hand, a low parallel form
reliability coefficient suggests that the different forms are probably not comparable; they may
be measuring different things and therefore cannot be used interchangeably.
3. Inter-rater reliability applies most often to examinations which through examiners
(vs. objective multiple-choice examinations). Inter-rater reliability indicates how consistent test
scores are likely to be if the test is scored by two or more raters. On some tests, raters evaluate
responses to questions and determine the score. Differences in judgments among raters are
likely to produce variations in test scores. A high inter-rater reliability coefficient indicates that
the judgment process is stable, and the resulting scores are reliable. Inter-rater reliability
coefficients are typically lower than other types of reliability estimates. However, it is possible
to obtain higher levels of inter-rater reliabilities if raters are appropriately trained.
4. Internal consistency reliability indicates the extent to which items on a test measure
the same thing. A high internal consistency reliability coefficient for a test indicates that the
items on the test are very similar to each other in content (homogeneous). It is important to note
that the length of a test can affect internal consistency reliability. For example, a very lengthy
test can spuriously inflate the reliability coefficient.
34
Eximia JournalVol. 1, 19-50, April, 2021
ISSN: 2784-0735www.eximiajournal.com

Interpretation of reliability
The reliability of a test is indicated by the reliability coefficient. It is denoted by the
letter “r,” and is expressed as a number ranging between 0 and 1.00, with r = 0 indicating no
reliability, and r = 1.00 indicating perfect reliability.
Generally, you will see the reliability of a test as a decimal, for example, r = .80 or r =
.93. The larger the reliability coefficient, the more repeatable or reliable the test scores.
General Guidelines for Interpreting Reliability Coefficients
Reliability Coefficient Value Interpretation
.90 and up excellent
.80 - .89 good
.70 - .79 adequate
below .70 may have limited applicability
One measure of reliability used is Cronbach’s Alpha. This is the general form of the
more commonly reported KR-20 and can be applied to tests composed of items with different
numbers of points given for different response alternatives. When coefficient alpha is applied
to tests in which each item has only one correct answer and all correct answers are worth the
same number of points, the resulting coefficient is identical to KR-20.
Estimates of test reliability are only meaningful when there are a sufficient number of
examinations administered, typically requiring data from at least 100 candidates. While newly
formed certification bodies may not have access to sufficient data to estimate reliability, it is
expected that more mature programs will estimate and consider statistical reliability in their
validation process.
Kuder-Richardson method
Kuder-Richardson Formula 20, or KR-20, is a measure reliability for a test with binary
variables (i.e. answers that are right or wrong). Reliability refers to how consistent the results
from the test are, or how well the test is actually measuring what you want it to measure.
The KR20 is used for items that have varying difficulty. For example, some items might
be very easy, others more challenging. It should only be used if there is a correct answer for
each question — it shouldn’t be used for questions with partial credit is possible or for scales
like the Likert Scale.
KR20 Scores: The scores for KR-20 range from 0 to 1, where 0 is no reliability and 1
is perfect reliability. The closer the score is to 1, the more reliable the test.
It is denoted as.
𝐾𝑅20 = [𝑛
𝑛 − 1] . [
1 − Σ(𝑝. 𝑞)
𝑉𝑎𝑟]
35
Eximia JournalVol. 1, 19-50, April, 2021
ISSN: 2784-0735www.eximiajournal.com

𝑛 : sample size for the test
𝑝 : proportion of people passing the item
𝑞 : proportion of people failing the item
𝑉𝑎𝑟 : variance for the test
Σ : sum up (add up). In other words, multiple Each question’s p by q, and then
add them all up. If you have 10 items, you’ll multiply p.q ten times, then you’ll add those ten
items up to get a total.
KR21 Scores: If all questions in your binary test are equally challenging, use the KR-
21.
It is denoted as.
𝐾𝑅21 = [𝑛
𝑛 − 1] . [
1 − (𝑀. (𝑛 − 𝑀)
𝑛. 𝑉𝑎𝑟]
𝑛 : sample size for the test
𝑉𝑎𝑟 : variance for the test
𝑀 : mean score for the test
For example, consider an exam with 20 participants that contains 45 multiple choice
questions. Since all questions in this situation are equally challenging, we would choose to use
the KR-21 score. If however, we take the summation of the product of people passing and failing
each item to be 8.0325 and the Variance to be 42.0275, we could deduce the KR20 score for
this exam to be -0.17, further verifying it is incorrect to use KR-20 in this scenario. Knowing
that that mean is 32.85, we could then deduce the KR-21 score to be 0.5299, indicating average
reliability of the test.
Cronbach’s Alpha: measures reliability, or internal consistency. If you have a test with
more than two answer possibilities (or opportunities for partial credit), use Cronbach’s Alpha
instead. Cronbach’s alpha is used to see if multiple-question Likert scale surveys are reliable.
It is denoted as.
𝛼 = 𝑘
(𝑘 − 1)[1 −
Σ𝜎𝑗2
𝜎𝑇2 ]
𝑘 : the number of items on the test
Σ𝜎𝑗2 : the sum of the j item score variances
𝜎𝑇2 : the variance of the total test scores
For example, consider an exam with 20 participants that contains 14 questions with
more than two answer possibilities (or opportunities for partial credit). If the sum of the j item
score variances is taken to be 42.9 and the variance of the total test scores is 161.4, Cronbach’s
Alpha can be calculated to be 0.7907, which would indicate adequate to good reliability.
36
Eximia JournalVol. 1, 19-50, April, 2021
ISSN: 2784-0735www.eximiajournal.com
Test validity
Validity tells you if the characteristic being measured by a test is related to job
qualifications and requirements for entry-level, competent practitioners. Validity gives meaning
to the test scores. Validity evidence indicates that there is linkage between test performance and
job performance.
It is important to understand the differences between reliability and validity. Validity
will tell you how good a test is for a particular situation; reliability will tell you how trustworthy
a score on that test will be. You should be careful that any test you select is both reliable and
valid for your situation.
Methods for conducting test validation studies
The validity of a certification examination requires analysis of the entire process,
including the supporting research for the examination (job analysis and scheme-development)
as well as the security and integrity of the process for administering and scoring examinations.
A wholistic-approach is necessary. Because of the diversity of facets which impact validity,
statistical indicators of validity of an examination are rarely employed but may be useful.
Broad constructs for analyses for certification examinations are often defined as “face
validity”, “criterion-related validity”, “content-related validity” and “construct-related
validity.” The simplest of these is “face validity” – whether or not the examination appears (to
examination candidates) to relate to important elements of professional practice. This is a
qualitative metric which is important for public acceptance and reputation of the examination.
The remaining constructs include quantitative metrics.
1- Criterion-related validation requires demonstration of a correlation or other
statistical relationship between test performance and job performance. In other words,
individuals who score high on the test tend to perform better on the job than those who score
low on the test. If the criterion is obtained at the same time the test is given, it is called
concurrent validity; if the criterion is obtained at a later time, it is called predictive validity.
The criterion-related validity of a test is measured by the validity coefficient. It is
reported as a number between 0 and 1.00 that indicates the magnitude of the relationship, “r,”
between the test and a measure of job performance (criterion). The larger the validity
coefficient, the more confidence you can have in predictions made from the test scores.
However, a single test can never fully predict job performance because success on the job
depends on so many varied factors. Therefore, validity coefficients, unlike reliability
coefficients, rarely exceed r = .40.
It is denoted as.
𝐶𝑜𝑟𝑟𝑒𝑙 (𝑋, 𝑌) = Σ (𝑥 − ��)(𝑦 − ��)
√Σ (𝑥 − ��)2Σ(𝑦 − ��)2
𝑥 : Exam score of test taker in group 1
�� : Arithmetic mean of the exam scores of group 1
𝑦 : Exam score of test taker in group 2
37
Eximia JournalVol. 1, 19-50, April, 2021
ISSN: 2784-0735www.eximiajournal.com
�� : Arithmetic mean of the exam scores of group 2
As a general rule, the higher the validity coefficient the more beneficial it is to use the
test. Validity coefficients of r=.21 to r=.35 are typical for a single test.
For example, consider an exam that contains 45 multiple choice questions with two
exam groups of 20 participants each. If we take the square of the summation of the difference
of individual scores to the mean score to be 840.55 in group 1 and 779.2 in group 2, and also
take the summation of their products to be 792.4, we can derive a correlation of 0.98 which is
incredibly beneficial.
General Guidelines for Interpreting Validity Coefficients
Validity coefficient value Interpretation
above .35 very beneficial
.21 - .35 likely to be useful
.11 - .20 depends on circumstances
below .11 unlikely to be useful
2- Content-related validation is a non-statistical type of validity and requires a
demonstration that the content of the test represents important job-related behaviors. In other
words, test items should be relevant to and measure directly important requirements and
qualifications for the job.
3- Construct-related validation requires a demonstration that the test measures the
construct or characteristic it claims to measure, and that this characteristic is important to
successful performance on the job.
Professionally developed tests should come with reports on validity evidence, including
detailed explanations of how validation studies were conducted. If you develop your own tests
or procedures, you will need to conduct your own validation studies.
Standard error of measurement (SEM)
All examinations are imperfect measures of professional competency. It is important
that certification bodies are aware of this and use available statistics to estimate the level of
error when this is possible. For traditional multiple-choice examinations, a statistical estimate
of this error is called the “Standard Error of Measurement” (SEM). The SEM is comparable to
the statistical estimate “Uncertainty of Measurement” (MU) which is estimated by product-
testing laboratories (ISO/IEC 17025).
SEM provides an estimate of the margin of error that you should expect in an individual
test score because of imperfect reliability of the test.
The SEM represents the degree of confidence that a person’s “true” score lies within a
particular range of scores. For example, an SEM of “2" indicates that a test taker’s “true” score
probably lies within 2 points in either direction of the score he or she receives on the test. This
means that if an individual receives a 91 on the test, there is a good chance that the person’s
“true” score lies somewhere between 89 and 93.
38
Eximia JournalVol. 1, 19-50, April, 2021
ISSN: 2784-0735www.eximiajournal.com

The SEM is a useful measure of the accuracy of individual test scores. The smaller the
SEM, the more accurate the measurements.
It is denoted as.
𝑆𝐸𝑀 = 𝑆𝐷√(1 − 𝑟𝑥𝑥)
SD : standard Deviation of tests scores
𝑟𝑥𝑥 : the reliability or precision of the test
𝑟𝑥𝑥 = 𝑆𝑇
2
𝑆𝑋2
𝑆𝑇2 : variance of the true scores.
𝑆𝑋2 : variance of the observed scores
We use the SEM to calculate confidence Intervals around obtained scores.
68 % CI = Score ± SEM
95 % CI = Score ± (1.96*SEM)
99 % CI = Score ± (2.58*SEM)
For example, consider an exam with 20 participants that contains 45 multiple choice
questions. If we take the standard deviation of the scores to be 6.65128 and the reliability of the
test to be 0.52988, we can then calculate the standard error of measurement to be 4.6. This
would imply that the true score would be raw score ± 4.6 for score in 68% Cl, raw score ± 9.02
for score in 95% Cl, and raw score ± 11.87 for raw score in 99% Cl.
39
Eximia JournalVol. 1, 19-50, April, 2021
ISSN: 2784-0735www.eximiajournal.com
Annex 1
Statistical Terms and Definitions that need to know
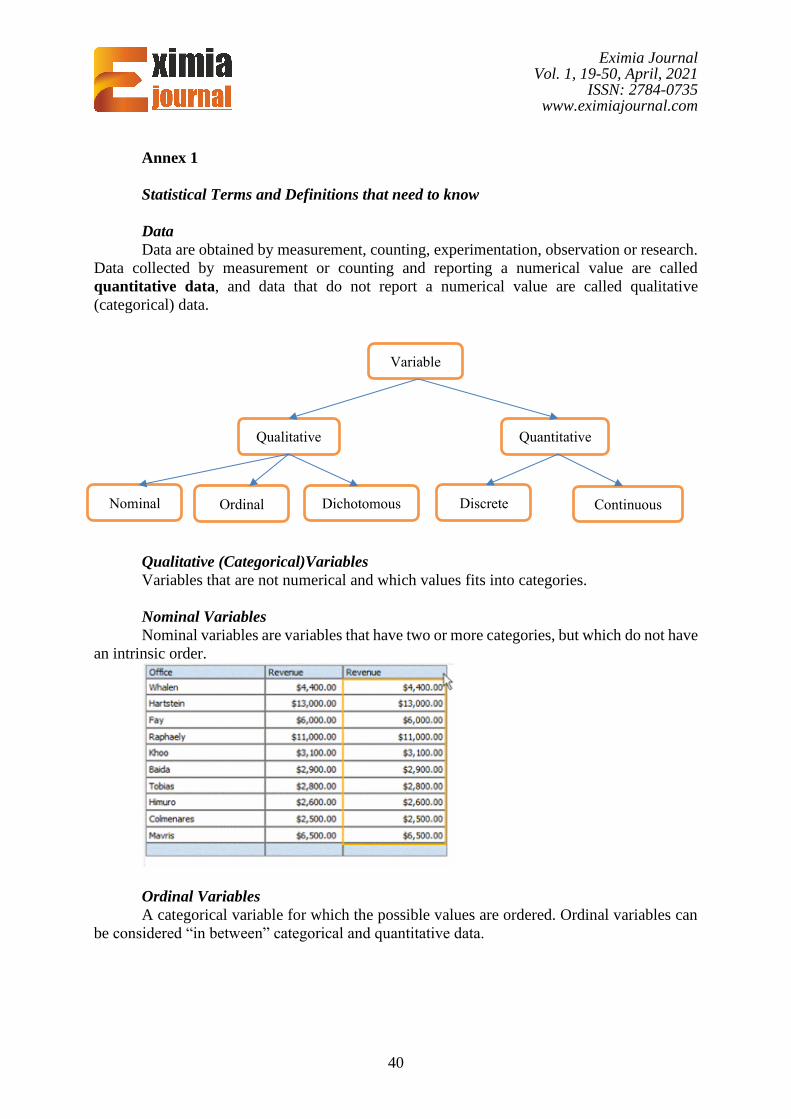
Data
Data are obtained by measurement, counting, experimentation, observation or research.
Data collected by measurement or counting and reporting a numerical value are called
quantitative data, and data that do not report a numerical value are called qualitative
(categorical) data.
Qualitative (Categorical)Variables
Variables that are not numerical and which values fits into categories.
Nominal Variables
Nominal variables are variables that have two or more categories, but which do not have
an intrinsic order.
Ordinal Variables
A categorical variable for which the possible values are ordered. Ordinal variables can
be considered “in between” categorical and quantitative data.
Variable
Qualitative Quantitative
Dichotomous Ordinal Nominal Discrete Continuous
40
Eximia JournalVol. 1, 19-50, April, 2021
ISSN: 2784-0735www.eximiajournal.com

Dichotomous Variables
Dichotomous variables are nominal variables which have only two categories or levels.
. Having only two possible values, e.g. “0/1, "Yes/No", "True/False" etc.
Quantitative Variables
A variable that reflects a notion of magnitude, that is, if the values it can take
are numbers. A quantitative variable represents thus a measure and is numerical.
Discrete Variables
Variables for which the values it can take are countable and have a finite number of
possibilities. The values are often (but not always) integers.
Continuous Variables
Variables for which the values are not countable and have an infinite number of
possibilities.
P.S. Misleading data encoding
In datasets it is very often the case that numbers are used for qualitative variables. For
instance, a person doing statistical analyze may assign the number “0” to the answer “False”
and “1” to the answer “True. Despite the numerical classification, the variable answer is still
a qualitative variable and not a discrete variable as it may look. The numerical classification
is only used to facilitate data collection and data management.
Median
The value separating the higher half from the lower half of a data sample
41
Eximia JournalVol. 1, 19-50, April, 2021
ISSN: 2784-0735www.eximiajournal.com
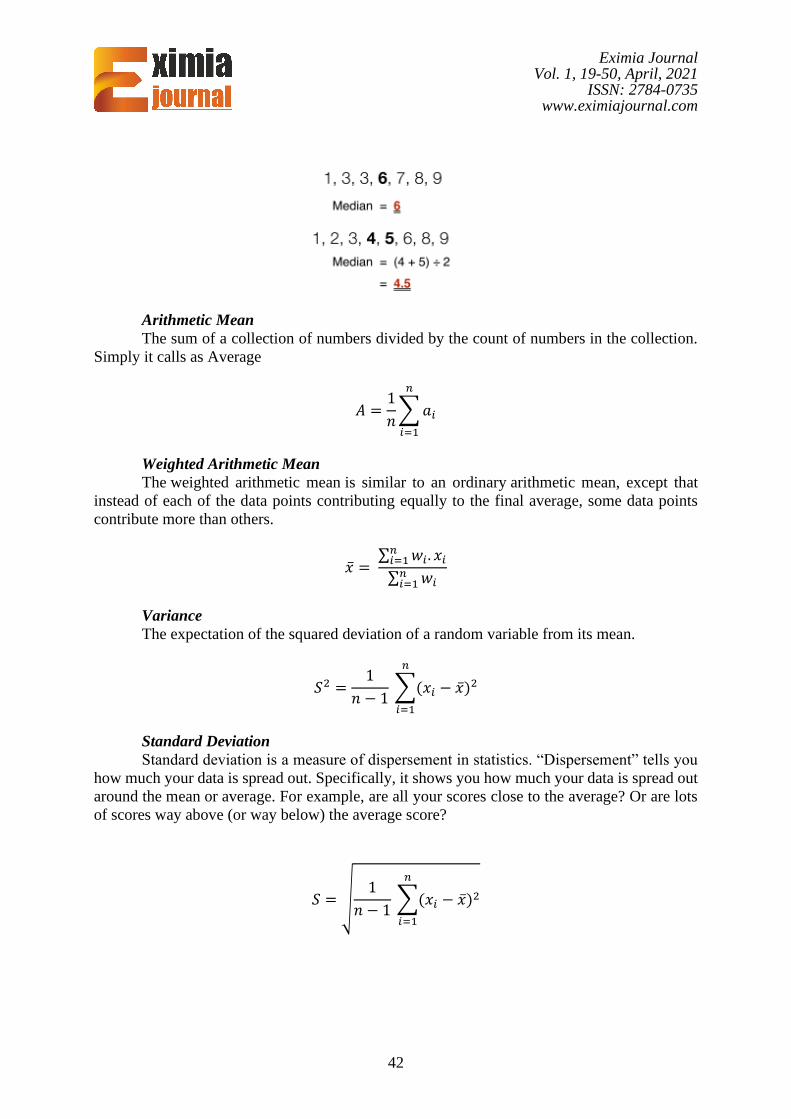
Arithmetic Mean
The sum of a collection of numbers divided by the count of numbers in the collection.
Simply it calls as Average
𝐴 =1
𝑛∑ 𝑎𝑖
𝑛
𝑖=1
Weighted Arithmetic Mean
The weighted arithmetic mean is similar to an ordinary arithmetic mean, except that
instead of each of the data points contributing equally to the final average, some data points
contribute more than others.
�� = ∑ 𝑤𝑖 . 𝑥𝑖
𝑛𝑖=1
∑ 𝑤𝑖𝑛𝑖=1
Variance
The expectation of the squared deviation of a random variable from its mean.
𝑆2 =1
𝑛 − 1 ∑(𝑥𝑖 − ��)2
𝑛
𝑖=1
Standard Deviation
Standard deviation is a measure of dispersement in statistics. “Dispersement” tells you
how much your data is spread out. Specifically, it shows you how much your data is spread out
around the mean or average. For example, are all your scores close to the average? Or are lots
of scores way above (or way below) the average score?
𝑆 = √1
𝑛 − 1 ∑(𝑥𝑖 − ��)2
𝑛
𝑖=1
42
Eximia JournalVol. 1, 19-50, April, 2021
ISSN: 2784-0735www.eximiajournal.com

Covariance
A measure of the joint variability of two random variables. In other words, a measure
of how much two random variables vary together. It’s similar to variance, but where variance
tells you how a single variable varies, co variance tells you how two variables vary together.
𝐶(𝑋, 𝑌) =∑ (𝑥𝑖 − ��). (𝑦𝑖 − ��)𝑛
𝑖=1
𝑛 − 1
Correlation
Correlation is a statistical technique that measures the relationship between two
variables, such as X and Y, in terms of the units of measurement results for these variables.
Correlation Coefficient that can be used according to variable types
Variable Y/X Quantitative X Ordinal X Nominal X
Quantitative Y Pearson r Biserial rbis Point Biserial rpbis
Ordinal Y Biserial rbis Spearman rho/Tetrachoric rtet Rank Biserial rrbis
Nominal Y Point Biserial rpbis Rank Biserial rrbis Phi, L, C, Lambda
Pearson Product Moment Correlation Coefficient (PPMC)
Correlation between sets of data is a measure of how well they are related. It shows the
linear relationship between two sets of data. In simple terms, it answers the question, Can I draw
a line graph to represent the data?
𝑟(𝑋, 𝑌) = 𝑛. ∑ 𝑥𝑖 . 𝑦𝑖 − (∑ 𝑥𝑖). (∑ 𝑦𝑖)
𝑛𝑖=1
𝑛𝑖=1
𝑛𝑖=1
√[𝑛. ∑ 𝑥𝑖𝑛𝑖=1 − (∑ 𝑥𝑖
𝑛𝑖=1 )2]. [𝑛. ∑ 𝑦𝚤
𝑛𝑖=1 − (∑ 𝑦𝑖
𝑛𝑖=1 )2]
Point Biserial Correlation Coefficient (rpbis)
Is a special case of Pearson in which one variable is quantitative and the other variable
is dichotomous and nominal. The calculations simplify since typically the values 1 (presence)
and 0 (absence) are used for the dichotomous variable.
𝑟𝑝𝑏𝑖𝑠 = ��1 − ��0
𝑆𝑋 √𝑝𝑞
Phi Correlation Coefficient (𝝋)
A measure of association for two binary variables. is used for contingency tables when:
• At least one variable is a nominal variable.
• Both variables are dichotomous variables.
Y/X 0 1 Totals
1 A B A+B
43
Eximia JournalVol. 1, 19-50, April, 2021
ISSN: 2784-0735www.eximiajournal.com
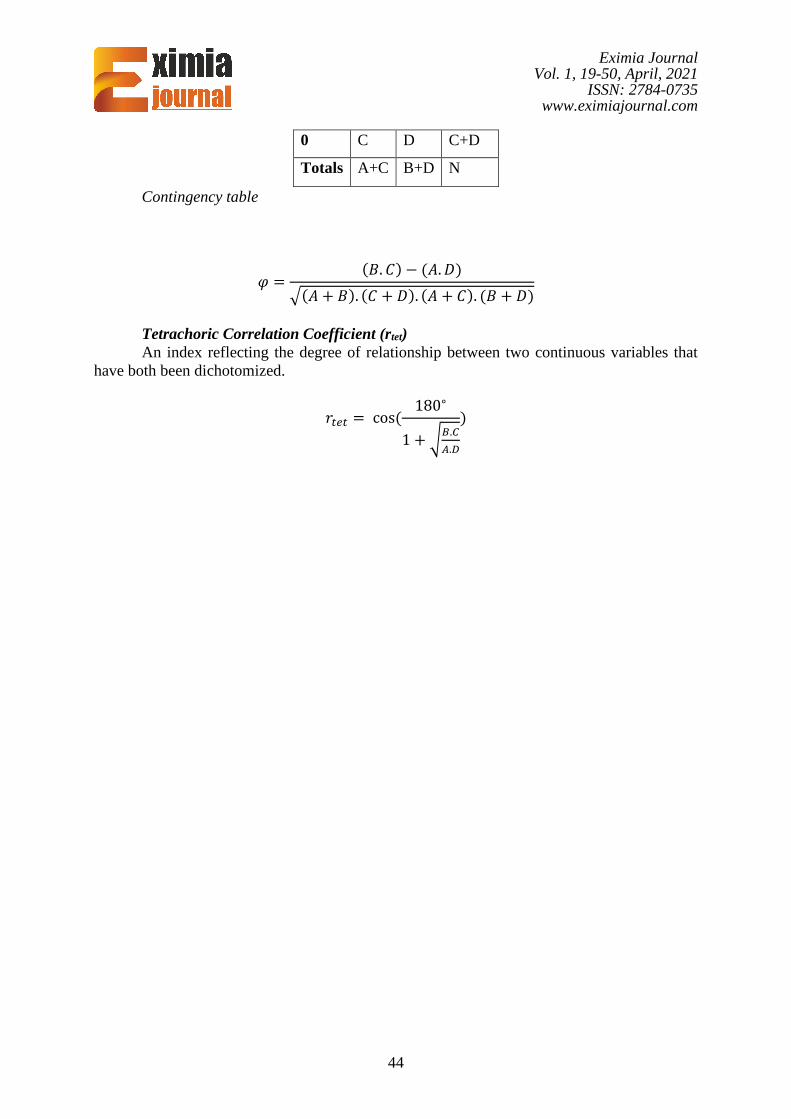
0 C D C+D
Totals A+C B+D N
Contingency table
𝜑 =(𝐵. 𝐶) − (𝐴. 𝐷)
√(𝐴 + 𝐵). (𝐶 + 𝐷). (𝐴 + 𝐶). (𝐵 + 𝐷)
Tetrachoric Correlation Coefficient (rtet)
An index reflecting the degree of relationship between two continuous variables that
have both been dichotomized.
𝑟𝑡𝑒𝑡 = cos(180∘
1 + √𝐵.𝐶
𝐴.𝐷
)
44
Eximia JournalVol. 1, 19-50, April, 2021
ISSN: 2784-0735www.eximiajournal.com
Annex 2
Classical Test Theory
Classical Test Theory (CTT), sometimes called the true score model, is the mathematics
behind creating and answering tests and measurement scales. The goal of CTT is to improve
tests, particularly the reliability and validity of tests.
Reliability implies consistency: if you take any test five times, you should get roughly
the same results every time. A test is valid if it measures what it’s supposed to.
True Scores
Classical Test Theory assumes that each person has an innate true score. It can be
summed up with an equation:
X = T + E
Where:
X is an observed score,
T is the true score,
E is random error.
For example, let’s assume you know exactly 70% of all the material covered in a
statistics course. This is your true score (T); A perfect end-of-semester test (which doesn’t exist)
should ideally reflect this true score. In reality, you’re likely to score around 65% to 75%. The
5% discrepancy from your true score is the error (E).
The errors are assumed to be normally distributed with a mean of zero; Hypothetically,
if you took the test an infinite number of times, your observed score should equal your true
score.
Statistics Used in Classical Test Theory
Is your test measuring what it’s supposed to?
Classical test theory is a collection of many statistics, including the average score, item
difficulty, and the test’s reliability.
1.Correlation
Correlation: shows how two variables X and Y are related to each other. Different
measures are used for different test types. For example, a dichotomously scored test (e.g. yes/no
answers) would be correlated with point-biserial correlation while a polytomously scored test
(one with multiple answers) would be scored with the Pearson Correlation Coefficient.
2. Covariance
45
Eximia JournalVol. 1, 19-50, April, 2021
ISSN: 2784-0735www.eximiajournal.com

Covariance is a measure of how much two random variables vary together. It’s similar
to variance, but where variance tells you how a single variable varies, co variance tells you
how two variables vary together.
3. Discrimination Index
Discrimination Index: the ability of the test to discriminate between different levels of
learning or other concept of interest. A high discrimination index indicates the test is able to
differentiate between levels.
4. Item difficulty
Item difficulty: a measure of individual test question difficulty. It is the proportion of
test takers who answered correctly out of the total number of test takers. For example, an item
difficulty score of 89/100 means that out of 100 people, 89 answered correctly.
5. Reliability Coefficient
Reliability coefficient — a measure of how well the test measures achievement. Several
methods exist for calculating the coefficient include test-retest, parallel or alternate-form and
internal analysis. Rules of thumb for preferred levels of the coefficient:
For high stakes tests (e.g. college admissions), > 0.85.
For low stakes tests (e.g. classroom assessment), > 0.70.
6. Sample Variance / Standard Deviation
The sample variance and sample standard deviation are measures of how spread out the
scores are.
7. Standard Error of Measurement
Standard Error of Measurement (SEM): a measure of how much measured test scores
are spread around a “true” score.
Reference:
Stephanie Glen. "Classical Test Theory: Definition" From StatisticsHowTo.com
46
Eximia JournalVol. 1, 19-50, April, 2021
ISSN: 2784-0735www.eximiajournal.com
Annex 3
Item Response Theory (IRT)
Item response Theory (IRT) is a way to analyze responses to tests or questionnaires with
the goal of improving measurement accuracy and reliability. If you want your test to actually
measure what it is supposed to measure (i.e. mathematical ability, a student’s reading ability or
historical knowledge), IRT is one way to develop your tests.
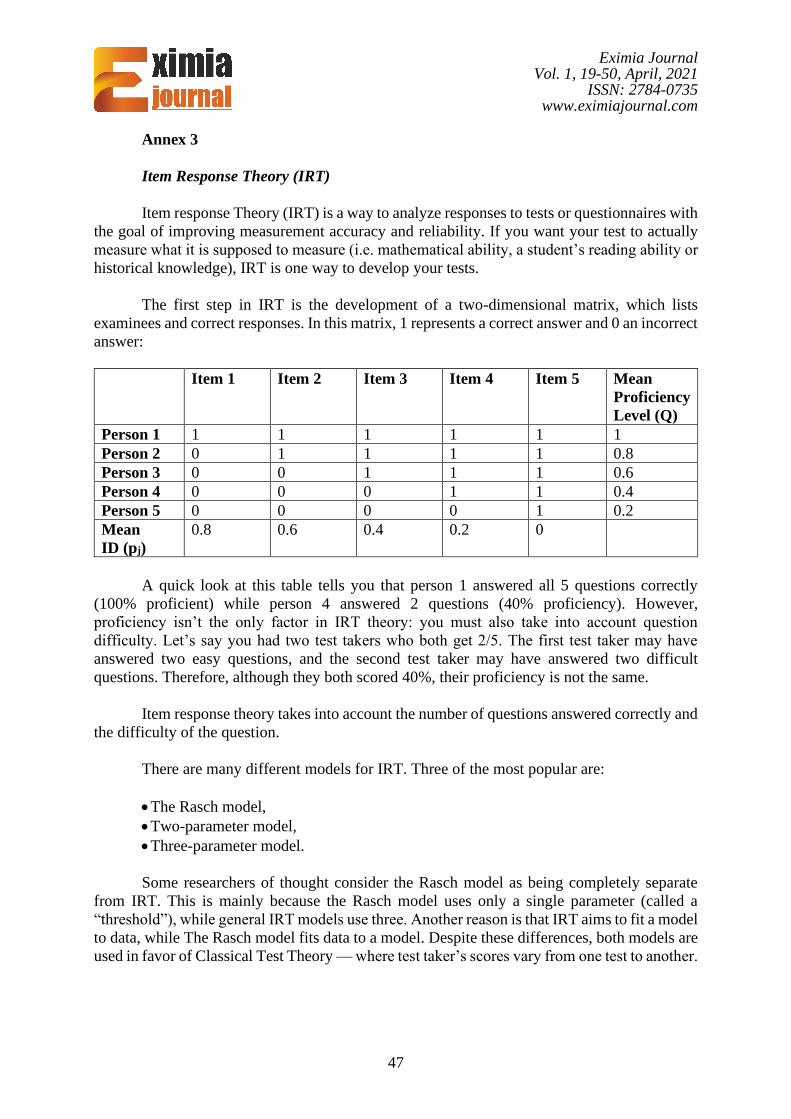
The first step in IRT is the development of a two-dimensional matrix, which lists
examinees and correct responses. In this matrix, 1 represents a correct answer and 0 an incorrect
answer:
Item 1 Item 2 Item 3 Item 4 Item 5 Mean
Proficiency
Level (Q)
Person 1 1 1 1 1 1 1
Person 2 0 1 1 1 1 0.8
Person 3 0 0 1 1 1 0.6
Person 4 0 0 0 1 1 0.4
Person 5 0 0 0 0 1 0.2
Mean
ID (pj)
0.8 0.6 0.4 0.2 0
A quick look at this table tells you that person 1 answered all 5 questions correctly
(100% proficient) while person 4 answered 2 questions (40% proficiency). However,
proficiency isn’t the only factor in IRT theory: you must also take into account question
difficulty. Let’s say you had two test takers who both get 2/5. The first test taker may have
answered two easy questions, and the second test taker may have answered two difficult
questions. Therefore, although they both scored 40%, their proficiency is not the same.
Item response theory takes into account the number of questions answered correctly and
the difficulty of the question.
There are many different models for IRT. Three of the most popular are:
• The Rasch model,
• Two-parameter model,
• Three-parameter model.
Some researchers of thought consider the Rasch model as being completely separate
from IRT. This is mainly because the Rasch model uses only a single parameter (called a
“threshold”), while general IRT models use three. Another reason is that IRT aims to fit a model
to data, while The Rasch model fits data to a model. Despite these differences, both models are
used in favor of Classical Test Theory — where test taker’s scores vary from one test to another.
47
Eximia JournalVol. 1, 19-50, April, 2021
ISSN: 2784-0735www.eximiajournal.com
Reference.
Stephanie Glen. "Item Response Theory: Simple Definition"
From StatisticsHowTo.com
The Rasch model
In item response theory, a model in which only one parameter, item difficulty, is
specified. This is thought to be a parsimonious way to describe the relation between an item
response and an underlying dimension and is thus preferred in some cases. Also called one-
parameter model.
Two-parameter model
In item response theory, a model that specifies two parameters affecting an individual’s
response to a particular test item: (a) the difficulty level of the item and (b) the item
discriminability.
Three-parameter model
In item response theory, a model that specifies three parameters affecting an individual’s
response to a particular test item: (a) the difficulty level of the item; (b) the discriminating
power of the item; and (c) in multiple-choice items, the effect of guessing. The probability of a
correct response to the item is held to be a mathematical function of these parameters.
Anchor test
A set of test items used as a reference point in comparing alternate forms of a test. One
alternate form is administered to one group of participants, another is administered to a different
group, and the items comprising the anchor test are administered to both groups. Scores on each
alternate form are then compared with scores on the anchor test.
48
Eximia JournalVol. 1, 19-50, April, 2021
ISSN: 2784-0735www.eximiajournal.com

Annex 4
Scheme Validation Process Flow Chart
Scheme analysis
Scheme Technical Committee (STC) with the support of specialized experts/consultants
proceed in a competence analysis. Scheme competences are documented. STC experts 18
5.2 Evaluation of academic/training requirements
STC members evaluate any applicable academic/training requirements of the
certification scheme according to all applicable (market/legal/statutory/normative) scheme
requirements.
5.3 Evaluation of experience requirements
STC members evaluate any applicable experience requirements of the certification
scheme according to all applicable (market/legal/statutory/normative) scheme requirements.
5.4 Evaluation of certification maintenance/recertification requirements
STC members evaluate any applicable certification maintenance/recertification
requirements of the certification scheme according to all applicable
(market/legal/statutory/normative) scheme requirements.
5.5 Selection and development of tests
Specialized experts/consultants evaluate the scheme analysis information
(competencies requirements) and determine the knowledge, skills and abilities and the methods
for their measurement.
5.6 Set cutting scores and review final test
STC experts review the test item-by-item. They select the correct answer, they are told
the keyed answer, and they are asked what percent of qualified candidates would pass each
item. The STC experts judge which, if any, of the knowledge, skills, or abilities is measured by
the tests. This is also their final review of the total test before it is printed. The detailed Scheme
Validation Procedure (modified Angoff model) is provided at the end of this document.
5.7 Edit, compose and print tests
Examination Department edits, composes, and prints (if required) the tests.
5.8 Writing of content validation report
Quality Assurance Manager writes a content-related validation report. The STC reviews
a draft and the final report detailing the activities undertaken is then is provided to Certification
Manager for approval and back to Quality Assurance Manager for inclusion to the Management
Review agenda.
49
Eximia JournalVol. 1, 19-50, April, 2021
ISSN: 2784-0735www.eximiajournal.com
Annex 4
References
The following list of reference material provides sources of information on specific
topics and issues relating to personnel testing and assessment. The main text has referred and
quoted to many of the publications listed below:
[1] Gathering, analyzing, and using data on test items, 1971, Henryson, S. in R.
L. Thorndike;
[2] How to Set Cutoff Scores for Knowledge Tests Used in Promotion, Training,
Certification, and Licensing, 1993, Richard E. Biddle;
[3] Testing and Assessment: An Employer’s Guide to Good Practices, 1999, U.S.
Department of Labor Employment and Training Administration;
[4] Validating Your Certification Exam, 2000, Association of Boards of
Certification;
[5] Comparison of Several Popular Discrimination Indices Based on Different
Criteria and Their Application in Item Analysis, 2008, Fu Liu;
[6] Setting the Passing Score of an Exam, 2018, Dr. George J. Anastasopoulos;
[7] Distractor Analysis Based on Item Difficulty Index and Item Discrimination
Index, 2019, Burcu Hasançebi, Yuksel Terzi, Zafer Küçük;
[8] Test Quality, Professional Testing Inc.;
[9] StatisticsHowTo.com;
[10] ISO/IEC 17024:2012 Conformity assessment — General requirements for
bodies operating certification of persons;
[11] ISO/IEC TS 17024:2014 Conformity assessment – Vocabulary related to
competence of persons used for certification of persons;
[12] AERA/APA/NCME The standards for educational and psychological testing,
2014.
50
Eximia JournalVol. 1, 19-50, April, 2021
ISSN: 2784-0735www.eximiajournal.com