Estimation of the diesel exhaust exposures of railroad workers: II. National and historical...
10
American Journal of Industrial Medicine 13:395-404 (1988) Estimation of the Diesel Exhaust Exposures of Railroad Workers: II. National and Historical Exposures Susan R. Woskie, MS, Thomas J. Smith, PhD, S. Katharine Hammond, PhD, Marc 6. Schenker, MD, MPH, Eric Garshick, MD, MOH, and Frank E. Speizer, MD ~ ~ ~ The diesel exhaust exposures of railroad workers in thirteen job groups from four railroads in the United States were used to estimate U.S. national average exposures with a linear statistical model which accounts for the significant variability in exposure caused by climate, the differences among railroads and the uneven distribution of railroad workers across climatic regions. Personal measurements of respirable particu- late matter, adjusted to remove the contribution of cigarette smoke particles, were used as a marker for diesel exhaust. The estimated national means of adjusted respirable particulate matter (ARP) averaged 10 pg/m3 lower than the simple means for each job group, reflecting the climatic differences between the northern railroads studied and the distribution of railroad workers nationally. Limited historical records, including some industrial hygiene data, were used to evaluate past diesel exhaust exposures, which were estimated to be approximately constant from the 1950’s to 1983. Key words: diesel exhaust, occupational exposures, railroad workers INTRODUCTION This exposure assessment was conducted as part of a series of epidemiological studies designed to examine the mortality experience of railroad workers exposed to diesel exhaust. The purpose of this assessment was to provide estimates of long-term diesel exhaust exposure for each of the subjects in the epidemiological studies. This required that we develop a method to generalize the current exposure measurements from selected jobs in a limited number of U.S. railroads to cover the national exposures over time. Department of Environmental Science and Physiology, Harvard School of Public Health, Bos- ton.(S.R.W., T.J.S., S.K.H.). Occupational and Environmental Health Unit, Department of Internal Medicine, University of Califor- nia, Davis (M.B.S.) Channing Laboratory, Department of Medicine, Brigham and Women’s Hospital, Harvard Medical School, Boston (E. G., F.E.S.) Susan R. Woskie, Thomas J. Smith, and S. Katherine Hammond are now at the Department of Family and Community Medicine, Environmental Health Science Program, University of Massachusetts Medi- cal School, Worcester, MA. Address reprint requests to Susan R. Woskie, Department of Family and Community Medicine, Envi- ronmental Health Science Program, University of Massachusetts Medical School, 55 Lake Ave North, Worcester, MA 01605. Accepted for publication September 30, 1987. 0 1988 Alan R. Liss, Inc.
-
Upload
independent -
Category
Documents
-
view
1 -
download
0
Transcript of Estimation of the diesel exhaust exposures of railroad workers: II. National and historical...
American Journal of Industrial Medicine 13:395-404 (1988)
Estimation of the Diesel Exhaust Exposures of Railroad Workers: II. National and Historical Exposures
Susan R. Woskie, MS, Thomas J. Smith, PhD, S. Katharine Hammond, PhD, Marc 6. Schenker, MD, MPH, Eric Garshick, MD, MOH, and Frank E. Speizer, MD
~ ~ ~
The diesel exhaust exposures of railroad workers in thirteen job groups from four railroads in the United States were used to estimate U.S. national average exposures with a linear statistical model which accounts for the significant variability in exposure caused by climate, the differences among railroads and the uneven distribution of railroad workers across climatic regions. Personal measurements of respirable particu- late matter, adjusted to remove the contribution of cigarette smoke particles, were used as a marker for diesel exhaust. The estimated national means of adjusted respirable particulate matter (ARP) averaged 10 pg/m3 lower than the simple means for each job group, reflecting the climatic differences between the northern railroads studied and the distribution of railroad workers nationally. Limited historical records, including some industrial hygiene data, were used to evaluate past diesel exhaust exposures, which were estimated to be approximately constant from the 1950’s to 1983.
Key words: diesel exhaust, occupational exposures, railroad workers
INTRODUCTION
This exposure assessment was conducted as part of a series of epidemiological studies designed to examine the mortality experience of railroad workers exposed to diesel exhaust. The purpose of this assessment was to provide estimates of long-term diesel exhaust exposure for each of the subjects in the epidemiological studies. This required that we develop a method to generalize the current exposure measurements from selected jobs in a limited number of U.S. railroads to cover the national exposures over time.
Department of Environmental Science and Physiology, Harvard School of Public Health, Bos- ton.(S.R.W., T.J.S., S.K.H.). Occupational and Environmental Health Unit, Department of Internal Medicine, University of Califor- nia, Davis (M.B.S.) Channing Laboratory, Department of Medicine, Brigham and Women’s Hospital, Harvard Medical School, Boston (E. G., F.E.S.) Susan R. Woskie, Thomas J. Smith, and S. Katherine Hammond are now at the Department of Family and Community Medicine, Environmental Health Science Program, University of Massachusetts Medi- cal School, Worcester, MA. Address reprint requests to Susan R. Woskie, Department of Family and Community Medicine, Envi- ronmental Health Science Program, University of Massachusetts Medical School, 55 Lake Ave North, Worcester, MA 01605. Accepted for publication September 30, 1987.
0 1988 Alan R. Liss, Inc.
3% Woskie et al.
Railroad jobs across the U.S. national system have similar definitions and work locations, because the definitions have been controlled by company agreements with national labor unions. Since jobs with similar work settings and degrees of contact with sources have similar exposures, it is reasonable that railroad workers in the same job across the nation have similar exposures unless local conditions vary systemati- cally. One of the most important of these local factors is climate. In the first paper of this set, we observed that outdoor temperature had an important effect on indoor exposures of some workers because indoor ventilation was substantially affected by opening or closing the windows and doors. A similar outdoor temperature effect has been observed by Eisen and et al [1984], who used an analysis of variance to determine its magnitude. A significant temperature effect could modify the exposures of railroad workers in various climatic regions of the United States, and must be considered when extrapolating national average exposures from data obtained on railroads in only one part of the country.
In addition, there may be other factors that make significant differences in the exposures of railroad jobs across the U.S. national system. For example, each railroad company could use somewhat different equipment, fuels, maintenance procedures or facility designs. These may affect both concentration (source output and work area accumulation) and composition of air contaminants. However, Eisen et al. [ 19841 observed that even when there were significant differences in average concentration among companies, the relative differences among the jobs was retained, that high exposure jobs remained high and low exposure jobs remained low. This is the pattern to be expected if the source output or work area accumulation varied among the work sites, without changing the job definitions. Thus, even if average locomotive emis- sions or facility designhentilation varied among the railroads, it would not alter the exposure gradient observed among the jobs. Since it was not possible to measure or identify all the factors affecting the exposure concentration at each railroad in the U.S. system, these factors were treated as a source of random variability in the job exposures. The overall exposure variation in a job was estimated by an equal weighting of the exposure means and variability found among the four railroads we evaluated.
MATERIALS AND METHODS
The companion paper describes the collection and use of personal respirable particulate samples adjusted to remove cigarette smoke contamination (ARP), as a marker to estimate the approximate level of exposure to diesel exhaust for 13 job groups from four northern U.S. railroads. In this paper, we use a linear statistical model to estimate a national mean exposure for each job group, accounting for the differences in climate across the U.S. and the variability of exposures among rail- roads. This model also accounted for the uneven distribution of railroad workers across the climate regions of the United States. The details of the method for calculating the mean and standard error are given in the Appendix but will be summarized here. First, the arithmetic mean exposures for each job group at each railroad and each weather condition (“cold” or “warm”) were calculated. The random variability seen among each railroad was assumed to contribute equally to the warm and cold weather exposure estimates. The mean job group exposures for each railroad in each weather condition were equally weighted to estimate the average job
National and Historic Exposures of Rail Workers 397
MID- MID- NORTH NORTH SOUTH
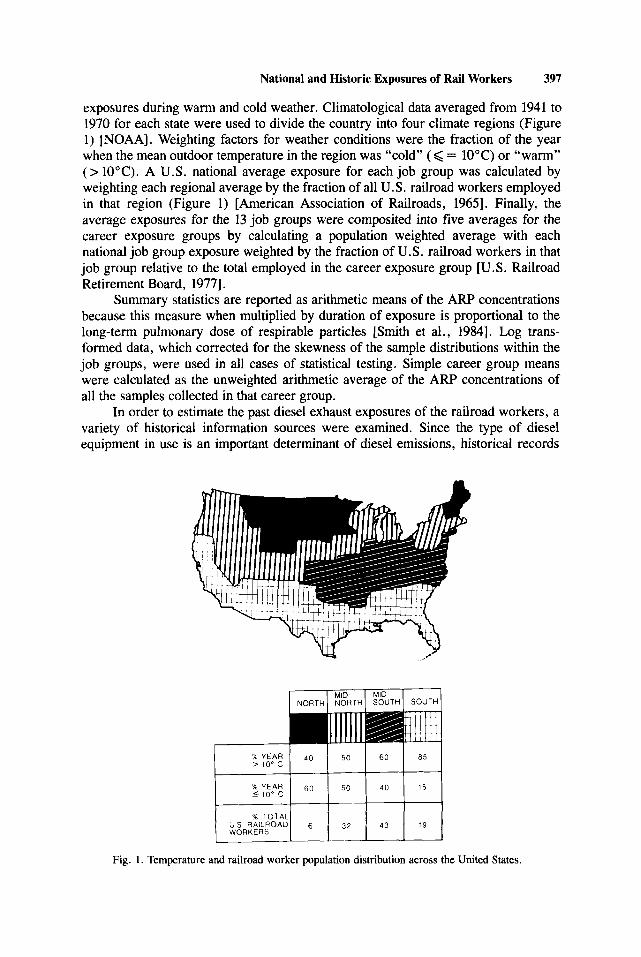
exposures during warm and cold weather. Climatological data averaged from 1941 to 1970 for each state were used to divide the country into four climate regions (Figure 1) [NOAA]. Weighting factors for weather conditions were the fraction of the year when the mean outdoor temperature in the region was “cold” (< = 10°C) or “warm” (> 10°C). A U.S. national average exposure for each job group was calculated by weighting each regional average by the fraction of all U.S. railroad workers employed in that region (Figure 1) [American Association of Railroads, 19651. Finally, the average exposures for the 13 job groups were composited into five averages for the career exposure groups by calculating a population weighted average with each national job group exposure weighted by the fraction of U.S. railroad workers in that job group relative to the total employed in the career exposure group [U.S. Railroad Retirement Board, 19771.
Summary statistics are reported as arithmetic means of the ARP concentrations because this measure when multiplied by duration of exposure is proportional to the long-term pulmonary dose of respirable particles [Smith et al., 19841. Log trans- formed data, which corrected for the skewness of the sample distributions within the job groups, were used in all cases of statistical testing. Simple career group means were calculated as the unweighted arithmetic average of the ARP concentrations of all the samples collected in that career group.
In order to estimate the past diesel exhaust exposures of the railroad workers, a variety of historical information sources were examined. Since the type of diesel equipment in use is an important determinant of diesel emissions, historical records
SOUTH
z 10“ c 01 c 10” c
Fig. 1. Temperature and railroad worker population distribution across the United States.
398 Woskie et al.
of new locomotive orders [General Motors Corp., 19731 were examined and com- pared to the current rosters of locomotive equipment being used by the study railroads and other larger national railroads [Allen, 19821. Data on historical changes in locomotive repair shop conditions were sought with letters to over 80 state public health and labor departments and the Association of Railroad Industrial Hygienists requesting historical industrial hygiene data from railroad surveys. Replies were received from 38 agencies, with historical industrial hygiene information from only two agencies: Massachusetts Division of Occupational Hygiene and Montana Depart- ment of Health and Environmental Sciences.
Historical exposure conditions were evaluated from data on measured nitrogen dioxide levels and on industry use of shop ventilation. Over time, the railroads have modified the steam locomotive ventilation systems to accommodate the diesel loco- motives or have built new facilities designed specifically for diesels. Historical time periods were assigned to the pre- and post-ventilation measurements by examining the dates and comments accompanying the historical industrial hygiene measurements and by using historical records of repair shop design recommendations [Howson, 1929; Howson, 1942; Howard, 1948; Dick, 1955; American Railway Engineering Association, 19841. These historical engineering manuals, which represent the state of the art at the time of their publication, show the evolution of ventilation controls beginning with simple smoke jacks during the era of steam locomotives and early dieselization (1950’s) and moving toward more local and mechanical exhaust ventila- tion after dieselization had occurred. The historical nitrogen dioxide data for the locomotive repair shops was evaluated over three time periods: pre-ventilation (1950- 1959), early ventilation (1960-1969) and current (1970-1983).
RESULTS
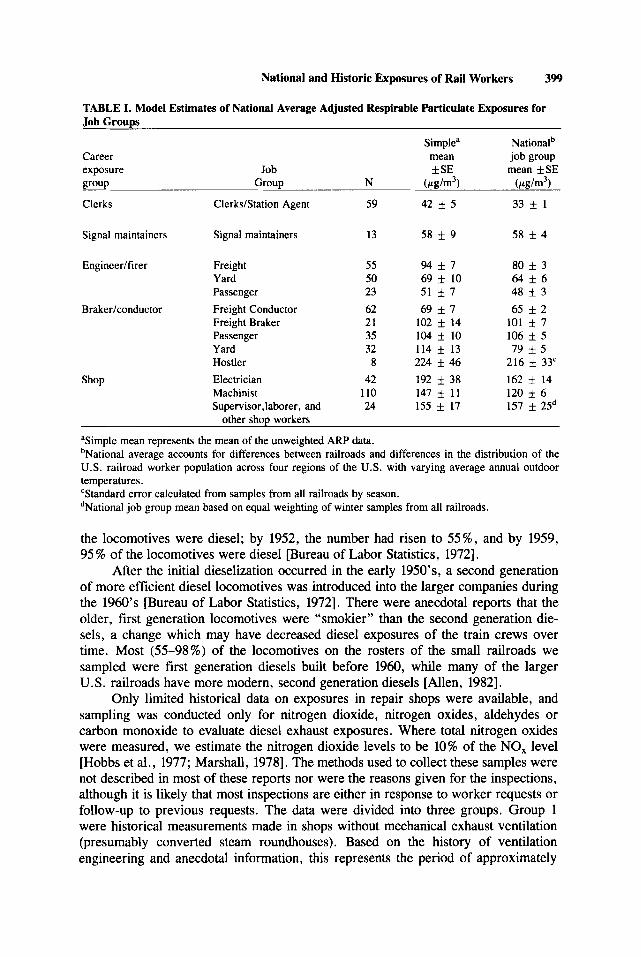
The estimates of the U.S. national mean exposures for the job groups were similar to or lower than the simple arithmetic mean of the samples collected for each job group (Table I). The correction observed in the national estimates was generally small, averaging only 10 pg/m3 for all the job groups. The largest differences were seen for the freight engineedfirers, yard braker/conductors, machinists and electri- cians. Several jobs showed essentially no difference. There was substantial variation in job exposures within the career exposure groupings. For example, the estimated national exposures of engineerdfirers ranged from 48 to 80 pg/m3. The national career group means are, on average, 8 pg/m3 lower than the simple career group means which are calculated as the unweighted average of all the samples collected within a career group (Table II).
A series of Tukey-Kramer multiple comparison tests examined the similarities of the log ARP exposures within each career exposure group. There were no significant differences (p < 0.05) in the exposures of the job group within each career exposure group, with the exception of the freight conductor/hostler compari- son. A single factor ANOVA model using career group as the explanatory variable for the log of the ARP concentration found career group was a significant (p = 0.OOOl) in explaining the variations in ARP exposures (R2 = 0.25).
In examining the history of dieselization, we found that diesel locomotives replaced steam locomotives over a relatively short time period. In 1947, only 14% of
National and Historic Exposures of Rail Workers 399
TABLE I. Model Estimates of National Average Adjusted Respirable Particulate Exposures for Job Groups
Simplea Nationalb Career mean job group exposure Job f SE mean f S E group Group N (pg/m3) (cLg/m3)
Clerks Clerks/Station Agent 59 42 f 5 33 f 1
Signal maintainers Signal maintainers 13 58 f 9 58 f 4
Engineedfirer Freight 55 9 4 + 7 80 f 3 Yard 50 69 f 10 6 4 f 6 Passenger 23 51 * 7 48 f 3
Brakerkonductor Freight Conductor 62 69 f 7 65 f 2 Freight Braker 21 102 f 14 101 * 7 Passenger 35 104 f 10 106 f 5 Yard 32 114 f 13 79 * 5 Hostler 8 224 f 46 216 f 33‘
Shop Electrician 42 192 f 38 162 f 14 Machinist 110 147 f 11 120 f 6 Supervisor,laborer, and 24 155 f 17 157 f 25*
other shop workers
‘Simple mean represents the mean of the unweighted ARP data. bNational average accounts for differences between railroads and differences in the distribution of the U.S. railroad worker population across four regions of the U.S. with varying average annual outdoor temperatures. ‘Standard error calculated from samples from all railroads by season. dNational job group mean based on equal weighting of winter samples from all railroads.
the locomotives were diesel; by 1952, the number had risen to 5 5 % , and by 1959, 95% of the locomotives were diesel [Bureau of Labor Statistics, 19721.
After the initial dieselization occurred in the early 1950’s, a second generation of more efficient diesel locomotives was introduced into the larger companies during the 1960’s [Bureau of Labor Statistics, 19721. There were anecdotal reports that the older, first generation locomotives were “smokier” than the second generation die- sels, a change which may have decreased diesel exposures of the train crews over time. Most (55-98%) of the locomotives on the rosters of the small railroads we sampled were first generation diesels built before 1960, while many of the larger U.S. railroads have more modern, second generation diesels [Allen, 19821.
Only limited historical data on exposures in repair shops were available, and sampling was conducted only for nitrogen dioxide, nitrogen oxides, aldehydes or carbon monoxide to evaluate diesel exhaust exposures. Where total nitrogen oxides were measured, we estimate the nitrogen dioxide levels to be 10% of the NO, level [Hobbs et al., 1977; Marshall, 19781. The methods used to collect these samples were not described in most of these reports nor were the reasons given for the inspections, although it is likely that most inspections are either in response to worker requests or follow-up to previous requests. The data were divided into three groups. Group 1 were historical measurements made in shops without mechanical exhaust ventilation (presumably converted steam roundhouses). Based on the history of ventilation engineering and anecdotal information, this represents the period of approximately
400 Woskie et al.
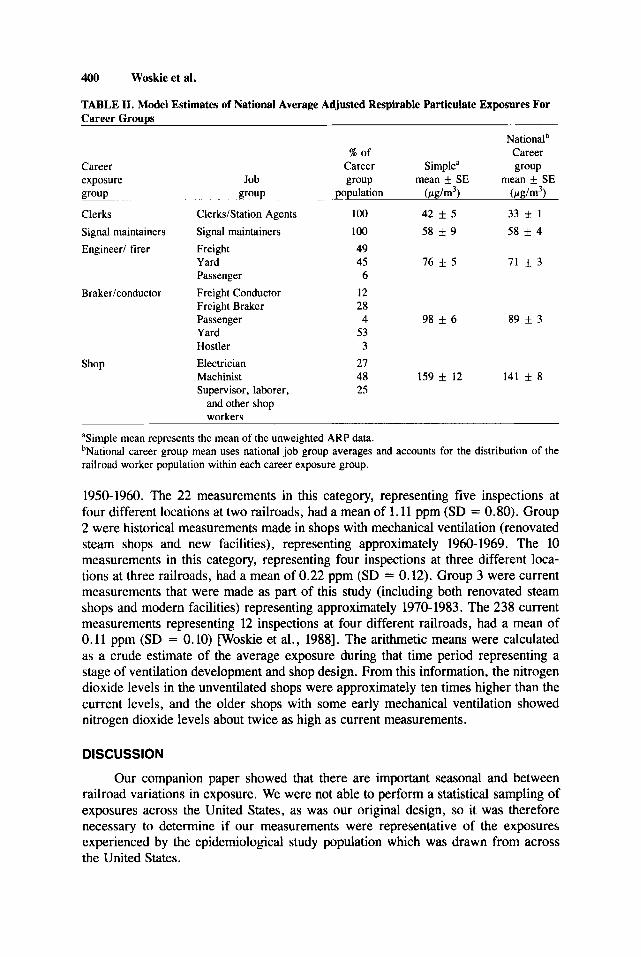
TABLE 11. Model Estimates of National Average Adjusted Respirable Particulate Exposures For Career Groups
Nationalb % of Career
Career Career Simple” group
group.. . . ~~~ group ~~ population (C(g/m3) (pg/n13)
Clerks Clerks/Station Agents 100 42 f 5 33 It 1
Engineer/ firer Freight 49
exposure Job group mean f SE mean f SE
Signal maintainers Signal maintainers 100 58 k 9 58 f 4
Yard 45 76 f 5 71 & 3 Passenger 6
Freight Braker 28 Passenger 4 98 + 6 89 f 3 Yard 53 Hostler 3
Shop Electrician 27 Machinist 48 159 f 12 141 f 8 Supervisor, laborer, 25
Brakericonductor Freight Conductor 12
and other shop workers
aSimple mean represents the mean of the unweighted ARP data. bNational career group mean uses national job group averages and accounts for the distribution of the railroad worker population within each career exposure group.
1950-1960. The 22 measurements in this category, representing five inspections at four different locations at two railroads, had a mean of 1.11 pprn (SD = 0.80). Group 2 were historical measurements made in shops with mechanical ventilation (renovated steam shops and new facilities), representing approximately 1960- 1969. The 10 measurements in this category, representing four inspections at three different loca- tions at three railroads, had a mean of 0.22 ppm (SD = 0.12). Group 3 were current measurements that were made as part of this study (including both renovated steam shops and modern facilities) representing approximately 1970-1983. The 238 current measurements representing 12 inspections at four different railroads, had a mean of 0.11 ppm (SD = 0.10) [Woskie et al., 19881. The arithmetic means were calculated as a crude estimate of the average exposure during that time period representing a stage of ventilation development and shop design. From this information, the nitrogen dioxide levels in the unventilated shops were approximately ten times higher than the current levels, and the older shops with some early mechanical ventilation showed nitrogen dioxide levels about twice as high as current measurements.
DISCUSSION
Our companion paper showed that there are important seasonal and between railroad variations in exposure. We were not able to perform a statistical sampling of exposures across the United States, as was our original design, so it was therefore necessary to determine if our measurements were representative of the exposures experienced by the epidemiological study population which was drawn from across the United States.
National and Historic Exposures of Rail Workers 401
When the variations in exposure due to climate and the regional distribution of railroad workers are taken into account in calculating the national mean exposures, the resulting estimates for the 13 job groups and five career exposure groups are all similar to or lower than the simple arithmetic mean exposures of the job groups. The national estimates are lower than the simple means because the bulk of the U.S. railroad workers (94%) work in regions of the United States that are warmer than the regions where we sampled, and because most of the job groups had lower exposures in the warmer weather. Even so, the average correction observed in the national estimate was only 10 pg/m3 for all the job groups. Larger corrections were seen in the locomotive shop where climatic differences greatly affect building ventilation and hence exposures. The standard error of the national estimates was smaller than that of the raw data because by using the model to control for the variance introduced by the seasons and railroads, we have improved our precision in estimating the mean of the national job groups.
The railroad workers were chosen for an epidemiological study because their jobs entail a range of exposures to diesel exhaust. It is important for the evaluation of possible dose-response relationships that there be groups of workers with significantly different exposure levels. An ANOVA of the log ARP concentrations showed that the career exposure groups were significant in explaining exposure differences. The 95 % confidence intervals (mean & two standard errors) of the national average ARP exposures for the five career groups were: clerks/dispatchers/station agents, 3 1-35 pg/m3; signal maintainers, 50-66 pg/m3; engineerdfirers, 65-77 pg/m3; brakersl conductors, 83-95 pg/m3; and locomotive shop workers, 125-157 pg/m3. The signif- icant difference in exposure between most of the career groups is important because most workers will stay within a single career group throughout their job history.
When we examined the ARP concentrations for the subcategories within the career exposure groups and the job groups, we found that they were not significantly different from each other. Although we suspect that there are differences in exposures within the career groups, they are small enough that more sampling would be needed to resolve them.
Examination of the historical distribution of types of diesel locomotive equip- ment used by the railroads showed that the equipment where our sampling was performed represents the type and age of locomotives used nationally from the 1950’s through the early 1970’s. The four railroads evaluated represent a mixture of equip- ment types and ages, the kind of diversity one might expect across the United States. Unfortunately, there was no way to verify that this mixture is actually representative of the national fleet during the period covered by the study, 1952-1980. In the absence of contradictory data, it is assumed that the national career group exposures for the braker/conductor and engineedfirer groups represent the national average level and variability of exposures that occurred during the period of the epidemiological studies.
Many anecdotes about historical conditions in the diesel repair shops were received during the field surveys. All of these reports cited the “smoky” working conditions during the 1950’s and 1960’s, and that a major reduction in smoke accompanied the improvement of ventilation by the time of our sampling. Although it was not possible to locate sampling data to indicate directly the historical air concentrations of diesel particulate matter, we did find a small amount of data on nitrogen oxide and dioxide levels in the shops. These data qualitatively support the reports of higher exposures in the early years. Since nitrogen oxides are part of diesel
402 Woskie et al.
exhaust emissions, we had hoped to use the historical industrial hygiene data of nitrogen oxide exposures as a roughly proportional indicator of diesel particulate emissions in the past. The data were too limited however, and have too many potential errors to be used for quantitation. Although particulate and nitrogen oxide emissions from diesel engines have a crude proportionality when examined across a range of engine inertial weights [French and Pike, 1981; National Research Council, 19821, fuel types [GM Status Report, 19831, air to fuel ratios and combustion timings [Alkidas and Cole, 19831, these relationships are very complex and not linear across the range of parameter combinations. In addition, this type of research has been done only with samples obtained directly from the exhaust port of an engine, which may not be relevant to the relationship of these operating parameters with emissions in the occupational environment. Also, we do not know the sampling methods used for most of the historical reports, nor how sampling methods used in the past compare to each other, or with the current method used in our study. Thus, although it seems very likely that early diesel exhaust exposures in repair shops were higher than those at present, we cannot say with certainty what the ratios of exposure levels were. Thus we were forced to make the common assumption that current exposures are estimates of past exposures for all of the jobs, despite the evidence that this was reasonable only for the road crews and unexposed groups.
The next step is to use these exposure estimates to describe the exposures received by each of the epidemiological subjects. Assuming a cumulative risk model for carcinogenesis, a railroad worker’s lifetime exposure to diesel exhaust can be described by the cumulative exposure index which is the sum of the average exposure in each job times the duration of the job, summed over all jobs [Eisen et al., 1984; Smith et al., 19841. The development of a model to estimate the cumulative diesel exhaust dose to the lungs of railroad workers will be discussed in a subsequent paper.
ACKNOWLEDGMENTS
This research was supported by Environmental Protection Agency Grant No. R807515010, Individual Research Award ES-05 157 (Schenker) and NHLBI Institu- tional Research Award HL07427 (Garshick). The writers wish to thank Fred Laidlaw, Paul Wennberg, Marilyn Hallock and Nancy Bettinger for their technical assistance during field work, and Ellen Eisen for suggestions on statistical methodology. Also, the authors sincerely thank the four railroads who allowed us access to their facilities; without the cooperation of management and the workers at these locations, this study would not have been possible.
REFERENCES
Alkidas AC, Cole RM (1983): Gaseous and Particulate Emissions from a Single-Cylinder Divided- Chamber Diesel Engine. In Society of Automotive Engineers,: “A Worldwide View of Diesel Combustion Emissions and Analysis P-130.” Warrendale, PA: 1-13.
Allen GF (ed) (1982): “Janes World Railways”. New York: Janes Publishing, pp. 542-589. American Association of Railroads (1965): “Yearbook of Railroad Facts” Washington, D.C., pp. 79. American Railway Engineering Association (1984): “ 1984- I985 Manual for Railway Engineering (Fixed
Bureau of Labor Statistics (1972): “Railroad Technology and Manpower in the 1970’s”. U.S. Depart- Properties)”. Washington, D.C. , pp. 6-4-(1-13).
mcnt of Labor Bulletin 1717. pp 13-17.

National and Historic Exposures of Rail Workers 403
Dick MH (ed) (1955): “Railway Track and Structures Cyclopedia”. New York: Simmons-Boardman,
Eisen EA, Smith TJ, Wegman DH, Louis TA, Froines J (1984): Estimation of long term dust exposures in the Vermont granite sheds. Am J Ind Hyg 45: 89-94.
French CCJ, Pike DA (1981): Diesel Engined, Light Duty Vehicles for an Emission Controlled Environment, In Society of Automotive Engineers: “The Measurement and Control of Diesel Particulate Emissions Part 2”. Warrendale PA. pp. 223-227.
General Motors Corporation (1973): “The locomotive industry and General Motors”. New York: Bar Press.
GM Status Report (1983): Diesel Particulate Emission Control Technology. In: U.S. Department of Transportation (eds): “Workshop on Unregulated Diesel Emissions and Their Potential Health Effects”. (DOT HS-803 527) pp. 183-209.
Hobbs JR, Walter RA, Hand T, Devoe T (1977): “Train generated air contaminants in the train crews working environment”. U.S. Department of Transportation (FRA/ORD-77/08).
Howard ND (ed) (1948): “Railway Engineering and Maintenance Cyclopedia”. Chicago: Simmons- Boardman, pp. 804-834.
Howson ET (ed) (1929): “Railway Engineering and Maintenance Cyclopedia”. Chicago: Simmons- Boardman, pp. 620-628.
Howson ET (ed) (1942): “Railway Engineering and Maintenance Cyclopedia”. Chicago: Simmons- Boardman, pp. 644-652.
Marshall WF (1978): “NO2 levels in diesel exhaust”. U.S. Department of Energy, (BERC/TRP-7811). National Oceanic and Atmospheric Administration (1978): “Climates of the States” Vol. I and 11,
Detroit: Gale Research Co., pp. 1-1185. National Research Council (1982): “Diesel Technology”. Washington, D.C., National Academy Press,
347-349. Smith TJ, Hammond SK, Laidlaw F, Fine S (1984): Respiratory exposures associated with silicon
carbide production: estimation of cumulative exposures for an epidemiological study. Brit J Ind
U.S. Railroad Retirement Board (1977): “Occupational Differences in Seperation Rates for Railroad
Woskie SR, Hammond SK, Smith TJ, Schenker M (1988): Nitrogen dioxide exposures among railroad
pp. 592-604.
Med 41:100-108.
Workers 1971-1974”. Actuarial Study # 12, pp. 8-9.
workers. Am Ind Hyg Assoc J (submitted for publication).
APPENDIX: Calculation of National Means and Standard Errors for Job and Career Groups
Calculation of the national railroad average exposure for each job and career exposure group involved several steps. Each step assumed a linear model of weighted arithmetic means and standard errors (SE).
Step 1 The job group estimate for cold or warm weather was based on an equal weighting of each railroads arithmetic mean exposure during that climate type because we assume that differences among railroads are random and representative of differ- ences in design, ventilation and work practices. A mean exposure for cold weather was calculated for each job group by taking the average cold weather exposure for each railroad (cold (RR)) and weighting it equally (1/4). The same was done for warm weather. For example, see below.
Job Group Cold Weather Mean (jobcold) = Sum (ml+ (0.25 x cold (m))
Job Group Cold Weather SE (SEcold) = Square Root [Sum ( ~ ~ 1 4 ) (0.252 X SE2 (RRcold))]

404 Woskieetal.
Step 2 The regional estimate for each job group average was based on the differences in the annual weather patterns in four regions of the United States. The regional job group average was calculated by weighting the job group cold and warm weather means from step 1 (jobcold; job,,) by the fraction of the year the tempera- ture is cold ( < = 10°C) or warm (> 10°C) in that region (f cold or fwarm).
Regional Job Group Average (bbreg) = t(fcold jobcold) + (fwarm jobwarn)]
Regional Job Group SE (SE,,,) = Sq. Root [(SE’ warm X f ,,,) + (SE2 cold f 2 cold]
Step 3 A national estimate for each job group mean was calculated to account for the distribution of the railroad worker population across the four regions of the United States. The national job group mean was calculated as the sum of the regional job group averages from step 2 (jobreg) weighted by the fraction of the railroad worker population in that region (freg).
Step 4 By using information about the distribution of railroad workers in the job groups that make up a career exposure group, a national career group average can be constructed. For each career group, a national career group mean is calculated from the sum of the national job group means from step 3 (jobna1) weighted by the fraction of workers from the whole career exposure group that make up that job group (fna3.
National Career Group Mean = Sum (natl-n) (fnat X job,aJ National Career Group SE = Sq. Root [Sum (na1l-n) (f “at X SE2 naJI 2