Participatory Forest Management and Environmental Science ...
Upload
khangminh22Category
view
2download
0
Environmental and Social Impact Assessment Forest Landscape Restoration Project
In Cajamarca, Peru 13th December 2021 Prepared for: Arbaro Advisors Prepared by:
Social Capital Group 445 Tacna Street Miraflores, Lima, Peru Tel +51-1 444 1300 / 444 1302 [email protected] www.s-c-g.net

Social Capital Group 1
TABLE OF CONTENTS
1 INTRODUCTION .......................................................................................... 13
2 EXECUTIVE SUMMARY ............................................................................... 14
2.1 PROJECT DESCRIPTION .................................................................................... 14
2.2 LEGAL ANALYSIS .............................................................................................. 14
2.2.1 Most relevant legal aspects for obtaining permits for the execution of forestry projects ....................................................................................... 14
2.2.2 Gap Analysis between IFC Performance Standards and applicable Peruvian legislation for five potential impacts of the Project .................. 15
2.3 ENVIRONMENTAL BASELINE ............................................................................ 15
2.3.1 Delimitation of the area of influence ....................................................... 16
2.3.2 Characterization of Wild Ecosystems ....................................................... 19
2.3.3 Baseline Analysis for the Implementation of the Forestry Project ........... 20
2.3.4 Potential Area of Influence (PAI) .............................................................. 21
2.4 SOCIAL BASELINE ............................................................................................. 22
2.4.1 Methodological design of the study ......................................................... 22
2.4.2 Initial Project Area (IPA) ........................................................................... 22
2.4.3 Potential Area of Influence (PAI) .............................................................. 25
2.5 ENVIRONMENTAL AND SOCIAL IMPACT ASSESSMENT.................................... 32
2.5.1 Social Impact Assessmet .......................................................................... 32
2.5.2 Social impact assessment ......................................................................... 33
2.6 ENVIRONMENTAL AND SOCIAL MANAGEMENT PLAN .................................... 35
2.6.1 Environmental Management Plan ............................................................ 35
2.6.2 Social Management Plan .......................................................................... 36
2.7 CONCLUSIONS AND RECOMMENDATIONS ..................................................... 38
3 LEGAL ANALYSIS ......................................................................................... 41
3.1 MOST RELEVANT LEGAL ASPECTS FOR OBTAINING PERMITS FOR THE DEVELOPMENT OF FLR AND FOREST PRODUCT PROCESSING PROJECTS ........ 41
3.1.1 Obtaining environmental certification in the agricultural sector ............. 41
3.1.2 Prior Consultation with Indigenous or Native Peoples ............................. 42
3.1.3 Obtaining Certificate of Non-existence of Archaeological Remains (CIRA) 43
3.1.4 Forest plantation registration .................................................................. 44
3.1.5 Primary and secondary processing of timber forest products ................. 45

Environmental and Social Impact Assessment of Forest Landscape Restoration Project December 2021
Social Capital Group 2
3.2 GAP ANALYSIS BETWEEN CERTAIN IFC PERFORMANCE STANDARDS AND THE APPLICABLE PERUVIAN LEGISLATION FOR FIVE POTENTIAL IMPACTS OF THE PROJECT ........................................................................................................... 45
3.2.1 Gaps identified ......................................................................................... 46
4 PROJECT DESCRIPTION ............................................................................... 50
4.1 INSTALLATION OF NEW PLANTATIONS, REPLANTING OF HARVESTED AREAS AND MANAGEMENT AND USE OF EXISTING PLANTATIONS ............................ 50
4.1.1 Installation and management of forest nurseries .................................... 51
4.1.2 Opening of forest roads ........................................................................... 52
4.1.3 Installation of new plantations and replanting of harvested areas ......... 53
4.1.4 Maintenance and pruning of plantations ................................................. 54
4.1.5 Thinning of plantations............................................................................. 55
4.1.6 Final felling, extraction of the logs and transport to the sawmill ............. 55
4.2 SAWMILLING AND PROCESSING OF THE ROUNDWOOD PRODUCED.............. 56
5 ENVIRONMENTAL BASELINE ...................................................................... 58
5.1 OBJECTIVES ...................................................................................................... 59
5.2 DELIMITATION OF THE AREA OF INFLUENCE .................................................. 59
5.3 STUDY TOPICS .................................................................................................. 61
5.4 METHODOLOGY............................................................................................... 61
5.4.1 Review of secondary sources ................................................................... 61
5.4.2 Fieldwork .................................................................................................. 62
5.4.3 Description of methodologies for determining environmental factors. .. 62
5.4.4 Description of methodology for determining vegetation cover ............... 65
5.5 INITIAL PROJECT AREA (IPA) ............................................................................ 68
5.5.1 IPA - Yanacocha Mining Company ............................................................ 68
5.5.2 IPA - Sociedad Agraria de Interés Social (SAIS) José Carlos Mariátegui .... 87
5.5.3 IPA - Llullapuquio Agricultural Workers' Cooperative (CAT) ...................105
5.5.4 Characterisation of Wildlife Ecosystems ................................................124
5.5.5 On the implementation of the Forestry Project .....................................132
5.6 POTENTIAL AREA OF INFLUENCE (PAI) ..........................................................134
5.6.1 Hydrology ...............................................................................................134
5.6.2 Increased land use capacity ...................................................................138
5.6.3 Current land use .....................................................................................142
5.6.4 Ecosystems .............................................................................................145

Environmental and Social Impact Assessment of Forest Landscape Restoration Project December 2021
Social Capital Group 3
5.6.5 Natural Protected Areas (NPA) ...............................................................156
6 SOCIAL BASELINE...................................................................................... 159
6.1 METHODOLOGICAL DESIGN OF THE STUDY ..................................................159
6.1.1 Objectives ...............................................................................................159
6.1.2 Delimitation of the area of influence .....................................................159
6.1.3 Study topics ............................................................................................161
6.1.4 Methodology ..........................................................................................161
6.2 INITIAL PROJECT AREA (IPA) - DIRECT AREA OF INFLUENCE ..........................166
6.2.1 Yanacocha Mining Company ..................................................................166
6.2.2 Agricultural Society of Social Interest José Carlos Mariátegui ................180
6.2.3 Llullapuquio Agrarian Workers' Cooperative ..........................................194
6.2.4 Recommendations for the implementation of the Project ....................261
6.3 POTENTIAL AREAS OF INFLUENCE (PAI) ........................................................262
6.3.1 Province of Cajamarca ............................................................................262
6.3.2 Province of San Pablo .............................................................................294
6.3.3 Province of Cajabamba ...........................................................................303
6.3.4 Summary of recommendations ..............................................................307
6.4 POTENTIAL AREA OF INFLUENCE: DISTRICTS .................................................308
6.4.1 Population ..............................................................................................308
6.4.2 Housing ..................................................................................................318
6.4.3 Education ...............................................................................................330
6.4.4 Health .....................................................................................................347
6.4.5 Employment ...........................................................................................273
6.4.6 Main economic activities ........................................................................291
6.4.7 Poverty and vulnerability........................................................................300
6.4.8 Political and institutional characteristics ................................................314
6.4.9 Culture ....................................................................................................324
7 ASSESSMENT OF ENVIRONMENTAL AND SOCIAL IMPACTS ..................... 333
7.1 IMPACT-SENSITIVE ENVIRONMENTAL FACTORS ...........................................333
7.2 POTENTIALLY IMPACTFUL PROJECT ACTIVITIES ............................................334
7.3 IDENTIFICATION AND ASSESSMENT OF IMPACTS .........................................334
7.3.1 Leopold Methodology ............................................................................334
7.3.2 Evaluation matrix....................................................................................335

Environmental and Social Impact Assessment of Forest Landscape Restoration Project December 2021
Social Capital Group 4
7.4 ENVIRONMENTAL AND SOCIAL IMPACT ASSESSMENT..................................337
7.4.1 Physical environment .............................................................................337
7.4.2 Biological Environment ...........................................................................337
7.4.3 Social Environment .................................................................................337
7.5 IMPACT ASSESSMENT BY PROJECT ACTIVITIES ..............................................338
7.6 IMPACT ASSESSMENT FOR ENVIRONMENTAL FACTORS ...............................340
7.7 IMPACT ASSESSMENT FOR SOCIAL FACTORS ................................................342
7.7.1 Social factors sensitive to impacts ..........................................................342
7.7.2 Project activities with a potential impact on the social environment ....342
7.7.3 Identification and assessment of impacts ..............................................343
7.7.4 Social impact assessment .......................................................................345
8 ENVIROMENTAL MANAGEMENT PLAN .................................................... 354
8.1 IMPACT MITIGATION PROGRAM ...................................................................354
8.1.1 Physical environment .............................................................................355
8.1.2 Biological medium ..................................................................................360
8.2 MONITORING AND FOLLOW-UP PROGRAM ..................................................362
9 SOCIAL MANAGEMENT PLAN ................................................................... 368
9.1 COMMUNITY OUTREACH PROGRAM ............................................................368
9.1.1 Communication with the population of the Project area .......................368
9.2 COMPLAINT OR CLAIMS ATTENTION PROGRAM ...........................................369
9.3 INCOME RESTORATION PROGRAM ...............................................................370
9.3.1 Periodic economic compensation for land use ......................................371
9.3.2 Access to replacement land for those affected ......................................371
9.3.3 Productivity improvement of land not destined for the FLR project .....371
9.3.4 Initiatives based on the use of plantations by-products ........................372
9.4 LOCAL EMPLOYMENT PROGRAM ..................................................................372
9.4.1 Hiring of local labor ................................................................................372
9.4.2 Prevention of risks and negative impacts on the health and safety of workers ...................................................................................................373
9.4.3 Code of Conduct .....................................................................................374
10 CONCLUSIONS AND RECOMMENDATIONS .............................................. 376
11 ANNEXES .................................................................................................. 378
11.1 ANNEX 1 - LOCATION OF TUMBADEN’S SAWMILL MAP................................378
11.2 ANNEXES 2 – ENVIRONMENTAL BASELINE ....................................................379

Environmental and Social Impact Assessment of Forest Landscape Restoration Project December 2021
Social Capital Group 5
11.2.1 Annex 2.1 – Climate map .......................................................................379
11.2.2 Annex 2.2 – River basins map .................................................................380
11.2.3 Annex 2.3 – Water quality sampling map...............................................381
11.2.4 Annex 2.4 – Optimal Land-use map .......................................................382
11.2.5 Annex 2.5 – Current land use map .........................................................383
11.2.6 Annex 1.6 – Multi-parameter calibration certificate ..............................384
11.2.7 Annex 1.7 – Laboratory test reports and chains of custody ...................385
11.2.8 Annex 1.8 – Photographic reports of water quality sampling ................390
11.2.9 Annex 1.9 – Ecosystem map ...................................................................393
11.2.10 Annex 1.10 – Land cover map ................................................................394
11.2.11 Annex 1.11 – Natural Protected Areas map ...........................................395
11.2.12 Annex 1.12 – Water quality sampling data point CP6 ...........................396
11.3 ANNEXES 2 – SOCIAL BASELINE .....................................................................397
11.3.1 Annex 2.1 – Map of the zone of interest in the Encañada District .........397
11.3.2 Annex 2.2 – Map of the zone of interest in the Cajamarca District........398
11.3.3 Annex 2.3 – Map of the zone of interest in the Chetilla District ............399
11.3.4 Annex 2.4 – Map of the zone of interest in the Cospán District.............400
11.3.5 Annex 2.5 – Map of the zone of interest in the Encañada District .........401
11.3.6 Annex 2.6 – Map of the zone of interest in the Los Baños del Inca District 402
11.3.7 Annex 2.7 – Map of the zone of interest in the Magdalena District ......403
11.3.8 Annex 2.8 – Map of the zone of interest in the Jesús District ................404
11.3.9 Annex 2.9 – Map of the zone of interest in the San Juan District ..........405
11.3.10 Annex 2.10 – Map of the zone of interest in the San Bernardino District 406
11.3.11 Annex 2.11 – Map of the zone of interest in the San Pablo District .......407
11.3.12 Annex 2.12 – Map of the zone of interest in the Tumbaden District .....408
11.3.13 Annex 2.13 – Map of the zone of interest in the Cachachi District ........409
11.3.14 Annex 2.14 – Main occupation types in the districts of the province of San Pablo and Cajabamba, by gender ....................................................410
11.3.15 Annex 2.15 – List of encountered diseases ............................................414

Environmental and Social Impact Assessment of Forest Landscape Restoration Project December 2021
Social Capital Group 6
List of tables
Table 2.4 Threatened Fauna in the study areas................................................................. 20 Table 2.5 Recommendations for the implementation of the forestry project .................. 20 Table 5.4 Water quality sampling points ........................................................................... 75 Table 5.5 Water quality sampling results .......................................................................... 76 Table 5.6 Location of observation points .......................................................................... 77 Table 5.7 Optimal land use capability units of Minera Yanacocha's IPA zones. ................. 78 Table 5.8 Current land use categories and subclasses of zones in the Minera Yanacocha IPA area. 81 Table 5.9 Coverage Classes (Ecosystems and Intervened areas) in Yanacocha Mining's IPA 84 Table 5.10 Water quality sampling points ........................................................................... 93 Table 5.11 Water quality sampling results .......................................................................... 95 Table 5.12 Location of observation points. ......................................................................... 97 Table 5.13 Optimal land-use capacity units of the IPA area Sociedad Agraria de Interés Social (SAIS) José Carlos Mariátegui ............................................................................................ 98 Table 5.14 Current land use categories and subclasses. ..................................................... 99 Table 5.15 Cover classes (Ecosystems and Intervened areas) in SAIS JCM ........................ 102 Table 5.16 Water quality sampling points ......................................................................... 111 Table 5.17 Water quality sampling results ........................................................................ 113 Table 5.18 Location of observation points ........................................................................ 114 Table 5.19 Optimal land use capacity units of Llullapuquio sector .................................... 115 Table 5.20 Current land use categories and subclasses. ................................................... 118 Table 5.21 Coverage (Ecosystems and Intervened areas) Llullapuquio IPA area ............... 121 Table 5.22 Bird species in the study areas ......................................................................... 129 Table 5.23 Mastofauna in the study areas ........................................................................ 131 Table 5.24 Herpetofauna in the study areas ..................................................................... 131 Table 5.25 Threatened fauna in the study areas ............................................................... 132 Table 5.26 Recommendations for the implementation of a future forestry project ......... 133 Table 5.27 Optimal land use capacity units of the PAI land. .............................................. 138 Table 5.28 Current land use categories and subclasses of the area (PAI).......................... 142 Table 6.1 SBL Topics from the IPA and PAI Areas ............................................................ 161 Table 6.2 List of interviewees .......................................................................................... 162 Table 6.3 Instruments for compliance with international standards ............................... 169 Table 6.4 Community afforestation projects 1992-2001 ................................................. 174 Table 6.5 Forestry activities 2002-2011 ........................................................................... 175 Table 6.6 Actions taken and strategic results of the Celendín Province Forestry Pilot Project, 2012-2014 .................................................................................................................... 176 Table 6.7 Stakeholders relevant to the Forestry Project (stakeholders) .......................... 179 Table 6.8 Use of Huacraruco Annex in the José Carlos Mariátegui SAIS .......................... 182 Table 6.9 Forestry production SAIS José Carlos Mariátegui ............................................. 189 Table 6.10 Recommendations for the implementation of a future forestry project ......... 261 Table 6.11 Data on localities in the zone of interest in the district of Asunción ................ 263 Table 6.12 Data on the localities of the zone of interest in the district of Cajamarca ....... 267 Table 6.13 Data on localities in the zone of interest in the Chetilla District ...................... 271 Table 6.14 Data on the localities of the zone of interest in the district of Cospán ............ 275 Table 6.15 Data on localities in the zone of interest in the Encañada District ................... 278 Table 6.16 Data on the hamlets in the zone of interest in the Los Baños del Inca District 281

Environmental and Social Impact Assessment of Forest Landscape Restoration Project December 2021
Social Capital Group 7
Table 6.17 Data on population centres in the area of interest in the Magdalena District . 284 Table 6.18 Data on the localities of the zone of interest in the district of Jesus ............... 289 Table 6.19 Data on the localities of the zone of interest in the district of San Juan .......... 292 Table 6.20 Data on the hamlets in the zone of interest in the Encañada District .............. 295 Table 6.21 Data on the hamlets in the zone of interest in the district of San Pablo .......... 297 Table 6.22 Data on localities in the zone of interest in the district of Tumbadén ............. 300 Table 6.23 Data on localities in the zone of interest in the district of Cachachi ................ 304 Table 6.24 List of recommendations on the implementation of forestry projects ............ 307 Table 6.25 Population size ................................................................................................. 308 Table 6.26 Population growth ........................................................................................... 309 Table 6.27 Age distribution................................................................................................ 311 Table 6.28 Distribution of the population by gender......................................................... 312 Table 6.29 Urban and rural population distribution .......................................................... 313 Table 6.30 Number of households .................................................................................... 315 Table 6.31 Number of persons per household .................................................................. 316 Table 6.32 Place of permanent residence ......................................................................... 316 Table 6.33 Place of residence 5 years ago ......................................................................... 317 Table 6.34 Predominant wall material ............................................................................... 318 Table 6.35 Predominant roofing material ......................................................................... 319 Table 6.36 Predominant material in floors ........................................................................ 321 Table 6.37 Dwellings with electric lighting ........................................................................ 322 Table 6.38 Type of water supply ........................................................................................ 323 Table 6.39 Availability of toilet facilities ............................................................................ 324 Table 6.40 Housing Tenure ................................................................................................ 325 Table 6.41 Number of Rooms in Dwellings ........................................................................ 327 Table 6.42 Households with overcrowding ....................................................................... 328 Table 6.43 Household access to media ............................................................................. 329 Table 6.44 Household access to household equipment .................................................... 330 Table 6.45 Number of educational institutions in the scope of the Project ...................... 331 Table 6.46 Number of regular basic level educational institutions according to population 332 Table 6.47 Number of Students (Enrollment) by Level of Education in Regular Basic Education 333 Table 6.48 Number of Students (Enrollment) in Non-School Modalities ........................... 334 Table 6.49 Student-teacher ratio....................................................................................... 335 Table 6.50 Level of education attained by gender............................................................. 336 Table 6.51 Population aged 18 to 24 years attending a higher level EI ............................. 341 Table 6.52 Illiteracy by gender .......................................................................................... 342 Table 6.53 School attendance rate (3 to 21 years) ............................................................ 343 Table 6.54 Backwardness Rates at the Primary and Secondary Levels .............................. 344 Table 6.55 Dropout Rate ................................................................................................... 346 Table 6.56 Level of Health Facilities................................................................................... 259 Table 6.57 Resolving Capacity by Health Facility Category ................................................ 261 Table 6.58 Doctor rate per habitant .................................................................................. 263 Table 6.59 Health Insurance .............................................................................................. 264 Table 6.60 Population according to type of health insurance ........................................... 266 Table 6.61 Morbidities (Summary Table)........................................................................... 267 Table 6.62 Morbidities (Detailed Table) ............................................................................ 269 Table 6.63 Mortality .......................................................................................................... 270

Environmental and Social Impact Assessment of Forest Landscape Restoration Project December 2021
Social Capital Group 8
Table 6.64 Maternal death ................................................................................................ 271 Table 6.65 Mortality from COVID-19 ................................................................................. 271 Table 6.66 Life expectancy at birth .................................................................................... 272 Table 6.67 Population with and without working age and total ........................................ 274 Table 6.68 Economically active, inactive and total population .......................................... 277 Table 6.69 Employed population by gender ...................................................................... 279 Table 6.70 Unemployed population by gender ................................................................. 281 Table 6.71 Activity Rate by District, Province and Region ................................................. 282 Table 6.72 Unemployment rate by gender, District, Province and Region ........................ 283 Table 6.73 Underemployment rate and other labor market indicators in the Cajamarca Region 284 Table 6.74 Type of main occupation in the study area ...................................................... 286 Table 6.75 Economic Activities of the EAP in the Cajamarca Region ................................. 289 Table 6.76 Average monthly income of the employed population by gender .................. 291 Table 6.77 Main crops in the Cajamarca Region................................................................ 292 Table 6.78 Main crops, volume, producers and destinations of agricultural production .. 293 Table 6.79 Main crops, volume, producers and destinations of agricultural production .. 294 Table 6.80 Livestock Activity in the Cajamarca Region ...................................................... 296 Table 6.81 Income from livestock and livestock by-products ............................................ 297 Table 6.82 Forest plantations in the Cajamarca Region .................................................... 298 Table 6.83 Producers and agricultural area by Region, Province and District ................... 300 Table 6.84 Poverty Level in the Districts of the Cajamarca Region .................................... 301 Table 6.85 Level of poverty by Unsatisfied Basic Needs in the districts of the Cajamarca Region 303 Table 6.86 Indicators that make up the UHN by Districts of the Cajamarca Region .......... 304 Table 6.87 Disability status by districts of the Cajamarca region (in percentages) ............ 306 Table 6.88 Coverage of the Cuna Más Programme in the Cajamarca Region ................... 307 Table 6.89 Coverage of the JUNTOS Program in the Cajamarca Region ............................ 308 Table 6.90 FONCODES Program Coverage in the Cajamarca Region ................................. 309 Table 6.91 Coverage of the Pension 65 Program in the Cajamarca Region ....................... 310 Table 6.92 Coverage of the Qali Warma Programme in the Cajamarca Region ................ 311 Table 6.93 PAIS Program Coverage in the Cajamarca Region ............................................ 312 Table 6.94 Coverage of the CONTIGO Program in the Cajamarca Region ......................... 313 Table 6.95 Political parties of the elected authorities in the last three periods ............... 314 Table 6.96 List of Water Commissions and Water User Boards in the 13 Districts ........... 316 Table 6.97 Productive Organizations Identified in the Districts ........................................ 317 Table 6.98 Police units and number of police personnel, 2019 ......................................... 318 Table 6.99 Crimes Reported to Police Departments, 2019................................................ 320 Table 6.100 Social Conflicts Identified in the Potential Zone of Interest ............................. 322 Table 6.101 Farmer Communities ....................................................................................... 325 Table 6.102 Language at regional, provincial and district levels .......................................... 327 Table 6.103 Festivities identified according to district level ................................................ 330 Table 6.104 Patron saint festivities, religion and heritage ................................................... 332 Table 7.1 Factors sensitive to impacts ............................................................................. 333 Table 7.2 Potentially impacting project activities ............................................................ 334 Table 7.3 Impact assessment matrix ............................................................................... 336 Table 7.4 Social factors and sub-factors sensitive to impacts .......................................... 342 Table 7.5 Project Components, Stages and Activities ...................................................... 343 Table 7.6 Leopold Matrix: Social Impacts ........................................................................ 344

Environmental and Social Impact Assessment of Forest Landscape Restoration Project December 2021
Social Capital Group 9
Table 8.1 Water quality monitoring points. ..................................................................... 363
List of Figures
Figure 5.1 Location Map IPA and PAI .................................................................................. 60 Figure 5.2 Map showing the regions of interst (ROI’s) in the IPA ....................................... 66 Figure 5.3 Overlight of the study area ................................................................................ 67 Figure 5.4 Location of Yanacocha Mining IPA area ............................................................. 69 Figure 5.5 Climate map of the Yanacocha mining company’s IPA área .............................. 70 Figure 5.6 Monthly Accumulated Precipitation (mm) ......................................................... 72 Figure 5.7 Hydrology of Yanacocha mining company IPA area ........................................... 74 Figure 5.8 Water quality sampling points CP6 .................................................................... 75 Figure 5.9 CUM of the Minera Yanacocha IPA area ............................................................ 80 Figure 5.10 Current land use in the Minera Yanacocha area ................................................ 82 Figure 5.11 Vegetation cover of the Minera Yanacocha IPA area. ........................................ 86 Figure 5.12 Location of the IPA area Sociedad Agraria de Interés Social (SAIS) José Carlos Mariátegui 87 Figure 5.13 Climate map of the IPA area Sociedad Agraria de Interés Social (SAIS) José Carlos Mariátegui 88 Figure 5.14 Hydrology of the IPA area Sociedad Agraria de Interés Social (SAIS) José Carlos Mariátegui 92 Figure 5.15 Water quality sampling points AG-01 and AG-03 .............................................. 94 Figure 5.16 Current use of the SAIS IPA área José Carlos Mariátegui ................................. 100 Figure 5.17 Vegetation cover of the SAIS José Carlos Mariátegui IPA area......................... 104 Figure 5.18 Location of the IPA Llullapuquio Agricultural Workers’ Cooperative (CAT)...... 105 Figure 5.19 Climate map of the Llullapuquio Agricultural Workers' Cooperative (CAT) IPA area 106 Figure 5.20 Hidrology of the Llullapuquio Agricultural Workers’ Cooperative (CTA) IPA .... 110 Figure 5.21 Water quality sampling point AG-02 ................................................................ 112 Figure 5.22 CUM of the soils of the CAT Llullapuquio IPA ................................................... 117 Figure 5.23 Current use of IPA área Llullapuquio Agricultural Workers Cooperative (CAT) 119 Figure 5.24 Vegetation cover of the CAT Llullapuquio IPA. ................................................. 123 Figure 5.25 Representative species of the Andeanjalca shrubland .................................... 125 Figure 5.26 Hydrography of the PAI areas .......................................................................... 135 Figure 5.27 Optimal land-use capacity of PAI areas ............................................................ 141 Figure 5.28 Currente Use of PAI area.................................................................................. 143 Figure 5.29 Jalca Ecosystem in PAI ...................................................................................... 146 Figure 5.30 Andean Scrub Ecosystem in PAI ....................................................................... 151 Figure 5.31 Seasonally dry hill and mountain forest ecosystem in PAI ............................... 153 Figure 5.32 Bofedal Ecosystem in PAI ................................................................................. 154 Figure 5.33 Western Slope Montane Montane Relict Forest Ecosystem ............................ 155 Figure 5.34 Natural Protected Areas and PAI area north of Cajamarca .............................. 156 Figure 5.35 ANP and PAI área south of Cajamarca ............................................................. 157 Figure 6.1 IPA and PAI áreas of influence ......................................................................... 160 Figure 6.2 Forest Zones at Yanacocha Mining Company .................................................. 173 Figure 6.3 Land use organization of Huacraruco Annex - SAIS JCM ................................. 184 Figure 6.4 Llullapuquio Cooperative ................................................................................ 201 Figure 6.5 Zone of interest in the Asunción District .......................................................... 263 Figure 6.6 Zone of interest in the Cajamarca District ....................................................... 266

Environmental and Social Impact Assessment of Forest Landscape Restoration Project December 2021
Social Capital Group 10
Figure 6.7 Zone of interest in the Chetilla District ............................................................ 271 Figure 6.8 Zone of interest in the Cospán District ............................................................ 275 Figure 6.9 Zone of interest in the Encañada District ......................................................... 278 Figure 6.10 Zone of interest in Los Baños del Inca District ................................................. 281 Figure 6.11 Zone of interest in the Magdalena District ...................................................... 284 Figure 6.12 Zone of interest in the Jesús District ................................................................ 289 Figure 6.13 Zone of interest in the San Juan District .......................................................... 292 Figure 6.14 Zone of interest in the San Bernardino District ................................................ 295 Figure 6.15 Zone of interest in the San Pablo District ......................................................... 297 Figure 6.16 Zone of interest in the Tumbaden District ....................................................... 300 Figure 6.17 Zone of interest in the Cachachi District .......................................................... 304 Figure 7.1 Leopold Matrix Model ...................................................................................... 335
List of Photos
Photo 5.1 Soils in the Minera Yanacocha IPA area ............................................................. 78 Photo 5.2 Land suitable for forest production in the Minera Yanacocha IPA area ............. 79 Photo 5.3 Current land use in the Minera Yanacocha ........................................................ 83 Photo 5.4 Water quality sampling points AG-01 and AG-03 .............................................. 93 Photo 5.5 Soil área IPA Sociedad Agraria de Interés Social (SAIS) José Carlos Mariátegui . 97 Photo 5.6 Land Suitable for forest production in the SAIS José Carlos Mariátegui IPA ...... 98 Photo 5.7 Current use in the SAIS IPA area José Carlos Mariátegui ................................. 100 Photo 5.8 Water quality sampling point AG-02 ................................................................ 111 Photo 5.9 Soil in the sector Cooperativa Agraria de Trabajadores (CAT) Llullapuquio ..... 115 Photo 5.10 Land suitable for forest production in the Llullapuquio CAT IPA...................... 116 Photo 5.11 Current use of IPA area Llullapuquio Agricultural Workers Cooperative (CAT) 120 Photo 5.12 Representative species of Andean shrubland .................................................. 126 Photo 5.13 Representative birds in the area CAT Llullapuquio .......................................... 127 Photo 5.14 Representative birds in the area ...................................................................... 128 Photo 5.15 Jalca ................................................................................................................. 147 Photo 5.16 Andean Scrubland ............................................................................................ 151
List of Graphs
Graph 5.1 Monthly Averages of Maximum Air Temperature (°C) ....................................... 71 Graph 5.2 Monthly Averages of Minimum Air Temperature (°C) ....................................... 71 Graph 5.3 Monthly Averages of Relative Humidity (%) ....................................................... 73 Graph 5.4 Distribution of ecosystems and disturbed areas in the Minera Yanacocha IPA area 85 Graph 5.5 Monthly Averages of Maximum Air Temperature (°C) ....................................... 89 Graph 5.6 Monthly Averages of Minimum Air Temperature (°C) ....................................... 89 Graph 5.7 Monthly Accumulated Precipitation (mm) ......................................................... 90 Graph 5.8 Monthly Averages of Relative Humidity (%) ....................................................... 91 Graph 5.9 Ecosystems and Intervention Areas ................................................................. 102 Graph 5.10 Monthly Averages of Maximum Air Temperature (°C) ..................................... 107 Graph 5.11 Monthly Averages of Minimum Air Temperature (°C) ..................................... 107 Graph 5.12 Monthly Accumulated Precipitation (mm) ....................................................... 108 Graph 5.13 Monthly Averages of Relative Humidity (%) ..................................................... 108
Environmental and Social Impact Assessment of Forest Landscape Restoration Project December 2021
Social Capital Group 11
ABBREVIATIONS AND ACRONYMS
ADEFOR Civil Association for Forestry Research and Development AGRORURAL Agrarian Rural Productive Development Programme ALA Local Water Authority ALAC Los Andes Association of Cajamarca ANA National Water Authority ANP Natural Protected Area BCR Central Reserve Bank CAT Agricultural Workers' Cooperative CC Farmer Community CENAGRO National Agrarian Census CICAFOR Forestry Research and Training Center CIE Educational Infrastructure Census CIRA Certificate of Non-existence of Archaeological Remains CITE Center for Productive Innovation and Technology Transfer COFIDE Employment Fund and Development Bank of Peru CODISEC District Committees on Citizen Security CTH Netherlands Technical Cooperation (The Netherlands) CONADIS National Council for the Integration of Persons with Disabilities DATACRIMS Integrated Crime and Citizen Security Statistics System DATASS Water Supply and Sanitation Diagnostics System DIRESA Regional Health Directorate EESS Health Facility EEZ Economic and Ecological Zoning EIA Environmental Impact Assessment ENAHO National Household Survey PPE Personal Protective Equipment ESSALUDS Social Health Insurance of Peru FDA Foundation for Agrarian Development FLR Forest Landscape Restoration FONCODES Cooperation Fund for Social Development FONCREAGRO Credit Fund for Agroforestry Development GMASS General Environmental Health & Safety (EHS) Guidelines GORE Regional Government ICMM International Council on Metals and the Mining HDI Human Development Index IFC International Finance Corporation INACC National Institute of Mining Concessions and Cadastre INEI National Institute of Statistics and Informatics INFORGUS National Health Personnel Registry INGEMMET Geological, Mining and Metallurgical Institute INIA National Institute for Agrarian Innovation INRENA National Institute of Natural Resources IUNC International Union for the Conservation of Nature IPA Initial Project Area IUCN International Union for Conservation of Nature JASS Sanitation Services Administration Boards EBL Environmental Baseline SBL Social Baseline

Environmental and Social Impact Assessment of Forest Landscape Restoration Project December 2021
Social Capital Group 12
MEF Ministry of Economy and Finance MIDAGRI Ministry of Agrarian Development and Irrigation MIDIS Ministry of Development and Social Inclusion MINAM Ministry of Environment MINCUL Ministry of Culture MINEDU Ministry of Education MINEM Ministry of Energy and Mines MININTER Ministry of the Interior MINPRO Ministry of Production MINTRA Ministry of Labour MINSA Ministry of Health MTC Ministry of Transport and Communications MVCS Ministry of Housing, Construction and Sanitation UBN Basic Unsatisfied Needs SDGS Sustainable Development Goals OAS Organization of American States OEI Organization of Ibero-American States for Education, Science and Culture OEFA Environmental Evaluation and Oversight Agency ONERN National Office for the Evaluation of Natural Resources ILO International Labour Organization NGO Non-Governmental Organization PAI Potential Area of Influence PAIS National Action Platforms for Social Inclusion Programme PCM Presidency of the Council of Ministers PDC Concerted Development Plan EAP Economically Active Population PET Working Age Population UNDP United Nations Development Programme PPF Forestry Pilot Project PRODESCA Project for the Development of Cajamarca PRONAMACH National Program of Watershed Management and Soil Conservation RENIPRESS National Registry of Health Service Providers ROF Rules of Organization and Functions SAF Family Accompaniment Service SAIS Agricultural Societies of Social Interest SEIA National System of Environmental Impact Assessment SENACE National Environmental Certification Service SERFOR National Forestry and Wildlife Service SERNANP National Service of Natural Protected Areas SICCAM Rural Communities Information System SINADEF National Computer System of Deaths SINIA National Environmental Information System SIS Integrated Health Insurance SUNAFIL National Superintendence of Labor Inspection TUPA Single Text of Administrative Procedures OHS Occupational Health & Safety MT Metric Tons UNEP United Nations Environment Programme UNALM National Agrarian University La Molina USAID United States Agency for International Development

Environmental and Social Impact Assessment of Forest Landscape Restoration Project December 2021
Social Capital Group 13
1 INTRODUCTION Arbaro Advisors (Arbaro), in partnership with Maderas Prosperidad, plans to develop a Forest Landscape Restoration Project (the Project) in the department of Cajamarca, in the northern highlands of Peru. This project includes the establishment of private landowner agreements for the use of existing pine plantations and the development of new plantations on their land, as well as the installation of a plant for the sawmilling and processing of the roundwood produced.
In order to comply with its environmental and social sustainability policies, which require the carrying out and publishing an Environmental and Social Impact Assessment (ESIA) as a step prior to the execution of its investments, Arbaro hired a consortium of consultants, led by Social Capital Group (SCG), to prepare this study. Considering that the requested ESIA does not have the immediate objective of obtaining an environmental certification from the Peruvian authorities, it was prepared on the basis of Terms of Reference agreed only with Arbaro, and not with the respective authorities. The environmental certification will be obtained as soon as the final decision to proceed with the Project has been made.
With respect to the Description of the Project and its location, it is important to highlight that at the time of preparation of this ESIA, the Project was still in the design phase and did not have an exact description of its location nor of its detailed activities. For this reason, Arbaro defined the boundaries of a preliminary Initial Project Area (IPA) and a much larger area for future potential expansion - the Potential Area of Influence (PAI). These areas were defined by Arbaro based on feasibility studies it had conducted developing in the area of interest. Error! Reference source not found. Figure 5.1 Location Map IPA and PAIshows the IPA and PAI boundaries. Regarding the Project design, Arbaro provided the general description presented in Chapter 4.
The study presented in the following sections has been developed based on the review of secondary information and the collection of qualitative information in the field. The Environmental and Social Baselines provide more detailed information in the IPA zones where the initial phase of the Project will be developed, and more general information for the PAI, where specific zones of interest are not yet defined. Consistent with this level of definition, the proposed impact assessment and management measures are general in nature and are more qualitative than quantitative. The proposed management measures of Chapter 8 and 9include recommendations on what to undertake as additional detailed studies (by the Project company) in any specific area before starting operations, but this only once having decided to proceed with the Project.
The following sections present an Executive Summary of the ESIA, a legal assessment of key legal aspects concerning the Project, the Project Description, the Environmental Baseline, the Social Baseline, the Impact Analysis and the corresponding Environmental and Social Management Measures for the main impacts identified.

Environmental and Social Impact Assessment of Forest Landscape Restoration Project December 2021
Social Capital Group 14
2 EXECUTIVE SUMMARY
2.1 Project Description
The project consists of establishing agreements with private landowners in the Cajamarca region of northern Peru to harvest 3,000 ha of existing pine forests and to establish 750 ha of new plantations in currently vacant areas. In order to maintain timber production over time, the project includes replanting the harvested areas after a rotation period of approximately 20 years. The project also foresees the installation of an industrial plant in the outskirts of the city of Cajamarca for sawmilling and processing of the timber produced.
Among the landowners and forest owners identified as potentially interested in establishing agreements are Minera Yanacocha SRL, the Llullapuquio Agrarian Workers Cooperative and the José Carlos Mariátegui Social Interest Agricultural Society (SAIS) (see Figure 4.1). Having said this, Arbaro still needs to negotiate and define the areas of forest and land to be included in the agreements with each of these landowners. In no case will these agreements imply the purchase of land, only the use and harvesting of forest land.
The main activities of the Project that have been the subject of the environmental and social impact analysis are as follows:
Installation and management of forest nurseries Opening of forest roads Establishment of new plantations and replanting of harvested areas Maintenance and pruning of plantations Thinning of plantations Final felling, extraction of logs and transport to the sawmill Sawmilling and processing of the roundwood produced
2.2 Legal Analysis
2.2.1 Most relevant legal aspects for obtaining permits for the execution of forestry projects
From a legal-administrative standpoint, the Project falls under the purview of the Forestry and Wildlife Service (SERFOR), which is part of the Ministry of Agriculture and Irrigation (MIDAGRI). The project is regulated by the Ministry of Production (PRODUCE) for roundwood processing at the industrial plant to be located on the outskirts of Cajamarca.
With regard to obtaining Environmental Certification, the National Environmental Impact Assessment System (SEIA) of the Ministry of the Environment (MINAM) indicates that forestry plantations must obtain environmental certification through the preparation of an environmental management instrument (IGA, for its acronym in Spanish). Depending on the categorization of the project, which must be done by the National Environmental Certification Service for Sustainable Investments (SENACE) based on its environmental and social risks, the required IGA may be a detailed Environmental Impact Assessment (EIA), a semi-detailed EIA or an Environmental Impact Declaration (EID).

Environmental and Social Impact Assessment of Forest Landscape Restoration Project December 2021
Social Capital Group 15
The national legislation also indicates that before starting the project, a Certificate of Non-existence of Archaeological Remains (CIRA) must be obtained in order to ensure that there are no archaeological remains on the surface of the land where the project is to be executed. This procedure is conducted through the Ministry of Culture (MINCUL).
According to the law of Prior Consultation, if there is a risk that the project may affect the collective rights of indigenous or native peoples, it must go through a Prior Consultation process to be implemented by the State. The identification of this risk must be done in the framework of obtaining the Environmental Certification of the Project, mentioned above, to be granted by SENACE.
2.2.2 Gap Analysis between IFC Performance Standards and applicable Peruvian legislation for five potential impacts of the Project
As part of the legal analysis, a gap analysis was undetaken between IFC regulations and Peruvian legislation, for five potential impacts of the Project, chosen for their particular reputational sensitivity for the companies in charge of the Project. The potential impacts evaluated are:
Potential impact on worker health and safety Potential impact on water availability Potential economic displacement of people Potential impact on biodiversity Potential impact on the collective rights of indigenous peoples due to lack of prior
consultation The results of the analysis indicate that Peruvian legislation covers almost all IFC requirements related to the potential impacts selected for this analysis. Only partial regulatory gaps were identified between Peruvian regulations and the Performance Standard 5 Land Acquisition and Involuntary Resettlement, with respect to the potential economic displacement of people.
2.3 Environmental Baseline
According to its Potential Area of Influence (PAI), the Forest Landscape Restoration (FLR) project in Cajamarca, Peru, is located in nine districts of the Province of Cajamarca, three districts of the Province of San Pablo, and one district of the Province of Cajabamba (Cachachi). The Initial Project Area (IPA) is made up of discontinuous territories belonging to three different owners: Minera Yanacocha S.R.L, the Cooperativa Agraria de Trabajadores (CAT) Llullapuquio and the Sociedad Agraria de Interés Social (SAIS) José Carlos Mariátegui.
The project will develop its activities in the western branch of the Andes, located altitudinally between 2800 and 3600 m.a.s.l. in the northern highlands of Peru. Its humidity conditions are relatively higher than in the southern highlands, with average monthly rainfall fluctuating between 2 and 47 mm, with a marked wet and dry season, which, together with temperate temperatures, favors the development of forestry plantations.
The landscape of the project area is rural, with the presence of agricultural activities, mainly pasture production for livestock, especially in the flatter areas.
Environmental and Social Impact Assessment of Forest Landscape Restoration Project December 2021
Social Capital Group 16
Finally, in reference to the ecosystems of the project area, a general description of the PAI zones and a supervised classification of the vegetation cover was carried out using the ecosystem map as a reference, and using classifiers and field sampling points in the IPA zones.
The Environmental Baseline (EBL) will describe the most important physical and biological characteristics of the IPA and PAI areas of the project. For the development of this study, different information gathering techniques were used for the IPA and PAI. Secondary information was reviewed in both areas, but field work to collect primary information was concentrated only in the IPA, specifically in water quality sampling and validation of aspects of soils and wild ecosystems.
2.3.1 Delimitation of the area of influence
The area of influence of the project is delimited by the IPA and PAI areas. The IPA is the area where the forestry project will be developed initially, taking advantage of existing plantations and land suitable for new plantations. The PAI area is where potential future pine forest plantation expansions are planned. No contact has been made with owners of existing plantations or land suitable for the development of new plantations in the PAI.
The IPA area is distributed among the territories owned by Minera Yanacocha S.R.L., the Llullapuquio Agrarian Workers' Cooperative (CAT) and the José Carlos Mariátegui Agrarian Society of Social Interest (SAIS).
2.3.1.1 IPA - Yanacocha Mining Company
The Yanacocha Mining Company's IPA is located approximately 12.96 kilometers from the city of Cajamarca and has an area of 5,119.90 ha.
According to the climatic classification, this zone of the IPA area is characterized by rainfall throughout the year and a cold climate. The rainfall regime is not homogeneous throughout the year and there is a marked variation between the rainy and dry periods. These characteristics are favorable for forest production. The average maximum temperature is between 16 and 17 °C. The highest rainfall in this area occurs between September and May (8 to 45 mm/month). The average relative humidity values in the study area are lowest between June and August.
This IPA is located within the Jequetepeque River watershed. This basin is a Pacific watershed with a surface area of 8,795.33 km², located in the departments of Lambayeque, La Libertad and Cajamarca. The Jequetepeque River has an average flow rate of 29 m³/s.
The anthropic activity carried out in the area that could affect water quality is mining; however, this activity is not altering the levels of water quality parameters.
Soils vary from shallow to deep, due to the moderately coarse to medium texture and slight surface stoniness. Drainage is good to excessive and permeability is moderately fast to moderate. These soils have medium to high organic matter content, while the fertility level can be low to medium. The soils in this zone have slopes that can vary from 8% to 50%. In this zone there is a predominance of land that can be used for forestry production, with medium to low agrological

Environmental and Social Impact Assessment of Forest Landscape Restoration Project December 2021
Social Capital Group 17
quality. In this zone, 45.85% of the land has no productive use; forest, pasture or grassland areas and mining company installations occupy 42.96%.
The IPA consists in an area of 5,119.90 ha, in which there are five land cover classes:
Table 2.1 Coverage Classes (Ecosystem and Intervened areas) in Yanacocha Minning’s IPA
Zone/ Ecosystem-Cover
Yanacocha IPA (ha) (%)
Jalca 2055.09 40.14
Andean scrubland 0.00 0.00
Agricultural zone 233.17 4.55
Forest Plantation 1925.08 37.60
Mining Zone 858.65 16.77
Artificial water body 47.91 0.94
Total 5119.90 100.00
Prepared by SCG
2.3.1.2 IPA - Sociedad Agraria de Interés Social (SAIS) José Carlos Mariátegui
This IPA area is located in the sector known as Huacraruco, corresponding to the SAIS José Carlos Mariátegui (SAIS JCM). It is approximately 9.87 kilometers from the city of Cajamarca and covers an area of 5,894.23 ha.
According to the climatic classification, this IPA area is characterized by the presence of precipitation in certain months of the year, the climate can vary from cold to temperate and dry winters can occur. During the months of August to September, the average maximum temperatures are higher than the rest of the year. The average temperature variation throughout the year is between 19 °C and 21 °C. In the months of December to April there is an increase in rainfall (9 mm to 21 mm). Humidity in the area is abundant throughout the year (between 80% and 90%).
This IPA, like the Yanachocha IPA, is located within the Jequetepeque watershed, which covers an area of 8,795.33 km² and has an average flow rate of 29 m³/s. The main body of water in this area is the Huacraruco River. The Asunción River, Agua Clara Creek, and Chontayoc Creek are also located in the area.
The anthropic activity in the area that could affect water quality is cattle ranching, as well as the forestry exploitation that is currently being carried out in some sectors of the SAIS JCM IPA area. However, according to the results, there is no alteration in the levels of the evaluated parameters.
Soils in the IPA area vary from shallow to deep, due to medium to moderately coarse texture and slight to moderate surface stoniness. The drainage is high to excessive and its permeability is moderate to moderately fast. These soils have a low to medium fertility level, with slopes from 8% to 50%.

Environmental and Social Impact Assessment of Forest Landscape Restoration Project December 2021
Social Capital Group 18
In the IPA area there is a predominance of land suitable for pasture of medium agrological quality, with soil limitations of low natural fertility, as well as erosion risks due to the slope, high rainfall and low temperatures. Soils without vegetation or with little vegetation account for 50.99%, while forested lands represent 25.49% of the soils. There are also large areas of pasture, located in the areas of lesser slope (23.52%).
The SAIS JCM consists of an area of 5,894.23 ha, which has four land cover classes:
Table 2.2 Cover classes (Ecosystems and Intervened areas) in SAIS JCM
Zone/ Ecosystem-Cover
Social Interest Agrarian Society (SAIS) José Carlos Mariátegui
(ha) (%) Jalca 1865.95 31.66
Andean scrubland 373.22 6.33
Agricultural zone 2443.30 41.45
Forest Plantation 1211.76 20.56
Total 5894.23 100.00
Prepared by SCG
It is important to indicate that plantations should be carried out while maintaining active biological corridors of native cover (jalca and Andean scrub). Likewise, resting grasslands and plantation areas used in this area should be prioritized for initiating plantations, avoiding native cover.
2.3.1.3 IPA - Llullapuquio Agricultural Workers Cooperative (CAT)
The IPA area of the Llullapuquio Agricultural Workers' Cooperative (CAT) is located approximately 6.98 kilometers from the city of Cajamarca, covering an area of 4,166 m2.
In this IPA, the climate is cold to temperate and rainfall is concentrated mainly between the summer months (December to March) while winters are dry. There is a noticeable increase in temperatures from June to September, with a variation that ranges from 21°C to approximately 26 °C. Precipitation in the area is almost nil between June and September. However, between the months of December to March, there is a significant increase. Relative humidity decreases from June to September.
This IPA is located between two watersheds. One part is within the Jequetepeque watershed, like the other two IPAs, and the other part is in the Crisnejas watershed. The latter has an area of 4,928 km² and belongs to the Atlantic slope. It is formed by the union of the Condebamba and Cajamarca rivers, and is one of the main tributaries of the Marañón, with an average annual flow of 5 m³/s.
The anthropic activity carried out in the area that could affect water quality is cattle ranching, as well as the forestry exploitation that is currently being carried out in some sectors. However, from the samplings it is concluded that there is no effect on the quality parameters.

Environmental and Social Impact Assessment of Forest Landscape Restoration Project December 2021
Social Capital Group 19
The slope of the soils averages 25 to 30%. The soils are both locally formed and come from the mountain slopes, with moderately coarse to fine texture, with a slight to moderate surface stoniness, which determines a moderately fast to slow permeability. These soils have organic matter content that can vary from medium to high, with a medium fertility level. Most of the soils are suitable for forestry production.
Most of the land in the area is used for the production of annual crops (61.51%), mainly food crops. There is also land used for forestry production, as well as for the conservation of natural forests associated with areas without vegetation (10.76%). On the other hand, there are unused and/or unproductive lands (26.30%), which are characterized by the absence of vegetation cover or scarce vegetation of the grassland type, as well as grasses and low-growing flora.
The IPA consists in an area of 4,166.02 ha where there are 4 coverage classes:
Table 2.3 Coverage (Ecosystems and Intervened areas) Llullapuquio IPA area Llullapuquio Agricultural Workers Cooperative (CAT)
Zone/ Ecosystem-Cover
Agricultural Workers' Cooperative (CAT) LLullapuquio
(ha) (%) Jalca 1930.12 46.33
Andean scrubland 214.49 5.15 Agricultural zone 1315.23 31.57 Forest Plantation 706.18 16.95
Total 4166.02 100.00
Prepared by SCG
It is important to indicate that plantations should be carried out while maintaining active biological corridors of native cover (jalca and Andean scrub). Likewise, resting grasslands and plantation areas used in this area should be prioritized for initiating plantations, avoiding native cover.
2.3.2 Characterization of Wild Ecosystems
Because ecosystems are a dynamic complex of flora, fauna and microorganism communities that interact as a functional unit, these are described jointly among the three areas that constitute the IPA: Minera Yanacocha, Cooperativa Agraria de Trabajadores (CAT) Llullapuquio and Sociedad Agraria de Interés Social (SAIS) José Carlos Mariátegui. That said, two classes of wild ecosystems have been observed in these areas: jalca and Andean scrub (MINAM, 2019).
Flora in the Jalca ecosystem The jalca is a transitional terrain between the puna and the páramo in the north of the country, in the western chain of the Andes, with specific characteristics for being more humid and less high than the puna (Mostacero et al., 1996; MINAM, 2019).
In the study area, the vegetation is dominated by grasslands, some oconales (partially flooded, swampy or semi-swampy wetlands present in the high Andean region of Peru above 3,300 m.a.s.l.) in the lower elevations and small areas of scrub in relatively sheltered areas. Details of the flora in this ecosystem are shown in the respective chapter.

Environmental and Social Impact Assessment of Forest Landscape Restoration Project December 2021
Social Capital Group 20
Flora in the Andean shrubland ecosystem This ecosystem is made up of shrubs and some scattered trees that reach a maximum height of 3 meters. They are distributed in patches between the jalca and other cover, with a greater proportion in the valley hollows that form a humid refuge and the vegetation has not been affected by anthropogenic activities. Details of the flora in this ecosystem are shown in the respective chapter.
Fauna The high Andean ecosystem called jalca is formed by the presence of geographic units of vegetation such as grasslands and shrub thickets, within which the wildlife population is characterized by the predominance of birds, due to their diversity and adaptability to high altitudes. In the study area, 50 bird species have been reported, including endemic birds such as Metallura Phoebe "black hummingbird", Leptasthenura pileata "crowned earwig", Colaptes atricollis "black-necked woodpecker" and Geocerthia serrana "Peruvian bansurrita" (Minera Yanacocha, 2019).
On the other hand, the mastofauna of the IPA study area is composed of 4 orders, 7 families and 11 genera, with the order Rodentia (rodents) having the highest number of records with respect to the other orders. It is followed by the orders Carnivora with 2 families and 2 species. In addition, areas covered by grasslands and rocky outcrops provide the ideal habitat for mammals endemic to the ecosystem such as Lagidium peruanum "Vizcacha" and Calomys sorellus "ratón de jalca", or jalca mouse (GORE, 2009).
Table 2.1 Threatened Fauna in the study areas
Source: SERFOR, 2018.
2.3.3 Baseline Analysis for the Implementation of the Forestry Project
Based on the analysis of the environmental baseline of the respective IPAs, the following recommendations have been made for the implementation of the project:
Table 2.2 Recommendations for the implementation of the forestry project
Yanacocha Mining Company Social Interest Agrarian Society (SAIS) José Carlos Mariátegui
Llullapuquio Agrarian Workers' Cooperative (CAT)
Area with greater limitations due to low temperatures
Climates suitable for forestry production Climates suitable for forestry production
Moderate slope but can be tolerable for forestry production
Moderate slope but can be tolerable for forestry production
Greater limitations due to the slope of the terrain
N° ORDER FAMILY SCIENTIFIC NAME COMMON NAME IUCN
1 CATHARTIFORMES CATHARTIDAE Vultur gryphus Andean Condor EN
2 CHARADRIIFORMES SCOLOPACIDAE Gallinago imperialis Large Quecheche NT 3 FALCONIFORMES FALCONIDAE Falco peregrinus Falcon NT 4 ANUROS BUFONIDAE Atelopus peruensis Peruvian Toad CR 5 ANUROS STRABOMANTIDAE Pristimantis simonsii Andean Páramo Frog CR 6 SAURIOS GYMNOPHTHALMIDAE Petracola ventrimaculatus Spotted lizard CR

Environmental and Social Impact Assessment of Forest Landscape Restoration Project December 2021
Social Capital Group 21
Yanacocha Mining Company Social Interest Agrarian Society (SAIS) José Carlos Mariátegui
Llullapuquio Agrarian Workers' Cooperative (CAT)
Well-drained soils with moderate to coarse textures, optimal for forestry production
Well-drained soils with moderate to coarse textures, optimal for forestry
production
Well-drained soils with coarse to fine textures, optimal for forestry
production Land use capacity is compatible with
forestry production Land use capacity is compatible with
forestry production Land use capacity is compatible with
forestry production Current land use is compatible with forest
development. Current land use is compatible with forest
development. Current land use is compatible with
forest development.
Source: Pacific PIR S.A.C., 2021.
2.3.4 Potential Area of Influence (PAI)
This chapter describes the environmental characteristics of the areas of interest for project expansion, or Potential Area of Influence (PAI). Since this area has not yet been finally defined, it does not require as precise a characterization as the IPA. For its description, secondary information was collected and analyzed to provide a broader description of the environmental factors.
2.3.4.1 Physical description of the area
The project's PAI area is located within four watersheds: Crisnejas, Jequetepeque, Chicama and the Marañon interbasin.
With respect to optimal land use, the lands in the PAI are characterized by medium to low agrological quality. They present limitations with respect to the risk of erosion due to the area’s slopes, as well as limitations due to the conditions (low temperatures) and low to medium natural fertility.
Within the PAI area, land has been identified mainly in the unused and/or unproductive category. Thus, 47.73% of the land has little or no vegetation, while 26.48% of the land has Andean crops for autoconsumption or local commercialization. There is a portion of land occupied by conifer and eucalyptus plantation forests, installed for forestry exploitation within a context of reforestation, environmental compensation, as well as soil and watershed conservation.
2.3.4.2 Biological description of the area
According to the classification of ecosystems taking as reference the classification of the map of ecosystems of Peru (MINAM, 2019), the southern PAI presents almost 38% of its extension of the Jalca ecosystem (19,256 ha), followed with 35% of agricultural area (17,591 ha), 21% of Andean scrubland (10,626 ha), 6% of forest plantation (3,193 ha) and 0.18% of western slope montane relict forest; the northern PAI presents 32% of its extension of the Jalca ecosystem (28,371 ha), followed by 30.5% agricultural area (26,831 ha), 18% forest plantation (15,870 ha), 12% Andean scrub (10,662 ha), 5.8% mining area (5,111 ha), less than 1% seasonally dry hill and mountain forest, wetlands and lakes and lagoons (1,126 ha).

Environmental and Social Impact Assessment of Forest Landscape Restoration Project December 2021
Social Capital Group 22
2.3.4.3 Natural Protected Areas (NPA)
In the project area, there is the Sunchubamba Game Reserve NPA. In the case of the PAI area located north of the city of Cajamarca, it does not overlap with this NPA or its buffer zone. However, for the IPA located south of the city of Cajamarca, it overlaps with the Sunchubamba Game Reserve and its buffer zone. In the game reserve area, forest plantations of Pinus radiata can be seen, which means that the project does not affect the objectives of the NPA.
2.4 Social Baseline
2.4.1 Methodological design of the study
This chapter describes the activities carried out to conduct the Social Baseline Study (SBLS) based on the objectives set. It also describes the geographic scope of the study, the issues addressed, the data collection techniques, and the secondary sources of information reviewed.
2.4.2 Initial Project Area (IPA)
This chapter presents the main characteristics of the three organizational entities that make up the initial area of interest of the Project (IPA).
2.4.2.1 Yanacocha Mining Company
Yanacocha Mining is located in the districts of Cajamarca, Baños del Inca and La Encañada, in the province of Cajamarca, 800 kilometers northeast of the city of Lima, Peru. Its area of operations is 45 kilometers from the district of Cajamarca, from where the mining complex is accessed by paved road. The Company has a scope of action that reaches approximately 120 villages, organized in towns, which constitute the area of influence of the Project.
History
Yanacocha began mining operations in 1993 within the framework of new legislation promoting the mining sector. Alongside mining operations, Yanacocha has supported forestry activities almost from the beginning. In the 1990s and up to 2001, the first forestry projects were carried out to promote the installation of silvopastoral and agroforestry production systems. In 1995, Yanacocha purchased 1,000 hectares of land with forestry plantations from its immediate neighbor, Granja Porcón - plantations that are still in place today. Between 2002 and 2011, projects focused on promoting the eco-business model with an agro-industrial vision of organic products were promoted. Subsequently, between 2012 and 2014, the Celendín Forestry Pilot Project was implemented, in which nurseries were established, and almost two million forestry seedlings were grown, with an emphasis on technical training processes.
Internal organization
For this project, two strategic units of the company stand out: Social Responsibility Management, in charge of strategic relations with the communities, and Environmental Management, oriented to prevent, control and mitigate the impacts of the mine's operating activities on the environment.

Environmental and Social Impact Assessment of Forest Landscape Restoration Project December 2021
Social Capital Group 23
Forestry activities
Internally, it includes management for the maintenance of natural forests, forest plantations and vegetation cover in general. Whenever any of these forest areas are not required for the mining operation, the actions of the Environment and Mine Closure Department are aimed at their conservation, particularly the species (flora or fauna) that have been identified as a priority.
Yanacocha currently has 1,000 hectares of forest plantations planted with patula and radiata pine. It also has natural forest and forest plantations, which together total approximately 700 hectares. As for the existing species, the main ones are patula pine, radiata pine (which represents 90% of the total plantation), and quinual which is an endemic and priority species for Yanacocha. In total, in 2018 and 2019, 76.85 hectares and 58.3 hectares respectively had been restored as part of the Progressive Closure Plan.
Externally, forestry activity has been very dynamic and aligned with the development activities of the Cajamarca Region. Between 2002 and 2014 Yanacocha has supported forestry activities in several districts in the provinces of Cajamarca and Celendín. In alliance with other private institutions1, a dozen forestry projects have been carried out with a focus on sustainability, which are described in the main document.
Relationship with other organizations and institutions
Stakeholders of the Mining Unit include both public and private sector actors. In the public sector are the Regional Directorate of Agriculture, which is the entity in charge of the "Poncho Verde" Program. In terms of private sector, Yanacocha pointed to the Granja Porcón as a successful reference in forestry; the College of Engineers as an interlocutor for the exchange of experiences, and also the farmer patrols (rondas), for their leadership and social recognition.
2.4.2.2 SAIS José Carlos Mariátegui
History
The Sociedad Agrícolas de Interés Social - SAIS José Carlos Mariátegui, was created in 1972 on the grounds of the Sunchubamba and Huacraruco farms, in the districts of Cospán, Cachachi, Jesús and San Juan, in the Province of Cajamarca. In the context of the Agrarian Reform, the Sunchubamba hacienda and its six annexes (an extension of 55,311 hectares) were expropriated, benefiting 711 families. SAIS JCM has 55,000 hectares and the Huacraruco Annex has more than 8,000 hectares. The SAIS is the owner of the entire territory, but each member owns a portion of land where they build their homes and carry out various economic activities.
Internal organization
The organizational structure of SAIS JCM consists of a General Assembly of members, the highest-ranking body made up of 36 delegate members, the Board of Directors made up of six people in charge of managing the company on behalf of the members, and the Supervisory Board made up
1 In this context, the Company has established cooperation alliances with the Asociación Los Andes de Cajamarca (ALAC), as well as with the Fundación para el Desarrollo Agrario (FDA) and the Universidad Nacional Agraria La Molina.

Environmental and Social Impact Assessment of Forest Landscape Restoration Project December 2021
Social Capital Group 24
of six people whose function is to supervise the accounting and administrative areas. The Management, Operating Units, and the specific Committees report to the Board of Directors.
Economic and forestry activities
Raising cattle and processing by-products is the main economic activity of the SAIS. They have dairy cattle and Hereford cattle for beef production. Livestock production is carried out under a salaried labor scheme. On the other hand, agricultural crops are minimal and the products they grow, such as potatoes and/or corn, are almost always for self-consumption.
Forestry is not a main economic activity, although it has been taken up again due to the reduction in the sale of fighting cattle. In general, the SAIS has not been directly involved in the production and management of forestry plantations and has maintained the mechanism of entering into agreements with other institutions that have been in charge of the production process, management and payment of workers, in exchange for which the SAIS cedes the land2. The species produced are eucalyptus and patula pine, of which 500 hectares are allocated for harvesting. There are also eucalyptus, pine and cypress for replanting, at least 100 hectares for each species.
Relationship with other organizations and institutions
The SAIS does not maintain a fluid relationship with the municipal authorities; they only interact with them to comply with their tax obligations. The SAIS does not develop social or productive programs at the initiative of the municipality, which has not even intervened in problems of social conflict, such as the one caused by the invasion of the company's lands.
For the past 10 years the Huacraruco and Huaycot areas have suffered land invasions by members/workers. These 500 hectares have been occupied by people forcing the SAIS to take protective measures and control the entrance of people. The Sunchubamba Protected Area, which has also been invaded, deserves special attention.
2.4.2.3 Llullapuquio Agrarian Workers' Cooperative
History
The Llullapuquio Agrarian Workers' Cooperative (CAT) is located in southern Cajamarca, in the district of Chetilla, province of Cajamarca and department of Cajamarca. With the Agrarian Reform of 1969, it was established first as a SAIS and then in 1986 as Cooperativa Agraria de Trabajadores Llullapuquio (Llullapuquio Agrarian Workers' Cooperative). It has an area of 3,499 hectares. The land is owned collectively and belongs to the CAT. Each member has been assigned one hectare of land to build a house and develop certain productive activities.
Internal organization
The Cooperative currently has 51 members, of which approximately 15 are women. The organizational structure includes the General Assembly of members, which is the highest-ranking body made up of the 51 members. Then there is the Board of Directors, which is responsible for
2 This procedure was used between 1978 and 1985 with ADEFOR, and more recently in 1995 with the Paramonga company.

Environmental and Social Impact Assessment of Forest Landscape Restoration Project December 2021
Social Capital Group 25
managing the company on behalf of the members. Thirdly, the Supervisory Board, made up of 5 partners in charge of administration, accounting and control functions. The Board of Directors and the Supervisory Board are appointed by the General Meeting of Partners for a period of 3 years.
Economic and forestry activities
Agricultural production, which makes up for the largest proportion of the land, specializes in two types of crops: legumes and tubers such as potatoes, 70% of which are for self-consumption. The interviewees pointed out that agricultural activity is not profitable and sometimes generates only enough to cover the salaries of external workers and other expenses.
CAT has Brown Swiss and Hereford cows, mainly for milk and beef production, and the cattle are raised on 300 hectares of land. According to the CAT representatives interviewed, this livestock activity is not very profitable either, which they attribute to several factors, such as the lack of good pastures and the lack of access to technology for genetic improvement of the cattle.
The Cooperative's forestry activities are carried out in Tambillo, Capulpampa, Quinuayoc, and Mala Muerte, where most of the pines are radiata pines. CAT has earmarked 600 hectares for this activity, 40% of which are currently unused. In past years, CAT cultivated pine plantations with support from MIDAGRI. Later, in 2004, it signed an agreement with ADEFOR for 200 hectares of timber plantations, which are committed and ready to be harvested. It should be noted that the Cooperative has no experience in timber harvesting or marketing. Recently in 2019, it installed a nursery with its own resources with a capacity of 60,000 seedlings, which has helped to forest 50 hectares of timber seedlings in the district of Chetilla with support from SERFOR and MIDAGRI.
Relationship with other organizations and institutions
With the local authorities they have managed to develop some interesting projects, such as the trout fish farm project, which is about to end. Also, with the provincial municipality, they have managed the donation of radiata pine seedlings that are being used in their forestry nursery.
Regarding the issue of social conflicts, almost since its creation, the CAT has been in conflict with those who disagreed with its creation and who even today propose the allocation of individual plots. Currently, the conflict remains without any prospect of a solution due to the inoperability of the authorities.
2.4.3 Potential Area of Influence (PAI)
This chapter describes the social characteristics of the Project's target areas in each of the thirteen districts located in the potential area of future expansion of operations (PAI). It presents the perceptions of the district authorities on the forestry potential of the areas of interest, and the experiences of forestry projects in the district.
2.4.3.1 Province of Cajamarca
In the province of Cajamarca, information was collected from the following districts: Asunción, Baños del Inca, Cajamarca, Chetilla, Cospán, Encañada, Jesús and Magdalena.

Environmental and Social Impact Assessment of Forest Landscape Restoration Project December 2021
Social Capital Group 26
Asunción District - According to the authorities interviewed, the area of interest currently has eucalyptus plantations, generally cultivated in small plots of 1 to 2 hectares, which act as a defensive barrier during the rainy season. According to the officials interviewed, there are no known recent forestry projects in the district. Only the District Municipality's Economic Development Sub-management body has as an institutional activity the production of seedlings in the municipal nursery, as well as their distribution to associations and families that request them.
Cajamarca District - There is currently pine (radiata and patula), eucalyptus, cypress, alder and tara (in the lowlands) plantations in the Cajamarca district. These plantations are the result of reforestation activities undertaken by the provincial municipality for the benefit of the population. The ideal areas for the possible implementation of a forestry project are the Cushunga, Sexemayo and Tual Campesino Communities due to the amount of available space. They also suggested Inca Corral, Chilimcaga, Majada Pampa, Chilimpampa Alto, Chamis, Chamis Alto and Pozo Seco. The Provincial Municipality of Cajamarca has been carrying out different reforestation actions since 2011, both in the district of Cajamarca and in the other districts that comprise the province of Cajamarca.
Chetilla District - In this district, forest plantations are located in the upper part of the district, where radiata and patula pines can be found. There are also localities in the district with suitable characteristics for reforestation. They indicated that Alto Chetilla, Manzano (upper part), Jamcate, Manzano, Casadencito and Quinuayoc are ideal places for forestry because they have slopes where forestry projects can be carried out. To reach the goal of 50,000 pine plantations, the District Municipality has implemented a municipal nursery that provides forestry and fruit seedlings, which are donated to the district's towns and villages3.
Cospán District - According to those interviewed, the entire area of interest in the Cospán district is suitable for forestry. The land is suitable for timber species and there is space available for reforestation, as the residents have an average of 5 to 7 hectares of land. Sunchubamba, Huaycotito and Alto Huariguro are the most forested areas. To date, no forestry projects have been developed; therefore, since the beginning of the current administration, the district municipality has been in talks with the Provincial Municipality of Cajamarca to carry out forestation activities.
Encañada District - The area of interest has suitable climatic conditions for forestry projects - the localities of Extrema and Apalina being the most suitable - although there are currently few pine (radiata and patula), cypress and eucalyptus plantations. The Encañada District Municipality has been developing pine and eucalyptus forestry activities in the district for the past two years with support from the Regional Government and the Ministry of Agriculture. In addition, 350,000 seedlings are currently being produced in the municipal nurseries each season and are destined for different villages and towns.
Baños del Inca District - This District Municipality is one of the main institutions promoting forestry activities in the district. It has produced more than 200,000 seedlings per year through two nurseries: Vivero Cepita and Vivero Tar Tar. In these nurseries, the production
3 As mentioned above, the district is home to CAT Llullapuquio, which has already developed a forestry project with support from SERFOR.

Environmental and Social Impact Assessment of Forest Landscape Restoration Project December 2021
Social Capital Group 27
of pine trees represents 80% of the seedlings, of which 60% are of the patula species and 40% radiata, which have been donated to families and associations through agreements. It has a project that is in the profile stage, called "Recovery of the Ecosystemic Service of Water Regulation in the Puyllucana, Chonta, Mashcon and Quinua Micro-watersheds in the district of Los Baños del Inca, Province of Cajamarca, Cajamarca Region".
Magdalena District -There are currently pine, cypress, and eucalyptus plantations in the lands of the Cúmbico Campesino Community. Likewise, officials indicate that the towns of Sexamayo, Catache, Cúmbico, Cunchupampa, Cunchupampa, Casadén and Succhabamaba are ideal areas for a possible forestry project. In the district of Magdalena there is no forestry project undertaken by the municipality in the district due to lack of budget. Only MIDAGRI distributed seedlings to the population approximately seven years ago.
District of Jesús - The towns of Totora, La Shita, Tranca and Morcilla Alta were identified as places where forestry activities could be carried out due to the amount of available space that still needs to be reforested. Although the district municipality has not carried out forestry activities in recent years, they do have municipal nurseries. There is currently a proposal from the municipality to start reforesting the upper part of the district.
San Juan District - The interviewees indicated that the higher elevations in the area of interest have the necessary humidity for tree species to grow. They also indicated that the towns of Huacraruco and Lanchepata have slopes for tree planting. Currently, the District Municipality of San Juan has the goal of planting 100,000 eucalyptus, pines and tayas trees as part of the municipal administration.
2.4.3.2 Province of San Pablo
The districts studied in San Pablo Province are San Bernardino district, San Pablo district and Tumbaden.
San Bernardino District - According to the authorities interviewed, there is sufficient space in the area of interest for planting pine trees. Other localities with forestry aptitude, but not in the preliminary zone of interest, are Maqui Maqui and Yuragalpa. They mention that in the villages of Chonta Alta and Chonta Baja there was a project five years ago to install forest plant nurseries with the support of AGRORURAL, although with limited scope.
District of San Pablo - According to San Pablo officials, the area of interest has ideal characteristics for a forestry project because of the climate and the availability of space for planting pine trees. In the district of San Pablo there is a joint effort between the Provincial Municipality, the San Pablo Agrarian Agency and the Economic Development Management of the Regional Government of Cajamarca to promote and carry out forestry plantations in the district.
Tumbadén District - It was indicated that the Morohuisha farmer community and the towns of Regalado, Chaupirume and Pozo Seco have ample land available for forestry. The interviewee also believes that the local population would be receptive to getting involved in a forestry project. Previous forestation projects have been carried out in all of Tumbaden's

Environmental and Social Impact Assessment of Forest Landscape Restoration Project December 2021
Social Capital Group 28
hamlets: where ADEFOR and the district municipality made agreements with MINAGRI, the Cajamarca Agrarian Agency and the San Pablo Agrarian Agency.
2.4.3.3 Province of Cajabamba
The district studied in Cajabamba Province is Cachachi. In the district of Cachachi, the district municipality is currently developing a forestry project to reforest the towns of Caruacushma and Huallabamba with radiata pine and cypress trees.
2.4.3.4 Potential Area of Interest: Districts
This chapter presents a comparative description of the main socioeconomic and cultural variables in the thirteen districts that are part of the PAI. It is based primarily on secondary sources.
Population
The population in the 13 districts of the PAI zones of interest is 396,198 people. The most populous districts are Cajamarca, followed by the districts of Baños del Inca, La Encañada and Jesús. The inter-census data reflect a tendency towards a decrease in population, except in the Baños del Inca and Cajamarca districts.
Temporary migrants are found mainly in the districts of San Juan, Cajamarca and Magdalena. The main destinations of Cajamarca's migrant population are the Coast (Lima and Callao, La Libertad and Lambayeque) and the Amazon areas (Amazonas and San Martin). 93.6% of every 100 people aged 5 years and older have lived in the same department for the last five years. The districts that show the greatest internal population movement are Baños del Inca and Cajamarca.
Housing
Most of the districts studied have adobe as the predominant material in the walls of the houses, with Cospán, Asunción and San Bernardino standing out. The districts that have calamine sheeting as the predominant roofing material are Magdalena, Cospán, Chetilla and Tumbadén. Tile roofing is predominant in the districts of Jesús, Cachachi and San Juan. Dwellings in the project districts have predominantly dirt floors, with percentages above 90%.
In Tumbadén, 62.2% of homes do not have access to electricity. Lower percentages of homes in Asunción, Cachachi and Encañada do not have electricity.
The use of the public water supply network inside the home is predominant in the districts of Cajamarca, San Pablo, and Baños del Inca. In other districts, the use of the network outside the home, the use of wells (subway water) and the use of water from rivers, irrigation ditches, and lagoons (the latter especially in San Bernardino, Cachachi, and Cospán) are predominant.
Toilets connected to the public network are available inside the home, mainly in the districts of Cajamarca and Baños del Inca. The rest of the districts use a blind or black well, latrines (with treatment), and use of the open field or outdoors (especially in Tumbadén, Cachachi, Magdalena, and Chetilla).

Environmental and Social Impact Assessment of Forest Landscape Restoration Project December 2021
Social Capital Group 29
Education
There are 738 preschool educational institutions in the PAI districts. A lower number of preschool educational institutions are located in the districts of Chetilla, San Bernardino and Tumbadén. At the primary education level, there are a total of 641 educational institutions in the PAI districts. At the secondary level, there are a total of 255 educational institutions, with the districts with the lowest number of educational institutions at this level being San Bernardino, San Juan and Tumbadén. Within the Project districts there are also 53 Alternative Basic Education (ABE) institutions, 5 Special Basic Education institutions, 21 Technical Productive Institutions, and 17 non-university higher education institutions.
The population of men who have attained some year of secondary education is almost 8 percentage points higher (30.0%) than the population of women (22.8%). The districts with the largest gender gaps in secondary education are La Encañada, Chetilla, Baños del Inca and San Juan.
In the Project districts, the highest percentages of school backwardness in primary school are found in the districts of Chetilla and Cospán. At the secondary level, the highest levels of backwardness are found in Chetilla, Asunción and San Juan.
Health
The Cajamarca Region concentrates the facilities with the highest level of resolution, with 13 hospitals for outpatient, emergency, hospitalization and intensive care. In the districts, there are 310 facilities, all of them at the first level of care, either medical posts or health centers (category I-1 and I-2).
Cajamarca is moving towards an "epidemiological accumulation" where infectious diseases represent 62.6% of care, with the districts of Cachachi, San Bernardino and San Pablo standing out. At the same time, chronic non-communicable diseases have appeared, with the highest percentages in the districts of Cajamarca, Tumbadén and San Bernardino.
Employment
At the district level, the Economically Active Population (EAP, population that is working or looking for a job) shows significant variations: in the districts of Asunción, Chetilla Cospán and San Juan, it does not exceed 40%. In a more modest situation are the districts of Encañada, Jesús, Magdalena, San Bernardino, San Pablo, Tumbaden and Cachachi, where the range of participation is between 40% and 50%. The districts of Baños del Inca and Cajamarca have a better participation rate, with over 50%. Disaggregation by gender shows an unfavorable imbalance towards women, as the EAP represents a significantly lower proportion than that of men.
The population of the Cajamarca Region that participates in the generation of some good or service is 461,312 people, equivalent to 95% of the EAP. At the district level, the employed population shows more significant changes, three districts (Asunción, Encañada and San Bernardino) are below 90%, another group made up of Baños del Inca, Cajamarca, Cospán, Jesús, San Pablo and Cachachi, show a level of participation between 90% and 95%. In both cases, participation is below the regional average.

Environmental and Social Impact Assessment of Forest Landscape Restoration Project December 2021
Social Capital Group 30
On the other hand, the unemployment rate is less favorable for women in all geographic districts; it reaches extremes in the districts of San Bernardino, Asunción and Cachachi, where the unemployment rate for women is four times higher than that of men.
Main types of occupation
In the districts, the occupational category of farmer has important weight. In seven of the nine districts of the Province of Cajamarca (Asunción, Chetilla, Cospán, Encañada, Jesús, Magdalena and San Juan), farmers and skilled agricultural, forestry and fishing workers are the main occupation, with more than 50% of the employed population.
Elementary occupations constitute the second main occupation in most of the districts of the Province of Cajamarca, with the exception of the district of Cajamarca, where service workers and store and market vendors constitute the second main occupation.
Farmers and skilled agricultural, forestry and fishing workers are the main occupation of men and women, but with greater intensity for men. This behavior is shared by the Districts of Asunción, Chetilla, Cospán, Encañada, Jesús, Magdalena and San Juan. On the other hand, in Baños del Inca and Cajamarca, the predominant occupations for men are construction workers, building, handicrafts, electricity and telecommunications; while for women they are elementary occupations and service workers and store and market vendors, respectively.
Main economic activities
Agriculture
In seven of Cajamarca's districts (Asunción, Baños del Inca, Cajamarca, Cospán, Encañada, Jesús and Magdalena), the main crop is potatoes. Potatoes also account for the largest number of producers. In the remaining two districts (Chetilla and San Juan), the main crops are corn and Olluco. It is worth noting that in the districts of Asunción, Chetilla, Cospán and San Juan, agricultural production is reduced to one or two products, while in the rest there is greater diversity, with up to nine different products (Baños del Inca and Cajamarca).
According to those interviewed, most of the potato and corn production is for self-consumption, while peas, avocado, tara and corn are mostly sold in local and regional markets, as well as in the city of Lima.
They also reported that, in the region, the form of production organization is mostly individualized or family based. Except for the districts of Magdalena, Baños del Inca, Chetilla, San Pablo, Tumbadén and San Bernardino, where there is a combination of minga practices, collective associations and individual work.
Livestock
In the study area, in 2020, there were at least four species of livestock (cattle, pigs, sheep and goats); there is also a large production of poultry. The most important derivatives or by-products of livestock farming are milk and egg production. The main source of income from livestock farming is obtained from milk production, followed in importance by beef.

Environmental and Social Impact Assessment of Forest Landscape Restoration Project December 2021
Social Capital Group 31
Livestock work is organized on an individual-family basis, although in some districts, such as Cospán, there are still communal pastures and in recent years associative forms have been promoted. Most of the labor used is family labor, except in large farms where labor is contracted.
Forestry
According to the 2012 National Agrarian Census, forest plantations cover 167.8 hectares of land in the region. The largest plantations are located in the districts of San Pablo with an area of 34.05 hectares, followed by Cajamarca with two plantations, the first with 29.32 hectares and the second with 16 hectares. In 2012, these three plantations accounted for 47.3% of the forest area in the study area registered in the Census. The forest by-products obtained are boards, strips, tables or other simple items that are processed in small private workshops located in some communities in the districts of Cajamarca, Encañada, Chetilla, Baños del Inca, Jesús, San Juan and Cospán. Production is destined for the market in the provinces of Trujillo and Cajamarca, as well as local markets. Interviewees also reported small-scale mushroom production in the districts of Baños del Inca and Jesús.
The authorities interviewed noted that forestry activities are regularly carried out by families. In cases where labor is contracted, the daily price per day was estimated to be between 30 and 40 soles.
Poverty and vulnerability
The poverty line is the monetary value against which a household's monthly per capita expenditure is compared to determine whether it is poor or not. At the district level, the district of Cajamarca has a lower incidence of poverty: two out of every ten households are poor. Baños del Inca has an incidence level that is double that of Cajamarca (36.7%). In the other districts, the situation becomes alarming because poverty reaches one out of every two households in Asunción, Magdalena and San Juan; and exceeds seven out of every ten households in Chetilla, Cospán, Encañada, Jesús, San Bernardino and Cachachi.
The Unsatisfied Basic Needs (UBN) method takes into consideration a set of indicators related to basic structural needs that are required to evaluate individual well-being. According to these criteria, three districts are located above the regional poverty average, Chetilla, Tumbaden and Cachachi, while the rest are located below. The case of Chetilla stands out, where the incidence of extreme poverty reaches its maximum in the region, where 13 households out of every 100 are in a condition of indigence. In contrast, the district of Cajamarca has the lowest incidence of poverty and extreme poverty.
Political and institutional characteristics
In the districts of the province of Cajamarca, there has not been a predominant political party or regional movement that has won the elections in the last three electoral periods. There are two important authorities in each district: the Lieutenant Governor and the Municipal Agent, who play an important role in the implementation of productive projects, both from the private sector and the State. Another relevant actor in the districts are the farmer patrols (rondas). Likewise, in the Cajamarca region and in the study districts, there are Water Commissions and Water User Boards (also known as Irrigation Boards).
Culture

Environmental and Social Impact Assessment of Forest Landscape Restoration Project December 2021
Social Capital Group 32
In the Cajamarca region, 38 rural communities were identified, of which 13 are within the Potential Area of Influence (PAI). These communities are located in the districts of Cajamarca, Asunción, Chetilla, Cospán, Magdalena and Tumbadén4.
The rural communities of Chirigpunta, Cochapampa, Mahuaypampa, Mishca Chica, in the district of Chetilla, and the community of La Encañada, in the district of the same name, declared that they belong to the indigenous or original Quechua people. These communities stated that their mother tongue was Quechua. The rest of the communities stated that they speak Spanish.
2.5 Environmental and Social Impact Assessment
This chapter will proceed to identify and evaluate the possible negative and/or positive, direct or indirect, environmental and social impacts that could arise as a consequence of the stages and activities involved in the development of the Project.
2.5.1 Social Impact Assessmet
Environmental impacts are identified and evaluated in a potential manner, i.e. with the application of mitigation measures, good industry practices, international certifications, among others. By applying the proposed measures, the assessment of impacts can be significantly reduced or even eliminated.
The model to be used is the so-called Leopold Matrix, which consists of a double-entry table in which the environmental factors that may be affected and the proposed actions (activities) that are carried out and may cause possible impacts are arranged in rows and columns.
As a result of the interactions in the matrix, the activities with the greatest impact are the following:
Sawing and processing of the round wood produced Final felling, extraction of logs and transportation to the sawmill Opening of forest roads Installation of plantations
In addition, as a result of the interactions in the matrix, the most affected environmental and social factors are the following:
Air pollution Noise Soil quality Waste generation Landscape quality Vegetation cover Loss of natural vegetation Habitat loss Affected individuals
4 Farmer communities are organizations made up of families that inhabit and control certain territories, linked by ancestral, social, economic and cultural ties.

Environmental and Social Impact Assessment of Forest Landscape Restoration Project December 2021
Social Capital Group 33
2.5.2 Social impact assessment
This chapter presents the possible negative and/or positive, direct or indirect environmental and social impacts that could arise as a result of the development of the Project, on which prevention, mitigation and monitoring measures will be focused. The model to be used is the Leopold Matrix, which relates environmental factors that are sensitive to impacts that may be affected by activities that could have an impact on the social environment.
2.5.2.1 Economy
Employment generation - The Project will generate employment opportunities for the population in the area of direct influence and in the areas surrounding the Project, mainly benefiting the labor forces of SAIS José Carlos Mariátegui and the Llullapuquio. The same goes for the population neighboring Yanacocha mine. According to the method used, the magnitude and importance has been rated as medium.
Increased job opportunities for women - Forestry-type projects developed in Cajamarca have shown that there is a demand for female labor due to their manual dexterity, especially in greenhouse work. The development of the project with a gender focus, which promotes the hiring of women in specific activities, could improve the working conditions of women in the families associated with the SAIS and CAT, and in the population at the district level.
The magnitude has been rated as medium because of the number of women that could be involved in the project. The importance has been rated as high given the current conditions of female employment.
Economic dynamization - The sources of this impact are mainly the economic income for SAIS and CAT members from land use agreements; the demand for goods and services for the development of the project; and the increase in income from the hiring of labor. The payment for the purchase or rental of such land may be reinvested in their livestock and/or forestry activities, as well as generating new businesses. The impact has been rated as medium to medium-high, and the magnitude has been rated as medium.
2.5.2.2 Generation of new business opportunities for the area of direct influence
Use of edible mushrooms - During the plantation maintenance and thinning stages of the project, there is the possibility of generating and using edible mushrooms that grow in the shade of the plantations. The magnitude has been rated as medium-high due to the current experience and the potential for marketing these products. The importance is rated as medium high because of the people that could be involved and the profitability of this product for the family economy.
Tourism development potential - Project activities such as the installation of nurseries and pine plantations, once thinning has been carried out, are activities with tourism potential. In Cajamarca there is already experience with the Granja Porcón, where tourism activities are being successfully developed. The magnitude has been rated as medium because of the expansion possibilities and the importance as medium-high because of the people that could be involved.

Environmental and Social Impact Assessment of Forest Landscape Restoration Project December 2021
Social Capital Group 34
2.5.2.3 Economic displacement due to impact on livestock activity
The impact of the Project's forest plantations would be directly to the vegetative cover of cultivated pastures that serve for the consumption of SAIS and CAT cattle. During the growth of the plantations, cattle would not be able to access this area, at least during the first ten years of the plantations. Also, during logging activities, noise could affect local livestock. This is a negative impact of high magnitude. The importance is medium-high, considering that livestock activity is fundamental to the local economy.
2.5.2.4 Population
Local capacity building - The project will implement training for local producers, from the nurseries, to the selection of the land, to the digging and care of the plantations. Local personnel hired for the activities will be able to increase their knowledge and skills and replicate them in their own initiatives and communities.
The magnitude of the impact is considered to be mainly medium, because a limited number of people with limited training will be involved. The importance is medium-high, as SAIS and CAT are currently engaged in forestry activities.
Noise and dust nuisance to the population - The opening of roads, carving and sawmilling activities have social repercussions of environmental impact on noise levels and air quality currently existing in the area of direct influence. Likewise, the opening of forest roads and the movement of vehicles during the operational phase of the project are activities that can generate the dispersion of particulate matter. The management measure for these impacts will be the monitoring of dust and noise, as well as the opinion of the population.
The magnitude of this negative impact is medium to medium-low, and the importance is medium to medium-low, being higher in the case of road opening and use.
2.5.2.5 Organizational and local culture
Improvement of the associativity conditions of the cooperatives - The SAIS and CAT, with an associative model, are entities that do not have an optimal economic development, generating scarce dividends for their associates. The intervention of the Project, whether to rent or buy land from these companies, will generate the necessary income to boost their economic activities and consolidate their internal organization. This impact is rated as medium-high magnitude and medium-high importance.
Better conditions for the maintenance of the patrimony of the communal enterprises - As has been pointed out in the SBL, both SAIS and CAT have been facing invasions of their territories, motivated by the demand for land from the populations. The current economic difficulties of these companies prevent them from developing security measures to monitor the entry of outsiders into their territory. The operation of the Project in the SAIS and CAT territories will generate a greater presence of people in the area and the development of a diversity of activities, reducing the risk of new invasions. The impact is rated as medium-high magnitude and medium-high importance.

Environmental and Social Impact Assessment of Forest Landscape Restoration Project December 2021
Social Capital Group 35
2.5.2.6 Preservation of cultural practices
It has been documented in the SBL that in the SAIS and CAT there are cultural practices of organized and collective work that come from the Andean cultural matrix (minka or minga). Hiring local labor will allow families to maintain these cultural traditions that give them identity and a sense of belonging. Accordingly, this impact on local culture is rated as of medium magnitude and medium importance.
2.5.2.7 Infrastructure
Improvements in road accessibility - The project includes road opening and improvement activities and works such as bridges and speed bumps. Currently, according to the SBL, both the SAIS and the CAT have limited road infrastructure of carriageable logs and problems during the rainy season. This is a positive impact of medium-high importance. The magnitude is also medium-high in the road opening and improvement activity.
2.5.2.8 Health
Risks of occupational accidents and illnesses - The Project will carry out activities that involve greater exposure to risks of occupational accidents, such as maintenance, thinning and logging with chainsaws, and opening roads with heavy machinery. It also increases the risk of contracting diseases as a result of inhaling wood particles, for example. To mitigate these health impacts, it will be essential to work on prevention through ongoing health and safety training, the use of personal protective equipment, and monitoring of working conditions. The magnitude of the negative impact is medium-low to high, and the importance is medium-low to medium.
2.6 Environmental and Social Management Plan
2.6.1 Environmental Management Plan
The Environmental Management Plan defines the measures necessary to prevent, mitigate, correct and/or compensate (if applicable) the environmental and social impacts generated by the project. In preparing the Environmental Management Plan (EMP), the mitigation hierarchy approach has been considered in order to minimize, restore, and compensate for those impacts that cannot be avoided.
2.6.1.1 Impact Mitigation Program
This program presents the management guidelines, incorporating the strategies and measures to be implemented in the different activities and components (physical, biological and social) of the project in order to minimize, prevent, mitigate or control the environmental and social impacts that were identified and evaluated in the previous chapter. The measures of the impact mitigation program are focused on:
Control of particulate matter and emission gases Control of noise levels Soil protection

Environmental and Social Impact Assessment of Forest Landscape Restoration Project December 2021
Social Capital Group 36
Protection of water sources
2.6.1.2 Solid Waste Management and Minimization Program
Waste generation will be evident in all project activities, which is why this plan was prepared in compliance with the provisions of the Integrated Solid Waste Management Law and its regulations.
2.6.1.3 Biological environmental management program
The following measures have been identified in this program:
Vegetation cover management Biodiversity conservation and habitat protection.
2.6.1.4 Monitoring and follow-up program
This chapter proposes the monitoring and follow-up to be carried out, both for the physical and biological environment. It establishes the parameters for monitoring the quality of the different environmental components that could be affected during the different stages of the project, as well as the control and measurement systems for these parameters. This program includes:
Water quality monitoring Noise level monitoring Biological environment monitoring
2.6.2 Social Management Plan
The Social Management Plan presents the prevention and mitigation measures for the identified social impacts and the guidelines for an optimal relationship with the IPA population and other Project stakeholders.
For the preparation of this Plan, the Terms of Reference of the study, the Good Practice Guide prepared based on the FLR Project under study, as well as the IFC Performance Standards, have been taken into account.
2.6.2.1 Community Outreach Program
The Program focuses on the stakeholders identified in the IPA, who would be directly affected and who may have an interest or influence on the Project.
For the development of this Plan, all stakeholders must be included in a database, with their corresponding contact information. This registry must be continuously updated according to the progress of the studies, the implementation of the Project and the environmental and social commitments assumed.

Environmental and Social Impact Assessment of Forest Landscape Restoration Project December 2021
Social Capital Group 37
Among the information activities, participatory workshops should be held at least once a year and the participation of women and vulnerable groups should be promoted. Other proposed activities include the issuance of newsletters and the establishment of a permanent information office.
The monitoring of this subprogram includes follow-up on the consultations held at the information office, compliance with agreements, the number of workshops and meetings held, and the percentage of women participating in these meetings.
2.6.2.2 Complaint or claims attention program
The mechanism for addressing complaints or claims is implemented so that the population can express their concerns and complaints about the Project, which are received, evaluated and resolved. This mechanism is complementary to, and does not replace, the relationship and communication with the population.
It should be noted that this mechanism should be disseminated among the local population during the start-up phase of the project and during its implementation.
2.6.2.3 Income restoration program
In principle, the physical displacement of any person should be avoided. However, if this is not possible, it is necessary to identify who would potentially be affected, quantify the benefits they obtain and the impact they will suffer, so that specific and appropriate measures can be designed to mitigate or compensate them. In this process, it is necessary to identify any vulnerable groups that could be affected.
For any of the compensation measures implemented, the Project must establish a monitoring plan to ensure that the planned measures are being complied with and to know how the situation of the people involved in the income restoration program is evolving.
In this regard, four specific short-term compensation measures are proposed:
Periodic economic compensation for land use - An effective measure is to establish periodic payments for the use of the land that will be used for the Project, so that these revenues can be used as a priority to compensate those affected. It is recommended that payment periods be annual, at most.
Access to replacement land for those affected - An alternative measure is to coordinate, as part of the agreements with the SAIS and CAT, that eventual affected parties are compensated for the loss of access to land with access to other lands of similar characteristics within the property. It is advisable to consider this alternative from the initial moment when the lands to be used for the forestry project are being selected.
Productivity improvement of land not destined for the FLR project - Productivity improvement actions on existing land should be based on a land analysis, which should be carried out in a participatory manner with the partners and in particular with the affected people who will be the main beneficiaries.

Environmental and Social Impact Assessment of Forest Landscape Restoration Project December 2021
Social Capital Group 38
Initiatives based on the use of plantation by-products - Among the initiatives to be considered are the use of forest mushrooms, the grazing of the grasses that grow among the pine trees (when the plantations are old enough not to be affected by livestock) and the development of tourism activities5. Regarding the latter, the SAIS and CAT Llullapuquio have identified an interest in tourism or ecotourism activities.
2.6.2.4 Local employment program
The employment program includes measures for the prioritization of labor recruitment and the social standards of the Workers' Code of Conduct.
Hiring of local labor
This program seeks to promote the hiring of local labor in order to expand opportunities for the local population, particularly CAT and SAIS members. If the CAT and SAIS are unable to find personnel, the call will be extended to a larger area of influence.
For the hiring of local personnel, a training program should be implemented, based on their skills and expectations, to improve their performance in project activities. Likewise, the hiring of women should be promoted, especially for those positions that best suit their skills.
In order to prevent risks and impacts on workers' health and safety, an Occupational Health and Safety Management System (OHSMS) must be implemented that considers the hazards and risks of the different phases of operations, both in the plantations and in the sawmilling and processing operations of the timber produced in the plant to be installed in the outskirts of the city of Cajamarca.
In the context of the COVID-19 pandemic, the Project must implement measures to prevent the infection of workers. In accordance with the sanitary protocol for forestry activities approved by RM N° 152-2020-MINAGRI, it is necessary to establish surveillance, prevention, and control measures for the health of workers, avoid the transmission of COVID-19 and provide timely attention to suspected or confirmed cases.
Code of Conduct
The objective is to regulate, in particular, the interaction of project workers, whether hired directly by the company or its contractors, with the population in the area of influence, as the aim is to have good neighborly relations with the population. To this end, workers must receive an induction lecture on the Code of Conduct.
2.7 Conclusions and recommendations
The Project is planned to be developed in its initial phase with the forests and land available in the properties of Yanacocha mine, CAT Llullapuquio and SAIS José Carlos Mariátegui. However, the Company in charge of the Project must still negotiate with these three owners to precisely define the land and plantations of each of them to be provided for the Project. Under no circumstances will the Project purchase land from these landowners; the planned modality is to
5 These are mentioned in the Good Practice Guide for the Development of FLR Projects on Community Lands.

Environmental and Social Impact Assessment of Forest Landscape Restoration Project December 2021
Social Capital Group 39
obtain surface rights for periods of time appropriate for forest rotations. The only land planned to be acquired will be the land necessary to install the sawmill and roundwood processing plant in the outskirts of the city of Cajamarca.
The partnership between the Company and the landowners, in particular CAT Llullapuquio and the SAIS JCM, has the potential to generate virtuous synergies for both parties, in particular income generation, employment and forest management training for the landowners, and access to lands of good suitability for forest development for the Company. However, it is very important that the Company takes the necessary time to assess the status of the owners' property titles and the potential existing land conflicts that could affect their investments. Likewise, it is important that the company makes sure to sign solid and stable agreements with the landowners, in a broad participatory manner, that give it the greatest possible assurance that the Project will be developed with the least number of socio-environmental conflicts throughout its extended rotation period. The Good Practice Guide for Private Sector Investments in Forest Landscape Restoration in Community Lands6 is a good reference to consult in this regard.
Regarding the formal processes and authorizations for the development of the Project, there are a series of regulations that must be followed subject to different institutions, mainly related to the environmental certification, plantation registration, primary and secondary timber processing, non-existence of archaeological remains, and prior consultation (in case of confirmation of the existence of indigenous communities or native peoples). However, in practice, there are no precedents of forestry plantations that have followed all of these processes. As such, the recommendation is to establish formal contact with SERFOR and SENACE so that these institutions can define the steps to follow to develop the project with all the formality and legality required.
With respect to the perception of the communities and the general public regarding the environmental and social impacts of the Project, it is important to mention that, unlike projects in sectors such as mining, hydrocarbons or hydroelectricity (often viewed with concern by communities and parts of the public due to their potential for negative impacts), forest plantations are generally perceived as a very positive activity. In many parts of Peru, particularly in Cajamarca, pine tree plantations are widespread among the communities and enjoy the support of authorities at all levels, who are very interested in their large-scale development.
From the impact analysis carried out in this study, it can be concluded that the main negative impacts that the Project could generate are the impact on native forest ecosystems and their biodiversity, loss of vegetal cover due to the opening of forest roads and installing of sawmill, impacts on the health and safety of workers due to logging, extraction, sawmilling and wood processing activities, and economic displacement of people who would use the plantations and land necessary for the development of the Project. However, through certification of the Project by the Forest Stewardship Council (FSC) and compliance with IFC's environmental and social standards, these risks can be eliminated and adequately mitigated and, where appropriate, compensated for. In this way, identified impact-generating activities can be prevented from expressing their potential negative impacts.
6 This public guide was also prepared by Social Capital Group in 2021 at the request of the same clients for whom this ESIA has been developed
Environmental and Social Impact Assessment of Forest Landscape Restoration Project December 2021
Social Capital Group 40
The positive impacts are related to the generation of a virtuous economic dynamic in the forest industry production chains, income generation for landowners, employment generation and training of CAT Llullapuquio and SAIS JCM members, as well as neighboring communities in general, in the best forestry management techniques.

Environmental and Social Impact Assessment of Forest Landscape Restoration Project December 2021
Social Capital Group 41
3 LEGAL ANALYSIS
This section is composed of two main parts. The first presents an analysis of the most relevant legal aspects for obtaining permits for the development of FLR projects on private land and for the processing of forest products in Peru. The second is a gap analysis between the World Bank's International Finance Corporation (IFC) regulations and Peruvian national legislation, for five potential environmental and social impacts and risks considered relevant to the FLR project in question.
3.1 Most relevant legal aspects for obtaining permits for the development of FLR and forest product processing projects
According to the evaluation carried out, the most relevant legal aspects related to obtaining permits are:
• Obtaining environmental certification in the agricultural sector • Prior consultation with indigenous peoples • Certificate of Non-Existence of Archaeological Remains • Forest plantation registration • Primary and secondary processing of forest products
The following sections provide a summary of each of these.
3.1.1 Obtaining environmental certification in the agricultural sector
According to the list of investment projects subject to the SEIA (National Environmental Impact Assessment System), forestry plantations require environmental certification. However, at the time of writing this report, the Agrarian Development and Irrigation sector, to which the forestry sub-sector belongs, did not have an advanced classification of its investment projects, nor did it have terms of reference for this type of project.
Because of this, it is advisable to start the environmental certification process with the presentation of a Preliminary Environmental Assessment (EVAP, for its acroym in Spanish) before the National Service of Environmental Certification for Sustainable Investments (SENACE), so that this institution evaluates and categorizes the Project according to its risks and potential impacts and establishes its category and the type of Environmental Management Instrument (IGA), which must be developed to obtain the environmental certification. The three possible categories of EMI are: Category I, Detailed Environmental Impact Assessment (EIAd), Category II, Semi-Detailed Environmental Impact Assessment (EIAsd) and Category III, Environmental Impact Declaration (EID).
If after evaluating the EVAP, SENACE determines that the Project is category I, the EIAd must be evaluated and approved by SENACE itself. If SENACE determines that the Project is category II or category III, the evaluation and approval must be made by the General Directorate of Agricultural Environmental Affairs (DGAAA) of MIDAGRI. It is important to mention that if the Project is category III, the EVAP itself becomes the EID and the resolution that approves the classification of the Project as type III, constitutes the Environmental Certification.
Environmental and Social Impact Assessment of Forest Landscape Restoration Project December 2021
Social Capital Group 42
SENACE's term to resolve the classification is 30 days and it will be in force as long as the material and technical conditions of the Project, its location or the identified environmental and social impacts are not modified.
It must be said that to date no precedents have been identified in Peru for FLR projects on private lands that have managed and obtained environmental certifications from SENACE. It is hoped that the project in question can help the relevant authorities set clear precedents in this regard.
Legal Basis
• General
– Law of the National System of Environmental Evaluation and Impact, Law No. 27446. – Regulation of the Law of the National System of Environmental Evaluation and
Impact, Law N° 27446, approved by DS N° 019-2009-MINAM. – Regulation on Transparency, Access to Environmental Public Information and Citizen
Participation and Consultation in Environmental Matters, approved by DS N.° 002-2009-MINAM
• Specific
– Regulation of Environmental Management of the Agricultural Sector, approved by
DS No. 019-2012-AG. – Regulation of Citizen Participation for the Evaluation, Approval and Monitoring of
Environmental Management Instruments of the Agrarian Sector, approved by DS N.° 018-2012-AG.
– Approval of the culmination of the process of transfer of functions from the Agriculture subsector of MIDAGRI to SENACE, approved by RM N° 194-2017-MINAM), through which SENACE assumes the functions to review and approve the EIA-d.
3.1.2 Prior Consultation with Indigenous or Native Peoples
Act No. 29785 on the right to prior consultation with indigenous or aboriginal peoples, based on ILO Convention No. 169, establishes that the State must carry out a process of prior consultation before approving any administrative or legislative measure that may affect the collective rights of any indigenous or aboriginal people.
This law regulates the stages of the consultation process, giving the State promoting entities (mainly ministries of the different sectors of the Executive Branch) the duty to identify the administrative measure that should be the subject of the consultation, as it is directly linked to the impact on the collective rights of indigenous peoples. In addition, the State's promotional entities must identify the indigenous peoples to be consulted, publish information on the legislative or administrative measure, evaluate the organization of the indigenous peoples, carry out the processes of dialogue between representatives of the State and representatives of the indigenous peoples, and decide.

Environmental and Social Impact Assessment of Forest Landscape Restoration Project December 2021
Social Capital Group 43
With regard to the forestry sector, Article 7 of the Regulations for Forestry and Wildlife Management for Native Communities and Farmer Communities establishes that prior consultation must be carried out before the approval of any measure that could affect the collective rights of indigenous peoples. However, the administrative measures to be consulted have not been determined, and at the time of this study, there were no precedents of FLR projects in Peru that had followed this process.
Legal Basis
• Law No. 29785 on the right to prior consultation with indigenous peoples, recognized in Convention No. 169 of the International Labour Organization (ILO).
• Regulation of Law No. 29785, Law on the Right to Prior Consultation of Indigenous or Original Peoples recognized in Convention 169 of the International Labour Organization (ILO), approved by Supreme Decree No. 001-2012-MC.
• Ministerial Resolution No. 350-2012-MEM/DM, which approves the administrative procedures in which the prior consultation process must be carried out.
• Vice-Ministerial Resolution No. 010-2013-VMI-MC, which approves the procedure for indigenous peoples' requests for inclusion in a process of prior consultation or for the conduct of such a process.
• Forestry and Wild Fauna Law, Law No. 29763 Regulations for Forestry and Wildlife Management for Native Communities and Farmer Communities, approved by DS N° 021-2015-MINAGRI
3.1.3 Obtaining Certificate of Non-existence of Archaeological Remains (CIRA)
All investment projects, whether public or private, are required to have the CIRA before starting work. This certificate is one of the requirements for mining activities, energy exploitation, communication routes, hydraulic works, installation or production plants, agricultural development, etc. The CIRA is a document through which the State certifies that, in a given area, there are no archaeological remains on the surface.
To obtain the CIRA, an application is submitted to the Directorate of Archaeology or the Regional Directorates of Culture, attaching proof of payment for issuance of the CIRA (according to the TUPA); plan of location and scope of intervention of the project and descriptive memory in UTM coordinates Datum WGS 84, signed by an engineer or architect.
The application is evaluated within a maximum period of 20 working days. This procedure is subject to positive administrative silence, i.e. if after 20 working days of submitting the application, the project holder considers the application approved.
Once the CIRA is issued, the project owner must prepare an Archaeological Monitoring Plan, prepared by a professional registered in the National Archaeological Registry of the Ministry of Culture. This plan is approved within a maximum of ten (10) working days by the Directorate of Archaeology.

Environmental and Social Impact Assessment of Forest Landscape Restoration Project December 2021
Social Capital Group 44
Legal Basis
• Supreme Decree N° 054-2013-PCM • Supreme Decree N° 060-2013-PCM • Ministerial Resolution No. 037-2013-VMPCIC-MC, Directive of Standards and Procedures
for the Issuance of the Certificate of Non-existence of Archaeological Remains (CIRA)
3.1.4 Forest plantation registration
All forest plantations on public or privately owned land must be registered in the National Register of Forest Plantations (RNPF, for its acronym in Spanish) conducted by the Forestry and Wildlife Service (SERFOR), through the Regional Forestry and Wildlife Authorities (ARFFS). The process is carried out through a simple, free and automatic procedure, according to procedure 6 of Annex 1 of the Regulation for Plantations.
The registration of plantations is carried out from the third year of establishment of the plantation or when the plants have achieved their definitive establishment in the field. Once the registration procedure has been completed, the ARFFS, at the request of the interested party, issues the corresponding registration certificate. The information entered in the register is a sworn statement subject to subsequent inspection by ARFFS.
For the registration of a plantation with the ARFFS the following is required:
• Registration form in the shape of a sworn declaration, in accordance with the format approved in the guidelines approved by SERFOR.
• Document accrediting legal representation, in the case of legal entities. • Copy of the property title or document that accredits the real right of the area of the
forest plantation, in case of private properties. • Location map of the property in UTM coordinates and Datum WGS84, indicating the
area, as well as its extension, in case of private properties. • Map of the plantation area drawn up in UTM coordinates and Datum WGS84, indicating
the area, as well as its extension. • Document that accredits the authorization of the owner of the area where the
installation and conduction of the plantation or agroforestry system will be carried out, contract between the investor and the owner of the area of the plantation or agroforestry system, in the case that the person who registers is not the owner of the area.
Legal Basis
• Forestry and Wild Fauna Law, Law No. 29763 • Regulations for the Management of Forest Plantations and Agroforestry Systems,
approved by DS N° 020-2015-MINAGRI • Regulation for Forest Management, approved by DS N° 018-2021-MINAGRI. • Guidelines for the inscription of plantations in the National Register of Forest Plantations
and its annexes, approved by RDE N° 165-2015-SERFOR-DE

Environmental and Social Impact Assessment of Forest Landscape Restoration Project December 2021
Social Capital Group 45
3.1.5 Primary and secondary processing of timber forest products
Primary processing is defined as the first transformation process to which forest products and by-products are subjected to in their natural state. Secondary processing is defined as the transformation process to which forest products and by-products from a primary processing industry are subjected in order to obtain an additional added value.
Primary processing is regulated by the Forestry Management Regulations. This forestry regulation regulates the procedure to obtain authorization for the establishment of primary processing centers and for the Collection Center (or warehouses) and Commercialization Centers. To obtain the authorization, the applicant must submit an application to the ARFFS accrediting their right over the area and declare the type of machinery and equipment necessary to carry out the activity, according to procedure No. 18 of Annex I of the Forest Management Regulations.
For secondary processing, Article 176 of the Regulation for Forest Management mentioned above, establishes that the competent authority to obtain the authorization of secondary processing center is the Ministry of Production (PRODUCE). In 2019, PRODUCE published the draft Supreme Decree approving the Regulation of the Registration of Secondary Timber Processing Center, but this has not yet been approved. Nevertheless, the Directorate for the Regulation of Industrial and Controlled Products of the General Directorate of Policies and Regulatory Analysis of PRODUCE grants the certificate of Registration of the Registry of Secondary Transformation Center Centers.
Legal Basis
Forestry and Wild Fauna Law, Law No. 29763 Regulations for the Management of Forest Plantations and Agroforestry Systems,
approved by DS N° 020-2015-MINAGRI Regulation for Forest Management, approved by DS N° 018-2015-MINAGRI. RM N° 296-2019-PRODUCE, draft Supreme Decree that approves the Regulation of the
Registry of Secondary Timber Processing Centres.
3.2 Gap Analysis between certain IFC Performance Standards and the applicable Peruvian legislation for five potential impacts of the Project
Table 2.1 presents a gap analysis between IFC Performance Standards (PS) and applicable Peruvian legislation for the following five cases or situations of potential negative impacts of the FLR project under study. These potential impacts have been chosen mainly because of the particular reputational sensitivity that they could have.
a. Potential impact on workers' health and safety The Project will generate potentially hazardous conditions for the safety of workers, mainly during thinning, felling and extraction of logs from the plantations, as well as during sawmilling and wood processing activities.

Environmental and Social Impact Assessment of Forest Landscape Restoration Project December 2021
Social Capital Group 46
b. Potential impact on water availability Pine plantations are sometimes questioned for their potential impact on water availability. Some studies indicate that plantations of these exotic species consume more water than do species in native ecosystems, reducing the surface runoff available to local people.
c. Potential economic displacement of people One potential impact is the economic displacement that some members of the community could suffer if they lose access to the natural resources on the land that will be used for plantations, particularly natural pastures for livestock feed.
d. Potential impact on biodiversity As in the case of water, monocultures of exotic species can generate negative impacts on biodiversity if they are installed on land that is home to biodiverse ecosystems, displacing the natural vegetation cover of these environments.
e. Potential impact on the collective rights of indigenous peoples due to lack of prior consultation
Although no native or indigenous peoples have been identified that should be consulted due to potential negative impacts of the Project on their collective rights, the high sensitivity of this issue in Peru is reason enough to include it in this gap analysis.
3.2.1 Gaps identified
As can be seen in Table 2.1, Peruvian legislation covers almost all of the IFC requirements related to the potential impacts selected for this analysis. Only partial regulatory gaps were identified with respect to PS 5 Land Acquisition and Involuntary Resettlement.
PS 5: Peruvian legislation only considers compensation for lost profits or consequential
damages. It does not consider compensation related to loss of access to natural resources or ecosystem services. On the other hand, Peruvian law requires that land rights are legally recognizable, while PS 5 requires only that the rights of affected people have been identified and validated in consensus with the local population and authorities.

Social Capital Group 47
Table 3.1 Gap Analysis IFC Performance Standards and Applicable National Legislation for five cases of potential impacts related to the FLR Project
N° Potential Impact Applicable
Performance Standard and Requirements
Applicable National Regulations Gap Analysis
1 Impacts on worker health and safety
PS 2:Work and working conditions
Subject: OHS
Requirement: 23
Law No. 29783, Law on Occupational Safety and Health. Regulation of the Law on Occupational Safety and Health, approved
by Supreme Decree No. 005-2012-TR. Law No. 30102, that provides for preventive measures against the
harmful effects on health due to prolonged exposure to solar radiation.
RM N° 152-2020-MINAGRI, approves the Sectoral Sanitary Protocol for COVID 19 in forestry activities.
Resolution No. 040-2018-OSINFOR, OSINFOR Field Work Contingency Protocol "SGC-E3-PRT-002-V.01".
No normative gaps were identified between the PS 2 requirements regarding workers' health and safety and the Peruvian regulations for these purposes. Peruvian regulations include the obligation for employers to implement an Occupational Health and Safety Management System according to the type of company, level of hazard and risk, and number of workers exposed. The system includes training programs, an internal regulation of health and safety at work, planning of preventive activities, mandatory records for the benefit of workers' OHS.
2 Impact on water
availability
PS 3: Resource efficiency and pollution prevention
Topic: Water consumption
Requirement: 9
Law on Water Resources, Law No. 293382. Regulation of the Law on Water Resources, approved by DS No. 001-
2010-AG3. Law of the National System of Environmental Impact Assessment, Law
No. 274464. Regulation of the Law of the National System of Environmental
Impact Assessment, approved by DS N° 019-2009-MINAM. Regulation for the Management of Forest Plantations, approved by DS
N° 020-2015-MINAGRI.
No regulatory gaps were identified between the PS 3 requirements regarding resource use efficiency and pollution prevention and Peruvian regulations on the matter. In addition to the regulations governing water use, the Peruvian State has the SEIA Law, which establishes that the owner of an investment project must evaluate the possible significant negative impacts to the components of the environment and establish measures to avoid or reduce them. Considering that water is a component of the environment, this standard covers the requirements of PS 3.
PS 6: Biodiversity conservation and
sustainable management of living natural resources
Subject: Management of
ecosystem services
Prerequisite: 9
General Environmental Law, Law No. 286112. Law of the National System of Environmental Impact Assessment, Law
No. 274463. Regulation of the Law of the National System of Environmental
Impact Assessment, approved by DS N° 019-2009-MINAM. Regulation of environmental management for the agrarian sector,
approved by DS N° 019-2012-AG. General guide for the environmental compensation plan, approved by
RM N° 066-2016-MINAM6.
No regulatory gaps were identified between the PS 6 requirements regarding biodiversity conservation and sustainable management of natural resources and Peruvian regulations on the matter. The Peruvian State has the SEIA Law, which establishes that the owner of an investment project must evaluate the possible significant negative impacts to the components of the environment and must establish measures to avoid or reduce them. Considering that biodiversity and natural resources are a component of the environment, this standard covers the requirements of PS 6.

Environmental and Social Impact Assessment of Forest Landscape Restoration Project December 2021
Social Capital Group 48
N° Potential Impact Applicable
Performance Standard and Requirements
Applicable National Regulations Gap Analysis
Regulation for the management of forest plantations and agroforestry systems, approved by DSN° 020-2015-MINAGRI.
3 Economic
displacement of people
PS 5: Land Acquisition and Involuntary Resettlement
Topic: Economic
Displacement Requirements: 26, 27 and
28
Legislative Decree No. 1192, Framework Law on the Acquisition and Expropriation of Real Estate, Transfer of State-Owned Real Estate, Release of Interferences, amended by Decree No. 3-2020 (Art. 20).
A regulatory gap was identified between the requirements of PS 5 regarding land acquisition and involuntary resettlement and Peruvian regulations. Both DL 1192 and its TUO only include compensation for possible damages that only include loss of profits and consequential damages. It does not contemplate compensation of an extra-patrimonial nature, such as, for example, that related to loss of access to natural resources or ecosystem services. On the other hand, Peruvian law requires that the rights or ownership over the land be legally recognizable according to Article 6 of the DL (they must be registered in the SUNARP/ the right of ownership is accredited with a document of a certain date), while PS 5 requires only that the affected rights have been identified and validated in consensus with the population and local authorities.
4
Impacts on biodiversity due to the installation of
monoculture plantations of exotic species.
PS 6: Biodiversity conservation and
sustainable management of living natural resources
Subject: Sustainable
management of living natural resources
Requirements: 26, 27, 28
and 29
General Environmental Law, Law No. 28611. Forestry and Wildlife Law, Law No. 297633.
Regulation for the classification of land by its capacity for optimal use, approved by DS N° 017-2009-AG4.
Regulation for the management of forest plantations and agroforestry systems, approved by DS N° 020-2015-MIAGRI.
No regulatory gaps were identified between the PS 6 requirements regarding biodiversity conservation and sustainable management of natural resources and Peruvian regulations. Peruvian regulations prohibit plantation projects in areas with mature primary and/or secondary forest cover. The regulation expressly prohibits deforesting or removing forest cover to install forestry plantations. The Peruvian standard covers PS 6.
Forestry and Wildlife Law, Law No. 297632 Regulation for the management of forest plantations and agroforestry
systems, approved by DS N° 020-2015-MINAGRI.
No normative gaps were identified between the PS 6 requirements referring to biodiversity conservation and sustainable management of natural resources and the Peruvian regulations on the matter. Peruvian regulations provide for verification or certification by accredited bodies.

Environmental and Social Impact Assessment of Forest Landscape Restoration Project December 2021
Social Capital Group 49
N° Potential Impact Applicable
Performance Standard and Requirements
Applicable National Regulations Gap Analysis
5
Negative impacts on the collective
rights of indigenous
peoples due to lack of prior
consultation.
PS 7: Indigenous Peoples
Topic:
1) Participation and consent.
Law on the right to prior consultation with indigenous or native peoples, recognized in Convention 169 of the International Labour
Organization - ILO, Law No. 29785 and its regulations. Forestry and Wildlife Act, Act No. 29763.
Regulation for forest and wildlife management in Native Communities and Farmer Communities, approved by DS N° 021-2015-MINAGRI.
No normative gaps were identified between the PS7 requirements regarding Indigenous Peoples and Peruvian regulations on the matter. Peruvian legislation regulates the State's obligation to carry out prior consultation on administrative measures that may violate the collective rights of Indigenous Peoples. Likewise, the Community Regulations provide for the participation of the representative organizations of the IIOO, in the event of situations that could violate their rights.

Social Capital Group 50
4 PROJECT DESCRIPTION
The Project includes the harvesting of existing pine plantations of Pinus radiata and Pinus patula species, the replanting of the areas harvested and the planting of new Pinus radiata plantations. It also includes the installation of a sawmill and processing plant for the timber produced.
Market estimates made by Arbaro indicate that approximately 3,000 ha of existing plantations of different ages need to be acquired and 750 ha of new plantations need to be planted. These estimates have been made considering that the productivity at the time of final harvest of the existing plantations will be approximately 250 to 300 m³/ha and that of the new plantations, that will be made with improved genetic material and optimal management from the beginning, will be 400 m³/ha. The rotation period of the plantations will be approximately 20 years.
In accordance with Arbaro's policies, agreements will be established with the owners of existing plantations for their management and final harvesting, and replanting the areas harvested, without acquiring the land where they are located. The same will be done in the case of new plantations, agreements will be established that will allow the company to plant, manage and extract the wood without the need to purchase the land. The only land that will be acquired will be the land where the sawmill and timber processing plant will be located on the outskirts of the city of Cajamarca. The following sections provide an overview of each of these three elements of the Project.
4.1 Installation of new plantations, replanting of harvested areas and management and use of existing plantations
A number of potential cooperation parties have been identiefied with whom the Project could do business. These are: Minera Yanacocha SRL, Cooperativa Agraria de Trabajadores Llullapuquio, and Sociedad Agrícola de Interés Social (SAIS) José Carlos Mariátegui (see Figure 4.1). Between these three owners, they have far more than the 750 ha required to install the new plantations of the initial phase of the Project. Having said that, the exact extension that will be planted on the lands of each owner has not yet been defined, nor the precise location of these lands within the properties. The same situation occurs with the existing plantations. In the properties of the three owners mentioned above, there is far more than the 3,000 ha required in the initial phase, however, again, the extention and the location of existing plantations that each owner will contribute has not yet been defined. The project company still needs to negotiate with these landowners to define these aspects.
The following sections describe, in general terms, the activities for the installation of new plantations, the replanting of areas already harvested and the exploitation of existing plantations. As the activities for replanting are not significantly different than the activities for installing new plantations, they are analyzed as a unique set of activities in section 4.1.3.

Environmental and Social Impact Assessment of Forest Landscape Restoration Project December 2021
Social Capital Group 51
Figure 4.1 Location of Tumbaden’s Sawmill
Source: SCG
4.1.1 Installation and management of forest nurseries
It is foreseen that 1 to 3 nurseries will produce bare-root seedlings, and that they will operate permanently to produce the plants that will be installed over the years. In accordance with the objectives of the Project, it is estimated that each nursery will have a production capacity of approximately between 70,000 and 200,000, seedlings / year, depending on the location and year. It has not yet been defined where the nurseries will be located.
For the installation of each nursery, a plot of land of approximately 0.5 to 1 ha is required. It should be relatively flat, with availability of water for irrigation, and strategically located so that the seedlings produced can be maintained and transported with the least effort to the final locations where the plantations will be installed. In the agreements to be established with

Environmental and Social Impact Assessment of Forest Landscape Restoration Project December 2021
Social Capital Group 52
Llullapuquio, SAIS JCM and Yanacocha, everything related to the installation of the nurseries will be included.
For the installation of the nurseries it is necessary to level the land, prepare the beds with the appropriate substrate for the growth of the seedlings, install the irrigation system and the structure to place the nets that will shade the seedlings.
The following table provides more details on the establishment of a typical nursery for the development of the Project.
• Land area: 0.5 to 1 ha • Production capacity: 70,000 to 200,000 seedlings / year
Table 4.1 Nursery Installation and Management
Activities Materials Tools and equipment
Workmanship Comments
Clearing and levelling of the land Local land Hand tools
Local unskilled, directed by forestry engineer
Bed preparation Substrate (soil, river sand, organic matter)
Hand tools Local unskilled, directed by forestry engineer
Shade construction Posts and beams of eucalyptus, raschel mesh
Hand tools Local unskilled, directed by forestry engineer
Installation of irrigation system
Hoses, micro-sprinklers, pumps, etc.
Hand tools Local unskilled, directed by forestry engineer
Construction of administrative office and tool storage
Wood, calamine Hand tools Local unskilled, directed by forestry engineer
Seedling production and nursery maintenance
Seeds, water Hand tools Local unskilled, directed by forestry engineer
4.1.2 Opening of forest roads
The opening of forest roads allows access to the different sectors of the Project areas to carry out the work efficiently and safely. However, it is the forest management activity that has the greatest impacts on soil and water. Proper planning and maintenance can minimize environmental impacts.
For the opening and maintenance of the roads, heavy machinery and dump trucks are used to remove earth and transport materials. In certain places such as stream crossings, specific works such as bridges, speed bumps, etc. must be constructed.
Further details on the opening of forest roads are presented in the table below.

Environmental and Social Impact Assessment of Forest Landscape Restoration Project December 2021
Social Capital Group 53
Table 4.2 Activities for the opening of forest roads
Activities Materials Tools, equipment
and machinery Workmanship Comments
Design and layout Topographical station, GPS Local Qualified
Road Opening Fuels, quarry material
Bulldozers, skidders with shovels, tractors with shovels, backhoes, hand tools.
Local unqualified, local qualified, directed by forestry engineer
4.1.3 Installation of new plantations and replanting of harvested areas
For the establishment of new plantations, it is necessary to identify, evaluate and select, together with the landowners, the land on which the plantations will be established. If the land is being used for agriculture, livestock or other uses, it is necessary to identify the people involved and the impacts they will be exposed to, in order to take the corresponding participatory management measures.
Once the land is well defined and free, soil studies should be carried out to characterize and identify its fertility. According to each situation and depending on the slope of the land, the Project can opt for soil braking, which is a 0.5 to 0.7 deep removal of the land with the use of agro tractors. This procedure serves to substantially improve the soil structure before the pitting. Subsequently, the sites where the seedlings will be planted must be marked, the holes must be dug, the land must be fenced and the planting must be done at the beginning of the rainy season.
The activities for replanting on already harvested land are practically the same as those for establishing plantations on new lands, for this reason, replanting is not being considered in a separate section.
The following table presents further details of the activities necessary for the installation of the plantations and replanting from the seedlings produced in the nurseries.
Table 4.3 Planting Installation Activities
Activities Materials Tools and equipment
Workmanship Comments
Soil survey Hand tools Local unskilled, directed by forestry engineer
Fencing of the land Impregnated wooden poles, staples and barbed wire
Hand tools Local unskilled, foreman-led
Hole opening Hand tools Local unskilled, directed by forestry engineer
Transportation of seedlings to the planting site Baskets, blankets Trucks
Local unskilled, directed by forestry engineer
Plantation Seedlings Hand tools Local unskilled, directed by forestry engineer

Environmental and Social Impact Assessment of Forest Landscape Restoration Project December 2021
Social Capital Group 54
Activities Materials Tools and equipment
Workmanship Comments
Undercut Seedlings Hand tools Local unskilled, directed by forestry engineer
4.1.4 Maintenance and pruning of plantations
Maintenance includes weed control operations, locally called "plateo" or "coroneo", which is the release of weeds around the seedlings. Also, fertilization, maintenance of the perimeter fence and the correction of the trees, which is a type of pruning to ensure that the seedlings have a single apex and do not generate bifurcations. These activities must be carried out until year 4.
When managing a territorial space some water and soil management works could be considered. Among the main existing alternatives are infiltration ditches, which are works to capture surface runoff and improve water infiltration into the soil; diversion channels, which prevent rainwater from flowing to places with high erosion potential. In addition, depending on each case, it may be necessary to build water retention dikes and gabions to control erosion on the banks of watercourses.
Pruning should be carried out from year 3 onwards. This consists of cutting the branches of the trunk, using saws and scissors, up to a maximum of 2/3 of the total size of the tree. This activity serves as a fire protection measure and improves the quality of the wood by generating knot-free growth. It also encourages growth at the apex of the tree, which stimulates growth in height. The cut branches are left in the field for a while, until all the needles have fallen to the ground, then the branches may be used as firewood, shred for composting or left in the soil to decompose.
The following table presents more details of the activities for the maintenance and pruning of the plantations.
Table 4.4 Planting, maintenance and pruning activities
Activities Materials Tools, equipment and machinery
Workmanship Comments
Weed control Hand tools, straight shovel Moto scythes Local unskilled, foreman-led
Fertilization
Fertilizers Hand tools, containers.
Local unskilled, directed by forestry engineer
Perimeter fence maintenance
Impregnated wooden poles, staples and barbed wire
Hand tools Local unskilled, foreman-led
Fustal correction Pruning shears Local unskilled, directed by forestry engineer
Opening of infiltration ditches
Fuel Backhoe and hand tools
Local qualified, directed by forestry engineer
Opening of diversion channels Fuel
Backhoe and hand tools
Local qualified, directed by forestry engineer

Environmental and Social Impact Assessment of Forest Landscape Restoration Project December 2021
Social Capital Group 55
Activities Materials Tools, equipment and machinery
Workmanship Comments
Pruning
Ladders, secateurs, pruning shears, pruning chainsaws, foxtail and bow saws, sharpeners.
Local unqualified, local qualified, directed by forestry engineer
4.1.5 Thinning of plantations
Thinning consists of removing underdeveloped, suppressed or defective trees that have not been selected to remain until the final felling. These are removed to avoid competition with the more vigorous and better formed trees. In general, one non-commercial thinning is carried out, which generates discarded wood, which should be given the same treatment as pruning, that is, to be used as firewood of for composting. As the plantations mature, one or two commercial thinnings are usually carried out. In this case, the felled trees are of a diameter that allows them to be used commercially. This activity also favors the incidence of light to the soil which promotes the recovery of biodiversity and favors the growth of grasses. After the second thinning, it is even possible to allow cattle to graze. The intensity of thinning will depend on the type of management and objective of the plantation. For the final thinning, 30% of the trees initially planted usually remain.
In order to plan thinning, forest inventories are carried out in permanent monitoring plots, which make it possible to determine the right time to carry out the activity. This activity increases the complexity of organization, safety and the use of equipment and machinery.
Further details on plantation thinning activities are presented in the following table.
Table 4.5 Thinning activities in plantations
Activities Materials Tools, equipment and
machinery Workmanship Comments
Forest inventories Hypsometer, compass, winchas, tape diametric and gps.
Local qualified, directed by forestry engineer
Tree removal
Hand tools, chainsaws, Local unskilled, directed by forestry engineer
Unpacking Tractors, skidders or elevated cables.
Local unskilled, local skilled, foreman, directed by forestry engineer.
Major transport Trucks from 10 to 20 T Local qualified, directed by Foreman
4.1.6 Final felling, extraction of the logs and transport to the sawmill
It includes the following sub-activities, felling and cutting, which consists of: cleaning the base of the trunk, determining the direction of fall, felling and cutting. Spilling, cutting the branches along the length of the logs to facilitate handling and stacking. Stacking and loading, if the shortwood method is used, the logs are stacked along the unlogging trails and loaded onto the tractor trailer;

Environmental and Social Impact Assessment of Forest Landscape Restoration Project December 2021
Social Capital Group 56
other methods, with short and long timber, involve overhead wires, hauling towers and skidders that lift the logs in whole or in part. Unloading consists of the movement of the tractor, skidders, or elevated cables with the load from the forest and unloading in the log yard or to preliminary stockpile yards and then by the tractors to the main stockpile.
When the wood is in the storage yards, it is loaded onto trailers. According to the roads, they can be trucks of 10 to 15 tons or trailers of 30 tons. The following table provides more details on the activities of final felling, log extraction and transportion to the sawmill.
Table 4.6 Activities for final felling, log extraction and transport to the sawmill
Sub Activities Materials Tools, equipment and machinery
Workmanship Comments
Lying and chopping Fuels Chainsaw Qualified local, managed by foreman and forestry engineer
Blunt and spilled
Fuels Chainsaw Local unskilled, directed by forestry engineer
Stacking and loading Fuels. Harvesters, loaders, mechanical arms.
Local unskilled, local skilled, foreman, directed by forestry engineer.
Unpacking Fuels. Tractors, skidders, cable and tower systems.
Local unskilled, local skilled, foreman, directed by forestry engineer.
Major transport Fuels 10 to 20 T trucks and 30 T trailers
Local qualified, directed by Foreman
4.2 Sawmilling and processing of the roundwood produced
The Project plans to set up an industrial plant in the outskirts of the city of Cajamarca for sawmilling pine logs and processing the timber produced, with an installed capacity to process 50,000 m3 of roundwood per year. The objective of the plant is to produce pieces sized for the manufacture of pallets and packaging of agro-industrial products at first, and later more elaborate products to supply the domestic market. The plant will also include kilns for drying sawn timber.
The plan is to acquire land of approximately 4 ha with good accessibility and power supply for the operation of the equipment and machinery that the plant will run. Preliminarily, a location with good road access is being evaluated in the district of Tumbadén, approximately 40 km west of the city of Cajamarca, on the road to the coast (see Map 11.1).
The main processes are: log handling at the intake yard, debarking, sawmilling, squaring and sizing, grading, lumber handling at the exit yard, drying, packaging and dispatching. Most of the processes generate waste by-products that can be reused to generate energy for the drying kilns.
Further details of the construction and operation of the sawmill and wood processing plant are presented in the following table.
• Land area: 4 ha

Environmental and Social Impact Assessment of Forest Landscape Restoration Project December 2021
Social Capital Group 57
• Production capacity: 50,000 m3of roundwood per year • Skilled labor: 20 to 25 • Unskilled labour: 20 to 25
Table 4.7 Sawmilling and processing activities for roundwood production
Activities Materials Tools and
equipment Workmanship Comments
Clearing and levelling of the land Industrial land
Heavy machinery, dump trucks
Regional, Qualified Local, unqualified
Construction of perimeter fence Brick, cement, iron
Hand tools, cement mixer
Regional, Qualified Local, unqualified
Construction of workshops and administrative offices
Bricks, cement, iron, calamines
Hand tools, cement mixer
Regional, Qualified Local, unqualified
Assembly of equipment and machinery
Equipment and machinery Forklifts, hand tools National, qualified
Log reception and unloading in yard Hand tools Regional, qualified
Stripping of bark Manual and mechanized tools.
Regional, unqualified
Sawing, squaring and dimensioning
Bandsaws, circular saws, trimming machines
Regional, qualified
Classified Conveyor belts Regional, unqualified
Oven drying Energy, biomass waste, boilers.
Front loader, forklifts, boilers Regional, qualified
Parts manufacturing Specialized machinery, saws, clamps, assemblers.
Regional, skilled and unskilled.
Packaging and dispatch Front loader, forklift. Regional, skilled and unskilled.

Environmental and Social Impact Assessment of Forest Landscape Restoration Project December 2021
Social Capital Group 58
5 ENVIRONMENTAL BASELINE
The forest landscape restoration project in Cajamarca, Peru, is located, according to its area of potential influence (PAI), in nine districts of the Province of Cajamarca (Asunción, Cajamarca, Chetilla, Cospán, Encañada, Los Baños del Inca, Magdalena, Jesús, San Juan), three districts of the Province of San Pablo (San Bernardino, San Pablo and Tumbaden), and one district of the Province of Cajabamba (Cachachi).
The initial project area (IPA) is made up of discontinuous territories, owned by different parties: Minera Yanacocha S.R.L, the Cooperativa Agraria de Trabajadores (CAT) Llullapuquio and the Sociedad Agraria de Interés Social (SAIS) José Carlos Mariátegui. The dispersed nature of the three locations identified as the initial area makes it necessary for the environmental baseline to present specific environmental information for each of them. This, although in many cases the information is quite similar or there are no substantive differences due to the scale of the information available.
The project will develop its activities in the part of the western branch of the Andes Mountains, located altitudinally between 2800 and 3600 m.a.s.l. in the northern highlands of Peru. Its humidity conditions are relatively higher than in the southern highlands - with average monthly rainfall fluctuating between 2 and 47 mm - with a marked wet and dry season, which, together with mild temperatures, favours the development of forestry plantations. In the project area, a temperate climate typical of the Peruvian Andes prevails, characterised by an alternating rainy season from November to April and a dry season from May to October. It is worth mentioning that the seasonal variations in temperature and length of daylight hours are not very marked as it is located in a tropical zone. On the other hand, variations in precipitation represent, in this zone, the most important seasonal difference.
Secondary environmental information on the project area is not extensive and the information that is available is, in several cases, at a scale that does not allow sufficient analysis to distinguish the specific conditions of each area. For the study, detailed information was validated for each area, in particular the three IPA zones, taking as a reference for the description of the hydrometeorological data the nearest SENAMHI stations, from which data was obtained for the last five years. This data is considered to be representative for the study area.
Hydrographically, the Project area comprises the upper parts of four river basins, three of which are Atlantic slopes and one Pacific slope. The existing plantations are mostly located in the Pacific basin, specifically in the Jequetepeque river basin, an area characterised by a generally rugged topography, with slopes ranging from 8% to 50%, which increases the risk of erosion, mainly due to climatic conditions. The area has seen an increase in the expansion of the agricultural and livestock frontier, with land that used to be covered by natural forests being used for food production. As part of the analysis, a general description of the watersheds and main water bodies in the Project area was carried out.
The landscape of the project area is rural, with the presence of agricultural activities, mainly the production of pasture for livestock, especially in the flatter areas. The presence of forestry plantations stands out, which have been established for more than 30 years and most of them do not have appropriate forestry management. This results in tall trees, thin diameters (due to competition for space) and a high presence of branches, which reduces the quality of the wood.

Environmental and Social Impact Assessment of Forest Landscape Restoration Project December 2021
Social Capital Group 59
With regard to the description of the land in the project area, its capacity for use and its current use, the information available from the Ecological Economic Zoning (ZEE) of Cajamarca was used. Although this information is on a larger scale (it was worked on for the whole department), it was contrasted and supported with primary information collected in the field.
Finally, in reference to the wild ecosystems of the project area, a general description of the PAI zones and a supervised classification of the vegetation cover was carried out, using the ecosystem map as a reference, using classifiers and field sampling points in the IPA zones. Flora and fauna were analysed by collecting direct information and reviewing secondary sources.
5.1 Objectives
The Environmental Baseline (EL) will describe the most salient physical and biological characteristics of the project's IPA and PAI areas.
The specific objectives of the EBL were as follows:
• Describe the climatic characteristics of the study area, in order to determine the most suitable areas for forestry production in Cajamarca.
• Describe the main soil characteristics, highlighting the most suitable soils for forest production.
• Describe the main ecosystems existing in the study area, specifying those that should be conserved due to their fragility.
• Identify the species of flora and fauna existing in the study area, in order to determine those with a conservation category.
5.2 Delimitation of the area of influence
The area of influence of the project is delimited by the areas known as IPA (Initial Project Area) and PAI (Potential Area of Influence). The IPA area is the area where the forestry project will be developed initially, taking advantage of existing plantations and land suitable for new plantations. The PAI area is the area where Arbaro plans to expand in the future, with pine forest plantations. No contact has been made with owners of existing plantations or land suitable for the development of new plantations in the PAI.
The IPA area is distributed among the territories owned by Minera Yanacocha S.R.L., the Llullapuquio Agrarian Workers' Cooperative (CAT) and the José Carlos Mariátegui Agrarian Society of Social Interest (SAIS). All of them within the PAI areas, as presented in Figure 4.1.
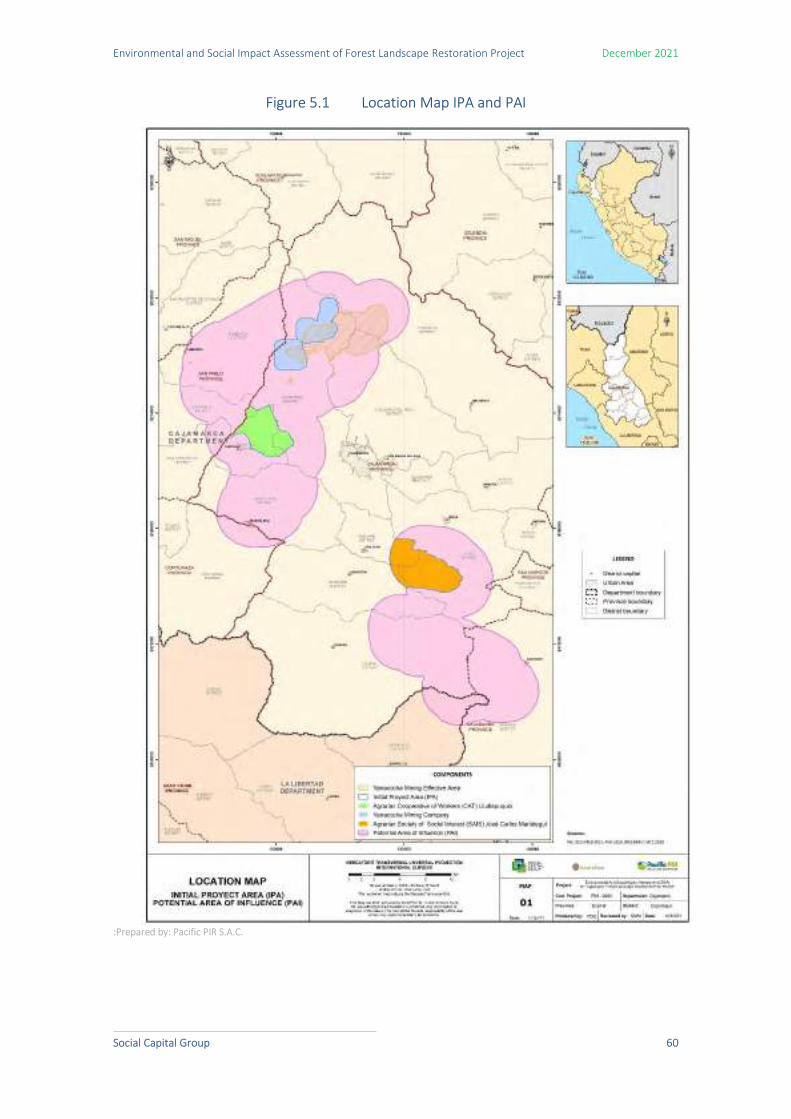
Environmental and Social Impact Assessment of Forest Landscape Restoration Project December 2021
Social Capital Group 60
Figure 5.1 Location Map IPA and PAI
:Prepared by: Pacific PIR S.A.C.

Environmental and Social Impact Assessment of Forest Landscape Restoration Project December 2021
Social Capital Group 61
5.3 Study topics
For the EBL study, the components and factors to be described for the two areas of interest of the Project (IPA and PAI) were previously defined. These variables are related to the most relevant aspects, preliminarily identified, that could affect or be affected by the Project. The three IPAs have two types of wild ecosystems: jalca and Andean scrubland, and these three areas share the same biological values of flora and fauna. For this reason, the description of this aspect is done jointly.
The following table shows the themes on which this EBL is developed.
Table 5.1 EBL Themes of the IPA and PAI areas
Selected topics
IPA (Minera Yanacocha, CAT
LLullapuquio and SAIS José Carlos Mariátegui)
Climate
Hydrology
Water quality
Soil
Increased land use capacity
Current land use
Vegetation cover
EPI
Hydrology
Increased land use capacity
Current land use
Wild ecosystems
Protected natural areas
Prepared by: Pacific PIR S.A.C.
5.4 Methodology
For the development of this study, different data collection techniques were used for the IPA and the PAI. Secondary information was reviewed in both areas, but fieldwork to collect primary information was concentrated only in the IPA.
5.4.1 Review of secondary sources
In order to describe the characteristics of the different environmental variables (physical and biological) in the PAI areas as IPA of the project, information from secondary sources from the following institutions was reviewed and processed:
ANA. 2015. Water Resources Assessment in the Crisnejas Basin. SENAMHI - Hydrometeorological data from weather stations in the IPA project area. SENAMHI - Climates of Peru, National Climate Classification Map. SENAMHI - Hydrological map of the department of Cajamarca. Regional Government of Cajamarca and MINAM - Economic and Ecological Zoning. MINAM - Map of ecosystems. First Substantive Technical Report (ITS) of the second modification of the Yanacocha
Environmental Impact Study, 30 July 2021

Environmental and Social Impact Assessment of Forest Landscape Restoration Project December 2021
Social Capital Group 62
Regional Government of Cajamarca, Regional Biodiversity Strategy of Cajamarca. Gobierno Regional de Cajamarca, Diversidad biológica en Cajamarca. CORBIDI. Ornithological inventory in the Sunchubamba Game Reserve. Roncal, M. Quick identification guide. Birds of the district of Chugur, Hualgayoc-
Cajamarca. Roncal, M. Quick identification guide. 11 endemic birds of the Cajamarca region. C. Carton & A. Chavez. Porcón, half a century of forestation in the Andes of Cajamarca. Quispe, R., Orillo, M., Vargas, J. (2009). Cajamarca Compendio Estadístico Departamental. Aspillaga, I. (2006). Land use planning and the extractive mining industry in Peru.
5.4.2 Fieldwork
The fieldwork was carried out between 13 and 17 September 2021, following a planning and coordination process for the visit to the IPA area. The specific work carried out during the fieldwork is described below:
- Water quality sampling. This was carried out at three points. One sample was taken in the Chancas stream in the area owned by the LLullapuquio Agricultural Workers' Cooperative (CAT). The other two samples were taken in the Huacraruco river and in a tributary of this river within the property of the Sociedad Agraria de Interés Social (SAIS) José Carlos Mariátegui). The water samples were taken following the appropriate parameters and then sent for analysis to the Servicios Analíticos Generales (SAG) laboratory, following all protocols. The parameters evaluated were: Biochemical Oxygen Demand (BOD), Chemical Oxygen Demand (COD), alkalinity, chlorides, calcium, magnesium, sulphates, total dissolved solids (TDS) and total suspended solids (TSS). In addition, in situ readings of parameters such as dissolved oxygen (DO), pH, temperature and electrical conductivity (EC) were taken at each sampled point using multi-parameter equipment.
- Soil characterisation. This activity was carried out within the IPA area. Information was taken at observation points in the field, where data was collected on vegetation cover, slope, limitations in relation to use, relief characteristics, among other important characteristics.
- Current land use. Through photographs and observation points, some physiographic particularities, slope, climate, topography and type of vegetation existing in the IPA area were identified.
- Wild ecosystems. Checkpoints were carried out to verify the different vegetation covers, as well as botanical collections and fauna sightings for the description of the wild ecosystems of the project areas.
5.4.3 Description of methodologies for determining environmental factors.
5.4.3.1 Climate
The territory of Cajamarca comprises, in general terms, two distinct climatic regions: one to the north, characterised by a semi-tropical system, and another to the south, which we could call Quechua, within which one can also find "islands" with a semi-tropical ecosystem. Its low altitude and proximity to the meteorological equator give it relatively different weather and climate

Environmental and Social Impact Assessment of Forest Landscape Restoration Project December 2021
Social Capital Group 63
characteristics from the rest of the departments7. The description of the climatic classification of the IPAs was made according to that specified by Köppen and Thornthwaite as identified in the Climate Classification Map of Peru (2020). This information is presented in the maps M- 03 - Climate Map (Annex 11.3.1).
Regarding the factors of precipitation, temperature and relative humidity of the study areas, data from the last 5 years (2017-2021) were used with data from the SENAMHI8 stations San Juan, San Pablo and Granja Porcón, as they are the closest and most representative of the study area. The parameters chosen for their description were:
a. Precipitation b. Maximum and minimum temperature c. Relative humidity
The location of the weather stations is presented in the map M-03 - Climate Map (Annex 1.1), as well as in the following table.
Table 5.2 Hydrometeorological stations
STATION UTM coordinates WGS
84 Altitude msnm
Nearest IPA area This North
San Juan 777021 807537.2 2253 Agrarian Society of Social Interest (SAIS) José Carlos Mariátegui
St. Paul's 739582 787327.6 2325 Workers' Agricultural Cooperative (CAT)
Porcón Farm 761445.7 778559.6 3149 Yanacocha Mining Company
Source: SENAMHI
5.4.3.2 Hydrology
In order to identify the main basins where the project areas are located, the two watersheds were analysed: Pacific and Atlantic. On the Pacific slope, the basins flow directly into the ocean, while on the Atlantic slope the basins flow into the Marañón River, which reaches the Atlantic Ocean via the Amazon River. The main bodies of water in the area were also determined, differentiating between those that maintain permanent runoff throughout the year and those that dry up during the dry season9. The hydrological basins are presented in Annex 1.2 Hydrological Map.
5.4.3.3 Water quality
Water quality was described based on the collection of water samples under the methodology stipulated in the National Protocol for Quality Monitoring in Natural Bodies of Surface Water, approved by the National Water Authority(ANA). This protocol provides rules for the preservation
7 Climate Map of Cajamarca 8 National Meteorological and Hydrological Service 9 Hydrological map of the department of Cajamarca

Environmental and Social Impact Assessment of Forest Landscape Restoration Project December 2021
Social Capital Group 64
of samples, procedures, materials and containers for sampling the parameters that will establish the quality of the water analysed.
Samples were taken and then sent for analysis to a certified laboratory (General Analytical Services - SAG). The parameters evaluated were: biochemical oxygen demand (BOD); chemical oxygen demand (COD); alkalinity; chlorides; calcium; magnesium; sulphates; total dissolved solids (TDS) and total suspended solids (TSS). These parameters were selected as they correspond to the basic parameters to be considered to indicate whether or not the water quality is adequate for the purposes to be achieved in the project.
The methodology employed included the evaluation of parameters in situ with a multi-parameter measuring equipment, duly calibrated (see Annex 1.6). The parameters evaluated were: dissolved oxygen (DO), pH, temperature and electrical conductivity (EC).
The information extracted in the field for the SAIS Jose Carlos Mariátegui IPA and CAT Llullapuquio areas was complemented with existing information from recent environmental studies in the Yanacocha mining company's IPA area.
5.4.3.4 Soil
The characterisation of the soils in the area of influence of the project was carried out on the basis of information from the Economic and Ecological Zoning prepared by the Regional Government of Cajamarca and various studies carried out by the National Office for the Evaluation of Natural Resources (ONERN). In addition, information was collected in the field on the area's vegetation cover, slope, relief, current land use, among other characteristics. The resulting information was analysed taking into account the criteria and norms established in the Regulation for the execution of the Soil Survey (D.S. 013-2010-AG) and the determination of the land's optimal use capacity was adapted to the guidelines established in the Regulation for the Classification of Land by Optimal Use Capacity of the Ministry of Agriculture (D.S. 017-2009-AG).
With regard to soil classification, an important aspect to take into account is the concept of slope phasing, as a factor that determines the topographical characteristics of the terrain. This constitutes an important parameter not only in the genesis but also in the elaboration of guidelines for the adequate use of the resource. In the case of soils with forestry potential, and in accordance with current regulations, the use of soils with a high slope range is established, in order not to reduce the agricultural potential of land suitable for clean, permanent crops or pastures. Thus, the slope phases taken as a reference are presented in the table below:
Table 5.3 Phases by slope
Symbol Slope range (%) Descriptive Term
A 0 – 2 Flat to almost level.
B 2 - 4 Slightly inclined.
C 4 - 8 Moderately inclined.
D 8 – 15 Steeply inclined.
E 15 – 25 Moderately steep.
F 25 - 50 Steep.

Environmental and Social Impact Assessment of Forest Landscape Restoration Project December 2021
Social Capital Group 65
Symbol Slope range (%) Descriptive Term
G 50 - 75 Very steep.
H > 75 Extremely steep.
Source: D.S. N° 013-2010-AG
5.4.3.5 Increased land use capacity
The capacity for optimal use refers to the potential of a soil for the development of productive activities, and its determination was made taking as a reference the information contained in the study of Ecological and Economic Zoning (ZEE) of the Cajamarca region. The maximum potential use was determined following the guidelines established in the Ministry of Agriculture's Regulation of Land Classification by Optimal Use Capacity (D.S. 017-2009-AG). This classification system considers five optimal use capacity groups: clean crops; permanent crops; pastures; forest production; and protection lands, which are determined for each edaphic unit taking into account the limitations observed in the field.
5.4.3.6 Current land use
The different forms of land use within the area of influence of the project were identified and described. The classification was made on the basis of the Land Use Classification System proposed by the International Geographical Union (IGU).
For the identification of current land use, the information contained in the Economic and Ecological Zoning prepared by the Regional Government of Cajamarca and approved by the Ministry of the Environment (MINAM) was used. As secondary information, the soil studies elaborated by the National Office for the Evaluation of Natural Resources (ONERN) were used as a reference. The analysis of this information, collected at cabinet level, was complemented with information collected in the field.
5.4.4 Description of methodology for determining vegetation cover
The characterisation of the natural biota was carried out in the IPA zone and for this purpose a supervised classification of the vegetation cover in the three zones of this area was developed. This classification provides greater precision on the extent of the natural cover that should be prioritised for conservation. With the results obtained, a characterisation of the flora and fauna representative of the study area was carried out.
Vegetation cover, understood as land cover, is the biophysical cover observed on the earth's surface. Strictly speaking, it should be limited to the description of vegetation, differentiating it from artificial elements, rocky outcrops and bodies of water (Di Gregorio, 2005). This coverage can be delimited as classifiable and differentiable units based on an analysis of the spectral responses determined by their physiognomic and environmental characteristics (IDEAM, 1997). In Peru we have different maps that have delimited land covers (MINAM, 2019; MINAM, 2015), which are of great help when carrying out work at a regional scale.
Thus, in order to evaluate the coverage classes in the three sectors of the IPA area, our study was based on the analysis and interpretation of Sentinel-2A satellite images with a resolution of 10m, using the Supervised Classification process, through two stages:

Environmental and Social Impact Assessment of Forest Landscape Restoration Project December 2021
Social Capital Group 66
Figure 5.2 Map showing the regions of interst (ROI’s) in the IPA
Fuente:
Note: A) Minera Yanacocha, B) Cooperativa Agraria de Trabajadores (CAT) Llullapuquio, and C) SAIS Jose Carlos Mariátegui (blue icon: forest plantation; red icon: shadows; orange icon: scrubland; yellow icon: jalca; green icon: agriculture; light blue icon: bare soil).
Stage 1: Data pre-processing:
In this part, the thematic maps were processed to delimit the areas of interest. We worked with the Map of Ecosystems of Peru (MINAM, 2019), which was used as a reference to elaborate the coverage classes within each sector: jalca, agricultural zones, forest plantation, scrubland, areas without vegetation and steep slopes (shadows). The topographic layers were elaborated with the DEM (Digital Elevation Model) images of the ALOS radar of 12.5 m resolution. These were processed in QGIS 3.18.3 to obtain the slope, orientation, topographic position index (TPI) and elevation layers at 10 m resolution.
Stage 2: Classification and validation of coverages in Google Earth Engine (GEE)
The acquisition of satellite images was obtained from the Sentinel-2 repository, within the Google Earth Engine (GEE) platform, where scenes were selected between April and May 2021 with cloud cover of less than 10%. The regions of interest (ROIs), i.e. the vector elements (points or polygons) representing the land cover classes for the area, were delimited based on field information and high-resolution images from Google Earth Pro, Mavic2pro drone images and field assessment. In total 342 ROIs were delimited which is an optimal number for an area of 15 180 ha; and also 7 cover classes (Congalton, 2009). Then, 18 classifiers were prepared based on Sentinel-2A images and DEM and 9 bands were selected (B2, B3, B4, B5, B6, B7, B8, B11 and B12); 5 vegetation related spectral indices such as NDVI, NDWI, SI, BI, NDMI were calculated; and 4 topographic layers were added: elevation, slope, topographic position index and orientation.
B
C
A

Environmental and Social Impact Assessment of Forest Landscape Restoration Project December 2021
Social Capital Group 67
With the ROIs, the information from the 18 classifiers was extracted in a file with 18 bands. This file was used to train the Random Forest classification algorithm with 100 decision trees, obtaining a preliminary coverage map. The accuracy of this preliminary map was then evaluated using a data partitioning test of the ROIs, using 70% of it for classification and 30% for accuracy evaluation. Finally, the Kappa index was used to determine the acceptability of the classification, considering a Kappa index > 0.85 for the study. Once a preliminary map was obtained, with an acceptable Kappa index, it was exported in "GEOTIFF" format for final processing and preparation of the coverage map.
Figure 5.3 Overlight of the study area
Note: A, B, C and D SAIS JCM Sociedad Agraria de Interés Social (SAIS) José Carlos Mariátegui. E, F and G. Cooperativa Agraria de Trabajadores (CAT) Llullapuquio E
Stage 3: Preparation of the Cover Map

Environmental and Social Impact Assessment of Forest Landscape Restoration Project December 2021
Social Capital Group 68
This process was carried out in the QGIS program. Preliminary coverages are obtained in raster format, which is reprojected to WGS 84 - UTM 17S datum and vectorised to polygons to calculate the area and discriminate polygons smaller than 0.5 ha.
After filtering and refining the polygons, we proceeded to improve the visualisation, correcting major errors in the classification and editing of the polygons to smooth the edges. Finally, each field was assigned the corresponding name of each cover based on the classification of the Ecosystems of Peru map (MINAM, 2019). This cartographic information will allow the project to identify the areas available for the establishment of commercial forestry plantations without affecting the native cover.
5.5 Initial Project Area (IPA)
This chapter presents a description of the environmental conditions of the IPA areas belonging to Minera Yanacocha, Cooperativa Agraria de Trabajadores (CAT) Llullapuquio and Sociedad Agraria de Interés Social (SAIS) José Carlos Mariátegui, based on information collected in the field and supported by existing secondary information. The environmental description is carried out at both the abiotic and biotic levels, highlighting the most relevant aspects for the development of the forestry project.
5.5.1 IPA - Yanacocha Mining Company
The Yanacocha Mining Company's IPA is located approximately 12.96 kilometres from the city of Cajamarca and has an area of 5119.90 hectares. The following figure shows its location.

Environmental and Social Impact Assessment of Forest Landscape Restoration Project December 2021
Social Capital Group 69
Figure 5.4 Location of Yanacocha Mining IPA area
Prepared by Pacific PIR S.A.C.
The following is the environmental description of the IPA area corresponding to the Yanacocha Mining Company.
5.5.1.1 Climate
According to the climatic classification, this part of the IPA area is characterised by year-round rainfall and a cold climate. The rainfall regime is not homogeneous throughout the year and there is a marked variation between the rainy and dry periods. These characteristics are favourable for forest production.
The climate categories according to Köppen and Thornthwaite for this IPA area are as follows:

Environmental and Social Impact Assessment of Forest Landscape Restoration Project December 2021
Social Capital Group 70
- A (r) C' Very rainy with abundant humidity all seasons. Cold
- B (r) C' Rainy with abundant humidity all seasons. Cold.
The following figure shows the climate classification of the Yanacocha mining company's IPA zone.
Figure 5.5 Climate map of the Yanacocha mining company’s IPA área
Prepared by Pacific PIR S.A.C.

Environmental and Social Impact Assessment of Forest Landscape Restoration Project December 2021
Social Capital Group 71
5.5.1.2 Temperature
As can be seen in the following graph, the average maximum temperature in the IPA area corresponding to Minera Yanacocha is between 17 and 16 °C throughout the year. These temperatures allow for moderate evapotranspiration and evaporation, keeping the soils moist for a longer period, which favours the development of the plantations.
Graph 5.1 Monthly Averages of Maximum Air Temperature (°C)
The following graph shows the average minimum air temperatures in this IPA. It can be seen that it varies between 5° and 3 °C. The months from June to September show the lowest values, with average minimum temperatures above freezing point.
Graph 5.2 Monthly Averages of Minimum Air Temperature (°C)

Environmental and Social Impact Assessment of Forest Landscape Restoration Project December 2021
Social Capital Group 72
It is worth mentioning that temperatures of around 3°C are conditions that favour the presence of snowfall and hailstorms, which reduces the early development of forest species. On the other hand, frosts are frequent in the coldest months, which affects the growth of plantations. In the country, it has been estimated that at altitudes higher than 3600 m above sea level, the growth of pine trees decreases considerably.
5.5.1.2.1 Precipitation
As can be seen in graph 5.5, the highest rainfall in this area occurs between September and May (8 to 45 mm/month). However, it should not be ruled out that this regime may change as a result of climate change.
Figure 5.6 Monthly Accumulated Precipitation (mm)
5.5.1.2.2 Relative humidity
As with the other parameters, average relative humidity values in the study area are lowest between June and August. This coincides with the months of lower rainfall and lower temperatures. The average humidity is between 70% and 80% throughout the year, which is considered a very favourable factor for forest development.

Environmental and Social Impact Assessment of Forest Landscape Restoration Project December 2021
Social Capital Group 73
Graph 5.3 Monthly Averages of Relative Humidity (%)
5.5.1.3 Hydrology
Minera Yanacocha's total IPA is located within the Jequetepeque river basin. This basin is a Pacific watershed with a surface area of 8,795.33 km2, located in the departments of Lambayeque, La Libertad and Cajamarca. The Jequetepeque river has an average flow of 29 3m/s.
The main water bodies in this area are the San Miguel, Tinte and Shoclla rivers, and the Shilmayo, La Pajuela, Cushuro, Del Barranco, Quinuamayo, Yanototora, Collpa, Shuito and Tranca streams.

Environmental and Social Impact Assessment of Forest Landscape Restoration Project December 2021
Social Capital Group 74
Figure 5.7 Hydrology of Yanacocha mining company IPA area
Prepared by Pacific PIR S.A.C.
5.5.1.4 Water quality
To describe the water quality present in the IPA of the Yanacocha mining company, information from a monitoring carried out on 08 December 2020 has been used, which was presented in the "First Technical Report on the Second Modification of the Yanacocha Environmental Impact Study" approved by Directorial Resolution No. 00125-2021-SENACE-PE/DEAR dated 21 September 2021. The monitoring point is indicated in the following table:

Environmental and Social Impact Assessment of Forest Landscape Restoration Project December 2021
Social Capital Group 75
Table 5.1 Water quality sampling points
Sampling points UTM coordinate WGS84 Location Water body
This North
CP6 767524 9227116 Yanacocha Mining Company Shoclla River
Source: Primer Informe Técnico Sutentatorio De La Segunda Modificación Del Estudio De Impacto Ambiental Yanacocha Prepared by: Pacific PIR S.A.C.
The following figure, and the map M-05 Water quality sampling map (Annex 1.3) show the location of the indicated sampling point.
Figure 5.8 Water quality sampling points CP6
Prepared by Pacific PIR S.A.C.
The following table shows the results obtained for the sampled water quality parameters, which were compared with the ECA for Water approved according to D.S. N° 004-2017-MINAM, specifically with Category 3: Irrigation of vegetables and animal drinking water.

Environmental and Social Impact Assessment of Forest Landscape Restoration Project December 2021
Social Capital Group 76
Table 5.2 Water quality sampling results
Sampling points
UTM coordinate WGS84
Location
Parameters measured in the field Measured parameters determined in the laboratory
This North Dissolved
oxygen mg/L
pH pH
unit
Temperature °C
Electrical conductivity
µS/cm
BOD mg/L
COD O2
mg/L
Alkalinity CaCO3 mg/L
Chlorides Cl mg/L
Calcium Ca mg/L
Magnesium Mg mg/L
Sulphates SO4 mg/L
Total dissolved
solids (TDS) mg/L
Total suspended solids (TSS)
mg/L
CP6 767524 9227116 Yanacocha
Mining Company
7,17 7,07 11.9 114,4 <5 22 - - - 0,0869 27,88 74,55 9
ECA >4 6,5 –
8,5 Δ 3 2500 15 40 - 500 - 250 1000 - -
Prepared by: Pacific PIR S.A.C.

Social Capital Group 77
Based on the results shown in the table above, it can be indicated that the water sampled is of good quality. The anthropic activity carried out in the area that could affect water quality is mining, however, this activity is not generating alterations in the levels of parameters such as BOD and COD, which are indicators of water pollution. The same is true for dissolved oxygen, which is above 4 mg/l, indicating that the aquatic environment is suitable for life.
With regard to magnesium in the water, it can be seen that this mineral is below the ECA and does not require softening treatments in order to be used.
With regard to Total Dissolved Solids (TDS), the value is lower than that obtained in the other sampling points, which indicates less existence of inorganic and organic substances, which may be affecting the water quality.
For Total Suspended Solids (TSS), a concentration of 9 mg/L was determined, although it is true that there is no reference value in the ECA, based on the data obtained it can be concluded that these solids will not affect the passage of sunlight necessary for the photosynthesis of the aquatic plants.
5.5.1.5 Soil
In the area of the IPA area corresponding to Minera Yanacocha there are rocky soils that have not yet been transported from their origin and soils that come from the mountain slopes. These can vary from shallow to deep, due to the moderately coarse to medium texture and slight surface stoniness. Drainage is good to excessive and permeability moderately rapid to moderate.
These soils have a strongly acid reaction and organic matter content that can vary from medium to high, while the fertility level can be low to medium. The soils in this area have slopes that can vary from 8% to 50%.
With regard to taxonomy, according to the FAO system, they belong to the Paramo andosol and Leptosol soil group, which in the Soil Taxonomy system are mainly soils of the Entisol and Inceptisol orders with little genetic development. This condition coincides with the above mentioned that the soils are formed by rocks that have not yet been displaced from their origin and come from the mountain slopes. The following table shows the observation points for the Minera Yanacocha IPA area.
Table 5.3 Location of observation points
Title Coordinates (UTM - WGS 84) Zone 17S Altitude
(masl) Sector
This North
PO-08 768121 9221453 3690 Yanacocha Mining Company
PO-10 767479 9227161 3417 Yanacocha Mining Company
PO-11 766999 9222648 3604 Yanacocha Mining Company
Prepared by: Pacific PIR S.A.C.
Below are representative photos of the soil of the Yanacocha mining company's IPA.
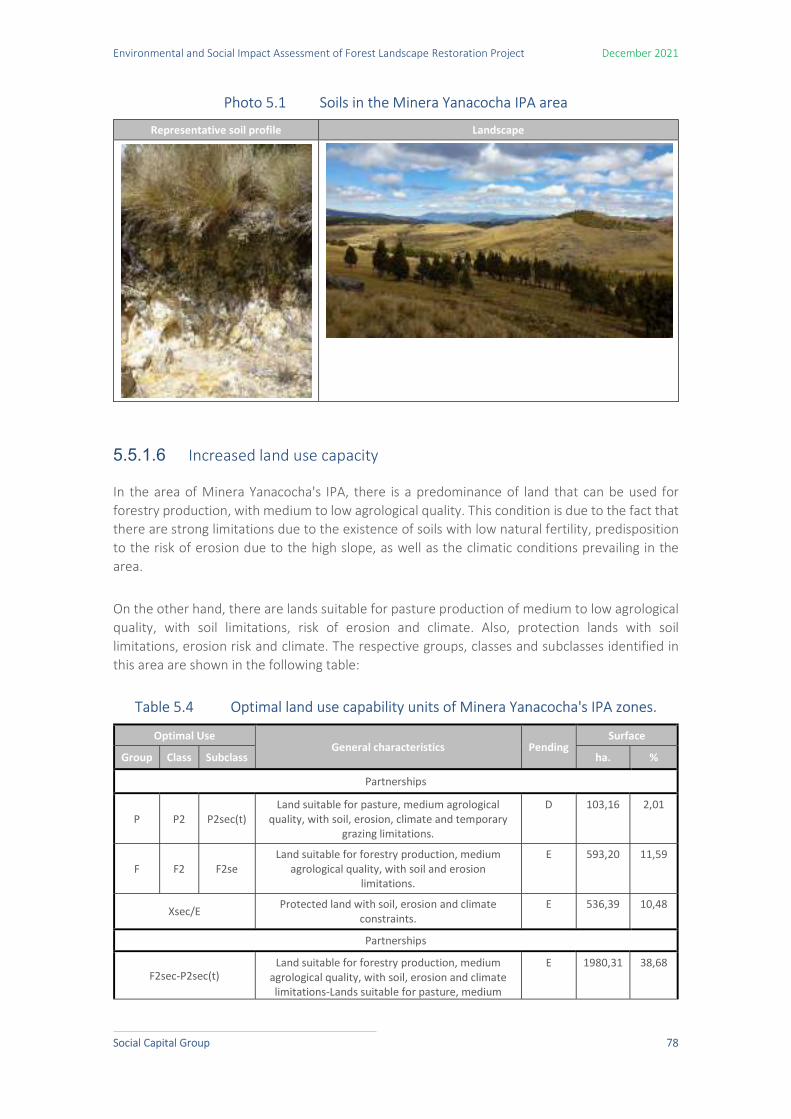
Environmental and Social Impact Assessment of Forest Landscape Restoration Project December 2021
Social Capital Group 78
Photo 5.1 Soils in the Minera Yanacocha IPA area
Representative soil profile Landscape
5.5.1.6 Increased land use capacity
In the area of Minera Yanacocha's IPA, there is a predominance of land that can be used for forestry production, with medium to low agrological quality. This condition is due to the fact that there are strong limitations due to the existence of soils with low natural fertility, predisposition to the risk of erosion due to the high slope, as well as the climatic conditions prevailing in the area.
On the other hand, there are lands suitable for pasture production of medium to low agrological quality, with soil limitations, risk of erosion and climate. Also, protection lands with soil limitations, erosion risk and climate. The respective groups, classes and subclasses identified in this area are shown in the following table:
Table 5.4 Optimal land use capability units of Minera Yanacocha's IPA zones.
Optimal Use General characteristics Pending
Surface
Group Class Subclass ha. %
Partnerships
P P2 P2sec(t) Land suitable for pasture, medium agrological
quality, with soil, erosion, climate and temporary grazing limitations.
D 103,16 2,01
F F2 F2se Land suitable for forestry production, medium
agrological quality, with soil and erosion limitations.
E 593,20 11,59
Xsec/E Protected land with soil, erosion and climate
constraints. E 536,39 10,48
Partnerships
F2sec-P2sec(t) Land suitable for forestry production, medium
agrological quality, with soil, erosion and climate limitations-Lands suitable for pasture, medium
E 1980,31 38,68

Environmental and Social Impact Assessment of Forest Landscape Restoration Project December 2021
Social Capital Group 79
Optimal Use General characteristics Pending
Surface
Group Class Subclass ha. %
agrological quality, with soil, erosion, climate and temporary grazing limitations.
F3sec-P2sec(t)
Land suitable for forestry production, low agrological quality, with soil, erosion and climate limitations-Lands suitable for pasture, medium
agrological quality, with soil, erosion, climate and temporary grazing limitations.
E 19,10 0,37
F3c-P3c
Land suitable for forestry production, low agrological quality, with climate constraints-Lands suitable for pasture, low agrological quality, with
climate constraints.
D 1699,95 33,20
P3sec(t)-Xsec Land suitable for pasture, low agrological quality, with soil, erosion, climate and temporary grazing limitations-Protection lands with soil, erosion and
climate limitations.
E 187,79 3,67
Total 5119,90 100,00
Source: Ecological and Economic Zoning - Cajamarca Region.
Photo 5.2 Land suitable for forest production in the Minera Yanacocha IPA area
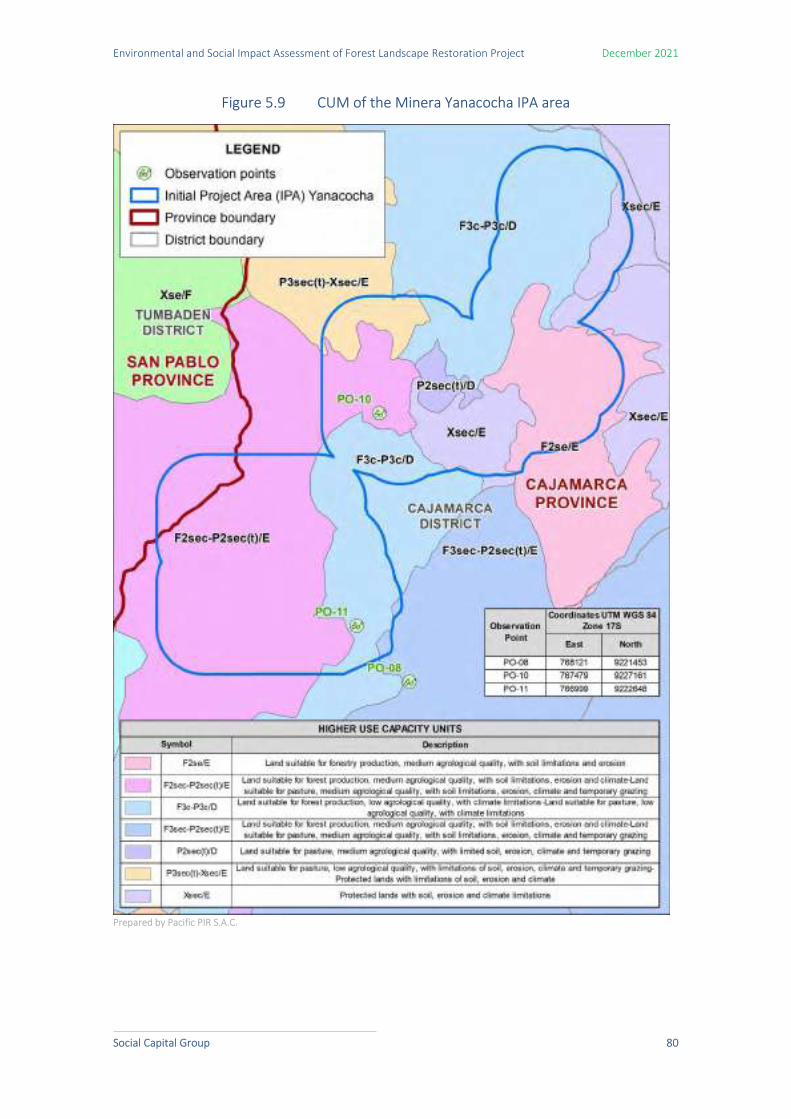
Environmental and Social Impact Assessment of Forest Landscape Restoration Project December 2021
Social Capital Group 80
Figure 5.9 CUM of the Minera Yanacocha IPA area
Prepared by Pacific PIR S.A.C.

Environmental and Social Impact Assessment of Forest Landscape Restoration Project December 2021
Social Capital Group 81
5.5.1.7 Current land use
In Minera Yanacocha's IPA area, 45.85% of the land has no productive use. Areas of forest, pasture or grassland and company facilities occupy 42.96%. Cultivated forests show a growth deficit in certain areas, probably as a result of low temperatures (at altitudes above 3600 metres above sea level, the frequency of frosts reduces the development of trees).
According to the information obtained, the following categories and units of current land use have been determined, which are shown in the following table:
Table 5.5 Current land use categories and subclasses of zones in the Minera Yanacocha IPA area.
Categories Units Symbol Surface
ha. %
Town centres Mining Unit Um 498,59 9,74
Land with natural pasture Land with natural pasture and
grassland. Pp 74,14 1,45
Forest land Natural and/or cultivated forest land
and natural pastures. Bnc-Pn 2199,76 42,96
Unused and/or unproductive land
Land with little or no vegetation. Sv 2347,41 45,85
Total Area 5119,90 100,00
Prepared by: Pacific PIR S.A.C.

Environmental and Social Impact Assessment of Forest Landscape Restoration Project December 2021
Social Capital Group 82
Figure 5.10 Current land use in the Minera Yanacocha area
Prepared by Pacific PIR S.A.C.

Environmental and Social Impact Assessment of Forest Landscape Restoration Project December 2021
Social Capital Group 83
Photo 5.3 Current land use in the Minera Yanacocha
Forest land
Land with natural pasture grasses and grasslands
5.5.1.8 Vegetation cover
The Minera Yanacocha IPA zone has an area of 5 119.90 ha, in which there are five land cover classes: Jalca, with 2 055.09 ha (40.1 %); Agricultural zone, with 233.17 ha (4.5 %); Forest plantation, with 1 925.08 ha (37.6 %); Mining zone, with 858.65 ha (16.8 %); and Artificial water bodies, with 47.91 ha (0.9 %).

Environmental and Social Impact Assessment of Forest Landscape Restoration Project December 2021
Social Capital Group 84
Figure 5.5 Zone of Minera Yanacocha's IPA area
Note: Left: preliminary map obtained with Random Forest, Right: final cover classification map.
Table 5.6 Coverage Classes (Ecosystems and Intervened areas) in Yanacocha Mining's IPA
Zone/ Ecosystem-Cover
Yanacocha IPA (ha) (%)
Jalca 2055.09 40.14
Andean scrubland 0.00 0.00
Agricultural area 233.17 4.55
Plantation Forestry 1925.08 37.60
Mining Zone 858.65 16.77
Artificial water body 47.91 0.94
Total 5119.90 100.00
Prepared by SCG

Environmental and Social Impact Assessment of Forest Landscape Restoration Project December 2021
Social Capital Group 85
Graph 5.4 Distribution of ecosystems and disturbed areas in the Minera Yanacocha IPA area
It is important to highlight the importance of generating plantations while maintaining active biological corridors of native vegetation. The jalca, although it does not grow trees or shrubs, is home to flora and fauna that maintain the stability of the ecosystem.

Environmental and Social Impact Assessment of Forest Landscape Restoration Project December 2021
Social Capital Group 86
Figure 5.11 Vegetation cover of the Minera Yanacocha IPA area.
Prepared by Pacific PIR S.A.C.

Environmental and Social Impact Assessment of Forest Landscape Restoration Project December 2021
Social Capital Group 87
5.5.2 IPA - Sociedad Agraria de Interés Social (SAIS) José Carlos Mariátegui
This IPA area is located in the sector known as Huacraruco, corresponding to the SAIS José Carlos Mariátegui. It is approximately 9.87 kilometres from the city of Cajamarca and covers an area of 5,894.23 hectares. The physical and biological characteristics of this area are described below.
Figure 5.12 Location of the IPA area Sociedad Agraria de Interés Social (SAIS) José Carlos Mariátegui
Prepared by Pacific PIR S.A.C.
5.5.2.1 Climate
According to the climatic classification, this IPA area is characterised by the presence of precipitation in certain months of the year, the climate can vary from cold to temperate and dry winters can occur. These climatic characteristics are favourable for forest production.
The study area falls into the following categories according to Köppen and Thornthwaite:
- A (r) C' Very rainy with abundant humidity all seasons. Cold.
- B (o, i) B' Rainy with dry autumn and winter. Temperate.
- B (r) C' Rainy with abundant humidity all seasons. Cold.
The following figure shows the location of this IPA and the climatic qualification of the area.

Environmental and Social Impact Assessment of Forest Landscape Restoration Project December 2021
Social Capital Group 88
Figure 5.13 Climate map of the IPA area Sociedad Agraria de Interés Social (SAIS) José Carlos Mariátegui
Prepared by Pacific PIR S.A.C.

Environmental and Social Impact Assessment of Forest Landscape Restoration Project December 2021
Social Capital Group 89
5.5.2.1.1 Temperature
In the SAIS IPA, in the months of August to September the average maximum temperatures are higher than the rest of the months of the year. The average temperature variation over the year is about 2 °C, varying between 19 °C and 21 °C.
Graph 5.5 Monthly Averages of Maximum Air Temperature (°C)
With regard to the minimum temperature, the values drop in June and July, however, throughout the year the temperatures remain at 12 °C. Minimum temperatures above freezing point favour the early development of the plantations, and the incidence of frost will be lower in this area.
Graph 5.6 Monthly Averages of Minimum Air Temperature (°C)

Environmental and Social Impact Assessment of Forest Landscape Restoration Project December 2021
Social Capital Group 90
5.5.2.1.2 Precipitation
In this IPA area, in the months of December to April there is an increase in rainfall ranging from 9 mm to 21 mm, which is favourable for the establishment of the plantations and to guarantee the availability of water for their growth. It is preferable to start planting in November until the end of February, so that the seedlings have more time to enjoy the moisture in the soil. The following graph shows the monthly accumulated rainfall.
Graph 5.7 Monthly Accumulated Precipitation (mm)
5.5.2.1.3 Relative humidity
With regard to this parameter, in the SAIS IPA, there is a decrease in humidity in the months of June to November, mainly due to the low rainfall during these months. However, humidity in the area is abundant throughout the year (between 80% and 90%).

Environmental and Social Impact Assessment of Forest Landscape Restoration Project December 2021
Social Capital Group 91
Graph 5.8 Monthly Averages of Relative Humidity (%)
5.5.2.2 Hydrology
The SAIS José Carlos Mariátegui IPA area is located within the Jequetepeque hydrographic basin, which occupies an area of 8 795.33 km2. This basin, located in the departments of Lambayeque, La Libertad and Cajamarca, in the northern half of the Peruvian territory, discharges its waters into the Pacific Ocean. The average flow of this basin is 29 m3/s.
The main body of water in this area is the Huacraruco River, which is fed from its right bank by the waters coming from the Calzada, Huascamonte and Clariyacu streams. The left bank is fed by the Pacachal river, which follows its course until very close to the locality of San Juan, where, with the contribution of the scarce waters of the La Tranca stream, it is renamed the San Juan river. The Asunción river, the Agua Clara ravine and the Chontayoc ravine are also located in the area.

Environmental and Social Impact Assessment of Forest Landscape Restoration Project December 2021
Social Capital Group 92
Figure 5.14 Hydrology of the IPA area Sociedad Agraria de Interés Social (SAIS) José Carlos Mariátegui
Prepared by Pacific PIR S.A.C.

Environmental and Social Impact Assessment of Forest Landscape Restoration Project December 2021
Social Capital Group 93
5.5.2.3 Water quality
Samples for this IPA were taken at two (02) sampling points, as presented in the table below.
Table 5.7 Water quality sampling points
Sampling points UTM coordinate
WGS84 Location Water body
This North
AG-01 786107 9191152 Agrarian Society of Social Interest (SAIS) José Carlos
Mariátegui
Tributary of the Huacraruco River
AG-03 785553 9190822 Agrarian Society of Social Interest (SAIS) José Carlos
Mariátegui
Huacraruco River
Prepared by: Pacific PIR S.A.C.
Photo 5.4 Water quality sampling points AG-01 and AG-03
Prepared by Pacific PIR S.A.C.
Map M-05 Water quality sampling map (Annex 1.3) shows the locations of the sampling stations, as shown in the following images.

Environmental and Social Impact Assessment of Forest Landscape Restoration Project December 2021
Social Capital Group 94
Figure 5.15 Water quality sampling points AG-01 and AG-03
In the following table, the results obtained for the sampled water quality parameters are presented. They were compared with the ECA for Water approved according to D.S. N° 004-2017-MINAM specifically with Category 3: Irrigation of vegetables and animal drinking.

Social Capital Group 95
Table 5.8 Water quality sampling results
Sampling points
UTM coordinate WGS84
Location
Parameters measured in the field Measured parameters determined in the laboratory
This North Dissolved
oxygen mg/L
pH pH
unit
Temperature °C
Electrical conductivity
µS/cm
BOD mg/L
COD O2
mg/L
Alkalinity CaCO3 mg/L
Chlorides Cl mg/L
Calcium Ca mg/L
Magnesium Mg mg/L
Sulphates SO4 mg/L
Total dissolved
solids (TDS) mg/L
Total suspended solids (TSS)
mg/L
AG-01 786107 9191152
Agrarian Society of
Social Interest
(SAIS) José Carlos
Mariátegui
9.43 6.5 13.3 111.9 <2.00 10.8 37.15 <2.0 9.85 8.52 13.01 58 21.56
AG-03 785553 9190822
Agrarian Society of
Social Interest
(SAIS) José Carlos
Mariátegui
10.51 8 12 110 <2.00 <10.0 9.39 <2.00 <0.31 2.14 11.11 25 <3.00
ECA >4 6,5 –
8,5 Δ 3 2500 15 40 - 500 - 250 1000 - -
Prepared by: Pacific PIR S.A.C.

Social Capital Group 96
Based on the results shown in the table above, it can be indicated that the water sampled is of good quality. The anthropic activity in the area that could affect water quality is livestock farming (mainly cattle and to a lesser extent sheep), and the forestry exploitation that is currently carried out in some sectors of the IPA area of the SAIS. However, this activity is not generating alterations in the levels of parameters such as BOD and COD, which are indicators of water pollution. The same is true for dissolved oxygen, which is at values above 5 mg/l, indicating that the aquatic environment is suitable for life.
A variation can be seen in the alkalinity of the points sampled, at point AG-01, higher values are presented with respect to what was evaluated at point AG-03, this indicates that at point AG-01 there is the presence of certain salts of weak acids or bases, which can easily change the pH of the water.
With regard to magnesium, as described above, the highest concentrations of this mineral are found at point AG-01. The same is true for calcium. These minerals are the reason for the hardness of the water or the concentration of its mineral compounds present. This indicates that the water is of good quality and does not need softening treatments in order to be used.
At sampling point AG-01, a greater presence of sulphates can be seen, which indicates that the rocks in this body of water have a higher concentration of the mixture of oxygen and sulphur that are incorporated into the water.
With regard to Total Dissolved Solids (TDS), the highest concentration of dissolved solids is found at sampling point AG-01. This indicates that it has a higher content of inorganic and organic substances. This sampling point was surrounded by tree vegetation and rocks.
With regard to Total Suspended Solids (TSS), the sample from point AG-03 was found to be below the laboratory detection limit, while the sample from point AG-01 showed a higher concentration. This higher TSS content in the water may affect the passage of sunlight necessary for photosynthesis of aquatic plants.
5.5.2.4 Soil
In the area IPA Sociedad Agraria de Interés Social (SAIS) José Carlos Mariátegui there are soils that have not yet been transported from their origin and soils that come from the mountain slopes. These soils can vary from shallow to deep, due to the medium to moderately coarse texture and slight to moderate surface stoniness. Drainage is high to excessive and permeability is moderate to moderately rapid.
These soils have a strong acid to moderately alkaline reaction, and an organic matter content that can vary from medium to high. The fertility level can be low to medium. The soils of the IPA Sociedad Agraria de Interés Social (SAIS) José Carlos Mariátegui, present slopes that can vary from 8% to -50%.
With respect to the taxonomy according to the FAO system, soils with characteristics typical of the Entisol order predominate, with little edaphogenetic development. The following table shows the soil observation points.

Environmental and Social Impact Assessment of Forest Landscape Restoration Project December 2021
Social Capital Group 97
Table 5.9 Location of observation points.
Title Coordinates (UTM - WGS 84) Zone
17S Altitude (masl)
Sector
This North
PO-01 784643 9191947 3038
Agrarian Society of Social Interest (SAIS) José Carlos Mariátegui
PO-02
784248 9192091 3115 Agrarian Society of Social Interest (SAIS) José Carlos Mariátegui
PO-03
785455 9192743 3387 Agrarian Society of Social Interest (SAIS) José Carlos
Mariátegui
PO-04 786960 9193463 3358
Agrarian Society of Social Interest (SAIS) José Carlos Mariátegui
PO-09
785580 9190801 2919
Agrarian Society of Social Interest (SAIS) José Carlos Mariátegui
Prepared by: Pacific PIR S.A.C.
Below are representative photos of the soils of the IPA area Sociedad Agraria de Interés Social (SAIS) José Carlos Mariátegui.
Photo 5.5 Soil área IPA Sociedad Agraria de Interés Social (SAIS) José Carlos Mariátegui
Representative soil profile Landscape
Prepared by: Pacific PIR S.A.C., 2021
5.5.2.5 Increased land use capacity
In the area of the IPA Sociedad Agraria de Interés Social (SAIS) José Carlos Mariátegui, there is a predominance of land suitable for pastures of medium agrological quality. There are soil limitations of low natural fertility, as well as erosion risks due to the high slopes that predominate in the area, high rainfall and low temperatures.
These lands are used for temporary grazing, due to the seasonal nature of the rainy season. In a smaller proportion of the area there are lands suitable for forestry production and for pastures associated with protection lands with soil and erosion limitations. The respective groups, classes and subclasses identified in the SAIS José Carlos Mariátegui IPA are shown in table 5.10.

Environmental and Social Impact Assessment of Forest Landscape Restoration Project December 2021
Social Capital Group 98
Table 5.10 Optimal land-use capacity units of the IPA area Sociedad Agraria de Interés Social (SAIS) José Carlos Mariátegui
Optimal Use General characteristics Pending
Surface
Group Class Subclass ha. %
Partnerships
P P2 P2sec(t) Land suitable for pasture, medium agrological
quality, with soil, erosion, climate and temporary grazing limitations.
D, F 4560,56 77,37
Partnerships
P2se(t)-Xse
Land suitable for pasture, medium agrological quality, with soil limitations, erosion and
temporary grazing-Protection lands with soil limitations and erosion.
F 8,77 0,15
P3sec(t)-Xsec
Land suitable for pasture, low agrological quality, with soil, erosion, climate and temporary grazing limitations-Protection lands with soil, erosion and
climate limitations.
F 622,98 10,57
F2se-Xse
Land suitable for forestry production, medium agrological quality, with soil and erosion
limitations-Protection lands with soil and erosion limitations.
E, F 701,92 11,91
Total 5894,23 100,00
Source: Ecological and Economic Zoning - Cajamarca Region.
Photo 5.6 Land Suitable for forest production in the SAIS José Carlos Mariátegui IPA
Prepared by: Pacific PIR S.A.C.
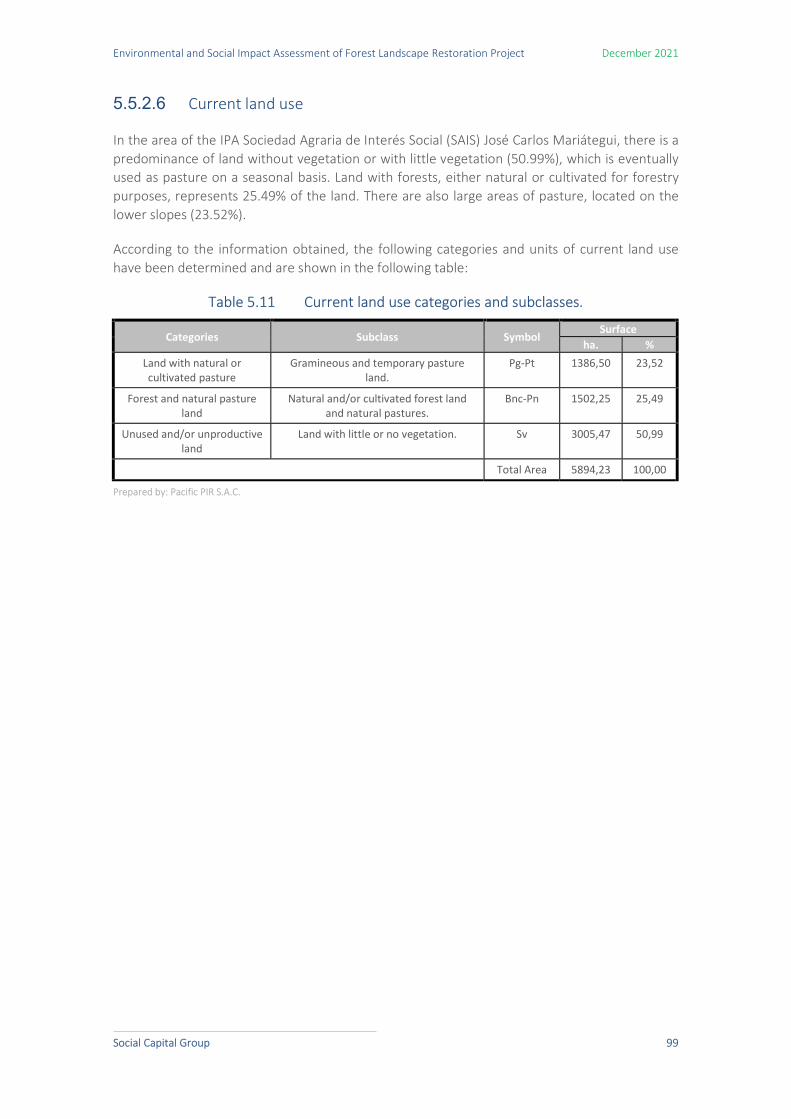
Environmental and Social Impact Assessment of Forest Landscape Restoration Project December 2021
Social Capital Group 99
5.5.2.6 Current land use
In the area of the IPA Sociedad Agraria de Interés Social (SAIS) José Carlos Mariátegui, there is a predominance of land without vegetation or with little vegetation (50.99%), which is eventually used as pasture on a seasonal basis. Land with forests, either natural or cultivated for forestry purposes, represents 25.49% of the land. There are also large areas of pasture, located on the lower slopes (23.52%).
According to the information obtained, the following categories and units of current land use have been determined and are shown in the following table:
Table 5.11 Current land use categories and subclasses.
Categories Subclass Symbol Surface
ha. % Land with natural or cultivated pasture
Gramineous and temporary pasture land.
Pg-Pt 1386,50 23,52
Forest and natural pasture land
Natural and/or cultivated forest land and natural pastures.
Bnc-Pn 1502,25 25,49
Unused and/or unproductive land
Land with little or no vegetation. Sv 3005,47 50,99
Total Area 5894,23 100,00
Prepared by: Pacific PIR S.A.C.

Environmental and Social Impact Assessment of Forest Landscape Restoration Project December 2021
Social Capital Group 100
Figure 5.16 Current use of the SAIS IPA área José Carlos Mariátegui
Prepared by: Pacific PIR S.A.C.
Photo 5.7 Current use in the SAIS IPA area José Carlos Mariátegui
Forest land
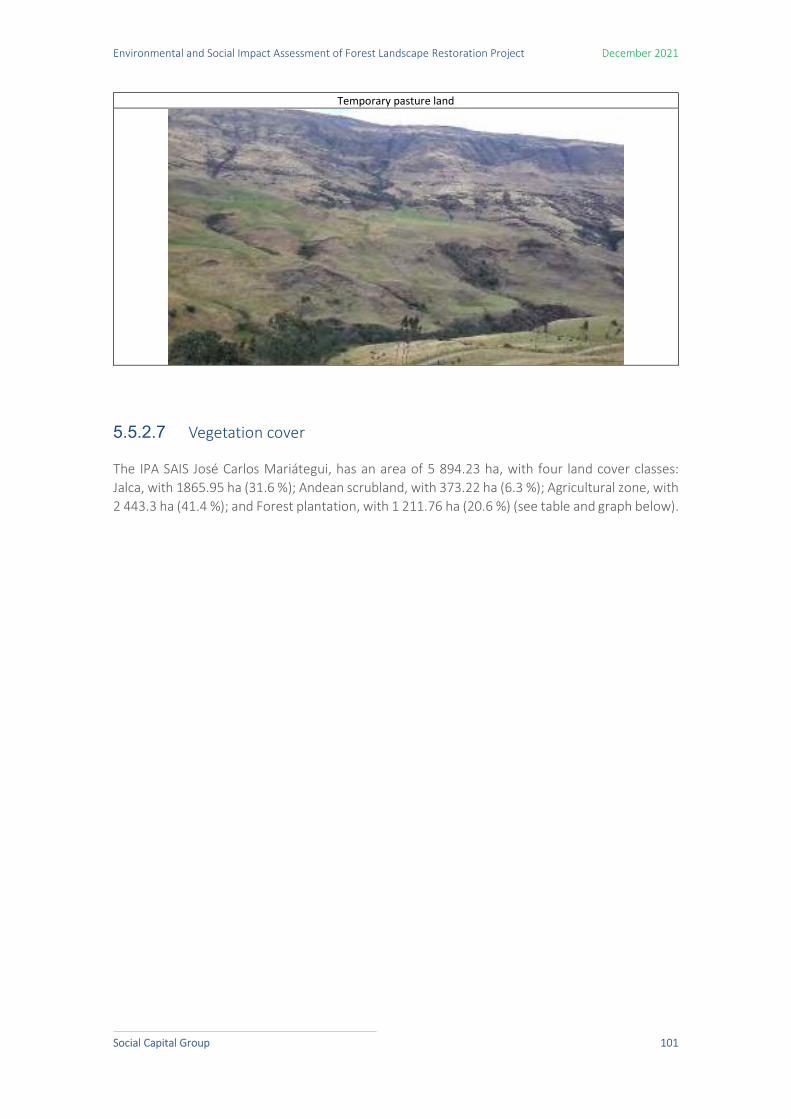
Environmental and Social Impact Assessment of Forest Landscape Restoration Project December 2021
Social Capital Group 101
5.5.2.7 Vegetation cover
The IPA SAIS José Carlos Mariátegui, has an area of 5 894.23 ha, with four land cover classes: Jalca, with 1865.95 ha (31.6 %); Andean scrubland, with 373.22 ha (6.3 %); Agricultural zone, with 2 443.3 ha (41.4 %); and Forest plantation, with 1 211.76 ha (20.6 %) (see table and graph below).
Temporary pasture land

Environmental and Social Impact Assessment of Forest Landscape Restoration Project December 2021
Social Capital Group 102
Figure 5.1 SAIS José Carlos Mariátegui IPA 5.2
Note: Left: preliminary map obtained with Random Forest. Right: final cover classification map
Table 5.12 Cover classes (Ecosystems and Intervened areas) in SAIS JCM
Zone/ Ecosystem-Cover
Agrarian Society of Social Interest (SAIS) José Carlos Mariátegui
(ha) (%) Jalca 1865.95 31.66
Andean scrubland 373.22 6.33
Agricultural area 2443.30 41.45
Plantation Forestry 1211.76 20.56
Mining Zone 0.00 0.00
Artificial water body 0.00 0.00
Total 5894.23 100.00 Prepared by SCG
Graph 5.9 Ecosystems and Intervention Areas

Environmental and Social Impact Assessment of Forest Landscape Restoration Project December 2021
Social Capital Group 103
It is important to stress the importance for this SAIS IPA area that plantations should be carried out while maintaining active biological corridors of native cover. The jalca and Andean scrub occupy more than a third of the territory of this study area. Actions that maintain and contribute to the increase of native cover are necessary for the project to meet its objectives.
Likewise, the resting grasslands and plantation areas used in this area should be prioritised for starting plantations, avoiding native cover. The Andean scrub cover is the most complex in terms of structure and biological diversity, so it must be maintained and increased with the presence of this project.

Environmental and Social Impact Assessment of Forest Landscape Restoration Project December 2021
Social Capital Group 104
Figure 5.17 Vegetation cover of the SAIS José Carlos Mariátegui IPA area
Prepared by: Pacific PIR S.A.C.
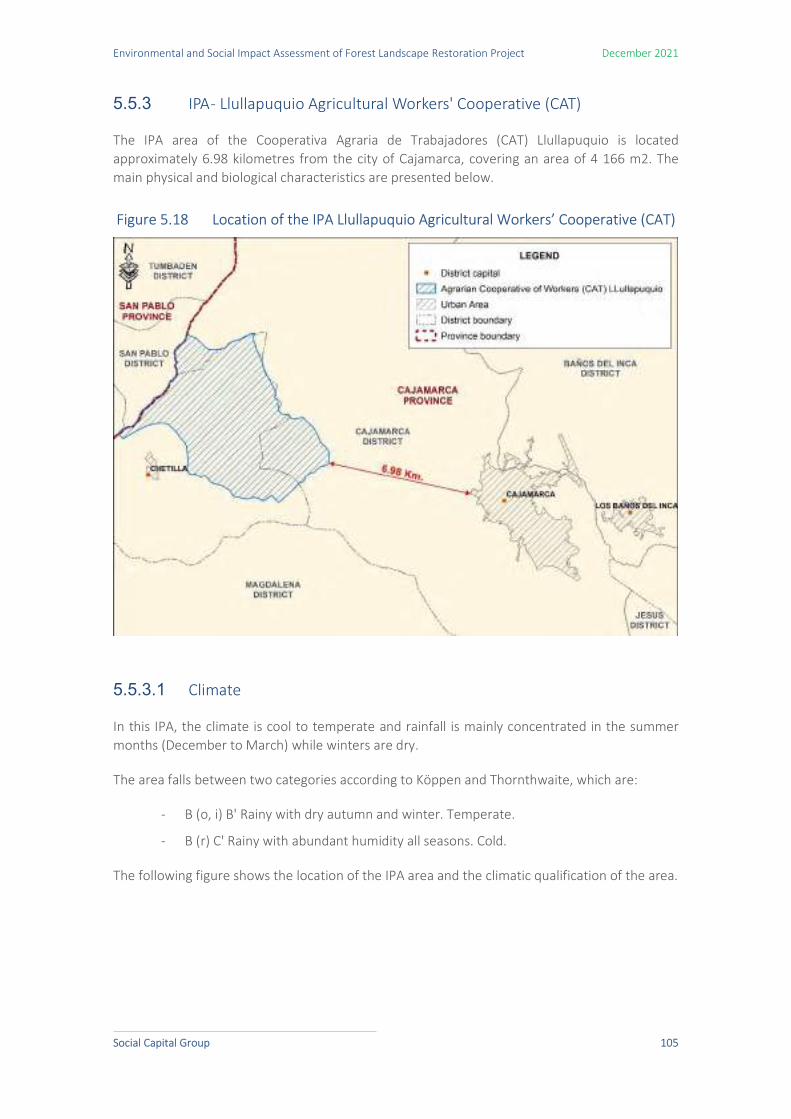
Environmental and Social Impact Assessment of Forest Landscape Restoration Project December 2021
Social Capital Group 105
5.5.3 IPA - Llullapuquio Agricultural Workers' Cooperative (CAT)
The IPA area of the Cooperativa Agraria de Trabajadores (CAT) Llullapuquio is located approximately 6.98 kilometres from the city of Cajamarca, covering an area of 4 166 m2. The main physical and biological characteristics are presented below.
Figure 5.18 Location of the IPA Llullapuquio Agricultural Workers’ Cooperative (CAT)
5.5.3.1 Climate
In this IPA, the climate is cool to temperate and rainfall is mainly concentrated in the summer months (December to March) while winters are dry.
The area falls between two categories according to Köppen and Thornthwaite, which are:
- B (o, i) B' Rainy with dry autumn and winter. Temperate.
- B (r) C' Rainy with abundant humidity all seasons. Cold.
The following figure shows the location of the IPA area and the climatic qualification of the area.

Environmental and Social Impact Assessment of Forest Landscape Restoration Project December 2021
Social Capital Group 106
Figure 5.19 Climate map of the Llullapuquio Agricultural Workers' Cooperative (CAT) IPA area
Prepared by: Pacific PIR S.A.C.

Environmental and Social Impact Assessment of Forest Landscape Restoration Project December 2021
Social Capital Group 107
5.5.3.1.1 Temperature
The graph below shows the average maximum temperatures of the CAT Llullapuquio IPA. It is possible to appreciate a notorious increase in temperatures in the months of June to September, with a variation that goes from 21° to 26°C approximately.
Graph 5.10 Monthly Averages of Maximum Air Temperature (°C)
In the average minimum temperatures, the lowest values occur between the months of June and July. The annual variation range is between 12° and 13° C.
Graph 5.11 Monthly Averages of Minimum Air Temperature (°C)

Environmental and Social Impact Assessment of Forest Landscape Restoration Project December 2021
Social Capital Group 108
5.5.3.1.2 Precipitation
Precipitation in the area is almost nil between June and September. However, between December and March, there is a significant increase.
Graph 5.12 Monthly Accumulated Precipitation (mm)
5.5.3.1.3 Relative humidity
With respect to relative humidity, a decrease is seen in the months from June to September, which indicates that it is related to the precipitation in the IPA area and the decrease in temperature.
Graph 5.13 Monthly Averages of Relative Humidity (%)

Environmental and Social Impact Assessment of Forest Landscape Restoration Project December 2021
Social Capital Group 109
5.5.3.2 Hydrology
The Llullapuquio CAT IPA is located between two watersheds. One part is within the Jequetepeque hydrographic basin. This basin belongs to the Pacific slope and extends over the departments of Lambayeque, La Libertad and Cajamarca. With a surface area of 8,795.33 km2, it stretches from the Pacific Ocean to the central mountain range. This basin has an average flow of 29 m3/s.
The other part is located in the Crisnejas basin, which has an extension of 4,928 km2 and belongs to the Atlantic slope. It is formed by the union of the Condebamba and Cajamarca rivers, being one of the main tributaries of the Marañón, with an average annual flow of 5 m3/s.
There are two main water bodies in the area: the Chancas stream and the Carcelcucho stream. The following figure shows the basins and water bodies of the Llullapuquio IPA.

Environmental and Social Impact Assessment of Forest Landscape Restoration Project December 2021
Social Capital Group 110
Figure 5.20 Hidrology of the Llullapuquio Agricultural Workers’ Cooperative (CTA) IPA
Prepared by: Pacific PIR S.A.C.

Environmental and Social Impact Assessment of Forest Landscape Restoration Project December 2021
Social Capital Group 111
5.5.3.3 Water quality
Samples were taken at one (01) sampling point specifically in the Chancas stream, as shown in the following table.
Table 5.13 Water quality sampling points
Sampling points UTM coordinate
WGS84 Location Water body
This North
AG-02 759711 9214893 Cooperativa Agraria de Trabajadores
(CAT) Llullapuquio Quebrada Chancas
Prepared by: Pacific PIR S.A.C.
Photo 5.8 Water quality sampling point AG-02
Prepared by: Pacific PIR S.A.C.
Map M-05 Water quality sampling map (Annex 1.3) shows the locations of the sampling stations, as shown in the following images.

Environmental and Social Impact Assessment of Forest Landscape Restoration Project December 2021
Social Capital Group 112
Figure 5.21 Water quality sampling point AG-02
.
Prepared by: Pacific PIR S.A.C.
The following table presents the results obtained for the sampled water quality parameters, which were compared with the ECA for Water approved according to D.S. N° 004-2017-MINAM specifically with Category 3: Irrigation of vegetables and animal drinking water.

Social Capital Group 113
Table 5.14 Water quality sampling results
Sampling points
UTM coordinate WGS84
Location
Parameters measured in the field Measured parameters determined in the laboratory
This North Dissolved
oxygen mg/L
pH pH unit
Temperature °C
Electrical conductivity
µS/cm
BOD mg/L
COD O2
mg/L
Alkalinity CaCO3 mg/L
Chlorides Cl mg/L
Calcium Ca
mg/L
Magnesium Mg mg/L
Sulphates SO4 mg/L
Total dissolved
solids (TDS) mg/L
Total suspended
solids (TSS) mg/L
AG-02 759711 9214893
Cooperativa Agraria de
Trabajadores (CAT)
Llullapuquio
11.49 6.38 11.4 64.4 <2.00 <10.0 83.95 <2.00 2.3 18.13 22.19 144 <3.00
ECA >4 6,5 – 8,5 Δ 3 2500 15 40 - 500 - 250 1000 - -
Prepared by: Pacific PIR S.A.C.

Social Capital Group 114
Based on the results shown in the table above, it can be indicated that the water sampled is of good quality. The anthropic activity carried out in the area that could affect water quality is livestock farming (mainly cattle and to a lesser extent sheep), and the forestry exploitation that is currently carried out in some sectors. However, there is no evidence that this is generating alterations in parameters such as BOD and COD, which are indicators of water pollution, as well as dissolved oxygen, which is at values above 5 mg/l. All this indicates that the aquatic environment is suitable for life.
At the point AG-02 sampled, high alkalinity values are present, which indicates that the presence of certain salts of weak acids or bases would be affecting the pH.
With regard to magnesium in the water, at point AG-02 high concentrations of magnesium and calcium are found, which give the water a hardness characteristic.
At sampling point AG-02, the presence of sulphates can be seen, probably coming from the materials that make up the bedrock through which the water flows.
With regard to Total Dissolved Solids (TDS), at sampling point AG-02 there is a high concentration of dissolved solids.
For Total Suspended Solids (TSS), point AG-02 was found to be below the laboratory detection limit.
5.5.3.4 Soil
The slope of the studied area of this IPA is on average 25-30 %. The soils are both locally formed and from the mountain slopes. Their texture is moderately coarse to fine, with slight to moderate surface stoniness, which determines a moderately fast to slow permeability.
These soils have an organic matter content that can vary from medium to high, strongly acid to moderately alkaline reaction. Their fertility level is medium.
In relation to taxonomy, according to the FAO system, these are soils of scarce genetic development of the Inceptisol and Entisol orders with a marked presence of rocky fragments and in some cases superficial organic horizons. The following table shows the location of the soil observation points.
Table 5.15 Location of observation points
Title Coordinates (UTM - WGS 84) Zone
17S Altitude (masl)
Sector
This North
PO-06 759648 9214849 3132 Cooperativa Agraria de Trabajadores (CAT) Llullapuquio
PO-07 762503 9211303 3729 Cooperativa Agraria de Trabajadores (CAT) Llullapuquio
Prepared by: Pacific PIR S.A.C.

Environmental and Social Impact Assessment of Forest Landscape Restoration Project December 2021
Social Capital Group 115
The following are representative photos of the soil in the IPA area Cooperativa Agraria de Trabajadores Cooperativa Agraria de Trabajadores (CAT) Llullapuquio.
Photo 5.9 Soil in the sector Cooperativa Agraria de Trabajadores (CAT) Llullapuquio
Prepared by: Pacific PIR S.A.C.
5.5.3.5 Increased land use capacity
Most of the soils in the IPA of the Llullapuquio CAT are suitable for forestry production. Their natural fertility is low and their agrological quality is medium. Due to the slope, the soils are at high risk of erosion.
To a lesser extent, there are soils classified as protection soils due to their steep slope and consequent risk of erosion. The respective groups, classes and subclasses identified in the Llullapuquio CAT are shown in the following table:
Table 5.16 Optimal land use capacity units of Llullapuquio sector
Optimal Use General characteristics Pending
Surface
Group Class Subclass ha. %
Partnerships
F F2 F2sec Land suitable for forestry production, medium
agrological quality, with soil and erosion limitations. F 468,68 89,11
Xsec Protected land with soil, erosion and climate constraints.
F 57.25 10.89
Total 525,93 100,00 Source: Ecological and Economic Zoning - Cajamarca Region.
Representative soil profile Landscape

Environmental and Social Impact Assessment of Forest Landscape Restoration Project December 2021
Social Capital Group 116
Photo 5.10 Land suitable for forest production in the Llullapuquio CAT IPA
Prepared by: Pacific PIR S.A.C.

Environmental and Social Impact Assessment of Forest Landscape Restoration Project December 2021
Social Capital Group 117
Figure 5.22 CUM of the soils of the CAT Llullapuquio IPA
Prepared by: Pacific PIR S.A.C.

Environmental and Social Impact Assessment of Forest Landscape Restoration Project December 2021
Social Capital Group 118
5.5.3.6 Current land use
In the IPA area of the Llullapuquio Agricultural Workers' Cooperative (CAT) there is a greater proportion of land used for the production of annual crops (61.51%), mainly food crops such as potatoes, maize, wheat, among others, associated in some cases with cultivated pastures. In addition, there is land used for forestry production, as well as for the conservation of natural forests associated with areas without vegetation (10.76%). On the other hand, there are unused and/or unproductive lands (26.30%), which are characterised by the absence of vegetation cover or scarce vegetation of the grassland type, as well as grasses and low-growing flora.
According to the information obtained, the following categories and units of current land use have been determined, which are shown in the following table:
Table 5.17 Current land use categories and subclasses.
Categories Subclass Symbol Surface
ha. % Land with natural forests
and pastures Land with natural and/or cultivated forests
and natural pastures Bnc-Ph 7,55 1,44
Land under cultivation Land with Andean crops. Ca 323,49 61,51
Forest land Natural and/or cultivated forest land - Land
without vegetation. Bnc - Sv 56,57 10,76
Unused and/or unproductive land
Land with little or no vegetation. Sv 138,33 26,30
Total Area 525,93 100,00 Prepared by: Pacific PIR S.A.C.
As can be seen in the table above, the area referred to the current land use of arable land stands out. This category includes land with pasture for livestock farming.

Environmental and Social Impact Assessment of Forest Landscape Restoration Project December 2021
Social Capital Group 119
Figure 5.23 Current use of IPA área Llullapuquio Agricultural Workers Cooperative (CAT)
Prepared by: Pacific PIR S.A.C.
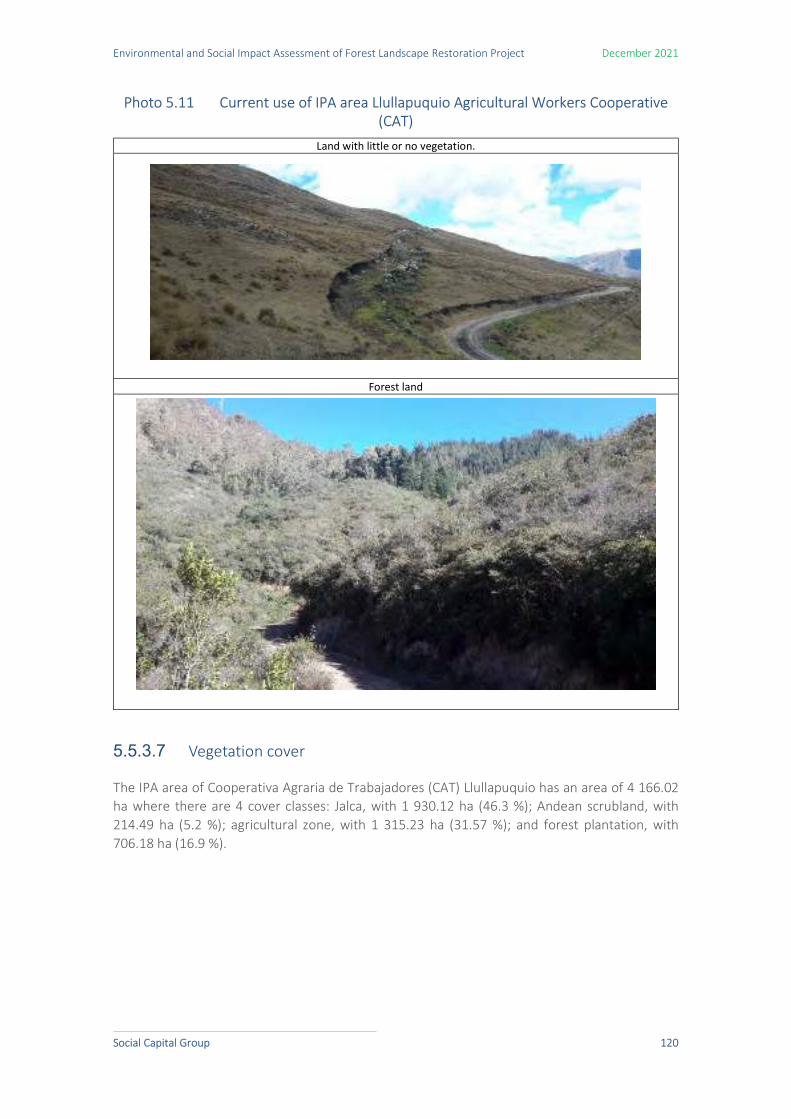
Environmental and Social Impact Assessment of Forest Landscape Restoration Project December 2021
Social Capital Group 120
Photo 5.11 Current use of IPA area Llullapuquio Agricultural Workers Cooperative (CAT)
Land with little or no vegetation.
Forest land
5.5.3.7 Vegetation cover
The IPA area of Cooperativa Agraria de Trabajadores (CAT) Llullapuquio has an area of 4 166.02 ha where there are 4 cover classes: Jalca, with 1 930.12 ha (46.3 %); Andean scrubland, with 214.49 ha (5.2 %); agricultural zone, with 1 315.23 ha (31.57 %); and forest plantation, with 706.18 ha (16.9 %).
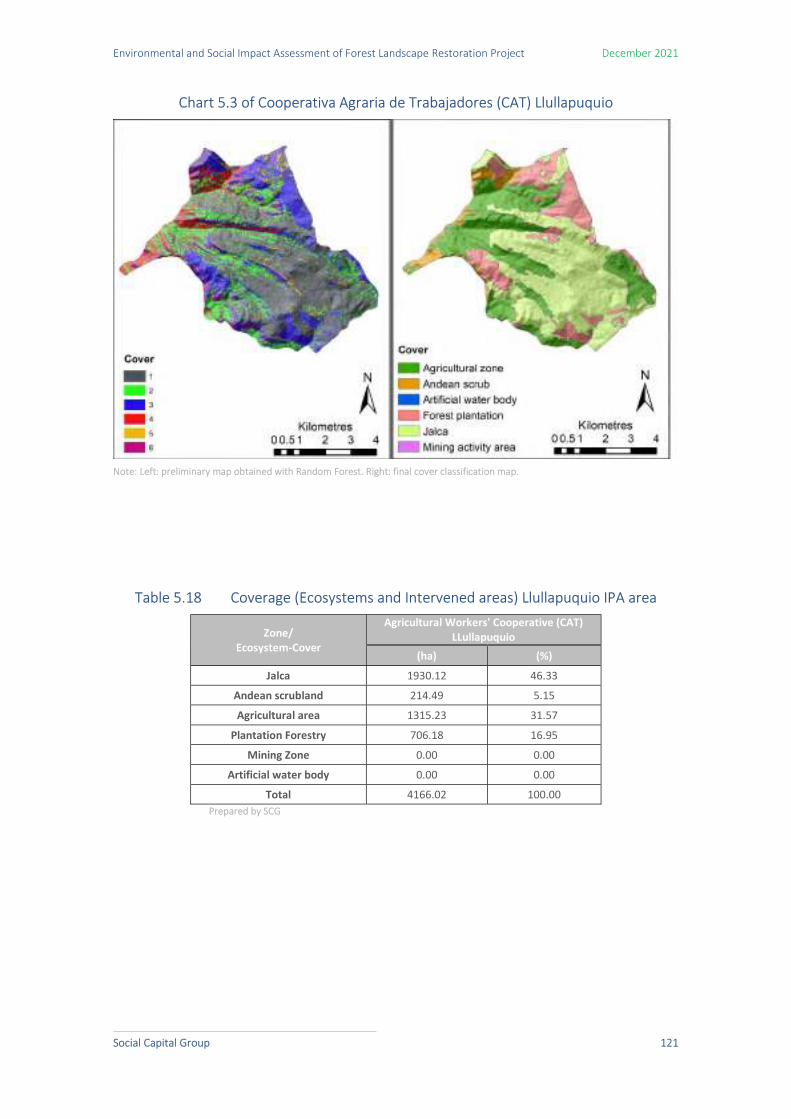
Environmental and Social Impact Assessment of Forest Landscape Restoration Project December 2021
Social Capital Group 121
Chart 5.3 of Cooperativa Agraria de Trabajadores (CAT) Llullapuquio
Note: Left: preliminary map obtained with Random Forest. Right: final cover classification map.
Table 5.18 Coverage (Ecosystems and Intervened areas) Llullapuquio IPA area
Zone/ Ecosystem-Cover
Agricultural Workers' Cooperative (CAT) LLullapuquio
(ha) (%)
Jalca 1930.12 46.33
Andean scrubland 214.49 5.15
Agricultural area 1315.23 31.57
Plantation Forestry 706.18 16.95
Mining Zone 0.00 0.00
Artificial water body 0.00 0.00
Total 4166.02 100.00 Prepared by SCG

Environmental and Social Impact Assessment of Forest Landscape Restoration Project December 2021
Social Capital Group 122
Figure 5.4 Ecosystems and intervened areas
It is important, for the area in question, to carry out plantations while maintaining active biological corridors of native cover. The jalca and Andean scrub occupy more than half of the territory. Therefore, actions that maintain and contribute to the increase of native cover are necessary for the fulfilment of the project's objectives.
Resting grasslands and harvested plantation areas should be prioritised for starting plantations, avoiding native cover. The Andean scrub cover is the most complex in structure and biological diversity, therefore, it should be maintained and increased with the presence of this projet.

Environmental and Social Impact Assessment of Forest Landscape Restoration Project December 2021
Social Capital Group 123
Figure 5.24 Vegetation cover of the CAT Llullapuquio IPA.
Prepared by: Pacific PIR S.A.C.
Environmental and Social Impact Assessment of Forest Landscape Restoration Project December 2021
Social Capital Group 124
5.5.4 Characterisation of Wildlife Ecosystems
Ecosystems are a dynamic complex of communities of flora, fauna and micro-organisms that interact as a functional unit. In the IPA area, divided into the three study areas of the project (Minera Yanacocha, Cooperativa Agraria de Trabajadores (CAT) Llullapuquio and Sociedad Agraria de Interés Social (SAIS) José Carlos Mariátegui), with similar ecosystems, it is not convenient to carry out a characterisation of wild ecosystems in each of them, as the work would be repetitive and the results would be the same.
Thus, in the proposed IPA area, which includes the three aforementioned areas, two types of wild ecosystems have been observed: jalca and Andean scrubland (MINAM, 2019). The characterisation of these wild ecosystems has been carried out through walks in different points of the three areas, where information has been collected on the flora and fauna characteristic of these ecosystems, which is complemented with secondary information.
5.5.4.1 Flora
Flora in the Jalca ecosystem The jalca is a transitional terrain between the puna and the páramo in the north of the country, in the western chain of the Andes, with specific characteristics as it is wetter and lower than the puna (Mostacero et al., 1996; MINAM, 2019).
The vegetation in the study area is dominated by pajonales, some oconales (partially flooded, swampy or semi-swampy wetlands present in the high Andean region of Peru above 3,300 m.a.s.l.) in the lower parts and small areas of scrubland in relatively sheltered places. The pajonales are the most notable element in the area, with dominant species such as Agrostis sp., Jarava ichu, Vulpia sp., Muhlenbergia angustata and Calamagrostis sp (Poaceae), Azorella crenata (Apiaceae), Baccharis caespitosa, Baccharis sp., Hypochaeris sp., and Werneria nubigena (Asteraceae), Gentiana sedifolia (Gentianaceae); and some scattered shrubs such as Hypericum laricifolium (Hypericaceae) and Vaccinium sp. (Ericaceae).

Environmental and Social Impact Assessment of Forest Landscape Restoration Project December 2021
Social Capital Group 125
Figure 5.25 Representative species of the Andeanjalca shrubland
Note: A) View of Jalca, B) Jarava ichu, C) Baccharis sp. and D) Hypericum laricifolium.
Flora in the Andean scrubland ecosystem This ecosystem is made up of shrubs and some scattered trees that reach a maximum height of 3 m. They are distributed in patches between the jalca and other vegetation, with a greater proportion in the hollows of the valleys that form a humid refuge and the vegetation has not been affected by anthropic activities. The floristic composition of this ecosystem is made up of shrubs of Baccharis sp., Agertina sp., Gynoxys calyculisolvens (Asteraceae), Lupinus sp. (Fabaceae), Myrsine sp. (Primulaceae), Miconia spp. (Melastomataceae), Cestrum sp. (Solanaceae), Vaccinum sp., Bejaria sp. (Ericaceae), and Oreocallis grandiflora (Proteaceae); lianas such as Passiflora sp. (Passifloraceae), Rubus sp. (Rosaceae) and some small trees such as Alnus acuminata (Betulaceae) and Oreopanax eriocephalus (Araliaceae).
A B
C D

Environmental and Social Impact Assessment of Forest Landscape Restoration Project December 2021
Social Capital Group 126
Photo 5.12 Representative species of Andean shrubland
Note: A) Oreocallis grandiflora, B) and D) Lupinus sp., C) Gynoxys calyculisolvens, E) View of the thicket and F) Oreopanax eriocephalus.
5.5.4.2 Fauna
The IPA area of the project corresponds mostly to a high Andean ecosystem called jalca and is made up of the presence of geographical vegetation units such as grasslands and shrub thickets. Within these, the wildlife population is characterised by the predominance of birds, due to their diversity and adaptability to high altitudes.
A
B
C
D
E
F

Environmental and Social Impact Assessment of Forest Landscape Restoration Project December 2021
Social Capital Group 127
In the study area, 50 bird species have been reported, which are distributed in 12 orders, 28 families and 49 genera. The order with the highest number of records is Passeriformes (songbirds, 31 species, 49.21 %), followed by the orders Anseriformes (ducks and geese, 7 species, 11.11 %). The species that were sighted during the field visit were: "Liqui Liqui" Vanellus resplendens, "American Kestrel" Falco sparverius, "Indio phisgo" Zonotrichia capensis, "Scrub Thrush" Dives warszewiczi, "Cargacha or Andean Woodpecker" Colaptes rupicola, "Black-necked Woodpecker Colaptes atricollis "Grey Eagle" Geranoaetus melanoleucus, "China linda" Phalcobaenus megalopterus, "Spectacled Titmouse" Myioborus melanocephalus, "Partridge" Nothoprocta pentlandii and "Thrush" Thurdus Chiguanco.
Endemic birds such as Metallura Phoebe "black hummingbird", Leptasthenura pileata "crowned earwig", Colaptes atricollis "black-necked woodpecker" and Geocerthia serrana "Peruvian bansurrita", have managed to establish themselves in this type of ecosystem (Minera Yanacocha, 2019).
Photo 5.13 Representative birds in the area CAT Llullapuquio
Note: A) "Liqui Liqui" Vanellus resplendens, B) "American Kestrel" Falco sparverius
A B

Environmental and Social Impact Assessment of Forest Landscape Restoration Project December 2021
Social Capital Group 128
Photo 5.14 Representative birds in the area
Note: A) "Indio phisgo" Zonotrichia capensis, B) "Tordo de matorral" Dives warszewiczi, C) "Cargacha o carpintero andino" Colaptes
rupícola, D) "Zorzal" Thurdus Chiguanco, E) "Perdiz" Nothoprocta pentlandii
A
C
B
D
E
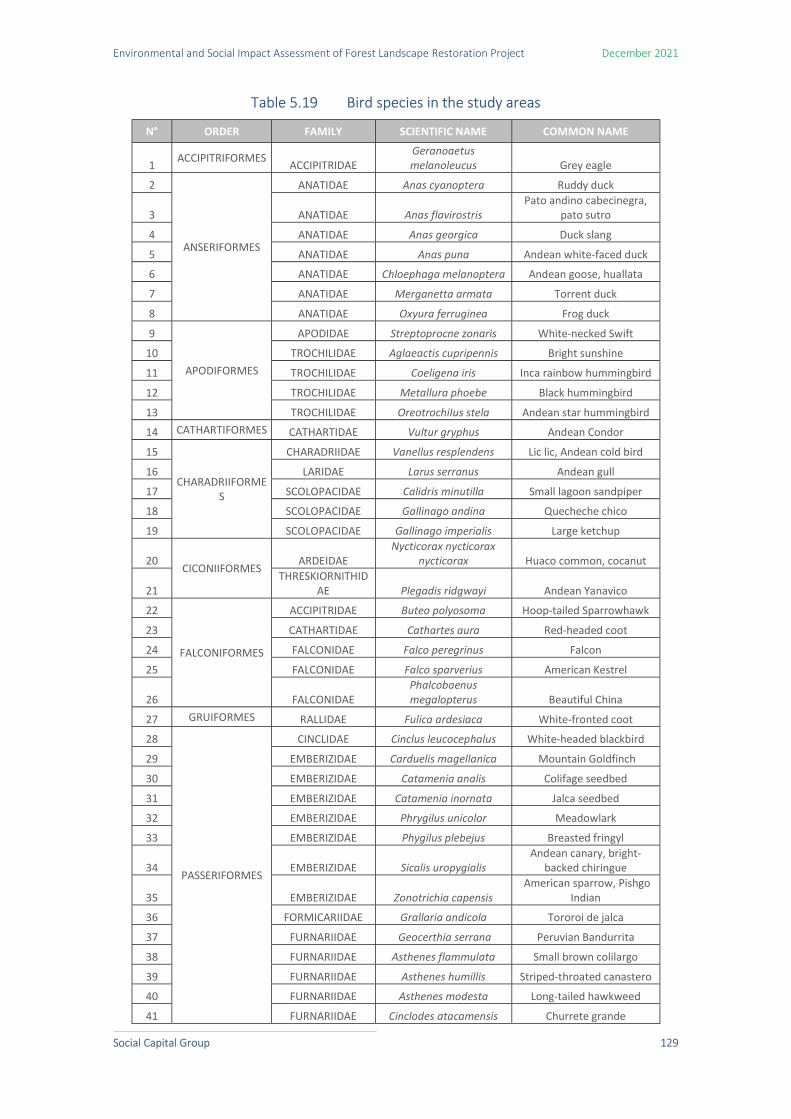
Environmental and Social Impact Assessment of Forest Landscape Restoration Project December 2021
Social Capital Group 129
Table 5.19 Bird species in the study areas
N° ORDER FAMILY SCIENTIFIC NAME COMMON NAME
1 ACCIPITRIFORMES
ACCIPITRIDAE Geranoaetus melanoleucus Grey eagle
2
ANSERIFORMES
ANATIDAE Anas cyanoptera Ruddy duck
3 ANATIDAE Anas flavirostris Pato andino cabecinegra,
pato sutro
4 ANATIDAE Anas georgica Duck slang
5 ANATIDAE Anas puna Andean white-faced duck
6 ANATIDAE Chloephaga melanoptera Andean goose, huallata
7 ANATIDAE Merganetta armata Torrent duck
8 ANATIDAE Oxyura ferruginea Frog duck
9
APODIFORMES
APODIDAE Streptoprocne zonaris White-necked Swift
10 TROCHILIDAE Aglaeactis cupripennis Bright sunshine
11 TROCHILIDAE Coeligena iris Inca rainbow hummingbird
12 TROCHILIDAE Metallura phoebe Black hummingbird
13 TROCHILIDAE OreotrochiIus stela Andean star hummingbird
14 CATHARTIFORMES CATHARTIDAE Vultur gryphus Andean Condor
15
CHARADRIIFORMES
CHARADRIIDAE Vanellus resplendens Lic lic, Andean cold bird
16 LARIDAE Larus serranus Andean gull
17 SCOLOPACIDAE Calidris minutilla Small lagoon sandpiper
18 SCOLOPACIDAE Gallinago andina Quecheche chico
19 SCOLOPACIDAE Gallinago imperialis Large ketchup
20 CICONIIFORMES
ARDEIDAE Nycticorax nycticorax
nycticorax Huaco common, cocanut
21 THRESKIORNITHID
AE Plegadis ridgwayi Andean Yanavico
22
FALCONIFORMES
ACCIPITRIDAE Buteo polyosoma Hoop-tailed Sparrowhawk
23 CATHARTIDAE Cathartes aura Red-headed coot
24 FALCONIDAE Falco peregrinus Falcon
25 FALCONIDAE Falco sparverius American Kestrel
26 FALCONIDAE Phalcobaenus megalopterus Beautiful China
27 GRUIFORMES RALLIDAE Fulica ardesiaca White-fronted coot
28
PASSERIFORMES
CINCLIDAE Cinclus leucocephalus White-headed blackbird
29 EMBERIZIDAE Carduelis magellanica Mountain Goldfinch
30 EMBERIZIDAE Catamenia analis Colifage seedbed
31 EMBERIZIDAE Catamenia inornata Jalca seedbed
32 EMBERIZIDAE Phrygilus unicolor Meadowlark
33 EMBERIZIDAE Phygilus plebejus Breasted fringyl
34 EMBERIZIDAE Sicalis uropygialis Andean canary, bright-
backed chiringue
35 EMBERIZIDAE Zonotrichia capensis American sparrow, Pishgo
Indian
36 FORMICARIIDAE Grallaria andicola Tororoi de jalca
37 FURNARIIDAE Geocerthia serrana Peruvian Bandurrita
38 FURNARIIDAE Asthenes flammulata Small brown colilargo
39 FURNARIIDAE Asthenes humillis Striped-throated canastero
40 FURNARIIDAE Asthenes modesta Long-tailed hawkweed
41 FURNARIIDAE Cinclodes atacamensis Churrete grande

Environmental and Social Impact Assessment of Forest Landscape Restoration Project December 2021
Social Capital Group 130
N° ORDER FAMILY SCIENTIFIC NAME COMMON NAME
42 FURNARIIDAE Cinclodes fuscus Churrete chico
43 FURNARIIDAE Leptasthenura pileata Tijeral de Corona
44 FURNARIIDAE Upucerthia dumetaria Bandurria curved beak
45 HIRUNDINIDAE Orochelidon murina Brown-bellied Swallow
46 HYRUNDINIDAE Stelgidopteryx andecola Grey swallow
47 ICTERIDAE Dives warszewiczi Scrub thrush
48 MOTACILLIDAE Anthus bogotensis Pampero yellow
49 PARULIDAE Myioborus
melanocephalus Spectacle tealight
50 THRAUPIDAE Conirostrum sitticolor Blue-backed honey
51 THRAUPIDAE Thraupis bonariensis Yellow-blue tanager
52 TROGLODYTIDAE Troglodytes aedon Turriche cordillerano
53 TURDIDAE Turdus chiguanco Chiguanco thrush
54 TURDIDAE Turdus serranus Black Thrush
55 TYRANNIDAE Agriornis montana Huaychao, jalca muleteer
56 TYRANNIDAE Muscisaxicola alpina Grey sleeper
57 TYRANNIDAE Muscisaxicola masculirostris Brown sleeper
58 TYRANNIDAE Muscisaxicola rufivertex Coronation sleepyhead
59 PICIFORMES
PICIDAE CoIaptes rupicola Cargacha
60 PICIDAE Colaptes atricollis Black-necked woodpecker
61 PODICIPEDIFORM
ES PODICIPEDIDAE Podiceps occipitalis Small diver
62 TINAMIFORMES
TINAMIDAE Nothoprocta curvirostris Curved-billed partridge
63 TINAMIDAE Nothoprocta pentlandii Mountain partridge Source: Sánchez et al., 2005 10; ALAC, 2005 11; GORE, 2009 12; GORE, 2012 13; Angulo, 2012 14; Roncal, 2016 15; Roncal, 2017
16; Yanacocha, 2019 17.
On the other hand, the mastofauna of the IPA study area is composed of 4 orders, 7 families and 11 genera, with the order Rodentia (rodents) having the highest number of records with respect to the other orders, with 3 families and 8 species. It is followed by the orders Carnivora with 2 families and 2 species. In addition, areas covered by grasslands and rocky outcrops provide the ideal habitat for mammals endemic to the ecosystem such as Lagidium peruanum "Vizcacha" and Calomys sorellus "Ratón de jalca" (GORE, 2009).
10 Sánchez, I.; Cabanillas, M.; Miranda, A.; Poma, W.; Díaz, J.; Terrones, F.; Bazán, H. 2005. La jalca, the cold ecosystem of northwestern Peru - Biological and ecological fundamentals. Lima, Peru. 196. 11 ALAC (Los Andes de Cajamarca). 2005. Baseline study of the province of Cajamarca. 112 p. 12 GORE (Regional Government of Cajamarca). 2009. Regional Biodiversity Strategy of Cajamarca to 2021. 148 p. 13 GORE. 2012. Biodiversity in Cajamarca. 208 p. 14 Angulo, F. 2012. Ornithological inventory in the Sunchubamba Game Reserve. CORBIDI. 15 Roncal, M. 2016. Quick identification guide. Birds of the district of Chugur, Hualgayoc- Cajamarca. 3 p. 16 Roncal, M. 2017. Quick identification guide. 11 endemic birds of the Cajamarca region. 1 p. 17 ANACOCHA. 2019. Environmental impact study. 303 p.

Environmental and Social Impact Assessment of Forest Landscape Restoration Project December 2021
Social Capital Group 131
Foto 5.1 "Grey white-tailed deer Odocoileus virginianus (in captivity at the hacienda of the SAIS José Carlos Mariátegui).
Table 5.20 Mastofauna in the study areas
N° ORDER FAMILY SCIENTIFIC NAME COMMON NAME
1 ARTIODACTYLA CERVIDAE Odocoileus virginianus Grey white-tailed deer
2 CARNIVORA CANIDAE Dusicyon culpaeus Andean fox
3 CARNIVORA MUSTELIDAE Conepatus semistriatus Pig snout skunk
4 CHIROPTERA PHYLLOSTOMIDAE Peruvian Anoura Peruvian tailless bat
5 CHIROPTERA VESPERTILIONIDAE Myotis oxytus Blackish bat
6 CHIROPTERA PHYLLOSTOMIDAE Sturnia bogotensis Yellow-shouldered bat
7 DIDELPHIMORPHIA DIDELPHlDAE Didelphis albiventris White-eared possum
8 RODENTIA CAVIIDAE Cavia tschudii Wild guinea pig
9 RODENTIA CHINCHILLIDAE Lagidium peruanum Vizcacha
10 RODENTIA MURIDAE Phyllotis andium Wild eared mouse
11 RODENTIA MURIDAE Akodon mollis Wild soft-furred mouse
12 RODENTIA MURIDAE Microryzomys altissimus Long-tailed mouse
13 RODENTIA MURIDAE Oligoryzomys andinus Andean grassland mouse
14 RODENTIA MURIDAE Calomys sorellus White-bellied mouse
15 RODENTIA MURIDAE Calomys lepidus Meadow-eared mouse Source: Sanchez et al., 2005. GORE, 2012, BioWeb
The herpetofauna is the least abundant. It is only made up of 2 orders, 6 families and 7 species (3 species of reptiles and 4 amphibians). Among these are the endemic species of amphibians such as Gastrotheca peruana "Rana marsupial", Pristimantis simonsii "Rana de páramo de los andes" and Atelopus peruensis "Sapo del Perú". As for reptile species, they are less numerous, the most common and endemic species being Petracola ventrimaculatus (GORE, 2009).
Table 5.21 Herpetofauna in the study areas
N° ORDER FAMILY SCIENTIFIC NAME COMMON NAME
1 ANUROS
HYLIDAE Gastrotheca peruana Marsupial frog
2 DENDROBATIDAE Colostethus elachyhistus Andean toad
3 BUFONIDAE Atelopus peruensis Peruvian Toad

Environmental and Social Impact Assessment of Forest Landscape Restoration Project December 2021
Social Capital Group 132
N° ORDER FAMILY SCIENTIFIC NAME COMMON NAME
4 STRABOMANTIDAE Pristimantis simonsii Andean Paramo Frog
5 SAURIOS
IGUANIDAE Stenocercus melanopygus Lizard
6 IGUANIDAE Stenocetcus chrysopygus Striped lizard
7 GYMNOPHTHALMIDAE Petracola ventrimaculatus Spotted lizard
Source: Sanchez et al., 2005; GORE, 2009; GORE, 2012; Yanacocha, 2019
5.5.4.3 Conservation status
Of the species recorded, 6 are in some category of threat in Peru (SERFOR, 2018)18 based on the classification of the International Union for Conservation of Nature (IUCN). Three birds: Vultur gryphus "Andean Condor", is endangered (EN) and Gallinago imperialis "Quecheche grande" and Falco peregrinus "falcon" as near-threatened species (NT).
The amphibians Pristimantis simonsii "Andean Paramo Frog" and Atelopus peruensis "Peruvian Toad", are categorised as Critically Endangered (CR); and the reptile Petracola ventrimaculatus "Spotted Lizard", also in the same category.
Table 5.22 Threatened fauna in the study areas
Source: SERFOR, 2018.
5.5.5 On the implementation of the Forestry Project
In relation to climate, it can be seen that in the areas IPA Sociedad Agraria de Interés Social (SAIS) José Carlos Mariátegui and IPA Cooperativa Agraria de Trabajadores (CAT) Llullapuquio there is a greater extension of areas favourable for developing commercial forestry plantations, in contrast to the IPA Minera Yanacocha which has areas with higher altitude, in which the development of plantations is lower.
The soils of the Initial Project Area (IPA) are mostly moderately stony at surface level and have a medium to coarse texture, which allows the soil to have good drainage capacity and permeability. In addition, the slopes vary from 8% to 50%, so that forest plantations are recommended in all areas because they will contribute to the reduction of erosion and give greater stability to the soils.
With regard to the optimal land use capacity within the IPA area, we note that most of the land within the project area is considered suitable for forestry production, either as associations or
18 SERFOR (National Forestry and Wildlife Service). 2018. Libro rojo de la fauna silvestre amenazada del Perú (Red book of the endangered wildlife of Peru). 1st edition. Lima, Peru. 558 p.
N° ORDER FAMILY SCIENTIFIC NAME COMMON NAME IUCN
1 CATHARTIFORMES CATHARTIDAE Vultur gryphus Andean Condor EN
2 CHARADRIIFORMES SCOLOPACIDAE Gallinago imperialis Large ketchup NT 3 FALCONIFORMES FALCONIDAE Falco peregrinus Falcon NT 4 ANUROS BUFONIDAE Atelopus peruensis Peruvian Toad RC 5 ANUROS STRABOMANTIDAE Pristimantis simonsii Andean Paramo Frog RC 6 SAURIOS GYMNOPHTHALMIDAE Petracola ventrimaculatus Spotted lizard RC

Environmental and Social Impact Assessment of Forest Landscape Restoration Project December 2021
Social Capital Group 133
associated with strong soil, erosion risk and climate constraints. Therefore, there will be no land-use capacity constraints, as the land is currently being used for forest production.
For vegetation cover, the accuracy analysis of the preliminary land cover map using the Kappa index (k=0.87) has a near-perfect score within the range of concordance strength (Landis and Koch, 1977).
In the three sectors of the IPA area, taking as a reference the classification of the map of ecosystems of Peru (MINAM, 2019), a total of 6 coverages were identified, delimited in 2 ecosystems (jalca and Andean scrub) and 3 intervened zones (agricultural zone, forest plantation, and mining zone), in addition to artificial water bodies. The jalca ecosystem represents 38.54 % (5851 ha) of the IPA area and the Andean scrubland only 3.87 % (587 ha). Within the intervened zones, the agricultural zone represents 26.3% (3991 ha) and the forestry plantation 25.3% (3843 ha), together representing the greatest extension of the area. Finally, the mining area represents only 5.6% (858 ha) and artificial water bodies 0.3% (47 ha). The latter are only present in the Minera Yanacocha IPA area.
Regarding the IPA areas, in IPA Minera Yanacocha most of the surface is occupied by the jalca ecosystem (40 %), followed by the forest plantation (37 %) and the rest by mining area (16.7 %), agricultural area (4.5 %) and artificial water bodies (0.9 %). In IPA Cooperativa Agraria de Trabajadores (CAT) Llullapuquio, the jalca also has the largest extension (46.3 %), followed by agricultural zone (31.5 %) and with less extension the forest plantation (16.9 %) and the Andean scrubland (5.1 %). And finally, in the IPA Sociedad Agraria de Interés Social (SAIS) José Carlos Mariátegui, the largest extension is represented by the agricultural zone (41.4 %), followed by the jalca (31.7 %), and with less extension the forest plantation (20.6 %) and the Andean scrubland (6.3 %). (6.3 %).
Regarding the overlapping of the Sunchubamba Game Preserve with the IPA area of the José Carlos Mariátegui Agrarian Society of Social Interest (SAIS), the project would be beneficial because it would guarantee forest areas for the existing wildlife species in the area. Also, since the area already has forest plantations, the ecosystems will not be affected by new activities. Furthermore, this will serve to preserve the CCS area, increase the area with reforested forests and beautify the landscape.
Table 5.23 Recommendations for the implementation of a future forestry project
Yanacocha Mining Company Agrarian Society of Social Interest (SAIS) José Carlos
Mariátegui
Cooperativa Agraria de Trabajadores (CAT)
Llullapuquio Area with greater limitations due to
low temperatures Climates suitable for forestry
production Climates suitable for forestry
production Moderate slope but can be tolerable
for forestry production Moderate slope but can be tolerable
for forestry production Greater limitations due to the
slope of the terrain Well-drained soils with moderate to coarse textures, optimal for forestry
production.
Well-drained soils with moderate to coarse textures, optimal for forestry
production.
Well-drained soils with coarse to fine textures, optimal for forestry
production. Land use capacity is compatible with
forestry production. Land use capacity is compatible with
forestry production. Land use capacity is compatible
with forestry production.

Environmental and Social Impact Assessment of Forest Landscape Restoration Project December 2021
Social Capital Group 134
Yanacocha Mining Company Agrarian Society of Social Interest (SAIS) José Carlos
Mariátegui
Cooperativa Agraria de Trabajadores (CAT)
Llullapuquio Current land use is compatible with
forest forest development. Current land use is compatible with
forest forest development. Current land use is compatible with
forest forest development.
Source: Pacific PIR S.A.C., 2021.
5.6 Potential Area of Influence (PAI)
This chapter describes the environmental characteristics of the areas of interest of the project or Potential Project Expansion Area (PAI). Since this area is not yet finally defined, it does not need to be characterised as precisely as the IPA. For its description, secondary information was collected and analysed to provide a broader description of the environmental factors.
5.6.1 Hydrology
The PAI area of the project is located within 4 watersheds: Crisnejas, Jequetepeque, Chicama and the Marañón inter-basin. The watershed map is attached (Annex 1.2), with the delimitation of the PAI areas and the existing watersheds. Below is an image of the hydrography of the area and a general description of the aforementioned watersheds:

Social Capital Group 135
Figure 5.26 Hydrography of the PAI areas
Prepared by: Pacific PIR S.A.C.

Social Capital Group 136
a. Crisnejas Basin
The Crisnejas basin covers an area of 4,928 km2, belonging to the Atlantic slope, and is located on the eastern border of the Western Cordillera, with the confluence of the Crinejas river with the Marañón river on the border with the Eastern Cordillera19.
The Western Cordillera is a positive macro physiographic unit with an elongated shape in a NW-SE direction, with altitudes between 3,000 and 4,800 m above sea level, the product of endogenous and exogenous processes that occurred during the Andean orogeny, in which Cretaceous rocks were folded and uplifted. In this unit there were deep dissections with steep slopes, caused by erosive and tectonic processes. The tributary network of the Crisnejas river valley flows from the Western Cordillera towards the Atlantic slope in a juvenile state, in V-shaped valleys, with processes of canyoning and regressive erosion.
In relation to the slope, as the main expression of the topography of the basin, the steepest slopes are located in the Crisnejas river valley to the east of La Grama, when its course was channeled, possibly to adapt the base level to the Marañón river, a subsiding basin in relation to the orogenic uplift of the Western Cordillera.
Also with moderate or steep slopes, the left slope of the Condebamba river, which flows in a S-N direction, and the headwaters of the tributaries of the Crisnejas river (also called Cajamarca in the upper basin) on the right bank before its confluence with the Condebamba river at La Grama.
In the north of the basin, the slopes are gentler, conditioned by less competent lithologies, affected to a greater extent by erosive processes. Low slopes are also observed along the valleys of the main rivers, which locally widen to form large plains, where the main population centres are located.
b. Jequetepeque Basin
Located in the departments of Lambayeque, La Libertad and Cajamarca, in the centre of the Peruvian territory, with a surface area of 8 795.33 km2, it stretches from the Pacific Ocean to the central mountain range.
It has terrain elevations ranging from sea level at the mouth of the river to approximately 4200 m above sea level in the upper part of the Huacraruco and Lagunas de Alto Perú subunits and the Yanacocha mine.
The temperature and precipitation of the basin area vary inversely with altitude. Thus, at sea level, the average annual temperature is about 22 °C and at the highest points 6°, while the average annual precipitation varies between 14 and 1165 mm respectively.
With these parameters, the Martonne index was calculated, which is also inversely related to the height of the terrain, showing that the upper part of the basin has the average annual condition of humid and per-humid environments, which is much more favourable and convenient for the
19 ANA. 2015. Water Resources Assessment in the Crisnejas Basin.

Environmental and Social Impact Assessment of Forest Landscape Restoration Project December 2021
Social Capital Group 137
retention and natural regulation of water, which occurs to a greater degree in this area than in the lower parts.
c. Interbasin Marañon IV (code 49897)
It occupies an area of 512 km2 and is a watershed of the Atlantic.
It is characterised by its abrupt relief with steep slopes of more than 45% and canyoned rivers, which form the highest foothills of the Marañón river basin. Likewise, its climate varies from rainy and cold to warm and humid semi-dry climates.
The hydrographic system is made up of drainages of the dentritic and sub-parallel type and receives contributions from first and second order streams, its waters flow into the Marañón River; three hydrographic units have been defined that receive the name of the main river (micro-basins of the Chon Chon and Púsac Rivers and the micro-basin of the Gramalote stream).
Five grades of slopes have been defined: flat, gentle, moderate, steep and steep, with very steep to steep slopes (25° - 25°) predominating in the study area. The geomorphological units recognised in the study area are the result of the action of tectonic (lithological-structural), erosional and depositional processes.
d. Chicama Basin
The Chicama river basin is located in the northern part of Peru and belongs to the Pacific Ocean basin. Its headwaters are located on the western slopes of the western Andes. The Chicama River is one of the most important rivers in the northern part of the country. It is decisive for irrigating large areas. In its lower basin there are historical farms such as Casagrande, Cartavio and Chócope.
Politically, the area is part of the provinces of Pacasmayo, Trujillo and Otuzco in the department of La Libertad and the provinces of Contumazá and Cotabambas in the department of Cajamarca. Geographically, the basin is bordered to the north by the Jequetepeque river basin, to the south by the basins of the Moche river and the Quebrada del Río Seco, to the southeast by the Santa river basin, to the west by the Pacific Ocean and to the east by the Marañón river basin.
Its extreme points are approximately between parallels 7º21' and 8º01' South Latitude and meridians 78º16' and 79º27' West Longitude of Greenwich. Hydrographically, the Chicama river basin covers a total extension of 5,822 Km2, of which approximately 2,472 Km2 correspond to the humid basin. Altitudinally, it extends from sea level to the line of peaks that forms the watershed between this basin and that of the Marañón River, the highest point of which is the Cerro Tuanga Signal (4,297 m above sea level).
Within the PAI areas, the following bodies of water can be found: Balconcito river, Cumbemayo river, Magdalena river, La Viña river, Chonta river, Rejo river, Cushuno river, Colorado river, Azufre river, Shoclla river, Tinte river, San Jose river, Grande river, Quillis river, Chilincaga river, Hornomayo river, Tolorane river, Porconcillo river, Manzana river, Caslunga river, Mashcon river, Huacraruco river, Asunción river, Lucima river, Huaricuro river, San Jorge river and Marabamba river.

Environmental and Social Impact Assessment of Forest Landscape Restoration Project December 2021
Social Capital Group 138
5.6.2 Increased land use capacity
The land in the project's Area of Potential Influence (PAI), in relation to its capacity for optimal use, is characterised by medium to low agrological quality. They present limitations with respect to the risk of erosion due to the slopes of the area, as well as limitations due to the conditions (low temperatures) and low to medium natural fertility.
The land in the area has greater potential for use as pasture or forestry production, and there are also large sectors considered to be protected, due to extreme limitations in relation to slope, shallow soils and frigid climatic characteristics. The respective groups, classes and subclasses identified in the area of potential influence (PAI) are shown in the following table:
Table 5.24 Optimal land use capacity units of the PAI land.
Optimal Use General characteristics Pending
Surface
Group Class Subclass ha. %
Partnerships
A
A2 A2sec(r) Land suitable for clean cultivation, medium agrological quality, with limitations of soil,
erosion, climate and requires irrigation.
F 959,94 0,75
A3 A3sec(r) Land suitable for clean cultivation, low
agrological quality, with limitations of soil, erosion, climate and requires irrigation.
D 53,56 0,04
C C2 C2sec(r) Land suitable for permanent cultivation, medium
agrological quality, with limitations of soil, erosion, climate and requires irrigation.
B 424,48 0,33
P
P2 P2sec(t) Land suitable for pasture, medium agrological
quality, with soil, erosion, climate and temporary grazing limitations.
D, E, F 17831,89 14,02
P3 P3sec(t) Land suitable for pasture, low agrological quality, with soil, erosion, climate and temporary grazing
limitations.
E, G 3555,09 2,79
F
F2
F2se Land suitable for forestry production, medium
agrological quality, with soil and erosion limitations.
E, F 895,14 0,77
F2sec Land suitable for forestry production, medium
agrological quality, with soil, erosion and climate limitations.
E, F 9745,44 7,65
F3 F3sec Land suitable for forestry production, low
agrological quality, with soil, erosion and climate limitations.
F 160,75 0,13
X
Xse Protection lands with soil and erosion
limitations. F 2653,45 2,09
Xsec Protected land with soil, erosion and climate
constraints. E, F, G 22256,02 17,49
Partnerships

Environmental and Social Impact Assessment of Forest Landscape Restoration Project December 2021
Social Capital Group 139
Optimal Use General characteristics Pending
Surface
Group Class Subclass ha. %
P2se(t)-Xse
Land suitable for pasture, medium agrological quality, with soil limitations, erosion and
temporary grazing-Protection lands with soil limitations and erosion.
F 1864,49 1,47
P2sec(t)-Xsec
Land suitable for pasture, medium agrological quality, with soil, erosion, climate and temporary
grazing limitations-Protection lands with soil, erosion and climate limitations.
E, F, G 8696,13 6,86
P3sec(t)-Xsec
Land suitable for pasture, low agrological quality, with soil, erosion, climate and temporary grazing
limitations-Protection lands with soil, erosion and climate limitations.
E, F, G 17111,24 13,44
F2se-Xse
Land suitable for forestry production, medium agrological quality, with soil and erosion
limitations-Protection lands with soil and erosion limitations.
E, F 3377,55 2,65
F2sec-P2sec(t)
Land suitable for forestry production, medium agrological quality, with soil, erosion and climate limitations-Lands suitable for pasture, medium agrological quality, with soil, erosion, climate
and temporary grazing limitations.
E 9821,93 7,72
F2sec-Xsec
Land suitable for forest production, medium agrological quality, with soil, erosion and climate limitations - Protected land with soil, erosion and
climate limitations.
F 3119,83 2,45
F3c-P2c
Land suitable for forestry production, low agrological quality, with climate constraints-
Lands suitable for pasture, medium agrological quality, with erosion constraints.
D 3003,53 2,36
F3c-P3c
Land suitable for forestry production, low agrological quality, with climate constraints-Lands suitable for pasture, low agrological
quality, with climate constraints.
D 5200,80 4,09
F3se-Xse
Land suitable for forestry production, low agrological quality, with soil and erosion
limitations-Protection lands with soil and erosion limitations.
F, G 2307,55 1,81
F3sec-P2sec(t)
Land suitable for forestry production, low agrological quality, with soil, erosion and climate limitations-Lands suitable for pasture, medium agrological quality, with soil, erosion, climate
and temporary grazing limitations.
E 8413,81 6,61
F3sec-Xsec
Land suitable for forestry production, low agrological quality, with soil, erosion and climate
limitations - Protected land, with soil, erosion and climate limitations.
F 5523,56 4,34
City centre Village areas - 80,78 0,06
Water body Lagoons - 64,81 0,05
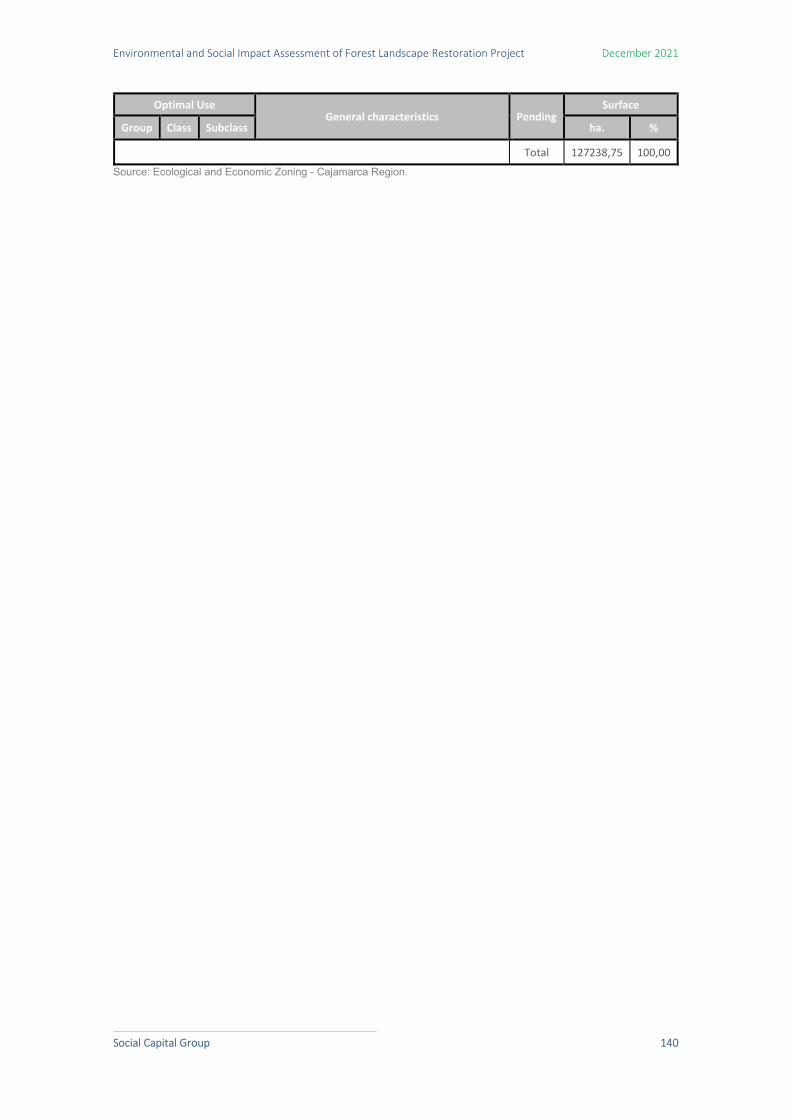
Environmental and Social Impact Assessment of Forest Landscape Restoration Project December 2021
Social Capital Group 140
Optimal Use General characteristics Pending
Surface
Group Class Subclass ha. %
Total 127238,75 100,00
Source: Ecological and Economic Zoning - Cajamarca Region.

Social Capital Group 141
Figure 5.27 Optimal land-use capacity of PAI areas
Prepared by: Pacific PIR S.A.C.

Social Capital Group 142
5.6.3 Current land use
Within the PAI area, land has been identified mainly in the unused and/or unproductive category. Thus, 47.73% of the land has little or no vegetation, while 26.48% of the land has Andean crops for self-consumption or local commercialisation.
There is a portion of land, occupied by coniferous and eucalyptus plantation forests, installed for forestry exploitation within a framework of reforestation, environmental compensation, as well as soil and watershed conservation.
Table 5.25 Current land use categories and subclasses of the area (PAI).
Categories Subclass Symbol Surface
ha. %
Town centres Mining unit. Um 3770,60 2,96
Urban area. Au 80,78 0,06
Land under cultivation Land with Andean crops. Ca 33694,62 26,48
Land with natural and/or cultivated crops and
pastures.
Land with Andean crops and cultivated pastures.
Ca-Pc 8001,27 6,29
Land with Andean crops and natural grasslands.
Ca-Pp 3003,53 2,36
Land with natural or cultivated pasture.
Gramineous, grassy and temporary pasture land.
Pgp-Pt 2773,04 2,18
Forest and natural pasture land.
Natural and/or cultivated forest land and natural pastures.
Bnc-Pn 15116,20 11,88
Unused and/or unproductive land
Land with little or no vegetation. Sv 60733,90 47,73
Lagoon land The 64,81 0,05
Total Area 127238,75 100,00
Prepared by: Pacific PIR S.A.C., 2021

Social Capital Group 143
Figure 5.28 Currente Use of PAI area
Prepared by: Pacific PIR S.A.C.
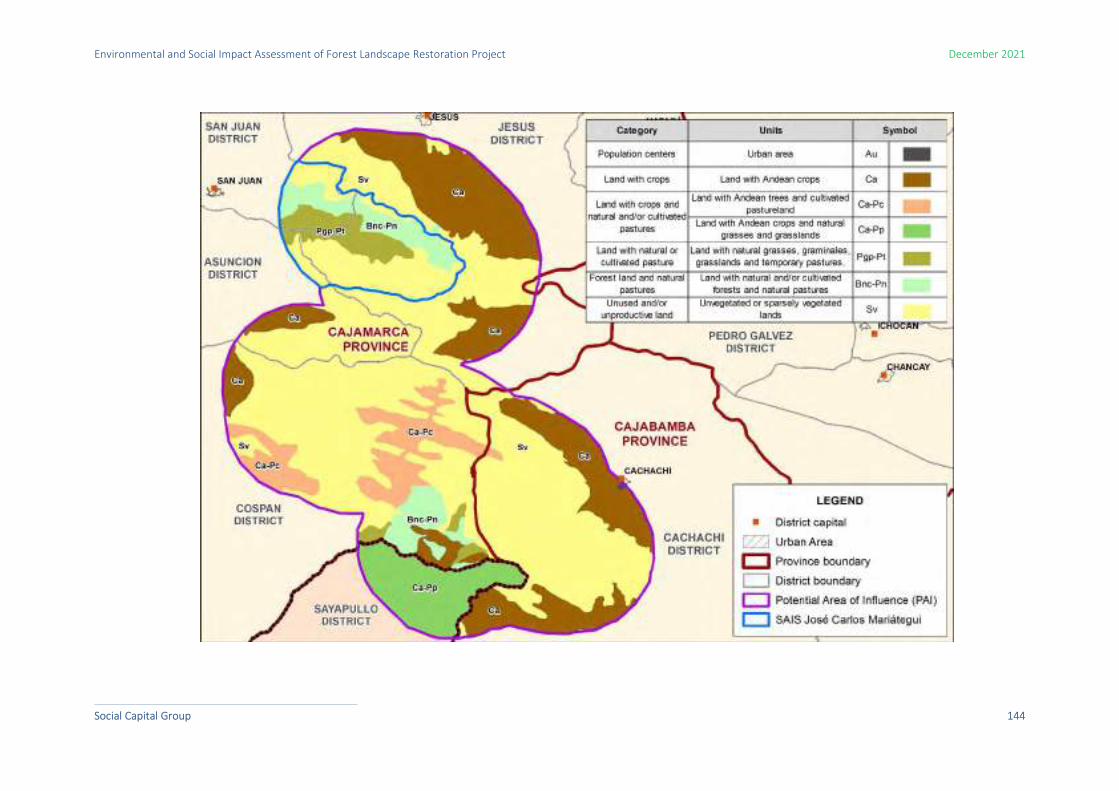
Environmental and Social Impact Assessment of Forest Landscape Restoration Project December 2021
Social Capital Group 144

Social Capital Group 145
5.6.4 Ecosystems
To describe the biota in the PAI area, the ecosystem map developed by MINAM 2019 was used. The information on the map was cross-referenced with the study areas, identifying the PAI North and PAI South areas.
Figure 5.5 Biota of the PAI areas
In both PAI areas, the jalca is the most abundant natural ecosystem. It is followed by the Andean scrubland; the seasonally dry hill and mountain forest (ecosystem of the coastal region); the bofedal; and the montane relict forest of the western slope. Below is a description of each of these ecosystems and their extent in the PAI area.
Jalca The jalca, in the PAI area, represents 4% of the total in the country. It is a transitional Andean ecosystem, from the north of the country, with herbaceous and humid shrub vegetation in a landscape with intermediate climatic characteristics between the páramo and the humid puna; with more humid conditions than in the puna, but with less intense rainfall and a less cloudy atmosphere than in the páramo. Its physiognomy corresponds to grasslands of 1 to 1.5 metres interspersed with shrubs of 1 to 3 metres. It shares botanical species with both the páramo and the humid puna, with a wealth of endemic species of the genera Agrostis, Poa, Festuca, Arcytophyllum, among others. Unlike the páramo, whose orography establishes a discontinuous landscape (like islands on the peaks of the mountain ranges), in the jalca, the landscape is continuous. In Peru, this ecosystem covers an area of 1.3 million hectares. 20
20 MINAM, 2019. Descriptive report of the National Map of Ecosystems. Lima, Peru.
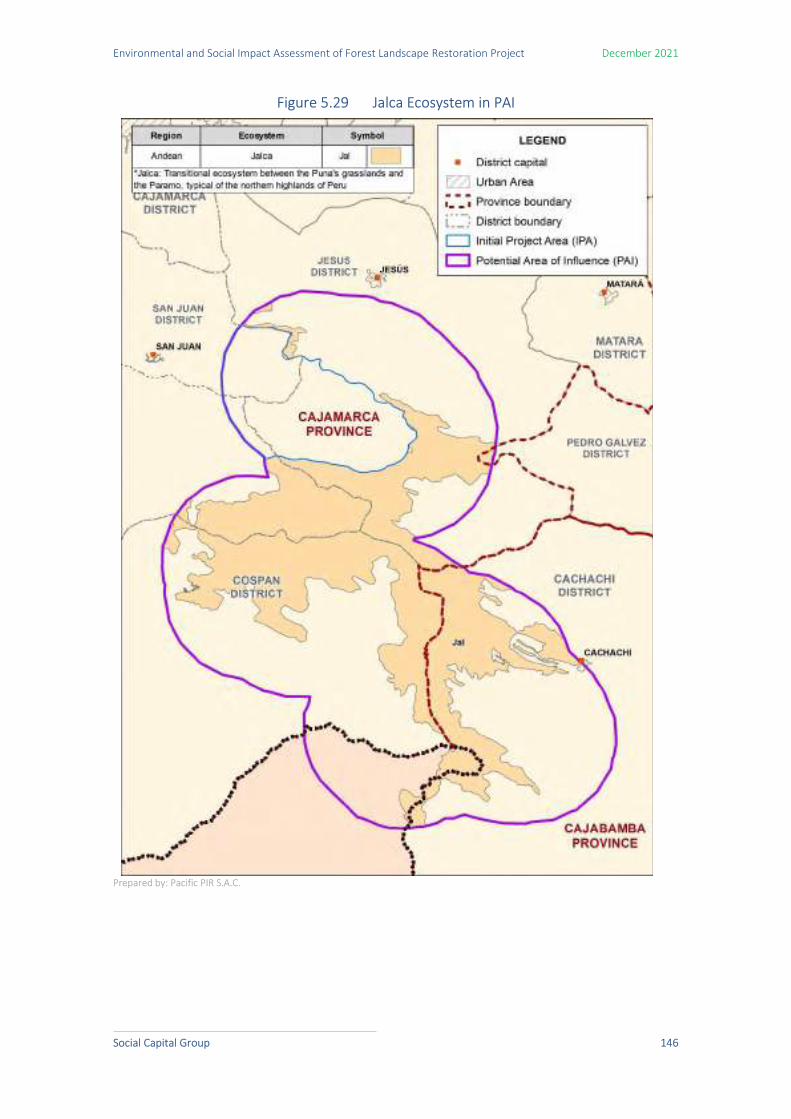
Environmental and Social Impact Assessment of Forest Landscape Restoration Project December 2021
Social Capital Group 146
Figure 5.29 Jalca Ecosystem in PAI
Prepared by: Pacific PIR S.A.C.

Environmental and Social Impact Assessment of Forest Landscape Restoration Project December 2021
Social Capital Group 147
Photo 5.15 Jalca
Prepared by: Pacific PIR S.A.C.
Jalca is an ancient Quechua word meaning frigid zone (Sánchez-Vega, 2008). It is distributed on the peaks of the northern Andes from 8°30'LS onwards, with discontinuity in the vicinity towards the equator, with macroclimbing grasses and other herbaceous perennials being the dominant vegetation in most cases. The Jalca is included within the concept of Tropical Andes, in which a high plant diversity has been determined in comparison with the central and southern Andes of the country. 21
Studies carried out in the upper basin of the Jequetepeque River conclude that the jalca ecosystem in this area is in a regular state of conservation, the main threats being the change in land use from natural pastures to forestry plantations and agricultural crops, overgrazing and burning of pastures by cattle ranchers.
Another element that should be understood and raise awareness for the conservation of this ecosystem is the diversity of endemic species that develop. Several studies have indicated the biological richness of this site, Elizabeth A. Cochachin, 2016, records 100 species of the Asteraceae family, grouped into 43 genera and 13 tribes. The genera Senecio and Baccharis, and the tribes Senecioneae and Astereae were the most representative. Twenty-five endemic species were recorded, of which 13 are reported only from northern Peru. 22
Torres and López indicate that, from the studies carried out in the jalcas of Cajamarca, it can be said that there is environmental, evolutionary and floristic evidence that establishes a significant distinction between the bio-region of the páramos distributed in the Andes between Ecuador and
21 León, H., 2016. Evaluation study of the conservation status of the ecosystems of the Jequetepeque river basin. MERESE-FIDA Project, Lima, Peru. 22 Cocachin, E. 2016. Diversity and phytogeographical relationships of the Asteraceae family in the jalca of the Cajabamba and Sitacocha dstrits, Cajabamba Province, Cajamarca.

Environmental and Social Impact Assessment of Forest Landscape Restoration Project December 2021
Social Capital Group 148
Venezuela and the jalca bio-region, as a transition zone between the punas and the páramos. In such a way that one could say the following according to various criteria: 23
- Environmental Criteria: The Jalcas, due to orographic and climatic factors, differ from the páramo, these range from 3º L. S. - 8º L.S. Area not influenced by the orographic feature of the Huancabamba depression.
- Criterion of adaptation of the plants to the climatic regime: A partial convergence in the physiognomy of the vegetation can be observed, as both ecosystems have almost the same life forms. However, the absence of emblematic species such as Espelletia is an important indicator of the environmental difference.
- Floristic criterion: The jalca is recognised as a natural bio-region different from the páramo because of its high number of endemic species.
Sánchez-Vega, I. and Dillon, M., 2006,24 describe the jalcas and their species with economic potential. They indicate that the jalca is a centre of wide plant diversity, greater than that existing in the puna, equal to or greater than the diversity of the páramo, but obviously less than that of the Andean montane forests. The most important species are organised by category:
Medicinal:
Gentinaceae
Gentianella graminea (Kunth) Fabris. The decoction of the leaves is used as an anti-influenza and against strong coughs. It is also attributed with curative properties for liver and kidney diseases. Common name: Gentian.
Valerianaceae
Valeriana pilosa Ruiz & Pav. The roots of this species are boiled for a few minutes and the tea is used as a sedative and to reduce stress. Common name: Valeriana.
Asteracea
Senecio canescens (Kunth) Cuatrec. It forms more or less large populations at altitudes between 3 800 and 4 000 m and its leaves are used in infusion for bladder and prostate inflammation; it is a cough palliative and also a sudorific (Sagástegui et al. 1999). Common name: Vira - vira.
Perezia multiflora (Kunth) Less. It lives between 3,600 and 3,800 m. Used in cooking for its diuretic, febrifuge and sudorific effect. Common name: Escorzonera.
Baccharis genistelloides (Lam.) Pers. Shrub of flooded soils of the jalcas, used in cooking to cure liver ailments, malaria and rheumatic pains. Common name: Carqueja.
23 Torres, F., López, G. 2008. Characterisation of the Páramo ecosystem in northern Peru: Paramo or Jalca? Piura, Peru. 24 Sánchez-Vega, I. & Dillon, M., 2006. Jalcas. Botánica Económica de los Andes Centrales. La Paz, Bolivia. 77-90.

Environmental and Social Impact Assessment of Forest Landscape Restoration Project December 2021
Social Capital Group 149
Tagetes filifolia Lag. Annual herb of the lower levels of the jalcas and open places, used in infusion as an aromatic and carminative. Common name: Anise of the sierra.
Chuquiraga weberbaueri Tovar Shrub with mucronate leaves and large orange-coloured flower heads. Its leaves are used as an infusion to combat Fasciola hepatica infestation in guinea pigs and cattle.
Lamiaceae
Satureja nubigena (Kunth) Briquet. Perennial herb, diffusely branched and prostrate, very fragrant, used in infusion as a stomachic, improving digestion.
Lepechinia meyenii (Walp.) Epling. Perennial herb, prostrate, with aromatic leaves, used in infusion to improve digestion and flu symptoms. Common name: Salvia parragada.
Ranunculaceae
Laccopetalum giganteum (Wedd.) Ulbr. Erect perennial herb, 1 m tall, crass, glaucous leaves of the Jalcas (3,900-4,500 m). The decoction of its flowers is used to improve throat and lung ailments (Sagástegui et al. 1999). According to information from cattle breeders in the Jalca, the decoction of flowers and leaves is given to drink to infertile cows to make them fertile (verbal information in the Jalca de Cajamarquilla, Bolivar). Common name: Pacra-pacra.
Polygonceae
Rumex peruanus Rechinger f. The ground green leaves are used as a poultice in the treatment of dermatosis, healing of sores or wounds. Common name: Putaca.
Geraniaceae
Geranium sessiliflorum Cav. The decoction of its roots is used to cure Diabetes, throat treatments, through gargling, expectorant. Common name: Andacushma.
Euphorbiaceae
Euphorbia huanchahana (Klotzsch & Garcke) Boissier Extracts from the roots of this plant are used as a vermifuge and induce diarrhoea (Orozco & Lentz 2005). Common name: Huachanccana.
Forestry
Rosaceae
Polylepis racemosa Ruiz & Pav. Heavy hardwood tree with abundant brown scaly rhytidomes. Inhabits the Jalcas from its lower limit to the high, exposed Jalca grasslands. In these places they are used as windbreaks enclosing houses. Common name: Quinual.
Polylepis multijuga Pilger It is a reddish hardwood tree that inhabits the lower limits of the Jalca, in the sheltered places to the N of Cajamarca and Amazonas.
Environmental and Social Impact Assessment of Forest Landscape Restoration Project December 2021
Social Capital Group 150
Asteraceae
Smallanthus jelskii (Hieron.) H. Rob. Soft-wooded, highly branched tree with broad leaves and easy vegetative propagation. Its stems are used as posts for live fences and windbreaks to protect houses.
Fruit trees
Ericaceae
Vaccinium floribundum Kunth Shrub of the lower limit of the Jalca, now well protected for its small, dark, sweet fruits which are sold in the market in the main cities of the North. Common name: Pushgay.
Dyeing
Clusiaceae
Hypericum laricifoliumJuss. Cooking leaves and stems are used to dye cotton and wool yellow. Common name: Chinchango.
Finally, they indicate that the current state of knowledge of the jalca has made it possible to recognise its scientific importance in terms of biodiversity, Andean biogeography, exuberant vegetation with high coverage and the presence of numerous species of economic importance. On the other hand, this formation provides environmental services resulting from the interaction between water, soil and vegetation. Thus, without snow-capped mountains, the Jalcas are a hydrological centre of great proportions, providing soil with abundant organic matter similar to peat, habitat for numerous terrestrial and aquatic fauna and scenic beauty for tourism and recreation. For this reason, the Jalcas undoubtedly deserve organic protection through legislation from central and local government (regional, provincial and district municipalities) to reduce the negative impact of anthropogenic action.
Andean scrubland This ecosystem represents 0.2% of the total area of the country in the PAI area. It is an Andean ecosystem with a wide distribution at national level that includes three types of scrubland (montane scrubland, dry puna scrubland and Andean scrubland), with an altitudinal range from 1500 to 4500 m a.s.l. It is characterised by the presence of woody and shrubby vegetation of variable composition and structure, with a ground cover of over 10% that extends over more than 0.5 hectares, and whose height above the ground does not exceed 4 metres. In the dry puna scrubland there are extensive areas of "tola" (Parastrephia spp.), as well as Lepidophyllum quadrangulare, Baccharis spp. and other species; in the montane scrubland there are sclerophyllous shrubs and saplings of up to 2 metres and the presence of epiphytes; and in the Andean scrubland itself there are thickets with scattered trees and cacti. In Peru, this ecosystem covers an area of 10.3 million hectares.

Environmental and Social Impact Assessment of Forest Landscape Restoration Project December 2021
Social Capital Group 151
Figure 5.30 Andean Scrub Ecosystem in PAI
Prepared by: Pacific PIR S.A.C.
Photo 5.16 Andean Scrubland

Environmental and Social Impact Assessment of Forest Landscape Restoration Project December 2021
Social Capital Group 152
This ecosystem represents 21% in the southern PAI and 12% in the northern PAI. In order to deepen the information on this second ecosystem of high conservation interest, we will present an adaptation generated by the GORE Cajamarca, which determines the regional biodiversity potential of Cajamarca. In its classification, this area is called the adopted mid-slope ecosystem25
In the Cajamarca region these ecosystems are found between the upper limit of the dry forest (1,900 to 2,200 m. a.s.l.) and the lower limit of the jalca and the páramo (3,000 to 3,150 m. a.s.l.). It is an area with high slopes and other moderate and gentle slopes, of variable extension, with more or less deep soils in which forest and scrub vegetation develops, with greater floristic diversity than the dry forest, formed by evergreen trees and shrubs and a high percentage of herbaceous perennials, which gives more permanent vegetation cover to the soil.
Most of the Andean cities are located in this ecosystem due to its cold temperate climate. It is the climate of the Quechua. The natural plant communities of the mid-slope have been, and still are, heavily intervened or replaced by cultural ecosystems of rain-fed agriculture and exotic forestry. The introduction of Eucalyptus globulus (eucalyptus) and Pennisetum clandestinum (kikuyo) has not only changed the Andean landscape but also the diversity of flora and fauna (birds) and the vegetation cover of this territory. Lately, the introduction of Pinus radiata (pine) has been acting in the same direction. Both eucalyptus and pine are mainly planted on the periphery of the crops, in the form of an agroforestry system.
The native trees of the middle slope have not been considered in this system, with rare exceptions such as Alnus acuminata (alder), Juglans neotropica (walnut), Schinus molle (molle) and Prunus serotina (capulí). This area of the region is the one that currently has the greatest anthropic influence, so that its natural ecosystems are reduced and discontinuous, in the manner of "islands", or have disappeared.
The space occupied by the mid-slope ecosystems includes both natural ecosystems, consisting mainly of montane forests and scrublands, and cultural ecosystems.
Within his analysis he subdivides into communities, the community found in the IAPs is the montane scrub.
Montane scrubland communities. They are distributed south of 7º LS, on open slopes and more or less deep ravines. They are made up of vegetation with a lower density of plants per unit area and low ground cover, in which saplings, shrubs and herbaceous perennials predominate. These characteristics are typical of sparse low forest and low scrub with a similarity to the steppe mountain range (Brack 1986) in which Lomatia hirsuta, Oreocallis grandiflora, Hesperomeles cuneata, Kageneckia lanceolata, Mauria heterophylla, Pineda incana and some liana-like supporting species such as Bomarea sp. predominate. This type of vegetation forms very little organic soil due to the scarce leaf litter that accumulates on the ground and the lower atmospheric humidity and precipitation; its soils are yellowish brown. Above the ravines, denser vegetation forms in the form of dwarf forests, dominated by Alnus acuminata, Clethra ferruginea, Myrica pubescens and Chusquea sp. among other species.
25 Sánchez, I., Sánchez, A., 2012. La Diversidad Biológica en Cajamarca, Una Visión étnico-cultural y potencialidades. Cajamarca, Peru.

Environmental and Social Impact Assessment of Forest Landscape Restoration Project December 2021
Social Capital Group 153
The following 3 ecosystems represent less than 1% occupation in the PAI zones and these will not be adjacent to the reforestation project.
Seasonally dry hill and mountain forest In the PAI area, it is found in the lower altitude parts, already in the coastal region, and represents only 0.03% of the total PAI area. It is a coastal ecosystem, generally deciduous, with a semi-arid climate and seasonal and scarce rainfall, with high inter-annual variation. Its physiognomy corresponds to semi-dense seasonal dry forest with a canopy height of up to 8 to 12 metres, with an understory of ephemeral grassland, shrubs and cacti. The hills can have a maximum relative height of between 30 and 180 metres and slopes of between 15 and 80 %, while the mountainous terrain is characterised by hills of more than 300 metres relative height and steep slopes (more than 50 %), with the Amotapes mountain range standing out. In the country it covers a total of 1.9 million hectares.Figura
Figure 5.31 Seasonally dry hill and mountain forest ecosystem in PAI
Prepared by: Pacific PIR S.A.C.

Environmental and Social Impact Assessment of Forest Landscape Restoration Project December 2021
Social Capital Group 154
Bofedal This ecosystem is only found in 0.1 % of the PAI area and is not present in the IPA area. It is a hydromorphic Andean ecosystem with herbaceous vegetation of hydrophilic type, which occurs in the Andes on flat soils, in depressions or slightly inclined; permanently flooded or saturated with running water (poor drainage), with dense and compact evergreen vegetation, cushion or cushion-shaped; the physiognomy of the vegetation corresponds to grasslands of 0.1 to 0.5 metres. The organic soils may be deep (peat). This type of ecosystem is considered an Andean wetland. It is usually found above the maximum altitudes for developing commercial forestry plantations. In the country, it has an extension of 0.5 million hectares.
Figure 5.32 Bofedal Ecosystem in PAI
Prepared by: Pacific PIR S.A.C.Figura

Environmental and Social Impact Assessment of Forest Landscape Restoration Project December 2021
Social Capital Group 155
Western slope montane relict forest In the project there are only 92 hectares of this type of ecosystem, which are located in the PAI South zone and outside the IPA zones. It is a humid ecosystem made up of relict forests on the western slopes of the Andes in the north of the country, distributed between 1 400 and 3 000 m above sea level. The physiognomy corresponds to dense forest, generally cloud forest with a canopy height of up to 15 metres, with emergent trees of 20 metres and abundant epiphytes. In the country its extension is of approximately 90 thousand hectares. It must be conserved.
Figure 5.33 Western Slope Montane Montane Relict Forest Ecosystem
Prepared by: Pacific PIR S.A.C.

Environmental and Social Impact Assessment of Forest Landscape Restoration Project December 2021
Social Capital Group 156
5.6.5 Natural Protected Areas (NPA)
In the project area, there is the ANP Coto de Caza Sunchubamba. In the case of the PAI area located to the north of the city of Cajamarca, it does not overlap with this PNA or its buffer zone. As can be seen in the following image, it is 12.45 kilometres away.
Figure 5.34 Natural Protected Areas and PAI area north of Cajamarca
Prepared by: Pacific PIR S.A.C.
However, for the IPA located to the south of the city of Cajamarca, it overlaps with the ANP Coto de Caza Sunchubamba and its buffer zone, as shown in the following image.

Social Capital Group 157
Figure 5.35 ANP and PAI área south of Cajamarca
Prepared by: Pacific PIR S.A.C.

Social Capital Group 158
5.6.5.1 Description of the ANP
The Sunchubamba Game Preserve was established on 22 April 1977, through Ministerial Resolution N° 00462-77-AG. 26It is part of the National System of Natural Areas Protected by the State (SINANPE). The CCS occupies an extension of 59,735 hectares and in its interior there are forests in the middle of a dense stratum of pastures, ideal conditions for the presence of wild fauna, the breeding of cattle and the defence of the soil against water erosion.
The main objective of the Sunchubamba Hunting Reserve is to regulate the rational use of wild game species and to promote the development of sport hunting, while conserving the resource itself. 27
In the CCS area, two types of vegetation are clearly evident: the natural forests typical of this region; and reforested forests, with forest species that have been incorporated into this natural setting. The introduced vegetation includes ten different species that have developed to an estimated 500 hectares, including the kiyuyo, a creeping herbaceous plant that has spread over 90% of the higher areas of the Game Reserve.
In the CCS, you can observe species such as grey deer, skunks, opossums and a large population of vizcachas (rodents). In the case of birds, you can see partridges, turtledoves, as well as birds of prey such as harriers, hawks and kestrels.
5.6.5.2 Current use of the PNA
One of the most outstanding uses of the CCS is ecotourism, as the area allows you to enjoy beautiful natural landscapes and observe species of flora and fauna. This ANP has a tourist area with lodging areas and restaurants.
On the other hand, in the CCS area, forest plantations of Pinus radiata can be seen, a species used mainly for the construction of houses and light posts. There are also plantations of Grevillea Grevillea robusta, used in the manufacture of musical instruments, and plantations of Cypress Cupressus sp. used for the construction of market boxes.
At present the area is also used for hunting, which is broken down as follows:
Big game species:
Mainly hunted species are the grey deer Odocoileus virginianus.
Small game species
Species for sport hunting include: Partridge Nothoprocta pentlandii, Turtle Dove Metriopelia melanoptera. In addition, the wild rabbit Sylvilagus brasiliensi is also taken for local consumption
26 GORE (Regional Government of Cajamarca). RM N° 00462-77-AG, Sunchubamba Hunting Reserve. 27 SERNANP, SINANPE, Coto de caza Sunchubamba, https://www.sernanp.gob.pe/sunchubamba, revised 09 October 2021.

Social Capital Group 159
6 SOCIAL BASELINE
6.1 Methodological design of the study
This section describes the activities carried out to carry out the social baseline study, based on the planned objectives. It describes the geographic scope of the study, the issues addressed, the data collection techniques, the results of the fieldwork and the sources of secondary information reviewed.
6.1.1 Objectives
The Social Baseline (SBL) of the Environmental and Social Impact Assessment for the Cajamarca Forest Land Restoration Project responds to the need for a diagnosis of the social, economic, political and cultural context of the population located in the area of direct and indirect influence of the Project. The specific objectives of the SBL were the following:
• Describe the socio-demographic, economic and cultural characteristics of the districts and areas of specific interest of the Project.
• Identify and distinguish the populations potentially impacted and benefited by the intervention of the Project.
• Collect the opinions and suggestions of the population and local authorities in the area of direct and indirect influence of the Project.
• Construct SBL indicators to monitor future changes in potentially impacted communities and establish the effects of the Project on them.
6.1.2 Delimitation of the area of influence
The area of influence of the project is delimited by areas called IPA (Initial Project Area) and PAI (Potential Area of Influence). The IPA areas are those where the forestry project will be developed initially, taking advantage of existing plantations and installing new plantations. PAI areas are areas where The Project plans to expand in the future but at the moment do not have a defined plan and sites and no contact has been established with owners of existing plantations or land suitable for the development of new plantations.
The IPA is made up of territories of the Yanacocha S.R.L. Mining Company, the LLullapuquio Agrarian Workers' Cooperative (CAT) and the José Carlos Mariátegui Agrarian Society of Social Interest (SAIS). The PAI covers 9 districts in the Province of Cajamarca (Asunción, Cajamarca, Chetilla, Cospán, Encañada, Los Baños del Inca, Magdalena, Jesús, San Juan), three districts in the Province of San Pablo (San Bernardino, San Pablo and Tumbaden), and one district in the Province of Cajabamba (Cachachi). (See Figure 6.1)

Environmental and Social Impact Assessment of Forest Landscape Restoration Project December 2021
Social Capital Group 160
Figure 6.1 IPA and PAI áreas of influence
Source: SCG

Environmental and Social Impact Assessment of Forest Landscape Restoration Project December 2021
Social Capital Group 161
6.1.3 Study topics
For the SBL study, the variables necessary for a diagnosis of the two areas of interest of the Project were previously defined. These variables are related to the potential impacts of the Project, which have been preliminarily identified. Table 6.1, shows the topics on which the present SBL is developed.
Table 6.1 SBL Topics from the IPA and PAI Areas
Scope Selected topics
IPA (Yanacocha, CAT Llullapuquio and
SAIS José Carlos Mariátegui).
History Characterization of the organization
Productive activities
Infrastructure
Relationship with other organizations and institutions
Cultural practices
Strengths and opportunities for the Project
PAI (13 districts)
Population
Housing
Public Infrastructure
Education
Health
Employment
Main economic activities
Poverty and vulnerability
Political and institutional organization
Citizen security
Culture and indigenous peoples
Prepared by SCG
6.1.4 Methodology
For the development of this study, different information gathering techniques were selected depending on whether the area of direct or potential influence of the Project was involved. Thus, for the IPA area, given that it is the area that would receive direct impacts from the Project in the short term, primary sources of information were selected. For the PAI, given that it includes areas that may or may not receive impacts and only in the long term, secondary sources of information were selected, complemented with some primary information.
This section describes the data collection techniques used in this study, specifying their content and mode of application.
6.1.4.1 Data collection techniques
The main primary data collection technique employed in this SBL study was structured interviews. Questionnaires were elaborated with the themes and variables of interest (see Table 6.1). For the IPA area, the questions focused on learning about the history of the sites selected for the study, identifying the main characteristics of these sites, determining the population living there, the

Environmental and Social Impact Assessment of Forest Landscape Restoration Project December 2021
Social Capital Group 162
economic activities carried out there, their experience in forestry projects and collecting the opinions, expectations and recommendations of those in charge of the selected companies.
When necessary, the information on the PPI area from the interviews has been complemented with a review of the institutional documents of these companies and with bibliography on specific topics.
For the PAI area, the main source of information was the search for secondary information that would make it possible to draw a demographic profile, infrastructure, economy, social services, citizen security, conflict and cultural practices of the districts selected for the Project. This profile was completed with the collection of primary information through interviews to some authorities of the District Municipalities. These interviews were focused on obtaining a characterization of the economic activities being developed, the efforts being made by local authorities for the development of the population, their experience with forestry projects and the facilities and challenges that can be found in each district for its implementation and, finally, to collect the opinions, recommendations and expectations of these authorities in relation to the Project.
6.1.4.2 Field work
The fieldwork was carried out from 12 to 26 September, after the planning, training and coordination process for the visit to the IPA cooperatives and the district and provincial municipalities of the PAI. The team in charge of the fieldwork consisted of two social specialists and a senior qualitative coordinator.
In the IPA area, representatives of CAT Llullapuquio, the Yanacocha Company and SAIS José Carlos Mariátegui were interviewed. In the PAI area, officials from the economic and/or social development departments of the district municipalities were interviewed. Contextual information was also collected from provincial municipalities, the Regional Government of Cajamarca and some key institutions in the forestry sector at the regional level.
A total of 46 interviews (42 face-to-face and 4 virtual) were conducted with the social actors identified. Table 6.2shows the list of interviews conducted.
Table 6.2 List of interviewees
NO. Informant Cargo Place Institution Date
1 Walter Rabanal Diaz Regional Manager of Natural Resources and Environmental
Management Cajamarca Regional Government
13/sept/21
2 Vildor Suarez Becerra
Specialist in Natural Resources Management
3 Juan Carlos
Mondragón Arroyo Regional Economic Development
Manager Cajamarca Regional
Government of Cajamarca
13/sept/21

Environmental and Social Impact Assessment of Forest Landscape Restoration Project December 2021
Social Capital Group 163
NO. Informant Cargo Place Institution Date
4 Arturo Bringa Sánchez
Specialist in Environmental Management of the Environmental Management (monitoring of social
conflicts)
Cajamarca Regional
Government of Cajamarca
13/sept/21
5 Julio Vilva Aquinua Director of Forestry Resources and
Wildlife of the Regional Management of Economic Development
Cajamarca Regional
Government of Cajamarca
20/sept/21
6 Violeta Vigo and
Andrés Castro
Executive Director Asociación Los Andes de Cajamarca and Director of
the Asociación Civil para la Investigación y Desarrollo Forestal
(Civil Association for Forestry Research and Development).
Cajamarca
The Andes Association of
Cajamarca -Yanacocha
14/sept/21
7 Levin Rojas Forestry and Wildlife Technical
Administrator Cajamarca
National Forestry and Wildlife
Service 14/sept/21
8 Levín Rojas Forestry and Wildlife Technical Administrator
Cajamarca National Forestry
and Wildlife Service
15/sept/21
9 William Hamas
Gutiérrez Aguilar,
Natural Resources Management Specialist of the Cajamarca Agro Rural
Program,
Cajamarca
Rural Agrarian Productive
Development Program,
Cajamarca headquarters.
15/sept/21 10
Juan Manuel Vargas Velasquez and
External Programme Consultant and Programme Nursery Assistant and
Manager
11 Alejandra Peralta
Balaver Institutional Nursery Manager
12 Angie Uriarte Administrative Director Cajamarca
Center for Productive
Innovation and Wood Technology
Transfer
24/sept/21
13 Francisco Cuadros
Rojas Superintendent Environment Cajamarca Yanacocha Company 22/sept/21
14 Marco Antonio Sainz
Chup Huacraruco Annex Administrator Huacraruco SAIS José Carlos
Mariátegui 14/sept/21
15 José Venancio León
Vásquez Pointer of the Huacraruco Annex Huacraruco
SAIS José Carlos Mariátegui
14/sept/21
16 Shimi Torres Huacal Economic Development Manager Cajamarca Provincial
Municipality of Cajamarca
14/sept/21
17 Jhonny Alberto
Mestanza Cabrera
Responsible for the production in the nursery and field promoter of the Rural
Development Sub-management. Cajamarca
Provincial Municipality of
Cajamarca 15/sept/21
18 Peter Terán Quispe Responsible for the Nursery of the
Submanagement of Rural Development
19 Milton Ruiz Mora Social Development Manager Cajabamba Cajabamba
Province 22/sept/21
20 Luis Javier Rodríguez
Ruiz Local Economic Development Manager Cajabamba Cajabamba
Province 22/sept/21
21 Victor Cerna
Irigoyen Economic Development and
Environment Manager Jesus
District Municipality of
Jesús 15/sept/21

Environmental and Social Impact Assessment of Forest Landscape Restoration Project December 2021
Social Capital Group 164
NO. Informant Cargo Place Institution Date
22 Ashley Farromeq
Coba Manager of Public Development and
Social Management Jesus District
Municipality of Jesús
15/sept/21
23 Amilcar Marcelo
Mantilla City Manager San Juan District
Municipality of San Juan
16/sept/21
24 Carlos Enrique Gallardo Rojas
Deputy Manager of Economic Development and Environmental
Management San Juan
District Municipality of
San Juan 16/sept/21
25 Cesar Augusto
Guarniz Rabanal Sub Manager of Economic
Development and Environment Magdalena District
Municipality of Magdalena
16/sept/21
26 Jeniffer Patricia Noboa Cabrera
Assistant Manager of Social Development
Magdalena District
Municipality of Magdalena
16/sept/21
27 Ramiro Eulogio Sánchez Noboa
Assistant Manager of Economic Development and Environment
Assumption District
Municipality of Asunción
17/sept/21
28 Melissa Paola Becerra Zelada
Deputy Manager of Social Development
Assumption District
Municipality of Asunción
17/sept/21
29 María Elena Iparraguirre
Assistant Manager Economic Development Chetilla
Chetilla District Municipality 20/sept/21
30 Eduardo Tambillo Agricultural manager Chetilla Chetilla District Municipality
20/sept/21
31
Emilio Tanta Cueva, Isidro Tanta
Huamán, Justiniano González Ramos, Antonio González
García
Members of the Board of Directors, partner and former partner-director
Chetilla CAT Llullapuquio 24/sept/21
32 Prospero Gutierrez
Diaz Mayor of the Municipality of Cospán Cospan District
Municipality of Cospán
17/sept/21
33 Harol Cabanillas
Vega Assistant Manager of Economic Development and Environment Cospáan
District Municipality of
Cospan 20/sept/21
34 Florencio Vega
Malaver Assistant Manager of Economic
Development, Baths of the Inca
District Municipality of Baños del Inca
21/sept/21 35 César Ocas Díaz
Head of Agricultural Development Promotion Unit
36 Roxana Callirgos
Raico Deputy Manager of Social
Development Baths of the
Inca
Baños del Inca District
Municipality 21/sept/21
37 Johnatan Paredes
Vásquez Head of Health Unit Encañada Encañada District
Municipality 21/sept/21
38 Carlos Urbina Burgos Local Development Manager Encañada Encañada District
Municipality 21/sept/21
39 Camilo Moza Chilón, Social Development Manager St. Paul's
Provincial Municipality of
San Pablo 21/sept/21
40 Nolberto Soto
Gamarra

Environmental and Social Impact Assessment of Forest Landscape Restoration Project December 2021
Social Capital Group 165
NO. Informant Cargo Place Institution Date
41 Juan Morales Alva Economic Development Manager St. Paul's Provincial
Municipality of San Pablo
22/sept/21
42 Ronald Estrada Julón
Coordinator of the Economic Development Area, Head of the Citizen
Security Area and Head of Civil Defence.
Tumbaden District
Municipality of Tumbadén
22/sept/21
43 Roberto Carranza Huaccha
Head of Economic Development Division
San Bernardino
District Municipality of San Bernardino
22/sept/21
44 Luis Tito González
Rodríguez Assistant Manager of Development
and Social Welfare San
Bernardino
District Municipality of San Bernardino
23/sept/21
45 Edin Junior Cotrina
Estrada Head of OMAPED Cachachi District
Municipality of Cachachi
23/sept/21
46 Jessica Sanchez
Raico Deputy Head of the Local Economic
Development Area Cachachi District
Municipality of Cachachi
23/sept/21
Prepared by SCG
6.1.4.3 Review of secondary sources
In order to describe the geographic, historical and socioeconomic characteristics of the districts that make up the PAI, information from secondary sources from the following institutions was reviewed and processed:
DATACRIM - Integrated System of Statistics on Crime and Public Safety MIDAGRI - Atlas of the agricultural surface of Peru 2021 INEI - Census of Farmer Communities 2017 INEI - National Agricultural Census 2012 INEI - National Infrastructure Census 2013 INEI - National Population and Housing Census 2007 INEI - National Population and Housing Census 2017 INEI - National Directory of Populated Centers 2017 INEI - Provincial and district monetary poverty map 2018. INEI - National Directory of Major Festivities at District Level 2013 MIDIS - Social Program Coverage Database (Info MIDIS) MINEDU - Educational Quality Statistics (ESCALE) MINCUL - Geographic Information System of Archaeology (SIGDA) MINSA - National Center for Epidemiology, Prevention and Disease Control MINSA - INFORHUS Database MINSA - National Registry of Health Service Providers Institutions (Renipress) MINSA - General Office of Information Technology 2019 MINSA - Situation Room for diseases and conditions MINSA - Covid-19 Situation Room MVCS - Rural Water Supply and Sanitation Diagnosis UNDP - United Nations Development Programme 2019

Environmental and Social Impact Assessment of Forest Landscape Restoration Project December 2021
Social Capital Group 166
Concerted Development Plans at the provincial and district levels. SICCAM - Information System of Farmer Communities
6.2 Initial Project Area (IPA) - Direct Area of Influence
This chapter presents the main characteristics of the organizational entities that make up the initial area of interest of the Project: Yanacocha Mining Company, SAIS José Carlos Mariátegui and CAT Llullapuquio. Each organizational entity is addressed individually, highlighting the perceptions, opinions and experiences of their representatives.
The organizational entity is introduced with the description of the most important milestones that make up its history, with the purpose of making known its origins, facts and experiences of the past that facilitate an interpretation of its current situation, its evolution and capacity of adaptability to the circumstances of its environment.
Next, aspects related to their organisational structure are discussed, and in the case of co-operatives, aspects of the profile of their members and participation mechanisms are described.
Subsequently, the productive activities and the conditions under which they are carried out are described, especially the details of their experience in the production and maintenance of forestry plantations. However, in the specific case of Yanacocha, the focus is on its intervention to promote forestry activities in the area of influence of the mining operation. This section is completed with information about the status and functionality of existing infrastructure as part of the local context.
Subsequently, the perceptions of the interviewees on the links and relationship of the organizational entities with other social actors and their evaluations of the organizations and institutions that exert some level of influence in the area are presented. Likewise, we inquire about the prevalence of social conflicts in which the organizations intervene.
After learning about the current situation of each of the organizational entities, this chapter closes with the contributions and recommendations of Yanacocha and the Cooperatives regarding the potential, challenges and risks to be considered in the eventual implementation of forestry projects in the Cajamarca area.
6.2.1 Yanacocha Mining Company
6.2.1.1 History
Yanacocha is the largest gold mine in Peru, and at the time, the largest in South America. The Mining Company was legally constituted in 1992, and a year later, in August 1993, it began operations in the area known as Carachugo. Subsequently, the integration of other projects that

Environmental and Social Impact Assessment of Forest Landscape Restoration Project December 2021
Social Capital Group 167
make up the mining complex was carried out in order to carry out exploration and extraction of gold, silver and copper. 28
The Mining Unit is operated by Newmont Second Capital Corporation, recognized as one of the world's largest gold mining companies, headquartered in Denver, Colorado. The current shareholder structure includes Compañía Minera Condesa, S.A. owned by Mina Buenaventura S.A.A. and Summit Global Managment II BV, a subsidiary of Sumitomo Corporation, a member of the Sumitomo Group. 29
The area where Minera Yanacocha's property is located has been explored since the 1960s, but it was only in the 1980s that exploitable deposits were discovered in the Sierra Norte region. Beginning in the 1990s, Peru experienced a period of economic stabilization and legislation favorable to foreign investment,30which resulted in increased investment in the mining sector, mainly in copper and gold production, which led to the diffusion of new technologies for mining production. At that time, the Peruvian company, Compañia de Minas Buenaventura, Newmont and the International Finance Corporation (IFC) partnered to form Empresa Minera Yanacocha S.R.L.
Within the framework of the new legislation promoting the mining sector, Minera Yanacocha represented the starting point towards the recovery of Peruvian mining, in an association with foreign and national capital participation, played a fundamental role in the provision of financial and technological resources, with a rapid growth in its production and the implementation of a subcontracting system (suppliers of goods, equipment, inputs, services), characteristics that allowed it to be considered as a "model" company, which continuously innovates to keep the deposit in operation. 31
When Yanacocha first began operations in Cajamarca in 1993, its plans were to implement a "medium gold operation" process, however, the conditions were created and it became a "large mining operation". Indeed, between 2003 and 2005, Yanacocha's operation reached its highest production peaks, ranking first in Latin America and second in the world. 32
Yanacocha Mining is located in the districts of Cajamarca, Baños del Inca and La Encañada, in the province of Cajamarca, 800 kilometers northeast of the city of Lima, Peru. Its area of operations is 45 kilometers from the district of Cajamarca, from where the mining complex is accessed by paved road. The Company has a scope of action that reaches approximately 120 villages, organized in towns, which constitute the area of influence of the Project.
28 In 1993 the Carachugo Project, 1994 the Maqui Maqui Project, 1996 San José, 1997 Cerro Yanacocha, 2001 La Quinua and 2003 Cerro Negro. Schwalb María, et. al. (2003). Cases of Social Responsibility, Serie Apuntes de estudio No. 53, Centro de Investigación, Universidad del Pacífico. 29 It is worth mentioning that from the beginning of the mining operation until 2016, the International Finance Corporation (IFC), an agency of the World Bank, was part of the Shareholders Group of the Mining Company; later, in 2019, Summit Global Managment II BV, a subsidiary of Sumitomo Corporation, was integrated. See: Yanacocha, Sustainability Reports for the years 2016 - 2019. 30 In 1991, Legislative Decree 662 was enacted to promote foreign investment; in the same year, the privatization of state enterprises was decreed (Legislative Decree 674); in 1996, incentives were granted for investment in natural resources through mega-projects (Legislative Decree 818), see ECLAC document (2000). Las aglomeraciones productivas alrededor de la minería: el caso de la Minera Yanacocha, United Nations, Santiago, Chile. 31 ECLAC Op. Cit. Pp.31-32. 32 Yanacocha, Sustainability Report 2016.

Environmental and Social Impact Assessment of Forest Landscape Restoration Project December 2021
Social Capital Group 168
According to the Yanacocha Sustainability Report, in 2011, its operations were carried out in an area of 59,897 hectares, the Company's mining concessions cover a total area of 310,001 hectares of land. The Company develops its activities in a territory crossed by several watersheds and micro watersheds, among the main ones are: Rejo River, Honda Creek, Chonta River and Grande or Porcón River.
In relation to the development of forestry as part of the history of Minera Yanacocha, it can be said that it dates back to 1995, when Yanacocha purchased one thousand hectares of land with forest plantations from its immediate neighbor, Granja Porcon. These remain to this day as a lush forest located in the highlands adjoining Yanacocha and Granja Porcon.
The trees on these one thousand hectares are part of the reforestation actions promoted by the Belgian Cooperation in the 1970s throughout the high Andean area. During that period, the Peruvian Government implemented the Cajamarca Development Project (PRODESCA) with the support of the Belgian Government, with the aim of strengthening public administration in the areas of education, infrastructure, agricultural production, marketing and reforestation. Project 03, called Servicio Silvo Agropecuario, in charge of the National University of Cajamarca, took over the forestry activities of PRODESCA. As a result of the above, in 1974 the Agrarian Cooperative "Athahualpa Jerusalen" of Workers was formed, better known as Granja Porcón, an associative entity with which Yanacocha has maintained harmonious relations of cooperation since its establishment in the nineties.
Subsequently, between 1982 and 1989, forestation activities were carried out in the Cajamarca Region, with the Porcón Farm as the Pilot Forestry Project.33 For the operation of the Yanacocha mine, starting in 1993, large tracts of land were acquired and some trees were removed for the expansion of its extractive operations; however, other areas of the territory have remained untouched to date.
Simultaneously with mining operations and as part of the environmental and social commitments made by the Yanacocha Company to the Peruvian State, the company has been working on a sustainable development strategy for urban and rural areas. According to the representative of Asociación Los Andes de Cajamarca (ALAC), its efforts are aimed at improving the quality of life of the population in the area of influence of the mining project, a situation that, at the same time, is expected to contribute to the reaffirmation of its link with Cajamarca.
In this context, almost from the beginning of the mine's operations, Yanacocha has supported a series of environmental and social programs and projects through the Social Responsibility Area, a unit responsible for the application of the strategic relationship policy with the communities and the implementation of control plans to monitor the social climate in the area of direct and indirect influence of the mining company. Since then, the Company has set itself the objective of maintaining this type of action throughout its operating life. 34
Consequently, in order to strengthen this corporate policy of social commitment, in 2004, the Los Andes de Cajamarca Association, better known as ALAC, joined this effort to support the Social
33 Carton Charles (2014) "Pioneers of green gold - The Green Poncho of the Peruvian Andes" in Revista Xilema Vol 27, 2014. Universidad Nacional Agraria La Molina, Peru. 34 Yanacocha, Social Balance 1992/2001.

Environmental and Social Impact Assessment of Forest Landscape Restoration Project December 2021
Social Capital Group 169
Responsibility Area in the execution of projects to take advantage of the benefits of mining and generate sustainable development among the villages in Yanacocha's area of influence. Among these projects are those that promote forestry activities:
In the decade from 1992 to 2001, the first forestry projects were carried out that promoted the installation of silvopastoral and agroforestry production systems; the following decade between 2002 and 2011, projects focused on the promotion of the eco-business model with an agro-industrial vision of organic products. Subsequently, between 2012 and 2014, the Celendín Forestry Pilot Project was worked on, through which nurseries were created, almost two million forest seedlings were grown, emphasis was placed on technical training processes for the sustainability of plantations and scientific research was carried out. After this project, the development of other projects that replicate some of the practices learned has continued, among them, "The enhancement of edible mushrooms in the pine forests of Cajamarca". This project has been developed in subsequent years, as stated in the Sustainability Reports 2015 and 2017 and ALAC's Annual Report for 2016.
In the decades between 2000-2020, other forestry initiatives were also carried out in the Cajamarca Region promoted by the public sector, as was the case of the National Watershed Management and Soil Conservation Program (PRONAMACH) and the Rural Agrarian Productive Development Program (AGRORURAL). More recently, in 2019, the reforestation initiative is the "Poncho Verde" Project, promoted from the Regional Government of Cajamarca through its Agrarian Agencies, with presence in the thirteen provinces that make it up, this project is planned to run until 2023, its goal is the cultivation of at least 30 million forest seedlings of different species, located and selected depending on the forest suitability of the area.
In addition to the social and environmental commitments acquired with the Peruvian State, and compliance with the regulations for the operation of the Mining Company in the country, the reference framework that has guided the structuring of its plans, projects and programs is related to the recognition and voluntary adherence of Newmont and Yanacocha to initiatives, The international standards set out requirements for the production/extraction process, impact management, risk prevention, observance of human rights, and social and natural resource relationships that promote sustainable development (see Table 6.3). Having these and other references as part of its history and business profile represents a significant achievement for Yanacocha, in terms of its qualification, global status and impact on dialogue with authorities, environmental regulators and institutions in the mining industry sector in the country.
Table 6.3 Instruments for compliance with international standards
Instruments, certifications and spaces for interlocution in chronological order
In 2001, it adhered to the Voluntary Principles on Security and Human Rights, promoted by the US State Department and the UK Foreign Office.
In 2004, it became part of the United Nations Global Compact, which implies the alignment of the Sustainable Development Goals (SDGs) to the mining company's lines of work.
In 2004, Newmont joined the Partnering Against Corruption Initiative as a founding partner, and incorporated the guiding principles into its policies and standards, including at Yanacocha operations.
Between 2007 and 2010, it obtained the Certification and recertification of the Environmental Management System ISO 14001, this international certification for the operations and processes of environmental management.

Environmental and Social Impact Assessment of Forest Landscape Restoration Project December 2021
Social Capital Group 170
Instruments, certifications and spaces for interlocution in chronological order
Between 2008 and 2011, it was certified and recertified with the International Cyanide Management Code, a program designed under the auspices of the United Nations Environment Programme (UNEP) and the International Council on Metals and the Environment (ICMM).
For the 2018-2020 period, Newmont Corporation and the International Union for Conservation of Nature signed a collaboration agreement to identify ways in which the company can meet its global biodiversity objectives.
Source: Yanacocha, Social Balance 2011 and 2019.
6.2.1.2 Internal organization
The Social Responsibility Management, specifically, in the case of the External Social Responsibility area, is in charge of the strategic relationship with the communities in rural areas. Among the functions it performs are
Prevents and facilitates the resolution of socio-environmental conflicts.
Ensures an adequate communication process between the social actors and the Company.
Follows up on the fulfillment of commitments made to the communities.
Implements mechanisms for community relations (community assemblies, guided tours of operations).
Institutional participation in social and academic events where economic, environmental, social and developmental issues are discussed.
Articulate a common and supportive agenda with the authorities to be part of the dialogue process between the central, regional and local governments and work for the development of Cajamarca.
The management of the Corporate Social Responsibility Area has been strengthened with the creation of ALAC, a35 corporate organization whose task is to contribute to the sustainable human development of the Cajamarca region. Strategically, ALAC articulates and promotes alliances with public and private institutions, non-governmental organizations and international cooperation agencies, to enhance the impact of the projects they execute. Among the main entities ALAC coordinates efforts for the implementation of social projects are: at the level of non-governmental organizations, the Credit Fund for Agroforestry Development (FONCREAGRO), the Civil Association for Forestry Research and Development (ADEFOR), the Fund for Agrarian Development (FDA), the Organization of Ibero-American States for Education, Science and Culture (OEI), and the USAID Cooperation Agency. On the public sector side, the Regional Government of Cajamarca and the Provincial Municipalities of the area of influence of Yanacocha, Fondo Empleo and Banco de Desarrollo del Perú (COFIDE), among others.
These alliances are made concrete to the extent that they coincide with the institutional visions and purposes aimed at improving the economic, socio-cultural and environmental conditions of the populations.36 The forms of coordination are established through cooperation agreements,
35 In documents prior to the creation of ALAC, mention is made of the Yanacocha Association that was in charge of supporting social projects in alliance with non-governmental organizations and International Cooperation entities. 36 ALAC, "El Futuro se hace hoy" Informe Anual de Gestión 2016, Los Andes de Cajamarca, Yanacocha, Peru. P. 9

Environmental and Social Impact Assessment of Forest Landscape Restoration Project December 2021
Social Capital Group 171
mechanisms of accompaniment to the groups of beneficiaries, according to the specialties of each external executing entity.
The Environmental Management is oriented to prevent, control and mitigate the impacts of the mine's operating activities on the environment, in accordance with national regulations and global standards. The institutional environmental policy indicates that Yanacocha permanently carries out monitoring, evaluation, restoration and research work. It also ensures that all environmental factors and characteristics are considered in new and modified facilities, as well as in the purchase of equipment and materials as necessary.
Manages water quality and quantity with the watershed approach and works on opportunities for improvement in cooperation with authorities and stakeholders.
Promotes participatory environmental monitoring programs involving communities, authorities and environmental institutions, ensuring the communication of results.
Develops new projects taking into account the needs and expectations of neighboring communities, responsibly and progressively carries out Mine Closure.
Promotes a responsible environmental culture, rigorously applies international standards subscribed voluntarily (ISO 14001, ISO 17025 and International Cyanide Management Code).
6.2.1.3 Forestry activities
As part of the social and environmental responsibility assumed by Minera Yanacocha, the forestry activities in which it is involved are located in two precise areas of action: internally within the Yanacocha territory and externally in the communities of the area of influence.
Internally, it includes the management for the maintenance of natural forests, forest plantations and vegetation cover in general (including the biodiversity that inhabits them), located within the territorial extension owned by the Company. Whenever any of these forest areas are not required for the mining operation, the actions of the Environment and Mine Closure Department are aimed at their conservation, particularly the species (flora or fauna) that have been identified as a priority.
In this same area of action, another situation that may arise is when a project to modify or expand its facilities for the mining operation is promoted, and that specific project requires reforestation actions for its operation, in which case, the corresponding Yanacocha teams intervene to enhance forestation. Also included are the corresponding activities for revegetation and rehabilitation of areas that will not be used again in the mining operation.
Externally, in the other area of Yanacocha's forestry activities, there are the social, economic and environmental programs and projects that are promoted through the Department of Social Responsibility, specifically, those executed by ALAC in coordination with other organizations and/or local institutions. Such projects are carried out with the participation of the populations settled in the villages and annexes that make up Yanacocha's direct and indirect area of influence.

Environmental and Social Impact Assessment of Forest Landscape Restoration Project December 2021
Social Capital Group 172
6.2.1.3.1 Forestry within Yanacocha's territory
According to Yanacocha's Environmental Management representative, the 1,000 hectares of forest plantations purchased from Granja Porcón are planted with patula and radiata pine and contain abundant ichu; these plantations are almost 30 years old.
Additionally, within Yanacocha's territory, there are other, rather scattered areas of natural forest and forest plantations, which together total approximately 700 hectares. Error! Reference source not found.shows the areas of natural forest, forest plantations and vegetation located in the western part of the mine's territory. The largest forest area is to the south, adjacent to the Porcón Farm.
As for the existing species at Yanacocha, the main ones are Patula pine, which is an introduced species (Belgian reforestation process), radiata pine and Quinual trees. None of the species are counted, however, the Yanacocha representative estimates that Radiata pine represents 90.0% of the total plantation. Of the above, the Quinual is a priority species for Yanacocha because it is an endemic species.
With regard to the Quinual species, the Terrestrial Biodiversity Monitoring Program and the Aquatic Life Monitoring Program, which are part of the Biodiversity Monitoring Plan, are aimed at monitoring the possible impacts of the mining operation on flora and fauna. In this regard, they are responsible for verifying the effectiveness of environmental controls and compliance with rehabilitation activities at mine closure. Through this Plan, an inventory of species within Yanacocha's area of operations was prepared. A total of 308 species of flora and 67 species of fauna were identified. Among the plant species, the Quinual tree was identified, a species of flora called Polylepsis Racemosa, which is on the Red List of the International Union for Conservation of Nature (IUCN) and on national conservation lists. Based on this finding, Yanacocha has taken on the protection and conservation of Quinual within its territory. It is a promising variety for reforestation and agroforestry; it is also a species that is easy to propagate in forest nurseries, a mechanism used by Yanacocha to revegetate closed areas. 37
Given that the conservation of Quinual, is an environmental commitment of Yanacocha with the Peruvian State, as explained by the representative of Yanacocha, a readjustment of plants or planting of similar plants in places similar to where it was impacted is made. Species are specifically counted according to the size of the mine's territory. Subsequently, at the Research Center under the direction of the Mine Closure Area, this forest species and other minor species of plants native to the area are produced for use in the closure stage, "the Ichu, Puna Grass, Chocho Silvestre and Quinual in association with introduced species, are used in revegetation campaigns in order to achieve landscape integration and biological recovery similar to the baseline conditions"38. In this Research Center, there is a greenhouse consisting of a small plot where plants are obtained and used for the process of closure in areas where it is required or deemed appropriate.
37 Yanacocha, Sustainability Report 2017. 38 Yanacocha, Sustainability Report 2014.

Environmental and Social Impact Assessment of Forest Landscape Restoration Project December 2021
Social Capital Group 173
Figure 6.2 Forest Zones at Yanacocha Mining Company
Source: Yanacocha, Map with forested areas
With reference to the restored habitats, with the different species that have been identified in the mine operation area, in 2018, 76.85 hectares had been restored, with a cumulative of 822.45 hectares; later in 2019, there were 58.3 hectares that have been rehabilitated as part of the progressive Closure Plan. In this process, manpower is assigned for species management, but not specifically but as part of the regular Mine Closure team.39
In the interview, the Yanacocha representative mentioned that the areas with forest plantations in the mine have not been subject to any technical or systematic management for their use, on the one hand, because it is not part of Yanacocha's business objectives; on the other hand, because there is no budget specifically earmarked for that purpose.
This has been so, in part, because Yanacocha's efforts to care for the environment have regularly been oriented towards the generation of environmental assets to contribute to the storage and control of the amount of water for the low water months. However, this has required integrated management of the water basins, including the establishment of forests to harvest water. 40
6.2.1.3.2 Forestry activity was promoted by Yanacocha in the villages of the direct and indirect area of influence.
As mentioned earlier in the section on Yanacocha's history, the Company's forestry activity in this area has been very dynamic since the beginning of its operations in Cajamarca. The Social Responsibility Area has ensured that this objective is aligned with development activities in Cajamarca, a region that is one of the first in the country to work systematically in reforestation, as it has significant extensions of plantations, thus demonstrating that forestry can be an economic alternative for land use and employment generation. 41
Yanacocha has supported forestry activity throughout the Cajamarca region, especially in the provinces of Celendín and Cajamarca with emphasis on Cajamarca, Baños del Inca, La Encañada and Sorochuco, Huasmín, Celendín, Bambamarca, Hualgayoc. 42
Together, Yanacocha, through the Social Responsibility and Community Relations Area and ALAC, have carried out approximately ten forestry projects, promoting the afforestation of at least twelve thousand planted hectares (12,000 ha) in villages in the Project's area of influence.43 According to the explanation of the ALAC representative, the projects are designed for a specific period with the purpose of generating capacities in the population for sustainability. Although they are distanced at the end of the project, they are accompanied by ALAC and ADEFOR, aware that forestry projects need long periods of time to extract the timber:
39 Yanacocha, Sustainability Report for 2018 and 2019. 40 Yanacocha, Sustainability Report 2011. 41 Collective interview with ALAC and ADEFOR representative, September 2021. 42 ALAC, Management Report 2012 43 Interview with ADEFOR representative, September 2021.

Environmental and Social Impact Assessment of Forest Landscape Restoration Project December 2021
Social Capital Group 174
"...our intervention is not for the whole time, we have a line of sustainability, from the beginning we are committed to involve the community. At a certain point, it is the community that follows the project. The average time is from three to five years...". 44
The following is a description of the projects that Yanacocha has promoted through Social Responsibility, executed by ALAC since the 1990s until 2014 when the Celendín Forestry Pilot Project ended. In this development can be found in greater detail the projects, the actions promoted and the results obtained. In the Yanacocha Management Balance (1992-2001), it is mentioned that the forestation process was carried out through three projects:
Forest Plantation Project in communities within Yanacocha's sphere of influence was implemented by the Yanacocha Association, ADEFOR and the community.
Silvopastures project for the development of rural organizations in the high Andean micro-watersheds of the Llaucano River, executed by the Technical Cooperation of the Netherlands (Holland)-CTH, ADEFOR, Yanacocha Association, Incalac and the community.
Silvopastures project for rural development, implemented by Fondoempleo, ADEFOR, Yanacocha Association and the community.
The purpose of these projects was to produce timber for domestic use and for marketing in local and regional markets, as well as to provide firewood for families. The details of the activities and some of their results can be seen in Table 6.4 Community afforestation projects 1992-2001In these projects an important feature to highlight was the development of road infrastructure and electricity services that were introduced in some communities to improve their living conditions.
Table 6.4 Community afforestation projects 1992-2001
Activities carried out Results obtained Impacts achieved
Plant production in nurseries
Forest plantation in thickets, fences, curtains and soil conservation systems.
Training and technical assistance
Installation of silvopastoral and agroforestry production systems.
3,410 hectares of plantations
3.5 million trees in forest stands in family plots
350 families benefited
Improvement of grasses located under the shade of the planted trees,
Livestock feeding was favoured
Provision of firewood for families
Territorial planning
Soil conservation in planted forest plots
Support for local infrastructure development
Road construction and maintenance
Rural electrification
Credit for expansion of improved pasture crops
Source: Yanacocha, Social Balance 1992-2001.
In the Social Balance reports for the years 2002 to 2011, projects oriented to the creation of capacities and knowledge in the management of forest crops and the generation of employment
44 Interview with ALAC representatives, Yanacocha, September 2021.

Environmental and Social Impact Assessment of Forest Landscape Restoration Project December 2021
Social Capital Group 175
and income for the families involved in the projects were reported. Table 6.5presents the main activities and their results. Part of the activities that were carried out were the first projects to obtain by-products from forest plantations, as new businesses. The one that has had the greatest acceptance and continuity to date is the "edible mushrooms" project, which takes advantage of the non-timber products of the forest and can be marketed fresh and dried.
Table 6.5 Forestry activities 2002-2011
Year Project (description or activities) Results
2002
Silvopastures for rural development Distribution of 2,200,000 plants for family plots Participation of the districts of Cajamarca, La Encañada, Baños del Inca, Hualgayoc and Tumbaden.
1,656,000 plants for reforestation of 1,000 hectares in the next campaign.
71.70 hectares reforested
800 families
2005
Economic Services Center New businesses with economic potential were promoted, such as wood, mushrooms and vegetables
2006
Afforestation Program Italian-Peruvian Agreement, with the support of ADEFOR, Yanacocha and San Cirilo.
475 hectares reforested
22 hamlets San Cirilo Association
160 families Forestation San José and Quishuar Agreement with ADEFOR
90 hectares reforested
San José - Quishuar Corral Sector
70 Families
2007
Productive development of tara Promotion of the organic and agro-industrial eco-business model San Juan District Youth training for forest management Training for adults of the SAIS José Carlos Mariátegui Cooperative in forest management.
40 hectares cultivated
573 tare trees
15 young people trained from San Juan
100 people trained from SAIS JCM
2010
Economic Services Center New businesses with economic potential were promoted, such as wood, mushrooms and vegetables
Projects for the Competitive Development of Cajamarca's Timber Forest Transformation and Commercialization Sector In addition to ALAC-Yanacocha, ADEFOR and other specialized institutions were involved. The project worked in eleven hamlets
200 hectares with silvicultural treatments
320 hectares forested
700 people trained in forestry techniques
78,200 seedlings planted
2011
Forestry Projects Activities carried out in conjunction with ADEFOR and other specialised institutions
170 hectares forested
253 people trained
11,761 seedlings planted
1 tractor s/track tractor delivered
Source: Yanacocha, report Social Balance 2002, Social and Environmental Balance 2006, 2007, 2010, Sustainability Report 2011.
In the period 2012-2014, the Pilot Forestry Project (PPF) Celendín was promoted, in whose execution, in addition to ALAC, the Foundation for Agrarian Development (FDA) and the National Agrarian University La Molina (UNALM, sponsor of the FDA) were involved. The Project was

Environmental and Social Impact Assessment of Forest Landscape Restoration Project December 2021
Social Capital Group 176
implemented in the area of influence of the Conga Mining Project, in the province of Celendín, in the districts of Celendín, Huasmín and Sorochuco. The objective of the project focused on generating short-term economic income for participating families through four components: forest nurseries, forest plantations, sustainability mechanisms and academic research. 45Table 6.6summarizes the components, main activities and social benefits of the project.
Table 6.6 Actions taken and strategic results of the Celendín Province Forestry Pilot Project, 2012-2014
Mechanism adopted by project component
Some activities Social / Environmental Benefits
a) Forest nurseries
They are strategic as a visual point of presence of the Project.
The following are relevant for the development of the plantation component
It is an expensive component given the short duration of the project.
Agreements and understandings with some local authorities do not guarantee continuity and sustainability of the component.
For the implementation of the nursery, infrastructure provision
Installation of a 2,700 litre water tank and a watering system through taps.
Social
1,472 families from 88 localities in the districts of Celendín, Huasmín and Sorochuco.
100,000 day wages generated in nursery and plantation activities
30% participation of women
74 community leaders and authorities trained as forestry promoters
1,991 ha of plantations, 1055 ha in woodlands and 936 ha in afroforestry.
6 community nurseries implemented
1,882,222 forest seedlings in the forest massif and agroforestry system
More than 33 ha planted and an average of 2.5 ha per participant in the forest and agroforestry
2 investigations carried out by Project staff
2 theses to obtain a professional degree at the National University of Cajamarca.
The production of by-products such as edible mushrooms and firewood.
Timber sales generate profits
Planted soils acquire added value that benefits their owners.
b) Forest plantations
Rural populations in the high Andean areas of the Conga Project area are interested in forest plantations.
Strategic the payment for pits and plantations
The number of promoters and foremen was increased, they were selected by the communities and financially compensated.
To implement a system of advancement of planting and planting by technicians of the executing agency.
The non-exclusion of participants based on their position regarding the Conga Project is a positive criterion to reduce conflict.
Identification of areas to be afforested
Planting process
The massifs are mainly patula pine.
For agroforestry, pine, eucalyptus, cypress and tara or taya were used.
c) Sustainability mechanisms
The sustainability of the Project starts with the technical quality, experience
Training and education of promoters
Identification of public and private support institutions
Environmental
Reforestation of 20% of the area with forest aptitude in Huasmin, Sorochuco and Celendin.
45 Yanacocha/ALAC, Final Evaluation of the Forestry Project, accessed online: https://www.losandes.org.pe/wp-content/uploads/2017/06/Evaluacin-Final-Proyecto-Forestal.pdf.

Environmental and Social Impact Assessment of Forest Landscape Restoration Project December 2021
Social Capital Group 177
Mechanism adopted by project component
Some activities Social / Environmental Benefits
and commitment of those who promote the Project.
Differentiate the commitments acquired by the Company and monitor their progress.
Access to training should be on an ongoing basis.
The signing of agreements with the provincial and district municipalities for the donation of facilities, materials and tools does not in itself generate commitment.
Infiltration of 2.5 million cubic meters of rainwater (25% of all rainfall in the area) for better productive use of soils and to prevent erosion.
Captures 25,000 tons of carbon, helps purify air
Improvement of the landscape in the intervention area
d) Academic Research
Conduct scientific demonstrations and record them systematically
Disseminate the results of the research that is carried out.
Scientific research of the Project promoted the elaboration of degree theses.
Source: Prepared by SCG with data from Final Evaluation Forestry Project and Interview with representatives of ALAC and ADEFOR, September 2021.
The Celendín Forestry Pilot Project ended when all plantations were handed over to community owners and farmers in 2014. This means that by 2022, these plantations will be able to harvest timber as a result of the relay. In the first stage it will be possible to extract wood to make romeados and in the next stage (5 years later) to build furniture and constructions, such as houses.
According to the ADEFOR representative, the land where the plantations are located is owned by the communities and their families, only in some exceptional cases are they organized as an association. The plantations are relatively dispersed because they are located at a short distance from each other. However, in two of the districts where the Celendín Project was developed (Huasmín and Sorochuco), the properties are not very concentrated and their owners are different; there is no continuity between the plantations.
The species used were patula pine, radiata, eucalyptus, cypress and tara or taya, although there is no record of the number of trees per species. In addition to the use of wood, the use of edible mushrooms began to be disseminated, which began to be produced in the fourth year of the plantation, generating an anticipated income for the families participating in the projects. The producers can obtain between 100 and 200 kilograms of fresh mushrooms per hectare of pine plantation, depending on weather conditions. With dehydrated mushrooms, for 13 kilograms of fresh mushrooms, only 1 kilogram of dehydrated mushrooms is produced.
In relation to potential markets for the marketing of the timber produced, although there are some furniture factories in Cajamarca and timber processing companies, the fact is that they need to develop a strategy to identify markets at the national level and abroad. In this task, the representatives interviewed indicated that the involvement of local governments is necessary to promote timber production and utilization.

Environmental and Social Impact Assessment of Forest Landscape Restoration Project December 2021
Social Capital Group 178
For their part, the markets for the commercialization of edible mushrooms are diverse, they have been able to place them in the domestic market, but they have also been able to export to Europe. However, the exploration of potential markets for both timber and by-products such as mushrooms is a pending task, according to ALAC and ADEFOR representatives.
The labor used in forestry projects is mainly family labor when their properties are less than 20 hectares in size, above that number, labor will need to be hired. For forestry projects there are two options:
a. The Project may pay for the labor for the paving by reviewing the available budget for the respective project.
b. As was done in the Celendín Forestry Pilot Project, the owners themselves made the holes, the Project paid them for this activity and in this way, the owners were able to generate income.
Both modalities have been used in forestry projects, depending on the locality and how the intervention is planned. The number of workers or people needed per hectare averages 52 workers.
According to those interviewed, some families in certain communities still use the Minka, or collective work, a custom that has been practiced throughout the highlands since pre-Columbian times. The Minka or minga, of Andean origin, is the form of local, traditional work practiced for agricultural work and for the construction of housing or community goods. In ancient times, the Minkas were fundamental to maintain links of solidarity that allowed the survival of the community (ayllu). This system involved and obliged all members of the community to work for the benefit of the community, always mediated by a sense of contribution of the community's labor force. 46
The use of the Minka has been related in some communities to the extraction of the edible mushrooms, a task that is carried out individually, while its placement in the dryers is done collectively, using the dryers that are of communal use.
With reference to productive infrastructure, according to those interviewed, the implementation of nurseries is the main activity in forestry projects, and establishing nurseries in one place is functional to avoid the movement of plants from Cajamarca to the hamlets. Otherwise, it would be necessary to consider the distances to be covered and the ruggedness of the roads, situations that could cause problems for the plants. Therefore, nurseries should be built as close as possible to the planting site. On the other hand, the equipment for forestry producers since the projects promoted by Yanacocha has been elementary, the tools are mainly handmade, such as pruning shears, shovels and scissors for pruning.
Among the most important aspects of forestry projects, is that they are focused as processes that are accompanied by training where producers participate from the selection of the land, learn to
46 Altamirano A. and Bueno A. (2011). El Ayni y la minka: dos formas colectivas de trabajo de las sociedades pre-Chavín en la sierra norte de Ancashy y Cajamarca, in Revista Investigaciones Sociales, No. 27 Vol. 15, UNMSM/IIIHS, Lima, Perú.

Environmental and Social Impact Assessment of Forest Landscape Restoration Project December 2021
Social Capital Group 179
differentiate the species according to the soil, perform the exercise of planting holes and are responsible for the entire process of caring for the plantation. The training is permanent while the direct accompaniment is provided, until they have the possibility to manage the plantations by themselves.
6.2.1.4 Stakeholders for forestry projects
According to the interviewees, stakeholders of the Mining Unit include both public and private sector actors, and because of their experience in the development of forestry projects with populations, they have considered the owners of the lands where forestry projects operate (see Table 6.7).
Among the public sector actors in Cajamarca, they highlighted the importance of the Regional Directorate of Agriculture, a dependency of the Regional Government, as the entity in charge of the "Poncho Verde" Program47. For Yanacocha's representatives, the current situation has the advantage that forestation is a government policy, therefore, investment in this productive economic sector and access to advice and technification, may have a better receptivity.
In the private sector, in addition to being included as stakeholders to be considered by The Project, they mentioned Granja Porcón, as a successful reference in forestry; the College of Engineers in its forestry chapter, for the thematic relevance and what the exchange of experiences in the field of technification could mean.
Finally, among the grassroots social organizations, they referred to the farmer patrols or vigilante committees, because of the leadership and social recognition that these groups have at the community level and because of their impact at the political level in the structuring of local power in some villages.
Table 6.7 Stakeholders relevant to the Forestry Project (stakeholders)
Public Sector Private Sector
Regional Government o Regional Directorate of Agriculture
Los Andes Association of Cajamarca
Provincial Municipalities Civil Association for Forestry Development
District Municipalities Governmental environmental organizations o Foresters/reforesters
Ministry of Agrarian Development and Irrigation National Forestry and Wildlife Service Rural Agrarian Productive Development Programme National University of Cajamarca
o Silvoaagropecuario Program National Institute for Agrarian Innovation
Private companies o Mining o Dedicated to environmental activities o Foresters/reforesters
College of Engineers o Forestry chapter
Chamber of Commerce
47 It is an afforestation project that is promoting the Regional Government of Cajamarca through its Agricultural Agencies, a thousand seedlings per Agency of trees that observe the aptitude and altitudinal floor from forest plants to fruit and native to the region. The Project promotes the production and installation of the plant.

Environmental and Social Impact Assessment of Forest Landscape Restoration Project December 2021
Social Capital Group 180
Public Sector Private Sector
Porcón Farm
Landowners and grassroots social organizations
Associative entities, the presidents and their leaders o Cooperatives o Social Interest Companies o Farmer Communities
Farmer patrols Individual Leaders
Source: SCG fieldwork, 2021.
6.2.2 Agricultural Society of Social Interest José Carlos Mariátegui
6.2.2.1 History
The agricultural societies of social interest were one of the associative forms that arose in the 1969 Agrarian Reform process of the military government of General Juan Velasco Alvarado. In this process, 659 agricultural companies were created, of which only five still exist today. One of them is the SAIS José Carlos Mariátegui, created in 1972 on the basis of the Sunchubamba and Huacraruco farms, in the districts of Cospán, Cachachi, Jesús and San Juan in the Province of Cajarmarca.
Approximately in 1916, the businessman Hans Enrique Gildermeister, bought the hacienda Huacraruco for the price of Peruvian Pound (Lp.) 18,000, later in 1919, he negotiated the neighboring hacienda Sunchubamba for Peruvian Pound (Lp.) 50,000. Both farms had an approximate extension of 60,000 hectares, the same ones were acquired in 1919 by the Agricultural Company Chicama (Andean Section), property of Gildermeister48, forming in that way the biggest and most important agricultural negotiation in all the department of Cajamarca. According to the description of that time, the hacienda covers the source of the Pacasmayo River and is located on the slope of the Cordillera Negra, near Asuncion. The Sunchubamba hacienda was located in the center of a cattle raising area. Hacienda Huacraruco had abundant water, good soils, and was located in a not very mountainous area.
Gildermeister imported cattle and by 1935, Huacraruco had 12,215 fine breed sheep, while Sunchubamba acquired 13,854 head of good quality sheep. Between 1916 and 1935, the Chicama Agricultural Company developed the necessary infrastructure to be operated as a modern livestock industry. To increase the labor force, they offered plots on the haciendas to smallholder farmers brought from neighboring communities under sharecropping conditions.49Production relations were established between the hacienda owner and the direct producer, this measure allowed the land to be cleared prior to the planting of pastures and an expansion with the production of cereals and vegetables.
48 Taken from correspondence from the Archivo de Fuero Agrario, Taylor Lewis, La historia sobre las haciendas Huacraruco y Sunchubamba, Cambios Capitalistas en las Haciendas Cajamarquinas, n/d. Electronic consultation: https://dialnet.unirioja.es 49 A contract by which the owner of agricultural land or a livestock facility transfers its operation to another person in exchange for payment of a sum of money, a share of the profits or fruits, or some other form of compensation.

Environmental and Social Impact Assessment of Forest Landscape Restoration Project December 2021
Social Capital Group 181
In the context of the Agrarian Reform, the Sunchubamba hacienda and its six annexes (an extension of 55,311 hectares) were expropriated from the Gildermeister family, including the cattle, equipment, machinery and the hacienda house with its interior goods. The expropriation was for the benefit of 711 families, who formed on October 18, 1972 the SAIS José Carlos Mariátegui No. 16 Ltda., which was registered on the same date in the Public Registry. Given that the act of its constitution took place in Sunchubamba, since then this place became the headquarters of the SAIS JCM until today, although it is now a populated center.
The SAIS has the following annexes: Campodén, Salagual and Huacraruco. Huacraruco is the annex of the SAIS that has more economic resources. Also, there are the sections: Casais, Huaycot, Huaycotito, Chigden, Huayllabamba. The sections do not have an administrator, but rather a section manager who coordinates with the administrator of a nearby annex. The sections are located near Sunchubamba. Before the Agrarian Reform, the haciendas had the same annexes.
The farmers who arrived before the Agrarian Reform as sharecroppers received 12 hectares from the owner of the hacienda. Later, in the context of the Agrarian Reform, those who joined to form part of the Cooperative were granted 6 hectares. Some time later, the Board of Directors qualified the new members and granted 3 hectares to each one, the last members comprising this group.
In the 1980s, at the time of terrorism, the population of the SAIS was attacked and defended by the same members and their families. In that same period, in the years 1985 and 1986, the SAIS JCM was affected by a strong drought, drastically reducing the birth rates of the cattle, in addition, they had to sell the cattle for lack of pasture for their feeding.
Despite the aforementioned facts, that decade marked a success in the management of SAIS in terms of livestock activity. Since 1983 - 1984, the SAIS (Salagual and Huacraruco) acquired fighting cattle, with which it gained a national reputation. They have had the opportunity to participate in different agricultural events in the country, competing with this type of cattle, obtaining titles and trophies in bullfighting rings.
Since 2012, there have been a series of invasions of SAIS territory by people from neighbouring communities. These acts of invasion have been marked by acts of violence, a situation that has increased in intensity, to the point of causing several deaths of SAIS José Carlos Mariátegui workers. According to the SAIS representative, the area has become a dangerous space that provokes fear among the members, and has had an impact on the activities and economic performance of the Cooperative.
"We can't walk through that area anymore. There was a road that used to be used, but they wait for them there and put bullets in it. This is causing the company to go bankrupt. 50
50 Interview with representative of SAIS José Carlos Mariátegui, September 2021.

Environmental and Social Impact Assessment of Forest Landscape Restoration Project December 2021
Social Capital Group 182
6.2.2.2 General characteristics
The SAIS has 55,000 hectares and the Huacraruco Annex has more than 8,000 hectares51. The SAIS is the owner of the entire territory, but each member owns a portion of land where they build their homes and carry out economic activities.
Most of the company's land is used for cattle farming, as well as the plots of the partners. SAIS has Hereford cattle for beef production, fighting bull cattle and cattle for milk production. To a lesser extent, some members carry out agricultural activities, they grow potatoes and corn, but their production is for the family's own consumption.
Part of the SAIS territory, specifically the Huacraruco Annex, is also dedicated to forestry, with eucalyptus, cypress and mainly radiata and patula pine trees. Although they do not have exact data on the number of hectares under forest, the SAIS representative mentioned approximately 500 hectares of eucalyptus and an equal number of pine for harvesting. They have 300 hectares for planting and replanting.
In the case of hectares for forest harvesting, production is sold per hectare. Each hectare has approximately 900 seedlings. The product of this sale is destined to solve the situation of the Huacraruco Annex, since the main source of income for this annex was the sale of fighting cattle. Since the pandemic until now, they have ventured into timber production with several buyers in the region, including ADEFOR.
Approximately 15.0% of the Huacraruco Annex’s territory is dedicated to forestry plantations. In 80.0% they work with livestock and the rest (5.0%) the land is used for agricultural (See Table 6.8and Error! Reference source not found.).
It should be noted that although the SAIS does not take advantage of the production of edible mushrooms from the pine plantations, the inhabitants of the villages of La Shita, Lapar, Granero, Lorito Pampa, Totora, La Cruz, must coordinate with the SAIS, for the use of edible mushrooms. The SAIS communicates to the villagers the times when the mushrooms can be harvested. The SAIS representative pointed out that if the Forestry Project is implemented, better control of the land could be maintained and better use could be made of the production of edible mushrooms.
Table 6.8 Use of Huacraruco Annex in the José Carlos Mariátegui SAIS
ZONE A ZONE B ZONE C ZONE D ZONE E
Huacraruco (top)
Pine plantations Lanchepata Huar Huar
Almost the entire area is
Felled and continue to be felled
(by the Cross - Chicus) Pine plantations
They are logging the area More pine forest still
unlogged compared to ZONE A
Space where the members live on their
plots with their families.
"They're enfeoffed areas."
or hamlets with inhabiting population.
20 to 30 members who make use of pastures for cattle.
The same partners go to the SAIS and ask to enter these
territories. Now they are authorized.
Permission must be requested from SAIS.
It can also be land for
afforestation, but this area of SAIS territory is
encroached upon.
ZONE C and D The land in these hamlets belongs to SAIS JCM
because SAIS has the title to the land.
51 The interviewees do not have the exact number of hectares.

Environmental and Social Impact Assessment of Forest Landscape Restoration Project December 2021
Social Capital Group 183
ZONE A ZONE B ZONE C ZONE D ZONE E
ZONE A has more eucalyptus trees than
ZONE B.
The land cannot be used for forestry activities, because it is used for grazing by the families and the
company.
ZONES A, B, C and D There are plots of land belonging to members, which are fenced off.
ZONES A and B It is also used for grazing. But you have to ask
permission from the company. They are fencing off the pine trees so that the cattle can't enter,
but it is possible to graze.
ZONES C and D are intended for grazing
ZONE A and B The places where a forestry project can be
carried out are in the same areas where trees are being cut down.
Source: SCG Fieldwork, September 2021

Social Capital Group 184
Figure 6.3 Land use organization of Huacraruco Annex - SAIS JCM
ZONE A
ZONE D
ZONE C
ZONE E
ZONE B

Social Capital Group 185
6.2.2.3 Organizational structure and decision making
The SAIS was initially constituted with 300 members, later during the Agrarian Reform process more members were added (the interviewees do not know the exact number). The last members were incorporated by an internal agreement ("decreto supremo") by the Board of Directors and approved by the General Assembly of Delegates (no date mentioned). At its peak, the SAIS had around 720 members, while at present it has only 150 members.
In Sunchubamba, more women participate as members than in the Huacraruco Annex. According to the SAIS representative interviewed, this is because it is a populated center with more inhabitants.
The associative entities formed in the context of the Agrarian Reform adopted the same previous organic structure, namely: a General Assembly of members in the case of cooperatives, and an Assembly of Delegates in the case of very large associative entities. In both cases, the Assembly is the highest decision-making body, in which all members participate.
The Board of Directors is elected at the General Assembly. It is in charge of managing the company on behalf of the members. The Supervisory Board, also elected at the General Assembly, is in charge of supervising the accounting and administrative areas. Both Councils are at the same level and report to the General Assembly. The Management, the Operative Units and the Specific Committees depend on the Board of Directors. 52
The General Assembly of Delegates is the highest decision-making body. This body is made up of 36 delegate members, including only one female member. The Assembly meets two or three times a year. In Huacraruco there are 30 or 40 members.
Any issue to be approved at the Assembly level is first reported to the SAIS Board of Directors. At a meeting of the Board of Directors, the issues are discussed in order to reach agreements. Subsequently, this decision is submitted to the Assembly of Delegates for evaluation.
The Board of Directors is made up of 6 people, with no female representation. This Council does not have regular meetings, it meets as often as necessary. This body discusses economic issues and generates agreements, which are then presented to the General Assembly of Delegates. For example, The Project would be discussed in the Council and would have to be approved by the Assembly.
The Supervisory Board is also made up of 6 people, without female representation. Its function is to supervise the use of the members' and the company's land. It is conceived as a supervisory body.
These three bodies are appointed through elections that are held every 3 years with renewal of thirds, that is, it allows the release of those members of the aforementioned bodies when they do not perform their functions efficiently. The same person may be re-elected up to three times. In the election procedure, lists are presented, an election committee is appointed and voting
52 Bonfiglio, Giovani (2019) Las Empresas de la Reforma Agraria Peruana, 40 años después, Instituto del Perú, Peru. Pp. 10-15.

Environmental and Social Impact Assessment of Forest Landscape Restoration Project December 2021
Social Capital Group 186
takes place by secret ballot. The elections take place in each Annex and the sections are concentrated in the Central of Sunchubamba.
On the other hand, regarding the membership structure that would allow for the renewal of the organization's organic cadres, the SAIS JCM statutes do not contemplate a procedure for accepting new members; only members who have died are replaced. However, the representatives interviewed pointed out that deceased members have not been replaced. Even the person in charge of accounting for members recently died for COVID-19, but no replacement has been sought. The replacement process is at an administrative impasse because the Board of Directors must formalize it.
In practice, some children are replacing their parents or are currently living on the hectares they occupied although they are not yet qualified - formally - as partners. According to the statute, the partners can be replaced by one of their children, being the families the ones who must decide who that child will be. In addition, the Board of Directors must formalize by applying the appropriate procedure.
Regarding the form of participation of the partners in the company, by internal statute, the SAIS prioritizes the hiring of workers within the universe of children of the partners, however, up to four forms of participation of partners and non-partners in the economic life of the company were identified:
Some members or family members of members participate as workers in the SAIS, but not all members do.
Other partners stay working on their own plot of land.
When a worker retires, he returns to his land and resumes work on his plot.
There are workers in SAIS who are not members.
SAIS workers are paid the minimum wage, which applies to both manual and administrative workers (257 US dollars). The daily wage is paid at approximately 31 to 32 soles. Job rotation also applies.
In Huacraruco, they have 24 permanent field workers who have different functions: milkers, herdsmen, carpenters, administrators, they have almost no free staff. On the administrative side there are six employees. They also have a contingent of 10 people who are temporary staff, they work one or two months, when they need reinforcements.
Regarding the educational level of the workers, most of them have finished their primary education, few have finished secondary school. Those who work in the administrative area, usually have completed secondary school.
Regarding the presence of disabled people in the workforce, SAIS has a worker who cannot walk, but rides a horse and thus works guarding livestock. According to the SAIS representative, "we are thinking of changing his job to a less risky activity, such as controlling the entry and exit of people to the Huacraruco Annex.

Environmental and Social Impact Assessment of Forest Landscape Restoration Project December 2021
Social Capital Group 187
6.2.2.4 Productive activities
This section presents the characteristics of the economic-productive activities that are developed in the SAIS José Carlos Mariátegui, in terms of the type of products, their main markets and how they are organized for production.
6.2.2.4.1 Livestock activities
Livestock breeding and the processing of by-products is the main economic activity of SAIS. All members dedicate space, time and effort to livestock breeding, production and sale of milk and meat.
Since the eighties, SAIS stands out as breeders of fighting cattle, as described in the historical section. In addition, they have dairy cattle and Hereford cattle for meat production. They do not breed smaller animals. Daily the company produces between 700 and 800 liters of milk and the production of meat, is 30 to 40 torillones every 6 months, representing approximately 200 kilos each torillon.
At the level of the partners, the interviewees indicated that each one has their own cattle for meat and milk production, they work and sell individually, however, there is no data about the volumes of their production.
The members do raise small animals, but on a small scale, such as chickens, guinea pigs and turkeys. Most of this production is for self-consumption and very few sell their animals.
Most of the Company's livestock and by-products are destined for commercialization. The meat is sold mainly in Cajamarca, Trujillo and Lima. The buyers go directly to the SAIS, the purchase/sale of the animals is determined by weight with scales. Milk is sold to the company Nestlé. The Huacraruco Annex has a milk cooling tank, so that every two days Nestlé comes to pick up the milk at this facility. On the other hand, the private producers sell it to the Gloria Company.
In the last two years, due to the COVID-19 sanitary emergency, the production and sale of fighting bulls has been reduced. In the years prior to the pandemic, they sold between 100 and 150 bulls a year, receiving an average of between 12,000 and 13,000 soles for each bull, and even up to 16,000 soles. Income now comes mainly from the sale of milk and forest products.
The company owns its livestock and the respective profits. The profits are destined to the payment of the workers, their insurances, the social laws and the respective taxes for the properties to the Municipalities, for the sales they make.
Livestock production is carried out under the scheme of salaried work. The workers can be the children or relatives of the members, who have priority over those who are not related to the members. They are paid the minimum monthly wage, which ranges between 30 and 40 soles per day.

Environmental and Social Impact Assessment of Forest Landscape Restoration Project December 2021
Social Capital Group 188
6.2.2.4.2 Agricultural activities
Agricultural crops in SAIS are minimal, the SAIS representative interviewed pointed out that it is more expensive to grow crops than to raise cattle for milk and meat.
The Company only grows one hectare of potatoes for self-consumption, specifically in the Huacraruco Annex. The potato harvest is used to feed the company's workers. No agricultural by-products are produced.
As for the members, each one has an average of 2 to 3 hectares of land, although some have up to 6 hectares, depending on when they became members of SAIS. The SAIS is the owner of the land where the members live and produce.
Each member and family member may have a section on their plot to grow agricultural products, but most use their plot for cattle grazing and milk sales. When a member sows an agricultural product (potato and/or maize), the entire production is for self-consumption.
On a few occasions they have had excess production and have decided to take to the Cajamarca market. On two unique occasions, SAIS has sold potatoes to the Cajamarca market.
For agricultural production, the members rely mainly on family labour on their plots of land. They do not receive a monthly income for agricultural work. Even the crops that are cultivated in the company are conducted by the workers themselves; they do not hire additional workers.
6.2.2.4.3 Forestry activities
SAIS has had previous experience in the production and harvesting of forest plantations, although it was never a main economic activity. However, the activity was recently resumed after the Pandemic affected the breeding and commercialization of fighting cattle, one of its main sources of income, as mentioned above.
The first precedent of forest production dates back to 1978, when the Belgian Cooperation promoted a reforestation process in the area through the cooperation agency CICAFOR (later this agency changed its name to ADEFOR). At that time, an agreement was made in which SAIS ceded the land and CICAFOR the plants, management and technical advice. According to this agreement, plantations were made in Zone A of SAIS (see Table 6.9). However, the management of the form of payment for the workers posed some problems:
Some months they were paid by CICAFOR
Other months, they were paid in kind, with food
In some cases, the SAIS paid for the labour costs
The planting phase of the Project was completed in 1985 and SAIS retained the hectares of forest crops. The plantations in Zone A have already been cut down. The interviewees did not specify whether there was any follow-up and advice on the management and care of the plantation.

Environmental and Social Impact Assessment of Forest Landscape Restoration Project December 2021
Social Capital Group 189
In 1995 SAIS made another agreement with the Paramonga company for the installation of forestry plantations in Zone B. At that time, Paramonga paid for the labour and SAIS ceded the land. That plantation is the area that is currently being logged. The production is divided, one part belongs to Paramonga (approximately 2 hectares) and the rest is being harvested by SAIS.
ADEFOR is currently buying plantations in Zone B from SAIS. According to interviewees, it has reportedly purchased three-quarters of the area. ADEFOR has reportedly told SAIS that it needs to buy more timber. ADEFOR has developed a management plan for Zone B, which is approximately 500 hectares. There it has grown a variation of pine called pseudostrobus, the rest is patula and radiata pine, which are SAIS's own.
Usually the companies that buy the wood are in charge of the plantation's production process. That is to say, the companies hire labor, made up of workers from outside the community, not members. The SAIS is only in charge of ceding the land for the companies' production. For this reason, SAIS does not currently hire labour for forestry activities.
Given the agreement with ADEFOR, to reforest areas that are being cut down, they will soon begin the process of hoyación to take advantage of the rainy season in January and February.
Regarding the production of SAIS, the representative who was interviewed said that the species they produce are eucalyptus and patula pine, of which 500 hectares are destined for harvesting. There are also eucalyptus, pine and cypress for replanting, at least 100 hectares for each species. In one hectare, up to 900 plants are concentrated or can be planted. See Table 6.9.
The SAIS does not harvest forest by-products (edible mushrooms or firewood), or at least it is not recognized as an economic-productive activity.
Table 6.9 Forestry production SAIS José Carlos Mariátegui
Forest species Size of the plantation
Eucalyptus 500 hectares for harvesting
Patula pine, pseudostrobus 500 hectares for harvesting
Cypress 4/5 hectares
Eucalyptus, Pine and Cypress 300 hectares (100 ha per species) for replanting
Source: SCG Fieldwork, September 2021
The timber production is distributed among about ten different buyers, some of them are the following:
ADEFOR. It buys the production, looks for it in the SAIS and transfers it to the market in Cajamarca where they are in charge of its transformation process.
Minor local buyers, who move the wood to Cajamarca and Trujillo for the manufacture of parihuelas.
Buyers from Cajamarca, Huamachuco and Sunchubamba

Environmental and Social Impact Assessment of Forest Landscape Restoration Project December 2021
Social Capital Group 190
In terms of species marketed, SAIS sells pine production, but is not currently marketing eucalyptus or cypress. The buyers are in charge of taking the wood to the road and transporting it to its final destination. They usually sell per hectare, that is, 900 seedlings. As an example, the official interviewed mentioned that the last sale of one hectare amounted to a total of 83,000 soles per hectare. The transactions are usually made with cash payment.
SAIS intends to become directly involved in the process of production and management of forest plantations, but due to the reduction of manpower because of the pandemic, they have not started. Among these plans is the production of square timber, which they plan to manage and sell directly.
Regarding the achievements and difficulties of the forestry activity, the interviewed officials pointed out that pine production is an important achievement in itself for SAIS, in addition to the livestock activity.
Fires are one of the most serious difficulties and risks for SAIS. So far, they are not sure how fires start, they do not have mechanisms or protocols for prevention or to maintain better control of their territory, considering that it is a vast terrain.
6.2.2.5 Infrastructure
In terms of the general infrastructure available to the SAIS, the road infrastructure is limited. The best access to the SAIS is the road that leads from the district of San Juan to Huacraruco, approximately 11 kilometers of dirt road. This is classified as a lower category road, which does not have the characteristics of a highway. These roads tend to have problems during the rainy season, making it difficult to travel on them. This road is used to transport timber, generally by means of large trailers. Because of this, several years ago there were accidents with the surrounding population due to the dust generated in the transfers. However, no complaints have been received recently for this reason.
An alternative road, which is used by trucks, leads from the district of San Juan to Huacraruco, passing through Huar Huar. There are 15 kilometers of dirt road, on which there have been no known accidents.
The other alternative road flows from the district of Jesus to Huacraruco, it involves 16 kilometers of dirt road, where trucks and vans circulate, however, there is not much traffic on that road.
In terms of means of transport, the SAIS has a van, a large truck, a small truck and a tractor.
On the other hand, in relation to the existence of public services, in the SAIS the water supply for livestock production is done through artesian irrigation ditches that reach some plots. Water from streams, springs and rivers is used in the plots. In the Company, they have canals and access to water through shifts for irrigation. The main natural water source is the Clarillaco stream, which supplies the entire SAIS.
Sprinkler irrigation is used for the Company's agricultural crops as well as for the crops on the partners' plots, but only rainwater is used for the forestry plantations.

Environmental and Social Impact Assessment of Forest Landscape Restoration Project December 2021
Social Capital Group 191
On the other hand, in terms of productive infrastructure, in Huacraruco there is a warehouse where the concentrated products for livestock feed are deposited. They buy 10 tons of these products every 3 or 4 months in the city of Trujillo that must be stored.
In addition to the warehouse, they have corrals for the animals, 5 spaces in total, which are located in Huacraruco. In this place they also have a milk cooling plant.
The internal productive equipment is very basic, while the interviewed official pointed out that they only have handmade tools.
For use in the administrative facilities of the company, they have desktop computers and laptops. These have internet connection only in the office, the provider is the company Claro. In the homes of the partners the main means of communication is the cell phone and the provider company is Entel, which has the largest coverage in Huacraruco.
Regarding basic services, the members' houses have a connection for drinking water. It is possible that the valves of the same need maintenance because sometimes the water is cut off. On the other hand, the artesian canals used for production are maintained from time to time. The drainage service only exists in the "big house" or former hacienda, where the SAIS offices are currently located. In the houses of the members, there are only latrines.
The electricity service is provided by Hidrandina. More than 50.0% of the population has electricity connection (the houses near the office); approximately 30.0% have connection with solar panels by the company Acciona, located in the area of Lanchepata; and 30.0% have no service at all.
6.2.2.6 Cultural practices in production processes
The SAIS JCM is located in the territory of three districts of Cajamarca, Asunción, San Juan and Jesús. The patronal feasts of Catholic tradition in these districts are celebrated on August 15 in honor of the Virgin of Asunción, in the district of Asunción; on January 20 they celebrate the patronal feast of the Dulce Nombre del Jesús in the district of Jesús; and, on June 24 is the patronal feast of the district of San Juan in honor of San Juan Bautista.
Notwithstanding the above, the main festival celebrated in the SAIS is in honor of Santa Monica, on May 4. According to the SAIS representative, this festivity has ceased to be celebrated as they used to, since the death of its promoter and organizer. This situation is compounded by the limitations that exist for any social, cultural or religious event in the current context of the COVID-19 pandemic.
On the other hand, the activities that SAIS is resuming as part of its tradition in livestock production, are the bullfights. The last one was held on August 30 of this year. According to the interviewee, approximately 200 visitors came from Cajamarca, Trujillo, Huamachuco, Matara, among others. This activity had a commercial purpose to promote the fighting cattle, sold tickets, whose value ranged between 30 and 100 soles, with the right to food. Given the success of the event, they are planning a second activity, a Coso Taurino, which will be held in Huacraruco.

Environmental and Social Impact Assessment of Forest Landscape Restoration Project December 2021
Social Capital Group 192
With these activities, the SAIS is recovering the space in which it participated in external bullfighting events, where it achieved recognition and awards for the bullfighting cattle it owns. Currently, it is replicating those spaces according to its experience, and surely, it is adapting and re-signifying them in the local context.
6.2.2.7 Relationship with other institutions
This section presents the public and private entities with which the SAIS JCM maintains links and relationships. It also addresses the situation of social conflict and how it is affecting the organization.
The SAIS does not maintain a fluid relationship with the municipal authorities; they only relate to them for the fulfilment of their tax obligations. The SAIS does not develop social or productive programs at the initiative of the municipality and has not even intervened in problems of social conflict, such as the one caused by the invasion of the company's land.
The National Service of Natural Areas Protected by the State (SERNANP) has provided them with specific training on the management of the State's hunting reserve, but according to the officials interviewed, they do not consider that these activities have been of any importance to the SAIS. Mainly, they point out that these activities have not been useful for the protection of the hunting reserve, as it is currently occupied in an informal manner.
There is also no presence of the State through the Peruvian National Police for security issues. The complaints presented by the SAIS regarding the invasions have not been received and responded to by this entity. Likewise, the Public Prosecutor's Office only intervenes when there are cases of deaths due to violence caused by land conflicts, but then they withdraw and do not follow up.
The only civil society organization with which they maintain an important relationship is ADEFOR, which has provided them with training and with which they conduct negotiations for plantations and timber sales. They also maintain relations with private companies that buy their products (milk and meat). Apart from these actors, they have no relationship with others.
According to the representative consulted, the main stakeholders of the SAIS are the authorities that must intervene in land conflicts: municipal authorities, the Peruvian National Police and the Public Prosecutor's Office.
In relation to the issue of conflict, one of the main conflicts in the history of SAIS, a little more than a decade ago, was the invasion of their territories located in the district of Cospan, by some members/workers of SAIS and their children. It was a violent event that resulted in the death of one of its directors. On that occasion, in order to end the conflict, SAIS negotiated with the invaders, allowing them to remain in the occupied territory in exchange for avoiding further invasions.
According to the SAIS representative, after the conflict in Cospán, there have been new invasions. In this case, the territory of Huacraruco is being invaded by people who are not members of the SAIS, but are people who come from other localities, some from the district of Asunción (La

Environmental and Social Impact Assessment of Forest Landscape Restoration Project December 2021
Social Capital Group 193
Rinconada), also from the district of Jesús (Huayllahual) and people from the coast. This time they are invading the territory in Huacraruco and there have been reports of disappearances and murders. So far, according to the interviewee, they have invaded approximately 500 hectares of territory where they have built houses and used the land to grow agricultural crops.
The invasions have been taking place in the Huacraruco and Huaycot areas for more than 5 years, but have not occurred in the Sunchubamba area. The SAIS is developing some strategies so that the invasions do not advance any further. For example, the gate at the entrance of Huacraruco has been established to control people entering the SAIS.
In these events, they consider that they have not had an adequate response from the institutions of the justice sector, as they have not been present. It is only the workers themselves and the company that defend their territory.
Likewise, another conflictive event occurred recently, on September 7 or 8, 2021, when the president of the Sanitation Service Administration Board (JASS), Mr. Freddy Torres, was shot. Several of these confrontations are due to the theft of cattle. The SAIS is trying to defend itself and recover the cattle.
According to the authorities of the Regional Government (GORE) consulted about this social phenomenon, the invasions in the SAIS have been going on for more than 10 years. They consider that the problem is complex and would require the intervention of one or more specialized public entities to solve it. Among the causes of the conflict they mention:
The lack of procedures to define the mechanism through which the children of the partners can replace their father if he dies or decides to retire.
The lack of operability of the Oversight Council, created to oversee the use of SAIS lands.
The lack of control and management of the Sunchubamba protected area or hunting reserve due to the implications it has had on the use of violence with firearms.
The trafficking and sale of land without the authorization of the SAIS bodies, which make decisions and operationalize them, i.e. the General Assembly of Delegates and the Board of Directors.
Institutional weaknesses due to the lack of cohesion of the social base and administrative and managerial limitations.
The lack of presence of State institutions in the area, as well as the lack of timely response by the authorities with the competence to intervene and mediate in the conflict, has led SAIS to apply defence mechanisms within its reach.

Environmental and Social Impact Assessment of Forest Landscape Restoration Project December 2021
Social Capital Group 194
6.2.2.8 Sunchubamba Protected Area
Ministerial Resolution No. 00462-77-AG, promulgated on April 22, 1977, established the Hunting Preserve on SAIS José Carlos Mariátegui Lands. In this Resolution, in its Article 1, it is called "Sunchubamba Hunting Preserve", and its boundaries are defined in the four cardinal points. Article 2 determines that the SAIS will administer the Game Preserve in accordance with the technical and administrative guidelines issued by the Forestry and Wildlife Directorate, with the Agrarian Zone III in Huaraz and with the legal provisions in force. Finally, it indicates that the mentioned Agrarian Zone will control the administration and operation of the activities of the Hunting Preserve and must inform, at that time, the General Forestry and Wildlife Directorate. These functions currently correspond to SERNANP.
The SAIS representative interviewed estimates that this protected area is approximately 10 hectares, located near Salagual and closer to Sunchubamba than to Huacraruco.
The official comments that it was a hunting reserve because there were deer in the area but that they are now extinct. According to him, this territory belongs to the State and not to the SAIS; the latter has no say in the management of the hunting reserve. Although, several years ago, there was a person in charge of the protected area on behalf of the Ministry of Agriculture, no one is currently protecting the reserve.
Surely because of this situation, the official indicates that the area was invaded and is now occupied and inhabited, there are houses and also cultivation areas. On occasion, they have been visited by representatives from SERNANP, Chiclayo Office, to talk about the protected area and the hunting ground, but nothing has been done about the invaders who now occupy the area.
6.2.3 Llullapuquio Agrarian Workers' Cooperative
6.2.3.1 History
The CAT Llullapuquio is located 40 km south of Cajamarca, in the district of Chetilla, department of Cajamarca and province of Cajamarca, in the Quechua Region, eastern slope of the Andes. Its territory is located in what was once the Llullapuquio hacienda, owned by the family of Mr. Roberto Cacho Cépeda of Trujillo origin, one of the last landowners in the region. At that time, the hacienda was dedicated to agriculture and cattle raising. In the agricultural activity, the ranch produced peas, beans, potatoes and olluco; while in the cattle raising, they were dedicated to the raising and commercialization of the bovine cattle.
In 1969, the Agrarian Reform was applied by the military government of Juan Velasco Alvarado, who expropriated large extensions of land from haciendas and awarded them to associative companies of workers53 and farmer communities. This measure was also applied in the Cajamarca region, constituting the SAIS José Carlos Mariátegui, SAIS Llullapuquio, SAIS La Collpa, SAIS El Milagro, SAIS Atahualpa and SAIS Chale. Of all these, only the first one remained as such, since
53 The two main workers' associative enterprises promoted by the Agrarian Reform were the Agrarian Production Cooperatives (CAPs) and the Agricultural Societies of Social Interest (SAIS). Although both are based on the principle of self-management, the difference between these organizations is that the latter have the old hacienda as their unit of production and also distribute the surplus of their production to the surrounding farmer communities that do not have greater resources. Chirinos-Almanza, Alfonso (1975) La Reforma Agraria Peruana, Nueva Sociedad.

Environmental and Social Impact Assessment of Forest Landscape Restoration Project December 2021
Social Capital Group 195
the others were subdivided among the owners or constituted as cooperatives. In the case of SAIS Llullapuquio and SAIS Atahualpa, both were constituted as cooperatives called Cooperativa Agraria de Trabajadores LLullapuquio and Cooperativa Agraria Atahualpa Jerusalén (Granja Porcón) respectively.
Since its constitution as an associative entity in 1986, CAT LLullapuquio has been immersed in a land conflict. Disagreements and internal divisions began in 1983 with discussions between those who promoted the creation of the cooperative entity and those who disagreed because they preferred the fragmentation of the ranch and the distribution of individual plots. In spite of these circumstances, the Cooperative was able to obtain title and become a cooperative in February 1986. The conflict over the land has been ongoing since then, and a confrontation between 700 people took place on March 14, 1992, where there was crossfire and farmers were killed.
Also, according to the cooperative's representatives, the group currently seeking the dissolution and liquidation of CAT Llullapuquio is made up of outsiders who are not members and who have acted judicially, achieving the issuance of a ruling by a judge ordering the dissolution and liquidation of the cooperative. However, the Board of Directors has filed an appeal, since the 51 members that currently make up the cooperative do not agree with this judicial sentence and consider it fraudulent, since only active members can request a dissolution. 54legal situation of CAT Llullapuquio is currently at an impasse.
Finally, the Cooperative is actively seeking to improve its productive activities in agriculture, livestock and forestry activities through technical advice and the acquisition of modern equipment.
6.2.3.2 General characteristics
According to property title 15485, CAT Llullapuquio has an extension of 3,499 hectares. The land is owned collectively and belongs to the CAT. Each member has been assigned one hectare of land to build a house and develop some productive activity. According to the representatives interviewed, most of the members accept collective ownership and do not want it to be divided into plots.
Since its origin, CAT has diversified its productive activities. Currently, most of the land in use (1,000 hectares), which is dispersed, is dedicated to agricultural production, mainly cereals and tubers.
For forestry plantations, they use the highest part of the land, 600 hectares in total, with crops of radiata and patula pine, eucalyptus and cypress, of which some plantations are more than two decades old, soon, they will start harvesting the wood.
Although the proportion of land dedicated to livestock farming is smaller than for agriculture and forestry plantations, cattle raising is the most important economic activity for the sustainability
54 Chronological details of the social conflict over the lands of the Llullapuquio Cooperative are developed below.

Environmental and Social Impact Assessment of Forest Landscape Restoration Project December 2021
Social Capital Group 196
of the Cooperative. For this activity, they allocate 300 hectares in the lower part of the territory, where the pastures are located for raising dairy and beef cows.
Given that they still have a considerable area available without productive use (1,500 hectares), the members have planned to expand and seek the necessary strengthening for the production of forestry plantations. The timber harvest that will begin soon, plus plans to expand forest production, motivated them to set up a carpentry workshop, an activity that is still in progress.
6.2.3.3 Organizational structure and decision making
Currently, the Cooperative is made up of 51 members, of which approximately 15 are women.
For its operation, the Cooperative relies on the organizational structure implemented during the Agrarian Reform, although it was instituted until 1986, when the context surrounding the conformation of associative entities was beginning to be questioned. 55
The General Assembly of Members, the highest decision-making body, is made up of the 51 members, all of whom are called upon to participate and give their opinions. In this space they expose their approaches and discuss to reconcile agreements.
The Board of Directors is in charge of managing the company on behalf of the partners, it is comprised of seven partners, two of whom are women. Under its direction is the Management, a position occupied by another partner, and other operative units, as well as the committees that are instituted to carry out specific functions. In the case of Llullapuquio, there are Marketing Committees for agricultural and livestock activities.
The Supervisory Board, made up of five members of the Cooperative, is the body in charge of supervising the accounting and administrative areas; however, it is more oriented towards the establishment of controls.
The Board of Directors and the Supervisory Board are appointed by the General Assembly of Members. This entity calls for elections every 3 years, ensuring the application of democratic methods by voting through slates of incumbents and alternates or viva voce, propose their candidates and elect them.
6.2.3.4 Productive activities
The Llullapuquio Cooperative has managed to diversify its productive activities, combining agricultural crops, livestock and forestry plantations; in the future, it intends to venture into carpentry and participated in a pilot project with the district municipality to raise trout.
6.2.3.4.1 Agricultural activities
Agriculture is the activity that concentrates the largest proportion of land for production (1,000 hectares). The agricultural production of the Cooperative specializes in two types of crops:
55 Bonfiglio, Giovani (2019) Las Empresas de la Reforma Agraria Peruana, 40 años después, Instituto del Perú, Peru.

Environmental and Social Impact Assessment of Forest Landscape Restoration Project December 2021
Social Capital Group 197
legumes, mainly peas, lentils and beans; they also plant tubers, such as potatoes, ollucos and ocas, although they did not specify the quantities that they usually cultivate and harvest annually, the interviewees indicated that approximately 70.0% of the agricultural production is destined for family self-consumption; 15.0% is kept as a seed reserve and another 15.0% is destined for commercialization.
The Cooperative does not process or transform agricultural products; however, the interviewees expressed their interest in strengthening their technical capacities to learn how to process some of their crops. For this, they recognize that they need accompaniment and advice to provide them with the tools to implement a process of transformation of legumes or tubers.
Regarding the way they organize themselves for agricultural production, in the CAT they use traditional communal work, or Minka, in all phases and tasks, including fallow, sowing, weeding and harvesting. However, recently the COVID-19 health emergency prevented this type of collective work from being carried out normally because of the impossibility of working together, causing delays in agricultural activities.
In the productive activities of the Cooperative, both the members and the members and their families are involved. Only when necessary, they resort to hiring labour from outside the CAT. External labour is hired only when the member/worker is not present. If workers from outside the CAT are hired for day labor, they are paid 30 soles per day, or 930 soles per month.
The cooperative's worker-members are paid the minimum wage: 930 soles per month, an average of 30 soles per day; however, on some occasions they have had difficulties in fulfilling this commitment due to legal problems that also demand expenses.
In total the Cooperative has a contingent of 70 workers with members and non-members, of which five are non-member women who are permanently employed. The women members are integrated into the work of the Cooperative a couple of days a week, regularly participating in grazing and milking cows. The rest are CAT members and some non-members involved in other livestock activities.
The workers who are not members of CAT come from Chetilla, Porcón Esperanza, Chames, all from surrounding communities to facilitate the transfer.
With regard to the educational level of the workers, the vast majority have only primary education, including some of the directors of the Board of Directors.
As for the commercialization of the products, the production is sold from the facilities of the CAT, their main clients are the populations of the neighboring hamlets that come to their offices. Part of the production is also transferred to the district market in Chetilla. But regularly people come to the CAT to look for the products.
As for the marketing mechanism, the Board of Directors has appointed a Marketing Committee, composed of five members of the Cooperative, who are responsible for negotiating and placing the production of the Cooperative, either in its administrative offices, or in the market of Chetilla.

Environmental and Social Impact Assessment of Forest Landscape Restoration Project December 2021
Social Capital Group 198
A percentage of the total sales of the agricultural production (the interviewees did not specify how much), is constituted in funds for the operation of the Cooperative and another minimum percentage goes to the partners/workers. The interviewees pointed out that the agricultural activity does not really generate profitability for them. Sometimes it generates only what is necessary to cover the salaries of external workers and other expenses, but at the level of the members, they receive very little income from this activity.
This situation is attributed to the lack of technology and technical advice not only for the transformation into agricultural by-products but also for the administrative aspects.
6.2.3.4.2 Livestock activities
The livestock activity is carried out in a space of approximately 300 hectares of land for the breeding and grazing of cattle. At the CAT level, they have Brown Swiss and Hereford cows, basically for milk and meat production. The representatives interviewed did not specify the number of head of cattle, nor the amount of milk and meat they produce. However, they indicated that milk production is marketed with the companies Nestlé and Gloria. Meat is taken to the market in the Plaza Agropecuaria in the city of Cajamarca, or else the collectors come to buy directly from the Cooperative.
Regarding family livestock production, this is only carried out with the raising of small animals (chickens), and is intended for self-consumption. The interviewees made no reference to the raising of cows on family plots.
The working mechanism for livestock production is through the designation of CAT members for that particular activity, or for the hiring of cowboys. Sales are in charge of the Marketing Committee.
Members/workers and family members who work as cowboys earn an average salary of 600 soles per month, which is below the minimum wage. Moreover, for this particular activity, they do not usually hire external labour. This means that livestock partners/workers, like agricultural partners/workers, have difficulties in receiving their full salary.
According to the perception of the CAT members, the livestock activity is not very successful either. They mentioned that the main difficulty is that they lack good pastures for cattle feeding, which can cause a decrease in milk and meat production; they also mentioned that they do not have access to technology for the genetic improvement of cattle. However, they do not consider necessary advice or the possibility of innovating their livestock production systems.
6.2.3.4.3 Forestry activities
The forestry activity has been carried out since before they were constituted as CAT, initiated by the former partners driven by the Belgian Cooperation and in coordination with the Peruvian State, which offered incentives for forestation. At that time the reforestation process was in force and functioning in various areas of the Cajamarca Region.

Environmental and Social Impact Assessment of Forest Landscape Restoration Project December 2021
Social Capital Group 199
For this activity, CAT allocates so far, approximately 600 hectares of land. It is worth mentioning that the land that remains available or without exploitation with some type of production, constitutes more than 40.0% of the total land area of the Cooperative (3,499 hectares). On the same, they indicated that it is projected to devote it to forestry activity.
The Cooperative's forestry activity takes place in the villages of Tambillo, Capulpampa, Quinuayoc, Mala Muerte, where most of the pines are radiata. They did not specify dimensions for each hamlet. The rest of the species, patula pine, eucalyptus and cypress were produced in smaller quantities, mainly the last two species.
The pine plantations date back to 1983, the cultivation was carried out with the support of MIDAGRI. Two decades later (2004), an agreement was made with ADEFOR for 200 hectares of plantation, wood that is committed and ready to be harvested. So far, the Cooperative has no experience in harvesting timber, nor has it had the experience to market it.
Recently, in 2019, the Cooperative installed a nursery with its own resources with a capacity of 60 thousand seedlings. As a result of the first production of this nursery, 50 hectares of timber seedlings were planted in the district of Chetilla with the support of SERFOR and MIDAGRI. Likewise, the plan is to plant up to 150 hectares in 2 years. To do this, they will require technical assistance, which they sometimes receive from SERFOR, 56although it is not a permanent accompaniment.
Regarding the production and use of forest by-products, edible mushrooms within the pine plantations are harvested and marketed. However, this is an activity that is done directly by the member and his family, with the permission of the CAT. The mushrooms are taken to the Chetilla market to sell, or some people buy them from the Cooperative.
According to those interviewed, the forestry activity will be carried out by the members who so decide, they will form the Marketing Committee, a foreman will be appointed and external workers will be hired if necessary.
In relation to this activity, the CAT representatives consider that the greatest benefit is the opportunity to engage in a new economic activity that allows the generation of sources of employment, mainly for the families of the members, including the youngest ones. Furthermore, in addition to the economic benefits, forestry activities allow them to have an economic activity close to their place of residence and not be forced to go to other distant locations to look for work.
So far, the main difficulty they have faced as CAT is not having all the necessary tools and machinery to carry out this type of activity, considering that their experience, knowledge and equipment may be limited.
The challenge for CAT, in the short term, is to improve the conditions of the forest nursery, expand the plantation, and take advantage of the by-products of the plantations.
56 Interview with SERFOR representative, September 2021.

Environmental and Social Impact Assessment of Forest Landscape Restoration Project December 2021
Social Capital Group 200
The alliance with ADEFOR for the sale of 200 hectares of the plantation is an opportunity to keep the forestry project alive and seek opportunities for economic benefits.

Social Capital Group 201
Figure 6.4 Llullapuquio Cooperative

Social Capital Group 261
6.2.3.5 Infrastructure
In relation to the infrastructure available to the CAT, access roads are key to the business dynamics. The main one is the road that leads from Llullapuquio to Chetilla, a trail that is affirmed by sections but is not in good condition. In the rainy season the road becomes dangerous and even more so because of the risk of landslides. Another key infrastructure is the access bridges, which are also deteriorated.
There are two alternative access routes to Llullapuquio, via Majarapampa and via La Colpa, but they can only be used in the summer months, since in winter they are more difficult to travel and could be dangerous.
In the area there is a lack of public transportation to Llullapuquio, so it is necessary to use taxis, with the estimated cost per trip being around 100 soles, an amount that doubles for round trips. In the area it is customary to use the "milk cart" of the Nestle Company, because it charges 5 soles per person per trip.
The infrastructure for production in CAT is quite basic. For agriculture they use gravity or flood irrigation through natural, unlined canals. The same canals are used for cattle watering. The representatives consider that the conditions of these canals are regular and therefore require maintenance. As part of the equipment, they have a tractor, two portable sawmills, an edging machine and yuntas.
The services in the CAT offices have had some improvements, the water facilities for human consumption are newly refurbished and have water reservoirs. For sanitation, there are no drains, but they have latrines (cesspools). They also have electricity from the Chetilla hydroelectric plant and pay a flat rate. Finally, they emphasized that they have considered it important to provide internet access, however, they do not have good coverage. The only operator that reaches the area, but with certain difficulties, is Claro.
6.2.3.6 Cultural practices in production processes
The Llullapuquio Cooperative maintains the tradition of collective work through the celebration of Minkas, for agricultural production, as explained above. Within this framework, the approach and assessments made by the representatives of the Llullapuquio CAT regarding their desire to maintain the associative figure to produce, market and coexist can be understood. These practices may be alien to some and may conflict with the current individualistic logic. On the other hand, the COVID-19 health emergency affected this collective work because of the impossibility of carrying out joint activities.
Regarding other cultural manifestations in the CAT, some festivities of religious origin stand out. Among these activities is the patron saint festival of Chetilla, in honor of San Sebastian Chetilla, which is celebrated on June 1; the carnivals in February and unshas in the district and hamlets. The unsha is a tree that is planted in the middle of the street and decorated with colors and various items, which must be felled with an axe. A festivity typical of the Llullapuquio Cooperative is the anniversary of the CAT, which used to be celebrated on December 14th of each year, but was left aside because of the COVID-19 pandemic. It is important to mention, however, that some
Environmental and Social Impact Assessment of Forest Landscape Restoration Project December 2021
Social Capital Group 260
of the members of CAT Llullapuquio, profess the Adventist religion, which is why they refrain from participating in cultural activities that contravene their beliefs or religious principles.
6.2.3.7 Relationship with other organizations and institutions
This section deals with the relationship between the Cooperative and public and private entities. It also describes the situation of social conflict around the Llullapuquio Cooperative and how it affects its institutional framework.
Relations with local authorities are not close although they have had the opportunity to develop some projects with some instances. With the District Mayor's Office they have developed a trout fish farm project, which is about to end. They should verify with this institution if in the short term they are going to develop a next phase. Likewise, with the Provincial Municipality, work has been done based on the donation to the Cooperative of radiata pine seedlings that are being used in their forestry nursery.
With public sector institutions, the Llullapuquio Cooperative has participated in SERFOR training and technical assistance activities. With non-governmental organizations, communication with ADEFOR is frequent around the agreement for the forest plantation that is in the harvesting phase.
The interviewees did not refer to any specific social actor with the capacity to influence that could be considered a stakeholder of the Cooperative. However, they mentioned that they do not agree with the mining activity.
In relation to the issue of conflict, CAT LLullapuquio has been immersed in land conflicts almost from the moment of its constitution in 1986. Disagreements and divisions began in 1983 between those who promoted the creation of the cooperative and those who disagreed, but the cooperative was founded in February 1986. The confrontations between the two groups continued over time, however, in March 1992 the situation escalated into a confrontation with firearms that resulted in the death of several people.
In 1994, by Ministerial Resolution 61-94, the CAT Llullapuquio was titled with the title 15484; a year later, in 1995, by means of Directorial Resolution 642-95, it was decided to annul the title so that individual plots could be adjudicated. Subsequently, the PETT Mission57of MIDAGRI stated that the disintegration of the CAT was not appropriate, nor was the nullity of title deed 15485.
In 2012, the antagonistic group requested the dissolution of the CAT Llullapuquio before judicial instances that resolved in their favor according to File 307-2012. Subsequently, the CAT has requested the nullity of this sentence as it is considered a fraudulent case, they are taking legal advice from private lawyers, which implies additional expenses and resources to the CAT.
The confrontations between the two groups have been maintained to date, on the one hand, the Directors of the CAT wish to remain organized under this associative figure; and, another group seeks the liquidation and dissolution of the Cooperative to proceed with the parceling of the
57 Special Land Titling and Rural Cadastre Project-PETT. Its mission is to formalize the ownership of land for agricultural use, to promote the development of an agile and transparent rural land market.
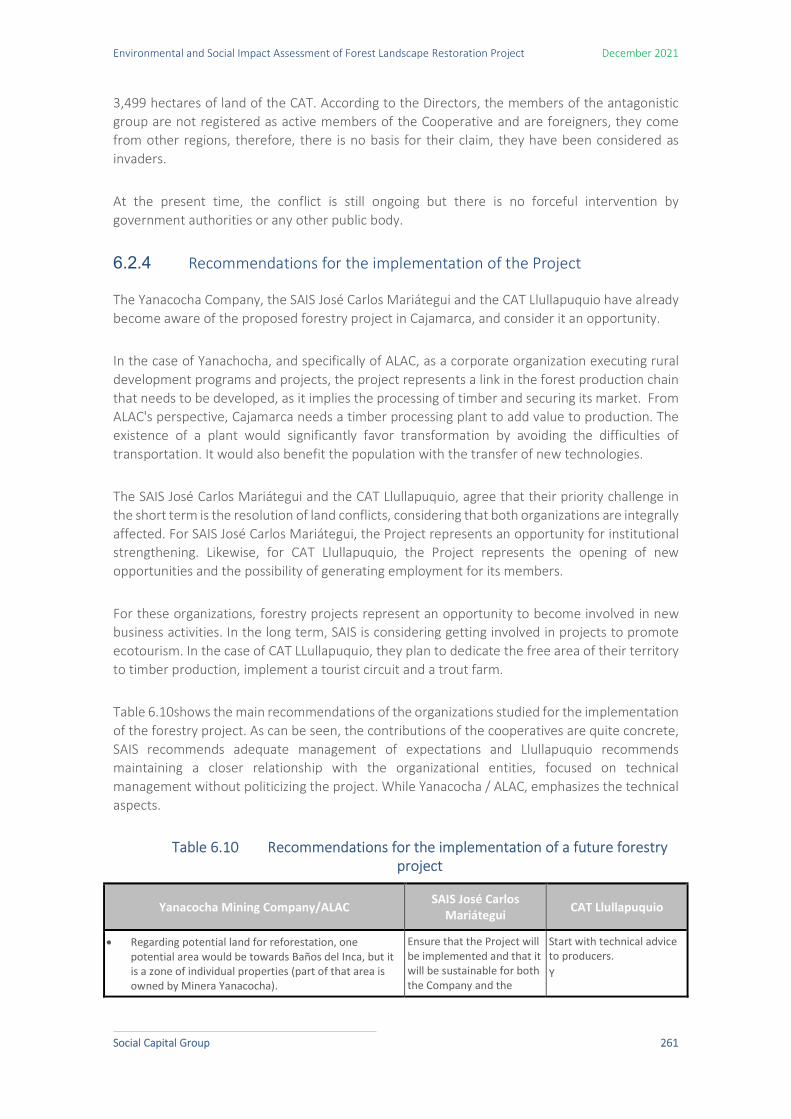
Environmental and Social Impact Assessment of Forest Landscape Restoration Project December 2021
Social Capital Group 261
3,499 hectares of land of the CAT. According to the Directors, the members of the antagonistic group are not registered as active members of the Cooperative and are foreigners, they come from other regions, therefore, there is no basis for their claim, they have been considered as invaders.
At the present time, the conflict is still ongoing but there is no forceful intervention by government authorities or any other public body.
6.2.4 Recommendations for the implementation of the Project
The Yanacocha Company, the SAIS José Carlos Mariátegui and the CAT Llullapuquio have already become aware of the proposed forestry project in Cajamarca, and consider it an opportunity.
In the case of Yanachocha, and specifically of ALAC, as a corporate organization executing rural development programs and projects, the project represents a link in the forest production chain that needs to be developed, as it implies the processing of timber and securing its market. From ALAC's perspective, Cajamarca needs a timber processing plant to add value to production. The existence of a plant would significantly favor transformation by avoiding the difficulties of transportation. It would also benefit the population with the transfer of new technologies.
The SAIS José Carlos Mariátegui and the CAT Llullapuquio, agree that their priority challenge in the short term is the resolution of land conflicts, considering that both organizations are integrally affected. For SAIS José Carlos Mariátegui, the Project represents an opportunity for institutional strengthening. Likewise, for CAT Llullapuquio, the Project represents the opening of new opportunities and the possibility of generating employment for its members.
For these organizations, forestry projects represent an opportunity to become involved in new business activities. In the long term, SAIS is considering getting involved in projects to promote ecotourism. In the case of CAT LLullapuquio, they plan to dedicate the free area of their territory to timber production, implement a tourist circuit and a trout farm.
Table 6.10shows the main recommendations of the organizations studied for the implementation of the forestry project. As can be seen, the contributions of the cooperatives are quite concrete, SAIS recommends adequate management of expectations and Llullapuquio recommends maintaining a closer relationship with the organizational entities, focused on technical management without politicizing the project. While Yanacocha / ALAC, emphasizes the technical aspects.
Table 6.10 Recommendations for the implementation of a future forestry project
Yanacocha Mining Company/ALAC SAIS José Carlos
Mariátegui CAT Llullapuquio
Regarding potential land for reforestation, one potential area would be towards Baños del Inca, but it is a zone of individual properties (part of that area is owned by Minera Yanacocha).
Ensure that the Project will be implemented and that it will be sustainable for both the Company and the
Start with technical advice to producers. Y

Environmental and Social Impact Assessment of Forest Landscape Restoration Project December 2021
Social Capital Group 262
Yanacocha Mining Company/ALAC SAIS José Carlos Mariátegui
CAT Llullapuquio
Carefully develop a strategy to explain the advantages of Cajamarca for timber production that does not lead to confusion and misinterpretation by individual landowners or associative entities.
Work in coordination with the producer, empowering them with knowledge and tools.
Distinguish strategies among the actors to be involved (authorities, institutions, universities, NGOs, landowners, Cooperatives/SAIS).
Solid bases to make the Project sustainable and attractive all twelve months of the year. Identified the benefit either for the Mining Company and/or the associative entities.
A clear reading of the economic, social and political context and situation.
Have the regulation up to date with all permits and clear processes
A careful analysis of the possible risks: distinguishing work with individual producers from work with collective producers, the difficulties of access roads in Cajamarca, the social conflict in the region over the mining issue, territory, etc.
producers involved in the Project.
Maintain a technical administrative management of the Project
Actors to involve: Regional, Provincial, District Governments (aligned on social welfare purposes) Public institutions of the agricultural and forestry sector, interested organizations and companies, the ronderos, the landowners (individual or collective)
Actors to involve: Only SAIS and the Company
Actors to involve: The Regional Government SERFOR Private companies
Source: SCG fieldwork, 2021.
6.3 Potential areas of influence (PAI)
This chapter describes the social characteristics of the Project's zones of interest in each of the thirteen districts located in the potential area of future expansion of operations (PAI). The zones of interest are those areas within the district territories where forest plantations are feasible, considering their altitude, slope and current land occupation.
In addition to the social characteristics of these areas, this section also presents the perceptions of the district authorities on the forestry potential of the areas of interest, the experiences of forestry projects in the district and the recommendations that the officials put forward in the case of an eventual future implementation of the Forestry Project.
6.3.1 Province of Cajamarca
6.3.1.1 District of Asunción
In the area of interest in the district of Asunción are the towns of Pachani de Huayllahual, Agua Colorada, Chim Chim and Shirac, located between 3182 and 3411 m.a.s.l., in the eastern part of

Environmental and Social Impact Assessment of Forest Landscape Restoration Project December 2021
Social Capital Group 263
the district, near the district boundary that borders the district of San Juan, Jesús and Cospán (see the following Figure).
Figure 6.5 Zone of interest in the Asunción District
Prepared by SCG
According to the INEI's 2017 Population Centers Directory, the hamlets of Chim Chim and Shirac have 165 and 112 registered inhabitants, respectively, while the hamlets of Pachani de Huallahual and Agua Colorada have 9 and 6 inhabitants, respectively. On the other hand, the closest hamlet to the district capital is Shirac and the farthest is Chim Chim (see Table 6.11).
Table 6.11 Data on localities in the zone of interest in the district of Asunción
Location Altitude (m.a.s.l.)
Census population Housing
Km to district capital
Time to district capital
Pachani of Huallahual 3 283 9 4 45.9 km 2 hours and 30
minutes
Agua Colorada 3 611 6 6 40.9 km 3 hours and 30
minutes
Chim Chim 3 468 165 57 29.6 km 5h
Shirac 3 182 112 77 55.4 km 2 h
Source: Directorio de Centros Poblados 2017 and Sistema de Consulta de Centros Poblados - INEI.

Environmental and Social Impact Assessment of Forest Landscape Restoration Project December 2021
Social Capital Group 264
According to the Information System on Campesino Communities of Peru (SICCAM), the hamlets of Chim Chim and Agua Colorada are within the territories of the San Juan de Cachilgón Campesino Community and annexes, recognized on November 23, 1949, with 2,330.27 hectares of titled extension.
According to the officials interviewed in the field58, the inhabitants of the hamlets in the area of interest are mainly engaged in subsistence agriculture and dairy cattle farming. In the agricultural activity, potato, olluco and ocas crops predominate, of which approximately 80% is destined for self-consumption. Regarding the livestock activity, the predominant activity is the breeding of cows for the sale of milk and the elaboration of cheese. The water supply for both activities comes mainly from rain, tributaries and springs. The interviewees mentioned that there are difficulties during the dry season (August-December) due to the low water flow, which affects the pastures for the dairy cattle, the main source of income for the hamlets.
Regarding access roads, the informants mentioned that there are dirt roads that are characterized by being stony and in regular maintenance condition. During the rainy season (January to April) there are stretches of the roads that become impassable. The area does not have public transportation services, so the inhabitants travel on foot, use private transportation (taxis, motorcycle taxis) or use the vehicles that the municipality makes available to the population.
The villages in the area of interest have water and sewage services. For the provision of water services, they have Administrative Boards of Sanitation Services (JASS). Likewise, the officials mentioned that the program Goal 5 established by the Central Government, which seeks the provision of the service and the quality of water in the districts59, has contributed to make improvements in the district regarding this service.
On the other hand, the authorities interviewed mentioned that there are sectors in the area of interest that could be dangerous due to security problems (one could be a victim of assaults and robberies). They also mentioned the land conflict between landholders related to the Huallahual and La Rinconada hamlets and the SAIS José Carlos Mariátegui. This conflict has reached a scale of violence with significant confrontations that have resulted in deaths and the reported use of firearms, as mentioned in the "Relationship with other institutions " section. These events have caused the border zone between the districts of San Juan, Jesús and Asunción to be considered by the local population and authorities as a red zone of citizen insecurity.
Perceptions of forestry potential in the area
According to the authorities interviewed, the area of interest currently has plantations. These are eucalyptus plantations, generally cultivated in small plots of 1 to 2 hectares. The population prefers this type of plantation because it functions as a defence or containment barrier against possible landslides during the rainy season. In this sense, in order to modify the production
58 Ramiro Eulogio Sánchez Noboa, Deputy Manager of Economic Development and Environment, and Melissa Paola Becerra Zelada, Deputy Manager of Social Development and Culture. 59 MEF (2021) - Guide for the fulfillment of Goal 5 of the Municipal Management Improvement Incentive Program https://www.mef.gob.pe/contenidos/presu_publ/migl/metas/GUIA_META_5_PI_2021.pdf

Environmental and Social Impact Assessment of Forest Landscape Restoration Project December 2021
Social Capital Group 265
system and diversify forest crops from eucalyptus to pine and move on to extensive plantations, it would be necessary to raise awareness and promote associativity among producers.
On the other hand, the authorities also mentioned other potential areas in the zone to be considered, but which are not in the area of interest shown in the reportError! Reference source not found.. These are the villages of Catulla and Catillambi, where large tracts of land are available for further reforestation.
Regarding the willingness of the authorities to support the Forestry Project, they mentioned that the current administration is willing. However, they stressed the importance of ensuring the benefits for the population and the proper management of information so as not to raise expectations, as this could cause social unrest. The authorities consider that they can support by socializing the Project in the hamlets involved and promoting associativity among the producers. Similarly, the officials consider that there would be receptiveness to a future forestry project among the local population in the area of interest, with prior explanation of the benefits and conditions to generate agreements between the interested parties.
Experiences from others forestry projects and recommendations for the implementation of the Project
According to the officials interviewed, there are no recent forestry projects in the district. The only institutional activity of the District Municipality's Economic Development Sub-management is the production of seedlings in the municipal nursery and their distribution to associations and families that request them. The agreement that is usually made between the municipality and the associations and families is that the former provides the seedlings (in general, the population prefers to ask for eucalyptus, cypress, avocado and custard apple) and the population is in charge of the digging, planting and care of the plant. The Municipality does not currently have processed statistical data on the amount of plantations produced and distributed, but on average they indicate that they have been able to provide between 500 to 1000 seedlings in each hamlet of the district.
They consider that the main achievement in the implementation of this institutional activity has been the promotion of eucalyptus afforestation due to its functionality as a barrier to prevent landslide risks. On the other hand, based on the experience to date, they consider that the challenges for the implementation of the Forestry Project are the following: to have the appropriate seed for the area considering its forestry aptitude; to seek technical strategies for water management in the face of changes in the frequency of rainfall; to seek mechanisms to facilitate access to larger areas in the higher parts of the highlands; and to organize forest producers in order to achieve extensive plantations.
Finally, the authorities recommend conducting a field study or census in the hamlets and population centers on the land available for a pine forest project. They also emphasize the importance of not generating false expectations if there is no certainty regarding the feasibility of the project.

Environmental and Social Impact Assessment of Forest Landscape Restoration Project December 2021
Social Capital Group 266
6.3.1.2 District of Cajamarca
The district of Cajamarca is the capital of the Province of Cajamarca and also the seat of the Regional Government; it has a population of 231,243 people and 171 population centers. The area of interest of the Project is located in the central and northern part of the district territory, in which 75 localities were identified between 2 991 and 3 798 m.a.s.l. (see the following Figure).
Figure 6.6 Zone of interest in the Cajamarca District
Prepared by SCG
According to the INEI's 2017 Population Centers Directory, the towns of Ayaviri Morowisha and La Shoclla had the lowest number of inhabitants registered in 2017 (24 and 22 people respectively). While the localities of La Pajuela and Porcón Bajo had the highest number of registered inhabitants (744 and 665 people respectively). Likewise, the closest locality to the district capital is Las Flores and the farthest is Quishuar Corral (see Table 6.12).
Taking into account the SICCAM, in the area of interest are the following farmer communities: Tual (recognized on December 14, 1966 with 214.06 hectares titled), Cherec (recognized on June 27, 1994 with 486.80 hectares titled), Cushunga (recognized on November 26, 1986 in process of titling) and Sexemayo Lot II (recognized on August 2, 1990 with 837.50 hectares titled).

Environmental and Social Impact Assessment of Forest Landscape Restoration Project December 2021
Social Capital Group 267
Table 6.12 Data on the localities of the zone of interest in the district of Cajamarca
Location Altitude (m.a.s.l.)
Census population
Housing Km to district capital
Time to district capital
Ayaviri Morowisha 3 798 24 12 54 km 2 h
The Shoclla 3 703 22 15 43.9 km 1 h
Quishuar Corral 3 515 505 86 34 km 3 h
La Pajuela 3 569 744 - 34 km 1 hour and 30
minutes
Chamcas 3 558 66 43 36.2 km 2 h 40 min
Uñigan 3 653 158 62 31.7 km 2 hours and 15 minutes
Choro Porcon 3 635 264 86 26.9 km 1 hour and 30
minutes
Chugurpampa 3 300 170 69 22.6 km 1 hour and 30
minutes
Porcon Potrero Bajo 3 275 93 45 21.3 km 1 hour and 30 minutes
Suro Porcon 3 261 164 81 19.3 km 1 h
Chaupimayo 3 205 243 82 17.5 km 1 hour and 15
minutes
Chilimcaga 3 171 148 70 19 km 50 minutes
Porconcillo Plan 2 991 684 263 12.3 km 40 minutes
Red Alder 3 470 305 379 43 km 1 hour and 20
minutes
El Coñor 3 058 157 86 14.6 km 1 h
Llanomayo (Totorillas) 3 229 87 110 15.6 km 1 hour and 30 minutes
Llushcapampa Baja 2 880 504 257 17.7 km 30 minutes
Puruay Bajo 3 050 195 130 22.2 km 45 minutes
Puruay Alto 3 240 533 256 26.1 km 1 hour and 35
minutes
Puruay Quinuamayo 3 510 164 101 42.8 km 2 h
Porconcillo Tuanzo Alto 3 504 79 32 24.8 km 1 h
Las Flores 3 064 229 84 14.2 km 20 minutes
Las Lagunas 3 489 45 19 62.1 km 1 h
Tual 3 452 462 277 21.8 km 45 minutes
Tierra Amarilla 3 308 167 61 20 km 40 minutes
Porcon Alto 3 513 456 185 24.1 km 1 hour and 15
minutes
Los Angeles 3 313 129 80 22.9 km 1 hour and 35
minutes
Porcon Central 3 502 88 41 24.3 km 1 hour and 35
minutes
Santa Rosa 3 168 124 48 15.6 km 1 hour and 30
minutes
Collpa Esperanza 3 264 99 40 24.2 km 1 hour and 30 minutes
Colpa Porcon 3 224 64 32 22.8 km 1 hour and 30
minutes

Environmental and Social Impact Assessment of Forest Landscape Restoration Project December 2021
Social Capital Group 268
Location Altitude (m.a.s.l.)
Census population Housing
Km to district capital
Time to district capital
San Juan Pampa 3 187 325 139 17.5 km 1 hour and 40
minutes
The Ramada 3 418 198 113 19.2 km 1 hour and 45
minutes
Hualtipampa Baja 3 403 182 175 26.5 km 1 hour and 15
minutes
Hualtipampa Alta 3 500 67 42 26.3 km 1 hour and 30 minutes
Quilish 38 3 538 138 97 37.7 km -
Coñorcucho 3 442 66 40 19 km 40 minutes
Sexemayo Lot I 3 410 108 56 18.7 km 2 hours and 40
minutes
Chilimpampa Baja 3 469 330 118 25.5 km 1 h
Kishuarpata 3 473 127 58 23.7 km 55 minutes
Cochapampa 3 313 665 228 19 km 1 hour and 30
minutes
San Pedro 3 360 122 66 22.1 km 45 minutes
Chilimpampa Alto 3 567 329 100 24.6 km 1 h
Munipampa 3 429 226 83 23.4 km 1 hour and 40
minutes
Lower Porcon 3 200 712 256 16.6 km 1 h
Yerba Buena 3 454 275 110 22.3 km 50 minutes
Yunyun High 3 452 183 64 20.5 km 2 h
Lower Yunyun 3 389 221 98 19.8 km 1 hour and 30 minutes
Capellanias Apples 3 165 220 102 17.1 km 30 minutes
Apples High 3 215 330 103 15.6 km 50 minutes
Apple Plan 3 048 455 209 12.2 km 25 minutes
Pacopampa 3 234 41 24 16.4 km 1 hour and 30
minutes
Yerba Santa 3 153 29 21 18.5 km 1 hour and 30
minutes
Cince Las Vizcachas 3 543 175 57 25.2 km 1 h
San Antonio Detail Plan 2 961 403 158 10.8 km 1 hour and 30 minutes
Chilcaloma 3 346 358 150 17.2 km 40 minutes
Chamis 3 308 512 156 16 km 30 minutes
Chaquisiniega 3 611 213 82 23.4 km 50 minutes
Cushunga 3 509 266 130 28 km 1 hour and 15
minutes
Carhuaquero 3 541 96 63 24.8 km 1 h
Sexemayo Lot II 3 662 240 91 33.9 km 50 minutes
The Mataracocha Lagoon 3 281 104 35 19.3 km 1 hour and 30
minutes
Maraynillo 3 225 114 50 29.4 km 3 h
Source: Directorio de Centros Poblados 2017 and Sistema de Consulta de Centros Poblados - INEI.

Environmental and Social Impact Assessment of Forest Landscape Restoration Project December 2021
Social Capital Group 269
The area of interest in the district of Cajamarca has as economic activity agriculture and livestock. In terms of agricultural activity, mainly corn, wheat, lentils, peas, beans, barley, quinoa and potatoes are grown. According to the officials interviewed60, agricultural activity has decreased due to the tendency to prioritize pastures for cattle grazing, since milk production has become an important economic income for the population. As for the livestock activity, there is the breeding of cattle, pigs and small animals such as poultry and guinea pigs. The livestock activity is centered on milk production, which is sold to Nestlé and Gloria through milk collectors. To a lesser extent, by-products such as quesillo and yogurt are produced.
The access roads are in good condition of trafficability, since they receive timely maintenance by the Provincial Municipality of Cajamarca. Likewise, there is public transportation (combis and motorcycle taxis) to get to the towns in the area of interest. However, the most remote villages can only be reached by private transportation (vans, trucks, and motorcycles).
Regarding water service coverage, the interviewees indicated that in the area of interest most of the inhabitants have access to drinking water and have a sewage system. Likewise, there is access to electrification service and good internet coverage from the different operators.
Regarding the public safety situation, the interviewees commented that the farmer patrols, both in urban and rural areas, collaborate in maintaining public order. Likewise, the municipal authorities state that no active social conflicts have been identified in the Project's area of interest.
Perceptions of forestry potential in the area
Currently, in the district of Cajamarca there are plantations of pine (radiata and patula), eucalyptus, cypress, alder and tara (in the lower areas). These plantations are the product of reforestation actions undertaken by the provincial municipality for the benefit of the population. The production of these plantations is destined for the city of Cajamarca and Trujillo. When consulted about the forestry aptitude of the area, the officials pointed out as suitable areas for the possible implementation of a forestry project, the Farmer Community of Cushunga, Sexemayo and Tual for the amount of available space. They also suggested the localities of Inca Corral, Chilimcaga, Majada Pampa, Chilimpampa Alto, Chamis, Chamis Alto and Pozo Seco, since they have forest plantations.
The municipal authorities are very open to the possibility of implementing a forestry project in the district, as it is part of the institutional agenda of the current administration. In this regard, they indicate that the Municipality could support the project in three ways: by identifying suitable areas for its development, with trained technical staff, and by making available the nursery managed by the Municipality.
Regarding the receptiveness of the population, the authorities consider that they would agree with the implementation of a forestry project, as this activity generates interest due to the potential ecological and economic benefits. Likewise, this interest is reflected in the requests that
60 Jhonny Alberto Mestanza Cabrera, forestry technician of the Rural Development Sub-management; Peter Teran Quispe, responsible for the municipal nursery; and Milton Ruiz Mora, Manager of Social Development.

Environmental and Social Impact Assessment of Forest Landscape Restoration Project December 2021
Social Capital Group 270
arrive to the Municipality to receive the forest plantations produced by the Provincial Municipality.
Experiences from others forestry projects and recommendations for the implementation of the Project
The Provincial Municipality of Cajamarca has been carrying out different reforestation actions since 2011, both in the district of Cajamarca and in the other districts that comprise the province of Cajamarca. These reforestations consist of the delivery of seedlings to different associations and beneficiary families so that they are the ones who are responsible for planting and maintaining the species. In addition, they are followed up for three months after the seedlings have been delivered to ensure the success of the plantations. The final benefit is for the associations and families.
Regarding the achievements of these activities, it was mentioned that the plantations benefit and protect the crops, as they help to cut the wind, protect from frost and prevent soil degradation. In addition, the benefit can be economic when the plantations have enough time for the timber to be marketed. On the other hand, a difficulty identified is the transportation of the seedlings to the beneficiaries' localities. To solve this inconvenience, the associates or families group together to be able to pay for sufficient transport to move the seedlings to their localities.
The main recommendations of the authorities regarding the implementation of a forestry project in the district are the following: coordinate closely with the Provincial Municipality of Cajamarca to identify suitable planting areas, provide constant technical follow-up to the beneficiaries (whether associations or families), design the project in such a way that the delivery of seeds, fertilizer and plantations is accompanied by training, and achieve sustained participation of the population.
6.3.1.3 Chetilla District
The area of interest in the district of Chetilla covers almost the entire district territory. Thirty-two localities were identified that are located between 2226 and 3640 m.a.s.l. (see the following Figure).

Environmental and Social Impact Assessment of Forest Landscape Restoration Project December 2021
Social Capital Group 271
Figure 6.7 Zone of interest in the Chetilla District
Prepared by SCG
According to the INEI's 2017 Population Centers Directory, the population center with the fewest registered inhabitants is Tomatepampa (two people) and the one with the most registered inhabitants is El Manzano (391 people). Also, according to the officials interviewed61, half of the population in Chetilla speaks Quechua and even wear traditional district dress (see Table 6.13).
Table 6.13 Data on localities in the zone of interest in the Chetilla District
Location Altitude (m.a.s.l.)
Census population Housing
Km to district capital
Time to district capital
Lanchipampa 2 652 53 20 46.5 km 1 hour and 10
minutes
The Tube 2 423 63 24 11.6 km 1 hour and 30
minutes
Tomatepampa 2 318 2 2 15.7 km 1 hour and 40 minutes
Aschapauca 2 750 17 5 - -
61 Eduardo Tambillo, Head of the Agricultural Area, and María Elena Yparraguirre, Deputy Manager of Economic Development.
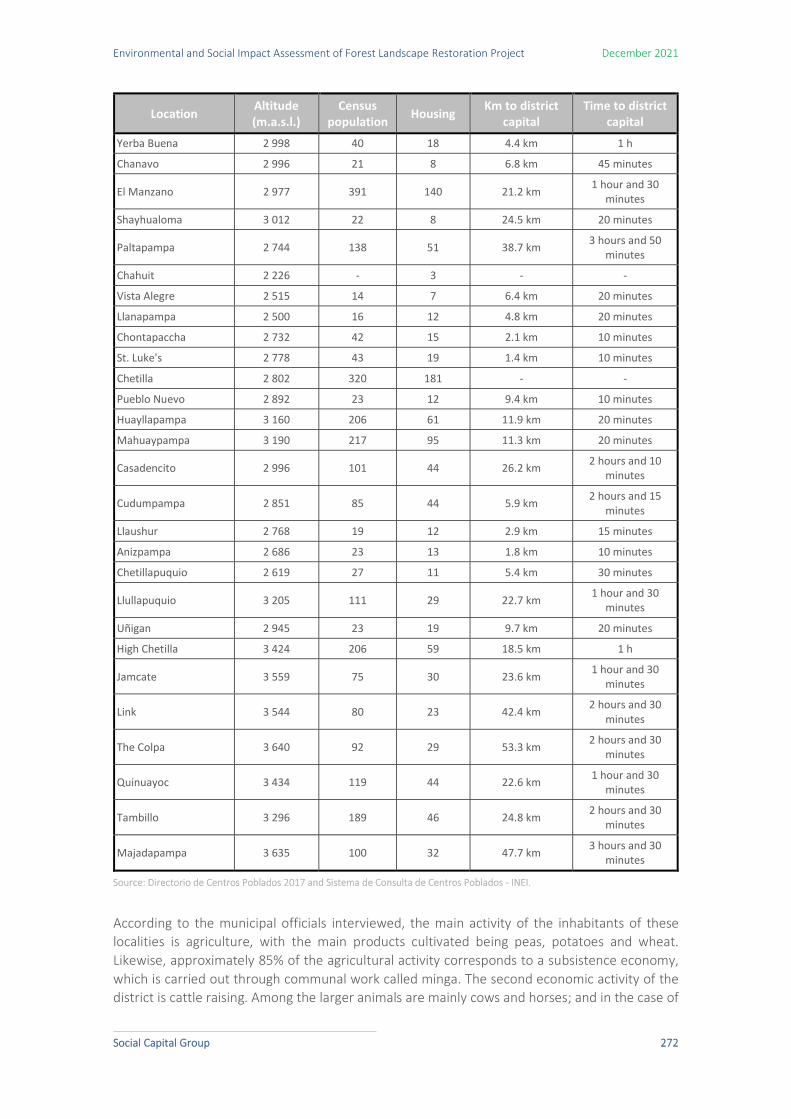
Environmental and Social Impact Assessment of Forest Landscape Restoration Project December 2021
Social Capital Group 272
Location Altitude (m.a.s.l.)
Census population Housing
Km to district capital
Time to district capital
Yerba Buena 2 998 40 18 4.4 km 1 h
Chanavo 2 996 21 8 6.8 km 45 minutes
El Manzano 2 977 391 140 21.2 km 1 hour and 30
minutes
Shayhualoma 3 012 22 8 24.5 km 20 minutes
Paltapampa 2 744 138 51 38.7 km 3 hours and 50 minutes
Chahuit 2 226 - 3 - -
Vista Alegre 2 515 14 7 6.4 km 20 minutes
Llanapampa 2 500 16 12 4.8 km 20 minutes
Chontapaccha 2 732 42 15 2.1 km 10 minutes
St. Luke's 2 778 43 19 1.4 km 10 minutes
Chetilla 2 802 320 181 - -
Pueblo Nuevo 2 892 23 12 9.4 km 10 minutes
Huayllapampa 3 160 206 61 11.9 km 20 minutes
Mahuaypampa 3 190 217 95 11.3 km 20 minutes
Casadencito 2 996 101 44 26.2 km 2 hours and 10 minutes
Cudumpampa 2 851 85 44 5.9 km 2 hours and 15
minutes
Llaushur 2 768 19 12 2.9 km 15 minutes
Anizpampa 2 686 23 13 1.8 km 10 minutes
Chetillapuquio 2 619 27 11 5.4 km 30 minutes
Llullapuquio 3 205 111 29 22.7 km 1 hour and 30
minutes
Uñigan 2 945 23 19 9.7 km 20 minutes
High Chetilla 3 424 206 59 18.5 km 1 h
Jamcate 3 559 75 30 23.6 km 1 hour and 30
minutes
Link 3 544 80 23 42.4 km 2 hours and 30
minutes
The Colpa 3 640 92 29 53.3 km 2 hours and 30
minutes
Quinuayoc 3 434 119 44 22.6 km 1 hour and 30 minutes
Tambillo 3 296 189 46 24.8 km 2 hours and 30
minutes
Majadapampa 3 635 100 32 47.7 km 3 hours and 30
minutes
Source: Directorio de Centros Poblados 2017 and Sistema de Consulta de Centros Poblados - INEI.
According to the municipal officials interviewed, the main activity of the inhabitants of these localities is agriculture, with the main products cultivated being peas, potatoes and wheat. Likewise, approximately 85% of the agricultural activity corresponds to a subsistence economy, which is carried out through communal work called minga. The second economic activity of the district is cattle raising. Among the larger animals are mainly cows and horses; and in the case of

Environmental and Social Impact Assessment of Forest Landscape Restoration Project December 2021
Social Capital Group 273
smaller animals, poultry and guinea pigs. Also, from the livestock activity are derived by-products such as milk, cheese, yogurt and blancmange for marketing, with milk being the main by-product that has as its main buyer the companies Nestle and Gloria.
The access roads are in fair condition because many of them are dirt roads that receive only periodic maintenance by the Chetilla District Municipality. However, they are affected during the rainy season, making them impassable and, in some sections, temporarily impassable. Those interviewed also mentioned that there is no public transportation and that the inhabitants travel in private vehicles. Regarding telecommunications, only the operator Claro has mobile coverage in the district. Regarding basic services, the informants mentioned that urban areas have water and sewage. However, in rural areas there is piped water (in some villages it is treated with chlorination) and septic tanks for drainage. There is also total coverage throughout the district of electricity service because they have their own hydroelectric plant. In Chetilla there is no police station, so the farmer patrols are important as mediators in cases of crime and conflicts that may arise. In the case of crimes, only a few cases of cattle rustling have been reported. In the same way, there are not many cases of conflict. The most common ones are related to the delimitation of hamlets and individual plots. When a larger-scale event occurs, the PNP of the district of Cajamarca is called in. Perceptions of forestry potential in the area
In the Chetilla district, forest plantations are found in the upper part of the district, where radiata and patula pines can be found. Likewise, according to those interviewed, there are localities in the district with suitable characteristics for reforestation. They indicated the localities of Alto Chetilla, Manzano (upper part), Jamcate, Manzano, Casadencito and Quinuayoc as ideal places for their forestry aptitude, since they have slopes where it is possible to carry out forestry projects.
On the other hand, the municipal authorities showed a positive attitude towards the possibility of planning and implementing a future forest project in the district. In this regard, the Municipality could support the selection of the project implementation area and act as an intermediary for direct communication with the population. In this way, confidence could be generated in the district's population towards the project.
Regarding the receptiveness of the population, the authorities state that they would be interested in a forestry project as long as there is correct and precise communication about the benefits that would be obtained, in order to avoid misunderstandings. The existence of CAT Llullapuquio, which already has experience in forestry issues, could also be a positive factor. Both the organizational capacity of the population and the experience in the subject could be advantageous for the development of a possible forestry project.
Experiences from others forestry projects and recommendations for the implementation of the Project
Environmental and Social Impact Assessment of Forest Landscape Restoration Project December 2021
Social Capital Group 274
The District Municipality of Chetilla's management goal is to reach 50,000 pine plantations throughout the district. To reach this goal, a municipal nursery has been implemented to provide forest and fruit seedlings, which are donated to the villages and hamlets of the district. However, these forestry activities of the municipality have been delayed because they do not have the necessary budget to do so. In view of this situation, the Provincial Municipality of Cajamarca is also supporting the donation of seedlings for forestation in the district of Chetilla. As already mentioned, in the district is the CAT Llullapuquio, which has already managed to develop a forestry project with support from SERFOR.
Among the main challenges for the implementation of a forestry project in this district, interviewees mentioned that access to water is limited. In this sense, the Municipality is evaluating the possibility of generating an ordinance that prohibits eucalyptus afforestation, since it absorbs a lot of water (almost 40 litres per day). In this sense, they consider that water harvesting and the possibility of carrying out a technical study of the different types of soils to classify them according to their use: grazing, agriculture, forestry plantations, among others, could not be left aside. Another challenge has to do with the lack of technical assistance in the area for the care of forest plantations.
Regarding the recommendations, the municipal authorities consider that it is important that the agricultural lands are not affected, that there is accompaniment of the owners from implementation to harvesting of the plantations and that constant communication is maintained with the Municipality. These conditions would help minimize the possibilities of generating social conflict or unrest in the population. Another recommendation made was to gather the lessons learned from the Llullapuquio CAT.
6.3.1.4 District of Cospán
In the area of interest in the district of Cospán, there are 15 localities located between 2,282 and 3,725 m.a.s.l., in the eastern part of the district that borders the districts of Asunción, Jesús, Cachachi and Sayapullo (see the following Figure).

Environmental and Social Impact Assessment of Forest Landscape Restoration Project December 2021
Social Capital Group 275
Figure 6.8 Zone of interest in the Cospán District
Prepared by SCG
According to the INEI's 2017 Population Centers Directory, the villages of Agua Blanca, Chinchin and Casais are the localities with the lowest number of inhabitants registered in 2017, with 2, 55 and 64 people respectively. On the other hand, the hamlets of Chicden, Huaycot and Huariguro were the localities with the highest number of registered inhabitants, with 281, 240 and 231 people respectively (see Table 6.14).
Table 6.14 Data on the localities of the zone of interest in the district of Cospán
Location Altitude (m.a.s.l.)
Census populatio
n Housing Km to district
capital Time to district
capital
Upper Huariguro 3 725 95 29 64.7 km 3 h
Huariguro 3 230 231 77 25.9 km 2h and 30 minutes
San Andreas 2 705 66 21 23 km 2 hours and 15
minutes
El Cerro 3 190 143 56 29.8 km 2 hours and 45
minutes
Las Pampas 2 759 91 25 19.5 km 1 h
Quinoa 2 948 116 31 55.1 km 3 h
Salagual 2 667 113 29 77.2 km 2 h
Chichin 2 885 55 24 61.8 km 4 h

Environmental and Social Impact Assessment of Forest Landscape Restoration Project December 2021
Social Capital Group 276
Location Altitude (m.a.s.l.)
Census populatio
n Housing
Km to district capital
Time to district capital
La Coronilla 2 891 80 20 113.1 km 4 h
Huaycot 3 193 240 60 201.7 km 3 hours and 30
minutes
Huaycotito 2 803 133 23 136.7 km 4 hours and 30
minutes
Chicden 2 282 281 75 93.1 km 2 hours and 30
minutes
White Water 2 644 2 4 125.2 km 5 hours and 30
minutes
Sunchubamba 2 431 581 179 104.4 km 4 hours and 10
minutes
Casais 2 431 64 19 116.7 km 4 hours and 30
minutes
Source: Directorio de Centros Poblados 2017 and Sistema de Consulta de Centros Poblados - INEI.
According to SICCAM, the localities of Huariguro, San Andrés and El Cerro are in the territory of the Huariguro Campesino Community. On the other hand, it is important to mention that the localities of Huaycot, Chinchin, Huaycotito, Salagual, La Quinua, La Coronilla, Chicden, Agua Blanca, Sunchubamba and Casais, are part of the SAIS José Carlos Mariátegui.
According to the officials interviewed62, the economic activities in the area of interest are cattle ranching and agriculture. In the higher areas (Alto Huariguro, Huariguro, San Andrés, El Cerro, Pampas and La Quinua) milk and quesillo are produced. These products are collected and taken to the cities of Asunción and Cajamarca. There are also goats and sheep, whose meat is sold in La Libertad and Cajamarca. In the case of the localities of Sunchubamba and Chicden, tara, whose productivity has increased in recent years, is marketed. According to those interviewed, approximately 90% of the tara forests are natural, which are harvested by the population and sold to SAIS José Carlos Mariátegui for commercialization.
Regarding the accesses to the localities of the area of interest, most of them have dirt roads, which are in regular conditions. The District Municipality maintains these roads from time to time. Likewise, there is no public transportation in these localities, only private transportation (trucks, vans, cars, motorcycles). In general, merchants enter the area to buy products once a week.
On the other hand, the informants mentioned that the villages have drinking water 24 hours a day. The supply is supervised by the JASS. However, they still use cesspools or latrines for drainage. Similarly, these localities have electricity service, with the exception of the hamlets of San Andrés and Casais. The informants also mentioned that most of the villages do not have telephone and internet service. Only Chicden and Casablanca have telephone coverage, from the Movistar operator.
62 Prospero Gutiérrez Ruiz, Mayor of the District Municipality of Cospán, and Harol Cabanillas Vega, Deputy Manager of Economic Development and Environment.

Environmental and Social Impact Assessment of Forest Landscape Restoration Project December 2021
Social Capital Group 277
Regarding the issue of conflict in the area, they mentioned the land conflict between the SAIS José Carlos Mariátegui and the current owners located in the towns of Alto Huariguro, San Andrés, El Cerro, Pampas, La Coronilla, Salagual and La Quinua. According to informants, the most critical moment of the conflict occurred in 2019, which resulted in one death. As a result, there was a change in the directive of the SAIS that allowed the possessors to stay on the occupied land in exchange for not allowing more people to invade the area. With this agreement, the area has been pacified. However, the agreement motivated other people to invade the land in Huacraruco.
Perceptions of forestry potential in the area
According to the authorities interviewed, the entire area of interest in the Cospán district is suitable for forestry. The lands are suitable for timber species and there are spaces available for reforestation, since the inhabitants have an average of approximately 5 to 7 hectares of land. Likewise, of the entire area of interest, the localities with the best forestry aptitude are Sunchubamba, Huaycotito and Alto Huariguro. While the localities with less aptitude are El Cerro, Pampas and Huariguro, due to the greater presence of pastures.
On the other hand, the localities of Huycot, Huaycotito, Chicden and Aguas blancas currently have pine (20%) and eucalyptus (80%) forest plantations, which can already be harvested. In addition to these localities, interviewees mentioned the locality of San Martin as a suitable area with favourable conditions to develop forestry projects, since it has available free areas; however, this locality is outside the preliminary area of interest.
Regarding the willingness of the authorities to support the forest project, they mentioned that the current administration is willing to support forest initiatives. They could mainly play the role of facilitating coordination with local authorities, providing support with technical sanitation and logistical resources, to the extent possible, taking into account the budgetary constraints of the municipality. Similarly, the officials consider that the population would agree with the project, as they have areas available for forestry activities.
Experiences from others forestry projects and recommendations for the implementation of the Project
According to those interviewed, no forestry projects have been developed in Cospán. For this reason, since the beginning of the current administration, the District Municipality initiated conversations with the Provincial Municipality of Cajamarca to carry out forestation activities, but no activities have yet been implemented. The only activity undertaken by the Municipality to date is the support to strengthen the SAIS José Carlos Mariátegui nursery, where pine, cypress and eucalyptus trees are produced.
As part of the challenges of a forestry project in the district, interviewees mentioned maintaining a balance between harvested plants and the amount of new plantations reforested. Currently there is a perception that forestry is not being produced in a sustainable manner. Another challenge is that there is no more elaborated timber production in the district, as producers only market roundwood. Thirdly, there is the challenge of improving road conditions to the sites of interest so that there is a good flow of transport for the Project.

Environmental and Social Impact Assessment of Forest Landscape Restoration Project December 2021
Social Capital Group 278
In addition, the officials recommended the Project to carry out plantations throughout the district with different varieties of timber trees. They also suggest strengthening the construction of micro-reservoirs for water harvesting. In this regard, they mentioned that currently in the district this activity is promoted by the Regional Government of Cajamarca through the Blue Revolution Project63. This initiative aims to mitigate the impact of climate change that has affected the frequency of rainfall in the district.
6.3.1.5 Encañada District
In the area of interest in the Encañada district are the localities of La Extrema, Apalina, Rio Colorado, La Pajuela, Cushurobamba and Las Lagunas, which are located between 3,515 and 4,031 m.a.s.l., in the western part of the district, near the district border with the districts of Cajamarca and Baños del Inca (see the following Figure).
Figure 6.9 Zone of interest in the Encañada District
Prepared by SCG
According to the Directory of Populated Centers 2017 of the INEI, Apalina and La Extrema have 128 and 99 registered inhabitants respectively, being the most populated villages in the area of interest. On the other hand, Rio Colorado and Pajuelo are the least populated, with 43 and 26 registered inhabitants respectively. On the other hand, the closest hamlet to the district capital is La Extrema, two hours away, and the farthest, Rio Colorado, is more than six and a half hours away (see Table 6.15).
Table 6.15 Data on localities in the zone of interest in the Encañada District
Location Altitude (m.a.s.l.)
Census population
Housing Km to district capital
Time to district capital
The Extreme 3 515 99 46 149.7 km 2 h
63
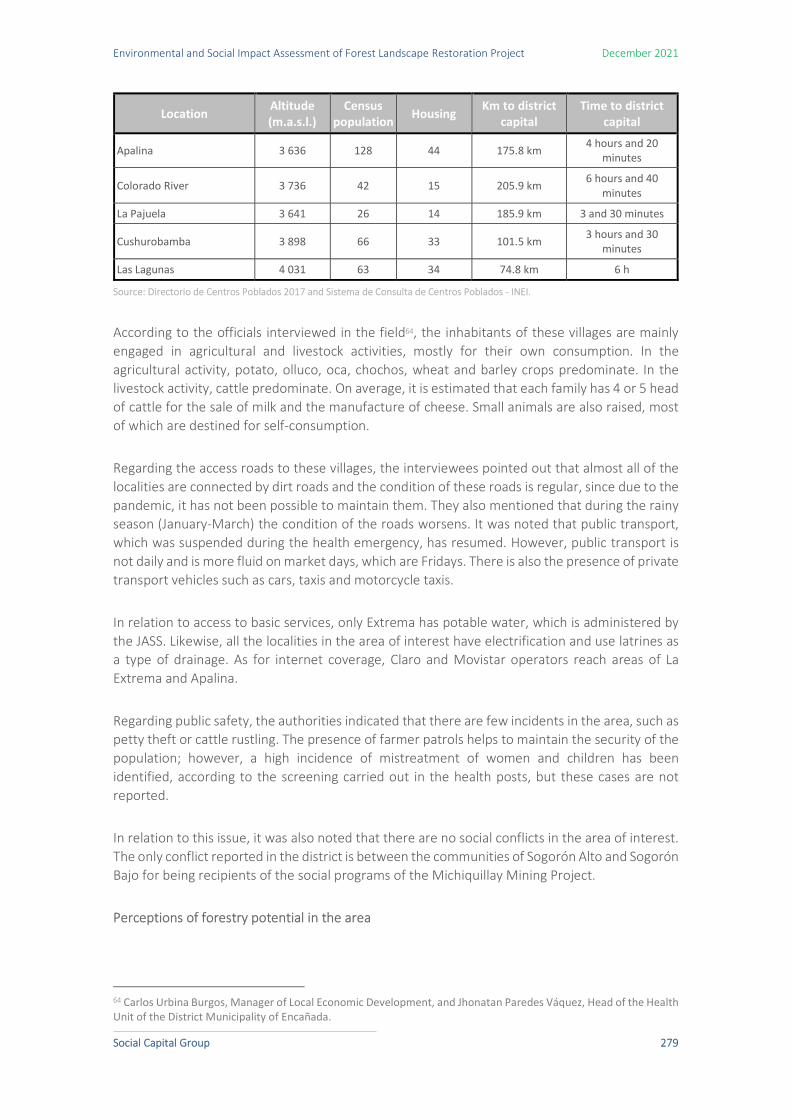
Environmental and Social Impact Assessment of Forest Landscape Restoration Project December 2021
Social Capital Group 279
Location Altitude (m.a.s.l.)
Census population Housing
Km to district capital
Time to district capital
Apalina 3 636 128 44 175.8 km 4 hours and 20
minutes
Colorado River 3 736 42 15 205.9 km 6 hours and 40
minutes
La Pajuela 3 641 26 14 185.9 km 3 and 30 minutes
Cushurobamba 3 898 66 33 101.5 km 3 hours and 30
minutes
Las Lagunas 4 031 63 34 74.8 km 6 h
Source: Directorio de Centros Poblados 2017 and Sistema de Consulta de Centros Poblados - INEI.
According to the officials interviewed in the field64, the inhabitants of these villages are mainly engaged in agricultural and livestock activities, mostly for their own consumption. In the agricultural activity, potato, olluco, oca, chochos, wheat and barley crops predominate. In the livestock activity, cattle predominate. On average, it is estimated that each family has 4 or 5 head of cattle for the sale of milk and the manufacture of cheese. Small animals are also raised, most of which are destined for self-consumption.
Regarding the access roads to these villages, the interviewees pointed out that almost all of the localities are connected by dirt roads and the condition of these roads is regular, since due to the pandemic, it has not been possible to maintain them. They also mentioned that during the rainy season (January-March) the condition of the roads worsens. It was noted that public transport, which was suspended during the health emergency, has resumed. However, public transport is not daily and is more fluid on market days, which are Fridays. There is also the presence of private transport vehicles such as cars, taxis and motorcycle taxis.
In relation to access to basic services, only Extrema has potable water, which is administered by the JASS. Likewise, all the localities in the area of interest have electrification and use latrines as a type of drainage. As for internet coverage, Claro and Movistar operators reach areas of La Extrema and Apalina.
Regarding public safety, the authorities indicated that there are few incidents in the area, such as petty theft or cattle rustling. The presence of farmer patrols helps to maintain the security of the population; however, a high incidence of mistreatment of women and children has been identified, according to the screening carried out in the health posts, but these cases are not reported.
In relation to this issue, it was also noted that there are no social conflicts in the area of interest. The only conflict reported in the district is between the communities of Sogorón Alto and Sogorón Bajo for being recipients of the social programs of the Michiquillay Mining Project.
Perceptions of forestry potential in the area
64 Carlos Urbina Burgos, Manager of Local Economic Development, and Jhonatan Paredes Váquez, Head of the Health Unit of the District Municipality of Encañada.

Environmental and Social Impact Assessment of Forest Landscape Restoration Project December 2021
Social Capital Group 280
According to the authorities interviewed, the area of interest has suitable climatic conditions for forestry projects. Specifically, the localities of Extrema and Apalina were highlighted as the most suitable and currently have few plantations of pine (radiata and patula), cypress and eucalyptus. It was also mentioned that in Las Lagunas it would be more complicated to carry out forestry activities, since there is not much water. Other localities with forestry potential, but outside the area of interest, are Nuevo Perú, Combayo and San Juan de Hierba Buena.
Regarding the reception and willingness of the authorities and the population to support the forestry project, the municipality considers that forestry projects represent an environmentally friendly economic activity, compared to mining activities. Therefore, they would provide support, through the installation of nurseries and sharing the knowledge of municipal technical staff. Similarly, they believe that the population would accept a future forestry project because of the economic and ecological benefits it would bring. However, they pointed out, it would be necessary to work on a constant community relationship, since at first there may be distrust towards new activities and towards people who are not from the same community.
Experiences from others forestry projects and recommendations for the implementation of the Project
For the last two years, the District Municipality of Encañada has been developing pine and eucalyptus forestry activities in the district with the support of the Regional Government and the Ministry of Agriculture, benefiting the localities of Huayllabamba and Carhuacusma. Likewise, 350,000 seedlings are currently being produced in the municipal nurseries, which are destined for the different villages and towns.
The main achievement of the implementation of this forestry activity is the increase of larger areas for forest production in the localities of the district. Among the challenges facing the implementation of a new forestry project, they mentioned as the main one, the dispersion of land in small landowners, usually of 2 hectares. It is also a challenge to have adequate technical advice and to manage the local idiosyncrasies of producers who expect to be provided with seeds and planted on their land.
Finally, the recommendations of the authorities interviewed are to financially support the provision of inputs and other materials necessary for the production process in the nurseries, as well as the implementation of social work and continuous awareness-raising in the localities.
6.3.1.6 District of Los Baños del Inca
In the area of interest in the Baños del Inca district are the villages of Carhuaquero, La Zarcilleja and Sacsha Rangra located between 3406 and 3504 m.a.s.l., in the northwestern part of the district, as shown in Error! Reference source not found.. According to officials interviewed in the

Environmental and Social Impact Assessment of Forest Landscape Restoration Project December 2021
Social Capital Group 281
field65, these hamlets belong to the district's Quinua micro-watershed, which is more suitable for forestry than other micro-watersheds 66.
Figure 6.10 Zone of interest in Los Baños del Inca District
Prepared by SCG
According to the INEI's Directory of Populated Centers 2017, in the hamlets of Carhuaquero and La Zarcilleja there were 187 and 121 people censused respectively, while in the hamlet of Sacsha Rangra only one person was censused. On the other hand, the closest hamlet to the district capital is La Zarcilleja and the farthest is Sacsha Rangra (see Table 6.16). According to SICCAM, there are no rural communities in the area of interest in this district.
Table 6.16 Data on the hamlets in the zone of interest in the Los Baños del Inca District
Location Altitude (m.a.s.l.)
Census populatio
n Housing
Km to district capital
Time to district capital
Carhuaquero 3 504 187 143 53.9 km 1h and 25 min
The Zarcilleja 3 406 121 62 48.4 km 1h and 25 min
Sacsha Rangra 3 496 1 8 70.3 km 1h and 20min
65 Florencio Vera Malaver, Deputy Manager of Economic Development; César Ocas Díaz, Head of the Agricultural Promotion Unit; and Roxana Callirgos Raico, Deputy Manager of Social Development. 66 According to those interviewed, the Baños del Inca district can be subdivided into four micro-watersheds: Pullucana, Quinua, Mashcon-Shultin and Chonta-Otuzco.
Environmental and Social Impact Assessment of Forest Landscape Restoration Project December 2021
Social Capital Group 282
Source: Directorio de Centros Poblados 2017 and Sistema de Consulta de Centros Poblados - INEI.
In relation to the main economic activities, the interviewees pointed out that dairy farming predominates, whose main buyers are Nestlé and Gloria. Also, local companies have recently appeared that manufacture yogurt and cheese, whose main markets are the cities of Cajamarca and Chiclayo. Regarding agricultural activity, vegetables, tubers and grains are grown, mainly for self-consumption. To carry out this production, the producers have tubular wells, sprinklers and water eyes for irrigation of crops and livestock grazing. The interviewees also mentioned that in these hamlets family work predominates and the minga is practiced 67for work. On the other hand, in this area there is a productive organization, Asociación de la Microcuenca Quinua68.
As for the access to these villages, there are dirt roads that are in regular conditions and that, during the rainy season, cannot be used. Likewise, the informants mentioned that there is no public transportation, so the population travels on foot, in private vehicles and in the milk collection trucks that enter the area every day.
Regarding basic services, the interviewees commented that there is piped water in the area, but that it is not drinkable. Accordingly, there is no sewage service and most of the inhabitants only have a latrine. Likewise, although there is electricity service, there is little internet coverage.
In terms of public safety, the authorities interviewed indicated that there are no significant criminal activities in the area, only minor thefts. They also pointed out that although there are farmer patrols, they do not have the same organizational strength as in other districts.
There are no known active social conflicts in the Project's area of interest. However, interviewees mentioned that in the Quinua micro-basin there are latent conflicts over water issues in the localities that are part of the Yanacocha company's mining area of influence.
Perceptions of forestry potential in the area
According to the authorities interviewed, the area of interest (Sacsha Ranga, Carhuaquero and Zarcilleta) has hillsides that have the right conditions for a forestry project due to their environmental characteristics and the availability of space for the activity. In these villages, landowners have an average of 5 to 10 hectares. In addition, most of the area is already forested with patula pines, which can now be harvested. The informants also mentioned that the population is starting to collect edible mushrooms from the pine plantations to market them.
Regarding the willingness of the authorities to support the Project, they mentioned that they would be interested in supporting it, as the District Municipality has pine tree forestry as an axis of development and investment. Likewise, among the ways in which they could contribute to the Project, they mentioned that it would be through the district's nursery infrastructure for the
67 Collective work of cooperation between families in a community to carry out agricultural and livestock activities together. This activity helps to reduce economic costs and strengthens the links between the population. 68 Each micro-watershed in the district has a productive association that was created and promoted by the District Municipality approximately 15 years ago, with the objective of improving canals, roads, irrigation ditches and managing agricultural resources. However, according to those interviewed, these associations are currently institutionally weakened.

Environmental and Social Impact Assessment of Forest Landscape Restoration Project December 2021
Social Capital Group 283
production of plants, personnel for technical advice, coordination with the productive associations and making available the logistics of the Municipality (vans, trucks, tools).
On the other hand, it was mentioned that the local population would be receptive to the development of a forest project, as they currently have pine plantations that are in the harvesting and marketing stage. Among the expectations of the population that have been identified are employment generation, access to markets for timber sales and an economic activity that promotes the conservation of natural resources in a sustainable manner.
Experiences from others forestry projects and recommendations for the implementation of the Project
The District Municipality of Los Baños del Inca is one of the main institutions that promote forestry activities in the district. It has come to produce more than 200,000 seedlings per year through two nurseries: Vivero Cepita and Vivero Tar Tar. In these nurseries, the production of pine trees represents 80% of the seedlings, of which 60% are of the patula species and 40% radiata. These seedlings have been donated to families and associations through agreements so that they can be planted in their territories. In general, these plantations are usually carried out through mingas and, in some cases, day laborers are used who are paid 50 soles to dig between 90 and 100 holes per day. According to the estimates of the officials, last year there were approximately 300 to 500 beneficiaries (between associations and families). Also, the plantations of 15 years ago, are already being harvested and taking advantage of the edible fungus. However, one limitation is that there is no wood processing industry in the district, only small carpenters who make furniture on a small scale.
On the other hand, the interviewees mentioned that the District Municipality has a project that is in the profile stage, called "Recovery of the Ecosystem Service of Water Regulation in the Puyllucana, Chonta, Mashcon and Quinua Micro-watersheds of the district of Los Baños del Inca, Province of Cajamarca, Cajamarca Region". They are currently seeking funding and resolving an observation made by the MEF. This observation consists of making agreements of cession of use with the private producers. In this agreement it has to be established that while the Project lasts, the District Municipality will be in charge of the planted lands. This point is a limitation, since it is not known if the producer families will accept these terms of the agreement for fear of losing the planted land.
Among the achievements of these forestry activities, interviewees identified the generation of more green areas in the district, the generation of firewood for households, the possible production of edible mushrooms and institutional strengthening in the promotion of plantations. Regarding the challenges facing forestry activities in the district, they mentioned the lack of manpower for nursery production, the lack of inputs, the change in climate related to the decrease in rainfall, and the challenge of implementing forestry projects on private land.
Among the recommendations for the Project, they mentioned that it is important to inform the population about the characteristics of the Project, to make initial contact with the local authority (lieutenant governors and municipal agents) before approaching the population, to evaluate the possibility of establishing nurseries in the area of interest (Quinua watershed), to maintain technical advice and to close the forest production circle by ensuring timber processing.
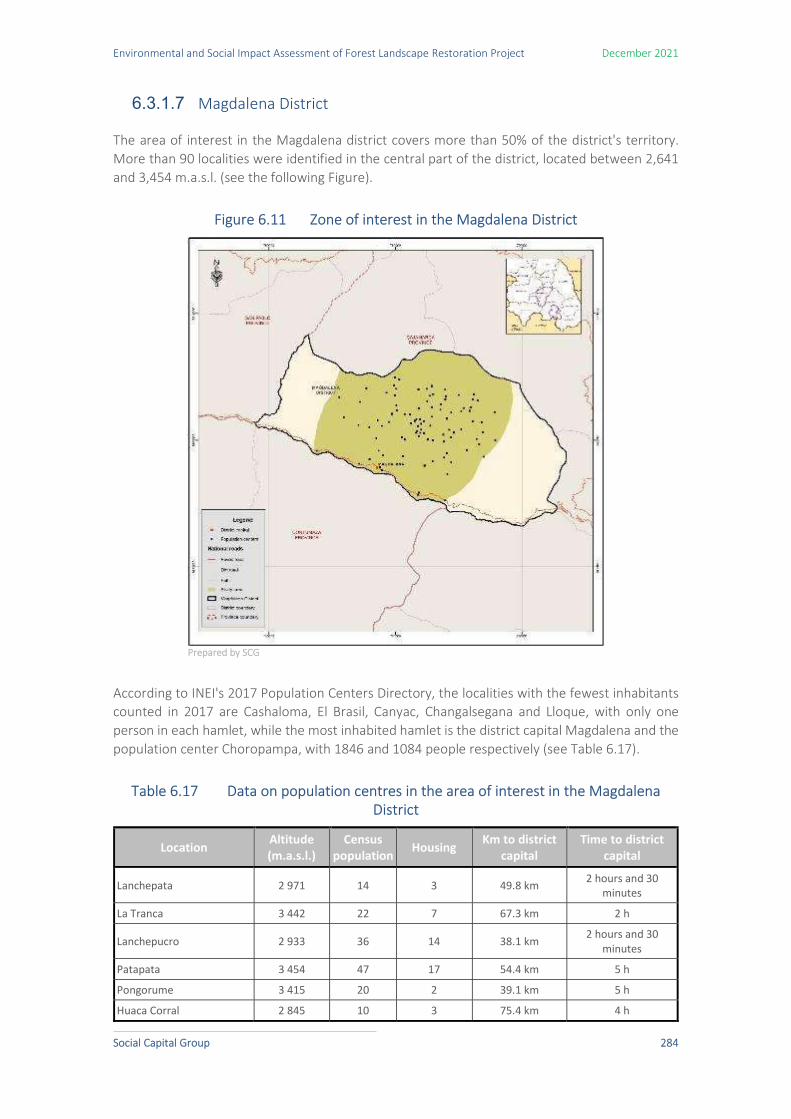
Environmental and Social Impact Assessment of Forest Landscape Restoration Project December 2021
Social Capital Group 284
6.3.1.7 Magdalena District
The area of interest in the Magdalena district covers more than 50% of the district's territory. More than 90 localities were identified in the central part of the district, located between 2,641 and 3,454 m.a.s.l. (see the following Figure).
Figure 6.11 Zone of interest in the Magdalena District
Prepared by SCG
According to INEI's 2017 Population Centers Directory, the localities with the fewest inhabitants counted in 2017 are Cashaloma, El Brasil, Canyac, Changalsegana and Lloque, with only one person in each hamlet, while the most inhabited hamlet is the district capital Magdalena and the population center Choropampa, with 1846 and 1084 people respectively (see Table 6.17).
Table 6.17 Data on population centres in the area of interest in the Magdalena District
Location Altitude (m.a.s.l.)
Census population
Housing Km to district
capital Time to district
capital
Lanchepata 2 971 14 3 49.8 km 2 hours and 30 minutes
La Tranca 3 442 22 7 67.3 km 2 h
Lanchepucro 2 933 36 14 38.1 km 2 hours and 30
minutes
Patapata 3 454 47 17 54.4 km 5 h
Pongorume 3 415 20 2 39.1 km 5 h
Huaca Corral 2 845 10 3 75.4 km 4 h

Environmental and Social Impact Assessment of Forest Landscape Restoration Project December 2021
Social Capital Group 285
Location Altitude (m.a.s.l.)
Census population Housing
Km to district capital
Time to district capital
The Willows 2 862 8 4 69.1 km 4 h
Good Weed 2 703 10 2 73.8 km 3 h
Penca Loma 2 774 16 5 63.2 km 2 hours and 30
minutes
La Laguna 2 734 13 9 60.2 km 3 h
Ramos Row 2 641 27 10 42.6 km 2 hours and 20 minutes
Pilancon 2 652 2 2 44.4 km 2 hours and 45
minutes
San Andreas 3 113 8 2 56.8 km 4 h
Posadapampa 2 523 6 4 20.2 km 2 hours and 40
minutes
Chiquero 2 718 3 2 34.9 km 3 h
The Pantheon 2 658 31 11 30.8 km 3 h
Chimula 2 598 2 3 24.5 km 2 hours and 30 minutes
Savoy 2 601 13 4 28.4 km 3 h
Brazil 1 584 1 3 59.2 km 3 hours and 30
minutes
Shillar 1 900 19 8 37.7 km 2 h
Canyac 2 223 1 6 28.6 km 2 h
Choctarume 1 969 6 4 17.8 km 2 h
Casaden 2 649 230 73 40.5 km 2 hours and 30
minutes
Choropampa 1 711 1 084 411 12.5 km 30 minutes
Ñamas 1 958 83 30 10.5 km 1 hour and 30 minutes
Buelta Grande 2 168 33 12 14.6 km 1 hour and 30
minutes
El Mirador 2 466 10 3 21.8 km 3 hours and 30
minutes
The Lucma 2 349 26 12 16.2 km 1 hour and 30 minutes
Tuyuloma 2 219 15 6 14.3 km 2 h
Shicut 2 331 4 4 35.3 km 2 h
Misquiyaco 3 004 47 21 51.4 km 4 h
Cashaloma 3 359 1 2 57.5 km 4 hours and 20
minutes
Lucmapampa 2 332 108 36 79.1 km 2 h
The Frame 1 325 540 235 - -
The Pajuro 2 423 18 8 37.5 km 2 hours and 30
minutes
La Laguna 2 598 93 31 63.3 km 2 h
Penca Pampa 2 326 48 16 66.1 km 1 hour and 20 minutes
El Membrillo 2 354 67 22 25.3 km 2 hours and 30
minutes

Environmental and Social Impact Assessment of Forest Landscape Restoration Project December 2021
Social Capital Group 286
Location Altitude (m.a.s.l.)
Census population Housing
Km to district capital
Time to district capital
El Batan 2 852 4 2 47.6 km 3 h 40 minutes
Atunpuquio 2 766 15 7 37.1 km 3 h
Changalsegana 2 902 1 2 46.1 km 3 hours and 50
minutes
Shadas 3 032 71 20 34.7 km 3 hours and 15 minutes
Shinshilpampa 3 392 31 15 62 km 3 h
The Valqui 2 732 79 31 42.4 km 3 h
Cebadaloma 2 870 12 3 32.6 km 3 h
Llungaspuquio 2 853 6 4 31.2 km 1 hour and 40
minutes
Peña Blanca 3 124 34 20 38.6 km 4 h
Cashaloma 2 526 6 6 33.3 km 3 h
Surumayo 3 046 9 5 39.7 km 2 hours and 30
minutes
Bell Tower 3 689 10 7 73.1 km 4 h
Gallorume 2 987 31 9 30.9 km 3 h
The Rejo 3 083 6 2 33.4 km 3 h
Paucamayo 2 845 26 4 27.9 km 3 h
Luluhuasch 3 138 36 10 34.3 km 4 h
White Corral 3 235 68 24 39.3 km 3 hours and 30
minutes
El Aliso 3 362 9 1 46.3 km 4 h
Tubungo 2 991 52 25 50.5 km 4 h
Luchococha 3 464 58 18 42.3 km 2 h
The Succha 2 638 79 34 52.7 km 1 hour and 50 minutes
El Chorro 3 214 25 10 63.7 km 4 h
Aricchana 2 556 15 8 21.5 km 2 hours and 40
minutes
Langusacha 2 455 19 4 18.7 km 2 h
Cumbico 2 598 83 37 22.5 km 2 h
Vista Alegre 2 663 12 7 26.5 km 3 hours and 30
minutes
Tambuloma 2 705 3 1 35.5 km 4 h
Ayorco 2 618 15 5 31.8 km 3 hours and 30 minutes
El Palto 1 746 19 7 47.6 km 10 minutes
The Altarpiece 2 631 25 13 45.2 km 3 h
The Sapote 1 530 17 7 6.8 km 30 minutes
La Viña 1 149 403 144 6.1 km 30 minutes
Capulipampa 3 312 88 26 69.8 km 3 hours and 30 minutes
Windows 3 525 187 72 50.6 km 2 hours and 30
minutes
Callatpampa 2 918 183 63 51.7 km 5 h

Environmental and Social Impact Assessment of Forest Landscape Restoration Project December 2021
Social Capital Group 287
Location Altitude (m.a.s.l.)
Census population Housing
Km to district capital
Time to district capital
San Cristobal 2 986 150 63 30.7 km 2 hours and 30
minutes
Amillas 1 273 37 14 1.7 km 20 minutes
Succhabamba 2 756 175 57 33.5 km 3 h
Monterrey 2 905 74 27 49.3 km 3 hours and 30 minutes
Catache 2 859 157 57 54.6 km 2 hours and 30
minutes
Marco la Granada 1 325 540 235 1.1 km 25 minutes
The Mirme 1 438 105 67 4.6 km 20 minutes
Choloque 1 631 72 48 14.3 km 30 minutes
Huana Huana 1 536 74 34 7.4 km 25 minutes
Lloque 2 028 1 1 35.5 km 2 hours and 30
minutes
Magdalena 1 298 1 846 685 - -
Source: Directorio de Centros Poblados 2017 and Sistema de Consulta de Centros Poblados - INEI.
According to the municipal officials interviewed69, the main economic activity in the district is agriculture and the type of crops grown depends on the altitude of the area. In the highlands, vegetables, potatoes, olluco, barley and wheat are grown, with wheat and potatoes being the main crops. In the lower part, rice, yucca, sweet potato and grapes, sugar cane and avocado are the main crops. Among the by-products of this activity, they mentioned the panela, chancaca and the alcoholic drink known as "cañazo", made from sugar cane. The second economic activity in the district is livestock farming, characterized by the raising of cattle and small animals. From this activity, the villagers sell by-products such as milk and quesillo, as well as small animals (poultry and guinea pigs).
Regarding the access roads to the localities of the area of interest, there are dirt roads, which are in good condition due to the fact that the current municipal management has been carrying out maintenance on a continuous basis. However, as in other districts in the region, these roads are affected during the rainy season. In spite of this, there is public transportation in the urban area of the district and in the towns of Cúmbico, San Cristóbal and Choropampa. In the rest of the localities, only private vehicles are used. According to the 2017 INEI Census, water service coverage reaches a little more than three quarters of the population, which has access to the public network inside the home or outside the home but inside the building, while the remaining quarter uses water tanks, springs, puquios, among others. Likewise, the authorities interviewed stated that in the urban area, the water supply is not continuous, but rather by the hour. In relation to this, more than 50% of the population still uses latrines and cesspools due to the lack of a sewage system. As for the electricity service, a quarter of the population of Magdalena still does not have lighting. In Magdalena there is a police unit and farmer patrols that contribute to maintaining security in the district. In this sense, there are not many reported cases of delinquency. Regarding cases of
69 Cesar Guarniz Rabanal, Deputy Manager of Economic Development and Environment, and Jeniffer Patricia Noboa Cabrera, Deputy Manager of Social Development.

Environmental and Social Impact Assessment of Forest Landscape Restoration Project December 2021
Social Capital Group 288
social conflict, the municipal authorities state that there have been no recent cases of social conflict in the district. Reference was only made to the socio-environmental conflict in 2000 with the Yanacocha mining company, due to the mercury spill in Choropampa. Perceptions of forestry potential in the area
The officials interviewed stated that there are currently pine, cypress and eucalyptus plantations on the lands of the Cúmbico Campesino Community, which are being harvested and sold in the city of Cajamarca. Likewise, the officials point out the localities of Sexamayo, Catache, Cúmbico, Succhabamaba, Cunchupampa and Casadén as suitable areas for the possible implementation of a forestry project.
The municipal authorities stated that they would be willing to support a forestry project. They consider that they can contribute by holding meetings with the residents to inform them about the benefits and conditions of the agreements with the Project, as well as by locating the most appropriate lands in the district for afforestation.
In terms of the population's receptiveness, the interviewees stated that the population would agree with the implementation of a forest project, as it is an activity that arouses interest due to its environmental and economic benefits. As a background, they highlighted that there was good receptivity from the population to the plantation activities of the Ministry of Agriculture and Irrigation that were carried out more than five years ago.
Experiences from others forestry projects and recommendations for the implementation of the Project
The interviewees mentioned that there is no forestry project undertaken by the Municipality in the district due to lack of budget. Only MIDAGRI distributed seedlings to the population approximately seven years ago. Likewise, the Cúmbico Campesino Community is dedicated to planting and harvesting tree species that are eventually marketed in Cajamarca.
As one of the achievements identified by the authorities with respect to this activity, they pointed out that lands that previously had no specific use have been reforested. Likewise, a complementary economic activity has been developed for the population. Regarding the challenges, the informants stated that there is a certain distrust among the population to sign agreements with long-term harvesting forestry projects, as the time horizon of perceived benefits is very distant. In this regard, they recommend that a local forest development proposal be generated and implemented in constant dialogue with the population, taking into account the most influential stakeholders identified in the area, such as the farmer patrols, the authorities of each population center and the Irrigation Boards.
6.3.1.8 Jesus District
The area of interest in the district of Jesús is located in the southwestern part of the district, bordering the districts of Asunción, San Juan and Cospán in the province of Cajamarca, the district of Pedro Gálvez in the province of San Marcos and the district of Cachachi in the province of

Environmental and Social Impact Assessment of Forest Landscape Restoration Project December 2021
Social Capital Group 289
Cajabamba. In this zone, 24 localities were identified between 2589 and 3711 m.a.s.l. (see Map 7.8). (see the following Figure).
Figure 6.12 Zone of interest in the Jesús District
Prepared by SCG
According to the INEI's 2017 Directory of Populated Centers, the locality with the fewest number of people in the census is La Toma with only 27 people, while the most inhabited is San José de Tumina, with 269 people. In addition, it is worth noting that the towns of Totora, Lorito Pampa, Granero and La Cruz are within the territories of the SAIS José Carlos Mariátegui (see Table 6.18).
Table 6.18 Data on the localities of the zone of interest in the district of Jesus
Location Altitude (m.a.s.l.)
Census population Housing
Km to district capital
Time to district capital
Totora 3 442 166 82 37.4 km 1 hour and 15
minutes
Pampas Parrot 3 438 104 50 32.7 km 45 minutes
Yuracmarca 3 046 128 73 15 km 1 hour and 30 minutes
Chuniguillay 2 903 157 71 11 km 1 h
La Toma 2 837 27 9 8.7 km 40 minutes
Luñibamba 2 589 41 12 1.8 km 15 minutes
Llimbe 2 589 41 12 2.2 km 15 minutes
Shuto 2 734 76 32 8.5 km 30 minutes
Shidin 2 835 121 69 8.2 km 1 h

Environmental and Social Impact Assessment of Forest Landscape Restoration Project December 2021
Social Capital Group 290
Location Altitude (m.a.s.l.)
Census population Housing
Km to district capital
Time to district capital
Barn 3 227 90 42 21.8 km 45 minutes
Lapar 3 294 36 18 37 km 2 hours and 30 minutes
The Shita 3 285 339 139 33.8 km 2 h
Laymina high 3 398 155 78 28.9 km 45 minutes
The Cross (Chicus) 3 423 69 28 30.5 km 2 hours and 10
minutes
Laimina Las Mercedes 3 316 151 72 25 km 2 h
San Jose de Tumina 2 939 269 76 22.6 km 45 minutes
Lock 1 3 293 252 90 36 km 1 hour and 15
minutes
Romeropampa 3 278 41 25 28.5 km 2 h
Tranca 2 3 449 109 53 32 km 1 h
New Porvenir 3 136 118 39 36.8 km 1 h
Llucmapampa 3 461 68 52 41.6 km 2 h
High Blood Sausage 3 711 191 41 95.9 km 2 hours and 30
minutes
Low Blood Sausage 3 467 114 31 108.2 km 2 hours and 30
minutes
Source: Directorio de Centros Poblados 2017 and Sistema de Consulta de Centros Poblados - INEI.
According to the district officials interviewed70, the main economic activity of the population is agriculture, followed by livestock. Crops depend on the altitude: in the higher areas, potatoes, wheat and barley predominate, and in the lower areas, corn, cabbage and alfalfa. Most of the potato and corn harvests are destined for self-consumption. To a lesser extent, aguaymanto is cultivated, which is also used for the production of jam in La Tranca. The second most important economic activity is the breeding of guinea pigs, which are marketed in Chiclayo, Trujillo, Jaén, Bagua and Cajamarca. The third important economic activity is the breeding of cattle and goats.
Regarding access roads in the area of interest, there are dirt roads that are in good condition. However, there is no public transportation to the villages and towns. The population travels on foot, using pack animals and private vehicles (cars and motorcycles). Likewise, they also make use of milk collection trucks to move around. Regarding the coverage of basic services, approximately 80% of the population in the area of interest has drinking water and uses latrines for drainage. Likewise, most of the inhabitants have electricity and telephone signal coverage, although the internet signal is deficient. Regarding public safety, it was noted that criminal activities are not frequent in the district thanks to the presence of the farmer patrols in the localities. On the other hand, those interviewed mentioned that there is a latent case of social conflict in the locality of El Grandero due to the use of water reservoirs among the inhabitants.
70 Victor Cerna Yrigoin, Manager of Economic Development and Environment, and Ashley Farromeq Coba, Manager of Public Development and Social Management.
Environmental and Social Impact Assessment of Forest Landscape Restoration Project December 2021
Social Capital Group 291
Perceptions of forestry potential in the area
The interviewees mentioned that the area of interest in the district of Jesús has potential for forest crops, as it has a good climate and its lands are suitable for planting pine trees. In this sense, they identified the localities of Totora, La Shita, Tranca and Morcilla Alta as places where forestry activities can be carried out due to the amount of available spaces that need to be reforested.
The municipal authorities interviewed mentioned that they are willing to learn more about a project in this area and have a favourable attitude towards its implementation in the district. They mentioned that the institution could collaborate with specialized technical staff, with the respective coordination with the authorities of each population center and hamlet, the creation of a list of beneficiaries and also with the identification of possible sites in the district with greater aptitude for forest development.
Regarding the receptiveness of the population, the authorities state that it is very likely that they will be in favour of the implementation of a forestry project, as the population is currently interested in this activity. Furthermore, forestry activities contribute to the improvement of the environmental quality of the surroundings and generate economic benefits for the population.
Experiences from others forestry projects and recommendations for the implementation of the Project
The officials interviewed indicated that in recent years there have been no forestry activities promoted by the district municipality, but they do have municipal nurseries. Currently, there is a proposal from the municipality to begin reforestation in the upper part of the district. This proposal seeks to promote the cultivation of radiata and patula pine species in order to take advantage of the edible mushrooms that fetch a good price on the market. However, the population is still asking for eucalyptus plantations, since they use it to fence the boundaries of their properties.
As part of the main recommendations for the planning and implementation of a forestry project, the municipal authorities pointed out the following: identify the authorities of each population centre and hamlet to meet with them and inform them about the Project; carry out appropriate technical monitoring of the plantations so that they are well managed; consider the population's perception of the short, medium and long-term benefits; and finally, try to involve the landowners in the plantation of large areas of land.
6.3.1.9 San Juan District
In the area of interest in the district of San Juan are the towns of Lanchepata and Huacraruco, located at 2910 and 2828 m.a.s.l. respectively, in the southern part of the district, bordering the districts of Asunción and Jesús (see the following Figure).

Environmental and Social Impact Assessment of Forest Landscape Restoration Project December 2021
Social Capital Group 292
Figure 6.13 Zone of interest in the San Juan District
Elaboración: SCG
According to the INEI's 2017 Population Centers Directory, Huacraruco registered a total of 102 people in the census, while Lanchepata had 41 people. Both localities are located approximately two hours from the district capital and belong to the José Carlos Mariátegui SAIS (see Table 6.19).
Table 6.19 Data on the localities of the zone of interest in the district of San Juan
Location Altitude (m.a.s.l.)
Census population
Housing Km to district
capital Time to district
capital
Lanchepata 2 910 41 16 31.2 km 2 h
Huacraruco 2 828 102 35 33.6 km 2 h
Source: Directorio de Centros Poblados 2017 and Sistema de Consulta de Centros Poblados - INEI.
The main economic activity in Huacraruco is cattle raising, mainly milk production, which is sold to Nestlé and Gloria. There is also self-consumption agriculture. In the case of Lanchepata, the main economic activity is the production of grains and tubers, also for self-consumption. In both localities, the predominant type of irrigation is gravity irrigation, but they also use tributaries and springs.
The access roads to these localities are dirt roads, which are affected during the rainy season (January-March) when landslides can occur. This situation is widespread throughout the district, being one of the main disadvantages for the economic activities of the population. On the other
Environmental and Social Impact Assessment of Forest Landscape Restoration Project December 2021
Social Capital Group 293
hand, there is no public transportation to the localities in the area of interest. The population tends to use motorcycle taxis and private cars to travel to these localities. With respect to basic services, according to the Diagnosis of Rural Water Supply and Sanitation (DATASS), 51% of the inhabitants of Huacraruco have access to drinking water. According to those interviewed, in Lanchepata approximately 30% of the population has access to potable water. The rest of the population uses water from wells, which is not treated. There is also a predominance of latrines as the only type of drainage. In terms of electricity service, the interviewees consider that approximately 25% do not have electrification. On the other hand, in relation to the issue of social conflicts, the authorities interviewed mentioned the invasion of land in the Huacraruco area (see section Relationship with other institutions ). They commented that the Huanumayo spring is located in this area, which is the source for a drinking water project to be executed by the Municipality. Being in the conflict zone, the Project could suffer delays or the need to negotiate the demands of the groups that have taken possession of the disputed territories. Perceptions of forestry potential in the area
The interviewees mentioned that the higher parts of the area of interest have the necessary humidity for the growth of tree species. They also indicated that the localities of Huacraruco and Lanchepata have slopes for forest planting. However, they pointed out that for the development of a project it would be necessary to coordinate with the SAIS José Carlos Mariátegui, since the area of interest belongs to that cooperative.
On the other hand, it was mentioned that forestry activity in the district is part of the municipal agenda, as it is in the Chetilla district. For this reason, the authorities interviewed indicated that the Municipality is in favor of forestry activities and any initiative that contributes to improving the quality of life of the district's population. They pointed out that municipal support could be given by linking the municipal forestry project with that of The Project. In this way, the implementation of a private forestry project could contribute to meeting the municipal reforestation goals.
Regarding the receptiveness of the population, the authorities stated that they would agree with the implementation of forestry activities, as it is an activity that arouses interest among the population. In addition, they stated that the identification of benefits is a key factor in achieving the acceptance of the population.
Experiences from others forestry projects and recommendations for the implementation of the Project
Currently, the District Municipality of San Juan has the goal of carrying out 100,000 forest plantations as part of the municipal management, which would be composed of eucalyptus plantations (60,000), pines (15,000), tayas (15,000) and other species (10,000). At present, this project is being implemented slowly, but it is still in force. As part of this institutional activity, the Provincial Municipality of Cajamarca donated 5,000 plantations to the district to be distributed among the population.

Environmental and Social Impact Assessment of Forest Landscape Restoration Project December 2021
Social Capital Group 294
Regarding the achievements of forestry activities, it was mentioned that there was previously a forest plantation project in the locality of Choten. As a result of this experience, timber marketing was achieved. The interviewees consider that this project, and its continuity on the part of the population, has contributed to improving the quality of life in the locality.
Among the main challenges for the implementation of a forestry project, the conflict over land invasion in Huacraruco was mentioned. This type of conflict discourages private investment in the area. There is also the challenge of negotiating with the local population and making agreements that generate benefits in the short and medium term. On the other hand, given that there is fear among the population of losing the land that is subject to agreements, there would also be a challenge in communication and the generation of trust with the landowners.
It was also commented that another problem is the forest fires, which are frequent in the district, caused by the local population itself, since there is a belief that by generating smoke, rain is attracted. In that sense, they point out, there were times when the fire got out of control, as in the year 2020, when there were 3 considerable fires that affected 20 hectares of trees in the hamlets of Las Quinuas, Gavilán and Chotén.
The recommendations provided by the officials for the implementation of a forest project are, in the first place, to inform each plot holder in the area of interest about the benefits to be derived from the project and to negotiate directly with them in order to meet their expectations. They also consider it relevant to promote productive associations, since there are no large areas in the district (each landowner will have an average of approximately 3 hectares). With these associations, the use of several producers' lands could be coordinated.
6.3.2 Province of San Pablo
6.3.2.1 San Bernardino District
In the area of interest in the district of San Bernardino are the hamlets of Chonta Baja and Chonta Alta, located at 2,245 and 3,214 m.a.s.l. respectively, in the northeastern part of the district, near the district boundary that borders the districts of San Pablo and Chetilla (see the following Figure).

Environmental and Social Impact Assessment of Forest Landscape Restoration Project December 2021
Social Capital Group 295
Figure 6.14 Zone of interest in the San Bernardino District
Prepared by SCG
According to the INEI's 2017 Population Centers Directory, the hamlets of Chonta Alta and Chonta Baja have 174 and 348 registered inhabitants, respectively. On the other hand, the closest hamlet to the district capital is Chonta Baja (see Table 6.20). No farmer communities were identified in the Project's area of interest.
Table 6.20 Data on the hamlets in the zone of interest in the Encañada District
Location Altitude (m.a.s.l.)
Census populatio
n Housing
Km to district capital
Time to district capital
High Chonta 3 214 174 54 104.4 km 3 hours and 10
minutes
Chonta Baja 2 245 348 103 76.6 km 3 h
Source: Directorio de Centros Poblados 2017 and Sistema de Consulta de Centros Poblados - INEI.
According to the officials interviewed71, the inhabitants of these hamlets are mostly engaged in cattle raising and, to a lesser extent, in agriculture. In livestock farming, they work individually to sell 90% of their milk production to Gloria and Nestlé. There are also manufacturers of cheese, which is sold in Cajamarca, San Pablo, Chilete and San Miguel. Regarding agriculture, in the upper part of the villages they grow grass for livestock, peas, wheat, ollucos and ocas. In the lower part, sugar cane, corn, yucca, beans, garlic and fruit trees are grown. Approximately 30% of the
71 Roberto Carranza Huaccha, Head of Economic Management, and Luis Tito González Rodríguez, Deputy Manager of Development and Social Welfare.

Environmental and Social Impact Assessment of Forest Landscape Restoration Project December 2021
Social Capital Group 296
agricultural products are for self-consumption. To supply water to these crops there are flood channels and recently sprinkler irrigation is being implemented.
Regarding the access roads to these villages, the authorities mention that there are dirt roads that need maintenance during the rainy season (January to March), since conditions worsen during those months. The area has public transportation in the form of trucks and vans. The population also travels in the milk collection trucks.
On the other hand, the hamlets in the area of interest do have drinking water supply services; however, in the dry season (June-December) the water flow decreases. They do not have sewage connections in their homes, so they resort to latrines or cesspits. Likewise, the hamlets have electricity service.
With regard to public safety, it was reported that the presence of farmer patrols has reduced problems such as cattle rustling. No active social conflicts were identified in the area of interest.
Perceptions of forestry potential in the area
According to the authorities interviewed, there is enough space in the area of interest for planting pine trees, since plots of approximately 10 hectares can be found and water is available. Currently in the localities of the area of interest there are pine and cypress plantations that can already be harvested. Other localities with forestry aptitude, but not in the preliminary area of interest, are Maqui Maqui and Yuragalpa.
Regarding the willingness of the authorities to support a future forest project, they mentioned that the district municipality would support the project and that it could be through the knowledge of the municipal forestry technicians and by promoting coordination with local authorities. Similarly, the interviewees considered that the population would accept the project if they were provided with timely information and facilities for plantation management and if short- and medium-term benefits were generated.
Experiences from others forestry projects and recommendations for the implementation of the Project
The authorities interviewed mentioned that five years ago in the villages of Chonta Alta and Chonta Baja there was a project to install forest plant nurseries with the support of AGRORURAL72. With this production, pine and cypress trees were later planted. However, they consider that the benefits obtained have only been for a few people, since they did not plant large hectares. In this sense, they consider that the main challenge of the new forestry projects will be to be able to benefit the greatest number of people and to articulate with the different social actors of the relevant area (local authorities, farmer patrols, municipal authorities).
Finally, the authorities recommend carrying out a census in the hamlets and population centers to identify the land available for a pine forest project. They also recommend training the
72 Entity attached to the Ministry of Agrarian Development and Irrigation. Its objective is to promote and execute rural agrarian development programs https://www.gob.pe/4417-programa-de-desarrollo-productivo-agrario-rural-que-hacemos

Environmental and Social Impact Assessment of Forest Landscape Restoration Project December 2021
Social Capital Group 297
population, providing the necessary tools for planting and getting the population involved in the project as paid labor.
6.3.2.2 District of San Pablo
In the area of interest in the San Pablo district there are seven localities located between 3 197 and 3 499 m.a.s.l., in the eastern part of the district as shown in the following Figure.
Figure 6.15 Zone of interest in the San Pablo District
Prepared by SCG
According to the INEI's 2017 Population Centers Directory, the hamlets of Las Vizcachas and Santa Rosa de Callancas have 248 and 180 registered inhabitants, while Curacocha and Yerba Santa have 87 and 72 inhabitants, respectively. Of these hamlets, the closest to the district capital are Las Vizcachas, Santa Rosa de Callancas and Pati (see Table 6.21). On the other hand, no farmer communities were identified in the Project's area of interest.
Table 6.21 Data on the hamlets in the zone of interest in the district of San Pablo
Location Altitude (m.a.s.l.)
Census populatio
n Housing
Km to district capital
Time to district capital
Yerba Santa 3 197 72 59 43.1 km 2 hours and 30
minutes

Environmental and Social Impact Assessment of Forest Landscape Restoration Project December 2021
Social Capital Group 298
Location Altitude (m.a.s.l.)
Census populatio
n Housing
Km to district capital
Time to district capital
El Rejo de Callancas 3 220 163 82 40. 7 km 2 hours and 30
minutes
Las Vizcachas 3 335 248 132 46.5 km 2 h
Santa Rosa de Callancas 3 384 180 134 62.8 km 2 h
Pati 3 499 149 94 59.2 km 2 h
Curacocha 3 397 87 55 62.1 km 2 hours and 45
minutes
Cachipampa 3 404 118 76 58.8 km 3 h
Source: Directorio de Centros Poblados 2017 and Sistema de Consulta de Centros Poblados - INEI.
According to the officials interviewed73, the inhabitants of these hamlets are mainly engaged in livestock and agriculture. Regarding livestock, dairy cattle are raised, 90% of whose production is sold to Nestlé and Gloria. The rest of the milk production is used to make cheese that is sold in San Pablo or Cajamarca. Agriculture is mainly focused on peas, avocado, avocado, avocado, tara and corn. Approximately 80% of the production of peas, corn, avocado and tara is destined for commercialization. For water supply, 70% of the producers use gravity irrigation and the rest use sprinkler irrigation.
As for the access roads to these villages, most of them are paved dirt roads, with the exception of the main road that connects San Pablo with Cajamarca, which is a paved road. During the rainy season, the dirt roads worsen their conditions, making transportation to the villages difficult. Likewise, there is no public transportation. Private transportation (taxis, motorcycles and trucks) is used to travel to the different villages or to the district capital.
Regarding basic services, the informants mentioned that in the area of interest there are water catchments from springs that are then made drinkable for consumption. On the other hand, the use of latrines predominates and there is electricity connection in the localities. As for the internet connection, the coverage is low and in the highlands there is more coverage of the operator Claro.
In terms of public safety, those interviewed mentioned that thanks to the presence of the farmer patrols that work together with the Police and Serenazgo, there are few cases of minor assaults and cattle rustling. Likewise, there are no social conflicts in the Project's area of interest.
Perceptions of forestry potential in the area
According to officials, the area of interest has ideal characteristics for a forestry project, due to the climate and the availability of space for planting pine trees. Currently, 500 hectares are forested in the towns of Yerba Santa, Pati, Santa Rosa de Callancas, Curacoccha and Cachipampa. The species found in greatest quantity in the area is pine and, to a lesser extent, avocado. Also, according to those interviewed, there is ample land in these localities that can still be reforested.
73 Juan Jaez Morales Alva, Economic Development Manager; Camilo Moza Chilón, Social Development Manager; and Nolberto Soto Gamarra, Deputy Manager of Community Services.

Environmental and Social Impact Assessment of Forest Landscape Restoration Project December 2021
Social Capital Group 299
On the other hand, the municipal authorities stated that they would support the Project, since it could contribute to improve the environmental conditions and would represent a complementary income for the local population. They consider that they could channel this support through the technical personnel of the municipality, financing some activities and supporting with labor in the production process in the nursery. In the same way, the interviewees consider that the population would be interested in a forestry project, considering the benefits in terms of environmental conservation, employment generation and the offer of a complementary source of income.
Experiences from others forestry projects and recommendations for the implementation of the Project
In the district there is a joint effort between the Provincial Municipality, the Agrarian Agency of San Pablo74 and the Management of Economic Development of the Regional Government of Cajamarca to promote and carry out forest plantations in the district. Currently, some of these plantations are already being harvested and marketed in Cajamarca, Trujillo and Piura. Likewise, the Provincial Municipality of San Pablo carries out activities of production of tara seedlings, which are distributed to the associations, authorities and families of the localities of the district.
In general terms, these projects have contributed to the conservation of the environment and the generation of employment and income for the local population. However, the interviewees pointed out that there is a challenge to manage the drought seasons, as there is a perceived change in the frequency of rainfall in the region. On the other hand, they also consider that it is a challenge to reforest the areas already harvested and make them sustainable over time.
As a recommendation, officials believe it is important to conduct soil studies to determine what type of species is adapted to the climatic conditions of San Pablo. They also suggest that the forestry campaign should coincide with the time when there is more rainfall so that the seedlings can benefit from it.
6.3.2.3 Tumbaden District
The area of interest in the district of Tumbaden covers almost the entire district territory. Twelve localities were identified in the central zone of the district and are located between 2 978 and 3 708 m.a.s.l. (see the following Figure).
74 The Agricultural Agencies are decentralized bodies of the Regional Directorate of Agriculture that facilitate the organization and coordination of agricultural activities in their respective jurisdictions.

Environmental and Social Impact Assessment of Forest Landscape Restoration Project December 2021
Social Capital Group 300
Figure 6.16 Zone of interest in the Tumbaden District
Prepared by SCG
According to the INEI's Directory of Populated Centers 2017, the hamlets of Morohuisha and Pozo Seco registered the lowest number of inhabitants registered in 2017 (11 and 40 people respectively). While the hamlets of Tumbaden Grande and El Progreso registered the highest number of inhabitants (331 and 219 respectively). On the other hand, the closest hamlet to the district capital is Maraypampa and the farthest is El Regalado (see Table 6.22).
Table 6.22 Data on localities in the zone of interest in the district of Tumbadén
Location Altitude (m.a.s.l.)
Census population Housing
Km to district capital
Time to district capital
Maraypampa 3 204 197 53 10.6 km 20 minutes
Tumbaden 3 041 181 65 - -
Peña Blanca 3 339 210 65 15.8 km 30 minutes
Dry Well 3 475 40 17 16.2 km 30 minutes
El Progreso 3 304 219 71 20.4 km 20 minutes
Large Tumbaden 2 978 331 93 16.4 km 45 minutes
Chaupiloma 3 087 215 71 65.3 km 1 h
Antivo La Ruda 3 219 104 31 47.7 km 50 minutes
Chaupirume 3 262 191 54 55.6 km 1 hour and 30
minutes
The Regalado 3 305 113 53 65.7 km 2 h
Pucará 3 325 98 32 65.6 km 2 h
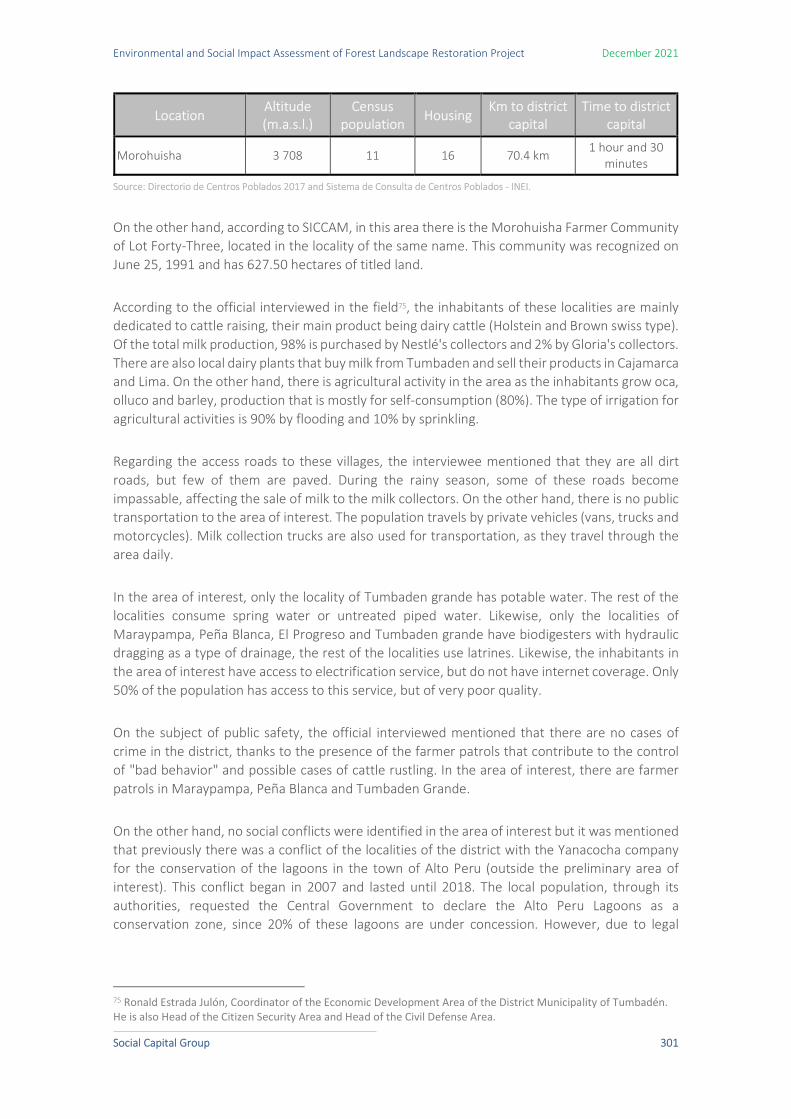
Environmental and Social Impact Assessment of Forest Landscape Restoration Project December 2021
Social Capital Group 301
Location Altitude (m.a.s.l.)
Census population Housing
Km to district capital
Time to district capital
Morohuisha 3 708 11 16 70.4 km 1 hour and 30
minutes
Source: Directorio de Centros Poblados 2017 and Sistema de Consulta de Centros Poblados - INEI.
On the other hand, according to SICCAM, in this area there is the Morohuisha Farmer Community of Lot Forty-Three, located in the locality of the same name. This community was recognized on June 25, 1991 and has 627.50 hectares of titled land.
According to the official interviewed in the field75, the inhabitants of these localities are mainly dedicated to cattle raising, their main product being dairy cattle (Holstein and Brown swiss type). Of the total milk production, 98% is purchased by Nestlé's collectors and 2% by Gloria's collectors. There are also local dairy plants that buy milk from Tumbaden and sell their products in Cajamarca and Lima. On the other hand, there is agricultural activity in the area as the inhabitants grow oca, olluco and barley, production that is mostly for self-consumption (80%). The type of irrigation for agricultural activities is 90% by flooding and 10% by sprinkling.
Regarding the access roads to these villages, the interviewee mentioned that they are all dirt roads, but few of them are paved. During the rainy season, some of these roads become impassable, affecting the sale of milk to the milk collectors. On the other hand, there is no public transportation to the area of interest. The population travels by private vehicles (vans, trucks and motorcycles). Milk collection trucks are also used for transportation, as they travel through the area daily.
In the area of interest, only the locality of Tumbaden grande has potable water. The rest of the localities consume spring water or untreated piped water. Likewise, only the localities of Maraypampa, Peña Blanca, El Progreso and Tumbaden grande have biodigesters with hydraulic dragging as a type of drainage, the rest of the localities use latrines. Likewise, the inhabitants in the area of interest have access to electrification service, but do not have internet coverage. Only 50% of the population has access to this service, but of very poor quality.
On the subject of public safety, the official interviewed mentioned that there are no cases of crime in the district, thanks to the presence of the farmer patrols that contribute to the control of "bad behavior" and possible cases of cattle rustling. In the area of interest, there are farmer patrols in Maraypampa, Peña Blanca and Tumbaden Grande.
On the other hand, no social conflicts were identified in the area of interest but it was mentioned that previously there was a conflict of the localities of the district with the Yanacocha company for the conservation of the lagoons in the town of Alto Peru (outside the preliminary area of interest). This conflict began in 2007 and lasted until 2018. The local population, through its authorities, requested the Central Government to declare the Alto Peru Lagoons as a conservation zone, since 20% of these lagoons are under concession. However, due to legal
75 Ronald Estrada Julón, Coordinator of the Economic Development Area of the District Municipality of Tumbadén. He is also Head of the Citizen Security Area and Head of the Civil Defense Area.

Environmental and Social Impact Assessment of Forest Landscape Restoration Project December 2021
Social Capital Group 302
issues, the Constitutional Court did not approve the population's request and the conflict is currently in a latent phase.
Perceptions of forestry potential in the area
The interviewed official pointed out that the Tumbaden territories have the environmental conditions to develop forestry projects. From the area of preliminary interest, it was indicated that the rural community Morohuisha and the localities Regalado, Chaupirume and Pozo Seco have ample land available for forestation. Likewise, in the localities of Peña Blanca and El Progreso there are already pine plantations that are beginning to be harvested. In addition, it was mentioned that the towns of Alto Peru and Ingatambo (which are outside the preliminary area of interest) also have extensive areas available for forestry activities.
Regarding the willingness of the authorities to support the forest project, the interviewee mentioned that there is a willingness to promote forest projects in the district. To this end, he considers that it would be important to sign working agreements to designate responsibilities, roles and functions among the different institutions involved in the project. Likewise, the Municipality could contribute by providing technical advice, coordinating with local authorities (lieutenant governors and municipal agents), managing municipal permits and providing machinery for afforestation.
The interviewee also believes that the local population would be receptive to getting involved in a forestry project. To this end, it is necessary to ensure that the population has the necessary information on the benefits and that there is clarity in the terms of the agreements to be signed. Similarly, he considered it important that there be assemblies in the localities where there is joint acceptance of the Project.
Experiences from others forestry projects and recommendations for the implementation of the Project
Previous forestation projects have been carried out in all the hamlets of Tumbaden. One of the first was carried out with ADEFORT in 2007, in the villages of Caramipampa, Peña Blanca, Progreso, part of Granja Porcón, Alto Perú, Ingatambo, Vista Alegre, Chaupirume and El Regalado. In this project, ADEFORT paid for the entire planting process in the localities and the production would be divided into 70% for the landowner and 30% for ADEFORT.
The district municipality has been able to reforest during the last two years in different areas of the district. For this, it made agreements with MINAGRI, the Agrarian Agency of Cajamarca and the Agrarian Agency of San Pablo. For this year it is scheduled to distribute seedlings to reforest 300 hectares. On the other hand, two years ago the Regional Government made a diagnosis for the Poncho Verde Project of the Regional Government that aims to promote forest production and plantation in the 13 provinces of Cajamarca, as well as to improve the productive infrastructure and the capacities of the beneficiaries. In this sense, forestation is planned throughout the district, giving priority to the patula pine. In this project, the Regional Government will only deliver the seedlings and the owner will be in charge of digging and planting for the plantation.

Environmental and Social Impact Assessment of Forest Landscape Restoration Project December 2021
Social Capital Group 303
As an achievement of forestry activities in the district, the official considers that they contribute to the economic improvement of the local population and to the conservation of the environment. Likewise, among the main challenges of these projects, he identifies sustainability, since after the harvest, the land cannot be used for other crops. In this sense, he considers that it is important to give continuity to the replanting of tree species.
As final recommendations, the interviewee suggested carrying out updated mappings and diagnoses of the available areas in the hamlets. To this end, it is recommended that the communities be called to a meeting through their lieutenants to ask each inhabitant how many hectares they have available for planting. This mechanism has been useful for the planting of pastures promoted by the District Municipality and has had good results. Another recommendation is to finance the labor involved in the planting process. In general, forestry projects usually have agreements where landowners are asked to provide the labor for free; however, since the land is large, this activity can be an additional burden and expense for the landowner. Finally, constant coordination with district and local authorities is recommended to assist in communication with the local population.
6.3.3 Province of Cajabamba
6.3.3.1 District of Cachachi
In the area of interest in the district of Cachachi there are 24 localities located between 2791 and 3720 m.a.s.l., in the northeastern part of the district, bordering the districts of Cospán and Jesús (see the following Figure).

Environmental and Social Impact Assessment of Forest Landscape Restoration Project December 2021
Social Capital Group 304
Figure 6.17 Zone of interest in the Cachachi District
Prepared by SCG
According to the INEI's 2017 Population Centers Directory, the locality with the fewest registered inhabitants is Lanchepata with only seven people, while the most inhabited is Tayapamba, with 363 people. Likewise, the closest locality to the district capital is Chimchimpata and the farthest is Hierba Buena (see Table 6.23). No campesino communities were identified in this zone of interest.
Table 6.23 Data on localities in the zone of interest in the district of Cachachi
Location Altitude (m.a.s.l.)
Census populatio
n Housing Km to district
capital Time to district
capital
White Water 3 641 17 11 17.7 km 1 h
Huangapata 3 720 92 32 34.3 km 1 hour and 30
minutes
New Santa Rosa 3 535 109 32 15.4 km 1 h
Round 3 514 260 64 10.9 km 30 minutes
Chimchimpata 3 483 266 96 7.9 km 20 minutes
Watchtower 3 637 18 3 18.9 km 1 h
The Capuli 3 201 42 14 134.8 km 6 h
Rodeobamba 3 321 219 70 3.6 km 20 minutes
Gloriabamba 3 312 75 27 3.6 km 20 minutes
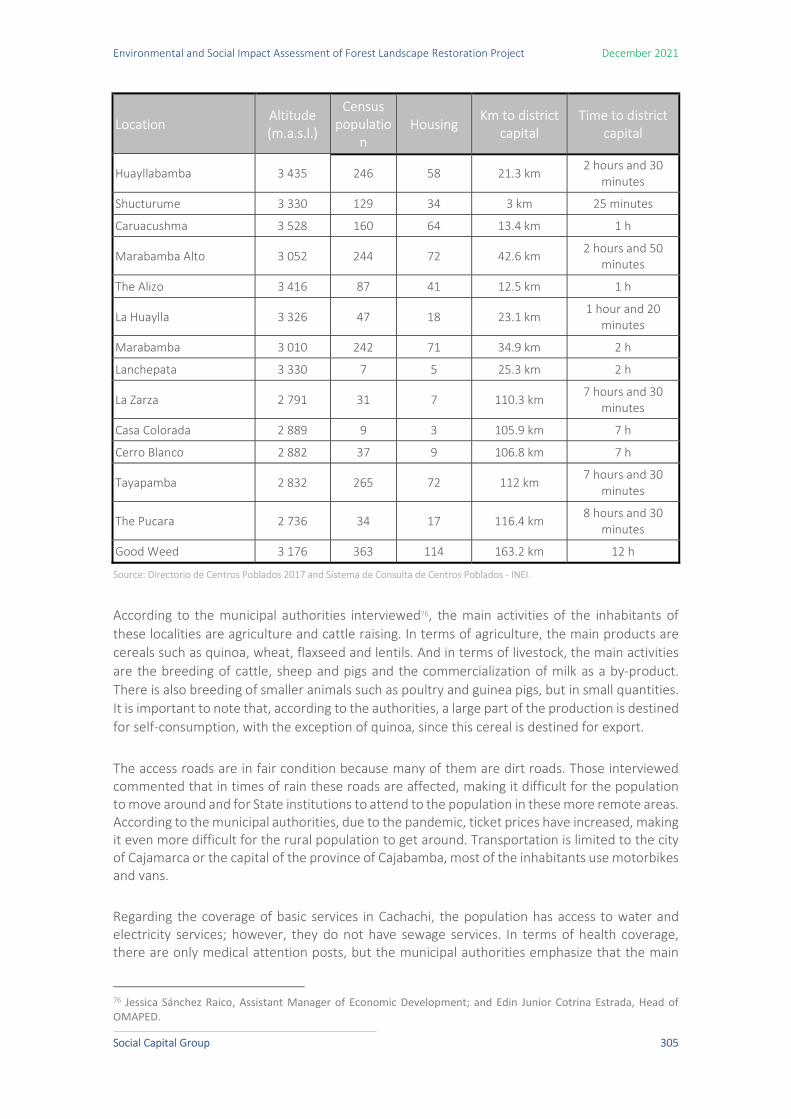
Environmental and Social Impact Assessment of Forest Landscape Restoration Project December 2021
Social Capital Group 305
Location Altitude (m.a.s.l.)
Census populatio
n Housing
Km to district capital
Time to district capital
Huayllabamba 3 435 246 58 21.3 km 2 hours and 30
minutes
Shucturume 3 330 129 34 3 km 25 minutes
Caruacushma 3 528 160 64 13.4 km 1 h
Marabamba Alto 3 052 244 72 42.6 km 2 hours and 50 minutes
The Alizo 3 416 87 41 12.5 km 1 h
La Huaylla 3 326 47 18 23.1 km 1 hour and 20
minutes
Marabamba 3 010 242 71 34.9 km 2 h
Lanchepata 3 330 7 5 25.3 km 2 h
La Zarza 2 791 31 7 110.3 km 7 hours and 30
minutes
Casa Colorada 2 889 9 3 105.9 km 7 h
Cerro Blanco 2 882 37 9 106.8 km 7 h
Tayapamba 2 832 265 72 112 km 7 hours and 30
minutes
The Pucara 2 736 34 17 116.4 km 8 hours and 30
minutes
Good Weed 3 176 363 114 163.2 km 12 h
Source: Directorio de Centros Poblados 2017 and Sistema de Consulta de Centros Poblados - INEI.
According to the municipal authorities interviewed76, the main activities of the inhabitants of these localities are agriculture and cattle raising. In terms of agriculture, the main products are cereals such as quinoa, wheat, flaxseed and lentils. And in terms of livestock, the main activities are the breeding of cattle, sheep and pigs and the commercialization of milk as a by-product. There is also breeding of smaller animals such as poultry and guinea pigs, but in small quantities. It is important to note that, according to the authorities, a large part of the production is destined for self-consumption, with the exception of quinoa, since this cereal is destined for export.
The access roads are in fair condition because many of them are dirt roads. Those interviewed commented that in times of rain these roads are affected, making it difficult for the population to move around and for State institutions to attend to the population in these more remote areas. According to the municipal authorities, due to the pandemic, ticket prices have increased, making it even more difficult for the rural population to get around. Transportation is limited to the city of Cajamarca or the capital of the province of Cajabamba, most of the inhabitants use motorbikes and vans. Regarding the coverage of basic services in Cachachi, the population has access to water and electricity services; however, they do not have sewage services. In terms of health coverage, there are only medical attention posts, but the municipal authorities emphasize that the main
76 Jessica Sánchez Raico, Assistant Manager of Economic Development; and Edin Junior Cotrina Estrada, Head of OMAPED.

Environmental and Social Impact Assessment of Forest Landscape Restoration Project December 2021
Social Capital Group 306
problem in the area is the lack of properly trained health professionals to serve the population. Regarding telecommunications, there is internet and mobile phone coverage, but it is unstable. In relation to citizen security, in the district of Cachachi there are police stations and farmer patrols that contribute to the resolution of conflicts among the population. Likewise, according to the officials interviewed, the most common cases of conflict are related to land boundaries between inhabitants, but they are of low intensity. They also note the existence of cases of illegal mining and illegal logging, which generates unrest among the population. Perceptions of forestry potential in the area
According to the interviews conducted, the entire area of interest has forest potential. In this sense, they recommend prioritizing the localities of Hierba buena, Lanchepata, Caruacushma and Chimchimpata. Additionally, they mention the localities of Chugur and Hualanga, which are not in the preliminary area of interest.
The authorities state that they would be in agreement with the implementation of a forestry project in the district, as it could mean a source of employment for the population, complementary to those that currently exist. The Municipality could support through the municipal nursery and with available technical personnel. They also indicated that they could contribute to the coordination with the local authorities of the hamlets.
They consider that the population would also be interested in carrying out forestry activities on their land, as the Municipality has been carrying out forestry activities on an annual basis for several years and they have been well received. However, they noted that the landowners are always interested in the type of agreement that would be made and will evaluate the remuneration/benefit that the forestry activity would generate.
Experiences from forestry projects and recommendations for the implementation of the Project
In the district of Cachachi, a forestry project is currently being developed by the district municipality, which aims to reforest the villages of Caruacushma and Huallabamba with radiata pines and cypresses. Those interviewed pointed out that although it is a new project that has not yet been harvested, it is already generating interest among the population. They also consider that the main difficulties in implementing the project are the conditions of the access roads to take the seedlings to the markets.
The interviewees gave three main recommendations for the planning and implementation of a forestry project in Cachachi. First, the signing of an agreement between the company in charge of the project and the municipality to generate greater confidence in the population regarding the entry of a private company. Second, to provide technical assistance to the population of Cachachi as one of the incentives to the population. In this way, the benefit of the population would not be merely economic, but also with knowledge and practices that they can use for the benefit of their community. Finally, they stressed the importance of the popular consultation. In this sense, they recommend scheduling a consultation meeting with the entire population to inform them of the scope and benefits of the Project.

Environmental and Social Impact Assessment of Forest Landscape Restoration Project December 2021
Social Capital Group 307
6.3.4 Summary of recommendations
This section summarizes the main recommendations made to the Project by the municipal officials interviewed. In general terms, the recommendations made by the authorities of the thirteen districts are relatively similar, since several districts share similar socio-economic and geographical conditions. These recommendations have been grouped into three groups: identification of suitable sites for implementation, relationship with the population and the suggested scope of the Project.
Regarding the first point, the municipal authorities consider it important to carry out complementary technical studies to determine the most suitable territories in terms of soil type and also the timber species that could grow in the districts. Regarding the second point, the most important recommendation revolves around the clarity of communication with the population to ensure transparency throughout the process and reduce the possibility of causing social unrest or rejection of the Project. Finally, regarding the scope of the Project, the recommendations suggest the possible components of the Project such as accompaniment to the population, delivery of seeds, technical or commercial training, payment of labor, among others.
Table 6.24 List of recommendations on the implementation of forestry projects
Theme Recommendations
Identification of suitable execution sites
- Conduct a census or assembly in the hamlets and population centers to identify directly with the population the lands that are available for a pine forest project. - Conduct soil studies to determine which type of pine species is adapted to the climatic conditions of the districts.
Relationship with the population
- Do not generate expectations in the population if there is no certainty regarding the feasibility of the Project. - Take into account the representative actors in the localities: authorities such as the Lieutenant Governor and Municipal Agent, the farmer patrols, the Irrigation Boards, among others. - Coordinate and sign an agreement with the District Municipality to generate greater confidence in the population regarding the entry of a private company. - Consultation meeting with the entire population to inform them of the scope and benefits of the Project - Consider the perception of the short, medium and long term benefit that the population has.
Suggested Project Scope
- Design the project in such a way that the delivery of seeds, fertilizer and plantations is accompanied by training to encourage the sustained participation of the population. - That there is no impact on agricultural land and livestock. - Strengthen the construction of micro-reservoirs for water harvesting. - Financially support the provision of inputs and other materials necessary for the production process in municipal nurseries. - Maintain technical advice and close the forestry production circle by ensuring the processing of wood. - Coincide the forestry campaign with the time when there is more rainfall so that the plantations benefit from it. - Consider partnering with landowners to plant large tracts of land. - To get the population involved in the Project as paid labour.
Source: SCG Fieldwork, 2021

Environmental and Social Impact Assessment of Forest Landscape Restoration Project December 2021
Social Capital Group 308
6.4 Potential area of influence: districts
This chapter presents a description of the main socio-economic and cultural variables of the thirteen districts that are part of the PAI.
6.4.1 Population
This chapter offers a description of the population of the thirteen districts where the Project will be developed. Information is presented on the size of the population according to districts; the population growth in the last 3 years; its distribution by zones (urban, rural), and by gender and age groups. Information is also presented on the number of households, the number of persons per household, temporary migration and population movement.
6.4.1.1 Population size
The region of Cajamarca, with its capital, the city of Cajamarca, is made up of 13 provinces and 127 districts. The population of the PAI is located in 13 districts of the region, belonging to the provinces of Cajamarca, San Pablo and Cajabamba. According to Table 6.25the majority of the population is located in the districts of the province of Cajamarca, followed by the districts of Cajabamba and finally San Pablo.
By district, the population volume of Cajamarca stands out (66.4%) because it is the capital of the region, followed by the districts of Baños del Inca (13.9%), and to a lesser extent, La Encañada (5.9%), and Jesús (4.6%), in the province of Cajamarca. The district of Cachachi stands out, which represents a little more than a third of the population of Cajabamba and San Pablo, which is home to 63.3% of the provincial population of San Pablo.
Table 6.25 Population size
N %
Cajamarca Region 1 341 012 100.0
Cajamarca Province 348433 26.0
Asunción District 8 484 2.4
Baños Del Inca District
48 602 13.9
Cajamarca District 231 243 66.4
Chetilla District 3 878 1.1
Cospán District 7 264 2.1
Encañada District 20 568 5.9
Jesus District 16 064 4.6
Magdalena District 8 848 2.5
San Juan District 4 564 1.3
Province of San Pablo
21 102 1.6
San Bernardino District 4 573 21.7

Environmental and Social Impact Assessment of Forest Landscape Restoration Project December 2021
Social Capital Group 309
N %
San Pablo District 13 352 63.3
Tumbaden District 3 649 17.3
Cajabamba Province 75 687 5.6
Cachachi District 25 109 33.2
Source: CPV 2017 - INEI
6.4.1.2 Population growth
Beginning in the second half of the 20th century, population and housing censuses showed a sharp drop in the population of the Cajamarca region. Thus, between 1993 and 2005 there was a drop in the population growth rate from 1.72 to 0.64 as a result of emigration. (Aramburu: 2006.pag 11).
The latest 2017 census as well as projections for 2019 and 2020 confirm the trend of population decline, which reaches 0.4 (Table 6.26 Population growth) in 2020. The same occurs in all the districts selected for the Project, except in the districts Baños del Inca (3.3), Cajamarca (1.9) and Jesús (1.1), which show a positive growth rate, although with a tendency to decrease, which shows the slow process of urbanization in Cajamarca and its districts.
Table 6.26 Population growth
Region/Province/ District 2018 2019 TCP 2019 2020 TCP 2020
Cajamarca Region 1,438,325 1,447,891 0.7 1,453,711 0.4
Cajamarca Province 375,029 382,068 1.9 388,170 1.6
Asunción District 8,366 8,137 -2.7 7,896 -3.0
Baños Del Inca District 49,824 51,608 3.6 53,298 3.3
Cajamarca District 235,184 240,461 2.2 245,137 1.9
Chetilla District 3,885 3,880 -0.1 3,863 -0.4
Cospán District 7,266 7,222 -0.6 7,159 -0.9
Encañada District 20,512 20,310 -1.0 20,052 -1.3
Jesus District 16,255 16,483 1.4 16,666 1.1
Magdalena District 8,868 8,851 -0.2 8,809 -0.5
San Juan District 4,572 4,560 -0.3 4,532 -0.6
Province of San Pablo 22,657 22,677 0.1 22,638 -0.2
San Bernardino District 4,590 4,590 0.0 4,578 -0.3
San Pablo District 13,417 13,457 0.3 13,460 0.0
Tumbaden District 3,667 3,677 0.3 3,678 0.0
Cajabamba Province 81,489 82,434 1.2 83,167 0.9
Cachachi District 25,315 25,479 0.6 25,575 0.4
Source: Population estimates and projections by region, province and district 2018 -2020 - INEI.

Environmental and Social Impact Assessment of Forest Landscape Restoration Project December 2021
Social Capital Group 310
6.4.1.3 Distribution of the population by age group and gender
Gender and age are the two most important demographic characteristics in the composition of populations.
According to official sources, at the national level, changes can be seen in the age structure of the population, with a smaller base and a progressive widening in the centres, reflecting a lower number of births and a larger working-age population. Likewise, a greater proportion of older adult population is observed, which indicates the beginning of the population ageing process. 77
In contrast to this national trend, the Cajamarca region has an age structure that is more centered on the Young adults (20.9%) and Youth (18.0%) age groups, and less population in the Childhood and Early Childhood groups, with 12.2% and 11.3% respectively, which can be attributed mainly to the decrease in fertility, and to a lesser extent to the emigration of families with young children78. The percentage of older adults is 11.8%, but it has been growing in recent decades, revealing an initial process of demographic aging. 79
According to districts, the population in early childhood (0 to 5 years old) tends to be higher in the districts of Cachachi (15.1%), Chetilla (14.0%), and Jesús (13.3%). The districts with the lowest population in this group are San Pablo (10.4%) and San Bernardino (10.8%).
The population of children (6 to 11 years old) has higher percentages in the districts of Cospán (15.3%), Cachachi (15.2%), and Jesús (14.2%). The districts of Cajamarca (10.6%) and San Bernardino (12.3%) have the lowest populations in this group.
The Adolescent population (ages 12 to 17) has higher percentages in Cospán (13.9%), Jesús (12.5%), and Cachachi (12.5%). But lower percentages in the Adolescents group are found in the districts of Cajamarca (9.7%), Baños del Inca (10.2%), and Encañada (11.0%).
The population in the Youth group (18 to 29 years old) tends to be higher in the districts of Cajamarca (23.2%), Baños del Inca (21.5%). The districts with the lowest population in this group are Cospán (13.2%), Asunción (13.4%) and San Pablo (15.5%).
In the population of young adults (30 to 44 years old), the highest percentages are observed in the districts of Cajamarca (23.0%) and Baños del Inca (23.0%). The districts with the lowest population in this group are Chetilla (17.4%) and Cospán (17.7%).
77 INEI. Peru: Sociodemographic Profile. National report. National Census 2017, p.36. 78 The 2017 Population and Housing Census records that the average number of children per woman has fallen to 1.8. Likewise, according to the ENDES 2013, between the 1996 and 2013 surveys, fertility in the Cajamarca region decreased 45.1%, going from 5.1 children per woman to 2.8. In: Cajamarca: Encuesta Demográfica y de Salud Familiar. INEI - ENDES 2013, p 42. 79 In previous censuses of 1981 and 2005, those over 65 years of age had gone from 4% to 6.3% of the total population. In: Aramburu Carlos Eduardo and María Bustinza: Cajamarca: el proceso demográfico. Contribuciones para una visión de desarrollo de Cajamarca. The Andes of Cajamarca. CDE July 2006. .

Environmental and Social Impact Assessment of Forest Landscape Restoration Project December 2021
Social Capital Group 311
In the adult population (45 to 59 years old), the highest percentages are found in San Pablo (15.8%), San Bernardino (15.6%) and Asunción (15.5%). The districts with the lowest adult population are Cachachi (12.1%), Baños del Inca (12.1%) and Jesús (12.9%).
Finally, with regard to the older adult population, the highest percentages are concentrated in the districts of Asunción (16.1%), San Juan (14.6%) and San Pablo (14.1%). Likewise, lower percentages of the older adult population are observed in Baños del Inca (8.2%), Cajamarca (9.2%) and Cachachi (9.8%).
Aramburú and Bustinza point out the main implications of these changes in the age structure. The decrease in child dependency creates an opportunity to expand coverage and improve the quality of maternal and child health services and early education. The growth of the adolescent and youth population will imply greater pressure on secondary, technical and higher education as well as opportunities for early labor market insertion, preventive health services including the prevention of adolescent pregnancy and STDs.
The higher growth in the young adult cohort (25-49 years) will imply a strong pressure on the labour market, housing and transport as well as opportunities for the development of productive activities (roads, micro-credits, access to markets and energy). Finally, in the medium term, the aging process (still incipient) will be felt more strongly. This implies the need to expand health services for the elderly, social security and family and institutional capacity for their care and support80.
Table 6.27 Age distribution
Population by life cycle
Early Childhood
(0 - 5 years)
Childhood (6 - 11
years old)
Adolescence (12 - 17 years)
Young people (18 - 29
years old)
Young adults
(30 - 44 years old)
Adults (45 - 59
years old)
Older adults
(60 and over)
Total
Cajamarca N 161 876 174 556 163 376 257 172 297 815 204 418 168 315 1 427 527 % 11.3% 12.2% 11.4% 18.0% 20.9% 14.3% 11.8% 100.0%
Cajamarca N 42 541 42 549 37 936 79 401 81 325 49 108 36 734 369 594 % 11.5% 11.5% 10.3% 21.5% 22.0% 13.3% 9.9% 100.0%
Assumption N 957 1 151 1 010 1 133 1 553 1 316 1 364 8 484 % 11.3% 13.6% 11.9% 13.4% 18.3% 15.5% 16.1% 100.0%
Baths of the Inca
N 6 098 6 034 4 962 10 468 11 154 5 882 4 002 48 602 % 12.5% 12.4% 10.2% 21.5% 23.0% 12.1% 8.2% 100.0%
Cajamarca N 25 332 24 426 22 403 53 647 53 238 30 888 21 308 231 243 % 11.0% 10.6% 9.7% 23.2% 23.0% 13.4% 9.2% 100.0%
Chetilla N 543 522 469 680 673 530 462 3 878 % 14.0% 13.4% 12.1% 17.5% 17.4% 13.7% 11.9% 100.0%
Cospan N 900 1 110 1 009 959 1 288 1 019 978 7 264 % 12.4% 15.3% 13.9% 13.2% 17.7% 14.0% 13.5% 100.0%
Encañada N 2 431 2 653 2 258 3 869 4 174 2 770 2 413 20 568 % 11.8% 12.9% 11.0% 18.8% 20.3% 13.5% 11.7% 100.0%
Jesus N 2 140 2 283 2 007 2 737 2 911 2 065 1 922 16 064 % 13.3% 14.2% 12.5% 17.0% 18.1% 12.9% 12.0% 100.0%
Magdalena N 969 1 099 1 046 1 466 1 750 1 352 1 165 8 848 % 11.0% 12.4% 11.8% 16.6% 19.8% 15.3% 13.2% 100.0%
San Juan N 514 587 535 802 829 630 667 4 564 % 11.3% 12.9% 11.7% 17.6% 18.2% 13.8% 14.6% 100.0%
St. Paul's N 2 402 2 904 2 618 3 548 4 405 3 517 3 178 22 572
80 Aramburu Carlos Eduardo and María Bustinza: pc. Cit. 2006.

Environmental and Social Impact Assessment of Forest Landscape Restoration Project December 2021
Social Capital Group 312
Population by life cycle
Early Childhood
(0 - 5 years)
Childhood (6 - 11
years old)
Adolescence (12 - 17 years)
Young people (18 - 29
years old)
Young adults
(30 - 44 years old)
Adults (45 - 59
years old)
Older adults
(60 and over)
Total
% 10.6% 12.9% 11.6% 15.7% 19.5% 15.6% 14.1% 100.0% St. Paul's N 1 388 1 730 1 579 2 066 2 604 2 105 1 879 13 352
% 10.4% 13.0% 11.8% 15.5% 19.5% 15.8% 14.1% 100.0% San Bernardino
N 492 560 515 777 890 713 625 4 573 % 10.8% 12.3% 11.3% 17.0% 19.5% 15.6% 13.7% 100.0%
Tumbaden N 429 500 431 588 714 527 460 3 649 % 11.8% 13.7% 11.8% 16.1% 19.6% 14.5% 12.6% 100.0%
Cajabamba N 10 840 11 391 9 860 13 435 15 298 10 555 9 252 80 630 % 13.4% 14.1% 12.2% 16.7% 19.0% 13.1% 11.5% 100.0%
Cachachi N 3 782 3 822 3 107 4 221 4 675 3 037 2 465 25 109 % 15.1% 15.2% 12.4% 16.8% 18.6% 12.1% 9.8% 100.0%
Source: CPV 2017 - INEI
According to the gender of the population, the male population of Peru is 14,450,757 men, representing 49.2% of the census population, and the female population is 14,931,127 women, or 50.8%. The masculinity index is 96.8, which means that the number of men is slightly lower than the number of women.
In Cajamarca, the masculinity index does not differ from the national index. However, there is greater variation at the district level. The districts of Cachachi, Cospán and San Bernardino show higher masculinity indexes with respect to the national and departmental average, while the districts of Chetilla, Tumbadén, Asunción, San Pablo, Encañada show the opposite, lower masculinity indexes, that is to say a markedly higher number of women than men, which could be indicating a greater male migration to labor markets that demand labor force for agricultural and forestry work such as the region of San Martín81.
Table 6.28 Distribution of the population by gender
Region/ Province/
District Man % Woman % Total
Masculinity index
Peru 14450757 49.2 14931127 50.8 29381884 96.8
Cajamarca 657634 49.0 683378 51.0 1341012 96.2
Cajamarca 166733 47.9 181700 52.1 348433 91.8
Assumption 4009 47.2 4475 52.8 8484 89.6
Baths of the Inca 23604 48.6 24998 51.4 48602 94.4
Cajamarca 111948 48.4 119293 51.6 231241 93.8
Chetilla 1751 45.2 2127 54.8 3878 82.3
Cospan 3644 50.2 3620 49.8 7264 100.7
Encañada 9807 47.7 10761 52.3 20568 91.1
Jesus 7734 48.1 8330 51.9 16064 92.8
Magdalena 4323 48.9 4525 51.1 8848 95.5
San Juan 2243 49.1 2321 50.9 4564 96.6
St. Paul's 10014 47.5 11088 52.5 21102 90.3
81 INEI/IOM. Internal migration in Peru at the departmental level. 2005.

Environmental and Social Impact Assessment of Forest Landscape Restoration Project December 2021
Social Capital Group 313
Region/ Province/
District Man % Woman % Total
Masculinity index
St. Paul's 2280 49.8 2293 50.2 4573 99.4
San Bernardino 6312 47.3 7040 52.7 13352 89.7
Tumbaden 1723 47.2 1926 52.8 3649 89.5
Cajabamba 37220 49.2 38467 50.8 75687 96.8
Cachachi 13108 52.2 12001 47.8 25109 109.2
Source: CPV 2017 - INEI
6.4.1.4 Urban and rural population distribution
The population of Cajamarca continues to be rural (60.3%) in contrast to the trend of the Peruvian population, which is mostly urban. According to Table 6.29the urban population exceeds the rural population only in the province of Cajamarca (61.4%) and in the district of Cajamarca (83.0%). In this sense, there are also districts in the process of urbanization, such as Baños del Inca and Magdalena, where the urban population reaches 42.5% and 34.6%, respectively.
In the rest of the districts, the populations are mostly rural, ranging between 70.7% and 92.9% in the districts of the province of Cajamarca, and between 73.6% and 95.4% in the districts of the province of San Pablo. Similarly, the population of the district of Cachachi (Cajabamba province) is 96.2% rural.
Table 6.29 Urban and rural population distribution
Location Area Cases %
Cajamarca Region
Urban 567 141 39.7%
Rural 860 386 60.3%
Total 1 427 527 100.0%
Cajamarca Province
Urban 227 095 61.4%
Rural 142 499 38.6%
Total 369 594 100.0%
Cajamarca District
Urban 191 935 83.0%
Rural 39 308 17.0%
Total 231 243 100.0%
Asunción District
Urban 1 216 14.3%
Rural 7 268 85.7%
Total 8 484 100.0%
Chetilla District
Urban 332 8.6%
Rural 3 546 91.4%
Total 3 878 100.0%
Cospan District
Urban 768 10.6%
Rural 6 496 89.4%
Total 7 264 100.0%
Encañada District Urban 1 470 7.1%
Rural 19 098 92.9%
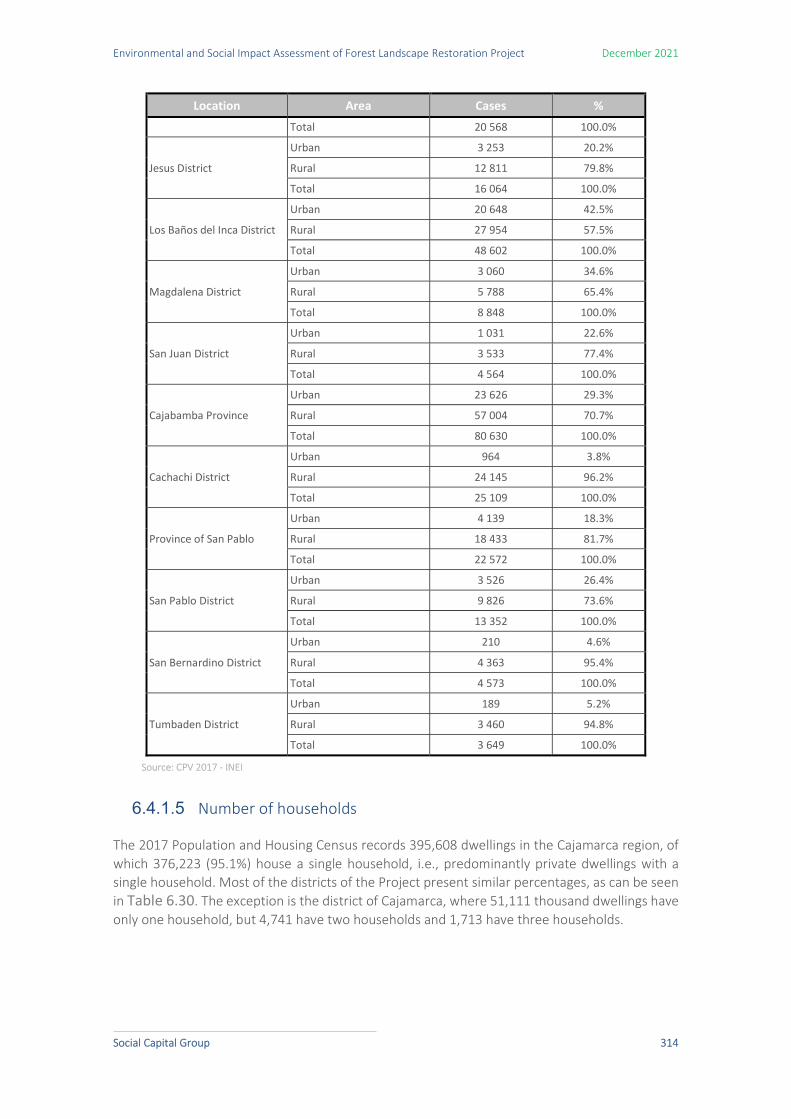
Environmental and Social Impact Assessment of Forest Landscape Restoration Project December 2021
Social Capital Group 314
Location Area Cases %
Total 20 568 100.0%
Jesus District
Urban 3 253 20.2%
Rural 12 811 79.8%
Total 16 064 100.0%
Los Baños del Inca District
Urban 20 648 42.5%
Rural 27 954 57.5%
Total 48 602 100.0%
Magdalena District
Urban 3 060 34.6%
Rural 5 788 65.4%
Total 8 848 100.0%
San Juan District
Urban 1 031 22.6%
Rural 3 533 77.4%
Total 4 564 100.0%
Cajabamba Province
Urban 23 626 29.3%
Rural 57 004 70.7%
Total 80 630 100.0%
Cachachi District
Urban 964 3.8%
Rural 24 145 96.2%
Total 25 109 100.0%
Province of San Pablo
Urban 4 139 18.3%
Rural 18 433 81.7%
Total 22 572 100.0%
San Pablo District
Urban 3 526 26.4%
Rural 9 826 73.6%
Total 13 352 100.0%
San Bernardino District
Urban 210 4.6%
Rural 4 363 95.4%
Total 4 573 100.0%
Tumbaden District
Urban 189 5.2%
Rural 3 460 94.8%
Total 3 649 100.0%
Source: CPV 2017 - INEI
6.4.1.5 Number of households
The 2017 Population and Housing Census records 395,608 dwellings in the Cajamarca region, of which 376,223 (95.1%) house a single household, i.e., predominantly private dwellings with a single household. Most of the districts of the Project present similar percentages, as can be seen in Table 6.30. The exception is the district of Cajamarca, where 51,111 thousand dwellings have only one household, but 4,741 have two households and 1,713 have three households.

Environmental and Social Impact Assessment of Forest Landscape Restoration Project December 2021
Social Capital Group 315
Table 6.30 Number of households
Region/Province/ District
Household number (N)
1 2 3 4 5 6 7 8 Total
Cajamarca Region 376223 13542 3799 1299 492 173 60 20 395608
Cajamarca Province 87524 5593 1917 708 288 103 34 10 96177
Asunción District 2377 30 3 0 0 0 0 0 2410
Baños del Inca District
11922 448 147 52 22 10 2 1 12604
Cajamarca District 51111 4741 1713 652 264 91 31 8 58611
Chetilla District 1023 2 0 0 0 0 0 0 1025
Cospán District 1839 41 4 0 0 0 0 0 1884
Encañada District 5947 71 8 0 0 0 0 0 6026
Jesus District 4067 82 11 0 0 0 0 0 4160
Magdalena District 2393 84 18 3 2 2 1 1 2504
San Juan District 1273 14 4 0 0 0 0 0 1291
Province of San Pablo
6408 129 20 5 0 0 0 0 6562
San Bernardino District 1306 4 0 0 0 0 0 0 1310
San Pablo District 3842 109 18 4 0 0 0 0 3973
Tumbaden District 933 16 2 1 0 0 0 0 952
Cajabamba Province 20146 660 162 44 16 2 1 1 21032
Cachachi District 5771 35 1 0 0 0 0 0 5807
Source: CPV 2017 - INEI
6.4.1.6 Number of persons per household
Table 6.31reveals that in the Cajamarca region 42% (166,628) of households are made up of 3 to 4 persons; 19.9% (79,144) of households are made up of two persons; 17.9% (70,879) of households are made up of 5 to 6 persons; 15.6% (62,074) of households are made up of only one person; and 4.3% (16,883) of households are made up of 7 or more persons.
At the district level, households with 3 to 4 persons per household are also in the majority, mainly in Baños del Inca (46.1%), Tumbadén and Encañada, both with 43.4%. However, the group of 5 to 6 persons per household tends to occupy second place, with the districts of Cachachi and Tumbadén standing out with 25.7% and 23.0% respectively.
Then, in households with two people, the districts of Encañada (24.6%), San Pablo (2.5%) and Magdalena (22.2%) are the most important. As for households with one person, Asunción (18.5%), San Pablo (17.8%) and San Juan (17.0%) stand out. Finally, Cachachi (8.7%) and Cospán (7.7%) have the highest percentages of households with more than seven people.

Environmental and Social Impact Assessment of Forest Landscape Restoration Project December 2021
Social Capital Group 316
Table 6.31 Number of persons per household
0 1 2 3 a 4 5 a 6 7 and over Total
N % N % N % N % N % N %
Cajamarca 1132 0.3 62074 15.6 79144 19.9 166628 42.0 70879 17.9 16883 4.3 396740
Cajamarca 306 0.3 13388 13.9 17300 17.9 40653 42.1 19262 20.0 5574 5.8 96483
Assumption 4 0.2 446 18.5 523 21.7 877 36.3 446 18.5 118 4.9 2414
The Inca Baths 19 0.2 1338 10.6 2158 17.1 5825 46.1 2640 20.9 643 5.1 12623
Cajamarca 227 0.4 8105 13.8 9758 16.6 25001 42.5 12058 20.5 3689 6.3 58838
Chetilla 0 0.0 139 13.6 213 20.8 376 36.7 227 22.1 70 6.8 1025
Cospan 5 0.3 266 14.1 362 19.2 715 37.9 395 20.9 146 7.7 1889
Encañada 36 0.6 830 13.7 1494 24.6 2629 43.4 925 15.3 148 2.4 6062
Jesus 3 0.1 611 14.7 754 18.1 1586 38.1 914 22.0 295 7.1 4163
Magdalena 8 0.3 392 15.6 557 22.2 997 39.7 454 18.1 104 4.1 2512
San Juan 3 0.2 220 17.0 279 21.6 472 36.5 232 17.9 88 6.8 1294
St. Paul's 8 0.1 1068 16.3 1453 22.1 2712 41.3 1119 17.0 210 3.2 6570
St. Paul's 2 0.2 204 15.5 283 21.6 549 41.8 225 17.1 49 3.7 1312
San Bernardino 6 0.2 709 17.8 896 22.5 1623 40.8 634 15.9 111 2.8 3979
Tumbaden 0 0.0 83 8.7 197 20.7 413 43.4 219 23.0 40 4.2 952
Cajabamba 76 0.4 3096 14.7 3961 18.8 8182 38.8 4565 21.6 1228 5.8 21108
Cachachi 17 0.3 726 12.5 976 16.8 2103 36.1 1496 25.7 506 8.7 5824
Source: CPV 2017 - INEI
6.4.1.7 Temporary Migration
According to Table 6.32, 97.4% of the population of the Cajamarca region lives permanently in the district. On the other hand, 2.6% do not live permanently, the so-called temporary migrant population. By district, temporary migrants are found mainly in San Juan (3.7%), Cajamarca (3.3%) and Magdalena (3.3%). In this regard, the main destinations of the migrant population of Cajamarca have been the coast (Lima and Callao, La Libertad and Lambayeque) and the Amazonian colonization areas (San Martín and Amazonas).
Table 6.32 Place of permanent residence
Yes, he lives permanently
in this district Do not live permanently
in this district Total
N % N % N %
Cajamarca 1306396 97.4 34616 2.6 1341012 100.0
Cajamarca 338018 97.0 10415 3.0 348433 100.0
Assumption 7773 97.9 166 2.1 7939 100.0
Baths of the Inca 44894 97.3 1255 2.7 46149 100.0
Cajamarca 211036 96.5 7705 3.5 218741 100.0
Chetilla 3602 98.4 58 1.6 3660 100.0
Cospan 6702 99.1 58 0.9 6760 100.0
Encañada 18942 98.8 233 1.2 19175 100.0
Jesus 14804 98.6 216 1.4 15020 100.0
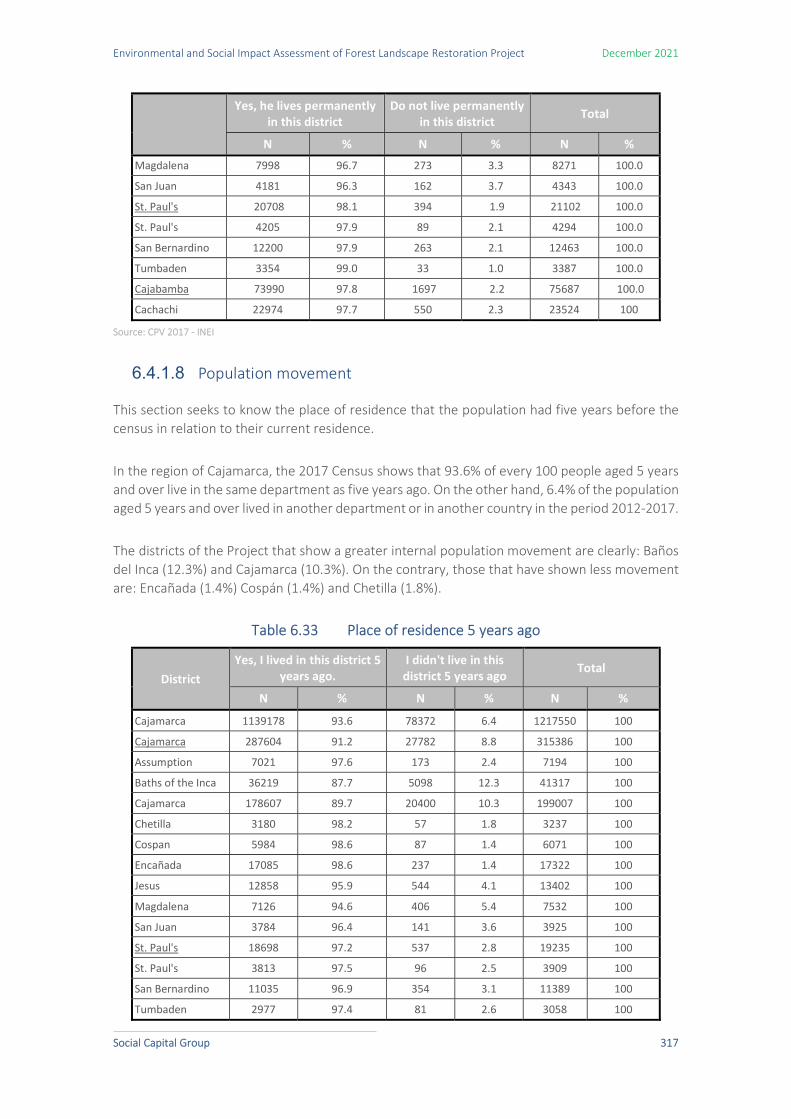
Environmental and Social Impact Assessment of Forest Landscape Restoration Project December 2021
Social Capital Group 317
Yes, he lives permanently
in this district Do not live permanently
in this district Total
N % N % N %
Magdalena 7998 96.7 273 3.3 8271 100.0
San Juan 4181 96.3 162 3.7 4343 100.0
St. Paul's 20708 98.1 394 1.9 21102 100.0
St. Paul's 4205 97.9 89 2.1 4294 100.0
San Bernardino 12200 97.9 263 2.1 12463 100.0
Tumbaden 3354 99.0 33 1.0 3387 100.0
Cajabamba 73990 97.8 1697 2.2 75687 100.0
Cachachi 22974 97.7 550 2.3 23524 100
Source: CPV 2017 - INEI
6.4.1.8 Population movement
This section seeks to know the place of residence that the population had five years before the census in relation to their current residence.
In the region of Cajamarca, the 2017 Census shows that 93.6% of every 100 people aged 5 years and over live in the same department as five years ago. On the other hand, 6.4% of the population aged 5 years and over lived in another department or in another country in the period 2012-2017.
The districts of the Project that show a greater internal population movement are clearly: Baños del Inca (12.3%) and Cajamarca (10.3%). On the contrary, those that have shown less movement are: Encañada (1.4%) Cospán (1.4%) and Chetilla (1.8%).
Table 6.33 Place of residence 5 years ago
District Yes, I lived in this district 5
years ago. I didn't live in this district 5 years ago
Total
N % N % N %
Cajamarca 1139178 93.6 78372 6.4 1217550 100
Cajamarca 287604 91.2 27782 8.8 315386 100
Assumption 7021 97.6 173 2.4 7194 100
Baths of the Inca 36219 87.7 5098 12.3 41317 100
Cajamarca 178607 89.7 20400 10.3 199007 100
Chetilla 3180 98.2 57 1.8 3237 100
Cospan 5984 98.6 87 1.4 6071 100
Encañada 17085 98.6 237 1.4 17322 100
Jesus 12858 95.9 544 4.1 13402 100
Magdalena 7126 94.6 406 5.4 7532 100
San Juan 3784 96.4 141 3.6 3925 100
St. Paul's 18698 97.2 537 2.8 19235 100
St. Paul's 3813 97.5 96 2.5 3909 100
San Bernardino 11035 96.9 354 3.1 11389 100
Tumbaden 2977 97.4 81 2.6 3058 100

Environmental and Social Impact Assessment of Forest Landscape Restoration Project December 2021
Social Capital Group 318
District Yes, I lived in this district 5
years ago. I didn't live in this district 5 years ago Total
N % N % N %
Cajabamba 63720 94.5 3716 5.5 67436 100
Cachachi 19848 96.2 780 3.8 20628 100
Source: CPV 2017 - INEI
6.4.2 Housing
This section describes the main characteristics of housing and basic services at the district level, household equipment and household access to the media.
6.4.2.1 Housing materials
In Cajamarca, 51.9 % of the dwellings have adobe as the predominant material for the exterior walls. Likewise, 22.1% of the dwellings have brick or cement block as the predominant material in the walls. Likewise, 18.4% of the dwellings have adobe as the predominant wall material. In smaller proportions, other materials such as stone with mud (2.6%), quincha (2.4%), wood (2.2%), and plywood (0.3%) are the predominant materials used.
Similarly, most of the districts studied have adobe as the predominant material in the walls of their dwellings, with the highest percentages in Cospán (98.1%), Asunción (96.1%) and San Bernardino (93.3%). Dwellings with brick or cement block material represent a higher percentage in the districts of Cajamarca (64.2%) and Baños del Inca (44.2%). In third place, the districts with the highest proportion of dwellings with walled walls are in Encañada (77.3%) and Jesús (69.2%).
Table 6.34 Predominant wall material
Brick or cement
block
Stone or
ashlar Adobe Tapia Quincha
Stone with mud
Wood
Plywood /
calamine /
matting
Total
Cajamarca N 83293 339 195103 69207 9023 9708 8315 1235 376223
% 22.1 0.1 51.9 18.4 2.4 2.6 2.2 0.3 100.0
Cajamarca N 39431 87 25462 20357 313 456 1006 412 87524
% 45.1 0.1 29.1 23.3 0.4 0.5 1.1 0.5 100.0
Assumption N 41 2284 22 20 5 3 2 2377
% 1.7 96.1 0.9 0.8 0.2 0.1 0.1 100.0
Baths of the Inca N 5269 12 4122 2023 65 85 255 91 11922
% 44.2 0.1 34.6 17.0 0.5 0.7 2.1 0.8 100.0
Cajamarca N 32830 71 9662 7285 133 216 644 270 51111
% 64.2 0.1 18.9 14.3 0.3 0.4 1.3 0.5 100.0
Chetilla N 15 620 371 10 3 3 1 1023
% 1.5 60.6 36.3 1.0 0.3 0.3 0.1 100.0
Cospan N 4 1804 9 8 12 2 1839
% 0.2 98.1 0.5 0.4 0.7 0.1 100.0
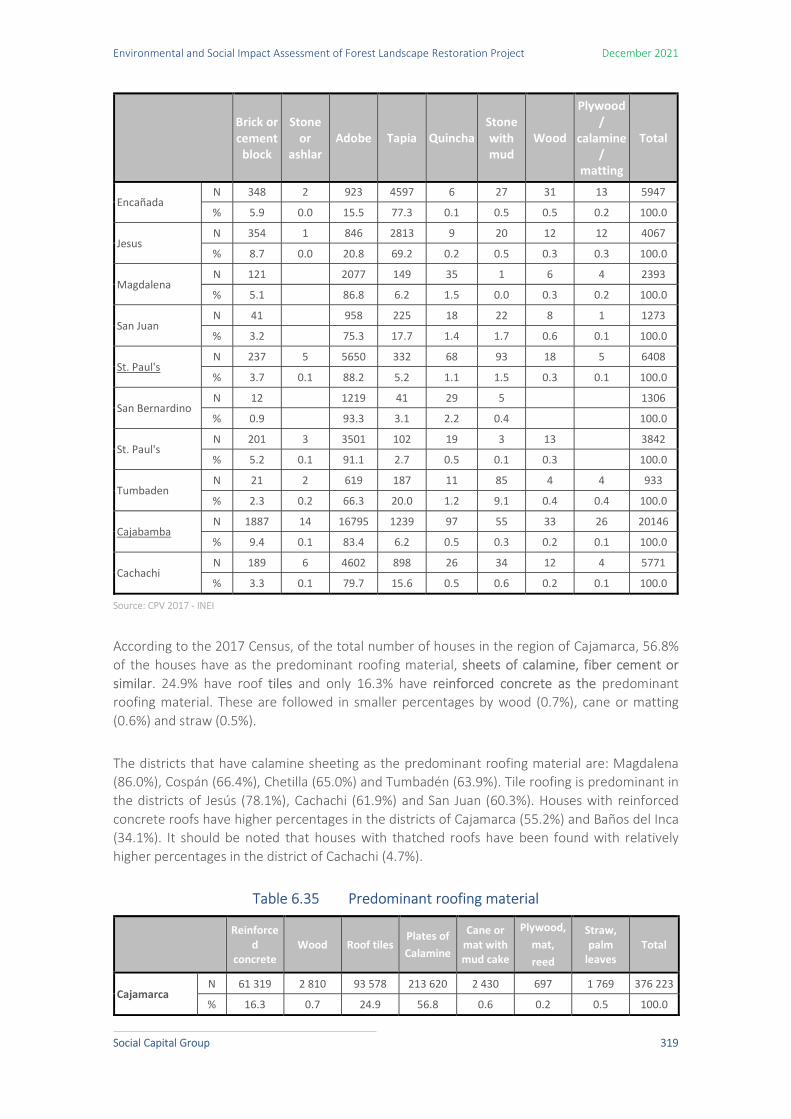
Environmental and Social Impact Assessment of Forest Landscape Restoration Project December 2021
Social Capital Group 319
Brick or cement
block
Stone or
ashlar Adobe Tapia Quincha
Stone with mud
Wood
Plywood /
calamine /
matting
Total
Encañada N 348 2 923 4597 6 27 31 13 5947
% 5.9 0.0 15.5 77.3 0.1 0.5 0.5 0.2 100.0
Jesus N 354 1 846 2813 9 20 12 12 4067
% 8.7 0.0 20.8 69.2 0.2 0.5 0.3 0.3 100.0
Magdalena N 121 2077 149 35 1 6 4 2393
% 5.1 86.8 6.2 1.5 0.0 0.3 0.2 100.0
San Juan N 41 958 225 18 22 8 1 1273
% 3.2 75.3 17.7 1.4 1.7 0.6 0.1 100.0
St. Paul's N 237 5 5650 332 68 93 18 5 6408
% 3.7 0.1 88.2 5.2 1.1 1.5 0.3 0.1 100.0
San Bernardino N 12 1219 41 29 5 1306
% 0.9 93.3 3.1 2.2 0.4 100.0
St. Paul's N 201 3 3501 102 19 3 13 3842
% 5.2 0.1 91.1 2.7 0.5 0.1 0.3 100.0
Tumbaden N 21 2 619 187 11 85 4 4 933
% 2.3 0.2 66.3 20.0 1.2 9.1 0.4 0.4 100.0
Cajabamba N 1887 14 16795 1239 97 55 33 26 20146
% 9.4 0.1 83.4 6.2 0.5 0.3 0.2 0.1 100.0
Cachachi N 189 6 4602 898 26 34 12 4 5771
% 3.3 0.1 79.7 15.6 0.5 0.6 0.2 0.1 100.0
Source: CPV 2017 - INEI
According to the 2017 Census, of the total number of houses in the region of Cajamarca, 56.8% of the houses have as the predominant roofing material, sheets of calamine, fiber cement or similar. 24.9% have roof tiles and only 16.3% have reinforced concrete as the predominant roofing material. These are followed in smaller percentages by wood (0.7%), cane or matting (0.6%) and straw (0.5%).
The districts that have calamine sheeting as the predominant roofing material are: Magdalena (86.0%), Cospán (66.4%), Chetilla (65.0%) and Tumbadén (63.9%). Tile roofing is predominant in the districts of Jesús (78.1%), Cachachi (61.9%) and San Juan (60.3%). Houses with reinforced concrete roofs have higher percentages in the districts of Cajamarca (55.2%) and Baños del Inca (34.1%). It should be noted that houses with thatched roofs have been found with relatively higher percentages in the district of Cachachi (4.7%).
Table 6.35 Predominant roofing material
Reinforce
d concrete
Wood Roof tiles Plates of Calamine
Cane or mat with mud cake
Plywood, mat, reed
Straw, palm
leaves Total
Cajamarca N 61 319 2 810 93 578 213 620 2 430 697 1 769 376 223
% 16.3 0.7 24.9 56.8 0.6 0.2 0.5 100.0

Environmental and Social Impact Assessment of Forest Landscape Restoration Project December 2021
Social Capital Group 320
Reinforce
d concrete
Wood Roof tiles Plates of Calamine
Cane or mat with mud cake
Plywood, mat, reed
Straw, palm
leaves Total
Cajamarca N 33 191 999 31 416 21 021 462 169 266 87 524
% 37.9 1.1 35.9 24.0 0.5 0.2 0.3 100.0
Assumption N 25 3 1 084 1 261 2 2 2 377
% 1.1 0.1 45.6 53.1 0.1 0.1 100.0
Baths of the Inca
N 4 065 205 5 424 2 138 36 31 23 11 922
% 34.1 1.7 45.5 17.9 0.3 0.3 0.2 100.0
Cajamarca N 28 200 696 12 858 8 778 400 115 64 51 111
% 55.2 1.4 25.2 17.2 0.8 0.2 0.1 100.0
Chetilla N 14 2 319 665 23 1 023
% 1.4 0.2 31.2 65.0 2.2 100.0
Cospan N 5 3 578 1 221 3 29 1 839
% 0.3 0.2 31.4 66.4 0.2 1.6 100.0
Encañada N 211 17 2 304 3 316 5 8 86 5 947
% 3.5 0.3 38.7 55.8 0.1 0.1 1.4 100.0
Jesus N 277 20 3 175 576 3 5 11 4 067
% 6.8 0.5 78.1 14.2 0.1 0.1 0.3 100.0
Magdalena N 78 21 220 2 057 7 10 2 393
% 3.3 0.9 9.2 86.0 0.3 0.4 100.0
San Juan N 32 12 768 455 3 3 1 273
% 2.5 0.9 60.3 35.7 0.2 0.2 100.0
St. Paul's N 132 49 2 017 4 183 8 7 12 6 408
% 2.1 0.8 31.5 65.3 0.1 0.1 0.2 100.0
San Bernardino N 4 17 69 1208 4 1 3 1306
% 0.3 1.3 5.3 92.5 0.3 0.1 0.2 100.0
St. Paul's N 120 31 1614 2067 3 1 6 3842
% 3.1 0.8 42.0 53.8 0.1 0.0 0.2 100.0
Tumbaden N 8 1 320 596 1 4 3 933
% 0.9 0.1 34.3 63.9 0.1 0.4 0.3 100.0
Cajabamba N 1 445 104 15 407 2 448 290 28 424 20 146
% 7.2 0.5 76.5 12.2 1.4 0.1 2.1 100.0
Cachachi N 154 15 3 574 1 738 8 12 270 5 771
% 2.7 0.3 61.9 30.1 0.1 0.2 4.7 100.0
Source: CPV 2017 - INEI
The homes in Cajamarca have predominantly dirt floors, 244,683 homes, which represents 65.0 %, have this material; followed by 102,862 homes with cement as the predominant material, which represents 27.3 %; while 21,970 homes have tile, terrazzo or ceramic tiles as the predominant material, which represents 5.8 %. It can be seen that there are other materials, but in smaller percentages, such as wood (1.2%), parquet (0.5%) and asphalt sheets (0.2%).
In the districts of the Project, a majority of houses have dirt floors with percentages above 90%, the most notorious districts being Chetilla (94.4%), Cospán (93.5%), Tumbadén (92.5%), San

Environmental and Social Impact Assessment of Forest Landscape Restoration Project December 2021
Social Capital Group 321
Bernardino (92.2%). The districts where cement floors predominate are Cajamarca (46.2%) and Baños del Inca (36.8%). Likewise, houses with tile, terrazzo, ceramic or similar floors have higher percentages in the districts of Cajamarca and Baños del Inca with 24.9% and 11.3% respectively.
Table 6.36 Predominant material in floors
Parquet Asphalt sheets
Tiles, terrazzo
Wood Cement Earth Total
Cajamarca N 1 775 582 21 970 4 351 102 862 244 683 376 223 % 0.5 0.2 5.8 1.2 27.3 65.0 100.0
Cajamarca N 1 520 385 14 163 1 086 31 242 39 128 87 524
% 1.7 0.4 16.2 1.2 35.7 44.7 100.0
Assumption N 5 7 208 2 157 2 377
% 0.2 0.3 8.8 90.7 100.0
Baths of the Inca
N 163 45 1 344 89 4 385 5 896 11 922
% 1.4 0.4 11.3 0.7 36.8 49.5 100.0
Cajamarca N 1 343 338 12 707 878 23 635 12 210 51 111
% 2.6 0.7 24.9 1.7 46.2 23.9 100.0
Chetilla N 1 56 966 1 023
% 0.1 5.5 94.4 100.0
Cospan N 2 15 103 1 719 1 839
% 0.1 0.8 5.6 93.5 100.0
Encañada N 9 16 12 444 5 466 5 947
% 0.2 0.3 0.2 7.5 91.9 100.0
Jesus N 1 28 11 733 3 294 4 067
% 0.0 0.7 0.3 18.0 81.0 100.0
Magdalena N 17 51 582 1 743 2 393
% 0.7 2.1 24.3 72.8 100.0
San Juan N 5 12 212 1 044 1 273
% 0.4 0.9 16.7 82.0 100.0
St. Paul's N 1 43 79 1 031 5 254 6 408
% 0.0 0.7 1.2 16.1 82.0 100.0
San Bernardino N 2 1 99 1 204 1 306
% 0.2 0.1 7.6 92.2 100.0
St. Paul's N 1 41 74 826 2 900 3 842
% 0.0 1.1 1.9 21.5 75.5 100.0
Tumbaden N 1 69 863 933
% 0.1 7.4 92.5 100.0
Cajabamba N 12 12 266 159 3 891 15 806 20 146
% 0.1 0.1 1.3 0.8 19.3 78.5 100.0
Cachachi N 6 28 532 5 205 5 771
% 0.1 0.5 9.2 90.2 100.0
Source: CPV 2017 - INEI

Environmental and Social Impact Assessment of Forest Landscape Restoration Project December 2021
Social Capital Group 322
6.4.2.2 Basic services in the home
6.4.2.2.1 Electric lighting
In the Cajamarca region, 80.7% of the total number of homes have electric lighting connected to the public network, while 19.3% do not have this service.
The census information indicates that at the regional level there is an increase in the number of houses in rural areas that have electric lighting. However, among the districts of the Project, the district of Tumbadén is the most clearly visible, with 62.2% of homes that do not have access to electricity. Likewise, the districts of Asunción, Cachachi and Encañada have 39.9%, 39.9% and 33.4%, respectively. Among the districts with the highest proportion of households with electric lighting are Cajamarca (93.5%), Chetilla (86.4%), and Baños del Inca (82.2%).
Table 6.37 Dwellings with electric lighting
Yes, it has electric lighting No electric lighting
TOTAL N % N %
Cajamarca 303 555 80.7 72 668 19.3 376 223
Cajamarca 75 635 86.4 11 889 13.6 87 524
Assumption 3 468 60.1 2 303 39.9 5 771
The Inca Baths 9 799 82.2 2 123 17.8 11 922
Cajamarca 47 812 93.5 3 299 6.5 51 111
Chetilla 884 86.4 139 13.6 1 023
Cospan 1 290 70.1 549 29.9 1 839
Encañada 3 959 66.6 1 988 33.4 5 947
Jesus 3 164 77.8 903 22.2 4 067
Magdalena 1 818 76.0 575 24.0 2 393
San Juan 945 74.2 328 25.8 1 273
St. Paul's 4 614 72.0 1 794 28.0 6 408
St. Paul's 930 71.2 376 28.8 1 306
San Bernardino 3 071 79.9 771 20.1 3 842
Tumbaden 353 37.8 580 62.2 933
Cajabamba 15 151 75.2 4 995 24.8 20 146
Cachachi 3 468 60.1 2 303 39.9 5 771
Source: CPV 2017-INEI
6.4.2.2.2 Water and toilet facilities
Regarding water supply in the region of Cajamarca, the results of the 2017 Census show that 52.9% of households have a public water supply inside the home, and 21.3% have a public water supply outside the home. Likewise, 13.2% of the dwellings are supplied with water through wells (groundwater) and 3.9% are supplied by rivers, ditches, springs or similar for human consumption. The rest of the water supply alternatives, such as a public water trough or pool, tanker truck, and another type of service, represent a total of 5.5%.

Environmental and Social Impact Assessment of Forest Landscape Restoration Project December 2021
Social Capital Group 323
At the district level, the use of the public network inside the dwelling is predominant in Cajamarca (79.9%), San Pablo (78.2%), and Baños del Inca (75.9%). The type of network outside the dwelling is observed mainly in the districts of Cospán (52.2%), San Juan (39.0%) and Cachachi (36.1%). The use of wells (groundwater) is most prevalent in the districts of Cachachi (20.4%) and Tumbadén (20.2%).
The use of water from rivers, irrigation ditches and lakes is relatively higher in San Bernardino (8.0%), Cachachi (6.8%) and Cospán (6.4%).
Table 6.38 Type of water supply
Public network
inside the home
Public network outside
the home
Pylon or basin
Truck - tanker
Well (sub-water)
terranea)
Spring or
puquio
River, ditch, lake, pond
Another
Neighbor Total
Cajamarca N 198968 80275 16860 506 49786 11903 14619 1327 1979 376223 % 52.9 21.3 4.5 0.1 13.2 3.2 3.9 0.4 0.5 100.0
Cajamarca N 62245 13093 2510 114 6021 2006 757 253 525 87524
% 71.1 15.0 2.9 0.1 6.9 2.3 0.9 0.3 0.6 100.0
Assumption N 1541 596 52 98 32 44 3 11 2377
% 64.8 25.1 2.2 4.1 1.3 1.9 0.1 0.5 100.0
Baths of the Inca
N 9050 1352 216 16 882 203 27 71 105 11922
% 75.9 11.3 1.8 0.1 7.4 1.7 0.2 0.6 0.9 100.0
Cajamarca N 40849 4965 1069 70 2752 840 195 90 281 51111
% 79.9 9.7 2.1 0.1 5.4 1.6 0.4 0.2 0.5 100.0
Chetilla N 503 218 92 131 31 41 1 6 1023
% 49.2 21.3 9.0 12.8 3.0 4.0 0.1 0.6 100.0
Cospan N 483 960 96 126 57 117 1839
% 26.3 52.2 5.2 6.9 3.1 6.4 100.0
Encañada N 2894 1476 248 3 771 372 125 37 21 5947
% 48.7 24.8 4.2 0.1 13.0 6.3 2.1 0.6 0.4 100.0
Jesus N 2698 642 149 15 342 146 42 3 30 4067
% 66.3 15.8 3.7 0.4 8.4 3.6 1.0 0.1 0.7 100.0
Magdalena N 1099 712 194 231 61 82 9 5 2393
% 45.9 29.8 8.1 9.7 2.5 3.4 0.4 0.2 100.0
San Juan N 570 497 26 113 31 24 8 4 1273
% 44.8 39.0 2.0 8.9 2.4 1.9 0.6 0.3 100.0
St. Paul's N 4502 549 133 680 224 279 12 29 6408
% 70.3 8.6 2.1 10.6 3.5 4.4 0.2 0.5 100.0
San Bernardino
N 816 144 13 160 61 104 5 3 1306
% 62.5 11.0 1.0 12.3 4.7 8.0 0.4 0.2 100.0
St. Paul's N 3004 168 95 319 113 115 5 23 3842
% 78.2 4.4 2.5 8.3 2.9 3.0 0.1 0.6 100.0
Tumbaden N 405 213 21 188 47 54 2 3 933
% 43.4 22.8 2.3 20.2 5.0 5.8 0.2 0.3 100.0
Cajabamba N 10029 6278 433 54 1836 670 586 55 205 20146
% 49.8 31.2 2.1 0.3 9.1 3.3 2.9 0.3 1.0 100.0
Cachachi N 1424 2081 119 44 1177 501 393 16 16 5771
% 24.7 36.1 2.1 0.8 20.4 8.7 6.8 0.3 0.3 100.0

Environmental and Social Impact Assessment of Forest Landscape Restoration Project December 2021
Social Capital Group 324
Source: CPV 2017 -INEI
In the region of Cajamarca, 32.5% of the dwellings have a toilet connected to the public network inside the dwelling, and only 5.5% are connected to the public network outside the dwelling. It is worth noting that 36.2% of households use a cesspit or cesspool and 16.0% have access to a latrine (with treatment). Likewise, 4.7% use the open field, outdoors, among others for excreta disposal, and 4.4% use a septic tank.
At the district level, only Cajamarca (68.3%) and Baños del Inca (42.8%) stand out for the percentage of dwellings that have access to the Internet inside the home. As for the percentage of households with access to a blind or black well, the percentages are high in the districts of Jesús (62.9%), San Bernardino (57.7%), Encañada (53.7%) and Tumbadén (52%).
The use of latrines (with treatment) is most widespread in the districts of Chetilla (37.8%), Cachachi (36.2%), San Pablo (28.7%) and San Bernardino (28.6%). Open field or open-air use is mainly practiced in the districts of Tumbadén (9.2%), Cachachi /7.7%), Magdalena (6.9%) and Chetilla (6.5%).
Table 6.39 Availability of toilet facilities
Public sewage
system inside the house
Public sewage system
outside the house
Septic tank
Latrine Cesspool
or cesspool
River, ditch, canal
Open field
Another
Total
Cajamarca
N 122 192 20 801 16 589 60 080 136 234 1 093 17 762 1 472 376 223 % 32.5 5.5 4.4 16.0 36.2 0.3 4.7 0.4 100.0
Cajamarca
N 43 777 4 994 4 267 12 374 19 995 250 1 635 232 87 524 % 50.0 5.7 4.9 14.1 22.8 0.3 1.9 0.3 100.0
Assumption
N 383 22 818 638 482 1 28 5 2 377 % 16.1 0.9 34.4 26.8 20.3 0.0 1.2 0.2 100.0
Baths of the Inca
N 5 101 810 746 2 235 2 887 12 82 49 11 922 % 42.8 6.8 6.3 18.7 24.2 0.1 0.7 0.4 100.0
Cajamarca
N 34 919 3 719 667 4 727 6 508 203 277 91 51 111 % 68.3 7.3 1.3 9.2 12.7 0.4 0.5 0.2 100.0
Chetilla N 96 9 330 387 128 2 66 5 1 023 % 9.4 0.9 32.3 37.8 12.5 0.2 6.5 0.5 100.0
Cospan N 149 37 195 460 922 3 71 2 1 839 % 8.1 2.0 10.6 25.0 50.1 0.2 3.9 0.1 100.0
Encañada N 548 92 548 1 258 3 194 8 291 8 5 947 % 9.2 1.5 9.2 21.2 53.7 0.1 4.9 0.1 100.0
Jesus N 670 12 51 637 2 557 2 127 11 4 067 % 16.5 0.3 1.3 15.7 62.9 0.0 3.1 0.3 100.0
Magdalena
N 816 103 28 359 902 4 164 17 2 393 % 34.1 4.3 1.2 15.0 37.7 0.2 6.9 0.7 100.0
San Juan N 264 29 327 187 439 2 19 6 1 273 % 20.7 2.3 25.7 14.7 34.5 0.2 1.5 0.5 100.0
St. Paul's N 1 211 126 234 1 737 2 770 23 278 29 6 408 % 18.9 2.0 3.7 27.1 43.2 0.4 4.3 0.5 100.0
San Bernardino
N 77 5 12 373 754 5 73 7 1 306 % 5.9 0.4 0.9 28.6 57.7 0.4 5.6 0.5 100.0
St. Paul's N 1 025 110 158 1 104 1 316 5 110 14 3 842 % 26.7 2.9 4.1 28.7 34.3 0.1 2.9 0.4 100.0
Tumbaden
N 41 6 63 245 485 3 86 4 933 % 4.4 0.6 6.8 26.3 52.0 0.3 9.2 0.4 100.0
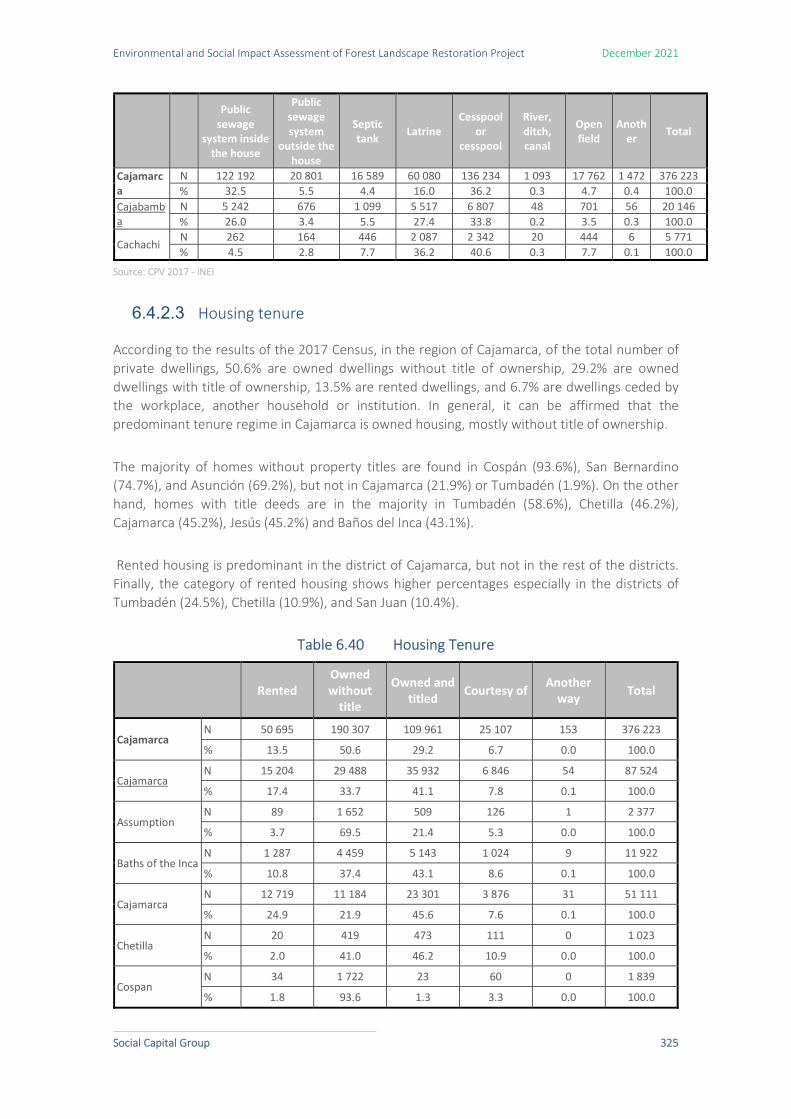
Environmental and Social Impact Assessment of Forest Landscape Restoration Project December 2021
Social Capital Group 325
Public sewage
system inside the house
Public sewage system
outside the house
Septic tank Latrine
Cesspool or
cesspool
River, ditch, canal
Open field
Another Total
Cajamarca
N 122 192 20 801 16 589 60 080 136 234 1 093 17 762 1 472 376 223 % 32.5 5.5 4.4 16.0 36.2 0.3 4.7 0.4 100.0
Cajabamba
N 5 242 676 1 099 5 517 6 807 48 701 56 20 146 % 26.0 3.4 5.5 27.4 33.8 0.2 3.5 0.3 100.0
Cachachi N 262 164 446 2 087 2 342 20 444 6 5 771 % 4.5 2.8 7.7 36.2 40.6 0.3 7.7 0.1 100.0
Source: CPV 2017 - INEI
6.4.2.3 Housing tenure
According to the results of the 2017 Census, in the region of Cajamarca, of the total number of private dwellings, 50.6% are owned dwellings without title of ownership, 29.2% are owned dwellings with title of ownership, 13.5% are rented dwellings, and 6.7% are dwellings ceded by the workplace, another household or institution. In general, it can be affirmed that the predominant tenure regime in Cajamarca is owned housing, mostly without title of ownership.
The majority of homes without property titles are found in Cospán (93.6%), San Bernardino (74.7%), and Asunción (69.2%), but not in Cajamarca (21.9%) or Tumbadén (1.9%). On the other hand, homes with title deeds are in the majority in Tumbadén (58.6%), Chetilla (46.2%), Cajamarca (45.2%), Jesús (45.2%) and Baños del Inca (43.1%).
Rented housing is predominant in the district of Cajamarca, but not in the rest of the districts. Finally, the category of rented housing shows higher percentages especially in the districts of Tumbadén (24.5%), Chetilla (10.9%), and San Juan (10.4%).
Table 6.40 Housing Tenure
Rented Owned without
title
Owned and titled Courtesy of
Another way Total
Cajamarca N 50 695 190 307 109 961 25 107 153 376 223
% 13.5 50.6 29.2 6.7 0.0 100.0
Cajamarca N 15 204 29 488 35 932 6 846 54 87 524
% 17.4 33.7 41.1 7.8 0.1 100.0
Assumption N 89 1 652 509 126 1 2 377
% 3.7 69.5 21.4 5.3 0.0 100.0
Baths of the Inca N 1 287 4 459 5 143 1 024 9 11 922
% 10.8 37.4 43.1 8.6 0.1 100.0
Cajamarca N 12 719 11 184 23 301 3 876 31 51 111
% 24.9 21.9 45.6 7.6 0.1 100.0
Chetilla N 20 419 473 111 0 1 023
% 2.0 41.0 46.2 10.9 0.0 100.0
Cospan N 34 1 722 23 60 0 1 839
% 1.8 93.6 1.3 3.3 0.0 100.0

Environmental and Social Impact Assessment of Forest Landscape Restoration Project December 2021
Social Capital Group 326
Rented Owned without
title
Owned and titled Courtesy of
Another way Total
Encañada N 203 3 388 1 913 443 0 5 947
% 3.4 57.0 32.2 7.4 0.0 100.0
Jesus N 285 1 568 1 837 374 3 4 067
% 7.0 38.6 45.2 9.2 0.1 100.0
Magdalena N 173 1 349 700 169 2 2 393
% 7.2 56.4 29.3 7.1 0.1 100.0
San Juan N 56 830 255 132 0 1 273
% 4.4 65.2 20.0 10.4 0.0 100.0
St. Paul's N 336 4 009 1 439 621 3 6 408
% 5.2 62.6 22.5 9.7 0.0 100.0
San Bernardino N 24 975 224 83 0 1 306
% 1.8 74.7 17.2 6.4 0.0 100.0
St. Paul's N 285 2 355 845 354 3 3 842
% 7.4 61.3 22.0 9.2 0.1 100.0
Tumbaden N 18 547 229 139 0 933
% 1.9 58.6 24.5 14.9 0.0 100.0
Cajabamba N 1 831 8 522 7 866 1 914 13 20 146
% 9.1 42.3 39.0 9.5 0.1 100.0
Cachachi N 301 2 838 2 170 456 6 5 771
% 5.2 49.2 37.6 7.9 0.1 100.0
Source: CPV 2017 - INEI
6.4.2.4 Housing size and overcrowding
In Cajamarca, according to the 2017 Census, 33.6% of dwellings have 1 bedroom, 32.2% have 2 bedrooms, 15.1% have 3 bedrooms, 13.3% have between 4 and 5 bedrooms. Likewise, it can be stated that the number of dwellings that have more than 6 rooms in the region is not very significant.
At the district level, the districts with the highest percentages of one-room dwellings are Chetilla (43.5%), Encañada (40.7%) and Jesús (30.5%). With two rooms, the most significant percentages are found in the districts of San Juan (42.3%), Chetilla (37.0%), Asunción (36.3%) and Tumbadén (36.3%). It should be noted that in all the districts there are a good number of dwellings with two bedrooms.
With three bedrooms, the houses in the districts of San Bernardino (26.6%), Cospán (22.7%) and Tumbadén (21.3%) stand out above all. With 4 and 5 rooms, the highest percentages are found in the districts of Cospán (35.3%), San Pablo (24.2%), Cajamarca (22.9%) and Cachachi (21.2%), while with 6 and 7 rooms the districts of Cospán (10.8%) and Cajamarca (10.4%).

Environmental and Social Impact Assessment of Forest Landscape Restoration Project December 2021
Social Capital Group 327
Table 6.41 Number of Rooms in Dwellings
TOTAL 1 bedroom 2 bedrooms 3 bedrooms 4 to 5
bedrooms From 6 to 7
rooms 8 and more
rooms
N % N % N % N % N % N %
Cajamarca 376223 126289 33.6 121144 32.2 56727 15.1 50148 13.3 14917 4.0 6998 1.9
Cajamarca 87524 20254 23.1 23830 27.2 14849 17.0 17696 20.2 6914 7.9 3981 4.5
Assumption 2377 327 13.8 864 36.3 455 19.1 527 22.2 179 7.5 25 1.1
Baths of the Inca 11922 3083 25.9 3396 28.5 2135 17.9 2272 19.1 681 5.7 355 3.0
Cajamarca 51111 9667 18.9 11904 23.3 9119 17.8 11697 22.9 5322 10.4 3402 6.7
Chetilla 1023 445 43.5 378 37.0 112 10.9 77 7.5 7 0.7 4 0.4
Cospan 1839 118 6.4 394 21.4 418 22.7 650 35.3 198 10.8 61 3.3
Encañada 5947 2423 40.7 2106 35.4 643 10.8 617 10.4 124 2.1 34 0.6
Jesus 4067 1242 30.5 1407 34.6 596 14.7 640 15.7 154 3.8 28 0.7
Magdalena 2393 591 24.7 829 34.6 409 17.1 452 18.9 92 3.8 20 0.8
San Juan 1273 313 24.6 539 42.3 164 12.9 196 15.4 45 3.5 16 1.3
St. Paul's 6408 1147 17.9 2201 34.3 1203 18.8 1397 21.8 371 5.8 89 1.4
St. Paul's 1306 180 13.8 433 33.2 347 26.6 262 20.1 67 5.1 17 1.3
San Bernardino 3842 711 18.5 1301 33.9 598 15.6 928 24.2 245 6.4 59 1.5
Tumbaden 933 205 22.0 339 36.3 199 21.3 134 14.4 47 5.0 9 1.0
Cajabamba 20146 4045 20.1 6617 32.8 3622 18.0 4328 21.5 1233 6.1 301 1.5
Cachachi 5771 985 17.1 1937 33.6 1210 21.0 1225 21.2 334 5.8 80 1.4
Source: CPV 2017 - INEI
Overcrowding in dwellings is defined as the ratio between the number of persons residing in a dwelling and the number of rooms in the dwelling (without considering bathrooms, kitchens, garages, passageways). Thus, a dwelling is considered to have this condition when it is inhabited by three or more persons82. Based on this definition, overcrowding in the Cajamarca region reaches 18.8% of all households. This percentage is much higher than the national average of 7% in 2017.
The most overcrowded districts are Chetilla (29.6%), Jesús (19.7%) and Encañada (19.6%). On the other hand, the districts with the lowest percentages of households living in overcrowded housing are Cospán (5.9%), San Bernardino (6.9%), Asunción (8.6%), and San Pablo (9.7%).
In this regard, official documents indicate that the high level of overcrowding (34% of the housing deficit is overcrowded housing) has a negative impact on the health condition of the population through the transmission of infectious diseases83. Other studies find an association between the lack of adequate space or overcrowding with alterations in both physical and mental health by
82 INEI. Peru Poverty profile by geographic domain 2004-2011 p.59 83 Ministry of Housing, Construction and Sanitation. National Housing and Urban Planning Policy. July 2021, p.31

Environmental and Social Impact Assessment of Forest Landscape Restoration Project December 2021
Social Capital Group 328
triggering situations of psychological stress and increasing the occurrence of accidents in the home84.
Table 6.42 Households with overcrowding
Total Persons Overcrowded households
N %
Cajamarca 1313100 246258 18.8
Cajamarca 339339 43746 12.9
Assumption 7820 669 8.6
Baths of the Inca
45238 5999 13.3
Cajamarca 211030 23097 10.9
Chetilla 3660 1085 29.6
Cospan 6736 385 5.7
Encañada 18965 3720 19.6
Jesus 14981 2947 19.7
Magdalena 8220 1217 14.8
San Juan 4323 672 15.5
St. Paul's 20994 2125 10.1
St. Paul's 4277 294 6.9
San Bernardino
12372 1202 9.7
Tumbaden 3387 529 15.6
Cajabamba 73920 10384 14
Cachachi 22262 3129 14.1
Source: CPV 2017 - INEI
6.4.2.5 Household access to media
The 2017 Census recorded for the department of Cajamarca that 74.7% of households have a cell phone, 40.9% have a color TV, 14.1% have a computer/Laptop/Tablet, 13.9% have a stereo, 13.7% have a cable or satellite TV connection, 9.3% have an internet connection and 4.9% have a landline telephone.
Among the districts, cell phone ownership stands out in Cajamarca (90.4%), Baños del Inca (80.5%), Tumbadén (79.1%) and San Pablo (78.4%). Among those with the least access to cell phones are San Juan (61.3%) and Jesús (62.3%). On the other hand, the households with the highest number of color television sets are Cajamarca (73.8%) and Baños del Inca (54.4%). And those with the least access are Tumbadén (7.5%) and Encañada (12.5%).
84 Lentini M. and D. Palero (1997) El hacinamiento: la dimensión no visible del déficit poblacional. Revista Invi N° 31, August 1997, Volume 12: 23 to 32 En:http://200.89.73.130/index.php/INVI/article/view/220/742?version=web

Environmental and Social Impact Assessment of Forest Landscape Restoration Project December 2021
Social Capital Group 329
In terms of computer/laptop/tablet ownership, greater access is registered in the districts of Cajamarca (44.5%) and Baños del Inca (23.2%). On the other hand, Tumbadén, San Bernardino and Cachachi have the lowest access with 1.2%, 1.6% and 1.8% respectively.
Access to cable connection is registered mainly in the districts of Cajamarca (28.6%) and Baños del Inca (13.4%). Internet access is practically restricted to the districts of Cajamarca (34.3%), Baños del Inca (18.1%) and Jesús (9.6%). But for the most part there is no internet access among the Project districts.
Table 6.43 Household access to media
Total Cell
phone Color TV
Computer/ Laptop/ Tablet
Sound system
Cable TV connection
Internet connection
Landline Phone
Cajamarca 395 608 74.7 40.9 14.1 13.9 13.7 9.3 4.9
Assumption 2410 69.4 22.1 2.4 3.3 0.7 1 0.2
Baths of the Inca
12 604 80.5 54.4 23.2 24.9 13.4 18.1 8.3
Cajamarca 58 611 90.4 73.8 44.5 38.5 28.6 34.3 22.9
Chetilla 1 025 67.2 18.8 2.4 3 1.5 0.3 0.3
Cospan 1 884 55.6 19.5 2.6 6.4 0.6 0.2 0.2
Encañada 6 026 62.4 12.5 1.8 2.9 3.0 0.8 0.3
Jesus 4 160 62.3 30.4 5.8 10.6 5.1 9.6 0.4
Magdalena 2 504 72.4 31.6 5 7.1 6.1 6 1.5
San Juan 1 291 61.3 21.2 3.7 5.5 3.3 0.9 0.9
St. Paul's 3 973 78.4 26 7.1 5.7 7.9 4.6 1.4
San Bernardino
1 310 70.8 18.3 1.6 4 1.5 0.8 0.2
Tumbaden 952 79.1 7.5 1.2 13.9 1.1 0.8 0.5
Cachachi 5 807 67.3 25.1 1.8 3.9 2.3 0.5 0.2
Source: CPV 2017 -INEI
6.4.2.6 Household equipment
In terms of kitchen equipment, in the department of Cajamarca, 46.7% of households have a gas cooker, 27.8% have a blender, 25.3% have an electric iron, 15.1% have a refrigerator or freezer, 7.1% have a washing machine, 5.8% have a microwave oven. 27.8% have a blender, 25.3% have an electric iron, 15.1% have a refrigerator or freezer, 7.1% have a washing machine, and 5.8% have a microwave oven. Regarding the ownership of means of locomotion in the department of Cajamarca, 9.5% stated that they owned a motorcycle, 4.1% of households owned a car or van and 0.2% owned a boat, motorboat or small boat.
Gas stove ownership is reported mainly in the districts of Cajamarca (79.0%), Baños del Inca (52.2%) and Asunción (47.9%). In Tumbadén, Chetilla and Cachachi, however, gas cookstove ownership is low: 5.5%, 10.7% and 15%, respectively.

Environmental and Social Impact Assessment of Forest Landscape Restoration Project December 2021
Social Capital Group 330
Refrigerator ownership is highest in Cajamarca (39.9%), Baños del Inca (22.5%) and Magdalena (10.3%). However, in the rest of the districts, there is notoriously low ownership of this important appliance, being lowest in the district of Tumbadén with 0.4%.
The districts of Cajamarca and Baños del Inca show greater access to means of transportation such as cars and vans with 14.4% and 11.3% respectively. Likewise, the ownership of motorcycles was registered mostly in these two districts (12.5% and 10.9%).
Table 6.44 Household access to household equipment
TOTAL
Gas cook
er
Refrigerator or freezer
Washing
machine
Microwave oven
Blender
Electric iron
Car, van
Motorcycle
Motorboat, motor boat or small boat, canoe
Cajamarca 39560
8 46.7 15.1 7.1 5.8 27.8 25.3 4.1 9.5 0.2
Assumption 2410 47.9 2.9 1.1 0.6 11.4 13.1 1.0 1.2 0.1
Baths of the Inca
12604 52.2 22.5 12.4 12.7 41.3 37.0 11.3 10.9 0.3
Cajamarca 58611 79.0 39.9 25.1 23.9 64.1 58.0 14.4 12.5 0.4
Chetilla 1025 10.7 2.3 0.5 0.9 8.5 10.6 0.6 1.3 0.1
Cospan 1884 34.4 2.5 0.8 0.7 8.2 7.9 0.7 1.6 0.0
Encañada 6026 20.9 1.4 0.5 0.4 6.1 5.6 0.9 2.5 0.2
Jesus 4160 41.2 5.9 1.9 1.8 17.7 14.7 2.7 4.0 0.3
Magdalena 2504 40.3 10.3 2.0 1.4 21.1 22.1 3.5 4.5 0.4
San Juan 1291 26.9 4.8 1.1 1.2 12.5 12.9 2.0 1.5 0.1
San Bernardino
1310 17.3 3.5 1.1 0.8 6.9 5.5 1.8 3.4 0.3
St. Paul's 3973 38.9 3.8 2.7 1.7 15.8 16.0 1.7 3.6 0.2
Tumbaden 952 5.5 0.4 0.0 0.0 2.3 2.3 0.6 2.1 0.0
Cachachi 5807 15.0 3.3 0.5 0.5 10.1 4.6 1.0 4.7 0.1
Source: CPV 2017 -INEI
6.4.3 Education
This section deals with educational infrastructure, educational services, educational level, illiteracy and educational quality indicators.
6.4.3.1 Number of IIEE, level, sections
A basic component of the right to education is Availability, which refers to the existence of educational institutions and programs in sufficient quantity for the subjects of the right, including qualified teachers, necessary infrastructure, and adequate materials. In addition to basic services, library, and sports areas.

Environmental and Social Impact Assessment of Forest Landscape Restoration Project December 2021
Social Capital Group 331
In the Cajamarca region, there are 4,254 preschool, 3,765 primary and 1,103 secondary schools in regular basic education. There are also three national universities and six private universities in the region.
There are a total of 738 pre-school educational institutions in the project districts, with the largest number in the districts of Cajamarca (240), Cachachi (112) and Encañada (80). A smaller number of pre-schools are in the districts of Chetilla (14), San Bernardino (15) and Tumbadén (18).
The primary education level totals 641 educational institutions in the Project districts, with the districts of Cajamarca, Encañada and Cachachi having the highest number of educational institutions at this level with 191, 88 and 73, respectively. The districts with the lowest number of educational institutions at this level are Chetilla (16), San Bernardino (19) and Tumbadén (18).
At the secondary education level, there are 255 educational institutions in the Project districts. At the secondary level, the district of Cajamarca has the highest number of educational institutions (109), much lower are Baños del Inca (21) and Encañada (20). Among the districts with the lowest number of secondary schools are San Bernardino (6), San Juan (6) and Tumbadén (7).
It should be noted that in the Project districts there are also 53 Alternative Basic Education (ABE) institutions, 5 Special Basic Education institutions, 21 Technical Productive Institutions, and 17 non-university higher education institutions.
Table 6.45 Number of educational institutions in the scope of the Project
District Initial Primary Secondary Basic
Alternative Basic
special Technical-productive
Non-university
higher education
total
Cajamarca 4254 3765 1103 107 33 56 60 9389
Cajamarca 754 538 225 52 4 22 16 1614
Assumption 22 26 10 0 0 0 0 58
Baths of the Inca 58 49 21 5 1 1 1 136
Cajamarca 240 191 109 44 3 18 15 623
Chetilla 14 16 10 0 0 0 0 40
Cospan 29 39 14 0 0 0 0 82
Encañada 80 88 20 0 0 1 0 189
Jesus 44 40 14 3 0 0 0 101
Magdalena 31 23 8 0 0 0 0 62
San Juan 25 20 6 0 0 0 0 51
St. Paul's 92 82 26 1 1 0 1 204
St. Paul's 15 19 6 0 0 0 0 40
San Bernardino 50 39 12 1 1 0 1 104
Tumbaden 18 18 7 0 0 0 0 43
Cajabamba 248 169 44 4 2 3 3 473
Cachachi 112 73 18 0 0 1 0 204

Environmental and Social Impact Assessment of Forest Landscape Restoration Project December 2021
Social Capital Group 332
District Initial Primary Secondary Basic
Alternative Basic
special Technical-productive
Non-university
higher education
total
Total IIEE 738 641 255 53 5 21 17 1733
Source: Escale 2021 - MINEDU: Escale 2021 - MINEDU
An indicator was created to compare the number of educational institutions with the population in the respective age group, as can be seen in Table 6.45. The districts of Cajamarca, Cachachi and Encañada have a greater number of early education institutions. However, the supply of these institutions is insufficient to meet the population demand in these districts. The most visible cases are the districts of Cajamarca (105.6) and Baños del Inca (105.1).
At the primary level, the districts of Cajamarca, Encañada and Cachachi have the largest number of institutions. However, they are also insufficient to meet the population's demand. This under-supply is most marked in the districts of Cajamarca (127.9) and Baños del Inca (123.2) and Jesús (57.1).
Finally, in secondary education, the districts with the largest number of schools are Cajamarca, Baños del Inca and Encañada, which are also insufficient to meet the population's demand. This under-supply is most marked in the districts of Baños del Inca (236.3), Cajamarca (205.5) and Cachachi (172.6).
Table 6.46 Number of regular basic level educational institutions according to population
INITIAL PRIMARY SECONDARY
IIEE Early
childhood population
Reason
IIEE
Childhood
population
Reason IIEE
Adolescent
population
Reason
Cajamarca 4254 161 876 38.1 3765 174 556 46.4 1103 163 376 148.1
Cajamarca 754 42 541 56.4 538 42 549 79.1 225 37 936 168.6
Assumption 22 957 43.5 26 1 151 44.3 10 1 010 101.0
Baths of the Inca 58 6 098 105.1 49 6 034 123.2 21 4 962 236.3
Cajamarca 240 25 332 105.6 191 24 426 127.9 109 22 403 205.5
Chetilla 14 543 38.8 16 522 32.6 10 469 46.9
Cospan 29 900 31.0 39 1 110 28.5 14 1 009 72.1
Encañada 80 2 431 30.4 88 2 653 30.2 20 2 258 112.9
Jesus 44 2 140 48.6 40 2 283 57.1 14 2 007 143.3
Magdalena 31 969 31.3 23 1 099 47.8 8 1 046 130.8
San Juan 25 514 20.6 20 587 29.4 6 535 89.2
St. Paul's 92 2 402 26.1 82 2 904 35.4 26 2 618 100.7
St. Paul's 15 492 32.8 19 560 29.5 6 515 85.8
San Bernardino 50 1 388 27.8 39 1 730 44.4 12 1 579 131.6
Tumbaden 18 429 23.8 18 500 27.8 7 431 61.5

Environmental and Social Impact Assessment of Forest Landscape Restoration Project December 2021
Social Capital Group 333
INITIAL PRIMARY SECONDARY
IIEE Early
childhood population
Reason
IIEE
Childhood
population
Reason IIEE
Adolescent
population
Reason
Cajabamba 248 10 840 43.7 169 11 391 67.4 44 9 860 224.1
Cachachi 112 3 782 33.8 73 3 822 52.4 18 3 107 172.6
Source: Escale 2021 - MINEDU: Escale 2021 - MINEDU
Finally, the first Educational Infrastructure Census (CIE 2014) has shown that most of these premises, mainly in rural areas, do not have basic conditions in terms of seismic resistance, and also have needs for corrective maintenance, furniture and equipment, legal physical sanitation, and access to water, sanitation, electricity, telecommunications and accessibility for the disabled population. Likewise, to accommodate the demand for new students, 1,982,934 m2 of new roofed area are needed for the initial and rural secondary education levels, respectively. 85
6.4.3.2 Number of students per Educational Institution
According to official data, 91.9% of regular basic education enrolment in the Cajamarca region is mainly in public institutions (2019). Likewise, statistics show that the supply in urban areas (56.7%) tends to be currently higher than in rural areas (43.3%)86.
In the Cajamarca region, primary education accounts for the largest share of total enrolment, with 46.2%. This is followed by secondary education with 32%, with a tendency to increase in recent years. Finally, the percentage of early education represents 21.8% of total enrolment.
By district, the highest enrolments at the pre-school level were in Baños del Inca (31.3%), Cachachi (24.4%) and San Juán (23.4%), and the lowest in Tumbadén (17.9%), Asunción (18.0%) and Cospán (19.3%).
At the primary level, the highest enrolments were in Cachachi (52.5%), Cospán (52.4%) and Tumbadén (49.4%), and the lowest in San Pablo (42.9%), Magdalena (43.9%) and Baños del Inca (44.4%).
At the secondary level, the highest enrolments are in San Pablo (36.9%), Magdalena (36.3%) and Asunción (33.5%), and the lowest in Cachachi (23.1%), Baños del Inca (24.3%) and Cospán (28.3%).
Table 6.47 Number of Students (Enrollment) by Level of Education in Regular Basic Education
District Total Initial Primary Secondary
N % N % N %
Cajamarca 392894 85674 21.8 181519 46.2 125701 32.0
Cajamarca 102263 23951 23.4 47040 46.0 31272 30.6
85 Ministry of Education. National Plan of Educational Infrastructure to 2015. Feb 2017 Res. Mn. N° 153-2017 86 Ministry of Education. Statistical data on the quality of education (Escale). Enrolment Cajamarca, year 2019.

Environmental and Social Impact Assessment of Forest Landscape Restoration Project December 2021
Social Capital Group 334
District Total Initial Primary Secondary
N % N % N %
Assumption 2249 405 18.0 1091 48.5 753 33.5
Baths of the Inca
9789 3063 31.3 4348 44.4 2378 24.3
Cajamarca 64469 13513 21.0 30172 46.8 20784 32.2
Chetilla 1262 248 19.7 607 48.1 407 32.3
Cospan 2418 467 19.3 1267 52.4 684 28.3
Encañada 5834 1250 21.4 2787 47.8 1797 30.8
Jesus 5013 1012 20.2 2355 47.0 1646 32.8
Magdalena 2619 519 19.8 1149 43.9 951 36.3
San Juan 1282 300 23.4 591 46.1 391 30.5
St. Paul's 6067 1212 20.0 2742 45.2 2113 34.8
St. Paul's 1021 199 19.5 496 48.6 326 31.9
San Bernardino 3729 755 20.2 1598 42.9 1376 36.9
Tumbaden 1016 182 17.9 502 49.4 332 32.7
Cajabamba 25017 5667 22.7 12470 49.8 6880 27.5
Cachachi 8479 2068 24.4 4449 52.5 1962 23.1
Source: Escale 2021 - MINEDU: Escale 2021 - MINEDU
In the Alternative Basic, Special Basic, Technical Productive, and Non-University Higher Education modalities, the type of management is mostly public, mainly in Special Basic (98.3%), which serves the disabled population. On the other hand, non-university technological higher education tends to be a more shared management: 47.6% public and 52.4% private87. In the study districts, all of these modalities are concentrated primarily in the districts of Cajamarca and Baños del Inca, and to a lesser extent in Jesús (productive technical) and San Bernardino (Alternative Basic), as shown in Table 6.48
Table 6.48 Number of Students (Enrollment) in Non-School Modalities
District Alternative
basic Basic
special Technical-productive
Non-university higher
education
Cajamarca 8315 351 4732 18768
Cajamarca 3548 109 1986 6653
Assumption 0 0 0 0
Baths of the Inca 643 50 157 440
Cajamarca 2844 59 1561 6210
Chetilla 0 0 0 0
Cospan 0 0 0 0
Encañada 6 0 0 0
Jesus 0 0 61 0
Magdalena 0 0 0 0
San Juan 0 0 0 0
87 87 Ministry of Education. Statistical data on the quality of education (Escale). Enrolment Cajamarca, year 2019.

Environmental and Social Impact Assessment of Forest Landscape Restoration Project December 2021
Social Capital Group 335
District Alternative
basic Basic
special Technical-productive
Non-university higher
education
St. Paul's 68 5 0 0
St. Paul's 0 0 0 0
San Bernardino 68 5 0 0
Tumbaden 0 0 0 0
Cajabamba 359 9 217 807
Cachachi 0 0 82 0
Source: Escale 2021 - MINEDU: Escale 2021 - MINEDU
6.4.3.3 Student-teacher ratio
This indicator shows the availability of teachers, that is, the number of students that each teacher is responsible for teaching on average, and is a reference used worldwide to analyze the state of education and educational achievement.
In the Cajamarca region, the pupil-teacher ratio at the initial level is 18, i.e. there is approximately one teacher for every 18 pupils. The rates for primary and secondary school are lower, at 14 and 11 respectively. It is worth noting that at the national level, there were rates of 15 at the initial level, and 14 and 11 at the primary and secondary levels in 2017.
The highest pupil-teacher ratios in early education are in the districts of Cospán (20), Baños del Inca (20), Jesús (18), and Encañada (18), and the lowest in Tumbadén (12) and San Bernardino (15).
At the primary level, the highest pupil-teacher ratios are in Cachachi (18), Cajamarca (18) and Baños del Inca (17), and the lowest are in San Bernardino (10), San Pablo (10) and Tumbadén (11).
Finally, at the secondary level, the highest student-teacher ratios are found in Cajamarca (15) and Jesús (13), and the lowest in Tumbadén (6) and San Bernardino (7).
It is important to take into account that although rural schools have relatively lower ratios than public schools in urban areas, teachers in rural schools have to deal with more heterogeneous students coming from different grades, age groups, and with different ways of handling the Spanish language88.
Table 6.49 Student-teacher ratio
District Initial Primary Secondary
Cajamarca 18 15 11
Cajamarca 18 17 13
Assumption 16 12 10
The Inca Baths 20 17 12
Cajamarca 16 18 15
88 CIES. Indicators of educational equity in Peru. Un análisis de los Censos Escolares de 1993 y 1998. GRADE 2002.

Environmental and Social Impact Assessment of Forest Landscape Restoration Project December 2021
Social Capital Group 336
District Initial Primary Secondary
Chetilla 17 13 8
Cospan 20 15 8
Encañada 18 13 10
Jesus 18 16 13
Magdalena 17 14 12
San Juan 17 13 8
St. Paul's 16 10 9
St. Paul's 15 10 7
San Bernardino 17 10 10
Tumbaden 12 11 6
Cajabamba 18 18 13
Cachachi 16 18 12
Source: Escale 2021 - MINEDU: Escale 2021 - MINEDU
6.4.3.4 Level of education attained by gender
According to the results of the 2017 Census, by educational level, the highest percentage of the population of Cajamarca reached some year or grade of primary education (41.2%), followed by those who managed to study some year of secondary education (26.3%). However, 12.8% of the population has no level of education.
According to gender, the level of education shows differences between men and women. Thus, the population of men who have attained some year of secondary education is almost 8 percentage points higher (30.0%) than the population of women (22.8%). In the districts, the largest gaps in secondary education are found in La Encañada (13.4), Chetilla (11.3), Baños del Inca (10.3) and San Juan (10.0) in the Province of Cajamarca, and in Tumbadén (11.5) in the Province of San Pablo.
It is also noteworthy that in the group of people with no level of education, the group of women is more than twice as large (17.5%) as that of men (8.1%). According to districts, high gaps are observed in almost all the selected districts (with the exception of Cajamarca and Cospán). In contrast, the districts of Chetilla and La Encañada show the widest gaps with more women than men with no education, with 24.8 and 18.1 percentage points respectively.
Table 6.50 Level of education attained by gender Education level Male % Female % Total % % Difference
Cajamarca Region
No Level 8.1 17.5 12.8 9.4
Initial 6.0 5.8 5.9 -0.2
Primary 41.7 40.6 41.2 -1.1
Secondary 30.0 22.8 26.3 -7.2
Basic special 0.0 0.1 0.1 0.0
Non-university higher education*. 6.0 6.0 6.0 0.0
Higher University 7.6 6.8 7.2 -0.8

Environmental and Social Impact Assessment of Forest Landscape Restoration Project December 2021
Social Capital Group 337
Education level Male % Female % Total % % Difference
Master's Degree / Doctorate 0.6 0.5 0.5 -0.1
Total 100.0 100.0 100.0 0.0
Cajamarca Province
No Level 6.0 14.7 10.5 8.7
Initial 6.3 5.8 6.0 -0.5
Primary 31.6 33.5 32.6 2.0
Secondary 31.3 23.2 27.1 -8.1
Basic special 0.1 0.1 0.1 0.0
Non-university higher education*. 7.7 7.7 7.7 0.0
Higher University 15.8 14.0 14.9 -1.8
Master's Degree / Doctorate
1.2 0.9 1.0 -0.3
Total 100.0 100.0 100.0 0.0
Asunción District
No Level 10.1 26.1 18.5 16.0
Initial 6.3 6.3 6.3 0.1
Primary 53.8 45.7 49.6 -8.1
Secondary 24.6 18.3 21.3 -6.3
Non-university higher education*.
3.0 2.2 2.6 -0.8
Higher University 2.1 1.2 1.7 -0.9
Master's Degree / Doctorate 0.1 0.1 0.1 0.0
Total 100.0 100.0 100.0 0.0
Baños del Inca District
No Level 6.8 17.9 12.5 11.1
Initial 7.0 6.4 6.7 -0.6
Primary 33.9 36.5 35.2 2.6
Secondary 33.6 23.3 28.3 -10.3
Basic special 0.1 0.2 0.1 0.1
Non-university higher education*. 7.6 6.4 6.9 -1.2
Higher University 10.2 8.8 9.5 -1.4
Master's Degree / Doctorate
0.9 0.5 0.7 -0.4
Total 100.0 100.0 100.0 0.0
Cajamarca District
No Level 4.5 10.7 7.7 6.1
Initial 6.1 5.5 5.8 -0.6
Primary 23.8 27.3 25.6 3.4
Secondary 32.1 25.1 28.5 -6.9
Basic special 0.1 0.1 0.1 0.0
Non-university higher education*.
9.6 10.2 9.9 0.5
Higher University 22.1 19.8 20.9 -2.2
Master's Degree / Doctorate 1.7 1.3 1.5 -0.4
Total 100.0 100.0 100.0 0.0

Environmental and Social Impact Assessment of Forest Landscape Restoration Project December 2021
Social Capital Group 338
Education level Male % Female % Total % % Difference
Chetilla District
No Level 17.3 42.1 30.9 24.8
Initial 4.3 3.4 3.8 -0.9
Primary 48.7 38.4 43.0 -10.4
Secondary 25.3 14.0 19.1 -11.3
Non-university higher education*. 3.3 1.5 2.4 -1.8
Higher University 0.9 0.6 0.7 -0.3
Master's Degree / Doctorate 0.1 0.0 0.0 -0.1
Total 100.0 100.0 100.0 0.0
Cospán District
No Level 9.9 17.8 13.8 8.0
Initial 6.0 6.5 6.2 0.5
Primary 59.6 57.4 58.5 -2.2
Secondary 22.2 16.3 19.3 -5.9
Non-university higher education*.
1.5 1.3 1.4 -0.1
Higher University 0.8 0.7 0.8 -0.2
Master's Degree / Doctorate
0.1 0.0 0.0 0.0
Total 100.0 100.0 100.0 0.0
Encañada District
No Level 10.8 28.9 20.3 18.1
Initial 6.6 6.6 6.6 0.0
Primary 47.4 44.5 45.9 -2.9
Secondary 31.2 17.8 24.2 -13.4
Basic special 0.1 0.0 0.0 -0.1
Non-university higher education
2.1 1.3 1.7 -0.8
Higher University 1.8 0.9 1.3 -0.9
Master's Degree / Doctorate 0.0 0.0 0.0 0.0
Total 100.0 100.0 100.0 0.0
Jesus District
No Level 8.5 18.9 13.9 10.4
Initial 6.6 6.3 6.4 -0.3
Primary 51.2 50.2 50.7 -0.9
Secondary 26.8 18.6 22.5 -8.2
Basic special 0.0 0.0 0.0 0.0
Non-university higher education*. 3.1 2.8 2.9 -0.4
Higher University 3.7 3.1 3.4 -0.5
Master's Degree / Doctorate
0.1 0.1 0.1 0.0
Total 100.0 100.0 100.0 0.0
Magdalena District
No Level 7.8 18.9 13.5 11.1
Initial 5.8 5.6 5.7 -0.2
Primary 48.2 47.8 48.0 -0.4
Secondary 30.4 22.0 26.1 -8.4

Environmental and Social Impact Assessment of Forest Landscape Restoration Project December 2021
Social Capital Group 339
Education level Male % Female % Total % % Difference
Basic special 0.0 0.0 0.0 0.0
Non-university higher education*. 3.7 3.0 3.3 -0.7
Higher University 4.0 2.7 3.3 -1.3
Master's Degree / Doctorate
0.2 0.0 0.1 -0.2
Total 100.0 100.0 100.0 0.0
San Juan District
No Level 8.6 21.6 15.2 12.9
Initial 5.6 6.0 5.9 0.4
Primary 47.4 46.8 47.1 -0.6
Secondary 29.7 19.7 24.6 -10.0
Basic special 0.0 0.0 0.0 0.0
Non-university higher education*.
4.2 2.9 3.5 -1.3
Higher University 4.2 2.9 3.5 -1.3
Master's Degree / Doctorate 0.1 0.1 0.1 -0.1
Total 100.0 100.0 100.0 0.0
Province of San Pablo
No Level 11.9 24.6 18.6 12.7
Initial 4.1 3.5 3.8 -0.6
Primary 46.4 44.9 45.6 -1.5
Secondary 28.1 19.4 23.6 -8.7
Basic special 0.0 0.1 0.0 0.0
Non-university higher education*. 5.4 5.0 5.2 -0.5
Higher University 3.7 2.3 3.0 -1.4
Master's Degree / Doctorate 0.4 0.2 0.3 -0.2
Total 100.0 100.0 100.0 0.0
San Bernardino District
No Level 14.3 29.4 22.0 15.1
Initial 3.9 3.6 3.7 -0.3
Primary 50.5 45.9 48.1 -4.6
Secondary 25.7 17.0 21.3 -8.7
Non-university higher education*.
3.6 2.9 3.3 -0.7
Higher University 1.8 1.0 1.4 -0.8
Master's Degree / Doctorate
0.3 0.1 0.2 -0.2
Total 100.0 100.0 100.0 0.0
San Pablo District
No Level 11.2 23.0 17.4 11.8
Initial 4.2 3.5 3.8 -0.7
Primary 43.9 43.1 43.5 -0.8
Secondary 28.1 20.1 23.9 -8.0
Basic special 0.0 0.1 0.1 0.1
Non-university higher education*.
7.0 6.7 6.9 -0.3

Environmental and Social Impact Assessment of Forest Landscape Restoration Project December 2021
Social Capital Group 340
Education level Male % Female % Total % % Difference
Higher University 5.0 3.2 4.0 -1.8
Master's Degree / Doctorate 0.6 0.2 0.4 -0.3
Total 100.0 100.0 100.0 0.0
Tumbaden District
No Level 11.6 25.6 19.0 13.9
Initial 4.3 3.6 3.9 -0.7
Primary 48.6 48.6 48.6 0.0
Secondary 31.7 20.2 25.6 -11.5
Non-university higher education*. 1.9 1.3 1.6 -0.6
Higher University 2.0 0.9 1.4 -1.1
Total 100.0 100.0 100.0 0.0
Cajabamba Province
No Level 10.1 19.2 14.7 9.0
Initial 6.6 6.7 6.6 0.0
Primary 51.6 49.0 50.3 -2.6
Secondary 22.8 16.8 19.8 -6.0
Basic special 0.0 0.0 0.0 0.0
Non-university higher education*. 5.3 5.1 5.2 -0.2
Higher University 3.3 3.1 3.2 -0.2
Master's Degree / Doctorate
0.3 0.2 0.2 -0.1
Total 100.0 100.0 100.0 0.0
Cachachi District
No Level 10.5 21.3 15.7 10.9
Initial 6.7 7.4 7.0 0.7
Primary 54.5 53.1 53.8 -1.4
Secondary 22.0 15.1 18.7 -6.9
Non-university higher education*.
4.2 2.1 3.2 -2.0
Higher University 2.0 0.9 1.5 -1.1
Master's Degree / Doctorate 0.1 0.0 0.1 -0.1
Total 100.0 100.0 100.0 0.0
Complete or incomplete
Source: CPV 2017 -INEI
6.4.3.5 Population aged 18 to 24 years attending a higher education institution (EI)
According to the 2017 Census, the Cajamarca region recorded 9,647 people aged 18-24 attending a higher education institution, representing 20.1% of the population in that cohort.
In the districts of Cajamarca (35.6%), Baños del Inca (25.7%) and Jesús (20.8%), more than 20% of the population aged 18-24 years studied in a higher education institution. While in Tumbadén (8.7%), Cachachi (11.5%) and San Bernardino (12.9%) there was a lower proportion of the population aged 18 to 24 with higher education.

Environmental and Social Impact Assessment of Forest Landscape Restoration Project December 2021
Social Capital Group 341
According to one study, in Cajamarca, enrolment 1998-2003 in technological Higher Education has tended to expand strongly in rural areas, with more men than women. On the other hand, enrolment in teacher training has tended to decrease in both men and women, despite the feminization of the teaching career89. In terms of university education, in addition to the National University of Cajamarca, there are the Private University of the North and the Antonio Guillermo Urrelo University.
Table 6.51 Population aged 18 to 24 years attending a higher level EI
District Do you attend a higher education institution?
Does not attend a higher education
institution TOTAL
N % N % N %
Cajamarca 9647 20.1 38322 79.9 47969 100.0
Cajamarca 4205 30.3 9653 69.7 13858 100.0
Assumption 34 15.0 5659 64.4 8784 100.0
Baths of the Inca 518 25.7 1496 74.3 2014 100.0
Cajamarca 3125 35.6 5659 64.4 8784 100.0
Chetilla 26 18.6 26 18.6 138 100.0
Cospan 22 17.3 103 82.7 124 100.0
Encañada 136 16.5 690 83.5 826 100.0
Jesus 103 20.8 391 79.2 494 100.0
Magdalena 66 19.9 267 80.1 333 100.0
San Juan 25 15.8 135 84.2 160 100.0
St. Paul's 111 16.1 578 83.9 688 100.0
St. Paul's 20 12.9 138 87.1 158 100.0
San Bernardino 71 19.1 302 80.9 373 100.0
Tumbaden 12 8.7 127 91.3 139 100.0
Cajabamba 289 14.3 1738 85.7 2027 100.0
Cachachi 70 11.5 539 88.5 609 100.0
Source: CPV 2017 - INEI
6.4.3.6 Illiteracy by gender
In the region of Cajamarca there are 139,555 people aged 15 and over who cannot read or write, that is, 14.8% of the population is illiterate. This percentage is much higher than the national average of 5.8%.
The district level presents a wide heterogeneity. Thus, Chetilla has the highest illiteracy rate (35.6%), followed by Encañada (26.3%) and Asunción (23.5%), while the district of Cajamarca has the lowest rate of 7.4%.
By gender, the illiteracy rate shows that there are more illiterate women (21.3%) than men (7.8%). The population rates of illiterate women are still very high in Chetilla (50.9%), Encañada
89 Iguiñez Manuel et al.: Cajamarca: Lineamientos para una política regional de Educación 2006. Los Andes de Cajamarca/CDE, P.40

Environmental and Social Impact Assessment of Forest Landscape Restoration Project December 2021
Social Capital Group 342
(37.9%) and Asunción (34.4%), in the province of Cajamarca, and also in San Bernardino (33.0%) in the province of San Pablo.
In general, there is a large illiterate population, especially among the female population.
Table 6.52 Illiteracy by gender
District Gender Population
aged 15 and over
Cannot read and write
Illiteracy rate
Cajamarca Region
Man 457,120 35,810 7.8
Woman 487,864 103,745 21.3
Total 944,984 139,555 14.8
Cajamarca Province
Man 116,969 5,474 4.7
Woman 132,571 22,534 17.0
Total 249,540 28,008 11.2
Asunción District
Man 2,520 272 10.8
Woman 2,927 1,008 34.4
Total 5,447 1,280 23.5
Baños del Inca District
Man 15,077 885 5.9
Woman 17,008 3,669 21.6
Total 32,085 4,554 14.2
Cajamarca District
Man 75,638 2,202 2.9
Woman 85,284 9,784 11.5
Total 160,922 11,986 7.4
Chetilla District
Man 1,020 151 14.8
Woman 1,382 704 50.9
Total 2,402 855 35.6
Cospán District
Man 2,170 227 10.5
Woman 2,202 489 22.2
Total 4,372 716 16.4
Encañada District
Man 6,092 769 12.6
Woman 7,158 2,711 37.9
Total 13,250 3,480 26.3
Jesus District
Man 4,546 239 5.3
Woman 5,335 1,187 22.2
Total 9,881 1,426 14.4
Magdalena District
Man 2,765 237 8.6
Woman 3,015 793 26.3
Total 5,780 1,030 17.8
San Juan District
Man 1,433 110 7.7
Woman 1,594 447 28.0
Total 3,027 557 18.4
Province of San Pablo
Man 6,782 623 9.2
Woman 7,936 2,119 26.7
Total 14,718 2,742 18.6

Environmental and Social Impact Assessment of Forest Landscape Restoration Project December 2021
Social Capital Group 343
District Gender Population
aged 15 and over
Cannot read and write Illiteracy rate
San Bernardino District
Man 1,457 171 11.7
Woman 1,574 520 33.0
Total 3,031 691 22.8
San Pablo District
Man 3,912 326 8.3
Woman 4,764 1,188 24.9
Total 8,676 1,514 17.5
Tumbaden District
Man 1,061 90 8.5
Woman 1,250 334 26.7
Total 2,311 424 18.3
Cajabamba Province
Man 24,047 2,136 8.9
Woman 25,794 5,979 23.2
Total 49,841 8,115 16.3
Cachachi District
Man 1,061 90 8.5
Woman 1,250 334 26.7
Total 2,311 424 18.3
Source: CPV 2017 -INEI
6.4.3.7 Attendance rate
In the Cajamarca region, 455,105 persons aged 3 to 24 years were attending an educational institution, school or college, high school or university, which represents an attendance rate of 80.2 per cent, higher than the national figure of 73.9 per cent.
The districts with the highest attendance rate are Cajamarca (84.4%), Magdalena (82.4%), and San Pablo (82.3%). On the other hand, districts with the lowest attendance rate are Cachachi (72.07%), Tumbadén (75.7%) and Encañada (76.6%).
Table 6.53 School attendance rate (3 to 21 years)
District Do you attend a school, college
or university? Does not attend school, college or
university Total
N % N % N %
Cajamarca Region 408731 80.2 100776 19.8 509507 100
Cajamarca Province 105798 82.3 22723 17.7 128521 100
Asunción District 2 515 82.5 535 17.5 3 050 100
Baños del Inca District 14 233 81.1 3 316 18.9 17 550 100
Cajamarca District 65 253 84.4 12 065 15.6 77 318 100
Chetilla District 1 169 76.9 351 23.1 1 520 100
Cospán District 2 265 76.9 680 23.1 2 945 100
Encañada District 5 680 76.6 1 731 23.4 7 411 100
Jesus District 5 009 78.4 1 381 21.6 6 390 100
Magdalena District 2 582 82.4 550 17.6 3 132 100

Environmental and Social Impact Assessment of Forest Landscape Restoration Project December 2021
Social Capital Group 344
District Do you attend a school, college
or university? Does not attend school, college or
university Total
N % N % N %
San Juan District 1 342 79.5 346 20.5 1 688 100
Province of San Pablo 6335 80.1 1572 19.9 7907 100
San Bernardino District 1201 76.7 364 23.3 1565 100
San Pablo District 3850 82.3 829 17.7 4679 100
Tumbaden District 1032 75.7 331 24.3 1363 100
Cajabamba Province 23736 75.4 7742 24.6 31477 100
Cachachi District 7472 72.0 2903 28.0 10375 100
Source: CPV 2017, INEI
6.4.3.8 School Tardy Rate
The rate of school backwardness or overage is defined by those students whose age is greater than the normative age of the grade or year they attend90. The extra age is explained by the students' living conditions that force them to remain in school for an additional time in order to complete their education, whether in the basic or alternative modality. In the region of Cajamarca, the rate of school backwardness in primary and secondary school was 4.9 and 11.5 respectively (year 2019). These rates are higher than the national averages, which are 4.0 in primary and 7.2 in secondary for the same year91.
For the year 2020, in the selected districts, the highest percentages of backwardness in primary school are found in Chetilla (13.2%) and Cospán (13.0%), compared to the low percentages in the districts of Cajamarca and San Pablo, with 2.3% and 4.2%, respectively. As for the backlog at the secondary level, the highest levels of backwardness are found in Chetilla again (26.1%), Asunción (23.0%) and San Juan (22.0%), and the lowest levels are found in the districts of Cajamarca (5.5%), Baños del Inca (7.4%) and San Pablo (7.5%).
Table 6.54 Backwardness Rates at the Primary and Secondary Levels
Backwardness rate (2020) %
Cajamarca Region Primary 4.2
Secondary 10.7
Cajamarca Province Primary 4.2
Secondary 8.9
Asunción District Primary 11.8
Secondary 23
Baños del Inca District Primary 4.5
Secondary 7.4
Cajamarca District Primary 2.3
Secondary 5.5
90 The normative age for primary education is between 6 and 11 years of age, and that for secondary education is between 12 and 16 years of age. In: Minedu. Norma sobre proceso de matrícula en la Educación Básica. R.M. N°447-2020. p. 12. 91 Escale

Environmental and Social Impact Assessment of Forest Landscape Restoration Project December 2021
Social Capital Group 345
Backwardness rate (2020) %
Chetilla District Primary 13.2
Secondary 26.1
Cospán District Primary 13.0
Secondary 20.1
Encañada District Primary 7.6
Secondary 19.3
Jesus District Primary 8.2
Secondary 9.9
Magdalena District Primary 7.1
Secondary 17.8
San Juan District Primary 11.8
Secondary 22
Province of San Pablo Primary 6.4
Secondary 10.2
San Bernardino District Primary 7.6
Secondary 16.1
San Pablo District Primary 4.2
Secondary 7.5
Tumbaden District Primary 11.1
Secondary 12.3
Cajabamba Province Primary 5.6
Secondary 11.5
Cachachi District Primary 8.5
Secondary 16.3
Source: Escale 2021 - MINEDU: Escale 2021 - MINEDU
6.4.3.9 School Dropout Rate
Dropout is defined as the total number of students withdrawn, passed or failed, from a period who do not ratify their enrollment in the following period. In the Cajamarca region, the 2019-2020 inter-annual school dropout indicator shows the following values: Initial (1.1%), Primary (1.3%) and Secondary (2.8%). Compared to the national percentages of 3.9% at the initial level, 1.7% at the primary level and 2.7% at the secondary level, the indicators are favourable for Cajamarca, especially at the initial level and also at the primary level.
In terms of the Project districts, dropout rates at the initial level are highest in the districts of Cachachi (2.2%), Encañada and Magdalena (1.9%), while the districts with the lowest dropout rates are San Bernardino, with zero dropout, and the districts of San Pablo and Chetilla, both with percentages of 0.4%.
At the primary level, the districts with the highest drop-out rates are Cospán (2.9%), Chetilla and San Juan, both with 2.0%. The districts of Tumbadén (0.4%) and Asunción (0.6%) have the lowest dropout rates at the primary level.
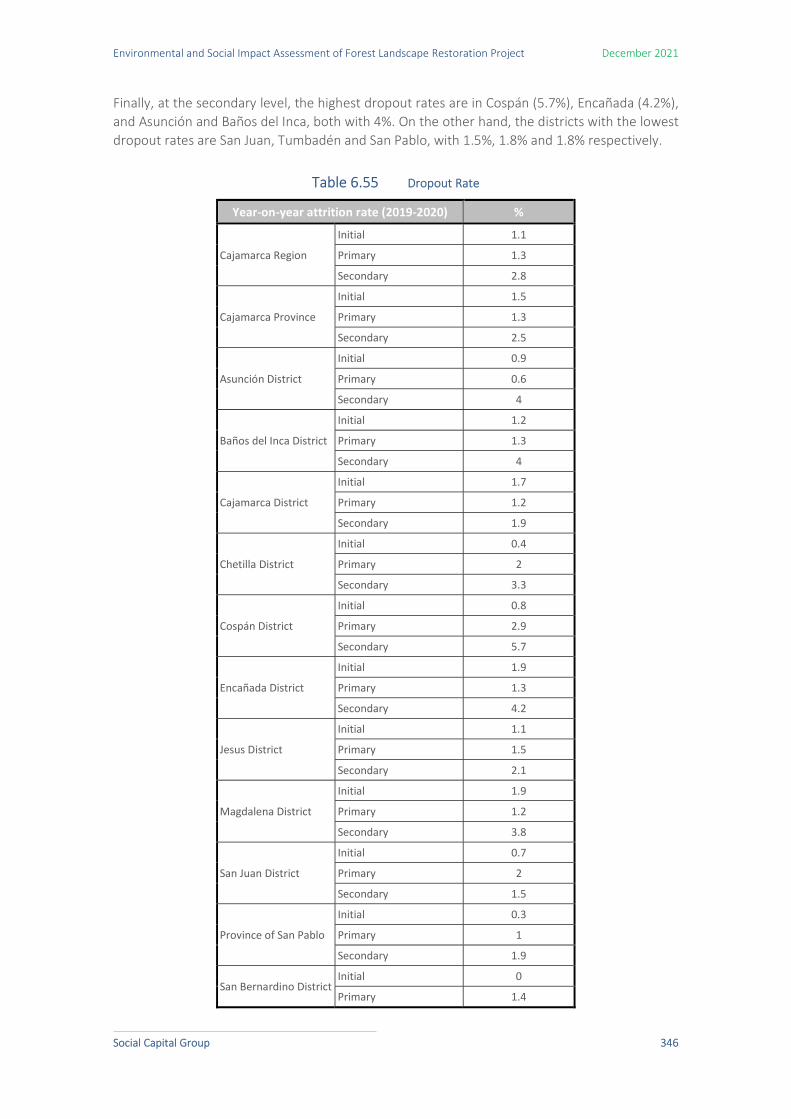
Environmental and Social Impact Assessment of Forest Landscape Restoration Project December 2021
Social Capital Group 346
Finally, at the secondary level, the highest dropout rates are in Cospán (5.7%), Encañada (4.2%), and Asunción and Baños del Inca, both with 4%. On the other hand, the districts with the lowest dropout rates are San Juan, Tumbadén and San Pablo, with 1.5%, 1.8% and 1.8% respectively.
Table 6.55 Dropout Rate
Year-on-year attrition rate (2019-2020) %
Cajamarca Region
Initial 1.1
Primary 1.3
Secondary 2.8
Cajamarca Province
Initial 1.5
Primary 1.3
Secondary 2.5
Asunción District
Initial 0.9
Primary 0.6
Secondary 4
Baños del Inca District
Initial 1.2
Primary 1.3
Secondary 4
Cajamarca District
Initial 1.7
Primary 1.2
Secondary 1.9
Chetilla District
Initial 0.4
Primary 2
Secondary 3.3
Cospán District
Initial 0.8
Primary 2.9
Secondary 5.7
Encañada District
Initial 1.9
Primary 1.3
Secondary 4.2
Jesus District
Initial 1.1
Primary 1.5
Secondary 2.1
Magdalena District
Initial 1.9
Primary 1.2
Secondary 3.8
San Juan District
Initial 0.7
Primary 2
Secondary 1.5
Province of San Pablo
Initial 0.3
Primary 1
Secondary 1.9
San Bernardino District Initial 0
Primary 1.4

Environmental and Social Impact Assessment of Forest Landscape Restoration Project December 2021
Social Capital Group 347
Year-on-year attrition rate (2019-2020) %
Secondary 1.9
San Pablo District
Initial 0.4
Primary 1.1
Secondary 1.8
Tumbaden District
Initial 0.5
Primary 0.4
Secondary 1.8
Cajabamba Province
Initial 2
Primary 2.6
Secondary 2.7
Cachachi District
Initial 2.2
Primary 3.3
Secondary 4.3
Source: Escale 2021 - MINEDU: Escale 2021 - MINEDU
6.4.4 Health
The health of a population is the result of several socioeconomic factors such as housing, basic services, food, working conditions and many others, so the approach to health care is necessarily intersectoral. This section will show the main health indicators (morbidity, mortality, life expectancy, etc.) as well as the organization of the health care system in the districts, which is the scope of the Project.
6.4.4.1 Number and level of health service facilities
The Technical Health Standard of the Ministry of Health "Categories of Health Sector Facilities" (NTS N°021 -MINSA/DGSP-V.02), recognizes 3 levels of care92. Each level in turn presents several categories of facilities, based on the existence of certain services considered minimum 93and on the mandatory fulfillment of activities. These categories are as follows:
In the First Level of attention: Categories I -1, I-2, I-3 and I-4, In the second level of care: Categories II-1, II-2 and II-E, In the Third Level of Care: Categories III-1, III-2 and III-E.
92 The first level is the gateway for the population to enter the health system, where promotional activities, specific protection, early diagnosis, and timely treatment of the most frequent health needs are carried out. It facilitates and coordinates the flow of users within the system through the referral and counter-referral system. The second level complements the care provided at the preceding level and adds a greater degree of specialization in both human and technological resources. The third level is the level with the highest level of specialization and capacity in terms of human and technological resources for health needs that are referred from the previous levels of care, as well as for those persons who come to the facilities at this level for reasons of urgency or emergency. Research is also carried out with greater emphasis at this level. 93 Health Services Producing Units (HPSU)

Environmental and Social Impact Assessment of Forest Landscape Restoration Project December 2021
Social Capital Group 348
Likewise, the health care system is organized into health networks, so that users at the head of the micro-network served by health posts can be transferred to facilities with a higher level of resolution to receive more specialized care and with the use of technological resources.
Official sources register 1,306 facilities that provide health services in the Cajamarca region94. These facilities belong to the first and second levels of care. Within the first level of care, almost half of the facilities (668) belong to category I-1, and are outpatient health posts that offer outpatient health services. In category I-2, there are 255 outpatient health facilities that offer outpatient services with a higher level of resolution than the previous category (e.g., they may include obstetrics). In category I-3, there are 205 outpatient health centers for outpatient consultation and clinical pathology services. Category I-4 includes 18 outpatient and inpatient health centers that offer outpatient services, clinical pathology, and pharmacy.
In the second level of care, in category II-1, there are 13 general care hospitals with outpatient, emergency, inpatient and intensive care. Finally, in category II-E there is 1 specialized care hospital. The second level hospitals offer a variety of health services, as shown in the table bellow.
94 National Registry of Health Service Provider Institutions - Renipress, Minsa 2021.

Social Capital Group 261
Table 6.57 Resolving Capacity by Health Facility Category
Resolving capacity
First level Second level
I-1Health post
I-2Health post
I-3Health
center
I-4Health
centre
II-1General care hospitals
II-2General care hospitals
II-Specialized care hospitals
Modalities of Care
Ambulatory Ambulatory Ambulatory Ambulatory
.
Ambulatory .Emergency
.Hospitalization.
Ambulatory .emergency
.hospitalization
.intensive care.
Ambulatory .Emergency
.Hospitalization.
Health Service Producing Units (HPSUs)
Outpatient Outpatient Outpatient
clinic.clinical pathology
Outpatient clinic.clinical
pathology .pharmacy.
Outpatient clinic .Emergency
.Hospitalization .Obstetric Center .Surgical Center
.Rehabilitation Medicine .Diagnostic Imaging
.Clinical Pathology (Clinical Laboratory) .Pharmacy.
Hemotherapy Center and Blood Bank
.Nutrition and Dietetics .Sterilization Center.
Outpatient .Emergency
.Hospitalization .Obstetric Center .Surgical Center. Intensive Care
.Rehabilitation Medicine .Diagnostic Imaging
.Clinical Pathology (Clinical Laboratory)
.Anatomical Pathology. Pharmacy
.Hemotherapy Center and Blood Bank
.Nutrition and Dietetics .Sterilization Center.
Outpatient clinic .Emergency
.Hospitalization .Obstetric Center .Surgical Center.
Rehabilitation Medicine .Diagnostic Imaging
.Clinical Pathology (Clinical Laboratory)
.Anatomical Pathology .Pharmacy
.Hemotherapy Center and Blood Bank
.Nutrition and Dietetics .Sterilization Center.
Emergencies and emergencies
Initial assessment and
care
Initial assessment and
care
Initial assessment and
care
Initial assessment and care. Training in
basic cardio respiratory,
stabilization of the user, and
transfer.
Elective and emergency surgical interventions in the specialties of general surgery, gynecology and
obstetrics with anesthesia support.
Initial management of priority I, II and II damage, as well as the
corresponding referral, in cases that warrant it, according to
current regulations.
Initial management of priority I, II and II damage, as well as the
corresponding referral, in cases that warrant it, according to
current regulations.

Environmental and Social Impact Assessment of Forest Landscape Restoration Project December 2021
Social Capital Group 336
Resolving capacity
First level Second level
I-1Health post
I-2Health post
I-3Health
center
I-4Health
centre
II-1General care hospitals
II-2General care hospitals
II-Specialized care hospitals
Childbirth care
Only if the pregnant
woman is in imminent
labour. Immediate care of the newborn.
Only if the pregnant
woman is in imminent
labour. Immediate care of the newborn.
Only if the expectant
mother is in imminent
labour .
Care of the pregnant woman in
uncomplicated labour and
immediate care of the newborn.
During the 24 hours care of vaginal delivery of the pregnant
woman with or without complications, immediate
puerperium, and care of the newborn.
24-hour vaginal delivery care for pregnant women with
complications and care of the newborn. Emergency care for pregnant women in imminent
labor. Care of newborns requiring
observation and/or neonatal care.
24-hour vaginal delivery care for pregnant women with
complications and care of the newborn. Emergency care for pregnant women in imminent
labor. Care of newborns requiring
observation and/or neonatal care.
Source: Prepared by the authors based on NTS N°021 -MINSA/DGSP-V.02

Social Capital Group 259
Finally, there are 144 health facilities at the regional level that are in the process of categorization.
In the districts covered by the project, there are 310 health facilities. With the exception of the district of Cajamarca, which has health facilities in all categories of the first and second level of care, in most districts there are mainly facilities in categories I-1 and I-2 (183).
The districts with the highest number of health posts at level I-1 are: Cajamarca (64), Encañada (10), Jesús (5), Baños del Inca (4) and Cachachi (4), with two I-1 category posts are the districts of Asunción, Magdalena, San Bernardino, San Pablo and Tumbadén. On the other hand, Cospán has only one I-1 health post, while Chetilla and San Juan do not have establishments in this category.
As for I-2 health posts, the districts with the largest number are Cajamarca (47), Cospán (23), Baños del Inca (4) and Cachachi (3). On the other hand, Asunción, Chetilla, Magdalena, San Bernardino, San Pablo and Tumaden have only 1 I-2 health post, while San Juan and Jesús have no facilities in this category.
In terms of I-3 health centers, the district of Cajamarca clearly has the largest number (56). This category is followed by Cachachi with two (2) health centers, while the districts of Baños del Inca, Encañada, Magdalena, Jesús and San Juan have one (1) in this category. It should be noted that there are no facilities in this category in the districts of Cospán, Asunción, Chetilla, San Bernardino, San Pablo and Tumbadén. Regarding I-4 health centers, Cajamarca has three health centers and Baños del Inca has one (1).
At Level of Care 2, only the district of Cajamarca has category II-1 (4), II-2 (2), and II-E (1) hospitals. Finally, in this district there are 53 establishments in the process of recategorization.
Table 6.56 Level of Health Facilities
EE.SS. Categories First Level Second Level
No Category Total I-1 I-2 I-3 I-4 II-1 II-2 II-E
Cajamarca Region 668 255 205 18 13 2 1 144 1306
Prov Cajamarca 96 62 63 3 4 2 1 54 285
Assumption 2 1 3
Baths of the Inca 4 4 1 1 10
Cajamarca 64 47 56 3 4 2 1 53 230
Chetilla 1 1
Cospan 1 23 24
Encañada 10 2 1 13
Jesus 5 1 6
Magdalena 2 1 1 4
San Juan 1 1
Prov San Pablo 9 4 1 14
San Bernardino 2 1 3
St. Paul's 2 1 3
Tumbaden 2 1 3

Environmental and Social Impact Assessment of Forest Landscape Restoration Project December 2021
Social Capital Group 336
EE.SS. Categories First Level Second Level
No Category Total I-1 I-2 I-3 I-4 II-1 II-2 II-E
Prov Cajabamba 11 8 10 1 1 31
Cachachi 4 3 2 9
Total EESS districts 98 85 63 4 4 2 1 53 310
Source: RENIPRESS 2021 - MINSA

Social Capital Group 261
Table 6.57 Resolving Capacity by Health Facility Category
Resolving capacity
First level Second level
I-1Health post
I-2Health post
I-3Health
center
I-4Health
centre
II-1General care hospitals
II-2General care hospitals
II-Specialized care hospitals
Modalities of Care
Ambulatory Ambulatory Ambulatory Ambulatory .
Ambulatory .Emergency
.Hospitalization.
Ambulatory .emergency
.hospitalization
.intensive care.
Ambulatory .Emergency
.Hospitalization.
Health Service Producing Units (HPSUs)
Outpatient Outpatient Outpatient
clinic.clinical pathology
Outpatient clinic.clinical
pathology .pharmacy.
Outpatient clinic .Emergency
.Hospitalization .Obstetric Center .Surgical Center
.Rehabilitation Medicine .Diagnostic Imaging
.Clinical Pathology (Clinical Laboratory) .Pharmacy.
Hemotherapy Center and Blood Bank
.Nutrition and Dietetics .Sterilization Center.
Outpatient .Emergency
.Hospitalization .Obstetric Center .Surgical Center. Intensive Care
.Rehabilitation Medicine .Diagnostic Imaging
.Clinical Pathology (Clinical Laboratory)
.Anatomical Pathology. Pharmacy
.Hemotherapy Center and Blood Bank
.Nutrition and Dietetics .Sterilization Center.
Outpatient clinic .Emergency
.Hospitalization .Obstetric Center .Surgical Center.
Rehabilitation Medicine .Diagnostic Imaging
.Clinical Pathology (Clinical Laboratory)
.Anatomical Pathology .Pharmacy
.Hemotherapy Center and Blood Bank
.Nutrition and Dietetics .Sterilization Center.
Emergencies and emergencies
Initial assessment and
care
Initial assessment and
care
Initial assessment and
care
Initial assessment and care. Training in
basic cardio respiratory,
stabilization of the user, and
transfer.
Elective and emergency surgical interventions in the specialties of general surgery, gynecology and
obstetrics with anesthesia support.
Initial management of priority I, II and II damage, as well as the
corresponding referral, in cases that warrant it, according to
current regulations.
Initial management of priority I, II and II damage, as well as the
corresponding referral, in cases that warrant it, according to
current regulations.

Environmental and Social Impact Assessment of Forest Landscape Restoration Project December 2021
Social Capital Group 262
Resolving capacity
First level Second level
I-1Health post
I-2Health post
I-3Health
center
I-4Health
centre
II-1General care hospitals
II-2General care hospitals
II-Specialized care hospitals
Childbirth care
Only if the pregnant
woman is in imminent
labour. Immediate care of the newborn.
Only if the pregnant
woman is in imminent
labour. Immediate care of the newborn.
Only if the expectant
mother is in imminent
labour .
Care of the pregnant woman in
uncomplicated labour and
immediate care of the newborn.
During the 24 hours care of vaginal delivery of the pregnant
woman with or without complications, immediate
puerperium, and care of the newborn.
24-hour vaginal delivery care for pregnant women with
complications and care of the newborn. Emergency care for pregnant women in imminent
labor. Care of newborns requiring
observation and/or neonatal care.
24-hour vaginal delivery care for pregnant women with
complications and care of the newborn. Emergency care for pregnant women in imminent
labor. Care of newborns requiring
observation and/or neonatal care.
Source: Prepared by the authors based on NTS N°021 -MINSA/DGSP-V.02

Social Capital Group 263
6.4.4.2 Physician per capita rate
The physician ratio is an important indicator to measure the availability of health care; it shows the ratio of physicians per certain number of inhabitants of a country, region or other political administrative division. If we accept that the country should have at least one doctor per 1000 inhabitants (equivalent to 10 per 10,000) we would say that at the national level we are barely covering the minimum number of doctors required. Peru, in 2020, had a rate of 0.99 per 1,000 inhabitants, although it should be noted that this national average does not allow us to appreciate the distribution of resources in the different regions, provinces and districts.
The Cajamarca Region shows a rate of 0.79 but also a very dissimilar distribution among the districts of the Project. The district with the highest doctor/inhabitant rate is Cajamarca (1.82). The rest of the Project districts have much lower rates, below the regional average. Those with a higher rate (without considering Cajamarca) are San Juan (0.66), Tumbadén (0.55) and Chetilla (0.52), while those with lower rates are Asunción (0.24), Baños del Inca (0.31) and Cachachi (0.32). As for the districts of San Bernardino and San Pablo, there is no presence of medical personnel in their health facilities.
Table 6.58 Doctor rate per habitant
Total population N° of Doctors Medical rate
(x 1000 inhab)
Cajamarca Region 1427527 1121 0.79
Cajamarca Province 369594 459 1.24
Asunción District 8484 2 0.24
Baños del Inca District 48602 15 0.31
Cajamarca District 231243 420 1.82
Chetilla District 3878 2 0.52
Cospán District 7264 3 0.41
Encañada District 20568 7 0.34
Jesus District 16064 7 0.44
Magdalena District 8848 4 0.45
San Juan District 4564 3 0.66
Province of San Pablo 13352 8 0.60
San Bernardino District 4573 0 -
San Pablo District 13352 0 -
Tumbaden District 3649 2 0.55
Cajabamba Province 80630 44 0.55
Cachachi District 25109 8 0.32
Source: Ministry of Health - Minsa.

Environmental and Social Impact Assessment of Forest Landscape Restoration Project December 2021
Social Capital Group 264
6.4.4.3 Insurance Holding and Type of Insurance
The results of the 2017 Census reveal that 75.5% of the country's population has some type of health insurance. In the Cajamarca region, health coverage reaches 84.7%, being higher in more rural districts, such as Chetilla (96.0%), San Bernardino (95.1%) and San Pablo (92.8%). In contrast, in more urban districts such as Cajamarca and Baños del Inca, coverage is lower, 71.6% and 75.3% respectively.
This trend is consistent with the results at the national level, which show that the rural population has greater coverage (83.2%) than the urban population (73.5%), which could be related to the expansion in recent years of social programmes in rural districts aimed at more vulnerable populations, such as the Juntos and Cuna Más programmes95.
Table 6.59 Health Insurance
Have health insurance N %
Cajamarca Region
If you have insurance 1 209 184 84.7
No insurance 218 343 15.3
Total 1 427 527 100.0
Cajamarca Province
If you have insurance 282 663 76.5
No insurance 86 931 23.5
Total 369 594 100.0
Asunción District
If you have insurance 7 632 90.0
No insurance 852 10.0
Total 8 484 100.0
Baños del Inca District
If you have insurance 36 569 75.3
No insurance 12 033 24.8
Total 48 602 100.0
Cajamarca District
If you have insurance 165 548 71.6
No insurance 65 695 28.4
Total 231 243 100.0
Cospán District
If you have insurance 6 493 89.4
No insurance 771 10.6
Total 7 264 100.0
Chetilla District
If you have insurance 3 722 96.0
No insurance 156 4.0
Total 3 878 100.0
Encañada District
If you have insurance 18 426 89.6
No insurance 2 142 10.4
Total 20 568 100.0
Jesus District If you have insurance 14 628 91.1
No insurance 1 436 8.9
95 The results of the Juntos Program indicate that the use of health services for children under five years of age and women of childbearing age had a significant increase in all available ENAHO indicators. In: Perova E. and R. Vakisl: The impact and potential of the Juntos Program in Peru. Dec 2010. World Bank and Programa Juntos. p.23.

Environmental and Social Impact Assessment of Forest Landscape Restoration Project December 2021
Social Capital Group 265
Have health insurance N %
Total 16 064 100.0
Magdalena District
If you have insurance 7 815 88.3
No insurance 1 033 11.7
Total 8 848 100.0
San Juan District
If you have insurance 4 163 91.2
No insurance 401 8.8
Total 4 564 100.0
Province of San Pablo
If you have insurance 21 052 93.3
No insurance 1 520 6.7
Total 22 572 100.0
San Bernardino District
If you have insurance 4 350 95. 1
No insurance 223 4.9
Total 4 573 100.0
San Pablo District
If you have insurance 12 391 92.8
No insurance 961 7.2
Total 13 352 100
Tumbaden District
If you have insurance 3 360 92.1
No insurance 289 7.9
Total 3 649 100
Cajabamba Province
If you have insurance 68 546 85
No insurance 12 084 15.0
Total 80 630 100.0
Cachachi District
If you have insurance 20 771 82.7
No insurance 4 338 17.3
Total 25 109 100.0
Source: CPV 2017 - INEI
According to type of health, Comprehensive Health Insurance (SIS) is most widespread in the districts of Chetilla (94.9%), San Bernardino (91.4%) and Tumbadén (89.4%). The districts with the lowest coverage are Cajamarca (37.7%) and Baños del Inca (54.0%).
On the other hand, the districts of Cajamarca and Baños del Inca show higher coverage of Essalud insurance, with 27.4% and 16.8% respectively. While districts such as Chetilla, Encañada, Tumbadén and Asunción have very low percentages of coverage of this insurance, which does not exceed 3%.
The types of insurance provided by the armed forces or police are found mainly in the districts of Cajamarca (1.3%) and Baños del Inca (0.7%), while in the remaining districts the percentages are negligible. The same is true for private insurance, which is found almost exclusively in Cajamarca (3.3%), Baños del Inca (2.4%) and Cospán (0.7%).
The "Other" category included cases that reported having two or more insurances, in different combinations, most of them belonging to the districts of Cajamarca (1.9%) and Baños del Inca (1.3%).

Environmental and Social Impact Assessment of Forest Landscape Restoration Project December 2021
Social Capital Group 266
Finally, in the "No insurance" category, the districts of Cajamarca (28.4%), Baños del Inca (24.8%) and Cachachi (17.3%) stand out, while lower percentages are found in Chetilla (4.0%), San Bernardino (4.9%) and San Pablo (7.2%).
Table 6.60 Population according to type of health insurance
Comprehensive
Health Insurance (SIS) Only
Only EsSalud
Military or Police
Insurance Only
Private Health
Insurance Only
Another No
insurance Total
Cajamarca Region 71.0 11.8 0.5 0.8 0.6 15.3
1,427,527.06
Cajamarca Province 51.4 20.3 1.0 2.4 1.4 23.5 369 594
Asunción District 87.0 2.6 0.1 0.1 0.1 10.0 8484.0
Baños del Inca District 54.0 16.8 0.7 2.4 1.3 24.8 48602
Cajamarca District 37.7 27.4 1.3 3.3 1.9 28.4 231243
Cospán District 83.7 4.8 0.1 0.7 0.1 10.6 7264
Chetilla District 94.9 1.0 0.0 0.0 0.1 4.0 3878
Encañada District 87.0 2.2 0.1 0.1 0.2 10.4 20568
Jesus District 85.2 4.9 0.2 0.4 0.3 8.9 16064
Magdalena District 83.3 4.3 0.4 0.3 0.2 11.7 8848
San Juan District 83.3 7.0 0.4 0.2 0.3 8.8 4564
Prov San Pablo 85.2 7.4 0.3 0.1 0.2 6.7 22 572
San Bernardino 91.4 3.1 0.4 0.2 0.1 4.9 4 573
San Pablo District 81.5 10.5 0.4 0.2 0.2 7.2 13 352
Tumbaden District 89.4 2.3 0.0 0.0 0.4 7.9 3 649
Cajabamba Province 75.6 8.7 0.2 0.2 0.3 15.0 80 630
Cachachi District 75.5 6.4 0.3 0.3 0.3 17.3 25 109
Source: CPV 2017 - INEI
6.4.4.4 Morbidity and Mortality (including Covid 19)
The decrease in fertility, changes in the structure of the population, migration processes and population concentration have their correlate in epidemiological changes, which translates into a decrease in infectious and communicable diseases and an increase in chronic diseases, not caused by infections and of slow progression. Similarly, in the transition from a situation previously dominated by mortality to one in which "morbidity is the dominant force"96.
For purposes of a better analysis of the information, the diseases reported by Sinadef 2021 were classified97 taking into account the epidemiological changes and the review of some documents98.
96 Ugarte Oscar and E. Marroquín. Cajamarca: Guidelines for a Regional Health Policy. 2006 P.45 97 The diseases reported are listed in Annex XX.
98 PAHO. Statistical classification of diseases and health-related problems. 2018, INEI Peru: Situation and prospects of mortality by gender and age groups 1990-2025. July 2010, among others.

Environmental and Social Impact Assessment of Forest Landscape Restoration Project December 2021
Social Capital Group 267
Two types of tables are presented below, one summarized and the other more detailed with respect to the morbidities present in the scope of the Project.
The following summary table shows that, contrary to epidemiological transition trends, Cajamarca is moving towards "epidemiological accumulation". Thus, infectious diseases still account for the majority of the total number of registered cases. Thus, in the Cajamarca region they represent 62.6% of reported cases and in the districts with the highest percentages are Cachachi (75%), San Bernardino (71.3%) and San Pablo (68.9%), while the districts with the lowest incidence of infectious diseases are Cajamarca (41.1%), Baños del Inca (43.8%) and Chetilla (44.3%). It should be noted that acute diarrhoeal diseases and parasitic infections are directly related to basic sanitation conditions in housing and access to safe water.
In second place, chronic non-communicable diseases represent 24.1% of the diseases in the Region, and the districts that report the highest percentages of this type of disease are: Cajamarca (22.9%), Tumbadén (20.8%) and San Bernardino (19.1%), while the districts with the lowest incidence of chronic diseases are Chetilla (10.0%) Cachachi (12.9%) and San Pablo (13.3%). Chronic diseases, as mentioned above, are of slow progression and are not transmissible. They appear with the growth of cities, the demands of work and the stress that living in demanding and insecure environments produces in the population. This group includes cardiovascular and musculoskeletal diseases, mental disorders, neoplasms, endocrine diseases, among others.
Likewise, with respect to the diseases that we have labeled as maternal perinatal, where we find health problems related to pregnancy, childbirth and puerperium and also diseases of the newborn, the percentage in the region is 4.2%. The highest percentages correspond to Baños del Inca (10.1%), Cajamarca (9.4%) and Chetilla (7.1%), while the lowest are Tumbadén (1.6%), San Bernardino (3.2%). In view of these results, it is possible to establish an association between the higher percentages of rural pregnant women who have accessed the SIS and other women in urban low-income sectors.
In terms of malnutrition-anemia, these cases are not reported by region or province. In the districts of the Project, the highest percentages of malnutrition cases are in Baños del Inca (14.5%), Encañada (11.9%) and San Juan (9.9%), while very low percentages are recorded in Tumbadén (1.4%), San Bernardino (3.1%) and San Pablo (3.2%).
Finally, in the "Other" category, the vast majority of cases included "general symptoms and signs" and, to a lesser extent, abnormal clinical and laboratory findings, not classified elsewhere; congenital malformations, deformities and chromosomal anomalies, general symptoms and signs, and also complications of medical care. In the Cajamarca region, the percentage is 9.1%, but in some districts there are high percentages, such as in Chetilla (34.3%), Jesús (24.9%) and also Cajamarca (19.1%). The lowest percentages correspond to the districts of San Bernardino (3.3%), Cachachi (3.9%) and Cospán (7.1%).
Table 6.61 Morbidities (Summary Table)
Diseases of infectious
origin
Maternal neo-natal
Chronic diseases, accidents
Malnutrition-anemia
Another Total
Cajamarca Region 62.6 4.2 24.1 9.1 877,333.00
Province of Cajamarca
40.7 7.7 35.2 16.4 113,106.00
District of Asunción 62.7 5.2 17.0 3.2 11.9 3,177.00

Environmental and Social Impact Assessment of Forest Landscape Restoration Project December 2021
Social Capital Group 268
Diseases of infectious
origin
Maternal neo-natal
Chronic diseases, accidents
Malnutrition-anemia
Another Total
Baths of the Inca 43.8 10.1 16.0 14.5 15.6 13,686.00
Cajamarca District 41.1 9.4 22.9 7.4 19.1 49,024.00
Cospán District 64.4 5.8 17.7 5.1 7.1 2,334.00
Chetilla District 44.3 7.1 10.0 4.3 34.3 70.00
Encañada District 53.4 5.4 15.6 11.9 13.8 10,373.00
Jesus District 48.4 5.4 16.6 4.8 24.9 9,343.00
Magdalena District 60.4 4.5 18.9 3.4 12.8 5,252.00
San Juan District 58.7 6.9 16.5 9.9 8.0 1,378.00
Province of San Pablo
58.4 3.2 30.3 8.1 14,696.00
San Bernardino District
71.3 3.2 19.1 3.1 3.3 2,432.00
San Pablo District 68.9 4.2 13.3 3.2 10.4 7,461.00
Tumbaden District 67.1 1.6 20.8 1.4 9.1 2,357.00
Cajabamba Province 50.4 5.1 35.3 9.2 31,426.00
Cachachi District 75.0 4.4 12.9 3.7 3.9 7,397.00
Source: Sinadef 2021 - MINSA

Social Capital Group 269
Table 6.62 Morbidities (Detailed Table)
Diseases of the
respiratory system
Diseases of the digestive
system
Other infectious
and/or communicable
diseases
Maternal neo-natal
Chronic circulatory
system
Other chronic non-
communicable diseases
Neoplasms External causes
(accidents) Another
Malnutrition-anemia Total cases
Cajamarca 17.7 16.4 28.5 4.2 2.6 15.5 0.2 5.7 9.1 877,333.00
Cajamarca 9.9 17.4 13.4 7.7 4.2 25.9 0.6 4.5 16.4 113,106.00
Assumption 19.6 14.7 28.3 5.2 10.2 2.3 4.5 11.9 3.2 3,177.00
Baths of the Inca
5.8 5.1 32.9 10.1 0.0 11.4 0.2 4.4 15.6 14.5 13,686.00
Cajamarca 8.4 6.9 25.8 9.4 18.1 0.9 3.9 19.1 7.4 49,024.00
Cospan 12.0 14.4 37.9 5.8 9.3 3.6 4.8 7.1 5.1 2,334.00
Chetilla 10.0 8.6 25.7 7.1 10.0 34.3 4.3 70.00
Encañada 12.7 10.0 30.6 5.4 10.5 0.2 4.9 13.8 11.9 10,373.00
Jesus 13.2 9.2 26.0 5.4 10.3 3.0 3.3 24.9 4.8 9,343.00
Magdalena 11.9 10.2 38.3 4.5 0.0 13.3 0.2 5.3 12.8 3.4 5,252.00
San Juan 15.2 12.5 31.1 6.9 10.7 0.8 5.0 8.0 9.9 1,378.00
St. Paul's 18.4 21.6 18.4 3.2 1.5 22.5 0.2 6.1 8.1 14,696.00
San Bernardino
29.5 11.4 30.3 3.2 12.9 6.2 3.3 3.1 2,432.00
St. Paul's 11.6 7.6 49.7 4.2 8.4 0.3 4.6 10.4 3.2 7,461.00
Tumbaden 23.9 13.7 29.4 1.6 11.8 0.1 8.9 9.1 1.4 2,357.00
Cajabamba 14.6 19.2 16.6 5.1 3.4 27.3 0.1 4.6 9.2 31,426.00
Cachachi 24.4 13.2 37.4 4.4 9.3 0.1 3.6 3.9 3.7 7,397.00
Source: Sinadef 2021 - MINSA
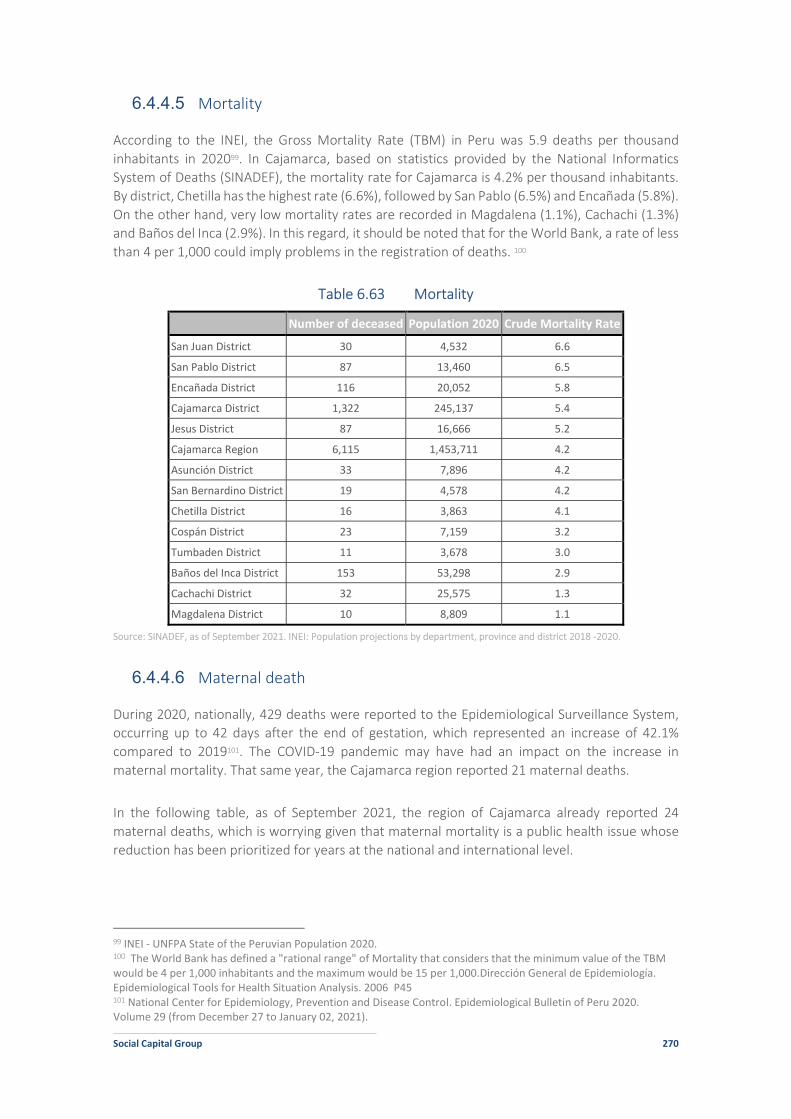
Social Capital Group 270
6.4.4.5 Mortality
According to the INEI, the Gross Mortality Rate (TBM) in Peru was 5.9 deaths per thousand inhabitants in 202099. In Cajamarca, based on statistics provided by the National Informatics System of Deaths (SINADEF), the mortality rate for Cajamarca is 4.2% per thousand inhabitants. By district, Chetilla has the highest rate (6.6%), followed by San Pablo (6.5%) and Encañada (5.8%). On the other hand, very low mortality rates are recorded in Magdalena (1.1%), Cachachi (1.3%) and Baños del Inca (2.9%). In this regard, it should be noted that for the World Bank, a rate of less than 4 per 1,000 could imply problems in the registration of deaths. 100
Table 6.63 Mortality
Number of deceased Population 2020 Crude Mortality Rate
San Juan District 30 4,532 6.6
San Pablo District 87 13,460 6.5
Encañada District 116 20,052 5.8
Cajamarca District 1,322 245,137 5.4
Jesus District 87 16,666 5.2
Cajamarca Region 6,115 1,453,711 4.2
Asunción District 33 7,896 4.2
San Bernardino District 19 4,578 4.2
Chetilla District 16 3,863 4.1
Cospán District 23 7,159 3.2
Tumbaden District 11 3,678 3.0
Baños del Inca District 153 53,298 2.9
Cachachi District 32 25,575 1.3
Magdalena District 10 8,809 1.1
Source: SINADEF, as of September 2021. INEI: Population projections by department, province and district 2018 -2020.
6.4.4.6 Maternal death
During 2020, nationally, 429 deaths were reported to the Epidemiological Surveillance System, occurring up to 42 days after the end of gestation, which represented an increase of 42.1% compared to 2019101. The COVID-19 pandemic may have had an impact on the increase in maternal mortality. That same year, the Cajamarca region reported 21 maternal deaths.
In the following table, as of September 2021, the region of Cajamarca already reported 24 maternal deaths, which is worrying given that maternal mortality is a public health issue whose reduction has been prioritized for years at the national and international level.
99 INEI - UNFPA State of the Peruvian Population 2020. 100 The World Bank has defined a "rational range" of Mortality that considers that the minimum value of the TBM would be 4 per 1,000 inhabitants and the maximum would be 15 per 1,000.Dirección General de Epidemiología. Epidemiological Tools for Health Situation Analysis. 2006 P45 101 National Center for Epidemiology, Prevention and Disease Control. Epidemiological Bulletin of Peru 2020. Volume 29 (from December 27 to January 02, 2021).

Environmental and Social Impact Assessment of Forest Landscape Restoration Project December 2021
Social Capital Group 271
As for the scope of the Project, as of September 2021, only 3 districts reported maternal deaths: Cajamarca (3), Jesús (1) and Magdalena (1).
Table 6.64 Maternal death
N
Cajamarca Region 24
Cajamarca Province 6
Asunción District 0
Baños del Inca District 0
Cajamarca District 3
Chetilla District 0
Cospán District 0
Encañada District 0
Jesus District 1
Magdalena District 1
San Juan District 0
Province of San Pablo 0
San Bernardino District 0
San Pablo District 0
Tumbaden District 0
Cajabamba Province 2
Cachachi District 0
Source: National Center of Epidemiology, as of September 2021 - MINSA
The pandemic caused by the Coronavirus (Covid-19) has been severely affecting the health of the population worldwide and nationally. Currently, in Peru, there are 2 million 185 thousand 355 infected with the disease, and 199,727 dead (figures as of October 12, 2021).
In the Cajamarca region, between March 2020 and August 2021, a total of 4,094 deaths were reported, of which 1,285 (31.4%) were found in the district of Cajamarca. Of these deaths, 65.1% were men and 34.9% were women, which could reveal possible patterns of behavior that could have exposed men to infection more than women, although we are still facing a caseload too small to be able to formulate possible hypotheses in this regard.
Table 6.65 Mortality from COVID-19
Female Male Total
N % N % N %
Cajamarca Region 1430 34.9 2664 65.1 4094 100
Cajamarca Province 539 35.1 996 64.9 1535 100
Asunción District 4 80.0 1 20.0 5 100
Baños del Inca District 44 41.1 63 58.9 107 100
Cajamarca District 445 34.6 840 65.4 1285 100
Chetilla District 2 28.6 5 71.4 7 100

Environmental and Social Impact Assessment of Forest Landscape Restoration Project December 2021
Social Capital Group 272
Female Male Total
N % N % N %
Cospán District 2 40.0 3 60.0 5 100
Encañada District 13 33.3 26 66.7 39 100
Jesus District 8 26.7 22 73.3 30 100
Magdalena District 2 20.0 8 80.0 10 100
San Juan District 7 41.2 10 58.8 17 100
Province of San Pablo 22 44.0 28 56.0 50 100
San Bernardino District 1 33.3 2 66.7 3 100
San Pablo District 20 48.8 21 51.2 41 100
Tumbaden District 0 0.0 2 100.0 2 100
Cajabamba Province 69 35.9 123 64.1 192 100
Cachachi District 11 34.4 21 65.6 32 100
Source: National Center for Epidemiology, Prevention and Control of Diseases, from March 2020 to August 2021 - MINSA.
6.4.4.7 Life expectancy
The changes observed in health are evident in indicators such as life expectancy at birth. In Peru, by the year 2021, life expectancy is expected to be 76 years, with men reaching 73 years of age and women 79 years. According to the following table for Cajamarca, life expectancy is less than 73.3, while in the districts covered by the Project, this indicator is more favorable in districts such as Cachachi (77.1), Encañada (76.6), Asunción (76.3) and Chetilla (76.2). On the other hand, in the districts of the province of San Pablo, these indicators are quite low: San Pablo (65.7%), San Bernardino (67.6%) and Tumbadén (67.9%), which could be associated with a higher risk of death among these populations as a result of mining activity in the area102.
Table 6.66 Life expectancy at birth
Years
Cajamarca Region 73.3
Cajamarca Province 74.2
Asunción District 76.3
Baños del Inca District 74.2
Cajamarca District 73.2
Chetilla District 76.2
Cospán District 72.2
Encañada District 76.6
Jesus District 76.1
Magdalena District 74.4
San Juan District 71.9
Province of San Pablo 66.6
San Bernardino District 67.6
San Pablo District 65.7
102 https://www.ecoportal.net/temas-especiales/mineria/cajamarca_peru_minera_yanacocha_en_cabecera_de_cuenca_en_san_pablo_cajamarca/

Environmental and Social Impact Assessment of Forest Landscape Restoration Project December 2021
Social Capital Group 273
Years
Tumbaden District 67.9
Cajabamba Province 77.7
Cachachi District 77.1
Source: National Center of Epidemiology, as of September 2021 - MINSA
6.4.5 Employment
This section describes the main characteristics of the labor market in the study area: Working Age Population (WAP), Economically Active Population (EAP), the types of occupation and economic activities of the employed EAP; as well as, the levels of unemployment, participation in the labor market and workers' income. Each of these variables is analyzed at different geographical, regional, provincial and district levels, in order to provide an overview of the behavior of the labor market.
6.4.5.1 PET and EAP (employed, unemployed) by gender 103
This section presents statistical information on the Working Age Population, WAP, and the Economically Active Population, EAP, broken down by gender.
Working Age Population (WAP)
According to the National Institute of Statistics and Informatics -INEI- the Working Age Population (WAP) is the population defined by international standards (International Labor Organization -ILO-), as apt in terms of age to exercise productive functions (14 years of age and older). This is subdivided into the economically active population (EAP), also known as the Labor Force, and the economically inactive population (Non-EAP).
The results of the 2017 population and housing census show that the PET reached almost one million in the Cajamarca Region. In the three provinces analysed, Cajamarca has the highest PET (255 620 people). In the districts the distribution is very differentiated, with the exception of Cajamarca (164 412), none of the other districts exceeds 35 000 people of working age, which allows inferring that in the study area the highest concentration of the population of working age to perform some economic activity is concentrated in the district of Cajamarca.
An analysis of the composition by gender shows that, with the exception of the district of Cachachi, in the other districts, provinces and the Cajamarca region, women constitute the majority in the composition of the PET, which is consistent with the demographic composition of the region and the country.
In relative terms, the nine districts that make up the province of Cajamarca do not exceed the participation of the province (73.4%) and the Cajamarca region (72.4%); the same situation is observed in the remaining four districts, none of which exceed the relative value of the province and the region to which they belong. The results presented in Table 6.67also show that the participation of women is greater than that of men, both in the region, the provinces and in most of the districts, the only exception being Cachachi, where there is almost parity between men and
103 The definitions used in this section correspond to those established by the INEI in the Permanent Employment Survey of Metropolitan Lima. Ficha Técnica - 2021.

Environmental and Social Impact Assessment of Forest Landscape Restoration Project December 2021
Social Capital Group 274
women. Another important aspect is that, in general, between six and seven people out of every ten are old enough to carry out some economic activity in the study area.
If the PET is made up of people over 14 years of age, the population that is not of working age (No PET) is made up of the rest of the people (under 14 years of age). Together, both variables make up the total population. As can be seen in Table 6.67, the distribution of the No PET is quite differentiated, ranging from 38.8% in the Cachachi district of Cajabamba Province to 28.9% in the district of Cajamarca, Cajamarca Province. This behavior may be due to several causes: in the districts where the presence of children under 14 years of age is higher, to the slow reduction of the birth rate or the high migration of adults to other parts of the national territory in search of better working conditions; while the opposite situation may be occurring in the districts where the presence of children under 14 years of age is lower.
On average, it can be inferred that about 1 out of every 3 inhabitants in the study area are children and adolescents under 14 years of age who depend on the working-age population for their livelihood. When the data is disaggregated by gender, there are more boys than girls, with the exception of the district of Cachachi, where the number of girls is relatively higher than that of boys (38.8% versus 38.7%, respectively).
The sum of the PET and the No PET reproduces the total population, the data can be seen at the end of Table 6.67. In summary, it shows us that the district of Cajamarca is the most populated of those that make up the study area, contributing 17.2% of the population and in economic terms the one with the largest number of people of working age. It is followed far behind by the districts of Baños del Inca (3.6%) and Cachachi (1.9%), the others have a less significant participation.
Table 6.67 Population with and without working age and total
Working age population -PET-.
District Man Woman Total
N % N % N %
Cajamarca Region 470 339 71.5 500 766 73.3 971 105 72.4
Cajamarca Province 119 952 71.9 135 668 74.7 255 620 73.4
Asunción District 2 616 65.3 3 022 67.5 5 638 66.5
Baños del Inca District 15 466 65.5 17 410 69.6 32 876 67.6
Cajamarca District 77 335 69.1 87 077 73.0 164 412 71.1
Chetilla District 1 069 61.1 1 425 67.0 2 494 64.3
Cospán District 2 257 61.9 2 308 63.8 4 565 62.8
Encañada District 6 284 64.1 7 328 68.1 13 612 66.2
Jesus District 4 719 61.0 5 503 66.1 10 222 63.6
Magdalena District 2 855 66.0 3 109 68.7 5 964 67.4
San Juan District 1 466 65.4 1 634 70.4 3 100 67.9
Province of San Pablo 6 980 69.7 8 131 73.3 15 111 71.6
San Bernardino District 1 484 65.1 1 613 70.3 3 097 67.7
San Pablo District 4 034 63.9 4 889 69.4 8 923 66.8
Tumbaden District 1 102 64.0 1 277 66.3 2 379 65.2
Cajabamba Province 24 880 66.8 26 593 69.1 51 473 68.0

Environmental and Social Impact Assessment of Forest Landscape Restoration Project December 2021
Social Capital Group 275
Cachachi District 8 029 61.3 7 340 61.2 15 369 61.2
Population not of working age -No PET-.
District Man Woman Total
N % N % N %
Cajamarca Region 187 295 28.5 182 612 26.7 369 907 27.6
Cajamarca Province 46 781 28.1 46 032 25.3 92 813 26.6
Asunción District 1 393 34.7 1 453 32.5 2 846 33.5
Baños del Inca District 8 138 34.5 7 588 30.4 15 726 32.4
Cajamarca District 34 615 30.9 32 216 27.0 66 831 28.9
Chetilla District 682 38.9 702 33.0 1 384 35.7
Cospán District 1 387 38.1 1 312 36.2 2 699 37.2
Encañada District 3 523 35.9 3 433 31.9 6 956 33.8
Jesus District 3 015 39.0 2 827 33.9 5 842 36.4
Magdalena District 1 468 34.0 1 416 31.3 2 884 32.6
San Juan District 777 34.6 687 29.6 1 464 32.1
Province of San Pablo 3 034 30.3 2 957 26.7 5 991 28.4
San Bernardino District 796 34.9 680 29.7 1 476 32.3
San Pablo District 2 278 36.1 2 151 30.6 4 429 33.2
Tumbaden District 621 36.0 649 33.7 1 270 34.8
Cajabamba Province 12 340 33.2 11 874 30.9 24 214 32.0
Cachachi District 5 079 38.7 4 661 38.8 9 740 38.8
Total population
District Man Woman Total
N % N % N %
Cajamarca Region 657 634 100.0 683 378 100.0 1341 012 100.0
Cajamarca Province 166 733 100.0 181 700 100.0 348 433 100.0
Asunción District 4 009 100.0 4 475 100.0 8 484 100.0
Baños del Inca District 23 604 100.0 24 998 100.0 48 602 100.0
Cajamarca District 111 950 100.0 119 293 100.0 231 243 100.0
Chetilla District 1 751 100.0 2 127 100.0 3 878 100.0
Cospán District 3 644 100.0 3 620 100.0 7 264 100.0
Encañada District 9 807 100.0 10 761 100.0 20 568 100.0
Jesus District 7 734 100.0 8 330 100.0 16 064 100.0
Magdalena District 4 323 100.0 4 525 100.0 8 848 100.0
San Juan District 2 243 100.0 2 321 100.0 4 564 100.0
Province of San Pablo 10 014 100.0 11 088 100.0 21 102 100.0
San Bernardino District 2 280 100.0 2 293 100.0 4 573 100.0
San Pablo District 6 312 100.0 7 040 100.0 13 352 100.0
Tumbaden District 1 723 100.0 1 926 100.0 3 649 100.0
Cajabamba Province 37 220 100.0 38 467 100.0 75 687 100.0
Cachachi District 13 108 100.0 12 001 100.0 25 109 100.0
Source: CPV 2017 - INEI
Economically Active Population (EAP)

Environmental and Social Impact Assessment of Forest Landscape Restoration Project December 2021
Social Capital Group 276
As noted in the previous section, the EAP in Peru comprises all persons aged fourteen (14) years and over who were in the reference week:
Working,
They didn't work, but they had jobs,
They were actively looking for a job.
In contrast to the PET, the EAP has a more economic meaning, since it is made up of the population aged fourteen and older who are working or actively seeking employment. Table 6.67the distribution of the EAP in the Cajamarca Region, according to some of the provinces and districts of interest in the study. The data show that the EAP in the Province of Cajamarca is more representative, both in absolute terms (133,061 persons) and relative terms (52.1%), than in the other provinces (San Pablo and Cajabamba) and the Cajamarca Region.
At the district level, the population that is working or looking for a job shows significant variations: in the Districts of Asunción, Chetilla Cospán and San Juan, it does not exceed 40%. In a more modest situation are the Districts of Encañada, Jesús, Magdalena, San Bernardino, San Pablo, Tumbaden and Cachachi, where the range of participation is between 40% and 50%. The districts of Baños del Inca and Cajamarca have better participation, with over 50%. These levels of participation show the limitations that people have in accessing the labor market and explain the conditions of poverty in which they live, as will be described in the following sections.
Disaggregation by gender shows another facet of the labour market in the study area: an imbalance unfavourable to women, since unlike in the PET where they were the majority, in the EAP they represent a significantly lower proportion than men. In ten districts (Asunción, Chetilla, Cospán, Encañada, Jesús, Magdalena, San Juan, San Bernardino, Tumbaden and Cachachi) the ratio is more than three to one. In the other districts, although the ratio is reduced to less than three, the gap is still significant. There are many factors that could explain this situation, however, domestic work and caregiving tasks are among the main barriers to women's access to the labor market.
Economically Inactive Population (Non EAP)
As mentioned above, the EAP constitutes one part of the PET, the other part being the Economically Inactive Population (EIP or Non-EAP). According to INEI criteria, it is made up of people of working age who do not participate in the labor market. That is, they do not perform or seek any economic activity. It is made up of students, retirees or pensioners, pensioners, people engaged in household chores, the elderly, etc.
As can be seen in Table 6.68 Economically active, inactive and total population, in the region and the provinces, about one out of every two persons aged 14 years or older is economically inactive, which generates a high dependence on active persons. In the districts, the situation is different: in Asunción, Chetilla, Cospán and San Juan, more than 6 out of every 10 people of working age are inactive, which indicates limited economic activity and the existence of structural barriers to the incorporation of women into productive activities, since they make up the bulk of the inactive population (between 60% and 90%).
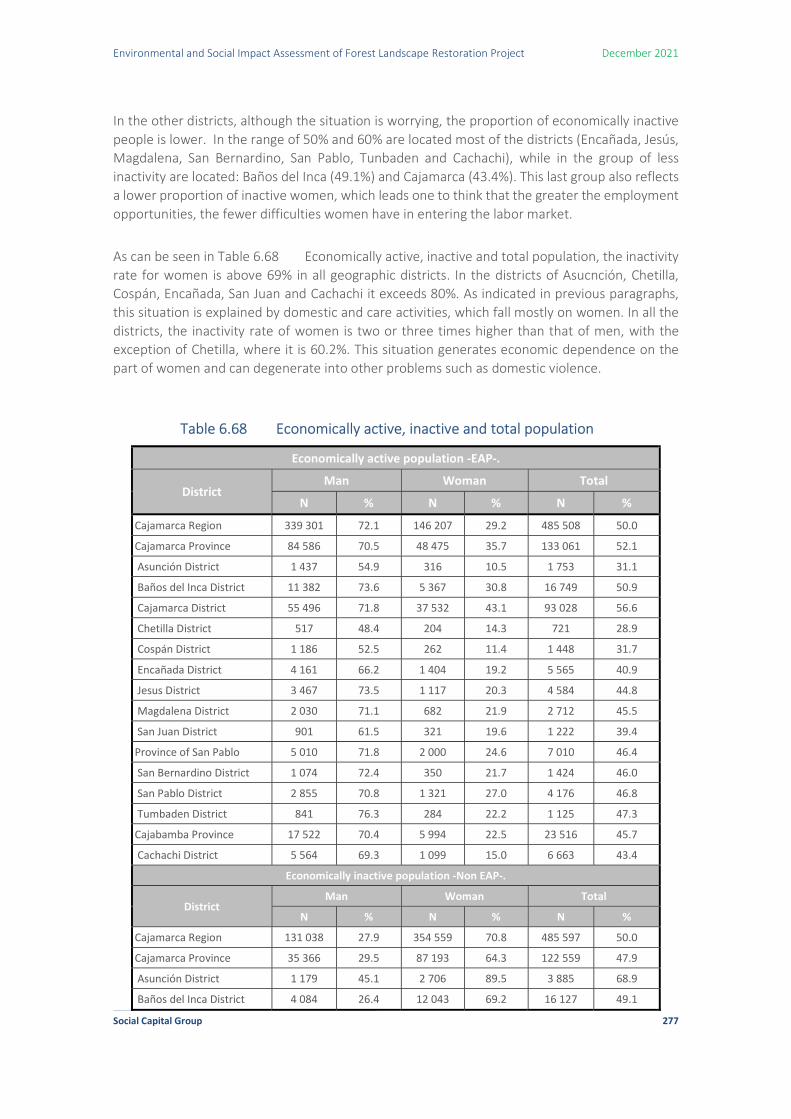
Environmental and Social Impact Assessment of Forest Landscape Restoration Project December 2021
Social Capital Group 277
In the other districts, although the situation is worrying, the proportion of economically inactive people is lower. In the range of 50% and 60% are located most of the districts (Encañada, Jesús, Magdalena, San Bernardino, San Pablo, Tunbaden and Cachachi), while in the group of less inactivity are located: Baños del Inca (49.1%) and Cajamarca (43.4%). This last group also reflects a lower proportion of inactive women, which leads one to think that the greater the employment opportunities, the fewer difficulties women have in entering the labor market.
As can be seen in Table 6.68 Economically active, inactive and total population, the inactivity rate for women is above 69% in all geographic districts. In the districts of Asucnción, Chetilla, Cospán, Encañada, San Juan and Cachachi it exceeds 80%. As indicated in previous paragraphs, this situation is explained by domestic and care activities, which fall mostly on women. In all the districts, the inactivity rate of women is two or three times higher than that of men, with the exception of Chetilla, where it is 60.2%. This situation generates economic dependence on the part of women and can degenerate into other problems such as domestic violence.
Table 6.68 Economically active, inactive and total population
Economically active population -EAP-.
District Man Woman Total
N % N % N %
Cajamarca Region 339 301 72.1 146 207 29.2 485 508 50.0
Cajamarca Province 84 586 70.5 48 475 35.7 133 061 52.1
Asunción District 1 437 54.9 316 10.5 1 753 31.1
Baños del Inca District 11 382 73.6 5 367 30.8 16 749 50.9
Cajamarca District 55 496 71.8 37 532 43.1 93 028 56.6
Chetilla District 517 48.4 204 14.3 721 28.9
Cospán District 1 186 52.5 262 11.4 1 448 31.7
Encañada District 4 161 66.2 1 404 19.2 5 565 40.9
Jesus District 3 467 73.5 1 117 20.3 4 584 44.8
Magdalena District 2 030 71.1 682 21.9 2 712 45.5
San Juan District 901 61.5 321 19.6 1 222 39.4
Province of San Pablo 5 010 71.8 2 000 24.6 7 010 46.4
San Bernardino District 1 074 72.4 350 21.7 1 424 46.0
San Pablo District 2 855 70.8 1 321 27.0 4 176 46.8
Tumbaden District 841 76.3 284 22.2 1 125 47.3
Cajabamba Province 17 522 70.4 5 994 22.5 23 516 45.7
Cachachi District 5 564 69.3 1 099 15.0 6 663 43.4
Economically inactive population -Non EAP-.
District Man Woman Total
N % N % N %
Cajamarca Region 131 038 27.9 354 559 70.8 485 597 50.0
Cajamarca Province 35 366 29.5 87 193 64.3 122 559 47.9
Asunción District 1 179 45.1 2 706 89.5 3 885 68.9
Baños del Inca District 4 084 26.4 12 043 69.2 16 127 49.1

Environmental and Social Impact Assessment of Forest Landscape Restoration Project December 2021
Social Capital Group 278
Economically active population -EAP-.
District Man Woman Total
N % N % N %
Cajamarca District 21 839 28.2 49 545 56.9 71 384 43.4
Chetilla District 552 51.6 1 221 85.7 1 773 71.1
Cospán District 1 071 47.5 2 046 88.6 3 117 68.3
Encañada District 2 123 33.8 5 924 80.8 8 047 59.1
Jesus District 1 252 26.5 4 386 79.7 5 638 55.2
Magdalena District 825 28.9 2 427 78.1 3 252 54.5
San Juan District 565 38.5 1 313 80.4 1 878 60.6
Province of San Pablo 1 970 28.2 6 131 75.4 8 101 53.6
San Bernardino District 410 27.6 1 263 78.3 1 673 54.0
San Pablo District 1 179 29.2 3 568 73.0 4 747 53.2
Tumbaden District 261 23.7 993 77.8 1 254 52.7
Cajabamba Province 7 358 29.6 20 599 77.5 27 957 54.3
Cachachi District 2 465 30.7 6 241 85.0 8 706 56.6
Total
District Man Woman Total
N % N % N %
Cajamarca Region 470 339 100.0 500 766 100.0 971 105 100.0
Cajamarca Province 119 952 100.0 135 668 100.0 255 620 100.0
Asunción District 2 616 100.0 3 022 100.0 5 638 100.0
Baños del Inca District 15 466 100.0 17 410 100.0 32 876 100.0
Cajamarca District 77 335 100.0 87 077 100.0 164 412 100.0
Chetilla District 1 069 100.0 1 425 100.0 2 494 100.0
Cospán District 2 257 100.0 2 308 100.0 4 565 100.0
Encañada District 6 284 100.0 7 328 100.0 13 612 100.0
Jesus District 4 719 100.0 5 503 100.0 10 222 100.0
Magdalena District 2 855 100.0 3 109 100.0 5 964 100.0
San Juan District 1 466 100.0 1 634 100.0 3 100 100.0
Province of San Pablo 6 980 100.0 8 131 100.0 15 111 100.0
San Bernardino District 1 484 100.0 1 613 100.0 3 097 100.0
San Pablo District 4 034 100.0 4 889 100.0 8 923 100.0
Tumbaden District 1 102 100.0 1 277 100.0 2 379 100.0
Cajabamba Province 24 880 100.0 26 593 100.0 51 473 100.0
Cachachi District 8 029 100.0 7 340 100.0 15 369 100.0
Source: : CPV 2017 - INEI
Employed EAP
To determine that a person is employed, the INEI uses four criteria, which are in line with international standards:
Employed are the persons 14 years of age and over who were participating in some economic activity in the reference period.

Environmental and Social Impact Assessment of Forest Landscape Restoration Project December 2021
Social Capital Group 279
Dependent workers who, having a permanent job, did not work the previous week because they were on vacation, strike, sick leave, pre- and post-natal leave, etc., all of them paid.
Self-employed persons, who were temporarily absent from work during the reference period; but, the enterprise or business continued to operate.
Persons who were not in any of the previous conditions are asked if they carried out any economic activity in the reference period, at least one hour, for which they will receive payment in money and/or kind. The objective is to recover the activities carried out, but which are not considered work by the persons.
The INEI also includes in the definition of employed persons those who worked 15 hours or more as unpaid family workers, paid or unpaid trainees, and officers and non-commissioned officers of the Armed Forces and the Police Forces.
As can be seen in Table 6.69, the population of the Cajamarca Region that participates in the generation of some good or service is 461,312 people, equivalent to 95% of the EAP. With some small variations, this participation is on par with that of the provinces; in Cajabamba it is slightly higher (95.5%), while in Cajamarca and San Pablo it is below (93.1% in both cases).
At the district level, the employed population shows more significant changes, three districts (Asunción, Encañada and San Bernardino) are located below 90%, another group formed by Baños del Inca, Cajamarca, Cospán, Jesús, San Pablo and Cachachi, present a level of participation between 90% and 95%. In both cases, participation is below the average for the region.
The districts of Chetilla, Magdalena, San Juan and Tumbaden are above the average employment rate. Despite the greater participation in the generation of some good or the provision of a service, in these districts more than 50% of the working age population is inactive, as mentioned in the previous item, which implies that many people have given up looking for work. It should be noted that the district of Cajamarca contributes the largest number of the region's employed EAP (18.8%), which is equivalent to two out of every ten employed persons.
When the data is disaggregated by gender, the lower participation of women in productive activities is again confirmed. As indicated, the employed population in the Cajamarca Region is 95.0%, however, in men it represents 96.5%, while in women it is 91.5%, a gap of 5 percentage points. In the districts of Asunción, Cospán, Encañada, Jesús, San Bernardino, Tumbaden and Cachachi, the gaps are more significant, which again shows the structural problems that women have in entering the labour market.
Table 6.69 Employed population by gender
District Man Woman Total
N % N % N %
Cajamarca Region 327573 96.5 133739 91.5 461312 95.0
Cajamarca Province 79629 94.1 44218 91.2 123847 93.1
Asunción District 1325 92.2 236 74.7 1561 89.0
Baños del Inca District 10733 94.3 4864 90.6 15597 93.1
Cajamarca District 52144 94.0 34445 91.8 86589 93.1
Chetilla District 501 96.9 193 94.6 694 96.3

Environmental and Social Impact Assessment of Forest Landscape Restoration Project December 2021
Social Capital Group 280
District Man Woman Total
N % N % N % Cospán District 1122 94.6 226 86.3 1348 93.1
Encañada District 3796 91.2 1198 85.3 4994 89.7
Jesus District 3342 96.4 999 89.4 4341 94.7
Magdalena District 1991 98.1 640 93.8 2631 97.0
San Juan District 867 96.2 297 92.5 1164 95.3
Province of San Pablo 4769 95.2 1759 88.0 6528 93.1
San Bernardino District 1023 95.3 257 73.4 1280 89.9
San Pablo District 2686 94.1 1199 90.8 3885 93.0
Tumbaden District 829 98.6 261 91.9 1090 96.9
Cajabamba Province 17013 97.1 5438 90.7 22451 95.5
Cachachi District 5383 96.7 895 81.4 6278 94.2
Source: CPV 2017 - INEI
Unemployed EAP
This category of the labor market includes both people who were looking for work but had worked before (unemployed) and those who were looking for work for the first time (job seekers). For the purposes of the survey conducted by the INEI, the unemployed are considered to be those persons 14 years of age and older who, during the reference week, were looking for work or took steps to establish a self-employed business. According to ILO (2013), the unemployed are all those persons, of either gender, who during the reference period simultaneously meet the following 3 requirements:
Unemployed, i.e., not employed at all, either as a wage earner or self-employed.
Currently available for work, i.e. available for paid employment or self-employment, during the reference period.
In search of employment, i.e. they had taken concrete actions to seek paid or self-employment in a specified reference period.
In the Cajamarca Region, the unemployed population amounts to 24,196 people, which is equivalent to 5% of the EAP. Only the Province of Cajabamba has a lower unemployment rate (4.5%), while Cajamarca and San Pablo register a higher level than this average (6.9% in each case). This unemployment rate can be catalogued as "normal" for the Peruvian economy104, however, it hides problems of quality and access, mainly for women, as has been indicated and will be described in the other indicators of the labor market. There is no doubt that as a consequence of the adverse effects of the COVID-19 health crisis, the level of unemployment has increased. At the district level, Asunción, Encañada and San Bernardino have unemployment levels above 10.0%, which means that one out of every 10 members of the EAP is unemployed. In an intermediate position (range between 5% and 10%) are the districts of Baños del Inca, Cajamarca,
104 The BCR reported a national unemployment rate of 7% as of December 2019, pre-pandemic.
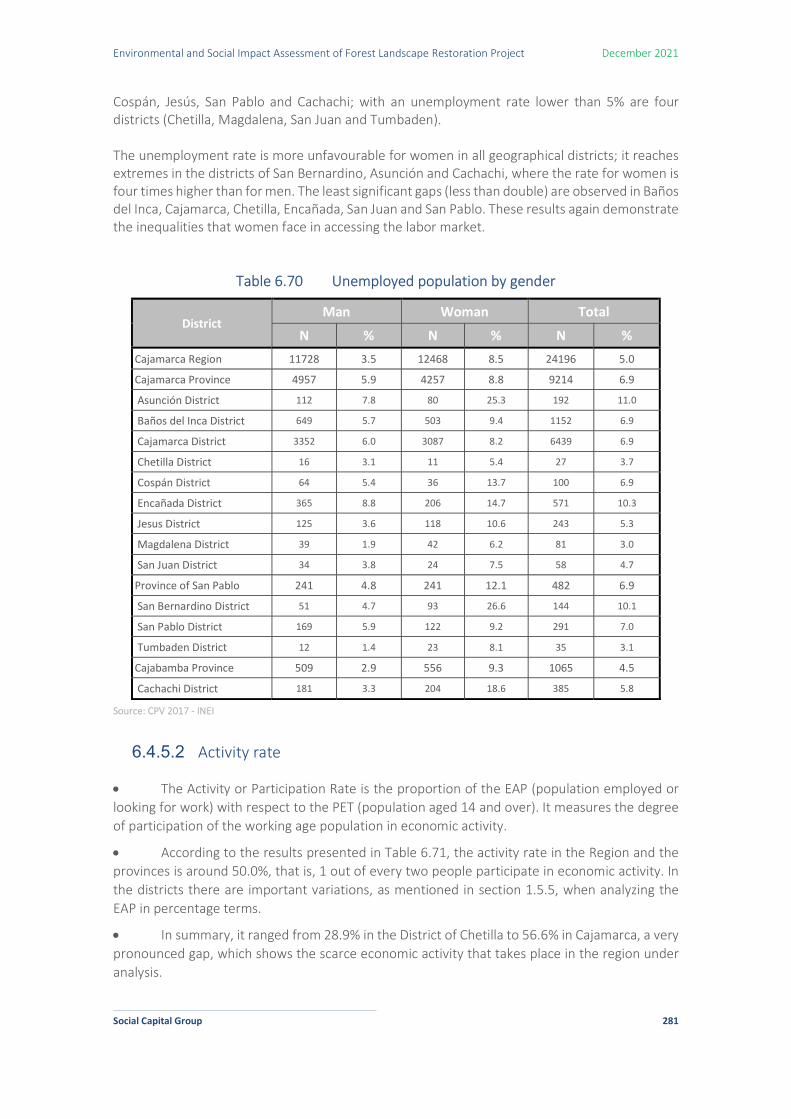
Environmental and Social Impact Assessment of Forest Landscape Restoration Project December 2021
Social Capital Group 281
Cospán, Jesús, San Pablo and Cachachi; with an unemployment rate lower than 5% are four districts (Chetilla, Magdalena, San Juan and Tumbaden). The unemployment rate is more unfavourable for women in all geographical districts; it reaches extremes in the districts of San Bernardino, Asunción and Cachachi, where the rate for women is four times higher than for men. The least significant gaps (less than double) are observed in Baños del Inca, Cajamarca, Chetilla, Encañada, San Juan and San Pablo. These results again demonstrate the inequalities that women face in accessing the labor market.
Table 6.70 Unemployed population by gender
District Man Woman Total
N % N % N %
Cajamarca Region 11728 3.5 12468 8.5 24196 5.0
Cajamarca Province 4957 5.9 4257 8.8 9214 6.9
Asunción District 112 7.8 80 25.3 192 11.0
Baños del Inca District 649 5.7 503 9.4 1152 6.9
Cajamarca District 3352 6.0 3087 8.2 6439 6.9
Chetilla District 16 3.1 11 5.4 27 3.7
Cospán District 64 5.4 36 13.7 100 6.9
Encañada District 365 8.8 206 14.7 571 10.3
Jesus District 125 3.6 118 10.6 243 5.3
Magdalena District 39 1.9 42 6.2 81 3.0
San Juan District 34 3.8 24 7.5 58 4.7
Province of San Pablo 241 4.8 241 12.1 482 6.9
San Bernardino District 51 4.7 93 26.6 144 10.1
San Pablo District 169 5.9 122 9.2 291 7.0
Tumbaden District 12 1.4 23 8.1 35 3.1
Cajabamba Province 509 2.9 556 9.3 1065 4.5
Cachachi District 181 3.3 204 18.6 385 5.8
Source: CPV 2017 - INEI
6.4.5.2 Activity rate
The Activity or Participation Rate is the proportion of the EAP (population employed or looking for work) with respect to the PET (population aged 14 and over). It measures the degree of participation of the working age population in economic activity.
According to the results presented in Table 6.71, the activity rate in the Region and the provinces is around 50.0%, that is, 1 out of every two people participate in economic activity. In the districts there are important variations, as mentioned in section 1.5.5, when analyzing the EAP in percentage terms.
In summary, it ranged from 28.9% in the District of Chetilla to 56.6% in Cajamarca, a very pronounced gap, which shows the scarce economic activity that takes place in the region under analysis.
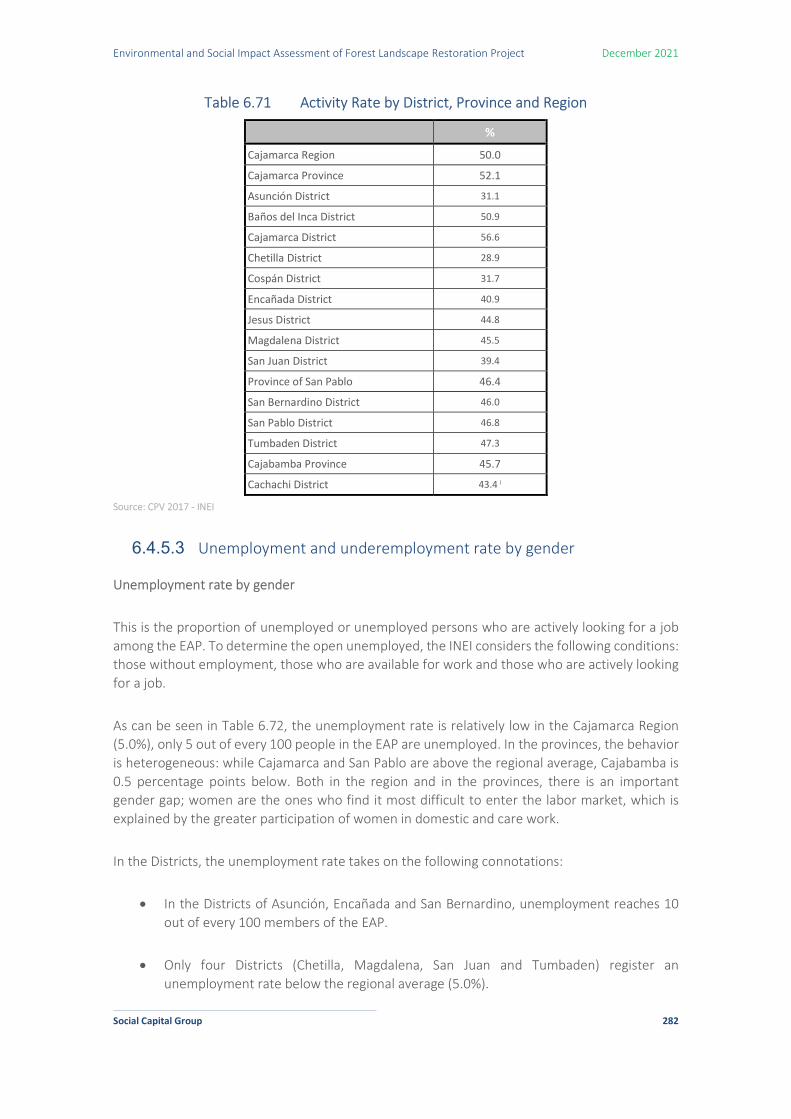
Environmental and Social Impact Assessment of Forest Landscape Restoration Project December 2021
Social Capital Group 282
Table 6.71 Activity Rate by District, Province and Region
%
Cajamarca Region 50.0
Cajamarca Province 52.1
Asunción District 31.1
Baños del Inca District 50.9
Cajamarca District 56.6
Chetilla District 28.9
Cospán District 31.7
Encañada District 40.9
Jesus District 44.8
Magdalena District 45.5
San Juan District 39.4
Province of San Pablo 46.4
San Bernardino District 46.0
San Pablo District 46.8
Tumbaden District 47.3
Cajabamba Province 45.7
Cachachi District 43.4 i
Source: CPV 2017 - INEI
6.4.5.3 Unemployment and underemployment rate by gender
Unemployment rate by gender
This is the proportion of unemployed or unemployed persons who are actively looking for a job among the EAP. To determine the open unemployed, the INEI considers the following conditions: those without employment, those who are available for work and those who are actively looking for a job.
As can be seen in Table 6.72, the unemployment rate is relatively low in the Cajamarca Region (5.0%), only 5 out of every 100 people in the EAP are unemployed. In the provinces, the behavior is heterogeneous: while Cajamarca and San Pablo are above the regional average, Cajabamba is 0.5 percentage points below. Both in the region and in the provinces, there is an important gender gap; women are the ones who find it most difficult to enter the labor market, which is explained by the greater participation of women in domestic and care work.
In the Districts, the unemployment rate takes on the following connotations:
In the Districts of Asunción, Encañada and San Bernardino, unemployment reaches 10 out of every 100 members of the EAP.
Only four Districts (Chetilla, Magdalena, San Juan and Tumbaden) register an unemployment rate below the regional average (5.0%).

Environmental and Social Impact Assessment of Forest Landscape Restoration Project December 2021
Social Capital Group 283
The unemployment rate for women is two to three times higher than that observed for men.
Table 6.72 Unemployment rate by gender, District, Province and Region
District Man Woman Total
% % %
Cajamarca Region 3.5 8.5 5.0
Cajamarca Province 5.9 8.8 6.9
Asunción District 7.8 25.3 11.0
Baños del Inca District 5.7 9.4 6.9
Cajamarca District 6.0 8.2 6.9
Chetilla District 3.1 5.4 3.7
Cospán District 5.4 13.7 6.9
Encañada District 8.8 14.7 10.3
Jesus District 3.6 10.6 5.3
Magdalena District 1.9 6.2 3.0
San Juan District 3.8 7.5 4.7
Province of San Pablo 4.8 12.1 6.9
San Bernardino District 4.7 26.6 10.1
San Pablo District 5.9 9.2 7.0
Tumbaden District 1.4 8.1 3.1
Cajabamba Province 2.9 9.3 4.5
Cachachi District 3.3 18.5 5.8
Source: CPV 2017 - INEI
The people consulted in Cajamarca, Cachachi and Jesús consider unemployment to be one of the main problems, because job opportunities are scarce, which causes the population to migrate and/or engage in illegal activities, such as informal mining.
Underemployment rate in the Cajamarca Region
The source of information used to describe the unemployment rate corresponds to the National Household Survey -ENAHO- because the Population and Housing Census does not record this information. For this reason, other labor market indicators are included to clarify the information.
As can be seen in Table 6.73, the employment rate of the EAP (98.1%) is very close to that reported according to the Census data (95.0%), of which the percentage of the population adequately employed105 is 27.5%, while the rest corresponds to the underemployed population (70.5%), which in turn is subdivided into the following groups: Underemployment by hours and Underemployment by income.
105 According to the INEI (Permanent Employment Survey of Metropolitan Lima, Ficha Técnica-2021), the adequately employed population is made up of those workers who work 35 or more hours a week and receive an income above the minimum reference income, and those who work less than 35 hours a week and do not wish to work more hours.

Environmental and Social Impact Assessment of Forest Landscape Restoration Project December 2021
Social Capital Group 284
The Rate of Underemployment by Hours, also known as Visible Underemployment, is the proportion of employed persons, who work less than 35 hours per week for involuntary causes, with respect to the EAP; who have the will and availability to work more hours, (desire and are willing to work more hours), 106represents the smallest proportion of the underemployed population (3.7%). The largest share (66.8%) is represented by the Income Underemployment Rate, also known as the Invisible Underemployment Rate, which represents the proportion of people who have a job (salaried or self-employed), who normally work 35 or more hours per week, but whose income is less than the value of the minimum family consumption basket per income earner; with respect to the EAP. 107
Finally, the unemployment rate stood at 1.9%, a low rate, which, as mentioned in previous paragraphs, hides problems of employment quality, such as a high level of underemployment and informality.
Table 6.73 Underemployment rate and other labor market indicators in the Cajamarca Region
%
Total EAP 100.0
Employed EAP 98.1
Suitable Employment 27.5
Sub Employment 70.5
Hourly 3.7
By revenue 66.8
Unemployment 1.9
Source: National Household Survey 2020 - INEI
6.4.5.4 Types of main occupation by gender
The INEI defines the main occupational categories of the EAP, which are shown in Table 6.74. According to this classification, the main occupation in the Cajamarca Region is that of farmer and skilled agricultural, forestry and fishing worker, which is exercised by more than a third of the population. In the provinces, this is the main occupational category in San Pablo (57.0%) and Cajabamba (41.4%); while, in Cajamarca, this category shares third place with the category of scientific and intellectual professionals, with the most important being elementary occupations. The preeminence of this occupation responds to a productive structure based on agriculture, as will be described in the following item.
The second category in the Cajamarca Region is elementary occupations,108 which is shared by the provinces of San Pablo and Cajabamba with a share of 18.7% and 23.4% respectively. The
106 INEI, Encuesta Permanente de Empleo Lima Metropolitana, Ficha Técnica-2021. 107 Ïdem. 108 According to INEI's National Classification of Occupations 2015, elementary occupations usually require the performance of simple and routine physical or manual tasks. They include tasks such as cleaning, excavation work, manual lifting or transporting of materials, manual selection, storage or assembly of products, driving non-motorized vehicles, and harvesting fruits, vegetables and legumes.

Environmental and Social Impact Assessment of Forest Landscape Restoration Project December 2021
Social Capital Group 285
exception is the province of Cajamarca, where service workers and shop and market vendors are the second main occupation.
The least representative occupational categories in the Region and the provinces are military and police occupations and members of the Executive, Legislative, and Judicial Branches, as well as managers in public and private administration, with a participation that does not exceed 1.0% in any of the geographic areas indicated. See Table 6.74.
In the districts, although the occupational category of farmer has an important weight, it is complemented by others of an elementary nature. In seven of the nine districts of the Province of Cajamarca (Asunción, Chetilla, Cospán, Encañada, Jesús, Magdalena and San Juan), farmers and skilled agricultural, forestry and fishing workers are the main occupation, since more than 50% of the employed population is engaged in this activity. The exceptions are: Baños del Inca, where the main occupation is elementary occupations (23.4%) and Cajamarca where it is scientific and intellectual professionals (20.3%).
Elementary occupations constitute the second main occupation in most of the districts of the Province of Cajamarca, with the exception of the district of Cajamarca, where service workers and shop and market vendors constitute the second main occupation.
Based on the occupational characteristics of the districts of the Province of Cajamarca, it can be established that the productive structure of the District of Cajamarca is the most diversified and is oriented towards the provision of services, while farmers have a modest representation.
In the districts of the province of San Pablo, the main occupation is that of farmer and qualified agricultural, forestry and fishing worker, with around six out of every ten employed persons carrying out this activity; in the district of Cachachi in the province of Cajabamba, it is also the main activity, however, it has a lower weight, with almost five out of every ten employed persons carrying it out. In second place are elementary occupations, which are carried out by about one out of every four employed persons. This composition of occupations is synonymous with a scarce productive diversification and low qualification of the labor force.

Social Capital Group 286
Table 6.74 Type of main occupation in the study area
Source: CPV 2017- INEI

Social Capital Group 287
The analysis by gender (Annex 2.14) shows that, in the Cajamarca Region, around four out of every ten men are farmers and skilled agricultural, forestry and fishing workers, with elementary occupations constituting the second occupational category. In the case of women, the situation is more diversified; three occupations account for almost seven out of every ten employed women: agriculture (22.4%), elementary occupations (21.7%), and service workers and salespersons in shops and markets (22.3%). As in the case of men, the occupations with the lowest participation are: military and police occupations and members of the executive, legislative and judicial branches of government and private administration; both activities do not exceed 1.0%.
In the Province of San Pablo, farmers and skilled agricultural, forestry and fishing workers are the main occupation of both women (44.0%) and men (61.7%). In Cajamarca and Cajabamba it is the main occupation for men (19.4% and 47.9% respectively) but not for women, for women it is service workers and shop and market sellers (28.5% and 26.5% respectively), agriculture is the third or fourth occupation for women, (see Annex 2.14).
Disaggregation by gender in the districts of the Province of Cajamarca shows a differentiated behavior, where two groups can be distinguished. In the first, farmers and skilled agricultural, forestry and fishing workers are the main occupation of men and women, but with greater intensity for men. This behavior is shared by the Districts of Asunción, Chetilla, Cospán, Encañada, Jesús, Magdalena and San Juan.
The second group is characterized by being a category different from that of farmers, which is the main occupation of men and women, in this group are the Districts of Baños del Inca and Cajamarca. In Baños del Inca and Cajamarca, the predominant occupations for men are construction workers, building, handicraft products, electricity and telecommunications, while for women they are elementary occupations and service workers and shop and market sellers, respectively (see Annex 10.14). (see Annex 2.14Error! Reference source not found.).
The main occupation for men in the districts of the provinces of San Pablo and Cajabamba is that of farmers and skilled agricultural, forestry and fishing workers; this same occupation is shared by women, but to a lesser extent. The second occupation for men and women in these Districts are elementary occupations, except in the case of women in the District of San Pablo, where the second occupation is that of scientific and intellectual professionals. (Annex 2.14)
6.4.5.5 Economic activities of the EAP
The participation of the employed population in the Cajamarca Region by branches of activity, presents agriculture, livestock, forestry and fishing as the main economic activity, with one out of every two people. This trend is replicated in the provinces, while in Cajamarca one out of every five employed persons is linked to this economic activity; in San Pablo and Cajabamba the importance is 71.7% and 57.11% respectively.
The second economic activity in the Region and the provinces of Cajamarca and Cajabamba is wholesale and retail trade, repair of motor vehicles and motorcycles, with a participation of 10.55%, 16.72% and 10.14% respectively, a significant difference with respect to the main activity. In the Province of São Paulo, education is in second place with a share of 6.86%.

Environmental and Social Impact Assessment of Forest Landscape Restoration Project December 2021
Social Capital Group 288
Although other productive activities are present in the study area, they are of modest importance. Thus, activities such as electricity, gas, steam and air conditioning supply; water supply; information and communications; financial and insurance activities; real estate and artistic activities do not register a participation of more than 1.0%: Financial and insurance activities; Real estate and artistic activities do not register a participation of more than 1.0%. These data show that the Cajamarca Region presents a scarcely diversified productive structure. Perhaps the only exception to the rule is the Province of Cajamarca, where there is a slow development of other productive activities.
The productive structure described above is shared by the districts of the Province of Cajamarca with some nuances. While in Asunción, Chetilla, Cospán, Encañada, Jesús, Magdalena and San Juan, agriculture is the productive activity par excellence (between six and eight people out of every ten have it as their main source of work), in Baños del Inca, in spite of being the main activity, only two out of every ten people practice it. Cajamarca is the exception, where agriculture is the fifth most important economic activity. With these elements, it can be concluded that, within the Province of Cajamarca, only the District of Cajamarca has a more diversified productive structure than the rest of the study area.
The second work activity for most of the employed in the Province of Cajamarca is Wholesale and retail trade; repair of motor vehicles and motorcycles, shared by the Districts of Asunción, Baños del Inca, Cajamarca, Encañada, Jesús and Magdalena. For Chetilla and San Juan it is Construction and finally for Cospán it is Teaching. The other economic activities, although they constitute a source of work for the employed population of the districts of the Province of Cajamarca, their importance is quite modest.
In the districts of the provinces of San Pablo and Cajabamba the main productive activity is agriculture, livestock, forestry and fishing, this activity represents the source of income for more than six out of ten workers. The second most important activity for San Bernardino and San Pablo is wholesale and retail trade; repair of motor vehicles and motorcycles; while for Tumbaden it is the manufacturing industry and for Cachachi it is the exploitation of mines and quarries. The other productive activities, although important for the generation of income, their development is incipient, participating modestly in the productive composition of the Districts.

Social Capital Group 289
Table 6.75 Economic Activities of the EAP in the Cajamarca Region

Social Capital Group 290
Source: CPV 2017 - INEI
The main economic activities described above have been confirmed by the authorities interviewed in the districts of the Cajamarca Region, but they added that handicrafts, tourism, mining and forestry activities are also representative. They also indicated that, in order to make the economic activities of the area more productive, mainly agriculture and livestock, it is necessary to incorporate new technologies, improve seeds, prioritize productive infrastructure, promote the organization of producers, search for new markets and productive diversification. In the latter, they emphasized the use of the forestry potential of the region. They emphasized that productive development requires the coordinated work of the different levels of government. Another limitation they mentioned for the development of economic activities is the limited access to credit, due to the scarce presence of financial entities in the provinces. In the cases where they do exist, it is reduced to bank agents, as in Asunción, San Pablo, Tumbaden, San Bernardino and Cachachi; or the presence of formal and informal credit cooperatives, as in Encañada and Chetilla.
6.4.5.6 EAP income (per capita and household, by gender)
In the National Household Survey 2019, information was recorded on the average monthly income of the employed EAP at the national level and in the Cajamarca Region109. The data allow us to have a general notion of the average income received by the employed population in the Cajamarca Region, compared to those observed at the national level.
At the national level, the average monthly income of the working population is 1 443.1 soles. The gender breakdown shows a significant national gender gap; while men receive 1,616.1 soles, women receive the equivalent of 74.2%, that is, an average monthly income of 1,199.4 soles.
The income received in the Cajamarca Region is significantly lower than that recorded at the national level: on average, the employed population earns 66.1%, or a total of 954.4 soles. These inequalities are a reflection of the level of development of the region, which has a productive structure based almost exclusively on agricultural activities. This situation is perceived by those interviewed as one of the main problems of the Cajamarca District.
Disaggregation by gender at the regional level also reveals gender inequality. The gap between the sexes reaches 458.1 Soles, to the detriment of women, which implies that women only receive 60.1% of men's income, even when they carry out the same productive activities as men.
The combination of territorial and gender gaps generates a condition of well-being that in general explains the marked incidence of poverty that prevails in the Cajamarca Region, as will be shown in the section on poverty and vulnerability.
109 The study domains of the survey do not allow for disaggregated data at the provincial and district levels.

Environmental and Social Impact Assessment of Forest Landscape Restoration Project December 2021
Social Capital Group 291
Table 6.76 Average monthly income of the employed population by gender
Geographical location
Gender Average Income
National
Man 1 616.1
Woman 1 199.4
Total 1 443.1
Cajamarca Region
Man 1 114.7
Woman 689.6
Total 954.4
Source: National Household Survey 2019 - INEI .
In summary, in the study region there is a high participation in the labor market, but there are underlying problems of underemployment, informality and high dependency. The main occupations are: farmer and elementary activities, which respond to a productive structure based on agriculture, which does not generate the necessary income to guarantee the well-being of the population. These conditions are combined with high gender inequality.
6.4.6 Main economic activities
This section describes the main economic activities in the study area, namely agriculture and livestock farming. Reference is also made to forestry plantations, an activity linked to the Project. Each of these activities is analysed, depending on the availability of information, in terms of the main products and by-products, production volume, destination markets and production income.
6.4.6.1 Agriculture
This section describes the main products of agricultural activity in the Cajamarca Region and the districts under analysis, as well as the volume of production, the number of producers and the main destinations of production.
Table 6.77shows that in the Cajamarca Region, the production of Rye Grass (grass to feed cattle) is the main crop, since its production reaches a volume of 1.4 million Metric Tons -MT-. With a lesser importance is the production of potato, whose production reaches 0.35 million MT. In a third and fourth position is located the production of Chilean grass and elegant grass, with a production of 0.29 and 0.27 million MT respectively.
Of the 64 varieties of crops grown in the region, the top ten products account for 89.2% of total agricultural production, another 20 of them do not exceed one thousand metric tons, so they represent barely 0.2% of total production. Among those with the lowest production volume are: achiote, loquat, passion fruit, cauliflower and castilla beans.

Environmental and Social Impact Assessment of Forest Landscape Restoration Project December 2021
Social Capital Group 292
Table 6.77 Main crops in the Cajamarca Region
Crops TM
Production
Crops TM
Production
Rye Grass 1 390 627 Granadilla 4 109
Pope 347 052 Dried bean 4 018
Chilean grass 290 590 Avocado 3 676
Elephant grass 267 010 Papaya 2 885
Gramalote 187 611 Green bean 2 373
Paddy rice 182 846 Purple corn 2 104
Alfalfa 169 918 Lima 1 900
Alcohol cane 161 631 Onion head 1 665
Parchment coffee 71 794 Pituca 1 589
Corn a. durum 71 773 Grape 1 377
Yucca 62 895 Cocoa 1 121
Banana 40 062 Quinoa 1 059
Starchy corn 30 917 Lentil 913
Wheat 26 119 Tomato 860
Corn 22 424 Fodder oats 591
Green bean peas 17 032 Subtle lemon 590
Olluco 16 403 Sieve 588
Pumpkin 15 898 Tuna 458
Dry bean 15 000 Caigua 447
Dry peas 13 992 Tarhui 445
Arracacha 13 568 Apple 401
Handle 11 043 Betarraga 361
Barley grain 9 570 Sweet lemon 352
Oca 7 519 Col 239
Sweet potato 7 135 Coco 145
Garlic 6 655 Lettuce 133
Pineapple 5 625 Chala corn 131
Pacae 5 027 Achiote 106
Green bean 5 025 Medlar 93
Orange 4 653 Passion Fruit 65
Custard Apple 4 393 Cauliflower 12
Carrot 4 267 Castille bean 2
Source: National Agrarian Census 2012 -INEI
In seven of the districts of Cajamarca (Asunción, Baños del Inca, Cajamarca, Cospán, Encañada, Jesús and Magdalena), the main production crop is potato. Around it, the largest number of producers is also concentrated. This product, as mentioned in the previous paragraph, is the second most important agricultural product in the Cajamarca Region. In the remaining two districts (Chetilla and San Juan), the main crops are corn and Olluco.

Environmental and Social Impact Assessment of Forest Landscape Restoration Project December 2021
Social Capital Group 293
It is worth noting that in the districts of Asunción, Chetilla, Cospán and San Juan, agricultural production is reduced to one or two products, while in the rest there is greater diversity, with up to nine different products. Baños del Inca and Cajamarca are the districts with the greatest diversity.
The perception of the authorities interviewed is that in the high Andean zones of Cajamarca Province, corn, wheat, lentils, peas, beans, barley, quinoa and potatoes are produced, but their production has been decreasing over the years; they also point out that oca, olluco and pastures are produced. In the lowlands, corn, cabbage, alfalfa, fruits, rice, yucca, sweet potato, sugar cane and avocado are produced, but they do not know the volumes of production.
They indicated that the agricultural by-products are very few, there is almost no transformation of the products of the land. The only cases referred to are the aguaymanto that is transformed into soft drinks, jam and liquor in the districts of Cajamarca and Jesús; sugar cane from which they obtain panela, chancaca and aguardiente in Magdalena; yacón is transformed into wine in LIma; and, peas, wheat and barley are transformed into flour in Chetilla.
The authorities also noted that few products are destined for export. Potatoes are destined for the markets of Bolivia, the United States, Spain and France; quinoa is exported to a greater diversity of countries, the United States, Mexico, Canada, Chile, Argentina, Brazil, China, Spain, France, Germany and Israel. The production of starchy maize goes to the United States and Spain; and carrots to Bolivia. Of all the districts, Chetilla is the only one that does not send agricultural production to foreign markets, as Table 6.78.
Table 6.78 Main crops, volume, producers and destinations of agricultural production
Districts Crops TM Production
Producers Main destinations
Assumption Pope 1 600 750 Bolivia, United States, Spain
Olluco 60 82
Baths of the Inca
Quinoa 7 10 United States, Mexico, Canada, Chile,
Argentina, Argentina, Brazil, China, Spain, France, Germany, Israel
Olluco 32.1 390
Oca 12.5 510
Corn Corn 312 1 301
Dry Bean 5.35 139
Green Bean 2.5
Barley 35 605
Green Pea 125
Pope 1 358.5 3 382 Bolivia, United States, Spain
Cajamarca
Pope 1 422.5 3 774 Bolivia, United States, Spain
Green Pea 65.6
Starchy Corn 52 485 United States
Corn Corn 372 2 577
Oca 27.2 1 085

Environmental and Social Impact Assessment of Forest Landscape Restoration Project December 2021
Social Capital Group 294
Districts Crops TM
Production Producers Main destinations
Olluco 32 785
Quinoa 4 14 United States, Mexico, Canada, Chile,
Argentina, Argentina, Brazil, China, Spain, France, Germany, Israel
Carrot 72 70 Bolivia
Chetilla Corn Corn 9 27
Cospan Pope 185 000 578 Bolivia, United States, Spain, France
Encañada
Corn Corn 455.5 919
Green Peas 336
Pope 6 786 7 795 Bolivia, United States, Spain
Jesus
Pope 1 660 905 Bolivia, United States, Spain
Green Peas 162
Starchy Corn 33 40 USA, New York, USA
Corn Corn 1 069.9 1 414
Magdalena
Pope 301 441 Bolivia, United States, Spain
Corn Corn 15 39
Olluco 53.8 44
San Juan Green Bean 12
Olluco 63.1 69
Source: National Agrarian Census 2012 - INEI
The productive diversity of the Province of Cajamarca is also observed in the districts of the provinces of San Pablo and Cajabamba. Potato is the main product in San Bernardino, San Pablo and Tumbaden, while in Cachachi it is hard yellow corn. Most of the producers are concentrated in the cultivation of the main product.
Potato production is destined for the export markets mentioned above; rice is exported to Colombia, Chile and the United States; and sweet potato to Chile, Ecuador and the Netherlands. Within this group, all provinces show a significant level of agricultural diversification, as can be seen in Table 6.79.
In the perception of those interviewed, most of the potato and maize production is for self-consumption; while peas, avocado, tara and corn are mostly sold in local markets and in the regions of Cajamarca and Trujillo, as well as in the city of Lima. It is also marketed through intermediaries or collectors who purchase the product directly from the plots.
Table 6.79 Main crops, volume, producers and destinations of agricultural production
Districts Crops TM
Production Producers Main destinations
San Bernardino
Pope 81.37 160 Bolivia, United States, Spain
Rice 5.5 40 Colombia, Chile, United States
Sweet potato 44.25 23 Chile, Ecuador, Netherlands
Dry Bean 29.07

Environmental and Social Impact Assessment of Forest Landscape Restoration Project December 2021
Social Capital Group 295
Districts Crops TM
Production Producers Main destinations
Dry Bean 8 3
Dried starchy corn 52.7 137
Yucca 23 74
St. Paul's
Pope 911.73 761 Bolivia, United States, Spain
Sweet potato 50.25 15 Chile, Ecuador, Netherlands
Barley 12.25 70
Dry Bean 112.15
Dry Bean 16.35 15
Dried starchy corn 227.55 418 USA, New York, USA
Oca 230.98 155
Olluco 182.13 212
Yucca 15 81
Tumbaden
Olluco 132.53 84
Oca 76.25 79
Dried starchy corn 20.25 203
Dry Bean 10.25 36
Dry Bean 7.85
Pope 656.9 430 Bolivia, United States, Spain
Cachachi
Pope 1 175 1979 Bolivia, United States, Spain
Hard Yellow Corn 1 590 852
Garlic 44 52
Dry Pea Grain 94
Dry Bean 207
Dry Bean 12 15
Dried starchy corn 80 737 USA, New York, USA
Quinoa 11.5 13
Yucca 90 245
Source: National Agrarian Census 2012 - INEI
The interviewees confirmed that the forms of irrigation used in the study area are: by gravity and canals, by rain, sprinkling and flooding; being the most representative by rain and flooding.
They also reported that in the region, the form of organization of production is mostly individualized or family-based, due to the small size of the plots. Exceptions are the districts of Magdalena, Baños del Inca, Chetilla, San Pablo, Tumbaden and San Bernardino, where the practices of minga, collective associations and individual work are combined. When labor is contracted, the price per day ranges between 25 and 40 soles, except in the case of Encañada, where it can reach 60 soles per day.
The authorities estimate that the average monthly income of farmers is between 500 and 1,000 soles per month. In some cases the amounts are lower, as is the case in San Pablo and Chetilla, where the income is between 150 and 300 soles. In Tumbaden, as the main destination of production is self-consumption, they do not receive any income.

Environmental and Social Impact Assessment of Forest Landscape Restoration Project December 2021
Social Capital Group 296
The majority of land tenure forms are property, but there are also leasing or renting, communal lands and possessors, although in a smaller proportion. In the San Pablo District, land tenure is held by possessors (80%). According to those interviewed.
6.4.6.2 Livestock
In the study area, the livestock activity is prolific, in 2020, at least four species of livestock breeding were counted (cattle, pigs, sheep and goats); also, there is a large production of poultry. The largest production in the Cajamarca Region is of cattle, with 21.9 thousand tons, which is four times more than that of pigs, which is in second place with 5.72 thousand tons. The interviewees agreed with the species cited in the statistics, but added the raising of smaller animals such as guinea pigs, rabbits, ducks, and turkeys.
In terms of population, the most representative is poultry with 171.1 million followed by sheep with 11.1 million. With the smallest population is goats, with 1.8 million.
The number of producers is another variable indicative of the relevance of livestock activity in the Cajamarca Region. The majority of cattle production is concentrated in the production of cattle, about 882 thousand producers. The poultry population despite being the most important concentrates only 519 producers in the Region.
The most important by-products of livestock production are milk and eggs. In 2020, 367 thousand tons of milk and 2.36 tons of eggs were produced, as can be seen in Table 6.80. These by-products are complemented by cheese, yoghurt, blancmange and meat, as indicated by interviewees, but the volume of production is uncertain.
Table 6.80 Livestock Activity in the Cajamarca Region
Species and by-products/volume 2020
Species
Beef
Regional Production in Thousands of Tons 21.9
Cattle population 5 636 388
Number of producers 881 919
Pig
Regional Production in Thousands of Tons 5.72
Pig population 3 265 145
Number of producers 598 363
Sheep
Regional Production in Thousands of Tons 0.91
Sheep population 11 097 551
Number of producers 655 604
Birds
Regional Production in Thousands of Tons 3.68
Bird population 171 058 627
Number of producers 519
Goat
Regional Production in Thousands of Tons 0.26
Goat population 1 801 257
Number of producers 0.65
Sub products Milk
Regional Production in Thousands of Tons 367.23
Milking (und) 906.689
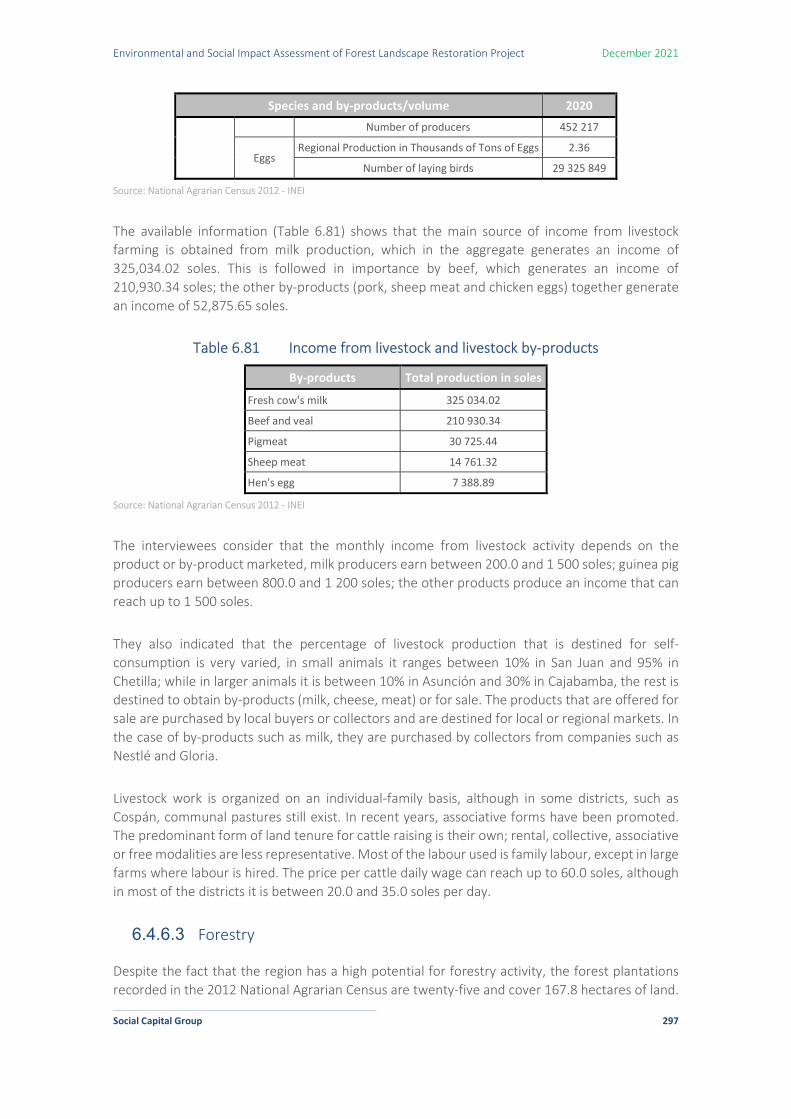
Environmental and Social Impact Assessment of Forest Landscape Restoration Project December 2021
Social Capital Group 297
Species and by-products/volume 2020
Number of producers 452 217
Eggs Regional Production in Thousands of Tons of Eggs 2.36
Number of laying birds 29 325 849
Source: National Agrarian Census 2012 - INEI
The available information (Table 6.81) shows that the main source of income from livestock farming is obtained from milk production, which in the aggregate generates an income of 325,034.02 soles. This is followed in importance by beef, which generates an income of 210,930.34 soles; the other by-products (pork, sheep meat and chicken eggs) together generate an income of 52,875.65 soles.
Table 6.81 Income from livestock and livestock by-products
By-products Total production in soles
Fresh cow's milk 325 034.02
Beef and veal 210 930.34
Pigmeat 30 725.44
Sheep meat 14 761.32
Hen's egg 7 388.89
Source: National Agrarian Census 2012 - INEI
The interviewees consider that the monthly income from livestock activity depends on the product or by-product marketed, milk producers earn between 200.0 and 1 500 soles; guinea pig producers earn between 800.0 and 1 200 soles; the other products produce an income that can reach up to 1 500 soles.
They also indicated that the percentage of livestock production that is destined for self-consumption is very varied, in small animals it ranges between 10% in San Juan and 95% in Chetilla; while in larger animals it is between 10% in Asunción and 30% in Cajabamba, the rest is destined to obtain by-products (milk, cheese, meat) or for sale. The products that are offered for sale are purchased by local buyers or collectors and are destined for local or regional markets. In the case of by-products such as milk, they are purchased by collectors from companies such as Nestlé and Gloria.
Livestock work is organized on an individual-family basis, although in some districts, such as Cospán, communal pastures still exist. In recent years, associative forms have been promoted. The predominant form of land tenure for cattle raising is their own; rental, collective, associative or free modalities are less representative. Most of the labour used is family labour, except in large farms where labour is hired. The price per cattle daily wage can reach up to 60.0 soles, although in most of the districts it is between 20.0 and 35.0 soles per day.
6.4.6.3 Forestry
Despite the fact that the region has a high potential for forestry activity, the forest plantations recorded in the 2012 National Agrarian Census are twenty-five and cover 167.8 hectares of land.

Environmental and Social Impact Assessment of Forest Landscape Restoration Project December 2021
Social Capital Group 298
The largest plantations are located in the districts of: San Pablo with a territorial extension of 34.05 hectares; Cajamarca with two plantations the first of 29.32 hectares and the second of 16 hectares. In 2012, these three plantations accounted for 47.3% of the forest area in the study area registered in the Census.
The other plantations were less representative in terms of territorial extension, as they did not exceed ten hectares, except for the one located in Cajamarca with an extension of 11.55 hectares. Forest plantations were located in almost all the districts of the Cajamarca Region, however, the highest concentration was in the Cajamarca Province (63.7%).
Table 6.82 Forest plantations in the Cajamarca Region
Plantations Province District Area (ha)
Sexemayo II Rural Community Cajamarca Cajamarca 29.32
Tongo Moreno De pastor, Margarita Cajamarca Jesus 0.66
Portal Cueva, Nélida Cajamarca Encañada 8.48
Tejada Chilón, José Vicente Cajamarca Cajamarca 2.16
Muñoz Agular, RosarioRiquelme de Muñoz, María Rosa
Cajamarca Encañada 3.58
Chuquimango Tafur, José Víctor St. Paul's Tumbaden 7.06
Malca Chávez, Valentín St. Paul's St. Paul's 34.05
Córdoba Vigo, Melanio Cajabamba Cachachi 3.63
Huamán Aquino, Isaías Cajamarca San Juan 0.13
Chávez Tejada, Gabriela Cajamarca Baths of the Inca 0.88
Mendoza Heras, Jesús Cajamarca Baths of the Inca 0.27
Infante Yopla, Vidal Cajamarca Encañada 16
Castro Castro, Flavio Cajamarca Magdalena 9.33
Crisóstomo Villanuevanu, Pedro Cajamarca San Juan 0.13
Pérez de Becerra Santos, Olinda Cajamarca Cajamarca 11.55
Revilla Guevara, SegundoVentura de Revilla, Ofelia St. Paul's Tumbaden 7.96
Díaz Cabanillas, Nelson Raúl St. Paul's Tumbaden 6.16
Chuquilin Arevalo, Alamiro St. Paul's St. Paul's 2.09
Terán Limay, José de la Cruz Cajamarca Chetilla 9.3
Alvarado Dias, AsterioMarín García, Mercedez Gladys
Cajamarca Encañada 1.03
Casstrejón Pompa, Jesús Cajamarca Cajamarca 2.52
Bustamanete Jara, Lázaro Cajamarca Magdalena 1.32
Yupanqui Roncal, Amuel Cajamarca Encañada 0.08
Gutierrez Limay, Leoncio Cajamarca Baths of the Inca 1.12
Tanta Gonzales, Alejandro Cajamarca Chetilla 9.01
Source: National Agrarian Census 2012 - INEI
Those interviewed said that since 2011, the Provincial Municipality of Cajamarca has been promoting reforestation in the districts of the province by delivering plants to associations or families, in some cases in coordination with the Agrorural Program. As a result of the coordination

Environmental and Social Impact Assessment of Forest Landscape Restoration Project December 2021
Social Capital Group 299
between the province and its districts, in San Juan it has been projected to obtain 100,000 thousand seedlings of different species (eucalyptus, taya and pine). In the 110case of Encañada and Cajabamba, forestry projects have been carried out with the support of the Regional Government (GORE), with the Poncho Verde Program; 111in Chetilla with the support of SERFOR. In San Bernardino, several species have been planted with the support of an NGO.
The authorities interviewed indicated that forestry activities are regularly carried out by families. In cases where labour is contracted, the daily price per day was estimated at between 30 or 40 soles, but it can increase to 70 soles or more if it is carried out by a chainsaw operator or a specialised person.
The forest by-products obtained are boards, strips, tables or other simple items that are processed in small private workshops located in some communities in the districts of Cajamarca, Encañada, Chetilla, Baños del Inca, Jesús, San Juan and Cospán. The production is destined for the market in the provinces of Trujillo and Cajamarca, as well as local markets. Interviewees also reported small-scale mushroom production in the districts of Baños del Inca and Jesús.
Due to the forestry potential of the study area, many districts expressed their willingness to support the Project, provided that the communities are made part of the benefits to be obtained.
6.4.6.4 Producers and agricultural area
According to the last Agricultural Census (2012), the number of agricultural producers in the Cajamarca Region amounted to 340 thousand, which together made use of 1.4 million hectares of land. Of the provinces, Cajamarca contributed the most in terms of both producers (55 thousand) and area used (165 thousand hectares). The other provinces contributed less; even when added together, they represent almost half the number of producers and hectares of land used by Cajamarca.
At the district level, the largest number of producers is located in Encañada (13.2 thousand) and Cajamarca (12.0 thousand), while the smallest group is located in Tumbaden (1.2 thousand) and Chetilla (1.3 thousand). The cultivated area corresponds to the number of producers in Encañada, as it is also the one that uses the largest area of land for its productive activities (47.8 hectares). In Cajamarca, despite the significant number of producers, it only uses 21.1 thousand hectares, which places it in third place.
In general, in 2012, the number of producers and the cultivated area is concentrated in the Province of Cajamarca, and within this, in the districts of Cajamarca and Encañada. In the case of cultivated area, Cachachi and Cospán are also added. The other districts have a less significant
110 This programme designs, promotes and manages rural agricultural development models that facilitate the articulation of public-private interventions and contribute to poverty reduction and the inclusion of rural families. 111 This initiative is implemented from 2019 and promotes that each Agrarian Agency makes 100 000 seedlings according to the altitudinal floor. From forestry to fruit growing. It has planted 4 500 hectares the first year. And this year is already 6 thousand hectares. They hope to reach the end of the management 2022, with 15 000 hectares. The project is implemented in all provinces.

Environmental and Social Impact Assessment of Forest Landscape Restoration Project December 2021
Social Capital Group 300
presence in terms of both the number of producers and the agricultural area used for agricultural activities.
Table 6.83 Producers and agricultural area by Region, Province and District
District Number of producers
Agricultural area (ha)
Cajamarca Region 339 979.0 1 409 291.7
Cajamarca Province 54 971.0 164 704.8
Asunción District 2 509 5 753.4
Baños del Inca District 9 774 12 050.8
Cajamarca District 11 956 21 117.2
Chetilla District 1 284 3 354.5
Cospán District 1 901 31 818.4
Encañada District 13 270 47 835.5
Jesus District 4 506 7 876.7
Magdalena District 1 775 7 068.6
San Juan District 1 493 7 063.5
Province of San Pablo 5 784.0 38 268.3
San Bernardino District 1 318 15 689.8
San Pablo District 3 097 10 312.4
Tumbaden District 1 158 8 588.5
Cajabamba Province 20 363.0 70 721.8
Cachachi District 8 136 40 581.2
Source: National Agrarian Census 2012 - INEI
In conclusion, the main economic activities in the region are agriculture and cattle raising. In the agricultural activity, cattle pasture, potato, Chilean grass and elegant grass stand out as the main products; while in livestock, livestock breeding (cattle, pigs, sheep and goats) and poultry production are the most representative products. Although there is a great forestry potential, according to the available data, this activity would be very little exploited.
6.4.7 Poverty and vulnerability
Poverty is defined as a condition in which one or more people have a level of well-being below the socially accepted minimum112. However, for the purposes of this baseline, poverty will be described using two official INEI methodologies: monetary poverty measured using the poverty line and unsatisfied basic needs. This section is also accompanied by an analysis of another condition of vulnerability in addition to poverty, such as the disability of a family member in the study area. This section also includes an analysis of the coverage of the State's social programs to alleviate poverty and other problems in the region.
112 INEI, Methodology for Measuring Poverty in Peru.

Environmental and Social Impact Assessment of Forest Landscape Restoration Project December 2021
Social Capital Group 301
6.4.7.1 Poverty line
According to the Ministry of Economy and Finance, this method focuses on the economic dimension of poverty and uses consumption expenditure as a measure of well-being. It has the advantage that it measures what a household actually consumes rather than what it can potentially consume at a given level of income. The poverty line is the monetary value against which a household's monthly per capita expenditure is compared to determine whether or not it is in poverty.
Taking into account the aforementioned methodological aspects and the results of the 2018 Monetary and District Poverty Map conducted by INEI, in the Cajamarca Region, one in three households is poor. The provinces, of Cajamarca and San Pablo share almost the same incidence of poverty as the Region (33.7% respectively). The situation in Cajabamba is more pressing in that one out of every two households is poor.
At the district level, the situation is very unequal: the district of Cajamarca has the lowest incidence of poverty, with 19.7%, which means that two out of every ten households are poor. This behaviour differs from the other districts. Baños del Inca has an incidence level that is double that of Cajamarca (36.7%), however, the figure is very similar to the average for the region (36.9%).
In the other districts, the situation is alarming in that poverty reaches one out of every two households in Asunción, Magdalena and San Juan; and exceeds seven out of every ten households in Chetilla, Cospán, Encañada, Jesús, San Bernardino and Cachachi. The rest of the districts are located in the middle of these two extremes.
This situation is perceived and confirmed in the interviews with the public authorities of the districts. In Jesús, Tumbaden and San Bernardino they indicated that the main problem they suffer from is extreme poverty.
The level of poverty prevailing in the region is closely related to the prevailing productive structure, based on primary activities, such as agriculture, whose development does not improve the well-being of households in the region. The only exception is the district of Cajamarca, which, as mentioned above, has a relatively more diversified productive structure, which has made it possible to expand employment opportunities for households and consequently reduce poverty levels.
Table 6.84 Poverty Level in the Districts of the Cajamarca Region
Geographical scope % of monetary poverty
Cajamarca Region 36.9
Cajamarca Province 33.7
Asunción District 58.3
Baños del Inca District 36.7
Cajamarca District 19.7
Chetilla District 74.4

Environmental and Social Impact Assessment of Forest Landscape Restoration Project December 2021
Social Capital Group 302
Geographical scope % of monetary poverty
Cospán District 73.6
Encañada District 74.9
Jesus District 70.5
Magdalena District 54.5
San Juan District 54.6
Province of San Pablo 33.7
San Bernardino District 72.0
San Pablo District 65.4
Tumbaden District 68.9
Cajabamba Province 52.55
Cachachi District 76.9
Source: Provincial and District Monetary Poverty Map 2018 - INEI.
6.4.7.2 Unsatisfied Basic Needs
This method takes into consideration a set of indicators related to basic structural needs that are required to evaluate individual welfare, these dimensions are different from the monetary condition, for its measurement the INEI uses the following indicators113:
Dwellings with inadequate physical characteristics, i.e. dwellings with exterior walls of
matting, or of quincha, stone with mud or wood.
Overcrowded households, i.e. more than 3 or 4 people per room, not counting the
bathroom, kitchen, hallway or garage.
Housing without toilet facilities,
Households with at least one child aged 6 to 12 years not attending school
Population in households with high economic dependency, that is, whose head of
household has incomplete primary education and with four or more persons per
employed person or without any employed member.
In practice, the method requires measuring each of these indicators per household and considers the proportion of households with at least one Unsatisfied Basic Need - UBN - to be in poverty and those with two or more to be in extreme poverty. According to the criteria established by the method, the total poverty rate in the study area during 2017 was 25.2%. Of these, 20% are poor and 5.2% are extremely poor.
In the provinces of Cajamarca and San Pablo, poverty is below the average observed in the region, but with nuances: in Cajamarca 14 out of every 100 households are poor and 3 are extremely
113 Peru: Poverty Profile by Geographical Domains 2004-2013. INEI.

Environmental and Social Impact Assessment of Forest Landscape Restoration Project December 2021
Social Capital Group 303
poor; in San Pablo it is 13 and 3 respectively; while in Cajabamba it reaches 14 and 4 households respectively.
At the district level, the situation is very heterogeneous: three districts are above the regional poverty average, Chetilla (24.9%), Tumbaden (23.3%) and Cachachi (21.9%), while the rest are below. The same behavior is observed in extreme poverty, with the same districts above and below the regional average. The case of Chetilla stands out, where the incidence of extreme poverty reaches its maximum in the region (12.5%), which is equivalent to saying that 13 households out of every 100 are in a condition of indigence.
In contrast, the district of Cajamarca has the lowest incidence of poverty and extreme poverty (11.7% and 1.6% respectively). As mentioned in previous paragraphs, it is very likely that this is due to a greater diversification of its productive structure, which has made it possible to improve the well-being of households. Despite its low level of incidence, in absolute terms it is the district with the highest number of households in the poverty and extreme poverty groups (6,834 and 932 households, respectively).
Table 6.85 Level of poverty by Unsatisfied Basic Needs in the districts of the Cajamarca Region
Geographical location Not poor Poor Poor extreme Total
N % N % N % N %
Cajamarca Region 295 733 74.8 79 223 20.0 20 646 5.2 395 602 100
Cajamarca Province 80 090 83.3 13 550 14.1 2 537 2.6 96 177 100
Asunción District 1 967 81.6 380 15.8 63 2.6 2 410 100
Baños del Inca District 10 366 82.2 1 919 15.2 319 2.5 12 604 100
Cajamarca District 50 845 86.7 6 834 11.7 932 1.6 58 611 100
Chetilla District 642 62.6 255 24.9 128 12.5 1 025 100
Cospán District 1 496 79.4 332 17.6 56 3.0 1 884 100
Encañada District 4 552 75.5 1 148 19.1 326 5.4 6 026 100
Jesus District 3 192 76.7 756 18.2 212 5.1 4 160 100
Magdalena District 1 953 78.0 455 18.2 96 3.8 2 504 100
San Juan District 1 034 80.1 207 16.0 50 3.9 1 291 100
Province of San Pablo 6 562 84.1 1 031 13.2 205 2.6 7 798 100
San Bernardino District 1 048 80.0 222 16.9 40 3.1 1 310 100
San Pablo District 3 353 84.4 542 13.6 78 2.0 3 973 100
Tumbaden District 655 68.8 222 23.3 75 7.9 952 100
Cajabamba Province 21 032 82.1 3 653 14.3 943 3.7 25 628 100
Cachachi District 4 106 70.7 1 274 21.9 427 7.4 5 807 100
Source: CPV 2017 - INEI
The individualized analysis of the UBN by components allows us to know which are the unsatisfied basic needs with the highest incidence in the population of the Cajamarca Region. The characteristics associated with the quality of housing are of greatest concern. Thus, in 2017, 12.5% of the population lives in overcrowded housing, in 6.7% the physical characteristics are inadequate and 5.2% lack hygienic services.

Environmental and Social Impact Assessment of Forest Landscape Restoration Project December 2021
Social Capital Group 304
In the provinces of Cajamarca, San Pablo and Cajabamba, the most important gaps are observed in the BIN of overcrowded housing and households with economic dependency; while the indicators with the smallest gaps are housing with inadequate physical characteristics in Cajabamba and households with children not attending school in the provinces of Cajamarca and San Pablo.
In the districts of Asunción, Chetilla, Cospán, San Bernardino and Cachachi, the greatest unsatisfied need is that of households with high economic dependency; in Baños del Inca, Cajamarca, Encañada, Jesús, Magdalena, San Juan, San Pablo and Tumbaden, the main UBN is that of overcrowded housing. On the contrary, the indicators where the lowest deprivations are observed are housing with inadequate physical characteristics (Asunción, Chetilla, Cospán, Encañada, Jesús, San Bernardino, San Pablo and Cachachi); households with children not attending school (Baños del Inca, Magdalena, San Juan and Tumbaden) and housing without sanitation (Cajamarca), as can be seen in Table 6.86.
Table 6.86 Indicators that make up the UHN by Districts of the Cajamarca Region
Geographical locations
Housing with inadequate
physical characteristics
Overcrowded housing
Housing without toilets
Households with children not attending
school
Households with high economic
dependence
Cajamarca Region 6.7 12.5 5.2 1.8 5.0
Cajamarca Province 2.0 9.1 2.2 1.6 4.7
Asunción District 1.2 5.0 1.4 1.7 12.0
Baños del Inca District 3.5 9.8 1.2 1.9 4.2
Cajamarca District 1.9 8.1 1.0 1.2 2.8
Chetilla District 1.6 19.4 7.1 2.5 21.0
Cospán District 1.2 3.6 4.1 2.7 12.6
Encañada District 1.2 12.9 5.1 3.1 8.4
Jesus District 1.3 13.0 3.4 2.5 8.9
Magdalena District 1.6 9.3 7.5 1.4 6.9
San Juan District 3.8 9.5 2.1 1.4 7.1
Province of San Pablo 2.7 6.3 5.1 2.3 5.9
San Bernardino District 2.6 3.9 6.5 4.0 6.3
San Pablo District 0.8 6.1 3.3 1.8 5.6
Tumbaden District 10.6 10.8 9.8 2.4 6.4
Cajabamba Province 1.0 9.2 3.8 3.1 9.8
Cachachi District 1.3 9.1 8.1 5.3 14.4
Source: CPV 2017 - INEI
For their part, the authorities interviewed pointed out that among the main problems that afflict the provinces is the lack of water or its limited supply; in the cases where the basic service exists, it is not suitable for human consumption due to the lack of treatment systems. This perception is shared by the districts of Magdalena, San Pablo and San Bernardino. In Tumbaden and San Juan, they add the lack of environmental sanitation services such as drainage and access to electricity. Perceptions that confirm the deficiencies indicated by UHN.

Environmental and Social Impact Assessment of Forest Landscape Restoration Project December 2021
Social Capital Group 305
6.4.7.3 Disability
The General Law on Persons with Disabilities (Law No. 29973) establishes that persons with disabilities are those who have one or more permanent physical, sensory, mental or intellectual impairments which, in interaction with various attitudinal and environmental barriers, do not exercise or may be impeded in the exercise of their rights and their full and effective inclusion in society, on an equal footing with others.
According to data from the XII Population Census and VII Housing Census 2017, in the area of analysis the population with at least one difficulty to perform activities reaches 11.0% of the total, i.e. they affect one out of every ten inhabitants of the Cajamarca Region. The problem is differentiated between the provinces analyzed, in San Pablo it reaches a percentage similar to the average for the region (11.0%); in the other two provinces, the condition is relatively lower (affecting 9.0% of the population).
The population of the study area presents various conditions of disability, the most representative being the ability to see even when wearing glasses (4.3%), followed by the ability to move or walk using arms and/or legs (2.5%); these two conditions account for 61.8% of the conditions of disability in the Cajamarca Region. In the provinces, they are also the most representative.
At the district level, in Tumbaden and Chetilla the condition of disability related to seeing, even when wearing glasses, does not exceed 2.0% of the population; while in San Pablo it exceeds 5.0%; the other districts are located between both extremes. In the case of the condition of moving or walking to use arms and/or legs, the lowest value observed is in Encañada (1.6%) and the highest in San Juan (3.6%).
The differences are also reflected in the percentage of people who suffer from some disability that limits them from carrying out daily activities. In the Districts of Chetilla, Jesús and Tumbaden, the level of difficulty does not exceed 7.0%; while in San Juan, San Bernardino and San Pablo, the limitations reach 13.0% of the population.
These conditions require an approach from the State by linking these needs to a robust public policy framework that allows the incorporation of people with disabilities into the economic activity and the enjoyment of the benefits it produces, through their access to the labor market in an appropriate manner.

Environmental and Social Impact Assessment of Forest Landscape Restoration Project December 2021
Social Capital Group 306
Table 6.87 Disability status by districts of the Cajamarca region (in percentages)
Geographical location
Disability status
See, even when
wearing
glasses
Hearing, even with
hearing aids
Speak or communicate, even if using sign language
or another language
Moving or
walking to use
arms and/or
legs
Understanding or learning (concentratin
g and remembering)
Relating to others by their
thoughts, feelings,
emotions, or
behaviors
None
Total
Cajamarca Region 4.3 1.8 0.7 2.5 1.0 0.6 89.0 100.0
Cajamarca Province 4.0 1.5 0.4 2.0 0.7 0.4 90.9 100.0
Asunción District 3.4 2.2 0.6 2.9 0.8 0.3 89.9 100.0
Baños del Inca District 3.1 1.4 0.4 1.9 0.9 0.4 91.8 100.0
Cajamarca District 4.5 1.4 0.4 1.9 0.7 0.5 90.6 100.0
Chetilla District 1.7 1.1 0.9 2.3 0.7 0.2 93.0 100.0
Cospán District 2.1 1.3 0.6 2.7 1.0 0.6 91.7 100.0
Encañada District 2.7 1.6 0.4 1.6 0.6 0.5 92.6 100.0
Jesus District 2.4 1.5 0.4 1.7 0.5 0.3 93.2 100.0
Magdalena District 4.7 1.8 0.6 2.8 0.9 0.5 88.7 100.0
San Juan District 4.6 2.6 0.6 3.6 1.7 0.7 86.2 100.0
Province of San Pablo 4.3 2.1 0.5 2.6 0.9 0.5 89.0 100.0
San Bernardino District 4.4 3.0 0.6 3.3 1.1 0.8 86.8 100.0
San Pablo District 5.2 2.2 0.5 2.6 1.0 0.5 87.9 100.0
Tumbaden District 1.4 1.1 0.3 1.6 0.4 0.4 95.0 100.0
Cajabamba Province 3.5 1.7 0.7 2.3 0.8 0.4 90.7 100.0
Cachachi District 2.5 1.3 0.9 1.8 0.7 0.4 92.4 100.0
Source: CPV 2017 - INEI
6.4.7.4 Coverage of social programs 114
This item presents a description of the coverage of social programs implemented by the State to alleviate poverty and other development problems in the Cajamarca Region. The programs presented are implemented by the Ministry of Development and Social Inclusion (MIDIS).
The Cuna Más National Programme promotes the development of children under 36 months of age in areas of poverty and extreme poverty by providing two free services: day care and support for families.
The day-care service provides comprehensive care for a total of 1,995 children under 36 months of age in the Cajamarca region. In the provinces, the service serves children in Cajamarca (863)
114 The definitions of social programs used in this section correspond to those established in the Single Digital Platform of the Peruvian State (https://www.gob.pe/midis).

Environmental and Social Impact Assessment of Forest Landscape Restoration Project December 2021
Social Capital Group 307
and Cajabamba (100); in San Pablo the service is not provided. At the district level, the programme is present only in Baños del Inca and Cajamarca (763 children).
The family support service (SAF), which includes weekly visits to households with children under 36 months of age or pregnant mothers, providing guidance to mothers and fathers to strengthen care and learning practices, has a greater presence in the study area. In the Cajamarca region, 18,619 households are served by this service, most of them in the provinces of Cajamarca (1,804) and Cajabamba (1,168). In San Pablo there are 522.
At the district level, five of the nine districts of Cajamarca Province under analysis (Asunción, Chetilla, Encañada, Jesús and San Juan) have FSS, as do the three in San Pablo and one in Cajabamba. Of all the districts that have the service, the highest coverage is in Cachachi (532), followed by Jesús (468) and Asunción (330).
Table 6.88 Coverage of the Cuna Más Programme in the Cajamarca Region
District Day Care
Accompanying Families
Cajamarca Region 1 995 18 619
Cajamarca Province 863 1 804
Asunción District 0 330
Baños del Inca District 184 0
Cajamarca District 579 0
Chetilla District 0 163
Cospán District
Encañada District 0 111
Jesus District 0 468
Magdalena District
San Juan District 0 205
Province of San Pablo 0 522
San Bernardino District 0 122
San Pablo District 0 290
Tumbaden District 0 110
Cajabamba Province 100 1,168
Cachachi District 0 532
Source: General Directorate of Monitoring and Evaluation. 2021 - MIDIS
The National Programme of Direct Support for the Poorest (JUNTOS), which channels resources from various State sectors to guarantee the health and education of children, adolescents up to the age of 19 and pregnant women in very poor households, has enrolled almost 114,000 households in the Cajamarca region, of which some 113,000 households have subscribed and complied with the established conditions.
Of the three provinces under analysis, Cajamarca has the highest number of affiliated and subscribed households (11 657 and 11 530 respectively), in relative terms, coverage is 12% of total households; while San Pablo has the lowest number (2 486 and 2 477 respectively),

Environmental and Social Impact Assessment of Forest Landscape Restoration Project December 2021
Social Capital Group 308
equivalent to coverage of 11.8% respectively of total households. Cajabamba lies between the two extremes in terms of the number of households affiliated and subscribers, but in terms of total households covered by the programme it is almost universal (90% in both cases).
Coverage in the districts is quite heterogeneous, while Encañada has the highest number of affiliated and subscribed households (2,440 and 2,432 respectively), in terms of total households covered it ranks second with around 40%. At the other extreme, Cajamarca is the one that reports the least (50 and 28 respectively), so the number of households covered by the programme is reduced to almost zero. The other districts fall within the range of affiliated and subscribing households, but in terms of total household coverage, the cases of San Bernardino and Tumbaden stand out, where almost half of the households are covered by the programme.
Table 6.89 Coverage of the JUNTOS Program in the Cajamarca Region
District Affiliated
households %
Subscribing households
% Total
households
Cajamarca Region 113,874 28.8 112,876 28.5 395,608
Cajamarca Province 11,657 12.1 11,530 12.0 96,177
Asunción District 860 35.7 855 35.5 2,410
Baños del Inca District 2,272 18.0 2,245 17.8 12,604
Cajamarca District 50 0.1 28 0.0 58,611
Chetilla District 431 42.0 433 42.2 1,025
Cospán District 699 37.1 691 36.7 1,884
Encañada District 2,440 40.5 2,432 40.4 6,026
Jesus District 1,436 34.5 1,422 34.2 4,160
Magdalena District 870 34.7 855 34.1 2,504
San Juan District 502 38.9 495 38.3 1,291
Province of San Pablo 2,486 11.8 2,477 11.8 21,032
San Bernardino District 608 46.4 605 46.2 1,310
San Pablo District 1,283 32.3 1,279 32.2 3,973
Tumbaden District 444 46.6 444 46.6 952
Cajabamba Province 5,946 90.6 5,875 89.5 6,562
Cachachi District 1,798 31.0 1,769 30.5 5,807
Source: General Directorate of Monitoring and Evaluation. 2021 - MIDIS
In addition, through the Cooperation Fund for Social Development (FONCODES), programmes and projects for productive development and economic and social infrastructure are managed for the population living in poverty and extreme poverty, vulnerability or exclusion, in rural and urban areas, coordinated at the territorial level in partnership with actors committed to local development.
FONCODES has different projects among which we can find the Haku Wiñay that aim to develop productive capacities and management of enterprises for food security, and the increase and diversification of income of rural households in subsistence economies, providing training, technical assistance, competitive funds and transfers of productive assets.

Environmental and Social Impact Assessment of Forest Landscape Restoration Project December 2021
Social Capital Group 309
Through this modality, 25,764 projects are under execution and 16,020 projects have been completed in the study area. Most of them have been completed and are being implemented in the Cajamarca and Cajabamba provinces, while in San Pablo only projects are under implementation, as shown in Table 6.90.
Of the thirteen districts considered in the baseline, only ten are implementing or have completed projects in the Haku Wiñay modality. Of these, five (Asunción, Cospán, Encañada, San Juan and San Pablo) are in execution; in four (Baños del Inca, Cajamarca, Chetilla and Jesús) the projects have been completed and in Cachachi they are in execution or have been completed.
Other projects are less represented, of which 135 are in execution and 38 are completed in the Cajamarca Region. Of these, most correspond to the Cajamarca Province with 12 and 9 respectively. In San Pablo and Cajabamba there are only projects in execution.
Projects are implemented or have been completed in nine of the thirteen districts in the region under analysis. Chetilla, Magdalena, San Bernardino and Tumbaden are the districts where no projects have been implemented or completed. The estimated number of users of the projects being implemented by the FONCODES programme is 104,195, with 9.6% in Cajamarca Province, 1.8% in San Pablo and 7.2% in Cajabamba.
At the district level, the estimated users correspond to the districts of Asunción, Cospán, Encañada, San Juan, San Pablo and Cachachi. The district with the largest number of beneficiaries is Cachachi with 2,399.
Table 6.90 FONCODES Program Coverage in the Cajamarca Region
District Estimated number of
users
N°. completed projects
N°. projects in execution
N°. Haku Wiñay Homes
-projects in execution
N°. Haku Wiñay Homes - completed
projects
Cajamarca Region 104,195 38 135 25,764 16,020
Cajamarca Province 9,971 9 12 2,432 2,848
Asunción District 1,771 2 432 0
Baños del Inca District 0 2 0 386
Cajamarca District 0 2 0 400
Chetilla District 0 416
Cospán District 1,640 2 400 0
Encañada District 1,640 2 400 0
Jesus District 0 2 0 372
Magdalena District
San Juan District 1,640 2 400 0
Province of San Pablo 1,845 0 2 450 0
San Bernardino District
San Pablo District 1,845 2 450 0
Tumbaden District
Cajabamba Province 7,528 0 8 1,836 1,767

Environmental and Social Impact Assessment of Forest Landscape Restoration Project December 2021
Social Capital Group 310
District Estimated number of
users
N°. completed projects
N°. projects in execution
N°. Haku Wiñay Homes
-projects in execution
N°. Haku Wiñay Homes - completed
projects
Cachachi District 2,399 2 585 1,188
Source: General Directorate of Monitoring and Evaluation. 2021 - MIDIS
The protection of older persons aged 65 and over who lack the basic conditions for their subsistence is covered by the National Solidarity Assistance Programme Pension 65, which provides a financial subsidy of 250.0 soles every two months to beneficiary older adults to meet their needs.
In the Cajamarca region, the programme covers 63,261 older adults, i.e., it protects one out of every two people in this age group. Of the total number of people covered, 13.9% are in Cajamarca Province, 2.1% in San Pablo and 5.2% in Cajabamba. However, coverage is highly differentiated: in the provinces of Cajamarca and San Pablo it represents 35.2% and 58.9% respectively, while in Cajabamba coverage for older adults is universal.
In the districts, the behavior is differentiated, the largest number of beneficiaries is registered in Baños del Inca (1 242), Cajamarca (2 672) and Encañada (1 011), all of them in the Cajamarca Province. The percentage of coverage is very similar in Baños del Inca (44.2% and Encañada (56.9%), however, in Cajamarca the coverage of the program reaches 472.1% of older adults, this overdraft can be explained by an underreporting of people of that age in the Census or by a high migration of older adults from other places to the district.
The districts of Tumbaden (195), San Juan (249) and Chetilla (255) have the lowest coverage of the PENSION 65 program, in no case the number of beneficiaries exceeds 300 older adults. The level of coverage in each of them exceeds 49%, that is to say, one out of every two adults over 65 years of age is covered by the program.
Table 6.91 Coverage of the Pension 65 Program in the Cajamarca Region
District PENSION 65 65 years and older % of coverage
Cajamarca Region 63,261 116,719 54.2
Cajamarca Province 8,819 25,062 35.2
Asunción District 636 1044 60.9
Baños del Inca District 1,242 2,811 44.2
Cajamarca District 2,672 566 472.1
Chetilla District 255 338 75.4
Cospán District 400 716 55.9
Encañada District 1,011 1,778 56.9
Jesus District 809 1406 57.5
Magdalena District 503 855 58.8
San Juan District 249 504 49.4
Province of San Pablo 1,350 2,292 58.9
San Bernardino District 307 489 62.8

Environmental and Social Impact Assessment of Forest Landscape Restoration Project December 2021
Social Capital Group 311
District PENSION 65 65 years and older % of coverage
San Pablo District 728 1420 51.3
Tumbaden District 195 344 56.7
Cajabamba Province 3,259 1,681 193.9
Cachachi District 865 1761 49.1
Source: General Directorate of Monitoring and Evaluation 2021 - MIDIS
The Qali Warma National School Feeding Programme provides food services with an educational supplement to children enrolled in public early childhood and primary education institutions at the national level, and in secondary schools in the Peruvian Amazon, in order to help improve classroom attendance, school attendance and eating habits, promoting the participation and co-responsibility of the local community.
The number of children covered by the programme in the study area was 266,888, while the number of affiliated educational institutions was 7,385, equivalent to a coverage level of 79 per cent of children aged 6 to 17. The province of Cajamarca has the highest number of children benefiting, equivalent to 57 per cent coverage, and the highest number of affiliated educational institutions. In absolute terms, it is followed in importance by the provinces of Cajabamba and San Pablo; however, in terms of coverage, it is almost universal, reaching 97.2% and 83.3% of the indicated ages, respectively, as can be seen in Table 6.92
Among the districts, Cajamarca has the largest number of children benefiting, which may be related to its larger demographic composition, but the programme covers only 40.7 per cent. In absolute terms, it is followed in importance by the districts of Baños del Inca (6,912 and 111 respectively) and Cachachi (6,992 and 177 respectively). It should be noted that, in the case of Cachachi and Chetilla, the programme has universal coverage of children aged 6 to 17, while in Encañada, San Juan and San Pablo coverage exceeds 90% of the population group.
Table 6.92 Coverage of the Qali Warma Programme in the Cajamarca Region
District No. of
children attended
Children (6 to 17
years old)
% of coverage
No. of IIEE
Cajamarca Region 266,888 337932 79.0 7,385
Cajamarca Province 45,864 80485 57.0 936
Asunción District 1,774 2161 82.1 53
Baños del Inca District 6,912 10997 62.9 111
Cajamarca District 19,062 46829 40.7 239
Chetilla District 1,047 990 105.8 31
Cospán District 1,868 2119 88.2 68
Encañada District 4,535 4911 92.3 160
Jesus District 3,200 4290 74.6 81
Magdalena District 1,442 2145 67.2 49
San Juan District 1,053 1122 93.9 42
Province of San Pablo 4,598 5522 83.3 168

Environmental and Social Impact Assessment of Forest Landscape Restoration Project December 2021
Social Capital Group 312
District No. of
children attended
Children (6 to 17
years old)
% of coverage
No. of IIEE
San Bernardino District 702 1075 65.3 34
San Pablo District 3,022 3309 91.3 84
Tumbaden District 675 931 72.5 36
Cajabamba Province 20,661 21251 97.2 388
Cachachi District 6,992 6929 100.9 177
Source: General Directorate of Monitoring and Evaluation 2021 - MIDIS
The National Programme of Action Platforms for Social Inclusion (PAIS) facilitates and coordinates the provision of services through programmes, projects and activities in the social, economic and productive areas of public and private institutions with a view to improving the quality of life of the rural and dispersed rural population.
This program is implemented through fixed platforms (Tambos) and mobile platforms (PIAS). The Tambos are operations that provide services to the population centers and the PIAS are Peruvian Navy ships and/or Air Force aircraft that bring State services to the communities.
In the region under study, the programme is implemented through 18 Tambos, four of which are located in Cajamarca Province, two in Cajabamba and none in San Pablo. The Tambos have provided 5 146 services and benefited 2 626 people, some of them located in the districts of Asunción (183), Chetilla (150), Jesús (68) and Cachachi (70). The districts of Baños del Inca, Cajamarca, Cospán, Encañada, Magdalena and San Juan in the province of Cajamarca, as well as the districts of the province of San Pablo do not report any beneficiaries, perhaps due to the absence of Tambos that provide the service, as can be seen in Table 6.93
Table 6.93 PAIS Program Coverage in the Cajamarca Region
District
N°. of Tambos
providing services
N°. of services provided through
the Tambos
N°. of beneficiaries
served through Tambos
Cajamarca Region 18 5,146 2,626
Cajamarca Province 4 1,454 593
Asunción District 1 208 183
Chetilla District 1 290 150
Jesus District 1 127 68
Cajabamba Province 2 376 216
Cachachi District 1 159 70
Source: General Directorate of Monitoring and Evaluation 2021 - MIDIS
Taking into account that 11% of the population in the study area has a disability, the State created the National Programme for the Delivery of a Non-Contributory Pension to Persons with Severe Disabilities in Poverty (CONTIGO), which provides a pension of 300.0 soles every two months to

Environmental and Social Impact Assessment of Forest Landscape Restoration Project December 2021
Social Capital Group 313
persons with severe disabilities in poverty or extreme poverty, in order to contribute to improving their quality of life.
This contribution benefits 11,650 persons with disabilities in the study area, 900 belonging to Cajamarca Province, 144 to San Pablo and 355 to Cajabamba, in both cases the level of coverage does not exceed 7.5%. In the districts, the situation is heterogeneous: Tumbaden, Encañada and San Bernardino have a coverage level of over 11%, while Cajamarca has the lowest coverage (1.8%). The other districts fall within the range, as Table 6.94.
Table 6.94 Coverage of the CONTIGO Program in the Cajamarca Region
District WITH YOU People with disabilities
% of coverage
Cajamarca Region 11,650 119,632 9.7
Cajamarca Province 900 26,474 3.4
Asunción District 27 673 4.0
Baños del Inca District 146 3,021 4.8
Cajamarca District 307 17,403 1.8
Chetilla District 16 228 7.0
Cospán District 46 510 9.0
Encañada District 148 1,183 12.5
Jesus District 50 767 6.5
Magdalena District 45 844 5.3
San Juan District 19 429 4.4
Province of San Pablo 144 1,928 7.5
San Bernardino District 49 440 11.1
San Pablo District 61 1,273 4.8
Tumbaden District 20 142 14.1
Cajabamba Province 355 5,804 6.1
Cachachi District 92 1,412 6.5
Source: General Directorate of Monitoring and Evaluation. 2021 - MIDIS
Despite the fact that the State implements a set of social programs, the perception in San Pablo and San Bernardino is that social programs do not reach or benefit vulnerable families, which generates dissatisfaction among the villagers.
In summary, in the Cajamarca Region, the population presents important challenges in terms of well-being, poverty measured by the poverty line and UBN, register a fairly representative rate (36.9% and 25.2% respectively), which is conditioned by a productive structure that is not very diversified. This problem is addressed by the State through a set of social programs, however, their coverage is limited and, in the opinion of those interviewed, the benefits do not reach the most needy.

Environmental and Social Impact Assessment of Forest Landscape Restoration Project December 2021
Social Capital Group 314
6.4.8 Political and institutional characteristics
6.4.8.1 Political authorities
This section presents the political and organizational arrangement of the districts that are part of this study. For this purpose, we describe the political organizations that have won in the last three periods at the three levels of government, the most relevant local authorities, and the social and productive organizations that were identified during the fieldwork.
As shown in Table 6.95, in the districts of the province of Cajamarca there has not been a predominant political party or regional movement that has won elections in the last three electoral periods. In the case of the 2018 elections, the political organizations that won electoral victories are the Regional Front of Cajamarca; the Broad Front for Justice, Life and Liberty; Cajamarca Always Green; Alliance for Progress; and the Democratic Party We Are Peru.
In the case of the Province of San Pablo, at the provincial level elections were won by regional political organizations in the last three electoral periods. This trend is also seen in the districts of San Bernardino and Tumbaden with the exception of the 2018 elections, in which the national political party Alianza para el Progreso won in both districts.
In Cajabamba, in 2010 and 2014 the elections were won by regional movements; while in 2018 by the national political party Alianza para el Progreso. This trend differs from what happened in the district of Cachachi, where national political organizations won in the last three electoral periods: Partido Aprista Peruano in 2010 and 2014; and Alianza para el Progreso in 2018.
Table 6.95 Political parties of the elected authorities in the last three periods
Scope Political party of the elected authority
2010 2014 2018
Cajamarca Region Regional Affirmation
Movement Social Affirmation
Movement Popular Action
Cajamarca Province National Restoration Popular Force Regional Front of
Cajamarca
Asunción District Regional Front of Cajamarca
Peruvian Aprista Party Regional Front of Cajamarca
Chetilla District Peruvian Aprista Party Regional Front of
Cajamarca The Broad Front for
Justice, Life and Liberty
Cospán District Popular Action Popular Force Alliance for Progress
Encañada District Regional Front of
Cajamarca Encañadinos in Action Alliance for Progress
Jesus District Popular Action Social Affirmation
Movement Regional Front of
Cajamarca
Los Baños del Inca District Bañosinos In Action
Movement Neighborhood Proposal Democratic Party We
Are Peru
Magdalena District Popular Action Popular Action Cajamarca Forever Green
San Juan District Regional Front of
Cajamarca Christian People's Party Democratic Party We
Are Peru

Environmental and Social Impact Assessment of Forest Landscape Restoration Project December 2021
Social Capital Group 315
Scope Political party of the elected authority
2010 2014 2018
Province of San Pablo Cajamarca Forever
Green Regional Front of
Cajamarca Cajamarca Forever
Green
San Bernardino District Farmers' Commitment Regional Front of
Cajamarca Alliance for Progress
Tumbaden District Cajamarca Forever Green
Social Affirmation Movement
Alliance for Progress
Cajabamba Province Gloriabamba Cajamarca Forever Green Alliance for Progress
Cachachi District Peruvian Aprista Party Peruvian Aprista Party Alliance for Progress
Source: Jurado Nacional de Elecciones 2021
6.4.8.2 Relevant Actors
According to the interviews conducted with district officials, in all the hamlets of the districts there are two important authorities: the Lieutenant Governor and the Municipal Agent. These authorities play an important role in the implementation of productive projects, both from the private sector and the State. According to the Research Report N° 43/2013-2014 of the Congress of the Republic115, the Lieutenant Governor is an ad honorem position that represents the President of the Republic and the Executive Power in the locality and responds to the District, Provincial and Regional Governors. The Municipal Agent is a position that depends hierarchically on the Municipal Management and is created by municipal ordinance. Among its functions is to promote the socioeconomic development of the locality.
Another relevant actor in the districts are the farmer patrols, which are urban and rural community organizations that collaborate with the State in matters of citizen security, conflict resolution, extrajudicial conciliation and maintaining internal order in the localities116. These organizations have boards of directors, are part of the District Citizen Security Committees (CODISEC) and are grouped into district federations. Likewise, according to the officials interviewed, the rondas have taken on a special role in the last few years, especially due to the new presidential term in which they are trying to strengthen these local organizations even more.
Likewise, in the Cajamarca region and in the study districts there are Water User Commissions and Boards (also known as Irrigation Boards), which are non-profit civil organizations whose objective is to manage water resources to improve agricultural profitability and provide technical assistance or training to associated users117. These organizations are usually grouped into commissions and coordinate with ANA and the ALAs for the different water resource management and water channel maintenance. Table 6.96presents a list of commissions and user boards that were identified during the field work.
115 Local political authorities in Peru: Governor and Lieutenant Governor (2014) 116 Law N° 27908 - Farmer Patrols Law 117 National Board of Users of the Irrigation Districts of Peru https://landportal.org/es/organization/junta-nacional-de-usuarios-de-los-distritos-de-riego-del-per%C3%BA

Environmental and Social Impact Assessment of Forest Landscape Restoration Project December 2021
Social Capital Group 316
Table 6.96 List of Water Commissions and Water User Boards in the 13 Districts
Scope User Commission Board of Users
Cajamarca Province
Asunción District - Commission of Users of Asunción
- San Miguel Central Committee
Board of Users of the Subdistrict of Non Regulated Irrigation Subdistrict Alto
Jequetepeque
Cajamarca District
- Mashcón River Users Commission - San Lucas River Users Commission
- Porcón River Users Commission - Rio Grande Users Commission
Junta De Usuarios Del Sector Hidraulico Menor Rio Mashcon-Clase B
Chetilla District - Chetilla user commission Junta De Usuarios Del Subdistrito De
Riego No Regulado Alto Jequetepeque
Cospán District - Jushm Alto Chicama Jushm Alto Chicama
Encañada District - Encañada River Users Commission Junta De Usuarios Del Sector Hidraulico
Menor Rio Chonta Y Cajamarquino- Class B
Jesus District - Cajamarcan River Commission
- Chonta River Commission Lower Part
Junta De Usuarios Del Sector Hidraulico Menor Rio Chonta Y Cajamarquino- Class
B
Los Baños del Inca District - Rio Grande Users Commission
Junta De Usuarios Del Sector Hidraulico Menor Rio Mashcon-Clase B
Magdalena District - Magdalena Users Commission Junta De Usuarios Del Subdistrito De
Riego No Regulado Alto Jequetepeque
San Juan District - San Juan Users Commission Junta De Usuarios Del Subdistrito De
Riego No Regulado Alto Jequetepeque
Province of San Pablo
San Bernardino District - Cuchihuarcuna Users Committee
Junta De Usuarios Del Subdistrito De Riego No Regulado Alto Jequetepeque
San Pablo District - San Pablo Users Commission Junta De Usuarios Del Subdistrito De
Riego No Regulado Alto Jequetepeque
Tumbaden District - Chilifruta Users Committee
- Quebrada Honda- Maraypampa-El Suro-Chumbil User's Committee
Junta De Usuarios Del Subdistrito De Riego No Regulado Alto Jequetepeque
Province of Cajabamba
Cachachi District - Chimin Commission
- Commission of Colpa Cañaris Araqueda - Chugur Chilca Users Commission
Junta De Usuarios Del Sector Hidráulico Menor Condebamba Class B
Source: SCG Fieldwork, 2021
A final type of organization that was also identified are the productive associations. According to the interviews with municipal officials, achieving associativity among independent producers is key to be able to implement the various productive projects executed by the Central Government, the Regional Government of Cajamarca, the Provincial Municipalities and the District Municipalities. However, as a general tendency it is not easy to achieve the constitution of productive organizations due to the costs involved in the management of formalizing the organization, the lack of information on the benefits of associativity, among other reasons. Nevertheless, important productive organizations have been consolidated in the study area, such as CAT LLullapuquio, SAIS José Carlos Mariátegui and ADEFOR. In addition to these, some other productive organizations present in the area have been identified (see Table 6.97).

Environmental and Social Impact Assessment of Forest Landscape Restoration Project December 2021
Social Capital Group 317
Table 6.97 Productive Organizations Identified in the Districts
Scope Productive organizations
Cajamarca Province
Asunción District - Association of Agricultural and Livestock Producers United hamlets of La
Asuncion - SAIS José Carlos Mariátegui
Cajamarca District - Civil Association for Forestry Research and Development
- Asociación Apoyo al Desarrollo Integral Sostenido
Chetilla District - LLullapuquio Agrarian Workers Cooperative
Cospán District - SAIS José Carlos Mariátegui
Encañada District - Agrarian Cooperative of Andean Crops
- Association of Producers El Rosario de Polloc - San Martin Producers Association
Jesus District - SAIS José Carlos Mariátegui
- Alturas Andinas de Jesus Agricultural and Livestock Industrial Association - Yapinel Agricultural Association of Huayamacara
Los Baños del Inca District
- Producers' Association Pullucana Micro-basin - Producers' Association Microcuencua Quinoa
-Mashcon -shultin micro-basin producers association Chonta Otuzco Micro-watershed Producers' Association
Magdalena District - Cooperativa Ecológica de Servicios Múltiples del Perú (Multiple Services
Ecological Cooperative of Peru)
San Juan District - SAIS José Carlos Mariátegui
Province of San Pablo
San Bernardino District
- Poquish Association of Agricultural Producers - Association of Agricultural Producers Puebo Nuevo
- Association of Agricultural Producers of Chupica - Union Tuñad Association of Agricultural Producers
San Pablo District
- Cultural and Tourist Association El Corongo - Association of Agricultural Producers Chary Wawa Association of Artisans
Chalaque - Association of Agroecological Producers Peace and Life of San Pablo
- Asociación Andina de Cultivos y Crianza de San Pablo Comité de Productores Agropecuarios Los Ingenieros Asociación de Reforestación y Agropecuaria El Rejo
de Unana - Kuntur Wasi Cultural Association
- Association of Beekeepers Kuntur Wasi San Pablo - Association of Agricultural and Forestry Producers Patiño
- United Farmers Association of the Caserío Cardón Alto - Association of Agricultural Producers Lalaquish Bajo
- Asociación Amigos Unidos con Ideas Innovadoras Rodeopampa (Friends United with Innovative Ideas Rodeopampa Association)
Tumbaden District
- Association of Producers of the South - Association of Producers 13 de Julio of the Regalado hamlet.
- Association for the Agro-productive Development of the Alto Peru hamlet - Asociación Unión Civil del centro poblado Ingatambo (Ingatambo Civil Union
Association) - Asociación Salmón Dorado del caserio Chaupiloma
- Mundaypacha Association of Chaupiloma - White Path Association of Ingatambo

Environmental and Social Impact Assessment of Forest Landscape Restoration Project December 2021
Social Capital Group 318
Scope Productive organizations - Association for the Development of Chacapampa
Province of Cajabamba
Cachachi District
- Association of producers of Marabamba Alto - Calluan and Tayapampa Producers Association
- Chuquibamba Producers Association - Producers Association Coevac
Source: SCG Fieldwork, September 2021
6.4.8.3 Citizen security
This section presents information related to citizen security in the 13 districts of this study. Citizen security is defined as the joint action of the State and citizens to ensure peaceful coexistence, reduce violence, make use of public spaces peacefully and prevent crime (Mininter, 2018)118.
According to the Integrated Crime and Citizen Security Statistics System (DATACRIM), of the 128 police stations in the Cajamarca region, 14 are in the province of Cajamarca, 2 in the province of San Pablo and 6 in the province of Cajabamba (see Table 6.98). Likewise, of the 1,756 police officers in the Cajamarca region, 24% are assigned to the province of the same name (429), 2% to the province of San Pablo (29) and 5% to the province of Cajabamba (82).
On the other hand, in the province of Cajamarca, the district of the same name has more police stations than the other districts studied, which have only one police station and even Chetillano has none. Likewise, the district of Cajamarca and Los Baños del Inca have the largest number of police officers (269 and 69, respectively). The districts of San San Juan, Asunción and Cospán have the fewest police officers (10, 10 and 9 respectively).
In the province of San Pablo, the districts of San Pablo and San Bernardino have one police station each, with 14 and 15 police officers assigned respectively. The district of Tumbaden does not have a police station or assigned police officers. Finally, the district of Cachachi has 3 police stations out of the 6 that exist in the province of Cajabamba and has 28 police officers.
Table 6.98 Police units and number of police personnel, 2019
Scope Number of police
stations No. of police
personnel
Cajamarca Region 128 1756
Cajamarca Province 14 429
District of Asunción 1 10
District of Cajamarca 4 269
Chetilla District - -
District of Cospán 1 9
Encañada District 2 20
Jesus District 1 11
118 National Plan for Citizen Security from 2019 to 2023 (2018) -

Environmental and Social Impact Assessment of Forest Landscape Restoration Project December 2021
Social Capital Group 319
Scope Number of police
stations No. of police
personnel
District of Los Baños del Inca 1 69
Magdalena District 1 11
San Juan District 1 10
Province of San Pablo 2 29
San Bernardino District 1 14
District of San Pablo 1 15
Tumbaden District - -
Province of Cajabamba 6 82
District of Cachachi 3 28
Source: Datacrim 2021 - INEI
Regarding the type of criminal activity, the DATACRIM system provides information on crimes reported to the police in 2019 (see Table 6.99). For that year, the district of Cajamarca had a total of 1,088 crimes reported, 67% of which were thefts or robberies, followed by injuries or damages (20%) and violations of sexual freedom (20%). The district with the next highest number of reported crimes is Magdalena (306 crimes), 85% of which are thefts or robberies. Likewise, the districts of Asunción, Chetilla and Cospán have no crimes reported in 2019.
In the case of the province of San Pablo, only the district of the same name has reported crimes in 2019. Of the 45 crimes reported, 58% correspond to injuries or damages and 24% to thefts or robberies. In the district of Cachachi, within the province of Cajabamba, only 5 cases of injury or damage and 4 cases of theft or robbery were reported.
According to the interviews conducted with officials during the fieldwork, there are urban and rural farmer patrols in most of the districts in this study. These organizations have played a leading role in maintaining internal order and resolving conflicts within the minimum localities, especially in the districts that do not have police stations or police personnel. Likewise, the interviewees mentioned that the presence of the farmer patrols has significantly reduced the cases of cattle rustling that were frequent before the creation of this social organization.

Social Capital Group 320
Table 6.99 Crimes Reported to Police Departments, 2019
Scope Theft and robberies Abigeato
Breaking and
entering
Unlawful appropriation
Violations of
parental rights
Injuries and
damages
Acts followed by death
Fraud and counterfeiting
Violation of sexual freedom
Common Danger Other Total
Cajamarca Province
District of Asunción - - - - - - - - - - - -
District of Cajamarca 727 10 - 27 32 222 - 12 50 - 8 1 088
Chetilla District - - - - - - - - - - - -
District of Cospán - - - - - - - - - - - -
Encañada District 11 - - 1 - 6 1 - - - - 19
Jesus District 28 3 2 1 - 18 1 - - 2 2 61
Baños del Inca District 42 - - 2 12 15 - - - 32 - 108
Magdalena District 262 - 3 - 1 - - 17 4 7 7 306
San Juan District 4 - - - - 4 - - 2 1 - 13
Province of San Pablo
San Bernardino District - - - - - - - - - - - -
District of San Pablo 11 - 1 - 4 26 - - - 3 - 45
Tumbaden District - - - - - - - - - - - -
Province of Cajabamba
District of Cachachi 4 - - - - 5 - - - - - 9
Source: Datacrim 2021 - INEI
Social Capital Group 321
6.4.8.4 Social conflicts
This section describes the social conflicts identified in the 13 study districts. To this end, information from the Ombudsman's Office, the Presidency of the Council of Ministers, the Regional Government and interviews with municipal officials conducted during the fieldwork are taken into account.
The Ombudsman's Office defines social conflicts as complex processes in which actors from different sectors of society (State, civil society and/or companies) perceive that their interests, objectives, values or needs are contradictory, which can generate a situation of violence between them119. The development of these conflicts will depend on the specific actors involved, the social context in which they are immersed and the institutional capacity to address them.
According to the information presented in Table 6.100, the most frequent social conflicts identified in the study area are related to mining activity and the alleged impact on water sources. The districts that have had this type of conflict are Cajamarca, Encañada, Baños del Inca, Magdalena, Tumbaden and Cachachi. These conflicts have occurred with both formal mining (Yanacocha and Pan American Silver) and artisanal mining (artisanal miners in Cajabamba). Likewise, according to the interview with the specialist in social conflicts of the Regional Government of Cajamarca120, the reports of conflicts related to mining and water increase during the dry season (June-September), since the flow of the rivers decreases, affecting agricultural and livestock activities.
On the other hand, another important type of conflict in the area is related to territorial problems. The most significant are the invasions that have occurred in the territories of the SAIS José Carlos Mariátegui in the districts of Cospán, San Juan and Asunción. In the case of the conflict in the invaded area in Cospán, an agreement has been reached between the current Board of Directors of the cooperative and the new owners, generating a climate of pacification. Nevertheless, the invasions on the side of the San Juan and Asunción districts are still active and are characterized by a significant escalation of violence. Another land conflict identified is the one in the district of San Bernardino between the San Antonio de Cachachi and San Luis Campesino Communities. This conflict has not led to violent actions but is in a latent phase. Likewise, in the district of Chetilla, minor boundary conflicts between landowners were reported.
Finally, in the district of San Pablo, no active or latent social conflicts were identified. Table 6.100presents the details of the conflicts identified in the 13 study districts.
119 Ombudsman's Office. Social peace and conflict prevention https://www.defensoria.gob.pe/areas_tematicas/paz-social-y-prevencion-de-conflictos/ 120 José Bringa Sánchez, Environmental Management Specialist of the Environmental Management of the Regional Government of Cajamarca.

Environmental and Social Impact Assessment of Forest Landscape Restoration Project December 2021
Social Capital Group 322
Table 6.100 Social Conflicts Identified in the Potential Zone of Interest
Name Description Source
Province of Cajamarca
District of Asunción
Conflict over land invasion in Huacraruco (SAIS José Carlos Mariátegui)
In the Huacraruco Annex of the SAIS José Carlos Mariátegui, there have been invasions for more than 5 years by unidentified persons on the border of the districts of San Juan and Jesús. This conflict has been characterized by the use of firearms and violence by the invaders, generating significant violence. Currently, the workers of the cooperative themselves are managing security in their territory.
Interviewing District
Officials (2021)
District of Cajamarca
Case of Tres Tingos, Quinua and Totora canals
In 2015, the users of the Tres Tingos, Quinua and Totora canals demanded that the National Water Authority (ANA) and Minera Yanacocha S.R.L. provide a solution to the decrease in water from the springs that supply the irrigation canals. As a result, several meetings were held to address these demands. Currently, the construction of a new reservoir in the area is being negotiated.
Regional Government of
Cajamarca (2021)
Shudal villagers' sit-in
In September 2021, the population of the village of Shudal demanded the provision of drinking water in their sector through a sit-in at the Empresa Prestadora de Servicios de Agua Potable y Saneamiento (SEDACAJ).
Presidency of the Council of
Ministers (2021)
Chetilla District
Minor land boundary disputes
According to those interviewed, there are recurrent minor conflicts over the delimitation of plots of land throughout the district. The authorities of the District Municipality and local authorities (lieutenant governors and municipal agents) intervene to find a solution.
Interviewing District
Officials (2021)
District of Cospán
Invasion of the SAIS José Carlos Mariátegui
The territories of the SAIS José Carlos Mariátegui in the district of Cospán have been invaded, generating a conflict of more than 10 years. A milestone in this conflict was the murder of the former administrator and manager of the cooperative in 2015. After the change of board of directors, talks began and permission was given for the invaders to become possessors in exchange for not taking care of the territories and not having any more invasions. With this agreement, the conflict has been pacified on the side of the district of Cospán; however, there were other invasions of SAIS on the side of the Huacraruco Annex in the districts of Asunción and San Juan.
Interviewing District
Officials (2021)
Encañada District
Requirements of the board of Azufre-Ventanillas irrigation canal users
In 2019, representatives of the Committee of Users of the Azufre Ventanillas Irrigation Channel claimed to Yanacocha Mining for the alleged negative impact generated to the quality and quantity of water in its channel as a result of the activities carried out in the Chaquicocha pit. Meetings were held between the Administrative Authorities of Water VI Marañón and the Regional Government of Cajamarca to evaluate the technical report issued by ANA.
Presidency of the Council of
Ministers (2019)
Opposition of the inhabitants of Combayo to the construction of the Chonta dam.
Since 2013, residents of the villages of Laurel del Valle, Molino del Arco, Ventanillas, Santa Rosa and the town of Combayo have opposed the construction of the Chonta dam, claiming that the project will affect their homes, roads and agricultural production.
Presidency of the Council of
Ministers (2019)
Jesus District
Case in El Granero
Problems with the use of water reservoirs were identified in the locality of El Granero among the villagers. The district municipality and the authorities of the hamlet initiated conversations to look for solutions until today.
Interviewing District
Officials (2021)
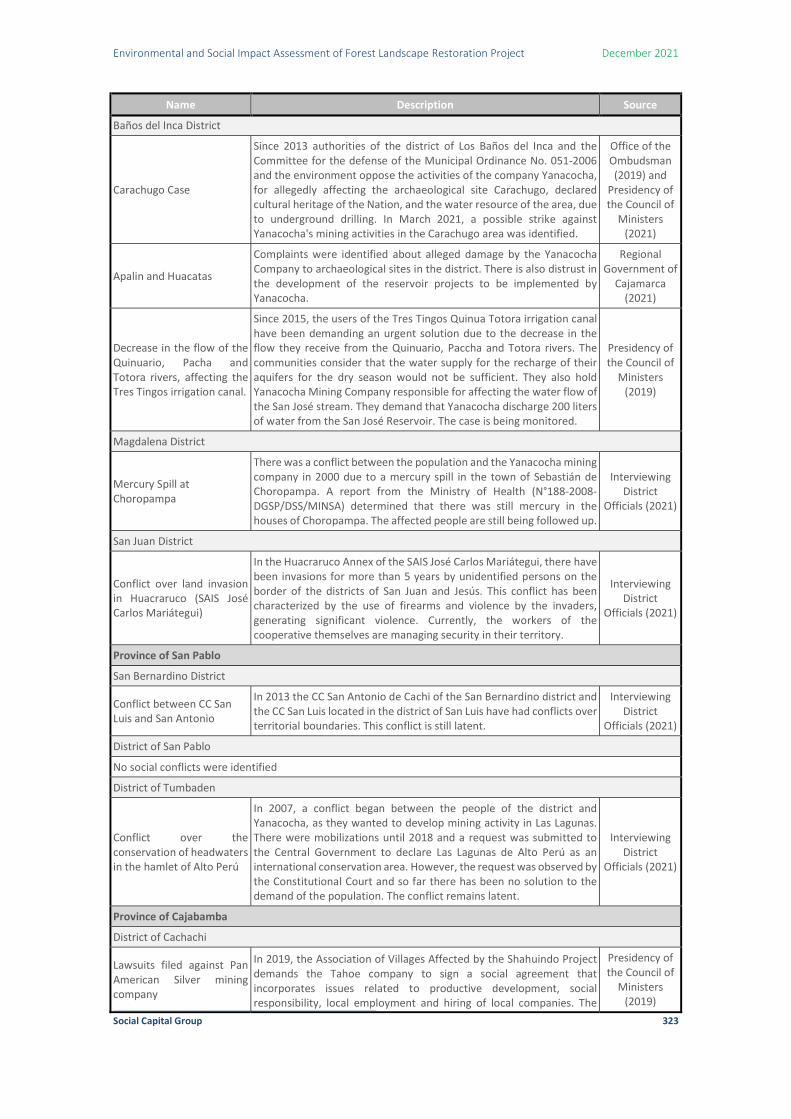
Environmental and Social Impact Assessment of Forest Landscape Restoration Project December 2021
Social Capital Group 323
Name Description Source
Baños del Inca District
Carachugo Case
Since 2013 authorities of the district of Los Baños del Inca and the Committee for the defense of the Municipal Ordinance No. 051-2006 and the environment oppose the activities of the company Yanacocha, for allegedly affecting the archaeological site Carachugo, declared cultural heritage of the Nation, and the water resource of the area, due to underground drilling. In March 2021, a possible strike against Yanacocha's mining activities in the Carachugo area was identified.
Office of the Ombudsman (2019) and
Presidency of the Council of
Ministers (2021)
Apalin and Huacatas
Complaints were identified about alleged damage by the Yanacocha Company to archaeological sites in the district. There is also distrust in the development of the reservoir projects to be implemented by Yanacocha.
Regional Government of
Cajamarca (2021)
Decrease in the flow of the Quinuario, Pacha and Totora rivers, affecting the Tres Tingos irrigation canal.
Since 2015, the users of the Tres Tingos Quinua Totora irrigation canal have been demanding an urgent solution due to the decrease in the flow they receive from the Quinuario, Paccha and Totora rivers. The communities consider that the water supply for the recharge of their aquifers for the dry season would not be sufficient. They also hold Yanacocha Mining Company responsible for affecting the water flow of the San José stream. They demand that Yanacocha discharge 200 liters of water from the San José Reservoir. The case is being monitored.
Presidency of the Council of
Ministers (2019)
Magdalena District
Mercury Spill at Choropampa
There was a conflict between the population and the Yanacocha mining company in 2000 due to a mercury spill in the town of Sebastián de Choropampa. A report from the Ministry of Health (N°188-2008-DGSP/DSS/MINSA) determined that there was still mercury in the houses of Choropampa. The affected people are still being followed up.
Interviewing District
Officials (2021)
San Juan District
Conflict over land invasion in Huacraruco (SAIS José Carlos Mariátegui)
In the Huacraruco Annex of the SAIS José Carlos Mariátegui, there have been invasions for more than 5 years by unidentified persons on the border of the districts of San Juan and Jesús. This conflict has been characterized by the use of firearms and violence by the invaders, generating significant violence. Currently, the workers of the cooperative themselves are managing security in their territory.
Interviewing District
Officials (2021)
Province of San Pablo
San Bernardino District
Conflict between CC San Luis and San Antonio
In 2013 the CC San Antonio de Cachi of the San Bernardino district and the CC San Luis located in the district of San Luis have had conflicts over territorial boundaries. This conflict is still latent.
Interviewing District
Officials (2021)
District of San Pablo
No social conflicts were identified
District of Tumbaden
Conflict over the conservation of headwaters in the hamlet of Alto Perú
In 2007, a conflict began between the people of the district and Yanacocha, as they wanted to develop mining activity in Las Lagunas. There were mobilizations until 2018 and a request was submitted to the Central Government to declare Las Lagunas de Alto Perú as an international conservation area. However, the request was observed by the Constitutional Court and so far there has been no solution to the demand of the population. The conflict remains latent.
Interviewing District
Officials (2021)
Province of Cajabamba
District of Cachachi
Lawsuits filed against Pan American Silver mining company
In 2019, the Association of Villages Affected by the Shahuindo Project demands the Tahoe company to sign a social agreement that incorporates issues related to productive development, social responsibility, local employment and hiring of local companies. The
Presidency of the Council of
Ministers (2019)

Environmental and Social Impact Assessment of Forest Landscape Restoration Project December 2021
Social Capital Group 324
Name Description Source
meeting was held in the framework of the space for dialogue between the 4 villages. It was reported that the meetings continue with the company Pan American Silver.
Opposition to formal and informal mining activities
Since 2015, the authorities and a sector of the population of Chuquibamba and Condebamba have opposed the formal mining activities that are intended to be developed in the province and the informal mining activities that are being developed in the Algamarca hill and the area of La Chilca, due to the negative environmental impact that these cause to the Condebamba valley.
Office of the Ombudsman
(2019)
Source: Ombudsman's Office, Presidency of Councils of Ministers and SCG fieldwork.
6.4.9 Culture
This chapter presents the main cultural aspects that characterize the study districts. It deals with the identification of farmer communities and indigenous peoples, the predominant language of the inhabitants and the traditions, customs and main cultural values of the population.
6.4.9.1 Identification of Farmer Communities and Indigenous Peoples
According to Article 2 of Law No. 24656121 , the Farmer Communities are organizations of public interest, with legal existence and legal personality, made up of families that inhabit and control certain territories, linked by ancestral, social, economic and cultural ties, expressed in the communal ownership of land, communal work, mutual aid, democratic government and the development of multisectoral activities.
In the districts of the three provinces of the Cajamarca region, 38 farmer communities were identified, of which 31 are located in the province of Cajamarca, 4 in the province of San Pablo and 3 in the province of Cajabamba. Likewise, the farmer community with the largest territorial extension is Cospán with 3,647.12 hectares and located in the district of the same name; while the smallest is Cochopampa with 33.8 hectares and located in the district of Chetilla. Regarding land titling conditions, more than 84% of the identified communities are titled and 6 of them are still in the process of titling (Cushunga, Chirigpunta, Huariguro, Santo Domingo de Culquimarca and Santa María de Magdalena in the province of Cajamarca; and María Parado de Bellido in the province of Cajabamba).
On the other hand, five communities stated that Quechua is an indigenous language. Four of these are located in the district of Chetilla and one in La Encañada. The rest of the communities stated that they speak Spanish. According to INEI's 2017 Directory of Native and Farmer Communities, the farmer communities of Chirigpunta, Cochapampa, Mahuaypampa, Mishca Chica, in the district of Chetilla, and the community of La Encañada, in the district of the same name, declared that they belong to the indigenous or native Quechua people.
Of the 38 communities identified, 13 are within the Project's Potential Area of Influence (PAI). These communities are located in the districts of Cajamarca, Asunción, Chetilla, Cospán, Magdalena and Tumbadén,
121 Law No. 24656 - General Law on Farmer Communities

Environmental and Social Impact Assessment of Forest Landscape Restoration Project December 2021
Social Capital Group 325
Table 6.101 Farmer Communities
Name Date of
Recognition Titled
Hectares
Indigenous or native language
Census population
Private Homes
Within the EPI
Cajamarca Province
Cajamarca District
Calispuquio 2/07/1987 152,62 English 874 334 No
Cushunga 26/11/1986 - English 266 130 Yes
Sexemayo Lot Ii 2/08/1990 837,50 English 240 91 Yes
Tual 14/12/1966 214,06 English 927 575 Yes
Asunción District
Catillambi 23/04/1946 420,62 English 1 495 665 No
Catulla Y Anexos , Palo Blanco and Layo 28/04/1961 876,66 English 365 135 No
Chamani Sapuj 1/04/1964 2 284,03 English 1 677 733 Yes
Huatum Vista Alegre 25/04/1966 190,10 English 720 314 No
San Juan De Cachilgon and its annexes 23/11/1949 2 330,27 English 291 117 Yes
Chetilla District
Chereg - - English 100 32 Yes
Chirigpunta 8/02/1990 - Quechua 206 59 No
Cochapampa 3/07/1987 33,80 Quechua 153 46 No
Mahuaypampa 31/05/1996 44,10 Quechua 217 95 Yes
Mishca Girl 9/09/1976 246,62 Quechua 500 246 Yes
Cospán District
Cospan 27/02/1964 3 647,12 English 1 272 494 No
Huacanal Pauca Cepo 10/05/1961 1 920,00 English 283 123 No
Huariguro 30/09/1992 - English 231 77 Yes
St. George 10/05/1961 704,30 English 231 90 No
Santo Domingo de Culquimarca 6/03/1990 - English 333 92 No
Encañada District
La Encañada 27/12/1946 2 730,63 Quechua 1 250 593 No
Michiquillay 25/07/1963 5 509,38 English 1 493 821 No
Jesus District
Hualqui 25/12/1946 41,70 English 1 412 467 No
Huancate Sumac Mollepata 12/03/1964 421,03 English 106 48 No
The Huaraclla 4/10/1946 249,05 English 1 690 649 No
Yanamango 4/10/1946 351,48 English 1 581 543 No
Magdalena District
Catache 24/02/1960 1 873,96 English 358 134 Yes
Cumbico 5/02/1962 1 841,88 English 249 111 Yes
Saint Mary of Magdalene 31/01/1990 - - - - Yes
Choropampa Row - 149,02 English 1 084 411 No

Environmental and Social Impact Assessment of Forest Landscape Restoration Project December 2021
Social Capital Group 326
Name Date of
Recognition Titled
Hectares
Indigenous or native language
Census population
Private Homes
Within the EPI
San Juan District
Quivinchan 4/08/1964 1 476,81 English 871 279 No
San Juan De Yanac 31/10/1943 1 556,25 English 1 863 816 No
Province of San Pablo
San Bernardino District
San Bernardino and San Antonio de Cachis 29/09/1955 10 126,87 English 1 073 430 No
San Pablo District
Cuzquiden and San Francisco del Monte
28/05/1948 110,15 English 1 622 741 No
Unanca 22/03/1936 2 352,50 English 1 537 832 No
Tumbaden District
Morohuisha Lot Forty-Three - - English 11 16 Yes
Cajabamba Province
Cachachi District
Chorobamba 11/05/1994 42,61 English 146 60 No
Laderon Las Rosas - Lluchucauday - - English 240 91 No
Maria Parado De Bellido 24/08/1987 - English 169 67 No
Source: INEI - Directorio de Comunidades Nativas y Campesinas (2017) and SICCAM - Sistema de Información sobre Comunidades Campesinas (2016).
6.4.9.2 Language
Language is a fundamental part of the cultural characteristics of a population. It is one of the means by which a people can express their particular vision of the world, preserve and exchange their knowledge, establish relationships with those around them and can keep their culture alive.
In the region of Cajamarca, almost all of the population speaks Spanish (98.6%), and to a much lesser extent Quechua (0.6%). This proportion is maintained in the province of Cajamarca with 98.2% of Spanish and 1.2% of Quechua. In the province of San Pablo, 99.4% of the population speaks Spanish and 0.3% Quechua. Similarly in the province of Cajabamba, with 99.4% of Spanish and 0.2% of Quechua.
In almost all the districts of the province of Cajamarca the proportion is similar to that of the provincial level. In the districts of Asunción, Baños del Inca, Cajamarca, Cospán, Encañada, Magdalena, San Juan, the percentage of people whose mother tongue is Spanish varies between 98% and 99.5%. In the case of those whose mother tongue is Quechua, the proportion varies between 0.01% and 1.3%; with the exception of the district of Chetilla, where the percentage of Quechua increases to 18% and that of Spanish is reduced to 81.9%.
In the province of San Pablo, the percentages within the districts are maintained with respect to the province. In San Bernardino and San Pablo, Spanish is the predominant mother tongue with

Environmental and Social Impact Assessment of Forest Landscape Restoration Project December 2021
Social Capital Group 327
99% in both cases and Quechua is between 0.2% and 0.3% respectively. In the district of Tumbaden, Spanish is the predominant mother tongue with 99.2% of the cases and Quechua represents 0.7% of the total cases.
Table 6.102 Language at regional, provincial and district levels
Scope Language N %
Cajamarca Region
Quechua 7 502 0.6 Aimara 116 0.0
Ashaninka 19 0.0
Awajún / Aguaruna 1 311 0.1
Shipibo - Konibo 20 0.0
Shawi/Chayahuita 13 0.0
Matsigenka/Machiguenga 8 0.0
Achuar 10 0.0
Other native language 2 0.0
English 1 332 516 98.6
Portuguese 111 0.0
Other foreign language 265 0.0
Peruvian Sign Language 762 0.1
Does not listen, does not speak 2 447 0.2
Wampis 21 0.0
Kukama kukamiria 1 0.0
Yagua 1 0.0
Harakbut 1 0.0
Don't know / No answer 6 131 0.5
Total 1 351 254 100.0
Cajamarca Province
Quechua 4 057 1.2
Aimara 45 0.0
Ashaninka 6 0.0
Awajún / Aguaruna 13 0.0
Shipibo - Konibo 5 0.0
Shawi/Chayahuita 2 0.0
Matsigenka/Machiguenga 3 0.0
Achuar 2 0.0
English 342 980 98.2
Portuguese 39 0.0
Other foreign language 201 0.1
Peruvian Sign Language 96 0.0
Does not listen, does not speak 260 0.1
Don't know / No answer 1 390 0.4
Total 349 100 100.0
Asunción District
Quechua 3 0.0
English 7 938 98.7
Portuguese 1 0.0
Peruvian Sign Language 2 0.0
Does not listen, does not speak 10 0.1
Don't know / No answer 85 1.1
Total 8 039 100.0
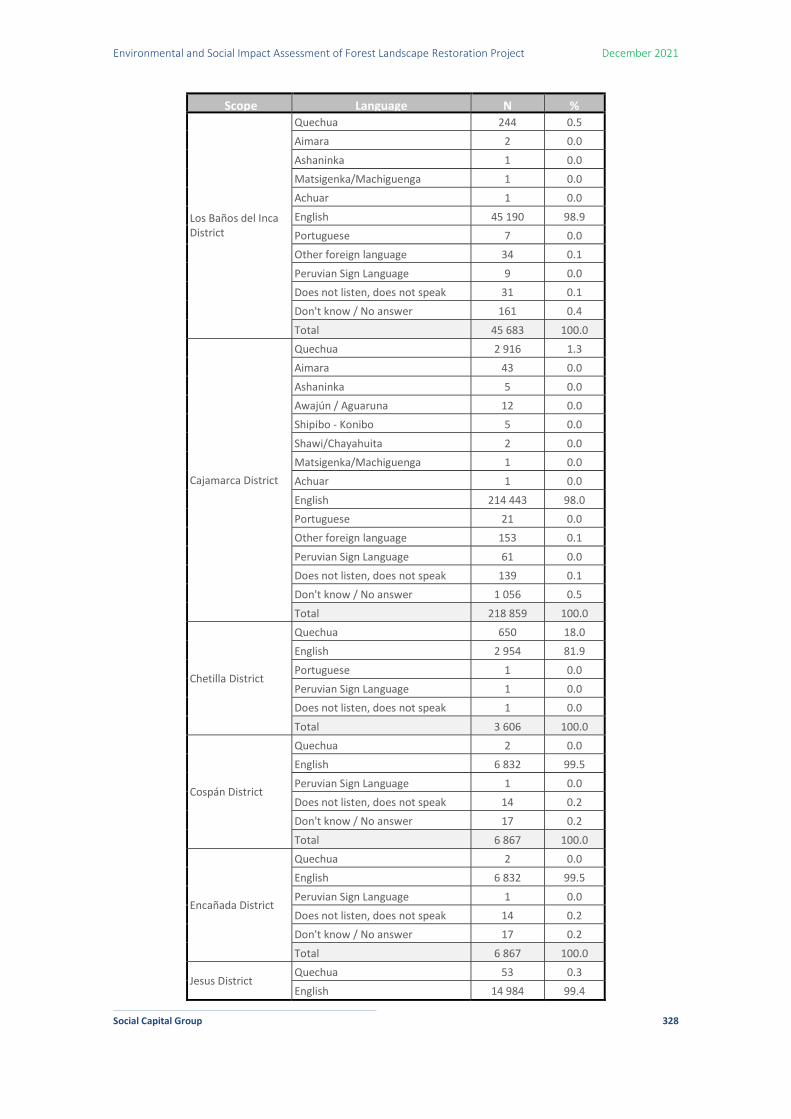
Environmental and Social Impact Assessment of Forest Landscape Restoration Project December 2021
Social Capital Group 328
Scope Language N %
Los Baños del Inca District
Quechua 244 0.5
Aimara 2 0.0
Ashaninka 1 0.0
Matsigenka/Machiguenga 1 0.0
Achuar 1 0.0
English 45 190 98.9
Portuguese 7 0.0
Other foreign language 34 0.1
Peruvian Sign Language 9 0.0
Does not listen, does not speak 31 0.1
Don't know / No answer 161 0.4
Total 45 683 100.0
Cajamarca District
Quechua 2 916 1.3
Aimara 43 0.0
Ashaninka 5 0.0
Awajún / Aguaruna 12 0.0
Shipibo - Konibo 5 0.0
Shawi/Chayahuita 2 0.0
Matsigenka/Machiguenga 1 0.0
Achuar 1 0.0
English 214 443 98.0
Portuguese 21 0.0
Other foreign language 153 0.1
Peruvian Sign Language 61 0.0
Does not listen, does not speak 139 0.1
Don't know / No answer 1 056 0.5
Total 218 859 100.0
Chetilla District
Quechua 650 18.0
English 2 954 81.9
Portuguese 1 0.0
Peruvian Sign Language 1 0.0
Does not listen, does not speak 1 0.0
Total 3 606 100.0
Cospán District
Quechua 2 0.0
English 6 832 99.5
Peruvian Sign Language 1 0.0
Does not listen, does not speak 14 0.2
Don't know / No answer 17 0.2
Total 6 867 100.0
Encañada District
Quechua 2 0.0
English 6 832 99.5
Peruvian Sign Language 1 0.0
Does not listen, does not speak 14 0.2
Don't know / No answer 17 0.2
Total 6 867 100.0
Jesus District Quechua 53 0.3
English 14 984 99.4

Environmental and Social Impact Assessment of Forest Landscape Restoration Project December 2021
Social Capital Group 329
Scope Language N % Portuguese 3 0.0
Other foreign language 2 0.0
Peruvian Sign Language 3 0.0
Does not listen, does not speak 12 0.1
Don't know / No answer 18 0.1
Total 15 075 100.0
Magdalena District
Quechua 55 0.6
Matsigenka/Machiguenga 1 0.0
English 8 333 99.2
Peruvian Sign Language 2 0.0
Does not listen, does not speak 7 0.1
Don't know / No answer 7 0.1
Total 8 404 100.0
San Juan District
Quechua 19 0.4
English 4 302 99.3
Peruvian Sign Language 1 0.0
Does not listen, does not speak 5 0.1
Don't know / No answer 4 0.1
Total 4 332 100.0
Province of San Pablo
Quechua 70 0.3
Shawi/Chayahuita 1 0.0
English 21 263 99.4
Other foreign language 2 0.0
Peruvian Sign Language 14 0.1
Does not listen, does not speak 25 0.1
Don't know / No answer 22 0.1
Total 21 397 100.0
San Bernardino District
Quechua 8 0.2
Shawi/Chayahuita 1 0.0
English 4 315 99.4
Peruvian Sign Language 5 0.1
Does not listen, does not speak 9 0.2
Don't know / No answer 4 0.1
Total 4 342 100.0
San Pablo District
Quechua 37 0.3
English 12 587 99.4
Other foreign language 2 0.0
Peruvian Sign Language 8 0.1
Does not listen, does not speak 12 0.1
Don't know / No answer 18 0.1
Total 12 663 100.0
Tumbaden District
Quechua 24 0.7
English 3 404 99.2
Does not listen, does not speak 3 0.1
Total 3 431 100.0
Cajabamba Province Quechua 157 0.2
Aimara 5 0.0

Environmental and Social Impact Assessment of Forest Landscape Restoration Project December 2021
Social Capital Group 330
Scope Language N % Ashaninka 1 0.0
Shipibo - Konibo 2 0.0
Achuar 1 0.0
Other native language 1 0.0
English 75 137 99.4
Portuguese 1 0.0
Other foreign language 5 0.0
Peruvian Sign Language 24 0.0
Does not listen, does not speak 102 0.1
Kukama kukamiria 1 0.0
Don't know / No answer 154 0.2
Total 75 592 100.0
Cachachi District
Quechua 50 0.2
Aimara 1 0.0
Shipibo - Konibo 1 0.0
English 23 194 99.3
Portuguese 1 0.0
Other foreign language 1 0.0
Peruvian Sign Language 5 0.0
Does not listen, does not speak 25 0.1
Don't know / No answer 70 0.3
Total 23 350 100.0
Source: INEI Census, 2017
6.4.9.3 Traditions, customs and main cultural values
This section presents the main festivities identified, the most important religious cults and the cultural heritage of the 13 districts of this study. For this, information from the INEI (Directory of native and farmer communities 2017, National Census 2017, National Directory of the Main Festivities at District Level 2013) and the information collected during the fieldwork are taken into account.
In general terms, district officials mentioned that cultural traditions have been lost over time, a situation that has worsened with the Covid-19 health emergency that has prevented activities in public spaces. However, some iconic traditions and festivities are still maintained in some districts. For example, the Festicuy in the district of Jesus, which takes place on November 26th where guinea pig contests are held. We can also mention the distillation of the cañazo that takes place annually in the Anispampa hamlet of the district of San Bernardino. In Cajamarca, the Cajamarca Carnival and Corpus Christi are celebrations that still manage to bring together the local population and national and foreign visitors. Table 6.103shows a list of festivities identified by the INEI with the dates of celebration and days of duration.
Table 6.103 Festivities identified according to district level
Scope Festivities Dates Days of duration
Asunción District Carnivals 1-Feb 7
Virgin Of The Gate 29-May 7

Environmental and Social Impact Assessment of Forest Landscape Restoration Project December 2021
Social Capital Group 331
Scope Festivities Dates Days of duration
Virgin Of The Assumption 15-Aug 20
St. Rose Of Lima 30-Aug 7
Virgin Of The Mercedes 24-Set 7
Saint Michael the Archangel 29-Set 5
District Anniversary 2-Oct 2
St. Martin De Porres 2-Nov 7
Baños del Inca District
Virgin Of Carmen 15-Jul 3
Virgin Of The Aurora 15-Aug 7
St. Rose Of Lima 30-Aug 1
Virgin Of The Nativity 6-Set 8
Las Mercedes And Santiago 15-Set 3
Jesus The Good Shepherd 29-Set 1
Captive Lord Of Ayabaca 14-Oct 7
St. Luke's 21-Oct 7
Cajamarca District
Carnivals 1-Feb 28
Fiesta De Las Cruces 10-Apr 6
Corpus Christi 18-Jun 7
Our Lady of the Rosary 1-Oct 7
Lord Of The Miracles 18-Oct 8
Chetilla District St. Rose Of Lima 29-Aug 7
St. Stephen's 29-Dec 9
Cospán District
Our Lady of the Rosary 27-Oct 14
St. George 8-Dec 6
Virgin Immaculate Conception 17-Dec 10
Encañada District San Pedro 28-Jun 3
Virgin Immaculate Conception 8-Dec 7
Jesus District Sweet Name Of Jesus 21-Jan 21
Mr. De Ramos 18-Mar 7
Magdalena District
San Sebastian 20-Jan 10
Saint Mary Magdalene 22-Jul 13
St. Rose Of Lima 30-Aug 5
Our Lady of the Rosary 8-Oct 5
San Antonio 15-Nov 5
San Juan District
Ascension of the Lord 15-May 11
Saint John the Baptist 24-Jun 13
St. Rose Of Lima 30-Aug 2
San Bernardino District
Carnivals 1-Feb 7
Easter Week 1-Apr 4
Corpus Christi 10-May 7
San Bernardino 20-May 10
All Saints 2-Nov 2
San Pablo District Saint John the Baptist 24-Jun 12
St. Martin De Porres 5-Aug 8

Environmental and Social Impact Assessment of Forest Landscape Restoration Project December 2021
Social Capital Group 332
Scope Festivities Dates Days of duration
Lord Of The Miracles 14-Set 7
Our Lady of the Rosary 2-Oct 5
Saint Francis Of Assisi 4-Oct 7
St. Martin De Porres 15-Nov 7
Tumbaden District
St. Rose Of Lima 30-Aug 4
Ingatambo 7-Set 3
Virgin Of The Mercedes 24-Set 4
Saint Francis Of Assisi 3-Oct 3
District Anniversary 7-Dec 4
Cachachi District
Carnivals 1-Feb 15
District Anniversary 11-Feb 5
San Isidro 15-May 2
Saint John the Baptist 24-Jun 2
Virgin Of The Mercedes 24-Set 5
Virgin Immaculate Conception 8-Dec 2
Source: INEI - Directorio Nacional de Principales Festividades a Nivel Distrital 2013.
In terms of religious worship, according to INEI's Directory of Farmer Communities of the 2017 Census, Catholic worship and worship of the Pachamama are the main religious references of the population of the districts in the area of interest. Likewise, in the districts of Los Baños del Inca, Chetilla and Jesús, evangelical worship was also identified. The following table shows both the types of religious cults and the cultural heritage identified at the district level.
Table 6.104 Patron saint festivities, religion and heritage
District Religiosity Heritage
Asunción District Catholic Worship, Pachamama Worship Archaeological Ruins-Bateas-El Calvario
Baños del Inca District Catholic Worship, Evangelical Worship Baños del Inca (Hot springs)
Cajamarca District Catholic Worship, Pachamama Worship Archaeological complex of Cumbemayo-Rescue Room
Chetilla District Catholic Worship, Evangelical Worship Archaeological Resources in Mahuaypampa
Cospán District Catholic Worship, Pachamama Worship N/A
Encañada District Catholic Worship, Pachamama Worship Ventanillas de Combayo, Ruins of the Santolayas, Kapac ñam
Jesus District Catholic Worship, Evangelical Worship La Succha , Quebrada (Hot springs)
Magdalena District Catholic Worship, Pachamama Worship Kapac Ñan - Las Huacas Sanctuary
San Juan District Catholic Worship, Pachamama Worship Yumagual Hot Springs
San Bernardino District Catholic Worship, Pachamama Worship Archaeological Zone of Yanaorco
San Pablo District Catholic Worship, Pachamama Worship Paredones Monument
Tumbaden District Catholic Worship, Pachamama Worship Archaeological Remains of Ventanilla
Cachachi District Catholic Worship, Pachamama Worship Archaeological zone of Condorcucho
Source: INEI - Directorio de Comunidades Nativas y Campesinas - Censo 20217: INEI - Directorio de Comunidades Nativas y Campesinas - Census 20217

Environmental and Social Impact Assessment of Forest Landscape Restoration Project December 2021
Social Capital Group 333
7 ASSESSMENT OF ENVIRONMENTAL AND SOCIAL IMPACTS
This chapter will proceed to identify and evaluate the possible negative and/or positive, direct or indirect environmental and social impacts that could arise as a consequence of the stages and activities involved in the development of the Project, generating environmental impacts that could occur due to alterations in one or more environmental components, and that could compromise the ecosystems and the health and wellbeing of the population. The baseline description has made it possible to identify and describe the main environmental impacts on the physical, biological, socio-economic and cultural environment that would be affected by the implementation of the project. The main prevention, mitigation, monitoring and compensation measures will be focused on these impacts, which are described in the Environmental Management Plan. Environmental impacts are identified and evaluated in a potential way, that is, without the application of mitigation measures, Good industry practices, international certifications, among others. By applying the proposed measures, the assessment of the impacts can be significantly reduced or even eliminated.
It is important to mention that due to the current level of development of the project (conceptual level), a qualitative method of evaluation will be used. The model to be used is the so-called Leopold Matrix, which consists of a double-entry table in which the environmental factors that can be affected are arranged as rows and the proposed actions (activities) that take place and can cause possible impacts are arranged as columns.
7.1 Impact-sensitive environmental factors
While there are a large number of environmental factors, it can be determined that there are some that are more important in order to identify the factors that will be directly or indirectly affected by the project activities.
The table below shows the table resulting from the identification of significant environmental factors for this project:
Table 7.1 Factors sensitive to impacts
Medium Factor Sub-factor
PHYSICAL
Air Air pollution
Noise
Water Water quality
Quantity of water
Soil Soil quality
Waste generation Slope stability
Landscape Landscape quality
BIOLOGICAL Vegetation
Vegetation cover Loss of natural vegetation
Fauna Habitat loss
Affecting individuals Prepared by: Pacific PIR S.A.C.

Environmental and Social Impact Assessment of Forest Landscape Restoration Project December 2021
Social Capital Group 334
7.2 Potentially Impactful Project Activities
The project activities that have a potential impact on the environment have been identified. It is known that the project has two main components: 1) installation of new plantations, management and use of existing plantations, and 2) sawmilling and processing of the roundwood produced, the potentially impacting activities have been identified and are presented chronologically below:
Table 7.2 Potentially impacting project activities
Stage Activity
Installation of new plantations, management and utilisation of existing plantations
Installation and management of forest nurseries
Opening of forest roads Installation of the plantations
Maintenance and pruning of plantations Thinning of plantations
Final felling, extraction of logs and transport to the sawmill
Sawmilling and processing of the roundwood produced Prepared by Pacific PIR S.A.C.
7.3 Identification and assessment of impacts
7.3.1 Leopold Methodology
The Leopold impact assessment methodology aims to establish, through the use of a matrix, the cause-effect relationships of the particular characteristics of a project, and the environmental factors likely to be modified by it.
The Leopold matrix is not in itself an environmental assessment system, but essentially an identification method, and it is the subsequent analysis of the results of the matrix that will enable the effects to be assessed and the best alternative solutions to be found.
The use of this methodology has been defined as opposed to others, due to the level at which the project is currently at (Conceptual), and there is no precise information on the activities to be carried out, the sites for the use and installation of components, chronograms, etc.
The first step of the Leopold Matrix methodology consists of identifying the existing interactions, for which the typical activities that the 2 stages of the project might have (installation of new plantations, management and use of existing plantations, and sawmilling and processing of the roundwood produced) were taken into account. Subsequently, for each action, all environmental factors that could be significantly affected were considered.
Each cell (product of the intersection of rows and columns) is divided diagonally, with the magnitude of the impact (M) at the top and the intensity or degree of impact (I) at the bottom.

Environmental and Social Impact Assessment of Forest Landscape Restoration Project December 2021
Social Capital Group 335
Magnitude (M): Assessment of the impact or potential alteration to be caused; degree, extent or scale; it is placed in the upper left half. It refers to the intensity, the dimension of the impact itself and is rated from 1 to 5 from lowest to highest, with a + sign for positive effects and a - sign for negative effects.
Importance (I): Weighted value, which gives the relative weight of the potential impact, written in the lower right half of the table. It refers to the relevance of the impact on the quality of the environment, and to the extension or territorial area affected, it is also rated from 1 to 5 in increasing order of importance.
The Leopold Matrix model to be used for the impact assessment is presented below.
Figure 7.1 Leopold Matrix Model
The sum of the values in the rows will indicate the impact of the whole on each environmental factor, while the sum of the values in the columns will give a relative assessment of the effect that each action will have on the environment.
Both estimations are made from a subjective point of view as there are no assessment criteria, however, it has been carried out jointly and thoroughly by a multidisciplinary team of experts in charge of the assessment, so that the way of operating is quite objective and serves as a preliminary assessment of the environmental impacts and allows decisions to be made in the face of them.
7.3.2 Evaluation matrix
The evaluation matrix with the factors and activities associated with the project are presented below.

Social Capital Group 336
Table 7.3 Impact assessment matrix
-3 3 -1 -4 -5 -102 4 1 3 3 13
-3 -2 -3 -5 -132 1 2 3 8
-1 -1 -21 1 2
-1 -11 1
-2 -1 -4 -3 -101 1 5 2 9
-1 -3 -1 -2 -2 -3 -5 -171 2 1 1 1 2 2 10
-1 3 -3 -11 5 4 10
-2 -1 3 -4 -3 -71 1 5 3 2 12
-2 -4 3 -4 -4 -111 2 5 3 2 13
-4 -3 1 -4 -101 5 1 1 8
-2 -4 1 -1 -2 -81 5 1 1 1 9
-2 -4 -1 -2 -2 -111 5 1 1 1 9
-6 -26 0 -2 -5 -28 -344 15 35 1 7 24 18
BIO
LOG
ICAL Vegetación
Landscape quality
MagnitudeImportance
Loss of natural vegetation
Loss of habitat
Individuals affectedFauna
PHYS
ICAL
Water quality
Amount of waterWater
SAWMILLING AND PROCESSING OF THE
ROUNDWOOD PRODUCED Im
port
ance
Mag
nitu
de
Vegetative cover
Landscape
Soil quality
Waste generationSoil
Slope stability
Air pollution
NoiseAir
COMPONENTS FACTOR SUBFACTOR
Thin
ning
of
plan
tatio
ns
Fina
l fel
ling,
ex
trac
tion
of lo
gs a
nd
tran
spor
t to
the
saw
mill
INSTALLATION OF NEW PLANTATIONS, MANAGEMENT AND UTILIZATION OF EXISTING PLANTATIONS
Inst
alla
tion
and
man
agem
ent o
f for
est
nurs
erie
s
Ope
ning
of f
ores
t ro
ads
Inst
alla
tion
of
plan
tatio
ns
Mai
nten
ance
and
pr
unin
g of
pla
ntat
ions

Environmental and Social Impact Assessment of Forest Landscape Restoration Project December 2021
337
7.4 Environmental and social impact assessment
As indicated above, it is the analysis of the results of the matrix that determines the evaluation of the effects and provides the best alternative solutions for them. It should be clear that this analysis is without considering the management measures that are proposed to eliminate, mitigate or compensate these impacts. After applying them, the level of impacts must be significantly reduced. As a result of the interactions in the matrix, the most impactful activities are the following:
Sawmilling and processing of roundwood produced (-34/18 )
Final felling, extraction of logs and transport to the sawmill (-28/24), for the installation of new plantations and the management and use of existing plantations.
Opening of forest roads (-26/15), for the installation of new plantations and the management and use of existing plantations.
Furthermore, as a result of the interactions in the matrix, the most affected environmental and social factors are as follows:
7.4.1 Physical environment
Waste generation (-17/10), mainly in sawmilling and wood processing activities, final logging, log extraction and transport, road opening and thinning, however, all activities are susceptible to the generation of both non-hazardous and hazardous waste.
Air pollution (-10/13), mainly during sawing and processing of timber, felling and transport of logs, as well as opening of forest roads.
Noise (-13/8), mainly during sawing and processing of timber, felling and transport of logs, as well as during the opening of forest roads.
7.4.2 Biological Environment
Vegetation cover (-11/13), mainly due to the installation of the area where sawmilling and processing of the roundwood produced will take place, the opening of forest roads, and final felling. The facilities are expected to be built on an already affected area or on an industrial área, which would reduce the impacts on plant cover.
Affectation of fauna individuals (-11/9), mainly due to the plantation activity, as a protection fence must be installed with the consequent affectation in the transit of species.
7.4.3 Social Environment
Economic displacement (-14/16), due to the use by the Project of areas used for cattle, that would affect the sources of incomes of the owners of the animals
Impacts due to dust and noise (-9/13), as a result of the opening of roads and use of machinery during thinning and felling.

Environmental and Social Impact Assessment of Forest Landscape Restoration Project December 2021
338
Risk of accidents and diseases (-18/18), especially due to maintenance activities, thinning and felling with chainsaws that imply greater exposure to risks of accidents and occupational diseases
In the following, the impacts will be described starting from the point of view of the project activities, and then from the point of view of the affected factor.
7.5 Impact assessment by project activities
Based on the most impactful project activities, i.e. those with the highest magnitude and intensity after summing up the columns, the impacts on environmental and social factors are described.
Sawmilling and processing of the roundwood produced
Considering that the site for the installation of the sawmill and wood processing plant has not yet been selected, the negative impacts have been evaluated at their maximum potential. In accordance with this, it has been considered for the evaluation that the vegetation cover of the site would have to be removed and the soil compacted, that there would be a large amount of solid waste and nearby populations that could be affected by noise and particulate emissions. Likewise, the potential risks for the health and safety of the workers derived from the sawmilling and wood processing activities have been considered. For these reasons, this activity has been considered the most impactful of the project, with a Magnitude -34 and a significance of 18.
However, by selecting a suitable site, previously intervened, sufficiently far from neighbors and applying environmental management measures and health and safety of workers, these impacts can be significantly reduced.
Final felling, extraction of logs and transport to the sawmill
The final logging activity is another of the most impacting activities of the project, with values of magnitude -28 and significance 24 having been determined.
This is because it is foreseen that machinery and equipment will be used for logging and log cutting, as well as trucks for transport to the sawmill, which generate gas and particulate emissions that could alter normal air quality conditions. The same applies to noise, as the use of machinery and vehicles will raise noise levels in the area. This type of impact is unavoidable, however, the use of modern, well-maintained machinery and equipment significantly reduces it.
This activity will also generate solid waste, both organic waste from the logging itself, as well as waste from the personnel in charge of the work, and even hazardous waste from the maintenance of machinery and equipment. This last type of waste, if not properly managed, could generate soil contamination, which is why the management plan specifies a specific programme to be taken into account.
The final felling will have a significant negative impact on the landscape, as the forest, which for a long time provided an attractive landscape for the population and visitors, will be lost. Likewise, the loss of the forest could affect the slopes and cause landslides, with the consequent impact on productive soils, accesses, risks to the population, etc. Likewise, vegetation cover will be lost, since

Environmental and Social Impact Assessment of Forest Landscape Restoration Project December 2021
339
during the development of the forest an undergrowth is generated under the canopy, losing the ecosystem and consequently affecting the fauna. However It is expected that the Project will replant these areas, which would reduce the impacts to the landscape as well as the soil and the associated ecosystem.
Opening of forest roads
For this activity, values of -26 for magnitude and 15 for importance were determined.
These values are mainly explained by the fact that the opening works, as well as the permanence of the roads after the felling of the forest, could affect in a general way the vegetation cover, as well as the natural vegetation by the action of land levelling activities, removal of topsoil, compaction, filling material, and prevent its recovery by the subsequent use that would be maintained of these roads.
The use of heavy machinery for these works of cutting, levelling, filling, compacting, earth moving, generates alterations in the noise levels of the area, as well as an increase in the concentration of particulate matter.
Failure to comply with solid waste management and machinery maintenance programmes could result in soil contamination due to improper waste disposal, oil or fuel spillage.
The opening of forest roads will be given both for the use of existing forests, as well as those that will be available in the future.
Installation of the plantations
For the planting activity, a magnitude of 0 and a significance of 35 was determined.
These values denote the importance of forest plantations for the environment. Mainly associated with the stability of slopes, improvement of the landscape, increase in vegetation cover and the consequent retention of water in the soil. At the beginning, the plantations must be protected, which is why fences are established to prevent the transit of fauna species. However, once the forest is consolidated, these fences are removed, achieving an integration of the plantation with the ecosystem.
It is important that an adequate waste management plan is defined during all work in the field and that it is complied with by the personnel carrying out the work, in order to avoid inadequate disposal of solid waste.
In the planting activity, there will also be an improvement in air quality, which is a positive impact, as oxygen availability will increase and the plants will help to reduce carbon dioxide, among other polluting gases.

Environmental and Social Impact Assessment of Forest Landscape Restoration Project December 2021
340
7.6 Impact assessment for environmental factors
The following is a description of the impacts with the greatest magnitude and intensity after adding up the rows, i.e. the description of the environmental factors that will be most affected by the implementation of this project.
Air pollution
This factor has a rating of -10 in magnitude and 13 in importance. Air quality is expected to be affected mainly by sawmilling and wood processing activities, the opening of forest roads and final logging, as heavy machinery and tools will be required to generate gaseous emissions and particulate matter.
As these impacting activities are of a one-off nature and carried out in defined periods, they will not generate a change in the current air quality condition of the area.
The impact on air quality will also be positive in this project, since the new plantations play an important role in improving air quality, as they act as a sink for particulate matter and polluting gases, which is why it has been assessed as positive in this case.
Noise
This factor scored -13 in magnitude and 8 in importance. As in the case of air quality, the use of machinery and tools for sawmilling and wood processing, the opening of forest roads, final felling and thinning will generate noise.
From the occupational point of view, it will be necessary to take protective measures for workers. These works are carried out in specific areas, intermittently, and far from populated centres, and for this reason noise levels will increase on an ad hoc basis, not generating a change in the current condition.
Soil quality
Soil quality could be affected mainly by the misuse or poor maintenance of machinery and tools, and their corresponding inputs, in the activities of opening forest roads, thinning and final felling. There may be spills or leaks of fuels, oils or grease that could affect soil components, in addition to this, the good waste management that will be in all project activities must be taken into consideration, as their poor storage and disposal could alter soil quality. This impact has been assessed with a magnitude of -10 and a significance of 9.
Waste generation
This impact is present in all project activities and has been assessed with a magnitude of -17 and a significance of 10.

Environmental and Social Impact Assessment of Forest Landscape Restoration Project December 2021
341
The project will generate common waste from field work, but also hazardous waste from the use and maintenance of power tools, vehicles and machinery. The waste must be temporarily stored according to its condition in suitable places for subsequent disposal to controlled sites.
Landscape quality
The quality of the landscape will be affected both positively and negatively throughout the implementation of the different stages of the project. When the planting of the new forest takes place, it will have a positive impact that will beautify the landscape, however, the final felling of the new forest, as well as the felling of the existing plantations, will leave the land devoid of pine forest, and the opening of new forest roads will reduce the quality of the landscape. However, the replanting of the areas already harvested, will reduce the impacts to the landscape as well as to the soil and the associated ecosystem.
Overall, i.e. the sum of positive and negative activities on this factor makes it a negatively affected factor with a magnitude of -7 out of 12.
Vegetation cover
This impact has been assessed with a magnitude of -11 and significance of 13. The vegetation cover will be altered by replacing any of the identified land covers with forest plantations for timber purposes. In this case, it is proposed and recommended that the change of use be of an already disturbed vegetation cover, such as agricultural cover, which includes agriculture and cultivated pastures, as well as for the existing plantations that will be felled and the space freed up.
Loss of natural vegetation
This impact has been assessed with a magnitude of -10 and an importance of 8. The immediate cover areas or those that share the ecological floor for the development of radiata pine have been described, which are the jalca and the Andean scrubland, both ecosystems have outstanding biological, ecological, landscape and ecosystemic values, which should not be altered, and on the contrary, actions that contribute to their recovery should be promoted. In native vegetation áreas, it is recommended not to carry out plantations, the environmental measures for this impact are presented in the Environmental Management Plan.
Habitat loss
This impact has been assessed with a magnitude of -8 and importance of 9. The fauna is dynamic, it transits throughout the project area, and the installation of forestry plantations for timber purposes will reduce the transit areas for one group of animals (the majority) and for another group it will act as a refuge from anthropic threats. On the other hand, during the first years of the plantation, the light does not reach the ground, and native species do not develop, which serve as sustenance for the fauna, generating a negative impact.
Affecting individuals

Environmental and Social Impact Assessment of Forest Landscape Restoration Project December 2021
342
This impact has been assessed with a magnitude of -11 and importance of 9. In this case, the greatest impact is the need to fence the plantations to prevent the transit of mainly cattle and sheep, but this fencing would also affect larger mammals such as deer and Andean foxes.
7.7 Impact Assessment for social factors
This section presents the identification and evaluation of the possible impacts on the socio-economic and cultural environment, negative and/or positive, direct or indirect, that could arise as a consequence of the stages and activities involved in the development of the Project. These impacts constitute alterations in one or more social components. For the identification of social impacts, those occurring as a repercussion of an environmental, biological or physical impact have also been considered.
The social impacts assessed will focus on the prevention, mitigation, monitoring and compensation measures described in the Social Management Plan. It is important to mention that due to the current level of development of the Project (conceptual level), a qualitative method of evaluation will be used. The model to be used is the Leopold Matrix, which consists of a double-entry table in which the environmental factors that may be affected are arranged as rows and the proposed actions (activities) taking place that may cause potential impacts are arranged as columns.
7.7.1 Social factors sensitive to impacts
Table 1.4 presents the results of the identification of significant environmental factors that could be sensitive to impacts by the Project:
Table 7.4 Social factors and sub-factors sensitive to impacts
Medium Environmental factor Environmental sub-factor
SOCIAL
Economy
Employment Livestock Economic dynamics Gender gaps Use of mushrooms Tourism
Population Noise and dust nuisance Local capacities
Infrastructure Access routes Health Risk of accidents
Prepared by: SCG
7.7.2 Project activities with a potential impact on the social environment
The activities of the project that have a potential impact on the environment have been identified. It is known that the project has two main components: 1) Use of existing forests, and 2) New forest

Environmental and Social Impact Assessment of Forest Landscape Restoration Project December 2021
343
plantations. For both cases, the stages and their corresponding potentially impacting activities have been identified and are presented chronologically in following table:
Table 7.5 Project Components, Stages and Activities
Stage Activity
Installation of new plantations, management and utilisation of existing
plantations
Installation and management of forest nurseries
Opening of forest roads
Installation of the plantations
Maintenance and pruning of plantations
Thinning of plantations
Final felling, extraction of logs and transport to the sawmill
Sawmilling and processing of the roundwood produced
Prepared by SCG
7.7.3 Identification and assessment of impacts
Following the Leopold impact assessment methodology, already described in section 1.3.1, the identification of potential impacts on the social environment has been carried out.
Table 1.6 presents the Leopold Matrix, where the importance and magnitude of the social impacts identified in Table 1.4 are rated.

Environmental and Social Impact Assessment of Forest Landscape Restoration Project December 2021
344
Table 7.6 Leopold Matrix: Social Impacts
3 3 3 3 3 3 3 213 3 3 3 3 3 3 21
-2 -2 -5 -5 -144 4 4 4 16
3 3 4 1 2 2 3 183 3 3 3 3 3 3 21
3 3 63 5 8
4 4 84 4 8
3 3 64 4 8
-3 -2 -2 -2 -9
4 3 3 3 133 3 3 3 3 4 19
4 4 4 4 4 2 224 4 8
5 5 104 4 8
4 4 84 4 8
4 4 84 4
4 4-2 -2 -1 -1 -2 -5 -5 -18
2 2 2 2 2 4 4 1819 3 16 8 15 1 3
32 20 29 25 27 17 15
Health Risk of accidents/illness
MagnitudeImportance
Local capabilities
Organizational and local culture
Partnership
Assets of communal companies
Cultural practices
Infrastructure Road accessibility
SOCI
AL
Economy
Employment
Livestock
Economic dynamics
Gender gaps
Mushroom utilization
Tourism
Population
Noise or dust nuisance to the population
Impo
rtan
ce
Inst
alla
tion
and
m
anag
emen
t of f
ores
t nu
rser
ies
Ope
ning
of f
ores
t ro
ads
Inst
alla
tion
of
plan
tatio
ns
Mai
nten
ance
and
pr
unin
g of
pla
ntat
ions
Thin
ning
of
plan
tatio
ns
Fina
l fel
ling,
ex
trac
tion
of l
ogs a
nd
tran
spor
t to
the
saw
millCOMPONENTS FACTOR SUBFACTOR
INSTALLATION OF NEW PLANTATIONS, MANAGEMENT AND UTILIZATION OF EXISTING PLANTATIONS
SAWMILLING AND PROCESSING OF THE
ROUNDWOOD PRODUCED M
agni
tude

Social Capital Group 345
7.7.4 Social impact assessment
In this section, the assessment of social impacts by social component is presented. It then identifies the impacts with the greatest importance and magnitude by Project activity. For each impact, an explanatory analysis is made and the management measures identified for their mitigation are presented.
7.7.4.1 Economy
The social impacts identified in the economic component, would be generatedby all the activities of he Project as a whole. However, it has been identified that the greatest effect will be produced by the initial installation activity, the replanting and by the management of forest nurseries. This section presents first the positive impacts and then the negative impacts on the local economy.
7.7.4.1.1 Employment generation
The Project requires the hiring of skilled and unskilled labour, so employment opportunities will be generated for the population in the area of direct influence and in the areas surrounding the Project. The stages that will concentrate the greatest number of jobs will be planting, thinning and extraction, as well as the opening and improvement of access roads. In the case of sawmilling, it could generate between 20 to 25 skilled workers and between 40 to 50 unskilled122,
Considering that the Project might be developed in the SAIS José Carlos Mariátegui and the CAT Llullapuquio, it could benefit from the existing labour force of both these two communities, taking advantage of the proximity of the potential workers to the Project facilities and the knowledge that this population has of the territory in which the Project is going to be developed.
If this is the case, the project will have a significant impact on employment opportunities for SAIS and CAT, since in both cases the employment opportunities they currently have are scarce. The members of both companies are engaged in livestock production, which they sell on the local market, an activity that does not allow them to satisfactorily cover the needs of their members. This is the reason why many of the members have to migrate to other areas in search of work, leaving other workers from neighbouring districts on their land when the member/worker is not there.
SAIS and CAT were not in a healthy economic situation and have also been affected by the Covid19 pandemic. The impact of the employment opportunities that the Project will generate could, therefore, not only affect the members of these companies but also extend to the inhabitants of the districts of Cospán, Cachachi, Jesús or San Juan, where SAIS is located, and to the inhabitants of the district of Chetilla, where CAT Llullapuquio is located.
On the other hand, the development of the Project on Yanacocha's land would imply the hiring of labour from outside the area, as there is no population in the company's concession area. Thus, the employment opportunity could be extended to a wider area of the province of Cajamarca;
122 At this stage in the development of the Project, there is still no precise information available regarding the number of workers that will be required for the rest of the Project activities.

Environmental and Social Impact Assessment of Forest Landscape Restoration Project December 2021
346
specifically, the districts of Cajamarca, Baños del Inca and La Encañada, where Minera Yanacocha is located.
The unemployment rate in the province of Cajamarca is 6.9 %, being higher in the case of women, while underemployment in the Cajamarca region reaches 70.5 %. In this labour context, the job opportunities that the Project will provide will be welcome.
In summary, the generation of employment opportunities is a positive impact of the various Project activities. This factor is rated 21 for magnitude and 21 for importance. The impact has been rated as medium in importance, due to the labour potential that can be absorbed by a forestry-type project. The magnitude has been rated as medium because of the current labour situation in SAIS and CAT.
7.7.4.1.2 Increasing employment opportunities for women
The employment situation of women in the area of direct and indirect influence of the project is very precarious. In the province of Cajamarca, where the SAIS, the CAT and the Yanacocha company are located, the female EAP is only 35.7% of the PET. Of the total female EAP, only 91.2 % is working and the rest is unemployed, while the No EAP, i.e. women who do not enter the labour market, amounts to 64.3 %, one of the highest at national level.
Forestry projects being developed in Cajamarca have shown that there is a demand for female labour due to their manual skills, especially in greenhouse work. In the Baseline, results have been presented for projects such as the "Pilot Forestry Project in Celendín Province, 2012-2014" (Table 6.4), which generated 100,000 daily wages in nursery and plantation activities, with 30% participation of women.
The development of the project with a gender approach, which promotes the hiring of women in specific activities, could improve the working conditions of the women in the families associated with the SAIS and CAT, and in the population at the district level. By doing so, women would have the possibility to improve their income and that of their families. Likewise, by taking part in the training activities carried out by the company, the women could improve their human capital, being able to replicate this knowledge in their own family and community. It should be noted that the partners and managers of both enterprises are mostly men, so the gender focus of the project should be explicit in order to generate this impact.
The Project could, therefore, provide an employment opportunity for women in the area of direct and indirect influence, significantly impacting a rather depressed market.
Consequently, the impact on women's employment opportunities is rated as a positive impact for women that would lead to the reduction of gaps in access to employment. This factor is rated 6 for magnitude and 10 for importance. The magnitude is rated as medium because of the number of women that could be involved in the project. The importance has been rated as high given the current conditions of women's employment. It should be noted that this impact has only been considered for the activities of installation and management of nurseries and maintenance of the project.

Environmental and Social Impact Assessment of Forest Landscape Restoration Project December 2021
347
7.7.4.1.3 Economic revitalisation
The Project can contribute to the revitalisation of the local economy in its direct and indirect area of influence. The sources of this impact are mainly the economic income for the SAIS and CAT partners as a result of the agreements for the use of land necessary for the installation of nurseries, plantations, sawmilling and the opening of roads; the demand for goods and services for the development of the Project; and the increase in income from the hiring of labour.
The project will require the lease of 3,000 ha of land for its implementation. The payment for the purchase or lease of this land can be re-invested by SAIS and CAT members in their livestock and/or forestry activities, for example, through the purchase of machinery and technological improvements. In the case of CAT, they currently have unused land that they have said could be converted to forestry use if they have the necessary investment amounts.
On the other hand, new businesses can be generated or profits increased in those local businesses that provide goods or services to the Project, for example, accommodation, food, transport, repairs, mechanics, laundry, among others. Likewise, these businesses, in order to provide these services and goods, require the hiring of personnel and, therefore, indirect employment is generated. Likewise, the presence of foreign personnel with spending power contributes to the dynamisation of the local economy.
In short, this is a positive impact on the local economy. This factor is rated 18 for magnitude and 21 for importance. The impact is rated as medium to medium-high importance, due to the incomes generated as result of the agreements for the use of the land and for the acquisition of local goods and services. The magnitude is rated as medium given the current dynamisation by the various local economic activities as cattle and forestry.
7.7.4.1.4 Generating new business opportunities for the area of direct influence
a. Use of edible mushrooms
During the plantation maintenance and thinning stages of the project, the possibility of generating and using edible mushrooms that grow in the shade of the plantations is opened up.
Flagship forestry projects such as the Porcón Farm have demonstrated the viability of these crops and the enormous commercial potential of the products, which can be marketed fresh or dried to growing urban markets. The Yanacocha company has supported several forestry development programmes in the Cajamarca region where edible mushrooms have been successfully exploited. For example, according to the SBL, the Celendín Forestry Pilot Project produced between 100 and 200 kilograms of fresh mushrooms per hectare of pine plantation, which were produced from the fourth year of planting. Dehydrated mushrooms have also been produced, obtaining 1 kilogram of dehydrated mushrooms for every 13 kilograms of fresh mushrooms. The market for the edible mushroom has been both national and international.
In the case of the SAIS, according to the SBL, it does not take advantage of the production of edible mushrooms from the pine plantations, but it is the inhabitants of the hamlets of La Shita, Lapar, Granero, Lorito Pampa, Totora, La Cruz, who, in coordination with the SAIS, make use of

Environmental and Social Impact Assessment of Forest Landscape Restoration Project December 2021
348
the edible mushrooms. It should be noted that the SAIS representative expressed his expectation that the project will improve the use of this resource.
In the case of CAT Llullapuquio, according to the SBL, edible mushrooms are harvested and marketed. This activity is carried out directly by the member and his family, with the permission of the cooperative. The mushrooms are sold at the Chetilla market or through buyers.
In the area of direct influence of the Project, there are also the necessary conditions to strengthen businesses of this type, as there are institutions such as ALAC and ADEFOR that have been supporting producers with various activities for several years.
An additional effect to consider is the impact of this type of business on women's employment opportunities. Experience from existing businesses shows that for the harvesting and drying of this product, there can be a significant demand for female labour.
In summary, the generation of business opportunities for the utilisation and marketing of edible mushrooms is a positive impact on the local economy. This factor is rated 8 for magnitude and 8 for importance. The magnitude is rated as medium high because of the current experience and the potential for marketing these products at the provincial level and in partnership with other actors. The importance is rated as medium high because of the people who could be involved and the profitability of this product for the family economy.
b. Tourism development potential
Project activities such as the installation of nurseries and pine plantations, once thinning has taken place, are activities with tourism potential. Both SAIS and CAT could benefit from this business opportunity as the Project will be developed within their territory. In the study area there is already an expectation on the part of CAT members to enter into tourism. However, this impact will depend on the Project's social responsibility actions to strengthen the tourism sector and local interest.
It is worth mentioning that in the Cajamarca region there is the experience of the Porcón Farm, where tourism is developed through cabins, tours, handicrafts, a zoo, restaurants and horseback riding123. Likewise, because of its diversity, tourism is an economic sector that can involve women and people of different age groups.
In short, this is a positive impact on the local economy. This factor has a rating of 6 for magnitude and 8 for importance. The magnitude is rated as medium because of the possibilities for expansion into different areas of tourism (services, food, employment), but which in turn requires investment and training on the part of the population. The importance is rated as medium-high because of the people who could be involved and the contribution to the family economy.
123 http://www.scielo.org.mx/pdf/esracdr/v29n53/2395-9169-esracdr-29-53-e19617.pdf
Environmental and Social Impact Assessment of Forest Landscape Restoration Project December 2021
349
7.7.4.1.5 Economic displacement due to the impact on livestock production
The Project involves the utilisation of 3,000 ha of existing plantations of different ages and new plantations on 750 ha. The installation of seedlings and the use of existing seedlings involve the utilisation of land that is currently mainly used for forestry and livestock (for fodder and grazing).
In the case of SAIS, according to the SBL, most of the land is used for livestock (Hereford cattle for beef production, fighting bull cattle and cattle for milk production). Thus, cattle farming occupies approximately 80% of the SAIS land. They have an important production of meat and sale of milk, and also individual members are involved in livestock farming. As stated in the SBL: "All members devote space, time and effort to livestock farming, production and sale of milk and meat".
This impact would be more significant if the Project were to involve the use of land in SAIS zones C and D, which are currently used for grazing by SAIS families. Zones A and B also have grazing use, albeit more restricted.
In the case of CAT Llullapuquio, its land is used for forestry, agriculture and, to a lesser extent, livestock farming. However, it should be noted that cattle raising, located on 300 hectares in the lower part, is the most important part of their livelihood; therefore, if grazing land were to be affected, it would have a direct impact on the family economy of the cooperative's members.
The impact of the Project's forest plantations would be directly on the vegetation cover of cultivated pastures that serve for the consumption of SAIS and CAT livestock. During plantation growth, livestock would not be able to access this area, at least for the first ten years of the plantations. Also during logging activities, noise could affect local livestock.
Considering the potential use of grazing or fodder areas of the SAIS or CAT for forest plantations, a possible mitigation measure would be to have space for the relocation of grazing areas. Another measure could be directed to pasture improvement, so as to increase productivity.
In summary, this is a negative impact of high magnitude. This factor has a rating of -14 in magnitude and 16 in importance. The importance is medium high, considering that livestock activity is fundamental to the local economy.
7.7.4.2 Population
In relation to the population, two types of impact have been identified, the increase in local capacities and the nuisance that may be generated by noise and dust for the local population.
7.7.4.2.1 Local capacity building
The project develops specialised skills in plantation implementation and forest management. The project will be implemented hand in hand with training for local producers, from nurseries, to site selection, to soil selection, to planting and care of plantations. Local staff recruited for the activities will be able to increase their knowledge and skills and replicate them in their own initiatives and communities.
Environmental and Social Impact Assessment of Forest Landscape Restoration Project December 2021
350
Both SAIS and CAT have sectors of their territory dedicated to forest management. The representatives and members of these organisations have also expressed their interest in continuing and developing in this area. The knowledge gained through the project could be used by these enterprises to strengthen their own forestry initiatives, indirectly benefiting the families of their associates.
In the province of Cajamarca, 10.4 % of the population over 15 years of age has no education at all, 26.7 % has only primary education and 31.2 % has only secondary education. For this reason, the training that the project can provide will be important in order to generate technical specialisation in forestry material.
In short, this is a positive impact for the local population. This factor is rated 19 for magnitude and 22 for importance. The magnitude of the impact is considered mainly medium, because a limited number of people will be involved in the trainings. The importance is medium high, because this training is locally relevant as SAIS and CAT are currently engaged in forestry.
7.7.4.2.2 Noise and dust nuisance to the population
Noise and dust nuisance in the local population is a social repercussion of the environmental impact on the noise level and air quality currently existing in the area of direct influence. This environmental impact has been identified during road opening, carving and sawmilling activities.
The opening of forest roads and the movement of vehicles during the operational phase of the Project are activities that may generate the dispersion of particulate matter. Potential receptors are the populated areas of the SAIS and the CAT that are adjacent to the roads, as well as the houses adjacent to the roads in the districts where the Project is located. If not addressed, this impact could generate sensitivity and/or social conflict.
On the other hand, the noise produced during felling, by the use of chainsaws, and the processing of roundwood in the sawmill, are activities that could cause a nuisance to nearby residents due to the noise generated.
The management measure for these impacts will be dust and noise monitoring, already discussed in the environmental section. The Project will also develop social perceptions monitoring in its direct area of influence to ensure that the population's opinion on this issue is known.
In summary, this is a negative impact for the local population. This factor has a rating of -9 for magnitude and 13 for importance. The magnitude of this impact is medium to medium-low, being higher in the case of the opening and use of roads. The importance is medium to medium-low, being higher in the case of the opening and use of roads, given the risk of affecting the population due to health issues or claims that generate conflict.

Environmental and Social Impact Assessment of Forest Landscape Restoration Project December 2021
351
7.7.4.3 Organisational and local culture
7.7.4.3.1 Improving the conditions for the associativity of cooperatives
The SAIS and the CAT, as business organisations with an associative model generated in the recent past of Andean rural agriculture, are entities that do not have an optimal economic development, generating few dividends for their associates. This is why the practice of migration is frequent among members, with the consequent abandonment of the land.
The intervention of the Project, either to rent or buy land from these companies, will generate the necessary income to boost their economic activities and to consolidate their internal organisation. The model of associativity that they promote is likely to disappear if they do not have the necessary economic means. This outcome would be detrimental to the associated families, who depend economically on the SAIS and CAT territory, which also provides them with a sense of belonging and cultural identity.
The positive impact of the project will be greater if, as a measure of social responsibility, training is provided to these enterprises in business management.
Accordingly, this factor is rated 8 for magnitude and 10 for importance. This impact is rated as medium high magnitude and medium high importance. The installation of nurseries and seedlings has been considered as a source of impact.
7.7.4.3.2 Improved conditions for the maintenance of the assets of communal enterprises
As has been pointed out in the SBL, both SAIS and CAT have been facing invasions of their territory, motivated by the demand for land from neighbouring populations. The current economic difficulties of these companies prevent them from developing security actions to monitor the entry of outsiders into their territory. Likewise, this economic problem means that some areas are rarely visited and frequented by managers, giving the appearance of abandonment. On the other hand, the need for members to seek employment opportunities outside the SAIS or CAT means that plots are entrusted to external staff who stay on as shepherds, who in turn may be attracted to encroach on seemingly abandoned land.
The operation of the Project in the territory of the SAIS and the CAT will generate a greater presence of people in the area and the development of a diversity of activities, expanding the occupation of this territory and reducing the risk of new invasions.
This will create the conditions for strengthening this type of business organisation, which provides sustenance and food security to a significant number of families.
According to the above, this factor is rated 8 for magnitude and 8 for importance. The impact is rated as medium-high magnitude and medium-high importance.

Environmental and Social Impact Assessment of Forest Landscape Restoration Project December 2021
352
7.7.4.3.3 Preservation of cultural practices
The Project has a demand for labour that will be preferentially taken up in the area of direct influence, i.e. in the SAIS and CAT territories. The demand for labour will be particularly high in the labour-intensive planting and thinning stages. In the SAIS and CAT there are cultural practices of organised and collective work, which come from the Andean cultural matrix that existed before the arrival of Western culture. The practice of minka or minga has been documented in the SBL and is reported to be used to this day in tasks that require the coordination of many individuals.
The Project will benefit from these labour-intensive working practices through the hiring of local labour. This will enable SAIS and CAT and the partner families to maintain these cultural traditions that give them identity and a sense of belonging, practices that could be lost if these business organisations languish under current economic pressures.
Accordingly, this factor is rated 8 for magnitude and 8 for importance. This impact on local culture is rated as medium in magnitude and medium importance.
7.7.4.4 Infrastructure
7.7.4.4.1 Improvements in road accessibility
The project includes road opening and improvement activities, including works such as bridges and speed bumps. Currently, according to the SBL, in the case of the SAIS, the road infrastructure is limited. The main road is an 11-kilometre dirt track leading to the district of San Juan de Huacrachuco. These roads tend to have problems in the rainy season, making accessibility difficult. In addition, there are two alternative roads, one 15 km long and the other 16 km long, both of which are dirt tracks.
In the case of the CAT's road infrastructure, the main one is the road leading from Llullapuquio to Chetilla, a dirt road that is in good condition. In the rainy season, the road is dangerous, even more so because of the risk of landslides. Another key infrastructure in the cooperative is the access bridges, which are also deteriorated. There are two alternative access routes to Llullapuquio, via Majarapampa and via La Colpa, but they can only be used in the summer months, due to the difficulty and danger in winter.
Any improvement in roads has a direct impact on the ability to access local health and education services in less time and at lower cost, as well as reducing the costs of moving products to local and intermediate markets.
In summary, this is a positive impact on local infrastructure and accessibility. This factor is rated 4 for magnitude and 4 for importance. The magnitude is rated as medium high, but only during the road opening and improvement activity. The importance in the social environment is medium high due to the current situation of deteriorating access roads.
7.7.4.5 Health
In the area of health, an impact has been identified in terms of the risks of accidents and occupational illnesses.

Environmental and Social Impact Assessment of Forest Landscape Restoration Project December 2021
353
7.7.4.5.1 Risks of occupational accidents and diseases
The Project will carry out activities such as maintenance, thinning, chainsaw logging, sawmilling and wood processing that involve increased exposure to risks of occupational accidents and diseases. Local staff will be exposed to these risks; occurrences could range from personal injury (requiring only first aid treatment) to non-fatal, but with permanent damage and fatal occurrences. Staff also increase the risk of contracting illnesses as a result of inappropriate use of protective equipment, for example, inhalation of wood particles could be caused by inappropriate use of respirators.
On the other hand, the opening of roads with heavy machinery and the transfer of timber with trucks or trailers and personnel could generate road accidents that affect local people and generate dust during construction.
In order to mitigate these health impacts, prevention work will be essential through continuous health and safety training, the use of personal protective equipment and the monitoring of working conditions. It should also be noted that workers will have health insurance with accident coverage.
In summary, this impact is negative for the health of local staff and villagers. This factor has a rating of -18 for magnitude and 18 for importance. The magnitude of the impact is medium low to high, being high in the case of logging and sawmilling. The importance is rated medium low to medium, given the likelihood of occurrence of this impact on the social environment.

Environmental and Social Impact Assessment of Forest Landscape Restoration Project December 2021
354
8 ENVIROMENTAL MANAGEMENT PLAN
The Environmental Management Plan defines the measures necessary to prevent, mitigate, correct and/or compensate for the environmental impacts generated by the project. In addition, management programs must be established to ensure adequate environmental management of the project's activities, in compliance with national requirements and regulations. For the preparation of the Environmental Management Plan (EMP), the mitigation hierarchy approach has been considered in order to minimize, restore and compensate for those impacts that cannot be avoided, thus achieving a net positive environmental impact.
Based on the above, the environmental measures were designed mainly for those impacts that were found to be slightly negative and moderately negative after the identification and evaluation of impacts.
The objective of the guidelines, programs and actions proposed in this chapter is to prevent, control, mitigate and compensate for the probable environmental impacts that could be generated as a result of the activities that will be developed during the aforementioned stages.
It is expected that after the implementation of the management measures proposed in this section, the importance of the negative impacts identified during the impact assessment will be significantly reduced.
Specific objectives of this environmental management plan are the following:
Propose the necessary measures to prevent, mitigate, correct and/or compensate the environmental and social impacts generated by the project during the different activities.
Implement control mechanisms to ensure that these measures are carried out correctly.
Define actions to address risk situations that may arise during the development of the project.
Establish guidelines to adequately respond to any contingency that may occur during the development of project activities.
Enhance the positive impacts that the project could generate.
8.1 Impact mitigation program
This program presents the management guidelines, incorporating the strategies and measures to be implemented in the different activities and components (physical and biological) of the Project in order to minimize, prevent, mitigate or control the environmental and social impacts that were identified and evaluated in the previous chapter:

Environmental and Social Impact Assessment of Forest Landscape Restoration Project December 2021
355
8.1.1 Physical environment
8.1.1.1 Control of particulate matter and emission gases
The guidelines for the control of particulate matter and gas emissions are framed in compliance with national air quality regulations and the control of industrial activities prone to the emission of air pollutants. In this regard, the project activities that must be carefully monitored are: the opening of forest roads, plantation thinning, final felling, log extraction and transport to the sawmill, and sawmilling and processing of the roundwood produced.
The guidelines to consider are:
For the opening of forest roads, as well as other activities involving earthmoving, the soil must be moistened in order to avoid the dispersion of dust / particulate matter that may cause discomfort to the local population. The wind direction should always be taken into account to avoid impacts downwind of the place where the activity is carried out.
Strict control of vehicle speed should be established, with a maximum speed limit of 30 kilometers per hour in populated areas.
All personnel must be provided with personal protective equipment, such as masks, glasses, among others, to prevent the generation of respiratory diseases caused by the dust and the generation of emission gases.
The areas affected by earthworks will be minimized. Additional movement of materials or extraction of material that has not been previously contemplated will be avoided.
Establish an air quality monitoring program that allows for the evaluation of the parameters established in D.S N° 003-2017 MINAM. This should be carried out mainly in impact zones, and only when activities with potential impact on air quality are being developed.
Particulate matter and gases are also emitted by the exhaust of the vehicles and machinery to be used, which must undergo a preventive maintenance program before starting work. Before entering the work areas, the vehicles and machinery to be used must have a technical inspection by a certified body to ensure that they are in good working order.
Preventive and periodic maintenance of the equipment to be used during the various activities of the project will be carried out to ensure its good condition and reduce gas emissions.
Any burning or incineration of waste generated within the Project area is prohibited.
8.1.1.2 Control of noise levels
Noise levels must be controlled in the following activities: opening of forest roads, plantation thinning, final felling, log extraction and transport to the sawmill, management and harvesting of existing plantations, and in the sawmilling and processing of the roundwood produced. The guidelines to be considered are:
Limit activities with the potential to generate high noise levels to daytime hours, in order to avoid affecting neighboring populations.

Environmental and Social Impact Assessment of Forest Landscape Restoration Project December 2021
356
All motorized equipment will have optimally functioning muffler devices to minimize noise emissions as much as possible.
The use of sirens or other unnecessary noise sources in vehicles shall be prohibited to avoid increasing noise levels. Sirens shall only be used in cases of emergency.
Likewise, it shall be prohibited to remove mufflers that attenuate the noise generated by the exhaust from any vehicle, as well as to place in the exhaust ducts any device that produces more noise.
Establish a monitoring program to evaluate the parameters established in D.S. No. 085-2003-PCM. This monitoring, as in the case of air quality, should be carried out in areas of potential impact, i.e., population centers.
In areas where noise is generated, workers shall use mandatory personal protective equipment according to the activity to be performed.
Preventive and periodic maintenance of the machinery and equipment to be used during this stage will be carried out to ensure their good condition and reduce noise emissions.
It is expected that the wood sawing area is where the highest noise levels are generated, which is why personnel must have the appropriate hearing protectors to avoid health problems.
The sawmill must be located in an industrial zone declared by the respective municipality. If this is not available, an area must be identified that is compatible with the activity, without the presence of neighboring populations that could be affected by the noise generated. If necessary, the encapsulation of certain fixed noise sources should be considered to prevent their propagation to the outside.
At the time of logging, equipment that generates the lowest noise levels should be used in order to avoid affecting neighboring populations and scaring off wildlife.
8.1.1.3 Soil protection
The soil factor will be affected in different ways: compaction from the use of machinery and equipment, potential contamination from possible hydrocarbon spills, and the generation of solid waste that will occur in all project activities. Based on the above, the following guidelines for soil protection are proposed:
For the activity of opening forest roads, it will be preferred to use those roads that are already established, when available, in order to generate the least possible impact on the soil.
Machinery and equipment must travel only on the marked roads.
Machinery and vehicles will be parked only in the place designated for this purpose, which will be waterproofed, so that in case of spills or leaks the hydrocarbon does not penetrate the ground.
A preventive and periodic review of all machinery and equipment to be used in the project will be carried out in order to identify any type of leak or spill that could affect the soil.

Environmental and Social Impact Assessment of Forest Landscape Restoration Project December 2021
357
8.1.1.4 Protection of water sources
The guidelines for the protection of water sources are aimed at minimizing the impacts that may be generated on them as a result of the passage of machinery and vehicles during the opening of forest roads and the sawmilling and processing of roundwood. Based on this, the following must be complied with:
Roads marked for the transit of machinery and vehicles should avoid passing through rivers, streams or water sources that do not have an established and adequate bridge or crossing.
Machinery and vehicles should only travel along the marked roads, thus avoiding detours that could lead them to cross a water source and alter its quality.
Avoid the accumulation of excess materials that affect the natural runoff of the land and therefore the natural recharge of water sources.
The accumulation of excess material and solid waste should be kept away from water sources to avoid runoff contamination.
Preventive maintenance of machinery and vehicles should be performed in impermeable sites and away from water sources to avoid contamination.
The storage of hazardous substances such as hydrocarbons, oils, grease, among others, must be done in an impermeable area and away from water sources.
The water supply for domestic and industrial use (irrigation of plants in nurseries) must be provided by authorized companies, or water must be collected from sources that do not jeopardize the supply of water to the population or other previously acquired uses. Likewise, it must have the respective authorizations from the corresponding authority.
Prohibit relieving oneself at water sources or areas near water sources and train workers on the importance of this measure. In field work, away from restrooms, portable toilets should be implemented for personnel.
8.1.1.5 Solid waste management and minimization program
Waste generation will occur in all project activities. For this reason, this program was prepared in compliance with the provisions of the Integrated Solid Waste Management Law and its regulations.
8.1.1.5.1 Objectives
The general objective of this program is the effective and responsible management of solid waste generated during the installation of new plantations, management and harvesting of existing plantations and during the sawmilling and processing of the roundwood produced, so that the health and safety of workers and local inhabitants is not compromised and the environment is protected. The specific objectives are:
Reduce the generation of solid waste through initiatives such as the implementation of good operational practices, training and awareness programs.
Promote the reuse and recycling of solid waste in the different stages of the project.

Environmental and Social Impact Assessment of Forest Landscape Restoration Project December 2021
358
Segregate, condition in temporary storage sites, transport to final disposal sites, treat and safely dispose of solid waste that cannot be reused or repositioned according to its hazardous characteristics.
Facilitate the training of personnel involved in the project on the proper management of solid waste in order to reduce health, safety, and environmental contamination risks.
8.1.1.5.2 Scope
This program applies to all stages (installation of new plantations, management and harvesting of existing plantations, and sawmilling and processing of roundwood produced) of this project. Likewise, the wastes covered by this minimization and management program are specifically solid and semi-solid wastes.
8.1.1.5.3 Principles
The program is based on the principles of minimization at the source, proper segregation, reuse, treatment, and appropriate final disposal. The program will be carried out according to the characteristics of volume, origin, costs, recovery possibilities, recycling, and local conditions for solid waste management. The program consists of the following activities:
Minimization at source.
Collection, recovery and segregation.
Temporary storage.
Transportation.
Treatment.
8.1.1.5.4 Waste sorting
The general classification of waste according to its hazardousness to health and the environment is established, defining two main categories: hazardous waste and non-hazardous waste. In turn, non-hazardous waste is classified according to its origin as domestic and industrial waste. Based on a more precise definition of the project, the different types of waste to be generated according to each activity should be established and their precise management defined on that basis.
It should be noted that one of the most abundant residues produced is wood waste (chips, sawdust, trimmings, bark, etc.). These residues are recyclable and can be used for soil improvement or reused to generate energy for the industrial sawmill and wood processing processes that will be carried out at the industrial plant.
8.1.1.5.5 Solid waste management
In general, waste management, subject to current regulations, must be sanitary and environmentally appropriate in order to prevent negative impacts and ensure health protection.

Environmental and Social Impact Assessment of Forest Landscape Restoration Project December 2021
359
For the disposal of solid waste, the following must be available:
Storage of non-hazardous waste: a sector will be set up for the temporary storage of non-hazardous industrial waste, including wood, plastic, metal trimmings, reusable material, etc.
Storage of domestic and similar waste: containers with lids will be used, individualized by type of waste (organic, glass, metal, paper, plastic and general), arranged in a duly identified area of the project.
The recovery of waste through its use to generate energy and the recycling of plastic containers, paper, cardboard, glass, among others, should be considered as a principle. By law, all waste must be handled by a duly registered and authorized waste management company.
8.1.1.5.6 Minimization at source
Minimization at source aims to reduce the generation of waste and mitigate or eliminate its hazardousness. This task will be carried out in a planned manner by applying it before, during and after the stages of the project, which among other measures includes:
Substitution of inputs and hazardous materials for biodegradable or reusable materials, which in some cases leads to modifications in equipment and operational procedures.
Actions on material inventory, including within the inventory control procedures (size, expiration, etc.) and control over storage (storage procedure, loss and contamination control).
8.1.1.5.7 Collection, recovery and segregation
A color code and/or labeling will be established to identify the different types of non-hazardous solid waste and thus make it easier for workers to correctly place the waste in the appropriate containers, thus avoiding dangerous mixtures.
Once the activities and the type of waste to be generated have been defined, plastic containers or cylinders with sufficient capacity will be placed in a timely manner at the collection points, which will be located according to the progress of the work, duly identified according to a defined color code.
Containers will be located outside areas of frequent traffic. Hazardous waste will be collected in original containers, if possible, or otherwise containers compatible with the hazardous substance will be used. All containers will be properly labeled and maintained in good condition.
8.1.1.5.8 Temporary storage
The waste will be kept stored in their respective cylinders until the authorized operator collects them for proper disposal.
This temporary storage will be carried out according to the physical, chemical and biological nature of the waste, considering its hazardous characteristics, its incompatibility with other wastes, and the reactions that may occur with the material of the container that contains it.
Temporary storage areas will have soil sealing measures.
Access restriction signs will be installed.

Environmental and Social Impact Assessment of Forest Landscape Restoration Project December 2021
360
Spill response equipment, such as absorbent cloths, neutralizing agents and fire extinguishers, as well as their respective user manuals, shall be available.
The following shall be taken into account in the storage of hazardous waste:
Hazardous wastes of the flammable type shall be kept away from sources of heat, sparks, flame or other ignition media.
Hazardous waste with corrosive, flammable, reactive or toxic characteristics will be kept in different spaces.
Storage of waste containing volatile components should be in ventilated areas.
8.1.1.5.9 Transportation
Waste must be transported by a solid waste operating company (EO-RS) registered with MINAM or in good standing with DIGESA.
8.1.1.5.10 Final disposition
Domestic, industrial and hazardous solid waste must be transported and disposed of by an EO-RS registered with MINAM or in good standing with DIGESA.
8.1.2 Biological medium
8.1.2.1 Vegetation cover management
Two ecosystems of high biological value have been identified and recognized, the Jalca and the Andean Scrubland. This is due to their scientific importance in biodiversity, Andean biogeography, exuberant vegetation of high coverage and the presence of numerous species of economic importance.
Following the principles and indicators of sustainable forest management, both dictated by the IFC (International Finance Corporation) and one of the main global certifiers related to forests FSC (Forest Stewardship Council), the following basic actions are proposed to mitigate the negative impacts on native forest cover.
Biodiversity conservation and habitat protection.
Numerous species have been identified in the sites of interest, therefore, for the conservation of these areas it is important to avoid them and to install pine plantations on sites with already intervened cover, whether they are agricultural areas 124or on sites occupied by existing plantations, after final logging.
It is important to reserve a considerable margin in riverbeds and streams, which should be at least 50 meters, due to the height that the trees of the introduced species can reach and the possibility of affecting the riverbed during harvesting. This would protect not only the riverbed but also the surrounding vegetation, which can serve as a biological corridor for local fauna species.
In order to favor native vegetation, promote biological corridors, mitigate particulate matter and gas emissions, it is recommended to reforest the margins of forest roads with native species,
124 Agricultural zones, these encompass plant foods such as cereals, fruits, vegetables, cultivated pasture and forage, fiber and energy crops.

Environmental and Social Impact Assessment of Forest Landscape Restoration Project December 2021
361
which serve as connectors for areas of native cover, increasing bird traffic and their own dynamics of regeneration, as well as helping to prevent dust from the roads during the dry season.
Another alternative forest plantation design to the massifs that are intended to be installed are the slow-formation terraces, which are the best option for water and soil conservation. The slow-formation terraces are plantations on contour lines, spaced according to slope, which stabilize areas at high risk of mass movement, mitigating greater water consumption in the system, derived from greater evapotranspiration of exotic species versus the native ecosystem. These terraces promote the establishment of biological corridors, agroforestry and silvopastoral systems.
The following species are proposed for the establishment of slow-forming terraces:
Alnus acuminata Baccharis latifolia Buddleja incana Cantua buxifolia Caesalpinia spinosa Cassia hookeriana Cassia tomentosa Erythrina edulis Escallonia resinosa Escallonia angustifolia Lupinus ballianus Polylepis racemosa Polylepis incana Prunus serotina Sambucus peruviana Schinus molle Tecoma sambucifolia
In order to promote biological diversity in areas with wide coverage of Jalca, it is important to generate small productive projects to improve productivity derived from the eventual displacement of agricultural areas. An opportune way to fulfill both aspects is the cultivation of medicinal plants. In this sense, an important number of native species with high economic interest for their therapeutic properties have been identified:
Gentianella graminea (Kunth) Fabris. Valeriana pilosa Ruiz & Pav. Senecio canescens (Kunth) Cuatrec. Perezia multiflora (Kunth) Less. Baccharis genistelloides (Lam.) Pers. Tagetes filifolia Lag. Chuquiraga weberbaueri Satureja nubigena (Kunth) Briquet. Lepechinia meyenii (Walp.) Epling. Laccopetalum giganteum (Wedd.) Ulbr. Rumex peruanus Rechinger f. Geranium sessiliflorum Cav. Euphorbia huanchahana

Environmental and Social Impact Assessment of Forest Landscape Restoration Project December 2021
362
8.1.2.2 Project Certification
As required by IFC Performance Standard No. 6, Biodiversity Conservation and Sustainable Management of Living Natural Resources, the Project must seek certification through adherence to globally recognized standards or at the national or regional level. For forest management, the most appropriate certification available in Peru are those of the Forest Stewardship Council (FSC).
8.2 Monitoring and follow-up program
This chapter proposes monitoring and follow-up activities to be carried out for both the physical and biological environment. With this objective in mind, the parameters for monitoring the quality of the different environmental components that could be affected during the different stages of the project are established, as well as the control and measurement systems for these parameters.
After the evaluation of these indicators, the information obtained will make it possible to implement preventive and/or corrective measures. Therefore, the monitoring and control plan serves as a management tool that provides feedback to the prevention, mitigation or correction program so that the defined environmental impacts are mitigated or eliminated.
8.2.1.1 Objectives
Provide information to ensure that the environmental impacts identified for the project activities are within the limits established by current regulations.
To know the real effects, on a spatial and temporal scale, caused by the project activities, through measurements of relevant parameters.
Verify the effectiveness of the prevention, control and mitigation measures proposed in the prevention, mitigation or correction of environmental impacts.
Verify compliance with applicable environmental regulations and commitments assumed by the project owner.
8.2.1.2 Physical environment monitoring
8.2.1.2.1 Water quality monitoring
Water quality should be monitored at the same points of the baseline, in order to be able to confirm any variation in water quality with respect to the activities to be carried out with this project.
This monitoring will be participatory with the communities/partners, so that they can verify if there are any changes in the components due to the project activities. The parameters to be monitored are: Dissolved Oxygen, pH, Temperature, Electrical Conductivity, BOD, COD, Alkalinity, Chlorides, Calcium, Magnesium, Sulfates, Total Dissolved Solids (TDS), and Total Suspended Solids.

Environmental and Social Impact Assessment of Forest Landscape Restoration Project December 2021
363
Table 8.1 Water quality monitoring points.
Sampling points UTM coordinate
WGS84 Location Water body
This North
AG-01 786107 9191152 Social Interest Agrarian Society (SAIS) José Carlos Mariátegui
Tributary of the Huacraruco River
AG-02 759711 9214893 Agricultural Workers'
Cooperative (CAT) LLullapuquio Chancas Creek
AG-03 785553 9190822 Social Interest Agrarian Society (SAIS) José Carlos Mariátegui
Huacraruco River
Prepared by: Pacific PIR S.A.C.
The results obtained will be compared with the RCT for Water approved according to D.S. N° 004-2017-MINAM specifically with Category 3: Irrigation of vegetables and animal drinking.
The frequency of monitoring will be every six months, while the activities of the installation stage of new plantations, management and use of existing plantations are being carried out.
8.2.1.2.2 Noise level monitoring.
Noise level monitoring will be carried out in areas of potential impact of noise levels generated by project activities, taking into consideration the location of population centers.
This monitoring will be participatory with the communities/partners, so that they can verify if there are any changes in the components due to project activities.
The results obtained will be compared with the values established in the "Reglamento de Estándares Nacionales de Calidad Ambiental para Ruido" (D.S. N° 085- 2003-PCM); which are defined for continuous exposures, taking as reference the industrial or residential area as appropriate.
8.2.1.3 Biological environment monitoring
It is important to carry out permanent studies on the biological diversity in the area; we recommend the establishment of camera traps for medium and large mammals, bird sighting studies, mist nets for birds and bats, and Sherman and Tomahawk traps for smaller fauna, such as rodents. These studies should be carried out in both wet and dry seasons, in order to complete the seasonality in the diversity of migratory species. These evaluations should be carried out in the areas defined for the installation of the plantations.
8.2.1.3.1 Amphibian and Reptile Evaluation
Amphibian and reptile communities should be evaluated through quantitative and qualitative sampling methods. The standardized quantitative method (Jaeger, 1994) consists of searching for amphibians and reptiles in 100 m x 4 m transects at a constant average speed. Likewise, searches
Environmental and Social Impact Assessment of Forest Landscape Restoration Project December 2021
364
should be carried out in 20 m x 20 m quadrats, visual encounters, and interviews with local community members in order to enrich the inventory of species in the study area. 125
All specimens must be identified in the field, captured specimens will be photographed and then released.
Visual Ecounter Surveys (VES)
With this technique, individuals of different species should be recorded in the different habitats within the sampling point, with a time limit of 30 minutes, in places with potential presence of herpetofauna. By applying this method, 5 VES points can be evaluated during one day per sampling site. The sampling effort should be done by the encounter rate expressed as the number of individuals of a species divided by the number of hours invested. An effort of 2 hours and 30 minutes (2.5 hours) should be made at each sampling site.
The record of each individual should include annotation of the species, location, altitude, description of the microhabitat, weather conditions during the activity and the record of the activity.
8.2.1.3.2 Bird Assessment
There are currently about 9,800 known species of birds in the world, occupying practically all existing environments. In South America there are more than 3,000 species, which constitute almost a third of all living species.
Of the 10 countries with the greatest diversity of birds in the world, Colombia ranks first, followed by Peru with more than 1,800 species including 118 endemic species (almost double the number of endemics for Colombia), followed by Brazil, Ecuador, Venezuela and Bolivia.
From a biological and conservation point of view, many bird species are indicators of environmental and human-induced changes, so researchers consider them in their monitoring designs. Birds are indicators of environmental quality, although this will depend on the objectives of the monitoring and how quickly you want to see the response to changes.
Basic and essential work equipment:
Binoculars, professional camera, telescope, field notebook, tape recorders, specialized bird books and bird song recordings.
To be taken into account during the evaluation:
The color of the clothing should be discreet (such as brown, gray or green), and no bright colors should be used for any reason.
125 Jaeger, R. 1994. Transect sampling. In: Measuring and Monitoring Biological Diversity, Standard Methods for Amphibians. Editors: Heyer, W. R. R., Donnelly, M.A., McDiarmid, R.W., Hayek, L.A.C. & Foster M.S. Smithsonian Institution Press (Washintong, D. C.). 103-107.

Environmental and Social Impact Assessment of Forest Landscape Restoration Project December 2021
365
The location of the observer should be, as far as possible, behind bushes, logs or rocks. To be able to distinguish colors more accurately, it is preferable that the sun be at the observer's back.
Do not make noise or violent movements, walk slowly and safely.
The group evaluated will not exceed two or a maximum of three people, they will walk without talking and if they find bird nests, they will not touch them for any reason and will not stay near them.
8.2.1.3.2.1 Bird monitoring:
From fixed radius points:
Two trails should be located along the area to be evaluated, at the beginning of each trail the first census point should be located, this census point should have an imaginary radius of 50 meters and the distance between census points should be 150 meters. Ten 1.5 km sampling trails should be established and 10 georeferenced sampling points (100 points) should be located on each trail.
The observer should stay at the central point for 15 minutes and count all the birds that can be seen and heard within an imaginary radius of 50 meters. After 15 minutes, the observer should walk to the next observation point and do the same as in the previous one.
For a better view, binoculars should be used. In addition, photographs should be taken and the birds' songs recorded. In the field notebook, the main characteristics of the birds and the distance at which they were seen from the central point should be noted.
The bird census should be carried out until 10:00 a.m. or at times when the birds are active. The most suitable times are during the rainy season (late November to March) and the dry season (May to August).
8.2.1.3.3 Mammal Evaluation
For the evaluation of mammals, the methods described in the field manual for monitoring terrestrial mammals in conservation areas (Arévalo J.E. 2001) should be followed, 126making a distinction between smaller mammals (small non-flying mammals and flying mammals) and larger mammals. Each group has different methodologies, which are detailed below:
Small mammals; these are species weighing less than 1 kilogram, including species of the orders Didelphimorphia, Rodentia and Chiroptera. In each of the evaluation sectors, transects must be established with traps for non-flying small mammals and mist nets for flying small mammals.
The transects should be established in places where there is evidence of the presence of these animals. For the capture of small mammals (rodents), 2 transects should be established per sampling site, with a total of 80 active traps during 2 nights (160 traps - night). The mist nets
126 Arévalo, J. E. (2001) Field manual for monitoring terrestrial mammals in conservation areas. Monetverde Conservation Association.

Environmental and Social Impact Assessment of Forest Landscape Restoration Project December 2021
366
should be set up at night, checking every hour to avoid damaging the specimen. After capture, the specimens are identified and released.
For larger mammals, diurnal censuses should be done walking at a speed of 1 km/h, with stops every 50 m (40 interval points along the route, with stops of 3 minutes of observation at each interval point) in which one should observe and listen carefully in the surroundings in search of individuals, tracks or vocalizations, which will total 4 hours of effective sampling per transect. Additionally, during the return trip, observations of species or tracks that were omitted during the initial trip should be recorded.
The duration of the return trip should be 2 hours, which added to the outbound trip should make a total of 6 hours of sampling. The night tour should be done with a sampling effort of 1 km of trail at a speed of 0.5 km/hour, in an approximate time of 3 hours. Similarly, during the return trip, additional records should be made, with an approximate total time of 4 hours. For sightings, the species, number of individuals, distance to the transect, time of observation, activity, altitude and type of forest should be recorded.
The search for traces such as footprints, scratches, evidence of feeding, burrows, roosts, feces, odors, trails, etc., will be part of the methodology and will be considered in the records since they provide evidence of the presence of several species that were probably not observed in short periods of time.
The presence of mammals can be monitored with camera traps. These camera traps have been successfully used to study presence, behavior, activity patterns and population parameters of different species. Recent studies apply a systematic methodology using camera traps to evaluate relative abundance of mammals (Griffith & Van Schaik, 1993). This methodology proposes to contribute to the estimation of the relative abundance of mammals in the area of the exploration locations. For this purpose, camera-traps should be used, which consist of an automatic 35 mm camera with a passive infrared light sensor that is activated when heat is detected, sensitive at a distance of 30 feet (9 meters). The traps (03 units) should remain for 10 days in each of the sampling stations selected within the study area. 127
8.2.1.3.4 Monitoring of vegetation cover
It is necessary to monitor changes in vegetation cover, with emphasis on the native cover of Jalca and Andean Scrub. This monitoring should be done taking as a baseline the one developed in the present study, which was based on the analysis and interpretation of 10m resolution Sentinel-2A satellite images, through the three stages of the Supervised Classification process.
The first monitoring should be done one year after the beginning of the operations, and thereafter at an interval of 2 years. The three stages of the supervised classification process that were implemented for the elaboration of the baseline of this study, and that must be repeated to monitor the evolution of the vegetation cover of the Jalca and Andean Scrub zones, are the following:
127 Griffiths, M. & C. P. van Schaick, 1993. Camera-trapping: A new tool for the study of elusive rain forest animals. Tropical Biodiversity, 1: 131-135.

Environmental and Social Impact Assessment of Forest Landscape Restoration Project December 2021
367
Stage 1: Data preprocessing:
In this part, the thematic maps were processed to delimit the areas of interest. We worked with the Ecosystems Map of Peru (MINAM, 2019), which was taken as a reference to elaborate the coverage classes within each sector: jalca, agricultural zones, forest plantation, scrubland, areas without vegetation and steep slopes (shadows). The topographic layers were elaborated with the DEM (Digital Elevation Model) images of the ALOS radar of 12.5 m resolution. These were processed in QGIS 3.18.3 to obtain the slope, orientation, topographic position index (TPI) and elevation layers with a 10 m resolution.
Stage 2: Classification and validation of coverages in Google Earth Engine (GEE)
The acquisition of satellite images was obtained from the Sentinel-2 repository, within the Google Earth Engine (GEE) platform, where scenes were selected from April to May 2021 with less than 10% cloud cover. The regions of interest (ROI's) were delimited, i.e. the vector elements (points or polygons) that represent the cover classes for the area, based on field information and high resolution images from Google Earth Pro, Mavic2pro drone images and field evaluation. A total of 342 ROI's were delimited, which is an optimal number for an area of 15,180 ha; and also 7 cover classes (Congalton, 2009). Then, 18 classifiers were prepared based on Sentinel-2A images and DEM and 9 bands were selected (B2, B3, B4, B5, B6, B7, B8, B11 and B12); 5 vegetation related spectral indices were calculated such as NDVI, NDWI, SI, BI, NDMI; and 4 topographic layers were added: elevation, slope, topographic position index and orientation.
With the ROI's, the information of the 18 classifiers was extracted in a file with 18 bands, this file was used to perform the training with the Random Forest classification algorithm with 100 decision trees, obtaining a preliminary coverage map. Next, the accuracy of this preliminary map was evaluated, using a data partition test of the ROIs, using 70% of it for the classification and 30% for the accuracy evaluation. Finally, the Kappa index that determines the acceptability of the classification was used, considering for the study a Kappa index > 0.85. Once a preliminary map was obtained, with an acceptable Kappa index, it was exported in "GEOTIFF" format for final processing and preparation of the coverage map.
Stage 3: Preparation of the Cover Map
This process was performed in the QGIS program. Preliminary coverages are obtained in raster format, which is reprojected to WGS 84 - UTM 17S datum and vectorized to polygons to calculate the area and discriminate polygons smaller than 0.5 ha.
After filtering and refining the polygons, we proceeded to improve the visualization, correcting major errors in the classification and editing of the polygons to smooth the edges. Finally, each field was assigned the corresponding name of each cover based on the classification of the Ecosystems of Peru map (MINAM, 2019). This cartographic information will allow the project to identify the areas available for the establishment of commercial forestry plantations without affecting the native cover.

Environmental and Social Impact Assessment of Forest Landscape Restoration Project December 2021
368
9 SOCIAL MANAGEMENT PLAN
This chapter presents the Social Management Plan prepared with the objective of having measures to prevent and mitigate the social impacts identified and to carry out an optimal relationship with the population of the IPA and other stakeholders of the Project.
The study's Terms of Reference, the RPF Project's Good Practice Guide, as well as IFC documents related to stakeholder engagement, grievance management, land acquisition and involuntary resettlement have been taken into account.
9.1 Community Outreach Program
The objective of a relationship plan is to generate the conditions to develop and maintain an adequate relationship with the social actors in the area of influence. To this end, the plan also includes a communication strategy that seeks to disseminate information that is easy for the population to understand in a timely and transparent manner, as well as to create spaces for them to express their concerns and suggestions.
In the Project, the population involved includes the members of the SAIS Jose Carlos Mariátegui and CAT Llullapuquio, and in general, the population surrounding these IPAs. Since there is no population in the Yanacocha PPI, this PPI has not been considered for the community engagement program.
In general, the Plan focuses on the stakeholders identified in the PPIs, who would be directly affected and who may have an interest or influence on the Project. As part of the population involved, this Plan gives special importance to women and other vulnerable population categories, such as the elderly and people with disabilities, among others.
For the development of this Plan, all stakeholders must be included in a database, with their corresponding contact information (telephone numbers, e-mail, address and position). This registry will be continuously updated according to the progress of the studies and the implementation of the Project. A matrix will also be prepared with a record of all the commitments made to the project's stakeholders.
Documentation is an important process in the relationship with stakeholders. Therefore, the consultations made and the answers provided in the consultation spaces will be recorded.
Regarding the management of the relationship process, it is necessary to designate who will be responsible for community relations with stakeholders, both in the IPAs and in external sites where there is a population that could be impacted by the Project. Those responsible for the project's community relations must have the necessary resources to carry out all the activities of the social management plan.
9.1.1 Communication with the population of the Project area
For optimal relations with the population in the area of influence, the potentially affected population must be informed about the characteristics of each stage of the project and whether

Environmental and Social Impact Assessment of Forest Landscape Restoration Project December 2021
369
it will involve environmental or social impacts or risks. Meetings should be held prior to initiating the activities of the different phases of the project. In this sense, opinions and consultations with stakeholders should be considered from the planning stages. It should be noted that the social baseline of this study identified local perceptions and recommendations, which have been considered to present the proposal for local initiatives that could be implemented and compensation measures.
As part of the Communication subprogram, the IPA population (SAIS and CAT partners) will be informed of the Project's characteristics, environmental and social commitments. The proposed information activities are as follows:
Conducting participatory workshops. These should be held at least once a year. The objective is to report to stakeholders and the local population on Project activities and eventual social investment actions carried out. Additional meetings may be held according to the needs of the Project. Adequate convening process will be foreseen to ensure that a maximum number of people participate. Ideally, coordination with the management of CAT Llullapuquio and SAIS is required. During the workshops, a record of the proceedings and agreements will be kept in the form of minutes. In the case of agreements, the personnel responsible for the relationship will follow up on them. The participation of women and vulnerable groups will be promoted.
Issuance of newsletters. It is advisable to do so at least every six months. This material should be prepared in simple and didactic language. These bulletins should provide information on the progress of the project and the implementation of environmental and social management activities.
Installation of a permanent information office. If the project is going to have a permanent presence with personnel in each IPA (in the nurseries, for example), the personnel must be informed and available to receive queries and questions from the population, as well as complaints and claims. A visitors' book should be kept, in which queries and responses should be recorded.
In the implementation of these communication mechanisms, respect for traditions, calendars and other cultural aspects will be maintained. It should be noted that the baseline has identified the use of cell phones as the main means of communication, so it will be essential to have this updated information available for the continuous call and communication by telephone.
All means of communication should be disseminated so that the population knows who to turn to in case of concerns or questions.
For the monitoring of this subprogram of actions, we foresee the follow-up of the consultations carried out at the information office, the fulfillment of agreements, the number of workshops and meetings held, and the percentage of women participating in these meetings.
9.2 Complaint or claims attention program
Complaints can be generated for various reasons, among them: the expectation of benefits or compensation, dissatisfaction with the commitments made, inconvenience or fear of environmental impacts, among others.

Environmental and Social Impact Assessment of Forest Landscape Restoration Project December 2021
370
The grievance mechanism is implemented so that the population can express their concerns and complaints about the project, and these are received, evaluated and resolved. At the beginning of the Project and during its execution, this mechanism must be disseminated among the local population, taking advantage of the instances in which they meet to deal with their internal management issues or promoting special meetings if necessary.
It should be noted that this mechanism is complementary to, and does not replace, the relationship and communication with the population.
The steps to be established for the complaints and claims procedure are as follows:
Complaints or claims may be submitted to the office or space that the Company has in the Project area, through a telephone number or e-mail that must be established for this purpose.
The record shall be made by noting the name of the person (or organization), the date, the subject matter, the action taken, and the manner and date in which the person or organization was informed of the response.
Once the complaint or claim has been received, an evaluation phase will be carried out and a decision will be made as to how to respond to it and the measures to be taken. It is recommended that this phase have a maximum term of 30 days.
Whenever possible, complaints should be dealt with immediately, even more so if there is an urgency or evident harm to the population that will be aggravated with the passage of time. However, in those cases where a prior evaluation is required, the need for the deadline should be explained to the person filing the complaint or grievance.
The response or solution to the complaint or grievance should be communicated to the person or organization that issued the complaint or grievance.
The measures adopted should be followed up.
In case the claimant is dissatisfied, a form of reconsideration of the measures adopted shall be foreseen, and the participation of a mediator may be used.
Information will be provided to stakeholders regarding the handling of complaints and grievances and actions taken.
Indicators should be established to monitor the functioning of the complaints and claims system.
9.3 Income restoration program
As evidenced in the baseline, SAIS and CAT use their corporate property for agricultural and forestry activities, although there are also unused areas. Likewise, the members of these companies occupy plots of land within the corporate property, where they live and produce their food and develop economic activities to generate family income.
In principle, physical displacement of any person should be avoided. With regard to economic displacement, as anticipated in the impact analysis chapter, it may be difficult to prevent land that could be used as a source of pasture or other resources, to satisfy needs or generate income
Environmental and Social Impact Assessment of Forest Landscape Restoration Project December 2021
371
for some members of the CAT or SAIS, or generate collective benefits for all members, from being used for the Project.
Preferably, it is necessary to try to avoid using land that is being exploited, so as to avoid the economic displacement of any person. However, if this is not possible, it is necessary to identify who would be potentially affected, quantify the benefits they obtain and the impact they will suffer, so that specific and appropriate measures can be designed to mitigate or compensate them. In this process, it is necessary to identify any vulnerable groups that could be affected.
For any of the compensation measures implemented, the Project must establish a monitoring plan to ensure that the planned measures are being complied with and to see how the situation of the people involved in the income restoration program is evolving.
9.3.1 Periodic economic compensation for land use
As identified in the impact assessment, the Project is likely to result in the immediate restriction of grazing and other uses on the land to be used for the Project. For this reason, it is necessary to establish short-term compensation measures for potentially affected people.
An effective measure is to establish periodic payments for the use of the land that will be used for the Project, so that these revenues can be used as a priority to compensate those affected. It is recommended that, at most, payment periods be annual. This approach should be coordinated as part of the Project's agreements with the SAIS and CAT, but the Project should be responsible for ensuring that these measures are implemented and, failing that, should assume direct responsibility for compensating those affected. It is important that those potentially affected are involved from the beginning and that they agree with the measures to be established.
9.3.2 Access to replacement land for those affected
An alternative measure is to coordinate, as part of the agreements with the SAIS and the CAT, that eventual affected by the loss of access to land, are compensated with access to other lands of similar characteristics within the property. This would avoid having to allocate part of the compensation agreed upon for the rental of the land to compensate the eventual affected parties. It is advisable to consider this alternative from the initial moment when the lands to be used for the forestry project are being selected.
9.3.3 Productivity improvement of land not destined for the FLR project
Another alternative is to improve the productivity of existing lands that will remain under the management of CAT or SAIS partners. The actions to be implemented should be based on an analysis of the lands where these actions will be implemented in order to identify the potential for improvement and the specific actions to be implemented. This should be done in a participatory manner with the partners and in particular with the affected people who will be the main beneficiaries. Some of the measures to be implemented include the improvement of water supply, improvement of irrigation systems, establishment of improved pastures, soil erosion control, improvement of livestock genetics, training in productive techniques, etc.

Environmental and Social Impact Assessment of Forest Landscape Restoration Project December 2021
372
9.3.4 Initiatives based on the use of plantations by-products
In order to promote economic development and economic dynamization of SAIS and CAT members and to compensate eventual losses of income caused by the loss of access to the lands that will be the object of the Project, an alternative is to support initiatives based on the development of the FLR project itself. These include the use of forest mushrooms, the use of pastures that grow among the pine trees (when the plantations are old enough not to be affected by livestock) and the development of tourism activities128.
The use of forest mushrooms is a practice that is carried out in many pine plantations in Cajamarca, but it can be enhanced by supporting the partners of CAT Llullapuquio and SAIS JC Marátegui in developing appropriate management, adding greater value and seeking marketing alternatives, mainly.
Regarding the use of pastures, after approximately 5 years, the plantations reach a size and state of maturity that allows the entry of cattle to take advantage of the pastures that grow among the trees. In this sense, allowing the entry of the cattle of the members of CAT Llullapuquio and SAIS JC Mariátegui
Regarding tourism, the SAIS and CAT Llullapuquio have identified an interest in engaging in tourism or ecotourism activities. The Porcón Farm is a reference point for the Cajamarca region and the country in general, an example of tourism development based on forestry development, which is a source of complementary income.
It is important to mention that the partners of CAT Llullapuquio and SAIS JC Mariátegui should take the initiative and lead the implementation of projects based on these alternatives.
9.4 Local employment program
The employment program includes measures for the prioritization of labor recruitment and the social standards of the Employee Code of Conduct.
9.4.1 Hiring of local labor
The objectives are:
Adequately inform about the procedures and requirements for the hiring of labor.
Prioritize the hiring of local skilled and unskilled labor, as long as it meets the profile of the required jobs.
Establish performance evaluations that allow for capacity building in forestry indutria throughout the development of the Project.
Improve the skills of local workers.
Maintain a gender focus in the hiring of local labor.
128 These are mentioned in the Good Practice Guide for the Development of FLR Projects on Community Lands.

Environmental and Social Impact Assessment of Forest Landscape Restoration Project December 2021
373
Within the framework of this program, the hiring of local labor should be promoted in order to expand opportunities for the local population, particularly CAT and SAIS members. To this end, first of all, information about the required jobs should be disseminated among the members of these organizations. It is advisable for candidates to present themselves on a list validated by the boards of directors. If no personnel can be found in the CAT and SAIS, the call for applications should be extended to a larger sphere of influence.
For the hiring of local personnel, there should be no discrimination and rather the hiring of women should be promoted. This should be promoted in particular for those jobs that are more suited to their skills, such as work in nurseries for example. It is important to have induction talks on gender and the importance of sharing roles in households, so that women's activities are not overburdened after they are hired.
For workers in general, a training program should be implemented, based on their skills and expectations, to improve their performance in Project activities, which will have an impact on their communities or personal initiatives.
Without affecting the development of operations, personnel rotation should be considered in order to provide employment opportunities to as many local personnel as possible, provided that they meet the required job profiles.
9.4.2 Prevention of risks and negative impacts on the health and safety of workers
In order to prevent risks and impacts on workers' health and safety, an Occupational Safety and Health Management System (OSHMS) must be implemented that considers the hazards and risks of the different phases of operations, both in the plantations and in the sawmilling and processing operations of the timber produced at the plant to be installed on the outskirts of the city of Cajamarca.
In accordance with national legislation, this system must be implemented in compliance with Law No. 29783 on Occupational Safety and Health, which aims to promote a culture of occupational risk prevention and the participation of workers and their organizations.
The occupational health and safety management system should be based mainly on the following elements:
The identification of hazards and risks for workers, at all stages and activities of the operation, especially those that may constitute a threat to their lives.
The establishment of preventive and protective measures for identified hazards and risks, including the modification, substitution or elimination of hazardous conditions and actions
Training of workers and the use of Personal Protective Equipment (PPE).
Documentation and presentation of reports and statistics on occupational accidents, diseases and incidents.

Environmental and Social Impact Assessment of Forest Landscape Restoration Project December 2021
374
The formation of an Occupational Health and Safety Committee, which includes representatives of the employees and the Employer.
The hiring of personnel qualified in SGSST to lead the implementation of the system during the development of the operations.
Emergency prevention, preparedness and response.
It is necessary to hire the services of an expert or experts in this type of system, with particular experience in forest plantation operations and sawmill and wood processing plants. Together with those responsible for the operation and in a participatory manner with workers' representatives knowledgeable about the local environment, these experts should design and initiate the implementation of the Project's ESMS.
9.4.2.1 COVID 19 Prevention
In the context of the COVID19 pandemic, the Project must implement measures to prevent the infection of workers. In accordance with the sanitary protocol for forestry activities approved by RM N° 152-2020-MINAGRI, it is necessary to establish surveillance, prevention and control measures for the health of workers, avoid the transmission of COVID 19 and provide timely attention to suspected or confirmed cases.
Measures should be based on the following elements:
Symptom identification and diagnosis through testing, when applicable
Isolation and quarantine of suspected cases
Maintaining appropriate distance between personnel
Use of masks
Hand cleaning and disinfection of tools and equipment
Promotion of staff vaccination
9.4.3 Code of Conduct
The purpose of the Code of Conduct is to establish guidelines for the behavior of project workers, whether they are hired directly by the company or its contractors. It especially regulates the interaction with the population of the area of influence, as it seeks to have good neighborly relations with the population.
Workers must receive an induction talk on the Code of Conduct and sign attendance lists that record their participation. In addition, during the development of the project, the importance of complying with the rules of conduct must be reinforced. The code of conduct will be disseminated to the local population, so that they can be vigilant about compliance by project workers.
The following are the rules of conduct:
Keep identification worn and visible during the work shift.
Be careful about your informal conversations with the local population, without raising expectations.

Environmental and Social Impact Assessment of Forest Landscape Restoration Project December 2021
375
Comply with traffic laws, avoid reckless actions when driving a vehicle and respect people and animals on the access roads.
Do not consume alcoholic beverages during working hours. The use of medicines must be prescribed by medical personnel and communicated to the company.
Be respectful of local customs and organizations, as well as their decision-making processes.
Do not hunt or collect specimens of local flora and fauna.
Follow established waste management procedures and guidelines.
Maintain respectful relations with neighboring populations.
Do not engage in any type of racial discrimination or sexual harassment.
For any complaints or concerns from the local population, contact the community relations officers.
Immediately report any damage to the environment or private property.

Environmental and Social Impact Assessment of Forest Landscape Restoration Project December 2021
376
10 CONCLUSIONS AND RECOMMENDATIONS
The Project is planned to be developed in its initial phase with the forests and land available in the properties of Yanacocha mine, CAT Llullapuquio and SAIS José Carlos Mariátegui. However, the Company in charge of the Project must still negotiate with these three owners to precisely define the land and plantations of each of them to be provided for the Project. Under no circumstances will the Project purchase land from these landowners; the planned modality is to obtain surface rights for periods of time appropriate for forest rotations. The only land planned to be acquired will be the land necessary to install the sawmill and roundwood processing plant in the outskirts of the city of Cajamarca.
The partnership between the Company and the landowners, in particular CAT Llullapuquio and the SAIS JCM, has the potential to generate virtuous synergies for both parties, in particular income generation, employment and forest management training for the landowners, and access to lands of good suitability for forest development for the Company. However, it is very important that the Company takes the necessary time to assess the status of the owners' property titles and the potential existing land conflicts that could affect their investments. Likewise, it is important that the company makes sure to sign solid and stable agreements with the landowners, in a broad participatory manner, that give it the greatest possible assurance that the Project will be developed with the least number of socio-environmental conflicts throughout its extended rotation period. The Good Practice Guide for Private Sector Investments in Forest Landscape Restoration in Community Lands129 is a good reference to consult in this regard.
Regarding the formal processes and authorizations for the development of the Project, there are a series of regulations that must be followed subject to different institutions, mainly related to the environmental certification, plantation registration, primary and secondary timber processing, non-existence of archaeological remains, and prior consultation (in case of confirmation of the existence of indigenous communities or native peoples). However, in practice, there are no precedents of forestry plantations that have followed all of these processes. As such, the recommendation is to establish formal contact with SERFOR and SENACE so that these institutions can define the steps to follow to develop the project with all the formality and legality required.
With respect to the perception of the communities and the general public regarding the environmental and social impacts of the Project, it is important to mention that, unlike projects in sectors such as mining, hydrocarbons or hydroelectricity (often viewed with concern by communities and parts of the public due to their potential for negative impacts), forest plantations are generally perceived as a very positive activity. In many parts of Peru, particularly in Cajamarca, pine tree plantations are widespread among the communities and enjoy the support of authorities at all levels, who are very interested in their large-scale development.
From the impact analysis carried out in this study, it can be concluded that the main negative impacts that the Project could generate are the impact on native forest ecosystems and their biodiversity, loss of vegetal cover due to the opening of forest roads and installing of sawmill, impacts on the health and safety of workers due to logging, extraction, sawmilling and wood
129 This public guide was also prepared by Social Capital Group in 2021 at the request of the same clients for whom this ESIA has been developed

Environmental and Social Impact Assessment of Forest Landscape Restoration Project December 2021
377
processing activities, and economic displacement of people who would use the plantations and land necessary for the development of the Project. However, through certification of the Project by the Forest Stewardship Council (FSC) and compliance with IFC's environmental and social standards, these risks can be eliminated and adequately mitigated and, where appropriate, compensated for. In this way, identified impact-generating activities can be prevented from expressing their potential negative impacts.
The positive impacts are related to the generation of a virtuous economic dynamic in the forest industry production chains, income generation for landowners, employment generation and training of CAT Llullapuquio and SAIS JCM members, as well as neighboring communities in general, in the best forestry management techniques.

Social Capital Group 378
11 ANNEXES
11.1 Annex 1 - Location of Tumbaden’s Sawmill map

Environmental and Social Impact Assessment of Forest Landscape Restoration Project December 2021
379
11.2 Annexes 2 – Environmental Baseline
11.2.1 Annex 2.1 – Climate map

Environmental and Social Impact Assessment of Forest Landscape Restoration Project December 2021
380
11.2.2 Annex 2.2 – River basins map

Environmental and Social Impact Assessment of Forest Landscape Restoration Project December 2021
381
11.2.3 Annex 2.3 – Water quality sampling map

Environmental and Social Impact Assessment of Forest Landscape Restoration Project December 2021
382
11.2.4 Annex 2.4 – Optimal Land-use map

Environmental and Social Impact Assessment of Forest Landscape Restoration Project December 2021
383
11.2.5 Annex 2.5 – Current land use map
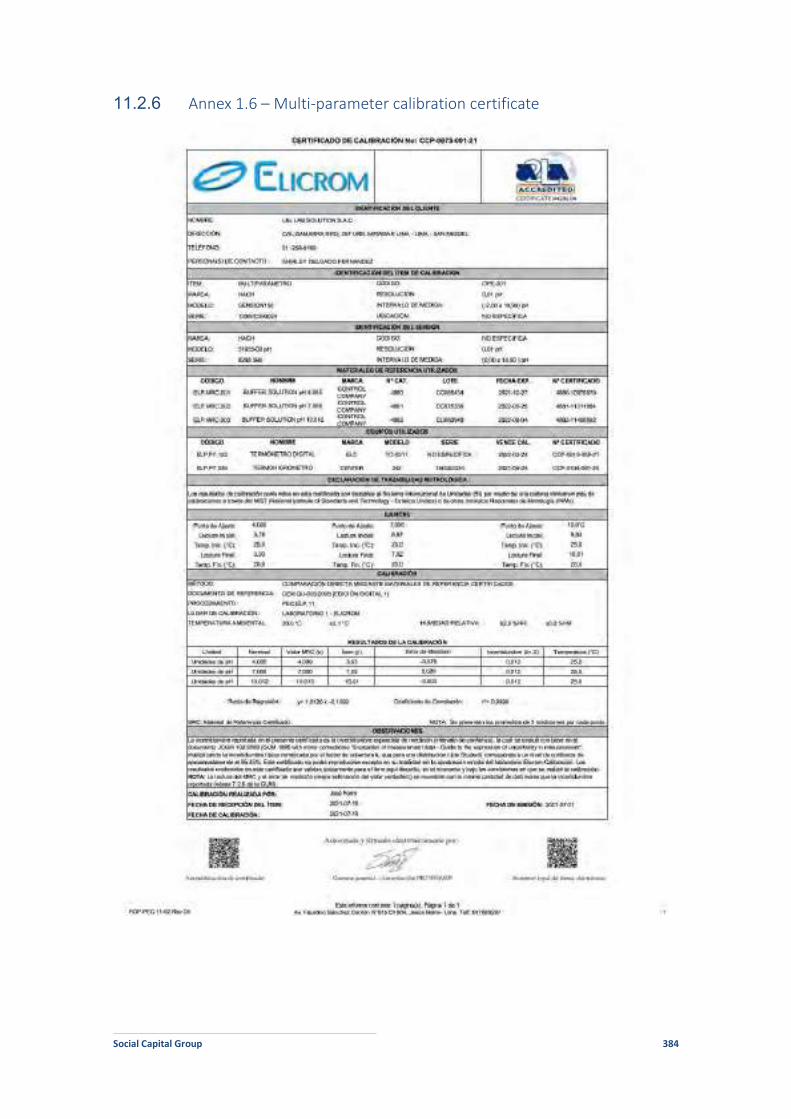
Social Capital Group 384
11.2.6 Annex 1.6 – Multi-parameter calibration certificate

Environmental and Social Impact Assessment of Forest Landscape Restoration Project December 2021
385
11.2.7 Annex 1.7 – Laboratory test reports and chains of custody

Environmental and Social Impact Assessment of Forest Landscape Restoration Project December 2021
386

Social Capital Group 387

Environmental and Social Impact Assessment of Forest Landscape Restoration Project December 2021
388

Environmental and Social Impact Assessment of Forest Landscape Restoration Project December 2021
389

Social Capital Group 390
11.2.8 Annex 1.8 – Photographic reports of water quality sampling
Sampling dates
Water quality sampling was carried out on 14, 15 and 16 September 2021.
Sampling points and parameters measured in the field
The following table shows the location of the sampling points and the photographic report.
Table N° 01. Data from water quality sampling points
Sampling point UTM coordinate WGS84
Location East North
AG-01 786107 9191152 Huacrarucro
Prepared by: Pacific PIR S.A.C., 2021.

Environmental and Social Impact Assessment of Forest Landscape Restoration Project December 2021
391
Sampling point
UTM coordinate WGS84
Location East North
AG-02 759711 9214893 Llulapuquio
Prepared by: Pacific PIR S.A.C., 2021.

Environmental and Social Impact Assessment of Forest Landscape Restoration Project December 2021
392
Punto de muestreo
Coordenada UTM WGS84
Ubicación Este Norte
AG-03 785553 9190822 Huacrarucro
Elaboración: Pacific PIR S.A.C., 2021.

Social Capital Group 393
11.2.9 Annex 1.9 – Ecosystem map

Environmental and Social Impact Assessment of Forest Landscape Restoration Project December 2021
394
11.2.10 Annex 1.10 – Land cover map

Environmental and Social Impact Assessment of Forest Landscape Restoration Project December 2021
395
11.2.11 Annex 1.11 – Natural Protected Areas map
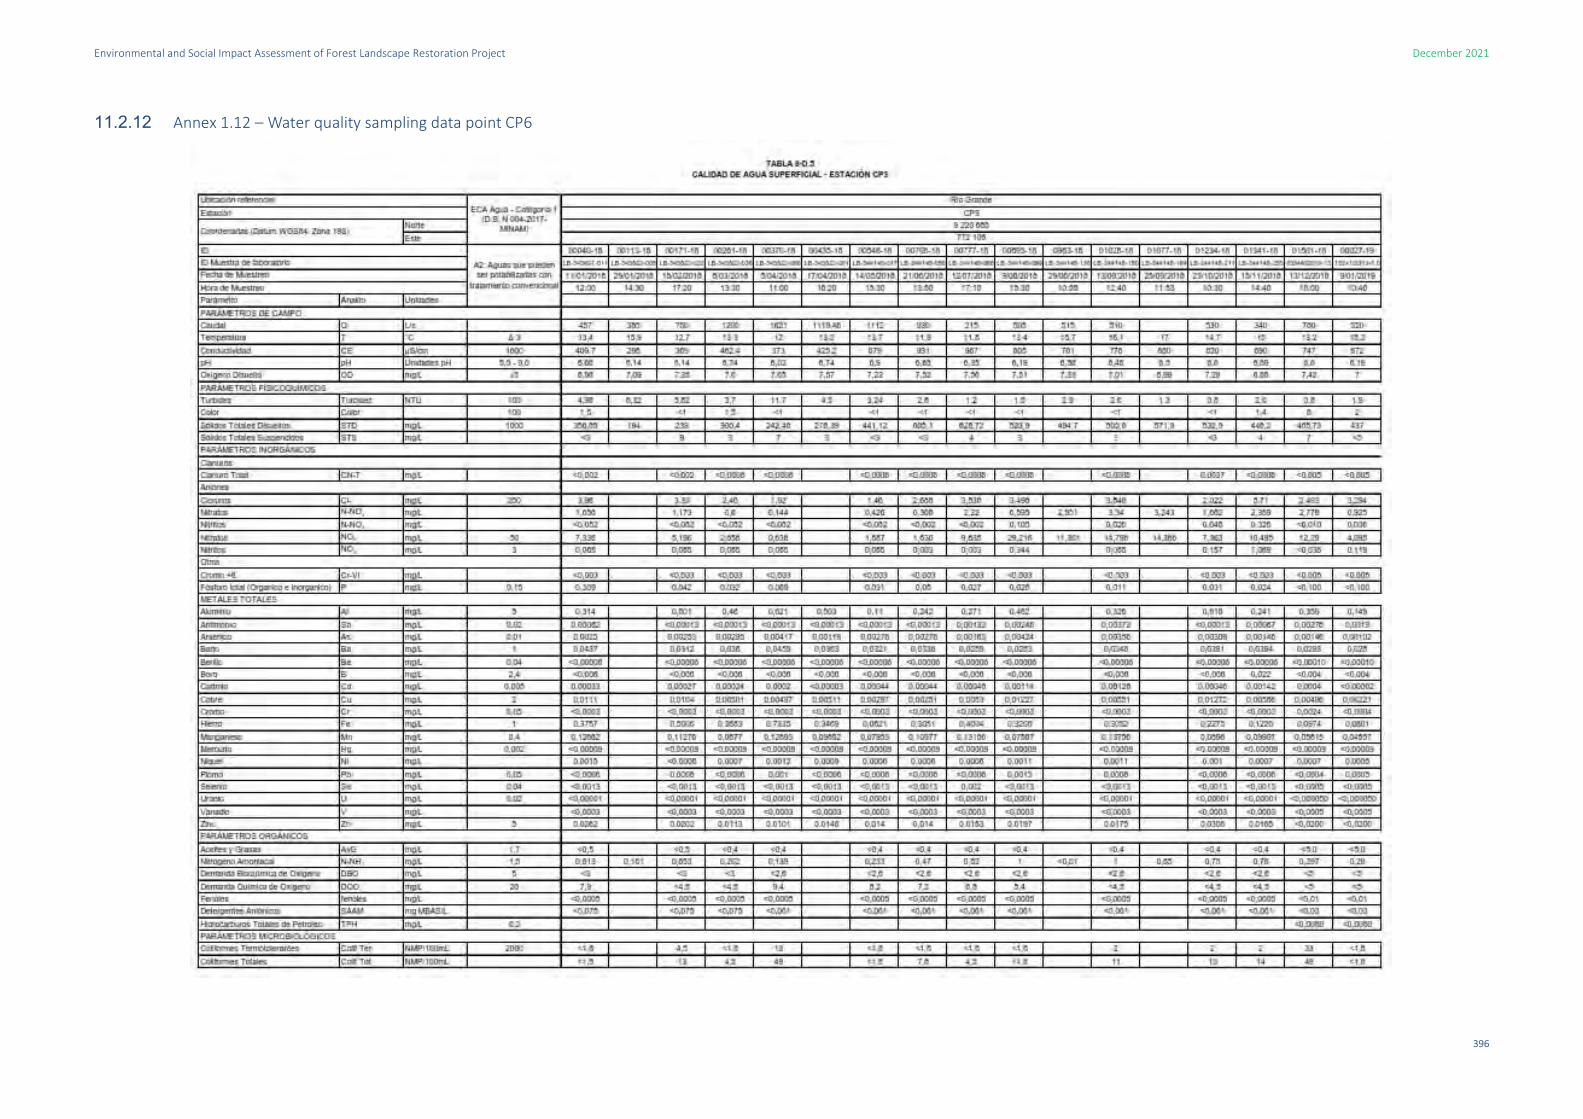
Environmental and Social Impact Assessment of Forest Landscape Restoration Project December 2021
396
11.2.12 Annex 1.12 – Water quality sampling data point CP6
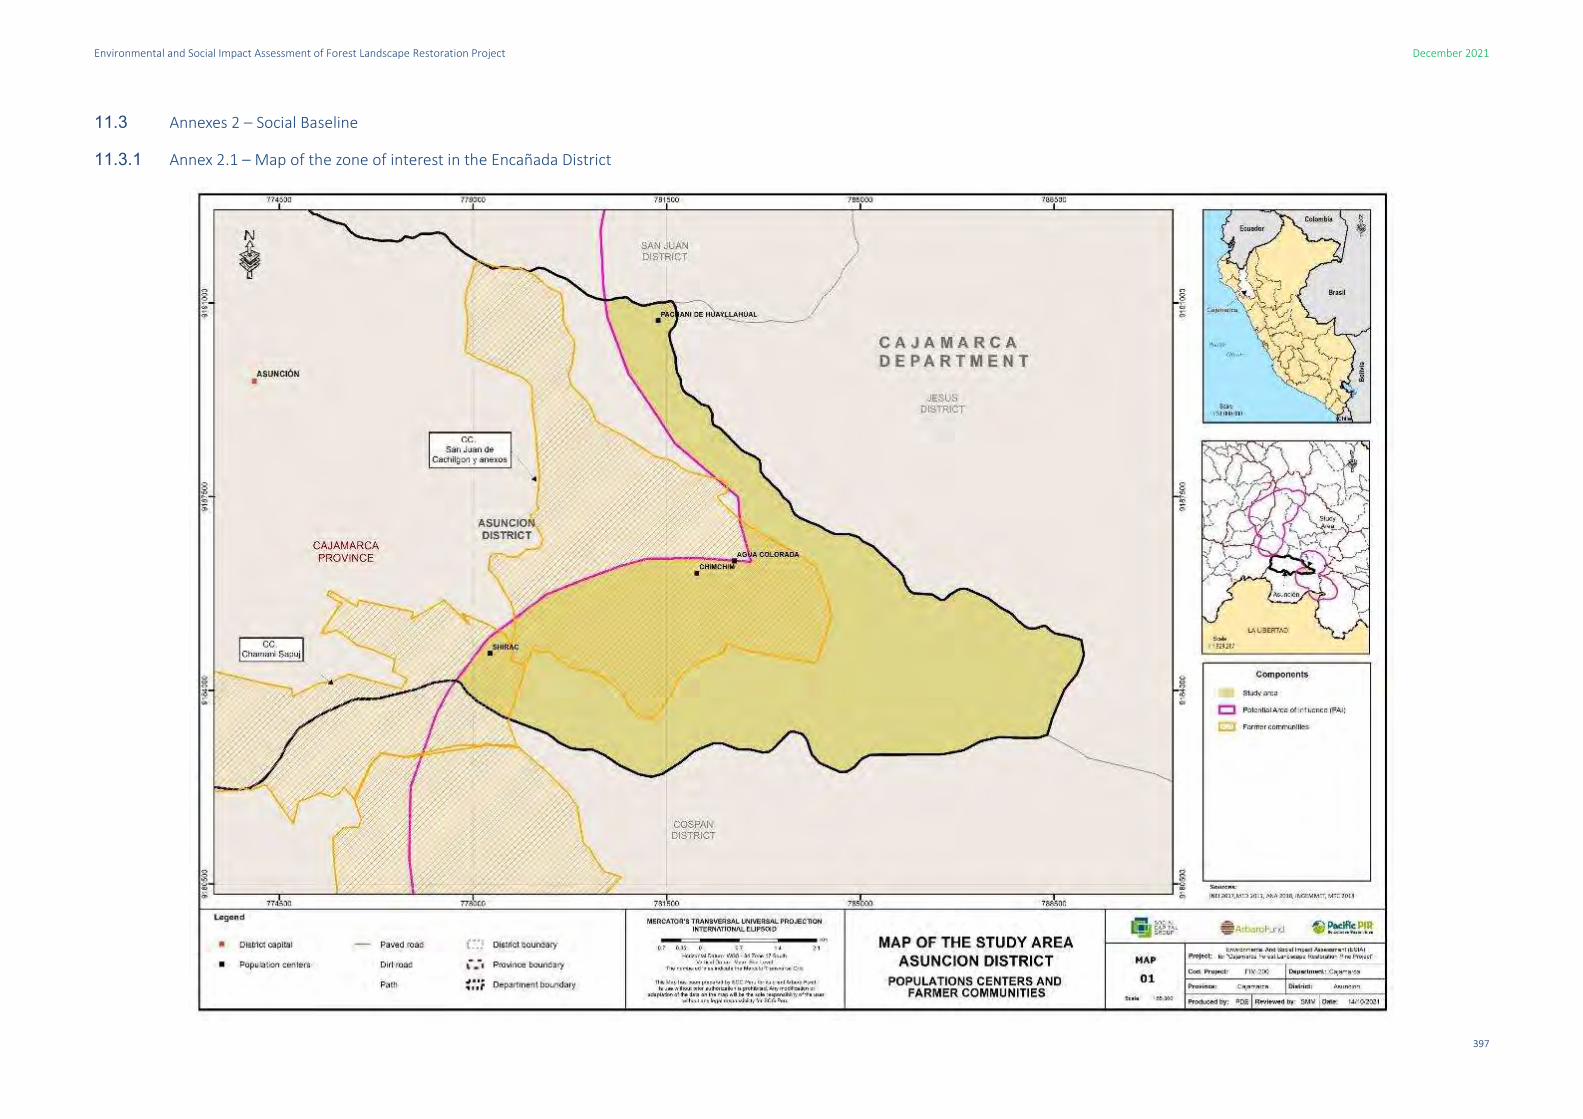
Environmental and Social Impact Assessment of Forest Landscape Restoration Project December 2021
397
11.3 Annexes 2 – Social Baseline
11.3.1 Annex 2.1 – Map of the zone of interest in the Encañada District

Environmental and Social Impact Assessment of Forest Landscape Restoration Project December 2021
398
11.3.2 Annex 2.2 – Map of the zone of interest in the Cajamarca District
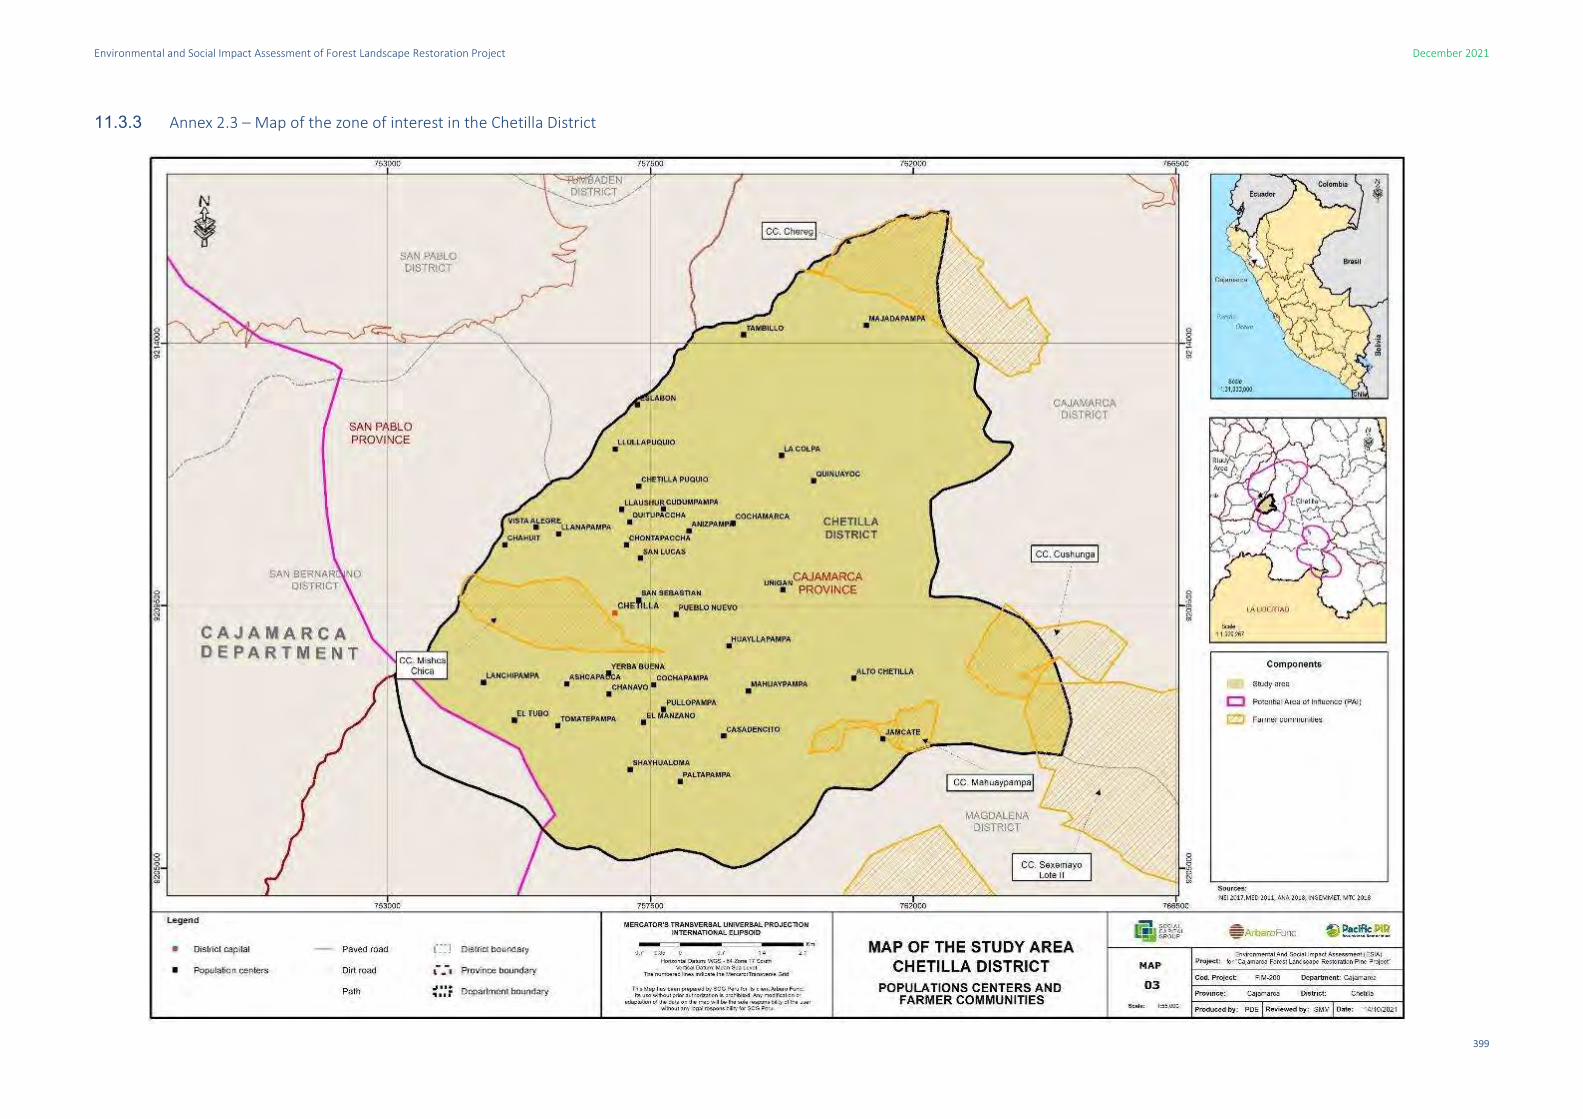
Environmental and Social Impact Assessment of Forest Landscape Restoration Project December 2021
399
11.3.3 Annex 2.3 – Map of the zone of interest in the Chetilla District

Environmental and Social Impact Assessment of Forest Landscape Restoration Project December 2021
400
11.3.4 Annex 2.4 – Map of the zone of interest in the Cospán District

Environmental and Social Impact Assessment of Forest Landscape Restoration Project December 2021
401
11.3.5 Annex 2.5 – Map of the zone of interest in the Encañada District

Environmental and Social Impact Assessment of Forest Landscape Restoration Project December 2021
402
11.3.6 Annex 2.6 – Map of the zone of interest in the Los Baños del Inca District

Environmental and Social Impact Assessment of Forest Landscape Restoration Project December 2021
403
11.3.7 Annex 2.7 – Map of the zone of interest in the Magdalena District

Environmental and Social Impact Assessment of Forest Landscape Restoration Project December 2021
404
11.3.8 Annex 2.8 – Map of the zone of interest in the Jesús District

Environmental and Social Impact Assessment of Forest Landscape Restoration Project December 2021
405
11.3.9 Annex 2.9 – Map of the zone of interest in the San Juan District

Environmental and Social Impact Assessment of Forest Landscape Restoration Project December 2021
406
11.3.10 Annex 2.10 – Map of the zone of interest in the San Bernardino District

Environmental and Social Impact Assessment of Forest Landscape Restoration Project December 2021
407
11.3.11 Annex 2.11 – Map of the zone of interest in the San Pablo District

Environmental and Social Impact Assessment of Forest Landscape Restoration Project December 2021
408
11.3.12 Annex 2.12 – Map of the zone of interest in the Tumbaden District

Environmental and Social Impact Assessment of Forest Landscape Restoration Project December 2021
409
11.3.13 Annex 2.13 – Map of the zone of interest in the Cachachi District

Social Capital Group 410
11.3.14 Annex 2.14 – Main occupation types in the districts of the province of San Pablo and Cajabamba, by gender
Main occupation Man Woman
N % N %
Cajamarca Region
Farmers and skilled agricultural, forestry and fishery workers 152 170 43.0 31 504 22.4
Elementary occupations 77 947 22.0 30 542 21.7
Service workers and vendors in shops and markets 21 955 6.2 31 390 22.3
Scientific and intellectual professionals 25 203 7.1 23 386 16.7
Workers in the construction, building, craft, electrical and telecommunication industries 29 408 8.3 7 643 5.4
Industrial machine operators, assemblers and transport drivers 26 288 7.4 522 0.4
Technical professionals 10 347 2.9 6 525 4.6
Managers and administrative employees 7 399 2.1 8 190 5.8
Military and police occupations 2 232 0.6 375 0.3
Members of the Executive, Legislative and Judicial Branches and senior staff of the public and private administration.
959 0.3 376 0.3
Total 353 907 100.0 140 454 100.0
Cajamarca Province
Elementary occupations 13 859 16.1 9 759 21.1
Service workers and vendors in shops and markets 8 971 10.4 13 186 28.5
Scientific and intellectual professionals 10 695 12.4 10 070 21.8
Farmers and skilled agricultural, forestry and fishery workers 16 695 19.4 4 010 8.7
Workers in the construction, building, craft, electrical and telecommunications industries 14 262 16.6 1 602 3.5
Industrial machine operators, assemblers and transport drivers 11 453 13.3 192 0.4
Technical professionals 5 228 6.1 3 144 6.8
Managers and administrative employees 3 318 3.9 3 750 8.1
Military and police occupations 990 1.2 270 0.6
Members of the Executive, Legislative and Judicial Branches and senior staff of the public and private administration.
472 0.5 238 0.5
Total 85 943 100.0 46 222 100.0
Asunción District
Farmers and skilled agricultural, forestry and fishery workers 995 69.1 82 32.9
Elementary occupations 203 14.1 58 23.3
Service workers and vendors in shops and markets 53 3.7 58 23.2
Workers in the construction, building, craft, electrical and telecommunication industries 86 6.0 9 3.8
Scientific and intellectual professionals 34 2.3 28 11.4
Industrial machine operators, assemblers and transport drivers 36 2.5 1 0.4
Technical professionals 21 1.4 5 2.1
Managers and administrative employees 11 0.7 6 2.5
Military and police occupations 2 0.1 1 0.4
Total 1 440 100.0 250 100.0
Baños del Inca District
Elementary occupations 2 367 20.6 1 512 30.1
Farmers and skilled agricultural, forestry and fishery workers 2 182 18.9 652 13.0
Workers in the construction, building, craft, electrical and telecommunication industries 2 377 20.6 223 4.4
Service workers and vendors in shops and markets 1 075 9.3 1 311 26.1
Industrial machine operators, assemblers and transport drivers 1 718 14.9 20 0.4
Scientific and intellectual professionals 832 7.2 637 12.7
Technical professionals 518 4.5 303 6.0
Managers and administrative employees 329 2.9 328 6.5
Military and police occupations 77 0.7 18 0.3
Members of the Executive, Legislative and Judicial Branches and senior staff of the public and private administration.
41 0.4 25 0.5
Total 11 514 100.0 5 027 100.0
Cajamarca District
Scientific and intellectual professionals 9 500 16.9 9 153 25.5
Service workers and vendors in shops and markets 7 293 13.0 10 866 30.3
Elementary occupations 7 455 13.3 6 904 19.2
Workers in the construction, building, craft, electrical and telecommunication industries 10 519 18.8 1 215 3.4
Industrial machine operators, assemblers and transport drivers 8 913 15.9 156 0.4
Technical professionals 4 536 8.1 2 736 7.6
Managers and administrative employees 2 835 5.1 3 263 9.1
Farmers and skilled agricultural, forestry and fishery workers 3 706 6.6 1 170 3.3
Military and police occupations 869 1.6 247 0.7
Members of the Executive, Legislative and Judicial Branches and senior staff of the public and private administration.
422 0.8 210 0.6
Total 56 049 100.0 35 920 100.0
Chetilla District
Farmers and skilled agricultural, forestry and fishery workers 430 79.1 149 71.3
Elementary occupations 47 8.7 33 15.7
Workers in the construction, building, craft, electrical and telecommunication industries 26 4.8 2 1.0
Service workers and vendors in shops and markets 7 1.4 14 6.9
Industrial machine operators, assemblers and transport drivers 13 2.4 0 0.0
Scientific and intellectual professionals 5 1.0 6 3.0

Environmental and Social Impact Assessment of Forest Landscape Restoration Project December 2021
411
Main occupation Man Woman
N % N %
Managers and administrative employees 8 1.4 2 1.0
Technical professionals 7 1.2 2 1.0
Total 543 100.0 209 100.0
Cospan District
Farmers and skilled agricultural, forestry and fishery workers 905 73.5 125 47.9
Elementary occupations 216 17.5 54 20.8
Service workers and vendors in shops and markets 24 1.9 41 15.6
Scientific and intellectual professionals 27 2.2 26 10.1
Workers in the construction, building, craft, electrical and telecommunications industries 29 2.4 3 1.2
Managers and administrative employees 7 0.6 6 2.4
Industrial machine operators, assemblers and transport drivers 11 0.9 1 0.4
Military and police occupations 7 0.6 1 0.4
Technical professionals 5 0.4 2 0.8
Members of the Executive, Legislative and Judicial Branches and senior staff of the public and private administration.
0 0.0 1 0.4
Total 1 231 100.0 261 100.0
Encañada District
Farmers and skilled agricultural, forestry and fishery workers 2 597 62.4 664 51.8
Elementary occupations 1 028 24.7 376 29.4
Service workers and vendors in shops and markets 131 3.1 152 11.9
Workers in the construction, building, craft, electrical and telecommunication industries 200 4.8 39 3.1
Industrial machine operators, assemblers and transport drivers 109 2.6 5 0.4
Managers and administrative employees 36 0.9 18 1.4
Scientific and intellectual professionals 27 0.6 13 1.0
Technical professionals 24 0.6 13 1.0
Military and police occupations 9 0.2 0 0.0
Members of the Executive, Legislative and Judicial Branches and senior staff of the public and private administration.
1 0.0 0 0.0
Total 4 162 100.0 1 280 100.0
Jesus District
Farmers and skilled agricultural, forestry and fishery workers 2 019 55.4 405 38.5
Elementary occupations 852 23.4 225 21.4
Service workers and vendors in shops and markets 122 3.3 230 21.9
Workers in the construction, building, craft, electrical and telecommunication industries 281 7.7 43 4.1
Industrial machine operators, assemblers and transport drivers 199 5.5 3 0.3
Scientific and intellectual professionals 92 2.5 72 6.8
Technical professionals 49 1.3 40 3.8
Managers and administrative employees 26 0.7 35 3.3
Military and police occupations 4 0.1 0 0.0
Members of the Executive, Legislative and Judicial Branches and senior staff of the public and private administration.
2 0.1 0 0.0
Total 3 646 100.0 1 052 100.0
Magdalena District
Farmers and skilled agricultural, forestry and fishery workers 1 301 59.9 248 36.5
Elementary occupations 396 18.2 146 21.5
Service workers and vendors in shops and markets 90 4.1 180 26.4
Workers in the construction, building, craft, electrical and telecommunication industries 144 6.6 13 1.9
Industrial machine operators, assemblers and transport drivers 131 6.0 3 0.5
Scientific and intellectual professionals 58 2.7 50 7.4
Managers and administrative employees 21 0.9 23 3.4
Technical professionals 22 1.0 16 2.3
Military and police occupations 9 0.4 1 0.2
Members of the Executive, Legislative and Judicial Branches and senior staff of the public and private administration.
2 0.1 0 0.0
Total 2 173 100.0 679 100.0
San Juan District
Farmers and skilled agricultural, forestry and fishery workers 556 59.5 161 51.1
Elementary occupations 175 18.8 45 14.2
Service workers and vendors in shops and markets 29 3.2 56 17.7
Workers in the construction, building, craft, electrical and telecommunications industries 74 8.0 10 3.0
Scientific and intellectual professionals 32 3.4 23 7.2
Industrial machine operators, assemblers and transport drivers 42 4.5 0 0.0
Managers and administrative employees 12 1.2 12 3.9
Technical professionals 4 0.4 6 1.9
Military and police occupations 8 0.9 2 0.6
Members of the Executive, Legislative and Judicial Branches and senior staff of the public and private administration.
1 0.1 1 0.3
Total 934 100.0 316 100.0
Province of San Pablo
Farmers and skilled agricultural, forestry and fishery workers 3 206 61.7 818 44.0
Elementary occupations 974 18.8 342 18.4
Scientific and intellectual professionals 280 5.4 251 13.5

Environmental and Social Impact Assessment of Forest Landscape Restoration Project December 2021
412
Main occupation Man Woman
N % N %
Service workers and vendors in shops and markets 149 2.9 239 12.9
Workers in the construction, building, craft, electrical and telecommunication industries 220 4.2 122 6.5
Industrial machine operators, assemblers and transport drivers 198 3.8 1 0.1
Managers and administrative employees 70 1.3 44 2.4
Technical professionals 62 1.2 37 2.0
Military and police occupations 29 0.5 3 0.2
Members of the Executive, Legislative and Judicial Branches and senior staff of the public and private administration.
6 0.1 3 0.2
Total 5 193 100.0 1 860 100.0
San Bernardino District
Farmers and skilled agricultural, forestry and fishery workers 720 64.8 152 55.9
Elementary occupations 247 22.2 54 20.1
Service workers and vendors in shops and markets 25 2.2 29 10.5
Workers in the construction, building, craft, electrical and telecommunication industries 41 3.7 2 0.8
Scientific and intellectual professionals 23 2.0 20 7.4
Industrial machine operators, assemblers and transport drivers 27 2.5 0 0.0
Managers and administrative employees 10 0.9 8 3.1
Technical professionals 8 0.7 4 1.5
Military and police occupations 10 0.9 1 0.4
Members of the Executive, Legislative and Judicial Branches and senior staff of the public and private administration.
1 0.1 1 0.4
Total 1 111 100.0 271 100.0
San Pablo District
Farmers and skilled agricultural, forestry and fishery workers 1 745 59.6 533 42.2
Elementary occupations 426 14.6 170 13.5
Scientific and intellectual professionals 233 7.9 222 17.5
Service workers and vendors in shops and markets 113 3.9 195 15.4
Workers in the construction, building, craft, electrical and telecommunications industries 155 5.3 78 6.2
Industrial machine operators, assemblers and transport drivers 135 4.6 1 0.1
Managers and administrative employees 50 1.7 31 2.5
Technical professionals 49 1.7 30 2.3
Military and police occupations 17 0.6 2 0.2
Members of the Executive, Legislative and Judicial Branches and senior staff of the public and private administration.
3 0.1 1 0.1
Total 2 925 100.0 1 263 100.0
Tumbaden District
Farmers and skilled agricultural, forestry and fishery workers 580 63.5 115 40.7
Elementary occupations 246 26.9 107 38.1
Workers in the construction, building, craft, electrical and telecommunication industries 23 2.5 41 14.4
Industrial machine operators, assemblers and transport drivers 28 3.1 0 0.0
Service workers and vendors in shops and markets 9 1.0 12 4.2
Scientific and intellectual professionals 13 1.4 4 1.5
Managers and administrative employees 8 0.8 0 0.0
Technical professionals 3 0.3 2 0.8
Members of the Executive, Legislative and Judicial Branches and senior staff of the public and private administration.
2 0.2 1 0.4
Military and police occupations 1 0.1 0 0.0
Total 913 100.0 282 100.0
Cajabamba Province
Farmers and skilled agricultural, forestry and fishery workers 8 857 47.9 1 134 20.0
Elementary occupations 4 251 23.0 1 401 24.7
Service workers and vendors in shops and markets 1 111 6.0 1 504 26.5
Scientific and intellectual professionals 845 4.6 909 16.0
Workers in the construction, building, craft, electrical and telecommunication industries 1 405 7.6 174 3.1
Industrial machine operators, assemblers and transport drivers 1 290 7.0 31 0.5
Technical professionals 383 2.1 229 4.0
Managers and administrative employees 232 1.3 265 4.7
Military and police occupations 79 0.4 12 0.2
Members of the Executive, Legislative and Judicial Branches and senior staff of the public and private administration.
30 0.2 10 0.2
Total 18 483 100.0 5 669 100.0
Cachachi District
Farmers and skilled agricultural, forestry and fishery workers 2 864 49.2 352 36.1
Elementary occupations 1 633 28.1 282 28.9
Service workers and vendors in shops and markets 273 4.7 212 21.8
Industrial machine operators, assemblers and transport drivers 449 7.7 16 1.7
Workers in the construction, building, craft, electrical and telecommunication industries 277 4.8 18 1.8
Technical professionals 142 2.4 19 2.0
Scientific and intellectual professionals 89 1.5 43 4.4
Managers and administrative employees 47 0.8 29 2.9
Military and police occupations 43 0.7 4 0.4

Environmental and Social Impact Assessment of Forest Landscape Restoration Project December 2021
413
Main occupation Man Woman
N % N %
Members of the Executive, Legislative and Judicial Branches and senior staff of the public and private administration.
3 0.1 0 0.0
Total 5 820 100.0 975 100.0
Source: CPV 2017 - INEI

Social Capital Group 414
11.3.15 Annex 2.15 – List of encountered diseases
– Respiratory tract infections
– Intestinal infections
– Other infectious and/or communicable diseases: Certain infectious and parasitic diseases; skin diseases; diseases of the genitourinary system; dental diseases; sexually transmitted diseases; anthropod-borne viral diseases; tuberculosis.
– Maternal perinatal: Pregnancy, childbirth and puerperium; certain conditions arising in the perinatal period.
– Chronic circulatory system: Diseases of the circulatory system; diseases of the blood and hematopoietic organs; certain disorders affecting the mechanism of immunity; coagulation and bleeding defects.
– Other Chronic non-communicable diseases: Diseases of the musculoskeletal system and connective tissue; diseases of the nervous system; mental and behavioural disorders; diseases of the eye and its appendages; diseases of the ear and mastoid apophysis; obesity; endocrine, nutritional and metabolic diseases.
– Neoplastic: Tumors (neoplasms)
– External causes: Trauma, poisoning and some other consequences of external causes; external causes of morbidity and mortality.
– Other: General symptoms and signs, abnormal clinical and laboratory findings, not elsewhere classified; congenital malformations, deformities and chromosomal abnormalities, general symptoms and signs; complications of medical care.
– Malnutrition-anemia
Copyright © 2022 FDOKUMEN