Enhanced visible light photocatalysis through fast crystallization of zinc oxide nanorods
7
14 Enhanced visible light photocatalysis through fast crystallization of zinc oxide nanorods Sunandan Baruah, Mohammad Abbas Mahmood, Myo Tay Zar Myint, Tanujjal Bora and Joydeep Dutta * Full Research Paper Open Access Address: Center of Excellence in Nanotechnology, School of Engineering and Technology, Asian Institute of Technology, Klong Luang, Pathumthani 12120, Thailand. Phone: +66 2 524 5680, Fax: +66 2 524 5617 Email: Sunandan Baruah - [email protected]; Joydeep Dutta * - [email protected] * Corresponding author Keywords: defects; nanoparticle; nanorod; photocatalysis; pollutant; ZnO Beilstein J. Nanotechnol. 2010, 1, 14–20. doi:10.3762/bjnano.1.3 Received: 23 August 2010 Accepted: 26 October 2010 Published: 22 November 2010 Associate Editor: J. J. Schneider © 2010 Baruah et al; licensee Beilstein-Institut. License and terms: see end of document. Abstract Hydrothermally grown ZnO nanorods have inherent crystalline defects primarily due to oxygen vacancies that enhance optical absorption in the visible spectrum, opening up possibilities for visible light photocatalysis. Comparison of photocatalytic activity of ZnO nanorods and nanoparticle films on a test contaminant methylene blue with visible light irradiation at 72 kilolux (klx) showed that ZnO nanorods are 12–24% more active than ZnO nanoparticulate films. This can be directly attributed to the increased effec- tive surface area for adsorption of target contaminant molecules. Defects, in the form of interstitials and vacancies, were intention- ally created by faster growth of the nanorods by microwave activation. Visible light photocatalytic activity was observed to improve by ≈8% attributed to the availability of more electron deficient sites on the nanorod surfaces. Engineered defect creation in nanostructured photocatalysts could be an attractive solution for visible light photocatalysis. 14 Introduction Photocatalysis is a light induced catalytic process whereby photogenerated electron-hole pairs in a semiconductor undergo redox reactions with molecules adsorbed onto the surface, thereby breaking them into smaller fragments. Photocatalysis with metal-oxide-semiconductor nanostructures has been an area of intense research over the last couple of decades with titania (TiO 2 ) receiving the most attention [1-4]. Optical absorp- tion in the ultraviolet region (peaking around 220 nm) [5] and low photoefficiency [6,7] are factors that deter the wide scale use of TiO 2 for photocatalytic activities under sunlight. Zinc oxide (ZnO), with a high surface reactivity owing to a large number of native defect sites arising from oxygen nonstoi- chiometry, has emerged to be an efficient photocatalyst ma- terial compared to other metal oxides [8-10]. ZnO exhibits com- paratively higher reaction and mineralization rates [11] and can generate hydroxyl ions more efficiently than titania (TiO 2 ) [12]. Surface area and surface defects play an important role in the photocatalytic activity of metal-oxide nanostructures, as the
Transcript of Enhanced visible light photocatalysis through fast crystallization of zinc oxide nanorods

14
Enhanced visible light photocatalysis through fastcrystallization of zinc oxide nanorods
Sunandan Baruah, Mohammad Abbas Mahmood, Myo Tay Zar Myint,Tanujjal Bora and Joydeep Dutta*
Full Research Paper Open Access
Address:Center of Excellence in Nanotechnology, School of Engineering andTechnology, Asian Institute of Technology, Klong Luang, Pathumthani12120, Thailand. Phone: +66 2 524 5680, Fax: +66 2 524 5617
Email:Sunandan Baruah - [email protected]; Joydeep Dutta* [email protected]
* Corresponding author
Keywords:defects; nanoparticle; nanorod; photocatalysis; pollutant; ZnO
Beilstein J. Nanotechnol. 2010, 1, 14–20.doi:10.3762/bjnano.1.3
Received: 23 August 2010Accepted: 26 October 2010Published: 22 November 2010
Associate Editor: J. J. Schneider
© 2010 Baruah et al; licensee Beilstein-Institut.License and terms: see end of document.
AbstractHydrothermally grown ZnO nanorods have inherent crystalline defects primarily due to oxygen vacancies that enhance optical
absorption in the visible spectrum, opening up possibilities for visible light photocatalysis. Comparison of photocatalytic activity of
ZnO nanorods and nanoparticle films on a test contaminant methylene blue with visible light irradiation at 72 kilolux (klx) showed
that ZnO nanorods are 12–24% more active than ZnO nanoparticulate films. This can be directly attributed to the increased effec-
tive surface area for adsorption of target contaminant molecules. Defects, in the form of interstitials and vacancies, were intention-
ally created by faster growth of the nanorods by microwave activation. Visible light photocatalytic activity was observed to
improve by ≈8% attributed to the availability of more electron deficient sites on the nanorod surfaces. Engineered defect creation in
nanostructured photocatalysts could be an attractive solution for visible light photocatalysis.
14
IntroductionPhotocatalysis is a light induced catalytic process whereby
photogenerated electron-hole pairs in a semiconductor undergo
redox reactions with molecules adsorbed onto the surface,
thereby breaking them into smaller fragments. Photocatalysis
with metal-oxide-semiconductor nanostructures has been an
area of intense research over the last couple of decades with
titania (TiO2) receiving the most attention [1-4]. Optical absorp-
tion in the ultraviolet region (peaking around 220 nm) [5] and
low photoefficiency [6,7] are factors that deter the wide scale
use of TiO2 for photocatalytic activities under sunlight. Zinc
oxide (ZnO), with a high surface reactivity owing to a large
number of native defect sites arising from oxygen nonstoi-
chiometry, has emerged to be an efficient photocatalyst ma-
terial compared to other metal oxides [8-10]. ZnO exhibits com-
paratively higher reaction and mineralization rates [11] and can
generate hydroxyl ions more efficiently than titania (TiO2) [12].
Surface area and surface defects play an important role in the
photocatalytic activity of metal-oxide nanostructures, as the
Beilstein J. Nanotechnol. 2010, 1, 14–20.
15
contaminant molecules need to be adsorbed on to the photocat-
alytic surface for the redox reactions to occur. The higher the
effective surface area, the higher will be the adsorption of target
molecules leading to better photocatalytic activity. One dimen-
sional nanostructures, such as nanowires and nanorods, offer
higher surface to volume ratio compared to nanoparticulate
coatings on a flat plate [13]. The design of transition metal-
oxide mesostructures has also been an area of interest for
researchers [14,15] owing to high porosity of such structures.
The effective surface area (adsorbed amount of target mole-
cules) and the diffusivity are important indexes to gauge photo-
catalytic activity [14]. Doping of metal oxides with metals and/
or transition metals creates quasi-stable energy states within the
band gap (surface defects) [16], thereby affecting the optical
and electronic properties [17]. Increased electron trapping due
to higher defect sites leads to enhancement in the photocat-
alytic efficiency. This increase in photocatalytic efficiency is
possible provided the electron-hole pair recombination rate is
lower than the rate of electron transfer to adsorbed molecules.
There are reports on the enhancement of visible light absorp-
tion in ZnO by doping with, e.g., cobalt (Co) [18], manganese
(Mn) [19], lead (Pb) and silver (Ag) [16], etc. Photocatalytic
activity comparable to doped ZnO was also observed with en-
gineered defects in ZnO crystals achieved by fast crystalliza-
tion during synthesis of the nanoparticles [20].
Results from photocatalysis experiments carried out using ZnO
nanoparticles prepared through a slow growth process (3 h
hydrolysis at 60 °C) and rapid crystallization (7 min under
microwave irradiation) have already been reported in a previous
publication [20]. A higher optical absorption in the visible
region was observed in this case. The faster degradation of
methylene blue (MB) in the presence of nonstoichiometric crys-
tallites of ZnO prepared through fast crystallization can be
attributed to quasi-stable surface states that enhance the photo-
catalytic activity. Time correlated single photon count spec-
troscopy (TCSPCS) carried out on conventionally synthesized
and rapidly crystallized nanoparticles clearly demonstrated that
a higher rate of injection of photoexcited electrons occurs in the
molecules adsorbed on the surface of defect engineered
nanoparticles [21]. Upon excitation of ZnO nanoparticles with
high-energy laser pulses at 375 nm in the presence of MB mole-
cules, a quick decay in photoluminescence in the fast-crystal-
lized particulate samples as compared to the conventionally
hydrolyzed ones was observed. The spectroscopic results
support the observation that surface defect states are created
when the ZnO crystals are grown rapidly, which facilitates
surface reactions such as photocatalysis. Even though the ZnO
nanoparticles could efficiently carry out photocatalytic degrad-
ation of MB, the removal of the 5–7 nm sized particles after the
completion of the photocatalytic reactions is cumbersome. This
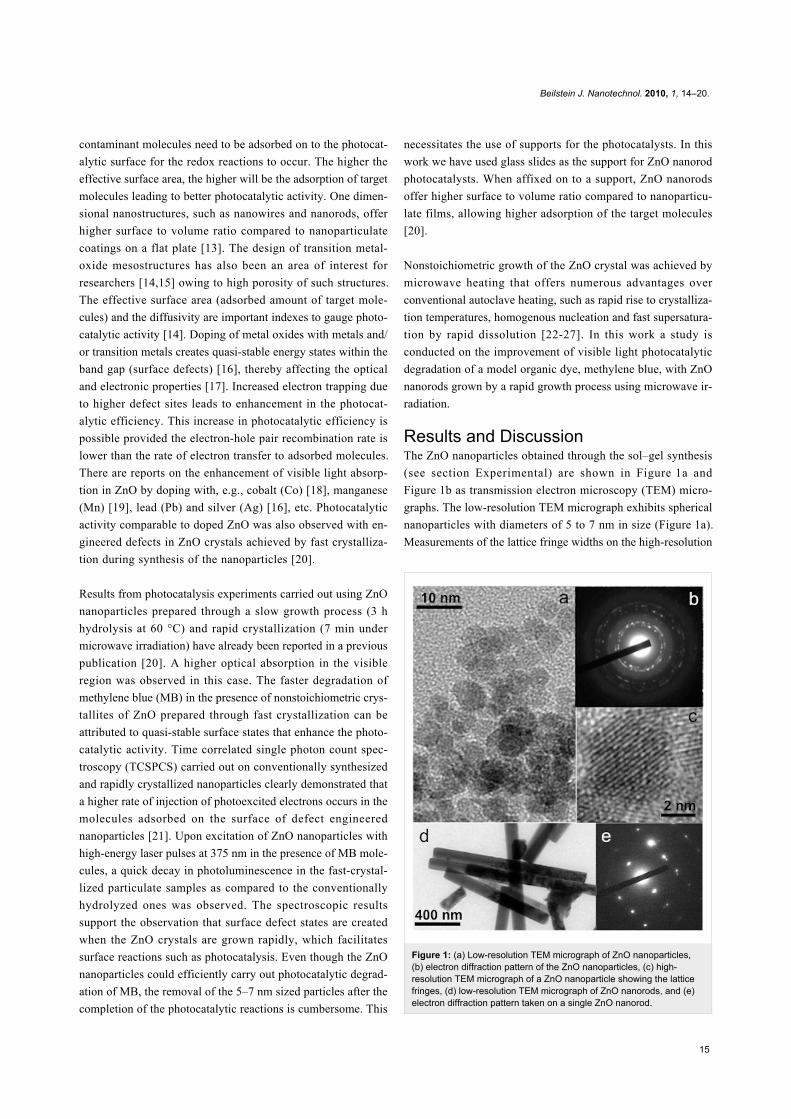
Figure 1: (a) Low-resolution TEM micrograph of ZnO nanoparticles,(b) electron diffraction pattern of the ZnO nanoparticles, (c) high-resolution TEM micrograph of a ZnO nanoparticle showing the latticefringes, (d) low-resolution TEM micrograph of ZnO nanorods, and (e)electron diffraction pattern taken on a single ZnO nanorod.
necessitates the use of supports for the photocatalysts. In this
work we have used glass slides as the support for ZnO nanorod
photocatalysts. When affixed on to a support, ZnO nanorods
offer higher surface to volume ratio compared to nanoparticu-
late films, allowing higher adsorption of the target molecules
[20].
Nonstoichiometric growth of the ZnO crystal was achieved by
microwave heating that offers numerous advantages over
conventional autoclave heating, such as rapid rise to crystalliza-
tion temperatures, homogenous nucleation and fast supersatura-
tion by rapid dissolution [22-27]. In this work a study is
conducted on the improvement of visible light photocatalytic
degradation of a model organic dye, methylene blue, with ZnO
nanorods grown by a rapid growth process using microwave ir-
radiation.
Results and DiscussionThe ZnO nanoparticles obtained through the sol–gel synthesis
(see section Experimental) are shown in Figure 1a and
Figure 1b as transmission electron microscopy (TEM) micro-
graphs. The low-resolution TEM micrograph exhibits spherical
nanoparticles with diameters of 5 to 7 nm in size (Figure 1a).
Measurements of the lattice fringe widths on the high-resolution

Beilstein J. Nanotechnol. 2010, 1, 14–20.
16
Table 1: Estimated effective area of ZnO nanorod surfaces on substrates of size 1 × 3 cm, grown at different reactant concentrations during thehydrothermal growth process at 90 °C with equimolar concentrations of zinc nitrate and hexamine in the starting aqueous solution.
Parameter Sample 1 Sample 2 Sample 3
Growth concentration 0.1 mM 1.0 mM 10.0 mMAverage width of nanorod w (nm) 20 200 1000Average length of nanorod l (nm) 150 1800 5000Area of each nanorod (µm2) 0.00952 1.132 16.3Number density of the nanorods on substrate (µm−2) 1200 14 0.8Total effective surface area on a substrate of size 1 × 3 cm (cm2) 34.27 47.54 39.12
Figure 2: Scanning electron micrograph of (a) ZnO nanoparticle thinfilm on glass substrate, (b) Sample 1 (0.1 mM), inset: cross-sectionalview, (c) Sample 2 (1.0 mM), inset: cross-sectional view, and (d)Sample 3 (10.0 mM), inset: cross-sectional view.
TEM micrographs (see Figure 1c) confirm the wurtzite struc-
ture of the zinc oxide crystallites. Fringe widths of 0.28 nm,
0.16 nm and 0.19 nm measured on different images show the
dominance of the (100), (110) and (102) planes. The electron
diffraction pattern shown in Figure 1b also confirms the crys-
tallinity of the ZnO nanoparticles. A TEM micrograph of ZnO
nanorods collected from the glass substrate is shown in
Figure 1d. The diffraction pattern taken on a single rod is shown
in Figure 1e demonstrating a single crystalline structure.
The width, length and density of the nanorods on the substrates
are dependent on the synthesis conditions, such as, seeding of
the substrates, concentration of precursors in the growth
solution, as well as the duration of hydrothermal process [27-
29]. The effective surface area available for dye adsorption is a
function not only of the thickness and length of the nanorods,
but also the density of the rods covering the substrate. The
average exposed surface area was approximated from measure-
ments using the scanning electron micrographs (Figure 2)
considering regular hexagonal ZnO nanorods. The free surface
Figure 3: Degradation of methylene blue as a function of ln(C/C0)versus the time of exposure to visible light on the ZnO nanoparticle filmand the nanorods with different dimensions.
area available for dye adsorption was estimated with the expres-
sion
(1)
where SA is the total surface area, w is the average width, l the
average length and d the number density of the ZnO nanorods
on the substrate. In Table 1 the estimated values of the exposed
surface area available for adsorption of the dye molecules in the
different samples are presented.
Figure 3 shows the photocatalytic results comparing the ZnO
nanoparticle film and the nanorods of different sizes and density
(thereby offering different surface to volume ratios) on glass
substrate (3 cm2). The photocatalytic degradation of MB could
be fitted using Equation 2 and the apparent rate constants
(k = ab) were calculated from the linear curves using
Equation 3:
(2)

Beilstein J. Nanotechnol. 2010, 1, 14–20.
17
Figure 4: Increase in width and length resulting from fast crystallization by the use of microwave irradiation after 10 h growth at different growthconcentrations: (a) 0.1 mM, (b) 1.0 mM, and (c) 10.0 mM.
(3)
The nanoparticle film demonstrated minimum photocatalytic
activity as expected owing to lower surface (SA ≈ 6 cm2)
exposed to the contaminant molecules [10]. After 180 min of
visible light illumination at 72 klx, the nanoparticulate thin film
showed minimum activity (degradation efficiency of 64% after
180 min; k = 0.005993 min−1). Sample 2 with the maximum
surface area (47.54 cm2) gave the highest activity (degradation
efficiency of 90%; k = 0.012792 min−1) and sample 1 with the
minimum surface area among the nanorod samples (34.27 cm2)
had the lowest activity (degradation efficiency of 78%; k =
0.008412 min−1).
As with the ZnO nanoparticles [17,18], an increase in the
density of vacancies and interstitial defects in the nanorod crys-
tals were obtained through accelerated crystallization using
microwaves and subsequent fast quenching reactions. Apart
from the oxygen nonstoichiometry, microwave induced growth
also reduces the growth time. A comparison of the ZnO
nanorod growth using the conventional process and through fast
crystallization (with microwave irradiation) is shown in
Figure 4. The width and length of the nanorods were measured
after 5 h growth with starting solutions of 0.1 mM, 1.0 mM and
10.0 mM zinc nitrate hexahydrate and hexamethylenetetramine
at a temperature of 90 °C. An increase in size was observed for
the samples prepared by microwave excitation indicating a
faster crystallization process. About 40 to 50% increase in
width of the nanorods was noted for the samples prepared by
microwave induced hydrolysis reactions. Similarly, an
increased length of ZnO nanorods by 36 to 66% was obtained
for different growth concentrations of the reactant solution.
Figure 5: A typical scanning electron micrograph showing the ZnOnanorods grown using microwave irradiation in a reaction bathcontaining 10.0 mM zinc nitrate and hexamethylenetetramine for 10 h;structural defects can be observed especially on the polar face.
A typical scanning electron micrograph of ZnO nanorods grown
through fast crystallization in a reaction bath containing 10.0
mM zinc nitrate hexahydrate and hexamethylenetetramine with
microwave irradiation for 10 h is shown in Figure 5. Visible
structural defects can be clearly observed on the surface of the
rods. In order to further confirm if the fast synthesis route
creates increased electron deficient sites, two samples with
comparable exposed surface areas, one prepared by the conven-
tional process (Sample 2 with surface area ≈ 47.54 cm2) and the
other by fast hydrolysis (surface area ≈ 33.74 cm2), were
selected. Sample 2 was selected as it showed maximum activity
compared to Sample 1 and Sample 3. The fast hydrolyzed
sample was grown using a reaction bath at a concentration of
10.0 mM of zinc nitrate and hexamine for 4 h under microwave
illumination. Optical absorption spectra of the two samples
(Figure 6: inset) show higher absorption in the rapidly crystal-

Beilstein J. Nanotechnol. 2010, 1, 14–20.
18
lized nanorods especially in the near UV and visible regions of
the electromagnetic spectrum up to about 500 nm. The optical
absorptions of both the samples are comparable above 500 nm.
Figure 6: Degradation of methylene blue as a function of ln(C/C0)versus the time of exposure to light in the presence of ZnO nanorodssynthesized by the conventional method (Sample 2 with surface area ≈47.54 cm2) and the fast crystallization method (surface area ≈ 33.74cm2). Inset: UV–vis absorption spectra of ZnO nanorods grown by theconventional hydrothermal method and by microwave irradiation ofcomparable exposed surface area.
The microwave hydrolyzed nanorods demonstrated better
photocatalytic activity (degradation efficiency of 97% in 180
min; k = 0.019481 min−1) as compared to the conventionally
synthesized rods (degradation efficiency of 90% in 180 min; k =
0.012792 min−1) (Figure 6). This is attributed to the higher
density of electron deficient sites generated during microwave
synthesis that can trap photogenerated electrons and reduce
recombinations, thereby improving the photocatalytic activity.
ZnO nanorods grown through fast crystallization under
microwave irradiation not only creates defective crystallites
ideal for photocatalysis (Figure 3), but this growth process is
also faster compared to the conventional process, thereby
saving time and energy during the growth process.
ConclusionOne-dimensional nanostructures with very high surface to
volume ratio can be attractive candidates for photocatalysis.
Comparative results of photocatalytic degradation studies on
methylene blue with visible light irradiation demonstrated that
ZnO nanorods are 12–24% more active than nanoparticulate
films. An enhancement of 8% in the photocatalytic activity of
ZnO nanorods was achieved through engineered creation of
oxygen deficient structures using a fast crystallization process
achieved by microwave assisted hydrolysis. This enhancement
in the photocatalytic activity was correlated to an increased
absorption efficiency of light in the UV and visible regions.
Intentional defect inclusion in the crystal of ZnO nanostruc-
tures during synthesis is an attractive option for visible light
photocatalysis and further results with different pollutants will
be presented in succeeding reports. ZnO, apart from having
specific structural properties, can also be grown on any type of
substrates, such as glass, alumina, polyethylene, polypropylene,
steel, cotton, amongst others, through proper seeding and hence
is suitable for a large number of applications, e.g., wastewater
treatment, etc. that is scalable for practical uses.
ExperimentalMaterials usedZinc acetate dihydrate [(CH3COO)2Zn·2H2O, Merck], sodium
hydroxide [NaOH, Merck], zinc nitrate hexahydrate
[Zn(NO3)2·6H2O, APS Ajax Finechem], hexamethylene-
tetramine [(CH2)6N4, Carlo Erba], ethanol [C2H5OH, J. T.
Baker], and methylene blue [C16H18N3CIS·3H2O, Carlo Erba].
Synthesis of ZnO nanoparticlesZnO nanoparticles were synthesized in a colloidal solution with
ethanol as the solvent. The co-precipitation technique has been
reported in previous publications from our group [19,30].
Briefly, 40 mL of 2 mM zinc acetate solution was heat treated
at 70 °C for half an hour. Then 20 mL of 4 mM NaOH solution
in deionised water was added and the admixture was
hydrolyzed for 2 h at 60 °C.
Growth of ZnO NanorodsThe ZnO nanorods were grown hydrothermally on glass
substrates, which were initially thiolated for better attachment
of the ZnO nanoparticle seeds [31]. Hydrothermal growth of
ZnO nanostructures is a simple and thermally efficient process
[27]. Seeding was done by dip coating with a colloidal solution
of ZnO nanoparticles and annealed at 100 oC for 30 min. The
seeds served as nucleation sites and the ZnO nanorods grew
preferentially along the c-axis of the wurtzite structure when the
seeded substrate was placed in an aqueous chemical bath
containing equimolar zinc nitrate hexahydrate and hexa-
methylenetetramine maintained at 90 °C [31]. Three different
growth concentrations were used: (1) Sample 1: 0.1 mM, (2)
Sample 2: 1.0 mM and (3) Sample 3: 10.0 mM. The growth of
the nanorods was continued for 20 h and the chemical bath was
replenished with fresh reactants every five hours to maintain the
growth rate [20]. The substrate was then removed and washed
several times with deionised water and then annealed at 250 °C
for 1 h to remove any unreacted organic deposits. Microwave
synthesis of ZnO nanorods on seeded substrates was carried out
in a commercial microwave oven operated at the low energy
mode for 5 h. Quantification of nanorod size and density were
carried out with Scion image processing software on Scanning
Electron Microscopy (SEM) obtained from a JEOL JSM-6301F
operated at 20 kV.

Beilstein J. Nanotechnol. 2010, 1, 14–20.
19
Photocatalysis TestsPhotocatalysis was conducted with a popular test contaminant,
methylene blue, which is a heterocyclic aromatic compound, in
aqueous solution. Photocatalytic degradation of methylene blue
[C16H18N3SCl] (MB) results in the formation of leuco-meth-
ylene blue (LMB). A 10 μM solution of MB was prepared in
deionised water and put in polymethyl methacrylate (PMMA)
cuvettes and a glass slide (3 × 1 cm) with a coating of nanorods
(Sample 1, Sample 2 and Sample 3) was placed inside the
cuvette with the nanorod surface facing a tungsten-halogen light
source (500 W). A glass vessel containing water was placed
between the light source and the cuvettes to absorb the UV and
infrared light radiated by the lamp. At the sample position, 72
klx of light was measured by a luxmeter calibrated to 550 nm.
As a control, a similar glass slide (3 × 1 cm) covered with a thin
film of ZnO nanoparticles (diameter ≈ 5–7 nm) by a dip coating
process was placed in a cuvette with the nanoparticle side
facing the light source. Optical absorption spectra were
recorded after different light exposure durations with an Ocean
Optics spectrophotometer in order to monitor the rate of
decolourisation of the test contaminant. The degradation of the
dye was estimated from the reduction in absorption intensity of
MB at a fixed wavelength λmax = 665 nm. The degradation effi-
ciency (DE) was then calculated as given in Equation 4:
(4)
where I0 is the initial absorption intensity of MB at λmax= 665
nm and I is the absorption intensity after photoirradiation. C0 is
the initial concentration of the dye and C is the concentration
after photoirradiation.
AcknowledgementsThe authors would like to acknowledge partial financial support
from the National Nanotechnology Center, belonging to the
National Science & Technology Development Agency
(NSTDA), Ministry of Science and Technology (MOST), Thai-
land and the Centre of Excellence in Nanotechnology at the
Asian Institute of Technology, Thailand.
References1. Fujishima, A.; Honda, K. Nature 1972, 238, 37–38.
doi:10.1038/238037a02. Fujishima, A.; Rao, T. N.; Tryk, D. A. J. Photochem. Photobiol., C 2000,
1, 1–21. doi:10.1016/S1389-5567(00)00002-23. Nozik, A. J.; Memming, R. J. Phys. Chem. 1996, 100, 13061–13078.
doi:10.1021/jp953720e4. Fernández-Ibáñez, P.; Blanco, J.; Malato, S.; De Las Nieves, F. J.
Water Res. 2003, 37, 3180–3188.doi:10.1016/S0043-1354(03)00157-X
5. Martyanov, I. N.; Savinov, E. N.; Klabunde, K. J.J. Colloid Interface Sci. 2003, 267, 111–116.doi:10.1016/S0021-9797(03)00678-7
6. Wilson, E. Chem. Eng. News 1996, 74, 29–33.7. Cabrera, M. I.; Alfano, O. M.; Cassano, A. E. J. Phys. Chem. 1996,
100, 20043–20050. doi:10.1021/jp962095q8. Ali, A. M.; Emanuelsson, E. A. C.; Patterson, D. A. Appl. Catal., B
2010, 97, 168–181. doi:10.1016/j.apcatb.2010.03.0379. Pardeshi, S. K.; Patil, A. B. J. Mol. Catal. A: Chem. 2009, 308, 32–40.
doi:10.1016/j.molcata.2009.03.02310. Qamar, M.; Muneer, M. Desalination 2009, 249, 535–540.
doi:10.1016/j.desal.2009.01.02211. Poulios, I.; Makri, D.; Prohaska, X. Global NEST 1999, 1, 55–62.12. Carraway, E. R.; Hoffman, A. J.; Hoffmann, M. R.
Environ. Sci. Technol. 1994, 28, 786–793. doi:10.1021/es00054a00713. Hornyak, G. L.; Dutta, J.; Tibbals, H. F.; Rao, A. Introduction to
nanoscience; CRC Press: Boca Raton, 2008.14. Kimura, T.; Yamauchi, Y.; Miyamoto, N. Chem.–Eur. J. 2010, 16,
12069–12073. doi:10.1002/chem.20100125115. Liu, G.; Sun, C.; Yang, H. G.; Smith, S. C.; Wang, L.; Lu, G. Q.;
Cheng, H. M. Chem. Commun. 2010, 46, 755–757.doi:10.1039/b919895d
16. Wang, R.; Xin, J. H.; Yang, Y.; Liu, H.; Xu, L.; Hu, J. Appl. Surf. Sci.2004, 227, 312–317. doi:10.1016/j.apsusc.2003.12.012
17. Vanheusden, K.; Warren, W. L.; Voigt, J. A.; Seager, C. H.;Tallant, D. R. Appl. Phys. Lett. 1995, 67, 1280–1282.doi:10.1063/1.114397
18. Colis, S.; Bieber, H.; Begin-Colin, S.; Schmerber, G.; Leuvrey, C.;Dinia, A. Chem. Phys. Lett. 2006, 422, 529–533.doi:10.1016/j.cplett.2006.02.109
19. Ullah, R.; Dutta, J. J. Hazard. Mater. 2008, 156, 194–200.doi:10.1016/j.jhazmat.2007.12.033
20. Baruah, S.; Rafique, R. F.; Dutta, J. NANO 2008, 3, 399–407.doi:10.1142/S179329200800126X
21. Baruah, S.; Sinha, S. S.; Ghosh, B.; Pal, S. K.; Raychaudhuri, A. K.;Dutta, J. J. Appl. Phys. 2009, 105, 074308. doi:10.1063/1.3100221
22. Gedye, R.; Smith, F.; Westaway, K.; Ali, H.; Baldisera, L.; Laberge, L.;Rousell, J. Tetrahedron Lett. 1986, 27, 279–282.doi:10.1016/S0040-4039(00)83996-9
23. Wang, W. W.; Zhu, Y. J. Inorg. Chem. Commun. 2004, 7, 1003–1005.doi:10.1016/j.inoche.2004.06.014
24. Huang, J.; Xia, C.; Cao, L.; Zeng, X. Mater. Sci. Eng., B 2008, 150,187–193. doi:10.1016/j.mseb.2008.05.014
25. Ma, M. G.; Zhu, Y. J.; Cheng, G. F.; Huang, Y. H. Mater. Lett. 2008, 62,507–510. doi:10.1016/j.matlet.2007.05.072
26. Peiro, A. M.; Ayllon, J. A.; Peral, J.; Domenech, X.; Domingo, C.J. Cryst. Growth 2005, 285, 6–16. doi:10.1016/j.jcrysgro.2005.07.028
27. Baruah, S.; Dutta, J. Sci. Technol. Adv. Mater. 2009, 10, 013001.doi:10.1088/1468-6996/10/1/013001
28. Baruah, S.; Dutta, J. J. Sol-Gel Sci. Technol. 2009, 50, 456–464.doi:10.1007/s10971-009-1917-2
29. Baruah, S.; Dutta, J. J. Cryst. Growth 2009, 311, 2549–2554.doi:10.1016/j.jcrysgro.2009.01.135
30. Sugunan, A.; Warad, H. C.; Boman, M.; Dutta, J.J. Sol-Gel Sci. Technol. 2006, 39, 49–56.doi:10.1007/s10971-006-6969-y
31. Claesson, E. M.; Philipse, A. P. Colloids Surf., A 2006, 297, 46–54.doi:10.1016/j.colsurfa.2006.10.019

Beilstein J. Nanotechnol. 2010, 1, 14–20.
20
License and TermsThis is an Open Access article under the terms of the
Creative Commons Attribution License
(http://creativecommons.org/licenses/by/2.0), which
permits unrestricted use, distribution, and reproduction in
any medium, provided the original work is properly cited.
The license is subject to the Beilstein Journal of
Nanotechnology terms and conditions:
(http://www.beilstein-journals.org/bjnano)
The definitive version of this article is the electronic one
which can be found at:
doi:10.3762/bjnano.1.3