Exciton-assisted optomechanics with suspended carbon nanotubes

Published: December 23, 2010
r 2010 American Chemical Society 2244 dx.doi.org/10.1021/jp110489u | J. Phys. Chem. C 2011, 115, 2244–2252
ARTICLE
pubs.acs.org/JPCC
Trends inMetal Oxide Stability for Nanorods, Nanotubes, and SurfacesD. J. Mowbray,*,†,‡ J. I. Martínez,†,§ F. Calle-Vallejo,† J. Rossmeisl,† K. S. Thygesen,†
K. W. Jacobsen,† and J. K. Nørskov†
†Center for Atomic-scale Materials Design, Department of Physics, Technical University of Denmark,DK-2800 Kongens Lyngby, Denmark‡Nano-Bio Spectroscopy Group and ETSF Scientific Development Centre, Departamento de Física Materiales,Universidad del País Vasco and DIPC, E-20018 San Sebasti�an, Spain§Departamento de Física Te�orica de la Materia Condensada, Universidad Aut�onoma de Madrid, E-28049 Madrid, Spain
ABSTRACT: The formation energies of nano-structures play an important role in determiningtheir properties, including their catalytic activity.For the case of 15 different rutile and 8 differentperovskite metal oxides, we used density func-tional theory (DFT) to calculate the formationenergies of (2,2) nanorods, (3,3) nanotubes,and the (110) and (100) surfaces. These for-mation energies can be described semiquanti-tatively (mean absolute error≈ 0.12 eV) by thefraction of metal-oxygen bonds broken andthemetal d-band and p-band centers in the bulkmetal oxide.
1. INTRODUCTION
The search for cleaner and more sustainable forms of energyprovides a strong impetus to the development of more affordable,active, selective, and stable new catalysts to convert solar radiationinto fuels.1,2 Just as theHaber-Bosch process fueled the populationexplosion of the 20th century,3,4 it is now hoped that new catalyticprocesses will provide sustainable energy in the 21st century.1,2
Near the top of any list of candidate catalytic materials aremetal oxides, which are already used extensively as catalysts,electrocatalysts, and photoelectrocatalysts.5-17 This is partlyowing to their high stability in harsh oxidizing environmentscompared to that of their pure metal counterparts.
Typically, oxide catalysts are in the form of nanoparticles orhighly porous materials. The structure of these oxide nanopar-ticles can be determined by the surface energy. For instance, forTiO2, it has recently been shown that it is the surface energiesthat determine whether it takes the anatase or rutile structure atthe nanoscale.18,19 The catalytic properties of these materials aredetermined to a high degree by the surface,20 and control of thesurface structure will allow control of the reactivity.21-24
This makes the surface and nanostructure formation energy,ΔEf, which is defined as the total energy difference from the bulkmetal oxide per functional unit (MO2 or SrMO3) of the surfaceor nanostructure, a quantity of interest. More precisely
ΔEf � ðE- EBulkÞ=Nf ð1ÞwhereE is the total energy of the surface or nanostructure,EBulk isthe total energy of the bulk metal oxide, and Nf is the number
of functional units (MO2 or SrMO3) of the surface or nano-structure. However, formation energies of metal oxide surfacesare difficult to measure experimentally, and only a few values areavailable in the literature18,19 For these reasons, finding trends insurface and nanostructure formation energies is an essential firststep in understanding the properties of oxide catalysts and theeventual design of novel catalytic materials.
In this study, we provide DFT-calculated (2,2) nanorod, (3,3)nanotube, and (110) surface formation energies for 15 differentrutile metal oxides, along with the (100) surface formation energiesfor 8 different perovskite metal oxides.21 Both the (2,2) nanorodand (3,3) nanotube structures were obtained by first rollingup a sheet of the material in the PtO2 structure. However,because of its small diameter, the (2,2) nanorod has a bond-ing structure resembling that of the bulk metal oxide afterrelaxation, as shown in Figure 1. For TiO2 and RuO2, thesestructures are quite stable, based on both molecular dynamicsimulations25 and calculated energies relative to other stableforms.21
However, serious questions have been raised as to whetherstandard DFT calculations can describe metal oxides withsufficient accuracy. For the purposes of the present study, it isworth noting that DFT calculations have recently been shown tosemiquantitatively reproduce the bulk heats of formation forboth rutile26 and perovskite27 metal oxides.
Received: November 2, 2010Revised: December 2, 2010

2245 dx.doi.org/10.1021/jp110489u |J. Phys. Chem. C 2011, 115, 2244–2252
The Journal of Physical Chemistry C ARTICLE
After describing our methodology for calculating formationenergies in section 2, we develop a simple model to describethese energies semiquantitatively in section 3 based on thefraction of metal-oxygen bonds broken and the metal d-bandand p-band centers in the bulk metal oxide. Our concludingremarks are followed by a tabulation of all calculated quantitiesand further comparisons of the bulk heats of formation, d-bandcenters, numbers of d electrons, cohesive energies, and formationenergies for the rutile metal oxides in Appendix A and a detailedanalysis of metal-oxide bond strengths based on the bulk metaloxide molecular orbitals in Appendix B.
2. METHODOLOGY
All DFT calculations were performed with the plane-wavecode DACAPO using the RPBE exchange-correlation (xc)functional;28,29 converged plane-wave cutoffs of 350 and 400 eVfor rutile and perovskite metal oxides, respectively; and a densitycutoff of 500 eV. The occupation of the Kohn-Sham orbitalswas calculated at kBT ≈ 0.1 eV, with all energies extrapolatedto T = 0 K. The product of the supercell dimensions and thenumber of k points30 is J25 Å in all repeated directions. Forthe antisymmetric perovskite surface slab calculations, a dipolecorrection was employed.31 All bulk calculations used a sufficientnumber of bands (25 perMO2 and 34-39 per SrMO3) to ensureconvergence of the d-band and p-band centers, as shown inFigure 5 of Appendix A for the rutile metal oxides.
We performed structural relaxations until a maximum forcebelow 0.05 eV/Å was obtained. At the same time, we minimizedthe strain on the unit cell in all periodically repeated directionsand employed more than 10 Å of vacuum between repeatednanorods, nanotubes, and surface slabs.
For CrO2 andMnO2 rutile metal oxides and for all perovskitesconsidered, we performed spin-polarized calculations. However,the relaxed structures of SrTiO3 and SrVO3 had no magneticmoment. These results are summarized in Tables 1 and 2 ofAppendix A.
3. RESULTS AND DISCUSSION
Schematics of the TiO2 (2,2) nanorod, (3,3) nanotube, and(110) surface, along with the SrTiO3 (100) TiO2- and SrO-terminated surfaces,32 are shown in Figure 1. The supercells usedwere repeated four times along the nanorod and nanotube axes inFigure 1a,b and four times in the surface plane for the surfacesshown in Figure 1c,d.
For the TiO2 (110) surface, our 4-layer-thick slab yieldedsurface formation energies of 0.44 J/m2, as also reported in ref 18,and in reasonable agreement with the GGA33 12-layer-thick slabvalue of 0.50 J/m2 from ref 18 and the B3LYP34 9-layer-thick slabvalue of 0.67 J/m2 from ref 35. Differences among these valuesare attributable to the choices of xc functional and number oflayers, especially for uneven slab calculations, which tend to yieldhigher energies and converge more slowly.18 As expected, thesevalues are below the experimental nanoparticle surface energy of2.2( 0.2 J/m2 for TiO2
19 (see Figure 2), because of the presenceof less stable kinked and stepped surfaces in the sample.
The formation energies of the (2,2) nanorod, (3,3) nanotube,and (110) surface depicted in Figure 1 are shown in Figure 2.In the following discussion, we analyze the nature of the forma-tion energies and relate them to other characteristics of the mate-rials. One possible descriptor for the (110) metal oxide surfaceformation energy, ΔEf
(110), might be the bulk heat of formation,ΔGf
Bulk, which is defined as the difference in free energy from theclean metal and water relative to H2. In other words
ΔGBulkf � GMO2 -GM - 2ðGH2O -GH2Þ ð2Þ
whereGMO2,GM,GH2O, andGH2 are the free energies for themetaloxide, clean metal, water, and hydrogen, respectively. With thisdefinition, ΔGf
Bulk is a measure of the metal oxide stability forcatalytic reactions in aqueous solution, as discussed in Appendix A.
AlthoughΔGfBulk andΔEf
(110) are somewhat correlated, as shownin Figure 2a, this correlation is rather counterintuitive. One mightexpect thatmore stable compoundswould have stronger bonds and,hence, higher surface formation energies, but Figure 2a shows thatthe opposite is the case. This makesΔGf
Bulk a poor choice of descri-ptor for the (110) surface formation energy.
On the other hand, we observe a stronger correlation betweenΔEf
(110) and the d-band center εd for the bulk rutile metal oxides,as shown in Figure 2b. Here, εd is the average energy, relative tothe Fermi level, εF, of the density of states (DOS) projected ontothe metal's atomic d-orbitals in the metal oxide nd(ε), so that
36
εd �Zðε- εFÞndðεÞ dε ð3Þ
For the nanorod and nanotube formation energies, we also founda qualitative correlation with ΔGf
Bulk, but a near-quantitativecorrelation with εd.
This suggests that metal oxide surface and nanostructureformation energies can be considered perturbations of the bulkmetal oxide's electronic structure, which is described by εd, due tobond breaking. In this case
ΔEf � ΔχεM-O ð4Þwhere Δχ is the fraction of metal-oxygen (M-O) bondsbroken and εM-O is the energy stored in M-O bonds, perfunctional unit of the surface or nanostructure. For the case of(110) surface formation, Δχ(110)≈ 1/6 per MO2, whereas fornanorod and nanotube formation, ΔχNT ≈ 2/6 ≈ 1/3 per MO2.
Figure 1. Structural schematics for (a) TiO2 (2,2) nanorod, (b) TiO2
(3,3) nanotube, (c) TiO2 (110) surface, and (d) SrTiO3 (100) TiO2-and SrO-terminated surfaces. Axes and Miller indices for the rutilestructures are shown for a and c.

2246 dx.doi.org/10.1021/jp110489u |J. Phys. Chem. C 2011, 115, 2244–2252
The Journal of Physical Chemistry C ARTICLE
Assuming εM-O≈-εd, we indeed find thatΔEf≈-Δχεd witha mean absolute error (MAE) of 0.08 eV, as shown in Figure 2c.
This correlation can be explained qualitatively by recallingthat transition metals are most stable when the average energyof the DOS projected onto the d-states of the metal atomsis εF, that is, εd ≈ 0. In most cases, this is equivalent to havinga half-full d-band.36 This is nearly the case for TiO2, whereεd ≈ -0.67 eV, and the (110) surface becomes very stable(ΔEf
(110)≈ 0.046 eV/TiO2). As the d-band shifts downward inenergy, the energy stored in the M-O bonds increases accord-ingly, so that εM-O ≈ -εd.
A more detailed analysis based on the molecular orbitals of thebulk metal oxide is provided in Appendix B based on refs 37-39.To summarize, as the number of d electrons, Nd, increases, theM-O coordinately unsaturated (cus) bond becomes stronger. Itis only this bond that is broken during (110) surface, nanorod,and nanotube formation for rutile metal oxides. This increase inbond strength occurs as one progresses from noncus bonding(Nd = 2), to M-M bond distortions (Nd = 3), to M-O cusbonding (Nd = 4), to nonbonding M orbitals with reduceddistortions (Nd = 5, 6), and to strongerM-Opσ bonds (Nd = 7).Further, for a fixed number of d electrons, the bond strengthincreases as the DOS shifts downward in energy. In effect, theenergy stored in rutile metal oxide M-O bonds is then equal tothe energy cost for “shifting” the bonding metal orbitals so thattheir d-band is symmetric about the Fermi level. In such a case,both bonding with cus O atoms and distortions of the octahedralstructure are minimized.
It is worth noting that we obtain near-quantitative agreement(MAE ≈ 0.08 eV) between the DFT-calculated formationenergies and this simple model, when applied to naturallyoccurring transition metal rutile oxides. We now show how thismodel
ΔEModelf � -Δχεd ð5Þ
can be extended to group 14 (group-IV) rutile oxides (GeO2,SnO2, and PbO2) and 3d transition metal perovskites (SrMO3),as shown in Figure 3.
For group 14metals, the d-band is fully occupied, and does notparticipate in the M-O bonding. Instead, the M-O bondingshould occur via the occupied portion (one-third) of the metal's
p-band. This should be described by the metal's p-band center inthe metal oxide
εp �Zðε- εFÞnpðεÞ dε ð6Þ
where np(ε) is the DOS projected onto the metal's atomicp-orbitals in the metal oxide. In any case, we find that theM-O bond energy εM-O for group 14 rutile oxides isapproximately negative one-third times the p-band center, -εp/3, so that
ΔEf � -Δχεp=3 ð7ÞThis approximation yields near-quantitative formation energies forgroup 14 metal oxide nanorods, nanotubes, and (110) surfaces, asseen in parts a-c, respectively, of Figure 3.
Because perovskite metal oxides share the MO6 octahedralstructure of rutile metal oxides with interstitial Sr,40,41 it isreasonable to expect that the same correlation with the metald-band centers εd should hold. From theDFT calculations for theperovskite (100) surface, we obtain the average of the formationenergies for both the MO2- and SrO-terminated surfaces. Assuch, our model predicts
ΔEð100Þf � - ðΔχMεMd þΔχSrεSrd Þ=2 ð8ÞwhereΔχM≈ 2/6≈ 1/3 per SrMO3 andΔχ
Sr≈ 2/12≈ 1/6 perSrMO3. From Figure 3d, we find that this is indeed the case, withan MAE of 0.08 eV.
In Figure 3a-c, we also plot the DFT-calculated forma-tion energies versusΔEf
Model for transition metals whose moststable metal oxide phase is not rutile. For these compounds,denoted by red symbols in Figure 3, we find that our modeltypically overestimates formation energies, yielding an MAEof 0.12 eV.
For the HexABC layer structure of PtO2,21 we find that the
formation energies are completely independent of εd and εp, asshown in Figure 4. However, this is also predicted by our model,because noM-O bonds are broken (Δχ≈ 0) when forming theHexABC layer. Instead, the energy cost to form the HexABClayer is related to the preference of oxygen to be either sp2- orsp3-hybridized in the metal oxide.
Figure 2. Formation energy, ΔEf, of rutile metal oxide (b) (2,2) nanorods, (O) (3,3) nanotubes, and (9) (110) surfaces in eV/MO2 versus(a) theoretical (black) and experimental (gray) bulk heats of formation,ΔGf
Bulk, for rutile metal oxides in eV/MO2 from ref 26; (b) d-band center, εd, forthe bulk metal oxide relative to the Fermi energy in eV; and (c) fraction of M-O bonds broken times the d-band center Δχεd in eV/MO2. Theexperimental nanoparticle surface energy19 is shown for rutile TiO2 (red box). Linear fits to the theoretical (solid line) and experimental (dashed line)ΔGf
Bulk data are provided for comparison.

2247 dx.doi.org/10.1021/jp110489u |J. Phys. Chem. C 2011, 115, 2244–2252
The Journal of Physical Chemistry C ARTICLE
4. CONCLUSIONS
In conclusion, we have demonstrated that the formationenergies for nanorods, nanotubes, and surfaces of metal oxidescan be determined semiquantitatively (MAE ≈ 0.12 eV) fromthe fraction ofM-Obonds that are broken,Δχ, and the bondingband centers, εd and εp, in the bulk metal oxide. We anticipatethat such models will prove useful in predicting the formationenergy of doped metal oxide surfaces and nanostructures, theirreactant adsorption energies, and their activities.
’APPENDIX A. FORMATION ENERGIES
In this appendix, we provide further details for the interestedreader concerning the results of the density functional theory (DFT)calculations and their analysis. We begin by plotting the projecteddensity of states (PDOS) for the bulk rutilemetal oxides, fromwhichthe d-band and p-band centers for the transition metal and group 14metal oxides were calculated. A tabulation of calculated d-band andp-band centers and formation energies for the (2,2) nanorod, (3,3)nanotube, HexABC layers, and (110) surface of the rutile metaloxides and the (100) surface of the perovskite metal oxides is alsoprovided. Finally, further comparisons are performed between thebulk heat of formation,ΔGf; the d-band and p-band centers, εd andεp; the number of d-electrons, Nd; the cohesive energies, Ecoh; andthe formation energies, ΔEf, to illustrate their relation to the elec-tronic structure of the metal oxide.
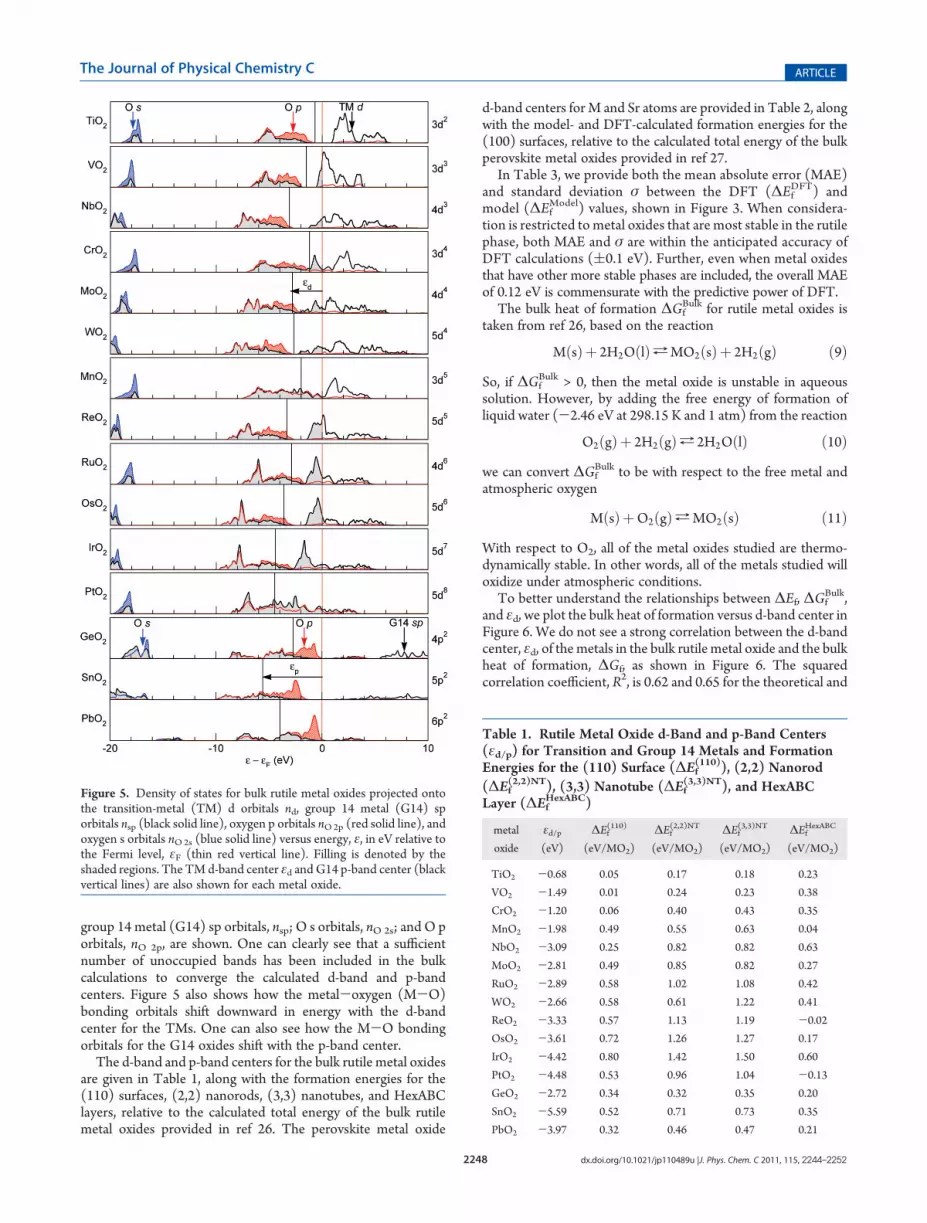
The DFT-calculated projected density of states (PDOS) forthe bulk rutile metal oxides studied is shown in Figure 5. TheDOS projections onto the transition metal (TM) d orbitals, nd;
Figure 3. DFT-calculated formation energy, ΔEfDFT, versus model prediction, ΔEf
Model, for (a) (b) (2,2) nanorods, (b) (O) (3,3) nanotubes, and(c) (9) (110) surfaces in eV/MO2 for rutiles and (d) (100) MO2- and SrO-terminated surfaces (() in eV/SrMO3 for perovskites. Red symbols denotemetal oxides whose most stable phase is not rutile. The standard deviation for each structure fromTable 3 of Appendix A is shown by regions of solid andstriped gray for naturally occurring and all considered metal oxides, respectively.
Figure 4. Formation energy for HexABC metal oxide layers, ΔEfHexABC, in
eV/MO2 obtained from DFT versus the M-O d-band and p-band centersfor themetal atom, εd/p, in the bulk rutilemetal oxide.
21 A linear fit of the data(black solid line) demonstrates that ΔEf
HexABC is completely uncorrelatedto εd/p. A schematic of the TiO2 HexABC structure is shown as an inset.
2248 dx.doi.org/10.1021/jp110489u |J. Phys. Chem. C 2011, 115, 2244–2252
The Journal of Physical Chemistry C ARTICLE
group 14 metal (G14) sp orbitals, nsp; O s orbitals, nO 2s; and O porbitals, nO 2p, are shown. One can clearly see that a sufficientnumber of unoccupied bands has been included in the bulkcalculations to converge the calculated d-band and p-bandcenters. Figure 5 also shows how the metal-oxygen (M-O)bonding orbitals shift downward in energy with the d-bandcenter for the TMs. One can also see how the M-O bondingorbitals for the G14 oxides shift with the p-band center.
The d-band and p-band centers for the bulk rutile metal oxidesare given in Table 1, along with the formation energies for the(110) surfaces, (2,2) nanorods, (3,3) nanotubes, and HexABClayers, relative to the calculated total energy of the bulk rutilemetal oxides provided in ref 26. The perovskite metal oxide
d-band centers for M and Sr atoms are provided in Table 2, alongwith the model- and DFT-calculated formation energies for the(100) surfaces, relative to the calculated total energy of the bulkperovskite metal oxides provided in ref 27.
In Table 3, we provide both the mean absolute error (MAE)and standard deviation σ between the DFT (ΔEf
DFT) andmodel (ΔEf
Model) values, shown in Figure 3. When considera-tion is restricted to metal oxides that are most stable in the rutilephase, both MAE and σ are within the anticipated accuracy ofDFT calculations ((0.1 eV). Further, even when metal oxidesthat have other more stable phases are included, the overall MAEof 0.12 eV is commensurate with the predictive power of DFT.
The bulk heat of formation ΔGfBulk for rutile metal oxides is
taken from ref 26, based on the reaction
MðsÞþ 2H2OðlÞaMO2ðsÞþ 2H2ðgÞ ð9ÞSo, if ΔGf
Bulk > 0, then the metal oxide is unstable in aqueoussolution. However, by adding the free energy of formation ofliquid water (-2.46 eV at 298.15 K and 1 atm) from the reaction
O2ðgÞþ 2H2ðgÞa 2H2OðlÞ ð10Þwe can convert ΔGf
Bulk to be with respect to the free metal andatmospheric oxygen
MðsÞþO2ðgÞaMO2ðsÞ ð11ÞWith respect to O2, all of the metal oxides studied are thermo-dynamically stable. In other words, all of the metals studied willoxidize under atmospheric conditions.
To better understand the relationships between ΔEf, ΔGfBulk,
and εd, we plot the bulk heat of formation versus d-band center inFigure 6. We do not see a strong correlation between the d-bandcenter, εd, of the metals in the bulk rutile metal oxide and the bulkheat of formation, ΔGf, as shown in Figure 6. The squaredcorrelation coefficient, R2, is 0.62 and 0.65 for the theoretical and
Figure 5. Density of states for bulk rutile metal oxides projected ontothe transition-metal (TM) d orbitals nd, group 14 metal (G14) sporbitals nsp (black solid line), oxygen p orbitals nO2p (red solid line), andoxygen s orbitals nO2s (blue solid line) versus energy, ε, in eV relative tothe Fermi level, εF (thin red vertical line). Filling is denoted by theshaded regions. The TM d-band center εd and G14 p-band center (blackvertical lines) are also shown for each metal oxide.
Table 1. Rutile Metal Oxide d-Band and p-Band Centers(εd/p) for Transition and Group 14 Metals and FormationEnergies for the (110) Surface (ΔEf
(110)), (2,2) Nanorod(ΔEf
(2,2)NT), (3,3) Nanotube (ΔEf(3,3)NT), and HexABC
Layer (ΔEfHexABC)
metal
oxide
εd/p(eV)
ΔEf(110)
(eV/MO2)
ΔEf(2,2)NT
(eV/MO2)
ΔEf(3,3)NT
(eV/MO2)
ΔEfHexABC
(eV/MO2)
TiO2 -0.68 0.05 0.17 0.18 0.23
VO2 -1.49 0.01 0.24 0.23 0.38
CrO2 -1.20 0.06 0.40 0.43 0.35
MnO2 -1.98 0.49 0.55 0.63 0.04
NbO2 -3.09 0.25 0.82 0.82 0.63
MoO2 -2.81 0.49 0.85 0.82 0.27
RuO2 -2.89 0.58 1.02 1.08 0.42
WO2 -2.66 0.58 0.61 1.22 0.41
ReO2 -3.33 0.57 1.13 1.19 -0.02
OsO2 -3.61 0.72 1.26 1.27 0.17
IrO2 -4.42 0.80 1.42 1.50 0.60
PtO2 -4.48 0.53 0.96 1.04 -0.13
GeO2 -2.72 0.34 0.32 0.35 0.20
SnO2 -5.59 0.52 0.71 0.73 0.35
PbO2 -3.97 0.32 0.46 0.47 0.21

2249 dx.doi.org/10.1021/jp110489u |J. Phys. Chem. C 2011, 115, 2244–2252
The Journal of Physical Chemistry C ARTICLE
experimentalΔGfBulk values, respectively, compared with 0.96 for
the surface and nanostructure formation energies.Based on Figures 6 and 2, one can conclude that the formation
energies of the nanostructures depend more on the center of themetal bands that bond to oxygen in the bulk metal oxide than onthe bulk heat of formation. This does not at all imply that the bulkheat of formation is not related to its electronic structure, as theredoes exist a correlation between ΔGf and the number of d
electrons, Nd, in the metal (and the group number) in a givend-line. In fact, ΔGf shows a stronger overall correlation with Nd
thanwith εd for the rutilemetal oxides, as shown in Figure 7. Suchcorrelations between Nd and heats of formation have beenpreviously reported for lanthanum perovskites,42 and a similarcorrelation is seen when plotting the formation energies of 3dmonoxides versus the number of d electrons.
Figure 7. Overall correlation between the bulk heat of formation,ΔGfBulk,
for 3d (blue diamonds), 4d (black squares), and 5d (red circles) rutilemetal oxides in eV/MO2 and the number of d electrons, Nd. Theoreticaland experimental values forΔGf
Bulk are shown as solid and open symbols,respectively, as provided in ref 25. A linear fit to the theoretical (solid line)and experimental (dashed line) ΔGf
Bulk data, with squared correlationcoefficients of R2 ≈ 0.93 and 0.95 and mean absolute errors (MAEs) of0.51 and 0.50 eV, respectively, is shown for comparison.
Figure 8. Comparisonof the bulk rutile cohesive energy,EcohBulk, in eV/MO2
and (a) the formation energy of the (2,2) nanorod, ΔEf(2,2), in eV/MO2,
and (b) the cohesive energy of the (2,2) nanorod, Ecoh(2,2), in eV/MO2. Red
symbols denote metal oxides whose most stable phase is not rutile.
Table 2. Perovskite Metal Oxide d-Band Centers for M (εdM)
and Sr (εdSr) and Formation Energies for the (100) Surface
from the Model (ΔEfModel) and DFT Calculations (ΔEf
DFT)
metal
oxide
εdM
(eV)
εdSr
(eV)
ΔEfModel
(eV/SrMO3)
ΔEfDFT
(eV/SrMO3)
SrTiO3 -1.73 -4.72 0.68 0.80
SrVO3 -2.05 -4.09 0.68 0.76
SrCrO3 -1.60 -2.40 0.47 0.57
SrMnO3 -2.40 -3.12 0.66 0.72
SrFeO3 -2.65 -3.54 0.74 0.69
SrCoO3 -2.36 -2.50 0.60 0.55
SrNiO3 -2.72 -0.75 0.52 0.43
SrCuO3 -3.48 -0.09 0.59 0.66
Table 3. Mean Absolute Error (MAE) and Standard DeviationσbetweenCalculated (ΔEf
DFT) andModel (ΔEfModel) Formation
Energies Shown in Figure 3 of (2,2) Nanorods, (3,3) Nanotubes,and the (110) Surface forRutileMetalOxides, and theMO2- andSrO-Terminated (100) Surfaces for Perovskitesa
mean absolute error (eV/Nf) standard deviation (eV/Nf)
(2,2) nanorod 0.12 (0.05) 0.17 (0.06)
(3,3) nanotube 0.13 (0.06) 0.18 (0.07)
(110) surface 0.13 (0.11) 0.15 (0.11)
(100) surface 0.08 (0.08) 0.08 (0.08)aValues in parentheses obtained by considering only naturally occurringmetal oxides.
Figure 6. Bulk heat of formation ΔGfBulk for 3d (blue diamonds), 4d
(black squares), and 5d (red circles) rutile metal oxides in eV/MO2
versus d-band center εd in eV. Theoretical and experimental values forΔGf
Bulk are shown as solid and open symbols, respectively, as provided inref 26. A linear fit to the theoretical (solid line) and experimental(dashed line)ΔGf
Bulk data, with squared correlation coefficients of R2≈0.62 and 0.65 and mean absolute errors (MAEs) of 1.08 and 1.15 eV,respectively, is shown for comparison.

2250 dx.doi.org/10.1021/jp110489u |J. Phys. Chem. C 2011, 115, 2244–2252
The Journal of Physical Chemistry C ARTICLE
In Figure 8, we compare the formation energy and cohesiveenergy for the (2,2) nanorodswith the cohesive energy for the bulkrutile metal oxide. The cohesive energy, Ecoh, is defined as the totalenergy relative to the isolated metal atoms and O2 in the gas phase
Ecoh � E- EM - EO2 ð12ÞAs is shown inFigure 8b, there is a general correlation between the cohe-sive energies for the bulk rutile metal oxides and the (2,2) nanorods.However, this correlation is only qualitative and over a largerange of energy values between-10 and 0 eV.When we considerthe formation energies of the (2,2) nanorods, we find littlecorrelation, ΔEf
(2,2) ≈ Ecoh(2,2) - Ecoh
Bulk 6¼ EcohBulk. Although energy
differences for metal oxide surfaces, nanostructures, and the bulkrelative to the clean metal (ΔGf) or metal atoms (Ecoh) aresomewhat correlated, this correlation is insufficient to allowpredictions of the surface and nanostructure formation energies.
The cohesive energy, Ecoh, and the M-O bond energy,εM-O, do not have a straightforward relationship, as theformer also contains the M-M interaction. The largestcontribution to the cohesive energy of transition metals and,therefore, of their compounds, is due to the formation of ad-band from the atomic d-orbitals. The M-O bonds formedby the hybridization of the metal's d-band with the p-states ofoxygen is described in ref 43. However, someM-Mbonds willbe present as well. As discussed in Appendix B, this is indeedthe case for Nd = 3, 4, and 5.
On the other hand, because εd is the average energy of thed-band relative to the Fermi level, it is expected that this valuewill describe all states, namely, bonding, nonbonding (if thereare any), and antibonding. In other words, εd and εp specificallydescribe the electronic structure of the metal states in the bulkmetal oxide. As such, we can use these descriptors to obtain anear-quantitative description of surface and nanostructure for-mation energies. This model should be valid as long as thestructural changes of the metal oxides under surface and nano-structure formation are primarily related to bond breaking.
’APPENDIX B. MOLECULAR ORBITAL ANALYSIS
We now provide a detailed review of the molecular orbitalanalysis of bulk rutile metal oxide bonding presented in refs 37-39.
Nd = 2: TiO2. As seen in Figure 9, for the octahedral structureof TiO2, the eg orbitals (dz2, dxy) are less stable and are at higherenergies than their t2g (dyz, dx2-y2, dxz) counterparts. For thisreason, the first two sets of Ti-O bonding orbitals are pre-dominantly O 2s andO 2px,y in character, whereas the opposite istrue for their higher energy antibonding counterparts. Thismeans that the σ bonding between the apex O atoms and Ti isweak. It is this bond that is broken upon forming the (110) metaloxide surface, leaving a Ti coordinately unsaturated (cus) site,which is occupied by the apex O atom in the bulk.On the other hand, the Ti dxz and dyz orbitals are rather close in
energy to the O pπ orbitals, yielding a stronger bond. However, Ti'sempty dxz and dyz states can both be “filled” only if they form bondswith the planar O atoms, as depicted schematically in Figure 9.Because only bonds betweenmetal and cus oxygen atoms are brokenwhen nanotubes, nanorods, and the (110) surface are formed, thisexplains why their formation energies are so low for rutile TiO2.
Nd = 3: VO2 and NbO2. In VO2, the dx2-y2 orbital forms newV-V σ bonds preferentially with one of the two V neighbors, asdepicted in Figure 9. This induces strain in the octahedral structure,so that VO2 and NbO2 are “monoclinic”. This induced stressexplains why the metal oxides with three d electrons (Nd = 3) aresomewhat less stable than those of TiO2.
Nd = 4: CrO2, MoO2, and WO2. For CrO2, MoO2, and WO2
the fourth d electron occupies a bonding dxzM-Mπ orbital, as itcan no longer overlap with the filled O pπ lone pairs in the plane.The empty dyz orbital now forms a M-O π bond with the apexoxygen, as shown in Figure 9.Whereas the M-M π bonds induce further distortions in the
octahedral structure, the O-M π orbital acts as a strong bond withthe cus O atom. This bond must first be broken to form the (110)surface and increasesΔEf for the nanostructures and (110) surfaces.
Figure 9. Molecular orbital schemes for rutile TiO2, VO2, MoO2, ReO2, OsO2, and IrO2 versus energy, ε, in eV relative to the Fermi level, εF.37-39
Filling is denoted by the shaded regions for M t2g (gray), O pσ (red), and O s (blue) orbitals. Cartoons of the Ti-Ononcus bonding (dxz( dyz)/(2)1/2,
V-V bonding dx2-y2, Mo-O cus bonding dyz, Re nonbonding dxz, Os nonbonding dx2-y2, and Ir-O antibonding dyz orbitals are shown below.
2251 dx.doi.org/10.1021/jp110489u |J. Phys. Chem. C 2011, 115, 2244–2252
The Journal of Physical Chemistry C ARTICLE
Nd = 5: MnO2 and ReO2. The fifth d electron for MnO2 andReO2 breaks the M-M π bond, so that dxz now becomes anonbonding orbital. This will remove distortions of the octahe-dral structure induced by this bond and should increase thestrength of the M-O π bond with the cus O. We find thisincreases the formation energies.
Nd = 6: RuO2 and OsO2. Similarly to the Nd = 5 metal oxides,for RuO2 and OsO2, the sixth d electron breaks the M-M σ bond,making the dx2-y2 orbitals nonbonding. This removes mostdistortions from the octahedral structure and makes the M cus Obond even stronger, resulting in an even higher surface energy.
Nd = 7: IrO2. IrO2's seventh d electron occupies the M-O π*antibonding states. In and of itself, this should weaken the M cus Obond. However, two competing factors, namely, the smaller energygap between Ir eg
2 sp3 andOpσ orbitals and the greater instability ofa single half-occupied Ir dyz orbital in the surface cus, tend tostrengthen the Ir-O σ bonds and destabilize the (110) surface,respectively. As a result, we find that IrO2 has the highest formationenergy cost for both the surfaces and the nanostructures.
Nd = 8: PtO2. For PtO2, the M-O π* antibonding orbitalwould be completely filled, so that only M-O σ orbitals play arole in Pt-O bonding. For this reason, PtO2 is rather unstable inits rutile form. The formation energies for the PtO2 (110) surfaceand nanostructures are thus significantly lower than those forIrO2, but at the same time much higher than those for TiO2.
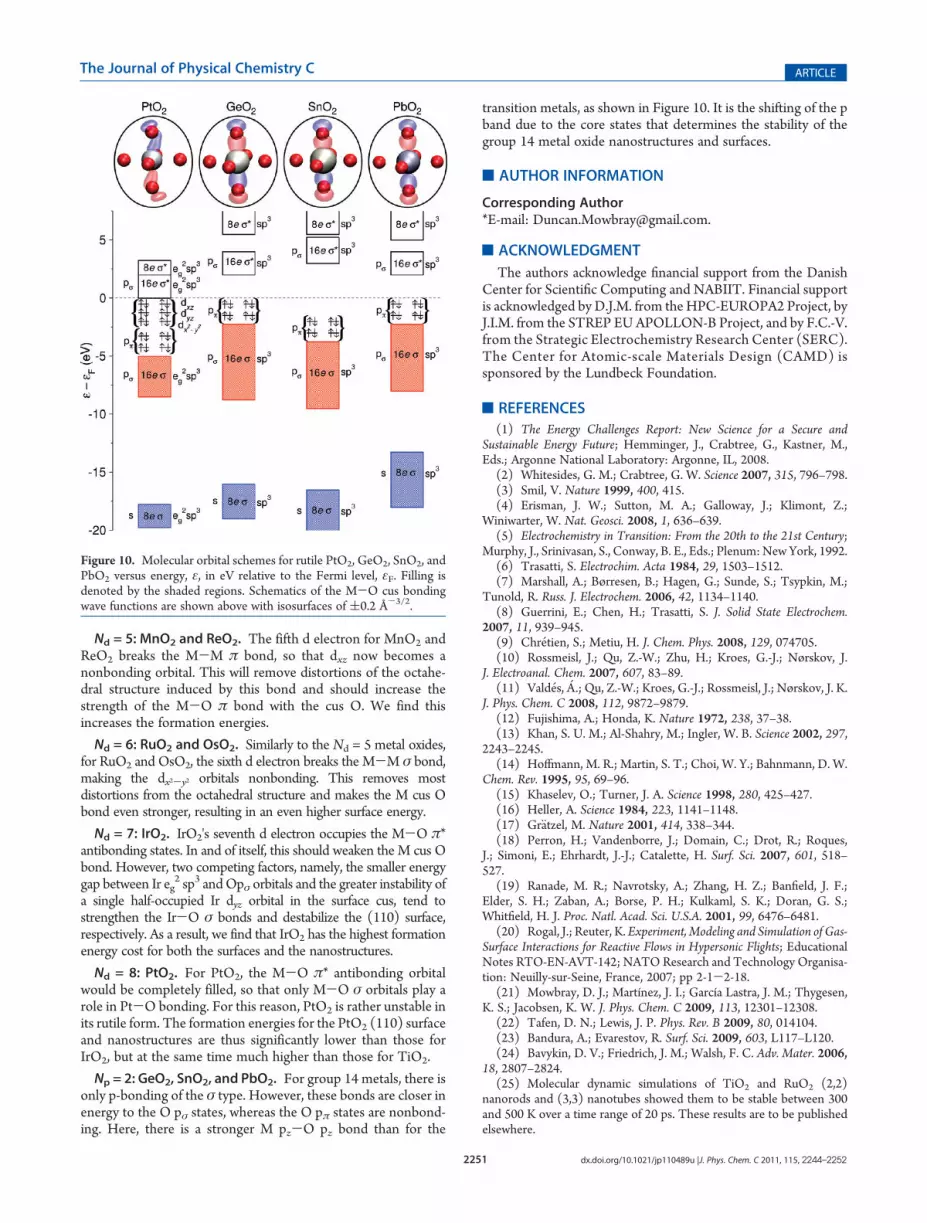
Np = 2: GeO2, SnO2, and PbO2. For group 14 metals, there isonly p-bonding of the σ type. However, these bonds are closer inenergy to the O pσ states, whereas the O pπ states are nonbond-ing. Here, there is a stronger M pz-O pz bond than for the
transition metals, as shown in Figure 10. It is the shifting of the pband due to the core states that determines the stability of thegroup 14 metal oxide nanostructures and surfaces.
’AUTHOR INFORMATION
Corresponding Author*E-mail: [email protected].
’ACKNOWLEDGMENT
The authors acknowledge financial support from the DanishCenter for Scientific Computing and NABIIT. Financial supportis acknowledged by D.J.M. from the HPC-EUROPA2 Project, byJ.I.M. from the STREP EU APOLLON-B Project, and by F.C.-V.from the Strategic Electrochemistry Research Center (SERC).The Center for Atomic-scale Materials Design (CAMD) issponsored by the Lundbeck Foundation.
’REFERENCES
(1) The Energy Challenges Report: New Science for a Secure andSustainable Energy Future; Hemminger, J., Crabtree, G., Kastner, M.,Eds.; Argonne National Laboratory: Argonne, IL, 2008.
(2) Whitesides, G. M.; Crabtree, G. W. Science 2007, 315, 796–798.(3) Smil, V. Nature 1999, 400, 415.(4) Erisman, J. W.; Sutton, M. A.; Galloway, J.; Klimont, Z.;
Winiwarter, W. Nat. Geosci. 2008, 1, 636–639.(5) Electrochemistry in Transition: From the 20th to the 21st Century;
Murphy, J., Srinivasan, S., Conway, B. E., Eds.; Plenum:New York, 1992.(6) Trasatti, S. Electrochim. Acta 1984, 29, 1503–1512.(7) Marshall, A.; Børresen, B.; Hagen, G.; Sunde, S.; Tsypkin, M.;
Tunold, R. Russ. J. Electrochem. 2006, 42, 1134–1140.(8) Guerrini, E.; Chen, H.; Trasatti, S. J. Solid State Electrochem.
2007, 11, 939–945.(9) Chr�etien, S.; Metiu, H. J. Chem. Phys. 2008, 129, 074705.(10) Rossmeisl, J.; Qu, Z.-W.; Zhu, H.; Kroes, G.-J.; Nørskov, J.
J. Electroanal. Chem. 2007, 607, 83–89.(11) Vald�es, �A.; Qu, Z.-W.; Kroes, G.-J.; Rossmeisl, J.; Nørskov, J. K.
J. Phys. Chem. C 2008, 112, 9872–9879.(12) Fujishima, A.; Honda, K. Nature 1972, 238, 37–38.(13) Khan, S. U. M.; Al-Shahry, M.; Ingler, W. B. Science 2002, 297,
2243–2245.(14) Hoffmann, M. R.; Martin, S. T.; Choi, W. Y.; Bahnmann, D. W.
Chem. Rev. 1995, 95, 69–96.(15) Khaselev, O.; Turner, J. A. Science 1998, 280, 425–427.(16) Heller, A. Science 1984, 223, 1141–1148.(17) Gr€atzel, M. Nature 2001, 414, 338–344.(18) Perron, H.; Vandenborre, J.; Domain, C.; Drot, R.; Roques,
J.; Simoni, E.; Ehrhardt, J.-J.; Catalette, H. Surf. Sci. 2007, 601, 518–527.
(19) Ranade, M. R.; Navrotsky, A.; Zhang, H. Z.; Banfield, J. F.;Elder, S. H.; Zaban, A.; Borse, P. H.; Kulkaml, S. K.; Doran, G. S.;Whitfield, H. J. Proc. Natl. Acad. Sci. U.S.A. 2001, 99, 6476–6481.
(20) Rogal, J.; Reuter, K. Experiment, Modeling and Simulation of Gas-Surface Interactions for Reactive Flows in Hypersonic Flights; EducationalNotes RTO-EN-AVT-142; NATO Research and Technology Organisa-tion: Neuilly-sur-Seine, France, 2007; pp 2-1-2-18.
(21) Mowbray, D. J.; Martínez, J. I.; García Lastra, J. M.; Thygesen,K. S.; Jacobsen, K. W. J. Phys. Chem. C 2009, 113, 12301–12308.
(22) Tafen, D. N.; Lewis, J. P. Phys. Rev. B 2009, 80, 014104.(23) Bandura, A.; Evarestov, R. Surf. Sci. 2009, 603, L117–L120.(24) Bavykin, D. V.; Friedrich, J. M.; Walsh, F. C. Adv. Mater. 2006,
18, 2807–2824.(25) Molecular dynamic simulations of TiO2 and RuO2 (2,2)
nanorods and (3,3) nanotubes showed them to be stable between 300and 500 K over a time range of 20 ps. These results are to be publishedelsewhere.
Figure 10. Molecular orbital schemes for rutile PtO2, GeO2, SnO2, andPbO2 versus energy, ε, in eV relative to the Fermi level, εF. Filling isdenoted by the shaded regions. Schematics of the M-O cus bondingwave functions are shown above with isosurfaces of (0.2 Å-3/2.
2252 dx.doi.org/10.1021/jp110489u |J. Phys. Chem. C 2011, 115, 2244–2252
The Journal of Physical Chemistry C ARTICLE
(26) Martínez, J. I.; Hansen, H. A.; Rossmeisl, J.; Nørskov, J. K. Phys.Rev. B 2009, 79, 045120.(27) Calle-Vallejo, F.; Martínez, J. I.; García-Lastra, J. M.;Mogensen,
M.; Rossmeisl, J. Angew. Chem. 2010, 122, 7864–7867.(28) Hammer, B.; Hansen, L. B.; Norskov, J. K. Phys. Rev. B 1999, 59,
7413–7421.(29) Bahn, S. R.; Jacobsen, K. W. Comput. Sci. Eng. 2002, 4, 56–66.(30) Monkhorst, H. J.; Pack, J. D. Phys. Rev. B 1976, 13, 5188–5192.(31) Bengtsson, L. Phys. Rev. B 1999, 59, 12301–12304.(32) Schrott, A. G.; Misewich, J. A.; Copel, M.; Abraham, D. W.;
Zhang, Y. Appl. Phys. Lett. 2001, 79, 1786–1788.(33) Perdew, J. P.; Wang, Y. Phys. Rev. B 1992, 45, 13244–13249.(34) Becke, A. D. J. Chem. Phys. 1993, 98, 5648–5652.(35) Beltr�an, A.; Andr�es, J.; Sambrano, J. R.; Longo, E. J. Phys. Chem.
A 2008, 112, 8943–8952.(36) Bligaard, T.; Nørskov, J. K. Electrochim. Acta 2007, 52, 5512–
5516.(37) Jiang, B.; Zuo, J. M.; Jiang, N.; O'Keeffe, M.; Spence, J. C. H.
Acta Cryst. A 2003, 59, 341–350.(38) Rogers, D. B.; Shannon, R. D.; Sleight, A.W.; Gillson, J. L. Inorg.
Chem. 1969, 8, 841–849.(39) Goodenough, J. B. Prog. Solid State Chem. 1971, 5, 145–399.(40) Yokokawa, H. Annu. Rev. Mater. Res. 2003, 33, 581–610.(41) Cheng, Z.; Zha, S.; Aguilar, L.; Liu, M. Solid State Ionics 2005,
176, 1921–1928.(42) Pankajavalli, R.; Sreedharan, O. M.Mater. Lett. 1995, 24, 247–
251.(43) Gelatt, C. D.; Williams, A. R.; Moruzzi, V. L. Phys. Rev. B 1983,
27, 2005–2013.
Copyright © 2022 FDOKUMEN