Enhanced Natural Remediation of White-Phosphorus ... - DTIC
30
US Army Corps of Engineers® Cold Regions Research & Engineering Laboratory Enhanced Natural Remediation of White-Phosphorus-Contaminated Wetlands through Controlled Pond Draining Michael R. Walsh, Marianne E. Walsh, and Charles M. Collins November 1999 gf/^> —-- «>;•"<'''* ' ''•'"' ßsl: ' •' J il jyjlC QUALITY DBäföCXED 1
-
Upload
khangminh22 -
Category
Documents
-
view
0 -
download
0
Transcript of Enhanced Natural Remediation of White-Phosphorus ... - DTIC

US Army Corps of Engineers® Cold Regions Research & Engineering Laboratory
Enhanced Natural Remediation of White-Phosphorus-Contaminated Wetlands through Controlled Pond Draining Michael R. Walsh, Marianne E. Walsh, and Charles M. Collins November 1999
gf/^> ■—--■■«>;•"<'''*■' ■'■'•'"'■ ßsl: ■ ■'■ •'Jil
jyjlC QUALITY DBäföCXED 1
Abstract: Detonation of projectiles containing white phosphorus, a smoke-producing munition, contami- nated Eagle River Flats (ERF), a salt marsh located on Fort Richardson, Alaska. Ingestion of the highly toxic white phosphorus residues by dabbling ducks and swans resulted in significant waterfowl mortality, lead- ing to the suspension of Army training with white phos- phorus in wetlands and designation of Eagle River Flats as a Superfund site. The permanent ponds at ERF are ideal for long-term storage of the millimeter-size particles of white phosphorus ejected from detonated mortar and howitzer shells. With the goal of reducing
waterfowl mortality, several treatment methods have been tested, the most promising of which is in-situ remediation by temporary removal of water from perma- nent ponds. A developmental, semiautonomous pump- ing system was fielded in 1997. Methods for fielding, placement, and operation of several pumping systems were developed and demonstrated in 1998. The con- trols were refined to optimize operations, and features added to reduce fuel consumption. Performance has continued to be refined, and results from the first two years of remediation indicate that the remediation method is highly effective.
Cover: Pump system 2, located in Pond 730, Area C/D, June 1999. In background are two data acquisition systems used to monitor remediation parameters. (Photo by M.R. Walsh, CRREL)
How to get copies of CRREL technical publications:
Department of Defense personnel and contractors may order reports through the Defense Technical Information Center: DTIC-BR SUITE 0944 8725 JOHN J KINGMAN RD FT BELVOIRVA 22060-6218 Telephone 1 800 225 3842 E-mail [email protected]
[email protected] WWW http://www.dtic.mil/
All others may order reports through the National Technical Information Service: NTIS 5285 PORT ROYAL RD SPRINGFIELD VA 22161 Telephone 1 703 487 4650
1 703 487 4639 (TDD for the hearing-impaired) E-mail [email protected] WWW http://www.ntis.gov/index.html
A complete list of all CRREL technical publications is available from USACRREL (CEERD-IM-HL) 72 LYME RD HANOVER NH 03755-1290 Telephone 1 603 646 4338 E-mail [email protected]
For information on all aspects of the Cold Regions Research and Engineering Laboratory, visit our World Wide Web site:
http://www.crrel.usace.army.mil

CRREL Report 99-10 US Army Corps of Engineers® Cold Regions Research & Engineering Laboratory
Enhanced Natural Remediation of White-Phosphorus-Contaminated Wetlands through Controlled Pond Draining Michael R. Walsh, Marianne E. Walsh, and Charles M. Collins November 1999
Prepared for U.S. ARMY ENVIRONMENTAL CENTER U.S. ARMY, ALASKA
Approved for public release; distribution is unlimited.

PREFACE
This report was prepared by Michael R. Walsh, Mechanical Engineer, Engineering Re- sources Division, and Marianne E. Walsh, Chemical Engineer, Geological Sciences Divi- sion, U.S. Army Cold Regions Research and Engineering Laboratory (CRREL), Hanover, New Hampshire, and Charles M. Collins, Research Physical Scientist, Geological Sciences Division, CRREL Alaskan Projects Office, Fairbanks, Alaska. Funding for this work was provided by the U.S. Army Environmental Center, Aberdeen Proving Ground, Maryland (Karen Wilson, Program Manager), through the Alaska District, Pacific Ocean Division, U.S. Army Corps of Engineers (JoAnn Walls, Project Monitor) and the Environmental Resources Department, Directorate of Public Works, U.S. Army, Alaska (William A. Goss- weiler, Army Remedial Project Manager).
Technical review of the manuscript was provided by Thomas J. Tantillo and Brent A. Koenen of CRREL.
The evolution and complexity of this project requires the assistance of many people from many organizations. The authors wish to acknowledge the contributions of the engi- neers at CH2M Hill in Anchorage for their assistance in contracting and quality control. Mey Wong, Colleen Berg, Patrick LeMay, and Beth Willson all contributed greatly to the execution and success of this project. Support from the Directorate of Public Works at USARAK was essential as well. The crew from Roads and Grounds included George Boice, James Tucker, Dennis Hubbard, Michael Hamilton, and Paul Woodward. The authors would especially like to thank Sherry Butters, our unexploded ordnance expert. They also appreciated the significant contribution from the Army and the Alaska National Guard. Their support has been critical in our operations in this unique environment. Help has come from CRREL, with the assistance of Lt. Colonel Michael Meeks, Major Al Lee, and Major Eric Wahlgren, who coordinated the blasting work at the Flats; the intrepid engineers of Charlie Company, 84th Engineers, USARAK, who conducted the demolitions work; the pilots of the Alaska National Guard, who fly the missions to transport the explo- sives, equipment, and fuel; and the Pathfinders, who work with the pilots rigging the pump equipment for transport into the field. Finally, the authors thank all the other peo- ple from CRREL who continue to contribute to the project, including Dennis Lambert, Arthur Gelvin, Stephen Lemieux, Troy Arnold, Thomas Tantillo, Ronald Bailey, and Tho- mas Ranney, who risk their lives every season on Eagle River Flats in our effort to make the world a safer place for ducks.
The contents of this report are not to be used for advertising or promotional purposes. Citation of brand names does not constitute an official endorsement or approval of the use of such commercial products.

CONTENTS
Preface n
Introduction 1 Background 1
Extent of contamination of Eagle River Flats 2 Persistence of white phosphorus in a wetland 3 Physical processes of Eagle River Flats 4 Treatment methodologies 5
Controlled pond draining feasibility study 8 Initial study deployment of a pump system 8 Monitoring methods 10 Feasibility study of large-scale deployment 13 Results 14
Conclusions 21 Recommendations 22 Literature cited 23 Abstract 25
ILLUSTRATIONS
Figure 1. Map of Eagle River Flats 2 2. Diurnal temperature variations of surface sediments at ERF 4 3. Physical barrier technologies tested at ERF 6 4. Remote dredge operation in Pond 146 6 5. Field trials of surface treatments to enhance in-situ attenuation of WP 7 6. Explosively excavated ditches for draining of ponds 7 7. Autonomous pumping system for Eagle River Flats 8 8. Switch logic diagram for pump operation 10 9. Map of composite sampling transects in Ponds 109 and 183 11
10. Airlifting pump equipment 14 11. Water level relationships between Area C and Area C/D 15 12. Data station locations, Pond 183, Area C 16 13. Area C moisture probe sensor output 17 14. Groundwater elevation and surface moisture content in Area C 18 15. Composite sampling transects in Area A 19 16. Percentile plot of WP contamination of an intermittent pond site 21 17. Plot of WP concentrations in DWRC pen 5, Pond 183, Area C 21
TABLES
Table 1. Concentrations of white phosphorus in ERF surface sediments 3 2. Pump system deployments 13 3. Maximum nonflooding periods 15 4. 1998 climatic data for ERF 16 5. Results of discrete sampling at Site 883 and Miller's Hole, Area C 20 6. Comparative sampling concentrations at DWRC pen 5 22
in

Enhanced Natural Remediation of White-Phosphorus-Contaminated Wetlands
through Controlled Pond Draining
MICHAEL R. WALSH, MARIANNE E. WALSH, AND CHARLES M. COLLINS
INTRODUCTION
White phosphorus (P4) is a highly toxic chemi- cal that does not normally occur in the natural environment. When milligram quantities of white phosphorus (WP) are ingested by water- fowl, the effect is devastating. In Eagle River Flats (ERF), an estuarine salt marsh off Knik Arm near Anchorage, Alaska, this devastation manifested itself in the deaths of thousands of waterfowl a year. The "Flats," situated on Ft. Richardson, had been used for many years by the U.S. military as a munitions impact area. The use of white phos- phorus rounds for targeting and practice had re- sulted in the deposition of unburned material in the many permanent ponds scattered throughout the area. Ft. Richardson biologists, alerted to the die-offs in the early 1980s, did a preliminary investigation to determine the extent of the prob- lem. When the magnitude of the situation was discovered, action to uncover the yet unknown cause was initiated, followed by efforts to devise an acceptable remediation method.
This report discusses the characteristics of white phosphorus, which led to the problem at Eagle River Flats, the physical processes of the ERF that exacerbate the persistence of the chemi- cal in the environment, and some of the initial treatment methods used to try to remediate the problem. The implementation of a composite sampling method for determining the distribu- tion of the nonhomogeneous particulate contami- nant will also be discussed. Finally, the feasibility and implementation of a remote, semiautono- mous pond pumping system to enhance the natu- ral remediation of the contaminant will be covered
in detail. This is the preferred method of remedia- tion for Eagle River Flats as determined by the Remediation Project Managers and described in the site Record of Decision (CH2M Hill 1998).
BACKGROUND
For over forty years, Eagle River Flats has been used by the U.S. military as a munitions impact area. Among the many types of munitions fired into the ERF were rounds containing white phos- phorus. White phosphorus is classified as a "smoke" munition because of the formation of large clouds of condensed water vapor generated during burning of the chemical. The vapor cloud can serve both as an obscurant and for marking targets. These clouds are very useful for training, especially as the moving cloud can be used as a dynamic target during practice firings.
There are two common fusing systems for smoke rounds. The first, an aerial burst fuse, ena- bles the round to explode at a preset height above the ground, allowing a much wider dispersal of the material, a higher burn rate, and more com- plete combustion. The second type of fuse is the comparatively inexpensive, more commonly used, point-detonating fuse. This type of fuse triggers on impact with the ground. With point detonating rounds, the dispersal is not as great, and some of the material is driven into the ground. The white phosphorus in a point-detonating round explod- ing in a muddy or permanently ponded area will not completely combust. These unburned particles of white phosphorus will embed in the saturated sediments. As solid white phosphorus is extremely

stable in saturated conditions, this results in the deposition and long-term storage of particles in permanently wetted areas. Unfortunately, these are the same areas frequented by dabbling water- fowl.
Waterfowl mortality at Eagle River Flats was first recognized in 1980 (Tweten 1989). Studies conducted from 1980 to 1989 quantified the magni- tude of the problem and narrowed the range of possible agents, but the causal agent remained elu- sive. However, important clues had emerged. The birds being affected were almost exclusively dab- bling waterfowl, such as shovelers, pintails, teal, mallards, and swans. Most of the deaths were occurring in or near the permanently ponded areas where these birds feed. Although a definitive cause of the deaths was not identified, explosives com- pounds were postulated as the most likely cause of the waterfowl mortalities, and it was recommend- ed that firing into ERF cease (ESE 1990). Despite the cessation of firing in February of 1990, the waterfowl deaths continued unabated over the course of several years.
In 1990, scientists from the U.S. Army Cold Regions Research and Engineering Laboratory (CRREL) were requested to participate in the investigation of the waterfowl mortality because of their experience with Alaskan wetlands and explosives chemistry. Investigators from Dart- mouth College, the U.S. Fish and Wildlife Service, the Alaska Department of Environmental Conser-
Area D
Otter Creek
1000 m Area B Racine
Island
Figure 1. Map of Eagle River Flats.
vation, and the Ft. Richardson Directorate of Public Works, Environmental Resources Branch, were called on to assist in the investigation. Over the course of the summer of 1990, explosives compo- nents such as RDX, TNT, and 2,4 DNT were elimi- nated from consideration either because of their absence in the sediment and water of Eagle River Flats or because they were not acutely toxic in the quantities available. Observation of smoke eman- ating from sediment samples collected at ERF led investigators to focus on white phosphorus, a sub- stance previously dismissed. Analysis of the sedi- ment samples and subsequent analysis of fatty tis- sues and gizzards of dead waterfowl from ERF indicated that the causal agent for the waterfowl mortality is white phosphorus (Racine et al. 1992a,b). The mechanism was hypothesized as being the selection of WP particles through sieving of the sediments in permanently ponded areas by dabbling waterfowl. Deaths were greater during the fall and spring migrations, when large num- bers of birds were feeding during brief stopovers at ERF. The pieces of the puzzle were coming to- gether. The next step was to determine what areas of ERF were contaminated and to better under- stand the nature of the contaminant.
Extent of contamination of Eagle River Flats From 1990 to 1993, analysis of surface sediment
samples taken at approximately 25-m intervals along transects through sections of Eagle River Flats identified several areas that are con-
taminated with white phosphorus (Ra- cine et al. 1993a and 1993b). Three areas, Area C, the Bread Truck (BT) Pond, and Racine Island (Fig. 1), had the highest rates of detections and samples with the highest concentrations. In these areas white phosphorus concentrations varied widely (Table 1), with relatively few sam- ples having concentrations large enough to present an acute lethal dose of white phosphorus to a duck. When samples were taken at close intervals (1 to 5 m) around sample points with high white phosphorus concentration, we again ob- served extreme heterogeneity, with non- detectable concentrations within a few meters of high concentration samples (over 100 Hg/g). This pattern of con- tamination led us to believe that most of the white phosphorus was located in "hot spots," probably at the point of im- pact of a WP-contaming projectile.
OB/OD Pad (EOD Pad)
AreaC

Table 1. Concentrations of white phosphorus in ERF surface sediments (CH2M 1997a).
No. of No. of locations Maximum Arithmetic Standard locations showing positive concentration mean deviation
Area Wg) results Wg) Wg) Wg)
A 195 26 (13%) 0.06202 0.00131 0.00705 B 43 0 (0%) 0.0 0.0 0.0 C 520 267 (51%) 1,100.0 3.49 49.5 C/D 42 4 (10%) 0.0121 0.000457 0.00195 D 36 0 (0%) 0.0 0.0 0.0 BT 85 38 (45%) 33.7 0.685 3.90 RI 62 45 (73%) 3,071.0 65.7 394.0 Coastal East 30 1 (3%) 0.217 0.000725 0.00397 Coastal West 6 0 (0%) 0.0 0.0 0.0 All ERF 1,090 381 (37%) 3,071.0 5.84 104.0
Based on tests conducted at an upland impact site, we determined that most of the white phos- phorus from the detonation of an 81-mm mortar WP smoke round is deposited in a hot spot with a diameter of approximately one meter at the point of impact. In these tests, substantial amounts of white phosphorus were driven into the ground within these hot spots. A several-meter-diameter halo around the initial hot spot contained much lower levels of white phosphorus scattered from the initial point of detonation. Beyond this halo, only a very minor amount of white phosphorus is deposited. White phosphorus concentrations in the soil can vary three orders of magnitude over just a few meters because of this hot spot distribu- tion (Walsh and Collins 1993).
Persistence of white phosphorus in a wetland The cold, water-saturated, anaerobic sediments
of Eagle River Flats are ideal for storage of white phosphorus particles. The rapid oxidation for which white phosphorus is known takes place when the white phosphorus is in the vapor phase. The vapor pressure of solid white phosphorus is sufficiently high above 30°C to result in spontane- ous ignition if exposed to air. To prevent this spontaneous combustion in laboratory or com- mercial settings, white phosphorus is stored and manipulated under water. Solid lumps of sub- merged white phosphorus can be stored indefin- itely, although the surface of the solid may devel- op a thin oxidized coating.
Detonation of WP munitions at ERF has con- taminated the sediments with uncombusted par- ticles of white phosphorus. Most of the particles, determined by microscopic examination of the sediments, are 2 mm or less in diameter (Roebuck et al. 1998). For perspective, a single particle with dimensions greater than 1.5 mm is large enough
to present a lethal dose to a mallard. In one study, the largest particle isolated from collected sedi- ments was 7.4 x 3.7 x 3.0 mm (82 mm3) and weighed approximately 150 mg (Walsh et al. 1997). The surfaces of the recovered particles have been lustrous, indicating the lack of an oxide layer, as would be expected in the anaerobic sedi- ments.
The size of the particles is important in terms of persistence in unsaturated sediments. In mudflat and intermittent pond sediments that periodically dry below water saturation, the solid particles will decrease in size due to sublimation from the parti- cle surfaces (Walsh et al. 1995, 1996). Because small particles have greater surface to volume ratios than large particles, a mass of white phos- phorus will vaporize much faster if it is finely divided into small particles than as a single large lump.
Temperature is the other major factor that determines persistence in unsaturated sediments, because vapor pressure decreases exponentially with temperature. During summers at ERF, typi- cal surface (top 5 cm) sediment temperatures aver- age around 15°C with a diurnal variation of approximately 10°C (Fig. 2). At these temper- atures, sublimation of a 2-mm-diam. particle bur- ied in unsaturated sediment is predicted to take about 90 days. Oxidation will presumably hasten the loss. At ERF, the sediments of contaminated permanent ponds could be decontaminated if they were allowed to desaturate. Desaturation requires that either the sediments be removed to an upland site (dredging) for treatment or water from the pond be removed to allow in-situ drying (draining). Given the enormous expense involved in removing contaminated sediment for treat- ment, such as is the case in dredging (Walsh and Collins 1998), an in-situ approach is preferred.

ü
E H
CO c 00 C 00 r 0» D) 3 C
00 C 00 ■£
3 C
00 c oo ■£ °> O) 3 'C
00 c CO
»§ O) o — o
3Z 3 'c
O) O — o
3Z O O _ O
O) o _ o 3 Z
— o D) 3 < -3 T3 -3 T3 -3 T3 -3 'L- ~3 T>
CO "= OJ 00 5 OJ *=
00 OJ OJ *= OJ CO "=
o CO cö^ CO
Figure 2. Diurnal temperature variations of surface sediments at ERF.
Physical processes of Eagle River Flats There are many natural mechanisms in action
at Eagle River Flats that contribute to the persis- tence of white phosphorus. The presence of wa- ter, flooding tides, low siltation rates, and the northern climate are all factors. Any remediation option used in ERF needs to take into account these processes and their effect on the natural attenuation of the contaminant.
Eagle River Flats is located off the Knik Arm of Cook Inlet, where the tides are the second highest in the world, ranging over 13.3 m from high to low tide. Knik Arm is also the repository of sever- al major glacial rivers, including the Matanuska, Susitna, Knik, and Eagle Rivers. Flooding tides occur as often as every 27 days and can last from two to seven days. In most cases, tides do not reach a flooding level (31.1 ft or 9.48 m msl) dur- ing the monthly lunar cycle, and over 100 days may pass between flooding tides.
The salinity level of the waters of Knik Arm tends to be low while sediment load is high. Salinities in Knik Arm range from about 15 to 25 ppt, while sediment loads can approach 3,000 mg/L. During flooding tides, these low salinities are further reduced by dilution with the nonsa- line Eagle River water. Salinities of the ponded and marsh areas of ERF range from 2 to 20 ppt, with the deeper ponds registering around 2 to 9 ppt. The sediment carried by the tides and Eagle River consists of a large amount of fine, glacially derived silts. Grain-size analyses indicate that
90% of the suspended sediment that settles in the ponded areas of ERF is 0.02 mm or finer. The low salinities result in very low settling rates for these fine, glacially derived particles. Thus, when flooding tides occur, very little sediment is depos- ited away from the area adjacent to the river banks, around 5 to 10 mm annually. Sedimenta- tion rates vary depending on distance from the river or ocean and time of year. These are gross sedimentation rates and do not take into account consolidation of the sediments, necessary to pre- vent penetration by dabbling ducks and resus- pension of the contaminant. Consolidation can easily halve the depth of the sedimentation layer. In addition, ice plucking of the sediments during winter flooding tides can remove the loose sedi- ment layer, transporting it away from the ponds.
Other system forces also affect the distribution and persistence of white phosphorus in a salt marsh like ERF. After a flooding tide, the water drains back into the Eagle River or Knik Arm through a series of swales and gullies. Over the course of time, erosion of the headwalls leads to gully advancement into ponded areas. This ad- vancement, if far enough, may drain parts or all of a ponded area. Erosion rates and direction of advancement are very difficult to predict and may differ over an order of magnitude from year to year. Thus, gully erosion cannot be counted on to significantly impact the integrity of ponded ar- eas over the short to moderate term (<20 years).
The transport of white phosphorus out of con-

taminated ponds has also been shown to be mini- mal. Investigations by Lawson et al. (1996a,b) show that intra-pond and drainage gully trans- port of white phosphorus, when it occurs, is not in the form of discrete, macroscopic particles. Rather, white phosphorus concentrations were sufficiently low to indicate that the white phos- phorus was sorbed to suspended sediment or organic matter. Observations of native fish (stickle- backs) and invertebrates (chironomids and amphi- pods) at ERF indicate that these organisms' lives are not adversely affected by the low concentra- tions of white phosphorus found in permanently ponded areas (Bouwkamp 1995, U.S. Army Envi- ronmental Hygiene Agency 1994 and 1995).
The physical system has a negative impact on the ability to remediate ERF. The periodic high tides wet and cool areas that are undergoing dry- ing and warming. This effectively blocks the pro- cess of natural attenuation of the contaminant. Some attenuation has occurred, most notably in the mudflat areas and the intermittent ponded areas between the mudflats and permanent ponds, since the cessation of firing of WP in ERF. However, the contaminant persists in the perma- nent ponds, requiring remediation efforts to resolve the problem.
Treatment methodologies A number of options have been proposed for
treating the white phosphorus contaminated sed- iments in Eagle River Flats since the agent was first identified. Many treatment ideas were reject- ed as either impractical or not feasible. Other ideas, while at first promising, failed when sub- jected to either bench scale or field tests. The vari- ous treatment options are summarized below. They can be divided into three basic types: (1) barriers that prevent the waterfowl from ingest- ing the contaminant (i.e., breaking the pathway), (2) contaminant removal where the white phos- phorus-laden sediment is physically removed from the salt marsh, and (3) alteration of habitat that either prevents waterfowl from ingesting the contaminant or that leads to removal of the con- taminant through in-situ sublimation and oxida- tion. A detailed summary of all the remedial alter- natives considered can be found in Section 3 of Operable Unit C: Final Feasibility Study Report (CH2M Hill 1997b).
Barriers Chemical barrier deterrent. One of the first treat-
ment methodologies developed and tested at
ERF was a chemical deterrent. Methyl anthra- nilate (Rejex-it™) is an encapsulated bird repel- lent that is applied to the contaminated ponds and settles to the bottom (Clark et al. 1993, Po- chop et al. 1999). The repellent is released when the micro-capsules are broken by feeding ducks. The repellant required multiple applications, due to microbial degradation of the capsule material, and was very expensive. Further development was postponed pending results from other, ongo- ing studies.
Physical barriers. Geotextile barriers were test- ed in field trials in Eagle River Flats (Henry et al. 1995). The geotextile barriers were used as a physical barrier to penetration by the bills of dab- bling ducks, thus preventing them from feeding in the underlying contaminated sediments. A reli- able method for anchoring the material against ice movement and a solution to the problem of trapped methane gas was not identified at the time of field testing. The installation of the barri- ers was labor intensive and exposed the workers to potential dangers from unexploded ordnance. There was also concern that the barriers would be subsequently damaged by artillery firing, ero- sion, or movement of ice, which would again expose the contaminated sediments to waterfowl.
Capping was also considered and tested. AquaBlok™ is a composite of bentonite, gravel, and polymers that is applied to pond bottoms. It hydrates after application and expands, sealing the pond bottom sediments. This material acts as a physical barrier to the penetration of the bills of dabbling ducks while they are feeding (Fig. 3). Vegetation appears to reestablish readily in the AquaBlok material based on observations of the treatment site on Racine Island (Pochop and Cummings 1994, Pochop et al. 1996, 1999). Cost of application of AquaBlok to large areas by heli- copter was very expensive, and consistency of ap- plication difficult to maintain. Possible use of AquaBlok or clean gravel was retained as a poten- tial treatment option for very localized, hard-to- treat areas.
Removal of contaminated sediment: dredging Use of a remote controlled dredge offered the
possibility of physical removal of the white-phos- phorus-contaminated sediment from the pond bottoms and the deposition of the sediment at an upland treatment site where the sediment can be allowed to dry and the white phosphorus allowed to sublime and oxidize (Fig. 4). Additionally, the deepening of the pond by dredging would place

a, AquaBlok® applied to Racine Island.
b. Geotextile barrier concept.
Geocompositc-SoU Barrier
Br*Jffl*ee ******
Figure 3. Physical barrier technologies tested at ERF.
Figure 4. Remote dredge operation in Pond 146.
any remaining contaminated sediments below the depth that dabbling waterfowl can reach. The presence of unexploded ordnance dictated the use of a remote-controlled dredge to reduce the danger to the dredge operator. A system was tested by CRREL in 1994 and 1995 and operated by a con- tractor in 1996 (Walsh, M.R., et al. 1996, Walsh and Collins 1998). The dredge and associated
upland retention basin were successful in remov- ing white-phosphorus-contaminated sediments. However, dredging was slow and expensive. The associated placement of anchors and cabling sys- tems also exposed workers to potential dangers from unexploded ordnance. Dredging was discon- tinued after the 1996 season, with less than 0.5 ha treated.

Alteration of habitat to promote in-situ decontamination
Chemical alteration of sediments. Both air sparg- ing and treatment by hydrogen peroxide were initially tested in the laboratory. Air sparging had little or no effect on white-phosphorus-contami- nated sediment. Hydrogen peroxide was ineffec- tive at treating sediment contaminated with white phosphorus particles (Racine et al. 1993b). Both treatment strategies were thus not pursued.
Enhancement of in-situ processes. Enhanced in- situ natural attenuation of white phosphorus is considered the least-invasive remediation meth- odology for areas conducive to this type of treat- ment. Natural attenuation of white phosphorus contamination through sublimation and oxida- tion was identified as occurring in intermittent ponds in ERF (Walsh and Collins 1995) that would lead to the eventual decontamination of these ponds. A treatability study was undertaken to see if enhancing the natural attenuation pro- cess was possible through surface warming. Vari- ous surface modifications and cover treatments were implemented to change the albedo and warm the soil (Fig. 5). The results showed soil moisture to be the controlling factor affecting
Figure 5. Field trials of surface treatments to enhance in-situ attenuation ofWP.
attenuation and that large-scale surface treat- ments would be difficult and only partially effec- tive unless the water could be drained out of the ponds. Although the concept of in-situ natural attenuation was ideal, another method of imple- mentation was required.
Pond draining: ditching Permanent draining of contaminated ponds
through explosive excavation of drainage ditches was successfully done for Pond 109 (Bread Truck
Pond) and Pond 293 (Racine Island). These ponds were two of the most contaminated ponds in Eagle River Flats. The excavation of ditches to these ponds, in April 1996 and April 1997 respec- tively, resulted in the permanent draining of most of the pond areas (Fig. 6). This removed them as habitat during periods of nonflooding tides, keeping the birds from feeding in the contamin- ated sediments of the areas drained. Permanent draining has been less successful in the removal of the white phosphorus through in-situ oxida- tion. Because the drainage ditch connecting the pond to the nearby tidal gullies has lowered the threshold flooding elevation into the pond basin, the former ponds are subjected to more frequent tidal inundation. This results in more frequent wetting and slower drying of the sediments and a much slower sublimation and oxidation rate of the white phosphorus (Collins et al. 1996, 1997,
a. Racine Island (Meek's Canyon).
b. Bread Truck Pond (Pond 109).
Figure 6. Explosively excavated ditches for draining of ponds.
1998). The major disturbance to the environment also contributed to the decision to use this reme- diation method only as a last resort.

Pond draining: pumping Temporary pond draining by pumping was an
intriguing alternative to ditching. Theoretically, it has the same positive benefits of permanent draining in that the habitat will be removed so that waterfowl will not feed in the contaminated sediments once the water is removed. However, it will not permanently remove the pond as habi- tat, allowing for the eventual restoration of the pond after the treatment is over. The threshold into the pond basin won't be lowered, as hap- pened with the excavation of a drainage ditch. Thus, the pond basin is not subjected to flooding during normally nonflooding high tides through- out the summer. Once the pond is pumped out and kept drained, the pond bottom sediments can be treated in-situ through natural attenua- tion. Based on the work in laboratory and the in- termittent ponds west of Pond 183, we knew that substantial sublimation and oxidation of the white phosphorus can be achieved if we can keep the pond sediments unsaturated and the sedi- ment temperature above about 15°C for a total of about thirty cumulative days over a season. Com- plete decontamination of a pond's surface sedi- ment can be expected with three to five complete seasons of treatment. Unknowns associated with pond pumping included rates of recharge into the ponds from groundwater and rates of inflow from the surrounding marsh areas. A pump sys- tem was designed and ordered to be tested in Pond 109 in 1995. Contracting delays and then funding constraints put the pond pumping study on hold, and Pond 109 was permanently drained using explosive excavation of a drainage ditch.
The remainder of this report describes and dis- cusses the pond pumping project at Eagle River Flats and the associated sampling program used to verify the efficacy of the method. As stated in the Introduction, pond pumping has been chosen as the main method of remediation at ERF based on the work described below.
CONTROLLED POND DRAINING FEASIBILITY STUDY
Initial study deployment of a pump system (1997)
In 1996, it became clear to both the Ft. Richard- son's Remedial Project Managers and the investi- gators involved with the dredge project that dredging was not going to be feasible at ERF. The widely scattered contaminant, the presence of large amounts of vegetation and woody debris,
the danger from unexploded ordnance, the time and manpower requirements, and the environ- mental impact all served to reduce the desirabil- ity of this option. Although effective in removing the contaminant, dredging was too time consum- ing, dangerous, and costly to be considered fur- ther. The one remediation option remaining to be tried at the time was wide-scale pond pumping to enhance natural attenuation.
A 126-L/s pump system had been built to specification for Eagle River Flats in 1995. This is the system mentioned above that had originally been designed to operate in Pond 109. This pump system is composed of two major components: a pump unit consisting of a 15-cm (6-in.) open- impeller centrifugal pump on floats and an 80- kW generator set (genset) with fuel tanks, also on floats (Fig. 7). The two units are connected to- gether by a four-conductor power cord, 70 m in length, and a control wire. The control wire inter- faces between the genset control and float switches mounted on or near the pump.
The pump is separated from the genset to pre-
a. System installed in Pond 290. Note datalogger (left).
b. Close-up of floating pump in sump.
Figure 7. Autonomous pumping system for Eagle River Flats.

vent damage to the genset and the possible spill of fuel and lubricant in case of ingestion and det- onation of unexploded ordnance by the pump. Originally, the pump was to be placed in the deepest section of the pond to be treated. The pump would then scour a small sump while drawing down the pond. Prior to deployment, however, we decided to blast a sump and place the pump within the preformed sump. The sump serves as a deep reservoir for the pump, reducing cycling of the system and thus conserving fuel.
To form a 2-m-deep x 6-m-diam. sump, two 18- kg shape charges and two 18-kg cratering charges are placed and detonated by military engineers. After the area has been cleared of ordnance, Ban- galore torpedoes (prepackaged line charges) are used in four locations to breach the rim of the sump, allowing free flow of the pond water into the sump. Detonation cord is then used to form small drainage ditches from the sump to low points in the pond. Finally, a minimal amount of hand-ditching with a shovel is done along cleared lanes to address problem spots.
The system was initially installed in Pond 183 in May of 1997. Both the pump and genset were flown to their locations using a UH-60L Black- hawk helicopter (capacity 4080 kg). Placement of the genset in a channel previously dredged between Pond 146 and the edge of Pond 183 allowed refueling of the genset via a skiff, which could be loaded from the pad near Clunie Creek. A 20-cm-diam. discharge line, consisting of 6-m sections of polyethylene pipe and various length sections of rubber hose, was installed between the pump and B-gully (a drainage gully adjacent to the discharge line in Pond 183, west of the pump), a total of 335 m. The 6-m sections of poly- ethylene pipe were transported by UH-1H heli- copter. Eight to ten sections at a time were loaded sideways through the open doors and flown out to locations along the planned right of way. The pipe was then carried into position and assem- bled by hand. Pump-down of the pond was initi- ated at 1125 on 16 May. By 0900 the following morning, Pond 183 had been drawn down such that water entering the sump was confined to a few channels through the sump rim. Initial draw- down for this 2.9-ha pond occurred in less than 12 hours.
Initially, only two pump-mounted reed-type water level switches were used to control the sys- tem. One was mounted on the pump such that it turned the pump off when the sump was pumped out. The second, a high-water switch,
was mounted above it; this would switch on the genset and then the pump when the water level rose in the sump, floating the pump. In operation, the reed-type switches were subject to being clogged by the fine-grained silt in the muddy water. Problems with these switches precluded operating the pump overnight during the first phase of testing. Replacement of the reed switches and modification of the control circuitry im- proved the system reliability to the point that it was operational by 21 May. The area continued to slowly dewater, and by 22 May, Pond 183 was essentially drained. Only isolated pockets of water remained in depressed areas not draining into the sump. These areas eventually dried through evaporation.
The reed switches were replaced with fully en- closed float switches, a more robust arrangement. Consideration of flooding tides led to the incorporation of a third float switch to shut the system down during flooding events. Circuitry needed to be added and the existing control cir- cuitry needed modification. In July, the third switch was added for the detection of flood tides. The flood tide switch was mounted away from the pump near the rim of the sump to better de- tect the rising tidewaters. The modifications were tested and operational prior to the flooding tide. On 21 July, a 9.7-m tide inundated Pond 183, trig- gering the flood tide switch and shutting down the system. The flood tide switch was set to trig- ger off when the natural drainage after the tide was nearly complete. This maximizes fuel con- servation by taking advantage of the natural drainage of the area. Pumping resumed on 25 July. Drawdown of Pond 183 occurred over the next three days. The configuration worked so well during testing that the highwater switch was also mounted off-pump near the sump rim. This further reduces cycling by delaying the resumption of pumping until the sump completely fills. A dia- gram of the final switch logic is shown in Figure 8.
During the marginal (9.47-m) flooding tide of 20 July, infiltration routes from the river to Pond 183 were scouted. The major infiltration passage was found to be B-gully. To prevent pond flood- ing during marginal flooding events (< 9.57 m), a tide gate was designed for installation at the highest, narrowest point of the gully. This gate serves as a one-way valve, preventing influx of water during lower flooding tides, but allowing passage of water out of the pond after higher flooding tides. A gate was fabricated and installed in September in time to test it during a

CShut down~~~~X, pump/gensetx^-
Force high/low switches off
Start pump/genset
Continue running
Figure 8. Switch logic diagram for pump operation.
minor flooding event on the 15th. The gate pre- vented flooding of the pond.
The final design modification to the system was a check valve for the discharge line. The line, 335 m in length and 20 cm in diameter, holds approximately 11,000 L of water when full. This is equivalent to one-fifth the volume of the sump, or 7.5 minutes of pump operation. Preventing the backflow of this water will thus increase the apparent size of the sump by about 20%. The check valve was installed and successfully tested in September.
The pump system was originally designed to operate with a 200-m discharge line. The use of the longer line (335-m) for deployment in Pond 183 resulted in the increase of line head loss and thus a decrease in discharge flow rate. An ultra- sonic flowmeter was installed on the line in Sep- tember to check the discharge rate. The change in line length resulted in a 12.5% decrease in flow rate, from 126 L/s to 110 L/s. This has a direct impact on the time required to initially drain the pond after flooding events, but has little effect on subsequent pumping of the sump due to the small volume of water involved.
In mid-September, during a high flooding tide (> 10.3 m), the genset and pump were manually floated back to the dredge channel adjacent to the EOD pad for retrograde to Ft. Richardson. The pipe was flown back to the EOD pad using a UH-
1H Huey helicopter. Retrograde operations required only a few days. During this time, a sec- ond 126-L/s pump system arrived for testing and run-in. This system was tested in the dredge chan- nel in Pond 146 prior to retrograde of the original system. Based on the system performance results in Pond 183, four additional units ranging in cap- acity from 63 to 190 L/s were ordered from the manufacturer for deployment in future years.
Monitoring methods The success of remediation of the white phos-
phorus contamination at ERF is monitored in several ways because of the complexity of the site and its unconventional contaminant. One compo- nent of the monitoring process is to confirm that the amount of white phosphorus in surface sedi- ments is decreasing, thereby becoming less of a threat to waterfowl. Using both composite and discrete samples, we measured white phospho- rus concentrations and examined sediment sam- ples for the presence of contaminant particles. We also monitored groundwater level, surface water level, sediment temperature, and moisture level to determine if conditions were conducive to sub- limation/oxidation. We then confirmed whether conditions were favorable or unfavorable by measuring the residue of white phosphorus par- ticles that we placed at various points in the drained ponds.
10

Composite sampling To determine if the contaminant is present in a
given area, composite sampling is conducted. We established transects bisecting ponds to monitor sublimation/oxidation conditions and for base- line and verification sediment sampling (Walsh et al. 1998). Transects were up to 200 m long, and at evenly spaced intervals, composite samples were collected to determine if hot spots (localized areas containing white phosphorus particles) were present (Fig. 9). Each composite sample was made up of sediment cores obtained at the nodes of a 1.82-m square grid covering a 5.46-m-wide area extending up to 20 m perpendicular to the bisecting transect. The grid spacing is based on
field corer, which has a handle and tapered tip that greatly facilitated insertion of the corer into the consolidated sediment. The corer's internal diameter was 2 cm, and when a 9-cm-length core was taken resulted in a 28-mL sediment sample. Up to five replicate composite samples were taken from each grid.
Discrete sampling During the investigation to determine which
areas of Eagle River Flats were contaminated, several highly contaminated locations were found in both intermittent and permanent ponds. Resampling of these locations has allowed us to monitor the decline in contamination with time.
Figure 9. Map of composite sampling transects in Pond 109 (BT) and 183 (Area C).
the assumption that the hot spots are 1 m in diam- eter (Gilbert 1987) (see Extent of Contamination of Eagle River Flats for the derivation of the 1-m sam- pling zone). At each grid node, a 50-mL sediment sample was obtained using a plastic syringe corer (2.65-cm i.d., 9-cm length). Because of sediment consolidation due to draining, insertion of the plastic corer into the sediment was very difficult. In areas that were drained after the initial pump deployment in Pond 183, we substituted an Oak-
The first location was initially sampled in 1992 and given the designation "Site 883," southwest of the edge of Pond 183. The white phosphorus concentration found here was one of the highest concentrations found in ERF, over 200 ng/g. When 270 mL of sediment from this site was sieved, over 100 white phosphorus particles were isolated. Located within the intermittent pond on the west side of Pond 183, this location was ideal for monitoring the persistence of white phospho-
11

rus in sediments that periodically desaturate. With the objective to determine spatial hetero- geneity of the contamination, in 1992 we collected discrete surface (top 9 cm) sediment samples at 1-m intervals out to 5 m along eight radii around the center point. Subsequent sampling in 1994, 1995, and 1997 was done to see if the white phos- phorus concentrations had changed with time. In 1998 subsurface samples were also collected.
The second location was on west side of Pond 183 in Area C. The west side of this pond was first sampled in 1991, and most of the samples had detectable levels of white phosphorus. More sam- pling was done in 1992 and 1993, when part of the pond was used for a bird repellant study by U.S. Department of Agriculture's Denver Wildlife Research Center (DWRC). A component of this study during 1992-1993 involved exposure of mallards to contaminated ERF sediment by con- fining the birds within six pens. For each experi- ment, six mallards were placed within these pens for various lengths of time, and feeding behavior and mortality monitored. In DWRC pen 5, nine groups of six mallards were penned for various lengths of time. Of these 54 mallards, 29 appeared to die of white phosphorus poisoning. In the experiments where the mallards were confined continuously for one week or more, all the birds died. Based on these results, we knew that this location contained white phosphorus that was available to feeding waterfowl. In 1996 we inten- sively sampled this pen by collecting discrete samples at the nodes of a 1.82-m square grid cov- ering a 5.46- x 20-m area. In 1998, after the sedi- ments had been exposed for parts of two sum- mers as a result of the pond pumping feasibility studies, we repeated the sampling.
Laboratory analysis of sediments for white phosphorus residues
In the laboratory, each composite sample was thoroughly mixed by stirring and kneading. To obtain an estimate of average white phosphorus concentration, a 200-g subsample was taken from each composite and analyzed using solvent extrac- tion (100 mL of isooctane) and gas chromatography (EPA SW-846 Method 7580). If concentrations were high, the remainder of each composite was rinsed through a 30-mesh sieve (0.59-mm sieve opening) to remove the fine-grained sediment. Material remaining on the sieve was placed in a septa jar and equilibrated at room temperature. To deter- mine if white phosphorus particles had been retained on the sieve, we performed headspace
solid-phase microextraction (SPME) followed by gas chromatography (Walsh et al. 1995). When the SPME method indicated that white phosphorus was present, the sample was spread in a thin layer on an aluminum pan and the sample heated until all water evaporated. If white phosphorus parti- cles are present, they are detected by the observa- tion of a localized area of intense smoke and flame and the formation of a bright orange residue.
Discrete samples were subsampled by taking a 40-g portion of sediment and extracting the white phosphorus with 20 mL of isooctane. Subsurface samples, which were obtained in the field with corers, were placed directly in isooctane. After shaking overnight, we analyzed the extracts by gas chromatography (see EPA SW-846 Method 7580 above).
Sublimation/oxidation conditions We installed sensors and dataloggers to moni-
tor sediment temperature and moisture condi- tions at various sites within the drained ponds. At each station, sediment temperatures were moni- tored at 5- and 10-cm depths using Campbell Sci- entific Model 107B soil/water thermistor probes. Sediment moisture conditions were monitored at 5- and 10-cm depths using Campbell Scientific model 257 (Watermark 200) soil moisture sensors. Output from both sets of sensors was taken every 10 minutes, and the hourly and 24-hour averages recorded by a Campbell CR10 Measurement and Control Module and an SM716 Storage Module.
Tensiometers provided another measure of sur- face sediment moisture conditions. SoilMoisture® Series 2725 tensiometers equipped with dial gauges were installed, one at 10-cm depth and another at 20-cm depth at most sites, and were read periodi- cally by personnel from CH2M Hill, an engineer- ing firm contracted to monitor the test sites and pumping equipment. A third tensiometer was equipped with a pressure transducer and wired to the datalogger where 24-hour average measure- ments were computed and recorded on a storage module.
To monitor subsurface water level in Area C, we relocated a shallow piezometer well used in 1994 (site 3 in Walsh et al. 1995), and placed the Druck pressure transducer 0.77 m below the sedi- ment surface. We also installed Drucks to monitor depth of any standing water in the ponds. How- ever, the ponds were drained for most of the mon- itoring period, and exposure to the weather caused erratic readings for most of the sensors.
At each datalogger station, we planted 10 white
12

phosphorus particles (1.8-mm diameter, 5.6 mg) that were made in the laboratory (Walsh et al. 1996). Each particle was first inserted into a plug of saturated sediment, then the plug of sediment was placed in a nylon stocking, which was then placed within the top 5 cm of saturated sediment at each monitoring station. At the end of the sea- son, we recovered five of the plugs to determine if white phosphorus mass had decreased. The remaining plugs were left for multiyear monitor- ing. To determine if the white phosphorus parti- cles had changed, we placed the sediment samples containing particles into isooctane to extract white phosphorus residue prior to analysis by gas chromatography.
Feasibility study of large-scale deployment (1998)
Results obtained from the initial deployment of the 126-L/s pumping system in Pond 183 indicat- ed that the enhancement of natural attenuation of white phosphorus from ponded areas using a pump was highly effective and feasible (see Results). Prior to the cessation of field activities in September of 1996, two more sumps were blasted, one in Area A (Pond 290), and an additional one in Area C (Pond 155). These ponds were chosen to further the feasibility study initiated in 1997. The Pond 155 deployment was planned to study the effects of pumping in adjacent, partially connected pond systems. Pond 290 was targeted to work out the logistics of a system deployment in a remote area of ERF, across the river from the support area on the EOD pad.
In the spring of 1998, the decision was made to attempt to deploy the two pumping systems on hand and the four systems on order. The areas the pumps were to be deployed were Ponds 146,155, and 183 in Area C and Ponds 256, 258, and 290 in Area A. Because of the magnitude of the deploy- ment, the lack of site preparation for the three additional systems, the need to troubleshoot the four new systems, and the lack of experience with remote deployments, the systems were to be fielded in two stages. This allowed the gaining of experi- ence with a remote system (Pond 290) and the blasting of the two additional sumps in Area A (Ponds 256 and 258). The pump in Pond 146 would be deployed in the existing dredge channel at the edge of the EOD pad. No sump was formed for the pump in Pond 146 due to time constraints.
Some problems developed with the systems over the course of testing and deployment, but most were quickly resolved. Two major problems
worth detailing did occur, however. The first con- cerned the switch logic. As configured on all sys- tems except the original, the pump can restart during the cool-down cycle if the genset warm- up timer is set lower than the cool-down timer. The immediate fix was to extend the warm-up time and decrease the cool-down time to work around the timing problem. This didn't resolve the underlying logic problem, so the circuitry was redesigned to eliminate the problem altogether. The fix actually simplified the circuitry and elimi- nated a relay. All five systems were modified, tested, and made operable within three days.
The second problem involved a substantial fuel spill that occurred in late June. A fuel filter on one of the units burst over a weekend, resulting in a spill of approximately 750 L. Fortunately, this occurred on the one shore-based genset (pump- ing system 3), so although the gravel pad beneath the unit was contaminated, no fuel entered ERF. The probable cause of the failure is a manufactur- ing defect in the case of the filter, although the manufacturer disputes this.
Deployment of all systems went smoothly. All gensets and pumps, with the exception of system 3, were sling loaded into place by an Alaska Na- tional Guard (AKANG) UH-60L Blackhawk heli- copter. The pipe for these systems was carried by a commercial UH-1H Huey helicopter. Pipe for pumping system 3 was deployed along the edge of the EOD pad, emptying into Eagle River near the southern end of the pad. In addition to the gensets and pumps, two 1,900-L double-walled fuel tanks were used to ferry fuel from a refueling point on the EOD pad to the remotely deployed gensets. The tanks are equipped with 12-V elec- tric transfer pumps that can be powered from the battery of the genset. Table 2 denotes the location of each system and some pertinent information regarding its deployment. Systems 1,3, 5, and 6
Table 2. Pump system deployments (1998).
Discharge System Capacity Operational Drawdown line length number Pond (L/s)* date date (in)
1 183 125 1 June 1 June 336 2 258 125 25 June Unknown 258 3 146 190 27 May 1 June+ 490 4 256 125 23 June 26 June 398 5 290 125 28 May 29 May 185 6 155 65 1 June 2 June 313
* Theoretical capacity. Pump 3 can operate at 63-, 126-, or 190-L/s levels,
t Drawdown date determined by level where pumping in Ponds 183 and 155 is minimal.
13

all utilized check valves in the discharge lines to minimize backflow. System 3 discharged directly into Eagle River, system 5 discharged into Otter Creek, and the remaining systems discharged into the nearest drainage gully Discharge points are at least 10 m beyond any existing gully headwall to reduce erosional advancement of the headwall.
In addition to the tide gate installed in B-gully in 1997, three additional tide gates were installed at the northern end of Pond 183 in Area C. These tide gates prevented flooding during a 9.54-m (31.3-ft) tide in June. A tide of the same height flooded the area in August from the south, where the river, at a high level, overflowed its banks and infiltrated the area. However, the pond was pumped out within a day, and flooding would have been very limited except that one of the gen- erators had run out of fuel and another was shut off. Area A did not flood during either of these events, so the use of flood gates should prove to limit flooding of the southern Area A ponds at even higher tidal levels.
In late August, the systems were shut down and the components retrograded by helicopter to shore. Pipe was once again flown out with a com- mercial Huey helicopter and the heavy equipment was flown out with a Blackhawk (Fig. 10). The total flight time required to remove the five off- shore units plus two 1,900-L double-walled fuel tanks was less than 2.5 hours. All equipment except the pumps, gensets, and hose are being
stored on the EOD Pad adjacent to ERF. The remain- der of the equipment is being stored in a yard on Ft. Richardson, 8 km from ERF. The hose is under cover to prevent ultraviolet radiation damage.
Results
Initial deployment—2997 Overall performance of the pumping system in
Pond 183 during the 1997 field season was much better than originally predicted. Post-flooding drawdown time after some natural drainage is approximately three days. If two days are allowed for natural drainage and another day is allowed for residual drainage, total time required for drainage is less than a week following the last flooding event in a series. Flow between Pond 146 and Pond 183 via the dredge channel was minimal after drawdown, and during part of the summer, there was no flow at all between the two pond sys- tems. It was hoped that with the tide gate deployed, some flooding events could be avoided altogether, thus eliminating subsequent flooding and pump- ing of the area being treated. Proof of this hypoth- esis would have to wait until the following season,
a. Riggers hooking up fuel transfer tank.
Figure 10. Airlifting pump equipment. b. Airlifting pump.
14

as the tides in September did not allow sufficient testing of the concept. The discharge rate for the system was 13% below the theoretical rate, due pri- marily to the length of the discharge line. Results from the installation of the tide gate indicated that marginal flooding tides may be prevented from in- filtrating into the treatment areas, but further study was required.
Full-scale deployment—2998 Results for the pond pumping remediation
effort can be measured two ways. The first is relat- ed to the pump performance: How dry we are able to keep the areas and how quickly they are drained after flooding? The second is related to contami- nant attenuation: How much is the natural attenu- ation enhanced, as measured by planted particles, composite sampling, and discrete sampling? Through the use of the tide gates, flooding of Area C was almost completely prevented throughout the core season (15 May to 15 September). After the final flooding tide of the spring on 28 May, the area was allowed to drain for a day and the pump sys- tems started. The area was drawn down by 1 June. The pumping system in Pond 155 was started on 1 June and drawdown occurred within one day. Pond 146 was never completely drawn down due to a lack of a sump for pump unit 3 and the recharge from a beaver channel nearby. Only one flooding tide affected the area adversely, occurring on 10 August. Because the contractor had allowed the genset in Pond 183 to run out of fuel, the flood-
ing was widespread. However, it was quickly ad- dressed after refueling, and the wetting was not thorough. Ponds in Area A, once drained, did not reflood until the resumption of high flooding tides on 6 September. Longest continuous nonflooding periods for the various ponds are listed in Table 3.
Table 3 does not tell the complete story. As shown in Figure 11, operation and maintenance problems with some of the equipment prevented the full utilization of the nonflooding period. For Pond 146, a potential "dry" period of 70 days has been reduced to three partially dry periods of approximately two weeks each. Although prob- lems occurred with the other systems, none were as widespread as with this system (system 3). Fig- ure 11 also shows the relationship between Area C/D and Area A. Although a constant stream of
Table 3. Maximum nonflooding peri- ods (1998).
Pond Start Flood Days not flooded
AreaC 146 1 June* 10 August 70* 155 2 June 10 August 70 183 1 June 10 August 71
Area A 256 26 June 5 September 72 258 5 September 290 29 May 5 September 100
Only areas outside of the previously dredged channel (1994-96) were not flooded.
Cfl > _CD
LU a> o ns t ■3
IS)
CD
a! 5
Figure 11. Water level relationships between Area C and Area C/D.
15
water flowed from the direction of C/D to Pond 146 along the border of ERF, the water does not seem to originate from C/D, but rather as inflow from the uplands adjacent to ERF between C and C/D. The hydrologic separation of these two areas was previously surmised, but has now been dem- onstrated. Isolation of these areas results in faster drawdown times and more effective drying.
Sublima tion/oxida tion conditions A major factor in the wetness of the areas
drained is the weather. The summer of 1998 was one of the wettest on record, with especially heavy rainfall in the months of May and June. These are normally the driest months of the core season. The late flooding tides of May eliminated any drying that month, and June was one of the wettest on record, with almost twice the normal rainfall. In addition, temperatures were below normal for July and August, and skies were cloudy for almost the entire three months from June through Aug- ust. Table 4 is a synopsis of the relevant climatic conditions for June, July, and August.
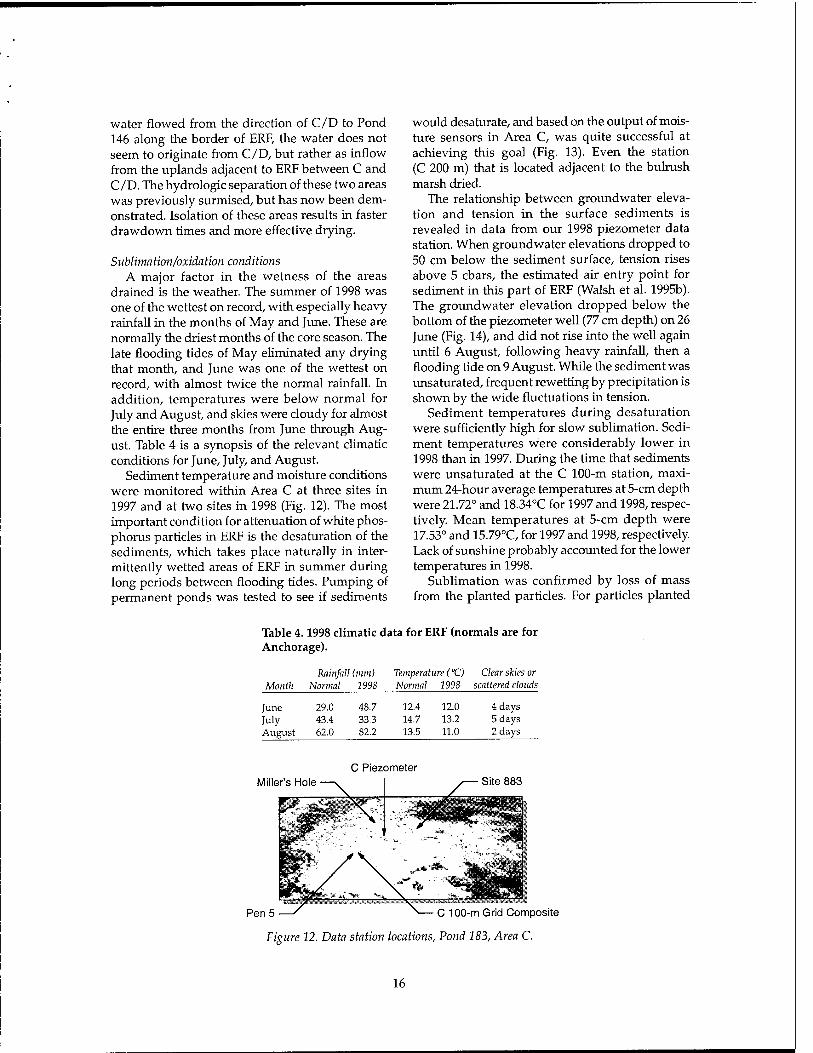
Sediment temperature and moisture conditions were monitored within Area C at three sites in 1997 and at two sites in 1998 (Fig. 12). The most important condition for attenuation of white phos- phorus particles in ERF is the desaturation of the sediments, which takes place naturally in inter- mittently wetted areas of ERF in summer during long periods between flooding tides. Pumping of permanent ponds was tested to see if sediments
would desaturate, and based on the output of mois- ture sensors in Area C, was quite successful at achieving this goal (Fig. 13). Even the station (C 200 m) that is located adjacent to the bulrush marsh dried.
The relationship between groundwater eleva- tion and tension in the surface sediments is revealed in data from our 1998 piezometer data station. When groundwater elevations dropped to 50 cm below the sediment surface, tension rises above 5 cbars, the estimated air entry point for sediment in this part of ERF (Walsh et al. 1995b). The groundwater elevation dropped below the bottom of the piezometer well (77 cm depth) on 26 June (Fig. 14), and did not rise into the well again until 6 August, following heavy rainfall, then a flooding tide on 9 August. While the sediment was unsaturated, frequent rewetting by precipitation is shown by the wide fluctuations in tension.
Sediment temperatures during desaturation were sufficiently high for slow sublimation. Sedi- ment temperatures were considerably lower in 1998 than in 1997. During the time that sediments were unsaturated at the C 100-m station, maxi- mum 24-hour average temperatures at 5-cm depth were 21.72° and 18.34°C for 1997 and 1998, respec- tively. Mean temperatures at 5-cm depth were 17.53° and 15.79°C, for 1997 and 1998, respectively. Lack of sunshine probably accounted for the lower temperatures in 1998.
Sublimation was confirmed by loss of mass from the planted particles. For particles planted
Table 4.1998 climatic data for ERF (normals are for Anchorage).
Rainfall (mm) Temperature (XI) Clear skies or Month Normal 1998 Normal 1998 scattered clouds
June July August
29.0 43.4 62.0
48.7 12.4 33.3 14.7 82.2 13.5
12.0 13.2 11.0
4 days 5 days 2 days
C Piez Miller's Hole —v
ometer - Site 883
wÜ ,..„.», _;
' '"'.■■,
%
;«
Pen 5—' N—C 100-m Grid Composite
Figure 12. Data station locations, Pond 183, Area C.
16

a. 1997 - Transect location 0 m.
b. 1997 - Transect location 100 m.
cr <u o a.
D.U I i i i i i i i i I I
— / r «™
5.0 — 10 cm —
4.0 - . I -
3.0 - / A
-
2.0 / i
1/ —
1.0
If' <■■' i i
/
/ '""A 4--% 3Sep|_
n n h-f" ~\ —f—1
c. 1997 - Transect location 200 m.
T- 1- CM
O) O) CD O) o. D D 3 D < < < < < CO ,_ 00 L/> CO en in
T- CM CM
Figure 13. Area C moisture probe sensor output (1997-98). Note: Increasing resistance denotes dry- ing of sediment.
17

0) DC
50 £
~ 0.6
d. 1998 - Transect location 100 m.
e. 1998 - Area C piezometer site.
Figure 13 (cont'd). Area C mois- ture probe sensor output (1997- 98). Note: Increasing resistance denotes drying of sediment.
o a > HI
3 •o
2 O
Figure 14. Groundwater ele- vation and surface moisture content in Area C (1998). Note: Surface elevation is 4.77 m.
18
and recovered in 1997, loss was approximately 50% in Area C. In 1998, loss was approximately 78%. Although drying conditions in 1998 were not as favorable as in 1997, the consolidation of the sediments over the course of the 1997 season boosted the effectiveness of the 1998 season.
Composite sampling The objectives of composite sampling are to pro-
vide a measure of mean concentration over a large area and to detect the presence of hot spots con- taining white phosphorus particles large enough to present a lethal dose to a duck. In June 1997, a 200- m-long transect was established through Area C, extending from the intermittent pond in the west through the permanent pond in the east. Compos- ite samples collected at 50-m intervals along the transect showed that the highest concentrations were in the middle (100 m) of the transect, at the western end of the permanent pond, where previ- ous discrete sampling showed high concentrations of white phosphorus. We sieved each of the com- posite samples through a 0.5-mm sieve and found macroscopic white phosphorus particles only in the 100-m grid sample. Water was pumped from the pond and the sediments allowed to consolidate and dry. Resampling of the 100-m grid in Septem- ber 1997 showed an 89% reduction in the mean concentration found in the grid. Samples collected from the grid in 1998 showed low concentrations persisting, despite drying of the sediment. We did not find white phosphorus particles when we sieved the September 1997 and the 1998 samples.
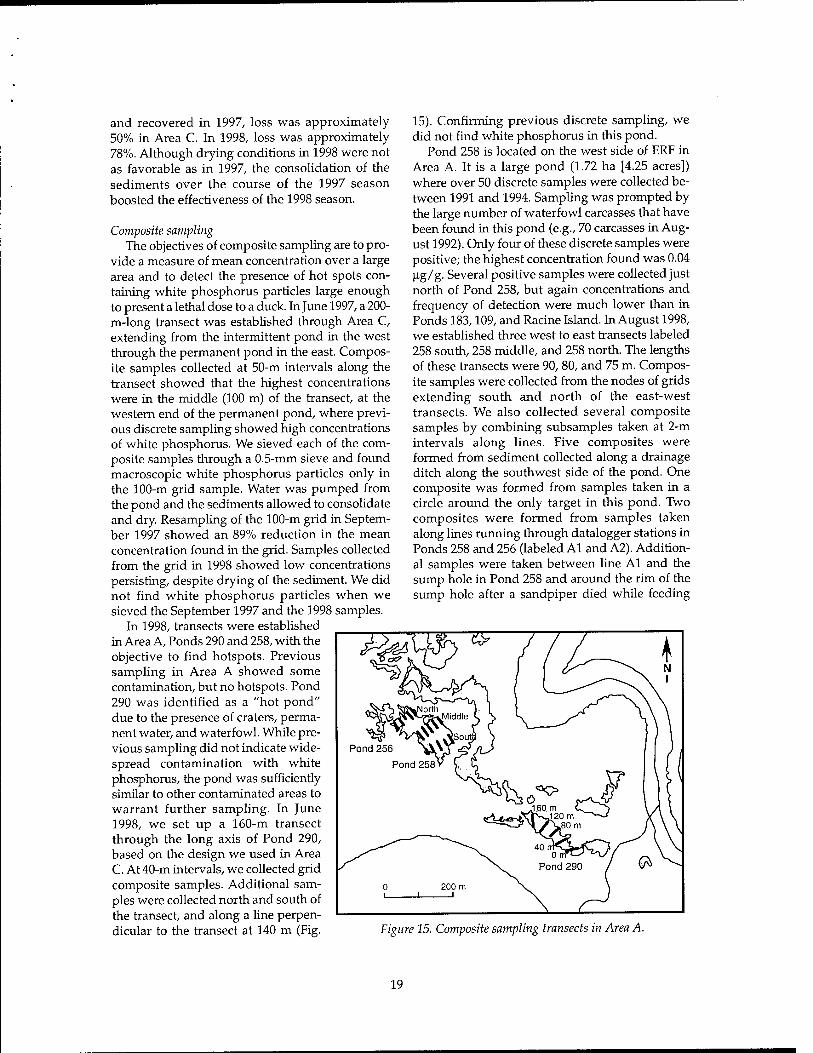
In 1998, transects were established in Area A, Ponds 290 and 258, with the objective to find hotspots. Previous sampling in Area A showed some contamination, but no hotspots. Pond 290 was identified as a "hot pond" due to the presence of craters, perma- nent water, and waterfowl. While pre- vious sampling did not indicate wide- spread contamination with white phosphorus, the pond was sufficiently similar to other contaminated areas to warrant further sampling. In June 1998, we set up a 160-m transect through the long axis of Pond 290, based on the design we used in Area C. At 40-m intervals, we collected grid composite samples. Additional sam- ples were collected north and south of the transect, and along a line perpen- dicular to the transect at 140 m (Fig.
15). Confirming previous discrete sampling, we did not find white phosphorus in this pond.
Pond 258 is located on the west side of ERF in Area A. It is a large pond (1.72 ha [4.25 acres]) where over 50 discrete samples were collected be- tween 1991 and 1994. Sampling was prompted by the large number of waterfowl carcasses that have been found in this pond (e.g., 70 carcasses in Aug- ust 1992). Only four of these discrete samples were positive; the highest concentration found was 0.04 Hg/g. Several positive samples were collected just north of Pond 258, but again concentrations and frequency of detection were much lower than in Ponds 183,109, and Racine Island. In August 1998, we established three west to east transects labeled 258 south, 258 middle, and 258 north. The lengths of these transects were 90, 80, and 75 m. Compos- ite samples were collected from the nodes of grids extending south and north of the east-west transects. We also collected several composite samples by combining subsamples taken at 2-m intervals along lines. Five composites were formed from sediment collected along a drainage ditch along the southwest side of the pond. One composite was formed from samples taken in a circle around the only target in this pond. Two composites were formed from samples taken along lines running through datalogger stations in Ponds 258 and 256 (labeled Al and A2). Addition- al samples were taken between line Al and the sump hole in Pond 258 and around the rim of the sump hole after a sandpiper died while feeding
Figure 15. Composite sampling transects in Area A.
19

Table 5. Results of discrete sampling at Site 883 and Miller's Hole, Area C.
a. Distribution of WP concentration ranges for 41 samples at Site 883.
Cone. Percentage of Samples (Hg/g) 19 Aug 1992 19 Aug 1994 17 Sep 1995 3 Sep 1997
<0.001 37% 59% 68% 98% 0.001 to 0.099 41% 29% 29% 2%
0.1 to 9.9 12% 10% 2% 0% >10 10% 2% 0% 0%
b. Concentrations found at Miller's Hole, a crater produced by the detonation of a WP UXO.
Days since WP Concentration (ng/g) Sampled explosion Center Rim
20 May 92 0 2,394 979 21 Aug 92* 93 184 0.00427 27 Aug 93+ 464 81.5 0.00177 30 Aug 94 832 9.5 not detected 17Sep95+ 1215 166 0.0006 3Sep97 1932 1.6 not detected
25 Aug 98 2288 0.037 not detected
"Crater under water when sampled, t Crater under water all summer.
there. Finally, two composites were formed from subsamples taken along the east side of the pond where previous sampling showed some contamina- tion. Again, confirming previous discrete sampling, we found low concentrations of white phosphorus in just a few samples (three out of 44 composite samples).
Discrete sampling in Area C Discrete samples were collected from previously
identified hot spots. Site 883 was first sampled in May 1992 and had a white phosphorus concentra- tion of over 200 ng/g- White phosphorus concen- trations in samples taken at 1-m intervals radiating out from this site on 19 August 1992 showed extreme spatial variability. Most of the 41 samples had measurable concentrations of white phos- phorus (only 37% of the samples were less than 0.001 ng/g [Table 5]). Since August of 1992, sedi- ments in this part of Area C were desaturated dur- ing the summers of 1993,1994, and for prolonged periods in 1997 and 1998. When sampled in Sep- tember of 1997 in the same pattern as was done in 1992,1994 and 1995, 98% of the samples were less then 0.001 ng/g. Only three samples contained detectable white phosphorus. These samples were located 2 m east (0.0006 ug/g), 3 m east (0.068 pig/ g), and 1 m southeast (0.0007 ug/g) from the center point at Site 883.
The decrease in white phosphorus contamina-
tion in the surface sediments at this intermittently dry site (Site 883) is obvious when the data are pre- sented as a percentile plot (Fig. 16). The y axis is presented as the log of concentration (ng/kg) to show the wide range in concentrations detected. Zero on this log scale is equivalent to 1 |^g/kg or 0.001 Mg/g. This plot shows the yearly decline in the percentage of samples that had concentrations greater than 0.001 |Jg/g, and a general decline in the maximum concentrations detected.
In the three samples that had detectable white phosphorus in 1997, the concentrations are too low to contain white phosphorus particles that could pose a threat to waterfowl. The surface sediments at this site can be considered remediated and future resampling of the surface sediments is unnecessary. In 1998 we collected subsurface sam- ples down to 30 cm at Site 883 and a second set 2 m east. The subsurface samples showed little con- tamination (one positive at 10-cm depth). Because firing of white phosphorus munitions was sus- pended in 1990, at least eight years have passed since this intermittently flooded location was con- taminated. It is now remediated.
The location of the DWRC pen 5 is within the permanent pond of Area C and the sediments have been covered by water since the cessation of firing of WP munitions. We intensively sampled this location in 1996 by taking discrete samples at the nodes of a 1.82-m square grid four columns wide
20

o O
4 —
_ i 1 1 1 I I I I I I I
■ I
_ ■ 1992 ■ □ — D 1994 ■
~" • 1995 ■
- O 1997 .-" —
- ■ ~
: ■ D □ Do _
- r a *
• o
-
- 1 I I I I I I I I I I I
1 —
-1 99 99.9 99.99 0.01 0.1 1 5 10 20 30 50 70 80 90 95
Percentile
figure 16. Percentile plot ofWP contamination of an intermittent pond site (Site 883).
1996 1998
6m
White Phosphorus Concentration (ug/g):
•* Not Detected □ < 0.001 O 0.001 to 0.0099 A 0.01 to 0.099 O 0.1 to 0.99 * >1 • > 1 and Particles Found
Notes:
Grid size is 1.82 m by 1.82 m. No particles were found in 1998.
6 m
Figure 17. Plot ofWP concentrations in DWRC pen 5, Pond 183, Area C.
and 12 rows long (Fig. 17). In 1996, all 48 samples contained detectable white phosphorus concen- trations ranging from 0.0024 to 421 ug/g (Table 6). Over 300 white phosphorus particles were found, one of which weighed 150 mg (Walsh et al. 1997). In the fall of 1998, white phosphorus was undetectable in 20 of the 48 samples. The concen- tration range in the positive samples was 0.00062 to 0.84 ug/g. In all cases where white phosphorus
was found, the concentrations were lower in 1998 than in 1996, and no white phosphorus particles were found.
CONCLUSIONS
Remediation of white phosphorus through enhanced natural attenuation using controlled pumping is both feasible and effective. Wide areas
21

Table 6. Comparative sampling concentrations at DWRC pen 5 (1996 vs. 1998).
Row WP Concentration (ng/g)
1996 1998
Row column
WP Conce ntration (\ig/g)
column 1996 1998
R1C1 0.049 not detected R7C1 22.9 0.0048
R1C2 0.005 not detected R7C2 0.039 not detected
R1C3 0.003 not detected R7C3 0.058 0.0007
R1C4 0.018 not detected R7C4 25.3 0.0034
R2C1 0.022 not detected R8C1 8.52 0.21
R2C2 0.002 not detected R8C2 6.01 not detected
R2C3 0.003 not detected R8C3 0.015 not detected
R2C4 0.003 not detected R8C4 0.760 0.0037
R3C1 0.008 not detected R9C1 0.129 0.0033
R3C2 0.004 not detected R9C2 0.061 0.0010
R3C3 0.008 not detected R9C3 1.73 0.089
R3C4 0.016 not detected R9C4 0.063 0.0010
R4C1 0.102 0.0006 R10C1 0.034 not detected
R4C2 4.30 0.0014 R10C2 0.112 0.0021
R4C3 0.032 not detected R10C3 19.7 0.19
R4C4 0.012 not detected R10C4 0.279 0.053
R5C1 0.135 not detected R11C1 421 0.0029
R5C2 5.38 0.050 R11C2 3.63 0.0024
R5C3 0.551 0.0067 R11C3 1.28 0.84
R5C4 0.010 0.0007 R11C4 0.69 0.0074
R6C1 0.029 0.0055 R12C1 5.24 0.026
R6C2 0.009 0.0015 R12C2 0.616 0.0042
R6C3 0.076 0.0042 R12C3 0.320 0.015
R6C4 0.008 not detected R12C4 0.337 0.0035
Notes: Grid size is 1.82-m square. See also Figure 17.
can be addressed with the minimum of permanent disruption to the ecosystem. Biological impacts, however, have not been monitored long enough to determine the total impact to the ecosystem due to temporary pond draining. Treatment periods will differ based on several factors, including weather and tidal behavior. Over the course of a good sea- son, when flooding tides are small or infrequent and climatic conditions are favorable, contami- nant reduction can be quite significant. Treatment periods may be as short as three years or exceed five. Finally, it is crucial that equipment downtime be minimized to ensure the maximum effect of this treatment method on drying.
RECOMMENDATIONS
The development of the semiautonomous pump- ing has been an evolutionary one since the first system was received in 1995. Field deployments in 1997 and 1998 have led to many improvements in the systems, the methods of deployment, and the operation of the equipment. However, there is al- ways room for improvement.
The lower discharge rate for the system 1 pump, 110 L/s vs. 126 L/s, can be offset by going
to a larger diameter pipe if the higher flow rate is required. A 25-cm pipe will reduce the head loss- es by approximately two-thirds, thus compensat- ing for the increased line length. Additional tide gates and further development of the currently deployed tide gates will help maximize the effi- ciency of the remediation strategy.
The key element to success of this methodol- ogy is keeping the equipment operating. This is especially critical during periods of flooding tides and heavy rains. The six units deployed in 1998 were almost too many to handle at Eagle River Flats, due to the remote locations of most of the systems. The presence of unexploded ord- nance made access difficult and time consuming. Use of a helicopter sped operations immensely, but may not be feasible over the course of a full season due to cost ($l,800/hr).
The results of the two-year feasibility study indicate that pond pumping is an effective strat- egy for addressing the white phosphorus contam- ination problem in Eagle River Flats. Further investigation into the effects on the ecosystem needs to be carried out to determine the impact of this method. However, of the treatment methods tested to date at ERF, including dredging, drain-
22

ing, and filling, pumping seems to be the best alternative when both impact and efficiency are considered.
LITERATURE CITED
Bouwkamp, C.A. (1995) Evaluation of white phosphorus effects on the aquatic ecosystem, Eagle River Flats, Fort Richardson, Alaska. In In- teragency Expanded Site Investigation: Evaluation of White Phosphorus Contamination and Potential Treat- ability at Eagle River Flats, Alaska (C.H. Racine and D. Cate, Ed.). CRREL Contract Report to U.S. Army, Alaska, Directorate of Public Works. FY94 Final Report, p. 335^02. CH2M Hill (1997a) Operable Unit C. Final Reme- dial Investigation Report. CERCLA Document. CH2M Hill Contract Report to U.S. Army Corps of Engineers, Alaska District, and U.S. Army, Alaska. CH2M Hill (1997b) Operable Unit C. Final Feasi- bility Study Report. CERCLA Document. CH2M Hill Contract Report to U.S. Army Corps of Engi- neers, Alaska District, and U.S. Army, Alaska. CH2M Hill (1998) Record of Decision for Opera- ble Unit C, Fort Richardson, Alaska. CERCLA Document. CH2M Hill Contract Report to U.S. Army Corps of Engineers, Alaska District, and U.S. Army, Alaska, September 1998. Clark, L., J.L. Cummings, S.A. Bird, J.E. Davis Jr., and RA. Pochop (1993) Preliminary evaluation of encapsulated methyl anthranilate at Eagle River Flats, Fort Richardson, Alaska. In USDA Denver Wildlife Research Center Tech. Rep. 93-1. U.S. Army Eagle River Flats: Protecting Waterfowl from Ingest- ing White Phosphorus, p. 34-57. Collins, CM., E.F. Chacho, M.R. Walsh, and M.E. Walsh (1996) Pond draining treatability: 1995 studies. In Interagency Expanded Site Investigation: Evaluation of White Phosphorus Contamination and Potential Treatability at Eagle River Flats, Alaska (C.H. Racine and D. Cate, Ed.). CRREL Contract Report to U.S. Army, Alaska, Directorate of Public Works. FY95 Final Report, p. 250-310. Collins, CM., M.E. Walsh, and M.R. Walsh (1997) Pond draining and sediment drying as a re- mediation of white phosphorus contaminated sediments in wetland, Ft. Richardson, Alaska. In Proceedings, SETAC 18th Annual Meeting, Novem- ber 16-20,1997, San Francisco, California, p. 124. Collins, CM., M.T. Meeks, and M.E. Walsh (1998) Draining of Racine Island Pond by explo- sive demolition of a drainage ditch. In Interagency Expanded Site Investigation: Evaluation of White Phosphorus Contamination and Potential Treatability
at Eagle River Flats, Alaska (C.H. Racine and D. Cate, Ed.). CRREL Contract Report to U.S. Army, Alaska, Directorate of Public Works. FY97 Final Report, p. 63-80. ESE (1990) Eagle River Flats expanded site investi- gation. Ft. Richardson, Alaska. Environmental Sci- ence and Engineering, Inc. Final Technical Report. Data Item A011. U.S. Army Toxic and Hazardous Materials Agency, Aberdeen, Maryland. Gilbert, R.O. (1987) Statistical Methods for Environ- mental Pollution Monitoring. New York: Van Nos- trand Reinhold. Henry, K.S., CM. Collins, and C.H. Racine (1995) Use of geosynthetics to prevent white phosphorus poisoning of waterfowl in Eagle River Flats, Alaska. In Proceedings, Geosynthetics '95, February 1995, Nashville, Tennessee, p. 483-496. Lawson, D.E., L.E. Hunter, S.R. Bigl, B.M. Nadeau, P.B. Weyrick, and J.H. Bodette (1996a) Physical system dynamics and white phosphorus fate and transport, 1994, Eagle River Flats, Fort Richardson, Alaska. USA Cold Regions Research and Engineering Laboratory, CRREL Report 96-9. Lawson, D.E., L.E. Hunter, and S.R. Bigl (1996b) Physical processes and natural attenuation alter- natives for white phosphorus contamination, Eagle River Flats, Fort Richardson, Alaska. USA Cold Regions Research and Engineering Labora- tory, CRREL Report 96-13. Pochop, P.A., and J.L. Cummings (1994) Labora- tory and field evaluation of AquaBlok® to reduce mortality of foraging waterfowl at Eagle River Flats, Fort Richardson, Alaska. In Proceedings, SETAC 15th Annual Meeting, October 30-Novem- ber 3,1994, Denver, Colorado, p. 3. Pochop, P.A., J.L. Cummings, and C.A. Yoder (1996) Evaluation of AquaBlok™ on contam- inated sediment to reduce mortality of foraging waterfowl. In Interagency Expanded Site Investiga- tion: Evaluation of White Phosphorus Contamination and Potential Treatability at Eagle River Flats, Alaska (C.H. Racine and D. Cate, Ed.). CRREL Contract Report to U.S. Army, Alaska, Directorate of Public Works. FY95 Final Report, p. 205-230. Pochop, P.A., J.L. Cummings, C.A. Yoder, and W.A. Gossweiler (1999) A physical barrier to reduce white phosphorus mortalities of foraging waterfowl. Journal of Environmental Engineering (in press). Racine, C.H., M.E. Walsh, B.D. Roebuck, CM. Collins, D.J. Calkins, L.R. Reitsma, P.J. Buchli, and G. Goldfarb (1992a) White phosphorus poi- soning of waterfowl in an Alaskan salt marsh. Journal of Wildlife Diseases, 28(4): 669-673.
23

Racine, C.H., M.E. Walsh, CM. Collins, DJ. Calkins, and B.D. Roebuck (1992b) Waterfowl mortality in Eagle River Flats, Alaska: The role of munitions residues. USA Cold Regions Research and Engineering Laboratory, CRREL Report 92-5. Racine, C.H., M.E. Walsh, CM. Collins, S. Tay- lor, B.D. Roebuck, L. Reitsma, and B. Steele (1993a) White phosphorus contamination of salt marsh sediments at Eagle River Flats, Alaska. USA Cold Regions Research and Engineering Laboratory, CRREL Report 93-17. Racine, C.H., M.E. Walsh, CM. Collins, D. Law- son, K. Henry, L. Reitsma, B. Steele, R. Harris, and S.T. Bird (1993b) White phosphorus contam- ination of salt marsh sediments at Eagle River Flats, Alaska. Part II. Remedial investigation report. CRREL Contract Report to the U.S. Army Environmental Center, Aberdeen Proving Ground, Maryland, AEC Report No. ENAEC-IR-CR-93063. Roebuck, B.D., S.I. Nam, D.L. MacMillan, K.J. Baumgartner, and M.E. Walsh (1998) Toxicology of white phosphorus (P4) to ducks and risk for their predators: Effects of particle size. Environ- mental Toxicology and Chemistry, 17(3): 511-518. Tweten, R. (1989) Eagle River Flats waterfowl mortality investigation progress report. U.S. Fish and Wildlife Service, Tudor Rd., Anchorage, Alaska (unpublished). U.S. Army Environmental Hygiene Agency (1994) Water, sediment, macroinvertebrate, and fish sampling, Eagle River Flats, Fort Richardson, Alaska. July 12-23,1993. U.S. Army Environmen- tal Hygiene Agency, Final Report Receiving Water Biological Study 32-24-H1ZV-93. U.S. Army Environmental Hygiene Agency (1995) Evaluation of white phosphorus effects on the aquatic ecosystem, Eagle River Flats, Fort Richardson, Alaska. May 8-17, August 22-Septem- ber 9, 1994. U.S. Army Environmental Hygiene Agency, Final Report Receiving Water Biological Study 32-24-H37Y-94.
Walsh, M.E., and CM. Collins (1993) Distribu- tion of white phosphorus residues from the detonation of 81-mm mortar WP smoke rounds at an upland site. USA Cold Regions Research and Engineering Laboratory, Special Report 93-18. Walsh, M.E., and CM. Collins (1995) Investiga- tions of natural size reduction of white phospho- rus particles in Eagle River Flats sediment. In Interagency Expanded Site Investigation: Evaluation of White Phosphorus Contamination and Potential Treatability at Eagle River Flats, Alaska (C.H. Racine and D. Cate, Ed.). CRREL Contract Report to U.S. Army, Alaska, Directorate of Public Works. FY94 Final Report, pp. 471-528. Walsh, M.E., CM. Collins, and C.R. Racine (1995) Factors that determine the persistence of white phosphorus particles in sediment. USA Cold Regions Research and Engineering Laboratory, CRREL Report 95-23. Walsh, M.E., CM. Collins, and C.H. Racine (1996) Persistence of white phosphorus (P4) particles in salt marsh sediments. Environmental Toxicology and Chemistry, 15(6): 846-855. Walsh, M.E., CM. Collins, R.N. Bailey, and CL. Grant (1997) Composite sampling of samples contaminated with white phosphorus. USA Cold Regions Research and Engineering Laboratory, CRREL Special Report 97-30. Walsh, M.R., and CM. Collins (1998) Dredging as remediation for white phosphorus contamina- tion at Eagle River Hats, Alaska. U.S. Army Cold Regions Research and Engineering Laboratory, CRREL Report 98-5. Walsh, M.R., E.J. Chamberlain, K.S. Henry, D.E. Garfield, and E. Sorenson (1996) Dredging in an active artillery impact area, Eagle River Flats, Alaska. USA Cold Regions Research and Engi- neering Laboratory, Special Report 96-22.
24

REPORT DOCUMENTATION PAGE Form Approved
OMB No. 0704-0188 Public reporting burden lor this collection ol inlormation is estimated to average 1 hour per response, including the time for reviewing instructions, searching existing data sources, gathering and maintaining the data needed, and completing and reviewing this collection of information. Send comments regarding this burden estimate or any other aspect of this collection of information, including suggestions for reducing this burden to Department of Defense, Washington Headquarters Services, Directorate for Information Operations and Reports (0704-0188), 1215 Jefferson Davis Highway, Suite 1204, Arlington, VA 22202-4302. Respondents should be aware that notwithstanding any other provision of law, no person shall be subject to any penalty for failing to comply with a collection of information if it does not display a currently valid OMB control number. PLEASE DO NOT RETURN YOUR FORM TO THE ABOVE ADDRESS. 1. REPORT DATE (DD-MM-YY)
November 1999 2. REPORT TYPE
4. TITLE AND SUBTITLE
Enhanced Natural Remediation of White-Phosphorus-Contaminated Wetlands through Controlled Pond Draining
3. DATES COVERED (From - To)
5a. CONTRACT NUMBER
5b. GRANT NUMBER
5c. PROGRAM ELEMENT NUMBER
6. AUTHOR(S)
Michael R. Walsh, Marianne E. Walsh, and Charles M. Collins
5d. PROJECT NUMBER
5e. TASK NUMBER
5f. WORK UNIT NUMBER
7. PERFORMING ORGANIZATION NAME(S) AND ADDRESS(ES)
U.S. Army Cold Regions Research and Engineering Laboratory 72 Lyme Road Hanover, New Hampshire 03755-1290
8. PERFORMING ORGANIZATION REPORT NUMBER
CRREL Report 99-10
9. SPONSORING/MONITORING AGENCY NAME(S) AND ADDRESS(ES)
U.S. Army Environmental Center Aberdeen Proving Ground, Maryland 21010-5401
U.S. Army, Alaska Fort Richardson, Alaska 99505
10. SPONSOR / MONITOR'S ACRONYM(S)
11. SPONSOR / MONITOR'S REPORT NUMBER(S)
12. DISTRIBUTION /AVAILABILITY STATEMENT
Approved for public release; distribution is unlimited.
Available from NTIS, Springfield, Virginia 22161.
13. SUPPLEMENTARY NOTES
14. ABSTRACT
Detonation of projectiles containing white phosphorus, a smoke-producing munition, contaminated Eagle River Flats (ERF), a salt marsh located on Fort Richardson, Alaska. Ingestion of the highly toxic white phosphorus residues by dabbling ducks and swans resulted in significant waterfowl mortality, leading to the suspension of Army training with white phosphorus in wetlands and designation of Eagle River Flats as a Superfund site. The permanent ponds at ERF are ideal for long-term storage of the millimeter-size particles of white phosphorus ejected from detonated mortar and howitzer shells. With the goal of reducing waterfowl mortality, several treatment methods have been tested, the most promising of which is in-situ remedi- ation by temporary removal of water from permanent ponds. A developmental, semiautonomous pumping system was fielded in 1997. Methods for fielding, placement, and operation of several pumping systems were developed and demonstrated in 1998. The controls were refined to optimize operations, and features added to reduce fuel consumption. Performance has continued to be refined, and results from the first two years of remediation indicate that the remediation method is highly effective.
15. SUBJECT TERMS Alaska Dabbling waterfowl Remediation Eagle River Flats Natural differentiation Pumping systems Unexploded ordnance
White phosphorus
16. SECURITY CLASSIFICATION OF:
a. REPORT
Unclassified
b. ABSTRACT
Unclassified
c. THIS PAGE
Unclassified
17. LIMITATION OF OF ABSTRACT
UL
18. NUMBER OF PAGES
28
19a. NAME OF RESPONSIBLE PERSON
19b. TELEPHONE NUMBER (include area code)
Standard Form 298 (Rev. 8-98) Prescribed by ANSI Std. 239.16