Pulsed-Field Gel Electrophoresis Diversity of Human and Bovine Clinical Salmonella Isolates
Upload
westernsydneyCategory
view
1download
0
BioMed CentralProteome Science
ss
Open AcceMethodologyEnhanced detergent extraction for analysis of membrane proteomes by two-dimensional gel electrophoresisMatthew A Churchward1, R Hussain Butt1, John C Lang1, Kimberly K Hsu1 and Jens R Coorssen*1,2,3Address: 1Dept. of Physiology and Biophysics, University of Calgary Faculty of Medicine, 3330 Hospital Drive NW, Calgary AB, T2N 4N1, CANADA, 2Dept. of Biochemistry and Molecular Biology, University of Calgary Faculty of Medicine, 3330 Hospital Drive NW, Calgary AB, T2N 4N1, CANADA and 3Hotchkiss Brain Institute, University of Calgary Faculty of Medicine, 3330 Hospital Drive NW, Calgary AB, T2N 4N1, CANADA
Email: Matthew A Churchward - [email protected]; R Hussain Butt - [email protected]; John C Lang - [email protected]; Kimberly K Hsu - [email protected]; Jens R Coorssen* - [email protected]
* Corresponding author
AbstractBackground: The analysis of hydrophobic membrane proteins by two-dimensional gelelectrophoresis has long been hampered by the concept of inherent difficulty due to solubilityissues. We have optimized extraction protocols by varying the detergent composition of thesolubilization buffer with a variety of commercially available non-ionic and zwitterionic detergentsand detergent-like phospholipids.
Results: After initial analyses by one-dimensional SDS-PAGE, quantitative two-dimensionalanalyses of human erythrocyte membranes, mouse liver membranes, and mouse brain membranes,extracted with buffers that included the zwitterionic detergent MEGA 10 (decanoyl-N-methylglucamide) and the zwitterionic lipid LPC (1-lauroyl lysophosphatidylcholine), showedselective improvement over extraction with the common 2-DE detergent CHAPS (3 [(3-cholamidopropyl)dimethylammonio]-1-propanesulfonate). Mixtures of the three detergentsshowed additive improvements in spot number, density, and resolution. Substantial improvementsin the analysis of a brain membrane proteome were observed.
Conclusion: This study demonstrates that an optimized detergent mix, coupled with rigoroussample handling and electrophoretic protocols, enables simple and effective analysis of membraneproteomes using two-dimensional electrophoresis.
BackgroundHistorically, the proteomic analysis of hydrophobic mem-brane proteins has been considered to be difficult withinthe bounds of conventional protocols for two-dimen-sional gel electrophoresis (2-DE). The nature of firstdimension isoelectric focusing (IEF) requires that proteinsbe thoroughly solubilized as they are subjected to an elec-
tric field in which they migrate to their isoelectric point,by definition the state of lowest possible net charge andthus lowest solubility in aqueous environments. In addi-tion to being highly hydrophobic, many integral mem-brane proteins tend to be very large: human Ca2+ channelshave 24 transmembrane helices and are typically > 200kDa [1], and tyrosine kinase receptors are frequently >
Published: 07 June 2005
Proteome Science 2005, 3:5 doi:10.1186/1477-5956-3-5
Received: 23 January 2005Accepted: 07 June 2005
This article is available from: http://www.proteomesci.com/content/3/1/5
© 2005 Churchward et al; licensee BioMed Central Ltd. This is an Open Access article distributed under the terms of the Creative Commons Attribution License (http://creativecommons.org/licenses/by/2.0), which permits unrestricted use, distribution, and reproduction in any medium, provided the original work is properly cited.
Page 1 of 11(page number not for citation purposes)

Proteome Science 2005, 3:5 http://www.proteomesci.com/content/3/1/5
100 kDa [2,3]. This leads to two major problems in thepreparation of membrane protein samples for 2-DE. First,effectively extracting membrane proteins into a detergentthat is IEF compatible. Second, maintaining protein solu-bility throughout loading onto IPG strips and the subse-quent first dimension IEF separation. Although highlyefficient membrane protein extractions are routinely car-ried out with a detergent such as SDS for one-dimensionalPAGE, SDS is incompatible with IEF due to the chargedhead group. To overcome this, SDS solubilized samplesoften undergo solvent or acid precipitation to remove orreduce SDS and lipids. Despite these harsh treatments andeven subsequent treatment of the precipitate with a strongbase [4], delipidation by solvent extraction is often citedas enhancing protein recovery [5,6] without discussion ofthe loss or modification of proteins during precipitation.For example, highly hydrophobic proteins (such as prote-olipids) and proteins with particular post-translationalmodifications (such as palmitoylation) are capable of par-titioning into the solvent phase [7-9], and TCA treatmentcan cause acid hydrolysis of proteins or alter post-transla-tional modifications. Additionally, some early generalproblems with effectively separating hydrophobic pro-teins by 2-DE have led to widespread general disregard forthe analysis of membrane proteins, particularly in thedevelopment of alternate proteomic approaches[4,5,10,11].
Since membrane proteins comprise approximately 30%of human proteins[12], and may account for substantiallymore cellular functions, the focus on soluble proteins inso-called 'full' proteomic analyses is somewhat concern-ing. There is evidence that optimization of extraction con-ditions by alteration of buffers, chaotropes, anddetergents is sufficient to reliably achieve high-resolutionmaps of membrane proteins [13-16]. To this end we havesought simple alternatives to optimize the detergent con-ditions used to extract proteins from native membranesby systematic analysis of the solubilization properties of awide range of commercially available non-ionic and zwit-terionic detergents and a range of natural and syntheticdetergent-like lipids [17-19]. Using proven syntheticdetergents, together with more native lipophilic agents,we find that combinations of these reagents generallyimprove the resolution of membrane proteomes analyzedby 2-DE, providing for select improvements in the yieldsof specific proteins. Optimization of conditions for partic-ular samples remains a key to any successful analysis [20-22].
Results & Discussion1D SDS-PAGE of RBC membraneAnalysis of RBC extracts using 1D SDS-PAGE allowed forthe rapid screening of a large number of extraction rea-gents (including glycerols, lipids, fatty acids, and isopre-
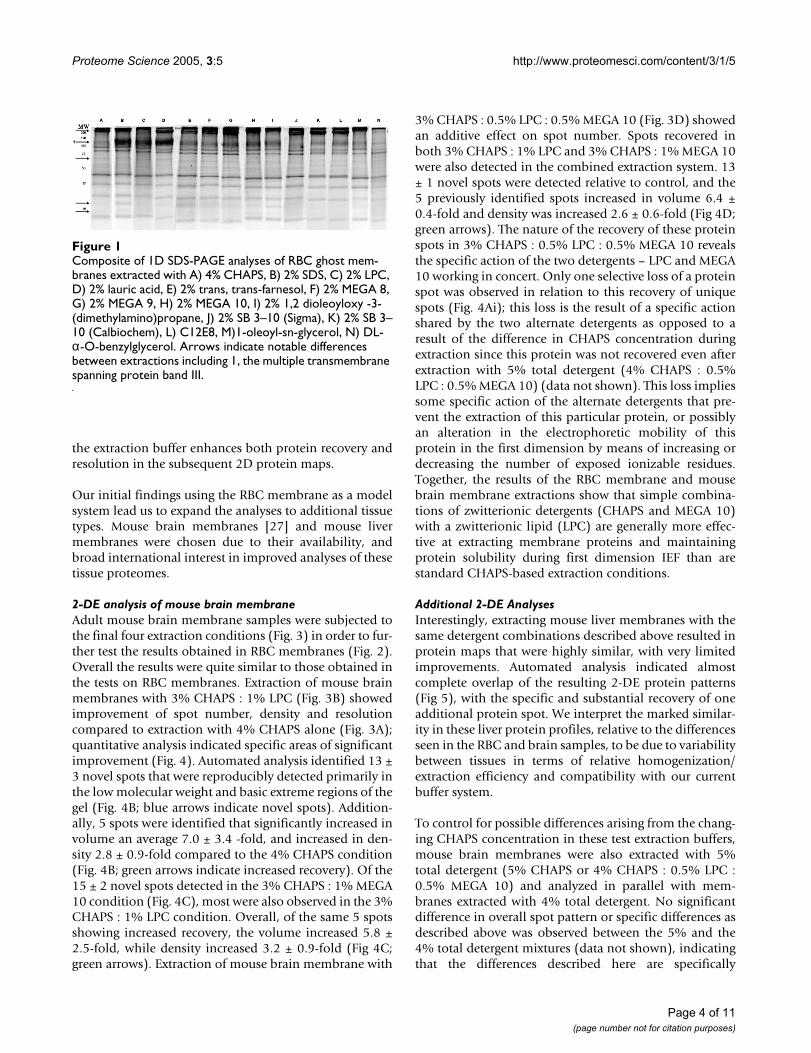
noids), providing results that could be interpretedqualitatively based on the selective increase and decreaseof protein banding patterns relative to control extractionswith CHAPS or SDS (Fig. 1). For example, band III, a largeprotein with multiple transmembrane spanning domains[23] could be clearly distinguished in SDS extracts at anapparent MW of ~110 kDa, compared to those made withCHAPS. Another band, at apparent MW of 28 kDa, wasalso observed in the SDS but not the CHAPS extract. Basedon these simple criteria, detergents were selected that gaveimproved banding patterns over the CHAPS controlextraction. An initial working series of effective detergentswas thus identified for further testing (Table 1), and thesewere then used to extract RBC membrane samples for sub-sequent analysis by 2-DE. Notably LPC, the N-methylglu-camide detergents MEGA 8, 9, and 10 and thesulfobetaine-based detergents ASB-14 and SB 3–10showed improvements in the 1D banding pattern relativeto the CHAPS control. A selection of natural source lipidswere also tested, including lysophsphatidylglycerol(LPG), lysophosphatidylethanolamine (LPE), lysophos-phatidylcholine (LPC, from egg), lysophosphatidylserine(LPS, from bovine brain), and cardiolipin (bovine heart).Although generally comparable, and of some selective usein extractions, most of these natural lipids proved to be oflimited general usefulness as they are charged at neutralpH, and thus inherently incompatible with IEF. This lim-itation does not obviate the potential application of theselipids as extraction agents for use with alternate proteinseparation paradigms.
2-DE analysis of Red Blood Cell membraneInitially, red blood cell (RBC) membranes were extractedwith a 2-DE buffer containing 4% total CHAPS (ourstandard concentration) or 1–2% total detergent, due tothe relatively lower solubility of most test detergents com-pared to the highly soluble CHAPS. Extraction of RBCmembranes with synthetic LPC (lauroyl chain, Sigma)and the zwitterionic detergent MEGA 10 under these con-ditions resulted in areas of selective improvement inresulting 2-DE patterns relative to the control extracts inCHAPS (data not shown). 2-DE of samples extracted withSB 3–10 yielded similar protein maps to CHAPS, howeverthis detergent was difficult to solubilize into high ureabuffer, as previously reported [24,25]. However, contraryto earlier reports [24,26], samples extracted with ASB-14did not show improvement over either CHAPS or SB 3–10(data not shown). In order to both appropriately accountfor more general effects of detergent concentration andtake advantage of the high solubility and efficient solubi-lizing properties of CHAPS, both LPC and MEGA 10 wereused to extract RBC membranes (Fig. 2), mouse brainmembranes (Fig. 3), and mouse liver membranes (Fig. 5)as mixtures of 3% CHAPS : 1% alternate detergent, for atotal 4% detergent.
Page 2 of 11(page number not for citation purposes)

Proteome Science 2005, 3:5 http://www.proteomesci.com/content/3/1/5
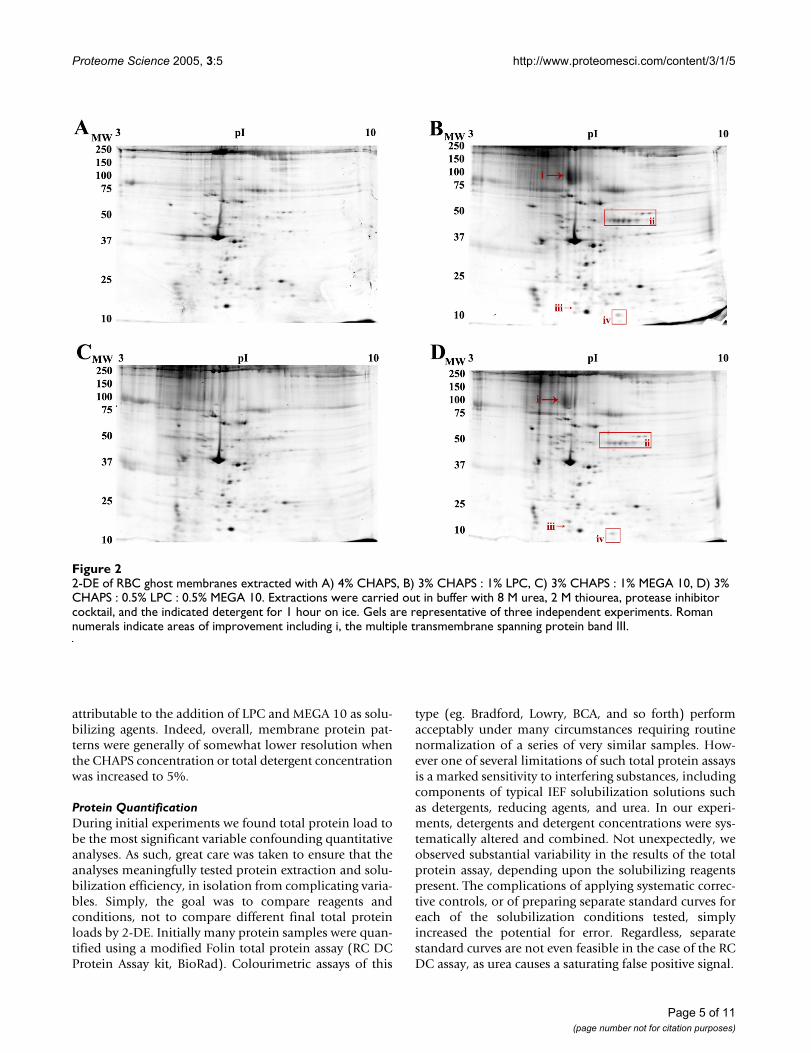
RBC membranes extracted with the 4% total detergentmixtures of CHAPS and LPC showed general evidence ofimproved spot densities (Fig. 2B), as well as specificimprovements in terms of reduced horizontal streaking inthe intermediate molecular weight region (Fig. 2A). Auto-mated spot detection and quantitative comparative analy-sis using Progenesis Workstation software identifiedspecific changes in the protein pattern. Specific areas ofthe gels showed improvement relative to parallel 4%CHAPS control gels (Fig. 2Bi–iv). In particular, a promi-nent spot corresponding to band III was clearly observed[15,16], as well as a 2.2 ± 0.1 – fold increase in the densityof a string of spots relative to the CHAPS extract (Fig.2Bii). Three additional unique spots were observed whenextracted with 3% CHAPS : 1% LPC (Fig 2Biii–iv). RBCmembrane samples extracted with 3% CHAPS : 1% MEGA10 (Fig. 2C) yielded protein maps of generally equivalent
resolution to both the 3% CHAPS : 1% LPC and the 4%CHAPS maps, but did not resolve the protein band III aseffectively as 3% CHAPS : 1% LPC.
In order to examine the overlapping effects of both thesetest detergents, but ameliorate the observed losses of pro-tein, 0.5% of each was mixed with 3% CHAPS and testedin the extraction and 2-DE analysis of RBC membraneproteins (Fig. 2D). Extraction with 3% CHAPS : 0.5% LPC: 0.5% MEGA 10 does not yield the extent of differencesidentified in the 3% CHAPS : 1% LPC extracted condition,although the maps show general improvements over thecontrol CHAPS condition that correlate with the improve-ments seen in the two individual detergent extractions(Figs. 2B, C). The density of the indicated string of pro-teins was increased an average of 1.7 ± 0.2 – fold overCHAPS (Fig. 2Dii). In general then, the addition of LPC to
Table 1: Summary of detergents tested using systematic 1D SDS-PAGE analysis. Overall extraction efficacy analyzed by 1D SDS-PAGE or 2-DE separation is expressed qualitatively relative to SDS extraction (for 1D analysis) or CHAPS extraction (for 2-DE). + indicates compatibility but poor perfomance, ++ indicates similar or slightly worse than CHAPS extraction, +++ indicates performance equal to or better than CHAPS, – indicates incompatibility.
Detergent 1D-PAGE 2-DE Comments & Rationale
SDS +++ - IEF incompatibleCHAPS ++ +++ Poor extraction of hydrophobic and high molecular weight proteinstrans, trans-farnesol +++ ++ Natural isoprenoidMEGA-8a +++ ++ Group of nonionic detergents commonly used for protein purification [35,36]MEGA-9b +++ ++MEGA-10c +++ +++amidosulfobetaine-14 (ASB-14) +++ ++ Sulfobetaine-based detergents reported to improve membrane protein extraction [24-26]Zwittergent® 3–10/SB 3–10d +++ +++LPC (synthetic, lauroyl chain)e +++ +++ Zwitterionic lysophospholipidLPC (egg, mixed chain)e ++ ++ Zwitterionic lysophospholipidLPS (bovine brain)f ++ - Anionic lysophospholipid, incompatible with IEFLPE (egg, mixed chain)g - - Zwitterionic lysophospholipid; low solubility in high urea bufferLPG (egg, mixed chain)h ++ - Anionic lysophospholipid, incompatible with IEFLPA (egg, mixed chain)i ++ - Anionic lysophospholipid, incompatible with IEFcardiolipin (bovine heart) ++ - Anionic lipid, incompatible with IEF, low solubility in high urea buffer5,7-docosadiynoic acid - - Synthetic fatty acid; low solubility in high urea bufferlauric acid +++ ++ Medium chain fatty acid; low solubility in high urea bufferfree fatty acids (mixed) - - Mixed natural fatty acids; low solubility in high urea bufferDODAPj +++ - Cationic lipid used as a transfection reagent [37], IEF incompatible1-oleoyl-sn-glycerol + - Uncharged monoacylated lipid, very low solubility in high urea bufferC12E8
k + - Nonionic detergent used to study membrane proteins [38]DL-α-O-benzylglycerol + - Amphipathic cyclic glycerol conjugatetryptophol ++ - Amphipathic heterocyclic metabolite of tryptophan; ionizable at low pH
a octanoyl-N-methylglucamideb nonanoyl-N-methylglucamidec decanoyl-N-methylglucamided N-decyl-N,N-dimethyl-3-ammonio-1-propanesulfonatee L-α-lysophosphatidylcholinef L-α-lysophosphatiylserineg L-α-lysophosphatidylethanolamineh L-α-lysophosphatidylglyceroli L-α-lysophosphatidic acidj 1,2-dioleoyloxy-3-(dimethylamino)propanek octaethylene glycol monododecyl ether
Page 3 of 11(page number not for citation purposes)
Proteome Science 2005, 3:5 http://www.proteomesci.com/content/3/1/5
the extraction buffer enhances both protein recovery andresolution in the subsequent 2D protein maps.
Our initial findings using the RBC membrane as a modelsystem lead us to expand the analyses to additional tissuetypes. Mouse brain membranes [27] and mouse livermembranes were chosen due to their availability, andbroad international interest in improved analyses of thesetissue proteomes.
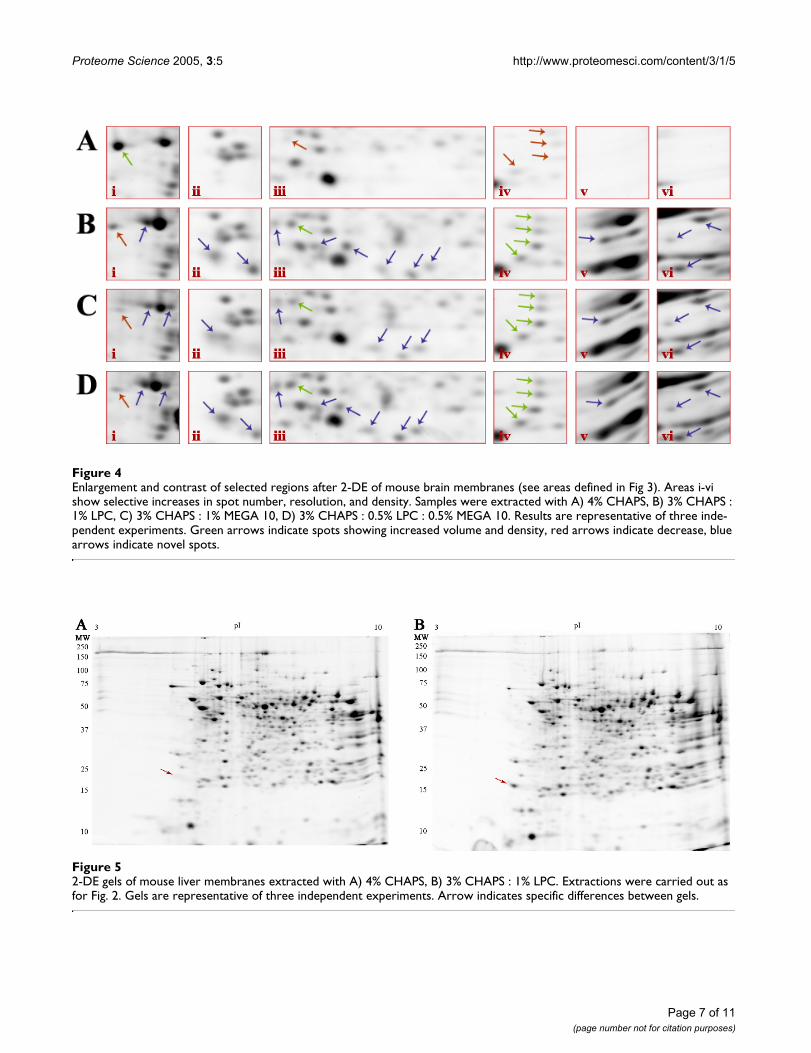
2-DE analysis of mouse brain membraneAdult mouse brain membrane samples were subjected tothe final four extraction conditions (Fig. 3) in order to fur-ther test the results obtained in RBC membranes (Fig. 2).Overall the results were quite similar to those obtained inthe tests on RBC membranes. Extraction of mouse brainmembranes with 3% CHAPS : 1% LPC (Fig. 3B) showedimprovement of spot number, density and resolutioncompared to extraction with 4% CHAPS alone (Fig. 3A);quantitative analysis indicated specific areas of significantimprovement (Fig. 4). Automated analysis identified 13 ±3 novel spots that were reproducibly detected primarily inthe low molecular weight and basic extreme regions of thegel (Fig. 4B; blue arrows indicate novel spots). Addition-ally, 5 spots were identified that significantly increased involume an average 7.0 ± 3.4 -fold, and increased in den-sity 2.8 ± 0.9-fold compared to the 4% CHAPS condition(Fig. 4B; green arrows indicate increased recovery). Of the15 ± 2 novel spots detected in the 3% CHAPS : 1% MEGA10 condition (Fig. 4C), most were also observed in the 3%CHAPS : 1% LPC condition. Overall, of the same 5 spotsshowing increased recovery, the volume increased 5.8 ±2.5-fold, while density increased 3.2 ± 0.9-fold (Fig 4C;green arrows). Extraction of mouse brain membrane with
3% CHAPS : 0.5% LPC : 0.5% MEGA 10 (Fig. 3D) showedan additive effect on spot number. Spots recovered inboth 3% CHAPS : 1% LPC and 3% CHAPS : 1% MEGA 10were also detected in the combined extraction system. 13± 1 novel spots were detected relative to control, and the5 previously identified spots increased in volume 6.4 ±0.4-fold and density was increased 2.6 ± 0.6-fold (Fig 4D;green arrows). The nature of the recovery of these proteinspots in 3% CHAPS : 0.5% LPC : 0.5% MEGA 10 revealsthe specific action of the two detergents – LPC and MEGA10 working in concert. Only one selective loss of a proteinspot was observed in relation to this recovery of uniquespots (Fig. 4Ai); this loss is the result of a specific actionshared by the two alternate detergents as opposed to aresult of the difference in CHAPS concentration duringextraction since this protein was not recovered even afterextraction with 5% total detergent (4% CHAPS : 0.5%LPC : 0.5% MEGA 10) (data not shown). This loss impliessome specific action of the alternate detergents that pre-vent the extraction of this particular protein, or possiblyan alteration in the electrophoretic mobility of thisprotein in the first dimension by means of increasing ordecreasing the number of exposed ionizable residues.Together, the results of the RBC membrane and mousebrain membrane extractions show that simple combina-tions of zwitterionic detergents (CHAPS and MEGA 10)with a zwitterionic lipid (LPC) are generally more effec-tive at extracting membrane proteins and maintainingprotein solubility during first dimension IEF than arestandard CHAPS-based extraction conditions.
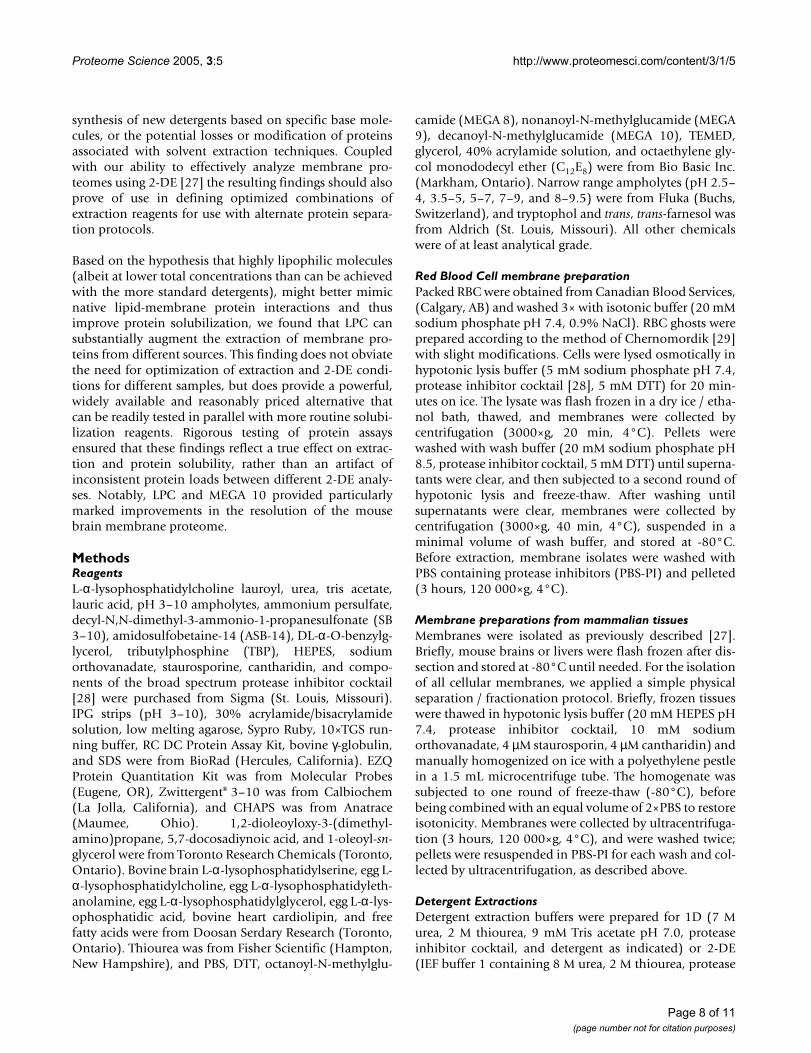
Additional 2-DE AnalysesInterestingly, extracting mouse liver membranes with thesame detergent combinations described above resulted inprotein maps that were highly similar, with very limitedimprovements. Automated analysis indicated almostcomplete overlap of the resulting 2-DE protein patterns(Fig 5), with the specific and substantial recovery of oneadditional protein spot. We interpret the marked similar-ity in these liver protein profiles, relative to the differencesseen in the RBC and brain samples, to be due to variabilitybetween tissues in terms of relative homogenization/extraction efficiency and compatibility with our currentbuffer system.
To control for possible differences arising from the chang-ing CHAPS concentration in these test extraction buffers,mouse brain membranes were also extracted with 5%total detergent (5% CHAPS or 4% CHAPS : 0.5% LPC :0.5% MEGA 10) and analyzed in parallel with mem-branes extracted with 4% total detergent. No significantdifference in overall spot pattern or specific differences asdescribed above was observed between the 5% and the4% total detergent mixtures (data not shown), indicatingthat the differences described here are specifically
Composite of 1D SDS-PAGE analyses of RBC ghost mem-branes extracted with A) 4% CHAPS, B) 2% SDS, C) 2% LPC, D) 2% lauric acid, E) 2% trans, trans-farnesol, F) 2% MEGA 8, G) 2% MEGA 9, H) 2% MEGA 10, I) 2% 1,2 dioleoyloxy -3-(dimethylamino)propane, J) 2% SB 3–10 (Sigma), K) 2% SB 3–10 (Calbiochem), L) C12E8, M)1-oleoyl-sn-glycerol, N) DL-α-O-benzylglycerolFigure 1Composite of 1D SDS-PAGE analyses of RBC ghost mem-branes extracted with A) 4% CHAPS, B) 2% SDS, C) 2% LPC, D) 2% lauric acid, E) 2% trans, trans-farnesol, F) 2% MEGA 8, G) 2% MEGA 9, H) 2% MEGA 10, I) 2% 1,2 dioleoyloxy -3-(dimethylamino)propane, J) 2% SB 3–10 (Sigma), K) 2% SB 3–10 (Calbiochem), L) C12E8, M)1-oleoyl-sn-glycerol, N) DL-α-O-benzylglycerol. Arrows indicate notable differences between extractions including 1, the multiple transmembrane spanning protein band III.
Page 4 of 11(page number not for citation purposes)
Proteome Science 2005, 3:5 http://www.proteomesci.com/content/3/1/5
attributable to the addition of LPC and MEGA 10 as solu-bilizing agents. Indeed, overall, membrane protein pat-terns were generally of somewhat lower resolution whenthe CHAPS concentration or total detergent concentrationwas increased to 5%.
Protein QuantificationDuring initial experiments we found total protein load tobe the most significant variable confounding quantitativeanalyses. As such, great care was taken to ensure that theanalyses meaningfully tested protein extraction and solu-bilization efficiency, in isolation from complicating varia-bles. Simply, the goal was to compare reagents andconditions, not to compare different final total proteinloads by 2-DE. Initially many protein samples were quan-tified using a modified Folin total protein assay (RC DCProtein Assay kit, BioRad). Colourimetric assays of this
type (eg. Bradford, Lowry, BCA, and so forth) performacceptably under many circumstances requiring routinenormalization of a series of very similar samples. How-ever one of several limitations of such total protein assaysis a marked sensitivity to interfering substances, includingcomponents of typical IEF solubilization solutions suchas detergents, reducing agents, and urea. In our experi-ments, detergents and detergent concentrations were sys-tematically altered and combined. Not unexpectedly, weobserved substantial variability in the results of the totalprotein assay, depending upon the solubilizing reagentspresent. The complications of applying systematic correc-tive controls, or of preparing separate standard curves foreach of the solubilization conditions tested, simplyincreased the potential for error. Regardless, separatestandard curves are not even feasible in the case of the RCDC assay, as urea causes a saturating false positive signal.
2-DE of RBC ghost membranes extracted with A) 4% CHAPS, B) 3% CHAPS : 1% LPC, C) 3% CHAPS : 1% MEGA 10, D) 3% CHAPS : 0.5% LPC : 0.5% MEGA 10Figure 22-DE of RBC ghost membranes extracted with A) 4% CHAPS, B) 3% CHAPS : 1% LPC, C) 3% CHAPS : 1% MEGA 10, D) 3% CHAPS : 0.5% LPC : 0.5% MEGA 10. Extractions were carried out in buffer with 8 M urea, 2 M thiourea, protease inhibitor cocktail, and the indicated detergent for 1 hour on ice. Gels are representative of three independent experiments. Roman numerals indicate areas of improvement including i, the multiple transmembrane spanning protein band III.
Page 5 of 11(page number not for citation purposes)

Proteome Science 2005, 3:5 http://www.proteomesci.com/content/3/1/5
We have found that the EZQ Protein Quantitation kit(Molecular Probes) is insensitive to the nature and con-centrations of detergent in all samples tested. In this assayformat, the immobilized protein sample is washedexhaustively with methanol to remove components of thesolubilization solution prior to addition of the fluorescentprotein detection reagent. Thus, the chemistry of the assayproceeds in the absence of potentially confounding con-taminants. In extensive comparisons, there were no signif-icant differences in standard protein assay curvesregardless of the type or quantity of detergent included(data not shown). Additionally, the method proved quitesensitive (routine detection of 0.030 µg of total protein/spot, or 15 µg/ml); this is fully 10-fold more sensitive andrequires 4-fold less material than the RC DC Assay. Thus,as the chemistry of the assay was not altered under our dif-ferent experimental conditions, we are confident that the
improvements observed in our final protein maps weretruly the result of differences in extraction and solubiliza-tion efficiency, and not artifacts generated by erroneoustotal protein assays leading to inconsistent total proteinIEF loads between different test conditions. Although theEZQ protein assay certainly has its caveats, not least ofwhich is cost, it does offer distinct benefits that support itsutility in these and other ongoing proteomic analyses.
ConclusionIn order to optimize recovery of hydrophobic proteins for2-DE, we have sought a simple, direct solution to theproblem of protein extraction and solubility during IEF.The systematic screening and combination of commer-cially available detergents offers a direct, inexpensive, andconvenient method for optimizing the conditions of IEFwithout entering into the complexities of a systematic
2-DE of mouse brain membranes extracted with A) 4% CHAPS, B) 3% CHAPS : 1% LPC, C) 3% CHAPS : 1% MEGA 10, D) 3% CHAPS : 0.5% LPC : 0.5% MEGA 10Figure 32-DE of mouse brain membranes extracted with A) 4% CHAPS, B) 3% CHAPS : 1% LPC, C) 3% CHAPS : 1% MEGA 10, D) 3% CHAPS : 0.5% LPC : 0.5% MEGA 10. Extractions were carried out as for Fig. 2. Gels are representative of three independent experiments. Areas defined with Roman numerals are shown in Fig. 4.
Page 6 of 11(page number not for citation purposes)
Proteome Science 2005, 3:5 http://www.proteomesci.com/content/3/1/5
Enlargement and contrast of selected regions after 2-DE of mouse brain membranes (see areas defined in Fig 3)Figure 4Enlargement and contrast of selected regions after 2-DE of mouse brain membranes (see areas defined in Fig 3). Areas i-vi show selective increases in spot number, resolution, and density. Samples were extracted with A) 4% CHAPS, B) 3% CHAPS : 1% LPC, C) 3% CHAPS : 1% MEGA 10, D) 3% CHAPS : 0.5% LPC : 0.5% MEGA 10. Results are representative of three inde-pendent experiments. Green arrows indicate spots showing increased volume and density, red arrows indicate decrease, blue arrows indicate novel spots.
2-DE gels of mouse liver membranes extracted with A) 4% CHAPS, B) 3% CHAPS : 1% LPCFigure 52-DE gels of mouse liver membranes extracted with A) 4% CHAPS, B) 3% CHAPS : 1% LPC. Extractions were carried out as for Fig. 2. Gels are representative of three independent experiments. Arrow indicates specific differences between gels.
Page 7 of 11(page number not for citation purposes)
Proteome Science 2005, 3:5 http://www.proteomesci.com/content/3/1/5
synthesis of new detergents based on specific base mole-cules, or the potential losses or modification of proteinsassociated with solvent extraction techniques. Coupledwith our ability to effectively analyze membrane pro-teomes using 2-DE [27] the resulting findings should alsoprove of use in defining optimized combinations ofextraction reagents for use with alternate protein separa-tion protocols.
Based on the hypothesis that highly lipophilic molecules(albeit at lower total concentrations than can be achievedwith the more standard detergents), might better mimicnative lipid-membrane protein interactions and thusimprove protein solubilization, we found that LPC cansubstantially augment the extraction of membrane pro-teins from different sources. This finding does not obviatethe need for optimization of extraction and 2-DE condi-tions for different samples, but does provide a powerful,widely available and reasonably priced alternative thatcan be readily tested in parallel with more routine solubi-lization reagents. Rigorous testing of protein assaysensured that these findings reflect a true effect on extrac-tion and protein solubility, rather than an artifact ofinconsistent protein loads between different 2-DE analy-ses. Notably, LPC and MEGA 10 provided particularlymarked improvements in the resolution of the mousebrain membrane proteome.
MethodsReagentsL-α-lysophosphatidylcholine lauroyl, urea, tris acetate,lauric acid, pH 3–10 ampholytes, ammonium persulfate,decyl-N,N-dimethyl-3-ammonio-1-propanesulfonate (SB3–10), amidosulfobetaine-14 (ASB-14), DL-α-O-benzylg-lycerol, tributylphosphine (TBP), HEPES, sodiumorthovanadate, staurosporine, cantharidin, and compo-nents of the broad spectrum protease inhibitor cocktail[28] were purchased from Sigma (St. Louis, Missouri).IPG strips (pH 3–10), 30% acrylamide/bisacrylamidesolution, low melting agarose, Sypro Ruby, 10×TGS run-ning buffer, RC DC Protein Assay Kit, bovine γ-globulin,and SDS were from BioRad (Hercules, California). EZQProtein Quantitation Kit was from Molecular Probes(Eugene, OR), Zwittergent® 3–10 was from Calbiochem(La Jolla, California), and CHAPS was from Anatrace(Maumee, Ohio). 1,2-dioleoyloxy-3-(dimethyl-amino)propane, 5,7-docosadiynoic acid, and 1-oleoyl-sn-glycerol were from Toronto Research Chemicals (Toronto,Ontario). Bovine brain L-α-lysophosphatidylserine, egg L-α-lysophosphatidylcholine, egg L-α-lysophosphatidyleth-anolamine, egg L-α-lysophosphatidylglycerol, egg L-α-lys-ophosphatidic acid, bovine heart cardiolipin, and freefatty acids were from Doosan Serdary Research (Toronto,Ontario). Thiourea was from Fisher Scientific (Hampton,New Hampshire), and PBS, DTT, octanoyl-N-methylglu-
camide (MEGA 8), nonanoyl-N-methylglucamide (MEGA9), decanoyl-N-methylglucamide (MEGA 10), TEMED,glycerol, 40% acrylamide solution, and octaethylene gly-col monododecyl ether (C12E8) were from Bio Basic Inc.(Markham, Ontario). Narrow range ampholytes (pH 2.5–4, 3.5–5, 5–7, 7–9, and 8–9.5) were from Fluka (Buchs,Switzerland), and tryptophol and trans, trans-farnesol wasfrom Aldrich (St. Louis, Missouri). All other chemicalswere of at least analytical grade.
Red Blood Cell membrane preparationPacked RBC were obtained from Canadian Blood Services,(Calgary, AB) and washed 3× with isotonic buffer (20 mMsodium phosphate pH 7.4, 0.9% NaCl). RBC ghosts wereprepared according to the method of Chernomordik [29]with slight modifications. Cells were lysed osmotically inhypotonic lysis buffer (5 mM sodium phosphate pH 7.4,protease inhibitor cocktail [28], 5 mM DTT) for 20 min-utes on ice. The lysate was flash frozen in a dry ice / etha-nol bath, thawed, and membranes were collected bycentrifugation (3000×g, 20 min, 4°C). Pellets werewashed with wash buffer (20 mM sodium phosphate pH8.5, protease inhibitor cocktail, 5 mM DTT) until superna-tants were clear, and then subjected to a second round ofhypotonic lysis and freeze-thaw. After washing untilsupernatants were clear, membranes were collected bycentrifugation (3000×g, 40 min, 4°C), suspended in aminimal volume of wash buffer, and stored at -80°C.Before extraction, membrane isolates were washed withPBS containing protease inhibitors (PBS-PI) and pelleted(3 hours, 120 000×g, 4°C).
Membrane preparations from mammalian tissuesMembranes were isolated as previously described [27].Briefly, mouse brains or livers were flash frozen after dis-section and stored at -80°C until needed. For the isolationof all cellular membranes, we applied a simple physicalseparation / fractionation protocol. Briefly, frozen tissueswere thawed in hypotonic lysis buffer (20 mM HEPES pH7.4, protease inhibitor cocktail, 10 mM sodiumorthovanadate, 4 µM staurosporin, 4 µM cantharidin) andmanually homogenized on ice with a polyethylene pestlein a 1.5 mL microcentrifuge tube. The homogenate wassubjected to one round of freeze-thaw (-80°C), beforebeing combined with an equal volume of 2×PBS to restoreisotonicity. Membranes were collected by ultracentrifuga-tion (3 hours, 120 000×g, 4°C), and were washed twice;pellets were resuspended in PBS-PI for each wash and col-lected by ultracentrifugation, as described above.
Detergent ExtractionsDetergent extraction buffers were prepared for 1D (7 Murea, 2 M thiourea, 9 mM Tris acetate pH 7.0, proteaseinhibitor cocktail, and detergent as indicated) or 2-DE(IEF buffer 1 containing 8 M urea, 2 M thiourea, protease
Page 8 of 11(page number not for citation purposes)

Proteome Science 2005, 3:5 http://www.proteomesci.com/content/3/1/5
inhibitor cocktail, and detergent as indicated [27]). Mem-brane pellets were resuspended by pipetting andvortexing. Extractions were incubated for 1 hour on ice,with periodic vortexing. Any insoluble material was sepa-rated by ultracentrifugation as previously described. Solu-bilized samples were assayed for total protein contentusing the EZQ Protein Quantitation Kit (MolecularProbes, Eugene, OR).
Protein QuantificationTotal protein was assayed using either the EZQ ProteinQuantitation Kit or the RC DC Protein Assay Kit (BioRad,Hercules, CA). The RC DC assay was carried out accordingto manufacturers instructions in 96-well plates andabsorbance was measured using the Wallac Victor2 Multi-label HTS Counter (PerkinElmer Life Sciences, Boston,MA). EZQ Protein Quantitation was carried out essen-tially according to manufacturers instructions except fluo-rescence was recorded by imaging on the Proexpressmultiwavelength fluorescent imager (PerkinElmer, Bos-ton MA) and spot fluorescence was quantified usingImageQuant 5.2 software (Molecular Dynamics, Sunny-vale, CA).
1D SDS-PAGE1D SDS-PAGE was performed in mini gel format using theBioRad Protean II Electrophoresis system, essentially asdescribed [30] with minor modifications [31]. Sampleswere normalized to 2 mg/ml in the appropriate extractionbuffer, and then diluted 1:1 (v/v) with 2 × SDS samplebuffer [30]. 10 µg total protein was loaded per well on12.5%T separating gels with 5%T stacking gels, bufferedwith 375 mM Tris (pH 8.8) as described [31]. Gels wererun at 125 V for 10 min to stack proteins, and then thevoltage was reduced to 90 V to completion [32].
2-DESamples for IEF were normalized to 2 mg/ml with theappropriate IEF buffer, then combined 1:1 (v/v) with anampholyte-containing IEF buffer (8 M urea, 2 M thiourea,1% pH 3–10 broad range ampholytes, 0.2% each narrowrange ampholytes (pH 2.5–4, 3.5–5, 5–7, 7–9, and 8–9.5)and detergent as indicated [27]), to introduce a workingconcentration of ampholytes to the sample.
Samples were sequentially reduced and alkylated essen-tially according to Herbert et al. [33,34] with some minormodifications. Briefly, the sample was reduced by theaddition of TBP and DTT to final concentrations of 2.3mM and 45 mM DTT, respectively, and incubated for 1hour at 25°C. The reduced sample was then alkylatedwith 230 mM acrylamide monomer for 1 hour at 25°C.Immediately following alkylation, the sample was loadedonto IPG strips for passive hydration at 25°C (12 hours).IEF was carried out at 15°C using the BioRad Protean IEF
Cell; voltage was ramped linearly to 4000 V (2 hours) andIEF was carried out at 4000 V (constant) for 37500Vhours. After focusing, IPG strips were equilibrated essen-tially according to the manufacturer's instructions bysequential immersion in equilibration buffer (6 M urea,2% SDS (w/v), 20 % glycerol (w/v), and 375 mM Tris pH8.8) containing 130 mM DTT for 10 minutes, followed byequilibration buffer with 350 mM acrylamide monomerfor 10 minutes. Following equilibration, IPG strips wereloaded onto 12.5%T separating gels with 5%T stackinggels (buffered as described for 1D) and sealed in placewith an agarose overlay (0.5% low melting agarose, 0.1%SDS and 375 mM Tris pH 8.8). SDS-PAGE was otherwisecarried out as described for 1D SDS-PAGE.
Image analysisAfter electrophoresis, gels were fixed in 10% methanol,7% acetic acid for 1 hour, washed thoroughly with waterand stained with Sypro Ruby overnight. Gels were visual-ized using the Proexpress multiwavelength fluorescentimager (PerkinElmer, Boston MA). Quantitative imageanalysis was performed using Progenesis Workstation2004 (Nonlinear Dynamics, Cambridge, UK). Parallel setsof gels were warped and matched by automated analysis,and volumes were normalized to a single spot consistentin size, shape, density and location across all gels.
Abbreviations usedLPC (12:0 L-α-lysophosphatidylcholine), LPG (L-α-lyso-phosphatidylglycerol), LPE (L-α-lysophosphatidyleth-anolamine), LPS (L-α-lysophosphatidylserine), MEGA 8(octanoyl-N-methylglucamide), MEGA 9 (nonanoyl-N-methylglucamide), MEGA 10 (decanoyl-N-methylgluca-mide), SB 3–10 (N-decyl-N,N-dimethyl-3-ammonio-1-propanesulfonate), ASB-14 (amidosulfobetaine-14),C12E8 (octaethylene glycol monododecyl ether), RBC(red blood cell)
Competing interestsThe author(s) declare that they have no competinginterests.
Authors' ContributionsMAC supervised the SDS-PAGE analysis, designed andcarried out the 2-DE analyses, data acquisition and inter-pretation and prepared the manuscript. RHB contributedto the experimental design, sample preparation, 2-DEanalyses, and participated in drafting the manuscript. JCLand KKH designed and carried out the SDS-PAGE analy-sis. JRC conceived and planned the study, and assisted ininterpretation of data and final preparation of the manu-script. All authors read and approved the finalmanuscript.
Page 9 of 11(page number not for citation purposes)
Proteome Science 2005, 3:5 http://www.proteomesci.com/content/3/1/5
AcknowledgementsThe authors would like to thank Tiffany Rice, Tammy Wilson, and Dr. V. Wee Yong for kindly providing mouse tissues. We would also like to thank Jeff Lamb, Dr. Sina Ahmadi Pirshahid, Marlies Ernst, and all the members of the Coorssen lab for helpful discussions and advice. J.R.C. acknowledges support from the Canadian Institutes of Health Research, the Canada Foun-dation for Innovation, the Alberta Heritage Foundation for Medical Research, the Alberta Network for Proteomics Innovation, and the Heart and Stroke Foundation of Canada.
References1. Perez-Reyes E, Wei XY, Castellano A, Birnbaumer L: Molecular
diversity of L-type calcium channels. Evidence for alternativesplicing of the transcripts of three non-allelic genes. J BiolChem 1990, 265:20430-20436.
2. Strausberg RL, Feingold EA, Grouse LH, Derge JG, Klausner RD, Col-lins FS, Wagner L, Shenmen CM, Schuler GD, Altschul SF, Zeeberg B,Buetow KH, Schaefer CF, Bhat NK, Hopkins RF, Jordan H, Moore T,Max SI, Wang J, Hsieh F, Diatchenko L, Marusina K, Farmer AA, RubinGM, Hong L, Stapleton M, Soares MB, Bonaldo MF, Casavant TL,Scheetz TE, Brownstein MJ, Usdin TB, Toshiyuki S, Carninci P, PrangeC, Raha SS, Loquellano NA, Peters GJ, Abramson RD, Mullahy SJ,Bosak SA, McEwan PJ, McKernan KJ, Malek JA, Gunaratne PH, Rich-ards S, Worley KC, Hale S, Garcia AM, Gay LJ, Hulyk SW, VillalonDK, Muzny DM, Sodergren EJ, Lu X, Gibbs RA, Fahey J, Helton E, Ket-teman M, Madan A, Rodrigues S, Sanchez A, Whiting M, Madan A,Young AC, Shevchenko Y, Bouffard GG, Blakesley RW, TouchmanJW, Green ED, Dickson MC, Rodriguez AC, Grimwood J, Schmutz J,Myers RM, Butterfield YS, Krzywinski MI, Skalska U, Smailus DE,Schnerch A, Schein JE, Jones SJ, Marra MA: Generation and initialanalysis of more than 15,000 full-length human and mousecDNA sequences. Proc Natl Acad Sci U S A 2002, 99:16899-16903.
3. Anzai T, Shiina T, Kimura N, Yanagiya K, Kohara S, Shigenari A,Yamagata T, Kulski JK, Naruse TK, Fujimori Y, Fukuzumi Y, YamazakiM, Tashiro H, Iwamoto C, Umehara Y, Imanishi T, Meyer A, Ikeo K,Gojobori T, Bahram S, Inoko H: Comparative sequencing ofhuman and chimpanzee MHC class I regions unveils inser-tions/deletions as the major path to genomic divergence.Proc Natl Acad Sci U S A 2003, 100:7708-7713.
4. Nandakumar MP, Shen J, Raman B, Marten MR: Solubilization oftrichloroacetic acid (TCA) precipitated microbial proteinsvia naOH for two-dimensional electrophoresis. J Proteome Res2003, 2:89-93.
5. Mastro R, Hall M: Protein delipidation and precipitation by tri-n-butylphosphate, acetone, and methanol treatment for iso-electric focusing and two-dimensional gel electrophoresis.Anal Biochem 1999, 273:313-315.
6. Aivaliotis M, Corvey C, Tsirogianni I, Karas M, Tsiotis G: Membraneproteome analysis of the green-sulfur bacterium Chloro-bium tepidum. Electrophoresis 2004, 25:3468-3474.
7. Hagopian K: Preparative electrophoretic method for the puri-fication of a hydrophobic membrane protein: subunit c of themitochondrial ATP synthase from rat liver. Anal Biochem 1999,273:240-251.
8. Ruppert C, Kavermann H, Wimmers S, Schmid R, Kellermann J, Lotts-peich F, Huber H, Stetter KO, Muller V: The proteolipid of theA(1)A(0) ATP synthase from Methanococcus jannaschii hassix predicted transmembrane helices but only two proton-translocating carboxyl groups. J Biol Chem 1999,274:25281-25284.
9. Skalidis G, Trifilieff E, Luu B: Selective extraction of the DM-20brain proteolipid. J Neurochem 1986, 46:297-299.
10. Zuo X, Speicher DW: A method for global analysis of complexproteomes using sample prefractionation by solution isoe-lectrofocusing prior to two-dimensional electrophoresis.Anal Biochem 2000, 284:266-278.
11. Vuong GL, Weiss SM, Kammer W, Priemer M, Vingron M, NordheimA, Cahill MA: Improved sensitivity proteomics by postharvestalkylation and radioactive labelling of proteins. Electrophoresis2000, 21:2594-2605.
12. Wallin E, von HG: Genome-wide analysis of integral mem-brane proteins from eubacterial, archaean, and eukaryoticorganisms. Protein Sci 1998, 7:1029-1038.
13. Rabilloud T, Blisnick T, Heller M, Luche S, Aebersold R, Lunardi J,Braun-Breton C: Analysis of membrane proteins by two-dimensional electrophoresis: comparison of the proteinsextracted from normal or Plasmodium falciparum-infectederythrocyte ghosts. Electrophoresis 1999, 20:3603-3610.
14. Santoni V, Kieffer S, Desclaux D, Masson F, Rabilloud T: Membraneproteomics: use of additive main effects with multiplicativeinteraction model to classify plasma membrane proteinsaccording to their solubility and electrophoretic properties.Electrophoresis 2000, 21:3329-3344.
15. Luche S, Santoni V, Rabilloud T: Evaluation of nonionic and zwit-terionic detergents as membrane protein solubilizers in two-dimensional electrophoresis. Proteomics 2003, 3:249-253.
16. Tastet C, Charmont S, Chevallet M, Luche S, Rabilloud T: Structure-efficiency relationships of zwitterionic detergents as proteinsolubilizers in two-dimensional electrophoresis. Proteomics2003, 3:111-121.
17. Kern R, Joseleau-Petit D, Chattopadhyay MK, Richarme G: Chaper-one-like properties of lysophospholipids. Biochem Biophys ResCommun 2001, 289:1268-1274.
18. Nekrasova E, Sosinskaya A, Natochin M, Lancet D, Gat U: Overex-pression, solubilization and purification of rat and humanolfactory receptors. Eur J Biochem 1996, 238:28-37.
19. Perez-Gil J, Cruz A, Casals C: Solubility of hydrophobic sur-factant proteins in organic solvent/water mixtures. Struc-tural studies on SP-B and SP-C in aqueous organic solventsand lipids. Biochim Biophys Acta 1993, 1168:261-270.
20. Navarre C, Degand H, Bennett KL, Crawford JS, Mortz E, Boutry M:Subproteomics: identification of plasma membrane proteinsfrom the yeast Saccharomyces cerevisiae. Proteomics 2002,2:1706-1714.
21. Santoni V, Molloy M, Rabilloud T: Membrane proteins and pro-teomics: un amour impossible? Electrophoresis 2000,21:1054-1070.
22. Witzmann F, Jarnot B, Parker D: Dodecyl maltoside detergentimproves resolution of hepatic membrane proteins in two-dimensional gels. Electrophoresis 1991, 12:687-688.
23. Lux SE, John KM, Kopito RR, Lodish HF: Cloning and characteri-zation of band 3, the human erythrocyte anion-exchangeprotein (AE1). Proc Natl Acad Sci U S A 1989, 86:9089-9093.
24. Rabilloud T, Gianazza E, Catto N, Righetti PG: Amidosulfo-betaines, a family of detergents with improved solubilizationproperties: application for isoelectric focusing under dena-turing conditions. Anal Biochem 1990, 185:94-102.
25. Navarrete R, Serrano R: Solubilization of yeast plasma mem-branes and mitochondria by different types of non-denatur-ing detergents. Biochim Biophys Acta 1983, 728:403-408.
26. Chevallet M, Santoni V, Poinas A, Rouquie D, Fuchs A, Kieffer S, Ros-signol M, Lunardi J, Garin J, Rabilloud T: New zwitterionic deter-gents improve the analysis of membrane proteins by two-dimensional electrophoresis. Electrophoresis 1998,19:1901-1909.
27. Butt RH, Coorssen JR: Postfractionation for enhanced pro-teomic analyses: Routine electrophoretic methods increasethe resolution of standard 2D-PAGE. J Proteome Res 2005,4(3982-91 [http://dx.doi.org/10.1021/pr050054d].
28. Coorssen JR, Blank PS, Tahara M, Zimmerberg J: Biochemical andfunctional studies of cortical vesicle fusion: the SNARE com-plex and Ca2+ sensitivity. J Cell Biol 1998, 143:1845-1857.
29. Chernomordik LV, Sowers AE: Evidence that the spectrin net-work and a nonosmotic force control the fusion productmorphology in electrofused erythrocyte ghosts. Biophys J1991, 60:1026-1037.
30. Laemmli UK: Cleavage of structural proteins during theassembly of the head of bacteriophage T4. Nature 1970,227:680-685.
31. Cannon-Carlson S, Tang J: Modification of the Laemmli sodiumdodecyl sulfate-polyacrylamide gel electrophoresis proce-dure to eliminate artifacts on reducing and nonreducing gels.Anal Biochem 1997, 246:146-148.
32. Coorssen JR, Blank PS, Albertorio F, Bezrukov L, Kolosova I, Back-lund PSJ, Zimmerberg J: Quantitative femto- to attomole immu-nodetection of regulated secretory vesicle proteins criticalto exocytosis. Anal Biochem 2002, 307:54-62.
33. Herbert B, Galvani M, Hamdan M, Olivieri E, MacCarthy J, PedersenS, Righetti PG: Reduction and alkylation of proteins in
Page 10 of 11(page number not for citation purposes)
Proteome Science 2005, 3:5 http://www.proteomesci.com/content/3/1/5
Publish with BioMed Central and every scientist can read your work free of charge
"BioMed Central will be the most significant development for disseminating the results of biomedical research in our lifetime."
Sir Paul Nurse, Cancer Research UK
Your research papers will be:
available free of charge to the entire biomedical community
peer reviewed and published immediately upon acceptance
cited in PubMed and archived on PubMed Central
yours — you keep the copyright
Submit your manuscript here:http://www.biomedcentral.com/info/publishing_adv.asp
BioMedcentral
preparation of two-dimensional map analysis: why, when,and how? Electrophoresis 2001, 22:2046-2057.
34. Herbert BR, Molloy MP, Gooley AA, Walsh BJ, Bryson WG, WilliamsKL: Improved protein solubility in two-dimensional electro-phoresis using tributyl phosphine as reducing agent. Electro-phoresis 1998, 19:845-851.
35. Lundahl P, Greijer E, Lindblom H, Fagerstam LG: Fractionation ofhuman red cell membrane proteins by ion-exchange chro-matography in detergent on Mono Q, with special referenceto the glucose transporter. J Chromatogr 1984, 297:129-137.
36. Poole RC, Halestrap AP: Reconstitution of the L-lactate carrierfrom rat and rabbit erythrocyte plasma membranes. BiochemJ 1988, 254:385-390.
37. Semple SC, Klimuk SK, Harasym TO, Dos SN, Ansell SM, Wong KF,Maurer N, Stark H, Cullis PR, Hope MJ, Scherrer P: Efficient encap-sulation of antisense oligonucleotides in lipid vesicles usingionizable aminolipids: formation of novel small multilamel-lar vesicle structures. Biochim Biophys Acta 2001, 1510:152-166.
38. Martin DW: Active unit of solubilized sarcoplasmic reticulumcalcium adenosinetriphosphatase: an active enzyme centrif-ugation analysis. Biochemistry 1983, 22:2276-2282.
Page 11 of 11(page number not for citation purposes)
Copyright © 2022 FDOKUMEN