ENGINEERING IMPLICATIONS OF GROUND MOTIONS FROM THE 1999 TURKEY EARTHQUAKES & SSI
15
1 ENGINEERING IMPLICATIONS OF GROUND MOTIONS FROM THE 1999 TURKEY EARTHQUAKES & SSI Mehmet ÇELEBI USGS (MS977), 345 Middlefield Road, Menlo Park, CA 94025 [Tel: 650-329-5623, Fax: 650-329-5163, e-mail: [email protected]] ABSTRACT The August 17, 1999 Izmit (Turkey) earthquake (M w =7.4) will be remembered as one of the largest earthquakes of recent times that affected a large urban environment (U.S. Geological Survey, 1999). The shaking that caused the widespread damage and destruction was recorded by a handful of accelerographs in the earthquake area operated by different networks. The characteristics of these records show that the recorded peak accelerations, even those from near field stations, are smaller than expected. On the other hand, smaller magnitude aftershocks yielded larger peak accelerations. This is attributed to the sparse networks, which possibly missed recording of larger motions during the main shock. The recorded motions exhibit specific characteristics of engineering importance including near fault effects. As rebuilding of Turkey starts and picks up speed, the recorded ground motions that adversely affected the built environment are being studied intensively to explain the past disaster and to infer implications for the next round. New forecasts of future large earthquakes in the ever growing large urban environment of Istanbul and vicinity necessitates better preparedness and extensive planning for upgrade and retrofit of existing infrastructure. For successful execution of these endeavors, it is imperative to have better defined ground motion characteristics. This paper aims to discuss the issues related to engineering implications of the recorded ground motions. Keywords: earthquake, near-fault, ground motion, accelerations, pulses, soil-structure interaction, permanent displacements, site response, transfer functions INTRODUCTION It is now well known that improper design and construction practices played an important role in detrimental performance of more than 20,000 structures during the August 17, 1999 (M w =7.4) Izmit earthquake. This being a given, the main goal must be to improve design and construction practices. During this process, it is important to assess the recorded ground motions, site effects and other earthquake related hazard issues which need to be considered during rebuilding efforts. On scale recordings of ground shaking during earthquakes are important for understanding causes of earthquake damage and the physics of fault rupture, and for advancing design codes. Approximately 38 strong motion ground records were made of the August 17, 1999 Izmit earthquake by different institutions in Turkey that operate either strong motion networks. The purposes of this paper are to (a) discuss the characteristics and engineering implications of the strong- motion records of the Izmit, Turkey earthquake, (b) relate them to experiences elsewhere, (c) deliberate on pragmatic applications in Turkey for assisting in rebuilding, and (d) identify issues that must be dealt with before the next earthquake strikes the area.
-
Upload
independent -
Category
Documents
-
view
2 -
download
0
Transcript of ENGINEERING IMPLICATIONS OF GROUND MOTIONS FROM THE 1999 TURKEY EARTHQUAKES & SSI
1
ENGINEERING IMPLICATIONS OF GROUND MOTIONS FROM THE 1999 TURKEY EARTHQUAKES & SSI
Mehmet ÇELEBI
USGS (MS977),
345 Middlefield Road, Menlo Park, CA 94025
[Tel: 650-329-5623, Fax: 650-329-5163, e-mail: [email protected]]
ABSTRACT
The August 17, 1999 Izmit (Turkey) earthquake (Mw=7.4) will be remembered as one of the largest earthquakes of recent times that affected a large urban environment (U.S. Geological Survey, 1999). The shaking that caused the widespread damage and destruction was recorded by a handful of accelerographs in the earthquake area operated by different networks. The characteristics of these records show that the recorded peak accelerations, even those from near field stations, are smaller than expected. On the other hand, smaller magnitude aftershocks yielded larger peak accelerations. This is attributed to the sparse networks, which possibly missed recording of larger motions during the main shock. The recorded motions exhibit specific characteristics of engineering importance including near fault effects. As rebuilding of Turkey starts and picks up speed, the recorded ground motions that adversely affected the built environment are being studied intensively to explain the past disaster and to infer implications for the next round. New forecasts of future large earthquakes in the ever growing large urban environment of Istanbul and vicinity necessitates better preparedness and extensive planning for upgrade and retrofit of existing infrastructure. For successful execution of these endeavors, it is imperative to have better defined ground motion characteristics. This paper aims to discuss the issues related to engineering implications of the recorded ground motions. Keywords: earthquake, near-fault, ground motion, accelerations, pulses, soil-structure interaction, permanent displacements, site response, transfer functions
INTRODUCTION It is now well known that improper design and construction practices played an important role in detrimental performance of more than 20,000 structures during the August 17, 1999 (Mw=7.4) Izmit earthquake. This being a given, the main goal must be to improve design and construction practices. During this process, it is important to assess the recorded ground motions, site effects and other earthquake related hazard issues which need to be considered during rebuilding efforts. On scale recordings of ground shaking during earthquakes are important for understanding causes of earthquake damage and the physics of fault rupture, and for advancing design codes. Approximately 38 strong motion ground records were made of the August 17, 1999 Izmit earthquake by different institutions in Turkey that operate either strong motion networks. The purposes of this paper are to (a) discuss the characteristics and engineering implications of the strong-motion records of the Izmit, Turkey earthquake, (b) relate them to experiences elsewhere, (c) deliberate on pragmatic applications in Turkey for assisting in rebuilding, and (d) identify issues that must be dealt with before the next earthquake strikes the area.

2
STRONG-MOTION RECORDS
The Networks and Recorded Accelerations The National strong-Motion Network of the earthquake Research Department of the Ministry of Public works (NSMN-ERD), the largest strong-motion network operator in Turkey has aimed to deploy one strong-motion instrument in every major town within the earthquake zones of Turkey. This systematic effort on part of NSMN-ERD, supplemented by strong motion stations deployed by Kandilli Observatory and Earthquake Research Institute (KOERI) and Istanbul Technical University (ITU) in Istanbul and Marmara Region produced very significant and important records that will be useful for studying the earthquake and establishing important and necessary criteria in rebuilding efforts. These organizations recorded the main shock at approximately 38 stations within the epicentral region. Peak accelerations of the records from some of the stations are plotted into the map in Figure 1. To date, detailed site characterizations of these stations have not been documented.
Figure 1. Map showing peak accelerations plotted at relative locations of significant strong-motion
stations within and in close proximity to the epicentral area (Base map courtesy of BKS Surveys Ltd., N. Ireland).
The current strong-motion network in the epicentral area (and in other segments of the North Anatolian Fault and elsewhere in Turkey, for that matter) is quite sparse. Therefore, it is important to consider that recording of larger peak accelerations were possibly missed. For example, no record of the main-shock was obtained in Gölcük and vicinity in the immediate epicentral area – where there was extensive damage. Hence, absence of strong-shaking records inhibits reliable evaluation of the effect of the shaking and consequential damage on the typical structures in the area. In addition, only one record (minus a component due to malfunction) was retrieved from Adapazari, at station SKR, which was on stiff soil in the undamaged part of Adapazari. There were no permanent stations in the fast-growing urban/industrial areas of the Adapazari basin. The peak accelerations in the basin, almost certainly were amplified compared to that recorded at the stiff soil site. The shaking in the basin would have revealed different characteristics such as amplification due to softer layered media, basin effects and in certain areas, the effect of liquefaction that occurred. Therefore, during the main shock of the August 17, 1999 earthquake, the largest recorded peak accelerations (SKR, 0.41 g horizontal and Düzce, 0.48 g vertical) were most likely not the largest that actually occurred. This possibility is strengthened by the fact that accelerations with larger peaks were recorded during events of smaller magnitudes. This is illustrated in Figure 2 which shows three acceleration time-histories recorded during: (a) the Ms=5.7 aftershock on 13 September 1999 at Tepetarla (a temporary station near Izmit) with peak ~ 0.6 g, larger than any peak recorded during the main shock, for example, (b) the SKR record, and (c) the November 12, 1999 (Ms=7.2) Duzce event, station (Bolu) with peak ~ 0.8 g (EW).

3
Figure 2. Comparison of peak accelerations for the August 17, 1999 main shock (station SKR) and two aftershocks, each recorded at a different location.
Two samples of recorded ground motions are presented. Figure 3a shows the acceleration time-histories recorded at SKR (Adapazari in Sakarya Province) on stiff soil. The records exhibit more than three different shocks. Figure 3b and c, respectively show 40 seconds of the records re-plotted and their sums of the acceleration over time to depict relative cumulative significant shaking (representative of energy). From this, in Figure 3d, the duration of strong shaking is determined as approximately 5 seconds, using the time span between 5%-95% of the normalized sums (Novikava and Trifunac, 1994). The main shock contributes to approximately 70% of the total significant shaking of the two shocks within the 40 seconds of the record.
Figure 3 (a): Time-history of SKR record (Longitudinal component malfunctioned). The plot shows
several events. In Figure 4a, the acceleration time-history of YPT (Petro-Chemical Plant in Körfez) is shown. The site is alluvial. The figure exhibits two distinctive earthquakes. Figure 4b shows the relative cumulative significant shaking as calculated by summing the square of the acceleration over time. This figure exhibits that the strong shaking of the earthquake lasted approximately 5-6 seconds.
Figure 3 (b) Only 40-second window of the SKR acceleration record re-plotted to show (c) the significant
strong shaking, almost all by the first shock and indicating the duration of strong-shaking as 5-6 s.

4
Figure 3 (d) Definition of duration of strong shaking (time between 5-95% of the relative cumulative
squared acceleration) [Reference: Novikava and Trifunac, 1994].
Figure 4a and b. Time-history of YPT. The plot shows the second event approximately 30-seconds after the first and (b) the significant strong shaking of the mainshock contributes approximately 70 % of the
total and the strong shaking duration is 5-6 s.
Near-Fault Issues and Pulses Abrahamson recently (2000) noted that, worldwide, for M>7 earthquakes between 1940 and 1999, there were only 8 records within <20 km from the fault. The Turkey earthquakes of 1999 and the Chi-Chi, Taiwan earthquake of September 21, 1999, respectively added 5 and 60 more records to a total of 73. One of the main reasons why near-fault motions are important is the presence of long-duration pulses that result in large displacements, which are detrimental to the performance of long-period structures. Somerville (1998) explains the long-period pulse characteristics of near-fault motions as follows:
• “the propagation of fault rupture toward a site at a velocity close the shear wave velocity causes most of the seismic energy from the rupture to arrive in a single large long-period pulse of motion,”
• “the pulse of motion represents the cumulative effect of almost all of the seismic radiation from the fault,” and
• “the radiation pattern of the shear dislocation on the fault causes this large pulse of motion to be oriented in the direction perpendicular to the fault, causing the fault-normal peak velocity to be larger than strike-parallel peak velocity.”
The translation of long-period pulses into large displacements is simply demonstrated by considering simple vibrational physics of pulse action. Consider four undamped, single sinusoidal accelerations with equal amplitudes, Ÿ, but having different pulse durations. Figure 5 shows that corresponding displacements, y, are increased with increase in pulse duration, Tp, by virtue of the relationship : y= -Ÿ/(2π/ Tp)
2.

5
Figure 5. Sinusoidal accelerations with constant amplitude but varying periods and corresponding displacements.
This grossly simplified visualization of the effect of long-period pulses in generating large pulse displacements are quantified and verified for three different earthquake records. The YPT record seen in Figure 4 is re-plotted in Figure 6a to better exhibit the long-period pulses and the amplitude spectra with a pulse period (Tp) of about 5 seconds (0.2 Hz) for the horizontal components. With peak acceleration of 0.32g for the EW component, the calculated pulse displacement, y = 0.32(981)/(2π/5)2~199cm. compares well with the displacement obtained by double-integration (Figure 6b). This and two other examples are summarized in Table 1. Figure 7a shows three components of accelerations recorded at Station TCU068 during the (M=7.3) September 21, 1999 Chi-chi (Taiwan) earthquake and their amplitude spectra that exhibit the lowest dominant frequency of approximately 0.11 Hz (Tp ˜ 9.09 s). With peak acceleration of 0.37g for the east-west component, the peak pulse displacement of 757 cm is calculated. This compares well with the displacement of 707 cm (Figure 7b) obtained by double integration of the acceleration record (Tsai, 2000). The third example is the 13 March 1992 Erzincan earthquake record (Figure 8). Accepting the Tp ~ 2 seconds and the peak acceleration as approximately 0.5g, then the estimated displacement is ~ 50 cm. The margin of variation of peak accelerations provides the calculated displacement variation of 35-70cm. Thus, since long-period pulses result in larger velocities and displacements, it is important to assess how the large displacements affect the response and performance of long-period structures such as tall buildings, long-span bridges, viaducts, overpasses, and base-isolated structures.
Figure 6a. The three components of the main-shock motions at YPT (Yarimca) recorded during the 19 August Izmit earthquake. The amplitude spectra of the motions are also shown.

6
Figure 6b. Recorded E-W component of acceleration and integrated velocity and double-integrated displacements at YPT.
Figure 7a. Accelerations recorded at the TCU068 Station during the Chi-Chi (Taiwan) earthquake and
the amplitude spectra [data from Lee, W, Shin, T., Kuo, K. and Chen, K., 1999).
Figure 7b. Recorded accelerations, integrated velocity and displacements of TCU068 Station EW Component (from Boore, 2000).

7
Figure 8. The N-S and E-W (acceleration, velocity and displacement) components of the 1992 Erzincan
record (note: the dominant lowest frequency of the acceleration record is ~ 0.5Hz.
Table 1. Evaluation of Peak Displacements Using Sinusoidal Pulse Analogy versus Double Integration of Recorded Acceleration.
Pulse Earthquake Mag.
Mw Station Peak
Acc.[g] f(Hz) Tp (s) Sinusoidal Pulse Displ.[cm]
Integrated Displ (cm)
Izmit [Turkey] 1999
7.4 YPT [EW]
0.32 0.2 5.0 199 ~180
Chi-chi [Taiwan] (1999
7.6 TCU068 [EW]
0.37 0.11 9.09 757 707
Erzincan [Turkey] 1992
5.8 ERZ 0.5 0.5 2.0 50 35-70
Consequently, to compensate for the additional demand in design strength caused by such large displacements, recent codes in the United States adopted the Near Fault Factors (UBC, 1997). Thus, the seismic zoning factors are effectively increased by a factor, 1<N<2 for seismic zone 4 (the highest seismic risk zones in the United States) within 10 km of those fault zones that are capable of generating (a) M≥7 earthquakes with slip rates exceeding 5 mm/year or (b) earthquakes M≥6.5 with slip rates smaller than 5 mm/year1. The North Anatolian Fault (NAF) is tectonically similar to the San Andreas Fault in California; therefore, such factors should also be considered in selective zones along the NAF. The recorded responses clearly show long period pulses (e.g. ~5 sec in case of YPT record – Figure 6a). 1 In the Uniform Building Code, the total design base shear in a given direction is determined from the following formula: V =? [ CvI /R T] W , where Cv is is the seismic coefficient (for zone 4, is given by 0.32Nv, 0.40Nv,
0.56Nv, 0.64Nv, 0.96Nv for soil profile types SA [shear wave velocity, Vs>1500 m/s] , SB [760< Vs <1500 m/s], SC
[360< Vs <1500 m/s], SD[180< Vs <360 m/s] and SE [Vs <180 m/s] respectively), I is the importance factor, R is the ductility factor, T is the fundamental period of the design structure and W is the weight of the structure. The total design base shear is not to exceed V=[2.5C a I/ R]W but is not to be less than V=?[0.11CaI W] where Ca is the seismic coefficient and similarly ranges as 0.32 Na, 0.40Na,0.40Na, 0.44Na and 0.36Na for the soil profiles SA, SB,SC, SD and SE respectively. Furthermore, for Seismic Zone 4, the total base shear shall also not be less than the following: V=?[0.8ZNvI/R]W. Z is the seismic zone factor and is 0.4 for zone 4. In the above, 1<Nv <2 and 1<Na<1.5] and are interpolated from tables according to different type of soil profiles and distance from fault. The highest factors are for sites less than 2 km from the faults (Uniform Building Code, 1997).

8
Response Spectra Figures 9a,b and c show the response spectra and the normalized response spectra (all calculated for 5 % damping), for north-south and east-west directions, respectively, for 5 stations, including the two for which the time-history plots have been presented (Figures 3-4). These stations cover the epicentral area (stations IZT and YPT) and locations that are heavily damaged east of the epicentral area (SKR and DZC) and a location in Istanbul (MCK). IZT, YPT and DZC are on alluvial sites whereas SKR and MCK are on stiff soil and rock, respectively. The response spectra show that at different stations, the resonant periods (frequencies) change drastically. Furthermore, the normalized response spectra indicate that both YPT and DZC have long periods (low frequencies). For comparison of response spectra shapes, Figure 9c also shows the current Turkish Code response spectra for stiff soil and alluvial site conditions (Specifications for structures to be built in disaster areas, English translation by Aydinoglu, 1998). The figure indicates that for periods between 0.1-1, the design response spectra, similar to those used in the United States, are challenged for this earthquake. Taller buildings on rocky hills of Istanbul, and the two suspension bridges in Istanbul were not adversely affected by the long-period motions of this earthquake – most likely due to attenuated ground motions. However, the important lifeline structures need to be reviewed for an earthquake that might occur closer to Istanbul.
Figure 9. (a and b) Response spectra (5 % damped) for 5 stations and (c) Normalized response spectra of
5 stations compared with design response spectra of Turkish Code (1998). AFTERSHOCK DEPLOYMENTS & SITE RESPONSE ISSUES
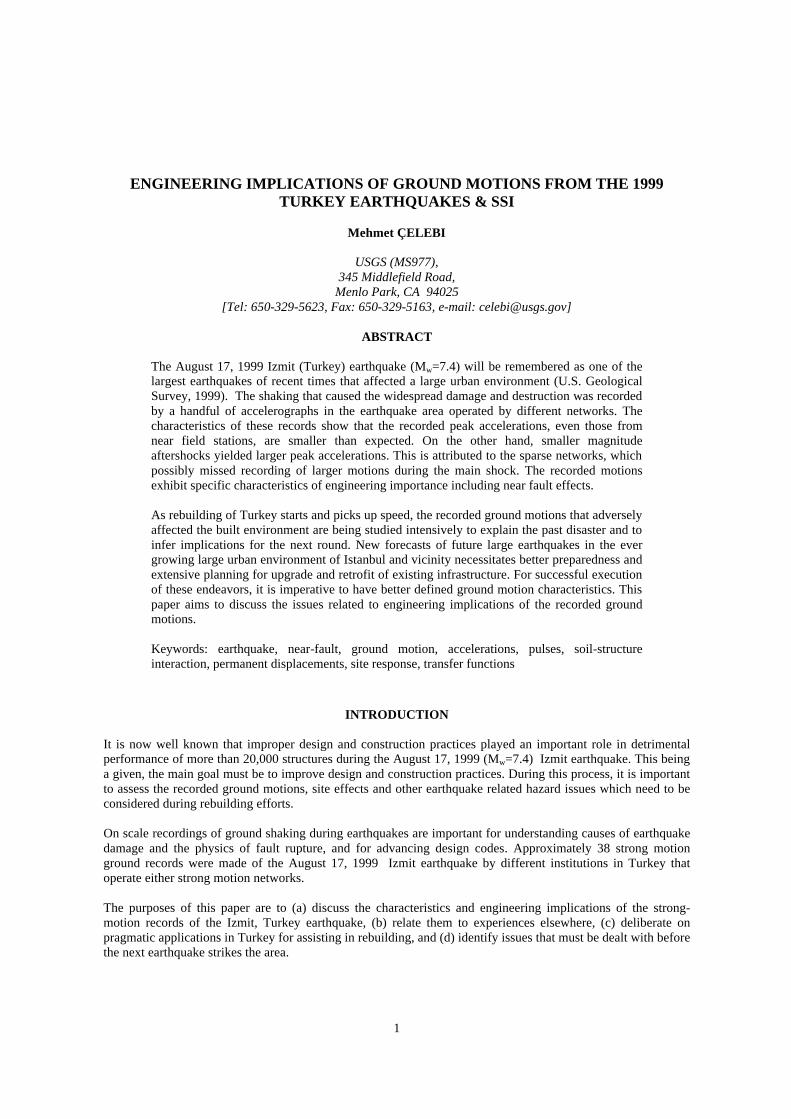
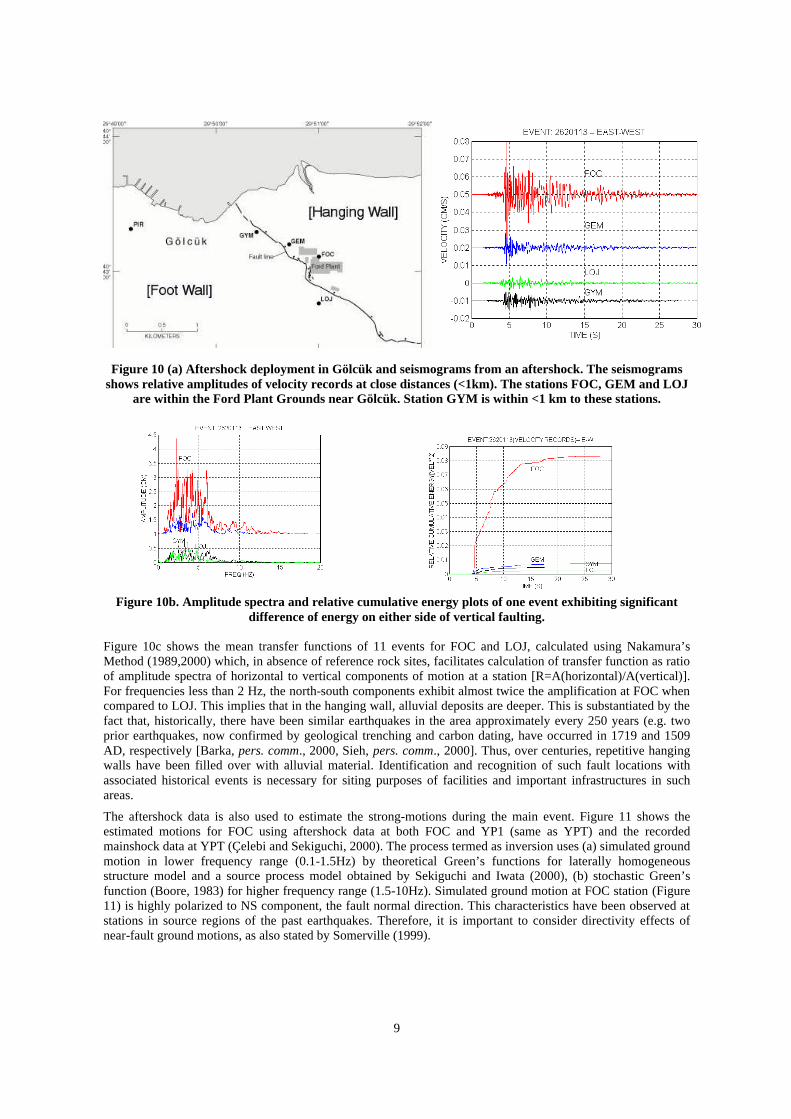
Since the strong-motion network in the epicentral area of the Izmit earthquake was not dense enough to define ground shaking at all damaged areas, a limited number of temporary arrays were deployed to obtain aftershock records to explain site effects at various locations. USGS deployed a number of acceleration and velocity transducers at the South Izmit Bay including Gölcük. Figure 10a shows the deployment of temporary array in Gölcük and a set of seismograms of an aftershock obtained from both sides of the observed normal fault scarp that occurred during the main event. Stations FOC and GEM are on the hanging wall and LOJ and GYM are on the footwall of the normal fault. The figure exhibits the variation of ground motion at locations that are short distances apart (<1 km) (Çelebi, Dietel and Glassmoyer, 2000, Çelebi and Sekiguichi, 2000) as well as the motions on both sides of the normal fault scarp. The differences of motions on either side of the normal fault are also observed in Figure 10b. The amplitude spectra and the relative cumulative energy plots further reinforce the larger energy at FOC and GEM, on the hanging wall as compared to LOJ and GYM, on the footwall.
9
Figure 10 (a) Aftershock deployment in Gölcük and seismograms from an aftershock. The seismograms shows relative amplitudes of velocity records at close distances (<1km). The stations FOC, GEM and LOJ
are within the Ford Plant Grounds near Gölcük. Station GYM is within <1 km to these stations.
Figure 10b. Amplitude spectra and relative cumulative energy plots of one event exhibiting significant
difference of energy on either side of vertical faulting. Figure 10c shows the mean transfer functions of 11 events for FOC and LOJ, calculated using Nakamura’s Method (1989,2000) which, in absence of reference rock sites, facilitates calculation of transfer function as ratio of amplitude spectra of horizontal to vertical components of motion at a station [R=A(horizontal)/A(vertical)]. For frequencies less than 2 Hz, the north-south components exhibit almost twice the amplification at FOC when compared to LOJ. This implies that in the hanging wall, alluvial deposits are deeper. This is substantiated by the fact that, historically, there have been similar earthquakes in the area approximately every 250 years (e.g. two prior earthquakes, now confirmed by geological trenching and carbon dating, have occurred in 1719 and 1509 AD, respectively [Barka, pers. comm., 2000, Sieh, pers. comm., 2000]. Thus, over centuries, repetitive hanging walls have been filled over with alluvial material. Identification and recognition of such fault locations with associated historical events is necessary for siting purposes of facilities and important infrastructures in such areas.
The aftershock data is also used to estimate the strong-motions during the main event. Figure 11 shows the estimated motions for FOC using aftershock data at both FOC and YP1 (same as YPT) and the recorded mainshock data at YPT (Çelebi and Sekiguchi, 2000). The process termed as inversion uses (a) simulated ground motion in lower frequency range (0.1-1.5Hz) by theoretical Green’s functions for laterally homogeneous structure model and a source process model obtained by Sekiguchi and Iwata (2000), (b) stochastic Green’s function (Boore, 1983) for higher frequency range (1.5-10Hz). Simulated ground motion at FOC station (Figure 11) is highly polarized to NS component, the fault normal direction. This characteristics have been observed at stations in source regions of the past earthquakes. Therefore, it is important to consider directivity effects of near-fault ground motions, as also stated by Somerville (1999).

10
Figure 10c. Mean transfer function of 11 events showing the amplification differences on both sides of vertical faulting.
Figure 11. Estimated (main-shock) ground motions and respective amplitude spectra at FOC using inversion technique with aftershock recordings at FOC and YP1 (from Çelebi and Sekiguchi, 2000). Note
the fault-normal motions are larger for both FOC and YP1.

11
OTHER ISSUES
Soil-Structure Interaction
The majority of the building inventory on alluvium media were most likely subjected to soil-structure interaction effects (SSI). The foundations of the buildings with 1-8 stories had very small or no embedment. Most were constructed on continuous beam foundations. SSI is particularly important for those structures that had little or no embedment (D) as compared to the height (H) or width (L) of a building ( 0< D/H<0.5). Aviles and Perez-Rocha (1998) recently showed (Figure 12) that the effective period of structures can increase by a factor of 2 for H/L~3. In this figure, accepting Th=H/(VsT) as relative measure of relative stiffness of the structure to that of the soil, Th can be approximated as Th~30/Vs (for average 3 m height per story and T~0.1 N, (N number of stories) for most structures. Vs, in general, is the shear wave velocity uppermost 30 m. For Vs =300, Th~0.1 and for softer soils with Vs =60 m/s, Th~0.5. The shifting of resonant period due to SSI may adversely affect the performance of structures. In rebuilding, embedment and foundation issues must be addressed.
Figure 12. Effect of foundation embedment on structural period when soil-structure interaction is included (redrawn from Aviles and Perez-Rocha, 1998).
Implications for the future
Finally, an issue that needs to be addressed is the future forecasting following the 17 August 1999 earthquake. Parsons and others (2000) forecasted that the August event increased the stress in the Marmara Sea closer to Istanbul (Figure 13), the largest city of Turkey. They forecast that the stress increase results in probability of 62 ± 15 % for a M>7 earthquake to occur in the next 30 years. Thus, there is an urgent need to be ready.
Figure 13. [courtesy of R. Stein] Change in Stress pattern triggered by the Izmit earthquake on 17 August 1999. Yellow to red colors indicate the area where stress increased whereas green to purple colors show
the area where the stress decreased in the wake of the Izmit event (Parsons and others, 2000).

12
Fault Rupture Zoning and Implications for Turkey The experiences in California related to fault rupture zones is particularly appropriate to be considered for Turkey also. The NAF and San Andreas Faults are both right-lateral strike slip faults, have similar lengths (~1500 km) and produce significant earthquakes.
In 1972, following the 1971 San Fernando earthquake in California, the California State Assembly passed the Alquist-Priola Earthquake Fault Zoning Act. The purpose of the law was to prevent construction on or near the surface fault rupture zones. It led to establishment of offset distances from the surface fault rupture zones. During the 17 August 1999 earthquake, numerous buildings and industrial plants were adversely affected because they were on or near the fault surface rupture zones. Turkey must establish such zones to be used by municipalities and provinces to prevent construction within the fault zones. A sample fault zone map is shown in Figure A-1. The Alquist Priola Act is provided in Appendix A. In 1990, in California, another significant act, Seismic Hazards Mapping Act was adopted. The important aspect of this act is summarized in this quotation: “ The Legislature finds and declares all of the following: (a) The effects of strong ground shaking, liquefaction, landslides, or other ground failure account for approximately 95 percent of economic losses caused by an earthquake, (b) Areas subject to these processes during an earthquake have not been identified or mapped statewide, despite the fact that scientific techniques are available to do so, (c) It is necessary to identify and map seismic hazard zones in order for cities and counties to adequately prepare the safety element of their general plans and to encourage land use management policies and regulations to reduce and mitigate those hazards to protect public health and safety.” Figure A-2 shows a sample seismic hazard map.
CONCLUSIONS
1. The strong-motion network on the North Anatolian Fault is very sparse. Denser arrays are necessary in
urban areas. The arrays should be supplemented with downhole accelerographs and piezometer arrays in liquefaction susceptible areas. It is important to increase the number of accelerographs in urban environments to cover different geological settings so that the actual motions in the basins and heavily damaged areas can be recorded.
2. Detailed site-characterization of the stations are not known. A systematic effort should be embarked upon to characterize the sites.
3. In event of absence of strong-motion records, aftershock motions have been used to estimate the strong-shaking during the main event. The estimated motions show stronger shaking in the fault-normal direction. Furthermore, on either side of a vertical fault, the amplification is proved to be larger on the hanging wall. Therefore, it is essential to better identify existing faults for siting of important infrastructure and facilities.
4. The long-period pulses from near-fault earthquakes must be accounted for in assessing the performance of structures. One possible way is to establish, in selected zones of the NAF, near-fault factors that increase the seismic coefficients in the codes.
5. Whenever applicable (e.g. in Adapazari basin), special site-specific design response spectra should be developed.
6. Soil-structure interaction effects possibly adversely affect the performance of the 4-8 story stiff structures (typically reinforced concrete framed buildings with infill walls) in the alluvial basin in Turkey. Most of these buildings have small embedment. Foundations must be properly designed to reduce the adverse effect of such interaction.
REFERENCES
Abrahamson, N., 2000, seminar talk at USGS. Ambraseys, N. N., 1988, Engineering seismology: Earthquake Engineering and Structural Dynamics, v. 17, no.
1, 1-105. Aviles, J., and Perez-Rocha, L. E., 1998, Effects of foundation embedment during building-soil interaction, Int’l Journal of Earthquake Eng. Struct. Dyn., 27, 1523-1540. Barka, A., personal communication, 2000. Boore, D. M.,1999, Bull. Seism. Soc. Am., 73, 1865-1894. Boore, D., 2000, effect of Baseline Corrections on Displacements and Response Spectra for Four Recordings of the 1999 Chi-Chi, Taiwan ,earthquake, BSAA, Chi-Chi Special Issue, v1.1.
13
Boore, D. M., W. B. Joyner, and T. E. Fumal, 1997, Equations for estimating horizontal response spectra and peak acceleration from western North American earthquakes: A summary of recent work, Seismological Research Letters, v. 68, 128-153. Çelebi, M., Dietel, C., and Glassmoyer, G., 2000, A Prelimanary report on the Aftershock Measurements following the Izmit (Turkey) earthquake of August 17, 1999 – in and near Gölcük and Ford-Otosan Plant Site, USGS Open-File report (in preparation). Çelebi, M., and Sekiguichi, H., 2000, Estimation of Ground Motions at Golcuk during the 1999 Kocaeli, Turkey, Earthquake, AGU Abstract, San Francisco, Ca. Dec. 2000. Çelebi,M., Toprak, S., and Holzer,T., 1999, Strong-Motion, Site-Effects and Hazard Issues in Rebuilding Turkey: in Light of the 17 august 1999 earthquake and its aftershocks , invited paper, PROC. ITU Conference on Marmara Earthquake of August 17, 1999: Scientific Assessments and Recommendations for Rebuilding, Istanbul Technical University, Istanbul, Turkey, 2-5 December 1999. Irikura, K. (1986). Proc. of 7th Japan Earthq. Eng. Symp., 151-156. Lee, W., Shin, T., Kuo, K., and Chen, K., 1999, CWD Free-Field Strong-Motion Data from the 9-21_1999 Chi- Chi earthquake, V. 1: Digital Acceleration Files on CD. Motosaka, M., A. Niousha and M. Nishihara (2000). Proc. of general conference, AIJ, 37-38 (in Japanese). Nakamura, Y. A Method for Dynamic Characteristics Estimation of Subsurface using Microtremor on the Ground surface, QR of RTRI, February 1989, vol. 30, no. 1, 25-33. Nakamura, Y. , 2000, Clear Identification of Fundamental Idea of Nakamura’s Technique and its Applications, CD-ROM Proceedings,12th World Conference on Earthquake Engineering, Auckland, New Zealand. Novikava, E. I., and Trifunac, M. D., 1994, Duration of ground motion in terms of earthquake magnitude, epicentral distance, site conditions and site geometry, Journal of Earthquake Engineering and Structural Dynamics, 23, 1023-1043. Parsons, T., Toda, S., Stein, R., Barka, A. and Dieterich, J., 2000, Heightened odds of large earthquakes near Istanbul: An interaction-based probability calculation, Science, v. 288, 28 April 2000. Sekiguchi, H. and T. Iwata (2000). submitted to Bull. Seismol. Soc. Am. Sieh, K., personal communication, 2000. Somerville, P.G., K. Irikura, R. Graves, S. Sawada, D. J. Wald, N. Abrahamson, Y. Iwasaki, T. Kagawa, N. Smith, and A. Kowada (1999). Seism. Res. Lett., 70, 59-80. Somerville, P., 1998, Development of an improved representation of near-fault ground motions, SMIP98 Seminar on Utilization of Strong-Motion Data, Dept. of Conservation, Div. of Mines and Geology, Calif. Strong Motion Instrumentation Program, Sept. 15, 1998. Specification for Structures to be Built in Disaster Areas , Ministry of Public Works and Settlement Government of Republic of Turkey, Issued on: 2.9.1997, Official GazetteNo.23098, Effective from: 1.1.1998, Amended on: 2.7.1998, Official Gazette No.23390 (English translation by N. Aydinoglu, 1998). Tsai, Y-B, (no date), Some Observations about the Chi-Chi, Taiwan earthquake of September 21, 1999 Technical report, National Taiwan University (Taiwan(, 29p. U. S. Geological Survey, 1999, Implications for earthquake risk reduction in the United States from the Kocaeli, Turkey, earthquake of August 17, 1999: U.S. Geological Circular 1193, in press. Uniform Building Code, 1997, International Conference of Building Officials, Whittier, Ca.
APPENDIX A: SHOULD TURKEY ESTABLISH ACTS EQUIVALENT TO ALQUIST-PRIOLA ACT OF CALIFORNIA?
The following are quoted from : http://www.consrv.ca.gov/dmg/rghm/a-p/releases/mpnp.htm and http://www.consrv.ca.gov/dmg/rghm/a-p/ap-intro.htm “The Alquist-Priolo Eartrhquake Fault Zoning Act was passed in 1972 to mitigate the hazard of surface faulting to structures for human occupancy. This state law was a direct result of the 1971 San Fernando Earthquake, which was associated with extensive surface fault ruptures that damaged numerous homes, commercial buildings, and other structures. Surface rupture is the most easily avoided seismic hazard.” “The Alquist-Priolo Earthquake Fault Zoning Act's main purpose is to prevent the construction of buildings used for human occupancy on the surface trace of active faults. The Act only addresses the hazard of surface fault rupture and is not directed toward other earthquake hazards. The Seismic Hazards Mapping Act, passed in 1990,

14
addresses non-surface fault rupture earthquake hazards, including liquefaction and seismically induced landslides.”
“The law requires the State Geologist to establish regulatory zones (known as Earthquake Fault Zones) around the surface traces of active faults and to issue appropriate maps. ["Earthquake Fault Zones" were called "Special Studies Zones" prior to January 1, 1994.] The maps are distributed to all affected cities, and state agencies for their use in planning and controlling new or renewed construction. Local agencies must regulate most development projects within the zones. Projects include all land divisions and most structures for human occupancy. Single family wood-frame and steel-frame dwellings up to two stories not part of a development of four units or more are exempt. However, local agencies can be more restrictive than state law requires. Before a project can be permitted, cities and counties must require a geologic investigation to demonstrate that proposed buildings will not be constructed across active faults. An evaluation and written report of a specific site must be prepared by a licensed geologist. If an active fault is found, a structure for human occupancy cannot be placed over the trace of the fault and must be set back from the fault (generally 50 feet).”
Figure A-1. Sample Earthquake Fault Zone Map [from: http://www.consrv.ca.gov/dmg/rghm/a-p/releases/mpnp.htm] Official Earthquake Fault Zones (EFZ) encompass traces of the Simi-Santa Rosa fault zone (not shown here). EFZs are shown in yellow; EFZ boundaries are shown as red circles connected by straight red line segments. The city boundary of Camarillo is delineated in light blue and Moorpark is shown in yellow.

15
Figure A-2. A sample hazard map showing liquefaction(green) and landslide (blue) susceptible areas (from http://www.consrv.ca.gov/dmg/shezp/maps/m_bur5.htm)