ENGINEERING DATA TRANSMITTAL No. - OSTI.GOV
272
P.0. 1 01 1 1.~0~ 628097 ENGINEERING DATA TRANSMITTAL 3. From: (0riOh.thp~btion) Distribution Retrieval Engineering 5. PmjlpmaJmpwcm.: 8. Cflghlor Runaw: 12. To: (Rocaivhg Organkmtbn) p R. S. Popielarczyk 373-5751 Document transmitted for approval and release. 4. Reblod EDT No.: 7. PunhrOrdarNo.: N/A N/A '0. Eq~.lcwnpocmrd No.: 10. wwff8dyy: Tank Pam 12. M.lorAUm. w. No.: 1 I RPP-5346 0 Waste Feed Delivery EQ 1 Transfer System Analysis ~~ ED-7400-172-2 (10/97) 00-7400-172-1
-
Upload
khangminh22 -
Category
Documents
-
view
1 -
download
0
Transcript of ENGINEERING DATA TRANSMITTAL No. - OSTI.GOV

P.0. 1 01 1 1 . ~ 0 ~ 628097 ENGINEERING DATA TRANSMITTAL
3. From: ( 0 r i O h . t h p ~ b t i o n )
Distribution Retrieval Engineering
5. PmjlpmaJmpwcm.:
8. Cflghlor Runaw:
12. To: (Rocaivhg Organkmtbn)
p R. S. Popielarczyk 373-5751
Document transmitted for approval and release.
4. Reblod EDT No.:
7. PunhrOrdarNo.:
N/A
N/A
'0 . Eq~.lcwnpocmrd No.:
10. w w f f 8 d y y :
Tank P a m 12. M.lorAUm. w. No.:
1 I
RPP-5346 0 Waste Feed Delivery EQ 1
Transfer System Analysis
~~
ED-7400-172-2 (10/97) 00-7400-172-1

~
DISTRIBUTION SHEET r
R. E. Larson
C. E. Leach
J. W. Lentsch
T4-07 X
R1-44 X
R3-25 x

DISTRIBUTION SHEET
To Distribution Proiect Titlework Order
- Page 2 of 2
Date May 3, 2000
RPP-5346, Rev. 0, Wate Feed Delivery Transfer System Analysis
Name
EDTNo. 628097
Text Attach.1 EDTIECN MSlN With All Text Only Appendix Only Attach. Only
~~
T. C. oten
S . M. O'Toole
R. S. Popielarczvk
G. W. McLellan I R3-47 I X I I I
R3-83 5
R2-53 X
R2-58 X
W. J. Millsap I R3-73 1 X I I I
J. A. Ranschau
S. €I. Rifaey
R. W. Root
D. H. Shuford
R. M. Orme I R3-73 I X I I I
57-07 X
R2-58 X
R2-53 X
R3-83 X
J. E. Van Beek
w. L. willis
W. J. Powell I S5-13 I X I I I
R3-47 X
R3-73 2
~~~
DIMC
K. S. Tollefson I R1-51 I X 1 I I
H7-15 X
Central Files I A3-88 I X I I I DOE Readins Room I H2-53 I X I I I
A-WOO-135 (lOB7)

s
Waste Feed Delivery Transfer System
RPP-5346 Revision 0
Prepared for the U.S. Department of Energy Assistant Secretary for Environmental Management
CH2MHILL Hanford Group, Inc.
Richland, Washington
Contractor for the U.S. Department of Ener y Office of River Protection under Contract DbC06-99RLl4047
Approved for Public Release; Further Dissemination Unlimited

LEGAL DISCLAIMER This report was prepared as an account of work sponsored by en agency of the United States Government. Neither the United States Government nor any agency thereof, nor any of their employees, nor any of their contractors, subcontractors or their employees, makes any warranty, express or implied, or assumes any legal liability or responsibility for the accuracy, completeness. or any third party's use or the results of such use of any information, apparatus, product, 01
process disclosed, or represents that its use would not infringe privately owned rights. Reference herein to any specific commercial product, process, or service by trade name, trademark, manufacturer, or otherwise. does not necessarily constitute or imply its endorsement, recommendation, or favoring by the United States Government or any agency thereof or its contractors or subcontractors. The views and opinions of authors expressed herein do not necessarily state or reflect those of the United States Government or any agency thereof.
This report has been reproduced from the best available COPY. Available in paper copy end microfiche.
Available electronically at htto://www.doe.novhridge. Available for a processing fee to the U.S. Department of Energy and its contractors, in paper, from: U.S. Depanment of Energy Office of Scientific and Technical Information P.O. Box 62 Oak Ridge, TN 37831-0062 phone: 865-576-8401 fax: 865-576-5728 email: [email protected](4231 576-8401
Available for sale to the public, in paper, from: U S . Department oi Commerce National Technical Information Service 5285 Pori Royal Road Springfield, VA 221 61 Phone: 800-553-6847 fax: 703-605-6900 email: orders@ ntis.fedworld.gov online ordering: http://www.ntis.eov/orderinn,htm
Printed in the United Slates of America

RPP-5346, Rev. 0
Waste Feed Delivery Transfer System Analysis
L. J. JUlyk .nd T. C. Otmn W. L. Willis CH2M Hill Hanford Group, Inc. Numatec Hanford Corporation Rlchland, W 99352 US. Department of Energy Contract DE-ACOB-00RL14047
Cost Center: 74700 Charge Code: 110300 B(LR Code: ~ 3 1 3 0 0 0 0 Total Pages: 291 EDTECN: 628097 UC: 721
hyhbrdS: Double-Shell Tank, Waste Feed Delivery, Engineering Basis, Waste Transfer System, Transfer Piping, Transfer Pumps
Abstract: This document provides a documented basis for the required design pressure rating and pump pressure capacity of the Hanford Site waste-transfer system in support of the waste feed delivery to the privatization contractor for vitrification. includes the 200 East Area double-shell tank waste transfer pipeline system and the associated transfer system pumps for a11 Phase 1B and Phase 2 waste transfers from AN, AP, AW, AY, and A2 Tank Farms.
The scope of the analysis
Approved For Public Release
AgoO2-767 (10199)

RPP-5356 Revision 0
Waste Feed Delivery Transfer System Analysis
Prepared by:
L. J. Julyk T. C. Oten W. L. Willis
Date Published May 2000
CH2MHILL Hanford Group, Inc.
P. 0. Box 1500 Richland, Washington
Contractor for the US. Department of Ener y Office of River Protection under Contract Dk-AC08-99RL14047
Approved for Public Release; Further Dissemination Unlimited

RPP-5346 REV 0
This page intentionally left blank.
.. 11

RPP-5346 REV 0
SUMMARY
This engineering analysis was prepared to provide a documented basis for the design pressure rating of the waste-transfer system pipeline and a documented basis for the design and operating pressure of the transfer-system pumps. The waste-transfer system will be used to transfer waste from the Hanford Site double-shell and single-shell tanks to the privatization contractor for vitrification. The scope of the analysis includes all Phase 1B and Phase 2 waste transfers from the AN, AP, AW, AY, and A 2 Tank Farms. In performing the analysis, no assumptions were made that might restrict how the wastes are processed before transfer to the privatization contractor. The analysis focuses on the hydraulics of the waste-transfer system using available waste-characterization data. The analysis also compares the design pressure rating of the existing transfer system pipeline to the design pressure rating determined by this analysis.
The initial approach of the analysis was to identify waste properties for each tank and then calculate the pressure drop through the planned transfer routes using the tank-specific waste properties. The pressure drop information is used to determine the pipe and pump design pressure ratings. Calculation of the pressure drop requires knowledge of the waste properties in addition to the physical dimensions of the transfer system. Waste properties include the liquid density, liquid viscosity, particle density, particle size distribution, and volume percent solids. After reviewing available waste-property information, it was found that there are insufficient tank-specific data available to perform the pressure drop calculations. Additionally, the waste feed delivery plan for Phase 1B and Phase 2, which identifies individual waste transfers, has not been finalized. Identification of individual waste transfers is required to determine the physical route of the transfer pipeline and to calculate the pressure drop. In the absence of complete tank- specific waste-property data for each tank and a final plan for waste transfers, the pressure drop for each of the Phase 1B and Phase 2 waste transfers could not be calculated.
As an alternative, this analysis calculates the pressure drop through each transfer route using three sets of typical slurry waste properties. Slurry waste properties, rather than supernate waste properties, were chosen to evaluate each transfer route to provide maximum flexibility for planning of the Phase 1B and Phase 2 transfers. If all of the transfer lines are capable of carrying slurry waste, the Phase 1B and Phase 2 transfers can use any of the transfer pipelines to transfer waste to the privatization contractor. The first set of waste properties was chosen to provide a conservative set of values that would encompass all of the tank waste transfers; it included 30 volume percent solids. The second and third sets of waste properties, while still somewhat conservative, were chosen to be more representative of actual slurry waste properties. These sets of properties included 15 and 10 volume percent solids, respectively, and are similar to the design bases used for projects that are currently making modifications to the waste-transfer system. In addition to the evaluation of the three sets of slurry waste properties, the pressure drop through each of the transfer routes was calculated for a total of 52 different combinations of waste properties. These combinations included supernate and slurry waste transfers. The waste combinations provide an indication of the sensitivity of the pressure drop in the pipeline to variations in the waste properties. The waste combinations also provide a tool to quickly evaluate the pressure drop through a particular transfer route with different waste properties. Waste-transfer routes were identified for all Phase 1B transfers using Hanford Tank Waste Operations Simulator (HTWOS) Cases 3.94 and 3S6D. The physical characteristics of each of
... 111

RPP-5346 REV 0
these waste-transfer routes were identified and used as the basis for the pressure-drop calculations. Transfer system physical characteristics include pipe size, equivalent lengths of the carbon steel and stainless steel portions of the transfer pipeline, changes in elevation over the transport route, and pipe interior surface roughness. The transfer routes that were evaluated are comprised of the existing transfer-system infrastructure and the modifications that are planned by Projects W-211, W-314 and W-521.
Calculation of the pressure drop through the transfer-system piping requires a determination of the critical velocity of the waste. The critical velocity correlation in “The Critical Velocity in Pipeline Flow of Slumes” (Oroskar and Turian 1980) was used to determine the minimum waste transport velocity required to maintain solids in suspension for slurry transfers. The velocity at the transition from laminar to turbulent flow was used as the critical velocity for supernate transfers. The pressure drop in the system is calculated at 1.3 times the predicted critical velocity to assure an adequate margin. The pressure-drop correlations in “Solid-Liquid Flow Slurry Pipeline Transportation” (Wasp et. al. 1977), with modifications from Applied Fluid Dynamics Handbook (Blevins 1984), were used to determine the drop in pressure resulting from friction losses in the transfer pipeline. The calculated pressure drop was then compared to the design pressure rating of the pipeline. Transfer routes that exceeded the pipe design pressure rating at the critical velocity were identified.
The results of this analysis show that supernate transfers will not exceed the design pressure rating of any of the transfer routes that were evaluated. There is sufficient design margin in the waste-transfer system to transfer supernate. The results of the analysis for slurry transfers show that portions of the waste-transfer system may not be adequate. Using the enveloping first set of slurry waste-property data (Appendix D, Case 3b, Group 2 Properties), a majority of the transfer routes would be subject to settling of solids and possibly plugging of the pipeline. The second and third sets of data (Appendix D, Case 4, Groups 1 and 2 Properties), which more closely approximate the actual waste streams, resulted in a slightly smaller percentage of pipelines being susceptible to plugging. The analysis indicates that there is insufficient design margin in the waste-transfer system to support the use of any of the three selected sets of slurry waste properties. An accurate evaluation of the hydraulics of the transfer system requires a more complete determination of the actual properties of the slurry during transfer. The results of the analysis also indicate that the pressure drop in the system is sensitive to changes in waste properties. A reduction in particle size, particle density, or volume percent solids will each reduce the pressure drop in the system. Reductions in more than one of these waste properties has the potential to significantly reduce the pressure drop in the system.
Based on the results of this analysis, alternatives are identified and recommendations are made to improve the ability to accurately evaluate the waste-transfer system. The recommendations are summarized below.
0
0
Consider addition of a lift station or staging transfers through Ap tank farm
Investigate the viability of increasing the design pressure rating of the existing waste- transfer pipeline that is rated at 1.9 MPa (275 Ibf/in2)
Determine the maximum design pressure rating of the new waste-transfer pipeline being installed by Project W-314 that could be achieved without design modifications
iv

RPP-5346 REV 0
Establish a test program to determine the maximum design pressure rating of the Plutonium-Uranium Extraction (PUREX) facility jumper connectors
Review particle-size data to identify methods of reducing the uncertainty associated with particle size and density
Inspect the inside of existing transfer lines to establish a baseline condition for the pipe to assess the level of corrosion and roughness
Ensure that future tank samples are analyzed for properties relevant to the determination of critical velocity and pressure drop and validate modeling with Hanford waste or simulant
Investigate the application of process controls to control or limit the range of waste properties that adversely affect pressure drop in the transfer system.
The results of this analysis should only be used for conceptual design and planning until more accurate waste characterization information is available.
All eight recommendations do not need to be performed. Favorable results from the recommendations related to waste characterization could preclude the necessity for a hardware related fix. Alternatively, some combination of hardware and better waste property characterization could be sufficient to ensure that the transfer system is adequate for the waste feed delivery mission.
V

RF'P-5346 REV 0
This page intentionally left blank.
vi

RPP-5346 REV 0
CONTENTS
1 . 0
2.0
INTRODUCTION ............................................................................................................ 1-1
WASTE FXOW CHARACTERISTICS .......................................................................... 2-1 2.1 CLASSIFICATION OF SLURRIES ................................................................... 2-1 2.2 CRITICAL VELOCITY ...................................................................................... 2-4 2.3 PRESSURE-DROP CORRELATIONS ............................................................... 2-7 2.4 EFFECT OF VARIATIONS ON CRITICAL VELOCITY AND
PRESSURE DROP ............................................................................................ 2-12
WASTE TRANSPORT BEHAVIOR .............................................................................. 3-1 3.1 WASTE PROPERTIES ........................................................................................ 3-1 3.2 TRANSFER SYSTEM CHARACTERISTICS ................................................... 3-2
Pipeline Diameter, Length, and Elevation Changes ................................. 3-2
3.0
3.2.1
3.2.3
. . 3.2.2 Pipeline Roughness .................................................................................. 3-3 Pipeline Design Pressure .......................................................................... 3-4
4.0 RESULTS ......................................................................................................................... 4-1 4.1 GENERAL ........................................................................................................... 4-1 4.2 CRITICAL VELOCITY ANALYSIS .................................................................. 4-3 4.3 PRESSURE-DROP ANALYSIS ......................................................................... 4-4 4.4 SENSITIVITY ..................................................................................................... 4-6 4.5 UNCERTAINTIES .............................................................................................. 4-8
4.5.1 Waste Characterization ............................................................................ 4-8 4.5.2 4.5.3 Critical Velocity and Pressure-Drop Correlations ................................... 4-9 4.5.4 Waste Rheology ....................................................................................... 4-9
Pipe Surface Roughness ........................................................................... 4-8
5.0 CONCLUSION ................................................................................................................ 5-1 5.1 DISCUSSION ...................................................................................................... 5-1 5.2 RECOMMENDATIONS ..................................................................................... 5-3
6.0 REFERENCES ................................................................................................................. 6-1
vii

RPP-5346 REV 0
APPENDICES
A Hanford Tank Waste Physical Property Estimates ................................................................. A-i B Transfer Routes in 200 East Area ........................................................................................... B-i C Surface Roughness of Carbon Steel and Stainless Steel Waste Transfer Lines Caused
by Corrosion and Scaling ....................................................................................................... C-i D Critical Velocity and Pressure Loss Evaluation Results for Double-Shell Tank
Transfer Piping in 200 East Area for Tank-to-Tank and Tank-to-BNFL Inc. Transfers Based on Hanford Tank Waste Operation Simulator Cases 3S4 and 3S6 Distinct Transfer Route Identification for Proposed Phase 1B Waste Feed Delivery Transfers ......... D-i
G Wasp Model Verification ....................................................................................................... G-i
E Sensitivity Analysis of the Transfer Route from Tank 241-AN-107 to BNFL Inc. ............... E-i F Critical Velocity and Pressure-Drop Correlation Equations .................................................... F-i
LIST OF FIGURES
2-1. Flow Regimes. ..................................................................................................................... 2-1
2-2. Pressure Loss vs. Velocity for a Heterogeneous Slurry ....................................................... 2-4
2-3. Pressure Loss vs. Velocity for a Homogeneous Slurry ........................................................ 2-5
2-4. “Vehicle” to Liquid Density and Viscosity Ratios vs. “Vehicle” Solids Concentration. ..2-10 . . . 3-1. C-104 Particle Size Distribution. ......................................................................................... 3-2
4-1. Waste-Property Sensitivity (AN-107 to BNFL). ................................................................. 4-7
4-2. Waste-Transfer System Sensitivity (AN-107 to BNFL) ...................................................... 4-7
5-1. Typical Purnp/System Curve. .............................................................................................. 5-3
LIST OF TABLES
2-1. Key Variables ..................................................................................................................... 2-13
3-1. In Situ Waste Properties ....................................................................................................... 3-1
3-2. Pipe Surface Roughness Estimates. ..................................................................................... 3-4
4-1. Waste-Property Comparison. ............................................... ............................................... 4-3
5-1. Waste-Property Design Criteria. .......................................................................................... 5-4
5-2. Pipe and Pump Design Criteria ............................................................................................ 5-5
. .
. .
viii

DST EOL HLW HTWOS LAW PUREX “C CP O F
ft ID in. kg k g n L Ibf/in2 mil MPa
Cun S
RPP-5346 REV 0
LIST OF ABBREVIATIONS AND UNITS
double-shell tank end of life high-level waste Hanford Tank Waste Operation Simulator low-activity waste Plutonium-Uranium Extraction (facility) degrees Celsius centipoise = 0.001 kg/m-s degrees Fahrenheit feet = 0.3048 meters (m) internal diameter inch = 2.54 centimeters (cm) kilogram kilogram per liter liter pounds per square inch = 0.006895 megapascals (MPa) 0.001 inch (in.) megapascal second (unit of time) micrometer or micron
ENGLISH SYMBOLS USED IN EQUATIONS
coefficient of drag liquid phase volume fraction particulate solid phase volume fraction particulate solid phase median size diameter internal pipe diameter pipe friction factor (Darcy) for siurry = f - f,, pipe friction factor for heterogeneous particulate solid phase of slurry pipe friction factor for homogeneous “vehicle” liquid phase of sluny gravitational acceleration fluid head head loss length of pipe hindered settling velocity exponent pressure flow regime designation particle Reynolds number pipe flow Reynolds number slurry velocity generic term for critical velocity
ix

RPP-5346 REV 0
vs V* V,
Xcaustic
Xsalt
Y 6 &V
P
settling velocity friction velocity characteristic velocity of a settling particulate fraction of dissolved solids composed of sodium hydroxide fraction of dissolved solids composed of sodium salts and other salts
GREEK SYMBOLS USED IN EQUATIONS
ratio of hindered settling velocity to critical velocity angle of pipeline relative to horizontal (positive for upward slope) percent root mean square deviation from critical velocity experimental data carrier liquid phase density particulate solid phase density homogeneous “vehicle” density density of water fraction of the turbulent fluid eddies that possess a velocity larger than the particulate settling velocity total volume percent solids attributed to homogeneous “vehicle” phase of slurry +sj - QVj, solid concentration of j” particle size remaining in heterogeneous phase of slurry solid concentration at pi solid concentration for j pamcle size attributed to homogeneous “vehicle” phase of slurry ratio of mass transport coefficient to momentum transport coefficient (see Equation 9) von Karman boundary-layer constant (see Equation 9) roughness of pipe carrier liquid phase viscosity homogeneous “vehicle” viscosity viscosity of water head loss per unit length of pipe
centerline for j” particle size r .
X

RPP-5346 REV 0
1.0 INTRODUCTION
CH2M HILL Hanford Group, Inc. is responsible for delivering waste from tanks on the Hanford Site to the privatization contractor for vitrification, BNFL Inc. As part of the planning process for waste feed delivery, the capability of the waste-transfer system is being evaluated. The waste-transfer system comprises the transfer pumps, transfer pipelines, transfer system valves, and associated structures and instrumentation used to transport waste between storage tanks and from storage tanks to the privatization contractor. Waste will be pumped out of the tanks using new transfer pumps and will be delivered to the privatization contractor through a combination of new and existing transfer pipelines. Double-Shell Tank (DST) Subsystem specifications are being prepared as a basis for the conceptual design of the new and replacement equipment required to provide a safe and reliable system for transferring waste. These specifications will include design criteria for parameters such as pipe size, pipe material, range of flow rates, transfer pump operating conditions, and waste characteristics. The purpose of this analysis is to provide a documented basis for DST subsystem specifications for piping and pumps.
Wastes have been successfully transferred between tanks at the Hanford Site for more than 50 years. Although a number of pipelines have been plugged during that period, the cause of the plugging generally has been attributed to the formation of salts as the waste cooled in the pipeline. Previous slurry transfers in the tank farms typically were maintained above a specified flow velocity to ensure that any solids that might be present in the waste would not settle out during the transfer. For approximately the last 20 years, the minimum flow velocity was specified in terms of a minimum Reynolds number of 20,000. In an 80 mm (3-in.) nominal pipeline, this equates to a flow velocity of approximately 1.8 m/s (6 Ws). To meet the mission of delivering waste feed to the privatization contractor, the existing transfer system had to be extended to the location of the new vitrification facility. This extension of the transfer system adds approximately 1,220 m (4,000 ft) of equivalent pipe length to connect the existing transfer system to the privatization contractor. Before the preparation of this analysis, several preliminary pressure-drop calculations were performed to evaluate the adequacy of the new waste-transfer routes to the vitrification facility. The results of the calculations indicated that the existing transfer pipelines might not be adequate to meet the needs of the waste feed delivery program.
The initial approach of the analysis was to identify waste properties for each tank and then calculate the pressure drop through the planned transfer routes using the tank-specific waste properties. The pressure drop information is used to determine the pipe and pump design pressure ratings. Calculation of the pressure drop requires knowledge of the waste properties in addition to the physical dimensions of the transfer system. Waste properties include the liquid density, liquid viscosity, particle density, particle size distribution, and volume percent solids. After reviewing available waste-property information, it was found that there are insufficient tank-specific data available to perform the pressure drop calculations. Additionally, the waste feed delivery plan for Phase 1B and Phase 2, which identifies individual waste transfers, has not been finalized. Identification of individual waste transfers is required to determine the physical route of the transfer pipeline and to calculate the pressure drop. In the absence of complete tank- specific waste-property data for each tank and a final plan for waste transfers, the pressure drop for each of the Phase 1B and Phase 2 waste transfers could not be calculated.
1-1

RPP-5346 REV 0
As an alternative, this analysis calculates the pressure drop through each transfer route using three sets of typical slurry waste properties. Slurry waste properties, rather than supernate waste properties, were chosen to evaluate each transfer route to provide maximum flexibility for planning of the Phase 1B and Phase 2 transfers. If all of the transfer lines are capable of carrying slurry waste, the Phase 1B and Phase 2 transfers can use any of the transfer pipelines to transfer waste to the privatization contractor. The first set of waste properties was chosen to provide a conservative set of values that would encompass all of the tank waste transfers; it included 30 volume percent solids. The second and third sets of waste properties, while still somewhat conservative, were chosen to be more representative of actual slurry waste properties. These sets of properties included 15 and 10 volume percent solids, respectively, and are similar to the design bases used for projects that are currently making modifications to the waste-transfer system. In addition to the evaluation of the three sets of slurry waste properties, the pressure drop through each of the transfer routes was calculated for a total of 52 different combinations of waste properties. These combinations included supernate and slurry waste transfers. The waste combinations provide an indication of the sensitivity of the pressure drop in the pipeline to variations in the waste properties. The waste combinations also provide a tool to quickly evaluate the pressure drop through a particular transfer route with different waste properties. Waste-transfer routes were identified for all Phase 1B transfers using Hanford Tank Waste Operations Simulator (HTWOS) Cases 3S4 and 3S6D. The physical characteristics of each of these waste-transfer routes were identified and used as the basis for the pressure-drop calculations. Transfer system physical characteristics include pipe size, equivalent lengths of the carbon steel and stainless steel portions of the transfer pipeline, changes in elevation over the transport route, and pipe interior surface roughness. The transfer routes that were evaluated are comprised of the existing transfer-system infrastructure and the modifications that are planned by Projects W-211, W-314 and W-521.
This analysis is concerned with the hydraulics of the waste as it is transported through the transfer system. The waste is considered to be a slurry because it is composed of a mixture of solids and liquid. The Hanford Site tank wastes cover a broad range of chemical compositions with a diversity of physical and rheological properties. Additionally, some of these properties are very sensitive to changes in temperature, pH, and salt concentrations. The analysis that follows is based on slurry properties alone. Although changes in viscosity with temperature are addressed, the effects of changes in temperature, pH, or salt concentrations are in general beyond the scope of this analysis.
Correlations for determining critical velocity and pressure drop resulting from friction losses in the waste-transfer system are discussed in Section 2.0. In Section 3.0, the various sources of information for the waste properties and transfer system characteristics are identified and some of the shortcomings in the data are discussed. An evaluation of the results of the analysis is included in Section 4.0, along with a description of some of the uncertainties associated with the analysis. Conclusions and recommendations are presented in Section 5.0. References cited in the text are listed in Section 6.0.
1-2

RPP-5346 REV 0
2.0 WASTE FLOW CHARACTERISTICS
Transfer of wastes from the tanks to the privatization contractor will require pumping a mixture of liquids and solids through the waste-transfer system. These mixtures are commonly referred to as suspensions or slurries. Prediction of the flow characteristics of a slurry often is more difficult than for a single-phase fluid because of the large number of variables required to describe the flow and the complexity of the solid-liquid interactions. Before the flow characteristics of the transfer system can be analyzed, the behavior of the slurry must be classified.
2.1 CLASSIFICATION OF SLURRIES
A large number of empirically based correlations have been developed to describe the behavior of slurries as they flow through piping systems. The correlations of interest in this analysis address flows with solids that are fully suspended. These correlations are divided broadly into two categories that treat the slurry as either a homogeneous mixture or a heterogeneous mixture. Within each of these categories, the slurry may be treated as either a single-phase or a multi- phase mixture. Although a slurry may be classified as either homogeneous or heterogeneous, it is far more common for the slurry to exhibit characteristics of both. Figure 2-1 shows a comparison of the distribution of solids for different categories of flow. The proper classification of slurry behavior is essential if the flow characteristics of the transfer system are to be modeled accurately.
Figure 2-1. Flow Regimes.
. .. . .*. . .. .. . .. ... .. . .*.... . .- . . .. . . . .. . . .*...e. -.: ’ . .. ... ..* .
Fully Segregated Flow Heterogeneous Flow Homogeneous Flow (Moving or Stationary Bed)
Homogeneous flow describes the condition where the solid particles are distributed uniformly throughout the cross section of the pipe. An inherently homogeneous flow generally is found in slurries containing high concentrations of solids and small particle sizes (Le., particle diameter 4 0 p). Homogeneous behavior also can be found in slurries with larger particle sizes where the solid-to-liquid density ratio is small or in slurries that flow with sufficient turbulence to distribute the particles evenly. The effect of the small particles in a homogeneous slurry is to increase the viscosity of the mixture as the solids concentration increases. At higher
2- 1

RPP-5346 REV 0
concentrations, the mixture will likely begin to exhibit non-Newtonian behavior. The point at which non-Newtonian behavior begins is difficult to predict because it is a function of the particle size distribution, particle shape, solids concentration, solid-to-liquid density ratio, and particle surface forces. Another characteristic of homogeneous flow is that the viscous or turbulent forces are dominant and the particle inertial forces are small. In the case of inherently homogeneous slurries, this characteristic results in a slurry that can flow at very low velocities without settling and allows the slurry to be treated as a single-phase fluid at all flow velocities. Examples of slurries that are inherently homogeneous include concentrated suspensions of fine limestone, paint, and ink.
Heterogeneous flow occurs when the solid particles are not distributed evenly across the cross section of the pipe although the particles are in suspension. The flow is characterized by a gradient in concentration along the vertical axis of the pipe. Heterogeneous flow generally is found in slurries with low concentrations of solids and larger particle sizes. It also can be found in slurries with smaller particle sizes when the solid-to-liquid density ratio is large. The larger particles found in heterogeneous flow do not have a significant effect on the viscosity of the mixture, and the flow is usually Newtonian in nature. Slllrries with a broad distribution of particle sizes may exhibit non-Newtonian behavior as the fine particles change the behavior of the liquid phase and the larger particles are carried along in a heterogeneous suspension. The particle inertial forces are more significant in heterogeneous flow because of the mass of the particles; therefore, the liquid and solid phases of the mixture are considered separately. Examples of slurries that behave heterogeneously include mixtures of sand or coal in water.
Although no single waste characteristic can be used to classify the behavior of a slurry, the particle size and the ratio of particle density to liquid density are important parameters. Documented particle size distributions for the double-shell tanks (DST) cover a wide range of values. Some tanks, such as 241-SY-101, contain particles that range from <I pm to >IO00 pm (Results of Viscosity Measurements of Tank 241-SY-IO1 Samples [ORourke 19991). Similarly, Tank 241-AW-101 covers a range of -6 pm to >IO00 pm (Resulrs ofDiluiion Studies wirh Wuste from Tank 241-AW-101 [HNF-4964]. Tank 241-AZ-101 has a range of 5 pm to 225 pn (Tank Characterization Report for Double-Shell Tank 241-AZ-IO1 [WHC-SD-WM-ER-410]). Other tanks have narrower distributions, such as 241-AN-104 with a range of <I pm to 40 pm (Results of Dilution Studies with Waste from Tank241-AN-104 [HNF-33521) and 241-AN-I05 with a range of <1 pm to 40 pn (Results of Dilution Studies with Waste from Tank 241-AN-105 [HNF-SD-WM-DTR-0461). Based on the data available, the range of particle sizes is so broad that the waste slurry that will be transferred cannot be classified as exhibiting either homogeneous or heterogeneous behavior. The waste will exhibit some combination of homogeneous and heterogeneous behavior depending on the mixture velocity, the ratio of particle density to liquid density, and the particle size distribution by volume.
Within the categories of homogeneous and heterogeneous slurries, the rheology of the slurry can be classified as either Newtonian or non-Newtonian. Viscosity is a measure of a fluid's resistance to deformation and is defined as the ratio of shear stress to shear rate. For a Newtonian fluid, the ratio of shear stress to shear rate is constant over a defined range of shear rates. In a Newtonian slurry, the viscosity does not change as the flow velocity in the transfer system pipe changes. Typical non-Newtonian slurries are characterized by viscosities that increase (shear thickening) or decrease (shear thinning) with increasing flow velocity and often
2-2

RPP-5346 REV 0
have a yield strength that must be overcome before flow will occur. Viscosity measurements are not available for a majority of the tanks, and the data that are available do not necessarily reflect the condition of the waste when it will be pumped through the waste-transfer system. Some tanks will be mixed to homogenize the waste, which will then be pumped to the vitrification plant. For other tanks the supernatant will be pumped off first, the remaining solids will be dissolved, and the remaining waste will be transferred to the privatization contractor. Other tanks will be mixed together, potentially changing the rheology of the waste before it is transferred to the privatization contractor. To properly model the flow characteristics of the waste it is necessary to understand its rheology. In the absence of specific data, and given that it is extremely difficult to accurately predict the viscosity of a mixture based on its individual constituents only, some simplifying assumptions were made.
Documented viscosity measurements indicate that the waste samples are predominately Newtonian. However, some samples exhibit non-Newtonian behavior. When reviewing the non-Newtonian test data, it was noted that most of the measurements were performed on tank samples that are not representative of the condition of the waste when it will be pumped. The waste samples typically are representative of in situ tank conditions and do not duplicate the dissolution of salts and mixing of the waste that will occur before being transferred. Dissolution and mixing in the tank has the effect of reducing the solids volume percent below the levels that would be found in a sample taken from a settled, undiluted tank. As the volume percent of solids is reduced, the behavior of the waste will tend toward Newtonian behavior. The non-Newtonian behavior primarily is a result of the presence of the solids in the slurry. It is important to note that there is the possibility that some wastes may be non-Newtonian when they are transferred. As more representative sample data are obtained, it may be possible to predict non-Newtonian behavior. For the purposes of this analysis, based on the data available and the anticipated waste characteristics, the waste that will be pumped through the transfer system will be modeled as Newtonian.
In analyzing the waste-transfer system, it is necessary to determine the critical velocity and the relationship between flow rate and pressure drop. The critical velocity is the minimum velocity that should be maintained to ensure stable and reliable operation of the system. The pressure drop through the waste-transfer system is required to establish the pipe design pressure and pump head requirements. Because the number and range of variables affecting slurry flow are large and the mechanics of the solid-liquid interactions are complex, there are no purely analytical solutions available. Instead, the equations presented in this analysis are correlations based on published data that were developed to predict critical velocity and pressure drop in slurry pipelines. The correlation for critical velocity is described in Section 2.2. The correlation for predicting pressure drop is discussed in Section 2.3. For a more detailed discussion of slurry flow and the derivation of these correlations, see “The Critical Velocity in Pipeline Flow of Slurries” (Oroskar and Turian 1980); Flow Velocity Analysis For Avoidance of Solids Deposition During Transport of Hanford Tank Waste Slurries (“F-2728); and “Solid-Liquid Flow Slurry Pipeline Transportation” (Wasp et al. 1977).
2-3

RPP-5346 REV 0
2.2 CRITICAL VELOCITY
In heterogeneous flow, operation of the waste-transfer system below a specified minimum velocity will result in solids settling or sliding along the bottom of the pipe. Continued operation below the critical velocity eventually will lead to plugging of the pipe. The critical velocity for a heterogeneous slurry is the velocity at which the solids begin to settle and is called the limit deposit velocity. The limit deposit or deposition velocity of a heterogeneous slurry is usually in the turbulent flow regime. Figure 2-2 shows the relationship between pressure loss and flow velocity for a heterogeneous slurry.
Figure 2-2. Pressure Loss vs. Velocity for a Heterogeneous Slurry.
LOGVELOCITY
In homogeneous flow, the critical velocity corresponds to the point at which the flow transitions to a turbulent flow regime. In purely homogeneous flow, deposition of solids does not occur below some minimum velocity. Nevertheless, it is desirable to maintain flow above the laminar- to-turbulent transition region (Reynolds number approximately > 4000) to ensure stable flow. In this analysis, both the limit deposit velocity and the transition velocity are calculated, and the greater of the two values is identified as the critical velocity. Figure 2-3 shows the relationship between pressure loss and flow velocity for an inherently homogeneous slurry.
The concept of critical velocity is very useful in designing slurry transport systems. If the flow rate is less than the critical velocity, buildup of solids will occur and the line will possibly plug. If flow is maintained above the critical velocity, plugging of the transfer line as a result of solids settling out will be avoided. All that remains is to predict the critical velocity accurately. When working with heterogeneous slurries, a large number of correlations are available to predict the limit deposit velocity. Most of the correlations are derived empirically for a specific range of slurry properties. If the correlations are applied to slurries other than those for which they were derived, there generally is poor agreement between the various correlations and actual operating and test data. When designing a transport system for a known slurry composition, it is always preferable to determine the critical velocity by test. In the absence of actual test data, some correlations have been shown to be more accurate than others. An evaluation of seven different correlations documented by HNF-2728 found that the Oroskar and Turian (1980) correlation was
2-4

RPP-5346 REV 0
Figure 2-3. Pressure Loss vs. Velocity for a Homogeneous Slurry.
!
LOG VELOCITY
the most sophisticated and yielded the most conservative results over the range f waste characteristics expected at the Hanford Site. Figure F-15 of Appendix F compares a number of correlations in addition to comparisons given in HNF-2728.
The Oroskar and Turian (1980) empirical equation was developed as an extension of their semitheoretical correlation to improve the accuracy of the critical velocity prediction. It is based on extensive slurry flow research and was slightly more accurate than the semitheoretical correlation. The Oroskar and Turian (1980) correlation for limit deposit velocity is given by
(1)
\
where
v,, = critical velocity g = gravitational acceleration d, = mean particle diameter ps = solids density p~ = liquid density C, = solids volume fraction CL = liquid volume fraction = 1 D = pipe inside diameter p~ = liquid viscosity x = eddy velocity factor.
- cs
2-5

RPP-5346 REV 0
In formulating their correlation for critical velocity, Oroskar and Turian (1980) developed the concept that the turbulent eddy currents in the slurry flow are responsible for keeping the solids suspended. Because only a fraction of the eddies are effective in lifting the particles, the eddy velocity factor was derived to account for this effect and is given by
where
V I
v cr y = -
v, = particle hindered settling velocity.
The hindered settling velocity, v, , is the settling velocity of a particle that takes into account collisions with other particles, and is a function of the concentration of particles in the slurry:
vs = v-(C, )"
where
and the particle Reynolds number is defined as
Re - dPv"p~ P -
CLL
(3)
(4)
The analytical expression for "n" given in Equation 5 was derived by Estey and Hu (HNF-2728) as an approximation to the graphical relation given by Oroskar and Turian (1980).
For slurry flow, the Reynolds number is approximated assuming that the particles are spheres.
The terminal (free fall) settling velocity, v,, of a spherical particle in a stagnant unbounded liquid is given by
2-6

RPP-5346 REV 0
The drag coefficient, CD, for a sphere is given by:
1 CD =[ er + 0 . 3 m ( ~ ~ ~ . ~ ~ ~ ~ ~ + 1.72013 + 0.018R5
Note that an iterative procedure is required to obtain v, because it is implicitly defined in Equation 7 through the particle Reynolds number (Equation 6) as used in Equation 8 for the particle drag coefficient.
The above empirical correlation (Equation 1) is one of the better correlations for predicting critical velocity, with an overall 21.8% root mean square deviation compared to experimental data (Oroskar and Turian 1980). Note that the critical velocity, v,,, is implicitly defined in Equation 1 with the introduction of Equations 2 and 3. Hence, an iterative procedure is required to obtain the critical velocity.
2.3 PRESSURE-DROP CORRELATIONS
As with critical velocity, there are a number of correlations that have been proposed for predicting pressure drop in slurry transport systems. The correlations generally fall into the semitheoretical or empirical categories. The weakness with most of the correlations is their inability to predict the pressure drop accurately for slurries with a wide range of slurry properties and flow regimes. Wasp et al. (1977) proposed a correlation for calculating pipeline pressure loss for a slurry with a broad band particle size distribution that accounts for a combination of heterogeneous and homogeneous flow. The correlation employs the concept of a “two-phase vehicle” to describe the homogeneous portion of the flow. It postulates that the concentration and size distribution of the particles that are found at the top of the pipe are equally distributed throughout the pipe. These equally distributed particles and the carrier liquid form the homogeneous “vehicle” portion of the slurry. The method adjusts the density and viscosity of the carrier liquid to account for the effects of the smaller particles in the homogeneous portion of the slurry. The particles that are not equally distributed across the pipe comprise the heterogeneous portion of the slurry. These particles are suspended and carried along by the homogeneous “vehicle” portion of the slurry. Using this concept, the total pressure drop in the system is calculated by summing the pressure-drop contribution from the homogeneous “vehicle“ and the additional pressure drop resulting from the remaining heterogeneous suspension.
The Wasp et al. (1977) correlation defines a criterion for determining which portion of the slurry is treated as part of the “vehicle” based on experimental data from ‘Turbulent Transfer Mechanism and Suspended Sediment in Closed Channels” (Ismail 1952). The correlation considers a slurry to be homogeneous when the ratio of the solid concentration ($) at 0.08D from the top of the pipe to the solid concentration (as) at the pipe centerline is at least 0.8. Wasp et al. (1977) provided the following empirical relationship for determining the concentration ratio for each particle size in the particle size distribution that joins the carrier liquid to form the homogeneous “vehicle” phase:
2-7

RPP-5346 REV 0
(9)
where
~$$j = solid concentration at pipe centerline for j“ particle size of the particle size
&, = solid concentration for j“ particle size of the particle size distribution that joins with
p = constant for a given particle size, varying from 1.0 for fine particles less than
distribution
the carrier liquid to form the homogeneous “vehicle” portion of the slurry
approximately 100 pm to 1.3 for coarse particles on the order of 0.1 mm. A value of p = 1.0 was used in this analysis.
large solids concentrations. A value of IC = 0.4 was used in this analysis. K = von Karman boundary-layer constant, varying from 0.4 for clear liquids to 0.25 for
The terminal settling velocity, v,,,,for the j” particle size in the particle size distribution is calculated from Equation 7 but using the “vehicle” modified carrier liquid density (pJ and viscosity (pv) properties as defined below.
The friction velocity, VI, is defined as
* E v = v -
where
fw = f v + fd cos 8 f, = homogeneous “vehicle” contribution to the friction factor fd = f, - f, = heterogeneous contribution to the friction factor v =bulk velocity of the slurry.
The cos 8 factor accounts for pipe slope from horizontal per Applied Fluid Dynamics Handbook (Blevins 1984).
The homogeneous “vehicle” friction factor, fv, is calculated using an equation developed in “Friction Factor Equation Spans All Fluids Regimes” (Churchill 1977) which is valid for the laminar, transition, and turbulent flow regimes and is given by
2-8

RPP-5346 REV 0
where
E = roughness of pipe
The pipe Reynolds number, Re, is calculated as follows:
where
pv = density of the homogeneous “vehicle” phase of slurry pv = viscosity of the homogeneous “vehicle” phase of slurry.
The viscosity of the “vehicle”, pv, is calculated using the correlation given in “Transport Characteristics of Suspensions: Part VIII. A Note on the Viscosity of Newtonian Suspension of Uniform Spherical Particles” (Thomas 1965) as
pv = pL(1+2.5@, +10.05@: +0.00273exp(16.6@.,)) (15)
where
@“ = total “vehicle” solids concentration = E &j, summed over each particle size in the particle size distribution.
The viscosity of the carrier liquid, p ~ , is described in Appendix A and is given as
2-9

RPP-5346 REV 0
3.5
3
2.5
2
1.5
where
p~ = viscosity of carrier liquid pwwater = viscosity of water at temperature pwater = density of water at temperature p~ = density of carrier liquid x,dt = the fraction of dissolved solids composed of sodium and other salts = 0.9 xcaustic = the fraction of dissolved solids composed of sodium hydroxide = 0.1.
The “vehicle” liquid density is given by
pv = P A + PL(1 - a)”)
A graph of “vehicle” to liquid viscosity and density ratios versus solids content is shown in Figure 2-4.
VehicldLiquid ,,’ Viscosity Ratio
(Wk)
I .’ ,.
,, .-- VehcldLiquid
Density Ratio _. L
Figure 2-4. “Vehicle” to Liquid Density and Viscosity Ratios vs. “Vehicle” Solids Concentration.
The determination of pressure loss in a piping system using the Wasp et al. (1977) correlation involves an iterative process. The first iteration assumes that all of the solids form part of the “vehicle.” The head loss in the system that is attributable to the “vehicle” is calculated using Darcy’s formula
hL.- f Y v2 Ah” =--- L 2gD
2-10

RPP-5346 REV 0
where
fv = pipe friction factor (Darcy) for “vehicle” (Equation 11) Ah, = head loss per unit length of pipe attributed to homogeneous “vehicle” h L = head loss L = length of pipeline.
The ratio of @v/@s for each size fraction of particles is calculated and multiplied by the volume percent solids of that size fraction to determine the “vehicle” portion of the slurry. The balance of the solids is assumed to be part of the heterogeneous suspension. A second iteration is performed to determine the head loss attributable to the “vehicle.” The head loss attributable to the heterogeneous portion of the slurry is calculated for each size fraction of particles using the correlation in “The Hydraulic Transportation of Coal and Other Materials in Pipes” (Durand 1953) as
where
fdJ = heterogeneous contribution to the friction factor for j” particle size in particle size
Ah-.,- = head loss per unit length attributable to “vehicle” relative to carrier liquid, Le., distribution
= All+ P P L
Odj = heterogeneous volume percent solids for j” particle size fraction of the particle size distribution
= Osj - &j
CD, = drag coefficient of j” particle size using Equation 8 with carrier liquid density ( p ~ ) and viscosity (p~) properties.
The head losses for each of the size fraction of the particle size distribution are added together to determine the total head loss attributable to the heterogeneous portion of the slurry. This is added to the head loss for the “vehicle” to obtain the total friction head loss. The “vehicle” head loss must be converted to the carrier liquid before adding it to the heterogeneous portion of the slurry to maintain a consistent basis. Additional iterations are performed until the difference in head loss between successive iterations converges within some small tolerances. The described methodology has been modified slightly for this analysis to include the effects of elevation changes along the pipe route. The equation for pressure loss includes a cos 8 factor to account for friction losses as the slurry travels through an inclined pipe per Blevins (1984), see Equation 10 above. The resulting total head loss, including the change in elevation, is given by
2-1 1

RPP-5346 REV 0
where
hL = head loss 8 = angle of inclination of pipeline from horizontal.
Because some transfer routes contain a combination of carbon steel and stainless steel pipe lengths, the pressure drop is calculated for each respective length with the corresponding pipe roughness for carbon and stainless steel (see Section 3.2.2) to obtain the total head (or pressure) loss.
2.4
The variables required to determine critical velocity and pressure drop have been identified in Sections 2.2 and 2.3, respectively. While it is evident that the equations are nonlinear, it is not obvious what effect a change in these variables will have on the critical velocity and pipeline pressure drop. Table 2-1 lists the key variables and indicates the general impact that a variation will have on critical velocity and pipeline pressure drop. The impact on differential pressure assumes that the flow velocity is above the critical velocity.
EFFECT OF VARIATIONS ON CRITICAL VELOCITY AND PRESSURE DROP
2-12

RPP-5346 REV 0
Solids volume fraction
Table 2- 1 . Key Variables.
raise ,r ?. lower J. J.
Pipe inside raise ?. J. lower J. diameter
2-13

RPP-5346 REV 0
This page intentionally left blank.
2-14

FWP-5346 REV 0
ProDertr Nominal
3.0 WASTE TRANSPORT BEHAVIOR
Bounding
The rheological and physical properties of the waste and the physical characteristics of the transfer system define the behavior of the waste during transport. The correlations developed for predicting pipeline pressure drop and estimating critical velocity are based on a combination of heterogeneous and homogeneous flow. The correlations predict the waste behavior based on the individual characteristics of the liquid and solid components of the slurry. Waste properties include liquid density, liquid viscosity, solids density, solids size and distribution, and solids volume fraction. A discussion of these properties is provided in Section 3.1. Physical characteristics of the waste-transfer system include pipe inside diameter, length of pipe in the transfer route, elevation changes in the transfer route, and surface roughness of the inside of the pipe. These characteristics are discussed in Section 3.2. The pressure ratings of the existing pipelines are also identified in Section 3.2.
Volume percent solids (C,) I 15% 30% Liquid density ( p ~ ) 1.21 k g L 1.46 k g L -
3.1 WASTE PROPERTIES
Accurate measurement of waste properties is essential to the accurate prediction of critical velocity and system pressure losses. The group of waste transfers identified in Phase 1B of the Tank Waste Remediation System Operation and Utilization Plan to Support Waste Feed Delivery (HNF-SD-WM-SP-012) focuses on transfers from DSTs in the 200 East Area. An initial review of characterization data for the DSTs was performed to determine if sufficient data were available to support an analysis of waste transfers based on tank specific data. It was found that supernatant density data were available for most of the tanks. Solids volume percent data were available from the Hanford Tank Waste Operating Simulator (HTWOS) for all of the Phase 1B transfers. HTWOS maintains an inventory of the liquid and solid components of the waste as it is transferred between tanks. Solids density data were available for -40% of the tanks. Data for supernatant viscosity and solids diameter were available for <30% of the DSTs. Based on the lack of necessary input data, Process Engineering was requested to provide an estimate of slurry properties. The estimate, attached in Appendix A, provides a summary of nominal and bounding in situ waste properties to be used as a basis for the analysis of the waste-transfer system. The estimated properties are summarized in Table 3-1.
I Liquid viscosity (VL) * *
fraction of dissolved salts and caustic. The equation for viscosity is provided in Appendix A.
3- I

RPP-5346 REV 0
Some of the properties listed in Table 3-1 (Le., particle size and liquid density) are based on actual test data. Other properties (i.e., volume percent solids, solids density, and viscosity) are based on known correlations or engineering judgment. It should be noted that the nominal and bounding cases are not defined quantitatively. Nominal properties are intended to reflect an average tank, not any specific tank. Likewise, the bounding case does not envelop the most extreme values of the individual properties listed.
The specified particle size is the median value from a distribution of particle sizes. The analysis assumes that the distribution of particle sizes approximates a log-normal curve. In performing the pressure-drop analysis, the shape of the particle distribution remains the same. Only the median value of the distribution changes with changing median particle size. A graph of particle size distribution for Tank C-104 is shown in Figure 3-1. The shape of the distribution curve is typical of the distribution used in the analysis.
Figure 3-1. C-104 Particle Size Distribution.
3.2 TRANSFER SYSTEM CHARACTERISTICS
3.2.1 Pipeline Diameter, Length, and Elevation Changes
The HTWOS models for Cases 3S4 and 3S6D were used to identify all waste transfers in Phase 1B. Additionally, a sampling of transfer routes from Case 3S6D, Phase 2 were included in the list of waste transfers. HTWOS identifies the source and receiver tank for each transfer but does not provide information related to the actual route that the waste travels during the transfer. This analysis focused on the transfer routes in the 200 East Area. The transfer routes that were analyzed are identified in Figure B-1 of Appendix B. Pipeline routing, pipe diameter, length of pipe for each transfer route, and elevation changes were identified from the physical piping drawings and from a previous study documented in HNF-2938, Evaluation of 241 -AN Tank Farm Supporting Phase 1 Privatization Waste Feed Delivery. All pipelines in the transfer routes identified were found to be 80 mm (3-in.) nominal-diameter, schedule40 pipe. Transfer routes for pipelines that have not been installed were based on preliminary infomation from the
3-2

RPP-5346 REV 0
projects. For the purpose of this analysis, it was assumed that all new pipe will be 80 mm (3-in.) nominal-diameter, schedule-40 pipe.
Equivalent pipe lengths for individual transfer routes are shown in Appendix D. Equivalent pipe lengths are used to simplify the analytical model for determining pressure drop while accounting for the friction losses in pipe fittings and valves. Equivalent lengths are based on the number of lineal feet of pipe in each transfer route plus the number of feet of pipe that will provide a pressure drop equivalent to the pressure drop that would be experienced through a pipe fitting or valve. Because the future configuration of fittings and valves in the pump and valve pits is not well defined, a standard configuration of valves and fittings was assumed for these locations. Transfers through valve pits were modeled by assuming that the flow passes through two 3-way valves (run), one 3-way valve (branch), three Plutonium-Uranium Extraction (PUREX) connectors, and five long radius elbows. Transfers through pump pits were modeled by assuming that the flow passes through one 3-way valve (run), two PUREX connectors, and two long radius elbows. If additional in-line components are present, then a greater pressure drop through the system would be expected. Equivalent pipe lengths were determined using the methodology described in Flow of Fluids Through Valves, Fittings, and Pipes (Crane 1981). The interface with the privatization contractor requires that the transferred waste move some distance within the vitrification facility. The equivalent lengths identified in the privatization contractor's calculations have been included in the lengths of pipe listed in Appendix D for all transfers to the vitrification facility.
Changes in elevation between end points of the transfer lines were identified from HNF-2938, physical piping drawings, preliminary project drawings, and the privatization contractor's calculations. The elevations of end points of the transfer line were determined from the elevations of the nozzles inside the pump or valve pits. Elevation changes are identified in Appendix D.
3.2.2 Pipeline Roughness
All pipelines in the transfer routes were found to be constructed from either carbon steel (ASTM A106 Grade B or A53 Type S, Grade B) or stainless steel (ASTM A312). Pipeline material for pipes that have not been installed were based on preliminary information from Projects W-314 and W-521. For the purpose of this analysis, it was assumed that all new pipe will be stainless steel.
The surface roughness of the interior of a pipe can be affected by corrosion and scale buildup because of the chemistry of the waste and flush water. The interior surface roughness can also be affected by erosion caused by abrasive solids in the waste and high waste flow rates. As the interior surface of the pipe deteriorates it becomes irregular and rough, and there may be a simultaneous reduction in the thickness of the pipe wall. Although the waste chemistry is controlled to reduce the effects of corrosion and scale buildup, waste-transfer lines have failed in the past. The metallurgical analysis of a failed jumper in the 241-A-B valve pit in 1984 (Metallurgical Analysis of Leak Failure of 241-A-B Valve Pit Jumper [WHC-SD-RE-TI-148]) is a good example of the combined effects of erosiodcorrosion on the interior of a pipe. The photographs in WHC-SD-RE-TI-148 document the rough surface condition of the pipe even at locations where the pipe did not fail. The effects of this increasing surface roughness can change
3-3

RPP-5346 REV 0
Pipe Material
Carbon Steel . EOL (50 vr)
the flow characteristics of a pipe system significantly. Because there are no data documenting the condition of the interior of the pipelines, surface roughness values were based on an evaluation by Anantarnula and Divine (1999), which is contained in Appendix C. For the purpose of this analysis, the values shown in Table 3-2 were used.
Surface Roughness
3810 150 (w) (mil)
Table 3-2. Pioe Surface Roughness Estimates.
Stainless Steel, EOL (40 yr) 254 10 Stainless or Carbon Steel, New
Erosion is expected to increase corrosion near elbows in the pipeline, however, the increase in corrosion is a result of removal of corrosion products. Under these conditions, a significant increase in the friction factor is not expected even though a rough uneven surface is produced. Recent laboratory studies indicated that even at velocities approaching 4.6 m/s (15 ftls), corrosion products are not removed from the steel surface and, therefore, the friction factors at the elbows are not expected to be significantly different from the straight sections of the pipe. As indicated in Appendix C, the surface roughness values reported are considered conservative for carbon steel since 98% relative humidity and lack of inhibiting effect from nitrite are assumed.
51 2
3.2.3 Pipeline Design Pressure
Most of the existing pipelines that will be used for waste retrieval have a design pressure of 2.7 MPa (400 lbf/in2). Some carbon steel lines in AN and AW tank farms have design pressure ratings of 1.9 MPa (275 Ibf/in2) but have been hydrotested to 3.1 MPa (450 lbf/in2) (HNF-2938). The pressure rating of the pipe provides an upper bound that limits the flow velocity through the system and the allowable shut-off head of the transfer pump.
3-4
RPP-5346 REV 0
4.0 RESULTS
This section presents the results of the critical velocity and pressure-drop calculations. A general discussion of waste parameters investigated is provided in Section 4.1. Results of critical velocity and pressure-drop analyses are given in Sections 4.2 and 4.3, respectively. The sensitivity of the waste and pipe parameters on the pressure drop at critical velocity is presented in Section 4.4. Uncertainties in the waste and pipe parameters are discussed in Section 4.5.
4.1 GENERAL
The critical velocity and transfer line pressure drop were calculated for each of the transfers identified under Cases 3S4 and 3S6D of the HTWOS model for Phase JB waste feed delivery. Case 3S4 was chosen because it is consistent with the latest multi-year work plan. Case 3S6D also was analyzed to evaluate the effects of the changes between the two cases. Approximately 30% of the transfer routes were changed when going from Case 3S4 to 3S6D. The calculations were performed using the length of pipe specific to each transfer route, pipe wall roughness values for new and old pipe at end of life (EOL), and different combinations of waste characterization data. Equivalent pipe lengths were used to account for the various valves and fittings in the transfer routes, and changes in elevation were factored into the calculations. The transfer pipe within the privatization contractor's facility also was included in the pipe routes. A total of 52 different combinations of waste properties and transfer routes were analyzed. These different combinations served to confirm that the analytical model was providing reasonable results and to provide an indication of the sensitivity of the transfer system to variations in waste properties. Of the 52 different combinations, three sets of data were identified for further evaluation. These three sets of data are described below.
Data Set 1
The first set of data is based on the in situ waste properties identified as the bounding case in Table 3-1. This case represents a set of waste properties that would be considered conservative for all of the waste-transfer routes. The intent was to determine whether one set of data could be used as the basis for specifying all new transfer system equipment. If it could be shown that the required critical velocity and associated pressure drop were within the design pressure limits of the pipe, no further evaluation of the pipe would be required. This set of data would then define the design bases for the waste-transfer system. The waste for this case has the following properties (Case 3b, Group 2 Properties - Tables D- 1 1 and D-25 in Appendix D for HTWOS Cases 3S4 and 3S6D, respectively):
Liquid Density 1.2 k g 5 Liquid Viscosity 0.01 to 0.1 g/cm-s (1-10 cP) Volume Percent Solids 30% Solids Density 3.0 k g 5 . Solids Median Size 400 P Temperature 10 "C to 60 "C
4- 1

RPP-5346 REV 0
Data Set 2
The second set of data is based on the same waste properties identified in the bounding case, with the exception of the liquid density and the volume percent solids. The liquid density was reduced to 1.2 kg/L to reflect the actual waste characteristics more accurately. The volume percent solids was reduced based on values predicted by HTWOS. Cases 3S4 and 3S6D were reviewed to determine the maximum volume percent solids that would be present in a slurry transfer. This value was increased by a factor of two to account for any density gradient that might exist during a transfer because of inadequate mixing or stratification in the tank. The waste for this case has the following properties (Case 4, Group 2 Properties -Tables D-14 and D-28 in Appendix D for HTWOS Cases 3S4 and 3S6D, respectively):
Liquid Density 1.2 k& Liquid Viscosity 0.01 to 0.1 g/cm-s (1-10 cP) Volume Percent Solids 15% Solids Density 3.0 kg/L Solids Median Size 400 P Temperature 10 "C to 60 "C
Data Set 3
Low-activity waste (LAW) feed transfers to the privatization contractor are primarily supernatant and have very low solids content. However, as part of the waste-staging process, waste with higher volume percent solids are transferred between tanks that are subsequently used for LAW feed to the privatization contractor. The third set of data is based on the same values used in the second case, with the exception of the volume percent solids. This property was revised to simulate performing a transfer between tanks. This was considered a bounding condition for a tank-to tank transfer. The waste properties for this case are as follows (Case 4, Group 1 Properties -Tables D-14 and D-28 in Appendix D for HTWOS Cases 3S4 and 3S6D, respectively):
Liquid Density 1.2 kg/L Liquid Viscosity 0.01 to 0.1 g/cm-s (1-10 cP) Volume Percent Solids 10%
0 Solids Density 3.0 k g L 0 Solids Median Size 400 P 0 Temperature 10 "C to 60 "C
The three sets of data were compared to design criteria for ongoing or recently completed projects to determine if there were any inconsistencies. The waste properties for Projects W-058, W-211, and W-3 14 are shown in Table 4-1. Each of these projects has or is in the process of upgrading the waste-transfer system. The waste properties for the three sets of data in this analysis were found to be similar to the project design criteria, with the exception of the solids density data and the data that Project W-058 used for non-Newtonian flow.
The waste characteristics, transfer line properties, and results of the analyses are tabulated in Appendix D. The first data set is presented in Tables D-1 1 and D-25 (Case 3b, Group 2 Properties) for HTWOS Cases 3S4 and 3S6D, respectively. The second and third data sets are
4-2

RPP-5346 REV 0
Property
presented in Tables D-14 (Case 4, Group 2 Properties) and D-28 (Case 4, Group 1 Properties) for HTWOS Cases 3S4 and 3S6D, respectively.
Project W-058 I Project W-211 1 Project W-314 Specific gravity Liquid density, kg/L Liquid viscosity, g/cm-s (cP) Volume percent solids Solids density, kg/L Solids size, pm
1.5 1.25 1.25 1.5 _ _ __ _- __
0.3 (30) 0.1 (10) 0.1 (10) 0.3 (30) 30% 20% 20% 30%
__ _ _ _- __ 0.5 - 4000 0.5 - 4000 0.5 - 4000 __
Temperature, "C I 2-93 I 2-93 27 - 93" 27- 116
4.2 CRITICAL VELOCITY ANALYSIS
Critical velocity is a function of the carrier liquid density and viscosity, solids diameter, density and volume fraction, and pipe diameter. Critical velocity values are tabulated in Appendix D for each set of data. The values of critical velocity are independent of transfer pipeline length. The critical velocity is calculated using Equation 1. A comparison is also performed to ensure that the flow is above the laminar-to-turbulent transition region. The calculated value of critical veIocity is adjusted by a factor, I&, which is equal to 1.3. This factor accounts for the percent root mean square deviation from experimental data for the critical velocity correlation (Oroskar and Turian 1980) and provides a margin above the calculated value of critical velocity to ensure stable operation.
Table 2-1 shows the general effect that raising or lowering a process variable has on the critical velocity. A review of the calculated values for critical velocity in Appendix D indicates that it is more sensitive to changes in some variables than in others. Appendix F contains a number of graphs that illustrate the effects of adjusting one process variable while holding the others constant. The variable that has the most significant impact on critical velocity is the ratio of carrier liquid density to solids density. Figure F-5b shows the effect on critical velocity for changes in the carrier liquid density, particle density, and temperature for a median particle size of 400 pm with a solids concentration of 10% by volume. Figures F-6a, F-7a, and F-8a of Appendix F show that a moderate percent increase in carrier liquid density will cause a moderate percent decrease in critical velocity. Likewise, Figures F-6b, F-7b, and F-8b of Appendix F demonstrate that a moderate percent decrease in solids density will cause a moderate percent decrease in critical velocity.
Friction factor I 0.0404b I __
4-3
__ --

RPP-5346 REV 0
The other three process variables (Le., volume percent solids, solids diameter, and carrier liquid viscosity) require larger percentage changes to have an equivalent effect on critical velocity. Figures F-6a and P 6 b of Appendix F show that large percent increases in volume percent solids are necessary to make moderate percent increases in critical velocity. Changes in solids diameter have a small impact on critical velocity. A comparison of Figures F-9a, F-9b, F -~c , and F-9d of Appendix F indicates that a large percent reduction in solids diameter is required to affect a moderate percent decrease in critical velocity. However, the Oroskar and Turian (1980) critical velocity correlation overestimates the critical velocity as the particle size decreases from 400 pm when compared to the Wasp et al. (1977) predicted pressure drop vs. flow velocity curves as shown in Figure E-6c of Appendix E. This is expected because the Oroskar and Turian (1980) correlation was based on large size particle data with a narrow particle size distribution. Note however, as shown in Figure E&, that this overestimate on the critical velocity does not significantly affect the pressure drop at the critical velocity. Viscosity also has a small effect on critical velocity. Figures F-6a, F-Sa, F-loa, and F-lob of Appendix F show that a significant percent decrease in carrier liquid temperature and corresponding increase in viscosity per Equation 16 is necessary to cause a small percent decrease in critical velocity. The results of the analysis show that it is possible to predict the direction and approximate magnitude of the change in critical velocity when a single variable is raised or lowered, but it is difficult to predict the change when multiple variables are adjusted simultaneously.
As shown in the tables in Appendix D, the calculated values for critical velocity ranged from 0.79 d s (2.6 ft/s) to 2.26 m l s (7.4 ft/s) for the sets of data that did not use HTWOS data for volume percent solids. The variation in critical velocity for these cases is attributable to the variation in particle size and the change in the ratio of solids density to liquid density. In general, the critical velocity decreased as the solids volume percent and solids diameter decreased.
4.3 PRESSURE-DROP ANALYSIS
The tables in Appendix D show the total equivalent length of pipe for each transfer route, the type of pipe material, and the total pressure drop at the critical velocity using values of surface roughness for old pipe at EOL and new pipe. The value for pipeline pressure drop was calculated using Equations 17, 18, and 19. The tables in Appendix D also show the maximum flow rate at a 2.7 MPa (400 Ibf/in2) pipe design pressure using values of surface roughness for old and new pipe. The values for pressure drop for old and new pipe were included to provide a range of possible values that might be seen during operation. Analysis of the adequacy of the transfer system is based on the old pipe values, which represent the condition of the pipe just before the end of life. The maximum flow rate at design pressure data is based on a pipeline with a design pressure of 2.7 MPa (400 Ibf/in2).
Appendix E, Figures E-1 through E-5 show waste-transfer system curves for the transfer route from Tank 241-AN-107 to the privatization contractor. Each set of curves shows the system pressure drop for a variety of waste properties at three different concentrations and at the beginning and end of the pipe design life. For each set of figures, the particle size is held constant so that the effects of changes in the other variables can be identified. The figures also identify the critical velocity, system operating pressure for the old and new pipe conditions, and
4-4

RPP-5346 REV 0
the maximum flow rate at the design pressure of the pipe. Figure E-6c shows the system pressure-drop curves at 400,200, 100, and 40 pm median particle sizes compared to clear liquid system curve for new pipe roughness condition. Also shown is the corresponding best-estimate critical velocity curve based on Oroskar and Turian (1980) and a modified Oroskar and Turian critical velocity based on the “vehicle” concept introduced by Wasp et al. (1977). Both methods appear to overpredict the critical velocity as the median particle size decreases as discussed above. Neither of these predictive results have been verified for this range of smaller particle sizes.
Pressure drop for a slurry is a function of the flow velocity, liquid density and viscosity, solids diameter, density and volume fraction, pipe diameter, pipe length (equivalent length), change in elevation, and pipe roughness. Pressure drop in the system is calculated at the critical velocity. The effects of changing the value of a waste property on the pressure drop in the pipeline can he difficult to predict because the critical velocity also changes. A change in a variable that results in an increase in critical velocity may lead to a decrease in pressure drop. As the viscosity of the carrier liquid is lowered, the critical velocity increases, hut the pressure drop in the system decreases. However, as the solids diameter is decreased, both the critical velocity and the pressure drop decrease. Similarly, as the solids density increases, the critical velocity and the pressure drop also increase. When one variable is changed, it is possible to predict the direction of the change in pressure drop if all other variables are held constant. The above effects can be seen through a careful study of the sensitivity analysis given in Appendix E and Figures F-5 through F-10 of Appendix F.
Using the first set of data based on in situ waste properties (Table D-25 in Appendix D), 48 of 63 transfer routes will exceed the rated pressure of at least a portion of the transfer line. The transfer route with the highest pressure drop will be required to operate at a pressure of 7.6 MPa (1,115 lbf/in2) at a critical velocity of 2.26 m / s (7.4 Ws). Figure B-2 in Appendix B shows the lines that exceed the rated pressure of the pipeline.
For the second set of data (Table D-28 in Appendix D), 38 of 63 transfer routes will exceed the rated pressure of some portion of the transfer line. The route with the highest pressure drop will be required to operate at a critical velocity of 2.16 m/s (7.1 ftls) and a pressure of 5.2 MPa (759 Ihf/in2). If all of the old pipe were to be upgraded to a design pressure of 2.7 MPa (400 lbflin’), 34 of 63 transfer routes would still exceed the rated pressure of the pipe. Figures B-3 and B-4 in Appendix B show the lines that exceed the pipeline pressure rating.
Using the third set of data (Table D-28 in Appendix D), 37 of 63 routes exceed the rated pressure of at least some portion of the transfer route. The transfer route with the highest pressure drop will be required to operate at a pressure of 4.2 MPa (618 Ibf/in2) and a critical velocity of 2.07 m/s (6.8 Ws). If all of the old pipe were to be upgraded to a design pressure of 2.7 MPa (400 lbf/in2), 31 of 63 transfer routes would still exceed the rated pressure of the pipe. Figures B-5 and B-6 in Appendix B show the lines that exceed the pressure rating of the pipeline.
Calculated values for pressure drop in individual transfer routes for the three sets of data range from 338 kPa (49 Ibf/in2) to 7.6 MPa (1,115 lbf/in2). Using the pipe roughness values for old pipe, Tables D-25 and D-28 in Appendix D show that a majority of transfer routes cannot meet the required critical velocity without exceeding the operating pressure of the system. Using the
4-5

RPP-5346 REV 0
roughness values for new pipe reduces the number of lines that will exceed their rating, but a majority of the routes still exceed their design pressure.
The pressure drop for supernate transfers was not calculated, but can be evaluated by reviewing the results presented in Appendix D. Cases IC and Id of Appendix D provide the calculated pressure drop using median solid particle sizes of 5 and 10 pm, and HTWOS volume percent solids values multiplied by a factor of 1.5 or 2.0. These sets of waste properties bound the pressure drop that would be calculated for supernate waste. The highest pressure drop through any transfer route in Cases 3S4 or 3S6D is 0.8 Mpa (123 Ibf/in2), assuming an end of life pipe roughness value. All of the transfer routes can be used to transfer supernate. It should be noted that the small pressure drops are based on low transfer flow velocities. The maximum calculated flow rate is 5.5 Us (87 gpm) which is equivalent to velocity of 1.2 m/s (3.8 ft/s) in a 80 mm (3 in.) pipe. However, these values for pressure drop are conservative because they are based on waste with some small particles for an actual supernate transfer, the pressure drop will be lower.
In the preceding discussion, the adequacy of each transfer system route is evaluated by comparison of the design pressure rating of the pipe to the calculated pressure drop. It should be noted that this comparison alone is not sufficient to verify that a particular route is designed adequately. The transfer system pipe also must be designed to withstand the shutoff head of the transfer pump. The transfer pump will be designed with a shutoff head that is -30% above the pressure drop calculated for each route. This additional design requirement will result in more transfer routes exceeding the rated pressure of the system than identified in the discussion above.
4.4 SENSITIVITY
In reviewing the pressure-drop results in Appendix D for various combinations of waste properties, it was noted that changes in some of the waste properties can have a significant impact on the calculated pressure drop. Figure 4-1 provides a comparison of the effect that changes in waste properties have on pressure drop. Figure 4-1 is based on the longest transfer route (241-AN-107 to BNFL) with a volume percent solid of 15%, 400 pn median size particle distribution, 60 "C, and old pipe. Figure 4-1 shows the magnitude of the change in pressure drop when a single waste parameter is varied from one end of its range to the other. Only one parameter is changed at a time, while the other parameters are held constant. It can be seen that the range of solids volume concentration and particle size have the most impact on the calculated pressure drop.
Figure 4-2 provides a more detailed comparison of the effects of variations in several waste properties and pipe parameters on the required system pressure. Figure 4-2 is based on the same transfer route as Figure 4-1, but also indicates values of pressure drop in the pipe at specific waste properties. The values of pressure drop are calculated by varying one variable while the others are held constant. Figure 4-2 shows that a reduction in solids density, solids size, or volume percent solids will result in a significant reduction in pressure drop. It should also be noted that the variables with the least amount of characterization data have the most significant effect on calculation of pressure drop. A more complete evaluation of the effects of the waste parameters on pressure drop is given in Appendix E for the transfer route from Tank 241-AN-107 to BNFL.
4-6

RPP-5346 REV 0
Figure 4-1. Waste-Property Sensitivity (AN-107 to BNFL).
Solids Volume Concentration
Median Panicle Size
E + k
. Liquid Density
L
0 Roughness 9
Solids
1 Density
Temperature 0 0 2w 400 600 803
Pressure (IbVin') at Critical Velocity
Figure 4-2. Waste-Transfer System Sensitivity (AN-107 to BNFL).
1,zw
4-7

RPP-5346 REV 0
4.5 UNCERTAINTIES
This analysis is based on a number of assumptions that are critical to a proper understanding of the results. The areas of greatest uncertainty are discussed in this section.
4.5.1 Waste Characterization
Waste characteristics from the process flow sheets, the latest revisions of the tank characterization reports, letter reports from the laboratories, and the HTWOS model were reviewed. It was found that liquid viscosity data and solids diameter data for the DSTs generally are not available. Because of the lack of tank-specific data, physical property estimates were provided by Process Engineering. In performing this analysis, some simplifying assumptions had to be made regarding the particle size and particle density. It has been assumed that the density of all solid particles is 3.0 kgL. This density value is based on densities of dominant chemical constituents in the tanks. The potential effect of this assumption is to overstate the pressure drop in the transfer system significantly if the larger particles are less dense or will be dissolved in the tanks before transfer.
The volume percent solids in the waste for Data Sets 2 and 3 has been estimated by doubling the highest solids content of any transfer identified in HTWOS. This value was then used for all transfers. The rationale for doubling the HTWOS value was to account for density gradients in the tanks during waste transfers. The rationale for using this value for all transfers was to accommodate future changes in the tank retrieval sequence that could affect the volume percent solids for a particular transfer route. In going from Case 3S4 to Case 3S6D, for instance, approximately 30% of the transfer routes were changed.
This analysis was intended to address Phase 1B and Phase 2 transfers from the AN, AP, AW, AY, and AZ tank farms using tank specific waste properties.. Because there is very little tank- specific information describing the Phase 2 transfers at this time, the analysis was performed using estimated slurry properties. HNF-SD-WM-SP-012, Revision 1 contains some assumptions for Phase 2 waste regarding volume percent solids, solids density and supernatant sodium content but does not address waste properties. The waste-transfer system is intended to be used for Phase 1B and Phase 2 transfers. The adequacy of the waste-transfer system for Phase 2 transfers cannot be verified without better data.
4.5.2 Pipe Surface Roughness
The pipe surface roughness was determined by analysis based on assumed waste conditions, a 50-yr life for the carbon steel lines and a 40-yr life for the stainless steel lines. Pipe surface roughness has a large impact on the calculation of pressure drop in the carbon steel transfer pipes. The roughness values provided in Appendix C may be non-conservative, but it is not possible to know without inspecting the inside of the pipe.
4-8
RPP-5346 REV 0
4.5.3 Critical Velocity and Pressure-Drop Correlations
Although the critical velocity and pressure-drop correlations have been developed from the analysis of extensive test data, these correlations have not been validated through testing for the Hanford-specific waste characteristics.
The correlation used for determining critical velocity is empirically derived from data that does not include particles 4 0 0 pm in diameter. HNF-2728 recommends the use of the Oroskar and Turian (1980) correlation. HNF-2728 compares the correlation to another correlation that is based on flows with smaller particles (< 80 pm) and shows that the Oroskar and Turian (1980) correlation is conservative. It is possible to overstate the critical velocity requirements for slurries with small-size particles without test results using wastes typical of the Hanford Site.
Additionally, the Oroskar and Turian (1980) correlation uses a median particle size to represent the distribution of all particle sizes. This is a reasonable simplification for a slurry with a narrow range of particle sizes. It can lead to underestimation of the velocity required to keep all particles in suspension for a slurry with a wide range of particle sizes.
4.5.4 Waste Rheology
The characterization data that are available indicate that the viscosity of the carrier liquid is very sensitive to temperature. This analysis has made the assumption that the transfers will occur at a temperature that will not cause the waste to begin to gel or cause large changes in the liquid viscosity, which is consistent with current practice. Variations in temperature during a waste transfer resulting from cooling in the pipeline could change the results of this analysis substantially. The effects of non-Newtonian waste also have not been evaluated in this analysis.
4-9

~
RPP-5346 REV 0
This page intentionally left blank.
4-10

RF'P-5346 REV 0
5.0 CONCLUSION
Section 5.1 provides a discussion of the analysis and identifies alternatives to address apparent deficiencies in the waste-transfer system. Section 5.2 provides recommendations to meet program needs and to evaluate the adequacy of the waste-transfer system more accurately.
5.1 DISCUSSION
The intent of this analysis was to provide a documented basis for the design pressure rating of the waste transfer system pipeline and a documented basis for the design and operating pressure of the transfer system pumps. Slurry correlations for heterogeneous and homogeneous flow were identified for estimating the critical velocity and the pressure drop through the waste-transfer pipelines. Transfer system characteristics were reviewed for each of the transfers identified in Phase 1B of Cases 3S4 and 3S6D. These transfer cases were consolidated into distinct transfer routes for evaluation of the transfer system fluid flow characteristics. More than 50 different combinations of waste properties were analyzed for each of the transfer routes in Cases 3S4 and 3S6D. Three different sets of slurry waste properties were identified as being representative for all of the waste transfers. One set of data was evaluated to determine whether a single set of waste properties could envelop all waste combinations and meet the design constraints of the transfer system. The other two sets of data were used to address specific types of waste transfers.
Use of a single waste composition that envelops all waste combinations requires a robust transfer system design. The results of the analysis for the first set of data indicates that approximately 75% of the transfer pipelines would exceed their design pressure at the critical velocity. Use of waste properties that more closely approximate expected waste conditions showed that the waste-transfer system would require fewer pipeline replacements. The results of the analysis for the second set of data found that over 50% of the lines could not meet the critical velocity without exceeding the design pressure of the pipe. The analysis for the third data set found that about 50% of the lines would exceed their design pressure at the critical velocity. Additionally, if some of the conservatism can be removed from the predicted surface roughness values by performing inspections of the pipe, fewer pipelines would have to be replaced in the system. Based on the results of the first three sets of slurry waste data, all of the 1.9 MPa (275 Ibf/in2) rated lines will have to be rated at a higher design pressure or replaced. Supernate transfers will not exceed the design pressure rating of any of the transfer routes that were evaluated.
Several alternatives exist to address the apparent deficiencies in the waste-transfer system and to reduce some of the uncertainty in the waste properties. Some of the alternatives would completely resolve the pressure limitations of the pipe if implemented. Others would contribute to a reduction in the required design pressure of the pipe. These alternatives are addressed below.
5-1

RPP-5346 REV 0
Alternative 1 Design the waste-transfer system to the highest calculated pressure, plus a 30% rise to pump shutoff, for the first set of data, 10 MPa (1,450 Ibf/in2). This alternative is not realistic because it assumes that the jumper connectors can be rated for a significantly higher pressure than their present rating. It also requires that the existing pipe be re-rated or replaced.
Alternative 2 Particle size and density have a large impact on the determination of pressure drop in the transfer system. Refinement of the particle size and density data has the potential to provide substantial reductions in the amount of rework that would be required by the present analysis. If it can be shown that the larger particles (>lo0 p) are not very dense and will not settle, a significant reduction can be made in the number of lines that exceed their design pressure.
Alternative 3 A large contribution to the overall pressure drop in the system is because of the long transfer routes that are required to pump waste to the privatization contractor. A method of reducing line lengths is to add a lift station adjacent to the new AP valve pit or to stage all transfers through the AP tank farm. A lift station would comprise storage tanks, pumps, instrumentation, power, and ventilation equipment. All transfers to the privatization contractor and between Tank Farms AN, AY, and AZ, and Tank Farms AP and AW would be routed through the lift station or Tank Farm AP. Table D-29 in Appendix D lists the pressure drops through the transfer system assuming that waste is staged through a lift station at the new AP valve pit. With the addition of a lift station, the critical velocity is 2.16 m/s (7.1 ft/s) and the largest pressure-drop estimate for any transfer is 2.8 MPa (409 Ibf/in2). A velocity of 2.16 m/s (7.1 ft/s) corresponds to a volumetric flow rate of 10 Us (160 gdmin). A discharge pressure of 2.8 MPa (409 Ibf/in2) corresponds to a discharge head of approximately 195 m (640 ft).
To account for wastes of different densities, the pressure at the discharge of the pump must be adjusted. The bulk density of the waste listed above is 1.47 kg/L. If, however, the liquid density were to be 1.46 kg/L (bounding value per Table 1 of Appendix A), the bulk density of the waste would be 1.69 k&. A centrifugal pump is rated in meters (or feet) of head. At a specified flow rate, the discharge head will remain constant, but the discharge pressure will vary if the density of the pumped liquid changes. The discharge pressure from a pump is estimated for a new density by the ratio of specific gravities:
2.8 MPa (409 Ibf/in*) x 1.69 / 1.47 = 3.2 MPa (470 Ibf/in2)
The pressure also is adjusted to account for a centrifugal pump with a head-flow characteristic that rises continuously to pump shutoff. Figure 5-1 shows a typical pump/system curve. For a centrifugal pump, a typical rise from operating point to shut-off is approximately 30%. Therefore, the new discharge pressure is:
3.2 MPa (470 Ibf/in2) x 1.3 = 4.2 MPa (61 1 Ibf/in2)
Based on the above, the design pressure of the piping system would be specified as 4.5 MPa (650 Ibf/inz). The higher pressure will allow for some variability in waste density and provide
5-2

RPP-5346 REV 0
some margin for the design of the pump. The pump would be designed to operate at 10 Us (160 gdmin) at a discharge head of 195 m (640 ft), with a shut-off head not to exceed a head of 268 m (880 ft). Installation of a lift station or staging through AP farm would require upgrading the transfer system to a design pressure of 4.5 MPa (650 lbf/in2). However, the waste-transfer system would have some design margin, and no further work would have to be performed to better characterize the waste. Other actions that are associated with this alternative include verifying that the jumper connectors and existing system can operate at 4.5 MPa (650 lbf/in*).
Figure 5-1. Typical Pump/System Curve.
Pump Shut-Of
1.3 x 0pemfI"p - P*S."(tl
Operating Pressui(
(-System Resistance Cuwe
W rn v) v) W
0
a
a
Operatlng Flow Rate
FLOW
Alternative 4 A fourth alternative is to place more emphasis on defining the waste properties for each specific transfer. The analysis results demonstrated that reducing the conservatism of the waste stream characterization data will reduce the amount of pipe rework required significantly. This alternative requires obtaining additional waste characterization data to be able to accurately predict the waste composition for Phase 1B and Phase 2 waste feeds. It also assumes that changes in the retrieval sequence will not affect the waste composition for a particular transfer significantly.
Alternative 5 A fifth alternative is to inspect the pipelines that have been identified as exceeding the design pressure to determine the actual surface roughness of the pipes. A reduction in the assumed roughness of the pipe will provide a direct reduction in the pressure drop through the carbon steel transfer lines.
5.2 RECOMMENDATIONS
Evaluation of the waste-transfer system begins with an accurate characterization of the waste. It also requires accurate information regarding the condition of the existing pipeline. Preparation
5-3

RPP-5346 REV 0
Liquid Density Liquid Viscosity Solids Density Solids Mean Diameter Solids Volume Percent
of specifications to procure waste-transfer system equipment before. having accurate characterization data involves the risk that the equipment will not meet the transfer system requirements. It also can lead to unnecessarily modifying or replacing portions of the transfer system that may be adequate if accurate waste characterization data were available.
The results of the analysis using the three data sets indicate that the existing transfer system can not reliably deliver slurry waste to the privatization contractor. It is recommended that several parallel paths be pursued to meet program needs and to evaluate the adequacy of the waste- transfer system more accurately. The first recommendation addresses the immediate need of providing a basis for the design of the transfer system pipe and transfer pumps. Recommendations 2 through 4 involve additional investigations to determine the structural capability of the existing transfer system. Recommendations 5 through 8 address activities that have the potential to reduce the uncertainties associated with this analysis.
Recommendation 1
Alternative 3 calls for adding a lift station. If no additional information is made available regarding waste properties or the condition of the existing pipe, Alternative 3 provides a technical solution that will meet the waste feed delivery system requirements. It is recommended that the waste properties, pipe, and pump design criteria from this analysis be used as a basis for the DST Subsystem specifications. Use of these criteria will allow conceptual design to proceed based on a technically defensible solution. As additional waste characterization data are obtained, it is highly likely that the pressure. requirements will decrease rather than increase. This recommendation provides a near-term path forward while minimizing impacts to projects currently in conceptual design. These criteria should be used only for planning and conceptual design until more accurate information is available on which to base detailed design. Table 5-1 is a list of the waste-property design criteria.
Table 5-1. Waste-Pronertv Design Criteria. 1.21 to 1.46 kg/L 0.01 to 0.1 g/cm-s (1 to 10 cP) 2.5 to 3.00 kg/L 40 to 400 pn 10 to 30 %
Because the transfer pump is selected based on the pressure drop in the system and the pressure drop is a function of waste properties, the pipe and pump sizing information should also be used only for planning and conceptual design. Table 5-2 is a list of criteria for the pipe and pump.
5-4

RPP-5346 REV 0
Pipe Design Pressure Pump Shutoff Head Pump Operating Point
Waste Density Viscositv
Table 5-2. PiDe and PumD Design Criteria. 4.5 MPa (650 Ibf/in2) not to exceed 268 m (880 ft) 10 Us (160 gumin) at a discharge head of 195 m (640 ft) 1.69 kg/L 10 CP
I Solids Content I 15% bv volume I I Surface Roughness, Carbon Steel I 51 to 3810 pm (2 to 150 mil)
Surface Roughness, Stainless Steel I 51 to 254 pm (2 to 10 mil)
Recommendation 2
The viability of increasing the design pressure rating of existing pipe rated at 1.9 MPa (275 Ibf/in2) should be investigated. Unless there is a substantial change in the waste properties used in this analysis, the design pressure of these lines is not high enough to support waste feed delivery. If the pressure rating of the lines cannot be increased, the lines will have to be replaced.
Recommendation 3
The design capacity of the Project W-314 pipe should be evaluated to determine if it can operate at a pressure higher than 2.7 MPa (400 lbf/in2). Figure B-7 of Appendix B shows that the scope of Project W-314 comprises a substantial portion of the waste-transfer system. If the design pressure of the system must be increased, it would be prudent to establish the capacity of the pipe before it is installed.
Recommendation 4
Because the PUREX connectors are an integral part of the transfer system, a concurrent assessment was performed (Waste Feed Delivery PUREX Process Connector Design Pressure [RPP-57931) to determine their design pressure retaining capacity, which was found to be 2.7 MPa (400 lbf/in2). If the pipe design pressure ultimately must be increased, this maximum design pressure will be challenged. A test program will be required to establish a design pressure higher than the generally accepted maximum pressure of 400 psig.
Recommendation 5
Alternative 2 addresses a more intensive evaluation of particle properties. A reduction in the size or density of the particles will reduce the critical velocity and the pressure drop in the system. Reductions in particle size and density have the potential to significantly reduce the number of lines that exceed their design pressure at the critical velocity. It is recommended that particle data and the particle measurement procedure be reviewed to identify methods of reducing the uncertainty associated with the size and density of the particles. The measurement procedure should simulate the shearing that is inherent in mixing and pumping the waste. It is also
5-5

RPP-5346 REV 0
recommended that the difference between measured values of solids density and calculated values of solids density be investigated.
Recommendation 6
The inside of the existing transfer pipelines should be inspected. If increasing the pressure rating of the existing pipelines is a viable alternative, some type of inspection will be required to establish a baseline condition of the pipe. Inspection should be performed after it has been confirmed by analysis that the pipe pressure rating can be increased. Additionally, if the existing level of corrosion is less than assumed, many of the transfer lines will be acceptable. If the projected corrosion is as extensive as assumed, a knowledgeable decision can then be made on the most cost-effective way to proceed.
Recommendation I
Additional data are required for evaluating the transfer system performance. Information such as supernatant viscosity, bulk viscosity, and density gradients in mixed tanks are required to confirm that the proper hydraulic models are being used and to perform the critical velocity and pressure-drop analyses. The characterization data should be requested when sampling the tanks, in addition to data typically obtained. Neither the Oroskar and Turien model, used to predict critical velocity, not the Wasp model used to predicted pressure drop have been validated for Hanford wastes. Validation of these models with actual waste or with simulant material under controlled conditions is recommended.
Recommendation 8
Changes in some waste properties have a more significant impact on pressure drop in the pipeline than others. Discussions should be initiated with the Process Development group to determine the feasibility of limiting or controlling these properties before the transfer of waste. An example would be solids volume fraction in the waste. Increases in solids volume fraction directly increase the pressure drop in the pipeline, yet solids volume fraction can be adjusted. A reduction in this value will reduce the pressure drop in the transfer lines and provide an expanded operating range.
5-6

RPP-5346 REV 0
6.0 REFERENCES
Blevins, R. D., 1984, Applied Fluid Dynamics Handbook, Van Nostrand Reinhold Company Inc., New York, New York.
Churchill, S. W., 1977, “Friction Factor Equation Spans All Fluids Regimes,” Chem. Eng., November 7,1977, Vol. 84, No. 24, pp. 91-92
Crane, 1981, Flow of Fluids Through Valves, Fittings, and Pipes, Technical Paper 410, Crane Company, New York.
Durand, R., 1952, “The Hydraulic Transportation of Coal and Other Materials in Pipes,” Colloq. of National Coal Board, London, England.
HNF-2728, 1998, Flow Velocity Analysis For Avoidance of Solids Deposition During Transport of Hanford Tank Waste Slurries, Rev. 0, Lockheed Martin Hanford Corporation, Richland, Washington.
HNF-2938, 1998, Evaluation of 241-AN Tank Farm Supporting Phase I Waste Feed Delivery, Rev. 0, Numatec Hanford Company, Richland, Washington.
HNF-3352, 1998, Results of Dilution Studies with Waste from Tank 241-Ah-104, Rev. 0, Numatec Hanford Corporation for Fluor Daniel Hanford, Inc., Richland, Washington.
HNF-4964, 1998, Results of Dilution Studies with Waste from Tank 241-AW-101, Rev. 0, Numatec Hanford Corporation for Fluor Daniel Hanford, Inc., Richland, Washington.
HNF-SD-WM-DTR-046, 1997, Results of Dilution Studies with Waste from Tank 241 -AN-I05, Rev. 0, Numatec Hanford Corporation for Fluor Daniel Hanford, Inc., Richland, Washington.
HNF-SD-WM-SP-012, 1999, Tank Waste Remediation System Operation and Utilization Plan to Support Waste Feed Delivery, Vol. I, Rev. 1, Numatec Hanford Corporation and COGEMA Engineering Corporation for Fluor Daniel Hanford, Inc., Richland, Washington.
Ismail, H. M., 1952, “Turbulent Transfer Mechanism and Suspended Sediment in Closed Channels,” Trans. ASCE, Vol. 117, pp. 409-447.
Oroskar, A. R., and R. M. Turian, 1980, “The Critical Velocity in Pipeline Flow of Slurries,” AIChE Journal, Vol. 26, No. 4, pp. 550-558.
O’Rourke, J . F., 1999, Results of Viscosity Measurements of Tank 241-SY-IO1 Samples, (Internal Memo 82100-99-017 to J. C. Person, May 3), Numatec Hanford Corporation., Richland, Washington
6- 1
RPP-5346 REV 0
RPP-5793,2OOO, Waste Feed Delivery PUREX Process Connector Design Pressure, Rev. 0, CH2M HILL Hanford Group, Inc., Richland, Washington.
Thomas, D. G., 1965, “Transport Characteristics of Suspensions: Part VIII. A Note on the Viscosity of Newtonian Suspension of Uniform Spherical Particles,” J. Colloid Sci., Vol20, pg. 267.
Wasp, E. J., J. P. Kenny, and R. L. Gandhi, 1977, “Solid-Liquid Flow Slurry Pipeline Transportation,” Series on Bulk Materials Handling, Vol. 1 (1975/77), No. 4, Trans Tech Publications, Clausthal, Germany
WHC-SD-RE-TI-148, 1997, Metallurgical Analysis of Leak Failure of 2.41-A-B Valve Pit Jumper, Rev. 0, Westinghouse Hanford Company, Richland, Washington.
WHC-SD-WM-ER-410, 1995, Tank Characterization Report for Double-Shell Tank 241-AZ-101, Rev. 0, Westinghouse Hanford Company, Richland, Washington.
6-2
RF'P-5346 REV 0
APPENDIX A
HANFORD TANK WASTE PHYSICAL PROPERTY ESTIMATES
A-i

RPP-5346 REV 0
This page intentionally left blank.
A-ii

RPP-5346 REV 0
M E M O R A N D U M CHBMHILL
74B50-00-001 R2
ALTERNATIVES GENERATION AND ANALYSIS FOR WASTE FEED DELIVERY TRANSFER PUMP DISCHARGE PRESSURE: HANFORD TANK WASTE PHYSICAL PROPERTY ESTIMATES
TO: W. L. Willis R3-73
COPIES: T. J. Conrads R3-73 F. F. Erian . K7-15 J. G. Field R2-12 ’ C. E. Grenard R3-73 L. J. Julyk R1-56 N. W. Kirch R2-11M W. L. Kuhn K7-15 T. C. Oten R1-56 D. A. Reynolds R2-1 1 SDE LBFile
FROM: Process Control
DATE: April 10,2000
References: (1) Internal Memorandum, “Alternatives Generation and Analysis for Waste Feed Delivery Transfer Pump Discharge Pressure: Hanford Tank Waste Physical Property Estimates,” memorandum number 74BSO-00-001R1, dated February 11,2000.
-
(2) Internal Memorandum, “Memorandum of Understanding Requirements Action Memo for the Alternatives Generation and Analysis for Feed Delivery Transfer Pump Discharge Pressure Control,” memorandum number 82400-99-093, dated December 30, 1999.
(3) Textbook, Shook, C.A. & M.C. Rocco, “Slurry Flow -Principles and Practice,” Butteworth-Heineman, Stoneham, Massachusetts,” published 1991.
(4) Handbook, Weast, C.W. & M.J. Astle, “CRC Handbook of Chemistryand Physics,” 61“ ed., CRC Press, Boca Raton, Florida,” published 1980.
This memorandum revises Reference (1) that was created in response to Reference (2) direction. This revision incopropates text changes and corrects information presented in the Attachment.
1 4 0 ~ ~ 1 1 2 D X
A- 1

RPP-5346 REV 0
W. L. Willis Page 2 of 5 April 10,2000
74B50-00-00 1 R2
Pipeline transport of wastes containing solids (a slurry) can be considered a two-phase flow, as required to estimate a critical velocity. Additionally, such a slurry can be considered to have bulk, or homogeneous properties, that are useful in (but not the only method available for) determining pressure drops and power requirements for the respective piping system. This memo attempts to give bounds and best estimates of the waste properties at shear rates applicable to typical Hanford pipeline transport velocities.
The following defmitions are needed to describe both two-phase and homogeneous slurry flow:
Subscript ''51) indicates the carrier liquid (Le., the continuous phase) of the slurry. Also included in the carrier liquid are any dissolved soluble solids.
Subscript 'Id" indicates the solid particulates @e., the dispersed phase) in the slurry. These particles can be both insoluble solids and precipitated soluble solids.
Subscript ''m'' indicates the bulk property of the slurry (Le., the mixed property of the two-phase fluid).
D = diameter of the spherical solid particulates in the waste
a = volume fraction
p = density
p = Newtonian dynamic viscosity (this estimate does not describe the potential non-Newtonian behavior of some of the Hanford tank wastes. However, the noh-Newtonian nature of these wastes should not be such as to create conditions that could terminate a waste transfer provided the waste can be initially mobilized and kept in suspension via sufficient flow velocity for the duration c of the transfer.)
Physical Relationships
ac = a w a i t i t adissolved ~oitdr
a c + a d = 1 P m = acPc + a d P d
ad ainrolubk solidi+ aprCcipiUtrdrdubls slid3
The summary of the nominal and bounding in-situ waste properties are shown in Table 1 :
A-2

RPP-5346 REV 0
Case 3 Nominal
W. L. Willis Page 3 of 5 April 10,2000
Bounding
74B50-00-001R2
-
Table 1: Slurry Physical Properties
0 These solid particulate diameters are stated as the median of the distribution, meaning that one-half of the total particulate mass is contained in particles with diameters smaller than the stated diameter, with the other half of the total particulate mass being contained in particles with a larger diameter.
The solid particulates in the waste are assumed to be spherical. The spherical shape gives the minimum isotropic drag coefficient for a particle of a given mass. This property should result in minimizing slurry flow pressure drop (a non-conservative result) while maximizing slurry flow critical velocity (a conservative result). There are many Hanford tank waste solids size distribution data available that indicate, at least in a qualitative sense, that the mass distribution of the majority of solids are under 40 pm in size. However, there is data suggesting particulate sizes exist at, and may exceed, the limit of instrument detection (in some cases, approximately 1 mm - see Attachment).
Ql Values from analysis of Tank Characterization Data (TCD) liquid wastes with the nominal value corresponding to the SO* percentile and the bounding value corresponding to the 90* percentile. (see Attachment)
@ Waste true solids densities qualitatively estimated as an engineering judgement. As a comparison, densities of some dominant chewical constituents that are known to or may exist as solids in the tank wastes are shown in Table 2:
A-3

RPP-5346 REV 0
W. L. Willis Page 4 of S April 10,2000
74BSO-00-OOlR2
Table 2: True (Particulate) Solid Densities (gdcc)'
? density is &own or compound is not documented
Table 2 gives some idea of a qualitative comparison to the estimated nominal and bounding solid densities of 2.50 and 3.00 gm/cc.
@ These estimates are conservative for pressure drop calculations but are not conservative for typical critical velocity correlations. In determining critical velocities, the most conservative assumption for pc is that it is equivalent to water. In contrast, for pressure drop calculations, higher values of pc result in higher pressure drops.
The viscosity of the carrier liquid is stated as:
utilizing the following definitions:
xd, = the fraction of dissolved solids composed of sodium nitrate, sodium nitrite, and other water soluble salts.
xUunie = the fraction of dissolved solids composed of sodium hydroxide.
Assume: x",, =0.9; X& =O.k (x,,,,+x-)=I
Over the temperature range of O°C to 100°C, this assumption gives:
P. * P- *(1+0.00848 *(wt% dissolvedsolids))

W. L. Willis Page 5 of 5 April 10,2000
-
RPP-5346 REV 0
74B50-00-001R2
Over the temperature range of 0°C to 100°C (from Reference 4):
999.83952+ 16.945 I 7 W - 7.9870401 IO-’(’r)’ - 46.1 70461 lO*(’r)’ + 105.56302* 10°F)‘ - 28O.S4253*lO”’m’ 1000*(1+16.879850* IO-’(T)’) P I , -
Over the temperature range of 0% to 20% (from Reference 4):
- 7.60390 2996 998.333 + 8.1855* (T - 20) + 0.00585. (T - 20)’
/l~‘lOo*CP*CX
And, over the temperature range of 2OoC to 100°C (from Reference 4):
3.0560(20-7)-0.00242yT-20)’ T+105
p-, = 1.002*CP*ex
CE, No exact method exists for determining pm Various researchers have proposed models that predict p,,, as a function of one or more variables in addition to h, and the resultant value of p,,, is typically expressed as a multiple of pc. If the model utilizes only one variable, it is usually ad.
As an example, several slurry viscosity models are. documented in Reference (3). These include models from Einstein, Eiler, Thomas, Kreiger, and Vocadlo. For these referenced models that are applicable to concentrated slurries, a reasonable selection of the independent variables predicts results within a factor of 2.0 for a slurry when ad = 0.3.
The model of Thomas is reproduced here because it has only one independent variablt (ad):
pM = pc *(1+2.5*ad +10.05*ad’ +0.00273*exp(16.6*ad))
-
S. D. Est:;, Engineer Process Control
sddmjg
Attachment
A-5

RPP-5346 REV 0
Gmunents by L. Jc~uen, February 8,2000
'Ibis following summary data for PARTICLE VOLUME DISTRIBUTION is from Table 2-2, HNF-2728 by S Estey and ATHu. The units arc pm.
SY-IM 9.32 0.2 10s 8Y.m 9.71 0.4
’Ihe follwing summary data for PARTICLE VOLUME DISTRIBUTION is from multiple internal mcmos by JF O’Rourke. The units arc pm.
ARadunent Page 1 of 7
A-6

RPP-5346 REV 0
Atrachmcnt to 74B50-00401-R2
comments:
1. There an not very many tanks with particle distribution data 2. The analytical methods do not give results greater than 150 and I020 pn. There may be particles
larger than 150 and 1020, but not detected by the analytical method. 3. The DSTs appear to be separated in to two classes, one with a small median pm and the other with a
large median pn. The reason is unknown. 4. The bounding value of 200 pun. is an underestimate of the median particle volume diseibution or the
maximum value. The analytical method maximum value of 1020 is reported for four samples. 5. Without having electronic copies of the original particle size data, it is not possible to give sta&&aI
measures of uncertainty associated with particle quantiles such as the median (50' percentile of the distribution) or values for the 25' or 75' percentile of the distribution.
Attachment Page 2 of 7
A-7

RPP-5346 REV 0
Attachatto 74B5060M)1-R2
Summary of Specific Gravity Results from the Tank Characterization Database.
A comparison between the (nominal, conservative; and boundmg) density values given in memorandum 74B50-00-001, and the analytical results from the Tank Characterization Database (TCD) has been completed. The values in the memorandum compare well with the 50', 75', and 90* percentiles of values from laboratory assays.
The tanks used in the analysis were those which had liquid results for the following eight constituents: aluminum, hydroxide, nitrate, nitrite, percent water, sodium, specific gravity, and total organic carbon. Twenty-one single shell, and twenty double shell tanks, met'this criteria. These tanks are listed in Table 1.
The painvise correlations of the eight constituents are given in Table 2. A correlation of one (or negative one) indicate that the constituents have a linear relationship. When this occurs, the value of one constituent can be used to predict the value of another. As an example, the -0.98 correlation between percent water and sodium, means that percent water decreases, in a predictable manner, as sodium increases. Similarly, the 0.92 correlation between specific gravity and sodium, means that specific gravity increases as the sodium concentration increases.
Attachmem Page 3 Of 7
A-8

RPP-5346 REV 0
Attachmmt to 74B5060401-RZ
Note that many of the constituents have correlations of 0.75 or greater. This is an indication that the waste tends to be either dilute, or concentrated, while the ratios of individual values to one another are fairly constant (at least for the analytes with large conEntrations).
The strong correlations given in Table 2 suggest that percentile estimates, calculated on a constituent by constituent basis, can be combined to produce reasonable estimates of dilute, or concentrated, waste.
By using the results in Table 3, and the equation on page three ofthe memorandum, viscosity estimates were calculated. The results are given in Table 4 the weight percentages are approximate). Note that the viscosity associated with the 50 percentile, and the Viscosity associated with the 906 percentile, are reasonably close to the “conservative” and “bounding” values given in the memorandum (1.7 versus 1.86 and 3.3 versus 3.04 respectively).
Results are on a weight basis.
b
Attachmolt Page 4 of 7
A-9

RPP-5346 REV 0
Multiply this number by the viscosity of water.
In the preceding analysis, all of the results from the 21 single shell, and 20 double shell tanks were combined. The 41 tanks used in the calculations were tanks that had data for each of eight major constituents.
An examination of all specific gravity results on TCD was also made. Except for tanks AN-106 and SY-103, all of the doubleshell tanks had specific gravity data. In addition, fi%four of the 149 single shell tanks had specific gravity measurements. Note that the 75" and 90 percentiles are similar for the two tank types, but the double shell tanks have lower values for the other percentiles. These results indicate that, if the results above are applied to double shell tanks only, then the lo", 25", and 50" percentiles may be biased high &e. they are "coaseruatiue" estimates)
Double Shell Tank 1 .oo 1.05 1.21 1.40 1.48
Attaduncm Wpe 5 of 7
A-10

RPP-5346 REV 0
Double-Shell Tanks: Specific Gravity versus Sodium Concentration
I I I
0 lO"8 2*10"8 31W8
Sodium Concentration (upn)
Altachuuml Page 6 of7
A-1 1
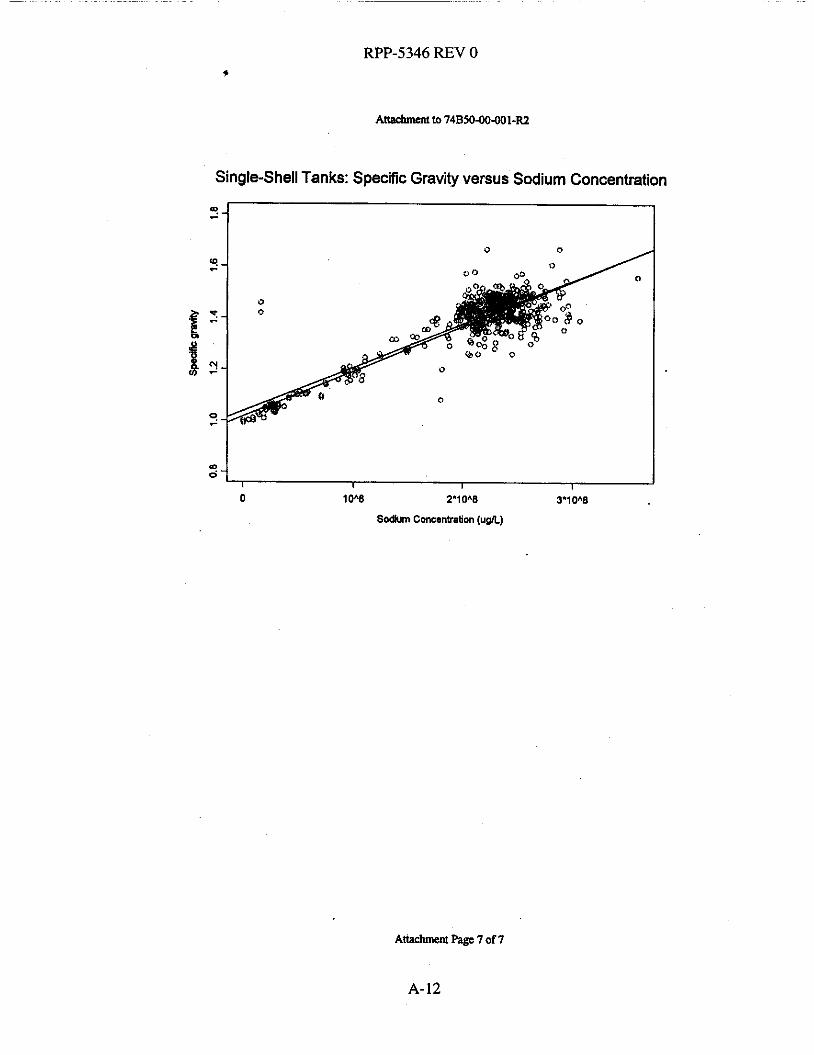
RPP-5346 REV 0
Anachmmtto 74BS060M)I-RZ
Single-Shell Tanks: Specific Gravity versus Sodium Concentration
I I I I
0 10"s 2'1LT8 3'10V
Sodurn Concarnation (ufl)
Attachment Page 7 of 7
A-12

RPP-5346 REV 0
APPENDIX B
TRANSFER ROUTES IN 200 EAST AREA
B-i

RPP-5346 REV 0
This page intentionally left blank.
E-ii

RPP-5346 REV 0
B- I B-2
B-3
B-4
B-5
B-6
B-7
LIST OF FIGURES
Waste Transfer System ............................................................................................ B-1 30 Volume Percent Solids/No Pipe Upgrades ......................................................... B-2
15 Volume Percent Solids/No Pipe Upgrades ......................................................... B-3
15 Volume Percent SolidsPipe Upgraded to 400 lbf/in2 ........................................ B-4 10 Volume Percent Solids/No Pipe Upgrades ......................................................... B-5
10 Volume Percent SolidsPipe Upgraded to 400 lbf/in2 ........................................ B-6
Projects W-314 and W-521 ...................................................................................... B-7
B-iii

RPP-5346 REV 0
This page intentionally left blank.
B-iv

RPP-5346 REV 0
Figure B-1 , Waste Transfer System.
B- 1

RPP-5346 REV 0
Figure B-2. 30 Volume Percent Solidflo Pipe Upgrades.
JFT 244-A STATION
=+-- , E . Y M I 10 s. .,E,
/
Az 1
FARM
CASE 3S6 WITH ALL PIPING AT CURRENT RATING, SOLIDS CONCENTRATION AT 30 VOL %, AND MEDIAN PARTICLE SIZE AT 400 MICRONS
- EXCEEDS RATED PRESSURE
MAXIMUM OPERATING PRESSURE IS 1 1 15 PSI TRANSFER VELOCITY IS 7.4 FT/SEC FLOW RATE IS 170 GALLONS/MINUTE
AW FARM
I v
PRIVATUATION CONXUCTOR
3 S 6 3 W A S I S . D W G
I v
PRIVATUATION CONXUCTOR
48 OUT OF 63 ROUTES EXCEED THE RATED PRESSURE OF AT LEAST A PORTION OF THE TRANSFER LINE
B-2

RPP-5346 REV 0
Figure B-3. 15 Volume Percent Solids/No Pipe Upgrades.
CASE 3S6 WITH ALL PIPING AT CURRENT RATING SOLIDS CONCENTRATION AT 1 5 VOL% AND MEDIAN PARTICLE SIZE AT 400
- EXCEEDS RATED LIFT STATION PRESSURE
MAXIMUM OPERATING PRESSURE IS 759 PSI TRANSFER VELOCITY IS 7 .1 FT/SEC FLOW RATE IS 163 GALLONS/MINUTE
38 OUT OF 63 ROUTES EXCEED THE RATED PRESSURE OF AT LEAST A PORTION OF THE TRANSFER LINE. IF THE LINE RATING WERE INCREASED TO 400 PSI ONLY 34 WOULD EXCEED THE RATED PRESSURE OF THE LINE.
FARM PIUVATlzAnON CONTRACTOR W ) =lE
3WB60.DWG
B-3

RPP-5346 REV 0
Figure B-4. 15 Volume Percent Solids/Pipe Upgraded to 400 lbf/inZ
CASE 3S6 WITH ALL PIPING RATED AT 400 PSI, SOLIDS CONCENTRATION AT 15 VOL %, AND MEDIAN PARTICLE SIZE AT 400 MICRONS
- EXCEEDS RATED PRESSURE
MAXIMUM OPERATING PRESSURE IS 759 PSI TRANSFER VELOCITY IS 7.1 FT/SEC FLOW RATE IS 163 GALLONS/MINUTE
34 OUT OF 63 ROUTES EXCEED THE RATED PRESSURE OF THE TRANSFER LINE
v u
LLW HLW
PRIVATl7,ATION CONTRACTOR W ) XTE
B-4

RPP-5346 REV 0
Figure B-5. 10 Volume Percent Solids/No Pipe Upgrades.
MB6010.DWG
B-5

RPP-5346 REV 0
Figure B-6. 10 Volume Percent Solids/ Pipe Upgraded to 4001bf/inz.
CASE 3 S 6 WITH ALL PIPING RATED AT 400 PSI WITH SOLIDS CONCENTRATIONS AT 1 0 VOL% AND MEDIAN PARTICLE SIZE AT 400
~ EXCEEDS RATED PRESSURE
LIFT STATION
MAXIMUM OPERATING PRESSURE IS 6 1 8 PSI TRANSFER VELOCITY IS 6.8 FT/SEC FLOW RATE IS 1 5 7 GALLONS/MINUTE
31 OUT OF 63 ROUTES EXCEED THE RATED PRESSURE OF THE TRANSFER LINE
I N
B-6

RPP-5346 REV 0
Figure B-7. Projects W-314 and W-521
BY
PROIECTW314DWG

RPP-5346 REV 0
This page intentionally left blank.
B-8

~
RPP-5346 REV 0
APPENDIX C
SURFACE ROUGHNESS OF CARBON STEEL AND STAINLESS STEEL WASTE TRANSFER LINES CAUSED
BY CORROSION AND SCALING
C-i

WP-5346 REV 0
This page intentionally left blank.
C-ii

RPP-5346 REV 0
CONTENTS
C 1 . 0 INTRODUCTION ........................................................................................................... C-3
C2.0 BACKGROUND ............................................................................................................. C-3
C3.0 CORROSION .................................................................................................................. C-4 C3.1 CORROSION BEHAVIOR OF CARBON AND STAINLESS STEELS ......... C-4 C3.2 SURFACE ROUGHNESS ESTIMATES - CORROSION ................................ C-5
C3.2.1 Carbon Steel ............................................................................................ C-5 C3.2.2 Stainless Steel .......................................................................................... C-7
C4.0 SCALING ........................................................................................................................ C-7 C4.1 SCALING PROCESSES .................................................................................... C-7 C4.2 DISCUSSION OF SCALING ............................................................................. C-9
C5.0 CONCLUSIONS AND RECOMMENDATIONS .......................................................... C-9
C6.0 REFERENCES .............................................................................................................. C-10
LIST OF TABLES
Table 1 . Table 2 . Table 3 . Table 4 .
Surface Roughness as a Function of Time for Carbon Steel ......................................... 6 Columbia River Water Composition ........................................................................... 8 Solubility Products ....................................................................................................... 8 Scaling Indices ............................................................................................................. 9
ATTACHMENT
c.1 . SUMMARY OF SEARCH FOR TRANSFER LINE SOLIDS BUILDUP/ SCALINGINFORMATION ......................................................................................... 11
C-iii

~~
RPP-5346 REV 0
This page intentionally left blank.
C-iv

RPP-5346 REV 0
APPENDIX C
SURFACE ROUGHNESS OF CARBON STEEL AND STAINLESS STEEL WASTE TRANSFER LINES CAUSED
BY CORROSION AND SCALING
November 5 , 1999
Prepared By:
R. P. Anantatmula And
J. R. Divine
LOCKHEED MARTIN HANFORD CORPORATION for the
U.S. Department of Energy Richland Operations Office
c- 1

RPP-5346 REV 0
This page intentionally left blank.
c-2
RPP-5346 REV 0
SURFACE ROUGHNESS OF CARBON STEEL AND STAINLESS STEEL WASTE TRANSFER LINES CAUSED BY
CORROSION AND SCALING
C1.0 INTRODUCTION
The waste transfer system in the 200 East Area of the Hanford Site operated by Lockheed Martin Hanford Corporation (LMHC) has several pipelines of carbon steel and stainless steel. The two materials are mixed in some pipelines while other lines are of one material only. The waste transfer system contains 1000 ft of 3 in. carbon steel pipe and 6000 ft of 3 in. stainless steel pipe believed to be AIS1 Type 304 or 304L. Much of the line has been used for up to fifteen years and plans are to use it for an additional 35 years. Both radioactive waste and "raw" water, essentially untreated Columbia River water, will be passed through the lines which will then be drained before being used again. Because pump requirements depend strongly on the pipe roughness, LMHC has requested information on changes in roughness due to corrosion and scaling. Surface roughness estimates were requested over a time period of 50 years for carbon steel and over a period of 40 years for stainless steel. This report discusses the contributions to surface roughness from corrosion and scaling.
C2.0 BACKGROUND
The waste transfer lines from Tank Farms to British Nuclear Fuel Limited, Inc. (BNFL) will be used more than three times annually, while the intertank pipelines will be used on an average once per year. The transfer piping is sloped in such a way that at the end of the waste transfer the waste water will drain into the tank in which the transfer is made with no possibility of stagnant water remaining in the pipe. Each waste transfer campaign is expected to last a total of ten days. The raw water will be heated in skid-mounted "boilers" and hot water will be used when it is deemed necessary. Corrosion inhibitors will be added to the water prior to its being pumped into the transfer lines. No heating, other than perhaps trace-heating to maintain the temperature, will be done on the line. There are two types of wastes that will be processed through the system: a high level waste (HLW) feed at 80°C containing 5 vol% solids and a low activity waste (LAW) feed at 45°C containing 2 voI% solids. The pH of the waste solutions is expected to be > 7. The waste solutions are generally expected to be 1 1 M N a N 0 2 , ~ 3 M NaN03 and 1 3 M NaOH. Between waste transfers, however, flush water containing raw water (Columbia River water) inhibited with 0.01M NaOH and 0.01 1M NaNOz will be used to flush the transfer lines after each transfer.
c-3

RPP-5346 REV 0
C3.0 CORROSION
C3.1
At the compositions quoted above, the waste solutions are benign toward carbon steel from a corrosion perspective (Anantatmula et al. 1994). Corrosion of stainless steel is expected to be negligible at the high pH and low temperature of the waste solutions containing low amounts of chloride. The inhibited flush water will not be aggressive toward carbon steel resulting in negligible corrosion. Raw water is usually corrosive to carbon steel unless it is inhibited or there is significant amounts of calcium and magnesium salts in the water that will form a protective scale. The Columbia River water, based on 1991 and 1994 analyses and the analysis in the scaling section of this report, has a Langelier index value of < 0 and Ryznar index value of > 6. Waters with Langelier index value of < 0 and Ryznar index value of > 6 tend not to form scales and be corrosive to steel (a discussion of Langelier and Ryznar indices is given in section 4.2). However, the addition of inhibitors to the raw water is expected to make the flush water benign towards steel. Therefore, only the carbon steel pipeline carrying the raw water to the inhibitor feed point will be subjected to a high general corrosion rate of - 4 mils per year (0.1 d y ) [ lmil= 0.001 in.] (Truitt and Wagner 1985). Stainless steel corrodes at a low general corrosion rate of < 0.1 mil per year (0.0025 mm/y) when exposed to fresh water at normal temperatures. The presence of inhibitors in the water is not expected to have any deleterious effects on the stainless steel, because the material has excellent resistance to general corrosion in solutions containing hydroxide, nitrate and nitrite. The chloride content and temperature of the raw water and waste solution is low enough to preclude pitting and stress corrosion cracking (SCC) of stainless steel pipe and preserve its integrity.
Corrosion of materials in aqueous systems is influenced by the following factors:
CORROSION BEHAVIOR OF CARBON AND STAINLESS STEELS
Water chemistry
Flow rate Temperature and Presence of microbes.
Physical configuration of the system
Presence of solids in the water
For the present surface roughness assessment, contribution to corrosion by microbes will be ignored since microbial corrosion primarily involves pitting corrosion. Depending on their abrasiveness, the presence of solids in the water is generally presumed to have a profound effect on corrosion if flow rates are high. However, studies performed by Pacific Northwest Laboratory (Smith and Elmore 1992) on simulated aging wastes at up to 15 Wsec fluid velocity indicated that the corrosion products were not removed from the carbon steel surface in spite of an increase in corrosion rate. The increase in corrosion rate was attributed to the ease with which fresh reactants were brought to the corroded surface by flowing waste as a result of a thinner boundary layer.
c-4

RPP-5346 REV 0
C3.2 SURFACE ROUGHNESS ESTIMATES - CORROSION
C3.2.1 Carbon Steel
The millscale (produced during hot rolling and forging) on carbon steel consists of three superimposed layers of iron oxides, viz., ferrous oxide (FeO) on the inside, magnetite (Fe304) in the middle, and ferric oxide (Fez03) on the outside. The relative portions of the three oxides vary with rolling temperature. A typical millscale on 9.5 mm plate would be about 50 pm thick and contains approximately 70% FeO, 20% Fe304, and 10% Fe2O3. Therefore, the surface roughness of as-received carbon steel pipe is - 2 mils (0.05 mm).
The contribution to transfer pipe surface roughness from corrosion is primarily from general corrosion mechanism, although from structural integrity standpoint pitting and SCC are very important mechanisms. Because higher corrosion rates will be experienced by the least used carbon steel transfer lines, to retain conservatism, it will be assumed that the waste transfer system will be used on an average once per year. Furthermore, each campaign is expected to last ten days. Because the waste solutions are compliant with double-shell tank waste specifications and the flush water is inhibited, with the exception of the short length of carbon steel pipeline carrying raw water, the general corrosion of carbon steel pipelines will be minimal. The corrosion contribution to surface roughness primarily occurs during the long waiting periods between the waste transfers. Immediately after the waste transfer, the flush water is drained into the receiving tank. The presence of any stagnant water in the pipe is detrimental to carbon steel because the inhibition characteristics of the water will be lost by a reaction of carbon dioxide in the air in the pipe with the hydroxide in the water. This could lead to pitting of carbon steel in near neutral pHs and if the water contains small amounts of chloride, pitting of the stainless steel is possible. Moreover, raw water may contain sufficient sulfate reducing bacteria to cause microbiologically influenced corrosion (MIC) in the stainless steel line. Savannah River Site and others have had MIC penetrate a pipe from the inside in a matter of weeks.
Assuming all the water drains into the receiving tank, a moist film of inhibited water will be left on the pipe surface. Some of the inhibition characteristics of the film will quickly be lost by a reaction of carbon dioxide in the air in the pipe with the hydroxide in the film. The effectiveness of the residual nitrite in the film as an inhibitor, however, is unknown. Because the pipe is open to the receiving tank, the interior of the pipe will be exposed to humid air conditions with a high relative humidity (RH).
Surface roughness of carbon steel under the humid air conditions described above can be estimated from the humid air corrosion models developed for carbon steel in the literature (Lee et al. 1996). The model, as modified by Anantatmula and Oh1 (1996) was used for the estimates. The penetration by general corrosion is expressed as a function of time, RH and temperature as follows:
ln Dg = + aJn (t) + aflH + a f l
c-5

RPP-5346 REV 0
25 30 35
where Dg is corrosion depth in pm, t is time in years, T is temperature in "K, and ao, al, a? and a3 are constants with the following values:
= 16.9865 a, = 0.6113 a2 = -893.76 and a3 = -833.53
The depth of penetration was calculated for times up to 50 years assuming 98% RH. An average temperature of 35°C was assumed although the temperature of waste solutions is expected to be in the range 45"-80"C. This is because the total waste transfer operation lasts for ten days and the pipe temperature is expected to drop to ambient temperature well before the next waste transfer.
Based on the above assumptions, the depth of penetration was calculated for carbon steel as a function of time from the model equation above. Depending on the availability of oxygen, the corrosion product on the inside surface of the carbon steel transfer lines could be either Fe304 or FezO3. Regardless of which oxide is assumed to be formed, the corrosion product thickness will be approximately twice that of the thickness of the metal lost. Using this information, conservative surface roughness estimates were made for the carbon steel pipe and are listed as a function of time in Table 1.
100 110 120
Table 1. Surface Roughness as a Function of Time for Carbon Steel.
45
15
140
~
70
50
1
150
I 20 I 85 I
I 40 I 130 I
The surface roughness values in the above table should be considered conservative because the tanks are ventilated resulting possibly in e 98% RH in the transfer pipes. In addition, at the present time, it is not known just how long the moist nitrite film will protect the carbon steel after each waste transfer. For the present calculations, it has been assumed that the nitrite film will not offer any protection. Based on a limited number of visual examinations, the roughness may be much less than estimated in Table 1.
C-6

RPP-5346 REV 0
C3.2.2 Stainless Steel
Unlike carbon steel, negligible amount of millscale is expected on as-received stainless steel pipe since the surface is normally protected by a chromium oxide film. Based on the foregoing, stainless steel corrodes at a low general corrosion rate of < 0.1 mpy (0.003 d y ) when exposed to fresh water at normal temperatures including temperatures above 100°C. Assuming a maximum general corrosion rate of 0.1 mpy (0.003 d y ) , a surface roughness value of 8 mils (0.203 mm) is estimated for a 40-yr time period. Including the thickness of the millscale on the as-received pipe, a maximum surface roughness value of 10 mils (0.254 mm) is predicted for the stainless steel line through 40 years of waste transfer operations.
C4.0 SCALING
C4.1 SCALING PROCESSES
Scaling is the deposition of soluble products from the liquid. When a chemical species exceeds its solubility limit, it has a tendency to precipitate. This tendency is increased by the amount the solubility is exceeded and by the presence of deposition nuclei. Other factors will include temperature and liquid shear forces (Becker 1998; Lane 1993).
If the precipitation occurs in the bulk liquid and forms a slurry, then deposits will be loose and easily removed unless they agglomerate while on the surface. On the other hand, if the deposition nucleus is on the surface, then the deposit will occur there and be more firmly attached.
Waste Composition As mentioned earlier, the waste composition is very benign from a corrosion standpoint. It is known that if the temperature of the waste stream is too low, some waste components will precipitate. In discussions with Mr D. A. Reynolds, LMHC, it was determined that flushing with hot water will remove such precipitates.
Water Composition The composition of the river water varies with the season and exact location of the sampling as well as uses of the river and surrounding lands change. Table 2 shows a composition measured in 1994.
c-7
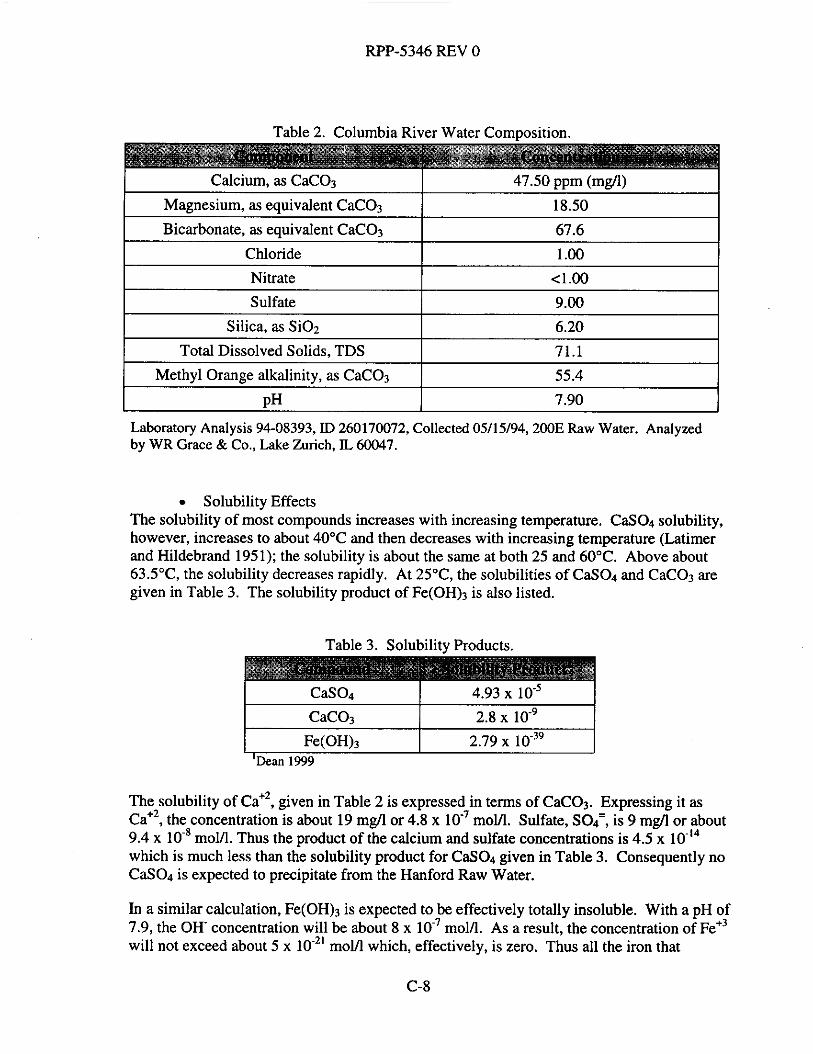
RPP-5346 REV 0
Magnesium, as equivalent CaCO3
Table 2. Columbia River Water Composition.
18.50 Bicarbonate, as equivalent CaCO3 67.6
I Chloride I 1 .00 I Nitrate Sulfate
Silica, as Si02
<1.00 9.00 6.20
Total Dissolved Solids, TDS Methyl Orange alkalinity, as CaCO3
UH
Laboratory Analysis 94-08393, ID 260170072, Collected O5/15/94,200E Raw Water. Analyzed by WR Grace & Co., Lake Zurich, IL. 60047.
71.1 55.4 7.90
Solubility Effects The solubility of most compounds increases with increasing temperature. Cas04 solubility, however, increases to about 40°C and then decreases with increasing temperature (Latimer and Hildebrand 1951); the solubility is about the same at both 25 and 60°C. Above about 63.5”C, the solubility decreases rapidly. At 2 5 T , the solubilities of Cas04 and CaC03 are given in Table 3. The solubility product of Fe(OH)3 is also listed.
Table 3. Solubilitv Products.
Cas04 4.93 10” CaCO3 2.8 10.~
I Fe(OHh I 2.79 10-39 I ‘Dean 1999
The solubility of Ca”, given in Table 2 is expressed in terms of CaC03. Expressing it as Ca”, the concentration is about 19 mgA or 4.8 x moVl. Sulfate, so4=, is 9 mgA or about 9.4 x 10.’ mol/l. Thus the product of the calcium and sulfate concentrations is 4.5 x which is much less than the solubility product for CaS04 given in Table 3. Consequently no CaS04 is expected to precipitate from the Hanford Raw Water.
In a similar calculation, Fe(OH)3 is expected to be effectively totally insoluble. With a pH of 7.9, the OH‘ concentration will be about 8 x mol/l. As a result, the concentration of Fe+’ will not exceed about 5 x lo-*’ moVl which, effectively, is zero. Thus all the iron that
C-8

RPP-5346 REV 0
corrodes will react with excess oxygen and precipitate in the immediate location of the corrosion site and form scale.
C4.2 DISCUSSION OF SCALING
Based on information from the various sources, it is not believed that scaling from the waste will be a problem because it is feasible to re-dissolve the material with hot water.
Langelier developed an empirical relationship to predict the potential for scaling. It considers carbonate solubility, pH, conductivity, and temperature. It is a crude estimate because other factors such as other salts are ignored. Ryznar modified the relationship for use in flowing streams. There are also modifications for use when the total dissolved salts exceed about 7,000 ppm.
These empirical relationships are called the Langelier Index and the Ryznar Index and provide very crude estimates. When using them it is best to err on the conservative side so that only if the prediction is strongly in favor of scaling should it be assumed to occur. Calculating the Langelier (stagnant or low flow rate water) and the Ryznar (flowing water) Indices (Kemmer 1998) for the raw water, the following were obtained, Table 4.
Table 4. Scaling Indices.
~ 1 0 ° C 1 -.7 1 ;;: 1 50°C 0.12 90°C 0.7
If the Langelier Index is negative, the water is considered non-scaling and corrosive. If the Ryznar Index is >6.0, the water is considered non-scaling and corrosive.
Because the water and the pipe will be hot only when the water is flowing, the conclusion is that the water will be somewhat corrosive (towards carbon steel) and non-scaling.
Consequently, most of the scaling due to carbonates would be expected to occur in the "boiler".
C5.0 CONCLUSIONS AND RECOMMENDATIONS
The surface roughness from corrosion for carbon steel is conservatively estimated as 150 mils for 50 years of waste transfer operations, while the corresponding value for stainless steel is expected to be a maximum of 10 mils. Scaling due to deposition from fluids in the pipe will not be a serious concern in the piping.
c-9

RPP-5346 REV 0
Based on the above estimates, the majority of the pressure drop will occur as a result of flow through the carbon steel part of the transfer pipeline. In order to check the validity of the estimates for carbon steel, it is recommended to inspect the inside surfaces of the carbon steel pipes that have been in operation for a known time period. Air drying of the pipes between waste transfers is recommended to reduce the surface roughness of the carbon steel pipes. The short section of carbon steel pipe carrying the raw water should also be checked periodically for its integrity. It is recommended to not let stagnant water remain in the transfer pipes, especially the stainless steel lines. Finally, if pressure drop must be minimized by minimizing the surface roughness of the transfer pipes, it is recommended to replace the carbon steel portion of the transfer line with stainless steel.
C6.0 REFERENCES
Anantatmula, R. P., M. J. Danielson and E. B. Schwenk, 1994, Characterization of the Corrosion Behavior of the Carbon Steel Liner in Hanford Site Single-Shell Tanks, WHC-EP-0772, Rev. 0, Westinghouse Hanford Company, Richland, Washington.
Anantatmula, R. P., and P. C. OM, 1996, DST Remaining Useful Life Estimates, WHC-SD-WM-ER-585, Rev. 0, Westinghouse Hanford Company, Richland, Washington.
Becker, J. R., 1998, Corrosion and Scale Handbook, PennWell Publishing, Tulsa, OK.
Dean, J. A., 1999, Lunge's Handbook of Chemistry, 15" Ed, McGraw-Hill, New York, NY
Kemmer, F. N. Ed, 1988, The NALCO Water Handbook, McGraw-Hill, New York, NY
Lane, R. W., 1993, Control of Scale and Corrosion in Building Water Systems, McGraw-Hill, New York, NY.
Latimer, W. M. and J. H Hildebrand, 1951, Reference Book of Znorganic Chemistry, 3" Edition, Macmillan Co., New York, NY
Lee, J. H., J. E. Atkins and R. W. Andrews, 1996, Humid-Air and Aqueous Corrosion Models for Corrosion-Allowance Barrier Material, Mat. Res. SOC. Symp. Proc., Vol. 412, p. 571.
Smith, H. D. and M. R. Elmore, 1992, Corrosion Studies of Carbon Steel Under Impinging Jets of Simulated Slurries of Neutralized Current Acid Waste (NCAW) and Neutralized Cladding Removal Waste (NCRW), PNL7816, Pacific Northwest Laboratory, Richland, Washington.
Truitt, J. B. and S. E. Wagner, 1985, N-Reactor Production Assurance Program Balance of Plant Evaluation. Task I : Buried Piping, UNI-3 133, Rev. 1, Westinghouse Hanford Company, Richland, Washington.
c-10

RPP-5346 REV 0
ATTACHMENT C-1
SUMMARY OF SEARCH FOR TRANSFER LINE SOLIDS
BUILDUP/SCALING INFORMATION
OCTOBER 1999
c-I1

RPP-5346 REV 0
This page intentionally left blank.
c-12

RPP-5346 REV 0
Summary of Search for Transfer Line Solids Buildup/Scaling Information, October 1999
Because of the long length of the transfer route, the pipe internal roughness is a major factor in determining the pump and piping design. For new lines, a significant increase in surface roughness with time in operation will significantly increase the pressure drop and must be accounted for in the design specification. Since there is no readily available information about the change in pipe roughness with time for a caustic waste transfer line, a brief and focused effort was made to find such information. The change in pipe roughness due to corrosion is investigated in a separate report.
Several sources of information were investigated and the results are included in the attached pages.
Expert opinion and experience were collected from personnel at Hanford, Savannah River, and Idaho Falls.
Hanford transfer line failure studies were reviewed
Savannah River transfer line failure studies were discussed
Hanford internal video inspections of transfer lines (no videos made available)
No quantitative information was found. However, there was also no event reported of chronic scale buildup.
To continue this effort to provide quantitative information, the following are recommended:
1. Review video inspections of Hanford transfer lines for evidence of adherent solids.
2. Evaluate two-phase transport of food products (sugars, salts, etc.) and problems/solutions to transport mechanisms.
3. Evaluate crystal formation, crystal size, adherence and solubility of waste salts.
4. Evaluate chemical production in high percent solids liquors and resultant production concerns (i.e., electro-chemical chlorine production in $5 NaCI, Yi NaOH solution).
5. Evaluate pipe linings and resistance to abrasion (in high percent solids), temperature, and thermal cycling and solids adherence after prolonged periods of non-use.
6. Evaluate available pipe interior finishes for weldments and general piping including ' mechanical and acid etching as a means to reduce solids adherence.
7. Evaluate stainless steel 300 series as the piping material of choice providing definitive data on its performance to: a) chloride attack in neutral or low pH solutions, b) scalingkolids build-up as related to increase in flow resistance, and c) solids build-up after long periods of non-use and dissolution of solids in water rinses.
C-13

RPP-5346 REV 0
HANFORD TRANSFER LINE PIPE ROUGHNESS AND SCALING ADHERENCE PROPERTIES AFFECTING PUMPING EQUIPMENT AND
LINE SELECTION
CONTACTS LISTING (October 1999):
David Lini, SAIC 509/373-9102
Darrel Duncan, NHC 509/372-1013
Jim Divine, ChemMet Ltd 509/967-2309
Richard W. Johnson, INEEL 208/526-0955
Richard Rice, INEEL 208/526-1992
R. P. (Mo) Anantatmula, LMHC 509/373-0785
Bruce Wiersma, SRS 803/725-5439
Earl Schwenk, COGEMA Engineering 509/943-4438
Charles Jenkins, SRS 803/725-1699
Daniel Reynolds, LMHC 5091373-31 15
John Keve, COGEMA Engineering 509/376-8061
Wesley Nelson, COGEMA Engineering 509/376-5403
Fred Reich, COGEMA Engineering 509/37 1-8046
Scott Wew, LMHC 509/373-183 1
Jim Field, LMHC 509/376-3753
Jeff Doeler, LMHC 509/373-6024
Jim Douglas, COGEMA Engineering 509/372-0989
Bill Morris, LMHC 509/372-3724
C-14

RPP-5346 REV 0
HANFORD TRANSFER LINE PIPE ROUGHNESS AND SCALING ADHERENCE PROPERTIES AFFECTING PUMPING EQUIPMENT AND LINE
SELECTION
TELEPHONE CONFERENCE WITH:
Charles Jenkins, SRS 803/725-1699
Finally got through to Chuck on October 13, 1999 to discuss Savannah River's transfer line scaling, related to roughness and line type. Chuck indicated that all cross-site or inter-area transfer lines are 304L stainless steel. A few intra-tank farm transfer lines are carbon steel. Stainless steel, by its nature, will not allow scaling buildup at the temperatures waste will be transferred under. If the temperature were 800" C, where oxidation could occur, scaling would be a significant problem.
Three stainless steel transfer lines have failed over the years, while no carbon steel lines have failed. The first SST line failure was due to chloride stress corrosion cracking. The transfer line was hydro-tested and the water was drained but the line was never dried, as called for in procedures. The pipe passed testing and set unused for years. The line was poorly sloped and was near the surface in 60 to 70 O F soil. Retesting of the line prior to use showed the line had failed. The results of the inspection indicated chloride stress corrosion cracking caused the transfer pipe failure. The second incident of stainless steel transfer pipe failure was a result of a steam leak. A steam line leak had occurred near a transfer pipe and heated the surrounding soil for some time. The heating and evaporation of water from within and outside the transfer line caused failure. The failure was most probably due to continued chloride attack over several months and the resultant stress corrosion cracking. (This failure is most likely the same as reported in the Wiersma write-up.) The third failure of a stainless steel transfer line was caused by thermal fatigue from continued pipe expansion and subsequent contraction. Waste transfers at SRS are conducted using a steam-lift principle. Steam is injected into the waste and the resultant vacuum lifts the liquid waste. Therefore, steam becomes part of the liquid waste stream. The continued expansion and contraction of transfer piping lead to the thermal failure. The cause of this failure, transfer lines too rigidly attached, has since been corrected at SRS.
Chuck also provided some general information: (1) all inspected transfer lines at SRS have appeared clean and clear of build-up, (2) SRS always flushes lines after transfers with several volumes of water, (3) SRS would never consider installation of anything other than a stainless steel for a waste transfer line, (4) certain pipe lines that will see high levels of chloride will be fabricated from Hastelloy C or other high Ni alloys, (5) no scaling on stainless steel lines has been observed and (6) for caustic waste transfers use a 300 series, 304L, stainless steel pipe.
C-15

RPP-5346 REV 0
HANFORD TRANSFER LINE PIPE ROUGHNESS AND SCALING ADHERENCE PROPERTIES AFFECTING PUMPING EQUIPMENT AND LINE
SELECTION
TELEPHONE CONFERENCE WITH
Bruce Wiersma, SRS 803/725-5439
Finally got with Bruce on October 12, 1999 to discuss any knowledge he has on waste transfer line scaling buildup as it relates to pipe roughness and adherence properties. Bruce indicated he is aware of only two instances of transfer pipe plugging or failure at SRS. The first instance concerned the plugging of a stainless steel gravity drain line from the evaporator. (Bruce noted that all waste transfer lines at SRS are stainless steel.) An inspection using an in-line viewing camera was conducted of the plugged line and concluded the evaporator clean out liquor was drained into the line where it cooled rapidly and crystallized, plugging the line. The internal surfaces of the pipe did not show any damage and in fact appeared quite smooth and clean.
The second waste transfer pipe mishap occurred when a steam line broke and caused a thermal failure in the pipe. An adjacent steam line that heated the stainless steel waste transfer line failed. The steam line heated the ground around the pipe and caused evaporation of the water flush in the transfer pipe. The high chloride attacked the piping welds causing stress corrosion cracking and failure of the pipe. The waste transfer pipe was made of 304L stainless steel. A write-up of the pipe failure and inspection is contained in the SRS internal report WSRC-TR-960356.
C-16

RPP-5346 REV 0
HANFORD TRANSFER LINE PIPE ROUGHNESS AND SCALING ADHERENCE PROPERTIES AFFECTING PUMPING EQUIPMENT AND LINE
SELECTION
TELEPHONE CONFERENCE WITH
Scott Werry, LMHC, Richland, WA 509/373-1831
I had called Dave Smet to inquire about videos of waste transfer lines. Dave indicated that I should speak with Scott Weny concerning any video work. I finally spoke with Scott on October 12, 1999 about any videos he may have of tank transfer line inspections or in-line inspections. Scott indicated his database consists of tank and pit inspections and does not contain any transfer line inspections. We spoke of the SL-I 19 work and he again indicated that video work is not in his database. He indicated that if any NDE inspection equipment was put in transfer lines it would have to pass the flammable gas controls and the line would have to be purged, which would go through Scott. Also the Flammable Gas Board would review and approve the work and most probably a USQ would have been conducted. Scott recalls no such actions ever being conducted. Scott indicated that several years ago, under Westinghouse, he was in the process of assembling the entire video library of all tank farm work. After the site contract change, that effort was split and now no central group possess all the videos or even knows of their whereabouts. Scott suggested I call Mike Sumsion (376-4643) for additional 200 East Area videos and Joe Gonzalez (373-3056) for 200 West Area videos.
Scott called back and indicated there was a document that had “TEEM in the title by EJ Walter that was done in the early 1990s that may be of some help. (The document was WHC-SD-WM- TEEM-001, Pressure Testing of Underground Transfer Piping for Single-Shell Tank Salt Well.) He also indicated that another document, HNF-SD-WM-ER-623, Rev 0 may have some data in a table at the end of the document. Scott again called and said I might also call Dan Pfluger (376-6164) as a source for additional information.
C-17

RPP-5346 REV 0
HANFORD TRANSFER LINE PIPE ROUGHNESS AND SCALING ADHERENCE PROPERTIES AFFECTING PUMPING EQUIPMENT AND LINE
SELECTION
TELEPHONE CONFERENCE WITH:
Earl Schwenk, COGEMA Engineering, Richland, WA 943-4438
Talked with Earl on October 12,1999 and he indicated that he had conducted a failure analysis of a stainless steel transfer line about 20 years ago and the line was smooth other than the pitting. The analysis did not involve evaluation of pipe scaling, pipe roughness and associated adherence or pipe plugging but was a corrosion assessment. Earl provided an assessment of conditions that needed to be met, both materials and conditions, to assure successful transfer in waste piping. He first pointed out that stainless steel should be the pipe material of choice. Stainless steel will show very little general corrosion attack over time and therefore should provide no surface anomalies for scaling or solids build-up. No carbon steel should be used as it will pit and corrode too badly. A 300 series (304L or 316) stainless steel may not be the best choice of stainless if high chloride and neutral pH conditions may occur. A stainless steel that is higher in Ni or Cr may be needed to combat these conditions. The pH must be maintained well above 8.0. Even pH in the neutral range (6.0 -7.0) can cause chloride stress corrosion cracking and pitting, degradation of welds, and pipe failure. Suspended solids at 30 wt% will require turbulent flow for transfer. If waste streams with this amount of solids are transferred in laminar flow the solids will undoubtedly settle out or collect. Special piping, such Teflon-lined, would undoubtedly suffer from abrasion with all the solids and Earl has no quantitative date on how such lined piping would hold up in this condition. It was agreed that a smooth surface of the piping would be essential for transfer of the tank wastes. Earl indicated Jim Divine would know much more concerning tank waste transfer line attack by chloride and corrosion cracking in neutral pH conditions and I should contact Jim for more on that subject. Earl also suggested I contact previous Grout Project engineers to ascertain what wt% solids and what specific conditions of the waste or equipment bounded grout waste transfers. Earl indicated I should also contact other industries to obtain two-phase material transfer data.
C-18

RPP-5346 REV 0
HANFORD TRANSFER LINE PIPE ROUGHNESS AND SCALING ADHERENCE PROPERTIES AFFECTING PUMPING EQUIPMENT AND LINE
SELECTION
TELEPHONE CONFERENCE WITH:
Richard W. Johnson, INEEL 2OW526-0955
A phone conversation was held with Richard on October 6, 1999 to discuss pipe roughness and adherence properties that may be in the Handbook Of Fluid Dynamics he had recently edited. (Richard’s name was given to me by Jim Divine, ChemMet LTD, as a possible contact that may have information on caustic waste transport issues.) Richard indicated no such material is contained in the edition and he has no knowledge or working experience with caustic waste transport, pipe roughness or piping adherence properties. Richard did indicate that I might check with Dick Rice, INEEL, (208/526-1992) who has worked in the field of two-phase transport and may have some information that may be of help to me.
c-19

WP-5346 REV 0
HANFORD TRANSFER LINE PIPE ROUGHNESS AND SCALING ADHERENCE PROPERTIES AFFECTING PUMPING EQUIPMENT AND LINE
SELECTION
TELEPHONE CONFERENCE WITH:
Fred Reich, COGEMA Engineering, Richland, WA 509/371-8046
I talked with Fred on October 12, 1999 about any past experience he may have had with NDE testing of waste transfer lines and results he obtained concerning detection of corrosion, scaling products, etc. Fred indicated his only experience has been in the petrol-chemical field detecting corrosion in iron piping. A pipe crawler using pulse-echo ultrasonics was used in petroleum cross-site transfer lines to detect pitting and general corrosion. No work was ever done for the detection of corrosion products or scaling buildup. In petroleum lines “sour crude” contained sulfur that would react with the iron creating corrosion. The crawler was designed to operate in 18-inch, or larger lines, while oil, gasoline, or diesel were running in the lines. Fred indicated no work was done with stainless steel pipe lines. Fred has had no experience with external NDE of waste transfer lines and does not know of anyone who has had such experience.
c-20

RPP-5346 REV 0
HANFORD TRANSFER LINE PIPE ROUGHNESS AND SCALING ADHERENCE PROPERTIES AFFECTING PUMPING EQUIPMENT AND LINE
SELECTION
TELEPHONE CONFERENCE WITH:
Dick Rice, INEEL, Idaho Falls, ID 208/526-1992
On October 6, 1999 I left a message for Dick to call me on his two-phase transport work as it may relate to caustic waste transfer. On October 7, Tish Stoots (2081526-1764) returned my call to obtain more information for Dick. Tish indicated she would get back to me with any information on the subject. On October 12, I again called Tish to inquire of any progress on the subject. She indicated she had spoken with Dick and he had no quantitative data on two-phase transport that would support Hanford high-level waste transport.
c-2 1

RPP-5346 REV 0
HANFORD TRANSFER LINE PIPE ROUGHNESS AND SCALING ADHERENCE PROPERTIES AFFECTING PUMPING EQUIPMENT AND LINE
SELECTION
TELEPHONE CONFERENCE WITH:
James Divine, ChemMet LM, West Richland, WA 509/967-2309
On October 4, 1999 I spoke with Jim Divine concerning his knowledge of scaling products deposition in tank transfer lines and associated roughness and adherence properties. Jim indicated that that no PNL studies were done in the past to evaluate the type of corrosion and resultant deposition. He indicated that if the transfer piping were to be made of stainless steel there would be no pitting corrosion only deposit accumulation. A carbon steel transfer line would exhibit pitting corrosion over time. Jim has had experience in the 300 Area with 6 and 8- inch water lines that have closed to 2-inch with deposition but nothing akin to tank wastes. Jim indicated that I should call Richard W. Johnson at INEEL since he had either written or edited a Handbook of Fluid Dynamics and may have some information.
On October 5, 1999 Jim called back to state he didn’t know of other contacts at any other DOE sites that would have any quantitative data concerning this subject. Jim did suggest that some simple experiments could be proposed that would produce data on pipe roughness and scale adherence affects on pump pressure output. But these data would be nothing different than calculations found in standard publications on momentum transfer.
Jim was very confident that no quantitative data exists on tank waste transfer lines scaling and adherence properties and was not aware of any specific work on adherence to stainless steel.
c-22
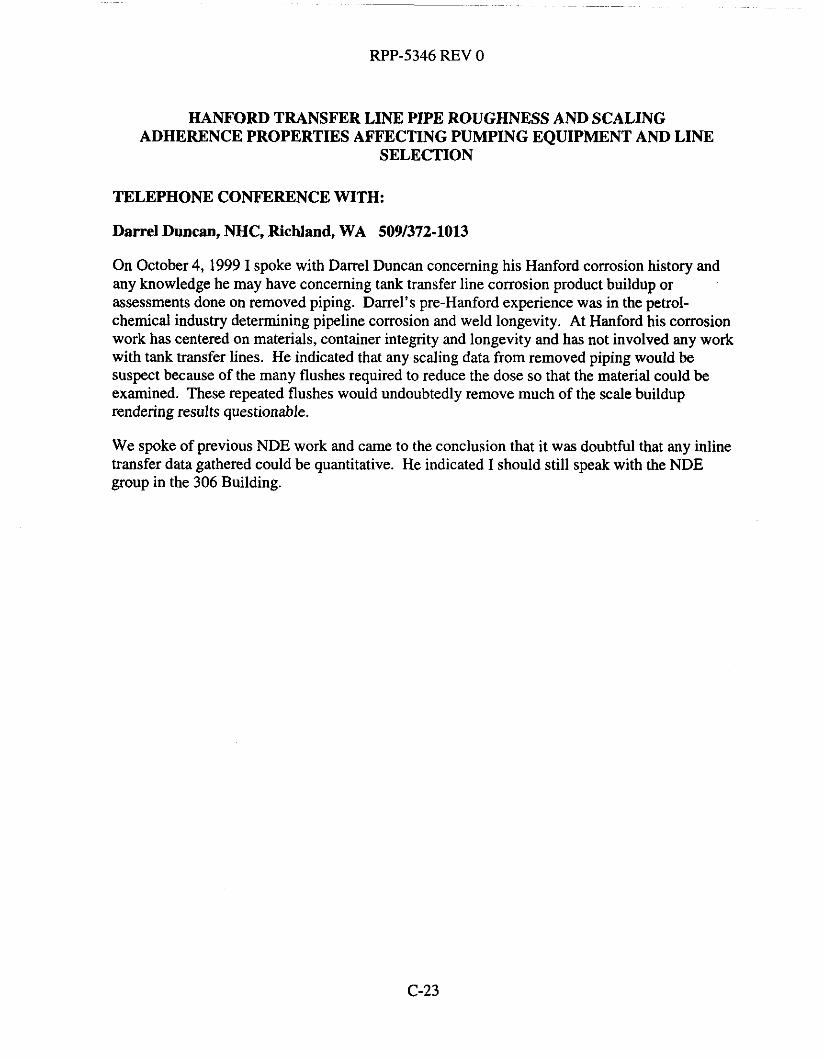
RPP-5346 REV 0
HANFORD TRANSFER LINE PIPE ROUGHNESS AND SCALING ADHERENCE PROPERTIES AFFECTING PUMPING EQUIPMENT AND LINE
SELECTION
TELEPHONE CONFERENCE WITH:
Darrel Duncan, NHC, Richland, WA 509/372-1013
On October 4, 1999 I spoke with Darrel Duncan concerning his Hanford corrosion history and any knowledge he may have concerning tank transfer line corrosion product buildup or assessments done on removed piping. Darrel’s pre-Hanford experience was in the petrol- chemical industry determining pipeline corrosion and weld longevity. At Hanford his corrosion work has centered on materials, container integrity and longevity and has not involved any work with tank transfer lines. He indicated that any scaling data from removed piping would be suspect because of the many flushes required to reduce the dose so that the material could be examined. These repeated flushes would undoubtedly remove much of the scale buildup rendering results questionable.
We spoke of previous NDE work and came to the conclusion that it was doubtful that any inline transfer data gathered could be quantitative. He indicated I should still speak with the NDE group in the 306 Building.
C-23

RPP-5346 REV 0
HANFORD TRANSFER LINE PIPE ROUGHNESS AND SCALING ADHERENCE PROPERTIES AFFECTING PUMPING EQUIPMENT AND LINE
SELECTION
TELEPHONE CONFERENCE WITH:
David Lini, SAIC, Richland, WA 509/373-9102
On October 5, 1999 Dave returned my call to discuss his 1975 document “Compilation of Hanford Corrosion Studies”, ARH-ST-111. Dave indicated the corrosion assessment in the document was centered on finding data to support either the “leave in place option” or the “retrieval option” for wastes contained in the high-level waste tanks. These two options were on the forefront at Hanford since deactivation of the 149 single-shell tanks was underway and future storage of all high-level liquid wastes was designated for double-shell tanks. The document focused on tank integrity assessments in an attempt to determine tank longevity. As Dave remembers, there is no information on tank transfer lines or any assessment of transfer line corrosion, product buildup and subsequent line plugging, or transfer line failure within the document. Dave did not know of any work done with caustic waste transfer lines concerning scaling buildup or transfer line pipe roughness assessments nor did he know of anyone on site that had such information.
C-24

RPP-5346 REV 0
HANFORD TRANSFER LINE PIPE ROUGHNESS AND SCALING ADHERENCE PROPERTIES AFFECTING PUMPING EQUIPMENT AND LINE
SELECTION
TELEPHONE CONFERENCE WITH
Wesley Nelson (509/376-5403) and John Keve (509/376-8061), COGEMA Engineering Corporation, Richland, WA
On October 6, 1999 I spoke with John and Wes concerning their work experience concerning any non-destructive examinations of removed or in-place tank transfer line piping. Neither had any experience conducting such examinations and stated that the 306 NDE shop had never done this type of work for tank transfer piping.
C-25

RPP-5346 REV 0
HANFORD TRANSFER LINE PIPE ROUGHNESS AND SCALING ADHERENCE PROPERTIES AFFECTING PUMPING EQUIPMENT AND LINE
SELECTION
TELEPHONE CONFERENCE WITH:
Daniel Reynolds, LMHC, Richland, WA 509/373-3115
Finally caught up with Dan on October 13, 1999. Dan indicated that almost all waste transfers in the last several years have been evaporator feed that contain very little solids. Volume % solids have not been traditionally reported in waste transfers. In approximately the last five years compatibility assessments of the transfer and receiving tanks are to be done. The assessment may contain SPG but claim no solids. A grab sample may be taken but is not necessarily representative since mixer pumps do not have to run for any period of time. Tank 101-SY solution transfer will utilize bulk density versus solution density to determine volume % suspended solids. Inline dilution instrumentation will be utilized to maintain the slurry <25 vol% solids. It is assumed that 60% of the solids in 101-SY, mainly NaN03 and NaN02, will dissolve as water is added. Tank C106 will be monitored for % solids as it is sluiced out. The same vol% solids measuring system will be used as 101-SY. However, the solids will be maintained at <15 vol% during the transfer of the C106 slurry.
C-26

RPP-5346 REV 0
HANFORD TRANSFER LINE PIPE ROUGHNESS AND SCALING ADHERENCE PROPERTIES AFFECTING PUMPING EQUIPMENT AND LINE
SELECTION
TELEPHONE CONFERENCE WITH:
Jim Douglas, COGEMA Engineering, Richland, WA 509/372-0989
I spoke with Jim on October 7, 1999 to find out what data was provided concerning waste tank transfers. The data Jim has been provided as he has compiled tank waste characterization documentation are:
Totalalpha Sodium(Na) Aluminum (Al) Nitrate (N03) Nitrite(N02) Hydroxide (OH) Specific gravity Sulfate (Sa) Phosphate (P04)
Jim believes the average temperature for waste being transferred is approximately 75 C. He indicated I should contact Jim Field of LMHC to double check the data provided with waste transfers. Jim indicated he has never seen a wt% solids value in any of the waste transfer data.
c-21

RPP-5346 REV 0
HANFORD TRANSFER LINE PIPE ROUGHNESS AND SCALING ADHERENCE PROPERTIES AFFECTING PUMPING EQUIPMENT AND LINE
SELECTION
TELEPHONE CONFERENCE WITH:
Jim Field, LMHC, Richland, WA 509/376-3753
Talked with Jim on October 13, 1999 concerning data available concerning waste transfers. Jim supported Jim Douglas's conversation in the constituents reported in waste transfers. Jim did indicate that grab samples were conducted to determine % solids. He also indicated that following waste transfers, three pipe volumes of water are used to flush the line(s). Flush volumes are being contested in lines that are of great length. Jim also stated that recommendations are continually made to turn on transfer line trace heaters to match the temperature of the tank the transfer is coming from. Average transfer temperature is something hard to quantify. The range of transfer liquids can vary by almost 1.50 "F as line length, trace heater conditiodsettings, initial waste temperature, water added to waste prior to transfer and other parameters can affect delivery temperature.
(2-28

RPP-5346 REV 0
HANFORD TRANSFER LINE PIPE ROUGHNESS AND SCALING ADHERENCE PROPERTIES AFFECTING PUMPING EQUIPMENT AND LINE
SELECTION
TELEPHONE CONFERENCE WITH:
Bill Morris, LMHC, Richland, WA 509/372-3724
Bill called on October 13, 1999 and indicated Joe Gonzalez had no knowledge of transfer line videos but he did. Bill is the camera group lead and recalls videos of the east-west transfer line video and the AY Tank Farm transfer line video inspection with a boroscope. He recalls that the videos were taken in the early 1990s. Bill will review his video records on transfer line inspections this afternoon and call me back with information concerning the videos.
C-29

RPP-5346 REV 0
LIST OF DOCUMENTS CONCERNING INSPECTIONS OR TESTING OF UNDERGROUND WASTE TRANSFER LINES
1. WHC-SD-WM-ANAL-014, 1994, S Tank Farm SL-119 Saltwell Piping Failure Analysis Report, Rev. 0, Westinghouse Hanford Company, Richland, Washington.
2. WHC-SD-WM-ES-259, 1993, Single-Shell Saltwell Transfer Piping Evaluation, Rev. 0, Westinghouse Hanford Company, Richland, Washington.
3. WHC-SD-WM-TEEM-001, 1992, Pressure Testing of Underground Transfer Piping for Single-Shell Tank Saltwell, Rev. 0, Westinghouse Hanford Company, RicNand, Washington.
4. HNF-SD-WM-ER-623, 1997, DST Waste Transfer Piping and Pit System Integrity Assessmenr Report, Rev. 0, Westinghouse Hanford Company, Richland, Washington.
5. WSRC-TR-96-0356, 1996, Materials Degradation Evaluation of High Level Waste Transfer Line System (U), Westinghouse Savannah River Company, Aiken, South Carolina.
C-30

RPP-5346 REV 0
APPENDIX D
CRITICAL VELOCITY AND PRESSURE LOSS EVALUATION RESULTS FOR DOUBLE-SHELL TANK TRANSFER PIPING IN 200 EAST AREA FOR
TANK-TO-TANK AND TANK-TO-BNFL INC. TRANSFERS BASED ON HANFORD TANK WASTE OPERATION SIMULATOR CASES 3S4 AND 3S6 DISTINCT TRANSFER ROUTE IDENTIFICATION FOR PROPOSED PHASE 1B WASTE FEED DELIVERY TRANSFERS
D-i

RPP-5346 REV 0
This page intentionally left blank.
D-ii

RPP-5346 REV 0
LIST OF TABLES
D- 1
D-2
D-3
D-4
D-5
D-6 D-7
D-8
D-9
D-10 D-11
D-12 D-13
D-14
D-15 D-16
D-17 D-18
D-19 D-20 D-21
D-22 D-23
D-24
D-25
D-26
D-27 D-28
D-29
3S4 Case Summary .................................................................................................. D-1
3S4 Case la .............................................................................................................. D-3
3S4 Case lb ............................................................................................................. D-5
3S4 Case IC .............................................................................................................. D-7
3S4 Case Id ............................................................................................................. D-9 3S4 Case 2a ............................................................................................................ D-11
3S4 Case 2b ........................................................................................................... D-13 3S4 Case 2c ............................................................................................................ D-15
3S4 Case 2d ........................................................................................................... D-17 3S4 Case 3a ............................................................................................................ D-19
3S4 Case 3b ........................................................................................................... D-21
3S4 Case 3c ............................................................................................................ D-23 3S4 Case 3d ........................................................................................................... D-25 3S4 Case 4 ............................................................................................................. D-27
3S6 Case Summary ................................................................................................ D-29 3S6 Case la ............................................................................................................ D-31
3S6 Case lb ........................................................................................................... D-33 3S6 Case IC ............................................................................................................ D-35
3S6 Case Id ........................................................................................................... D-37 3S6 Case 2a ............................................................................................................ D-39
3S6 Case 2b ........................................................................................................... D-41
3S6 Case 2c ............................................................................................................ D-43 3S6 Case 2d ........................................................................................................... D-45
3S6 Case 3a ............................................................................................................ D-47
3S6 Case 3b ........................................................................................................... D-49
3S6 Case 3c ............................................................................................................ D-51
3S6 Case 3d ........................................................................................................... D-53 3S6 Case 4 ............................................................................................................. D-55
3S6 Case 4-st ......................................................................................................... D-57
D-iii

RPP-5346 REV 0
ft in. lbflin’ mils gPm CP
CONVERSIONS
feet = 0.3048 meter (m) inch = 2.54 centimeters (cm) pounds per square inch = 0.06895 megapascals (MPa) 0.001 in. = 0.0254 millimeter (mm) 0.063 1 literlsecond (Us) centipose = 0.001 kilogradmeter-second (kg/m-s)
D-iv

RPP-5346 REV 0
Table D-I. 3S4 Case Summary.
D- 1

~~~
RPP-5346 REV 0
This page intentionally left blank.
D-2

P n
m $;ie


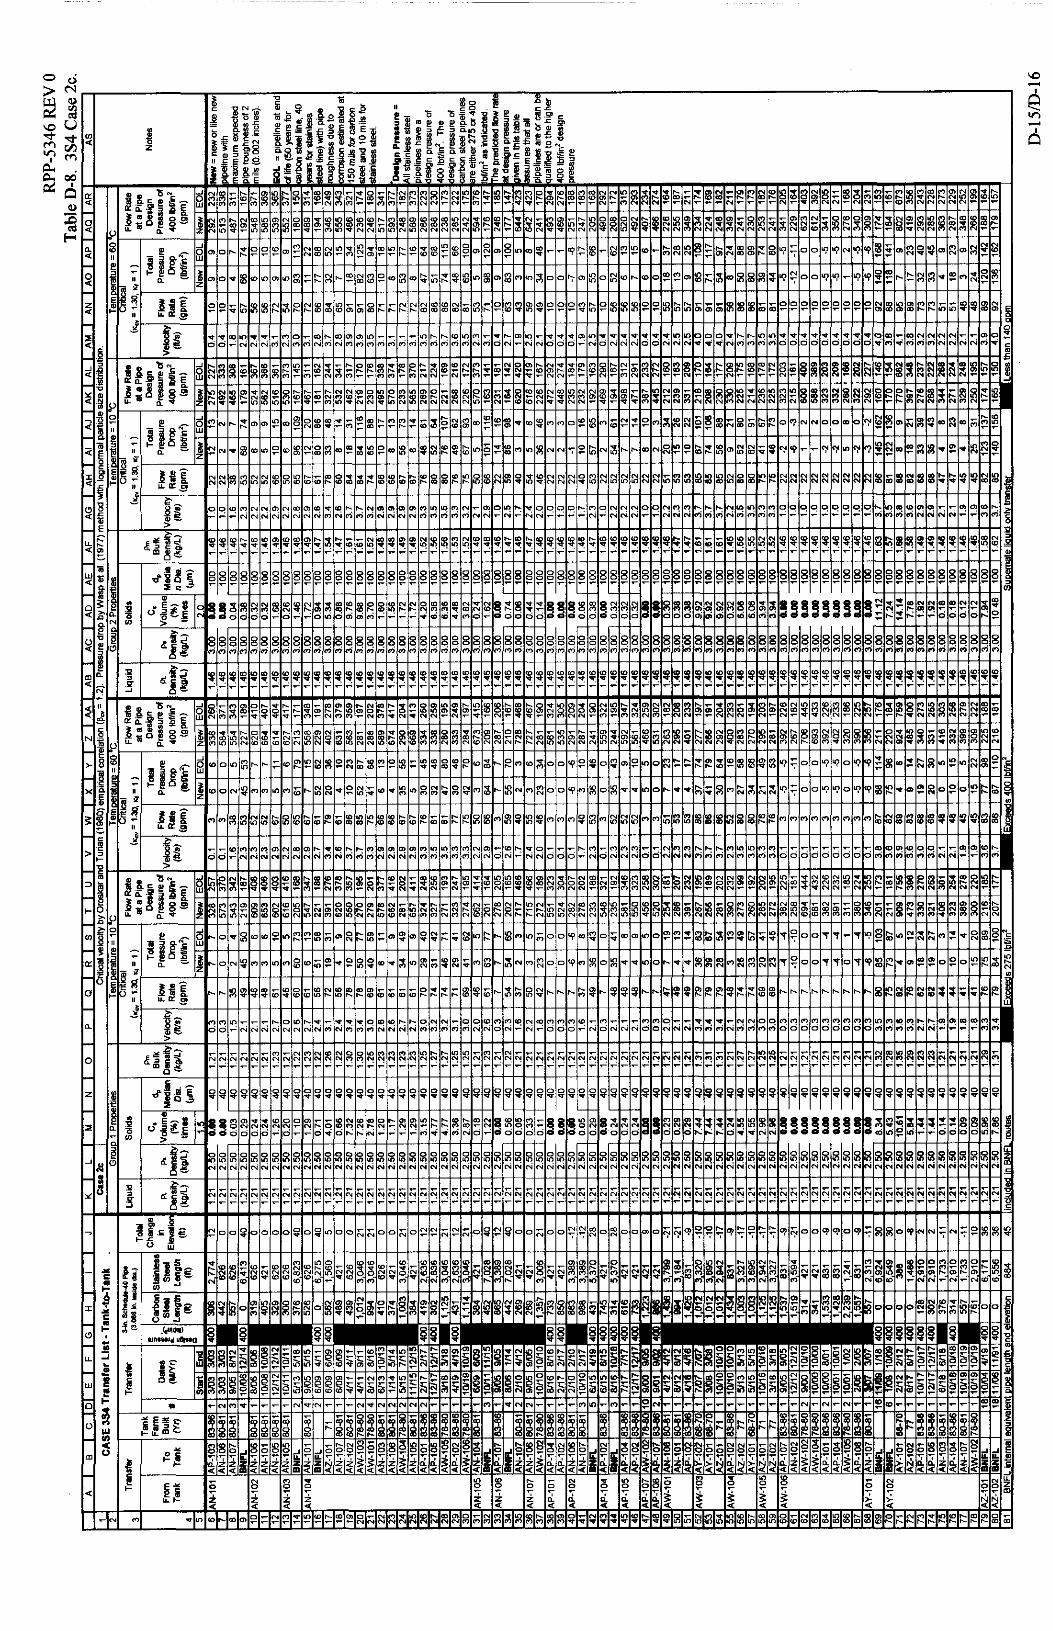


This page cannot be converted.
Please view the native document
for the original page.
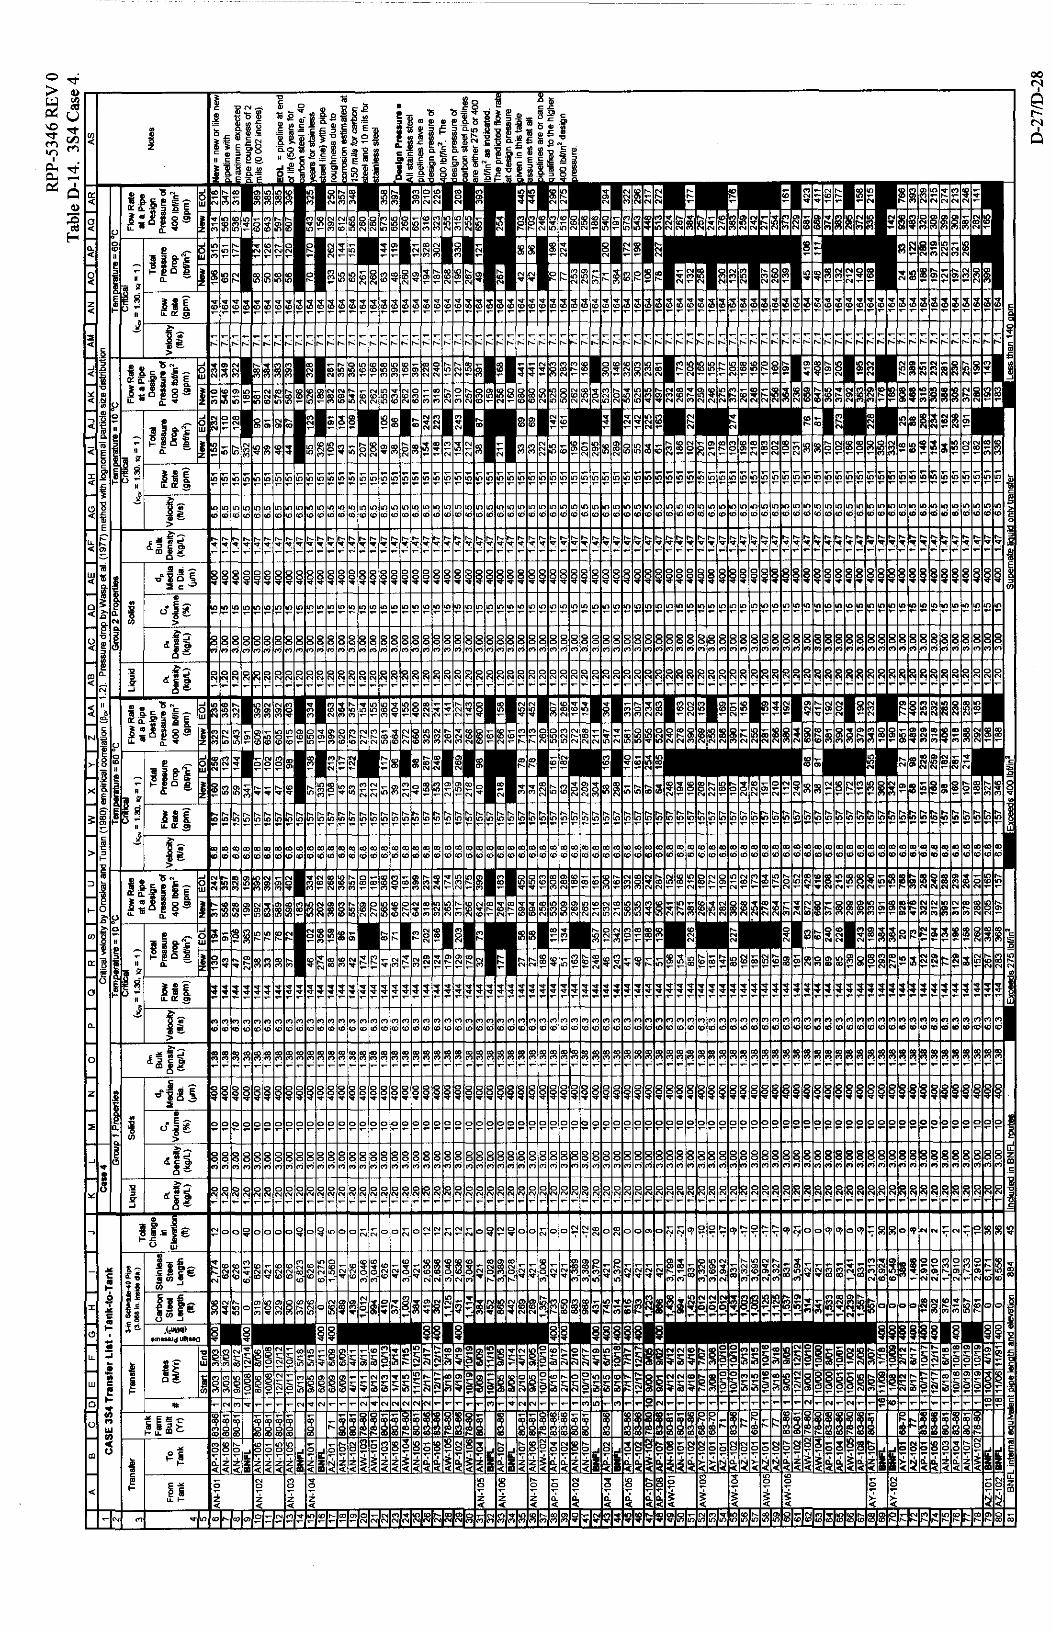

RPP-5346 REV 0
Table D-15. 3S6 Case Summary.
D-29

RPP-5346 REV 0
This page intentionally left blank.
D-30
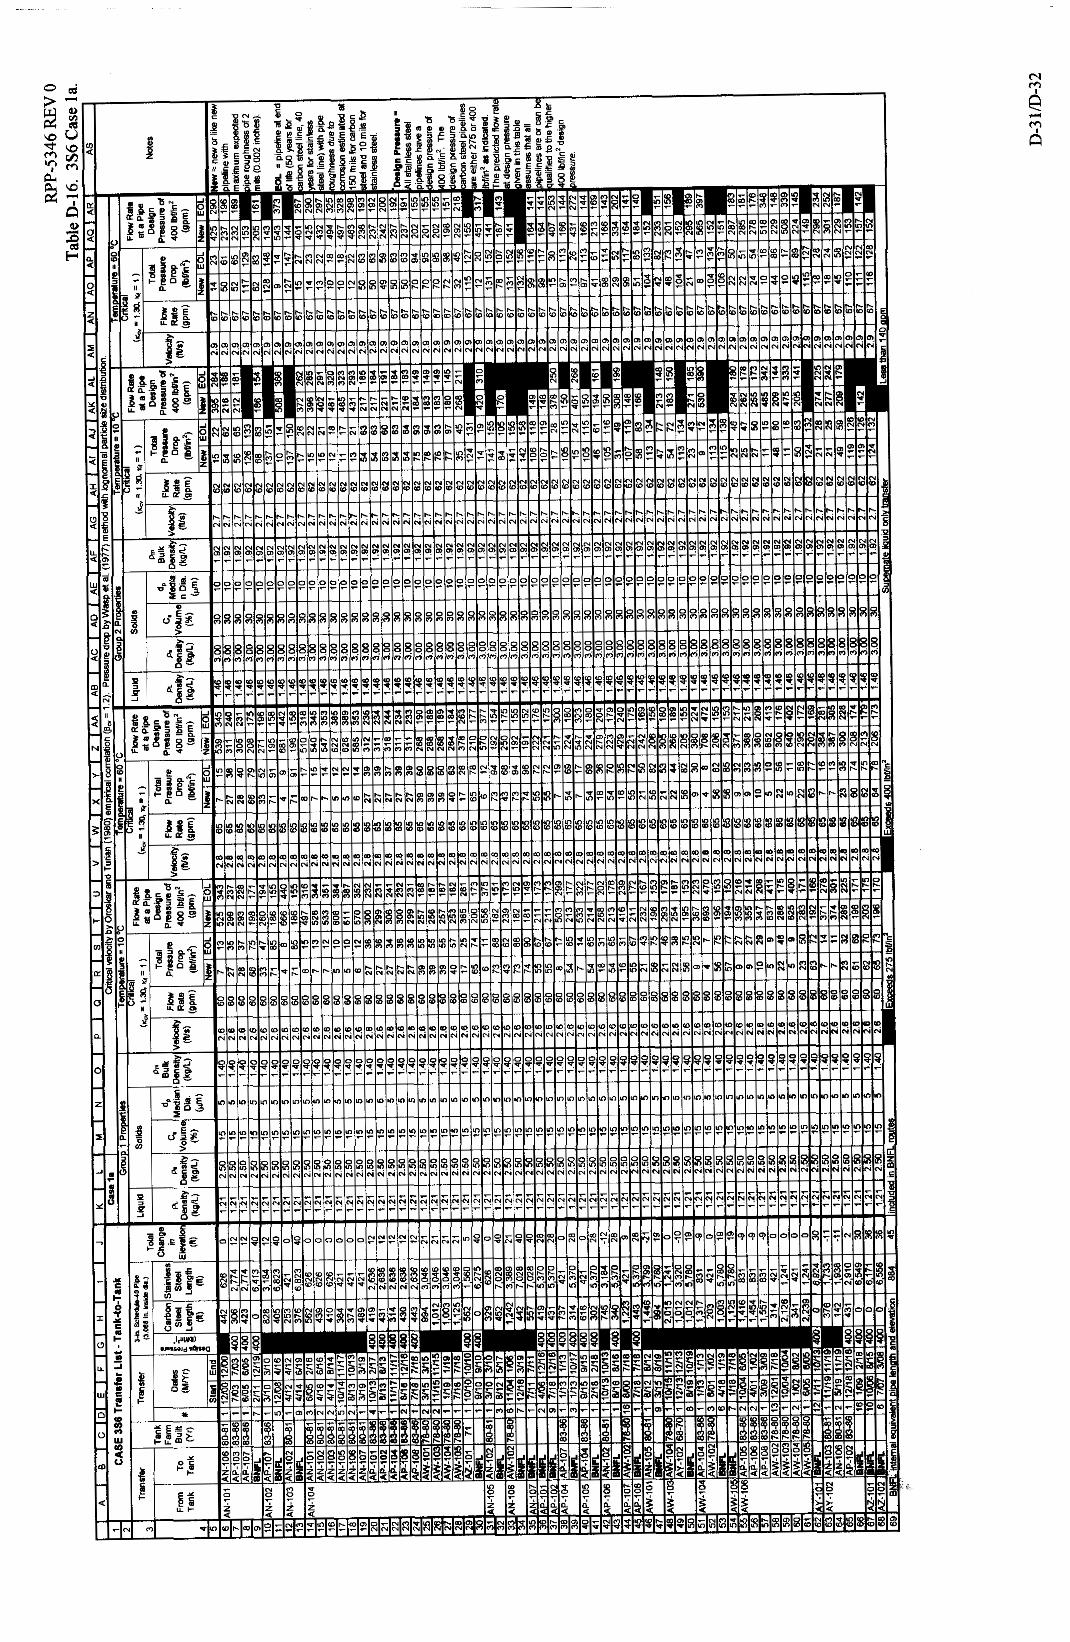


W "?
d


d


/ , , ! ! ! ! ! ! ! ! ! ! ! ! ! , ! ! ! ! ! ! ! ! !
d


d


111 "J I I I I I I I I I I I l l l l l l l l 1 1 1 1 1 1 1 1 1 1 1 1 1 1 1 1 1 1 1 1 1 1 1 1 1 1 1 1 1 1 1 1 1 1 1 1 1 1 1 1 1 1 1 1 1


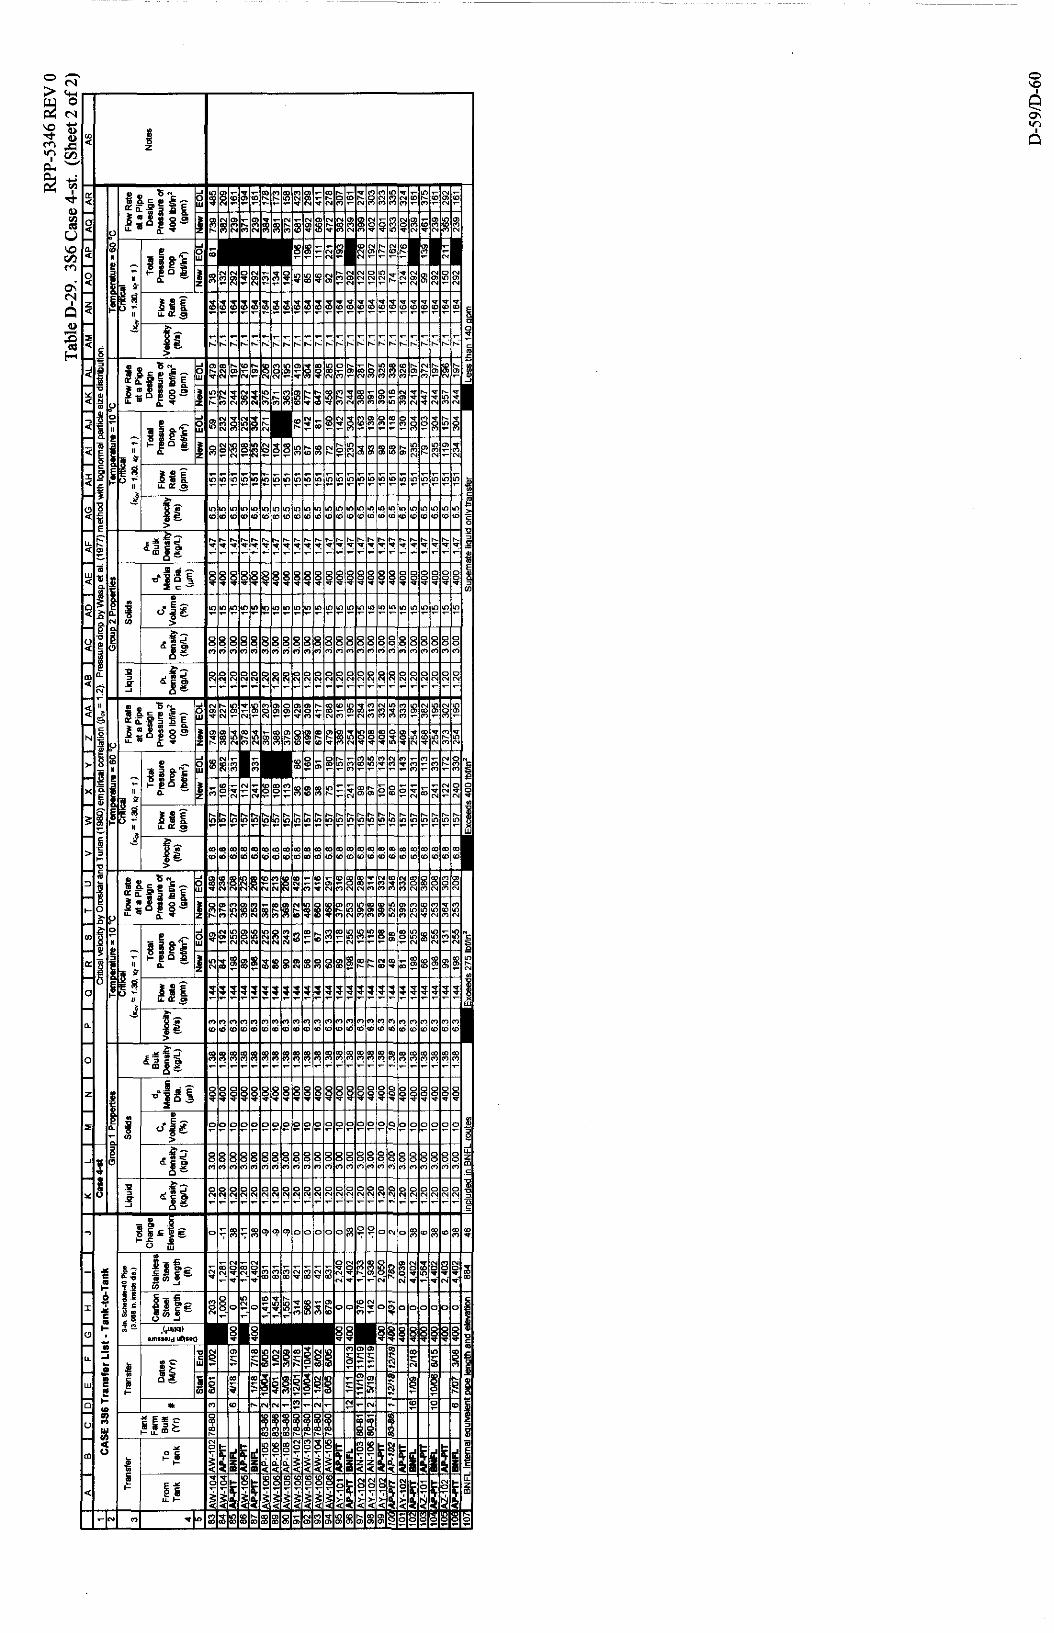
I I I I I I I I I I I I l I l l l l l l l l ,

RPP-5346 REV 0
APPENDIX E
SENSITIVITY ANALYSIS OF THE TRANSFER ROUTE FROM TANK 241-AN-107 TO BNFL INC.
Calculntions contained herein were produced in Mathcad 2000 Professional (Mathcad is a registered trademark of MathSofl, Inc. of Cambridge, Massachusetts).
E-i

RPP-5346 REV 0
This page intentionally left blank.
E-ii

RPP-5346 REV 0
LIST OF FIGURES
E-la
E-lb
E-lc
E-ld
E-le
E-2a
E-2b
E-2c
E-2d
E-2e
E-3a
E-3b
E-3c
E-3d
E-3e
E-4a
E-4b
dp=400 pm Case - Cumulative and Probability Density Particle Size
Pressure Drop for AN-107 to BNFL - dp=400 pm, p ~ = l . 2 kgL, ps=3 k g L Case,
Distribution by Volume ................................................................................................ E-2
T = 10 and 60 "C .......................................................................................................... E-3 Pressure Drop for AN-107 to BNFL - dp=400 pn, pL=l.46 kgL, ps=3 k g L Case, T = 10 and 60 "C ................................................................................................ E-4
Pressure Drop for AN-107 to BNFL - dp=400 pm, pL=1.2 kg/L, ps=2.5 k g L Case, T = 10 and 60 "C ................................................................................................ E-5
Pressure Drop for AN-107 to BNFL - dp=400 pm, pL=1.46 kgL, p,=2.5 k g L Case, T = 10 and 60 OC ................................................................................................ E-6
dp=200 pm Case - Cumulative and Probability Density Particle Size Distribution by Volume ................................................................................................ E-7
Pressure Drop for AN-107 to BNFL - dp=200 pm, p~=1.2 kg/L, ps=3 kg/L Case, T = 10 and 60 "C .......................................................................................................... E-8
Pressure Drop for AN-107 to BNFL - dp=200 pm, p~=l .46 kgL, ps=3 k g L Case, T = 10 and 60 "C ................................................................................................ E-9
Pressure Drop for AN-107 to BNFL - dp=200 pn, pL=l.2 kg/L, p,=2.5 kg/L Case, T = 10 and 60 "C .............................................................................................. E-10
Pressure Drop for AN-107 to BNFL - d,=200 pm, pL=l.46 kg/L, ps=2.5 kg/L Case, T = 10 and 60 "C .............................................................................................. E-1 1
dp=lOO pm Case - Cumulative and Probability Density Particle Size Distribution by Volume ................... .......................................................................... E-12
Pressure Drop for AN-107 to BNFL - dp=laO pm, p~=1.2 kgL, ps=3 kg/L Case, T = 10 and 60 "C ........................................................................................................ E-13
Pressure Drop for AN-107 to BNFL - dp=lOO pm, pL=l.46 kg/L, ps=3 k g L Case, T = 10 and 60 "C .............................................................................................. E-14
Pressure Drop for AN-107 to BNFL - %=lo0 pm, pL=l.2 kgL, ps=2.5 k g L Case, T = 10 and 60 "C .............................................................................................. E-15
Pressure Drop for AN-107 to BNFL - dp=lOO pm, p~=1.46 kgL, ps=2.5 kg/L Case, T = 10 and 60 "C ............................................................................................... E-16
dp=40 pm Case -Cumulative and Probability Density Particle Size Distribution by Volume .................................................................................................................. E-17
Pressure Drop for AN-107 to BNFL - dp=40 pm, p ~ = l . 2 kg/L, ps=3 kg/L Case, T = 10 and 60 "C ........................................................................................................ E-18
E-iii

RPP-5346 REV 0
LIST OF FIGURES (CONTINUED)
E-4c
E-4d
E-4e
E-5a
E-5b
E-5c
E-5d
E-5e
E-6a E-6b
E-6c
E-7a
E-7b
E-Sa
E-8b
Pressure Drop for AN-107 to BNFL - dp=40 pm, p~=1.46 kgL, ps=3 k g L Case, T = 10 and 60 "C ........................................................................................................ E-19
Pressure Drop for AN-107 to BNFL - dp=40 p, p~=1.2 kgL, p,=2.5 k g L Case, T = 10 and 60 "C .............................................................................................. E-20
Pressure Drop for AN-107 to BNFL - dp=40 pm, p~=1.46 kgL, ps=2.5 kg/L Case, T = 10 and 60 'C .............................................................................................. E-21
dp=5 pm Case - Cumulative and Probability Density Particle Size Distribution by Volume .................................................................................................................. E-22
Pressure Drop for AN-107 to BNFL - dp=5 pm, pL=l.2 k&, ps=3 k g L Case, T - 10 and 60 "C ........................................................................................................... E-23
Pressure Drop for AN-107 to BNFL - dp=5 pm, pL=1.46 kg/L, p,=3 kg/L Case, T = 10 and 60 "C ........................................................................................................ E-24
Pressure Drop for AN-107 to BNFL - d,=5 pm, p~=1.2 kgL, ps=2.5 k g L Case,
Pressure Drop for AN-107 to BNFL - dp=5 pm, p~=1.46 kgL, ps=2.5 k g L Case, T = 10 and 60 "C .............................................................................................. E-26 Critical Velocity Comparison - New Pipe ................................................................. E-27
Pressure Drop at Critical Velocity Comparison for New Pipe at Selected Median Particle Sizes - AN-107-to-BNFL Transfer Route ....................................... E-28
Pressure Drop and Critical Velocity Comparison for New Pipe at Selected Median Particle Sizes - AN-107-to-BNFL Transfer Route ....................................... E-29 Pressure Drop at Critical Velocity for AN-107-to-BNFL Transfer Route vs. Median Particle Size and Selected Solid Volume Concentrations - p~ = 1.2 kgL, ps = 3 k&, T = 10 and 6 0 T , for New (dashed lines) and EOL (solid lines) Pipe Roughness Estimates ...................................................... E-3 1
Critical Velocity for AN-107-to-BNFL Transfer Route vs. Median Particle Size and Selected Solid Volume Concentrations - p~ = 1.2 kgL, ps = 3 k g k , T = 10
Pressure Drop at Critical Velocity for AN-107-to-BNFL Transfer Route vs. Median Particle Size and Selected Solid Volume Concentrations - pL = 1.2 kg/L, ps = 2.5 kg/L, T = 10 and 60°C. for New (dashed lines) and EOL (solid lines) Pipe Roughness Estimates ...................................................................... E-33
Critical Velocity for AN-107-to-BNFL Transfer Route vs. Median Particle Size and Selected Solid Volume Concentrations - p~ = 1.2 k&, ps = 2.5 kgL, T = 10 (dashed lines) and 6OoC (solid lines) .................................................................... E-34
-
T = 10 and 60 "C ........................................................................................................ E-25
(dashed lines) and 60°C (solid lines) ......................................................................... E-32
. .
E-iv

RPP-5346 REV 0
LIST OF FIGURES (CONTINUED)
E-9a Pressure Drop at Critical Velocity for AN-107-to-BNFL Transfer Route vs. Median Particle Size and Selected Solid Volume Concentrations - p~ = 1.4 kgL, ps = 3 kgL, T = 10 and 60"C, for New (dashed lines) and EOL (solid lines) Pipe Roughness Estimates ...................................................... E-35
Critical Velocity for AN-107-to-BNFL Transfer Route vs. Median Particle Size and Selected Solid Volume Concentrations - p~ = 1.4 k&, ps = 3 kgL, T = 10 (dashed lines) and 60°C (solid lines) ......................................................................... E-36
Pressure Drop at Critical Velocity for AN-107-to-BNFL Transfer Route vs. Median Particle Size and Selected Solid Volume Concentrations - p~ = 1.4 kgL, ps = 2.5 kgL, T = 10 and 60°C, for New (dashed lines) and EOL (solid lines) Pipe Roughness Estimates ...................................................................... E-37
Critical Velocity for AN-107-to-BNFL Transfer Route vs. Median Particle Size and Selected Solid Volume Concentrations - p~ = 1.4 kgL, ps = 2.5 kgL, T = 10 (dashed lines) and 60°C (solid lines) .................................................................... E-38
E-9b
E-loa
E-lob
E-v

RPP-5346 REV 0
ft in. lbf/in2 mils gpm CP
CONVERSIONS
feet = 0.3048 meter (m) inch = 2.54 centimeters (cm) pounds per square inch = 0.06895 megapascals (MPa) 0.001 in. = 0.0254 millimeter (mm) 0.063 1 literkecond (Us) centipose = 0.001 kilograndmeter-second (kg/m-s)
E-vi

RPP-5346 REV 0 C H 2 M H I L L Hanford Group, Inc.
Client: Numatec Hanford Comoration WO/Job No. 110299 8c 110300/BA10 Subject: Critical Velocitv and Pressure Drou Shldv in Suuuort of
Waste Tank Feed Transfer System Checked 03/10/2000 By: T. C. Ot- Location: 200 Area - Hanford Site. Richland Washington Revised By:
Calc. No. RPP-UJ-002 EVACUATION ANALYSIS Revision: 3
PageNo.
By: L. J. Ju lvkd . Date: 03/08/2000
SENSlTWITY ANALYSIS - AN-107-to-BNFL Transfer Route
The AN-107-twBNFL transfer route was identified as one of the longest transfer mutes in the Case 3S6 Transfer List Hence. thls transfer route was chosen for a sensitivity analysis on the pipellne pressure drop for the range of waste properties being considered for waste feed delivery to BNFL. The assumed particle size distribution by volume is based on a Rosin-Rammler cumulatlve and robabili dens1 function (Shook and Row 1991 curve fit to the particle size
slze distribution had a median particle size (ds) of 184 pm (see Appendix F). The resulting curve-fit Rosln-Rammier cumulative and probability density function was then shifted to target medlan particle sizes for the sensitivity analysis.
The following waste and pipe parameter ware considered in the sensitivity analysis:
disMbution measurements obtain i o ? ? m Ten 2414 -101 waste samples (O'Rourke 1 999). The Tank 2414Y-I01 particle
Internal pipe diameter (nominal)
Pipe rou hness estimates (Anantatmula and Divine 1999. new and end-of-life (EOL) pipe conditions
D,ip A 3.068in
new commerdal pipe
for stainless steel plpe et end of 40-year service life
for carbon steel pipe at end of 50-year service life
indicat 2 by dashed and solid lines, respectively in following plots) znOv = 2 mil
ss = lomil
cs = ISOmil
Waste parameters (Estey 2000)
pL = 1.2 and 1.46 kglL
pa = 2.5 and 3 ka/L
T = 10 and 60OC
dp = 400, 200,100,40. and 5 pm
C. = 5.10. and 15%
- -
liquid "carrier" density
solids particle density
temperature of waste feed
median particle size (ds) of shifted particle size distribution
volume percent concentration of solids.
A pipeline design pressure of 400 IbfW is assumed for reference (horizontal dashed line). Critical velocity and pressure drop estimates are based on Oroskar and Turian (1980) and Wasp et ai. (1977 empirical correlations, respectively (see waste and pipe parameters. In Fi ure € 4 the Oroskar and Turian (I980 Critical velodiy conelation is compared to a crIW velocity rediction based on the dasp "vehicle" concept (see Appendix J). Fi res E-7 through 10 shows the pressure drop
Appendlx F). Results are given in Figures E-1 through E-5 ford, = 400.200.1 do -40. and 5 pm. respecthrdy for the above
at the c & d Velocity versus the median particle size for selected waste trans 8" er parameters and pipe roughness values.
REFERENCES
Anantatmula, R. P. and J. R. Divine, 1999, Surface Roughness of Carbon Steel and Stalnless Steel Waste Transfer Lines Caused by corrosion and Scaling. Appendix B of RPP-5346, Rev. 0. CH2M HILL Hanford Group. Inc.. Richland. Washington. Este , S. D. 2000. "Alternatives Generation and Analysis for Waste Feed Dellv
Hanford Group, Inc., dated April 10. Oroskw. A. R.. and R. M. Turian, 1980, The W c a l Velocity in Pipeline Flownfslunies. AlChE Journal. 26,550558.
ORourke, J. F., 1999, "Shear Strength end Particle Size Distribution Measurements on Tank 241-SY-101 Samples". Internal Memo, 82100-99-036. to F. H. Steen, dated September 27, Numatec Hanford Corporation, Richland. Washington.
Shook, C. A., and M. C. Roco. 1991, Slurry Flow Principles and Pmdice. Butterworth-Heinemann, Boston, MA.
Transfer Pump Discha e hessure: Han / ord Tank Waste Physical Properly Estimates.' Internal Memorandum, 748 %00-001-R2, to W. L. Wii 'B s. CH2M Hill
Wasp, E. J., J. P. Kenny, and R. L. Gandhi, 1977. Sdid-Liquid Flow - S/unyP(peline Transportation, Trans. Tech. PUN., Rockport. MA.
W a S p W O AN-107ptl.mcd El

RPP-5346 REV 0 CHZMHILL Hanford Group, Inc.
Client: Numatec Hanford Cornoration WO/Job No. 110299 & Subject:
Location: 200 Area - Hanford Site. Richland. Washineton Revised By:
Calc. No. RPP-WJ-002
Page No. 2 of 38 EVALUATION ANALYSIS Revision: 2
Date: 03/08/2000 Critical Velocitv and Pressure BOD Studv in SUDDOI~ of Waste Tank Feed Transfer System Checked 03/10/2000 By: T. C. Ot
Figure E-la. dp=400 pm Case - Curnulathre and Probability Density Particle Size Distribution by Volume.
TOL= I x 1 0 - ~
Waspsen AN-107ptl.mcd
dpm := d,l(rcp reset units
Dpm = 373 pm
10 lop 1 .Id Plnicvlac Solida DIM^ (micmnr)
1.10'

1 4 6 8 ~
Flow Velocity (Wr) 0 2 4 6 8
Flow Velocity (VI)
ener
c. 15%
10%
6%
0
W a s p a ~ l AN-lO7ptl.mcd E-3

FWP-5346 REV 0 CHZMHILL Hanford Group, Inc.
EVALUATION ANALYSIS Calc. No. RF'P-LJJ-002
Revision: ~ ~~ 4~ . . Page No. 4 01. 38
By: L. J. J u l v f Client: Numatec Hanford Cornration WO/Job No. 110299 & 110300/BA10 Subject:
Location: 200 Area - Hanford Site. Richland Washinaton Revised By:
Critical Velocitv and Pressure D ~ D Study in Su~wrl of Waste Tank Feed Transfer Svstrm Checked: 03/10/2000 By: T. C. Or
Date: 03/08/2000
E m
c, 15% 10% 5%
Waapsen AN-lO7pIl.mcd E-4

CHZMHILL Hanford Grouo. Inc. RPP-5346 REV 0
.. EVALUATION ANALYSlS
Calc. No. RPP-LJJ-002 Revision: 9 Page No. 5 of 38
By: L. J. J u l v f Client: Numatec Hanford Cornration WO/Job No. 110299 & 110300/BA10 Subjcet: Critical Velocitv and Pressure DIUD Studv in S U D W ~ ~ of
Waste Tank Feed Transfer Svstem Checked 03/10/2M)O By: T.C.Ot Location: 200 Area - Hanford Site. Richland. Washington Revised: By:
Date: 03/08/2000
Flow Velocity (NI)
t m
G 15%
10%
5%
I Flow Velocity (Nr)
Waap-aen AN-107ptl.mcd E-5

CHZMHILL Hanford GrouD. h e . RPP-5346 REV 0
_ I
EVALUATION ANALYSIS Calc. No. RPP-UJ-002
Revision: 9 Page No. 6 of 38
Client: Numatec Hanford Corn ration WONobNo. 110299 8r 110300/BA10 Subject: Critical Velocih, and Pressure DIOD SUdv in Sumrt of Date: 03/08/2000 By: L. J. Jul
Waste Tank Feed Transfer System Checked 03/10/2000 By: T. C. Ot Location: 200 Area - Hanford Site. Richland. Washineton Revised By:
Flow Vclocily (Ns)
Waspsen AN-107ptl.mcd E-6
Flow Velosiry (Ns)

RPP-5346 REV 0 CHZMHILL Hanford Group, Inc. &IC. NO. RPP-WJ-002
EVALUATION ANALYSIS Revision: 4 PageNo. 7of 38
By: L. J. J U I Y I Client: Numatcc Hanford Cornration WONobNo. 110299& 110300BA10 Subject: Critical Velocitv and Pressure Drol, Studv in Sumrt of
Waste Tank Feed Transfer System Checked: 03/10/2000 By: T. C. Ot Location: Revised: By:
Date: 03/08/2000
Figure E-Za. dp=200 pm Case - Cumulative and Probabllfty Density Particle Slze Distribution by Volume.
IO
B - 4 It 2 0
I
WaSpsdn AN-107ptl.mcd
MI II U
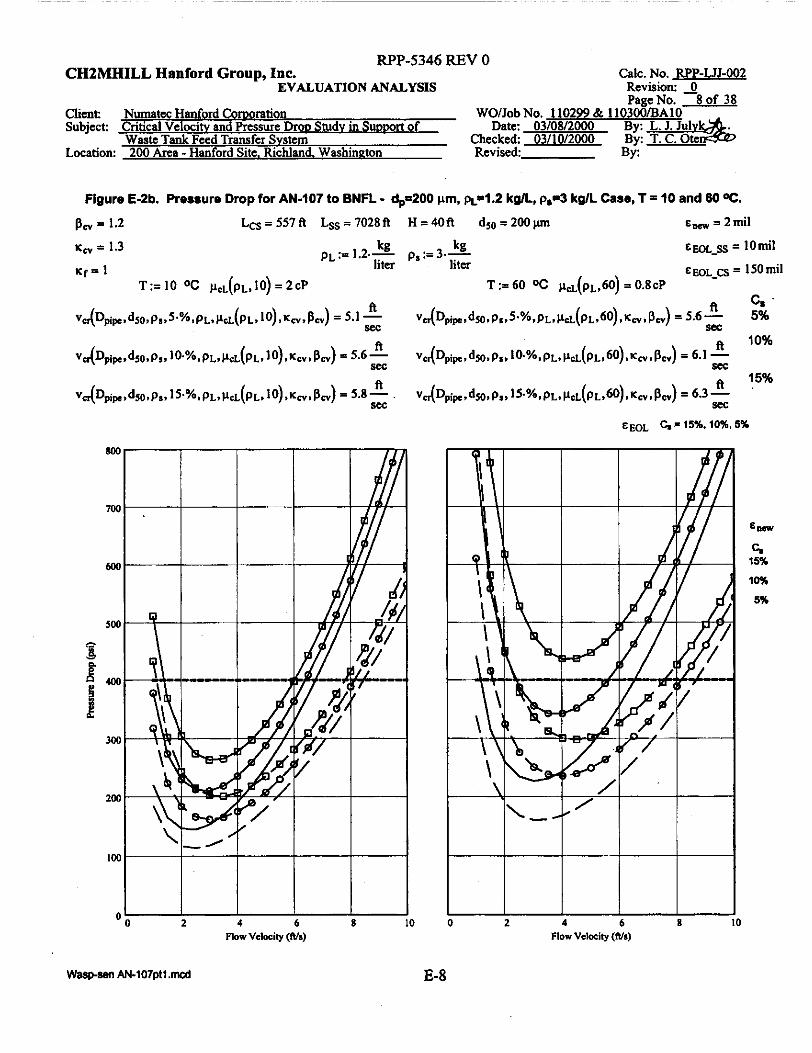
RPP-5346 REV 0 CHZMHILL Hanford Group, Inc.
Client: Numatcc Hanford C o r n mtion WO/Job No. 110299 & 110300/BA10 Subject: Critical Velocitv and Pressure Droo Studv in Suouoti of
Waste Tank Feed Transfer Svstem Checked 03/10/2000 By: T C Ote Location: 200 Area - Hanford Site. Richland. Washinnton Revised By:
Calc. No. RPP-LJJ-002
Page No. 8 of 38
Date: 03/08/2000 By: L: J..Julvk&
EVALUATION ANALYSIS Revision: 0
Row Velocity (MI) Flow Velocity (MI)
WaspSan AN-107pIl.mcd E-8

RPP-5346 REV 0 CHZMHILL Hanford Group, Inc.
Client: Numatcc Hanford Cornration WO/Job No. 110299 & 110300/BAlO Subject: Critical Velocitv and Pressure Drou Shtdv in SUDWI? of
Waste Tank Peed Transfer Svstem Checked 03/10/2000 By: T. C. Oten Location: 200 Area - Hanford Site. Richland Washinaton Revised: By:
Calc. No. RPP-UJ-002
Page No. 9 of 38
By: L. J. Julvk&
EVALUATION ANALYSIS Revision: 9
Date: 03/08/2000
Flow Velocity (IUS)
Waspsen AN-107ptl.md E-9
t- I
-+- I 2
Flow Velocity (Na)
~ n r y
G 1 5% 10% 5%
I
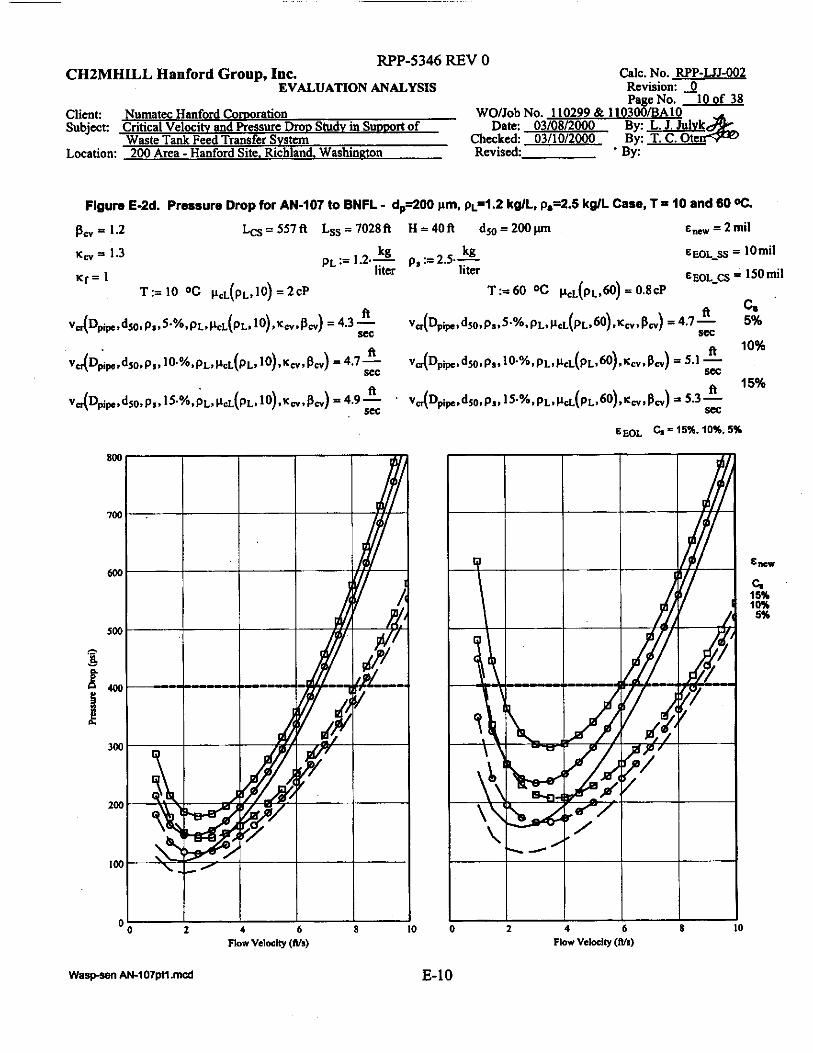
RPP-5346 REV a CH2MHILL Hanford Group, Inc. Cak. NO. RPP-UJ-002
EVALUATION ANALYSIS Revision: 9 Page No. IO of 38
By: L. J. lulvk&, Client: Numatec Hdord Comoration WO/Job No. 110299 & 110300iBA10 Subject: Critical Velocitv and Pressure DIOD Studv in SUDOOI~ of
Waste Tank Feed Transfer Svstem Checked 03/10/2000 By: T.C.Ote Location: 200 Area - Hanford Site. Richland Washineton Revised ' By:
Date: 03/08/2000
Flow Velociry (Ws)
Waspsen AN-107ptl.mcd E-10
Flow Velocity (All)

RPP-5346 REV 0 CHZMHILL Hanford Group, Inc.
Client: Numatcc Hanford Cornorah 'on WONobNo. 110299Br 110300/BA10 Subject: Critical Velocitv and Pressure DIOD Study in SUDDOI~ of
Waste Tank Feed Transfer System checked. 03/10/2000 By: T. C. Ote Location: 200 Area - Hanford Site. Richland. Washineton' Revised By:
Calc. No. RPP-LJJ-002
Page No. 11 of 38
By: L. J. l d v k ~
EVALUATION ANALYSIS Revision: 9
Date: 03/08/2000
" 0 2 4 6 8 Flow Velocity (Ws)
, I 2 4 6 8 I O
Flow Vclwity (Wr)
Waspaen AN-lO7ptl.med E-1 1

Calc. No. RPP-LJJ-002
Page No. 12 of 38
By: L. J. ! u l s
RPP-5346 REV 0 CHZMHILL Hanford Group, Inc.
Client: Numatec Hanford Comra ti0n WO/Job No. 110299 & 110300/BA1 Subject: Critical Vclocitv and Pressure Drou Shldv in Suouort of
Waste Tank Feed Transfer Svstem Checked 03/10/2000 By: T . C . 0 Location: 200 Area - Hanford Site, Richland Washineton Revised By:
EVALUATION ANALYSIS Revision: 3
Date: 03/08/2000
Figure E&. dp=lOO pm Case -Cumulative and Probability Density Particle Size Distribution by Volume.
loo
80
20
0
Waspaen AN-lO7ptl.mCd
1.10'
I 40'

RPP-5346 REV 0 . - - . - . - - . CHZMHILL Hanford Group, h e . Calc. No. RF'P-LJJ-002
EVALUATION ANALYSIS Revision: 2
Figure EJb. Pressure Drop for AN-107 to BNFL - dp=lOO pm, h4.2 kg/L, p p 3 kglL Case, T = I O and 86 OC.
pev = 1.2 Lcs=557A L,=7028A H=40A d s o = I O O p ~ - = 2 m i l
Flow Velocity (ma)
ElK*
G 15% 10% 5%
3
WaSPS6n AN-lO7ptl.mcd E-13

RF’P-5346 REV 0 CH2MHILL Hanford Group, Inc.
Client: Numatec Hanford Comoration WONobNo. 110299 & 110300E3A10 Subject: Critical Velocitv and Pressure DIOD Studv in Suowrt of
Waste Tank Feed Transfer Svstem Check& 03/10/2000 By: T. C. Ote Location: 200 Area - Hanford Site. Richland. Washington Revised By:
Calc. No. RPP-LJJ-002
Page No. 14 of 38
By: L. J. Julvk&
EVALUATION ANALYSIS Revision: 9
Dah: 03/08/2000
Figure E&. Pressure Drop for AN-107 to BNFL - dp=l 00 pm, p~-1.46 kgL, p p 3 k g L Case, T - 10 and 80 W.
p, = 1.2 &=557ft Lss=7028B H=40f t d s o = 1 0 0 p cnCV = 2 mil
K, = 1.3 p ~ : = 1.46.- ks p,:=3.- k8 E E ~ - = lomil liter liter E ~ L a = ISOmil -
T:=60 O C pa(p~,60) = 3.7cP
EmL c. = 15%. 10%. 5% 8-
I I I I
Flow Velocity (Ws) o b 2 4 6 8 0 2
G 15%
10%
5%
6 8 10 Flow Velocity (Ws)
E-14 Waspsen AN-lO7ptl.mcd

RPP-5346 REV 0 Calc. No. RPP-UJ-002
Page No. 15 of 38
By: -L. J. Julvk&,
CH2MHILL Hanford Group, Inc.
Client: Numatec Hanford Corn ration WONob No. 110299 & 110300/BA10 Subject:
Location: 200 Area - Hanford Site. Richland Washineton Revised By:
EVALUATION ANALYSIS Revision: 9
Critical Velocitv and Pressure DIOD Study in Suuwrt of Waste Tank Feed Transfer Svstcm Checked 03/10/2000 By: T.C.Oten 8
Date: 03/08/2000
now velocity (IUS)
Wasp-sfm AN-107ptl.mOd E-15

RPP-5346 REV 0 CH2MHILL Hanford Group, Inc.
Client: Numatec Hanford Cornration WO/JobNo. 110299& 110300/BAIO Subject: Date: 03/08/2000 By: L. I. Julvk&&,
Location: 200 Area - Hanford Site, Richland. Washinnton Revised: By:
Calc. No. RPP-UJ-002
Page No. 16 of 38 EVALUATION ANALYSIS Revision: 3
Waste Tank Feed Transfer System Checked 03/10/2000 By: T. C. Oten
. -1 pi:= 1.46.- kg p,:= 2.5.- kg
liter liter E ~ L - = lOmi1
e ~ a - a - l5Omil xCy = 1.3
T:=M) OC p c ~ ( p ~ , 6 0 ) =3.7cP IC(= 1
Flaw Velocity (tvd
Waspsen AN-107ptl.mcd E-16
Fbw Velocity (Wr)

RPP-5346 REV 0 CHZMHILL Hanford Group, Inc.
Client: Numatec Hanford Cornration WO/Job No. 110299 & 110300/BA10
Location: 200 Area - Hanford Site. Richland. Washington Revised By:
Calc. No. RF'P-UJ-002
Page No. 17 of 38 EVALUATlON ANALYSIS Revision: 9
Subject Critical Velocitv and Pressure Drm Studv in Smori of Date: 03/08/2000 By: L. J. Waste Tank Feed Transfer Svstcm Checked 03/10/2000 By: T. C. Ote
Figure E4a. d,=40 pm Case -Cumulative and Probability bnslty Particle Size Distribution by Volume.
I W
80
I m 1, 5
i 4 0
20
0 I
8
P F
Wup-aen AN-107ptl.mcd
reset units
10
8
6
4
2
0

Flow Velocity (Us)
E,
G 15%
10%
5%
Flow Velocity (Us)
Waspsen AN-107ptl.mcd E-18

RPP-5346 REV 0 CH2MHILL Hanford Group, Inc.
Client: Numatec Hanford Comora tion WO/Job No. 110299 & 110300iBA10 Subject: Critical Velocih, and Prcssun Drou Studv in Suuwrt of
Waste Tank Feed Transfer Svstcm Checked: 03/10/2000 By: T. C. Ot Location: 200 Area - Hanford Site, Richland Washineton Revised By:
Calc. No. RPP-UJ-002
Page No. 19 of 38
By: L. J. J u l v , ’
EVALUATION ANALYSIS Revision: 9
Date: 03/08/2000
Figure E-4c. Pressure Drop for AN-I07 to BNFL - dp40 pm, h4.48 k&, p p 3 ka/L Case, T = 10 and 80 e. pw = 1.2 L n = 5 5 7 A Lss=7028fl H=40A dso=40pYll E- = 2mil
E ~ I , ss = lomil ucv = 1.3 p ~ : = 1.46.- kg p s : = 3 . s - liter liter E E ~ C- = 15Omil u f = 1 -
T := 10 O C pc~(p~ . lO) = 8.4cP T := 60 OC p&1,.60) = 3.7cP
E ~ O L 12, - 15%. 10%. 5%
Flow Velocity (Ws) 2 4 6 8
Flow Velocity (Ws)
c* ’
5%
10%
15%
E,,
c. 15%
10%
5%
Waspsen AN-107ptl.mcd E-I9

RPP-5346 REV 0 CHtMHILL Hanford Group, Inc.
Client: Numa tec Hanford Cornoration WO/Job No. 110299 & 110300/BA10 Subject: Critical Velocih, and Pressure Drm Study in Suwon of
Waste Tank Feed Transfer Svstm Checked: 03/10/2000 By: T. C. Oten Location: 200 Area - Hanford Site, Richland. Washington Revised: By:
Calc. No. RPP-UJ-002
Page No. 20 of 38 EVALUATION ANALYSIS Revision: 2
Date: 03/08/2000 By: L. I. Jul~k&, ,
FhVelwily [Ws)
Waspaan ~N-107ptl.mcd E-20

RPP-5346 REV 0 CH2MHILL Hanford Group, Inc.
Client: Numatec Hanford Cornration WONobNo. 110299 & 110300iBA10 Subjict: Critical Velocitv and Pressure DIOD Studv in SuDDOrt of
Waste Tank F e d Transfer Svstem Checked 03/10/2000 By: T. C. Ote Location: 200 Area - Hanford Site. Richland Washington Revised By:
Calc. No. RPP-LJJ-002
Page No. 21 of 38
By: L. J. J u l v k s
EVALUATION ANALYSIS Revision: 9
Date: 03/08/2000
Figure E&. Pressure Drop for AN-I07 to BNFL - dp40 pm, hpl.46 k g k , pp2.5 k g L Case, T - I O and 60 OC.
PN = 1.2 L a = S S 7 A Lss=7028ft H=40R d50=4Oplll 6, = 2 mil
IC,=, = 1.3 hWIL ss = 10mil kg kg - p~:=l.46.- p,:=Z.S.- EEOL a = 150mil liter liter -
T:= 60 OC p&~,60) = 3.7cP ..
I I I I 2 4 6 8
Flow Velocity (Wr)
Wsspeen AN-lO7ptl.mcd
Flmv Velocity (Wr)
E-21

RPP-5346 REV 0 Calc. No. RPP-LJJ-002
PagcNo. 22of 38
CHZMHILL Hanford Group, Inc.
Client: Numstec Hanford Corw ration WO/Job No. 110299 & 110300/BAlO Subject:
Location: 200 Area - Henford Site. Richland, Washineton Revised By:
EVALUATION ANALYSIS Revision: 3
Date: 03/08/2000 By: L. J. Julvk Critical Velocitv and Pressure Droo Studv in S U D O O ~ ~ of Waste Tank Feed Transfer Svstem Checked 03/10/2000 By: T. C.
Figure Eba. dp=5 pm C u e -Cumulative and Probabllity Density Particle Size Distribution by Volume.
I W
2c
10
E b 4 ~:: B
2
00.1
I 10
I
IW
1 10 I
Waspeen AN-107ptl.mcd
Particulate Soli& Dimmer (rnicmnr)
E-22

UP-5346 REV 0 CH2MHILL Hanford Group, Inc. Calc. NO. RPP-UJ-002
EVALUATION ANALYSIS Revision: 4 Page No. 23 of 38
By: L. J. J u l v k s h Client: Numatec Hanford Cornration WO/Job No. 110299 & 110300/BA10 Subject: Critical Velocitv and Pressure Drou Studv in Sumrt of
Waste Tank Feed Transfer Svstem Checked: 03/10/2000 By: T. C. Otc Location: 200 Area - Hanford Site. Richland. Washington Revised By:
Date: 03/08/2000
Figure €ab. Pressure Drop for AN-I07 to BNFL - dp=5 pm, ~ ~ 4 . 2 kg/L, p p 3 kgk Case, T = 10 and 80 OC.
pcY = 1.2 L,3=557ft Lss=7028t? H=40f t d~o=5pl I l E., = 2mil
K~~ = 1.3 kg ks EEOL - = lomil E ~ L - C ~ = 150mil liter 8 .- pL:= 1.2.- p -3.-
liter K f = 1 T : = I O oc ~ & L , I o ) = z c P T:=60 OC pc~(p~.60) = 0.8cP
2 4 6 8 IO Flow Velaily (fds) Flow Velocity (MI)
Waspaen AN-107~11 .mcd E-23

6mL 4 - 15%. 10%. 5%
Flow Velocity (Wr)
I I 2 4 6 8
Flow Velocity (Ws)
%w
4 15%
10%
5%
I
E-24 Waspaen ~ 1 0 7 p I l . m c d
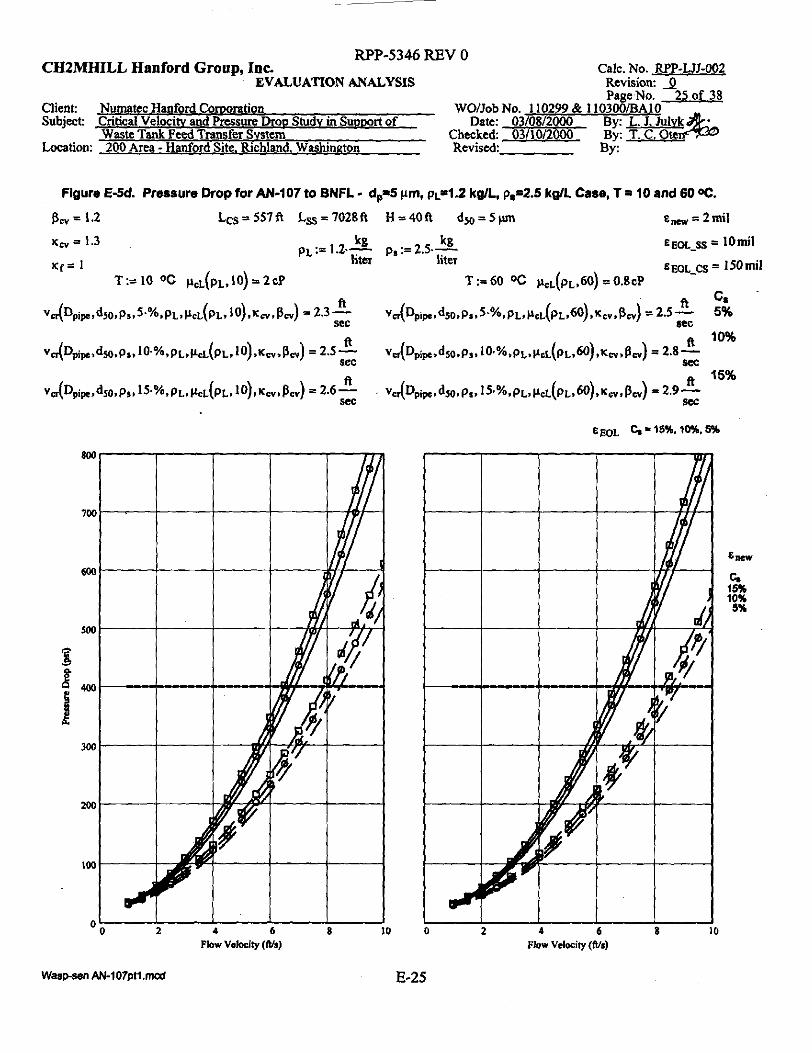
E l K I
G 15% 10% 5%
I I I I I 0 2 4 6 8 10
Flow Velocity (Wa)
Waspsen AN-lO7ptl.mcd E-25
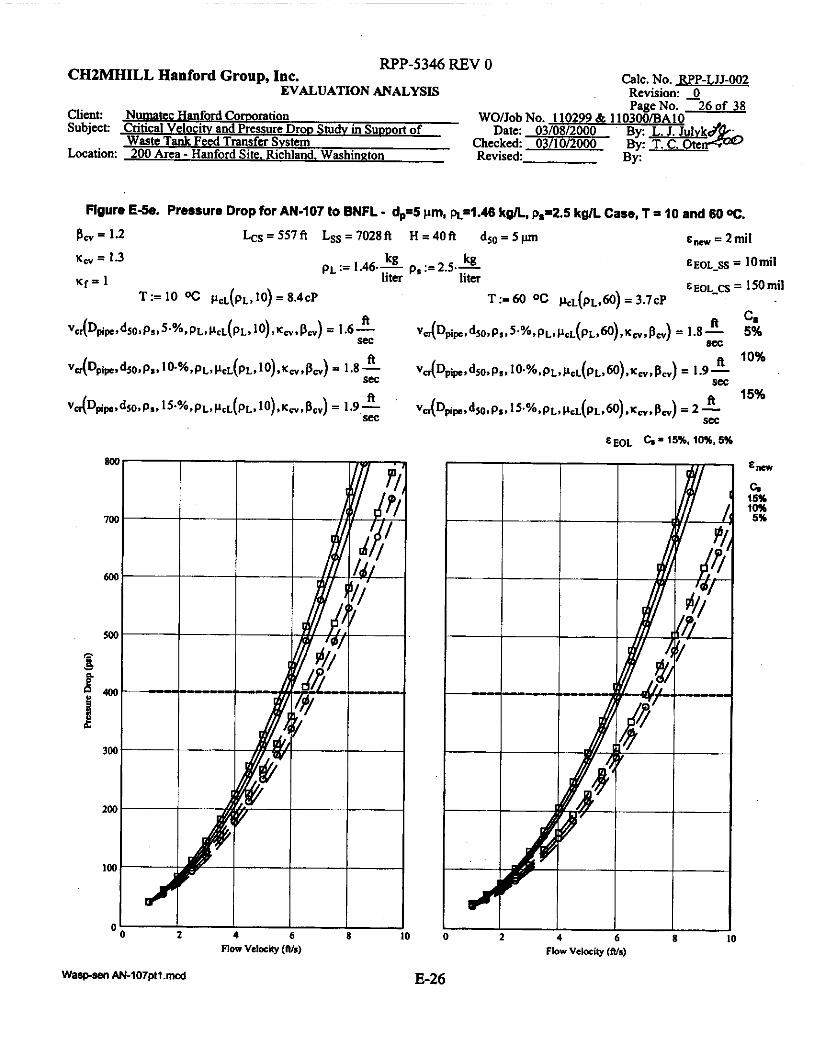
RPP-5346 REV 0 CHtMHILL Hanford Group, Inc.
Client: Numatec Hanford Cornration WO/Job No. 110299 & 110300/BA1 Subject: Critical Velociw and Fvessure D r o ~ Studv in Sumort of
Wash Tank Feed Transfer Svstem Checked 03/10/2000 By: T. C. O h Location: 200 Area - Hanford Site. Richland. Washington Revised By:
Calc. No. RF'P-LJJ-002
PageNo. 26of 38
By: L. J. !ulvko&,
EVALUATION ANALYSIS Revision: 2
Date: 03/08/2000
Flours E&. Pressure Drop for AN-107 to BNFL - dp=5 pm, ~ 4 . 4 8 kg/L, pp2.5 kg/L Case, T = 10 and 60 OC.
p, = 1.2 Lcs=557ft Lss=7028ft H=40f t dso=Spm
I I I I o b 2 4 6 8
Flow Velocity (Ws,
I I I I 2 4 6 8
Flow Velocity (Wr)
~.cr
G 15% IOY 5%
E26

CHZMHILL Hanford Grow. h e . RPP-5346 REV 0 .-
EVALUATION ANALYSIS Calc. No. RPP-LJJ-002
Revision: 4 Page No. 27 of 38
Client: Numatec Hanford Cornration WO/Job No. 110299 8i 110300/BAlQ Subject: Critical Velocitv and Pressure DIOD Studv in Suwort of Date: 03/08/2000 By: L. J. Julvk
Waste Tank Feed Transfer Svstcm Checked 03/10/2000 By: T. C. Oten Location: 200 Area - Hanford Site. Richland Washincton Revised By:
Flgure E-&. Critical Velocltv Cornpariaon - New Pipe.
p~ := 1.2.- E :=E-
= 1 K, := 1 best-estimate dSo := 400.pn1 C,:=I5.% TOL=lx lo-' ~ = 2 m i l
kg T := 60 OC pL := pcL(pL,T) PL = 0.77cP p, := 3.- kg Dpip := 3.068411 liter liter
(dPRR +=) :=distRR(dpR,dsO) dpRR :=dpRR.pm reset units
+mwn := cu d d - I = 57
Settlina velocitv
1 Oroskar and Turian (1980) maximum of semi-theoretical and empirical equation
1.1 Oroskar and Turlan 1980 semi theoretkal equation 1.2 Omskar and Turian [ISSO] ernpicar equation
~ C V = 2 Wasp et ai. (1977) . 3 Zandl and Govatos (1967)
4 Shook(1969
6 Robinson and Graf (1972) 5 Gogus and II okpinar (1999)
0, = 1.539%
Waspsen AN-107pt2.mcd E27

RPP-5346 REV 0 CH2MHILL Hanford Group, Inc.
Client: Numatec Hanford Cornration WO/Job No. I IO299 & 1103d/BAiO Subject: Critical Velocitv and Pressure Dmu Studv in Suwort of
Waste Tank Feed Transfer Svstem Checked 03/10/2000 By: T. C. Oten Location: 200 Area - Hanford Site. Richland. Washiupton Revised By:
Calc. No. RPP-LJJ-002
Pa eNo 28of 38
By: L. J. Julvk$,
EVALUATION ANALYSIS Revision: 3
Dah: 03/08/2000
/2.64\ 2.96 3.73 3.99 4.35 4.65 4.88 5.07 5.23
5.36
5.48 5.59
\5.69,
APm - =
in’
Ibl -
70 1 81
114
136 I85 246 301 349 392 43 I 465
496 ~ 5 2 4 ,
dso - = lUn
f 5 \
IO 40
60 100
150 v m
200 n 250 yf
300
350 400
450
= - -
(500 )
f 1.24’ 1.63 2.84 3.29 3.87 4.31
= 4.62
4.85 5.04
5.2
5.33 5.45
k5.56)
tl - S s
(37’ 44 85 115 I 74 241
= 299
349 393 432 467
498 \525)

RPP-5346 REV 0 CH2MHILL Hsnford Group, Inc.
EVALUATION ANALYSIS Calc. No. RPP-LJJ-002
Revision: 9 - PageNo. 290f 38
By: L. J. J d v k s Client: Numatec Hanford Cornration WONob No. 110299 & 110300/BA10 Subject: Critical Velocity and Pressure Drou Studv in Sumrt of
Waste Tank Feed Transfer Svstem Checked 03/10/2000 By: T.C.Ote Date: 03/08/2000
Location: 200 Area - Hanford Site. Richland, Washinnton Rwised By:
Figure E&. Pressure Drop and Critical Veloclty Corn rlson for New Plpe at Selected Median Partlcle Slses - AN-1074o-BNFhnsfer Route.
DpiP = 3.068in = 557 ft L s = 7028 ft H = 4 0 f t ~,--=2mil csss=2mil
p, = 1.2
Flow Velocity (NLOE) - Critical velocity - Oroskar and %rim ---I Critical Velocity using Wasp vehicle concept
400 m i m median particle size + 200 micron median particle size
100 m i m median particle size 40 m i m median particle size - - Clear liquid (no solid particles)
-
Waspsen AN-107pQ.mcd E-29
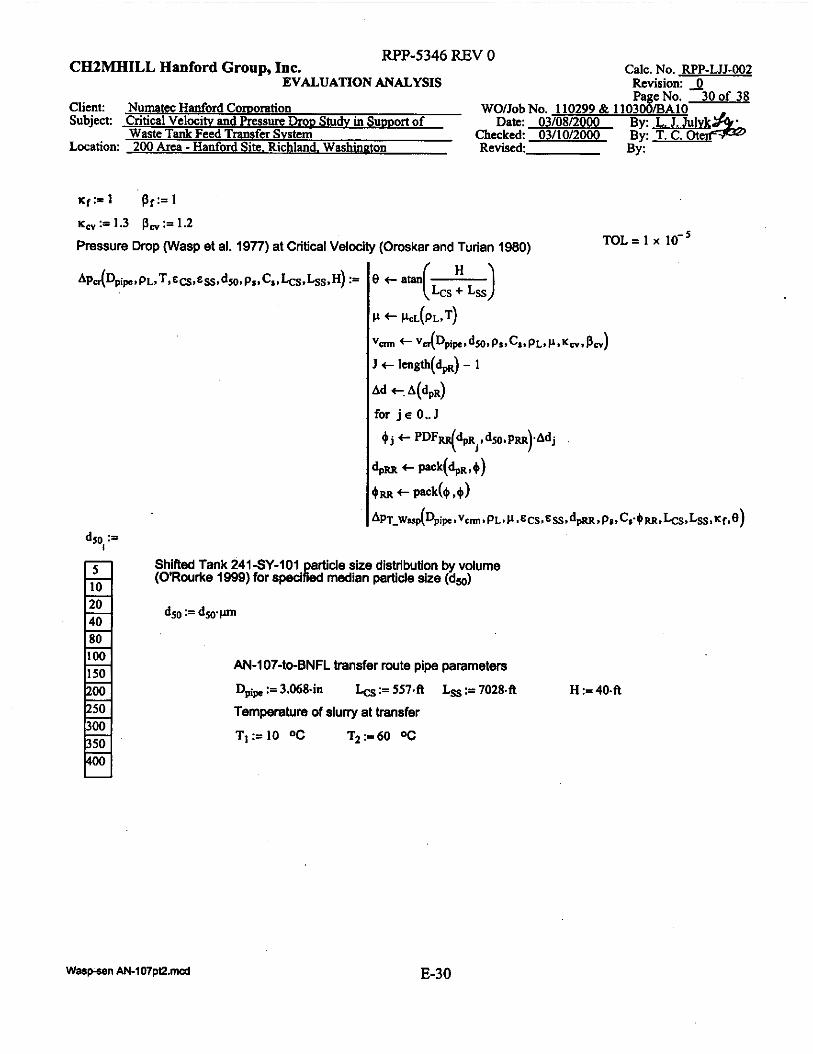
CHZMHILL Hanford Grout). Inc. RPP-5346 REV 0
.I
EVALUATION ANALYSIS
Client: Numatcf Hanford Cornration WOlJob No. 110299 & 1 Subject: Critical Velocitv and Pressure D r o ~ Studv in Suwott of Date 03/08/2000
Waste Tank Feed Transfer Svstcm Checked 03/10/2000 Location: 200 Ana - Hanford Site. Richland. Washmeton Revised:
K f : L I pf:= 1
KcV:=1.3 p,:=1.2
Pressure Drop (Wasp et al. 1977) at Critical Velocity (Oroskar and Turian 1980)
Calc. No. RPP-UJ-002 Revision: 0 - Pa eNo. 300f 38
By: L. J. JuIvk.& By: T. C. Ot By:
1030%/BA10
TOL = 1 x
Shifted Tank 24lSY-101 artide size distribution by volume (ORourke 1999) for specitmi median partide size (dW)
AN-107-to-BNFL transfer route pipe parameters
Temperature of slurry at transfer Dpip := 3.068411 LCS := 5 5 7 4 L s := 7028.R H := 40.R
T1:=10 OC T2:=60 OC
Warpsen AN-lO7ptZ.mcd E-30

E EoL-ss = 10 mil = 1.3 B, = 1.2 pL:= 1.2.- kg p, := 3.- kg liter liter
p&,Tl) = 2.021cP pc~(pL,Tz) = 0.771cP
Figure E-7a. Pressure Drop at Critlcal Velocity for AN-107-to-BNFL Transfer Route VS. Median Particle S i and Selected Solid Volume Concentrations - ~ ~ 4 . 2 kgk, p.93 kgk, T - I O and 6oOC.
for New (dashed lines) and EOL (solld lines) Pipe Roughness Estimates.
12W
T l = l O QC
c, (%)
30
15
10
5
2
Medim Purislc Sirs (microns)
Waspsen AK107pn.rncd E-3 1

Figure E-7b. Critical Velocity for AN-107-to-BNFL Transfer Route VS. Median Particle Slze and Selected Solid Volume Concentratlons - PL-1.2 k a , p,=3 kg/L, T = 10 (dashed lines) and 80% (solid lines).
0 0 I 0 0 ) 300 Medirn M c k Size (micmns)
E-32

~ ~ ~ = 2 m i l E E O L ~ = 15OmiI - Kf=l p f = 1 Dpip = 3.068in Lm=557R Lss=7028fl H = 4 0 R
EEOL-SS = lOmil kg ps := 2.5.- kg pL := 1.2.- p&,Tl) = 2.021 CP p&~,T2) = 0.771 CP K- = 1.3 Dw = 1.2
liter liter Figure E&. Pressure Drop at Crltlcal Velocity for AN-107-to-BNFL Transfer Route VI. Median Partlcls Size
and Selected Solid Volume Concentrations - pL-1.2 kglL. ~ ~ ~ 2 . 5 kg/L, T - 10 and SO%, for New (dashed lines) and EOL (solid lines) Pipe Roughness Estlmatcur.
C
I I
- 200
Mcdim Panicle S i (microns)
I I I 0 0 200 300
Median Putisle Si2c (mimom)
E-33

CH2MHILL Hanford Grouo. Inc. RPP-5346 REV 0 .-
EVALUATION ANALYSIS Calc. No. RPP-LJJ-002
Revision: 4 PageNo. 340f 38
Client Numatec Hanford Corwration WO/JobNo. 110299& 110300/BA10 Subject: Critical Velocih, and Pressure DroD Studv in Suuuort of Date: 03/08/2000 By: L. J. Julvk
Waste Tank Feed Transfer System Checked 03/10/2000 By: T. C. Oten Location: 200 Area - Hanford Site, Richland Washinaton Revised By:
Figure E-8b. Crltlcal Velocity for AN-IO74oBNFL Transfer Route VI. Median Particle Size and Selected Solid Volume Concentrations - pL=l.2 kgL, p,=2.5 kg/L, T= I O (dashed lines) and 60- (solid lines).
Waspwn AN-1 07pt2.d E-34

RPP-5346 REV 0 CH2MHILL Hanford Group, Ine.
Client: Numatcc W o r d Cornration WO/Job No. 110299 & 110300/BAlO Subject Critical Velocity and Pressure h o u Shrdv in SUDDO~~ of Date: 03/08/2000 By: L. 1. Julvk
Waste Tank Feed Transfer Svstcm Checked 03/10/2000 By: T.C.Otcn Location: 200 Area - Hanford Site Richland. Washington Revised By:
Calc. No. RPP-LJJ-002 Revision: 2 Page No. 35 of 38
EVALUATION ANALYSIS
~ " ~ = Z m i l ~ ~ o ~ ~ = l S O m i l - K f = 1 DPip=3.068in k s = 5 5 7 f t L,=7028ft H=40ft
E ~ O L = lomil - I .- K~ = 1.3 p... = 1.2 pL:= 1.4.- kg p - 3 . A psL(pL.T,) = 5.401cP pcL(pL.Tz) = 2.274cP
liter IitR
Figure EQa. Pressure Drop at Crltlcal Velocity for AN-1074o-BNFL Transfer Route vs. Median Particle Size and Selected Solid Volume Concentratlons - p~ml .4 kgL, p.33 kg/L, T = 10 and 60%.
for New (dashed lines) and EOL (solid ilnes) PIP. Rouohness Estimates.
I I I 100 2M) 3M
MediM PMislc Sire (minms)
E-35 Warpsen AN-107pt2.mcd
30
IS
IO
5
2
Mcdim PMiclo S i I m i m )

Figure EQb. Critical Velocity for AN-107-to-BNFL Transfer Route vs. Median Particle Size and Selected Solid Volume Concentrations - pL-1.4 kg/L, p,=3 kg/L, T = 10 (dashed lines) and 80% (solid Ilnec).
I I I I
T=6W
cs (%) T-1%
30 C. 15 (%)
10 30 15
5 10
5 2
2
E-36

RPP-5346 REV 0 CHZMHILL Hanford Group, Inc.
EVALUATION ANALYSIS Calc. No. RPP-LJJ-002 Revision: 0 - Page No. 37 of 38
Client: Numstec Hanford Cornoration WO/JobNo. 110299 & 110300/BA10 Subject: Critical Velocitv and Pressure Drou Studv in Sumort of Date: 03/08/2000 By: L. I. Julvk
Waste Tank Fccd Transfer Svstem Checked: 03/10/2000 By: T. C. Otcn Location: 200 Area - Hanford Site. Richland. Washington Revised: By:
Figure E-10s. Pressure Drop at Critical Velocity for AN-10740-BNFL Transfer Route M. Median Particle Size and Selected Solid Volume Concentrations - ~ ~ 4 . 4 kgk, pp2.5 kgk. T = IO and 8ooc,
for New (dashed lines) and EOL (solid lines) Pipe Roughness Estimates.
c, (%I 30
IS
IO
5
2
I
Waspsen AN-107ptZ.rncd E-37

Figure E-lob. Critical Velocity for ANdO7.to-BNFL Transfer Route vs. Median Particle Size and Selected Solid Volume Concentratlona - PI-1.4 kg/L, p,=Z.S kg/L, T - 10 (dashed lines) and 60% (solid lines).
I
5
3
2
I
0
Median Pmislc Size (minonr)
Waspan AN-107ptZ.mCd E-38

~~
RPP-5346 REV 0
APPENDIX F
CRITICAL VELOCITY AND PRESSURE DROP CORRELATION EQUATIONS
Calculations contained herein were produced in Mathcad 2oW Professional (Mathcad is a registered trademark of MathSof, Inc. of Cambridge, Massachusetrs).
F-i
RPP-5346 REV 0
This page intentionally left blank.
F-ii

RPP-5346 REV 0
CONTENTS
............................................................................................................ 1 . 0 INTRODUCTION F- 1
2.0 APPROACH .................................................................................................................... F-1
3.0 SUMMARY RESULTS ................................................................................................... F-1
4.0 REFERENCES ................................................................................................................. F-2
HANFORD WASTE AND TRANSFER PIPE PHYSICAL PROPERTIES .................. F-3
CRITICALITY VELOCmY AND PRESSURE DROP CORRELATIONS .................. F-4
5.0
6.0 6.1 HETEROGENEOUS FLOW ............................................................................... F-4
6.1.1 Critical Velocity ....................................................................................... F-4
6.1.3 Pressure Drop ......................................................................................... F-16
FLOW - WASP METHOD ............................................................................... F-18 6.2.1 Prelimnanes ........................................................................................... F- 18 6.2.2 Wasp’s Method for Pressure Drop Estimate .......................................... F-20 6.2.3 Critical Velocity Based on Wasp “Vehicle” Concept ............................ F-22 6.2.4 Generic Particle Size Distributed for Hanford Waste Feed Delivery .... F-24
. . 6.1.2 Friction Factors ...................................................................................... F-10
6.2 COMBINED HOMOGENEOUS-HETEROGENEOUS SLURRY
. .
7.0 ANALYSIS OF TRANSFER PIPELINES FOR PROPOSED TRANSFERS -Wasp Method ....................................................................................... F-28
F-iii

RPP-5346 REV 0
LIST OF FIGURES
F-la
F-lb
F-2
F-3
F-4
F-5a
F-5b
F-6a
F-6b
F-7a
F-7b
F-8a
F-8b
F-9a
F-9b
F-9c
F-9d
F-loa
Viscosity of Water vs. Temperature ............................................................................. F-32
Viscosity of Hanford Waste vs. Density of Carrier Liquid at Selected Temperatures .............. ........ ........ ......... .... ..... ... ................... .......... ................................ F-32
Correlations for the Drag Coefficient of a Sphere in Free Fall in a Stagnant Unbound Liquid ..... ... ... ... .. ... ... .. ..... .... .. ....... ... ... .. ... ... ... ..... .......... ........... ............ ... ........ F-33
Hindering Settling Velocity Exponent as a Function of Particle Reynolds Number ...... .. ... ... ..... ... ... ... ..... .. ... .. ..... .. .. .. .. . .. .. . ..... ... ... ..... ... ..... .. ....... .. ....... .. ... ..... ..... .. ... F-34
. .
Plot of x(*l) .................................................................................................................... F-35
Contour Plot of Oroskar and Turian (1980) Semi-Theoretical Equation for the Critical Velocity vs. Particle Solids Density and Carrier Liquid Density - T=60"C (solid line), T=IO"C (dash line) ...................................................... F-36
Contour Plot of Oroskar and Turian (1980) Empirical Equation for the Critical Velocity (ft/s) vs. Particle Solids Density and Carrier Liquid Density - T=60°C (solid line), T=lO"C (dash line) .................................................................................... F-36 Best-Estimate Critical Velocity Prediction vs. Carrier Liquid Density at Selected Solids Volume Fractions - Oroskar and Turian (1980) ................................................ F-37
Best-Estimate Critical Velocity Prediction vs. Particle Solids Density at Selected Solids Volume Fractions - Oroskar and Turian (1980) ................................................ F-37
Best-Estimate Critical Velocity Prediction vs. Carrier Liquid Density at Selected Solids Volume Fractions - Oroskar and Turian (1980) ................................................ F-38
Best-Estimate Critical Velocity Prediction vs. Particle Solids Density at Selected Solids Volume Fractions - Oroskar and Turian (1980) ................................................ F-38
Best-Estimate Critical Velocity Prediction vs. Carrier Liquid Density at Selected Solids Volume Fractions - Oroskar and Turian (1980) ................................................ F-39
Best-Estimate Critical Velocity Prediction vs. Particle Solids Density at Selected Solids Volume Fractions - Oroskar and Turian (1980) ................................................ F-39
Best-Estimate Critical Velocity Prediction vs. Particle Solids Median Diameter at Selected Solids Volume Fractions - Oroskar and Turian (1980) ................................. F-40
Best-Estimate Critical Velocity Prediction vs. Particle Solids Median Diameter at Selected Particle Solids Densities - Oroskar and Turian (1980) .................................. F-40
Best-Estimate Critical Velocity Prediction vs. Particle Solids Median Diameter at Selected Particle Solids Densities - Oroskar and Turian (1980) .................................. F-41
Best-Estimate Critical Velocity Prediction vs. Particle Solids Median Diameter at Selected Particle Solids Densities - Oroskar and Turian (1980) .................................. F-41
Best-Estimate Critical Velocity Prediction vs. Carrier Liquid Density at Selected Solids Volume Fractions - Oroskar and Turian (1980) ................................................ F-42
F-iv

RPP-5346 REV 0
LIST OF FIGURES (CONTINUED)
F-lob Best-Estimate Critical Velocity Prediction vs. Carrier Liquid Density at Selected Solids Volume Fractions - Oroskar and Turian (1980) ................................................ F-42 Darcy Friction Factor vs. Reynolds Number and Relative Roughness ........................ F-43
Flow Regime Diagram for 112411. Pipe - Check Case ................................................. F-44
Flow Regime Diagram for 2-in. Pipe - Check Case ..................................................... F-45
Flow Regime Diagram for 3-in. Pipe ........................................................................... F-46
Compahon of Best-Estimate Critical Velocity Predictions vs. Particle Solids Median Diameter .......................................................................................................... F ~ 8
F-15b Comparison of Best-Estimate Critical Velocity Predictions vs. Particle Solids Median Diameter ........ ... ................. ......... .... ............ ..................... ................................ F-49
F-1% Comparison of Best-Estimate Critical Velocity Predictions vs. Solid Particle Volume Fraction ..... ..... ... ............ ... ......... .... ....... .. ............... .......................................... F-50
F-15d Comparison of Best-Estimate Critical Velocity Predictions vs. Solid Particle Volume Fraction ........................................................................................................... F-5 1
F-16 A Friction Factor (fd = f - f,) Comparison .................................................................... F-52
F-17 Friction Factor vs. Carrier Liquid Flow Velocity Comparison .................................... F-53
F-18a Contour Plot of Best-Estimate Pressure Drop per loo0 ft of Pipe at Specified Flow Velocity (CS solid line, S S dashed line) vs. Particle Solids Density and Carrier Liquid Density - (Turian, Hsu, and Ma 1987) ................................................. F-54
F-18b Corresponding Flow Regime Contour Plot .................................................................. F-54
F-18c Contour Plot of Best-Estimate Critical Velocity (ft/s) (Oroskar and Turian 1980) vs. Carrier Liquid Density and Particle Density for Selected Particle Volume Fractions ....................................................................................................................... F-55
F-19a Contour Plot of Best-Estimate Pressure Drop per loo0 ft of Pipe at Specified Flow Velocity (CS solid line, S S dashed line) vs. Particle Solids Density and Carrier Liquid Density - (Turian, Hsu, and Ma 1987) ................................................. F-56
F-19b Corresponding Flow Regime Contour Plot .................................................................. F-56
F-19c Contour Plot of Best-Estimate Critical Velocity (ft/s) (Oroskar and Turian 1980) vs. Carrier Liquid Density and Particle Density for Selected Particle Volume Fractions ...... ....... ... .. .................................... ............................................................ ..... F-57
F-20a Contour Plot of Best-Estimate Pressure Drop per loo0 ft of Pipe at Specified Flow Velocity (CS solid line, S S dashed line) vs. Particle Solids Density and Carrier Liquid Density - (Turian, Hsu, and Ma 1987) ................................................. F-58
F-1 1
F-12
F-13
F-14
F-15a
F-v

RPP-5346 REV 0
LIST OF FIGURES (CONTINUED)
F-20b Corresponding Flow Regime Contour Plot .................................................................. F-58 F-20c Contour Plot of Best-Estimate Critical Velocity (ftls) (Oroskar and Turian 1980)
vs. Carrier Liquid Density and Particle Density for Selected Particle Volume Fractions ....................................................................................................................... F-59 Normalized “Vehicle” Liquid Density and Viscosity Relations vs. “Vehicle” Solids Concentration ..................................................................................................... F-60
F-21
CONVERSIONS
ft in. Ibf/in2 mils @m CP
feet = 0.3048 meter (m) inch = 2.54 centimeters (cm) pounds per square inch = 0.06895 megapascals (MPa) 0.001 in. = 0.0254 millimeter (mm) 0.063 1 litedsecond (Us) centipose = 0.001 kilogradmeter-second (kg/m-s)
F-vi

CH2MHILL Hanford GrOUD. Inc. RPP-5346 REV 0
_ I
EVALUATION ANALYSIS Calc. No. RPP-LJJ-002
Revision: 0 - PageNo. I of 60
By: L. J. JulvkdP$' Client: Numatec Hanford Comoration WO/JobNo. 110299& 110300/BAIO Subject: Critical Velocitv and Pressure Drou Studv in S U O W ~ ~ of
Waste Tank Fe ed Transfe r Svstem Checked: 03/10/2000 By: T. C. O t e m Location: 200 Area - Hanford Site. Richland. Washineton Revised By:
Date: 03/08/2000
1.0 INTRODUCTION
Current pressure ratings of existing and proposed additions to the tank-to-tank, 3-inch diameter, Schedule-40. transfer pipelines for the doubleshell tanks (DSTs) in the 200 East Area are 275 and 400 Ibflinz. The 275 lbfhnz lines are carbon steel pipelines that were installed approximately 20 years ago. All new lines are expected to be stainless steel.
Corrosion of in-place Hanford waste tank transfer pipelines could restrict proposed waste feed activities. Corrosion of the inner pipe surface reduces the effective wall thickness necessary to maintain pipe structural integrity and increases the effective roughness of the pipe causing increased frictional resistance or pressure loss. The increased pressure loss requires greater pump capacity to achieve required flow. The flow rate must be maintained above a minimum Row rate to assure that solid particles in the waste stream do not settle in the pipeline, leading to line plugging. The maximum flow rate is restricted by the design pressure rating of the pipeline system.
Hence, increased corrosion leads to a reduction in the effective operating flow range of the pump and pipe system. An investigation of the proposed transfer conditions. pipeline configurations, and potential corrosion is necessary to evaluate pump requirements and adequacy of existing pipellne pressure ratings, as well as, requirements for any pipe additions.
2.0 APPROACH
Minimum flow rates (critical velocity) to maintain partlcle suspension and flow rate at the design pipeline pressure rating is estimated based on critical velocity and pipeline pressure drop correlations for slurry flow. Estey and Hu (1998) compared various critical velocity correlations and recommended the correlation developed by Oroskar and Turian (1980).
The pipeline pressure drop correlation for slurry flow developed by Wasp et al. (1977) is applied to obtain pressure drop estimates for each of the proposed transfer routes and waste conditions. New pipe and end-of-life (EOL) pipe roughness values for carbon and stainless steel pipe were applied from estimates given by Anantatmula and Divine (1999) to envelop the pressure drop estimates.
.
3.0 SUMMARY RESULTS
Although alternate critical velocity and pressure drop correlations were investigated, the Oroskar and Turian (1980) critical velocity and Wasp et al. (1977) pressure drop correlations were selected as bdng the most appropriate based on current limited knowledge of the waste physical properties during proposed transfers. Hanford waste feed delivery physical property data was estimated from the data summary provided in Estey 2000 for the in situ waste physical properties, as well as, from various waste characterization reports and flowsheets for Cases 3S4 and 3S6 from the Hanford Tank Waste Operation Simulator (HTWOS) model (Kirkbride et al. 1999). The range of waste and transfer pipe physical properties of interest are identified in Section 5.0 of this appendix. The assumed particle size disttibutiin for the solid parlicles is based on the measured particle size distribution by volume for Tank 241-SY-101 (O'Rourke lS99). The measured distribution was curve fit to a Rosin-Rammler distribution functlon (Shook and Roco 1991) and then shiffed to obtain a distribution with the target median particle size of interest. Appendix D provides a tabular listing of the critical velocity. pressure drop at critical velocity, and flow rate at a reference pipeline design pressure of 400 lbf/in* for each of the 200-East Area transfer routes identified in Cases 3S4 and 3S6 from the HTWOS model for a range of waste transfer properties. An alternate solutions to reduce the predicted pressure drops for wost-case conditions was also considered. This alternate solution assumed e pump lift station in AP Farms located at the AP "n&' valve pit. Selected long intermediate tank-to-tank transfers and all transfers to BNFL (Caw &st) would go through the pump lift station. Appendix E provides the results of a "sensitivity" analysis on the longest transfer route (AN-107 to BNFL) for the range of waste transfer properties considered appropriate. See main body of this report for a discussion of the detail results. Appendix G provides results of Wasp model verification.
PIPE-OTeq.MCD F- 1

CH2MHILL Hanrord Grouo. Inc. RPP-5346 REV 0
.I
EVALUATION ANALYSIS Calc. No. RPP-LJJ-002
Revision: 4 Page No. -2 of 60
Client: N w t e c Hanford Corpora tion Subject: Critical Velocitv and Pressure D ~ D Studv in Sumort of
Waste Tank Feed Transfer Svstcm Location: 200 Area - Hanford Site. Richland Washinnton Revised By:
4.0 REFERENCES
Anantatmula. R. P. and J. R. Divine. 1999. Surface Roughness of Carbon Steel and Stainless Steel Waste Transfer Unes Caused by Corrosion and Scaling, Appendix B of RPP-5346. Rev. 0. CH2M HILL Hanford Group Inc, Richland. Washington.
Blevins, R. D., 1984, Applied Fluid Dynamics Handbook. Van Nostrand Reinhdd Company Inc., New York, New York.
brand. R.. 1953, Minnesota Int. Hydraulics Convention, Pm.. p.89. Int. Assoc. for Hydraulic Research.
Este , S D. and T. A. Hu, 1998. Ffm Vefocffy Ana&& forAvoidanca of SofMs Deposnion During Transport of Han&tdTank Waste Sun'ies, HNF-2728, Rev. 0, Lockheed Marlin Hanford Corporation. Richland. Washington.
Este , S. D.2000. 'Alternatives Generetion and Analysis for Waste Feed Dellve Transfer Pump Discha e Pressure: Hanird Tank Waste Physical Property Estimates," internal Memorandum. 748&30-001-R1. to W. L. W 8 . CH2M Hili, Hanfwd Group, Inc.; dated February 11.
Gogus, M.. and M. A. Kokpinar. 1999. "An Empirical Expression for the determination of Mean Critical Flow Velocity in Sluny Transporting Pipeline Systems," Sluny Handling and Pipeline Transport, HVdrotransport f4, BHR Gmup Conference Series, Publication No. 36.
Govier, G. W.. and K. kit, 1972. The Flow of Complex Mixfuras in Pipes, Robert E. Krieger Publishing Company, Malabar. Florida.
Heywood. N.. 1.. 1999. Stop Your Shrnes from Stining Up Trouble. Chemical Engineering P m s s , September, pp. 21-41.
Kirkbride. R. A.. et al.. 1999. Tank Waste Remediatidn System Operation and Utilization Plan to Supporl Waste Feed Delivery, HNF-SD-WMSP-012, Revision 1, Nurnatec Hanford Corporation. Richland, Washlngton.
Olujuc, 2.. 1981, Compufa Friction Factors Fast for Flow in Pipes, Chemical Engineering. December Issue.
Omskar. A. R. and R. M. Turian, 1980, The Critical Velocify in Pipeline Flow of Sfuhs, AlChE Journal, 26.550-556.
O'Rwrke. J. F., 1999. "Shear Strength and Partide Size Distribution Measurements on lank 241SY-101 Samples", lntemai Memo, 82100-99-036. to F. H. Steen, dated September 27. Numatec Hanford Coporetion. Richland. Washington.
Robinson, M. P.. and W. H. Graf. 1972. Pmc. ASCE. J. Hydraulics Div.. 78.1221.
Shook, C. A., 1969, "Pipelinin Solids: The Design of Short-Distance Pipelines," Symposium on Pipeline Transpod d
Shook, C. A.. and M. C. Roco, 1991, Sfuny Flow Principles and Practice. Butterworth-Heinemann. Boston, MA.
Turian. R. M.. T. Yuan and G. Mauri, 1971, Pressure Drop Conelafbn for Plpefine Flow ofsolid-liguid Suspensions. AlChE Journal, 17,809-817.
Turian, R. M. and T. Yuan, 1977, Flow of SIUnles In Pipelines. AlChE Joumal, 23.232-243.
Turian, R. M. and A. R. Oroskar, 1978, Letter to the Editor. AlChE Journal, 24,1144.
Turian. R. M., F. L. Hsu, and T. -W. Ma. 1987. Esffmatlon ofthe Critical Velodty in Plpeline Flow of Sunjes. Powder Technology, 51,35-47.
&/ids, Canadian Society for 8 hemical Engineering.
,Wasp, E. J., J. P. Kenny, and R. L. Gandhi, 1977. Sdid-UquidFlow - Sunypipeline Transportation, Trans. Tech. Publ.. Rockport, MA.
Zandi. I., and G. Govatos. 1967, Hefercgeneous Flowof Solids in Pipelines. ASCE Pm., Hydraulics Div., 93 (HY3). pp. 145-159.

CH2MHILL Hanford GrouD. Inc. RPP-5346 REV 0
.I
EVALUATION ANALYSIS
Client: Numatec Hanfor Cornoration WO/Job No. 110299 & 1 Subject: 9 Date 03/08/2000
Waste Tank Feed Transfer System Checked 03/10/2000 Location: 200 Area - Hanford Site. Richland. Washinaton Revised
Calc. No. RPP-LJJ-002 Revision: 0 Page No. -3 of 60
By:
5.0 HANFORD WASTE AND TRANSFER PIPE PHYSICAL PROPERTIES T O L = I ~ I O - ~
Development of the expressions for the critical velocity and pressure drop correlations require knowledge of the following transfer pipe and waste physical property parameters.
Transfer pipeline parameters DpiP := 3.068.in
ppip_daisn := 400.- Ibf DPP inside diameter of transfer pipeline
pipe design pressure 2
Ibf or 275.- in 2 in P p i p - k i p
The following roughness values are assumed for the Sin. transfer pipe llnes (Anantatmula and DMne 1999)
new pipe upper assumed cwroded - 3 . bound roughness upper bound mil := 10 .in
roughness E- := Zmil
6- = Zmil E E ~ L - ~ := 150.mil
EEOL - ss := 10.mil
for carbon steel plpe at end of myear sewice life
for stainless steel pipe at end of 40-year servica life
Waste transfer parameters
ad or C,
adad) := ( I - a d ) carrier liquid volume fraction
particulate solids volume fraction 0 < ' a d Z 030 ad < 0.10 (typical)
Dd Or d,
Pd Or Ps
particulate solid phase effective median diameter (rm)
particulate solid phase density (kgL) I 5 Dd 5 400
1.4 5 pd Z 4
10-6.m
Pc or P L carrier liquid phase density (kgL) ~ ~ ~ 5 ~ ~ ~ 1 . 5
Po or P L carrier liquid phase viscosity (cP) p d k ) 5 pCs 5 IO CP - 10-*.poise
The densi and viscosity of water as a function of temperature (OC) were obtained from Shook and Roc0 (1991) and Estey and % u (1998) as
mass density of
(F-1) pMd'c) := 999.7 - o.losiz.(t, - IO) - O.OOSIZI.(~, - + o.o0001329.(~ - IO)^].: water
( 5 o c < ~ < 1 o o o c ) viscosity of water as a function of temperature (0C)
- 3.30233 .cP if s 20 I1 pvster(tc):= I iw-exfwioj[ 1301
998.333 + S.lSSS.(t, - 20) + O.OoSSS.(t, - 20)' ~~
[1.3272.(20 - t,) - 0.001053.(t, - ZO)21]1-. othmvi~
'c+ 10s
PIPE-OTaq.MCD F-3

WP-5346 REV 0 CHZMHILL Hanford Group, Inc.
Client: Numatec Hanford Cornoration
Location: 200 Area - Hanford Site. Richland Washington Revised By:
Calc. No. RPP-LJJ-002 EVALUATION ANALYSIS Revision: 0
P8gCNO. 40f 60 WO/Job No. 110299 & 110300/BAl
Date: 03/08/ 2000 By: Checked 03/10/2000 By:
Subject: Critical Velocitv and Pressure Drw Shrdv in Suuwrt o f Waste Tank Feed Transfer System
The above pro erties of water can be assumed for the pipeline flush condition as a function of the
The viscosity of water based on the above correlation Is plotted in Figure F-la as a function of temperature.
The viscosity of the carrier liquid is given in Estey 2000 by the following relation:
temperature o P the flush water. These properties can vary if the flush water Is treated.
PL density of carrier liquid with dissolved sollds
fraction of dissolved solids composed of sodium and other salts
fraction of dissolved sdids composed of sodium hydroxide
xUlt := 0.9
xuwtlc := 0.1
This relation is shown In Flgure F-lb vs. the density of the carrier liquid at selected temperatures.
The following temperature conversion functions are defined to convert between Fahrenheit and Celsius temperature scales.
9 T F ( ~ ) := -.k + 32 5 5 9
TC(1F) := -.(tF - 32)
6.0 CRITICAL VELOCITY AND PRESSURE DROP CORRELATIONS
6.1 HETEROGENEOUS FLOW
6.1.1 Critical Velocity
'Este and Hu (1998) recommended that the OCO.kar and Turirn (1860) critical velocity empirical codation be u d f o r Hanford waste transfer conditions. The flow should be maintained above the Critical velocity to prevent parUdes from settling In the pipe which could lead to pipe plugging. Thls correlation as well as altemate correlation's from the open literature are provided below for comparison. These alternate correlation's expand on
PIPE-OTeq.MCD F-4

the cornoarison cliven in Estev and Hu (1998). However. the Oroskar and Turian (1980) correlation is stlll selected for application to thg Hanford wabte transfer conditions as i i is generally more consektive when compared to the alternate correlation's without direct experimental data for the Hanford waste.
The Oroskar and Turian (1980) critical velocity and alternate correlation's are given below.
The Reynolds Number for Newtonian flow is deflned as
R ~ D . ~ , ~ , ~ ) :=D.v.- P P
where D is a characteristic length, v Is the flow velocity, p Is the fluid density. and p Is the fluid viscosity.
The terminal settling velocity (v,) of spherical particle settling in a stagnant unbound liquid Is glven by the fdlowing:
For Stokes flow (Re < 0.1 ) the drag coefncient of a spherical particle is given by
For Stokes and nonStokes flow Turian (1971) gives the following correlation for Co valid for Re < 1.5. IO'
and v, iS then given by V~Dd,pd,ps,p,,V) :-
ft which is implicit in v, but can be Iteratively solved as follows VI:- 0.1.- initial guess SCC
To preclude an iteratlve solution Turian (1971) developed the following approximate correlation for vm with the introduction of the following non dimensional parameter
(F-10)
(F-11)
A h ) := -1.38 + 1.94.IoAA) - 8.6~10-2~10g(A)2 - 2.52.10-2.10g(A)3 + 9.19~10-4.10g(A)4 + 5.35.10-'~l0g(h)~ (F-12)
PIPE-OTeq.MCD F-5

RPP-5346 REV 0 CHZMHILL Hanford Group, Inc.
EVALUATION ANALYSIS Calc. No. RPP-LJJ-002
Revision: 4 Page No. -6 of 60
Client: Numatec Hanford Comorat ion WONobNo. 110299Br 110300/BAIO Subject: Critical Velocitv and Pressure Droo Studv in SUDDOII o f By: L. J. Julvk&
Waste Tank Feed Transfer Svstem Checked 03/10R000 By: T. C. Oren- Location: 200 Area - Hanford Site. Richland. Washineton Revised: By:
Date: 03/08/ 2000
Reynolds Number for a settling spherical particle at terminal velocity is given by
Rem(Dd 9 Pdv Pc, Pc) := Re(Dd.vm(Dd, Pd I Pss Pc), PE, Pc)
The above drag coefficients correlations, as well as a third comekition referenced in Estey end Hu (1998), are compared in Figure F-2. Equations F-8 through F-10 are used herein for greater accuracy over a full range of particle sizes.
In accordance with Oroskar and Turian (1980), the hindered settling velocity of a spherical particle is given by the following relations:
(F-13)
(F-14)
(F-15)
A plot of the hindered settling velocity exponent versus Reynolds Number is shown in Figure F-3 for comparison with Figure 5 given in Oroskar and Turian (1980). Equations F-15 and F-16 were derived by Estey and Hu (1998) as an analytical approximation to the graphical relation given in Figure 5 of Oroskar and Turian (1980).
The ratio of particle hindered settling velocity to critical velocity
The fraction of the turbulent fluid eddies possessing a velocity larger than the particulate settling velocity is given (in corrected form derived from Equation 42 of Oroskar and Turian 1980) as
x versus y is plotted in Figure F 4 for comparison with Figure 6 in Oroskar and Turian (1 980).
(F-18)
(F-19)
F-6 PIPE-OTeqMCD

CH2MHILL Hanford Grouo. Inc. RF'P-5346 REV 0
Calc. NO. RPP-UJ-002 ~~ .. EVALUATION ANALYSIS Revision: 0
Date: 0 /OW2 By: L. J. Julvk %bd% By: T.C.Otcn Critical Vclocitv and Pressure DrOD Studv in Sum13 of Waste Tank Fwd Transfer Svstern Checked 0 /IO/
PageNo. 7 o f 60 Client: N m t e c Hanford Comoration WONobNo. 110299Br 1103M)/BA10 Subject:
Location: 200 Area - Hanford Site. Richland. Washinnton Reviscd: By:
The Oroskar and Turian (1980) semi-theoretical correlation for the critical velocity (vl) is given by:
vd(Dd,Pd.Pc) :=/g'Dd[; - 1) characteristic velocity of a settling particle (F-20)
where Dpipe is the inside diameter of pipe and the other parameters are as defined above.
The Oroskar and Turian (1980) empirical correlation for the critical velocity (ve) is given by:
The Omskar and Turian (1980) semi-theorelical and empirical equations given above were uxlsldered to do the best overall job of predicting the critical velocity. The overail compared to at least twice this for the other seven CorreKons considered.
Este and Hsu (1998) recommended that the slurry flow critical veidty be taken as the maximum value of the
m n t nns deviation was 25.94 and 21.82, respectively
Oros 1 ar end Turian (1980) semi-theoretical and empirical equations, i.e.,
(F-27)

RPP-5346 REV 0 CHZMHILL Hanford Group, Inc.
Client: Numatec Hanford Corn ration WONob No. 110299 & 110300/BA10
Location: 4 Revised By:
Calc. No. RPP-LJJ-002
PageNo. 8of 60 EVALUATION ANALYSIS Revision: 3
Subject: Critical Velocihr and Pressure &OD Studv in Sumrt of Date: By: Waste Tank Feed Transfer System Checked 03/10/2000
T u r i ~ . Hsu, and Ma (1987) compared 36 critkal velocity correlations. Correlations proposed by Roblnson and Graf (1972). Omskar and Turian (1980). and by Wasp et al. (1977) were determined to do a betterJob of predicting the critical velocity than the other correlations considered. The relations by Robinson and Gnf (1972) and Wasp et 11. (1977) are given, respectively as
(F-26) .
(F-2s)
Zandl and Govatw (1967) pro osed a crltlcal velocity relation developed from more than lo00 data points collected from 11 references. fhe critical velocity at trensltion from saltation to heterogeneous flow was g h w as
4O.c~~gD.i~. - - I 1 Pd
Shook (1969) used the Durend's pressure loss correlation and detemined the velocity wrrespondlng to minimum pressure loss and proposed the following relation which is similar to the Zandi and Govatos (1987) relation.
Gogus and Kokpinar (1999) developed the followln em lrical correlation based on ex erimental data for the ranges 230 pm Dd 5430 pm, 1.04 kg/liter pd e 5.68 &/liter, 0.0254 m D m e 0.&24 m, and 0.0075 e ad < 0.30.
The authors dam only 15% average error in this prediction equation.
PlPE-OTeqMCD F-8

RPP-5346 REV 0 CH2MHILL Hanford Group, Inc.
Client: Numahc Hanford Comoration WO/Job No. 110299 & 110300/BA Subject:
Location: 200 Area - Hanford Site. Richland. Washington Revised By:
Calc. No. RPP-LJJ-002
PageNo. 9of 60
Date: 03/08/2000 By: L . J.'.&k%
' EVALUATION ANALYSIS Revision: -Q
Critical Velocitv and Pressure DIOD Studv io SUDDOI~ of Waste Tank Feed Transfer Svstcm Checked: 03/10/2000 By: T. C. Oten
Figure F-5 indicates that the Oroskar and Tunan (1980) empirical equation generally
empirical equation to the liquid density, liquid viscosity. article wilds density, partide solids diameter. and solids
lcts a hi her uitical velodty than the Omkar and Turian (1980) semi-theoretical equation. The sensitivtty of the P B roskar and urian (1980)
volume fraction are shown in Figures F-6 through F-10 P or solid-liquid flow in a 3-inch diameter pipe.
The following relation provides easy access to each of the above correlations and assures that the critical velocity returned is greater than the transition to turbulence velocity
transition to turbulence veioclty
The critical velocity correlation selection key for equation F-34 is given as follows:
I Oroskar and Turian maximum of semi-theoretical and empirical equation 1.1 Oroskar and Turian 1.2 Oroskar and Turian
Bm = 2 Wasp et al. (1977) 3 Zandi and Govatos (1967) 4 Shook(1969) 5 Gogus and Kokpinar (1999) 6 Robinson and Graf (1 972)
semi-theoretical equation empirical equatlon
K,=, is the uncettainty factor on the critical, set to I to obtain the "best-estimate" prediction. Recommend at least 1.3 for upper bound estimate to account for uncertainties in the empirical correlation and to indude sufflaent margin above the critical veioclty for minimum operating flow rate.
Figures F-6 through F-IO show the sensitivity of the slurry parameters on the Oroskar and Turian (1980) empirical equation for the critical velocity best-estimate predication. The other correlations are compared to the Oroskar and Turian (1980) semi-theoretical and empirical equations in Figure F-16 along With the Turian, Hsu, and Ma (1987) regime transition correlation discussed in Section 6.1.2.2 blow.
P1PE-OTeq.MCD F-9

RPP-5346 REV 0 CHZMHILL Hanford Group, Inc.
Client: Juma ec Hanfo rd Comoration WO/JobNo. 110299Br 110300/BAlO Subject:
Location: 200 Area - Hanford Site. Richland. Washington Revised. By:
Calc. No. RPP-LJJ-002
PagcNo. 10of 60
Date 03/08/ 2000 By: L. J. J u l v k s
EVALUATION ANALYSIS Revision: 3
Waste Tank Feed Transfer Svstem Checked 03/10/2000 By: T. C. Ote
PARe,q) :=
6.1.2 Frlctlon Factors
In addition to ipe roughness, the friction factor for pipe flow is affected by the physical properties of the carrier liquid
6.1.2.1 Friction Factor for Pipa Flow Due to Carrier Llquld
Slurry volume entirely liquid, a, = 0.
Colebmok-White correlation for the Darcy or Moody friction factor ( f ) In the turbulent regime is oiven bv
and the parti s as In suspension.
16 1 A c
E hL AP 11'-
D,, strictly valid for where f = - =
L v' E roughness of pipe
4.103 5 Re 5 lo* D 2.g -
This relation is implicit in the friction factor but Olujic (1981) obtained the following explicit approxlmation
~(~e,C,t l ) :=[-2.10{~ - z . i o g E $ + (E)]] J' turbulent Re,qooo regime.
For the laminar regime, Re c 2100
f i (R~) := - 64 Re
(independent of roughness)
Olujlc (1981) also reports the following approximatlon developed by Churchill In 1977 that includes the laminar and turbulent regimes as well as the transition regime between laminar and turbulent flow
16
' IB + (F) 1 -
A + B
where v, flow velocity of carrier liquid
(Note that the transition regime is not well defined in practice but is approximated with a "smooth" transition curve for numerical convenience only. This approximation slightly over shoots the Webrook-White friction factor m l a t i o n at the start of the turbulent regime.)
(F-377)
Figure I 1 shows the resulting D a w friction factor for pipe flow of Newtonlan carrier fluid as a function of Reynolds Number and relative roughness (0 = s /Dpip.).
PIPE-OTeq.MCD F-10

RPP-5346 REV 0 CHZMHILL Hanford Group, h e .
Client: Numatec Hanford Cormration WONob No. I10299 & 110300/BA10 Subject: Critical Velocitv and Pressure DIOD Studv in Suuuort of
Waste Tank Feed Transfer Svstem Location: 200 Area - Hanford Site. Richland. Washinnton Revised By:
Calc. No. RPP-LJJ-002
Page No. 11 of 60 EVALUATION ANALYSIS Revision: 4
Date: 03/08/ OOO By: Checked By: T. C. Ot
6.1.2.2 Friction Factor for Plw Flow Due to Particles
A refined correlation of the particle contribution to the friction factor was iven by Turian and Yuan (1977) and Turian. Hsu. and Ma (1987) as a function of flow regime based on the Fanning Action factor definition. The Darcy friction factor Is qua i to 4 times the Fanning friction factor. The corresponding results in terms of the Darcy Mction factor definition become
Turian. Hsu, and Ma (1987) Turian and Yuan (1977)
I = K,:= a,:= p,:= ys:= S,:= K', :=
flow regime flow regime I (saltation)
flow regime 2 (heterogeneous)
flow regime 3 (homogeneous)
I I
G(O.1) =4641.4 al(O,l)= 1.0818 pl(O.l) = 1.0632 ~ ~ ( 0 . 1 ) = -0.0616 K',(O,l) 131.8
u 1 . 2 ) = 6.8319 aX1.2) = 02261 pl(I ,2) = -0.2333 yt(l ,2) = -0.3841 K'l(1,2)=2.4113
K,(2,3) =40.4362 a,(2,3) = 1.0751 pX2,3) =-0.6692 y&2,3) = -0.9372 K;(2,3) - 0.2861
K,(I ,3) = 12.5143 a,(l.3) = 0.5151 !31(1,3)=-0.3817 yd1,3) - 4 5 7 2 4 k,(1,3) I 1.1672
I q O . 2 ) = 0.1042 a,(O,Z) = -0.3227 pt(0,2) = -1.0649 yt(0,2) = -0.591 K'd0,Z) = 0.4605
&(0,3) = 1.6038 a,(0,3) = 0.3183 pt(0.3) = -0.8834 yt(0,3) = -0.7498 K',(0,3) = 0.3702
Flow regime numbers for selecting appropriate flow regime is given by
PIPE-OTeq.MCD F-11

RPP-5346 REV 0 Cdc. NO. RPP-UJ-002 CHZMHILL Hanford Group, Iae.
EVALUATION ANALYSIS Revision: -9 PageNo. 12 of 60*.
Client: Nmntec W o r d Cornoration WO/Job No. 110299 & 110300/BA10 Subject: Critical Velocitv and Pressure h o u Shldv in SUODO It of
Wwte Tank Feed Transfer Svstm Checked: 03/1012000 By: T. C. Location: 200 Area - Hanford Site. Richland Washinaton Revised By:
Date: 03/08/ 2Mx) By: L J . Julvkzd,
The flow regime number retrieval fundon is given by
PIPE-0Tsq.MCD F-12

RPP-5346 REV 0 CHZMHILL Hanford Group, Inc.
Client: Numatec Hanford Comoration WO/Job No. 110299 & 1103oo/BA1 Subject: Critical Velocihr and Pressure Drw Studv in Suuwrt of
Waste Tank Feed Transfer Svstem Checked: 03/10/2000 By: T. C. Oten Location: 200 Area - Hanford Site. Richland. Wasbinaton Revised: By:
Calc. No. RPP-LJJ-002
Page No. 13 of 60 EVALUATION ANALYSIS Revision: 9
Date: 03/08/ 2000 By: L. J. h v k $)'
Cfitical velocity based on flow regime transition identification Is given by
Turian and Oroskah (1978) Figure I flow regime diagrams for pipe inside diameters 1.58 and 5.25 an ( I n and 2 in.) based on Turian, Hw, and Ma 1987 corrected equations are given In Figures 12 and 13 as a check and also demonstrate the effect liquid is assumed with a regime diagrams for the I .58 and regime diagrams for the 3inch
pipe with water at 22.5 OC for the carrier
are shown in Figures 12 and 13. respectively. Flow in FIgure 14 for the conditions indicated.
with a 2.977 gmlcm3 partide solids density. The flow
PIPE-OTeq.MCD F-13

RPP-5346 REV 0 CHZMHILL Hanford Group, Inc.
Client: Numatec Hanford Comoration WO/JobNo. 110299 & 110300/BA10 Subject: Critical Velocitv and F'ressure D ~ D Studv in Sumrt of
Waste Tank Feed Transfer Svstem Checked 03/10/2000 By: T. C. O b Location: 200 Area - Hanford Site. Richland Washineton Revised: By:
Calc. No. RPP-LJJ-002
PageNo. 14 of 60 EVALUATION ANALYSIS Revision: 9
Date: 03/08/ 2000 By: L. J. JuIv&&
fdZPndl(Dplp.V,Pe.llE.6,DdlPd.ad.xf) :=Kras~Dpip.v,P,.p, .E).
Figure 15 compares the best-estimate critical velocity predictions from Robinson and Graf (1972), Wasp et ai. (1977). Oroskar and Turian (1980) semi-theoretical and empirical equations, and the critical velocity derived from the regime transition boundaries defined in Turian and Yuan (1977) for a smooth pipe with wrrected relations given in Turian, Hsu. and Ma (1987).
2 V .JCD(Dd.V,(Dd. Pd.Pel Pc) .Pc. Po)
V t &Dpp.(Z - 1 1
280.y-"93 if I+I e 10
6.30. V- O"" othenvise
Note that the critical velocity correlations compared in Figure 15 were obtained for natmw band disMbuUons of medlan dlameter solid particles greater than 100 pm. Hence, the results shown in Figure 15 for solld partides 1- than 100 pm requlres extrapolation and should be used with caution. In addition. it must be recognized that the critical velocity data is based on subjective observations and hence introduce uncertainty in the data upon which Ihe correlations twm developed. These correlations were developed for solid Darticles with a narrow distributions. The effect of d i d particles with a wide distribution needs lo be addressed.
For fine artides (diameter mush less than 100 pm) the two-phase a proach to determining pressure loss end minimum settling &tical) velocity begins to break down. In this case the liquic!solid flow approaches a homogeneous type behavior in which the fine particle remain suspended but the mixture may exhibit non-Newlonian shear characteristics.
The following additional friction factor correlations (f - fc = fd) based on large partides are provided for comparison:
Durand (1953) friction factor correlation per equation 11.84a as reported In Grovier and Azh 1972 - 3
Note that Grovier and Azlz (1972) indicate that the abscissa of Figure 10 in the paper by Durand (1953 appears to be mislabeled, and others appear to have erroneously determined from it the value of the constant (l$]as either 81. 82, or 84.9 rather than 150.
PIPE-OTeq.MCD F-14

FU'P-5346 REV 0 CHZMHILL Hanford Group, h e .
EVALUATION ANALYSIS Cnlc. No. RPP-UJ-002
Revision: 2 PageNo. 15 o
Client: Numatcc Hanford Cornration WO/JobNo. 110299 & 110300!BAlO~ f60
% Subject: Critical Velociw and Pressure DroD Studv in SUDDOII of Date: 03/08/ 2000 By: L. J. Julvk Waste Tank Feed Transfer Svstem Checked 03/10/2000 By: T. C. Otm
Location: 200 Area - Hanford Site. Richland. Washineton Revised By:
The above Durand (1953) and Zandi and Govatos (1967) Darcy friction factor correlations for twc-phase llquld-solid partide pe ipe flow are compared in Flgure 16 to the Turian and Yuan (1977) correlation with the Turian, Hsu, and Mafi98P) correctlon. The correlations give slmilar results but the Turian correlation was selected for application because of Its purported overall better perfonance over the full range of Row veldties over each R o w regime. However. it is dear that there is a large uncertainty band for any of these correlations.
The friction factor correlation selection key is given by
0 liquid only, no solid particles. ad = 0 1 Turian. Hsu. and Ma (1967)
Bf = 2 Turian and Yuan (1977) 3 Zandl and Govatos (1967) 4 Heywood (1999) 02 150 = KD Durand (1953)
KI is the uncertainty factor on the friclion factor due to solid particles, set to 1 to obtain the %&-estimate" prediction. Recommend at least 1.25 for upper bound estimate to account for uncectalnties In the correlations.
Figure 17 compares the best-estimate predications of the total friction factor for pipe slurry R o w based on Turian. Hsu, and Ma (1987). Durand (1953), Zandi and Govatos (1967). and Heywood (1999) as a function of the R o w velocity and pipe roughness estimates of Interest. The friction factor (f, for the liquid on1 Is also shown for comparison. At velocities below the critical v e l d , the friction factor o 1 Turian. Hsu, an J Ma (1987) or Heywood (1999) are expected to be more reliable because % e data was more systematically evaluated in this regime.
Note that application of the above predicted friction factors for slurry flows with median solid particle diameters less than 100 pm requires extra atlon beyond the database wed in the development of the correlations and hence should be used wi P . caution
PIPE-0Teq.MCD F-15

CH2MHILL Hanford GrouD. Inc. RPP-5346 REV 0
Calc. No. RPP-LJJ-002 _. EVALUATION ANALYSIS Revision: 9
Client: Numstec Hanford Cornoration WO/Job No. 110299 & 110300E~AlO Subject: Critical Velocitv and F’ressurc Drou Studv in Suuuort of Date: 03/08/ ZOO0 By: L. J. Julvk
Waste Tank Feed Transfer Svstem Checked 03/10/2000 By: T. C. Otm Location: 200 Area - Hanford Site. Richland Washineton Revised By:
Page No. 16 of 60
The flow area and flow rate are given by
2
A(Dpip) := n.- flow area of pipe Dpipc 4
Q(vc,Dpipc) :=Vc.A(Dpipc) pipe flow rate
Dpip := 3.068411
A ( D ~ ~ ) = 7.393inz
The following sample pressure drop calculation is provided for mparlson of the results from the various pressure drop correlations:
PIPE-OTeq.MCD F-16

Sample Pressure Drop CalculaUon - AN-10740-BNFL Transfer Route
fI pc:= I . 2 . S Dpir := 3.068.in v := 6.- liter Kf:= 1 ECS := En- E=:=€- Dd:=40@p sa:
ad := 15% Lcs := 557,fI Lss := 7M8.b H := 40.R kg pd := 3'- p, := 1.2 K, := 1 liter
e:=*( n ) T:=60 OC Pc:= PcL(Pc,T) pC = 0.771 CP Lcs + Lss
critical velocity fI Vcr(Dpip Dd, Pd.ud, P c . ~ . KEY. a,) = 5.482 - sec
Total pressure drop
liquid only, no solid particles
Zandi and Govatos (1987)
Herwood (1999) Ibf
APPT(Dpipe. V 8 Pe. Ps.Ecs. ESS, Dd. Pd,ud,kS.Lss.4 S f , @ ) = 475 7 in
Ibf AP.pr(Dpipc.v,P,.Pc.Ecs.Ess.Dd.Pd.~d.Lcs,Lss.82.Kf.~) = 468 7
in
ibf AP.pr(DpwnV B Pcr Pc. ECS. ESS,Dd, Pdsad.kS.LSSp 1 5O,Kf$B) = 694 -
2 in
KO = 82, Durand (1953)
KO = 150, Durand (1953)
Note that there is a wide variation in results between the various correlations.
For sluny flow in a %inch pipe, Figures 18 through 20 show best-estimate pressure dmp contour plots per 1.ooO R of pipe, corresponding flow regime contour plots, and crltlcal velocity contour plots for the range of carder liquid density and particle density of interest for the Hanford waste. The pressure dmp results are based on the Turian, Hsu. and Ma (1987) friction factor correlation and the uitical velocity results are based on the Oroskar and Turian (1980 empirical m i a t i o n . The pressure drop results are shown at a flow velocity of 5 Ws for endof-life EOF) pipe mug A ness estimates for carbon and stainless steel as iven above. The solid particle size, sdid fra dl on by volume, and temperature of the flow are indicated In the w gures. These flgures provide an upper bound estimate to the Mction pressure loss, particularly for s d M particle diameters legs than 100 pm. For sluny flm with broad solid partiie distributions the method of Wasp et ai. (1977) which accounts for the effect of the "fine" and large particles is expected to provide more realistic predictions.
PIPE-OTea.MC0 F-17

RPP-5346 REV 0 CHZMHILL Hanford Group, Inc.
Client: Numatec Hanford Cornration Subject: Critical Vclocitv and Pressure Drou Studv in SUDWI~ of
Waste Tank Feed TrAnsfes Svstcm Location: 200 Area - Hanford Site. Richland. Washington Revised: By:
Calc. No. RPP-LJJ-002
Page No. 18 of 60
By: -L. J. Julvk
EVALUATION ANALYSIS Revision: 9
6.2 COMBINED HOMOGENEOUSHETEROGENEOUS SLURRY FLOW -WASP METHOD
Wasp (1977) developed a method to estimate the pipe pressure loss for a combined hoqeneous-hetercgenogeneous flow with multiple partide shes based on the concept of a "two-phase vehicle." Fine particles join with the carrier liquid to form a homogeneous "vehicle" while the course particles are suspended es a heterogeneous 'bed" within this homogeneous vehicle. The fine particles in the vehicle modify the effective liquid density and rheology of the liquid. High concentrations (approaching 30% by vdume) of "fine" partides (partide size diameters less than 100 pm) can result in non-Newtonian viscosity characteristics. in the application herein the viscosity of the vehicle is assumed to remain Newtonian and increase with increasing fine particle concentration in ewrdance with the Thomas conelation
.
(F-53)
(-4)
pdpL,mv) := pr( I + 2.5q + 10.0s.m: + 0.00273.e~~16.6.0,))
P4PS>PL.@V) :=Pi@" + PL(1 - QV)
Thomas correietion (Wasp et ai. 1977)
and the effective density of the vehicle is given by
where mv is the concentration of fine particles joining with the carrier fluid.
Although other viscosity correlations are available, they require additional empirical parameters. Hence. the Thomas correlation was selected as a first e proximation due to the lack of date applicable to the Hanford waste. The above relations are shown in Figure F-21 & r the selected conditions indicated.
The Wasp method requires a article size distributton. The assumad particla size distributkm for the d i d partlclas is based on the measured part& size distribution by volume for Tank 241-SY-I01 (O'Rourke 1999). The measured distribution was curve fit to a Rosin-Rammler distribution function (Shook and Row 1991) and then shifled to obtain e distribution with the target median particle size of interest.
6.2.1 Prellmlnarles
Retum cumulative vector barn for frequency distribution vector 0
cum(+) := 1 for j E 0.. length(+) - 1
(F-55)
Return values of vector OP in accordance with nonzero values in vector > AE
:= J t Imgth(+$ - 1
I k + O
waspeqn.mcd F-18

RF'P-5346 REV 0 CH2MHILL Hanford Group, Ine.
EVALUATION ANALYSIS
A(dp) :=
Client: Numatec Hanford Comoration WOIJob No. 110299 &I Subject: Critical Velocitv and Pressure D r o ~ Studv in SUDDOII of Date: 03/08/2000 c Checked: 03/10/2oM)
J t Imgth(d,) - 1
d, - d Dp(dp,O-,P) := J + lagth(0cm) - 1
for k e O..J I Po
for j E l . . J - l
Ado c break if 0- > p ( F a )
k (F-57)
2
.(P - + c y J + d~, , dPj+, - dP,-, 4, - dpw Adj c
0 m -+cum k k- I 2
d - d PI %I Ad, t
Ad
2
Location: 200Area -~HHar; for~S~~ .Rich ,~ash ine ton Revised.
Calc. No. RPP-UJ-002 Revision: p Page No. 19 of 6Q
By: T. C. Oten By: L. J. Julvk
By:
10300/BA10
Parllal derivative of Rosin-Rammler CDF with respect to parameter p
Log normal
waspeqn.mcd F-19

RPP-5346 REV 0 CHZMHILL Hanford Group, Inc. Calc. No. RPP-UJ-002
EVALUATION ANALYSIS Revision: 0 - Client: Numa ec Hanford Cornomtion Subject: Date: 03/08/2000
Location: 200 Area - Hanford Site. Richland Washin&ton Revised: By: Waste Tank Feed Transfer Svstem Checked
Partial derivative of Log-noma1 CDF with respect to parameter p
8.2.2 Wasp's Method for Pressure Drop Estimate
In accordance with Wasp et al. 1977. assume p := 1 x := 0.4 von Kaman constant
Return total concentration of solid particle attributed to "vehicle" liquld from each particle of particle size distribution using vehicle properties
J
initial guess LD', c 0.5. +,, 1 I j = O
F-20

RPP-5346 REV 0 CHZMHILL Hanford Group, Inc.
EVALUATION ANALYSIS Calc. No. RPP-LJJ-002
Revision: 0 - Pa eNo 21 of 60
Client: Numatec Hanford Cornoration WO/Job No. 110299 & 1103d/BAiO Subject: Critical Vclocitv and Pressure Drou Study in SUDDOI~ of Date: 03/08/2000 By: L. I. Julvk
Waste Tank Feed Transfer System Checked 03/10/2000 By: T. C. Oten Location: 200 Area - Hanford Site. Richland. Washinaton R e v i d By:
Darcy friction factor and pressure loss based on Wasp method using Durand friction factor m i a t i o n (see Equation F-45) with
homogeneous vehide friction contribution normalized to dear liquid
Ius friction contribution L m remaining heterogeneous particles
V*PL.Pv,Pv,dp i v~s*+s ,s f ) I
Oaj Osi - Ovj using clear liquid properties
ff := 0.025 initial guess I A 0 := TOL.10-
F-2 1

RF'P-5346 REV 0 C ~ C . NO. RPP-WE002 CHZMHILL Hanford Group, Inc.
Client: Numatcc Hanford Cornoration WO/JobNo. 110299B 110300/BA10 Subject: Critical Velocitv and Pressure Drou Studv in Sumrt of Date: 0 3 V u l v k &&-
Waste Tank Feed Transfcr Svstem Checked 03/10/2000 By: T. C. &en+ Location: 200 Area - Hanford Site, Richland, Washinaton Revised By:
EVALUATION ANALYSIS Revision: 9 Page No. 22 of 60
8.2.3 Critical Velocity Based on Wasp Yehlde" Concept
This procedure predicts a lower critical velocity for a given partide sue distribution as the median pa+ sire for the distribution decreases. Although this procedure appears log~cal. it is provided here for cornpanson only because it has not been validated by experimental results.

RPP-5346 REV 0 &IC. NO. RF'P-UJ-002 CHZMHILL Hanford Group, Inc.
EVALUATION ANALYSIS Revision: 9 PageNo. 23 of 60
Client: Numatcc Hanford Corntation WO/Job No. 110259 & I10300/BA10 Subject: Critical Velocitv and Pressure Droo Study in Surnort of Date: 03/08/2000 By: L. J. Jufvk
Location: 200 Area - Hanford Site. Richland. Washineton Revised By: Waste Tank Feed Transfer Svstem Checked 03/10/2000 By: T.C.Oten
Transition to Turbulence Velocity R q := 4000
(F-678)
(F-67b)
1 Omskar and Turian (1980) maximum of semi-theoretical and empirical equation 1.1 semi-thearetical eauation
kv Is the uncertainhr factor on the uiticai. set to 1 to obtain the '&t-estimate' prediction. Recommend at least 1.3 for up er bound estimate to account for uncertainties In the empirica correlation and to indude suffident margin above the ctitical velocity for minimum operating flow rate.
P 3 Zandi and Gbvatds (1967) 4 Shook(1969
6 Robinson and Graf (1972) 5 Gogus and i okpinar (1999)
rmsp-e.qn.mcd F-23

RPP-5346 REV 0 CH2MHILL Hanford Group, Inc.
Client: Numatec Hanford Cowration WONob No. 110299 & 110300/BA10 Subject: Critical Velocitv and Pressure Drou Study in Suuuort of Date: 03/08/2000
Location: 200 Area - Hanford Site. Richland Washinnton Revised By:
Calc. No. RPP-WJ-002
Page No. 24 of 60 EVALUATION ANALYSIS Revision: 0
Waste Tank Feed Transfer Svstem Checked: 03/10/2000
8.2.4 Generlc Particle Size Distribution for Hanford Waate Feed Delivery
Tank SY-101 partide size distribution (partial listing displayed) (O'Rourke 1999) volume
d~ (w) frequency (%) SYlOl :=
dp := SYIOl(o).pm
$le :=SYIOI(1).%
hgth(+fi) - 1 = 113
Curnulathre undersize volume dlstrlbutlcm
Curve fit to Rosin-Rammler and Log Normal distributlon functions
warpeqn.mcd F-24

FG'P-5346 REV 0 CHZMHILL Haoford Group, Inc.
Client: Numats Hanford Cornration WO/JobNo. 110299 & 110300/BA10 Subject: Critical Velocity and Pressure Bar, Studv in Sumort of Date: 03/0S/2000 By: L. J. Julvk 1 Checked: 03/10/2000 By: T. C. Men Location: 200 Area - Hanford Site. Richland. Washineton Revised: By:
Calc. No. RPP-WJ-002
PageNo. 25 of 60 EVALUATION ANALYSIS Revision: 3
Comparison of SY-101 cumulative and frequency data to Rosin-Rammler and Log Normal distribution function curve fits.
Particle Size Cumulative Distribution
I
Particle Size Frequency Distribution
SY-IO1 Rata

Rep-5346 REV 0 CHZMHILL Hauford Group, Inc.
Client: Numatcc Hanford Cornration WO/Job No. 110299 & 110300/BA1 Subject:
Location: 200 Area - Hanford Site. Richland. Washington Revised By:
Cslc. No. RPP-LJJ-002
PageNo. 260f 60 EVALUATION ANALYSIS Revision: 9
Critical Vclocitv and Pressure Drop Smdv in Sumrt of Waste Tank Feed Transfer Svstem Checked 03/10/2000 By: T.C.0t
Date: 03/08/2000 . By: L. J . ! u l v s
dist=(dp.d5o) :=
dPR := dp AdpR := Adp j, := 0.. Imgth(dp) - I +R:='$b OsurnR:= +cml
Pack original sdid particle distribution for analysis to remove zero frequency data
dp := pak(dp ,h )
+r,:=P~k(+r..+fs)
J c lmgth(dp) - 1
Ad c A(dp)
for j E 0.. J
distddp,d50) := J c lmgth(dp) - 1
Ad c A(dp)
for j E 0..1 (F-70)
91 PDFRR(dp J . ~ s o , P R R ) A ~ ~ + j + PDFLN($Jsdso,Pm)Adj
d pak(dp,+).W-' d pack(dp,+)yn-'
+ +- pack(+.+)
(d 0) (d 0) 0 +- p=k(+ ,+)
waspegn.mcd F-26

RPP-5346 REV 0 CHZMHILL Hanford Group, Inc.
Client: Numatcc Hanford Cornration WO/Job No. 110299 & 110308/BAiO Subject: Critical Velocitv and Pressure Droo Study in Sumrt of Date: 03/08/2000 By: L. J. Julvk
Location: 200 Area - Hanford Site. Richland Washineton Revised: By:
Calc. No. RPP-LJJ-002
Pa eNo 21of 60 EVALUATION ANALYSIS Revision: 4
Waste Tank Feed Transfer Svstem Checked 03/10/2000
Appendix D provides a tabular listing of the critical velocity, pressure drop at critical velocity. and flow rate at a reference pipeline design pressure of 400 IbfAn2 for each of the 200-East Area transfer m t e s identified in Cases 3.9 and 356 from the HTWOS model for a range of waste transfer pro rties An alternate solutions to reducs the predicted pressure drops for wost-case conditions was also consldereBeThIsalternate soluUon assumed a pump lift staUon in AP Farms located at the AF' "new" valve pit. Selected long intermediate lank-to-tank transfers and an transfers to BNFL (Case 4 4 ) would go through the pump lift station. Appendix E provides Me results of a "sensitivity' analysis on the longest transfer route (AN-I07 to BNFL) for the range of waste transfer properties considered appropriate. See main body of this report for a discussion of the detail results. Appendix 0 provides results of Wasp model verification.
waspeqn.rncd F-27

RPP-5346 REV 0 CHZMHILL Hanford Group, Inc. Calc. No. RPP-LJJ-002
EVALUATION ANALYSIS Revision: 2 Page No. 28 of 60
By: L. 1. J u l v k A Client: Numatcc Hanfmd Cornoration WO/Job No. I10299 & 110300/BA10 Subject: Critical Velocitv and Pressure Drou Studv in S u m rt of
Waste Tank Feed Transfer Svstem Checked 03/10/2000 By: T.C.Ote Location: 200 Area - Hanford Site, Richland Washington Revised By:
Date: 03/08/2000
7.0 ANALYSIS OF TRANSFER PIPELINES FOR PROPOSED TRANSFERS -Wasp Method
read transfer pi eline physical
transfer parameters from worksheet
TOL = 5 x
Dpip := 3.06841
Pipe design pressure
Ibf ppipo_+,ip := 400.- 2 in
parameters an B data sets for waste (3 := ,
wmdlca p, := I .2
:= DL(O).~~ L~~ := DL(').~ H:=DL (2) .ft N := length(&) N = 75 i:=O..N-I j := 0.. 5 +
H ) Lcs + Lss
The above Critical velocity and ressure drop correlations are "best-estimate'correlations. In application of these
uncertainty factor on predicted critlcai velocity plus factor to assure operation above the critical velocity
uncertainty factor on predicted friction factor - for best-estimate q = 1
correlations, the uncertainly in &, e predictive correlation must be considered.
K~~ := 1.30 approximate 20 uncemlnty factors on predictive correlations :=
Data Set 0 -Group 1 Properties T := 10 OC
ROi,j :=0 d p := 0 +m:=0
( dpRR(i) dRR(') := distRR(dpR,Dai) dpm := d p W F reset units
3S4 Case la.MCD F-28

RPP-5346 REV 0 CH2MHILL Hanford Group, Inc. &IC. NO. RPP-LJJ-002
EVALUATION ANALYSIS Revision: 9 Page No. 29 of 60
By: -L. J. Julvk % Client: Numatec Hanford Comoration WO/Job No. 110299 & 110300/BA10 Subject: Critical Velocitv and Pressure Drou Studv in Suuuort of
Waste Tank Feed Transfer Svstem Checked 03/10/2000 By: T. C. Oten Location: 200 Area - Hanford Site. Richland. Washineton Revised By:
Date: 03/08/2000
Data Set 0 -Group 1 Propertles T:=60 OC Rlj,j := 0
3S4 Case la.MCD F-29

F-30

Data Set 1 -Group 2 Propertles T:=60 OC
return summary results of analysis to worksheet
(RO RI RZ R3)
3S4 Ca+e la.MCD F-3 1

RPP-5346 REV 0 CHZMHILL Hanford Group, Inc.
Client: Numatee Hanford Comration Subject:
ha t ion: ~ Revised: By:
Calc. No. RPP-UJ-002
Page No. 32 of 60 EVALUATION ANALYSIS Revision: 9
WO/Job No. 110299 8c 1103GWBA10 Date: 03/08/2000 By:
Checked 03/10/2000 By: Critical Velocitv and Pressure Drop Studv in Suuuort of Waste Tank Feed Transfer S v s m
8
6
6 Y ,e 4 i >
2
TOL = I x 10-6
Figure P-la. Vlscosity of Water vs. Temperature.
IO
1
3
0. I
IO IW 0.01
Tmpnm (F)
25 TI
/ , 80 140
.*
v ’ e * * *.-- /’ ..-- /’ / ._-.- /- - / * ___---.- I
_______._.---*---- /- - c -- _ _ _ _ _ _ _ .-------.
____.-- . - - 0 1 1.05 1.1 1.15 1.2 1.25 1.3
PIPE-OTpl.MCD
1.35 1.4
F-32

RPP-5346 REV 0 CHZMHILL Hanford Group, Inc.
Client: Numatec Hanford Cornoration WO/JobNo. 110299 & 110300/BA10 Subject: Critical Velocitv and Pressure Droo Studv in Suwort of Date: 03/08/2000
Location: 200 Area - Hanford Site. Richland. Washington Revised By:
Calc. No. RPP-LJJ-002
Page No. 33 of 60 EVALUATION ANALYSIS Revision: 0
Waste Tank Feed Transfer System Checked 03/10/2000 By: T.C.Ot
Figure F-2. Correlations for the Drag Coefficient of a Sphere in Free Fall in a Stagnant Unbound LIquM.
PIPE-OTpl.MCD F-33

RPP-5346 REV 0 Calc. No. RF'P-WJ-002
Page No. 34 of 60
CHZMHILL Hanford Group, Inc. EVALUATION ANALYSIS Revision: 3
Client: Numatec Hanford Cornoration WO/Job No. 110299 & 110300/BA10 Subject: Critical Velocitv and Pressure Drou Study in Suuuort of
Waste Tank Feed Transfer Svstem Checked 03/10/2000 By: T. C. Ot Location: 200 Area - Hanford Site. Richland. Washineton Revised By:
Date: 03/08/2000 By: -L. 1. J u l ~ f
1
Figure Fa. Hindering Settling Velocity Exponent as a Function of Particle Reynolds Number.
0.01 0. I I 1 . I d 11111
1.10'
PIPE-OTplMCD F-34

RPP-5346 REV 0 CH2MHILL Hanford Group, Inc. &IC. No. RPP-LJJ-UUL
Revision: 9 EVALUATION ANALYSIS
1 d Washington Revised
Figure F4. Plot of ~(7).
PIPE-OTpl.MCD F-35

CHZMHILL Hanford Group, Inc. RPP-5346 REV 0
EVALUATION ANALYSIS Cak. NO. RPP-UJ-002
Revision: 9 Page No. 36 of 60
Client: Numa tec Hanford Comoratio II WO/JobNo. m 2 9 9 & 110300/BA10 Subject: Critical Velocitv and Pressure Drm Stu dv in Suwort of Date 03/08/2000 By: J. J. J ( Checked 03/10/2000
Location: 200 Area - Hanford Site. Richland. Washington Revised By:
Figure F5a. Contour Plot of Oroskar and Turian (1980) Semi-Theoretical Equatlon for the Critical Velocity (Ws) vs. Partlcle Sollds
Density and Carrier Llquld Density - T=BoOC (solid he ) , T=lOOC (dash h e ) .
Figure FJb. Contour Plot of Oroskar and Turian (lS80) Ernplrical Equation for the Critical Velocity (Wa) n. Putlcle Sollds
Density and Carrier Llquld Density - T=BooC (solid line)), T=IOOC (dash line).
K~~ = 1 Dpip = 3.068in .
Particle Density (WL)
Carrier Liquid Density (kgA) Carrier Liquid Density (kgA)
PIPE-OTpl.MCD F-36

Figure F a . Best-Estirnato Critical Velocity Prediction VS. Carrier Liquid Density at Selected Solids Volume Fractions - Oroskar and Turian (1980).
O C p, := 1.2 K~ := I Dpip = 3.068in
-
7
6
5
4
3 . ~ 2 1.35
I I 1.05 1.1 1.15 I .2 1.25 1.3 wrier liquid density (kg/L)
Figure FBb. Bost-Estirnate Critical Velocity Prediction VI. Particle Solids Density at Selected Solids Volume Fractions - Oroskar and Turian (WOO).
a d
0.30 0.10 0.05
0.02
I
PIPE-OTpl.MCD F-37
ps:= 1.2.- p] ad
0.30
0.10
0.05
0.02

RPP-5346 REV 0 CHZMHILL Hanford Group, Inc.
Client: Numatec Hanfod Cornoration Subject:
Location: 200 Area - Hanford Site, Richland. Washington Revised By:
Calc. No. RPP-LJJ-002
Page No. 38 of 60 EVALUATION ANdYSlS Revision: p
WO/Job No. 1102 Dah: 4 “ t $ % ’ & v ~
Waste Tank Feed Transfer System Checked 031). /ZOO0 By: T. C. Ot
Figure F-78. Best-Estimate Critical Velocity Prediction VS. Carrier Liquid Density at Selected Solids Volume Fractions - Oroskar and Turian (1980).
m C p,, = 1.2 K~ = 1 Dpip = 3.068in
a d
0.30 0.10 0.05 0.02
pc:= 13.- M i ~ r liquid density @E&)
Figure F-7b. Eest-Estimate Critical Velocity Prediction va. Particle Solids Denslty at Selected Solids Volume Fractions - Oroskar and Turian (1980).
a d
0.30
0.10
0.05
0.02
PIPE-OTpl.MCD F-38

RPP-5346 REV 0 Calc. No. RPP-LJJ-002
Page No. 39 of 60
CHZMHILL Hanford Group, Inc.
Client: Numatec Hanford Cornoration WO/Job No. 110299 & 11030O/BAlO Subject: Critical Velocih, and Pressure D m Studv in Sumort of Daw 03/08/2000
Location: 200 Area - Hanford Site. Richland. Washinaton Revised By:
EVALUATION ANALYSIS Revision: 9
By: L. J. Julv% Waste Tank Feed Transfer System Checked 03/10/2000 By: T. C. Ot
Figure Fda. Best-E.timate Critical Velocity Prediction VS. Carrier Liquid Density at Selected Solids Volume Fractions - Oloskar and Turian (1980).
I 1.05 1.1 1.15 I .2 1.25 1.3 1.35 carrier liquid density (ton)
Figure Fdb. Best-Estirnate Critical Velocity Prediction v.. Particle Solids D e ~ i t y &Selected Solids Volume Fractions - Oroskar and Turlan (1980).
ad
0.30 0.10 0.05 0.02
pa:= 1.2.-
a d
0.30 0.10 0.05
0.02
PIPE-OTpLMCD
pmhlme solids dnuity (ton)
F-39

RPP-5346 REV 0 CHZMHILL Hanford Group, Inc.
EVALUATION ANALYSIS
2
Calc. No. RPP-LJJ-002 Revision: 0 - ~~ ~~~ ~~
Page No. 40 of 60 Client: N m t e c Hanford Comration WO/Job No. 110299 & i10300/BA10 Subject: Critical Velocilv and Pressure DroD Study in SUDDOII of Dare: 03/08/2000
Location: 200 Area - Hanford Site, Richland, WashinKton Revised By: By: - Waste Tank Feed Transfer Svstem Checked 03/10/2000 By: T. C. Oten
Flgure F=9a. Bast-Estimate Critical Velocity Predictlon vs. Particle Solids Median Diameter at Seiec3ct.d Soilds Volume Fractlons - Oroskar and Turlan (1980).
ps := 1.2.- -1 -1 liter
Figure F-9b. Bast-Estlmab Critical Velocity Prediction v.. Particle Solids Median Diameter at Se1.ct.d Particle Solids Densities - Oroskar and Turlan (1980).
so I so 200 250 300 150 purieulue soli& d i M M (m-)
a d
0.30
0.10
0.05
0.02
I
P..(Z) 4
3
2.5
2
1.4
PIPE-OTpl.MCD F-40

RPP-5346 REV 0 CHZMHILL Hanford Group, h e .
Client: Numatcc Hanford Comoration WO/JobNo. 110299& 110300/BA10 Subject Critical Velocitv and Pressure D ~ O D Studv in Sumort of
Waste Tank Feed Transfer Svstem Location: 200 Area - Hanford Site, Richland. Washinxton Revised By:
Calc. No. RPP-UJ-002
PageNo. 41 of 60 EVALUATION ANALYSIS Revision: 9
Date: 03/08/2000 By: L. J. J u l v k s Checked: 03/10/2000 By: T. C. Ote
Figure F4c. Best-Estimate Critical Velocity Prediction VS. Particle Solids Median Diameter at Selected Particle Solids Densities - Oroskar and Turian (1980).
ps:= 1 . 2 . 2 I liter
8
7
6
5
4
3
P & ( ~ liter J
4
3
2.5
2
putisulmc mli& diameter (microns)
Flgure F a . Best-Estimate Critical Velocity Prediction vs. Particle Solids Median Diameter al Selected Particle Sollds Densities - Oroskar and Turian l19eOL
pnisuhtc wlids d i m (microns)
F-41 PIPE-OTpl.MCO
4
3
2.5
2
1.4

RF'P-5346 REV 0 Calc. No. RF'P-LJJ-002
Page No. 42 of 60
CHZMHILL Hanford Group, h e .
Client: Numatec Hanford Cornoration WO/Job No. 110299 & 110300/BA10 Subject:
Location: 200 Area - Hanford Site. Richland. Washineton R e v k d By:
EVALUATION ANALYSIS Revision: 9
Critical Velocitv and Pressure Drou Studv in Suuwrl of Waste Tank Feed Transfer Svstem Checked 03/10/2000 By: T. C. Ote
Date: 03/08/2000 By: L. J. Julvk&
Figure F-loa. Best-Estimate Crnicai Velocity Prediction vs. Carrier Liquid Density at Selected Solids Voiume Fractions - Oroskar and Turlan (1980).
pa := 3.- I 3 8
1
6
5
4
3
2 .
I I 1.0s 1.1 1.1s 1.2 1.2s 1.3 1.35 I .4 &a liquid density WL)
Figure lob. Best-Estimate Critical Velocity Prediction vs. Carrier LI uid Density at Selected Solids Volume FracUonr - Oroskar and Turian (1 '9 80).
urria liquid density WL)
PIPE-OTpl.MCD F-42
a d
0.30 0.10 0.05 0.02
a d
0.30 0.10 0.05 0.02

RF’P-5346 REV 0 CH2MHILL Hanford Group, Inc.
EVALUATION ANALYSIS Revision: 0 Client: Numatcc Hanford Comoration WO/JobNo. 110299 & 110300BA10 Subject: Critical Velocitv and Pressure Dmu Studv in Suuwrt of Date: 03/08/2000 By: L. J. Julvk
Waste Tank Feed Transfer Svstem Checked 03/10/2000 By: T. C. Oten Location: 200 Area - Hanford Site. Richland Washington Revised: By:
Calc. No. RPP-LJJ-002
PageNo. 43 of 60
Figure F-11. Darcy Friction Factor VS. Reynolds Number and Relative Roughnear.
0. I
Y Ii
i B 3 0.01
I .IO-’ 100
PIPE-OTpl.MCD
1.10’ kymbtimter .Id
F-43
I .lob 1.10’
E - D 0.05 0.04 0.03
0.02 0.015 0.01
0.006 0.004
0.002
0.001 O.OOO6 O.OOO4 0.0002 0.0001
o.oooo1
0
I .to’

RF’P-5346 REV 0 CHZMHILL Hanford Group, Inc.
EVALUATION ANALYSIS &IC. No. PpP-UJ-00 2
Revision: 3 PageNo. 44of 60 .
Client: Comorat ion WO/Job No. 110299 & 110300 SubJCCt: h S S U r e Droo SNdv in sumn of Date: 03/08/2OOO
Checked: 93/l0/2000 Location: 2WArea - Hanford Site. hchland. Washineton Revised By:
Waste Tank Feed Transfer Svstem
pLs := pmtJT) pc = 0.944cP E := 0 . p Kf := 1
Flgure F-12. Flow Regline Dlagram for 112-in. Pipe - Check Case. ID,,] R01=1 Rt2=1
Median Particle
Diameter (v)
F-44 PIPE-OTpl.Mc0

RPP-5346 REV 0 CHZMHILL Hanford Group, Inc. Calc. No. BpP-UJ-OQ2
PageNo. 45 of 6Q EVALUATION ANALYSIS Revision: 4
Client: Subject:
Location: 200Arca - Hanford Site. Richland. Washineton Revised By:
Juma tec Hanford Comora tion Date: 03/08/2000 Critical Velocitv and Pressure Dnm Sh&.A Suwort of
Waste Tank Feed Transfer Svstern Checked 03/10/2000
WO/Job No. J 9299% 110300/BA10
Dpip := 5.25.cm 7 1 Figure F-13. Flow Regime Diagram for 24n. Pipe -Check Case. %1=1
Median Particle Diameter (w)
Stationary
(regime 0) Saltatia
RR Mean Velocity of Sluny Flow (mlsec)
PIPE-OTpl.MC0 F-45

RPP-5346 REV 0 CHZMHILL Hanford Group, Inc.
EVALUATION ANALYSIS Calc. No. PpP-UJ-002
Revision: 9 PageNo. 460f 6Q
Client: N WOIJob No. 110299 & 11-A 10 Subject: Critical Velocitv and Pre ssure DIOD Studv in SUDDOI~ of Date: 03/08/2000 By: Id&JMs
Waste Tank Feed Transfer Svst em Check& 0 3 1 1 0 1 2 ~ BY 2AL?m Location: 200 Area - Hanford Site. Richland. Washineton Rcvised: By:
Flgure F-14. Flow Reglme Dlagram for %In. Plpe.
ID,, := 3.068.inl 5 =2mil ~ r : = l
Median Particle
Diameter m)
Man VelaityofSlvy Flow (milos)
40
30
20
10
2
RR Mean Velocity of Sluny Flow (fvsec)
F-46

RPP-5346 REV 0 CHZMHILL Hanford Group, h e .
Client: Jumatec H a n f o r d o n WO/lob No. J 10299 & 110300lBA1 Subject: meal Velocitv and Pressure Droo S tudv in Suuwrt of
Waste Tank Feed Transfer Svstem Checked 03/10/2000 By: Location: 200 Area - Hanford Site. Richland. Washineton Revised By:
Calc. No. RPP-UJ-002
PageNo. 470f 6Q EVALUATION ANALYSIS Revision: 9
Date: 03/08/2000
Dpip = 3.068 in
I .Id
Median Panicle
Diameter (P)
PIPE-OTpl.MCD F-47

RPP-5346 REV 0 Calc. No. RPP-LJJ-002
Page No. 48 of 60
CHZMHILL Hanford Group, Inc. EVALUATION ANALYSIS Revision: _I!
Client: Numatcc Hanford Corwration WO/Job No. 1 10299 & 110300lBAl Subject: Critical Velociot and Pressure Drop Studv in Sumrt of
Waste Tank Feed Transfer System Checked 03/10/2000 By: T. C. Ot Location: 200 Area - Hanford Site. Richland. Washington Revised By:
Date: 03/08/2000 By: L. J. hvk&
Figure F-15a. Comparison of Best-Estimate Critical Velocity Predictlons vs. Particle Solids Median Diameter.
kg liter liter
pLc:=pC~(pc.T) pO=O.771cP pd:=3.- F l kg T :e 60 OC K~~ = 1 Dpip := 3.0684~1 ps := 1.2.-
PIPE-OTplMCD F-48
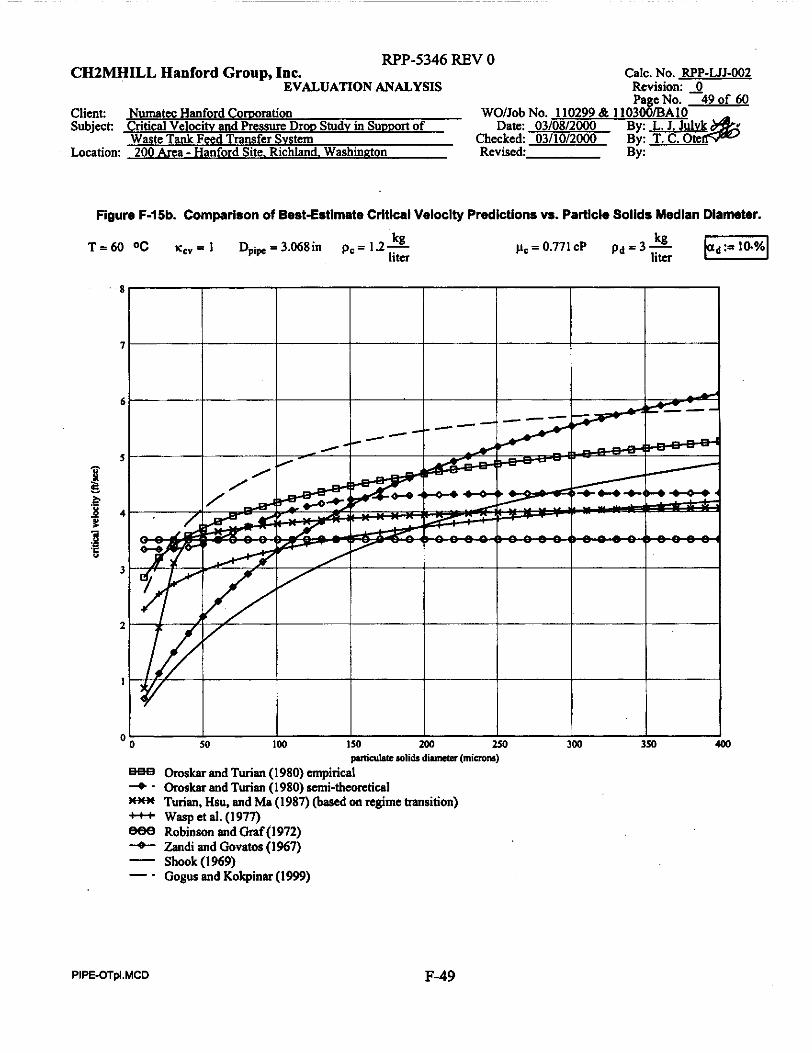
RPP-5346 REV 0 CH2MHILL Hanford Group, Inc.
EVALUATION ANALYSIS Calc. No. RPP-LJJ-002
Revision: 0 - Page No. 49 of 60
Client: Nwnatcc: Hanford C o r n ration WO/Job No. 110299 & 110300/BA10 Subject:
Location: 200 Area - Hanford Site. Rxhland. Washington Revised By:
CnhCal Velocih, and Pressure DIOD Studv in SunDon of Waste Tank Feed Transfer Svstem Checked 03/10/2000 By: T. C. Oa
Date: 03/08/2000 By: L. J. Jul&&j
Figure F-15b. Comparison of Best-Estimate Critical Velocity Predictions VI. Partlcle Solids Medlan Diameter.
pc = 0.771 CP pd = 3 lit, T = 6 0 O C K ~ " = I Dpip=3.068in pE=1.2- kg liter
paddale lolids d*mtar (minON) h k m and Turian (1980) empirical
+ - Oroskar and Turian (1980) semi-theoretical n-xie Turian. Hsu. and Ma (1987) (based on regime transition)
888 Robinson and Craf (1972) + h d i and Govatos (1967)
-_ Gogus and Kokpinar (1999)
m- WaspCtal.(1977)
Shook (1969) -
0 Kl
PIPE-OTplMCD F-49

RPP-5346 REV 0 CHZMHILL Hanford Group, Inc.
Client: N m t e c Had& Cornration Subject: Location: 200 Area - Hanford Site. Richland. Washinnton Revised By:
Calc. No. RF'P-LJJ-002
Page No. 50 of 60 EVALUATION ANALYSIS Revision: 4
WO/Job No. 110299 & 110300/BA10 By: L. I. J u l y k s Critical Velocilv and Pressure Drw Studv in SUOOOII Of
Waste Tank Feed Transfer Svstem Checked 03/10/2000 By: T. C. Ote Date: 03/08/2MH)
Figure F-lk. Comparison of Ekst-EstImate Critics1 Velocity Predictions VI. Solid Particle Volume F~action.
kg T = 6 0 OC K ~ " = I Dpip,=3.068in pc=l.2- liter
3 d i d p n i S l C volume mstim
%ee Oroskar and Tunan (1 980) empirical 4 - Oroskar and Turian (1980) mi-theoretical mcW Turian, Hsu, and Ma (1987) (based on regime transition) + Wasp aal. (1977) 888 Robinson and Oraf(1972) --C Zandi and Govatos (1967) - Shook (1969) -. Gogus and Kokpinar (1999)
PIPE-OTpl.MCD F-50

RPP-5346 REV 0 CH2MHILL Hanford Group, Inc.
EVALUATION ANALYSIS Calc. No. RPP-WJ-002
Revision: 0 - PagcNo. 51 of 60
By: L. J. July% Client: N m t e c Hanford Cornoration WO/Job No. 110299 Br 110300/BA10 Subject: Critical Vclocitv and Pressure D~OD Study in S U D D ~ ~ of
Waste Tank Feed Transfer Svstem Location: 200 Area - Hanford Site. Rlchland. Washinnton Revised By:
Date: 03/08/2000 Checked: 03/10/2000 By: T. C. Oren
Figure F-15d. Comparison of Best-Estlmate Critical Velocity Predictions VS. Solid Partlcle Volunw Fraction.
T=60 OC w,=I Dpip=3.068in pc=l .2 - kg pc = 0.771 CP pd = 3 liter liter
1
t
J
ii e 2 4 c. 4
3
2
I
0
I
aolid W I c volwm maion Oroskar and Turian (1980) empirical
+ . Oroskar and Turian (1980) semi-theoretical X++M Turian, Hsu, and Ma (1987) (aased on regime transition) - Wasp ct al. (1977) 888 Robinson and Graf (1972) + Zandi and Govatos (1967)
-. Gogus and Kokpinar(1999) Shook (1 969) -
0.25 0.3
PIPE-OTpl.MCD F-5 1

Figure F-16. A Friction Factor ( f,j = f - fJ Comparison.
o Turian. Hsu. and Ma (1987)
x Dutand (1953) Withl(0=150
+ Zandi and Govatos (1967)
- Heywood (Ism)
E= cs = 15Omil -
PIPE-OTpl.MC0
now velocity (fvlco)
F-52

RPP-5346 REV 0 CHZMHILL Hanford Group, Inc.
Client: Numatec Hanford Cornration WO/Job No. 110299 & 110300/BAlO Subject Critical Vclocitv and Pressure D m Studv in Sumrt of
Waste Tank Feed Transfer Svstem Checked 03/10/2000 By: T. C. 0 Location: 200 Area - Hanford Site, Richland, Washington Revised: By:
Calc. No. RPP-WJ-002
Page No. 53 of 60
By: L. J. "1-
EVALUATION ANALYSIS Revision: 3
Date: 03/08/2000
T = 60
G + 6
E
Figure 17. Friction Factor VI. Carrier Liquid Flow Velocity Comparison.
'DC Dpiw=3.068in ps= liter
o Turian, Hsu. and Ma (1987)
x Durand (1953)
+ Zandi and
W i t h ~ = 1 5 0
Garatas (1967)
PIPE-OTplMCD F-53

RPP-5346 REV 0 CHZMHILL Hanford Group, Ine.
EVALUATION ANALYSIS
~~
3.8
3.6
3.4-
3.2-
3
2.8
2.6
24
Calc. No. RpP-LJJ-002 Revision: 4 Page No. 54 of 60
I I j I I ! 1 ! !
I 1 I )
I .+-- I
- WO/Job No. J 10299 & 1 10 B;C)Fedvli ~.
Date: 03/08 12000 Client: H anford Cornorah 'on Subject: m a l Velocitv and Pressure D r o ~ Studv in Suooorl of
Waste Tank Feed Transfer Svstc m Checked 03/10/2000 By: T.C.O# Location: 2OOAre a - Hanford Site. RI 'chland. Washineton Revised By:
~~
IDd:=400,1 Dpip := 3.068.in L:= 1OOO.ft 0 := 0.dcg vc:= 5.- E l ~ f : = l P r : = l T = 6 0 D C
APCsi ,j := AP(Dpip .Vc. Pc, 9 Pci 9 EEOL-CS,Ddi Pdj ,ad*L* h. K f s e )
:= AP Dp,p,vc,pci, k i , EEOL-SS ,Dd, Pd. .ad. L, h. Kfve)
%SIJ :=Rd(Dpip.vc. Pg.~~i .EEOL_CS~Dd.Pdj ,ad, l )
RSSij := Rd(Dpip.Vc* Pci, Poi sEEOL-SS,Dd*Pd. 1 sad* I ) Ap% ( I
Figure 18a. Contour Plot of Beat-Estimate Preasure Drop (psi) per 1000 R of Pipe at Specifled
Flgure lab. Corresponding flow Regime Contour Plot.
Flow Velocity (5 tu.) (CS solid line, SS dashed line) = 0 R 0 RCSNr = 0 RSNR = 0 vs.Particie Solids Density and Carrier Uquld OR = o r
RS = 3 RCSNS = 3 NS
Density - (Turian, Hsu, and Ma lS87) &- = 2 R, = I 0.0 0.0
Canier Liquid Density (kg/L)
PIPE-OTpl.MCD
Carrier Liquid Density (kg/L)
F-54

CHZMHILL Hanford Group, he . RPP-5346 REV 0
-. EVALUATION ANALYSIS
Calc. No. RPP-UJ-002 Revision: 0 - PageNo. 5 5 0 f 6 p
Client: Subject: Critical Velocitv and DIOD Studv in Suo00 rt of
Location: 200 A n a - Hanford Site. R ichland. Washineton Revised By:
N m tec Hanford C OIDOl2tl '011
Waste Tank Feed Transfer Svstem Checked 03/10/2000 By: T. C. Oten
WO/Job No. D 9 9 & 110300/BAlQ Date: 03/08 /zoo0 By: L. 1. J u l v k G
K ~ : = 1 &,:= 1.2 T=60 O C -1 Dpip =3.068in
Figure lk. Contour Plot of Best-Estimat. Critical Velocity (Ws) IOroskar and Turian lB8.0) v.. Carrlr Liquid Densitysnd Particla
Denslty for Selected Particle Voiunw Fractions.
ad 0.05
0.10
0.30
Carrier Liquid Density (ken)
PIPE-OTpl.MCD F-55

RPP-5346 REV 0 CHZMHILL Hanford Group, Inc.
EVALUATION ANALYSIS Calc. No. PpP-UJ-002
Revision: 9 PaaeNo. 2i6~L@
~~ ~ - Client: ~ C o m m h ‘OD WOlJob No. 110299 & 1 103 Subject: Critical Velocitv and Pressure DIOD SNdv in S U D D O ~ ~ of Date: 03/08/2000
Waste Tank Feed Transfer Svstem Checked: 03/10 12000 By: J. C. Oten ~. Location: 200 Area - Hanford Site. Richland. Washinaton Revised: By:
K ~ = 1 T=60 Dc Dpip,=3.068in L=1OOOft e=Odeg
1 i. 2 i.3 i.4
Carrier Liquid Density (ken) Carrier Liquid Density (kgll)
PIPE-OTpl.MCD F-56

RPP-5346 REV 0 CHZMHILL Hanford Group, Inc.
EVALUATION ANALYSIS Calc. No. RPP-UJ402
Revision: 9 Page No. 57 of 6Q
Client: 2 WO/Job No. 110299 & 1)030WBA10 Subject: Sritical Velocitv and Pressure D ~ O D Studv ill SUDDOfl Of Date: 03/08/2000 By: L u J Y k
Waste Tank Feed Transfer Svste m Checked 03/10/ 2000 By: Jxxml Location: 200Arca - Hanford Site. Richland. Washington Revised By:
K ~ = I j3,,=1.2 T = 6 0 @ C Dpiw = 3.068in
Figure I&. Contour Plot of Beat-EatImate Critical Velocity (Ma) (Oroskar and Turlan lg80) va. Carrier Llquld Denalty and Particle
Denalty for Selected Particle Volume Fractlona.
ad
0.05
0.10
0.30
Carrier Liquid Density (ken)
PIPE-OTpl.MCD F-SI

RPP-5346 REV 0 CHZMHILL Hanford Group, Inc.
EVALUATION ANALYSIS Calc. No. XPP-LJJ-MIZ Revision: 4 page NO. -58 of SQ
'on WOlJob No. a 0 2 9 9 & 10 Subject: Critical Velocihr and Pressure Dron S- SUDDO~ of
Location: 200 Area - Hanford Site. Richland. Washineton Revised. By:
Date: 03/08/2000 ~ d v k & $ & Climt: Numatec Ha&.&&mmt~
Waste Tank Feed Transfe r-rn Checked 03/10/2000 By: T. C. Ohm
Particle Density (kg/L)
Carrier Liquid Density (kglL)
PIPE-OTp(.MCD
Carrier Liquid Denally (kgA)
F-58

RPP-5346 REV 0 &IC. NO. RPP-LJJ-002 CHZMHILL Hanford Group, Inc.
EVALUATION ANALYSIS Revision: 9 PageNo. 59of 6Q
client: N m teC Hmfd c o m i ion AI0 Subject: Critical Vel- P~CSSUR Dr OD s t u d w n of
Location: 200Are a - Hanford Site. Richland. Washineton Revised By: Checked 03/10/2000 Waste Tank Feed Transfer Swtcm
ID,='"..] Dpip = 3.068 in
Figure 2Oc. Contour Plot of Best-Estlmrte Critical Velocity (fth) (Oroskar and Turlan 1980) va. Carrier Llquld Denslty and Particle
Denalty for Selected Particle Volume Fractlona.
Particle Density
a d
0.05
0.10
0.30
PIPE-OTpl.MCD F-59

Flgure F-21. Normalized "Vehicle" Liquid Density and Viscosity Relations vs. "Vehicle" Solids Concentration.
p4pL,@") := pr( 1 + 2.54, + lO.OS.@,' + O.Oo273.exp( 16.6.a"))
P4PS.PL,@") := P,% + P r ( 1 - @")
kg p~ := p e ~ ( p ~ . . T ) p~ = 0.771 CP p, := 3.- liter liter kg T:=60 OC p ~ : = 1.2.-
VehiclelCanier Liquid Viscosity Ratio
VehicldCanier Liquid Density Ratio
Vehicle Soli& Conmuation W)
PIPE-OTpl.MCD F-60

RPP-5346 REV 0
APPENDIX G
WASP MODEL VERIFICATION
Calculations contained herein were produced in Mathcad 2000 Professional (Mafhcad is a registered frademurk of MafhSoft, Inc. of Cambridge, Massachusetts).
G-i

RPP-5346 REV 0
This page intentionally left blank.
G-ii

ft in. Ibf/in* mils a m C P
RPP-5346 REV 0
CONVERSIONS
feet = 0.3048 meter (m) inch = 2.54 centimeters (cm) pounds per square inch = 0.06895 megapascals (MPa) 0.001 in. = 0.0254 millimeter (mm) 0.063 1 litedsecond (Us) centipose = 0.001 kilogramlmeter-second (kg/m-s)
G-iii

RPP-5346 REV 0
This page intentionally left blank.
G-iv

RPP-5346 REV 0 CHZMHILL Hanford Group, Inc. Calc. No. RPP-UJ-002
EVALUATION ANALYSIS Revision: 4 PageNo. I of 7
Client: Numatec Hanford Comora tion WO/Job No. 110299 & 110300/BA10- Subject: Critical VelociN and Pressure DroD SNdv in Sumort of By: L. J. J u l v k a
Waste Tank Feed Transfer Svstem (Warn Test Case) Checked 03/10/2000 By: T. C. Otcn Location: 200 Area - Hanford Site, Richland. Washinaton Revised By:
Date: 03/08/2000
PROBLEM Verification check of Wasp method against published example.
APPROACH
Compare results of Wasp et at. 1977. illustrative example, page 95. with results obtained through application of equations Qiven in Appendix F. All necessary equations are copied from Appendix F with foliowlng modnlcations unique to the check problem:
I. The viscosity relation fmm Wasp et al. 1977. illustrative example, a 2. Stokes flow for the settling particles is assumed In accordance !vi&
95 is used. illustrative example.
CONCLUSION
Less than 0.2% e m is shown between results obtained through application of equations given in Appendix F and results of Wasp et al. 1977, Illustrative example, page 95. This validates the implementation of the Wasp method in Appendix F.
REFERENCES Wasp, E. J.,J. P. Kenny, and R. L. Gandhi, 1977, Solic-LipuidFlow - Sluny Pipeline Transporlaflon. Trans. Tech. Publ.. Rockport, MA.
T O L = I ~ ~ O - '
p I 10-6.m
CP = 1o-*.poiSs
PRELIMINARIES
k :=TOL.IO-' ~e = 1 x io- 8
Return values of vector Op in accordance with nonzero values in
Return da partide diameter that is Bth percentile value by volumes
Da(dp.Om*B) :=
I t length(+$ - 1
k c O
for j E O . . l
if 0 , >k I
o k 'h, I k c k + l
waspchsck.mcd G- 1

RPP-5346 REV 0 CHZMHILL Hanford Group, h e .
Client: Numatec Hanford Como ration WO/JobNo. 110299 & 110300/BA10 Subject: Critical Velocitv and Pressure BOD Study in Suuwrt of Date: 03/08/2000 By:
Location: 200 Area - Hanford Site. Richland. Washinaton Revised By:
Calc. No. RPP-LJJ-002 EVALUATION ANALYSIS Revision: 9
PageNo.
Waste Tank Feed Transfer Svstem (Wasu Test Case) Checked: 03/10/2000 By: T. C. Ote
The Reynolds Number for Newtonian flow is defined as
R C ( D , V , ~ , ~ ) := D+- P P
where D is a characteristic length, v is the flow velocity. p is the fluid density, and p is the fluid viscosity.
The terminal settling velocity (v, ) of spherical partide settling in a stagnant unbound liquid is given by the following:
For Stokes flow (Re c 0.1 )the drag coefficient of a spherical partide is given by
24
Re(Dd, V. PC. ~ c ) cD(Dd,V. Psr P$ :=
V&d.Pd.Pc.Pc) :=P(Pd - Pc)@d)'.(18+k)-'
which leads the following explicit relation for v-
Note that the check problem a s s u m Stokes flow.
The appmximation developed by Churchiil in 19?7 that includes the laminar and turbulent regimes as well as the transition regime between laminar and turbulent flow is used for the friction factor. i.e.;
16 ' 1
where vc flow velocity of carrler liquid
Density of water as a function of temperature (OC)
pw~T)::=[999.7-0.10512~(T- 10)-0.005121.(T- 10)'+0.00001329.(T- IO) 3 1.7 kg m
Viscosity of water as a function of temperature (OC)
massdensityofwater
(5oCcTc100oC)
-3.30233 .cP if T S20 I1 1301
998.333 + 8.1855.(T - 20) + O.O0585.(T - 20)'
.cP othmvise 13 1.3272.(20 - T) - 0.001053.(T - 20)21 T + 105
Waspcheck.rncd G-2

RPP-5346 REV 0 CHZMHILL Hanford Group, Inc.
Client: Numatec Hanford C o r n ration WO/Job No. 110299 & 110300EJA10 Subject: Critical Velociw and Pressure DNJD Studv in SUDWI~ of
Waste Tank Feed Transfer Svstem (Wasp Test Case) Cheeked 03/10/2000 By: T. C. Otcn Location: 200 Area - Hanford Site. Richland. Washington Revised By:
Calc. No. RPP-LJJ-002 EVALUATION ANALYSIS Revision: 4
PageNo.
By: L. J. Julvk&, Date: 03/08/2000
Liquid Density as a Function of Solids Concentration
Pc(PS.PL.@") := PU@" + PL(1 - @")
Viscosity as a function of solids concentration per
Wasp 1977. illustrative example. page 95
il :=0..5 VOI := V k l := I1 il
114 L - 23
Cornparlson of Vlscoslty Relations va. "Vehicle" Solldr Comentratlon.
Wasp et al. 1977. illustrative example, page 95
Waspcheck.mcd G-3

RPP-5346 REV 0 CH2MHILL Hanford Group, Iuc. Calc. No. RPP-LJJ-002
PageNo. 4of 7 Client: Numatec Hanford Colaoration WODobNo. 110299 & 1 1 0 3 0 0 / B A 1 0 ~ Subject: Critical Velwih, and Pressure DIOD Study in Suuoort of Date: 03/08/2000 By: L. J. Julvk
Waste Tank Feed Transfer Svstcm (Warn Test Case) Checked: 03/10/2000 By: T. C. Oten Location: 200 Area - Hanford Site. Richland. Washineton Revised By:
EVALUATION ANALYSIS Revision: 2
Wasp's Method for Pressure Drop Estimate (Wasp et al. 1977)
assume p:= I K := 0.4 L. - 1.8 V*(dp.P..PC.PI)
Durand friction factor correlation (f, = f - fc) using clear liquid densify and viscosity properties of carrier liquid.
vehicle friction contribution normalized to liquid
plus friction contribution from remaining heterogeneous particles
Ovj + Or(V.PLsPv.Pv.dp .PI, o I , f) I
. using dear liquid pmperties
Waspheh.mcd

d Site, Richland. Washineton Revised: BY:
G-5

RPP-5346 REV 0 CH2MHILL Hanford Group, h e . Cak. NO. RPP-LJJ-002
EVALUATION ANALYSIS Revision: 9 PagcNo. 6of 7
By: L. J. J u l v k d Client: Numatec Hanford Cornration WO/Job No. 110299 & 110300/BA10 Subject: Critical VelociN and Pressure Droo Shldv in Su~wrt of
Waste Tank Feed Transfer Svstem ~ W ~ S D Test Case) Checked: 03/10/2000 By: T. C. Ote Location: 200 Area - Hanford Site. Richland Washineton Revised By:
Date: 03/08/2000
Wasp et al. 1977. Illustrative examde. mae 95 dp:=O
Given solid particle size distribution Given parameters
&la := 0.0021 19.55 p 5 .- .-,.s
liter 0.01 11 1.15 Dpjp := 12.h
E := O.Wi.in ft v := 4.5-
L:= 1.R SeC
d = P
Carrier liquid viscosity
Carrier liquid density
Average solids density
ID of pipe
pipe roughness
flow velocity
pipe unit length
WL = 1.002cP
pL = ~ . ~ 8 - kg liter
J :=length(+,) - 1 J = 2 I j
Q,=0.23 j:=O..J Ornj :=-.E +si 0 5 . , = 0
Cumulative undersize volume distribution I I Waspcheck.mcd G-6

FU'P-5346 REV 0 Calc. No. RPP-WJ-002
EVALUATION ANALYSIS Revision: 0 Page No. -7 of 7
WO/JobNo. 110299& 110300iBA10 Date: 03/08/2000 By:
Checked: 03/10/2000 By: Location: 200 Area - Hanford Site, Richland. Washington Revised: By:
Clienk Numatcc Hanford Cornration Subject: Critical Velocitv and Pressure D ~ D Studv in Sumrt of
Waste Tank Feed Transfer Svstem (WUD Test Case)
TOL = 1 x lo-'
~ W : = ~ W ~ ~ D ~ ~ ~ , V , P L , ~ L . E . ~ ~ , P , , ~ ~ , ~ ) fw= 0.05282
= 0.01662 A (ft of waterm of pipe) 0.01659 fl water / fl of pipe reported in Wasp et al. 1977 as approximate answer
APwup(DpiprV.PL,PL,E,dp,PI.o.,L.8)
PUB
Check OK 0.01662 - 0.01659 = o.18% e ~ o o T
0.01659
i o.,,j=0.85%
j = O j = O

RPP-5346
This page intentionally left blank.
G-8